Table of Contents
| 2015 Prospectus |
 |
| ► | iShares Emerging Markets Corporate Bond ETF | CEMB | BATS |
Table of Contents
Table of Contents
|
|
S-1 |
|
|
1 |
|
|
2 |
|
|
13 |
|
|
14 |
|
|
14 |
|
|
17 |
|
|
26 |
|
|
27 |
|
|
28 |
|
|
28 |
|
|
30 |
Table of Contents
Table of Contents
| Ticker: CEMB | Stock Exchange: BATS |
| Annual
Fund Operating Expenses (ongoing expenses that you pay each year as a percentage of the value of your investments) 1 | ||||||
| Management
Fees |
Distribution
and Service (12b-1) Fees |
Other
Expenses |
Total
Annual Fund Operating Expenses | |||
| 0.50% | None | None | 0.50% | |||
| 1 | The expense information in the table has been restated as of March 2, 2015 to reflect current fees. |
| 1 Year | 3 Years | 5 Years | 10 Years | |||
| $51 | $160 | $280 | $628 |
Table of Contents
Table of Contents
Table of Contents
Table of Contents
Table of Contents
Table of Contents
Table of Contents
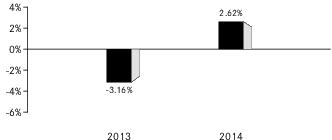
| One Year | Since
Fund Inception | ||
| (Inception Date: 4/17/2012) | |||
| Return Before Taxes | 2.62% | 2.99% | |
| Return After Taxes on Distributions1 | 0.81% | 1.36% | |
| Return After Taxes on Distributions and Sale of Fund Shares1 | 1.50% | 1.60% | |
| Morningstar ® Emerging Markets Corporate Bond IndexSM (Index returns do not reflect deductions for fees, expenses, or taxes) | 3.47% | 3.62% |
| 1 | After-tax returns in the table above are calculated using the historical highest individual U.S. federal marginal income tax rates and do not reflect the impact of state or local taxes. Actual after-tax returns depend on an investor’s tax situation and may differ from those shown, and after-tax returns shown are not relevant to tax-exempt investors or investors who hold shares through tax-deferred arrangements, such as 401(k) plans or individual retirement accounts (“IRAs”). Fund returns after taxes on distributions and sales of Fund shares are calculated assuming that an investor has sufficient capital gains of the same character from other investments to offset any capital losses from the sale of Fund shares. As a result, Fund returns after taxes on distributions and sales of Fund shares may exceed Fund returns before taxes and/or returns after taxes on distributions. |
Table of Contents
Table of Contents
Table of Contents
Table of Contents
Table of Contents
| ■ | The risk of delays in settling portfolio transactions and the risk of loss arising out of the system of share registration and custody used in certain Eastern European countries; |
| ■ | Risks in connection with the maintenance of the Fund's portfolio securities and cash with foreign sub-custodians and securities depositories, including the risk that appropriate sub-custody arrangements will not be available to the Fund; |
Table of Contents
| ■ | The risk that the Fund's ownership rights in portfolio securities could be lost through fraud or negligence as a result of the fact that ownership in shares of certain Eastern European companies is recorded by the companies themselves and by registrars, rather than a central registration system; |
| ■ | The risk that the Fund may not be able to pursue claims on behalf of its shareholders because of the system of share registration and custody, and because certain Eastern European banking institutions and registrars are not guaranteed by their respective governments; and |
| ■ | Risks in connection with Eastern European countries' dependence on the economic health of Western European countries and the European Union (the “EU”) as a whole. |
Table of Contents
Table of Contents
Table of Contents
Table of Contents
Table of Contents
Table of Contents
Table of Contents
Table of Contents
Table of Contents
Table of Contents
Table of Contents
Table of Contents
Table of Contents
Table of Contents
Table of Contents
Table of Contents
Table of Contents
Table of Contents
Table of Contents
Table of Contents
Table of Contents
| Approximate
Value of a Creation Unit |
Creation
Unit Size |
Standard
Creation/ Redemption Transaction Fee |
Maximum
Additional Charge for Creations* |
Maximum
Additional Charge for Redemptions* | ||||
| $5,067,000 | 100,000 | $100 | 3.0% | 2.0% |
| * | As a percentage of the net asset value per Creation Unit, inclusive, in the case of redemptions, of the standard redemption transaction fee. |
Table of Contents
Table of Contents
(For a share outstanding throughout each period)
| Year
ended Oct. 31, 2014 |
Year
ended Oct. 31, 2013 |
Period
from Apr. 17, 2012a to Oct. 31, 2012 | |||
| Net asset value, beginning of period | $ 50.48 | $ 52.93 | $ 50.00 | ||
| Income
from investment operations: | |||||
| Net investment incomeb | 2.01 | 1.92 | 1.07 | ||
| Net realized and unrealized gain (loss)c | 0.75 | (2.49) | 2.76 | ||
| Total from investment operations | 2.76 | (0.57) | 3.83 | ||
| Less distributions from: | |||||
| Net investment income | (2.06) | (1.88) | (0.90) | ||
| Total distributions | (2.06) | (1.88) | (0.90) | ||
| Net asset value, end of period | $ 51.18 | $ 50.48 | $ 52.93 | ||
| Total return | 5.61% | (1.07)% | 7.75% d | ||
| Ratios/Supplemental data: | |||||
| Net assets, end of period (000s) | $25,591 | $35,338 | $21,170 | ||
| Ratio of expenses to average net assetse | 0.60% | 0.60% | 0.60% | ||
| Ratio of net investment income to average net assetse | 3.99% | 3.74% | 3.87% | ||
| Portfolio turnover ratef | 20% | 33% | 29% | ||
| a | Commencement of operations. |
| b | Based on average shares outstanding throughout each period. |
| c | The amounts reported for a share outstanding may not accord with the change in aggregate gains and losses in securities for the fiscal period due to the timing of capital share transactions in relation to the fluctuating market values of the Fund's underlying securities. |
| d | Not annualized. |
| e | Annualized for periods of less than one year. |
| f | Portfolio turnover rates exclude portfolio securities received or delivered as a result of processing capital share transactions in Creation Units. |
Table of Contents
Table of Contents
Table of Contents
| Premium/Discount Range | Number of Days | Percentage of Total Days | ||
| Greater than 1.0% | 1 | 0.40% | ||
| Greater than 0.5% and Less than 1.0% | 13 | 5.16 | ||
| Between 0.5% and -0.5% | 135 | 53.57 | ||
| Less than -0.5% and Greater than -1.0% | 40 | 15.87 | ||
| Less than -1.0% and Greater than -1.5% | 53 | 21.03 | ||
| Less than -1.5% and Greater than -2.0% | 7 | 2.78 | ||
| Less than -2.0% and Greater than -2.5% | 2 | 0.79 | ||
| Less than -2.5% and Greater than -3.0% | 1 | 0.40 | ||
| 252 | 100.00% |
Table of Contents
| Average Annual Total Returns | Cumulative Total Returns | ||||||
| NAV | MARKET | INDEX | NAV | MARKET | INDEX | ||
| 1 Year | 5.61% | 7.24% | 6.12% | 5.61% | 7.24% | 6.12% | |
| Since Inception* | 4.77% | 4.53% | 5.27% | 12.57% | 11.93% | 13.92% | |
| * | Total returns for the period since inception are calculated from the inception date of the Fund (4/17/12). The first day of secondary market trading in shares of the Fund was 4/19/12. |
Table of Contents
Table of Contents
Table of Contents
|
|
| Call: | 1-800-iShares
or 1-800-474-2737 (toll free) Monday through Friday, 8:30 a.m. to 6:30 p.m. (Eastern time) |
| Email: | iSharesETFs@blackrock.com |
| Write: | c/o
BlackRock Investments, LLC 1 University Square Drive, Princeton, NJ 08540 |

Table of Contents
| 2015 Prospectus |
|
| ► | iShares Emerging Markets High Yield Bond ETF | EMHY | BATS |
Table of Contents
Table of Contents
|
|
S-1 |
|
|
1 |
|
|
2 |
|
|
13 |
|
|
14 |
|
|
14 |
|
|
17 |
|
|
26 |
|
|
27 |
|
|
28 |
|
|
28 |
|
|
30 |
Table of Contents
Table of Contents
| Ticker: EMHY | Stock Exchange: BATS |
| Annual
Fund Operating Expenses (ongoing expenses that you pay each year as a percentage of the value of your investments) 1 | ||||||
| Management
Fees |
Distribution
and Service (12b-1) Fees |
Other
Expenses |
Total
Annual Fund Operating Expenses | |||
| 0.50% | None | None | 0.50% | |||
| 1 | The expense information in the table has been restated as of March 2, 2015 to reflect current fees. |
| 1 Year | 3 Years | 5 Years | 10 Years | |||
| $51 | $160 | $280 | $628 |
Table of Contents
Table of Contents
Table of Contents
Table of Contents
Table of Contents
Table of Contents
Table of Contents
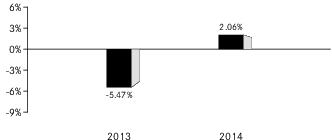
| One Year | Since
Fund Inception | ||
| (Inception Date: 4/3/2012) | |||
| Return Before Taxes | 2.06% | 3.66% | |
| Return After Taxes on Distributions1 | -0.54% | 1.27% | |
| Return After Taxes on Distributions and Sale of Fund Shares1 | 1.22% | 1.81% | |
| Morningstar ® Emerging Markets High Yield Bond IndexSM (Index returns do not reflect deductions for fees, expenses, or taxes) | 2.63% | 4.24% |
| 1 | After-tax returns in the table above are calculated using the historical highest individual U.S. federal marginal income tax rates and do not reflect the impact of state or local taxes. Actual after-tax returns depend on an investor’s tax situation and may differ from those shown, and after-tax returns shown are not relevant to tax-exempt investors or investors who hold shares through tax-deferred arrangements, such as 401(k) plans or individual retirement accounts (“IRAs”). Fund returns after taxes on distributions and sales of Fund shares are calculated assuming that an investor has sufficient capital gains of the same character from other investments to offset any capital losses from the sale of Fund shares. As a result, Fund returns after taxes on distributions and sales of Fund shares may exceed Fund returns before taxes and/or returns after taxes on distributions. |
Table of Contents
Table of Contents
Table of Contents
Table of Contents
Table of Contents
| ■ | The risk of delays in settling portfolio transactions and the risk of loss arising out of the system of share registration and custody used in certain Eastern European countries; |
| ■ | Risks in connection with the maintenance of the Fund's portfolio securities and cash with foreign sub-custodians and securities depositories, including the risk that appropriate sub-custody arrangements will not be available to the Fund; |
Table of Contents
| ■ | The risk that the Fund's ownership rights in portfolio securities could be lost through fraud or negligence as a result of the fact that ownership in shares of certain Eastern European companies is recorded by the companies themselves and by registrars, rather than a central registration system; |
| ■ | The risk that the Fund may not be able to pursue claims on behalf of its shareholders because of the system of share registration and custody, and because certain Eastern European banking institutions and registrars are not guaranteed by their respective governments; and |
| ■ | Risks in connection with Eastern European countries' dependence on the economic health of Western European countries and the EU as a whole. |
Table of Contents
Table of Contents
Table of Contents
Table of Contents
Table of Contents
Table of Contents
Table of Contents
Table of Contents
Table of Contents
Table of Contents
Table of Contents
Table of Contents
Table of Contents
Table of Contents
Table of Contents
Table of Contents
Table of Contents
Table of Contents
Table of Contents
Table of Contents
Table of Contents
| Approximate
Value of a Creation Unit |
Creation
Unit Size |
Standard
Creation/ Redemption Transaction Fee |
Maximum
Additional Charge for Creations* |
Maximum
Additional Charge for Redemptions* | ||||
| $5,012,000 | 100,000 | $100 | 3.0% | 2.0% |
| * | As a percentage of the net asset value per Creation Unit, inclusive, in the case of redemptions, of the standard redemption transaction fee. |
Table of Contents
Table of Contents
(For a share outstanding throughout each period)
| Year
ended Oct. 31, 2014 |
Year
ended Oct. 31, 2013 |
Period
from Apr. 3, 2012a to Oct. 31, 2012 | |||
| Net asset value, beginning of period | $ 50.90 | $ 53.62 | $ 50.02 | ||
| Income
from investment operations: | |||||
| Net investment incomeb | 2.93 | 2.97 | 1.60 | ||
| Net realized and unrealized gain (loss)c | 0.15 | (2.91) | 3.40 | ||
| Total from investment operations | 3.08 | 0.06 | 5.00 | ||
| Less distributions from: | |||||
| Net investment income | (2.95) | (2.78) | (1.40) | ||
| Total distributions | (2.95) | (2.78) | (1.40) | ||
| Net asset value, end of period | $ 51.03 | $ 50.90 | $ 53.62 | ||
| Total return | 6.24% | 0.14% | 10.21% d | ||
| Ratios/Supplemental data: | |||||
| Net assets, end of period (000s) | $199,005 | $203,604 | $166,231 | ||
| Ratio of expenses to average net assetse | 0.65% | 0.65% | 0.65% | ||
| Ratio of net investment income to average net assetse | 5.78% | 5.64% | 5.34% | ||
| Portfolio turnover ratef | 24% | 57% | 40% | ||
| a | Commencement of operations. |
| b | Based on average shares outstanding throughout each period. |
| c | The amounts reported for a share outstanding may not accord with the change in aggregate gains and losses in securities for the fiscal period due to the timing of capital share transactions in relation to the fluctuating market values of the Fund's underlying securities. |
| d | Not annualized. |
| e | Annualized for periods of less than one year. |
| f | Portfolio turnover rates exclude portfolio securities received or delivered as a result of processing capital share transactions in Creation Units. |
Table of Contents
Table of Contents
Table of Contents
| Premium/Discount Range | Number of Days | Percentage of Total Days | ||
| Greater than 1.5% | 2 | 0.79% | ||
| Greater than 1.0% and Less than 1.5% | 1 | 0.40 | ||
| Greater than 0.5% and Less than 1.0% | 90 | 35.72 | ||
| Between 0.5% and -0.5% | 152 | 60.31 | ||
| Less than -0.5% and Greater than -1.0% | 4 | 1.59 | ||
| Less than -1.0% and Greater than -1.5% | 2 | 0.79 | ||
| Less than -1.5% and Greater than -2.0% | 1 | 0.40 | ||
| 252 | 100.00% |
Table of Contents
| Average Annual Total Returns | Cumulative Total Returns | ||||||
| NAV | MARKET | INDEX | NAV | MARKET | INDEX | ||
| 1 Year | 6.24% | 6.94% | 6.86% | 6.24% | 6.94% | 6.86% | |
| Since Inception* | 6.36% | 6.55% | 6.96% | 17.24% | 17.80% | 18.91% | |
| * | Total returns for the period since inception are calculated from the inception date of the Fund (4/3/12). The first day of secondary market trading in shares of the Fund was 4/3/12. |
Table of Contents
Table of Contents
Table of Contents
|
|
| Call: | 1-800-iShares
or 1-800-474-2737 (toll free) Monday through Friday, 8:30 a.m. to 6:30 p.m. (Eastern time) |
| Email: | iSharesETFs@blackrock.com |
| Write: | c/o
BlackRock Investments, LLC 1 University Square Drive, Princeton, NJ 08540 |

Table of Contents
| 2015 Prospectus |
|
| ► | iShares Emerging Markets Local Currency Bond ETF | LEMB | NYSE ARCA |
Table of Contents
Table of Contents
|
|
S-1 |
|
|
1 |
|
|
2 |
|
|
12 |
|
|
13 |
|
|
13 |
|
|
17 |
|
|
25 |
|
|
26 |
|
|
27 |
|
|
27 |
|
|
29 |
Table of Contents
Table of Contents
| Ticker: LEMB | Stock Exchange: NYSE Arca |
| Annual
Fund Operating Expenses (ongoing expenses that you pay each year as a percentage of the value of your investments) 1 | ||||||
| Management
Fees |
Distribution
and Service (12b-1) Fees |
Other
Expenses |
Total
Annual Fund Operating Expenses | |||
| 0.50% | None | None | 0.50% | |||
| 1 | The expense information in the table has been restated as of March 2, 2015 to reflect current fees. |
| 1 Year | 3 Years | 5 Years | 10 Years | |||
| $51 | $160 | $280 | $628 |
Table of Contents
Table of Contents
Table of Contents
Table of Contents
Table of Contents
Table of Contents
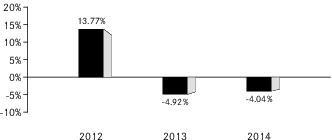
| One Year | Since
Fund Inception | ||
| (Inception Date: 10/18/2011) | |||
| Return Before Taxes | -4.04% | 0.38% | |
| Return After Taxes on Distributions1 | -5.02% | -0.47% | |
| Return After Taxes on Distributions and Sale of Fund Shares1 | -2.13% | 0.05% | |
| Barclays Emerging Markets Broad Local Currency Bond Index (Index returns do not reflect deductions for fees, expenses, or taxes) | -3.67% | 0.67% |
| 1 | After-tax returns in the table above are calculated using the historical highest individual U.S. federal marginal income tax rates and do not reflect the impact of state or local taxes. Actual after-tax returns depend on an investor’s tax situation and may differ from those shown, and after-tax returns shown are not relevant to tax-exempt investors or investors who hold shares through tax-deferred arrangements, such as 401(k) plans or individual retirement accounts (“IRAs”). Fund returns after taxes on distributions and sales of Fund shares are calculated assuming that an investor has sufficient capital gains of the same character from other investments to offset any capital losses from the sale of Fund shares. As a result, Fund returns after taxes on distributions and sales of Fund shares may exceed Fund returns before taxes and/or returns after taxes on distributions. |
Table of Contents
Table of Contents
Table of Contents
Table of Contents
Table of Contents
| ■ | The risk of delays in settling portfolio transactions and the risk of loss arising out of the system of share registration and custody used in certain Eastern European countries; |
| ■ | Risks in connection with the maintenance of the Fund's portfolio securities and cash with foreign sub-custodians and securities depositories, including the risk that appropriate sub-custody arrangements will not be available to the Fund; |
| ■ | The risk that the Fund's ownership rights in portfolio securities could be lost through fraud or negligence as a result of the fact that ownership in shares of certain Eastern European companies is recorded by the companies themselves and by registrars, rather than a central registration system; |
| ■ | The risk that the Fund may not be able to pursue claims on behalf of its shareholders because of the system of share registration and custody, and because certain Eastern European banking institutions and registrars are not guaranteed by their respective governments; and |
| ■ | Risks in connection with Eastern European countries' dependence on the economic health of Western European countries and the European Union as a whole. |
Table of Contents
Table of Contents
Table of Contents
Table of Contents
Table of Contents
Table of Contents
Table of Contents
Table of Contents
Table of Contents
Table of Contents
Table of Contents
Table of Contents
Table of Contents
Table of Contents
Table of Contents
Table of Contents
Table of Contents
Table of Contents
Table of Contents
Table of Contents
| Approximate
Value of a Creation Unit |
Creation
Unit Size |
Standard
Creation/ Redemption Transaction Fee |
Maximum
Additional Charge for Creations* |
Maximum
Additional Charge for Redemptions* | ||||
| $9,506,000 | 200,000 | $2,000 | 7.0% | 2.0% |
| * | As a percentage of the net asset value per Creation Unit, inclusive, in the case of redemptions, of the standard redemption transaction fee. |
Table of Contents
Table of Contents
(For a share outstanding throughout each period)
| Year
ended Oct. 31, 2014 |
Year
ended Oct. 31, 2013 |
Year
ended Oct. 31, 2012 |
Period
from Oct. 18, 2011a to Oct. 31, 2011 | ||||
| Net asset value, beginning of period | $ 50.66 | $ 51.94 | $ 51.13 | $ 49.85 | |||
| Income
from investment operations: | |||||||
| Net investment incomeb | 2.26 | 2.07 | 2.31 | 0.02 | |||
| Net realized and unrealized gain (loss)c | (2.84) | (1.92) | 0.41 | 1.26 | |||
| Total from investment operations | (0.58) | 0.15 | 2.72 | 1.28 | |||
| Less distributions from: | |||||||
| Net investment income | (1.31) | (1.39) | (0.81) | − | |||
| Return of capital | (0.03) | (0.04) | (1.10) | − | |||
| Total distributions | (1.34) | (1.43) | (1.91) | − | |||
| Net asset value, end of period | $ 48.74 | $ 50.66 | $ 51.94 | $ 51.13 | |||
| Total return | (1.14)% | 0.28% | 5.48% | 2.57% d | |||
| Ratios/Supplemental data: | |||||||
| Net assets, end of period (000s) | $584,857 | $638,342 | $207,753 | $30,681 | |||
| Ratio of expenses to average net assetse | 0.59% | 0.60% | 0.60% | 0.60% | |||
| Ratio of expenses to average net assets prior to waived feese | 0.60% | n/a | n/a | n/a | |||
| Ratio of net investment income to average net assetse | 4.56% | 4.04% | 4.57% | 1.21% | |||
| Portfolio turnover ratef | 43% | 41% | 61% | 0% | |||
| a | Commencement of operations. |
| b | Based on average shares outstanding throughout each period. |
| c | The amounts reported for a share outstanding may not accord with the change in aggregate gains and losses in securities for the fiscal period due to the timing of capital share transactions in relation to the fluctuating market values of the Fund's underlying securities. |
| d | Not annualized. |
| e | Annualized for periods of less than one year. |
| f | Portfolio turnover rates exclude portfolio securities received or delivered in Creation Units but include portfolio transactions that are executed as a result of the Fund processing capital share transactions in Creation Units partially for cash in U.S. dollars. Excluding such cash transactions, the portfolio turnover rates for the years ended October 31, 2014, October 31, 2013 and October 30, 2012 were 36%, 39% and 61%, respectively. |
Table of Contents
Table of Contents
Table of Contents
| Premium/Discount Range | Number of Days | Percentage of Total Days | ||
| Greater than 1.0% and Less than 1.5% | 4 | 1.59% | ||
| Greater than 0.5% and Less than 1.0% | 24 | 9.52 | ||
| Between 0.5% and -0.5% | 217 | 86.11 | ||
| Less than -0.5% and Greater than -1.0% | 7 | 2.78 | ||
| 252 | 100.00% |
Table of Contents
| Average Annual Total Returns | Cumulative Total Returns | ||||||
| NAV | MARKET | INDEX | NAV | MARKET | INDEX | ||
| 1 Year | (1.14)% | (0.89)% | (0.53)% | (1.14)% | (0.89)% | (0.53)% | |
| Since Inception* | 2.35% | 2.24% | 2.69% | 7.31% | 6.97% | 8.38% | |
| * | Total returns for the period since inception are calculated from the inception date of the Fund (10/18/11). The first day of secondary market trading in shares of the Fund was 10/20/11. |
Table of Contents
Table of Contents
|
|
| Call: | 1-800-iShares
or 1-800-474-2737 (toll free) Monday through Friday, 8:30 a.m. to 6:30 p.m. (Eastern time) |
| Email: | iSharesETFs@blackrock.com |
| Write: | c/o
BlackRock Investments, LLC 1 University Square Drive, Princeton, NJ 08540 |

Table of Contents
| 2015 Prospectus |
|
| ► | iShares Global ex USD High Yield Corporate Bond ETF | HYXU | BATS |
Table of Contents
Table of Contents
|
|
S-1 |
|
|
1 |
|
|
2 |
|
|
10 |
|
|
11 |
|
|
11 |
|
|
14 |
|
|
23 |
|
|
24 |
|
|
25 |
|
|
25 |
|
|
27 |
Table of Contents
Table of Contents
| Ticker: HYXU | Stock Exchange: BATS |
| Annual
Fund Operating Expenses (ongoing expenses that you pay each year as a percentage of the value of your investments) | ||||||||||
| Management
Fees |
Distribution
and Service (12b-1) Fees |
Other
Expenses |
Total
Annual Fund Operating Expenses |
Fee Waiver | Total
Annual Fund Operating Expenses After Fee Waiver | |||||
| 0.55% | None | None | 0.55% | (0.15)% | 0.40% | |||||
| 1 Year | 3 Years | 5 Years | 10 Years | |||
| $41 | $161 | $292 | $675 |
Table of Contents
Table of Contents
Table of Contents
Table of Contents
Table of Contents
Table of Contents
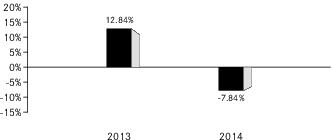
| One Year | Since
Fund Inception | ||
| (Inception Date: 4/3/2012) | |||
| Return Before Taxes | -7.84% | 5.64% | |
| Return After Taxes on Distributions1 | -9.46% | 3.51% | |
| Return After Taxes on Distributions and Sale of Fund Shares1 | -4.35% | 3.44% | |
| Markit iBoxx Global Developed Markets ex-US High Yield Index (Index returns do not reflect deductions for fees, expenses, or taxes) | -7.90% | 5.59% |
| 1 | After-tax returns in the table above are calculated using the historical highest individual U.S. federal marginal income tax rates and do not reflect the impact of state or local taxes. Actual after-tax returns depend on an investor’s tax situation and may differ from those shown, and after-tax returns shown are not relevant to tax-exempt investors or investors who hold shares through tax-deferred arrangements, such as 401(k) plans or individual retirement accounts (“IRAs”). Fund returns after taxes on distributions and sales of Fund shares are calculated assuming that an investor has sufficient capital gains of the same character from other investments to offset any capital losses from the sale of Fund shares. As a result, Fund returns after taxes on distributions and sales of Fund shares may exceed Fund returns before taxes and/or returns after taxes on distributions. |
Table of Contents
Table of Contents
Table of Contents
Table of Contents
Table of Contents
Table of Contents
Table of Contents
Table of Contents
Table of Contents
Table of Contents
Table of Contents
Table of Contents
Table of Contents
Table of Contents
Table of Contents
Table of Contents
Table of Contents
Table of Contents
Table of Contents
Table of Contents
Table of Contents
Table of Contents
Table of Contents
| Approximate
Value of a Creation Unit |
Creation
Unit Size |
Standard
Creation/ Redemption Transaction Fee |
Maximum
Additional Charge for Creations* |
Maximum
Additional Charge for Redemptions* | ||||
| $5,276,000 | 100,000 | $1,900 | 3.0% | 2.0% |
| * | As a percentage of the net asset value per Creation Unit, inclusive, in the case of redemptions, of the standard redemption transaction fee. |
Table of Contents
Table of Contents
(For a share outstanding throughout each period)
| Year
ended Oct. 31, 2014 |
Year
ended Oct. 31, 2013 |
Period
from Apr. 3, 2012a to Oct. 31, 2012 | |||
| Net asset value, beginning of period | $ 56.84 | $ 52.01 | $ 50.14 | ||
| Income
from investment operations: | |||||
| Net investment incomeb | 2.43 | 3.15 | 1.94 | ||
| Net realized and unrealized gain (loss)c | (3.55) | 4.51 | 1.18 | ||
| Total from investment operations | (1.12) | 7.66 | 3.12 | ||
| Less distributions from: | |||||
| Net investment income | (2.82) | (2.83) | (1.25) | ||
| Total distributions | (2.82) | (2.83) | (1.25) | ||
| Net asset value, end of period | $ 52.90 | $ 56.84 | $ 52.01 | ||
| Total return | (2.20)% | 15.20% | 6.49% d | ||
| Ratios/Supplemental data: | |||||
| Net assets, end of period (000s) | $142,827 | $51,153 | $26,004 | ||
| Ratio of expenses to average net assetse | 0.40% | 0.40% | 0.40% | ||
| Ratio of expenses to average net assets prior to waived feese | 0.55% | 0.55% | 0.55% | ||
| Ratio of net investment income to average net assetse | 4.25% | 5.85% | 6.92% | ||
| Portfolio turnover ratef | 25% | 33% | 18% | ||
| a | Commencement of operations. |
| b | Based on average shares outstanding throughout each period. |
| c | The amounts reported for a share outstanding may not accord with the change in aggregate gains and losses in securities for the fiscal period due to the timing of capital share transactions in relation to the fluctuating market values of the Fund's underlying securities. |
| d | Not annualized. |
| e | Annualized for periods of less than one year. |
| f | Portfolio turnover rates exclude portfolio securities received or delivered as a result of processing capital share transactions in Creation Units. |
Table of Contents
Table of Contents
Table of Contents
| Premium/Discount Range | Number of Days | Percentage of Total Days | ||
| Greater than 1.0% and Less than 1.5% | 4 | 1.59% | ||
| Greater than 0.5% and Less than 1.0% | 79 | 31.35 | ||
| Between 0.5% and -0.5% | 161 | 63.88 | ||
| Less than -0.5% and Greater than -1.0% | 4 | 1.59 | ||
| Less than -1.0% and Greater than -1.5% | 2 | 0.79 | ||
| Less than -1.5% and Greater than -2.0% | 1 | 0.40 | ||
| Less than -2.0% | 1 | 0.40 | ||
| 252 | 100.00% |
Table of Contents
| Average Annual Total Returns | Cumulative Total Returns | ||||||
| NAV | MARKET | INDEX | NAV | MARKET | INDEX | ||
| 1 Year | (2.20)% | (2.27)% | (2.27)% | (2.20)% | (2.27)% | (2.27)% | |
| Since Inception* | 7.31% | 7.51% | 7.24% | 19.98% | 20.56% | 19.73% | |
| * | Total returns for the period since inception are calculated from the inception date of the Fund (4/3/12). The first day of secondary market trading in shares of the Fund was 4/3/12. |
Table of Contents
Table of Contents
Table of Contents
Table of Contents
|
|
| Call: | 1-800-iShares
or 1-800-474-2737 (toll free) Monday through Friday, 8:30 a.m. to 6:30 p.m. (Eastern time) |
| Email: | iSharesETFs@blackrock.com |
| Write: | c/o
BlackRock Investments, LLC 1 University Square Drive, Princeton, NJ 08540 |

Table of Contents
| 2015 Prospectus |
|
| ► | iShares Global High Yield Corporate Bond ETF | GHYG | BATS |
Table of Contents
Table of Contents
Table of Contents
Table of Contents
| Ticker: GHYG | Stock Exchange: BATS |
| Annual
Fund Operating Expenses (ongoing expenses that you pay each year as a percentage of the value of your investments) | ||||||||||
| Management
Fees |
Distribution
and Service (12b-1) Fees |
Other
Expenses |
Total
Annual Fund Operating Expenses |
Fee Waiver | Total
Annual Fund Operating Expenses After Fee Waiver | |||||
| 0.55% | None | None | 0.55% | (0.15)% | 0.40% | |||||
| 1 Year | 3 Years | 5 Years | 10 Years | |||
| $41 | $161 | $292 | $675 |
Table of Contents
Table of Contents
Table of Contents
Table of Contents
Table of Contents
Table of Contents
| One Year | Since
Fund Inception | ||
| (Inception Date: 4/3/2012) | |||
| Return Before Taxes | -0.67% | 6.00% | |
| Return After Taxes on Distributions1 | -2.96% | 3.57% | |
| Return After Taxes on Distributions and Sale of Fund Shares1 | -0.34% | 3.56% | |
| Markit iBoxx Global Developed Markets High Yield Index (Index returns do not reflect deductions for fees, expenses, or taxes) | -0.68% | 6.11% |
| 1 | After-tax returns in the table above are calculated using the historical highest individual U.S. federal marginal income tax rates and do not reflect the impact of state or local taxes. Actual after-tax returns depend on an investor’s tax situation and may differ from those shown, and after-tax returns shown are not relevant to tax-exempt investors or investors who hold shares through tax-deferred arrangements, such as 401(k) plans or individual retirement accounts (“IRAs”). Fund returns after taxes on distributions and sales of Fund shares are calculated assuming that an investor has sufficient capital gains of the same character from other investments to offset any capital losses from the sale of Fund shares. As a result, Fund returns after taxes on distributions and sales of Fund shares may exceed Fund returns before taxes and/or returns after taxes on distributions. |
Table of Contents
Table of Contents
Table of Contents
Table of Contents
Table of Contents
Table of Contents
Table of Contents
Table of Contents
Table of Contents
Table of Contents
Table of Contents
Table of Contents
Table of Contents
Table of Contents
Table of Contents
Table of Contents
http://www.batstrading.com/listings/market_maker/etp/. This reference to the BATS website does not incorporate the contents of that website into this prospectus.
Table of Contents
Table of Contents
Table of Contents
Table of Contents
Table of Contents
Table of Contents
Table of Contents
| Approximate
Value of a Creation Unit |
Creation
Unit Size |
Standard
Creation/ Redemption Transaction Fee |
Maximum
Additional Charge for Creations* |
Maximum
Additional Charge for Redemptions* | ||||
| $5,145,000 | 100,000 | $1,250 | 3.0% | 2.0% |
| * | As a percentage of the net asset value per Creation Unit, inclusive, in the case of redemptions, of the standard redemption transaction fee. |
Table of Contents
Table of Contents
(For a share outstanding throughout each period)
| Year
ended Oct. 31, 2014 |
Year
ended Oct. 31, 2013 |
Period
from Apr. 3, 2012a to Oct. 31, 2012 | |||
| Net asset value, beginning of period | $ 53.50 | $ 51.67 | $ 50.00 | ||
| Income
from investment operations: | |||||
| Net investment incomeb | 2.84 | 3.05 | 1.82 | ||
| Net realized and unrealized gain (loss)c | (1.28) | 1.70 | 1.35 | ||
| Total from investment operations | 1.56 | 4.75 | 3.17 | ||
| Less distributions from: | |||||
| Net investment income | (3.06) | (2.92) | (1.50) | ||
| Total distributions | (3.06) | (2.92) | (1.50) | ||
| Net asset value, end of period | $ 52.00 | $ 53.50 | $ 51.67 | ||
| Total return | 2.91% | 9.50% | 6.53% d | ||
| Ratios/Supplemental data: | |||||
| Net assets, end of period (000s) | $104,002 | $74,893 | $36,169 | ||
| Ratio of expenses to average net assetse | 0.40% | 0.40% | 0.40% | ||
| Ratio of expenses to average net assets prior to waived feese | 0.55% | 0.55% | 0.55% | ||
| Ratio of net investment income to average net assetse | 5.31% | 5.82% | 6.28% | ||
| Portfolio turnover ratef | 21% | 20% | 10% | ||
| a | Commencement of operations. |
| b | Based on average shares outstanding throughout each period. |
| c | The amounts reported for a share outstanding may not accord with the change in aggregate gains and losses in securities for the fiscal period due to the timing of capital share transactions in relation to the fluctuating market values of the Fund's underlying securities. |
| d | Not annualized. |
| e | Annualized for periods of less than one year. |
| f | Portfolio turnover rates exclude portfolio securities received or delivered as a result of processing capital share transactions in Creation Units. |
Table of Contents
Table of Contents
Table of Contents
| Premium/Discount Range | Number of Days | Percentage of Total Days | ||
| Greater than 1.0% | 3 | 1.19% | ||
| Greater than 0.5% and Less than 1.0% | 42 | 16.67 | ||
| Between 0.5% and -0.5% | 198 | 78.57 | ||
| Less than -0.5% and Greater than -1.0% | 5 | 1.98 | ||
| Less than -1.0% | 4 | 1.59 | ||
| 252 | 100.00% |
Table of Contents
| Average Annual Total Returns | Cumulative Total Returns | ||||||
| NAV | MARKET | INDEX | NAV | MARKET | INDEX | ||
| 1 Year | 2.91% | 2.38% | 2.94% | 2.91% | 2.38% | 2.94% | |
| Since Inception* | 7.33% | 7.31% | 7.48% | 20.04% | 19.96% | 20.41% | |
| * | Total returns for the period since inception are calculated from the inception date of the Fund (4/3/12). The first day of secondary market trading in shares of the Fund was 4/5/12. |
Table of Contents
Table of Contents
Table of Contents
Table of Contents
|
|
| Call: | 1-800-iShares
or 1-800-474-2737 (toll free) Monday through Friday, 8:30 a.m. to 6:30 p.m. (Eastern time) |
| Email: | iSharesETFs@blackrock.com |
| Write: | c/o
BlackRock Investments, LLC 1 University Square Drive, Princeton, NJ 08540 |

Table of Contents
| 2014 Prospectus |
 |
| ► | iShares Core MSCI Emerging Markets ETF | IEMG | NYSE ARCA |
Table of Contents
Table of Contents
|
|
S-1 |
|
|
1 |
|
|
2 |
|
|
15 |
|
|
18 |
|
|
19 |
|
|
22 |
|
|
33 |
|
|
34 |
|
|
35 |
|
|
35 |
|
|
37 |
Table of Contents
Table of Contents
| Ticker: IEMG | Stock Exchange: NYSE Arca |
| Annual
Fund Operating Expenses (ongoing expenses that you pay each year as a percentage of the value of your investments) | ||||||||||||||
| Management
Fees |
Distribution
and Service (12b-1) Fees |
Foreign
Taxes |
Other
Expenses |
Acquired
Fund Fees and Expenses |
Total
Annual Fund Operating Expenses |
Fee Waiver | Total
Annual Fund Operating Expenses After Fee Waiver | |||||||
| 0.18% | None | 0.00% | None | 0.00% | 0.18% | (0.00)% | 0.18% | |||||||
Table of Contents
| 1 Year | 3 Years | 5 Years | 10 Years | |||
| $18 | $58 | $101 | $230 |
Table of Contents
Table of Contents
Table of Contents
Table of Contents
Table of Contents
| 1 | The Fund’s year-to-date return as of September 30, 2014 was 2.73%. |
Table of Contents
| One Year | Since
Fund Inception | ||
| (Inception Date: 10/18/2012) | |||
| Return Before Taxes | -2.16% | 1.90% | |
| Return After Taxes on Distributions1 | -2.55% | 1.53% | |
| Return After Taxes on Distributions and Sale of Fund Shares1 | -0.86% | 1.48% | |
| MSCI Emerging Markets IMI (Index returns do not reflect deductions for fees, expenses or taxes) | -2.20% | 1.72% |
| 1 | After-tax returns in the table above are calculated using the historical highest individual U.S. federal marginal income tax rates and do not reflect the impact of state or local taxes. Actual after-tax returns depend on an investor’s tax situation and may differ from those shown, and after-tax returns shown are not relevant to tax-exempt investors or investors who hold shares through tax-deferred arrangements, such as 401(k) plans or individual retirement accounts (“IRAs”). Fund returns after taxes on distributions and sales of Fund shares are calculated assuming that an investor has sufficient capital gains of the same character from other investments to offset any capital losses from the sale of Fund shares. As a result, Fund returns after taxes on distributions and sales of Fund shares may exceed Fund returns before taxes and/or returns after taxes on distributions. |
Table of Contents
Table of Contents
Table of Contents
Table of Contents
Table of Contents
Table of Contents
Table of Contents
Table of Contents
Table of Contents
Table of Contents
| ■ | Lower levels of liquidity and market efficiency; |
| ■ | Greater securities price volatility; |
| ■ | Exchange rate fluctuations and exchange controls; |
| ■ | Less availability of public information about issuers; |
| ■ | Limitations on foreign ownership of securities; |
| ■ | Imposition of withholding or other taxes; |
| ■ | Imposition of restrictions on the expatriation of the funds or other assets of the Fund; |
Table of Contents
| ■ | Higher transaction and custody costs and delays in settlement procedures; |
| ■ | Difficulties in enforcing contractual obligations; |
| ■ | Lower levels of regulation of the securities markets; |
| ■ | Weaker accounting, disclosure and reporting requirements; and |
| ■ | Legal principles relating to corporate governance, directors’ fiduciary duties and liabilities and stockholders’ rights in markets in which the Fund invests may differ and/or may not be as extensive or protective as those that apply in the United States. |
Table of Contents
| ■ | The risk of delays in settling portfolio transactions and the risk of loss arising out of the system of share registration and custody used in Russia; |
| ■ | Risks in connection with the maintenance of the Fund’s portfolio securities and cash with foreign sub-custodians and securities depositories, including the risk that appropriate sub-custody arrangements will not be available to the Fund; |
| ■ | The risk that the Fund’s ownership rights in portfolio securities could be lost through fraud or negligence as a result of the fact that ownership in shares of Russian companies is recorded by the companies themselves and by registrars, rather than by a central registration system; and |
| ■ | The risk that the Fund may not be able to pursue claims on behalf of its shareholders because of the system of share registration and custody, and because Russian banking institutions and registrars are not guaranteed by the Russian government. |
Table of Contents
Table of Contents
Table of Contents
Table of Contents
| ■ | where a non-resident investor has made any investment, directly or indirectly, in a foreign institutional investor (“FII”) which has invested in India; |
| ■ | investment by the non-resident investor in a fund or a fund pooling vehicle, which does not result in participation in control and management of the fund; or |
| ■ | where a non-resident investor along with its associates, does not have more than a 26% share in total capital of the company. |
| ■ | creates rights, or obligations, which are not ordinarily created between persons dealing at arm's length; |
| ■ | results, directly or indirectly, in the misuse, or abuse, of the provisions of IT Act; |
| ■ | lacks commercial substance; or |
| ■ | is entered into, or carried out, by means, or in a manner, which are not ordinarily employed for bona fide purposes. |
| ■ | any arrangement where the aggregate tax benefit to all the parties of the arrangement in the relevant financial year does not exceed INR 30 Million; |
| ■ | FIIs that choose not to take any benefit under any tax treaty entered with India and |
Table of Contents
| ■ | non-resident investor in an FII who has invested in an FII, directly or indirectly, by way of an offshore derivative instrument or otherwise; or |
| ■ | any income derived from the transfer of investments made prior to August 30, 2010. |
Table of Contents
Table of Contents
| ■ | The risk of delays in settling portfolio transactions and the risk of loss arising out of the system of share registration and custody used in certain Eastern European countries; |
| ■ | Risks in connection with the maintenance of the Fund's portfolio securities and cash with foreign sub-custodians and securities depositories, including the risk that appropriate sub-custody arrangements will not be available to the Fund; |
| ■ | The risk that the Fund's ownership rights in portfolio securities could be lost through fraud or negligence as a result of the fact that ownership in shares of certain Eastern European companies is recorded by the companies themselves and by registrars, rather than a central registration system; |
| ■ | The risk that the Fund may not be able to pursue claims on behalf of its shareholders because of the system of share registration and custody, and because certain Eastern European banking institutions and registrars are not guaranteed by their respective governments; and |
| ■ | Risks in connection with Eastern European countries' dependence on the economic health of Western European countries and the EU as a whole. |
Table of Contents
Table of Contents
Table of Contents
Table of Contents
Table of Contents
Table of Contents
Table of Contents
Table of Contents
Table of Contents
Table of Contents
Table of Contents
| ■ | Dividend: Dividend income earned by the Subsidiary will not be subject to Indian tax. However, the Indian company declaring and paying such dividend would be subject to Dividend Distribution Tax at an effective rate of 20% (approx.) (effective starting October 1, 2014) on the amount of the dividend paid out. |
| ■ | Interest: Interest paid to the Subsidiary in respect of debt obligations of Indian issuers will be subject to Indian income tax. The tax rate in the case of a rupee-denominated debt obligation is 43.26%. However if the Subsidiary is a SEBI registered sub-account, interest income earned from June 1, 2013 to May 31, 2015 on rupee denominated bonds of Indian companies and Indian government securities will be subject to tax at the rate of 5.41%, provided that the rate of interest does not exceed the prescribed rates. In the case of a foreign-currency denominated debt obligation, the tax rate is 21.63%. For approved foreign-currency loans advanced |
Table of Contents
| from July 1, 2012 to June 30, 2017, the tax rate on interest is 5.41% and for approved foreign currency long-term bonds issued from October 1, 2014 to June 30, 2017, the tax rate on interest is 5.41%. However, if the Subsidiary is registered as a sub-account with SEBI, interest from securities will be subject to tax at the rate of 21.63%. | |
| ■ | Securities Transaction Tax: Transactions involving the purchase or sale of shares or any other security traded on a recognized Indian stock exchange are subject to Securities Transaction Tax (“STT”). STT will be levied at the rate of 0.001% on the seller in case of actual delivery of the security and at the rate of 0.2% on the sale of unlisted shares in an initial public offering. This STT is not applicable to primary issuances of equity shares by a company or to off-market transactions. Hence, STT will be payable if the Subsidiary buys or sells listed securities on a recognized Indian stock exchange. |
| ■ | Capital Gains: The taxation of capital gains would be as follows: (i) long-term capital gains (being gains on sale of shares held for a period of more than twelve months) listed on a recognized stock exchange would not be taxable in India provided STT has been paid on the same (as discussed above); (ii) short-term capital gains (being gains on sale of shares held for a period of twelve months or less) from the sale of Indian shares listed on a recognized stock exchange will be taxed at the rate of 16.223% provided STT has been paid on the same; (iii) long-term capital gains (being gains on sale of shares held for a period of more than 36 months) arising to the Subsidiary from the sale of unlisted securities will be taxed at the rate of 10.815% (without indexation) and short-term capital gains (being gains on sale of shares held for a period of 36 months or less) will be taxed at the rate of 43.26%;* (iv) capital gains realized on sale of listed equity shares not executed on a recognized stock exchange in India would be taxed at the rate of 21.63% for long-term gains (being gains on sale of shares held for a period of more than 12 months) and at 43.26% in the case of short-term gains (being gains on sale of shares held for a period of 12 months or less);* and (v) capital gains arising from the transfer of depositary receipts outside India between non-resident investors will not be subject to tax in India. |
| * | However, if the Subsidiary is a SEBI registered sub-account, the rates will be 10.816% and 32.45%, respectively. |
Table of Contents
| ■ | any arrangement where the aggregate tax benefit to all the parties of the arrangement in the relevant financial year does not exceed INR 30 Million; |
| ■ | FIIs that choose not to take any benefit under any tax treaty entered with India and has invested in listed or unlisted securities with prior permission of the competent authority in accordance with the applicable regulations; |
| ■ | non-resident investor in an FII who has invested in an FII, directly or indirectly, by way of an offshore derivative instrument or otherwise; or |
| ■ | any income derived from the transfer of investments made prior to August 30, 2010. |
Table of Contents
Table of Contents
| Approximate
Value of a Creation Unit |
Creation
Unit Size |
Standard
Creation/ Redemption Transaction Fee |
Maximum
Additional Charge for Creations* |
Maximum
Additional Charge for Redemptions* | ||||
| $10,010,000 | 200,000 | $15,000 | 5.0% | 2.0% |
| * | As a percentage of the net asset value per Creation Unit, inclusive, in the case of redemptions, of the standard redemption transaction fee. |
Table of Contents
Table of Contents
(For a share outstanding throughout each period)
| Year
ended Aug. 31, 2014 |
Period
from Oct. 18, 2012a to Aug. 31, 2013 | ||
| Net asset value, beginning of period | $ 45.71 | $ 49.06 | |
| Income
from investment operations: | |||
| Net investment incomeb | 1.31 | 1.33 | |
| Net realized and unrealized gain (loss)c | 7.78 | (4.14) | |
| Total from investment operations | 9.09 | (2.81) | |
| Less distributions from: | |||
| Net investment income | (0.91) | (0.54) | |
| Total distributions | (0.91) | (0.54) | |
| Net asset value, end of period | $ 53.89 | $ 45.71 | |
| Total return | 20.05% | (5.75)% d | |
| Ratios/Supplemental data: | |||
| Net assets, end of period (000s) | $5,669,167 | $1,864,965 | |
| Ratio of expenses to average net assetse | 0.17% | 0.05% | |
| Ratio of expenses to average net assets prior to waived feese | 0.18% | 0.18% | |
| Ratio of net investment income to average net assetse | 2.61% | 3.17% | |
| Portfolio turnover ratef | 8% | 15% | |
| a | Commencement of operations. |
| b | Based on average shares outstanding throughout each period. |
| c | The amounts reported for a share outstanding may not accord with the change in aggregate gains and losses in securities for the fiscal period due to the timing of capital share transactions in relation to the fluctuating market values of the Fund's underlying securities. |
| d | Not annualized. |
| e | Annualized for periods of less than one year. |
| f | Portfolio turnover rates exclude portfolio securities received or delivered in Creation Units but includes portfolio transactions that are executed as a result of the Fund processing capital share transactions in Creation Units partially for cash in U.S. dollars. Excluding such cash transactions, the portfolio turnover rates for the year ended August 31, 2014 and the period ended August 31, 2013 were 8% and 15%, respectively. |
Table of Contents
Table of Contents
Table of Contents
| Premium/Discount Range | Number of Days | Percentage of Total Days | ||
| Greater than 2.0% | 1 | 0.23% | ||
| Greater than 1.5% and Less than 2.0% | 7 | 1.59 | ||
| Greater than 1.0% and Less than 1.5% | 19 | 4.32 | ||
| Greater than 0.5% and Less than 1.0% | 102 | 23.18 | ||
| Between 0.5% and -0.5% | 258 | 58.64 | ||
| Less than -0.5% and Greater than -1.0% | 36 | 8.18 | ||
| Less than -1.0% and Greater than -1.5% | 12 | 2.73 | ||
| Less than -1.5% and Greater than -2.0% | 3 | 0.68 | ||
| Less than -2.0% and Greater than -2.5% | 2 | 0.45 | ||
| 440 | 100.00% |
Table of Contents
| Average Annual Total Returns | Cumulative Total Returns | ||||||
| NAV | MARKET | INDEX | NAV | MARKET | INDEX | ||
| 1 Year | 20.05% | 20.98% | 20.12% | 20.05% | 20.98% | 20.12% | |
| Since Inception* | 6.83% | 6.87% | 6.83% | 13.15% | 13.24% | 13.13% | |
| * | Total returns for the period since inception are calculated from the inception date of the Fund (10/18/12). The first day of secondary market trading in shares of the Fund was 10/22/12. |
Table of Contents
Table of Contents
Table of Contents
Table of Contents
| Call: | 1-800-iShares
or 1-800-474-2737 (toll free) Monday through Friday, 8:30 a.m. to 6:30 p.m. (Eastern time) |
| Email: | iSharesETFs@blackrock.com |
| Write: | c/o
BlackRock Investments, LLC 1 University Square Drive, Princeton, NJ 08540 |


Table of Contents
| 2014 Prospectus |
|
| ► | iShares MSCI BRIC ETF | BKF | NYSE ARCA |
Table of Contents
Table of Contents
|
|
S-1 |
|
|
1 |
|
|
2 |
|
|
17 |
|
|
19 |
|
|
19 |
|
|
23 |
|
|
35 |
|
|
36 |
|
|
37 |
|
|
37 |
|
|
39 |
Table of Contents
Table of Contents
| Ticker: BKF | Stock Exchange: NYSE Arca |
| Annual
Fund Operating Expenses (ongoing expenses that you pay each year as a percentage of the value of your investments) | ||||||||
| Management
Fees |
Distribution
and Service (12b-1) Fees |
Foreign
Taxes |
Other
Expenses |
Total
Annual Fund Operating Expenses | ||||
| 0.68% | None | 0.00% | None | 0.68% | ||||
| 1 Year | 3 Years | 5 Years | 10 Years | |||
| $69 | $218 | $379 | $847 |
Table of Contents
Table of Contents
Table of Contents
Table of Contents
Table of Contents
Table of Contents
| 1 | The Fund’s year-to-date return as of September 30, 2014 was 0.71%. |
Table of Contents
| One Year | Five Years | Since
Fund Inception | |||
| (Inception Date: 11/12/2007) | |||||
| Return Before Taxes | -4.26% | 11.27% | -4.66% | ||
| Return After Taxes on Distributions1 | -4.71% | 10.93% | -4.95% | ||
| Return After Taxes on Distributions and Sale of Fund Shares1 | -1.87% | 9.17% | -3.34% | ||
| MSCI BRIC Index (Index returns do not reflect deductions for fees, expenses or taxes) | -3.53% | 12.52% | -4.26% |
| 1 | After-tax returns in the table above are calculated using the historical highest individual U.S. federal marginal income tax rates and do not reflect the impact of state or local taxes. Actual after-tax returns depend on an investor’s tax situation and may differ from those shown, and after-tax returns shown are not relevant to tax-exempt investors or investors who hold shares through tax-deferred arrangements, such as 401(k) plans or individual retirement accounts (“IRAs”). Fund returns after taxes on distributions and sales of Fund shares are calculated assuming that an investor has sufficient capital gains of the same character from other investments to offset any capital losses from the sale of Fund shares. As a result, Fund returns after taxes on distributions and sales of Fund shares may exceed Fund returns before taxes and/or returns after taxes on distributions. |
Table of Contents
Table of Contents
Table of Contents
Table of Contents
Table of Contents
Table of Contents
Table of Contents
Table of Contents
Table of Contents
Table of Contents
| ■ | Lower levels of liquidity and market efficiency; |
| ■ | Greater securities price volatility; |
| ■ | Exchange rate fluctuations and exchange controls; |
| ■ | Less availability of public information about issuers; |
| ■ | Limitations on foreign ownership of securities; |
| ■ | Imposition of withholding or other taxes; |
| ■ | Imposition of restrictions on the expatriation of the funds or other assets of the Fund; |
| ■ | Higher transaction and custody costs and delays in settlement procedures; |
Table of Contents
| ■ | Difficulties in enforcing contractual obligations; |
| ■ | Lower levels of regulation of the securities markets; |
| ■ | Weaker accounting, disclosure and reporting requirements; and |
| ■ | Legal principles relating to corporate governance, directors’ fiduciary duties and liabilities and stockholders’ rights in markets in which the Fund invests may differ and/or may not be as extensive or protective as those that apply in the United States. |
Table of Contents
Table of Contents
| ■ | The risk of delays in settling portfolio transactions and the risk of loss arising out of the system of share registration and custody used in Russia; |
| ■ | Risks in connection with the maintenance of the Fund’s portfolio securities and cash |
Table of Contents
| ■ | The risk that the Fund’s ownership rights in portfolio securities could be lost through fraud or negligence as a result of the fact that ownership in shares of Russian companies is recorded by the companies themselves and by registrars, rather than by a central registration system; and |
| ■ | The risk that the Fund may not be able to pursue claims on behalf of its shareholders because of the system of share registration and custody, and because Russian banking institutions and registrars are not guaranteed by the Russian government. |
Table of Contents
Table of Contents
Heavy Government Control and Regulation. Despite significant recent reform and privatization, the Russian government continues to control a large share of economic activity in the region. The Russian government owns shares in corporations in a range of sectors, including banking, energy production, and distribution, automotive, transportation and telecommunications. Government spending in Russia remains high compared to that of other countries.
Table of Contents
| ■ | where a non-resident investor has made any investment, directly or indirectly, in a foreign institutional investor (“FII”) which has invested in India; |
| ■ | investment by the non-resident investor in a fund or a fund pooling vehicle, which does not result in participation in control and management of the fund; or |
| ■ | where a non-resident investor along with its associates, does not have more than a 26% share in total capital of the company. |
Table of Contents
| ■ | creates rights, or obligations, which are not ordinarily created between persons dealing at arm's length; |
| ■ | results, directly or indirectly, in the misuse, or abuse, of the provisions of IT Act; |
| ■ | lacks commercial substance; or |
| ■ | is entered into, or carried out, by means, or in a manner, which are not ordinarily employed for bona fide purposes. |
| ■ | any arrangement where the aggregate tax benefit to all the parties of the arrangement in the relevant financial year does not exceed INR 30 Million; |
| ■ | FIIs that choose not to take any benefit under any tax treaty entered with India and has invested in listed or unlisted securities with prior permission of the competent authority in accordance with the applicable regulations; |
| ■ | non-resident investor in an FII who has invested in an FII, directly or indirectly, by way of an offshore derivative instrument or otherwise; or |
| ■ | any income derived from the transfer of investments made prior to August 30, 2010. |
Table of Contents
Table of Contents
| ■ | The risk of delays in settling portfolio transactions and the risk of loss arising out of the system of share registration and custody used in certain Eastern European countries; |
| ■ | Risks in connection with the maintenance of the Fund's portfolio securities and cash with foreign sub-custodians and securities depositories, including the risk that appropriate sub-custody arrangements will not be available to the Fund; |
| ■ | The risk that the Fund's ownership rights in portfolio securities could be lost through fraud or negligence as a result of the fact that ownership in shares of certain Eastern European companies is recorded by the companies themselves and by registrars, rather than a central registration system; |
| ■ | The risk that the Fund may not be able to pursue claims on behalf of its shareholders because of the system of share registration and custody, and because certain Eastern European banking institutions and registrars are not guaranteed by their respective governments; and |
| ■ | Risks in connection with Eastern European countries' dependence on the economic health of Western European countries and the EU as a whole. |
Table of Contents
Table of Contents
Table of Contents
Table of Contents
Table of Contents
Table of Contents
Table of Contents
Table of Contents
Table of Contents
Table of Contents
Table of Contents
Table of Contents
| ■ | Dividend: Dividend income earned by the Subsidiary will not be subject to Indian tax. However, the Indian company declaring and paying such dividend would be subject to Dividend Distribution Tax at an effective rate of 20% (approx.) (effective starting October 1, 2014) on the amount of the dividend paid out. |
| ■ | Interest: Interest paid to the Subsidiary in respect of debt obligations of Indian issuers will be subject to Indian income tax. The tax rate in the case of a rupee-denominated debt obligation is 43.26%. However if the Subsidiary is a SEBI registered sub-account, interest income earned from June 1, 2013 to May 31, 2015 on rupee denominated bonds of Indian companies and Indian government securities will be subject to tax at the rate of 5.41%, provided that the rate of interest does not exceed the prescribed rates. In the case of a foreign-currency denominated debt obligation, the tax rate is 21.63%. For approved foreign-currency loans advanced from July 1, 2012 to June 30, 2017, the tax rate on interest is 5.41% and for approved foreign currency long-term bonds issued from October 1, 2014 to June 30, 2017, the tax rate on interest is 5.41%. However, if the Subsidiary is registered as a sub-account with SEBI, interest from securities will be subject to tax at the rate of 21.63%. |
| ■ | Securities Transaction Tax: Transactions involving the purchase or sale of shares or any other security traded on a recognized Indian stock exchange are subject to Securities Transaction Tax (“STT”). STT will be levied at the rate of 0.001% on the seller in case of actual delivery of the security and at the rate of 0.2% on the sale of unlisted shares in an initial public offering. This STT is not applicable to primary issuances of equity shares by a company or to off-market transactions. Hence, STT will be payable if the Subsidiary buys or sells listed securities on a recognized Indian stock exchange. |
| ■ | Capital Gains: The taxation of capital gains would be as follows: (i) long-term capital gains (being gains on sale of shares held for a period of more than twelve months) listed on a recognized stock exchange would not be taxable in India provided STT has been paid on the same (as discussed above); (ii) short-term capital gains (being gains on sale of shares held for a period of twelve months or less) from the sale of Indian shares listed on a recognized stock exchange will be taxed at the rate of 16.223% provided STT has been paid on the same; (iii) long-term capital gains (being gains on sale of shares held for a period of more than 36 months) arising to the Subsidiary from the sale of unlisted securities will be taxed at the rate of 10.815% (without indexation) and short-term capital gains (being gains on sale of shares held for a period of 36 months or less) will be taxed at the rate of 43.26%;* (iv) capital |
Table of Contents
| * | However, if the Subsidiary is a SEBI registered sub-account, the rates will be 10.816% and 32.45%, respectively. |
| ■ | any arrangement where the aggregate tax benefit to all the parties of the arrangement in the relevant financial year does not exceed INR 30 Million; |
| ■ | FIIs that choose not to take any benefit under any tax treaty entered with India and has invested in listed or unlisted securities with prior permission of the competent authority in accordance with the applicable regulations; |
| ■ | non-resident investor in an FII who has invested in an FII, directly or indirectly, by way of an offshore derivative instrument or otherwise; or |
Table of Contents
| ■ | any income derived from the transfer of investments made prior to August 30, 2010. |
Table of Contents
Table of Contents
| Approximate
Value of a Creation Unit |
Creation
Unit Size |
Standard
Creation/ Redemption Transaction Fee |
Maximum
Additional Charge for Creations* |
Maximum
Additional Charge for Redemptions* | ||||
| $1,867,000 | 50,000 | $5,900 | 7.0% | 2.0% |
| * | As a percentage of the net asset value per Creation Unit, inclusive, in the case of redemptions, of the standard redemption transaction fee. |
Table of Contents
Table of Contents
(For a share outstanding throughout each period)
| Year
ended Aug. 31, 2014 (Consolidated) |
Year
ended Aug. 31, 2013 (Consolidated) |
Year
ended Aug. 31, 2012 (Consolidated) |
Year
ended Aug. 31, 2011 (Consolidated) |
Year
ended Aug. 31, 2010 | |||||
| Net asset value, beginning of year | $ 34.41 | $ 35.68 | $ 42.25 | $ 42.94 | $ 37.57 | ||||
| Income
from investment operations: |
|||||||||
| Net investment incomea | 0.89 | 0.84 | 0.98 | 0.89 | 0.66 | ||||
| Net realized and unrealized gain (loss)b | 6.53 | (1.25) | (6.62) | (0.58) | 5.35 | ||||
| Total from investment operations | 7.42 | (0.41) | (5.64) | 0.31 | 6.01 | ||||
| Less distributions from: | |||||||||
| Net investment income | (0.71) | (0.86) | (0.93) | (1.00) | (0.64) | ||||
| Total distributions | (0.71) | (0.86) | (0.93) | (1.00) | (0.64) | ||||
| Net asset value, end of year | $ 41.12 | $ 34.41 | $ 35.68 | $ 42.25 | $ 42.94 | ||||
| Total return | 21.73% | (1.17)% | (13.33)% | 0.49% | 15.95% | ||||
| Ratios/Supplemental data: | |||||||||
| Net assets, end of year (000s) | $411,164 | $474,861 | $685,149 | $866,194 | $946,814 | ||||
| Ratio of expenses to average net assets | 0.68% | 0.67% | 0.69% | 0.67% | 0.69% | ||||
| Ratio of expenses to average net assets prior to waived fees | n/a | n/a | n/a | 0.67% | n/a | ||||
| Ratio of net investment income to average net assets | 2.38% | 2.18% | 2.55% | 1.86% | 1.52% | ||||
| Portfolio turnover ratec | 10% | 10% | 32% | 13% | 9% | ||||
| a | Based on average shares outstanding throughout each period. |
| b | The amounts reported for a share outstanding may not accord with the change in aggregate gains and losses in securities for the fiscal period due to the timing of capital share transactions in relation to the fluctuating market values of the Fund's underlying securities. |
| c | Portfolio turnover rates exclude portfolio securities received or delivered in Creation Units but include portfolio transactions that are executed as a result of the Fund processing capital share transactions in Creation Units partially for cash in U.S. dollars. Excluding such cash transactions, the portfolio turnover rates for the years ended August 31, 2014, August 31, 2013, August 31, 2012, August 31, 2011 and August 31, 2010 were 6%, 9%, 20%, 10% and 8%, respectively. |
Table of Contents
Table of Contents
Table of Contents
| Premium/Discount Range | Number of Days | Percentage of Total Days | ||
| Greater than 2.0% | 2 | 0.45% | ||
| Greater than 1.5% and Less than 2.0% | 2 | 0.45 | ||
| Greater than 1.0% and Less than 1.5% | 9 | 2.05 | ||
| Greater than 0.5% and Less than 1.0% | 33 | 7.50 | ||
| Between 0.5% and -0.5% | 275 | 62.50 | ||
| Less than -0.5% and Greater than -1.0% | 81 | 18.41 | ||
| Less than -1.0% and Greater than -1.5% | 28 | 6.36 | ||
| Less than -1.5% and Greater than -2.0% | 8 | 1.82 | ||
| Less than -2.0% and Greater than -2.5% | 1 | 0.23 | ||
| Less than -2.5% and Greater than -3.0% | 1 | 0.23 | ||
| 440 | 100.00% |
Table of Contents
| Average Annual Total Returns | Cumulative Total Returns | ||||||
| NAV | MARKET | INDEX | NAV | MARKET | INDEX | ||
| 1 Year | 21.73% | 22.74% | 22.80% | 21.73% | 22.74% | 22.80% | |
| 5 Years | 3.97% | 4.10% | 4.90% | 21.51% | 22.24% | 26.99% | |
| Since Inception* | (2.75)% | (2.74)% | (2.30)% | (17.25)% | (17.23)% | (14.66)% | |
| * | Total returns for the period since inception are calculated from the inception date of the Fund (11/12/07). The first day of secondary market trading in shares of the Fund was 11/16/07. |
Table of Contents
Table of Contents
| Call: | 1-800-iShares
or 1-800-474-2737 (toll free) Monday through Friday, 8:30 a.m. to 6:30 p.m. (Eastern time) |
| Email: | iSharesETFs@blackrock.com |
| Write: | c/o
BlackRock Investments, LLC 1 University Square Drive, Princeton, NJ 08540 |

Table of Contents
| 2014 Prospectus |
|
| ► | iShares MSCI Colombia Capped ETF | ICOL | NYSE ARCA |
Table of Contents
Table of Contents
|
|
S-1 |
|
|
1 |
|
|
2 |
|
|
11 |
|
|
12 |
|
|
13 |
|
|
16 |
|
|
25 |
|
|
26 |
|
|
27 |
|
|
27 |
|
|
29 |
Table of Contents
Table of Contents
| Ticker: ICOL | Stock Exchange: NYSE Arca |
| Annual
Fund Operating Expenses (ongoing expenses that you pay each year as a percentage of the value of your investments) | ||||||
| Management
Fees |
Distribution
and Service (12b-1) Fees |
Other
Expenses |
Total
Annual Fund Operating Expenses | |||
| 0.61% | None | None | 0.61% | |||
| 1 Year | 3 Years | 5 Years | 10 Years | |||
| $62 | $195 | $340 | $762 |
Table of Contents
Table of Contents
Table of Contents
Table of Contents
Table of Contents
Table of Contents
Table of Contents
Table of Contents
Table of Contents
Table of Contents
Table of Contents
Table of Contents
Table of Contents
Table of Contents
Table of Contents
| ■ | Lower levels of liquidity and market efficiency; |
| ■ | Greater securities price volatility; |
| ■ | Exchange rate fluctuations and exchange controls; |
| ■ | Less availability of public information about issuers; |
| ■ | Limitations on foreign ownership of securities; |
| ■ | Imposition of withholding or other taxes; |
| ■ | Imposition of restrictions on the expatriation of the funds or other assets of the Fund; |
| ■ | Higher transaction and custody costs and delays in settlement procedures; |
Table of Contents
| ■ | Difficulties in enforcing contractual obligations; |
| ■ | Lower levels of regulation of the securities markets; |
| ■ | Weaker accounting, disclosure and reporting requirements; and |
| ■ | Legal principles relating to corporate governance, directors’ fiduciary duties and liabilities and stockholders’ rights in markets in which the Fund invests may differ and/or may not be as extensive or protective as those that apply in the United States. |
Table of Contents
Table of Contents
Table of Contents
Table of Contents
Table of Contents
Table of Contents
Table of Contents
Table of Contents
Table of Contents
Table of Contents
Table of Contents
Table of Contents
Table of Contents
Table of Contents
Table of Contents
| Approximate
Value of a Creation Unit |
Creation
Unit Size |
Standard
Creation/ Redemption Transaction Fee |
Maximum
Additional Charge for Creations* |
Maximum
Additional Charge for Redemptions* | ||||
| $1,248,500 | 50,000 | $3,600 | 3.0% | 2.0% |
| * | As a percentage of the net asset value per Creation Unit, inclusive, in the case of redemptions, of the standard redemption transaction fee. |
Table of Contents
Table of Contents
(For a share outstanding throughout each period)
| Year
ended Aug. 31, 2014 |
Period
from Jun. 18, 2013a to Aug. 31,2013 | ||
| Net asset value, beginning of period | $ 25.98 | $ 25.28 | |
| Income
from investment operations: |
|||
| Net investment incomeb | 0.67 | 0.03 | |
| Net realized and unrealized gainc | 2.24 | 0.67 | |
| Total from investment operations | 2.91 | 0.70 | |
| Less distributions from: | |||
| Net investment income | (0.63) | − | |
| Net realized gain | (0.03) | − | |
| Return of capital | (0.01) | − | |
| Total distributions | (0.67) | − | |
| Net asset value, end of period | $ 28.22 | $ 25.98 | |
| Total return | 11.44% | 2.77% d | |
| Ratios/Supplemental data: | |||
| Net assets, end of period (000s) | $25,396 | $18,188 | |
| Ratio of expenses to average net assetse | 0.61% | 0.61% | |
| Ratio of net investment income to average net assetse | 2.54% | 0.61% | |
| Portfolio turnover ratef | 34% | 2% | |
| a | Commencement of operations. |
| b | Based on average shares outstanding throughout each period. |
| c | The amounts reported for a share outstanding may not accord with the change in aggregate gains and losses in securities for the fiscal period due to the timing of capital share transactions in relation to the fluctuating market values of the Fund's underlying securities. |
| d | Not annualized. |
| e | Annualized for periods of less than one year. |
| f | Portfolio turnover rates include portfolio transactions that are executed as a result of the Fund processing capital share transactions in Creation Units solely for cash in U.S. dollars. Excluding such transactions, the portfolio turnover rates for the year ended August 31, 2014 and for the period ended August 31, 2013 were 33% and 2%, respectively. |
Table of Contents
Table of Contents
Table of Contents
| Premium/Discount Range | Number of Days | Percentage of Total Days | ||
| Greater than 2.0% and Less than 2.5% | 2 | 0.63% | ||
| Greater than 1.5% and Less than 2.0% | 8 | 2.53 | ||
| Greater than 1.0% and Less than 1.5% | 38 | 12.03 | ||
| Greater than 0.5% and Less than 1.0% | 101 | 31.96 | ||
| Between 0.5% and -0.5% | 163 | 51.58 | ||
| Less than -0.5% and Greater than -1.0% | 4 | 1.27 | ||
| 316 | 100.00% |
Table of Contents
| Average Annual Total Returns | Cumulative Total Returns | ||||||
| NAV | MARKET | INDEX | NAV | MARKET | INDEX | ||
| 1 Year | 11.44% | 12.31% | 13.21% | 11.44% | 12.31% | 13.21% | |
| Since Inception* | 11.91% | 12.46% | 13.21% | 14.53% | 15.20% | 16.05% | |
| * | Total returns for the period since inception are calculated from the inception date of the Fund (6/18/13). The first day of secondary market trading in shares of the Fund was 6/20/13. |
Table of Contents
Table of Contents
| Call: | 1-800-iShares
or 1-800-474-2737 (toll free) Monday through Friday, 8:30 a.m. to 6:30 p.m. (Eastern time) |
| Email: | iSharesETFs@blackrock.com |
| Write: | c/o
BlackRock Investments, LLC 1 University Square Drive, Princeton, NJ 08540 |

Table of Contents
| 2014 Prospectus |
|
| ► | iShares MSCI Emerging Markets Asia ETF | EEMA | NASDAQ |
Table of Contents
Table of Contents
|
|
S-1 |
|
|
1 |
|
|
2 |
|
|
14 |
|
|
16 |
|
|
16 |
|
|
19 |
|
|
31 |
|
|
31 |
|
|
33 |
|
|
33 |
|
|
35 |
Table of Contents
Table of Contents
ASIA ETF
| Ticker: EEMA | Stock Exchange: NASDAQ |
| Annual
Fund Operating Expenses (ongoing expenses that you pay each year as a percentage of the value of your investments) | ||||||||||
| Management
Fees |
Distribution
and Service (12b-1) Fees |
Other
Expenses |
Total
Annual Fund Operating Expenses |
Fee Waiver | Total
Annual Fund Operating Expenses After Fee Waiver | |||||
| 0.68% | None | None | 0.68% | (0.19)% | 0.49% | |||||
| 1 Year | 3 Years | 5 Years | 10 Years | |||
| $50 | $198 | $360 | $829 |
Table of Contents
Table of Contents
Table of Contents
Table of Contents
Table of Contents
Table of Contents
Table of Contents

| 1 | The Fund’s year-to-date return as of September 30, 2014 was 4.56%. |
| One Year | Since
Fund Inception | ||
| (Inception Date: 2/8/2012) | |||
| Return Before Taxes | 1.98% | 3.75% | |
| Return After Taxes on Distributions2 | 1.39% | 3.39% | |
| Return After Taxes on Distributions and Sale of Fund Shares2 | 1.61% | 3.02% | |
| MSCI EM Asia Index (Index returns do not reflect deductions for fees, expenses or taxes) | 1.98% | 3.91% |
| 2 | After-tax returns in the table above are calculated using the historical highest individual U.S. federal marginal income tax rates and do not reflect the impact of state or local taxes. Actual after-tax returns depend on an investor’s tax situation and may differ from those shown, and after-tax returns shown are not relevant to tax-exempt investors or investors who hold shares through tax-deferred arrangements, such as 401(k) plans or individual retirement accounts (“IRAs”). Fund returns after taxes on distributions and sales of Fund shares are calculated assuming that an investor has sufficient capital gains of the same character from other investments to offset any capital losses from the sale of Fund shares. As a result, Fund returns after taxes on distributions and sales of Fund shares may exceed Fund returns before taxes and/or returns after taxes on distributions. |
Table of Contents
Table of Contents
Table of Contents
Table of Contents
| ■ | Government Control and Regulations. Governments of many Asian countries have implemented significant economic reforms in order to liberalize trade policy, promote foreign investment in their economies, reduce government control of the economy and develop market mechanisms. There can be no assurance these reforms will continue or that they will be effective. Despite recent reform and privatizations, significant regulation of investment and industry is still pervasive in |
Table of Contents
| many Asian countries and may restrict foreign ownership of domestic corporations and repatriation of assets, which may adversely affect Fund investments. | |
| ■ | Political and Social Risk. Governments in some Asian countries are authoritarian in nature, have been installed or removed as a result of military coups or have periodically used force to suppress civil dissent. Disparities of wealth, the pace and success of democratization, and ethnic, religious and racial disaffection may exacerbate social turmoil, violence and labor unrest in some countries. Unanticipated or sudden political or social developments may result in sudden and significant investment losses. |
| ■ | Expropriation Risk. Investing in certain Asian countries involves risk of loss due to expropriation, nationalization, or confiscation of assets and property or the imposition of restrictions on foreign investments and on repatriation of capital invested. |
Table of Contents
Table of Contents
Table of Contents
Table of Contents
Table of Contents
| ■ | Lower levels of liquidity and market efficiency; |
| ■ | Greater securities price volatility; |
| ■ | Exchange rate fluctuations and exchange controls; |
| ■ | Less availability of public information about issuers; |
| ■ | Limitations on foreign ownership of securities; |
| ■ | Imposition of withholding or other taxes; |
| ■ | Imposition of restrictions on the expatriation of the funds or other assets of the Fund; |
| ■ | Higher transaction and custody costs and delays in settlement procedures; |
| ■ | Difficulties in enforcing contractual obligations; |
| ■ | Lower levels of regulation of the securities markets; |
| ■ | Weaker accounting, disclosure and reporting requirements; and |
| ■ | Legal principles relating to corporate governance, directors’ fiduciary duties and liabilities and stockholders’ rights in markets in which the Fund invests may differ and/or may not be as extensive or protective as those that apply in the United States. |
Table of Contents
Table of Contents
Table of Contents
Table of Contents
Table of Contents
| ■ | where a non-resident investor has made any investment, directly or indirectly, in a foreign institutional investor (“FII”) which has invested in India; |
| ■ | investment by the non-resident investor in a fund or a fund pooling vehicle, which does not result in participation in control and management of the fund; or |
| ■ | where a non-resident investor along with its associates, does not have more than a 26% share in total capital of the company. |
| ■ | creates rights, or obligations, which are not ordinarily created between persons dealing at arm's length; |
| ■ | results, directly or indirectly, in the misuse, or abuse, of the provisions of IT Act; |
| ■ | lacks commercial substance; or |
| ■ | is entered into, or carried out, by means, or in a manner, which are not ordinarily employed for bona fide purposes. |
Table of Contents
| ■ | any arrangement where the aggregate tax benefit to all the parties of the arrangement in the relevant financial year does not exceed INR 30 Million; |
| ■ | FIIs that choose not to take any benefit under any tax treaty entered with India and has invested in listed or unlisted securities with prior permission of the competent authority in accordance with the applicable regulations; |
| ■ | non-resident investor in an FII who has invested in an FII, directly or indirectly, by way of an offshore derivative instrument or otherwise; or |
| ■ | any income derived from the transfer of investments made prior to August 30, 2010. |
Table of Contents
Table of Contents
Table of Contents
Table of Contents
Table of Contents
Table of Contents
Table of Contents
Table of Contents
Table of Contents
Table of Contents
Table of Contents
Table of Contents
| ■ | Dividend: Dividend income earned by the Subsidiary will not be subject to Indian tax. However, the Indian company declaring and paying such dividend would be subject to Dividend Distribution Tax at an effective rate of 20% (approx.) (effective starting October 1, 2014) on the amount of the dividend paid out. |
| ■ | Interest: Interest paid to the Subsidiary in respect of debt obligations of Indian issuers will be subject to Indian income tax. The tax rate in the case of a rupee-denominated debt obligation is 43.26%. However if the Subsidiary is a SEBI registered sub-account, interest income earned from June 1, 2013 to May 31, 2015 on rupee denominated bonds of Indian companies and Indian government securities will be subject to tax at the rate of 5.41%, provided that the rate of interest does not exceed the prescribed rates. In the case of a foreign-currency denominated debt obligation, the tax rate is 21.63%. For approved foreign-currency loans advanced from July 1, 2012 to June 30, 2017, the tax rate on interest is 5.41% and for approved foreign currency long-term bonds issued from October 1, 2014 to June 30, 2017, the tax rate on interest is 5.41%. However, if the Subsidiary is registered as a sub-account with SEBI, interest from securities will be subject to tax at the rate of 21.63%. |
| ■ | Securities Transaction Tax: Transactions involving the purchase or sale of shares or any other security traded on a recognized Indian stock exchange are subject to Securities Transaction Tax (“STT”). STT will be levied at the rate of 0.001% on the seller in case of actual delivery of the security and at the rate of 0.2% on the sale of unlisted shares in an initial public offering. This STT is not applicable to primary issuances of equity shares by a company or to off-market transactions. Hence, STT |
Table of Contents
| will be payable if the Subsidiary buys or sells listed securities on a recognized Indian stock exchange. | |
| ■ | Capital Gains: The taxation of capital gains would be as follows: (i) long-term capital gains (being gains on sale of shares held for a period of more than twelve months) listed on a recognized stock exchange would not be taxable in India provided STT has been paid on the same (as discussed above); (ii) short-term capital gains (being gains on sale of shares held for a period of twelve months or less) from the sale of Indian shares listed on a recognized stock exchange will be taxed at the rate of 16.223% provided STT has been paid on the same; (iii) long-term capital gains (being gains on sale of shares held for a period of more than 36 months) arising to the Subsidiary from the sale of unlisted securities will be taxed at the rate of 10.815% (without indexation) and short-term capital gains (being gains on sale of shares held for a period of 36 months or less) will be taxed at the rate of 43.26%;* (iv) capital gains realized on sale of listed equity shares not executed on a recognized stock exchange in India would be taxed at the rate of 21.63% for long-term gains (being gains on sale of shares held for a period of more than 12 months) and at 43.26% in the case of short-term gains (being gains on sale of shares held for a period of 12 months or less);* and (v) capital gains arising from the transfer of depositary receipts outside India between non-resident investors will not be subject to tax in India. |
| * | However, if the Subsidiary is a SEBI registered sub-account, the rates will be 10.816% and 32.45%, respectively. |
Table of Contents
| ■ | any arrangement where the aggregate tax benefit to all the parties of the arrangement in the relevant financial year does not exceed INR 30 Million; |
| ■ | FIIs that choose not to take any benefit under any tax treaty entered with India and has invested in listed or unlisted securities with prior permission of the competent authority in accordance with the applicable regulations; |
| ■ | non-resident investor in an FII who has invested in an FII, directly or indirectly, by way of an offshore derivative instrument or otherwise; or |
| ■ | any income derived from the transfer of investments made prior to August 30, 2010. |
Table of Contents
Table of Contents
| Approximate
Value of a Creation Unit |
Creation
Unit Size |
Standard
Creation/ Redemption Transaction Fee |
Maximum
Additional Charge for Creations* |
Maximum
Additional Charge for Redemptions* | ||||
| $2,924,500 | 50,000 | $15,000 | 3.0% | 2.0% |
| * | As a percentage of the net asset value per Creation Unit, inclusive, in the case of redemptions, of the standard redemption transaction fee. |
Table of Contents
(For a share outstanding throughout each period)
Table of Contents
| Year
ended Aug. 31, 2014 |
Year
ended Aug. 31, 2013 |
Period
from Feb. 8, 2012a to Aug. 31, 2012 | |||
| Net asset value, beginning of period | $ 52.23 | $ 50.18 | $ 54.71 | ||
| Income
from investment operations: | |||||
| Net investment incomeb | 1.36 | 1.15 | 0.87 | ||
| Net realized and unrealized gain (loss)c | 9.75 | 1.82 | (4.99) | ||
| Total from investment operations | 11.11 | 2.97 | (4.12) | ||
| Less distributions from: | |||||
| Net investment income | (1.26) | (0.92) | (0.41) | ||
| Total distributions | (1.26) | (0.92) | (0.41) | ||
| Net asset value, end of period | $ 62.08 | $ 52.23 | $ 50.18 | ||
| Total return | 21.54% e | 5.88% | (7.52)% d | ||
| Ratios/Supplemental data: | |||||
| Net assets, end of period (000s) | $80,706 | $31,341 | $20,071 | ||
| Ratio of expenses to average net assetsf | 0.49% | 0.49% | 0.49% | ||
| Ratio of expenses to average net assets prior to waived feesf | 0.68% | 0.68% | 0.68% | ||
| Ratio of net investment income to average net assetsf | 2.36% | 2.09% | 3.05% | ||
| Portfolio turnover rateg | 33% | 174% | 3% | ||
| a | Commencement of operations. |
| b | Based on average shares outstanding throughout each period. |
| c | The amounts reported for a share outstanding may not accord with the change in aggregate gains and losses in securities for the fiscal period due to the timing of capital share transactions in relation to the fluctuating market values of the Fund's underlying securities. |
| d | Not annualized. |
| e | Includes payment from an affiliate. Not including these proceeds, the Fund’s total return would have been 21.46%. |
| f | Annualized for periods of less than one year. |
| g | Portfolio turnover rates exclude portfolio securities received or delivered in Creation Units but include portfolio transactions that are executed as a result of the Fund processing capital share transactions in Creation Units partially for cash in U.S. dollars. Excluding such cash transactions, the portfolio turnover rates for the years ended August 31, 2014, August 31, 2013 and the period ended August 31, 2012 were 33%, 21% and 3%, respectively. |
Table of Contents
Table of Contents
Table of Contents
| Premium/Discount Range | Number of Days | Percentage of Total Days | ||
| Greater than 2.5% | 1 | 0.23% | ||
| Greater than 2.0% and Less than 2.5% | 2 | 0.45 | ||
| Greater than 1.5% and Less than 2.0% | 6 | 1.36 | ||
| Greater than 1.0% and Less than 1.5% | 32 | 7.27 | ||
| Greater than 0.5% and Less than 1.0% | 101 | 22.96 | ||
| Between 0.5% and -0.5% | 216 | 49.10 | ||
| Less than -0.5% and Greater than -1.0% | 53 | 12.05 | ||
| Less than -1.0% and Greater than -1.5% | 19 | 4.32 | ||
| Less than -1.5% and Greater than -2.0% | 6 | 1.36 | ||
| Less than -2.0% and Greater than -2.5% | 2 | 0.45 | ||
| Less than -2.5% and Greater than -3.0% | 2 | 0.45 | ||
| 440 | 100.00% |
Table of Contents
| Average Annual Total Returns | Cumulative Total Returns | ||||||
| NAV | MARKET | INDEX | NAV | MARKET | INDEX | ||
| 1 Year | 21.54% | 23.10% | 21.79% | 21.54% | 23.10% | 21.79% | |
| Since Inception* | 7.02% | 7.11% | 7.40% | 18.99% | 19.25% | 20.07% | |
| * | Total returns for the period since inception are calculated from the inception date of the Fund (2/8/12). The first day of secondary market trading in shares of the Fund was 2/9/12. |
Table of Contents
Table of Contents
| Call: | 1-800-iShares
or 1-800-474-2737 (toll free) Monday through Friday, 8:30 a.m. to 6:30 p.m. (Eastern time) |
| Email: | iSharesETFs@blackrock.com |
| Write: | c/o
BlackRock Investments, LLC 1 University Square Drive, Princeton, NJ 08540 |

Table of Contents
| 2014 Prospectus |
|
| ► | iShares MSCI Emerging Markets Consumer Discretionary ETF | EMDI | NASDAQ |
Table of Contents
Table of Contents
|
|
S-1 |
|
|
1 |
|
|
2 |
|
|
13 |
|
|
14 |
|
|
14 |
|
|
17 |
|
|
29 |
|
|
30 |
|
|
31 |
|
|
31 |
|
|
33 |
Table of Contents
Table of Contents
| Ticker: EMDI | Stock Exchange: NASDAQ |
| Annual
Fund Operating Expenses (ongoing expenses that you pay each year as a percentage of the value of your investments) | ||||||
| Management
Fees |
Distribution
and Service (12b-1) Fees |
Other
Expenses |
Total
Annual Fund Operating Expenses | |||
| 0.67% | None | None | 0.67% | |||
| 1 Year | 3 Years | 5 Years | 10 Years | |||
| $68 | $214 | $373 | $835 |
Table of Contents
Table of Contents
Table of Contents
Table of Contents
Table of Contents
Table of Contents

| 1 | The Fund’s year-to-date return as of September 30, 2014 was 0.42%. |
| One Year | Since
Fund Inception | ||
| (Inception Date: 2/8/2012) | |||
| Return Before Taxes | 5.13% | 4.31% | |
| Return After Taxes on Distributions2 | 5.12% | 4.28% | |
| Return After Taxes on Distributions and Sale of Fund Shares2 | 3.18% | 3.49% | |
| MSCI Emerging Markets Consumer Discretionary Index (Index returns do not reflect deductions for fees, expenses or taxes) | 5.79% | 4.99% |
| 2 | After-tax returns in the table above are calculated using the historical highest individual U.S. federal marginal income tax rates and do not reflect the impact of state or local taxes. Actual after-tax returns depend on an investor’s tax situation and may differ from those shown, and after-tax returns shown are not relevant to tax-exempt investors or investors who hold shares through tax-deferred arrangements, such as 401(k) plans or individual retirement accounts (“IRAs”). Fund returns after taxes on distributions and sales of Fund shares are calculated assuming that an investor has sufficient capital gains of the same character from other investments to offset any capital losses from the sale of Fund shares. As a result, Fund returns after taxes on distributions and sales of Fund shares may exceed Fund returns before taxes and/or returns after taxes on distributions. |
Table of Contents
Table of Contents
Table of Contents
Table of Contents
Table of Contents
Table of Contents
Table of Contents
Table of Contents
| ■ | Lower levels of liquidity and market efficiency; |
| ■ | Greater securities price volatility; |
| ■ | Exchange rate fluctuations and exchange controls; |
| ■ | Less availability of public information about issuers; |
| ■ | Limitations on foreign ownership of securities; |
| ■ | Imposition of withholding or other taxes; |
| ■ | Imposition of restrictions on the expatriation of the funds or other assets of the Fund; |
| ■ | Higher transaction and custody costs and delays in settlement procedures; |
| ■ | Difficulties in enforcing contractual obligations; |
| ■ | Lower levels of regulation of the securities markets; |
| ■ | Weaker accounting, disclosure and reporting requirements; and |
| ■ | Legal principles relating to corporate governance, directors’ fiduciary duties and liabilities and stockholders’ rights in markets in which the Fund invests may differ and/or may not be as extensive or protective as those that apply in the United States. |
Table of Contents
Table of Contents
Table of Contents
Table of Contents
| ■ | where a non-resident investor has made any investment, directly or indirectly, in a foreign institutional investor (“FII”) which has invested in India; |
| ■ | investment by the non-resident investor in a fund or a fund pooling vehicle, which does not result in participation in control and management of the fund; or |
| ■ | where a non-resident investor along with its associates, does not have more than a 26% share in total capital of the company. |
| ■ | creates rights, or obligations, which are not ordinarily created between persons dealing at arm's length; |
| ■ | results, directly or indirectly, in the misuse, or abuse, of the provisions of IT Act; |
| ■ | lacks commercial substance; or |
Table of Contents
| ■ | is entered into, or carried out, by means, or in a manner, which are not ordinarily employed for bona fide purposes. |
| ■ | any arrangement where the aggregate tax benefit to all the parties of the arrangement in the relevant financial year does not exceed INR 30 Million; |
| ■ | FIIs that choose not to take any benefit under any tax treaty entered with India and has invested in listed or unlisted securities with prior permission of the competent authority in accordance with the applicable regulations; |
| ■ | non-resident investor in an FII who has invested in an FII, directly or indirectly, by way of an offshore derivative instrument or otherwise; or |
| ■ | any income derived from the transfer of investments made prior to August 30, 2010. |
Table of Contents
Table of Contents
Table of Contents
Table of Contents
Table of Contents
Table of Contents
Table of Contents
Table of Contents
Table of Contents
Table of Contents
Table of Contents
Table of Contents
| ■ | Dividend: Dividend income earned by the Subsidiary will not be subject to Indian tax. However, the Indian company declaring and paying such dividend would be subject to Dividend Distribution Tax at an effective rate of 20% (approx.) (effective starting October 1, 2014) on the amount of the dividend paid out. |
| ■ | Interest: Interest paid to the Subsidiary in respect of debt obligations of Indian issuers will be subject to Indian income tax. The tax rate in the case of a rupee-denominated debt obligation is 43.26%. However if the Subsidiary is a SEBI registered sub-account, interest income earned from June 1, 2013 to May 31, 2015 on rupee denominated bonds of Indian companies and Indian government securities will be subject to tax at the rate of 5.41%, provided that the rate of interest does not exceed the prescribed rates. In the case of a foreign-currency denominated debt obligation, the tax rate is 21.63%. For approved foreign-currency loans advanced from July 1, 2012 to June 30, 2017, the tax rate on interest is 5.41% and for approved foreign currency long-term bonds issued from October 1, 2014 to June 30, 2017, the tax rate on interest is 5.41%. However, if the Subsidiary is registered as a sub-account with SEBI, interest from securities will be subject to tax at the rate of 21.63%. |
| ■ | Securities Transaction Tax: Transactions involving the purchase or sale of shares or any other security traded on a recognized Indian stock exchange are subject to Securities Transaction Tax (“STT”). STT will be levied at the rate of 0.001% on the seller in case of actual delivery of the security and at the rate of 0.2% on the sale of unlisted shares in an initial public offering. This STT is not applicable to primary issuances of equity shares by a company or to off-market transactions. Hence, STT will be payable if the Subsidiary buys or sells listed securities on a recognized Indian stock exchange. |
| ■ | Capital Gains: The taxation of capital gains would be as follows: (i) long-term capital gains (being gains on sale of shares held for a period of more than twelve months) listed on a recognized stock exchange would not be taxable in India provided STT has been paid on the same (as discussed above); (ii) short-term capital gains (being gains on sale of shares held for a period of twelve months or less) from the sale of |
Table of Contents
| * | However, if the Subsidiary is a SEBI registered sub-account, the rates will be 10.816% and 32.45%, respectively. |
| ■ | any arrangement where the aggregate tax benefit to all the parties of the arrangement in the relevant financial year does not exceed INR 30 Million; |
| ■ | FIIs that choose not to take any benefit under any tax treaty entered with India and |
Table of Contents
| ■ | non-resident investor in an FII who has invested in an FII, directly or indirectly, by way of an offshore derivative instrument or otherwise; or |
| ■ | any income derived from the transfer of investments made prior to August 30, 2010. |
Table of Contents
Table of Contents
| Approximate
Value of a Creation Unit |
Creation
Unit Size |
Standard
Creation/ Redemption Transaction Fee |
Maximum
Additional Charge for Creations* |
Maximum
Additional Charge for Redemptions* | ||||
| $2,747,500 | 50,000 | $3,500 | 3.0% | 2.0% |
| * | As a percentage of the net asset value per Creation Unit, inclusive, in the case of redemptions, of the standard redemption transaction fee. |
Table of Contents
Table of Contents
(For a share outstanding throughout each period)
| Year
ended Aug. 31, 2014 |
Year
ended Aug. 31, 2013 |
Period
from Feb. 8, 2012a to Aug. 31, 2012 | |||
| Net asset value, beginning of period | $50.16 | $48.48 | $ 51.54 | ||
| Income
from investment operations: | |||||
| Net investment incomeb | 0.44 | 0.39 | 0.26 | ||
| Net realized and unrealized gain (loss)c | 11.15 | 1.90 | (3.19) | ||
| Total from investment operations | 11.59 | 2.29 | (2.93) | ||
| Less distributions from: | |||||
| Net investment income | (0.29) | (0.61) | (0.13) | ||
| Total distributions | (0.29) | (0.61) | (0.13) | ||
| Net asset value, end of period | $ 61.46 | $ 50.16 | $48.48 | ||
| Total return | 23.16% | 4.73% | (5.68)% d | ||
| Ratios/Supplemental data: | |||||
| Net assets, end of period (000s) | $ 6,146 | $ 2,508 | $ 2,424 | ||
| Ratio of expenses to average net assetse | 0.67% | 0.67% | 0.68% | ||
| Ratio of net investment income to average net assetse | 0.79% | 0.76% | 0.94% | ||
| Portfolio turnover ratef | 10% | 10% | 54% | ||
| a | Commencement of operations. |
| b | Based on average shares outstanding throughout each period. |
| c | The amounts reported for a share outstanding may not accord with the change in aggregate gains and losses in securities for the fiscal period due to the timing of capital share transactions in relation to the fluctuating market values of the Fund's underlying securities. |
| d | Not annualized. |
| e | Annualized for periods of less than one year. |
| f | Portfolio turnover rates exclude portfolio securities received or delivered in Creation Units but include portfolio transactions that are executed as a result of the Fund processing capital share transactions in Creation Units partially for cash in U.S. dollars. Excluding such cash transactions, the portfolio turnover rates for the years ended August 31, 2014, August 31, 2013 and the period ended August 31, 2012 were 10%, 10%, and 5%, respectively. |
Table of Contents
Table of Contents
Table of Contents
| Premium/Discount Range | Number of Days | Percentage of Total Days | ||
| Greater than 2.5% | 4 | 0.91% | ||
| Greater than 2.0% and Less than 2.5% | 3 | 0.68 | ||
| Greater than 1.5% and Less than 2.0% | 7 | 1.59 | ||
| Greater than 1.0% and Less than 1.5% | 24 | 5.45 | ||
| Greater than 0.5% and Less than 1.0% | 79 | 17.95 | ||
| Between 0.5% and -0.5% | 264 | 60.01 | ||
| Less than -0.5% and Greater than -1.0% | 44 | 10.01 | ||
| Less than -1.0% and Greater than -1.5% | 10 | 2.27 | ||
| Less than -1.5% and Greater than -2.0% | 2 | 0.45 | ||
| Less than -2.0% and Greater than -2.5% | 3 | 0.68 | ||
| 440 | 100.00% |
Table of Contents
| Average Annual Total Returns | Cumulative Total Returns | ||||||
| NAV | MARKET | INDEX | NAV | MARKET | INDEX | ||
| 1 Year | 23.16% | 24.80% | 24.04% | 23.16% | 24.80% | 24.04% | |
| Since Inception* | 7.95% | 8.30% | 8.78% | 21.66% | 22.66% | 24.05% | |
| * | Total returns for the period since inception are calculated from the inception date of the Fund (2/8/12). The first day of secondary market trading in shares of the Fund was 2/9/12. |
Table of Contents
Table of Contents
| Call: | 1-800-iShares
or 1-800-474-2737 (toll free) Monday through Friday, 8:30 a.m. to 6:30 p.m. (Eastern time) |
| Email: | iSharesETFs@blackrock.com |
| Write: | c/o
BlackRock Investments, LLC 1 University Square Drive, Princeton, NJ 08540 |

Table of Contents
| 2014 Prospectus |
|
| ► | iShares MSCI Emerging Markets EMEA ETF | EEME | NASDAQ |
Table of Contents
Table of Contents
|
|
S-1 |
|
|
1 |
|
|
2 |
|
|
13 |
|
|
15 |
|
|
15 |
|
|
18 |
|
|
27 |
|
|
28 |
|
|
29 |
|
|
29 |
|
|
31 |
Table of Contents
Table of Contents
| Ticker: EEME | Stock Exchange: NASDAQ |
| Annual
Fund Operating Expenses (ongoing expenses that you pay each year as a percentage of the value of your investments) | ||||||||||
| Management
Fees |
Distribution
and Service (12b-1) Fees |
Other
Expenses |
Total
Annual Fund Operating Expenses |
Fee Waiver | Total
Annual Fund Operating Expenses After Fee Waiver | |||||
| 0.68% | None | None | 0.68% | (0.19)% | 0.49% | |||||
| 1 Year | 3 Years | 5 Years | 10 Years | |||
| $50 | $198 | $360 | $829 |
Table of Contents
Table of Contents
Table of Contents
Table of Contents
Table of Contents
Table of Contents
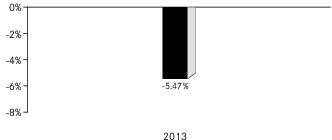
| 1 | The Fund’s year-to-date return as of September 30, 2014 was -5.82%. |
| One Year | Since
Fund Inception | ||
| (Inception Date: 1/18/2012) | |||
| Return Before Taxes | -5.47% | 3.77% | |
| Return After Taxes on Distributions2 | -5.65% | 3.62% | |
| Return After Taxes on Distributions and Sale of Fund Shares2 | -2.35% | 3.42% | |
| MSCI Emerging Markets EMEA Index (Index returns do not reflect deductions for fees, expenses or taxes) | -5.16% | 4.27% |
| 2 | After-tax returns in the table above are calculated using the historical highest individual U.S. federal marginal income tax rates and do not reflect the impact of state or local taxes. Actual after-tax returns depend on an investor’s tax situation and may differ from those shown, and after-tax returns shown are not relevant to tax-exempt investors or investors who hold shares through tax-deferred arrangements, such as 401(k) plans or individual retirement accounts (“IRAs”). Fund returns after taxes on distributions and sales of Fund shares are calculated assuming that an investor has sufficient capital gains of the same character from other investments to offset any capital losses from the sale of Fund shares. As a result, Fund returns after taxes on distributions and sales of Fund shares may exceed Fund returns before taxes and/or returns after taxes on distributions. |
Table of Contents
Table of Contents
Table of Contents
Table of Contents
Table of Contents
| ■ | The risk of delays in settling portfolio transactions and the risk of loss arising out of the system of share registration and custody used in certain Eastern European countries; |
| ■ | Risks in connection with the maintenance of the Fund's portfolio securities and cash with foreign sub-custodians and securities depositories, including the risk that appropriate sub-custody arrangements will not be available to the Fund; |
| ■ | The risk that the Fund's ownership rights in portfolio securities could be lost through fraud or negligence as a result of the fact that ownership in shares of certain Eastern European companies is recorded by the companies themselves and by registrars, rather than a central registration system; |
| ■ | The risk that the Fund may not be able to pursue claims on behalf of its shareholders because of the system of share registration and custody, and because certain Eastern European banking institutions and registrars are not guaranteed by their respective governments; and |
| ■ | Risks in connection with Eastern European countries' dependence on the economic health of Western European countries and the European Union (the “EU”) as a whole. |
Table of Contents
Table of Contents
Table of Contents
Table of Contents
Table of Contents
| ■ | Lower levels of liquidity and market efficiency; |
| ■ | Greater securities price volatility; |
| ■ | Exchange rate fluctuations and exchange controls; |
| ■ | Less availability of public information about issuers; |
| ■ | Limitations on foreign ownership of securities; |
| ■ | Imposition of withholding or other taxes; |
| ■ | Imposition of restrictions on the expatriation of the funds or other assets of the Fund; |
| ■ | Higher transaction and custody costs and delays in settlement procedures; |
| ■ | Difficulties in enforcing contractual obligations; |
| ■ | Lower levels of regulation of the securities markets; |
| ■ | Weaker accounting, disclosure and reporting requirements; and |
| ■ | Legal principles relating to corporate governance, directors’ fiduciary duties and liabilities and stockholders’ rights in markets in which the Fund invests may differ and/or may not be as extensive or protective as those that apply in the United States. |
Table of Contents
| ■ | The risk of delays in settling portfolio transactions and the risk of loss arising out of the system of share registration and custody used in Russia; |
| ■ | Risks in connection with the maintenance of the Fund’s portfolio securities and cash with foreign sub-custodians and securities depositories, including the risk that appropriate sub-custody arrangements will not be available to the Fund; |
| ■ | The risk that the Fund’s ownership rights in portfolio securities could be lost through fraud or negligence as a result of the fact that ownership in shares of Russian companies is recorded by the companies themselves and by registrars, rather than by a central registration system; and |
| ■ | The risk that the Fund may not be able to pursue claims on behalf of its |
Table of Contents
Table of Contents
Table of Contents
Table of Contents
Table of Contents
Table of Contents
Table of Contents
Table of Contents
Table of Contents
Table of Contents
Table of Contents
Table of Contents
Table of Contents
Table of Contents
Table of Contents
Table of Contents
| Approximate
Value of a Creation Unit |
Creation
Unit Size |
Standard
Creation/ Redemption Transaction Fee |
Maximum
Additional Charge for Creations* |
Maximum
Additional Charge for Redemptions* | ||||
| $4,840,000 | 100,000 | $5,500 | 3.0% | 2.0% |
| * | As a percentage of the net asset value per Creation Unit, inclusive, in the case of redemptions, of the standard redemption transaction fee. |
Table of Contents
Table of Contents
(For a share outstanding throughout each period)
| Year
ended Aug. 31, 2014 |
Year
ended Aug. 31, 2013 |
Period
from Jan. 18, 2012a to Aug. 31, 2012 | |||
| Net asset value, beginning of period | $ 47.98 | $51.72 | $ 51.16 | ||
| Income
from investment operations: | |||||
| Net investment incomeb | 1.23 | 1.26 | 1.43 | ||
| Net realized and unrealized gain (loss)c | 3.38 | (3.22) | 0.02 | ||
| Total from investment operations | 4.61 | (1.96) | 1.45 | ||
| Less distributions from: | |||||
| Net investment income | (0.79) | (1.78) | (0.89) | ||
| Total distributions | (0.79) | (1.78) | (0.89) | ||
| Net asset value, end of period | $ 51.80 | $47.98 | $ 51.72 | ||
| Total return | 9.61% | (3.95)% | 2.91% d | ||
| Ratios/Supplemental data: | |||||
| Net assets, end of period (000s) | $10,360 | $ 4,798 | $10,343 | ||
| Ratio of expenses to average net assetse | 0.49% | 0.49% | 0.49% | ||
| Ratio of expenses to average net assets prior to waived feese | 0.68% | 0.68% | 0.68% | ||
| Ratio of net investment income to average net assetse | 2.39% | 2.39% | 4.46% | ||
| Portfolio turnover ratef | 18% | 8% | 5% | ||
| a | Commencement of operations. |
| b | Based on average shares outstanding throughout each period. |
| c | The amounts reported for a share outstanding may not accord with the change in aggregate gains and losses in securities for the fiscal period due to the timing of capital share transactions in relation to the fluctuating market values of the Fund's underlying securities. |
| d | Not annualized. |
| e | Annualized for periods of less than one year. |
| f | Portfolio turnover rates exclude portfolio securities received or delivered as a result of processing capital share transactions in Creation Units. |
Table of Contents
Table of Contents
Table of Contents
| Premium/Discount Range | Number of Days | Percentage of Total Days | ||
| Greater than 4.0% | 1 | 0.23% | ||
| Greater than 3.5% and Less than 4.0% | 4 | 0.91 | ||
| Greater than 3.0% and Less than 3.5% | 13 | 2.95 | ||
| Greater than 2.5% and Less than 3.0% | 9 | 2.05 | ||
| Greater than 2.0% and Less than 2.5% | 13 | 2.95 | ||
| Greater than 1.5% and Less than 2.0% | 23 | 5.23 | ||
| Greater than 1.0% and Less than 1.5% | 33 | 7.50 | ||
| Greater than 0.5% and Less than 1.0% | 92 | 20.91 | ||
| Between 0.5% and -0.5% | 201 | 45.68 | ||
| Less than -0.5% and Greater than -1.0% | 32 | 7.27 | ||
| Less than -1.0% and Greater than -1.5% | 11 | 2.50 | ||
| Less than -1.5% and Greater than -2.0% | 5 | 1.14 | ||
| Less than -2.0% and Greater than -2.5% | 2 | 0.45 | ||
| Less than -2.5% and Greater than -3.0% | 1 | 0.23 | ||
| 440 | 100.00% |
Table of Contents
| Average Annual Total Returns | Cumulative Total Returns | ||||||
| NAV | MARKET | INDEX | NAV | MARKET | INDEX | ||
| 1 Year | 9.61% | 9.67% | 9.98% | 9.61% | 9.67% | 9.98% | |
| Since Inception* | 3.11% | 3.59% | 3.55% | 8.35% | 9.67% | 9.55% | |
| * | Total returns for the period since inception are calculated from the inception date of the Fund (1/18/12). The first day of secondary market trading in shares of the Fund was 1/19/12. |
Table of Contents
Table of Contents
Table of Contents
Table of Contents
| Call: | 1-800-iShares
or 1-800-474-2737 (toll free) Monday through Friday, 8:30 a.m. to 6:30 p.m. (Eastern time) |
| Email: | iSharesETFs@blackrock.com |
| Write: | c/o
BlackRock Investments, LLC 1 University Square Drive, Princeton, NJ 08540 |

Table of Contents
| 2014 Prospectus |
|
| ► | iShares MSCI Emerging Markets Energy Capped ETF | EMEY | NASDAQ |
Table of Contents
Table of Contents
|
|
S-1 |
|
|
1 |
|
|
2 |
|
|
16 |
|
|
17 |
|
|
18 |
|
|
21 |
|
|
33 |
|
|
34 |
|
|
35 |
|
|
35 |
|
|
37 |
Table of Contents
Table of Contents
| Ticker: EMEY | Stock Exchange: NASDAQ |
| Annual
Fund Operating Expenses (ongoing expenses that you pay each year as a percentage of the value of your investments) | ||||||
| Management
Fees |
Distribution
and Service (12b-1) Fees |
Other
Expenses |
Total
Annual Fund Operating Expenses | |||
| 0.67% | None | None | 0.67% | |||
| 1 Year | 3 Years | 5 Years | 10 Years | |||
| $68 | $214 | $373 | $835 |
Table of Contents
Table of Contents
Table of Contents
Table of Contents
Table of Contents
Table of Contents
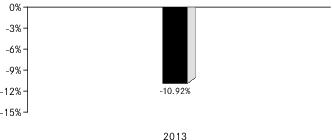
| 1 | The Fund’s year-to-date return as of September 30, 2014 was -3.65%. |
Table of Contents
| One Year | Since
Fund Inception | ||
| (Inception Date: 2/8/2012) | |||
| Return Before Taxes | -10.92% | -12.61% | |
| Return After Taxes on Distributions1 | -11.19% | -12.77% | |
| Return After Taxes on Distributions and Sale of Fund Shares1 | -5.44% | -9.06% | |
| MSCI Emerging Markets Energy 25/50 Index (Index returns do not reflect deductions for fees, expenses or taxes) | -10.75% | -12.14% |
| 1 | After-tax returns in the table above are calculated using the historical highest individual U.S. federal marginal income tax rates and do not reflect the impact of state or local taxes. Actual after-tax returns depend on an investor’s tax situation and may differ from those shown, and after-tax returns shown are not relevant to tax-exempt investors or investors who hold shares through tax-deferred arrangements, such as 401(k) plans or individual retirement accounts (“IRAs”). Fund returns after taxes on distributions and sales of Fund shares are calculated assuming that an investor has sufficient capital gains of the same character from other investments to offset any capital losses from the sale of Fund shares. As a result, Fund returns after taxes on distributions and sales of Fund shares may exceed Fund returns before taxes and/or returns after taxes on distributions. |
Table of Contents
Table of Contents
Table of Contents
Table of Contents
Table of Contents
| ■ | The risk of delays in settling portfolio transactions and the risk of loss arising out of the system of share registration and custody used in certain Eastern European countries; |
| ■ | Risks in connection with the maintenance of the Fund's portfolio securities and cash |
Table of Contents
| ■ | The risk that the Fund's ownership rights in portfolio securities could be lost through fraud or negligence as a result of the fact that ownership in shares of certain Eastern European companies is recorded by the companies themselves and by registrars, rather than a central registration system; |
| ■ | The risk that the Fund may not be able to pursue claims on behalf of its shareholders because of the system of share registration and custody, and because certain Eastern European banking institutions and registrars are not guaranteed by their respective governments; and |
| ■ | Risks in connection with Eastern European countries' dependence on the economic health of Western European countries and the European Union (the “EU”) as a whole. |
Table of Contents
Table of Contents
Table of Contents
Table of Contents
| ■ | Lower levels of liquidity and market efficiency; |
| ■ | Greater securities price volatility; |
| ■ | Exchange rate fluctuations and exchange controls; |
| ■ | Less availability of public information about issuers; |
| ■ | Limitations on foreign ownership of securities; |
| ■ | Imposition of withholding or other taxes; |
| ■ | Imposition of restrictions on the expatriation of the funds or other assets of the Fund; |
| ■ | Higher transaction and custody costs and delays in settlement procedures; |
| ■ | Difficulties in enforcing contractual obligations; |
| ■ | Lower levels of regulation of the securities markets; |
| ■ | Weaker accounting, disclosure and reporting requirements; and |
| ■ | Legal principles relating to corporate governance, directors’ fiduciary duties and liabilities and stockholders’ rights in markets in which the Fund invests may differ and/or may not be as extensive or protective as those that apply in the United States. |
Table of Contents
Table of Contents
Government Control and Regulations. The Chinese government has implemented significant economic reforms in order to liberalize trade policy, promote foreign investment in the economy, reduce government control of the economy and develop market mechanisms. There can be no assurance these reforms will continue or that they will be effective. Despite recent reform and privatizations, significant regulation of investment and industry is still pervasive and the Chinese government may restrict foreign ownership of Chinese corporations and/or repatriate assets. Chinese markets generally continue to experience inefficiency, volatility and pricing anomalies that may be connected to governmental influence, a lack of publicly-available information and/or political and social instability.
Table of Contents
| ■ | The risk of delays in settling portfolio transactions and the risk of loss arising out of the system of share registration and custody used in Russia; |
| ■ | Risks in connection with the maintenance of the Fund’s portfolio securities and cash with foreign sub-custodians and securities depositories, including the risk that appropriate sub-custody arrangements will not be available to the Fund; |
| ■ | The risk that the Fund’s ownership rights in portfolio securities could be lost through |
Table of Contents
| ■ | The risk that the Fund may not be able to pursue claims on behalf of its shareholders because of the system of share registration and custody, and because Russian banking institutions and registrars are not guaranteed by the Russian government. |
Table of Contents
Table of Contents
Table of Contents
| ■ | where a non-resident investor has made any investment, directly or indirectly, in a foreign institutional investor (“FII”) which has invested in India; |
| ■ | investment by the non-resident investor in a fund or a fund pooling vehicle, which does not result in participation in control and management of the fund; or |
| ■ | where a non-resident investor along with its associates, does not have more than a 26% share in total capital of the company. |
| ■ | creates rights, or obligations, which are not ordinarily created between persons dealing at arm's length; |
| ■ | results, directly or indirectly, in the misuse, or abuse, of the provisions of IT Act; |
| ■ | lacks commercial substance; or |
| ■ | is entered into, or carried out, by means, or in a manner, which are not ordinarily employed for bona fide purposes. |
| ■ | any arrangement where the aggregate tax benefit to all the parties of the arrangement in the relevant financial year does not exceed INR 30 Million; |
Table of Contents
| ■ | FIIs that choose not to take any benefit under any tax treaty entered with India and has invested in listed or unlisted securities with prior permission of the competent authority in accordance with the applicable regulations; |
| ■ | non-resident investor in an FII who has invested in an FII, directly or indirectly, by way of an offshore derivative instrument or otherwise; or |
| ■ | any income derived from the transfer of investments made prior to August 30, 2010. |
Table of Contents
Table of Contents
Table of Contents
Table of Contents
Table of Contents
Table of Contents
Table of Contents
Table of Contents
Table of Contents
Table of Contents
Table of Contents
Table of Contents
| ■ | Dividend: Dividend income earned by the Subsidiary will not be subject to Indian tax. However, the Indian company declaring and paying such dividend would be subject to Dividend Distribution Tax at an effective rate of 20% (approx.) (effective starting October 1, 2014) on the amount of the dividend paid out. |
| ■ | Interest: Interest paid to the Subsidiary in respect of debt obligations of Indian issuers will be subject to Indian income tax. The tax rate in the case of a rupee-denominated debt obligation is 43.26%. However if the Subsidiary is a SEBI registered sub-account, interest income earned from June 1, 2013 to May 31, 2015 on rupee denominated bonds of Indian companies and Indian government securities will be subject to tax at the rate of 5.41%, provided that the rate of interest does not exceed the prescribed rates. In the case of a foreign-currency denominated debt obligation, the tax rate is 21.63%. For approved foreign-currency loans advanced from July 1, 2012 to June 30, 2017, the tax rate on interest is 5.41% and for approved foreign currency long-term bonds issued from October 1, 2014 to June 30, 2017, the tax rate on interest is 5.41%. However, if the Subsidiary is registered as a sub-account with SEBI, interest from securities will be subject to tax at the rate of 21.63%. |
| ■ | Securities Transaction Tax: Transactions involving the purchase or sale of shares or any other security traded on a recognized Indian stock exchange are subject to Securities Transaction Tax (“STT”). STT will be levied at the rate of 0.001% on the seller in case of actual delivery of the security and at the rate of 0.2% on the sale of unlisted shares in an initial public offering. This STT is not applicable to primary issuances of equity shares by a company or to off-market transactions. Hence, STT will be payable if the Subsidiary buys or sells listed securities on a recognized Indian stock exchange. |
| ■ | Capital Gains: The taxation of capital gains would be as follows: (i) long-term capital gains (being gains on sale of shares held for a period of more than twelve months) listed on a recognized stock exchange would not be taxable in India provided STT has been paid on the same (as discussed above); (ii) short-term capital gains (being gains on sale of shares held for a period of twelve months or less) from the sale of Indian shares listed on a recognized stock exchange will be taxed at the rate of 16.223% provided STT has been paid on the same; (iii) long-term capital gains (being gains on sale of shares held for a period of more than 36 months) arising to the Subsidiary from the sale of unlisted securities will be taxed at the rate of 10.815% (without indexation) and short-term capital gains (being gains on sale of shares held for a period of 36 months or less) will be taxed at the rate of 43.26%;* (iv) capital gains realized on sale of listed equity shares not executed on a recognized stock |
Table of Contents
| * | However, if the Subsidiary is a SEBI registered sub-account, the rates will be 10.816% and 32.45%, respectively. |
| ■ | any arrangement where the aggregate tax benefit to all the parties of the arrangement in the relevant financial year does not exceed INR 30 Million; |
| ■ | FIIs that choose not to take any benefit under any tax treaty entered with India and has invested in listed or unlisted securities with prior permission of the competent authority in accordance with the applicable regulations; |
| ■ | non-resident investor in an FII who has invested in an FII, directly or indirectly, by way of an offshore derivative instrument or otherwise; or |
| ■ | any income derived from the transfer of investments made prior to August 30, 2010. |
Table of Contents
Table of Contents
Table of Contents
| Approximate
Value of a Creation Unit |
Creation
Unit Size |
Standard
Creation/ Redemption Transaction Fee |
Maximum
Additional Charge for Creations* |
Maximum
Additional Charge for Redemptions* | ||||
| $1,785,500 | 50,000 | $2,500 | 3.0% | 2.0% |
| * | As a percentage of the net asset value per Creation Unit, inclusive, in the case of redemptions, of the standard redemption transaction fee. |
Table of Contents
Table of Contents
(For a share outstanding throughout each period)
| Year
ended Aug. 31, 2014 |
Year
ended Aug. 31, 2013 |
Period
from Feb. 8, 2012a to Aug. 31, 2012 | |||
| Net asset value, beginning of period | $ 36.10 | $40.16 | $ 51.12 | ||
| Income
from investment operations: | |||||
| Net investment incomeb | 1.05 | 1.04 | 1.05 | ||
| Net realized and unrealized gain (loss)c | 3.13 | (4.16) | (11.14) | ||
| Total from investment operations | 4.18 | (3.12) | (10.09) | ||
| Less distributions from: | |||||
| Net investment income | (0.70) | (0.94) | (0.84) | ||
| Return of capital | − | − | (0.03) | ||
| Total distributions | (0.70) | (0.94) | (0.87) | ||
| Net asset value, end of period | $39.58 | $36.10 | $ 40.16 | ||
| Total return | 11.65% | (7.73)% | (19.71)% d | ||
| Ratios/Supplemental data: | |||||
| Net assets, end of period (000s) | $ 1,979 | $ 1,805 | $ 2,008 | ||
| Ratio of expenses to average net assetse | 0.67% | 0.67% | 0.68% | ||
| Ratio of net investment income to average net assetse | 2.79% | 2.56% | 4.23% | ||
| Portfolio turnover ratef | 15% | 7% | 29% | ||
| a | Commencement of operations. |
| b | Based on average shares outstanding throughout each period. |
| c | The amounts reported for a share outstanding may not accord with the change in aggregate gains and losses in securities for the fiscal period due to the timing of capital share transactions in relation to the fluctuating market values of the Fund's underlying securities. |
| d | Not annualized. |
| e | Annualized for periods of less than one year. |
| f | Portfolio turnover rates exclude portfolio securities received or delivered in Creation Units but include portfolio transactions that are executed as a result of the Fund processing capital share transactions in Creation Units partially for cash in U.S. dollars. Excluding such cash transactions, the portfolio turnover rates for the years ended August 31, 2014, August 31, 2013 and the period ended August 31, 2012 were 15%, 7% and 3%, respectively. |
Table of Contents
Table of Contents
Table of Contents
| Premium/Discount Range | Number of Days | Percentage of Total Days | ||
| Greater than 2.5% | 1 | 0.23% | ||
| Greater than 2.0% and Less than 2.5% | 2 | 0.45 | ||
| Greater than 1.5% and Less than 2.0% | 3 | 0.68 | ||
| Greater than 1.0% and Less than 1.5% | 13 | 2.95 | ||
| Greater than 0.5% and Less than 1.0% | 54 | 12.27 | ||
| Between 0.5% and -0.5% | 277 | 62.97 | ||
| Less than -0.5% and Greater than -1.0% | 55 | 12.50 | ||
| Less than -1.0% and Greater than -1.5% | 25 | 5.67 | ||
| Less than -1.5% and Greater than -2.0% | 8 | 1.82 | ||
| Less than -2.0% and Greater than -2.5% | 1 | 0.23 | ||
| Less than -2.5% and Greater than -3.0% | 1 | 0.23 | ||
| 440 | 100.00% |
Table of Contents
| Average Annual Total Returns | Cumulative Total Returns | ||||||
| NAV | MARKET | INDEX | NAV | MARKET | INDEX | ||
| 1 Year | 11.65% | 12.42% | 12.19% | 11.65% | 12.42% | 12.19% | |
| Since Inception* | (7.14)% | (7.24)% | (6.59)% | (17.29)% | (17.52)% | (16.02)% | |
| * | Total returns for the period since inception are calculated from the inception date of the Fund (2/8/12). The first day of secondary market trading in shares of the Fund was 2/9/12. |
Table of Contents
Table of Contents
Table of Contents
Table of Contents
| Call: | 1-800-iShares
or 1-800-474-2737 (toll free) Monday through Friday, 8:30 a.m. to 6:30 p.m. (Eastern time) |
| Email: | iSharesETFs@blackrock.com |
| Write: | c/o
BlackRock Investments, LLC 1 University Square Drive, Princeton, NJ 08540 |

Table of Contents
| 2014 Prospectus |
|
| ► | iShares MSCI Emerging Markets Growth ETF | EGRW | NASDAQ |
Table of Contents
Table of Contents
|
|
S-1 |
|
|
1 |
|
|
2 |
|
|
15 |
|
|
17 |
|
|
17 |
|
|
20 |
|
|
32 |
|
|
32 |
|
|
34 |
|
|
34 |
|
|
36 |
Table of Contents
Table of Contents
| Ticker: EGRW | Stock Exchange: NASDAQ |
| Annual
Fund Operating Expenses (ongoing expenses that you pay each year as a percentage of the value of your investments) | ||||||||||
| Management
Fees |
Distribution
and Service (12b-1) Fees |
Other
Expenses |
Total
Annual Fund Operating Expenses |
Fee Waiver | Total
Annual Fund Operating Expenses After Fee Waiver | |||||
| 0.68% | None | None | 0.68% | (0.19)% | 0.49% | |||||
| 1 Year | 3 Years | 5 Years | 10 Years | |||
| $50 | $198 | $360 | $829 |
Table of Contents
Table of Contents
Table of Contents
Table of Contents
Table of Contents
Table of Contents
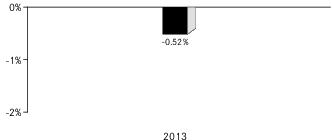
| 1 | The Fund’s year-to-date return as of September 30, 2014 was 1.47%. |
Table of Contents
| One Year | Since
Fund Inception | ||
| (Inception Date: 2/8/2012) | |||
| Return Before Taxes | -0.52% | 2.68% | |
| Return After Taxes on Distributions1 | -0.78% | 2.32% | |
| Return After Taxes on Distributions and Sale of Fund Shares1 | 0.00% | 2.19% | |
| MSCI Emerging Markets Growth Index (Index returns do not reflect deductions for fees, expenses or taxes) | -0.18% | 3.24% |
| 1 | After-tax returns in the table above are calculated using the historical highest individual U.S. federal marginal income tax rates and do not reflect the impact of state or local taxes. Actual after-tax returns depend on an investor’s tax situation and may differ from those shown, and after-tax returns shown are not relevant to tax-exempt investors or investors who hold shares through tax-deferred arrangements, such as 401(k) plans or individual retirement accounts (“IRAs”). Fund returns after taxes on distributions and sales of Fund shares are calculated assuming that an investor has sufficient capital gains of the same character from other investments to offset any capital losses from the sale of Fund shares. As a result, Fund returns after taxes on distributions and sales of Fund shares may exceed Fund returns before taxes and/or returns after taxes on distributions. |
Table of Contents
Table of Contents
Table of Contents
Table of Contents
Table of Contents
Table of Contents
Table of Contents
Table of Contents
Table of Contents
Table of Contents
| ■ | Lower levels of liquidity and market efficiency; |
| ■ | Greater securities price volatility; |
| ■ | Exchange rate fluctuations and exchange controls; |
| ■ | Less availability of public information about issuers; |
| ■ | Limitations on foreign ownership of securities; |
| ■ | Imposition of withholding or other taxes; |
| ■ | Imposition of restrictions on the expatriation of the funds or other assets of the Fund; |
| ■ | Higher transaction and custody costs and delays in settlement procedures; |
| ■ | Difficulties in enforcing contractual obligations; |
| ■ | Lower levels of regulation of the securities markets; |
| ■ | Weaker accounting, disclosure and reporting requirements; and |
| ■ | Legal principles relating to corporate governance, directors’ fiduciary duties and liabilities and stockholders’ rights in markets in which the Fund invests may differ and/or may not be as extensive or protective as those that apply in the United States. |
Table of Contents
Table of Contents
| ■ | The risk of delays in settling portfolio transactions and the risk of loss arising out of the system of share registration and custody used in Russia; |
| ■ | Risks in connection with the maintenance of the Fund’s portfolio securities and cash with foreign sub-custodians and securities depositories, including the risk that appropriate sub-custody arrangements will not be available to the Fund; |
| ■ | The risk that the Fund’s ownership rights in portfolio securities could be lost through fraud or negligence as a result of the fact that ownership in shares of Russian companies is recorded by the companies themselves and by registrars, rather than by a central registration system; and |
| ■ | The risk that the Fund may not be able to pursue claims on behalf of its shareholders because of the system of share registration and custody, and because Russian banking institutions and registrars are not guaranteed by the Russian government. |
Table of Contents
Table of Contents
Table of Contents
| ■ | where a non-resident investor has made any investment, directly or indirectly, in a foreign institutional investor (“FII”) which has invested in India; |
| ■ | investment by the non-resident investor in a fund or a fund pooling vehicle, which does not result in participation in control and management of the fund; or |
| ■ | where a non-resident investor along with its associates, does not have more than a 26% share in total capital of the company. |
Table of Contents
| ■ | creates rights, or obligations, which are not ordinarily created between persons dealing at arm's length; |
| ■ | results, directly or indirectly, in the misuse, or abuse, of the provisions of IT Act; |
| ■ | lacks commercial substance; or |
| ■ | is entered into, or carried out, by means, or in a manner, which are not ordinarily employed for bona fide purposes. |
| ■ | any arrangement where the aggregate tax benefit to all the parties of the arrangement in the relevant financial year does not exceed INR 30 Million; |
| ■ | FIIs that choose not to take any benefit under any tax treaty entered with India and has invested in listed or unlisted securities with prior permission of the competent authority in accordance with the applicable regulations; |
| ■ | non-resident investor in an FII who has invested in an FII, directly or indirectly, by way of an offshore derivative instrument or otherwise; or |
| ■ | any income derived from the transfer of investments made prior to August 30, 2010. |
Table of Contents
Table of Contents
| ■ | The risk of delays in settling portfolio transactions and the risk of loss arising out of the system of share registration and custody used in certain Eastern European countries; |
| ■ | Risks in connection with the maintenance of the Fund's portfolio securities and cash with foreign sub-custodians and securities depositories, including the risk that appropriate sub-custody arrangements will not be available to the Fund; |
| ■ | The risk that the Fund's ownership rights in portfolio securities could be lost through fraud or negligence as a result of the fact that ownership in shares of certain Eastern European companies is recorded by the companies themselves and by registrars, rather than a central registration system; |
| ■ | The risk that the Fund may not be able to pursue claims on behalf of its shareholders because of the system of share registration and custody, and because certain Eastern European banking institutions and registrars are not guaranteed by their respective governments; and |
Table of Contents
| ■ | Risks in connection with Eastern European countries' dependence on the economic health of Western European countries and the EU as a whole. |
Table of Contents
Table of Contents
Table of Contents
Table of Contents
Table of Contents
Table of Contents
Table of Contents
Table of Contents
Table of Contents
Table of Contents
| ■ | Dividend: Dividend income earned by the Subsidiary will not be subject to Indian tax. However, the Indian company declaring and paying such dividend would be subject to Dividend Distribution Tax at an effective rate of 20% (approx.) (effective starting October 1, 2014) on the amount of the dividend paid out. |
| ■ | Interest: Interest paid to the Subsidiary in respect of debt obligations of Indian issuers will be subject to Indian income tax. The tax rate in the case of a rupee-denominated debt obligation is 43.26%. However if the Subsidiary is a SEBI registered sub-account, interest income earned from June 1, 2013 to May 31, 2015 on rupee denominated bonds of Indian companies and Indian government securities will be subject to tax at the rate of 5.41%, provided that the rate of interest does not exceed the prescribed rates. In the case of a foreign-currency denominated debt obligation, the tax rate is 21.63%. For approved foreign-currency loans advanced from July 1, 2012 to June 30, 2017, the tax rate on interest is 5.41% and for approved foreign currency long-term bonds issued from October 1, 2014 to June 30, 2017, the tax rate on interest is 5.41%. However, if the Subsidiary is registered as a sub-account with SEBI, interest from securities will be subject to tax at the rate of 21.63%. |
| ■ | Securities Transaction Tax: Transactions involving the purchase or sale of shares or any other security traded on a recognized Indian stock exchange are subject to Securities Transaction Tax (“STT”). STT will be levied at the rate of 0.001% on the seller in case of actual delivery of the security and at the rate of 0.2% on the sale of unlisted shares in an initial public offering. This STT is not applicable to primary |
Table of Contents
| issuances of equity shares by a company or to off-market transactions. Hence, STT will be payable if the Subsidiary buys or sells listed securities on a recognized Indian stock exchange. | |
| ■ | Capital Gains: The taxation of capital gains would be as follows: (i) long-term capital gains (being gains on sale of shares held for a period of more than twelve months) listed on a recognized stock exchange would not be taxable in India provided STT has been paid on the same (as discussed above); (ii) short-term capital gains (being gains on sale of shares held for a period of twelve months or less) from the sale of Indian shares listed on a recognized stock exchange will be taxed at the rate of 16.223% provided STT has been paid on the same; (iii) long-term capital gains (being gains on sale of shares held for a period of more than 36 months) arising to the Subsidiary from the sale of unlisted securities will be taxed at the rate of 10.815% (without indexation) and short-term capital gains (being gains on sale of shares held for a period of 36 months or less) will be taxed at the rate of 43.26%;* (iv) capital gains realized on sale of listed equity shares not executed on a recognized stock exchange in India would be taxed at the rate of 21.63% for long-term gains (being gains on sale of shares held for a period of more than 12 months) and at 43.26% in the case of short-term gains (being gains on sale of shares held for a period of 12 months or less);* and (v) capital gains arising from the transfer of depositary receipts outside India between non-resident investors will not be subject to tax in India. |
| * | However, if the Subsidiary is a SEBI registered sub-account, the rates will be 10.816% and 32.45%, respectively. |
Table of Contents
| ■ | any arrangement where the aggregate tax benefit to all the parties of the arrangement in the relevant financial year does not exceed INR 30 Million; |
| ■ | FIIs that choose not to take any benefit under any tax treaty entered with India and has invested in listed or unlisted securities with prior permission of the competent authority in accordance with the applicable regulations; |
| ■ | non-resident investor in an FII who has invested in an FII, directly or indirectly, by way of an offshore derivative instrument or otherwise; or |
| ■ | any income derived from the transfer of investments made prior to August 30, 2010. |
Table of Contents
Table of Contents
| Approximate
Value of a Creation Unit |
Creation
Unit Size |
Standard
Creation/ Redemption Transaction Fee |
Maximum
Additional Charge for Creations* |
Maximum
Additional Charge for Redemptions* | ||||
| $2,762,500 | 50,000 | $14,500 | 3.0% | 2.0% |
| * | As a percentage of the net asset value per Creation Unit, inclusive, in the case of redemptions, of the standard redemption transaction fee. |
Table of Contents
(For a share outstanding throughout each period)
Table of Contents
| Year
ended Aug. 31, 2014 |
Year
ended Aug. 31, 2013 |
Period
from Feb. 8, 2012a to Aug. 31, 2012 | |||
| Net asset value, beginning of period | $50.26 | $50.60 | $ 54.24 | ||
| Income
from investment operations: | |||||
| Net investment incomeb | 0.81 | 0.85 | 0.66 | ||
| Net realized and unrealized gain (loss)c | 8.86 | 0.13 | (3.87) | ||
| Total from investment operations | 9.67 | 0.98 | (3.21) | ||
| Less distributions from: | |||||
| Net investment income | (0.75) | (1.32) | (0.43) | ||
| Total distributions | (0.75) | (1.32) | (0.43) | ||
| Net asset value, end of period | $ 59.18 | $50.26 | $ 50.60 | ||
| Total return | 19.36% | 1.76% | (5.90)% d | ||
| Ratios/Supplemental data: | |||||
| Net assets, end of period (000s) | $ 5,918 | $ 5,026 | $10,121 | ||
| Ratio of expenses to average net assetse | 0.49% | 0.49% | 0.49% | ||
| Ratio of expenses to average net assets prior to waived feese | 0.68% | 0.68% | 0.68% | ||
| Ratio of net investment income to average net assetse | 1.47% | 1.59% | 2.27% | ||
| Portfolio turnover ratef | 26% | 64% | 12% | ||
| a | Commencement of operations. |
| b | Based on average shares outstanding throughout each period. |
| c | The amounts reported for a share outstanding may not accord with the change in aggregate gains and losses in securities for the fiscal period due to the timing of capital share transactions in relation to the fluctuating market values of the Fund's underlying securities. |
| d | Not annualized. |
| e | Annualized for periods of less than one year. |
| f | Portfolio turnover rates exclude portfolio securities received or delivered in Creation Units but include portfolio transactions that are executed as a result of the Fund processing capital share transactions in Creation Units partially for cash in U.S. dollars. Excluding such cash transactions, the portfolio turnover rates for the years ended August 31, 2014, August 31, 2013 and the period ended August 31, 2012 were 26%, 28% and 12%, respectively. |
Table of Contents
Table of Contents
Table of Contents
| Premium/Discount Range | Number of Days | Percentage of Total Days | ||
| Greater than 3.5% | 1 | 0.23% | ||
| Greater than 3.0% and Less than 3.5% | 4 | 0.91 | ||
| Greater than 2.5% and Less than 3.0% | 23 | 5.23 | ||
| Greater than 2.0% and Less than 2.5% | 40 | 9.09 | ||
| Greater than 1.5% and Less than 2.0% | 38 | 8.64 | ||
| Greater than 1.0% and Less than 1.5% | 58 | 13.18 | ||
| Greater than 0.5% and Less than 1.0% | 55 | 12.50 | ||
| Between 0.5% and -0.5% | 170 | 38.63 | ||
| Less than -0.5% and Greater than -1.0% | 39 | 8.86 | ||
| Less than -1.0% and Greater than -1.5% | 10 | 2.27 | ||
| Less than -1.5% and Greater than -2.0% | 1 | 0.23 | ||
| Less than -2.0% and Greater than -2.5% | 1 | 0.23 | ||
| 440 | 100.00% |
Table of Contents
| Average Annual Total Returns | Cumulative Total Returns | ||||||
| NAV | MARKET | INDEX | NAV | MARKET | INDEX | ||
| 1 Year | 19.36% | 17.28% | 20.16% | 19.36% | 17.28% | 20.16% | |
| Since Inception* | 5.35% | 5.20% | 6.11% | 14.29% | 13.87% | 16.39% | |
| * | Total returns for the period since inception are calculated from the inception date of the Fund (2/8/12). The first day of secondary market trading in shares of the Fund was 2/9/12. |
Table of Contents
Table of Contents
Table of Contents
Table of Contents
Table of Contents
| Call: | 1-800-iShares
or 1-800-474-2737 (toll free) Monday through Friday, 8:30 a.m. to 6:30 p.m. (Eastern time) |
| Email: | iSharesETFs@blackrock.com |
| Write: | c/o
BlackRock Investments, LLC 1 University Square Drive, Princeton, NJ 08540 |

Table of Contents
| 2014 Prospectus |
|
| ► | iShares MSCI Emerging Markets Value ETF | EVAL | NASDAQ |
Table of Contents
Table of Contents
|
|
S-1 |
|
|
1 |
|
|
2 |
|
|
15 |
|
|
18 |
|
|
18 |
|
|
21 |
|
|
32 |
|
|
32 |
|
|
34 |
|
|
34 |
|
|
36 |
Table of Contents
Table of Contents
| Ticker: EVAL | Stock Exchange: NASDAQ |
| Annual
Fund Operating Expenses (ongoing expenses that you pay each year as a percentage of the value of your investments) | ||||||||||
| Management
Fees |
Distribution
and Service (12b-1) Fees |
Other
Expenses |
Total
Annual Fund Operating Expenses |
Fee Waiver | Total
Annual Fund Operating Expenses After Fee Waiver | |||||
| 0.68% | None | None | 0.68% | (0.19)% | 0.49% | |||||
| 1 Year | 3 Years | 5 Years | 10 Years | |||
| $50 | $198 | $360 | $829 |
Table of Contents
Table of Contents
Table of Contents
Table of Contents
Table of Contents
Table of Contents

| 1 | The Fund’s year-to-date return as of September 30, 2014 was 2.02%. |
Table of Contents
| One Year | Since
Fund Inception | ||
| (Inception Date: 2/8/2012) | |||
| Return Before Taxes | -5.43% | -4.18% | |
| Return After Taxes on Distributions1 | -5.88% | -4.54% | |
| Return After Taxes on Distributions and Sale of Fund Shares1 | -2.47% | -2.88% | |
| MSCI Emerging Markets Value Index (Index returns do not reflect deductions for fees, expenses or taxes) | -5.11% | -3.87% |
| 1 | After-tax returns in the table above are calculated using the historical highest individual U.S. federal marginal income tax rates and do not reflect the impact of state or local taxes. Actual after-tax returns depend on an investor’s tax situation and may differ from those shown, and after-tax returns shown are not relevant to tax-exempt investors or investors who hold shares through tax-deferred arrangements, such as 401(k) plans or individual retirement accounts (“IRAs”). Fund returns after taxes on distributions and sales of Fund shares are calculated assuming that an investor has sufficient capital gains of the same character from other investments to offset any capital losses from the sale of Fund shares. As a result, Fund returns after taxes on distributions and sales of Fund shares may exceed Fund returns before taxes and/or returns after taxes on distributions. |
Table of Contents
Table of Contents
Table of Contents
Table of Contents
Table of Contents
Table of Contents
Table of Contents
Table of Contents
Table of Contents
Table of Contents
| ■ | Lower levels of liquidity and market efficiency; |
| ■ | Greater securities price volatility; |
| ■ | Exchange rate fluctuations and exchange controls; |
| ■ | Less availability of public information about issuers; |
| ■ | Limitations on foreign ownership of securities; |
| ■ | Imposition of withholding or other taxes; |
| ■ | Imposition of restrictions on the expatriation of the funds or other assets of the Fund; |
| ■ | Higher transaction and custody costs and delays in settlement procedures; |
| ■ | Difficulties in enforcing contractual obligations; |
| ■ | Lower levels of regulation of the securities markets; |
| ■ | Weaker accounting, disclosure and reporting requirements; and |
| ■ | Legal principles relating to corporate governance, directors’ fiduciary duties and liabilities and stockholders’ rights in markets in which the Fund invests may differ and/or may not be as extensive or protective as those that apply in the United States. |
Table of Contents
Table of Contents
| ■ | The risk of delays in settling portfolio transactions and the risk of loss arising out of the system of share registration and custody used in Russia; |
| ■ | Risks in connection with the maintenance of the Fund’s portfolio securities and cash with foreign sub-custodians and securities depositories, including the risk that appropriate sub-custody arrangements will not be available to the Fund; |
| ■ | The risk that the Fund’s ownership rights in portfolio securities could be lost through fraud or negligence as a result of the fact that ownership in shares of Russian companies is recorded by the companies themselves and by registrars, rather than by a central registration system; and |
| ■ | The risk that the Fund may not be able to pursue claims on behalf of its shareholders because of the system of share registration and custody, and because Russian banking institutions and registrars are not guaranteed by the Russian government. |
Table of Contents
Table of Contents
Table of Contents
| ■ | where a non-resident investor has made any investment, directly or indirectly, in a foreign institutional investor (“FII”) which has invested in India; |
| ■ | investment by the non-resident investor in a fund or a fund pooling vehicle, which does not result in participation in control and management of the fund; or |
| ■ | where a non-resident investor along with its associates, does not have more than a 26% share in total capital of the company. |
Table of Contents
| ■ | creates rights, or obligations, which are not ordinarily created between persons dealing at arm's length; |
| ■ | results, directly or indirectly, in the misuse, or abuse, of the provisions of IT Act; |
| ■ | lacks commercial substance; or |
| ■ | is entered into, or carried out, by means, or in a manner, which are not ordinarily employed for bona fide purposes. |
| ■ | any arrangement where the aggregate tax benefit to all the parties of the arrangement in the relevant financial year does not exceed INR 30 Million; |
| ■ | FIIs that choose not to take any benefit under any tax treaty entered with India and has invested in listed or unlisted securities with prior permission of the competent authority in accordance with the applicable regulations; |
| ■ | non-resident investor in an FII who has invested in an FII, directly or indirectly, by way of an offshore derivative instrument or otherwise; or |
| ■ | any income derived from the transfer of investments made prior to August 30, 2010. |
Table of Contents
Table of Contents
| ■ | The risk of delays in settling portfolio transactions and the risk of loss arising out of the system of share registration and custody used in certain Eastern European countries; |
| ■ | Risks in connection with the maintenance of the Fund's portfolio securities and cash with foreign sub-custodians and securities depositories, including the risk that appropriate sub-custody arrangements will not be available to the Fund; |
| ■ | The risk that the Fund's ownership rights in portfolio securities could be lost through fraud or negligence as a result of the fact that ownership in shares of certain Eastern European companies is recorded by the companies themselves and by registrars, rather than a central registration system; |
| ■ | The risk that the Fund may not be able to pursue claims on behalf of its shareholders because of the system of share registration and custody, and because certain Eastern European banking institutions and registrars are not guaranteed by their respective governments; and |
| ■ | Risks in connection with Eastern European countries' dependence on the economic health of Western European countries and the EU as a whole. |
Table of Contents
Table of Contents
Table of Contents
Table of Contents
Table of Contents
Table of Contents
Table of Contents
Table of Contents
Table of Contents
Table of Contents
Table of Contents
Table of Contents
| ■ | Dividend: Dividend income earned by the Subsidiary will not be subject to Indian tax. However, the Indian company declaring and paying such dividend would be subject to Dividend Distribution Tax at an effective rate of 20% (approx.) (effective starting October 1, 2014) on the amount of the dividend paid out. |
| ■ | Interest: Interest paid to the Subsidiary in respect of debt obligations of Indian issuers will be subject to Indian income tax. The tax rate in the case of a rupee-denominated debt obligation is 43.26%. However if the Subsidiary is a SEBI registered sub-account, interest income earned from June 1, 2013 to May 31, 2015 on rupee denominated bonds of Indian companies and Indian government securities will be subject to tax at the rate of 5.41%, provided that the rate of interest does not exceed the prescribed rates. In the case of a foreign-currency denominated debt obligation, the tax rate is 21.63%. For approved foreign-currency loans advanced from July 1, 2012 to June 30, 2017, the tax rate on interest is 5.41% and for approved foreign currency long-term bonds issued from October 1, 2014 to June 30, 2017, the tax rate on interest is 5.41%. However, if the Subsidiary is registered as a sub-account with SEBI, interest from securities will be subject to tax at the rate of 21.63%. |
| ■ | Securities Transaction Tax: Transactions involving the purchase or sale of shares or any other security traded on a recognized Indian stock exchange are subject to Securities Transaction Tax (“STT”). STT will be levied at the rate of 0.001% on the seller in case of actual delivery of the security and at the rate of 0.2% on the sale of unlisted shares in an initial public offering. This STT is not applicable to primary issuances of equity shares by a company or to off-market transactions. Hence, STT will be payable if the Subsidiary buys or sells listed securities on a recognized Indian stock exchange. |
| ■ | Capital Gains: The taxation of capital gains would be as follows: (i) long-term capital gains (being gains on sale of shares held for a period of more than twelve months) listed on a recognized stock exchange would not be taxable in India provided STT has been paid on the same (as discussed above); (ii) short-term capital gains (being gains on sale of shares held for a period of twelve months or less) from the sale of Indian shares listed on a recognized stock exchange will be taxed at the rate of 16.223% provided STT has been paid on the same; (iii) long-term capital gains (being gains on sale of shares held for a period of more than 36 months) arising to the Subsidiary from the sale of unlisted securities will be taxed at the rate of 10.815% (without indexation) and short-term capital gains (being gains on sale of shares held for a period of 36 months or less) will be taxed at the rate of 43.26%;* (iv) capital gains realized on sale of listed equity shares not executed on a recognized stock exchange in India would be taxed at the rate of 21.63% for long-term gains (being |
Table of Contents
| * | However, if the Subsidiary is a SEBI registered sub-account, the rates will be 10.816% and 32.45%, respectively. |
| ■ | any arrangement where the aggregate tax benefit to all the parties of the arrangement in the relevant financial year does not exceed INR 30 Million; |
| ■ | FIIs that choose not to take any benefit under any tax treaty entered with India and has invested in listed or unlisted securities with prior permission of the competent authority in accordance with the applicable regulations; |
| ■ | non-resident investor in an FII who has invested in an FII, directly or indirectly, by way of an offshore derivative instrument or otherwise; or |
| ■ | any income derived from the transfer of investments made prior to August 30, 2010. |
Table of Contents
Table of Contents
| Approximate
Value of a Creation Unit |
Creation
Unit Size |
Standard
Creation/ Redemption Transaction Fee |
Maximum
Additional Charge for Creations* |
Maximum
Additional Charge for Redemptions* | ||||
| $2,312,000 | 50,000 | $15,000 | 3.0% | 2.0% |
| * | As a percentage of the net asset value per Creation Unit, inclusive, in the case of redemptions, of the standard redemption transaction fee. |
Table of Contents
Table of Contents
(For a share outstanding throughout each period)
| Year
ended Aug. 31, 2014 |
Year
ended Aug. 31, 2013 |
Period
from Feb. 8, 2012a to Aug. 31, 2012 | |||
| Net asset value, beginning of period | $ 43.15 | $ 45.30 | $ 52.58 | ||
| Income
from investment operations: | |||||
| Net investment incomeb | 1.36 | 1.34 | 1.00 | ||
| Net realized and unrealized gain (loss)c | 6.83 | (2.11) | (7.54) | ||
| Total from investment operations | 8.19 | (0.77) | (6.54) | ||
| Less distributions from: | |||||
| Net investment income | (0.97) | (1.38) | (0.74) | ||
| Total distributions | (0.97) | (1.38) | (0.74) | ||
| Net asset value, end of period | $ 50.37 | $ 43.15 | $ 45.30 | ||
| Total return | 19.20% | (1.83)% | (12.41)% d | ||
| Ratios/Supplemental data: | |||||
| Net assets, end of period (000s) | $25,186 | $10,787 | $ 9,061 | ||
| Ratio of expenses to average net assetse | 0.49% | 0.49% | 0.49% | ||
| Ratio of expenses to average net assets prior to waived feese | 0.68% | 0.68% | 0.68% | ||
| Ratio of net investment income to average net assetse | 2.94% | 2.84% | 3.73% | ||
| Portfolio turnover ratef | 25% | 47% | 12% | ||
| a | Commencement of operations. |
| b | Based on average shares outstanding throughout each period. |
| c | The amounts reported for a share outstanding may not accord with the change in aggregate gains and losses in securities for the fiscal period due to the timing of capital share transactions in relation to the fluctuating market values of the Fund's underlying securities. |
| d | Not annualized. |
| e | Annualized for periods of less than one year. |
| f | Portfolio turnover rates exclude portfolio securities received or delivered in Creation Units but include portfolio transactions that are executed as a result of the Fund processing capital share transactions in Creation Units partially for cash in U.S. dollars. Excluding such cash transactions, the portfolio turnover rates for the years ended August 31, 2014, August 31, 2013 and the period ended August 31, 2012, were 25%, 26% and 12%, respectively. |
Table of Contents
Table of Contents
Table of Contents
| Premium/Discount Range | Number of Days | Percentage of Total Days | ||
| Greater than 5.0% and Less than 5.5% | 5 | 1.14% | ||
| Greater than 4.5% and Less than 5.0% | 9 | 2.05 | ||
| Greater than 4.0% and Less than 4.5% | 7 | 1.59 | ||
| Greater than 3.5% and Less than 4.0% | 12 | 2.73 | ||
| Greater than 3.0% and Less than 3.5% | 14 | 3.18 | ||
| Greater than 2.5% and Less than 3.0% | 25 | 5.67 | ||
| Greater than 2.0% and Less than 2.5% | 32 | 7.27 | ||
| Greater than 1.5% and Less than 2.0% | 71 | 16.14 | ||
| Greater than 1.0% and Less than 1.5% | 80 | 18.18 | ||
| Greater than 0.5% and Less than 1.0% | 89 | 20.23 | ||
| Between 0.5% and -0.5% | 84 | 19.09 | ||
| Less than -0.5% and Greater than -1.0% | 9 | 2.05 | ||
| Less than -1.0% and Greater than -1.5% | 3 | 0.68 | ||
| 440 | 100.00% |
Table of Contents
| Average Annual Total Returns | Cumulative Total Returns | ||||||
| NAV | MARKET | INDEX | NAV | MARKET | INDEX | ||
| 1 Year | 19.20% | 20.62% | 19.77% | 19.20% | 20.62% | 19.77% | |
| Since Inception* | 0.96% | 2.07% | 1.41% | 2.49% | 5.38% | 3.64% | |
| * | Total returns for the period since inception are calculated from the inception date of the Fund (2/8/12). The first day of secondary market trading in shares of the Fund was 2/9/12. |
Table of Contents
Table of Contents
Table of Contents
Table of Contents
Table of Contents
| Call: | 1-800-iShares
or 1-800-474-2737 (toll free) Monday through Friday, 8:30 a.m. to 6:30 p.m. (Eastern time) |
| Email: | iSharesETFs@blackrock.com |
| Write: | c/o
BlackRock Investments, LLC 1 University Square Drive, Princeton, NJ 08540 |

Table of Contents
| 2014 Prospectus |
|
| ► | iShares MSCI Frontier 100 ETF | FM | NYSE ARCA |
Table of Contents
Table of Contents
|
|
S-1 |
|
|
1 |
|
|
2 |
|
|
11 |
|
|
12 |
|
|
12 |
|
|
15 |
|
|
25 |
|
|
26 |
|
|
27 |
|
|
27 |
|
|
29 |
Table of Contents
Table of Contents
| Ticker: FM | Stock Exchange: NYSE Arca |
| Annual
Fund Operating Expenses (ongoing expenses that you pay each year as a percentage of the value of your investments) | ||||||
| Management
Fees |
Distribution
and Service (12b-1) Fees |
Other
Expenses |
Total
Annual Fund Operating Expenses | |||
| 0.79% | None | None | 0.79% | |||
| 1 Year | 3 Years | 5 Years | 10 Years | |||
| $81 | $252 | $439 | $978 |
Table of Contents
Table of Contents
Table of Contents
Table of Contents
Table of Contents
Table of Contents
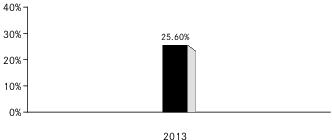
| 1 | The Fund’s year-to-date return as of September 30, 2014 was 18.29%. |
| One Year | Since
Fund Inception | ||
| (Inception Date: 9/12/2012) | |||
| Return Before Taxes | 25.60% | 24.31% | |
| Return After Taxes on Distributions2 | 25.16% | 23.98% | |
| Return After Taxes on Distributions and Sale of Fund Shares2 | 14.64% | 18.56% | |
| MSCI Frontier Markets 100 Index (Index returns do not reflect deductions for fees, expenses or taxes) | 25.91% | 24.90% |
| 2 | After-tax returns in the table above are calculated using the historical highest individual U.S. federal marginal income tax rates and do not reflect the impact of state or local taxes. Actual after-tax returns depend on an investor’s tax situation and may differ from those shown, and after-tax returns shown are not relevant to tax-exempt investors or investors who hold shares through tax-deferred arrangements, such as 401(k) plans or individual retirement accounts (“IRAs”). Fund returns after taxes on distributions and sales of Fund shares are calculated assuming that an investor has sufficient capital gains of the same character from other investments to offset any capital losses from the sale of Fund shares. As a result, Fund returns after taxes on distributions and sales of Fund shares may exceed Fund returns before taxes and/or returns after taxes on distributions. |
Table of Contents
Table of Contents
Table of Contents
Table of Contents
Table of Contents
Table of Contents
Table of Contents
Table of Contents
Table of Contents
| ■ | Lower levels of liquidity and market efficiency; |
Table of Contents
| ■ | Greater securities price volatility; |
| ■ | Exchange rate fluctuations and exchange controls; |
| ■ | Less availability of public information about issuers; |
| ■ | Limitations on foreign ownership of securities; |
| ■ | Imposition of withholding or other taxes; |
| ■ | Imposition of restrictions on the expatriation of the funds or other assets of the Fund; |
| ■ | Higher transaction and custody costs and delays in settlement procedures; |
| ■ | Difficulties in enforcing contractual obligations; |
| ■ | Lower levels of regulation of the securities markets; |
| ■ | Weaker accounting, disclosure and reporting requirements; and |
| ■ | Legal principles relating to corporate governance, directors’ fiduciary duties and liabilities and stockholders’ rights in markets in which the Fund invests may differ and/or may not be as extensive or protective as those that apply in the United States. |
Table of Contents
Table of Contents
Table of Contents
Table of Contents
Table of Contents
Table of Contents
Table of Contents
Table of Contents
Table of Contents
Table of Contents
Table of Contents
Table of Contents
Table of Contents
Table of Contents
Table of Contents
| Approximate
Value of a Creation Unit |
Creation
Unit Size |
Standard
Creation/ Redemption Transaction Fee |
Maximum
Additional Charge for Creations* |
Maximum
Additional Charge for Redemptions* | ||||
| $1,916,000 | 50,000 | $6,800 | 5.0% | 2.0% |
| * | As a percentage of the net asset value per Creation Unit, inclusive, in the case of redemptions, of the standard redemption transaction fee. |
Table of Contents
Table of Contents
(For a share outstanding throughout each period)
| Year
ended Aug. 31, 2014 |
Period
from Sep. 12, 2012a to Aug. 31, 2013 | ||
| Net asset value, beginning of period | $ 30.12 | $ 25.25 | |
| Income
from investment operations: | |||
| Net investment incomeb | 1.09 | 0.67 | |
| Net realized and unrealized gainc | 7.47 | 4.51 | |
| Total from investment operations | 8.56 | 5.18 | |
| Less distributions from: | |||
| Net investment income | (0.89) | (0.28) | |
| Return of capital | − | (0.03) | |
| Total distributions | (0.89) | (0.31) | |
| Net asset value, end of period | $ 37.79 | $ 30.12 | |
| Total return | 28.56% | 20.54% d | |
| Ratios/Supplemental data: | |||
| Net assets, end of period (000s) | $799,349 | $280,084 | |
| Ratio of expenses to average net assetse | 0.79% | 0.79% | |
| Ratio of net investment income to average net assetse | 3.07% | 2.32% | |
| Portfolio turnover ratef | 61% | 18% | |
| a | Commencement of operations. |
| b | Based on average shares outstanding throughout each period. |
| c | The amounts reported for a share outstanding may not accord with the change in aggregate gains and losses in securities for the fiscal period due to the timing of capital share transactions in relation to the fluctuating market values of the Fund's underlying securities. |
| d | Not annualized. |
| e | Annualized for periods of less than one year. |
| f | Portfolio turnover rates exclude portfolio securities received or delivered in Creation Units but include portfolio transactions that are executed as a result of the Fund processing capital share transactions in Creation Units partially for cash in U.S. dollars. Excluding such cash transactions, the portfolio turnover rates for the year ended August 31, 2014 and period ended August 31, 2013 were 42% and 10%, respectively. |
Table of Contents
Table of Contents
Table of Contents
| Premium/Discount Range | Number of Days | Percentage of Total Days | ||
| Greater than 3.0% and Less than 3.5% | 6 | 1.36% | ||
| Greater than 2.5% and Less than 3.0% | 9 | 2.05 | ||
| Greater than 2.0% and Less than 2.5% | 53 | 12.05 | ||
| Greater than 1.5% and Less than 2.0% | 146 | 33.17 | ||
| Greater than 1.0% and Less than 1.5% | 104 | 23.64 | ||
| Greater than 0.5% and Less than 1.0% | 39 | 8.86 | ||
| Between 0.5% and -0.5% | 26 | 5.91 | ||
| Less than -0.5% and Greater than -1.0% | 29 | 6.59 | ||
| Less than -1.0% and Greater than -1.5% | 21 | 4.78 | ||
| Less than -1.5% and Greater than -2.0% | 4 | 0.91 | ||
| Less than -2.0% and Greater than -2.5% | 1 | 0.23 | ||
| Less than -2.5% and Greater than -3.0% | 2 | 0.45 | ||
| 440 | 100.00% |
Table of Contents
| Average Annual Total Returns | Cumulative Total Returns | ||||||
| NAV | MARKET | INDEX | NAV | MARKET | INDEX | ||
| 1 Year | 28.56% | 27.73% | 29.55% | 28.56% | 27.73% | 29.55% | |
| Since Inception* | 24.91% | 25.52% | 25.57% | 54.97% | 56.47% | 56.49% | |
| * | Total returns for the period since inception are calculated from the inception date of the Fund (9/12/12). The first day of secondary market trading in shares of the Fund was 9/13/12. |
Table of Contents
Table of Contents
| Call: | 1-800-iShares
or 1-800-474-2737 (toll free) Monday through Friday, 8:30 a.m. to 6:30 p.m. (Eastern time) |
| Email: | iSharesETFs@blackrock.com |
| Write: | c/o
BlackRock Investments, LLC 1 University Square Drive, Princeton, NJ 08540 |

Table of Contents
| 2014 Prospectus |
|
| ► | iShares MSCI Global Agriculture Producers ETF | VEGI | NYSE ARCA |
Table of Contents
Table of Contents
|
|
S-1 |
|
|
1 |
|
|
2 |
|
|
11 |
|
|
13 |
|
|
13 |
|
|
16 |
|
|
25 |
|
|
25 |
|
|
27 |
|
|
27 |
|
|
29 |
Table of Contents
Table of Contents
| Ticker: VEGI | Stock Exchange: NYSE Arca |
| Annual
Fund Operating Expenses (ongoing expenses that you pay each year as a percentage of the value of your investments) | ||||||||||||
| Management
Fees |
Distribution
and Service (12b-1) Fees |
Other
Expenses |
Acquired
Fund Fees and Expenses |
Total
Annual Fund Operating Expenses |
Fee Waiver | Total
Annual Fund Operating Expenses After Fee Waiver | ||||||
| 0.39% | None | None | 0.01% | 0.40% | (0.01)% | 0.39% | ||||||
Table of Contents
| 1 Year | 3 Years | 5 Years | 10 Years | |||
| $40 | $127 | $223 | $504 |
Table of Contents
Table of Contents
Table of Contents
Table of Contents
Table of Contents
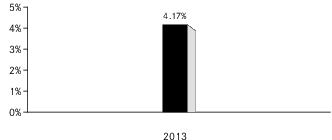
| 1 | The Fund’s year-to-date return as of September 30, 2014 was -1.42%. |
| One Year | Since
Fund Inception | ||
| (Inception Date: 1/31/2012) | |||
| Return Before Taxes | 4.17% | 6.44% | |
| Return After Taxes on Distributions2 | 3.87% | 6.25% | |
| Return After Taxes on Distributions and Sale of Fund Shares2 | 2.76% | 5.11% | |
| MSCI ACWI Select Agriculture Producers IMI (Index returns do not reflect deductions for fees, expenses or taxes) | 4.52% | 6.81% |
| 2 | After-tax returns in the table above are calculated using the historical highest individual U.S. federal marginal income tax rates and do not reflect the impact of state or local taxes. Actual after-tax returns depend on an investor’s tax situation and may differ from those shown, and after-tax returns shown are not relevant to tax-exempt investors or investors who hold shares through tax-deferred arrangements, such as 401(k) plans or individual retirement accounts (“IRAs”). Fund returns after taxes on distributions and sales of Fund shares are calculated assuming that an investor has sufficient capital gains of the same character from other investments to offset any capital losses from the sale of Fund shares. As a result, Fund returns after taxes on distributions and sales of Fund shares may exceed Fund returns before taxes and/or returns after taxes on distributions. |
Table of Contents
Table of Contents
Table of Contents
Table of Contents
Table of Contents
Table of Contents
Table of Contents
Table of Contents
| ■ | Lower levels of liquidity and market efficiency; |
| ■ | Greater securities price volatility; |
| ■ | Exchange rate fluctuations and exchange controls; |
| ■ | Less availability of public information about issuers; |
| ■ | Limitations on foreign ownership of securities; |
| ■ | Imposition of withholding or other taxes; |
| ■ | Imposition of restrictions on the expatriation of the funds or other assets of the Fund; |
| ■ | Higher transaction and custody costs and delays in settlement procedures; |
| ■ | Difficulties in enforcing contractual obligations; |
| ■ | Lower levels of regulation of the securities markets; |
| ■ | Weaker accounting, disclosure and reporting requirements; and |
| ■ | Legal principles relating to corporate governance, directors’ fiduciary duties and liabilities and stockholders’ rights in markets in which the Fund invests may differ and/or may not be as extensive or protective as those that apply in the United States. |
Table of Contents
| ■ | The risk of delays in settling portfolio transactions and the risk of loss arising out of the system of share registration and custody used in Russia; |
| ■ | Risks in connection with the maintenance of the Fund’s portfolio securities and cash with foreign sub-custodians and securities depositories, including the risk that appropriate sub-custody arrangements will not be available to the Fund; |
| ■ | The risk that the Fund’s ownership rights in portfolio securities could be lost through fraud or negligence as a result of the fact that ownership in shares of Russian companies is recorded by the companies themselves and by registrars, rather than by a central registration system; and |
| ■ | The risk that the Fund may not be able to pursue claims on behalf of its shareholders because of the system of share registration and custody, and because Russian banking institutions and registrars are not guaranteed by the Russian government. |
Table of Contents
Also, if an affected security is included in the Fund’s Underlying Index, the Fund may, where practicable, seek to eliminate its holdings of the affected security by employing or augmenting its representative sampling strategy to seek to track the investment results of its Underlying Index. The use of (or increased use of) a representative sampling strategy may increase the Fund’s tracking error risk. If the affected securities constitute a significant percentage of the Underlying Index, the Fund may not be able to effectively implement a representative sampling strategy, which may result in significant tracking error between the Fund’s performance and the performance of its Underlying Index.
Table of Contents
Table of Contents
Table of Contents
Table of Contents
Table of Contents
Table of Contents
Table of Contents
Table of Contents
Table of Contents
Table of Contents
Table of Contents
Table of Contents
Table of Contents
Table of Contents
Table of Contents
| Approximate
Value of a Creation Unit |
Creation
Unit Size |
Standard
Creation/ Redemption Transaction Fee |
Maximum
Additional Charge for Creations* |
Maximum
Additional Charge for Redemptions* | ||||
| $1,327,000 | 50,000 | $5,100 | 3.0% | 2.0% |
| * | As a percentage of the net asset value per Creation Unit, inclusive, in the case of redemptions, of the standard redemption transaction fee. |
Table of Contents
(For a share outstanding throughout each period)
Table of Contents
| Year
ended Aug. 31, 2014 |
Year
ended Aug. 31, 2013 |
Period
from Jan. 31, 2012a to Aug. 31, 2012 | |||
| Net asset value, beginning of period | $ 24.63 | $ 24.91 | $24.88 | ||
| Income
from investment operations: | |||||
| Net investment incomeb | 0.58 | 0.50 | 0.28 | ||
| Net realized and unrealized gain (loss)c | 2.63 | (0.46) | (0.05) | ||
| Total from investment operations | 3.21 | 0.04 | 0.23 | ||
| Less distributions from: | |||||
| Net investment income | (0.55) | (0.32) | (0.20) | ||
| Total distributions | (0.55) | (0.32) | (0.20) | ||
| Net asset value, end of period | $ 27.29 | $ 24.63 | $ 24.91 | ||
| Total return | 13.05% | 0.10% | 0.97% d | ||
| Ratios/Supplemental data: | |||||
| Net assets, end of period (000s) | $46,395 | $35,716 | $ 9,965 | ||
| Ratio of expenses to average net assetse | 0.38% | 0.38% | 0.38% | ||
| Ratio of expenses to average net assets prior to waived feese | 0.39% | 0.39% | 0.39% | ||
| Ratio of net investment income to average net assetse | 2.17% | 1.87% | 1.93% | ||
| Portfolio turnover ratef | 14% | 6% | 6% | ||
| a | Commencement of operations. |
| b | Based on average shares outstanding throughout each period. |
| c | The amounts reported for a share outstanding may not accord with the change in aggregate gains and losses in securities for the fiscal period due to the timing of capital share transactions in relation to the fluctuating market values of the Fund's underlying securities. |
| d | Not annualized. |
| e | Annualized for periods of less than one year. |
| f | Portfolio turnover rates exclude portfolio securities received or delivered in Creation Units but include portfolio transactions that are executed as a result of the Fund processing capital share transactions in Creation Units partially for cash in U.S. dollars. Excluding such cash transactions, the portfolio turnover rates for the years ended August 31, 2014, August 31, 2013 and the period ended August 31, 2012 were 13%, 6% and 6%, respectively. |
Table of Contents
Table of Contents
Table of Contents
| Premium/Discount Range | Number of Days | Percentage of Total Days | ||
| Greater than 1.5% and Less than 2.0% | 2 | 0.45% | ||
| Greater than 1.0% and Less than 1.5% | 8 | 1.82 | ||
| Greater than 0.5% and Less than 1.0% | 217 | 49.34 | ||
| Between 0.5% and -0.5% | 211 | 47.94 | ||
| Less than -0.5% and Greater than -1.0% | 2 | 0.45 | ||
| 440 | 100.00% |
Table of Contents
| Average Annual Total Returns | Cumulative Total Returns | ||||||
| NAV | MARKET | INDEX | NAV | MARKET | INDEX | ||
| 1 Year | 13.05% | 13.38% | 13.29% | 13.05% | 13.38% | 13.29% | |
| Since Inception* | 5.30% | 5.50% | 5.53% | 14.26% | 14.82% | 14.92% | |
| * | Total returns for the period since inception are calculated from the inception date of the Fund (1/31/12). The first day of secondary market trading in shares of the Fund was 2/2/12. |
Table of Contents
Table of Contents
| Call: | 1-800-iShares
or 1-800-474-2737 (toll free) Monday through Friday, 8:30 a.m. to 6:30 p.m. (Eastern time) |
| Email: | iSharesETFs@blackrock.com |
| Write: | c/o
BlackRock Investments, LLC 1 University Square Drive, Princeton, NJ 08540 |

Table of Contents
| 2014 Prospectus |
|
| ► | iShares MSCI Global Energy Producers ETF | FILL | NYSE ARCA |
Table of Contents
Table of Contents
|
|
S-1 |
|
|
1 |
|
|
2 |
|
|
11 |
|
|
12 |
|
|
12 |
|
|
15 |
|
|
25 |
|
|
26 |
|
|
27 |
|
|
27 |
|
|
29 |
Table of Contents
Table of Contents
| Ticker: FILL | Stock Exchange: NYSE Arca |
| Annual
Fund Operating Expenses (ongoing expenses that you pay each year as a percentage of the value of your investments) | ||||||
| Management
Fees |
Distribution
and Service (12b-1) Fees |
Other
Expenses |
Total
Annual Fund Operating Expenses | |||
| 0.39% | None | None | 0.39% | |||
| 1 Year | 3 Years | 5 Years | 10 Years | |||
| $40 | $125 | $219 | $493 |
Table of Contents
Table of Contents
Table of Contents
Table of Contents
Table of Contents
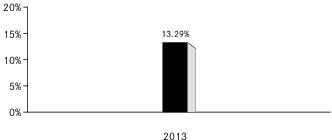
| 1 | The Fund’s year-to-date return as of September 30, 2014 was 0.28%. |
Table of Contents
| One Year | Since
Fund Inception | ||
| (Inception Date: 1/31/2012) | |||
| Return Before Taxes | 13.29% | 5.34% | |
| Return After Taxes on Distributions1 | 12.71% | 4.94% | |
| Return After Taxes on Distributions and Sale of Fund Shares1 | 8.15% | 4.29% | |
| MSCI ACWI Select Energy Producers IMI (Index returns do not reflect deductions for fees, expenses or taxes) | 13.12% | 5.27% |
| 1 | After-tax returns in the table above are calculated using the historical highest individual U.S. federal marginal income tax rates and do not reflect the impact of state or local taxes. Actual after-tax returns depend on an investor’s tax situation and may differ from those shown, and after-tax returns shown are not relevant to tax-exempt investors or investors who hold shares through tax-deferred arrangements, such as 401(k) plans or individual retirement accounts (“IRAs”). Fund returns after taxes on distributions and sales of Fund shares are calculated assuming that an investor has sufficient capital gains of the same character from other investments to offset any capital losses from the sale of Fund shares. As a result, Fund returns after taxes on distributions and sales of Fund shares may exceed Fund returns before taxes and/or returns after taxes on distributions. |
Table of Contents
Table of Contents
Table of Contents
Table of Contents
Table of Contents
Table of Contents
Table of Contents
Table of Contents
| ■ | Lower levels of liquidity and market efficiency; |
| ■ | Greater securities price volatility; |
| ■ | Exchange rate fluctuations and exchange controls; |
| ■ | Less availability of public information about issuers; |
| ■ | Limitations on foreign ownership of securities; |
| ■ | Imposition of withholding or other taxes; |
| ■ | Imposition of restrictions on the expatriation of the funds or other assets of the Fund; |
| ■ | Higher transaction and custody costs and delays in settlement procedures; |
| ■ | Difficulties in enforcing contractual obligations; |
| ■ | Lower levels of regulation of the securities markets; |
| ■ | Weaker accounting, disclosure and reporting requirements; and |
| ■ | Legal principles relating to corporate governance, directors’ fiduciary duties and liabilities and stockholders’ rights in markets in which the Fund invests may differ and/or may not be as extensive or protective as those that apply in the United States. |
Table of Contents
| ■ | The risk of delays in settling portfolio transactions and the risk of loss arising out of the system of share registration and custody used in Russia; |
| ■ | Risks in connection with the maintenance of the Fund’s portfolio securities and cash with foreign sub-custodians and securities depositories, including the risk that appropriate sub-custody arrangements will not be available to the Fund; |
| ■ | The risk that the Fund’s ownership rights in portfolio securities could be lost through fraud or negligence as a result of the fact that ownership in shares of Russian companies is recorded by the companies themselves and by registrars, rather than by a central registration system; and |
| ■ | The risk that the Fund may not be able to pursue claims on behalf of its shareholders because of the system of share registration and custody, and because Russian banking institutions and registrars are not guaranteed by the Russian government. |
Table of Contents
Table of Contents
Table of Contents
Table of Contents
Table of Contents
Table of Contents
Table of Contents
Table of Contents
Table of Contents
Table of Contents
Table of Contents
Table of Contents
Table of Contents
Table of Contents
Table of Contents
Table of Contents
| Approximate
Value of a Creation Unit |
Creation
Unit Size |
Standard
Creation/ Redemption Transaction Fee |
Maximum
Additional Charge for Creations* |
Maximum
Additional Charge for Redemptions* | ||||
| $2,574,000 | 100,000 | $6,100 | 3.0% | 2.0% |
| * | As a percentage of the net asset value per Creation Unit, inclusive, in the case of redemptions, of the standard redemption transaction fee. |
Table of Contents
Table of Contents
(For a share outstanding throughout each period)
| Year
ended Aug. 31, 2014 |
Year
ended Aug. 31, 2013 |
Period
from Jan. 31, 2012a to Aug. 31, 2012 | |||
| Net asset value, beginning of period | $24.06 | $23.51 | $24.79 | ||
| Income
from investment operations: | |||||
| Net investment incomeb | 0.68 | 0.63 | 0.43 | ||
| Net realized and unrealized gain (loss)c | 3.96 | 0.55 | (1.39) | ||
| Total from investment operations | 4.64 | 1.18 | (0.96) | ||
| Less distributions from: | |||||
| Net investment income | (0.64) | (0.63) | (0.32) | ||
| Total distributions | (0.64) | (0.63) | (0.32) | ||
| Net asset value, end of period | $28.06 | $24.06 | $23.51 | ||
| Total return | 19.44% | 5.10% | (3.77)% d | ||
| Ratios/Supplemental data: | |||||
| Net assets, end of period (000s) | $ 8,419 | $ 4,811 | $ 4,701 | ||
| Ratio of expenses to average net assetse | 0.39% | 0.39% | 0.39% | ||
| Ratio of net investment income to average net assetse | 2.57% | 2.61% | 3.16% | ||
| Portfolio turnover ratef | 8% | 6% | 5% | ||
| a | Commencement of operations. |
| b | Based on average shares outstanding throughout each period. |
| c | The amounts reported for a share outstanding may not accord with the change in aggregate gains and losses in securities for the fiscal period due to the timing of capital share transactions in relation to the fluctuating market values of the Fund's underlying securities. |
| d | Not annualized. |
| e | Annualized for periods of less than one year. |
| f | Portfolio turnover rates exclude portfolio securities received or delivered in Creation Units but include portfolio transactions that are executed as a result of the Fund processing capital share transactions in Creation Units partially for cash in U.S. dollars. Excluding such cash transactions, the portfolio turnover rates for the years ended August 31, 2014, August 31, 2013 and the period ended August 31, 2012 were 8%, 6% and 5%, respectively. |
Table of Contents
Table of Contents
Table of Contents
| Premium/Discount Range | Number of Days | Percentage of Total Days | ||
| Greater than 1.0% | 2 | 0.45% | ||
| Greater than 0.5% and Less than 1.0% | 10 | 2.27 | ||
| Between 0.5% and -0.5% | 418 | 95.00 | ||
| Less than -0.5% and Greater than -1.0% | 9 | 2.05 | ||
| Less than -1.0% and Greater than -1.5% | 1 | 0.23 | ||
| 440 | 100.00% |
Table of Contents
| Average Annual Total Returns | Cumulative Total Returns | ||||||
| NAV | MARKET | INDEX | NAV | MARKET | INDEX | ||
| 1 Year | 19.44% | 19.36% | 19.63% | 19.44% | 19.36% | 19.63% | |
| Since Inception* | 7.59% | 7.51% | 7.58% | 20.79% | 20.58% | 20.78% | |
| * | Total returns for the period since inception are calculated from the inception date of the Fund (1/31/12). The first day of secondary market trading in shares of the Fund was 2/2/12. |
Table of Contents
Table of Contents
| Call: | 1-800-iShares
or 1-800-474-2737 (toll free) Monday through Friday, 8:30 a.m. to 6:30 p.m. (Eastern time) |
| Email: | iSharesETFs@blackrock.com |
| Write: | c/o
BlackRock Investments, LLC 1 University Square Drive, Princeton, NJ 08540 |

Table of Contents
| 2014 Prospectus |
|
| ► | iShares MSCI Global Metals & Mining Producers ETF | PICK | NYSE ARCA |
Table of Contents
Table of Contents
|
|
S-1 |
|
|
1 |
|
|
2 |
|
|
11 |
|
|
13 |
|
|
13 |
|
|
16 |
|
|
25 |
|
|
25 |
|
|
27 |
|
|
27 |
|
|
29 |
Table of Contents
Table of Contents
| Ticker: PICK | Stock Exchange: NYSE Arca |
| Annual
Fund Operating Expenses (ongoing expenses that you pay each year as a percentage of the value of your investments) | ||||||||||||
| Management
Fees |
Distribution
and Service (12b-1) Fees |
Other
Expenses |
Acquired
Fund Fees and Expenses |
Total
Annual Fund Operating Expenses |
Fee Waiver | Total
Annual Fund Operating Expenses After Fee Waiver | ||||||
| 0.39% | None | None | 0.00% | 0.39% | (0.00)% | 0.39% | ||||||
Table of Contents
| 1 Year | 3 Years | 5 Years | 10 Years | |||
| $40 | $125 | $219 | $493 |
Table of Contents
Table of Contents
Table of Contents
Table of Contents
Table of Contents
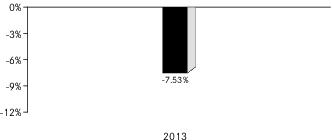
| 1 | The Fund’s year-to-date return as of September 30, 2014 was -6.74%. |
| One Year | Since
Fund Inception | ||
| (Inception Date: 1/31/2012) | |||
| Return Before Taxes | -7.53% | -8.55% | |
| Return After Taxes on Distributions2 | -8.37% | -9.06% | |
| Return After Taxes on Distributions and Sale of Fund Shares2 | -3.73% | -6.42% | |
| MSCI ACWI Select Metals & Mining Producers ex Gold & Silver IMI (Index returns do not reflect deductions for fees, expenses or taxes) | -7.56% | -8.66% |
| 2 | After-tax returns in the table above are calculated using the historical highest individual U.S. federal marginal income tax rates and do not reflect the impact of state or local taxes. Actual after-tax returns depend on an investor’s tax situation and may differ from those shown, and after-tax returns shown are not relevant to tax-exempt investors or investors who hold shares through tax-deferred arrangements, such as 401(k) plans or individual retirement accounts (“IRAs”). Fund returns after taxes on distributions and sales of Fund shares are calculated assuming that an investor has sufficient capital gains of the same character from other investments to offset any capital losses from the sale of Fund shares. As a result, Fund returns after taxes on distributions and sales of Fund shares may exceed Fund returns before taxes and/or returns after taxes on distributions. |
Table of Contents
Table of Contents
Table of Contents
Table of Contents
Table of Contents
Table of Contents
Table of Contents
Table of Contents
| ■ | Lower levels of liquidity and market efficiency; |
| ■ | Greater securities price volatility; |
| ■ | Exchange rate fluctuations and exchange controls; |
| ■ | Less availability of public information about issuers; |
| ■ | Limitations on foreign ownership of securities; |
| ■ | Imposition of withholding or other taxes; |
| ■ | Imposition of restrictions on the expatriation of the funds or other assets of the Fund; |
| ■ | Higher transaction and custody costs and delays in settlement procedures; |
| ■ | Difficulties in enforcing contractual obligations; |
| ■ | Lower levels of regulation of the securities markets; |
| ■ | Weaker accounting, disclosure and reporting requirements; and |
Table of Contents
| ■ | Legal principles relating to corporate governance, directors’ fiduciary duties and liabilities and stockholders’ rights in markets in which the Fund invests may differ and/or may not be as extensive or protective as those that apply in the United States. |
Table of Contents
| ■ | The risk of delays in settling portfolio transactions and the risk of loss arising out of the system of share registration and custody used in Russia; |
| ■ | Risks in connection with the maintenance of the Fund’s portfolio securities and cash with foreign sub-custodians and securities depositories, including the risk that appropriate sub-custody arrangements will not be available to the Fund; |
| ■ | The risk that the Fund’s ownership rights in portfolio securities could be lost through fraud or negligence as a result of the fact that ownership in shares of Russian companies is recorded by the companies themselves and by registrars, rather than by a central registration system; and |
| ■ | The risk that the Fund may not be able to pursue claims on behalf of its shareholders because of the system of share registration and custody, and because Russian banking institutions and registrars are not guaranteed by the Russian government. |
Table of Contents
Table of Contents
Table of Contents
Table of Contents
Table of Contents
Table of Contents
Table of Contents
Table of Contents
Table of Contents
Table of Contents
Table of Contents
Table of Contents
Table of Contents
Table of Contents
Table of Contents
| Approximate
Value of a Creation Unit |
Creation
Unit Size |
Standard
Creation/ Redemption Transaction Fee |
Maximum
Additional Charge for Creations* |
Maximum
Additional Charge for Redemptions* | ||||
| $915,000 | 50,000 | $8,400 | 3.0% | 2.0% |
| * | As a percentage of the net asset value per Creation Unit, inclusive, in the case of redemptions, of the standard redemption transaction fee. |
Table of Contents
(For a share outstanding throughout each period)
Table of Contents
| Year
ended Aug. 31, 2014 |
Year
ended Aug. 31, 2013 |
Period
from Jan. 31, 2012a to Aug. 31, 2012 | |||
| Net asset value, beginning of period | $ 18.11 | $ 19.00 | $ 24.76 | ||
| Income
from investment operations: | |||||
| Net investment incomeb | 0.50 | 0.50 | 0.37 | ||
| Net realized and unrealized gain (loss)c | 2.23 | (1.00) | (6.00) | ||
| Total from investment operations | 2.73 | (0.50) | (5.63) | ||
| Less distributions from: | |||||
| Net investment income | (0.65) | (0.39) | (0.13) | ||
| Total distributions | (0.65) | (0.39) | (0.13) | ||
| Net asset value, end of period | $ 20.19 | $ 18.11 | $ 19.00 | ||
| Total return | 15.32% | (2.68)% | (22.76)% d | ||
| Ratios/Supplemental data: | |||||
| Net assets, end of period (000s) | $183,699 | $222,808 | $123,524 | ||
| Ratio of expenses to average net assetse | 0.39% | 0.39% | 0.39% | ||
| Ratio of expenses to average net assets prior to waived feese | 0.39% | 0.39% | 0.39% | ||
| Ratio of net investment income to average net assetse | 2.53% | 2.51% | 2.98% | ||
| Portfolio turnover ratef | 18% | 11% | 1% | ||
| a | Commencement of operations. |
| b | Based on average shares outstanding throughout each period. |
| c | The amounts reported for a share outstanding may not accord with the change in aggregate gains and losses in securities for the fiscal period due to the timing of capital share transactions in relation to the fluctuating market values of the Fund's underlying securities. |
| d | Not annualized. |
| e | Annualized for periods of less than one year. |
| f | Portfolio turnover rates exclude portfolio securities received or delivered in Creation Units but include portfolio transactions that are executed as a result of the Fund processing capital share transactions in Creation Units partially for cash in U.S. dollars. Excluding such cash transactions, the portfolio turnover rates for the years ended August 31, 2014, August 31, 2013 and the period ended August 31, 2012 were 15%, 7% and 1%, respectively. |
Table of Contents
Table of Contents
Table of Contents
| Premium/Discount Range | Number of Days | Percentage of Total Days | ||
| Greater than 2.0% | 2 | 0.45% | ||
| Greater than 1.5% and Less than 2.0% | 13 | 2.95 | ||
| Greater than 1.0% and Less than 1.5% | 69 | 15.68 | ||
| Greater than 0.5% and Less than 1.0% | 125 | 28.41 | ||
| Between 0.5% and -0.5% | 200 | 45.46 | ||
| Less than -0.5% and Greater than -1.0% | 20 | 4.55 | ||
| Less than -1.0% and Greater than -1.5% | 10 | 2.27 | ||
| Less than -1.5% and Greater than -2.0% | 1 | 0.23 | ||
| 440 | 100.00% |
Table of Contents
| Average Annual Total Returns | Cumulative Total Returns | ||||||
| NAV | MARKET | INDEX | NAV | MARKET | INDEX | ||
| 1 Year | 15.32% | 17.19% | 15.67% | 15.32% | 17.19% | 15.67% | |
| Since Inception* | (5.38)% | (5.21)% | (5.43)% | (13.31)% | (12.90)% | (13.43)% | |
| * | Total returns for the period since inception are calculated from the inception date of the Fund (1/31/12). The first day of secondary market trading in shares of the Fund was 2/2/12. |
Table of Contents
Table of Contents
| Call: | 1-800-iShares
or 1-800-474-2737 (toll free) Monday through Friday, 8:30 a.m. to 6:30 p.m. (Eastern time) |
| Email: | iSharesETFs@blackrock.com |
| Write: | c/o
BlackRock Investments, LLC 1 University Square Drive, Princeton, NJ 08540 |

Table of Contents
| 2014 Prospectus |
|
| ► | iShares Currency Hedged MSCI Emerging Markets ETF | HEEM | NYSE ARCA |
Table of Contents
Table of Contents
|
|
S-1 |
|
|
1 |
|
|
2 |
|
|
15 |
|
|
18 |
|
|
18 |
|
|
19 |
|
|
23 |
|
|
31 |
|
|
33 |
|
|
33 |
|
|
33 |
Table of Contents
Table of Contents
| Ticker: HEEM | Stock Exchange: NYSE Arca |
| Annual
Fund Operating Expenses (ongoing expenses that you pay each year as a percentage of the value of your investments)1 | ||||||||||||
| Management
Fees |
Distribution
and Service (12b-1) Fees |
Other
Expenses |
Acquired
Fund Fees and Expenses |
Total
Annual Fund Operating Expenses |
Fee Waiver | Total
Annual Fund Operating Expenses After Fee Waiver | ||||||
| 0.78% | None | None | 0.68% | 1.46% | (0.78)% | 0.68% | ||||||
| 1 | The expense information in the table has been restated to reflect current fees. |
Table of Contents
| 1 Year | 3 Years | ||||
| $69 | $218 |
Table of Contents
Table of Contents
Table of Contents
Table of Contents
Table of Contents
Table of Contents
Table of Contents
Table of Contents
Table of Contents
Table of Contents
Table of Contents
Table of Contents
Table of Contents
Table of Contents
Table of Contents
Table of Contents
Table of Contents
Table of Contents
Table of Contents
| ■ | Lower levels of liquidity and market efficiency; |
| ■ | Greater securities price volatility; |
| ■ | Exchange rate fluctuations and exchange controls; |
| ■ | Less availability of public information about issuers; |
| ■ | Limitations on foreign ownership of securities; |
| ■ | Imposition of withholding or other taxes; |
| ■ | Imposition of restrictions on the expatriation of the funds or other assets of the Fund; |
| ■ | Higher transaction and custody costs and delays in settlement procedures; |
| ■ | Difficulties in enforcing contractual obligations; |
| ■ | Lower levels of regulation of the securities markets; |
| ■ | Weaker accounting, disclosure and reporting requirements; and |
| ■ | Legal principles relating to corporate governance, directors’ fiduciary duties and liabilities and stockholders’ rights in markets in which the Fund invests may differ and/or may not be as extensive or protective as those that apply in the United States. |
Table of Contents
Table of Contents
Table of Contents
Table of Contents
Table of Contents
| ■ | The risk of delays in settling portfolio transactions and the risk of loss arising out of the system of share registration and custody used in certain Eastern European countries; |
| ■ | Risks in connection with the maintenance of the Fund's portfolio securities and cash with foreign sub-custodians and securities depositories, including the risk that appropriate sub-custody arrangements will not be available to the Fund; |
| ■ | The risk that the Fund's ownership rights in portfolio securities could be lost through fraud or negligence as a result of the fact that ownership in shares of certain Eastern European companies is recorded by the companies themselves and by registrars, rather than a central registration system; |
| ■ | The risk that the Fund may not be able to pursue claims on behalf of its shareholders because of the system of share registration and custody, and because certain Eastern European banking institutions and registrars are not guaranteed by their respective governments; and |
| ■ | Risks in connection with Eastern European countries' dependence on the economic health of Western European countries and the EU as a whole. |
Table of Contents
Table of Contents
Table of Contents
Table of Contents
Table of Contents
Table of Contents
Table of Contents
Table of Contents
Table of Contents
Table of Contents
Table of Contents
Table of Contents
Table of Contents
Table of Contents
Table of Contents
| Approximate
Value of a Creation Unit |
Creation
Unit Size |
Standard
Creation/ Redemption Transaction Fee |
Maximum
Additional Charge for Creations* |
Maximum
Additional Charge for Redemptions* | ||||
| $ 1,205,000 | 50,000 | $500 | 3.0% | 2.0% |
| * | As a percentage of the net asset value per Creation Unit, inclusive, in the case of redemptions, of the standard redemption transaction fee. |
Table of Contents
Table of Contents
Table of Contents
Table of Contents
Table of Contents
Table of Contents
Table of Contents
| Call: | 1-800-iShares
or 1-800-474-2737 (toll free) Monday through Friday, 8:30 a.m. to 6:30 p.m. (Eastern time) |
| Email: | iSharesETFs@blackrock.com |
| Write: | c/o
BlackRock Investments, LLC 1 University Square Drive, Princeton, NJ 08540 |

Table of Contents
| 2014 Prospectus |
|
| ► | iShares MSCI Global Gold Miners ETF | RING | NYSE ARCA |
Table of Contents
Table of Contents
|
|
S-1 |
|
|
1 |
|
|
2 |
|
|
10 |
|
|
12 |
|
|
12 |
|
|
15 |
|
|
24 |
|
|
25 |
|
|
26 |
|
|
26 |
|
|
28 |
Table of Contents
Table of Contents
| Ticker: RING | Stock Exchange: NYSE Arca |
| Annual
Fund Operating Expenses (ongoing expenses that you pay each year as a percentage of the value of your investments) | ||||||
| Management
Fees |
Distribution
and Service (12b-1) Fees |
Other
Expenses |
Total
Annual Fund Operating Expenses | |||
| 0.39% | None | None | 0.39% | |||
| 1 Year | 3 Years | 5 Years | 10 Years | |||
| $40 | $125 | $219 | $493 |
Table of Contents
Table of Contents
Table of Contents
Table of Contents
Table of Contents
Table of Contents
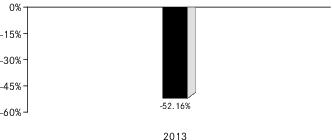
| 1 | The Fund’s year-to-date return as of September 30, 2014 was 0.98%. |
| One Year | Since
Fund Inception | ||
| (Inception Date: 1/31/2012) | |||
| Return Before Taxes | -52.16% | -40.40% | |
| Return After Taxes on Distributions1 | -52.27% | -40.49% | |
| Return After Taxes on Distributions and Sale of Fund Shares1 | -29.32% | -28.72% | |
| MSCI ACWI Select Gold Miners IMI (Index returns do not reflect deductions for fees, expenses or taxes) | -52.21% | -40.40% |
| 1 | After-tax returns in the table above are calculated using the historical highest individual U.S. federal marginal income tax rates and do not reflect the impact of state or local taxes. Actual after-tax returns depend on an investor’s tax situation and may differ from those shown, and after-tax returns shown are not relevant to tax-exempt investors or investors who hold shares through tax-deferred arrangements, such as 401(k) plans or individual retirement accounts (“IRAs”). Fund returns after taxes on distributions and sales of Fund shares are calculated assuming that an investor has sufficient capital gains of the same character from other investments to offset any capital losses from the sale of Fund shares. As a result, Fund returns after taxes on distributions and sales of Fund shares may exceed Fund returns before taxes and/or returns after taxes on distributions. |
Table of Contents
Table of Contents
Table of Contents
Table of Contents
Table of Contents
Table of Contents
Table of Contents
Table of Contents
Non-Diversification Risk. The Fund is classified as “non-diversified.” This means that the Fund may invest a large percentage of its assets in securities issued by or representing a small number of issuers. As a result, the Fund may be more susceptible to the risks associated with these particular issuers, or to a single economic, political or regulatory occurrence affecting these issuers.
| ■ | Lower levels of liquidity and market efficiency; |
| ■ | Greater securities price volatility; |
| ■ | Exchange rate fluctuations and exchange controls; |
| ■ | Less availability of public information about issuers; |
| ■ | Limitations on foreign ownership of securities; |
| ■ | Imposition of withholding or other taxes; |
| ■ | Imposition of restrictions on the expatriation of the funds or other assets of the Fund; |
| ■ | Higher transaction and custody costs and delays in settlement procedures; |
| ■ | Difficulties in enforcing contractual obligations; |
| ■ | Lower levels of regulation of the securities markets; |
| ■ | Weaker accounting, disclosure and reporting requirements; and |
| ■ | Legal principles relating to corporate governance, directors’ fiduciary duties and liabilities and stockholders’ rights in markets in which the Fund invests may differ and/or may not be as extensive or protective as those that apply in the United States. |
Table of Contents
Table of Contents
Table of Contents
Table of Contents
Table of Contents
Table of Contents
Table of Contents
Table of Contents
Table of Contents
Table of Contents
Table of Contents
Table of Contents
Table of Contents
Table of Contents
Table of Contents
Table of Contents
| Approximate
Value of a Creation Unit |
Creation
Unit Size |
Standard
Creation/ Redemption Transaction Fee |
Maximum
Additional Charge for Creations* |
Maximum
Additional Charge for Redemptions* | ||||
| $455,000 | 50,000 | $800 | 3.0% | 2.0% |
| * | As a percentage of the net asset value per Creation Unit, inclusive, in the case of redemptions, of the standard redemption transaction fee. |
Table of Contents
Table of Contents
(For a share outstanding throughout each period)
| Year
ended Aug. 31, 2014 |
Year
ended Aug. 31, 2013 |
Period
from Jan. 31, 2012a to Aug. 31, 2012 | |||
| Net asset value, beginning of period | $ 11.60 | $ 20.05 | $ 25.00 | ||
| Income
from investment operations: | |||||
| Net investment incomeb | 0.08 | 0.21 | 0.15 | ||
| Net realized and unrealized lossc | (0.33) | (8.47) | (5.02) | ||
| Total from investment operations | (0.25) | (8.26) | (4.87) | ||
| Less distributions from: | |||||
| Net investment income | (0.08) | (0.19) | (0.08) | ||
| Total distributions | (0.08) | (0.19) | (0.08) | ||
| Net asset value, end of period | $ 11.27 | $ 11.60 | $ 20.05 | ||
| Total return | (2.01)% | (41.28)% | (19.45)% d | ||
| Ratios/Supplemental data: | |||||
| Net assets, end of period (000s) | $70,976 | $38,285 | $32,084 | ||
| Ratio of expenses to average net assetse | 0.39% | 0.39% | 0.39% | ||
| Ratio of net investment income to average net assetse | 0.81% | 1.37% | 1.25% | ||
| Portfolio turnover ratef | 22% | 19% | 11% | ||
| a | Commencement of operations. |
| b | Based on average shares outstanding throughout each period. |
| c | The amounts reported for a share outstanding may not accord with the change in aggregate gains and losses in securities for the fiscal period due to the timing of capital share transactions in relation to the fluctuating market values of the Fund's underlying securities. |
| d | Not annualized. |
| e | Annualized for periods of less than one year. |
| f | Portfolio turnover rates exclude portfolio securities received or delivered as a result of processing capital share transactions in Creation Units. |
Table of Contents
Table of Contents
Table of Contents
| Premium/Discount Range | Number of Days | Percentage of Total Days | ||
| Greater than 2.0% | 3 | 0.68% | ||
| Greater than 1.5% and Less than 2.0% | 1 | 0.23 | ||
| Greater than 1.0% and Less than 1.5% | 11 | 2.50 | ||
| Greater than 0.5% and Less than 1.0% | 97 | 22.04 | ||
| Between 0.5% and -0.5% | 315 | 71.59 | ||
| Less than -0.5% and Greater than -1.0% | 9 | 2.05 | ||
| Less than -1.0% and Greater than -1.5% | 3 | 0.68 | ||
| Less than -1.5% and Greater than -2.0% | 1 | 0.23 | ||
| 440 | 100.00% |
Table of Contents
| Average Annual Total Returns | Cumulative Total Returns | ||||||
| NAV | MARKET | INDEX | NAV | MARKET | INDEX | ||
| 1 Year | (2.01)% | (2.61)% | (1.90)% | (2.01)% | (2.61)% | (1.90)% | |
| Since Inception* | (25.75)% | (25.85)% | (25.67)% | (53.65)% | (53.82)% | (53.52)% | |
| * | Total returns for the period since inception are calculated from the inception date of the Fund (1/31/12). The first day of secondary market trading in shares of the Fund was 2/2/12. |
Table of Contents
Table of Contents
Table of Contents
| Call: | 1-800-iShares
or 1-800-474-2737 (toll free) Monday through Friday, 8:30 a.m. to 6:30 p.m. (Eastern time) |
| Email: | iSharesETFs@blackrock.com |
| Write: | c/o
BlackRock Investments, LLC 1 University Square Drive, Princeton, NJ 08540 |

Table of Contents
| 2014 Prospectus |
|
| ► | iShares MSCI Global Silver Miners ETF | SLVP | NYSE ARCA |
Table of Contents
Table of Contents
|
|
S-1 |
|
|
1 |
|
|
2 |
|
|
11 |
|
|
12 |
|
|
12 |
|
|
15 |
|
|
24 |
|
|
25 |
|
|
26 |
|
|
26 |
|
|
28 |
Table of Contents
Table of Contents
MINERS ETF
| Ticker: SLVP | Stock Exchange: NYSE Arca |
| Annual
Fund Operating Expenses (ongoing expenses that you pay each year as a percentage of the value of your investments) | ||||||
| Management
Fees |
Distribution
and Service (12b-1) Fees |
Other
Expenses |
Total
Annual Fund Operating Expenses | |||
| 0.39% | None | None | 0.39% | |||
| 1 Year | 3 Years | 5 Years | 10 Years | |||
| $40 | $125 | $219 | $493 |
Table of Contents
Table of Contents
Table of Contents
Table of Contents
Table of Contents
Table of Contents
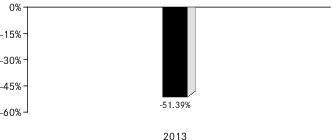
| 1 | The Fund’s year-to-date return as of September 30, 2014 was -3.75%. |
| One Year | Since
Fund Inception | ||
| (Inception Date: 1/31/2012) | |||
| Return Before Taxes | -51.39% | -35.10% | |
| Return After Taxes on Distributions2 | -51.60% | -35.36% | |
| Return After Taxes on Distributions and Sale of Fund Shares2 | -28.94% | -25.25% | |
| MSCI ACWI Select Silver Miners IMI (Index returns do not reflect deductions for fees, expenses or taxes) | -51.46% | -35.07% |
| 2 | After-tax returns in the table above are calculated using the historical highest individual U.S. federal marginal income tax rates and do not reflect the impact of state or local taxes. Actual after-tax returns depend on an investor’s tax situation and may differ from those shown, and after-tax returns shown are not relevant to tax-exempt investors or investors who hold shares through tax-deferred arrangements, such as 401(k) plans or individual retirement accounts (“IRAs”). Fund returns after taxes on distributions and sales of Fund shares are calculated assuming that an investor has sufficient capital gains of the same character from other investments to offset any capital losses from the sale of Fund shares. As a result, Fund returns after taxes on distributions and sales of Fund shares may exceed Fund returns before taxes and/or returns after taxes on distributions. |
Table of Contents
Table of Contents
Table of Contents
Table of Contents
Table of Contents
Table of Contents
Table of Contents
| ■ | Lower levels of liquidity and market efficiency; |
| ■ | Greater securities price volatility; |
Table of Contents
| ■ | Exchange rate fluctuations and exchange controls; |
| ■ | Less availability of public information about issuers; |
| ■ | Limitations on foreign ownership of securities; |
| ■ | Imposition of withholding or other taxes; |
| ■ | Imposition of restrictions on the expatriation of the funds or other assets of the Fund; |
| ■ | Higher transaction and custody costs and delays in settlement procedures; |
| ■ | Difficulties in enforcing contractual obligations; |
| ■ | Lower levels of regulation of the securities markets; |
| ■ | Weaker accounting, disclosure and reporting requirements; and |
| ■ | Legal principles relating to corporate governance, directors’ fiduciary duties and liabilities and stockholders’ rights in markets in which the Fund invests may differ and/or may not be as extensive or protective as those that apply in the United States. |
Table of Contents
Table of Contents
Table of Contents
Table of Contents
Table of Contents
Table of Contents
Table of Contents
Table of Contents
Table of Contents
Table of Contents
Table of Contents
Table of Contents
Table of Contents
Table of Contents
Table of Contents
Table of Contents
| Approximate
Value of a Creation Unit |
Creation
Unit Size |
Standard
Creation/ Redemption Transaction Fee |
Maximum
Additional Charge for Creations* |
Maximum
Additional Charge for Redemptions* | ||||
| $1,007,000 | 100,000 | $500 | 3.0% | 2.0% |
| * | As a percentage of the net asset value per Creation Unit, inclusive, in the case of redemptions, of the standard redemption transaction fee. |
Table of Contents
Table of Contents
(For a share outstanding throughout each period)
| Year
ended Aug. 31, 2014 |
Year
ended Aug. 31, 2013 |
Period
from Jan. 31, 2012a to Aug. 31, 2012 | |||
| Net asset value, beginning of period | $ 13.92 | $ 20.94 | $ 24.87 | ||
| Income
from investment operations: | |||||
| Net investment incomeb | 0.08 | 0.16 | 0.11 | ||
| Net realized and unrealized gain (loss)c | (1.15) | (6.90) | (3.90) | ||
| Total from investment operations | (1.07) | (6.74) | (3.79) | ||
| Less distributions from: | |||||
| Net investment income | (0.15) | (0.28) | (0.14) | ||
| Total distributions | (0.15) | (0.28) | (0.14) | ||
| Net asset value, end of period | $ 12.70 | $ 13.92 | $ 20.94 | ||
| Total return | (7.48)% | (32.49)% | (15.18)% d | ||
| Ratios/Supplemental data: | |||||
| Net assets, end of period (000s) | $13,975 | $ 6,959 | $ 2,094 | ||
| Ratio of expenses to average net assetse | 0.39% | 0.39% | 0.39% | ||
| Ratio of net investment income to average net assetse | 0.63% | 1.03% | 0.86% | ||
| Portfolio turnover ratef | 22% | 13% | 9% | ||
| a | Commencement of operations. |
| b | Based on average shares outstanding throughout each period. |
| c | The amounts reported for a share outstanding may not accord with the change in aggregate gains and losses in securities for the fiscal period due to the timing of capital share transactions in relation to the fluctuating market values of the Fund's underlying securities. |
| d | Not annualized. |
| e | Annualized for periods of less than one year. |
| f | Portfolio turnover rates exclude portfolio securities received or delivered as a result of processing capital share transactions in Creation Units. |
Table of Contents
Table of Contents
Table of Contents
| Premium/Discount Range | Number of Days | Percentage of Total Days | ||
| Greater than 3.0% and Less than 3.5% | 1 | 0.23% | ||
| Greater than 2.5% and Less than 3.0% | 3 | 0.68 | ||
| Greater than 2.0% and Less than 2.5% | 5 | 1.14 | ||
| Greater than 1.5% and Less than 2.0% | 13 | 2.95 | ||
| Greater than 1.0% and Less than 1.5% | 47 | 10.68 | ||
| Greater than 0.5% and Less than 1.0% | 123 | 27.95 | ||
| Between 0.5% and -0.5% | 237 | 53.87 | ||
| Less than -0.5% and Greater than -1.0% | 5 | 1.14 | ||
| Less than -1.0% and Greater than -1.5% | 6 | 1.36 | ||
| 440 | 100.00% |
Table of Contents
| Average Annual Total Returns | Cumulative Total Returns | ||||||
| NAV | MARKET | INDEX | NAV | MARKET | INDEX | ||
| 1 Year | (7.48)% | (7.49)% | (7.24)% | (7.48)% | (7.49)% | (7.24)% | |
| Since Inception* | (21.80)% | (21.54)% | (21.69)% | (47.02)% | (46.56)% | (46.84)% | |
| * | Total returns for the period since inception are calculated from the inception date of the Fund (1/31/12). The first day of secondary market trading in shares of the Fund was 2/2/12. |
Table of Contents
Table of Contents
Table of Contents
| Call: | 1-800-iShares
or 1-800-474-2737 (toll free) Monday through Friday, 8:30 a.m. to 6:30 p.m. (Eastern time) |
| Email: | iSharesETFs@blackrock.com |
| Write: | c/o
BlackRock Investments, LLC 1 University Square Drive, Princeton, NJ 08540 |

Table of Contents
| 2014 Prospectus |
|
| ► | iShares MSCI Russia Capped ETF | ERUS | NYSE ARCA |
Table of Contents
Table of Contents
|
|
S-1 |
|
|
1 |
|
|
2 |
|
|
13 |
|
|
13 |
|
|
13 |
|
|
17 |
|
|
26 |
|
|
27 |
|
|
28 |
|
|
28 |
|
|
30 |
Table of Contents
Table of Contents
| Ticker: ERUS | Stock Exchange: NYSE Arca |
| Annual
Fund Operating Expenses (ongoing expenses that you pay each year as a percentage of the value of your investments) | ||||||
| Management
Fees |
Distribution
and Service (12b-1) Fees |
Other
Expenses |
Total
Annual Fund Operating Expenses | |||
| 0.62% | None | None | 0.62% | |||
| 1 Year | 3 Years | 5 Years | 10 Years | |||
| $63 | $199 | $346 | $774 |
Table of Contents
Table of Contents
Table of Contents
Table of Contents
Table of Contents
Table of Contents
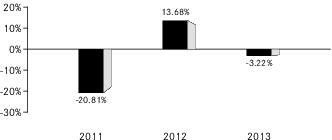
| 1 | The Predecessor Fund’s year-to-date return as of September 30, 2014 was -19.14%. |
Table of Contents
| One Year | Since
Predecessor Fund Inception | ||
| (Predecessor Fund Inception Date: 11/9/2010) | |||
| Return Before Taxes | -3.22% | -2.50% | |
| Return After Taxes on Distributions1 | -3.39% | -2.52% | |
| Return After Taxes on Distributions and Sale of Fund Shares1 | -0.87% | -1.44% | |
| MSCI Russia 25/50 Index (Index returns do not reflect deductions for fees, expenses or taxes) | -2.44% | -1.90% |
| 1 | After-tax returns in the table above are calculated using the historical highest individual U.S. federal marginal income tax rates and do not reflect the impact of state or local taxes. Actual after-tax returns depend on an investor’s tax situation and may differ from those shown, and after-tax returns shown are not relevant to tax-exempt investors or investors who hold shares through tax-deferred arrangements, such as 401(k) plans or individual retirement accounts (“IRAs”). Fund returns after taxes on distributions and sales of Fund shares are calculated assuming that an investor has sufficient capital gains of the same character from other investments to offset any capital losses from the sale of Fund shares. As a result, Fund returns after taxes on distributions and sales of Fund shares may exceed Fund returns before taxes and/or returns after taxes on distributions. |
Table of Contents
Table of Contents
Table of Contents
Table of Contents
Table of Contents
| ■ | The risk of delays in settling portfolio transactions and the risk of loss arising out of the system of share registration and custody used in certain Eastern European countries; |
| ■ | Risks in connection with the maintenance of the Fund's portfolio securities and cash with foreign sub-custodians and securities depositories, including the risk that appropriate sub-custody arrangements will not be available to the Fund; |
| ■ | The risk that the Fund's ownership rights in portfolio securities could be lost through fraud or negligence as a result of the fact that ownership in shares of certain Eastern European companies is recorded by the companies themselves and by registrars, rather than a central registration system; |
| ■ | The risk that the Fund may not be able to pursue claims on behalf of its shareholders because of the system of share registration and custody, and because certain Eastern European banking institutions and registrars are not guaranteed by their respective governments; and |
| ■ | Risks in connection with Eastern European countries' dependence on the economic health of Western European countries and the European Union (the “EU”) as a whole. |
Table of Contents
Table of Contents
Table of Contents
Table of Contents
Table of Contents
Table of Contents
| ■ | Lower levels of liquidity and market efficiency; |
| ■ | Greater securities price volatility; |
| ■ | Exchange rate fluctuations and exchange controls; |
| ■ | Less availability of public information about issuers; |
| ■ | Limitations on foreign ownership of securities; |
| ■ | Imposition of withholding or other taxes; |
| ■ | Imposition of restrictions on the expatriation of the funds or other assets of the Fund; |
| ■ | Higher transaction and custody costs and delays in settlement procedures; |
| ■ | Difficulties in enforcing contractual obligations; |
| ■ | Lower levels of regulation of the securities markets; |
| ■ | Weaker accounting, disclosure and reporting requirements; and |
| ■ | Legal principles relating to corporate governance, directors’ fiduciary duties and liabilities and stockholders’ rights in markets in which the Fund invests may differ and/or may not be as extensive or protective as those that apply in the United States. |
Table of Contents
| ■ | The risk of delays in settling portfolio transactions and the risk of loss arising out of the system of share registration and custody used in Russia; |
| ■ | Risks in connection with the maintenance of the Fund’s portfolio securities and cash with foreign sub-custodians and securities depositories, including the risk that appropriate sub-custody arrangements will not be available to the Fund; |
| ■ | The risk that the Fund’s ownership rights in portfolio securities could be lost through fraud or negligence as a result of the fact that ownership in shares of Russian companies is recorded by the companies themselves and by registrars, rather than by a central registration system; and |
| ■ | The risk that the Fund may not be able to pursue claims on behalf of its shareholders because of the system of share registration and custody, and because Russian banking institutions and registrars are not guaranteed by the Russian government. |
Table of Contents
Table of Contents
Table of Contents
Table of Contents
Table of Contents
Table of Contents
Table of Contents
Table of Contents
Table of Contents
Table of Contents
Table of Contents
Table of Contents
Table of Contents
Table of Contents
Table of Contents
| Approximate
Value of a Creation Unit |
Creation
Unit Size |
Standard
Creation/ Redemption Transaction Fee |
Maximum
Additional Charge for Creations* |
Maximum
Additional Charge for Redemptions* | ||||
| $868,500 | 50,000 | $2,300 | 3.0% | 2.0% |
| * | As a percentage of the net asset value per Creation Unit, inclusive, in the case of redemptions, of the standard redemption transaction fee. |
Table of Contents
Table of Contents
(For a share outstanding throughout each period)
| Year
ended Aug. 31, 2014 |
Year
ended Aug. 31, 2013 |
Year
ended Aug. 31, 2012 |
Period
from Nov. 9, 2010a to Aug. 31, 2011 | ||||
| Net asset value, beginning of period | $ 19.84 | $ 21.15 | $ 25.13 | $ 25.00 | |||
| Income
from investment operations: | |||||||
| Net investment incomeb | 0.63 | 0.62 | 0.50 | 0.45 | |||
| Net realized and unrealized gain (loss)c | (2.00) | (1.35) | (4.00) | 0.03 | |||
| Total from investment operations | (1.37) | (0.73) | (3.50) | 0.48 | |||
| Less distributions from: | |||||||
| Net investment income | (0.13) | (0.58) | (0.48) | (0.35) | |||
| Total distributions | (0.13) | (0.58) | (0.48) | (0.35) | |||
| Net asset value, end of period | $ 18.34 | $ 19.84 | $ 21.15 | $ 25.13 | |||
| Total return | (7.00)% | (3.40)% | (13.75)% | 1.76% d | |||
| Ratios/Supplemental data: | |||||||
| Net assets, end of period (000s) | $289,775 | $310,511 | $147,026 | $111,835 | |||
| Ratio of expenses to average net assetse | 0.62% | 0.61% | 0.61% | 0.58% | |||
| Ratio of net investment income to average net assetse | 3.14% | 2.87% | 2.22% | 1.99% | |||
| Portfolio turnover ratef | 15% | 14% | 16% | 22% | |||
| a | Commencement of operations. |
| b | Based on average shares outstanding throughout each period. |
| c | The amounts reported for a share outstanding may not accord with the change in aggregate gains and losses in securities for the fiscal period due to the timing of capital share transactions in relation to the fluctuating market values of the Predecessor Fund's underlying securities. |
| d | Not annualized. |
| e | Annualized for periods of less than one year. |
| f | Portfolio turnover rates exclude portfolio securities received or delivered as a result of processing capital share transactions in Creation Units. |
Table of Contents
Table of Contents
Table of Contents
| Premium/Discount Range | Number of Days | Percentage of Total Days | ||
| Greater than 4.5% | 1 | 0.23% | ||
| Greater than 4.0% and Less than 4.5% | 3 | 0.68 | ||
| Greater than 3.5% and Less than 4.0% | 1 | 0.23 | ||
| Greater than 3.0% and Less than 3.5% | 1 | 0.23 | ||
| Greater than 2.5% and Less than 3.0% | 1 | 0.23 | ||
| Greater than 2.0% and Less than 2.5% | 2 | 0.45 | ||
| Greater than 1.5% and Less than 2.0% | 5 | 1.14 | ||
| Greater than 1.0% and Less than 1.5% | 18 | 4.09 | ||
| Greater than 0.5% and Less than 1.0% | 59 | 13.41 | ||
| Between 0.5% and -0.5% | 268 | 60.90 | ||
| Less than -0.5% and Greater than -1.0% | 48 | 10.91 | ||
| Less than -1.0% and Greater than -1.5% | 20 | 4.55 | ||
| Less than -1.5% and Greater than -2.0% | 6 | 1.36 | ||
| Less than -2.0% and Greater than -2.5% | 4 | 0.91 | ||
| Less than -2.5% | 3 | 0.68 | ||
| 440 | 100.00% |
Table of Contents
| Average Annual Total Returns | Cumulative Total Returns | ||||||
| NAV | MARKET | INDEX | NAV | MARKET | INDEX | ||
| 1 Year | (7.00)% | (6.73)% | (6.65)% | (7.00)% | (6.73)% | (6.65)% | |
| Since Inception* | (6.05)% | (6.07)% | (5.55)% | (21.15)% | (21.24)% | (19.55)% | |
| * | Total returns for the period since inception are calculated from the inception date of the Predecessor Fund (11/9/10). The first day of secondary market trading in shares of the Predecessor Fund was 11/10/10. |
Table of Contents
Table of Contents
Table of Contents
| Call: | 1-800-iShares
or 1-800-474-2737 (toll free) Monday through Friday, 8:30 a.m. to 6:30 p.m. (Eastern time) |
| Email: | iSharesETFs@blackrock.com |
| Write: | c/o
BlackRock Investments, LLC 1 University Square Drive, Princeton, NJ 08540 |

Table of Contents
| 2014 Prospectus |
|
| ► | iShares Emerging Markets Dividend ETF | DVYE | NYSE ARCA |
Table of Contents
Table of Contents
|
|
S-1 |
|
|
1 |
|
|
2 |
|
|
12 |
|
|
15 |
|
|
15 |
|
|
18 |
|
|
28 |
|
|
29 |
|
|
30 |
|
|
32 |
|
|
33 |
Table of Contents
Table of Contents
DIVIDEND ETF
| Ticker: DVYE | Stock Exchange: NYSE Arca |
| Annual
Fund Operating Expenses (ongoing expenses that you pay each year as a percentage of the value of your investments) | ||||||||||||
| Management
Fees |
Distribution
and Service (12b-1) Fees |
Other
Expenses |
Acquired
Fund Fees and Expenses |
Total
Annual Fund Operating Expenses |
Fee Waiver | Total
Annual Fund Operating Expenses After Fee Waiver | ||||||
| 0.68% | None | None | 0.00% | 0.68% | (0.19)% | 0.49% | ||||||
Table of Contents
| 1 Year | 3 Years | 5 Years | 10 Years | |||
| $50 | $198 | $360 | $829 |
Table of Contents
Table of Contents
Table of Contents
Table of Contents
Table of Contents
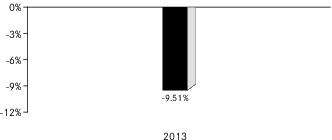
| 1 | The Fund’s total return for the six months ended June 30, 2014 was 2.92%. |
| One Year | Since
Fund Inception | ||
| (Inception Date: 2/23/2012) | |||
| Return Before Taxes | -9.51% | -2.10% | |
| Return After Taxes on Distributions2 | -10.60% | -2.98% | |
| Return After Taxes on Distributions and Sale of Fund Shares2 | -4.70% | -1.45% | |
| Dow Jones Emerging Markets Select Dividend Index (Index returns do not reflect deductions for fees, expenses, or taxes) | -10.01% | -2.52% |
| 2 | After-tax returns in the table above are calculated using the historical highest individual U.S. federal marginal income tax rates and do not reflect the impact of state or local taxes. Actual after-tax returns depend on an investor’s tax situation and may differ from those shown, and after-tax returns shown are not relevant to tax-exempt investors or investors who hold shares through tax-deferred arrangements, such as 401(k) plans or individual retirement accounts (“IRAs”). Fund returns after taxes on distributions and sales of Fund shares are calculated assuming that an investor has sufficient capital gains of the same character from other investments to offset any capital losses from the sale of Fund shares. As a result, Fund returns after taxes on distributions and sales of Fund shares may exceed Fund returns before taxes and/or returns after taxes on distributions. |
Table of Contents
Table of Contents
Table of Contents
Table of Contents
Table of Contents
Table of Contents
Table of Contents
Table of Contents
| ■ | Lower levels of liquidity and market efficiency; |
| ■ | Greater securities price volatility; |
| ■ | Exchange rate fluctuations and exchange controls; |
| ■ | Less availability of public information about issuers; |
| ■ | Limitations on foreign ownership of securities; |
| ■ | Imposition of withholding or other taxes; |
| ■ | Imposition of restrictions on the expatriation of the funds or other assets of the Fund; |
| ■ | Higher transaction and custody costs and delays in settlement procedures; |
| ■ | Difficulties in enforcing contractual obligations; |
| ■ | Lower levels of regulation of the securities markets; |
| ■ | Weaker accounting, disclosure and reporting requirements; and |
| ■ | Legal principles relating to corporate governance, directors’ fiduciary duties and liabilities and stockholders’ rights in markets in which the Fund invests may differ and/or may not be as extensive or protective as those that apply in the United States. |
Table of Contents
Table of Contents
| ■ | The risk of delays in settling portfolio transactions and the risk of loss arising out of the system of share registration and custody used in Russia; |
| ■ | Risks in connection with the maintenance of the Fund’s portfolio securities and cash with foreign sub-custodians and securities depositories, including the risk that appropriate sub-custody arrangements will not be available to the Fund; |
| ■ | The risk that the Fund’s ownership rights in portfolio securities could be lost through fraud or negligence as a result of the fact that ownership in shares of Russian companies is recorded by the companies themselves and by registrars, rather than by a central registration system; and |
Table of Contents
| ■ | The risk that the Fund may not be able to pursue claims on behalf of its shareholders because of the system of share registration and custody, and because Russian banking institutions and registrars are not guaranteed by the Russian government. |
Table of Contents
Table of Contents
Table of Contents
| ■ | The risk of delays in settling portfolio transactions and the risk of loss arising out of the system of share registration and custody used in certain Eastern European countries; |
| ■ | Risks in connection with the maintenance of the Fund's portfolio securities and cash with foreign sub-custodians and securities depositories, including the risk that appropriate sub-custody arrangements will not be available to the Fund; |
| ■ | The risk that the Fund's ownership rights in portfolio securities could be lost through fraud or negligence as a result of the fact that ownership in shares of certain Eastern European companies is recorded by the companies themselves and by registrars, rather than a central registration system; |
| ■ | The risk that the Fund may not be able to pursue claims on behalf of its shareholders because of the system of share registration and custody, and because certain Eastern European banking institutions and registrars are not guaranteed by their respective governments; and |
| ■ | Risks in connection with Eastern European countries' dependence on the economic health of Western European countries and the EU as a whole. |
Table of Contents
Table of Contents
Table of Contents
Table of Contents
Table of Contents
Table of Contents
Table of Contents
Table of Contents
Table of Contents
Table of Contents
Table of Contents
Table of Contents
Table of Contents
Table of Contents
| Approximate
Value of a Creation Unit |
Creation
Unit Size |
Standard
Creation/ Redemption Transaction Fee |
Maximum
Additional Charge for Creations* |
Maximum
Additional Charge for Redemptions* | ||||
| $2,443,500 | 50,000 | $3,000 | 3.0% | 2.0% |
| * | As a percentage of the net asset value per Creation Unit, inclusive, in the case of redemptions, of the standard redemption transaction fee. |
Table of Contents
Table of Contents
(For a share outstanding throughout each period)
| Year
ended Apr. 30,2014 |
Year
ended Apr. 30, 2013 |
Period
from Feb. 23, 2012a to Apr. 30, 2012 | |||
| Net asset value, beginning of period | $ 53.80 | $ 53.23 | $ 54.61 | ||
| Income
from investment operations: | |||||
| Net investment incomeb | 1.96 | 2.02 | 0.74 | ||
| Net realized and unrealized gain (loss)c | (5.18) | 0.56 | (1.98) | ||
| Total from investment operations | (3.22) | 2.58 | (1.24) | ||
| Less distributions from: | |||||
| Net investment income | (2.25) | (2.01) | (0.14) | ||
| Total distributions | (2.25) | (2.01) | (0.14) | ||
| Net asset value, end of period | $ 48.33 | $ 53.80 | $ 53.23 | ||
| Total return | (5.86)% | 5.09% | (2.27)% d | ||
| Ratios/Supplemental data: | |||||
| Net assets, end of period (000s) | $178,838 | $131,806 | $15,970 | ||
| Ratio of expenses to average net assetse | 0.49% | 0.49% | 0.49% | ||
| Ratio of expenses to average net assets prior to waived feese | 0.68% | 0.68% | 0.68% | ||
| Ratio of net investment income to average net assetse | 4.01% | 3.80% | 7.51% | ||
| Portfolio turnover ratef | 44% | 41% | 2% | ||
| a | Commencement of operations. |
| b | Based on average shares outstanding throughout each period. |
| c | The amounts reported for a share outstanding may not accord with the change in aggregate gains and losses in securities for the fiscal period due to the timing of capital share transactions in relation to the fluctuating market values of the Fund's underlying securities. |
| d | Not annualized. |
| e | Annualized for periods of less than one year. |
| f | Portfolio turnover rates exclude portfolio securities received or delivered in Creation Units but include portfolio transactions that are executed as a result of the Fund processing capital share transactions in Creation Units partially for cash in U.S. dollars. Excluding such cash transactions, the portfolio turnover rates for the years ended April 30, 2014 and April 30, 2013 were 39% and 41%, respectively. |
Table of Contents
Table of Contents
Table of Contents
Table of Contents
| Premium/Discount Range | Number of Days | Percentage of Total Days | ||
| Greater than 2.0% | 1 | 0.27% | ||
| Greater than 1.5% and Less than 2.0% | 1 | 0.27 | ||
| Greater than 1.0% and Less than 1.5% | 15 | 3.99 | ||
| Greater than 0.5% and Less than 1.0% | 99 | 26.33 | ||
| Between 0.5% and -0.5% | 208 | 55.31 | ||
| Less than -0.5% and Greater than -1.0% | 35 | 9.31 | ||
| Less than -1.0% and Greater than -1.5% | 14 | 3.72 | ||
| Less than -1.5% and Greater than -2.0% | 1 | 0.27 | ||
| Less than -2.0% and Greater than -2.5% | 2 | 0.53 | ||
| 376 | 100.00% |
Table of Contents
| Average Annual Total Returns | Cumulative Total Returns | ||||||
| NAV | MARKET | INDEX | NAV | MARKET | INDEX | ||
| 1 Year | (5.86)% | (5.96)% | (6.35)% | (5.86)% | (5.96)% | (6.35)% | |
| Since Inception* | (1.53)% | (1.25)% | (1.80)% | (3.31)% | (2.72)% | (3.88)% | |
| * | Total returns for the period since inception are calculated from the inception date of the Fund (2/23/12). The first day of secondary market trading in shares of the Fund was 2/24/12. |
Table of Contents
Table of Contents
| Call: | 1-800-iShares
or 1-800-474-2737 (toll free) Monday through Friday, 8:30 a.m. to 6:30 p.m. (Eastern time) |
| Email: | iSharesETFs@blackrock.com |
| Write: | c/o
BlackRock Investments, LLC 1 University Square Drive, Princeton, NJ 08540 |

Table of Contents
| 2015 Prospectus |
|
| ► | iShares Latin America Bond ETF | LTAM | NASDAQ |
Table of Contents
Table of Contents
Table of Contents
Table of Contents
| Ticker: LTAM | Stock Exchange: NASDAQ |
| Annual
Fund Operating Expenses (ongoing expenses that you pay each year as a percentage of the value of your investments) | ||||||
| Management
Fees |
Distribution
and Service (12b-1) Fees |
Other
Expenses |
Total
Annual Fund Operating Expenses | |||
| 0.49% | None | None | 0.49% | |||
| 1 Year | 3 Years | ||||
| $50 | $157 |
Table of Contents
Table of Contents
Table of Contents
Table of Contents
Table of Contents
Table of Contents
Table of Contents
Table of Contents
Table of Contents
Table of Contents
Table of Contents
Table of Contents
Table of Contents
| ■ | Structural Risk. Certain Latin American countries are subject to a considerable degree of economic, political and social instability, which could adversely affect investments in the Fund. |
| ■ | Economic Risk. Certain Latin American countries have experienced economic instability resulting from periods of high inflation and currency devaluations. |
| ■ | Political and Social Risk. Certain Latin American countries have experienced periods of instability and social unrest in the past. For example, Mexico has been destabilized by local insurrections, social upheavals and drug related violence. Disparities of wealth, the pace and success of democratization and capital market development and ethnic, religious and racial disaffection may exacerbate social unrest, violence and labor unrest in a number of Latin American countries. Certain Latin American countries experience significant unemployment in certain regions, as well as widespread underemployment. |
Table of Contents
Table of Contents
Table of Contents
Table of Contents
Table of Contents
Table of Contents
Table of Contents
Table of Contents
Table of Contents
Table of Contents
Table of Contents
Table of Contents
Table of Contents
Table of Contents
Table of Contents
Table of Contents
| Approximate
Value of a Creation Unit |
Creation
Unit Size |
Standard
Creation/ Redemption Transaction Fee |
Maximum
Additional Charge for Creations* |
Maximum
Additional Charge for Redemptions* | ||||
| $10,000,000 | 200,000 | $1,300 | 3.0% | 2.0% |
| * | As a percentage of the net asset value per Creation Unit, inclusive, in the case of redemptions, of the standard redemption transaction fee. |
Table of Contents
Table of Contents
Table of Contents
Table of Contents
Table of Contents
Table of Contents
|
|
| Call: | 1-800-iShares
or 1-800-474-2737 (toll free) Monday through Friday, 8:30 a.m. to 6:30 p.m. (Eastern time) |
| Email: | iSharesETFs@blackrock.com |
| Write: | c/o
BlackRock Investments, LLC 1 University Square Drive, Princeton, NJ 08540 |

Table of Contents
| 2015 Prospectus |
|
| ► | iShares MSCI Emerging Workforce ETF | EMWK | NYSE ARCA |
Table of Contents
Table of Contents
Table of Contents
Table of Contents
WORKFORCE ETF
| Ticker: EMWK | Stock Exchange: NYSE Arca |
| Annual
Fund Operating Expenses (ongoing expenses that you pay each year as a percentage of the value of your investments) | ||||||
| Management
Fees |
Distribution
and Service (12b-1) Fees |
Other
Expenses |
Total
Annual Fund Operating Expenses | |||
| 0.67% | None | None | 0.67% | |||
| 1 Year | 3 Years | ||||
| $68 | $214 |
Table of Contents
Table of Contents
Table of Contents
Table of Contents
Table of Contents
Table of Contents
Table of Contents
Table of Contents
Table of Contents
Table of Contents
Table of Contents
Table of Contents
Table of Contents
Table of Contents
Table of Contents
| ■ | Lower levels of liquidity and market efficiency; |
| ■ | Greater securities price volatility; |
| ■ | Exchange rate fluctuations and exchange controls; |
| ■ | Less availability of public information about issuers; |
| ■ | Limitations on foreign ownership of securities; |
| ■ | Imposition of withholding or other taxes; |
| ■ | Imposition of restrictions on the expatriation of the funds or other assets of the Fund; |
| ■ | Higher transaction and custody costs and delays in settlement procedures; |
| ■ | Difficulties in enforcing contractual obligations; |
| ■ | Lower levels of regulation of the securities markets; |
| ■ | Weaker accounting, disclosure and reporting requirements; and |
| ■ | Legal principles relating to corporate governance, directors’ fiduciary duties and |
Table of Contents
Table of Contents
Economic Risk. The Chinese economy has grown rapidly during the past several years and there is no assurance that this growth rate will be maintained. In fact, the Chinese economy may experience a significant slowdown as a result of, among other things, a deterioration in global demand for Chinese exports, as well as contraction in spending on domestic goods by Chinese consumers. In addition, China may experience substantial rates of inflation or economic recessions, which would have a negative effect on its economy and securities market. Delays in enterprise restructuring, slow development of well-functioning financial markets and widespread corruption have also hindered performance of the Chinese economy. China continues to receive substantial pressure from trading partners to liberalize official currency exchange rates.
Table of Contents
Table of Contents
Table of Contents
Table of Contents
Table of Contents
Table of Contents
Table of Contents
Table of Contents
Table of Contents
Table of Contents
Table of Contents
Table of Contents
Table of Contents
Table of Contents
Table of Contents
Table of Contents
Table of Contents
| Approximate
Value of a Creation Unit |
Creation
Unit Size |
Standard
Creation/ Redemption Transaction Fee |
Maximum
Additional Charge for Creations* |
Maximum
Additional Charge for Redemptions* | ||||
| $1,250,000 | 50,000 | $10,600 | 3.0% | 2.0% |
| * | As a percentage of the net asset value per Creation Unit, inclusive, in the case of redemptions, of the standard redemption transaction fee. |
Table of Contents
Table of Contents
Table of Contents
Table of Contents
Table of Contents
| Call: | 1-800-iShares
or 1-800-474-2737 (toll free) Monday through Friday, 8:30 a.m. to 6:30 p.m. (Eastern time) |
| Email: | iSharesETFs@blackrock.com |
| Write: | c/o
BlackRock Investments, LLC 1 University Square Drive, Princeton, NJ 08540 |

Table of Contents
(as revised June 22, 2015)
| Funds | Ticker | Stock Exchange | ||
| iShares Emerging Markets Corporate Bond ETF | CEMB | BATS | ||
| iShares Emerging Markets High Yield Bond ETF | EMHY | BATS | ||
| iShares Emerging Markets Local Currency Bond ETF | LEMB | NYSE Arca | ||
| iShares Global ex USD High Yield Corporate Bond ETF | HYXU | BATS | ||
| iShares Global High Yield Corporate Bond ETF | GHYG | BATS |
Table of Contents
Table of Contents
Table of Contents
Table of Contents
Table of Contents
| • | iShares Emerging Markets Corporate Bond ETF |
| • | iShares Emerging Markets High Yield Bond ETF |
| • | iShares Emerging Markets Local Currency Bond ETF |
| • | iShares Global ex USD High Yield Corporate Bond ETF |
| • | iShares Global High Yield Corporate Bond ETF |
Table of Contents
Table of Contents
Table of Contents
Table of Contents
| • | High yield bonds may be issued by less creditworthy companies. These securities are vulnerable to adverse changes in the issuer’s industry and to general economic conditions. Issuers of high yield bonds may be unable to meet their interest or principal payment obligations because of an economic downturn, specific issuer developments or the unavailability of additional financing. |
| • | The issuers of high yield bonds may have a larger amount of outstanding debt relative to their assets than issuers of investment grade bonds. If the issuer experiences financial stress, it may be unable to meet its debt obligations. The issuer’s ability to pay its debt obligations also may be lessened by specific issuer developments, or the unavailability of additional financing. Issuers of high yield securities are often in the growth stage of their development and/or involved in a reorganization or takeover. |
| • | High yield bonds are frequently ranked junior to claims by other creditors. If the issuer cannot meet its obligations, the senior obligations are generally paid off before the junior obligations, which will potentially limit a Fund’s ability to fully recover principal or to receive interest payments when senior securities are in default. Thus, investors in high yield securities frequently have a lower degree of protection with respect to principal and interest payments than do investors in higher rated securities. |
| • | High yield bonds frequently have redemption features that permit an issuer to repurchase the security from a Fund before it matures. If an issuer redeems the high yield bonds, a Fund may have to invest the proceeds in bonds with lower yields and may lose income. |
| • | Prices of high yield bonds are subject to extreme fluctuations. Negative economic developments may have a greater impact on the prices of high yield bonds than on those of other higher rated fixed income securities. |
| • | High yield bonds may be less liquid than higher rated fixed income securities even under normal economic conditions. Under certain economic and/or market conditions, a Fund may have difficulty disposing of certain high yield securities due to the limited number of investors in that sector of the market. There are fewer dealers in the high yield bond market, and there may be significant differences in the prices quoted for high yield bonds by dealers, and such quotations may not be the actual prices available for a purchase or sale. Because high yield bonds are less liquid, judgment may play a greater role in the prices and values generated for such securities than in the case of securities trading in a more liquid market. |
| • | The secondary markets for high yield securities are not as liquid as the secondary markets for higher rated securities. The secondary markets for high yield securities are concentrated in relatively few market makers and participants in the markets are mostly institutional investors, including insurance companies, banks, other financial institutions and mutual funds. In addition, the trading volume for high yield securities is generally lower than that for higher rated securities and the secondary markets could contract under adverse market or economic conditions independent of any specific adverse changes in the condition of a particular issuer. Under certain economic and/or market conditions, a Fund may have difficulty disposing of certain high yield securities due to the limited number of investors in that sector of the market. A less liquid secondary market may adversely affect the market price of the high yield security, which may result in increased difficulty selling the particular issue and obtaining accurate market quotations on the issue when valuing a Fund’s assets. Market quotations on high yield securities are available only from a limited number of dealers, and such quotations may not be the actual prices available for a purchase or sale. When the secondary market for high yield securities becomes more illiquid, or in the absence of readily available market quotations for such securities, the relative lack of reliable objective data makes it more difficult to value such securities, and judgment plays a more important role in determining such valuations. |
| • | A Fund may incur expenses to the extent necessary to seek recovery upon default or to negotiate new terms with a defaulting issuer. |
| • | The high yield bond markets may react strongly to adverse news about an issuer or the economy, or to the perception or expectation of adverse news, whether or not it is based on fundamental analysis. Additionally, prices for high yield securities may be affected by legislative and regulatory developments. These developments could adversely affect a Fund’s net asset value and investment practices, the secondary market for high yield securities, |
Table of Contents
| the financial condition of issuers of these securities and the value and liquidity of outstanding high yield securities, especially in a thinly traded market. For example, federal legislation requiring the divestiture by federally insured savings and loan associations of their investments in high yield bonds and limiting the deductibility of interest by certain corporate issuers of high yield bonds adversely affected the market in the past. |
Table of Contents
Table of Contents
Table of Contents
Table of Contents
Table of Contents
Table of Contents
Table of Contents
Table of Contents
Table of Contents
Table of Contents
Table of Contents
Table of Contents
Table of Contents
Table of Contents
Table of Contents
Table of Contents
Table of Contents
Table of Contents
Table of Contents
Table of Contents
Table of Contents
| • | Each Fund generally supports the board’s nominees in the election of directors and generally supports proposals that strengthen the independence of boards of directors; |
| • | When a director has committed himself or herself to service on more than four public company boards (but no more than six public company boards in most circumstances), a Fund will consider such director’s individual circumstances in determining whether the director will be able to commit sufficient focus and time to a particular company; |
| • | Each Fund generally defers to an issuer’s choice of auditors so long as the corporate auditors represent the interests of shareholders and provide an independent view of the propriety of financial reporting decisions of management; |
| • | Each Fund generally favors disclosure of a company’s compensation and benefits policies and opposes excessive compensation, but believes that compensation matters are normally best determined by a company’s board of directors; |
| • | Each Fund generally expects to support capital structure requests that it believes enhance the rights of common shareholders and oppose requests that appear to be unreasonably dilutive; |
| • | Each Fund generally does not support proposals on social issues that lack a demonstrable economic benefit to the issuer and the Fund investing in such issuer; and |
| • | Each Fund generally votes against anti-takeover proposals and proposals that would create additional barriers or costs to corporate transactions that are likely to deliver a premium to shareholders. |
Table of Contents
Table of Contents
Table of Contents
Table of Contents
| 1. | Concentrate its investments (i.e., invest 25% or more of its total assets in the securities of a particular industry or group of industries), except that the Fund will concentrate to approximately the same extent that the Underlying Index concentrates in the securities of a particular industry or group of industries. For purposes of this limitation, securities of the U.S. government (including its agencies and instrumentalities), repurchase agreements collateralized by U.S. government securities, and securities of state or municipal governments and their political subdivisions are not considered to be issued by members of any industry. |
| 2. | Borrow money, except that (i) the Fund may borrow from banks for temporary or emergency (not leveraging) purposes, including the meeting of redemption requests which might otherwise require the untimely disposition of securities; and (ii) the Fund may, to the extent consistent with its investment policies, enter into repurchase agreements, reverse repurchase agreements, forward roll transactions and similar investment strategies and techniques. To the extent that it engages in transactions described in (i) and (ii), the Fund will be limited so that no more than 33 1/3% of the value of its total assets (including the amount borrowed) is derived from such transactions. Any borrowings which come to exceed this amount will be reduced in accordance with applicable law. |
Table of Contents
| 3. | Issue any senior security, except as permitted under the 1940 Act, as interpreted, modified or otherwise permitted by any regulatory authority having jurisdiction, from time to time. |
| 4. | Make loans, except as permitted under the 1940 Act, as interpreted, modified or otherwise permitted by regulatory authority having jurisdiction, from time to time. |
| 5. | Purchase or sell real estate unless acquired as a result of ownership of securities or other instruments (but this restriction shall not prevent the Fund from investing in securities of companies engaged in the real estate business or securities or other instruments backed by real estate or mortgages), or commodities or commodity contracts (but this restriction shall not prevent the Fund from trading in futures contracts and options on futures contracts, including options on currencies to the extent consistent with the Fund’s investment objective and policies). |
| 6. | Engage in the business of underwriting securities issued by other persons, except to the extent that the Fund may technically be deemed to be an underwriter under the 1933 Act, in disposing of portfolio securities. |
| 1. | Concentrate its investments (i.e., invest 25% or more of its total assets in the securities of a particular industry or group of industries), except that the Fund will concentrate to approximately the same extent that the Underlying Index concentrates in the securities of a particular industry or group of industries. For purposes of this limitation, securities of the U.S. government (including its agencies and instrumentalities), repurchase agreements collateralized by U.S. government securities, and securities of state or municipal governments and their political subdivisions are not considered to be issued by members of any industry. |
| 2. | Borrow money, except that (i) the Fund may borrow from banks for temporary or emergency (not leveraging) purposes, including the meeting of redemption requests which might otherwise require the untimely disposition of securities; and (ii) the Fund may, to the extent consistent with its investment policies, enter into repurchase agreements, reverse repurchase agreements, forward roll transactions and similar investment strategies and techniques. To the extent that it engages in transactions described in (i) and (ii), the Fund will be limited so that no more than 33 1/3% of the value of its total assets (including the amount borrowed) is derived from such transactions. Any borrowings which come to exceed this amount will be reduced in accordance with applicable law. |
| 3. | Issue “senior securities” as defined in the 1940 Act and the rules, regulations and orders thereunder, except as permitted under the 1940 Act and the rules, regulation and orders thereunder. |
| 4. | Make loans, except as permitted under the 1940 Act, as interpreted, modified or otherwise permitted by regulatory authority having jurisdiction, from time to time. |
| 5. | Purchase or sell real estate unless acquired as a result of ownership of securities or other instruments (but this restriction shall not prevent the Fund from investing in securities of companies engaged in the real estate business or securities or other instruments backed by real estate or mortgages), or commodities or commodity contracts (but this restriction shall not prevent the Fund from trading in futures contracts and options on futures contracts, including options on currencies to the extent consistent with the Fund’s investment objective and policies). |
| 6. | Engage in the business of underwriting securities issued by other persons, except to the extent that the Fund may technically be deemed to be an underwriter under the 1933 Act, in disposing of portfolio securities. |
| • | The frequency of trades and quotes for the security; |
| • | The number of dealers wishing to purchase or sell the security and the number of other potential purchasers; |
| • | Dealer undertakings to make a market in the security; and |
Table of Contents
| • | The nature of the security and the nature of the marketplace in which it trades (e.g., the time needed to dispose of the security, the method of soliciting offers and the mechanics of transfer). |
Table of Contents
| Name (Age) | Position | Principal
Occupation(s) During the Past 5 Years |
Other
Directorships Held by Director | |||
| Robert
S. Kapito1 (58) |
Director
(since 2009). |
President and Director, BlackRock, Inc. (since 2006); Vice Chairman of BlackRock, Inc. and Head of BlackRock, Inc.’s Portfolio Management Group (since its formation in 1998) and BlackRock, Inc.’s predecessor entities (since 1988); Trustee, University of Pennsylvania (since 2009); President of Board of Directors, Hope & Heroes Children’s Cancer Fund (since 2002); President of the Board of Directors, Periwinkle Theatre for Youth (since 1983). | Trustee of iShares Trust (since 2009); Director of iShares MSCI Russia Capped ETF, Inc. (since 2010); Trustee of iShares U.S. ETF Trust (since 2011); Director of BlackRock, Inc. (since 2006). | |||
| Mark
Wiedman2 (44) |
Director (since 2013). | Managing Director, BlackRock, Inc. (since 2007); Global Head of iShares (since 2011); Head of Corporate Strategy, BlackRock, Inc. (2009-2011). | Trustee of iShares Trust (since 2013); Director of iShares MSCI Russia Capped ETF, Inc. (since 2013); Trustee of iShares U.S. ETF Trust (since 2013); Director of PennyMac Financial Services, Inc. (since 2008). |
| 1 | Robert S. Kapito is deemed to be an “interested person” (as defined in the 1940 Act) of the Company due to his affiliations with BlackRock, Inc. |
| 2 | Mark Wiedman is deemed to be an “interested person” (as defined in the 1940 Act) of the Company due to his affiliations with BlackRock, Inc. and its affiliates. |
Table of Contents
| Name (Age) | Position | Principal
Occupation(s) During the Past 5 Years |
Other
Directorships Held by Director | |||
| Robert
H. Silver (59) |
Director
(since 2007); Independent Chairman (since 2012). |
President and Co-Founder of The Bravitas Group, Inc. (since 2006); Director and Vice Chairman of the YMCA of Greater NYC (2001-2011); Broadway Producer (2006-2011); Co-Founder and Vice President of Parentgiving Inc. (since 2008); Director and Member of the Audit and Compensation Committee of EPAM Systems, Inc. (2006-2009); President and Chief Operating Officer of UBS Financial Services Inc. (formerly Paine Webber Inc.) (2003-2005) and various executive positions with UBS and its affiliates (1988-2005); CPA and Audit Manager of KPMG, LLP (formerly Peat Marwick Mitchell) (1977-1983). | Trustee of iShares Trust (since 2007); Director of iShares MSCI Russia Capped ETF, Inc. (since 2010); Trustee of iShares U.S. ETF Trust (since 2011); Independent Chairman of iShares Trust, iShares MSCI Russia Capped ETF, Inc. and iShares U.S. ETF Trust (since 2012). | |||
| John
E. Martinez (53) |
Director
(since 2003); Securities Lending Committee Chair (since 2012). |
Director of FirstREX Agreement Corp. (formerly EquityRock, Inc.) (since 2005). | Trustee of iShares Trust (since 2003); Director of iShares MSCI Russia Capped ETF, Inc. (since 2010); Trustee of iShares U.S. ETF Trust (since 2011). | |||
| Cecilia
H. Herbert (65) |
Director
(since 2005); Nominating and Governance Committee Chair and Equity Plus Committee Chair (since 2012). |
Director (1998-2013) and President (2007-2011) of the Board of Directors, Catholic Charities CYO; Trustee (2002-2011) and Chair of the Finance and Investment Committee (2006-2010) of the Thacher School; Member (since 1992) and Chair (1994-2005) of the Investment Committee, Archdiocese of San Francisco; Trustee and Member of the Investment Committee, WNET, the New York public broadcasting/media company (since 2011). | Trustee of iShares Trust (since 2005); Director of iShares MSCI Russia Capped ETF, Inc. (since 2010); Trustee of iShares U.S. ETF Trust (since 2011); Director of Forward Funds (34 portfolios) (since 2009). | |||
| Charles
A. Hurty (71) |
Director
(since 2005); Audit Committee Chair (since 2006). |
Retired; Partner, KPMG LLP (1968-2001). | Trustee of iShares Trust (since 2005); Director of iShares MSCI Russia Capped ETF, Inc. (since 2010); Trustee of iShares U.S. ETF Trust (since 2011); Director of GMAM Absolute Return Strategy Fund (1 portfolio) (since 2002); Director of SkyBridge Alternative Investments Multi-Adviser Hedge Fund Portfolios LLC (2 portfolios) (since 2002). |
Table of Contents
| Name (Age) | Position | Principal
Occupation(s) During the Past 5 Years |
Other
Directorships Held by Director | |||
| John
E. Kerrigan (59) |
Director
(since 2005); Fixed Income Plus Committee Chair (since 2012). |
Chief Investment Officer, Santa Clara University (since 2002). | Trustee of iShares Trust (since 2005); Director of iShares MSCI Russia Capped ETF, Inc. (since 2010); Trustee of iShares U.S. ETF Trust (since 2011). | |||
| Madhav
V. Rajan (50) |
Director
(since 2011); 15(c) Committee Chair (since 2012). |
Robert K. Jaedicke Professor of Accounting and Senior Associate Dean for Academic Affairs and Head of MBA Program, Stanford University Graduate School of Business (since 2001); Professor of Law (by courtesy), Stanford Law School (since 2005); Visiting Professor, University of Chicago (2007-2008). | Trustee
of iShares Trust (since 2011); Director of iShares MSCI Russia Capped ETF, Inc. (since 2011); Trustee of iShares U.S. ETF Trust (since 2011); Director, Cavium, Inc. (since 2013). | |||
| Jane
D. Carlin (59) |
Director
(since 2015). |
Managing Director and Global Head of Financial Holding Company Governance & Assurance and the Global Head of Operational Risk Management of Morgan Stanley Group (2006-2012). | Trustee of iShares Trust (since 2015); Trustee of iShares U.S. ETF Trust (since 2015); Director of PHH Corporation (mortgage solutions) (since 2012). |
| Name (Age) | Position | Principal
Occupation(s) During the Past 5 Years | ||
| Manish
Mehta (44) |
President (since 2013). | Managing Director, BlackRock, Inc. (since 2009); Chief Operating Officer for iShares (since 2009); Head of Strategy and Corporate Development, BGI (2005-2009); Chief of Staff to the CEO, BGI (2005-2009). | ||
| Jack
Gee (55) |
Treasurer
and Chief Financial Officer (since 2008). |
Managing Director, BlackRock, Inc. (since 2009); Senior Director of Fund Administration of Intermediary Investor Business, BGI (2009); Director of Fund Administration of Intermediary Investor Business, BGI (2004-2009). | ||
| Charles
Park (47) |
Chief
Compliance Officer and Anti-Money Laundering Officer (since 2006). |
Chief Compliance Officer of BlackRock Advisors, LLC and the BlackRock-advised Funds in the Equity-Bond Complex, the Equity-Liquidity Complex and the Closed-End Complex (since 2014); Principal of and Chief Compliance Officer for iShares® Delaware Trust Sponsor LLC (since 2012) and BFA (since 2006); Chief Compliance Officer for BlackRock Asset Management International Inc. (since 2012). |
Table of Contents
| Name (Age) | Position | Principal
Occupation(s) During the Past 5 Years | ||
| Eilleen
M. Clavere (62) |
Secretary
(since 2007). |
Director of Global Fund Administration, BlackRock, Inc. (since 2009); Director of Legal Administration of Intermediary Investor Business, BGI (2006-2009); Legal Counsel and Vice President of Atlas Funds, Atlas Advisers, Inc. and Atlas Securities, Inc. (2005-2006); Counsel at Kirkpatrick & Lockhart LLP (2001-2005). | ||
| Edward
B. Baer (46) |
Vice
President and Chief Legal Officer (since 2012). |
Managing Director of Legal & Compliance, BlackRock, Inc. (since 2006); Director of Legal & Compliance, BlackRock, Inc. (2004-2006). | ||
| Scott
Radell (46) |
Executive
Vice President (since 2012). |
Managing Director, BlackRock, Inc. (since 2009); Head of Portfolio Solutions, BlackRock, Inc. (since 2009); Head of Portfolio Solutions, BGI (2007-2009); Credit Portfolio Manager, BGI (2005-2007); Credit Research Analyst, BGI (2003-2005). | ||
| Amy
Schioldager (52) |
Executive
Vice President (since 2007). |
Senior Managing Director, BlackRock, Inc. (since 2009); Global Head of Index Equity, BGI (2008-2009); Global Head of U.S. Indexing, BGI (2006-2008); Head of Domestic Equity Portfolio Management, BGI (2001-2006). | ||
| Ira
P. Shapiro (51) |
Vice
President (since 2007). |
Managing Director, BlackRock, Inc. (since 2009); Head of Strategic Product Initiatives for iShares (since 2012); Chief Legal Officer, Exchange-Traded Fund Complex (2007-2012); Associate General Counsel, BGI (2004-2009). |
Table of Contents
Table of Contents
Table of Contents
Table of Contents
Table of Contents
| Name of Director | Fund | Dollar
Range of Equity Securities in the Fund |
Aggregate
Dollar Range of Equity Securities in all Registered Investment Companies Overseen by Director in Family of Investment Companies | |||
| Robert S. Kapito | None | None | None | |||
| Mark Wiedman | iShares Core MSCI EAFE ETF | $50,001-$100,000 | Over $100,000 | |||
| iShares Core MSCI Emerging Markets ETF | $50,001-$100,000 | |||||
| iShares Core S&P Total U.S. Stock Market ETF | $50,001-$100,000 | |||||
| Robert H. Silver | iShares Core High Dividend ETF | Over $100,000 | Over $100,000 | |||
| iShares Core MSCI EAFE ETF | Over $100,000 | |||||
| iShares Core MSCI Emerging Markets ETF | Over $100,000 | |||||
| iShares Core MSCI Total International Stock ETF | Over $100,000 | |||||
| iShares Core S&P 500 ETF | Over $100,000 | |||||
| iShares Core S&P Mid-Cap ETF | Over $100,000 | |||||
| iShares Core S&P Small-Cap ETF | Over $100,000 | |||||
| iShares Core S&P Total U.S. Stock Market ETF | Over $100,000 | |||||
| iShares Global Energy ETF | Over $100,000 | |||||
| iShares Global Tech ETF | $50,001-$100,000 | |||||
| iShares iBonds Sep 2015 AMT-Free Muni Bond ETF | Over $100,000 | |||||
| iShares iBonds Sep 2016 AMT-Free Muni Bond ETF | Over $100,000 | |||||
| iShares iBonds Sep 2017 AMT-Free Muni Bond ETF | Over $100,000 | |||||
| iShares iBonds Sep 2018 AMT-Free Muni Bond ETF | Over $100,000 |
Table of Contents
| Name of Director | Fund | Dollar
Range of Equity Securities in the Fund |
Aggregate
Dollar Range of Equity Securities in all Registered Investment Companies Overseen by Director in Family of Investment Companies | |||
| iShares iBoxx $ Investment Grade Corporate Bond ETF | Over $100,000 | |||||
| iShares International Developed Real Estate ETF | $1-$10,000 | |||||
| iShares J.P. Morgan USD Emerging Markets Bond ETF | $1-$10,000 | |||||
| iShares MSCI ACWI ex U.S. ETF | $1-$10,000 | |||||
| iShares MSCI China ETF | Over $100,000 | |||||
| iShares MSCI EAFE ETF | Over $100,000 | |||||
| iShares MSCI Emerging Markets ETF | Over $100,000 | |||||
| iShares MSCI EMU ETF | Over $100,000 | |||||
| iShares MSCI Frontier 100 ETF | Over $100,000 | |||||
| iShares Nasdaq Biotechnology ETF | $50,001-$100,000 | |||||
| iShares National AMT-Free Muni Bond ETF | Over $100,000 | |||||
| iShares Russell 1000 Growth ETF | Over $100,000 | |||||
| iShares Russell 1000 Value ETF | Over $100,000 | |||||
| iShares Russell 2000 ETF | $10,001-$50,000 | |||||
| iShares Russell 2000 Growth ETF | Over $100,000 | |||||
| iShares Russell 2000 Value ETF | Over $100,000 | |||||
| iShares Russell Mid-Cap Growth ETF | $1-$10,000 | |||||
| iShares Russell Mid-Cap Value ETF | $1-$10,000 | |||||
| iShares S&P 100 ETF | $50,001-$100,000 | |||||
| iShares Select Dividend ETF | $10,001-$50,000 | |||||
| iShares U.S. Broker-Dealers ETF | Over $100,000 | |||||
| iShares U.S. Financial Services ETF | $50,001-$100,000 | |||||
| iShares U.S. Preferred Stock ETF | Over $100,000 | |||||
| iShares U.S. Regional Banks ETF | Over $100,000 | |||||
| iShares U.S. Technology ETF | Over $100,000 | |||||
| John E. Martinez | iShares Core MSCI Emerging Markets ETF | $50,001-$100,000 | Over $100,000 | |||
| iShares Core S&P 500 ETF | Over $100,000 | |||||
| iShares Core S&P Mid-Cap ETF | $10,001-$50,000 | |||||
| iShares Core S&P Small-Cap ETF | $10,001-$50,000 | |||||
| iShares Core S&P Total U.S. Stock Market ETF | $1-$10,000 | |||||
| iShares Global Consumer Staples ETF | Over $100,000 | |||||
| iShares MSCI All Country Asia ex Japan ETF | Over $100,000 | |||||
| iShares MSCI EAFE ETF | Over $100,000 | |||||
| iShares Russell 1000 ETF | Over $100,000 | |||||
| iShares Russell 1000 Value ETF | Over $100,000 |
Table of Contents
| Name of Director | Fund | Dollar
Range of Equity Securities in the Fund |
Aggregate
Dollar Range of Equity Securities in all Registered Investment Companies Overseen by Director in Family of Investment Companies | |||
| iShares Russell 2000 ETF | Over $100,000 | |||||
| Cecilia H. Herbert | iShares China Large-Cap ETF | Over $100,000 | Over $100,000 | |||
| iShares Core Dividend Growth ETF | $10,001-$50,000 | |||||
| iShares Core MSCI Emerging Markets ETF | $10,001-$50,000 | |||||
| iShares Core MSCI Total International Stock ETF | $10,001-$50,000 | |||||
| iShares Core S&P Total U.S. Stock Market ETF | $10,001-$50,000 | |||||
| iShares Core U.S. Growth ETF | $10,001-$50,000 | |||||
| iShares Core U.S. Value ETF | $10,001-$50,000 | |||||
| iShares iBoxx $ High Yield Corporate Bond ETF | $10,001-$50,000 | |||||
| iShares International Select Dividend ETF | $1-$10,000 | |||||
| iShares MSCI EAFE ETF | $1-$10,000 | |||||
| iShares MSCI Emerging Markets ETF | $1-$10,000 | |||||
| iShares MSCI Japan ETF | $10,001-$50,000 | |||||
| iShares National AMT-Free Muni Bond ETF | $10,001-$50,000 | |||||
| Charles A. Hurty | iShares China Large-Cap ETF | $10,001-$50,000 | Over $100,000 | |||
| iShares Core High Dividend ETF | $10,001-$50,000 | |||||
| iShares Core MSCI Emerging Markets ETF | $50,001-$100,000 | |||||
| iShares Core S&P 500 ETF | $10,001-$50,000 | |||||
| iShares Global Energy ETF | $10,001-$50,000 | |||||
| iShares Global Healthcare ETF | $10,001-$50,000 | |||||
| iShares Global Tech ETF | $10,001-$50,000 | |||||
| iShares MSCI EAFE ETF | $10,001-$50,000 | |||||
| iShares MSCI Japan ETF | $10,001-$50,000 | |||||
| iShares MSCI USA Value Factor ETF | $10,001-$50,000 | |||||
| iShares North American Tech-Multimedia Networking ETF | $1-$10,000 | |||||
| iShares Russell 2000 ETF | $10,001-$50,000 | |||||
| iShares Select Dividend ETF | $1-$10,000 | |||||
| iShares U.S. Basic Materials ETF | $10,001-$50,000 | |||||
| iShares U.S. Energy ETF | $10,001-$50,000 | |||||
| iShares U.S. Financials ETF | $1-$10,000 | |||||
| iShares U.S. Technology ETF | $50,001-$100,000 | |||||
| John E. Kerrigan | iShares MSCI ACWI ETF | $10,001-$50,000 | Over $100,000 | |||
| iShares MSCI ACWI ex U.S. ETF | Over $100,000 |
Table of Contents
| Name of Director | Fund | Dollar
Range of Equity Securities in the Fund |
Aggregate
Dollar Range of Equity Securities in all Registered Investment Companies Overseen by Director in Family of Investment Companies | |||
| iShares Short-Term National AMT-Free Muni Bond ETF | Over $100,000 | |||||
| Madhav V. Rajan | iShares Core Dividend Growth ETF | Over $100,000 | Over $100,000 | |||
| iShares Core High Dividend ETF | Over $100,000 | |||||
| iShares Core MSCI Emerging Markets ETF | Over $100,000 | |||||
| iShares Core S&P 500 ETF | Over $100,000 | |||||
| iShares iBoxx $ High Yield Corporate Bond ETF | Over $100,000 | |||||
| iShares iBoxx $ Investment Grade Corporate Bond ETF | Over $100,000 | |||||
| iShares Russell 2000 ETF | Over $100,000 | |||||
| iShares Select Dividend ETF | Over $100,000 | |||||
| Jane D. Carlin1 | iShares Core MSCI EAFE ETF | $10,001-$50,000 | Over $100,000 | |||
| iShares Core S&P Small-Cap ETF | $10,001-$50,000 | |||||
| iShares Global Tech ETF | $50,001-$100,000 |
| 1 | Appointed to serve as an Independent Director effective February 3, 2015. |
| Name of Director | iShares
Emerging Markets Corporate Bond ETF |
iShares
Emerging Markets High Yield Bond ETF |
iShares
Emerging Markets Local Currency Bond ETF | |||
| Independent Directors:1 | ||||||
Table of Contents
| Name of Director | iShares
Emerging Markets Corporate Bond ETF |
iShares
Emerging Markets High Yield Bond ETF |
iShares
Emerging Markets Local Currency Bond ETF | |||
| George G.C. Parker2 | $ 10 | $76 | $215 | |||
| John E. Kerrigan | 10 | 80 | 227 | |||
| Charles A. Hurty | 11 | 87 | 247 | |||
| Cecilia H. Herbert | 11 | 84 | 239 | |||
| Robert H. Silver | 12 | 90 | 254 | |||
| John E. Martinez | 10 | 80 | 227 | |||
| Madhav V. Rajan | 10 | 80 | 227 | |||
| Interested Directors: | ||||||
| Robert S. Kapito | $ 0 | $0 | $0 | |||
| Mark Wiedman | 0 | 0 | 0 |
| Name of Director | iShares
Global ex USD High Yield Corporate Bond ETF |
iShares
Global High Yield Corporate Bond ETF | ||
| Independent Directors:1 | ||||
| George G.C. Parker2 | $ 55 | $40 | ||
| John E. Kerrigan | 58 | 42 | ||
| Charles A. Hurty | 62 | 46 | ||
| Cecilia H. Herbert | 61 | 44 | ||
| Robert H. Silver | 64 | 47 | ||
| John E. Martinez | 58 | 42 | ||
| Madhav V. Rajan | 58 | 42 | ||
| Interested Directors: | ||||
| Robert S. Kapito | $ 0 | $ 0 | ||
| Mark Wiedman | 0 | 0 |
| Name of Director | Pension
or Retirement Benefits Accrued As Part of Company Expenses3 |
Estimated
Annual Benefits Upon Retirement3 |
Total
Compensation From the Funds and Fund Complex4 | |||
| Independent Directors:1 | ||||||
| Robert H. Silver | Not Applicable | Not Applicable | $ 350,000 | |||
| George G.C. Parker2 | Not Applicable | Not Applicable | 300,000 | |||
| John E. Kerrigan | Not Applicable | Not Applicable | 326,807 | |||
| Charles A. Hurty | Not Applicable | Not Applicable | 340,000 | |||
| Cecilia H. Herbert | Not Applicable | Not Applicable | 330,000 | |||
| John E. Martinez | Not Applicable | Not Applicable | 315,000 | |||
| Madhav V. Rajan | Not Applicable | Not Applicable | 326,772 | |||
| Interested Directors: | ||||||
| Robert S. Kapito | Not Applicable | Not Applicable | $ 0 |
Table of Contents
| Name of Director | Pension
or Retirement Benefits Accrued As Part of Company Expenses3 |
Estimated
Annual Benefits Upon Retirement3 |
Total
Compensation From the Funds and Fund Complex4 | |||
| Mark Wiedman | Not Applicable | Not Applicable | 0 |
| 1 | Compensation is not shown for Jane D. Carlin because she was appointed to serve as an Independent Director of the Company effective February 3, 2015. |
| 2 | Served as an Independent Director through December 31, 2014. |
| 3 | No Director or officer is entitled to any pension or retirement benefits from the Company. |
| 4 | Includes compensation for service on the Boards of Trustees for iShares Trust and iShares U.S. ETF Trust and the Board of Directors of iShares MSCI Russia Capped ETF, Inc. |
| Fund | Name | Percentage
of Ownership | ||
| iShares Emerging Markets Corporate Bond ETF | National
Financial Services LLC 200 Liberty Street 5th Floor New York, NY 10281 |
15.03% | ||
| Scotia
Capital Inc. Scotia Plaza 40 King Street West 23rd Floor Toronto, ON M5W 2X6 CA |
9.96% | |||
| Morgan
Stanley Smith Barney LLC 1300 Thames Street 6th Floor Baltimore, MD 21231 |
9.30% | |||
| Charles
Schwab & Co., Inc. 111 Pavonia Avenue Jersey City, NJ 07310 |
7.37% | |||
| J.P.
Morgan Clearing Corp One Metrotech Center North Brooklyn, NY 11201 |
7.29% | |||
| Brown
Brothers Harriman & Co. 525 Washington Blvd. 11th Floor Jersey City, NJ 07310 |
6.49% | |||
| UBS
Financial Services Inc. 1000 Harbor Blvd. 4th Floor Weehawken, NJ 07087 |
5.03% | |||
| iShares Emerging Markets High Yield Bond ETF | American
Enterprise Investment Services Inc. 2178 AXP Financial Center Minneapolis, MN 55474 |
22.48% |
Table of Contents
| Fund | Name | Percentage
of Ownership | ||
| National
Financial Services LLC 200 Liberty Street 5th Floor New York, NY 10281 |
21.57% | |||
| Pershing
LLC One Pershing Plaza Jersey City, NJ 07399 |
12.41% | |||
| Morgan
Stanley Smith Barney LLC 1300 Thames Street 6th Floor Baltimore, MD 21231 |
5.70% | |||
| iShares Emerging Markets Local Currency Bond ETF | The
Bank of New York Mellon/Mellon Trust of New England, National Association One Boston Place 8th Floor Boston, MA 02108 |
50.00% | ||
| Goldman,
Sachs & Co. 30 Hudson Street 16th Floor Jersey City, NJ 07302 |
15.31% | |||
| Merrill
Lynch, Pierce Fenner & Smith Safekeeping 101 Hudson Street 8th Floor Jersey City, NJ 07302 |
7.02% | |||
| iShares Global ex USD High Yield Corporate Bond ETF | JPMorgan
Chase Bank, National Association 14201 Dallas Pkwy 12th Floor Dallas, TX 75240 |
60.75% | ||
| National
Financial Services LLC 200 Liberty Street 5th Floor New York, NY 10281 |
7.14% | |||
| iShares Global High Yield Corporate Bond ETF | Merrill
Lynch, Pierce Fenner & Smith Safekeeping 101 Hudson Street 8th Floor Jersey City, NJ 07302 |
28.91% | ||
| National
Financial Services LLC 200 Liberty Street 5th Floor New York, NY 10281 |
12.00% | |||
| J.P.
Morgan Clearing Corp One Metrotech Center North Brooklyn, NY 11201 |
7.11% | |||
| The
Bank of New York Mellon 401 Salina Street 2nd Floor Syracuse, NY 13202 |
6.86% |
Table of Contents
| Fund | Name | Percentage
of Ownership | ||
| Raymond,
James & Associates, Inc. 880 Carillon Parkway P.O. Box 12749 St. Petersburg, FL 33733 |
5.81% | |||
| Pershing
LLC One Pershing Plaza Jersey City, NJ 07399 |
5.43% |
Table of Contents
Table of Contents
Table of Contents
Table of Contents
Table of Contents
Table of Contents
Table of Contents
| Fund | Management
Fee for Fiscal Year Ended Oct. 31, 2014 |
Fund
Inception Date |
Management
Fees Paid for Fiscal Year Ended Oct. 31, 2014 |
Management
Fees Paid for Fiscal Year Ended Oct. 31, 2013 |
Management
Fees Paid for Fiscal Year Ended Oct. 31, 2012 | |||||
| iShares Emerging Markets Corporate Bond ETF1 | 0.60% | 04/17/12 | $ 154,114 | $ 202,526 | $ 41,205 | |||||
| iShares Emerging Markets High Yield Bond ETF2 | 0.65% | 04/03/12 | 1,265,426 | 1,462,488 | 82,350 | |||||
| iShares Emerging Markets Local Currency Bond ETF3 | 0.60% | 10/18/11 | 3,558,782 | 3,298,880 | 288,363 | |||||
| iShares Global ex USD High Yield Corporate Bond ETF4 | 0.55% | 04/03/12 | 723,375 | 215,773 | 77,202 | |||||
| iShares Global High Yield Corporate Bond ETF5 | 0.55% | 04/03/12 | 515,709 | 302,079 | 90,198 |
| 1 | Effective March 2, 2015, the management fee for the iShares Emerging Markets Corporate Bond ETF is 0.50%. Prior to March 2, 2015, it was 0.60%. |
| 2 | Effective March 2, 2015, the management fee for the iShares Emerging Markets High Yield Bond ETF is 0.50%. Prior to March 2, 2015, it was 0.65%. |
| 3 | Effective October 9, 2014, for the iShares Emerging Markets Local Currency Bond ETF, BFA has voluntarily agreed to waive a portion of its management fee in order to limit the management fee to 0.50%. Any such voluntary waiver or reimbursement may be eliminated by BFA at any time, without notice. For the fiscal year ended October 31, 2014, BFA waived $36,951 of its management fees. Effective March 2, 2015, the management fee for the iShares Emerging Markets Local Currency Bond ETF is 0.50%. Prior to March 2, 2015, it was 0.60%. |
| 4 | For the iShares Global ex USD High Yield Corporate Bond ETF, BFA has contractually agreed to waive a portion of its management fee for its investment advisory services to the iShares Global ex USD High Yield Corporate Bond ETF in order to limit the Total Annual Fund Operating Expenses to 0.40% of average daily net assets until February 29, 2016. The contractual waiver may be terminated prior to February 29, 2016 only upon written agreement of the Company and BFA. For the fiscal years ended October 31, 2014 and October 31, 2013, BFA waived $197,284 and $58,847 of its management fees, respectively. |
| 5 | For the iShares Global High Yield Corporate Bond ETF, BFA has contractually agreed to waive a portion of its management fee for its investment advisory services to the iShares Global High Yield Corporate Bond ETF in order to limit the Total Annual Fund Operating Expenses to 0.40% of average daily net assets until February 29, 2016. The contractual waiver may be terminated prior to February 29, 2016 only upon written agreement of the Company and BFA. For the fiscal years ended October 31, 2014 and October 31, 2013, BFA waived $140,648 and $82,385 of its management fees, respectively. |
Table of Contents
| James Mauro | ||||
| Types of Accounts | Number | Total Assets | ||
| Registered Investment Companies | 78 | $157,000,000,000 | ||
| Other Pooled Investment Vehicles | 15 | 18,000,000,000 | ||
| Other Accounts | 9 | 13,000,000,000 | ||
| Accounts with Incentive-Based Fee Arrangements | 1 | 1,000,000,000 |
| Scott Radell | ||||
| Types of Accounts | Number | Total Assets | ||
| Registered Investment Companies | 83 | $156,500,000,000 | ||
| Other Pooled Investment Vehicles | 4 | 3,000,000,000 | ||
| Other Accounts | 5 | 3,200,000,000 | ||
| Accounts with Incentive-Based Fee Arrangements | 2 | 1,700,000,000 |
Table of Contents
| James Mauro | ||||
| Types of Accounts | Number
of Other Accounts with Performance Fees Managed by Portfolio Manager |
Aggregate
of Total Assets | ||
| Registered Investment Companies | 0 | N/A | ||
| Other Pooled Investment Vehicles | 0 | N/A | ||
| Other Accounts | 1 | $1,000,000,000 |
| Scott Radell | ||||
| Types of Accounts | Number
of Other Accounts with Performance Fees Managed by Portfolio Manager |
Aggregate
of Total Assets | ||
| Registered Investment Companies | 0 | N/A | ||
| Other Pooled Investment Vehicles | 1 | $900,000,000 | ||
| Other Accounts | 1 | 800,000,000 |
Table of Contents
Table of Contents
| Fund | Fund
Inception Date |
Custody,
Administration, Transfer Agency Expenses Paid During Fiscal Year Ended Oct. 31, 2014 |
Custody,
Administration, Transfer Agency Expenses Paid During Fiscal Year Ended Oct. 31, 2013 |
Custody,
Administration, Transfer Agency Expenses Paid During Fiscal Year Ended Oct. 31, 2012 | ||||
| iShares Emerging Markets Corporate Bond ETF | 04/17/12 | $ 11,113 | $ 11,537 | $ 4,263 | ||||
| iShares Emerging Markets High Yield Bond ETF | 04/03/12 | 34,232 | 36,840 | 8,657 | ||||
| iShares Emerging Markets Local Currency Bond ETF | 10/18/11 | 272,841 | 265,969 | 39,993 | ||||
| iShares Global ex USD High Yield Corporate Bond ETF | 04/03/12 | 27,834 | 13,173 | 7,320 | ||||
| iShares Global High Yield Corporate Bond ETF | 04/03/12 | 16,040 | 12,904 | 5,614 |
| Fund | Fund
Inception Date |
Distributor
Compensation Paid From November 1, 2012 to October 31, 20141 |
Distributor
Compensation Paid From November 1, 2012 to October 31, 20131 |
Distributor
Compensation Paid From April 1, 2012 to October 31, 20121 |
Distributor
Compensation Paid From November 1, 2011 to March 31, 20122 | |||||
| iShares Emerging Markets Corporate Bond ETF | 04/17/12 | $5,122 | $8,663 | $4,403 | N/A | |||||
| iShares Emerging Markets High Yield Bond ETF | 04/03/12 | 5,122 | 8,663 | 4,403 | N/A | |||||
| iShares Emerging Markets Local Currency Bond ETF | 10/18/11 | 5,122 | 8,663 | 4,403 | $3,355 | |||||
| iShares Global ex USD High Yield Corporate Bond ETF | 04/03/12 | 5,122 | 8,663 | 4,403 | N/A |
Table of Contents
| Fund | Fund
Inception Date |
Distributor
Compensation Paid From November 1, 2012 to October 31, 20141 |
Distributor
Compensation Paid From November 1, 2012 to October 31, 20131 |
Distributor
Compensation Paid From April 1, 2012 to October 31, 20121 |
Distributor
Compensation Paid From November 1, 2011 to March 31, 20122 | |||||
| iShares Global High Yield Corporate Bond ETF | 04/03/12 | 5,122 | 8,663 | 4,403 | N/A |
| 1 | BRIL serves as the distributor to the Funds effective April 1, 2012. These fees reflect payments made to SEI, acting as an agent of the Distributor. |
| 2 | SEI served as the distributor to the Funds through March 31, 2012. |
Table of Contents
Table of Contents
Table of Contents
Table of Contents
Table of Contents
Table of Contents
| Fund | Fiscal Year ended October 31, 2014 | Fiscal Year ended October 31, 2013 | ||
| iShares Emerging Markets Corporate Bond ETF | 20% | 33% | ||
| iShares Emerging Markets High Yield Bond ETF | 24% | 57% | ||
| iShares Emerging Markets Local Currency Bond ETF | 43% | 41% | ||
| iShares Global ex USD High Yield Corporate Bond ETF | 25% | 33% | ||
| iShares Global High Yield Corporate Bond ETF | 21% | 20% |
Table of Contents
Table of Contents
Table of Contents
| Fund | Shares
Per Creation Unit |
Value
Per Creation Unit (U.S.$) | ||
| iShares Emerging Markets Corporate Bond ETF | 100,000 | $ 5,067,000 | ||
| iShares Emerging Markets High Yield Bond ETF | 100,000 | 5,012,000 | ||
| iShares Emerging Markets Local Currency Bond ETF | 200,000 | 9,506,000 | ||
| iShares Global ex USD High Yield Corporate Bond ETF | 100,000 | 5,276,000 | ||
| iShares Global High Yield Corporate Bond ETF | 100,000 | 5,145,000 |
Table of Contents
Table of Contents
Table of Contents
Table of Contents
| Fund | Standard
Creation Transaction Fee |
Maximum
Additional Charge* | ||
| iShares Emerging Markets Corporate Bond ETF | $ 100 | 3.0% | ||
| iShares Emerging Markets High Yield Bond ETF | 100 | 3.0% | ||
| iShares Emerging Markets Local Currency Bond ETF | 2,000 | 7.0% | ||
| iShares Global ex USD High Yield Corporate Bond ETF | 1,900 | 3.0% | ||
| iShares Global High Yield Corporate Bond ETF | 1,250 | 3.0% |
| * | As a percentage of the net asset value per Creation Unit. |
Table of Contents
| Fund | Standard
Redemption Transaction Fee |
Maximum
Additional Charge* | ||
| iShares Emerging Markets Corporate Bond ETF | $ 100 | 2.0% | ||
| iShares Emerging Markets High Yield Bond ETF | 100 | 2.0% | ||
| iShares Emerging Markets Local Currency Bond ETF | 2,000 | 2.0% | ||
| iShares Global ex USD High Yield Corporate Bond ETF | 1,900 | 2.0% | ||
| iShares Global High Yield Corporate Bond ETF | 1,250 | 2.0% |
| * | As a percentage of the net asset value per Creation Unit, inclusive of the standard transaction fee. |
Table of Contents
Table of Contents
Table of Contents
Table of Contents
| Fund | Non-Expiring | |
| iShares Emerging Markets Corporate Bond ETF | $ 262,109 | |
| iShares Emerging Markets High Yield Bond ETF | 8,103,223 | |
| iShares Emerging Markets Local Currency Bond ETF | 5,235,569 | |
| iShares Global High Yield Corporate Bond ETF | 11,224 |
Table of Contents
Table of Contents
Table of Contents
Table of Contents
Table of Contents
Table of Contents
Table of Contents
Table of Contents
Table of Contents
Table of Contents
Table of Contents
(as revised June 22, 2015)
| Funds | Ticker | Stock Exchange | ||
| iShares Core MSCI Emerging Markets ETF | IEMG | NYSE Arca | ||
| iShares MSCI All Country World Minimum Volatility ETF | ACWV | NYSE Arca | ||
| iShares MSCI Brazil Capped ETF | EWZ | NYSE Arca | ||
| iShares MSCI BRIC ETF | BKF | NYSE Arca | ||
| iShares MSCI Chile Capped ETF | ECH | NYSE Arca | ||
| iShares MSCI Colombia Capped ETF | ICOL | NYSE Arca | ||
| iShares MSCI Emerging Markets Asia ETF | EEMA | NASDAQ | ||
| iShares MSCI Emerging Markets Consumer Discretionary ETF | EMDI | NASDAQ | ||
| iShares MSCI Emerging Markets EMEA ETF | EEME | NASDAQ | ||
| iShares MSCI Emerging Markets Energy Capped ETF | EMEY | NASDAQ | ||
| iShares MSCI Emerging Markets ETF | EEM | NYSE Arca | ||
| iShares MSCI Emerging Markets Growth ETF | EGRW | NASDAQ | ||
| iShares MSCI Emerging Markets Minimum Volatility ETF | EEMV | NYSE Arca | ||
| iShares MSCI Emerging Markets Small-Cap ETF | EEMS | NYSE Arca | ||
| iShares MSCI Emerging Markets Value ETF | EVAL | NASDAQ | ||
| iShares MSCI Frontier 100 ETF | FM | NYSE Arca | ||
| iShares MSCI Global Agriculture Producers ETF | VEGI | NYSE Arca | ||
| iShares MSCI Global Energy Producers ETF | FILL | NYSE Arca | ||
| iShares MSCI Global Metals & Mining Producers ETF | PICK | NYSE Arca | ||
| iShares MSCI Malaysia ETF | EWM | NYSE Arca | ||
| iShares MSCI South Korea Capped ETF | EWY | NYSE Arca | ||
| iShares MSCI Taiwan ETF | EWT | NYSE Arca |
Table of Contents
Table of Contents
Table of Contents
Table of Contents
Table of Contents
Table of Contents
| • | iShares Core MSCI Emerging Markets ETF |
| • | iShares MSCI All Country World Minimum Volatility ETF |
| • | iShares MSCI Brazil Capped ETF |
| • | iShares MSCI BRIC ETF |
| • | iShares MSCI Chile Capped ETF |
| • | iShares MSCI Colombia Capped ETF |
| • | iShares MSCI Emerging Markets Asia ETF |
| • | iShares MSCI Emerging Markets Consumer Discretionary ETF |
| • | iShares MSCI Emerging Markets EMEA ETF |
| • | iShares MSCI Emerging Markets Energy Capped ETF |
| • | iShares MSCI Emerging Markets ETF |
| • | iShares MSCI Emerging Markets Growth ETF |
| • | iShares MSCI Emerging Markets Minimum Volatility ETF |
| • | iShares MSCI Emerging Markets Small-Cap ETF |
| • | iShares MSCI Emerging Markets Value ETF |
| • | iShares MSCI Frontier 100 ETF |
| • | iShares MSCI Global Agriculture Producers ETF |
| • | iShares MSCI Global Energy Producers ETF |
| • | iShares MSCI Global Metals & Mining Producers ETF |
| • | iShares MSCI Malaysia ETF |
| • | iShares MSCI South Korea Capped ETF |
| • | iShares MSCI Taiwan ETF |
Table of Contents
Table of Contents
Table of Contents
A currency futures contract is a contract involving an obligation to deliver or acquire the specified amount of a specific currency, at a specified price and at a specified future time. Currency futures contracts may be settled on a net cash payment basis rather than by the sale and delivery of the underlying currency. To the extent required by law, liquid assets committed to futures contracts will be maintained.
| Diversified Funds | Non-Diversified Funds | |
| iShares Core MSCI Emerging Markets ETF | iShares MSCI Brazil Capped ETF | |
| iShares MSCI All Country World Minimum Volatility ETF | iShares MSCI Chile Capped ETF | |
| iShares MSCI BRIC ETF | iShares MSCI Colombia Capped ETF | |
| iShares MSCI Emerging Markets Asia ETF | iShares MSCI Emerging Markets Consumer Discretionary ETF | |
| iShares MSCI Emerging Markets ETF | iShares MSCI Emerging Markets EMEA ETF | |
| iShares MSCI Emerging Markets Minimum Volatility ETF | iShares MSCI Emerging Markets Energy Capped ETF | |
| iShares MSCI Emerging Markets Small-Cap ETF | iShares MSCI Emerging Markets Growth ETF | |
| iShares MSCI Emerging Markets Value ETF |
Table of Contents
| Diversified Funds | Non-Diversified Funds | |
| iShares MSCI Frontier 100 ETF | ||
| iShares MSCI Global Agriculture Producers ETF | ||
| iShares MSCI Global Energy Producers ETF | ||
| iShares MSCI Global Metals & Mining Producers ETF | ||
| iShares MSCI Malaysia ETF | ||
| iShares MSCI South Korea Capped ETF | ||
| iShares MSCI Taiwan ETF |
Table of Contents
Table of Contents
Table of Contents
Table of Contents
Table of Contents
Table of Contents
Table of Contents
Table of Contents
Table of Contents
| • | where a non-resident investor has made any investment, directly or indirectly, in a Foreign Institutional Investor (“FII”) which has invested in India; |
| • | investment by the non-resident investor in a fund or a fund pooling vehicle, which do not result in participation in control and management of the fund; or |
Table of Contents
| • | where a non-resident investor along with its associates, does not have more than a 26% share in total capital of the company. |
| • | creates rights, or obligations, which are not ordinarily created between persons dealing at arm's length; |
| • | results, directly or indirectly, in the misuse, or abuse, of the provisions of IT Act; |
| • | lacks commercial substance; or |
| • | is entered into, or carried out, by means, or in a manner, which are not ordinarily employed for bona fide purposes. |
| • | any arrangement where the aggregate tax benefit to all the parties of the arrangement in the relevant financial year does not exceed INR 30 Million; |
| • | FIIs that choose not to take any benefit under any tax treaty entered with India and has invested in listed or unlisted securities with prior permission of the competent authority in accordance with the applicable regulations; |
| • | non-resident investor in an FII who has invested in an FII, directly or indirectly, by way of an offshore derivative instrument or otherwise; or |
| • | any income derived from the transfer of investments made prior to August 30, 2010. |
Table of Contents
Table of Contents
Table of Contents
Table of Contents
Table of Contents
Table of Contents
Table of Contents
Table of Contents
Table of Contents
Table of Contents
Table of Contents
Table of Contents
Table of Contents
Table of Contents
Table of Contents
Table of Contents
Table of Contents
Table of Contents
Table of Contents
| • | Each Fund generally supports the board’s nominees in the election of directors and generally supports proposals that strengthen the independence of boards of directors; |
| • | When a director has committed himself or herself to service on more than four public company boards (but no more than six public company boards in most circumstances), a Fund will consider such director’s individual circumstances in determining whether the director will be able to commit sufficient focus and time to a particular company; |
| • | Each Fund generally defers to an issuer’s choice of auditors so long as the corporate auditors represent the interests of shareholders and provide an independent view of the propriety of financial reporting decisions of management; |
| • | Each Fund generally favors disclosure of a company’s compensation and benefits policies and opposes excessive compensation, but believes that compensation matters are normally best determined by a company’s board of directors; |
| • | Each Fund generally expects to support capital structure requests that it believes enhance the rights of common shareholders and oppose requests that appear to be unreasonably dilutive; |
| • | Each Fund generally does not support proposals on social issues that lack a demonstrable economic benefit to the issuer and the Fund investing in such issuer; and |
| • | Each Fund generally votes against anti-takeover proposals and proposals that would create additional barriers or costs to corporate transactions that are likely to deliver a premium to shareholders. |
Table of Contents
Table of Contents
| • | MSCI Global Standard Indexes cover all investable large- and mid-cap securities by including approximately 85% of each market's free float-adjusted market capitalization. |
| • | MSCI Global Small Cap Indexes provide coverage to all companies with a market capitalization below that of the companies in the MSCI Global Standard Indexes by including above and beyond the coverage of the MSCI Global Standard Indexes. |
Table of Contents
| • | Achieving global size integrity by ensuring that companies of comparable and relevant sizes are included in a given size segment across all markets in a composite index; and |
| • | Achieving consistent market coverage by ensuring that each market's size segment is represented in its proportional weight in the composite universe. |
Table of Contents
| • | Semi-Annual Index Reviews (“SAIRs”), conducted on a fixed semi-annual timetable that systematically reassess the various dimensions of the equity universe for all markets; |
| • | Quarterly Index Reviews (“QIRs”), aimed at promptly reflecting other significant market events; and |
| • | Ongoing event-related changes, such as mergers, acquisitions, spin-offs, bankruptcies, reorganizations and other similar corporate events, which generally are implemented in the indexes as they occur. |
| • | The maximum weight of an index constituent will be the lower of 1.5% or 20 times its weight in the MSCI Global Standard Index; |
| • | The minimum weight of an index constituent will be 0.05%; |
| • | For countries in the MSCI Global Standard Index with weight greater than or equal to 2.5%, the MSCI Global Minimum Volatility Indexes weight will not deviate by more than ±5% of its weight in the MSCI Global Standard Index; |
| • | For countries in the MSCI Global Standard Index with weight less than 2.5%, the maximum MSCI Global Minimum Volatility Indexes weight will be three times its weight in the MSCI Global Standard Index; |
| • | Sector weights will not deviate by more than ±5% from its weight in the MSCI Global Standard Index; |
| • | Exposure to risk indices from Barra’s multi-factor risk model, including (i) Momentum; (ii) Value; (iii) Size; (iv) Size Nonlinearity; (v) Growth; (vi) Liquidity; and (vii) Financial Leverage will be limited to ±0.25 standard deviations relative to the MSCI Global Standard Index; exposure to the volatility risk index will be unlimited; and |
Table of Contents
| • | The maximum one-way turnover will be 10%. |
| • | Poultry and Livestock: companies are included only if they are significantly involved in the breeding of animals by themselves or through contract farming; |
| • | Dairy: manufacturers of milk and milk products such as cheese and yogurt, are excluded due to the absence of revenue break up; |
| • | Sugar: manufacturers of sugar are included even if they do not farm sugarcane. Companies selling sweeteners, sugar free, syrups, etc. are excluded; |
| • | Edible oil: companies processing edible oil without cultivating the plantation are excluded; |
| • | Confectioneries and snacks: manufacturers of finished products are excluded due to their presence at the lower spectrum of the value chain; |
| • | Coffee: coffee companies are excluded due to their reliance on external parties for raw materials; and |
| • | Fishing: fishing companies are generally included whether they operate fisheries or receive their catch from the ocean. |
Table of Contents
Table of Contents
Table of Contents
Table of Contents
Table of Contents
Table of Contents
Table of Contents
| 1. | Concentrate its investments in a particular industry, as that term is used in the Investment Company Act, except that the Fund will concentrate to approximately the same extent that its Underlying Index concentrates in the securities of a particular industry or group of industries. |
| 2. | Borrow money, except as permitted under the Investment Company Act. |
| 3. | Issue senior securities to the extent such issuance would violate the Investment Company Act. |
| 4. | Purchase or hold real estate, except the Fund may purchase and hold securities or other instruments that are secured by, or linked to, real estate or interests therein, securities of real estate investment trusts, mortgage-related securities and securities of issuers engaged in the real estate business, and the Fund may purchase and hold real estate as a result of the ownership of securities or other instruments. |
| 5. | Underwrite securities issued by others, except to the extent that the sale of portfolio securities by the Fund may be deemed to be an underwriting or as otherwise permitted by applicable law. |
| 6. | Purchase or sell commodities or commodity contracts, except as permitted by the Investment Company Act. |
| 7. | Make loans to the extent prohibited by the Investment Company Act. |
Table of Contents
| a. | Make short sales of securities or maintain a short position, except to the extent permitted by the Fund’s Prospectus and Statement of Additional Information, as amended from time to time, and applicable law. |
| 1. | Make loans, except as permitted under the 1940 Act, as amended, and as interpreted, modified or otherwise permitted by regulatory authority having jurisdiction, from time to time; |
Table of Contents
| 2. | Issue any senior security, except as permitted under the 1940 Act, as amended, and as interpreted, modified or otherwise permitted by regulatory authority having jurisdiction, from time to time; |
| 3. | Pledge, hypothecate, mortgage or otherwise encumber its assets, except to secure permitted borrowings. (The deposit of underlying securities and other assets in escrow and collateral arrangements with respect to initial or variation margin for currency transactions and futures contracts will not be deemed to be pledges of the Fund’s assets); |
| 4. | Purchase, hold or deal in real estate, or oil, gas or mineral interests or leases, but the Fund may purchase and sell securities that are issued by companies that invest or deal in such assets; |
| 5. | Act as an underwriter of securities of other issuers, except to the extent the Fund may be deemed an underwriter in connection with the sale of securities in its portfolio; |
| 6. | Purchase securities on margin, except for such short-term credits as are necessary for the clearance of transactions, except that the Fund may make margin deposits in connection with transactions in currencies, options, futures and options on futures; |
| 7. | Sell securities short; or |
| 8. | Invest in commodities or commodity contracts, except that the Fund may buy and sell currencies and forward contracts with respect thereto, and may transact in futures contracts on securities, stock indices and currencies and options on such futures contracts and make margin deposits in connection with such contracts. |
| 1. | Concentrate its investments (i.e., invest 25% or more of its total assets in the securities of a particular industry or group of industries), except that each Fund will concentrate to approximately the same extent that its Underlying Index concentrates in the securities of such particular industry or group of industries. For purposes of this limitation, securities of the U.S. government (including its agencies and instrumentalities), repurchase agreements collateralized by U.S. government securities, and securities of state or municipal governments and their political subdivisions are not considered to be issued by members of any industry. |
| 2. | Borrow money, except that (i) each Fund may borrow from banks for temporary or emergency (not leveraging) purposes, including the meeting of redemption requests which might otherwise require the untimely disposition of securities; and (ii) each Fund may, to the extent consistent with its investment policies, enter into repurchase agreements, reverse repurchase agreements, forward roll transactions and similar investment strategies and techniques. To the extent that it engages in transactions described in (i) and (ii), each Fund will be limited so that no more than 33 1/3% of the value of its total assets (including the amount borrowed) is derived from such transactions. Any borrowings which come to exceed this amount will be reduced in accordance with applicable law. |
| 3. | Issue any senior security, except as permitted under the 1940 Act, as interpreted, modified or otherwise permitted by regulatory authority having jurisdiction, from time to time. |
| 4. | Make loans, except as permitted under the 1940 Act, as interpreted, modified or otherwise permitted by regulatory authority having jurisdiction, from time to time. |
| 5. | Purchase or sell real estate unless acquired as a result of ownership of securities or other instruments (but this restriction shall not prevent each Fund from investing in securities of companies engaged in the real estate business or securities or other instruments backed by real estate or mortgages), or commodities or commodity contracts (but this restriction shall not prevent each Fund from investing in securities of companies engaged in the production, ownership or distribution of commodities or in commodity-related businesses for the iShares Frontier 100 ETF, iShares MSCI Global Agriculture Producers ETF, iShares MSCI Global Energy Producers ETF and iShares MSCI Global Metals & Mining Producers ETF or from trading in futures contracts and options on futures contracts, including options on currencies to the extent consistent with each Fund’s investment objective and policies). |
Table of Contents
| 6. | Engage in the business of underwriting securities issued by other persons, except to the extent that each Fund may technically be deemed to be an underwriter under the 1933 Act, in disposing of portfolio securities. |
| 1. | Lend any funds or other assets except through the purchase of all or a portion of an issue of securities or obligations of the type in which it is permitted to invest (including participation interests in such securities or obligations) and except that a Fund may lend its portfolio securities in an amount not to exceed 33 1/3% of the value of its total assets; |
| 2. | Issue senior securities or borrow money, except borrowings from banks for temporary or emergency purposes in an amount up to 33 1/3% of the value of the Fund’s total assets (including the amount borrowed), valued at the lesser of cost or market, less liabilities (not including the amount borrowed) valued at the time the borrowing is made, and the Fund will not purchase securities while borrowings in excess of 5% of the Fund’s total assets are outstanding, provided, that for purposes of this restriction, short-term credits necessary for the clearance of transactions are not considered borrowings; |
| 3. | Pledge, hypothecate, mortgage or otherwise encumber its assets, except to secure permitted borrowings. (The deposit of underlying securities and other assets in escrow and collateral arrangements with respect to initial or variation margin for currency transactions and futures contracts will not be deemed to be pledges of the Fund’s assets); |
| 4. | Purchase a security (other than obligations of the U.S. government, its agencies or instrumentalities) if as a result 25% or more of its total assets would be invested in a single issuer. (This restriction applies to the iShares MSCI South Korea Capped ETF only); |
| 5. | Purchase, hold or deal in real estate, or oil, gas or mineral interests or leases, but a Fund may purchase and sell securities that are issued by companies that invest or deal in such assets; |
| 6. | Act as an underwriter of securities of other issuers, except to the extent the Fund may be deemed an underwriter in connection with the sale of securities in its portfolio; |
| 7. | Purchase securities on margin, except for such short-term credits as are necessary for the clearance of transactions, except that a Fund may make margin deposits in connection with transactions in currencies, options, futures and options on futures; |
| 8. | Sell securities short; or |
| 9. | Invest in commodities or commodity contracts, except that a Fund may buy and sell currencies and forward contracts with respect thereto, and may transact in futures contracts on securities, stock indices and currencies and options on such futures contracts and make margin deposits in connection with such contracts. |
| 1. | Concentrate its investments (i.e., invest 25% or more of its total assets in the securities of a particular industry or group of industries), except that the Fund will concentrate to approximately the same extent that the Underlying Index concentrates in the securities of such particular industry or group of industries. For purposes of this limitation, securities of the U.S. government (including its agencies and instrumentalities), repurchase agreements collateralized by U.S. government securities, and securities of state or municipal governments and their political subdivisions are not considered to be issued by members of any industry. |
| 2. | Borrow money, except that (i) the Fund may borrow from banks for temporary or emergency (not leveraging) purposes, including the meeting of redemption requests which might otherwise require the untimely disposition of securities; and (ii) the Fund may, to the extent consistent with its investment policies, enter into repurchase agreements, reverse repurchase agreements, forward roll transactions and similar investment strategies and techniques. To the extent that it engages in transactions described in (i) and (ii), the Fund will be limited so that no more than 33 1/3% of the value of its total assets (including the amount borrowed) is derived from such transactions. Any borrowings which come to exceed this amount will be reduced in accordance with applicable law. |
| 3. | Issue “senior securities” as defined in the 1940 Act and the rules, regulations and orders thereunder, except as permitted under the 1940 Act and the rules, regulation and orders thereunder. |
Table of Contents
| 4. | Make loans, except as permitted under the 1940 Act, and as interpreted, modified or otherwise permitted by regulatory authority having jurisdiction, from time to time. |
| 5. | Purchase or sell real estate unless acquired as a result of ownership of securities or other instruments (but this restriction shall not prevent the Fund from investing in securities of companies engaged in the real estate business or securities or other instruments backed by real estate or mortgages), or commodities or commodity contracts (but this restriction shall not prevent the Fund from trading in futures contracts and options on futures contracts, including options on currencies to the extent consistent with the Fund’s investment objective and policies). |
| 6. | Engage in the business of underwriting securities issued by other persons, except to the extent that the Fund may technically be deemed to be an underwriter under the 1933 Act, in disposing of portfolio securities. |
| Fund | Industry or Industries | |
| iShares MSCI Emerging Markets Consumer Discretionary ETF | Auto Manufacturers | |
| iShares MSCI Emerging Markets Energy Capped ETF | Oil & Gas | |
| iShares MSCI Frontier 100 ETF | Banks | |
| iShares MSCI Global Agriculture Producers ETF | Chemicals | |
| iShares MSCI Global Energy Producers ETF | Oil & Gas | |
| iShares MSCI Global Metals & Mining Producers ETF | Mining | |
| iShares MSCI Global Metals & Mining Producers ETF | Iron & Steel | |
| iShares MSCI Malaysia ETF | Banks | |
| iShares MSCI South Korea ETF | Semiconductors | |
| iShares MSCI Taiwan ETF | Semiconductors |
Table of Contents
| • | The frequency of trades and quotes for the security; |
| • | The number of dealers wishing to purchase or sell the security and the number of other potential purchasers; |
| • | Dealer undertakings to make a market in the security; and |
| • | The nature of the security and the nature of the marketplace in which it trades (e.g., the time needed to dispose of the security, the method of soliciting offers and the mechanics of transfer). |
Table of Contents
| Name (Age) | Position | Principal
Occupation(s) During the Past 5 Years |
Other
Directorships Held by Director | |||
| Robert
S. Kapito1 (57) |
Director
(since 2009). |
President and Director, BlackRock, Inc. (since 2006); Vice Chairman of BlackRock, Inc. and Head of BlackRock, Inc.’s Portfolio Management Group (since its formation in 1998) and BlackRock, Inc.’s predecessor entities (since 1988); Trustee, University of Pennsylvania (since 2009); President of Board of Directors, Hope & Heroes Children’s Cancer Fund (since 2002); President of the Board of Directors, Periwinkle Theatre for Youth (since 1983). | Trustee of iShares Trust (since 2009); Director of iShares MSCI Russia Capped ETF, Inc. (since 2010); Trustee of iShares U.S. ETF Trust (since 2011); Director of BlackRock, Inc. (since 2006). | |||
| Mark
Wiedman2 (44) |
Director (since 2013). | Managing Director, BlackRock, Inc. (since 2007); Global Head of iShares (since 2011); Head of Corporate Strategy, BlackRock, Inc. (2009-2011). | Trustee of iShares Trust (since 2013); Director of iShares MSCI Russia Capped ETF, Inc. (since 2013); Trustee of iShares U.S. ETF Trust (since 2013); Director of PennyMac Financial Services, Inc. (since 2008). |
| 1 | Robert S. Kapito is deemed to be an “interested person” (as defined in the 1940 Act) of the Company due to his affiliations with BlackRock, Inc. |
| 2 | Mark Wiedman is deemed to be an “interested person” (as defined in the 1940 Act) of the Company due to his affiliations with BlackRock, Inc. and its affiliates. |
Table of Contents
| Name (Age) | Position | Principal
Occupation(s) During the Past 5 Years |
Other
Directorships Held by Director | |||
| Robert
H. Silver (59) |
Director
(since 2007); Independent Chairman (since 2012). |
President and Co-Founder of The Bravitas Group, Inc. (since 2006); Director and Vice Chairman of the YMCA of Greater NYC (2001-2011); Broadway Producer (2006-2011); Co-Founder and Vice President of Parentgiving Inc. (since 2008); Director and Member of the Audit and Compensation Committee of EPAM Systems, Inc. (2006-2009); President and Chief Operating Officer of UBS Financial Services Inc. (formerly Paine Webber Inc.) (2003-2005) and various executive positions with UBS and its affiliates (1988-2005); CPA and Audit Manager of KPMG, LLP (formerly Peat Marwick Mitchell) (1977-1983). | Trustee of iShares Trust (since 2007); Director of iShares MSCI Russia Capped ETF, Inc. (since 2010); Trustee of iShares U.S. ETF Trust (since 2011); Independent Chairman of iShares Trust, iShares MSCI Russia Capped ETF, Inc. and iShares U.S. ETF Trust (since 2012). | |||
| John
E. Martinez (53) |
Director
(since 2003); Securities Lending Committee Chair (since 2012). |
Director of FirstREX Agreement Corp. (formerly EquityRock, Inc.) (since 2005). | Trustee of iShares Trust (since 2003); Director of iShares MSCI Russia Capped ETF, Inc. (since 2010); Trustee of iShares U.S. ETF Trust (since 2011). | |||
| Cecilia
H. Herbert (65) |
Director
(since 2005); Nominating and Governance Committee Chair and Equity Plus Committee Chair (since 2012). |
Director (1998-2013) and President (2007-2011) of the Board of Directors, Catholic Charities CYO; Trustee (2002-2011) and Chair of the Finance and Investment Committee (2006-2010) of the Thacher School; Member (since 1992) and Chair (1994-2005) of the Investment Committee, Archdiocese of San Francisco; Trustee and Member of the Investment Committee, WNET, the New York public broadcasting/media company (since 2011). | Trustee of iShares Trust (since 2005); Director of iShares MSCI Russia Capped ETF, Inc. (since 2010); Trustee of iShares U.S. ETF Trust (since 2011); Director of Forward Funds (34 portfolios) (since 2009). | |||
| Charles
A. Hurty (71) |
Director
(since 2005); Audit Committee Chair (since 2006). |
Retired; Partner, KPMG LLP (1968-2001). | Trustee of iShares Trust (since 2005); Director of iShares MSCI Russia Capped ETF, Inc. (since 2010); Trustee of iShares U.S. ETF Trust (since 2011); Director of GMAM Absolute Return Strategy Fund (1 portfolio) (since 2002); Director of SkyBridge Alternative Investments Multi-Adviser Hedge Fund Portfolios LLC (2 portfolios) (since 2002). |
Table of Contents
| Name (Age) | Position | Principal
Occupation(s) During the Past 5 Years |
Other
Directorships Held by Director | |||
| John
E. Kerrigan (59) |
Director
(since 2005); Fixed Income Plus Committee Chair (since 2012). |
Chief Investment Officer, Santa Clara University (since 2002). | Trustee of iShares Trust (since 2005); Director of iShares MSCI Russia Capped ETF, Inc. (since 2010); Trustee of iShares U.S. ETF Trust (since 2011). | |||
| Madhav
V. Rajan (50) |
Director
(since 2011); 15(c) Committee Chair (since 2012). |
Robert K. Jaedicke Professor of Accounting and Senior Associate Dean for Academic Affairs and Head of MBA Program, Stanford University Graduate School of Business (since 2001); Professor of Law (by courtesy), Stanford Law School (since 2005); Visiting Professor, University of Chicago (2007-2008). | Trustee
of iShares Trust (since 2011); Director of iShares MSCI Russia Capped ETF, Inc. (since 2011); Trustee of iShares U.S. ETF Trust (since 2011); Director, Cavium, Inc. (since 2013). | |||
| Jane
D. Carlin (59) |
Director
(since 2015). |
Managing Director and Global Head of Financial Holding Company Governance & Assurance and the Global Head of Operational Risk Management of Morgan Stanley Group (2006-2012). | Trustee of iShares Trust (since 2015); Trustee of iShares U.S. ETF Trust (since 2015); Director of PHH Corporation (mortgage solutions) (since 2012). |
| Name (Age) | Position | Principal
Occupation(s) During the Past 5 Years | ||
| Manish
Mehta (43) |
President (since 2013). | Managing Director, BlackRock, Inc. (since 2009); Chief Operating Officer for iShares (since 2009); Head of Strategy and Corporate Development, BGI (2005-2009); Chief of Staff to the CEO, BGI (2005-2009). | ||
| Jack
Gee (55) |
Treasurer
and Chief Financial Officer (since 2008). |
Managing Director, BlackRock, Inc. (since 2009); Senior Director of Fund Administration of Intermediary Investor Business, BGI (2009); Director of Fund Administration of Intermediary Investor Business, BGI (2004-2009). | ||
| Eilleen
M. Clavere (62) |
Secretary
(since 2007). |
Director of Global Fund Administration, BlackRock, Inc. (since 2009); Director of Legal Administration of Intermediary Investor Business, BGI (2006-2009); Legal Counsel and Vice President of Atlas Funds, Atlas Advisers, Inc. and Atlas Securities, Inc. (2005-2006); Counsel at Kirkpatrick & Lockhart LLP (2001-2005). |
Table of Contents
| Name (Age) | Position | Principal
Occupation(s) During the Past 5 Years | ||
| Edward
B. Baer (46) |
Vice
President and Chief Legal Officer (since 2012). |
Managing Director of Legal & Compliance, BlackRock, Inc. (since 2006); Director of Legal & Compliance, BlackRock, Inc. (2004-2006). | ||
| Scott
Radell (46) |
Executive
Vice President (since 2012). |
Managing Director, BlackRock, Inc. (since 2009); Head of Portfolio Solutions, BlackRock, Inc. (since 2009); Head of Portfolio Solutions, BGI (2007-2009); Credit Portfolio Manager, BGI (2005-2007); Credit Research Analyst, BGI (2003-2005). | ||
| Amy
Schioldager (52) |
Executive
Vice President (since 2007). |
Senior Managing Director, BlackRock, Inc. (since 2009); Global Head of Index Equity, BGI (2008-2009); Global Head of U.S. Indexing, BGI (2006-2008); Head of Domestic Equity Portfolio Management, BGI (2001-2006). | ||
| Ira
P. Shapiro (51) |
Vice
President (since 2007). |
Managing Director, BlackRock, Inc. (since 2009); Head of Strategic Product Initiatives for iShares (since 2012); Chief Legal Officer, Exchange-Traded Fund Complex (2007-2012); Associate General Counsel, BGI (2004-2009). |
Table of Contents
Table of Contents
Table of Contents
Table of Contents
Table of Contents
| Name of Director | Fund | Dollar
Range of Equity Securities in the Fund |
Aggregate
Dollar Range of Equity Securities in all Registered Investment Companies Overseen by Director in Family of Investment Companies | |||
| Robert S. Kapito | None | None | None | |||
| Mark Wiedman1 | iShares Core MSCI EAFE ETF | Over $100,000 | Over $100,000 | |||
| iShares Core MSCI Emerging Markets ETF | $50,001-$100,000 | |||||
| iShares Core S&P Total U.S. Stock Market ETF | $50,001-$100,000 | |||||
| Robert H. Silver | iShares iBonds Sep 2015 AMT-Free Muni Bond ETF | Over $100,000 | Over $100,000 | |||
| iShares iBonds Sep 2016 AMT-Free Muni Bond ETF | Over $100,000 | |||||
| iShares iBonds Sep 2017 AMT-Free Muni Bond ETF | Over $100,000 | |||||
| iShares iBonds Sep 2018 AMT-Free Muni Bond ETF | Over $100,000 | |||||
| iShares Core High Dividend ETF | Over $100,000 | |||||
| iShares Core MSCI EAFE ETF | Over $100,000 | |||||
| iShares Core MSCI Emerging Markets ETF | Over $100,000 | |||||
| iShares Core MSCI Total International Stock ETF | Over $100,000 | |||||
| iShares Core S&P 500 ETF | Over $100,000 | |||||
| iShares Core S&P Mid-Cap ETF | Over $100,000 | |||||
| iShares Core S&P Small-Cap ETF | Over $100,000 | |||||
| iShares Core S&P Total U.S. Stock Market ETF | Over $100,000 | |||||
| iShares iBoxx $ Investment Grade Corporate Bond ETF | Over $100,000 | |||||
| iShares J.P. Morgan USD Emerging Markets Bond ETF | $1-$10,000 | |||||
| iShares MSCI ACWI ex U.S. ETF | $1-$10,000 | |||||
| iShares MSCI BRIC ETF | $10,001-$50,000 | |||||
| iShares MSCI Emerging Markets ETF | $1-$10,000 | |||||
| iShares MSCI Frontier 100 ETF | $50,001-$100,000 | |||||
| iShares National AMT-Free Muni Bond ETF | Over $100,000 | |||||
| iShares Russell 1000 Growth ETF | Over $100,000 |
Table of Contents
| Name of Director | Fund | Dollar
Range of Equity Securities in the Fund |
Aggregate
Dollar Range of Equity Securities in all Registered Investment Companies Overseen by Director in Family of Investment Companies | |||
| iShares Russell 1000 Value ETF | Over $100,000 | |||||
| iShares Russell 2000 ETF | $10,001-$50,000 | |||||
| iShares Russell 2000 Growth ETF | Over $100,000 | |||||
| iShares Russell 2000 Value ETF | Over $100,000 | |||||
| iShares Russell 3000 ETF | Over $100,000 | |||||
| iShares Russell Mid-Cap Growth ETF | $1-$10,000 | |||||
| iShares Russell Mid-Cap Value ETF | $1-$10,000 | |||||
| iShares Select Dividend ETF | $10,001-$50,000 | |||||
| iShares U.S. Broker-Dealers ETF | Over $100,000 | |||||
| iShares U.S. Financial Services ETF | $50,001-$100,000 | |||||
| iShares U.S. Preferred Stock ETF | Over $100,000 | |||||
| iShares U.S. Regional Banks ETF | Over $100,000 | |||||
| iShares U.S. Technology ETF | $50,001-$100,000 | |||||
| George G.C. Parker | iShares California AMT-Free Muni Bond ETF | Over $100,000 | Over $100,000 | |||
| iShares Core S&P 500 ETF | Over $100,000 | |||||
| iShares Core U.S. Aggregate Bond ETF | $10,001-$50,000 | |||||
| iShares iBoxx $ Investment Grade Corporate Bond ETF | Over $100,000 | |||||
| iShares MSCI EAFE ETF | Over $100,000 | |||||
| iShares S&P 100 ETF | Over $100,000 | |||||
| iShares Select Dividend ETF | Over $100,000 | |||||
| John E. Martinez | iShares Core MSCI Emerging Markets ETF | $50,001-$100,000 | Over $100,000 | |||
| iShares Core S&P 500 ETF | Over $100,000 | |||||
| iShares Emerging Markets Infrastructure ETF | Over $100,000 | |||||
| iShares Global Consumer Staples ETF | Over $100,000 | |||||
| iShares MSCI All Country Asia ex Japan ETF | Over $100,000 | |||||
| iShares MSCI EAFE ETF | Over $100,000 | |||||
| iShares Russell 1000 ETF | Over $100,000 | |||||
| iShares Russell 1000 Value ETF | Over $100,000 | |||||
| iShares Russell 2000 ETF | Over $100,000 | |||||
| iShares TIPS Bond ETF | Over $100,000 | |||||
| Cecilia H. Herbert | iShares China Large-Cap ETF | Over $100,000 | Over $100,000 | |||
| iShares Core MSCI Emerging Markets ETF | $10,001-$50,000 | |||||
| iShares Core MSCI Total International Stock ETF | $10,001-$50,000 |
Table of Contents
| Name of Director | Fund | Dollar
Range of Equity Securities in the Fund |
Aggregate
Dollar Range of Equity Securities in all Registered Investment Companies Overseen by Director in Family of Investment Companies | |||
| iShares Core S&P Total U.S. Stock Market ETF | $10,001-$50,000 | |||||
| iShares iBoxx $ High Yield Corporate Bond ETF | $10,001-$50,000 | |||||
| iShares International Select Dividend ETF | $1-$10,000 | |||||
| iShares MSCI EAFE ETF | $10,001-$50,000 | |||||
| iShares MSCI Emerging Markets ETF | $1-$10,000 | |||||
| iShares MSCI Japan ETF | $10,001-$50,000 | |||||
| iShares National AMT-Free Muni Bond ETF | $10,001-$50,000 | |||||
| iShares U.S. Preferred Stock ETF | $10,001-$50,000 | |||||
| Charles A. Hurty | iShares China Large-Cap ETF | $10,001-$50,000 | Over $100,000 | |||
| iShares Core High Dividend ETF | $10,001-$50,000 | |||||
| iShares Core MSCI Emerging Markets ETF | $50,001-$100,000 | |||||
| iShares Core S&P 500 ETF | $10,001-$50,000 | |||||
| iShares Global Energy ETF | $10,001-$50,000 | |||||
| iShares Global Tech ETF | $10,001-$50,000 | |||||
| iShares MSCI EAFE ETF | $10,001-$50,000 | |||||
| iShares MSCI Japan ETF | $10,001-$50,000 | |||||
| iShares North American Tech-Multimedia Networking ETF | $1-$10,000 | |||||
| iShares U.S. Energy ETF | $10,001-$50,000 | |||||
| iShares U.S. Financials ETF | $1-$10,000 | |||||
| iShares U.S. Technology ETF | $50,001-$100,000 | |||||
| John E. Kerrigan | iShares MSCI ACWI ex U.S. ETF | Over $100,000 | Over $100,000 | |||
| iShares Short-Term National AMT-Free Muni Bond ETF | Over $100,000 | |||||
| Madhav V. Rajan | iShares Core High Dividend ETF | Over $100,000 | Over $100,000 | |||
| iShares Core MSCI Emerging Markets ETF | Over $100,000 | |||||
| iShares Core S&P 500 ETF | Over $100,000 | |||||
| iShares iBoxx $ High Yield Corporate Bond ETF | $50,001-$100,000 | |||||
| iShares iBoxx $ Investment Grade Corporate Bond ETF | Over $100,000 | |||||
| iShares Select Dividend ETF | Over $100,000 | |||||
| Jane D. Carlin2 | iShares Core MSCI EAFE ETF | $10,001-$50,000 | Over $100,000 | |||
| iShares Core S&P Small-Cap ETF | $10,001-$50,000 |
Table of Contents
| Name of Director | Fund | Dollar
Range of Equity Securities in the Fund |
Aggregate
Dollar Range of Equity Securities in all Registered Investment Companies Overseen by Director in Family of Investment Companies | |||
| iShares Global Tech ETF | $50,001-$100,000 |
| 1 | Appointed to serve as an Interested Director effective December 31, 2013. |
| 2 | Appointed to serve as an Independent Director effective February 3, 2015. The funds held and dollar range of equity securities beneficially owned by Jane D. Carlin are as of December 31, 2014. |
| Directors | iShares
Core MSCI Emerging Markets ETF |
iShares
MSCI All Country World Minimum Volatility ETF |
iShares
MSCI Brazil Capped ETF |
iShares
MSCI BRIC ETF | ||||
| Independent Directors:1 | ||||||||
| Robert H. Silver | $ 2,549 | $ 573 | $2,469 | $ 187 | ||||
| George G.C. Parker | 2,157 | 485 | 2,089 | 158 | ||||
| John E. Martinez | 2,274 | 511 | 2,203 | 167 | ||||
| Cecilia H. Herbert | 2,392 | 538 | 2,317 | 175 | ||||
| Charles A. Hurty | 2,470 | 556 | 2,393 | 181 | ||||
| John E. Kerrigan | 3,797 | 511 | 2,203 | 1,689 | ||||
| Madhav V. Rajan | 2,966 | 511 | 2,203 | 859 | ||||
| Interested Directors: | ||||||||
| Robert S. Kapito | $ 0 | $ 0 | $ 0 | $ 0 | ||||
| Mark Wiedman2 | 0 | 0 | 0 | 0 | ||||
| Michael Latham3 | 0 | 0 | 0 | 0 |
Table of Contents
| Directors | iShares
MSCI Chile Capped ETF |
iShares
MSCI Colombia Capped ETF |
iShares
MSCI Emerging Markets Asia ETF |
iShares
MSCI Emerging Markets Consumer Discretionary ETF | ||||
| Independent Directors:1 | ||||||||
| Robert H. Silver | $ 144 | $ 12 | $ 37 | $ 3 | ||||
| George G.C. Parker | 122 | 10 | 31 | 2 | ||||
| John E. Martinez | 129 | 10 | 33 | 2 | ||||
| Cecilia H. Herbert | 135 | 11 | 34 | 3 | ||||
| Charles A. Hurty | 140 | 11 | 36 | 3 | ||||
| John E. Kerrigan | 129 | 10 | 1,555 | 1,525 | ||||
| Madhav V. Rajan | 129 | 10 | 725 | 695 | ||||
| Interested Directors:1 | ||||||||
| Robert S. Kapito | $ 0 | $ 0 | $ 0 | $ 0 | ||||
| Mark Wiedman2 | 0 | 0 | 0 | 0 | ||||
| Michael Latham3 | 0 | 0 | 0 | 0 |
| Directors | iShares
MSCI Emerging Markets EMEA ETF |
iShares
MSCI Emerging Markets Energy Capped ETF |
iShares
MSCI Emerging Markets ETF |
iShares
MSCI Emerging Markets Growth ETF | ||||
| Independent Directors:1 | ||||||||
| Robert H. Silver | $5 | $ 1 | $ 19,988 | $ 3 | ||||
| George G.C. Parker | 4 | 1 | 16,913 | 2 | ||||
| John E. Martinez | 4 | 1 | 17,836 | 2 | ||||
| Cecilia H. Herbert | 4 | 1 | 18,758 | 3 | ||||
| Charles A. Hurty | 5 | 1 | 19,373 | 3 | ||||
| John E. Kerrigan | 4 | 1,523 | 19,358 | 1,525 | ||||
| Madhav V. Rajan | 4 | 693 | 18,528 | 694 | ||||
| Interested Directors:1 | ||||||||
| Robert S. Kapito | $0 | $ 0 | $ 0 | $ 0 | ||||
| Mark Wiedman2 | 0 | 0 | 0 | 0 | ||||
| Michael Latham3 | 0 | 0 | 0 | 0 |
| Directors | iShares
MSCI Emerging Markets Minimum Volatility ETF |
iShares
MSCI Emerging Markets Small-Cap ETF |
iShares
MSCI Emerging Markets Value ETF |
iShares
MSCI Frontier 100 ETF1 | ||||
| Independent Directors:1 | ||||||||
| Robert H. Silver | $ 927 | $ 20 | $ 11 | $363 | ||||
| George G.C. Parker | 784 | 17 | 10 | 307 | ||||
| John E. Martinez | 827 | 18 | 10 | 324 | ||||
| Cecilia H. Herbert | 870 | 19 | 11 | 341 | ||||
| Charles A. Hurty | 898 | 19 | 11 | 352 | ||||
| John E. Kerrigan | 2,350 | 1,540 | 1,533 | 324 | ||||
| Madhav V. Rajan | 1,519 | 710 | 702 | 324 | ||||
| Interested Directors:1 | ||||||||
Table of Contents
| Directors | iShares
MSCI Emerging Markets Minimum Volatility ETF |
iShares
MSCI Emerging Markets Small-Cap ETF |
iShares
MSCI Emerging Markets Value ETF |
iShares
MSCI Frontier 100 ETF1 | ||||
| Robert S. Kapito | $0 | $0 | $0 | $0 | ||||
| Mark Wiedman2 | 0 | 0 | 0 | 0 | ||||
| Michael Latham3 | 0 | 0 | 0 | 0 |
| Directors | iShares
MSCI Global Agriculture Producers ETF |
iShares
MSCI Global Energy Producers ETF |
iShares
MSCI Global Metals & Mining Producers ETF |
iShares
MSCI Malaysia ETF | ||||
| Independent Directors:1 | ||||||||
| Robert H. Silver | $ 21 | $4 | $83 | $ 357 | ||||
| George G.C. Parker | 18 | 3 | 71 | 302 | ||||
| John E. Martinez | 19 | 3 | 74 | 319 | ||||
| Cecilia H. Herbert | 20 | 4 | 78 | 335 | ||||
| Charles A. Hurty | 20 | 4 | 81 | 346 | ||||
| John E. Kerrigan | 19 | 3 | 74 | 319 | ||||
| Madhav V. Rajan | 19 | 3 | 74 | 319 | ||||
| Interested Directors:1 | ||||||||
| Robert S. Kapito | $ 0 | $0 | $ 0 | $ 0 | ||||
| Mark Wiedman2 | 0 | 0 | 0 | 0 | ||||
| Michael Latham3 | 0 | 0 | 0 | 0 |
| Directors | iShares
MSCI South Korea Capped ETF |
iShares
MSCI Taiwan ETF | ||
| Independent Directors:1 | ||||
| Robert H. Silver | $ 2,220 | $ 1,492 | ||
| George G.C. Parker | 1,879 | 1,263 | ||
| John E. Martinez | 1,981 | 1,332 | ||
| Cecilia H. Herbert | 2,083 | 1,401 | ||
| Charles A. Hurty | 2,152 | 1,447 | ||
| John E. Kerrigan | 1,981 | 1,332 | ||
| Madhav V. Rajan | 1,981 | 1,332 | ||
| Interested Directors: | ||||
| Robert S. Kapito | $ 0 | $ 0 | ||
| Mark Wiedman2 | 0 | 0 | ||
| Michael Latham3 | 0 | 0 |
| Directors | Pension
or Retirement Benefits Accrued As Part of Company Expenses4 |
Estimated
Annual Benefits Upon Retirement4 |
Total
Compensation From the Funds and Fund Complex5 | |||
| Independent Directors:1 | ||||||
| Robert H. Silver | Not Applicable | Not Applicable | $325,000 |
Table of Contents
| Directors | Pension
or Retirement Benefits Accrued As Part of Company Expenses4 |
Estimated
Annual Benefits Upon Retirement4 |
Total
Compensation From the Funds and Fund Complex5 | |||
| George G.C. Parker | Not Applicable | Not Applicable | 275,000 | |||
| John E. Martinez | Not Applicable | Not Applicable | 290,000 | |||
| Cecilia H. Herbert | Not Applicable | Not Applicable | 305,000 | |||
| Charles A. Hurty | Not Applicable | Not Applicable | 315,000 | |||
| John E. Kerrigan | Not Applicable | Not Applicable | 315,882 | |||
| Madhav V. Rajan | Not Applicable | Not Applicable | 301,765 | |||
| Interested Directors: | ||||||
| Robert S. Kapito | Not Applicable | Not Applicable | $ 0 | |||
| Mark Wiedman2 | Not Applicable | Not Applicable | 0 | |||
| Michael Latham3 | Not Applicable | Not Applicable | 0 | |||
| 1 | Compensation is not shown for Jane D. Carlin because she was appointed to serve as an Independent Director of the Company effective February 3, 2015. |
| 2 | Appointed to serve as an Interested Director effective December 31, 2013. |
| 3 | Served as an Interested Director through December 31, 2013. |
| 4 | No Director or officer is entitled to any pension or retirement benefits from the Company. |
| 5 | Includes compensation for service on the Boards of Trustees of iShares Trust and iShares U.S. ETF Trust and the Board of Directors of iShares MSCI Russia Capped ETF, Inc. |
| Fund | Name | Percentage
of Ownership | ||
| iShares Core MSCI Emerging Markets ETF | State
Street Bank and Trust Company 1776 Heritage Drive North Quincy, MA 02171 |
16.80% | ||
| Merrill
Lynch, Pierce Fenner & Smith Safekeeping 101 Hudson Street 8th Floor Jersey City, NJ 07302 |
13.50% | |||
| National
Financial Services LLC 200 Liberty Street 5th Floor New York, NY 10281 |
11.51% |
Table of Contents
| Fund | Name | Percentage
of Ownership | ||
| UBS
Financial Services Inc. 1000 Harbor Blvd. 4th Floor Weehawken, NJ 07087 |
7.76% | |||
| TD
Ameritrade Clearing, Inc. 1005 N. Ameritrade Place Bellevue, NE 68005 |
6.49% | |||
| Charles
Schwab & Co., Inc. 111 Pavonia Avenue Jersey City, NJ 07310 |
5.07% | |||
| iShares MSCI All Country World Minimum Volatility ETF | Northern
Trust Company/ United Nations Joint Staff Pension Fund 50 South LaSalle Street Chicago, IL 60675 |
41.63% | ||
| Citibank,
N.A. 3800 CitiBank Center Tampa Building A/Floor 2 Tampa, FL 33610 |
5.80% | |||
| Brown
Brothers Harriman & Co. 525 Washington Blvd. 11th Floor Jersey City, NJ 07310 |
5.62% | |||
| iShares MSCI Brazil Capped ETF | Brown
Brothers Harriman & Co. 525 Washington Blvd. 11th Floor Jersey City, NJ 07310 |
9.61% | ||
| Deutsche
Bank Securities Inc./Cedear 1251 Avenue of the Americas New York, NY 10020 |
8.45% | |||
| Credit
Suisse Securities (USA) LLC One Madison Ave 3rd Floor New York, NY 10010 |
7.33% | |||
| The
Bank of New York Mellon 401 Salina Street 2nd Floor Syracuse, NY 13202 |
7.21% | |||
| State
Street Bank and Trust Company 1776 Heritage Drive North Quincy, MA 02171 |
6.16% | |||
| Goldman
Sachs International 30 Hudson Street Jersey City, NJ 07302 |
5.96% | |||
| Merrill
Lynch, Pierce, Fenner & Smith Incorporated 101 Hudson Street 9th Floor Jersey City, NJ 07302-3997 |
5.27% |
Table of Contents
| Fund | Name | Percentage
of Ownership | ||
| Citibank,
N.A. 3800 CitiBank Center Tampa Building A/Floor 2 Tampa, FL 33610 |
5.02% | |||
| iShares MSCI BRIC ETF | National
Financial Services LLC 200 Liberty Street 5th Floor New York, NY 10281 |
10.03% | ||
| Computershare
Trust Company, N.A. 250 Royall Street Canton, MA 02021 |
9.40% | |||
| Brown
Brothers Harriman & Co. 525 Washington Blvd. 11th Floor Jersey City, NJ 07310 |
8.95% | |||
| TD
Ameritrade Clearing, Inc. 1005 N. Ameritrade Place Bellevue, NE 68005 |
7.27% | |||
| Morgan
Stanley & Co. Harborside Financial Center Plaza 3, 1st Floor Jersey City, NJ 07311 |
6.30% | |||
| Charles
Schwab & Co., Inc. 111 Pavonia Avenue Jersey City, NJ 07310 |
5.88% | |||
| iShares MSCI Chile Capped ETF | Brown
Brothers Harriman & Co. 525 Washington Blvd. 11th Floor Jersey City, NJ 07310 |
24.88% | ||
| JPMorgan
Chase Bank, National Association 14201 Dallas Pkwy 12th Floor Dallas, TX 75240 |
7.72% | |||
| Pershing
LLC One Pershing Plaza Jersey City, NJ 07399 |
7.38% | |||
| Charles
Schwab & Co., Inc. 111 Pavonia Avenue Jersey City, NJ 07310 |
5.17% | |||
| The
Bank of New York Mellon 401 Salina Street 2nd Floor Syracuse, NY 13202 |
5.05% | |||
| iShares MSCI Colombia Capped ETF | JPMorgan
Chase Bank, National Association 14201 Dallas Pkwy 12th Floor Dallas, TX 75240 |
79.32% |
Table of Contents
| Fund | Name | Percentage
of Ownership | ||
| J.P.
Morgan Clearing Corp One Metrotech Center North Brooklyn, NY 11201 |
5.75% | |||
| iShares MSCI Emerging Markets Asia ETF | Charles
Schwab & Co., Inc. 111 Pavonia Avenue Jersey City, NJ 07310 |
44.39% | ||
| RBC
Capital Markets Corporation One Liberty Plaza New York, NY 10006-1446 |
10.26% | |||
| National
Financial Services LLC 200 Liberty Street 5th Floor New York, NY 10281 |
7.41% | |||
| iShares MSCI Emerging Markets Consumer Discretionary ETF | Charles
Schwab & Co., Inc. 111 Pavonia Avenue Jersey City, NJ 07310 |
20.60% | ||
| Knight
Clearing Services LLC 545 Washington BLVD Jersey City, NJ 07310 |
14.84% | |||
| National
Financial Services LLC 200 Liberty Street 5th Floor New York, NY 10281 |
13.34% | |||
| Fifth
Third Bank (The) 5001 Kingsley Drive Cincinnati, OH 45263 |
7.04% | |||
| RBC
Capital Markets Corporation One Liberty Plaza New York, NY 10006-1446 |
6.83% | |||
| TD
Ameritrade Clearing, Inc. 1005 N. Ameritrade Place Bellevue, NE 68005 |
5.61% | |||
| iShares MSCI Emerging Markets EMEA ETF | National
Financial Services LLC 200 Liberty Street 5th Floor New York, NY 10281 |
44.53% | ||
| Charles
Schwab & Co., Inc. 111 Pavonia Avenue Jersey City, NJ 07310 |
15.54% | |||
| Goldman
Sachs Execution & Clearing, L.P. 30 Hudson Street 27th Floor Jersey City, NJ 07302 |
13.95% | |||
| JPMorgan
Chase Bank, National Association 14201 Dallas Pkwy 12th Floor Dallas, TX 75240 |
5.82% | |||
Table of Contents
| Fund | Name | Percentage
of Ownership | ||
| iShares MSCI Emerging Markets Energy Capped ETF | Morgan
Stanley & Co. Harborside Financial Center Plaza 3, 1st Floor Jersey City, NJ 07311 |
41.55% | ||
| Merrill
Lynch, Pierce, Fenner & Smith Incorporated 101 Hudson Street 9th Floor Jersey City, NJ 07302-3997 |
21.89% | |||
| RBC
Capital Markets Corporation One Liberty Plaza New York, NY 10006-1446 |
10.10% | |||
| National
Financial Services LLC 200 Liberty Street 5th Floor New York, NY 10281 |
5.65% | |||
| iShares MSCI Emerging Markets ETF | State
Street Bank and Trust Company 1776 Heritage Drive North Quincy, MA 02171 |
14.32% | ||
| Mellon
Trust of New England, National Association Three Mellon Bank Center Floor 1533700 Pittsburgh, PA 15259 |
12.74% | |||
| Brown
Brothers Harriman & Co. 525 Washington Blvd. 11th Floor Jersey City, NJ 07310 |
9.00% | |||
| JPMorgan
Chase Bank, National Association 14201 Dallas Pkwy 12th Floor Dallas, TX 75240 |
5.42% | |||
| iShares MSCI Emerging Markets Growth ETF | J.P.
Morgan Clearing Corp One Metrotech Center North Brooklyn, NY 11201 |
25.49% | ||
| Raymond,
James & Associates, Inc. 880 Carillon Parkway P.O. Box 12749 St. Petersburg, FL 33733 |
8.40% | |||
| Brown
Brothers Harriman & Co. 525 Washington Blvd. 11th Floor Jersey City, NJ 07310 |
7.84% | |||
| National
Financial Services LLC 200 Liberty Street 5th Floor New York, NY 10281 |
6.93% |
Table of Contents
| Fund | Name | Percentage
of Ownership | ||
| Goldman
Sachs Execution & Clearing, L.P. 30 Hudson Street 27th Floor Jersey City, NJ 07302 |
6.47% | |||
| Charles
Schwab & Co., Inc. 111 Pavonia Avenue Jersey City, NJ 07310 |
6.33% | |||
| The
Huntington National Bank 7 Easton Oval-EA4 Columbus, OH 43219 |
5.00% | |||
| iShares MSCI Emerging Markets Minimum Volatility ETF | Bank
of America, National Association 411 N. Akard Street 5th Floor Dallas, TX 75201 |
11.07% | ||
| Charles
Schwab & Co., Inc. 111 Pavonia Avenue Jersey City, NJ 07310 |
9.75% | |||
| National
Financial Services LLC 200 Liberty Street 5th Floor New York, NY 10281 |
9.48% | |||
| Morgan
Stanley & Co. Harborside Financial Center Plaza 3, 1st Floor Jersey City, NJ 07311 |
9.40% | |||
| BlackRock
Institutional Trust Company, N.A. 400 Howard Street San Francisco, CA 94105 |
6.02% | |||
| Mellon
Trust of New England, National Association Three Mellon Bank Center Floor 1533700 Pittsburgh, PA 15259 |
5.77% | |||
| UBS
Financial Services Inc. 1000 Harbor Blvd. 4th Floor Weehawken, NJ 07087 |
5.26% | |||
| iShares MSCI Emerging Markets Small-Cap ETF | National
Financial Services LLC 200 Liberty Street 5th Floor New York, NY 10281 |
30.84% | ||
| Charles
Schwab & Co., Inc. 111 Pavonia Avenue Jersey City, NJ 07310 |
16.88% | |||
| Merrill
Lynch, Pierce, Fenner & Smith Incorporated 101 Hudson Street 9th Floor Jersey City, NJ 07302-3997 |
6.50% |
Table of Contents
| Fund | Name | Percentage
of Ownership | ||
| Citibank,
N.A. 3800 CitiBank Center Tampa Building A/Floor 2 Tampa, FL 33610 |
6.28% | |||
| TD
Ameritrade Clearing, Inc. 1005 N. Ameritrade Place Bellevue, NE 68005 |
5.06% | |||
| iShares MSCI Emerging Markets Value ETF | National
Financial Services LLC 200 Liberty Street 5th Floor New York, NY 10281 |
48.27% | ||
| Charles
Schwab & Co., Inc. 111 Pavonia Avenue Jersey City, NJ 07310 |
13.36% | |||
| Pershing
LLC One Pershing Plaza Jersey City, NJ 07399 |
8.96% | |||
| iShares MSCI Frontier 100 ETF | National
Financial Services LLC 200 Liberty Street 5th Floor New York, NY 10281 |
14.22% | ||
| Charles
Schwab & Co., Inc. 111 Pavonia Avenue Jersey City, NJ 07310 |
10.06% | |||
| The
Bank of New York Mellon 401 Salina Street 2nd Floor Syracuse, NY 13202 |
6.21% | |||
| Morgan
Stanley & Co. Harborside Financial Center Plaza 3, 1st Floor Jersey City, NJ 07311 |
5.64% | |||
| TD
Ameritrade Clearing, Inc. 1005 N. Ameritrade Place Bellevue, NE 68005 |
5.40% | |||
| Northern
Trust Company/ United Nations Joint Staff Pension Fund 50 South LaSalle Street Chicago, IL 60675 |
5.39% | |||
| Merrill
Lynch, Pierce Fenner & Smith Safekeeping 101 Hudson Street 8th Floor Jersey City, NJ 07302 |
5.35% | |||
| iShares MSCI Global Agriculture Producers ETF | National
Financial Services LLC 200 Liberty Street 5th Floor New York, NY 10281 |
23.73% |
Table of Contents
| Fund | Name | Percentage
of Ownership | ||
| The
Bank of New York Mellon 401 Salina Street 2nd Floor Syracuse, NY 13202 |
13.02% | |||
| Pershing
LLC One Pershing Plaza Jersey City, NJ 07399 |
10.51% | |||
| J.P.
Morgan Clearing Corp One Metrotech Center North Brooklyn, NY 11201 |
10.01% | |||
| State
Street Bank and Trust Company 1776 Heritage Drive North Quincy, MA 02171 |
8.57% | |||
| iShares MSCI Global Energy Producers ETF | Pershing
LLC One Pershing Plaza Jersey City, NJ 07399 |
25.72% | ||
| National
Financial Services LLC 200 Liberty Street 5th Floor New York, NY 10281 |
12.62% | |||
| Charles
Schwab & Co., Inc. 111 Pavonia Avenue Jersey City, NJ 07310 |
9.47% | |||
| Merrill
Lynch, Pierce Fenner & Smith Safekeeping 101 Hudson Street 8th Floor Jersey City, NJ 07302 |
8.84% | |||
| iShares MSCI Global Metals & Mining Producers ETF | Citibank,
N.A. 3800 CitiBank Center Tampa Building A/Floor 2 Tampa, FL 33610 |
72.65% | ||
| National
Financial Services LLC 200 Liberty Street 5th Floor New York, NY 10281 |
5.35% | |||
| iShares MSCI Malaysia ETF | State
Street Bank and Trust Company 1776 Heritage Drive North Quincy, MA 02171 |
19.63% | ||
| Brown
Brothers Harriman & Co. 525 Washington Blvd. 11th Floor Jersey City, NJ 07310 |
16.56% | |||
| First
Clearing, LLC 901 East Byrd Street Richmond, VA 23219 |
15.90% | |||
Table of Contents
| Fund | Name | Percentage
of Ownership | ||
| iShares MSCI South Korea Capped ETF | Citibank,
N.A. 3800 CitiBank Center Tampa Building A/Floor 2 Tampa, FL 33610 |
16.23% | ||
| State
Street Bank and Trust Company 1776 Heritage Drive North Quincy, MA 02171 |
13.63% | |||
| Brown
Brothers Harriman & Co. 525 Washington Blvd. 11th Floor Jersey City, NJ 07310 |
12.83% | |||
| The
Bank of New York Mellon 401 Salina Street 2nd Floor Syracuse, NY 13202 |
6.13% | |||
| Deutsche
Bank Securities Inc./Cedear 1251 Avenue of the Americas New York, NY 10020 |
5.43% | |||
| iShares MSCI Taiwan ETF | Brown
Brothers Harriman & Co. 525 Washington Blvd. 11th Floor Jersey City, NJ 07310 |
29.91% | ||
| State
Street Bank and Trust Company 1776 Heritage Drive North Quincy, MA 02171 |
15.38% | |||
| JPMorgan
Chase Bank, National Association 14201 Dallas Pkwy 12th Floor Dallas, TX 75240 |
6.70% | |||
| Northern
Trust Company/ United Nations Joint Staff Pension Fund 50 South LaSalle Street Chicago, IL 60675 |
5.89% | |||
| The
Bank of New York Mellon 401 Salina Street 2nd Floor Syracuse, NY 13202 |
5.89% |
Table of Contents
Table of Contents
Table of Contents
Table of Contents
Table of Contents
Table of Contents
Table of Contents
Table of Contents
| Fund | Management
Fee for the Fiscal Year Ended August 31, 2014 |
Fund
Inception Date |
Management
Fees Paid For Fiscal Year Ended August 31, 2014 |
Management
Fees Paid For Fiscal Year Ended August 31, 2013 |
Management
Fees Paid For Fiscal Year Ended August 31, 2012 | |||||
| iShares Core MSCI Emerging Markets ETF1 | 0.18% | 10/18/12 | $ 6,606,028 | $ 1,376,356 | N/A | |||||
| iShares MSCI All Country World Minimum Volatility ETF2 | 0.33% | 10/18/11 | 3,757,055 | 2,816,648 | $ 538,193 | |||||
| iShares MSCI Brazil Capped ETF | 0.62% | 07/10/00 | 29,033,197 | 47,012,111 | 55,389,902 | |||||
| iShares MSCI BRIC ETF | 0.68% | 11/12/07 | 2,950,620 | 4,460,564 | 5,399,206 | |||||
| iShares MSCI Chile Capped ETF | 0.62% | 11/12/07 | 2,104,233 | 3,237,806 | 3,655,560 | |||||
| iShares MSCI Colombia Capped ETF | 0.61% | 06/18/13 | 129,378 | 19,007 | N/A | |||||
| iShares MSCI Emerging Markets Asia ETF3 | 0.68% | 02/08/12 | 296,354 | 481,059 | 64,202 | |||||
| iShares MSCI Emerging Markets Consumer Discretionary ETF | 0.67% | 02/08/12 | 34,904 | 16,966 | 31,777 |
Table of Contents
| Fund | Management
Fee for the Fiscal Year Ended August 31, 2014 |
Fund
Inception Date |
Management
Fees Paid For Fiscal Year Ended August 31, 2014 |
Management
Fees Paid For Fiscal Year Ended August 31, 2013 |
Management
Fees Paid For Fiscal Year Ended August 31, 2012 | |||||
| iShares MSCI Emerging Markets EMEA ETF4 | 0.68% | 01/18/12 | 66,881 | 46,239 | 31,766 | |||||
| iShares MSCI Emerging Markets Energy Capped ETF | 0.67% | 02/08/12 | 12,636 | 13,558 | 28,472 | |||||
| iShares MSCI Emerging Markets ETF5 | 0.68% | 04/07/03 | 258,410,222 | 281,065,191 | 238,711,967 | |||||
| iShares MSCI Emerging Markets Growth ETF6 | 0.68% | 02/08/12 | 37,510 | 24,208 | 39,428 | |||||
| iShares MSCI Emerging Markets Minimum Volatility ETF7 | 0.67% | 10/18/11 | 15,031,499 | 9,484,500 | 726,408 | |||||
| iShares MSCI Emerging Markets Small-Cap ETF | 0.67% | 08/16/11 | 247,131 | 133,724 | 246,547 | |||||
| iShares MSCI Emerging Markets Value ETF8 | 0.68% | 02/08/12 | 123,624 | 68,841 | 36,290 | |||||
| iShares MSCI Frontier 100 ETF | 0.79% | 09/12/12 | 4,380,187 | 690,651 | N/A | |||||
| iShares MSCI Global Agriculture Producers ETF9 | 0.39% | 01/31/12 | 162,274 | 81,354 | 11,217 | |||||
| iShares MSCI Global Energy Producers ETF | 0.39% | 01/31/12 | 21,673 | 18,793 | 10,385 | |||||
| iShares MSCI Global Metals & Mining Producers ETF10 | 0.39% | 01/31/12 | 670,187 | 884,095 | 6,435 | |||||
| iShares MSCI Malaysia ETF | 0.48% | 03/12/96 | 3,846,410 | 4,872,823 | 4,728,077 | |||||
| iShares MSCI South Korea Capped ETF | 0.62% | 05/09/00 | 26,444,377 | 19,187,742 | 19,188,641 | |||||
| iShares MSCI Taiwan ETF | 0.62% | 06/20/00 | 18,110,836 | 15,871,664 | 14,284,338 |
| 1 | For the iShares Core MSCI Emerging Markets ETF, BFA has contractually agreed to waive a portion of its management fee in an amount equal to the Fund’s pro rata share of the fees and expenses attributable to the Fund’s investments in other series of iShares Trust, iShares, Inc. and iShares MSCI Russia Capped ETF, Inc., “Acquired Fund Fees and Expenses,” until December 31, 2015. The contractual waiver may be terminated prior to December 31, 2015 only upon written agreement of the Company and BFA. For the fiscal years ended August 31, 2013 and August 31, 2014, BFA waived $116,082 and $0, respectively, of its management fees. BFA may voluntarily waive a portion of its management fee, as it determines, from time to time. Any such voluntary waiver or reimbursement may be eliminated by BFA at any time. For the fiscal years ended August 31, 2013 and August 31, 2014, respectively, BFA waived $875,684 and $501,946 of its management fees. As of November 1, 2013, the voluntary waiver is no longer in effect. |
| 2 | For the iShares MSCI All Country World Minimum Volatility ETF, BFA has contractually agreed to waive a portion of its management fees, in an amount equal to the Fund's pro rata share of the fees and expenses attributable to the Fund's investments in other series of iShares Trust, iShares, Inc. and iShares MSCI Russia Capped ETF, Inc., “Acquired Fund Fees and Expenses,” until December 31, 2015. The contractual waiver may be terminated prior to December 31, 2015 only upon written agreement of the Company and BFA. For the fiscal years ended August 31, 2012, August 31, 2013 and August 31, 2014, BFA waived $6,796, $20,001 and $6,390, respectively, of its management fees. Effective September 11, 2014, BFA has contractually agreed to waive any additional portion of its management fee necessary to limit the Total Annual Fund Operating Expenses to 0.20% of average daily net assets until December 31, 2015. The contractual waiver may be terminated prior to December 31, 2015 only upon written agreement of the Company and BFA. For the fiscal years ended August 31, 2012, August 31, 2013 and August 31, 2014, BFA voluntarily waived $171,948, $1,136,018 and $1,493,893, respectively, of its management fees. As of September 12, 2014, the voluntary waiver is no longer in effect. |
| 3 | For the iShares MSCI Emerging Markets Asia ETF, BFA has contractually agreed to waive a portion of its management fee for its investment advisory services to the Fund in order to limit Total Annual Fund Operating Expenses to 0.49% of average daily net assets until December 31, 2015. The contractual waiver may be terminated prior to December 31, 2015 only upon written agreement of the Company and BFA. For the fiscal years ended August 31, 2012, August 31, 2013 and August 31, 2014, BFA waived $17,939, $134,414 and $82,805, respectively, of its management fees. |
| 4 | For the iShares MSCI Emerging Markets EMEA ETF, BFA has contractually agreed to waive a portion of its management fee for its investment advisory services to the Fund in order to limit Total Annual Fund Operating Expenses to 0.49% of average daily net assets until December 31, 2015. The contractual waiver may be terminated prior to December 31, 2015 only upon written agreement of the Company and BFA. For the fiscal years ended August 31, 2012, August 31, 2013 and August 31, 2014, BFA waived $8,876, $12,920 and $18,687, respectively, of its management fees. |
| 5 | For the iShares MSCI Emerging Markets ETF, BFA has contractually agreed to waive a portion of its management fees in an amount equal to the Fund's pro rata share of the fees and expenses attributable to the Fund's investments in other series of iShares Trust, iShares, Inc. and iShares MSCI Russia Capped ETF, Inc., “Acquired Fund Fees and Expenses,” until December 31, 2015. The contractual waiver may be terminated prior to December 31, 2015 only upon written agreement of the Company and BFA. For the fiscal years ended August 31, 2012, August 31, 2013 and August 31, 2014, BFA waived $4,168, $0 and $0, respectively, of its management fees. For the fiscal years ended August 31, 2012, August 31, 2013 and August 31, 2014, BFA voluntarily waived $2,966,217, $427,889 and $784,811, respectively, of its management fees. As of September 12, 2014, the voluntary waiver is no longer in effect. |
| 6 | For the iShares MSCI Emerging Markets Growth ETF, BFA has contractually agreed to waive a portion of its management fee for its investment advisory services to the Fund in order to limit Total Annual Fund Operating Expenses to 0.49% of average daily net assets until December 31, 2015. The contractual waiver may be terminated prior to December 31, 2015 only upon written agreement of the Company and BFA. For the fiscal years ended August 31, 2012, August 31, 2013 and August 31, 2014, BFA waived $11,017, $6,764 and $10,481, respectively, of its management fees. |
Table of Contents
| 7 | For the iShares MSCI Emerging Markets Minimum Volatility ETF, BFA has contractually agreed to waive a portion of its management fee for its investment advisory services to the Fund in order to limit Total Annual Fund Operating Expenses to 0.25% of average daily net assets until December 31, 2015. The contractual waiver may be terminated prior to December 31, 2015 only upon written agreement of the Company and BFA. For the fiscal years ended August 31, 2012, August 31, 2013 and August 31, 2014, BFA waived $461,865, $5,941,097 and $9,452,759, respectively, of its management fees. |
| 8 | For the iShares MSCI Emerging Markets Value ETF, BFA has contractually agreed to waive a portion of its management fee for its investment advisory services to the Fund in order to limit Total Annual Fund Operating Expenses to 0.49% of average daily net assets until December 31, 2015. The contractual waiver may be terminated prior to December 31, 2015 only upon written agreement of the Company and BFA. For the fiscal years ended August 31, 2012, August 31, 2013 and August 31, 2014, BFA waived $10,140, $19,235 and $34,542, respectively, of its management fees. |
| 9 | For the iShares MSCI Global Agriculture Producers ETF, BFA has contractually agreed to waive a portion of its management fee in an amount equal to the Fund’s pro rata share of the fees and expenses attributable to the Fund’s investments in other series of iShares Trust, iShares, Inc. and iShares MSCI Russia Capped ETF, Inc., “Acquired Fund Fees and Expenses,” until December 31, 2015. The contractual waiver may be terminated prior to December 31, 2015 only upon written agreement of the Company and BFA. For the fiscal years ended August 31, 2012, August 31, 2013 and August 31, 2014, BFA waived $206, $1,448 and $2,676, respectively, of its management fees. |
| 10 | For the iShares MSCI Global Metals & Mining Producers ETF, BFA has contractually agreed to waive a portion of its management fee in an amount equal to the Fund’s pro rata share of the fees and expenses attributable to the Fund’s investments in other series of iShares Trust, iShares, Inc. and iShares MSCI Russia Capped ETF, Inc., “Acquired Fund Fees and Expenses,” until December 31, 2015. The contractual waiver may be terminated prior to December 31, 2015 only upon written agreement of the Company and BFA. For the fiscal years ended August 31, 2012, August 31, 2013 and August 31, 2014, BFA waived $0, $0 and $0, respectively, of its management fees. |
| Matthew Goff | ||||
| Types of Accounts | Number | Total Assets | ||
| Registered Investment Companies | 236 | $525,000,000,000 | ||
| Other Pooled Investment Vehicles | 0 | N/A | ||
| Other Accounts | 2 | 200,000,000 | ||
| Accounts with Incentive-Based Fee Arrangements | 0 | N/A |
| Diane Hsiung | ||||
| Types of Accounts | Number | Total Assets | ||
| Registered Investment Companies | 236 | $525,000,000,000 | ||
| Other Pooled Investment Vehicles | 21 | 7,750,000,000 | ||
| Other Accounts | 0 | N/A | ||
| Accounts with Incentive-Based Fee Arrangements | 0 | N/A |
Table of Contents
| Jennifer Hsui | ||||
| Types of Accounts | Number | Total Assets | ||
| Registered Investment Companies | 238 | $526,000,000,000 | ||
| Other Pooled Investment Vehicles | 0 | N/A | ||
| Other Accounts | 0 | N/A | ||
| Accounts with Incentive-Based Fee Arrangements | 0 | N/A |
| Greg Savage | ||||
| Types of Accounts | Number | Total Assets | ||
| Registered Investment Companies | 302 | $590,000,000,000 | ||
| Other Pooled Investment Vehicles | 89 | 45,000,000,000 | ||
| Other Accounts | 12 | 1,500,000,000 | ||
| Accounts with Incentive-Based Fee Arrangements | 0 | N/A |
| Matthew Goff | ||||
| Types of Accounts | Number
of Other Accounts with Performance Fees Managed by Portfolio Manager |
Aggregate
of Total Assets | ||
| Registered Investment Companies | 0 | N/A | ||
| Other Pooled Investment Vehicles | 0 | N/A | ||
| Other Accounts | 0 | N/A |
Table of Contents
| Diane Hsiung | ||||
| Types of Accounts | Number
of Other Accounts with Performance Fees Managed by Portfolio Manager |
Aggregate
of Total Assets | ||
| Registered Investment Companies | 0 | N/A | ||
| Other Pooled Investment Vehicles | 0 | N/A | ||
| Other Accounts | 0 | N/A |
| Jennifer Hsui | ||||
| Types of Accounts | Number
of Other Accounts with Performance Fees Managed by Portfolio Manager |
Aggregate
of Total Assets | ||
| Registered Investment Companies | 0 | N/A | ||
| Other Pooled Investment Vehicles | 0 | N/A | ||
| Other Accounts | 0 | N/A |
| Greg Savage | ||||
| Types of Accounts | Number
of Other Accounts with Performance Fees Managed by Portfolio Manager |
Aggregate
of Total Assets | ||
| Registered Investment Companies | 0 | N/A | ||
| Other Pooled Investment Vehicles | 0 | N/A | ||
| Other Accounts | 0 | N/A |
Table of Contents
| Matthew Goff | |||||||||||||||
| Dollar Range | |||||||||||||||
| Fund | None | $1 to $10k | $10,001
to $50k |
$50,001
to $100k |
$100,001
to $500k |
$500,001
to $1m |
over
$1m |
||||||||
| iShares Core MSCI Emerging Markets ETF | X | ||||||||||||||
| iShares MSCI All Country World Minimum Volatility ETF | X | ||||||||||||||
| iShares MSCI Brazil Capped ETF | X | ||||||||||||||
| iShares MSCI BRIC ETF | X | ||||||||||||||
| iShares MSCI Chile Capped ETF | X | ||||||||||||||
| iShares MSCI Colombia Capped ETF | X | ||||||||||||||
| iShares MSCI Emerging Markets Asia ETF | X | ||||||||||||||
| iShares MSCI Emerging Markets Consumer Discretionary ETF | X | ||||||||||||||
| iShares MSCI Emerging Markets EMEA ETF | X | ||||||||||||||
| iShares MSCI Emerging Markets Energy Capped ETF | X | ||||||||||||||
| iShares MSCI Emerging Markets ETF | X | ||||||||||||||
| iShares MSCI Emerging Markets Growth ETF | X | ||||||||||||||
| iShares MSCI Emerging Markets Minimum Volatility ETF | X | ||||||||||||||
| iShares MSCI Emerging Markets Small-Cap ETF | X | ||||||||||||||
| iShares MSCI Emerging Markets Value ETF | X | ||||||||||||||
| iShares MSCI Frontier 100 ETF | X | ||||||||||||||
| iShares MSCI Global Agriculture Producers ETF | X | ||||||||||||||
| iShares MSCI Global Energy Producers ETF | X | ||||||||||||||
| iShares MSCI Global Metals & Mining Producers ETF | X | ||||||||||||||
| iShares MSCI Malaysia ETF | X | ||||||||||||||
| iShares MSCI South Korea Capped ETF | X | ||||||||||||||
| iShares MSCI Taiwan ETF | X | ||||||||||||||
Table of Contents
| Diane Hsiung | |||||||||||||||
| Dollar Range | |||||||||||||||
| Fund | None | $1 to $10k | $10,001
to $50k |
$50,001
to $100k |
$100,001
to $500k |
$500,001
to $1m |
over
$1m |
||||||||
| iShares Core MSCI Emerging Markets ETF | X | ||||||||||||||
| iShares MSCI All Country World Minimum Volatility ETF | X | ||||||||||||||
| iShares MSCI Brazil Capped ETF | X | ||||||||||||||
| iShares MSCI BRIC ETF | X | ||||||||||||||
| iShares MSCI Chile Capped ETF | X | ||||||||||||||
| iShares MSCI Colombia Capped ETF | X | ||||||||||||||
| iShares MSCI Emerging Markets Asia ETF | X | ||||||||||||||
| iShares MSCI Emerging Markets Consumer Discretionary ETF | X | ||||||||||||||
| iShares MSCI Emerging Markets EMEA ETF | X | ||||||||||||||
| iShares MSCI Emerging Markets Energy Capped ETF | X | ||||||||||||||
| iShares MSCI Emerging Markets ETF | X | ||||||||||||||
| iShares MSCI Emerging Markets Growth ETF | X | ||||||||||||||
| iShares MSCI Emerging Markets Minimum Volatility ETF | X | ||||||||||||||
| iShares MSCI Emerging Markets Small-Cap ETF | X | ||||||||||||||
| iShares MSCI Emerging Markets Value ETF | X | ||||||||||||||
| iShares MSCI Frontier 100 ETF | X | ||||||||||||||
| iShares MSCI Global Agriculture Producers ETF | X | ||||||||||||||
| iShares MSCI Global Energy Producers ETF | X | ||||||||||||||
| iShares MSCI Global Metals & Mining Producers ETF | X | ||||||||||||||
| iShares MSCI Malaysia ETF | X | ||||||||||||||
| iShares MSCI South Korea Capped ETF | X | ||||||||||||||
| iShares MSCI Taiwan ETF | X | ||||||||||||||
| Jennifer Hsui | |||||||||||||||
| Dollar Range | |||||||||||||||
| Fund | None | $1 to $10k | $10,001
to $50k |
$50,001
to $100k |
$100,001
to $500k |
$500,001
to $1m |
over
$1m |
||||||||
| iShares Core MSCI Emerging Markets ETF | X | ||||||||||||||
| iShares MSCI All Country World Minimum Volatility ETF | X | ||||||||||||||
| iShares MSCI Brazil Capped ETF | X | ||||||||||||||
| iShares MSCI BRIC ETF | X | ||||||||||||||
| iShares MSCI Chile Capped ETF | X | ||||||||||||||
| iShares MSCI Colombia Capped ETF | X | ||||||||||||||
| iShares MSCI Emerging Markets Asia ETF | X | ||||||||||||||
| iShares MSCI Emerging Markets Consumer Discretionary ETF | X | ||||||||||||||
| iShares MSCI Emerging Markets EMEA ETF | X | ||||||||||||||
| iShares MSCI Emerging Markets Energy Capped ETF | X | ||||||||||||||
| iShares MSCI Emerging Markets ETF | X | ||||||||||||||
Table of Contents
| Jennifer Hsui | |||||||||||||||
| Dollar Range | |||||||||||||||
| Fund | None | $1 to $10k | $10,001
to $50k |
$50,001
to $100k |
$100,001
to $500k |
$500,001
to $1m |
over
$1m |
||||||||
| iShares MSCI Emerging Markets Growth ETF | X | ||||||||||||||
| iShares MSCI Emerging Markets Minimum Volatility ETF | X | ||||||||||||||
| iShares MSCI Emerging Markets Small-Cap ETF | X | ||||||||||||||
| iShares MSCI Emerging Markets Value ETF | X | ||||||||||||||
| iShares MSCI Frontier 100 ETF | X | ||||||||||||||
| iShares MSCI Global Agriculture Producers ETF | X | ||||||||||||||
| iShares MSCI Global Energy Producers ETF | X | ||||||||||||||
| iShares MSCI Global Metals & Mining Producers ETF | X | ||||||||||||||
| iShares MSCI Malaysia ETF | X | ||||||||||||||
| iShares MSCI South Korea Capped ETF | X | ||||||||||||||
| iShares MSCI Taiwan ETF | X | ||||||||||||||
| Greg Savage | |||||||||||||||
| Dollar Range | |||||||||||||||
| Fund | None | $1 to $10k | $10,001
to $50k |
$50,001
to $100k |
$100,001
to $500k |
$500,001
to $1m |
over
$1m |
||||||||
| iShares Core MSCI Emerging Markets ETF | X | ||||||||||||||
| iShares MSCI All Country World Minimum Volatility ETF | X | ||||||||||||||
| iShares MSCI Brazil Capped ETF | X | ||||||||||||||
| iShares MSCI BRIC ETF | X | ||||||||||||||
| iShares MSCI Chile Capped ETF | X | ||||||||||||||
| iShares MSCI Colombia Capped ETF | X | ||||||||||||||
| iShares MSCI Emerging Markets Asia ETF | X | ||||||||||||||
| iShares MSCI Emerging Markets Consumer Discretionary ETF | X | ||||||||||||||
| iShares MSCI Emerging Markets EMEA ETF | X | ||||||||||||||
| iShares MSCI Emerging Markets Energy Capped ETF | X | ||||||||||||||
| iShares MSCI Emerging Markets ETF | X | ||||||||||||||
| iShares MSCI Emerging Markets Growth ETF | X | ||||||||||||||
| iShares MSCI Emerging Markets Minimum Volatility ETF | X | ||||||||||||||
| iShares MSCI Emerging Markets Small-Cap ETF | X | ||||||||||||||
| iShares MSCI Emerging Markets Value ETF | X | ||||||||||||||
| iShares MSCI Frontier 100 ETF | X | ||||||||||||||
| iShares MSCI Global Agriculture Producers ETF | X | ||||||||||||||
| iShares MSCI Global Energy Producers ETF | X | ||||||||||||||
| iShares MSCI Global Metals & Mining Producers ETF | X | ||||||||||||||
| iShares MSCI Malaysia ETF | X | ||||||||||||||
| iShares MSCI South Korea Capped ETF | X | ||||||||||||||
| iShares MSCI Taiwan ETF | X | ||||||||||||||
Table of Contents
| Fund | Fund
Inception Date |
Administration,
Custodian, Transfer Agency Expenses Paid During Fiscal Year Ended August 31, 2014 |
Administration,
Custodian, Transfer Agency Expenses Paid During Fiscal Year Ended August 31, 2013 |
Administration,
Custodian, Transfer Agency Expenses Paid During Fiscal Year Ended August 31, 2012 | ||||
| iShares Core MSCI Emerging Markets ETF | 10/18/12 | $1,465,620 | $ 412,062 | N/A | ||||
| iShares MSCI All Country World Minimum Volatility ETF | 10/18/11 | 127,080 | 87,071 | $ 38,593 | ||||
| iShares MSCI Brazil Capped ETF | 07/10/00 | 919,967 | 1,386,926 | 2,201,629 | ||||
| iShares MSCI BRIC ETF | 11/12/07 | 176,744 | 238,562 | 327,518 | ||||
| iShares MSCI Chile Capped ETF | 11/12/07 | 760,304 | 1,086,999 | 1,218,196 | ||||
| iShares MSCI Colombia Capped ETF | 06/18/13 | 105,161 | 15,246 | N/A | ||||
| iShares MSCI Emerging Markets Asia ETF | 02/08/12 | 14,813 | 36,171 | 22,673 | ||||
| iShares MSCI Emerging Markets Consumer Discretionary ETF | 02/08/12 | 10,330 | 5,362 | 9,079 | ||||
| iShares MSCI Emerging Markets EMEA ETF | 01/18/12 | 52,125 | 14,924 | 15,028 | ||||
| iShares MSCI Emerging Markets Energy Capped ETF | 02/08/12 | 12,548 | 5,974 | 10,666 |
Table of Contents
| Fund | Fund
Inception Date |
Administration,
Custodian, Transfer Agency Expenses Paid During Fiscal Year Ended August 31, 2014 |
Administration,
Custodian, Transfer Agency Expenses Paid During Fiscal Year Ended August 31, 2013 |
Administration,
Custodian, Transfer Agency Expenses Paid During Fiscal Year Ended August 31, 2012 | ||||
| iShares MSCI Emerging Markets ETF | 04/07/03 | 12,892,794 | 13,283,559 | 11,972,729 | ||||
| iShares MSCI Emerging Markets Growth ETF | 02/08/12 | 30,760 | 26,034 | 26,886 | ||||
| iShares MSCI Emerging Markets Minimum Volatility ETF | 10/18/11 | 1,127,202 | 737,475 | 91,139 | ||||
| iShares MSCI Emerging Markets Small-Cap ETF | 08/16/11 | 55,099 | 45,384 | 50,003 | ||||
| iShares MSCI Emerging Markets Value ETF | 02/08/12 | 50,200 | 30,528 | 26,686 | ||||
| iShares MSCI Frontier 100 ETF | 09/12/12 | 2,645,084 | 425,841 | N/A | ||||
| iShares MSCI Global Agriculture Producers ETF | 01/31/12 | 27,334 | 12,441 | 11,700 | ||||
| iShares MSCI Global Energy Producers ETF | 01/31/12 | 11,668 | 6,093 | 12,779 | ||||
| iShares MSCI Global Metals & Mining Producers ETF | 01/31/12 | 53,841 | 42,352 | 14,747 | ||||
| iShares MSCI Malaysia ETF | 03/12/96 | 224,810 | 250,626 | 354,845 | ||||
| iShares MSCI South Korea Capped ETF | 05/09/00 | 915,327 | 696,983 | 656,330 | ||||
| iShares MSCI Taiwan ETF | 06/20/00 | 696,950 | 674,661 | 721,934 |
Table of Contents
| Fund | Fund
Inception Date |
Distributor
Compensation Paid During Fiscal Year Ended August 31, 20141 |
Distributor
Compensation Paid During Fiscal Year Ended August 31, 20131 |
Distributor
Compensation Paid From April 1, 2012 to August 31, 20121 |
Distributor
Compensation Paid From September 1, 2011 to March 31, 20122 | ||||
| iShares Core MSCI Emerging Markets ETF | 10/18/12 | $6,438 | $ 7,166 | N/A | N/A | ||||
| iShares MSCI All Country World Minimum Volatility ETF | 10/18/11 | 6,438 | 7,721 | $3,318 | $ 5,369 | ||||
| iShares MSCI Brazil Capped ETF | 07/10/00 | 6,438 | 7,721 | 3,318 | 6,270 | ||||
| iShares MSCI BRIC ETF | 11/12/07 | 6,438 | 7,721 | 3,318 | 6,270 | ||||
| iShares MSCI Chile Capped ETF | 11/12/07 | 6,438 | 7,721 | 3,318 | 6,270 | ||||
| iShares MSCI Colombia Capped ETF | 06/18/13 | 6,438 | 2,094 | N/A | N/A | ||||
| iShares MSCI Emerging Markets Asia ETF | 02/08/12 | 6,438 | 7,721 | 3,318 | 1,712 | ||||
| iShares MSCI Emerging Markets Consumer Discretionary ETF | 02/08/12 | 6,438 | 7,721 | 3,318 | 1,712 | ||||
| iShares MSCI Emerging Markets EMEA ETF | 01/18/12 | 6,438 | 7,721 | 3,318 | 2,621 | ||||
| iShares MSCI Emerging Markets Energy Capped ETF | 02/08/12 | 6,438 | 7,721 | 3,318 | 1,712 | ||||
| iShares MSCI Emerging Markets ETF | 04/07/03 | 6,438 | 7,721 | 3,318 | 6,270 | ||||
| iShares MSCI Emerging Markets Growth ETF | 02/08/12 | 6,438 | 7,721 | 3,318 | 1,712 | ||||
| iShares MSCI Emerging Markets Minimum Volatility ETF | 10/18/11 | 6,438 | 7,721 | 3,318 | 5,369 | ||||
| iShares MSCI Emerging Markets Small-Cap ETF | 08/16/11 | 6,438 | 7,721 | 3,318 | 6,270 | ||||
| iShares MSCI Emerging Markets Value ETF | 02/08/12 | 6,438 | 7,721 | 3,318 | 1,712 | ||||
| iShares MSCI Frontier 100 ETF | 09/12/12 | 6,438 | 7,721 | N/A | N/A | ||||
| iShares MSCI Global Agriculture Producers ETF | 01/31/12 | 6,438 | 7,721 | 3,318 | 1,712 | ||||
| iShares MSCI Global Energy Producers ETF | 01/31/12 | 6,438 | 7,721 | 3,318 | 1,712 | ||||
| iShares MSCI Global Metals & Mining Producers ETF | 01/31/12 | 6,438 | 7,721 | 3,318 | 1,712 | ||||
| iShares MSCI Malaysia ETF | 03/12/96 | 6,438 | 7,721 | 3,318 | 6,270 | ||||
| iShares MSCI South Korea Capped ETF | 05/09/00 | 6,438 | 7,721 | 3,318 | 6,270 | ||||
| iShares MSCI Taiwan ETF | 06/20/00 | 6,438 | 7,721 | 3,318 | 6,270 |
| 1 | BRIL serves as the distributor to the Funds effective April 1, 2012. These fees reflected payments made to SEI, acting as an agent of the Distributor. |
| 2 | SEI served as the distributor to the Funds through March 31, 2012. |
Table of Contents
Table of Contents
Table of Contents
Table of Contents
Table of Contents
Table of Contents
| Fund | Fund
Inception Date |
Brokerage
Commissions Paid During Fiscal Year Ended August 31, 2014 |
Brokerage
Commissions Paid During Fiscal Year Ended August 31, 2013 |
Brokerage
Commissions Paid During Fiscal Year Ended August 31, 2012 | ||||
| iShares Core MSCI Emerging Markets ETF | 10/18/12 | $ 1,734,760 | $ 1,043,502 | N/A | ||||
| iShares MSCI All Country World Minimum Volatility ETF | 10/18/11 | 348,651 | 71,080 | $ 21,707 | ||||
| iShares MSCI Brazil Capped ETF | 07/10/00 | 848,728 | 1,433,628 | 745,661 | ||||
| iShares MSCI BRIC ETF | 11/12/07 | 60,924 | 91,262 | 454,612 | ||||
| iShares MSCI Chile Capped ETF | 11/12/07 | 507,866 | 326,522 | 469,532 | ||||
| iShares MSCI Colombia Capped ETF | 06/18/13 | 19,263 | 15,658 | N/A | ||||
| iShares MSCI Emerging Markets Asia ETF | 02/08/12 | 31,590 | 120,182 | 5,255 | ||||
| iShares MSCI Emerging Markets Consumer Discretionary ETF | 02/08/12 | 1,039 | 173 | 1,969 | ||||
| iShares MSCI Emerging Markets EMEA ETF | 01/18/12 | 2,634 | 604 | 830 | ||||
| iShares MSCI Emerging Markets Energy Capped ETF | 02/08/12 | 180 | 166 | 1,313 | ||||
| iShares MSCI Emerging Markets ETF | 04/07/03 | 10,188,164 | 9,938,587 | 6,520,213 | ||||
| iShares MSCI Emerging Markets Growth ETF | 02/08/12 | 1,008 | 1,815 | 2,115 | ||||
| iShares MSCI Emerging Markets Minimum Volatility ETF | 10/18/11 | 874,319 | 1,036,060 | 137,666 |
Table of Contents
| Fund | Fund
Inception Date |
Brokerage
Commissions Paid During Fiscal Year Ended August 31, 2014 |
Brokerage
Commissions Paid During Fiscal Year Ended August 31, 2013 |
Brokerage
Commissions Paid During Fiscal Year Ended August 31, 2012 | ||||
| iShares MSCI Emerging Markets Small-Cap ETF | 08/16/11 | 8,901 | 11,056 | 24,118 | ||||
| iShares MSCI Emerging Markets Value ETF | 02/08/12 | 6,507 | 3,856 | 2,140 | ||||
| iShares MSCI Frontier 100 ETF | 09/12/12 | 4,805,891 | 1,839,738 | N/A | ||||
| iShares MSCI Global Agriculture Producers ETF | 01/31/12 | 3,180 | 1,459 | 565 | ||||
| iShares MSCI Global Energy Producers ETF | 01/31/12 | 351 | 94 | 272 | ||||
| iShares MSCI Global Metals & Mining Producers ETF | 01/31/12 | 24,100 | 25,493 | 8,990 | ||||
| iShares MSCI Malaysia ETF | 03/12/96 | 169,350 | 234,799 | 286,073 | ||||
| iShares MSCI South Korea Capped ETF | 05/09/00 | 727,654 | 643,784 | 924,271 | ||||
| iShares MSCI Taiwan ETF | 06/20/00 | 362,060 | 563,909 | 819,930 |
| Fund | Fiscal
Year Ended August 31, 2014 |
Fiscal
Year Ended August 31, 2013 | ||
| iShares Core MSCI Emerging Markets ETF | 8% | 15% | ||
| iShares MSCI All Country World Minimum Volatility ETF | 24% | 13% | ||
| iShares MSCI Brazil Capped ETF | 54% | 56% | ||
| iShares MSCI BRIC ETF | 10% | 10% | ||
| iShares MSCI Chile Capped ETF | 91% | 34% | ||
| iShares MSCI Colombia Capped ETF | 34% | 2% | ||
| iShares MSCI Emerging Markets Asia ETF | 33% | 174% | ||
| iShares MSCI Emerging Markets Consumer Discretionary ETF | 10% | 10% | ||
| iShares MSCI Emerging Markets EMEA ETF | 18% | 8% | ||
| iShares MSCI Emerging Markets Energy Capped ETF | 15% | 7% | ||
| iShares MSCI Emerging Markets ETF | 22% | 24% | ||
| iShares MSCI Emerging Markets Growth ETF | 26% | 64% | ||
| iShares MSCI Emerging Markets Minimum Volatility ETF | 34% | 23% | ||
| iShares MSCI Emerging Markets Small-Cap ETF | 20% | 21% |
Table of Contents
| Fund | Fiscal
Year Ended August 31, 2014 |
Fiscal
Year Ended August 31, 2013 | ||
| iShares MSCI Emerging Markets Value ETF | 25% | 47% | ||
| iShares MSCI Frontier 100 ETF | 61% | 18% | ||
| iShares MSCI Global Agriculture Producers ETF | 14% | 6% | ||
| iShares MSCI Global Energy Producers ETF | 8% | 6% | ||
| iShares MSCI Global Metals & Mining Producers ETF | 18% | 11% | ||
| iShares MSCI Malaysia ETF | 16% | 17% | ||
| iShares MSCI South Korea Capped ETF | 13% | 13% | ||
| iShares MSCI Taiwan ETF | 11% | 21% |
Table of Contents
Table of Contents
Table of Contents
| Fund | Shares
Per Creation Unit |
Value
Per Creation Unit (U.S.$) | ||
| iShares Core MSCI Emerging Markets ETF | 200,000 | $10,010,000.00 | ||
| iShares MSCI All Country World Minimum Volatility ETF | 100,000 | 6,667,000.00 | ||
| iShares MSCI Brazil Capped ETF | 50,000 | 2,175,500.00 | ||
| iShares MSCI BRIC ETF | 50,000 | 1,867,000.00 | ||
| iShares MSCI Chile Capped ETF | 50,000 | 2,126,000.00 | ||
| iShares MSCI Colombia Capped ETF | 50,000 | 1,248,500.00 | ||
| iShares MSCI Emerging Markets Asia ETF | 50,000 | 2,924,500.00 | ||
| iShares MSCI Emerging Markets Consumer Discretionary ETF | 50,000 | 2,747,500.00 |
Table of Contents
| Fund | Shares
Per Creation Unit |
Value
Per Creation Unit (U.S.$) | ||
| iShares MSCI Emerging Markets EMEA ETF | 100,000 | 4,840,000.00 | ||
| iShares MSCI Emerging Markets Energy Capped ETF | 50,000 | 1,785,500.00 | ||
| iShares MSCI Emerging Markets ETF | 450,000 | 18,783,000.00 | ||
| iShares MSCI Emerging Markets Growth ETF | 50,000 | 2,762,500.00 | ||
| iShares MSCI Emerging Markets Minimum Volatility ETF | 100,000 | 5,980,000.00 | ||
| iShares MSCI Emerging Markets Small-Cap ETF | 50,000 | 2,451,000.00 | ||
| iShares MSCI Emerging Markets Value ETF | 50,000 | 2,312,000.00 | ||
| iShares MSCI Frontier 100 ETF | 50,000 | 1,916,000.00 | ||
| iShares MSCI Global Agriculture Producers ETF | 50,000 | 1,327,000.00 | ||
| iShares MSCI Global Energy Producers ETF | 100,000 | 2,574,000.00 | ||
| iShares MSCI Global Metals & Mining Producers ETF | 50,000 | 915,000.00 | ||
| iShares MSCI Malaysia ETF | 75,000 | 1,155,750.00 | ||
| iShares MSCI South Korea Capped ETF | 50,000 | 3,050,000.00 | ||
| iShares MSCI Taiwan ETF | 200,000 | 3,058,000.00 |
Table of Contents
Table of Contents
Table of Contents
Table of Contents
| Fund | Standard
Creation Transaction Fee |
Maximum
Additional Charge* | ||
| iShares Core MSCI Emerging Markets ETF | $ 15,000 | 5.0% | ||
| iShares MSCI All Country World Minimum Volatility ETF | 4,200 | 3.0% | ||
| iShares MSCI Brazil Capped ETF | 2,400 | 7.0% | ||
| iShares MSCI BRIC ETF | 5,900 | 7.0% | ||
| iShares MSCI Chile Capped ETF | 3,000 | 3.0% | ||
| iShares MSCI Colombia Capped ETF | 3,600 | 3.0% | ||
| iShares MSCI Emerging Markets Asia ETF | 15,000 | 3.0% | ||
| iShares MSCI Emerging Markets Consumer Discretionary ETF | 3,500 | 3.0% | ||
| iShares MSCI Emerging Markets EMEA ETF | 5,500 | 3.0% | ||
| iShares MSCI Emerging Markets Energy Capped ETF | 2,500 | 3.0% | ||
| iShares MSCI Emerging Markets ETF | 7,700 | 3.0% | ||
| iShares MSCI Emerging Markets Growth ETF | 14,500 | 3.0% | ||
| iShares MSCI Emerging Markets Minimum Volatility ETF | 6,100 | 3.0% | ||
| iShares MSCI Emerging Markets Small-Cap ETF | 15,000 | 3.0% | ||
| iShares MSCI Emerging Markets Value ETF | 15,000 | 3.0% | ||
| iShares MSCI Frontier 100 ETF | 6,800 | 5.0% | ||
| iShares MSCI Global Agriculture Producers ETF | 5,100 | 3.0% | ||
| iShares MSCI Global Energy Producers ETF | 6,100 | 3.0% | ||
| iShares MSCI Global Metals & Mining Producers ETF | 8,400 | 3.0% | ||
| iShares MSCI Malaysia ETF | 5,000 | 3.0% | ||
| iShares MSCI South Korea Capped ETF | 4,000 | 3.0% | ||
| iShares MSCI Taiwan ETF | 4,500 | 3.0% |
| * | As a percentage of the net asset value per Creation Unit. |
Table of Contents
| Fund | Standard
Redemption Transaction Fee |
Maximum
Additional Charge* | ||
| iShares Core MSCI Emerging Markets ETF | $ 15,000 | 2.0% | ||
| iShares MSCI All Country World Minimum Volatility ETF | 4,200 | 2.0% | ||
| iShares MSCI Brazil Capped ETF | 2,400 | 2.0% | ||
| iShares MSCI BRIC ETF | 5,900 | 2.0% | ||
| iShares MSCI Chile Capped ETF | 3,000 | 2.0% | ||
| iShares MSCI Colombia Capped ETF | 3,600 | 2.0% | ||
| iShares MSCI Emerging Markets Asia ETF | 15,000 | 2.0% | ||
| iShares MSCI Emerging Markets Consumer Discretionary ETF | 3,500 | 2.0% | ||
| iShares MSCI Emerging Markets EMEA ETF | 5,500 | 2.0% | ||
| iShares MSCI Emerging Markets Energy Capped ETF | 2,500 | 2.0% | ||
| iShares MSCI Emerging Markets ETF | 7,700 | 2.0% | ||
| iShares MSCI Emerging Markets Growth ETF | 14,500 | 2.0% |
Table of Contents
| Fund | Standard
Redemption Transaction Fee |
Maximum
Additional Charge* | ||
| iShares MSCI Emerging Markets Minimum Volatility ETF | 6,100 | 2.0% | ||
| iShares MSCI Emerging Markets Small-Cap ETF | 15,000 | 2.0% | ||
| iShares MSCI Emerging Markets Value ETF | 15,000 | 2.0% | ||
| iShares MSCI Frontier 100 ETF | 6,800 | 2.0% | ||
| iShares MSCI Global Agriculture Producers ETF | 5,100 | 2.0% | ||
| iShares MSCI Global Energy Producers ETF | 6,100 | 2.0% | ||
| iShares MSCI Global Metals & Mining Producers ETF | 8,400 | 2.0% | ||
| iShares MSCI Malaysia ETF | 5,000 | 2.0% | ||
| iShares MSCI South Korea Capped ETF | 4,000 | 2.0% | ||
| iShares MSCI Taiwan ETF | 4,500 | 2.0% |
| * | As a percentage of the net asset value per Creation Unit, inclusive of the standard redemption transaction fee. |
Table of Contents
Table of Contents
Table of Contents
Table of Contents
Table of Contents
Table of Contents
Table of Contents
| 2015 | ||||||
| Country | Trade
Date |
Settlement
Date |
Number
of Days to Settle | |||
| Australia | 12/21/15 | 12/29/15 | 8 | |||
| 12/22/15 | 12/30/15 | 8 | ||||
| 12/23/15 | 01/04/16 | 12 | ||||
| China | 02/13/15 | 02/25/15 | 12 | |||
| 02/16/15 | 02/26/15 | 10 | ||||
| 02/17/15 | 02/27/15 | 10 | ||||
| 09/28/15 | 10/08/15 | 10 | ||||
| 09/29/15 | 10/09/15 | 10 | ||||
| 09/30/15 | 10/12/15 | 12 | ||||
| Indonesia | 07/13/15 | 07/22/15 | 9 | |||
| 07/14/15 | 07/23/15 | 9 | ||||
| 07/15/15 | 07/24/15 | 9 | ||||
| Ireland | 12/22/15 | 12/30/15 | 8 | |||
| 12/23/15 | 12/31/15 | 8 | ||||
| Japan | 04/28/15 | 05/07/15 | 9 | |||
| 04/30/15 | 05/08/15 | 8 | ||||
| 05/01/15 | 05/11/15 | 10 | ||||
| 09/16/15 | 09/24/15 | 8 | ||||
| 09/17/15 | 09/25/15 | 8 | ||||
| 09/18/15 | 09/28/15 | 11 | ||||
| The Philippines | 12/23/15 | 01/04/16 | 12 | |||
| 12/28/15 | 01/05/16 | 8 | ||||
| 12/29/15 | 01/06/16 | 8 | ||||
| Russia | 12/24/15 | 01/11/16 | 18 | |||
| 12/28/15 | 01/15/16 | 15 | ||||
| 12/29/15 | 01/18/15 | 18 | ||||
| South Africa | 03/27/15 | 04/07/15 | 11 | |||
| 03/30/15 | 04/08/15 | 9 | ||||
| 03/31/15 | 04/09/15 | 9 | ||||
| 04/01/15 | 04/10/15 | 9 | ||||
| 04/02/15 | 04/13/15 | 11 | ||||
| 04/20/15 | 04/28/15 | 8 | ||||
| 04/21/15 | 04/29/15 | 8 | ||||
| 04/22/15 | 04/30/15 | 8 | ||||
| 04/23/15 | 05/01/15 | 8 | ||||
| 04/23/15 | 05/04/15 | 11 | ||||
| 04/24/15 | 05/05/15 | 11 | ||||
| 04/28/15 | 05/06/15 | 8 | ||||
| 04/29/15 | 05/07/15 | 8 | ||||
| 04/30/15 | 05/08/15 | 8 | ||||
| 06/09/15 | 06/17/15 | 8 | ||||
| 06/10/15 | 06/18/15 | 8 | ||||
| 06/11/15 | 06/19/15 | 8 | ||||
| 06/12/15 | 06/22/15 | 10 | ||||
| 06/15/15 | 06/23/15 | 8 | ||||
| 08/03/15 | 08/11/15 | 8 | ||||
Table of Contents
| 2015 | ||||||
| Country | Trade
Date |
Settlement
Date |
Number
of Days to Settle | |||
| 08/04/15 | 08/12/15 | 8 | ||||
| 08/05/15 | 08/13/15 | 8 | ||||
| 08/06/15 | 08/14/15 | 8 | ||||
| 08/07/15 | 08/17/15 | 10 | ||||
| 09/17/15 | 09/25/15 | 8 | ||||
| 09/18/15 | 09/28/15 | 10 | ||||
| 09/21/15 | 09/29/15 | 8 | ||||
| 09/22/15 | 09/30/15 | 8 | ||||
| 09/23/15 | 10/01/15 | 8 | ||||
| 12/09/15 | 12/17/15 | 8 | ||||
| 12/10/15 | 12/18/15 | 8 | ||||
| 12/11/15 | 12/21/15 | 10 | ||||
| 12/14/15 | 12/22/15 | 8 | ||||
| 12/15/15 | 12/23/15 | 8 | ||||
| 12/18/15 | 12/28/15 | 10 | ||||
| 12/21/15 | 12/29/15 | 8 | ||||
| 12/22/15 | 12/30/15 | 8 | ||||
| 12/23/15 | 12/31/15 | 8 | ||||
| 12/24/15 | 01/04/16 | 11 | ||||
| 12/28/15 | 01/05/16 | 8 | ||||
| 12/29/15 | 01/06/16 | 8 | ||||
| 12/30/15 | 01/07/16 | 8 | ||||
| 12/31/15 | 01/08/16 | 8 | ||||
| Spain | 03/30/15 | 04/07/15 | 8 | |||
| 03/31/15 | 04/08/15 | 8 | ||||
| 04/01/15 | 04/09/15 | 8 | ||||
| Taiwan | 02/12/15 | 02/24/15 | 12 | |||
| 02/13/15 | 02/25/15 | 12 | ||||
| Thailand | 04/08/15 | 04/16/15 | 8 | |||
| 04/09/15 | 04/17/15 | 8 | ||||
| 04/10/15 | 04/20/15 | 10 | ||||
| * | These worst-case redemption cycles are based on information regarding regular holidays, which may be out of date. Based on changes in holidays, longer (worse) redemption cycles are possible. |
Table of Contents
Table of Contents
| Fund | Non-Expiring 1 | Expiring
2015 |
Expiring
2016 |
Expiring
2017 |
Expiring
2018 |
Expiring
2019 |
Total | |||||||
| iShares
Core MSCI Emerging Markets ETF |
$ 6,567,880 | — | — | — | — | — | $ 6,567,880 | |||||||
| iShares MSCI All Country World Minimum Volatility ETF | 5,163,254 | — | — | — | — | — | 5,163,254 | |||||||
| iShares MSCI Brazil Capped ETF | 989,412,231 | — | — | — | $ 198,226,310 | — | 1,187,638,541 | |||||||
| iShares MSCI BRIC ETF | 141,120,103 | — | — | $ 1,540,740 | 11,268,086 | $ 7,760,558 | 161,689,487 | |||||||
| iShares MSCI Chile Capped ETF | 65,990,195 | — | — | 1,886,881 | 11,712,090 | 976,991 | 80,566,157 | |||||||
| iShares MSCI Emerging Markets Asia ETF | 9,289,694 | — | — | — | — | — | 9,289,694 | |||||||
| iShares MSCI Emerging Markets Consumer Discretionary ETF | 811,736 | — | — | — | — | — | 811,736 | |||||||
| iShares MSCI Emerging Markets EMEA ETF | 138,849 | — | — | — | — | — | 138,849 | |||||||
| iShares MSCI Emerging Markets Energy Capped ETF | 996,570 | — | — | — | — | — | 996,570 | |||||||
| iShares MSCI Emerging Markets ETF | 3,444,042,588 | $ 29,973,301 | $ 13,844,901 | 228,196,854 | 1,201,366,175 | 873,167,649 | 5,790,591,468 | |||||||
| iShares MSCI Emerging Markets Growth ETF | 627,663 | — | — | — | — | — | 627,663 | |||||||
| iShares MSCI Emerging Markets Minimum Volatility ETF | 15,978,688 | — | — | — | — | — | 15,978,688 | |||||||
| iShares MSCI Emerging Markets Small-Cap ETF | 8,080,278 | — | — | — | — | — | 8,080,278 | |||||||
| iShares MSCI Emerging Markets Value ETF | 511,452 | — | — | — | — | — | 511,452 | |||||||
| iShares MSCI Global Agriculture Producers ETF | 17,007 | — | — | — | — | — | 17,007 | |||||||
| iShares MSCI Global Energy Producers ETF | 38,653 | — | — | — | — | — | 38,653 | |||||||
| iShares MSCI Global Metals & Mining Producers ETF | 1,369,119 | — | — | — | — | — | 1,369,119 | |||||||
| iShares MSCI South Korea Capped ETF | 13,366,759 | — | — | 60,990,953 | 226,591,665 | 78,503,704 | 379,453,081 | |||||||
| iShares MSCI Taiwan ETF | 48,030,508 | 64,999,586 | 16,734,578 | 343,375,145 | 363,052,013 | 19,669,958 | 855,861,788 |
| 1 | Must be utilized prior to losses subject to expiration. |
Table of Contents
Table of Contents
Table of Contents
Table of Contents
Table of Contents
| • | Capital gains resulting from the sale of Indian securities (including depositary receipts issued by Indian companies) will not be subject to tax in India, provided the Subsidiary does not have Permanent Establishments (“PE”) in India; |
| • | Dividends on shares received from an Indian company on which dividend distribution tax has been paid are exempt from tax in the hands of the shareholders. However, the Indian company distributing dividends is subject to a dividend distribution tax at the rate of 20% (approx.) (effective starting October 1, 2014); and |
| • | Interest paid to a Subsidiary in respect of the debt obligations of Indian issuers will be subject to Indian income tax. The tax rate, in the case of rupee-denominated debt obligations, is 43.26%. However if the Subsidiary is a SEBI registered sub-account, interest income earned from June 1, 2013 to May 31, 2015 on rupee-denominated bonds of Indian companies and Government securities, will be subject to tax at the rate of 5.41%, provided that the rate of interest does not exceed the prescribed rates. In the case of foreign currency-denominated debt obligations, the tax rate is 21.63%. For approved foreign currency loans advanced from July 1, 2012 to June 30, 2017, the tax rate on interest is 5.41% and for approved foreign currency long-term bonds issued from October 1, 2014 to June 30, 2017, the tax rate on interest is 5.41%. However, if the Subsidiary is a SEBI registered sub-account, the interest from securities will be subject to tax at the rate of 21.63%. |
Table of Contents
| • | Long-term capital gains (being gains on sale of shares held for a period of more than twelve months) listed on a recognized stock exchange would not be taxable in India provided Securities Transaction Tax (“STT”) has been paid on the same (as discussed below); |
| • | Short-term capital gains (being gains on sale of shares held for a period of twelve months or less) from the sale of Indian shares listed on a recognized stock exchange will be taxed at the rate of 16.223% provided STT has been paid on the same; |
| • | Long-term capital gains (being gains on sale of shares held for a period of more than 36 months) arising to the Subsidiary from the sale of unlisted securities will be taxed at the rate of 10.815% (without indexation) and short-term capital gains (being gains on sale of shares held for a period of 36 months or less) will be taxed at the rate of 43.26%;* |
| • | Capital gains realized on sale of listed equity shares not executed on a recognized stock exchange in India would be taxed at the rate of 21.63% for long-term gains (being gains on sale of shares held for a period of more than 12 months) and at 43.26% in the case of short-term gains (being gains on sale of shares held for a period of 12 months or less);* and |
| • | Capital gains arising from the transfer of depositary receipts outside India between non-resident investors will not be subject to tax in India. |
| * | However, if the Subsidiary is a SEBI registered sub-account, the rates will be 10.816% and 32.45%, respectively. |
Table of Contents
| • | any arrangement where the aggregate tax benefit to all the parties of the arrangement in the relevant financial year does not exceed INR 30 Million; |
| • | FIIs that choose not to take any benefit under any tax treaty entered with India and has invested in listed or unlisted securities with prior permission of the competent authority in accordance with the applicable regulations; |
| • | non-resident investor in an FII who has invested in an FII, directly or indirectly, by way of an offshore derivative instrument or otherwise; or |
| • | any income derived from the transfer of investments made prior to August 30, 2010. |
Table of Contents
Table of Contents
Table of Contents
Table of Contents
Table of Contents
iShares MSCI Brazil Capped ETF
iShares MSCI BRIC ETF
iShares MSCI Emerging Markets ETF
iShares MSCI Emerging Markets Minimum Volatility ETF
iShares MSCI Frontier 100 ETF
iShares MSCI Malaysia ETF
iShares MSCI South Korea Capped ETF
iShares MSCI Taiwan ETF
Table of Contents
Table of Contents
(as revised June 22, 2015)
| Fund | Ticker | Stock Exchange | ||
| iShares Currency Hedged MSCI Emerging Markets ETF (the “Fund”) | HEEM | NYSE Arca |
Table of Contents
Table of Contents
Table of Contents
Table of Contents
Table of Contents
Table of Contents
Table of Contents
Table of Contents
Table of Contents
Table of Contents
Table of Contents
Table of Contents
Table of Contents
Table of Contents
Table of Contents
Table of Contents
Table of Contents
Table of Contents
Table of Contents
Table of Contents
Table of Contents
Table of Contents
Table of Contents
Table of Contents
Table of Contents
Table of Contents
Table of Contents
| • | The Fund generally supports the board’s nominees in the election of directors and generally supports proposals that strengthen the independence of boards of directors; |
| • | When a director has committed himself or herself to service on more than four public company boards (but no more than six public company boards in most circumstances), the Fund will consider such director’s individual circumstances in determining whether the director will be able to commit sufficient focus and time to a particular company; |
| • | The Fund generally defers to an issuer’s choice of auditors so long as the corporate auditors represent the interests of shareholders and provide an independent view of the propriety of financial reporting decisions of management; |
| • | The Fund generally favors disclosure of a company’s compensation and benefits policies and opposes excessive compensation, but believes that compensation matters are normally best determined by a company’s board of directors; |
| • | The Fund generally expects to support capital structure requests that it believes enhance the rights of common shareholders and oppose requests that appear to be unreasonably dilutive; |
| • | The Fund generally does not support proposals on social issues that lack a demonstrable economic benefit to the issuer and the Fund investing in such issuer; and |
| • | The Fund generally votes against anti-takeover proposals and proposals that would create additional barriers or costs to corporate transactions that are likely to deliver a premium to shareholders. |
Table of Contents
Table of Contents
| • | MSCI Global Standard Indexes cover all investable large- and mid-cap securities by including approximately 85% of each market's free float-adjusted market capitalization. |
| • | MSCI Global Small Cap Indexes provide coverage to all companies with a market capitalization below that of the companies in the MSCI Global Standard Indexes by including above and beyond the coverage of the MSCI Global Standard Indexes. |
| • | Achieving global size integrity by ensuring that companies of comparable and relevant sizes are included in a given size segment across all markets in a composite index; and |
| • | Achieving consistent market coverage by ensuring that each market's size segment is represented in its proportional weight in the composite universe. |
Table of Contents
| • | Semi-Annual Index Reviews (“SAIRs”), conducted on a fixed semi-annual timetable that systematically reassess the various dimensions of the equity universe for all markets; |
| • | Quarterly Index Reviews (“QIRs”), aimed at promptly reflecting other significant market events; and |
| • | Ongoing event-related changes, such as mergers, acquisitions, spin-offs, bankruptcies, reorganizations and other similar corporate events, which generally are implemented in the indexes as they occur. |
Table of Contents
| 1. | Concentrate its investments in a particular industry, as that term is used in the Investment Company Act, except that the Fund will concentrate to approximately the same extent that its Underlying Index concentrates in the securities of a particular industry or group of industries. |
| 2. | Borrow money, except as permitted under the Investment Company Act. |
| 3. | Issue senior securities to the extent such issuance would violate the Investment Company Act. |
| 4. | Purchase or hold real estate, except the Fund may purchase and hold securities or other instruments that are secured by, or linked to, real estate or interests therein, securities of real estate investment trusts, mortgage-related securities and securities of issuers engaged in the real estate business, and the Fund may purchase and hold real estate as a result of the ownership of securities or other instruments. |
| 5. | Underwrite securities issued by others, except to the extent that the sale of portfolio securities by the Fund may be deemed to be an underwriting or as otherwise permitted by applicable law. |
| 6. | Purchase or sell commodities or commodity contracts, except as permitted by the Investment Company Act. |
| 7. | Make loans to the extent prohibited by the Investment Company Act. |
Table of Contents
Table of Contents
| a. | Provided that such policy will only be in effect if the Fund ceases to invest its assets in reliance on Section 12(d)(1)(G) in the iShares MSCI Emerging Markets ETF (or a different Underlying Fund): Purchase securities of other investment companies, except to the extent permitted by the Investment Company Act. As a matter of policy, however, the Fund will not purchase shares of any registered open-end investment company or registered unit investment trust, in reliance on Section 12(d)(1)(F) or (G) (the “fund of funds” provisions) of the Investment Company Act, at any time the Fund has knowledge that its shares are purchased by another investment company investor in reliance on the provisions of subparagraph (G) of Section 12(d)(1). |
| b. | Make short sales of securities or maintain a short position, except to the extent permitted by the Fund’s Prospectus and Statement of Additional Information, as amended from time to time, and applicable law. |
| • | The frequency of trades and quotes for the security; |
| • | The number of dealers wishing to purchase or sell the security and the number of other potential purchasers; |
| • | Dealer undertakings to make a market in the security; and |
| • | The nature of the security and the nature of the marketplace in which it trades (e.g., the time needed to dispose of the security, the method of soliciting offers and the mechanics of transfer). |
Table of Contents
Table of Contents
| Name (Age) | Position | Principal
Occupation(s) During the Past 5 Years |
Other
Directorships Held by Director | |||
| Robert
S. Kapito1 (57) |
Director
(since 2009). |
President and Director, BlackRock, Inc. (since 2006); Vice Chairman of BlackRock, Inc. and Head of BlackRock, Inc.’s Portfolio Management Group (since its formation in 1998) and BlackRock, Inc.’s predecessor entities (since 1988); Trustee, University of Pennsylvania (since 2009); President of Board of Directors, Hope & Heroes Children’s Cancer Fund (since 2002); President of the Board of Directors, Periwinkle Theatre for Youth (since 1983). | Trustee of iShares Trust (since 2009); Director of iShares MSCI Russia Capped ETF, Inc. (since 2010); Trustee of iShares U.S. ETF Trust (since 2011); Director of BlackRock, Inc. (since 2006). | |||
| Mark
Wiedman2 (44) |
Director (since 2013). | Managing Director, BlackRock, Inc. (since 2007); Global Head of iShares (since 2011); Head of Corporate Strategy, BlackRock, Inc. (2009-2011). | Trustee of iShares Trust (since 2013); Director of iShares MSCI Russia Capped ETF, Inc. (since 2013);Trustee of iShares U.S. ETF Trust (since 2013); Director of PennyMac Financial Services, Inc. (since 2008). |
| 1 | Robert S. Kapito is deemed to be an “interested person” (as defined in the 1940 Act) of the Company due to his affiliations with BlackRock, Inc. |
| 2 | Mark Wiedman is deemed to be an “interested person” (as defined in the 1940 Act) of the Company due to his affiliations with BlackRock, Inc. and its affiliates. |
| Name (Age) | Position | Principal
Occupation(s) During the Past 5 Years |
Other
Directorships Held by Director | |||
| Robert
H. Silver (59) |
Director
(since 2007); Independent Chairman (since 2012). |
President and Co-Founder of The Bravitas Group, Inc. (since 2006); Director and Vice Chairman of the YMCA of Greater NYC (2001-2011); Broadway Producer (2006-2011); Co-Founder and Vice President of Parentgiving Inc. (since 2008); Director and Member of the Audit and Compensation Committee of EPAM Systems, Inc. (2006-2009); President and Chief Operating Officer of UBS Financial Services Inc. (formerly Paine Webber Inc.) (2003-2005) and various executive positions with UBS and its affiliates (1988-2005); CPA and Audit Manager of KPMG, LLP (formerly Peat Marwick Mitchell) (1977-1983). | Trustee of iShares Trust (since 2007); Director of iShares MSCI Russia Capped ETF, Inc. (since 2010); Trustee of iShares U.S. ETF Trust (since 2011); Independent Chairman of iShares Trust, iShares MSCI Russia Capped ETF, Inc. and iShares U.S. ETF Trust (since 2012). |
Table of Contents
| Name (Age) | Position | Principal
Occupation(s) During the Past 5 Years |
Other
Directorships Held by Director | |||
| John
E. Martinez (53) |
Director
(since 2003); Securities Lending Committee Chair (since 2012). |
Director of FirstREX Agreement Corp. (formerly EquityRock, Inc.) (since 2005). | Trustee of iShares Trust (since 2003); Director of iShares MSCI Russia Capped ETF, Inc. (since 2010); Trustee of iShares U.S. ETF Trust (since 2011). | |||
| Cecilia
H. Herbert (65) |
Director
(since 2005); Nominating and Governance Committee Chair and Equity Plus Committee Chair (since 2012). |
Director (1998-2013) and President (2007-2011) of the Board of Directors, Catholic Charities CYO; Trustee (2002-2011) and Chair of the Finance and Investment Committee (2006-2010) of the Thacher School; Member (since 1992) and Chair (1994-2005) of the Investment Committee, Archdiocese of San Francisco; Trustee and Member of the Investment Committee, WNET, the New York public broadcasting/media company (since 2011). | Trustee of iShares Trust (since 2005); Director of iShares MSCI Russia Capped ETF, Inc. (since 2010); Trustee of iShares U.S. ETF Trust (since 2011); Director of Forward Funds (34 portfolios) (since 2009). | |||
| Charles
A. Hurty (71) |
Director
(since 2005); Audit Committee Chair (since 2006). |
Retired; Partner, KPMG LLP (1968-2001). | Trustee of iShares Trust (since 2005); Director of iShares MSCI Russia Capped ETF, Inc. (since 2010); Trustee of iShares U.S. ETF Trust (since 2011); Director of GMAM Absolute Return Strategy Fund (1 portfolio) (since 2002); Director of SkyBridge Alternative Investments Multi-Adviser Hedge Fund Portfolios LLC (2 portfolios) (since 2002). | |||
| John
E. Kerrigan (59) |
Director
(since 2005); Fixed Income Plus Committee Chair (since 2012). |
Chief Investment Officer, Santa Clara University (since 2002). | Trustee of iShares Trust (since 2005); Director of iShares MSCI Russia Capped ETF, Inc. (since 2010); Trustee of iShares U.S. ETF Trust (since 2011). | |||
| Madhav
V. Rajan (50) |
Director
(since 2011); 15(c) Committee Chair (since 2012). |
Robert K. Jaedicke Professor of Accounting and Senior Associate Dean for Academic Affairs and Head of MBA Program, Stanford University Graduate School of Business (since 2001); Professor of Law (by courtesy), Stanford Law School (since 2005); Visiting Professor, University of Chicago (2007-2008). | Trustee
of iShares Trust (since 2011); Director of iShares MSCI Russia Capped ETF, Inc. (since 2011); Trustee of iShares U.S. ETF Trust (since 2011); Director, Cavium, Inc. (since 2013). | |||
| Jane
D. Carlin (59) |
Director
(since 2015). |
Managing Director and Global Head of Financial Holding Company Governance & Assurance and the Global Head of Operational Risk Management of Morgan Stanley Group (2006-2012). | Trustee of iShares Trust (since 2015); Trustee of iShares U.S. ETF Trust (since 2015); Director of PHH Corporation (mortgage solutions) (since 2012). |
Table of Contents
| Name (Age) | Position | Principal
Occupation(s) During the Past 5 Years | ||
| Manish
Mehta (43) |
President (since 2013). | Managing Director, BlackRock, Inc. (since 2009); Chief Operating Officer for iShares (since 2009); Head of Strategy and Corporate Development, BGI (2005-2009); Chief of Staff to the CEO, BGI (2005-2009). | ||
| Jack
Gee (55) |
Treasurer
and Chief Financial Officer (since 2008). |
Managing Director, BlackRock, Inc. (since 2009); Senior Director of Fund Administration of Intermediary Investor Business, BGI (2009); Director of Fund Administration of Intermediary Investor Business, BGI (2004-2009). | ||
| Eilleen
M. Clavere (62) |
Secretary
(since 2007). |
Director of Global Fund Administration, BlackRock, Inc. (since 2009); Director of Legal Administration of Intermediary Investor Business, BGI (2006-2009); Legal Counsel and Vice President of Atlas Funds, Atlas Advisers, Inc. and Atlas Securities, Inc. (2005-2006); Counsel at Kirkpatrick & Lockhart LLP (2001-2005). | ||
| Edward
B. Baer (46) |
Vice
President and Chief Legal Officer (since 2012). |
Managing Director of Legal & Compliance, BlackRock, Inc. (since 2006); Director of Legal & Compliance, BlackRock, Inc. (2004-2006). | ||
| Scott
Radell (46) |
Executive
Vice President (since 2012). |
Managing Director, BlackRock, Inc. (since 2009); Head of Portfolio Solutions, BlackRock, Inc. (since 2009); Head of Portfolio Solutions, BGI (2007-2009); Credit Portfolio Manager, BGI (2005-2007); Credit Research Analyst, BGI (2003-2005). | ||
| Amy
Schioldager (52) |
Executive
Vice President (since 2007). |
Senior Managing Director, BlackRock, Inc. (since 2009); Global Head of Index Equity, BGI (2008-2009); Global Head of U.S. Indexing, BGI (2006-2008); Head of Domestic Equity Portfolio Management, BGI (2001-2006). |
Table of Contents
| Name (Age) | Position | Principal
Occupation(s) During the Past 5 Years | ||
| Ira
P. Shapiro (51) |
Vice
President (since 2007). |
Managing Director, BlackRock, Inc. (since 2009); Head of Strategic Product Initiatives for iShares (since 2012); Chief Legal Officer, Exchange-Traded Fund Complex (2007-2012); Associate General Counsel, BGI (2004-2009). |
Table of Contents
Table of Contents
Table of Contents
Table of Contents
| Name of Director | Fund | Dollar
Range of Equity Securities in the Fund |
Aggregate
Dollar Range of Equity Securities in all Registered Investment Companies Overseen by Director in Family of Investment Companies | |||
| Robert S. Kapito | None | None | None | |||
| Mark Wiedman1 | iShares Core MSCI EAFE ETF | Over $100,000 | Over $100,000 | |||
| iShares Core MSCI Emerging Markets ETF | $50,001-$100,000 |
Table of Contents
| Name of Director | Fund | Dollar
Range of Equity Securities in the Fund |
Aggregate
Dollar Range of Equity Securities in all Registered Investment Companies Overseen by Director in Family of Investment Companies | |||
| iShares Core S&P Total U.S. Stock Market ETF | $50,001-$100,000 | |||||
| Robert H. Silver | iShares iBonds Sep 2015 AMT-Free Muni Bond ETF | Over $100,000 | Over $100,000 | |||
| iShares iBonds Sep 2016 AMT-Free Muni Bond ETF | Over $100,000 | |||||
| iShares iBonds Sep 2017 AMT-Free Muni Bond ETF | Over $100,000 | |||||
| iShares iBonds Sep 2018 AMT-Free Muni Bond ETF | Over $100,000 | |||||
| iShares Core High Dividend ETF | Over $100,000 | |||||
| iShares Core MSCI EAFE ETF | Over $100,000 | |||||
| iShares Core MSCI Emerging Markets ETF | Over $100,000 | |||||
| iShares Core MSCI Total International Stock ETF | Over $100,000 | |||||
| iShares Core S&P 500 ETF | Over $100,000 | |||||
| iShares Core S&P Mid-Cap ETF | Over $100,000 | |||||
| iShares Core S&P Small-Cap ETF | Over $100,000 | |||||
| iShares Core S&P Total U.S. Stock Market ETF | Over $100,000 | |||||
| iShares iBoxx $ Investment Grade Corporate Bond ETF | Over $100,000 | |||||
| iShares J.P. Morgan USD Emerging Markets Bond ETF | $1-$10,000 | |||||
| iShares MSCI ACWI ex U.S. ETF | $1-$10,000 | |||||
| iShares MSCI BRIC ETF | $10,001-$50,000 | |||||
| iShares MSCI Emerging Markets ETF | $1-$10,000 | |||||
| iShares MSCI Frontier 100 ETF | $50,001-$100,000 | |||||
| iShares National AMT-Free Muni Bond ETF | Over $100,000 | |||||
| iShares Russell 1000 Growth ETF | Over $100,000 | |||||
| iShares Russell 1000 Value ETF | Over $100,000 | |||||
| iShares Russell 2000 ETF | $10,001-$50,000 | |||||
| iShares Russell 2000 Growth ETF | Over $100,000 | |||||
| iShares Russell 2000 Value ETF | Over $100,000 | |||||
| iShares Russell 3000 ETF | Over $100,000 | |||||
| iShares Russell Mid-Cap Growth ETF | $1-$10,000 | |||||
| iShares Russell Mid-Cap Value ETF | $1-$10,000 | |||||
| iShares Select Dividend ETF | $10,001-$50,000 | |||||
| iShares U.S. Broker-Dealers ETF | Over $100,000 | |||||
| iShares U.S. Financial Services ETF | $50,001-$100,000 | |||||
| iShares U.S. Preferred Stock ETF | Over $100,000 |
Table of Contents
| Name of Director | Fund | Dollar
Range of Equity Securities in the Fund |
Aggregate
Dollar Range of Equity Securities in all Registered Investment Companies Overseen by Director in Family of Investment Companies | |||
| iShares U.S. Regional Banks ETF | Over $100,000 | |||||
| iShares U.S. Technology ETF | $50,001-$100,000 | |||||
| George G.C. Parker | iShares California AMT-Free Muni Bond ETF | Over $100,000 | Over $100,000 | |||
| iShares Core S&P 500 ETF | Over $100,000 | |||||
| iShares Core U.S. Aggregate Bond ETF | $10,001-$50,000 | |||||
| iShares iBoxx $ Investment Grade Corporate Bond ETF | Over $100,000 | |||||
| iShares MSCI EAFE ETF | Over $100,000 | |||||
| iShares S&P 100 ETF | Over $100,000 | |||||
| iShares Select Dividend ETF | Over $100,000 | |||||
| John E. Martinez | iShares Core MSCI Emerging Markets ETF | $50,001-$100,000 | Over $100,000 | |||
| iShares Core S&P 500 ETF | Over $100,000 | |||||
| iShares Emerging Markets Infrastructure ETF | Over $100,000 | |||||
| iShares Global Consumer Staples ETF | Over $100,000 | |||||
| iShares MSCI All Country Asia ex Japan ETF | Over $100,000 | |||||
| iShares MSCI EAFE ETF | Over $100,000 | |||||
| iShares Russell 1000 ETF | Over $100,000 | |||||
| iShares Russell 1000 Value ETF | Over $100,000 | |||||
| iShares Russell 2000 ETF | Over $100,000 | |||||
| iShares TIPS Bond ETF | Over $100,000 | |||||
| Cecilia H. Herbert | iShares China Large-Cap ETF | Over $100,000 | Over $100,000 | |||
| iShares Core MSCI Emerging Markets ETF | $10,001-$50,000 | |||||
| iShares Core MSCI Total International Stock ETF | $10,001-$50,000 | |||||
| iShares Core S&P Total U.S. Stock Market ETF | $10,001-$50,000 | |||||
| iShares iBoxx $ High Yield Corporate Bond ETF | $10,001-$50,000 | |||||
| iShares International Select Dividend ETF | $1-$10,000 | |||||
| iShares MSCI EAFE ETF | $10,001-$50,000 | |||||
| iShares MSCI Emerging Markets ETF | $1-$10,000 | |||||
| iShares MSCI Japan ETF | $10,001-$50,000 | |||||
| iShares National AMT-Free Muni Bond ETF | $10,001-$50,000 | |||||
| iShares U.S. Preferred Stock ETF | $10,001-$50,000 | |||||
| Charles A. Hurty | iShares China Large-Cap ETF | $10,001-$50,000 | Over $100,000 | |||
| iShares Core High Dividend ETF | $10,001-$50,000 |
Table of Contents
| Name of Director | Fund | Dollar
Range of Equity Securities in the Fund |
Aggregate
Dollar Range of Equity Securities in all Registered Investment Companies Overseen by Director in Family of Investment Companies | |||
| iShares Core MSCI Emerging Markets ETF | $50,001-$100,000 | |||||
| iShares Core S&P 500 ETF | $10,001-$50,000 | |||||
| iShares Global Energy ETF | $10,001-$50,000 | |||||
| iShares Global Tech ETF | $10,001-$50,000 | |||||
| iShares MSCI EAFE ETF | $10,001-$50,000 | |||||
| iShares MSCI Japan ETF | $10,001-$50,000 | |||||
| iShares North American Tech-Multimedia Networking ETF | $1-$10,000 | |||||
| iShares U.S. Energy ETF | $10,001-$50,000 | |||||
| iShares U.S. Financials ETF | $1-$10,000 | |||||
| iShares U.S. Technology ETF | $50,001-$100,000 | |||||
| John E. Kerrigan | iShares MSCI ACWI ex U.S. ETF | Over $100,000 | Over $100,000 | |||
| iShares Short-Term National AMT-Free Muni Bond ETF | Over $100,000 | |||||
| Madhav V. Rajan | iShares Core High Dividend ETF | Over $100,000 | Over $100,000 | |||
| iShares Core MSCI Emerging Markets ETF | Over $100,000 | |||||
| iShares Core S&P 500 ETF | Over $100,000 | |||||
| iShares iBoxx $ High Yield Corporate Bond ETF | $50,001-$100,000 | |||||
| iShares iBoxx $ Investment Grade Corporate Bond ETF | Over $100,000 | |||||
| iShares Select Dividend ETF | Over $100,000 | |||||
| Jane D. Carlin2 | iShares Core MSCI EAFE ETF | $10,001-$50,000 | Over $100,000 | |||
| iShares Core S&P Small-Cap ETF | $10,001-$50,000 | |||||
| iShares Global Tech ETF | $50,001-$100,000 |
Table of Contents
| Name of Director | iShares
Currency Hedged MSCI Emerging Markets ETF |
Pension
or Retirement Benefits Accrued As Part of Company Expenses5 |
Estimated
Annual Benefits Upon Retirement5 |
Total
Compensation From the Fund and Fund Complex6 | ||||
| Independent Directors:1 | ||||||||
| Robert H. Silver | $0 | Not Applicable | Not Applicable | $ 325,000 | ||||
| George G.C. Parker2 | 0 | Not Applicable | Not Applicable | 275,000 | ||||
| John E. Kerrigan | 0 | Not Applicable | Not Applicable | 315,882 | ||||
| Charles A. Hurty | 0 | Not Applicable | Not Applicable | 315,000 | ||||
| Cecilia H. Herbert | 0 | Not Applicable | Not Applicable | 305,000 | ||||
| John E. Martinez | 0 | Not Applicable | Not Applicable | 290,000 | ||||
| Madhav V. Rajan | 0 | Not Applicable | Not Applicable | 301,765 | ||||
| Interested Directors: | ||||||||
| Robert S. Kapito | $0 | Not Applicable | Not Applicable | $ 0 | ||||
| Mark Wiedman3 | 0 | Not Applicable | Not Applicable | 0 | ||||
| Michael Latham4 | 0 | Not Applicable | Not Applicable | 0 |
| 1 | Compensation is not shown for Jane D. Carlin because she was appointed to serve as an Independent Director of the Company effective February 3, 2015. |
| 2 | Served as an Independent Director through December 31, 2014. |
| 3 | Appointed to serve as an Interested Director effective December 31, 2013. |
| 4 | Served as an Interested Director through December 31, 2013. |
| 5 | No Director or officer is entitled to any pension or retirement benefits from the Company. |
| 6 | Includes compensation for service on the Board of Trustees of iShares U.S. ETF Trust and the Boards of Directors of iShares, Inc. and iShares MSCI Russia Capped ETF, Inc. |
Table of Contents
| Name and Address | Percentage
of Ownership | |
| Merrill
Lynch, Pierce, Fenner & Smith Incorporated 101 Hudson Street 9th Floor Jersey City, NJ 07302-3997 |
79.35% | |
| National
Financial Services LLC 200 Liberty Street 5th Floor New York, NY 10281 |
15.93% |
Table of Contents
Table of Contents
Table of Contents
Table of Contents
Table of Contents
Table of Contents
Table of Contents
| Matthew Goff | ||||
| Types of Accounts | Number | Total Assets | ||
| Registered Investment Companies | 258 | $595,000,000,000 | ||
| Other Pooled Investment Vehicles | 0 | N/A | ||
| Other Accounts | 2 | 200,000,000 | ||
| Accounts with Incentive-Based Fee Arrangements | 0 | N/A |
| Diane Hsiung | ||||
| Types of Accounts | Number | Total Assets | ||
| Registered Investment Companies | 258 | $595,000,000,000 | ||
| Other Pooled Investment Vehicles | 21 | 7,750,000,000 | ||
| Other Accounts | 0 | N/A | ||
| Accounts with Incentive-Based Fee Arrangements | 0 | N/A |
| Jennifer Hsui | ||||
| Types of Accounts | Number | Total Assets | ||
| Registered Investment Companies | 260 | $595,000,000,000 | ||
| Other Pooled Investment Vehicles | 0 | N/A | ||
| Other Accounts | 0 | N/A | ||
| Accounts with Incentive-Based Fee Arrangements | 0 | N/A |
| Orlando Montalvo | ||||
| Types of Accounts | Number | Total Assets | ||
| Registered Investment Companies | 4 | $ 91,000,000 | ||
| Other Pooled Investment Vehicles | 22 | 7,000,000,000 | ||
| Other Accounts | 68 | 21,000,000,000 | ||
| Accounts with Incentive-Based Fee Arrangements | 0 | N/A |
Table of Contents
| Greg Savage | ||||
| Types of Accounts | Number | Total Assets | ||
| Registered Investment Companies | 324 | $660,000,000,000 | ||
| Other Pooled Investment Vehicles | 89 | 45,000,000,000 | ||
| Other Accounts | 12 | 1,500,000,000 | ||
| Accounts with Incentive-Based Fee Arrangements | 0 | N/A |
| Matthew Goff | ||||
| Types of Accounts | Number
of Other Accounts with Performance Fees Managed by Portfolio Manager |
Aggregate
of Total Assets | ||
| Registered Investment Companies | 0 | N/A | ||
| Other Pooled Investment Vehicles | 0 | N/A | ||
| Other Accounts | 0 | N/A |
| Diane Hsiung | ||||
| Types of Accounts | Number
of Other Accounts with Performance Fees Managed by Portfolio Manager |
Aggregate
of Total Assets | ||
| Registered Investment Companies | 0 | N/A | ||
| Other Pooled Investment Vehicles | 0 | N/A | ||
| Other Accounts | 0 | N/A |
Table of Contents
| Jennifer Hsui | ||||
| Types of Accounts | Number
of Other Accounts with Performance Fees Managed by Portfolio Manager |
Aggregate
of Total Assets | ||
| Registered Investment Companies | 0 | N/A | ||
| Other Pooled Investment Vehicles | 0 | N/A | ||
| Other Accounts | 0 | N/A |
| Orlando Montalvo | ||||
| Types of Accounts | Number
of Other Accounts with Performance Fees Managed by Portfolio Manager |
Aggregate
of Total Assets | ||
| Registered Investment Companies | 0 | N/A | ||
| Other Pooled Investment Vehicles | 0 | N/A | ||
| Other Accounts | 0 | N/A |
| Greg Savage | ||||
| Types of Accounts | Number
of Other Accounts with Performance Fees Managed by Portfolio Manager |
Aggregate
of Total Assets | ||
| Registered Investment Companies | 0 | N/A | ||
| Other Pooled Investment Vehicles | 0 | N/A | ||
| Other Accounts | 0 | N/A |
Table of Contents
Table of Contents
Table of Contents
Table of Contents
Table of Contents
Table of Contents
Table of Contents
Table of Contents
Table of Contents
Table of Contents
Table of Contents
| Shares
Per Creation Unit |
Value
Per Creation Unit (U.S.$) | |
| 50,000 | $1,205,000 |
Table of Contents
Table of Contents
Table of Contents
| Standard
Creation Transaction Fee |
Maximum
Additional Charge* | |
| $500 | 3.0% |
| * | As a percentage of the net asset value per Creation Unit. |
Table of Contents
| Standard
Redemption Transaction Fee |
Maximum
Additional Charge* | |
| $500 | 2.0% |
| * | As a percentage of the net asset value per Creation Unit, inclusive of the standard redemption transaction fee. |
Table of Contents
Table of Contents
Table of Contents
Table of Contents
Table of Contents
| 2015 | ||||||
| Country | Trade
Date |
Settlement
Date |
Number
of Days to Settle | |||
| China | 02/13/15 | 02/25/15 | 12 | |||
| 02/16/15 | 02/26/15 | 10 | ||||
| 02/17/15 | 02/27/15 | 10 | ||||
| 09/28/15 | 10/08/15 | 10 | ||||
| 09/29/15 | 10/09/15 | 10 | ||||
| 09/30/15 | 10/12/15 | 12 | ||||
| Indonesia | 07/13/15 | 07/22/15 | 9 | |||
| 07/14/15 | 07/23/15 | 9 | ||||
| 07/15/15 | 07/24/15 | 9 | ||||
| Qatar | 07/15/15 | 07/23/15 | 8 | |||
| 07/16/15 | 07/26/15 | 10 | ||||
| 07/19/15 | 07/27/15 | 8 | ||||
| 09/16/15 | 09/24/15 | 8 | ||||
| 09/17/15 | 09/27/15 | 10 | ||||
| 09/20/15 | 09/28/15 | 8 | ||||
| Russia | 12/24/15 | 01/11/16 | 18 | |||
| 12/28/15 | 01/15/16 | 15 | ||||
| 12/29/15 | 01/18/15 | 18 | ||||
| South Africa | 03/27/15 | 04/07/15 | 11 | |||
| 03/30/15 | 04/08/15 | 9 | ||||
| 03/31/15 | 04/09/15 | 9 | ||||
| 04/01/15 | 04/10/15 | 9 | ||||
| 04/02/15 | 04/13/15 | 11 | ||||
| 04/20/15 | 04/28/15 | 8 | ||||
| 04/21/15 | 04/29/15 | 8 | ||||
| 04/22/15 | 04/30/15 | 8 | ||||
| 04/23/15 | 05/01/15 | 8 | ||||
| 04/23/15 | 05/04/15 | 11 | ||||
| 04/24/15 | 05/05/15 | 11 | ||||
| 04/28/15 | 05/06/15 | 8 | ||||
| 04/29/15 | 05/07/15 | 8 | ||||
| 04/30/15 | 05/08/15 | 8 | ||||
| 06/09/15 | 06/17/15 | 8 | ||||
| 06/10/15 | 06/18/15 | 8 | ||||
| 06/11/15 | 06/19/15 | 8 | ||||
| 06/12/15 | 06/22/15 | 10 | ||||
| 06/15/15 | 06/23/15 | 8 | ||||
| 08/03/15 | 08/11/15 | 8 | ||||
| 08/04/15 | 08/12/15 | 8 | ||||
| 08/05/15 | 08/13/15 | 8 | ||||
| 08/06/15 | 08/14/15 | 8 | ||||
| 08/07/15 | 08/17/15 | 10 | ||||
| 09/17/15 | 09/25/15 | 8 | ||||
| 09/18/15 | 09/28/15 | 10 | ||||
| 09/21/15 | 09/29/15 | 8 | ||||
Table of Contents
| 2015 | ||||||
| Country | Trade
Date |
Settlement
Date |
Number
of Days to Settle | |||
| 09/22/15 | 09/30/15 | 8 | ||||
| 09/23/15 | 10/01/15 | 8 | ||||
| 12/09/15 | 12/17/15 | 8 | ||||
| 12/10/15 | 12/18/15 | 8 | ||||
| 12/11/15 | 12/21/15 | 10 | ||||
| 12/14/15 | 12/22/15 | 8 | ||||
| 12/15/15 | 12/23/15 | 8 | ||||
| 12/18/15 | 12/28/15 | 10 | ||||
| 12/21/15 | 12/29/15 | 8 | ||||
| 12/22/15 | 12/30/15 | 8 | ||||
| 12/23/15 | 12/31/15 | 8 | ||||
| 12/24/15 | 01/04/16 | 11 | ||||
| 12/28/15 | 01/05/16 | 8 | ||||
| 12/29/15 | 01/06/16 | 8 | ||||
| 12/30/15 | 01/07/16 | 8 | ||||
| 12/31/15 | 01/08/16 | 8 | ||||
| Taiwan | 02/12/15 | 02/24/15 | 12 | |||
| 02/13/15 | 02/25/15 | 12 | ||||
| Thailand | 04/08/15 | 04/16/15 | 8 | |||
| 04/09/15 | 04/17/15 | 8 | ||||
| 04/10/15 | 04/20/15 | 10 | ||||
| * | These worst-case redemption cycles are based on information regarding regular holidays, which may be out of date. Based on changes in holidays, longer (worse) redemption cycles are possible. |
Table of Contents
Table of Contents
Table of Contents
Table of Contents
Table of Contents
Table of Contents
Table of Contents
Table of Contents
Table of Contents
Table of Contents
(as revised June 22, 2015)
| Fund | Ticker | Stock Exchange | ||
| iShares MSCI Russia Capped ETF (the “Fund”) | ERUS | NYSE Arca |
Table of Contents
Table of Contents
Table of Contents
Table of Contents
Table of Contents
Table of Contents
Table of Contents
Table of Contents
Table of Contents
Table of Contents
Table of Contents
Table of Contents
Table of Contents
Table of Contents
Table of Contents
Table of Contents
Table of Contents
Table of Contents
Table of Contents
Table of Contents
Table of Contents
Table of Contents
| • | The Fund generally supports the board’s nominees in the election of directors and generally supports proposals that strengthen the independence of boards of directors; |
| • | When a director has committed himself or herself to service on more than four public company boards (but no more than six public company boards in most circumstances), the Fund will consider such director’s individual circumstances in determining whether the director will be able to commit sufficient focus and time to a particular company; |
| • | The Fund generally defers to an issuer’s choice of auditors so long as the corporate auditors represent the interests of shareholders and provide an independent view of the propriety of financial reporting decisions of management; |
| • | The Fund generally favors disclosure of a company’s compensation and benefits policies and opposes excessive compensation, but believes that compensation matters are normally best determined by a company’s board of directors; |
Table of Contents
| • | The Fund generally expects to support capital structure requests that it believes enhance the rights of common shareholders and oppose requests that appear to be unreasonably dilutive; |
| • | The Fund generally does not support proposals on social issues that lack a demonstrable economic benefit to the issuer and the Fund investing in such issuer; and |
| • | The Fund generally votes against anti-takeover proposals and proposals that would create additional barriers or costs to corporate transactions that are likely to deliver a premium to shareholders. |
Table of Contents
| • | MSCI Global Standard Indexes cover all investable large- and mid-cap securities by including approximately 85% of each market's free float-adjusted market capitalization. |
| • | MSCI Global Small Cap Indexes provide coverage to all companies with a market capitalization below that of the companies in the MSCI Global Standard Indexes by including above and beyond the coverage of the MSCI Global Standard Indexes. |
Table of Contents
| • | Achieving global size integrity by ensuring that companies of comparable and relevant sizes are included in a given size segment across all markets in a composite index; and |
| • | Achieving consistent market coverage by ensuring that each market's size segment is represented in its proportional weight in the composite universe. |
Table of Contents
| • | Semi-Annual Index Reviews (“SAIRs”), conducted on a fixed semi-annual timetable that systematically reassess the various dimensions of the equity universe for all markets; |
| • | Quarterly Index Reviews (“QIRs”), aimed at promptly reflecting other significant market events; and |
| • | Ongoing event-related changes, such as mergers, acquisitions, spin-offs, bankruptcies, reorganizations and other similar corporate events, which generally are implemented in the indexes as they occur. |
Table of Contents
| 1. | Concentrate its investments (i.e., invest 25% or more of its total assets in the securities of a particular industry or group of industries), except that the Fund will concentrate to approximately the same extent that the Underlying Index concentrates in the securities of such particular industry or group of industries. For purposes of this limitation, securities of the U.S. government (including its agencies and instrumentalities), repurchase agreements collateralized by U.S. government securities, and securities of state or municipal governments and their political subdivisions are not considered to be issued by members of any industry. |
| 2. | Borrow money, except that (i) the Fund may borrow from banks for temporary or emergency (not leveraging) purposes, including the meeting of redemption requests which might otherwise require the untimely disposition of securities; and (ii) the Fund may, to the extent consistent with its investment policies, enter into repurchase agreements, reverse repurchase agreements, forward roll transactions and similar investment strategies and techniques. To the extent that it engages in transactions described in (i) and (ii), the Fund will be limited so that no more than 33 1/3% of the value of its total assets (including the amount borrowed) is derived from such transactions. Any borrowings which come to exceed this amount will be reduced in accordance with applicable law. |
| 3. | Issue any senior security, except as permitted under the 1940 Act, as interpreted, modified or otherwise permitted by regulatory authority having jurisdiction, from time to time. |
| 4. | Make loans, except as permitted under the 1940 Act, as interpreted, modified or otherwise permitted by regulatory authority having jurisdiction, from time to time. |
| 5. | Purchase or sell real estate unless acquired as a result of ownership of securities or other instruments (but this restriction shall not prevent the Fund from investing in securities of companies engaged in the real estate business or securities or other instruments backed by real estate or mortgages), or commodities or commodity contracts (but this restriction shall not prevent the Fund from trading in futures contracts and options on futures contracts, including options on currencies to the extent consistent with the Fund’s investment objective and policies). |
| 6. | Engage in the business of underwriting securities issued by other persons, except to the extent that the Fund may technically be deemed to be an underwriter under the 1933 Act, in disposing of portfolio securities. |
| • | The frequency of trades and quotes for the security; |
| • | The number of dealers wishing to purchase or sell the security and the number of other potential purchasers; |
| • | Dealer undertakings to make a market in the security; and |
| • | The nature of the security and the nature of the marketplace in which it trades (e.g., the time needed to dispose of the security, the method of soliciting offers and the mechanics of transfer). |
Table of Contents
Table of Contents
| Name (Age) | Position | Principal
Occupation(s) During the Past 5 Years |
Other
Directorships Held by Director | |||
| Robert
S. Kapito1 (57) |
Director
(since 2009). |
President and Director, BlackRock, Inc. (since 2006); Vice Chairman of BlackRock, Inc. and Head of BlackRock, Inc.’s Portfolio Management Group (since its formation in 1998) and BlackRock, Inc.’s predecessor entities (since 1988); Trustee, University of Pennsylvania (since 2009); President of Board of Directors, Hope & Heroes Children’s Cancer Fund (since 2002); President of the Board of Directors, Periwinkle Theatre for Youth (since 1983). | Trustee of iShares Trust (since 2009); Director of iShares MSCI Russia Capped ETF, Inc. (since 2010); Trustee of iShares U.S. ETF Trust (since 2011); Director of BlackRock, Inc. (since 2006). | |||
| Mark
Wiedman2 (43) |
Director (since 2013). | Managing Director, BlackRock, Inc. (since 2007); Global Head of iShares (since 2011); Head of Corporate Strategy, BlackRock, Inc. (2009-2011). | Trustee of iShares Trust (since 2013); Director of iShares MSCI Russia Capped ETF, Inc. (since 2013); Trustee of iShares U.S. ETF Trust (since 2013); Director of PennyMac Financial Services, Inc. (since 2008). |
| 1 | Robert S. Kapito is deemed to be an “interested person” (as defined in the 1940 Act) of the Company due to his affiliations with BlackRock, Inc. |
| 2 | Mark Wiedman is deemed to be an “interested person” (as defined in the 1940 Act) of the Company due to his affiliations with BlackRock, Inc. and its affiliates. |
Table of Contents
| Name (Age) | Position | Principal
Occupation(s) During the Past 5 Years |
Other
Directorships Held by Director | |||
| Robert
H. Silver (59) |
Director
(since 2007); Independent Chairman (since 2012). |
President and Co-Founder of The Bravitas Group, Inc. (since 2006); Director and Vice Chairman of the YMCA of Greater NYC (2001-2011); Broadway Producer (2006-2011); Co-Founder and Vice President of Parentgiving Inc. (since 2008); Director and Member of the Audit and Compensation Committee of EPAM Systems, Inc. (2006-2009); President and Chief Operating Officer of UBS Financial Services Inc. (formerly Paine Webber Inc.) (2003-2005) and various executive positions with UBS and its affiliates (1988-2005); CPA and Audit Manager of KPMG, LLP (formerly Peat Marwick Mitchell) (1977-1983). | Trustee of iShares Trust (since 2007); Director of iShares MSCI Russia Capped ETF, Inc. (since 2010); Trustee of iShares U.S. ETF Trust (since 2011); Independent Chairman of iShares Trust, iShares MSCI Russia Capped ETF, Inc. and iShares U.S. ETF Trust (since 2012). | |||
| John
E. Martinez (53) |
Director
(since 2003); Securities Lending Committee Chair (since 2012). |
Director of FirstREX Agreement Corp. (formerly EquityRock, Inc.) (since 2005). | Trustee of iShares Trust (since 2003); Director of iShares MSCI Russia Capped ETF, Inc. (since 2010); Trustee of iShares U.S. ETF Trust (since 2011). | |||
| Cecilia
H. Herbert (65) |
Director
(since 2005); Nominating and Governance Committee Chair and Equity Plus Committee Chair (since 2012). |
Director (1998-2013) and President (2007-2011) of the Board of Directors, Catholic Charities CYO; Trustee (2002-2011) and Chair of the Finance and Investment Committee (2006-2010) of the Thacher School; Member (since 1992) and Chair (1994-2005) of the Investment Committee, Archdiocese of San Francisco; Trustee and Member of the Investment Committee, WNET, the New York public broadcasting/media company (since 2011). | Trustee of iShares Trust (since 2005); Director of iShares MSCI Russia Capped ETF, Inc. (since 2010); Trustee of iShares U.S. ETF Trust (since 2011); Director of Forward Funds (34 portfolios) (since 2009). | |||
| Charles
A. Hurty (71) |
Director
(since 2005); Audit Committee Chair (since 2006). |
Retired; Partner, KPMG LLP (1968-2001). | Trustee of iShares Trust (since 2005); Director of iShares MSCI Russia Capped ETF, Inc. (since 2010); Trustee of iShares U.S. ETF Trust (since 2011); Director of GMAM Absolute Return Strategy Fund (1 portfolio) (since 2002); Director of SkyBridge Alternative Investments Multi-Adviser Hedge Fund Portfolios LLC (2 portfolios) (since 2002). |
Table of Contents
| Name (Age) | Position | Principal
Occupation(s) During the Past 5 Years |
Other
Directorships Held by Director | |||
| John
E. Kerrigan (59) |
Director
(since 2005); Fixed Income Plus Committee Chair (since 2012). |
Chief Investment Officer, Santa Clara University (since 2002). | Trustee of iShares Trust (since 2005); Director of iShares MSCI Russia Capped ETF, Inc. (since 2010); Trustee of iShares U.S. ETF Trust (since 2011). | |||
| Madhav
V. Rajan (50) |
Director
(since 2011); 15(c) Committee Chair (since 2012). |
Robert K. Jaedicke Professor of Accounting and Senior Associate Dean for Academic Affairs and Head of MBA Program, Stanford University Graduate School of Business (since 2001); Professor of Law (by courtesy), Stanford Law School (since 2005); Visiting Professor, University of Chicago (2007-2008). | Trustee of iShares Trust (since 2011); Director of iShares MSCI Russia Capped ETF, Inc. (since 2011); Trustee of iShares U.S. ETF Trust (since 2011). | |||
| Jane
D. Carlin (59) |
Director
(since 2015). |
Managing Director and Global Head of Financial Holding Company Governance & Assurance and the Global Head of Operational Risk Management of Morgan Stanley Group (2006-2012). | Trustee of iShares Trust (since 2015); Trustee of iShares U.S. ETF Trust (since 2015); Director of PHH Corporation (mortgage solutions) (since 2012). |
| Name (Age) | Position | Principal
Occupation(s) During the Past 5 Years | ||
| Manish
Mehta (43) |
President (since 2013). | Managing Director, BlackRock, Inc. (since 2009); Chief Operating Officer for iShares (since 2009); Head of Strategy and Corporate Development, BGI (2005-2009); Chief of Staff to the CEO, BGI (2005-2009). | ||
| Jack
Gee (55) |
Treasurer
and Chief Financial Officer (since 2008). |
Managing Director, BlackRock, Inc. (since 2009); Senior Director of Fund Administration of Intermediary Investor Business, BGI (2009); Director of Fund Administration of Intermediary Investor Business, BGI (2004-2009). | ||
| Eilleen
M. Clavere (62) |
Secretary
(since 2007). |
Director of Global Fund Administration, BlackRock, Inc. (since 2009); Director of Legal Administration of Intermediary Investor Business, BGI (2006-2009); Legal Counsel and Vice President of Atlas Funds, Atlas Advisers, Inc. and Atlas Securities, Inc. (2005-2006); Counsel at Kirkpatrick & Lockhart LLP (2001-2005). |
Table of Contents
| Name (Age) | Position | Principal
Occupation(s) During the Past 5 Years | ||
| Edward
B. Baer (46) |
Vice
President and Chief Legal Officer (since 2012). |
Managing Director of Legal & Compliance, BlackRock, Inc. (since 2006); Director of Legal & Compliance, BlackRock, Inc. (2004-2006). | ||
| Scott
Radell (45) |
Executive
Vice President (since 2012). |
Managing Director, BlackRock, Inc. (since 2009); Head of Portfolio Solutions, BlackRock, Inc. (since 2009); Head of Portfolio Solutions, BGI (2007-2009); Credit Portfolio Manager, BGI (2005-2007); Credit Research Analyst, BGI (2003-2005). | ||
| Amy
Schioldager (52) |
Executive
Vice President (since 2007). |
Senior Managing Director, BlackRock, Inc. (since 2009); Global Head of Index Equity, BGI (2008-2009); Global Head of U.S. Indexing, BGI (2006-2008); Head of Domestic Equity Portfolio Management, BGI (2001-2006). | ||
| Ira
P. Shapiro (51) |
Vice
President (since 2007). |
Managing Director, BlackRock, Inc. (since 2009); Head of Strategic Product Initiatives for iShares (since 2012); Chief Legal Officer, Exchange-Traded Fund Complex (2007-2012); Associate General Counsel, BGI (2004-2009). |
Table of Contents
Table of Contents
Table of Contents
Table of Contents
Table of Contents
| Name of Director | Fund | Dollar
Range of Equity Securities in the Fund |
Aggregate
Dollar Range of Equity Securities in all Registered Investment Companies Overseen by Director in Family of Investment Companies | |||
| Robert S. Kapito | None | None | None | |||
| Mark Wiedman1 | iShares Core MSCI EAFE ETF | Over $100,000 | Over $100,000 | |||
| iShares Core MSCI Emerging Markets ETF | $50,001-$100,000 | |||||
| iShares Core S&P Total U.S. Stock Market ETF | $50,001-$100,000 | |||||
| Robert H. Silver | iShares iBonds Sep 2015 AMT-Free Muni Bond ETF | Over $100,000 | Over $100,000 | |||
| iShares iBonds Sep 2016 AMT-Free Muni Bond ETF | Over $100,000 | |||||
| iShares iBonds Sep 2017 AMT-Free Muni Bond ETF | Over $100,000 | |||||
| iShares iBonds Sep 2018 AMT-Free Muni Bond ETF | Over $100,000 | |||||
| iShares Core High Dividend ETF | Over $100,000 | |||||
| iShares Core MSCI EAFE ETF | Over $100,000 | |||||
| iShares Core MSCI Emerging Markets ETF | Over $100,000 | |||||
| iShares Core MSCI Total International Stock ETF | Over $100,000 | |||||
| iShares Core S&P 500 ETF | Over $100,000 | |||||
| iShares Core S&P Mid-Cap ETF | Over $100,000 | |||||
| iShares Core S&P Small-Cap ETF | Over $100,000 | |||||
| iShares Core S&P Total U.S. Stock Market ETF | Over $100,000 | |||||
| iShares iBoxx $ Investment Grade Corporate Bond ETF | Over $100,000 | |||||
| iShares J.P. Morgan USD Emerging Markets Bond ETF | $1-$10,000 | |||||
| iShares MSCI ACWI ex U.S. ETF | $1-$10,000 | |||||
| iShares MSCI BRIC ETF | $10,001-$50,000 | |||||
| iShares MSCI Emerging Markets ETF | $1-$10,000 | |||||
| iShares MSCI Frontier 100 ETF | $50,001-$100,000 | |||||
| iShares National AMT-Free Muni Bond ETF | Over $100,000 | |||||
| iShares Russell 1000 Growth ETF | Over $100,000 |
Table of Contents
| Name of Director | Fund | Dollar
Range of Equity Securities in the Fund |
Aggregate
Dollar Range of Equity Securities in all Registered Investment Companies Overseen by Director in Family of Investment Companies | |||
| iShares Russell 1000 Value ETF | Over $100,000 | |||||
| iShares Russell 2000 ETF | $10,001-$50,000 | |||||
| iShares Russell 2000 Growth ETF | Over $100,000 | |||||
| iShares Russell 2000 Value ETF | Over $100,000 | |||||
| iShares Russell 3000 ETF | Over $100,000 | |||||
| iShares Russell Mid-Cap Growth ETF | $1-$10,000 | |||||
| iShares Russell Mid-Cap Value ETF | $1-$10,000 | |||||
| iShares Select Dividend ETF | $10,001-$50,000 | |||||
| iShares U.S. Broker-Dealers ETF | Over $100,000 | |||||
| iShares U.S. Financial Services ETF | $50,001-$100,000 | |||||
| iShares U.S. Preferred Stock ETF | Over $100,000 | |||||
| iShares U.S. Regional Banks ETF | Over $100,000 | |||||
| iShares U.S. Technology ETF | $50,001-$100,000 | |||||
| George G.C. Parker | iShares California AMT-Free Muni Bond ETF | Over $100,000 | Over $100,000 | |||
| iShares Core S&P 500 ETF | Over $100,000 | |||||
| iShares Core U.S. Aggregate Bond ETF | $10,001-$50,000 | |||||
| iShares iBoxx $ Investment Grade Corporate Bond ETF | Over $100,000 | |||||
| iShares MSCI EAFE ETF | Over $100,000 | |||||
| iShares S&P 100 ETF | Over $100,000 | |||||
| iShares Select Dividend ETF | Over $100,000 | |||||
| John E. Martinez | iShares Core MSCI Emerging Markets ETF | $50,001-$100,000 | Over $100,000 | |||
| iShares Core S&P 500 ETF | Over $100,000 | |||||
| iShares Emerging Markets Infrastructure ETF | Over $100,000 | |||||
| iShares Global Consumer Staples ETF | Over $100,000 | |||||
| iShares MSCI All Country Asia ex Japan ETF | Over $100,000 | |||||
| iShares MSCI EAFE ETF | Over $100,000 | |||||
| iShares Russell 1000 ETF | Over $100,000 | |||||
| iShares Russell 1000 Value ETF | Over $100,000 | |||||
| iShares Russell 2000 ETF | Over $100,000 | |||||
| iShares TIPS Bond ETF | Over $100,000 | |||||
| Cecilia H. Herbert | iShares China Large-Cap ETF | Over $100,000 | Over $100,000 | |||
| iShares Core MSCI Emerging Markets ETF | $10,001-$50,000 | |||||
| iShares Core MSCI Total International Stock ETF | $10,001-$50,000 |
Table of Contents
| Name of Director | Fund | Dollar
Range of Equity Securities in the Fund |
Aggregate
Dollar Range of Equity Securities in all Registered Investment Companies Overseen by Director in Family of Investment Companies | |||
| iShares Core S&P Total U.S. Stock Market ETF | $10,001-$50,000 | |||||
| iShares iBoxx $ High Yield Corporate Bond ETF | $10,001-$50,000 | |||||
| iShares International Select Dividend ETF | $1-$10,000 | |||||
| iShares MSCI EAFE ETF | $10,001-$50,000 | |||||
| iShares MSCI Emerging Markets ETF | $1-$10,000 | |||||
| iShares MSCI Japan ETF | $10,001-$50,000 | |||||
| iShares National AMT-Free Muni Bond ETF | $10,001-$50,000 | |||||
| iShares U.S. Preferred Stock ETF | $10,001-$50,000 | |||||
| Charles A. Hurty | iShares China Large-Cap ETF | $10,001-$50,000 | Over $100,000 | |||
| iShares Core High Dividend ETF | $10,001-$50,000 | |||||
| iShares Core MSCI Emerging Markets ETF | $50,001-$100,000 | |||||
| iShares Core S&P 500 ETF | $10,001-$50,000 | |||||
| iShares Global Energy ETF | $10,001-$50,000 | |||||
| iShares Global Tech ETF | $10,001-$50,000 | |||||
| iShares MSCI EAFE ETF | $10,001-$50,000 | |||||
| iShares MSCI Japan ETF | $10,001-$50,000 | |||||
| iShares North American Tech-Multimedia Networking ETF | $1-$10,000 | |||||
| iShares U.S. Energy ETF | $10,001-$50,000 | |||||
| iShares U.S. Financials ETF | $1-$10,000 | |||||
| iShares U.S. Technology ETF | $50,001-$100,000 | |||||
| John E. Kerrigan | iShares MSCI ACWI ex U.S. ETF | Over $100,000 | Over $100,000 | |||
| iShares Short-Term National AMT-Free Muni Bond ETF | Over $100,000 | |||||
| Madhav V. Rajan | iShares Core High Dividend ETF | Over $100,000 | Over $100,000 | |||
| iShares Core MSCI Emerging Markets ETF | Over $100,000 | |||||
| iShares Core S&P 500 ETF | Over $100,000 | |||||
| iShares iBoxx $ High Yield Corporate Bond ETF | $50,001-$100,000 | |||||
| iShares iBoxx $ Investment Grade Corporate Bond ETF | Over $100,000 | |||||
| iShares Select Dividend ETF | Over $100,000 | |||||
| Jane D. Carlin2 | iShares Core MSCI EAFE ETF | $10,001-$50,000 | Over $100,000 | |||
| iShares Core S&P Small-Cap ETF | $10,001-$50,000 |
Table of Contents
| Name of Director | Fund | Dollar
Range of Equity Securities in the Fund |
Aggregate
Dollar Range of Equity Securities in all Registered Investment Companies Overseen by Director in Family of Investment Companies | |||
| iShares Global Tech ETF | $50,001-$100,000 |
| 1 | Appointed to serve as an Interested Director effective December 31, 2013. |
| 2 | Appointed to serve as an Independent Director effective February 3, 2015. The funds held and dollar range of equity securities beneficially owned by Jane D. Carlin are as of December 31, 2014 |
| Name of Director | iShares
MSCI Russia Capped ETF |
Pension
or Retirement Benefits Accrued As Part of Company Expenses5 |
Estimated
Annual Benefits Upon Retirement5 |
Total
Compensation From the Fund and Fund Complex6 | ||||
| Independent Directors:1 | ||||||||
| Robert H. Silver | $ 129 | Not Applicable | Not Applicable | $ 325,000 | ||||
| George G.C. Parker2 | 110 | Not Applicable | Not Applicable | 275,000 | ||||
| John E. Martinez | 116 | Not Applicable | Not Applicable | 290,000 | ||||
| Cecilia H. Herbert | 121 | Not Applicable | Not Applicable | 305,000 | ||||
| Charles A. Hurty | 125 | Not Applicable | Not Applicable | 315,000 | ||||
| John E. Kerrigan | 116 | Not Applicable | Not Applicable | 315,882 | ||||
| Madhav V. Rajan | 116 | Not Applicable | Not Applicable | 301,765 | ||||
| Interested Directors: | ||||||||
| Robert S. Kapito | $ 0 | Not Applicable | Not Applicable | $ 0 | ||||
| Mark Wiedman3 | 0 | Not Applicable | Not Applicable | 0 |
Table of Contents
| Name of Director | iShares
MSCI Russia Capped ETF |
Pension
or Retirement Benefits Accrued As Part of Company Expenses5 |
Estimated
Annual Benefits Upon Retirement5 |
Total
Compensation From the Fund and Fund Complex6 | ||||
| Michael Latham4 | 0 | Not Applicable | Not Applicable | 0 |
| 1 | Compensation is not shown for Jane D. Carlin because she was appointed to serve as an Independent Director of the Company effective February 3, 2015. |
| 2 | Served as an Independent Director through December 31, 2014. |
| 3 | Appointed to serve as an Interested Director effective December 31, 2013. |
| 4 | Served as an Interested Director through December 31, 2013. |
| 5 | No Director or officer is entitled to any pension or retirement benefits from the Company. |
| 6 | Includes compensation for service on the Boards of Trustees of iShares Trust and iShares U.S. ETF Trust and the Board of Directors of iShares MSCI Russia Capped ETF, Inc. |
| Name and Address | Percentage
of Ownership | |
| State
Street Bank and Trust Company 1776 Heritage Drive North Quincy, MA 02171 |
21.14% | |
| JPMorgan
Chase Bank, National Association 14201 Dallas Pkwy 12th Floor Dallas, TX 75240 |
20.23% | |
| Charles
Schwab & Co., Inc. 111 Pavonia Avenue Jersey City, NJ 07310 |
7.20% | |
| Brown
Brothers Harriman & Co. 525 Washington Blvd. 11th Floor Jersey City, NJ 07310 |
7.15% | |
| Citibank,
N.A. 3800 CitiBank Center Tampa Building A/Floor 2 Tampa, FL 33610 |
5.25% |
Table of Contents
Table of Contents
Table of Contents
Table of Contents
Table of Contents
Table of Contents
Table of Contents
| Management
Fee |
Predecessor
Fund Inception Date |
Management
Fees Paid for Fiscal Year Ended August 31, 2014 |
Management
Fees Paid for Fiscal Year Ended August 31, 2013 |
Management
Fees Paid for Fiscal Year Ended August 31, 2012 | ||||
| 0.62% | 11/09/10 | $1,894,067 | $1,378,297 | $684,597 |
Table of Contents
| Matthew Goff | ||||
| Types of Accounts | Number | Total Assets | ||
| Registered Investment Companies | 258 | $595,000,000,000 | ||
| Other Pooled Investment Vehicles | 0 | N/A | ||
| Other Accounts | 2 | 200,000,000 | ||
| Accounts with Incentive-Based Fee Arrangements | 0 | N/A |
| Diane Hsiung | ||||
| Types of Accounts | Number | Total Assets | ||
| Registered Investment Companies | 258 | $595,000,000,000 | ||
| Other Pooled Investment Vehicles | 21 | 7,750,000,000 | ||
| Other Accounts | 0 | N/A | ||
| Accounts with Incentive-Based Fee Arrangements | 0 | N/A |
| Jennifer Hsui | ||||
| Types of Accounts | Number | Total Assets | ||
| Registered Investment Companies | 260 | $595,000,000,000 | ||
| Other Pooled Investment Vehicles | 0 | N/A | ||
| Other Accounts | 0 | N/A | ||
| Accounts with Incentive-Based Fee Arrangements | 0 | N/A |
| Greg Savage | ||||
| Types of Accounts | Number | Total Assets | ||
| Registered Investment Companies | 324 | $660,000,000,000 | ||
| Other Pooled Investment Vehicles | 89 | 45,000,000,000 | ||
| Other Accounts | 12 | 1,500,000,000 | ||
| Accounts with Incentive-Based Fee Arrangements | 0 | N/A |
Table of Contents
| Matthew Goff | ||||
| Types of Accounts | Number
of Other Accounts with Performance Fees Managed by Portfolio Manager |
Aggregate
of Total Assets | ||
| Registered Investment Companies | 0 | N/A | ||
| Other Pooled Investment Vehicles | 0 | N/A | ||
| Other Accounts | 0 | N/A |
| Diane Hsiung | ||||
| Types of Accounts | Number
of Other Accounts with Performance Fees Managed by Portfolio Manager |
Aggregate
of Total Assets | ||
| Registered Investment Companies | 0 | N/A | ||
| Other Pooled Investment Vehicles | 0 | N/A | ||
| Other Accounts | 0 | N/A |
| Jennifer Hsui | ||||
| Types of Accounts | Number
of Other Accounts with Performance Fees Managed by Portfolio Manager |
Aggregate
of Total Assets | ||
| Registered Investment Companies | 0 | N/A | ||
| Other Pooled Investment Vehicles | 0 | N/A | ||
| Other Accounts | 0 | N/A |
| Greg Savage | ||||
| Types of Accounts | Number
of Other Accounts with Performance Fees Managed by Portfolio Manager |
Aggregate
of Total Assets | ||
| Registered Investment Companies | 0 | N/A | ||
| Other Pooled Investment Vehicles | 0 | N/A | ||
| Other Accounts | 0 | N/A |
Table of Contents
Table of Contents
| Predecessor Fund Inception Date | Administration,
Custodian, Transfer Agency Expenses Paid During Fiscal Year Ended August 31, 2014 |
Administration,
Custodian, Transfer Agency Expenses Paid During Fiscal Year Ended August 31, 2013 |
Administration,
Custodian, Transfer Agency Expenses Paid During Fiscal Year Ended August 31, 2012 | |||
| 11/09/10 | $596,265 | $438,949 | $246,675 |
Table of Contents
| Predecessor Fund Inception Date | Distributor
Compensation Paid During Fiscal Year Ended August 31, 20141 |
Distributor
Compensation Paid During Fiscal Year Ended August 31, 20131 |
Distributor
Compensation Paid From April 1, 2012 to August 31, 20121 |
Distributor
Compensation Paid From Sept. 1, 2011 to March 31, 20122 | ||||
| 11/09/10 | $6,438 | $7,721 | $ 3,318 | $6,270 |
| 1 | BRIL served as the distributor to the Predecessor Fund effective April 1, 2012 and to the Fund since its inception. These fees reflect payments made to SEI, acting as an agent of the Distributor. |
| 2 | SEI served as the distributor to the Predecessor Fund through March 31, 2012. |
Table of Contents
Table of Contents
Table of Contents
Table of Contents
Table of Contents
Table of Contents
| Predecessor Fund Inception Date | Brokerage
Commissions Paid During Fiscal Year Ended August 31, 2014 |
Brokerage
Commissions Paid During Fiscal Year Ended August 31, 2013 |
Brokerage
Commissions Paid During Fiscal Year Ended August 31, 2012 | |||
| 11/09/10 | $26,540 | $35,337 | $27,198 |
| Fiscal
Year Ended August 31, 2014 |
Fiscal
Year Ended August 31, 2013 | |
| 15% | 14% |
Table of Contents
Table of Contents
Table of Contents
| Shares
Per Creation Unit |
Value
Per Creation Unit (U.S.$) | |
| 50,000 | $868,500 |
Table of Contents
Table of Contents
Table of Contents
| Standard
Creation Transaction Fee |
Maximum
Additional Charge* | |
| $2,300 | 3.0% |
| * | As a percentage of the net asset value per Creation Unit. |
Table of Contents
| Standard
Redemption Transaction Fee |
Maximum
Additional Charge* | |
| $2,300 | 2.0% |
| * | As a percentage of the net asset value per Creation Unit, inclusive of the standard redemption transaction fee. |
Table of Contents
Table of Contents
Table of Contents
| Russia | |||
| January 1 | January 7 | March 9 | June 12 |
| January 2 | January 8 | May 1 | November 4 |
| January 5 | January 9 | May 4 | December 31 |
| January 6 | February 23 | May 11 | |
| 2015 | ||||||
| Country | Trade
Date |
Settlement
Date |
Number
of Days to Settle | |||
| Russia | 12/28/15 | 01/13/16** | 16 | |||
| 12/29/15 | 01/14/16** | 16 | ||||
| 12/30/15 | 01/15/16** | 16 | ||||
| * | These worst-case redemption cycles are based on information regarding regular holidays, which may be out of date. Based on changes in holidays, longer (worse) redemption cycles are possible. |
| ** | Based on expected January holidays in 2016 known at the time of filing this SAI. |
Table of Contents
Table of Contents
Table of Contents
Table of Contents
Table of Contents
Table of Contents
Table of Contents
Table of Contents
Table of Contents
Table of Contents
(as revised June 22, 2015)
| Fund | Ticker | Stock Exchange | ||
| iShares Emerging Markets Dividend ETF (the “Fund”) | DVYE | NYSE Arca |
Table of Contents
Table of Contents
Table of Contents
Table of Contents
Table of Contents
Table of Contents
Table of Contents
Table of Contents
Table of Contents
Table of Contents
Table of Contents
Table of Contents
Table of Contents
Table of Contents
Table of Contents
Table of Contents
Table of Contents
Table of Contents
Table of Contents
Also, if an affected security is included in the Fund’s Underlying Index, the Fund may, where practicable, seek to eliminate its holdings of the affected security by employing or augmenting its representative sampling strategy to seek to track the investment results of its Underlying Index. The use of (or increased use of) a representative sampling strategy may increase the Fund’s tracking error risk. If the affected securities constitute a significant percentage of the Underlying Index, the Fund may not be able to effectively implement a representative sampling strategy, which may result in significant tracking error between the Fund’s performance and the performance of its Underlying Index.
Table of Contents
Table of Contents
Table of Contents
Table of Contents
Table of Contents
Table of Contents
Table of Contents
Table of Contents
Table of Contents
| • | The Fund generally supports the board’s nominees in the election of directors and generally supports proposals that strengthen the independence of boards of directors; |
| • | When a director has committed himself or herself to service on more than four public company boards (but no more than six public company boards in most circumstances), the Fund will consider such director’s individual circumstances in determining whether the director will be able to commit sufficient focus and time to a particular company; |
| • | The Fund generally defers to an issuer’s choice of auditors so long as the corporate auditors represent the interests of shareholders and provide an independent view of the propriety of financial reporting decisions of management; |
| • | The Fund generally favors disclosure of a company’s compensation and benefits policies and opposes excessive compensation, but believes that compensation matters are normally best determined by a company’s board of directors; |
| • | The Fund generally expects to support capital structure requests that it believes enhance the rights of common shareholders and oppose requests that appear to be unreasonably dilutive; |
| • | The Fund generally does not support proposals on social issues that lack a demonstrable economic benefit to the issuer and the Fund investing in such issuer; and |
| • | The Fund generally votes against anti-takeover proposals and proposals that would create additional barriers or costs to corporate transactions that are likely to deliver a premium to shareholders. |
Table of Contents
Table of Contents
| 1. | Concentrate its investments (i.e., invest 25% or more of its total assets in the securities of a particular industry or group of industries), except that the Fund will concentrate to approximately the same extent that the Underlying Index concentrates in the securities of a particular industry or group of industries. For purposes of this limitation, securities of the U.S. government (including its agencies and instrumentalities), repurchase agreements collateralized by U.S. government securities, and securities of state or municipal governments and their political subdivisions are not considered to be issued by members of any industry. |
| 2. | Borrow money, except that (i) the Fund may borrow from banks for temporary or emergency (not leveraging) purposes, including the meeting of redemption requests which might otherwise require the untimely disposition of securities; and (ii) the Fund may, to the extent consistent with its investment policies, enter into repurchase agreements, reverse repurchase agreements, forward roll transactions and similar investment strategies and techniques. To the extent that it engages in transactions described in (i) and (ii), the Fund will be limited so that no more than 33 1/3% of the value of its total assets (including the amount borrowed) is derived from such transactions. Any borrowings which come to exceed this amount will be reduced in accordance with applicable law. |
| 3. | Issue any senior security, except as permitted under the 1940 Act, as interpreted, modified or otherwise permitted by any regulatory authority having jurisdiction, from time to time. |
Table of Contents
| 4. | Make loans, except as permitted under the 1940 Act, as interpreted, modified or otherwise permitted by regulatory authority having jurisdiction, from time to time. |
| 5. | Purchase or sell real estate unless acquired as a result of ownership of securities or other instruments (but this restriction shall not prevent the Fund from investing in securities of companies engaged in the real estate business or securities or other instruments backed by real estate or mortgages), or commodities or commodity contracts (but this restriction shall not prevent the Fund from trading in futures contracts and options on futures contracts, including options on currencies to the extent consistent with the Fund’s investment objective and policies). |
| 6. | Engage in the business of underwriting securities issued by other persons, except to the extent that the Fund may technically be deemed to be an underwriter under the 1933 Act, in disposing of portfolio securities. |
| • | The frequency of trades and quotes for the security; |
| • | The number of dealers wishing to purchase or sell the security and the number of other potential purchasers; |
| • | Dealer undertakings to make a market in the security; and |
| • | The nature of the security and the nature of the marketplace in which it trades (e.g., the time needed to dispose of the security, the method of soliciting offers and the mechanics of transfer). |
Table of Contents
| Name (Age) | Position | Principal
Occupation(s) During the Past 5 Years |
Other
Directorships Held by Director | |||
| Robert
S. Kapito1 (57) |
Director
(since 2009). |
President and Director, BlackRock, Inc. (since 2006); Vice Chairman of BlackRock, Inc. and Head of BlackRock, Inc.’s Portfolio Management Group (since its formation in 1998) and BlackRock, Inc.’s predecessor entities (since 1988); Trustee, University of Pennsylvania (since 2009); President of Board of Directors, Hope & Heroes Children’s Cancer Fund (since 2002); President of the Board of Directors, Periwinkle Theatre for Youth (since 1983). | Trustee of iShares Trust (since 2009); Director of iShares MSCI Russia Capped ETF, Inc. (since 2010); Trustee of iShares U.S. ETF Trust (since 2011); Director of BlackRock, Inc. (since 2006). |
Table of Contents
| Name (Age) | Position | Principal
Occupation(s) During the Past 5 Years |
Other
Directorships Held by Director | |||
| Mark
Wiedman2 (43) |
Director (since 2013). | Managing Director, BlackRock, Inc. (since 2007); Global Head of iShares (since 2011); Head of Corporate Strategy, BlackRock, Inc. (2009-2011). | Trustee of iShares Trust (since 2013); Director of iShares MSCI Russia Capped ETF, Inc. (since 2013); Trustee of iShares U.S. ETF Trust (since 2013); Director of PennyMac Financial Services, Inc. (since 2008). |
| 1 | Robert S. Kapito is deemed to be an “interested person” (as defined in the 1940 Act) of the Company due to his affiliations with BlackRock, Inc. |
| 2 | Mark Wiedman is deemed to be an “interested person” (as defined in the 1940 Act) of the Company due to his affiliations with BlackRock, Inc. and its affiliates. |
| Name (Age) | Position | Principal
Occupation(s) During the Past 5 Years |
Other
Directorships Held by Director | |||
| Robert
H. Silver (59) |
Director
(since 2007); Independent Chairman (since 2012). |
President and Co-Founder of The Bravitas Group, Inc. (since 2006); Director and Vice Chairman of the YMCA of Greater NYC (2001-2011); Broadway Producer (2006-2011); Co-Founder and Vice President of Parentgiving Inc. (since 2008); Director and Member of the Audit and Compensation Committee of EPAM Systems, Inc. (2006-2009); President and Chief Operating Officer of UBS Financial Services Inc. (formerly Paine Webber Inc.) (2003-2005) and various executive positions with UBS and its affiliates (1988-2005); CPA and Audit Manager of KPMG, LLP (formerly Peat Marwick Mitchell) (1977-1983). | Trustee of iShares Trust (since 2007); Director of iShares MSCI Russia Capped ETF, Inc. (since 2010); Trustee of iShares U.S. ETF Trust (since 2011); Independent Chairman of iShares Trust, iShares MSCI Russia Capped ETF, Inc. and iShares U.S. ETF Trust (since 2012). | |||
| John
E. Martinez (53) |
Director
(since 2003); Securities Lending Committee Chair (since 2012). |
Director of FirstREX Agreement Corp. (formerly EquityRock, Inc.) (since 2005). | Trustee of iShares Trust (since 2003); Director of iShares MSCI Russia Capped ETF, Inc. (since 2010); Trustee of iShares U.S. ETF Trust (since 2011). |
Table of Contents
| Name (Age) | Position | Principal
Occupation(s) During the Past 5 Years |
Other
Directorships Held by Director | |||
| Cecilia
H. Herbert (65) |
Director
(since 2005); Nominating and Governance Committee Chair and Equity Plus Committee Chair (since 2012). |
Director (1998-2013) and President (2007-2011) of the Board of Directors, Catholic Charities CYO; Trustee (2002-2011) and Chair of the Finance and Investment Committee (2006-2010) of the Thacher School; Member (since 1992) and Chair (1994-2005) of the Investment Committee, Archdiocese of San Francisco; Trustee and Member of the Investment Committee, WNET, the New York public broadcasting/media company (since 2011). | Trustee of iShares Trust (since 2005); Director of iShares MSCI Russia Capped ETF, Inc. (since 2010); Trustee of iShares U.S. ETF Trust (since 2011); Director of Forward Funds (34 portfolios) (since 2009). | |||
| Charles
A. Hurty (70) |
Director
(since 2005); Audit Committee Chair (since 2006). |
Retired; Partner, KPMG LLP (1968-2001). | Trustee of iShares Trust (since 2005); Director of iShares MSCI Russia Capped ETF, Inc. (since 2010); Trustee of iShares U.S. ETF Trust (since 2011); Director of GMAM Absolute Return Strategy Fund (1 portfolio) (since 2002); Director of SkyBridge Alternative Investments Multi-Adviser Hedge Fund Portfolios LLC (2 portfolios) (since 2002). | |||
| John
E. Kerrigan (59) |
Director
(since 2005); Fixed Income Plus Committee Chair (since 2012). |
Chief Investment Officer, Santa Clara University (since 2002). | Trustee of iShares Trust (since 2005); Director of iShares MSCI Russia Capped ETF, Inc. (since 2010); Trustee of iShares U.S. ETF Trust (since 2011). | |||
| Madhav
V. Rajan (50) |
Director
(since 2011); 15(c) Committee Chair (since 2012). |
Robert K. Jaedicke Professor of Accounting and Senior Associate Dean for Academic Affairs and Head of MBA Program, Stanford University Graduate School of Business (since 2001); Professor of Law (by courtesy), Stanford Law School (since 2005); Visiting Professor, University of Chicago (2007-2008). | Trustee
of iShares Trust (since 2011); Director of iShares MSCI Russia Capped ETF, Inc. (since 2011); Trustee of iShares U.S. ETF Trust (since 2011); Director, Cavium, Inc. (since 2013). | |||
| Jane
D. Carlin (59) |
Director
(since 2015). |
Managing Director and Global Head of Financial Holding Company Governance & Assurance and the Global Head of Operational Risk Management of Morgan Stanley Group (2006-2012). | Trustee of iShares Trust (since 2015); Trustee of iShares U.S. ETF Trust (since 2015); Director of PHH Corporation (mortgage solutions) (since 2012). |
Table of Contents
| Name (Age) | Position | Principal
Occupation(s) During the Past 5 Years | ||
| Manish
Mehta (43) |
President (since 2013). | Managing Director, BlackRock, Inc. (since 2009); Chief Operating Officer for iShares (since 2009); Head of Strategy and Corporate Development, BGI (2005-2009); Chief of Staff to the CEO, BGI (2005-2009). | ||
| Jack
Gee (54) |
Treasurer
and Chief Financial Officer (since 2008). |
Managing Director, BlackRock, Inc. (since 2009); Senior Director of Fund Administration of Intermediary Investor Business, BGI (2009); Director of Fund Administration of Intermediary Investor Business, BGI (2004-2009). | ||
| Eilleen
M. Clavere (62) |
Secretary
(since 2007). |
Director of Global Fund Administration, BlackRock, Inc. (since 2009); Director of Legal Administration of Intermediary Investor Business, BGI (2006-2009); Legal Counsel and Vice President of Atlas Funds, Atlas Advisers, Inc. and Atlas Securities, Inc. (2005-2006); Counsel at Kirkpatrick & Lockhart LLP (2001-2005). | ||
| Edward
B. Baer (45) |
Vice
President and Chief Legal Officer (since 2012). |
Managing Director of Legal & Compliance, BlackRock, Inc. (since 2006); Director of Legal & Compliance, BlackRock, Inc. (2004-2006). | ||
| Scott
Radell (45) |
Executive
Vice President (since 2012). |
Managing Director, BlackRock, Inc. (since 2009); Head of Portfolio Solutions, BlackRock, Inc. (since 2009); Head of Portfolio Solutions, BGI (2007-2009); Credit Portfolio Manager, BGI (2005-2007); Credit Research Analyst, BGI (2003-2005). | ||
| Amy
Schioldager (51) |
Executive
Vice President (since 2007). |
Senior Managing Director, BlackRock, Inc. (since 2009); Global Head of Index Equity, BGI (2008-2009); Global Head of U.S. Indexing, BGI (2006-2008); Head of Domestic Equity Portfolio Management, BGI (2001-2006). |
Table of Contents
| Name (Age) | Position | Principal
Occupation(s) During the Past 5 Years | ||
| Ira
P. Shapiro (51) |
Vice
President (since 2007). |
Managing Director, BlackRock, Inc. (since 2009); Head of Strategic Product Initiatives for iShares (since 2012); Chief Legal Officer, Exchange-Traded Fund Complex (2007-2012); Associate General Counsel, BGI (2004-2009). |
Table of Contents
Table of Contents
Table of Contents
Table of Contents
| Name of Director | Fund | Dollar
Range of Equity Securities in the Fund |
Aggregate
Dollar Range of Equity Securities in all Registered Investment Companies Overseen by Director in Family of Investment Companies | |||
| Robert S. Kapito | None | None | None | |||
| Mark Wiedman1 | iShares Core MSCI EAFE ETF | Over $100,000 | Over $100,000 | |||
| iShares Core MSCI Emerging Markets ETF | $50,001-$100,000 | |||||
| iShares Core S&P Total U.S. Stock Market ETF | $50,001-$100,000 | |||||
Table of Contents
| Name of Director | Fund | Dollar
Range of Equity Securities in the Fund |
Aggregate
Dollar Range of Equity Securities in all Registered Investment Companies Overseen by Director in Family of Investment Companies | |||
| Robert H. Silver | iShares iBonds Sep 2015 AMT-Free Muni Bond ETF | Over $100,000 | Over $100,000 | |||
| iShares iBonds Sep 2016 AMT-Free Muni Bond ETF | Over $100,000 | |||||
| iShares iBonds Sep 2017 AMT-Free Muni Bond ETF | Over $100,000 | |||||
| iShares iBonds Sep 2018 AMT-Free Muni Bond ETF | Over $100,000 | |||||
| iShares Core High Dividend ETF | Over $100,000 | |||||
| iShares Core MSCI EAFE ETF | Over $100,000 | |||||
| iShares Core MSCI Emerging Markets ETF | Over $100,000 | |||||
| iShares Core MSCI Total International Stock ETF | Over $100,000 | |||||
| iShares Core S&P 500 ETF | Over $100,000 | |||||
| iShares Core S&P Mid-Cap ETF | Over $100,000 | |||||
| iShares Core S&P Small-Cap ETF | Over $100,000 | |||||
| iShares Core S&P Total U.S. Stock Market ETF | Over $100,000 | |||||
| iShares iBoxx $ Investment Grade Corporate Bond ETF | Over $100,000 | |||||
| iShares J.P. Morgan USD Emerging Markets Bond ETF | $1-$10,000 | |||||
| iShares MSCI ACWI ex U.S. ETF | $1-$10,000 | |||||
| iShares MSCI BRIC ETF | $10,001-$50,000 | |||||
| iShares MSCI Emerging Markets ETF | $1-$10,000 | |||||
| iShares MSCI Frontier 100 ETF | $50,001-$100,000 | |||||
| iShares National AMT-Free Muni Bond ETF | Over $100,000 | |||||
| iShares Russell 1000 Growth ETF | Over $100,000 | |||||
| iShares Russell 1000 Value ETF | Over $100,000 | |||||
| iShares Russell 2000 ETF | $10,001-$50,000 | |||||
| iShares Russell 2000 Growth ETF | Over $100,000 | |||||
| iShares Russell 2000 Value ETF | Over $100,000 | |||||
| iShares Russell 3000 ETF | Over $100,000 | |||||
| iShares Russell Mid-Cap Growth ETF | $1-$10,000 | |||||
| iShares Russell Mid-Cap Value ETF | $1-$10,000 | |||||
| iShares Select Dividend ETF | $10,001-$50,000 | |||||
| iShares U.S. Broker-Dealers ETF | Over $100,000 | |||||
| iShares U.S. Financial Services ETF | $50,001-$100,000 | |||||
| iShares U.S. Preferred Stock ETF | Over $100,000 | |||||
| iShares U.S. Regional Banks ETF | Over $100,000 | |||||
| iShares U.S. Technology ETF | $50,001-$100,000 |
Table of Contents
| Name of Director | Fund | Dollar
Range of Equity Securities in the Fund |
Aggregate
Dollar Range of Equity Securities in all Registered Investment Companies Overseen by Director in Family of Investment Companies | |||
| George G.C. Parker | iShares California AMT-Free Muni Bond ETF | Over $100,000 | Over $100,000 | |||
| iShares Core S&P 500 ETF | Over $100,000 | |||||
| iShares Core U.S. Aggregate Bond ETF | $10,001-$50,000 | |||||
| iShares iBoxx $ Investment Grade Corporate Bond ETF | Over $100,000 | |||||
| iShares MSCI EAFE ETF | Over $100,000 | |||||
| iShares S&P 100 ETF | Over $100,000 | |||||
| iShares Select Dividend ETF | Over $100,000 | |||||
| John E. Martinez | iShares Core MSCI Emerging Markets ETF | $50,001-$100,000 | Over $100,000 | |||
| iShares Core S&P 500 ETF | Over $100,000 | |||||
| iShares Emerging Markets Infrastructure ETF | Over $100,000 | |||||
| iShares Global Consumer Staples ETF | Over $100,000 | |||||
| iShares MSCI All Country Asia ex Japan ETF | Over $100,000 | |||||
| iShares MSCI EAFE ETF | Over $100,000 | |||||
| iShares Russell 1000 ETF | Over $100,000 | |||||
| iShares Russell 1000 Value ETF | Over $100,000 | |||||
| iShares Russell 2000 ETF | Over $100,000 | |||||
| iShares TIPS Bond ETF | Over $100,000 | |||||
| Cecilia H. Herbert | iShares China Large-Cap ETF | Over $100,000 | Over $100,000 | |||
| iShares Core MSCI Emerging Markets ETF | $10,001-$50,000 | |||||
| iShares Core MSCI Total International Stock ETF | $10,001-$50,000 | |||||
| iShares Core S&P Total U.S. Stock Market ETF | $10,001-$50,000 | |||||
| iShares iBoxx $ High Yield Corporate Bond ETF | $10,001-$50,000 | |||||
| iShares International Select Dividend ETF | $1-$10,000 | |||||
| iShares MSCI EAFE ETF | $10,001-$50,000 | |||||
| iShares MSCI Emerging Markets ETF | $1-$10,000 | |||||
| iShares MSCI Japan ETF | $10,001-$50,000 | |||||
| iShares National AMT-Free Muni Bond ETF | $10,001-$50,000 | |||||
| iShares U.S. Preferred Stock ETF | $10,001-$50,000 | |||||
| Charles A. Hurty | iShares China Large-Cap ETF | $10,001-$50,000 | Over $100,000 | |||
| iShares Core High Dividend ETF | $10,001-$50,000 | |||||
| iShares Core MSCI Emerging Markets ETF | $50,001-$100,000 | |||||
| iShares Core S&P 500 ETF | $10,001-$50,000 |
Table of Contents
| Name of Director | Fund | Dollar
Range of Equity Securities in the Fund |
Aggregate
Dollar Range of Equity Securities in all Registered Investment Companies Overseen by Director in Family of Investment Companies | |||
| iShares Global Energy ETF | $10,001-$50,000 | |||||
| iShares Global Tech ETF | $10,001-$50,000 | |||||
| iShares MSCI EAFE ETF | $10,001-$50,000 | |||||
| iShares MSCI Japan ETF | $10,001-$50,000 | |||||
| iShares North American Tech-Multimedia Networking ETF | $1-$10,000 | |||||
| iShares U.S. Energy ETF | $10,001-$50,000 | |||||
| iShares U.S. Financials ETF | $1-$10,000 | |||||
| iShares U.S. Technology ETF | $50,001-$100,000 | |||||
| John E. Kerrigan | iShares MSCI ACWI ex U.S. ETF | Over $100,000 | Over $100,000 | |||
| iShares Short-Term National AMT-Free Muni Bond ETF | Over $100,000 | |||||
| Madhav V. Rajan | iShares Core High Dividend ETF | Over $100,000 | Over $100,000 | |||
| iShares Core MSCI Emerging Markets ETF | Over $100,000 | |||||
| iShares Core S&P 500 ETF | Over $100,000 | |||||
| iShares iBoxx $ High Yield Corporate Bond ETF | $50,001-$100,000 | |||||
| iShares iBoxx $ Investment Grade Corporate Bond ETF | Over $100,000 | |||||
| iShares Select Dividend ETF | Over $100,000 | |||||
| Jane D. Carlin2 | iShares Core MSCI EAFE ETF | $10,001-$50,000 | Over $100,000 | |||
| iShares Core S&P Small-Cap ETF | $10,001-$50,000 | |||||
| iShares Global Tech ETF | $50,001-$100,000 |
Table of Contents
| Name of Director | iShares
Emerging Markets Dividend ETF |
Pension
or Retirement Benefits Accrued As Part of Company Expenses5 |
Estimated
Annual Benefits Upon Retirement5 |
Total
Compensation From the Fund and Fund Complex6 | ||||
| Independent Directors:1 | ||||||||
| Robert H. Silver | $ 337 | Not Applicable | Not Applicable | $ 325,000 | ||||
| George G.C. Parker2 | 285 | Not Applicable | Not Applicable | 275,000 | ||||
| John E. Kerrigan | 301 | Not Applicable | Not Applicable | 315,882 | ||||
| Charles A. Hurty | 327 | Not Applicable | Not Applicable | 315,000 | ||||
| Cecilia H. Herbert | 317 | Not Applicable | Not Applicable | 305,000 | ||||
| John E. Martinez | 301 | Not Applicable | Not Applicable | 290,000 | ||||
| Madhav V. Rajan | 301 | Not Applicable | Not Applicable | 301,765 | ||||
| Interested Directors: | ||||||||
| Robert S. Kapito | $ 0 | Not Applicable | Not Applicable | $ 0 | ||||
| Mark Wiedman3 | 0 | Not Applicable | Not Applicable | 0 | ||||
| Michael Latham4 | 0 | Not Applicable | Not Applicable | 0 | ||||
| 1 | Compensation is not shown for Jane D. Carlin because she was appointed to serve as an Independent Director of the Company effective February 3, 2015. |
| 2 | Served as an Interested Director through December 31, 2014. |
| 3 | Appointed to serve as an Interested Director effective December 31, 2013. |
| 4 | Served as an Interested Director through December 31, 2013. |
| 5 | No Director or officer is entitled to any pension or retirement benefits from the Company. |
| 6 | Includes compensation for service on the Boards of Trustees for iShares Trust and iShares U.S. ETF Trust and the Board of Directors of iShares MSCI Russia Capped ETF, Inc. |
Table of Contents
| Name and Address | Percentage
of Ownership | |
| National
Financial Services LLC 200 Liberty Street 5th Floor New York, NY 10281 |
34.76% | |
| Merrill
Lynch, Pierce Fenner & Smith Safekeeping 101 Hudson Street 8th Floor Jersey City, NJ 07302 |
14.67% | |
| Morgan
Stanley & Co. Harborside Financial Center Plaza 3, 1st Floor Jersey City, NJ 07311 |
7.25% | |
| Charles
Schwab & Co., Inc. 111 Pavonia Avenue Jersey City, NJ 07310 |
6.08% |
Table of Contents
Table of Contents
Table of Contents
Table of Contents
Table of Contents
Table of Contents
Table of Contents
| Management
Fee |
Fund
Inception Date |
Management
Fees Paid for Fiscal Year Ended April 30, 2014 |
Management
Fees Paid for Fiscal Year Ended April 30, 2013 |
Management
Fees Paid for Fiscal Year Ended April 30, 2012 | ||||
| 0.68% | 02/23/12 | $1,133,588 | $382,587 | $14,853 |
| Matthew Goff | ||||
| Types of Accounts | Number | Total Assets | ||
| Registered Investment Companies | 248 | $544,000,000,000 | ||
| Other Pooled Investment Vehicles | 3 | 13,000,000,000 | ||
| Other Accounts | 2 | 185,500,000 | ||
| Accounts with Incentive-Based Fee Arrangements | 0 | N/A |
| Diane Hsiung | ||||
| Types of Accounts | Number | Total Assets | ||
| Registered Investment Companies | 252 | $546,000,000,000 | ||
| Other Pooled Investment Vehicles | 6 | 89,300,000 | ||
| Other Accounts | 1 | 19,000,000 | ||
| Accounts with Incentive-Based Fee Arrangements | 0 | N/A |
Table of Contents
| Jennifer Hsui | ||||
| Types of Accounts | Number | Total Assets | ||
| Registered Investment Companies | 252 | $546,000,000,000 | ||
| Other Pooled Investment Vehicles | 0 | N/A | ||
| Other Accounts | 0 | N/A | ||
| Accounts with Incentive-Based Fee Arrangements | 0 | N/A |
| Greg Savage | ||||
| Types of Accounts | Number | Total Assets | ||
| Registered Investment Companies | 319 | $609,000,000,000 | ||
| Other Pooled Investment Vehicles | 91 | 89,300,000,000 | ||
| Other Accounts | 2 | 185,500,000,000 | ||
| Accounts with Incentive-Based Fee Arrangements | 0 | N/A |
| Matthew Goff | ||||
| Types of Accounts | Number
of Other Accounts with Performance Fees Managed by Portfolio Manager |
Aggregate
of Total Assets | ||
| Registered Investment Companies | N/A | N/A | ||
| Other Pooled Investment Vehicles | N/A | N/A | ||
| Other Accounts | N/A | N/A |
Table of Contents
| Diane Hsiung | ||||
| Types of Accounts | Number
of Other Accounts with Performance Fees Managed by Portfolio Manager |
Aggregate
of Total Assets | ||
| Registered Investment Companies | N/A | N/A | ||
| Other Pooled Investment Vehicles | N/A | N/A | ||
| Other Accounts | N/A | N/A |
| Jennifer Hsui | ||||
| Types of Accounts | Number
of Other Accounts with Performance Fees Managed by Portfolio Manager |
Aggregate
of Total Assets | ||
| Registered Investment Companies | N/A | N/A | ||
| Other Pooled Investment Vehicles | N/A | N/A | ||
| Other Accounts | N/A | N/A |
| Greg Savage | ||||
| Types of Accounts | Number
of Other Accounts with Performance Fees Managed by Portfolio Manager |
Aggregate
of Total Assets | ||
| Registered Investment Companies | N/A | N/A | ||
| Other Pooled Investment Vehicles | N/A | N/A | ||
| Other Accounts | N/A | N/A |
Table of Contents
| Fund
Inception Date |
Administration,
Custodian, Transfer Agency Expenses Paid During Fiscal Year Ended April 30, 2014 |
Administration,
Custodian, Transfer Agency Expenses Paid During Fiscal Year Ended April 30, 2013 |
Administration,
Custodian, Transfer Agency Expenses Paid During Fiscal Year Ended April 30, 2012 | |||
| 02/23/12 | $57,635 | $30,238 | $5,628 |
Table of Contents
| Fund
Inception Date |
Distributor
Compensation Paid During Fiscal Year Ended April 30, 2014 |
Distributor
Compensation Paid During Fiscal Year Ended April 30, 2013 |
Distributor
Compensation Paid From April 1, 2012 to April 30, 20121 |
Distributor
Compensation Paid From February 23, 2012 to March 31, 20122 | ||||
| 02/23/12 | $7,660 | $7,457 | $827 | $1,712 |
| 1 | BRIL serves as the distributor to the Fund effective April 1, 2012. These fees reflect payments made to SEI, acting as an agent of the Distributor. |
| 2 | SEI served as the distributor to the Fund through March 31, 2012. |
Table of Contents
Table of Contents
Table of Contents
Table of Contents
Table of Contents
Table of Contents
| Fund
Inception Date |
Brokerage
Commissions Paid During Fiscal Year Ended April 30, 2014 |
Brokerage
Commissions Paid During Fiscal Year Ended April 30, 2013 |
Brokerage
Commissions Paid During Fiscal Year Ended April 30, 2012 | |||
| 02/23/12 | $106,226 | $72,996 | $4,318 |
Table of Contents
| Fiscal Year ended April 30, 2014 | Fiscal Year ended April 30, 2013 | |||
| 44% | 41% |
Table of Contents
Table of Contents
Table of Contents
| Shares
Per Creation Unit |
Value
Per Creation Unit (U.S.$) | |
| 50,000 | $2,443,500 |
Table of Contents
Table of Contents
Table of Contents
| Standard
Creation Transaction Fee |
Maximum
Additional Charge* | |
| $3,000 | 3.0% |
| * | As a percentage of the net asset value per Creation Unit. |
Table of Contents
Table of Contents
| Standard
Redemption Transaction Fee |
Maximum
Additional Charge* | |
| $3,000 | 2.0% |
| * | As a percentage of the net asset value per Creation Unit, inclusive of the standard redemption transaction fee. |
Table of Contents
Table of Contents
Table of Contents
Table of Contents
| 2015 | ||||||
| Country | Trade
Date |
Settlement
Date |
Number
of Days to Settle | |||
| China | 02/13/15 | 02/25/15 | 12 | |||
| 02/16/15 | 02/26/15 | 10 | ||||
| 02/17/15 | 02/27/15 | 10 | ||||
| 09/28/15 | 10/08/15 | 10 | ||||
| 09/29/15 | 10/09/15 | 10 | ||||
| 09/30/15 | 10/12/15 | 12 | ||||
| Russia | 12/24/15 | 01/11/16 | 18 | |||
| 12/28/15 | 01/15/16 | 15 | ||||
| 12/29/15 | 01/18/16 | 18 | ||||
| South Africa | 03/27/15 | 04/07/15 | 11 | |||
| 03/30/15 | 04/08/15 | 9 | ||||
| 03/31/15 | 04/09/15 | 9 | ||||
| 04/01/15 | 04/10/15 | 9 | ||||
| 04/02/15 | 04/13/15 | 11 | ||||
| 04/20/15 | 04/28/15 | 8 | ||||
| 04/21/15 | 04/29/15 | 8 | ||||
| 04/22/15 | 04/30/15 | 8 | ||||
| 04/23/15 | 05/01/15 | 8 | ||||
| 04/23/15 | 05/04/15 | 11 | ||||
| 04/24/15 | 05/05/15 | 11 | ||||
| 04/28/15 | 05/06/15 | 8 | ||||
| 04/29/15 | 05/07/15 | 8 | ||||
| 04/30/15 | 05/08/15 | 8 | ||||
| 06/09/15 | 06/17/15 | 8 | ||||
| 06/10/15 | 06/18/15 | 8 | ||||
| 06/11/15 | 06/19/15 | 8 | ||||
| 06/12/15 | 06/22/15 | 10 | ||||
| 06/15/15 | 06/23/15 | 8 | ||||
| 08/03/15 | 08/11/15 | 8 | ||||
| 08/04/15 | 08/12/15 | 8 | ||||
| 08/05/15 | 08/13/15 | 8 | ||||
| 08/06/15 | 08/14/15 | 8 | ||||
| 08/07/15 | 08/17/15 | 10 | ||||
| 09/17/15 | 09/25/15 | 8 | ||||
| 09/18/15 | 09/28/15 | 10 | ||||
| 09/21/15 | 09/29/15 | 8 | ||||
| 09/22/15 | 09/30/15 | 8 | ||||
| 09/23/15 | 10/01/15 | 8 | ||||
| 12/09/15 | 12/17/15 | 8 | ||||
| 12/10/15 | 12/18/15 | 8 | ||||
| 12/11/15 | 12/21/15 | 10 | ||||
| 12/14/15 | 12/22/15 | 8 | ||||
| 12/15/15 | 12/23/15 | 8 | ||||
| 12/18/15 | 12/28/15 | 10 | ||||
| 12/21/15 | 12/29/15 | 8 | ||||
| 12/22/15 | 12/30/15 | 8 | ||||
| 12/23/15 | 12/31/15 | 8 | ||||
| 12/24/15 | 01/04/16 | 11 | ||||
Table of Contents
| 2015 | ||||||
| Country | Trade
Date |
Settlement
Date |
Number
of Days to Settle | |||
| 12/28/15 | 01/05/16 | 8 | ||||
| 12/29/15 | 01/06/16 | 8 | ||||
| 12/30/15 | 01/07/16 | 8 | ||||
| 12/31/15 | 01/08/16 | 8 | ||||
| Taiwan | 02/16/15 | 02/24/15 | 8 | |||
| 02/17/15 | 02/25/15 | 8 | ||||
| Thailand | 04/08/15 | 04/16/15 | 8 | |||
| 04/09/15 | 04/17/15 | 8 | ||||
| 04/10/15 | 04/20/15 | 10 | ||||
| * | These worst-case redemption cycles are based on information regarding regular holidays, which may be out of date. Based on changes in holidays, longer (worse) redemption cycles are possible. |
Table of Contents
Table of Contents
Table of Contents
Table of Contents
Table of Contents
Table of Contents
Table of Contents
Table of Contents
Table of Contents
Table of Contents
(as revised June 22, 2015)
| Fund | Ticker | Stock Exchange | ||
| iShares Latin America Bond ETF (the “Fund”) | LTAM | NASDAQ |
Table of Contents
Table of Contents
Table of Contents
Table of Contents
Table of Contents
Table of Contents
Table of Contents
Table of Contents
| • | High yield bonds may be issued by less creditworthy companies. These securities are vulnerable to adverse changes in the issuer’s industry and to general economic conditions. Issuers of high yield bonds may be unable to meet their interest or principal payment obligations because of an economic downturn, specific issuer developments or the unavailability of additional financing. |
| • | The issuers of high yield bonds may have a larger amount of outstanding debt relative to their assets than issuers of investment grade bonds. If the issuer experiences financial stress, it may be unable to meet its debt obligations. The |
Table of Contents
| issuer’s ability to pay its debt obligations also may be lessened by specific issuer developments, or the unavailability of additional financing. Issuers of high yield securities are often in the growth stage of their development and/or involved in a reorganization or takeover. | |
| • | High yield bonds are frequently ranked junior to claims by other creditors. If the issuer cannot meet its obligations, the senior obligations are generally paid off before the junior obligations, which will potentially limit the Fund’s ability to fully recover principal or to receive interest payments when senior securities are in default. Thus, investors in high yield securities frequently have a lower degree of protection with respect to principal and interest payments than do investors in higher rated securities. |
| • | High yield bonds frequently have redemption features that permit an issuer to repurchase the security from the Fund before it matures. If an issuer redeems the high yield bonds, the Fund may have to invest the proceeds in bonds with lower yields and may lose income. |
| • | Prices of high yield bonds are subject to extreme fluctuations. Negative economic developments may have a greater impact on the prices of high yield bonds than on those of other higher rated fixed income securities. |
| • | High yield bonds may be less liquid than higher rated fixed income securities even under normal economic conditions. Under certain economic and/or market conditions, the Fund may have difficulty disposing of certain high yield securities due to the limited number of investors in that sector of the market. There are fewer dealers in the high yield bond market, and there may be significant differences in the prices quoted for high yield bonds by dealers, and such quotations may not be the actual prices available for a purchase or sale. Because high yield bonds are less liquid, judgment may play a greater role in the prices and values generated for such securities than in the case of securities trading in a more liquid market. |
| • | The secondary markets for high yield securities are not as liquid as the secondary markets for higher rated securities. The secondary markets for high yield securities are concentrated in relatively few market makers and participants in the markets are mostly institutional investors, including insurance companies, banks, other financial institutions and mutual funds. In addition, the trading volume for high yield securities is generally lower than that for higher rated securities and the secondary markets could contract under adverse market or economic conditions independent of any specific adverse changes in the condition of a particular issuer. Under certain economic and/or market conditions, the Fund may have difficulty disposing of certain high yield securities due to the limited number of investors in that sector of the market. A less liquid secondary market may adversely affect the market price of the high yield security, which may result in increased difficulty selling the particular issue and obtaining accurate market quotations on the issue when valuing the Fund’s assets. Market quotations on high yield securities are available only from a limited number of dealers, and such quotations may not be the actual prices available for a purchase or sale. When the secondary market for high yield securities becomes more illiquid, or in the absence of readily available market quotations for such securities, the relative lack of reliable objective data makes it more difficult to value such securities, and judgment plays a more important role in determining such valuations. |
| • | The Fund may incur expenses to the extent necessary to seek recovery upon default or to negotiate new terms with a defaulting issuer. |
| • | The high yield bond markets may react strongly to adverse news about an issuer or the economy, or to the perception or expectation of adverse news, whether or not it is based on fundamental analysis. Additionally, prices for high yield securities may be affected by legislative and regulatory developments. These developments could adversely affect the Fund’s net asset value and investment practices, the secondary market for high yield securities, the financial condition of issuers of these securities and the value and liquidity of outstanding high yield securities, especially in a thinly traded market. For example, federal legislation requiring the divestiture by federally insured savings and loan associations of their investments in high yield bonds and limiting the deductibility of interest by certain corporate issuers of high yield bonds adversely affected the market in the past. |
Table of Contents
Table of Contents
Table of Contents
Table of Contents
Table of Contents
Table of Contents
Table of Contents
Table of Contents
Table of Contents
Table of Contents
Table of Contents
Table of Contents
Table of Contents
Table of Contents
Table of Contents
Table of Contents
| • | The Fund generally supports the board’s nominees in the election of directors and generally supports proposals that strengthen the independence of boards of directors; |
| • | When a director has committed himself or herself to service on more than four public company boards (but no more than six public company boards in most circumstances), the Fund will consider such director’s individual circumstances in determining whether the director will be able to commit sufficient focus and time to a particular company; |
| • | The Fund generally defers to an issuer’s choice of auditors so long as the corporate auditors represent the interests of shareholders and provide an independent view of the propriety of financial reporting decisions of management; |
| • | The Fund generally favors disclosure of a company’s compensation and benefits policies and opposes excessive compensation, but believes that compensation matters are normally best determined by a company’s board of directors; |
| • | The Fund generally expects to support capital structure requests that it believes enhance the rights of common shareholders and oppose requests that appear to be unreasonably dilutive; |
| • | The Fund generally does not support proposals on social issues that lack a demonstrable economic benefit to the issuer and the Fund investing in such issuer; and |
| • | The Fund generally votes against anti-takeover proposals and proposals that would create additional barriers or costs to corporate transactions that are likely to deliver a premium to shareholders. |
Table of Contents
Table of Contents
Table of Contents
| 1. | Concentrate its investments (i.e., invest 25% or more of its total assets in the securities of a particular industry or group of industries), except that the Fund will concentrate to approximately the same extent that the Underlying Index concentrates in the securities of a particular industry or group of industries. For purposes of this limitation, securities of the U.S. government (including its agencies and instrumentalities), repurchase agreements collateralized by U.S. government securities, and securities of state or municipal governments and their political subdivisions are not considered to be issued by members of any industry. |
| 2. | Borrow money, except that (i) the Fund may borrow from banks for temporary or emergency (not leveraging) purposes, including the meeting of redemption requests which might otherwise require the untimely disposition of securities; and (ii) the Fund may, to the extent consistent with its investment policies, enter into repurchase agreements, reverse repurchase agreements, forward roll transactions and similar investment strategies and techniques. To the extent that it engages in transactions described in (i) and (ii), the Fund will be limited so that no more than 33 1/3% of the value of its total assets (including the amount borrowed) is derived from such transactions. Any borrowings which come to exceed this amount will be reduced in accordance with applicable law. |
| 3. | Issue “senior securities” as defined in the 1940 Act and the rules, regulations and orders thereunder, except as permitted under the 1940 Act and the rules, regulation and orders thereunder. |
| 4. | Make loans, except as permitted under the 1940 Act, as interpreted, modified or otherwise permitted by regulatory authority having jurisdiction, from time to time. |
| 5. | Purchase or sell real estate unless acquired as a result of ownership of securities or other instruments (but this restriction shall not prevent the Fund from investing in securities of companies engaged in the real estate business or securities or other instruments backed by real estate or mortgages), or commodities or commodity contracts (but this restriction shall not prevent the Fund from trading in futures contracts and options on futures contracts, including options on currencies to the extent consistent with the Fund’s investment objective and policies). |
| 6. | Engage in the business of underwriting securities issued by other persons, except to the extent that the Fund may technically be deemed to be an underwriter under the 1933 Act, in disposing of portfolio securities. |
| • | The frequency of trades and quotes for the security; |
| • | The number of dealers wishing to purchase or sell the security and the number of other potential purchasers; |
| • | Dealer undertakings to make a market in the security; and |
| • | The nature of the security and the nature of the marketplace in which it trades (e.g., the time needed to dispose of the security, the method of soliciting offers and the mechanics of transfer). |
Table of Contents
Table of Contents
| Name (Age) | Position | Principal
Occupation(s) During the Past 5 Years |
Other
Directorships Held by Director | |||
| Robert
S. Kapito1 (58) |
Director
(since 2009). |
President and Director, BlackRock, Inc. (since 2006); Vice Chairman of BlackRock, Inc. and Head of BlackRock, Inc.’s Portfolio Management Group (since its formation in 1998) and BlackRock, Inc.’s predecessor entities (since 1988); Trustee, University of Pennsylvania (since 2009); President of Board of Directors, Hope & Heroes Children’s Cancer Fund (since 2002); President of the Board of Directors, Periwinkle Theatre for Youth (since 1983). | Trustee of iShares Trust (since 2009); Director of iShares MSCI Russia Capped ETF, Inc. (since 2010); Trustee of iShares U.S. ETF Trust (since 2011); Director of BlackRock, Inc. (since 2006). | |||
| Mark
Wiedman2 (44) |
Director (since 2013). | Managing Director, BlackRock, Inc. (since 2007); Global Head of iShares (since 2011); Head of Corporate Strategy, BlackRock, Inc. (2009-2011). | Trustee of iShares Trust (since 2013); Director of iShares MSCI Russia Capped ETF, Inc. (since 2013);Trustee of iShares U.S. ETF Trust (since 2013); Director of PennyMac Financial Services, Inc. (since 2008). |
| 1 | Robert S. Kapito is deemed to be an “interested person” (as defined in the 1940 Act) of the Company due to his affiliations with BlackRock, Inc. |
| 2 | Mark Wiedman is deemed to be an “interested person” (as defined in the 1940 Act) of the Company due to his affiliations with BlackRock, Inc. and its affiliates. |
Table of Contents
| Name (Age) | Position | Principal
Occupation(s) During the Past 5 Years |
Other
Directorships Held by Director | |||
| Robert
H. Silver (59) |
Director
(since 2007); Independent Chairman (since 2012). |
President and Co-Founder of The Bravitas Group, Inc. (since 2006); Director and Vice Chairman of the YMCA of Greater NYC (2001-2011); Broadway Producer (2006-2011); Co-Founder and Vice President of Parentgiving Inc. (since 2008); Director and Member of the Audit and Compensation Committee of EPAM Systems, Inc. (2006-2009); President and Chief Operating Officer of UBS Financial Services Inc. (formerly Paine Webber Inc.) (2003-2005) and various executive positions with UBS and its affiliates (1988-2005); CPA and Audit Manager of KPMG, LLP (formerly Peat Marwick Mitchell) (1977-1983). | Trustee of iShares Trust (since 2007); Director of iShares MSCI Russia Capped ETF, Inc. (since 2010); Trustee of iShares U.S. ETF Trust (since 2011); Independent Chairman of iShares Trust, iShares MSCI Russia Capped ETF, Inc. and iShares U.S. ETF Trust (since 2012). | |||
| John
E. Martinez (53) |
Director
(since 2003); Securities Lending Committee Chair (since 2012). |
Director of FirstREX Agreement Corp. (formerly EquityRock, Inc.) (since 2005). | Trustee of iShares Trust (since 2003); Director of iShares MSCI Russia Capped ETF, Inc. (since 2010); Trustee of iShares U.S. ETF Trust (since 2011). | |||
| Cecilia
H. Herbert (65) |
Director
(since 2005); Nominating and Governance Committee Chair and Equity Plus Committee Chair (since 2012). |
Director (1998-2013) and President (2007-2011) of the Board of Directors, Catholic Charities CYO; Trustee (2002-2011) and Chair of the Finance and Investment Committee (2006-2010) of the Thacher School; Member (since 1992) and Chair (1994-2005) of the Investment Committee, Archdiocese of San Francisco; Trustee and Member of the Investment Committee, WNET, the New York public broadcasting/media company (since 2011). | Trustee of iShares Trust (since 2005); Director of iShares MSCI Russia Capped ETF, Inc. (since 2010); Trustee of iShares U.S. ETF Trust (since 2011); Director of Forward Funds (34 portfolios) (since 2009). | |||
| Charles
A. Hurty (71) |
Director
(since 2005); Audit Committee Chair (since 2006). |
Retired; Partner, KPMG LLP (1968-2001). | Trustee of iShares Trust (since 2005); Director of iShares MSCI Russia Capped ETF, Inc. (since 2010); Trustee of iShares U.S. ETF Trust (since 2011); Director of GMAM Absolute Return Strategy Fund (1 portfolio) (since 2002); Director of SkyBridge Alternative Investments Multi-Adviser Hedge Fund Portfolios LLC (2 portfolios) (since 2002). |
Table of Contents
| Name (Age) | Position | Principal
Occupation(s) During the Past 5 Years |
Other
Directorships Held by Director | |||
| John
E. Kerrigan (59) |
Director
(since 2005); Fixed Income Plus Committee Chair (since 2012). |
Chief Investment Officer, Santa Clara University (since 2002). | Trustee of iShares Trust (since 2005); Director of iShares MSCI Russia Capped ETF, Inc. (since 2010); Trustee of iShares U.S. ETF Trust (since 2011). | |||
| Madhav
V. Rajan (50) |
Director
(since 2011); 15(c) Committee Chair (since 2012). |
Robert K. Jaedicke Professor of Accounting and Senior Associate Dean for Academic Affairs and Head of MBA Program, Stanford University Graduate School of Business (since 2001); Professor of Law (by courtesy), Stanford Law School (since 2005); Visiting Professor, University of Chicago (2007-2008). | Trustee
of iShares Trust (since 2011); Director of iShares MSCI Russia Capped ETF, Inc. (since 2011); Trustee of iShares U.S. ETF Trust (since 2011); Director, Cavium, Inc. (since 2013). | |||
| Jane
D. Carlin (59) |
Director
(since 2015). |
Managing Director and Global Head of Financial Holding Company Governance & Assurance and the Global Head of Operational Risk Management of Morgan Stanley Group (2006-2012). | Trustee of iShares Trust (since 2015); Trustee of iShares U.S. ETF Trust (since 2015); Director of PHH Corporation (mortgage solutions) (since 2012). |
| Name (Age) | Position | Principal
Occupation(s) During the Past 5 Years | ||
| Manish
Mehta (44) |
President (since 2013). | Managing Director, BlackRock, Inc. (since 2009); Chief Operating Officer for iShares (since 2009); Head of Strategy and Corporate Development, BGI (2005-2009); Chief of Staff to the CEO, BGI (2005-2009). | ||
| Jack
Gee (55) |
Treasurer
and Chief Financial Officer (since 2008). |
Managing Director, BlackRock, Inc. (since 2009); Senior Director of Fund Administration of Intermediary Investor Business, BGI (2009); Director of Fund Administration of Intermediary Investor Business, BGI (2004-2009). | ||
| Charles
Park (47) |
Chief
Compliance Officer and Anti-Money Laundering Officer (since 2006). |
Chief Compliance Officer of BlackRock Advisors, LLC and the BlackRock-advised Funds in the Equity-Bond Complex, the Equity-Liquidity Complex and the Closed-End Complex (since 2014); Principal of and Chief Compliance Officer for iShares® Delaware Trust Sponsor LLC (since 2012) and BFA (since 2006); Chief Compliance Officer for BlackRock Asset Management International Inc. (since 2012). |
Table of Contents
| Name (Age) | Position | Principal
Occupation(s) During the Past 5 Years | ||
| Eilleen
M. Clavere (62) |
Secretary
(since 2007). |
Director of Global Fund Administration, BlackRock, Inc. (since 2009); Director of Legal Administration of Intermediary Investor Business, BGI (2006-2009); Legal Counsel and Vice President of Atlas Funds, Atlas Advisers, Inc. and Atlas Securities, Inc. (2005-2006); Counsel at Kirkpatrick & Lockhart LLP (2001-2005). | ||
| Edward
B. Baer (46) |
Vice
President and Chief Legal Officer (since 2012). |
Managing Director of Legal & Compliance, BlackRock, Inc. (since 2006); Director of Legal & Compliance, BlackRock, Inc. (2004-2006). | ||
| Scott
Radell (46) |
Executive
Vice President (since 2012). |
Managing Director, BlackRock, Inc. (since 2009); Head of Portfolio Solutions, BlackRock, Inc. (since 2009); Head of Portfolio Solutions, BGI (2007-2009); Credit Portfolio Manager, BGI (2005-2007); Credit Research Analyst, BGI (2003-2005). | ||
| Amy
Schioldager (52) |
Executive
Vice President (since 2007). |
Senior Managing Director, BlackRock, Inc. (since 2009); Global Head of Index Equity, BGI (2008-2009); Global Head of U.S. Indexing, BGI (2006-2008); Head of Domestic Equity Portfolio Management, BGI (2001-2006). | ||
| Ira
P. Shapiro (51) |
Vice
President (since 2007). |
Managing Director, BlackRock, Inc. (since 2009); Head of Strategic Product Initiatives for iShares (since 2012); Chief Legal Officer, Exchange-Traded Fund Complex (2007-2012); Associate General Counsel, BGI (2004-2009). |
Table of Contents
Table of Contents
Table of Contents
Table of Contents
Table of Contents
| Name of Director | Fund | Dollar
Range of Equity Securities in the Fund |
Aggregate
Dollar Range of Equity Securities in all Registered Investment Companies Overseen by Director in Family of Investment Companies | |||
| Robert S. Kapito | None | None | None | |||
| Mark Wiedman | iShares Core MSCI EAFE ETF | $50,001-$100,000 | Over $100,000 | |||
| iShares Core MSCI Emerging Markets ETF | $50,001-$100,000 | |||||
| iShares Core S&P Total U.S. Stock Market ETF | $50,001-$100,000 | |||||
| Robert H. Silver | iShares Core High Dividend ETF | Over $100,000 | Over $100,000 | |||
| iShares Core MSCI EAFE ETF | Over $100,000 | |||||
| iShares Core MSCI Emerging Markets ETF | Over $100,000 | |||||
| iShares Core MSCI Total International Stock ETF | Over $100,000 | |||||
| iShares Core S&P 500 ETF | Over $100,000 | |||||
| iShares Core S&P Mid-Cap ETF | Over $100,000 | |||||
| iShares Core S&P Small-Cap ETF | Over $100,000 | |||||
| iShares Core S&P Total U.S. Stock Market ETF | Over $100,000 | |||||
| iShares Global Energy ETF | Over $100,000 | |||||
| iShares Global Tech ETF | $50,001-$100,000 | |||||
| iShares iBonds Sep 2015 AMT-Free Muni Bond ETF | Over $100,000 | |||||
| iShares iBonds Sep 2016 AMT-Free Muni Bond ETF | Over $100,000 | |||||
| iShares iBonds Sep 2017 AMT-Free Muni Bond ETF | Over $100,000 | |||||
| iShares iBonds Sep 2018 AMT-Free Muni Bond ETF | Over $100,000 |
Table of Contents
| Name of Director | Fund | Dollar
Range of Equity Securities in the Fund |
Aggregate
Dollar Range of Equity Securities in all Registered Investment Companies Overseen by Director in Family of Investment Companies | |||
| iShares iBoxx $ Investment Grade Corporate Bond ETF | Over $100,000 | |||||
| iShares International Developed Real Estate ETF | $1-$10,000 | |||||
| iShares J.P. Morgan USD Emerging Markets Bond ETF | $1-$10,000 | |||||
| iShares MSCI ACWI ex U.S. ETF | $1-$10,000 | |||||
| iShares MSCI China ETF | Over $100,000 | |||||
| iShares MSCI EAFE ETF | Over $100,000 | |||||
| iShares MSCI Emerging Markets ETF | Over $100,000 | |||||
| iShares MSCI EMU ETF | Over $100,000 | |||||
| iShares MSCI Frontier 100 ETF | Over $100,000 | |||||
| iShares Nasdaq Biotechnology ETF | $50,001-$100,000 | |||||
| iShares National AMT-Free Muni Bond ETF | Over $100,000 | |||||
| iShares Russell 1000 Growth ETF | Over $100,000 | |||||
| iShares Russell 1000 Value ETF | Over $100,000 | |||||
| iShares Russell 2000 ETF | $10,001-$50,000 | |||||
| iShares Russell 2000 Growth ETF | Over $100,000 | |||||
| iShares Russell 2000 Value ETF | Over $100,000 | |||||
| iShares Russell Mid-Cap Growth ETF | $1-$10,000 | |||||
| iShares Russell Mid-Cap Value ETF | $1-$10,000 | |||||
| iShares S&P 100 ETF | $50,001-$100,000 | |||||
| iShares Select Dividend ETF | $10,001-$50,000 | |||||
| iShares U.S. Broker-Dealers ETF | Over $100,000 | |||||
| iShares U.S. Financial Services ETF | $50,001-$100,000 | |||||
| iShares U.S. Preferred Stock ETF | Over $100,000 | |||||
| iShares U.S. Regional Banks ETF | Over $100,000 | |||||
| iShares U.S. Technology ETF | Over $100,000 | |||||
| John E. Martinez | iShares Core MSCI Emerging Markets ETF | $50,001-$100,000 | Over $100,000 | |||
| iShares Core S&P 500 ETF | Over $100,000 | |||||
| iShares Core S&P Mid-Cap ETF | $10,001-$50,000 | |||||
| iShares Core S&P Small-Cap ETF | $10,001-$50,000 | |||||
| iShares Core S&P Total U.S. Stock Market ETF | $1-$10,000 | |||||
| iShares Global Consumer Staples ETF | Over $100,000 | |||||
| iShares MSCI All Country Asia ex Japan ETF | Over $100,000 | |||||
| iShares MSCI EAFE ETF | Over $100,000 | |||||
| iShares Russell 1000 ETF | Over $100,000 | |||||
| iShares Russell 1000 Value ETF | Over $100,000 |
Table of Contents
| Name of Director | Fund | Dollar
Range of Equity Securities in the Fund |
Aggregate
Dollar Range of Equity Securities in all Registered Investment Companies Overseen by Director in Family of Investment Companies | |||
| iShares Russell 2000 ETF | Over $100,000 | |||||
| Cecilia H. Herbert | iShares China Large-Cap ETF | Over $100,000 | Over $100,000 | |||
| iShares Core Dividend Growth ETF | $10,001-$50,000 | |||||
| iShares Core MSCI Emerging Markets ETF | $10,001-$50,000 | |||||
| iShares Core MSCI Total International Stock ETF | $10,001-$50,000 | |||||
| iShares Core S&P Total U.S. Stock Market ETF | $10,001-$50,000 | |||||
| iShares Core U.S. Growth ETF | $10,001-$50,000 | |||||
| iShares Core U.S. Value ETF | $10,001-$50,000 | |||||
| iShares iBoxx $ High Yield Corporate Bond ETF | $10,001-$50,000 | |||||
| iShares International Select Dividend ETF | $1-$10,000 | |||||
| iShares MSCI EAFE ETF | $1-$10,000 | |||||
| iShares MSCI Emerging Markets ETF | $1-$10,000 | |||||
| iShares MSCI Japan ETF | $10,001-$50,000 | |||||
| iShares National AMT-Free Muni Bond ETF | $10,001-$50,000 | |||||
| Charles A. Hurty | iShares China Large-Cap ETF | $10,001-$50,000 | Over $100,000 | |||
| iShares Core High Dividend ETF | $10,001-$50,000 | |||||
| iShares Core MSCI Emerging Markets ETF | $50,001-$100,000 | |||||
| iShares Core S&P 500 ETF | $10,001-$50,000 | |||||
| iShares Global Energy ETF | $10,001-$50,000 | |||||
| iShares Global Healthcare ETF | $10,001-$50,000 | |||||
| iShares Global Tech ETF | $10,001-$50,000 | |||||
| iShares MSCI EAFE ETF | $10,001-$50,000 | |||||
| iShares MSCI Japan ETF | $10,001-$50,000 | |||||
| iShares MSCI USA Value Factor ETF | $10,001-$50,000 | |||||
| iShares North American Tech-Multimedia Networking ETF | $1-$10,000 | |||||
| iShares Russell 2000 ETF | $10,001-$50,000 | |||||
| iShares Select Dividend ETF | $1-$10,000 | |||||
| iShares U.S. Basic Materials ETF | $10,001-$50,000 | |||||
| iShares U.S. Energy ETF | $10,001-$50,000 | |||||
| iShares U.S. Financials ETF | $1-$10,000 | |||||
| iShares U.S. Technology ETF | $50,001-$100,000 | |||||
| John E. Kerrigan | iShares MSCI ACWI ETF | $10,001-$50,000 | Over $100,000 | |||
| iShares MSCI ACWI ex U.S. ETF | Over $100,000 |
Table of Contents
| Name of Director | Fund | Dollar
Range of Equity Securities in the Fund |
Aggregate
Dollar Range of Equity Securities in all Registered Investment Companies Overseen by Director in Family of Investment Companies | |||
| iShares Short-Term National AMT-Free Muni Bond ETF | Over $100,000 | |||||
| Madhav V. Rajan | iShares Core Dividend Growth ETF | Over $100,000 | Over $100,000 | |||
| iShares Core High Dividend ETF | Over $100,000 | |||||
| iShares Core MSCI Emerging Markets ETF | Over $100,000 | |||||
| iShares Core S&P 500 ETF | Over $100,000 | |||||
| iShares iBoxx $ High Yield Corporate Bond ETF | Over $100,000 | |||||
| iShares iBoxx $ Investment Grade Corporate Bond ETF | Over $100,000 | |||||
| iShares Russell 2000 ETF | Over $100,000 | |||||
| iShares Select Dividend ETF | Over $100,000 | |||||
| Jane D. Carlin1 | iShares Core MSCI EAFE ETF | $10,001-$50,000 | Over $100,000 | |||
| iShares Core S&P Small-Cap ETF | $10,001-$50,000 | |||||
| iShares Global Tech ETF | $50,001-$100,000 |
| 1 | Appointed to serve as an Independent Director effective February 3, 2015. |
| Name of Trustee | iShares
Latin America Bond ETF |
Pension
or Retirement Benefits Accrued As Part of Company Expenses3 |
Estimated
Annual Benefits Upon Retirement3 |
Total
Compensation From the Fund and Fund Complex4 | ||||
| Independent Director:1 |
Table of Contents
| Name of Trustee | iShares
Latin America Bond ETF |
Pension
or Retirement Benefits Accrued As Part of Company Expenses3 |
Estimated
Annual Benefits Upon Retirement3 |
Total
Compensation From the Fund and Fund Complex4 | ||||
| Robert H. Silver | $0 | Not Applicable | Not Applicable | $ 350,000 | ||||
| George G.C. Parker2 | 0 | Not Applicable | Not Applicable | 300,000 | ||||
| John E. Kerrigan | 0 | Not Applicable | Not Applicable | 326,807 | ||||
| Charles A. Hurty | 0 | Not Applicable | Not Applicable | 340,000 | ||||
| Cecilia H. Herbert | 0 | Not Applicable | Not Applicable | 330,000 | ||||
| John E. Martinez | 0 | Not Applicable | Not Applicable | 315,000 | ||||
| Madhav V. Rajan | 0 | Not Applicable | Not Applicable | 326,772 | ||||
| Interested Director: | ||||||||
| Robert S. Kapito | $0 | Not Applicable | Not Applicable | $ 0 | ||||
| Mark Wiedman | 0 | Not Applicable | Not Applicable | 0 |
| 1 | Compensation is not shown for Jane D. Carlin because she was appointed to serve as an Independent Director of the Company effective February 3, 2015. |
| 3 | No Director or officer is entitled to any pension or retirement benefits from the Company. |
| 4 | Includes compensation for service on the Boards of Trustees for iShares Trust and iShares U.S. ETF Trust and the Board of Directors of iShares MSCI Russia Capped ETF, Inc. |
Table of Contents
Table of Contents
Table of Contents
Table of Contents
Table of Contents
Table of Contents
Table of Contents
| James Mauro | ||||
| Types of Accounts | Number | Total Assets | ||
| Registered Investment Companies | 83 | $151,100,000,000 | ||
| Other Pooled Investment Vehicles | 15 | 18,000,000,000 | ||
| Other Accounts | 9 | 13,000,000,000 | ||
| Accounts with Incentive-Based Fee Arrangements | 1 | 1,000,000,000 |
| Scott Radell | ||||
| Types of Accounts | Number | Total Assets | ||
| Registered Investment Companies | 88 | $157,800,000,000 | ||
| Other Pooled Investment Vehicles | 4 | 3,000,000,000 | ||
| Other Accounts | 5 | 3,200,000,000 | ||
| Accounts with Incentive-Based Fee Arrangements | 2 | 1,700,000,000 |
Table of Contents
| James Mauro | ||||
| Types of Accounts | Number
of Other Accounts with Performance Fees Managed by Portfolio Manager |
Aggregate
of Total Assets | ||
| Registered Investment Companies | 0 | N/A | ||
| Other Pooled Investment Vehicles | 0 | N/A | ||
| Other Accounts | 1 | $1,000,000,000 |
| Scott Radell | ||||
| Types of Accounts | Number
of Other Accounts with Performance Fees Managed by Portfolio Manager |
Aggregate
of Total Assets | ||
| Registered Investment Companies | 0 | N/A | ||
| Other Pooled Investment Vehicles | 1 | $900,000,000 | ||
| Other Accounts | 1 | 800,000,000 |
Table of Contents
Table of Contents
Table of Contents
Table of Contents
Table of Contents
Table of Contents
Table of Contents
Table of Contents
Table of Contents
Table of Contents
Table of Contents
| Shares
Per Creation Unit |
Value
Per Creation Unit (U.S.$) | |
| 200,000 | $10,000,000 |
Table of Contents
Table of Contents
Table of Contents
Table of Contents
| Standard
Creation Transaction Fee |
Maximum
Additional Charge* | |
| $1,300 | 3.0% |
| * | As a percentage of the net asset value per Creation Unit. |
Table of Contents
| Standard
Redemption Transaction Fee |
Maximum
Additional Charge* | |
| $1,300 | 2.0% |
| * | As a percentage of the net asset value per Creation Unit, inclusive of the standard redemption transaction fee. |
Table of Contents
Table of Contents
Table of Contents
Table of Contents
Table of Contents
Table of Contents
Table of Contents
Table of Contents
Table of Contents
Table of Contents
Table of Contents