Table of Contents
| 2014 Prospectus |
 |
| ► | iShares Emerging Markets Dividend ETF | DVYE | NYSE ARCA |
Table of Contents
Table of Contents
|
|
S-1 |
|
|
1 |
|
|
2 |
|
|
12 |
|
|
15 |
|
|
15 |
|
|
19 |
|
|
28 |
|
|
29 |
|
|
30 |
|
|
32 |
|
|
33 |
Table of Contents
Table of Contents
DIVIDEND ETF
| Ticker: DVYE | Stock Exchange: NYSE Arca |
| Annual
Fund Operating Expenses (ongoing expenses that you pay each year as a percentage of the value of your investments) | ||||||||||||
| Management
Fees |
Distribution
and Service (12b-1) Fees |
Other
Expenses |
Acquired
Fund Fees and Expenses |
Total
Annual Fund Operating Expenses |
Fee Waiver | Total
Annual Fund Operating Expenses After Fee Waiver | ||||||
| 0.68% | None | None | 0.00% | 0.68% | (0.19)% | 0.49% | ||||||
Table of Contents
| 1 Year | 3 Years | 5 Years | 10 Years | |||
| $50 | $198 | $360 | $829 |
Table of Contents
Table of Contents
Table of Contents
Table of Contents
Table of Contents
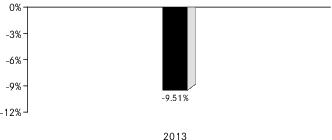
| 1 | The Fund’s total return for the six months ended June 30, 2014 was 2.92%. |
| One Year | Since
Fund Inception | ||
| (Inception Date: 2/23/2012) | |||
| Return Before Taxes | -9.51% | -2.10% | |
| Return After Taxes on Distributions2 | -10.60% | -2.98% | |
| Return After Taxes on Distributions and Sale of Fund Shares2 | -4.70% | -1.45% | |
| Dow Jones Emerging Markets Select Dividend Index (Index returns do not reflect deductions for fees, expenses, or taxes) | -10.01% | -2.52% |
| 2 | After-tax returns in the table above are calculated using the historical highest individual U.S. federal marginal income tax rates and do not reflect the impact of state or local taxes. Actual after-tax returns depend on an investor’s tax situation and may differ from those shown, and after-tax returns shown are not relevant to tax-exempt investors or investors who hold shares through tax-deferred arrangements, such as 401(k) plans or individual retirement accounts (“IRAs”). Fund returns after taxes on distributions and sales of Fund shares are calculated assuming that an investor has sufficient capital gains of the same character from other investments to offset any capital losses from the sale of Fund shares. As a result, Fund returns after taxes on distributions and sales of Fund shares may exceed Fund returns before taxes and/or returns after taxes on distributions. |
Table of Contents
Table of Contents
Table of Contents
Table of Contents
Table of Contents
Table of Contents
Table of Contents
Table of Contents
| ■ | Lower levels of liquidity and market efficiency; |
| ■ | Greater securities price volatility; |
| ■ | Exchange rate fluctuations and exchange controls; |
| ■ | Less availability of public information about issuers; |
| ■ | Limitations on foreign ownership of securities; |
| ■ | Imposition of withholding or other taxes; |
| ■ | Imposition of restrictions on the expatriation of the funds or other assets of the Fund; |
| ■ | Higher transaction and custody costs and delays in settlement procedures; |
| ■ | Difficulties in enforcing contractual obligations; |
| ■ | Lower levels of regulation of the securities markets; |
| ■ | Weaker accounting, disclosure and reporting requirements; and |
| ■ | Legal principles relating to corporate governance, directors’ fiduciary duties and liabilities and stockholders’ rights in markets in which the Fund invests may differ and/or may not be as extensive or protective as those that apply in the United States. |
Table of Contents
Table of Contents
| ■ | The risk of delays in settling portfolio transactions and the risk of loss arising out of the system of share registration and custody used in Russia; |
| ■ | Risks in connection with the maintenance of the Fund’s portfolio securities and cash with foreign sub-custodians and securities depositories, including the risk that appropriate sub-custody arrangements will not be available to the Fund; |
| ■ | The risk that the Fund’s ownership rights in portfolio securities could be lost through fraud or negligence as a result of the fact that ownership in shares of Russian companies is recorded by the companies themselves and by registrars, rather than by a central registration system; and |
Table of Contents
| ■ | The risk that the Fund may not be able to pursue claims on behalf of its shareholders because of the system of share registration and custody, and because Russian banking institutions and registrars are not guaranteed by the Russian government. |
Table of Contents
Table of Contents
Table of Contents
| ■ | The risk of delays in settling portfolio transactions and the risk of loss arising out of the system of share registration and custody used in certain Eastern European countries; |
| ■ | Risks in connection with the maintenance of the Fund's portfolio securities and cash with foreign sub-custodians and securities depositories, including the risk that appropriate sub-custody arrangements will not be available to the Fund; |
| ■ | The risk that the Fund's ownership rights in portfolio securities could be lost through fraud or negligence as a result of the fact that ownership in shares of certain Eastern European companies is recorded by the companies themselves and by registrars, rather than a central registration system; |
| ■ | The risk that the Fund may not be able to pursue claims on behalf of its shareholders because of the system of share registration and custody, and because certain Eastern European banking institutions and registrars are not guaranteed by their respective governments; and |
| ■ | Risks in connection with Eastern European countries' dependence on the economic health of Western European countries and the EU as a whole. |
Table of Contents
Table of Contents
Table of Contents
Table of Contents
Table of Contents
Table of Contents
Table of Contents
Table of Contents
Table of Contents
Table of Contents
Table of Contents
Table of Contents
Table of Contents
Table of Contents
| Approximate
Value of a Creation Unit |
Creation
Unit Size |
Standard
Creation/ Redemption Transaction Fee |
Maximum
Additional Charge for Creations* |
Maximum
Additional Charge for Redemptions* | ||||
| $2,443,500 | 50,000 | $3,000 | 3.0% | 2.0% |
| * | As a percentage of the net asset value per Creation Unit, inclusive, in the case of redemptions, of the standard redemption transaction fee. |
Table of Contents
Table of Contents
(For a share outstanding throughout each period)
| Year
ended Apr. 30,2014 |
Year
ended Apr. 30, 2013 |
Period
from Feb. 23, 2012a to Apr. 30, 2012 | |||
| Net asset value, beginning of period | $ 53.80 | $ 53.23 | $ 54.61 | ||
| Income
from investment operations: | |||||
| Net investment incomeb | 1.96 | 2.02 | 0.74 | ||
| Net realized and unrealized gain (loss)c | (5.18) | 0.56 | (1.98) | ||
| Total from investment operations | (3.22) | 2.58 | (1.24) | ||
| Less distributions from: | |||||
| Net investment income | (2.25) | (2.01) | (0.14) | ||
| Total distributions | (2.25) | (2.01) | (0.14) | ||
| Net asset value, end of period | $ 48.33 | $ 53.80 | $ 53.23 | ||
| Total return | (5.86)% | 5.09% | (2.27)% d | ||
| Ratios/Supplemental data: | |||||
| Net assets, end of period (000s) | $178,838 | $131,806 | $15,970 | ||
| Ratio of expenses to average net assetse | 0.49% | 0.49% | 0.49% | ||
| Ratio of expenses to average net assets prior to waived feese | 0.68% | 0.68% | 0.68% | ||
| Ratio of net investment income to average net assetse | 4.01% | 3.80% | 7.51% | ||
| Portfolio turnover ratef | 44% | 41% | 2% | ||
| a | Commencement of operations. |
| b | Based on average shares outstanding throughout each period. |
| c | The amounts reported for a share outstanding may not accord with the change in aggregate gains and losses in securities for the fiscal period due to the timing of capital share transactions in relation to the fluctuating market values of the Fund's underlying securities. |
| d | Not annualized. |
| e | Annualized for periods of less than one year. |
| f | Portfolio turnover rates exclude portfolio securities received or delivered in Creation Units but include portfolio transactions that are executed as a result of the Fund processing capital share transactions in Creation Units partially for cash in U.S. dollars. Excluding such cash transactions, the portfolio turnover rates for the years ended April 30, 2014 and April 30, 2013 were 39% and 41%, respectively. |
Table of Contents
Table of Contents
Table of Contents
Table of Contents
| Premium/Discount Range | Number of Days | Percentage of Total Days | ||
| Greater than 2.0% | 1 | 0.27% | ||
| Greater than 1.5% and Less than 2.0% | 1 | 0.27 | ||
| Greater than 1.0% and Less than 1.5% | 15 | 3.99 | ||
| Greater than 0.5% and Less than 1.0% | 99 | 26.33 | ||
| Between 0.5% and -0.5% | 208 | 55.31 | ||
| Less than -0.5% and Greater than -1.0% | 35 | 9.31 | ||
| Less than -1.0% and Greater than -1.5% | 14 | 3.72 | ||
| Less than -1.5% and Greater than -2.0% | 1 | 0.27 | ||
| Less than -2.0% and Greater than -2.5% | 2 | 0.53 | ||
| 376 | 100.00% |
Table of Contents
| Average Annual Total Returns | Cumulative Total Returns | |||||||
| NAV | MARKET | INDEX | NAV | MARKET | INDEX | |||
| 1 Year | (5.86)% | (5.96)% | (6.35)% | (5.86)% | (5.96)% | (6.35)% | ||
| Since Inception* | (1.53)% | (1.25)% | (1.80)% | (3.31)% | (2.72)% | (3.88)% | ||
| * | Total returns for the period since inception are calculated from the inception date of the Fund (2/23/12). The first day of secondary market trading in shares of the Fund was 2/24/12. |
Table of Contents
Table of Contents
|
|
| Call: | 1-800-iShares
or 1-800-474-2737 (toll free) Monday through Friday, 8:30 a.m. to 6:30 p.m. (Eastern time) |
| Email: | iSharesETFs@blackrock.com |
| Write: | c/o
BlackRock Investments, LLC 1 University Square Drive, Princeton, NJ 08540 |

Table of Contents
| 2014 Prospectus |
|
| ► | iShares MSCI Emerging Markets Horizon ETF | EMHZ | BATS |
Table of Contents
Table of Contents
Table of Contents
Table of Contents
| Ticker: EMHZ | Stock Exchange: BATS |
| Annual
Fund Operating Expenses (ongoing expenses that you pay each year as a percentage of the value of your investments) | ||||||
| Management
Fees |
Distribution
and Service (12b-1) Fees |
Other
Expenses |
Total
Annual Fund Operating Expenses | |||
| 0.50% | None | None | 0.50% | |||
| 1 Year | 3 Years | ||||
| $51 | $160 |
Table of Contents
Table of Contents
Table of Contents
Table of Contents
Table of Contents
Table of Contents
Table of Contents
Table of Contents
Table of Contents
Table of Contents
Table of Contents
Table of Contents
Table of Contents
Table of Contents
| ■ | Lower levels of liquidity and market efficiency; |
| ■ | Greater securities price volatility; |
| ■ | Exchange rate fluctuations and exchange controls; |
| ■ | Less availability of public information about issuers; |
| ■ | Limitations on foreign ownership of securities; |
| ■ | Imposition of withholding or other taxes; |
| ■ | Imposition of restrictions on the expatriation of the funds or other assets of the Fund; |
| ■ | Higher transaction and custody costs and delays in settlement procedures; |
| ■ | Difficulties in enforcing contractual obligations; |
| ■ | Lower levels of regulation of the securities markets; |
| ■ | Weaker accounting, disclosure and reporting requirements; and |
Table of Contents
| ■ | Legal principles relating to corporate governance, directors’ fiduciary duties and liabilities and stockholders’ rights in markets in which the Fund invests may differ and/or may not be as extensive or protective as those that apply in the United States. |
Table of Contents
Table of Contents
Table of Contents
Table of Contents
| ■ | The risk of delays in settling portfolio transactions and the risk of loss arising out of the system of share registration and custody used in certain Eastern European countries; |
Table of Contents
| ■ | Risks in connection with the maintenance of the Fund's portfolio securities and cash with foreign sub-custodians and securities depositories, including the risk that appropriate sub-custody arrangements will not be available to the Fund; |
| ■ | The risk that the Fund's ownership rights in portfolio securities could be lost through fraud or negligence as a result of the fact that ownership in shares of certain Eastern European companies is recorded by the companies themselves and by registrars, rather than a central registration system; |
| ■ | The risk that the Fund may not be able to pursue claims on behalf of its shareholders because of the system of share registration and custody, and because certain Eastern European banking institutions and registrars are not guaranteed by their respective governments; and |
| ■ | Risks in connection with Eastern European countries' dependence on the economic health of Western European countries and the EU as a whole. |
Table of Contents
Table of Contents
Table of Contents
Table of Contents
Table of Contents
Table of Contents
Table of Contents
Table of Contents
Table of Contents
Table of Contents
Table of Contents
Table of Contents
Table of Contents
Table of Contents
| Approximate
Value of a Creation Unit |
Creation
Unit Size |
Standard
Creation/ Redemption Transaction Fee |
Maximum
Additional Charge for Creations* |
Maximum
Additional Charge for Redemptions* | ||||
| $1,250,000 | 50,000 | $10,500 | 3.0% | 2.0% |
| * | As a percentage of the net asset value per Creation Unit, inclusive, in the case of redemptions, of the standard redemption transaction fee. |
Table of Contents
Table of Contents
Table of Contents
Table of Contents
Table of Contents
|
|
| Call: | 1-800-iShares
or 1-800-474-2737 (toll free) Monday through Friday, 8:30 a.m. to 6:30 p.m. (Eastern time) |
| Email: | iSharesETFs@blackrock.com |
| Write: | c/o
BlackRock Investments, LLC 1 University Square Drive, Princeton, NJ 08540 |

Table of Contents
| 2014 Prospectus |
|
| ► | iShares Emerging Markets Corporate Bond ETF | CEMB | BATS |
Table of Contents
Table of Contents
|
|
S-1 |
|
|
1 |
|
|
2 |
|
|
13 |
|
|
14 |
|
|
15 |
|
|
17 |
|
|
26 |
|
|
27 |
|
|
28 |
|
|
28 |
|
|
30 |
Table of Contents
Table of Contents
| Ticker: CEMB | Stock Exchange: BATS |
| Annual
Fund Operating Expenses (ongoing expenses that you pay each year as a percentage of the value of your investments) | ||||||
| Management
Fees |
Distribution
and Service (12b-1) Fees |
Other
Expenses |
Total
Annual Fund Operating Expenses | |||
| 0.60% | None | None | 0.60% | |||
| 1 Year | 3 Years | 5 Years | 10 Years | |||
| $61 | $192 | $335 | $750 |
Table of Contents
Table of Contents
Table of Contents
Table of Contents
Table of Contents
Table of Contents
Table of Contents
| One Year | Since
Fund Inception | ||
| (Inception Date: 4/17/2012) | |||
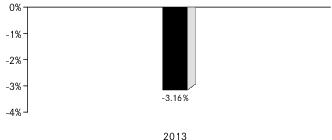
| Return Before Taxes | -3.16% | 3.21% | |
| Return After Taxes on Distributions1 | -4.75% | 1.68% | |
| Return After Taxes on Distributions and Sale of Fund Shares1 | -1.79% | 1.84% | |
| Morningstar ® Emerging Markets Corporate Bond IndexSM (Index returns do not reflect deductions for fees, expenses, or taxes) | -2.81% | 3.71% |
| 1 | After-tax returns in the table above are calculated using the historical highest individual U.S. federal marginal income tax rates and do not reflect the impact of state or local taxes. Actual after-tax returns depend on an investor’s tax situation and may differ from those shown, and after-tax returns shown are not relevant to tax-exempt investors or investors who hold shares through tax-deferred arrangements, such as 401(k) plans or individual retirement accounts (“IRAs”). Fund returns after taxes on distributions and sales of Fund shares are calculated assuming that an investor has sufficient capital gains of the same character from other investments to offset any capital losses from the sale of Fund shares. As a result, Fund returns after taxes on distributions and sales of Fund shares may exceed Fund returns before taxes and/or returns after taxes on distributions. |
Table of Contents
Table of Contents
Table of Contents
Table of Contents
Table of Contents
| ■ | The risk of delays in settling portfolio transactions and the risk of loss arising out of the system of share registration and custody used in certain Eastern European countries; |
| ■ | Risks in connection with the maintenance of the Fund's portfolio securities and cash |
Table of Contents
| ■ | The risk that the Fund's ownership rights in portfolio securities could be lost through fraud or negligence as a result of the fact that ownership in shares of certain Eastern European companies is recorded by the companies themselves and by registrars, rather than a central registration system; |
| ■ | The risk that the Fund may not be able to pursue claims on behalf of its shareholders because of the system of share registration and custody, and because certain Eastern European banking institutions and registrars are not guaranteed by their respective governments; and |
| ■ | Risks in connection with Eastern European countries' dependence on the economic health of Western European countries and the European Union (the “EU”) as a whole. |
Table of Contents
Table of Contents
Table of Contents
Table of Contents
Table of Contents
Table of Contents
Table of Contents
Table of Contents
Table of Contents
Table of Contents
Table of Contents
Table of Contents
Table of Contents
Table of Contents
Table of Contents
Table of Contents
Table of Contents
Table of Contents
Table of Contents
Table of Contents
Table of Contents
| Approximate
Value of a Creation Unit |
Creation
Unit Size |
Standard
Creation/ Redemption Transaction Fee |
Maximum
Additional Charge for Creations* |
Maximum
Additional Charge for Redemptions* | ||||
| $4,972,000 | 100,000 | $100 | 3.0% | 2.0% |
| * | As a percentage of the net asset value per Creation Unit, inclusive, in the case of redemptions, of the standard redemption transaction fee. |
Table of Contents
Table of Contents
(For a share outstanding throughout each period)
| Year
ended Oct. 31, 2013 |
Period
from Apr. 17, 2012a to Oct. 31, 2012 | ||
| Net asset value, beginning of period | $ 52.93 | $ 50.00 | |
| Income
from investment operations: | |||
| Net investment incomeb | 1.92 | 1.07 | |
| Net realized and unrealized gain (loss)c | (2.49) | 2.76 | |
| Total from investment operations | (0.57) | 3.83 | |
| Less distributions from: | |||
| Net investment income | (1.88) | (0.90) | |
| Total distributions | (1.88) | (0.90) | |
| Net asset value, end of period | $ 50.48 | $ 52.93 | |
| Total return | (1.07)% | 7.75% d | |
| Ratios/Supplemental data: | |||
| Net assets, end of period (000s) | $35,338 | $21,170 | |
| Ratio of expenses to average net assetse | 0.60% | 0.60% | |
| Ratio of net investment income to average net assetse | 3.74% | 3.87% | |
| Portfolio turnover ratef | 33% | 29% | |
| a | Commencement of operations. |
| b | Based on average shares outstanding throughout each period. |
| c | The amounts reported for a share outstanding may not accord with the change in aggregate gains and losses in securities for the fiscal period due to the timing of capital share transactions in relation to the fluctuating market values of the Fund's underlying securities. |
| d | Not annualized. |
| e | Annualized for periods of less than one year. |
| f | Portfolio turnover rates exclude portfolio securities received or delivered as a result of processing capital share transactions in Creation Units. |
Table of Contents
Table of Contents
Table of Contents
| Premium/Discount Range | Number of Days | Percentage of Total Days | ||
| Greater than 2.0% | 1 | 0.53% | ||
| Greater than 1.5% and Less than 2.0% | 3 | 1.60 | ||
| Greater than 1.0% and Less than 1.5% | 78 | 41.48 | ||
| Greater than 0.5% and Less than 1.0% | 28 | 14.89 | ||
| Between 0.5% and -0.5% | 16 | 8.51 | ||
| Less than -0.5% and Greater than -1.0% | 8 | 4.26 | ||
| Less than -1.0% and Greater than -1.5% | 14 | 7.45 | ||
| Less than -1.5% and Greater than -2.0% | 13 | 6.91 | ||
| Less than -2.0% and Greater than -2.5% | 19 | 10.11 | ||
| Less than -2.5% and Greater than -3.0% | 5 | 2.66 | ||
| Less than -3.0% and Greater than -3.5% | 3 | 1.60 | ||
| 188 | 100.00% |
Table of Contents
| Average Annual Total Returns | Cumulative Total Returns | |||||||
| NAV | MARKET | INDEX | NAV | MARKET | INDEX | |||
| 1 Year | (1.07)% | (4.06)% | (0.68)% | (1.07)% | (4.06)% | (0.68)% | ||
| Since Inception* | 4.22% | 2.81% | 4.73% | 6.59% | 4.37% | 7.35% | ||
| * | Total returns for the period since inception are calculated from the inception date of the Fund (4/17/12). The first day of secondary market trading in shares of the Fund was 4/19/12. |
Table of Contents
Table of Contents
Table of Contents
|
|
| Call: | 1-800-iShares
or 1-800-474-2737 (toll free) Monday through Friday, 8:30 a.m. to 6:30 p.m. (Eastern time) |
| Email: | iSharesETFs@blackrock.com |
| Write: | c/o
BlackRock Investments, LLC 1 University Square Drive, Princeton, NJ 08540 |

Table of Contents
| 2014 Prospectus |
|
| ► | iShares Emerging Markets High Yield Bond ETF | EMHY | BATS |
Table of Contents
Table of Contents
|
|
S-1 |
|
|
1 |
|
|
2 |
|
|
12 |
|
|
14 |
|
|
14 |
|
|
17 |
|
|
26 |
|
|
27 |
|
|
28 |
|
|
28 |
|
|
30 |
Table of Contents
Table of Contents
| Ticker: EMHY | Stock Exchange: BATS |
| Annual
Fund Operating Expenses (ongoing expenses that you pay each year as a percentage of the value of your investments) | ||||||
| Management
Fees |
Distribution
and Service (12b-1) Fees |
Other
Expenses |
Total
Annual Fund Operating Expenses | |||
| 0.65% | None | None | 0.65% | |||
| 1 Year | 3 Years | 5 Years | 10 Years | |||
| $66 | $208 | $362 | $810 |
Table of Contents
Table of Contents
Table of Contents
Table of Contents
Table of Contents
Table of Contents
Table of Contents
| One Year | Since
Fund Inception | ||
| (Inception Date: 4/3/2012) | |||
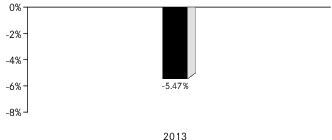
| Return Before Taxes | -5.47% | 4.59% | |
| Return After Taxes on Distributions1 | -7.81% | 2.32% | |
| Return After Taxes on Distributions and Sale of Fund Shares1 | -3.08% | 2.60% | |
| Morningstar ® Emerging Markets High Yield Bond IndexSM (Index returns do not reflect deductions for fees, expenses, or taxes) | -4.99% | 5.18% |
| 1 | After-tax returns in the table above are calculated using the historical highest individual U.S. federal marginal income tax rates and do not reflect the impact of state or local taxes. Actual after-tax returns depend on an investor’s tax situation and may differ from those shown, and after-tax returns shown are not relevant to tax-exempt investors or investors who hold shares through tax-deferred arrangements, such as 401(k) plans or individual retirement accounts (“IRAs”). Fund returns after taxes on distributions and sales of Fund shares are calculated assuming that an investor has sufficient capital gains of the same character from other investments to offset any capital losses from the sale of Fund shares. As a result, Fund returns after taxes on distributions and sales of Fund shares may exceed Fund returns before taxes and/or returns after taxes on distributions. |
Table of Contents
Table of Contents
Table of Contents
Table of Contents
Table of Contents
Table of Contents
Table of Contents
Table of Contents
Table of Contents
Table of Contents
Table of Contents
Table of Contents
Table of Contents
Table of Contents
Table of Contents
| ■ | The risk of delays in settling portfolio transactions and the risk of loss arising out of the system of share registration and custody used in certain Eastern European countries; |
| ■ | Risks in connection with the maintenance of the Fund's portfolio securities and cash with foreign sub-custodians and securities depositories, including the risk that appropriate sub-custody arrangements will not be available to the Fund; |
| ■ | The risk that the Fund's ownership rights in portfolio securities could be lost through fraud or negligence as a result of the fact that ownership in shares of certain Eastern European companies is recorded by the companies themselves and by registrars, rather than a central registration system; |
| ■ | The risk that the Fund may not be able to pursue claims on behalf of its shareholders because of the system of share registration and custody, and because certain Eastern European banking institutions and registrars are not guaranteed by their respective governments; and |
| ■ | Risks in connection with Eastern European countries' dependence on the economic health of Western European countries and the EU as a whole. |
Table of Contents
Table of Contents
Table of Contents
Table of Contents
Table of Contents
Table of Contents
Table of Contents
Table of Contents
Table of Contents
Table of Contents
Table of Contents
Table of Contents
| Approximate
Value of a Creation Unit |
Creation
Unit Size |
Standard
Creation/ Redemption Transaction Fee |
Maximum
Additional Charge for Creations* |
Maximum
Additional Charge for Redemptions* | ||||
| $4,928,000 | 100,000 | $100 | 3.0% | 2.0% |
| * | As a percentage of the net asset value per Creation Unit, inclusive, in the case of redemptions, of the standard redemption transaction fee. |
Table of Contents
Table of Contents
(For a share outstanding throughout each period)
| Year
ended Oct. 31, 2013 |
Period
from Apr. 3, 2012a to Oct. 31, 2012 | ||
| Net asset value, beginning of period | $ 53.62 | $ 50.02 | |
| Income
from investment operations: | |||
| Net investment incomeb | 2.97 | 1.60 | |
| Net realized and unrealized gain (loss)c | (2.91) | 3.40 | |
| Total from investment operations | 0.06 | 5.00 | |
| Less distributions from: | |||
| Net investment income | (2.78) | (1.40) | |
| Total distributions | (2.78) | (1.40) | |
| Net asset value, end of period | $ 50.90 | $ 53.62 | |
| Total return | 0.14% | 10.21% d | |
| Ratios/Supplemental data: | |||
| Net assets, end of period (000s) | $203,604 | $166,231 | |
| Ratio of expenses to average net assetse | 0.65% | 0.65% | |
| Ratio of net investment income to average net assetse | 5.64% | 5.34% | |
| Portfolio turnover ratef | 57% | 40% | |
| a | Commencement of operations. |
| b | Based on average shares outstanding throughout each period. |
| c | The amounts reported for a share outstanding may not accord with the change in aggregate gains and losses in securities for the fiscal period due to the timing of capital share transactions in relation to the fluctuating market values of the Fund's underlying securities. |
| d | Not annualized. |
| e | Annualized for periods of less than one year. |
| f | Portfolio turnover rates exclude portfolio securities received or delivered as a result of processing capital share transactions in Creation Units. |
Table of Contents
Table of Contents
Table of Contents
| Premium/Discount Range | Number of Days | Percentage of Total Days | ||
| Greater than 1.0% and Less than 1.5% | 15 | 7.98% | ||
| Greater than 0.5% and Less than 1.0% | 86 | 45.74 | ||
| Between 0.5% and -0.5% | 75 | 39.89 | ||
| Less than -0.5% and Greater than -1.0% | 9 | 4.79 | ||
| Less than -1.0% and Greater than -1.5% | 3 | 1.60 | ||
| 188 | 100.00% |
Table of Contents
| Average Annual Total Returns | Cumulative Total Returns | |||||||
| NAV | MARKET | INDEX | NAV | MARKET | INDEX | |||
| 1 Year | 0.14% | (1.44)% | 0.53% | 0.14% | (1.44)% | 0.53% | ||
| Since Inception* | 6.43% | 6.31% | 7.02% | 10.36% | 10.15% | 11.27% | ||
| * | Total returns for the period since inception are calculated from the inception date of the Fund (4/3/12). The first day of secondary market trading in shares of the Fund was 4/3/12. |
Table of Contents
Table of Contents
Table of Contents
|
|
| Call: | 1-800-iShares
or 1-800-474-2737 (toll free) Monday through Friday, 8:30 a.m. to 6:30 p.m. (Eastern time) |
| Email: | iSharesETFs@blackrock.com |
| Write: | c/o
BlackRock Investments, LLC 1 University Square Drive, Princeton, NJ 08540 |

Table of Contents
| 2014 Prospectus |
|
| ► | iShares Emerging Markets Local Currency Bond ETF | LEMB | NYSE ARCA |
Table of Contents
Table of Contents
|
|
S-1 |
|
|
1 |
|
|
2 |
|
|
11 |
|
|
13 |
|
|
13 |
|
|
16 |
|
|
24 |
|
|
25 |
|
|
27 |
|
|
27 |
|
|
29 |
Table of Contents
Table of Contents
| Ticker: LEMB | Stock Exchange: NYSE Arca |
| Annual
Fund Operating Expenses (ongoing expenses that you pay each year as a percentage of the value of your investments) | ||||||
| Management
Fees |
Distribution
and Service (12b-1) Fees |
Other
Expenses |
Total
Annual Fund Operating Expenses | |||
| 0.60% | None | None | 0.60% | |||
| 1 Year | 3 Years | 5 Years | 10 Years | |||
| $61 | $192 | $335 | $750 |
Table of Contents
Table of Contents
Table of Contents
Table of Contents
Table of Contents
Table of Contents
| One Year | Since
Fund Inception | ||
| (Inception Date: 10/18/2011) | |||
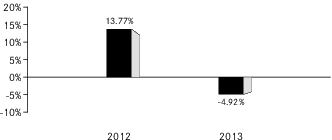
| Return Before Taxes | -4.92% | 2.46% | |
| Return After Taxes on Distributions1 | -5.94% | 1.67% | |
| Return After Taxes on Distributions and Sale of Fund Shares1 | -2.64% | 1.66% | |
| Barclays Emerging Markets Broad Local Currency Bond Index (Index returns do not reflect deductions for fees, expenses, or taxes) | -4.61% | 2.71% |
| 1 | After-tax returns in the table above are calculated using the historical highest individual U.S. federal marginal income tax rates and do not reflect the impact of state or local taxes. Actual after-tax returns depend on an investor’s tax situation and may differ from those shown, and after-tax returns shown are not relevant to tax-exempt investors or investors who hold shares through tax-deferred arrangements, such as 401(k) plans or individual retirement accounts (“IRAs”). Fund returns after taxes on distributions and sales of Fund shares are calculated assuming that an investor has sufficient capital gains of the same character from other investments to offset any capital losses from the sale of Fund shares. As a result, Fund returns after taxes on distributions and sales of Fund shares may exceed Fund returns before taxes and/or returns after taxes on distributions. |
Table of Contents
Table of Contents
Table of Contents
Table of Contents
| ■ | The risk of delays in settling portfolio transactions and the risk of loss arising out of the system of share registration and custody used in certain Eastern European countries; |
| ■ | Risks in connection with the maintenance of the Fund's portfolio securities and cash |
Table of Contents
| ■ | The risk that the Fund's ownership rights in portfolio securities could be lost through fraud or negligence as a result of the fact that ownership in shares of certain Eastern European companies is recorded by the companies themselves and by registrars, rather than a central registration system; |
| ■ | The risk that the Fund may not be able to pursue claims on behalf of its shareholders because of the system of share registration and custody, and because certain Eastern European banking institutions and registrars are not guaranteed by their respective governments; and |
| ■ | Risks in connection with Eastern European countries' dependence on the economic health of Western European countries and the European Union (the “EU”) as a whole. |
Table of Contents
Table of Contents
Table of Contents
Table of Contents
Table of Contents
Table of Contents
Table of Contents
Table of Contents
Table of Contents
Table of Contents
Table of Contents
Table of Contents
Table of Contents
Table of Contents
Table of Contents
Table of Contents
Table of Contents
Table of Contents
Table of Contents
Table of Contents
| Approximate
Value of a Creation Unit |
Creation
Unit Size |
Standard
Creation/ Redemption Transaction Fee |
Maximum
Additional Charge for Creations* |
Maximum
Additional Charge for Redemptions* | ||||
| $9,824,000 | 200,000 | $2,000 | 7.0% | 2.0% |
| * | As a percentage of the net asset value per Creation Unit, inclusive, in the case of redemptions, of the standard redemption transaction fee. |
Table of Contents
(For a share outstanding throughout each period)
| Year
ended Oct. 31, 2013 |
Year
ended Oct. 31, 2012 |
Period
from Oct. 18, 2011a to Oct. 31, 2011 | |||
| Net asset value, beginning of period | $ 51.94 | $ 51.13 | $ 49.85 | ||
| Income
from investment operations: | |||||
| Net investment incomeb | 2.07 | 2.31 | 0.02 | ||
| Net realized and unrealized gain (loss)c | (1.92) | 0.41 | 1.26 | ||
| Total from investment operations | 0.15 | 2.72 | 1.28 | ||
| Less distributions from: | |||||
| Net investment income | (1.39) | (0.81) | − | ||
| Return of capital | (0.04) | (1.10) | − | ||
| Total distributions | (1.43) | (1.91) | − | ||
| Net asset value, end of period | $ 50.66 | $ 51.94 | $ 51.13 | ||
| Total return | 0.28% | 5.48% | 2.57% d | ||
| Ratios/Supplemental data: | |||||
| Net assets, end of period (000s) | $638,342 | $207,753 | $30,681 | ||
| Ratio of expenses to average net assetse | 0.60% | 0.60% | 0.60% | ||
| Ratio of net investment income to average net assetse | 4.04% | 4.57% | 1.21% | ||
| Portfolio turnover ratef | 41% | 61% | 0% | ||
| a | Commencement of operations. |
| b | Based on average shares outstanding throughout each period. |
| c | The amounts reported for a share outstanding may not accord with the change in aggregate gains and losses in securities for the fiscal period due to the timing of capital share transactions in relation to the fluctuating market values of the Fund's underlying securities. |
| d | Not annualized. |
| e | Annualized for periods of less than one year. |
| f | Portfolio turnover rates exclude portfolio securities received or delivered in Creation Units but includes portfolio transactions that are executed as a result of the Fund processing capital share transactions in Creation Units partially for cash in U.S. dollars. Excluding |
Table of Contents
Table of Contents
Table of Contents
Table of Contents
| Premium/Discount Range | Number of Days | Percentage of Total Days | ||
| Greater than 2.0% and Less than 2.5% | 1 | 0.40% | ||
| Greater than 1.5% and Less than 2.0% | 7 | 2.78 | ||
| Greater than 1.0% and Less than 1.5% | 79 | 31.34 | ||
| Greater than 0.5% and Less than 1.0% | 36 | 14.29 | ||
| Between 0.5% and -0.5% | 111 | 44.05 | ||
| Less than -0.5% and Greater than -1.0% | 16 | 6.35 | ||
| Less than -1.0% | 2 | 0.79 | ||
| 252 | 100.00% |
Table of Contents
| Average Annual Total Returns | Cumulative Total Returns | |||||||
| NAV | MARKET | INDEX | NAV | MARKET | INDEX | |||
| 1 Year | 0.28% | (1.60)% | 0.57% | 0.28% | (1.60)% | 0.57% | ||
| Since Inception* | 4.10% | 3.82% | 4.31% | 8.54% | 7.93% | 8.96% | ||
| * | Total returns for the period since inception are calculated from the inception date of the Fund (10/18/11). The first day of secondary market trading in shares of the Fund was 10/20/11. |
Table of Contents
Table of Contents
|
|
| Call: | 1-800-iShares
or 1-800-474-2737 (toll free) Monday through Friday, 8:30 a.m. to 6:30 p.m. (Eastern time) |
| Email: | iSharesETFs@blackrock.com |
| Write: | c/o
BlackRock Investments, LLC 1 University Square Drive, Princeton, NJ 08540 |

Table of Contents
(as revised January 7, 2015)
| Fund | Ticker | Stock Exchange | ||
| iShares Emerging Markets Dividend ETF (the “Fund”) | DVYE | NYSE Arca |
Table of Contents
Table of Contents
Table of Contents
Table of Contents
Table of Contents
Table of Contents
Table of Contents
Table of Contents
Table of Contents
Table of Contents
Table of Contents
Table of Contents
Table of Contents
Table of Contents
Table of Contents
Table of Contents
Table of Contents
Table of Contents
Table of Contents
Table of Contents
Table of Contents
Table of Contents
Table of Contents
Table of Contents
Table of Contents
Table of Contents
Table of Contents
| • | The Fund generally supports the board’s nominees in the election of directors and generally supports proposals that strengthen the independence of boards of directors; |
| • | When a director has committed himself or herself to service on more than four public company boards (but no |
Table of Contents
| more than six public company boards in most circumstances), the Fund will consider such director’s individual circumstances in determining whether the director will be able to commit sufficient focus and time to a particular company; | |
| • | The Fund generally defers to an issuer’s choice of auditors so long as the corporate auditors represent the interests of shareholders and provide an independent view of the propriety of financial reporting decisions of management; |
| • | The Fund generally favors disclosure of a company’s compensation and benefits policies and opposes excessive compensation, but believes that compensation matters are normally best determined by a company’s board of directors; |
| • | The Fund generally expects to support capital structure requests that it believes enhance the rights of common shareholders and oppose requests that appear to be unreasonably dilutive; |
| • | The Fund generally does not support proposals on social issues that lack a demonstrable economic benefit to the issuer and the Fund investing in such issuer; and |
| • | The Fund generally votes against anti-takeover proposals and proposals that would create additional barriers or costs to corporate transactions that are likely to deliver a premium to shareholders. |
Table of Contents
Table of Contents
| 1. | Concentrate its investments (i.e., invest 25% or more of its total assets in the securities of a particular industry or group of industries), except that the Fund will concentrate to approximately the same extent that the Underlying Index concentrates in the securities of a particular industry or group of industries. For purposes of this limitation, securities of the U.S. government (including its agencies and instrumentalities), repurchase agreements collateralized by U.S. government securities, and securities of state or municipal governments and their political subdivisions are not considered to be issued by members of any industry. |
| 2. | Borrow money, except that (i) the Fund may borrow from banks for temporary or emergency (not leveraging) purposes, including the meeting of redemption requests which might otherwise require the untimely disposition of securities; and (ii) the Fund may, to the extent consistent with its investment policies, enter into repurchase agreements, reverse repurchase agreements, forward roll transactions and similar investment strategies and techniques. To the extent that it engages in transactions described in (i) and (ii), the Fund will be limited so that no more than 33 1/3% of the value of its total assets (including the amount borrowed) is derived from such transactions. Any borrowings which come to exceed this amount will be reduced in accordance with applicable law. |
| 3. | Issue any senior security, except as permitted under the 1940 Act, as interpreted, modified or otherwise permitted by any regulatory authority having jurisdiction, from time to time. |
| 4. | Make loans, except as permitted under the 1940 Act, as interpreted, modified or otherwise permitted by regulatory authority having jurisdiction, from time to time. |
| 5. | Purchase or sell real estate unless acquired as a result of ownership of securities or other instruments (but this restriction shall not prevent the Fund from investing in securities of companies engaged in the real estate business or securities or other instruments backed by real estate or mortgages), or commodities or commodity contracts (but this restriction shall not prevent the Fund from trading in futures contracts and options on futures contracts, including options on currencies to the extent consistent with the Fund’s investment objective and policies). |
| 6. | Engage in the business of underwriting securities issued by other persons, except to the extent that the Fund may technically be deemed to be an underwriter under the 1933 Act, in disposing of portfolio securities. |
Table of Contents
| • | The frequency of trades and quotes for the security; |
| • | The number of dealers wishing to purchase or sell the security and the number of other potential purchasers; |
| • | Dealer undertakings to make a market in the security; and |
| • | The nature of the security and the nature of the marketplace in which it trades (e.g., the time needed to dispose of the security, the method of soliciting offers and the mechanics of transfer). |
Table of Contents
| Name (Age) | Position | Principal
Occupation(s) During the Past 5 Years |
Other
Directorships Held by Director | |||
| Robert
S. Kapito1 (57) |
Director
(since 2009). |
President and Director, BlackRock, Inc. (since 2006); Vice Chairman of BlackRock, Inc. and Head of BlackRock, Inc.’s Portfolio Management Group (since its formation in 1998) and BlackRock, Inc.’s predecessor entities (since 1988); Trustee, University of Pennsylvania (since 2009); President of Board of Directors, Hope & Heroes Children’s Cancer Fund (since 2002); President of the Board of Directors, Periwinkle Theatre for Youth (since 1983). | Trustee of iShares Trust (since 2009); Director of iShares MSCI Russia Capped ETF, Inc. (since 2010); Trustee of iShares U.S. ETF Trust (since 2011); Director of BlackRock, Inc. (since 2006). | |||
| Mark
Wiedman2 (43) |
Director (since 2013). | Managing Director, BlackRock, Inc. (since 2007); Global Head of iShares (since 2011); Head of Corporate Strategy, BlackRock, Inc. (2009-2011). | Trustee of iShares Trust (since 2013); Director of iShares MSCI Russia Capped ETF, Inc. (since 2013); Trustee of iShares U.S. ETF Trust (since 2013); Director of PennyMac Financial Services, Inc. (since 2008). |
| 1 | Robert S. Kapito is deemed to be an “interested person” (as defined in the 1940 Act) of the Company due to his affiliations with BlackRock, Inc. |
| 2 | Mark Wiedman is deemed to be an “interested person” (as defined in the 1940 Act) of the Company due to his affiliations with BlackRock, Inc. and its affiliates. |
Table of Contents
| Name (Age) | Position | Principal
Occupation(s) During the Past 5 Years |
Other
Directorships Held by Director | |||
| Robert
H. Silver (59) |
Director
(since 2007); Independent Chairman (since 2012). |
President and Co-Founder of The Bravitas Group, Inc. (since 2006); Director and Vice Chairman of the YMCA of Greater NYC (2001-2011); Broadway Producer (2006-2011); Co-Founder and Vice President of Parentgiving Inc. (since 2008); Director and Member of the Audit and Compensation Committee of EPAM Systems, Inc. (2006-2009); President and Chief Operating Officer of UBS Financial Services Inc. (formerly Paine Webber Inc.) (2003-2005) and various executive positions with UBS and its affiliates (1988-2005); CPA and Audit Manager of KPMG, LLP (formerly Peat Marwick Mitchell) (1977-1983). | Trustee of iShares Trust (since 2007); Director of iShares MSCI Russia Capped ETF, Inc. (since 2010); Trustee of iShares U.S. ETF Trust (since 2011); Independent Chairman of iShares Trust, iShares MSCI Russia Capped ETF, Inc. and iShares U.S. ETF Trust (since 2012). | |||
| George
G.C. Parker (75) |
Director
(since 2002). |
Dean Witter Distinguished Professor of Finance, Emeritus, Stanford University Graduate School of Business (Professor since 1973; Emeritus since 2006). | Trustee of iShares Trust (since 2000); Director of iShares MSCI Russia Capped ETF, Inc. (since 2010); Trustee of iShares U.S. ETF Trust (since 2011); Director of Tejon Ranch Company (since 1999); Director of Threshold Pharmaceuticals (since 2004); Director of Colony Financial, Inc. (since 2009); Director of First Republic Bank (since 2010). | |||
| John
E. Martinez (53) |
Director
(since 2003); Securities Lending Committee Chair (since 2012). |
Director of FirstREX Agreement Corp. (formerly EquityRock, Inc.) (since 2005). | Trustee of iShares Trust (since 2003); Director of iShares MSCI Russia Capped ETF, Inc. (since 2010); Trustee of iShares U.S. ETF Trust (since 2011). | |||
| Cecilia
H. Herbert (65) |
Director
(since 2005); Nominating and Governance Committee Chair and Equity Plus Committee Chair (since 2012). |
Director (1998-2013) and President (2007-2011) of the Board of Directors, Catholic Charities CYO; Trustee (2002-2011) and Chair of the Finance and Investment Committee (2006-2010) of the Thacher School; Member (since 1992) and Chair (1994-2005) of the Investment Committee, Archdiocese of San Francisco; Trustee and Member of the Investment Committee, WNET, the New York public broadcasting/media company (since 2011). | Trustee of iShares Trust (since 2005); Director of iShares MSCI Russia Capped ETF, Inc. (since 2010); Trustee of iShares U.S. ETF Trust (since 2011); Director of Forward Funds (34 portfolios) (since 2009). |
Table of Contents
| Name (Age) | Position | Principal
Occupation(s) During the Past 5 Years |
Other
Directorships Held by Director | |||
| Charles
A. Hurty (70) |
Director
(since 2005); Audit Committee Chair (since 2006). |
Retired; Partner, KPMG LLP (1968-2001). | Trustee of iShares Trust (since 2005); Director of iShares MSCI Russia Capped ETF, Inc. (since 2010); Trustee of iShares U.S. ETF Trust (since 2011); Director of GMAM Absolute Return Strategy Fund (1 portfolio) (since 2002); Director of SkyBridge Alternative Investments Multi-Adviser Hedge Fund Portfolios LLC (2 portfolios) (since 2002). | |||
| John
E. Kerrigan (59) |
Director
(since 2005); Fixed Income Plus Committee Chair (since 2012). |
Chief Investment Officer, Santa Clara University (since 2002). | Trustee of iShares Trust (since 2005); Director of iShares MSCI Russia Capped ETF, Inc. (since 2010); Trustee of iShares U.S. ETF Trust (since 2011). | |||
| Madhav
V. Rajan (50) |
Director
(since 2011); 15(c) Committee Chair (since 2012). |
Robert K. Jaedicke Professor of Accounting and Senior Associate Dean for Academic Affairs and Head of MBA Program, Stanford University Graduate School of Business (since 2001); Professor of Law (by courtesy), Stanford Law School (since 2005); Visiting Professor, University of Chicago (2007-2008). | Trustee
of iShares Trust (since 2011); Director of iShares MSCI Russia Capped ETF, Inc. (since 2011); Trustee of iShares U.S. ETF Trust (since 2011); Director, Cavium, Inc. (since 2013). |
| Name (Age) | Position | Principal
Occupation(s) During the Past 5 Years | ||
| Manish
Mehta (43) |
President (since 2013). | Managing Director, BlackRock, Inc. (since 2009); Chief Operating Officer for iShares (since 2009); Head of Strategy and Corporate Development, BGI (2005-2009); Chief of Staff to the CEO, BGI (2005-2009). | ||
| Jack
Gee (54) |
Treasurer
and Chief Financial Officer (since 2008). |
Managing Director, BlackRock, Inc. (since 2009); Senior Director of Fund Administration of Intermediary Investor Business, BGI (2009); Director of Fund Administration of Intermediary Investor Business, BGI (2004-2009). |
Table of Contents
| Name (Age) | Position | Principal
Occupation(s) During the Past 5 Years | ||
| Eilleen
M. Clavere (62) |
Secretary
(since 2007). |
Director of Global Fund Administration, BlackRock, Inc. (since 2009); Director of Legal Administration of Intermediary Investor Business, BGI (2006-2009); Legal Counsel and Vice President of Atlas Funds, Atlas Advisers, Inc. and Atlas Securities, Inc. (2005-2006); Counsel at Kirkpatrick & Lockhart LLP (2001-2005). | ||
| Edward
B. Baer (45) |
Vice
President and Chief Legal Officer (since 2012). |
Managing Director of Legal & Compliance, BlackRock, Inc. (since 2006); Director of Legal & Compliance, BlackRock, Inc. (2004-2006). | ||
| Scott
Radell (45) |
Executive
Vice President (since 2012). |
Managing Director, BlackRock, Inc. (since 2009); Head of Portfolio Solutions, BlackRock, Inc. (since 2009); Head of Portfolio Solutions, BGI (2007-2009); Credit Portfolio Manager, BGI (2005-2007); Credit Research Analyst, BGI (2003-2005). | ||
| Amy
Schioldager (51) |
Executive
Vice President (since 2007). |
Senior Managing Director, BlackRock, Inc. (since 2009); Global Head of Index Equity, BGI (2008-2009); Global Head of U.S. Indexing, BGI (2006-2008); Head of Domestic Equity Portfolio Management, BGI (2001-2006). | ||
| Ira
P. Shapiro (51) |
Vice
President (since 2007). |
Managing Director, BlackRock, Inc. (since 2009); Head of Strategic Product Initiatives for iShares (since 2012); Chief Legal Officer, Exchange-Traded Fund Complex (2007-2012); Associate General Counsel, BGI (2004-2009). |
Table of Contents
Table of Contents
Table of Contents
Table of Contents
Table of Contents
| Name of Director | Fund | Dollar
Range of Equity Securities in the Fund |
Aggregate
Dollar Range of Equity Securities in all Registered Investment Companies Overseen by Director in Family of Investment Companies | |||
| Robert S. Kapito | None | None | None | |||
| Mark Wiedman1 | iShares Core MSCI EAFE ETF | Over $100,000 | Over $100,000 | |||
| iShares Core MSCI Emerging Markets ETF | $50,001-$100,000 | |||||
| iShares Core S&P Total U.S. Stock Market ETF | $50,001-$100,000 | |||||
| Robert H. Silver | iShares iBonds Sep 2015 AMT-Free Muni Bond ETF | Over $100,000 | Over $100,000 | |||
| iShares iBonds Sep 2016 AMT-Free Muni Bond ETF | Over $100,000 | |||||
| iShares iBonds Sep 2017 AMT-Free Muni Bond ETF | Over $100,000 | |||||
| iShares iBonds Sep 2018 AMT-Free Muni Bond ETF | Over $100,000 | |||||
| iShares Core High Dividend ETF | Over $100,000 | |||||
| iShares Core MSCI EAFE ETF | Over $100,000 | |||||
| iShares Core MSCI Emerging Markets ETF | Over $100,000 | |||||
| iShares Core MSCI Total International Stock ETF | Over $100,000 | |||||
| iShares Core S&P 500 ETF | Over $100,000 | |||||
| iShares Core S&P Mid-Cap ETF | Over $100,000 | |||||
| iShares Core S&P Small-Cap ETF | Over $100,000 | |||||
| iShares Core S&P Total U.S. Stock Market ETF | Over $100,000 | |||||
| iShares iBoxx $ Investment Grade Corporate Bond ETF | Over $100,000 |
Table of Contents
| Name of Director | Fund | Dollar
Range of Equity Securities in the Fund |
Aggregate
Dollar Range of Equity Securities in all Registered Investment Companies Overseen by Director in Family of Investment Companies | |||
| iShares J.P. Morgan USD Emerging Markets Bond ETF | $1-$10,000 | |||||
| iShares MSCI ACWI ex U.S. ETF | $1-$10,000 | |||||
| iShares MSCI BRIC ETF | $10,001-$50,000 | |||||
| iShares MSCI Emerging Markets ETF | $1-$10,000 | |||||
| iShares MSCI Frontier 100 ETF | $50,001-$100,000 | |||||
| iShares National AMT-Free Muni Bond ETF | Over $100,000 | |||||
| iShares Russell 1000 Growth ETF | Over $100,000 | |||||
| iShares Russell 1000 Value ETF | Over $100,000 | |||||
| iShares Russell 2000 ETF | $10,001-$50,000 | |||||
| iShares Russell 2000 Growth ETF | Over $100,000 | |||||
| iShares Russell 2000 Value ETF | Over $100,000 | |||||
| iShares Russell 3000 ETF | Over $100,000 | |||||
| iShares Russell Mid-Cap Growth ETF | $1-$10,000 | |||||
| iShares Russell Mid-Cap Value ETF | $1-$10,000 | |||||
| iShares Select Dividend ETF | $10,001-$50,000 | |||||
| iShares U.S. Broker-Dealers ETF | Over $100,000 | |||||
| iShares U.S. Financial Services ETF | $50,001-$100,000 | |||||
| iShares U.S. Preferred Stock ETF | Over $100,000 | |||||
| iShares U.S. Regional Banks ETF | Over $100,000 | |||||
| iShares U.S. Technology ETF | $50,001-$100,000 | |||||
| George G.C. Parker | iShares California AMT-Free Muni Bond ETF | Over $100,000 | Over $100,000 | |||
| iShares Core S&P 500 ETF | Over $100,000 | |||||
| iShares Core U.S. Aggregate Bond ETF | $10,001-$50,000 | |||||
| iShares iBoxx $ Investment Grade Corporate Bond ETF | Over $100,000 | |||||
| iShares MSCI EAFE ETF | Over $100,000 | |||||
| iShares S&P 100 ETF | Over $100,000 | |||||
| iShares Select Dividend ETF | Over $100,000 | |||||
| John E. Martinez | iShares Core MSCI Emerging Markets ETF | $50,001-$100,000 | Over $100,000 | |||
| iShares Core S&P 500 ETF | Over $100,000 | |||||
| iShares Emerging Markets Infrastructure ETF | Over $100,000 | |||||
| iShares Global Consumer Staples ETF | Over $100,000 | |||||
| iShares MSCI All Country Asia ex Japan ETF | Over $100,000 | |||||
| iShares MSCI EAFE ETF | Over $100,000 | |||||
| iShares Russell 1000 ETF | Over $100,000 |
Table of Contents
| Name of Director | Fund | Dollar
Range of Equity Securities in the Fund |
Aggregate
Dollar Range of Equity Securities in all Registered Investment Companies Overseen by Director in Family of Investment Companies | |||
| iShares Russell 1000 Value ETF | Over $100,000 | |||||
| iShares Russell 2000 ETF | Over $100,000 | |||||
| iShares TIPS Bond ETF | Over $100,000 | |||||
| Cecilia H. Herbert | iShares China Large-Cap ETF | Over $100,000 | Over $100,000 | |||
| iShares Core MSCI Emerging Markets ETF | $10,001-$50,000 | |||||
| iShares Core MSCI Total International Stock ETF | $10,001-$50,000 | |||||
| iShares Core S&P Total U.S. Stock Market ETF | $10,001-$50,000 | |||||
| iShares iBoxx $ High Yield Corporate Bond ETF | $10,001-$50,000 | |||||
| iShares International Select Dividend ETF | $1-$10,000 | |||||
| iShares MSCI EAFE ETF | $10,001-$50,000 | |||||
| iShares MSCI Emerging Markets ETF | $1-$10,000 | |||||
| iShares MSCI Japan ETF | $10,001-$50,000 | |||||
| iShares National AMT-Free Muni Bond ETF | $10,001-$50,000 | |||||
| iShares U.S. Preferred Stock ETF | $10,001-$50,000 | |||||
| Charles A. Hurty | iShares China Large-Cap ETF | $10,001-$50,000 | Over $100,000 | |||
| iShares Core High Dividend ETF | $10,001-$50,000 | |||||
| iShares Core MSCI Emerging Markets ETF | $50,001-$100,000 | |||||
| iShares Core S&P 500 ETF | $10,001-$50,000 | |||||
| iShares Global Energy ETF | $10,001-$50,000 | |||||
| iShares Global Tech ETF | $10,001-$50,000 | |||||
| iShares MSCI EAFE ETF | $10,001-$50,000 | |||||
| iShares MSCI Japan ETF | $10,001-$50,000 | |||||
| iShares North American Tech-Multimedia Networking ETF | $1-$10,000 | |||||
| iShares U.S. Energy ETF | $10,001-$50,000 | |||||
| iShares U.S. Financials ETF | $1-$10,000 | |||||
| iShares U.S. Technology ETF | $50,001-$100,000 | |||||
| John E. Kerrigan | iShares MSCI ACWI ex U.S. ETF | Over $100,000 | Over $100,000 | |||
| iShares Short-Term National AMT-Free Muni Bond ETF | Over $100,000 | |||||
| Madhav V. Rajan | iShares Core High Dividend ETF | Over $100,000 | Over $100,000 | |||
| iShares Core MSCI Emerging Markets ETF | Over $100,000 | |||||
| iShares Core S&P 500 ETF | Over $100,000 | |||||
| iShares iBoxx $ High Yield Corporate Bond ETF | $50,001-$100,000 |
Table of Contents
| Name of Director | Fund | Dollar
Range of Equity Securities in the Fund |
Aggregate
Dollar Range of Equity Securities in all Registered Investment Companies Overseen by Director in Family of Investment Companies | |||
| iShares iBoxx $ Investment Grade Corporate Bond ETF | Over $100,000 | |||||
| iShares Select Dividend ETF | Over $100,000 |
| Name of Director | iShares
Emerging Markets Dividend ETF |
Pension
or Retirement Benefits Accrued As Part of Company Expenses3 |
Estimated
Annual Benefits Upon Retirement3 |
Total
Compensation From the Fund and Fund Complex4 | ||||
| Independent Directors: | ||||||||
| Robert H. Silver | $ 337 | Not Applicable | Not Applicable | $ 325,000 | ||||
| George G.C. Parker | 285 | Not Applicable | Not Applicable | 275,000 | ||||
| John E. Kerrigan | 301 | Not Applicable | Not Applicable | 315,882 | ||||
| Charles A. Hurty | 327 | Not Applicable | Not Applicable | 315,000 | ||||
| Cecilia H. Herbert | 317 | Not Applicable | Not Applicable | 305,000 | ||||
| John E. Martinez | 301 | Not Applicable | Not Applicable | 290,000 | ||||
| Madhav V. Rajan | 301 | Not Applicable | Not Applicable | 301,765 | ||||
| Interested Directors: | ||||||||
| Robert S. Kapito | $ 0 | Not Applicable | Not Applicable | $ 0 | ||||
| Mark Wiedman1 | 0 | Not Applicable | Not Applicable | 0 | ||||
| Michael Latham2 | 0 | Not Applicable | Not Applicable | 0 |
Table of Contents
| Name of Director | iShares
Emerging Markets Dividend ETF |
Pension
or Retirement Benefits Accrued As Part of Company Expenses3 |
Estimated
Annual Benefits Upon Retirement3 |
Total
Compensation From the Fund and Fund Complex4 | ||||
| 1 | Appointed to serve as an Interested Director effective December 31, 2013. |
| 2 | Served as an Interested Director through December 31, 2013. |
| 3 | No Director or officer is entitled to any pension or retirement benefits from the Company. |
| 4 | Includes compensation for service on the Boards of Trustees for iShares Trust and iShares U.S. ETF Trust and the Board of Directors of iShares MSCI Russia Capped ETF, Inc. |
| Name and Address | Percentage
of Ownership | |
| National
Financial Services LLC 200 Liberty Street 5th Floor New York, NY 10281 |
34.76% | |
| Merrill
Lynch, Pierce Fenner & Smith Safekeeping 101 Hudson Street 8th Floor Jersey City, NJ 07302 |
14.67% | |
| Morgan
Stanley & Co. Harborside Financial Center Plaza 3, 1st Floor Jersey City, NJ 07311 |
7.25% | |
| Charles
Schwab & Co., Inc. 111 Pavonia Avenue Jersey City, NJ 07310 |
6.08% |
Table of Contents
Table of Contents
Table of Contents
Table of Contents
Table of Contents
Table of Contents
Table of Contents
| Management
Fee |
Fund
Inception Date |
Management
Fees Paid for Fiscal Year Ended April 30, 2014 |
Management
Fees Paid for Fiscal Year Ended April 30, 2013 |
Management
Fees Paid for Fiscal Year Ended April 30, 2012 | ||||
| 0.68% | 02/23/12 | $1,133,588 | $382,587 | $14,853 |
| Christopher Bliss | ||||
| Types of Accounts | Number | Total Assets | ||
| Registered Investment Companies | 51 | $ 75,000,000,000 | ||
| Other Pooled Investment Vehicles | 290 | 767,000,000,000 | ||
| Other Accounts | 296 | 463,000,000,000 | ||
| Accounts with Incentive-Based Fee Arrangements | 0 | N/A |
Table of Contents
| Matthew Goff | ||||
| Types of Accounts | Number | Total Assets | ||
| Registered Investment Companies | 248 | $544,000,000,000 | ||
| Other Pooled Investment Vehicles | 3 | 13,000,000,000 | ||
| Other Accounts | 2 | 185,500,000 | ||
| Accounts with Incentive-Based Fee Arrangements | 0 | N/A |
| Diane Hsiung | ||||
| Types of Accounts | Number | Total Assets | ||
| Registered Investment Companies | 252 | $546,000,000,000 | ||
| Other Pooled Investment Vehicles | 6 | 89,300,000 | ||
| Other Accounts | 1 | 19,000,000 | ||
| Accounts with Incentive-Based Fee Arrangements | 0 | N/A |
| Jennifer Hsui | ||||
| Types of Accounts | Number | Total Assets | ||
| Registered Investment Companies | 252 | $546,000,000,000 | ||
| Other Pooled Investment Vehicles | 0 | N/A | ||
| Other Accounts | 0 | N/A | ||
| Accounts with Incentive-Based Fee Arrangements | 0 | N/A |
| Greg Savage | ||||
| Types of Accounts | Number | Total Assets | ||
| Registered Investment Companies | 319 | $609,000,000,000 | ||
| Other Pooled Investment Vehicles | 91 | 89,300,000,000 | ||
| Other Accounts | 2 | 185,500,000,000 | ||
| Accounts with Incentive-Based Fee Arrangements | 0 | N/A |
Table of Contents
| Christopher Bliss | ||||
| Types of Accounts | Number
of Other Accounts with Performance Fees Managed by Portfolio Manager |
Aggregate
of Total Assets | ||
| Registered Investment Companies | N/A | N/A | ||
| Other Pooled Investment Vehicles | N/A | N/A | ||
| Other Accounts | N/A | N/A |
| Matthew Goff | ||||
| Types of Accounts | Number
of Other Accounts with Performance Fees Managed by Portfolio Manager |
Aggregate
of Total Assets | ||
| Registered Investment Companies | N/A | N/A | ||
| Other Pooled Investment Vehicles | N/A | N/A | ||
| Other Accounts | N/A | N/A |
| Diane Hsiung | ||||
| Types of Accounts | Number
of Other Accounts with Performance Fees Managed by Portfolio Manager |
Aggregate
of Total Assets | ||
| Registered Investment Companies | N/A | N/A | ||
| Other Pooled Investment Vehicles | N/A | N/A | ||
| Other Accounts | N/A | N/A |
| Jennifer Hsui | ||||
| Types of Accounts | Number
of Other Accounts with Performance Fees Managed by Portfolio Manager |
Aggregate
of Total Assets | ||
| Registered Investment Companies | N/A | N/A | ||
| Other Pooled Investment Vehicles | N/A | N/A | ||
| Other Accounts | N/A | N/A |
| Greg Savage | ||||
| Types of Accounts | Number
of Other Accounts with Performance Fees Managed by Portfolio Manager |
Aggregate
of Total Assets | ||
| Registered Investment Companies | N/A | N/A | ||
| Other Pooled Investment Vehicles | N/A | N/A | ||
| Other Accounts | N/A | N/A |
Table of Contents
Table of Contents
| Fund
Inception Date |
Administration,
Custodian, Transfer Agency Expenses Paid During Fiscal Year Ended April 30, 2014 |
Administration,
Custodian, Transfer Agency Expenses Paid During Fiscal Year Ended April 30, 2013 |
Administration,
Custodian, Transfer Agency Expenses Paid During Fiscal Year Ended April 30, 2012 | |||
| 02/23/12 | $57,635 | $30,238 | $5,628 |
| Fund
Inception Date |
Distributor
Compensation Paid During Fiscal Year Ended April 30, 2014 |
Distributor
Compensation Paid During Fiscal Year Ended April 30, 2013 |
Distributor
Compensation Paid From April 1, 2012 to April 30, 20121 |
Distributor
Compensation Paid From February 23, 2012 to March 31, 20122 | ||||
| 02/23/12 | $7,660 | $7,457 | $827 | $1,712 |
| 1 | BRIL serves as the distributor to the Fund effective April 1, 2012. These fees reflect payments made to SEI, acting as an agent of the Distributor. |
| 2 | SEI served as the distributor to the Fund through March 31, 2012. |
Table of Contents
Table of Contents
Table of Contents
Table of Contents
Table of Contents
Table of Contents
| Fund
Inception Date |
Brokerage
Commissions Paid During Fiscal Year Ended April 30, 2014 |
Brokerage
Commissions Paid During Fiscal Year Ended April 30, 2013 |
Brokerage
Commissions Paid During Fiscal Year Ended April 30, 2012 | |||
| 02/23/12 | $106,226 | $72,996 | $4,318 |
Table of Contents
| Fiscal Year ended April 30, 2014 | Fiscal Year ended April 30, 2013 | |||
| 44% | 41% |
Table of Contents
Table of Contents
Table of Contents
| Shares
Per Creation Unit |
Value
Per Creation Unit (U.S.$) | |
| 50,000 | $2,443,500 |
Table of Contents
Table of Contents
Table of Contents
Table of Contents
| Standard
Creation Transaction Fee |
Maximum
Additional Charge* | |
| $3,000 | 3.0% |
| * | As a percentage of the net asset value per Creation Unit. |
Table of Contents
| Standard
Redemption Transaction Fee |
Maximum
Additional Charge* | |
| $3,000 | 2.0% |
| * | As a percentage of the net asset value per Creation Unit, inclusive of the standard redemption transaction fee. |
Table of Contents
Table of Contents
Table of Contents
Table of Contents
Table of Contents
| 2014 | ||||||
| Country | Trade
Date |
Settlement
Date |
Number
of Days to Settle | |||
| China | 01/27/14 | 02/10/14 | 14 | |||
| 01/28/14 | 02/11/14 | 14 | ||||
| 01/29/14 | 02/12/14 | 14 | ||||
| 04/28/14 | 05/08/14 | 10 | ||||
| 04/29/14 | 05/09/14 | 10 | ||||
| 04/30/14 | 05/12/14 | 12 | ||||
| 09/26/14 | 10/08/14 | 12 | ||||
| 09/29/14 | 10/09/14 | 10 | ||||
Table of Contents
| 2014 | ||||||
| Country | Trade
Date |
Settlement
Date |
Number
of Days to Settle | |||
| 09/30/14 | 10/10/14 | 10 | ||||
| The Czech Republic | 12/19/14 | 12/29/14 | 10 | |||
| 12/22/14 | 12/30/14 | 8 | ||||
| 12/23/14 | 01/02/15 | 10 | ||||
| Egypt | 01/06/14 | 01/14/14 | 8 | |||
| 04/14/14 | 04/22/14 | 8 | ||||
| 04/15/14 | 04/23/14 | 8 | ||||
| 04/16/14 | 04/24/14 | 8 | ||||
| 04/17/14 | 04/27/14 | 10 | ||||
| 07/21/14 | 07/31/14 | 10 | ||||
| 07/22/14 | 08/03/14 | 12 | ||||
| 07/24/14 | 08/04/14 | 11 | ||||
| 09/29/14 | 10/07/14 | 8 | ||||
| 09/30/14 | 10/08/14 | 8 | ||||
| 10/01/14 | 10/09/14 | 8 | ||||
| 10/02/14 | 10/12/14 | 10 | ||||
| Hungary | 12/19/14 | 12/29/14 | 10 | |||
| 12/22/14 | 12/30/14 | 8 | ||||
| 12/23/14 | 12/31/14 | 8 | ||||
| Indonesia | 07/23/14 | 08/04/14 | 12 | |||
| 07/24/14 | 08/05/14 | 12 | ||||
| 07/25/14 | 08/06/14 | 12 | ||||
| 12/19/14 | 12/29/14 | 10 | ||||
| 12/22/14 | 12/30/14 | 8 | ||||
| 12/23/14 | 01/02/15 | 11 | ||||
| Malaysia | 01/27/14 | 02/04/14 | 8 | |||
| 01/28/14 | 02/05/14 | 8 | ||||
| 01/29/14 | 02/06/14 | 8 | ||||
| 07/23/14 | 07/31/14 | 8 | ||||
| 07/24/14 | 08/01/14 | 8 | ||||
| 07/25/14 | 08/04/14 | 10 | ||||
| The Philippines | 12/19/14 | 12/29/14 | 10 | |||
| 12/22/14 | 01/02/15 | 11 | ||||
| 12/23/14 | 01/05/15 | 13 | ||||
| 12/28/14 | 01/05/15 | 8 | ||||
| 12/29/14 | 01/06/15 | 8 | ||||
| Russia | 12/27/14 | 01/09/15 | 13 | |||
| 12/30/14 | 01/10/15 | 11 | ||||
| 12/31/14 | 01/13/15 | 13 | ||||
| 12/24/14 | 01/09/15 | 16 | ||||
| 12/26/14 | 01/12/15 | 17 | ||||
| 12/29/14 | 01/13/15 | 15 | ||||
Table of Contents
| 2014 | ||||||
| Country | Trade
Date |
Settlement
Date |
Number
of Days to Settle | |||
| South Africa | 03/14/14 | 03/24/14 | 10 | |||
| 03/17/14 | 03/25/14 | 8 | ||||
| 03/18/14 | 03/26/14 | 8 | ||||
| 03/19/14 | 03/27/14 | 8 | ||||
| 03/20/14 | 03/28/14 | 8 | ||||
| 04/11/14 | 04/22/14 | 9 | ||||
| 04/14/14 | 04/23/14 | 9 | ||||
| 04/15/14 | 04/24/14 | 9 | ||||
| 04/16/14 | 04/25/14 | 9 | ||||
| 04/17/14 | 04/29/14 | 12 | ||||
| 04/22/14 | 04/30/14 | 8 | ||||
| 04/23/14 | 05/02/14 | 9 | ||||
| 04/24/14 | 05/05/14 | 11 | ||||
| 04/25/14 | 05/06/14 | 11 | ||||
| 04/29/14 | 05/07/14 | 8 | ||||
| 04/30/14 | 05/08/14 | 8 | ||||
| 06/09/14 | 06/17/14 | 8 | ||||
| 06/10/14 | 06/18/14 | 8 | ||||
| 06/11/14 | 06/19/14 | 8 | ||||
| 06/12/14 | 06/20/14 | 8 | ||||
| 06/13/14 | 06/23/14 | 10 | ||||
| 09/17/14 | 09/25/14 | 8 | ||||
| 09/18/14 | 09/26/14 | 8 | ||||
| 09/19/14 | 09/29/14 | 10 | ||||
| 09/22/14 | 09/30/14 | 8 | ||||
| 09/23/14 | 10/01/14 | 8 | ||||
| 12/09/14 | 12/17/14 | 8 | ||||
| 12/10/14 | 12/18/14 | 8 | ||||
| 12/11/14 | 12/19/14 | 8 | ||||
| 12/12/14 | 12/22/14 | 10 | ||||
| 12/15/14 | 12/23/14 | 8 | ||||
| 12/18/14 | 12/29/14 | 11 | ||||
| 12/19/14 | 12/30/14 | 11 | ||||
| 12/22/14 | 12/31/14 | 9 | ||||
| 12/23/14 | 01/02/15 | 10 | ||||
| 12/24/14 | 01/05/15 | 12 | ||||
| 12/29/14 | 01/06/15 | 8 | ||||
| 12/30/14 | 01/07/15 | 8 | ||||
| 12/31/14 | 01/08/15 | 8 | ||||
| Taiwan | 01/24/14 | 02/05/14 | 12 | |||
| 01/27/14 | 02/06/14 | 10 | ||||
| 2015 | ||||||
| Country | Trade
Date |
Settlement
Date |
Number
of Days to Settle | |||
| China | 02/13/15 | 02/25/15 | 12 | |||
| 02/16/15 | 02/26/15 | 10 | ||||
Table of Contents
| 2015 | ||||||
| Country | Trade
Date |
Settlement
Date |
Number
of Days to Settle | |||
| 02/17/15 | 02/27/15 | 10 | ||||
| 09/28/15 | 10/08/15 | 10 | ||||
| 09/29/15 | 10/09/15 | 10 | ||||
| 09/30/15 | 10/12/15 | 12 | ||||
| Russia | 12/24/15 | 01/11/16 | 18 | |||
| 12/28/15 | 01/15/16 | 15 | ||||
| 12/29/15 | 01/18/16 | 18 | ||||
| South Africa | 03/27/15 | 04/07/15 | 11 | |||
| 03/30/15 | 04/08/15 | 9 | ||||
| 03/31/15 | 04/09/15 | 9 | ||||
| 04/01/15 | 04/10/15 | 9 | ||||
| 04/02/15 | 04/13/15 | 11 | ||||
| 04/20/15 | 04/28/15 | 8 | ||||
| 04/21/15 | 04/29/15 | 8 | ||||
| 04/22/15 | 04/30/15 | 8 | ||||
| 04/23/15 | 05/01/15 | 8 | ||||
| 04/23/15 | 05/04/15 | 11 | ||||
| 04/24/15 | 05/05/15 | 11 | ||||
| 04/28/15 | 05/06/15 | 8 | ||||
| 04/29/15 | 05/07/15 | 8 | ||||
| 04/30/15 | 05/08/15 | 8 | ||||
| 06/09/15 | 06/17/15 | 8 | ||||
| 06/10/15 | 06/18/15 | 8 | ||||
| 06/11/15 | 06/19/15 | 8 | ||||
| 06/12/15 | 06/22/15 | 10 | ||||
| 06/15/15 | 06/23/15 | 8 | ||||
| 08/03/15 | 08/11/15 | 8 | ||||
| 08/04/15 | 08/12/15 | 8 | ||||
| 08/05/15 | 08/13/15 | 8 | ||||
| 08/06/15 | 08/14/15 | 8 | ||||
| 08/07/15 | 08/17/15 | 10 | ||||
| 09/17/15 | 09/25/15 | 8 | ||||
| 09/18/15 | 09/28/15 | 10 | ||||
| 09/21/15 | 09/29/15 | 8 | ||||
| 09/22/15 | 09/30/15 | 8 | ||||
| 09/23/15 | 10/01/15 | 8 | ||||
| 12/09/15 | 12/17/15 | 8 | ||||
| 12/10/15 | 12/18/15 | 8 | ||||
| 12/11/15 | 12/21/15 | 10 | ||||
| 12/14/15 | 12/22/15 | 8 | ||||
| 12/15/15 | 12/23/15 | 8 | ||||
| 12/18/15 | 12/28/15 | 10 | ||||
| 12/21/15 | 12/29/15 | 8 | ||||
| 12/22/15 | 12/30/15 | 8 | ||||
| 12/23/15 | 12/31/15 | 8 | ||||
| 12/24/15 | 01/04/16 | 11 | ||||
| 12/28/15 | 01/05/16 | 8 | ||||
| 12/29/15 | 01/06/16 | 8 | ||||
Table of Contents
| 2015 | ||||||
| Country | Trade
Date |
Settlement
Date |
Number
of Days to Settle | |||
| 12/30/15 | 01/07/16 | 8 | ||||
| 12/31/15 | 01/08/16 | 8 | ||||
| Taiwan | 02/16/15 | 02/24/15 | 8 | |||
| 02/17/15 | 02/25/15 | 8 | ||||
| Thailand | 04/08/15 | 04/16/15 | 8 | |||
| 04/09/15 | 04/17/15 | 8 | ||||
| 04/10/15 | 04/20/15 | 10 | ||||
| * | These worst-case redemption cycles are based on information regarding regular holidays, which may be out of date. Based on changes in holidays, longer (worse) redemption cycles are possible. |
Table of Contents
Table of Contents
Table of Contents
Table of Contents
Table of Contents
Table of Contents
Table of Contents
Table of Contents
Table of Contents
Table of Contents
(as revised January 7, 2015)
| Fund | Ticker | Stock Exchange | ||
| iShares MSCI Emerging Markets Horizon ETF (the “Fund”) | EMHZ | BATS |
Table of Contents
Table of Contents
Table of Contents
Table of Contents
Table of Contents
Table of Contents
Table of Contents
Table of Contents
Table of Contents
Table of Contents
Table of Contents
Table of Contents
Table of Contents
Table of Contents
Table of Contents
Table of Contents
Table of Contents
Table of Contents
Table of Contents
Table of Contents
Table of Contents
Table of Contents
Table of Contents
Table of Contents
Table of Contents
| • | The Fund generally supports the board’s nominees in the election of directors and generally supports proposals that strengthen the independence of boards of directors; |
| • | When a director has committed himself or herself to service on more than four public company boards (but no more than six public company boards in most circumstances), the Fund will consider such director’s individual circumstances in determining whether the director will be able to commit sufficient focus and time to a particular company; |
| • | The Fund generally defers to an issuer’s choice of auditors so long as the corporate auditors represent the interests of shareholders and provide an independent view of the propriety of financial reporting decisions of management; |
| • | The Fund generally favors disclosure of a company’s compensation and benefits policies and opposes excessive compensation, but believes that compensation matters are normally best determined by a company’s board of directors; |
| • | The Fund generally expects to support capital structure requests that it believes enhance the rights of common shareholders and oppose requests that appear to be unreasonably dilutive; |
Table of Contents
| • | The Fund generally does not support proposals on social issues that lack a demonstrable economic benefit to the issuer and the Fund investing in such issuer; and |
| • | The Fund generally votes against anti-takeover proposals and proposals that would create additional barriers or costs to corporate transactions that are likely to deliver a premium to shareholders. |
Table of Contents
| • | MSCI Global Standard Indexes cover all investable large- and mid-cap securities by including approximately 85% of each market's free float-adjusted market capitalization. |
| • | MSCI Global Small Cap Indexes provide coverage to all companies with a market capitalization below that of the companies in the MSCI Global Standard Indexes by including above and beyond the coverage of the MSCI Global Standard Indexes. |
Table of Contents
| • | Achieving global size integrity by ensuring that companies of comparable and relevant sizes are included in a given size segment across all markets in a composite index; and |
| • | Achieving consistent market coverage by ensuring that each market's size segment is represented in its proportional weight in the composite universe. |
Table of Contents
| • | Semi-Annual Index Reviews (“SAIRs”), conducted on a fixed semi-annual timetable that systematically reassess the various dimensions of the equity universe for all markets; |
| • | Quarterly Index Reviews (“QIRs”), aimed at promptly reflecting other significant market events; and |
| • | Ongoing event-related changes, such as mergers, acquisitions, spin-offs, bankruptcies, reorganizations and other similar corporate events, which generally are implemented in the indexes as they occur. |
Table of Contents
| 1. | Concentrate its investments in a particular industry, as that term is used in the Investment Company Act, except that the Fund will concentrate to approximately the same extent that its Underlying Index concentrates in the securities of a particular industry or group of industries. |
| 2. | Borrow money, except as permitted under the Investment Company Act. |
| 3. | Issue senior securities to the extent such issuance would violate the Investment Company Act. |
| 4. | Purchase or hold real estate, except the Fund may purchase and hold securities or other instruments that are secured by, or linked to, real estate or interests therein, securities of real estate investment trusts, mortgage-related securities and securities of issuers engaged in the real estate business, and the Fund may purchase and hold real estate as a result of the ownership of securities or other instruments. |
| 5. | Underwrite securities issued by others, except to the extent that the sale of portfolio securities by the Fund may be deemed to be an underwriting or as otherwise permitted by applicable law. |
| 6. | Purchase or sell commodities or commodity contracts, except as permitted by the Investment Company Act. |
| 7. | Make loans to the extent prohibited by the Investment Company Act. |
Table of Contents
| a. | Purchase securities of other investment companies, except to the extent permitted by the Investment Company Act. As a matter of policy, however, the Fund will not purchase shares of any registered open-end investment company or registered unit investment trust, in reliance on Section 12(d)(1)(F) or (G) (the “fund of funds” provisions) of the Investment Company Act, at any time the Fund has knowledge that its shares are purchased by another investment company investor in reliance on the provisions of subparagraph (G) of Section 12(d)(1). |
| b. | Make short sales of securities or maintain a short position, except to the extent permitted by the Fund’s Prospectus and Statement of Additional Information, as amended from time to time, and applicable law. |
Table of Contents
Table of Contents
| Name (Age) | Position | Principal
Occupation(s) During the Past 5 Years |
Other
Directorships Held by Director | |||
| Robert
S. Kapito1 (57) |
Director
(since 2009). |
President and Director, BlackRock, Inc. (since 2006); Vice Chairman of BlackRock, Inc. and Head of BlackRock, Inc.’s Portfolio Management Group (since its formation in 1998) and BlackRock, Inc.’s predecessor entities (since 1988); Trustee, University of Pennsylvania (since 2009); President of Board of Directors, Hope & Heroes Children’s Cancer Fund (since 2002); President of the Board of Directors, Periwinkle Theatre for Youth (since 1983). | Trustee of iShares Trust (since 2009); Director of iShares MSCI Russia Capped ETF, Inc. (since 2010); Trustee of iShares U.S. ETF Trust (since 2011); Director of BlackRock, Inc. (since 2006). | |||
| Mark
Wiedman2 (43) |
Director (since 2013). | Managing Director, BlackRock, Inc. (since 2007); Global Head of iShares (since 2011); Head of Corporate Strategy, BlackRock, Inc. (2009-2011). | Trustee of iShares Trust (since 2013); Director of iShares MSCI Russia Capped ETF, Inc. (since 2013);Trustee of iShares U.S. ETF Trust (since 2013); Director of PennyMac Financial Services, Inc. (since 2008). |
| 1 | Robert S. Kapito is deemed to be an “interested person” (as defined in the 1940 Act) of the Company due to his affiliations with BlackRock, Inc. |
| 2 | Mark Wiedman is deemed to be an “interested person” (as defined in the 1940 Act) of the Company due to his affiliations with BlackRock, Inc. and its affiliates. |
| Name (Age) | Position | Principal
Occupation(s) During the Past 5 Years |
Other
Directorships Held by Director | |||
| Robert
H. Silver (59) |
Director
(since 2007); Independent Chairman (since 2012). |
President and Co-Founder of The Bravitas Group, Inc. (since 2006); Director and Vice Chairman of the YMCA of Greater NYC (2001-2011); Broadway Producer (2006-2011); Co-Founder and Vice President of Parentgiving Inc. (since 2008); Director and Member of the Audit and Compensation Committee of EPAM Systems, Inc. (2006-2009); President and Chief Operating Officer of UBS Financial Services Inc. (formerly Paine Webber Inc.) (2003-2005) and various executive positions with UBS and its affiliates (1988-2005); CPA and Audit Manager of KPMG, LLP (formerly Peat Marwick Mitchell) (1977-1983). | Trustee of iShares Trust (since 2007); Director of iShares MSCI Russia Capped ETF, Inc. (since 2010); Trustee of iShares U.S. ETF Trust (since 2011); Independent Chairman of iShares Trust, iShares MSCI Russia Capped ETF, Inc. and iShares U.S. ETF Trust (since 2012). |
Table of Contents
| Name (Age) | Position | Principal
Occupation(s) During the Past 5 Years |
Other
Directorships Held by Director | |||
| George
G.C. Parker (75) |
Director
(since 2002). |
Dean Witter Distinguished Professor of Finance, Emeritus, Stanford University Graduate School of Business (Professor since 1973; Emeritus since 2006). | Trustee of iShares Trust (since 2000); Director of iShares MSCI Russia Capped ETF, Inc. (since 2010); Trustee of iShares U.S. ETF Trust (since 2011); Director of Tejon Ranch Company (since 1999); Director of Threshold Pharmaceuticals (since 2004); Director of Colony Financial, Inc. (since 2009); Director of First Republic Bank (since 2010). | |||
| John
E. Martinez (53) |
Director
(since 2003); Securities Lending Committee Chair (since 2012). |
Director of FirstREX Agreement Corp. (formerly EquityRock, Inc.) (since 2005). | Trustee of iShares Trust (since 2003); Director of iShares MSCI Russia Capped ETF, Inc. (since 2010); Trustee of iShares U.S. ETF Trust (since 2011). | |||
| Cecilia
H. Herbert (65) |
Director
(since 2005); Nominating and Governance Committee Chair and Equity Plus Committee Chair (since 2012). |
Director (1998-2013) and President (2007-2011) of the Board of Directors, Catholic Charities CYO; Trustee (2002-2011) and Chair of the Finance and Investment Committee (2006-2010) of the Thacher School; Member (since 1992) and Chair (1994-2005) of the Investment Committee, Archdiocese of San Francisco; Trustee and Member of the Investment Committee, WNET, the New York public broadcasting/media company (since 2011). | Trustee of iShares Trust (since 2005); Director of iShares MSCI Russia Capped ETF, Inc. (since 2010); Trustee of iShares U.S. ETF Trust (since 2011); Director of Forward Funds (34 portfolios) (since 2009). | |||
| Charles
A. Hurty (71) |
Director
(since 2005); Audit Committee Chair (since 2006). |
Retired; Partner, KPMG LLP (1968-2001). | Trustee of iShares Trust (since 2005); Director of iShares MSCI Russia Capped ETF, Inc. (since 2010); Trustee of iShares U.S. ETF Trust (since 2011); Director of GMAM Absolute Return Strategy Fund (1 portfolio) (since 2002); Director of SkyBridge Alternative Investments Multi-Adviser Hedge Fund Portfolios LLC (2 portfolios) (since 2002). | |||
| John
E. Kerrigan (59) |
Director
(since 2005); Fixed Income Plus Committee Chair (since 2012). |
Chief Investment Officer, Santa Clara University (since 2002). | Trustee of iShares Trust (since 2005); Director of iShares MSCI Russia Capped ETF, Inc. (since 2010); Trustee of iShares U.S. ETF Trust (since 2011). |
Table of Contents
| Name (Age) | Position | Principal
Occupation(s) During the Past 5 Years |
Other
Directorships Held by Director | |||
| Madhav
V. Rajan (50) |
Director
(since 2011); 15(c) Committee Chair (since 2012). |
Robert K. Jaedicke Professor of Accounting and Senior Associate Dean for Academic Affairs and Head of MBA Program, Stanford University Graduate School of Business (since 2001); Professor of Law (by courtesy), Stanford Law School (since 2005); Visiting Professor, University of Chicago (2007-2008). | Trustee
of iShares Trust (since 2011); Director of iShares MSCI Russia Capped ETF, Inc. (since 2011); Trustee of iShares U.S. ETF Trust (since 2011); Director, Cavium, Inc. (since 2013). |
| Name (Age) | Position | Principal
Occupation(s) During the Past 5 Years | ||
| Manish
Mehta (43) |
President (since 2013). | Managing Director, BlackRock, Inc. (since 2009); Chief Operating Officer for iShares (since 2009); Head of Strategy and Corporate Development, BGI (2005-2009); Chief of Staff to the CEO, BGI (2005-2009). | ||
| Jack
Gee (55) |
Treasurer
and Chief Financial Officer (since 2008). |
Managing Director, BlackRock, Inc. (since 2009); Senior Director of Fund Administration of Intermediary Investor Business, BGI (2009); Director of Fund Administration of Intermediary Investor Business, BGI (2004-2009). | ||
| Eilleen
M. Clavere (62) |
Secretary
(since 2007). |
Director of Global Fund Administration, BlackRock, Inc. (since 2009); Director of Legal Administration of Intermediary Investor Business, BGI (2006-2009); Legal Counsel and Vice President of Atlas Funds, Atlas Advisers, Inc. and Atlas Securities, Inc. (2005-2006); Counsel at Kirkpatrick & Lockhart LLP (2001-2005). | ||
| Edward
B. Baer (46) |
Vice
President and Chief Legal Officer (since 2012). |
Managing Director of Legal & Compliance, BlackRock, Inc. (since 2006); Director of Legal & Compliance, BlackRock, Inc. (2004-2006). | ||
| Scott
Radell (45) |
Executive
Vice President (since 2012). |
Managing Director, BlackRock, Inc. (since 2009); Head of Portfolio Solutions, BlackRock, Inc. (since 2009); Head of Portfolio Solutions, BGI (2007-2009); Credit Portfolio Manager, BGI (2005-2007); Credit Research Analyst, BGI (2003-2005). |
Table of Contents
| Name (Age) | Position | Principal
Occupation(s) During the Past 5 Years | ||
| Amy
Schioldager (52) |
Executive
Vice President (since 2007). |
Senior Managing Director, BlackRock, Inc. (since 2009); Global Head of Index Equity, BGI (2008-2009); Global Head of U.S. Indexing, BGI (2006-2008); Head of Domestic Equity Portfolio Management, BGI (2001-2006). | ||
| Ira
P. Shapiro (51) |
Vice
President (since 2007). |
Managing Director, BlackRock, Inc. (since 2009); Head of Strategic Product Initiatives for iShares (since 2012); Chief Legal Officer, Exchange-Traded Fund Complex (2007-2012); Associate General Counsel, BGI (2004-2009). |
Table of Contents
Table of Contents
Table of Contents
Table of Contents
Table of Contents
| Name of Director | Fund | Dollar
Range of Equity Securities in the Fund |
Aggregate
Dollar Range of Equity Securities in all Registered Investment Companies Overseen by Director in Family of Investment Companies | |||
| Robert S. Kapito | None | None | None | |||
| Mark Wiedman1 | iShares Core MSCI EAFE ETF | Over $100,000 | Over $100,000 | |||
| iShares Core MSCI Emerging Markets ETF | $50,001-$100,000 | |||||
| iShares Core S&P Total U.S. Stock Market ETF | $50,001-$100,000 | |||||
| Robert H. Silver | iShares iBonds Sep 2015 AMT-Free Muni Bond ETF | Over $100,000 | Over $100,000 | |||
| iShares iBonds Sep 2016 AMT-Free Muni Bond ETF | Over $100,000 | |||||
| iShares iBonds Sep 2017 AMT-Free Muni Bond ETF | Over $100,000 | |||||
| iShares iBonds Sep 2018 AMT-Free Muni Bond ETF | Over $100,000 | |||||
| iShares Core High Dividend ETF | Over $100,000 | |||||
| iShares Core MSCI EAFE ETF | Over $100,000 | |||||
| iShares Core MSCI Emerging Markets ETF | Over $100,000 | |||||
| iShares Core MSCI Total International Stock ETF | Over $100,000 | |||||
| iShares Core S&P 500 ETF | Over $100,000 | |||||
| iShares Core S&P Mid-Cap ETF | Over $100,000 | |||||
| iShares Core S&P Small-Cap ETF | Over $100,000 | |||||
| iShares Core S&P Total U.S. Stock Market ETF | Over $100,000 | |||||
| iShares iBoxx $ Investment Grade Corporate Bond ETF | Over $100,000 | |||||
| iShares J.P. Morgan USD Emerging Markets Bond ETF | $1-$10,000 | |||||
| iShares MSCI ACWI ex U.S. ETF | $1-$10,000 | |||||
| iShares MSCI BRIC ETF | $10,001-$50,000 | |||||
| iShares MSCI Emerging Markets ETF | $1-$10,000 | |||||
| iShares MSCI Frontier 100 ETF | $50,001-$100,000 | |||||
| iShares National AMT-Free Muni Bond ETF | Over $100,000 | |||||
| iShares Russell 1000 Growth ETF | Over $100,000 | |||||
| iShares Russell 1000 Value ETF | Over $100,000 | |||||
| iShares Russell 2000 ETF | $10,001-$50,000 | |||||
| iShares Russell 2000 Growth ETF | Over $100,000 | |||||
| iShares Russell 2000 Value ETF | Over $100,000 | |||||
| iShares Russell 3000 ETF | Over $100,000 | |||||
| iShares Russell Mid-Cap Growth ETF | $1-$10,000 | |||||
| iShares Russell Mid-Cap Value ETF | $1-$10,000 |
Table of Contents
| Name of Director | Fund | Dollar
Range of Equity Securities in the Fund |
Aggregate
Dollar Range of Equity Securities in all Registered Investment Companies Overseen by Director in Family of Investment Companies | |||
| iShares Select Dividend ETF | $10,001-$50,000 | |||||
| iShares U.S. Broker-Dealers ETF | Over $100,000 | |||||
| iShares U.S. Financial Services ETF | $50,001-$100,000 | |||||
| iShares U.S. Preferred Stock ETF | Over $100,000 | |||||
| iShares U.S. Regional Banks ETF | Over $100,000 | |||||
| iShares U.S. Technology ETF | $50,001-$100,000 | |||||
| George G.C. Parker | iShares California AMT-Free Muni Bond ETF | Over $100,000 | Over $100,000 | |||
| iShares Core S&P 500 ETF | Over $100,000 | |||||
| iShares Core U.S. Aggregate Bond ETF | $10,001-$50,000 | |||||
| iShares iBoxx $ Investment Grade Corporate Bond ETF | Over $100,000 | |||||
| iShares MSCI EAFE ETF | Over $100,000 | |||||
| iShares S&P 100 ETF | Over $100,000 | |||||
| iShares Select Dividend ETF | Over $100,000 | |||||
| John E. Martinez | iShares Core MSCI Emerging Markets ETF | $50,001-$100,000 | Over $100,000 | |||
| iShares Core S&P 500 ETF | Over $100,000 | |||||
| iShares Emerging Markets Infrastructure ETF | Over $100,000 | |||||
| iShares Global Consumer Staples ETF | Over $100,000 | |||||
| iShares MSCI All Country Asia ex Japan ETF | Over $100,000 | |||||
| iShares MSCI EAFE ETF | Over $100,000 | |||||
| iShares Russell 1000 ETF | Over $100,000 | |||||
| iShares Russell 1000 Value ETF | Over $100,000 | |||||
| iShares Russell 2000 ETF | Over $100,000 | |||||
| iShares TIPS Bond ETF | Over $100,000 | |||||
| Cecilia H. Herbert | iShares China Large-Cap ETF | Over $100,000 | Over $100,000 | |||
| iShares Core MSCI Emerging Markets ETF | $10,001-$50,000 | |||||
| iShares Core MSCI Total International Stock ETF | $10,001-$50,000 | |||||
| iShares Core S&P Total U.S. Stock Market ETF | $10,001-$50,000 | |||||
| iShares iBoxx $ High Yield Corporate Bond ETF | $10,001-$50,000 | |||||
| iShares International Select Dividend ETF | $1-$10,000 | |||||
| iShares MSCI EAFE ETF | $10,001-$50,000 | |||||
| iShares MSCI Emerging Markets ETF | $1-$10,000 | |||||
| iShares MSCI Japan ETF | $10,001-$50,000 | |||||
| iShares National AMT-Free Muni Bond ETF | $10,001-$50,000 |
Table of Contents
| Name of Director | Fund | Dollar
Range of Equity Securities in the Fund |
Aggregate
Dollar Range of Equity Securities in all Registered Investment Companies Overseen by Director in Family of Investment Companies | |||
| iShares U.S. Preferred Stock ETF | $10,001-$50,000 | |||||
| Charles A. Hurty | iShares China Large-Cap ETF | $10,001-$50,000 | Over $100,000 | |||
| iShares Core High Dividend ETF | $10,001-$50,000 | |||||
| iShares Core MSCI Emerging Markets ETF | $50,001-$100,000 | |||||
| iShares Core S&P 500 ETF | $10,001-$50,000 | |||||
| iShares Global Energy ETF | $10,001-$50,000 | |||||
| iShares Global Tech ETF | $10,001-$50,000 | |||||
| iShares MSCI EAFE ETF | $10,001-$50,000 | |||||
| iShares MSCI Japan ETF | $10,001-$50,000 | |||||
| iShares North American Tech-Multimedia Networking ETF | $1-$10,000 | |||||
| iShares U.S. Energy ETF | $10,001-$50,000 | |||||
| iShares U.S. Financials ETF | $1-$10,000 | |||||
| iShares U.S. Technology ETF | $50,001-$100,000 | |||||
| John E. Kerrigan | iShares MSCI ACWI ex U.S. ETF | Over $100,000 | Over $100,000 | |||
| iShares Short-Term National AMT-Free Muni Bond ETF | Over $100,000 | |||||
| Madhav V. Rajan | iShares Core High Dividend ETF | Over $100,000 | Over $100,000 | |||
| iShares Core MSCI Emerging Markets ETF | Over $100,000 | |||||
| iShares Core S&P 500 ETF | Over $100,000 | |||||
| iShares iBoxx $ High Yield Corporate Bond ETF | $50,001-$100,000 | |||||
| iShares iBoxx $ Investment Grade Corporate Bond ETF | Over $100,000 | |||||
| iShares Select Dividend ETF | Over $100,000 |
Table of Contents
| Name of Director | iShares
MSCI Emerging Markets Horizon ETF |
Pension
or Retirement Benefits Accrued As Part of Company Expenses1 |
Estimated
Annual Benefits Upon Retirement1 |
Total
Compensation From the Fund and Fund Complex2 | ||||
| Independent Director: | ||||||||
| Robert H. Silver | $0 | Not Applicable | Not Applicable | $ 325,000 | ||||
| George G.C. Parker | 0 | Not Applicable | Not Applicable | 275,000 | ||||
| John E. Kerrigan | 0 | Not Applicable | Not Applicable | 315,882 | ||||
| Charles A. Hurty | 0 | Not Applicable | Not Applicable | 315,000 | ||||
| Cecilia H. Herbert | 0 | Not Applicable | Not Applicable | 305,000 | ||||
| John E. Martinez | 0 | Not Applicable | Not Applicable | 290,000 | ||||
| Madhav V. Rajan | 0 | Not Applicable | Not Applicable | 301,765 | ||||
| Interested Director: | ||||||||
| Robert S. Kapito | $0 | Not Applicable | Not Applicable | $ 0 | ||||
| Mark Wiedman3 | 0 | Not Applicable | Not Applicable | 0 | ||||
| Michael Latham4 | 0 | Not Applicable | Not Applicable | 0 |
| 1 | No Director or officer is entitled to any pension or retirement benefits from the Company. |
| 2 | Includes compensation for service on the Boards of Trustees for iShares Trust and iShares U.S. ETF Trust and the Board of Directors of iShares MSCI Russia Capped ETF, Inc. |
| 3 | Appointed to serve as an Interested Director effective December 31, 2013. |
| 4 | Served as an Interested Director through December 31, 2013. |
Table of Contents
Table of Contents
Table of Contents
Table of Contents
Table of Contents
Table of Contents
Table of Contents
| Matthew Goff | ||||
| Types of Accounts | Number | Total Assets | ||
| Registered Investment Companies | 258 | $595,000,000,000 | ||
| Other Pooled Investment Vehicles | 0 | N/A | ||
| Other Accounts | 2 | $ 200,000,000 | ||
| Accounts with Incentive-Based Fee Arrangements | 0 | N/A |
| Diane Hsiung | ||||
| Types of Accounts | Number | Total Assets | ||
| Registered Investment Companies | 258 | $595,000,000,000 | ||
| Other Pooled Investment Vehicles | 21 | $ 7,750,000,000 | ||
| Other Accounts | 0 | N/A | ||
| Accounts with Incentive-Based Fee Arrangements | 0 | N/A |
| Jennifer Hsui | ||||
| Types of Accounts | Number | Total Assets | ||
| Registered Investment Companies | 260 | $595,000,000,000 | ||
| Other Pooled Investment Vehicles | 0 | N/A | ||
| Other Accounts | 0 | N/A | ||
| Accounts with Incentive-Based Fee Arrangements | 0 | N/A |
Table of Contents
| Greg Savage | ||||
| Types of Accounts | Number | Total Assets | ||
| Registered Investment Companies | 324 | $660,000,000,000 | ||
| Other Pooled Investment Vehicles | 89 | $ 45,000,000,000 | ||
| Other Accounts | 12 | $ 1,500,000,000 | ||
| Accounts with Incentive-Based Fee Arrangements | 0 | N/A |
| Matthew Goff | ||||
| Types of Accounts | Number
of Other Accounts with Performance Fees Managed by Portfolio Manager |
Aggregate
of Total Assets | ||
| Registered Investment Companies | 0 | N/A | ||
| Other Pooled Investment Vehicles | 0 | N/A | ||
| Other Accounts | 0 | N/A |
| Diane Hsiung | ||||
| Types of Accounts | Number
of Other Accounts with Performance Fees Managed by Portfolio Manager |
Aggregate
of Total Assets | ||
| Registered Investment Companies | 0 | N/A | ||
| Other Pooled Investment Vehicles | 0 | N/A | ||
| Other Accounts | 0 | N/A |
Table of Contents
| Jennifer Hsui | ||||
| Types of Accounts | Number
of Other Accounts with Performance Fees Managed by Portfolio Manager |
Aggregate
of Total Assets | ||
| Registered Investment Companies | 0 | N/A | ||
| Other Pooled Investment Vehicles | 0 | N/A | ||
| Other Accounts | 0 | N/A |
| Greg Savage | ||||
| Types of Accounts | Number
of Other Accounts with Performance Fees Managed by Portfolio Manager |
Aggregate
of Total Assets | ||
| Registered Investment Companies | 0 | N/A | ||
| Other Pooled Investment Vehicles | 0 | N/A | ||
| Other Accounts | 0 | N/A |
Table of Contents
Table of Contents
Table of Contents
Table of Contents
Table of Contents
Table of Contents
Table of Contents
Table of Contents
Table of Contents
Table of Contents
Table of Contents
| Shares
Per Creation Unit |
Value
Per Creation Unit (U.S.$) | |
| 50,000 | $1,250,000 |
Table of Contents
Table of Contents
Table of Contents
Table of Contents
| Standard
Creation Transaction Fee |
Maximum
Additional Charge* | |
| $10,500 | 3.0% |
| * | As a percentage of the net asset value per Creation Unit. |
Table of Contents
| Standard
Redemption Transaction Fee |
Maximum
Additional Charge* | |
| $10,500 | 2.0% |
| * | As a percentage of the net asset value per Creation Unit, inclusive of the standard redemption transaction fee. |
Table of Contents
Table of Contents
Table of Contents
Table of Contents
Table of Contents
| 2014 | ||||||
| Country | Trade
Date |
Settlement
Date |
Number
of Days to Settle | |||
| The Czech Republic | 12/19/14 | 12/29/14 | 10 | |||
| 12/22/14 | 12/30/14 | 8 | ||||
| 12/23/14 | 01/02/15 | 10 | ||||
| Egypt | 01/06/14 | 01/14/14 | 8 | |||
| 04/14/14 | 04/22/14 | 8 | ||||
| 04/15/14 | 04/23/14 | 8 | ||||
| 04/16/14 | 04/24/14 | 8 | ||||
Table of Contents
| 2014 | ||||||
| Country | Trade
Date |
Settlement
Date |
Number
of Days to Settle | |||
| 04/17/14 | 04/27/14 | 10 | ||||
| 07/21/14 | 07/31/14 | 10 | ||||
| 07/22/14 | 08/03/14 | 12 | ||||
| 07/24/14 | 08/04/14 | 11 | ||||
| 09/29/14 | 10/07/14 | 8 | ||||
| 09/30/14 | 10/08/14 | 8 | ||||
| 10/01/14 | 10/09/14 | 8 | ||||
| 10/02/14 | 10/12/14 | 10 | ||||
| Hungary | 12/19/14 | 12/29/14 | 10 | |||
| 12/22/14 | 12/30/14 | 8 | ||||
| 12/23/14 | 12/31/14 | 8 | ||||
| Indonesia | 07/23/14 | 08/04/14 | 12 | |||
| 07/24/14 | 08/05/14 | 12 | ||||
| 07/25/14 | 08/06/14 | 12 | ||||
| 12/19/14 | 12/29/14 | 10 | ||||
| 12/22/14 | 12/30/14 | 8 | ||||
| 12/23/14 | 01/02/15 | 11 | ||||
| Malaysia | 01/27/14 | 02/04/14 | 8 | |||
| 01/28/14 | 02/05/14 | 8 | ||||
| 01/29/14 | 02/06/14 | 8 | ||||
| 07/23/14 | 07/31/14 | 8 | ||||
| 07/24/14 | 08/01/14 | 8 | ||||
| 07/25/14 | 08/04/14 | 10 | ||||
| The Philippines | 12/19/14 | 12/29/14 | 10 | |||
| 12/22/14 | 01/02/15 | 11 | ||||
| 12/23/14 | 01/05/15 | 13 | ||||
| 12/28/14 | 01/05/15 | 8 | ||||
| 12/29/14 | 01/06/15 | 8 | ||||
| Qatar | 07/23/14 | 08/03/14 | 11 | |||
| 07/24/14 | 08/04/14 | 11 | ||||
| 07/27/14 | 08/05/14 | 11 | ||||
| 09/30/14 | 10/08/14 | 8 | ||||
| 10/01/14 | 10/09/14 | 8 | ||||
| 10/02/14 | 10/12/14 | 10 | ||||
| The United Arab Emirates | 07/22/14 | 07/30/14 | 8 | |||
| 07/23/14 | 07/31/14 | 8 | ||||
| 07/24/14 | 08/01/14 | 8 | ||||
| 11/26/14 | 12/04/14 | 8 | ||||
| 11/27/14 | 12/08/14 | 11 | ||||
| 2015 | ||||||
| Country | Trade
Date |
Settlement
Date |
Number
of Days to Settle | |||
| Qatar | 07/15/15 | 07/23/15 | 8 | |||
| 07/16/15 | 07/26/15 | 10 | ||||
| 07/19/15 | 07/27/15 | 8 | ||||
| 09/16/15 | 09/24/15 | 8 | ||||
Table of Contents
| 2015 | ||||||
| Country | Trade
Date |
Settlement
Date |
Number
of Days to Settle | |||
| 09/17/15 | 09/27/15 | 10 | ||||
| 09/20/15 | 09/28/15 | 8 | ||||
| Thailand | 04/08/15 | 04/16/15 | 8 | |||
| 04/09/15 | 04/17/15 | 8 | ||||
| 04/10/15 | 04/20/15 | 10 | ||||
| * | These worst-case redemption cycles are based on information regarding regular holidays, which may be out of date. Based on changes in holidays, longer (worse) redemption cycles are possible. |
Table of Contents
Table of Contents
Table of Contents
Table of Contents
Table of Contents
Table of Contents
Table of Contents
Table of Contents
Table of Contents
(as revised January 7, 2015)
| Funds | Ticker | Stock Exchange | ||
| iShares Emerging Markets Corporate Bond ETF | CEMB | BATS | ||
| iShares Emerging Markets High Yield Bond ETF | EMHY | BATS | ||
| iShares Emerging Markets Local Currency Bond ETF | LEMB | NYSE Arca | ||
| iShares Global ex USD High Yield Corporate Bond ETF | HYXU | BATS | ||
| iShares Global High Yield Corporate Bond ETF | GHYG | BATS |
Table of Contents
Table of Contents
Table of Contents
Table of Contents
Table of Contents
| • | iShares Emerging Markets Corporate Bond ETF1 |
| • | iShares Emerging Markets High Yield Bond ETF2 |
| • | iShares Emerging Markets Local Currency Bond ETF3 |
| • | iShares Global ex USD High Yield Corporate Bond ETF4 |
| • | iShares Global High Yield Corporate Bond ETF5 |
Table of Contents
Table of Contents
Table of Contents
Table of Contents
| • | High yield bonds may be issued by less creditworthy companies. These securities are vulnerable to adverse changes in the issuer’s industry and to general economic conditions. Issuers of high yield bonds may be unable to meet their interest or principal payment obligations because of an economic downturn, specific issuer developments or the unavailability of additional financing. |
| • | The issuers of high yield bonds may have a larger amount of outstanding debt relative to their assets than issuers of investment grade bonds. If the issuer experiences financial stress, it may be unable to meet its debt obligations. The issuer’s ability to pay its debt obligations also may be lessened by specific issuer developments, or the unavailability of additional financing. Issuers of high yield securities are often in the growth stage of their development and/or involved in a reorganization or takeover. |
| • | High yield bonds are frequently ranked junior to claims by other creditors. If the issuer cannot meet its obligations, the senior obligations are generally paid off before the junior obligations, which will potentially limit a Fund’s ability to fully recover principal or to receive interest payments when senior securities are in default. Thus, investors in high yield securities have a lower degree of protection with respect to principal and interest payments than do investors in higher rated securities. |
| • | High yield bonds frequently have redemption features that permit an issuer to repurchase the security from a Fund before it matures. If an issuer redeems the high yield bonds, a Fund may have to invest the proceeds in bonds with lower yields and may lose income. |
| • | Prices of high yield bonds are subject to extreme fluctuations. Negative economic developments may have a greater impact on the prices of high yield bonds than on those of other higher rated fixed income securities. |
| • | High yield bonds may be less liquid than higher rated fixed income securities even under normal economic conditions. Under certain economic and/or market conditions, a Fund may have difficulty disposing of certain high |
Table of Contents
| yield securities due to the limited number of investors in that sector of the market. There are fewer dealers in the high yield bond market, and there may be significant differences in the prices quoted for high yield bonds by dealers, and such quotations may not be the actual prices available for a purchase or sale. Because high yield bonds are less liquid, judgment may play a greater role in the prices and values generated for such securities than in the case of securities trading in a more liquid market. | |
| • | The secondary markets for high yield securities are not as liquid as the secondary markets for higher rated securities. The secondary markets for high yield securities are concentrated in relatively few market makers and participants in the markets are mostly institutional investors, including insurance companies, banks, other financial institutions and mutual funds. In addition, the trading volume for high yield securities is generally lower than that for higher rated securities and the secondary markets could contract under adverse market or economic conditions independent of any specific adverse changes in the condition of a particular issuer. Under certain economic and/or market conditions, a Fund may have difficulty disposing of certain high yield securities due to the limited number of investors in that sector of the market. A less liquid secondary market may adversely affect the market price of the high yield security, which may result in increased difficulty selling the particular issue and obtaining accurate market quotations on the issue when valuing a Fund’s assets. Market quotations on high yield securities are available only from a limited number of dealers, and such quotations may not be the actual prices available for a purchase or sale. When the secondary market for high yield securities becomes more illiquid, or in the absence of readily available market quotations for such securities, the relative lack of reliable objective data makes it more difficult to value such securities, and judgment plays a more important role in determining such valuations. |
| • | A Fund may incur expenses to the extent necessary to seek recovery upon default or to negotiate new terms with a defaulting issuer. |
| • | The high yield bond markets may react strongly to adverse news about an issuer or the economy, or to the perception or expectation of adverse news, whether or not it is based on fundamental analysis. Additionally, prices for high yield securities may be affected by legislative and regulatory developments. These developments could adversely affect a Fund’s net asset value and investment practices, the secondary market for high yield securities, the financial condition of issuers of these securities and the value and liquidity of outstanding high yield securities, especially in a thinly traded market. For example, federal legislation requiring the divestiture by federally insured savings and loan associations of their investments in high yield bonds and limiting the deductibility of interest by certain corporate issuers of high yield bonds adversely affected the market in the past. |
Table of Contents
Table of Contents
Table of Contents
Table of Contents
Table of Contents
Table of Contents
Table of Contents
Table of Contents
Table of Contents
Table of Contents
Table of Contents
Table of Contents
Table of Contents
Table of Contents
Table of Contents
Table of Contents
Table of Contents
Table of Contents
Table of Contents
Table of Contents
| • | Each Fund generally supports the board’s nominees in the election of directors and generally supports proposals that strengthen the independence of boards of directors; |
| • | When a director has committed himself or herself to service on more than four public company boards (but no more than six public company boards in most circumstances), a Fund will consider such director’s individual circumstances in determining whether the director will be able to commit sufficient focus and time to a particular company; |
| • | Each Fund generally defers to an issuer’s choice of auditors so long as the corporate auditors represent the interests of shareholders and provide an independent view of the propriety of financial reporting decisions of management; |
| • | Each Fund generally favors disclosure of a company’s compensation and benefits policies and opposes excessive compensation, but believes that compensation matters are normally best determined by a company’s board of directors; |
| • | Each Fund generally expects to support capital structure requests that it believes enhance the rights of common shareholders and oppose requests that appear to be unreasonably dilutive; |
| • | Each Fund generally does not support proposals on social issues that lack a demonstrable economic benefit to the issuer and the Fund investing in such issuer; and |
| • | Each Fund generally votes against anti-takeover proposals and proposals that would create additional barriers or costs to corporate transactions that are likely to deliver a premium to shareholders. |
Table of Contents
Table of Contents
Table of Contents
Table of Contents
Table of Contents
| 1. | Concentrate its investments (i.e., invest 25% or more of its total assets in the securities of a particular industry or group of industries), except that the Fund will concentrate to approximately the same extent that the Underlying Index concentrates in the securities of a particular industry or group of industries. For purposes of this limitation, securities of the U.S. government (including its agencies and instrumentalities), repurchase agreements collateralized by U.S. government securities, and securities of state or municipal governments and their political subdivisions are not considered to be issued by members of any industry. |
| 2. | Borrow money, except that (i) the Fund may borrow from banks for temporary or emergency (not leveraging) purposes, including the meeting of redemption requests which might otherwise require the untimely disposition of securities; and (ii) the Fund may, to the extent consistent with its investment policies, enter into repurchase agreements, reverse repurchase agreements, forward roll transactions and similar investment strategies and techniques. To the extent that it engages in transactions described in (i) and (ii), the Fund will be limited so that no more than 33 1/3% of the value of its total assets (including the amount borrowed) is derived from such transactions. Any borrowings which come to exceed this amount will be reduced in accordance with applicable law. |
| 3. | Issue any senior security, except as permitted under the 1940 Act, as interpreted, modified or otherwise permitted by any regulatory authority having jurisdiction, from time to time. |
| 4. | Make loans, except as permitted under the 1940 Act, as interpreted, modified or otherwise permitted by regulatory authority having jurisdiction, from time to time. |
| 5. | Purchase or sell real estate unless acquired as a result of ownership of securities or other instruments (but this restriction shall not prevent the Fund from investing in securities of companies engaged in the real estate business or securities or other instruments backed by real estate or mortgages), or commodities or commodity contracts (but this restriction shall not prevent the Fund from trading in futures contracts and options on futures contracts, including options on currencies to the extent consistent with the Fund’s investment objective and policies). |
| 6. | Engage in the business of underwriting securities issued by other persons, except to the extent that the Fund may technically be deemed to be an underwriter under the 1933 Act, in disposing of portfolio securities. |
| 1. | Concentrate its investments (i.e., invest 25% or more of its total assets in the securities of a particular industry or group of industries), except that the Fund will concentrate to approximately the same extent that the Underlying Index concentrates in the securities of a particular industry or group of industries. For purposes of this limitation, securities of the U.S. government (including its agencies and instrumentalities), repurchase agreements collateralized by U.S. government securities, and securities of state or municipal governments and their political subdivisions are not considered to be issued by members of any industry. |
| 2. | Borrow money, except that (i) the Fund may borrow from banks for temporary or emergency (not leveraging) purposes, including the meeting of redemption requests which might otherwise require the untimely disposition of securities; and (ii) the Fund may, to the extent consistent with its investment policies, enter into repurchase agreements, reverse repurchase agreements, forward roll transactions and similar investment strategies and techniques. To the extent that it engages in transactions described in (i) and (ii), the Fund will be limited so that no more than 33 1/3% of the value of its total assets (including the amount borrowed) is derived from such transactions. Any borrowings which come to exceed this amount will be reduced in accordance with applicable law. |
Table of Contents
| 3. | Issue “senior securities” as defined in the 1940 Act and the rules, regulations and orders thereunder, except as permitted under the 1940 Act and the rules, regulation and orders thereunder. |
| 4. | Make loans, except as permitted under the 1940 Act, as interpreted, modified or otherwise permitted by regulatory authority having jurisdiction, from time to time. |
| 5. | Purchase or sell real estate unless acquired as a result of ownership of securities or other instruments (but this restriction shall not prevent the Fund from investing in securities of companies engaged in the real estate business or securities or other instruments backed by real estate or mortgages), or commodities or commodity contracts (but this restriction shall not prevent the Fund from trading in futures contracts and options on futures contracts, including options on currencies to the extent consistent with the Fund’s investment objective and policies). |
| 6. | Engage in the business of underwriting securities issued by other persons, except to the extent that the Fund may technically be deemed to be an underwriter under the 1933 Act, in disposing of portfolio securities. |
| • | The frequency of trades and quotes for the security; |
| • | The number of dealers wishing to purchase or sell the security and the number of other potential purchasers; |
| • | Dealer undertakings to make a market in the security; and |
| • | The nature of the security and the nature of the marketplace in which it trades (e.g., the time needed to dispose of the security, the method of soliciting offers and the mechanics of transfer). |
Table of Contents
| Name (Age) | Position | Principal
Occupation(s) During the Past 5 Years |
Other
Directorships Held by Director | |||
| Robert
S. Kapito1 (57) |
Director
(since 2009). |
President and Director, BlackRock, Inc. (since 2006); Vice Chairman of BlackRock, Inc. and Head of BlackRock’s Portfolio Management Group (since its formation in 1998) and BlackRock’s predecessor entities (since 1988); Trustee, University of Pennsylvania (since 2009); President of Board of Directors, Hope & Heroes Children’s Cancer Fund (since 2002); President of the Board of Directors, Periwinkle Theatre for Youth (since 1983). | Trustee of iShares Trust (since 2009); Director of iShares MSCI Russia Capped ETF, Inc. (since 2010); Trustee of iShares U.S. ETF Trust (since 2011); Director of BlackRock, Inc. (since 2006). |
Table of Contents
| Name (Age) | Position | Principal
Occupation(s) During the Past 5 Years |
Other
Directorships Held by Director | |||
| Mark
Wiedman2 (43) |
Director (since 2013). | Managing Director, BlackRock, Inc. (since 2007); Global Head of iShares (since 2011); Head of Corporate Strategy, BlackRock, Inc. (2009-2011). | Trustee of iShares Trust (since 2013); Director of iShares MSCI Russia Capped ETF, Inc. (since 2013);Trustee of iShares U.S. ETF Trust (since 2013); Director of PennyMac Financial Services, Inc. (since 2008). |
| 1 | Robert S. Kapito is deemed to be an “interested person” (as defined in the 1940 Act) of the Company due to his affiliations with BlackRock, Inc. |
| 2 | Mark Wiedman is deemed to be an “interested person” (as defined in the 1940 Act) of the Company due to his affiliations with BlackRock, Inc. and its affiliates. |
| Name (Age) | Position | Principal
Occupation(s) During the Past 5 Years |
Other
Directorships Held by Director | |||
| Robert
H. Silver (58) |
Director
(since 2007); Independent Chairman (since 2012). |
President and Co-Founder of The Bravitas Group, Inc. (since 2006); Director and Vice Chairman of the YMCA of Greater NYC (2001-2011); Broadway Producer (2006-2011); Co-Founder and Vice President of Parentgiving Inc. (since 2008); Director and Member of the Audit and Compensation Committee of EPAM Systems, Inc. (2006-2009); President and Chief Operating Officer of UBS Financial Services Inc. (formerly Paine Webber Inc.) (2003-2005) and various executive positions with UBS and its affiliates (1988-2005); CPA and Audit Manager of KPMG, LLP (formerly Peat Marwick Mitchell) (1977-1983). | Trustee of iShares Trust (since 2007); Director of iShares MSCI Russia Capped ETF, Inc. (since 2010); Trustee of iShares U.S. ETF Trust (since 2011); Independent Chairman of iShares Trust, iShares MSCI Russia Capped ETF, Inc. and iShares U.S. ETF Trust (since 2012). | |||
| George
G.C. Parker (74) |
Director
(since 2002). |
Dean Witter Distinguished Professor of Finance, Emeritus, Stanford University Graduate School of Business (Professor since 1973; Emeritus since 2006). | Trustee of iShares Trust (since 2000); Director of iShares MSCI Russia Capped ETF, Inc. (since 2010); Trustee of iShares U.S. ETF Trust (since 2011); Director of Tejon Ranch Company (since 1999); Director of Threshold Pharmaceuticals (since 2004); Director of Colony Financial, Inc. (since 2009); Director of First Republic Bank (since 2010). | |||
| John
E. Martinez (52) |
Director
(since 2003); Securities Lending Committee Chair (since 2012). |
Director of FirstREX Agreement Corp. (formerly EquityRock, Inc.) (since 2005). | Trustee of iShares Trust (since 2003); Director of iShares MSCI Russia Capped ETF, Inc. (since 2010); Trustee of iShares U.S. ETF Trust (since 2011). |
Table of Contents
| Name (Age) | Position | Principal
Occupation(s) During the Past 5 Years |
Other
Directorships Held by Director | |||
| Cecilia
H. Herbert (64) |
Director
(since 2005); Nominating and Governance Committee Chair and Equity Plus Committee Chair (since 2012). |
Director (1998-2013) and President (2007-2011) of the Board of Directors, Catholic Charities CYO; Trustee (2002-2011) and Chair of the Finance and Investment Committee (2006-2010) of the Thacher School; Member (since 1992) and Chair (1994-2005) of the Investment Committee, Archdiocese of San Francisco; Trustee and Member of the Investment Committee, WNET, the New York public broadcasting/media company (since 2011). | Trustee of iShares Trust (since 2005); Director of iShares MSCI Russia Capped ETF, Inc. (since 2010); Trustee of iShares U.S. ETF Trust (since 2011); Director of Forward Funds (34 portfolios) (since 2009). | |||
| Charles
A. Hurty (70) |
Director
(since 2005); Audit Committee Chair (since 2006). |
Retired; Partner, KPMG LLP (1968-2001). | Trustee of iShares Trust (since 2005); Director of iShares MSCI Russia Capped ETF, Inc. (since 2010); Trustee of iShares U.S. ETF Trust (since 2011); Director of GMAM Absolute Return Strategy Fund (1 portfolio) (since 2002); Director of SkyBridge Alternative Investments Multi-Adviser Hedge Fund Portfolios LLC (2 portfolios) (since 2002). | |||
| John
E. Kerrigan (58) |
Director
(since 2005); Fixed Income Plus Committee Chair (since 2012). |
Chief Investment Officer, Santa Clara University (since 2002). | Trustee of iShares Trust (since 2005); Director of iShares MSCI Russia Capped ETF, Inc. (since 2010); Trustee of iShares U.S. ETF Trust (since 2011). | |||
| Madhav
V. Rajan (49) |
Director
(since 2011); 15(c) Committee Chair (since 2012). |
Robert K. Jaedicke Professor of Accounting and Senior Associate Dean for Academic Affairs and Head of MBA Program, Stanford University Graduate School of Business (since 2001); Professor of Law (by courtesy), Stanford Law School (since 2005); Visiting Professor, University of Chicago (2007-2008). | Trustee
of iShares Trust (since 2011); Director of iShares MSCI Russia Capped ETF, Inc. (since 2011); Trustee of iShares U.S. ETF Trust (since 2011); Director, Cavium, Inc. (since 2013). |
| Name (Age) | Position | Principal
Occupation(s) During the Past 5 Years | ||
| Manish
Mehta (43) |
President (since 2013). | Managing Director, BlackRock, Inc. (since 2009); Chief Operating Officer for iShares (since 2009); Head of Strategy and Corporate Development, BGI (2005-2009); Chief of Staff to the CEO, BGI (2005-2009). |
Table of Contents
| Name (Age) | Position | Principal
Occupation(s) During the Past 5 Years | ||
| Jack
Gee (54) |
Treasurer
and Chief Financial Officer (since 2008). |
Managing Director, BlackRock (since 2009); Senior Director of Fund Administration of Intermediary Investor Business, BGI (2009); Director of Fund Administration of Intermediary Investor Business, BGI (2004-2009). | ||
| Eilleen
M. Clavere (61) |
Secretary
(since 2007). |
Director of Global Fund Administration, BlackRock (since 2009); Director of Legal Administration of Intermediary Investor Business, BGI (2006-2009); Legal Counsel and Vice President of Atlas Funds, Atlas Advisers, Inc. and Atlas Securities, Inc. (2005-2006); Counsel at Kirkpatrick & Lockhart LLP (2001-2005). | ||
| Edward
B. Baer (45) |
Vice
President and Chief Legal Officer (since 2012). |
Managing Director of Legal & Compliance, BlackRock (since 2006); Director of Legal & Compliance, BlackRock (2004-2006). | ||
| Warren
Collier (48) |
Executive Vice President (since 2013). | Managing Director, BlackRock (since 2009); COO, BlackRock Latin America and Iberia (2009-2012); COO, BGINA and BGI Canada Limited (2007-2009). | ||
| Scott
Radell (45) |
Executive
Vice President (since 2012). |
Managing Director, BlackRock (since 2009); Head of Portfolio Solutions, BlackRock (since 2009); Head of Portfolio Solutions, BGI (2007-2009); Credit Portfolio Manager, BGI (2005-2007); Credit Research Analyst, BGI (2003-2005). | ||
| Amy
Schioldager (51) |
Executive
Vice President (since 2007). |
Senior Managing Director, BlackRock (since 2009); Global Head of Index Equity, BGI (2008-2009); Global Head of U.S. Indexing, BGI (2006-2008); Head of Domestic Equity Portfolio Management, BGI (2001-2006). | ||
| Ira
P. Shapiro (50) |
Vice
President (since 2007). |
Managing Director, BlackRock (since 2009); Head of Strategic Product Initiatives for iShares (since 2012); Chief Legal Officer, Exchange-Traded Fund Complex (2007-2012); Associate General Counsel, BGI (2004-2009). |
Table of Contents
Table of Contents
Table of Contents
Table of Contents
Table of Contents
| Name of Director | Fund | Dollar
Range of Equity Securities in the Fund |
Aggregate
Dollar Range of Equity Securities in all Registered Investment Companies Overseen by Director in Family of Investment Companies | |||
| Robert S. Kapito | None | None | None | |||
| Mark Wiedman1 | iShares Core MSCI EAFE ETF | Over $100,000 | Over $100,000 | |||
| iShares Core MSCI Emerging Markets ETF | $50,001-$100,000 | |||||
| iShares Core S&P Total U.S. Stock Market ETF | $50,001-$100,000 | |||||
| Robert H. Silver | iShares 2015 AMT-Free Muni Term ETF | Over $100,000 | Over $100,000 | |||
| iShares 2016 AMT-Free Muni Term ETF | Over $100,000 | |||||
| iShares 2017 AMT-Free Muni Term ETF | Over $100,000 | |||||
| iShares 2018 AMT-Free Muni Term ETF | Over $100,000 | |||||
| iShares Core MSCI EAFE ETF | Over $100,000 | |||||
| iShares Core MSCI Emerging Markets ETF | Over $100,000 | |||||
| iShares Core MSCI Total International Stock ETF | Over $100,000 | |||||
| iShares Core S&P 500 ETF | Over $100,000 |
Table of Contents
| Name of Director | Fund | Dollar
Range of Equity Securities in the Fund |
Aggregate
Dollar Range of Equity Securities in all Registered Investment Companies Overseen by Director in Family of Investment Companies | |||
| iShares Core S&P Mid-Cap ETF | Over $100,000 | |||||
| iShares Core S&P Small-Cap ETF | Over $100,000 | |||||
| iShares Core S&P Total U.S. Stock Market ETF | Over $100,000 | |||||
| iShares High Dividend ETF | Over $100,000 | |||||
| iShares iBoxx $ Investment Grade Corporate Bond ETF | Over $100,000 | |||||
| iShares J.P. Morgan USD Emerging Markets Bond ETF | $1-$10,000 | |||||
| iShares MSCI ACWI ex U.S. ETF | $1-$10,000 | |||||
| iShares MSCI BRIC ETF | $10,001-$50,000 | |||||
| iShares MSCI Emerging Markets ETF | $1-$10,000 | |||||
| iShares MSCI Frontier 100 ETF | $50,001-$100,000 | |||||
| iShares National AMT-Free Muni Bond ETF | Over $100,000 | |||||
| iShares Russell 1000 Growth ETF | Over $100,000 | |||||
| iShares Russell 1000 Value ETF | Over $100,000 | |||||
| iShares Russell 2000 ETF | $10,001-$50,000 | |||||
| iShares Russell 2000 Growth ETF | Over $100,000 | |||||
| iShares Russell 2000 Value ETF | Over $100,000 | |||||
| iShares Russell 3000 ETF | Over $100,000 | |||||
| iShares Russell Mid-Cap Growth ETF | $1-$10,000 | |||||
| iShares Russell Mid-Cap Value ETF | $1-$10,000 | |||||
| iShares Select Dividend ETF | $10,001-$50,000 | |||||
| iShares U.S. Broker-Dealers ETF | Over $100,000 | |||||
| iShares U.S. Financial Services ETF | $50,001-$100,000 | |||||
| iShares U.S. Preferred Stock ETF | Over $100,000 | |||||
| iShares U.S. Regional Banks ETF | Over $100,000 | |||||
| iShares U.S. Technology ETF | $50,001-$100,000 | |||||
| George G.C. Parker | iShares California AMT-Free Muni Bond ETF | Over $100,000 | Over $100,000 | |||
| iShares Core S&P 500 ETF | Over $100,000 | |||||
| iShares Core Total U.S. Bond Market ETF | $10,001-$50,000 | |||||
| iShares iBoxx $ Investment Grade Corporate Bond ETF | Over $100,000 | |||||
| iShares MSCI EAFE ETF | Over $100,000 | |||||
| iShares S&P 100 ETF | Over $100,000 | |||||
| iShares Select Dividend ETF | Over $100,000 | |||||
| John E. Martinez | iShares Core MSCI Emerging Markets ETF | $50,001-$100,000 | Over $100,000 |
Table of Contents
| Name of Director | Fund | Dollar
Range of Equity Securities in the Fund |
Aggregate
Dollar Range of Equity Securities in all Registered Investment Companies Overseen by Director in Family of Investment Companies | |||
| iShares Core S&P 500 ETF | Over $100,000 | |||||
| iShares Emerging Markets Infrastructure ETF | Over $100,000 | |||||
| iShares Global Consumer Staples ETF | Over $100,000 | |||||
| iShares MSCI All Country Asia ex Japan ETF | Over $100,000 | |||||
| iShares MSCI EAFE ETF | Over $100,000 | |||||
| iShares Russell 1000 ETF | Over $100,000 | |||||
| iShares Russell 1000 Value ETF | Over $100,000 | |||||
| iShares Russell 2000 ETF | Over $100,000 | |||||
| iShares TIPS Bond ETF | Over $100,000 | |||||
| Cecilia H. Herbert | iShares China Large-Cap ETF | Over $100,000 | Over $100,000 | |||
| iShares Core MSCI Emerging Markets ETF | $10,001-$50,000 | |||||
| iShares Core MSCI Total International Stock ETF | $10,001-$50,000 | |||||
| iShares Core S&P Total U.S. Stock Market ETF | $10,001-$50,000 | |||||
| iShares iBoxx $ High Yield Corporate Bond ETF | $10,001-$50,000 | |||||
| iShares International Select Dividend ETF | $1-$10,000 | |||||
| iShares MSCI EAFE ETF | $10,001-$50,000 | |||||
| iShares MSCI Emerging Markets ETF | $1-$10,000 | |||||
| iShares MSCI Japan ETF | $10,001-$50,000 | |||||
| iShares National AMT-Free Muni Bond ETF | $10,001-$50,000 | |||||
| iShares U.S. Preferred Stock ETF | $10,001-$50,000 | |||||
| Charles A. Hurty | iShares China Large-Cap ETF | $10,001-$50,000 | Over $100,000 | |||
| iShares Core MSCI Emerging Markets ETF | $50,001-$100,000 | |||||
| iShares Core S&P 500 ETF | $10,001-$50,000 | |||||
| iShares Global Energy ETF | $10,001-$50,000 | |||||
| iShares Global Tech ETF | $10,001-$50,000 | |||||
| iShares High Dividend ETF | $10,001-$50,000 | |||||
| iShares MSCI EAFE ETF | $10,001-$50,000 | |||||
| iShares MSCI Japan ETF | $10,001-$50,000 | |||||
| iShares North American Tech-Multimedia Networking ETF | $1-$10,000 | |||||
| iShares U.S. Energy ETF | $10,001-$50,000 | |||||
| iShares U.S. Financials ETF | $1-$10,000 | |||||
| iShares U.S. Technology ETF | $50,001-$100,000 | |||||
| John E. Kerrigan | iShares MSCI ACWI ex U.S. ETF | Over $100,000 | Over $100,000 |
Table of Contents
| Name of Director | Fund | Dollar
Range of Equity Securities in the Fund |
Aggregate
Dollar Range of Equity Securities in all Registered Investment Companies Overseen by Director in Family of Investment Companies | |||
| iShares Short-Term National AMT-Free Muni Bond ETF | Over $100,000 | |||||
| Madhav V. Rajan | iShares Core MSCI Emerging Markets ETF | Over $100,000 | Over $100,000 | |||
| iShares Core S&P 500 ETF | Over $100,000 | |||||
| iShares High Dividend ETF | Over $100,000 | |||||
| iShares iBoxx $ High Yield Corporate Bond ETF | $50,001-$100,000 | |||||
| iShares iBoxx $ Investment Grade Corporate Bond ETF | Over $100,000 | |||||
| iShares Select Dividend ETF | Over $100,000 |
| Name of Director | iShares
Emerging Markets Corporate Bond ETF1 |
iShares
Emerging Markets High Yield Bond ETF1 |
iShares
Emerging Markets Local Currency Bond ETF | |||
| Independent Directors: | ||||||
| George G.C. Parker | $ 15 | $85 | $264 | |||
| John E. Kerrigan | 14 | 83 | 258 | |||
| Charles A. Hurty | 16 | 94 | 295 | |||
| Cecilia H. Herbert | 15 | 85 | 265 | |||
| Robert H. Silver | 16 | 94 | 294 |
Table of Contents
| Name of Director | iShares
Emerging Markets Corporate Bond ETF1 |
iShares
Emerging Markets High Yield Bond ETF1 |
iShares
Emerging Markets Local Currency Bond ETF | |||
| John E. Martinez | 14 | 81 | 254 | |||
| Madhav V. Rajan | 14 | 81 | 254 | |||
| Interested Directors: | ||||||
| Robert S. Kapito | $ 0 | $0 | $0 | |||
| Michael Latham | 0 | 0 | 0 |
| Name of Director | iShares
Global ex USD High Yield Corporate Bond ETF1 |
iShares
Global High Yield Corporate Bond ETF | ||
| Independent Directors: | ||||
| George G.C. Parker | $ 21 | $ 31 | ||
| John E. Kerrigan | 21 | 30 | ||
| Charles A. Hurty | 24 | 35 | ||
| Cecilia H. Herbert | 21 | 31 | ||
| Robert H. Silver | 24 | 35 | ||
| John E. Martinez | 20 | 30 | ||
| Madhav V. Rajan | 20 | 30 | ||
| Interested Directors: | ||||
| Robert S. Kapito | $ 0 | $ 0 | ||
| Michael Latham | 0 | 0 |
| Name of Director | Pension
or Retirement Benefits Accrued As Part of Company Expenses1 |
Estimated
Annual Benefits Upon Retirement1 |
Total
Compensation From the Funds and Fund Complex2 | |||
| Independent Directors: | ||||||
| Robert H. Silver | Not Applicable | Not Applicable | $ 325,000 | |||
| George G.C. Parker | Not Applicable | Not Applicable | 275,000 | |||
| John E. Kerrigan | Not Applicable | Not Applicable | 315,882 | |||
| Charles A. Hurty | Not Applicable | Not Applicable | 315,000 | |||
| Cecilia H. Herbert | Not Applicable | Not Applicable | 305,000 | |||
| John E. Martinez | Not Applicable | Not Applicable | 290,000 | |||
| Madhav V. Rajan | Not Applicable | Not Applicable | 301,765 | |||
| Interested Directors: | ||||||
| Robert S. Kapito | Not Applicable | Not Applicable | $ 0 | |||
| Mark Wiedman3 | Not Applicable | Not Applicable | $ 0 | |||
| Michael Latham4 | Not Applicable | Not Applicable | $ 0 |
| 1 | No Director or officer is entitled to any pension or retirement benefits from the Company. |
| 2 | Includes compensation for service on the Boards of Trustees for iShares Trust and iShares U.S. ETF Trust and the Board of Directors of iShares MSCI Russia Capped ETF, Inc. |
| 3 | Appointed to serve as an Interested Director effective December 31, 2013. |
Table of Contents
| 4 | Served as an Interested Director through December 31, 2013. |
| Fund | Name | Percentage
of Ownership | ||
| iShares Emerging Markets Corporate Bond ETF | National
Financial Services LLC 200 Liberty Street 5th Floor New York, NY 10281 |
11.81% | ||
| Morgan
Stanley & Co. Harborside Financial Center Plaza 3, 1st Floor Jersey City, NJ 07311 |
10.52% | |||
| Goldman
Sachs Execution & Clearing, L.P. 30 Hudson Street 27th Floor Jersey City, NJ 07302 |
9.60% | |||
| JPMorgan
Chase Bank, National Association 14201 Dallas Pkwy 12th Floor Dallas, TX 75240 |
7.62% | |||
| Charles
Schwab & Co., Inc. 111 Pavonia Avenue Jersey City, NJ 07310 |
5.18% | |||
| Pershing
LLC One Pershing Plaza Jersey City, NJ 07399 |
5.02% | |||
| iShares Emerging Markets High Yield Bond ETF | National
Financial Services LLC 200 Liberty Street 5th Floor New York, NY 10281 |
30.45% | ||
| American
Enterprise Investment Services Inc. 2178 AXP Financial Center Minneapolis, MN 55474 |
18.49% | |||
| Pershing
LLC One Pershing Plaza Jersey City, NJ 07399 |
14.68% | |||
| Charles
Schwab & Co., Inc. 111 Pavonia Avenue Jersey City, NJ 07310 |
5.60% | |||
| iShares Emerging Markets Local Currency Bond ETF | Mellon
Trust of New England, National Association Three Mellon Bank Center Floor 1533700 Pittsburgh, PA 15259 |
47.05% |
Table of Contents
| Fund | Name | Percentage
of Ownership | ||
| Goldman,
Sachs & Co. 30 Hudson Street 16th Floor Jersey City, NJ 07302 |
10.59% | |||
| Northern
Trust Company (The) 801 South Canal Street Chicago, IL 60612 |
9.55% | |||
| Merrill
Lynch, Pierce Fenner & Smith Safekeeping 101 Hudson Street 8th Floor Jersey City, NJ 07302 |
8.87% | |||
| iShares Global ex USD High Yield Corporate Bond ETF | National
Financial Services LLC 200 Liberty Street 5th Floor New York, NY 10281 |
20.02% | ||
| TD
Ameritrade Clearing, Inc. 1005 N. Ameritrade Place Bellevue, NE 68005 |
13.74% | |||
| Charles
Schwab & Co., Inc. 111 Pavonia Avenue Jersey City, NJ 07310 |
8.19% | |||
| Merrill
Lynch, Pierce, Fenner & Smith Incorporated 101 Hudson Street 9th Floor Jersey City, NJ 07302-3997 |
7.15% | |||
| Brown
Brothers Harriman & Co. 525 Washington Blvd. 11th Floor Jersey City, NJ 07310 |
5.71% | |||
| Pershing
LLC One Pershing Plaza Jersey City, NJ 07399 |
5.50% | |||
| iShares Global High Yield Corporate Bond ETF | Merrill
Lynch, Pierce Fenner & Smith Safekeeping 101 Hudson Street 8th Floor Jersey City, NJ 07302 |
24.76% | ||
| TD
Ameritrade Clearing, Inc. 1005 N. Ameritrade Place Bellevue, NE 68005 |
18.60% | |||
| Morgan
Stanley & Co. Harborside Financial Center Plaza 3, 1st Floor Jersey City, NJ 07311 |
9.45% | |||
| Pershing
LLC One Pershing Plaza Jersey City, NJ 07399 |
6.97% |
Table of Contents
| Fund | Name | Percentage
of Ownership | ||
| National
Financial Services LLC 200 Liberty Street 5th Floor New York, NY 10281 |
5.78% | |||
| Raymond,
James & Associates, Inc. 880 Carillon Parkway P.O. Box 12749 St. Petersburg, FL 33733 |
5.18% |
Table of Contents
Table of Contents
Table of Contents
Table of Contents
Table of Contents
Table of Contents
| Fund | Management
Fee |
Fund
Inception Date |
Management
Fees Paid for Fiscal Year Ended October 31, 2013 |
Management
Fees Paid for Fiscal Year Ended October 31, 2012 |
Management
Fees Paid for Fiscal Year Ended October 31, 2011 | |||||
| iShares Emerging Markets Corporate Bond ETF | 0.60% | 04/17/12 | $ 202,526 | $ 41,205 | N/A | |||||
| iShares Emerging Markets High Yield Bond ETF | 0.65% | 04/03/12 | 1,462,488 | 82,350 | N/A | |||||
| iShares Emerging Markets Local Currency Bond ETF | 0.60% | 10/18/11 | 3,298,880 | 288,363 | $6,483 | |||||
| iShares Global ex USD High Yield Corporate Bond ETF1 | 0.55% | 04/03/12 | 215,773 | 77,202 | N/A |
Table of Contents
| Fund | Management
Fee |
Fund
Inception Date |
Management
Fees Paid for Fiscal Year Ended October 31, 2013 |
Management
Fees Paid for Fiscal Year Ended October 31, 2012 |
Management
Fees Paid for Fiscal Year Ended October 31, 2011 | |||||
| iShares Global High Yield Corporate Bond ETF2 | 0.55% | 04/03/12 | 302,079 | 90,198 | N/A |
| 1 | For the iShares Global ex USD High Yield Corporate Bond ETF, BFA has contractually agreed to waive a portion of its management fee for its investment advisory services to the Fund in order to limit the Total Annual Fund Operating Expenses to 0.40% of average daily net assets until February 28, 2015. The contractual waiver may be terminated prior to February 28, 2015 only upon written agreement of the Company and BFA. For the fiscal year ended October 31, 2013, BFA waived $58,847 of its management fees. |
| 2 | For the iShares Global High Yield Corporate Bond ETF, BFA has contractually agreed to waive a portion of its management fee for its investment advisory services to the Fund in order to limit the Total Annual Fund Operating Expenses to 0.40% of average daily net assets until February 28, 2015. The contractual waiver may be terminated prior to February 28, 2015 only upon written agreement of the Company and BFA. For the fiscal year ended October 31, 2013, BFA waived $82,385 of its management fees. |
Table of Contents
| James Mauro | ||||
| Types of Accounts | Number | Total Assets | ||
| Registered Investment Companies | 65 | $132,700,000,000 | ||
| Other Pooled Investment Vehicles | 16 | $ 17,300,000,000 | ||
| Other Accounts | 9 | $ 13,300,000,000 | ||
| Accounts with Incentive-Based Fee Arrangements | 1 | $ 1,000,000,000 |
| Scott Radell | ||||
| Types of Accounts | Number | Total Assets | ||
| Registered Investment Companies | 71 | $139,700,000,000 | ||
| Other Pooled Investment Vehicles | 4 | $ 3,000,000,000 | ||
| Other Accounts | 5 | $ 2,800,000,000 | ||
| Accounts with Incentive-Based Fee Arrangements | 2 | $ 1,700,000,000 |
Table of Contents
| James Mauro | ||||
| Types of Accounts | Number
of Other Accounts with Performance Fees Managed by Portfolio Manager |
Aggregate
of Total Assets | ||
| Registered Investment Companies | 0 | N/A | ||
| Other Pooled Investment Vehicles | 0 | N/A | ||
| Other Accounts | 1 | $1,000,000,000 |
| Scott Radell | ||||
| Types of Accounts | Number
of Other Accounts with Performance Fees Managed by Portfolio Manager |
Aggregate
of Total Assets | ||
| Registered Investment Companies | 0 | N/A | ||
| Other Pooled Investment Vehicles | 1 | $1,100,000,000 | ||
| Other Accounts | 1 | $ 600,000,000 |
Table of Contents
| Fund | Fund
Inception Date |
Custody,
Administration, Transfer Agency Expenses Paid During Fiscal Year Ended Oct. 31, 2013 |
Custody,
Administration, Transfer Agency Expenses Paid During Fiscal Year Ended Oct. 31, 2012 |
Custody,
Administration, Transfer Agency Expenses Paid During Fiscal Year Ended Oct. 31, 2011 | ||||
| iShares Emerging Markets Corporate Bond ETF | 04/17/12 | $ 11,537 | $ 4,263 | N/A | ||||
| iShares Emerging Markets High Yield Bond ETF | 04/03/12 | 36,840 | 8,657 | N/A | ||||
| iShares Emerging Markets Local Currency Bond ETF | 10/18/11 | 265,969 | 39,993 | $5,219 | ||||
| iShares Global ex USD High Yield Corporate Bond ETF | 04/03/12 | 13,173 | 7,320 | N/A | ||||
| iShares Global High Yield Corporate Bond ETF | 04/03/12 | 12,904 | 5,614 | N/A |
Table of Contents
| Fund | Fund
Inception Date |
Distributor
Compensation Paid From November 1, 2012 to October 31, 2013 |
Distributor
Compensation Paid From April 1, 2012 to October 31, 20121 |
Distributor
Compensation Paid From November 1, 2011 to March 31, 20122 |
Distributor
Compensation Paid During Fiscal Year Ended October 31, 20112 | |||||
| iShares Emerging Markets Corporate Bond ETF | 04/17/12 | $8,663 | $4,403 | N/A | N/A | |||||
| iShares Emerging Markets High Yield Bond ETF | 04/03/12 | 8,663 | 4,403 | N/A | N/A | |||||
| iShares Emerging Markets Local Currency Bond ETF | 10/18/11 | 8,663 | 4,403 | $3,355 | $ 913 | |||||
| iShares Global ex USD High Yield Corporate Bond ETF | 04/03/12 | 8,663 | 4,403 | N/A | N/A | |||||
| iShares Global High Yield Corporate Bond ETF | 04/03/12 | 8,663 | 4,403 | N/A | N/A |
Table of Contents
Table of Contents
Table of Contents
Table of Contents
Table of Contents
Table of Contents
| Fund | Issuer | Market
Value of Investment | ||
| iShares Emerging Markets Corporate Bond ETF | Banco Santander Brasil SA | $103,500 |
Table of Contents
| Fund | Fiscal Year ended October 31, 2013 | Fiscal Year ended October 31, 2012 | ||
| iShares Emerging Markets Corporate Bond ETF | 33% | 29% | ||
| iShares Emerging Markets High Yield Bond ETF | 57% | 40% | ||
| iShares Emerging Markets Local Currency Bond ETF | 41% | 61% | ||
| iShares Global ex USD High Yield Corporate Bond ETF | 33% | 18% | ||
| iShares Global High Yield Corporate Bond ETF | 20% | 10% |
Table of Contents
Table of Contents
| Fund | Shares
Per Creation Unit |
Value
Per Creation Unit (U.S.$) | ||
| iShares Emerging Markets Corporate Bond ETF | 100,000 | $4,972,000 |
Table of Contents
| Fund | Shares
Per Creation Unit |
Value
Per Creation Unit (U.S.$) | ||
| iShares Emerging Markets High Yield Bond ETF | 100,000 | 4,928,000 | ||
| iShares Emerging Markets Local Currency Bond ETF | 200,000 | 9,824,000 | ||
| iShares Global ex USD High Yield Corporate Bond ETF | 100,000 | 5,709,000 | ||
| iShares Global High Yield Corporate Bond ETF | 100,000 | 5,347,000 |
Table of Contents
Table of Contents
Table of Contents
| Fund | Standard
Creation Transaction Fee |
Maximum
Additional Charge* | ||
| iShares Emerging Markets Corporate Bond ETF | $ 100 | 3.0% | ||
| iShares Emerging Markets High Yield Bond ETF | $ 100 | 3.0% |
Table of Contents
| Fund | Standard
Creation Transaction Fee |
Maximum
Additional Charge* | ||
| iShares Emerging Markets Local Currency Bond ETF | $ 2,000 | 7.0% | ||
| iShares Global ex USD High Yield Corporate Bond ETF | $ 1,900 | 3.0% | ||
| iShares Global High Yield Corporate Bond ETF | $ 1,250 | 3.0% |
| * | As a percentage of the net asset value per Creation Unit. |
Table of Contents
| Fund | Standard
Redemption Transaction Fee |
Maximum
Additional Charge* | ||
| iShares Emerging Markets Corporate Bond ETF | $ 100 | 2.0% | ||
| iShares Emerging Markets High Yield Bond ETF | $ 100 | 2.0% | ||
| iShares Emerging Markets Local Currency Bond ETF | $ 2,000 | 2.0% | ||
| iShares Global ex USD High Yield Corporate Bond ETF | $ 1,900 | 2.0% | ||
| iShares Global High Yield Corporate Bond ETF | $ 1,250 | 2.0% |
| * | As a percentage of the net asset value per Creation Unit, inclusive of the standard transaction fee. |
Table of Contents
Table of Contents
Table of Contents
Table of Contents
Table of Contents
Table of Contents
Table of Contents
Table of Contents
Table of Contents
Table of Contents
Table of Contents
Table of Contents
Table of Contents
| 2014 | ||||||
| Country | Trade
Date |
Settlement
Date |
Number
of Days to Settle | |||
| Austria | 12/19/14 | 12/29/14 | 10 | |||
| 12/22/14 | 12/30/14 | 8 | ||||
| 12/23/14 | 01/02/15 | 10 | ||||
| China | 01/27/14 | 02/10/14 | 14 | |||
| 01/28/14 | 02/11/14 | 14 | ||||
| 01/29/14 | 02/12/14 | 14 | ||||
| 04/28/14 | 05/08/14 | 10 | ||||
| 04/29/14 | 05/09/14 | 10 | ||||
| 04/30/14 | 05/12/14 | 12 | ||||
| 09/26/14 | 10/08/14 | 12 | ||||
| 09/29/14 | 10/09/14 | 10 | ||||
| 09/30/14 | 10/10/14 | 10 | ||||
| The Czech Republic | 12/23/13 | 01/02/14 | 10 | |||
| 12/19/14 | 12/29/14 | 10 | ||||
| 12/22/14 | 12/30/14 | 8 | ||||
| 12/23/14 | 01/02/15 | 10 | ||||
| Denmark | 12/23/13 | 01/02/14 | 10 | |||
| 04/14/14 | 04/23/14 | 8 | ||||
| 04/15/14 | 04/24/14 | 8 | ||||
| 04/16/14 | 04/25/14 | 8 | ||||
| 12/19/14 | 12/29/14 | 10 | ||||
| 12/22/14 | 12/30/14 | 8 | ||||
| 12/23/14 | 01/02/15 | 10 | ||||
| Egypt | 12/31/13 | 01/08/14 | 8 | |||
| 01/06/14 | 01/14/14 | 8 | ||||
| 04/14/14 | 04/22/14 | 8 | ||||
| 04/15/14 | 04/23/14 | 8 | ||||
| 04/16/14 | 04/24/14 | 8 | ||||
| 04/17/14 | 04/27/14 | 10 | ||||
| 07/21/14 | 07/31/14 | 10 | ||||
| 07/22/14 | 08/03/14 | 12 | ||||
| 07/24/14 | 08/04/14 | 11 | ||||
| 09/29/14 | 10/07/14 | 8 | ||||
| 09/30/14 | 10/08/14 | 8 | ||||
| 10/01/14 | 10/09/14 | 8 | ||||
| 10/02/14 | 10/12/14 | 10 | ||||
| Finland | 12/23/13 | 01/02/14 | 10 | |||
| 12/19/14 | 12/29/14 | 10 | ||||
| 12/22/14 | 12/30/14 | 8 | ||||
| 12/23/14 | 01/02/15 | 10 | ||||
| Hungary | 12/19/14 | 12/29/14 | 10 | |||
| 12/22/14 | 12/30/14 | 8 | ||||
| 12/23/14 | 12/31/14 | 8 | ||||
| Indonesia | 12/23/13 | 01/02/14 | 10 | |||
| 07/23/14 | 08/04/14 | 12 | ||||
| 07/24/14 | 08/05/14 | 12 | ||||
Table of Contents
| 2014 | ||||||
| Country | Trade
Date |
Settlement
Date |
Number
of Days to Settle | |||
| 07/25/14 | 08/06/14 | 12 | ||||
| 12/19/14 | 12/29/14 | 10 | ||||
| 12/22/14 | 12/30/14 | 8 | ||||
| 12/23/14 | 01/02/15 | 11 | ||||
| Ireland | 12/23/14 | 01/02/14 | 10 | |||
| 12/19/14 | 12/30/14 | 11 | ||||
| 12/22/14 | 12/31/14 | 9 | ||||
| 12/23/14 | 01/02/15 | 10 | ||||
| Italy | 12/23/13 | 01/02/14 | 10 | |||
| 12/19/14 | 12/29/14 | 10 | ||||
| 12/22/14 | 12/30/14 | 8 | ||||
| 12/23/14 | 01/02/15 | 10 | ||||
| Luxembourg | 12/19/14 | 12/29/14 | 10 | |||
| 12/22/14 | 12/30/14 | 8 | ||||
| 12/23/14 | 12/31/14 | 8 | ||||
| Malaysia | 01/27/14 | 02/04/14 | 8 | |||
| 01/28/14 | 02/05/14 | 8 | ||||
| 01/29/14 | 02/06/14 | 8 | ||||
| 07/23/14 | 07/31/14 | 8 | ||||
| 07/24/14 | 08/01/14 | 8 | ||||
| 07/25/14 | 08/04/14 | 10 | ||||
| Norway | 12/23/13 | 01/02/14 | 10 | |||
| 04/14/14 | 04/22/14 | 8 | ||||
| 04/15/14 | 04/23/14 | 8 | ||||
| 04/16/14 | 04/24/14 | 8 | ||||
| 12/19/14 | 12/29/14 | 10 | ||||
| 12/22/14 | 12/30/14 | 8 | ||||
| 12/23/14 | 01/02/15 | 10 | ||||
| Pakistan | 07/23/14 | 08/01/14 | 9 | |||
| 07/24/14 | 08/04/14 | 11 | ||||
| The Philippines | 12/23/13 | 01/02/14 | 10 | |||
| 12/26/13 | 01/03/14 | 8 | ||||
| 12/27/13 | 01/06/14 | 10 | ||||
| 12/23/14 | 01/02/15 | 10 | ||||
| 12/26/14 | 01/05/15 | 10 | ||||
| 12/29/14 | 01/06/15 | 8 | ||||
| Portugal | 12/19/14 | 12/29/14 | 10 | |||
| 12/22/14 | 12/30/14 | 8 | ||||
| 12/23/14 | 12/31/14 | 8 | ||||
| Qatar | 07/23/14 | 08/03/14 | 11 | |||
| 07/24/14 | 08/04/14 | 11 | ||||
| 07/27/14 | 08/05/14 | 11 | ||||
| 09/30/14 | 10/08/14 | 8 | ||||
| 10/01/14 | 10/09/14 | 8 | ||||
| 10/02/14 | 10/12/14 | 10 | ||||
| Russia | 12/27/14 | 01/09/14 | 13 | |||
| 12/30/14 | 01/10/14 | 11 | ||||
| 12/31/14 | 01/13/14 | 13 | ||||
| South Africa | 12/23/13 | 01/02/14 | 10 | |||
| 12/24/13 | 01/03/14 | 10 | ||||
Table of Contents
| 2014 | ||||||
| Country | Trade
Date |
Settlement
Date |
Number
of Days to Settle | |||
| 12/27/13 | 01/06/14 | 10 | ||||
| 12/30/13 | 01/07/14 | 8 | ||||
| 12/31/13 | 01/08/14 | 8 | ||||
| 03/14/14 | 03/24/14 | 10 | ||||
| 03/17/14 | 03/25/14 | 8 | ||||
| 03/18/14 | 03/26/14 | 8 | ||||
| 03/19/14 | 03/27/14 | 8 | ||||
| 03/20/14 | 03/28/14 | 8 | ||||
| 04/11/14 | 04/22/14 | 9 | ||||
| 04/14/14 | 04/23/14 | 9 | ||||
| 04/15/14 | 04/24/14 | 9 | ||||
| 04/16/14 | 04/25/14 | 9 | ||||
| 04/17/14 | 04/29/14 | 12 | ||||
| 04/22/14 | 04/30/14 | 8 | ||||
| 04/23/14 | 05/02/14 | 9 | ||||
| 04/24/14 | 05/05/14 | 11 | ||||
| 04/25/14 | 05/06/14 | 11 | ||||
| 04/29/14 | 05/07/14 | 8 | ||||
| 04/30/14 | 05/08/14 | 8 | ||||
| 06/09/14 | 06/17/14 | 8 | ||||
| 06/10/14 | 06/18/14 | 8 | ||||
| 06/11/14 | 06/19/14 | 8 | ||||
| 06/12/14 | 06/20/14 | 8 | ||||
| 06/13/14 | 06/23/14 | 10 | ||||
| 09/17/14 | 09/25/14 | 8 | ||||
| 09/18/14 | 09/26/14 | 8 | ||||
| 09/19/14 | 09/29/14 | 10 | ||||
| 09/22/14 | 09/30/14 | 8 | ||||
| 09/23/14 | 10/01/14 | 8 | ||||
| 12/09/14 | 12/17/14 | 8 | ||||
| 12/10/14 | 12/18/14 | 8 | ||||
| 12/11/14 | 12/19/14 | 8 | ||||
| 12/12/14 | 12/22/14 | 10 | ||||
| 12/15/14 | 12/23/14 | 8 | ||||
| 12/18/14 | 12/29/14 | 11 | ||||
| 12/19/14 | 12/30/14 | 11 | ||||
| 12/22/14 | 12/31/14 | 9 | ||||
| 12/23/14 | 01/02/15 | 10 | ||||
| 12/14/14 | 01/05/15 | 12 | ||||
| 12/29/14 | 01/06/15 | 8 | ||||
| 12/30/14 | 01/07/15 | 8 | ||||
| 12/31/14 | 01/08/15 | 8 | ||||
| Spain | 04/14/14 | 04/22/14 | 8 | |||
| 04/15/14 | 04/23/14 | 8 | ||||
| 04/16/14 | 04/24/14 | 8 | ||||
| Sri Lanka | 04/09/14 | 04/19/14 | 10 | |||
| 04/12/14 | 04/20/14 | 8 | ||||
| 04/13/14 | 04/21/14 | 8 | ||||
| Sweden | 12/23/13 | 01/02/14 | 10 | |||
| 12/19/14 | 12/29/14 | 10 | ||||
Table of Contents
| 2014 | ||||||
| Country | Trade
Date |
Settlement
Date |
Number
of Days to Settle | |||
| 12/22/14 | 12/30/14 | 8 | ||||
| 12/23/14 | 01/02/15 | 10 | ||||
| Switzerland | 12/23/13 | 01/03/14 | 11 | |||
| 12/27/13 | 01/06/14 | 10 | ||||
| 12/30/13 | 01/07/14 | 8 | ||||
| 12/19/14 | 12/29/14 | 10 | ||||
| 12/22/14 | 12/30/14 | 8 | ||||
| 12/23/14 | 01/05/14 | 13 | ||||
| 12/29/14 | 01/06/14 | 8 | ||||
| 12/30/14 | 01/07/14 | 8 | ||||
| The United Arab Emirates | 07/22/14 | 07/30/14 | 8 | |||
| 07/23/14 | 07/31/14 | 8 | ||||
| 07/24/14 | 08/01/14 | 8 | ||||
| 11/26/14 | 12/04/14 | 8 | ||||
| 11/27/14 | 12/08/14 | 11 | ||||
| Vietnam | 04/29/14 | 05/07/14 | 8 | |||
| 2015 | ||||||
| Country | Trade
Date |
Settlement
Date |
Number
of Days to Settle | |||
| China | 02/13/15 | 02/25/15 | 12 | |||
| 02/16/15 | 02/26/15 | 10 | ||||
| 02/17/15 | 02/27/15 | 10 | ||||
| 09/28/15 | 10/08/15 | 10 | ||||
| 09/29/15 | 10/09/15 | 10 | ||||
| 09/30/15 | 10/12/15 | 12 | ||||
| Denmark | 03/30/15 | 04/07/15 | 8 | |||
| 03/31/15 | 04/08/15 | 8 | ||||
| 04/01/15 | 04/09/15 | 8 | ||||
| Norway | 03/30/15 | 04/07/15 | 8 | |||
| 03/31/15 | 04/08/15 | 8 | ||||
| 04/01/15 | 04/09/15 | 8 | ||||
| The Philippines | 12/22/14 | 01/02/15 | 11 | |||
| 12/23/14 | 01/04/15 | 12 | ||||
| 12/23/14 | 01/05/15 | 13 | ||||
| 12/28/14 | 01/05/15 | 8 | ||||
| 12/29/14 | 01/06/15 | 8 | ||||
| Qatar | 07/15/15 | 07/23/15 | 8 | |||
| 07/16/15 | 07/26/15 | 10 | ||||
| 07/19/15 | 07/27/15 | 8 | ||||
| 09/16/15 | 09/24/15 | 8 | ||||
| 09/17/15 | 09/27/15 | 10 | ||||
| 09/20/15 | 09/28/15 | 8 | ||||
| Russia | 12/24/14 | 01/09/15 | 16 | |||
| 12/26/14 | 01/12/15 | 17 | ||||
| 12/29/14 | 01/13/15 | 15 | ||||
| 12/24/15 | 01/11/16 | 18 | ||||
| 12/28/15 | 01/15/16 | 15 | ||||
Table of Contents
| 2015 | ||||||
| Country | Trade
Date |
Settlement
Date |
Number
of Days to Settle | |||
| 12/29/15 | 01/18/15 | 18 | ||||
| South Africa | 12/23/14 | 01/02/15 | 10 | |||
| 12/24/14 | 01/05/15 | 12 | ||||
| 12/29/14 | 01/06/15 | 8 | ||||
| 12/30/14 | 01/07/15 | 8 | ||||
| 12/31/14 | 01/08/15 | 8 | ||||
| 03/27/15 | 04/07/15 | 11 | ||||
| 03/30/15 | 04/08/15 | 9 | ||||
| 03/31/15 | 04/09/15 | 9 | ||||
| 04/01/15 | 04/10/15 | 9 | ||||
| 04/02/15 | 04/13/15 | 11 | ||||
| 04/20/15 | 04/28/15 | 8 | ||||
| 04/21/15 | 04/29/15 | 8 | ||||
| 04/22/15 | 04/30/15 | 8 | ||||
| 04/23/15 | 05/01/15 | 8 | ||||
| 04/23/15 | 05/04/15 | 11 | ||||
| 04/24/15 | 05/05/15 | 11 | ||||
| 04/28/15 | 05/06/15 | 8 | ||||
| 04/29/15 | 05/07/15 | 8 | ||||
| 04/30/15 | 05/08/15 | 8 | ||||
| 06/09/15 | 06/17/15 | 8 | ||||
| 06/10/15 | 06/18/15 | 8 | ||||
| 06/11/15 | 06/19/15 | 8 | ||||
| 06/12/15 | 06/22/15 | 10 | ||||
| 06/15/15 | 06/23/15 | 8 | ||||
| 08/03/15 | 08/11/15 | 8 | ||||
| 08/04/15 | 08/12/15 | 8 | ||||
| 08/05/15 | 08/13/15 | 8 | ||||
| 08/06/15 | 08/14/15 | 8 | ||||
| 08/07/15 | 08/17/15 | 10 | ||||
| 09/17/15 | 09/25/15 | 8 | ||||
| 09/18/15 | 09/28/15 | 10 | ||||
| 09/21/15 | 09/29/15 | 8 | ||||
| 09/22/15 | 09/30/15 | 8 | ||||
| 09/23/15 | 10/01/15 | 8 | ||||
| 12/09/15 | 12/17/15 | 8 | ||||
| 12/10/15 | 12/18/15 | 8 | ||||
| 12/11/15 | 12/21/15 | 10 | ||||
| 12/14/15 | 12/22/15 | 8 | ||||
| 12/15/15 | 12/23/15 | 8 | ||||
| 12/18/15 | 12/28/15 | 10 | ||||
| 12/21/15 | 12/29/15 | 8 | ||||
| 12/22/15 | 12/30/15 | 8 | ||||
| 12/23/15 | 12/31/15 | 8 | ||||
| 12/24/15 | 01/04/16 | 11 | ||||
| 12/28/15 | 01/05/16 | 8 | ||||
| 12/29/15 | 01/06/16 | 8 | ||||
| 12/30/15 | 01/07/16 | 8 | ||||
| 12/31/15 | 01/08/16 | 8 | ||||
| Spain | 03/30/15 | 04/07/15 | 8 | |||
Table of Contents
| 2015 | ||||||
| Country | Trade
Date |
Settlement
Date |
Number
of Days to Settle | |||
| 03/31/15 | 04/08/15 | 8 | ||||
| 04/01/15 | 04/09/15 | 8 | ||||
| Switzerland | 12/23/14 | 01/05/15 | 13 | |||
| 12/29/14 | 01/07/15 | 9 | ||||
| 12/30/14 | 01/08/15 | 9 | ||||
| 12/30/15 | 01/07/16 | 8 | ||||
| Thailand | 04/08/15 | 04/16/15 | 8 | |||
| 04/09/15 | 04/17/15 | 8 | ||||
| 04/10/15 | 04/20/15 | 10 | ||||
| Vietnam | 02/13/15 | 02/25/15 | 12 | |||
| 02/16/15 | 02/26/15 | 10 | ||||
| 02/17/15 | 02/27/15 | 10 | ||||
| 04/24/15 | 05/04/15 | 10 | ||||
| 04/27/15 | 05/05/15 | 8 | ||||
| * | These worst-case redemption cycles are based on information regarding regular holidays, which may be out of date. Based on changes in holidays, longer (worse) redemption cycles are possible. |
Table of Contents
Table of Contents
| Fund | Non-Expiring | |
| iShares Emerging Markets Corporate Bond ETF | $ 177,446 | |
| iShares Emerging Markets High Yield Bond ETF | 6,533,856 | |
| iShares Emerging Markets Local Currency Bond ETF | 2,413,710 | |
| iShares Global High Yield Corporate Bond ETF | 13,975 |
Table of Contents
Table of Contents
Table of Contents
Table of Contents
Table of Contents
Table of Contents
Table of Contents
Table of Contents
Table of Contents