Table of Contents
| 2014 Prospectus |
 |
| ► | iShares MSCI BRIC ETF | BKF | NYSE ARCA |
Table of Contents
Table of Contents
|
|
S-1 |
|
|
1 |
|
|
2 |
|
|
17 |
|
|
19 |
|
|
19 |
|
|
23 |
|
|
35 |
|
|
36 |
|
|
37 |
|
|
37 |
|
|
39 |
Table of Contents
Table of Contents
| Ticker: BKF | Stock Exchange: NYSE Arca |
| Annual
Fund Operating Expenses (ongoing expenses that you pay each year as a percentage of the value of your investments) | ||||||||
| Management
Fees |
Distribution
and Service (12b-1) Fees |
Foreign
Taxes |
Other
Expenses |
Total
Annual Fund Operating Expenses | ||||
| 0.68% | None | 0.00% | None | 0.68% | ||||
| 1 Year | 3 Years | 5 Years | 10 Years | |||
| $69 | $218 | $379 | $847 |
Table of Contents
Table of Contents
Table of Contents
Table of Contents
Table of Contents
Table of Contents
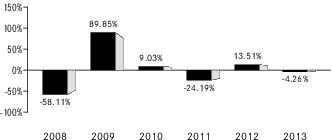
| 1 | The Fund’s year-to-date return as of September 30, 2014 was 0.71%. |
Table of Contents
| One Year | Five Years | Since
Fund Inception | |||
| (Inception Date: 11/12/2007) | |||||
| Return Before Taxes | -4.26% | 11.27% | -4.66% | ||
| Return After Taxes on Distributions1 | -4.71% | 10.93% | -4.95% | ||
| Return After Taxes on Distributions and Sale of Fund Shares1 | -1.87% | 9.17% | -3.34% | ||
| MSCI BRIC Index (Index returns do not reflect deductions for fees, expenses or taxes) | -3.53% | 12.52% | -4.26% |
| 1 | After-tax returns in the table above are calculated using the historical highest individual U.S. federal marginal income tax rates and do not reflect the impact of state or local taxes. Actual after-tax returns depend on an investor’s tax situation and may differ from those shown, and after-tax returns shown are not relevant to tax-exempt investors or investors who hold shares through tax-deferred arrangements, such as 401(k) plans or individual retirement accounts (“IRAs”). Fund returns after taxes on distributions and sales of Fund shares are calculated assuming that an investor has sufficient capital gains of the same character from other investments to offset any capital losses from the sale of Fund shares. As a result, Fund returns after taxes on distributions and sales of Fund shares may exceed Fund returns before taxes and/or returns after taxes on distributions. |
Table of Contents
Table of Contents
Table of Contents
Table of Contents
Table of Contents
Table of Contents
Table of Contents
Table of Contents
Table of Contents
Table of Contents
| ■ | Lower levels of liquidity and market efficiency; |
| ■ | Greater securities price volatility; |
| ■ | Exchange rate fluctuations and exchange controls; |
| ■ | Less availability of public information about issuers; |
| ■ | Limitations on foreign ownership of securities; |
| ■ | Imposition of withholding or other taxes; |
| ■ | Imposition of restrictions on the expatriation of the funds or other assets of the Fund; |
| ■ | Higher transaction and custody costs and delays in settlement procedures; |
Table of Contents
| ■ | Difficulties in enforcing contractual obligations; |
| ■ | Lower levels of regulation of the securities markets; |
| ■ | Weaker accounting, disclosure and reporting requirements; and |
| ■ | Legal principles relating to corporate governance, directors’ fiduciary duties and liabilities and stockholders’ rights in markets in which the Fund invests may differ and/or may not be as extensive or protective as those that apply in the United States. |
Table of Contents
Table of Contents
| ■ | The risk of delays in settling portfolio transactions and the risk of loss arising out of the system of share registration and custody used in Russia; |
| ■ | Risks in connection with the maintenance of the Fund’s portfolio securities and cash |
Table of Contents
| ■ | The risk that the Fund’s ownership rights in portfolio securities could be lost through fraud or negligence as a result of the fact that ownership in shares of Russian companies is recorded by the companies themselves and by registrars, rather than by a central registration system; and |
| ■ | The risk that the Fund may not be able to pursue claims on behalf of its shareholders because of the system of share registration and custody, and because Russian banking institutions and registrars are not guaranteed by the Russian government. |
Table of Contents
Table of Contents
Heavy Government Control and Regulation. Despite significant recent reform and privatization, the Russian government continues to control a large share of economic activity in the region. The Russian government owns shares in corporations in a range of sectors, including banking, energy production, and distribution, automotive, transportation and telecommunications. Government spending in Russia remains high compared to that of other countries.
Table of Contents
| ■ | where a non-resident investor has made any investment, directly or indirectly, in a foreign institutional investor (“FII”) which has invested in India; |
| ■ | investment by the non-resident investor in a fund or a fund pooling vehicle, which does not result in participation in control and management of the fund; or |
| ■ | where a non-resident investor along with its associates, does not have more than a 26% share in total capital of the company. |
Table of Contents
| ■ | creates rights, or obligations, which are not ordinarily created between persons dealing at arm's length; |
| ■ | results, directly or indirectly, in the misuse, or abuse, of the provisions of IT Act; |
| ■ | lacks commercial substance; or |
| ■ | is entered into, or carried out, by means, or in a manner, which are not ordinarily employed for bona fide purposes. |
| ■ | any arrangement where the aggregate tax benefit to all the parties of the arrangement in the relevant financial year does not exceed INR 30 Million; |
| ■ | FIIs that choose not to take any benefit under any tax treaty entered with India and has invested in listed or unlisted securities with prior permission of the competent authority in accordance with the applicable regulations; |
| ■ | non-resident investor in an FII who has invested in an FII, directly or indirectly, by way of an offshore derivative instrument or otherwise; or |
| ■ | any income derived from the transfer of investments made prior to August 30, 2010. |
Table of Contents
Table of Contents
| ■ | The risk of delays in settling portfolio transactions and the risk of loss arising out of the system of share registration and custody used in certain Eastern European countries; |
| ■ | Risks in connection with the maintenance of the Fund's portfolio securities and cash with foreign sub-custodians and securities depositories, including the risk that appropriate sub-custody arrangements will not be available to the Fund; |
| ■ | The risk that the Fund's ownership rights in portfolio securities could be lost through fraud or negligence as a result of the fact that ownership in shares of certain Eastern European companies is recorded by the companies themselves and by registrars, rather than a central registration system; |
| ■ | The risk that the Fund may not be able to pursue claims on behalf of its shareholders because of the system of share registration and custody, and because certain Eastern European banking institutions and registrars are not guaranteed by their respective governments; and |
| ■ | Risks in connection with Eastern European countries' dependence on the economic health of Western European countries and the EU as a whole. |
Table of Contents
Table of Contents
Table of Contents
Table of Contents
Table of Contents
Table of Contents
Table of Contents
Table of Contents
Table of Contents
Table of Contents
Table of Contents
Table of Contents
| ■ | Dividend: Dividend income earned by the Subsidiary will not be subject to Indian tax. However, the Indian company declaring and paying such dividend would be subject to Dividend Distribution Tax at an effective rate of 20% (approx.) (effective starting October 1, 2014) on the amount of the dividend paid out. |
| ■ | Interest: Interest paid to the Subsidiary in respect of debt obligations of Indian issuers will be subject to Indian income tax. The tax rate in the case of a rupee-denominated debt obligation is 43.26%. However if the Subsidiary is a SEBI registered sub-account, interest income earned from June 1, 2013 to May 31, 2015 on rupee denominated bonds of Indian companies and Indian government securities will be subject to tax at the rate of 5.41%, provided that the rate of interest does not exceed the prescribed rates. In the case of a foreign-currency denominated debt obligation, the tax rate is 21.63%. For approved foreign-currency loans advanced from July 1, 2012 to June 30, 2017, the tax rate on interest is 5.41% and for approved foreign currency long-term bonds issued from October 1, 2014 to June 30, 2017, the tax rate on interest is 5.41%. However, if the Subsidiary is registered as a sub-account with SEBI, interest from securities will be subject to tax at the rate of 21.63%. |
| ■ | Securities Transaction Tax: Transactions involving the purchase or sale of shares or any other security traded on a recognized Indian stock exchange are subject to Securities Transaction Tax (“STT”). STT will be levied at the rate of 0.001% on the seller in case of actual delivery of the security and at the rate of 0.2% on the sale of unlisted shares in an initial public offering. This STT is not applicable to primary issuances of equity shares by a company or to off-market transactions. Hence, STT will be payable if the Subsidiary buys or sells listed securities on a recognized Indian stock exchange. |
| ■ | Capital Gains: The taxation of capital gains would be as follows: (i) long-term capital gains (being gains on sale of shares held for a period of more than twelve months) listed on a recognized stock exchange would not be taxable in India provided STT has been paid on the same (as discussed above); (ii) short-term capital gains (being gains on sale of shares held for a period of twelve months or less) from the sale of Indian shares listed on a recognized stock exchange will be taxed at the rate of 16.223% provided STT has been paid on the same; (iii) long-term capital gains (being gains on sale of shares held for a period of more than 36 months) arising to the Subsidiary from the sale of unlisted securities will be taxed at the rate of 10.815% (without indexation) and short-term capital gains (being gains on sale of shares held for a period of 36 months or less) will be taxed at the rate of 43.26%;* (iv) capital |
Table of Contents
| * | However, if the Subsidiary is a SEBI registered sub-account, the rates will be 10.816% and 32.45%, respectively. |
| ■ | any arrangement where the aggregate tax benefit to all the parties of the arrangement in the relevant financial year does not exceed INR 30 Million; |
| ■ | FIIs that choose not to take any benefit under any tax treaty entered with India and has invested in listed or unlisted securities with prior permission of the competent authority in accordance with the applicable regulations; |
| ■ | non-resident investor in an FII who has invested in an FII, directly or indirectly, by way of an offshore derivative instrument or otherwise; or |
Table of Contents
| ■ | any income derived from the transfer of investments made prior to August 30, 2010. |
Table of Contents
Table of Contents
| Approximate
Value of a Creation Unit |
Creation
Unit Size |
Standard
Creation/ Redemption Transaction Fee |
Maximum
Additional Charge for Creations* |
Maximum
Additional Charge for Redemptions* | ||||
| $1,867,000 | 50,000 | $5,900 | 7.0% | 2.0% |
| * | As a percentage of the net asset value per Creation Unit, inclusive, in the case of redemptions, of the standard redemption transaction fee. |
Table of Contents
Table of Contents
(For a share outstanding throughout each period)
| Year
ended Aug. 31, 2014 (Consolidated) |
Year
ended Aug. 31, 2013 (Consolidated) |
Year
ended Aug. 31, 2012 (Consolidated) |
Year
ended Aug. 31, 2011 (Consolidated) |
Year
ended Aug. 31, 2010 | |||||
| Net asset value, beginning of year | $ 34.41 | $ 35.68 | $ 42.25 | $ 42.94 | $ 37.57 | ||||
| Income
from investment operations: |
|||||||||
| Net investment incomea | 0.89 | 0.84 | 0.98 | 0.89 | 0.66 | ||||
| Net realized and unrealized gain (loss)b | 6.53 | (1.25) | (6.62) | (0.58) | 5.35 | ||||
| Total from investment operations | 7.42 | (0.41) | (5.64) | 0.31 | 6.01 | ||||
| Less distributions from: | |||||||||
| Net investment income | (0.71) | (0.86) | (0.93) | (1.00) | (0.64) | ||||
| Total distributions | (0.71) | (0.86) | (0.93) | (1.00) | (0.64) | ||||
| Net asset value, end of year | $ 41.12 | $ 34.41 | $ 35.68 | $ 42.25 | $ 42.94 | ||||
| Total return | 21.73% | (1.17)% | (13.33)% | 0.49% | 15.95% | ||||
| Ratios/Supplemental data: | |||||||||
| Net assets, end of year (000s) | $411,164 | $474,861 | $685,149 | $866,194 | $946,814 | ||||
| Ratio of expenses to average net assets | 0.68% | 0.67% | 0.69% | 0.67% | 0.69% | ||||
| Ratio of expenses to average net assets prior to waived fees | n/a | n/a | n/a | 0.67% | n/a | ||||
| Ratio of net investment income to average net assets | 2.38% | 2.18% | 2.55% | 1.86% | 1.52% | ||||
| Portfolio turnover ratec | 10% | 10% | 32% | 13% | 9% | ||||
| a | Based on average shares outstanding throughout each period. |
| b | The amounts reported for a share outstanding may not accord with the change in aggregate gains and losses in securities for the fiscal period due to the timing of capital share transactions in relation to the fluctuating market values of the Fund's underlying securities. |
| c | Portfolio turnover rates exclude portfolio securities received or delivered in Creation Units but include portfolio transactions that are executed as a result of the Fund processing capital share transactions in Creation Units partially for cash in U.S. dollars. Excluding such cash transactions, the portfolio turnover rates for the years ended August 31, 2014, August 31, 2013, August 31, 2012, August 31, 2011 and August 31, 2010 were 6%, 9%, 20%, 10% and 8%, respectively. |
Table of Contents
Table of Contents
Table of Contents
| Premium/Discount Range | Number of Days | Percentage of Total Days | ||
| Greater than 2.0% | 2 | 0.45% | ||
| Greater than 1.5% and Less than 2.0% | 2 | 0.45 | ||
| Greater than 1.0% and Less than 1.5% | 9 | 2.05 | ||
| Greater than 0.5% and Less than 1.0% | 33 | 7.50 | ||
| Between 0.5% and -0.5% | 275 | 62.50 | ||
| Less than -0.5% and Greater than -1.0% | 81 | 18.41 | ||
| Less than -1.0% and Greater than -1.5% | 28 | 6.36 | ||
| Less than -1.5% and Greater than -2.0% | 8 | 1.82 | ||
| Less than -2.0% and Greater than -2.5% | 1 | 0.23 | ||
| Less than -2.5% and Greater than -3.0% | 1 | 0.23 | ||
| 440 | 100.00% |
Table of Contents
| Average Annual Total Returns | Cumulative Total Returns | |||||||
| NAV | MARKET | INDEX | NAV | MARKET | INDEX | |||
| 1 Year | 21.73% | 22.74% | 22.80% | 21.73% | 22.74% | 22.80% | ||
| 5 Years | 3.97% | 4.10% | 4.90% | 21.51% | 22.24% | 26.99% | ||
| Since Inception* | (2.75)% | (2.74)% | (2.30)% | (17.25)% | (17.23)% | (14.66)% | ||
| * | Total returns for the period since inception are calculated from the inception date of the Fund (11/12/07). The first day of secondary market trading in shares of the Fund was 11/16/07. |
Table of Contents
Table of Contents
|
|
| Call: | 1-800-iShares
or 1-800-474-2737 (toll free) Monday through Friday, 8:30 a.m. to 6:30 p.m. (Eastern time) |
| Email: | iSharesETFs@blackrock.com |
| Write: | c/o
BlackRock Investments, LLC 1 University Square Drive, Princeton, NJ 08540 |

Table of Contents
| 2014 Prospectus |
|
| ► | iShares MSCI Emerging Markets ETF | EEM | NYSE ARCA |
Table of Contents
Table of Contents
|
|
S-1 |
|
|
1 |
|
|
2 |
|
|
15 |
|
|
18 |
|
|
19 |
|
|
22 |
|
|
34 |
|
|
35 |
|
|
36 |
|
|
36 |
|
|
38 |
Table of Contents
Table of Contents
| Ticker: EEM | Stock Exchange: NYSE Arca |
| Annual
Fund Operating Expenses (ongoing expenses that you pay each year as a percentage of the value of your investments) | ||||||||||||||
| Management
Fees |
Distribution
and Service (12b-1) Fees |
Foreign
Taxes |
Other
Expenses |
Acquired
Fund Fees and Expenses |
Total
Annual Fund Operating Expenses |
Fee Waiver | Total
Annual Fund Operating Expenses After Fee Waiver | |||||||
| 0.68% | None | 0.00% | None | 0.00% | 0.68% | (0.00)% | 0.68% | |||||||
Table of Contents
| 1 Year | 3 Years | 5 Years | 10 Years | |||
| $69 | $218 | $379 | $847 |
Table of Contents
Table of Contents
Table of Contents
Table of Contents
Table of Contents
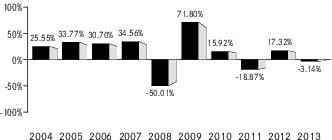
| 1 | The Fund’s year-to-date return as of September 30, 2014 was 1.87%. |
Table of Contents
| One Year | Five Years | Ten Years | |||
| (Inception Date: 4/7/2003) | |||||
| Return Before Taxes | -3.14% | 12.92% | 10.49% | ||
| Return After Taxes on Distributions1 | -3.49% | 12.78% | 10.38% | ||
| Return After Taxes on Distributions and Sale of Fund Shares1 | -1.26% | 10.70% | 9.00% | ||
| MSCI Emerging Markets Index (Index returns do not reflect deductions for fees, expenses or taxes) | -2.60% | 14.79% | 11.17% |
| 1 | After-tax returns in the table above are calculated using the historical highest individual U.S. federal marginal income tax rates and do not reflect the impact of state or local taxes. Actual after-tax returns depend on an investor’s tax situation and may differ from those shown, and after-tax returns shown are not relevant to tax-exempt investors or investors who hold shares through tax-deferred arrangements, such as 401(k) plans or individual retirement accounts (“IRAs”). Fund returns after taxes on distributions and sales of Fund shares are calculated assuming that an investor has sufficient capital gains of the same character from other investments to offset any capital losses from the sale of Fund shares. As a result, Fund returns after taxes on distributions and sales of Fund shares may exceed Fund returns before taxes and/or returns after taxes on distributions. |
Table of Contents
Table of Contents
Table of Contents
Table of Contents
Table of Contents
Table of Contents
Table of Contents
Table of Contents
Table of Contents
Table of Contents
| ■ | Lower levels of liquidity and market efficiency; |
| ■ | Greater securities price volatility; |
| ■ | Exchange rate fluctuations and exchange controls; |
| ■ | Less availability of public information about issuers; |
| ■ | Limitations on foreign ownership of securities; |
| ■ | Imposition of withholding or other taxes; |
| ■ | Imposition of restrictions on the expatriation of the funds or other assets of the Fund; |
| ■ | Higher transaction and custody costs and delays in settlement procedures; |
| ■ | Difficulties in enforcing contractual obligations; |
Table of Contents
| ■ | Lower levels of regulation of the securities markets; |
| ■ | Weaker accounting, disclosure and reporting requirements; and |
| ■ | Legal principles relating to corporate governance, directors’ fiduciary duties and liabilities and stockholders’ rights in markets in which the Fund invests may differ and/or may not be as extensive or protective as those that apply in the United States. |
Table of Contents
| ■ | The risk of delays in settling portfolio transactions and the risk of loss arising out of the system of share registration and custody used in Russia; |
| ■ | Risks in connection with the maintenance of the Fund’s portfolio securities and cash with foreign sub-custodians and securities depositories, including the risk that appropriate sub-custody arrangements will not be available to the Fund; |
| ■ | The risk that the Fund’s ownership rights in portfolio securities could be lost through fraud or negligence as a result of the fact that ownership in shares of Russian companies is recorded by the companies themselves and by registrars, rather than by a central registration system; and |
| ■ | The risk that the Fund may not be able to pursue claims on behalf of its shareholders because of the system of share registration and custody, and because Russian banking institutions and registrars are not guaranteed by the Russian government. |
Table of Contents
Table of Contents
Table of Contents
| ■ | where a non-resident investor has made any investment, directly or indirectly, in a foreign institutional investor (“FII”) which has invested in India; |
Table of Contents
| ■ | investment by the non-resident investor in a fund or a fund pooling vehicle, which does not result in participation in control and management of the fund; or |
| ■ | where a non-resident investor along with its associates, does not have more than a 26% share in total capital of the company. |
| ■ | creates rights, or obligations, which are not ordinarily created between persons dealing at arm's length; |
| ■ | results, directly or indirectly, in the misuse, or abuse, of the provisions of IT Act; |
| ■ | lacks commercial substance; or |
| ■ | is entered into, or carried out, by means, or in a manner, which are not ordinarily employed for bona fide purposes. |
| ■ | any arrangement where the aggregate tax benefit to all the parties of the arrangement in the relevant financial year does not exceed INR 30 Million; |
| ■ | FIIs that choose not to take any benefit under any tax treaty entered with India and has invested in listed or unlisted securities with prior permission of the competent authority in accordance with the applicable regulations; |
Table of Contents
| ■ | non-resident investor in an FII who has invested in an FII, directly or indirectly, by way of an offshore derivative instrument or otherwise; or |
| ■ | any income derived from the transfer of investments made prior to August 30, 2010. |
Table of Contents
Table of Contents
| ■ | The risk of delays in settling portfolio transactions and the risk of loss arising out of the system of share registration and custody used in certain Eastern European countries; |
| ■ | Risks in connection with the maintenance of the Fund's portfolio securities and cash with foreign sub-custodians and securities depositories, including the risk that appropriate sub-custody arrangements will not be available to the Fund; |
| ■ | The risk that the Fund's ownership rights in portfolio securities could be lost through fraud or negligence as a result of the fact that ownership in shares of certain Eastern European companies is recorded by the companies themselves and by registrars, rather than a central registration system; |
| ■ | The risk that the Fund may not be able to pursue claims on behalf of its shareholders because of the system of share registration and custody, and because certain Eastern European banking institutions and registrars are not guaranteed by their respective governments; and |
| ■ | Risks in connection with Eastern European countries' dependence on the economic health of Western European countries and the EU as a whole. |
Table of Contents
Table of Contents
Table of Contents
Table of Contents
Table of Contents
Table of Contents
Table of Contents
Table of Contents
Table of Contents
Table of Contents
Table of Contents
Table of Contents
| ■ | Dividend: Dividend income earned by the Subsidiary will not be subject to Indian tax. However, the Indian company declaring and paying such dividend would be subject to Dividend Distribution Tax at an effective rate of 20% (approx.) (effective starting October 1, 2014) on the amount of the dividend paid out. |
| ■ | Interest: Interest paid to the Subsidiary in respect of debt obligations of Indian issuers will be subject to Indian income tax. The tax rate in the case of a rupee-denominated debt obligation is 43.26%. However if the Subsidiary is a SEBI registered sub-account, interest income earned from June 1, 2013 to May 31, 2015 on rupee denominated bonds of Indian companies and Indian government securities will be subject to tax at the rate of 5.41%, provided that the rate of interest does not exceed the prescribed rates. In the case of a foreign-currency denominated debt obligation, the tax rate is 21.63%. For approved foreign-currency loans advanced from July 1, 2012 to June 30, 2017, the tax rate on interest is 5.41% and for approved foreign currency long-term bonds issued from October 1, 2014 to June 30, 2017, the tax rate on interest is 5.41%. However, if the Subsidiary is registered as a sub-account with SEBI, interest from securities will be subject to tax at the rate of 21.63%. |
| ■ | Securities Transaction Tax: Transactions involving the purchase or sale of shares or |
Table of Contents
| ■ | Capital Gains: The taxation of capital gains would be as follows: (i) long-term capital gains (being gains on sale of shares held for a period of more than twelve months) listed on a recognized stock exchange would not be taxable in India provided STT has been paid on the same (as discussed above); (ii) short-term capital gains (being gains on sale of shares held for a period of twelve months or less) from the sale of Indian shares listed on a recognized stock exchange will be taxed at the rate of 16.223% provided STT has been paid on the same; (iii) long-term capital gains (being gains on sale of shares held for a period of more than 36 months) arising to the Subsidiary from the sale of unlisted securities will be taxed at the rate of 10.815% (without indexation) and short-term capital gains (being gains on sale of shares held for a period of 36 months or less) will be taxed at the rate of 43.26%;* (iv) capital gains realized on sale of listed equity shares not executed on a recognized stock exchange in India would be taxed at the rate of 21.63% for long-term gains (being gains on sale of shares held for a period of more than 12 months) and at 43.26% in the case of short-term gains (being gains on sale of shares held for a period of 12 months or less);* and (v) capital gains arising from the transfer of depositary receipts outside India between non-resident investors will not be subject to tax in India. |
| * | However, if the Subsidiary is a SEBI registered sub-account, the rates will be 10.816% and 32.45%, respectively. |
Table of Contents
| ■ | any arrangement where the aggregate tax benefit to all the parties of the arrangement in the relevant financial year does not exceed INR 30 Million; |
| ■ | FIIs that choose not to take any benefit under any tax treaty entered with India and has invested in listed or unlisted securities with prior permission of the competent authority in accordance with the applicable regulations; |
| ■ | non-resident investor in an FII who has invested in an FII, directly or indirectly, by way of an offshore derivative instrument or otherwise; or |
| ■ | any income derived from the transfer of investments made prior to August 30, 2010. |
Table of Contents
Table of Contents
| Approximate
Value of a Creation Unit |
Creation
Unit Size |
Standard
Creation/ Redemption Transaction Fee |
Maximum
Additional Charge for Creations* |
Maximum
Additional Charge for Redemptions* | ||||
| $18,783,000 | 450,000 | $7,700 | 3.0% | 2.0% |
| * | As a percentage of the net asset value per Creation Unit, inclusive, in the case of redemptions, of the standard redemption transaction fee. |
Table of Contents
Table of Contents
(For a share outstanding throughout each period)
| Year
ended Aug. 31, 2014 (Consolidated) |
Year
ended Aug. 31, 2013 (Consolidated) |
Year
ended Aug. 31, 2012 (Consolidated) |
Year
ended Aug. 31, 2011 (Consolidated) |
Year
ended Aug. 31, 2010 | |||||
| Net asset value, beginning of year | $ 38.44 | $ 39.22 | $ 42.71 | $ 40.19 | $ 35.48 | ||||
| Income
from investment operations: |
|||||||||
| Net investment incomea | 0.83 | 0.75 | 0.86 | 0.81 | 0.58 | ||||
| Net realized and unrealized gain (loss)b | 6.55 | (0.76) | (3.53) | 2.56 | 4.73 | ||||
| Total from investment operations | 7.38 | (0.01) | (2.67) | 3.37 | 5.31 | ||||
| Less distributions from: | |||||||||
| Net investment income | (0.71) | (0.77) | (0.82) | (0.85) | (0.60) | ||||
| Total distributions | (0.71) | (0.77) | (0.82) | (0.85) | (0.60) | ||||
| Net asset value, end of year | $ 45.11 | $ 38.44 | $ 39.22 | $ 42.71 | $ 40.19 | ||||
| Total return | 19.34% | (0.08)% | (6.18)% | 8.23% | 14.97% | ||||
| Ratios/Supplemental data: | |||||||||
| Net assets, end of year (000s) | $44,336,401 | $34,804,192 | $34,256,628 | $33,496,549 | $39,766,955 | ||||
| Ratio of expenses to average net assets | 0.67% | 0.67% | 0.68% | 0.67% | 0.68% | ||||
| Ratio of expenses to average net assets prior to waived fees | 0.68% | 0.67% | 0.69% | 0.67% | 0.68% | ||||
| Ratio of net investment income to average net assets | 1.98% | 1.78% | 2.13% | 1.76% | 1.45% | ||||
| Portfolio turnover ratec | 22% | 24% | 15% | 17% | 14% | ||||
| a | Based on average shares outstanding throughout each period. |
| b | The amounts reported for a share outstanding may not accord with the change in aggregate gains and losses in securities for the fiscal period due to the timing of capital share transactions in relation to the fluctuating market values of the Fund's underlying securities. |
| c | Portfolio turnover rates exclude portfolio securities received or delivered in Creation Units but include portfolio transactions that are executed as a result of the Fund processing capital share transactions in Creation Units partially for cash in U.S. dollars. Excluding such cash transactions, the portfolio turnover rates for the years ended August 31, 2014, August 31, 2013, August 31, 2012 and August 31, 2011 were 7%, 9%, 10% and 15%, respectively. |
Table of Contents
Table of Contents
Table of Contents
| Premium/Discount Range | Number of Days | Percentage of Total Days | ||
| Greater than 2.0% | 1 | 0.23% | ||
| Greater than 1.5% and Less than 2.0% | 5 | 1.14 | ||
| Greater than 1.0% and Less than 1.5% | 10 | 2.27 | ||
| Greater than 0.5% and Less than 1.0% | 68 | 15.45 | ||
| Between 0.5% and -0.5% | 255 | 57.95 | ||
| Less than -0.5% and Greater than -1.0% | 67 | 15.23 | ||
| Less than -1.0% and Greater than -1.5% | 23 | 5.23 | ||
| Less than -1.5% and Greater than -2.0% | 6 | 1.36 | ||
| Less than -2.0% and Greater than -2.5% | 4 | 0.91 | ||
| Less than -2.5% and Greater than -3.0% | 1 | 0.23 | ||
| 440 | 100.00% |
Table of Contents
| Average Annual Total Returns | Cumulative Total Returns | |||||||
| NAV | MARKET | INDEX | NAV | MARKET | INDEX | |||
| 1 Year | 19.34% | 20.48% | 19.98% | 19.34% | 20.48% | 19.98% | ||
| 5 Years | 6.84% | 6.90% | 7.90% | 39.21% | 39.61% | 46.26% | ||
| 10 Years | 11.55% | 11.57% | 12.16% | 198.39% | 198.90% | 215.01% | ||
Table of Contents
Table of Contents
Table of Contents
|
|
| Call: | 1-800-iShares
or 1-800-474-2737 (toll free) Monday through Friday, 8:30 a.m. to 6:30 p.m. (Eastern time) |
| Email: | iSharesETFs@blackrock.com |
| Write: | c/o
BlackRock Investments, LLC 1 University Square Drive, Princeton, NJ 08540 |

Table of Contents
| 2014 Prospectus |
|
| ► | iShares MSCI Emerging Markets Eastern Europe ETF | ESR | NYSE ARCA |
Table of Contents
Table of Contents
|
|
S-1 |
|
|
1 |
|
|
2 |
|
|
12 |
|
|
13 |
|
|
14 |
|
|
17 |
|
|
26 |
|
|
27 |
|
|
28 |
|
|
28 |
|
|
30 |
Table of Contents
Table of Contents
| Ticker: ESR | Stock Exchange: NYSE Arca |
| Annual
Fund Operating Expenses (ongoing expenses that you pay each year as a percentage of the value of your investments) | ||||||
| Management
Fees |
Distribution
and Service (12b-1) Fees |
Other
Expenses |
Total
Annual Fund Operating Expenses | |||
| 0.67% | None | None | 0.67% | |||
| 1 Year | 3 Years | 5 Years | 10 Years | |||
| $68 | $214 | $373 | $835 |
Table of Contents
Table of Contents
Table of Contents
Table of Contents
Table of Contents
Table of Contents
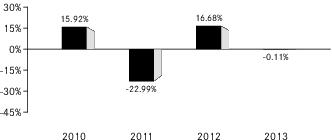
| 1 | The Fund’s year-to-date return as of September 30, 2014 was -15.01%. |
| One Year | Since
Fund Inception | ||
| (Inception Date: 9/30/2009) | |||
| Return Before Taxes | -0.11% | 3.40% | |
| Return After Taxes on Distributions2 | -0.18% | 3.42% | |
| Return After Taxes on Distributions and Sale of Fund Shares2 | 0.40% | 3.13% | |
| MSCI EM Eastern Europe Index (Index returns do not reflect deductions for fees, expenses or taxes) | 0.72% | 3.95% |
| 2 | After-tax returns in the table above are calculated using the historical highest individual U.S. federal marginal income tax rates and do not reflect the impact of state or local taxes. Actual after-tax returns depend on an investor’s tax situation and may differ from those shown, and after-tax returns shown are not relevant to tax-exempt investors or investors who hold shares through tax-deferred arrangements, such as 401(k) plans or individual retirement accounts (“IRAs”). Fund returns after taxes on distributions and sales of Fund shares are calculated assuming that an investor has sufficient capital gains of the same character from other investments to offset any capital losses from the sale of Fund shares. As a result, Fund returns after taxes on distributions and sales of Fund shares may exceed Fund returns before taxes and/or returns after taxes on distributions. |
Table of Contents
Table of Contents
Table of Contents
Table of Contents
| ■ | The risk of delays in settling portfolio transactions and the risk of loss arising out of the system of share registration and custody used in certain Eastern European countries; |
| ■ | Risks in connection with the maintenance of the Fund's portfolio securities and cash with foreign sub-custodians and securities depositories, including the risk that appropriate sub-custody arrangements will not be available to the Fund; |
| ■ | The risk that the Fund's ownership rights in portfolio securities could be lost through fraud or negligence as a result of the fact that ownership in shares of certain Eastern European companies is recorded by the companies themselves and by registrars, rather than a central registration system; |
| ■ | The risk that the Fund may not be able to pursue claims on behalf of its shareholders because of the system of share registration and custody, and because certain Eastern European banking institutions and registrars are not guaranteed by their respective governments; and |
| ■ | Risks in connection with Eastern European countries' dependence on the economic health of Western European countries and the European Union (the “EU”) as a whole. |
Table of Contents
Table of Contents
Table of Contents
Table of Contents
Table of Contents
| ■ | Lower levels of liquidity and market efficiency; |
| ■ | Greater securities price volatility; |
| ■ | Exchange rate fluctuations and exchange controls; |
| ■ | Less availability of public information about issuers; |
| ■ | Limitations on foreign ownership of securities; |
| ■ | Imposition of withholding or other taxes; |
| ■ | Imposition of restrictions on the expatriation of the funds or other assets of the Fund; |
| ■ | Higher transaction and custody costs and delays in settlement procedures; |
| ■ | Difficulties in enforcing contractual obligations; |
| ■ | Lower levels of regulation of the securities markets; |
| ■ | Weaker accounting, disclosure and reporting requirements; and |
| ■ | Legal principles relating to corporate governance, directors’ fiduciary duties and liabilities and stockholders’ rights in markets in which the Fund invests may differ and/or may not be as extensive or protective as those that apply in the United States. |
Table of Contents
| ■ | The risk of delays in settling portfolio transactions and the risk of loss arising out of the system of share registration and custody used in Russia; |
| ■ | Risks in connection with the maintenance of the Fund’s portfolio securities and cash with foreign sub-custodians and securities depositories, including the risk that appropriate sub-custody arrangements will not be available to the Fund; |
| ■ | The risk that the Fund’s ownership rights in portfolio securities could be lost through fraud or negligence as a result of the fact that ownership in shares of Russian companies is recorded by the companies themselves and by registrars, rather than by a central registration system; and |
| ■ | The risk that the Fund may not be able to pursue claims on behalf of its |
Table of Contents
Table of Contents
Table of Contents
Table of Contents
Table of Contents
Table of Contents
Table of Contents
Table of Contents
Table of Contents
Table of Contents
Table of Contents
Table of Contents
Table of Contents
Table of Contents
Table of Contents
Table of Contents
| Approximate
Value of a Creation Unit |
Creation
Unit Size |
Standard
Creation/ Redemption Transaction Fee |
Maximum
Additional Charge for Creations* |
Maximum
Additional Charge for Redemptions* | ||||
| $1,098,500 | 50,000 | $800 | 3.0% | 2.0% |
| * | As a percentage of the net asset value per Creation Unit, inclusive, in the case of redemptions, of the standard redemption transaction fee. |
Table of Contents
Table of Contents
(For a share outstanding throughout each period)
| Year
ended Aug. 31, 2014 |
Year
ended Aug. 31, 2013 |
Year
ended Aug. 31, 2012 |
Year
ended Aug. 31, 2011 |
Period
from Sep. 30, 2009a to Aug. 31, 2010 | |||||
| Net asset value, beginning of period | $ 23.88 | $ 24.24 | $ 29.28 | $ 25.66 | $ 24.65 | ||||
| Income
from investment operations: | |||||||||
| Net investment incomeb | 0.67 | 0.73 | 1.01 | 0.67 | 0.26 | ||||
| Net realized and unrealized gain (loss)c | (1.41) | (0.77) | (4.92) | 3.45 | 0.89 | ||||
| Total from investment operations | (0.74) | (0.04) | (3.91) | 4.12 | 1.15 | ||||
| Less distributions from: | |||||||||
| Net investment income | (0.33) | (0.32) | (1.13) | (0.50) | (0.13) | ||||
| Net realized gain | − | − | − | − | (0.01) | ||||
| Total distributions | (0.33) | (0.32) | (1.13) | (0.50) | (0.14) | ||||
| Net asset value, end of period | $ 22.81 | $ 23.88 | $ 24.24 | $ 29.28 | $ 25.66 | ||||
| Total return | (3.21)% | (0.20)% | (13.14)% | 15.86% | 4.68% d | ||||
| Ratios/Supplemental data: | |||||||||
| Net assets, end of period (000s) | $150,566 | $121,797 | $20,602 | $32,212 | $12,832 | ||||
| Ratio of expenses to average net assetse | 0.67% | 0.67% | 0.69% | 0.68% | 0.69% | ||||
| Ratio of expenses to average net assets prior to waived fees | n/a | n/a | n/a | 0.68% | n/a | ||||
| Ratio of net investment income to average net assetse | 2.75% | 2.96% | 3.97% | 2.06% | 1.05% | ||||
| Portfolio turnover ratef | 8% | 9% | 8% | 24% | 13% | ||||
| a | Commencement of operations. |
| b | Based on average shares outstanding throughout each period. |
| c | The amounts reported for a share outstanding may not accord with the change in aggregate gains and losses in securities for the fiscal period due to the timing of capital share transactions in relation to the fluctuating market values of the Fund's underlying securities. |
| d | Not annualized. |
| e | Annualized for periods of less than one year. |
| f | Portfolio turnover rates exclude portfolio securities received or delivered as a result of processing capital share transactions in Creation Units. |
Table of Contents
Table of Contents
Table of Contents
| Premium/Discount Range | Number of Days | Percentage of Total Days | ||
| Greater than 3.0% | 2 | 0.45% | ||
| Greater than 2.5% and Less than 3.0% | 2 | 0.45 | ||
| Greater than 2.0% and Less than 2.5% | 2 | 0.45 | ||
| Greater than 1.5% and Less than 2.0% | 2 | 0.45 | ||
| Greater than 1.0% and Less than 1.5% | 16 | 3.64 | ||
| Greater than 0.5% and Less than 1.0% | 53 | 12.05 | ||
| Between 0.5% and -0.5% | 287 | 65.24 | ||
| Less than -0.5% and Greater than -1.0% | 47 | 10.68 | ||
| Less than -1.0% and Greater than -1.5% | 18 | 4.09 | ||
| Less than -1.5% and Greater than -2.0% | 6 | 1.36 | ||
| Less than -2.0% and Greater than -2.5% | 4 | 0.91 | ||
| Less than -2.5% and Greater than -3.0% | 1 | 0.23 | ||
| 440 | 100.00% |
Table of Contents
| Average Annual Total Returns | Cumulative Total Returns | |||||||
| NAV | MARKET | INDEX | NAV | MARKET | INDEX | |||
| 1 Year | (3.21)% | (2.90)% | (2.83)% | (3.21)% | (2.90)% | (2.83)% | ||
| Since Inception* | 0.36% | 0.34% | 0.85% | 1.76% | 1.70% | 4.25% | ||
| * | Total returns for the period since inception are calculated from the inception date of the Fund (9/30/09). The first day of secondary market trading in shares of the Fund was 10/2/09. |
Table of Contents
Table of Contents
Table of Contents
Table of Contents
Table of Contents
|
|
| Call: | 1-800-iShares
or 1-800-474-2737 (toll free) Monday through Friday, 8:30 a.m. to 6:30 p.m. (Eastern time) |
| Email: | iSharesETFs@blackrock.com |
| Write: | c/o
BlackRock Investments, LLC 1 University Square Drive, Princeton, NJ 08540 |

Table of Contents
| 2014 Prospectus |
|
| ► | iShares MSCI Emerging Markets Energy Capped ETF | EMEY | NASDAQ |
Table of Contents
Table of Contents
|
|
S-1 |
|
|
1 |
|
|
2 |
|
|
16 |
|
|
17 |
|
|
18 |
|
|
21 |
|
|
33 |
|
|
34 |
|
|
35 |
|
|
35 |
|
|
37 |
Table of Contents
Table of Contents
| Ticker: EMEY | Stock Exchange: NASDAQ |
| Annual
Fund Operating Expenses (ongoing expenses that you pay each year as a percentage of the value of your investments) | ||||||
| Management
Fees |
Distribution
and Service (12b-1) Fees |
Other
Expenses |
Total
Annual Fund Operating Expenses | |||
| 0.67% | None | None | 0.67% | |||
| 1 Year | 3 Years | 5 Years | 10 Years | |||
| $68 | $214 | $373 | $835 |
Table of Contents
Table of Contents
Table of Contents
Table of Contents
Table of Contents
Table of Contents
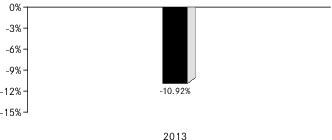
| 1 | The Fund’s year-to-date return as of September 30, 2014 was -3.65%. |
Table of Contents
| One Year | Since
Fund Inception | ||
| (Inception Date: 2/8/2012) | |||
| Return Before Taxes | -10.92% | -12.61% | |
| Return After Taxes on Distributions1 | -11.19% | -12.77% | |
| Return After Taxes on Distributions and Sale of Fund Shares1 | -5.44% | -9.06% | |
| MSCI Emerging Markets Energy 25/50 Index (Index returns do not reflect deductions for fees, expenses or taxes) | -10.75% | -12.14% |
| 1 | After-tax returns in the table above are calculated using the historical highest individual U.S. federal marginal income tax rates and do not reflect the impact of state or local taxes. Actual after-tax returns depend on an investor’s tax situation and may differ from those shown, and after-tax returns shown are not relevant to tax-exempt investors or investors who hold shares through tax-deferred arrangements, such as 401(k) plans or individual retirement accounts (“IRAs”). Fund returns after taxes on distributions and sales of Fund shares are calculated assuming that an investor has sufficient capital gains of the same character from other investments to offset any capital losses from the sale of Fund shares. As a result, Fund returns after taxes on distributions and sales of Fund shares may exceed Fund returns before taxes and/or returns after taxes on distributions. |
Table of Contents
Table of Contents
Table of Contents
Table of Contents
Table of Contents
| ■ | The risk of delays in settling portfolio transactions and the risk of loss arising out of the system of share registration and custody used in certain Eastern European countries; |
| ■ | Risks in connection with the maintenance of the Fund's portfolio securities and cash |
Table of Contents
| ■ | The risk that the Fund's ownership rights in portfolio securities could be lost through fraud or negligence as a result of the fact that ownership in shares of certain Eastern European companies is recorded by the companies themselves and by registrars, rather than a central registration system; |
| ■ | The risk that the Fund may not be able to pursue claims on behalf of its shareholders because of the system of share registration and custody, and because certain Eastern European banking institutions and registrars are not guaranteed by their respective governments; and |
| ■ | Risks in connection with Eastern European countries' dependence on the economic health of Western European countries and the European Union (the “EU”) as a whole. |
Table of Contents
Table of Contents
Table of Contents
Table of Contents
| ■ | Lower levels of liquidity and market efficiency; |
| ■ | Greater securities price volatility; |
| ■ | Exchange rate fluctuations and exchange controls; |
| ■ | Less availability of public information about issuers; |
| ■ | Limitations on foreign ownership of securities; |
| ■ | Imposition of withholding or other taxes; |
| ■ | Imposition of restrictions on the expatriation of the funds or other assets of the Fund; |
| ■ | Higher transaction and custody costs and delays in settlement procedures; |
| ■ | Difficulties in enforcing contractual obligations; |
| ■ | Lower levels of regulation of the securities markets; |
| ■ | Weaker accounting, disclosure and reporting requirements; and |
| ■ | Legal principles relating to corporate governance, directors’ fiduciary duties and liabilities and stockholders’ rights in markets in which the Fund invests may differ and/or may not be as extensive or protective as those that apply in the United States. |
Table of Contents
Table of Contents
Government Control and Regulations. The Chinese government has implemented significant economic reforms in order to liberalize trade policy, promote foreign investment in the economy, reduce government control of the economy and develop market mechanisms. There can be no assurance these reforms will continue or that they will be effective. Despite recent reform and privatizations, significant regulation of investment and industry is still pervasive and the Chinese government may restrict foreign ownership of Chinese corporations and/or repatriate assets. Chinese markets generally continue to experience inefficiency, volatility and pricing anomalies that may be connected to governmental influence, a lack of publicly-available information and/or political and social instability.
Table of Contents
| ■ | The risk of delays in settling portfolio transactions and the risk of loss arising out of the system of share registration and custody used in Russia; |
| ■ | Risks in connection with the maintenance of the Fund’s portfolio securities and cash with foreign sub-custodians and securities depositories, including the risk that appropriate sub-custody arrangements will not be available to the Fund; |
| ■ | The risk that the Fund’s ownership rights in portfolio securities could be lost through |
Table of Contents
| ■ | The risk that the Fund may not be able to pursue claims on behalf of its shareholders because of the system of share registration and custody, and because Russian banking institutions and registrars are not guaranteed by the Russian government. |
Table of Contents
Table of Contents
Table of Contents
| ■ | where a non-resident investor has made any investment, directly or indirectly, in a foreign institutional investor (“FII”) which has invested in India; |
| ■ | investment by the non-resident investor in a fund or a fund pooling vehicle, which does not result in participation in control and management of the fund; or |
| ■ | where a non-resident investor along with its associates, does not have more than a 26% share in total capital of the company. |
| ■ | creates rights, or obligations, which are not ordinarily created between persons dealing at arm's length; |
| ■ | results, directly or indirectly, in the misuse, or abuse, of the provisions of IT Act; |
| ■ | lacks commercial substance; or |
| ■ | is entered into, or carried out, by means, or in a manner, which are not ordinarily employed for bona fide purposes. |
| ■ | any arrangement where the aggregate tax benefit to all the parties of the arrangement in the relevant financial year does not exceed INR 30 Million; |
Table of Contents
| ■ | FIIs that choose not to take any benefit under any tax treaty entered with India and has invested in listed or unlisted securities with prior permission of the competent authority in accordance with the applicable regulations; |
| ■ | non-resident investor in an FII who has invested in an FII, directly or indirectly, by way of an offshore derivative instrument or otherwise; or |
| ■ | any income derived from the transfer of investments made prior to August 30, 2010. |
Table of Contents
Table of Contents
Table of Contents
Table of Contents
Table of Contents
Table of Contents
Table of Contents
Table of Contents
Table of Contents
Table of Contents
Table of Contents
Table of Contents
| ■ | Dividend: Dividend income earned by the Subsidiary will not be subject to Indian tax. However, the Indian company declaring and paying such dividend would be subject to Dividend Distribution Tax at an effective rate of 20% (approx.) (effective starting October 1, 2014) on the amount of the dividend paid out. |
| ■ | Interest: Interest paid to the Subsidiary in respect of debt obligations of Indian issuers will be subject to Indian income tax. The tax rate in the case of a rupee-denominated debt obligation is 43.26%. However if the Subsidiary is a SEBI registered sub-account, interest income earned from June 1, 2013 to May 31, 2015 on rupee denominated bonds of Indian companies and Indian government securities will be subject to tax at the rate of 5.41%, provided that the rate of interest does not exceed the prescribed rates. In the case of a foreign-currency denominated debt obligation, the tax rate is 21.63%. For approved foreign-currency loans advanced from July 1, 2012 to June 30, 2017, the tax rate on interest is 5.41% and for approved foreign currency long-term bonds issued from October 1, 2014 to June 30, 2017, the tax rate on interest is 5.41%. However, if the Subsidiary is registered as a sub-account with SEBI, interest from securities will be subject to tax at the rate of 21.63%. |
| ■ | Securities Transaction Tax: Transactions involving the purchase or sale of shares or any other security traded on a recognized Indian stock exchange are subject to Securities Transaction Tax (“STT”). STT will be levied at the rate of 0.001% on the seller in case of actual delivery of the security and at the rate of 0.2% on the sale of unlisted shares in an initial public offering. This STT is not applicable to primary issuances of equity shares by a company or to off-market transactions. Hence, STT will be payable if the Subsidiary buys or sells listed securities on a recognized Indian stock exchange. |
| ■ | Capital Gains: The taxation of capital gains would be as follows: (i) long-term capital gains (being gains on sale of shares held for a period of more than twelve months) listed on a recognized stock exchange would not be taxable in India provided STT has been paid on the same (as discussed above); (ii) short-term capital gains (being gains on sale of shares held for a period of twelve months or less) from the sale of Indian shares listed on a recognized stock exchange will be taxed at the rate of 16.223% provided STT has been paid on the same; (iii) long-term capital gains (being gains on sale of shares held for a period of more than 36 months) arising to the Subsidiary from the sale of unlisted securities will be taxed at the rate of 10.815% (without indexation) and short-term capital gains (being gains on sale of shares held for a period of 36 months or less) will be taxed at the rate of 43.26%;* (iv) capital gains realized on sale of listed equity shares not executed on a recognized stock |
Table of Contents
| * | However, if the Subsidiary is a SEBI registered sub-account, the rates will be 10.816% and 32.45%, respectively. |
| ■ | any arrangement where the aggregate tax benefit to all the parties of the arrangement in the relevant financial year does not exceed INR 30 Million; |
| ■ | FIIs that choose not to take any benefit under any tax treaty entered with India and has invested in listed or unlisted securities with prior permission of the competent authority in accordance with the applicable regulations; |
| ■ | non-resident investor in an FII who has invested in an FII, directly or indirectly, by way of an offshore derivative instrument or otherwise; or |
| ■ | any income derived from the transfer of investments made prior to August 30, 2010. |
Table of Contents
Table of Contents
Table of Contents
| Approximate
Value of a Creation Unit |
Creation
Unit Size |
Standard
Creation/ Redemption Transaction Fee |
Maximum
Additional Charge for Creations* |
Maximum
Additional Charge for Redemptions* | ||||
| $1,785,500 | 50,000 | $2,500 | 3.0% | 2.0% |
| * | As a percentage of the net asset value per Creation Unit, inclusive, in the case of redemptions, of the standard redemption transaction fee. |
Table of Contents
Table of Contents
(For a share outstanding throughout each period)
| Year
ended Aug. 31, 2014 |
Year
ended Aug. 31, 2013 |
Period
from Feb. 8, 2012a to Aug. 31, 2012 | |||
| Net asset value, beginning of period | $ 36.10 | $40.16 | $ 51.12 | ||
| Income
from investment operations: | |||||
| Net investment incomeb | 1.05 | 1.04 | 1.05 | ||
| Net realized and unrealized gain (loss)c | 3.13 | (4.16) | (11.14) | ||
| Total from investment operations | 4.18 | (3.12) | (10.09) | ||
| Less distributions from: | |||||
| Net investment income | (0.70) | (0.94) | (0.84) | ||
| Return of capital | − | − | (0.03) | ||
| Total distributions | (0.70) | (0.94) | (0.87) | ||
| Net asset value, end of period | $39.58 | $36.10 | $ 40.16 | ||
| Total return | 11.65% | (7.73)% | (19.71)% d | ||
| Ratios/Supplemental data: | |||||
| Net assets, end of period (000s) | $ 1,979 | $ 1,805 | $ 2,008 | ||
| Ratio of expenses to average net assetse | 0.67% | 0.67% | 0.68% | ||
| Ratio of net investment income to average net assetse | 2.79% | 2.56% | 4.23% | ||
| Portfolio turnover ratef | 15% | 7% | 29% | ||
| a | Commencement of operations. |
| b | Based on average shares outstanding throughout each period. |
| c | The amounts reported for a share outstanding may not accord with the change in aggregate gains and losses in securities for the fiscal period due to the timing of capital share transactions in relation to the fluctuating market values of the Fund's underlying securities. |
| d | Not annualized. |
| e | Annualized for periods of less than one year. |
| f | Portfolio turnover rates exclude portfolio securities received or delivered in Creation Units but include portfolio transactions that are executed as a result of the Fund processing capital share transactions in Creation Units partially for cash in U.S. dollars. Excluding such cash transactions, the portfolio turnover rates for the years ended August 31, 2014, August 31, 2013 and the period ended August 31, 2012 were 15%, 7% and 3%, respectively. |
Table of Contents
Table of Contents
Table of Contents
| Premium/Discount Range | Number of Days | Percentage of Total Days | ||
| Greater than 2.5% | 1 | 0.23% | ||
| Greater than 2.0% and Less than 2.5% | 2 | 0.45 | ||
| Greater than 1.5% and Less than 2.0% | 3 | 0.68 | ||
| Greater than 1.0% and Less than 1.5% | 13 | 2.95 | ||
| Greater than 0.5% and Less than 1.0% | 54 | 12.27 | ||
| Between 0.5% and -0.5% | 277 | 62.97 | ||
| Less than -0.5% and Greater than -1.0% | 55 | 12.50 | ||
| Less than -1.0% and Greater than -1.5% | 25 | 5.67 | ||
| Less than -1.5% and Greater than -2.0% | 8 | 1.82 | ||
| Less than -2.0% and Greater than -2.5% | 1 | 0.23 | ||
| Less than -2.5% and Greater than -3.0% | 1 | 0.23 | ||
| 440 | 100.00% |
Table of Contents
| Average Annual Total Returns | Cumulative Total Returns | |||||||
| NAV | MARKET | INDEX | NAV | MARKET | INDEX | |||
| 1 Year | 11.65% | 12.42% | 12.19% | 11.65% | 12.42% | 12.19% | ||
| Since Inception* | (7.14)% | (7.24)% | (6.59)% | (17.29)% | (17.52)% | (16.02)% | ||
| * | Total returns for the period since inception are calculated from the inception date of the Fund (2/8/12). The first day of secondary market trading in shares of the Fund was 2/9/12. |
Table of Contents
Table of Contents
Table of Contents
Table of Contents
|
|
| Call: | 1-800-iShares
or 1-800-474-2737 (toll free) Monday through Friday, 8:30 a.m. to 6:30 p.m. (Eastern time) |
| Email: | iSharesETFs@blackrock.com |
| Write: | c/o
BlackRock Investments, LLC 1 University Square Drive, Princeton, NJ 08540 |

Table of Contents
| 2014 Prospectus |
|
| ► | iShares MSCI Emerging Markets EMEA ETF | EEME | NASDAQ |
Table of Contents
Table of Contents
|
|
S-1 |
|
|
1 |
|
|
2 |
|
|
13 |
|
|
15 |
|
|
15 |
|
|
18 |
|
|
27 |
|
|
28 |
|
|
29 |
|
|
29 |
|
|
31 |
Table of Contents
Table of Contents
| Ticker: EEME | Stock Exchange: NASDAQ |
| Annual
Fund Operating Expenses (ongoing expenses that you pay each year as a percentage of the value of your investments) | ||||||||||
| Management
Fees |
Distribution
and Service (12b-1) Fees |
Other
Expenses |
Total
Annual Fund Operating Expenses |
Fee Waiver | Total
Annual Fund Operating Expenses After Fee Waiver | |||||
| 0.68% | None | None | 0.68% | (0.19)% | 0.49% | |||||
| 1 Year | 3 Years | 5 Years | 10 Years | |||
| $50 | $198 | $360 | $829 |
Table of Contents
Table of Contents
Table of Contents
Table of Contents
Table of Contents
Table of Contents
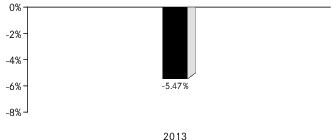
| 1 | The Fund’s year-to-date return as of September 30, 2014 was -5.82%. |
| One Year | Since
Fund Inception | ||
| (Inception Date: 1/18/2012) | |||
| Return Before Taxes | -5.47% | 3.77% | |
| Return After Taxes on Distributions2 | -5.65% | 3.62% | |
| Return After Taxes on Distributions and Sale of Fund Shares2 | -2.35% | 3.42% | |
| MSCI Emerging Markets EMEA Index (Index returns do not reflect deductions for fees, expenses or taxes) | -5.16% | 4.27% |
| 2 | After-tax returns in the table above are calculated using the historical highest individual U.S. federal marginal income tax rates and do not reflect the impact of state or local taxes. Actual after-tax returns depend on an investor’s tax situation and may differ from those shown, and after-tax returns shown are not relevant to tax-exempt investors or investors who hold shares through tax-deferred arrangements, such as 401(k) plans or individual retirement accounts (“IRAs”). Fund returns after taxes on distributions and sales of Fund shares are calculated assuming that an investor has sufficient capital gains of the same character from other investments to offset any capital losses from the sale of Fund shares. As a result, Fund returns after taxes on distributions and sales of Fund shares may exceed Fund returns before taxes and/or returns after taxes on distributions. |
Table of Contents
Table of Contents
Table of Contents
Table of Contents
Table of Contents
| ■ | The risk of delays in settling portfolio transactions and the risk of loss arising out of the system of share registration and custody used in certain Eastern European countries; |
| ■ | Risks in connection with the maintenance of the Fund's portfolio securities and cash with foreign sub-custodians and securities depositories, including the risk that appropriate sub-custody arrangements will not be available to the Fund; |
| ■ | The risk that the Fund's ownership rights in portfolio securities could be lost through fraud or negligence as a result of the fact that ownership in shares of certain Eastern European companies is recorded by the companies themselves and by registrars, rather than a central registration system; |
| ■ | The risk that the Fund may not be able to pursue claims on behalf of its shareholders because of the system of share registration and custody, and because certain Eastern European banking institutions and registrars are not guaranteed by their respective governments; and |
| ■ | Risks in connection with Eastern European countries' dependence on the economic health of Western European countries and the European Union (the “EU”) as a whole. |
Table of Contents
Table of Contents
Table of Contents
Table of Contents
Table of Contents
| ■ | Lower levels of liquidity and market efficiency; |
| ■ | Greater securities price volatility; |
| ■ | Exchange rate fluctuations and exchange controls; |
| ■ | Less availability of public information about issuers; |
| ■ | Limitations on foreign ownership of securities; |
| ■ | Imposition of withholding or other taxes; |
| ■ | Imposition of restrictions on the expatriation of the funds or other assets of the Fund; |
| ■ | Higher transaction and custody costs and delays in settlement procedures; |
| ■ | Difficulties in enforcing contractual obligations; |
| ■ | Lower levels of regulation of the securities markets; |
| ■ | Weaker accounting, disclosure and reporting requirements; and |
| ■ | Legal principles relating to corporate governance, directors’ fiduciary duties and liabilities and stockholders’ rights in markets in which the Fund invests may differ and/or may not be as extensive or protective as those that apply in the United States. |
Table of Contents
| ■ | The risk of delays in settling portfolio transactions and the risk of loss arising out of the system of share registration and custody used in Russia; |
| ■ | Risks in connection with the maintenance of the Fund’s portfolio securities and cash with foreign sub-custodians and securities depositories, including the risk that appropriate sub-custody arrangements will not be available to the Fund; |
| ■ | The risk that the Fund’s ownership rights in portfolio securities could be lost through fraud or negligence as a result of the fact that ownership in shares of Russian companies is recorded by the companies themselves and by registrars, rather than by a central registration system; and |
| ■ | The risk that the Fund may not be able to pursue claims on behalf of its |
Table of Contents
Table of Contents
Table of Contents
Table of Contents
Table of Contents
Table of Contents
Table of Contents
Table of Contents
Table of Contents
Table of Contents
Table of Contents
Table of Contents
Table of Contents
Table of Contents
Table of Contents
Table of Contents
| Approximate
Value of a Creation Unit |
Creation
Unit Size |
Standard
Creation/ Redemption Transaction Fee |
Maximum
Additional Charge for Creations* |
Maximum
Additional Charge for Redemptions* | ||||
| $4,840,000 | 100,000 | $5,500 | 3.0% | 2.0% |
| * | As a percentage of the net asset value per Creation Unit, inclusive, in the case of redemptions, of the standard redemption transaction fee. |
Table of Contents
Table of Contents
(For a share outstanding throughout each period)
| Year
ended Aug. 31, 2014 |
Year
ended Aug. 31, 2013 |
Period
from Jan. 18, 2012a to Aug. 31, 2012 | |||
| Net asset value, beginning of period | $ 47.98 | $51.72 | $ 51.16 | ||
| Income
from investment operations: | |||||
| Net investment incomeb | 1.23 | 1.26 | 1.43 | ||
| Net realized and unrealized gain (loss)c | 3.38 | (3.22) | 0.02 | ||
| Total from investment operations | 4.61 | (1.96) | 1.45 | ||
| Less distributions from: | |||||
| Net investment income | (0.79) | (1.78) | (0.89) | ||
| Total distributions | (0.79) | (1.78) | (0.89) | ||
| Net asset value, end of period | $ 51.80 | $47.98 | $ 51.72 | ||
| Total return | 9.61% | (3.95)% | 2.91% d | ||
| Ratios/Supplemental data: | |||||
| Net assets, end of period (000s) | $10,360 | $ 4,798 | $10,343 | ||
| Ratio of expenses to average net assetse | 0.49% | 0.49% | 0.49% | ||
| Ratio of expenses to average net assets prior to waived feese | 0.68% | 0.68% | 0.68% | ||
| Ratio of net investment income to average net assetse | 2.39% | 2.39% | 4.46% | ||
| Portfolio turnover ratef | 18% | 8% | 5% | ||
| a | Commencement of operations. |
| b | Based on average shares outstanding throughout each period. |
| c | The amounts reported for a share outstanding may not accord with the change in aggregate gains and losses in securities for the fiscal period due to the timing of capital share transactions in relation to the fluctuating market values of the Fund's underlying securities. |
| d | Not annualized. |
| e | Annualized for periods of less than one year. |
| f | Portfolio turnover rates exclude portfolio securities received or delivered as a result of processing capital share transactions in Creation Units. |
Table of Contents
Table of Contents
Table of Contents
| Premium/Discount Range | Number of Days | Percentage of Total Days | ||
| Greater than 4.0% | 1 | 0.23% | ||
| Greater than 3.5% and Less than 4.0% | 4 | 0.91 | ||
| Greater than 3.0% and Less than 3.5% | 13 | 2.95 | ||
| Greater than 2.5% and Less than 3.0% | 9 | 2.05 | ||
| Greater than 2.0% and Less than 2.5% | 13 | 2.95 | ||
| Greater than 1.5% and Less than 2.0% | 23 | 5.23 | ||
| Greater than 1.0% and Less than 1.5% | 33 | 7.50 | ||
| Greater than 0.5% and Less than 1.0% | 92 | 20.91 | ||
| Between 0.5% and -0.5% | 201 | 45.68 | ||
| Less than -0.5% and Greater than -1.0% | 32 | 7.27 | ||
| Less than -1.0% and Greater than -1.5% | 11 | 2.50 | ||
| Less than -1.5% and Greater than -2.0% | 5 | 1.14 | ||
| Less than -2.0% and Greater than -2.5% | 2 | 0.45 | ||
| Less than -2.5% and Greater than -3.0% | 1 | 0.23 | ||
| 440 | 100.00% |
Table of Contents
| Average Annual Total Returns | Cumulative Total Returns | |||||||
| NAV | MARKET | INDEX | NAV | MARKET | INDEX | |||
| 1 Year | 9.61% | 9.67% | 9.98% | 9.61% | 9.67% | 9.98% | ||
| Since Inception* | 3.11% | 3.59% | 3.55% | 8.35% | 9.67% | 9.55% | ||
| * | Total returns for the period since inception are calculated from the inception date of the Fund (1/18/12). The first day of secondary market trading in shares of the Fund was 1/19/12. |
Table of Contents
Table of Contents
Table of Contents
Table of Contents
|
|
| Call: | 1-800-iShares
or 1-800-474-2737 (toll free) Monday through Friday, 8:30 a.m. to 6:30 p.m. (Eastern time) |
| Email: | iSharesETFs@blackrock.com |
| Write: | c/o
BlackRock Investments, LLC 1 University Square Drive, Princeton, NJ 08540 |

Table of Contents
| 2014 Prospectus |
|
| ► | iShares Core MSCI Emerging Markets ETF | IEMG | NYSE ARCA |
Table of Contents
Table of Contents
|
|
S-1 |
|
|
1 |
|
|
2 |
|
|
15 |
|
|
18 |
|
|
19 |
|
|
22 |
|
|
33 |
|
|
34 |
|
|
35 |
|
|
35 |
|
|
37 |
Table of Contents
Table of Contents
| Ticker: IEMG | Stock Exchange: NYSE Arca |
| Annual
Fund Operating Expenses (ongoing expenses that you pay each year as a percentage of the value of your investments) | ||||||||||||||
| Management
Fees |
Distribution
and Service (12b-1) Fees |
Foreign
Taxes |
Other
Expenses |
Acquired
Fund Fees and Expenses |
Total
Annual Fund Operating Expenses |
Fee Waiver | Total
Annual Fund Operating Expenses After Fee Waiver | |||||||
| 0.18% | None | 0.00% | None | 0.00% | 0.18% | (0.00)% | 0.18% | |||||||
Table of Contents
| 1 Year | 3 Years | 5 Years | 10 Years | |||
| $18 | $58 | $101 | $230 |
Table of Contents
Table of Contents
Table of Contents
Table of Contents
Table of Contents
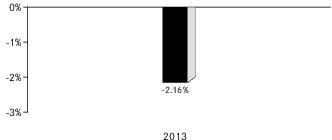
| 1 | The Fund’s year-to-date return as of September 30, 2014 was 2.73%. |
Table of Contents
| One Year | Since
Fund Inception | ||
| (Inception Date: 10/18/2012) | |||
| Return Before Taxes | -2.16% | 1.90% | |
| Return After Taxes on Distributions1 | -2.55% | 1.53% | |
| Return After Taxes on Distributions and Sale of Fund Shares1 | -0.86% | 1.48% | |
| MSCI Emerging Markets IMI (Index returns do not reflect deductions for fees, expenses or taxes) | -2.20% | 1.72% |
| 1 | After-tax returns in the table above are calculated using the historical highest individual U.S. federal marginal income tax rates and do not reflect the impact of state or local taxes. Actual after-tax returns depend on an investor’s tax situation and may differ from those shown, and after-tax returns shown are not relevant to tax-exempt investors or investors who hold shares through tax-deferred arrangements, such as 401(k) plans or individual retirement accounts (“IRAs”). Fund returns after taxes on distributions and sales of Fund shares are calculated assuming that an investor has sufficient capital gains of the same character from other investments to offset any capital losses from the sale of Fund shares. As a result, Fund returns after taxes on distributions and sales of Fund shares may exceed Fund returns before taxes and/or returns after taxes on distributions. |
Table of Contents
Table of Contents
Table of Contents
Table of Contents
Table of Contents
Table of Contents
Table of Contents
Table of Contents
Table of Contents
Table of Contents
| ■ | Lower levels of liquidity and market efficiency; |
| ■ | Greater securities price volatility; |
| ■ | Exchange rate fluctuations and exchange controls; |
| ■ | Less availability of public information about issuers; |
| ■ | Limitations on foreign ownership of securities; |
| ■ | Imposition of withholding or other taxes; |
| ■ | Imposition of restrictions on the expatriation of the funds or other assets of the Fund; |
Table of Contents
| ■ | Higher transaction and custody costs and delays in settlement procedures; |
| ■ | Difficulties in enforcing contractual obligations; |
| ■ | Lower levels of regulation of the securities markets; |
| ■ | Weaker accounting, disclosure and reporting requirements; and |
| ■ | Legal principles relating to corporate governance, directors’ fiduciary duties and liabilities and stockholders’ rights in markets in which the Fund invests may differ and/or may not be as extensive or protective as those that apply in the United States. |
Table of Contents
| ■ | The risk of delays in settling portfolio transactions and the risk of loss arising out of the system of share registration and custody used in Russia; |
| ■ | Risks in connection with the maintenance of the Fund’s portfolio securities and cash with foreign sub-custodians and securities depositories, including the risk that appropriate sub-custody arrangements will not be available to the Fund; |
| ■ | The risk that the Fund’s ownership rights in portfolio securities could be lost through fraud or negligence as a result of the fact that ownership in shares of Russian companies is recorded by the companies themselves and by registrars, rather than by a central registration system; and |
| ■ | The risk that the Fund may not be able to pursue claims on behalf of its shareholders because of the system of share registration and custody, and because Russian banking institutions and registrars are not guaranteed by the Russian government. |
Table of Contents
Table of Contents
Table of Contents
Table of Contents
| ■ | where a non-resident investor has made any investment, directly or indirectly, in a foreign institutional investor (“FII”) which has invested in India; |
| ■ | investment by the non-resident investor in a fund or a fund pooling vehicle, which does not result in participation in control and management of the fund; or |
| ■ | where a non-resident investor along with its associates, does not have more than a 26% share in total capital of the company. |
| ■ | creates rights, or obligations, which are not ordinarily created between persons dealing at arm's length; |
| ■ | results, directly or indirectly, in the misuse, or abuse, of the provisions of IT Act; |
| ■ | lacks commercial substance; or |
| ■ | is entered into, or carried out, by means, or in a manner, which are not ordinarily employed for bona fide purposes. |
| ■ | any arrangement where the aggregate tax benefit to all the parties of the arrangement in the relevant financial year does not exceed INR 30 Million; |
| ■ | FIIs that choose not to take any benefit under any tax treaty entered with India and |
Table of Contents
| ■ | non-resident investor in an FII who has invested in an FII, directly or indirectly, by way of an offshore derivative instrument or otherwise; or |
| ■ | any income derived from the transfer of investments made prior to August 30, 2010. |
Table of Contents
Table of Contents
| ■ | The risk of delays in settling portfolio transactions and the risk of loss arising out of the system of share registration and custody used in certain Eastern European countries; |
| ■ | Risks in connection with the maintenance of the Fund's portfolio securities and cash with foreign sub-custodians and securities depositories, including the risk that appropriate sub-custody arrangements will not be available to the Fund; |
| ■ | The risk that the Fund's ownership rights in portfolio securities could be lost through fraud or negligence as a result of the fact that ownership in shares of certain Eastern European companies is recorded by the companies themselves and by registrars, rather than a central registration system; |
| ■ | The risk that the Fund may not be able to pursue claims on behalf of its shareholders because of the system of share registration and custody, and because certain Eastern European banking institutions and registrars are not guaranteed by their respective governments; and |
| ■ | Risks in connection with Eastern European countries' dependence on the economic health of Western European countries and the EU as a whole. |
Table of Contents
Table of Contents
Table of Contents
Table of Contents
Table of Contents
Table of Contents
Table of Contents
Table of Contents
Table of Contents
Table of Contents
Table of Contents
| ■ | Dividend: Dividend income earned by the Subsidiary will not be subject to Indian tax. However, the Indian company declaring and paying such dividend would be subject to Dividend Distribution Tax at an effective rate of 20% (approx.) (effective starting October 1, 2014) on the amount of the dividend paid out. |
| ■ | Interest: Interest paid to the Subsidiary in respect of debt obligations of Indian issuers will be subject to Indian income tax. The tax rate in the case of a rupee-denominated debt obligation is 43.26%. However if the Subsidiary is a SEBI registered sub-account, interest income earned from June 1, 2013 to May 31, 2015 on rupee denominated bonds of Indian companies and Indian government securities will be subject to tax at the rate of 5.41%, provided that the rate of interest does not exceed the prescribed rates. In the case of a foreign-currency denominated debt obligation, the tax rate is 21.63%. For approved foreign-currency loans advanced |
Table of Contents
| from July 1, 2012 to June 30, 2017, the tax rate on interest is 5.41% and for approved foreign currency long-term bonds issued from October 1, 2014 to June 30, 2017, the tax rate on interest is 5.41%. However, if the Subsidiary is registered as a sub-account with SEBI, interest from securities will be subject to tax at the rate of 21.63%. | |
| ■ | Securities Transaction Tax: Transactions involving the purchase or sale of shares or any other security traded on a recognized Indian stock exchange are subject to Securities Transaction Tax (“STT”). STT will be levied at the rate of 0.001% on the seller in case of actual delivery of the security and at the rate of 0.2% on the sale of unlisted shares in an initial public offering. This STT is not applicable to primary issuances of equity shares by a company or to off-market transactions. Hence, STT will be payable if the Subsidiary buys or sells listed securities on a recognized Indian stock exchange. |
| ■ | Capital Gains: The taxation of capital gains would be as follows: (i) long-term capital gains (being gains on sale of shares held for a period of more than twelve months) listed on a recognized stock exchange would not be taxable in India provided STT has been paid on the same (as discussed above); (ii) short-term capital gains (being gains on sale of shares held for a period of twelve months or less) from the sale of Indian shares listed on a recognized stock exchange will be taxed at the rate of 16.223% provided STT has been paid on the same; (iii) long-term capital gains (being gains on sale of shares held for a period of more than 36 months) arising to the Subsidiary from the sale of unlisted securities will be taxed at the rate of 10.815% (without indexation) and short-term capital gains (being gains on sale of shares held for a period of 36 months or less) will be taxed at the rate of 43.26%;* (iv) capital gains realized on sale of listed equity shares not executed on a recognized stock exchange in India would be taxed at the rate of 21.63% for long-term gains (being gains on sale of shares held for a period of more than 12 months) and at 43.26% in the case of short-term gains (being gains on sale of shares held for a period of 12 months or less);* and (v) capital gains arising from the transfer of depositary receipts outside India between non-resident investors will not be subject to tax in India. |
| * | However, if the Subsidiary is a SEBI registered sub-account, the rates will be 10.816% and 32.45%, respectively. |
Table of Contents
| ■ | any arrangement where the aggregate tax benefit to all the parties of the arrangement in the relevant financial year does not exceed INR 30 Million; |
| ■ | FIIs that choose not to take any benefit under any tax treaty entered with India and has invested in listed or unlisted securities with prior permission of the competent authority in accordance with the applicable regulations; |
| ■ | non-resident investor in an FII who has invested in an FII, directly or indirectly, by way of an offshore derivative instrument or otherwise; or |
| ■ | any income derived from the transfer of investments made prior to August 30, 2010. |
Table of Contents
Table of Contents
| Approximate
Value of a Creation Unit |
Creation
Unit Size |
Standard
Creation/ Redemption Transaction Fee |
Maximum
Additional Charge for Creations* |
Maximum
Additional Charge for Redemptions* | ||||
| $10,010,000 | 200,000 | $15,000 | 5.0% | 2.0% |
| * | As a percentage of the net asset value per Creation Unit, inclusive, in the case of redemptions, of the standard redemption transaction fee. |
Table of Contents
Table of Contents
(For a share outstanding throughout each period)
| Year
ended Aug. 31, 2014 |
Period
from Oct. 18, 2012a to Aug. 31, 2013 | ||
| Net asset value, beginning of period | $ 45.71 | $ 49.06 | |
| Income
from investment operations: | |||
| Net investment incomeb | 1.31 | 1.33 | |
| Net realized and unrealized gain (loss)c | 7.78 | (4.14) | |
| Total from investment operations | 9.09 | (2.81) | |
| Less distributions from: | |||
| Net investment income | (0.91) | (0.54) | |
| Total distributions | (0.91) | (0.54) | |
| Net asset value, end of period | $ 53.89 | $ 45.71 | |
| Total return | 20.05% | (5.75)% d | |
| Ratios/Supplemental data: | |||
| Net assets, end of period (000s) | $5,669,167 | $1,864,965 | |
| Ratio of expenses to average net assetse | 0.17% | 0.05% | |
| Ratio of expenses to average net assets prior to waived feese | 0.18% | 0.18% | |
| Ratio of net investment income to average net assetse | 2.61% | 3.17% | |
| Portfolio turnover ratef | 8% | 15% | |
| a | Commencement of operations. |
| b | Based on average shares outstanding throughout each period. |
| c | The amounts reported for a share outstanding may not accord with the change in aggregate gains and losses in securities for the fiscal period due to the timing of capital share transactions in relation to the fluctuating market values of the Fund's underlying securities. |
| d | Not annualized. |
| e | Annualized for periods of less than one year. |
| f | Portfolio turnover rates exclude portfolio securities received or delivered in Creation Units but includes portfolio transactions that are executed as a result of the Fund processing capital share transactions in Creation Units partially for cash in U.S. dollars. Excluding such cash transactions, the portfolio turnover rates for the year ended August 31, 2014 and the period ended August 31, 2013 were 8% and 15%, respectively. |
Table of Contents
Table of Contents
Table of Contents
| Premium/Discount Range | Number of Days | Percentage of Total Days | ||
| Greater than 2.0% | 1 | 0.23% | ||
| Greater than 1.5% and Less than 2.0% | 7 | 1.59 | ||
| Greater than 1.0% and Less than 1.5% | 19 | 4.32 | ||
| Greater than 0.5% and Less than 1.0% | 102 | 23.18 | ||
| Between 0.5% and -0.5% | 258 | 58.64 | ||
| Less than -0.5% and Greater than -1.0% | 36 | 8.18 | ||
| Less than -1.0% and Greater than -1.5% | 12 | 2.73 | ||
| Less than -1.5% and Greater than -2.0% | 3 | 0.68 | ||
| Less than -2.0% and Greater than -2.5% | 2 | 0.45 | ||
| 440 | 100.00% |
Table of Contents
| Average Annual Total Returns | Cumulative Total Returns | |||||||
| NAV | MARKET | INDEX | NAV | MARKET | INDEX | |||
| 1 Year | 20.05% | 20.98% | 20.12% | 20.05% | 20.98% | 20.12% | ||
| Since Inception* | 6.83% | 6.87% | 6.83% | 13.15% | 13.24% | 13.13% | ||
| * | Total returns for the period since inception are calculated from the inception date of the Fund (10/18/12). The first day of secondary market trading in shares of the Fund was 10/22/12. |
Table of Contents
Table of Contents
Table of Contents
Table of Contents
|
|
| Call: | 1-800-iShares
or 1-800-474-2737 (toll free) Monday through Friday, 8:30 a.m. to 6:30 p.m. (Eastern time) |
| Email: | iSharesETFs@blackrock.com |
| Write: | c/o
BlackRock Investments, LLC 1 University Square Drive, Princeton, NJ 08540 |

Table of Contents
| 2014 Prospectus |
|
| ► | iShares MSCI All Country World Minimum Volatility ETF | ACWV | NYSE ARCA |
Table of Contents
Table of Contents
|
|
S-1 |
|
|
1 |
|
|
2 |
|
|
12 |
|
|
14 |
|
|
14 |
|
|
18 |
|
|
27 |
|
|
27 |
|
|
29 |
|
|
29 |
|
|
31 |
Table of Contents
Table of Contents
| Ticker: ACWV | Stock Exchange: NYSE Arca |
| Annual
Fund Operating Expenses (ongoing expenses that you pay each year as a percentage of the value of your investments)1 | ||||||||||||
| Management
Fees |
Distribution
and Service (12b-1) Fees |
Other
Expenses |
Acquired
Fund Fees and Expenses |
Total
Annual Fund Operating Expenses |
Fee Waiver | Total
Annual Fund Operating Expenses After Fee Waiver | ||||||
| 0.33% | None | None | 0.00% | 0.33% | (0.13)% | 0.20% | ||||||
| 1 | The expense information in the table has been restated to reflect current fees. |
Table of Contents
| 1 Year | 3 Years | 5 Years | 10 Years | |||
| $20 | $93 | $172 | $405 |
Table of Contents
Table of Contents
Table of Contents
Table of Contents
Table of Contents
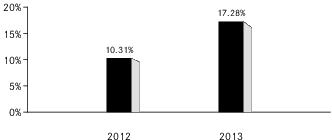
| 1 | The Fund’s year-to-date return as of September 30, 2014 was 6.57%. |
| One Year | Since
Fund Inception | ||
| (Inception Date: 10/18/2011) | |||
| Return Before Taxes | 17.28% | 13.84% | |
| Return After Taxes on Distributions2 | 16.49% | 13.25% | |
| Return After Taxes on Distributions and Sale of Fund Shares2 | 10.24% | 10.70% | |
| MSCI ACWI Minimum Volatility (USD) Index (Index returns do not reflect deductions for fees, expenses or taxes) | 16.90% | 13.53% |
| 2 | After-tax returns in the table above are calculated using the historical highest individual U.S. federal marginal income tax rates and do not reflect the impact of state or local taxes. Actual after-tax returns depend on an investor’s tax situation and may differ from those shown, and after-tax returns shown are not relevant to tax-exempt investors or investors who hold shares through tax-deferred arrangements, such as 401(k) plans or individual retirement accounts (“IRAs”). Fund returns after taxes on distributions and sales of Fund shares are calculated assuming that an investor has sufficient capital gains of the same character from other investments to offset any capital losses from the sale of Fund shares. As a result, Fund returns after taxes on distributions and sales of Fund shares may exceed Fund returns before taxes and/or returns after taxes on distributions. |
Table of Contents
Table of Contents
Table of Contents
Table of Contents
Table of Contents
Table of Contents
Table of Contents
Table of Contents
| ■ | Lower levels of liquidity and market efficiency; |
| ■ | Greater securities price volatility; |
| ■ | Exchange rate fluctuations and exchange controls; |
| ■ | Less availability of public information about issuers; |
| ■ | Limitations on foreign ownership of securities; |
| ■ | Imposition of withholding or other taxes; |
| ■ | Imposition of restrictions on the expatriation of the funds or other assets of the Fund; |
| ■ | Higher transaction and custody costs and delays in settlement procedures; |
| ■ | Difficulties in enforcing contractual obligations; |
| ■ | Lower levels of regulation of the securities markets; |
| ■ | Weaker accounting, disclosure and reporting requirements; and |
| ■ | Legal principles relating to corporate governance, directors’ fiduciary duties and liabilities and stockholders’ rights in markets in which the Fund invests may differ and/or may not be as extensive or protective as those that apply in the United States. |
Table of Contents
| ■ | The risk of delays in settling portfolio transactions and the risk of loss arising out of the system of share registration and custody used in Russia; |
| ■ | Risks in connection with the maintenance of the Fund’s portfolio securities and cash |
Table of Contents
| ■ | The risk that the Fund’s ownership rights in portfolio securities could be lost through fraud or negligence as a result of the fact that ownership in shares of Russian companies is recorded by the companies themselves and by registrars, rather than by a central registration system; and |
| ■ | The risk that the Fund may not be able to pursue claims on behalf of its shareholders because of the system of share registration and custody, and because Russian banking institutions and registrars are not guaranteed by the Russian government. |
Table of Contents
Table of Contents
Economic Risk. Some MSCI ACWI Index countries may experience economic instability, including instability resulting from substantial rates of inflation or significant devaluations of their currency, or economic recessions, which would have a negative effect on the economies and securities markets of their economies. Some of these countries may also impose restrictions on the exchange or export of currency or adverse currency exchange rates and may be characterized by a lack of available currency hedging instruments.
Table of Contents
Table of Contents
Table of Contents
Table of Contents
Table of Contents
Table of Contents
Table of Contents
Table of Contents
Table of Contents
Table of Contents
Table of Contents
Table of Contents
Table of Contents
Table of Contents
Table of Contents
| Approximate
Value of a Creation Unit |
Creation
Unit Size |
Standard
Creation/ Redemption Transaction Fee |
Maximum
Additional Charge for Creations* |
Maximum
Additional Charge for Redemptions* | ||||
| $6,667,000 | 100,000 | $4,200 | 3.0% | 2.0% |
| * | As a percentage of the net asset value per Creation Unit, inclusive, in the case of redemptions, of the standard redemption transaction fee. |
Table of Contents
(For a share outstanding throughout each period)
Table of Contents
| Year
ended Aug. 31, 2014 |
Year
ended Aug. 31, 2013 |
Period
from Oct. 18, 2011a to Aug. 31, 2012 | |||
| Net asset value, beginning of period | $ 59.99 | $ 55.65 | $ 50.02 | ||
| Income
from investment operations: | |||||
| Net investment incomeb | 1.72 | 1.68 | 1.49 | ||
| Net realized and unrealized gainc | 8.18 | 4.20 | 4.67 | ||
| Total from investment operations | 9.90 | 5.88 | 6.16 | ||
| Less distributions from: | |||||
| Net investment income | (1.64) | (1.54) | (0.53) | ||
| Total distributions | (1.64) | (1.54) | (0.53) | ||
| Net asset value, end of period | $ 68.25 | $ 59.99 | $ 55.65 | ||
| Total return | 16.70% | 10.69% | 12.41% d | ||
| Ratios/Supplemental data: | |||||
| Net assets, end of period (000s) | $1,283,012 | $1,007,760 | $578,776 | ||
| Ratio of expenses to average net assetse | 0.20% | 0.20% | 0.23% | ||
| Ratio of expenses to average net assets prior to waived feese | 0.33% | 0.34% | 0.34% | ||
| Ratio of net investment income to average net assetse | 2.67% | 2.83% | 3.17% | ||
| Portfolio turnover ratef | 24% | 13% | 22% | ||
| a | Commencement of operations. |
| b | Based on average shares outstanding throughout each period. |
| c | The amounts reported for a share outstanding may not accord with the change in aggregate gains and losses in securities for the fiscal period due to the timing of capital share transactions in relation to the fluctuating market values of the Fund's underlying securities. |
| d | Not annualized. |
| e | Annualized for periods of less than one year. |
| f | Portfolio turnover rates exclude portfolio securities received or delivered in Creation Units but include portfolio transactions that are executed as a result of the Fund processing capital share transactions in Creation Units partially for cash in U.S. dollars. Excluding such cash transactions, the portfolio turnover rates for the years ended August 31, 2014, August 31, 2013 and the period ended August 31, 2012 were 23%, 13%, and 22%, respectively. |
Table of Contents
Table of Contents
Table of Contents
| Premium/Discount Range | Number of Days | Percentage of Total Days | ||
| Greater than 0.5% and Less than 1.0% | 15 | 3.41% | ||
| Between 0.5% and -0.5% | 416 | 94.54 | ||
| Less than -0.5% and Greater than -1.0% | 8 | 1.82 | ||
| Less than -1.0% and Greater than -1.5% | 1 | 0.23 | ||
| 440 | 100.00% |
Table of Contents
| Average Annual Total Returns | Cumulative Total Returns | |||||||
| NAV | MARKET | INDEX | NAV | MARKET | INDEX | |||
| 1 Year | 16.70% | 16.83% | 16.53% | 16.70% | 16.83% | 16.53% | ||
| Since Inception* | 13.87% | 13.80% | 13.58% | 45.20% | 44.92% | 44.09% | ||
| * | Total returns for the period since inception are calculated from the inception date of the Fund (10/18/11). The first day of secondary market trading in shares of the Fund was 10/20/11. |
Table of Contents
Table of Contents
Table of Contents
Table of Contents
|
|
| Call: | 1-800-iShares
or 1-800-474-2737 (toll free) Monday through Friday, 8:30 a.m. to 6:30 p.m. (Eastern time) |
| Email: | iSharesETFs@blackrock.com |
| Write: | c/o
BlackRock Investments, LLC 1 University Square Drive, Princeton, NJ 08540 |

Table of Contents
| 2014 Prospectus |
|
| ► | iShares MSCI Emerging Markets Growth ETF | EGRW | NASDAQ |
Table of Contents
Table of Contents
|
|
S-1 |
|
|
1 |
|
|
2 |
|
|
15 |
|
|
17 |
|
|
17 |
|
|
20 |
|
|
32 |
|
|
32 |
|
|
34 |
|
|
34 |
|
|
36 |
Table of Contents
Table of Contents
| Ticker: EGRW | Stock Exchange: NASDAQ |
| Annual
Fund Operating Expenses (ongoing expenses that you pay each year as a percentage of the value of your investments) | ||||||||||
| Management
Fees |
Distribution
and Service (12b-1) Fees |
Other
Expenses |
Total
Annual Fund Operating Expenses |
Fee Waiver | Total
Annual Fund Operating Expenses After Fee Waiver | |||||
| 0.68% | None | None | 0.68% | (0.19)% | 0.49% | |||||
| 1 Year | 3 Years | 5 Years | 10 Years | |||
| $50 | $198 | $360 | $829 |
Table of Contents
Table of Contents
Table of Contents
Table of Contents
Table of Contents
Table of Contents
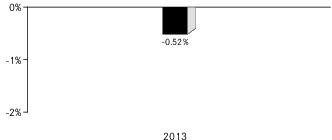
| 1 | The Fund’s year-to-date return as of September 30, 2014 was 1.47%. |
Table of Contents
| One Year | Since
Fund Inception | ||
| (Inception Date: 2/8/2012) | |||
| Return Before Taxes | -0.52% | 2.68% | |
| Return After Taxes on Distributions1 | -0.78% | 2.32% | |
| Return After Taxes on Distributions and Sale of Fund Shares1 | 0.00% | 2.19% | |
| MSCI Emerging Markets Growth Index (Index returns do not reflect deductions for fees, expenses or taxes) | -0.18% | 3.24% |
| 1 | After-tax returns in the table above are calculated using the historical highest individual U.S. federal marginal income tax rates and do not reflect the impact of state or local taxes. Actual after-tax returns depend on an investor’s tax situation and may differ from those shown, and after-tax returns shown are not relevant to tax-exempt investors or investors who hold shares through tax-deferred arrangements, such as 401(k) plans or individual retirement accounts (“IRAs”). Fund returns after taxes on distributions and sales of Fund shares are calculated assuming that an investor has sufficient capital gains of the same character from other investments to offset any capital losses from the sale of Fund shares. As a result, Fund returns after taxes on distributions and sales of Fund shares may exceed Fund returns before taxes and/or returns after taxes on distributions. |
Table of Contents
Table of Contents
Table of Contents
Table of Contents
Table of Contents
Table of Contents
Table of Contents
Table of Contents
Table of Contents
Table of Contents
| ■ | Lower levels of liquidity and market efficiency; |
| ■ | Greater securities price volatility; |
| ■ | Exchange rate fluctuations and exchange controls; |
| ■ | Less availability of public information about issuers; |
| ■ | Limitations on foreign ownership of securities; |
| ■ | Imposition of withholding or other taxes; |
| ■ | Imposition of restrictions on the expatriation of the funds or other assets of the Fund; |
| ■ | Higher transaction and custody costs and delays in settlement procedures; |
| ■ | Difficulties in enforcing contractual obligations; |
| ■ | Lower levels of regulation of the securities markets; |
| ■ | Weaker accounting, disclosure and reporting requirements; and |
| ■ | Legal principles relating to corporate governance, directors’ fiduciary duties and liabilities and stockholders’ rights in markets in which the Fund invests may differ and/or may not be as extensive or protective as those that apply in the United States. |
Table of Contents
Table of Contents
| ■ | The risk of delays in settling portfolio transactions and the risk of loss arising out of the system of share registration and custody used in Russia; |
| ■ | Risks in connection with the maintenance of the Fund’s portfolio securities and cash with foreign sub-custodians and securities depositories, including the risk that appropriate sub-custody arrangements will not be available to the Fund; |
| ■ | The risk that the Fund’s ownership rights in portfolio securities could be lost through fraud or negligence as a result of the fact that ownership in shares of Russian companies is recorded by the companies themselves and by registrars, rather than by a central registration system; and |
| ■ | The risk that the Fund may not be able to pursue claims on behalf of its shareholders because of the system of share registration and custody, and because Russian banking institutions and registrars are not guaranteed by the Russian government. |
Table of Contents
Table of Contents
Table of Contents
| ■ | where a non-resident investor has made any investment, directly or indirectly, in a foreign institutional investor (“FII”) which has invested in India; |
| ■ | investment by the non-resident investor in a fund or a fund pooling vehicle, which does not result in participation in control and management of the fund; or |
| ■ | where a non-resident investor along with its associates, does not have more than a 26% share in total capital of the company. |
Table of Contents
| ■ | creates rights, or obligations, which are not ordinarily created between persons dealing at arm's length; |
| ■ | results, directly or indirectly, in the misuse, or abuse, of the provisions of IT Act; |
| ■ | lacks commercial substance; or |
| ■ | is entered into, or carried out, by means, or in a manner, which are not ordinarily employed for bona fide purposes. |
| ■ | any arrangement where the aggregate tax benefit to all the parties of the arrangement in the relevant financial year does not exceed INR 30 Million; |
| ■ | FIIs that choose not to take any benefit under any tax treaty entered with India and has invested in listed or unlisted securities with prior permission of the competent authority in accordance with the applicable regulations; |
| ■ | non-resident investor in an FII who has invested in an FII, directly or indirectly, by way of an offshore derivative instrument or otherwise; or |
| ■ | any income derived from the transfer of investments made prior to August 30, 2010. |
Table of Contents
Table of Contents
| ■ | The risk of delays in settling portfolio transactions and the risk of loss arising out of the system of share registration and custody used in certain Eastern European countries; |
| ■ | Risks in connection with the maintenance of the Fund's portfolio securities and cash with foreign sub-custodians and securities depositories, including the risk that appropriate sub-custody arrangements will not be available to the Fund; |
| ■ | The risk that the Fund's ownership rights in portfolio securities could be lost through fraud or negligence as a result of the fact that ownership in shares of certain Eastern European companies is recorded by the companies themselves and by registrars, rather than a central registration system; |
| ■ | The risk that the Fund may not be able to pursue claims on behalf of its shareholders because of the system of share registration and custody, and because certain Eastern European banking institutions and registrars are not guaranteed by their respective governments; and |
Table of Contents
| ■ | Risks in connection with Eastern European countries' dependence on the economic health of Western European countries and the EU as a whole. |
Table of Contents
Table of Contents
Table of Contents
Table of Contents
Table of Contents
Table of Contents
Table of Contents
Table of Contents
Table of Contents
Table of Contents
| ■ | Dividend: Dividend income earned by the Subsidiary will not be subject to Indian tax. However, the Indian company declaring and paying such dividend would be subject to Dividend Distribution Tax at an effective rate of 20% (approx.) (effective starting October 1, 2014) on the amount of the dividend paid out. |
| ■ | Interest: Interest paid to the Subsidiary in respect of debt obligations of Indian issuers will be subject to Indian income tax. The tax rate in the case of a rupee-denominated debt obligation is 43.26%. However if the Subsidiary is a SEBI registered sub-account, interest income earned from June 1, 2013 to May 31, 2015 on rupee denominated bonds of Indian companies and Indian government securities will be subject to tax at the rate of 5.41%, provided that the rate of interest does not exceed the prescribed rates. In the case of a foreign-currency denominated debt obligation, the tax rate is 21.63%. For approved foreign-currency loans advanced from July 1, 2012 to June 30, 2017, the tax rate on interest is 5.41% and for approved foreign currency long-term bonds issued from October 1, 2014 to June 30, 2017, the tax rate on interest is 5.41%. However, if the Subsidiary is registered as a sub-account with SEBI, interest from securities will be subject to tax at the rate of 21.63%. |
| ■ | Securities Transaction Tax: Transactions involving the purchase or sale of shares or any other security traded on a recognized Indian stock exchange are subject to Securities Transaction Tax (“STT”). STT will be levied at the rate of 0.001% on the seller in case of actual delivery of the security and at the rate of 0.2% on the sale of unlisted shares in an initial public offering. This STT is not applicable to primary |
Table of Contents
| issuances of equity shares by a company or to off-market transactions. Hence, STT will be payable if the Subsidiary buys or sells listed securities on a recognized Indian stock exchange. | |
| ■ | Capital Gains: The taxation of capital gains would be as follows: (i) long-term capital gains (being gains on sale of shares held for a period of more than twelve months) listed on a recognized stock exchange would not be taxable in India provided STT has been paid on the same (as discussed above); (ii) short-term capital gains (being gains on sale of shares held for a period of twelve months or less) from the sale of Indian shares listed on a recognized stock exchange will be taxed at the rate of 16.223% provided STT has been paid on the same; (iii) long-term capital gains (being gains on sale of shares held for a period of more than 36 months) arising to the Subsidiary from the sale of unlisted securities will be taxed at the rate of 10.815% (without indexation) and short-term capital gains (being gains on sale of shares held for a period of 36 months or less) will be taxed at the rate of 43.26%;* (iv) capital gains realized on sale of listed equity shares not executed on a recognized stock exchange in India would be taxed at the rate of 21.63% for long-term gains (being gains on sale of shares held for a period of more than 12 months) and at 43.26% in the case of short-term gains (being gains on sale of shares held for a period of 12 months or less);* and (v) capital gains arising from the transfer of depositary receipts outside India between non-resident investors will not be subject to tax in India. |
| * | However, if the Subsidiary is a SEBI registered sub-account, the rates will be 10.816% and 32.45%, respectively. |
Table of Contents
| ■ | any arrangement where the aggregate tax benefit to all the parties of the arrangement in the relevant financial year does not exceed INR 30 Million; |
| ■ | FIIs that choose not to take any benefit under any tax treaty entered with India and has invested in listed or unlisted securities with prior permission of the competent authority in accordance with the applicable regulations; |
| ■ | non-resident investor in an FII who has invested in an FII, directly or indirectly, by way of an offshore derivative instrument or otherwise; or |
| ■ | any income derived from the transfer of investments made prior to August 30, 2010. |
Table of Contents
Table of Contents
| Approximate
Value of a Creation Unit |
Creation
Unit Size |
Standard
Creation/ Redemption Transaction Fee |
Maximum
Additional Charge for Creations* |
Maximum
Additional Charge for Redemptions* | ||||
| $2,762,500 | 50,000 | $14,500 | 3.0% | 2.0% |
| * | As a percentage of the net asset value per Creation Unit, inclusive, in the case of redemptions, of the standard redemption transaction fee. |
Table of Contents
(For a share outstanding throughout each period)
Table of Contents
| Year
ended Aug. 31, 2014 |
Year
ended Aug. 31, 2013 |
Period
from Feb. 8, 2012a to Aug. 31, 2012 | |||
| Net asset value, beginning of period | $50.26 | $50.60 | $ 54.24 | ||
| Income
from investment operations: | |||||
| Net investment incomeb | 0.81 | 0.85 | 0.66 | ||
| Net realized and unrealized gain (loss)c | 8.86 | 0.13 | (3.87) | ||
| Total from investment operations | 9.67 | 0.98 | (3.21) | ||
| Less distributions from: | |||||
| Net investment income | (0.75) | (1.32) | (0.43) | ||
| Total distributions | (0.75) | (1.32) | (0.43) | ||
| Net asset value, end of period | $ 59.18 | $50.26 | $ 50.60 | ||
| Total return | 19.36% | 1.76% | (5.90)% d | ||
| Ratios/Supplemental data: | |||||
| Net assets, end of period (000s) | $ 5,918 | $ 5,026 | $10,121 | ||
| Ratio of expenses to average net assetse | 0.49% | 0.49% | 0.49% | ||
| Ratio of expenses to average net assets prior to waived feese | 0.68% | 0.68% | 0.68% | ||
| Ratio of net investment income to average net assetse | 1.47% | 1.59% | 2.27% | ||
| Portfolio turnover ratef | 26% | 64% | 12% | ||
| a | Commencement of operations. |
| b | Based on average shares outstanding throughout each period. |
| c | The amounts reported for a share outstanding may not accord with the change in aggregate gains and losses in securities for the fiscal period due to the timing of capital share transactions in relation to the fluctuating market values of the Fund's underlying securities. |
| d | Not annualized. |
| e | Annualized for periods of less than one year. |
| f | Portfolio turnover rates exclude portfolio securities received or delivered in Creation Units but include portfolio transactions that are executed as a result of the Fund processing capital share transactions in Creation Units partially for cash in U.S. dollars. Excluding such cash transactions, the portfolio turnover rates for the years ended August 31, 2014, August 31, 2013 and the period ended August 31, 2012 were 26%, 28% and 12%, respectively. |
Table of Contents
Table of Contents
Table of Contents
| Premium/Discount Range | Number of Days | Percentage of Total Days | ||
| Greater than 3.5% | 1 | 0.23% | ||
| Greater than 3.0% and Less than 3.5% | 4 | 0.91 | ||
| Greater than 2.5% and Less than 3.0% | 23 | 5.23 | ||
| Greater than 2.0% and Less than 2.5% | 40 | 9.09 | ||
| Greater than 1.5% and Less than 2.0% | 38 | 8.64 | ||
| Greater than 1.0% and Less than 1.5% | 58 | 13.18 | ||
| Greater than 0.5% and Less than 1.0% | 55 | 12.50 | ||
| Between 0.5% and -0.5% | 170 | 38.63 | ||
| Less than -0.5% and Greater than -1.0% | 39 | 8.86 | ||
| Less than -1.0% and Greater than -1.5% | 10 | 2.27 | ||
| Less than -1.5% and Greater than -2.0% | 1 | 0.23 | ||
| Less than -2.0% and Greater than -2.5% | 1 | 0.23 | ||
| 440 | 100.00% |
Table of Contents
| Average Annual Total Returns | Cumulative Total Returns | |||||||
| NAV | MARKET | INDEX | NAV | MARKET | INDEX | |||
| 1 Year | 19.36% | 17.28% | 20.16% | 19.36% | 17.28% | 20.16% | ||
| Since Inception* | 5.35% | 5.20% | 6.11% | 14.29% | 13.87% | 16.39% | ||
| * | Total returns for the period since inception are calculated from the inception date of the Fund (2/8/12). The first day of secondary market trading in shares of the Fund was 2/9/12. |
Table of Contents
Table of Contents
Table of Contents
Table of Contents
Table of Contents
|
|
| Call: | 1-800-iShares
or 1-800-474-2737 (toll free) Monday through Friday, 8:30 a.m. to 6:30 p.m. (Eastern time) |
| Email: | iSharesETFs@blackrock.com |
| Write: | c/o
BlackRock Investments, LLC 1 University Square Drive, Princeton, NJ 08540 |

Table of Contents
| 2014 Prospectus |
|
| ► | iShares MSCI Emerging Markets Minimum Volatility ETF | EEMV | NYSE ARCA |
Table of Contents
Table of Contents
|
|
S-1 |
|
|
1 |
|
|
2 |
|
|
16 |
|
|
19 |
|
|
19 |
|
|
22 |
|
|
34 |
|
|
34 |
|
|
36 |
|
|
36 |
|
|
38 |
Table of Contents
Table of Contents
| Ticker: EEMV | Stock Exchange: NYSE Arca |
| Annual
Fund Operating Expenses (ongoing expenses that you pay each year as a percentage of the value of your investments) | ||||||||||||
| Management
Fees |
Distribution
and Service (12b-1) Fees |
Foreign
Taxes |
Other
Expenses |
Total
Annual Fund Operating Expenses |
Fee Waiver | Total
Annual Fund Operating Expenses After Fee Waiver | ||||||
| 0.67% | None | 0.00% | None | 0.67% | (0.42)% | 0.25% | ||||||
Table of Contents
| 1 Year | 3 Years | 5 Years | 10 Years | |||
| $26 | $172 | $332 | $795 |
Table of Contents
Table of Contents
Table of Contents
Table of Contents
Table of Contents
Table of Contents
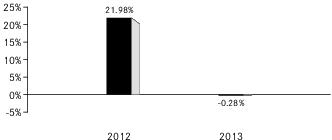
| 1 | The Fund’s year-to-date return as of September 30, 2014 was 4.43%. |
| One Year | Since
Fund Inception | ||
| (Inception Date: 10/18/2011) | |||
| Return Before Taxes | -0.28% | 10.47% | |
| Return After Taxes on Distributions2 | -0.89% | 9.91% | |
| Return After Taxes on Distributions and Sale of Fund Shares2 | 0.31% | 8.17% | |
| MSCI Emerging Markets Minimum Volatility (USD) Index (Index returns do not reflect deductions for fees, expenses or taxes) | -0.05% | 10.74% |
| 2 | After-tax returns in the table above are calculated using the historical highest individual U.S. federal marginal income tax rates and do not reflect the impact of state or local taxes. Actual after-tax returns depend on an investor’s tax situation and may differ from those shown, and after-tax returns shown are not relevant to tax-exempt investors or investors who hold shares through tax-deferred arrangements, such as 401(k) plans or individual retirement accounts (“IRAs”). Fund returns after taxes on distributions and sales of Fund shares are calculated assuming that an investor has sufficient capital gains of the same character from other investments to offset any capital losses from the sale of Fund shares. As a result, Fund returns after taxes on distributions and sales of Fund shares may exceed Fund returns before taxes and/or returns after taxes on distributions. |
Table of Contents
Table of Contents
Table of Contents
Table of Contents
Table of Contents
Table of Contents
Table of Contents
Table of Contents
Table of Contents
| ■ | Lower levels of liquidity and market efficiency; |
| ■ | Greater securities price volatility; |
Table of Contents
| ■ | Exchange rate fluctuations and exchange controls; |
| ■ | Less availability of public information about issuers; |
| ■ | Limitations on foreign ownership of securities; |
| ■ | Imposition of withholding or other taxes; |
| ■ | Imposition of restrictions on the expatriation of the funds or other assets of the Fund; |
| ■ | Higher transaction and custody costs and delays in settlement procedures; |
| ■ | Difficulties in enforcing contractual obligations; |
| ■ | Lower levels of regulation of the securities markets; |
| ■ | Weaker accounting, disclosure and reporting requirements; and |
| ■ | Legal principles relating to corporate governance, directors’ fiduciary duties and liabilities and stockholders’ rights in markets in which the Fund invests may differ and/or may not be as extensive or protective as those that apply in the United States. |
Table of Contents
Table of Contents
| ■ | The risk of delays in settling portfolio transactions and the risk of loss arising out of the system of share registration and custody used in Russia; |
| ■ | Risks in connection with the maintenance of the Fund’s portfolio securities and cash |
Table of Contents
| ■ | The risk that the Fund’s ownership rights in portfolio securities could be lost through fraud or negligence as a result of the fact that ownership in shares of Russian companies is recorded by the companies themselves and by registrars, rather than by a central registration system; and |
| ■ | The risk that the Fund may not be able to pursue claims on behalf of its shareholders because of the system of share registration and custody, and because Russian banking institutions and registrars are not guaranteed by the Russian government. |
Table of Contents
Table of Contents
Tracking Error Risk. Tracking error is the divergence of the Fund’s performance from that of the Underlying Index. Tracking error may occur because of differences between the securities held in the Fund’s portfolio and those included in the Underlying Index, pricing differences (including differences between a security’s price at the local market close and the intrinsic value of a security at the time of calculation of the NAV), transaction costs, the Fund holding uninvested cash, differences in timing of the accrual of dividends, changes to the Underlying Index or the costs of complying with various new or existing regulatory requirements. This risk may be heightened during times of increased market volatility or other unusual market conditions. Tracking error also may result because the Fund incurs fees and expenses, while the Underlying Index does not. FUNDS THAT TRACK INDICES WITH SIGNIFICANT WEIGHT IN EMERGING MARKETS ISSUERS MAY EXPERIENCE HIGHER TRACKING ERROR THAN OTHER INDEX ETFs THAT DO NOT TRACK SUCH INDICES.
Table of Contents
| ■ | where a non-resident investor has made any investment, directly or indirectly, in a foreign institutional investor (“FII”) which has invested in India; |
| ■ | investment by the non-resident investor in a fund or a fund pooling vehicle, which does not result in participation in control and management of the fund; or |
| ■ | where a non-resident investor along with its associates, does not have more than a 26% share in total capital of the company. |
Table of Contents
| ■ | creates rights, or obligations, which are not ordinarily created between persons dealing at arm's length; |
| ■ | results, directly or indirectly, in the misuse, or abuse, of the provisions of IT Act; |
| ■ | lacks commercial substance; or |
| ■ | is entered into, or carried out, by means, or in a manner, which are not ordinarily employed for bona fide purposes. |
| ■ | any arrangement where the aggregate tax benefit to all the parties of the arrangement in the relevant financial year does not exceed INR 30 Million; |
| ■ | FIIs that choose not to take any benefit under any tax treaty entered with India and has invested in listed or unlisted securities with prior permission of the competent authority in accordance with the applicable regulations; |
| ■ | non-resident investor in an FII who has invested in an FII, directly or indirectly, by way of an offshore derivative instrument or otherwise; or |
| ■ | any income derived from the transfer of investments made prior to August 30, 2010. |
Table of Contents
Table of Contents
Table of Contents
Table of Contents
Table of Contents
Table of Contents
Table of Contents
Table of Contents
Table of Contents
Table of Contents
Table of Contents
Table of Contents
Table of Contents
Table of Contents
| ■ | Dividend: Dividend income earned by the Subsidiary will not be subject to Indian tax. However, the Indian company declaring and paying such dividend would be subject to Dividend Distribution Tax at an effective rate of 20% (approx.) (effective starting October 1, 2014) on the amount of the dividend paid out. |
| ■ | Interest: Interest paid to the Subsidiary in respect of debt obligations of Indian issuers will be subject to Indian income tax. The tax rate in the case of a rupee-denominated debt obligation is 43.26%. However if the Subsidiary is a SEBI registered sub-account, interest income earned from June 1, 2013 to May 31, 2015 on rupee denominated bonds of Indian companies and Indian government securities will be subject to tax at the rate of 5.41%, provided that the rate of interest does not exceed the prescribed rates. In the case of a foreign-currency denominated debt obligation, the tax rate is 21.63%. For approved foreign-currency loans advanced from July 1, 2012 to June 30, 2017, the tax rate on interest is 5.41% and for approved foreign currency long-term bonds issued from October 1, 2014 to June 30, 2017, the tax rate on interest is 5.41%. However, if the Subsidiary is registered as a sub-account with SEBI, interest from securities will be subject to tax at the rate of 21.63%. |
| ■ | Securities Transaction Tax: Transactions involving the purchase or sale of shares or any other security traded on a recognized Indian stock exchange are subject to Securities Transaction Tax (“STT”). STT will be levied at the rate of 0.001% on the seller in case of actual delivery of the security and at the rate of 0.2% on the sale of unlisted shares in an initial public offering. This STT is not applicable to primary issuances of equity shares by a company or to off-market transactions. Hence, STT will be payable if the Subsidiary buys or sells listed securities on a recognized Indian stock exchange. |
| ■ | Capital Gains: The taxation of capital gains would be as follows: (i) long-term capital gains (being gains on sale of shares held for a period of more than twelve months) listed on a recognized stock exchange would not be taxable in India provided STT has been paid on the same (as discussed above); (ii) short-term capital gains (being gains on sale of shares held for a period of twelve months or less) from the sale of |
Table of Contents
| * | However, if the Subsidiary is a SEBI registered sub-account, the rates will be 10.816% and 32.45%, respectively. |
| ■ | any arrangement where the aggregate tax benefit to all the parties of the arrangement in the relevant financial year does not exceed INR 30 Million; |
| ■ | FIIs that choose not to take any benefit under any tax treaty entered with India and |
Table of Contents
| ■ | non-resident investor in an FII who has invested in an FII, directly or indirectly, by way of an offshore derivative instrument or otherwise; or |
| ■ | any income derived from the transfer of investments made prior to August 30, 2010. |
Table of Contents
Table of Contents
| Approximate
Value of a Creation Unit |
Creation
Unit Size |
Standard
Creation/ Redemption Transaction Fee |
Maximum
Additional Charge for Creations* |
Maximum
Additional Charge for Redemptions* | ||||
| $5,980,000 | 100,000 | $6,100 | 3.0% | 2.0% |
| * | As a percentage of the net asset value per Creation Unit, inclusive, in the case of redemptions, of the standard redemption transaction fee. |
Table of Contents
(For a share outstanding throughout each period)
Table of Contents
| Year
ended Aug. 31, 2014 |
Year
ended Aug. 31, 2013 |
Period
from Oct. 18, 2011a to Aug. 31, 2012 | |||
| Net asset value, beginning of period | $ 55.56 | $ 55.32 | $ 49.30 | ||
| Income
from investment operations: | |||||
| Net investment incomeb | 1.51 | 1.85 | 1.93 | ||
| Net realized and unrealized gain (loss)c | 6.94 | (0.60) | 5.41 | ||
| Total from investment operations | 8.45 | 1.25 | 7.34 | ||
| Less distributions from: | |||||
| Net investment income | (1.54) | (1.01) | (1.32) | ||
| Total distributions | (1.54) | (1.01) | (1.32) | ||
| Net asset value, end of period | $ 62.47 | $ 55.56 | $ 55.32 | ||
| Total return | 15.44% | 2.22% | 15.16% d | ||
| Ratios/Supplemental data: | |||||
| Net assets, end of period (000s) | $2,080,363 | $2,455,727 | $387,227 | ||
| Ratio of expenses to average net assetse | 0.25% | 0.25% | 0.25% | ||
| Ratio of expenses to average net assets prior to waived feese | 0.67% | 0.67% | 0.69% | ||
| Ratio of net investment income to average net assetse | 2.58% | 3.13% | 4.08% | ||
| Portfolio turnover ratef | 34% | 23% | 31% | ||
| a | Commencement of operations. |
| b | Based on average shares outstanding throughout each period. |
| c | The amounts reported for a share outstanding may not accord with the change in aggregate gains and losses in securities for the fiscal period due to the timing of capital share transactions in relation to the fluctuating market values of the Fund's underlying securities. |
| d | Not annualized. |
| e | Annualized for periods of less than one year. |
| f | Portfolio turnover rates exclude portfolio securities received or delivered in Creation Units but include portfolio transactions that are executed as a result of the Fund processing capital share transactions in Creation Units partially for cash in U.S. dollars. Excluding such cash transactions, the portfolio turnover rates for the years ended August 31, 2014, August 31, 2013 and the period ended August 31, 2012 were 26%, 23% and 16%, respectively. |
Table of Contents
Table of Contents
Table of Contents
| Premium/Discount Range | Number of Days | Percentage of Total Days | ||
| Greater than 2.5% | 1 | 0.23% | ||
| Greater than 2.0% and Less than 2.5% | 1 | 0.23 | ||
| Greater than 1.5% and Less than 2.0% | 2 | 0.45 | ||
| Greater than 1.0% and Less than 1.5% | 8 | 1.82 | ||
| Greater than 0.5% and Less than 1.0% | 64 | 14.55 | ||
| Between 0.5% and -0.5% | 286 | 64.99 | ||
| Less than -0.5% and Greater than -1.0% | 54 | 12.27 | ||
| Less than -1.0% and Greater than -1.5% | 17 | 3.86 | ||
| Less than -1.5% and Greater than -2.0% | 5 | 1.14 | ||
| Less than -2.0% and Greater than -2.5% | 1 | 0.23 | ||
| Less than -2.5% and Greater than -3.0% | 1 | 0.23 | ||
| 440 | 100.00% |
Table of Contents
| Average Annual Total Returns | Cumulative Total Returns | |||||||
| NAV | MARKET | INDEX | NAV | MARKET | INDEX | |||
| 1 Year | 15.44% | 16.73% | 15.63% | 15.44% | 16.73% | 15.63% | ||
| Since Inception* | 11.27% | 11.34% | 11.54% | 35.89% | 36.14% | 36.79% | ||
| * | Total returns for the period since inception are calculated from the inception date of the Fund (10/18/11). The first day of secondary market trading in shares of the Fund was 10/20/11. |
Table of Contents
Table of Contents
Table of Contents
|
|
| Call: | 1-800-iShares
or 1-800-474-2737 (toll free) Monday through Friday, 8:30 a.m. to 6:30 p.m. (Eastern time) |
| Email: | iSharesETFs@blackrock.com |
| Write: | c/o
BlackRock Investments, LLC 1 University Square Drive, Princeton, NJ 08540 |

Table of Contents
| 2014 Prospectus |
|
| ► | iShares MSCI Emerging Markets Small-Cap ETF | EEMS | NYSE ARCA |
Table of Contents
Table of Contents
|
|
S-1 |
|
|
1 |
|
|
2 |
|
|
15 |
|
|
18 |
|
|
18 |
|
|
21 |
|
|
32 |
|
|
33 |
|
|
34 |
|
|
34 |
|
|
36 |
Table of Contents
Table of Contents
| Ticker: EEMS | Stock Exchange: NYSE Arca |
| Annual
Fund Operating Expenses (ongoing expenses that you pay each year as a percentage of the value of your investments) | ||||||
| Management
Fees |
Distribution
and Service (12b-1) Fees |
Other
Expenses |
Total
Annual Fund Operating Expenses | |||
| 0.67% | None | None | 0.67% | |||
| 1 Year | 3 Years | 5 Years | 10 Years | |||
| $68 | $214 | $373 | $835 |
Table of Contents
Table of Contents
Table of Contents
Table of Contents
Table of Contents
Table of Contents
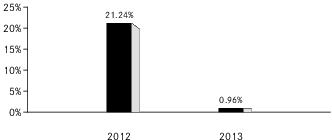
| 1 | The Fund’s year-to-date return as of September 30, 2014 was 5.94%. |
Table of Contents
| One Year | Since
Fund Inception | ||
| (Inception Date: 8/16/2011) | |||
| Return Before Taxes | 0.96% | 0.02% | |
| Return After Taxes on Distributions1 | 0.33% | -0.78% | |
| Return After Taxes on Distributions and Sale of Fund Shares1 | 0.86% | -0.01% | |
| MSCI Emerging Markets Small Cap Index (Index returns do not reflect deductions for fees, expenses or taxes) | 1.04% | 0.55% |
| 1 | After-tax returns in the table above are calculated using the historical highest individual U.S. federal marginal income tax rates and do not reflect the impact of state or local taxes. Actual after-tax returns depend on an investor’s tax situation and may differ from those shown, and after-tax returns shown are not relevant to tax-exempt investors or investors who hold shares through tax-deferred arrangements, such as 401(k) plans or individual retirement accounts (“IRAs”). Fund returns after taxes on distributions and sales of Fund shares are calculated assuming that an investor has sufficient capital gains of the same character from other investments to offset any capital losses from the sale of Fund shares. As a result, Fund returns after taxes on distributions and sales of Fund shares may exceed Fund returns before taxes and/or returns after taxes on distributions. |
Table of Contents
Table of Contents
Table of Contents
Table of Contents
Table of Contents
Table of Contents
Table of Contents
Table of Contents
Table of Contents
Table of Contents
| ■ | Lower levels of liquidity and market efficiency; |
| ■ | Greater securities price volatility; |
| ■ | Exchange rate fluctuations and exchange controls; |
| ■ | Less availability of public information about issuers; |
| ■ | Limitations on foreign ownership of securities; |
| ■ | Imposition of withholding or other taxes; |
| ■ | Imposition of restrictions on the expatriation of the funds or other assets of the Fund; |
| ■ | Higher transaction and custody costs and delays in settlement procedures; |
| ■ | Difficulties in enforcing contractual obligations; |
| ■ | Lower levels of regulation of the securities markets; |
| ■ | Weaker accounting, disclosure and reporting requirements; and |
| ■ | Legal principles relating to corporate governance, directors’ fiduciary duties and liabilities and stockholders’ rights in markets in which the Fund invests may differ and/or may not be as extensive or protective as those that apply in the United States. |
Table of Contents
Table of Contents
| ■ | The risk of delays in settling portfolio transactions and the risk of loss arising out of the system of share registration and custody used in Russia; |
| ■ | Risks in connection with the maintenance of the Fund’s portfolio securities and cash with foreign sub-custodians and securities depositories, including the risk that appropriate sub-custody arrangements will not be available to the Fund; |
| ■ | The risk that the Fund’s ownership rights in portfolio securities could be lost through fraud or negligence as a result of the fact that ownership in shares of Russian companies is recorded by the companies themselves and by registrars, rather than by a central registration system; and |
| ■ | The risk that the Fund may not be able to pursue claims on behalf of its shareholders because of the system of share registration and custody, and because Russian banking institutions and registrars are not guaranteed by the Russian government. |
Table of Contents
Table of Contents
Table of Contents
| ■ | where a non-resident investor has made any investment, directly or indirectly, in a foreign institutional investor (“FII”) which has invested in India; |
| ■ | investment by the non-resident investor in a fund or a fund pooling vehicle, which does not result in participation in control and management of the fund; or |
| ■ | where a non-resident investor along with its associates, does not have more than a 26% share in total capital of the company. |
Table of Contents
| ■ | creates rights, or obligations, which are not ordinarily created between persons dealing at arm's length; |
| ■ | results, directly or indirectly, in the misuse, or abuse, of the provisions of IT Act; |
| ■ | lacks commercial substance; or |
| ■ | is entered into, or carried out, by means, or in a manner, which are not ordinarily employed for bona fide purposes. |
| ■ | any arrangement where the aggregate tax benefit to all the parties of the arrangement in the relevant financial year does not exceed INR 30 Million; |
| ■ | FIIs that choose not to take any benefit under any tax treaty entered with India and has invested in listed or unlisted securities with prior permission of the competent authority in accordance with the applicable regulations; |
| ■ | non-resident investor in an FII who has invested in an FII, directly or indirectly, by way of an offshore derivative instrument or otherwise; or |
| ■ | any income derived from the transfer of investments made prior to August 30, 2010. |
Table of Contents
Table of Contents
Table of Contents
Table of Contents
Table of Contents
Table of Contents
Table of Contents
Table of Contents
Table of Contents
Table of Contents
Table of Contents
Table of Contents
Table of Contents
Table of Contents
| ■ | Dividend: Dividend income earned by the Subsidiary will not be subject to Indian tax. However, the Indian company declaring and paying such dividend would be subject to Dividend Distribution Tax at an effective rate of 20% (approx.) (effective starting October 1, 2014) on the amount of the dividend paid out. |
| ■ | Interest: Interest paid to the Subsidiary in respect of debt obligations of Indian issuers will be subject to Indian income tax. The tax rate in the case of a rupee-denominated debt obligation is 43.26%. However if the Subsidiary is a SEBI registered sub-account, interest income earned from June 1, 2013 to May 31, 2015 on rupee denominated bonds of Indian companies and Indian government securities will be subject to tax at the rate of 5.41%, provided that the rate of interest does not exceed the prescribed rates. In the case of a foreign-currency denominated debt obligation, the tax rate is 21.63%. For approved foreign-currency loans advanced from July 1, 2012 to June 30, 2017, the tax rate on interest is 5.41% and for approved foreign currency long-term bonds issued from October 1, 2014 to June 30, 2017, the tax rate on interest is 5.41%. However, if the Subsidiary is registered as a sub-account with SEBI, interest from securities will be subject to tax at the rate of 21.63%. |
| ■ | Securities Transaction Tax: Transactions involving the purchase or sale of shares or any other security traded on a recognized Indian stock exchange are subject to Securities Transaction Tax (“STT”). STT will be levied at the rate of 0.001% on the seller in case of actual delivery of the security and at the rate of 0.2% on the sale of unlisted shares in an initial public offering. This STT is not applicable to primary issuances of equity shares by a company or to off-market transactions. Hence, STT will be payable if the Subsidiary buys or sells listed securities on a recognized Indian stock exchange. |
| ■ | Capital Gains: The taxation of capital gains would be as follows: (i) long-term capital gains (being gains on sale of shares held for a period of more than twelve months) listed on a recognized stock exchange would not be taxable in India provided STT has been paid on the same (as discussed above); (ii) short-term capital gains (being gains on sale of shares held for a period of twelve months or less) from the sale of Indian shares listed on a recognized stock exchange will be taxed at the rate of 16.223% provided STT has been paid on the same; (iii) long-term capital gains (being gains on sale of shares held for a period of more than 36 months) arising to the Subsidiary from the sale of unlisted securities will be taxed at the rate of 10.815% (without indexation) and short-term capital gains (being gains on sale of shares held for a period of 36 months or less) will be taxed at the rate of 43.26%;* (iv) capital gains realized on sale of listed equity shares not executed on a recognized stock exchange in India would be taxed at the rate of 21.63% for long-term gains (being gains on sale of shares held for a period of more than 12 months) and at 43.26% in |
Table of Contents
| * | However, if the Subsidiary is a SEBI registered sub-account, the rates will be 10.816% and 32.45%, respectively. |
| ■ | any arrangement where the aggregate tax benefit to all the parties of the arrangement in the relevant financial year does not exceed INR 30 Million; |
| ■ | FIIs that choose not to take any benefit under any tax treaty entered with India and has invested in listed or unlisted securities with prior permission of the competent authority in accordance with the applicable regulations; |
| ■ | non-resident investor in an FII who has invested in an FII, directly or indirectly, by way of an offshore derivative instrument or otherwise; or |
| ■ | any income derived from the transfer of investments made prior to August 30, 2010. |
Table of Contents
Table of Contents
| Approximate
Value of a Creation Unit |
Creation
Unit Size |
Standard
Creation/ Redemption Transaction Fee |
Maximum
Additional Charge for Creations* |
Maximum
Additional Charge for Redemptions* | ||||
| $2,451,000 | 50,000 | $15,000 | 3.0% | 2.0% |
| * | As a percentage of the net asset value per Creation Unit, inclusive, in the case of redemptions, of the standard redemption transaction fee. |
Table of Contents
Table of Contents
(For a share outstanding throughout each period)
| Year
ended Aug. 31, 2014 |
Year
ended Aug. 31, 2013 |
Year
ended Aug. 31, 2012 |
Period
from Aug. 16, 2011a to Aug. 31, 2011 | ||||
| Net asset value, beginning of period | $ 43.78 | $ 43.44 | $ 49.60 | $ 50.54 | |||
| Income
from investment operations: | |||||||
| Net investment incomeb | 0.93 | 1.07 | 0.50 | 0.07 | |||
| Net realized and unrealized gain (loss)c | 7.67 | 1.13 | (5.52) | (1.01) | |||
| Total from investment operations | 8.60 | 2.20 | (5.02) | (0.94) | |||
| Less distributions from: | |||||||
| Net investment income | (1.01) | (1.86) | (1.14) | − | |||
| Total distributions | (1.01) | (1.86) | (1.14) | − | |||
| Net asset value, end of period | $ 51.37 | $ 43.78 | $43.44 | $ 49.60 | |||
| Total return | 19.92% e | 4.85% | (9.98)% | (1.86)% d | |||
| Ratios/Supplemental data: | |||||||
| Net assets, end of period (000s) | $43,666 | $30,644 | $ 8,689 | $69,443 | |||
| Ratio of expenses to average net assetsf | 0.67% | 0.67% | 0.69% | 0.69% | |||
| Ratio of net investment income to average net assetsf | 1.93% | 2.26% | 1.13% | 3.33% | |||
| Portfolio turnover rateg | 20% | 21% | 32% | 2% | |||
| a | Commencement of operations. |
| b | Based on average shares outstanding throughout each period. |
| c | The amounts reported for a share outstanding may not accord with the change in aggregate gains and losses in securities for the fiscal period due to the timing of capital share transactions in relation to the fluctuating market values of the Fund's underlying securities. |
| d | Not annualized. |
| e | Includes payment from an affiliate. Not including these proceeds, the Fund’s total return would have been 19.73%. |
| f | Annualized for periods of less than one year. |
| g | Portfolio turnover rates exclude portfolio securities received or delivered in Creation Units but include portfolio transactions that are executed as a result of the Fund processing capital share transactions in Creation Units partially for cash in U.S. dollars. Excluding such cash transactions, the portfolio turnover rates for the years ended August 31, 2014, August 31, 2013, August 31, 2012 and the period ended August 31, 2011 were 20%, 21%, 17% and 2%, respectively. |
Table of Contents
Table of Contents
Table of Contents
| Premium/Discount Range | Number of Days | Percentage of Total Days | ||
| Greater than 5.5% | 1 | 0.23% | ||
| Greater than 5.0% and Less than 5.5% | 1 | 0.23 | ||
| Greater than 4.5% and Less than 5.0% | 1 | 0.23 | ||
| Greater than 4.0% and Less than 4.5% | 1 | 0.23 | ||
| Greater than 3.5% and Less than 4.0% | 2 | 0.45 | ||
| Greater than 3.0% and Less than 3.5% | 2 | 0.45 | ||
| Greater than 2.5% and Less than 3.0% | 2 | 0.45 | ||
| Greater than 2.0% and Less than 2.5% | 11 | 2.50 | ||
| Greater than 1.5% and Less than 2.0% | 20 | 4.55 | ||
| Greater than 1.0% and Less than 1.5% | 40 | 9.09 | ||
| Greater than 0.5% and Less than 1.0% | 103 | 23.41 | ||
| Between 0.5% and -0.5% | 211 | 47.94 | ||
| Less than -0.5% and Greater than -1.0% | 31 | 7.05 | ||
| Less than -1.0% and Greater than -1.5% | 8 | 1.82 | ||
| Less than -1.5% and Greater than -2.0% | 4 | 0.91 | ||
| Less than -2.0% and Greater than -2.5% | 1 | 0.23 | ||
| Less than -2.5% and Greater than -3.0% | 1 | 0.23 | ||
| 440 | 100.00% |
Table of Contents
| Average Annual Total Returns | Cumulative Total Returns | |||||||
| NAV | MARKET | INDEX | NAV | MARKET | INDEX | |||
| 1 Year | 19.92% | 21.48% | 21.14% | 19.92% | 21.48% | 21.14% | ||
| Since Inception* | 3.51% | 3.63% | 4.35% | 11.08% | 11.46% | 13.83% | ||
| * | Total returns for the period since inception are calculated from the inception date of the Fund (8/16/11). The first day of secondary market trading in shares of the Fund was 8/18/11. |
Table of Contents
Table of Contents
Table of Contents
Table of Contents
Table of Contents
|
|
| Call: | 1-800-iShares
or 1-800-474-2737 (toll free) Monday through Friday, 8:30 a.m. to 6:30 p.m. (Eastern time) |
| Email: | iSharesETFs@blackrock.com |
| Write: | c/o
BlackRock Investments, LLC 1 University Square Drive, Princeton, NJ 08540 |
