Table of Contents
September 1, 2014
(as revised January 2, 2015)
| 2014 Prospectus |
 |
| ► | iShares Asia/Pacific Dividend ETF | DVYA | NYSE ARCA |
The Securities and Exchange Commission
(“SEC”) has not approved or disapproved these securities or passed upon the adequacy of this prospectus. Any representation to the contrary is a criminal offense.
Table of Contents
Table of Contents
Table of Contents
|
|
S-1 |
|
|
1 |
|
|
2 |
|
|
9 |
|
|
10 |
|
|
10 |
|
|
13 |
|
|
22 |
|
|
24 |
|
|
25 |
|
|
27 |
|
|
28 |
S&P®
is a registered trademark of Standard & Poor’s Financial Services LLC (“SPFS”); Dow Jones® is a registered trademark of Dow Jones Trademark Holdings LLC
(“Dow Jones”). These trademarks have been licensed for use by S&P Dow Jones Indices LLC, a subsidiary of McGraw Hill Financial, Inc. (“SPDJI”) and its subsidiaries and sublicensed for certain purposes by BlackRock Fund
Advisors and/or its affiliates. The Dow Jones Asia/Pacific Select Dividend 30TM Index (the “Underlying Index”) is a product of SPDJI and has been licensed for use by BlackRock
Fund Advisors and its affiliates. iShares® and BlackRock® are registered trademarks of BlackRock Fund Advisors and its
affiliates. The Fund is not sponsored, endorsed, sold or promoted by SPDJI, SPFS, Dow Jones, their respective affiliates or their third party licensors and none of such parties makes any representation regarding the advisability of investing in such
product(s) nor do they have any liability for any errors, omissions, or interruptions of the Underlying Index.
i
Table of Contents
[THIS PAGE INTENTIONALLY LEFT BLANK]
Table of Contents
iSHARES® ASIA/PACIFIC
DIVIDEND ETF
| Ticker: DVYA | Stock Exchange: NYSE Arca |
Investment Objective
The iShares Asia/Pacific Dividend ETF (the “Fund”)
seeks to track the investment results of an index composed of relatively high dividend paying equities in Asia/Pacific developed markets.
Fees and Expenses
The following table describes the fees and expenses that you
will incur if you own shares of the Fund. The investment advisory agreement between iShares, Inc. (the “Company”) and BlackRock Fund Advisors (“BFA”) (formerly, Barclays Global Fund Advisors (“BGFA”)) (the
“Investment Advisory Agreement”) provides that BFA will pay all operating expenses of the Fund, except interest expenses, taxes, brokerage expenses, future distribution fees or expenses, and extraordinary expenses.
You may also incur usual and customary brokerage commissions
when buying or selling shares of the Fund, which are not reflected in the Example that follows:
| Annual
Fund Operating Expenses (ongoing expenses that you pay each year as a percentage of the value of your investments) | ||||||
| Management
Fees |
Distribution
and Service (12b-1) Fees |
Other
Expenses |
Total
Annual Fund Operating Expenses | |||
| 0.49% | None | None | 0.49% | |||
Example. This Example is intended to help you compare the cost of owning shares of the Fund with the cost of investing in other funds. The Example assumes that you invest $10,000 in the Fund for the time periods indicated and
then sell all of your shares at the end of those periods. The Example also assumes that your investment has a 5% return each year and that the Fund’s operating expenses remain the same. Although your actual costs may be higher or lower, based
on these assumptions, your costs would be:
| 1 Year | 3 Years | 5 Years | 10 Years | |||
| $50 | $157 | $274 | $616 |
S-1
Table of Contents
S-2
Table of Contents
S-3
Table of Contents
S-4
Table of Contents
S-5
Table of Contents
S-6
Table of Contents
Performance Information
The bar chart and table that follow show how the Fund has
performed on a calendar year basis and provide an indication of the risks of investing in the Fund. Both assume that all dividends and distributions have been reinvested in the Fund. Past performance (before and after taxes) does not necessarily
indicate how the Fund will perform in the future. Supplemental information about the Fund’s performance is shown under the heading Total Return Information in the
Supplemental Information section of the Fund's prospectus (the “Prospectus”).
Year by Year Returns1 (Year Ended December 31)
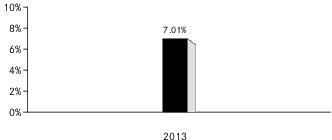
| 1 | The Fund’s total return for the six months ended June 30, 2014 was 10.34%. |
The best calendar quarter return during the period shown above
was 10.08% in the 1st quarter of 2013; the worst was -8.12% in the 2nd quarter of 2013.
Updated performance information is available at www.iShares.com
or by calling 1-800-iShares (1-800-474-2737) (toll free).
Average Annual Total Returns
(for the periods ended December 31, 2013)
| One Year | Since
Fund Inception | ||
| (Inception Date: 2/23/2012) | |||
| Return Before Taxes | 7.01% | 8.52% | |
| Return After Taxes on Distributions2 | 5.31% | 7.03% | |
| Return After Taxes on Distributions and Sale of Fund Shares2 | 4.80% | 6.45% | |
| Dow Jones Asia / Pacific Select Dividend 30 Index (Index returns do not reflect deductions for fees, expenses, or taxes) | 7.36% | 9.04% |
| 2 | After-tax returns in the table above are calculated using the historical highest individual U.S. federal marginal income tax rates and do not reflect the impact of state or local taxes. Actual after-tax returns depend on an investor’s tax situation and may differ from those shown, and after-tax returns shown are not relevant to tax-exempt investors or investors who hold shares through tax-deferred arrangements, such as 401(k) plans or individual retirement accounts (“IRAs”). Fund returns after taxes on distributions and sales of Fund shares are calculated assuming that an investor has sufficient capital gains of the same character from other investments to offset any capital losses from the sale of Fund shares. As a result, Fund returns after taxes on distributions and sales of Fund shares may exceed Fund returns before taxes and/or returns after taxes on distributions. |
S-7
Table of Contents
S-8
Table of Contents
More Information About the Fund
This Prospectus contains important information about investing
in the Fund. Please read this Prospectus carefully before you make any investment decisions. Additional information regarding the Fund is available at www.iShares.com.
BFA is the investment adviser to the Fund. Shares of the Fund
are listed for trading on NYSE Arca, Inc. (“NYSE Arca”). The market price for a share of the Fund may be different from the Fund’s most recent NAV.
ETFs are funds that trade like other publicly traded
securities. The Fund is designed to track an index. Similar to shares of an index mutual fund, each share of the Fund represents a partial ownership in an underlying portfolio of securities intended to track a market index. Unlike shares of a mutual
fund, which can be bought and redeemed from the issuing fund by all shareholders at a price based on NAV, shares of the Fund may be purchased or redeemed directly from the Fund at NAV solely by Authorized Participants (as defined in the Creations and Redemptions section of this Prospectus). Also unlike shares of a mutual fund, shares of the Fund are listed on a national securities exchange and trade in the secondary market at market prices that
change throughout the day.
The Fund invests in a
particular segment of the securities markets and seeks to track the performance of a securities index that generally is not representative of the market as a whole. The Fund is designed to be used as part of broader asset allocation strategies.
Accordingly, an investment in the Fund should not constitute a complete investment program.
An index is a theoretical financial calculation while the Fund
is an actual investment portfolio. The performance of the Fund and the Underlying Index may vary due to transaction costs, non-U.S. currency valuations, asset valuations, corporate actions (such as mergers and spin-offs), timing variances and
differences between the Fund’s portfolio and the Underlying Index resulting from legal restrictions (such as diversification requirements) that apply to the Fund but not to the Underlying Index or to the use of representative sampling.
“Tracking error” is the divergence of the performance (return) of the Fund's portfolio from that of the Underlying Index. BFA expects that, over time, the Fund’s tracking error will not exceed 5%. Because the Fund uses a
representative sampling indexing strategy, it can be expected to have a larger tracking error than if it used a replication indexing strategy. “Replication” is an indexing strategy in which a fund invests in substantially all of the
securities in its underlying index in approximately the same proportions as in the underlying index.
An investment in the Fund is not a bank deposit and it is not
insured or guaranteed by the Federal Deposit Insurance Corporation or any other government agency, BFA or any of its affiliates.
The Fund's investment objective and the Underlying Index may be
changed without shareholder approval.
1
Table of Contents
A Further Discussion of Principal Risks
The Fund is subject to various risks, including the principal
risks noted below, any of which may adversely affect the Fund’s NAV, trading price, yield, total return and ability to meet its investment objective. You could lose all or part of your investment in the Fund, and the Fund could underperform
other investments.
Asian Economic Risk. Many Asian economies have experienced rapid growth and industrialization in recent years, but there is no assurance that this growth rate will be maintained. Other Asian economies, however, have experienced high
inflation, high unemployment, currency devaluations and restrictions, and over-extension of credit. During the recent global recession, many of the export-driven Asian economies experienced the effects of the economic slowdown in the United States
and Europe, and certain Asian governments implemented stimulus plans, low-rate monetary policies and currency devaluations. Economic events in any one Asian country may have a significant economic effect on the entire Asian region, as well as on
major trading partners outside Asia. Any adverse event in the Asian markets may have a significant adverse effect on some or all of the economies of the countries in which the Fund invests. Many Asian countries are subject to political risk,
including corruption and regional conflict with neighboring countries. In addition, many Asian countries are subject to social and labor risks associated with demands for improved political, economic and social conditions. These risks, among others,
may adversely affect the value of the Fund’s investments.
Asset Class Risk. The
securities in the Underlying Index or in the Fund’s portfolio may underperform the returns of other securities or indexes that track other countries, groups of countries, regions, industries, groups of industries, markets, asset classes or
sectors. Various types of securities or indexes tend to experience cycles of outperformance and underperformance in comparison to the general securities markets.
Australasian Economic Risk. The
economies of Australasia, which include Australia and New Zealand, are dependent on exports from the agricultural and mining sectors. This makes Australasian economies susceptible to fluctuations in the commodity markets. Australasian economies are
also increasingly dependent on their growing service industries. Because the economies of Australasia are dependent on the economies of Asia, Europe and the United States as key trading partners and investors, reduction in spending by any of these
trading partners on Australasian products and services, or negative changes in any of these economies, may cause an adverse impact on some or all of the Australasian economies.
Concentration Risk. The Fund
may be more susceptible to an increased risk of loss due to adverse occurrences to the extent that the Fund's investments are concentrated in the securities of a particular issuer or issuers, country, group of countries, region, market, industry,
group of industries, sector or asset class. The Fund may be more adversely affected by the underperformance of those securities, may experience increased price volatility and may be more susceptible to adverse economic, market, political or
regulatory occurrences affecting those securities than a fund that does not concentrate its investments.
2
Table of Contents
Currency Risk. Because the
Fund’s NAV is determined on the basis of the U.S. dollar, investors may lose money if the currency of a non-U.S. market in which the Fund invests depreciates against the U.S. dollar, even if the local currency value of the Fund's holdings in
that market increases.
Custody Risk. Custody risk refers to the risks inherent in the process of clearing and settling trades and the holding of securities by local banks, agents and depositories. Low trading volumes and volatile prices in less developed
markets may make trades harder to complete and settle, and governments or trade groups may compel local agents to hold securities in designated depositories that may not be subject to independent evaluation. Local agents are held only to the
standards of care of their local markets. In general, the less developed a country’s securities market is, the greater the likelihood of custody problems.
Dividend-Paying Stock Risk. The
Fund's strategy of investing in dividend-paying stocks involves the risk that such stocks may fall out of favor with investors and underperform the market. Companies that issue dividend-paying stocks are not required to continue to pay dividends on
such stocks. Therefore, there is the possibility that such companies could reduce or eliminate the payment of dividends in the future or the anticipated acceleration of dividends could not occur. Depending upon market conditions, dividend-paying
stocks that meet the Fund’s investment criteria may not be widely available and/or may be highly concentrated in only a few market sectors.
Equity Securities Risk. The
Fund invests in equity securities, which are subject to changes in value that may be attributable to market perception of a particular issuer or to general stock market fluctuations that affect all issuers. Investments in equity securities may be
more volatile than investments in other asset classes.
Financials Sector Risk.
Companies in the financials sector of an economy are often subject to extensive governmental regulation and intervention, which may adversely affect the scope of their activities, the prices they can charge and the amount of capital they must
maintain. Governmental regulation may change frequently and may have significant adverse consequences for companies in the financials sector, including effects not intended by such regulation. The impact of recent or future regulation in various
countries on any individual financial company or on the sector as a whole cannot be predicted. Certain risks may impact the value of investments in the financials sector more severely than those of investments outside this sector, including the
risks associated with companies that operate with substantial financial leverage. Companies in the financials sector may also be adversely affected by increases in interest rates and loan losses, decreases in the availability of money or asset
valuations, credit rating downgrades and adverse conditions in other related markets. Insurance companies, in particular, may be subject to severe price competition and/or rate regulation, which may have an adverse impact on their profitability. In
the recent past, deterioration of the credit markets impacted a broad range of mortgage, asset-backed, auction rate, sovereign debt and other markets, including U.S. and non-U.S. credit and interbank money markets, thereby affecting a wide range of
financial institutions and markets. A number of large financial institutions have failed, have merged with stronger institutions or have had significant government infusions of capital. Instability in the financial markets has caused certain
financial companies to
3
Table of Contents
incur large losses. Some financial companies experienced declines in the
valuations of their assets, took actions to raise capital (such as the issuance of debt or equity securities), or even ceased operations. Some financial companies borrowed significant amounts of capital from government sources and may face future
government-imposed restrictions on their businesses or increased government intervention. Those actions caused the securities of many financial companies to decline in value. The financials sector is particularly sensitive to fluctuations in
interest rates.
Geographic Risk. Some of the markets in which the Fund invests are located in parts of the world that have historically been prone to natural disasters, such as earthquakes, tornadoes, volcanic eruptions, droughts, floods, hurricanes or
tsunamis, and are economically sensitive to environmental events. Any such event may adversely impact the economies of these geographic areas, causing an adverse impact on the value of the Fund.
Index-Related Risk. The Fund
seeks to achieve a return which corresponds generally to the price and yield performance, before fees and expenses, of the Underlying Index as published by the Index Provider. There is no assurance that the Index Provider will compile the Underlying
Index accurately, or that the Underlying Index will be determined, composed or calculated accurately. While the Index Provider provides descriptions of what the Underlying Index is designed to achieve, the Index Provider does not provide any
warranty or accept any liability in relation to the quality, accuracy or completeness of data in respect of its indices, and does not guarantee that the Underlying Index will be in line with the Index Provider’s methodology. BFA’s
mandate as described in this Prospectus is to manage the Fund consistently with the Underlying Index provided to BFA. Consequently, BFA does not provide any warranty or guarantee for Index Provider errors. Errors in respect of the quality, accuracy
and completeness of the data may occur from time to time and may not be identified and corrected by the Index Provider for a period of time, particularly where the indices are less commonly used. Therefore, gains, losses or costs associated with
Index Provider errors will generally be borne by the Fund and its shareholders. For example, during a period where the Fund’s Underlying Index contains incorrect constituents, the Fund would have market exposure to such constituents and would
be underexposed to the Underlying Index’s other constituents. Such errors may negatively or positively impact the Fund and its shareholders. Any gains due to Index Provider errors will be kept by the Fund and its shareholders and any losses
resulting from Index Provider errors will be borne by the Fund and its shareholders.
Apart from scheduled rebalances, the Index Provider may carry
out additional ad hoc rebalances to the Underlying Index in order, for example, to correct an error in the selection of index constituents. Where the Underlying Index of the Fund is rebalanced and the Fund in turn rebalances its portfolio to attempt
to correlate it to the Underlying Index, any transaction costs and market exposure arising from such portfolio rebalancing will be borne directly by the Fund and its shareholders. Unscheduled rebalances to the Underlying Index may also expose the
Fund to tracking error risk, which is the risk that the Fund’s returns may not track those of the Underlying Index. Therefore, errors and additional ad hoc rebalances carried out by the Index Provider to the Underlying Index may increase the
costs and market exposure risk of the Fund.
4
Table of Contents
Industrials Sector Risk. The
value of securities issued by companies in the industrials sector may be adversely affected by supply and demand related to their specific products or services and industrials sector products in general. The products of manufacturing companies may
face obsolescence due to rapid technological developments and frequent new product introduction. Government regulations, world events, economic conditions and exchange rates may adversely affect the performance of companies in the industrials
sector. Companies in the industrials sector may be adversely affected by liability for environmental damage and product liability claims. The industrials sector may also be adversely affected by changes or trends in commodity prices, which may be
influenced by unpredictable factors.
Issuer Risk. The performance of the Fund depends on the performance of individual securities to which the Fund has exposure. Any issuer of these securities may perform poorly, causing the value of its securities to decline. Poor
performance may be caused by poor management decisions, competitive pressures, changes in technology, expiration of patent protection, disruptions in supply, labor problems or shortages, corporate restructurings, fraudulent disclosures or other
factors. Issuers may, in times of distress or at their own discretion, decide to reduce or eliminate dividends, which may also cause their stock prices to decline.
Management Risk. The Fund may
not fully replicate the Underlying Index and may hold securities not included in the Underlying Index. As a result, the Fund is subject to the risk that BFA’s investment strategy, the implementation of which is subject to a number of
constraints, may not produce the intended results.
Market Risk. The Fund could
lose money due to short-term market movements and over longer periods during market downturns. Securities may decline in value due to factors affecting securities markets generally or particular asset classes or industries represented in the
markets. The value of a security may decline due to general market conditions, economic trends or events that are not specifically related to the issuer of the security or to factors that affect a particular industry or group of industries. During a
general downturn in the securities markets, multiple asset classes may be negatively affected.
Market Trading Risk
Absence of Active Market.
Although shares of the Fund are listed for trading on one or more stock exchanges, there can be no assurance that an active trading market for such shares will develop or be maintained by market makers or Authorized Participants.
Risk of Secondary Listings.
The Fund's shares may be listed or traded on U.S. and non-U.S. stock exchanges other than the U.S. stock exchange where the Fund's primary listing is maintained. There can be no assurance that the Fund’s shares
will continue to trade on any such stock exchange or in any market or that the Fund’s shares will continue to meet the requirements for listing or trading on any exchange or in any market. The Fund's shares may be less actively traded in
certain markets than in others, and investors are subject to the execution and settlement risks and market standards of the market where they or their broker direct their trades for execution. Certain information available to investors who trade
Fund shares on a U.S. stock
5
Table of Contents
exchange during regular U.S. market hours may not be available to investors
who trade in other markets, which may result in secondary market prices in such markets being less efficient.
Secondary Market Trading Risk.
Shares of the Fund may trade in the secondary market at times when the Fund does not accept orders to purchase or redeem shares. At such times, shares may trade in the secondary market with more significant premiums or discounts than might be
experienced at times when the Fund accepts purchase and redemption orders.
Secondary market trading in Fund shares may be halted by a
stock exchange because of market conditions or for other reasons. In addition, trading in Fund shares on a stock exchange or in any market may be subject to trading halts caused by extraordinary market volatility pursuant to “circuit
breaker” rules on the stock exchange or market. There can be no assurance that the requirements necessary to maintain the listing or trading of Fund shares will continue to be met or will remain unchanged.
Shares of the Fund, similar to shares of other issuers listed
on a stock exchange, may be sold short and are therefore subject to the risk of increased volatility associated with short selling.
Shares of the Fund May Trade at Prices Other Than NAV. Shares of the Fund trade on stock exchanges at prices at, above or below the Fund’s most recent NAV. The NAV of the Fund is calculated at the end of each business day and fluctuates with changes in the market value
of the Fund’s holdings. The trading price of the Fund's shares fluctuates continuously throughout trading hours based on both market supply of and demand for Fund shares and the underlying value of the Fund's portfolio holdings or NAV. As
a result, the trading prices of the Fund’s shares may deviate significantly from NAV during periods of market volatility. ANY OF THESE FACTORS, AMONG OTHERS, MAY LEAD TO THE FUND'S
SHARES TRADING AT A PREMIUM OR DISCOUNT TO NAV. However, because shares can be created and redeemed in Creation Units at NAV, BFA believes that large discounts or premiums to the NAV of the Fund are not likely
to be sustained over the long term (unlike shares of many closed-end funds, which frequently trade at appreciable discounts from, and sometimes at premiums to, their NAVs). While the creation/redemption feature is designed to make it more likely
that the Fund’s shares normally will trade on stock exchanges at prices close to the Fund’s next calculated NAV, exchange prices are not expected to correlate exactly with the Fund's NAV due to timing reasons, supply and demand
imbalances and other factors. In addition, disruptions to creations and redemptions, including disruptions at market makers or Authorized Participants, to market participants or during periods of significant market volatility may result in trading
prices for shares of the Fund that differ significantly from its NAV.
Costs of Buying or Selling Fund Shares. Buying or selling Fund shares on an exchange involves two types of costs that apply to all securities transactions. When buying or selling shares of the Fund through a broker, you will likely incur a brokerage commission
or other charges imposed by brokers as determined by that broker. In addition, you may incur the cost of the “spread,” that is, the difference between what investors are willing to pay for Fund shares (the “bid” price) and
the price at which they
6
Table of Contents
are
willing to sell Fund shares (the “ask” price). Because of the costs inherent in buying or selling Fund shares, frequent trading may detract significantly from investment results and an investment in Fund shares may not be advisable for
investors who anticipate regularly making small investments.
Mid-Capitalization Companies Risk. Stock prices of mid-capitalization companies may be more volatile than those of large-capitalization companies and, therefore, the Fund’s share price may be more volatile than those of funds that invest a larger
percentage of their assets in stocks issued by large-capitalization companies. Stock prices of mid-capitalization companies are also more vulnerable than those of large-capitalization companies to adverse business or economic developments, and the
stocks of mid-capitalization companies may be less liquid, making it difficult for the Fund to buy and sell them. In addition, mid-capitalization companies generally have less diverse product lines than large-capitalization companies have and are
more susceptible to adverse developments related to their products.
Non-Diversification Risk. The
Fund is classified as “non-diversified.” This means that the Fund may invest a large percentage of its assets in securities issued by or representing a small number of issuers. As a result, the Fund may be more susceptible to the risks
associated with these particular issuers, or to a single economic, political or regulatory occurrence affecting these issuers.
Non-U.S. Securities Risk.
Investments in the securities of non-U.S. issuers are subject to the risks of investing in the markets where such issuers are located, including heightened risks of inflation or nationalization and market fluctuations caused by economic and
political developments. As a result of investing in non-U.S. securities, the Fund may be subject to increased risk of loss caused by any of the factors listed below:
| ■ | Lower levels of liquidity and market efficiency; |
| ■ | Greater securities price volatility; |
| ■ | Exchange rate fluctuations and exchange controls; |
| ■ | Less availability of public information about issuers; |
| ■ | Limitations on foreign ownership of securities; |
| ■ | Imposition of withholding or other taxes; |
| ■ | Imposition of restrictions on the expatriation of the funds or other assets of the Fund; |
| ■ | Higher transaction and custody costs and delays in settlement procedures; |
| ■ | Difficulties in enforcing contractual obligations; |
| ■ | Lower levels of regulation of the securities markets; |
| ■ | Weaker accounting, disclosure and reporting requirements; and |
| ■ | Legal principles relating to corporate governance, directors’ fiduciary duties and liabilities and stockholders’ rights in markets in which the Fund invests may differ and/or may not be as extensive or protective as those that apply in the United States. |
7
Table of Contents
Passive Investment Risk. The
Fund is not actively managed and may be affected by a general decline in market segments related to the Underlying Index. The Fund invests in securities included in, or representative of, the Underlying Index, regardless of their investment merits.
BFA generally does not attempt to take defensive positions under any market conditions, including declining markets.
Reliance on Trading Partners Risk. The economies of some countries in which the Fund invests are dependent on trade with certain key trading partners. Reduction in spending on the products and services of these countries, institution of tariffs or other
trade barriers by any of their key trading partners or a slowdown in the economies of any of their key trading partners may cause an adverse impact on the economies of such countries.
Risk of Investing in Australia.
Investment in Australian issuers may subject the Fund to regulatory, political, currency, security, and economic risk specific to Australia. The Australian economy is heavily dependent on exports from the agricultural and mining sectors. As a
result, the Australian economy is susceptible to fluctuations in the commodity markets. The Australian economy is also becoming increasingly dependent on its growing services industry. The Australian economy is dependent on trading with key trading
partners, including the United States, China, Japan, Singapore and certain European countries. Reduction in spending on Australian products and services, or changes in any of the economies may cause an adverse impact on the Australian
economy.
Securities Lending Risk. The Fund may engage in securities lending. Securities lending involves the risk that the Fund may lose money because the borrower of the loaned securities fails to return the securities in a timely manner or at all. The
Fund could also lose money in the event of a decline in the value of the collateral provided for the loaned securities or a decline in the value of any investments made with cash collateral. These events could also trigger adverse tax consequences
for the Fund. In addition, BlackRock Institutional Trust Company, N.A. (“BTC”), the Fund’s securities lending agent, will take into account the tax impact to shareholders of substitute payments for dividends when managing the
Fund’s securities lending program.
Telecommunications Sector Risk.
The telecommunications sector is subject to extensive government regulation. The costs of complying with governmental regulations, delays or failure to receive required regulatory approvals, or the enactment of new regulatory requirements may
negatively affect the business of telecommunications companies. Government actions around the world, specifically in the area of pre-marketing clearance of products and prices, can be arbitrary and unpredictable. Companies in the telecommunications
sector may encounter distressed cash flows due to the need to commit substantial capital to meet increasing competition, particularly in formulating new products and services using new technology. Technological innovations may make the products and
services of certain telecommunications companies obsolete.
Tracking Error Risk. Tracking
error is the divergence of the Fund’s performance from that of the Underlying Index. Tracking error may occur because of differences between the securities held in the Fund’s portfolio and those included in the Underlying Index, pricing
differences, transaction costs, the Fund holding uninvested cash, differences in
8
Table of Contents
timing of the accrual of dividends, changes to the Underlying Index or the
costs of complying with various new or existing regulatory requirements. This risk may be heightened during times of increased market volatility or other unusual market conditions. Tracking error also may result because the Fund incurs fees and
expenses, while the Underlying Index does not.
U.S.
Economic Risk. The Fund has significant exposure to U.S. issuers. Decreasing imports or exports, changes in trade regulations and/or an economic recession in the United States may have a material adverse effect on
the U.S. economy and the securities listed on U.S. exchanges. The financial crisis that began in 2007 caused a significant decline in the value and liquidity of issuers in the United States. Policy and legislative changes in the United States are
changing many aspects of financial and other regulation and may have a significant effect on the U.S. markets generally, as well as the value of certain securities. In addition, a continued rise in the U.S. public debt level or U.S. austerity
measures may adversely affect U.S. economic growth and the securities to which the Fund has exposure.
Valuation Risk. The sale price
the Fund could receive for a security may differ from the Fund's valuation of the security and may differ from the value used by the Underlying Index , particularly for securities that trade in low volume or volatile markets, or that are valued
using a fair value methodology. Because non-U.S. exchanges may be open on days when the Fund does not price its shares, the value of the securities in the Fund’s portfolio may change on days when shareholders will not be able to purchase or
sell the Fund’s shares. In addition, for purposes of calculating the Fund's NAV, the value of assets denominated in non-U.S. currencies is converted into U.S. dollars using prevailing market rates on the date of valuation as quoted by one or
more data service providers. This conversion may result in a difference between the prices used to calculate the Fund's NAV and the prices used by the Underlying Index, which, in turn, could result in a difference between the Fund's performance and
the performance of the Underlying Index.
A
Further Discussion of Other Risks
The Fund may also be
subject to certain other risks associated with its investments and investment strategies.
Consumer Services Industry
Risk. The success of consumer product manufacturers and retailers (including food and drug retailers, general retailers, media, and travel and leisure companies) is tied closely to the performance of the domestic
and international economies, interest rates, exchange rates and consumer confidence. The consumer services industry depends heavily on disposable household income and consumer spending. Companies in the consumer services industry may be subject to
severe competition, which may also have an adverse impact on their profitability. Changes in consumer demographics and preferences may affect the success of consumer products.
Oil and Gas Industry Risk. The
profitability of companies in the oil and gas industry is related to worldwide energy prices, exploration costs and production spending. Companies in the oil and gas industry may be at risk for environmental damage claims and other types of
litigation. Companies in the oil and gas industry may be adversely
9
Table of Contents
affected by natural disasters or other catastrophes, changes in exchange
rates, interest rates, changes in prices for competitive energy services, economic conditions, tax treatment, government regulation and intervention, negative public perception and unfavorable events in the regions where companies operate (e.g., expropriation, nationalization, confiscation of assets and property or imposition of restrictions on foreign investments and repatriation of capital, military coups, social unrest, violence or labor unrest).
Companies in the oil and gas industry may have significant capital investments in, or engage in transactions involving, emerging market countries, which may heighten these risks. Companies that own or operate gas pipelines are subject to certain
risks, including pipeline and equipment leaks and ruptures, explosions, fires, unscheduled downtime, transportation interruptions, discharges or releases of toxic or hazardous gases and other environmental risks.
Small-Capitalization Companies Risk. Stock prices of small-capitalization companies may be more volatile than those of larger companies and, therefore, the Fund's share price may be more volatile than those of funds that invest a larger percentage of their
assets in stocks issued by mid- or large-capitalization companies. Stock prices of small-capitalization companies are generally more vulnerable than those of mid- or large-capitalization companies to adverse business and economic developments.
Securities of small-capitalization companies may be thinly traded, making it difficult for the Fund to buy and sell them. In addition, small-capitalization companies are typically less financially stable than larger, more established companies and
may depend on a small number of essential personnel, making them more vulnerable to experiencing adverse effects due to the loss of personnel. Small-capitalization companies also normally have less diverse product lines than mid- or
large-capitalization companies have and are more susceptible to adverse developments concerning their products.
Portfolio Holdings Information
A description of the Company's policies and procedures with
respect to the disclosure of the Fund’s portfolio securities is available in the Fund's Statement of Additional Information (“SAI”). The top holdings of the Fund can be found at www.iShares.com. Fund fact sheets provide information
regarding the Fund's top holdings and may be requested by calling 1-800-iShares (1-800-474-2737).
Management
Investment Adviser. As
investment adviser, BFA has overall responsibility for the general management and administration of the Company. BFA provides an investment program for the Fund and manages the investment of the Fund’s assets. In managing the Fund, BFA may
draw upon the research and expertise of its asset management affiliates with respect to certain portfolio securities . In seeking to achieve the Fund's investment objective, BFA uses teams of portfolio managers, investment strategists and other
investment specialists. This team approach brings together many disciplines and leverages BFA’s extensive resources.
Pursuant to the Investment Advisory Agreement between BFA and
the Company (entered into on behalf of the Fund), BFA is responsible for substantially all expenses of
10
Table of Contents
the
Fund, except interest expenses, taxes, brokerage expenses, future distribution fees or expenses and extraordinary expenses.
For its investment advisory services to the Fund, BFA is
entitled to receive a management fee from the Fund based on a percentage of the Fund's average daily net assets, at an annual rate of 0.49%.
BFA is located at 400 Howard Street, San Francisco, CA 94105.
It is an indirect wholly-owned subsidiary of BlackRock, Inc. (“BlackRock”). As of June 30, 2014, BFA and its affiliates provided investment advisory services for assets in excess of $4.59 trillion. BFA and its affiliates deal, trade and
invest for their own accounts in the types of securities in which the Fund may also invest.
A discussion regarding the basis for the Company's Board of
Directors' (the “Board”) approval of the Investment Advisory Agreement with BFA is available in the Fund's semi-annual report for the six-month period ended October 31.
Portfolio Managers. Matthew
Goff, Diane Hsiung, Jennifer Hsui and Greg Savage are primarily responsible for the day-to-day management of the Fund. Each Portfolio Manager is responsible for various functions related to portfolio management, including, but not limited to,
investing cash inflows, coordinating with members of his or her portfolio management team to focus on certain asset classes, implementing investment strategy, researching and reviewing investment strategy and overseeing members of his or her
portfolio management team that have more limited responsibilities.
Matthew Goff has been employed by BFA and BTC (formerly,
Barclays Global Investors, N.A. (“BGI”)) as a portfolio manager since 2008. Prior to that, Mr. Goff was a portfolio manager from 2007 to 2008 for US Trust, a product manager from 2006 to 2007 for Iris Financial Solutions and a product
manager from 2003 to 2006 for MSCI Barra. Mr. Goff has been a Portfolio Manager of the Fund since 2013.
Diane Hsiung has been employed by BFA and BTC as a senior
portfolio manager since 2007. Prior to that, Ms. Hsiung was a portfolio manager from 2002 to 2006 for BGFA and BGI. Ms. Hsiung has been a Portfolio Manager of the Fund since 2012.
Jennifer Hsui has been employed by BFA and BTC as a senior
portfolio manager since 2007. Prior to that, Ms. Hsui was a portfolio manager from 2006 to 2007 for BGFA and BGI. Ms. Hsui has been a Portfolio Manager of the Fund since 2012.
Greg Savage has been employed by BFA and BTC as a senior
portfolio manager since 2006. Prior to that, Mr. Savage was a portfolio manager from 2001 to 2006 for BGFA and BGI. Mr. Savage has been a Portfolio Manager of the Fund since 2012.
The Fund's SAI provides additional information about the
Portfolio Managers' compensation, other accounts managed by the Portfolio Managers and the Portfolio Managers' ownership (if any) of shares in the Fund.
Administrator, Custodian and Transfer Agent. State Street Bank and Trust Company (“State Street”) is the administrator, custodian and transfer agent for the Fund.
Conflicts of Interest. BFA
wants you to know that it has relationships with certain entities that may give rise to conflicts of interest or the appearance of conflicts of
11
Table of Contents
interest. These entities are BFA’s affiliates, including BlackRock and
The PNC Financial Services Group, Inc., and each of their affiliates, directors, partners, trustees, managing members, officers and employees (collectively, the “Affiliates”).
The activities of BFA and the Affiliates in the management of,
or their interest in, their own accounts and other accounts they manage, may present conflicts of interest that could disadvantage the Fund and its shareholders. BFA and the Affiliates provide investment management services to other funds and
discretionary managed accounts that may follow an investment program similar to that of the Fund. BFA and the Affiliates are involved worldwide with a broad spectrum of financial services and asset management activities and may engage in the
ordinary course of business in activities in which their interests or the interests of their clients may conflict with those of the Fund. BFA or one or more of the Affiliates acts, or may act, as an investor, investment banker, research provider,
investment manager, commodity trading adviser, financier, underwriter, adviser, market maker, trader, prime broker, lender, agent or principal, and have other direct and indirect interests, in securities, currencies, commodities and other
instruments in which the Fund may directly or indirectly invest. Thus, it is likely that the Fund will have multiple business relationships with and will invest in, engage in transactions with, make voting decisions with respect to, or obtain
services from, entities for which BFA or an Affiliate seeks to perform investment banking or other services.
BFA or one or more Affiliates may engage in proprietary trading
and advise accounts and funds that have investment objectives similar to those of the Fund and/or that engage in and compete for transactions in the same types of securities, currencies and other instruments as the Fund, including in securities
issued by other open-end and closed-end investment management companies, including investment companies that are affiliated with the Fund and BFA, to the extent permitted under the Investment Company Act of 1940, as amended (the “1940
Act”). The trading activities of BFA and these Affiliates are carried out without reference to positions held directly or indirectly by the Fund and may result in BFA or an Affiliate having positions in certain securities that are adverse to
those of the Fund.
No Affiliate is under any obligation
to share any investment opportunity, idea or strategy with the Fund. As a result, an Affiliate may compete with the Fund for appropriate investment opportunities. As a result of this and several other factors, the results of the Fund's investment
activities may differ from those of an Affiliate and of other accounts managed by an Affiliate, and it is possible that the Fund could sustain losses during periods in which one or more Affiliates and other accounts achieve profits on their trading
for proprietary or other accounts. The opposite result is also possible.
The Fund may, from time to time, enter into transactions in
which BFA’s or an Affiliate’s clients have an interest adverse to the Fund. Furthermore, transactions undertaken by Affiliate-advised clients may adversely impact the Fund. Transactions by one or more Affiliate-advised clients or BFA may
have the effect of diluting or otherwise disadvantaging the values, prices or investment strategies of the Fund.
The Fund's activities may be limited because of regulatory
restrictions applicable to one or more Affiliates and/or their internal policies designed to comply with such
12
Table of Contents
restrictions. In addition, the Fund may invest in securities of companies with
which an Affiliate has developed or is trying to develop investment banking relationships or in which an Affiliate has significant debt or equity investments or other interests. The Fund also may invest in securities of companies for which an
Affiliate provides or may in the future provide research coverage. An Affiliate may have business relationships with, and purchase, distribute or sell services or products from or to, distributors, consultants or others who recommend the Fund or who
engage in transactions with or for the Fund, and may receive compensation for such services. The Fund may also make brokerage and other payments to Affiliates in connection with the Fund's portfolio investment transactions.
Pursuant to a securities lending program approved by the Board,
the Fund has retained an Affiliate of BFA to serve as the securities lending agent for the Fund to the extent that the Fund participates in the securities lending program. For these services, the lending agent may receive a fee from the Fund,
including a fee based on the returns earned on the Fund’s investment of the cash received as collateral for any loaned securities. BFA may receive compensation for managing the reinvestment of cash collateral. In addition, one or more
Affiliates may be among the entities to which the Fund may lend its portfolio securities under the securities lending program.
The activities of BFA or the Affiliates may give rise to other
conflicts of interest that could disadvantage the Fund and its shareholders. BFA has adopted policies and procedures designed to address these potential conflicts of interest. See the Fund's SAI for further information.
Shareholder Information
Additional shareholder information, including how to buy and
sell shares of the Fund, is available free of charge by calling toll-free: 1-800-iShares (1-800-474-2737) or visiting our website at www.iShares.com.
Buying and Selling Shares.
Shares of the Fund may be acquired or redeemed directly from the Fund only in Creation Units or multiples thereof, as discussed in the Creations and Redemptions section of this Prospectus. Only an Authorized Participant (as defined in the Creations and Redemptions section) may
engage in creation or redemption transactions directly with the Fund. Once created, shares of the Fund generally trade in the secondary market in amounts less than a Creation Unit.
Shares of the Fund are listed on a national securities exchange
for trading during the trading day. Shares can be bought and sold throughout the trading day like shares of other publicly traded companies. The Company does not impose any minimum investment for shares of the Fund purchased on an exchange. The
Fund's shares trade under the trading symbol “DVYA.”
Buying or selling Fund shares on an exchange involves two types
of costs that may apply to all securities transactions. When buying or selling shares of the Fund through a broker, you will likely incur a brokerage commission or other charges determined by your broker. The commission is frequently a fixed amount
and may be a significant proportional cost for investors seeking to buy or sell small amounts of shares. In addition, you may incur the cost of the “spread,” that is, any difference between the
13
Table of Contents
bid
price and the ask price. The spread varies over time for shares of the Fund based on the Fund’s trading volume and market liquidity, and is generally lower if the Fund has a lot of trading volume and market liquidity, and higher if the Fund
has little trading volume and market liquidity (which is often the case for funds that are newly launched or small in size). The Fund's spread may also be impacted by the liquidity of the underlying securities held by the Fund, particularly for
newly launched or smaller funds or in instances of significant volatility of the underlying securities.
The Fund participates in NYSE Arca’s Lead Market Maker
Incentive Program (the “Incentive Program”), which is designed to encourage market makers to act as lead market makers (“LMMs”) for exchange traded products whose trading volumes do not exceed specified levels. Participating
LMMs receive payments from NYSE Arca of up to $40,000 per year subject to minimum quote standards and maximum spread requirements. The payments are funded through a supplemental listing fee, which BFA has agreed to pay, although it may elect not to
do so in the future. There are risks associated with the Incentive Program because it may act to artificially influence trading in the Fund shares, and pricing and liquidity of the shares could be adversely impacted if the Fund were to leave the
Incentive Program or the Incentive Program were discontinued. The Incentive Program is scheduled to terminate on or about September 4, 2015. Market makers participating in the Incentive Program are free to provide financing on Fund shares.
Additional information about the Incentive Program is available on the website of NYSE Arca at www.nyse.com/products/etp-incentive-program. This reference to the website does not incorporate the contents of the website into this prospectus.
The Board has adopted a policy of not monitoring for frequent
purchases and redemptions of Fund shares (“frequent trading”) that appear to attempt to take advantage of a potential arbitrage opportunity presented by a lag between a change in the value of the Fund’s portfolio securities after
the close of the primary markets for the Fund’s portfolio securities and the reflection of that change in the Fund’s NAV (“market timing”), because the Fund generally sells and redeems its shares directly through transactions
that are in-kind and/or for cash, subject to the conditions described below under Creations and Redemptions. The Board has not adopted a policy of monitoring for other frequent trading activity because shares
of the Fund are listed for trading on a national securities exchange.
The national securities exchange on which the Fund's shares are
listed is open for trading Monday through Friday and is closed on weekends and the following holidays: New Year’s Day, Martin Luther King, Jr. Day, Presidents’ Day, Good Friday, Memorial Day, Independence Day, Labor Day, Thanksgiving Day
and Christmas Day. The Fund’s primary listing exchange is NYSE Arca.
Section 12(d)(1) of the 1940 Act restricts investments by
investment companies in the securities of other investment companies. Registered investment companies are permitted to invest in the Fund beyond the limits set forth in Section 12(d)(1), subject to certain terms and conditions set forth in SEC rules
or in an SEC exemptive order issued to the Company. In order for a registered investment company to invest in shares of the Fund beyond the limitations of Section 12(d)(1) pursuant to the
14
Table of Contents
exemptive relief obtained by the Company, the registered investment company
must enter into an agreement with the Company.
Book Entry. Shares of the Fund are held in book-entry form, which means that no stock certificates are issued. The Depository Trust Company (“DTC”) or its nominee is the record owner of all outstanding shares of the
Fund and is recognized as the owner of all shares for all purposes.
Investors owning shares of the Fund are beneficial owners as
shown on the records of DTC or its participants. DTC serves as the securities depository for shares of the Fund. DTC participants include securities brokers and dealers, banks, trust companies, clearing corporations and other institutions that
directly or indirectly maintain a custodial relationship with DTC. As a beneficial owner of shares, you are not entitled to receive physical delivery of stock certificates or to have shares registered in your name, and you are not considered a
registered owner of shares. Therefore, to exercise any right as an owner of shares, you must rely upon the procedures of DTC and its participants. These procedures are the same as those that apply to any other securities that you hold in book-entry
or “street name” form.
Share Prices. The trading prices of the Fund’s shares in the secondary market generally differ from the Fund’s daily NAV and are affected by market forces such as supply of and demand for ETF shares and shares of
underlying securities held by the Fund, economic conditions and other factors. Information regarding the intraday value of shares of the Fund, also known as the “indicative optimized portfolio value” (“IOPV”), is disseminated
every 15 seconds throughout the trading day by the national securities exchange on which the Fund's shares are listed or by market data vendors or other information providers. The IOPV is based on the current market value of the securities and/or
cash required to be deposited in exchange for a Creation Unit. The IOPV does not necessarily reflect the precise composition of the current portfolio of securities held by the Fund at a particular point in time or the best possible valuation of the
current portfolio. Therefore, the IOPV should not be viewed as a “real-time” update of the Fund's NAV, which is computed only once a day. The IOPV is generally determined by using both current market quotations and/or price quotations
obtained from broker-dealers that may trade in the portfolio securities held by the Fund. The quotations of certain Fund holdings may not be updated during U.S. trading hours if such holdings do not trade in the United States. The Fund is not
involved in, or responsible for, the calculation or dissemination of the IOPV and makes no representation or warranty as to its accuracy.
Determination of Net Asset Value. The NAV of the Fund normally is determined once daily Monday through Friday, generally as of the regularly scheduled close of business of the New York Stock Exchange (“NYSE”) (normally 4:00 p.m., Eastern
time) on each day that the NYSE is open for trading, based on prices at the time of closing provided that (a) any Fund assets or liabilities denominated in currencies other than the U.S. dollar are translated into U.S. dollars at the prevailing
market rates on the date of valuation as quoted by one or more data service providers (as detailed below) and (b) U.S. fixed-income assets may be valued as of the announced closing time for trading in fixed-income instruments in a particular market
or exchange. The NAV of the Fund is calculated by dividing the value of the net assets of the Fund (i.e., the value of
15
Table of Contents
its
total assets less total liabilities) by the total number of outstanding shares of the Fund, generally rounded to the nearest cent.
The value of the securities and other assets and liabilities
held by the Fund are determined pursuant to valuation policies and procedures approved by the Board. The Fund's assets and liabilities are valued on the basis of market quotations, when readily available.
Equity investments are valued at market value, which is
generally determined using the last reported official closing price or last trading price on the exchange or market on which the security is primarily traded at the time of valuation.
The Fund invests in non-U.S. securities. Foreign currency
exchange rates are generally determined as of 4:00 p.m., London time. Non-U.S. securities held by the Fund may trade on weekends or other days when the Fund does not price its shares. As a result, the Fund’s NAV may change on days when
Authorized Participants will not be able to purchase or redeem Fund shares.
Generally, trading in non-U.S. securities, U.S. government
securities, money market instruments and certain fixed-income securities is substantially completed each day at various times prior to the close of business on the NYSE. The values of such securities used in computing the NAV of the Fund are
determined as of such times.
When market quotations are
not readily available or are believed by BFA to be unreliable, the Fund’s investments are valued at fair value. Fair value determinations are made by BFA in accordance with policies and procedures approved by the Company's Board. BFA may
conclude that a market quotation is not readily available or is unreliable if a security or other asset or liability does not have a price source due to its lack of liquidity, if a market quotation differs significantly from recent price quotations
or otherwise no longer appears to reflect fair value, where the security or other asset or liability is thinly traded, or where there is a significant event subsequent to the most recent market quotation. A “significant event” is an
event that, in the judgment of BFA, is likely to cause a material change to the closing market price of the asset or liability held by the Fund. Non-U.S. securities whose values are affected by volatility that occurs in U.S. markets for related or
highly correlated assets (e.g., American Depositary Receipts, Global Depositary Receipts or ETFs) on a trading day after the close of non-U.S. securities markets may be fair valued.
Fair value represents a good faith approximation of the value
of an asset or liability. The fair value of an asset or liability held by the Fund is the amount the Fund might reasonably expect to receive from the current sale of that asset or the cost to extinguish that liability in an arm’s-length
transaction. Valuing the Fund’s investments using fair value pricing will result in prices that may differ from current market valuations and that may not be the prices at which those investments could have been sold during the period in which
the particular fair values were used. Use of fair value prices and certain current market valuations could result in a difference between the prices used to calculate the Fund’s NAV and the prices used by the Underlying Index, which, in turn,
could result in a difference between the Fund’s performance and the performance of the Underlying Index.
16
Table of Contents
The value of assets or liabilities denominated in non-U.S.
currencies will be converted into U.S. dollars using prevailing market rates on the date of valuation as quoted by one or more data service providers. Use of a rate different from the rate used by the Index Provider may adversely affect the
Fund’s ability to track the Underlying Index.
Dividends and Distributions
General Policies. Dividends
from net investment income, if any, generally are declared and paid at least once a year by the Fund. Distributions of net realized securities gains, if any, generally are declared and paid once a year, but the Company may make distributions on a
more frequent basis for the Fund. The Company reserves the right to declare special distributions if, in its reasonable discretion, such action is necessary or advisable to preserve its status as a regulated investment company (“RIC”) or
to avoid imposition of income or excise taxes on undistributed income or realized gains.
Dividends and other distributions on shares of the Fund are
distributed on a pro rata basis to beneficial owners of such shares. Dividend payments are made through DTC participants and indirect participants to beneficial owners then of record with proceeds received
from the Fund.
Dividend Reinvestment Service. No dividend reinvestment service is provided by the Company. Broker-dealers may make available the DTC book-entry Dividend Reinvestment Service for use by beneficial owners of the Fund for reinvestment of their dividend
distributions. Beneficial owners should contact their broker to determine the availability and costs of the service and the details of participation therein. Brokers may require beneficial owners to adhere to specific procedures and timetables. If
this service is available and used, dividend distributions of both income and realized gains will be automatically reinvested in additional whole shares of the Fund purchased in the secondary market.
Taxes. As with any investment,
you should consider how your investment in shares of the Fund will be taxed. The tax information in this Prospectus is provided as general information, based on current law. You should consult your own tax professional about the tax consequences of
an investment in shares of the Fund.
Unless your
investment in Fund shares is made through a tax-exempt entity or tax-deferred retirement account, such as an IRA, you need to be aware of the possible tax consequences when the Fund makes distributions or you sell Fund shares.
Taxes on Distributions.
Distributions from the Fund’s net investment income (other than qualified dividend income), including distributions of income from securities lending and distributions out of the Fund’s net short-term capital gains, if any, are taxable
to you as ordinary income. Distributions by the Fund of net long-term capital gains in excess of net short-term capital losses (capital gain dividends) are taxable to you as long-term capital gains, regardless of how long you have held the
Fund’s shares. Distributions by the Fund that qualify as qualified dividend income are taxable to you at long-term capital gain rates. Long-term capital gains and qualified dividend income are generally eligible for taxation at a maximum rate
of 15% for non-corporate shareholders with incomes below approximately $400,000 ($450,000 if married and filing jointly), adjusted annually for inflation, and 20% for individuals with any income above these amounts that is net long-term capital gain
or qualified dividend income. In
17
Table of Contents
addition, a 3.8% U.S. federal Medicare contribution tax is imposed on
“net investment income,” including, but not limited to, interest, dividends, and net gain, of U.S. individuals with income exceeding $200,000 (or $250,000 if married and filing jointly) and of estates and trusts.
Dividends will be qualified dividend income to you if they are
attributable to qualified dividend income received by the Fund. Generally, qualified dividend income includes dividend income from taxable U.S. corporations and qualified non-U.S. corporations, provided that the Fund satisfies certain holding period
requirements in respect of the stock of such corporations and has not hedged its position in the stock in certain ways. Substitute dividends received by the Fund with respect to dividends paid on securities lent out will not be qualified dividend
income. For this purpose, a qualified non-U.S. corporation means any non-U.S. corporation that is eligible for benefits under a comprehensive income tax treaty with the United States, which includes an exchange of information program, or if the
stock with respect to which the dividend was paid is readily tradable on an established United States securities market. The term excludes a corporation that is a passive foreign investment company.
Dividends received by the Fund from a real estate investment
trust (“REIT”) or another RIC generally are qualified dividend income only to the extent the dividend distributions are made out of qualified dividend income received by such REIT or RIC. It is expected that dividends received by the
Fund from a REIT and distributed to a shareholder generally will be taxable to the shareholder as ordinary income.
For a dividend to be treated as qualified dividend income, the
dividend must be received with respect to a share of stock held without being hedged by the Fund, and with respect to a share of the Fund held without being hedged by you, for 61 days during the 121-day period beginning at the date which is 60 days
before the date on which such share becomes ex-dividend with respect to such dividend or, in the case of certain preferred stock, 91 days during the 181-day period beginning 90 days before such date.
If your Fund shares are loaned out pursuant to a securities
lending arrangement, you may lose the ability to use foreign tax credits passed through by the Fund or to treat Fund dividends paid while the shares are held by the borrower as qualified dividend income.
In general, your distributions are subject to U.S. federal
income tax for the year when they are paid. Certain distributions paid in January, however, may be treated as paid on December 31 of the prior year.
If the Fund’s distributions exceed current and
accumulated earnings and profits, all or a portion of the distributions made in the taxable year may be recharacterized as a return of capital to shareholders. Distributions in excess of the Fund’s minimum distribution requirements, but not in
excess of the Fund’s earnings and profits, will be taxable to shareholders and will not constitute nontaxable returns of capital. A return of capital distribution generally will not be taxable but will reduce the shareholder’s cost basis
and result in a higher capital gain or lower capital loss when those shares on which the distribution was received are sold. Once a shareholder's cost basis is
18
Table of Contents
reduced to zero, further distributions will be treated as capital gain, if the
shareholder holds shares of the Fund as capital assets.
If you are neither a resident nor a citizen of the United
States or if you are a non-U.S. entity, the Fund’s ordinary income dividends (which include distributions of net short-term capital gains) will generally be subject to a 30% U.S. withholding tax, unless a lower treaty rate applies, provided
that withholding tax will generally not apply to any gain or income realized by a non-U.S. shareholder in respect of any distributions of long-term capital gains or upon the sale or other disposition of shares of the Fund.
A 30% withholding tax will be imposed on U.S.-source dividends,
interest and other income items paid after June 30, 2014, and proceeds from the sale of property producing U.S.-source dividends and interest paid after December 31, 2016, to (i) foreign financial institutions, including non-U.S. investment funds,
unless they agree to collect and disclose to the Internal Revenue Service (“IRS”) information regarding their direct and indirect U.S. account holders and (ii) certain other foreign entities, unless they certify certain information
regarding their direct and indirect U.S. owners. To avoid withholding, foreign financial institutions will need to (i) enter into agreements with the IRS that state that they will provide the IRS information, including the names, addresses and
taxpayer identification numbers of direct and indirect U.S. account holders, comply with due diligence procedures with respect to the identification of U.S. accounts, report to the IRS certain information with respect to U.S. accounts maintained,
agree to withhold tax on certain payments made to non-compliant foreign financial institutions or to account holders who fail to provide the required information, and determine certain other information concerning their account holders, or (ii) in
the event that an applicable intergovernmental agreement and implementing legislation are adopted, provide local revenue authorities with similar account holder information. Other foreign entities may need to report the name, address, and taxpayer
identification number of each substantial U.S. owner or provide certifications of no substantial U.S. ownership unless certain exceptions apply.
Dividends, interest and capital gains earned by the Fund with
respect to non-U.S. securities may give rise to withholding, capital gains and other taxes imposed by non-U.S. countries. Tax conventions between certain countries and the United States may reduce or eliminate such taxes. If more than 50% of the
total assets of the Fund at the close of a year consists of non-U.S. stocks or securities (generally, for this purpose, depositary receipts, no matter where traded, of non-U.S. companies are treated as “non-U.S.”), the Fund may
“pass through” to you certain non-U.S. income taxes (including withholding taxes) paid by the Fund. This means that you would be considered to have received as an additional dividend your share of such non-U.S. taxes, but you may be
entitled to either a corresponding tax deduction in calculating your taxable income, or, subject to certain limitations, a credit in calculating your U.S. federal income tax.
For purposes of foreign tax credits for U.S. shareholders of
the Fund, foreign capital gains taxes may not produce associated foreign source income, thereby limiting a U.S. person's ability to use such credits.
19
Table of Contents
If you are a resident or a citizen of the United States, by
law, back-up withholding at a 28% rate will apply to your distributions and proceeds if you have not provided a taxpayer identification number or social security number and made other required certifications.
Taxes When Shares are Sold.
Currently, any capital gain or loss realized upon a sale of Fund shares is generally treated as a long-term gain or loss if the shares have been held for more than one year. Any capital gain or loss realized upon a sale of Fund shares held for one
year or less is generally treated as short-term gain or loss, except that any capital loss on the sale of shares held for six months or less is treated as long-term capital loss to the extent that capital gain dividends were paid with respect to
such shares. Any such capital gains, including from sales of Fund shares or from capital gain dividends, are included in “net investment income” for purposes of the 3.8% U.S. federal Medicare contribution tax mentioned
above.
If your shares are lent out pursuant to a
securities lending arrangement, you may lose the ability to use the non-U.S. tax credits passed through by the Fund or to treat Fund dividends (paid while the shares are held by the borrower) as qualified dividend income.
The foregoing discussion summarizes some of the consequences
under current U.S. federal tax law of an investment in the Fund. It is not a substitute for personal tax advice. You may also be subject to state and local taxation on Fund distributions and sales of shares. Consult your personal tax advisor about
the potential tax consequences of an investment in shares of the Fund under all applicable tax laws.
Creations and Redemptions.
Prior to trading in the secondary market, shares of the Fund are “created” at NAV by market makers, large investors and institutions only in block-size Creation Units of 50,000 shares or multiples thereof. Each “creator” or
“Authorized Participant” enters into an authorized participant agreement with the Fund's distributor, BlackRock Investments, LLC (the “Distributor”), an affiliate of BFA.
A creation transaction, which is subject to acceptance by the
transfer agent, generally takes place when an Authorized Participant deposits into the Fund a designated portfolio of securities (including any portion of such securities for which cash may be substituted) and a specified amount of cash
approximating the holdings of the Fund in exchange for a specified number of Creation Units. To the extent practicable, the composition of such portfolio generally corresponds pro rata to the holdings of the
Fund. However, creation and redemption baskets may differ.
Similarly, shares can be redeemed only in Creation Units,
generally for a designated portfolio of securities (including any portion of such securities for which cash may be substituted) held by the Fund and a specified amount of cash. Except when aggregated in Creation
Units, shares are not redeemable by the Fund.
The
prices at which creations and redemptions occur are based on the next calculation of NAV after a creation or redemption order is received in an acceptable form under the authorized participant agreement.
Only an Authorized Participant may create or redeem Creation
Units directly with the Fund.
20
Table of Contents
As a result of any system failure or other interruption,
including disruptions at market makers or Authorized Participants, orders to purchase or redeem Creation Units either may not be executed according to the Fund's instructions or may not be executed at all, or the Fund may not be able to place or
change orders.
To the extent the Fund engages in in-kind
transactions, the Fund intends to comply with the U.S. federal securities laws in accepting securities for deposit and satisfying redemptions with redemption securities by, among other means, assuring that any securities accepted for deposit and any
securities used to satisfy redemption requests will be sold in transactions that would be exempt from registration under the Securities Act of 1933, as amended (the “1933 Act”). Further, an Authorized Participant that is not a
“qualified institutional buyer,” as such term is defined under Rule 144A of the 1933 Act, will not be able to receive restricted securities eligible for resale under Rule 144A.
Creations and redemptions must be made through a firm that is
either a member of the Continuous Net Settlement System of the National Securities Clearing Corporation or a DTC participant and has executed an agreement with the Distributor with respect to creations and redemptions of Creation Unit aggregations.
Information about the procedures regarding creation and redemption of Creation Units (including the cut-off times for receipt of creation and redemption orders) is included in the Fund's SAI.
Because new shares may be created and issued on an ongoing
basis, at any point during the life of the Fund a “distribution,” as such term is used in the 1933 Act, may be occurring. Broker-dealers and other persons are cautioned that some activities on their part may, depending on the
circumstances, result in their being deemed participants in a distribution in a manner that could render them statutory underwriters and subject to the prospectus delivery and liability provisions of the 1933 Act. Any determination of whether one is
an underwriter must take into account all the relevant facts and circumstances of each particular case.
Broker-dealers should also note that dealers who are not
“underwriters” but are participating in a distribution (as contrasted to ordinary secondary transactions), and thus dealing with shares that are part of an “unsold allotment” within the meaning of Section 4(a)(3)(C) of the
1933 Act, would be unable to take advantage of the prospectus delivery exemption provided by Section 4(a)(3) of the 1933 Act. For delivery of prospectuses to exchange members, the prospectus delivery mechanism of Rule 153 under the 1933 Act is
available only with respect to transactions on a national securities exchange.
Costs Associated with Creations and Redemptions. Authorized Participants are charged standard creation and redemption transaction fees to offset transfer and other transaction costs associated with the issuance and redemption of Creation Units. The standard creation
and redemption transaction fees are set forth in the table below. The standard creation transaction fee is charged to the Authorized Participant on the day such Authorized Participant creates a Creation Unit, and is the same regardless of the number
of Creation Units purchased by the Authorized Participant on the applicable business day. Similarly, the standard redemption transaction fee is charged to the Authorized Participant on the day such Authorized Participant redeems a Creation Unit, and
is the same regardless of the number of Creation Units redeemed
21
Table of Contents
by
the Authorized Participant on the applicable business day. Creations and redemptions for cash (when cash creations and redemptions (in whole or in part) are available or specified) are also subject to an additional charge (up to the maximum amounts
shown in the table below). This charge is intended to compensate for brokerage, tax, foreign exchange, execution, market impact and other costs and expenses related to cash transactions. Investors who use the services of a broker or other financial
intermediary to acquire or dispose of Fund shares may pay fees for such services.
The following table shows, as of May 31, 2014, the approximate
value of one Creation Unit, standard fees and maximum additional charges for creations and redemptions (as described above):
| Approximate
Value of a Creation Unit |
Creation
Unit Size |
Standard
Creation/ Redemption Transaction Fee |
Maximum
Additional Charge for Creations* |
Maximum
Additional Charge for Redemptions* | ||||
| $2,916,000 | 50,000 | $800 | 3.0% | 2.0% |
| * | As a percentage of the net asset value per Creation Unit, inclusive, in the case of redemptions, of the standard redemption transaction fee. |
Householding. Householding is
an option available to certain Fund investors. Householding is a method of delivery, based on the preference of the individual investor, in which a single copy of certain shareholder documents can be delivered to investors who share the same
address, even if their accounts are registered under different names. Please contact your broker-dealer if you are interested in enrolling in householding and receiving a single copy of prospectuses and other shareholder documents, or if you are
currently enrolled in householding and wish to change your householding status.
Distribution
The Distributor or its agent distributes Creation Units for the
Fund on an agency basis. The Distributor does not maintain a secondary market in shares of the Fund. The Distributor has no role in determining the policies of the Fund or the securities that are purchased or sold by the Fund. The
Distributor’s principal address is 1 University Square Drive, Princeton, NJ 08540.
BFA or its Affiliates make payments to broker-dealers,
registered investment advisers, banks or other intermediaries (together, “intermediaries”) related to marketing activities and presentations, educational training programs, conferences, the development of technology platforms and
reporting systems, or their making shares of the Fund and certain other iShares funds available to their customers generally and in certain investment programs. Such payments, which may be significant to the intermediary, are not made by the Fund.
Rather, such payments are made by BFA or its Affiliates from their own resources, which come directly or indirectly in part from fees paid by the iShares funds complex. Payments of this type are sometimes referred to as revenue-sharing payments. A
financial intermediary may make decisions about which investment options it recommends or makes available, or the level of services
22
Table of Contents
provided, to its customers based on the payments it is eligible to receive.
Therefore, such payments to an intermediary create conflicts of interest between the intermediary and its customers and may cause the intermediary to recommend the Fund or other iShares funds over another investment. More information regarding these
payments is contained in the Fund's SAI. Please contact your salesperson or other investment professional for more information regarding any such payments his or her firm may receive from BFA or its
Affiliates.
23
Table of Contents
Financial Highlights
The financial highlights table is intended to help investors
understand the Fund’s financial performance since inception. Certain information reflects financial results for a single share of the Fund. The total returns in the table represent the rate that an investor would have earned (or lost) on an
investment in the Fund, assuming reinvestment of all dividends and distributions. This information has been audited by PricewaterhouseCoopers LLP, whose report is included, along with the Fund's financial statements, in the Fund's Annual Report
(available upon request).
Financial Highlights
(For a share outstanding throughout each period)
(For a share outstanding throughout each period)
| Year
ended Apr. 30, 2014 |
Year
ended Apr. 30, 2013 |
Period
from Feb. 23, 2012a to Apr. 30, 2012 | |||
| Net asset value, beginning of period | $ 61.76 | $ 52.74 | $ 51.62 | ||
| Income
from investment operations: | |||||
| Net investment incomeb | 2.61 | 2.71 | 0.55 | ||
| Net realized and unrealized gain (loss)c | (4.04) | 8.86 | 1.14 | ||
| Total from investment operations | (1.43) | 11.57 | 1.69 | ||
| Less distributions from: | |||||
| Net investment income | (3.06) | (2.55) | (0.54) | ||
| Net realized gain | − | − | (0.01) | ||
| Return of capital | − | − | (0.02) | ||
| Total distributions | (3.06) | (2.55) | (0.57) | ||
| Net asset value, end of period | $ 57.27 | $ 61.76 | $ 52.74 | ||
| Total return | (1.78)% | 22.87% | 3.32% d | ||
| Ratios/Supplemental data: | |||||
| Net assets, end of period (000s) | $48,676 | $43,229 | $13,186 | ||
| Ratio of expenses to average net assetse | 0.49% | 0.49% | 0.49% | ||
| Ratio of net investment income to average net assetse | 4.77% | 4.99% | 5.76% | ||
| Portfolio turnover ratef | 33% | 32% | 1% | ||
| a | Commencement of operations. |
| b | Based on average shares outstanding throughout each period. |
| c | The amounts reported for a share outstanding may not accord with the change in aggregate gains and losses in securities for the fiscal period due to the timing of capital share transactions in relation to the fluctuating market values of the Fund's underlying securities. |
| d | Not annualized. |
| e | Annualized for periods of less than one year. |
| f | Portfolio turnover rates exclude portfolio securities received or delivered as a result of processing capital share transactions in Creation Units. |
24
Table of Contents
Index Provider
The Underlying Index is a product of SPDJI, and has been
licensed for use by BFA or its affiliates. S&P® is a registered trademark of SPFS; Dow Jones® is a registered trademark
of Dow Jones; and these trademarks have been licensed for use by SPDJI and sublicensed for certain purposes by BFA or its affiliates. The Fund is not sponsored, endorsed, sold or promoted by SPDJI, Dow Jones, SPFS or any of their respective
affiliates or third party licensors (collectively, “S&P Dow Jones Indices”). S& P Dow Jones Indices make no representation or warranty, express or implied, to the owners of the Fund or any member of the public regarding the
advisability of investing in securities generally or in the Fund particularly or the ability of the Underlying Index to track general market performance. S&P Dow Jones Indices’ only relationship to BFA or its affiliates with respect to the
Underlying Index is the licensing of the Underlying Index and certain trademarks, service marks and/or trade names of S&P Dow Jones Indices and/or its licensors. The Underlying Index is determined, composed and calculated by S&P Dow Jones
Indices without regard to BFA or its affiliates or the Fund. S&P Dow Jones Indices have no obligation to take the needs of BFA or its affiliates or the owners of the Fund into consideration in determining, composing or calculating the Underlying
Index. S&P Dow Jones Indices are not responsible for and have not participated in the determination of the prices, and amount of the Fund or the timing of the issuance or sale of the Fund or in the determination or calculation of the equation by
which the Fund is to be converted into cash, surrendered or redeemed, as the case may be. S&P Dow Jones Indices have no obligation or liability in connection with the administration, marketing or trading of the Fund. There is no assurance that
investment products based on the Underlying Index will accurately track index performance or provide positive investment returns. SPDJI is not an investment advisor. Inclusion of a security within an index is not a recommendation by S&P Dow
Jones Indices to buy, sell, or hold such security, nor is it considered to be investment advice.
S&P DOW JONES INDICES DO NOT GUARANTEE THE ADEQUACY,
ACCURACY, TIMELINESS AND/OR THE COMPLETENESS OF THE UNDERLYING INDEX OR ANY DATA RELATED THERETO OR ANY COMMUNICATION, INCLUDING BUT NOT LIMITED TO, ORAL OR WRITTEN COMMUNICATION (INCLUDING ELECTRONIC COMMUNICATIONS) WITH RESPECT THERETO. S&P
DOW JONES INDICES SHALL NOT BE SUBJECT TO ANY DAMAGES OR LIABILITY FOR ANY ERRORS, OMISSIONS, OR DELAYS THEREIN. S&P DOW JONES INDICES MAKE NO EXPRESS OR IMPLIED WARRANTIES, AND EXPRESSLY DISCLAIMS ALL WARRANTIES, OF MERCHANTABILITY OR FITNESS
FOR A PARTICULAR PURPOSE OR USE OR AS TO RESULTS TO BE OBTAINED BY BFA OR ITS AFFILIATES, OWNERS OF SHARES OF THE FUND, OR ANY OTHER PERSON OR ENTITY FROM THE USE OF THE UNDERLYING INDEX OR WITH RESPECT TO ANY DATA RELATED THERETO. WITHOUT LIMITING
ANY OF THE FOREGOING, IN NO EVENT WHATSOEVER SHALL S&P DOW JONES INDICES BE LIABLE FOR ANY INDIRECT, SPECIAL, INCIDENTAL, PUNITIVE, OR CONSEQUENTIAL DAMAGES INCLUDING BUT NOT LIMITED TO, LOSS OF PROFITS, TRADING LOSSES, LOST TIME OR GOODWILL,
EVEN IF THEY HAVE BEEN ADVISED OF THE POSSIBLITY OF SUCH DAMAGES, WHETHER IN CONTRACT, TORT, STRICT LIABILITY, OR
25
Table of Contents
OTHERWISE. THERE ARE NO THIRD PARTY BENEFICIARIES OF ANY AGREEMENTS OR
ARRANGEMENTS BETWEEN S&P DOW JONES INDICES AND BFA OR ITS AFFILATES, OTHER THAN THE LICENSORS OF S&P DOW JONES INDICES.
SPDJI is the world’s largest, global resource for
index-based concepts, data and research. Home to iconic financial market indicators, such as the S&P 500® and the Dow Jones Industrial Average®, SPDJI has over 115 years of experience constructing innovative and transparent solutions that fulfill the needs of institutional and retail investors. More assets are invested in products
based upon SPDJI’s indices than any other provider in the world. With over 830,000 indices covering a wide range of asset classes across the globe, SPDJI defines the way investors measure and trade the markets. To learn more about SPDJI,
please visit www.spdji.com.
BFA or its affiliates have
entered into a license agreement with the Index Provider to use the Underlying Index. BFA or its affiliates sublicense rights in the Underlying Index to the Company at no charge.
26
Table of Contents
Disclaimers
Shares of the Fund are not sponsored, endorsed or promoted by
NYSE Arca. NYSE Arca makes no representation or warranty, express or implied, to the owners of the shares of the Fund or any member of the public regarding the ability of the Fund to track the total return performance of the Underlying Index or the
ability of the Underlying Index to track stock market performance. NYSE Arca is not responsible for, nor has it participated in, the determination of the compilation or the calculation of the Underlying Index, nor in the determination of the timing
of, prices of, or quantities of shares of the Fund to be issued, nor in the determination or calculation of the equation by which the shares are redeemable. NYSE Arca has no obligation or liability to owners of the shares of the Fund in connection
with the administration, marketing or trading of the shares of the Fund.
NYSE Arca does not guarantee the accuracy and/or the completeness
of the Underlying Index or any data included therein. NYSE Arca makes no warranty, express or implied, as to results to be obtained by the Company on behalf of the Fund as licensee, licensee’s customers and counterparties, owners of the shares
of the Fund, or any other person or entity from the use of the subject index or any data included therein in connection with the rights licensed as described herein or for any other use. NYSE Arca makes no express or implied warranties and hereby
expressly disclaims all warranties of merchantability or fitness for a particular purpose with respect to the Underlying Index or any data included therein. Without limiting any of the foregoing, in no event shall NYSE Arca have any liability for
any direct, indirect, special, punitive, consequential or any other damages (including lost profits) even if notified of the possibility of such damages.
The past performance of the Underlying Index is not a guide to
future performance. BFA does not guarantee the accuracy or the completeness of the Underlying Index or any data included therein and BFA shall have no liability for any errors, omissions or interruptions therein. BFA makes no warranty, express or
implied, to the owners of shares of the Fund or to any other person or entity, as to results to be obtained by the Fund from the use of the Underlying Index or any data included therein. Without limiting any of the foregoing, in no event shall BFA
have any liability for any special, punitive, direct, indirect or consequential damages (including lost profits), even if notified of the possibility of such damages.
27
Table of Contents
Supplemental Information
I. Premium/Discount Information
The table that follows presents information about the
differences between the daily market price on secondary markets for shares of the Fund and the Fund’s NAV. NAV is the price at which the Fund issues and redeems shares. It is calculated in accordance with the standard formula for valuing
mutual fund shares. The price used to calculate market returns (“Market Price”) of the Fund generally is determined using the midpoint between the highest bid and the lowest ask on the primary securities exchange on which shares of the
Fund are listed for trading, as of the time that the Fund’s NAV is calculated. The Fund’s Market Price may be at, above or below its NAV. The NAV of the Fund will fluctuate with changes in the value of its portfolio holdings. The Market
Price of the Fund will fluctuate in accordance with changes in its NAV, as well as market supply and demand.
Premiums or discounts are the differences (expressed as a
percentage) between the NAV and Market Price of the Fund on a given day, generally at the time the NAV is calculated. A premium is the amount that the Fund is trading above the reported NAV, expressed as a percentage of the NAV. A discount is the
amount that the Fund is trading below the reported NAV, expressed as a percentage of the NAV.
The following information shows the frequency of distributions
of premiums and discounts for the Fund for each full calendar quarter of 2013 through June 30, 2014.
Each line in the table shows the number of trading days in
which the Fund traded within the premium/discount range indicated. The number of trading days in each premium/discount range is also shown as a percentage of the total number of trading days in the period covered by the table. All data presented
here represents past performance, which cannot be used to predict future results.
| Premium/Discount Range | Number of Days | Percentage of Total Days | ||
| Greater than 2.0% | 2 | 0.53% | ||
| Greater than 1.5% and Less than 2.0% | 2 | 0.53 | ||
| Greater than 1.0% and Less than 1.5% | 18 | 4.79 | ||
| Greater than 0.5% and Less than 1.0% | 85 | 22.6 | ||
| Between 0.5% and -0.5% | 228 | 60.64 | ||
| Less than -0.5% and Greater than -1.0% | 29 | 7.72 | ||
| Less than -1.0% and Greater than -1.5% | 9 | 2.39 | ||
| Less than -1.5% and Greater than -2.0% | 1 | 0.27 | ||
| Less than -2.0% and Greater than -2.5% | 2 | 0.53 | ||
| 376 | 100.00% |
28
Table of Contents
II. Total Return Information
The table that follows presents information about the total
returns of the Fund and the Underlying Index as of the fiscal year ended April 30, 2014.
“Average Annual Total Returns” represent the
average annual change in value of an investment over the periods indicated. “Cumulative Total Returns” represent the total change in value of an investment over the period indicated.
The Fund’s NAV is the value of one share of the Fund as
calculated in accordance with the standard formula for valuing mutual fund shares. The NAV return is based on the NAV of the Fund and the market return is based on the Market Price of the Fund. Market Price generally is determined by using the
midpoint between the highest bid and the lowest ask on the primary stock exchange on which shares of the Fund are listed for trading, as of the time that the Fund's NAV is calculated. Since shares of the Fund did not trade in the secondary market
until after the Fund's inception, for the period from inception to the first day of secondary market trading in shares of the Fund, the NAV of the Fund is used as a proxy for the Market Price to calculate market returns. Market and NAV returns
assume that dividends and capital gain distributions have been reinvested in the Fund at Market Price and NAV, respectively.
An index is a statistical composite that tracks a specified
financial market or sector. Unlike the Fund, the Underlying Index does not actually hold a portfolio of securities and therefore does not incur the expenses incurred by the Fund. These expenses negatively impact the performance of the Fund. Also,
market returns do not include brokerage commissions that may be payable on secondary market transactions. If brokerage commissions were included, market returns would be lower. The returns shown in the following table do not reflect the deduction of
taxes that a shareholder would pay on Fund distributions or the redemption or sale of Fund shares. The investment return and principal value of shares of the Fund will vary with changes in market conditions. Shares of the Fund may be worth more or
less than their original cost when they are redeemed or sold in the market. The Fund’s past performance is no guarantee of future results.
Performance as of April 30, 2014
| Average Annual Total Returns | Cumulative Total Returns | |||||||
| NAV | MARKET | INDEX | NAV | MARKET | INDEX | |||
| 1 Year | (1.78)% | (1.77)% | (1.53)% | (1.78)% | (1.77)% | (1.53)% | ||
| Since Inception* | 10.63% | 10.78% | 11.08% | 24.68% | 25.04% | 25.80% | ||
| * | Total returns for the period since inception are calculated from the inception date of the Fund (2/23/12). The first day of secondary market trading in shares of the Fund was 2/24/12. |
29
Table of Contents
[THIS PAGE INTENTIONALLY LEFT BLANK]
Table of Contents
Table of Contents
|
|
For more information visit www.iShares.com or call
1-800-474-2737
Copies of the Prospectus, SAI and recent
shareholder reports can be found on our website at www.iShares.com. For more information about the Fund, you may request a copy of the SAI. The SAI provides detailed information about the Fund and is incorporated by reference into this Prospectus.
This means that the SAI, for legal purposes, is a part of this Prospectus.
Additional information about the Fund's investments is
available in the Fund's Annual and Semi-Annual reports to shareholders. In the Fund's Annual Report, you will find a discussion of the market conditions and investment strategies that significantly affected the Fund's performance during the last
fiscal year.
If you have any questions about the Company
or shares of the Fund or you wish to obtain the SAI, Semi-Annual or Annual report free of charge, please:
| Call: | 1-800-iShares
or 1-800-474-2737 (toll free) Monday through Friday, 8:30 a.m. to 6:30 p.m. (Eastern time) |
| Email: | iSharesETFs@blackrock.com |
| Write: | c/o
BlackRock Investments, LLC 1 University Square Drive, Princeton, NJ 08540 |
Information about the Fund (including the SAI) can be reviewed
and copied at the SEC's Public Reference Room in Washington, D.C., and information on the operation of the Public Reference Room may be obtained by calling the SEC at 1-202-551-8090. Reports and other information about the Fund are available on the
EDGAR database on the SEC's website at www.sec.gov, and copies of this information may be obtained, after paying a duplicating fee, by electronic request at the following e-mail address: publicinfo@sec.gov, or by writing to the SEC's Public
Reference Section, Washington, D.C. 20549-1520.
No person
is authorized to give any information or to make any representations about the Fund and its shares not contained in this Prospectus and you should not rely on any other information. Read and keep this Prospectus for future reference.
©2014 BlackRock, Inc. All rights reserved. iSHARES and BLACKROCK are registered trademarks of BFA and its affiliates. All other marks are the property of their respective owners.
Investment Company Act File No.: 811-09102
IS-P-DVYA-0115

Table of Contents
March 1, 2014
(as revised January 2, 2015)
| 2014 Prospectus |
|
| ► | iShares Emerging Markets Corporate Bond ETF | CEMB | BATS |
The Securities and Exchange Commission
(“SEC”) has not approved or disapproved these securities or passed upon the adequacy of this prospectus. Any representation to the contrary is a criminal offense.
Table of Contents
Table of Contents
Table of Contents
|
|
S-1 |
|
|
1 |
|
|
2 |
|
|
13 |
|
|
14 |
|
|
14 |
|
|
17 |
|
|
26 |
|
|
27 |
|
|
28 |
|
|
28 |
|
|
30 |
“Morningstar®” and “Morningstar® Emerging Markets Corporate Bond
IndexSM” are trademarks or servicemarks of Morningstar, Inc. and have been licensed for use for certain purposes by BlackRock Fund Advisors or its affiliates. iShares® and BlackRock® are registered trademarks of BlackRock, Inc. or its affiliates. The Fund is not sponsored, endorsed, sold or
promoted by Morningstar, Inc., and Morningstar, Inc. makes no representation regarding the advisability of investing in the Fund.
i
Table of Contents
[THIS PAGE INTENTIONALLY LEFT BLANK]
Table of Contents
iSHARES® EMERGING MARKETS
CORPORATE BOND ETF
| Ticker: CEMB | Stock Exchange: BATS |
Investment Objective
The iShares Emerging Markets Corporate Bond ETF (the
“Fund”) seeks to track the investment results of an index composed of U.S. dollar-denominated, emerging market corporate bonds.
Fees and Expenses
The following table describes the fees and expenses that you
will incur if you own shares of the Fund. The investment advisory agreement between iShares, Inc. (the “Company”) and BlackRock Fund Advisors (“BFA”) (the “Investment Advisory Agreement”) provides that BFA will
pay all operating expenses of the Fund, except interest expenses, taxes, brokerage expenses, future distribution fees or expenses, and extraordinary expenses.
You may also incur usual and customary brokerage commissions
when buying or selling shares of the Fund, which are not reflected in the Example that follows:
| Annual
Fund Operating Expenses (ongoing expenses that you pay each year as a percentage of the value of your investments) | ||||||
| Management
Fees |
Distribution
and Service (12b-1) Fees |
Other
Expenses |
Total
Annual Fund Operating Expenses | |||
| 0.60% | None | None | 0.60% | |||
Example. This Example is intended to help you compare the cost of owning shares of the Fund with the cost of investing in other funds. The Example assumes that you invest $10,000 in the Fund for the time periods indicated and
then sell all of your shares at the end of those periods. The Example also assumes that your investment has a 5% return each year and that the Fund’s operating expenses remain the same. Although your actual costs may be higher or lower, based
on these assumptions, your costs would be:
| 1 Year | 3 Years | 5 Years | 10 Years | |||
| $61 | $192 | $335 | $750 |
S-1
Table of Contents
S-2
Table of Contents
S-3
Table of Contents
S-4
Table of Contents
S-5
Table of Contents
S-6
Table of Contents
S-7
Table of Contents
Performance Information
The bar chart and table that follow show how the Fund has
performed on a calendar year basis and provide an indication of the risks of investing in the Fund. Both assume that all dividends and distributions have been reinvested in the Fund. Past performance (before and after taxes) does not necessarily
indicate how the Fund will perform in the future. Supplemental information about the Fund’s performance is shown under the heading Total Return Information in the
Supplemental Information section of the Fund's prospectus (the “Prospectus”).
Year by Year Returns (Year Ended December 31)
The best calendar quarter
return during the period shown above was 1.35% in the 3rd quarter of 2013; the worst was -5.00% in the 2nd quarter of 2013.
Updated performance information is available at www.iShares.com
or by calling 1-800-iShares (1-800-474-2737) (toll free).
Average Annual Total Returns
(for the periods ended December 31, 2013)
| One Year | Since
Fund Inception | ||
| (Inception Date: 4/17/2012) | |||
| Return Before Taxes | -3.16% | 3.21% | |
| Return After Taxes on Distributions1 | -4.75% | 1.68% | |
| Return After Taxes on Distributions and Sale of Fund Shares1 | -1.79% | 1.84% | |
| Morningstar ® Emerging Markets Corporate Bond IndexSM (Index returns do not reflect deductions for fees, expenses, or taxes) | -2.81% | 3.71% |
| 1 | After-tax returns in the table above are calculated using the historical highest individual U.S. federal marginal income tax rates and do not reflect the impact of state or local taxes. Actual after-tax returns depend on an investor’s tax situation and may differ from those shown, and after-tax returns shown are not relevant to tax-exempt investors or investors who hold shares through tax-deferred arrangements, such as 401(k) plans or individual retirement accounts (“IRAs”). Fund returns after taxes on distributions and sales of Fund shares are calculated assuming that an investor has sufficient capital gains of the same character from other investments to offset any capital losses from the sale of Fund shares. As a result, Fund returns after taxes on distributions and sales of Fund shares may exceed Fund returns before taxes and/or returns after taxes on distributions. |
S-8
Table of Contents
S-9
Table of Contents
[THIS PAGE INTENTIONALLY LEFT BLANK]
Table of Contents
More Information About the Fund
This Prospectus contains important information about investing
in the Fund. Please read this Prospectus carefully before you make any investment decisions. Additional information regarding the Fund is available at www.iShares.com.
On July 1, 2013, the name of the Fund changed from the iShares
Emerging Markets Corporate Bond Fund to the iShares Emerging Markets Corporate Bond ETF.
BFA is the investment adviser to the Fund. Shares of the Fund
are listed for trading on BATS Exchange, Inc. (“BATS”). The market price for a share of the Fund may be different from the Fund’s most recent NAV.
ETFs are funds that trade like other publicly traded
securities. The Fund is designed to track an index. Similar to shares of an index mutual fund, each share of the Fund represents a partial ownership in an underlying portfolio of securities intended to track a market index. Unlike shares of a mutual
fund, which can be bought and redeemed from the issuing fund by all shareholders at a price based on NAV, shares of the Fund may be purchased or redeemed directly from the Fund at NAV solely by Authorized Participants (as defined in the Creations and Redemptions section of this Prospectus). Also unlike shares of a mutual fund, shares of the Fund are listed on a national securities exchange and trade in the secondary market at market prices that
change throughout the day.
The Fund invests in a
particular segment of the securities markets and seeks to track the performance of a securities index that generally is not representative of the market as a whole. The Fund is designed to be used as part of broader asset allocation strategies.
Accordingly, an investment in the Fund should not constitute a complete investment program.
An index is a theoretical financial calculation while the Fund
is an actual investment portfolio. The performance of the Fund and the Underlying Index may vary due to transaction costs, non-U.S. currency valuations, asset valuations, corporate actions (such as mergers and spin-offs), timing variances and
differences between the Fund’s portfolio and the Underlying Index resulting from legal restrictions (such as diversification requirements) that apply to the Fund but not to the Underlying Index or to the use of representative sampling.
“Tracking error” is the divergence of the performance (return) of the Fund's portfolio from that of the Underlying Index. BFA expects that, over time, the Fund’s tracking error will not exceed 5%. Because the Fund uses a
representative sampling indexing strategy, it can be expected to have a larger tracking error than if it used a replication indexing strategy. “Replication” is an indexing strategy in which a fund invests in substantially all of the
securities in its underlying index in approximately the same proportions as in the underlying index.
An investment in the Fund is not a bank deposit and it is not
insured or guaranteed by the Federal Deposit Insurance Corporation or any other government agency, BFA or any of its affiliates.
1
Table of Contents
The Fund's investment objective and the Underlying Index may be
changed without shareholder approval.
A Further
Discussion of Principal Risks
The Fund is subject to
various risks, including the principal risks noted below, any of which may adversely affect the Fund’s NAV, trading price, yield, total return and ability to meet its investment objective. You could lose all or part of your investment in the
Fund, and the Fund could underperform other investments.
Asian Economic Risk. Certain
Asian economies have experienced high inflation, high unemployment, currency devaluations and restrictions, and over-extension of credit. Many Asian economies have experienced rapid growth and industrialization, and there is no assurance that this
growth rate will be maintained. During the recent global recession, many of the export-driven Asian economies experienced the effects of the economic slowdown in the United States and Europe, and certain Asian governments implemented stimulus plans,
low-rate monetary policies and currency devaluations. Economic events in any one Asian country may have a significant economic effect on the entire Asian region, as well as on major trading partners outside Asia. Any adverse event in the Asian
markets may have a significant adverse effect on some or all of the economies of the countries in which the Fund invests. Many Asian countries are subject to political risk, including corruption and regional conflict with neighboring countries. In
addition, many Asian countries are subject to social and labor risks associated with demands for improved political, economic and social conditions. These risks, among others, may adversely affect the value of the Fund’s
investments.
Asset Class Risk. The securities in the Underlying Index or in the Fund’s portfolio may underperform the returns of other securities or indexes that track other countries, groups of countries, regions, industries, groups of
industries, markets, asset classes or sectors. Various types of securities or indexes tend to experience cycles of outperformance and underperformance in comparison to the general securities markets.
Call Risk. During periods of
falling interest rates, an issuer of a callable bond held by the Fund may “call” or repay the security before its stated maturity, which may result in the Fund having to reinvest the proceeds at lower interest rates, resulting in a
decline in the Fund’s income.
Central and
South American Economic Risk. The economies and financial sectors of certain emerging markets countries are affected by the economies of Central and South American countries, some of which have experienced high
interest rates, economic volatility, inflation, currency devaluations, government defaults, high unemployment rates, and expropriation and/or nationalization of assets. In addition, commodities (such as oil, gas and minerals) represent a significant
percentage of the region's exports and many economies in this region are particularly sensitive to fluctuations in commodity prices. Adverse economic events in one country may have a significant adverse effect on other countries in this region and
on the financial sectors of emerging markets countries.
2
Table of Contents
Concentration Risk. The
Fund’s investments will generally follow the weightings of the Underlying Index, which may result in concentration of the Fund’s investments in a particular quasi-sovereign entity or entities in a particular country, group of countries,
region, market, sector or asset class. To the extent that its investments are concentrated in a particular quasi-sovereign entity or entities in a particular country, group of countries, region, market, sector or asset class, the Fund may be more
adversely affected by the underperformance of those bonds, may be subject to increased price volatility and may be more susceptible to adverse economic, market, political or regulatory occurrences affecting those securities than a fund that does not
concentrate its investments.
Credit Risk. Credit risk is the risk that an issuer or guarantor of debt instruments or the counterparty to a derivatives contract, repurchase agreement or loan of portfolio securities is unable or unwilling to make timely interest
and/or principal payments or to otherwise honor its obligations.
The Fund’s portfolio may include below investment grade
bonds, which generally are subject to greater levels of credit risk than higher rated securities. There is the chance that the Fund’s holdings will have their credit ratings downgraded or will default (fail to make scheduled interest or
principal payments), potentially reducing the Fund’s income level and share price. Debt instruments are subject to varying degrees of credit risk, which may be reflected in their credit ratings.
Custody Risk. Custody risk
refers to the risks inherent in the process of clearing and settling trades and the holding of securities by local banks, agents and depositories. Low trading volumes and volatile prices in less developed markets may make trades harder to complete
and settle, and governments or trade groups may compel local agents to hold securities in designated depositories that may not be subject to independent evaluation. Local agents are held only to the standards of care of their local markets. In
general, the less developed a country’s securities market is, the greater the likelihood of custody problems.
Eastern European Economic Risk.
An investment in Eastern European issuers may subject the Fund to legal, regulatory, political, currency, security and economic risks specific to Eastern Europe. Economies of certain Eastern European countries rely
heavily on export of commodities, including oil and gas, and certain metals. As a result, such economies will be impacted by international commodity prices and are particularly vulnerable to global demand for these products. Acts of terrorism in
certain Eastern European countries may cause uncertainty in their financial markets and adversely affect the performance of the issuers to which the Fund has exposure. The securities markets in Eastern European countries are substantially smaller
and inexperienced, with less government supervision and regulation of stock exchanges and less liquid and more volatile than securities markets in the United States or Western European countries. In addition, investing in securities of Eastern
European issuers involves:
| ■ | The risk of delays in settling portfolio transactions and the risk of loss arising out of the system of share registration and custody used in certain Eastern European countries; |
| ■ | Risks in connection with the maintenance of the Fund's portfolio securities and cash |
3
Table of Contents
with foreign sub-custodians and securities depositories,
including the risk that appropriate sub-custody arrangements will not be available to the Fund;
| ■ | The risk that the Fund's ownership rights in portfolio securities could be lost through fraud or negligence as a result of the fact that ownership in shares of certain Eastern European companies is recorded by the companies themselves and by registrars, rather than a central registration system; |
| ■ | The risk that the Fund may not be able to pursue claims on behalf of its shareholders because of the system of share registration and custody, and because certain Eastern European banking institutions and registrars are not guaranteed by their respective governments; and |
| ■ | Risks in connection with Eastern European countries' dependence on the economic health of Western European countries and the European Union (the “EU”) as a whole. |
Other risks related to investing in securities of Eastern
European issuers include: the absence of legal structures governing private and foreign investments and private property; the possibility of the loss of all or a substantial portion of the Fund’s assets invested in Eastern European issuers as
a result of expropriation; and certain national policies which may restrict the Fund’s investment opportunities, including, without limitation, restrictions on investing in issuers or industries deemed sensitive to relevant national
interests.
European Economic Risk. The Economic and Monetary Union of the EU requires compliance with restrictions on inflation rates, deficits, interest rates, debt levels and fiscal and monetary controls, each of which may significantly affect every
country in Europe. Decreasing imports or exports, changes in governmental or EU regulations on trade, changes in the exchange rate of the euro (the common currency of certain EU countries), the default or threat of default by an EU member country on
its sovereign debt, and/or an economic recession in an EU member country may have a significant adverse effect on the economies of EU member countries and their trading partners. The European financial markets have recently experienced volatility
and adverse trends due to concerns about economic downturns or rising government debt levels in several European countries, including Greece, Ireland, Italy, Portugal and Spain. These events have adversely affected the exchange rate of the euro and
may continue to significantly affect every country in Europe, including countries that do not use the euro.
Responses to the financial problems by European governments,
central banks and others, including austerity measures and reforms, may not produce the desired results, may result in social unrest and may limit future growth and economic recovery or have other unintended consequences. Further defaults or
restructurings by governments and other entities of their debt could have additional adverse effects on economies, financial markets and asset valuations around the world. In addition, one or more countries may abandon the euro and/or withdraw from
the EU. The impact of these actions, especially if they occur in a disorderly fashion, is not clear but could be significant and far-reaching.
4
Table of Contents
Extension Risk. During periods
of rising interest rates, certain debt obligations will be paid off substantially more slowly than originally anticipated and the value of those securities may fall sharply, resulting in a decline in the Fund’s income and potentially in the
value of the Fund’s investments.
Financials
Sector Risk. Companies in the financials sector of an economy are often subject to extensive governmental regulation and intervention, which may adversely affect the scope of their activities, the prices they can
charge and the amount of capital they must maintain. Governmental regulation may change frequently and may have significant adverse consequences for companies in the financials sector, including effects not intended by such regulation. The impact of
recent or future regulation in various countries on any individual financial company or on the sector as a whole cannot be predicted. Certain risks may impact the value of investments in the financials sector more severely than those of investments
outside this sector, including the risks associated with companies that operate with substantial financial leverage. Companies in the financials sector may also be adversely affected by increases in interest rates and loan losses, decreases in the
availability of money or asset valuations, credit rating downgrades and adverse conditions in other related markets. Insurance companies, in particular, may be subject to severe price competition and/or rate regulation, which may have an adverse
impact on their profitability. In the recent past, deterioration of the credit markets impacted a broad range of mortgage, asset-backed, auction rate, sovereign debt and other markets, including U.S. and non-U.S. credit and interbank money markets,
thereby affecting a wide range of financial institutions and markets. A number of large financial institutions have failed, merged with stronger institutions or have had significant government infusions of capital. Instability in the financial
markets has caused certain financial companies to incur large losses. Some financial companies experienced declines in the valuations of their assets, took actions to raise capital (such as the issuance of debt or equity securities), or even ceased
operations. Some financial companies borrowed significant amounts of capital from government sources and may face future government-imposed restrictions on their businesses or increased government intervention. Those actions caused the securities of
many financial companies to decline in value. The financials sector is particularly sensitive to fluctuations in interest rates.
Geographic Risk. Some of the
markets in which the Fund invests are located in parts of the world that have historically been prone to natural disasters, such as earthquakes, tornadoes, volcanoes, droughts, floods, hurricanes or tsunamis, and are economically sensitive to
environmental events. Any such event may adversely impact the economies of these geographic areas, causing an adverse impact on the value of the Fund.
High Yield Securities Risk.
Securities that are rated below investment-grade (commonly referred to as “junk bonds,” including those bonds rated lower than “BBB-” by Standard & Poor's Ratings Services and Fitch or “Baa3” by
Moody’s), or are unrated, may be deemed speculative and may be more volatile than higher-rated securities of similar maturity.
High yield securities may also be subject to greater levels of
credit or default risk than higher-rated securities. The value of high yield securities can be adversely affected by
5
Table of Contents
overall economic conditions, such as an economic downturn or a period of
rising interest rates, and high yield securities may be less liquid and more difficult to sell at an advantageous time or price or to value than higher-rated securities.
In particular, high yield securities are often issued by
smaller, less creditworthy companies or by highly leveraged (indebted) companies, which are generally less able than more financially stable companies to make scheduled payments of interest and principal.
Income Risk. The Fund’s
income may decline when interest rates fall. This decline can occur because the Fund must invest in lower-yielding bonds as bonds in its portfolio mature, bonds in the Underlying Index are substituted or the Fund otherwise needs to purchase
additional bonds. The Index Provider’s substitution of bonds in the Underlying Index may occur, for example, when the time to maturity for the bond no longer matches the Underlying Index’s stated maturity guidelines.
Index-Related Risk. The Fund
seeks to achieve a return which corresponds generally to the price and yield performance, before fees and expenses, of the Underlying Index as published by the Index Provider. There is no assurance that the Index Provider will compile the Underlying
Index accurately, or that the Underlying Index will be determined, composed or calculated accurately. While the Index Provider does provide descriptions of what the Underlying Index is designed to achieve, the Index Provider does not provide any
warranty or accept any liability in relation to the quality, accuracy or completeness of data in respect of their indices, and does not guarantee that the Underlying Index will be in line with their described index methodology. BFA’s mandate
as described in this Prospectus is to manage the Fund consistently with the Underlying Index provided to BFA. Consequently, BFA does not provide any warranty or guarantee for Index Provider errors. Errors in respect of the quality, accuracy and
completeness of the data may occur from time to time and may not be identified and corrected for a period of time, particularly where the indices are less commonly used. Therefore, gains, losses or costs associated with Index Provider errors will
generally be borne by the Fund and its shareholders. For example, during a period where the Fund’s Underlying Index contains incorrect constituents, the Fund would have market exposure to such constituents and would be underexposed to the
Underlying Index’s other constituents. As such, errors may result in a negative or positive performance impact to the Fund and its shareholders. Shareholders should understand that any gains from Index Provider errors will be kept by the Fund
and its shareholders and any losses resulting from Index Provider errors will be borne by the Fund and its shareholders.
Apart from scheduled rebalances, the Index Provider may carry
out additional ad hoc rebalances to the Underlying Index in order, for example, to correct an error in the selection of index constituents. Where the Underlying Index of the Fund is rebalanced and the Fund in turn rebalances its portfolio to bring
it in line with the Underlying Index, any transaction costs and market exposure arising from such portfolio rebalancing will be borne directly by the Fund and its shareholders. Unscheduled rebalances to the Underlying Index may also expose the Fund
to tracking error risk, which is the risk that its returns may not track exactly those of the Underlying Index.
6
Table of Contents
Therefore, errors and additional ad hoc rebalances carried out by the Index
Provider to the Underlying Index may increase the costs and market exposure risk of the Fund.
Industrials Sector Risk. The
value of securities issued by companies in the industrials sector may be affected by supply and demand, both for their specific product or service and for industrials sector products in general. The products of manufacturing companies may face
obsolescence due to rapid technological developments and frequent new product introduction. Government regulations, world events, economic conditions and exchange rates affect the performance of companies in the industrials sector. Companies in the
industrials sector may be adversely affected by liability for environmental damage and product liability claims. The industrials sector may also be adversely affected by changes or trends in commodity prices, which may be influenced by unpredictable
factors.
Interest Rate Risk. As interest rates rise, the value of a fixed-income security held by the Fund is likely to decrease. Securities with longer durations tend to be more sensitive to interest rate changes, usually making them more volatile
than securities with shorter durations. To the extent the Fund invests a substantial portion of its assets in fixed-income securities with longer-term maturities, rising interest rates may cause the value of the Fund’s investments to decline
significantly.
Issuer Risk. Fund performance depends on the performance of individual securities to which the Fund has exposure. Changes to the financial condition or credit rating of an issuer of those securities may cause the value of the
securities to decline.
Liquidity Risk. Liquidity risk exists when particular investments are difficult to purchase or sell. To the extent the Fund invests in illiquid securities or securities that become less liquid, such investments may have a negative
effect on the returns of the Fund because the Fund may be unable to sell the illiquid securities at an advantageous time or price. To the extent that the Fund’s principal investment strategies involve investing in securities with substantial
market and/or credit risk, the Fund will tend to have the greatest exposure to liquidity risk. Liquid investments may become illiquid after purchase by the Fund, particularly during periods of market turmoil. Illiquid investments may be harder to
value, especially in changing markets, and if the Fund is forced to sell these investments to meet redemption requests or for other cash needs, the Fund may suffer a loss. There can be no assurance that a security that is deemed to be liquid when
purchased will continue to be liquid for as long as it is held by the Fund.
Management Risk. The Fund may
not fully replicate the Underlying Index and may hold securities not included in the Underlying Index. As a result, the Fund is subject to the risk that BFA’s investment strategy, the implementation of which is subject to a number of
constraints, may not produce the intended results.
Market Risk. The Fund could
lose money due to short-term market movements and over longer periods during market downturns. Securities may decline in value due to factors affecting securities markets generally or particular asset classes or industries represented in the
markets. The value of a security may decline due to general market conditions, economic trends or events that are not specifically related to the issuer of the security or to factors that affect a particular industry or group of industries.
During
7
Table of Contents
a
general downturn in the securities markets, multiple asset classes may be negatively affected. The Fund invests primarily in emerging market bonds and, as a result, the Fund’s portfolio may have greater exposure to market risk than a fund that
invests in securities of developed markets. Fixed-income securities with short-term maturities are generally less sensitive to such changes than fixed-income securities with longer term maturities.
Market Trading Risk
Absence of Active Market.
Although shares of the Fund are listed for trading on one or more stock exchanges, there can be no assurance that an active trading market for such shares will develop or be maintained by market makers or Authorized Participants.
Risk of Secondary Listings.
The Fund's shares may be listed or traded on U.S. and non-U.S. stock exchanges other than the U.S. stock exchange where the Fund's primary listing is maintained. There can be no assurance that the Fund’s shares
will continue to trade on any such stock exchange or in any market or that the Fund’s shares will continue to meet the requirements for listing or trading on any exchange or in any market. The Fund's shares may be less actively traded in
certain markets than in others, and investors are subject to the execution and settlement risks and market standards of the market where they or their broker direct their trades for execution. Certain information available to investors who trade
Fund shares on a U.S. stock exchange during regular U.S. market hours may not be available to investors who trade in other markets, which may result in secondary market prices in such markets being less efficient.
Secondary Market Trading Risk.
Shares of the Fund may trade in the secondary market at times when the Fund does not accept orders to purchase or redeem shares. At such times, shares may trade in the secondary market with more significant premiums or discounts than might be
experienced at times when the Fund accepts purchase and redemption orders.
Secondary market trading in Fund shares may be halted by a
stock exchange because of market conditions or for other reasons. In addition, trading in Fund shares on a stock exchange or in any market may be subject to trading halts caused by extraordinary market volatility pursuant to “circuit
breaker” rules on the stock exchange or market. There can be no assurance that the requirements necessary to maintain the listing or trading of Fund shares will continue to be met or will remain unchanged.
Shares of the Fund, similar to shares of other issuers listed
on a stock exchange, may be sold short and are therefore subject to the risk of increased volatility associated with short selling.
Shares of the Fund May Trade at Prices Other Than NAV. Shares of the Fund trade on stock exchanges at prices at, above or below the Fund’s most recent NAV. The NAV of the Fund is calculated at the end of each business day and fluctuates with changes in the market value
of the Fund’s holdings. The trading price of the Fund's shares fluctuates continuously throughout trading hours based on both market supply of and demand for Fund shares and the underlying value of the Fund's portfolio holdings
or
8
Table of Contents
NAV.
As a result, the trading prices of the Fund’s shares may deviate significantly from NAV during periods of market volatility. ANY OF THESE FACTORS, AMONG OTHERS, MAY LEAD TO THE FUND'S SHARES TRADING AT A PREMIUM
OR DISCOUNT TO NAV. However, because shares can be created and redeemed in Creation Units at NAV (unlike shares of many closed-end funds, which frequently trade at appreciable discounts from, and sometimes at premiums to, their NAVs), BFA
believes that large discounts or premiums to the NAV of the Fund are not likely to be sustained over the long term. While the creation/redemption feature is designed to make it more likely that the Fund’s shares normally will trade on stock
exchanges at prices close to the Fund’s next calculated NAV, exchange prices are not expected to correlate exactly with the Fund's NAV due to timing reasons, supply and demand imbalances and other factors. In addition, disruptions to creations
and redemptions, including disruptions at market makers or Authorized Participants, or to market participants or during periods of significant market volatility, may result in trading prices for shares of the Fund that differ significantly from its
NAV.
Costs of Buying or Selling Fund Shares. Buying or selling Fund shares on an exchange involves two types of costs that apply to all securities transactions. When buying or selling shares of the Fund through a broker, you will likely incur a brokerage commission
or other charges imposed by brokers as determined by that broker. In addition, you may incur the cost of the “spread,” that is, the difference between what investors are willing to pay for Fund shares (the “bid” price) and
the price at which they are willing to sell Fund shares (the “ask” price). Because of the costs inherent in buying or selling Fund shares, frequent trading may detract significantly from investment results and an investment in Fund
shares may not be advisable for investors who anticipate regularly making small investments.
Non-Diversification Risk. The
Fund is classified as “non-diversified.” This means that the Fund may invest a large percentage of its assets in securities issued by or representing a small number of issuers. As a result, the Fund may be more susceptible to the risks
associated with these particular issuers, or to a single economic, political or regulatory occurrence affecting these issuers.
Non-U.S. Issuers Risk.
Securities issued by non-U.S. issuers have different risks from securities issued by U.S. issuers. These include differences in accounting, auditing and financial reporting standards, the possibility of expropriation or confiscatory taxation,
adverse changes in investment or exchange control regulations, political instability which could affect U.S. investments in non-U.S. countries, and potential restrictions of the flow of international capital. Non-U.S. issuers may be subject to less
governmental regulation than U.S. issuers. Moreover, individual non-U.S. economies may differ favorably or unfavorably from the U.S. economy in such respects as growth of gross domestic product, rate of inflation, capital reinvestment, resource
self-sufficiency and balance of payment positions. In addition, the value of these securities may fluctuate due to changes in the exchange rate of the issuer’s local currency against the U.S. dollar.
The United States and the EU, along with the regulatory bodies
of a number of countries including Japan, Australia and Canada (collectively, “Sanctioning Bodies”), have imposed economic sanctions, which consist of asset freezes and sectorial
9
Table of Contents
sanctions on certain Russian individuals and Russian corporate entities. The
Sanctioning Bodies could also institute broader sanctions on Russia. These sanctions, or even the threat of further sanctions, may result in the decline of the value and liquidity of Russian securities, a weakening of the ruble or other adverse
consequences to the Russian economy. These sanctions could also result in the immediate freeze of Russian securities, impairing the ability of the Fund to buy, sell, receive or deliver those securities.
The sanctions against certain Russian issuers include
prohibitions on transacting in or dealing in new debt of longer than 30 or 90 days maturity or new equity of such issuers. Securities held by the Fund issued prior to the date of the sanctions being imposed are not currently subject to any
restrictions under the sanctions. However, compliance with each of these sanctions may impair the ability of the Fund to buy, sell, hold, receive or deliver the affected securities or other securities of such issuers. If it becomes impracticable or
unlawful for the Fund to hold securities subject to, or otherwise affected by, sanctions (collectively, “affected securities”), or if deemed appropriate by the Fund’s investment adviser, the Fund may prohibit in-kind deposits of
the affected securities in connection with creation transactions and instead require a cash deposit, which may also increase the Fund's transaction costs.
Also, if an affected security is included in the Fund’s
Underlying Index, the Fund may, where practicable, seek to eliminate its holdings of the affected security by employing or augmenting its representative sampling strategy to seek to track the investment results of its Underlying Index. The use of
(or increased use of) a representative sampling strategy may increase the Fund’s tracking error risk. If the affected securities constitute a significant percentage of the Underlying Index, the Fund may not be able to effectively implement a
representative sampling strategy, which may result in significant tracking error between the Fund’s performance and the performance of its Underlying Index.
Current or future sanctions may result in Russia taking counter
measures or retaliatory actions, which may further impair the value and liquidity of Russian securities. These retaliatory measures may include the immediate freeze of Russian assets held by the Fund. In the event of such a freeze of any fund
assets, including depositary receipts, the Fund may need to liquidate non-restricted assets in order to satisfy any fund redemption orders. The liquidation of fund assets during this time may also result in the Fund receiving substantially lower
prices for its securities.
These sanctions may also lead
to changes in the Fund’s Underlying Index. The Fund’s Index Provider may remove securities from the Underlying Index or implement caps on the securities of certain issuers that have been subject to recent economic sanctions. In such an
event, it is expected that the Fund will rebalance its portfolio to bring it in line with the Underlying Index as a result of any such changes, which may result in transaction costs and increased tracking error.
Passive Investment Risk. The
Fund is not actively managed and may be affected by a general decline in market segments related to the Underlying Index. The Fund invests in securities included in, or representative of, the Underlying Index, regardless of their investment merits.
BFA generally does not attempt to take defensive positions under any market conditions, including declining markets.
10
Table of Contents
Privately-Issued Securities Risk. The Fund may invest in privately-issued securities, including those that are normally purchased pursuant to Rule 144A or Regulation S of the 1933 Act. Privately-issued securities typically may be resold only to qualified
institutional buyers, or in a privately negotiated transaction, or to a limited number of purchasers, or in limited quantities after they have been held for a specified period of time and other conditions are met for an exemption from registration.
Because there may be relatively few potential purchasers for such securities, especially under adverse markets or economic conditions or in the event of adverse changes in the financial condition of the issuer, the Fund may find it more difficult to
sell such securities when it may be advisable to do so or it may be able to sell such securities only at prices lower than if such securities were more widely held and traded. At times, it also may be more difficult to determine the fair value of
such securities for purposes of computing the Fund’s NAV due to the absence of an active trading market. There can be no assurance that a privately-issued security that is deemed to be liquid when purchased will continue to be liquid for as
long as it is held by the Fund.
Quasi-Sovereign
Obligations Risk. The Fund may invest in quasi-sovereign debt obligations. An investment in quasi-sovereign debt obligations involves special risks generally not present in corporation debt obligations.
Quasi-sovereign debt includes investments in securities issued or guaranteed by an entity affiliated with or backed by a sovereign government. Generally, quasi-sovereign debt obligations are issued by companies in which a government owns a majority
of the issuer’s voting shares. They are often considered strategically important to the sovereign entity but do not legally carry sovereign status for purposes of debt repayment. While certain quasi-sovereign debt issuers have received
sovereign government support in the past, such past support is not a guarantee that it will continue in the future. In fact, in the past certain quasi-sovereign debt issuers have pushed their creditors toward debt restructuring, rather than meeting
their payment obligations. Quasi-sovereign debt obligations are typically less liquid and less standardized than sovereign debt obligations.
Reliance on Trading Partners Risk. Economies in emerging market countries generally are heavily dependent upon commodity prices and international trade and, accordingly, have been and may continue to be affected adversely by the economies of their
trading partners, trade barriers, exchange controls, managed adjustments in relative currency values, and may suffer from extreme and volatile debt burdens or inflation rates. These countries may be subject to other protectionist measures imposed or
negotiated by the countries with which they trade.
Risk of Investing in Emerging Markets. Investments in emerging markets are subject to a greater risk of loss than investments in more developed markets. This is due to, among other things, the potential for greater market volatility, lower trading volume,
inflation, political and economic instability, greater risk of a market shutdown and more governmental limitations on foreign investments than typically found in more developed markets. In addition, emerging markets often have less uniformity in
accounting and reporting requirements, unreliable securities valuation and greater risks associated with custody of securities, as well as greater risk of capital controls through such measures as taxes or interest rate control. Certain emerging
market countries may also lack the infrastructure necessary to attract large amounts of
11
Table of Contents
foreign trade and investment. Local securities markets may trade a small
number of securities and may be unable to respond effectively to increases in trading volume, potentially making prompt liquidation of holdings difficult or impossible at times. Settlement procedures in emerging market countries are frequently less
developed and reliable than those in the United States (and other developed countries). In addition, significant delays may occur in certain markets in registering the transfer of securities. Settlement or registration problems may make it more
difficult for the Fund to value its portfolio securities and could cause the Fund to miss attractive investment opportunities.
Securities Lending Risk. The
Fund may engage in securities lending. Securities lending involves the risk that the Fund may lose money because the borrower of the loaned securities fails to return the securities in a timely manner or at all. The Fund could also lose money in the
event of a decline in the value of the collateral provided for the loaned securities or a decline in the value of any investments made with cash collateral. These events could also trigger adverse tax consequences for the Fund. In addition,
BlackRock Institutional Trust Company, N.A., the Fund’s securities lending agent, will take the tax impact to shareholders of substitute payments for dividends into account when managing the Fund’s securities lending
program.
Security Risk. Some geographic areas in which the Fund invests have experienced acts of terrorism or strained international relations due to territorial disputes, historical animosities or other defense concerns. These situations may
cause uncertainty in the markets of these geographic areas and may adversely affect their economies.
Structural Risk. Certain
countries in which the Fund invests may experience currency devaluations, substantial rates of inflation or economic recessions, causing a negative effect on their economies and securities markets.
Tracking Error Risk. Tracking
error is the divergence of the Fund’s performance from that of the Underlying Index. Tracking error may occur because of differences between the securities held in the Fund’s portfolio and those included in the Underlying Index, pricing
differences, transaction costs, the Fund holding uninvested cash, differences in timing of the accrual of distributions, changes to the Underlying Index or the costs of complying with various new or existing regulatory requirements. This risk may be
heightened during times of increased market volatility or other unusual market conditions. Tracking error also may result because the Fund incurs fees and expenses, while the Underlying Index does not. BFA EXPECTS THAT THE FUND MAY EXPERIENCE HIGHER
TRACKING ERROR THAN IS TYPICAL FOR SIMILAR INDEX EXCHANGE-TRADED FUNDS, ESPECIALLY BEFORE THE FUND REACHES SUFFICIENT SCALE AND FURTHER BROADENS ITS HOLDINGS.
U.S. Economic Risk. The United
States is a significant, and in some cases the most significant, trading partner of, or foreign investor in certain markets, and the economies of these countries may be particularly affected by adverse changes in the U.S. economy. A decrease in U.S.
imports, new trade regulations, changes in the U.S. dollar exchange rates or an economic slowdown in the United States may have a material adverse effect on the economies of these countries and, as a result, securities to which the Fund has
exposure.
12
Table of Contents
Utilities Sector Risk.
Deregulation is subjecting utility companies to greater competition and may adversely affect profitability. As deregulation allows utility companies to diversify outside of their original geographic regions and their traditional lines of business,
utility companies may engage in riskier ventures. Companies in the utilities industry may have difficulty obtaining an adequate return on invested capital, raising capital, and financing large construction programs during periods of inflation or
unsettled capital markets; face restrictions on operations and increased cost and delays attributable to environmental considerations and regulation; find that existing plants, equipment or products have been rendered obsolete by technological
innovations; and be subject to increased costs because of the scarcity of certain fuels or the effects of man-made disasters. Existing and possible future regulations or legislation may make it difficult for utility companies to operate profitably.
Government regulators monitor and control utility revenues and costs, and therefore may limit utility profits. In certain countries, regulatory authorities may also restrict utility companies’ access to new markets, thereby diminishing these
companies’ long-term prospects. There is no assurance that regulatory authorities will, in the future, grant rate increases, or that such increases will be adequate to permit the payment of coupon payments on bonds issued by such
company. The deregulation of certain utility companies may eliminate restrictions on profits, but may also subject these companies to greater risks of loss. Energy conservation and changes in climate policy may also have a significant adverse impact
on the revenues and expenses of utility companies.
Valuation Risk. The sale price
the Fund could receive for a security may differ from the Fund's valuation of the security and may differ from the value used by the Underlying Index, particularly for securities that trade in low volume or volatile markets, or that are valued
using a fair value methodology. Because non-U.S. stock exchanges may be open on days when the Fund does not price its shares, the value of the securities in the Fund’s portfolio may change on days when shareholders will not be able to purchase
or sell the Fund’s shares. In addition, for purposes of calculating the Fund's NAV, the value of assets denominated in non-U.S. currencies is converted into U.S. dollars using exchange rates deemed appropriate by BFA. This conversion may
result in a difference between the prices used to calculate the Fund's NAV and the prices used by the Underlying Index, which, in turn, could result in a difference between the Fund's performance and the performance of the Underlying
Index.
A Further Discussion of Other Risks
The Fund may also be subject to certain other risks associated
with its investments and investment strategies.
Middle
Eastern Economic Risk. Many Middle Eastern countries have little or no democratic tradition and the political and legal systems in such countries may adversely impact the companies in which the Fund invests and the
value of the Fund. Middle Eastern governments have exercised and continue to exercise substantial influence over many aspects of the private sector. Many economies in the Middle East are highly reliant on income from the sale of oil or trade with
countries involved in the sale of oil, and their economies are therefore vulnerable to changes in the market for
13
Table of Contents
oil
and foreign currency values. As global demand for oil fluctuates, many Middle Eastern economies may be significantly impacted. A sustained decrease in commodity prices could have a significant negative impact on all aspects of the economy in the
region. Middle Eastern economies may be subject to acts of terrorism, political strife, religious, ethnic or socioeconomic unrest and sudden outbreaks of hostilities with neighboring countries.
Certain Middle Eastern countries have strained relations with
other Middle Eastern countries due to territorial disputes, historical animosities, religious tensions or defense concerns, which may adversely affect the economies of these countries. Certain Middle Eastern countries experience significant
unemployment, as well as widespread underemployment.
Recently, many Middle Eastern countries have experienced
political, economic and social unrest as protestors have called for widespread reform. Some of these protests have resulted in regime change. If regime change were to occur in any of these countries, the new government may not immediately stabilize
such country, which could adversely affect the economies of Middle Eastern countries in which the Fund invests and could decrease the value of the Fund’s investments.
North American Economic Risk.
Decreasing imports or exports, changes in trade regulations and/or an economic recession in any one North American country can have a significant economic effect on the entire North American region, and on some or all of the North American countries
in which the Fund invests.
The United States is
Mexico's largest trading and investment partner. The Mexican economy is significantly affected by developments in the U.S. economy. Since the implementation of the North American Free Trade Agreement (“NAFTA”) in 1994 among Canada, the
United States and Mexico, total merchandise trade between the three countries has increased. To further this relationship, the three NAFTA countries entered into the Security and Prosperity Partnership of North America in March 2005, which may
further affect Mexico's dependency on the U.S. economy. Policy and legislative changes in one country may have a significant effect on North American markets generally, as well as the value of certain securities.
Portfolio Holdings Information
A description of the Company's policies and procedures with
respect to the disclosure of the Fund’s portfolio securities is available in the Fund's Statement of Additional Information (“SAI”). The top holdings of the Fund can be found at www.iShares.com. Fund fact sheets provide information
regarding the Fund's top holdings and may be requested by calling 1-800-iShares (1-800-474-2737).
Management
Investment Adviser. As
investment adviser, BFA has overall responsibility for the general management and administration of the Company. BFA provides an investment program for the Fund and manages the investment of the Fund’s assets. In managing the Fund, BFA may
draw upon the research and expertise of its asset management affiliates with respect to certain portfolio securities. In seeking to achieve the Fund's
14
Table of Contents
investment objective, BFA uses teams of portfolio managers, investment
strategists and other investment specialists. This team approach brings together many disciplines and leverages BFA’s extensive resources.
Pursuant to the Investment Advisory Agreement between BFA and
the Company (entered into on behalf of the Fund), BFA is responsible for substantially all expenses of the Fund, except interest expenses, taxes, brokerage expenses, future distribution fees or expenses and extraordinary expenses.
For its investment advisory services to the Fund, BFA is
entitled to receive a management fee from the Fund based on a percentage of the Fund's average daily net assets, at an annual rate of 0.60%.
BFA is located at 400 Howard Street, San Francisco, CA 94105.
It is an indirect wholly-owned subsidiary of BlackRock, Inc. (“BlackRock”). As of December 31, 2013, BFA and its affiliates provided investment advisory services for assets in excess of $4.32 trillion. BFA and its affiliates deal, trade
and invest for their own accounts in the types of securities in which the Fund may also invest.
A discussion regarding the basis for the Company's Board of
Directors' (the “Board”) approval of the Investment Advisory Agreement with BFA is available in the Fund's annual report for the period ended October 31.
Portfolio Managers. James Mauro
and Scott Radell are primarily responsible for the day-to-day management of the Fund. Each Portfolio Manager is responsible for various functions related to portfolio management, including, but not limited to, investing cash inflows, coordinating
with members of his portfolio management team to focus on certain asset classes, implementing investment strategy, researching and reviewing investment strategy and overseeing members of his portfolio management team that have more limited
responsibilities.
James Mauro has been employed by
BFA and BlackRock Institutional Trust Company, N.A. (“BTC”) as a portfolio manager since 2011. Prior to that, Mr. Mauro was a Vice President at State Street Global Advisors. Mr. Mauro has been a Portfolio Manager of the Fund since
2012.
Scott Radell has been employed by BFA (formerly,
Barclays Global Fund Advisors (“BGFA”)) and BTC (formerly, Barclays Global Investors, N.A. (“BGI”)) as a portfolio manager since 2004. Mr. Radell was a credit strategist from 2003 to 2004 and became a portfolio manager at
BGFA and BGI in 2004. Mr. Radell has been a Portfolio Manager of the Fund since 2012.
The Fund's SAI provides additional information about the
Portfolio Managers' compensation, other accounts managed by the Portfolio Managers and the Portfolio Managers' ownership (if any) of shares in the Fund.
Administrator, Custodian and Transfer Agent. State Street Bank and Trust Company (“State Street”) is the administrator, custodian and transfer agent for the Fund.
Conflicts of Interest. BFA
wants you to know that it has relationships with certain entities that may give rise to conflicts of interest or the appearance of conflicts of interest. These entities are BFA’s affiliates, including BlackRock and the PNC
Financial
15
Table of Contents
Services Group, Inc., and each of their affiliates, directors, partners,
trustees, managing members, officers and employees (collectively, the “Affiliates”).
The activities of BFA and the Affiliates in the management of,
or their interest in, their own accounts and other accounts they manage, may present conflicts of interest that could disadvantage the Fund and its shareholders. BFA and the Affiliates provide investment management services to other funds and
discretionary managed accounts that may follow an investment program similar to that of the Fund. BFA and the Affiliates are involved worldwide with a broad spectrum of financial services and asset management activities and may engage in the
ordinary course of business in activities in which their interests or the interests of their clients may conflict with those of the Fund. BFA or one or more of the Affiliates acts, or may act, as an investor, investment banker, research provider,
investment manager, financier, underwriter, adviser, market maker, trader, prime broker, lender, agent or principal, and have other direct and indirect interests, in securities, currencies and other instruments in which the Fund may directly or
indirectly invest. Thus, it is likely that the Fund will have multiple business relationships with and will invest in, engage in transactions with, make voting decisions with respect to, or obtain services from, entities for which BFA or an
Affiliate seeks to perform investment banking or other services.
BFA or one or more Affiliates may engage in proprietary trading
and advise accounts and funds that have investment objectives similar to those of the Fund and/or that engage in and compete for transactions in the same types of securities, currencies and other instruments as the Fund, including in securities
issued by other open-end and closed-end investment management companies, including investment companies that are affiliated with the Fund and BFA, to the extent permitted under the Investment Company Act of 1940, as amended (the “1940
Act”). The trading activities of BFA and these Affiliates are carried out without reference to positions held directly or indirectly by the Fund and may result in BFA or an Affiliate having positions that are adverse to those of the
Fund.
No Affiliate is under any obligation to share any
investment opportunity, idea or strategy with the Fund. As a result, an Affiliate may compete with the Fund for appropriate investment opportunities. As a result of this and several other factors, the results of the Fund's investment activities may
differ from those of an Affiliate and of other accounts managed by an Affiliate, and it is possible that the Fund could sustain losses during periods in which one or more Affiliates and other accounts achieve profits on their trading for proprietary
or other accounts. The opposite result is also possible.
The Fund may, from time to time, enter into transactions in
which BFA’s or an Affiliate’s clients have an interest adverse to the Fund. Furthermore, transactions undertaken by Affiliate-advised clients may adversely impact the Fund. Transactions by one or more Affiliate-advised clients or BFA may
have the effect of diluting or otherwise disadvantaging the values, prices or investment strategies of the Fund.
The Fund's activities may be limited because of regulatory
restrictions applicable to one or more Affiliates, and/or their internal policies designed to comply with such restrictions. In addition, the Fund may invest in securities of companies with which an Affiliate has developed or is trying to develop
investment banking relationships or in
16
Table of Contents
which an Affiliate has significant debt or equity investments or other
interests. The Fund also may invest in securities of companies for which an Affiliate provides or may in the future provide research coverage. An Affiliate may have business relationships with, and purchase, distribute or sell services or products
from or to, distributors, consultants or others who recommend the Fund or who engage in transactions with or for the Fund, and may receive compensation for such services. The Fund may also make brokerage and other payments to Affiliates in
connection with the Fund's portfolio investment transactions.
Pursuant to a securities lending program approved by the Board,
the Fund has retained an Affiliate of BFA to serve as the securities lending agent for the Fund to the extent that the Fund participates in the securities lending program. For these services, the lending agent may receive a fee from the Fund,
including a fee based on the returns earned on the Fund’s investment of the cash received as collateral for any loaned securities. BFA may receive compensation for managing the reinvestment of the cash collateral. In addition, one or more
Affiliates may be among the entities to which the Fund may lend its portfolio securities under the securities lending program.
The activities of BFA or the Affiliates may give rise to other
conflicts of interest that could disadvantage the Fund and its shareholders. BFA has adopted policies and procedures designed to address these potential conflicts of interest. See the Fund's SAI for further information.
Shareholder Information
Additional shareholder information, including how to buy and
sell shares of the Fund, is available free of charge by calling toll-free: 1-800-iShares (1-800-474-2737) or visiting our website at www.iShares.com.
Buying and Selling Shares.
Shares of the Fund may be acquired or redeemed directly from the Fund only in Creation Units or multiples thereof, as discussed in the Creations and Redemptions section of this Prospectus. Only an Authorized Participant (as defined in the Creations and Redemptions section) may
engage in creation or redemption transactions directly with the Fund. Once created, shares of the Fund generally trade in the secondary market in amounts less than a Creation Unit.
Shares of the Fund are listed on a national securities exchange
for trading during the trading day. Shares can be bought and sold throughout the trading day like shares of other publicly traded companies. The Company does not impose any minimum investment for shares of the Fund purchased on an exchange. The
Fund's shares trade under the trading symbol “CEMB.”
Buying or selling Fund shares on an exchange involves two types
of costs that may apply to all securities transactions. When buying or selling shares of the Fund through a broker, you will likely incur a brokerage commission or other charges determined by your broker. The commission is frequently a fixed amount
and may be a significant proportional cost for investors seeking to buy or sell small amounts of shares. In addition, you may incur the cost of the “spread,” that is, any difference between the bid price and the ask price. The spread
varies over time for shares of the Fund based on the Fund’s trading volume and market liquidity, and is generally lower if the Fund
17
Table of Contents
has
a lot of trading volume and market liquidity, and higher if the Fund has little trading volume and market liquidity (which is often the case for funds that are newly launched or small in size). The Fund's spread may also be impacted by the liquidity
of the underlying securities held by the Fund, particularly for newly launched or smaller iShares funds or in instances of significant volatility of the underlying securities.
The Fund participates in the BATS Competitive Liquidity
Provider Program (the “Incentive Program”), which is designed to strengthen market quality by providing enhanced rebates for lead market makers (“LMMs”) in exchange traded products whose trading volumes do not exceed
specified levels. Rebates are allocated to eligible LMMs based on a competitive quote evaluation process. Rebates, which for the Fund may be up to $30,000 per year, are funded by a supplemental listing fee paid by the Adviser and not by the Fund.
BATS has proposed to amend the Incentive Program to restructure the incentive payments and eliminate the standard listing fee for exchange traded products. There are risks associated with the Incentive Program because it may act to artificially
influence trading in the Fund shares, and pricing and liquidity of the shares could be adversely impacted if the Fund were to leave the Incentive Program or the Incentive Program were discontinued. The Incentive Program is scheduled to terminate on
or about July 28, 2015. LMMs participating in the Incentive Program are restricted in their ability to finance Fund shares. Additional information about the Incentive Program is available on the website of BATS at
http://www.batstrading.com/listings/market_maker/etp/. This reference to the website does not incorporate the contents of the website into this prospectus.
The Board has adopted a policy of not monitoring for frequent
purchases and redemptions of Fund shares (“frequent trading”) that appear to attempt to take advantage of a potential arbitrage opportunity presented by a lag between a change in the value of the Fund’s portfolio securities after
the close of the primary markets for the Fund’s portfolio securities and the reflection of that change in the Fund’s NAV (“market timing”), because the Fund generally sells and redeems its shares directly through transactions
that are in-kind and/or for cash, subject to the conditions described below under Creations and Redemptions. The Board has not adopted a policy of monitoring for other frequent trading activity because shares
of the Fund are listed for trading on a national securities exchange.
The national securities exchange on which the Fund's shares are
listed is open for trading Monday through Friday and is closed on weekends and the following holidays: New Year’s Day, Martin Luther King, Jr. Day, Presidents’ Day, Good Friday, Memorial Day, Independence Day, Labor Day, Thanksgiving Day
and Christmas Day. The Fund’s primary Listing Exchange is BATS.
Section 12(d)(1) of the 1940 Act restricts investments by
investment companies in the securities of other investment companies. Registered investment companies are permitted to invest in the Fund beyond the limits set forth in Section 12(d)(1), subject to certain terms and conditions set forth in SEC rules
or in an SEC exemptive order issued to the Company. In order for a registered investment company to invest in shares of the Fund beyond the limitations of Section 12(d)(1) pursuant to the exemptive relief obtained by the Company, the registered
investment company must enter into an agreement with the Company.
18
Table of Contents
Book Entry. Shares of the Fund
are held in book-entry form, which means that no stock certificates are issued. The Depository Trust Company (“DTC”) or its nominee is the record owner of all outstanding shares of the Fund and is recognized as the owner of all shares
for all purposes.
Investors owning shares of the
Fund are beneficial owners as shown on the records of DTC or its participants. DTC serves as the securities depository for shares of the Fund. DTC participants include securities brokers and dealers, banks, trust companies, clearing corporations and
other institutions that directly or indirectly maintain a custodial relationship with DTC. As a beneficial owner of shares, you are not entitled to receive physical delivery of stock certificates or to have shares registered in your name, and you
are not considered a registered owner of shares. Therefore, to exercise any right as an owner of shares, you must rely upon the procedures of DTC and its participants. These procedures are the same as those that apply to any other securities that
you hold in book-entry or “street name” form.
Share Prices. The trading
prices of the Fund’s shares in the secondary market generally differ from the Fund’s daily NAV and are affected by market forces such as supply of and demand for ETF shares and underlying securities held by the Fund, economic conditions
and other factors. Information regarding the intraday value of shares of the Fund, also known as the “indicative optimized portfolio value” (“IOPV”), is disseminated every 15 seconds throughout the trading day by the national
securities exchange on which the Fund's shares are listed or by market data vendors or other information providers. The IOPV is based on the current market value of the securities and/or cash required to be deposited in exchange for a Creation Unit.
The IOPV does not necessarily reflect the precise composition of the current portfolio of securities held by the Fund at a particular point in time or the best possible valuation of the current portfolio. Therefore, the IOPV should not be viewed as
a “real-time” update of the Fund's NAV, which is computed only once a day. The IOPV is generally determined by using both current market quotations and/or price quotations obtained from broker-dealers that may trade in the portfolio
securities held by the Fund. The quotations of certain Fund holdings may not be updated during U.S. trading hours if such holdings do not trade in the United States. The Fund is not involved in, or responsible for, the calculation or dissemination
of the IOPV and makes no representation or warranty as to its accuracy.
Determination of Net Asset Value. The NAV of the Fund normally is determined once daily Monday through Friday, generally as of the regularly scheduled close of business of the New York Stock Exchange (“NYSE”) (normally 4:00 p.m., Eastern
time) on each day that the NYSE is open for trading, based on prices at the time of closing provided that (a) any Fund assets or liabilities denominated in currencies other than the U.S. dollar are translated into U.S. dollars at the prevailing
market rates on the date of valuation as quoted by one or more data service providers (as detailed below) and (b) U.S. fixed-income assets may be valued as of the announced closing time for trading in fixed-income instruments in a particular market
or exchange. The NAV of the Fund is calculated by dividing the value of the net assets of the Fund (i.e., the value of its total assets less total
liabilities) by the total number of outstanding shares of the Fund, generally rounded to the nearest cent.
19
Table of Contents
The value of the securities and other assets and liabilities
held by the Fund are determined pursuant to valuation policies and procedures approved by the Board. The Fund's assets and liabilities are valued on the basis of market quotations, when readily available.
The Fund values fixed-income portfolio securities using prices
provided directly from one or more broker-dealers, market makers, or independent third-party pricing services which may use matrix pricing and valuation models, as well as recent market transactions for the same or similar assets, to derive values.
Certain short-term debt securities may be valued on the basis of amortized cost.
The Fund invests in non-U.S. securities. Foreign currency
exchange rates are generally determined as of 4:00 p.m., London time. Non-U.S. securities held by the Fund may trade on weekends or other days when the Fund does not price its shares. As a result, the Fund’s NAV may change on days when
Authorized Participants will not be able to purchase or redeem Fund shares.
Generally, trading in non-U.S. securities, U.S. government
securities, money market instruments and certain fixed-income securities is substantially completed each day at various times prior to the close of business on the NYSE. The values of such securities used in computing the NAV of the Fund are
determined as of such times.
When market quotations are
not readily available or are believed by BFA to be unreliable, the Fund’s investments are valued at fair value. Fair value determinations are made by BFA in accordance with policies and procedures approved by the Company's Board. BFA may
conclude that a market quotation is not readily available or is unreliable if a security or other asset or liability does not have a price source due to its lack of liquidity, if a market quotation differs significantly from recent price quotations
or otherwise no longer appears to reflect fair value, where the security or other asset or liability is thinly traded, or where there is a significant event subsequent to the most recent market quotation. A “significant event” is an
event that, in the judgment of BFA, is likely to cause a material change to the closing market price of the asset or liability held by the Fund. Non-U.S. securities whose values are affected by volatility that occurs in U.S. markets for related or
highly correlated assets (e.g., American Depositary Receipts, Global Depositary Receipts or ETFs) on a trading day after the close of non-U.S. securities markets may be fair valued.
Fair value represents a good faith approximation of the value
of an asset or liability. The fair value of an asset or liability held by the Fund is the amount the Fund might reasonably expect to receive from the current sale of that asset or the cost to extinguish that liability in an arm’s-length
transaction. Valuing the Fund’s investments using fair value pricing will result in prices that may differ from current market valuations and that may not be the prices at which those investments could have been sold during the period in which
the particular fair values were used. Use of fair value prices and certain current market valuations could result in a difference between the prices used to calculate the Fund’s NAV and the prices used by the Underlying Index, which, in turn,
could result in a difference between the Fund’s performance and the performance of the Underlying Index.
20
Table of Contents
The value of assets or liabilities denominated in non-U.S.
currencies will be converted into U.S. dollars using exchange rates deemed appropriate by BFA as investment adviser. Use of a rate different from the rate used by the Index Provider may adversely affect the Fund’s ability to track the
Underlying Index.
Dividends and Distributions
General Policies. Dividends
from net investment income, if any, generally are declared and paid at least once a year by the Fund. Distributions of net realized securities gains, if any, generally are declared and paid once a year, but the Company may make distributions on a
more frequent basis for the Fund. The Company reserves the right to declare special distributions if, in its reasonable discretion, such action is necessary or advisable to preserve its status as a regulated investment company (“RIC”) or
to avoid imposition of income or excise taxes on undistributed income or realized gains.
Dividends and other distributions on shares of the Fund are
distributed on a pro rata basis to beneficial owners of such shares. Dividend payments are made through DTC participants and indirect participants to beneficial owners then of record with proceeds received
from the Fund.
Dividend Reinvestment Service. No dividend reinvestment service is provided by the Company. Broker-dealers may make available the DTC book-entry Dividend Reinvestment Service for use by beneficial owners of the Fund for reinvestment of their dividend
distributions. Beneficial owners should contact their broker to determine the availability and costs of the service and the details of participation therein. Brokers may require beneficial owners to adhere to specific procedures and timetables. If
this service is available and used, dividend distributions of both income and realized gains will be automatically reinvested in additional whole shares of the Fund purchased in the secondary market.
Taxes. As with any investment,
you should consider how your investment in shares of the Fund will be taxed. The tax information in this Prospectus is provided as general information, based on current law. There is no guarantee that shares of the Fund will receive certain
regulatory or accounting treatment. You should consult your own tax professional about the tax consequences of an investment in shares of the Fund.
Unless your investment in Fund shares is made through a
tax-exempt entity or tax-deferred retirement account, such as an IRA, you need to be aware of the possible tax consequences when the Fund makes distributions or you sell Fund shares.
Taxes on Distributions.
Distributions from the Fund’s net investment income, including distributions of income from securities lending and distributions out of the Fund's net short-term capital gains, if any, are taxable to you as ordinary income. The Fund's
distributions of net long-term capital gains, if any, in excess of net short-term capital losses are taxable as long-term capital gains, regardless of how long you have held the shares. Distributions from the Fund are subject to a 3.8% U.S. federal
Medicare contribution tax on “net investment income,” for individuals with incomes exceeding $200,000 ($250,000 if married filing jointly) and of estates and trusts. In general, your distributions are subject to U.S. federal income tax
for the year when they are paid. Certain distributions paid in January, however, may be treated as paid on December 31 of the prior year.
21
Table of Contents
If the Fund's distributions exceed current and accumulated
earnings and profits, all or a portion of the distributions made in the taxable year may be recharacterized as a return of capital to shareholders. Distributions in excess of the Fund’s minimum distribution requirements, but not in excess of
the Fund’s earnings and profits, will be taxable to shareholders and will not constitute nontaxable returns of capital. A return of capital distribution generally will not be taxable but will reduce the shareholder's cost basis and will result
in a higher capital gain or lower capital loss when those shares on which the distribution was received are sold. Once a shareholder's cost basis is reduced to zero, further distributions will be treated as capital gain, if the shareholder holds
shares of the Fund as capital assets.
Interest received
by the Fund with respect to non-U.S. securities may give rise to withholding and other taxes imposed by non-U.S. countries. Tax conventions between certain countries and the U.S. may reduce or eliminate such taxes. If more than 50% of the total
assets of the Fund at the close of a year consists of securities of non-U.S. corporations, the Fund may “pass through” to you certain non-U.S. income taxes (including withholding taxes) paid by the Fund. This means that you would be
considered to have received as an additional dividend your share of such non-U.S. taxes, but you may be entitled to either a corresponding tax deduction in calculating your U.S. federal taxable income, or, subject to certain limitations, a credit in
calculating your U.S. federal income tax.
If you are
neither a resident nor a citizen of the United States or if you are a non-U.S. entity, the Fund’s ordinary income dividends (which include distributions of net short-term capital gains) will generally be subject to a 30% U.S. federal
withholding tax, unless a lower treaty rate applies.
A
30% withholding tax will be imposed on U.S.-source dividends, interest and other income items paid after June 30, 2016, and proceeds from the sale of property producing U.S.-source dividends and interest paid after December 31, 2016, to (i) foreign
financial institutions, including non-U.S. investment funds, unless they agree to collect and disclose to the U.S. Internal Revenue Service (“IRS”) information regarding their direct and indirect U.S. account holders and (ii) certain
other foreign entities, unless they certify certain information regarding their direct and indirect U.S. owners. To avoid withholding, foreign financial institutions will need to (i) enter into agreements with the IRS that state that they will
provide the IRS information, including the names, addresses and taxpayer identification numbers of direct and indirect U.S. account holders; comply with due diligence procedures with respect to the identification of U.S. accounts; report to the IRS
certain information with respect to U.S. accounts maintained, agree to withhold tax on certain payments made to non-compliant foreign financial institutions or to account holders who fail to provide the required information; and determine certain
other information concerning their account holders, or (ii) in the event that an applicable intergovernmental agreement and implementing legislation are adopted, provide local revenue authorities with similar account holder information. Other
foreign entities will need to provide the name, address, and taxpayer identification number of each substantial U.S. owner or certifications of no substantial U.S. ownership, unless certain exceptions apply.
22
Table of Contents
If you are a resident or a citizen of the United States, by
law, back-up withholding at a 28% rate will apply to your distributions and proceeds if you have not provided a taxpayer identification number or social security number and made other required certifications.
Taxes When Shares are Sold.
Currently, any capital gain or loss realized upon a sale of Fund shares is generally treated as a long-term gain or loss if the shares have been held for more than one year. Any capital gain or loss realized upon a sale of Fund shares held for one
year or less is generally treated as short-term gain or loss, except that any capital loss on the sale of shares held for six months or less is treated as long-term capital loss to the extent that capital gain dividends were paid with respect to
such shares. Any such capital gains, including from sales of Fund shares or from capital gain dividends, are included in “net investment income” for purposes of the 3.8% U.S. federal Medicare contribution tax mentioned
above.
The foregoing discussion summarizes some of
the consequences under current U.S. federal tax law of an investment in the Fund. It is not a substitute for personal tax advice. You may also be subject to state and local taxation on Fund distributions and sales of shares. Consult your personal
tax advisor about the potential tax consequences of an investment in shares of the Fund under all applicable tax laws.
Creations and Redemptions.
Prior to trading in the secondary market, shares of the Fund are “created” at NAV by market makers, large investors and institutions only in block-size Creation Units of 100,000 shares or multiples thereof. Each “creator” or
“Authorized Participant” enters into an authorized participant agreement with the Fund's distributor, BlackRock Investments, LLC (the “Distributor”), an affiliate of BFA.
A creation transaction, which is subject to acceptance by the
transfer agent, generally takes place when an Authorized Participant deposits into the Fund a designated portfolio of securities (including any portion of such securities for which cash may be substituted) and a specified amount of cash
approximating the holdings of the Fund in exchange for a specified number of Creation Units. To the extent practicable, the composition of such portfolio generally corresponds pro rata to the holdings of the
Fund. However, creation baskets will generally correspond to the price and yield performance of the Fund.
Similarly, shares can be redeemed only in Creation Units,
generally for a designated portfolio of securities (including any portion of such securities for which cash may be substituted) held by the Fund (“Fund Securities”) and a specified amount of cash. Except
when aggregated in Creation Units, shares are not redeemable by the Fund.
The prices at which creations and redemptions occur are based
on the next calculation of NAV after a creation or redemption order is received in an acceptable form under the authorized participant agreement.
The portfolio of securities required for purchase of a Creation
Unit may be different than the portfolio of securities the Fund will deliver upon redemption of Fund shares. The Deposit Securities and Fund Securities, as applicable, in connection with a purchase or redemption of a Creation Unit, generally will
correspond pro rata, to the extent practicable, to the securities held by the Fund.
23
Table of Contents
Only an Authorized Participant may create or redeem Creation
Units directly with the Fund.
As a result of any system
failure or other interruption, including disruptions at market makers or Authorized Participants, orders to purchase or redeem Creation Units either may not be executed according to the Fund's instructions or may not be executed at all, or the Fund
may not be able to place or change orders.
To the extent
the Fund engages in in-kind transactions, the Fund intends to comply with the U.S. federal securities laws in accepting securities for deposit and satisfying redemptions with redemption securities by, among other means, assuring that any securities
accepted for deposit and any securities used to satisfy redemption requests will be sold in transactions that would be exempt from registration under the 1933 Act. Further, an Authorized Participant that is not a “qualified institutional
buyer,” as such term is defined under Rule 144A of the 1933 Act, will not be able to receive securities that are restricted securities eligible for resale under Rule 144A.
Creations and redemptions must be made through a firm that is
either a member of the Continuous Net Settlement System of the National Securities Clearing Corporation or a DTC participant and has executed an agreement with the Distributor with respect to creations and redemptions of Creation Unit aggregations.
Information about the procedures regarding creation and redemption of Creation Units (including the cut-off times for receipt of creation and redemption orders) is included in the Fund's SAI.
Because new shares may be created and issued on an ongoing
basis, at any point during the life of the Fund a “distribution,” as such term is used in the 1933 Act, may be occurring. Broker-dealers and other persons are cautioned that some activities on their part may, depending on the
circumstances, result in their being deemed participants in a distribution in a manner that could render them statutory underwriters and subject to the prospectus delivery and liability provisions of the 1933 Act. Any determination of whether one is
an underwriter must take into account all the relevant facts and circumstances of each particular case.
Broker-dealers should also note that dealers who are not
“underwriters” but are participating in a distribution (as contrasted to ordinary secondary transactions), and thus dealing with shares that are part of an “unsold allotment” within the meaning of Section 4(a)(3)(C) of the
1933 Act, would be unable to take advantage of the prospectus delivery exemption provided by Section 4(a)(3) of the 1933 Act. For delivery of prospectuses to exchange members, the prospectus delivery mechanism of Rule 153 under the 1933 Act is
available only with respect to transactions on a national securities exchange.
Costs Associated with Creations and Redemptions. Authorized Participants are charged standard creation and redemption transaction fees to offset transfer and other transaction costs associated with the issuance and redemption of Creation Units. The standard creation
and redemption transaction fees are set forth in the table below. The standard creation transaction fee is charged to the Authorized Participant on the day such Authorized Participant creates a Creation Unit, and is the same regardless of the number
of Creation Units purchased by the Authorized Participant on the applicable business day. Similarly, the standard redemption transaction fee is
24
Table of Contents
charged to the Authorized Participant on the day such Authorized Participant
redeems a Creation Unit, and is the same regardless of the number of Creation Units redeemed by the Authorized Participant on the applicable business day. Creations and redemptions for cash (when cash creations and redemptions (in whole or in part)
are available or specified) are also subject to an additional charge (up to the maximum amounts shown in the table below). This charge is intended to compensate for brokerage, tax, foreign exchange, execution, market impact and other costs and
expenses related to cash transactions. Investors who use the services of a broker or other financial intermediary to acquire or dispose of Fund shares may pay fees for such services.
The following table shows, as of November 30, 2013, the
approximate value of one Creation Unit, standard fees and maximum additional charges for creations and redemptions (as described above):
| Approximate
Value of a Creation Unit |
Creation
Unit Size |
Standard
Creation/ Redemption Transaction Fee |
Maximum
Additional Charge for Creations* |
Maximum
Additional Charge for Redemptions* | ||||
| $4,972,000 | 100,000 | $100 | 3.0% | 2.0% |
| * | As a percentage of the net asset value per Creation Unit, inclusive, in the case of redemptions, of the standard redemption transaction fee. |
Householding. Householding is
an option available to certain Fund investors. Householding is a method of delivery, based on the preference of the individual investor, in which a single copy of certain shareholder documents can be delivered to investors who share the same
address, even if their accounts are registered under different names. Please contact your broker-dealer if you are interested in enrolling in householding and receiving a single copy of prospectuses and other shareholder documents, or if you are
currently enrolled in householding and wish to change your householding status.
25
Table of Contents
Distribution
The Distributor or its agent distributes Creation Units for the
Fund on an agency basis. The Distributor does not maintain a secondary market in shares of the Fund. The Distributor has no role in determining the policies of the Fund or the securities that are purchased or sold by the Fund. The
Distributor’s principal address is 1 University Square Drive, Princeton, NJ 08540.
BFA or its Affiliates make payments to broker-dealers,
registered investment advisers, banks or other intermediaries (together, “intermediaries”) related to marketing activities and presentations, educational training programs, conferences, the development of technology platforms and
reporting systems, or their making shares of the Fund and certain other iShares funds available to their customers generally and in certain investment programs. Such payments, which may be significant to the intermediary, are not made by the Fund.
Rather, such payments are made by BFA or its Affiliates from their own resources, which come directly or indirectly in part from fees paid by the iShares funds complex. Payments of this type are sometimes referred to as revenue-sharing payments. A
financial intermediary may make decisions about which investment options it recommends or makes available, or the level of services provided, to its customers based on the payments it is eligible to receive. Therefore, such payments to an
intermediary create conflicts of interest between the intermediary and its customers and may cause the intermediary to recommend the Fund or other iShares funds over another investment. More information regarding these payments is contained in the
Fund's SAI. Please contact your salesperson or other investment professional for more information regarding any such payments his or her firm may receive from BFA or its Affiliates.
26
Table of Contents
Financial Highlights
The financial highlights table is intended to help investors
understand the Fund’s financial performance since inception. Certain information reflects financial results for a single share of the Fund. The total returns in the table represent the rate that an investor would have earned (or lost) on an
investment in the Fund, assuming reinvestment of all dividends and distributions. This information has been audited by PricewaterhouseCoopers LLP, whose report is included, along with the Fund's financial statements, in the Fund's Annual Report
(available upon request).
Financial Highlights
(For a share outstanding throughout each period)
(For a share outstanding throughout each period)
| Year
ended Oct. 31, 2013 |
Period
from Apr. 17, 2012a to Oct. 31, 2012 | ||
| Net asset value, beginning of period | $ 52.93 | $ 50.00 | |
| Income
from investment operations: | |||
| Net investment incomeb | 1.92 | 1.07 | |
| Net realized and unrealized gain (loss)c | (2.49) | 2.76 | |
| Total from investment operations | (0.57) | 3.83 | |
| Less distributions from: | |||
| Net investment income | (1.88) | (0.90) | |
| Total distributions | (1.88) | (0.90) | |
| Net asset value, end of period | $ 50.48 | $ 52.93 | |
| Total return | (1.07)% | 7.75% d | |
| Ratios/Supplemental data: | |||
| Net assets, end of period (000s) | $35,338 | $21,170 | |
| Ratio of expenses to average net assetse | 0.60% | 0.60% | |
| Ratio of net investment income to average net assetse | 3.74% | 3.87% | |
| Portfolio turnover ratef | 33% | 29% | |
| a | Commencement of operations. |
| b | Based on average shares outstanding throughout each period. |
| c | The amounts reported for a share outstanding may not accord with the change in aggregate gains and losses in securities for the fiscal period due to the timing of capital share transactions in relation to the fluctuating market values of the Fund's underlying securities. |
| d | Not annualized. |
| e | Annualized for periods of less than one year. |
| f | Portfolio turnover rates exclude portfolio securities received or delivered as a result of processing capital share transactions in Creation Units. |
27
Table of Contents
Index Provider
Morningstar is a leading provider of independent investment
research. The company offers an extensive line of internet, software, and print-based products for individual investors, financial advisors and institutions. Morningstar is not affiliated with the Company, BFA, State Street, or the Distributor.
Credit Suisse maintains and calculates the Morningstar Indexes for Morningstar pursuant to a contractual agreement. Credit Suisse is not affiliated with Morningstar, the Company, BFA, the Distributor, or any of their respective affiliates.
BFA or its affiliates have entered into a license agreement
with the Index Provider to use the Underlying Index. BFA or its affiliates sublicense rights in the Underlying Index to the Company at no charge.
Disclaimers
The Fund is not sponsored, endorsed, sold or promoted by
Morningstar. Morningstar makes no representation or warranty, express or implied, to the owners of shares of the Fund or any member of the public regarding the advisability of investing in securities generally or in the Fund particularly or the
ability of the Underlying Index to track general stock market performance. Morningstar's only relationship to the Company and BFA or its affiliates is the licensing of certain trademarks and trade names of Morningstar and of the Underlying Index
which is determined, composed and calculated by Morningstar without regard to the Company, BFA or its affiliates or the Fund. Morningstar has no obligation to take the needs of BFA or its affiliates or the owners of shares of the Fund into
consideration in determining, composing or calculating the Underlying Index. Morningstar is not responsible for and has not participated in the determination of the prices and amount of shares of the Fund, or the timing of the issuance or sale of
such shares or in the determination or calculation of the equation by which shares of the Fund are to be converted into cash. Morningstar has no obligation or liability in connection with the administration, marketing or trading of shares of the
Fund. Morningstar does not guarantee the accuracy or the completeness of the Underlying Index or any data included therein and Morningstar shall have no liability for any errors, omissions or interruptions therein.
Morningstar makes no warranty, express or implied, as to results
to be obtained by BFA or its affiliates, owners of shares of the Fund or any other person or entity from the use of the Underlying Index or any data included therein. Morningstar makes no express or implied warranties and expressly disclaims all
warranties of merchantability or fitness for a particular purpose or use with respect to the Underlying Index or any data included therein. Without limiting any of the foregoing, in no event shall Morningstar have any liability for any special,
punitive, direct, indirect or consequential damages (including lost profits) resulting from the use of the Underlying Index or any data included therein, even if notified of the possibility of such damages.
28
Table of Contents
Shares of the Fund are not sponsored, endorsed or promoted by
BATS. BATS makes no representation or warranty, express or implied, to the owners of the shares of the Fund or any member of the public regarding the ability of the Fund to track the total return performance of the Underlying Index or the ability of
the Underlying Index to track stock market performance. BATS is not responsible for, nor has it participated in, the determination of the compilation or the calculation of the Underlying Index, nor in the determination of the timing of, prices of,
or quantities of shares of the Fund to be issued, nor in the determination or calculation of the equation by which the shares are redeemable. BATS has no obligation or liability to owners of the shares of the Fund in connection with the
administration, marketing or trading of the shares of the Fund.
BATS does not guarantee the accuracy and/or the completeness of
the Underlying Index or any data included therein. BATS makes no warranty, express or implied, as to results to be obtained by the Company on behalf of the Fund as licensee, licensee’s customers and counterparties, owners of the shares of the
Fund, or any other person or entity from the use of the subject index or any data included therein in connection with the rights licensed as described herein or for any other use. BATS makes no express or implied warranties and hereby expressly
disclaims all warranties of merchantability or fitness for a particular purpose with respect to the Underlying Index or any data included therein. Without limiting any of the foregoing, in no event shall BATS have any liability for any direct,
indirect, special, punitive, consequential or any other damages (including lost profits) even if notified of the possibility of such damages.
The past performance of the Underlying Index is not a guide to
future performance. BFA does not guarantee the accuracy or the completeness of the Underlying Index or any data included therein and BFA shall have no liability for any errors, omissions or interruptions therein. BFA makes no warranty, express or
implied, to the owners of shares of the Fund or to any other person or entity, as to results to be obtained by the Fund from the use of the Underlying Index or any data included therein. Without limiting any of the foregoing, in no event shall BFA
have any liability for any special, punitive, direct, indirect or consequential damages (including lost profits), even if notified of the possibility of such damages.
29
Table of Contents
Supplemental Information
I. Premium/Discount Information
The table that follows presents information about the
differences between the daily market price on secondary markets for shares of the Fund and the Fund’s NAV. NAV is the price at which the Fund issues and redeems shares. It is calculated in accordance with the standard formula for valuing
mutual fund shares. The price used to calculate market returns (“Market Price”) of the Fund generally is determined using the midpoint between the highest bid and the lowest offer on the primary securities exchange on which shares of the
Fund are listed for trading, as of the time that the Fund’s NAV is calculated. The Fund’s Market Price may be at, above or below its NAV. The NAV of the Fund will fluctuate with changes in the value of its portfolio holdings. The Market
Price of the Fund will fluctuate in accordance with changes in its NAV, as well as market supply and demand.
Premiums or discounts are the differences (expressed as a
percentage) between the NAV and Market Price of the Fund on a given day, generally at the time the NAV is calculated. A premium is the amount that the Fund is trading above the reported NAV, expressed as a percentage of the NAV. A discount is the
amount that the Fund is trading below the reported NAV, expressed as a percentage of the NAV.
The following information shows the frequency of distributions
of premiums and discounts for the Fund for each full calendar quarter of 2013.
Each line in the table shows the number of trading days in
which the Fund traded within the premium/discount range indicated. The number of trading days in each premium/discount range is also shown as a percentage of the total number of trading days in the period covered by the table. All data presented
here represents past performance, which cannot be used to predict future results.
| Premium/Discount Range | Number of Days | Percentage of Total Days | ||
| Greater than 2.0% | 1 | 0.53% | ||
| Greater than 1.5% and Less than 2.0% | 3 | 1.60 | ||
| Greater than 1.0% and Less than 1.5% | 78 | 41.48 | ||
| Greater than 0.5% and Less than 1.0% | 28 | 14.89 | ||
| Between 0.5% and -0.5% | 16 | 8.51 | ||
| Less than -0.5% and Greater than -1.0% | 8 | 4.26 | ||
| Less than -1.0% and Greater than -1.5% | 14 | 7.45 | ||
| Less than -1.5% and Greater than -2.0% | 13 | 6.91 | ||
| Less than -2.0% and Greater than -2.5% | 19 | 10.11 | ||
| Less than -2.5% and Greater than -3.0% | 5 | 2.66 | ||
| Less than -3.0% and Greater than -3.5% | 3 | 1.60 | ||
| 188 | 100.00% |
30
Table of Contents
II. Total Return Information
The table that follows presents information about the total
returns of the Fund and the Underlying Index as of the fiscal year ended October 31, 2013.
“Average Annual Total Returns” represent the
average annual change in value of an investment over the periods indicated. “Cumulative Total Returns” represent the total change in value of an investment over the period indicated.
The Fund’s NAV is the value of one share of the Fund as
calculated in accordance with the standard formula for valuing mutual fund shares. The NAV return is based on the NAV of the Fund and the market return is based on the Market Price of the Fund. Market Price is determined by using the midpoint
between the highest bid and the lowest offer on the primary stock exchange on which shares of the Fund are listed for trading, as of the time that the Fund's NAV is calculated. Since shares of the Fund did not trade in the secondary market until
after the Fund's inception, for the period from inception to the first day of secondary market trading in shares of the Fund, the NAV of the Fund is used as a proxy for the Market Price to calculate market returns. Market and NAV returns assume that
dividends and capital gain distributions have been reinvested in the Fund at Market Price and NAV, respectively.
An index is a statistical composite that tracks a specified
financial market or sector. Unlike the Fund, the Underlying Index does not actually hold a portfolio of securities and therefore does not incur the expenses incurred by the Fund. These expenses negatively impact the performance of the Fund. Also,
market returns do not include brokerage commissions that may be payable on secondary market transactions. If brokerage commissions were included, market returns would be lower. The returns shown in the following table do not reflect the deduction of
taxes that a shareholder would pay on Fund distributions or the redemption or sale of Fund shares. The investment return and principal value of shares of the Fund will vary with changes in market conditions. Shares of the Fund may be worth more or
less than their original cost when they are redeemed or sold in the market. The Fund’s past performance is no guarantee of future results.
Performance as of October 31, 2013
| Average Annual Total Returns | Cumulative Total Returns | |||||||
| NAV | MARKET | INDEX | NAV | MARKET | INDEX | |||
| 1 Year | (1.07)% | (4.06)% | (0.68)% | (1.07)% | (4.06)% | (0.68)% | ||
| Since Inception* | 4.22% | 2.81% | 4.73% | 6.59% | 4.37% | 7.35% | ||
| * | Total returns for the period since inception are calculated from the inception date of the Fund (4/17/12). The first day of secondary market trading in shares of the Fund was 4/19/12. |
31
Table of Contents
[THIS PAGE INTENTIONALLY LEFT BLANK]
Table of Contents
Table of Contents
|
|
For more information visit www.iShares.com or call
1-800-474-2737
Copies of the Prospectus, SAI and recent
shareholder reports can be found on our website at www.iShares.com. For more information about the Fund, you may request a copy of the SAI. The SAI provides detailed information about the Fund and is incorporated by reference into this Prospectus.
This means that the SAI, for legal purposes, is a part of this Prospectus.
Additional information about the Fund's investments is
available in the Fund's Annual and Semi-Annual reports to shareholders. In the Fund's Annual Report, you will find a discussion of the market conditions and investment strategies that significantly affected the Fund's performance during the last
fiscal year.
If you have any questions about the Company
or shares of the Fund or you wish to obtain the SAI, Semi-Annual or Annual report free of charge, please:
| Call: | 1-800-iShares
or 1-800-474-2737 (toll free) Monday through Friday, 8:30 a.m. to 6:30 p.m. (Eastern time) |
| Email: | iSharesETFs@blackrock.com |
| Write: | c/o
BlackRock Investments, LLC 1 University Square Drive, Princeton, NJ 08540 |
Information about the Fund (including the SAI) can be reviewed
and copied at the SEC's Public Reference Room in Washington, D.C., and information on the operation of the Public Reference Room may be obtained by calling the SEC at 1-202-551-8090. Reports and other information about the Fund are available on the
EDGAR database on the SEC's website at www.sec.gov, and copies of this information may be obtained, after paying a duplicating fee, by electronic request at the following e-mail address: publicinfo@sec.gov, or by writing to the SEC's Public
Reference Section, Washington, D.C. 20549-1520.
No person
is authorized to give any information or to make any representations about the Fund and its shares not contained in this Prospectus and you should not rely on any other information. Read and keep this Prospectus for future reference.
©2014 BlackRock, Inc. All rights reserved. iSHARES and BLACKROCK are registered trademarks of BlackRock, Inc. or its affiliates. All other marks are the property of their respective owners.
Investment Company Act File No.: 811-09102
IS-P-CEMB-0115

Table of Contents
March 1, 2014
(as revised January 2, 2015)
| 2014 Prospectus |
|
| ► | iShares Emerging Markets High Yield Bond ETF | EMHY | BATS |
The Securities and Exchange Commission
(“SEC”) has not approved or disapproved these securities or passed upon the adequacy of this prospectus. Any representation to the contrary is a criminal offense.
Table of Contents
Table of Contents
Table of Contents
|
|
S-1 |
|
|
1 |
|
|
2 |
|
|
12 |
|
|
14 |
|
|
14 |
|
|
17 |
|
|
26 |
|
|
27 |
|
|
28 |
|
|
28 |
|
|
30 |
“Morningstar®” and “Morningstar® Emerging Markets High Yield Bond
IndexSM” are trademarks or servicemarks of Morningstar, Inc. and have been licensed for use for certain purposes by BlackRock Fund Advisors or its affiliates. iShares® and BlackRock® are registered trademarks of BlackRock, Inc. or its affiliates. The Fund is not sponsored, endorsed, sold or
promoted by Morningstar, Inc., and Morningstar, Inc. makes no representation regarding the advisability of investing in the Fund.
i
Table of Contents
[THIS PAGE INTENTIONALLY LEFT BLANK]
Table of Contents
iSHARES® EMERGING MARKETS
HIGH YIELD BOND ETF
| Ticker: EMHY | Stock Exchange: BATS |
Investment Objective
The iShares Emerging Markets High Yield Bond ETF (the
“Fund”) seeks to track the investment results of an index composed of U.S. dollar-denominated, emerging market high yield sovereign and corporate bonds.
Fees and Expenses
The following table describes the fees and expenses that you
will incur if you own shares of the Fund. The investment advisory agreement between iShares, Inc. (the “Company”) and BlackRock Fund Advisors (“BFA”) (the “Investment Advisory Agreement”) provides that BFA will
pay all operating expenses of the Fund, except interest expenses, taxes, brokerage expenses, future distribution fees or expenses, and extraordinary expenses.
You may also incur usual and customary brokerage commissions
when buying or selling shares of the Fund, which are not reflected in the Example that follows:
| Annual
Fund Operating Expenses (ongoing expenses that you pay each year as a percentage of the value of your investments) | ||||||
| Management
Fees |
Distribution
and Service (12b-1) Fees |
Other
Expenses |
Total
Annual Fund Operating Expenses | |||
| 0.65% | None | None | 0.65% | |||
Example. This Example is intended to help you compare the cost of owning shares of the Fund with the cost of investing in other funds. The Example assumes that you invest $10,000 in the Fund for the time periods indicated and
then sell all of your shares at the end of those periods. The Example also assumes that your investment has a 5% return each year and that the Fund’s operating expenses remain the same. Although your actual costs may be higher or lower, based
on these assumptions, your costs would be:
| 1 Year | 3 Years | 5 Years | 10 Years | |||
| $66 | $208 | $362 | $810 |
S-1
Table of Contents
S-2
Table of Contents
S-3
Table of Contents
S-4
Table of Contents
S-5
Table of Contents
S-6
Table of Contents
S-7
Table of Contents
Performance Information
The bar chart and table that follow show how the Fund has
performed on a calendar year basis and provide an indication of the risks of investing in the Fund. Both assume that all dividends and distributions have been reinvested in the Fund. Past performance (before and after taxes) does not necessarily
indicate how the Fund will perform in the future. Supplemental information about the Fund’s performance is shown under the heading Total Return Information in the
Supplemental Information section of the Fund's prospectus (the “Prospectus”).
Year by Year Returns (Year Ended December 31)
The best calendar quarter
return during the period shown above was 0.88% in the 4th quarter of 2013; the worst was -5.58% in the 2nd quarter of 2013.
Updated performance information is available at www.iShares.com
or by calling 1-800-iShares (1-800-474-2737) (toll free).
Average Annual Total Returns
(for the periods ended December 31, 2013)
| One Year | Since
Fund Inception | ||
| (Inception Date: 4/3/2012) | |||
| Return Before Taxes | -5.47% | 4.59% | |
| Return After Taxes on Distributions1 | -7.81% | 2.32% | |
| Return After Taxes on Distributions and Sale of Fund Shares1 | -3.08% | 2.60% | |
| Morningstar ® Emerging Markets High Yield Bond IndexSM (Index returns do not reflect deductions for fees, expenses, or taxes) | -4.99% | 5.18% |
| 1 | After-tax returns in the table above are calculated using the historical highest individual U.S. federal marginal income tax rates and do not reflect the impact of state or local taxes. Actual after-tax returns depend on an investor’s tax situation and may differ from those shown, and after-tax returns shown are not relevant to tax-exempt investors or investors who hold shares through tax-deferred arrangements, such as 401(k) plans or individual retirement accounts (“IRAs”). Fund returns after taxes on distributions and sales of Fund shares are calculated assuming that an investor has sufficient capital gains of the same character from other investments to offset any capital losses from the sale of Fund shares. As a result, Fund returns after taxes on distributions and sales of Fund shares may exceed Fund returns before taxes and/or returns after taxes on distributions. |
S-8
Table of Contents
S-9
Table of Contents
[THIS PAGE INTENTIONALLY LEFT BLANK]
Table of Contents
More Information About the Fund
This Prospectus contains important information about investing
in the Fund. Please read this Prospectus carefully before you make any investment decisions. Additional information regarding the Fund is available at www.iShares.com.
On July 1, 2013, the name of the Fund changed from the iShares
Emerging Markets High Yield Bond Fund to the iShares Emerging Markets High Yield Bond ETF.
BFA is the investment adviser to the Fund. Shares of the Fund
are listed for trading on BATS Exchange, Inc. (“BATS”). The market price for a share of the Fund may be different from the Fund’s most recent NAV.
ETFs are funds that trade like other publicly traded
securities. The Fund is designed to track an index. Similar to shares of an index mutual fund, each share of the Fund represents a partial ownership in an underlying portfolio of securities intended to track a market index. Unlike shares of a mutual
fund, which can be bought and redeemed from the issuing fund by all shareholders at a price based on NAV, shares of the Fund may be purchased or redeemed directly from the Fund at NAV solely by Authorized Participants (as defined in the Creations and Redemptions section of this Prospectus). Also unlike shares of a mutual fund, shares of the Fund are listed on a national securities exchange and trade in the secondary market at market prices that
change throughout the day.
The Fund invests in a
particular segment of the securities markets and seeks to track the performance of a securities index that generally is not representative of the market as a whole. The Fund is designed to be used as part of broader asset allocation strategies.
Accordingly, an investment in the Fund should not constitute a complete investment program.
An index is a theoretical financial calculation while the Fund
is an actual investment portfolio. The performance of the Fund and the Underlying Index may vary due to transaction costs, non-U.S. currency valuations, asset valuations, corporate actions (such as mergers and spin-offs), timing variances and
differences between the Fund’s portfolio and the Underlying Index resulting from legal restrictions (such as diversification requirements) that apply to the Fund but not to the Underlying Index or to the use of representative sampling.
“Tracking error” is the divergence of the performance (return) of the Fund's portfolio from that of the Underlying Index. BFA expects that, over time, the Fund’s tracking error will not exceed 5%. Because the Fund uses a
representative sampling indexing strategy, it can be expected to have a larger tracking error than if it used a replication indexing strategy. “Replication” is an indexing strategy in which a fund invests in substantially all of the
securities in its underlying index in approximately the same proportions as in the underlying index.
An investment in the Fund is not a bank deposit and it is not
insured or guaranteed by the Federal Deposit Insurance Corporation or any other government agency, BFA or any of its affiliates.
1
Table of Contents
The Fund's investment objective and the Underlying Index may be
changed without shareholder approval.
A Further
Discussion of Principal Risks
The Fund is subject to
various risks, including the principal risks noted below, any of which may adversely affect the Fund’s NAV, trading price, yield, total return and ability to meet its investment objective. You could lose all or part of your investment in the
Fund, and the Fund could underperform other investments.
Asian Economic Risk. Certain
Asian economies have experienced high inflation, high unemployment, currency devaluations and restrictions, and over-extension of credit. Many Asian economies have experienced rapid growth and industrialization, and there is no assurance that this
growth rate will be maintained. During the recent global recession, many of the export-driven Asian economies experienced the effects of the economic slowdown in the United States and Europe, and certain Asian governments implemented stimulus plans,
low-rate monetary policies and currency devaluations. Economic events in any one Asian country may have a significant economic effect on the entire Asian region, as well as on major trading partners outside Asia. Any adverse event in the Asian
markets may have a significant adverse effect on some or all of the economies of the countries in which the Fund invests. Many Asian countries are subject to political risk, including corruption and regional conflict with neighboring countries. In
addition, many Asian countries are subject to social and labor risks associated with demands for improved political, economic and social conditions. These risks, among others, may adversely affect the value of the Fund’s
investments.
Asset Class Risk. The securities in the Underlying Index or in the Fund’s portfolio may underperform the returns of other securities or indexes that track other countries, groups of countries, regions, industries, groups of
industries, markets, asset classes or sectors. Various types of securities or indexes tend to experience cycles of outperformance and underperformance in comparison to the general securities markets.
Call Risk. During periods of
falling interest rates, an issuer of a callable bond held by the Fund may “call” or repay the security before its stated maturity, which may result in the Fund having to reinvest the proceeds at lower interest rates, resulting in a
decline in the Fund’s income.
Central and
South American Economic Risk. The economies and financial sectors of certain emerging markets countries are affected by the economies of Central and South American countries, some of which have experienced high
interest rates, economic volatility, inflation, currency devaluations, government defaults, high unemployment rates, and expropriation and/or nationalization of assets. In addition, commodities (such as oil, gas and minerals) represent a significant
percentage of the region's exports and many economies in this region are particularly sensitive to fluctuations in commodity prices. Adverse economic events in one country may have a significant adverse effect on other countries in this region and
on the financial sectors of emerging markets countries.
2
Table of Contents
Concentration Risk. The
Fund’s investments will generally follow the weightings of the Underlying Index, which may result in concentration of the Fund’s investments in a particular sovereign and quasi-sovereign entity or entities in a particular country, group
of countries, region, market, sector or asset class. To the extent that its investments are concentrated in a particular sovereign and quasi-sovereign entity or entities in a particular country, group of countries, region, market, sector or asset
class, the Fund may be more adversely affected by the underperformance of those bonds, may be subject to increased price volatility and may be more susceptible to adverse economic, market, political or regulatory occurrences affecting those
securities than a fund that does not concentrate its investments.
Credit Risk. Credit risk is the
risk that an issuer or guarantor of debt instruments or the counterparty to a derivatives contract, repurchase agreement or loan of portfolio securities is unable or unwilling to make timely interest and/or principal payments or to otherwise honor
its obligations.
The Fund’s portfolio may
include below investment grade bonds, which generally are subject to greater levels of credit risk than higher rated securities. There is the chance that the Fund’s holdings will have their credit ratings downgraded or will default (fail to
make scheduled interest or principal payments), potentially reducing the Fund’s income level and share price. Debt instruments are subject to varying degrees of credit risk, which may be reflected in their credit ratings.
Custody Risk. Custody risk
refers to the risks inherent in the process of clearing and settling trades and the holding of securities by local banks, agents and depositories. Low trading volumes and volatile prices in less developed markets may make trades harder to complete
and settle, and governments or trade groups may compel local agents to hold securities in designated depositories that may not be subject to independent evaluation. Local agents are held only to the standards of care of their local markets. In
general, the less developed a country’s securities market is, the greater the likelihood of custody problems.
Extension Risk. During periods
of rising interest rates, certain debt obligations will be paid off substantially more slowly than originally anticipated and the value of those securities may fall sharply, resulting in a decline in the Fund’s income and potentially in the
value of the Fund’s investments.
European
Economic Risk. The Economic and Monetary Union of the European Union (the “EU”) requires compliance with restrictions on inflation rates, deficits, interest rates, debt levels and fiscal and monetary
controls, each of which may significantly affect every country in Europe. Decreasing imports or exports, changes in governmental or EU regulations on trade, changes in the exchange rate of the euro (the common currency of certain EU countries), the
default or threat of default by an EU member country on its sovereign debt, and/or an economic recession in an EU member country may have a significant adverse effect on the economies of EU member countries and their trading partners. The European
financial markets have recently experienced volatility and adverse trends due to concerns about economic downturns or rising government debt levels in several European countries, including Greece, Ireland, Italy, Portugal and Spain. These events
have adversely affected the
3
Table of Contents
exchange rate of the euro and may continue to significantly affect every
country in Europe, including countries that do not use the euro.
Responses to the financial problems by European governments,
central banks and others, including austerity measures and reforms, may not produce the desired results, may result in social unrest and may limit future growth and economic recovery or have other unintended consequences. Further defaults or
restructurings by governments and other entities of their debt could have additional adverse effects on economies, financial markets and asset valuations around the world. In addition, one or more countries may abandon the euro and/or withdraw from
the EU. The impact of these actions, especially if they occur in a disorderly fashion, is not clear but could be significant and far-reaching.
Financials Sector Risk.
Companies in the financials sector of an economy are often subject to extensive governmental regulation and intervention, which may adversely affect the scope of their activities, the prices they can charge and the amount of capital they must
maintain. Governmental regulation may change frequently and may have significant adverse consequences for companies in the financials sector, including effects not intended by such regulation. The impact of recent or future regulation in various
countries on any individual financial company or on the sector as a whole cannot be predicted. Certain risks may impact the value of investments in the financials sector more severely than those of investments outside this sector, including the
risks associated with companies that operate with substantial financial leverage. Companies in the financials sector may also be adversely affected by increases in interest rates and loan losses, decreases in the availability of money or asset
valuations, credit rating downgrades and adverse conditions in other related markets. Insurance companies, in particular, may be subject to severe price competition and/or rate regulation, which may have an adverse impact on their profitability. In
the recent past, deterioration of the credit markets impacted a broad range of mortgage, asset-backed, auction rate, sovereign debt and other markets, including U.S. and non-U.S. credit and interbank money markets, thereby affecting a wide range of
financial institutions and markets. A number of large financial institutions have failed, merged with stronger institutions or have had significant government infusions of capital. Instability in the financial markets has caused certain financial
companies to incur large losses. Some financial companies experienced declines in the valuations of their assets, took actions to raise capital (such as the issuance of debt or equity securities), or even ceased operations. Some financial companies
borrowed significant amounts of capital from government sources and may face future government-imposed restrictions on their businesses or increased government intervention. Those actions caused the securities of many financial companies to decline
in value. The financials sector is particularly sensitive to fluctuations in interest rates.
Geographic Risk. Some of the
markets in which the Fund invests are located in parts of the world that have historically been prone to natural disasters, such as earthquakes, tornadoes, volcanoes, droughts, floods, hurricanes or tsunamis, and are economically sensitive to
environmental events. Any such event may adversely impact the economies of these geographic areas, causing an adverse impact on the value of the Fund.
4
Table of Contents
High Yield Securities Risk.
Securities that are rated below investment-grade (commonly referred to as “junk bonds,” including those bonds rated lower than “BBB-” by Standard & Poor's Ratings Services and Fitch or “Baa3” by
Moody’s), or are unrated, may be deemed speculative and may be more volatile than higher-rated securities of similar maturity.
High yield securities may also be subject to greater levels of
credit or default risk than higher-rated securities. The value of high yield securities can be adversely affected by overall economic conditions, such as an economic downturn or a period of rising interest rates, and high yield securities may be
less liquid and more difficult to sell at an advantageous time or price or to value than higher-rated securities.
In particular, high yield securities are often issued by
smaller, less creditworthy countries and companies or by highly leveraged (indebted) countries and companies, which are generally less able than more financially stable countries and companies to make scheduled payments of interest and
principal.
Income Risk.
The Fund’s income may decline when interest rates fall. This decline can occur because the Fund must invest in lower-yielding bonds as bonds in its portfolio mature, bonds in the Underlying Index are substituted or the Fund otherwise needs to
purchase additional bonds. The Index Provider’s substitution of bonds in the Underlying Index may occur, for example, when the time to maturity for the bond no longer matches the Underlying Index’s stated maturity
guidelines.
Index-Related Risk. The Fund seeks to achieve a return which corresponds generally to the price and yield performance, before fees and expenses, of the Underlying Index as published by the Index Provider. There is no assurance that the
Index Provider will compile the Underlying Index accurately, or that the Underlying Index will be determined, composed or calculated accurately. While the Index Provider does provide descriptions of what the Underlying Index is designed to achieve,
the Index Provider does not provide any warranty or accept any liability in relation to the quality, accuracy or completeness of data in respect of their indices, and does not guarantee that the Underlying Index will be in line with their described
index methodology. BFA’s mandate as described in this Prospectus is to manage the Fund consistently with the Underlying Index provided to BFA. Consequently, BFA does not provide any warranty or guarantee for Index Provider errors. Errors in
respect of the quality, accuracy and completeness of the data may occur from time to time and may not be identified and corrected for a period of time, particularly where the indices are less commonly used. Therefore, gains, losses or costs
associated with Index Provider errors will generally be borne by the Fund and its shareholders. For example, during a period where the Fund’s Underlying Index contains incorrect constituents, the Fund would have market exposure to such
constituents and would be underexposed to the Underlying Index’s other constituents. As such, errors may result in a negative or positive performance impact to the Fund and its shareholders. Shareholders should understand that any gains from
Index Provider errors will be kept by the Fund and its shareholders and any losses resulting from Index Provider errors will be borne by the Fund and its shareholders.
Apart from scheduled rebalances, the Index Provider may carry
out additional ad hoc rebalances to the Underlying Index in order, for example, to correct an error in the
5
Table of Contents
selection of index constituents. Where the Underlying Index of the Fund is
rebalanced and the Fund in turn rebalances its portfolio to bring it in line with the Underlying Index, any transaction costs and market exposure arising from such portfolio rebalancing will be borne directly by the Fund and its shareholders.
Unscheduled rebalances to the Underlying Index may also expose the Fund to tracking error risk, which is the risk that its returns may not track exactly those of the Underlying Index. Therefore, errors and additional ad hoc rebalances carried out by
the Index Provider to the Underlying Index may increase the costs and market exposure risk of the Fund.
Industrials Sector Risk. The
value of securities issued by companies in the industrials sector may be affected by supply and demand, both for their specific product or service and for industrials sector products in general. The products of manufacturing companies may face
obsolescence due to rapid technological developments and frequent new product introduction. Government regulations, world events, economic conditions and exchange rates affect the performance of companies in the industrials sector. Companies in the
industrials sector may be adversely affected by liability for environmental damage and product liability claims. The industrials sector may also be adversely affected by changes or trends in commodity prices, which may be influenced by unpredictable
factors.
Interest Rate Risk. As interest rates rise, the value of a fixed-income security held by the Fund is likely to decrease. Securities with longer durations tend to be more sensitive to interest rate changes, usually making them more volatile
than securities with shorter durations. To the extent the Fund invests a substantial portion of its assets in fixed-income securities with longer-term maturities, rising interest rates may cause the value of the Fund’s investments to decline
significantly.
Issuer Risk. Fund performance depends on the performance of individual securities to which the Fund has exposure. Changes to the financial condition or credit rating of an issuer of those securities may cause the value of the
securities to decline.
Liquidity Risk. Liquidity risk exists when particular investments are difficult to purchase or sell. To the extent the Fund invests in illiquid securities or securities that become less liquid, such investments may have a negative
effect on the returns of the Fund because the Fund may be unable to sell the illiquid securities at an advantageous time or price. To the extent that the Fund’s principal investment strategies involve investing in securities with substantial
market and/or credit risk, the Fund will tend to have the greatest exposure to liquidity risk. Liquid investments may become illiquid after purchase by the Fund, particularly during periods of market turmoil. Illiquid investments may be harder to
value, especially in changing markets, and if the Fund is forced to sell these investments to meet redemption requests or for other cash needs, the Fund may suffer a loss. There can be no assurance that a security that is deemed to be liquid when
purchased will continue to be liquid for as long as it is held by the Fund.
Management Risk. The Fund may
not fully replicate the Underlying Index and may hold securities not included in the Underlying Index. As a result, the Fund is subject to the risk that BFA’s investment strategy, the implementation of which is subject to a number of
constraints, may not produce the intended results.
6
Table of Contents
Market Risk. The Fund could
lose money due to short-term market movements and over longer periods during market downturns. Securities may decline in value due to factors affecting securities markets generally or particular asset classes or industries represented in the
markets. The value of a security may decline due to general market conditions, economic trends or events that are not specifically related to the issuer of the security or to factors that affect a particular industry or group of industries. During a
general downturn in the securities markets, multiple asset classes may be negatively affected. The Fund invests primarily in emerging market bonds and, as a result, the Fund’s portfolio may have greater exposure to market risk than a fund that
invests in securities of developed markets. Fixed-income securities with short-term maturities are generally less sensitive to such changes than fixed-income securities with longer term maturities.
Market Trading Risk
Absence of Active Market.
Although shares of the Fund are listed for trading on one or more stock exchanges, there can be no assurance that an active trading market for such shares will develop or be maintained by market makers or Authorized Participants.
Risk of Secondary Listings.
The Fund's shares may be listed or traded on U.S. and non-U.S. stock exchanges other than the U.S. stock exchange where the Fund's primary listing is maintained. There can be no assurance that the Fund’s shares
will continue to trade on any such stock exchange or in any market or that the Fund’s shares will continue to meet the requirements for listing or trading on any exchange or in any market. The Fund's shares may be less actively traded in
certain markets than in others, and investors are subject to the execution and settlement risks and market standards of the market where they or their broker direct their trades for execution. Certain information available to investors who trade
Fund shares on a U.S. stock exchange during regular U.S. market hours may not be available to investors who trade in other markets, which may result in secondary market prices in such markets being less efficient.
Secondary Market Trading Risk.
Shares of the Fund may trade in the secondary market at times when the Fund does not accept orders to purchase or redeem shares. At such times, shares may trade in the secondary market with more significant premiums or discounts than might be
experienced at times when the Fund accepts purchase and redemption orders.
Secondary market trading in Fund shares may be halted by a
stock exchange because of market conditions or for other reasons. In addition, trading in Fund shares on a stock exchange or in any market may be subject to trading halts caused by extraordinary market volatility pursuant to “circuit
breaker” rules on the stock exchange or market. There can be no assurance that the requirements necessary to maintain the listing or trading of Fund shares will continue to be met or will remain unchanged.
Shares of the Fund, similar to shares of other issuers listed
on a stock exchange, may be sold short and are therefore subject to the risk of increased volatility associated with short selling.
7
Table of Contents
Shares of the Fund May Trade at Prices Other Than NAV. Shares of the Fund trade on stock exchanges at prices at, above or below the Fund’s most recent NAV. The NAV of the Fund is calculated at the end of each business day and fluctuates with changes in the market value
of the Fund’s holdings. The trading price of the Fund's shares fluctuates continuously throughout trading hours based on both market supply of and demand for Fund shares and the underlying value of the Fund's portfolio holdings or NAV. As
a result, the trading prices of the Fund’s shares may deviate significantly from NAV during periods of market volatility. ANY OF THESE FACTORS, AMONG OTHERS, MAY LEAD TO THE FUND'S
SHARES TRADING AT A PREMIUM OR DISCOUNT TO NAV. However, because shares can be created and redeemed in Creation Units at NAV (unlike shares of many closed-end funds, which frequently trade at appreciable
discounts from, and sometimes at premiums to, their NAVs), BFA believes that large discounts or premiums to the NAV of the Fund are not likely to be sustained over the long term. While the creation/redemption feature is designed to make it more
likely that the Fund’s shares normally will trade on stock exchanges at prices close to the Fund’s next calculated NAV, exchange prices are not expected to correlate exactly with the Fund's NAV due to timing reasons, supply and demand
imbalances and other factors. In addition, disruptions to creations and redemptions, including disruptions at market makers or Authorized Participants, or to market participants or during periods of significant market volatility, may result in
trading prices for shares of the Fund that differ significantly from its NAV.
Costs of Buying or Selling Fund Shares. Buying or selling Fund shares on an exchange involves two types of costs that apply to all securities transactions. When buying or selling shares of the Fund through a broker, you will likely incur a brokerage commission
or other charges imposed by brokers as determined by that broker. In addition, you may incur the cost of the “spread,” that is, the difference between what investors are willing to pay for Fund shares (the “bid” price) and
the price at which they are willing to sell Fund shares (the “ask” price). Because of the costs inherent in buying or selling Fund shares, frequent trading may detract significantly from investment results and an investment in Fund
shares may not be advisable for investors who anticipate regularly making small investments.
Non-Diversification Risk. The
Fund is classified as “non-diversified.” This means that the Fund may invest a large percentage of its assets in securities issued by or representing a small number of issuers. As a result, the Fund may be more susceptible to the risks
associated with these particular issuers, or to a single economic, political or regulatory occurrence affecting these issuers.
Non-U.S. Issuers Risk.
Securities issued by non-U.S. issuers have different risks from securities issued by U.S. issuers. These include differences in accounting, auditing and financial reporting standards, the possibility of expropriation or confiscatory taxation,
adverse changes in investment or exchange control regulations, political instability which could affect U.S. investments in non-U.S. countries, and potential restrictions of the flow of international capital. Non-U.S. issuers may be subject to less
governmental regulation than U.S. issuers. Moreover, individual non-U.S. economies may differ favorably or unfavorably from the U.S. economy in such respects as growth of gross domestic product, rate of inflation, capital reinvestment, resource
self-sufficiency and
8
Table of Contents
balance of payment positions. In addition, the value of these securities may
fluctuate due to changes in the exchange rate of the issuer’s local currency against the U.S. dollar.
The United States and the EU, along with the regulatory bodies
of a number of countries including Japan, Australia and Canada (collectively, “Sanctioning Bodies”), have imposed economic sanctions, which consist of asset freezes and sectorial sanctions on certain Russian individuals and Russian
corporate entities. The Sanctioning Bodies could also institute broader sanctions on Russia. These sanctions, or even the threat of further sanctions, may result in the decline of the value and liquidity of Russian securities, a weakening of the
ruble or other adverse consequences to the Russian economy. These sanctions could also result in the immediate freeze of Russian securities, impairing the ability of the Fund to buy, sell, receive or deliver those securities.
The sanctions against certain Russian issuers include
prohibitions on transacting in or dealing in new debt of longer than 30 or 90 days maturity or new equity of such issuers. Securities held by the Fund issued prior to the date of the sanctions being imposed are not currently subject to any
restrictions under the sanctions. However, compliance with each of these sanctions may impair the ability of the Fund to buy, sell, hold, receive or deliver the affected securities or other securities of such issuers. If it becomes impracticable or
unlawful for the Fund to hold securities subject to, or otherwise affected by, sanctions (collectively, “affected securities”), or if deemed appropriate by the Fund’s investment adviser, the Fund may prohibit in-kind deposits of
the affected securities in connection with creation transactions and instead require a cash deposit, which may also increase the Fund's transaction costs.
Also, if an affected security is included in the Fund’s
Underlying Index, the Fund may, where practicable, seek to eliminate its holdings of the affected security by employing or augmenting its representative sampling strategy to seek to track the investment results of its Underlying Index. The use of
(or increased use of) a representative sampling strategy may increase the Fund’s tracking error risk. If the affected securities constitute a significant percentage of the Underlying Index, the Fund may not be able to effectively implement a
representative sampling strategy, which may result in significant tracking error between the Fund’s performance and the performance of its Underlying Index.
Current or future sanctions may result in Russia taking counter
measures or retaliatory actions, which may further impair the value and liquidity of Russian securities. These retaliatory measures may include the immediate freeze of Russian assets held by the Fund. In the event of such a freeze of any fund
assets, including depositary receipts, the Fund may need to liquidate non-restricted assets in order to satisfy any fund redemption orders. The liquidation of fund assets during this time may also result in the Fund receiving substantially lower
prices for its securities.
These sanctions may also lead
to changes in the Fund’s Underlying Index. The Fund’s Index Provider may remove securities from the Underlying Index or implement caps on the securities of certain issuers that have been subject to recent economic sanctions. In such an
event, it is expected that the Fund will rebalance its portfolio to bring it in
9
Table of Contents
line
with the Underlying Index as a result of any such changes, which may result in transaction costs and increased tracking error.
Passive Investment Risk. The
Fund is not actively managed and may be affected by a general decline in market segments related to the Underlying Index. The Fund invests in securities included in, or representative of, the Underlying Index, regardless of their investment merits.
BFA generally does not attempt to take defensive positions under any market conditions, including declining markets.
Privately-Issued Securities Risk. The Fund will invest in privately-issued securities, including those that are normally purchased pursuant to Rule 144A or Regulation S of the 1933 Act. Privately-issued securities typically may be resold only to
qualified institutional buyers, or in a privately negotiated transaction, or to a limited number of purchasers, or in limited quantities after they have been held for a specified period of time and other conditions are met for an exemption from
registration. Because there may be relatively few potential purchasers for such securities, especially under adverse markets or economic conditions or in the event of adverse changes in the financial condition of the issuer, the Fund may find it
more difficult to sell such securities when it may be advisable to do so or it may be able to sell such securities only at prices lower than if such securities were more widely held and traded. At times, it also may be more difficult to determine
the fair value of such securities for purposes of computing the Fund’s NAV due to the absence of an active trading market. There can be no assurance that a privately-issued security that is deemed to be liquid when purchased will continue to
be liquid for as long as it is held by the Fund.
Reliance on Trading Partners Risk. Economies in emerging market countries generally are heavily dependent upon commodity prices and international trade and, accordingly, have been and may continue to be affected adversely by the economies of their
trading partners, trade barriers, exchange controls, managed adjustments in relative currency values, and may suffer from extreme and volatile debt burdens or inflation rates. These countries may be subject to other protectionist measures imposed or
negotiated by the countries with which they trade.
Risk of Investing in Emerging Markets. Investments in emerging markets are subject to a greater risk of loss than investments in more developed markets. This is due to, among other things, the potential for greater market volatility, lower trading volume,
inflation, political and economic instability, greater risk of a market shutdown and more governmental limitations on foreign investments than typically found in more developed markets. In addition, emerging markets often have less uniformity in
accounting and reporting requirements, unreliable securities valuation and greater risks associated with custody of securities, as well as greater risk of capital controls through such measures as taxes or interest rate control. Certain emerging
market countries may also lack the infrastructure necessary to attract large amounts of foreign trade and investment. Local securities markets may trade a small number of securities and may be unable to respond effectively to increases in trading
volume, potentially making prompt liquidation of holdings difficult or impossible at times. Settlement procedures in emerging market countries are frequently less developed and reliable than those in the United States (and other developed
countries). In addition, significant delays may occur in certain markets in registering the transfer of
10
Table of Contents
securities. Settlement or registration problems may make it more difficult for
the Fund to value its portfolio securities and could cause the Fund to miss attractive investment opportunities.
Securities Lending Risk. The
Fund may engage in securities lending. Securities lending involves the risk that the Fund may lose money because the borrower of the loaned securities fails to return the securities in a timely manner or at all. The Fund could also lose money in the
event of a decline in the value of the collateral provided for the loaned securities or a decline in the value of any investments made with cash collateral. These events could also trigger adverse tax consequences for the Fund. In addition,
BlackRock Institutional Trust Company, N.A., the Fund’s securities lending agent, will take the tax impact to shareholders of substitute payments for dividends into account when managing the Fund’s securities lending
program.
Security Risk. Some geographic areas in which the Fund invests have experienced acts of terrorism or strained international relations due to territorial disputes, historical animosities or other defense concerns. These situations may
cause uncertainty in the markets of these geographic areas and may adversely affect their economies.
Sovereign and Quasi-Sovereign Obligations Risk. An investment in sovereign or quasi-sovereign debt obligations involves special risks not present in corporate debt obligations. Sovereign debt includes securities issued by or guaranteed by a non-U.S. sovereign
government, and quasi-sovereign debt includes securities issued by or guaranteed by an entity affiliated with or backed by a sovereign government. The issuer of the sovereign debt that controls the repayment of the debt may be unable or unwilling to
repay principal or interest when due, and the Fund may have limited recourse in the event of a default. Similar to other issuers, changes to the financial condition or credit rating of a government may cause the value of a sovereign debt, including
treasury obligations, to decline. During periods of economic uncertainty, the market prices of sovereign debt may be more volatile than prices of U.S. debt obligations and may affect the Fund's NAV. Quasi-sovereign debt obligations are typically
less liquid and less standardized than sovereign debt obligations. In the past, certain emerging market countries have encountered difficulties in servicing their debt obligations, withheld payments of principal and interest and declared moratoria
on the payment of principal and interest on their sovereign debts. Several countries in which the Fund invests have defaulted on their sovereign obligations in the past or encountered downgrades of their sovereign obligations, and those countries
(or other countries) may default or risk further downgrades in the future.
Structural Risk. Certain
countries in which the Fund invests may experience currency devaluations, substantial rates of inflation or economic recessions, causing a negative effect on their economies and securities markets.
Tracking Error Risk. Tracking
error is the divergence of the Fund’s performance from that of the Underlying Index. Tracking error may occur because of differences between the securities held in the Fund’s portfolio and those included in the Underlying Index, pricing
differences, transaction costs, the Fund holding uninvested cash, differences in timing of the accrual of distributions, changes to the Underlying Index or the costs of complying with various new or existing regulatory requirements. This risk may be
heightened during times of increased market volatility or other unusual market
11
Table of Contents
conditions. Tracking error also may result because the Fund incurs fees and
expenses, while the Underlying Index does not. BFA EXPECTS THAT THE FUND MAY EXPERIENCE HIGHER TRACKING ERROR THAN IS TYPICAL FOR SIMILAR INDEX EXCHANGE-TRADED FUNDS, ESPECIALLY BEFORE THE FUND REACHES SUFFICIENT SCALE AND FURTHER BROADENS ITS
HOLDINGS.
U.S. Economic Risk. The United States is a significant, and in some cases the most significant, trading partner of, or foreign investor in certain markets, and the economies of these countries may be particularly affected by adverse
changes in the U.S. economy. A decrease in U.S. imports, new trade regulations, changes in the U.S. dollar exchange rates or an economic slowdown in the United States may have a material adverse effect on the economies of these countries and, as a
result, securities to which the Fund has exposure.
Valuation Risk. The sale price
the Fund could receive for a security may differ from the Fund's valuation of the security and may differ from the value used by the Underlying Index, particularly for securities that trade in low volume or volatile markets, or that are valued
using a fair value methodology. Because non-U.S. stock exchanges may be open on days when the Fund does not price its shares, the value of the securities in the Fund’s portfolio may change on days when shareholders will not be able to purchase
or sell the Fund’s shares. In addition, for purposes of calculating the Fund's NAV, the value of assets denominated in non-U.S. currencies is converted into U.S. dollars using exchange rates deemed appropriate by BFA. This conversion may
result in a difference between the prices used to calculate the Fund's NAV and the prices used by the Underlying Index, which, in turn, could result in a difference between the Fund's performance and the performance of the Underlying
Index.
A Further Discussion of Other Risks
The Fund may also be subject to certain other risks associated
with its investments and investment strategies.
Eastern
European Economic Risk. An investment in Eastern European issuers may subject the Fund to legal, regulatory, political, currency, security and economic risks specific to Eastern Europe. Economies of certain Eastern
European countries rely heavily on export of commodities, including oil and gas, and certain metals. As a result, such economies will be impacted by international commodity prices and are particularly vulnerable to global demand for these products.
Acts of terrorism in certain Eastern European countries may cause uncertainty in their financial markets and adversely affect the performance of the issuers to which the Fund has exposure. The securities markets in Eastern European countries are
substantially smaller and inexperienced, with less government supervision and regulation of stock exchanges and less liquid and more volatile than securities markets in the United States or Western European countries. In addition, investing in
securities of Eastern European issuers involves:
| ■ | The risk of delays in settling portfolio transactions and the risk of loss arising out of the system of share registration and custody used in certain Eastern European countries; |
| ■ | Risks in connection with the maintenance of the Fund's portfolio securities and cash |
12
Table of Contents
with foreign sub-custodians and securities depositories,
including the risk that appropriate sub-custody arrangements will not be available to the Fund;
| ■ | The risk that the Fund's ownership rights in portfolio securities could be lost through fraud or negligence as a result of the fact that ownership in shares of certain Eastern European companies is recorded by the companies themselves and by registrars, rather than a central registration system; |
| ■ | The risk that the Fund may not be able to pursue claims on behalf of its shareholders because of the system of share registration and custody, and because certain Eastern European banking institutions and registrars are not guaranteed by their respective governments; and |
| ■ | Risks in connection with Eastern European countries' dependence on the economic health of Western European countries and the EU as a whole. |
Other risks related to investing in securities of Eastern
European issuers include: the absence of legal structures governing private and foreign investments and private property; the possibility of the loss of all or a substantial portion of the Fund’s assets invested in Eastern European issuers as
a result of expropriation; and certain national policies which may restrict the Fund’s investment opportunities, including, without limitation, restrictions on investing in issuers or industries deemed sensitive to relevant national
interests.
Middle Eastern Economic Risk. Many Middle Eastern countries have little or no democratic tradition and the political and legal systems in such countries may adversely impact the companies in which the Fund invests and the value of the Fund. Middle
Eastern governments have exercised and continue to exercise substantial influence over many aspects of the private sector. Many economies in the Middle East are highly reliant on income from the sale of oil or trade with countries involved in the
sale of oil, and their economies are therefore vulnerable to changes in the market for oil and foreign currency values. As global demand for oil fluctuates, many Middle Eastern economies may be significantly impacted. A sustained decrease in
commodity prices could have a significant negative impact on all aspects of the economy in the region. Middle Eastern economies may be subject to acts of terrorism, political strife, religious, ethnic or socioeconomic unrest and sudden outbreaks of
hostilities with neighboring countries.
Certain
Middle Eastern countries have strained relations with other Middle Eastern countries due to territorial disputes, historical animosities, religious tensions or defense concerns, which may adversely affect the economies of these countries. Certain
Middle Eastern countries experience significant unemployment, as well as widespread underemployment.
Recently, many Middle Eastern countries have experienced
political, economic and social unrest as protestors have called for widespread reform. Some of these protests have resulted in regime change. If regime change were to occur in any of these countries, the new government may not immediately stabilize
such country, which could adversely affect the economies of Middle Eastern countries in which the Fund invests and could decrease the value of the Fund’s investments.
13
Table of Contents
North American Economic Risk.
Decreasing imports or exports, changes in trade regulations and/or an economic recession in any one North American country can have a significant economic effect on the entire North American region, and on some or all of the North American countries
in which the Fund invests.
The United States is
Canada and Mexico's largest trading and investment partner. The Canadian and Mexican economies are significantly affected by developments in the U.S. economy. Since the implementation of the North American Free Trade Agreement (“NAFTA”)
in 1994 among Canada, the United States and Mexico, total merchandise trade between the three countries has increased. To further this relationship, the three NAFTA countries entered into the Security and Prosperity Partnership of North America in
March 2005, which may further affect Canada's and Mexico's dependency on the U.S. economy. Policy and legislative changes in one country may have a significant effect on North American markets generally, as well as the value of certain
securities.
Portfolio Holdings Information
A description of the Company's policies and procedures with
respect to the disclosure of the Fund’s portfolio securities is available in the Fund's Statement of Additional Information (“SAI”). The top holdings of the Fund can be found at www.iShares.com. Fund fact sheets provide information
regarding the Fund's top holdings and may be requested by calling 1-800-iShares (1-800-474-2737).
Management
Investment Adviser. As
investment adviser, BFA has overall responsibility for the general management and administration of the Company. BFA provides an investment program for the Fund and manages the investment of the Fund’s assets. In managing the Fund, BFA may
draw upon the research and expertise of its asset management affiliates with respect to certain portfolio securities. In seeking to achieve the Fund's investment objective, BFA uses teams of portfolio managers, investment strategists and other
investment specialists. This team approach brings together many disciplines and leverages BFA’s extensive resources.
Pursuant to the Investment Advisory Agreement between BFA and
the Company (entered into on behalf of the Fund), BFA is responsible for substantially all expenses of the Fund, except interest expenses, taxes, brokerage expenses, future distribution fees or expenses and extraordinary expenses.
For its investment advisory services to the Fund, BFA is
entitled to receive a management fee from the Fund based on a percentage of the Fund's average daily net assets, at an annual rate of 0.65%.
BFA is located at 400 Howard Street, San Francisco, CA 94105.
It is an indirect wholly-owned subsidiary of BlackRock, Inc. (“BlackRock”). As of December 31, 2013, BFA and its affiliates provided investment advisory services for assets in excess of $4.32 trillion. BFA and its affiliates deal, trade
and invest for their own accounts in the types of securities in which the Fund may also invest.
14
Table of Contents
A discussion regarding the basis for the Company's Board of
Directors' (the “Board”) approval of the Investment Advisory Agreement with BFA is available in the Fund's annual report for the period ended October 31.
Portfolio Managers. James Mauro
and Scott Radell are primarily responsible for the day-to-day management of the Fund. Each Portfolio Manager is responsible for various functions related to portfolio management, including, but not limited to, investing cash inflows, coordinating
with members of his portfolio management team to focus on certain asset classes, implementing investment strategy, researching and reviewing investment strategy and overseeing members of his portfolio management team that have more limited
responsibilities.
James Mauro has been employed by
BFA and BlackRock Institutional Trust Company, N.A. (“BTC”) as a portfolio manager since 2011. Prior to that, Mr. Mauro was a Vice President at State Street Global Advisors. Mr. Mauro has been a Portfolio Manager of the Fund since
2012.
Scott Radell has been employed by BFA (formerly,
Barclays Global Fund Advisors (“BGFA”)) and BTC (formerly, Barclays Global Investors, N.A. (“BGI”)) as a portfolio manager since 2004. Mr. Radell was a credit strategist from 2003 to 2004 and became a portfolio manager at
BGFA and BGI in 2004. Mr. Radell has been a Portfolio Manager of the Fund since 2012.
The Fund's SAI provides additional information about the
Portfolio Managers' compensation, other accounts managed by the Portfolio Managers and the Portfolio Managers' ownership (if any) of shares in the Fund.
Administrator, Custodian and Transfer Agent. State Street Bank and Trust Company (“State Street”) is the administrator, custodian and transfer agent for the Fund.
Conflicts of Interest. BFA
wants you to know that it has relationships with certain entities that may give rise to conflicts of interest or the appearance of conflicts of interest. These entities are BFA’s affiliates, including BlackRock and the PNC Financial Services
Group, Inc., and each of their affiliates, directors, partners, trustees, managing members, officers and employees (collectively, the “Affiliates”).
The activities of BFA and the Affiliates in the management of,
or their interest in, their own accounts and other accounts they manage, may present conflicts of interest that could disadvantage the Fund and its shareholders. BFA and the Affiliates provide investment management services to other funds and
discretionary managed accounts that may follow an investment program similar to that of the Fund. BFA and the Affiliates are involved worldwide with a broad spectrum of financial services and asset management activities and may engage in the
ordinary course of business in activities in which their interests or the interests of their clients may conflict with those of the Fund. BFA or one or more of the Affiliates acts, or may act, as an investor, investment banker, research provider,
investment manager, financier, underwriter, adviser, market maker, trader, prime broker, lender, agent or principal, and have other direct and indirect interests, in securities, currencies and other instruments in which the Fund may directly or
indirectly invest. Thus, it is likely that the Fund will have multiple business relationships with and will invest in, engage in transactions with, make voting
15
Table of Contents
decisions with respect to, or obtain services from, entities for which BFA or
an Affiliate seeks to perform investment banking or other services.
BFA or one or more Affiliates may engage in proprietary trading
and advise accounts and funds that have investment objectives similar to those of the Fund and/or that engage in and compete for transactions in the same types of securities, currencies and other instruments as the Fund, including in securities
issued by other open-end and closed-end investment management companies, including investment companies that are affiliated with the Fund and BFA, to the extent permitted under the Investment Company Act of 1940, as amended (the “1940
Act”). The trading activities of BFA and these Affiliates are carried out without reference to positions held directly or indirectly by the Fund and may result in BFA or an Affiliate having positions that are adverse to those of the
Fund.
No Affiliate is under any obligation to share any
investment opportunity, idea or strategy with the Fund. As a result, an Affiliate may compete with the Fund for appropriate investment opportunities. As a result of this and several other factors, the results of the Fund's investment activities may
differ from those of an Affiliate and of other accounts managed by an Affiliate, and it is possible that the Fund could sustain losses during periods in which one or more Affiliates and other accounts achieve profits on their trading for proprietary
or other accounts. The opposite result is also possible.
The Fund may, from time to time, enter into transactions in
which BFA’s or an Affiliate’s clients have an interest adverse to the Fund. Furthermore, transactions undertaken by Affiliate-advised clients may adversely impact the Fund. Transactions by one or more Affiliate-advised clients or BFA may
have the effect of diluting or otherwise disadvantaging the values, prices or investment strategies of the Fund.
The Fund's activities may be limited because of regulatory
restrictions applicable to one or more Affiliates, and/or their internal policies designed to comply with such restrictions. In addition, the Fund may invest in securities of companies with which an Affiliate has developed or is trying to develop
investment banking relationships or in which an Affiliate has significant debt or equity investments or other interests. The Fund also may invest in securities of companies for which an Affiliate provides or may in the future provide research
coverage. An Affiliate may have business relationships with, and purchase, distribute or sell services or products from or to, distributors, consultants or others who recommend the Fund or who engage in transactions with or for the Fund, and may
receive compensation for such services. The Fund may also make brokerage and other payments to Affiliates in connection with the Fund's portfolio investment transactions.
Pursuant to a securities lending program approved by the Board,
the Fund has retained an Affiliate of BFA to serve as the securities lending agent for the Fund to the extent that the Fund participates in the securities lending program. For these services, the lending agent may receive a fee from the Fund,
including a fee based on the returns earned on the Fund’s investment of the cash received as collateral for any loaned securities. BFA may receive compensation for managing the reinvestment of the cash collateral. In addition, one or more
Affiliates may be among the entities to which the Fund may lend its portfolio securities under the securities lending program.
16
Table of Contents
The activities of BFA or the Affiliates may give rise to other
conflicts of interest that could disadvantage the Fund and its shareholders. BFA has adopted policies and procedures designed to address these potential conflicts of interest. See the Fund's SAI for further information.
Shareholder Information
Additional shareholder information, including how to buy and
sell shares of the Fund, is available free of charge by calling toll-free: 1-800-iShares (1-800-474-2737) or visiting our website at www.iShares.com.
Buying and Selling Shares.
Shares of the Fund may be acquired or redeemed directly from the Fund only in Creation Units or multiples thereof, as discussed in the Creations and Redemptions section of this Prospectus. Only an Authorized Participant (as defined in the Creations and Redemptions section) may
engage in creation or redemption transactions directly with the Fund. Once created, shares of the Fund generally trade in the secondary market in amounts less than a Creation Unit.
Shares of the Fund are listed on a national securities exchange
for trading during the trading day. Shares can be bought and sold throughout the trading day like shares of other publicly traded companies. The Company does not impose any minimum investment for shares of the Fund purchased on an exchange. The
Fund's shares trade under the trading symbol “EMHY.”
Buying or selling Fund shares on an exchange involves two types
of costs that may apply to all securities transactions. When buying or selling shares of the Fund through a broker, you will likely incur a brokerage commission or other charges determined by your broker. The commission is frequently a fixed amount
and may be a significant proportional cost for investors seeking to buy or sell small amounts of shares. In addition, you may incur the cost of the “spread,” that is, any difference between the bid price and the ask price. The spread
varies over time for shares of the Fund based on the Fund’s trading volume and market liquidity, and is generally lower if the Fund has a lot of trading volume and market liquidity, and higher if the Fund has little trading volume and market
liquidity (which is often the case for funds that are newly launched or small in size). The Fund's spread may also be impacted by the liquidity of the underlying securities held by the Fund, particularly for newly launched or smaller iShares funds
or in instances of significant volatility of the underlying securities.
The Fund participates in the BATS Competitive Liquidity
Provider Program (the “Incentive Program”), which is designed to strengthen market quality by providing enhanced rebates for lead market makers (“LMMs”) in exchange traded products whose trading volumes do not exceed
specified levels. Rebates are allocated to eligible LMMs based on a competitive quote evaluation process. Rebates, which for the Fund may be up to $30,000 per year, are funded by a supplemental listing fee paid by the Adviser and not by the Fund.
BATS has proposed to amend the Incentive Program to restructure the incentive payments and eliminate the standard listing fee for exchange traded products. There are risks associated with the Incentive Program because it may act to artificially
influence trading in the Fund shares, and pricing and liquidity of the shares could be adversely impacted if the Fund were to leave the Incentive Program or the Incentive Program were discontinued. The Incentive Program is scheduled to
17
Table of Contents
terminate on or about July 28, 2015. LMMs participating in the Incentive
Program are restricted in their ability to finance Fund shares. Additional information about the Incentive Program is available on the website of BATS at http://www.batstrading.com/listings/market_maker/etp/. This reference to the website does not
incorporate the contents of the website into this prospectus.
The Board has adopted a policy of not monitoring for frequent
purchases and redemptions of Fund shares (“frequent trading”) that appear to attempt to take advantage of a potential arbitrage opportunity presented by a lag between a change in the value of the Fund’s portfolio securities after
the close of the primary markets for the Fund’s portfolio securities and the reflection of that change in the Fund’s NAV (“market timing”), because the Fund generally sells and redeems its shares directly through transactions
that are in-kind and/or for cash, subject to the conditions described below under Creations and Redemptions. The Board has not adopted a policy of monitoring for other frequent trading activity because shares
of the Fund are listed for trading on a national securities exchange.
The national securities exchange on which the Fund's shares are
listed is open for trading Monday through Friday and is closed on weekends and the following holidays: New Year’s Day, Martin Luther King, Jr. Day, Presidents’ Day, Good Friday, Memorial Day, Independence Day, Labor Day, Thanksgiving Day
and Christmas Day. The Fund’s primary Listing Exchange is BATS.
Section 12(d)(1) of the 1940 Act restricts investments by
investment companies in the securities of other investment companies. Registered investment companies are permitted to invest in the Fund beyond the limits set forth in Section 12(d)(1), subject to certain terms and conditions set forth in SEC rules
or in an SEC exemptive order issued to the Company. In order for a registered investment company to invest in shares of the Fund beyond the limitations of Section 12(d)(1) pursuant to the exemptive relief obtained by the Company, the registered
investment company must enter into an agreement with the Company.
Book Entry. Shares of the Fund
are held in book-entry form, which means that no stock certificates are issued. The Depository Trust Company (“DTC”) or its nominee is the record owner of all outstanding shares of the Fund and is recognized as the owner of all shares
for all purposes.
Investors owning shares of the
Fund are beneficial owners as shown on the records of DTC or its participants. DTC serves as the securities depository for shares of the Fund. DTC participants include securities brokers and dealers, banks, trust companies, clearing corporations and
other institutions that directly or indirectly maintain a custodial relationship with DTC. As a beneficial owner of shares, you are not entitled to receive physical delivery of stock certificates or to have shares registered in your name, and you
are not considered a registered owner of shares. Therefore, to exercise any right as an owner of shares, you must rely upon the procedures of DTC and its participants. These procedures are the same as those that apply to any other securities that
you hold in book-entry or “street name” form.
Share Prices. The trading
prices of the Fund’s shares in the secondary market generally differ from the Fund’s daily NAV and are affected by market forces such as
18
Table of Contents
supply of and demand for ETF shares and underlying securities held by the
Fund, economic conditions and other factors. Information regarding the intraday value of shares of the Fund, also known as the “indicative optimized portfolio value” (“IOPV”), is disseminated every 15 seconds throughout the
trading day by the national securities exchange on which the Fund's shares are listed or by market data vendors or other information providers. The IOPV is based on the current market value of the securities and/or cash required to be deposited in
exchange for a Creation Unit. The IOPV does not necessarily reflect the precise composition of the current portfolio of securities held by the Fund at a particular point in time or the best possible valuation of the current portfolio. Therefore, the
IOPV should not be viewed as a “real-time” update of the Fund's NAV, which is computed only once a day. The IOPV is generally determined by using both current market quotations and/or price quotations obtained from broker-dealers that
may trade in the portfolio securities held by the Fund. The quotations of certain Fund holdings may not be updated during U.S. trading hours if such holdings do not trade in the United States. The Fund is not involved in, or responsible for, the
calculation or dissemination of the IOPV and makes no representation or warranty as to its accuracy.
Determination of Net Asset Value. The NAV of the Fund normally is determined once daily Monday through Friday, generally as of the regularly scheduled close of business of the New York Stock Exchange (“NYSE”) (normally 4:00 p.m., Eastern
time) on each day that the NYSE is open for trading, based on prices at the time of closing provided that (a) any Fund assets or liabilities denominated in currencies other than the U.S. dollar are translated into U.S. dollars at the prevailing
market rates on the date of valuation as quoted by one or more data service providers (as detailed below) and (b) U.S. fixed-income assets may be valued as of the announced closing time for trading in fixed-income instruments in a particular market
or exchange. The NAV of the Fund is calculated by dividing the value of the net assets of the Fund (i.e., the value of its total assets less total
liabilities) by the total number of outstanding shares of the Fund, generally rounded to the nearest cent.
The value of the securities and other assets and liabilities
held by the Fund are determined pursuant to valuation policies and procedures approved by the Board. The Fund's assets and liabilities are valued on the basis of market quotations, when readily available.
The Fund values fixed-income portfolio securities using prices
provided directly from one or more broker-dealers, market makers, or independent third-party pricing services which may use matrix pricing and valuation models, as well as recent market transactions for the same or similar assets, to derive values.
Certain short-term debt securities may be valued on the basis of amortized cost.
The Fund invests in non-U.S. securities. Foreign currency
exchange rates are generally determined as of 4:00 p.m., London time. Non-U.S. securities held by the Fund may trade on weekends or other days when the Fund does not price its shares. As a result, the Fund’s NAV may change on days when
Authorized Participants will not be able to purchase or redeem Fund shares.
Generally, trading in non-U.S. securities, U.S. government
securities, money market instruments and certain fixed-income securities is substantially completed each day at
19
Table of Contents
various times prior to the close of business on the NYSE. The values of such
securities used in computing the NAV of the Fund are determined as of such times.
When market quotations are not readily available or are
believed by BFA to be unreliable, the Fund’s investments are valued at fair value. Fair value determinations are made by BFA in accordance with policies and procedures approved by the Company's Board. BFA may conclude that a market quotation
is not readily available or is unreliable if a security or other asset or liability does not have a price source due to its lack of liquidity, if a market quotation differs significantly from recent price quotations or otherwise no longer appears to
reflect fair value, where the security or other asset or liability is thinly traded, or where there is a significant event subsequent to the most recent market quotation. A “significant event” is an event that, in the judgment of BFA, is
likely to cause a material change to the closing market price of the asset or liability held by the Fund. Non-U.S. securities whose values are affected by volatility that occurs in U.S. markets for related or highly correlated assets (e.g., American Depositary Receipts, Global Depositary Receipts or ETFs) on a trading day after the close of non-U.S. securities markets may be fair valued.
Fair value represents a good faith approximation of the value
of an asset or liability. The fair value of an asset or liability held by the Fund is the amount the Fund might reasonably expect to receive from the current sale of that asset or the cost to extinguish that liability in an arm’s-length
transaction. Valuing the Fund’s investments using fair value pricing will result in prices that may differ from current market valuations and that may not be the prices at which those investments could have been sold during the period in which
the particular fair values were used. Use of fair value prices and certain current market valuations could result in a difference between the prices used to calculate the Fund’s NAV and the prices used by the Underlying Index, which, in turn,
could result in a difference between the Fund’s performance and the performance of the Underlying Index.
The value of assets or liabilities denominated in non-U.S.
currencies will be converted into U.S. dollars using exchange rates deemed appropriate by BFA as investment adviser. Use of a rate different from the rate used by the Index Provider may adversely affect the Fund’s ability to track the
Underlying Index.
Dividends and Distributions
General Policies. Dividends
from net investment income, if any, generally are declared and paid at least once a year by the Fund. Distributions of net realized securities gains, if any, generally are declared and paid once a year, but the Company may make distributions on a
more frequent basis for the Fund. The Company reserves the right to declare special distributions if, in its reasonable discretion, such action is necessary or advisable to preserve its status as a regulated investment company (“RIC”) or
to avoid imposition of income or excise taxes on undistributed income or realized gains.
Dividends and other distributions on shares of the Fund are
distributed on a pro rata basis to beneficial owners of such shares. Dividend payments are made through DTC participants and indirect participants to beneficial owners then of record with proceeds received
from the Fund.
20
Table of Contents
Dividend Reinvestment Service.
No dividend reinvestment service is provided by the Company. Broker-dealers may make available the DTC book-entry Dividend Reinvestment Service for use by beneficial owners of the Fund for reinvestment of their dividend distributions. Beneficial
owners should contact their broker to determine the availability and costs of the service and the details of participation therein. Brokers may require beneficial owners to adhere to specific procedures and timetables. If this service is available
and used, dividend distributions of both income and realized gains will be automatically reinvested in additional whole shares of the Fund purchased in the secondary market.
Taxes. As with any investment,
you should consider how your investment in shares of the Fund will be taxed. The tax information in this Prospectus is provided as general information, based on current law. There is no guarantee that shares of the Fund will receive certain
regulatory or accounting treatment. You should consult your own tax professional about the tax consequences of an investment in shares of the Fund.
Unless your investment in Fund shares is made through a
tax-exempt entity or tax-deferred retirement account, such as an IRA, you need to be aware of the possible tax consequences when the Fund makes distributions or you sell Fund shares.
Taxes on Distributions.
Distributions from the Fund’s net investment income, including distributions of income from securities lending and distributions out of the Fund's net short-term capital gains, if any, are taxable to you as ordinary income. The Fund's
distributions of net long-term capital gains, if any, in excess of net short-term capital losses are taxable as long-term capital gains, regardless of how long you have held the shares. Distributions from the Fund are subject to a 3.8% U.S. federal
Medicare contribution tax on “net investment income,” for individuals with incomes exceeding $200,000 ($250,000 if married filing jointly) and of estates and trusts. In general, your distributions are subject to U.S. federal income tax
for the year when they are paid. Certain distributions paid in January, however, may be treated as paid on December 31 of the prior year.
If the Fund's distributions exceed current and accumulated
earnings and profits, all or a portion of the distributions made in the taxable year may be recharacterized as a return of capital to shareholders. Distributions in excess of the Fund’s minimum distribution requirements, but not in excess of
the Fund’s earnings and profits, will be taxable to shareholders and will not constitute nontaxable returns of capital. A return of capital distribution generally will not be taxable but will reduce the shareholder's cost basis and will result
in a higher capital gain or lower capital loss when those shares on which the distribution was received are sold. Once a shareholder's cost basis is reduced to zero, further distributions will be treated as capital gain, if the shareholder holds
shares of the Fund as capital assets.
Interest received
by the Fund with respect to non-U.S. securities may give rise to withholding and other taxes imposed by non-U.S. countries. Tax conventions between certain countries and the U.S. may reduce or eliminate such taxes. If more than 50% of the total
assets of the Fund at the close of a year consists of securities of non-U.S. corporations, the Fund may “pass through” to you certain non-U.S. income taxes (including withholding taxes) paid by the Fund. This means that you would be
considered to have received as an additional dividend your share of such non-U.S.
21
Table of Contents
taxes, but you may be entitled to either a corresponding tax deduction in
calculating your U.S. federal taxable income, or, subject to certain limitations, a credit in calculating your U.S. federal income tax.
If you are neither a resident nor a citizen of the United
States or if you are a non-U.S. entity, the Fund’s ordinary income dividends (which include distributions of net short-term capital gains) will generally be subject to a 30% U.S. federal withholding tax, unless a lower treaty rate
applies.
A 30% withholding tax will be imposed on
U.S.-source dividends, interest and other income items paid after June 30, 2016, and proceeds from the sale of property producing U.S.-source dividends and interest paid after December 31, 2016, to (i) foreign financial institutions, including
non-U.S. investment funds, unless they agree to collect and disclose to the U.S. Internal Revenue Service (“IRS”) information regarding their direct and indirect U.S. account holders and (ii) certain other foreign entities, unless they
certify certain information regarding their direct and indirect U.S. owners. To avoid withholding, foreign financial institutions will need to (i) enter into agreements with the IRS that state that they will provide the IRS information, including
the names, addresses and taxpayer identification numbers of direct and indirect U.S. account holders; comply with due diligence procedures with respect to the identification of U.S. accounts; report to the IRS certain information with respect to
U.S. accounts maintained, agree to withhold tax on certain payments made to non-compliant foreign financial institutions or to account holders who fail to provide the required information; and determine certain other information concerning their
account holders, or (ii) in the event that an applicable intergovernmental agreement and implementing legislation are adopted, provide local revenue authorities with similar account holder information. Other foreign entities will need to provide the
name, address, and taxpayer identification number of each substantial U.S. owner or certifications of no substantial U.S. ownership, unless certain exceptions apply.
If you are a resident or a citizen of the United States, by
law, back-up withholding at a 28% rate will apply to your distributions and proceeds if you have not provided a taxpayer identification number or social security number and made other required certifications.
Taxes When Shares are Sold.
Currently, any capital gain or loss realized upon a sale of Fund shares is generally treated as a long-term gain or loss if the shares have been held for more than one year. Any capital gain or loss realized upon a sale of Fund shares held for one
year or less is generally treated as short-term gain or loss, except that any capital loss on the sale of shares held for six months or less is treated as long-term capital loss to the extent that capital gain dividends were paid with respect to
such shares. Any such capital gains, including from sales of Fund shares or from capital gain dividends, are included in “net investment income” for purposes of the 3.8% U.S. federal Medicare contribution tax mentioned
above.
The foregoing discussion summarizes some of
the consequences under current U.S. federal tax law of an investment in the Fund. It is not a substitute for personal tax advice. You may also be subject to state and local taxation on Fund distributions and sales of shares. Consult your personal
tax advisor about the potential tax consequences of an investment in shares of the Fund under all applicable tax laws.
22
Table of Contents
Creations and Redemptions.
Prior to trading in the secondary market, shares of the Fund are “created” at NAV by market makers, large investors and institutions only in block-size Creation Units of 100,000 shares or multiples thereof. Each “creator” or
“Authorized Participant” enters into an authorized participant agreement with the Fund's distributor, BlackRock Investments, LLC (the “Distributor”), an affiliate of BFA.
A creation transaction, which is subject to acceptance by the
transfer agent, generally takes place when an Authorized Participant deposits into the Fund a designated portfolio of securities (including any portion of such securities for which cash may be substituted) and a specified amount of cash
approximating the holdings of the Fund in exchange for a specified number of Creation Units. To the extent practicable, the composition of such portfolio generally corresponds pro rata to the holdings of the
Fund. However, creation baskets will generally correspond to the price and yield performance of the Fund.
Similarly, shares can be redeemed only in Creation Units,
generally for a designated portfolio of securities (including any portion of such securities for which cash may be substituted) held by the Fund (“Fund Securities”) and a specified amount of cash. Except
when aggregated in Creation Units, shares are not redeemable by the Fund.
The prices at which creations and redemptions occur are based
on the next calculation of NAV after a creation or redemption order is received in an acceptable form under the authorized participant agreement.
The portfolio of securities required for purchase of a Creation
Unit may be different than the portfolio of securities the Fund will deliver upon redemption of Fund shares. The Deposit Securities and Fund Securities, as applicable, in connection with a purchase or redemption of a Creation Unit, generally will
correspond pro rata, to the extent practicable, to the securities held by the Fund.
Only an Authorized Participant may create or redeem Creation
Units directly with the Fund.
As a result of any system
failure or other interruption, including disruptions at market makers or Authorized Participants, orders to purchase or redeem Creation Units either may not be executed according to the Fund's instructions or may not be executed at all, or the Fund
may not be able to place or change orders.
To the extent
the Fund engages in in-kind transactions, the Fund intends to comply with the U.S. federal securities laws in accepting securities for deposit and satisfying redemptions with redemption securities by, among other means, assuring that any securities
accepted for deposit and any securities used to satisfy redemption requests will be sold in transactions that would be exempt from registration under the 1933 Act. Further, an Authorized Participant that is not a “qualified institutional
buyer,” as such term is defined under Rule 144A of the 1933 Act, will not be able to receive securities that are restricted securities eligible for resale under Rule 144A.
Creations and redemptions must be made through a firm that is
either a member of the Continuous Net Settlement System of the National Securities Clearing Corporation or a DTC participant and has executed an agreement with the Distributor with respect to creations and redemptions of Creation Unit aggregations.
Information about the
23
Table of Contents
procedures regarding creation and redemption of Creation Units (including the
cut-off times for receipt of creation and redemption orders) is included in the Fund's SAI.
Because new shares may be created and issued on an ongoing
basis, at any point during the life of the Fund a “distribution,” as such term is used in the 1933 Act, may be occurring. Broker-dealers and other persons are cautioned that some activities on their part may, depending on the
circumstances, result in their being deemed participants in a distribution in a manner that could render them statutory underwriters and subject to the prospectus delivery and liability provisions of the 1933 Act. Any determination of whether one is
an underwriter must take into account all the relevant facts and circumstances of each particular case.
Broker-dealers should also note that dealers who are not
“underwriters” but are participating in a distribution (as contrasted to ordinary secondary transactions), and thus dealing with shares that are part of an “unsold allotment” within the meaning of Section 4(a)(3)(C) of the
1933 Act, would be unable to take advantage of the prospectus delivery exemption provided by Section 4(a)(3) of the 1933 Act. For delivery of prospectuses to exchange members, the prospectus delivery mechanism of Rule 153 under the 1933 Act is
available only with respect to transactions on a national securities exchange.
Costs Associated with Creations and Redemptions. Authorized Participants are charged standard creation and redemption transaction fees to offset transfer and other transaction costs associated with the issuance and redemption of Creation Units. The standard creation
and redemption transaction fees are set forth in the table below. The standard creation transaction fee is charged to the Authorized Participant on the day such Authorized Participant creates a Creation Unit, and is the same regardless of the number
of Creation Units purchased by the Authorized Participant on the applicable business day. Similarly, the standard redemption transaction fee is charged to the Authorized Participant on the day such Authorized Participant redeems a Creation Unit, and
is the same regardless of the number of Creation Units redeemed by the Authorized Participant on the applicable business day. Creations and redemptions for cash (when cash creations and redemptions (in whole or in part) are available or specified)
are also subject to an additional charge (up to the maximum amounts shown in the table below). This charge is intended to compensate for brokerage, tax, foreign exchange, execution, market impact and other costs and expenses related to cash
transactions. Investors who use the services of a broker or other financial intermediary to acquire or dispose of Fund shares may pay fees for such services.
24
Table of Contents
The following table shows, as of November 30, 2013, the
approximate value of one Creation Unit, standard fees and maximum additional charges for creations and redemptions (as described above):
| Approximate
Value of a Creation Unit |
Creation
Unit Size |
Standard
Creation/ Redemption Transaction Fee |
Maximum
Additional Charge for Creations* |
Maximum
Additional Charge for Redemptions* | ||||
| $4,928,000 | 100,000 | $100 | 3.0% | 2.0% |
| * | As a percentage of the net asset value per Creation Unit, inclusive, in the case of redemptions, of the standard redemption transaction fee. |
Householding. Householding is
an option available to certain Fund investors. Householding is a method of delivery, based on the preference of the individual investor, in which a single copy of certain shareholder documents can be delivered to investors who share the same
address, even if their accounts are registered under different names. Please contact your broker-dealer if you are interested in enrolling in householding and receiving a single copy of prospectuses and other shareholder documents, or if you are
currently enrolled in householding and wish to change your householding status.
25
Table of Contents
Distribution
The Distributor or its agent distributes Creation Units for the
Fund on an agency basis. The Distributor does not maintain a secondary market in shares of the Fund. The Distributor has no role in determining the policies of the Fund or the securities that are purchased or sold by the Fund. The
Distributor’s principal address is 1 University Square Drive, Princeton, NJ 08540.
BFA or its Affiliates make payments to broker-dealers,
registered investment advisers, banks or other intermediaries (together, “intermediaries”) related to marketing activities and presentations, educational training programs, conferences, the development of technology platforms and
reporting systems, or their making shares of the Fund and certain other iShares funds available to their customers generally and in certain investment programs. Such payments, which may be significant to the intermediary, are not made by the Fund.
Rather, such payments are made by BFA or its Affiliates from their own resources, which come directly or indirectly in part from fees paid by the iShares funds complex. Payments of this type are sometimes referred to as revenue-sharing payments. A
financial intermediary may make decisions about which investment options it recommends or makes available, or the level of services provided, to its customers based on the payments it is eligible to receive. Therefore, such payments to an
intermediary create conflicts of interest between the intermediary and its customers and may cause the intermediary to recommend the Fund or other iShares funds over another investment. More information regarding these payments is contained in the
Fund's SAI. Please contact your salesperson or other investment professional for more information regarding any such payments his or her firm may receive from BFA or its Affiliates.
26
Table of Contents
Financial Highlights
The financial highlights table is intended to help investors
understand the Fund’s financial performance since inception. Certain information reflects financial results for a single share of the Fund. The total returns in the table represent the rate that an investor would have earned (or lost) on an
investment in the Fund, assuming reinvestment of all dividends and distributions. This information has been audited by PricewaterhouseCoopers LLP, whose report is included, along with the Fund's financial statements, in the Fund's Annual Report
(available upon request).
Financial Highlights
(For a share outstanding throughout each period)
(For a share outstanding throughout each period)
| Year
ended Oct. 31, 2013 |
Period
from Apr. 3, 2012a to Oct. 31, 2012 | ||
| Net asset value, beginning of period | $ 53.62 | $ 50.02 | |
| Income
from investment operations: | |||
| Net investment incomeb | 2.97 | 1.60 | |
| Net realized and unrealized gain (loss)c | (2.91) | 3.40 | |
| Total from investment operations | 0.06 | 5.00 | |
| Less distributions from: | |||
| Net investment income | (2.78) | (1.40) | |
| Total distributions | (2.78) | (1.40) | |
| Net asset value, end of period | $ 50.90 | $ 53.62 | |
| Total return | 0.14% | 10.21% d | |
| Ratios/Supplemental data: | |||
| Net assets, end of period (000s) | $203,604 | $166,231 | |
| Ratio of expenses to average net assetse | 0.65% | 0.65% | |
| Ratio of net investment income to average net assetse | 5.64% | 5.34% | |
| Portfolio turnover ratef | 57% | 40% | |
| a | Commencement of operations. |
| b | Based on average shares outstanding throughout each period. |
| c | The amounts reported for a share outstanding may not accord with the change in aggregate gains and losses in securities for the fiscal period due to the timing of capital share transactions in relation to the fluctuating market values of the Fund's underlying securities. |
| d | Not annualized. |
| e | Annualized for periods of less than one year. |
| f | Portfolio turnover rates exclude portfolio securities received or delivered as a result of processing capital share transactions in Creation Units. |
27
Table of Contents
Index Provider
Morningstar is a leading provider of independent investment
research. The company offers an extensive line of internet, software, and print-based products for individual investors, financial advisors and institutions. Morningstar is not affiliated with the Company, BFA, State Street, or the Distributor.
Credit Suisse maintains and calculates the Morningstar Indexes for Morningstar pursuant to a contractual agreement. Credit Suisse is not affiliated with Morningstar, the Company, BFA, the Distributor, or any of their respective affiliates.
BFA or its affiliates have entered into a license agreement
with the Index Provider to use the Underlying Index. BFA or its affiliates sublicense rights in the Underlying Index to the Company at no charge.
Disclaimers
The Fund is not sponsored, endorsed, sold or promoted by
Morningstar. Morningstar makes no representation or warranty, express or implied, to the owners of shares of the Fund or any member of the public regarding the advisability of investing in securities generally or in the Fund particularly or the
ability of the Underlying Index to track general stock market performance. Morningstar's only relationship to the Company and BFA or its affiliates is the licensing of certain trademarks and trade names of Morningstar and of the Underlying Index
which is determined, composed and calculated by Morningstar without regard to the Company, BFA or its affiliates or the Fund. Morningstar has no obligation to take the needs of BFA or its affiliates or the owners of shares of the Fund into
consideration in determining, composing or calculating the Underlying Index. Morningstar is not responsible for and has not participated in the determination of the prices and amount of shares of the Fund, or the timing of the issuance or sale of
such shares or in the determination or calculation of the equation by which shares of the Fund are to be converted into cash. Morningstar has no obligation or liability in connection with the administration, marketing or trading of shares of the
Fund. Morningstar does not guarantee the accuracy or the completeness of the Underlying Index or any data included therein and Morningstar shall have no liability for any errors, omissions or interruptions therein.
Morningstar makes no warranty, express or implied, as to results
to be obtained by BFA or its affiliates, owners of shares of the Fund or any other person or entity from the use of the Underlying Index or any data included therein. Morningstar makes no express or implied warranties and expressly disclaims all
warranties of merchantability or fitness for a particular purpose or use with respect to the Underlying Index or any data included therein. Without limiting any of the foregoing, in no event shall Morningstar have any liability for any special,
punitive, direct, indirect or consequential damages (including lost profits) resulting from the use of the Underlying Index or any data included therein, even if notified of the possibility of such damages.
28
Table of Contents
Shares of the Fund are not sponsored, endorsed or promoted by
BATS. BATS makes no representation or warranty, express or implied, to the owners of the shares of the Fund or any member of the public regarding the ability of the Fund to track the total return performance of the Underlying Index or the ability of
the Underlying Index to track stock market performance. BATS is not responsible for, nor has it participated in, the determination of the compilation or the calculation of the Underlying Index, nor in the determination of the timing of, prices of,
or quantities of shares of the Fund to be issued, nor in the determination or calculation of the equation by which the shares are redeemable. BATS has no obligation or liability to owners of the shares of the Fund in connection with the
administration, marketing or trading of the shares of the Fund.
BATS does not guarantee the accuracy and/or the completeness of
the Underlying Index or any data included therein. BATS makes no warranty, express or implied, as to results to be obtained by the Company on behalf of the Fund as licensee, licensee’s customers and counterparties, owners of the shares of the
Fund, or any other person or entity from the use of the subject index or any data included therein in connection with the rights licensed as described herein or for any other use. BATS makes no express or implied warranties and hereby expressly
disclaims all warranties of merchantability or fitness for a particular purpose with respect to the Underlying Index or any data included therein. Without limiting any of the foregoing, in no event shall BATS have any liability for any direct,
indirect, special, punitive, consequential or any other damages (including lost profits) even if notified of the possibility of such damages.
The past performance of the Underlying Index is not a guide to
future performance. BFA does not guarantee the accuracy or the completeness of the Underlying Index or any data included therein and BFA shall have no liability for any errors, omissions or interruptions therein. BFA makes no warranty, express or
implied, to the owners of shares of the Fund or to any other person or entity, as to results to be obtained by the Fund from the use of the Underlying Index or any data included therein. Without limiting any of the foregoing, in no event shall BFA
have any liability for any special, punitive, direct, indirect or consequential damages (including lost profits), even if notified of the possibility of such damages.
29
Table of Contents
Supplemental Information
I. Premium/Discount Information
The table that follows presents information about the
differences between the daily market price on secondary markets for shares of the Fund and the Fund’s NAV. NAV is the price at which the Fund issues and redeems shares. It is calculated in accordance with the standard formula for valuing
mutual fund shares. The price used to calculate market returns (“Market Price”) of the Fund generally is determined using the midpoint between the highest bid and the lowest offer on the primary securities exchange on which shares of the
Fund are listed for trading, as of the time that the Fund’s NAV is calculated. The Fund’s Market Price may be at, above or below its NAV. The NAV of the Fund will fluctuate with changes in the value of its portfolio holdings. The Market
Price of the Fund will fluctuate in accordance with changes in its NAV, as well as market supply and demand.
Premiums or discounts are the differences (expressed as a
percentage) between the NAV and Market Price of the Fund on a given day, generally at the time the NAV is calculated. A premium is the amount that the Fund is trading above the reported NAV, expressed as a percentage of the NAV. A discount is the
amount that the Fund is trading below the reported NAV, expressed as a percentage of the NAV.
The following information shows the frequency of distributions
of premiums and discounts for the Fund for each full calendar quarter of 2013.
Each line in the table shows the number of trading days in
which the Fund traded within the premium/discount range indicated. The number of trading days in each premium/discount range is also shown as a percentage of the total number of trading days in the period covered by the table. All data presented
here represents past performance, which cannot be used to predict future results.
| Premium/Discount Range | Number of Days | Percentage of Total Days | ||
| Greater than 1.0% and Less than 1.5% | 15 | 7.98% | ||
| Greater than 0.5% and Less than 1.0% | 86 | 45.74 | ||
| Between 0.5% and -0.5% | 75 | 39.89 | ||
| Less than -0.5% and Greater than -1.0% | 9 | 4.79 | ||
| Less than -1.0% and Greater than -1.5% | 3 | 1.60 | ||
| 188 | 100.00% |
30
Table of Contents
II. Total Return Information
The table that follows presents information about the total
returns of the Fund and the Underlying Index as of the fiscal year ended October 31, 2013.
“Average Annual Total Returns” represent the
average annual change in value of an investment over the periods indicated. “Cumulative Total Returns” represent the total change in value of an investment over the period indicated.
The Fund’s NAV is the value of one share of the Fund as
calculated in accordance with the standard formula for valuing mutual fund shares. The NAV return is based on the NAV of the Fund and the market return is based on the Market Price of the Fund. Market Price is determined by using the midpoint
between the highest bid and the lowest offer on the primary stock exchange on which shares of the Fund are listed for trading, as of the time that the Fund's NAV is calculated. Since shares of the Fund did not trade in the secondary market until
after the Fund's inception, for the period from inception to the first day of secondary market trading in shares of the Fund, the NAV of the Fund is used as a proxy for the Market Price to calculate market returns. Market and NAV returns assume that
dividends and capital gain distributions have been reinvested in the Fund at Market Price and NAV, respectively.
An index is a statistical composite that tracks a specified
financial market or sector. Unlike the Fund, the Underlying Index does not actually hold a portfolio of securities and therefore does not incur the expenses incurred by the Fund. These expenses negatively impact the performance of the Fund. Also,
market returns do not include brokerage commissions that may be payable on secondary market transactions. If brokerage commissions were included, market returns would be lower. The returns shown in the following table do not reflect the deduction of
taxes that a shareholder would pay on Fund distributions or the redemption or sale of Fund shares. The investment return and principal value of shares of the Fund will vary with changes in market conditions. Shares of the Fund may be worth more or
less than their original cost when they are redeemed or sold in the market. The Fund’s past performance is no guarantee of future results.
Performance as of October 31, 2013
| Average Annual Total Returns | Cumulative Total Returns | |||||||
| NAV | MARKET | INDEX | NAV | MARKET | INDEX | |||
| 1 Year | 0.14% | (1.44)% | 0.53% | 0.14% | (1.44)% | 0.53% | ||
| Since Inception* | 6.43% | 6.31% | 7.02% | 10.36% | 10.15% | 11.27% | ||
| * | Total returns for the period since inception are calculated from the inception date of the Fund (4/3/12). The first day of secondary market trading in shares of the Fund was 4/3/12. |
31
Table of Contents
[THIS PAGE INTENTIONALLY LEFT BLANK]
Table of Contents
Table of Contents
|
|
For more information visit www.iShares.com or call
1-800-474-2737
Copies of the Prospectus, SAI and recent
shareholder reports can be found on our website at www.iShares.com. For more information about the Fund, you may request a copy of the SAI. The SAI provides detailed information about the Fund and is incorporated by reference into this Prospectus.
This means that the SAI, for legal purposes, is a part of this Prospectus.
Additional information about the Fund's investments is
available in the Fund's Annual and Semi-Annual reports to shareholders. In the Fund's Annual Report, you will find a discussion of the market conditions and investment strategies that significantly affected the Fund's performance during the last
fiscal year.
If you have any questions about the Company
or shares of the Fund or you wish to obtain the SAI, Semi-Annual or Annual report free of charge, please:
| Call: | 1-800-iShares
or 1-800-474-2737 (toll free) Monday through Friday, 8:30 a.m. to 6:30 p.m. (Eastern time) |
| Email: | iSharesETFs@blackrock.com |
| Write: | c/o
BlackRock Investments, LLC 1 University Square Drive, Princeton, NJ 08540 |
Information about the Fund (including the SAI) can be reviewed
and copied at the SEC's Public Reference Room in Washington, D.C., and information on the operation of the Public Reference Room may be obtained by calling the SEC at 1-202-551-8090. Reports and other information about the Fund are available on the
EDGAR database on the SEC's website at www.sec.gov, and copies of this information may be obtained, after paying a duplicating fee, by electronic request at the following e-mail address: publicinfo@sec.gov, or by writing to the SEC's Public
Reference Section, Washington, D.C. 20549-1520.
No person
is authorized to give any information or to make any representations about the Fund and its shares not contained in this Prospectus and you should not rely on any other information. Read and keep this Prospectus for future reference.
©2014 BlackRock, Inc. All rights reserved. iSHARES and BLACKROCK are registered trademarks of BlackRock, Inc. or its affiliates. All other marks are the property of their respective owners.
Investment Company Act File No.: 811-09102
IS-P-EMHY-0115

Table of Contents
March 1, 2014
(as revised January 2, 2015)
| 2014 Prospectus |
|
| ► | iShares Global ex USD High Yield Corporate Bond ETF | HYXU | BATS |
The Securities and Exchange Commission
(“SEC”) has not approved or disapproved these securities or passed upon the adequacy of this prospectus. Any representation to the contrary is a criminal offense.
Table of Contents
Table of Contents
Table of Contents
|
|
S-1 |
|
|
1 |
|
|
2 |
|
|
10 |
|
|
11 |
|
|
12 |
|
|
15 |
|
|
24 |
|
|
25 |
|
|
26 |
|
|
26 |
|
|
28 |
“Markit®” and “iBoxx®” are the registered trademarks of Markit Group Limited and Markit Indices Limited respectively
and have been licensed for use for certain purposes by BlackRock Fund Advisors or its affiliates. iShares® and BlackRock®
are registered trademarks of BlackRock, Inc. or its affiliates.
i
Table of Contents
[THIS PAGE INTENTIONALLY LEFT BLANK]
Table of Contents
iSHARES® GLOBAL EX USD
HIGH YIELD CORPORATE BOND ETF
| Ticker: HYXU | Stock Exchange: BATS |
Investment Objective
The iShares Global ex USD High Yield Corporate Bond ETF (the
“Fund”) seeks to track the investment results of an index composed of euro, British pound sterling and Canadian dollar-denominated, high yield corporate bonds.
Fees and Expenses
The following table describes the fees and expenses that you
will incur if you own shares of the Fund. The investment advisory agreement between iShares, Inc. (the “Company”) and BlackRock Fund Advisors (“BFA”) (the “Investment Advisory Agreement”) provides that BFA will
pay all operating expenses of the Fund, except interest expenses, taxes, brokerage expenses, future distribution fees or expenses, and extraordinary expenses. BFA, the investment adviser to the Fund, has contractually agreed to waive a portion of
its management fees in order to limit Total Annual Fund Operating Expenses to 0.40% of average daily net assets until February 28, 2015. The contractual waiver may be terminated prior to February 28, 2015 only upon written agreement of the Company
and BFA.
You may also incur usual and customary brokerage
commissions when buying or selling shares of the Fund, which are not reflected in the Example that follows:
| Annual
Fund Operating Expenses (ongoing expenses that you pay each year as a percentage of the value of your investments) | ||||||||||
| Management
Fees |
Distribution
and Service (12b-1) Fees |
Other
Expenses |
Total
Annual Fund Operating Expenses |
Fee Waiver | Total
Annual Fund Operating Expenses After Fee Waiver | |||||
| 0.55% | None | None | 0.55% | (0.15)% | 0.40% | |||||
Example. This Example is intended to help you compare the cost of owning shares of the Fund with the cost of investing in other funds. The Example assumes that you invest $10,000 in the Fund for the time periods indicated and
then sell all of your shares at the end of those periods. The Example also assumes that your investment has a 5% return each year and that the Fund’s operating expenses remain the same. Although your actual costs may be higher or lower, based
on these assumptions, your costs would be:
| 1 Year | 3 Years | 5 Years | 10 Years | |||
| $41 | $161 | $292 | $675 |
S-1
Table of Contents
S-2
Table of Contents
S-3
Table of Contents
S-4
Table of Contents
S-5
Table of Contents
S-6
Table of Contents
Performance Information
The bar chart and table that follow show how the Fund has
performed on a calendar year basis and provide an indication of the risks of investing in the Fund. Both assume that all dividends and distributions have been reinvested in the Fund. Past performance (before and after taxes) does not necessarily
indicate how the Fund will perform in the future. Supplemental information about the Fund’s performance is shown under the heading Total Return Information in the
Supplemental Information section of the Fund's prospectus (the “Prospectus”). If BFA had not waived certain Fund fees during certain periods, the Fund's returns would have been lower.
Year by Year Returns (Year Ended December 31)

The best calendar quarter
return during the period shown above was 7.67% in the 3rd quarter of 2013; the worst was -1.50% in the 1st quarter of 2013.
Updated performance information is available at www.iShares.com
or by calling 1-800-iShares (1-800-474-2737) (toll free).
Average Annual Total Returns
(for the periods ended December 31, 2013)
| One Year | Since
Fund Inception | ||
| (Inception Date: 4/3/2012) | |||
| Return Before Taxes | 12.84% | 14.23% | |
| Return After Taxes on Distributions1 | 10.28% | 11.76% | |
| Return After Taxes on Distributions and Sale of Fund Shares1 | 7.17% | 9.82% | |
| Markit iBoxx Global Developed Markets ex-US High Yield Index (Index returns do not reflect deductions for fees, expenses, or taxes) | 12.69% | 14.21% |
| 1 | After-tax returns in the table above are calculated using the historical highest individual U.S. federal marginal income tax rates and do not reflect the impact of state or local taxes. Actual after-tax returns depend on an investor’s tax situation and may differ from those shown, and after-tax returns shown are not relevant to tax-exempt investors or investors who hold shares through tax-deferred arrangements, such as 401(k) plans or individual retirement accounts (“IRAs”). Fund returns after taxes on distributions and sales of Fund shares are calculated assuming that an investor has sufficient capital gains of the same character from other investments to offset any capital losses from the sale of Fund shares. As a result, Fund returns after taxes on distributions and sales of Fund shares may exceed Fund returns before taxes and/or returns after taxes on distributions. |
S-7
Table of Contents
S-8
Table of Contents
More Information About the Fund
This Prospectus contains important information about investing
in the Fund. Please read this Prospectus carefully before you make any investment decisions. Additional information regarding the Fund is available at www.iShares.com.
On July 1, 2013, the name of the Fund changed from the iShares
Global ex USD High Yield Corporate Bond Fund to the iShares Global ex USD High Yield Corporate Bond ETF.
BFA is the investment adviser to the Fund and BlackRock
International Limited is the sub-adviser (the “Sub-Adviser”). Shares of the Fund are listed for trading on BATS Exchange, Inc. (“BATS”). The market price for a share of the Fund may be different from the Fund’s most
recent NAV.
ETFs are funds that trade like other publicly
traded securities. The Fund is designed to track an index. Similar to shares of an index mutual fund, each share of the Fund represents a partial ownership in an underlying portfolio of securities intended to track a market index. Unlike shares of a
mutual fund, which can be bought and redeemed from the issuing fund by all shareholders at a price based on NAV, shares of the Fund may be purchased or redeemed directly from the Fund at NAV solely by Authorized Participants (as defined in the Creations and Redemptions section of this Prospectus). Also unlike shares of a mutual fund, shares of the Fund are listed on a national securities exchange and trade in the secondary market at market prices that
change throughout the day.
The Fund invests in a
particular segment of the securities markets and seeks to track the performance of a securities index that generally is not representative of the market as a whole. The Fund is designed to be used as part of broader asset allocation strategies.
Accordingly, an investment in the Fund should not constitute a complete investment program.
An index is a theoretical financial calculation while the Fund
is an actual investment portfolio. The performance of the Fund and the Underlying Index may vary due to transaction costs, non-U.S. currency valuations, asset valuations, corporate actions (such as mergers and spin-offs), timing variances and
differences between the Fund’s portfolio and the Underlying Index resulting from legal restrictions (such as diversification requirements) that apply to the Fund but not to the Underlying Index or to the use of representative sampling.
“Tracking error” is the divergence of the performance (return) of the Fund's portfolio from that of the Underlying Index. BFA expects that, over time, the Fund’s tracking error will not exceed 5%. Because the Fund uses a
representative sampling indexing strategy, it can be expected to have a larger tracking error than if it used a replication indexing strategy. “Replication” is an indexing strategy in which a fund invests in substantially all of the
securities in its underlying index in approximately the same proportions as in the underlying index.
1
Table of Contents
An investment in the Fund is not a bank deposit and it is not
insured or guaranteed by the Federal Deposit Insurance Corporation or any other government agency, BFA or any of its affiliates.
The Fund's investment objective and the Underlying Index may be
changed without shareholder approval.
A Further
Discussion of Principal Risks
The Fund is subject to
various risks, including the principal risks noted below, any of which may adversely affect the Fund’s NAV, trading price, yield, total return and ability to meet its investment objective. You could lose all or part of your investment in the
Fund, and the Fund could underperform other investments.
Asian Economic Risk. Certain
Asian economies have experienced high inflation, high unemployment, currency devaluations and restrictions, and over-extension of credit. Many Asian economies have experienced rapid growth and industrialization, and there is no assurance that this
growth rate will be maintained. During the recent global recession, many of the export-driven Asian economies experienced the effects of the economic slowdown in the United States and Europe, and certain Asian governments implemented stimulus plans,
low-rate monetary policies and currency devaluations. Economic events in any one Asian country may have a significant economic effect on the entire Asian region, as well as on major trading partners outside Asia. Any adverse event in the Asian
markets may have a significant adverse effect on some or all of the economies of the countries in which the Fund invests. Many Asian countries are subject to political risk, including corruption and regional conflict with neighboring countries. In
addition, many Asian countries are subject to social and labor risks associated with demands for improved political, economic and social conditions. These risks, among others, may adversely affect the value of the Fund’s
investments.
Asset Class Risk. The securities in the Underlying Index or in the Fund’s portfolio may underperform the returns of other securities or indexes that track other countries, groups of countries, regions, industries, groups of
industries, markets, asset classes or sectors. Various types of securities or indexes tend to experience cycles of outperformance and underperformance in comparison to the general securities markets.
Australasian Economic Risk. The
economies of Australasia, which include Australia and New Zealand, are dependent on exports from the agricultural and mining sectors. This makes Australasian economies susceptible to fluctuations in the commodity markets. Australasian economies are
also increasingly dependent on their growing service industries. Because the economies of Australasia are dependent on the economies of Asia, Europe and the United States as key trading partners and investors, reduction in spending by any of these
trading partners on Australasian products and services, or negative changes in any of these economies, may cause an adverse impact on some or all of the Australasian economies.
Call Risk. During periods of
falling interest rates, an issuer of a callable bond held by the Fund may “call” or repay the security before its stated maturity, which may result in
2
Table of Contents
the
Fund having to reinvest the proceeds at lower interest rates, resulting in a decline in the Fund’s income.
Concentration Risk. The
Fund’s investments will generally follow the weightings of the Underlying Index, which may result in concentration of the Fund’s investments in a small group of countries. To the extent that its investments are concentrated the Fund may
be more adversely affected by the underperformance of those bonds, may be subject to increased price volatility and may be more susceptible to adverse economic, market, political or regulatory occurrences affecting those securities than a fund that
does not concentrate its investments.
Consumer Goods
Industry Risk. The consumer goods industry may be strongly affected by social trends, marketing campaigns and other factors affecting consumer demand. Governmental regulation affecting the use of various food
additives may affect the profitability of certain consumer goods companies represented in the Underlying Index. In addition, tobacco companies may be adversely affected by new laws, regulations and litigation. Many consumer goods may be marketed
globally, and consumer goods companies may be affected by the demand and market conditions in other countries and regions.
Credit Risk. Credit risk is the
risk that an issuer or guarantor of debt instruments or the counterparty to a derivatives contract, repurchase agreement or loan of portfolio securities is unable or unwilling to make timely interest and/or principal payments or to otherwise honor
its obligations.
The Fund’s portfolio will
include below investment grade bonds, which generally are subject to greater levels of credit risk than higher rated securities. There is the chance that the Fund’s holdings will have their credit ratings downgraded or will default (fail to
make scheduled interest or principal payments), potentially reducing the Fund’s income level and share price. Debt instruments are subject to varying degrees of credit risk, which may be reflected in their credit ratings.
Currency Risk. Because the
Fund’s NAV is determined on the basis of the U.S. dollar, investors may lose money if the currency of a non-U.S. market in which the Fund invests depreciates against the U.S. dollar, even if the local currency value of the Fund's holdings in
that market increases. Generally, when the U.S. dollar rises in value against a foreign currency, a security denominated in that currency loses value because the currency is worth fewer U.S. dollars. Conversely, when the U.S. dollar decreases in
value against a foreign currency, a security denominated in that currency gains value because the currency is worth more U.S. dollars. This risk, generally known as “currency risk,” means that a strong U.S. dollar will reduce returns for
U.S. investors, while a weak U.S. dollar will increase those returns.
European Economic Risk. The
Economic and Monetary Union of the European Union (the “EU”) requires compliance with restrictions on inflation rates, deficits, interest rates, debt levels and fiscal and monetary controls, each of which may significantly affect every
country in Europe. Decreasing imports or exports, changes in governmental or EU regulations on trade, changes in the exchange rate of the euro (the common currency of certain EU countries), the default or threat of default by an EU member country on
its sovereign debt, and/or an economic recession in an EU
3
Table of Contents
member country may have a significant adverse effect on the economies of EU
member countries and their trading partners. The European financial markets have recently experienced volatility and adverse trends due to concerns about economic downturns or rising government debt levels in several European countries, including
Greece, Ireland, Italy, Portugal and Spain. These events have adversely affected the exchange rate of the euro and may continue to significantly affect every country in Europe, including countries that do not use the euro.
Responses to the financial problems by European governments,
central banks and others, including austerity measures and reforms, may not produce the desired results, may result in social unrest and may limit future growth and economic recovery or have other unintended consequences. Further defaults or
restructurings by governments and other entities of their debt could have additional adverse effects on economies, financial markets and asset valuations around the world. In addition, one or more countries may abandon the euro and/or withdraw from
the EU. The impact of these actions, especially if they occur in a disorderly fashion, is not clear but could be significant and far-reaching.
Extension Risk. During periods
of rising interest rates, certain debt obligations will be paid off substantially more slowly than originally anticipated and the value of those securities may fall sharply, resulting in a decline in the Fund’s income and potentially in the
value of the Fund’s investments.
Financials
Sector Risk. Companies in the financials sector of an economy are often subject to extensive governmental regulation and intervention, which may adversely affect the scope of their activities, the prices they can
charge and the amount of capital they must maintain. Governmental regulation may change frequently and may have significant adverse consequences for companies in the financials sector, including effects not intended by such regulation. The impact of
recent or future regulation in various countries on any individual financial company or on the sector as a whole cannot be predicted. Certain risks may impact the value of investments in the financials sector more severely than those of investments
outside this sector, including the risks associated with companies that operate with substantial financial leverage. Companies in the financials sector may also be adversely affected by increases in interest rates and loan losses, decreases in the
availability of money or asset valuations, credit rating downgrades and adverse conditions in other related markets. Insurance companies, in particular, may be subject to severe price competition and/or rate regulation, which may have an adverse
impact on their profitability. In the recent past, deterioration of the credit markets impacted a broad range of mortgage, asset-backed, auction rate, sovereign debt and other markets, including non-U.S. credit and interbank money markets, thereby
affecting a wide range of financial institutions and markets. A number of large financial institutions have failed, merged with stronger institutions or have had significant government infusions of capital. Instability in the financial markets has
caused certain financial companies to incur large losses. Some financial companies experienced declines in the valuations of their assets, took actions to raise capital (such as the issuance of debt or equity securities), or even ceased operations.
Some financial companies borrowed significant amounts of capital from government sources and may face future government-imposed restrictions on their
4
Table of Contents
businesses or increased government intervention. Those actions caused the
securities of many financial companies to decline in value. The financials sector is particularly sensitive to fluctuations in interest rates.
Geographic Risk. Some of the
markets in which the Fund invests are located in parts of the world that have historically been prone to natural disasters, such as earthquakes, tornadoes, volcanoes, droughts, floods, hurricanes or tsunamis, and are economically sensitive to
environmental events. Any such event may adversely impact the economies of these geographic areas, causing an adverse impact on the value of the Fund.
High Yield Securities Risk.
Securities that are rated below investment-grade (commonly referred to as “junk bonds,” including those bonds rated lower than “BBB-” by Standard & Poor's Ratings Services and Fitch or “Baa3” by
Moody’s), or are unrated, may be deemed speculative and may be more volatile than higher-rated securities of similar maturity.
High yield securities may also be subject to greater levels of
credit or default risk than higher-rated securities. The value of high yield securities can be adversely affected by overall economic conditions, such as an economic downturn or a period of rising interest rates, and high yield securities may be
less liquid and more difficult to sell at an advantageous time or price or to value than higher-rated securities.
In particular, high yield securities are often issued by
smaller, less creditworthy companies or by highly leveraged (indebted) companies, which are generally less able than more financially stable companies to make scheduled payments of interest and principal.
Income Risk. The Fund’s
income may decline when interest rates fall. This decline can occur because the Fund must invest in lower-yielding bonds as bonds in its portfolio mature, bonds in the Underlying Index are substituted or the Fund otherwise needs to purchase
additional bonds. The Index Provider’s substitution of bonds in the Underlying Index may occur, for example, when the time to maturity for the bond no longer matches the Underlying Index’s stated maturity guidelines.
Index-Related Risk. The Fund
seeks to achieve a return which corresponds generally to the price and yield performance, before fees and expenses, of the Underlying Index as published by the Index Provider. There is no assurance that the Index Provider will compile the Underlying
Index accurately, or that the Underlying Index will be determined, composed or calculated accurately. While the Index Provider does provide descriptions of what the Underlying Index is designed to achieve, the Index Provider does not provide any
warranty or accept any liability in relation to the quality, accuracy or completeness of data in respect of their indices, and does not guarantee that the Underlying Index will be in line with their described index methodology. BFA’s mandate
as described in this Prospectus is to manage the Fund consistently with the Underlying Index provided to BFA. Consequently, BFA does not provide any warranty or guarantee for Index Provider errors. Errors in respect of the quality, accuracy and
completeness of the data may occur from time to time and may not be identified and corrected for a period of time, particularly where the indices are less commonly used. Therefore, gains, losses or costs associated with Index Provider errors will
generally be borne by
5
Table of Contents
the
Fund and its shareholders. For example, during a period where the Fund’s Underlying Index contains incorrect constituents, the Fund would have market exposure to such constituents and would be underexposed to the Underlying Index’s other
constituents. As such, errors may result in a negative or positive performance impact to the Fund and its shareholders. Shareholders should understand that any gains from Index Provider errors will be kept by the Fund and its shareholders and any
losses resulting from Index Provider errors will be borne by the Fund and its shareholders.
Apart from scheduled rebalances, the Index Provider may carry
out additional ad hoc rebalances to the Underlying Index in order, for example, to correct an error in the selection of index constituents. Where the Underlying Index of the Fund is rebalanced and the Fund in turn rebalances its portfolio to bring
it in line with the Underlying Index, any transaction costs and market exposure arising from such portfolio rebalancing will be borne directly by the Fund and its shareholders. Unscheduled rebalances to the Underlying Index may also expose the Fund
to tracking error risk, which is the risk that its returns may not track exactly those of the Underlying Index. Therefore, errors and additional ad hoc rebalances carried out by the Index Provider to the Underlying Index may increase the costs and
market exposure risk of the Fund.
Industrials Sector Risk. The value of securities issued by companies in the industrials sector may be affected by supply and demand, both for their specific product or service and for industrials sector products in general. The products of
manufacturing companies may face obsolescence due to rapid technological developments and frequent new product introduction. Government regulations, world events, economic conditions and exchange rates affect the performance of companies in the
industrials sector. Companies in the industrials sector may be adversely affected by liability for environmental damage and product liability claims. The industrials sector may also be adversely affected by changes or trends in commodity prices,
which may be influenced by unpredictable factors.
Interest Rate Risk. As interest
rates rise, the value of a fixed-income security held by the Fund is likely to decrease. Securities with longer durations tend to be more sensitive to interest rate changes, usually making them more volatile than securities with shorter durations.
To the extent the Fund invests a substantial portion of its assets in fixed-income securities with longer-term maturities, rising interest rates may cause the value of the Fund’s investments to decline significantly.
Issuer Risk. Fund performance
depends on the performance of individual securities to which the Fund has exposure. Changes to the financial condition or credit rating of an issuer of those securities may cause the value of the securities to decline.
Liquidity Risk. Liquidity risk
exists when particular investments are difficult to purchase or sell. To the extent the Fund invests in illiquid securities or securities that become less liquid, such investments may have a negative effect on the returns of the Fund because the
Fund may be unable to sell the illiquid securities at an advantageous time or price. To the extent that the Fund’s principal investment strategies involve investing in securities with substantial market and/or credit risk, the Fund will tend
to have the greatest exposure to liquidity risk. Liquid investments may become illiquid after purchase by the Fund, particularly during periods of market turmoil. Illiquid
6
Table of Contents
investments may be harder to value, especially in changing markets, and if the
Fund is forced to sell these investments to meet redemption requests or for other cash needs, the Fund may suffer a loss. There can be no assurance that a security that is deemed to be liquid when purchased will continue to be liquid for as long as
it is held by the Fund.
Management Risk. The Fund may not fully replicate the Underlying Index and may hold securities not included in the Underlying Index. As a result, the Fund is subject to the risk that BFA’s investment strategy, the implementation
of which is subject to a number of constraints, may not produce the intended results.
Market Risk. The Fund could
lose money due to short-term market movements and over longer periods during market downturns. Securities may decline in value due to factors affecting securities markets generally or particular asset classes or industries represented in the
markets. The value of a security may decline due to general market conditions, economic trends or events that are not specifically related to the issuer of the security or to factors that affect a particular industry or group of industries. During a
general downturn in the securities markets, multiple asset classes may be negatively affected. Fixed-income securities with short-term maturities are generally less sensitive to such changes than fixed-income securities with longer-term
maturities.
Market Trading Risk
Absence of Active Market.
Although shares of the Fund are listed for trading on one or more stock exchanges, there can be no assurance that an active trading market for such shares will develop or be maintained by market makers or Authorized Participants.
Risk of Secondary Listings.
The Fund's shares may be listed or traded on U.S. and non-U.S. stock exchanges other than the U.S. stock exchange where the Fund's primary listing is maintained. There can be no assurance that the Fund’s shares
will continue to trade on any such stock exchange or in any market or that the Fund’s shares will continue to meet the requirements for listing or trading on any exchange or in any market. The Fund's shares may be less actively traded in
certain markets than in others, and investors are subject to the execution and settlement risks and market standards of the market where they or their broker direct their trades for execution. Certain information available to investors who trade
Fund shares on a U.S. stock exchange during regular U.S. market hours may not be available to investors who trade in other markets, which may result in secondary market prices in such markets being less efficient.
Secondary Market Trading Risk.
Shares of the Fund may trade in the secondary market at times when the Fund does not accept orders to purchase or redeem shares. At such times, shares may trade in the secondary market with more significant premiums or discounts than might be
experienced at times when the Fund accepts purchase and redemption orders.
Secondary market trading in Fund shares may be halted by a
stock exchange because of market conditions or for other reasons. In addition, trading in Fund shares on a stock exchange or in any market may be subject to trading halts caused by extraordinary market volatility pursuant to “circuit
breaker” rules on the stock
7
Table of Contents
exchange or market. There can be no assurance that the requirements necessary
to maintain the listing or trading of Fund shares will continue to be met or will remain unchanged.
Shares of the Fund, similar to shares of other issuers listed
on a stock exchange, may be sold short and are therefore subject to the risk of increased volatility associated with short selling.
Shares of the Fund May Trade at Prices Other Than NAV. Shares of the Fund trade on stock exchanges at prices at, above or below the Fund’s most recent NAV. The NAV of the Fund is calculated at the end of each business day and fluctuates with changes in the market value
of the Fund’s holdings. The trading price of the Fund's shares fluctuates continuously throughout trading hours based on both market supply of and demand for Fund shares and the underlying value of the Fund's portfolio holdings or NAV. As
a result, the trading prices of the Fund’s shares may deviate significantly from NAV during periods of market volatility. ANY OF THESE FACTORS, AMONG OTHERS, MAY LEAD TO THE FUND'S
SHARES TRADING AT A PREMIUM OR DISCOUNT TO NAV. However, because shares can be created and redeemed in Creation Units at NAV (unlike shares of many closed-end funds, which frequently trade at appreciable
discounts from, and sometimes at premiums to, their NAVs), BFA believes that large discounts or premiums to the NAV of the Fund are not likely to be sustained over the long term. While the creation/redemption feature is designed to make it more
likely that the Fund’s shares normally will trade on stock exchanges at prices close to the Fund’s next calculated NAV, exchange prices are not expected to correlate exactly with the Fund's NAV due to timing reasons, supply and demand
imbalances and other factors. In addition, disruptions to creations and redemptions, including disruptions at market makers or Authorized Participants, or to market participants or during periods of significant market volatility, may result in
trading prices for shares of the Fund that differ significantly from its NAV.
Costs of Buying or Selling Fund Shares. Buying or selling Fund shares on an exchange involves two types of costs that apply to all securities transactions. When buying or selling shares of the Fund through a broker, you will likely incur a brokerage commission
or other charges imposed by brokers as determined by that broker. In addition, you may incur the cost of the “spread,” that is, the difference between what investors are willing to pay for Fund shares (the “bid” price) and
the price at which they are willing to sell Fund shares (the “ask” price). Because of the costs inherent in buying or selling Fund shares, frequent trading may detract significantly from investment results and an investment in Fund
shares may not be advisable for investors who anticipate regularly making small investments.
Non-Diversification Risk. The
Fund is classified as “non-diversified.” This means that the Fund may invest a large percentage of its assets in securities issued by or representing a small number of issuers. As a result, the Fund may be more susceptible to the risks
associated with these particular issuers, or to a single economic, political or regulatory occurrence affecting these issuers.
Non-U.S. Issuers Risk.
Securities issued by non-U.S. issuers have different risks from securities issued by U.S. issuers. These include differences in accounting, auditing and financial reporting standards, the possibility of expropriation or confiscatory
taxation,
8
Table of Contents
adverse changes in investment or exchange control regulations, political
instability which could affect U.S. investments in non-U.S. countries, and potential restrictions of the flow of international capital. Non-U.S. issuers may be subject to less governmental regulation than U.S. issuers. Moreover, individual non-U.S.
economies may differ favorably or unfavorably from the U.S. economy in such respects as growth of gross domestic product, rate of inflation, capital reinvestment, resource self-sufficiency and balance of payment positions. In addition, the value of
these securities may fluctuate due to changes in the exchange rate of the issuer’s local currency against the U.S. dollar.
North American Economic Risk.
Decreasing imports or exports, changes in trade regulations and/or an economic recession in any one North American country can have a significant economic effect on the entire North American region, and on some or all of the North American countries
in which the Fund invests.
The United States is
Canada's largest trading and investment partner. The Canadian economy is significantly affected by developments in the U.S. economy. Since the implementation of the North American Free Trade Agreement (“NAFTA”) in 1994 among Canada, the
United States and Mexico, total merchandise trade between the three countries has increased. To further this relationship, the three NAFTA countries entered into the Security and Prosperity Partnership of North America in March 2005, which may
further affect Canada's dependency on the U.S. economy. Policy and legislative changes in one country may have a significant effect on North American markets generally, as well as the value of certain securities.
Passive Investment Risk. The
Fund is not actively managed and may be affected by a general decline in market segments related to the Underlying Index. The Fund invests in securities included in, or representative of, the Underlying Index, regardless of their investment merits.
BFA generally does not attempt to take defensive positions under any market conditions, including declining markets.
Privately-Issued Securities Risk. Privately-issued securities typically may be resold only to qualified institutional buyers, or in a privately negotiated transaction, or to a limited number of purchasers, or in limited quantities after they have been
held for a specified period of time and other conditions are met for an exemption from registration. Because there may be relatively few potential purchasers for such securities, especially under adverse markets or economic conditions or in the
event of adverse changes in the financial condition of the issuer, the Fund may find it more difficult to sell such securities when it may be advisable to do so or it may be able to sell such securities only at prices lower than if such securities
were more widely held and traded. At times, it also may be more difficult to determine the fair value of such securities for purposes of computing the Fund’s NAV due to the absence of an active trading market. There can be no assurance that a
privately-issued security that is deemed to be liquid when purchased will continue to be liquid for as long as it is held by the Fund.
Reliance on Trading Partners Risk. Many countries in which the Fund invests are dependent on trade with certain key trading partners. Reduction in spending on the products and services of the countries, institution of tariffs or other trade barriers
by
9
Table of Contents
any
of their key trading partners or a slowdown in the economies of any of their key trading partners may cause an adverse impact on the economies of the countries.
Securities Lending Risk. The
Fund may engage in securities lending. Securities lending involves the risk that the Fund may lose money because the borrower of the loaned securities fails to return the securities in a timely manner or at all. The Fund could also lose money in the
event of a decline in the value of the collateral provided for the loaned securities or a decline in the value of any investments made with cash collateral. These events could also trigger adverse tax consequences for the Fund. In addition,
BlackRock Institutional Trust Company, N.A., the Fund’s securities lending agent, will take the tax impact to shareholders of substitute payments for dividends into account when managing the Fund’s securities lending
program.
Structural Risk. Certain countries in which the Fund invests may experience currency devaluations, substantial rates of inflation or economic recessions, causing a negative effect on their economies and securities markets.
Tracking Error Risk. Tracking
error is the divergence of the Fund’s performance from that of the Underlying Index. Tracking error may occur because of differences between the securities held in the Fund’s portfolio and those included in the Underlying Index, pricing
differences, transaction costs, the Fund holding uninvested cash, differences in timing of the accrual of distributions, changes to the Underlying Index or the costs of complying with various new or existing regulatory requirements. This risk may be
heightened during times of increased market volatility or other unusual market conditions. Tracking error also may result because the Fund incurs fees and expenses, while the Underlying Index does not. BFA EXPECTS THAT THE FUND MAY EXPERIENCE HIGHER
TRACKING ERROR THAN IS TYPICAL FOR SIMILAR INDEX EXCHANGE-TRADED FUNDS, ESPECIALLY BEFORE THE FUND REACHES SUFFICIENT SCALE AND FURTHER BROADENS ITS HOLDINGS.
Valuation Risk. The sale price
the Fund could receive for a security may differ from the Fund's valuation of the security and may differ from the value used by the Underlying Index, particularly for securities that trade in low volume or volatile markets, or that are valued
using a fair value methodology. Because non-U.S. stock exchanges may be open on days when the Fund does not price its shares, the value of the securities in the Fund’s portfolio may change on days when shareholders will not be able to purchase
or sell the Fund’s shares. In addition, for purposes of calculating the Fund's NAV, the value of assets denominated in non-U.S. currencies is converted into U.S. dollars using exchange rates deemed appropriate by BFA. This conversion may
result in a difference between the prices used to calculate the Fund's NAV and the prices used by the Underlying Index, which, in turn, could result in a difference between the Fund's performance and the performance of the Underlying
Index.
A Further Discussion of Other Risks
The Fund may also be subject to certain other risks associated
with its investments and investment strategies.
Basic
Materials Industry Risk. Issuers in the basic materials industry may be adversely affected by commodity price volatility, exchange rates, import controls and
10
Table of Contents
increased competition. Production of industrial materials often exceeds demand
as a result of over-building or economic downturns, leading to poor investment returns. Issuers in the basic materials industry are at risk for environmental damage and product liability claims and may be adversely affected by depletion of
resources, delays in technical progress, labor relations and government regulations.
Consumer Services Industry
Risk. The success of consumer product manufacturers and retailers (including food and drug retailers, general retailers, media, and travel and leisure) is tied closely to the performance of the domestic and
international economy, interest rates, exchange rates and consumer confidence. The consumer services industry depends heavily on disposable household income and consumer spending. Companies in the consumer services industry may be subject to severe
competition, which may also have an adverse impact on their profitability. Changes in consumer demographics and preferences may affect the success of consumer products.
Technology Sector Risk.
Technology companies face intense competition, both domestically and internationally, which may have an adverse effect on profit margins. Technology companies may have limited product lines, markets, financial resources or personnel. The products of
technology companies may face obsolescence due to rapid technological developments and frequent new product introduction, unpredictable changes in growth rates and competition for the services of qualified personnel. Companies in the technology
sector are heavily dependent on patent and intellectual property rights. The loss or impairment of these rights would adversely affect the profitability of these companies. The technology sector may also be adversely affected by changes or trends in
commodity prices, which may be influenced or characterized by unpredictable factors.
Telecommunications Sector Risk.
The telecommunications sector of an economy is often subject to extensive government regulation. The costs of complying with governmental regulations, delays or failure to receive required regulatory approvals, or the enactment of new regulatory
requirements may negatively affect the business of telecommunications companies. Government actions around the world, specifically in the area of pre-marketing clearance of products and prices, can be arbitrary and unpredictable. Companies in the
telecommunications sector may encounter distressed cash flows due to the need to commit substantial capital to meet increasing competition, particularly in formulating new products and services using new technology. Technological innovations may
make the products and services of certain telecommunications companies obsolete.
Portfolio Holdings Information
A description of the Company's policies and procedures with
respect to the disclosure of the Fund’s portfolio securities is available in the Fund's Statement of Additional Information (“SAI”). The top holdings of the Fund can be found at www.iShares.com. Fund fact sheets provide information
regarding the Fund's top holdings and may be requested by calling 1-800-iShares (1-800-474-2737).
11
Table of Contents
Management
Investment Adviser. As
investment adviser, BFA has overall responsibility for the general management and administration of the Company. BFA provides an investment program for the Fund and manages the investment of the Fund’s assets. In managing the Fund, BFA may
draw upon the research and expertise of its asset management affiliates with respect to certain portfolio securities. In seeking to achieve the Fund's investment objective, BFA uses teams of portfolio managers, investment strategists and other
investment specialists. This team approach brings together many disciplines and leverages BFA’s extensive resources.
Pursuant to the Investment Advisory Agreement between BFA and
the Company (entered into on behalf of the Fund), BFA is responsible for substantially all expenses of the Fund, except interest expenses, taxes, brokerage expenses, future distribution fees or expenses and extraordinary expenses.
For its investment advisory services to the Fund, BFA is
entitled to receive a management fee from the Fund based on a percentage of the Fund's average daily net assets, at an annual rate of 0.55%. BFA has contractually agreed to waive a portion of its management fee for its investment advisory services
to the Fund in order to limit Total Annual Fund Operating Expenses to 0.40% of average daily net assets until February 28, 2015. The contractual waiver may be terminated prior to February 28, 2015 only upon written agreement of the Company and
BFA.
BFA has entered into a sub-advisory agreement with
the Sub-Adviser, an affiliate of BFA, under which BFA pays the Sub-Adviser for services it provides either: (i) a fee equal to a percentage of the management fee paid to BFA under the Investment Advisory Agreement or (ii) an amount based on the cost
of the services provided. The Sub-Adviser, subject to the supervision and oversight of the Company's Board of Directors (the “Board”) and BFA, will be primarily responsible for execution of securities transactions outside the United
States and Canada and may, from time to time, participate in the management of specified assets in the Fund’s portfolio. If the Sub-Adviser provides services relating to both portfolio management and trading, it is entitled to receive from BFA
an amount equal to 20% of BFA’s management fee, and if the Sub-Adviser provides services related solely to trading, then it is entitled to receive from BFA an amount equal to 110% of the actual pre-tax costs incurred by the Sub-Adviser.
BFA is located at 400 Howard Street, San Francisco, CA 94105.
It is an indirect wholly-owned subsidiary of BlackRock, Inc. (“BlackRock”). As of December 31, 2013, BFA and its affiliates provided investment advisory services for assets in excess of $4.32 trillion. BlackRock International Limited is
an investment adviser located in the United Kingdom at 40 Torphichen Street, Edinburgh EH3 8JB. The Sub-Adviser is a registered investment adviser and a commodity pool operator organized in 1999. As of December 31, 2013, the Sub-Adviser’s
total assets under management were approximately $25.2 billion. BFA, the Sub-Adviser, and their affiliates deal, trade and invest for their own accounts in the types of securities in which the Fund may also invest.
12
Table of Contents
A discussion regarding the basis for the Board's approval of
the Investment Advisory Agreement with BFA and the sub-advisory agreement between BFA and the Sub-Adviser is available in the Fund's annual report for the period ended October 31.
Portfolio Managers. James Mauro
and Scott Radell are primarily responsible for the day-to-day management of the Fund. Each Portfolio Manager is responsible for various functions related to portfolio management, including, but not limited to, investing cash inflows, coordinating
with members of his portfolio management team to focus on certain asset classes, implementing investment strategy, researching and reviewing investment strategy and overseeing members of his portfolio management team that have more limited
responsibilities.
James Mauro has been employed by
BFA and BlackRock Institutional Trust Company, N.A. (“BTC”) as a portfolio manager since 2011. Prior to that, Mr. Mauro was a Vice President at State Street Global Advisors. Mr. Mauro has been a Portfolio Manager of the Fund since
2012.
Scott Radell has been employed by BFA (formerly,
Barclays Global Fund Advisors (“BGFA”)) and BTC (formerly, Barclays Global Investors, N.A. (“BGI”)) as a portfolio manager since 2004. Mr. Radell was a credit strategist from 2003 to 2004 and became a portfolio manager at
BGFA and BGI in 2004. Mr. Radell has been a Portfolio Manager of the Fund since 2012.
The Fund's SAI provides additional information about the
Portfolio Managers' compensation, other accounts managed by the Portfolio Managers and the Portfolio Managers' ownership (if any) of shares in the Fund.
Administrator, Custodian and Transfer Agent. State Street Bank and Trust Company (“State Street”) is the administrator, custodian and transfer agent for the Fund.
Conflicts of Interest. BFA
wants you to know that it has relationships with certain entities that may give rise to conflicts of interest or the appearance of conflicts of interest. These entities are BFA’s affiliates, including BlackRock and the PNC Financial Services
Group, Inc., and each of their affiliates, directors, partners, trustees, managing members, officers and employees (collectively, the “Affiliates”).
The activities of BFA and the Affiliates in the management of,
or their interest in, their own accounts and other accounts they manage, may present conflicts of interest that could disadvantage the Fund and its shareholders. BFA and the Affiliates provide investment management services to other funds and
discretionary managed accounts that may follow an investment program similar to that of the Fund. BFA and the Affiliates are involved worldwide with a broad spectrum of financial services and asset management activities and may engage in the
ordinary course of business in activities in which their interests or the interests of their clients may conflict with those of the Fund. BFA or one or more of the Affiliates acts, or may act, as an investor, investment banker, research provider,
investment manager, financier, underwriter, adviser, market maker, trader, prime broker, lender, agent or principal, and have other direct and indirect interests, in securities, currencies and other instruments in which the Fund may directly or
indirectly invest. Thus, it is likely that the Fund will have multiple business relationships with and will invest in, engage in transactions with, make voting
13
Table of Contents
decisions with respect to, or obtain services from, entities for which BFA or
an Affiliate seeks to perform investment banking or other services.
BFA or one or more Affiliates may engage in proprietary trading
and advise accounts and funds that have investment objectives similar to those of the Fund and/or that engage in and compete for transactions in the same types of securities, currencies and other instruments as the Fund, including in securities
issued by other open-end and closed-end investment management companies, including investment companies that are affiliated with the Fund and BFA, to the extent permitted under the Investment Company Act of 1940, as amended (the “1940
Act”). The trading activities of BFA and these Affiliates are carried out without reference to positions held directly or indirectly by the Fund and may result in BFA or an Affiliate having positions that are adverse to those of the
Fund.
No Affiliate is under any obligation to share any
investment opportunity, idea or strategy with the Fund. As a result, an Affiliate may compete with the Fund for appropriate investment opportunities. As a result of this and several other factors, the results of the Fund's investment activities may
differ from those of an Affiliate and of other accounts managed by an Affiliate, and it is possible that the Fund could sustain losses during periods in which one or more Affiliates and other accounts achieve profits on their trading for proprietary
or other accounts. The opposite result is also possible.
The Fund may, from time to time, enter into transactions in
which BFA’s or an Affiliate’s clients have an interest adverse to the Fund. Furthermore, transactions undertaken by Affiliate-advised clients may adversely impact the Fund. Transactions by one or more Affiliate-advised clients or BFA may
have the effect of diluting or otherwise disadvantaging the values, prices or investment strategies of the Fund.
The Fund's activities may be limited because of regulatory
restrictions applicable to one or more Affiliates, and/or their internal policies designed to comply with such restrictions. In addition, the Fund may invest in securities of companies with which an Affiliate has developed or is trying to develop
investment banking relationships or in which an Affiliate has significant debt or equity investments or other interests. The Fund also may invest in securities of companies for which an Affiliate provides or may in the future provide research
coverage. An Affiliate may have business relationships with, and purchase, distribute or sell services or products from or to, distributors, consultants or others who recommend the Fund or who engage in transactions with or for the Fund, and may
receive compensation for such services. The Fund may also make brokerage and other payments to Affiliates in connection with the Fund's portfolio investment transactions.
Pursuant to a securities lending program approved by the Board,
the Fund has retained an Affiliate of BFA to serve as the securities lending agent for the Fund to the extent that the Fund participates in the securities lending program. For these services, the lending agent may receive a fee from the Fund,
including a fee based on the returns earned on the Fund’s investment of the cash received as collateral for any loaned securities. BFA may receive compensation for managing the reinvestment of the cash collateral. In addition, one or more
Affiliates may be among the entities to which the Fund may lend its portfolio securities under the securities lending program.
14
Table of Contents
The activities of BFA or the Affiliates may give rise to other
conflicts of interest that could disadvantage the Fund and its shareholders. BFA has adopted policies and procedures designed to address these potential conflicts of interest. See the Fund's SAI for further information.
Shareholder Information
Additional shareholder information, including how to buy and
sell shares of the Fund, is available free of charge by calling toll-free: 1-800-iShares (1-800-474-2737) or visiting our website at www.iShares.com.
Buying and Selling Shares.
Shares of the Fund may be acquired or redeemed directly from the Fund only in Creation Units or multiples thereof, as discussed in the Creations and Redemptions section of this Prospectus. Only an Authorized Participant (as defined in the Creations and Redemptions section) may
engage in creation or redemption transactions directly with the Fund. Once created, shares of the Fund generally trade in the secondary market in amounts less than a Creation Unit.
Shares of the Fund are listed on a national securities exchange
for trading during the trading day. Shares can be bought and sold throughout the trading day like shares of other publicly traded companies. The Company does not impose any minimum investment for shares of the Fund purchased on an exchange. The
Fund's shares trade under the trading symbol “HYXU.”
Buying or selling Fund shares on an exchange involves two types
of costs that may apply to all securities transactions. When buying or selling shares of the Fund through a broker, you will likely incur a brokerage commission or other charges determined by your broker. The commission is frequently a fixed amount
and may be a significant proportional cost for investors seeking to buy or sell small amounts of shares. In addition, you may incur the cost of the “spread,” that is, any difference between the bid price and the ask price. The spread
varies over time for shares of the Fund based on the Fund’s trading volume and market liquidity, and is generally lower if the Fund has a lot of trading volume and market liquidity, and higher if the Fund has little trading volume and market
liquidity (which is often the case for funds that are newly launched or small in size). The Fund's spread may also be impacted by the liquidity of the underlying securities held by the Fund, particularly for newly launched or smaller iShares funds
or in instances of significant volatility of the underlying securities.
The Fund participates in the BATS Competitive Liquidity
Provider Program (the “Incentive Program”), which is designed to strengthen market quality by providing enhanced rebates for lead market makers (“LMMs”) in exchange traded products whose trading volumes do not exceed
specified levels. Rebates are allocated to eligible LMMs based on a competitive quote evaluation process. Rebates, which for the Fund may be up to $30,000 per year, are funded by a supplemental listing fee paid by the Adviser and not by the Fund.
BATS has proposed to amend the Incentive Program to restructure the incentive payments and eliminate the standard listing fee for exchange traded products. There are risks associated with the Incentive Program because it may act to artificially
influence trading in the Fund shares, and pricing and liquidity of the shares could be adversely impacted if the Fund were to leave the Incentive Program or the Incentive Program were discontinued. The Incentive Program is scheduled to
15
Table of Contents
terminate on or about July 28, 2015. LMMs participating in the Incentive
Program are restricted in their ability to finance Fund shares. Additional information about the Incentive Program is available on the website of BATS at http://www.batstrading.com/listings/market_maker/etp/. This reference to the website does not
incorporate the contents of the website into this prospectus.
The Board has adopted a policy of not monitoring for frequent
purchases and redemptions of Fund shares (“frequent trading”) that appear to attempt to take advantage of a potential arbitrage opportunity presented by a lag between a change in the value of the Fund’s portfolio securities after
the close of the primary markets for the Fund’s portfolio securities and the reflection of that change in the Fund’s NAV (“market timing”), because the Fund generally sells and redeems its shares directly through transactions
that are in-kind and/or for cash, subject to the conditions described below under Creations and Redemptions. The Board has not adopted a policy of monitoring for other frequent trading activity because shares
of the Fund are listed for trading on a national securities exchange.
The national securities exchange on which the Fund's shares are
listed is open for trading Monday through Friday and is closed on weekends and the following holidays: New Year’s Day, Martin Luther King, Jr. Day, Presidents’ Day, Good Friday, Memorial Day, Independence Day, Labor Day, Thanksgiving Day
and Christmas Day. The Fund’s primary Listing Exchange is BATS.
Section 12(d)(1) of the 1940 Act restricts investments by
investment companies in the securities of other investment companies. Registered investment companies are permitted to invest in the Fund beyond the limits set forth in Section 12(d)(1), subject to certain terms and conditions set forth in SEC rules
or in an SEC exemptive order issued to the Company. In order for a registered investment company to invest in shares of the Fund beyond the limitations of Section 12(d)(1) pursuant to the exemptive relief obtained by the Company, the registered
investment company must enter into an agreement with the Company.
Book Entry. Shares of the Fund
are held in book-entry form, which means that no stock certificates are issued. The Depository Trust Company (“DTC”) or its nominee is the record owner of all outstanding shares of the Fund and is recognized as the owner of all shares
for all purposes.
Investors owning shares of the
Fund are beneficial owners as shown on the records of DTC or its participants. DTC serves as the securities depository for shares of the Fund. DTC participants include securities brokers and dealers, banks, trust companies, clearing corporations and
other institutions that directly or indirectly maintain a custodial relationship with DTC. As a beneficial owner of shares, you are not entitled to receive physical delivery of stock certificates or to have shares registered in your name, and you
are not considered a registered owner of shares. Therefore, to exercise any right as an owner of shares, you must rely upon the procedures of DTC and its participants. These procedures are the same as those that apply to any other securities that
you hold in book-entry or “street name” form.
Share Prices. The trading
prices of the Fund’s shares in the secondary market generally differ from the Fund’s daily NAV and are affected by market forces such as
16
Table of Contents
supply of and demand for ETF shares and underlying securities held by the
Fund, economic conditions and other factors. Information regarding the intraday value of shares of the Fund, also known as the “indicative optimized portfolio value” (“IOPV”), is disseminated every 15 seconds throughout the
trading day by the national securities exchange on which the Fund's shares are listed or by market data vendors or other information providers. The IOPV is based on the current market value of the securities and/or cash required to be deposited in
exchange for a Creation Unit. The IOPV does not necessarily reflect the precise composition of the current portfolio of securities held by the Fund at a particular point in time or the best possible valuation of the current portfolio. Therefore, the
IOPV should not be viewed as a “real-time” update of the Fund's NAV, which is computed only once a day. The IOPV is generally determined by using both current market quotations and/or price quotations obtained from broker-dealers that
may trade in the portfolio securities held by the Fund. The quotations of certain Fund holdings may not be updated during U.S. trading hours if such holdings do not trade in the United States. The Fund is not involved in, or responsible for, the
calculation or dissemination of the IOPV and makes no representation or warranty as to its accuracy.
Determination of Net Asset Value. The NAV of the Fund normally is determined once daily Monday through Friday, generally as of the regularly scheduled close of business of the New York Stock Exchange (“NYSE”) (normally 4:00 p.m., Eastern
time) on each day that the NYSE is open for trading, based on prices at the time of closing provided that (a) any Fund assets or liabilities denominated in currencies other than the U.S. dollar are translated into U.S. dollars at the prevailing
market rates on the date of valuation as quoted by one or more data service providers (as detailed below) and (b) U.S. fixed-income assets may be valued as of the announced closing time for trading in fixed-income instruments in a particular market
or exchange. The NAV of the Fund is calculated by dividing the value of the net assets of the Fund (i.e., the value of its total assets less total
liabilities) by the total number of outstanding shares of the Fund, generally rounded to the nearest cent.
The value of the securities and other assets and liabilities
held by the Fund are determined pursuant to valuation policies and procedures approved by the Board. The Fund's assets and liabilities are valued on the basis of market quotations, when readily available.
The Fund values fixed-income portfolio securities using prices
provided directly from one or more broker-dealers, market makers, or independent third-party pricing services which may use matrix pricing and valuation models, as well as recent market transactions for the same or similar assets, to derive values.
Certain short-term debt securities may be valued on the basis of amortized cost.
The Fund invests in non-U.S. securities. Foreign currency
exchange rates are generally determined as of 4:00 p.m., London time. Non-U.S. securities held by the Fund may trade on weekends or other days when the Fund does not price its shares. As a result, the Fund’s NAV may change on days when
Authorized Participants will not be able to purchase or redeem Fund shares.
Generally, trading in non-U.S. securities, U.S. government
securities, money market instruments and certain fixed-income securities is substantially completed each day at
17
Table of Contents
various times prior to the close of business on the NYSE. The values of such
securities used in computing the NAV of the Fund are determined as of such times.
When market quotations are not readily available or are
believed by BFA to be unreliable, the Fund’s investments are valued at fair value. Fair value determinations are made by BFA in accordance with policies and procedures approved by the Company's Board. BFA may conclude that a market quotation
is not readily available or is unreliable if a security or other asset or liability does not have a price source due to its lack of liquidity, if a market quotation differs significantly from recent price quotations or otherwise no longer appears to
reflect fair value, where the security or other asset or liability is thinly traded, or where there is a significant event subsequent to the most recent market quotation. A “significant event” is an event that, in the judgment of BFA, is
likely to cause a material change to the closing market price of the asset or liability held by the Fund. Non-U.S. securities whose values are affected by volatility that occurs in U.S. markets for related or highly correlated assets (e.g., American Depositary Receipts, Global Depositary Receipts or ETFs) on a trading day after the close of non-U.S. securities markets may be fair valued.
Fair value represents a good faith approximation of the value
of an asset or liability. The fair value of an asset or liability held by the Fund is the amount the Fund might reasonably expect to receive from the current sale of that asset or the cost to extinguish that liability in an arm’s-length
transaction. Valuing the Fund’s investments using fair value pricing will result in prices that may differ from current market valuations and that may not be the prices at which those investments could have been sold during the period in which
the particular fair values were used. Use of fair value prices and certain current market valuations could result in a difference between the prices used to calculate the Fund’s NAV and the prices used by the Underlying Index, which, in turn,
could result in a difference between the Fund’s performance and the performance of the Underlying Index.
The value of assets or liabilities denominated in non-U.S.
currencies will be converted into U.S. dollars using exchange rates deemed appropriate by BFA as investment adviser. Use of a rate different from the rate used by the Index Provider may adversely affect the Fund’s ability to track the
Underlying Index.
Dividends and Distributions
General Policies. Dividends
from net investment income, if any, generally are declared and paid at least once a year by the Fund. Distributions of net realized securities gains, if any, generally are declared and paid once a year, but the Company may make distributions on a
more frequent basis for the Fund. The Company reserves the right to declare special distributions if, in its reasonable discretion, such action is necessary or advisable to preserve its status as a regulated investment company (“RIC”) or
to avoid imposition of income or excise taxes on undistributed income or realized gains.
Dividends and other distributions on shares of the Fund are
distributed on a pro rata basis to beneficial owners of such shares. Dividend payments are made through DTC participants and indirect participants to beneficial owners then of record with proceeds received
from the Fund.
18
Table of Contents
Dividend Reinvestment Service.
No dividend reinvestment service is provided by the Company. Broker-dealers may make available the DTC book-entry Dividend Reinvestment Service for use by beneficial owners of the Fund for reinvestment of their dividend distributions. Beneficial
owners should contact their broker to determine the availability and costs of the service and the details of participation therein. Brokers may require beneficial owners to adhere to specific procedures and timetables. If this service is available
and used, dividend distributions of both income and realized gains will be automatically reinvested in additional whole shares of the Fund purchased in the secondary market.
Taxes. As with any investment,
you should consider how your investment in shares of the Fund will be taxed. The tax information in this Prospectus is provided as general information, based on current law. There is no guarantee that shares of the Fund will receive certain
regulatory or accounting treatment. You should consult your own tax professional about the tax consequences of an investment in shares of the Fund.
Unless your investment in Fund shares is made through a
tax-exempt entity or tax-deferred retirement account, such as an IRA, you need to be aware of the possible tax consequences when the Fund makes distributions or you sell Fund shares.
Taxes on Distributions.
Distributions from the Fund’s net investment income, including distributions of income from securities lending and distributions out of the Fund's net short-term capital gains, if any, are taxable to you as ordinary income. The Fund's
distributions of net long-term capital gains, if any, in excess of net short-term capital losses are taxable as long-term capital gains, regardless of how long you have held the shares. Distributions from the Fund are subject to a 3.8% U.S. federal
Medicare contribution tax on “net investment income,” for individuals with incomes exceeding $200,000 ($250,000 if married filing jointly) and of estates and trusts. In general, your distributions are subject to U.S. federal income tax
for the year when they are paid. Certain distributions paid in January, however, may be treated as paid on December 31 of the prior year.
If the Fund's distributions exceed current and accumulated
earnings and profits, all or a portion of the distributions made in the taxable year may be recharacterized as a return of capital to shareholders. Distributions in excess of the Fund’s minimum distribution requirements, but not in excess of
the Fund’s earnings and profits, will be taxable to shareholders and will not constitute nontaxable returns of capital. A return of capital distribution generally will not be taxable but will reduce the shareholder's cost basis and will result
in a higher capital gain or lower capital loss when those shares on which the distribution was received are sold. Once a shareholder's cost basis is reduced to zero, further distributions will be treated as capital gain, if the shareholder holds
shares of the Fund as capital assets.
Interest received
by the Fund with respect to non-U.S. securities may give rise to withholding and other taxes imposed by non-U.S. countries. Tax conventions between certain countries and the U.S. may reduce or eliminate such taxes. If more than 50% of the total
assets of the Fund at the close of a year consists of securities of non-U.S. corporations, the Fund may “pass through” to you certain non-U.S. income taxes (including withholding taxes) paid by the Fund. This means that you would be
considered to have received as an additional dividend your share of such non-U.S.
19
Table of Contents
taxes, but you may be entitled to either a corresponding tax deduction in
calculating your U.S. federal taxable income, or, subject to certain limitations, a credit in calculating your U.S. federal income tax.
If you are neither a resident nor a citizen of the United
States or if you are a non-U.S. entity, the Fund’s ordinary income dividends (which include distributions of net short-term capital gains) will generally be subject to a 30% U.S. federal withholding tax, unless a lower treaty rate
applies.
A 30% withholding tax will be imposed on
U.S.-source dividends, interest and other income items paid after June 30, 2016, and proceeds from the sale of property producing U.S.-source dividends and interest paid after December 31, 2016, to (i) foreign financial institutions, including
non-U.S. investment funds, unless they agree to collect and disclose to the U.S. Internal Revenue Service (“IRS”) information regarding their direct and indirect U.S. account holders and (ii) certain other foreign entities, unless they
certify certain information regarding their direct and indirect U.S. owners. To avoid withholding, foreign financial institutions will need to (i) enter into agreements with the IRS that state that they will provide the IRS information, including
the names, addresses and taxpayer identification numbers of direct and indirect U.S. account holders; comply with due diligence procedures with respect to the identification of U.S. accounts; report to the IRS certain information with respect to
U.S. accounts maintained, agree to withhold tax on certain payments made to non-compliant foreign financial institutions or to account holders who fail to provide the required information; and determine certain other information concerning their
account holders, or (ii) in the event that an applicable intergovernmental agreement and implementing legislation are adopted, provide local revenue authorities with similar account holder information. Other foreign entities will need to provide the
name, address, and taxpayer identification number of each substantial U.S. owner or certifications of no substantial U.S. ownership, unless certain exceptions apply.
If you are a resident or a citizen of the United States, by
law, back-up withholding at a 28% rate will apply to your distributions and proceeds if you have not provided a taxpayer identification number or social security number and made other required certifications.
Taxes When Shares are Sold.
Currently, any capital gain or loss realized upon a sale of Fund shares is generally treated as a long-term gain or loss if the shares have been held for more than one year. Any capital gain or loss realized upon a sale of Fund shares held for one
year or less is generally treated as short-term gain or loss, except that any capital loss on the sale of shares held for six months or less is treated as long-term capital loss to the extent that capital gain dividends were paid with respect to
such shares. Any such capital gains, including from sales of Fund shares or from capital gain dividends, are included in “net investment income” for purposes of the 3.8% U.S. federal Medicare contribution tax mentioned
above.
The foregoing discussion summarizes some of
the consequences under current U.S. federal tax law of an investment in the Fund. It is not a substitute for personal tax advice. You may also be subject to state and local taxation on Fund distributions and sales of shares. Consult your personal
tax advisor about the potential tax consequences of an investment in shares of the Fund under all applicable tax laws.
20
Table of Contents
Creations and Redemptions.
Prior to trading in the secondary market, shares of the Fund are “created” at NAV by market makers, large investors and institutions only in block-size Creation Units of 100,000 shares or multiples thereof. Each “creator” or
“Authorized Participant” enters into an authorized participant agreement with the Fund's distributor, BlackRock Investments, LLC (the “Distributor”), an affiliate of BFA.
A creation transaction, which is subject to acceptance by the
transfer agent, generally takes place when an Authorized Participant deposits into the Fund a designated portfolio of securities (including any portion of such securities for which cash may be substituted) and a specified amount of cash
approximating the holdings of the Fund in exchange for a specified number of Creation Units. To the extent practicable, the composition of such portfolio generally corresponds pro rata to the holdings of the
Fund. However, creation baskets will generally correspond to the price and yield performance of the Fund.
Similarly, shares can be redeemed only in Creation Units,
generally for a designated portfolio of securities (including any portion of such securities for which cash may be substituted) held by the Fund (“Fund Securities”) and a specified amount of cash. Except
when aggregated in Creation Units, shares are not redeemable by the Fund.
The prices at which creations and redemptions occur are based
on the next calculation of NAV after a creation or redemption order is received in an acceptable form under the authorized participant agreement.
The portfolio of securities required for purchase of a Creation
Unit may be different than the portfolio of securities the Fund will deliver upon redemption of Fund shares. The Deposit Securities and Fund Securities, as applicable, in connection with a purchase or redemption of a Creation Unit, generally will
correspond pro rata, to the extent practicable, to the securities held by the Fund.
Only an Authorized Participant may create or redeem Creation
Units directly with the Fund.
As a result of any system
failure or other interruption, including disruptions at market makers or Authorized Participants, orders to purchase or redeem Creation Units either may not be executed according to the Fund's instructions or may not be executed at all, or the Fund
may not be able to place or change orders.
To the extent
the Fund engages in in-kind transactions, the Fund intends to comply with the U.S. federal securities laws in accepting securities for deposit and satisfying redemptions with redemption securities by, among other means, assuring that any securities
accepted for deposit and any securities used to satisfy redemption requests will be sold in transactions that would be exempt from registration under the 1933 Act. Further, an Authorized Participant that is not a “qualified institutional
buyer,” as such term is defined under Rule 144A of the 1933 Act, will not be able to receive securities that are restricted securities eligible for resale under Rule 144A.
Creations and redemptions must be made through a firm that is
either a member of the Continuous Net Settlement System of the National Securities Clearing Corporation or a DTC participant and has executed an agreement with the Distributor with respect to creations and redemptions of Creation Unit aggregations.
Information about the
21
Table of Contents
procedures regarding creation and redemption of Creation Units (including the
cut-off times for receipt of creation and redemption orders) is included in the Fund's SAI.
Because new shares may be created and issued on an ongoing
basis, at any point during the life of the Fund a “distribution,” as such term is used in the 1933 Act, may be occurring. Broker-dealers and other persons are cautioned that some activities on their part may, depending on the
circumstances, result in their being deemed participants in a distribution in a manner that could render them statutory underwriters and subject to the prospectus delivery and liability provisions of the 1933 Act. Any determination of whether one is
an underwriter must take into account all the relevant facts and circumstances of each particular case.
Broker-dealers should also note that dealers who are not
“underwriters” but are participating in a distribution (as contrasted to ordinary secondary transactions), and thus dealing with shares that are part of an “unsold allotment” within the meaning of Section 4(a)(3)(C) of the
1933 Act, would be unable to take advantage of the prospectus delivery exemption provided by Section 4(a)(3) of the 1933 Act. For delivery of prospectuses to exchange members, the prospectus delivery mechanism of Rule 153 under the 1933 Act is
available only with respect to transactions on a national securities exchange.
Costs Associated with Creations and Redemptions. Authorized Participants are charged standard creation and redemption transaction fees to offset transfer and other transaction costs associated with the issuance and redemption of Creation Units. The standard creation
and redemption transaction fees are set forth in the table below. The standard creation transaction fee is charged to the Authorized Participant on the day such Authorized Participant creates a Creation Unit, and is the same regardless of the number
of Creation Units purchased by the Authorized Participant on the applicable business day. Similarly, the standard redemption transaction fee is charged to the Authorized Participant on the day such Authorized Participant redeems a Creation Unit, and
is the same regardless of the number of Creation Units redeemed by the Authorized Participant on the applicable business day. Creations and redemptions for cash (when cash creations and redemptions (in whole or in part) are available or specified)
are also subject to an additional charge (up to the maximum amounts shown in the table below). This charge is intended to compensate for brokerage, tax, foreign exchange, execution, market impact and other costs and expenses related to cash
transactions. Investors who use the services of a broker or other financial intermediary to acquire or dispose of Fund shares may pay fees for such services.
22
Table of Contents
The following table shows, as of November 30, 2013, the
approximate value of one Creation Unit, standard fees and maximum additional charges for creations and redemptions (as described above):
| Approximate
Value of a Creation Unit |
Creation
Unit Size |
Standard
Creation/ Redemption Transaction Fee |
Maximum
Additional Charge for Creations* |
Maximum
Additional Charge for Redemptions* | ||||
| $5,709,000 | 100,000 | $1,900 | 3.0% | 2.0% |
| * | As a percentage of the net asset value per Creation Unit, inclusive, in the case of redemptions, of the standard redemption transaction fee. |
Householding. Householding is
an option available to certain Fund investors. Householding is a method of delivery, based on the preference of the individual investor, in which a single copy of certain shareholder documents can be delivered to investors who share the same
address, even if their accounts are registered under different names. Please contact your broker-dealer if you are interested in enrolling in householding and receiving a single copy of prospectuses and other shareholder documents, or if you are
currently enrolled in householding and wish to change your householding status.
23
Table of Contents
Distribution
The Distributor or its agent distributes Creation Units for the
Fund on an agency basis. The Distributor does not maintain a secondary market in shares of the Fund. The Distributor has no role in determining the policies of the Fund or the securities that are purchased or sold by the Fund. The
Distributor’s principal address is 1 University Square Drive, Princeton, NJ 08540.
BFA or its Affiliates make payments to broker-dealers,
registered investment advisers, banks or other intermediaries (together, “intermediaries”) related to marketing activities and presentations, educational training programs, conferences, the development of technology platforms and
reporting systems, or their making shares of the Fund and certain other iShares funds available to their customers generally and in certain investment programs. Such payments, which may be significant to the intermediary, are not made by the Fund.
Rather, such payments are made by BFA or its Affiliates from their own resources, which come directly or indirectly in part from fees paid by the iShares funds complex. Payments of this type are sometimes referred to as revenue-sharing payments. A
financial intermediary may make decisions about which investment options it recommends or makes available, or the level of services provided, to its customers based on the payments it is eligible to receive. Therefore, such payments to an
intermediary create conflicts of interest between the intermediary and its customers and may cause the intermediary to recommend the Fund or other iShares funds over another investment. More information regarding these payments is contained in the
Fund's SAI. Please contact your salesperson or other investment professional for more information regarding any such payments his or her firm may receive from BFA or its Affiliates.
24
Table of Contents
Financial Highlights
The financial highlights table is intended to help investors
understand the Fund’s financial performance since inception. Certain information reflects financial results for a single share of the Fund. The total returns in the table represent the rate that an investor would have earned (or lost) on an
investment in the Fund, assuming reinvestment of all dividends and distributions. This information has been audited by PricewaterhouseCoopers LLP, whose report is included, along with the Fund's financial statements, in the Fund's Annual Report
(available upon request).
Financial Highlights
(For a share outstanding throughout each period)
(For a share outstanding throughout each period)
| Year
ended Oct. 31, 2013 |
Period
from Apr. 3, 2012a to Oct. 31, 2012 | ||
| Net asset value, beginning of period | $ 52.01 | $ 50.14 | |
| Income
from investment operations: | |||
| Net investment incomeb | 3.15 | 1.94 | |
| Net realized and unrealized gainc | 4.51 | 1.18 | |
| Total from investment operations | 7.66 | 3.12 | |
| Less distributions from: | |||
| Net investment income | (2.83) | (1.25) | |
| Total distributions | (2.83) | (1.25) | |
| Net asset value, end of period | $ 56.84 | $ 52.01 | |
| Total return | 15.20% | 6.49% d | |
| Ratios/Supplemental data: | |||
| Net assets, end of period (000s) | $51,153 | $26,004 | |
| Ratio of expenses to average net assetse | 0.40% | 0.40% | |
| Ratio of expenses to average net assets prior to waived feese | 0.55% | 0.55% | |
| Ratio of net investment income to average net assetse | 5.85% | 6.92% | |
| Portfolio turnover ratef | 33% | 18% | |
| a | Commencement of operations. |
| b | Based on average shares outstanding throughout each period. |
| c | The amounts reported for a share outstanding may not accord with the change in aggregate gains and losses in securities for the fiscal period due to the timing of capital share transactions in relation to the fluctuating market values of the Fund's underlying securities. |
| d | Not annualized. |
| e | Annualized for periods of less than one year. |
| f | Portfolio turnover rates exclude portfolio securities received or delivered as a result of processing capital share transactions in Creation Units. |
25
Table of Contents
Index Provider
Markit owns, compiles and publishes the iBoxx bond and iTraxx
credit derivative indices, which are used around the world by financial market participants as benchmarks and as the basis for traded products. Markit is a leading provider of independent data, portfolio valuations and over-the-counter (OTC)
derivatives trade processing to the financial markets. Markit is not affiliated with the Company, BFA, State Street, the Distributor, or any of their respective affiliates, and has licensed these indices in connection with the Fund and has licensed
the Underlying Index in connection with the Fund. “Markit®” and “iBoxx®” are the registered
trademarks of Markit Group Limited and Markit Indices Limited respectively.
Disclaimers
“iBoxx” is a registered trademark of Markit Indices
Limited and is licensed for use by BFA or its affiliates. BFA or its affiliates have not been passed on by these entities or their affiliates as to their legality or suitability. Markit does not approve, sponsor endorse or recommend BFA or the Fund.
Markit makes no representation regarding the advisability of investing in the Fund. The Fund is derived from a source considered reliable, but Markit and its employees, suppliers, subcontractors and agents (together “Markit Associates”)
do not guarantee the veracity, completeness or accuracy of the Fund or other information furnished in connection with the Fund. No representation, warranty or condition, express or implied, statutory or otherwise, as to condition, satisfactory
quality, performance, or fitness for purpose are given or assumed by Markit or any of the Markit Associates in respect of 1) an iBoxx Index, Fund, or any data included in it, 2) the use by any person or entity of the Fund of that data, 3) the
results obtained from the use of any iBoxx Index, 4) the creditworthiness of any entity, or the likelihood of the occurrence of a credit event or similar event (however defined) with respect to an obligation, in an iBoxx Index at any particular time
on any particular date or otherwise, or 5) the ability of an iBoxx Index to track relevant markets' performances or otherwise relating to an iBoxx Index or any transaction or product with respect thereto. All such representations, warranties and
conditions are excluded save to the extent that such exclusion is prohibited by law. The Markit Associates shall not have any liability to any party for any act or failure to act in connection with the determination, adjustment, calculation or
maintenance of an iBoxx Index.
Shares of the Fund are not
sponsored, endorsed or promoted by BATS. BATS makes no representation or warranty, express or implied, to the owners of the shares of the Fund or any member of the public regarding the ability of the Fund to track the total return performance of the
Underlying Index or the ability of the Underlying Index to track stock market performance. BATS is not responsible for, nor has it participated in, the determination of the compilation or the calculation of the Underlying Index, nor in the
determination of the timing of, prices of, or quantities of shares of the Fund to be issued, nor in the determination or calculation of the equation by which the shares are redeemable. BATS has no obligation or liability to owners of the shares of
the Fund in connection with the administration, marketing or trading of the shares of the Fund.
26
Table of Contents
BATS does not guarantee the accuracy and/or the completeness of
the Underlying Index or any data included therein. BATS makes no warranty, express or implied, as to results to be obtained by the Company on behalf of the Fund as licensee, licensee’s customers and counterparties, owners of the shares of the
Fund, or any other person or entity from the use of the subject index or any data included therein in connection with the rights licensed as described herein or for any other use. BATS makes no express or implied warranties and hereby expressly
disclaims all warranties of merchantability or fitness for a particular purpose with respect to the Underlying Index or any data included therein. Without limiting any of the foregoing, in no event shall BATS have any liability for any direct,
indirect, special, punitive, consequential or any other damages (including lost profits) even if notified of the possibility of such damages.
The past performance of the Underlying Index is not a guide to
future performance. BFA does not guarantee the accuracy or the completeness of the Underlying Index or any data included therein and BFA shall have no liability for any errors, omissions or interruptions therein. BFA makes no warranty, express or
implied, to the owners of shares of the Fund or to any other person or entity, as to results to be obtained by the Fund from the use of the Underlying Index or any data included therein. Without limiting any of the foregoing, in no event shall BFA
have any liability for any special, punitive, direct, indirect or consequential damages (including lost profits), even if notified of the possibility of such damages.
27
Table of Contents
Supplemental Information
I. Premium/Discount Information
The table that follows presents information about the
differences between the daily market price on secondary markets for shares of the Fund and the Fund’s NAV. NAV is the price at which the Fund issues and redeems shares. It is calculated in accordance with the standard formula for valuing
mutual fund shares. The price used to calculate market returns (“Market Price”) of the Fund generally is determined using the midpoint between the highest bid and the lowest offer on the primary securities exchange on which shares of the
Fund are listed for trading, as of the time that the Fund’s NAV is calculated. The Fund’s Market Price may be at, above or below its NAV. The NAV of the Fund will fluctuate with changes in the value of its portfolio holdings. The Market
Price of the Fund will fluctuate in accordance with changes in its NAV, as well as market supply and demand.
Premiums or discounts are the differences (expressed as a
percentage) between the NAV and Market Price of the Fund on a given day, generally at the time the NAV is calculated. A premium is the amount that the Fund is trading above the reported NAV, expressed as a percentage of the NAV. A discount is the
amount that the Fund is trading below the reported NAV, expressed as a percentage of the NAV.
The following information shows the frequency of distributions
of premiums and discounts for the Fund for each full calendar quarter of 2013.
Each line in the table shows the number of trading days in
which the Fund traded within the premium/discount range indicated. The number of trading days in each premium/discount range is also shown as a percentage of the total number of trading days in the period covered by the table. All data presented
here represents past performance, which cannot be used to predict future results.
| Premium/Discount Range | Number of Days | Percentage of Total Days | ||
| Greater than 3.5% and Less than 4.0% | 1 | 0.53% | ||
| Greater than 3.0% and Less than 3.5% | 2 | 1.06 | ||
| Greater than 2.5% and Less than 3.0% | 1 | 0.53 | ||
| Greater than 2.0% and Less than 2.5% | 3 | 1.60 | ||
| Greater than 1.5% and Less than 2.0% | 14 | 7.45 | ||
| Greater than 1.0% and Less than 1.5% | 25 | 13.30 | ||
| Greater than 0.5% and Less than 1.0% | 99 | 52.66 | ||
| Between 0.5% and -0.5% | 42 | 22.34 | ||
| Less than -0.5% and Greater than -1.0% | 1 | 0.53 | ||
| 188 | 100.00% |
28
Table of Contents
II. Total Return Information
The table that follows presents information about the total
returns of the Fund and the Underlying Index as of the fiscal year ended October 31, 2013.
“Average Annual Total Returns” represent the
average annual change in value of an investment over the periods indicated. “Cumulative Total Returns” represent the total change in value of an investment over the period indicated.
The Fund’s NAV is the value of one share of the Fund as
calculated in accordance with the standard formula for valuing mutual fund shares. The NAV return is based on the NAV of the Fund and the market return is based on the Market Price of the Fund. Market Price is determined by using the midpoint
between the highest bid and the lowest offer on the primary stock exchange on which shares of the Fund are listed for trading, as of the time that the Fund's NAV is calculated. Since shares of the Fund did not trade in the secondary market until
after the Fund's inception, for the period from inception to the first day of secondary market trading in shares of the Fund, the NAV of the Fund is used as a proxy for the Market Price to calculate market returns. Market and NAV returns assume that
dividends and capital gain distributions have been reinvested in the Fund at Market Price and NAV, respectively.
An index is a statistical composite that tracks a specified
financial market or sector. Unlike the Fund, the Underlying Index does not actually hold a portfolio of securities and therefore does not incur the expenses incurred by the Fund. These expenses negatively impact the performance of the Fund. Also,
market returns do not include brokerage commissions that may be payable on secondary market transactions. If brokerage commissions were included, market returns would be lower. The returns shown in the following table do not reflect the deduction of
taxes that a shareholder would pay on Fund distributions or the redemption or sale of Fund shares. The investment return and principal value of shares of the Fund will vary with changes in market conditions. Shares of the Fund may be worth more or
less than their original cost when they are redeemed or sold in the market. The Fund’s past performance is no guarantee of future results.
Performance as of October 31, 2013
| Average Annual Total Returns | Cumulative Total Returns | |||||||
| NAV | MARKET | INDEX | NAV | MARKET | INDEX | |||
| 1 Year | 15.20% | 15.57% | 15.10% | 15.20% | 15.57% | 15.10% | ||
| Since Inception* | 13.80% | 14.21% | 13.76% | 22.68% | 23.37% | 22.51% | ||
| * | Total returns for the period since inception are calculated from the inception date of the Fund (4/3/12). The first day of secondary market trading in shares of the Fund was 4/3/12. |
29
Table of Contents
[THIS PAGE INTENTIONALLY LEFT BLANK]
Table of Contents
Table of Contents
|
|
For more information visit www.iShares.com or call
1-800-474-2737
Copies of the Prospectus, SAI and recent
shareholder reports can be found on our website at www.iShares.com. For more information about the Fund, you may request a copy of the SAI. The SAI provides detailed information about the Fund and is incorporated by reference into this Prospectus.
This means that the SAI, for legal purposes, is a part of this Prospectus.
Additional information about the Fund's investments is
available in the Fund's Annual and Semi-Annual reports to shareholders. In the Fund's Annual Report, you will find a discussion of the market conditions and investment strategies that significantly affected the Fund's performance during the last
fiscal year.
If you have any questions about the Company
or shares of the Fund or you wish to obtain the SAI, Semi-Annual or Annual report free of charge, please:
| Call: | 1-800-iShares
or 1-800-474-2737 (toll free) Monday through Friday, 8:30 a.m. to 6:30 p.m. (Eastern time) |
| Email: | iSharesETFs@blackrock.com |
| Write: | c/o
BlackRock Investments, LLC 1 University Square Drive, Princeton, NJ 08540 |
Information about the Fund (including the SAI) can be reviewed
and copied at the SEC's Public Reference Room in Washington, D.C., and information on the operation of the Public Reference Room may be obtained by calling the SEC at 1-202-551-8090. Reports and other information about the Fund are available on the
EDGAR database on the SEC's website at www.sec.gov, and copies of this information may be obtained, after paying a duplicating fee, by electronic request at the following e-mail address: publicinfo@sec.gov, or by writing to the SEC's Public
Reference Section, Washington, D.C. 20549-1520.
No person
is authorized to give any information or to make any representations about the Fund and its shares not contained in this Prospectus and you should not rely on any other information. Read and keep this Prospectus for future reference.
©2014 BlackRock, Inc. All rights reserved. iSHARES and BLACKROCK are registered trademarks of BlackRock, Inc. or its affiliates. All other marks are the property of their respective owners.
Investment Company Act File No.: 811-09102
IS-P-HYXU-0115

Table of Contents
March 1, 2014
(as revised January 2, 2015)
| 2014 Prospectus |
|
| ► | iShares Global High Yield Corporate Bond ETF | GHYG | BATS |
The Securities and Exchange Commission
(“SEC”) has not approved or disapproved these securities or passed upon the adequacy of this prospectus. Any representation to the contrary is a criminal offense.
Table of Contents
Table of Contents
Table of Contents
|
|
S-1 |
|
|
1 |
|
|
2 |
|
|
11 |
|
|
12 |
|
|
12 |
|
|
15 |
|
|
24 |
|
|
25 |
|
|
26 |
|
|
26 |
|
|
28 |
“Markit®” and “iBoxx®” are the registered trademarks of Markit Group Limited and Markit Indices Limited respectively
and have been licensed for use for certain purposes by BlackRock Fund Advisors or its affiliates. iShares® and BlackRock®
are registered trademarks of BlackRock, Inc. or its affiliates.
i
Table of Contents
[THIS PAGE INTENTIONALLY LEFT BLANK]
Table of Contents
iSHARES® GLOBAL HIGH YIELD
CORPORATE BOND ETF
| Ticker: GHYG | Stock Exchange: BATS |
Investment Objective
The iShares Global High Yield Corporate Bond ETF (the
“Fund”) seeks to track the investment results of an index composed of U.S. dollar, euro, British pound sterling and Canadian dollar-denominated, high yield corporate bonds.
Fees and Expenses
The following table describes the fees and expenses that you
will incur if you own shares of the Fund. The investment advisory agreement between iShares, Inc. (the “Company”) and BlackRock Fund Advisors (“BFA”) (the “Investment Advisory Agreement”) provides that BFA will
pay all operating expenses of the Fund, except interest expenses, taxes, brokerage expenses, future distribution fees or expenses, and extraordinary expenses. BFA, the investment adviser to the Fund, has contractually agreed to waive a portion of
its management fees in order to limit Total Annual Fund Operating Expenses to 0.40% of average daily net assets until February 28, 2015. The contractual waiver may be terminated prior to February 28, 2015 only upon written agreement of the Company
and BFA.
You may also incur usual and customary brokerage
commissions when buying or selling shares of the Fund, which are not reflected in the Example that follows:
| Annual
Fund Operating Expenses (ongoing expenses that you pay each year as a percentage of the value of your investments) | ||||||||||
| Management
Fees |
Distribution
and Service (12b-1) Fees |
Other
Expenses |
Total
Annual Fund Operating Expenses |
Fee Waiver | Total
Annual Fund Operating Expenses After Fee Waiver | |||||
| 0.55% | None | None | 0.55% | (0.15)% | 0.40% | |||||
Example. This Example is intended to help you compare the cost of owning shares of the Fund with the cost of investing in other funds. The Example assumes that you invest $10,000 in the Fund for the time periods indicated and
then sell all of your shares at the end of those periods. The Example also assumes that your investment has a 5% return each year and that the Fund’s operating expenses remain the same. Although your actual costs may be higher or lower, based
on these assumptions, your costs would be:
| 1 Year | 3 Years | 5 Years | 10 Years | |||
| $41 | $161 | $292 | $675 |
S-1
Table of Contents
S-2
Table of Contents
S-3
Table of Contents
S-4
Table of Contents
S-5
Table of Contents
S-6
Table of Contents
Performance Information
The bar chart and table that follow show how the Fund has
performed on a calendar year basis and provide an indication of the risks of investing in the Fund. Both assume that all dividends and distributions have been reinvested in the Fund. Past performance (before and after taxes) does not necessarily
indicate how the Fund will perform in the future. Supplemental information about the Fund’s performance is shown under the heading Total Return Information in the
Supplemental Information section of the Fund's prospectus (the “Prospectus”). If BFA had not waived certain Fund fees during certain periods, the Fund's returns would have been lower.
Year by Year Returns (Year Ended December 31)
The best calendar quarter
return during the period shown above was 3.89% in the 4th quarter of 2013; the worst was -1.15% in the 2nd quarter of 2013.
Updated performance information is available at www.iShares.com
or by calling 1-800-iShares (1-800-474-2737) (toll free).
Average Annual Total Returns
(for the periods ended December 31, 2013)
| One Year | Since
Fund Inception | ||
| (Inception Date: 4/3/2012) | |||
| Return Before Taxes | 7.78% | 10.02% | |
| Return After Taxes on Distributions1 | 5.18% | 7.50% | |
| Return After Taxes on Distributions and Sale of Fund Shares1 | 4.34% | 6.60% | |
| Markit iBoxx Global Developed Markets High Yield Index (Index returns do not reflect deductions for fees, expenses, or taxes) | 7.70% | 10.21% |
| 1 | After-tax returns in the table above are calculated using the historical highest individual U.S. federal marginal income tax rates and do not reflect the impact of state or local taxes. Actual after-tax returns depend on an investor’s tax situation and may differ from those shown, and after-tax returns shown are not relevant to tax-exempt investors or investors who hold shares through tax-deferred arrangements, such as 401(k) plans or individual retirement accounts (“IRAs”). Fund returns after taxes on distributions and sales of Fund shares are calculated assuming that an investor has sufficient capital gains of the same character from other investments to offset any capital losses from the sale of Fund shares. As a result, Fund returns after taxes on distributions and sales of Fund shares may exceed Fund returns before taxes and/or returns after taxes on distributions. |
S-7
Table of Contents
S-8
Table of Contents
More Information About the Fund
This Prospectus contains important information about investing
in the Fund. Please read this Prospectus carefully before you make any investment decisions. Additional information regarding the Fund is available at www.iShares.com.
On July 1, 2013, the name of the Fund changed from the iShares
Global High Yield Corporate Bond Fund to the iShares Global High Yield Corporate Bond ETF.
BFA is the investment adviser to the Fund and BlackRock
International Limited is the sub-adviser (the “Sub-Adviser”). Shares of the Fund are listed for trading on BATS Exchange, Inc. (“BATS”). The market price for a share of the Fund may be different from the Fund’s most
recent NAV.
ETFs are funds that trade like other publicly
traded securities. The Fund is designed to track an index. Similar to shares of an index mutual fund, each share of the Fund represents a partial ownership in an underlying portfolio of securities intended to track a market index. Unlike shares of a
mutual fund, which can be bought and redeemed from the issuing fund by all shareholders at a price based on NAV, shares of the Fund may be purchased or redeemed directly from the Fund at NAV solely by Authorized Participants (as defined in the Creations and Redemptions section of this Prospectus). Also unlike shares of a mutual fund, shares of the Fund are listed on a national securities exchange and trade in the secondary market at market prices that
change throughout the day.
The Fund invests in a
particular segment of the securities markets and seeks to track the performance of a securities index that generally is not representative of the market as a whole. The Fund is designed to be used as part of broader asset allocation strategies.
Accordingly, an investment in the Fund should not constitute a complete investment program.
An index is a theoretical financial calculation while the Fund
is an actual investment portfolio. The performance of the Fund and the Underlying Index may vary due to transaction costs, non-U.S. currency valuations, asset valuations, corporate actions (such as mergers and spin-offs), timing variances and
differences between the Fund’s portfolio and the Underlying Index resulting from legal restrictions (such as diversification requirements) that apply to the Fund but not to the Underlying Index or to the use of representative sampling.
“Tracking error” is the divergence of the performance (return) of the Fund's portfolio from that of the Underlying Index. BFA expects that, over time, the Fund’s tracking error will not exceed 5%. Because the Fund uses a
representative sampling indexing strategy, it can be expected to have a larger tracking error than if it used a replication indexing strategy. “Replication” is an indexing strategy in which a fund invests in substantially all of the
securities in its underlying index in approximately the same proportions as in the underlying index.
An investment in the Fund is not a bank deposit and it is not
insured or guaranteed by the Federal Deposit Insurance Corporation or any other government agency, BFA or any of its affiliates.
1
Table of Contents
The Fund's investment objective and the Underlying Index may be
changed without shareholder approval.
A Further
Discussion of Principal Risks
The Fund is subject to
various risks, including the principal risks noted below, any of which may adversely affect the Fund’s NAV, trading price, yield, total return and ability to meet its investment objective. You could lose all or part of your investment in the
Fund, and the Fund could underperform other investments.
Asian Economic Risk. Certain
Asian economies have experienced high inflation, high unemployment, currency devaluations and restrictions, and over-extension of credit. Many Asian economies have experienced rapid growth and industrialization, and there is no assurance that this
growth rate will be maintained. During the recent global recession, many of the export-driven Asian economies experienced the effects of the economic slowdown in the United States and Europe, and certain Asian governments implemented stimulus plans,
low-rate monetary policies and currency devaluations. Economic events in any one Asian country may have a significant economic effect on the entire Asian region, as well as on major trading partners outside Asia. Any adverse event in the Asian
markets may have a significant adverse effect on some or all of the economies of the countries in which the Fund invests. Many Asian countries are subject to political risk, including corruption and regional conflict with neighboring countries. In
addition, many Asian countries are subject to social and labor risks associated with demands for improved political, economic and social conditions. These risks, among others, may adversely affect the value of the Fund’s
investments.
Asset Class Risk. The securities in the Underlying Index or in the Fund’s portfolio may underperform the returns of other securities or indexes that track other countries, groups of countries, regions, industries, groups of
industries, markets, asset classes or sectors. Various types of securities or indexes tend to experience cycles of outperformance and underperformance in comparison to the general securities markets.
Australasian Economic Risk. The
economies of Australasia, which include Australia and New Zealand, are dependent on exports from the agricultural and mining sectors. This makes Australasian economies susceptible to fluctuations in the commodity markets. Australasian economies are
also increasingly dependent on their growing service industries. Because the economies of Australasia are dependent on the economies of Asia, Europe and the United States as key trading partners and investors, reduction in spending by any of these
trading partners on Australasian products and services, or negative changes in any of these economies, may cause an adverse impact on some or all of the Australasian economies.
Call Risk. During periods of
falling interest rates, an issuer of a callable bond held by the Fund may “call” or repay the security before its stated maturity, which may result in the Fund having to reinvest the proceeds at lower interest rates, resulting in a
decline in the Fund’s income.
Concentration
Risk. The Fund’s investments will generally follow the weightings of the Underlying Index, which may result in concentration of the Fund’s investments in a
2
Table of Contents
small group of countries. To the extent that its investments are concentrated
the Fund may be more adversely affected by the underperformance of those bonds, may be subject to increased price volatility and may be more susceptible to adverse economic, market, political or regulatory occurrences affecting those securities than
a fund that does not concentrate its investments.
Consumer
Services Industry Risk. The success of consumer product manufacturers and retailers (including food and drug retailers, general retailers, media, and travel and leisure) is tied closely to the performance of the
domestic and international economy, interest rates, exchange rates and consumer confidence. The consumer services industry depends heavily on disposable household income and consumer spending. Companies in the consumer services industry may be
subject to severe competition, which may also have an adverse impact on their profitability. Changes in consumer demographics and preferences may affect the success of consumer products.
Credit Risk. Credit risk is the
risk that an issuer or guarantor of debt instruments or the counterparty to a derivatives contract, repurchase agreement or loan of portfolio securities is unable or unwilling to make timely interest and/or principal payments or to otherwise honor
its obligations.
The Fund’s portfolio will
include below investment grade bonds, which generally are subject to greater levels of credit risk than higher rated securities. There is the chance that the Fund’s holdings will have their credit ratings downgraded or will default (fail to
make scheduled interest or principal payments), potentially reducing the Fund’s income level and share price. Debt instruments are subject to varying degrees of credit risk, which may be reflected in their credit ratings.
Currency Risk. Because the
Fund’s NAV is determined on the basis of the U.S. dollar, investors may lose money if the currency of a non-U.S. market in which the Fund invests depreciates against the U.S. dollar, even if the local currency value of the Fund's holdings in
that market increases. Generally, when the U.S. dollar rises in value against a foreign currency, a security denominated in that currency loses value because the currency is worth fewer U.S. dollars. Conversely, when the U.S. dollar decreases in
value against a foreign currency, a security denominated in that currency gains value because the currency is worth more U.S. dollars. This risk, generally known as “currency risk,” means that a strong U.S. dollar will reduce returns for
U.S. investors, while a weak U.S. dollar will increase those returns.
European Economic Risk. The
Economic and Monetary Union of the European Union (the “EU”) requires compliance with restrictions on inflation rates, deficits, interest rates, debt levels and fiscal and monetary controls, each of which may significantly affect every
country in Europe. Decreasing imports or exports, changes in governmental or EU regulations on trade, changes in the exchange rate of the euro (the common currency of certain EU countries), the default or threat of default by an EU member country on
its sovereign debt, and/or an economic recession in an EU member country may have a significant adverse effect on the economies of EU member countries and their trading partners. The European financial markets have recently experienced volatility
and adverse trends due to concerns about economic downturns or rising government debt levels in several European countries, including Greece, Ireland, Italy, Portugal and Spain. These events have adversely affected the
3
Table of Contents
exchange rate of the euro and may continue to significantly affect every
country in Europe, including countries that do not use the euro.
Responses to the financial problems by European governments,
central banks and others, including austerity measures and reforms, may not produce the desired results, may result in social unrest and may limit future growth and economic recovery or have other unintended consequences. Further defaults or
restructurings by governments and other entities of their debt could have additional adverse effects on economies, financial markets and asset valuations around the world. In addition, one or more countries may abandon the euro and/or withdraw from
the EU. The impact of these actions, especially if they occur in a disorderly fashion, is not clear but could be significant and far-reaching.
Extension Risk. During periods
of rising interest rates, certain debt obligations will be paid off substantially more slowly than originally anticipated and the value of those securities may fall sharply, resulting in a decline in the Fund’s income and potentially in the
value of the Fund’s investments.
Financials
Sector Risk. Companies in the financials sector of an economy are often subject to extensive governmental regulation and intervention, which may adversely affect the scope of their activities, the prices they can
charge and the amount of capital they must maintain. Governmental regulation may change frequently and may have significant adverse consequences for companies in the financials sector, including effects not intended by such regulation. The impact of
recent or future regulation in various countries on any individual financial company or on the sector as a whole cannot be predicted. Certain risks may impact the value of investments in the financials sector more severely than those of investments
outside this sector, including the risks associated with companies that operate with substantial financial leverage. Companies in the financials sector may also be adversely affected by increases in interest rates and loan losses, decreases in the
availability of money or asset valuations, credit rating downgrades and adverse conditions in other related markets. Insurance companies, in particular, may be subject to severe price competition and/or rate regulation, which may have an adverse
impact on their profitability. In the recent past, deterioration of the credit markets impacted a broad range of mortgage, asset-backed, auction rate, sovereign debt and other markets, including U.S. and non-U.S. credit and interbank money markets,
thereby affecting a wide range of financial institutions and markets. A number of large financial institutions have failed, merged with stronger institutions or have had significant government infusions of capital. Instability in the financial
markets has caused certain financial companies to incur large losses. Some financial companies experienced declines in the valuations of their assets, took actions to raise capital (such as the issuance of debt or equity securities), or even ceased
operations. Some financial companies borrowed significant amounts of capital from government sources and may face future government-imposed restrictions on their businesses or increased government intervention. Those actions caused the securities of
many financial companies to decline in value. The financials sector is particularly sensitive to fluctuations in interest rates.
Geographic Risk. Some of the
markets in which the Fund invests are located in parts of the world that have historically been prone to natural disasters, such as
4
Table of Contents
earthquakes, tornadoes, volcanoes, droughts, floods, hurricanes or tsunamis,
and are economically sensitive to environmental events. Any such event may adversely impact the economies of these geographic areas, causing an adverse impact on the value of the Fund.
High Yield Securities Risk.
Securities that are rated below investment-grade (commonly referred to as “junk bonds,” including those bonds rated lower than “BBB-” by Standard & Poor's Ratings Services and Fitch or “Baa3” by
Moody’s), or are unrated, may be deemed speculative and may be more volatile than higher-rated securities of similar maturity.
High yield securities may also be subject to greater levels of
credit or default risk than higher-rated securities. The value of high yield securities can be adversely affected by overall economic conditions, such as an economic downturn or a period of rising interest rates, and high yield securities may be
less liquid and more difficult to sell at an advantageous time or price or to value than higher-rated securities.
In particular, high yield securities are often issued by
smaller, less creditworthy companies or by highly leveraged (indebted) companies, which are generally less able than more financially stable companies to make scheduled payments of interest and principal.
Income Risk. The Fund’s
income may decline when interest rates fall. This decline can occur because the Fund must invest in lower-yielding bonds as bonds in its portfolio mature, bonds in the Underlying Index are substituted or the Fund otherwise needs to purchase
additional bonds. The Index Provider’s substitution of bonds in the Underlying Index may occur, for example, when the time to maturity for the bond no longer matches the Underlying Index’s stated maturity guidelines.
Index-Related Risk. The Fund
seeks to achieve a return which corresponds generally to the price and yield performance, before fees and expenses, of the Underlying Index as published by the Index Provider. There is no assurance that the Index Provider will compile the Underlying
Index accurately, or that the Underlying Index will be determined, composed or calculated accurately. While the Index Provider does provide descriptions of what the Underlying Index is designed to achieve, the Index Provider does not provide any
warranty or accept any liability in relation to the quality, accuracy or completeness of data in respect of their indices, and does not guarantee that the Underlying Index will be in line with their described index methodology. BFA’s mandate
as described in this Prospectus is to manage the Fund consistently with the Underlying Index provided to BFA. Consequently, BFA does not provide any warranty or guarantee for Index Provider errors. Errors in respect of the quality, accuracy and
completeness of the data may occur from time to time and may not be identified and corrected for a period of time, particularly where the indices are less commonly used. Therefore, gains, losses or costs associated with Index Provider errors will
generally be borne by the Fund and its shareholders. For example, during a period where the Fund’s Underlying Index contains incorrect constituents, the Fund would have market exposure to such constituents and would be underexposed to the
Underlying Index’s other constituents. As such, errors may result in a negative or positive performance impact to the Fund and its shareholders. Shareholders should understand that any
5
Table of Contents
gains from Index Provider errors will be kept by the Fund and its shareholders
and any losses resulting from Index Provider errors will be borne by the Fund and its shareholders.
Apart from scheduled rebalances, the Index Provider may carry
out additional ad hoc rebalances to the Underlying Index in order, for example, to correct an error in the selection of index constituents. Where the Underlying Index of the Fund is rebalanced and the Fund in turn rebalances its portfolio to bring
it in line with the Underlying Index, any transaction costs and market exposure arising from such portfolio rebalancing will be borne directly by the Fund and its shareholders. Unscheduled rebalances to the Underlying Index may also expose the Fund
to tracking error risk, which is the risk that its returns may not track exactly those of the Underlying Index. Therefore, errors and additional ad hoc rebalances carried out by the Index Provider to the Underlying Index may increase the costs and
market exposure risk of the Fund.
Industrials Sector Risk. The value of securities issued by companies in the industrials sector may be affected by supply and demand, both for their specific product or service and for industrials sector products in general. The products of
manufacturing companies may face obsolescence due to rapid technological developments and frequent new product introduction. Government regulations, world events, economic conditions and exchange rates affect the performance of companies in the
industrials sector. Companies in the industrials sector may be adversely affected by liability for environmental damage and product liability claims. The industrials sector may also be adversely affected by changes or trends in commodity prices,
which may be influenced by unpredictable factors.
Interest Rate Risk. As interest
rates rise, the value of a fixed-income security held by the Fund is likely to decrease. Securities with longer durations tend to be more sensitive to interest rate changes, usually making them more volatile than securities with shorter durations.
To the extent the Fund invests a substantial portion of its assets in fixed-income securities with longer-term maturities, rising interest rates may cause the value of the Fund’s investments to decline significantly.
Issuer Risk. Fund performance
depends on the performance of individual securities to which the Fund has exposure. Changes to the financial condition or credit rating of an issuer of those securities may cause the value of the securities to decline.
Liquidity Risk. Liquidity risk
exists when particular investments are difficult to purchase or sell. To the extent the Fund invests in illiquid securities or securities that become less liquid, such investments may have a negative effect on the returns of the Fund because the
Fund may be unable to sell the illiquid securities at an advantageous time or price. To the extent that the Fund’s principal investment strategies involve investing in securities with substantial market and/or credit risk, the Fund will tend
to have the greatest exposure to liquidity risk. Liquid investments may become illiquid after purchase by the Fund, particularly during periods of market turmoil. Illiquid investments may be harder to value, especially in changing markets, and if
the Fund is forced to sell these investments to meet redemption requests or for other cash needs, the Fund may suffer a loss. There can be no assurance that a security that is deemed to be liquid when purchased will continue to be liquid for as long
as it is held by the Fund.
6
Table of Contents
Management Risk. The Fund may
not fully replicate the Underlying Index and may hold securities not included in the Underlying Index. As a result, the Fund is subject to the risk that BFA’s investment strategy, the implementation of which is subject to a number of
constraints, may not produce the intended results.
Market Risk. The Fund could
lose money due to short-term market movements and over longer periods during market downturns. Securities may decline in value due to factors affecting securities markets generally or particular asset classes or industries represented in the
markets. The value of a security may decline due to general market conditions, economic trends or events that are not specifically related to the issuer of the security or to factors that affect a particular industry or group of industries. During a
general downturn in the securities markets, multiple asset classes may be negatively affected. Fixed-income securities with short-term maturities are generally less sensitive to such changes than fixed-income securities with longer-term
maturities.
Market Trading Risk
Absence of Active Market.
Although shares of the Fund are listed for trading on one or more stock exchanges, there can be no assurance that an active trading market for such shares will develop or be maintained by market makers or Authorized Participants.
Risk of Secondary Listings.
The Fund's shares may be listed or traded on U.S. and non-U.S. stock exchanges other than the U.S. stock exchange where the Fund's primary listing is maintained. There can be no assurance that the Fund’s shares
will continue to trade on any such stock exchange or in any market or that the Fund’s shares will continue to meet the requirements for listing or trading on any exchange or in any market. The Fund's shares may be less actively traded in
certain markets than in others, and investors are subject to the execution and settlement risks and market standards of the market where they or their broker direct their trades for execution. Certain information available to investors who trade
Fund shares on a U.S. stock exchange during regular U.S. market hours may not be available to investors who trade in other markets, which may result in secondary market prices in such markets being less efficient.
Secondary Market Trading Risk.
Shares of the Fund may trade in the secondary market at times when the Fund does not accept orders to purchase or redeem shares. At such times, shares may trade in the secondary market with more significant premiums or discounts than might be
experienced at times when the Fund accepts purchase and redemption orders.
Secondary market trading in Fund shares may be halted by a
stock exchange because of market conditions or for other reasons. In addition, trading in Fund shares on a stock exchange or in any market may be subject to trading halts caused by extraordinary market volatility pursuant to “circuit
breaker” rules on the stock exchange or market. There can be no assurance that the requirements necessary to maintain the listing or trading of Fund shares will continue to be met or will remain unchanged.
7
Table of Contents
Shares of the Fund, similar to shares of other issuers listed
on a stock exchange, may be sold short and are therefore subject to the risk of increased volatility associated with short selling.
Shares of the Fund May Trade at Prices Other Than NAV. Shares of the Fund trade on stock exchanges at prices at, above or below the Fund’s most recent NAV. The NAV of the Fund is calculated at the end of each business day and fluctuates with changes in the market value
of the Fund’s holdings. The trading price of the Fund's shares fluctuates continuously throughout trading hours based on both market supply of and demand for Fund shares and the underlying value of the Fund's portfolio holdings or NAV. As
a result, the trading prices of the Fund’s shares may deviate significantly from NAV during periods of market volatility. ANY OF THESE FACTORS, AMONG OTHERS, MAY LEAD TO THE FUND'S
SHARES TRADING AT A PREMIUM OR DISCOUNT TO NAV. However, because shares can be created and redeemed in Creation Units at NAV (unlike shares of many closed-end funds, which frequently trade at appreciable
discounts from, and sometimes at premiums to, their NAVs), BFA believes that large discounts or premiums to the NAV of the Fund are not likely to be sustained over the long term. While the creation/redemption feature is designed to make it more
likely that the Fund’s shares normally will trade on stock exchanges at prices close to the Fund’s next calculated NAV, exchange prices are not expected to correlate exactly with the Fund's NAV due to timing reasons, supply and demand
imbalances and other factors. In addition, disruptions to creations and redemptions, including disruptions at market makers or Authorized Participants, or to market participants or during periods of significant market volatility, may result in
trading prices for shares of the Fund that differ significantly from its NAV.
Costs of Buying or Selling Fund Shares. Buying or selling Fund shares on an exchange involves two types of costs that apply to all securities transactions. When buying or selling shares of the Fund through a broker, you will likely incur a brokerage commission
or other charges imposed by brokers as determined by that broker. In addition, you may incur the cost of the “spread,” that is, the difference between what investors are willing to pay for Fund shares (the “bid” price) and
the price at which they are willing to sell Fund shares (the “ask” price). Because of the costs inherent in buying or selling Fund shares, frequent trading may detract significantly from investment results and an investment in Fund
shares may not be advisable for investors who anticipate regularly making small investments.
Non-Diversification Risk. The
Fund is classified as “non-diversified.” This means that the Fund may invest a large percentage of its assets in securities issued by or representing a small number of issuers. As a result, the Fund may be more susceptible to the risks
associated with these particular issuers, or to a single economic, political or regulatory occurrence affecting these issuers.
Non-U.S. Issuers Risk.
Securities issued by non-U.S. issuers have different risks from securities issued by U.S. issuers. These include differences in accounting, auditing and financial reporting standards, the possibility of expropriation or confiscatory taxation,
adverse changes in investment or exchange control regulations, political instability which could affect U.S. investments in non-U.S. countries, and potential restrictions of the flow of international capital. Non-U.S. issuers may be subject to less
governmental
8
Table of Contents
regulation than U.S. issuers. Moreover, individual non-U.S. economies may
differ favorably or unfavorably from the U.S. economy in such respects as growth of gross domestic product, rate of inflation, capital reinvestment, resource self-sufficiency and balance of payment positions. In addition, the value of these
securities may fluctuate due to changes in the exchange rate of the issuer’s local currency against the U.S. dollar.
North American Economic Risk.
Decreasing imports or exports, changes in trade regulations and/or an economic recession in any one North American country can have a significant economic effect on the entire North American region, and on some or all of the North American countries
in which the Fund invests.
The United States is
Canada and Mexico's largest trading and investment partner. The Canadian and Mexican economies are significantly affected by developments in the U.S. economy. Since the implementation of the North American Free Trade Agreement (“NAFTA”)
in 1994 among Canada, the United States and Mexico, total merchandise trade between the three countries has increased. To further this relationship, the three NAFTA countries entered into the Security and Prosperity Partnership of North America in
March 2005, which may further affect Canada's and Mexico's dependency on the U.S. economy. Policy and legislative changes in one country may have a significant effect on North American markets generally, as well as the value of certain
securities.
Passive Investment Risk. The Fund is not actively managed and may be affected by a general decline in market segments related to the Underlying Index. The Fund invests in securities included in, or representative of, the Underlying Index,
regardless of their investment merits. BFA generally does not attempt to take defensive positions under any market conditions, including declining markets.
Privately-Issued Securities Risk. Privately-issued securities typically may be resold only to qualified institutional buyers, or in a privately negotiated transaction, or to a limited number of purchasers, or in limited quantities after they have been
held for a specified period of time and other conditions are met for an exemption from registration. Because there may be relatively few potential purchasers for such securities, especially under adverse markets or economic conditions or in the
event of adverse changes in the financial condition of the issuer, the Fund may find it more difficult to sell such securities when it may be advisable to do so or it may be able to sell such securities only at prices lower than if such securities
were more widely held and traded. At times, it also may be more difficult to determine the fair value of such securities for purposes of computing the Fund’s NAV due to the absence of an active trading market. There can be no assurance that a
privately-issued security that is deemed to be liquid when purchased will continue to be liquid for as long as it is held by the Fund.
Reliance on Trading Partners Risk. Many countries in which the Fund invests are dependent on trade with certain key trading partners. Reduction in spending on the products and services of the countries, institution of tariffs or other trade barriers by
any of their key trading partners or a slowdown in the economies of any of their key trading partners may cause an adverse impact on the economies of the countries.
9
Table of Contents
Risk of Investing in the United States. The Fund has significant exposure to United States issuers. Decreasing imports or exports, changes in trade regulations and/or an economic recession in the United States may have a material adverse effect on the U.S.
economy and the securities listed on U.S. exchanges. The financial crisis that began in 2007 caused a significant decline in the value and liquidity of issuers in the United States. Policy and legislative changes in the United States are changing
many aspects of financial and other regulation and may have a significant effect on the U.S. markets generally, as well as the value of certain securities. In addition, a continued rise in the U.S. public debt level or U.S. austerity measures may
adversely affect U.S. economic growth and the securities to which the Fund has exposure.
Securities Lending Risk. The
Fund may engage in securities lending. Securities lending involves the risk that the Fund may lose money because the borrower of the loaned securities fails to return the securities in a timely manner or at all. The Fund could also lose money in the
event of a decline in the value of the collateral provided for the loaned securities or a decline in the value of any investments made with cash collateral. These events could also trigger adverse tax consequences for the Fund. In addition,
BlackRock Institutional Trust Company, N.A., the Fund’s securities lending agent, will take the tax impact to shareholders of substitute payments for dividends into account when managing the Fund’s securities lending
program.
Structural Risk. Certain countries in which the Fund invests may experience currency devaluations, substantial rates of inflation or economic recessions, causing a negative effect on their economies and securities markets.
Tracking Error Risk. Tracking
error is the divergence of the Fund’s performance from that of the Underlying Index. Tracking error may occur because of differences between the securities held in the Fund’s portfolio and those included in the Underlying Index, pricing
differences, transaction costs, the Fund holding uninvested cash, differences in timing of the accrual of distributions, changes to the Underlying Index or the costs of complying with various new or existing regulatory requirements. This risk may be
heightened during times of increased market volatility or other unusual market conditions. Tracking error also may result because the Fund incurs fees and expenses, while the Underlying Index does not. BFA EXPECTS THAT THE FUND MAY EXPERIENCE HIGHER
TRACKING ERROR THAN IS TYPICAL FOR SIMILAR INDEX EXCHANGE-TRADED FUNDS, ESPECIALLY BEFORE THE FUND REACHES SUFFICIENT SCALE AND FURTHER BROADENS ITS HOLDINGS.
Valuation Risk. The sale price
the Fund could receive for a security may differ from the Fund's valuation of the security and may differ from the value used by the Underlying Index, particularly for securities that trade in low volume or volatile markets, or that are valued
using a fair value methodology. Because non-U.S. stock exchanges may be open on days when the Fund does not price its shares, the value of the securities in the Fund’s portfolio may change on days when shareholders will not be able to purchase
or sell the Fund’s shares. In addition, for purposes of calculating the Fund's NAV, the value of assets denominated in non-U.S. currencies is converted into U.S. dollars using exchange rates deemed appropriate by BFA. This conversion may
result in a difference between the prices used to calculate the Fund's NAV and the
10
Table of Contents
prices used by the Underlying Index, which, in turn, could result in a
difference between the Fund's performance and the performance of the Underlying Index.
A Further Discussion of Other Risks
The Fund may also be subject to certain other risks associated
with its investments and investment strategies.
Basic
Materials Industry Risk. Issuers in the basic materials industry may be adversely affected by commodity price volatility, exchange rates, import controls and increased competition. Production of industrial materials
often exceeds demand as a result of over-building or economic downturns, leading to poor investment returns. Issuers in the basic materials industry are at risk for environmental damage and product liability claims and may be adversely affected by
depletion of resources, delays in technical progress, labor relations and government regulations.
Consumer Goods Industry Risk.
The consumer goods industry may be strongly affected by social trends, marketing campaigns and other factors affecting consumer demand. Governmental regulation affecting the use of various food additives may affect the profitability of certain
consumer goods companies represented in the Underlying Index. In addition, tobacco companies may be adversely affected by new laws, regulations and litigation. Many consumer goods may be marketed globally, and consumer goods companies may be
affected by the demand and market conditions in other countries and regions.
Healthcare Sector Risk. The
profitability of companies in the healthcare sector may be affected by extensive government regulations, restrictions on government reimbursement for medical expenses, rising costs of medical products and services, pricing pressure, an increased
emphasis on outpatient services, limited number of products, industry innovation, changes in technologies and other market developments. Many healthcare companies are heavily dependent on patent protection. The expiration of patents may adversely
affect the profitability of these companies. Many healthcare companies are subject to extensive litigation based on product liability and similar claims. Healthcare companies are subject to competitive forces that may make it difficult to raise
prices and, in fact, may result in price discounting. Many new products in the healthcare sector may be subject to regulatory approvals. The process of obtaining such approvals may be long and costly and may be ultimately unsuccessful. Companies in
the healthcare sector may be thinly capitalized and may be susceptible to product obsolescence.
Oil and Gas Industry Risk. The
profitability of companies in the oil and gas industry is related to worldwide energy prices, exploration costs and production spending. Companies in the oil and gas industry may be at risk for environmental damage claims and other types of
litigation. Companies in the oil and gas industry may be adversely affected by natural disasters or other catastrophes, changes in exchange rates, interest rates, changes in prices for competitive energy services, economic conditions, tax treatment,
government regulation and intervention, negative perception and unfavorable events in the regions where companies operate (e.g., expropriation,
nationalization, confiscation of assets and property or imposition of restrictions on foreign investments and repatriation of capital, military coups, social unrest, violence
11
Table of Contents
or
labor unrest). Companies in the oil and gas industry may have significant capital investments in, or engage in transactions involving, emerging market countries, which may heighten these risks. Companies that own or operate gas pipelines are subject
to certain risks, including pipeline and equipment leaks and ruptures, explosions, fires, unscheduled downtime, transportation interruptions, discharges or releases of toxic or hazardous gases and other environmental risks.
Technology Sector Risk.
Technology companies face intense competition, both domestically and internationally, which may have an adverse effect on profit margins. Technology companies may have limited product lines, markets, financial resources or personnel. The products of
technology companies may face obsolescence due to rapid technological developments and frequent new product introduction, unpredictable changes in growth rates and competition for the services of qualified personnel. Companies in the technology
sector are heavily dependent on patent and intellectual property rights. The loss or impairment of these rights would adversely affect the profitability of these companies. The technology sector may also be adversely affected by changes or trends in
commodity prices, which may be influenced or characterized by unpredictable factors.
Telecommunications Sector Risk.
The telecommunications sector of an economy is often subject to extensive government regulation. The costs of complying with governmental regulations, delays or failure to receive required regulatory approvals, or the enactment of new regulatory
requirements may negatively affect the business of telecommunications companies. Government actions around the world, specifically in the area of pre-marketing clearance of products and prices, can be arbitrary and unpredictable. Companies in the
telecommunications sector may encounter distressed cash flows due to the need to commit substantial capital to meet increasing competition, particularly in formulating new products and services using new technology. Technological innovations may
make the products and services of certain telecommunications companies obsolete.
Portfolio Holdings Information
A description of the Company's policies and procedures with
respect to the disclosure of the Fund’s portfolio securities is available in the Fund's Statement of Additional Information (“SAI”). The top holdings of the Fund can be found at www.iShares.com. Fund fact sheets provide information
regarding the Fund's top holdings and may be requested by calling 1-800-iShares (1-800-474-2737).
Management
Investment Adviser. As
investment adviser, BFA has overall responsibility for the general management and administration of the Company. BFA provides an investment program for the Fund and manages the investment of the Fund’s assets. In managing the Fund, BFA may
draw upon the research and expertise of its asset management affiliates with respect to certain portfolio securities. In seeking to achieve the Fund's investment objective, BFA uses teams of portfolio managers, investment strategists and other
investment specialists. This team approach brings together many disciplines and leverages BFA’s extensive resources.
12
Table of Contents
Pursuant to the Investment Advisory Agreement between BFA and
the Company (entered into on behalf of the Fund), BFA is responsible for substantially all expenses of the Fund, except interest expenses, taxes, brokerage expenses, future distribution fees or expenses and extraordinary expenses.
For its investment advisory services to the Fund, BFA is
entitled to receive a management fee from the Fund based on a percentage of the Fund's average daily net assets, at an annual rate of 0.55%. BFA has contractually agreed to waive a portion of its management fee for its investment advisory services
to the Fund in order to limit Total Annual Fund Operating Expenses to 0.40% of average daily net assets until February 28, 2015. The contractual waiver may be terminated prior to February 28, 2015 only upon written agreement of the Company and
BFA.
BFA has entered into a sub-advisory agreement with
the Sub-Adviser, an affiliate of BFA, under which BFA pays the Sub-Adviser for services it provides either: (i) a fee equal to a percentage of the management fee paid to BFA under the Investment Advisory Agreement or (ii) an amount based on the cost
of the services provided. The Sub-Adviser, subject to the supervision and oversight of the Company's Board of Directors (the “Board”) and BFA, will be primarily responsible for execution of securities transactions outside the United
States and Canada and may, from time to time, participate in the management of specified assets in the Fund’s portfolio. If the Sub-Adviser provides services relating to both portfolio management and trading, it is entitled to receive from BFA
an amount equal to 20% of BFA’s management fee, and if the Sub-Adviser provides services related solely to trading, then it is entitled to receive from BFA an amount equal to 110% of the actual pre-tax costs incurred by the Sub-Adviser.
BFA is located at 400 Howard Street, San Francisco, CA 94105.
It is an indirect wholly-owned subsidiary of BlackRock, Inc. (“BlackRock”). As of December 31, 2013, BFA and its affiliates provided investment advisory services for assets in excess of $4.32 trillion. BlackRock International Limited is
an investment adviser located in the United Kingdom at 40 Torphichen Street, Edinburgh EH3 8JB. The Sub-Adviser is a registered investment adviser and a commodity pool operator organized in 1999. As of December 31, 2013, the Sub-Adviser’s
total assets under management were approximately $25.2 billion. BFA, the Sub-Adviser, and their affiliates deal, trade and invest for their own accounts in the types of securities in which the Fund may also invest.
A discussion regarding the basis for the Board's approval of
the Investment Advisory Agreement with BFA and the sub-advisory agreement between BFA and the Sub-Adviser is available in the Fund's annual report for the period ended October 31.
Portfolio Managers. James Mauro
and Scott Radell are primarily responsible for the day-to-day management of the Fund. Each Portfolio Manager is responsible for various functions related to portfolio management, including, but not limited to, investing cash inflows, coordinating
with members of his portfolio management team to focus on certain asset classes, implementing investment strategy, researching and reviewing investment strategy and overseeing members of his portfolio management team that have more limited
responsibilities.
13
Table of Contents
James Mauro has been employed by BFA and BlackRock
Institutional Trust Company, N.A. (“BTC”) as a portfolio manager since 2011. Prior to that, Mr. Mauro was a Vice President at State Street Global Advisors. Mr. Mauro has been a Portfolio Manager of the Fund since 2012.
Scott Radell has been employed by BFA (formerly, Barclays
Global Fund Advisors (“BGFA”)) and BTC (formerly, Barclays Global Investors, N.A. (“BGI”)) as a portfolio manager since 2004. Mr. Radell was a credit strategist from 2003 to 2004 and became a portfolio manager at BGFA and BGI
in 2004. Mr. Radell has been a Portfolio Manager of the Fund since 2012.
The Fund's SAI provides additional information about the
Portfolio Managers' compensation, other accounts managed by the Portfolio Managers and the Portfolio Managers' ownership (if any) of shares in the Fund.
Administrator, Custodian and Transfer Agent. State Street Bank and Trust Company (“State Street”) is the administrator, custodian and transfer agent for the Fund.
Conflicts of Interest. BFA
wants you to know that it has relationships with certain entities that may give rise to conflicts of interest or the appearance of conflicts of interest. These entities are BFA’s affiliates, including BlackRock and the PNC Financial Services
Group, Inc., and each of their affiliates, directors, partners, trustees, managing members, officers and employees (collectively, the “Affiliates”).
The activities of BFA and the Affiliates in the management of,
or their interest in, their own accounts and other accounts they manage, may present conflicts of interest that could disadvantage the Fund and its shareholders. BFA and the Affiliates provide investment management services to other funds and
discretionary managed accounts that may follow an investment program similar to that of the Fund. BFA and the Affiliates are involved worldwide with a broad spectrum of financial services and asset management activities and may engage in the
ordinary course of business in activities in which their interests or the interests of their clients may conflict with those of the Fund. BFA or one or more of the Affiliates acts, or may act, as an investor, investment banker, research provider,
investment manager, financier, underwriter, adviser, market maker, trader, prime broker, lender, agent or principal, and have other direct and indirect interests, in securities, currencies and other instruments in which the Fund may directly or
indirectly invest. Thus, it is likely that the Fund will have multiple business relationships with and will invest in, engage in transactions with, make voting decisions with respect to, or obtain services from, entities for which BFA or an
Affiliate seeks to perform investment banking or other services.
BFA or one or more Affiliates may engage in proprietary trading
and advise accounts and funds that have investment objectives similar to those of the Fund and/or that engage in and compete for transactions in the same types of securities, currencies and other instruments as the Fund, including in securities
issued by other open-end and closed-end investment management companies, including investment companies that are affiliated with the Fund and BFA, to the extent permitted under the Investment Company Act of 1940, as amended (the “1940
Act”). The trading activities of BFA and these Affiliates are carried out without reference to positions held directly or indirectly
14
Table of Contents
by
the Fund and may result in BFA or an Affiliate having positions that are adverse to those of the Fund.
No Affiliate is under any obligation to share any investment
opportunity, idea or strategy with the Fund. As a result, an Affiliate may compete with the Fund for appropriate investment opportunities. As a result of this and several other factors, the results of the Fund's investment activities may differ from
those of an Affiliate and of other accounts managed by an Affiliate, and it is possible that the Fund could sustain losses during periods in which one or more Affiliates and other accounts achieve profits on their trading for proprietary or other
accounts. The opposite result is also possible.
The Fund
may, from time to time, enter into transactions in which BFA’s or an Affiliate’s clients have an interest adverse to the Fund. Furthermore, transactions undertaken by Affiliate-advised clients may adversely impact the Fund. Transactions
by one or more Affiliate-advised clients or BFA may have the effect of diluting or otherwise disadvantaging the values, prices or investment strategies of the Fund.
The Fund's activities may be limited because of regulatory
restrictions applicable to one or more Affiliates, and/or their internal policies designed to comply with such restrictions. In addition, the Fund may invest in securities of companies with which an Affiliate has developed or is trying to develop
investment banking relationships or in which an Affiliate has significant debt or equity investments or other interests. The Fund also may invest in securities of companies for which an Affiliate provides or may in the future provide research
coverage. An Affiliate may have business relationships with, and purchase, distribute or sell services or products from or to, distributors, consultants or others who recommend the Fund or who engage in transactions with or for the Fund, and may
receive compensation for such services. The Fund may also make brokerage and other payments to Affiliates in connection with the Fund's portfolio investment transactions.
Pursuant to a securities lending program approved by the Board,
the Fund has retained an Affiliate of BFA to serve as the securities lending agent for the Fund to the extent that the Fund participates in the securities lending program. For these services, the lending agent may receive a fee from the Fund,
including a fee based on the returns earned on the Fund’s investment of the cash received as collateral for any loaned securities. BFA may receive compensation for managing the reinvestment of the cash collateral. In addition, one or more
Affiliates may be among the entities to which the Fund may lend its portfolio securities under the securities lending program.
The activities of BFA or the Affiliates may give rise to other
conflicts of interest that could disadvantage the Fund and its shareholders. BFA has adopted policies and procedures designed to address these potential conflicts of interest. See the Fund's SAI for further information.
Shareholder Information
Additional shareholder information, including how to buy and
sell shares of the Fund, is available free of charge by calling toll-free: 1-800-iShares (1-800-474-2737) or visiting our website at www.iShares.com.
15
Table of Contents
Buying and Selling Shares.
Shares of the Fund may be acquired or redeemed directly from the Fund only in Creation Units or multiples thereof, as discussed in the Creations and Redemptions section of this Prospectus. Only an Authorized Participant (as defined in the Creations and Redemptions section) may
engage in creation or redemption transactions directly with the Fund. Once created, shares of the Fund generally trade in the secondary market in amounts less than a Creation Unit.
Shares of the Fund are listed on a national securities exchange
for trading during the trading day. Shares can be bought and sold throughout the trading day like shares of other publicly traded companies. The Company does not impose any minimum investment for shares of the Fund purchased on an exchange. The
Fund's shares trade under the trading symbol “GHYG.”
Buying or selling Fund shares on an exchange involves two types
of costs that may apply to all securities transactions. When buying or selling shares of the Fund through a broker, you will likely incur a brokerage commission or other charges determined by your broker. The commission is frequently a fixed amount
and may be a significant proportional cost for investors seeking to buy or sell small amounts of shares. In addition, you may incur the cost of the “spread,” that is, any difference between the bid price and the ask price. The spread
varies over time for shares of the Fund based on the Fund’s trading volume and market liquidity, and is generally lower if the Fund has a lot of trading volume and market liquidity, and higher if the Fund has little trading volume and market
liquidity (which is often the case for funds that are newly launched or small in size). The Fund's spread may also be impacted by the liquidity of the underlying securities held by the Fund, particularly for newly launched or smaller iShares funds
or in instances of significant volatility of the underlying securities.
The Fund participates in the BATS Competitive Liquidity
Provider Program (the “Incentive Program”), which is designed to strengthen market quality by providing enhanced rebates for lead market makers (“LMMs”) in exchange traded products whose trading volumes do not exceed
specified levels. Rebates are allocated to eligible LMMs based on a competitive quote evaluation process. Rebates, which for the Fund may be up to $30,000 per year, are funded by a supplemental listing fee paid by the Adviser and not by the Fund.
BATS has proposed to amend the Incentive Program to restructure the incentive payments and eliminate the standard listing fee for exchange traded products. There are risks associated with the Incentive Program because it may act to artificially
influence trading in the Fund shares, and pricing and liquidity of the shares could be adversely impacted if the Fund were to leave the Incentive Program or the Incentive Program were discontinued. The Incentive Program is scheduled to terminate on
or about July 28, 2015. LMMs participating in the Incentive Program are restricted in their ability to finance Fund shares. Additional information about the Incentive Program is available on the website of BATS at
http://www.batstrading.com/listings/market_maker/etp/. This reference to the website does not incorporate the contents of the website into this prospectus.
The Board has adopted a policy of not monitoring for frequent
purchases and redemptions of Fund shares (“frequent trading”) that appear to attempt to take advantage of a potential arbitrage opportunity presented by a lag between a change in the value of the Fund’s portfolio securities after
the close of the primary markets for
16
Table of Contents
the
Fund’s portfolio securities and the reflection of that change in the Fund’s NAV (“market timing”), because the Fund generally sells and redeems its shares directly through transactions that are in-kind and/or for cash,
subject to the conditions described below under Creations and Redemptions. The Board has not adopted a policy of monitoring for other frequent trading activity because shares of the Fund are listed for trading
on a national securities exchange.
The national
securities exchange on which the Fund's shares are listed is open for trading Monday through Friday and is closed on weekends and the following holidays: New Year’s Day, Martin Luther King, Jr. Day, Presidents’ Day, Good Friday, Memorial
Day, Independence Day, Labor Day, Thanksgiving Day and Christmas Day. The Fund’s primary Listing Exchange is BATS.
Section 12(d)(1) of the 1940 Act restricts investments by
investment companies in the securities of other investment companies. Registered investment companies are permitted to invest in the Fund beyond the limits set forth in Section 12(d)(1), subject to certain terms and conditions set forth in SEC rules
or in an SEC exemptive order issued to the Company. In order for a registered investment company to invest in shares of the Fund beyond the limitations of Section 12(d)(1) pursuant to the exemptive relief obtained by the Company, the registered
investment company must enter into an agreement with the Company.
Book Entry. Shares of the Fund
are held in book-entry form, which means that no stock certificates are issued. The Depository Trust Company (“DTC”) or its nominee is the record owner of all outstanding shares of the Fund and is recognized as the owner of all shares
for all purposes.
Investors owning shares of the
Fund are beneficial owners as shown on the records of DTC or its participants. DTC serves as the securities depository for shares of the Fund. DTC participants include securities brokers and dealers, banks, trust companies, clearing corporations and
other institutions that directly or indirectly maintain a custodial relationship with DTC. As a beneficial owner of shares, you are not entitled to receive physical delivery of stock certificates or to have shares registered in your name, and you
are not considered a registered owner of shares. Therefore, to exercise any right as an owner of shares, you must rely upon the procedures of DTC and its participants. These procedures are the same as those that apply to any other securities that
you hold in book-entry or “street name” form.
Share Prices. The trading
prices of the Fund’s shares in the secondary market generally differ from the Fund’s daily NAV and are affected by market forces such as supply of and demand for ETF shares and underlying securities held by the Fund, economic conditions
and other factors. Information regarding the intraday value of shares of the Fund, also known as the “indicative optimized portfolio value” (“IOPV”), is disseminated every 15 seconds throughout the trading day by the national
securities exchange on which the Fund's shares are listed or by market data vendors or other information providers. The IOPV is based on the current market value of the securities and/or cash required to be deposited in exchange for a Creation Unit.
The IOPV does not necessarily reflect the precise composition of the current portfolio of securities held by the Fund at a particular point in time or the best possible valuation of the current portfolio. Therefore, the IOPV should not be viewed as
a “real-time” update of
17
Table of Contents
the
Fund's NAV, which is computed only once a day. The IOPV is generally determined by using both current market quotations and/or price quotations obtained from broker-dealers that may trade in the portfolio securities held by the Fund. The quotations
of certain Fund holdings may not be updated during U.S. trading hours if such holdings do not trade in the United States. The Fund is not involved in, or responsible for, the calculation or dissemination of the IOPV and makes no representation or
warranty as to its accuracy.
Determination of Net Asset
Value. The NAV of the Fund normally is determined once daily Monday through Friday, generally as of the regularly scheduled close of business of the New York Stock Exchange (“NYSE”) (normally 4:00 p.m.,
Eastern time) on each day that the NYSE is open for trading, based on prices at the time of closing provided that (a) any Fund assets or liabilities denominated in currencies other than the U.S. dollar are translated into U.S. dollars at the
prevailing market rates on the date of valuation as quoted by one or more data service providers (as detailed below) and (b) U.S. fixed-income assets may be valued as of the announced closing time for trading in fixed-income instruments in a
particular market or exchange. The NAV of the Fund is calculated by dividing the value of the net assets of the Fund (i.e., the value of its total
assets less total liabilities) by the total number of outstanding shares of the Fund, generally rounded to the nearest cent.
The value of the securities and other assets and liabilities
held by the Fund are determined pursuant to valuation policies and procedures approved by the Board. The Fund's assets and liabilities are valued on the basis of market quotations, when readily available.
The Fund values fixed-income portfolio securities using prices
provided directly from one or more broker-dealers, market makers, or independent third-party pricing services which may use matrix pricing and valuation models, as well as recent market transactions for the same or similar assets, to derive values.
Certain short-term debt securities may be valued on the basis of amortized cost.
The Fund invests in non-U.S. securities. Foreign currency
exchange rates are generally determined as of 4:00 p.m., London time. Non-U.S. securities held by the Fund may trade on weekends or other days when the Fund does not price its shares. As a result, the Fund’s NAV may change on days when
Authorized Participants will not be able to purchase or redeem Fund shares.
Generally, trading in non-U.S. securities, U.S. government
securities, money market instruments and certain fixed-income securities is substantially completed each day at various times prior to the close of business on the NYSE. The values of such securities used in computing the NAV of the Fund are
determined as of such times.
When market quotations are
not readily available or are believed by BFA to be unreliable, the Fund’s investments are valued at fair value. Fair value determinations are made by BFA in accordance with policies and procedures approved by the Company's Board. BFA may
conclude that a market quotation is not readily available or is unreliable if a security or other asset or liability does not have a price source due to its lack of liquidity, if a market quotation differs significantly from recent price quotations
or otherwise no longer appears to reflect fair value, where the security or
18
Table of Contents
other asset or liability is thinly traded, or where there is a significant
event subsequent to the most recent market quotation. A “significant event” is an event that, in the judgment of BFA, is likely to cause a material change to the closing market price of the asset or liability held by the Fund. Non-U.S.
securities whose values are affected by volatility that occurs in U.S. markets for related or highly correlated assets (e.g., American Depositary Receipts, Global Depositary Receipts or ETFs) on a trading day
after the close of non-U.S. securities markets may be fair valued.
Fair value represents a good faith approximation of the value
of an asset or liability. The fair value of an asset or liability held by the Fund is the amount the Fund might reasonably expect to receive from the current sale of that asset or the cost to extinguish that liability in an arm’s-length
transaction. Valuing the Fund’s investments using fair value pricing will result in prices that may differ from current market valuations and that may not be the prices at which those investments could have been sold during the period in which
the particular fair values were used. Use of fair value prices and certain current market valuations could result in a difference between the prices used to calculate the Fund’s NAV and the prices used by the Underlying Index, which, in turn,
could result in a difference between the Fund’s performance and the performance of the Underlying Index.
The value of assets or liabilities denominated in non-U.S.
currencies will be converted into U.S. dollars using exchange rates deemed appropriate by BFA as investment adviser. Use of a rate different from the rate used by the Index Provider may adversely affect the Fund’s ability to track the
Underlying Index.
Dividends and Distributions
General Policies. Dividends
from net investment income, if any, generally are declared and paid at least once a year by the Fund. Distributions of net realized securities gains, if any, generally are declared and paid once a year, but the Company may make distributions on a
more frequent basis for the Fund. The Company reserves the right to declare special distributions if, in its reasonable discretion, such action is necessary or advisable to preserve its status as a regulated investment company (“RIC”) or
to avoid imposition of income or excise taxes on undistributed income or realized gains.
Dividends and other distributions on shares of the Fund are
distributed on a pro rata basis to beneficial owners of such shares. Dividend payments are made through DTC participants and indirect participants to beneficial owners then of record with proceeds received
from the Fund.
Dividend Reinvestment Service. No dividend reinvestment service is provided by the Company. Broker-dealers may make available the DTC book-entry Dividend Reinvestment Service for use by beneficial owners of the Fund for reinvestment of their dividend
distributions. Beneficial owners should contact their broker to determine the availability and costs of the service and the details of participation therein. Brokers may require beneficial owners to adhere to specific procedures and timetables. If
this service is available and used, dividend distributions of both income and realized gains will be automatically reinvested in additional whole shares of the Fund purchased in the secondary market.
19
Table of Contents
Taxes. As with any investment,
you should consider how your investment in shares of the Fund will be taxed. The tax information in this Prospectus is provided as general information, based on current law. There is no guarantee that shares of the Fund will receive certain
regulatory or accounting treatment. You should consult your own tax professional about the tax consequences of an investment in shares of the Fund.
Unless your investment in Fund shares is made through a
tax-exempt entity or tax-deferred retirement account, such as an IRA, you need to be aware of the possible tax consequences when the Fund makes distributions or you sell Fund shares.
Taxes on Distributions.
Distributions from the Fund’s net investment income, including distributions of income from securities lending and distributions out of the Fund's net short-term capital gains, if any, are taxable to you as ordinary income. The Fund's
distributions of net long-term capital gains, if any, in excess of net short-term capital losses are taxable as long-term capital gains, regardless of how long you have held the shares. Distributions from the Fund are subject to a 3.8% U.S. federal
Medicare contribution tax on “net investment income,” for individuals with incomes exceeding $200,000 ($250,000 if married filing jointly) and of estates and trusts. In general, your distributions are subject to U.S. federal income tax
for the year when they are paid. Certain distributions paid in January, however, may be treated as paid on December 31 of the prior year.
If the Fund's distributions exceed current and accumulated
earnings and profits, all or a portion of the distributions made in the taxable year may be recharacterized as a return of capital to shareholders. Distributions in excess of the Fund’s minimum distribution requirements, but not in excess of
the Fund’s earnings and profits, will be taxable to shareholders and will not constitute nontaxable returns of capital. A return of capital distribution generally will not be taxable but will reduce the shareholder's cost basis and will result
in a higher capital gain or lower capital loss when those shares on which the distribution was received are sold. Once a shareholder's cost basis is reduced to zero, further distributions will be treated as capital gain, if the shareholder holds
shares of the Fund as capital assets.
Interest received
by the Fund with respect to non-U.S. securities may give rise to withholding and other taxes imposed by non-U.S. countries. Tax conventions between certain countries and the U.S. may reduce or eliminate such taxes. If more than 50% of the total
assets of the Fund at the close of a year consists of securities of non-U.S. corporations, the Fund may “pass through” to you certain non-U.S. income taxes (including withholding taxes) paid by the Fund. This means that you would be
considered to have received as an additional dividend your share of such non-U.S. taxes, but you may be entitled to either a corresponding tax deduction in calculating your U.S. federal taxable income, or, subject to certain limitations, a credit in
calculating your U.S. federal income tax.
If you are
neither a resident nor a citizen of the United States or if you are a non-U.S. entity, the Fund’s ordinary income dividends (which include distributions of net short-term capital gains) will generally be subject to a 30% U.S. federal
withholding tax, unless a lower treaty rate applies.
20
Table of Contents
A 30% withholding tax will be imposed on U.S.-source dividends,
interest and other income items paid after June 30, 2016, and proceeds from the sale of property producing U.S.-source dividends and interest paid after December 31, 2016, to (i) foreign financial institutions, including non-U.S. investment funds,
unless they agree to collect and disclose to the U.S. Internal Revenue Service (“IRS”) information regarding their direct and indirect U.S. account holders and (ii) certain other foreign entities, unless they certify certain information
regarding their direct and indirect U.S. owners. To avoid withholding, foreign financial institutions will need to (i) enter into agreements with the IRS that state that they will provide the IRS information, including the names, addresses and
taxpayer identification numbers of direct and indirect U.S. account holders; comply with due diligence procedures with respect to the identification of U.S. accounts; report to the IRS certain information with respect to U.S. accounts maintained,
agree to withhold tax on certain payments made to non-compliant foreign financial institutions or to account holders who fail to provide the required information; and determine certain other information concerning their account holders, or (ii) in
the event that an applicable intergovernmental agreement and implementing legislation are adopted, provide local revenue authorities with similar account holder information. Other foreign entities will need to provide the name, address, and taxpayer
identification number of each substantial U.S. owner or certifications of no substantial U.S. ownership, unless certain exceptions apply.
If you are a resident or a citizen of the United States, by
law, back-up withholding at a 28% rate will apply to your distributions and proceeds if you have not provided a taxpayer identification number or social security number and made other required certifications.
Taxes When Shares are Sold.
Currently, any capital gain or loss realized upon a sale of Fund shares is generally treated as a long-term gain or loss if the shares have been held for more than one year. Any capital gain or loss realized upon a sale of Fund shares held for one
year or less is generally treated as short-term gain or loss, except that any capital loss on the sale of shares held for six months or less is treated as long-term capital loss to the extent that capital gain dividends were paid with respect to
such shares. Any such capital gains, including from sales of Fund shares or from capital gain dividends, are included in “net investment income” for purposes of the 3.8% U.S. federal Medicare contribution tax mentioned
above.
The foregoing discussion summarizes some of
the consequences under current U.S. federal tax law of an investment in the Fund. It is not a substitute for personal tax advice. You may also be subject to state and local taxation on Fund distributions and sales of shares. Consult your personal
tax advisor about the potential tax consequences of an investment in shares of the Fund under all applicable tax laws.
Creations and Redemptions.
Prior to trading in the secondary market, shares of the Fund are “created” at NAV by market makers, large investors and institutions only in block-size Creation Units of 100,000 shares or multiples thereof. Each “creator” or
“Authorized Participant” enters into an authorized participant agreement with the Fund's distributor, BlackRock Investments, LLC (the “Distributor”), an affiliate of BFA.
A creation transaction, which is subject to acceptance by the
transfer agent, generally takes place when an Authorized Participant deposits into the Fund a designated
21
Table of Contents
portfolio of securities (including any portion of such securities for which
cash may be substituted) and a specified amount of cash approximating the holdings of the Fund in exchange for a specified number of Creation Units. To the extent practicable, the composition of such portfolio generally corresponds pro rata to the holdings of the Fund. However, creation baskets will generally correspond to the price and yield performance of the Fund.
Similarly, shares can be redeemed only in Creation Units,
generally for a designated portfolio of securities (including any portion of such securities for which cash may be substituted) held by the Fund (“Fund Securities”) and a specified amount of cash. Except
when aggregated in Creation Units, shares are not redeemable by the Fund.
The prices at which creations and redemptions occur are based
on the next calculation of NAV after a creation or redemption order is received in an acceptable form under the authorized participant agreement.
The portfolio of securities required for purchase of a Creation
Unit may be different than the portfolio of securities the Fund will deliver upon redemption of Fund shares. The Deposit Securities and Fund Securities, as applicable, in connection with a purchase or redemption of a Creation Unit, generally will
correspond pro rata, to the extent practicable, to the securities held by the Fund.
Only an Authorized Participant may create or redeem Creation
Units directly with the Fund.
As a result of any system
failure or other interruption, including disruptions at market makers or Authorized Participants, orders to purchase or redeem Creation Units either may not be executed according to the Fund's instructions or may not be executed at all, or the Fund
may not be able to place or change orders.
To the extent
the Fund engages in in-kind transactions, the Fund intends to comply with the U.S. federal securities laws in accepting securities for deposit and satisfying redemptions with redemption securities by, among other means, assuring that any securities
accepted for deposit and any securities used to satisfy redemption requests will be sold in transactions that would be exempt from registration under the 1933 Act. Further, an Authorized Participant that is not a “qualified institutional
buyer,” as such term is defined under Rule 144A of the 1933 Act, will not be able to receive securities that are restricted securities eligible for resale under Rule 144A.
Creations and redemptions must be made through a firm that is
either a member of the Continuous Net Settlement System of the National Securities Clearing Corporation or a DTC participant and has executed an agreement with the Distributor with respect to creations and redemptions of Creation Unit aggregations.
Information about the procedures regarding creation and redemption of Creation Units (including the cut-off times for receipt of creation and redemption orders) is included in the Fund's SAI.
Because new shares may be created and issued on an ongoing
basis, at any point during the life of the Fund a “distribution,” as such term is used in the 1933 Act, may be occurring. Broker-dealers and other persons are cautioned that some activities on their part may, depending on the
circumstances, result in their being deemed participants in a distribution in a manner that could render them statutory underwriters and subject to the prospectus delivery and liability provisions of the 1933 Act. Any determination of whether one is
an underwriter must take into account all the relevant facts and circumstances of each particular case.
Broker-dealers should also note that dealers who are not
“underwriters” but are participating in a distribution (as contrasted to ordinary secondary transactions), and
22
Table of Contents
thus
dealing with shares that are part of an “unsold allotment” within the meaning of Section 4(a)(3)(C) of the 1933 Act, would be unable to take advantage of the prospectus delivery exemption provided by Section 4(a)(3) of the 1933 Act. For
delivery of prospectuses to exchange members, the prospectus delivery mechanism of Rule 153 under the 1933 Act is available only with respect to transactions on a national securities exchange.
Costs Associated with Creations and Redemptions. Authorized Participants are charged standard creation and redemption transaction fees to offset transfer and other transaction costs associated with the issuance and redemption of Creation Units. The standard creation
and redemption transaction fees are set forth in the table below. The standard creation transaction fee is charged to the Authorized Participant on the day such Authorized Participant creates a Creation Unit, and is the same regardless of the number
of Creation Units purchased by the Authorized Participant on the applicable business day. Similarly, the standard redemption transaction fee is charged to the Authorized Participant on the day such Authorized Participant redeems a Creation Unit, and
is the same regardless of the number of Creation Units redeemed by the Authorized Participant on the applicable business day. Creations and redemptions for cash (when cash creations and redemptions (in whole or in part) are available or specified)
are also subject to an additional charge (up to the maximum amounts shown in the table below). This charge is intended to compensate for brokerage, tax, foreign exchange, execution, market impact and other costs and expenses related to cash
transactions. Investors who use the services of a broker or other financial intermediary to acquire or dispose of Fund shares may pay fees for such services.
The following table shows, as of November 30, 2013, the
approximate value of one Creation Unit, standard fees and maximum additional charges for creations and redemptions (as described above):
| Approximate
Value of a Creation Unit |
Creation
Unit Size |
Standard
Creation/ Redemption Transaction Fee |
Maximum
Additional Charge for Creations* |
Maximum
Additional Charge for Redemptions* | ||||
| $5,347,000 | 100,000 | $1,250 | 3.0% | 2.0% |
| * | As a percentage of the net asset value per Creation Unit, inclusive, in the case of redemptions, of the standard redemption transaction fee. |
Householding. Householding is
an option available to certain Fund investors. Householding is a method of delivery, based on the preference of the individual investor, in which a single copy of certain shareholder documents can be delivered to investors who share the same
address, even if their accounts are registered under different names. Please contact your broker-dealer if you are interested in enrolling in householding and receiving a single copy of prospectuses and other shareholder documents, or if you are
currently enrolled in householding and wish to change your householding status.
23
Table of Contents
Distribution
The Distributor or its agent distributes Creation Units for the
Fund on an agency basis. The Distributor does not maintain a secondary market in shares of the Fund. The Distributor has no role in determining the policies of the Fund or the securities that are purchased or sold by the Fund. The
Distributor’s principal address is 1 University Square Drive, Princeton, NJ 08540.
BFA or its Affiliates make payments to broker-dealers,
registered investment advisers, banks or other intermediaries (together, “intermediaries”) related to marketing activities and presentations, educational training programs, conferences, the development of technology platforms and
reporting systems, or their making shares of the Fund and certain other iShares funds available to their customers generally and in certain investment programs. Such payments, which may be significant to the intermediary, are not made by the Fund.
Rather, such payments are made by BFA or its Affiliates from their own resources, which come directly or indirectly in part from fees paid by the iShares funds complex. Payments of this type are sometimes referred to as revenue-sharing payments. A
financial intermediary may make decisions about which investment options it recommends or makes available, or the level of services provided, to its customers based on the payments it is eligible to receive. Therefore, such payments to an
intermediary create conflicts of interest between the intermediary and its customers and may cause the intermediary to recommend the Fund or other iShares funds over another investment. More information regarding these payments is contained in the
Fund's SAI. Please contact your salesperson or other investment professional for more information regarding any such payments his or her firm may receive from BFA or its Affiliates.
24
Table of Contents
Financial Highlights
The financial highlights table is intended to help investors
understand the Fund’s financial performance since inception. Certain information reflects financial results for a single share of the Fund. The total returns in the table represent the rate that an investor would have earned (or lost) on an
investment in the Fund, assuming reinvestment of all dividends and distributions. This information has been audited by PricewaterhouseCoopers LLP, whose report is included, along with the Fund's financial statements, in the Fund's Annual Report
(available upon request).
Financial Highlights
(For a share outstanding throughout each period)
(For a share outstanding throughout each period)
| Year
ended Oct. 31, 2013 |
Period
from Apr. 3, 2012a to Oct. 31, 2012 | ||
| Net asset value, beginning of period | $ 51.67 | $ 50.00 | |
| Income
from investment operations: | |||
| Net investment incomeb | 3.05 | 1.82 | |
| Net realized and unrealized gainc | 1.70 | 1.35 | |
| Total from investment operations | 4.75 | 3.17 | |
| Less distributions from: | |||
| Net investment income | (2.92) | (1.50) | |
| Total distributions | (2.92) | (1.50) | |
| Net asset value, end of period | $ 53.50 | $ 51.67 | |
| Total return | 9.50% | 6.53% d | |
| Ratios/Supplemental data: | |||
| Net assets, end of period (000s) | $74,893 | $36,169 | |
| Ratio of expenses to average net assetse | 0.40% | 0.40% | |
| Ratio of expenses to average net assets prior to waived feese | 0.55% | 0.55% | |
| Ratio of net investment income to average net assetse | 5.82% | 6.28% | |
| Portfolio turnover ratef | 20% | 10% | |
| a | Commencement of operations. |
| b | Based on average shares outstanding throughout each period. |
| c | The amount reported for a share outstanding may not accord with the change in aggregate gains and losses in securities for the fiscal period due to the timing of capital share transactions in relation to the fluctuating market values of the Fund's underlying securities. |
| d | Not annualized. |
| e | Annualized for periods of less than one year. |
| f | Portfolio turnover rates exclude portfolio securities received or delivered as a result of processing capital share transactions in Creation Units. |
25
Table of Contents
Index Provider
Markit owns, compiles and publishes the iBoxx bond and iTraxx
credit derivative indices, which are used around the world by financial market participants as benchmarks and as the basis for traded products. Markit is a leading provider of independent data, portfolio valuations and over-the-counter (OTC)
derivatives trade processing to the financial markets. Markit is not affiliated with the Company, BFA, State Street, the Distributor, or any of their respective affiliates, and has licensed these indices in connection with the Fund and has licensed
the Underlying Index in connection with the Fund. “Markit®” and “iBoxx®” are the registered
trademarks of Markit Group Limited and Markit Indices Limited respectively.
Disclaimers
“iBoxx” is a registered trademark of Markit Indices
Limited and is licensed for use by BFA or its affiliates. BFA or its affiliates have not been passed on by these entities or their affiliates as to their legality or suitability. Markit does not approve, sponsor endorse or recommend BFA or the Fund.
Markit makes no representation regarding the advisability of investing in the Fund. The Fund is derived from a source considered reliable, but Markit and its employees, suppliers, subcontractors and agents (together “Markit Associates”)
do not guarantee the veracity, completeness or accuracy of the Fund or other information furnished in connection with the Fund. No representation, warranty or condition, express or implied, statutory or otherwise, as to condition, satisfactory
quality, performance, or fitness for purpose are given or assumed by Markit or any of the Markit Associates in respect of 1) an iBoxx Index, Fund, or any data included in it, 2) the use by any person or entity of the Fund of that data, 3) the
results obtained from the use of any iBoxx Index, 4) the creditworthiness of any entity, or the likelihood of the occurrence of a credit event or similar event (however defined) with respect to an obligation, in an iBoxx Index at any particular time
on any particular date or otherwise, or 5) the ability of an iBoxx Index to track relevant markets' performances or otherwise relating to an iBoxx Index or any transaction or product with respect thereto. All such representations, warranties and
conditions are excluded save to the extent that such exclusion is prohibited by law. The Markit Associates shall not have any liability to any party for any act or failure to act in connection with the determination, adjustment, calculation or
maintenance of an iBoxx Index.
Shares of the Fund are not
sponsored, endorsed or promoted by BATS. BATS makes no representation or warranty, express or implied, to the owners of the shares of the Fund or any member of the public regarding the ability of the Fund to track the total return performance of the
Underlying Index or the ability of the Underlying Index to track stock market performance. BATS is not responsible for, nor has it participated in, the determination of the compilation or the calculation of the Underlying Index, nor in the
determination of the timing of, prices of, or quantities of shares of the Fund to be issued, nor in the determination or calculation of the equation by which the shares are
26
Table of Contents
redeemable. BATS has no obligation or liability to owners of the shares of the
Fund in connection with the administration, marketing or trading of the shares of the Fund.
BATS does not guarantee the accuracy and/or the completeness of
the Underlying Index or any data included therein. BATS makes no warranty, express or implied, as to results to be obtained by the Company on behalf of the Fund as licensee, licensee’s customers and counterparties, owners of the shares of the
Fund, or any other person or entity from the use of the subject index or any data included therein in connection with the rights licensed as described herein or for any other use. BATS makes no express or implied warranties and hereby expressly
disclaims all warranties of merchantability or fitness for a particular purpose with respect to the Underlying Index or any data included therein. Without limiting any of the foregoing, in no event shall BATS have any liability for any direct,
indirect, special, punitive, consequential or any other damages (including lost profits) even if notified of the possibility of such damages.
The past performance of the Underlying Index is not a guide to
future performance. BFA does not guarantee the accuracy or the completeness of the Underlying Index or any data included therein and BFA shall have no liability for any errors, omissions or interruptions therein. BFA makes no warranty, express or
implied, to the owners of shares of the Fund or to any other person or entity, as to results to be obtained by the Fund from the use of the Underlying Index or any data included therein. Without limiting any of the foregoing, in no event shall BFA
have any liability for any special, punitive, direct, indirect or consequential damages (including lost profits), even if notified of the possibility of such damages.
27
Table of Contents
Supplemental Information
I. Premium/Discount Information
The table that follows presents information about the
differences between the daily market price on secondary markets for shares of the Fund and the Fund’s NAV. NAV is the price at which the Fund issues and redeems shares. It is calculated in accordance with the standard formula for valuing
mutual fund shares. The price used to calculate market returns (“Market Price”) of the Fund generally is determined using the midpoint between the highest bid and the lowest offer on the primary securities exchange on which shares of the
Fund are listed for trading, as of the time that the Fund’s NAV is calculated. The Fund’s Market Price may be at, above or below its NAV. The NAV of the Fund will fluctuate with changes in the value of its portfolio holdings. The Market
Price of the Fund will fluctuate in accordance with changes in its NAV, as well as market supply and demand.
Premiums or discounts are the differences (expressed as a
percentage) between the NAV and Market Price of the Fund on a given day, generally at the time the NAV is calculated. A premium is the amount that the Fund is trading above the reported NAV, expressed as a percentage of the NAV. A discount is the
amount that the Fund is trading below the reported NAV, expressed as a percentage of the NAV.
The following information shows the frequency of distributions
of premiums and discounts for the Fund for each full calendar quarter of 2013.
Each line in the table shows the number of trading days in
which the Fund traded within the premium/discount range indicated. The number of trading days in each premium/discount range is also shown as a percentage of the total number of trading days in the period covered by the table. All data presented
here represents past performance, which cannot be used to predict future results.
| Premium/Discount Range | Number of Days | Percentage of Total Days | ||
| Greater than 1.5% and Less than 2.0% | 2 | 1.06% | ||
| Greater than 1.0% and Less than 1.5% | 25 | 13.30 | ||
| Greater than 0.5% and Less than 1.0% | 108 | 57.45 | ||
| Between 0.5% and -0.5% | 53 | 28.19 | ||
| 188 | 100.00% |
28
Table of Contents
II. Total Return Information
The table that follows presents information about the total
returns of the Fund and the Underlying Index as of the fiscal year ended October 31, 2013.
“Average Annual Total Returns” represent the
average annual change in value of an investment over the periods indicated. “Cumulative Total Returns” represent the total change in value of an investment over the period indicated.
The Fund’s NAV is the value of one share of the Fund as
calculated in accordance with the standard formula for valuing mutual fund shares. The NAV return is based on the NAV of the Fund and the market return is based on the Market Price of the Fund. Market Price is determined by using the midpoint
between the highest bid and the lowest offer on the primary stock exchange on which shares of the Fund are listed for trading, as of the time that the Fund's NAV is calculated. Since shares of the Fund did not trade in the secondary market until
after the Fund's inception, for the period from inception to the first day of secondary market trading in shares of the Fund, the NAV of the Fund is used as a proxy for the Market Price to calculate market returns. Market and NAV returns assume that
dividends and capital gain distributions have been reinvested in the Fund at Market Price and NAV, respectively.
An index is a statistical composite that tracks a specified
financial market or sector. Unlike the Fund, the Underlying Index does not actually hold a portfolio of securities and therefore does not incur the expenses incurred by the Fund. These expenses negatively impact the performance of the Fund. Also,
market returns do not include brokerage commissions that may be payable on secondary market transactions. If brokerage commissions were included, market returns would be lower. The returns shown in the following table do not reflect the deduction of
taxes that a shareholder would pay on Fund distributions or the redemption or sale of Fund shares. The investment return and principal value of shares of the Fund will vary with changes in market conditions. Shares of the Fund may be worth more or
less than their original cost when they are redeemed or sold in the market. The Fund’s past performance is no guarantee of future results.
Performance as of October 31, 2013
| Average Annual Total Returns | Cumulative Total Returns | |||||||
| NAV | MARKET | INDEX | NAV | MARKET | INDEX | |||
| 1 Year | 9.50% | 9.50% | 9.55% | 9.50% | 9.50% | 9.55% | ||
| Since Inception* | 10.23% | 10.55% | 10.47% | 16.65% | 17.18% | 16.97% | ||
| * | Total returns for the period since inception are calculated from the inception date of the Fund (4/3/12). The first day of secondary market trading in shares of the Fund was 4/5/12. |
29
Table of Contents
[THIS PAGE INTENTIONALLY LEFT BLANK]
Table of Contents
Table of Contents
|
|
For more information visit www.iShares.com or call
1-800-474-2737
Copies of the Prospectus, SAI and recent
shareholder reports can be found on our website at www.iShares.com. For more information about the Fund, you may request a copy of the SAI. The SAI provides detailed information about the Fund and is incorporated by reference into this Prospectus.
This means that the SAI, for legal purposes, is a part of this Prospectus.
Additional information about the Fund's investments is
available in the Fund's Annual and Semi-Annual reports to shareholders. In the Fund's Annual Report, you will find a discussion of the market conditions and investment strategies that significantly affected the Fund's performance during the last
fiscal year.
If you have any questions about the Company
or shares of the Fund or you wish to obtain the SAI, Semi-Annual or Annual report free of charge, please:
| Call: | 1-800-iShares
or 1-800-474-2737 (toll free) Monday through Friday, 8:30 a.m. to 6:30 p.m. (Eastern time) |
| Email: | iSharesETFs@blackrock.com |
| Write: | c/o
BlackRock Investments, LLC 1 University Square Drive, Princeton, NJ 08540 |
Information about the Fund (including the SAI) can be reviewed
and copied at the SEC's Public Reference Room in Washington, D.C., and information on the operation of the Public Reference Room may be obtained by calling the SEC at 1-202-551-8090. Reports and other information about the Fund are available on the
EDGAR database on the SEC's website at www.sec.gov, and copies of this information may be obtained, after paying a duplicating fee, by electronic request at the following e-mail address: publicinfo@sec.gov, or by writing to the SEC's Public
Reference Section, Washington, D.C. 20549-1520.
No person
is authorized to give any information or to make any representations about the Fund and its shares not contained in this Prospectus and you should not rely on any other information. Read and keep this Prospectus for future reference.
©2014 BlackRock, Inc. All rights reserved. iSHARES and BLACKROCK are registered trademarks of BlackRock, Inc. or its affiliates. All other marks are the property of their respective owners.
Investment Company Act File No.: 811-09102
IS-P-GHYG-0115

Table of Contents
October 6, 2014
(as revised January 2, 2015)
| 2014 Prospectus |
|
| ► | iShares MSCI Emerging Markets Horizon ETF | EMHZ | BATS |
The Securities and Exchange Commission
(“SEC”) has not approved or disapproved these securities or passed upon the adequacy of this prospectus. Any representation to the contrary is a criminal offense.
Table of Contents
Table of Contents
Table of Contents
“MSCI Emerging Markets Horizon Index” is a
servicemark of MSCI Inc. and has been licensed for use for certain purposes by BlackRock Fund Advisors or its affiliates. iShares® and BlackRock® are registered trademarks of BlackRock Fund Advisors and its affiliates. The Fund is not sponsored, endorsed, sold, or promoted by MSCI Inc., nor does MSCI Inc. make any representation
regarding the advisability of investing in the Fund.
i
Table of Contents
[THIS PAGE INTENTIONALLY LEFT BLANK]
Table of Contents
iSHARES® MSCI EMERGING
MARKETS HORIZON ETF
| Ticker: EMHZ | Stock Exchange: BATS |
Investment Objective
The iShares MSCI Emerging Markets Horizon ETF (the
“Fund”) seeks to track the investment results of an index that takes the smallest 25% of countries by market capitalization from the universe of an index of emerging markets countries, and then excludes Brazil, China, India and
Russia.
Fees and Expenses
The following table describes the fees and expenses that you
will incur if you own shares of the Fund. The investment advisory agreement between iShares, Inc. (the “Company”) and BlackRock Fund Advisors (“BFA”) (formerly, Barclays Global Fund Advisors (“BGFA”)) (the
“Investment Advisory Agreement”) provides that BFA will pay all operating expenses of the Fund, except interest expenses, taxes, brokerage expenses, future distribution fees or expenses, and extraordinary expenses.
You may also incur usual and customary brokerage commissions
when buying or selling shares of the Fund, which are not reflected in the Example that follows:
| Annual
Fund Operating Expenses (ongoing expenses that you pay each year as a percentage of the value of your investments) | ||||||
| Management
Fees |
Distribution
and Service (12b-1) Fees |
Other
Expenses |
Total
Annual Fund Operating Expenses | |||
| 0.50% | None | None | 0.50% | |||
Example. This Example is intended to help you compare the cost of owning shares of the Fund with the cost of investing in other funds. The Example assumes that you invest $10,000 in the Fund for the time periods indicated and
then sell all of your shares at the end of those periods. The Example also assumes that your investment has a 5% return each year and that the Fund’s operating expenses remain the same. Although your actual costs may be higher or lower, based
on these assumptions, your costs would be:
| 1 Year | 3 Years | ||||
| $51 | $160 |
S-1
Table of Contents
S-2
Table of Contents
S-3
Table of Contents
S-4
Table of Contents
S-5
Table of Contents
S-6
Table of Contents
S-7
Table of Contents
[THIS PAGE INTENTIONALLY LEFT BLANK]
Table of Contents
More Information About the Fund
This Prospectus contains important information about investing
in the Fund. Please read this Prospectus carefully before you make any investment decisions. Additional information regarding the Fund is available at www.iShares.com.
BFA is the investment adviser to the Fund. Shares of the Fund
are listed for trading on BATS Exchange, Inc. (“BATS”). The market price for a share of the Fund may be different from the Fund’s most recent NAV.
ETFs are funds that trade like other publicly traded
securities. The Fund is designed to track an index. Similar to shares of an index mutual fund, each share of the Fund represents a partial ownership in an underlying portfolio of securities intended to track a market index. Unlike shares of a mutual
fund, which can be bought and redeemed from the issuing fund by all shareholders at a price based on NAV, shares of the Fund may be purchased or redeemed directly from the Fund at NAV solely by Authorized Participants (as defined in the Creations and Redemptions section of this Prospectus). Also unlike shares of a mutual fund, shares of the Fund are listed on a national securities exchange and trade in the secondary market at market prices that
change throughout the day.
The Fund invests in a
particular segment of the securities markets and seeks to track the performance of a securities index that generally is not representative of the market as a whole. The Fund is designed to be used as part of broader asset allocation strategies.
Accordingly, an investment in the Fund should not constitute a complete investment program.
An index is a theoretical financial calculation while the Fund
is an actual investment portfolio. The performance of the Fund and the Underlying Index may vary due to transaction costs, non-U.S. currency valuations, asset valuations, corporate actions (such as mergers and spin-offs), timing variances and
differences between the Fund’s portfolio and the Underlying Index resulting from legal restrictions (such as diversification requirements) that apply to the Fund but not to the Underlying Index or to the use of representative sampling.
“Tracking error” is the divergence of the performance (return) of the Fund's portfolio from that of the Underlying Index. BFA expects that, over time, the Fund’s tracking error will not exceed 5%. Because the Fund uses a
representative sampling indexing strategy, it can be expected to have a larger tracking error than if it used a replication indexing strategy. “Replication” is an indexing strategy in which a fund invests in substantially all of the
securities in its underlying index in approximately the same proportions as in the underlying index.
An investment in the Fund is not a bank deposit and it is not
insured or guaranteed by the Federal Deposit Insurance Corporation or any other government agency, BFA or any of its affiliates.
The Fund's investment objective and the Underlying Index may be
changed without shareholder approval.
1
Table of Contents
A Further Discussion of Principal Risks
The Fund is subject to various risks, including the principal
risks noted below, any of which may adversely affect the Fund’s NAV, trading price, yield, total return and ability to meet its investment objective. You could lose all or part of your investment in the Fund, and the Fund could underperform
other investments.
Asian Economic Risk. Many Asian economies have experienced rapid growth and industrialization in recent years, but there is no assurance that this growth rate will be maintained. Other Asian economies, however, have experienced high
inflation, high unemployment, currency devaluations and restrictions, and over-extension of credit. During the recent global recession, many of the export-driven Asian economies experienced the effects of the economic slowdown in the United States
and Europe, and certain Asian governments implemented stimulus plans, low-rate monetary policies and currency devaluations. Economic events in any one Asian country may have a significant economic effect on the entire Asian region, as well as on
major trading partners outside Asia. Any adverse event in the Asian markets may have a significant adverse effect on some or all of the economies of the countries in which the Fund invests. Many Asian countries are subject to political risk,
including corruption and regional conflict with neighboring countries. In addition, many Asian countries are subject to social and labor risks associated with demands for improved political, economic and social conditions. These risks, among others,
may adversely affect the value of the Fund’s investments.
Asset Class Risk. The
securities in the Underlying Index or in the Fund’s portfolio may underperform the returns of other securities or indexes that track other countries, groups of countries, regions, industries, groups of industries, markets, asset classes or
sectors. Various types of securities or indexes tend to experience cycles of outperformance and underperformance in comparison to the general securities markets.
Commodity Risk. The energy,
materials, and agriculture sectors account for a large portion of the exports of certain countries in which the Fund invests. Any changes in these sectors or fluctuations in the commodity markets could have an adverse impact on a country's economy.
Commodity prices may be influenced or characterized by unpredictable factors, including, where applicable, high volatility, changes in supply and demand relationships, weather, agriculture, trade, pestilence, political instability, changes in
interest rates and monetary and other governmental policies. Securities of companies held by the Fund that are dependent on a single commodity, or are concentrated in a single commodity sector, may typically exhibit even higher volatility
attributable to commodity prices.
Concentration
Risk. The Fund may be susceptible to an increased risk of loss, including losses due to adverse occurrences affecting the Fund more than the market as a whole, to the extent that the Fund's investments are
concentrated in the securities of a particular issuer or issuers, country, group of countries, region, market, industry, group of industries, sector or asset class. The Fund may be more adversely affected by the underperformance of those securities,
may experience increased price volatility and may be more susceptible to adverse economic, market, political or
2
Table of Contents
regulatory occurrences affecting those securities than a fund that does not
concentrate its investments.
Consumer Staples Sector Risk. The consumer staples sector may be affected by the permissibility of using various product components and production methods, marketing campaigns and other factors affecting consumer demand. Tobacco companies, in
particular, may be adversely affected by new laws, regulations and litigation. The consumer staples sector may also be adversely affected by changes or trends in commodity prices, which may be influenced or characterized by unpredictable
factors.
Currency Risk. Because the Fund’s NAV is determined on the basis of the U.S. dollar, investors may lose money if the currency of a non-U.S. market in which the Fund invests depreciates against the U.S. dollar, even if the local
currency value of the Fund's holdings in that market increases.
Custody Risk. Custody risk
refers to the risks inherent in the process of clearing and settling trades and the holding of securities by local banks, agents and depositories. Low trading volumes and volatile prices in less developed markets may make trades harder to complete
and settle, and governments or trade groups may compel local agents to hold securities in designated depositories that may not be subject to independent evaluation. Local agents are held only to the standards of care of their local markets. In
general, the less developed a country’s securities market is, the greater the likelihood of custody problems.
Equity Securities Risk. The
Fund invests in equity securities, which are subject to changes in value that may be attributable to market perception of a particular issuer or to general stock market fluctuations that affect all issuers. Investments in equity securities may be
more volatile than investments in other asset classes.
European Economic Risk. The
Economic and Monetary Union (the “EMU”) of the European Union (the “EU”) requires compliance with restrictions on inflation rates, deficits, interest rates, debt levels and fiscal and monetary controls, each of which may
significantly affect every country in Europe. Decreasing imports or exports, changes in governmental or EU regulations on trade, changes in the exchange rate of the euro (the common currency of certain EU countries), the default or threat of default
by an EU member country on its sovereign debt, and/or an economic recession in an EU member country may have a significant adverse effect on the economies of EU member countries and their trading partners. The European financial markets have
recently experienced volatility and adverse trends due to concerns about economic downturns or rising government debt levels in several European countries, including Greece, Ireland, Italy, Portugal and Spain. These events have adversely affected
the exchange rate of the euro and may continue to significantly affect every country in Europe, including countries that do not use the euro.
Responses to financial problems by European governments,
central banks and others, including austerity measures and reforms, may not produce the desired results, may result in social unrest and may limit future growth and economic recovery or have other unintended consequences. Further defaults or
restructurings by governments and other entities of their debt could have additional adverse effects on economies,
3
Table of Contents
financial markets and asset valuations around the world. In addition, one or
more countries may abandon the euro and/or withdraw from the EU. The impact of these actions, especially if they occur in a disorderly fashion, is not clear but could be significant and far-reaching.
Financials Sector Risk.
Companies in the financials sector of an economy are often subject to extensive governmental regulation and intervention, which may adversely affect the scope of their activities, the prices they can charge and the amount of capital they must
maintain. Governmental regulation may change frequently and may have significant adverse consequences for companies in the financials sector, including effects not intended by such regulation. The impact of recent or future regulation in various
countries on any individual financial company or on the sector as a whole cannot be predicted. Certain risks may impact the value of investments in the financials sector more severely than those of investments outside this sector, including the
risks associated with companies that operate with substantial financial leverage. Companies in the financials sector may also be adversely affected by increases in interest rates and loan losses, decreases in the availability of money or asset
valuations, credit rating downgrades and adverse conditions in other related markets. Insurance companies, in particular, may be subject to severe price competition and/or rate regulation, which may have an adverse impact on their profitability. In
the recent past, deterioration of the credit markets impacted a broad range of mortgage, asset-backed, auction rate, sovereign debt and other markets, including U.S. and non-U.S. credit and interbank money markets, thereby affecting a wide range of
financial institutions and markets. A number of large financial institutions have failed, have merged with stronger institutions or have had significant government infusions of capital. Instability in the financial markets has caused certain
financial companies to incur large losses. Some financial companies experienced declines in the valuations of their assets, took actions to raise capital (such as the issuance of debt or equity securities), or even ceased operations. Some financial
companies borrowed significant amounts of capital from government sources and may face future government-imposed restrictions on their businesses or increased government intervention. Those actions caused the securities of many financial companies
to decline in value. The financials sector is particularly sensitive to fluctuations in interest rates.
Geographic Risk. Some of the
markets in which the Fund invests are located in parts of the world that have historically been prone to natural disasters, such as earthquakes, volcanoes, droughts, hurricanes or tsunamis, and are economically sensitive to environmental events. Any
such event may adversely impact the economies of these geographic areas, causing an adverse impact on the value of the Fund.
Index-Related Risk. The Fund
seeks to achieve a return which corresponds generally to the price and yield performance, before fees and expenses, of the Underlying Index as published by the Index Provider. There is no assurance that the Index Provider will compile the Underlying
Index accurately, or that the Underlying Index will be determined, composed or calculated accurately. While the Index Provider provides descriptions of what the Underlying Index is designed to achieve, the Index Provider does not provide any
warranty or accept any liability in relation to the quality, accuracy
4
Table of Contents
or
completeness of data in respect of its indices, and does not guarantee that the Underlying Index will be in line with the Index Provider’s methodology. BFA’s mandate as described in this Prospectus is to manage the Fund consistently with
the Underlying Index provided by the Index Provider to BFA. Consequently, BFA does not provide any warranty or guarantee for Index Provider errors. Errors in respect of the quality, accuracy and completeness of the data may occur from time to time
and may not be identified and corrected by the Index Provider for a period of time, particularly where the indices are less commonly used. Therefore, gains, losses or costs associated with Index Provider errors will generally be borne by the Fund
and its shareholders. For example, during a period where the Fund’s Underlying Index contains incorrect constituents, the Fund would have market exposure to such constituents and would be underexposed to the Underlying Index’s other
constituents. Such errors may negatively or positively impact the Fund and its shareholders. Any gains due to Index Provider errors will be kept by the Fund and its shareholders and any losses resulting from Index Provider errors will be borne by
the Fund and its shareholders.
Apart from scheduled
rebalances, the Index Provider may carry out additional ad hoc rebalances to the Underlying Index in order, for example, to correct an error in the selection of index constituents. Where the Underlying Index of the Fund is rebalanced and the Fund in
turn rebalances its portfolio to attempt to correlate it to the Underlying Index, any transaction costs and market exposure arising from such portfolio rebalancing will be borne directly by the Fund and its shareholders. Unscheduled rebalances to
the Underlying Index may also expose the Fund to tracking error risk, which is the risk that the Fund’s returns may not track those of the Underlying Index. Therefore, errors and additional ad hoc rebalances carried out by the Index Provider
to the Underlying Index may increase the costs and market exposure risk of the Fund.
Issuer Risk. The performance of
the Fund depends on the performance of individual securities to which the Fund has exposure. Any issuer of these securities may perform poorly, causing the value of its securities to decline. Poor performance may be caused by poor management
decisions, competitive pressures, changes in technology, expiration of patent protection, disruptions in supply, labor problems or shortages, corporate restructurings, fraudulent disclosures or other factors. Issuers may, in times of distress or at
their own discretion, decide to reduce or eliminate dividends, which may also cause their stock prices to decline.
Management Risk. The Fund may
not fully replicate the Underlying Index and may hold securities not included in the Underlying Index. As a result, the Fund is subject to the risk that BFA’s investment strategy, the implementation of which is subject to a number of
constraints, may not produce the intended results.
Market Risk. The Fund could
lose money due to short-term market movements and over longer periods during market downturns. Securities may decline in value due to factors affecting securities markets generally or particular asset classes or industries represented in the
markets. The value of a security may decline due to general market conditions, economic trends or events that are not specifically related to the issuer of the security or to factors that affect a particular industry or group of industries. During a
general downturn in the securities markets, multiple asset classes may be negatively affected.
5
Table of Contents
Market Trading Risk
Absence of Active Market.
Although shares of the Fund are listed for trading on one or more stock exchanges, there can be no assurance that an active trading market for such shares will develop or be maintained by market makers or Authorized Participants.
Risk of Secondary Listings.
The Fund's shares may be listed or traded on U.S. and non-U.S. stock exchanges other than the U.S. stock exchange where the Fund's primary listing is maintained. There can be no assurance that the Fund’s shares
will continue to trade on any such stock exchange or in any market or that the Fund’s shares will continue to meet the requirements for listing or trading on any exchange or in any market. The Fund's shares may be less actively traded in
certain markets than in others, and investors are subject to the execution and settlement risks and market standards of the market where they or their broker direct their trades for execution. Certain information available to investors who trade
Fund shares on a U.S. stock exchange during regular U.S. market hours may not be available to investors who trade in other markets, which may result in secondary market prices in such markets being less efficient.
Secondary Market Trading Risk.
Shares of the Fund may trade in the secondary market at times when the Fund does not accept orders to purchase or redeem shares. At such times, shares may trade in the secondary market with more significant premiums or discounts than might be
experienced at times when the Fund accepts purchase and redemption orders.
Secondary market trading in Fund shares may be halted by a
stock exchange because of market conditions or for other reasons. In addition, trading in Fund shares on a stock exchange or in any market may be subject to trading halts caused by extraordinary market volatility pursuant to “circuit
breaker” rules on the stock exchange or market. There can be no assurance that the requirements necessary to maintain the listing or trading of Fund shares will continue to be met or will remain unchanged.
Shares of the Fund, similar to shares of other issuers listed
on a stock exchange, may be sold short and are therefore subject to the risk of increased volatility associated with short selling.
Shares of the Fund May Trade at Prices Other Than NAV. Shares of the Fund trade on stock exchanges at prices at, above or below the Fund’s most recent NAV. The NAV of the Fund is calculated at the end of each business day and fluctuates with changes in the market value
of the Fund’s holdings. The trading price of the Fund's shares fluctuates continuously throughout trading hours based on both market supply of and demand for Fund shares and the underlying value of the Fund's portfolio holdings or NAV. As
a result, the trading prices of the Fund’s shares may deviate significantly from NAV during periods of market volatility. ANY OF THESE FACTORS, AMONG OTHERS, MAY LEAD TO THE FUND'S
SHARES TRADING AT A PREMIUM OR DISCOUNT TO NAV. However, because shares can be created and redeemed in Creation Units at NAV, BFA believes that large discounts or premiums to the NAV of the Fund are not likely
to be sustained over the long term (unlike shares of many closed-end funds,
6
Table of Contents
which frequently trade at appreciable discounts from, and sometimes at
premiums to, their NAVs). While the creation/redemption feature is designed to make it more likely that the Fund’s shares normally will trade on stock exchanges at prices close to the Fund’s next calculated NAV, exchange prices are not
expected to correlate exactly with the Fund's NAV due to timing reasons, supply and demand imbalances and other factors. In addition, disruptions to creations and redemptions, including disruptions at market makers, Authorized Participants, or
market participants or during periods of significant market volatility, may result in trading prices for shares of the Fund that differ significantly from its NAV.
Costs of Buying or Selling Fund Shares. Buying or selling Fund shares on an exchange involves two types of costs that apply to all securities transactions. When buying or selling shares of the Fund through a broker, you will likely incur a brokerage commission
or other charges imposed by brokers as determined by that broker. In addition, you may incur the cost of the “spread,” that is, the difference between what investors are willing to pay for Fund shares (the “bid” price) and
the price at which they are willing to sell Fund shares (the “ask” price). Because of the costs inherent in buying or selling Fund shares, frequent trading may detract significantly from investment results and an investment in Fund
shares may not be advisable for investors who anticipate regularly making small investments.
Non-Diversification Risk. The
Fund is classified as “non-diversified.” This means that the Fund may invest a large percentage of its assets in securities issued by or representing a small number of issuers. As a result, the Fund may be more susceptible to the risks
associated with these particular issuers, or to a single economic, political or regulatory occurrence affecting these issuers.
Non-U.S. Securities Risk.
Investments in the securities of non-U.S. issuers are subject to the risks of investing in the markets where such issuers are located, including heightened risks of inflation or nationalization and market fluctuations caused by economic and
political developments. As a result of investing in non-U.S. securities, the Fund may be subject to increased risk of loss caused by any of the factors listed below:
| ■ | Lower levels of liquidity and market efficiency; |
| ■ | Greater securities price volatility; |
| ■ | Exchange rate fluctuations and exchange controls; |
| ■ | Less availability of public information about issuers; |
| ■ | Limitations on foreign ownership of securities; |
| ■ | Imposition of withholding or other taxes; |
| ■ | Imposition of restrictions on the expatriation of the funds or other assets of the Fund; |
| ■ | Higher transaction and custody costs and delays in settlement procedures; |
| ■ | Difficulties in enforcing contractual obligations; |
| ■ | Lower levels of regulation of the securities markets; |
| ■ | Weaker accounting, disclosure and reporting requirements; and |
7
Table of Contents
| ■ | Legal principles relating to corporate governance, directors’ fiduciary duties and liabilities and stockholders’ rights in markets in which the Fund invests may differ and/or may not be as extensive or protective as those that apply in the United States. |
North American Economic
Risk. A decrease in imports or exports, changes in trade regulations and/or an economic recession in any North American country may have a significant economic effect on the entire North American region and on some
or all of the North American countries in which the Fund invests.
The United States is Mexico's largest trading and investment
partner. The Mexican economy is significantly affected by developments in the U.S. economy. Since the implementation of the North American Free Trade Agreement (“NAFTA”) in 1994 among Canada, the United States and Mexico, total
merchandise trade between the three countries has increased. To further this relationship, the three NAFTA countries entered into the Security and Prosperity Partnership of North America in March 2005, which has further affected Mexico's dependency
on the U.S. economy. Policy and legislative changes in one country may have a significant effect on North American markets generally, as well as on the value of certain securities.
Passive Investment Risk. The
Fund is not actively managed and may be affected by a general decline in market segments related to the Underlying Index. The Fund invests in securities included in, or representative of, the Underlying Index, regardless of their investment merits.
BFA generally does not attempt to take defensive positions under any market conditions, including declining markets.
Privatization Risk. Some
countries in which the Fund invests have privatized or have begun the process of privatizing certain entities and industries. In some instances, investors in some newly privatized entities have suffered losses due to the inability of the newly
privatized entities to adjust quickly to a competitive environment or changing regulatory and legal standards or, in some cases, due to re-nationalization of such privatized entities. There is no assurance that such losses will not
recur.
Reliance on Trading Partners Risk. Economies in emerging market countries generally are heavily dependent upon commodity prices and international trade. Accordingly, these countries have been and may continue to be affected adversely by the economies of
their trading partners, trade barriers, exchange controls or managed adjustments in relative currency values and may suffer from extreme and volatile debt burdens or inflation rates.
Risk of Investing in Emerging Markets. Investments in emerging markets are subject to a greater risk of loss than investments in more developed markets. This is due to, among other things, the potential for greater market volatility, lower trading volume,
inflation, political and economic instability, greater risk of a market shutdown and more governmental limitations on foreign investments than typically found in more developed markets. Moreover, emerging markets often have less uniformity in
accounting and reporting requirements, unreliable securities valuation and greater risks associated with custody of securities. In addition, emerging markets often have greater risk of capital controls through such measures as taxes or interest rate
control.
8
Table of Contents
Certain emerging market countries may also lack the infrastructure necessary
to attract large amounts of foreign trade and investment.
Risk of Investing in Mexico.
Investment exposure to Mexican issuers involves risks that are specific to Mexico, including regulatory, political, and economic risks. The Mexican economy, among other things, is dependent upon external trade with other economies, specifically with
the United States. As a result, Mexico is dependent on, among other things, the U.S. economy and any change in the price or demand for Mexican exports may have an adverse impact on the Mexican economy. Recently, Mexico has experienced an outbreak of
violence related to drug trafficking. Incidents involving Mexico’s security may have an adverse effect on the Mexican economy and cause uncertainty in its financial markets. In the past, Mexico has experienced high interest rates, economic
volatility and high unemployment rates.
Political
and Social Risk. Mexico has been destabilized by local insurrections, social upheavals, drug related violence, and the public health crisis related to the H1N1 influenza outbreak. Recurrence of these or similar
conditions may adversely impact the Mexican economy. Recently, Mexican elections have been contentious and have been very closely decided. Changes in political parties or other Mexican political events may affect the economy and cause
instability.
Securities Lending Risk. The Fund may engage in securities lending. Securities lending involves the risk that the Fund may lose money because the borrower of the loaned securities fails to return the securities in a timely manner or at all. The
Fund could also lose money in the event of a decline in the value of the collateral provided for the loaned securities or a decline in the value of any investments made with cash collateral. These events could also trigger adverse tax consequences
for the Fund. In addition, BlackRock Institutional Trust Company, N.A. (“BTC”), the Fund’s securities lending agent, will take into account the tax impact to shareholders of substitute payments for dividends when managing the
Fund’s securities lending program.
Securities
Market Risk. Local securities markets may trade a small number of securities and may be unable to respond effectively to increases in trading volume, potentially making prompt liquidation of holdings difficult or
impossible at times. Settlement procedures in emerging market countries are frequently less developed and reliable than those in the United States (and other developed countries). In addition, significant delays may occur in certain markets in
registering the transfer of securities. Settlement or registration problems may make it more difficult for the Fund to value its portfolio securities.
Security Risk. Some geographic
areas in which the Fund invests have experienced acts of terrorism or strained international relations due to territorial disputes, historical animosities or other defense concerns. These situations may cause uncertainty in the markets of these
geographic areas and may adversely affect their economies.
Structural Risk. Certain
emerging market countries are subject to a considerable degree of economic, political and social instability.
Economic Risk. Some emerging
market countries have experienced currency devaluations and substantial (and, in some cases, extremely high) rates of inflation, while others have experienced economic recessions causing a negative effect on the
9
Table of Contents
economies and securities markets of such emerging countries.
Expropriation Risk. Investing
in emerging market countries involves a great risk of loss due to expropriation, nationalization, confiscation of assets and property or the imposition of restrictions on foreign investments and repatriation of capital invested by certain emerging
market countries.
Political and Social Risk. Some governments in emerging market countries are authoritarian in nature or have been installed or removed as a result of military coups, and some governments have periodically used force to suppress civil dissent.
Disparities of wealth, the pace and success of democratization, and ethnic, religious and racial disaffection, have also led to social unrest, violence and/or labor unrest in some emerging market countries. Unanticipated political or social
developments may result in sudden and significant investment losses.
Telecommunications Sector Risk.
The telecommunications sector of a country's economy is often subject to extensive government regulation. The costs of complying with governmental regulations, delays or failure to receive required regulatory approvals, or the enactment of new
regulatory requirements may negatively affect the business of telecommunications companies. Government actions around the world, specifically in the area of pre-marketing clearance of products and prices, can be arbitrary and unpredictable.
Companies in the telecommunications sector may encounter distressed cash flows due to the need to commit substantial capital to meet increasing competition, particularly in formulating new products and services using new technology. Technological
innovations may make the products and services of certain telecommunications companies obsolete.
Tracking Error Risk. Tracking
error is the divergence of the Fund’s performance from that of the Underlying Index. Tracking error may occur because of differences between the securities held in the Fund’s portfolio and those included in the Underlying Index, pricing
differences, transaction costs, the Fund holding uninvested cash, differences in timing of the accrual of dividends, changes to the Underlying Index or the costs of complying with various new or existing regulatory requirements. This risk may be
heightened during times of increased market volatility or other unusual market conditions. Tracking error also may result because the Fund incurs fees and expenses, while the Underlying Index does not. FUNDS THAT TRACK INDICES WITH SIGNIFICANT
WEIGHT IN EMERGING MARKETS ISSUERS MAY EXPERIENCE HIGHER TRACKING ERROR THAN OTHER INDEX EXCHANGE-TRADED FUNDS THAT DO NOT TRACK SUCH INDICES.
U.S. Economic Risk. The United
States is a significant, and in some cases the most significant, trading partner of certain markets in which the Fund invests. A decrease in U.S. imports, new trade regulations, changes in the U.S. dollar exchange rates or an economic slowdown in
the United States may have an adverse impact on these markets and, as a result, securities to which the Fund has exposure.
Valuation Risk. The sale price
the Fund could receive for a security may differ from the Fund's valuation of the security and may differ from the value used by the Underlying Index, particularly for securities or assets that trade in low volume or volatile markets, or that
are valued using a fair value methodology. Because non-U.S. exchanges may be open on days when the Fund does not price its shares, the value of
10
Table of Contents
the
securities or assets in the Fund’s portfolio may change on days when shareholders will not be able to purchase or sell the Fund’s shares. In addition, for purposes of calculating the Fund's NAV, the value of assets denominated in
non-U.S. currencies is converted into U.S. dollars using prevailing market rates on the date of valuation as quoted by one or more data service providers. This conversion may result in a difference between the prices used to calculate the Fund's NAV
and the prices used by the Underlying Index, which, in turn, could result in a difference between the Fund's performance and the performance of the Underlying Index.
A Further Discussion of Other Risks
The Fund may also be subject to certain other risks associated
with its investments and investment strategies.
Central and
South American Economic Risk. The economies of certain Central and South American countries have experienced high interest rates, economic volatility, inflation, currency devaluations, government defaults and high
unemployment rates. In addition, commodities (such as oil, gas and minerals) represent a significant percentage of exports for these regions and many economies in these regions are particularly sensitive to fluctuations in commodity prices. Adverse
economic events in one country may have a significant adverse effect on other countries in these regions.
Consumer Discretionary Sector Risk. The success of consumer product manufacturers and retailers is tied closely to the performance of domestic and international economies, interest rates, exchange rates, competition, consumer confidence, changes in
demographics and consumer preferences. Companies in the consumer discretionary sector depend heavily on disposable household income and consumer spending, and may be strongly affected by social trends and marketing campaigns. These companies may be
subject to severe competition, which may have an adverse impact on their profitability.
Eastern European Economic Risk.
An investment in issuers located or operating in Eastern Europe may subject the Fund to legal, regulatory, political, currency, security and economic risks specific to Eastern Europe. Economies of certain Eastern
European countries rely heavily on the export of commodities, including oil, gas, and certain metals. As a result, such economies will be impacted by international commodity prices and are particularly vulnerable to global demand for these products.
Acts of terrorism in certain Eastern European countries may cause uncertainty in their financial markets and adversely affect the performance of the issuers to which the Fund has exposure. The securities markets in Eastern European countries are
substantially smaller and less developed, with less government supervision and regulation of stock exchanges, and are less liquid and more volatile than securities markets in the United States or Western European countries. In addition, investing in
securities of issuers located or operating in Eastern Europe involves:
| ■ | The risk of delays in settling portfolio transactions and the risk of loss arising out of the system of share registration and custody used in certain Eastern European countries; |
| ■ | Risks in connection with the maintenance of the Fund's portfolio securities and cash |
11
Table of Contents
with foreign sub-custodians and securities depositories,
including the risk that appropriate sub-custody arrangements will not be available to the Fund;
| ■ | The risk that the Fund's ownership rights in portfolio securities could be lost through fraud or negligence as a result of the fact that ownership in shares of certain Eastern European companies is recorded by the companies themselves and by registrars, rather than a central registration system; |
| ■ | The risk that the Fund may not be able to pursue claims on behalf of its shareholders because of the system of share registration and custody, and because certain Eastern European banking institutions and registrars are not guaranteed by their respective governments; and |
| ■ | Risks in connection with Eastern European countries' dependence on the economic health of Western European countries and the EU as a whole. |
Other risks related to investing in securities of issuers
located or operating in Eastern Europe include: the absence of legal structures governing private and foreign investments and private property; the possibility of the loss of all or a substantial portion of the Fund’s assets invested in
issuers located or operating in Eastern Europe as a result of expropriation; and certain national policies which may restrict the Fund’s investment opportunities, including, without limitation, restrictions on investing in issuers or
industries deemed sensitive to relevant national interests.
Energy Sector Risk. The energy
sector of an economy is cyclical and highly dependent on energy prices. The market value of companies in the energy sector is strongly affected by the levels and volatility of global energy prices, energy supply and demand, capital expenditures on
exploration and production of energy sources, energy conservation efforts, exchange rates, interest rates, economic conditions, tax treatment, increased competition and technological advances, among other factors. Companies in this sector may be
subject to substantial government regulation and contractual fixed pricing, which may increase the cost of doing business and limit the earnings of these companies. A significant portion of the revenues of these companies depends on a relatively
small number of customers, including governmental entities and utilities. As a result, governmental budget constraints may have a material adverse effect on the stock prices of companies in this sector. Energy companies may also operate in, or
engage in transactions involving countries with, less developed regulatory regimes or a history of expropriation, nationalization or other adverse policies. Energy companies also face a significant risk of liability from accidents resulting in
injury or loss of life or property, pollution or other environmental problems, equipment malfunctions or mishandling of materials and a risk of loss from terrorism, political strife and natural disasters. Any such event could have serious
consequences for the general population of the affected area and could have an adverse impact on the Fund’s portfolio and the performance of the Fund. Energy companies can be significantly affected by the supply of, and demand for, specific
products (e.g., oil and natural gas) and services, exploration and production spending, government subsidization, world events and general economic
conditions.
Industrials Sector Risk. The value of securities issued by companies in the industrials sector may be adversely affected by supply and demand related to their specific products or services and industrials sector products in general. The
products of
12
Table of Contents
manufacturing companies may face obsolescence due to rapid technological
developments and frequent new product introduction. Government regulations, world events, economic conditions and exchange rates may adversely affect the performance of companies in the industrials sector. Companies in the industrials sector may be
adversely affected by liability for environmental damage and product liability claims. The industrials sector may also be adversely affected by changes or trends in commodity prices, which may be influenced by unpredictable factors.
Materials Sector Risk.
Companies in the materials sector may be adversely affected by commodity price volatility, exchange rates, import controls, increased competition, depletion of resources, technical advances, labor relations and government regulations, among other
factors. Also, companies in the materials sector are at risk of liability for environmental damage and product liability claims. Production of materials may exceed demand as a result of market imbalances or economic downturns, leading to poor
investment returns.
Mid-Capitalization Companies
Risk. Stock prices of mid-capitalization companies may be more volatile than those of large-capitalization companies and, therefore, the Fund’s share price may be more volatile than those of funds that invest
a larger percentage of their assets in stocks issued by large-capitalization companies. Stock prices of mid-capitalization companies are also more vulnerable than those of large-capitalization companies to adverse business or economic developments,
and the stocks of mid-capitalization companies may be less liquid, making it difficult for the Fund to buy and sell them. In addition, mid-capitalization companies generally have less diverse product lines than large-capitalization companies have
and are more susceptible to adverse developments related to their products.
Middle Eastern Economic Risk.
Many Middle Eastern countries have little or no democratic tradition and the political and legal systems in such countries may adversely impact the companies in which the Fund invests and the value of the Fund. Middle Eastern governments have
exercised and continue to exercise substantial influence over many aspects of the private sector. Many economies in the Middle East are highly reliant on income from the sale of oil or trade with countries involved in the sale of oil, and their
economies are therefore vulnerable to changes in the market for oil and foreign currency values. As global demand for oil fluctuates, many Middle Eastern economies may be significantly impacted. A sustained decrease in commodity prices could have a
significant negative impact on all aspects of the economy in the region. Middle Eastern economies may be subject to acts of terrorism, political strife, religious, ethnic or socioeconomic unrest and sudden outbreaks of hostilities with neighboring
countries.
Certain Middle Eastern countries have
strained relations with other Middle Eastern countries due to territorial disputes, historical animosities, religious tensions or defense concerns, which may adversely affect the economies of these countries. Certain Middle Eastern countries
experience significant unemployment, as well as widespread underemployment.
Recently, many Middle Eastern countries have experienced
political, economic and social unrest as protestors have called for widespread reform. Some of these protests have resulted in regime change. If further regime change were to occur in any of these
13
Table of Contents
countries, the new government may not immediately stabilize such country,
which could adversely affect the economies of Middle Eastern countries in which the Fund invests and could decrease the value of the Fund’s investments.
Utilities Sector Risk.
Deregulation is subjecting utility companies to greater competition and may adversely affect their profitability. As deregulation allows utility companies to diversify outside of their original geographic regions and their traditional lines of
business, utility companies may engage in riskier ventures. Companies in the utilities industry may have difficulty obtaining an adequate return on invested capital, raising capital, or financing large construction programs during periods of
inflation or unsettled capital markets; face restrictions on operations and increased cost and delays attributable to environmental considerations and regulation; find that existing plants, equipment or products have been rendered obsolete by
technological innovations; or be subject to increased costs because of the scarcity of certain fuels or the effects of man-made or natural disasters. Existing and future regulations or legislation may make it difficult for utility companies to
operate profitably. Government regulators monitor and control utility revenues and costs, and therefore may limit utility profits. In certain countries, regulatory authorities may also restrict utility companies’ access to new markets, thereby
diminishing these companies’ long-term prospects. There is no assurance that regulatory authorities will, in the future, grant rate increases, or that such increases will be adequate to permit the payment of dividends on stocks issued by a
utility company. The deregulation of certain utility companies may eliminate restrictions on profits, but may also subject these companies to greater risks of loss. Energy conservation and changes in climate policy may also have a significant
adverse impact on the revenues and expenses of utility companies.
Portfolio Holdings Information
A description of the Company's policies and procedures with
respect to the disclosure of the Fund’s portfolio securities is available in the Fund's Statement of Additional Information (“SAI”). The top holdings of the Fund can be found at www.iShares.com. Fund fact sheets provide information
regarding the Fund's top holdings and may be requested by calling 1-800-iShares (1-800-474-2737).
Management
Investment Adviser. As
investment adviser, BFA has overall responsibility for the general management and administration of the Company. BFA provides an investment program for the Fund and manages the investment of the Fund’s assets. In managing the Fund, BFA may
draw upon the research and expertise of its asset management affiliates with respect to certain portfolio securities. In seeking to achieve the Fund's investment objective, BFA uses teams of portfolio managers, investment strategists and other
investment specialists. This team approach brings together many disciplines and leverages BFA’s extensive resources.
Pursuant to the Investment Advisory Agreement between BFA and
the Company (entered into on behalf of the Fund), BFA is responsible for substantially all expenses of
14
Table of Contents
the
Fund, except interest expenses, taxes, brokerage expenses, future distribution fees or expenses and extraordinary expenses.
For its investment advisory services to the Fund, BFA will be
paid a management fee from the Fund based on a percentage of the Fund's average daily net assets, at an annual rate of 0.50%.
BFA is located at 400 Howard Street, San Francisco, CA 94105.
It is an indirect wholly-owned subsidiary of BlackRock, Inc. (“BlackRock”). As of June 30, 2014, BFA and its affiliates provided investment advisory services for assets in excess of $4.59 trillion. BFA and its affiliates deal, trade and
invest for their own accounts in the types of securities in which the Fund may also invest.
A discussion regarding the basis for the Company's Board of
Directors' (the “Board”) approval of the Investment Advisory Agreement with BFA will be available in the Fund's semi-annual report for the six-month period ending February 28.
Portfolio Managers. Matthew
Goff, Diane Hsiung, Jennifer Hsui and Greg Savage are primarily responsible for the day-to-day management of the Fund. Each Portfolio Manager is responsible for various functions related to portfolio management, including, but not limited to,
investing cash inflows, coordinating with members of his or her portfolio management team to focus on certain asset classes, implementing investment strategy, researching and reviewing investment strategy and overseeing members of his or her
portfolio management team that have more limited responsibilities.
Matthew Goff has been employed by BFA and BTC (formerly,
Barclays Global Investors, N.A. (“BGI”)) as a portfolio manager since 2008. Prior to that, Mr. Goff was a portfolio manager from 2007 to 2008 for US Trust, a product manager from 2006 to 2007 for Iris Financial Solutions and a product
manager from 2003 to 2006 for MSCI Barra. Mr. Goff has been a Portfolio Manager of the Fund since its inception.
Diane Hsiung has been employed by BFA and BTC as a senior
portfolio manager since 2007. Prior to that, Ms. Hsiung was a portfolio manager from 2002 to 2006 for BGFA and BGI. Ms. Hsiung has been a Portfolio Manager of the Fund since its inception.
Jennifer Hsui has been employed by BFA and BTC as a senior
portfolio manager since 2007. Prior to that, Ms. Hsui was a portfolio manager from 2006 to 2007 for BGFA and BGI. Ms. Hsui has been a Portfolio Manager of the Fund since its inception.
Greg Savage has been employed by BFA and BTC as a senior
portfolio manager since 2006. Prior to that, Mr. Savage was a portfolio manager from 2001 to 2006 for BGFA and BGI. Mr. Savage has been a Portfolio Manager of the Fund since its inception.
The Fund's SAI provides additional information about the
Portfolio Managers' compensation, other accounts managed by the Portfolio Managers and the Portfolio Managers' ownership (if any) of shares in the Fund.
Administrator, Custodian and Transfer Agent. State Street Bank and Trust Company (“State Street”) is the administrator, custodian and transfer agent for the Fund.
Conflicts of Interest. BFA
wants you to know that it has relationships with certain entities that may give rise to conflicts of interest or the appearance of conflicts of
15
Table of Contents
interest. These entities are BFA’s affiliates, including BlackRock and
The PNC Financial Services Group, Inc., and each of their affiliates, directors, partners, trustees, managing members, officers and employees (collectively, the “Affiliates”).
The activities of BFA and the Affiliates in the management of,
or their interest in, their own accounts and other accounts they manage, may present conflicts of interest that could disadvantage the Fund and its shareholders. BFA and the Affiliates provide investment management services to other funds and
discretionary managed accounts that may follow an investment program similar to that of the Fund. BFA and the Affiliates are involved worldwide with a broad spectrum of financial services and asset management activities and may engage in the
ordinary course of business in activities in which their interests or the interests of their clients may conflict with those of the Fund. BFA or one or more of the Affiliates acts, or may act, as an investor, investment banker, research provider,
investment manager, commodity trading advisor, financier, underwriter, adviser, market maker, trader, prime broker, lender, agent or principal, and have other direct and indirect interests in securities, currencies, commodities and other instruments
in which the Fund may directly or indirectly invest. Thus, it is likely that the Fund will have multiple business relationships with and will invest in, engage in transactions with, make voting decisions with respect to, or obtain services from,
entities for which BFA or an Affiliate seeks to perform investment banking or other services.
BFA or one or more Affiliates may engage in proprietary trading
and advise accounts and funds that have investment objectives similar to those of the Fund and/or that engage in and compete for transactions in the same types of securities, currencies and other instruments as the Fund, including in securities
issued by other open-end and closed-end management investment companies, which may include investment companies that are affiliated with the Fund and BFA, to the extent permitted under the Investment Company Act of 1940, as amended (the “1940
Act”). The trading activities of BFA and these Affiliates are carried out without reference to positions held directly or indirectly by the Fund and may result in BFA or an Affiliate having positions in certain securities that are adverse to
those of the Fund.
No Affiliate is under any obligation
to share any investment opportunity, idea or strategy with the Fund. As a result, an Affiliate may compete with the Fund for appropriate investment opportunities. As a result of this and several other factors, the results of the Fund's investment
activities may differ from those of an Affiliate and of other accounts managed by an Affiliate, and it is possible that the Fund could sustain losses during periods in which one or more Affiliates and other accounts achieve profits on their trading
for proprietary or other accounts. The opposite result is also possible.
The Fund may, from time to time, enter into transactions in
which BFA’s or an Affiliate’s clients have an interest adverse to the Fund. Furthermore, transactions undertaken by Affiliate-advised clients may adversely impact the Fund. Transactions by one or more Affiliate-advised clients or BFA may
have the effect of diluting or otherwise disadvantaging the values, prices or investment strategies of the Fund.
The Fund's activities may be limited because of regulatory
restrictions applicable to one or more Affiliates and/or their internal policies designed to comply with such
16
Table of Contents
restrictions. In addition, the Fund may invest in securities of companies with
which an Affiliate has developed or is trying to develop investment banking relationships or in which an Affiliate has significant debt or equity investments or other interests. The Fund also may invest in securities of companies for which an
Affiliate provides or may in the future provide research coverage. An Affiliate may have business relationships with, and purchase, distribute or sell services or products from or to, distributors, consultants or others who recommend the Fund or who
engage in transactions with or for the Fund, and may receive compensation for such services. The Fund may also make brokerage and other payments to Affiliates in connection with the Fund's portfolio investment transactions.
Pursuant to a securities lending program approved by the Board,
the Fund has retained an Affiliate of BFA to serve as the securities lending agent for the Fund to the extent that the Fund participates in the securities lending program. For these services, the lending agent may receive a fee from the Fund,
including a fee based on the returns earned on the Fund’s investment of the cash received as collateral for any loaned securities. BFA may receive compensation for managing the reinvestment of cash collateral. In addition, one or more
Affiliates may be among the entities to which the Fund may lend its portfolio securities under the securities lending program.
The activities of BFA or the Affiliates may give rise to other
conflicts of interest that could disadvantage the Fund and its shareholders. BFA has adopted policies and procedures designed to address these potential conflicts of interest. See the Fund's SAI for further information.
Shareholder Information
Additional shareholder information, including how to buy and
sell shares of the Fund, is available free of charge by calling toll-free: 1-800-iShares (1-800-474-2737) or visiting our website at www.iShares.com.
Buying and Selling Shares.
Shares of the Fund may be acquired or redeemed directly from the Fund only in Creation Units or multiples thereof, as discussed in the Creations and Redemptions section of this Prospectus. Only an Authorized Participant (as defined in the Creations and Redemptions section) may
engage in creation or redemption transactions directly with the Fund. Once created, shares of the Fund generally trade in the secondary market in amounts less than a Creation Unit.
Shares of the Fund are listed on a national securities exchange
for trading during the trading day. Shares can be bought and sold throughout the trading day like shares of other publicly traded companies. The Company does not impose any minimum investment for shares of the Fund purchased on an exchange. The
Fund's shares trade under the trading symbol “EMHZ.”
Buying or selling Fund shares on an exchange involves two types
of costs that may apply to all securities transactions. When buying or selling shares of the Fund through a broker, you will likely incur a brokerage commission or other charges determined by your broker. The commission is frequently a fixed amount
and may be a significant proportional cost for investors seeking to buy or sell small amounts of shares. In addition, you may incur the cost of the “spread,” that is, any difference between the
17
Table of Contents
bid
price and the ask price. The spread varies over time for shares of the Fund based on the Fund’s trading volume and market liquidity, and is generally lower if the Fund has a lot of trading volume and market liquidity, and higher if the Fund
has little trading volume and market liquidity (which is often the case for funds that are newly launched or small in size). The Fund's spread may also be impacted by the liquidity of the underlying securities held by the Fund, particularly for
newly launched or smaller funds or in instances of significant volatility of the underlying securities.
The Fund participates in the BATS Competitive Liquidity
Provider Program (the “Incentive Program”), which is designed to strengthen market quality by providing enhanced rebates for lead market makers (“LMMs”) in exchange traded products whose trading volumes do not exceed
specified levels. Rebates are allocated to eligible LMMs based on a competitive quote evaluation process. Rebates, which for the Fund may be up to $30,000 per year, are funded by a supplemental listing fee paid by the Adviser and not by the Fund.
BATS has proposed to amend the Incentive Program to restructure the incentive payments and eliminate the standard listing fee for exchange traded products. There are risks associated with the Incentive Program because it may act to artificially
influence trading in the Fund shares, and pricing and liquidity of the shares could be adversely impacted if the Fund were to leave the Incentive Program or the Incentive Program were discontinued. The Incentive Program is scheduled to terminate on
or about July 28, 2015. LMMs participating in the Incentive Program are restricted in their ability to finance Fund shares. Additional information about the Incentive Program is available on the website of BATS at
http://www.batstrading.com/listings/market_maker/etp/. This reference to the website does not incorporate the contents of the website into this prospectus.
The Board has adopted a policy of not monitoring for frequent
purchases and redemptions of Fund shares (“frequent trading”) that appear to attempt to take advantage of a potential arbitrage opportunity presented by a lag between a change in the value of the Fund’s portfolio securities after
the close of the primary markets for the Fund’s portfolio securities and the reflection of that change in the Fund’s NAV (“market timing”), because the Fund generally sells and redeems its shares directly through transactions
that are in-kind and/or for cash, subject to the conditions described below under Creations and Redemptions. The Board has not adopted a policy of monitoring for other frequent trading activity because shares
of the Fund are listed for trading on a national securities exchange.
The national securities exchange on which the Fund's shares are
listed is open for trading Monday through Friday and is closed on weekends and the following holidays: New Year’s Day, Martin Luther King, Jr. Day, Presidents’ Day, Good Friday, Memorial Day, Independence Day, Labor Day, Thanksgiving Day
and Christmas Day. The Fund’s primary Listing Exchange is BATS .
Section 12(d)(1) of the 1940 Act restricts investments by
investment companies in the securities of other investment companies. Registered investment companies are permitted to invest in the Fund beyond the limits set forth in Section 12(d)(1), subject to certain terms and conditions set forth in SEC rules
or in an SEC exemptive order issued to the Company. In order for a registered investment company to invest in shares of the Fund beyond the limitations of Section 12(d)(1) pursuant to the
18
Table of Contents
exemptive relief obtained by the Company, the registered investment company
must enter into an agreement with the Company.
Book Entry. Shares of the Fund are held in book-entry form, which means that no stock certificates are issued. The Depository Trust Company (“DTC”) or its nominee is the record owner of all outstanding shares of the
Fund and is recognized as the owner of all shares for all purposes.
Investors owning shares of the Fund are beneficial owners as
shown on the records of DTC or its participants. DTC serves as the securities depository for shares of the Fund. DTC participants include securities brokers and dealers, banks, trust companies, clearing corporations and other institutions that
directly or indirectly maintain a custodial relationship with DTC. As a beneficial owner of shares, you are not entitled to receive physical delivery of stock certificates or to have shares registered in your name, and you are not considered a
registered owner of shares. Therefore, to exercise any right as an owner of shares, you must rely upon the procedures of DTC and its participants. These procedures are the same as those that apply to any other securities that you hold in book-entry
or “street name” form.
Share Prices. The trading prices of the Fund’s shares in the secondary market generally differ from the Fund’s daily NAV and are affected by market forces such as supply of and demand for ETF shares and shares of
underlying securities held by the Fund, economic conditions and other factors. Information regarding the intraday value of shares of the Fund, also known as the “indicative optimized portfolio value” (“IOPV”), is disseminated
every 15 seconds throughout the trading day by the national securities exchange on which the Fund's shares are listed or by market data vendors or other information providers. The IOPV is based on the current market value of the securities and/or
cash required to be deposited in exchange for a Creation Unit. The IOPV does not necessarily reflect the precise composition of the current portfolio of securities held by the Fund at a particular point in time or the best possible valuation of the
current portfolio. Therefore, the IOPV should not be viewed as a “real-time” update of the Fund's NAV, which is computed only once a day. The IOPV is generally determined by using both current market quotations and/or price quotations
obtained from broker-dealers that may trade in the portfolio securities held by the Fund. The quotations of certain Fund holdings may not be updated during U.S. trading hours if such holdings do not trade in the United States. The Fund is not
involved in, or responsible for, the calculation or dissemination of the IOPV and makes no representation or warranty as to its accuracy.
Determination of Net Asset Value. The NAV of the Fund normally is determined once daily Monday through Friday, generally as of the regularly scheduled close of business of the New York Stock Exchange (“NYSE”) (normally 4:00 p.m., Eastern
time) on each day that the NYSE is open for trading, based on prices at the time of closing provided that (a) any Fund assets or liabilities denominated in currencies other than the U.S. dollar are translated into U.S. dollars at the prevailing
market rates on the date of valuation as quoted by one or more data service providers (as detailed below) and (b) U.S. fixed-income assets may be valued as of the announced closing time for trading in fixed-income instruments in a particular market
or exchange. The NAV of the Fund is calculated by dividing the value of the net assets of the Fund (i.e., the value of
19
Table of Contents
its
total assets less total liabilities) by the total number of outstanding shares of the Fund, generally rounded to the nearest cent.
The value of the securities and other assets and liabilities
held by the Fund are determined pursuant to valuation policies and procedures approved by the Board. The Fund's assets and liabilities are valued on the basis of market quotations, when readily available.
Equity investments are valued at market value, which is
generally determined using the last reported official closing price or last trading price on the exchange or market on which the security is primarily traded at the time of valuation.
The Fund invests in non-U.S. securities. Foreign currency
exchange rates are generally determined as of 4:00 p.m., London time. Non-U.S. securities held by the Fund may trade on weekends or other days when the Fund does not price its shares. As a result, the Fund’s NAV may change on days when
Authorized Participants will not be able to purchase or redeem Fund shares.
Generally, trading in non-U.S. securities, U.S. government
securities, money market instruments and certain fixed-income securities is substantially completed each day at various times prior to the close of business on the NYSE. The values of such securities used in computing the NAV of the Fund are
determined as of such times.
When market quotations are
not readily available or are believed by BFA to be unreliable, the Fund’s investments are valued at fair value. Fair value determinations are made by BFA in accordance with policies and procedures approved by the Company's Board. BFA may
conclude that a market quotation is not readily available or is unreliable if a security or other asset or liability does not have a price source due to its lack of liquidity, if a market quotation differs significantly from recent price quotations
or otherwise no longer appears to reflect fair value, where the security or other asset or liability is thinly traded, or where there is a significant event subsequent to the most recent market quotation. A “significant event” is an
event that, in the judgment of BFA, is likely to cause a material change to the closing market price of the asset or liability held by the Fund. Non-U.S. securities whose values are affected by volatility that occurs in U.S. markets for related or
highly correlated assets (e.g., American Depositary Receipts, Global Depositary Receipts or ETFs) on a trading day after the close of non-U.S. securities markets may be fair valued.
Fair value represents a good faith approximation of the value
of an asset or liability. The fair value of an asset or liability held by the Fund is the amount the Fund might reasonably expect to receive from the current sale of that asset or the cost to extinguish that liability in an arm’s-length
transaction. Valuing the Fund’s investments using fair value pricing will result in prices that may differ from current market valuations and that may not be the prices at which those investments could have been sold during the period in which
the particular fair values were used. Use of fair value prices and certain current market valuations could result in a difference between the prices used to calculate the Fund’s NAV and the prices used by the Underlying Index, which, in turn,
could result in a difference between the Fund’s performance and the performance of the Underlying Index.
20
Table of Contents
The value of assets or liabilities denominated in non-U.S.
currencies will be converted into U.S. dollars using prevailing market rates on the date of valuation as quoted by one or more data service providers. Use of a rate different from the rate used by the Index Provider may adversely affect the
Fund’s ability to track the Underlying Index.
Dividends and Distributions
General Policies. Dividends
from net investment income, if any, generally are declared and paid at least once a year by the Fund. Distributions of net realized securities gains, if any, generally are declared and paid once a year, but the Company may make distributions on a
more frequent basis for the Fund. The Company reserves the right to declare special distributions if, in its reasonable discretion, such action is necessary or advisable to preserve its status as a regulated investment company (“RIC”) or
to avoid imposition of income or excise taxes on undistributed income or realized gains.
Dividends and other distributions on shares of the Fund are
distributed on a pro rata basis to beneficial owners of such shares. Dividend payments are made through DTC participants and indirect participants to beneficial owners then of record with proceeds received
from the Fund.
Dividend Reinvestment Service. No dividend reinvestment service is provided by the Company. Broker-dealers may make available the DTC book-entry Dividend Reinvestment Service for use by beneficial owners of the Fund for reinvestment of their dividend
distributions. Beneficial owners should contact their broker to determine the availability and costs of the service and the details of participation therein. Brokers may require beneficial owners to adhere to specific procedures and timetables. If
this service is available and used, dividend distributions of both income and realized gains will be automatically reinvested in additional whole shares of the Fund purchased in the secondary market.
Taxes. As with any investment,
you should consider how your investment in shares of the Fund will be taxed. The tax information in this Prospectus is provided as general information, based on current law. You should consult your own tax professional about the tax consequences of
an investment in shares of the Fund.
Unless your
investment in Fund shares is made through a tax-exempt entity or tax-deferred retirement account, such as an IRA, you need to be aware of the possible tax consequences when the Fund makes distributions or you sell Fund shares.
Taxes on Distributions.
Distributions from the Fund’s net investment income (other than qualified dividend income), including distributions of income from securities lending and distributions out of the Fund’s net short-term capital gains, if any, are taxable
to you as ordinary income. Distributions by the Fund of net long-term capital gains in excess of net short-term capital losses (capital gain dividends) are taxable to you as long-term capital gains, regardless of how long you have held the
Fund’s shares. Distributions by the Fund that qualify as qualified dividend income are taxable to you at long-term capital gain rates. Long-term capital gains and qualified dividend income are generally eligible for taxation at a maximum rate
of 15% for non-corporate shareholders with incomes below approximately $400,000 ($450,000 if married and filing jointly), adjusted annually for inflation, and 20% for individuals with any income above these amounts that is net long-term capital gain
or qualified dividend income. In
21
Table of Contents
addition, a 3.8% U.S. federal Medicare contribution tax is imposed on
“net investment income,” including, but not limited to, interest, dividends, and net gain, of U.S. individuals with income exceeding $200,000 (or $250,000 if married and filing jointly) and of estates and trusts.
Dividends will be qualified dividend income to you if they are
attributable to qualified dividend income received by the Fund. Generally, qualified dividend income includes dividend income from taxable U.S. corporations and qualified non-U.S. corporations, provided that the Fund satisfies certain holding period
requirements in respect of the stock of such corporations and has not hedged its position in the stock in certain ways. Substitute dividends received by the Fund with respect to dividends paid on securities lent out will not be qualified dividend
income. For this purpose, a qualified non-U.S. corporation means any non-U.S. corporation that is eligible for benefits under a comprehensive income tax treaty with the United States, which includes an exchange of information program, or if the
stock with respect to which the dividend was paid is readily tradable on an established United States securities market. The term excludes a corporation that is a passive foreign investment company.
Dividends received by the Fund from a RIC generally are
qualified dividend income only to the extent the dividend distributions are made out of qualified dividend income received by such RIC. It is expected that dividends received by the Fund from a REIT and distributed to a shareholder generally will be
taxable to the shareholder as ordinary income.
For a
dividend to be treated as qualified dividend income, the dividend must be received with respect to a share of stock held without being hedged by the Fund, and with respect to a share of the Fund held without being hedged by you, for 61 days during
the 121-day period beginning at the date which is 60 days before the date on which such share becomes ex-dividend with respect to such dividend or, in the case of certain preferred stock, 91 days during the 181-day period beginning 90 days before
such date.
If your Fund shares are loaned out pursuant to
a securities lending arrangement, you may lose the ability to use foreign tax credits passed through by the Fund or to treat Fund dividends paid while the shares are held by the borrower as qualified dividend income.
In general, your distributions are subject to U.S. federal
income tax for the year when they are paid. Certain distributions paid in January, however, may be treated as paid on December 31 of the prior year.
If the Fund’s distributions exceed current and
accumulated earnings and profits, all or a portion of the distributions made in the taxable year may be recharacterized as a return of capital to shareholders. Distributions in excess of the Fund’s minimum distribution requirements, but not in
excess of the Fund’s earnings and profits, will be taxable to shareholders and will not constitute nontaxable returns of capital. A return of capital distribution generally will not be taxable but will reduce the shareholder’s cost basis
and result in a higher capital gain or lower capital loss when those shares on which the distribution was received are sold. Once a shareholder's cost basis is
22
Table of Contents
reduced to zero, further distributions will be treated as capital gain, if the
shareholder holds shares of the Fund as capital assets.
If you are neither a resident nor a citizen of the United
States or if you are a non-U.S. entity, the Fund’s ordinary income dividends (which include distributions of net short-term capital gains) will generally be subject to a 30% U.S. withholding tax, unless a lower treaty rate applies, provided
that withholding tax will generally not apply to any gain or income realized by a non-U.S. shareholder in respect of any distributions of long-term capital gains or upon the sale or other disposition of shares of the Fund.
A 30% withholding tax will be imposed on U.S.-source dividends,
interest and other income items paid after June 30, 2014, and proceeds from the sale of property producing U.S.-source dividends and interest paid after December 31, 2016, to (i) foreign financial institutions, including non-U.S. investment funds,
unless they agree to collect and disclose to the Internal Revenue Service (“IRS”) information regarding their direct and indirect U.S. account holders and (ii) certain other foreign entities, unless they certify certain information
regarding their direct and indirect U.S. owners. To avoid withholding, foreign financial institutions will need to (i) enter into agreements with the IRS that state that they will provide the IRS information, including the names, addresses and
taxpayer identification numbers of direct and indirect U.S. account holders, comply with due diligence procedures with respect to the identification of U.S. accounts, report to the IRS certain information with respect to U.S. accounts maintained,
agree to withhold tax on certain payments made to non-compliant foreign financial institutions or to account holders who fail to provide the required information, and determine certain other information concerning their account holders, or (ii) in
the event that an applicable intergovernmental agreement and implementing legislation are adopted, provide local revenue authorities with similar account holder information. Other foreign entities may need to report the name, address, and taxpayer
identification number of each substantial U.S. owner or provide certifications of no substantial U.S. ownership unless certain exceptions apply.
Dividends, interest and capital gains earned by the Fund with
respect to non-U.S. securities may give rise to withholding and other taxes imposed by non-U.S. countries. Tax conventions between certain countries and the United States may reduce or eliminate such taxes. If more than 50% of the total assets of
the Fund at the close of a year consists of non-U.S. stocks or securities, the Fund may “pass through” to you certain non-U.S. income taxes (including withholding taxes) paid by the Fund. This means that you would be considered to have
received as an additional dividend your share of such non-U.S. taxes, but you may be entitled to either a corresponding tax deduction in calculating your taxable income, or, subject to certain limitations, a credit in calculating your U.S. federal
income tax.
For purposes of foreign tax credits for U.S.
shareholders of the Fund, foreign capital gains taxes may not produce associated foreign source income, thereby limiting a U.S. person's ability to use such credits.
If you are a resident or a citizen of the United States, by
law, back-up withholding at a 28% rate will apply to your distributions and proceeds if you have not provided a taxpayer identification number or social security number and made other required certifications.
23
Table of Contents
Taxes When Shares are Sold.
Currently, any capital gain or loss realized upon a sale of Fund shares is generally treated as a long-term gain or loss if the shares have been held for more than one year. Any capital gain or loss realized upon a sale of Fund shares held for one
year or less is generally treated as short-term gain or loss, except that any capital loss on the sale of shares held for six months or less is treated as long-term capital loss to the extent that capital gain dividends were paid with respect to
such shares. Any such capital gains, including from sales of Fund shares or from capital gain dividends, are included in “net investment income” for purposes of the 3.8% U.S. federal Medicare contribution tax mentioned
above.
If your shares are lent out pursuant to a
securities lending arrangement, you may lose the ability to use the non-U.S. tax credits passed through by the Fund or to treat Fund dividends (paid while the shares are held by the borrower) as qualified dividend income.
The foregoing discussion summarizes some of the consequences
under current U.S. federal tax law of an investment in the Fund. It is not a substitute for personal tax advice. You may also be subject to state and local taxation on Fund distributions and sales of shares. Consult your personal tax advisor about
the potential tax consequences of an investment in shares of the Fund under all applicable tax laws.
Creations and Redemptions.
Prior to trading in the secondary market, shares of the Fund are “created” at NAV by market makers, large investors and institutions only in block-size Creation Units of 50,000 shares or multiples thereof. Each “creator” or
“Authorized Participant” enters into an authorized participant agreement with the Fund's distributor, BlackRock Investments, LLC (the “Distributor”), an affiliate of BFA.
A creation transaction, which is subject to acceptance by the
transfer agent, generally takes place when an Authorized Participant deposits into the Fund a designated portfolio of securities (including any portion of such securities for which cash may be substituted) and a specified amount of cash
approximating the holdings of the Fund in exchange for a specified number of Creation Units. To the extent practicable, the composition of such portfolio generally corresponds pro rata to the holdings of the
Fund. However, creation and redemption baskets may differ.
Similarly, shares can be redeemed only in Creation Units,
generally for a designated portfolio of securities (including any portion of such securities for which cash may be substituted) held by the Fund and a specified amount of cash. Except when aggregated in Creation
Units, shares are not redeemable by the Fund.
The
prices at which creations and redemptions occur are based on the next calculation of NAV after a creation or redemption order is received in an acceptable form under the authorized participant agreement.
Only an Authorized Participant may create or redeem Creation
Units directly with the Fund.
In the event of a system
failure or other interruption, including disruptions at market makers or Authorized Participants, orders to purchase or redeem Creation Units either may not be executed according to the Fund's instructions or may not be executed at all, or the Fund
may not be able to place or change orders.
24
Table of Contents
To the extent the Fund engages in in-kind transactions, the
Fund intends to comply with the U.S. federal securities laws in accepting securities for deposit and satisfying redemptions with redemption securities by, among other means, assuring that any securities accepted for deposit and any securities used
to satisfy redemption requests will be sold in transactions that would be exempt from registration under the Securities Act of 1933, as amended (the “1933 Act”). Further, an Authorized Participant that is not a “qualified
institutional buyer,” as such term is defined under Rule 144A of the 1933 Act, will not be able to receive restricted securities eligible for resale under Rule 144A.
Creations and redemptions must be made through a firm that is
either a member of the Continuous Net Settlement System of the National Securities Clearing Corporation or a DTC participant and has executed an agreement with the Distributor with respect to creations and redemptions of Creation Unit aggregations.
Information about the procedures regarding creation and redemption of Creation Units (including the cut-off times for receipt of creation and redemption orders) is included in the Fund's SAI.
Because new shares may be created and issued on an ongoing
basis, at any point during the life of the Fund a “distribution,” as such term is used in the 1933 Act, may be occurring. Broker-dealers and other persons are cautioned that some activities on their part may, depending on the
circumstances, result in their being deemed participants in a distribution in a manner that could render them statutory underwriters and subject to the prospectus delivery and liability provisions of the 1933 Act. Any determination of whether one is
an underwriter must take into account all the relevant facts and circumstances of each particular case.
Broker-dealers should also note that dealers who are not
“underwriters” but are participating in a distribution (as contrasted to ordinary secondary transactions), and thus dealing with shares that are part of an “unsold allotment” within the meaning of Section 4(a)(3)(C) of the
1933 Act, would be unable to take advantage of the prospectus delivery exemption provided by Section 4(a)(3) of the 1933 Act. For delivery of prospectuses to exchange members, the prospectus delivery mechanism of Rule 153 under the 1933 Act is
available only with respect to transactions on a national securities exchange.
Costs Associated with Creations and Redemptions. Authorized Participants are charged standard creation and redemption transaction fees to offset transfer, processing and other transaction costs associated with the issuance and redemption of Creation Units. The
standard creation and redemption transaction fees are set forth in the table below. The standard creation and redemption transaction fees are charged on each Creation Unit created or redeemed, as applicable, by an Authorized Participant on the day
of the transaction. The standard transaction fee is generally fixed at the amount shown in the table regardless of the number of Creation Units being purchased or redeemed, but may be reduced by the Fund if transfer and processing expenses
associated with the creation or redemption are anticipated to be lower than the stated fee. If a purchase or redemption consists solely or partially of cash, the Authorized Participant may be required to pay an additional transaction charge (up to
the maximum amounts shown in the table below) to cover brokerage and certain other costs related to a creation or redemption transaction. Investors who use the services
25
Table of Contents
of a
broker or other financial intermediary to acquire or dispose of Fund shares may pay fees for such services.
The following table shows, as of October 6, 2014, the
approximate value of one Creation Unit, standard fees and maximum additional charges for creations and redemptions (as described above):
| Approximate
Value of a Creation Unit |
Creation
Unit Size |
Standard
Creation/ Redemption Transaction Fee |
Maximum
Additional Charge for Creations* |
Maximum
Additional Charge for Redemptions* | ||||
| $1,250,000 | 50,000 | $10,500 | 3.0% | 2.0% |
| * | As a percentage of the net asset value per Creation Unit, inclusive, in the case of redemptions, of the standard redemption transaction fee. |
If a purchase or redemption consists solely or partially of
cash and the Fund places a brokerage transaction for portfolio securities with the Authorized Participant or its affiliated broker-dealer, the Authorized Participant (or its affiliated broker-dealer) may be required, in its capacity as broker-dealer
with respect to that transaction, to cover certain brokerage, tax, foreign exchange, execution, and market impact costs through a brokerage execution guarantee, as further described in the Fund’s SAI.
Householding. Householding is
an option available to certain Fund investors. Householding is a method of delivery, based on the preference of the individual investor, in which a single copy of certain shareholder documents can be delivered to investors who share the same
address, even if their accounts are registered under different names. Please contact your broker-dealer if you are interested in enrolling in householding and receiving a single copy of prospectuses and other shareholder documents, or if you are
currently enrolled in householding and wish to change your householding status.
Distribution
The Distributor or its agent distributes Creation Units for the
Fund on an agency basis. The Distributor does not maintain a secondary market in shares of the Fund. The Distributor has no role in determining the policies of the Fund or the securities that are purchased or sold by the Fund. The
Distributor’s principal address is 1 University Square Drive, Princeton, NJ 08540.
BFA or its Affiliates make payments to broker-dealers,
registered investment advisers, banks or other intermediaries (together, “intermediaries”) related to marketing activities and presentations, educational training programs, conferences, the development of technology platforms and
reporting systems, or their making shares of the Fund and certain other iShares funds available to their customers generally and in certain investment programs. Such payments, which may be significant to the intermediary, are not made by the Fund.
Rather, such payments are made by BFA or its Affiliates from their own resources, which come directly or indirectly in part from fees paid by the iShares funds complex. Payments of this type are sometimes referred to as revenue-sharing payments. A
financial intermediary may make decisions about which
26
Table of Contents
investment options it recommends or makes available, or the level of services
provided, to its customers based on the payments it is eligible to receive. Therefore, such payments to an intermediary create conflicts of interest between the intermediary and its customers and may cause the intermediary to recommend the Fund or
other iShares funds over another investment. More information regarding these payments is contained in the Fund's SAI. Please contact your salesperson or other investment professional for more information regarding
any such payments his or her firm may receive from BFA or its Affiliates.
Financial Highlights
Financial highlights for the Fund are not available because, as
of the effective date of this Prospectus, the Fund has not commenced operations, and therefore has no financial highlights to report.
27
Table of Contents
Index Provider
MSCI is a leading provider of investment decision support tools
to investors globally. MSCI products and services include indices, portfolio risk and performance analytics, and governance tools. MSCI is not affiliated with the Company, BFA, State Street, the Distributor or any of their respective
affiliates.
BFA or its affiliates have entered into a
license agreement with the Index Provider to use the Underlying Index. BFA or its affiliates sublicense rights in the Underlying Index to the Company at no charge.
Disclaimers
The Fund is not sponsored, endorsed, sold or promoted by MSCI or
any affiliate of MSCI. Neither MSCI nor any other party makes any representation or warranty, express or implied, to the owners of the Fund or any member of the public regarding advisability of investing in funds generally or in the Fund
particularly or the ability of the Underlying Index to track general stock market performance. MSCI is the licensor of certain trademarks, service marks and trade names of MSCI and of the Underlying Index which is determined, composed and calculated
by MSCI without regard to the issuer of the Fund or the Fund. MSCI has no obligation to take the needs of the issuer of the Fund or the owners of the Fund into consideration in determining, composing or calculating the Underlying Index. MSCI is not
responsible for and has not participated in the determination of the timing of, prices at, or quantities of the Fund to be issued or in the determination or calculation of the equation by which the Fund is redeemable for cash. Neither MSCI nor any
other party has any obligation or liability to owners of the Fund in connection with the administration, marketing or trading of the Fund.
ALTHOUGH MSCI SHALL OBTAIN INFORMATION FOR INCLUSION IN OR FOR
USE IN THE CALCULATION OF THE INDEXES FROM SOURCES WHICH MSCI CONSIDERS RELIABLE, NEITHER MSCI NOR ANY OTHER PARTY GUARANTEES THE ACCURACY AND/OR THE COMPLETENESS OF THE INDEXES OR ANY DATA INCLUDED THEREIN. NEITHER MSCI NOR ANY OTHER PARTY MAKES
ANY WARRANTY, EXPRESS OR IMPLIED, AS TO RESULTS TO BE OBTAINED BY LICENSEE, LICENSEE'S CUSTOMERS AND COUNTERPARTIES, OWNERS OF THE FUND, OR ANY OTHER PERSON OR ENTITY FROM THE USE OF THE INDEXES OR ANY DATA INCLUDED THEREIN IN CONNECTION WITH THE
RIGHTS LICENSED HEREUNDER OR FOR ANY OTHER USE. NEITHER MSCI NOR ANY OTHER PARTY MAKES ANY EXPRESS OR IMPLIED WARRANTIES, AND MSCI HEREBY EXPRESSLY DISCLAIMS ALL WARRANTIES OF MERCHANTABILITY OR FITNESS FOR A PARTICULAR PURPOSE WITH RESPECT TO THE
INDEXES OR ANY DATA INCLUDED THEREIN. WITHOUT LIMITING ANY OF THE FOREGOING, IN NO EVENT SHALL MSCI OR ANY OTHER PARTY HAVE ANY LIABILITY FOR ANY DIRECT, INDIRECT, SPECIAL, PUNITIVE, CONSEQUENTIAL OR ANY OTHER DAMAGES (INCLUDING LOST PROFITS) EVEN
IF NOTIFIED OF THE POSSIBILITY OF SUCH DAMAGES.
28
Table of Contents
Shares of the Fund are not sponsored, endorsed or promoted by
BATS. BATS makes no representation or warranty, express or implied, to the owners of the shares of the Fund or any member of the public regarding the ability of the Fund to track the total return performance of the Underlying Index or the ability of
the Underlying Index to track stock market performance. BATS is not responsible for, nor has it participated in, the determination of the compilation or the calculation of the Underlying Index, nor in the determination of the timing of, prices of,
or quantities of shares of the Fund to be issued, nor in the determination or calculation of the equation by which the shares are redeemable. BATS has no obligation or liability to owners of the shares of the Fund in connection with the
administration, marketing or trading of the shares of the Fund.
BATS does not guarantee the accuracy and/or the completeness of
the Underlying Index or any data included therein. BATS makes no warranty, express or implied, as to results to be obtained by the Company on behalf of the Fund as licensee, licensee’s customers and counterparties, owners of the shares of the
Fund, or any other person or entity from the use of the subject index or any data included therein in connection with the rights licensed as described herein or for any other use. BATS makes no express or implied warranties and hereby expressly
disclaims all warranties of merchantability or fitness for a particular purpose with respect to the Underlying Index or any data included therein. Without limiting any of the foregoing, in no event shall BATS have any liability for any direct,
indirect, special, punitive, consequential or any other damages (including lost profits) even if notified of the possibility of such damages.
The past performance of the Underlying Index is not a guide to
future performance. BFA does not guarantee the accuracy or the completeness of the Underlying Index or any data included therein and BFA shall have no liability for any errors, omissions or interruptions therein. BFA makes no warranty, express or
implied, to the owners of shares of the Fund or to any other person or entity, as to results to be obtained by the Fund from the use of the Underlying Index or any data included therein. Without limiting any of the foregoing, in no event shall BFA
have any liability for any special, punitive, direct, indirect or consequential damages (including lost profits), even if notified of the possibility of such damages.
29
Table of Contents
[THIS PAGE INTENTIONALLY LEFT BLANK]
Table of Contents
Table of Contents
|
|
For more information visit www.iShares.com or call
1-800-474-2737
Copies of the Prospectus, SAI and other
information can be found on our website at www.iShares.com. For more information about the Fund, you may request a copy of the SAI. The SAI provides detailed information about the Fund and is incorporated by reference into this Prospectus. This
means that the SAI, for legal purposes, is a part of this Prospectus.
If you have any questions about the Company or shares of the
Fund or you wish to obtain the SAI free of charge, please:
| Call: | 1-800-iShares
or 1-800-474-2737 (toll free) Monday through Friday, 8:30 a.m. to 6:30 p.m. (Eastern time) |
| Email: | iSharesETFs@blackrock.com |
| Write: | c/o
BlackRock Investments, LLC 1 University Square Drive, Princeton, NJ 08540 |
Information about the Fund (including the SAI) can be reviewed
and copied at the SEC's Public Reference Room in Washington, D.C., and information on the operation of the Public Reference Room may be obtained by calling the SEC at 1-202-551-8090. Reports and other information about the Fund are available on the
EDGAR database on the SEC's website at www.sec.gov, and copies of this information may be obtained, after paying a duplicating fee, by electronic request at the following e-mail address: publicinfo@sec.gov, or by writing to the SEC's Public
Reference Section, Washington, D.C. 20549-1520.
No person
is authorized to give any information or to make any representations about the Fund and its shares not contained in this Prospectus and you should not rely on any other information. Read and keep this Prospectus for future reference.
©2014 BlackRock, Inc. All rights reserved. iSHARES and BLACKROCK are registered trademarks of BFA and its affiliates. All other marks are the property of their respective owners.
Investment Company Act File No.: 811-09102
IS-P-EMHZ-0115
