
iShares®
The following changes will take effect
for the Fund on February 11, 2013 or as soon as practicable thereafter.
| Current | New | |
| Fund Name | iShares MSCI Brazil Index Fund | iShares MSCI Brazil Capped Index Fund |
| Underlying Index | MSCI Brazil Index | MSCI Brazil 25/50 Index |
| Investment Policy | The iShares MSCI Brazil Index Fund seeks investment results that correspond generally to the price and yield performance, before fees and expenses, of the MSCI Brazil Index. | The iShares MSCI Brazil Capped Index Fund seeks investment results that correspond generally to the price and yield performance, before fees and expenses, of the MSCI Brazil 25/50 Index. |
| Description of Underlying Index | The MSCI Brazil Index consists of stocks traded primarily on the BM&FBOVESPA (the Brazilian exchange). | The MSCI Brazil 25/50 Index consists of stocks traded primarily on the BM&FBOVESPA (the Brazilian exchange). A capping methodology is applied that limits the weight of any single component to a maximum of 25% of the MSCI Brazil 25/50 Index. Additionally, the sum of the components that individually constitute more than 5% of the weight of the MSCI Brazil 25/50 Index cannot exceed a maximum of 50% of the weight of the MSCI Brazil 25/50 Index in the aggregate. |
If you have any questions, please call
1-800-iShares (1-800-474-2737).
iSHARES® MSCI BRAZIL INDEX
FUND
Ticker: EWZStock Exchange: NYSE Arca
Investment Objective
The iShares MSCI Brazil Index Fund (the
“Fund”) seeks investment results that correspond generally to the price and yield performance, before fees and expenses, of the MSCI Brazil Index (the “Underlying Index”).
Fees and Expenses
The following table describes the fees and
expenses that you will incur if you own shares of the Fund. The investment advisory agreement between iShares, Inc. (the “Company”) and BlackRock Fund Advisors (“BFA”) (the “Investment Advisory Agreement”)
provides that BFA will pay all operating expenses of the Fund, except interest expenses, taxes, brokerage expenses, future distribution fees or expenses, and extraordinary expenses.
You may also incur usual and customary brokerage
commissions when buying or selling shares of the Fund, which are not reflected in the example that follows:
| Annual
Fund Operating Expenses (ongoing expenses that you pay each year as a percentage of the value of your investments) | |||
| Management
Fees |
Distribution
and Service (12b-1) Fees |
Other
Expenses |
Total
Annual Fund Operating Expenses |
| 0.61% | None | None | 0.61% |
Example. This Example is intended to help you compare the cost of owning shares of the Fund with the cost of investing in other funds. The Example assumes that you invest $10,000 in the Fund for the time periods indicated and
then sell all of your shares at the end of those periods. The Example also assumes that your investment has a 5% return each year and that the Fund’s operating expenses remain the same. Although your actual costs may be higher or lower, based
on these assumptions, your costs would be:
| 1 Year | 3 Years | 5 Years | 10 Years |
| $62 | $195 | $340 | $762 |
S-1
Performance Information
The bar chart and table that follow show how the
Fund has performed on a calendar year basis and provide an indication of the risks of investing in the Fund. Both assume that all dividends and distributions have been reinvested in the Fund. Past performance (before and after taxes) does not
necessarily indicate how the Fund will perform in the future. Supplemental information about the Fund’s performance is shown under the heading Total Return Information in the Supplemental Information section of the Fund's prospectus (the “Prospectus”).
Year by Year Returns1 (Years Ended December 31)
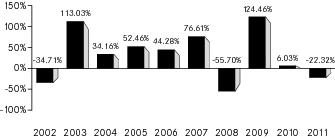
| 1 | The Fund’s total return for the nine months ended September 30, 2012 was -3.69%. |
The best calendar quarter return during the
periods shown above was 41.20% in the 2nd quarter of 2009; the worst was -40.27% in the 3rd quarter of 2002.
Updated performance information is available at
www.iShares.com or by calling 1-800-iShares (1-800-474-2737) (toll free).
Average Annual Total Returns
(for the periods ended December 31, 2011)
(for the periods ended December 31, 2011)
| One Year | Five Years | Ten Years | |
| (Inception Date: 7/10/2000) | |||
| Return Before Taxes | -22.32% | 7.66% | 19.50% |
| Return After Taxes on Distributions1 | -22.70% | 6.65% | 18.71% |
| Return After Taxes on Distributions and Sale of Fund Shares1 | -14.20% | 6.16% | 17.45% |
| MSCI Brazil Index (Index returns do not reflect deductions for fees, expenses or taxes) | -21.85% | 8.35% | 21.23% |
| 1 | After-tax returns in the table above are calculated using the historical highest individual U.S. federal marginal income tax rates and do not reflect the impact of state or local taxes. Actual after-tax returns depend on an investor’s tax situation and may differ from those shown, and after-tax returns shown are not relevant to tax-exempt investors or investors who hold shares through tax-deferred arrangements, such as 401(k) plans or individual retirement accounts (“IRAs”). Fund returns after taxes on distributions and sales of Fund shares are calculated assuming that an investor has sufficient capital gains of the same character from other investments to offset any capital losses from the sale of Fund shares. As a result, Fund returns after taxes on distributions and sales of Fund shares may exceed Fund returns before taxes and/or returns after taxes on distributions. |
S-6

For more information
visit www.iShares.com or call 1-800-474-2737
Investment Company Act file No.: 811-09102
IS-SP-EWZ-0113
