Q2 2015 Redwood Review
|
|
REDWOOD TRUST |
T A B L E O F C O N T E N T S |
|
| |
Introduction | |
| |
Shareholder Letter | |
| |
Quarterly Overview | |
| |
Ñ Second Quarter 2015 Highlights | |
| |
Ñ GAAP Earnings | |
| |
Ñ GAAP Book Value | |
| |
Ñ Quarterly Investment Activity | |
| |
Ñ Analysis of GAAP Results by Business Segment | |
| |
Ñ Capital and Liquidity | |
| |
Financial Insights | |
| |
Ñ Balance Sheet | |
| |
Ñ Residential Loans | |
| |
Ñ Real Estate Securities | |
| |
Ñ Commercial Loans | |
| |
Ñ MSRs | |
| |
Ñ Corporate Long-term Debt | |
| |
Appendix | |
| |
Ñ Changes to Financial Statement Presentation | |
| |
Ñ Redwood’s Business Overview | |
| |
Ñ Dividend Policy | |
| |
Ñ Glossary | |
| |
Ñ Financial Tables | |
|
|
|
THE REDWOOD REVIEW I 2ND QUARTER 2015 1 |
|
|
REDWOOD TRUST |
C A U T I O N A R Y S T A T E M E N T |
This Redwood Review contains forward-looking statements within the meaning of the safe harbor provisions of the Private Securities Litigation Reform Act of 1995. Forward-looking statements involve numerous risks and uncertainties. Our actual results may differ from our expectations, estimates, and projections and, consequently, you should not rely on these forward-looking statements as predictions of future events. Forward-looking statements are not historical in nature and can be identified by words such as “anticipate,” “estimate,” “will,” “should,” “expect,” “believe,” “intend,” “seek,” “plan,” and similar expressions or their negative forms, or by references to strategy, plans, goals, or intentions. These forward-looking statements are subject to risks and uncertainties, including, among other things, those described in our most recent Annual Report on Form 10-K under the caption “Risk Factors.” Other risks, uncertainties, and factors that could cause actual results to differ materially from those projected are described below and may be described from time to time in reports we file with the Securities and Exchange Commission, including reports on Forms 10-K, 10-Q, and 8-K. We undertake no obligation to update or revise forward-looking statements, whether as a result of new information, future events, or otherwise.
Statements regarding the following subjects, among others, are forward-looking by their nature: (i) statements we make regarding Redwood’s business strategy and strategic focus, including statements relating to our confidence in our overall market position, strategy and long-term prospects, and our belief in the long-term efficiency of private label securitization as a form of mortgage financing; (ii) statements related to our expectations regarding market conditions and interest rate volatility during the remainder of 2015; (iii) statements related to our residential mortgage banking activities, including our expectations to purchase $5.5 - $7 billion of jumbo loans and $6 - $7 billion of conforming loans, with average loan sale profit margins within our long-term target range of 25 to 50 basis points, our expectations with respect to the expansion of the MPF Direct initiative with FHLB-member banks, and statements related to leveraging our conforming loan business to create tailored Agency securities that could attract higher prices from investors; (iv) statements we make regarding additional opportunities to participate in risk-sharing transactions with the GSEs; (v) statements we make regarding the outlook for our commercial business, including statements regarding our pipeline of senior loans (loans closed or under application) at June 30, 2015 and at July 31, 2015, our expectation to originate $1.0 - $1.25 billion of senior commercial loans in 2015 at margins in line with our 1.5% goal, our expectations regarding industry-wide origination volumes over the next two-to-three years, and our intentions to add expand our commercial platform; (vi) statements relating to sources of capital, including our belief that capital is available to us through our normal portfolio activities, and our expectation that an increase in the borrowing capacity of our FHLB-member subsidiary should allow for a significant increase in the portfolio of residential loans our subsidiary holds for long-term investment; (vii) statements regarding our expectations regarding financial and operating results for the remainder of 2015, including expectations regarding operating expenses, and our expectations regarding the long-term investment returns on our MSR investments and residential loans held-for-investment, (viii) statements relating to acquiring residential mortgage loans in the future that we have identified for purchase or plan to purchase, including the amount of such loans that we
|
|
|
THE REDWOOD REVIEW I 2ND QUARTER 2015 2 |
|
|
REDWOOD TRUST |
C A U T I O N A R Y S T A T E M E N T |
identified for purchase during the second quarter of 2015 and at June 30, 2015, and statements relating to expected fallout and the corresponding volume of residential mortgage loans expected to be available for purchase; (ix) statements relating to our estimate of our available capital (including that we estimate our available capital at June 30, 2015 to be approximately $156 million); (x) statements we make regarding our dividend policy, including our intention to pay a regular dividend of $0.28 per share per quarter in 2015; and (xi) statements regarding our expectations and estimates relating to the characterization for income tax purposes of our dividend distributions, our expectations and estimates relating to tax accounting, tax liabilities and tax savings, and GAAP tax provisions, our estimates of REIT taxable income and TRS taxable income, and our anticipation of additional credit losses for tax purposes in future periods (and, in particular, our statement that, for tax purposes, we expect an additional $30 million of tax credit losses on residential securities we currently own to be realized over an estimated three- to five-year period).
Important factors, among others, that may affect our actual results include: general economic trends, the performance of the housing, commercial real estate, mortgage, credit, and broader financial markets, and their effects on the prices of earning assets and the credit status of borrowers; federal and state legislative and regulatory developments, and the actions of governmental authorities, including those affecting the mortgage industry or our business (including, but not limited to, the Federal Housing Finance Agency’s notice of proposed rulemaking relating to FHLB membership requirements and the potential implications for our captive insurance subsidiary’s membership in the FHLB); developments related to the fixed income and mortgage finance markets and the Federal Reserve’s statements regarding its future open market activity and monetary policy; our exposure to credit risk and the timing of credit losses within our portfolio; the concentration of the credit risks we are exposed to, including due to the structure of assets we hold and the geographical concentration of real estate underlying assets we own; our exposure to adjustable-rate mortgage loans; the efficacy and expense of our efforts to manage or hedge credit risk, interest rate risk, and other financial and operational risks; changes in credit ratings on assets we own and changes in the rating agencies’ credit rating methodologies; changes in interest rates; changes in mortgage prepayment rates; the availability of assets for purchase at attractive prices and our ability to reinvest cash we hold; changes in the values of assets we own; changes in liquidity in the market for real estate securities and loans; our ability to finance the acquisition of real estate-related assets with short-term debt; the ability of counterparties to satisfy their obligations to us; our involvement in securitization transactions, the profitability of those transactions, and the risks we are exposed to in engaging in securitization transactions; exposure to claims and litigation, including litigation arising from our involvement in securitization transactions; whether we have sufficient liquid assets to meet short-term needs; our ability to successfully compete and retain or attract key personnel; our ability to adapt our business model and strategies to changing circumstances; changes in our investment, financing, and hedging strategies and new risks we may be exposed to if we expand our business activities; our exposure to a disruption or breach of the security of our technology infrastructure and systems; exposure to environmental liabilities; our failure to comply with applicable laws and regulations; our failure to maintain appropriate internal controls over financial reporting and disclosure controls and
|
|
|
THE REDWOOD REVIEW I 2ND QUARTER 2015 3 |
|
|
REDWOOD TRUST |
C A U T I O N A R Y S T A T E M E N T |
procedures; the impact on our reputation that could result from our actions or omissions or from those of others; changes in accounting principles and tax rules; our ability to maintain our status as a REIT for tax purposes; limitations imposed on our business due to our REIT status and our status as exempt from registration under the Investment Company Act of 1940; decisions about raising, managing, and distributing capital; and other factors not presently identified.
This Redwood Review may contain statistics and other data that in some cases have been obtained from or compiled from information made available by servicers and other third-party service providers.
|
|
|
THE REDWOOD REVIEW I 2ND QUARTER 2015 4 |
|
|
REDWOOD TRUST |
I N T R O D U C T I O N |
Note to Readers:
We file annual reports (on Form 10-K) and quarterly reports (on Form 10-Q) with the Securities and Exchange Commission. These filings and our earnings press releases provide information about Redwood and our financial results in accordance with generally accepted accounting principles (GAAP). We urge you to review these documents, which are available through our website, www.redwoodtrust.com.
This document, called The Redwood Review, is an additional format for providing information about Redwood through a discussion of our GAAP financial results, as well as other metrics, such as taxable income. Supplemental information is also provided in the Financial Tables in this Review to facilitate more detailed understanding and analysis of Redwood. We may also provide non-GAAP financial measures in this Review. When we use non-GAAP financial measures it is because we believe that these figures provide additional insight into Redwood’s business. In each case in which we discuss a non-GAAP financial measure you will find an explanation of how it has been calculated, why we think the figure is important, and a reconciliation between the GAAP and non-GAAP figures.
References herein to “Redwood,” the “company,” “we,” “us,” and “our” include Redwood Trust, Inc. and its consolidated subsidiaries. Note that because we round numbers in the tables to millions, except per share amounts, some numbers may not foot due to rounding. References to the “second quarter” refer to the quarter ending June 30, 2015, and references to the “first quarter” refer to the quarter ending March 31, 2015, unless otherwise specified.
We hope you find this Review helpful to your understanding of our business. We thank you for your input and suggestions, which have resulted in our changing the form and content of The Redwood Review over time.
|
| | | | | | | | | | | |
| | Selected Financial Highlights |
| |
| | Quarter:Year | | GAAP Income per Share | | REIT Taxable Income per Share (1) | | Annualized GAAP Return on Equity | | GAAP Book Value per Share | | Dividends per Share |
| | Q215 | | $0.31 | | $0.21 | | 9% | | $14.96 | | $0.28 |
| | Q115 | | $0.16 | | $0.18 | | 5% | | $15.01 | | $0.28 |
| | Q414 | | $0.31 | | $0.19 | | 9% | | $15.05 | | $0.28 |
| | Q314 | | $0.50 | | $0.21 | | 14% | | $15.21 | | $0.28 |
| | Q214 | | $0.18 | | $0.17 | | 5% | | $15.03 | | $0.28 |
| | Q114 | | $0.14 | | $0.19 | | 4% | | $15.14 | | $0.28 |
| | Q413 | | $0.29 | | $0.20 | | 8% | | $15.10 | | $0.28 |
| | Q313 | | $0.25 | | $0.24 | | 7% | | $14.65 | | $0.28 |
| | Q213 | | $0.71 | | $0.25 | | 22% | | $14.69 | | $0.28 |
(1) REIT taxable income per share for 2014 and 2015 are estimates until we file tax returns.
|
|
|
THE REDWOOD REVIEW I 2ND QUARTER 2015 5 |
|
|
REDWOOD TRUST |
S H A R E H O L D E R L E T T E R |
Dear Fellow Shareholders:
In this letter, we will focus on recent milestones we have achieved, as well as the challenges we face and our current outlook for the remainder of 2015. We will also balance this near-term discussion by reviewing our big picture opportunities and commitment to our long-term strategy.
We would characterize our second quarter performance as “reasonably good” considering the significant interest-rate volatility that reemerged near quarter-end. All told, we earned $0.31 per share for the second quarter compared to $0.16 per share in the first quarter of 2015. Margins improved in both our residential and commercial mortgage banking businesses. Book value was essentially flat after paying our quarterly dividend. We also made good operating progress, particularly in our residential business.
In our on-going effort to make our financials and disclosures as transparent and as simple as possible, we made some meaningful changes this quarter to the Quarterly Overview and Financial Insights sections of this Redwood Review. We hope these changes help your understanding.
Market Conditions and Impact of Interest Rate Volatility
The second quarter started off on a positive note with credit spreads tightening, whole loan prices firming, and interest rate volatility calming down. By June, we encountered an almost systemic reversal of these conditions in response to the financial dislocations in Greece and China. The 10-year Treasury yield ranged from a low of 1.87% to a high of 2.48%, before closing at 2.35% on June 30th, an increase of 43 basis points from March 31st.
As we discussed last quarter, heightened interest rate volatility poses challenges to us on several fronts. When volatility is high, whole loan buyers and RMBS investors typically demand a higher yield (i.e., lower prices) to account for greater uncertainty and liquidity risk. Higher volatility also negatively impacts our interest rate sensitive investments, particularly our mortgage servicing rights (MSRs) and interest-only (IO) securities. Additionally, the more rates fluctuate, the more expensive it becomes to hedge as we must continually add or remove hedge positions. Thus, while our earnings improved from the first quarter of 2015, interest rate volatility again weighed significantly on our bottom-line results.
The start of the third quarter of 2015 has thus far been similar to the calmer rate environment we saw back in April 2015, a positive sign for our businesses. But we are still expecting varying levels of volatility to be with us for the remainder of the year. With that in mind, we are in the process of fine-tuning our hedging and portfolio strategies with the goal of reducing our overall sensitivity to interest rate volatility.
|
|
|
THE REDWOOD REVIEW I 2ND QUARTER 2015 6 |
|
|
REDWOOD TRUST |
S H A R E H O L D E R L E T T E R |
Residential
In addition to improvements in our residential operating results, we made meaningful progress in several longer-term strategic areas during the second quarter and in July 2015:
| |
Ñ | In July, we entered into a risk-sharing arrangement with Freddie Mac. Under this arrangement Redwood, through a special-purpose entity, commits to absorb the first 1% of credit losses on up to $1 billion of new conforming loans we expect to deliver to Freddie Mac during the third quarter of 2015. Through this risk-sharing arrangement, we create attractive credit investments for Redwood which, in concept, are similar to investing in the subordinate RMBS we retain through our Sequoia securitization transactions. This transaction follows on the risk-sharing transaction we entered into with Fannie Mae last year, making Redwood the first to execute proprietary risk sharing arrangements with both GSEs. |
These risk-sharing transactions represent important examples of the GSEs’ capabilities to share credit risk with private capital participants in the mortgage market through various forms of transactions, consistent with the goals set for the GSEs by their regulator, the FHFA. Risk-sharing arrangements like these also further the alignment of interests between Redwood and the GSEs in the credit performance of loans, while providing added liquidity to the mortgage market. Redwood continues in its efforts to do additional risk-sharing transactions with the GSEs.
| |
Ñ | We also completed two jumbo Sequoia securitizations during the second quarter. Although RMBS spreads remain volatile, we continue to believe that private-label securitization will play a key role in housing finance over the long-term and plan to remain an active participant and leader in this market. We continue to introduce new enhancements into our Sequoia transactions, with the goal of attracting more institutional investors and increasing liquidity for triple-A rated RMBS. |
| |
Ñ | Finally, we continued making progress with the MPF DirectTM initiative we have with the FHLB-Chicago, adding MPF DirectTM loan sellers in the FHLB-Chicago district and beginning to add sellers in the FHLB-Boston district. In addition, four other FHLB districts received regulatory approval to offer the MPF DirectTM product to their members. Although production from this channel grows incrementally, it is not yet substantial. Over the coming months, we expect that the rollout of the initiative to additional FHLB districts, coupled with the recently announced increase in the loan size limit for MPF DirectTM from $729,500 to $1.5 million, will accelerate the pace of adding new MPF DirectTM loan sellers and result in more substantial volumes towards the end of 2015. |
|
|
|
THE REDWOOD REVIEW I 2ND QUARTER 2015 7 |
|
|
REDWOOD TRUST |
S H A R E H O L D E R L E T T E R |
Through July 31, 2015, we had purchased $3.0 billion of jumbo loans and $3.2 billion of conforming loans since the start of 2015. At the beginning of the year, we stated that we expected to purchase $7 billion of jumbo loans and $8 billion of conforming loans in 2015, but noted that our focus would be on achieving these volumes while also maintaining margins consistent with our long-term target range of 25-to-50 basis points. Based on our progress to date, we believe that for the full year 2015 we are on track to purchase $5.5 - $7 billion of jumbo loans and $6 - $7 billion of conforming loans, with average margins within the target range noted above. Again, a key determinant to our overall production volumes for the full year will be where we can price loans in order to distribute them while achieving our target returns.
Commercial
During the second quarter, our commercial results improved compared to our results from the prior, and seasonally slower, first quarter. However, interest rate volatility and lender overcapacity contributed to a more aggressive lending environment and loan sale margins that fell short of our expectations. While many lenders continue to build out infrastructure in anticipation of a significant wave of refinance demand beginning in the second half of 2015, overall industry originations to date have remained at a pace more consistent with last year, resulting in increased competition among lenders. Additionally, the CMBS market continues to face liquidity challenges stemming from a limited group of active subordinate CMBS “B-piece” buyers.
As of July 31, 2015, our pipeline of senior loans (loans closed or under application) was $246 million, and we had originated a total of $440 million of senior loans since the start of 2015. At the beginning of the year, we stated that we were focused on achieving originations of $1.5 billion of senior CMBS loans during 2015, at an average 1.5% margin. While our originations are up slightly compared to where they were a year ago and we expect the second half of this year to look much like the second half of last year when we completed the bulk of our 2014 origination activity, we are lowering our expectations for 2015 from the $1.5 billion target we set at the beginning of the year to $1.0 - $1.25 billion. We expect margins in the second half of the year to be in line with our 1.5% goal.
Looking further out on the horizon, origination volumes are expected to grow considerably over the next two-to-three years to the extent the much talked about refinancing wave arrives. We believe our platform is well positioned and prepared for this opportunity, having originated over $460 million of mezzanine loans for our own portfolio and contributed $2.2 billion of senior loans to CMBS conduits since we initiated this business in 2010. Our loans have performed extremely well to date, and we believe our platform is highly regarded by potential borrowers. We intend to add more talent, offer more lending solutions to borrowers, and diversify our financing sources, so that we can build towards a more robust platform that is sustainable for the longer-term, across market cycles.
|
|
|
THE REDWOOD REVIEW I 2ND QUARTER 2015 8 |
|
|
REDWOOD TRUST |
S H A R E H O L D E R L E T T E R |
Available Capital and Share Repurchase Authorization
Through the second quarter of 2015, our liquidity remained strong and at June 30, 2015, we had approximately $156 million of capital readily available to make new investments. We also believe there is additional capital available to us through our normal portfolio activities. In July, our captive insurance subsidiary, which is a member of the FHLB-Chicago, received approval from the FHLB-Chicago for an increase in its borrowing capacity with the FHLB-Chicago to $1.4 billion. This increase represents an additional $400 million in borrowing capacity, which should allow for a significant increase in the portfolio of residential loans our subsidiary holds for long-term investment.
As we determine the best use for our available capital, some have asked for our thoughts on Redwood potentially repurchasing shares of common stock. Our response remains consistent with our past practice. If we believe Redwood shares are trading at attractive levels relative to other uses of capital, we have the willingness and capacity to invest in our own shares. In that regard, in early August 2015, Redwood’s Board of Directors authorized the purchase of shares of Redwood common stock in an amount up to $100 million. This Board authorization updates and replaces the previous Board-authorized stock purchase authorization under which Redwood had remaining authority to purchase up to four million shares.
Closing Thoughts
We have built both our residential and commercial businesses with a disciplined credit philosophy and a principal investor’s mentality, the same approach we have applied throughout our history. Nevertheless, history has shown that in the cyclical mortgage markets, growth has rarely occurred in a straight line. As we navigate through this most recent wave of market volatility, we continue to believe that our residential and commercial loan platforms are well positioned to capitalize on the evolution of mortgage finance, and to provide us with steady sources of attractive investments and fee generating opportunities. Our strong liquidity and capital position provides us the flexibility to continue creating new investments through these platforms when other investment opportunities seem scarce. To highlight this point, our portfolio returns have been strong as we have deployed a total of $225 million into new investments over the course of the first and second quarters of 2015. Over two-thirds of these investments were sourced directly from our operating platforms.
|
|
|
THE REDWOOD REVIEW I 2ND QUARTER 2015 9 |
|
|
REDWOOD TRUST |
S H A R E H O L D E R L E T T E R |
As fellow shareholders, we would like to reiterate management’s emphasis on increasing shareholder value. We are well aware of the competitive challenges facing REITs and mortgage companies today in a world awash with liquidity and uncertainty surrounding future interest rates. From a communication standpoint, we want to ensure that our business is properly differentiated from competitors who cannot easily replicate our brand, infrastructure, seller network, or team. And while our daily focus continues to be generating higher economic returns from our businesses, we want our franchise value to adequately reflect the big picture and not just the most recent wave of market volatility. Simply put, we believe the capabilities of our platforms are hard to match and there remain significant investment opportunities ahead. We hope to illustrate this belief through even better results in the coming quarters.
Thank you for your support.
|
| | |
| | |
Marty Hughes | | Brett D. Nicholas |
CEO | | President |
|
|
|
THE REDWOOD REVIEW I 2ND QUARTER 2015 10 |
|
|
REDWOOD TRUST |
Q U A R T E R L Y O V E R V I E W |
To our Shareholders,
We have restructured this quarter’s Redwood Review to provide increased transparency around our financial results as well as the performance of our business segments. This includes significant changes to our Quarterly Overview as well as the Financial Insights section. Our goal, as always, is for the Redwood Review to remain current and in step with changes that affect our business, which is constantly evolving. We hope you find the changes helpful and we welcome your ongoing input and suggestions.
Sincerely,
|
|
|
THE REDWOOD REVIEW I 2ND QUARTER 2015 11 |
|
|
REDWOOD TRUST |
Q U A R T E R L Y O V E R V I E W |
Second Quarter 2015 Highlights
| |
Ñ | We earned $0.31 per share for the second quarter of 2015, as compared to $0.16 per share for the first quarter of 2015. GAAP earnings increased from the prior quarter primarily due to higher margins on residential jumbo loans and commercial loans, and an increase in the value of our MSR portfolio as a result of higher benchmark interest rates. |
| |
Ñ | Our GAAP book value at June 30, 2015, was $14.96 per share, as compared to $15.01 per share at March 31, 2015. |
| |
Ñ | We deployed $92 million of capital in the second quarter toward new investments, and $225 million year to date. Over two-thirds of the capital deployed year to date was into investments created through our residential and commercial mortgage-banking operations. |
| |
Ñ | We sold $177 million of predominantly lower yielding RMBS during the second quarter. These sales freed up approximately $57 million of capital for reinvestment. |
| |
Ñ | Our combined residential jumbo and conforming loan purchase volume was $2.8 billion for the second quarter, an increase of 15% from the first quarter of 2015. At June 30, 2015, our pipeline of residential loans identified for purchase was $1.6 billion and included $1.2 billion of jumbo loans and $0.5 billion of conforming loans, unadjusted for fallout expectations. |
| |
Ñ | We completed two Sequoia securitizations totaling $712 million during the second quarter (SEMT 2015-2 and SEMT 2015-3), and created $16 million of new investments for our portfolio, including $10 million of subordinate securities and $6 million of MSRs. In addition, we sold $708 million of jumbo loans to third parties during the second quarter. |
| |
Ñ | At June 30, 2015, we had 212 loan sellers, up from 180 at the end of the first quarter. The majority of the increase was from the addition of 21 MPF Direct sellers from the Chicago and Boston FHLB districts. |
Ñ We originated $258 million of senior commercial loans during the second quarter, and $350 million year to date. At July 31, 2015, our pipeline of senior loans (loans closed or under application) we expect to sell into third-party CMBS transactions was $246 million.
|
|
|
THE REDWOOD REVIEW I 2ND QUARTER 2015 12 |
|
|
REDWOOD TRUST |
Q U A R T E R L Y O V E R V I E W |
GAAP Earnings
We have modified the layout of our GAAP income statement to better present the offsetting impacts of volatile interest rates throughout our business. These modifications exclusively impact the "Non-interest income" portion of our income statement. A detailed description of these presentation changes can be found in the Changes to Financial Statement Presentation section of the Appendix of this Review.
The following table sets forth the components of Redwood’s GAAP net income for the second and first quarters of 2015.
|
| | | | | | | | |
|
Consolidated Statements of Income |
($ in millions, except per share data) |
| Three Months Ended | |
| 6/30/2015 | | 3/31/2015 | |
| | | | |
Interest income | $ | 63 |
| | $ | 64 |
| |
Interest expense | (23 | ) | | (24 | ) | |
Net interest income | 40 |
| | 40 |
| |
| | | | |
Provision for loan losses | — |
| | — |
| |
Non-interest income | | | | |
Mortgage banking and investment activities, net (1) | 6 |
| | 1 |
| |
MSR income (loss), net (2) | 1 |
| | (11 | ) | |
Other income | 1 |
| | 1 |
| |
Realized gains, net | 6 |
| | 4 |
| |
Total non-interest income, net | 14 |
| | (5 | ) | |
| | | | |
Operating expenses | (25 | ) | | (25 | ) | |
(Provision for) benefit from income taxes | (2 | ) | | 5 |
| |
| | | | |
Net income | $ | 27 |
| | $ | 15 |
| |
| | | | |
Net income per diluted common share | $ | 0.31 |
| | $ | 0.16 |
| |
| |
(1) | Mortgage banking and investment activities, net, now includes mortgage banking activities at both our residential and commercial mortgage banking operations in addition to investment activities, which includes market valuation changes on our Sequoia IO securities and other fair value securities, loans held-for-investment, and related derivatives. For additional information on this line item please refer to the Analysis of GAAP Results by Business Segment section of this Redwood Review. |
| |
(2) | During the second quarter of 2015 we began to include market valuation changes of derivatives associated with our MSRs in MSR income (loss), net. Amounts presented in this line for the first quarter of 2015 do not include the effects of hedges. See the Changes to Financial Statement Presentation section of the Appendix to this Redwood Review for additional information on the change in the MSR Income (loss), net line item. |
|
|
|
THE REDWOOD REVIEW I 2ND QUARTER 2015 13 |
|
|
REDWOOD TRUST |
Q U A R T E R L Y O V E R V I E W |
| |
Ñ | Net interest income was $40 million for the second quarter of 2015, unchanged from the first quarter of 2015. During the second quarter, we received $2 million of non-recurring yield maintenance interest relating to the prepayment of three commercial mezzanine loans. This was offset by lower net interest income received on residential loans held for sale due to increased sale and securitization activity. |
| |
Ñ | MSR income (loss), net improved during the second quarter of 2015, as the value of our MSR portfolio increased due to higher benchmark interest rates. This increase was offset by higher derivative expenses as a result of significant interest rate volatility during the quarter. See the Analysis of GAAP Results by Business Segments - Residential Investments section that follows for the detailed components of MSR income (loss), net for the second quarter. |
| |
Ñ | Mortgage banking and investment activities, net, increased to $6 million for the second quarter of 2015, as compared to $1 million for the first quarter of 2015, primarily as a result of higher loan sale margins for both our residential and commercial loans. |
| |
Ñ | Operating expenses were $25 million for the second quarter of 2015, unchanged from the first quarter of 2015. We do not currently anticipate significant changes to operating expenses in the second half of 2015. |
| |
Ñ | We recorded a tax provision of $2 million for the second quarter of 2015, as compared to a tax benefit of $5 million for the first quarter of 2015. The provision was primarily due to changes in GAAP income at our taxable REIT subsidiaries during the second quarter. A reconciliation of GAAP and taxable income is set forth in Table 3 of the Financial Tables Appendix of this Review. |
| |
Ñ | Additional details on our earnings are included in the Analysis of GAAP Results by Business Segment section that follows. |
|
|
|
THE REDWOOD REVIEW I 2ND QUARTER 2015 14 |
|
|
REDWOOD TRUST |
Q U A R T E R L Y O V E R V I E W |
GAAP Book Value
The following table sets forth the changes in Redwood’s GAAP book value per share for the second and first quarters of 2015.
|
| | | | | | | | |
|
Changes in GAAP Book Value Per Share |
($ in per share) |
| Three Months Ended | |
| 6/30/2015 | | 3/31/2015 | |
| | | | |
Beginning book value | $ | 15.01 |
| | $ | 15.05 |
| |
Earnings | 0.31 |
| | 0.16 |
| |
Changes in unrealized gains on securities, net: | | | | |
Mezzanine RMBS used for hedging | (0.06 | ) | | 0.10 |
| |
Other securities | (0.06 | ) | | (0.05 | ) | |
Total change in unrealized gains on securities, net | (0.12 | ) | | 0.05 |
| |
Other, net | 0.05 |
| | 0.02 |
| |
Dividends | (0.28 | ) | | (0.28 | ) | |
Equity award distributions | (0.19 | ) | | — |
| |
Changes in derivatives used to hedge long-term debt | 0.18 |
| | (0.10 | ) | |
Impact of new accounting standard | — |
| | 0.11 |
| |
| | | | |
Ending book value | $ | 14.96 |
| | $ | 15.01 |
| |
| |
Ñ | During the second quarter, our GAAP book value per share declined $0.05 to $14.96. Although earnings exceeded our dividend payment, annual equity award distributions - which have historically occurred in May of each year - reduced book value per share. The decline was mostly offset by an increase in the value of derivatives designated as hedges of our long-term debt. |
| |
Ñ | Included in our book value per share was $6 million, or $0.06 per share, of negative market valuation adjustments on mezzanine RMBS used in part for hedging our enterprise-wide exposure to changes in interest rates. These securities, which are classified as available-for-sale, had an aggregate market value of $257 million at June 30, 2015. Unlike most of our assets and derivatives that we use to manage our interest rate exposure, market valuation adjustments on these investments are not recorded to our income statement based on the accounting elections we apply. |
|
|
|
THE REDWOOD REVIEW I 2ND QUARTER 2015 15 |
|
|
REDWOOD TRUST |
Q U A R T E R L Y O V E R V I E W |
Quarterly Investment Activity
The following table details our capital invested for the second and first quarters of 2015.
|
| | | | | | | | |
|
Quarterly Investment Activity |
($ in millions) |
| Three Months Ended | |
| 6/30/2015 | | 3/31/2015 | |
| | | | |
Residential | | | | |
Sequoia RMBS | $ | 10 |
| | $ | 6 |
| |
Third-party RMBS | 22 |
| | 27 |
| |
Less: Short-term debt/Other liabilities | (11 | ) | | (9 | ) | |
Total RMBS, net | 21 |
| | 24 |
| |
| | | | |
Loans, net – FHLBC (1) | 37 |
| | 82 |
| |
MSR investments | 32 |
| | 19 |
| |
Total residential | 90 |
| | 125 |
| |
| | | | |
Commercial | | | | |
Mezzanine loans | 2 |
| | 8 |
| |
| | | | |
Capital invested | $ | 92 |
| | $ | 133 |
| |
| |
(1) | Includes loans transferred to our FHLBC member subsidiary and FHLBC stock acquired, less secured borrowings. |
Net of financing, we deployed $92 million of capital in the second quarter, and $225 million through the first six months of 2015. Notable investments in the second quarter included $37 million invested in $215 million of loans held by our FHLB-member subsidiary, $32 million of investments in MSRs, and $10 million of investments in retained subordinate securities created from the Sequoia securitizations we completed during the second quarter. Our second quarter capital investments were partially offset by the sale of $177 million of predominately subordinate mezzanine and IO securities. After the repayment of associated short-term debt, these sales freed up approximately $57 million of capital for reinvestment.
Our combined residential and commercial investment portfolios increased by $57 million during the second quarter to $2.9 billion at June 30, 2015, and included $1.2 billion of securities, $1.2 billion of loans held-for-investment, $168 million of MSR investments, and $385 million of commercial loans.
Following the end of the second quarter and through July 31, 2015, we invested $19 million of capital, including $1 million in third party securities, $5 million in MSR investments, $2 million in risk-sharing investments, and $11 million in commercial mezzanine loans.
|
|
|
THE REDWOOD REVIEW I 2ND QUARTER 2015 16 |
|
|
REDWOOD TRUST |
Q U A R T E R L Y O V E R V I E W |
Analysis of GAAP Results by Business Segment
We report on our business using three distinct segments: Residential Mortgage Banking, Residential Investments, and Commercial Mortgage Banking and Investments. The Redwood's Business Overview section located in the Appendix of this Redwood Review includes full descriptions of these segments and how they fit into Redwood's business model. The following table shows the results from each of these segments reconciled to our GAAP net income for the second and first quarters of 2015.
|
| | | | | | | | |
|
Segment Results Summary (1) |
($ in millions) |
| Three Months Ended | |
| 6/30/2015 | | 3/31/2015 | |
| | | | |
Segment contribution from: | | | | |
Residential mortgage banking | 1 |
| | 3 |
| |
Residential investments | 34 |
| | 24 |
| |
Commercial mortgage banking and investments | 9 |
| | 4 |
| |
Corporate/Other | (17 | ) | | (17 | ) | |
| | | | |
Net income | $ | 27 |
| | $ | 15 |
| |
| |
(1) | See Table 2 of the Financial Tables section of the Appendix to this Redwood Review for a more comprehensive presentation of our segment results. |
Residential Mortgage Banking
The following table presents the results of our Residential Mortgage Banking segment for the second and first quarters of 2015.
|
| | | | | | | | |
|
Segment Results - Residential Mortgage Banking |
($ in millions) |
| Three Months Ended | |
| 6/30/2015 | | 3/31/2015 | |
| | | | |
Net interest income | | | | |
Loans | $ | 7 |
| | $ | 8 |
| |
Sequoia IO Securities (1) | — |
| | 4 |
| |
Total net interest income | 7 |
| | 12 |
| |
| | | | |
Non-interest income | | | | |
Mortgage banking activities, net | 5 |
| | 2 |
| |
Total non-interest income | 5 |
| | 2 |
| |
| | | | |
Direct operating expenses | (11 | ) | | (11 | ) | |
Tax benefit | 1 |
| | — |
| |
| | | | |
Segment contribution | $ | 1 |
| | $ | 3 |
| |
| |
(1) | On April 1, 2015, $62 million of Sequoia IO securities were permanently transferred from the Residential Mortgage Banking segment to the Residential Investments segment. These securities generated $3 million of net interest income during the second quarter of 2015. |
|
|
|
THE REDWOOD REVIEW I 2ND QUARTER 2015 17 |
|
|
REDWOOD TRUST |
Q U A R T E R L Y O V E R V I E W |
| |
Ñ | Excluding a one-time transfer of IO securities to our Residential Investments segment (noted in the table above), our Residential Mortgage Banking results improved from the first quarter of 2015, primarily due to higher loan sale profit margins. |
| |
Ñ | Loan purchase commitments (LPCs), adjusted for fallout expectations, were $2.7 billion during the second quarter and generated mortgage banking activity income of $5 million. This compared to $2.8 billion of LPCs during the first quarter of 2015 that generated $2 million of mortgage banking activity income. |
| |
Ñ | Our Residential Mortgage Banking operations created $76 million of investments for our investment portfolio during the second quarter, and $181 million year to date. |
| |
Ñ | Net interest income at our Residential Mortgage Banking segment includes interest income on loans held for sale or securitization and the associated interest expense on warehouse facilities utilized to fund these loans while they are held on our balance sheet. Net interest income declined during the second quarter due to the average balance of loans held-for-sale decreasing 16% to $1.1 billion, as we experienced faster turnover of loans during the second quarter. |
| |
Ñ | Direct operating expenses in the second quarter were unchanged from the first quarter of 2015. These expenses primarily include costs associated with the purchase, underwriting and sale of residential loans. |
|
|
|
THE REDWOOD REVIEW I 2ND QUARTER 2015 18 |
|
|
REDWOOD TRUST |
Q U A R T E R L Y O V E R V I E W |
Residential Investments
The following table presents the results of our Residential Investments segment for the second and first quarters of 2015.
|
| | | | | | | | |
|
Segment Results - Residential Investments |
($ in millions) |
| Three Months Ended | |
| 6/30/2015 | | 3/31/2015 | |
| | | | |
Net interest income | | | | |
Residential securities | $ | 19 |
| | $ | 21 |
| |
Residential loans | 9 |
| | 6 |
| |
Sequoia IO securities (1) | 3 |
| | — |
| |
Total net interest income | 32 |
| | 27 |
| |
| | | | |
Non-interest income | | | | |
Investment activities, net | (1 | ) | | — |
| |
MSR income (loss), net (2) | 1 |
| | (11 | ) | |
Other income | 1 |
| | 1 |
| |
Realized gains, net | 6 |
| | 4 |
| |
Total non-interest income (loss) | 7 |
| | (6 | ) | |
| | | | |
Direct operating expenses | (1 | ) | | (1 | ) | |
Tax (provision) benefit | (4 | ) | | 4 |
| |
| | | | |
Segment contribution | $ | 34 |
| | $ | 24 |
| |
| |
(1) | On April 1, 2015, $62 million of Sequoia IO securities were permanently transferred to the Residential Investments segment from the Residential Mortgage Banking segment. These securities generated $4 million of net interest income during the first quarter of 2015. |
(2) MSR income (loss), net, now includes changes in value of associated derivatives used to hedge our MSRs' exposure to interest rate volatility. See the table on the following page for additional detail.
| |
Ñ | Our results from Residential Investments improved during the second quarter, primarily due to a higher valuation of our MSR investments resulting from rising benchmark interest rates during the second quarter. |
|
|
|
THE REDWOOD REVIEW I 2ND QUARTER 2015 19 |
|
|
REDWOOD TRUST |
Q U A R T E R L Y O V E R V I E W |
The following table presents the components of MSR income (loss), net for the second and first quarters of 2015.
|
| | | | | | | | |
|
Components of MSR Income (Loss), net |
($ in millions) |
| Three Months Ended | |
| 6/30/2015 | | 3/31/2015 | |
| | | | |
Net fee income | $ | 7 |
| | $ | 9 |
| |
Changes in fair value of MSRs due to: | | | | |
Change in basis (1) | (3 | ) | | (5 | ) | |
Change in interest rates (2) | 19 |
| | (14 | ) | |
Associated derivatives (3) | (22 | ) | | — |
| |
| | | | |
MSR income (loss), net | $ | 1 |
| | $ | (11 | ) | |
| |
(1) | Represents changes due to the receipt of expected cash flows. |
| |
(2) | Primarily reflects changes in prepayment assumptions due to changes in benchmark interest rates. |
| |
(3) | Beginning in the second quarter of 2015, we began to include the change in value of derivatives used to hedge our exposure to changes in market interest rates. See the Changes to Financial Statement Presentation section located in the Appendix of this Redwood Review for additional information on this change. |
| |
Ñ | In aggregate, we currently expect our MSR investments to generate an investment return of 7% - 9% on an annualized basis, or approximately $3 million to $4 million per quarter, based on our portfolio held at June 30, 2015. While MSR valuations improved during the second quarter due to higher benchmark interest rates, the high level of interest rate volatility increased our cost to hedge this exposure. The resulting derivative expense for the second quarter reduced our MSR return below our long-term expectation. |
| |
Ñ | Excluding the one-time transfer of IO securities from our Residential Mortgage Banking segment, net interest income increased $1 million, as the average balance of residential loans held-for-investment increased 53% to $1.0 billion. This increase was partially offset by lower net interest income from our securities portfolio, as principal paydowns and sales of lower yielding securities exceeded new investments during the quarter. |
| |
Ñ | During the second quarter, we invested $90 million of capital in our Residential Investments segment, including $21 million into securities, $32 million into MSR investments and $37 million related to residential loans held-for-investment. |
| |
Ñ | During the second quarter, we sold $177 million of securities, including $133 million of mezzanine securities and $44 million of Sequoia senior securities, realizing a gain on sale of $6 million. After the repayment of the associated short-term debt, these security sales freed up $57 million of capital for reinvestment. A portion of the proceeds from these security sales was used to fund our investment in residential loans held-for-investment, which we expect in aggregate to generate a higher return on capital than the securities we sold. |
|
|
|
THE REDWOOD REVIEW I 2ND QUARTER 2015 20 |
|
|
REDWOOD TRUST |
Q U A R T E R L Y O V E R V I E W |
| |
Ñ | As of June 30, 2015, we had $2.5 billion of investments in our Residential Investments segment, including $1.2 billion of securities, $1.2 billion of residential loans held-for-investment, and $168 million of MSR investments. The credit performance of our portfolio remains strong, with no credit losses incurred to date and minimal delinquencies. |
The following table presents the components of investment activities, net in our Residential Investments segment for the second and first quarters of 2015.
|
| | | | | | | | |
|
Components of Investment Activities, net |
($ in millions) |
| Three Months Ended | |
| 6/30/2015 | | 3/31/2015 | |
| | | | |
Market valuation changes on: | | | | |
Sequoia IO securities (1) | $ | 8 |
| | $ | — |
| |
Other real estate securities | (2 | ) | | — |
| |
Residential loans held-for-investment | (6 | ) | | 2 |
| |
Other investments | — |
| | (1 | ) | |
Derivatives and hedging allocation | (2 | ) | | (1 | ) | |
| | | | |
Total investment activities, net | $ | (1 | ) | | $ | — |
| |
| |
(1) | The $8 million in the second quarter of 2015 represents the change in value of our Sequoia IO securities that were transferred into this segment on April 1, 2015. We recorded negative $14 million of fair value changes on Sequoia IO securities in the first quarter of 2015 that were recorded in our Residential Mortgage Banking segment. |
|
|
|
THE REDWOOD REVIEW I 2ND QUARTER 2015 21 |
|
|
REDWOOD TRUST |
Q U A R T E R L Y O V E R V I E W |
Commercial Mortgage Banking and Investments
The following table presents the results of our Commercial Mortgage Banking and Investments segment for the second and first quarters of 2015.
|
| | | | | | | | |
|
Segment Results - Commercial Mortgage Banking and Investments |
($ in millions) |
| Three Months Ended | |
| 6/30/2015 | | 3/31/2015 | |
| | | | |
Net interest income | | | | |
Mezzanine loans | $ | 9 |
| | $ | 7 |
| |
Senior loans | 1 |
| | 1 |
| |
Total net interest income | 9 |
| | 7 |
| |
| | | | |
Provision for loan losses | — |
| | — |
| |
Non-interest income | | | | |
Mortgage banking activities, net | 3 |
| | — |
| |
Total non-interest income | 3 |
| | — |
| |
| | | | |
Operating expenses | (3 | ) | | (3 | ) | |
Tax benefit | — |
| | 1 |
| |
| | | | |
Segment contribution | $ | 9 |
| | $ | 4 |
| |
| |
Ñ | Our results from Commercial Mortgage Banking and Investments improved in the second quarter as a result of higher net interest income, higher origination volume, and improved gain on sale margins from senior loans. |
| |
Ñ | Net interest income increased $2 million in the second quarter, primarily from the one-time receipt of $2 million of non-recurring yield maintenance interest from the prepayment of three mezzanine loans. |
| |
Ñ | Total senior loan originations were $258 million for the second quarter, and generated $3 million of mortgage banking activity income. This represented an increase from $93 million of senior loan originations for the first quarter of 2015 that generated a loss of less than $1 million. |
| |
Ñ | At June 30, 2015, we had $320 million of commercial mezzanine and subordinate loans held-for-investment with a weighted average yield of approximately 10% and a weighted average maturity of over four years. The credit quality of our mezzanine loan portfolio remains strong and we do not currently anticipate any material credit issues on maturing loans. |
|
|
|
THE REDWOOD REVIEW I 2ND QUARTER 2015 22 |
|
|
REDWOOD TRUST |
Q U A R T E R L Y O V E R V I E W |
Capital and Liquidity
Our total capital was $1.9 billion at June 30, 2015, and included $1.3 billion of equity capital and $0.6 billion of the total $1.6 billion of long-term debt on our consolidated balance sheet. This portion of long-term debt included $140 million of trust-preferred securities due in 2037, $288 million of convertible debt due in 2018, and $205 million of exchangeable debt due in 2019.
At June 30, 2015, we held $226 million in cash, and our available capital (defined as the approximate amount of capital we had readily available for long-term investments) was approximately $156 million. This amount excludes cash flow we expect to receive in future quarters from investments and cash proceeds that we could generate from the sale of non-core investments such as our mezzanine RMBS securities.
In August 2015, our Board of Directors authorized the repurchase of up to $100 million of our common stock, replacing the Board’s previous share repurchase authorization. Our share repurchase authorization does not obligate us to acquire any specific number of shares. Under this authorization, shares may be repurchased in privately negotiated and/or open market transactions, including under plans complying with Rule 10b5-1 under the Securities Exchange Act of 1934, as amended. Like other investments we may make, any repurchases of our common stock under this authorization would reduce our available capital described above.
During July of 2015, the FHLBC approved an increase to our FHLB-member subsidiary’s financing limit, bringing our subsidiary’s total financing capacity with the FHLBC to $1.4 billion. Our FHLB-member subsidiary borrowed an additional $31 million of long-term debt from the FHLBC during the second quarter, which increased total long-term debt associated with FHLBC borrowings to $882 million at June 30, 2015.
|
|
|
THE REDWOOD REVIEW I 2ND QUARTER 2015 23 |
|
|
REDWOOD TRUST |
Q U A R T E R L Y O V E R V I E W |
The following table presents certain components of our debt, categorized by the type of asset securing the debt, and additional information related to these borrowings at June 30, 2015.
|
| | | | | | | | | | | | | | | | | | | | | | |
|
Financing Summary |
($ in millions) |
| Secured Debt by Collateral Type | | | |
| Residential Loans Held-for Sale | Residential Loans Held-for-Investment | Residential Securities | Commercial Loans Held-for-Sale | Commercial Loans Held-for-Investment | TruPS and Convertible Debt | Total | |
| | | | | | | | |
Collateral securing debt | $ | 860 |
| $ | 1,000 |
| $ | 615 |
| $ | 60 |
| $ | 83 |
| NA |
| | |
| | | | | | | | |
Short-term debt | $ | 777 |
| $ | — |
| $ | 493 |
| $ | 45 |
| $ | 52 |
| $ | — |
| $ | 1,367 |
| |
Long-term debt | — |
| 882 |
| — |
| — |
| — |
| 632 |
| 1,514 |
| |
Debt (1) | $ | 777 |
| $ | 882 |
| $ | 493 |
| $ | 45 |
| $ | 52 |
| $ | 632 |
| $ | 2,881 |
|
|
| | | | | | | | |
Financing Summary | | | | | | | | |
Cost of funds | 1.73 | % | 0.27 | % | 1.43 | % | 2.44 | % | 5.19 | % | 6.11 | % | | |
Total borrowing capacity (2) | $ | 1,800 |
| $ | 1,000 |
| NA |
| $ | 300 |
| $ | 150 |
| NA |
| | |
| | | | | | | | |
| |
(1) | Excludes ABS issued and commercial secured borrowings. See Table 4 in the Financial Tables section of the Appendix to this Redwood Review for additional information on our consolidated debt. |
| |
(2) | Represents our total uncommitted borrowing capacity for residential and commercial warehouse facilities. Subsequent to June 30, 2015, our financing capacity for residential loans held-for-investment with the FHLBC was increased to $1.4 billion. In July, we elected not to renew one warehouse facility for residential loans held-for-sale, with a borrowing capacity of $500 million. As a result, at July 31, 2015 our total uncommitted borrowing capacity under our four remaining residential warehouse facilities was $1.3 billion. |
At June 30, 2015, we had five uncommitted warehouse facilities for residential loans held-for-sale, two uncommitted warehouse facilities for senior commercial loans held-for-sale, and one uncommitted warehouse facility for mezzanine and subordinate commercial loans held-for-investment. Our residential loans held-for-investment were financed with borrowings from the FHLBC through our FHLB-member subsidiary.
|
|
|
THE REDWOOD REVIEW I 2ND QUARTER 2015 24 |
|
|
REDWOOD TRUST |
F I N A N C I A L I N S I G H T S |
Balance Sheet
The following table presents our consolidated balance sheets at June 30, 2015 and March 31, 2015.
|
| | | | | | | | |
|
Consolidated Balance Sheets (1) |
($ in millions) |
| 6/30/2015 | | 3/31/2015 | |
| | | | |
Residential loans | $ | 3,286 |
| | $ | 3,400 |
| |
Real estate securities | 1,158 |
| | 1,285 |
| |
Commercial loans | 551 |
| | 460 |
| |
Mortgage servicing rights | 168 |
| | 120 |
| |
Cash and cash equivalents | 226 |
| | 304 |
| |
Total earning assets | 5,390 |
| | 5,569 |
| |
| | | | |
Other assets | 206 |
| | 247 |
| |
Total assets | $ | 5,596 |
| | $ | 5,816 |
| |
| | | | |
Short-term debt | | | | |
Mortgage loan warehouse debt | $ | 874 |
| | $ | 896 |
| |
Security repurchase facilities | 493 |
| | 606 |
| |
Other liabilities | 123 |
| | 153 |
| |
Asset-backed securities issued | 1,262 |
| | 1,353 |
| |
Long-term debt | 1,579 |
| | 1,551 |
| |
Total liabilities | 4,331 |
| | 4,559 |
| |
| | | | |
Stockholders’ equity | 1,265 |
| | 1,257 |
| |
| | | | |
Total liabilities and equity | $ | 5,596 |
| | $ | 5,816 |
| |
| |
(1) | Our consolidated balance sheets include assets of consolidated variable interest entities (“VIEs”) that can only be used to settle obligations of these VIEs and liabilities of consolidated VIEs for which creditors do not have recourse to the primary beneficiary (Redwood Trust, Inc.). At June 30, 2015 and March 31, 2015, assets of consolidated VIEs totaled $1,623 and $1,717, respectively, and liabilities of consolidated VIEs totaled $1,263 and $1,354, respectively. See Table 8 in the Financial Tables section of the Appendix to this Redwood Review for additional detail on consolidated VIEs. |
|
|
|
THE REDWOOD REVIEW I 2ND QUARTER 2015 25 |
|
|
REDWOOD TRUST |
F I N A N C I A L I N S I G H T S |
Residential Loans
The following table presents residential loan activity during the second and first quarters of 2015.
|
| | | | | | | | | | | | | | | | | | | | |
|
Residential Loans |
($ in millions) |
| Conforming Held-for-Sale | | Jumbo Held-for- Sale | | Jumbo Held-for-Investment | | Consolidated Sequoia Entities | | Total | |
| | | | | | | | | | |
Fair value at December 31, 2014 | $ | 245 |
| | $ | 1,098 |
| | $ | 582 |
| | $ | 1,474 |
| | $ | 3,399 |
| |
Accounting adoption (1) | — |
| | — |
| | — |
| | (104 | ) | | (104 | ) | |
Acquisitions | 1,365 |
| | 1,112 |
| | — |
| | — |
| | 2,477 |
| |
Sales | (1,408 | ) | | (858 | ) | | — |
| | — |
| | (2,266 | ) | |
Transfers between portfolios (2) | — |
| | (447 | ) | | 447 |
| | — |
| | — |
| |
Principal payments | — |
| | (15 | ) | | (30 | ) | | (67 | ) | | (112 | ) | |
Change in fair value, net | (1 | ) | | 3 |
| | 2 |
| | 3 |
| | 7 |
| |
Other, net | — |
| | — |
| | — |
| | (2 | ) | | (2 | ) | |
Fair value at March 31, 2015 | $ | 201 |
| | $ | 894 |
| | $ | 1,000 |
| | $ | 1,304 |
| | $ | 3,400 |
| |
Acquisitions | 1,440 |
| | 1,407 |
| | — |
| | — |
| | 2,847 |
| |
Sales | (1,396 | ) | | (1,420 | ) | | — |
| | — |
| | (2,816 | ) | |
Transfers between portfolios (2) | — |
| | (216 | ) | | 216 |
| | — |
| | — |
| |
Principal payments | — |
| | (14 | ) | | (53 | ) | | (69 | ) | | (136 | ) | |
Change in fair value, net | 4 |
| | (7 | ) | | (6 | ) | | 3 |
| | (6 | ) | |
Other, net | — |
| | — |
| | — |
| | (1 | ) | | (1 | ) | |
| | | | |
| | | | | |
Ending fair value at June 30, 2015 | $ | 248 |
| | $ | 642 |
| | $ | 1,157 |
| | $ | 1,237 |
| | $ | 3,286 |
| |
| |
(1) | On January 1, 2015, we adopted FASB Accounting Standard Update 2014-13 (ASU 2014-13). The amount in the Accounting adoption line item represents the adjustment to switch from amortized cost to fair value accounting for these loans. |
| |
(2) | Represents transfers of loans to our Residential Investments segment from our Residential Mortgage Banking segment. |
Our $3.3 billion of residential loans are comprised of jumbo and conforming loans held-for-sale through our Residential Mortgage Banking segment, loans held-for-investment in our Residential Investments segment and loans at consolidated Sequoia entities.
Residential Loans Held-for-Sale
In the second quarter of 2015, our jumbo sales included $712 million sold through two securitizations and $708 million of bulk sales, as compared to $348 million sold through one securitization and $511 million of bulk sales in the first quarter of 2015.
In the second quarter of 2015, industry-wide private-label jumbo RMBS issuance totaled $3.1 billion, compared to $4.6 billion in the first quarter of 2015, according to Inside Nonconforming Markets. Redwood has sponsored, through its Sequoia platform, $10.8 billion, or 31%, of the
|
|
|
THE REDWOOD REVIEW I 2ND QUARTER 2015 26 |
|
|
REDWOOD TRUST |
F I N A N C I A L I N S I G H T S |
$34.9 billion of total private-label RMBS issuance from 2010 through June 30, 2015, as reported by Inside Nonconforming Markets.
At June 30, 2015, we had short-term residential mortgage warehouse debt outstanding of $777 million, which was secured by $860 million of residential mortgage loans held-for-sale.
Residential Loans Held-for-Investment
During the second quarter of 2015, we transferred $216 million of held-for-sale loans from our Residential Mortgage Banking segment to our Residential Investments segment and reclassified the loans as held-for-investment. At June 30, 2015, nearly all of our of held-for-investment jumbo loans were held by our FHLB-member subsidiary and $1.0 billion were financed on a secured basis with the FHLBC. At June 30, 2015, held-for-investment loans with a carrying value of $153 million had been transferred to our FHLB-member subsidiary, but were not financed and pledged with the FHLBC until shortly after the quarter-end.
At June 30, 2015, these loans included $1.0 billion of fixed-rate loans, and $106 million of hybrid loans, which combined had a weighted average original LTV of 65% and FICO of 772. At June 30, 2015, one of these loans was 90-or-more days delinquent.
At June 30, 2015, our FHLB-member subsidiary had $882 million of borrowings outstanding under its FHLB borrowing agreement with a weighted average interest rate of 0.23% and a weighted average maturity of six years. Advances under this agreement are charged interest based on a specified margin over the FHLBC’s 13-week discount note rate, which resets every 13 weeks. At June 30, 2015, these advances were secured by residential mortgage loans with a fair value of $1.0 billion.
Consolidated Sequoia Investments
For financial reporting purposes, we are required under GAAP to consolidate the assets and liabilities of certain Sequoia securitization entities we sponsored prior to 2012. Upon adoption of ASU 2014-13 in January 2015, we began to measure both the financial assets and liabilities (ABS issued) of these Sequoia entities at fair value. At June 30, 2015, the fair value of our investments in these entities (represented by retained RMBS) totaled $69 million. See Table 8 in the Appendix section for additional detail on the assets and liabilities of consolidated Sequoia entities.
Our consolidated Sequoia entities generated $2 million of net interest income and $2 million of net income for the second quarter of 2015, as compared to $3 million of net interest income and $1 million of net income in the first quarter of 2015.
|
|
|
THE REDWOOD REVIEW I 2ND QUARTER 2015 27 |
|
|
REDWOOD TRUST |
F I N A N C I A L I N S I G H T S |
Real Estate Securities
Our real estate securities are comprised of investments in residential mortgage backed securities. The table below details the change in fair value of real estate securities during the second and first quarters of 2015.
|
| | | | | | | | |
|
Real Estate Securities |
($ in millions) |
| Three Months Ended | |
| 6/30/15 | | 3/31/2015 | |
| | | | |
Beginning fair value | $ | 1,285 |
| | $ | 1,379 |
| |
Acquisitions | | | | |
Sequoia securities (1) | 43 |
| | 6 |
| |
Third-party securities | 31 |
| | 27 |
| |
Sales | | | | |
Sequoia securities | (147 | ) | | (98 | ) | |
Third-party securities | (30 | ) | | (7 | ) | |
Gain on sale/calls, net | 6 |
| | 4 |
| |
Effect of principal payments | (33 | ) | | (25 | ) | |
Change in fair value, net | 3 |
| | (2 | ) | |
| | | | |
Ending fair value (2) | $ | 1,158 |
| | $ | 1,285 |
| |
| |
(1) | Sequoia securities represent interests we have retained in Sequoia securitizations we sponsored and that were not consolidated for GAAP purposes. |
| |
(2) | During the second quarter of 2015, we transferred $62 million of Sequoia IO securities from our Residential Mortgage Banking segment to our Residential Investments segment. As of June 30, 2015, all of our real estate securities are held in our Residential Investments segment. |
We directly finance our holdings of residential securities through a combination of short-term debt secured by securities and our Residential Resecuritization. At June 30, 2015, we had short-term debt incurred through securities repurchase facilities of $493 million, which was secured by $615 million of real estate securities. During the second quarter of 2015, average short-term debt secured by securities was $523 million.
At June 30, 2015, we had $19 million outstanding of non-recourse, asset-backed debt issued at our Residential Resecuritization, at a stated interest rate of one-month LIBOR plus 200 basis points, or 2.18% (excluding deferred issuance costs), which provided financing for securities with a carrying value of $195 million. See Table 8 in the Appendix for additional detail on our consolidated variable interest entities, including our Residential Resecuritization.
|
|
|
THE REDWOOD REVIEW I 2ND QUARTER 2015 28 |
|
|
REDWOOD TRUST |
F I N A N C I A L I N S I G H T S |
The following table presents the fair value of our residential real estate securities at June 30, 2015. We categorize our Sequoia and third-party securities by portfolio vintage (the year the securities were issued), priority of cash flow (senior, re-REMIC, and subordinate) and the underwriting characteristics of the underlying loans (prime and non-prime).
|
| | | | | | | | | | | | | | | | | | | | | | | |
|
Real Estate Securities - Vintage and Category |
June 30, 2015 |
($ in millions) |
| Sequoia Securities 2012-2015 | | Third-party Securities | | | | | |
| | 2012-2015 | | 2006-2008 | | <=2005 | | Total Securities | | % of Total Securities | |
| | | | | | | | | | | | |
Seniors | | | | | | | | | | | | |
Prime | $ | 62 |
| | $ | — |
| | $ | 57 |
| | $ | 222 |
| | $ | 341 |
| | 29 | % | |
Non-prime (1) | — |
| | — |
| | 4 |
| | 169 |
| | 173 |
| | 15 | % | |
Total seniors | 62 |
| | — |
| | 61 |
| | 391 |
| | 514 |
| | 44 | % | |
Re-REMIC | — |
| | — |
| | 110 |
| | 59 |
| | 169 |
| | 15 | % | |
Prime subordinates (2) | | | | | | | | | | | | |
Mezzanine | 202 |
| | 88 |
| | — |
| | — |
| | 290 |
| | 25 | % | |
Subordinate | 102 |
| | 33 |
| | 1 |
| | 48 |
| | 184 |
| | 16 | % | |
Prime subordinates | 304 |
| | 121 |
| | 1 |
| | 48 |
| | 474 |
| | 41 | % | |
| | | | | | | | | | | | |
Total real estate securities | $ | 366 |
| | $ | 121 |
| | $ | 172 |
| | $ | 498 |
| | $ | 1,158 |
| | 100 | % | |
| |
(1) | Non-prime residential senior securities consist of Alt-A senior securities. |
| |
(2) | Prime mezzanine includes securities initially rated AA, A, and BBB- and issued in 2012 or later. |
The following table presents information on our residential real estate securities at June 30, 2015.
|
| | | | | | | | | | | | | | | | | | | | | | | | |
| |
Real Estate Securities - Carrying Values | |
June 30, 2015 | |
($ in millions) | |
| Senior | | | | Subordinate | | | |
| Prime | | Non- prime | | Re-REMIC | | Mezzanine | | Subordinate | | Total | |
| | | | | | | | | | | | |
Available-for-sale securities | | | | | | | | | | | | |
Current face | $ | 283 |
| | $ | 183 |
| | $ | 193 |
| | $ | 267 |
| | $ | 269 |
| | $ | 1,194 |
| |
Credit reserve | (3 | ) | | (9 | ) | | (13 | ) | | — |
| | (37 | ) | | (62 | ) | |
Net unamortized discount | (30 | ) | | (28 | ) | | (76 | ) | | (26 | ) | | (114 | ) | | (273 | ) | |
Amortized cost | 250 |
| | 146 |
| | 104 |
| | 241 |
| | 118 |
| | 860 |
| |
Unrealized gains | 31 |
| | 21 |
| | 65 |
| | 17 |
| | 52 |
| | 185 |
| |
Unrealized losses | (2 | ) | | — |
| | — |
| | — |
| | — |
| | (3 | ) | |
Carrying Value | 279 |
| | 166 |
| | 169 |
| | 257 |
| | 170 |
| | 1,041 |
| |
| | | | | | | | | | | | |
Trading securities | 62 |
| | 7 |
| | — |
| | 33 |
| | 14 |
| | 116 |
| |
| | | | | | | | | | | | |
Fair value of residential securities | $ | 341 |
| | $ | 173 |
| | $ | 169 |
| | $ | 290 |
| | $ | 184 |
| | $ | 1,158 |
| |
|
|
|
THE REDWOOD REVIEW I 2ND QUARTER 2015 29 |
|
|
REDWOOD TRUST |
F I N A N C I A L I N S I G H T S |
For GAAP, we account for the majority of our securities as available-for-sale (AFS) and the others as trading securities, and in both cases the securities are reported at their estimated fair value. Changes in fair values of our AFS securities are recorded on our balance sheet through stockholders' equity. Changes in fair values of trading securities are recorded through our income statement.
At June 30, 2015, residential securities we owned (as a percentage of current market value) consisted of fixed-rate assets (53%), adjustable-rate assets (22%), and hybrid assets that reset within the next year (25%).
We hedge the portion of our securities portfolio that is most sensitive to changes in market interest rates, which is primarily comprised of our interest only (IO) senior securities classified as trading and our mezzanine securities, which are mostly classified as AFS. As the changes in the fair values of our hedges are recorded through our income statement, this creates a mismatch with respect to the hedged AFS securities that are recorded through our balance sheet. During the second quarter of 2015, we recorded negative fair value changes of $6 million on mezzanine securities classified as AFS, as compared to positive $8 million in the first quarter of 2015.
Additional information on the residential securities we own is set forth in Tables 6 and 7 of the Financial Tables section of the Appendix to this Redwood Review.
|
|
|
THE REDWOOD REVIEW I 2ND QUARTER 2015 30 |
|
|
REDWOOD TRUST |
F I N A N C I A L I N S I G H T S |
Commercial Loans
The following table details commercial loan activity during the second and first quarters of 2015.
|
| | | | | | | | | | | | | | | | | | | | |
|
Commercial Loans |
($ in millions) |
| Senior Held-for-Sale | | Held-for-Investment | | | |
| | A-Notes (1) | | Unsecuritized Mezzanine | | Securitized Mezzanine | | Total | |
| | | | | | | | | | |
Carrying value December 31, 2014 | $ | 166 |
| | $ | 67 |
| | $ | 138 |
| | $ | 195 |
| | $ | 567 |
| |
Originations | 93 |
| | | | 8 |
| | | | 100 |
| |
Sales | (210 | ) | | — |
| | — |
| | — |
| | (210 | ) | |
Principal payments/amortization | — |
| | — |
| | — |
| | (4 | ) | | (4 | ) | |
Change in fair value, net | 6 |
| | 1 |
| | — |
| | — |
| | 7 |
| |
Change in allowance for loan losses | — |
| | — |
| | — |
| | — |
| | — |
| |
| | | | | | | | | | |
Carrying value at March 31, 2015 | $ | 54 |
| | $ | 68 |
| | $ | 146 |
| | $ | 192 |
| | $ | 460 |
| |
| | | | | | | | | | |
Originations | 258 |
| | — |
| | 2 |
| | — |
| | 259 |
| |
Sales | (147 | ) | | — |
| | — |
| | — |
| | (147 | ) | |
Principal payments/amortization | — |
| | — |
| | (10 | ) | | (10 | ) | | (20 | ) | |
Change in fair value, net | 1 |
| | (3 | ) | | — |
| | — |
| | (2 | ) | |
Change in allowance for loan losses | — |
| | — |
| | — |
| | — |
| | — |
| |
| | | | | | | | | | |
Carrying value at June 30, 2015 | $ | 166 |
| | $ | 65 |
| | $ | 138 |
| | $ | 182 |
| | $ | 551 |
| |
| |
(1) | A-notes presented above were previously sold to third-parties but did not meet the sale criteria under GAAP, and remain on our balance sheet, carried at fair value. As such, we recorded the transfer of loans as secured borrowings, which are also carried at a fair value of $65 million as of June 30, 2015. Our investment in the B-note portions of these loans was $5 million at June 30, 2015 and is included in the Unsecuritized Mezzanine column presented above. |
Commercial Loans Held-for-Sale
During the second quarter of 2015, we originated and funded 23 senior commercial loans for $258 million, and sold 17 senior loans totaling $147 million. This compares to the first quarter of 2015 when we originated and funded eight senior loans for $93 million, and sold 16 senior loans totaling $210 million. At June 30, 2015, we had 11 senior commercial loans held-for-sale with a carrying value of $166 million.
At June 30, 2015, we had $45 million of short-term borrowings outstanding under one loan warehouse facility that was secured by senior commercial loans with a carrying value of $60 million.
|
|
|
THE REDWOOD REVIEW I 2ND QUARTER 2015 31 |
|
|
REDWOOD TRUST |
F I N A N C I A L I N S I G H T S |
Commercial Loans Held-for-Investment
The following table provides information on our portfolio of commercial mezzanine and subordinate loans held-for-investment as of June 30, 2015.
|
| | | | | | | | | | | | |
|
Commercial Loans Held-for-Investment |
June 30, 2015 |
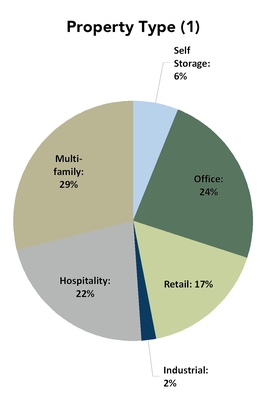
Property Type | Number of Loans | | Original Weighted Average DSCR (1) | | Original Weighted Average LTV (2) | |
Average Loan Size ($ in millions) | |
| | | | | | | | |
Multifamily | 26 |
| | 1.34x | | 79 | % | | 4 |
| |
Hospitality | 11 |
| | 1.39x | | 66 | % | | 8 |
| |
Office | 11 |
| | 1.22x | | 76 | % | | 8 |
| |
Retail | 9 |
| | 1.18x | | 77 | % | | 6 |
| |
Self Storage | 3 |
| | 1.39x | | 75 | % | | 6 |
| |
Industrial | 3 |
| | 1.52x | | 73 | % | | 2 |
| |
| | | | | | | | |
Total portfolio | 63 |
| | 1.30x | | 74 | % | | $ | 6 |
| |
| |
(1) | The debt service coverage ratio (DSCR) is defined as the property’s annual net operating income divided by the annual principal and interest payments. The weighted average DSCRs in this table are based on the ratios at the time the loans were originated and are not based on subsequent time periods during which there may have been increases or decreases in each property’s operating income. |
| |
(2) | The loan-to-value (LTV) calculation is defined as the sum of the senior and all subordinate loan amounts divided by the value of the property at the time the loan was originated. |
During the second quarter of 2015, we originated one commercial mezzanine and subordinate loan for $2 million, as compared to two mezzanine loans for $8 million in the first quarter of 2015. At June 30, 2015, our unsecuritized and securitized portfolios of commercial mezzanine and subordinate loans held-for-investment had an outstanding principal balance of $332 million (excluding A-notes), unamortized discount of $4 million, an allowance for loan losses of $7 million, and a carrying value of $320 million.
At June 30, 2015, we had $52 million of short-term borrowings outstanding under commercial warehouse facilities, secured by $83 million of mezzanine and subordinate loans.
At June 30, 2015, we had $70 million outstanding of non-recourse, asset-backed debt issued at our Commercial Securitization, at a stated interest rate of 5.62% (excluding deferred issuance costs), which provided financing for commercial loans with a carrying value of $182 million. See Appendix Table 8 for additional detail on our consolidated variable interest entities, including our Commercial Securitization.
On average, our commercial mezzanine loans held-for-investment have a maturity of more than four years and an unlevered yield of approximately 10% per annum before credit costs.
|
|
|
THE REDWOOD REVIEW I 2ND QUARTER 2015 32 |
|
|
REDWOOD TRUST |
F I N A N C I A L I N S I G H T S |
At June 30, 2015, we had one loan with a carrying value of $26 million on our watch list. The loan is current and we expect to receive all amounts due according to the contractual terms of the loan.
The following charts present the property types and geographic locations of the commercial real estate underlying our portfolio of commercial mezzanine and subordinate loans held-for-investment at June 30, 2015.
(1) Percentages based on outstanding loan balances
(2) Other includes NJ, OR, TN, AL, CO, WV, AR, RI, and MA each with less than 3%; and 10 other states each with less than 1%
|
|
|
THE REDWOOD REVIEW I 2ND QUARTER 2015 33 |
|
|
REDWOOD TRUST |
F I N A N C I A L I N S I G H T S |
Mortgage Servicing Rights (MSRs)
The table below details the change in fair value and associated loan principal of MSRs held during the second and first quarters of 2015.
|
| | | | | | | | | | | | | | | | |
|
MSRs |
($ in millions) |
| Three Months Ended | |
| 6/30/2015 | | 3/31/2015 | |
| Fair Value | | Associated Principal | | Fair
Value | | Associated
Principal | |
| | | | | | | | |
Beginning fair value | $ | 120 |
| | $ | 12,653 |
| | $ | 139 |
| | $ | 13,668 |
| |
Additions | 32 |
| | 2,998 |
| | 19 |
| | 1,909 |
| |
Sales | — |
| | — |
| | (18 | ) | | (2,166 | ) | |
Change in fair value due to: | | | | | | | | |
Changes in assumptions | 19 |
| | — |
| | (14 | ) | | — |
| |
Other changes (1) | (3 | ) | | (585 | ) | | (6 | ) | | (758 | ) | |
| | | | | | | | |
Ending fair value | $ | 168 |
| | $ | 15,066 |
| | $ | 120 |
| | $ | 12,653 |
| |
| |
(1) | Primarily represents changes in the basis of our investment from the receipt of expected fees during the quarter. |
During the second quarter of 2015, we added $32 million of MSRs, including $21 million of MSRs acquired through our residential mortgage banking operations and $11 million of bulk-purchased MSRs.
At June 30, 2015, we owned $67 million of jumbo MSRs and $101 million of conforming MSRs associated with residential loans that had aggregate principal balances of $6.1 billion and $8.9 billion, respectively.
The GAAP carrying value, which is the estimated fair value of our MSRs was equal to 1.12% of the aggregate principal balance of the associated residential loans at June 30, 2015, as compared to 0.95% at March 31, 2015. At June 30, 2015, the 60-day-plus delinquency rate (by current principal balance) of loans associated with our MSR investments was 0.05%.
We earn fees from these MSRs, but outsource the actual servicing of the associated loans to third-party servicers.
|
|
|
THE REDWOOD REVIEW I 2ND QUARTER 2015 34 |
|
|
REDWOOD TRUST |
F I N A N C I A L I N S I G H T S |
Corporate Long-Term Debt
At June 30, 2015, RWT Holdings, Inc., a wholly-owned taxable REIT subsidiary of Redwood Trust, Inc., had $205 million of exchangeable senior notes outstanding at a stated interest rate of 5.625% (excluding deferred issuance costs) that are exchangeable for 46.1798 shares of Redwood Trust, Inc. common stock per $1,000 principal amount (equivalent to an exchange price of $21.65 per common share and subject to certain adjustments) on or before their maturity in November 2019.
In addition, at June 30, 2015, we had $288 million of convertible senior notes outstanding at a stated interest rate of 4.625% (excluding deferred issuance costs) that are convertible into 41.1320 shares of common stock per $1,000 principal amount (equivalent to a conversion price of $24.31 per common share and subject to certain adjustments) on or before their maturity in April 2018.
At June 30, 2015, we had $140 million of other long-term debt outstanding, due in 2037, with a stated interest rate of three-month LIBOR plus 225 basis points (excluding deferred issuance costs). In 2010, we effectively fixed the interest rate on this long-term debt at approximately 6.75% (excluding deferred issuance costs) through interest rate swaps.
|
|
|
THE REDWOOD REVIEW I 2ND QUARTER 2015 35 |
|
|
REDWOOD TRUST |
C H A N G E S T O F I N A N C I A L S T A T E M E N T P R E S E N T A T I O N |
Changes to Financial Statement Presentation
Changes to our Consolidated Income Statement
In the second quarter of 2015, we began to specifically identify derivatives that are used to hedge our exposure to market interest rate risk associated with our MSR investments. As a result, beginning in the second quarter of 2015, we changed our income statement presentation to include the change in market value of these derivatives in the line item “MSR income (loss), net.”
As we previously managed our market interest rate risk on a portfolio-wide basis and did not necessarily rely on derivatives to exclusively hedge our MSRs, we cannot conform prior periods to the current presentation. Therefore, in periods prior to the second quarter of 2015 presented in our consolidated statements of income (in the Quarterly Overview section and the Appendix tables to this Redwood Review), amounts in “MSR income (loss), net” do not reflect the impact of hedging. In prior periods, our MSRs were effectively hedged, as part of an enterprise-wide approach to interest rate risk management, through a combination of derivatives and other portfolio assets. The changes in market value of these derivatives and portfolio assets are included in "Mortgage banking and investment activities, net" in periods prior to the second quarter of 2015, presented in this Redwood Review.
Additionally, beginning in the second quarter of 2015, we combined our “Mortgage banking activities” and “Other market valuation adjustments” line items on our consolidated statements of income into a single line, now called “Mortgage banking and investment activities, net.” As we continue to manage our market interest rate risk on certain other assets (i.e., residential jumbo loans and real estate securities) on a net basis, we believe that combining these two line items better reflects the net effect of our hedging activities on the assets and associated derivatives that are marked-to-market each quarter. We have conformed the presentation of prior periods related to this change for consistency of comparison.
|
|
|
THE REDWOOD REVIEW I 2ND QUARTER 2015 37 |
|
|
REDWOOD TRUST |
C H A N G E S T O F I N A N C I A L S T A T E M E N T P R E S E N T A T I O N |
The following table sets forth the components of our GAAP net income under our new format and previous format for the second quarter of 2015 and our previous format for the first quarter of 2015.
|
| | | | | | | | | | | | |
|
GAAP Income |
($ in millions) |
| Q2 2015 | | Q1 2015 | |
| New Format | | Previous Format | | Previous Format | |
| | | | | | |
Interest income | $ | 63 |
| | $ | 63 |
| | $ | 64 |
| |
Interest expense | (23 | ) | | (23 | ) | | (24 | ) | |
Net interest income | 40 |
| | 40 |
| | 40 |
| |
| | | | | | |
Provision for loan losses | — |
| | — |
| | — |
| |
Non-interest income | | | | | | |
Mortgage banking and investment activities, net (1) | 6 |
| | — |
| | — |
| |
Mortgage banking activities (1) | — |
| | 7 |
| | 2 |
| |
MSR income (loss), net | 1 |
| | 23 |
| | (11 | ) | |
Other market valuation adjustments (1) | — |
| | (24 | ) | | (1 | ) | |
Other income | 1 |
| | 1 |
| | 1 |
| |
Realized gains, net | 6 |
| | 6 |
| | 4 |
| |
Total non-interest income, net | 14 |
| | 14 |
| | (5 | ) | |
| | | | | | |
Operating expenses | (25 | ) | | (25 | ) | | (25 | ) | |
(Provision for) benefit from income taxes | (2 | ) | | (2 | ) | | 5 |
| |
| | | | | | |
Net Income | $ | 27 |
| | $ | 27 |
| | $ | 15 |
| |
| |
(1) | Mortgage banking activities and Other market valuation adjustments utilized in our previous format were combined into Mortgage banking and investment activities, net in our new format. |
Changes to Our Segment Reporting
Prior to the second quarter of 2015, we utilized certain Sequoia interest only (IO) securities in part to serve as hedges in our Residential Mortgage Banking segment. As such, we included these securities in the segment’s assets as well as the interest income and valuation adjustments related to the securities in the segment’s results. During the second quarter of 2015, we permanantly transferred these securities to our Residential Investments segment.
Additionally, in the second quarter of 2015, we began to record a hedging allocation between our segments. As we continue to manage certain aspects of our market interest rate risk on an enterprise-wide basis (i.e., for residential jumbo loans and real estate securities), we rely on certain assets to serve as natural hedges to other assets, and in some cases these assets can be in different segments. We use this allocation to assess the economic returns of each segment on a stand-alone basis and the allocation has no impact on our consolidated results. This is a prospective change in how we are managing our business and allocating capital to each segment. As such, we have not conformed prior period results for our segments.
|
|
|
THE REDWOOD REVIEW I 2ND QUARTER 2015 38 |
|
|
REDWOOD TRUST |
R E D W O O D' S B U S I N E S S O V E R V I E W |
Redwood’s Business Overview
Redwood is focused on investing in mortgage- and other real estate-related assets and engaging in residential and commercial mortgage banking activities. Our business has evolved substantially since the onset of the financial crisis, driven in part by our desire to build a franchise with a value-producing business model positioned to capitalize on the evolution of the mortgage finance markets. Specifically, we strive to be highly competitive in a post-crisis era of greater regulatory and capital requirements for all mortgage market participants, particularly for more heavily regulated banks. We have invested in and expanded our residential and commercial operating platforms to act as intermediaries between borrowers and investors, with the goal of creating our own steady sources of attractive investments and fee-generating opportunities. We believe these platforms take advantage of the strength of our balance sheet and the talents and extensive relationships of the professionals who make up our residential and commercial teams.
Redwood Trust is structured as a REIT for federal tax purposes. Our REIT holds most of our mortgage-related investments, due to the tax advantages afforded to REITs. Our mortgage-banking activities, including our ownership of mortgage servicing rights, are conducted through taxable REIT subsidiaries that pay corporate income taxes.
For management and financial reporting purposes, we have structured our business to consist of three segments - Residential Mortgage Banking, Residential Investments, and Commercial Mortgage Banking & Investments. Each of these segments is further described below.
Residential Mortgage Banking
Our Residential Mortgage Banking segment primarily consists of operating a mortgage loan conduit that acquires residential loans from third-party originators for subsequent sale. We typically acquire prime, jumbo mortgages and the related mortgage servicing rights on a flow basis from our network of loan sellers and distribute those loans through our Sequoia private-label securitization program or to institutions that acquire pools of whole loans. We also acquire conforming loans (defined as loans eligible for sale to Fannie Mae and Freddie Mac) and the related servicing rights on a flow basis from our seller network. Conforming loans we acquire are generally sold to Fannie Mae or Freddie Mac. We occasionally supplement our flow purchases with bulk loan acquisitions.
This segment’s main source of revenue is income from mortgage banking activities, which includes valuation increases (or gains) on the sale or securitization of loans, and from hedges used to manage risks associated with these activities. Additionally, this segment may generate interest income on loans held pending securitization or sale. Funding expenses, direct operating expenses, and tax expenses associated with these activities are also included in this segment.
|
|
|
THE REDWOOD REVIEW I 2ND QUARTER 2015 39 |
|
|
REDWOOD TRUST |
R E D W O O D' S B U S I N E S S O V E R V I E W |
Residential Investments
Our Residential Investments segment includes a portfolio of investments in residential mortgage-backed securities (RMBS) retained from our Sequoia securitizations, as well as RMBS issued by third parties. In addition, this segment includes a subsidiary of Redwood Trust that is a member of the Federal Home Loan Bank of Chicago (FHLBC) and that utilizes attractive long-term financing from the FHLBC to make long-term investments directly in residential mortgage loans. Finally, this segment includes MSRs associated with residential loans we have sold or securitized, as well as MSRs purchased from third parties.
This segment’s main source of revenue is net interest income from portfolio securities and loans held-for-investment, as well as income from MSRs. Additionally, this segment may realize gains upon the sale of securities. Funding expenses, hedging expenses, direct operating expenses, and tax expenses associated with these activities are also included in this segment.
Commercial Mortgage Banking & Investments
Our Commercial Mortgage Banking and Investments segment consists primarily of a mortgage loan conduit that originates senior commercial loans for subsequent sale to third-party CMBS sponsors or other investors. In addition to senior loans, we offer complimentary forms of commercial real estate financing directly to borrowers that may include mezzanine loans, subordinate mortgage loans, and other financing solutions. We typically hold the mezzanine and other subordinate loans we originate in our commercial investment portfolio.
This segment’s main sources of revenue are mortgage banking income, which includes valuation increases (or gains) on the sale of senior commercial loans and associated hedges, and net interest income from mezzanine or subordinate loans held in our investment portfolio. Funding expenses, direct operating expenses, and tax expenses associated with these activities are also included in this segment.
|
|
|
THE REDWOOD REVIEW I 2ND QUARTER 2015 40 |
|
|
REDWOOD TRUST |
D I V I D E N D P O L I C Y |
Dividend Policy
Summary
As a REIT, Redwood is required to distribute to shareholders at least 90% of its REIT taxable income, excluding net capital gains. REIT taxable income is defined as taxable income earned at Redwood and its qualified REIT subsidiaries and certain pass-through entities. To the extent Redwood retains REIT taxable income, it is taxed at corporate tax rates. Redwood also earns taxable income at its taxable REIT subsidiaries (TRS), which it is not required to distribute.
Dividend Policy Overview
Our Board of Directors has maintained a policy of paying regular quarterly dividends, although we have not been required to distribute dividends in recent years in order to comply with the provisions of the Internal Revenue Code applicable to REITs. In November 2014, the Board of Directors announced its intention to pay a regular dividend of $0.28 per share per quarter in 2015. During the first and second quarters of 2015, the Board of Directors declared and paid regular quarterly dividends of $0.28 per share. In August 2015, the Board of Directors declared a regular dividend of $0.28 per share for the third quarter of 2015, which is payable on September 30, 2015 to shareholders of record on September 15, 2015.
Dividend Distribution Requirement
Our estimated REIT taxable income was $18 million, or $0.21 per share, for the second quarter of 2015 and $15 million, or $0.18 per share, for the first quarter of 2015. Under normal circumstances, our minimum REIT dividend requirement would be 90% of our annual REIT taxable income. However, we currently maintain a federal $70 million REIT net operating loss carry forward (NOL) that affords us the option of retaining REIT taxable income up to the NOL amount, tax free, rather than distributing it as dividends. Federal income tax rules require the dividends paid deduction to be applied to reduce taxable income before the applicability of NOLs is considered. We do not expect our estimated REIT taxable income to exceed our dividend distributions in 2015; therefore, our entire NOL will likely carry forward into 2016.
|
|
|
THE REDWOOD REVIEW I 2ND QUARTER 2015 41 |
|
|
REDWOOD TRUST |
D I V I D E N D P O L I C Y |
Income Tax Characterization of Dividend for Shareholders
Irrespective of our minimum distribution requirement, federal income tax rules require that the actual dividends we distribute in 2015 be taxed at the shareholder level based on our full-year 2015 taxable income plus net capital gains before application of any loss carry forwards. Based on this requirement, we expect much of the dividends we distribute in 2015 will be taxable as ordinary income to shareholders and a smaller portion to be a return of capital, which is generally non-taxable. None of Redwood’s 2015 dividend distributions are expected to be characterized as long-term capital gains for federal income tax purposes. Factors that significantly affect the taxation of our 2015 dividends to shareholders include but are not limited to: (i) capital gains on sales of securities and (ii) the timing of realized credit losses on legacy investments.
(i)For the six months ended June 30, 2015, we realized net capital gains of $19 million at the REIT level for tax purposes. Net capital gains generated by the REIT for the entire year could increase the portion of our 2015 dividends that are characterized as ordinary income to our shareholders. However, if the REIT realized net capital losses for 2015, those losses would have no effect on the taxability of our 2015 dividends. None of our 2015 dividend distributions are expected to be characterized as long-term capital gains, based on applicable federal income tax rules.
(ii)Our estimated REIT taxable income for the six months ended June 30, 2015 included $4 million of realized credit losses on legacy investments that were taken in previous periods for GAAP reporting purposes. We anticipate an additional $30 million of tax credit losses to be realized over an estimated three to five-year period based on the securities we currently own. This is a decrease from $34 million at December 31, 2014 and $59 million at December 31, 2013. Even though the impact of realized losses on our current period taxable income is declining, our GAAP earnings, which have provisioned for these losses in prior periods, will likely continue to exceed our REIT taxable income.
|
|
|
THE REDWOOD REVIEW I 2ND QUARTER 2015 42 |
|
|
REDWOOD TRUST |
G L O S S A R Y |
A-NOTES
A-Notes are senior interests in commercial mortgage debt which are promissory notes secured by either a deed of trust or a mortgage. A-Notes are senior to any subordinate financing, such as B-Notes, and mezzanine financing. See B-Notes and Mezzanine Loan definitions.
ADJUSTABLE-RATE MORTGAGES (ARM)
Adjustable-rate mortgages (“ARMs”) are loans that have coupons that adjust at least once per year. We make a distinction between ARMs (loans with a rate adjustment at least annually) and hybrids (loans that have a fixed-rate period of 2-10 years and then become adjustable-rate).
AGENCY
Agency refers to government-sponsored enterprises (“GSEs”), including Federal National Mortgage Association (“Fannie Mae”), Federal Home Loan Mortgage Corporation (“Freddie Mac”), and Government National Mortgage Association (“Ginnie Mae”).
ALT-A SECURITIES and ALT-A LOANS
Alt-A securities are residential mortgage-backed securities backed by loans that have higher credit quality than subprime and lower credit quality than prime. Alt-A originally represented loans with alternative documentation, but the definition has shifted over time to include loans with additional risk characteristics and in some cases investor loans. In an Alt-A loan, the borrower’s income may not be verified, and in some cases, may not be disclosed on the loan application. Alt-A loans may also have expanded criteria that allow for higher debt-to-income ratios with higher accompanying loan-to-value ratios than would otherwise be permissible for prime loans.
AMORTIZED COST
Amortized cost is the initial acquisition cost of an available-for-sale (“AFS”) security, minus principal repayments or principal reductions through credit losses, plus or minus premium or discount amortization. At the point in time an AFS security is deemed other-than-temporarily impaired, the amortized cost is adjusted (by changing the amount of unamortized premium or discount) by the amount of other-than temporary impairment taken through the income statement.
ASSET-BACKED SECURITIES (ABS)
Asset-backed securities (“ABS”) are securities backed by financial assets that generate cash flows. Each ABS issued from a securitization entity has a unique priority with respect to receiving principal and interest cash flows and absorbing any credit losses from the assets owned by the entity.
|
|
|
THE REDWOOD REVIEW I 2ND QUARTER 2015 43 |
|
|
REDWOOD TRUST |
G L O S S A R Y |
AVAILABLE-FOR-SALE (AFS)
An accounting method for debt and equity securities in which the securities are reported at their fair value. Positive changes in the fair value are accounted for as increases to stockholders’ equity and do not flow through the income statement. Negative changes in fair value may be recognized through the income statement or balance sheet.
B-NOTES
B-Notes are subordinate interests in commercial mortgage debt which are either (i) evidenced by a subordinated promissory note secured by the same mortgage that also secures the senior debt relating to the same property or (ii) junior participation interests in mortgage debt that are subordinate to senior participation interests in the same mortgage debt. B-Notes typically provide the holder with certain rights to approve modifications to related lending agreements and to trigger foreclosure under the mortgage following an event of default. B-Notes also typically provide the holder certain limited rights to cure a borrower default under senior debt secured by the same mortgage in order to keep the senior debt current and avoid foreclosure.
BOOK VALUE (GAAP)
Book value is the value of our common equity in accordance with GAAP.
COMMERCIAL MORTGAGE-BACKED SECURITIES (CMBS)
A type of mortgage-backed security that is secured by one or more loans on commercial properties.
CONFORMING LOAN
A conforming loan is a mortgage loan that conforms to the underwriting standards of Fannie Mae and Freddie Mac, including the maximum loan limit, which is currently $417,000 except in defined high-cost areas of the country, where the limit is higher. Changes to this maximum loan limit are announced annually by the Federal Housing Finance Agency (“FHFA”), which is the regulator and conservator of both Fannie Mae and Freddie Mac.
CONSTANT (or CONDITIONAL) PREPAYMENT RATE (CPR)
Constant (or conditional) prepayment rate (“CPR”) is an industry-standard measure of the speed at which mortgage loans prepay. It approximates the annual percentage rate at which a pool of loans is paying down due to unscheduled principal prepayments.
CREDIT SUPPORT
Credit support is the face amount of securities subordinate (or junior) to the applicable security that protects the security from credit losses and is generally expressed as a percentage of the securitization’s underlying pool balance.
|
|
|
THE REDWOOD REVIEW I 2ND QUARTER 2015 44 |
|
|
REDWOOD TRUST |
G L O S S A R Y |
DEBT
Debt is an obligation of Redwood. See Long-term debt and Short-term debt.
FALLOUT
The percentage of loans that an originator plans or commits to sell to a buyer that ultimately do not close and are not delivered to the buyer.
FASB
Financial Accounting Standards Board.
FHFA
The FHFA refers to the Federal Housing Finance Authority.
FHLB and FHLBC
The FHLB refers to the Federal Home Loan Bank system. The FHLBC refers to the Federal Home Loan Bank of Chicago.
FORWARD SALE COMMITMENT
A contract pertaining to the future sale of a loan at a specified price and within a specified time period. Mortgage bankers often use forward sale commitments to hedge interest rate risk between the date they agree to buy and the date in which the loan is sold, which is often between 30 and 60 days. This commitment qualifies as a derivative in accordance with GAAP. Any change in the value of this forward sale commitment is recorded as a market valuation adjustment in mortgage banking activities.
GAAP
Generally Accepted Accounting Principles in the United States.
GOVERNMENT-SPONSORED ENTERPRISE (GSE)
A government-sponsored enterprise is a financial services corporation created by the United States Congress to enhance the flow of credit to targeted sectors of the economy. Among the GSEs chartered by Congress are Fannie Mae, Freddie Mac, Ginnie Mae, and the Federal Home Loan Banks. When we refer to GSEs, we are generally referring to Fannie Mae and Freddie Mac.
|
|
|
THE REDWOOD REVIEW I 2ND QUARTER 2015 45 |
|
|
REDWOOD TRUST |
G L O S S A R Y |
INTEREST-ONLY SECURITIES (IOs)
Interest-only securities (“IOs”) are specialized securities created by securitization entities where the projected cash flows generated by the underlying assets exceed the cash flows projected to be paid to the securities that are issued with principal balances. Typically, IOs do not have a principal balance and they will not receive principal payments. Interest payments to IOs usually equal an interest rate formula multiplied by a “notional” principal balance. The notional principal balances for IOs are typically reduced over time as the actual principal balance of the underlying pool of assets pays down, thus reducing the cash flows to the IOs over time. Cash flows on IOs are typically reduced more quickly when asset prepayments increase.
INVESTMENT CAPACITY
The amount of capacity we estimate that we have to invest in new assets. Our estimate of our investment capacity takes into account, among other things, cash on hand, cash we estimate we could raise by prudently increasing short-term borrowings, and cash needed to cover short-term operations, working capital, and a liquidity cushion.
JUMBO LOAN
A jumbo loan is a residential mortgage loan that generally conforms to the underwriting standards of Fannie Mae and Freddie Mac except that the dollar amount of the loan exceeds the conforming loan limit set annually by the FHFA. See Conforming Loan Definition.
LEVERAGE RATIOS
Leverage ratios measure financial leverage and are used to assess a company’s ability to meet its financial obligations. Financial leverage ratios are often expressed as debt to equity and assets to equity. In the mortgage banking industry, financial leverage is most commonly calculated using debt to equity. At Redwood, the two financial leverage ratios used are consolidated GAAP debt to equity and recourse debt to equity. The former calculation includes the consolidated ABS issued from certain Sequoia securitization entities (generally those issued prior to 2012) even though those obligations are not financial obligations of Redwood but are obligations of each the consolidated securitization trusts and are payable only from the cash flow from the assets owned by each of those trusts. The latter calculation of recourse debt to equity excludes debt related to consolidated securitizations and only includes debt for which Redwood has an obligation to repay. Both ratios are calculated at the bottom of Table 4: Book Value and Financial Ratios in the Appendix section.
|
|
|
THE REDWOOD REVIEW I 2ND QUARTER 2015 46 |
|
|
REDWOOD TRUST |
G L O S S A R Y |
LOAN PURCHASE COMMITMENT
A commitment to purchase a residential mortgage loan from a mortgage loan originator at a specified price and within a specified time period. A “best efforts” loan purchase commitment becomes effective once the originator has closed the loan with the borrower. A “mandatory” loan purchase commitment becomes effective once the commitment is entered into among the buyer and the originator, regardless if the originator has closed the loan. Mortgage buyers such as Redwood often issue 30 to 60 day loan purchase commitments to loan originators so they can in turn offer a similar commitments to their borrowers. To hedge interest rate risk during the commitment period, buyers will often enter in to a forward sale commitment or hedge the risk using derivatives. (See Forward Sale Commitment definition.) A loan purchase commitment for a conforming loan qualifies as a derivative in accordance with GAAP. Beginning January 1, 2015, our loan purchase commitment for a non-conforming loan qualifies as a derivative in accordance with GAAP. Any change in the value of a loan purchase commitment is recorded as a market valuation adjustment in mortgage banking activities.
LONG-TERM DEBT
Long-term debt is debt that is an obligation of Redwood that is not payable within a year and includes convertible debt, junior subordinated notes and trust preferred securities. We generally treat long-term debt as part of our capital base when it is not payable in the near future.
MARK-TO-MARKET (MTM) ACCOUNTING
Mark-to-market (“MTM”) accounting uses estimated fair values of assets, liabilities, and hedges. Many assets on our consolidated balance sheet are carried at their fair value rather than amortized cost. Taxable income is generally not affected by market valuation adjustments.
MARKET VALUATION ADJUSTMENTS (MVAs)
Market valuation adjustments (“MVAs”) are changes in market values for certain assets and liabilities that are reported through our GAAP income statement. They include all changes in market values for assets and liabilities accounted for at fair value, such as trading securities and derivatives. They also include the credit portion of other-than-temporary impairments on securities available-for-sale, as well as impairments of loans held-for-sale and REO properties.
MEZZANINE LOAN
A mezzanine loan is a loan secured by the membership interests, partnership interests, and/or stock in a single purpose entity formed to own a commercial property, for example. If the mezzanine borrower fails to make its payments or otherwise defaults under the mezzanine loan documents, the mezzanine lender may pursue its remedies, including taking control of the single purpose entity that owns the property.
|
|
|
THE REDWOOD REVIEW I 2ND QUARTER 2015 47 |
|
|
REDWOOD TRUST |
G L O S S A R Y |
MEZZANINE SECURITIES
Mezzanine securities are a type of subordinate security and refer to the securities in a residential mortgage-backed securitization that are rated AA, A, and BBB. They rank junior to the AAA securities, and senior to the securities rated below BBB which typically include BB and B rated securities, and any non-rated securities.
MORTGAGE SERVICING RIGHT (MSR)
A mortgage servicing right (“MSR”) gives the holder the contractual right to service a mortgage loan. MSRs typically include the right to collect monthly mortgage principal and interest payments, as well as related tax and insurance payments, from borrowers, disburse funds to the mortgage debt holders and remit related insurance and tax payments, collect late payments, and process modifications and foreclosures. MSRs are created when mortgage loans are sold in a transaction in which the seller retains the right to service the loans. The holder of an MSR receives a monthly servicing fee (which generally ranges from 0.25% to 0.375% per annum of the outstanding principal balance of the related mortgage loan), which is deducted from the borrower’s monthly interest payments. For accounting purposes, MSRs are capitalized at the net present value of the servicing
fee less the servicing cost. When Redwood holds MSRs relating to residential mortgage loans, it retains a sub-servicer to carry out actual servicing functions, as Redwood does not directly service residential mortgage loans.
NON-PRIME SECURITIES
Non-prime securities are Alt-A, option ARM, and subprime securities. See definitions of Alt-A, option ARM, and subprime securities.
OPTION ARM LOAN
An option ARM loan is a residential mortgage loan that generally offers a borrower monthly payment options such as: 1) a minimum payment that results in negative amortization; 2) an interest-only payment; 3) a payment that would fully amortize the loan over an original 31-year amortization schedule; and, 4) a payment that would fully amortize the loan over a 15-year amortization schedule. To the extent the borrower has chosen an option that is not fully amortizing the loan (or negatively amortizing the loan), after a period – usually five years or once the negatively amortized loan balance reaches a certain level (generally 15% to 25% higher than the original balance) – the loan payments are recast. This recast provision resets the payment at a level that fully amortizes the loan over its remaining life and the new payment may be materially different than under the borrowers’ previous option.
|
|
|
THE REDWOOD REVIEW I 2ND QUARTER 2015 48 |
|
|
REDWOOD TRUST |
G L O S S A R Y |
PREFERRED EQUITY
A preferred equity investment is an investment in preferred equity of a special purpose entity that directly or indirectly owns a commercial property. An investor in preferred equity is typically entitled to a preferred return (relative to a holder of common equity of the same entity) and has the right, if the preferred return is not paid, to take control of the entity (and thereby control the underlying commercial property).
PRIME RESIDENTIAL REAL ESTATE LOANS
Prime loans are residential loans with higher quality credit characteristics, such as borrowers with higher FICO credit scores, lower loan-to-value ratios, lower debt-to-income ratios, greater levels of other assets, and more documentation.
PRIME SECURITIES
Prime securities are residential mortgage-backed securities backed by prime loans, generally with balances greater than conforming loan limits. Prime securities are typically backed by loans that have relatively high weighted average FICO scores (e.g., 700 or higher at origination), low weighted average LTVs (e.g., 75% or less at origination), limited concentrations of investor properties, and low percentages of loans with low FICO scores or high loan-to-value ratios.
PRINCIPAL-ONLY SECURITIES (POs)
Principal-only securities (“POs”) are specialized securities created by securitization entities where the holder is only entitled to receive regular cash flows that are derived from incoming principal repayments on an underlying mortgage loan pool. This security is created by splitting a mortgage-backed security into its interest and principal payments. The principal payments create a string of cash flows which are sold at a discount to investors. These investors will receive the principal portions of the monthly mortgage payments from the underlying pool of loans. The yield on a PO strip depends on the prepayment speed of the underlying loan. The faster the principal is repaid, the higher the yield an investor will receive.
PROFITABILITY RATIOS
Many financial institution analysts use asset-based profitability ratios such as interest rate spread and interest rate margin when analyzing financial institutions. These are asset-based measures. Since we consolidate the assets and liabilities of certain securitization entities for GAAP purposes, our total GAAP assets and liabilities may vary over time, and may not be comparable to assets typically used in profitability calculations for other financial institutions. As a result, we believe equity-based profitability ratios may be more appropriate than asset-based measures for analyzing Redwood’s operations and results. We provide various profitability ratios in Table 4 in the Financial Tables in this Review.
|
|
|
THE REDWOOD REVIEW I 2ND QUARTER 2015 49 |
|
|
REDWOOD TRUST |
G L O S S A R Y |
REAL ESTATE INVESTMENT TRUST (REIT)
A real estate investment trust (“REIT”) is an entity that makes a tax election to be taxed as a REIT, invests in real estate assets, and meets other REIT qualifications, including the distribution as dividends of at least 90% of its REIT taxable income, excluding net capital gains. A REIT’s profits are not taxed at the corporate level to the extent that these profits are distributed as dividends to stockholders, providing an operating cost savings. On the other hand, the requirement to pay out as dividends most of the REIT’s taxable profits means it can be harder for a REIT to grow using only internally-generated funds (as opposed to raising new capital).
REAL ESTATE OWNED (REO)
Real estate owned (“REO”) refers to real property owned by the lender or loan owner that has been acquired through foreclosure.
REIT SUBSIDIARY
A REIT subsidiary is a subsidiary of a REIT that is taxed as a REIT, also referred to as a qualified REIT subsidiary.
REIT TAXABLE INCOME
REIT taxable income is not a measure calculated in accordance with GAAP. REIT taxable income is income calculated for tax purposes at Redwood including only its qualified REIT subsidiaries (i.e., excluding its taxable subsidiaries, with certain adjustments). REIT taxable income is an important measure as it is the basis of our dividend distribution requirements. We must annually distribute at least 90% of REIT taxable income, excluding net capital gains, as dividends to shareholders. As a REIT, we are not subject to corporate income taxes on the REIT taxable income we distribute. We pay corporate income tax on the REIT taxable income we retain, if any (and we are permitted to retain up to 10% of total REIT taxable income, plus net capital gains).
REMIC
A real estate mortgage investment conduit (“REMIC”) is a special purpose vehicle used to pool real estate mortgages and issue mortgage-backed securities. REMICs are typically exempt from tax at the entity level. REMICs may invest only in qualified mortgages and permitted investments, including single family or multifamily mortgages, commercial mortgages, second mortgages, mortgage participations, and federal agency pass-through securities.
RE-REMIC SECURITY
A Re-REMIC is a re-securitization of asset-backed securities. The cash flows from and any credit losses absorbed by the underlying assets can be redirected to the resulting Re-REMIC securities in a variety of ways.
|
|
|
THE REDWOOD REVIEW I 2ND QUARTER 2015 50 |
|
|
REDWOOD TRUST |
G L O S S A R Y |
RESECURITIZATION
A resecuritization is a securitization of two or more mortgage-backed securities into a new mortgage-backed security.
RESIDENTIAL MORTGAGE-BACKED SECURITIES (RMBS)
A type of mortgage-backed security that is backed by a pool of mortgages on residential properties.
RETURN ON EQUITY (ROE)
ROE is the amount of profit we generate each year per dollar of equity capital and equals GAAP income divided by GAAP equity.
SENIOR SECURITIES
Generally, senior securities have the least credit risk in a securitization transaction because they are generally the last securities to absorb credit losses. In addition, the senior securities have the highest claim on the principal and interest payments (after the fees to servicers and trustees are paid). To further reduce credit risk, most if not all, principal collected from the underlying asset pool is used to pay down the senior securities until certain performance tests are satisfied. If certain performance tests are satisfied, principal payments are shared between the senior securities and the subordinate securities, generally on a pro rata basis. At issuance, senior securities are generally triple A-rated.
SEQUOIA
Sequoia is the brand name for securitizations of residential real estate loans Redwood sponsors. Sequoia entities are independent securitization entities that acquire residential mortgage loans and create and issue asset-backed securities (“ABS”) backed by these loans. Most of the loans that Sequoia entities acquire are prime-quality loans. Most of the senior ABS created by Sequoia are sold to third-party investors. Redwood usually acquires most of the subordinated ABS and may also acquire the interest-only securities (“IOs”).
SHORT-TERM DEBT
Short-term debt is debt that is an obligation of Redwood and payable within a year. We may obtain this debt from a variety of Wall Street firms, banks, and other institutions. We may issue these or other forms of short term debt in the future. We may use short-term debt to finance the accumulation of assets prior to sale to a securitization entity and to finance investments in loans and securities.
|
|
|
THE REDWOOD REVIEW I 2ND QUARTER 2015 51 |
|
|
REDWOOD TRUST |
G L O S S A R Y |
SUBORDINATE DEBT INVESTMENTS
Subordinate Debt Investments mean Mezzanine Loans, Preferred Equity, and B-Notes.
SUBORDINATE SECURITIES (JUNIOR SECURITIES or NON-SENIOR SECURITIES)
Subordinate securities absorb the initial credit losses from a securitization structure, thus protecting the senior securities. Subordinate securities have a lower priority to receive principal and interest payments than the senior securities. Subordinate securities receive little, if any, principal payments until certain performance tests are satisfied. If certain performance tests are satisfied, principal payments are shared between the senior securities and the subordinate securities, generally on a pro rata basis. Subordinate securities generally receive interest payments even if they do not receive principal payments. At issuance, subordinate securities are generally rated double-A or below.
SUBPRIME SECURITIES
Subprime securities are residential mortgage-backed securities backed by loans to borrowers who typically have lower credit scores and/or other credit deficiencies that prevent them from qualifying for prime or Alt-A mortgages and may have experienced credit problems in the past, such as late payments or bankruptcies. To compensate for the greater risks and higher costs to service the loans, subprime borrowers pay higher interest rates, points, and origination fees.
TAXABLE INCOME
Taxable income is not a measure calculated in accordance with GAAP. Taxable income is income for Redwood and all its subsidiaries as calculated for tax purposes. Taxable income calculations differ significantly from GAAP income calculations. A reconciliation of taxable income to GAAP income appears in Table 3 in the Financial Tables in this Review.
TAXABLE SUBSIDIARY
A taxable subsidiary is a subsidiary of a REIT that is not taxed as a REIT and thus pays taxes on its income. A taxable subsidiary is not limited to investing in real estate and it can choose to retain all of its after-tax profits.
TO BE ANNOUNCED (TBA)
A term used to describe a forward Agency mortgage-backed securities trade. Pass-through securities issued by Freddie Mac, Fannie Mae and Ginnie Mae trade in the TBA market. The term TBA is derived from the fact that the actual mortgage-backed security that will be delivered to fulfill a TBA trade is not designated at the time the trade is made. The securities are “to be announced” 48 hours prior to the established trade settlement date.
|
|
|
THE REDWOOD REVIEW I 2ND QUARTER 2015 52 |
|
|
REDWOOD TRUST |
G L O S S A R Y |
|
|
|
THE REDWOOD REVIEW I 2ND QUARTER 2015 53 |
|
| | | | | | | | | | | | | | | | | | | | | | | | | | | | | | | | | | | | | | | | | | | | |
| Table 1: GAAP Earnings (in thousands, except per share data) |
| | | | | | | | | | | | | | | | | | | | | | |
| | 2015 Q2 | | 2015
Q1 | | 2014
Q4 | | 2014
Q3 | | 2014
Q2 | | 2014
Q1 | | 2013
Q4 | | 2013
Q3 | | 2013
Q2 | | Six Months 2015 | | Six Months 2014 |
Interest income | $ | 53,857 |
| | $ | 53,713 |
| | $ | 56,029 |
| | $ | 53,323 |
| | $ | 48,347 |
| | $ | 45,145 |
| | $ | 48,331 |
| | $ | 50,139 |
| | $ | 51,195 |
| | $ | 107,570 |
| | $ | 93,492 |
|
Discount amortization on securities, net | 9,324 |
| | 9,838 |
| | 10,061 |
| | 10,890 |
| | 10,586 |
| | 11,298 |
| | 10,311 |
| | 8,785 |
| | 8,153 |
| | 19,162 |
| | 21,884 |
|
Discount (premium) amortization on loans, net | 192 |
| | 195 |
| | (839 | ) | | (863 | ) | | (940 | ) | | (967 | ) | | (1,150 | ) | | (1,504 | ) | | (1,629 | ) | | 387 |
| | (1,907 | ) |
Total interest income | 63,373 |
| | 63,746 |
| | 65,251 |
| | 63,350 |
| | 57,993 |
| | 55,476 |
| | 57,492 |
| | 57,420 |
| | 57,719 |
| | 127,119 |
| | 113,469 |
|
Interest expense on short-term debt | (6,527 | ) | | (7,224 | ) | | (8,581 | ) | | (8,440 | ) | | (5,142 | ) | | (3,827 | ) | | (3,715 | ) | | (5,227 | ) | | (4,686 | ) | | (13,751 | ) | | (8,969 | ) |
Interest expense on ABS issued from consolidated trusts | (5,645 | ) | | (6,202 | ) | | (6,765 | ) | | (7,838 | ) | | (8,183 | ) | | (8,441 | ) | | (8,903 | ) | | (9,604 | ) | | (10,250 | ) | | (11,847 | ) | | (16,624 | ) |
Interest expense on long-term debt | (10,836 | ) | | (10,535 | ) | | (8,557 | ) | | (7,071 | ) | | (7,826 | ) | | (6,792 | ) | | (6,910 | ) | | (6,894 | ) | | (6,480 | ) | | (21,371 | ) | | (14,618 | ) |
Total interest expense | (23,008 | ) | | (23,961 | ) | | (23,903 | ) | | (23,349 | ) | | (21,151 | ) | | (19,060 | ) | | (19,528 | ) | | (21,725 | ) | | (21,416 | ) | | (46,969 | ) | | (40,211 | ) |
Net interest income | 40,365 |
| | 39,785 |
| | 41,348 |
| | 40,001 |
| | 36,842 |
| | 36,416 |
| | 37,964 |
| | 35,695 |
| | 36,303 |
| | 80,150 |
| | 73,258 |
|
(Provision for) reversal of provision for loan losses – Residential | — |
| | — |
| | (1,562 | ) | | 708 |
| | 604 |
| | (627 | ) | | (3,374 | ) | | (883 | ) | | 4,163 |
| | — |
| | (23 | ) |
(Provision for) reversal of provision for loan losses – Commercial | 261 |
| | (206 | ) | | (27 | ) | | 889 |
| | (289 | ) | | (655 | ) | | (869 | ) | | (844 | ) | | (891 | ) | | 55 |
| | (944 | ) |
Net interest income after provision | 40,626 |
| | 39,579 |
| | 39,759 |
| | 41,598 |
| | 37,157 |
| | 35,132 |
| | 33,721 |
| | 33,968 |
| | 39,575 |
| | 80,205 |
| | 72,291 |
|
Non-interest income | | | | | | | | | | | | | | | | | | | | | |
Mortgage banking and investment activities, net | | | | | | | | | | | | | | | | | | | | | |
Residential mortgage banking | 4,833 |
| | 2,217 |
| | 9,850 |
| | 11,429 |
| | 1,342 |
| | (1,067 | ) | | 10,114 |
| | (12,236 | ) | | 42,290 |
| | 7,050 |
| | 275 |
|
Commercial mortgage banking | 2,613 |
| | (292 | ) | | 1,140 |
| | 6,486 |
| | 4,981 |
| | 833 |
| | 6,818 |
| | 3,538 |
| | 6,433 |
| | 2,321 |
| | 5,814 |
|
Investments | (1,787 | ) | | (1,147 | ) | | 3,817 |
| | (3,750 | ) | | (4,134 | ) | | (6,136 | ) | | 390 |
| | 462 |
| | (6,258 | ) | | (2,934 | ) | | (10,270 | ) |
Mortgage servicing rights income (loss), net | | | | | | | | | | | | | | | | | | | | | |
MSR servicing fee income | 7,292 |
| | 8,487 |
| | 6,281 |
| | 4,153 |
| | 3,776 |
| | 3,318 |
| | 3,261 |
| | 2,653 |
| | 1,720 |
| | 15,779 |
| | 7,094 |
|
MSR market valuation adjustments | 15,352 |
| | (19,411 | ) | | (15,192 | ) | | 1,668 |
| | (5,553 | ) | | (2,712 | ) | | 2,367 |
| | 460 |
| | 8,827 |
| | (4,059 | ) | | (8,265 | ) |
MSR derivatives (1) | (21,814 | ) | | — |
| | — |
| | — |
| | — |
| | — |
| | — |
| | — |
| | — |
| | (21,814 | ) | | — |
|
Realized gains, net | 6,316 |
| | 4,306 |
| | 4,790 |
| | 8,533 |
| | 1,063 |
| | 1,092 |
| | 1,968 |
| | 10,469 |
| | 556 |
| | 10,622 |
| | 2,155 |
|
Other income | 1,299 |
| | 809 |
| | 181 |
| | 1,600 |
| | — |
| | — |
| | — |
| | — |
| | — |
| | 2,108 |
| | — |
|
Total non-interest income (loss), net | 14,104 |
| | (5,031 | ) | | 10,867 |
| | 30,119 |
| | 1,475 |
| | (4,671 | ) | | 24,918 |
| | 5,346 |
| | 53,568 |
| | 9,073 |
| | (3,197 | ) |
Fixed compensation expense | (9,286 | ) | | (9,155 | ) | | (7,948 | ) | | (7,445 | ) | | (6,872 | ) | | (6,792 | ) | | (5,750 | ) | | (5,808 | ) | | (6,080 | ) | | (18,441 | ) | | (13,664 | ) |
Variable compensation expense | (3,578 | ) | | (3,991 | ) | | (6,462 | ) | | (2,418 | ) | | (3,021 | ) | | (2,731 | ) | | (3,908 | ) | | (5,621 | ) | | (3,961 | ) | | (7,569 | ) | | (5,752 | ) |
Equity compensation expense | (3,539 | ) | | (2,738 | ) | | (2,335 | ) | | (2,261 | ) | | (2,824 | ) | | (2,330 | ) | | (2,196 | ) | | (1,997 | ) | | (3,396 | ) | | (6,277 | ) | | (5,154 | ) |
Severance expense | — |
| | — |
| | (5 | ) | | (4 | ) | | (222 | ) | | — |
| | — |
| | (445 | ) | | (3,366 | ) | | — |
| | (222 | ) |
Other operating expense | (8,815 | ) | | (9,179 | ) | | (9,712 | ) | | (9,280 | ) | | (9,343 | ) | | (8,119 | ) | | (7,816 | ) | | (8,449 | ) | | (7,627 | ) | | (17,994 | ) | | (17,462 | ) |
Total operating expenses | (25,218 | ) | | (25,063 | ) | | (26,462 | ) | | (21,408 | ) | | (22,282 | ) | | (19,971 | ) | | (19,670 | ) | | (22,320 | ) | | (24,430 | ) | | (50,281 | ) | | (42,254 | ) |
Other expense | — |
| | — |
| | — |
| | — |
| | — |
| | — |
| | (12,000 | ) | | — |
| | — |
| | — |
| | — |
|
Benefit from (provision for) income taxes | (2,448 | ) | | 5,316 |
| | 2,959 |
| | (5,213 | ) | | (333 | ) | | 1,843 |
| | (1,835 | ) | | 4,935 |
| | (3,140 | ) | | 2,868 |
| | 1,510 |
|
Net income | $ | 27,064 |
| | $ | 14,801 |
| | $ | 27,123 |
| | $ | 45,096 |
| | $ | 16,017 |
| | $ | 12,333 |
| | $ | 25,134 |
| | $ | 21,929 |
| | $ | 65,573 |
| | $ | 41,865 |
| | $ | 28,350 |
|
Diluted average shares | 94,950 | | 85,622 | | 85,384 | | 96,956 | | 85,033 | | 84,941 | | 84,395 | | 84,422 | | 96,172 | | 85,474 | | 84,994 |
Net income per share | $ | 0.31 |
| | $ | 0.16 |
| | $ | 0.31 |
| | $ | 0.50 |
| | $ | 0.18 |
| | $ | 0.14 |
| | $ | 0.29 |
| | $ | 0.25 |
| | $ | 0.71 |
| | $ | 0.47 |
| | $ | 0.32 |
|
| |
(1) | During the second quarter of 2015 we began to include market valuation changes of derivatives associated with our MSRs, in MSR income (loss), net. See the Changes to Financial Statement Presentation section of the Appendix to this Redwood Review for additional information on the change in the MSR Income (loss), net line item. |
THE REDWOOD REVIEW I 2ND QUARTER 2015 Table 1: GAAP Earnings 54
|
| | | | | | | | | | | | | | | | | | | | | | | | | | | | | | | | | | | | | | | | | | | |
| Table 2: Segment Results (in thousands) |
| | | | | | | | | | | | | | | | | | | | | | | |
| | | Three Months Ended June 30, 2015 | | | Three Months Ended March 31, 2015 | |
| | | Residential Mortgage Banking | | Residential Investments | | Commercial Mortgage Banking and Investments | | Corporate/ Other | | Total | | | Residential Mortgage Banking | | Residential Investments | | Commercial Mortgage Banking and Investments | | Corporate/ Other | | Total | |
Interest income | | $ | 9,976 |
| | $ | 34,249 |
| | $ | 12,679 |
| | $ | 6,469 |
| | $ | 63,373 |
| | | $ | 15,795 |
| | $ | 30,012 |
| | $ | 10,914 |
| | $ | 7,025 |
| | $ | 63,746 |
| |
Interest expense | | (3,298 | ) | | (2,660 | ) | | (3,497 | ) | | (13,553 | ) | | (23,008 | ) | | | (3,778 | ) | | (2,810 | ) | | (3,489 | ) | | (13,884 | ) | | (23,961 | ) | |
Net interest income (loss) | | 6,678 |
| | 31,589 |
| | 9,182 |
| | (7,084 | ) | | 40,365 |
| | | 12,017 |
| | 27,202 |
| | 7,425 |
| | (6,859 | ) | | 39,785 |
| |
| | | | | | | | | | | | | | | | | | | | | | | |
Reversal of (provision for) loan losses | | — |
| | — |
| | 261 |
| | — |
| | 261 |
| | | — |
| | — |
| | (206 | ) | | — |
| | (206 | ) | |
Net interest income (loss) after provision | | 6,678 |
| | 31,589 |
| | 9,443 |
| | (7,084 | ) | | 40,626 |
| | | 12,017 |
| | 27,202 |
| | 7,219 |
| | (6,859 | ) | | 39,579 |
| |
Non-interest income | | | | | | | | | | | | | | | | | | | | | | |
Mortgage banking and investment activities, net | | 4,833 |
| | (1,104 | ) | | 2,614 |
| | (684 | ) | | 5,659 |
| | | 2,217 |
| | (19 | ) | | (292 | ) | | (1,128 | ) | | 778 |
| |
MSR income (loss), net (1) | | — |
| | 830 |
| | — |
| | — |
| | 830 |
| | | — |
| | (10,924 | ) | | — |
| | — |
| | (10,924 | ) | |
Other income | | — |
| | 1,299 |
| | — |
| | — |
| | 1,299 |
| | | — |
| | 809 |
| | — |
| | — |
| | 809 |
| |
Realized gains, net | | — |
| | 6,316 |
| | — |
| | — |
| | 6,316 |
| | | — |
| | 4,306 |
| | — |
| | — |
| | 4,306 |
| |
Total non-interest income (loss) | | 4,833 |
| | 7,341 |
| | 2,614 |
| | (684 | ) | | 14,104 |
| | | 2,217 |
| | (5,828 | ) | | (292 | ) | | (1,128 | ) | | (5,031 | ) | |
| | | | | | | | | | | | | | | | | | | | | | | |
Operating expenses | | (11,033 | ) | | (1,171 | ) | | (3,020 | ) | | (9,994 | ) | | (25,218 | ) | | | (10,903 | ) | | (1,118 | ) | | (3,482 | ) | | (9,560 | ) | | (25,063 | ) | |
Benefit from (provision for) income taxes | | 865 |
| | (3,768 | ) | | (143 | ) | | 598 |
| | (2,448 | ) | | | 8 |
| | 3,510 |
| | 853 |
| | 945 |
| | 5,316 |
| |
Segment contribution | | $ | 1,343 |
| | $ | 33,991 |
| | $ | 8,894 |
| | $ | (17,164 | ) | | | | | $ | 3,339 |
| | $ | 23,766 |
| | $ | 4,298 |
| | $ | (16,602 | ) | | | |
| | | | | | | | | | | | | | | | | | | | | | | |
Net income | | | | | | | | | | $ | 27,064 |
| | | | | | | | | | | $ | 14,801 |
| |
| | | | | | | | | | | | | | | | | | | | | | | |
Additional information: | | | | | | | | | | | | | | | | | | | | | | |
Residential loans | | $ | 892,081 |
| | $ | 1,157,285 |
| | $ | — |
| | $ | 1,237,114 |
| | $ | 3,286,480 |
| | | $ | 1,094,885 |
| | $ | 1,000,444 |
| | $ | — |
| | $ | 1,304,426 |
| | $ | 3,399,755 |
| |
Commercial loans | | — |
| | — |
| | 551,331 |
| | — |
| | 551,331 |
| | | — |
| | — |
| | 460,342 |
| | — |
| | 460,342 |
| |
Real estate securities | | — |
| | 1,157,599 |
| | — |
| | — |
| | 1,157,599 |
| | | 65,809 |
| | 1,219,434 |
| | — |
| | — |
| | 1,285,243 |
| |
Mortgage servicing rights | | — |
| | 168,462 |
| | — |
| | — |
| | 168,462 |
| | | — |
| | 120,324 |
| | — |
| | — |
| | 120,324 |
| |
Total Assets | | 938,720 |
| | 2,559,481 |
| | 560,956 |
| | 1,536,727 |
| | 5,595,884 |
| | | 1,204,055 |
| | 2,446,100 |
| | 467,200 |
| | 1,698,664 |
| | 5,816,019 |
| |
| | | | | | | | | | | | | | | | | | | | | | | |
| |
(1) | During the second quarter of 2015 we began to include market valuation changes of derivatives associated with our MSRs, in MSR income (loss), net. Amounts presented in this line for the first quarter of 2015 do not include the effects of hedges. See the Changes to Financial Statement Presentation section of the Appendix to this Redwood Review for additional information on the change in the MSR Income (loss), net line item. |
THE REDWOOD REVIEW I 2ND QUARTER 2015 Table 2: Segment Results 55
|
| | | | | | | | | | | | | | | | | | | | | | | | | | | | | | | | | | | | |
| Table 3: Taxable and GAAP Income (1) Differences and Dividends (in thousands, except for share data) |
| | | | | | | | | | | | | | | | | | |
| | Estimated Six Months 2015 | | Estimated Twelve Months 2014 (2) | | Actual Twelve Months 2013 (2) |
| | Taxable Income | | GAAP Income | | Differences | | Taxable Income | | GAAP Income | | Differences | | Taxable Income | | GAAP Income | | Differences |
Taxable and GAAP Income Differences | | | | | | | | | | | | | | | | | |
Interest income | $ | 108,657 |
| | $ | 127,119 |
| | $ | (18,462 | ) | | $ | 206,147 |
| | $ | 242,070 |
| | $ | (35,923 | ) | | $ | 209,317 |
| | $ | 226,156 |
| | $ | (16,839 | ) |
Interest expense | (38,365 | ) | | (46,969 | ) | | 8,604 |
| | (67,259 | ) | | (87,463 | ) | | 20,204 |
| | (55,099 | ) | | (80,971 | ) | | 25,872 |
|
Net interest income | 70,292 |
| | 80,150 |
| | (9,858 | ) | | 138,888 |
| | 154,607 |
| | (15,719 | ) | | 154,218 |
| | 145,185 |
| | 9,033 |
|
Reversal of provision (provision for) loan losses | — |
| | 55 |
| | (55 | ) | | — |
| | (961 | ) | | 961 |
| | — |
| | (4,737 | ) | | 4,737 |
|
Realized credit losses | (3,825 | ) | | — |
| | (3,825 | ) | | (6,930 | ) | | — |
| | (6,930 | ) | | (12,911 | ) | | — |
| | (12,911 | ) |
Mortgage banking and investment activities, net | (17,836 | ) | | 6,437 |
| | (24,273 | ) | | 3,784 |
| | 24,792 |
| | (21,008 | ) | | 19,526 |
| | 96,785 |
| | (77,259 | ) |
MSR income (loss), net | 9,476 |
| | (10,094 | ) | | 19,570 |
| | 15,763 |
| | (4,261 | ) | | 20,024 |
| | 8,218 |
| | 20,309 |
| | (12,091 | ) |
Operating expenses | (55,891 | ) | | (50,281 | ) | | (5,610 | ) | | (97,583 | ) | | (90,123 | ) | | (7,460 | ) | | (79,361 | ) | | (86,607 | ) | | 7,246 |
|
Other income (expense), net | 1,053 |
| | 2,108 |
| | (1,055 | ) | | (8,219 | ) | | 1,781 |
| | (10,000 | ) | | — |
| | (12,000 | ) | | 12,000 |
|
Realized gains, net | — |
| | 10,622 |
| | (10,622 | ) | | — |
| | 15,478 |
| | (15,478 | ) | | — |
| | 25,259 |
| | (25,259 | ) |
(Provision for) benefit from income taxes | (7 | ) | | 2,868 |
| | (2,875 | ) | | (132 | ) | | (744 | ) | | 612 |
| | (283 | ) | | (10,948 | ) | | 10,665 |
|
Income | $ | 3,262 |
| | $ | 41,865 |
| | $ | (38,603 | ) | | $ | 45,571 |
| | $ | 100,569 |
| | $ | (54,998 | ) | | $ | 89,407 |
| | $ | 173,246 |
| | $ | (83,839 | ) |
| | | | | | | | | | | | | | | | | |
| | | | | | | | | | | | | | | | | |
REIT taxable income | $ | 32,723 |
| | | | | | $ | 63,578 |
| | | | | | $ | 72,429 |
| | | | |
Taxable (loss) income at taxable subsidiaries | (29,461 | ) | | | | | | (18,007 | ) | | | | | | 16,978 |
| | | | |
Taxable income | $ | 3,262 |
| | | | | | $ | 45,571 |
| | | | | | $ | 89,407 |
| | | | |
| | | | | | | | | | | | | | | | | |
Shares used for taxable EPS calculation | 84,552 |
| | | | | | 83,443 |
| | | | | | 82,505 |
| | | | |
REIT taxable income per share (3) | $ | 0.39 |
| | | | | | $ | 0.76 |
| | | | | | $ | 0.88 |
| | | | |
Taxable income (loss) per share at taxable subsidiaries | $ | (0.35 | ) | | | | | | $ | (0.22 | ) | | | | | | $ | 0.21 |
| | | | |
Taxable income per share (3) | $ | 0.04 |
| | | | | | $ | 0.55 |
| | | | | | $ | 1.09 |
| | | | |
Dividends | | | | | | | | | | | | | | | | | |
Dividends declared | $ | 47,004 |
| | | | | | $ | 92,935 |
| | | | | | $ | 92,005 |
| | | | |
Dividends per share (4) | $ | 0.56 |
| | | | | | $ | 1.12 |
| | | | | | $ | 1.12 |
| | | | |
| |
(1) | Taxable income for 2015 and 2014 are estimates until we file our tax returns for those years. To the extent we expect to pay tax at the corporate level (generally as a result of activity at our taxable REIT subsidiaries), we are required to record a tax provision for GAAP reporting purposes. Any tax provision (or benefit) is not intended to reflect the actual amount we expect to pay (or receive as an income tax refund) as it is expected to be utilized in future periods, as GAAP income is earned at our TRS. We do not expect to generate excess inclusion income in 2015, but in the event we do, it is our intention to retain it at our TRS and not pass it through to our shareholders. |
| |
(2) | Reconciliation of GAAP income to taxable income (loss) for prior quarters is provided in the respective Redwood Reviews for those quarters. |
| |
(3) | REIT taxable income per share and taxable income (loss) per share are based on the number of shares outstanding at the end of each quarter. The annual REIT taxable income per share and taxable income (loss) per share are the sum of the four quarterly per share estimates. |
| |
(4) | Dividends in 2014 were characterized as 90% ordinary income (or $84 million), and 10% return of capital (or $9 million). Dividends in 2013 were characterized as 89% ordinary income (or $82 million), and 11% return of capital (or $10 million). The portion of Redwood's dividends characterized as a return of capital is not taxable to a shareholder and reduces a shareholder's basis for shares held at each quarterly distribution date, but not to below $0. |
THE REDWOOD REVIEW I 2ND QUARTER 2015 Table 3: Taxable and GAAP Income Differences and Dividends 56
|
| | | | | | | | | | | | | | | | | | | | | | | | | | | | | | | | | | | | | | | | | | | | |
| Table 4: Financial Ratios and Book Value ($ in thousands, except per share data) |
| | | | | | | | | | | | | | | | | | | | | | |
| | 2015 Q2 | | 2015
Q1 | | 2014
Q4 | | 2014
Q3 | | 2014
Q2 | | 2014
Q1 | | 2013
Q4 | | 2013
Q3 | | 2013
Q2 | | Six Months 2015 | | Six Months 2014 |
Financial performance ratios | | | | | | | | | | | | | | | | | | | | | |
Net interest income | $ | 40,365 |
| | $ | 39,785 |
| | $ | 41,348 |
| | $ | 40,001 |
| | $ | 36,842 |
| | $ | 36,416 |
| | $ | 37,964 |
| | $ | 35,695 |
| | $ | 36,303 |
| | $ | 80,150 |
| | $ | 73,258 |
|
Operating expenses | $ | (25,218 | ) | | $ | (25,063 | ) | | $ | (26,462 | ) | | $ | (21,408 | ) | | $ | (22,282 | ) | | $ | (19,971 | ) | | $ | (19,670 | ) | | $ | (22,320 | ) | | $ | (24,430 | ) | | $ | (50,281 | ) | | $ | (42,254 | ) |
GAAP net income | $ | 27,064 |
| | $ | 14,801 |
| | $ | 27,123 |
| | $ | 45,096 |
| | $ | 16,017 |
| | $ | 12,333 |
| | $ | 25,134 |
| | $ | 21,929 |
| | $ | 65,573 |
| | $ | 41,865 |
| | $ | 28,350 |
|
Average total assets | $ | 5,730,268 |
| | $ | 5,866,851 |
| | $ | 5,848,856 |
| | $ | 5,631,421 |
| | $ | 5,140,932 |
| | $ | 4,791,512 |
| | $ | 4,681,988 |
| | $ | 5,010,779 |
| | $ | 5,103,812 |
| | $ | 5,798,182 |
| | $ | 4,967,187 |
|
Average total equity | $ | 1,265,647 |
| | $ | 1,262,883 |
| | $ | 1,259,581 |
| | $ | 1,254,352 |
| | $ | 1,245,346 |
| | $ | 1,243,006 |
| | $ | 1,217,273 |
| | $ | 1,217,418 |
| | $ | 1,204,807 |
| | $ | 1,264,273 |
| | $ | 1,244,182 |
|
Operating expenses / average total assets | 1.76 | % | | 1.71 | % | | 1.81 | % | | 1.52 | % | | 1.73 | % | | 1.67 | % | | 1.68 | % | | 1.78 | % | | 1.91 | % | | 1.73 | % | | 1.70 | % |
Operating expenses / average total equity | 7.97 | % | | 7.94 | % | | 8.40 | % | | 6.83 | % | | 7.16 | % | | 6.43 | % | | 6.46 | % | | 7.33 | % | | 8.11 | % | | 7.95 | % | | 6.79 | % |
GAAP net income / average total assets | 1.89 | % | | 1.01 | % | | 1.85 | % | | 3.20 | % | | 1.25 | % | | 1.03 | % | | 2.15 | % | | 1.75 | % | | 5.14 | % | | 1.44 | % | | 1.14 | % |
GAAP net income / average equity (GAAP ROE) | 8.55 | % | | 4.69 | % | | 8.61 | % | | 14.38 | % | | 5.14 | % | | 3.97 | % | | 8.26 | % | | 7.21 | % | | 21.77 | % | | 6.62 | % | | 4.56 | % |
| | | | | | | | | | | | | | | | | | | | | | |
Leverage ratios and book value per share | | | | | | | | | | | | | | | | | | | | | |
Short-term debt | $ | 1,367,062 |
| | $ | 1,502,164 |
| | $ | 1,793,825 |
| | $ | 1,887,688 |
| | $ | 1,718,430 |
| | $ | 1,288,761 |
| | $ | 862,763 |
| | $ | 838,299 |
| | $ | 1,445,961 |
| | | | |
Long-term debt – Commercial secured borrowing | 65,232 |
| | 68,077 |
| | 66,707 |
| | 66,146 |
| | 66,692 |
| | 34,774 |
| | — |
| | — |
| | — |
| | | | |
Long-term debt – Other | 1,514,122 |
| | 1,482,792 |
| | 1,127,860 |
| | 630,756 |
| | 479,916 |
| | 478,458 |
| | 476,467 |
| | 471,605 |
| | 443,591 |
| | | | |
Total debt at Redwood | $ | 2,946,416 |
| | $ | 3,053,033 |
| | $ | 2,988,392 |
| | $ | 2,584,590 |
| | $ | 2,265,038 |
| | $ | 1,801,993 |
| | $ | 1,339,230 |
| | $ | 1,309,904 |
| | $ | 1,889,552 |
| | | | |
| | | | | | | | | | | | | | | | | | | | | |
ABS issued at consolidated entities | | | | | | | | | | | | | | | | | | | | | |
Residential Resecuritization ABS issued | 18,872 |
| | 34,280 |
| | 45,044 |
| | 56,508 |
| | 69,709 |
| | 82,179 |
| | 94,934 |
| | 112,179 |
| | 134,156 |
| | | | |
Commercial Securitization ABS issued | 69,914 |
| | 79,676 |
| | 83,313 |
| | 114,943 |
| | 144,700 |
| | 147,574 |
| | 153,693 |
| | 158,799 |
| | 159,526 |
| | | | |
Legacy Sequoia entities ABS issued | 1,173,336 |
| | 1,239,065 |
| | 1,416,762 |
| | 1,484,751 |
| | 1,553,669 |
| | 1,624,591 |
| | 1,694,335 |
| | 1,790,687 |
| | 1,920,614 |
| | | | |
Total ABS issued | 1,262,122 |
| | 1,353,021 |
| | 1,545,119 |
| | 1,656,202 |
| | 1,768,078 |
| | 1,854,344 |
| | 1,942,962 |
| | 2,061,665 |
| | 2,214,296 |
| | | | |
Consolidated GAAP Debt | $ | 4,208,538 |
| | $ | 4,406,054 |
| | $ | 4,533,511 |
| | $ | 4,240,792 |
| | $ | 4,033,116 |
| | $ | 3,656,337 |
| | $ | 3,282,192 |
| | $ | 3,371,569 |
| | $ | 4,103,848 |
| | | | |
Stockholders' equity | $ | 1,264,785 |
| | $ | 1,257,210 |
| | $ | 1,256,142 |
| | $ | 1,266,678 |
| | $ | 1,248,904 |
| | $ | 1,250,887 |
| | $ | 1,245,783 |
| | $ | 1,207,170 |
| | $ | 1,209,313 |
| | | | |
Debt at Redwood to stockholders' equity (1) | 2.3x |
| | 2.4x |
| | 2.3x |
| | 2.0x |
| | 1.8x |
| | 1.4x |
| | 1.1x |
| | 1.1x |
| | 1.6x |
| | | | |
Consolidated GAAP debt to stockholders' equity | 3.3x |
| | 3.5x |
| | 3.6x |
| | 3.4x |
| | 3.2x |
| | 2.9x |
| | 2.6x |
| | 2.8x |
| | 3.4x |
| | | | |
Shares outstanding at period end (in thousands) | 84,552 |
| | 83,749 |
| | 83,443 |
| | 83,284 |
| | 83,080 |
| | 82,620 |
| | 82,505 |
| | 82,389 |
| | 82,332 |
| | | | |
Book value per share | $ | 14.96 |
| | $ | 15.01 |
| | $ | 15.05 |
| | $ | 15.21 |
| | $ | 15.03 |
| | $ | 15.14 |
| | $ | 15.10 |
| | $ | 14.65 |
| | $ | 14.69 |
| | | | |
| |
(1) | Excludes obligations of consolidated securitization entities, including legacy Sequoia securitizations completed prior to 2012, the residential resecuritization completed in 2011, and the commercial securitization completed in 2012. Also excludes commercial secured borrowings associated with commercial A-notes that were sold, but treated as secured borrowings under GAAP. |
THE REDWOOD REVIEW I 2ND QUARTER 2015 Table 4: Financial Ratios and Book Value 57
|
| | | | | | | | | | | | | | | | | | | | | | | | | | | | | | | | | | | | | | | | | | | | |
| Table 5: Average Balance Sheet ($ in thousands) |
| | | | | | | | | | | | | | | | | | | | | | |
| | 2015
Q2 | | 2015
Q1 | | 2014
Q4 | | 2014
Q3 | | 2014
Q2 | | 2014
Q1 | | 2013
Q4 | | 2013
Q3 | | 2013
Q2 | | Six Months
2015 | | Six Months
2014 |
Real estate assets | | | | | | | | | | | | | | | | | | | | | |
Residential loans, held-for-sale | $ | 1,080,448 |
| | $ | 1,292,153 |
| | $ | 1,433,059 |
| | $ | 1,268,231 |
| | $ | 739,934 |
| | $ | 518,054 |
| | $ | 554,467 |
| | $ | 860,923 |
| | $ | 1,060,347 |
| | $ | 1,185,716 |
| | $ | 629,606 |
|
Residential loans, held-for-investment at Sequoias (1) | 1,259,923 |
| | 1,362,612 |
| | 1,496,685 |
| | 1,570,425 |
| | 1,642,410 |
| | 1,711,438 |
| | 1,793,535 |
| | 1,910,814 |
| | 2,043,820 |
| | 1,310,984 |
| | 1,676,734 |
|
Residential loans, held-for-investment at Redwood | 1,017,835 |
| | 667,543 |
| | 370,886 |
| | 100,409 |
| | — |
| | — |
| | — |
| | — |
| | — |
| | 843,657 |
| | — |
|
Commercial loans, held-for-sale | 107,025 |
| | 137,977 |
| | 214,110 |
| | 170,156 |
| | 75,449 |
| | 68,169 |
| | 73,204 |
| | 67,999 |
| | 50,366 |
| | 122,416 |
| | 71,829 |
|
Commercial loans, held-for-investment, at fair value | 72,524 |
| | 71,224 |
| | 70,663 |
| | 71,205 |
| | 69,565 |
| | 20,626 |
| | — |
| | — |
| | — |
| | 71,877 |
| | 45,231 |
|
Commercial loans, held-for-investment, at amortized cost | 328,193 |
| | 336,258 |
| | 322,723 |
| | 349,288 |
| | 343,815 |
| | 343,705 |
| | 346,333 |
| | 347,633 |
| | 332,113 |
| | 332,203 |
| | 343,760 |
|
Senior residential securities | | | | | | | | | | | | | | | | | | | | | |
Prime | 331,394 |
| | 352,583 |
| | 388,577 |
| | 611,211 |
| | 835,987 |
| | 725,551 |
| | 586,675 |
| | 440,616 |
| | 453,230 |
| | 341,930 |
| | 781,074 |
|
Non-prime | 156,383 |
| | 161,163 |
| | 164,940 |
| | 169,741 |
| | 171,033 |
| | 174,811 |
| | 178,994 |
| | 187,724 |
| | 227,295 |
| | 158,760 |
| | 172,912 |
|
Total senior residential securities | 487,777 |
| | 513,746 |
| | 553,517 |
| | 780,952 |
| | 1,007,020 |
| | 900,362 |
| | 765,669 |
| | 628,340 |
| | 680,525 |
| | 500,690 |
| | 953,986 |
|
Residential Re-REMIC securities | 103,384 |
| | 101,238 |
| | 106,433 |
| | 114,433 |
| | 115,746 |
| | 109,753 |
| | 102,836 |
| | 101,808 |
| | 100,824 |
| | 102,317 |
| | 112,766 |
|
Subordinate residential securities | 429,827 |
| | 554,460 |
| | 521,647 |
| | 532,881 |
| | 530,273 |
| | 509,906 |
| | 492,708 |
| | 441,521 |
| | 322,541 |
| | 491,799 |
| | 520,146 |
|
Mortgage servicing rights | 144,472 |
| | 128,001 |
| | 134,438 |
| | 81,968 |
| | 65,705 |
| | 62,943 |
| | 60,822 |
| | 55,622 |
| | 31,318 |
| | 136,282 |
| | 64,332 |
|
Total real estate assets | 5,031,408 |
| | 5,165,212 |
| | 5,224,161 |
| | 5,039,948 |
| | 4,589,917 |
| | 4,244,956 |
| | 4,189,574 |
| | 4,414,660 |
| | 4,621,854 |
| | 5,097,941 |
| | 4,418,390 |
|
Cash and cash equivalents | 222,362 |
| | 232,575 |
| | 182,372 |
| | 151,447 |
| | 131,557 |
| | 159,089 |
| | 167,453 |
| | 274,657 |
| | 96,998 |
| | 227,440 |
| | 145,247 |
|
Earning assets | 5,253,770 |
| | 5,397,787 |
| | 5,406,533 |
| | 5,191,395 |
| | 4,721,474 |
| | 4,404,045 |
| | 4,357,027 |
| | 4,689,317 |
| | 4,718,852 |
| | 5,325,381 |
| | 4,563,637 |
|
Balance sheet mark-to-market adjustments | 139,864 |
| | 138,547 |
| | 151,304 |
| | 162,695 |
| | 162,081 |
| | 153,975 |
| | 125,953 |
| | 119,498 |
| | 139,843 |
| | 139,209 |
| | 158,050 |
|
Earning assets – reported value | 5,393,634 |
| | 5,536,334 |
| | 5,557,837 |
| | 5,354,090 |
| | 4,883,555 |
| | 4,558,020 |
| | 4,482,980 |
| | 4,808,815 |
| | 4,858,695 |
| | 5,464,590 |
| | 4,721,687 |
|
Other assets | 336,634 |
| | 330,517 |
| | 291,019 |
| | 277,331 |
| | 257,377 |
| | 233,492 |
| | 199,008 |
| | 201,964 |
| | 245,117 |
| | 333,592 |
| | 245,500 |
|
Total assets | $ | 5,730,268 |
| | $ | 5,866,851 |
| | $ | 5,848,856 |
| | $ | 5,631,421 |
| | $ | 5,140,932 |
| | $ | 4,791,512 |
| | $ | 4,681,988 |
| | $ | 5,010,779 |
| | $ | 5,103,812 |
| | $ | 5,798,182 |
| | $ | 4,967,187 |
|
| | | | | | | | | | | | | | | | | | | | | | |
Short-term debt | 1,380,965 |
| | 1,590,179 |
| | 1,868,906 |
| | 1,873,704 |
| | 1,329,568 |
| | 1,006,349 |
| | 893,481 |
| | 1,150,917 |
| | 1,053,610 |
| | 1,484,993 |
| | 1,168,852 |
|
Residential Resecuritization ABS issued | 24,269 |
| | 37,313 |
| | 48,687 |
| | 60,932 |
| | 73,617 |
| | 85,236 |
| | 99,940 |
| | 118,338 |
| | 138,817 |
| | 30,755 |
| | 79,394 |
|
Commercial Securitization ABS issued | 75,283 |
| | 80,637 |
| | 85,089 |
| | 123,012 |
| | 142,400 |
| | 144,936 |
| | 150,716 |
| | 155,661 |
| | 155,812 |
| | 77,945 |
| | 143,661 |
|
Consolidated Sequoia ABS issued | 1,195,749 |
| | 1,295,852 |
| | 1,437,258 |
| | 1,507,998 |
| | 1,577,888 |
| | 1,644,626 |
| | 1,722,583 |
| | 1,835,401 |
| | 1,965,149 |
| | 1,245,525 |
| | 1,611,073 |
|
Other liabilities | 229,994 |
| | 354,375 |
| | 266,368 |
| | 243,917 |
| | 240,977 |
| | 186,997 |
| | 131,277 |
| | 82,748 |
| | 151,927 |
| | 291,841 |
| | 214,136 |
|
Other long-term debt | 1,558,361 |
| | 1,245,612 |
| | 882,967 |
| | 567,506 |
| | 531,136 |
| | 480,362 |
| | 466,718 |
| | 450,296 |
| | 433,690 |
| | 1,402,850 |
| | 505,889 |
|
Total liabilities | 4,464,621 |
| | 4,603,968 |
| | 4,589,275 |
| | 4,377,069 |
| | 3,895,586 |
| | 3,548,506 |
| | 3,464,715 |
| | 3,793,361 |
| | 3,899,005 |
| | 4,533,909 |
| | 3,723,005 |
|
Total equity | 1,265,647 |
| | 1,262,883 |
| | 1,259,581 |
| | 1,254,352 |
| | 1,245,346 |
| | 1,243,006 |
| | 1,217,273 |
| | 1,217,418 |
| | 1,204,807 |
| | 1,264,273 |
| | 1,244,182 |
|
Total liabilities and equity | $ | 5,730,268 |
| | $ | 5,866,851 |
| | $ | 5,848,856 |
| | $ | 5,631,421 |
| | $ | 5,140,932 |
| | $ | 4,791,512 |
| | $ | 4,681,988 |
| | $ | 5,010,779 |
| | $ | 5,103,812 |
| | $ | 5,798,182 |
| | $ | 4,967,187 |
|
| | | | | | | | | | | | | | | | | | | | | | |
| | | | | | | | | | | | | | | | | | | | | | |
| |
(1) | Residential loans, held-for-investment at Sequoia is comprised of loans held in consolidated Sequoia entities. |
THE REDWOOD REVIEW I 2ND QUARTER 2015 Table 5: Average Balance Sheet 58
|
| | | | | | | | | | | | | | | | | | | | | | | | | | | | | | | | | | | | | | | | | | | | | | | | | |
| Table 6: Balance & Yields by Portfolio (1) ($ in thousands) |
| | | | | | | | | | | | | | | | | | | | | | | | | |
| | 2015 Q2 | | 2015 Q1 | | 2014
Q4 | | 2014
Q3 | | 2014
Q2 | | 2014
Q1 | | | 2015
Q2 | | 2015 Q1 | | 2014
Q4 | | 2014
Q3 | | 2014
Q2 | | 2014
Q1 |
Securities – Prime Senior | | | | | | | | | | Securities – Subordinate | | | | | | | | | | |
Principal balance | $ | 305,660 |
| | $ | 305,502 |
| | $ | 317,626 |
| | $ | 366,122 |
| | $ | 772,127 |
| | $ | 703,977 |
| Principal balance | | $ | 596,127 |
| | $ | 693,179 |
| | $ | 763,501 |
| | $ | 705,661 |
| | $ | 733,192 |
| | $ | 712,072 |
|
Unamortized discount | (30,713 | ) | | (32,612 | ) | | (34,833 | ) | | (41,242 | ) | | (36,853 | ) | | (42,255 | ) | Unamortized discount | | (153,368 | ) | | (155,943 | ) | | (162,249 | ) | | (154,391 | ) | | (151,097 | ) | | (147,084 | ) |
Credit reserve | (2,650 | ) | | (2,830 | ) | | (3,660 | ) | | (4,082 | ) | | (5,476 | ) | | (6,815 | ) | Credit reserve | | (36,804 | ) | | (39,060 | ) | | (41,561 | ) | | (43,346 | ) | | (50,315 | ) | | (56,658 | ) |
Unrealized gains, net | 29,090 |
| | 31,301 |
| | 34,682 |
| | 41,307 |
| | 44,329 |
| | 44,879 |
| Unrealized gains, net | | 67,858 |
| | 71,536 |
| | 61,589 |
| | 57,249 |
| | 48,755 |
| | 34,536 |
|
Interest-only securities | 40,000 |
| | 62,320 |
| | 87,800 |
| | 97,321 |
| | 96,894 |
| | 106,228 |
| Interest-only securities | | 234 |
| | 283 |
| | 293 |
| | 289 |
| | 279 |
| | 194 |
|
Fair value | $ | 341,387 |
| | $ | 363,681 |
| | $ | 401,615 |
| | $ | 459,426 |
| | $ | 871,021 |
| | $ | 806,014 |
| Fair value | | $ | 474,047 |
| | $ | 569,995 |
| | $ | 621,573 |
| | $ | 565,462 |
| | $ | 580,814 |
| | $ | 543,060 |
|
| | | | | | | | | | | | | | | | | | | | | | | | | |
Average amortized cost | $ | 331,394 |
| | $ | 352,583 |
| | $ | 388,577 |
| | $ | 611,211 |
| | $ | 835,987 |
| | $ | 725,551 |
| Mezzanine (2) | | | | | | | | | | | | |
Interest income | $ | 8,252 |
| | $ | 9,506 |
| | $ | 10,434 |
| | $ | 13,229 |
| | $ | 15,080 |
| | $ | 14,640 |
| Average amortized cost | | $ | 290,927 |
| | $ | 421,731 |
| | $ | 408,600 |
| | $ | 421,111 |
| | $ | 415,418 |
| | $ | 399,134 |
|
Annualized yield (3) | 9.96 | % | | 10.78 | % | | 10.74 | % | | 8.66 | % | | 7.22 | % | | 8.07 | % | Interest income | | $ | 3,895 |
| | $ | 5,392 |
| | $ | 5,092 |
| | $ | 5,308 |
| | $ | 5,325 |
| | $ | 5,127 |
|
| | | | | | | | | | | | Annualized yield | | 5.36 | % | | 5.11 | % | | 4.98 | % | | 5.04 | % | | 5.13 | % | | 5.14 | % |
Securities – Non-Prime Senior | | | | | | | | | | | | | | | | | | | | | |
Principal balance | $ | 182,719 |
| | $ | 190,790 |
| | $ | 196,258 |
| | $ | 202,811 |
| | $ | 209,967 |
| | $ | 212,629 |
| Subordinate (2) | | | | | | | | | | | | |
Unamortized discount | (27,533 | ) | | (29,791 | ) | | (31,491 | ) | | (33,675 | ) | | (36,387 | ) | | (36,867 | ) | Average amortized cost | | $ | 138,900 |
| | $ | 132,730 |
| | $ | 113,047 |
| | $ | 111,770 |
| | $ | 114,855 |
| | $ | 110,772 |
|
Credit reserve | (9,175 | ) | | (9,027 | ) | | (9,644 | ) | | (9,894 | ) | | (9,697 | ) | | (11,625 | ) | Interest income | | $ | 4,225 |
| | $ | 4,237 |
| | $ | 4,413 |
| | $ | 4,135 |
| | $ | 4,131 |
| | $ | 4,179 |
|
Unrealized gains, net | 20,365 |
| | 22,902 |
| | 24,621 |
| | 26,980 |
| | 28,373 |
| | 28,860 |
| Annualized yield | | 12.17 | % | | 12.77 | % | | 15.61 | % | | 14.80 | % | | 14.39 | % | | 15.09 | % |
Interest-only securities | 6,705 |
| | 7,454 |
| | 7,951 |
| | 7,758 |
| | 8,380 |
| | 8,729 |
| | | | | | | | | | | | | |
Fair value | $ | 173,081 |
| | $ | 182,328 |
| | $ | 187,695 |
| | $ | 193,980 |
| | $ | 200,636 |
| | $ | 201,726 |
| Residential Loans, held-for-investment at Redwood | | | | | | | | |
| | | | | | | | | | | | | | | | | | | | | | | | |
| | | | | | | | | | | | Principal balance | | $ | 1,131,844 |
| | $ | 971,541 |
| | $ | 566,371 |
| | $ | 233,142 |
| | $ | — |
| | $ | — |
|
Average amortized cost | $ | 156,383 |
| | $ | 161,163 |
| | $ | 164,940 |
| | $ | 169,741 |
| | $ | 171,033 |
| | $ | 174,811 |
| Unrealized gains, net | | $ | 25,441 |
| | $ | 28,903 |
| | $ | 15,296 |
| | 5,509 |
| | — |
| | — |
|
Interest income | $ | 3,946 |
| | $ | 4,210 |
| | $ | 4,370 |
| | $ | 4,507 |
| | $ | 4,404 |
| | $ | 4,388 |
| Fair value | | $ | 1,157,285 |
| | $ | 1,000,444 |
| | $ | 581,667 |
| | $ | 238,651 |
| | $ | — |
| | $ | — |
|
| | | | | | | | | | | | | | | | | | | | | | | | |
Annualized yield | 10.09 | % | | 10.45 | % | | 10.60 | % | | 10.62 | % | | 10.30 | % | | 10.04 | % | Average amortized cost | | $ | 1,017,835 |
| | $ | 667,543 |
| | $ | 370,886 |
| | $ | 100,409 |
| | $ | — |
| | $ | — |
|
| | | | | | | | | | | | Interest income | | $ | 9,370 |
| | $ | 6,522 |
| | $ | 3,427 |
| | $ | 1,057 |
| | $ | — |
| | $ | — |
|
| | | | | | | | | | | | Annualized yield | | 3.68 | % | | 3.91 | % | | 3.70 | % | | 4.21 | % | | N/A |
| | N/A |
|
| | | | | | | | | | | | | | | | | | | | | | | | |
Securities – Re-REMIC | | | | | | | | | | | | | | | | | | | | | | | | |
Principal balance | $ | 193,221 |
| | $ | 194,296 |
| | $ | 195,098 |
| | $ | 206,212 |
| | $ | 223,389 |
| | $ | 223,709 |
| Commercial Loans, held-for-investment at amortized cost | |
Unamortized discount | (75,658 | ) | | (79,401 | ) | | (79,611 | ) | | (80,986 | ) | | (89,089 | ) | | (87,910 | ) | Principal balance | | $ | 332,122 |
| | $ | 350,188 |
| | $ | 346,305 |
| | $ | 336,825 |
| | $ | 361,870 |
| | $ | 359,773 |
|
Credit reserve | (13,071 | ) | | (12,667 | ) | | (15,202 | ) | | (16,553 | ) | | (17,788 | ) | | (20,590 | ) | Unamortized discount | | (4,476 | ) | | (4,668 | ) | | (4,863 | ) | | (2,253 | ) | | (2,327 | ) | | (2,471 | ) |
Unrealized gains, net | 64,592 |
| | 67,011 |
| | 68,062 |
| | 67,444 |
| | 76,084 |
| | 76,999 |
| Credit reserve | | (7,401 | ) | | (7,662 | ) | | (7,456 | ) | | (7,429 | ) | | (8,317 | ) | | (8,028 | ) |
Fair value | $ | 169,084 |
| | $ | 169,239 |
| | $ | 168,347 |
| | $ | 176,117 |
| | $ | 192,596 |
| | $ | 192,208 |
| Carrying value | | $ | 320,245 |
| | $ | 337,858 |
| | $ | 333,986 |
| | $ | 327,143 |
| | $ | 351,226 |
| | $ | 349,274 |
|
| | | | | | | | | | | | | | | | | | | | | | | | |
Average amortized cost | $ | 103,384 |
| | $ | 101,238 |
| | $ | 106,433 |
| | $ | 114,433 |
| | $ | 115,746 |
| | $ | 109,753 |
| Average amortized cost | | $ | 328,193 |
| | $ | 336,258 |
| | $ | 322,723 |
| | $ | 349,288 |
| | $ | 343,815 |
| | $ | 343,705 |
|
Interest income | $ | 4,524 |
| | $ | 4,428 |
| | $ | 4,122 |
| | $ | 4,278 |
| | $ | 4,231 |
| | $ | 4,096 |
| Interest income | | $ | 10,551 |
| | $ | 8,855 |
| | $ | 10,071 |
| | $ | 9,663 |
| | $ | 9,360 |
| | $ | 9,248 |
|
Annualized yield | 17.50 | % | | 17.50 | % | | 15.49 | % | | 14.95 | % | | 14.62 | % | | 14.93 | % | Annualized yield | | 12.86 | % | | 10.53 | % | | 12.48 | % | | 11.07 | % | | 10.89 | % | | 10.76 | % |
| |
(1) | Annualized yields for AFS securities portfolios are based on average amortized cost. Cash flows from many of our subordinate securities can be volatile and in certain cases (e.g., when the fair value of certain securities are close to zero) any interest income earned can result in unusually high reported yields that are not sustainable and not necessarily meaningful. |
| |
(2) | Mezzanine and subordinate together comprise our subordinate portfolio of securities. We have shown them separately to present their different yield profiles. |
| |
(3) | Yields for senior securities - prime senior, includes investments in Sequoia IO securities, for which yields are calculated using fair value, as these are trading securities. |
THE REDWOOD REVIEW I 2ND QUARTER 2015 Table 6: Balances & Yields by Portfolio 59
|
| | | | | | | | | | | | | | | | | | | | | | | | | | | | | | | | | | | | | | | | | | | | | | | | |
| Table 7: Securities and Loan Portfolio Activity ($ in thousands) |
| | | | | | | | | | | | | | | | | | | | | | | | |
| 2015 Q2 | | 2015
Q1 | | 2014
Q4 | | 2014
Q3 | | 2014
Q2 | | 2014
Q1 | | | 2015 Q2 | | 2015 Q1 | | 2014
Q4 | | 2014
Q3 | | 2014
Q2 | | 2014
Q1 |
Securities – Prime Senior | | | | | | | | | | | | Residential Loans, held-for-sale | | | | | | | | | | |
Beginning fair value | $ | 363,681 |
| | $ | 401,615 |
| | $ | 459,426 |
| | $ | 871,021 |
| | $ | 806,014 |
| | $ | 772,811 |
| Beginning carrying value | | $ | 1,094,885 |
| | $ | 1,342,520 |
| | $ | 1,502,429 |
| | $ | 1,107,877 |
| | $ | 774,936 |
| | 404,267 |
|
Acquisitions | 34,686 |
| | 6,972 |
| | 5,918 |
| | 3,522 |
| | 111,520 |
| | 63,889 |
| Acquisitions | | 2,847,135 |
| | 2,477,644 |
| | 2,755,689 |
| | 3,387,875 |
| | 1,790,909 |
| | 1,092,971 |
|
Sales | (44,157 | ) | | (15,091 | ) | | (33,752 | ) | | (380,112 | ) | | (321 | ) | | — |
| Sales | | (2,816,143 | ) | | (2,265,449 | ) | | (2,567,113 | ) | | (2,757,955 | ) | | (1,466,955 | ) | | (722,403 | ) |
Effect of principal payments | (20,988 | ) | | (14,650 | ) | | (16,922 | ) | | (34,879 | ) | | (41,144 | ) | | (29,307 | ) | Principal repayments | | (14,794 | ) | | (14,098 | ) | | (10,407 | ) | | (7,687 | ) | | (5,006 | ) | | (7,025 | ) |
Change in fair value, net | 8,165 |
| | (15,165 | ) | | (13,055 | ) | | (126 | ) | | (5,048 | ) | | (1,379 | ) | Transfers to held-for-investment | | (215,826 | ) | | (447,791 | ) | | (354,794 | ) | | (241,282 | ) | | — |
| | — |
|
Ending fair value | $ | 341,387 |
| | $ | 363,681 |
| | $ | 401,615 |
| | $ | 459,426 |
| | $ | 871,021 |
| | $ | 806,014 |
| Changes in fair value, net | | (3,176 | ) | | 2,058 |
| | 16,716 |
| | 13,601 |
| | 13,993 |
| | 7,126 |
|
| | | | | | | | | | | | | | | | | | | | | | | | |
| | | | | | | | | | | | Ending fair value | | $ | 892,081 |
| | $ | 1,094,884 |
| | $ | 1,342,520 |
| | $ | 1,502,429 |
| | $ | 1,107,877 |
| | 774,936 |
|
| | | | | | | | | | | | | | | | | | | | | | | | |
Securities – Non-Prime Senior | | | | | | | | | | | | | | | | | | | | | | | | |
Beginning fair value | $ | 182,328 |
| | $ | 187,695 |
| | $ | 193,980 |
| | $ | 200,636 |
| | $ | 201,726 |
| | $ | 202,456 |
| Residential Loans, held-for-investment (excluding consolidated Sequoia Entities) | | | | | | |
Acquisitions | — |
| | — |
| | — |
| | (31 | ) | | 3,613 |
| | — |
| Beginning carrying value | | $ | 1,000,444 |
| | $ | 581,667 |
| | $ | 238,651 |
| | $ | — |
| | $ | — |
| | — |
|
Sales | — |
| | — |
| | — |
| | — |
| | — |
| | — |
| Acquisitions | | — |
| | — |
| | — |
| | 453 |
| | — |
| | — |
|
Effect of principal payments | (7,300 | ) | | (4,992 | ) | | (6,066 | ) | | (6,495 | ) | | (5,593 | ) | | (5,294 | ) | Principal repayments | | (53,104 | ) | | (30,902 | ) | | (12,060 | ) | | (2,092 | ) | | — |
| | — |
|
Change in fair value, net | (1,947 | ) | | (375 | ) | | (219 | ) | | (130 | ) | | 890 |
| | 4,564 |
| Transfers from held-for-investment | | 215,830 |
| | 447,791 |
| | 354,794 |
| | 241,282 |
| | — |
| | — |
|
Ending fair value | $ | 173,081 |
| | $ | 182,328 |
| | $ | 187,695 |
| | $ | 193,980 |
| | $ | 200,636 |
| | $ | 201,726 |
| Changes in fair value, net | | (5,885 | ) | | 1,978 |
| | 282 |
| | (992 | ) | | — |
| | — |
|
| | | | | | | | | | | | | | | | | | | | | | | | |
| | | | | | | | | | | | Ending fair value | | $ | 1,157,285 |
| | $ | 1,000,444 |
| | $ | 581,667 |
| | $ | 238,651 |
| | $ | — |
| | — |
|
| | | | | | | | | | | | | | | | | | | | | | | | |
Securities – Re-REMIC | | | | | | | | | | | | | | | | | | | | | | | | |
Beginning fair value | $ | 169,239 |
| | $ | 168,347 |
| | $ | 176,117 |
| | $ | 192,596 |
| | $ | 192,208 |
| | $ | 176,376 |
| Residential Loans, held-for-investment at Consolidated Sequoia Entities | | | | | | | | |
Acquisitions | — |
| | — |
| | — |
| | — |
| | — |
| | 10,200 |
| Beginning carrying value | | $ | 1,304,426 |
| | $ | 1,474,386 |
| | $ | 1,546,507 |
| | $ | 1,616,504 |
| | $ | 1,689,994 |
| | 1,762,167 |
|
Sales | — |
| | — |
| | (10,060 | ) | | (9,458 | ) | | — |
| | — |
| Principal repayments | | (71,075 | ) | | (67,250 | ) | | (69,325 | ) | | (67,025 | ) | | (71,903 | ) | | (70,649 | ) |
Effect of principal payments | (182 | ) | | (126 | ) | | (66 | ) | | — |
| | — |
| | — |
| Charge-Offs | | — |
| | — |
| | 2,133 |
| | 1,354 |
| | 994 |
| | 484 |
|
Change in fair value, net | 27 |
| | 1,018 |
| | 2,356 |
| | (7,021 | ) | | 388 |
| | 5,632 |
| Transfers to REO | | 1,287 |
| | (1,916 | ) | | (2,338 | ) | | (3,988 | ) | | (2,094 | ) | | (267 | ) |
Ending fair value | $ | 169,084 |
| | $ | 169,239 |
| | $ | 168,347 |
| | $ | 176,117 |
| | $ | 192,596 |
| | $ | 192,208 |
| Loan loss (provision) reversal | | — |
| | — |
| | (1,562 | ) | | 708 |
| | 605 |
| | (628 | ) |
| | | | | | | | | | | | Discount amortization, net | | — |
| | — |
| | (1,029 | ) | | (1,046 | ) | | (1,092 | ) | | (1,113 | ) |
Securities – Subordinate (1) | | | | | | | | | | | | Adoption of ASU 2014-13 | | — |
| | (103,649 | ) | | — |
| | — |
| | — |
| | — |
|
Beginning fair value | $ | 569,995 |
| | $ | 621,573 |
| | $ | 565,462 |
| | $ | 580,814 |
| | $ | 543,060 |
| | $ | 531,218 |
| Changes in fair value, net | | 2,476 |
| | 2,855 |
| | — |
| | — |
| | — |
| | — |
|
Acquisitions | 39,193 |
| | 25,943 |
| | 54,722 |
| | 39,330 |
| | 26,361 |
| | — |
| Ending fair value | | $ | 1,237,114 |
| | $ | 1,304,426 |
| | $ | 1,474,386 |
| | $ | 1,546,507 |
| | $ | 1,616,504 |
| | 1,689,994 |
|
Sales | (127,353 | ) | | (85,017 | ) | | 0 |
| | (58,273 | ) | | — |
| | — |
| | | | | | | | | | | | | |
Effect of principal payments | (4,176 | ) | | (5,179 | ) | | (4,568 | ) | | (5,082 | ) | | (4,596 | ) | | (3,356 | ) | | | | | | | | | | | | | |
Change in fair value, net | (3,612 | ) | | 12,675 |
| | 5,957 |
| | 8,673 |
| | 15,989 |
| | 15,198 |
| Commercial Loans, held-for-sale | | | | | | | | | |
Ending fair value | $ | 474,047 |
| | $ | 569,995 |
| | $ | 621,573 |
| | $ | 565,462 |
| | $ | 580,814 |
| | $ | 543,060 |
| Beginning carrying value | | $ | 54,407 |
| | $ | 166,234 |
| | $ | 104,709 |
| | $ | 50,848 |
| | $ | 77,155 |
| | 89,111 |
|
| | | | | | | | | | | | Originations | | 257,671 |
| | 92,713 |
| | 325,970 |
| | 340,200 |
| | 148,915 |
| | 88,415 |
|
| | | | | | | | | | | | Sales | | (147,132 | ) | | (210,309 | ) | | (271,260 | ) | | (290,561 | ) | | (180,652 | ) | | (65,336 | ) |
Securities – Mezzanine (1) | | | | | | | | | | | | Principal repayments | | (80 | ) | | (88 | ) | | (329 | ) | | (83 | ) | | (83 | ) | | (87 | ) |
Beginning fair value | $ | 380,935 |
| | $ | 448,838 |
| | $ | 411,784 |
| | $ | 425,202 |
| | $ | 395,196 |
| | $ | 384,849 |
| Transfers to HFI | | — |
| | — |
| | — |
| | — |
| | — |
| | (37,631 | ) |
Acquisitions | 22,744 |
| | 10,518 |
| | 37,730 |
| | 33,985 |
| | 20,305 |
| | — |
| Changes in fair value, net | | 987 |
| | 5,857 |
| | 7,144 |
| | 4,305 |
| | 5,513 |
| | 2,683 |
|
Sales | (105,590 | ) | | (85,017 | ) | | — |
| | (50,961 | ) | | — |
| | — |
| Ending fair value | | $ | 165,853 |
| | $ | 54,407 |
| | $ | 166,234 |
| | $ | 104,709 |
| | $ | 50,848 |
| | 77,155 |
|
Effect of principal payments | (2,010 | ) | | (2,585 | ) | | (2,476 | ) | | (2,537 | ) | | (2,372 | ) | | (2,068 | ) | | | | | | | | | | | | | |
Change in fair value, net | (5,796 | ) | | 9,181 |
| | 1,800 |
| | 6,095 |
| | 12,073 |
| | 12,415 |
| | | | | | | | | | | | | |
Ending fair value | $ | 290,283 |
| | $ | 380,935 |
| | $ | 448,838 |
| | $ | 411,784 |
| | $ | 425,202 |
| | $ | 395,196 |
| Commercial Loans, held-for-investment at amortized cost | | | | | | | | |
| | | | | | | | | | | | Beginning carrying value | | $ | 337,858 |
| | $ | 333,986 |
| | $ | 327,143 |
| | $ | 351,226 |
| | $ | 349,274 |
| | 343,344 |
|
| | | | | | | | | | | | Originations | | 1,750 |
| | 7,600 |
| | 21,870 |
| | 26,140 |
| | 5,993 |
| | 6,592 |
|
| | | | | | | | | | | | Principal repayments | | (19,816 | ) | | (3,717 | ) | | (15,190 | ) | | (51,295 | ) | | (3,904 | ) | | (152 | ) |
| | | | | | | | | | | | Provision for loan losses | | 261 |
| | (206 | ) | | (27 | ) | | 888 |
| | (289 | ) | | (655 | ) |
| | | | | | | | | | | | Discount/fee amortization | | 192 |
| | 195 |
| | 190 |
| | 184 |
| | 152 |
| | 145 |
|
| | | | | | | | | | | | Ending carrying value (2) | | $ | 320,245 |
| | 337,858 |
| | $ | 333,986 |
| | $ | 327,143 |
| | $ | 351,226 |
| | 349,274 |
|
| | | | | | | | | | | | | | | | | | | | | | | | |
| | | | | | | | | | | | Mortgage Servicing Rights | | | | | | | | | |
| | | | | | | | | | | | Beginning carrying value | | $ | 120,324 |
| | 139,293 |
| | 135,152 |
| | 71,225 |
| | 64,971 |
| | 64,824 |
|
| | | | | | | | | | | | Additions | | 32,463 |
| | 18,754 |
| | 19,279 |
| | 61,606 |
| | 11,807 |
| | 2,858 |
|
| | | | | | | | | | | | Sales | | 0 |
| | (18,206 | ) | | — |
| | — |
| | — |
| | — |
|
| | | | | | | | | | | | Changes in fair value, net | | 15,675 |
| | (19,517 | ) | | (15,138 | ) | | 2,321 |
| | (5,553 | ) | | (2,711 | ) |
| | | | | | | | | | | | Ending fair value | | $ | 168,462 |
| | $ | 120,324 |
| | $ | 139,293 |
| | $ | 135,152 |
| | $ | 71,225 |
| | 64,971 |
|
| | | | | | | | | | | | | | | | | | | | | | | | |
| |
(1) | Securities-mezzanine are a component of securities-subordinate. They are broken-out to provide additional detail on this portion of the subordinate securities portfolio. |
| |
(2) | The carrying value of our commercial loans, held-for-investment at amortized cost excludes commercial A-notes, which are carried at fair value. |
THE REDWOOD REVIEW I 2ND QUARTER 2015 Table 7: Securities and Loan Portfolio Activity 60
|
| | | | | | | | | | | | | | | | | | | | | | | | | | | | | | | | | | | | | | | | | | | | | | | | |
| Table 8: Consolidating Balance Sheet ($ in thousands) |
| | | | | | | | | | | | | | | | | | | | | | | | |
| As of June 30, 2015 | | As of March 31, 2015 |
| | | Consolidated VIEs (1) | | | | | | Consolidated VIEs (1) | | |
| At Redwood (1) | | Commercial Securitization | | Residential Resecuritization(2) | | Consolidated Sequoia Entities | | Total | | Redwood Consolidated | | At
Redwood (1) | | Commercial
Securitization | | Residential
Resecuritization | | Consolidated
Sequoia
Entities | | Total | | Redwood
Consolidated |
Residential loans | $ | 2,049,366 |
| | $ | — |
| | $ | — |
| | $ | 1,237,114 |
| | $ | 1,237,114 |
| | $ | 3,286,480 |
| | $ | 2,095,329 |
| | $ | — |
| | $ | — |
| | $ | 1,304,426 |
| | $ | 1,304,426 |
| | $ | 3,399,755 |
|
Commercial loans (2) | 369,147 |
| | 182,184 |
| | — |
| | — |
| | 182,184 |
| | 551,331 |
| | 268,767 |
| | 191,575 |
| | — |
| | — |
| | 191,575 |
| | 460,342 |
|
Real estate securities | 962,321 |
| | — |
| | 195,278 |
| | — |
| | 195,278 |
| | 1,157,599 |
| | 1,073,927 |
| | — |
| | 211,316 |
| | — |
| | 211,316 |
| | 1,285,243 |
|
Mortgage servicing rights | 168,462 |
| | — |
| | — |
| | — |
| | — |
| | 168,462 |
| | 120,324 |
| | — |
| | — |
| | — |
| | — |
| | 120,324 |
|
Cash and cash equivalents | 226,426 |
| | — |
| | — |
| | — |
| | — |
| | 226,426 |
| | 303,820 |
| | — |
| | — |
| | — |
| | — |
| | 303,820 |
|
Total earning assets | 3,775,722 |
| | 182,184 |
| | 195,278 |
| | 1,237,114 |
| | 1,614,576 |
| | 5,390,298 |
| | 3,862,167 |
| | 191,575 |
| | 211,316 |
| | 1,304,426 |
| | 1,707,317 |
| | 5,569,484 |
|
Other assets | 197,526 |
| | 1,506 |
| | 409 |
| | 6,145 |
| | 8,060 |
| | 205,586 |
| | 237,289 |
| | 1,626 |
| | 449 |
| | 7,171 |
| | 9,246 |
| | 246,535 |
|
Total assets | $ | 3,973,248 |
| | $ | 183,690 |
| | $ | 195,687 |
| | $ | 1,243,259 |
| | $ | 1,622,636 |
| | $ | 5,595,884 |
| | $ | 4,099,456 |
| | $ | 193,201 |
| | $ | 211,765 |
| | $ | 1,311,597 |
| | $ | 1,716,563 |
| | $ | 5,816,019 |
|
| | | | | | | | | | | | | | | | | | | | | | | |
Short-term debt | $ | 1,367,062 |
| | $ | — |
| | $ | — |
| | $ | — |
| | $ | — |
| | $ | 1,367,062 |
| | $ | 1,502,164 |
| | $ | — |
| | $ | — |
| | $ | — |
| | $ | — |
| | $ | 1,502,164 |
|
Other liabilities | 121,435 |
| | 328 |
| | 2 |
| | 797 |
| | 1,127 |
| | 122,562 |
| | 151,299 |
| | 374 |
| | 189 |
| | 893 |
| | 1,456 |
| | 152,755 |
|
ABS issued | — |
| | 69,914 |
| | 18,872 |
| | 1,173,336 |
| | 1,262,122 |
| | 1,262,122 |
| | — |
| | 79,676 |
| | 34,280 |
| | 1,239,065 |
| | 1,353,021 |
| | 1,353,021 |
|
Long-term debt (2) | 1,579,354 |
| | — |
| | — |
| | — |
| | — |
| | 1,579,354 |
| | 1,550,869 |
| | — |
| | — |
| | — |
| | — |
| | 1,550,869 |
|
Total liabilities | 3,067,851 |
| | 70,242 |
| | 18,874 |
| | 1,174,133 |
| | 1,263,249 |
| | 4,331,100 |
| | 3,204,332 |
| | 80,050 |
| | 34,469 |
| | 1,239,958 |
| | 1,354,477 |
| | 4,558,809 |
|
| | | | | | | | | | | | | | | | | | | | | | | |
Equity | 905,397 |
| | 113,448 |
| | 176,813 |
| | 69,126 |
| | 359,387 |
| | 1,264,784 |
| | 895,124 |
| | 113,151 |
| | 177,296 |
| | 71,639 |
| | 362,086 |
| | 1,257,210 |
|
Total liabilities and equity | $ | 3,973,248 |
| | $ | 183,690 |
| | $ | 195,687 |
| | $ | 1,243,259 |
| | $ | 1,622,636 |
| | $ | 5,595,884 |
| | $ | 4,099,456 |
| | $ | 193,201 |
| | $ | 211,765 |
| | $ | 1,311,597 |
| | $ | 1,716,563 |
| | $ | 5,816,019 |
|
| | | | | | | | | | | | | | | | | | | | | | | |
| | | | | | | | | | | | | | | | | | | | | | | |
| |
(1) | The format of this consolidating balance sheet is provided to more clearly delineate between the assets belonging to certain securitization entities (Consolidated variable interest entities, or VIEs) that we are required to consolidate on our balance sheet in accordance with GAAP, but which are not legally ours, and the liabilities of these consolidated VIEs, which are payable only from the cash flows generated by their assets and are, therefore, nonrecourse to us, and the assets that are legally ours and the liabilities of ours for which there is recourse to us. |
| |
(2) | In accordance with GAAP, we account for the Residential Resecuritization as a financing even though these securities are owned by the resecuritization entity and are legally not ours. We own only the securities and interests that we acquired from the resecuritization entity, which amounted to $170 million at June 30, 2015. As a result, to adjust at June 30, 2015, for the legal and economic interests that resulted from the resecuritization, our total senior securities would be decreased by $195 million to $319 million, prime re-REMIC securities would be increased by $170 million to $339 million, and total real estate securities would be reduced by $25 million to $1.13 billion. |
| |
(3) | Commercial loans at Redwood and long-term debt at Redwood include $65 million of commercial A-notes and $65 million of commercial secured borrowings, respectively. Although these loans were sold, we are required under GAAP to retain the loans on our balance sheet and treat the proceeds as secured borrowings. |
THE REDWOOD REVIEW I 2ND QUARTER 2015 Table 8: Consolidating Balance Sheet 61
REDWOOD TRUST CORPORATE INFORMATION
|
| |
EXECUTIVE OFFICERS | DIRECTORS |
| |
Marty Hughes | Richard D. Baum |
Chief Executive Officer | Chairman of the Board |
| Former Chief Deputy Insurance |
Brett D. Nicholas | Commissioner for the State of California |
President | |
| Douglas B. Hansen |
Fred J. Matera | Vice-Chairman of the Board |
Chief Investment Officer | Private Investor |
| |
Christopher J. Abate | Mariann Byerwalter |
Chief Financial Officer | Chairman, SRI International |
| Chairman, JDN Corporate Advisory LLC |
Andrew P. Stone | |
General Counsel | Marty Hughes |
| Chief Executive Officer |
| |
CORPORATE HEADQUARTERS: | Greg H. Kubicek |
One Belvedere Place, Suite 300 | President, The Holt Group, Inc. |
Mill Valley, California 94941 | |
Telephone: (415) 389-7373 | Karen R. Pallotta |
| Owner, KRP Advisory Services, LLC |
CHICAGO OFFICE: | |
225 W. Washington Street, Suite 1440 | Jeffrey T. Pero |
Chicago, IL 60606 | Retired Partner, Latham & Watkins LLP |
| |
DENVER METRO AREA OFFICE: | Georganne C. Proctor |
8310 South Valley Highway, Suite 425 | Former Chief Financial Officer, TIAA-CREF |
Englewood, Colorado 80112 | |
| Charles J. Toeniskoetter |
NEW YORK OFFICE: | Chairman, Toeniskoetter Development, Inc. |
1114 Avenue of the Americas, Suite 2810 | Chairman & CEO, Toeniskoetter Construction, Inc. |
New York, New York 10036 | |
| |
| |
| |
STOCK LISTING | INVESTOR RELATIONS |
The Company's common stock is traded | Kristin Brown |
on the New York Stock Exchange under | |
the symbol RWT | Investor Relations Hotline: (866) 269-4976 |
| Email: investorrelations@redwoodtrust.com |
TRANSFER AGENT | |
Computershare Trust Company, N.A. | |
2 North LaSalle Street | |
Chicago, IL 60602 | |
| |
For more information about Redwood Trust, visit our website at www.redwoodtrust.com |