| Annual Report on Form 20-F 2023 |
| Forward-looking statements This Annual Report contains forward-looking statements within the meaning of Section 27A of the US Securities Act of 1933, as amended, and Section 21E of the US Securities Exchange Act of 1934, as amended. These statements are subject to risks and uncertainties that could cause actual results or outcomes of RELX PLC (together with its subsidiaries, “RELX”, “we” or “our”) to differ materially from those expressed in any forward-looking statement. We consider any statements that are not historical facts to be “forward-looking statements”. The terms “outlook”, “estimate”, “forecast”, “project”, “plan”, “intend”, “expect”, “should”, “could”, “will”, “believe”, “trends” and similar expressions may indicate a forward-looking statement. Important factors that could cause actual results or outcomes to differ materially from estimates or forecasts contained in the forward-looking statements include, among others: regulatory and other changes regarding the collection or use of personal data; changes in law and legal interpretations affecting RELX intellectual property rights and internet communications; current and future geopolitical, economic and market conditions; changes in the payment model for RELX scientific, technical and medical research products; competitive factors in the industries in which RELX operates and demand for RELX products and services; inability to realise the future anticipated benefits of acquisitions; compromises of RELX cyber security systems or other unauthorised access to our databases; changes in economic cycles, communicable disease epidemics or pandemics, severe weather events, natural disasters and terrorism; failure of third parties to whom RELX has outsourced business activities; significant failure or interruption of RELX systems; inability to retain high-quality employees and management; changes in tax laws and uncertainty in their application; exchange rate fluctuations; adverse market conditions or downgrades to the credit ratings of our debt; changes in the market values of defined benefit pension scheme assets and in the market-related assumptions used to value scheme liabilities; breaches of generally accepted ethical business standards or applicable laws; and other risks referenced from time to time in the filings of RELX PLC with the US Securities and Exchange Commission. You should not place undue reliance on these forward-looking statements, which speak only as of the date of this Annual Report. Except as may be required by law, we undertake no obligation to publicly update or release any revisions to these forward-looking statements to reflect events or circumstances after the date of this Annual Report or to reflect the occurrence of unanticipated events. RELX is a global provider of information-based analytics and decision tools for professional and business customers, enabling them to make better decisions, getbetter results and be more productive. Our purpose is to benefit society by developing products that help researchers advance scientific knowledge; doctors and nurses improve the lives of patients; lawyers promote the rule of law and achieve justice andfair results for their clients; businesses and governments prevent fraud; consumers access financial services and get fair prices on insurance; and customers learn about markets and complete transactions. Our purpose guides our actions beyond the products that we develop. It defines us as a company. Every day across RELX our employees are inspired to undertake initiatives that make unique contributions to society andthe communities in which we operate. About us Annual Report 2023 |
| 1 Strategic report Overview 2 2023 highlights 3 Chair’s statement 4 Chief Executive Officer’s report 5 RELX business overview Market segments 14 Risk 20 Scientific, Technical & Medical 26 Legal 32 Exhibitions Corporate responsibility 38 Introduction 45 Our unique contributions 50 CR governance 54 People 60 Customers 65 Community 69 Supply chain 73 Environment 82 CR disclosure standards Financial review 92 Chief Financial Officer’s report 98 Principal and emerging risks Governance Governance 108 Board Directors 110 RELX senior executives 112 Chair’s introduction to corporate governance 113 Corporate governance review 125 Report of the Nominations Committee 128 Directors’ remuneration report 149 Report of the Audit Committee 153 Directors’ report Financial statements and shareholder information Financial statements 158 Independent auditor’s report 166 Consolidated financial statements 214 RELX PLC company only financial statements 220 Summary consolidated financial information in US dollars 221 Summary consolidated financial information in euros 222 Alternative performance measures Shareholder information 232 Shareholder information 235 2024 financial calendar RELX Annual Report 2023 Contents Market segments Governance and shareholder information Financial statements Financial review Corporate Responsibility Overview To download the full Annual Report and for further information about our Company visit relx.com |
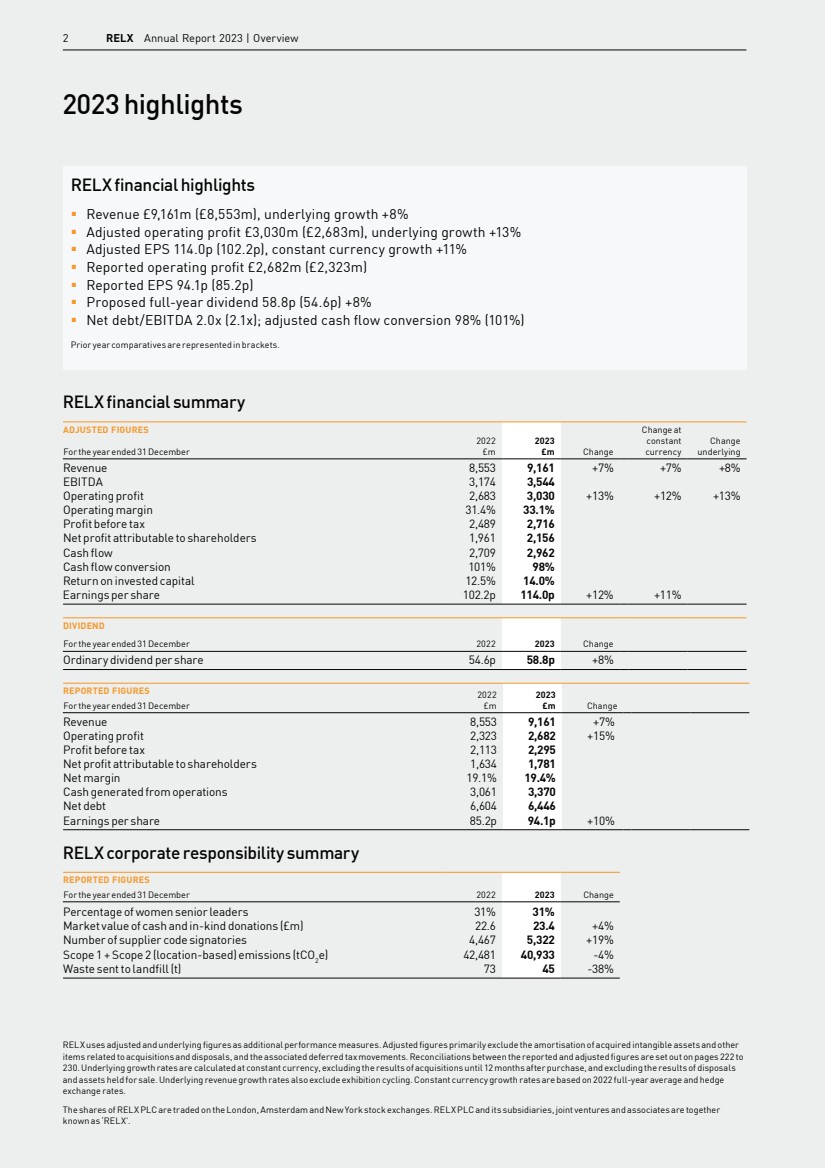
| 2 RELX Annual Report 2023 | Overview RELX financial summary ADJUSTED FIGURES 2022 £m 2023 £m Change Change at constant currency Change For the year ended 31 December underlying Revenue 8,553 9,161 +7% +7% +8% EBITDA 3,174 3,544 Operating profit 2,683 3,030 +13% +12% +13% Operating margin 31.4% 33.1% Profit before tax 2,489 2,716 Net profit attributable to shareholders 1,961 2,156 Cash flow 2,709 2,962 Cash flow conversion 101% 98% Return on invested capital 12.5% 14.0% Earnings per share 102.2p 114.0p +12% +11% DIVIDEND For the year ended 31 December 2022 2023 Change Ordinary dividend per share 54.6p 58.8p +8% REPORTED FIGURES 2022 £m 2023 For the year ended 31 December £m Change Revenue 8,553 9,161 +7% Operating profit 2,323 2,682 +15% Profit before tax 2,113 2,295 Net profit attributable to shareholders 1,634 1,781 Net margin 19.1% 19.4% Cash generated from operations 3,061 3,370 Net debt 6,604 6,446 Earnings per share 85.2p 94.1p +10% RELX corporate responsibility summary REPORTED FIGURES For the year ended 31 December 2022 2023 Change Percentage of women senior leaders 31% 31% Market value of cash and in-kind donations (£m) 22.6 23.4 +4% Number of supplier code signatories 4,467 5,322 +19% Scope 1 + Scope 2 (location-based) emissions (tCO2 e) 42,481 40,933 -4% Waste sent to landfill (t) 73 45 -38% RELX uses adjusted and underlying figures as additional performance measures. Adjusted figures primarily exclude the amortisation of acquired intangible assets and other items related to acquisitions and disposals, and the associated deferred tax movements. Reconciliations between the reported and adjusted figures are set out on pages 222 to 230. Underlying growth rates are calculated at constant currency, excluding the results of acquisitions until 12 months after purchase, and excluding the results of disposals and assets held for sale. Underlying revenue growth rates also exclude exhibition cycling. Constant currency growth rates are based on 2022 full-year average and hedge exchange rates. The shares of RELX PLC are traded on the London, Amsterdam and New York stock exchanges. RELX PLC and its subsidiaries, joint ventures and associates are together known as ‘RELX’. 2023 highlights RELX financial highlights § Revenue £9,161m (£8,553m), underlying growth +8% § Adjusted operating profit £3,030m (£2,683m), underlying growth +13% § Adjusted EPS 114.0p (102.2p), constant currency growth +11% § Reported operating profit £2,682m (£2,323m) § Reported EPS 94.1p (85.2p) § Proposed full-year dividend 58.8p (54.6p) +8% § Net debt/EBITDA 2.0x (2.1x); adjusted cash flow conversion 98% (101%) Prior year comparatives are represented in brackets. |
| RELX Annual Report 2023 3 was appointed a Non-Executive Director. Alistair served as Chief Executive of Hays from 2007 until 2023, and Chief Executive of Xansa from 2002 to 2007. He was formerly a Non-Executive Director of Just Eat and 3i. Suzanne Wood became Senior Independent Director and Robert MacLeod became Chair of the Remuneration Committee. Marike van Lier Lels, who has been on the Board since 2015, will be stepping down as a Non-Executive Director after the Annual General Meeting. Bianca Tetteroo will become a Non-Executive Director from July 2024, subject to her election by shareholders attheAnnual General Meeting. Bianca is Chief Executive and Chair ofthe Executive Board of Achmea, a leading Netherlands-based financial services organisation, a role she has held since 2021. She previously spent 13 years with Fortis Group. I would like to thank Wolfhart and Marike for their support and advice. I am delighted to welcome Alistair to the Board and look forward to Bianca joining us. Remuneration Policy In 2023, following an in-depth review, the Board presented anupdated Directors’ Remuneration Policy for shareholder consideration. The updated policy received strong support fromshareholders. Governance RELX maintains a strong corporate governance framework and believes doing so is critical to achieving long-term, sustainable growth. Corporate Responsibility remains a priority for RELX. During the year, the Board reviewed the company’s Corporate Responsibility activities, including progress on RELX’s unique contributions to society as well as its Corporate Responsibility governance, people, customers, community, supply chain and environment. Our performance was again recognised by external agencies: RELX achieved a AAA MSCI Environmental, Social and Governance rating for an eighth consecutive year; was ranked second in our sector by Sustainalytics; maintained fifth place in the Responsibility100 Index, and was a constituent of the Bloomberg Gender Equality Index for the fifth consecutive year. On behalf of the Board, I would like to thank RELX employees for their many contributions throughout 2023. I am confident that with their knowledge and commitment, RELX will continue to be successful inthe year ahead. Paul Walker Chair Chair’s statement RELX had another year of strong growth in 2023 as it continues to execute well on its strategic priorities. As RELX has continued to execute its strategy, it has also delivered strong shareholder returns and received external recognition for its Corporate Responsibility performance. Paul Walker, Chair RELX had another year of strong growth in 2023 as the company continues to execute well on its strategic priorities. I am particularly pleased that all business areas have performed strongly. Underlying revenue growth was 8%, with underlying adjusted operating profit growth of 13%. Adjusted earnings per share grew 11% at constant currency to 114.0p (102.2p). Reported earnings per share were 94.1p (85.2p). As RELX has continued to execute its strategy, ithas also delivered strong shareholder returns. In the decade to the end of 2023, RELX has delivered Total Shareholder Returns of 347%, compared with 67% for the FTSE100 over the same period. Culture and Employee Engagement RELX places significant emphasis on the way we do business and onacting with integrity and in accordance with the highest ethical standards. Our commitment is set out in our statement on Purpose, strategy, values and culture on page 116 of this report and we strive to ensure decisions taken are aligned with RELX’s values. We also believe maintaining high levels of employee engagement is an important driver of growth in the business. The Board draws insights about culture and employee engagement from a range of sources including annual employee opinion surveys and the activities of our dedicated Non-Executive Director responsible for employee engagement, which facilitate a direct link with the Board and allow it to further understand and consider the views of employees. Employee engagement scores from the annual survey remained at very high levels. Dividends In recognition of our strong performance and outlook for the company we are proposing an 8% increase in the full year dividend of 58.8p (54.6p). Balance sheet Net debt was £6.4bn at 31 December 2023. Net debt/EBITDA including pensions was 2.0x, compared with 2.1x in 2022. Capital expenditure represented 5% of revenues. Share buybacks We deployed £800m on share buybacks in 2023. In recognition of our strong financial position and cash flow we intend to deploy a total of £1,000m on share buybacks in 2024, of which £150m has already been completed. The Board At the 2023 Annual General Meeting, Wolfhart Hauser, the Senior Independent Director and Chair of the Remuneration Committee, retired from the Board having served since 2013, and Alistair Cox Market segments Governance and shareholder information Financial statements Financial review Corporate Responsibility Overview |
| 4 RELX Annual Report 2023 | Overview Chief Executive Officer’s report RELX delivered strong revenue and profit growth in 2023, driven by the ongoing shift in business mix towards higher growth information-based analytics and decision tools that deliver enhanced value to our customers across market segments Erik Engstrom, Chief Executive Officer 2023 progress RELX delivered strong revenue and profit growth in 2023, driven by the ongoing shift in business mix towards higher growth information-based analytics and decision tools that deliver enhanced value to our customers across market segments. We have been able to develop and deploy these tools across the company for well over a decade by leveraging deep customer understanding to combine leading content and data sets with powerful technologies. We are confident that our ability to leverage artificial intelligence and other technologies, as they evolve, will continue to be an important driver of customer value and growth in our business for many years to come. Electronic revenue, representing 83% of the total grew 7%, with strong growth in face-to-face activity more than offsetting the print decline, bringing the overall group underlying revenue growth rate to 8%. Underlying adjusted operating profit grew 13%.Our strategy of driving continuous process innovation to manage cost growth below revenue growth, together with the recovery in face-to-face activity, resulted in an improvement in the group adjusted operating margin to 33.1% compared with 31.4% in 2022. Corporate responsibility We performed well on our Corporate Responsibility priorities in 2023, on our unique contributions to society, and on our key metrics. Our unique contributions are where we make a positive impact on society in the conduct of our business, encompassing protection of society, advancing science and health, promotion of the rule of law and access to justice, and fostering communities. Recognising that across RELX we have products, services, tools and events that advance the United Nations’ 17 Sustainable Development Goals (SDG), we continued to expand the free RELX SDG Resource Centre contributing to a 21% increase in content. We further improved on our key Corporate Responsibility performance metrics. We advanced inclusion and belonging, including through our Women in Tech Mentoring programme; rolled-out the RELX Responsible Artificial Intelligence Principles across the business; increased the number of suppliers that signed our Supplier Code of Conduct; and continued to ensure all of our electricity came from renewable sources and renewable energy certificates, while reducing our Scope 1 and 2 carbon emissions. 2024 Outlook We continue to see positive momentum across the group, and we expect another year of strong underlying growth in revenue and adjusted operating profit, as well as strong growth in adjusted earnings per share on a constant currency basis. Erik Engstrom Chief Executive Officer |
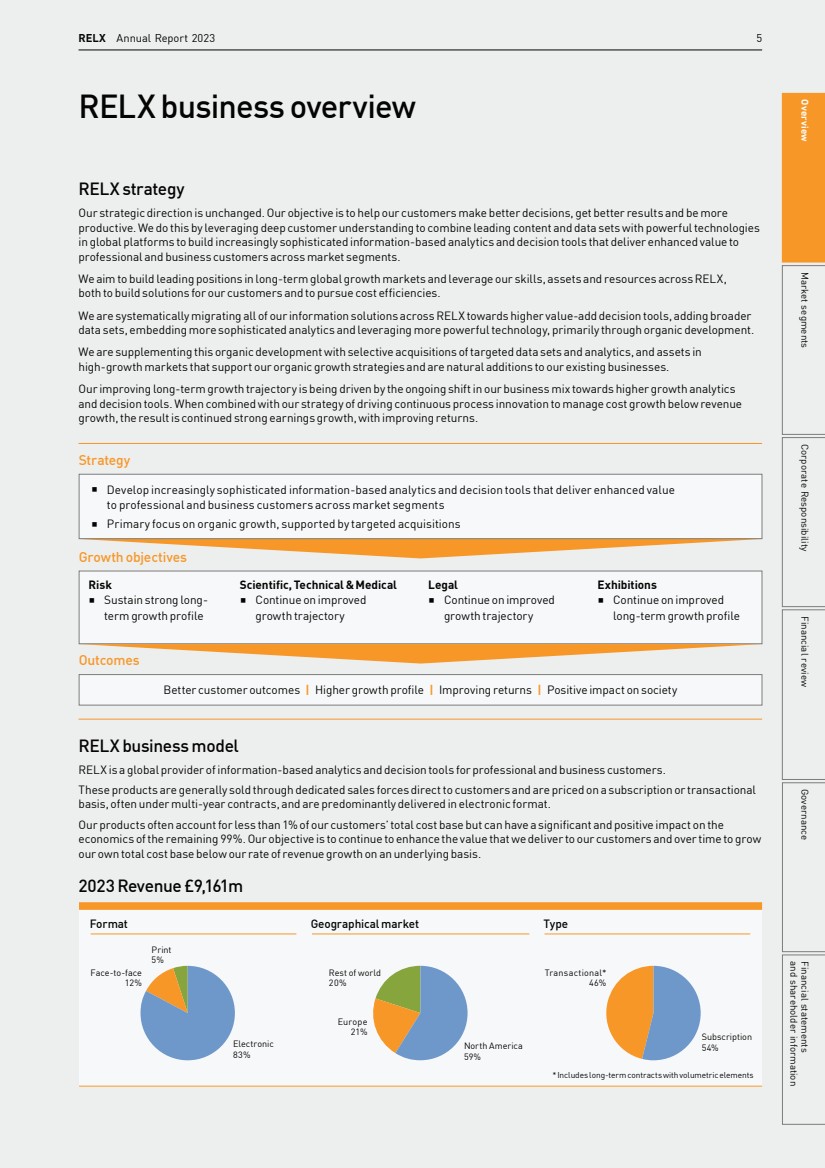
| RELX Annual Report 2023 5 RELX business overview RELX strategy Our strategic direction is unchanged. Our objective is to help our customers make better decisions, get better results and be more productive. We do this by leveraging deep customer understanding to combine leading content and data sets with powerful technologies in global platforms to build increasingly sophisticated information-based analytics and decision tools that deliver enhanced value to professional and business customers across market segments. We aim to build leading positions in long-term global growth markets and leverage our skills, assets and resources across RELX, both to build solutions for our customers and to pursue cost efficiencies. We are systematically migrating all of our information solutions across RELX towards higher value-add decision tools, adding broader data sets, embedding more sophisticated analytics and leveraging more powerful technology, primarily through organic development. We are supplementing this organic development with selective acquisitions of targeted data sets and analytics, and assets in high-growth markets that support our organic growth strategies and are natural additions to our existing businesses. Our improving long-term growth trajectory is being driven by the ongoing shift in our business mix towards higher growth analytics and decision tools. When combined with our strategy of driving continuous process innovation to manage cost growth below revenue growth, the result is continued strong earnings growth, with improving returns. RELX business model RELX is a global provider of information-based analytics and decision tools for professional and business customers. These products are generally sold through dedicated sales forces direct to customers and are priced on a subscription or transactional basis, often under multi-year contracts, and are predominantly delivered in electronic format. Our products often accountfor less than 1% of our customers’total cost base but can have a significant and positive impact on the economics of the remaining 99%. Our objective is to continue to enhance the value that we deliver to our customers and over time to grow our own total cost base below our rate of revenue growth on an underlying basis. § Develop increasingly sophisticated information-based analytics and decision tools that deliver enhanced value to professional and business customers across market segments § Primary focus on organic growth, supported by targeted acquisitions Better customer outcomes | Higher growth profile | Improving returns | Positive impact on society Risk § Sustain strong long-term growth profile Scientific, Technical & Medical § Continue on improved growth trajectory Legal § Continue on improved growth trajectory Strategy Growth objectives Outcomes Exhibitions § Continue on improved long-term growth profile 2023 Revenue £9,161m Format Geographicalmarket Type Print 5% Face-to-face 12% Electronic 83% Rest of world 20% Europe 21% North America 59% Transactional* 46% Subscription 54% * Includes long-term contracts with volumetric elements Market segments Governance and shareholder information Financial statements Financial review Corporate Responsibility Overview |
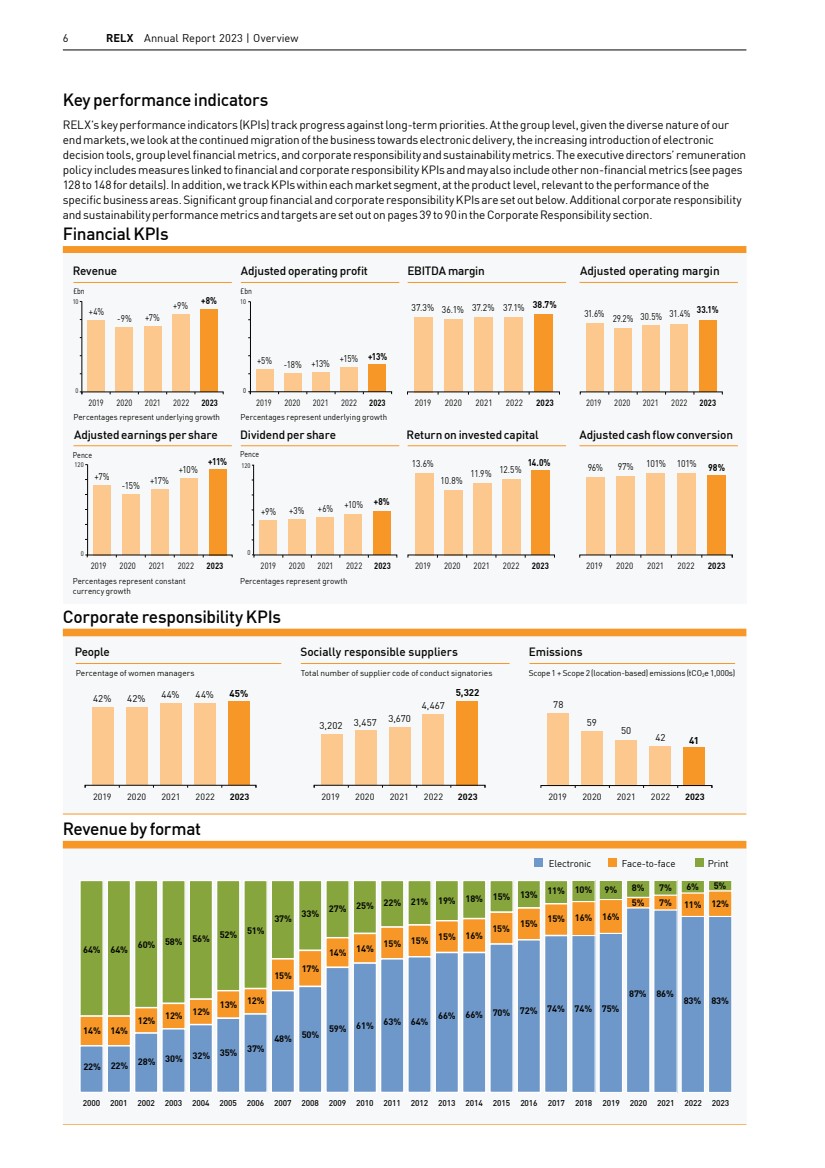
| Key performance indicators RELX’s key performance indicators (KPIs) track progress against long-term priorities. At the group level, given the diverse nature of our end markets, we look at the continued migration of the business towards electronic delivery, the increasing introduction of electronic decisiontools,grouplevelfinancialmetrics,andcorporateresponsibilityandsustainabilitymetrics.Theexecutivedirectors’ remuneration policy includesmeasures linkedtofinancialandcorporateresponsibilityKPIsandmayalsoincludeothernon-financialmetrics (seepages 128 to 148 for details). In addition, we track KPIs within each market segment, at the product level, relevant to the performance of the specificbusinessareas.SignificantgroupfinancialandcorporateresponsibilityKPIsaresetoutbelow.Additional corporateresponsibility and sustainability performance metrics and targets are set out on pages 39 to 90 in the Corporate Responsibility section. 6 RELX Annual Report 2023 | Overview 2019 2020 2021 2022 2023 2019 2020 2021 2022 2023 2019 2020 2021 2022 2023 3,202 3,457 78 59 50 3,670 Percentage of women managers Total number of supplier code of conduct signatories Scope 1 + Scope 2 (location-based) emissions (tCO2e 1,000s) 42 42% 42% 44% 44% 45% 4,467 5,322 41 People Socially responsible suppliers Emissions 2019 2020 2021 2022 2023 +4% -9% +7% Percentages represent underlying growth £bn 10 0 +9% +8% Revenue 2019 2020 2021 2022 2023 +5% -18% +13% Percentages represent underlying growth £bn 10 0 +15% +13% Adjusted operating profit 2019 2020 2021 2022 2023 13.6% 10.8% 11.9% 12.5% 14.0% Returnoninvested capital 2019 2020 2021 2022 2023 96% 97% 101% 101% 98% Adjusted cashflowconversion 2019 2020 2021 2022 2023 +7% -15% Percentages represent constant currency growth Pence 120 0 +17% +10% +11% Adjusted earnings per share 2019 2020 2021 2022 2023 +9% +3% +6% Percentages represent growth Pence 120 0 +10% +8% Dividend per share 2019 2020 2021 2022 2023 37.3% 36.1% 37.2% 37.1% 38.7% EBITDA margin 2019 2020 2021 2022 2023 31.6% 29.2% 30.5% 31.4% 33.1% Adjusted operating margin Financial KPIs Corporate responsibility KPIs Electronic Face-to-face Print 2000 2001 2002 2003 2004 2005 2006 2007 2008 2009 2010 2011 2012 2013 2014 2015 2016 2017 2018 22% 22% 28% 30% 32% 35% 37% 48% 50% 59% 61% 63% 64% 66% 66% 70% 74% 74% 14% 14% 12% 12% 12% 13% 12% 15% 17% 14% 14% 15% 15% 15% 16% 15% 15% 64% 64% 60% 58% 56% 52% 51% 37% 33% 27% 25% 22% 21% 19% 18% 15% 11% 16% 10% 2019 2020 2021 2022 2023 75% 16% 9% 86% 7% 7% 83% 12% 5% 83% 11% 6% 87% 5% 8% 72% 15% 13% Revenue by format |
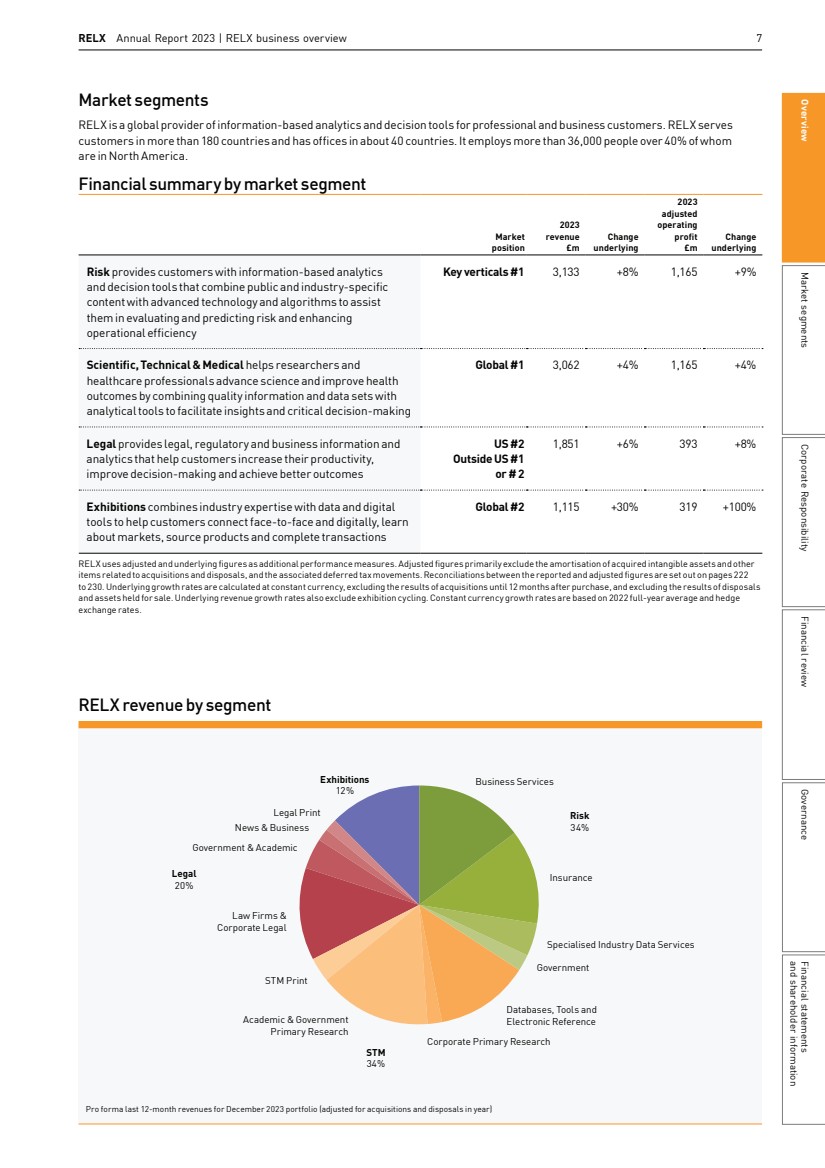
| RELX Annual Report 2023 | RELX business overview 7 Pro forma last 12-month revenues for December 2023 portfolio (adjusted for acquisitions and disposals in year) Business Services Insurance Specialised Industry Data Services Government Academic & Government Primary Research Corporate Primary Research Databases, Tools and Electronic Reference STM Print Law Firms & Corporate Legal Government & Academic News & Business Legal Print Exhibitions 12% Risk 34% Legal 20% STM 34% Market segments RELX is a global provider of information-based analytics and decision tools for professional and business customers. RELX serves customers in more than 180 countries and has offices in about 40 countries. It employs more than 36,000 people over 40% of whom are in North America. RELX revenue by segment Financial summary by market segment Market position 2023 revenue £m Change underlying 2023 adjusted operating profit £m Change underlying Risk provides customers with information-based analytics and decision tools that combine public and industry-specific content with advanced technology and algorithms to assist them in evaluating and predicting risk and enhancing operational efficiency Key verticals #1 3,133 +8% 1,165 +9% Scientific, Technical & Medical helps researchers and healthcare professionals advance science and improve health outcomes by combining quality information and data sets with analytical tools to facilitate insights and critical decision-making Global #1 3,062 +4% 1,165 +4% Legal provides legal, regulatory and business information and analytics that help customers increase their productivity, improve decision-making and achieve better outcomes US #2 Outside US #1 or # 2 1,851 +6% 393 +8% Exhibitions combines industry expertise with data and digital tools to help customers connect face-to-face and digitally, learn about markets, source products and complete transactions Global #2 1,115 +30% 319 +100% RELX uses adjusted and underlying figures as additional performancemeasures.Adjusted figures primarily exclude the amortisation of acquired intangible assets and other items related to acquisitions and disposals, and the associated deferred taxmovements.Reconciliations between the reported and adjusted figures are set out on pages 222 to 230. Underlying growth rates are calculated at constant currency, excluding the results of acquisitions until 12 months after purchase, and excluding the results of disposals and assets held for sale. Underlying revenue growth rates also exclude exhibition cycling. Constant currency growth rates are based on 2022 full-year average and hedge exchange rates. Market segments Governance and shareholder information Financial statements Financial review Corporate Responsibility Overview |
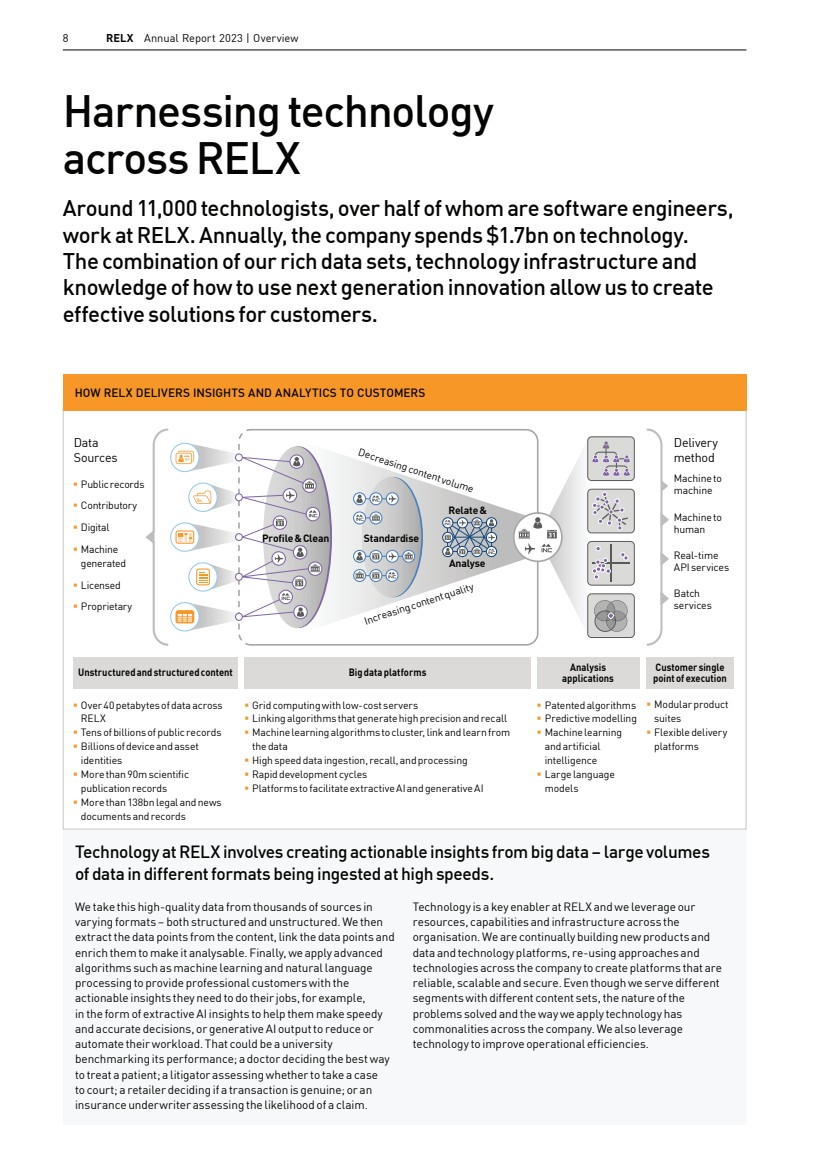
| 8 RELX Annual Report 2023 | Overview Technology at RELX involves creating actionable insights from big data – large volumes of data in different formats being ingested at high speeds. We take this high-quality data from thousands of sources in varying formats – both structured and unstructured. We then extract the data points from the content, link the data points and enrich them to make it analysable. Finally, we apply advanced algorithms such as machine learning and natural language processing to provide professional customers with the actionable insights they need to do their jobs, for example, in the form of extractive AI insights to help them make speedy and accurate decisions, or generative AI output to reduce or automate their workload. That could be a university benchmarking its performance; a doctor deciding the best way to treat a patient; a litigator assessing whether to take a case to court; a retailer deciding if a transaction is genuine; or an insurance underwriter assessing the likelihood of a claim. Technology is a key enabler at RELX and we leverage our resources, capabilities and infrastructure across the organisation. We are continually building new products and data and technology platforms, re-using approaches and technologies across the company to create platforms that are reliable, scalable and secure. Even though we serve different segments with different content sets, the nature of the problems solved and the way we apply technology has commonalities across the company. We also leverage technology to improve operational efficiencies. Harnessing technology across RELX Around 11,000 technologists, over half of whom are software engineers, work at RELX. Annually, the company spends $1.7bn ontechnology. The combination of our rich data sets, technology infrastructure and knowledge of how to use next generation innovationallow us to create effective solutions for customers. HOW RELX DELIVERS INSIGHTS AND ANALYTICS TO CUSTOMERS § Over 40 petabytes of data across RELX § Tens of billions of public records § Billions of device and asset identities § Morethan90mscientific publication records § More than 138bn legal and news documents and records § Public records § Contributory § Digital § Machine generated § Licensed § Proprietary § Grid computing with low-cost servers § Linking algorithms that generate high precision and recall § Machine learning algorithms to cluster, link and learn from the data § High speed data ingestion, recall, and processing § Rapid development cycles § Platforms to facilitate extractive AI and generative AI § Patented algorithms § Predictive modelling § Machine learning andartificial intelligence § Large language models § Modular product suites § Flexible delivery platforms Unstructured and structured content Big data platforms Analysis applications Customer single point of execution Machine to machine Machine to human Real-time API services Batch services Profile & Clean Standardise Relate & Analyse Decreasing content volume Increasing content quality Data Sources Delivery method |
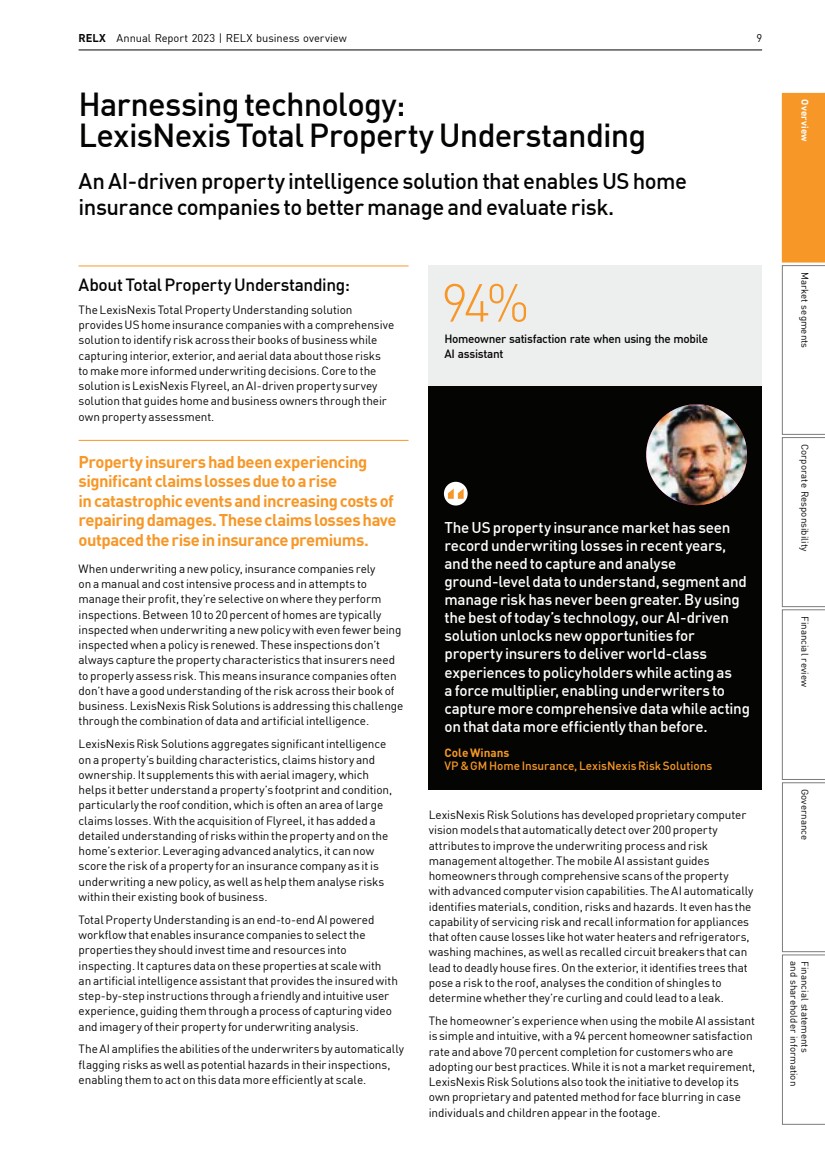
| RELX Annual Report 2023 | RELX business overview 9 The US property insurance market has seen record underwriting losses in recent years, and the need to capture and analyse ground-level data to understand, segment and manage risk has never been greater. By using the best of today’s technology, our AI-driven solution unlocks new opportunities for property insurers to deliver world-class experiences to policyholders while acting as a force multiplier, enabling underwriters to capture more comprehensive data while acting on that data more efficiently than before. Cole Winans VP & GM Home Insurance, LexisNexis Risk Solutions About Total Property Understanding: The LexisNexis Total Property Understanding solution provides US home insurance companies with a comprehensive solution to identify risk across their books of business while capturing interior, exterior, and aerial data about those risks to make more informed underwriting decisions. Core to the solution is LexisNexis Flyreel, an AI-driven property survey solution that guides home and business owners through their own property assessment. Property insurers had been experiencing significant claims losses due to a rise incatastrophic events and increasing costs of repairing damages. These claimslosses have outpaced the rise ininsurance premiums. When underwriting a new policy, insurance companies rely on a manual and cost intensive process and in attempts to manage their profit,they’re selective on where they perform inspections. Between 10 to 20 percent of homes are typically inspected when underwriting a new policy with even fewer being inspected when a policy is renewed. These inspections don’t always capture the property characteristics that insurers need to properly assess risk. This means insurance companies often don’t have a good understanding of the risk across their book of business. LexisNexis Risk Solutions is addressing this challenge through the combination of data and artificialintelligence. LexisNexisRiskSolutions aggregates significantintelligence on a property’s building characteristics, claims history and ownership. It supplements this with aerial imagery, which helps it better understand a property’s footprint and condition, particularly the roof condition, which is often an area of large claims losses. With the acquisition of Flyreel, it has added a detailed understanding of risks within the property and on the home’s exterior. Leveraging advanced analytics, it can now score the risk of a property for an insurance company as it is underwriting a new policy, as well as help them analyse risks within their existing book of business. Total Property Understanding is an end-to-end AI powered workflow that enables insurance companies to selectthe properties they should invest time and resources into inspecting. It captures data on these properties at scale with an artificialintelligence assistantthat provides the insured with step-by-step instructions through a friendly and intuitive user experience, guiding them through a process of capturing video and imagery of their property for underwriting analysis. TheAI amplifies the abilities oftheunderwriters by automatically flagging risks as well as potential hazards in their inspections, enabling them to act on this data more efficiently at scale. LexisNexis Risk Solutions has developed proprietary computer vision models that automatically detect over 200 property attributes to improve the underwriting process and risk management altogether. The mobile AI assistant guides homeowners through comprehensive scans of the property with advanced computer vision capabilities. The AI automatically identifies materials, condition, risks and hazards. It even has the capability of servicing risk and recall information for appliances that often cause losses like hot water heaters and refrigerators, washing machines, as well as recalled circuit breakers that can lead to deadly house fires.On the exterior, itidentifies trees that pose a risk to the roof, analyses the condition of shingles to determine whether they’re curling and could lead to a leak. The homeowner’s experience when using the mobile AI assistant is simple and intuitive, with a 94 percent homeowner satisfaction rate and above 70 percent completion for customers who are adopting our best practices. While it is not a market requirement, LexisNexis Risk Solutions also took the initiative to develop its own proprietary and patented method for face blurring in case individuals and children appear in the footage. 94% Homeowner satisfaction rate when using the mobile AI assistant Harnessing technology: LexisNexis Total Property Understanding An AI-driven property intelligence solution that enables US home insurance companies to better manage and evaluate risk. Market segments Governance and shareholder information Financial statements Financial review Corporate Responsibility Overview |
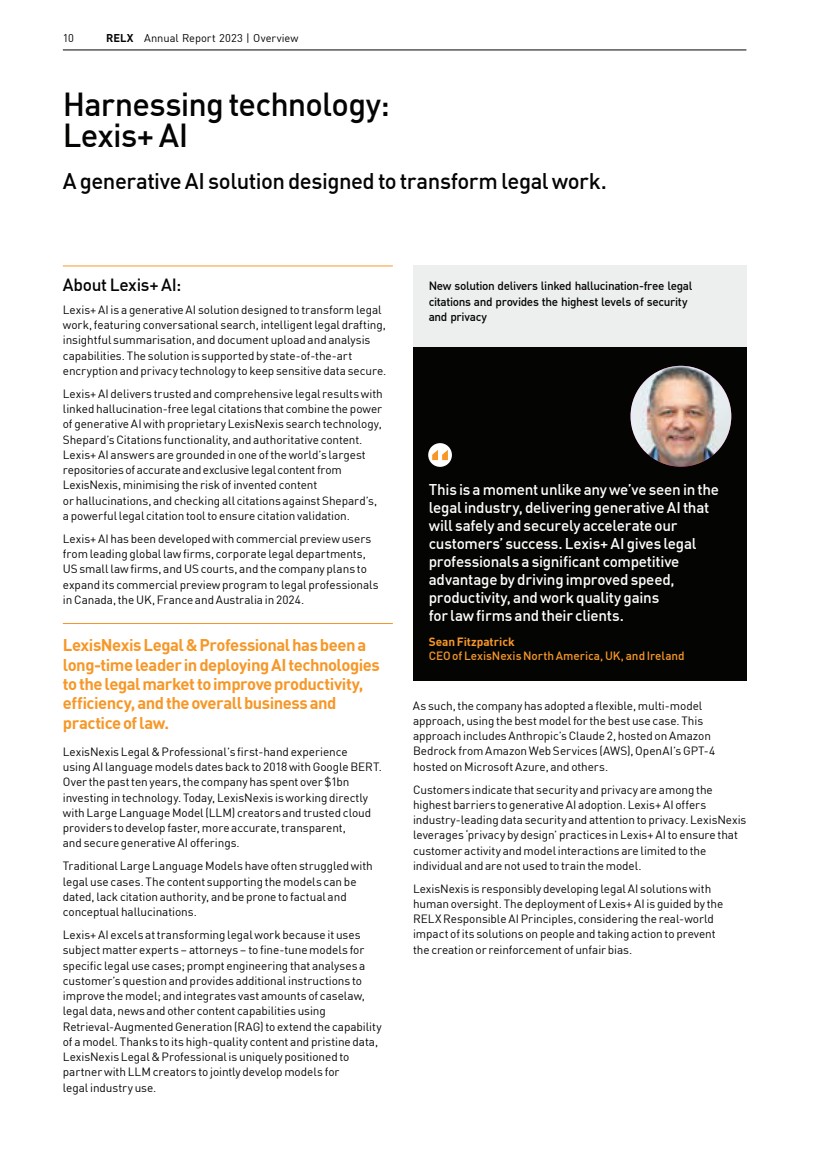
| 10 RELX Annual Report 2023 | Overview This is a moment unlike any we’ve seen in the legal industry, delivering generative AI that will safely and securely accelerate our customers’ success. Lexis+ AI gives legal professionals a significant competitive advantage by driving improved speed, productivity, and work quality gains for lawfirms and their clients. Sean Fitzpatrick CEO of LexisNexis North America, UK, and Ireland About Lexis+ AI: Lexis+ AI is a generative AI solution designed to transform legal work, featuring conversational search, intelligent legal drafting, insightful summarisation, and document upload and analysis capabilities. The solution is supported by state-of-the-art encryption and privacy technology to keep sensitive data secure. Lexis+ AI delivers trusted and comprehensive legal results with linked hallucination-free legal citations that combine the power of generative AI with proprietary LexisNexis search technology, Shepard’s Citations functionality, and authoritative content. Lexis+ AI answers are grounded in one of the world’s largest repositories of accurate and exclusive legal content from LexisNexis, minimising the risk of invented content or hallucinations, and checking all citations against Shepard’s, a powerful legal citation tool to ensure citation validation. Lexis+ AI has been developed with commercial preview users from leading globallaw firms, corporate legal departments, US smalllaw firms, andUScourts, and the company plans to expand its commercial preview program to legal professionals in Canada, the UK, France and Australia in 2024. LexisNexis Legal & Professional has beena long-time leader in deploying AItechnologies to the legal market to improve productivity, efficiency, and the overall business and practice of law. LexisNexis Legal & Professional’s first-hand experience usingAI language models dates back to 2018 with Google BERT. Over the past ten years, the company has spent over $1bn investing in technology. Today, LexisNexis is working directly with Large Language Model (LLM) creators and trusted cloud providers to develop faster, more accurate, transparent, and secure generative AI offerings. Traditional Large Language Models have often struggled with legal use cases. The content supporting the models can be dated, lack citation authority, and be prone to factual and conceptual hallucinations. Lexis+ AI excels at transforming legal work because it uses subject matter experts – attorneys – to fine-tune models for specific legal use cases; prompt engineering that analyses a customer’s question and provides additional instructions to improve the model; and integrates vast amounts of caselaw, legal data, news and other content capabilities using Retrieval-Augmented Generation (RAG) to extend the capability of a model. Thanks to its high-quality content and pristine data, LexisNexis Legal & Professional is uniquely positioned to partner with LLM creators to jointly develop models for legalindustry use. As such,the company has adopted aflexible, multi-model approach, using the best model for the best use case. This approach includesAnthropic’sClaude 2, hosted onAmazon Bedrock from Amazon Web Services (AWS),OpenAI’sGPT-4 hosted on MicrosoftAzure, and others. Customers indicate that security and privacy are among the highest barriers to generative AI adoption. Lexis+ AI offers industry-leading data security and attention to privacy. LexisNexis leverages ‘privacy by design’ practices in Lexis+ AI to ensure that customer activity and model interactions are limited to the individual and are not used to train the model. LexisNexis is responsibly developing legal AI solutions with human oversight. The deployment of Lexis+ AI is guided by the RELX Responsible AI Principles, considering the real-world impact of its solutions on people and taking action to prevent the creation or reinforcement of unfair bias. New solution delivers linked hallucination-free legal citations and provides the highest levels of security and privacy Harnessing technology: Lexis+ AI A generative AI solution designed to transform legal work. |
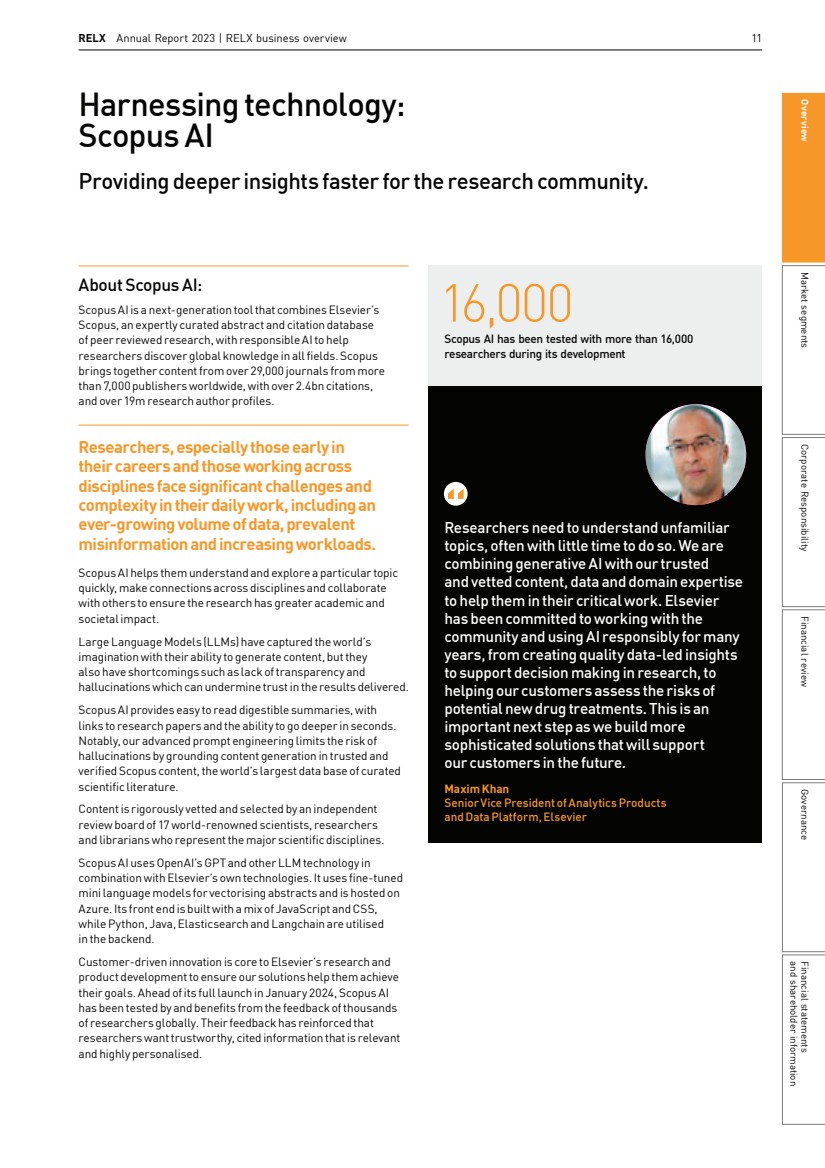
| RELX Annual Report 2023 | RELX business overview 11 About Scopus AI: Scopus AI is a next-generation tool that combines Elsevier’s Scopus, an expertly curated abstract and citation database of peer reviewed research, with responsible AI to help researchers discover global knowledge in all fields. Scopus brings together content from over 29,000 journals from more than 7,000 publishers worldwide, with over 2.4bn citations, and over 19mresearch author profiles. Researchers, especially those early in theircareers and those working across disciplines face significant challenges and complexity in their daily work, including an ever-growing volume of data, prevalent misinformation and increasing workloads. Scopus AI helps them understand and explore a particular topic quickly, make connections across disciplines and collaborate with others to ensure the research has greater academic and societalimpact. Large Language Models (LLMs) have captured the world’s imagination with their ability to generate content, but they also have shortcomings such as lack of transparency and hallucinations which can undermine trust in the results delivered. Scopus AI provides easy to read digestible summaries, with links to research papers and the ability to go deeper in seconds. Notably, our advanced prompt engineering limits the risk of hallucinations by grounding content generation in trusted and verifiedScopus content,the world’s largest data base of curated scientific literature. Content is rigorously vetted and selected by an independent review board of 17 world-renowned scientists, researchers and librarians who representthe major scientific disciplines. Scopus AI uses OpenAI’s GPT and other LLM technology in combination withElsevier’s own technologies. It uses fine-tuned mini language models for vectorising abstracts and is hosted on Azure. Its front end is built with a mix of JavaScript andCSS, while Python, Java,Elasticsearch and Langchain are utilised in the backend. Customer-driven innovation is core to Elsevier’s research and product development to ensure our solutions help them achieve their goals.Ahead ofits fulllaunch in January 2024,ScopusAI has been tested by and benefits from the feedback ofthousands of researchers globally. Their feedback has reinforced that researchers want trustworthy, cited information that is relevant and highly personalised. Researchers need to understand unfamiliar topics, often with little time to do so. We are combining generative AI with our trusted and vetted content, data and domain expertise to help them in their critical work. Elsevier has been committed to working with the community and using AI responsibly for many years, from creating quality data-led insights to support decision making in research, to helping our customers assess the risks of potential new drug treatments. This is an important next step as we build more sophisticated solutions that will support our customers in the future. Maxim Khan Senior Vice President of Analytics Products and Data Platform, Elsevier 16,000 Scopus AI has been tested with more than 16,000 researchers during its development Harnessing technology: Scopus AI Providing deeper insights faster for the research community. Market segments Governance and shareholder information Financial statements Financial review Corporate Responsibility Overview |
| 12 RELX Annual Report 2023 Market segments In this section 14 Risk 20 Scientific, Technical & Medical 26 Legal 32 Exhibitions |
| RELX Annual Report 2023 13 Market segments Overview Corporate Responsibility Financial review Governance and shareholder information Financial statements |
| 14 RELX Annual Report 2023 | Market segments Business overview Risk provides customers with information-based analytics and decision tools that combine public and industry-specific content with advanced technology and algorithms to assist them in evaluating and predicting risk and enhancing operational efficiency. LexisNexis Risk Solutions, headquartered in Alpharetta, Georgia, has principal operations in California, Florida, Illinois, New York and Ohio in North America as well as London and Paris in Europe, São Paulo in Latin America and Beijing and Singapore in Asia Pacific. It has 11,100 employees and serves customers in more than 180 countries. Revenues for the year ended 31 December 2023 were £3,133m, compared with £2,909m in 2022 and £2,474m in 2021. In 2023, 79% of revenue came from North America, 14% from Europe and the remaining 7% from the rest of the world. Subscription revenue represented 40% of the total and transactional revenues, including long-term contracts with volumetric elements, represented 60%. LexisNexis Risk Solutions comprises the following market-facing industry/sector verticals: Business Services, Insurance, Specialised Industry Data Services and Government Solutions. Business Services, representing around 45% of revenue, enables global financial transparency and inclusion by providing holistic and actionable insights for all risk and compliance segments. We help customers address some of today’s greatest societal challenges, including identifying fraud, cybercrime, bribery, corruption, human trafficking, economic sanctions, global terrorism and abusive practices. The combination of our proprietary insights and advanced analytics powered by Artificial Intelligence (AI) and Machine Learning (ML) delivers actionable intelligence to customers to help improve decisions and operational efficiency. The cornerstone of our growth strategy in Business Services is maximising penetration in our current markets across our customers’ workflows and through international expansion. In 2023, Business Services further established itself as a platform provider with industry analyst recognition for both its Dynamic Decision Platform and RiskNarrative platform. Across solutions we were recognised as leaders in 16 industry analyst reports, including Forrester Research for both Identify Verification and Fraud Detection Management, Chartis Research for Payment Risk Solutions, KuppingerCole for Fraud Reduction Intelligence Platforms and Juniper Research for Financial Crime Prevention. Business Services has introduced a number of product enhancements and launches, including a cloud-enabled version ofits Firco Continuity transaction screening solution and new behavioural biometrics functionality within its global fraud and identity portfolio following the completion of its BehavioSec integration. Business Services UK enhanced its FraudPoint solution to provide more robust protection from increasingly prevalent risks such as synthetic identity fraud. It also enhanced its IDU identity verification product with Remote Check to enable seamless digital onboarding across industries. We combine data and analytics with deep industry expertise to help customers make better decisions and manage risk. We help detect and prevent online fraud and money laundering and deliver insight to insurance companies. We provide digital tools that help industries from aviation to banking improve their operations. § We do business with 92% of the Fortune 100; 84% of the Fortune 500; nine of the world’s top ten banks and 21 of the world’s top 25 insurers § The LexisNexis Digital Identity Network analyses more than 300m transactions daily and more than 100bn transactions annually § More than 180,000 websites and mobile applications around the world implement the LexisNexis Digital Identity Network § Our solutions detected 579m human initiated attacks and 2.1bn automated bot attacks for customers in H1 2023 § We delivered more than 500m US consumer credit assessments in 2023 § 86% of new US auto insurance policies issued to consumers in 2023 benefited from our products § More than 7,500 federal, state and local government agencies use our solutions to prevent fraud and allow citizens faster access to important government systems, maintain program integrity, reduce risk and fight crime § ICIS has been providing pricing data and insight on the recycled plastics market for over 15 years, helping customers architect a sustainable future in the transition to a circular economy § Cirium powers the data and analytics needs of the majority of the top 100 airline groups, representing over 90% of the world’s 2023 airline passenger traffic, and four out of five of the Big Five Tech Firms. It tracks 99% of flights globally in real time Risk |
| RELX Annual Report 2023 | Risk 15 Insurance, representing just under 40% of revenue, provides comprehensive data, analytics and decision tools for personal auto and home, commercial and life insurance carriers to improve critical aspects of their business. Information solutions help insurers assess risks, improve customer experience, increase efficiency in pricing and underwriting insurance policies, and settle claims in the US and other key markets. Industry-leading products provide real-time information on policy holders, identify insurance coverage details and lapses in coverage, and give insurers access to vehicle and behaviour-centric data, standardised across automakers for the underwriting and claims processes. Innovative decision tools seamlessly integrate into an insurer’s workflow and are delivered through a single point of access within an insurer’s infrastructure. Insurance solutions drive more consistency and efficiency in claims, providing data and decisions for challenging total losses at first notice of loss and throughout the claim life cycle. Insurance solutions provide comprehensive interior, exterior and aerial data for home insurers and offers AI-enabled insights to fast-track decision making for new business or renewal underwriting and claims processes. Life insurers use predictive models, public and motor vehicle records to better understand mortality risk and make life insurance more accessible. In 2023 we acquired Human API, a provider of consumer-driven health data via a proprietary platform, enabling more efficient underwriting processes for life insurers. Specialised Industry Data Services, representing just over 10% of revenue, provides critical business intelligence, data, software and analytics solutions to professionals in many of the world’s largest industries. These solutions include: ICIS, an independent source of data and intelligence for the global commodities and chemicals markets; Cirium, the aviation analytics company; XpertHR, a compliance, benchmarking and pay-equity data and analytics business driving global HR topics; and Nextens, a provider of workflow solutions, content and analytics for tax professionals. Government, representing just over 5% of revenue, has helped US agencies shift from identity verification to authentication to confront fraud, waste, and abuse. Front-end identity authentication is central to how the government dispenses hundreds of billions of dollars in entitlements, stimulus, benefits and contracts to people and businesses. Our solution synthesises thousands of data sources and billions of relationships into modernised interfaces, providing agencies immediate access to identity and authentication analytics. It allows recipients fast and secure access to critical government benefit programmes through near-frictionless identity verification and authentication for everything from unemployment insurance claims and remote government workforce access to matching of patient data, providing a snapshot in time for public health researchers. Market opportunities We operate in markets with strong long-term growth in demand for high-quality advanced analytics based on industry information and insight, including: financial crime compliance; business risk; fraud and identity solutions; due diligence requirements surrounding customer enrolment; security and privacy considerations; insurance underwriting transactions; insurance acquisition, retention and claims handling; data and advanced analytics for the banking, commodities and chemicals, aviation and human resources sectors; and tax and public benefits fraud. Expansion of mobile and digital use cases and the growing mix of consumer payment options continue to drive opportunity for Business Services solutions that drive efficiency in risk decision making. As criminals continuously adjust attack vectors targeting financial transactions, organisations are utilising our solutions to evolve their fraud detection and prevention, financial crime, compliance and consumer and business credit programmes. Financial Crime Compliance Portfolio Fraud and Identity Management Portfolio Our integrated financial crime compliance offerings deliver comprehensive solutions for addressing financial crime risk. Business Services released the latest version of its cloud-based transaction screening tool, Firco Continuity, with capabilities that help reduce false positive alerts and provide traceable, auditable and explainable retrospective proof to auditors and regulators of compliance policies We provide digital, physical, device and behavioral risk signals to help organisations better assess consumers, prevent fraudulent transactions, improve operational efficiencies and protect accounts while minimising friction for trusted users. Fraud and Identity launched additional behavioural biometrics capabilities in 2023 with the completed integration of BehavioSec Credit Portfolio LexisNexis Claims Compass LexisNexis Total Property Understanding Our Credit Risk solutions use differentiated content technology to develop more robust consumer and business credit assessments and drive financial inclusion. We fully integrated ID Analytics into new versions of our flagship credit scores, RiskView Spectrum 6.0 and RiskView Optics 6.0, and significantly increased our fill rates for firmographic attributes to improve performance of BusinessPeople Link, one of our commercial lending assessment offerings Our data analytics platform delivers LexisNexis Claims Datafill, VINsights, CarrierDiscovery, Claims Clarity and LexisNexis Police Records solutions directly into insurer workflows to improve the claims process from first notice ofloss, triage, investigation and resolution, through recovery Our complete property risk assessment solution helps home insurance underwriters more easily identify properties with risk or coverage opportunities and survey those priority properties using consumer-friendly, configurable AI-driven property assessment technology that delivers actionable insights into the underwriting workflow For more information visit relx.com Market segments Governance and shareholder information Financial statements Financial review Corporate Responsibility Overview |
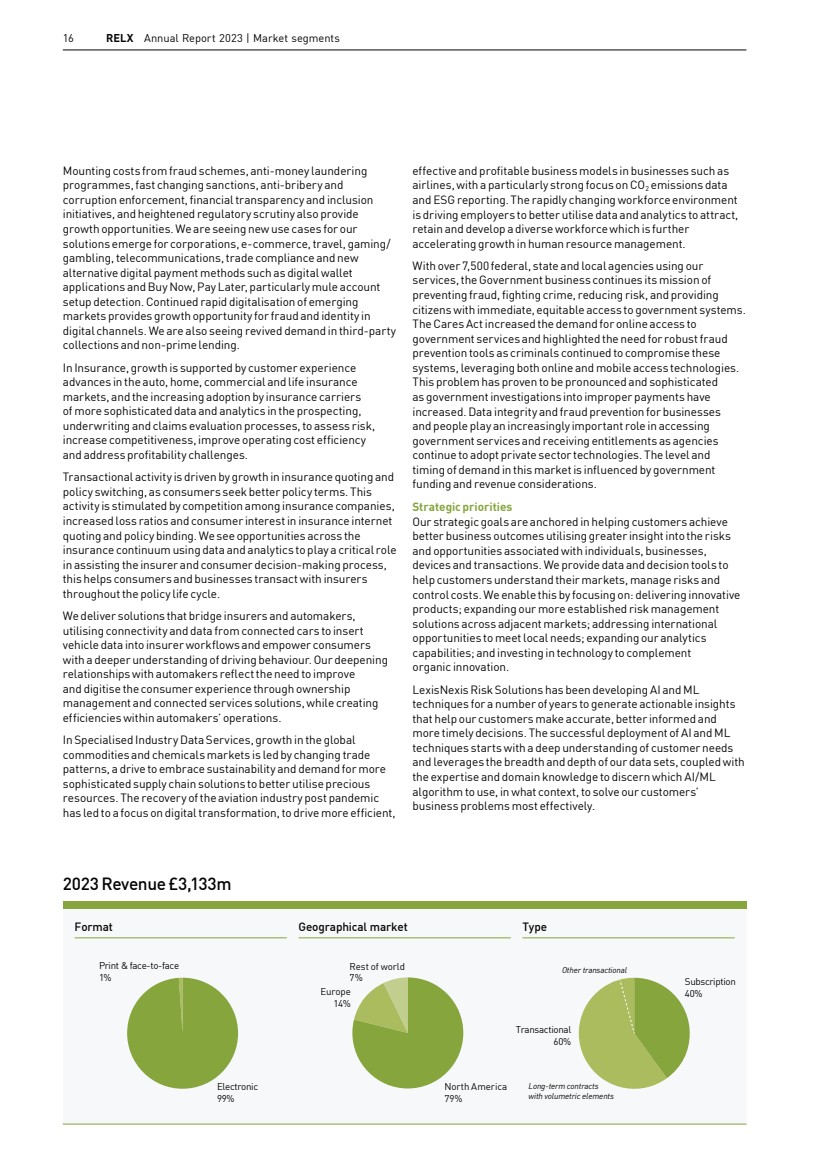
| 16 RELX Annual Report 2023 | Market segments Electronic 99% Print & face-to-face Rest of world 7% Europe 14% North America 79% Subscription 40% Other transactional Format Geographical market Type 1% Transactional 60% Long-term contracts with volumetric elements 2023 Revenue £3,133m effective and profitable business models in businesses such as airlines, with a particularly strong focus on CO2 emissions data and ESG reporting. The rapidly changing workforce environment is driving employers to better utilise data and analytics to attract, retain and develop a diverse workforce which is further accelerating growth in human resource management. With over 7,500 federal, state and local agencies using our services, the Government business continues its mission of preventing fraud, fighting crime, reducing risk, and providing citizens with immediate, equitable access to government systems. The Cares Act increased the demand for online access to government services and highlighted the need for robust fraud prevention tools as criminals continued to compromise these systems, leveraging both online and mobile access technologies. This problem has proven to be pronounced and sophisticated as government investigations into improper payments have increased. Data integrity and fraud prevention for businesses and people play an increasingly important role in accessing government services and receiving entitlements as agencies continue to adopt private sector technologies. The level and timing of demand in this market is influenced by government funding and revenue considerations. Strategic priorities Our strategic goals are anchored in helping customers achieve better business outcomes utilising greater insight into the risks and opportunities associated with individuals, businesses, devices and transactions. We provide data and decision tools to help customers understand their markets, manage risks and control costs. We enable this by focusing on: delivering innovative products; expanding our more established risk management solutions across adjacent markets; addressing international opportunities to meet local needs; expanding our analytics capabilities; and investing in technology to complement organic innovation. LexisNexis Risk Solutions has been developing AI and ML techniques for a number of years to generate actionable insights that help our customers make accurate, better informed and more timely decisions. The successful deployment of AI and ML techniques starts with a deep understanding of customer needs and leverages the breadth and depth of our data sets, coupled with the expertise and domain knowledge to discern which AI/ML algorithm to use, in what context, to solve our customers’ business problems most effectively. Mounting costs from fraud schemes, anti-money laundering programmes, fast changing sanctions, anti-bribery and corruption enforcement, financial transparency and inclusion initiatives, and heightened regulatory scrutiny also provide growth opportunities. We are seeing new use cases for our solutions emerge for corporations, e-commerce, travel, gaming/ gambling, telecommunications, trade compliance and new alternative digital payment methods such as digital wallet applications and Buy Now, Pay Later, particularly mule account setup detection. Continued rapid digitalisation of emerging markets provides growth opportunity for fraud and identity in digital channels. We are also seeing revived demand in third-party collections and non-prime lending. In Insurance, growth is supported by customer experience advances in the auto, home, commercial and life insurance markets, and the increasing adoption by insurance carriers of more sophisticated data and analytics in the prospecting, underwriting and claims evaluation processes, to assess risk, increase competitiveness, improve operating cost efficiency and address profitability challenges. Transactional activity is driven by growth in insurance quoting and policy switching, as consumers seek better policy terms. This activity is stimulated by competition among insurance companies, increased loss ratios and consumer interest in insurance internet quoting and policy binding. We see opportunities across the insurance continuum using data and analytics to play a critical role in assisting the insurer and consumer decision-making process, this helps consumers and businesses transact with insurers throughout the policy life cycle. We deliver solutions that bridge insurers and automakers, utilising connectivity and data from connected cars to insert vehicle data into insurer workflows and empower consumers with a deeper understanding of driving behaviour. Our deepening relationships with automakers reflect the need to improve and digitise the consumer experience through ownership management and connected services solutions, while creating efficiencies within automakers’ operations. In Specialised Industry Data Services, growth in the global commodities and chemicals markets is led by changing trade patterns, a drive to embrace sustainability and demand for more sophisticated supply chain solutions to better utilise precious resources. The recovery of the aviation industry post pandemic has led to a focus on digital transformation, to drive more efficient, |
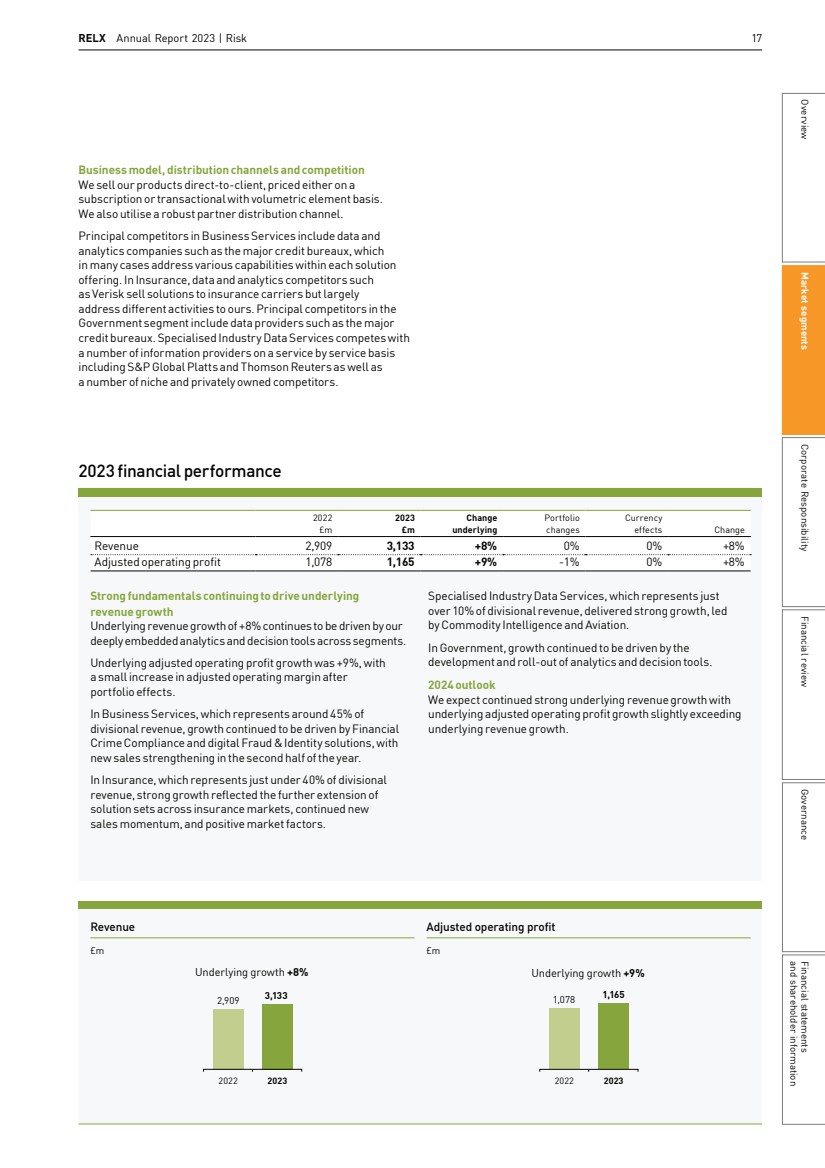
| RELX Annual Report 2023 | Risk 17 Revenue 2023 3,133 2,909 Underlying growth +8% 2022 £m Adjusted operating profit 2023 1,165 1,078 Underlying growth +9% 2022 £m Strong fundamentals continuing to drive underlying revenuegrowth Underlying revenue growth of +8% continues to be driven by our deeply embedded analytics and decision tools across segments. Underlying adjusted operating profit growth was +9%, with a small increase in adjusted operating margin after portfolio effects. In Business Services, which represents around 45% of divisional revenue, growth continued to be driven by Financial Crime Compliance and digital Fraud & Identity solutions, with new sales strengthening in the second half of the year. In Insurance, which represents just under 40% of divisional revenue, strong growth reflected the further extension of solution sets across insurance markets, continued new salesmomentum, and positive market factors. Specialised Industry Data Services, which represents just over 10% of divisional revenue, delivered strong growth, led byCommodity Intelligence and Aviation. In Government, growth continued to be driven by the development and roll-out of analytics and decision tools. 2024 outlook We expect continued strong underlying revenue growth with underlying adjusted operating profit growth slightly exceeding underlying revenue growth. 2023 financial performance 2022 £m 2023 £m Change underlying Portfolio changes Currency effects Change Revenue 2,909 3,133 +8% 0% 0% +8% Adjusted operating profit 1,078 1,165 +9% -1% 0% +8% Business model, distribution channels and competition We sell our products direct-to-client, priced either on a subscription or transactional with volumetric element basis. We also utilise a robust partner distribution channel. Principal competitors in Business Services include data and analytics companies such as the major credit bureaux, which in many cases address various capabilities within each solution offering. In Insurance, data and analytics competitors such as Verisk sell solutions to insurance carriers but largely address different activities to ours. Principal competitors in the Government segment include data providers such as the major credit bureaux. Specialised Industry Data Services competes with a number ofinformation providers on a service by service basis including S&P Global Platts and Thomson Reuters as well as a number of niche and privately owned competitors. Market segments Governance and shareholder information Financial statements Financial review Corporate Responsibility Overview |
| 18 RELX Annual Report 2023 | Market segments About LexisNexis Risk Solutions: LexisNexis Risk Solutions is a global provider of information-based analytics and decision tools for professional and business customers. It harnesses the power of data, sophisticated analytics platforms and technology solutions to provide insights that help businesses and governmental entities reduce risk and improve decisions to benefit people around the globe. Its LexisNexis RiskView Credit Solutions products enable more unbanked and underserved consumers to gain broader access to traditional credit and financial products. LexisNexis Risk Solutions: How alternative data unlocks the doors to homeownership |

| RELX Annual Report 2023 | Risk 19 Habitat for Humanity was founded in1976 and is a global nonprofit housing organisation working in local communities across all 50 states in the US and in more than 70 countries. Families in need of decent, affordable housing apply for homeownership withtheir local Habitat for Humanity. Itshomeowners help build their own homes alongside volunteers and pay anaffordable mortgage. Most banks assess a consumer’s lending risk by using a traditional credit score, which relies on a consumer’s debt repayment history and total amount of debt. A good score is required for consumers to access mainstream financial products and services, including home mortgages, car loans and credit cards. Without a strong FICO score, consumers face difficulties in obtaining these financial services and often resort to payday lenders and other high-interest credit sources for short-term funds. Habitat for Humanity sought to move beyond traditional credit scores to identify consumers it could provide loans to at affordable rates. LexisNexis RiskView uses non-credit events to assess a consumer’s stability, asset profile and numerous non-derogatory data signals, such as education history, personal property ownership and professional licence data. It provides lenders, such as Habitat for Humanity, an alternative method for evaluating loan affordability and the likelihood of debt repayment. Consequently, they can expand their customer base safely, while consumers gain access to more affordable and dependable credit. Jalynnka Harris, a single mother of two working as a packing instructor in Indianapolis, approached Habitat for Humanity to help purchase a home for her family after repeated rent increases for their apartment. Despite having a steady job, no outstanding debts and a college degree, she lacked a credit rating because she had paid for everything she owned in cash or by cheque. Habitat for Humanity used alternative data from LexisNexis Risk Solutions to take a holistic view of Harris’ credit risk and approved her for a mortgage of approximately $500 per month over 20 years, which was less than her previous rent payments. We look more holistically at their entire credit profile: Their ability to pay, their willingness to partner, versus just looking at their credit report and saying, ‘You know what? They don’t fit this guideline profile that we’re trying to go by, sowe can’t help them’. Instead, we look at how long they have been in their job, doing their tax returns, their ability to pay. We’re looking at life stability. Jennifer Brammer Vice president for homeownership and mortgage services, Greater Indianapolis Habitat for Humanity Market segments Governance and shareholder information Financial statements Financial review Corporate Responsibility Overview |
| 20 RELX Annual Report 2023 | Market segments Business overview Scientific, Technical & Medical helps researchers and healthcare professionals advance science and improve health outcomes by combining quality information and data sets with analytical tools to facilitate insights and critical decision-making. Elsevier is headquartered in Amsterdam, with principal sites inBoston, New York, Philadelphia, St. Louis and Berkeley in NorthAmerica; London, Oxford, Frankfurt, Munich, Madrid and Paris in Europe; Beijing, Shanghai, Chennai, Delhi, Chatswood, Singapore and Tokyo in Asia Pacific, and Rio de Janeiro in South America. It has 9,500 employees with customers in over 170 countries. Revenues for the year ended 31 December 2023 were £3,062m, compared with £2,909m in 2022 and £2,649m in 2021. In 2023, 47% of revenue came from North America, 22% from Europe and the remaining 31% from the rest of the world. Subscription revenue represented 74% of total revenue and transactional revenues represented 26%. Elsevier’s customers are scientists, research leaders, librarians, medical researchers, doctors, nurses, allied health professionals and students, as well as hospitals, academic and research institutions, health insurers, managed healthcare organisations, research-intensive corporations, funders, and governments. Elsevier’s services across Academic & Government, Corporate and Health segments focus on: Databases, Tools and Electronic Reference; Primary Research; and Print products. In each of these markets, our objective is to be a trusted partner to the customers we serve and be known for quality. Databases, Tools and Electronic Reference, together with Corporate Primary Research, accounts for around 45% of STM revenues, with Academic & Government Primary Research accounting for a similar amount, all in electronic format. The remaining 10% of revenues is derived from Print sales. Databases, Tools & Electronic Reference. Elsevier offers tools for Academic & Government, Corporate and Health organisations helping them to solve complex problems and make critical decisions. Solutions include Scopus, SciVal, Pure, ClinicalKey, ClinicalPath, Embase, Engineering Village, Interfolio, Reaxys, SciBite, HESI, Sherpath, Shadow Health, Complete Anatomy, Osmosis andGravitas. Elsevier’s research intelligence portfolio of products combines quality, curated content with extensive data sets and responsible AI and large language model technology to help researchers, academic leaders, policy-makers, funders and R&D-led corporations to generate insights, set and implement research strategies, evaluate impact, drive innovation and make critical decisions with confidence. This portfolio integrates with and enhances the systems institutions rely on, using curated and connected data, artificialintelligence technologies, and interoperability driven byApplication Programming Interface technologies (APIs). In 2023Elsevier announced Scopus AI, a generative AI-enhanced research tool integrated into the Scopus platform to help early-career academics and researchers get deeper research insights faster, navigate and understand different disciplines more easily and support interdisciplinary collaboration. For corporate R&D, SciBite tools and the data as a service proposition follow Elsevier’s ontology-led approach and support corporate R&D customers in extracting scientific insights from vast amounts of unstructured text and databases. In 2023 Elsevier launched EmBiology, a research tool that draws on more than We help researchers share knowledge, collaborate, find funding opportunities, make discoveries and accelerate innovation. We deliver analysis and insights that help universities, research institutions, governments and funders achieve their strategic goals. We help doctors and nurses improve the lives of patients, providing insights and tools to find the right clinical answers. § We help ensure quality research accelerates progress for society by helping validate, improve and disseminate over 17% of the world’s scientific articles § Elsevier’s over 2,900 journals published more than 630,000 articles in 2023,from almost 3m submitted § 233 of 234 science and economics Nobel Prize winners since 2000 have published in an Elsevier journal § ScienceDirect, the world’s largest platform dedicated to peer-reviewed primary scientific and medical research, hosts over 21m pieces of content from over 4,700 journals and over 46,000 e-books, and has over 20m monthly unique visitors. Its Ahref ranking places it as one of the Top 200 platforms on the internet § SciVal is a web-based analytics solution that provides insights into the research performance of over 24,000 academic, industry and government research institutions § Scopus is an expertly curated abstract and citation database with content from over 29,000 journals from more than 7,000 publishers to help researchers track and discover global knowledge in all fields § ClinicalKey, the flagship clinical reference platform, is used by doctors, nurses, medical students and educators at over 5,000 institutions in over 80 countries and territories § Reaxys, Elsevier’s chemistry research platform, utilises data on 275m substances, 64m reactions, with 109m documents and 40m patents § Sherpath, an adaptive teaching and learning solution, provides personalised learning paths at over 600 institutions, supporting more than 250,000 course enrolments Scientific, Technical & Medical |
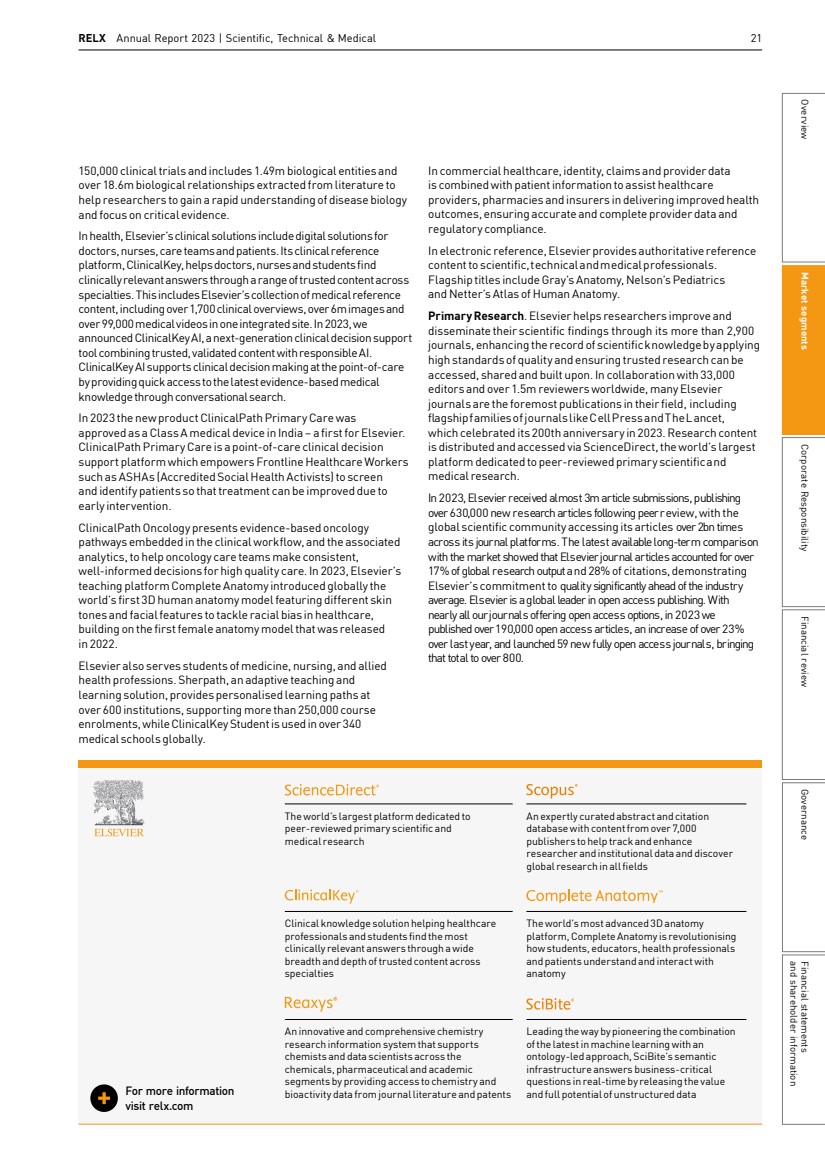
| RELX Annual Report 2023 | Scientific, Technical & Medical 21 150,000 clinical trials and includes 1.49m biological entities and over 18.6m biological relationships extracted from literature to help researchers to gain a rapid understanding of disease biology and focus on critical evidence. In health, Elsevier’s clinical solutions include digital solutions for doctors, nurses, care teams and patients. Its clinical reference platform, ClinicalKey, helps doctors, nurses and students find clinically relevant answers through a range of trusted content across specialties. This includes Elsevier’s collection of medical reference content, including over 1,700 clinical overviews, over 6mimages and over 99,000 medical videos in one integrated site. In 2023, we announced ClinicalKey AI, a next-generation clinical decision support tool combining trusted, validated content with responsible AI. ClinicalKey AI supports clinical decision making atthe point-of-care by providing quick access to the latest evidence-based medical knowledge through conversational search. In 2023 the new productClinicalPath Primary Care was approved as a Class A medical device in India – a first for Elsevier. ClinicalPath Primary Care is a point-of-care clinical decision support platform which empowers Frontline Healthcare Workers such as ASHAs (Accredited Social Health Activists) to screen and identify patients so that treatment can be improved due to early intervention. ClinicalPath Oncology presents evidence-based oncology pathways embedded in the clinical workflow, and the associated analytics, to help oncology care teams make consistent, well-informed decisions for high quality care. In 2023, Elsevier’s teaching platform Complete Anatomy introduced globally the world’s first 3D human anatomy model featuring different skin tones and facial features to tackle racial bias in healthcare, building on the first female anatomy model that was released in 2022. Elsevier also serves students of medicine, nursing, and allied health professions. Sherpath, an adaptive teaching and learning solution, provides personalised learning paths at over 600 institutions, supporting more than 250,000 course enrolments, while ClinicalKey Student is used in over 340 medical schools globally. In commercial healthcare, identity, claims and provider data is combined with patientinformation to assist healthcare providers, pharmacies and insurers in delivering improved health outcomes, ensuring accurate and complete provider data and regulatory compliance. In electronic reference,Elsevier provides authoritative reference content to scientific, technical and medical professionals. Flagship titles includeGray’sAnatomy, Nelson’sPediatrics and Netter’s Atlas of HumanAnatomy. PrimaryResearch. Elsevier helps researchers improve and disseminate their scientific findings through its more than 2,900 journals, enhancing the record of scientificknowledgeby applying high standards of quality and ensuring trusted research can be accessed, shared and built upon. In collaboration with 33,000 editors and over 1.5m reviewers worldwide, many Elsevier journals are the foremost publications in their field, including flagshipfamilies of journalslikeCellPress andTheLancet, which celebrated its 200th anniversary in 2023. Research content is distributed and accessed via ScienceDirect, the world’s largest platform dedicated to peer-reviewed primary scientific and medical research. In 2023, Elsevier received almost 3m article submissions, publishing over 630,000 new research articles following peer review, with the global scientific community accessing its articles over 2bn times across its journal platforms. The latest available long-term comparison with the market showed that Elsevier journal articles accounted for over 17% of global research output and 28% of citations, demonstrating Elsevier’s commitmentto quality significantly ahead of the industry average. Elsevier is a global leader in open access publishing. With nearly all our journals offering open access options, in 2023 we published over 190,000 open access articles, an increase of over 23% over last year, and launched 59 new fully open access journals, bringing that total to over 800. The world’s largest platform dedicated to peer-reviewed primary scientific and medical research An expertly curated abstract and citation database with content from over 7,000 publishers to help track and enhance researcher and institutional data and discover global research in all fields Clinical knowledge solution helping healthcare professionals and students find the most clinically relevant answers through a wide breadth and depth of trusted content across specialties The world’s most advanced 3D anatomy platform, Complete Anatomy is revolutionising how students, educators, health professionals and patients understand and interact with anatomy An innovative and comprehensive chemistry research information system that supports chemists and data scientists across the chemicals, pharmaceutical and academic segments by providing access to chemistry and bioactivity data from journal literature and patents Leading the way by pioneering the combination of the latest in machine learning with an ontology-led approach, SciBite’s semantic infrastructure answers business-critical questions in real-time by releasing the value For more information and full potential of unstructured data visit relx.com Market segments Governance and shareholder information Financial statements Financial review Corporate Responsibility Overview |
| 22 RELX Annual Report 2023 | Market segments Electronic 90% Transactional 26% Subscription 74% Format Geographical market Type Print & face-to-face 10% Rest of world 31% Europe 22% North America 47% In Primary Research, Elsevier’s priority is to support researchers by finding a home for every sound science article submitted, and providing choice in payment model, quality tier, and scientific discipline. We aim to deliver above industry average journal and article quality, at below average article cost, leveraging our scale and expertise. Elsevier works with customers to help them reach their research goals through excellence in content, service and value. Elsevier is building on its premium brands, enhancing quality through peer review, and increasing article volume through new journal launches, the expansion of open access journals and growth from emerging markets; and broadening the range and quality of insights across research solutions. We continue to improve customer experience while driving operational efficiency and effectiveness; and collaborate to advance open science, inclusive research and inclusive health and support the UN SDGs, through our business and the Elsevier Foundation. In 2023 the homepage of ScienceDirect, our flagship platform dedicated to peer-reviewed primary scientific and medical research was recognised as the most accessible homepage by WebAIM among 1m websites. We also published the white paper ‘Demystifying Sustainability Assessment and Reporting Frameworks’ to help institutions plan and implement their societal impact initiatives. Business model, distribution channels and competition In Databases, Tools and Electronic Reference, solutions like Scopus, ClinicalKey and Reaxys, are generally sold direct to institutional, healthcare and corporate customers through a global sales force. Reference and educational content is sold directly to institutions and individuals and accessed on Elsevier platforms. In Primary Research, science and medical research is distributed via the ScienceDirect platform, supported by two separate payment models to suit author preferences: pay-to-read articles funded by payments for reading made by individuals or institutions; and pay to publish (commonly known as open access) funded by payments for publishing, made by authors, their institution or funding bodies. Elsevier offers a range of pay to read and pay to publish options, both subscription-based and transactional, to fit the diverse needs of institutions, funders, and researchers worldwide. As of 2023, Elsevier serves over 2,600 institutions worldwide with transformative deals that support open access to research. Nearly all of Elsevier’s over 2,900 journals enable open access publishing, with more than 800 dedicated author pays journals, the largest portfolio of open access titles. Elsevier has invested in other research solutions, such as SSRN an open access online pre-print community where researchers post early-stage research, Scopus Author Profiles showing pre-prints to provide an early view into a researcher’s focus areas and Digital Commons helping academic libraries showcase and share their institutions’ research via institutional repositories for greatest impact. Print includes primary research and reference content in print format and some print-based commercial marketing services in pharma & life science promotion. Market opportunities Scientific, technical and medical information markets have positive long-term growth characteristics. Investment in R&D is critical for nations and corporations to create competitive advantage, drive innovation and economic growth, and solve societal issues such as climate change. This leads to long-term growth in R&D spending and sustained increases in researchers worldwide. As people live longer and aim to live healthier lives, health expenditure and the number of physicians and nurses also continue to grow strongly. As a proportion of R&D is funded directly or indirectly by governments, spending is influenced by policy and budgetary considerations. Commitments to research and health provision remain high, even in difficult budgetary environments. Strategic priorities Elsevier’s strategic priorities are to help our customers solve critical and complex problems, by expanding content quality, coverage and utility; combining content with analytics and technology to build integrated solutions and decision tools that utilise advanced machine learning and artificial intelligence to improve productivity and outcomes, and enable insights underpinning critical decisions, benchmarking and evaluation. In Databases, Tools and Electronic Reference, Elsevier is applying advanced linking capabilities to our vast research information, patent, research grant, drug information and medical claims data sets to develop products that help our Academic & Government, Corporate and Health customers make the right decisions based on their needs. For example, within health, Elsevier is developing clinical decision support applications using cognitive technologies and large image and text content repositories, leveraging its proprietary health graph. These applications will enhance delivery of content in care, helping health professionals make more accurate diagnoses, ensure appropriate care delivery and save lives. 2023 Revenue £3,062m |
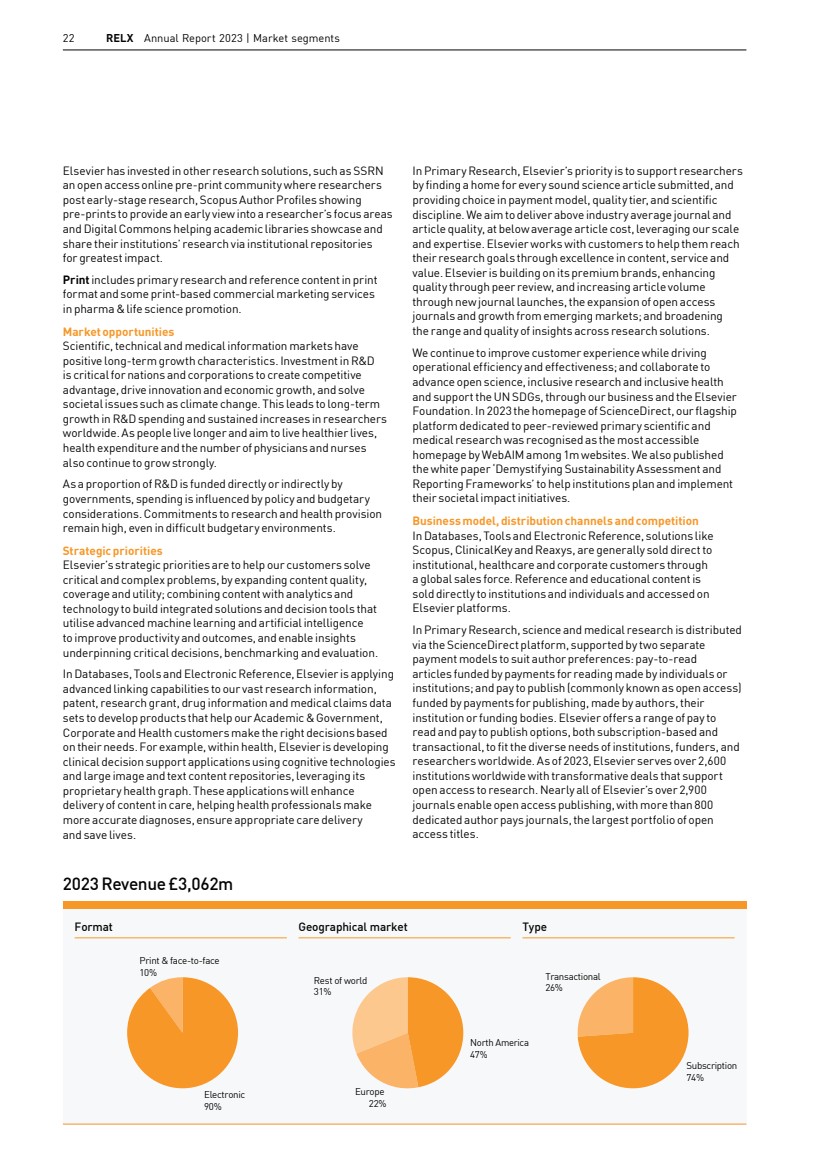
| RELX Annual Report 2023 | Scientific, Technical & Medical 23 Further development of analytics continuing to drive underlying revenue growth Underlying revenue growth of +4% continues to be driven by the evolution of the business mix, with higher growth segments representing an increasing proportion of divisional revenue. Underlying adjusted operating profit growth was +4%, with a small increase in adjusted operating margin after portfolio changes and currency effects. Databases, Tools & Electronic Reference and Corporate Primary Research, which together represent around 45% of divisional revenue, continued to deliver strong growth, driven by content development and further evolution of higher value-add analytics and decision tools. Primary Research Academic & Government segments, which also represent around 45% of divisional revenue, continue to be driven by volume growth. Article submissions returned to strong growth, with pay-to-publish open access articles continuing to grow particularly strongly. 2024 outlook We expect continued good underlying revenue growth with underlying adjusted operating profit growth slightly exceeding underlying revenue growth. 2023 financial performance 2022 £m 2023 £m Change underlying Portfolio changes Currency effects Change Revenue 2,909 3,062 +4% 0% +1% +5% Adjusted operating profit 1,100 1,165 +4% -1% +3% +6% Revenue 2023 3,062 2,909 Underlying growth +4% 2022 £m Adjusted operating profit 2023 1,165 1,100 Underlying growth +4% 2022 £m Elsevier is a founding and driving partner of Research4Life, aUnited Nations initiative, providing free or low-cost access to research for publicly funded institutions in the world’s least resourced countries. Over 11,000 institutions in 125 countries participate. In 2023, Elsevier announced a geographic pricing pilotfor its article publishing charges to support authors in low-and middle-income countries with equitable open access publishing choices. Printed books are sold through retailers, wholesalers and directly to users. Competition within science and medical reference content is generally on a title-by-title and product-by-product basis, typically with learned society publishers and professional information providers, such as Springer Nature, Clarivate and Wolters Kluwer. Decision tools face similar competition, plus software companies and customer home-grown solutions. Market segments Governance and shareholder information Financial statements Financial review Corporate Responsibility Overview |
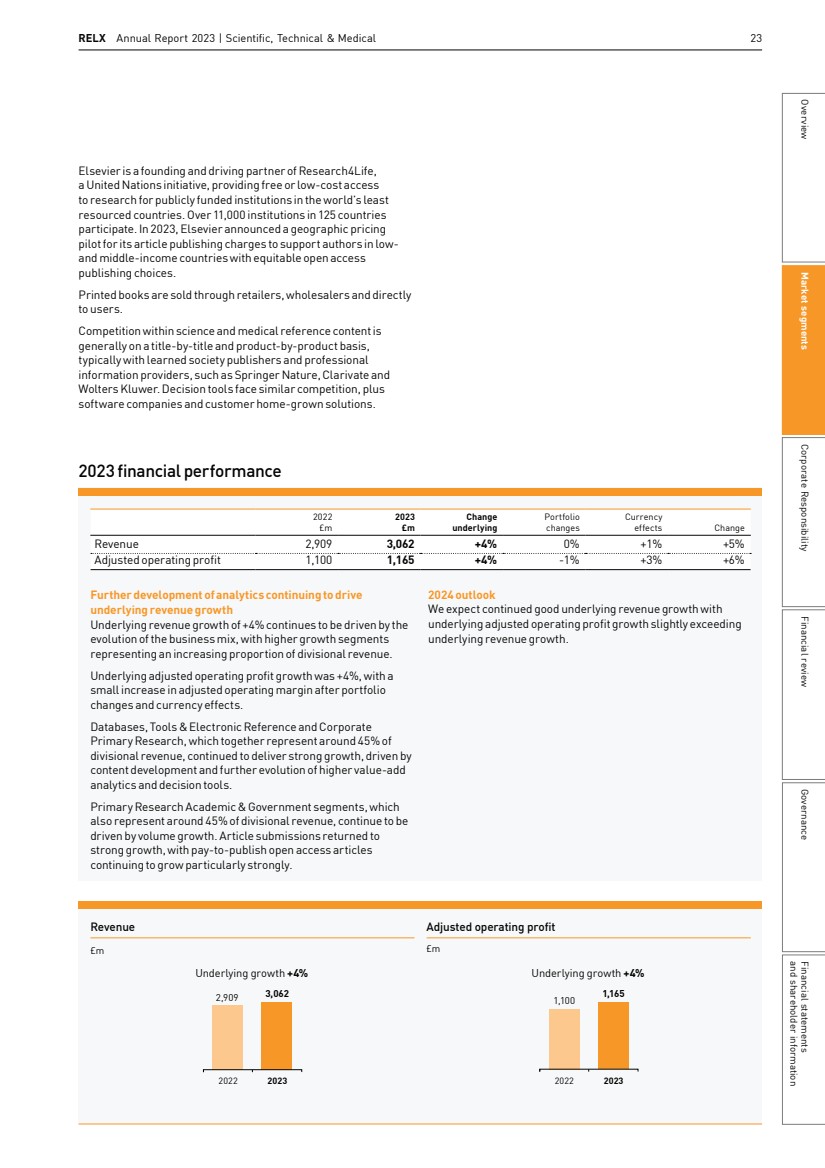
| 24 RELX Annual Report 2023 | Market segments About ClinicalPath: An evidence-based clinical decision support tool directly embedded into the clinical workflow. ClinicalPath: Helping improve patient outcomes while reducing the cost of care |
| RELX Annual Report 2023 | Scientific, Technical & Medical 25 Advances in digital healthcare information and technology help hospitals to deliver better patient outcomes while managing healthcare costs. When Cone Health Cancer Center deployed Elsevier’s ClinicalPath, an evidence-based oncology pathways clinical decision support tool, as part of their clinical workflow, they embarked on a journey that would improve patient outcomes at lower cost. Monica Schmidt MPH, PhD, Executive Director of Health Economics andHealth Equity Analytics at Cone Health, explains: “We wanted to look at whether the ClinicalPath product… could reduce care variation, improve patient outcomes in terms of short-term survival and reduce the cost of care,” Dr. Schmidt said. “We hypothesised that giving our providers this kind of evidence-based guidance directly in the clinical workflow would result in achieving all three goals.” The cancer center is part of Cone Health’s private, not-for-profit integrated healthcare network in North Carolina. It prides itself on providing state-of-the-art treatments and interventions for a variety of cancers in a compassionate community-hospital setting and recognises the importance of supporting its clinicians with the tools needed to make consistent, well-informed decisions for high-quality care. To measure whether ClinicalPath could help reduce care variation, Cone Health Cancer Center looked at costs and outcomes for more than 6,700 patients treated between 2017 and 2022. The research team documented patient survival rates at three, six and 12 months, as well as the variable direct costs of care for the patients in the study. The group also measured the contribution margin, or the amount of revenue available after both variable and fixed costs of care were covered by recouped payments. The results showed the impact of ClinicalPath, as Dr Schmidt explains: “…from the time patients received their first treatment for their cancer, they were more likely to survive all the way through 12 months if their oncologist managed care with decision support from ClinicalPath pathways.” The group of patients documented as on-pathway in ClinicalPath were half as likely to die within three, six or 12 months of when the treatment began compared to cases in which it was not used or notfollowed through the entire clinical care pathway.* When researchers looked at care costs they found that the use ofClinicalPath increased the overall cost of care for patients. The higher direct variable costs were due to the drugs or other treatments recommended by the care pathway. However, the same evidence-based guidelines present in the pathway also influence reimbursement by providing reasoning around treatment decisions. On average, contribution margin increased by 74% when oncologists used ClinicalPath to guide treatment*. The recouped payments meant that cases guided byClinicalPath were more profitable for the cancer center. “Even though we were providing more care at a higher cost, we were seeing higher reimbursements to cover those costs,” DrSchmidt said. Timothy Finnegan, MD Chief of Oncology, ConeHealth Cancer Center agreed, saying, “Using ClinicalPath and collaborating with Elsevier has been a positive experience for both clinicians and patients. Patient-centric focus is of utmostimportance.” 12 months Patients were more likely to survive through 12 months if their oncologist managed care with decision support from ClinicalPath pathways* This collaboration has been a positive experience for both clinicians and patients. Patient‑centric focus is of utmostimportance. Timothy Finnegan, MD Chief of Oncology, Cone Health Cancer Center Even though we were providing more care at a higher cost, we were seeing higher reimbursements to cover these costs. Monica Schmidt MPH, PhD Executive Director of Health Economics and Health Equity Analytics, Cone Health Cancer Center * Schmidt, M. (2023, 2-6 June). The impact of using Elsevier ClinicalPath oncology treatment pathways on survival and cost of care. Poster presented at the ASCO Annual Conference, McCormick Place. Available from: https://meetings.asco.org/abstracts-presentations/221866 Market segments Governance and shareholder information Financial statements Financial review Corporate Responsibility Overview |
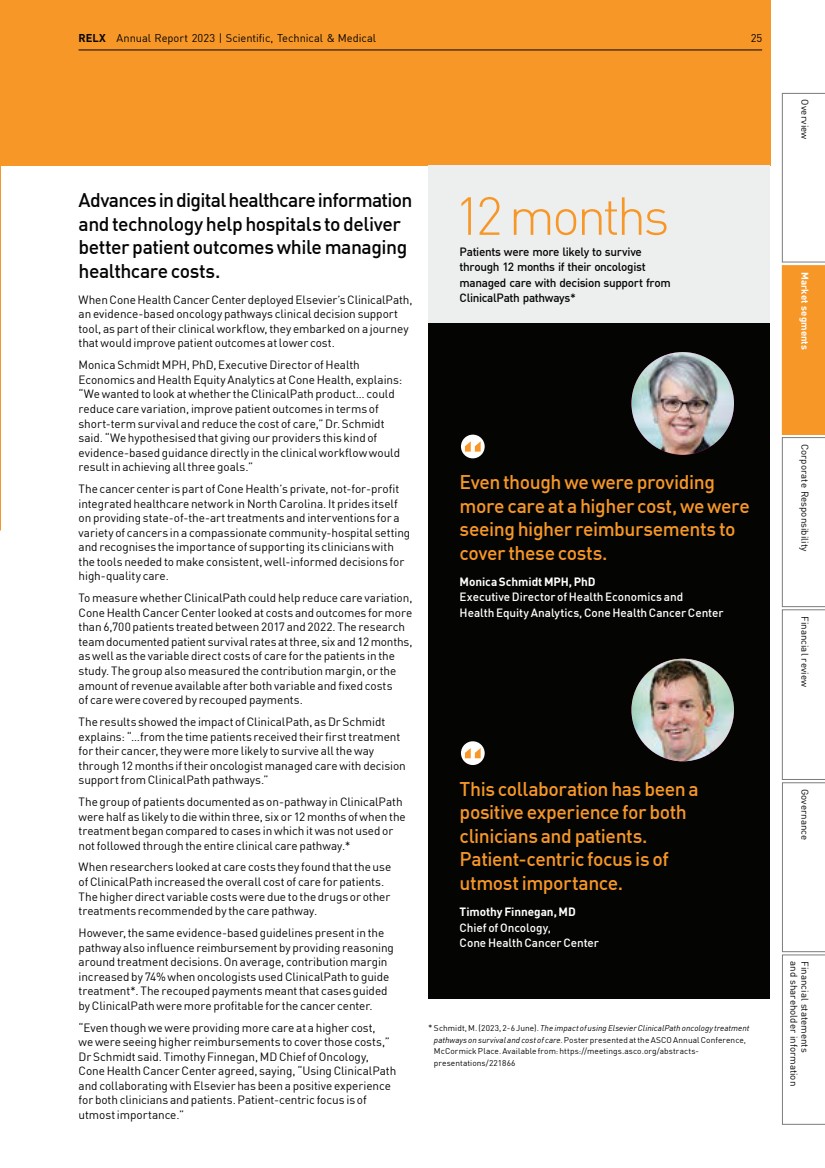
| 26 RELX Annual Report 2023 | Market segments Business overview Legal provides legal, regulatory, and business information and analytics that help customers increase their productivity, improve decision-making, and achieve better outcomes. LexisNexis Legal & Professional is headquartered in New York and has further principal operations in Dayton, Raleigh, and Toronto in North America, London and Paris in Europe, and cities in several other countries in Africa and Asia Pacific. It has 11,800 employees worldwide and serves customers in almost 150 countries and territories. Revenues for the year ended 31 December 2023 were £1,851m, compared with £1,782m in 2022 and £1,587m in 2021. In 2023, 68% of revenue came from North America, 21% from Europe, and the remaining 11% from the rest of the world. Subscription represented 79% of revenue and transactional revenues represented 21%. LexisNexis Legal & Professional is organised in market-facing groups, focused on Law Firms & Corporate Legal, Government & Academic, and News & Business markets. Services are delivered primarily in electronic format, with print formats available where there is customer demand. Content and tools are tailored to the specific geographic markets served, supported by global shared services organisations providing platform and product development, operational and distribution services, and other support functions. Law Firms & Corporate Legal, representing over 60% of revenue, provides legal professionals across law firms and corporate legal departments with electronic reference, decision tools, and analytics to help make better informed decisions in the practice oflaw. Standard products for legal research and analytics include Lexis, Lexis+, and Lexis+ AI which provide statutes and case law with analysis and expert commentaries from secondary sources, such as Matthew Bender. Lexis, Lexis+ and Lexis+ AI include the leading citation service, Shepard’s, which advises on the continuing relevance of case law precedents. Lexis+ AI was introduced in the US in 2023 and is a generative AI platform designed to transform legal work. It is built and trained on one of the world’s largest repositories of accurate and exclusive legal content, leveraging an extensive collection of documents and records to provide customers with trusted, comprehensive legal results with unmatched speed and precision and backed by verifiable, citable authority. The new Lexis+ AItechnology features conversational search, insightful summarisation, and intelligent legal drafting capabilities, all supported by state-of-the-art encryption and privacy technology to keep sensitive data secure. Conversational search simplifies the complex and time-consuming legal research journey, providing a search experience for diverse legal questions with citations, facilitating lawyers’ ability to complete research effectively and efficiently. Summarisation provides a custom summary of legal documents to provide quick and insightful analysis. Drafting guides customers throughout the legal drafting process, generating a first draft of a legal document and allowing users to change the language and tone from a simple prompt. We help lawyers win cases, manage their work more efficiently, serve their clients better, and grow their practices. We assist corporations in better understanding their markets and monitoring relevant news. We partner with leading global associations and customers to help advance the Rule of Law across the world. § LexisNexis hosts over 138bn legal and news documents and records § On average, over 2.2m new legal documents are added daily from over 50,000 sources, generating over 158bn connections with over 35m legal documents processed per day § Nexis news and business content includes over 39,000 premium sources in over 50 languages, covering around 180 countries. It includes over 540m company profiles with a content archive that dates back 45 years § PatentSight includes ratings on the innovative strength of over 152m patent documents from over 100 countries § LexisNexis content includes more than 307m court dockets and documents, over 168m patent documents, over 4.75m State Trial Orders, and over 1.5m jury verdict and settlement documents § In 2023, Law360 produced over 65,000 news and analysis articles § Lex Machina has normalised over 127m counsel mentions and over 134m party mentions since 2016 § LexisNexis is committed to advancing the Rule of Law through operations and solutions that provide transparency into the law in almost 150 countries and territories § More than 875,000 Lexis+ users across nine countries including the US, Canada, UK, Australia, Singapore, Hong Kong, South Africa, Malaysia and New Zealand Legal |
| RELX Annual Report 2023 | Legal 27 Lexis+ is the cornerstone of online research and is being rolled out in additional countries and enhanced in existing countries. Lexis+ Canada was enhanced in 2023 with the introduction of Legal News Hub which brings together legal news stories, case summaries, analysis, podcasts, and more. In 2023, LexisNexis launched Lexis+ in Australia, Hong Kong, Singapore, and South Africa. The enhanced platform aims to deliver greater efficiency and better outcomes, with data-driven insights to generate precise recommendations and search suggestions. Lexis+ Australia enables customers to quickly identify the key cases in relation to a specific legislative provision. In 2023, LexisNexis continued to broaden the reach of its decision tools and analytics. Lex Machina, incorporated in Lexis+, expanded its API to provide access to Legal Analytics for State and Federal Appellate cases. Intelligize launched Board Profiles & Compensation, which analyses datapoints from proxy statements across thousands of companies and enables benchmarking in areas such as pay versus performance and board diversity. LexisNexis also continued to expand legal news coverage with Law360 in 2023, with deeper reporting across the US, Canada, and UK including the launch of Bankruptcy Authority, UK Intellectual Property, and enhanced US jurisdictional coverage. LexisNexis continued to enrich core solutions across global segments in 2023. In France, it completed the acquisition of Case Law Analytics, a French legal technology company that specialises in modelling legal risk data using AI. In Malaysia, Case Target was launched – an innovative, AI tool that synthesises a user’s search results, providing concise summary of the most authoritative cases within the practice area, complete with the most pertinent judicial reasonings. In 2023, Practical Guidance released the Federal Government module, which provides practitioners with guidance on government contracting, agency law, administrative law, information law, and labour and employment law. In the Intellectual Property (IP) analytics space, LexisNexis acquired Cipher, which utilises AI and supervised machine learning to classify patents using custom and industry standard taxonomies, helping customers uncover insights into complex patent landscapes and support strategic decisions. LexisNexis Regulatory Compliance is positioned to support our clients in key regions globally, including the US and UK, assisting them in maintaining compliance registers across numerous topics including Cybersecurity, Banking, Gambling, ESG and more. The continuously expanding content portfolio is focusing on key legal obligations content in highly regulated industries and areas of law. LexisNexis also supplies Legal Business Solutions such as legal spend management, matter management, and client engagement software. It launched InterAction+, a new cloud-based legal customer relationship management solution that unites a feature-rich business development tool with a modern user experience, cloud infrastructure, and exclusive content from LexisNexis to help lawyers manage relationships and identify opportunities and at-risk clients. Supporting its Rule of Law mission, the LexisNexis Rule of Law Foundation today partners with organisations in over 35 countries with more than 160 projects and activities since inception. Supporting its Rule of Law mission, LexisNexis, in partnership with the African Ancestry Network, has provided scholarships to 45 students at the six Historically Black Colleges and Universities law schools to examine issues of systemic racism in the justice system. The programme is expanding to include fellows from SouthAfrican universities. LexisNexis is also working with the Bangladesh Legal Aid Services Trust (BLAST) to enhance an app which allows workers to examine employment rights and laws on their phone and seek legal aid assistance if needed. The collaboration has enabled the app to address two new industries – construction and tannery – to those already covered. Government & Academic, representing around 20% of revenue, serves customers across government organisations and law schools. Lexis+ AI is a generative AI platform designed to transform legal work with an initial emphasis on enhanced search, summarisation and drafting Lexis+ is a legal analytics ecosystem that uses AI and superior search technology to deliver legal research and news, data-driven insights, and practical guidance seamlessly into legal workflows Intelligize is the leading provider of content, news, regulatory insights, and analytics for compliance, transactional and financial reporting professionals Lex Machina provides Legal Analytics to law firms and companies, enabling them to craft successful strategies, win cases, and close business CounselLink is the leading enterprise legal management solution designed to help corporate legal departments gain 100% visibility into their work, matters, and invoices Nexis is a comprehensive research and content tool for business professionals that curates the most robust global collection of trusted news, company profiles, legal content, public records, and industry information For more information visit relx.com Market segments Governance and shareholder information Financial statements Financial review Corporate Responsibility Overview |
| 28 RELX Annual Report 2023 | Market segments Format Geographical market Type Transactional 21% Subscription 79% Print & face-to-face 10% Electronic 90% Rest of world 11% Europe 21% North America 68% Market opportunities Longer-term growth in legal and regulatory markets worldwide is driven by increasing levels of legislation, regulation, regulatory complexity and litigation, and an increasing number of lawyers. Additional market opportunities are presented by the advent of Generative AI and increasing demand for online information solutions, legal analytics, and other solutions, along with decision support solutions that improve the quality and productivity of research, deliver better legal outcomes, and improve business performance. Notwithstanding this, legal activity and legal information markets are also influenced by economic conditions and corporate activity. Strategic priorities LexisNexis Legal & Professional’s strategic goal is to enable better legal outcomes and be the leading provider of workflow and productivity enhancing information, analytics, and information-based decision tools in its market. To achieve this, LexisNexis is focused on introducing next-generation products and solutions on the global New Lexis platform and infrastructure; incorporating advanced technologies including generative AI; driving long-term international growth; and upgrading operational infrastructure, improving process efficiency, and gradually improving margins. Across segments, LexisNexis is focused on the ongoing development of advanced legal research and practice solutions that help lawyers make data-driven decisions with greater accuracy and efficiency. Global functions and presence enable LexisNexis to effectively launch and scale products such as Lexis+ AI across segments, leveraging shared assets from product design to back-end functionality. LexisNexis is also continuing its mission to advance the Rule of Law around the world through the efforts of the LexisNexis Rule of Law Foundation, a non-profit entity that conducts projects globally to promote transparency of the law, access to legal remedy, equal treatment under the law, and independent judiciaries. LexisNexis legal research and analytics tools empower legal professionals across major US federal agencies and state and local government in upholding the rule of law. Products such as Lexis+ and Practical Guidance enable efficient research, while CaseMap helps manage and collaborate on legal cases. With the release of the Federal Government Practice Area, Practical Guidance usage in the Federal Government Segment grew over 20% in 2023 compared to 2022. LexisNexis Reed Tech also provides patent data and document management services to the US Patent and Trademark Office, with over 50 years of partnership. LexisNexis actively engages with law school users, reaching faculty and students across over 200 law schools in 2023. Initiatives include product training, law course integrations, and support in legal employment preparation. Through these activities, LexisNexis helps students build search dexterity and use leading legal analytics tools to tackle complex research, deliver quality drafts, and track key issues in the practice of law. News & Business, representing just under 10% of revenue, provides customers across industries with news and business information and insights, including company information and US Public Records. The flagship product is Nexis, which provides an easy way to search across a deep corpus of content of over 39,000 licensed sources, including a 45-year news archive across over 50 different languages. Other core products include Nexis Newsdesk, an analytics-driven solution for media monitoring, and Nexis Diligence, an all-in-one diligence solution for risk assessments across use cases. In 2023, Nexis Solutions launched Nexis Diligence+, a global due diligence solution with high-volume screening and advanced negative news analytics, delivering significant process efficiencies for risk professionals. It also launched Nexis Hub, a new workflow tool enabling users to gather information and organise and prioritise it in a single place, driving significant time savings and reduced risk of information loss. Print, representing about 10% of revenue, provides traditional print materials as well as e-books with case law, statutes, and other primary law sources that include leading brands such as Matthew Bender, Mealey’s, Michie, LexisNexis A.S. Pratt and LexisNexis Sheshunoff. 2023 Revenue £1,851m |
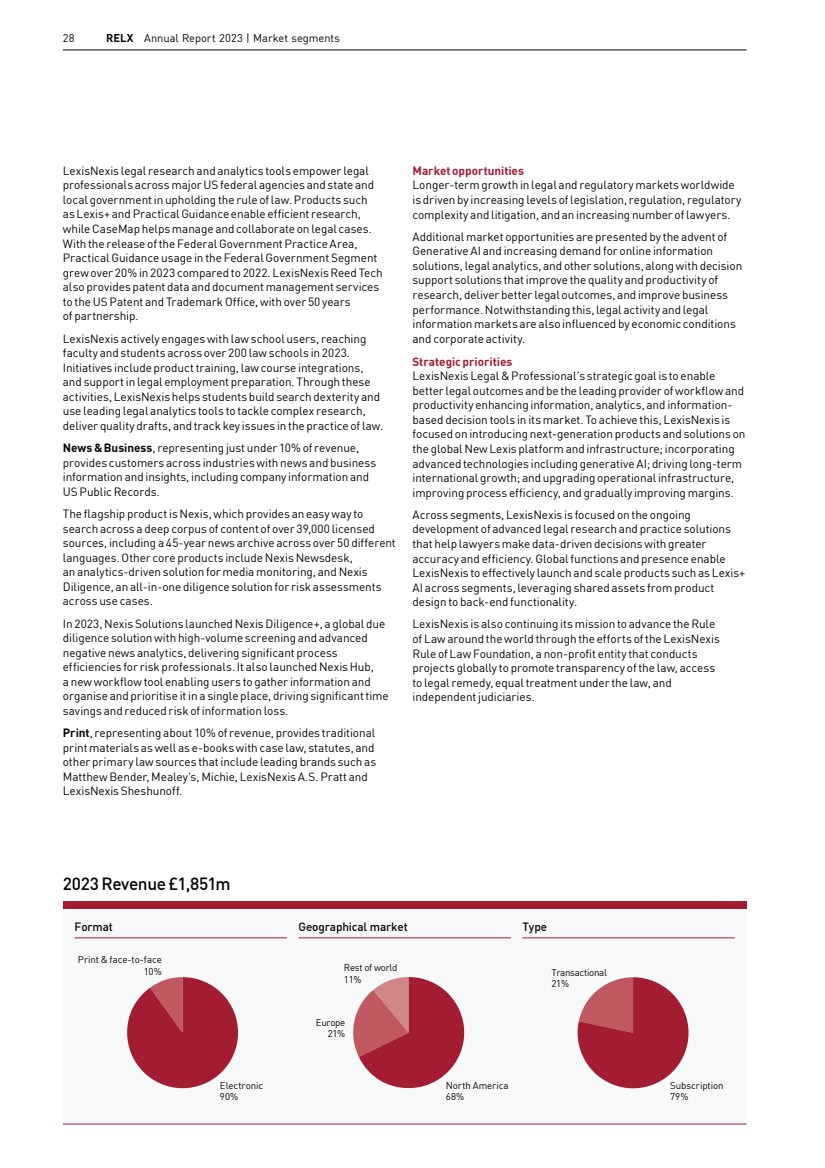
| RELX Annual Report 2023 | Legal 29 Further improvement in underlying revenue growth driven by legal analytics Underlying revenue growth improved to +6%, driven by the continuing shift in business mix towards higher growth legal analytics. Underlying adjusted operating profit growth was +8%, with underlying cost growth below underlying revenue growth, leading to a continued improvement in adjusted operating margin. Law Firms & Corporate Legal markets, which account for over 60% of divisional revenue, saw strong growth. Lexis+, our integrated platform with leading analytics based on extractive AI functionality, continues to see increasing customer adoption and usage across markets. In October, we announced the commercial launch of Lexis+ AI, our new platform leveraging generative AI functionality. Initial customer reaction has been positive, and the roll-out has started well. Government & Academic, which accounts for around 20% of divisional revenue, and News & Business,which accounts for just under 10% of divisional revenue, both delivered good growth. Renewals and new sales remain strong across all key segments. 2024 outlook We expect continued strong underlying revenue growth with underlying adjusted operating profit growth exceeding underlying revenue growth. 2023 financial performance 2022 £m 2023 £m Change underlying Portfolio changes Currency effects Change Revenue 1,782 1,851 +6% -1% -1% +4% Adjusted operating profit 372 393 +8% -1% -1% +6% Revenue 2023 1,851 1,782 Underlying growth +6% 2022 £m Adjusted operating profit 2023 393 372 Underlying growth +8% 2022 £m Business model, distribution channels and competition LexisNexis Legal & Professional products and services are generally sold directly to law firms and to corporate, government and academic customers on a paid subscription basis, with subscriptions often under multi-year contracts. Principal competitors for LexisNexis in US legal markets are Westlaw (Thomson Reuters), CCH (Wolters Kluwer), and Bloomberg. In news and business information, key competitors are Bloomberg, Factiva (News Corporation) and Reuters News (Thomson Reuters). Significant international competitors include Thomson Reuters, Wolters Kluwer and Factiva. Market segments Governance and shareholder information Financial statements Financial review Corporate Responsibility Overview |
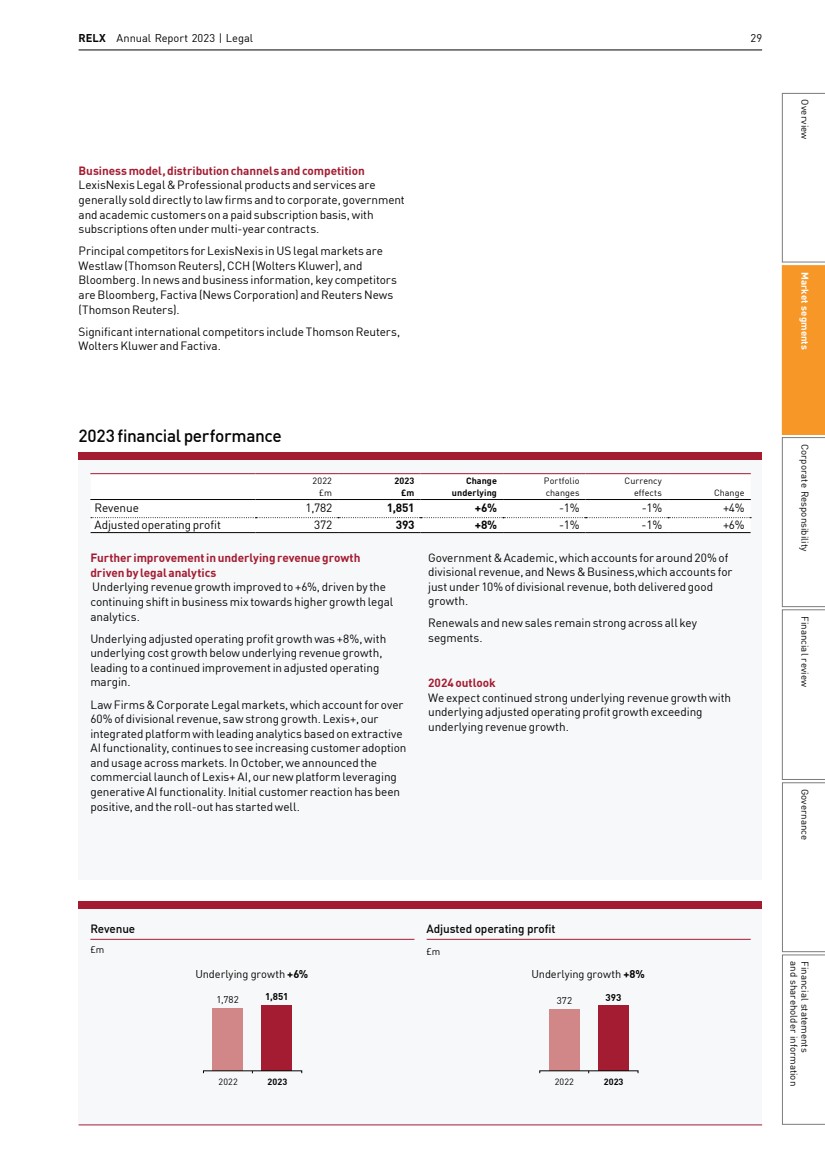
| 30 RELX Annual Report 2023 | Market segments Lexis+: a comprehensive resource for fast and accurate case law research About Lexis+: Lexis+ Singapore is a premium all-in-one ecosystem of integrated legal solutions, complete with superior research, practical guidance and gold standard drafting tools. |
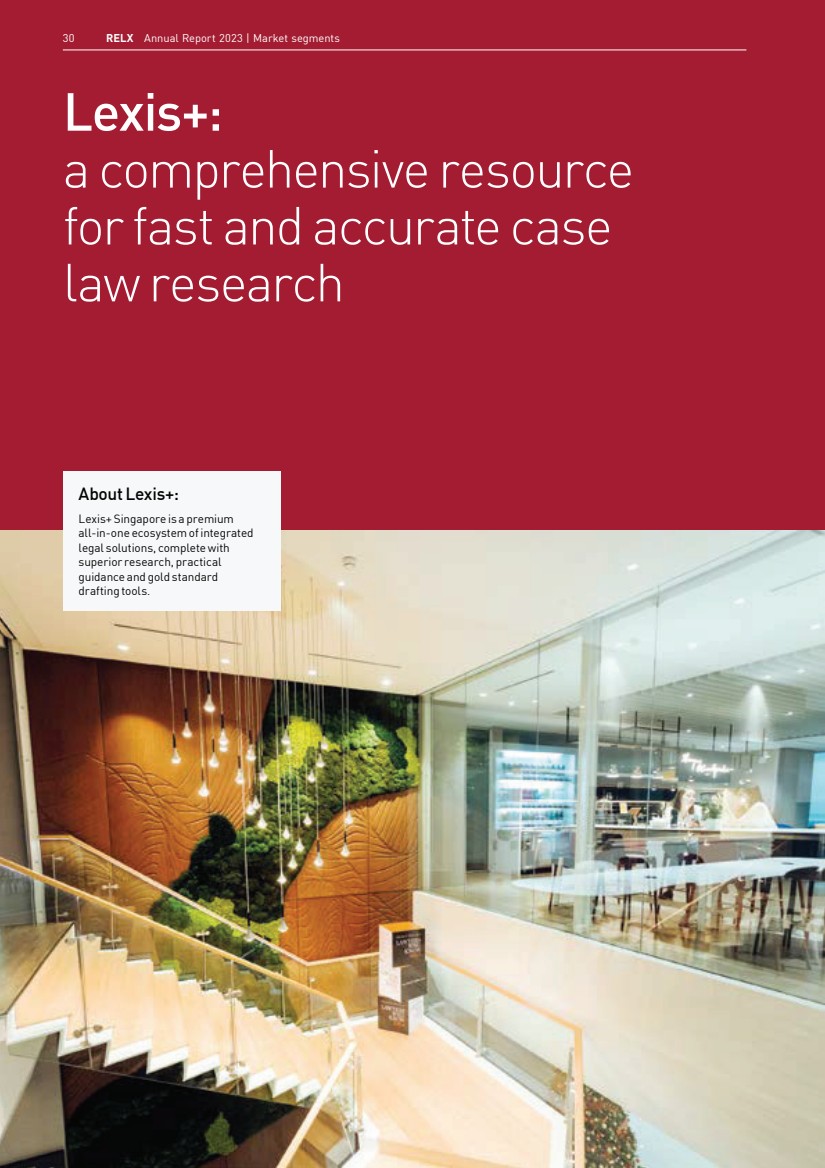
| RELX Annual Report 2023 | Legal 31 Up to 20% We estimate that Lexis+ has made our legal research at least 10 to 20% more efficient based on how easy we’re able to identify and focus on the materials relevant to our research, allowing us more time to focus on analysing the outcome of our legal research. Rajah & Tann’s legacy is built on a commitment to excellence and to care for its colleagues, clients, and community. Founded in 1976 to pursue social justice through law, Rajah & Tann Singapore is now one of the ‘big four’ full-service firms in Singapore and a founding member of Rajah & Tann Asia, a network of legal practices which boasts over 970 fee earners across 10 countries. They are known for being early technology adopters and were one of thefirst large law firms to adopt Lexis+ in the region. In a technology-driven, ‘always-on’ professional world, clients now expect legal services to be immediately accessible at all times, while their legal and regulatory questions are becoming increasingly complex. Rajah & Tann’s ambition is to be unrivalled in its responsiveness to client demands, while continuously seeking new opportunities to deepen its foothold in Asia. The company also acknowledges that this vision must be pursued in a sustainable manner, without compromising on their values offairness, integrity, generosity, and compassion, especially toward the well-being of their colleagues. Rajah & Tann firmly believes that leveraging technology in the delivery of legal services is necessary to meet both client expectations and the needs of their team members. Through a combination of market-leading AI search technology, large proprietary content-sets, and superior data visualisation features, Lexis+, launched in June 2023 with case digests of Singapore supreme court judgements for the first time, cuts down the time needed for lawyers to conduct legal research while maintaining the accuracy and quality of the research output. Rajah & Tann lawyers can now use Lexis+ as the first port of call when conducting case law research. The solution’s user-friendly features have made legal research ‘less stressful’, as they can now simply ‘browse through the sections of the materials containing the search terms without having to open each search result. This makes it much easier to filter, identify and zoom in to the materials likely to be useful for their research’. The benefits are not limited to fee-earners: the Knowledge Management team now spend less time training lawyers on using the system. For example, the innovative ‘Search Tree’ feature is particularly appreciated among younger lawyers, replacing the need to memorise and deploy traditional Boolean search techniques. This faster uptake in usage means a quicker return on investment on the firm’s subscription to Lexis+. For Rajah & Tann, the future of legal services hinges on the firm’s success in technology adoption, and Lexis+ is a key element in the delivery of the firm’s growth strategy. The pace of legal practice has accelerated in recent years, influenced by client expectations for prompt and accessible legal services and the rapidly evolving legal and regulatory landscape. Rajah & Tann is constantly assessing and deploying technological solutions and innovations to help our lawyers work more efficiently to keep up with this pace, while maintaining ahealthier work-life harmony. Lexis+ is one such solution that hashelped our lawyers reduce research time and make legal research a less ‘stressful’ task. Rajesh Sreenivasan Head, Technology, Media & Telecommunications Market segments Governance and shareholder information Financial statements Financial review Corporate Responsibility Overview |

| 32 RELX Annual Report 2023 | Market segments Business overview Exhibitions (RX) combines industry expertise with data and digital tools to help customers connect face-to-face and digitally, learn about markets, source products and complete transactions. RX has its headquarters in London and has further principal offices in Paris, Vienna, Düsseldorf, Norwalk (Connecticut), Mexico City, São Paulo, Beijing, Shanghai, Tokyo, Singapore and Sydney. RX has 3,500 employees worldwide and its portfolio of events serves 42 industry sectors. Revenues for the year ended 31 December 2023 were £1,115m compared with £953m in 2022 and £534m in 2021. In 2023, 20% of RX’s revenue came from North America, 38% from Europe and the remaining 42% from the rest of the world on an event location basis. Over 6m participants welcomed the opportunity to build their businesses at RX face-to-face events. RX ran 286 face-to-face events in 25 countries, up from 254 events in 2022. 2023 was a year of growth, with RX and its customers operating without major disruption throughout the year and in all geographies. Performance relative to pre-pandemic level improved through the year with the majority of events trading above pre-pandemic revenue levels. In 2023, RX improved the range of digital products offered, increasing their sophistication and the value delivered to customers. RX’s digital products extended the reach of the event beyond the exhibition hall and increased the value of participating. Digital products grew in 2023 with electronic revenue accounting for 8% of revenue, up from 7% in 2022. RX organises influential events in key markets focused on addressing the needs of each particular industry, where participants from around the world meet face-to-face to do business, to network and to learn. Its events encompass a wide range of sectors. They include construction, cosmetics, data analytics, electronics, energy and alternative energy, engineering, entertainment, gifts and jewellery, healthcare, hospitality, interior design, logistics, manufacturing, media, pharmaceuticals, real estate, recreation, security and safety, transport and travel. RX makes selective acquisitions to enter or increase presence in attractive sectors with high growth potential. In 2023 RX acquired Big Data & AI Paris expanding its access to the high growth market in data, analytics and artificial intelligence (AI). Combined with Big Data London (acquired in 2021 and growing strongly) and the scheduled launch of Data Universe in New York in 2024, RX can now effectively and efficiently support this segment in three key geographies. Similarly RX made selective launches to enter new attractive sectors (e.g. Renodays for green building renovation, Paris) or extend successful value propositions into new markets (e.g.Agri Week expanding into Kyushu, Japan; BCB for the drinks industry expanding into Singapore) or additional calendar slots (e.g. Content Tokyo into the winter). Exhibitions Our business leverages industry expertise, large data sets and technology to enable our customers to build their businesses by connecting face-to-face and digitally. This enables innovation and generates billions of dollars of revenues for the economic development of local markets and national economies around the world. § In 2023 RX ran 286 face-to-face events in 25 countries, up from 254 events in 2022 § In 2023, over 6m participants welcomed the opportunity to build their businesses at RX events § 42 industry sectors are served in 25 countries across the globe |
| RELX Annual Report 2023 | Exhibitions 33 Market opportunities RX is well positioned for growth in face-to-face events. This will occur in parallel with an increased use of, and revenue from, digital tools and platforms, both stand-alone and as part of multi-channel events. These events combined with digital tools and platforms are a key lever for RX customers’ businesses and national economies to expand. Growth in the exhibitions market is influenced both by business-to-business marketing spend and by business investment. Historically, these have been driven by levels of corporate profitability, which in turn has followed overall growth in gross domestic product. Emerging markets and higher growth sectors provide additional opportunities. RX’s broad geographical footprint and sector coverage allows it to respond effectively to changes in global trade and capture growth opportunities as they emerge. As some events are held other than annually, growth in any one year is affected by the cycle of non-annual exhibitions. This cycle was disrupted by Covid-19 but re-established in 2023. Strategic priorities RX’s long-term strategic goal is to enable industry communities to conduct business, network and learn through a range of market-leading events and digital tools and platforms in all major geographic markets and higher growth sectors. This allows exhibitors to target and reach new customers quickly and cost-effectively, under one roof and with an integrated set of digital tools, resulting in measurably higher value and improved outcomes for both buyers and sellers. RX focuses on four main areas that position it for long-term success. Value to customers: RX constantly looks for ways to increase the value generated for customers, by innovating the offering and format of its events, and by deploying digital tools and platforms to enhance the face-to-face experience. Portfolio optimisation: RX actively continues to shape its portfolio through a combination of new launches, strategic partnerships and selective acquisitions in faster growing sectors and geographies. Best practice innovation: RX continues to drive best practices in a number of activities which increase the value generated for customers and improve its business performance, including marketing excellence, sales techniques, and the use of analytics to generate insights both for RX and its customers. Operational efficiency: a lean, nimble structure is in place, able to respond to changing circumstances and customer needs. RX’s global technology platforms and more specialist functions allow RX to accelerate revenue growth, while controlling costs and embedding sustainability throughout the organisation. It also enables a faster and more agile deployment of digital products, new events and process innovation. RX is committed to continuously improving customer solutions and experience by developing global technology platforms based on industry databases, digital tools and data analytics. By providing a variety of services, including its integrated web platform, the company continues to increase customer value and satisfaction by proactively putting the right buyers and sellers together on the event floor. Increasingly, digital and multi-channel services such as active matchmaking are becoming a normal part of the customer expectation and product offering, enhancing the value delivered through attendance at the event. Using customer insights, RX has developed an innovative product offering that underpins the value proposition for exhibitors by broadening their options in terms of the type and location of stand they take and the channels through which they can address potential buyers. RX’s digital tools and platforms are being enhanced by a data lake that integrates internal data with external sources to provide better insights for its customers. Business model, distribution channels and competition Over 70% of RX’s revenue is derived from exhibitor fees, with the balance primarily consisting of admission charges, conference fees, sponsorship fees and online and offline advertising. Exhibition space is sold directly or through local agents where applicable. RX often works in collaboration with trade associations, which use the events to promote access for members to domestic and export markets, and with governments, for which events can provide important support to stimulate foreign investment and promote regional and national economic activity. Increasingly, RX is offering visitors and exhibitors the opportunity to interact before and after the show using digital tools and platforms such as online directories, matchmaking and mobile apps. RX is one of the largest global event organisers in a fragmented industry, holding a global market share of less than 10%. Other international exhibition organisers include Informa, Clarion and some of the larger German Messen, including Messe Frankfurt, Messe Düsseldorf and Messe Munich. Competition also comes from industry trade associations and convention centre and exhibition hall owners. Market segments Governance and shareholder information Financial statements Financial review Corporate Responsibility Overview |
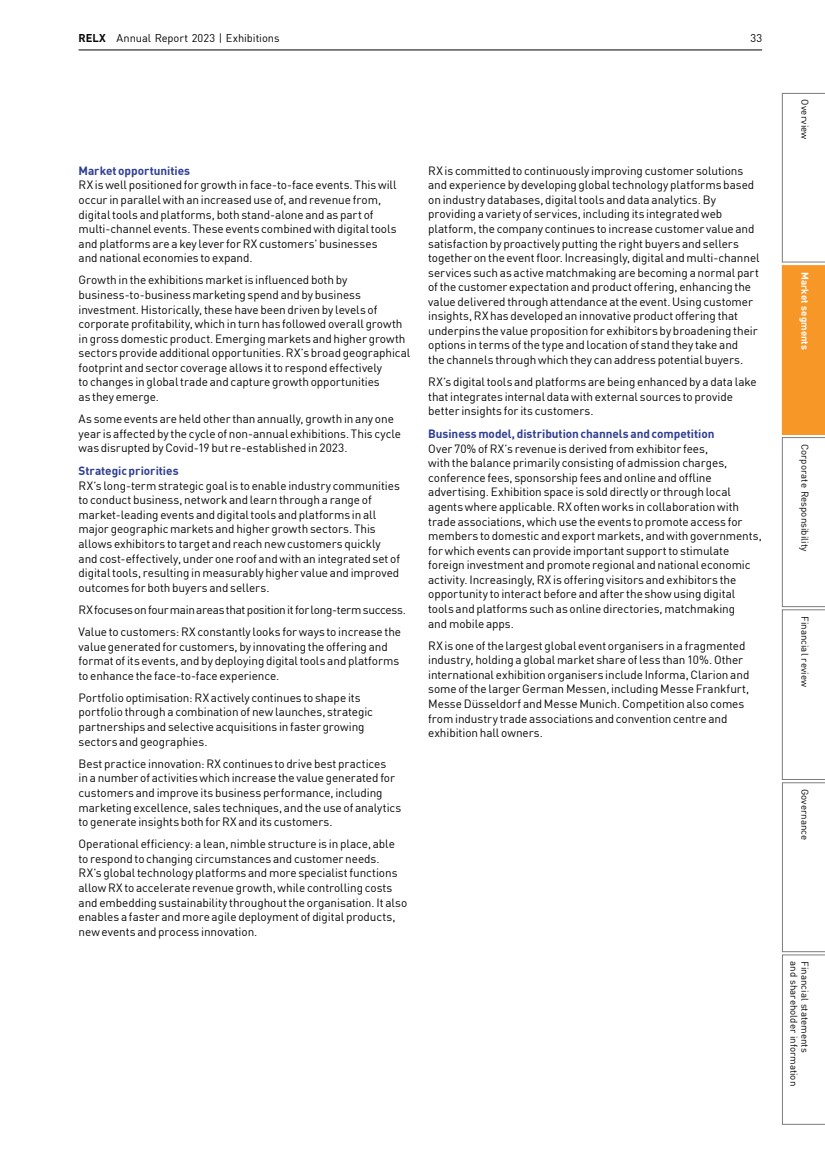
| 34 RELX Annual Report 2023 | Market segments Format Geographical market Source Face-to-face 92% Electronic 8% Rest of world 42% Europe 38% North America 20% Visitors and other 28% Exhibitors 72% Location: France The world’s property market Location: UK Premier global event for the travel industry Location: US The North American jewellery industry’s premier event Location: US International Security Conference & Exhibition Location: France International exhibition for personal care ingredients Location: China One of the largest business gifts & home fairs in China Location: US The East Coast’s largest pop culture convention Location: Japan Japan’s one-stop shop for office related products and services Location: Australia Australia’s trade event for the retail industry Location: Japan Japan’s comprehensive exhibition for smart and renewable energy Location: Spain Global event for the meetings, incentives, conferences and events industry Location: Thailand Machine tools and metalworking exhibition serving ASEAN Location: France International exhibition of environmental equipment, technologies and services Location: Brazil International trade fair for autoparts, equipment and services Location: Japan Japan’s manufacturing industry trade event Location: Germany International trade show for fitness, wellness & health For more information visit relx.com 2023 Revenue £1,115m |
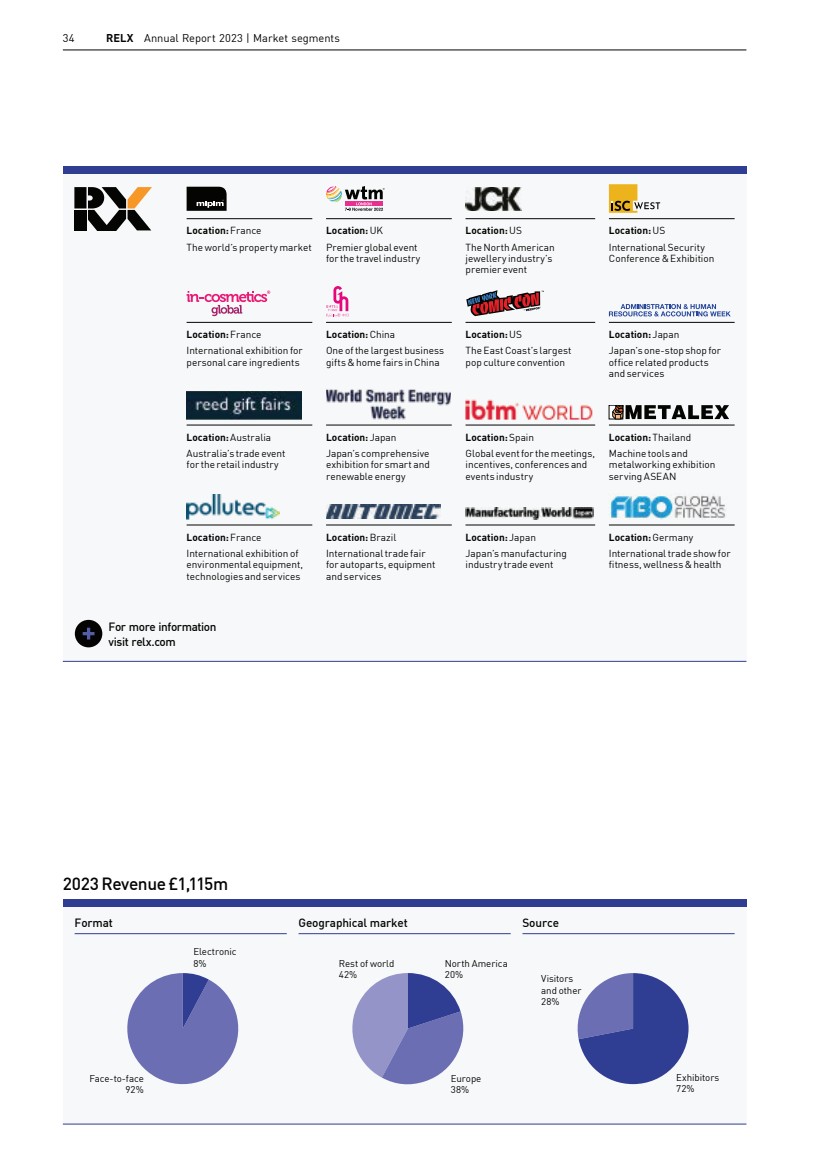
| RELX Annual Report 2023 | Exhibitions 35 Revenue 2023 1,115 953 2022 Underlying growth +30% £m Adjusted operating profit 2022 2023 319 162 £m Underlying growth +100% Strong underlying revenue growth and profitability improvement Strong underlying revenue growth was driven by a significant increase in face-to-face activity across geographies, with average like-for-like event revenue across the portfolio ahead of pre-pandemic levels. We continue to make good progress on digital initiatives, with increased usage of a growing range of value enhancing digital tools for the customers of our face-to-face events. The improvement in profitability reflects the higher activity levels and the structurally lower cost base of the streamlined event portfolio, with the adjusted operating margin now above pre-pandemic levels. 2024 outlook We expect strong underlying revenue growth with a further improvement in adjusted operating margin. 2023 financial performance 2022 £m 2023 £m Change underlying Portfolio changes Currency effects Change Revenue 953 1,115 +30% -11%* -2% +17% Adjusted operating profit 162 319 +100% +5% -8% +97% * includes cycling effects of -11% Market segments Governance and shareholder information Financial statements Financial review Corporate Responsibility Overview |
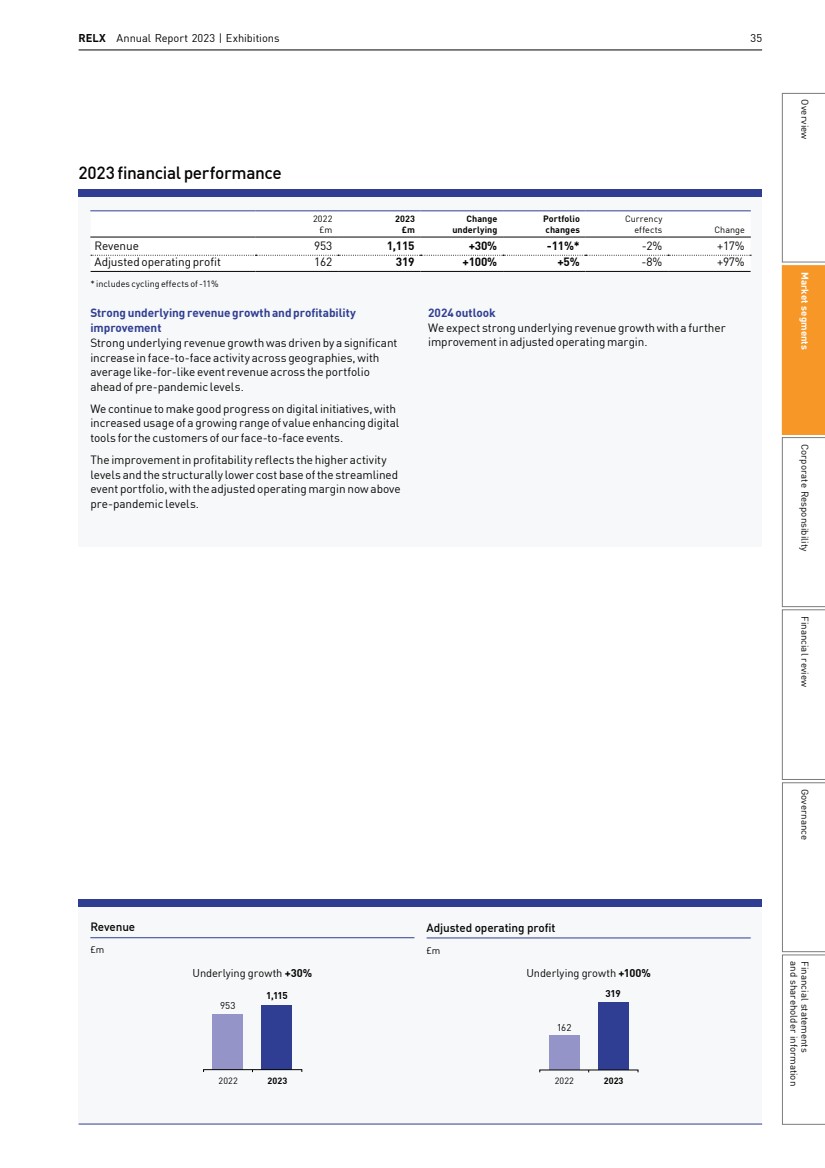
| 36 RELX Annual Report 2023 | Market segments Big Data London: Where data-driven businesses go for growth About Big Data London: Big Data London is a leading data, analytics and AI conference and exhibition. The 2023 event, held from 20-21 September, was the largest in its eight year history, featuring over 180 exhibiting technology providers and consultants, and 300 global data experts speaking across 15 theatre stages. A record 15,617 attendees came to discover the latest tools and techniques and hear from pioneers and industry leaders about the most effective data driven strategies. RX is taking Big Data London’s successful format to the US, with the launch of Data Universe 2024 in New York City in April 2024. |
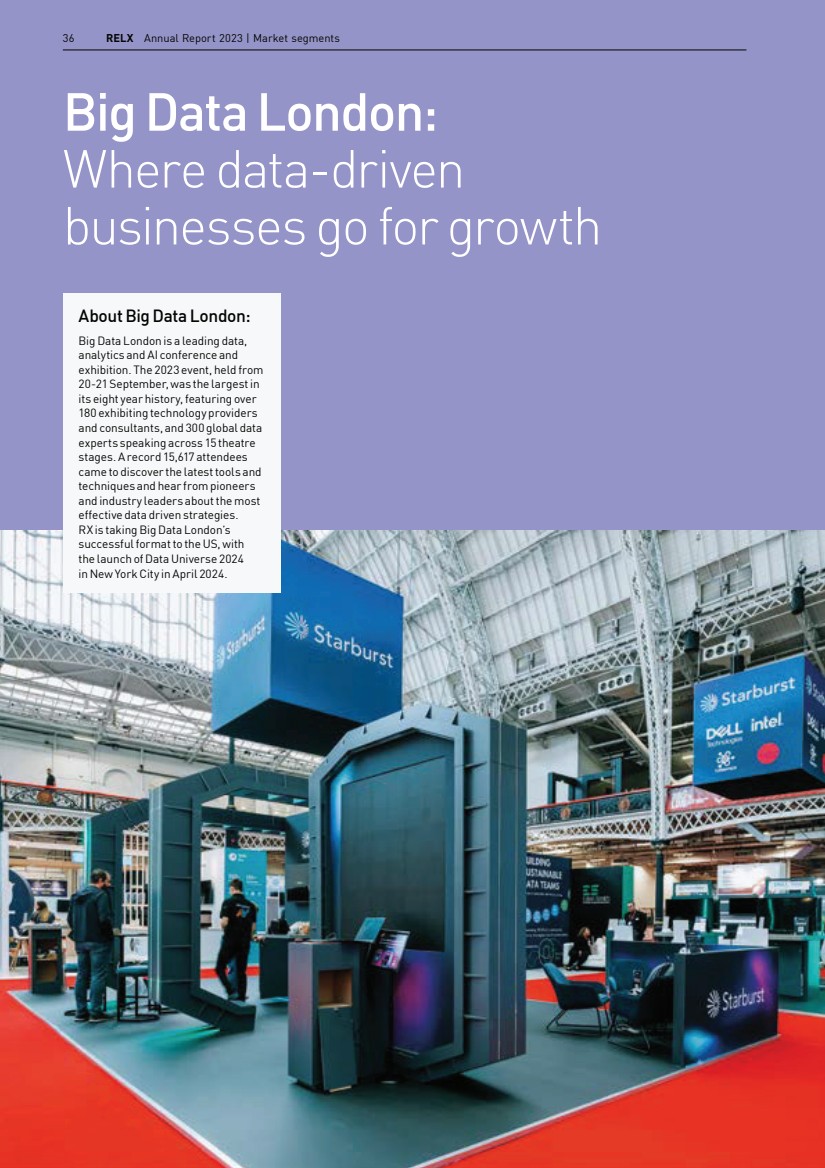
| RELX Annual Report 2023 | Exhibitions 37 550 qualified leads Starburst data welcomed over 2,400 visitors to its stand at Big Data London 2023 and attracted 1,600 attendees to its plenary keynote. It also delivered approximately 200 demos, held 90 meetings, and generated more than 550 qualified leads for follow-up. Founded in 2017, and headquartered in Boston, Massachusetts, Starburst Data is focused on solving the pains of data access. Its solution, a full featured data lake analytics platform built on open source Trino, gives data-driven companies the capabilities they require to discover, organise, and consume data without the need for time-consuming and costly migrations. In just six years, Starburst has grown into an industry-leading data mesh enterprise, trusted by companies like Sky, EMIS Health andSociété Générale. Starburst Data’s partnership with Big Data London began in 2021when the company participated as a Platinum Sponsor to establish its presence in the UK and European market. It has since come to regard the event as a strategic point in the calendar, providing the perfect platform to introduce and showcase its solutions, amplify its voice, and position the company as the industry leader in data lake analytics. As a Diamond Sponsor of Big Data London 2023, with the largest exhibiting footprint on the show floor, Starburst’s objectives were clear-cut. The company strategically unveiled its partnership with Dell Technologies and used the platform to announce several pivotal updates for Starburst Galaxy. It brought HSBC and 7Bridges to the event to share their data lake house customer journeys. And it shared its latest co-engineered solutions with Dell Technologies, Oakland Group, and Turin TechAI. Starburst believes that Big Data London has had a transformative influence on its business as a catalyst for growth and collaboration in the world of data analytics and AI, fostering not only client relationships but also strategic partnerships. It has now joined forces with RX as the Title Sponsor for a ground-breaking new event, Data Universe 2024 New York, modelled on Big Data London’s winning event format. In addition to a premier presence on the experiential expo floor, Starburst will deliver content curation for a dedicated data lake theatre atData Universe 2024, offering use cases, presentations, and hands on workshops over the two days. Big Data London never ceases to amaze us. The rich content, diverse attendee profile, the sheer size and shape of the event, and the exceptional team behind its success make it an unrivalled platform for us to engage with our audience and drive our business goals. Big Data London really is a true barometer for the rapidly growing data and AI industry. Matt Browning VP Marketing EMEA and APAC Market segments Governance and shareholder information Financial statements Financial review Corporate Responsibility Overview |
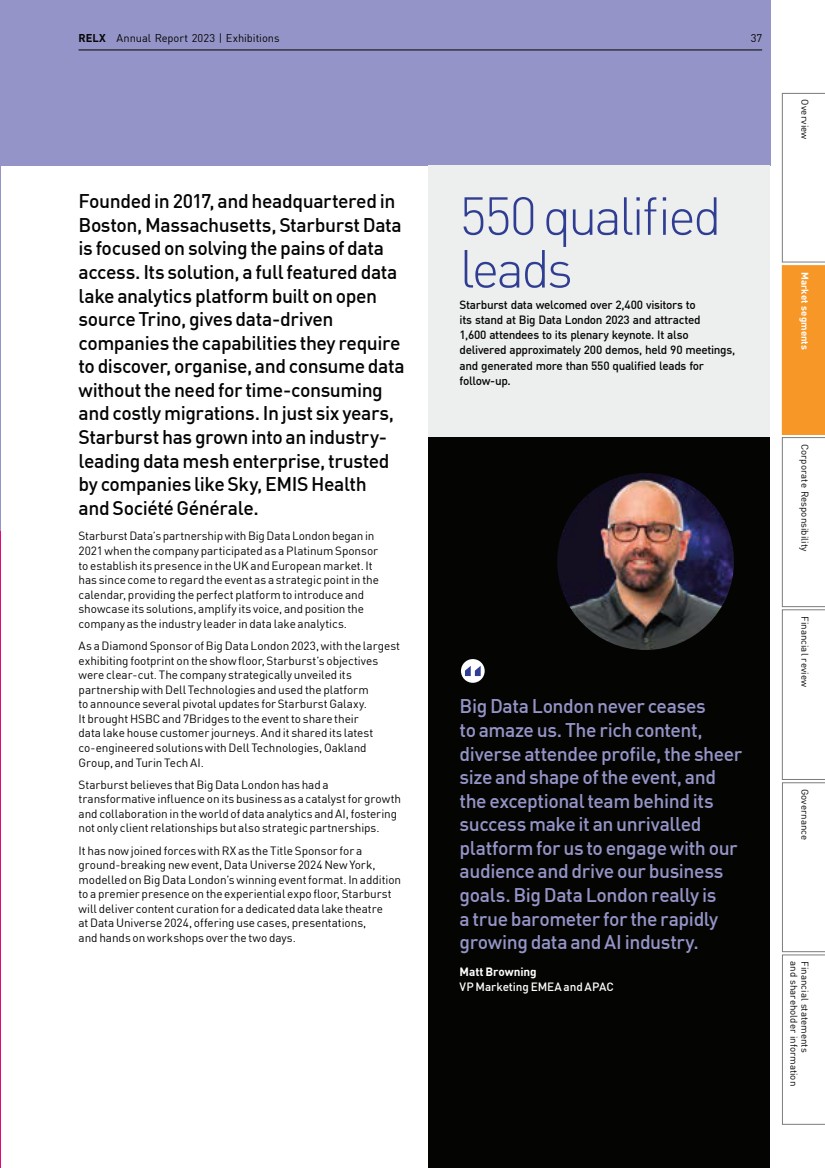
| 38 RELX Annual Report 2023 In this section 38 Introduction 45 Our unique contributions 50 CR governance 54 People 60 Customers 65 Community 69 Supply chain 73 Environment 82 CR disclosure standards Corporate responsibility Contact details Your views are important to us. Please send your comments to: corporate.responsibility@relx.com Or write to: Dr Márcia Balisciano Chief Sustainability Officer and Global Head ofCorporate Responsibility RELX 1–3 Strand London WC2N 5JR United Kingdom For more information, visit: www.relx.com/corporateresponsibility This report contains the RELX PLC Non-Financial and Sustainability Information Statement for the purposes of Section 414CA and 414CB of the Companies Act 2006. |
| RELX Annual Report 2023 | Introduction 39 and shareholder information Financial statements Governance Financial review Corporate Responsibility Market segments Overview Non-financial and sustainability information statement RELX is required to comply with the reporting requirements of Sections 414CA and 414CB of the Companies Act 2006, which relate to non-financial and sustainability information. The list below outlines where this information can be found: Reporting requirement: Environmental matters 73-81, 82-87 Employees 54-59 Social matters 45-49 Human rights 45-49, 54-59, 69-72 Anti-corruption and anti-bribery matters 50-53, 69-72 Policies, due diligence processes and outcomes 50-53, 69-72 Description and management of principal and emerging risks and impact of business activity 98-107 Description of business model 4-13 Non-financial metrics 41 Climate-related financial information 82-87 Directors’ duties and Section 172 Statement The Directors of RELX PLC – and those of all UK companies – must act in accordance with their duties under the CompaniesAct 2006 (the Act). These include a fundamental duty to promote the success of the Company for the benefit of its members as a whole. The Board of RELX PLC, and its individual Directors, consider that they have done so for the year ending 31December 2023. Details of how the Board and its Directors have fulfilled these duties can be found throughout this 2023 Report, and therefore the following sections have been incorporated by reference into this Section 172 Statement and, where necessary, the RELX 2023 Strategic Report: Business model and strategy 4-13 Corporate responsibility report 38-90 Principal risks 98-107 Culture and workforce policies 113-125 Board decision-making 113-125 Stakeholder engagement 113-125 Section 172 of the Act requires the Directors to have regard to, among other matters, the interests of the company’s stakeholders in working to promote the success of the company. The Board recognises the importance of building and maintaining sound relationships with RELX’s key stakeholders inorder to achieve its business aims. Among the Group’s many and varied stakeholders, the Board has identified investors, employees, customers, suppliers and the communities in which we operate, as the company’s key stakeholders. Given its size, diversity and global business, stakeholder engagement takes place at alllevels across the Group. To ensure adequate visibility of key stakeholder views, the Board received a detailed overview in the year covering engagement channels and activities the Company has with each of its key stakeholders. In 2023, the Board also continued to oversee our substantial corporate responsibility activities, andmaintained its focus on RELX’s Sustainability performance. The Board’s oversight on these matters is detailed on page 117 as part of Board activities, and page119 as part of the Board’sengagement with the communities in which we operate. We review the implications of our identified risks to ensure appropriate mitigation. For example, one strategic risk is customer acceptance of our products and services; we must therefore make certain they are reliable and high quality, responding to the views expressed through customer feedback programmes, including Net Promoter Score, and access initiatives to ensure those who might benefit from our products and services can do so. In this way, we minimise risk of financial loss and damage to our corporate reputation. The Corporate Responsibility Report is an integral part of our Annual Report. This section highlights performance against our 2023 corporate responsibility objectives. |
| 40 RELX Annual Report 2023 | Corporate responsibility Our approach to corporate responsibility We align the objectives we set for our unique contributions, as well as those for the significant areas that affect all companies – governance, people, customers, community, supply chain and environment – with the United Nations Sustainable Development Goals (SDGs) to support the achievement of these 17 global goals by 2030. We believe in timely, comprehensive reporting (see CR Disclosure Standards 2 and 3 for how we align with key standards, including theGlobal Reporting Initiative). Key non-financial metrics for environment, people and supply chain are independently assured. Corporate Citizenship assure our community disclosures against the Business for Societal Impact (B4SI) Framework. Full assurance statements are available at www.relx.com/additional-cr-resources. CR is an integral part ofthe statements of the Chair, CEO and CFO (seepages 3, 4, and92-97). RELX is subject to the European Union’s Corporate Sustainability Reporting Directive (CSRD) from January 2024 and ourfirst CSRD Sustainability Statement will feature in this section ofour 2024 Annual Report. We pursue robust governance of CR issues for which the CEO is responsible to the Board. The leaders of our four business areas and our Functional leaders all have accountability for our CR performance, reinforced by objective setting and monitoring by our CR Forum and the involvement of over 4,400 colleagues in our internal CR networks. CR priorities In this report we outline our approach to Corporate Responsibility (CR), our principal CR risks and how they map to our CR priorities, including operating with the highest standards, meeting customer needs, attracting and retaining the right people, maintaining an ethical supply chain and managing climate risks as presented in our Taskforce for Climate-related Financial Disclosure (see CRDisclosure Standards 1). This Report also sets out alignment with the Sustainability and Accounting Standards Board (seeCR Disclosure Standards 2). Corporate responsibility performance begins with the purpose of the company. RELX is a global provider of information-based analytics and decision tools for professional and business customers, enabling them to make better decisions, get better results and be more productive. Our purpose is to benefit society by developing products thathelp researchers advance scientific knowledge; doctors and nurses improve the lives of patients; lawyers promote the rule of law and achieve justice and fair results for their clients; businesses and governments prevent fraud; consumers access financial services and get fair prices; and customers learn about markets, source products and complete transactions. Our purpose guides our actions beyond the products that we develop. It defines us as a company. Every day across RELX our employees are inspired to undertake initiatives that make unique contributions to society and the communities in which we operate. To be a leading company we must act with the highest responsible standards, while channelling our strengths to make a positive difference for society. To us, CR is not a programme or prescriptive set of activities, it is how we do what we do on a daily basis. It is the responsibility of everyone at RELX. CR gives us long-term sustainable competitive advantage. It inspires confidence in our stakeholders, and provides a ‘licence to operate’ in the communities in which we live and work. It underpins our business strategy to deliver improved outcomes for our customers by combining content and data with analytics and technology across global platforms and helps us build leading positions in our markets by leveraging our skills and assets. Sustainable Development Goals (SDGs) We’re committed to doing our part to advance these essential objectives for the world. Throughout the Corporate Responsibility section of this report, SDG icons highlight the SDGs relevant to the content. Visit the RELX SDG Resource Centre www.sdgresources.relx.com We set annual and longer-term objectives to ensure we continue to increase the positive impact we have on society through our business. Dr Márcia Balisciano Global Head of ESG and Corporate Responsibility, RELX |
| RELX Annual Report 2023 | Introduction 41 and shareholder information Financial statements Governance Financial review Corporate Responsibility Market segments Overview 2023 key corporate responsibility data 2019 2020 2021 2022 2023 Revenue (£m) 7,874 7,110 7,244 8,553 9,161 People Number of full-time equivalent employees (year end) 33,200 33,200 33,500 35,700 36,500 Percentage of women employees (%) 50 50 50 50 51 Percentage of women managers (%) 42 42 44 44 45 Percentage of women senior leaders (%)1 30 28 30 31 31 Percentage of ethnic minority US/UK managers (%) 17 19 19 20 Percentage of ethnic minority US/UK senior leaders (%)1 9 10 12 15 Community2 Total cash and in-kind donations (products, services and time (£m)) 9.2 9.2 10.4 12.3 12.4 Market value of cash and in-kind donations (£m) 18.7 17.6 20.6 22.6 23.4 Percentage of staff volunteering (%)3 45 26 32 36 36 Total number of days volunteered in company time 12,127 6,821 10,362 12,830 16,529 Health and safety (lost time) 4 Incident rate (cases per 1,000 employees) 0.50 0.11 0.07 0.17 0.30 Frequency rate (cases per 200,000 hours worked) 0.06 0.01 0.01 0.02 0.03 Severity rate (lost days per 200,000 hours worked) 0.69 0.07 0.02 0.36 0.41 Number of lost time incidents (>1 day) 14 3 2 5 9 Socially Responsible Suppliers (SRS) Number of key suppliers on SRS database5 354 412 359 724 796 Number of independent external audits 6 93 99 111 119 125 Percentage signing Supplier Code of Conduct (%)7 91 91 96 87 87 Environment 8 Total energy (MWh) 176,682 142,098 125,095 117,997 110,750 Renewable electricity purchased (MWh)9 135,710 120,710 105,793 98,013 92,621 Percentage of electricity from renewable sources (%)9 91 100 100 100 100 Waste sent to landfill (t)10 804 210 150 73 45 Percentage of waste diverted from landfill (%)10 81 91 93 97 97 Water usage (m3 ) 344,304 226,509 183,575 156,734 142,374 Climate change (tCO2e)8 Scope 1 (direct) emissions 8,498 5,217 5,644 5,211 4,317 Scope 2 (location-based) emissions 69,616 53,740 44,051 37,270 36,616 Scope 2 (market-based) emissions 18,384 11,384 8,321 8,952 8,598 Scope 3 (flights) Cirium’s EmeraldSky flight emissions methodology11 40,544 8,961 3,402 15,879 16,999 Scope 1 + Scope 2 (location-based) emissions 78,114 58,957 49,695 42,481 40,933 Scope 1 + Scope 2 (location-based) + Scope 3 (flights) emissions 118,658 67,918 53,097 58,360 57,932 Scope 1 + Scope 2 (market-based) + Scope 3 (flights) emissions 67,426 25,562 17,367 30,042 29,914 Paper Production paper (t) 34,599 36,259 40,910 28,466 22,561 Sustainable content (%)12 96 92 98 99 100 SDG Resource Centre Unique users 89,902 133,832 155,082 220,815 New content items 717 970 658 822 1 We define senior leaders as colleagues with a management grade of 17 and above. 2 Data reporting methodology assured by Business for Societal Impact (B4SI). Reporting period covers 12 months from December 2022 to November 2023. See B4SI assurance statement at www.relx.com/additional-cr-resources. 3 All Group employees can take up to two days off per year, coordinated with line managers, to work on community projects that matter to them. Number of staff volunteering reflects the number of staff using volunteering hours, as well as those who participated in other Company-sponsored volunteer activities. 4 Accident reporting covers approximately 82% of global employees. 5 We continue to refine our supplier classification and hierarchy data, contributing to changes in the number of suppliers we track year-on-year. 6 For 2023, RELX moved to a new third party audit platform, which allows sharing of supplier audits across the platform therefore increasing the total number of audits. 7 Signatories to the RELX Supplier Code of Conduct include suppliers who have not signed the Supplier Code, but have equivalent codes. These suppliers are subject to the same audit requirements as Supplier Code signatories. 8 Climate change and environmental data (carbon, energy, water, waste) covers the 12 months from December 2022 to November 2023. 9 We purchase renewable electricity on green tariffs at locations in the UK and Europe. US Green-e certified Renewable Energy Certificates (RECs) are applied to electricity consumption in the US. US Green-e certified RECs are also purchased to equal 100% of any non-renewable electricity consumed outside the US; we do not apply any market-based emissions factors on this portion of electricity consumption. 10 Waste sent to/ diverted from landfill from reporting locations excluding estimates. 11 Covers all flights booked through our corporate travel partner in the calendar year. Uses the proprietary Ciriumfuel-derived methodology. Further details are available on page 76. Previous figures restated following independent assurance. 12 Percentage of paper graded as known and responsible sources by the Book Chain Project or certified to FSC or PEFC. Includes less than 0.5% of paper not yet graded or certified. Independently assured. See Independent Assurance Statement. Reporting guidelines, methodology and independent assurance statements are available on www.relx.com/additional-cr-resources |
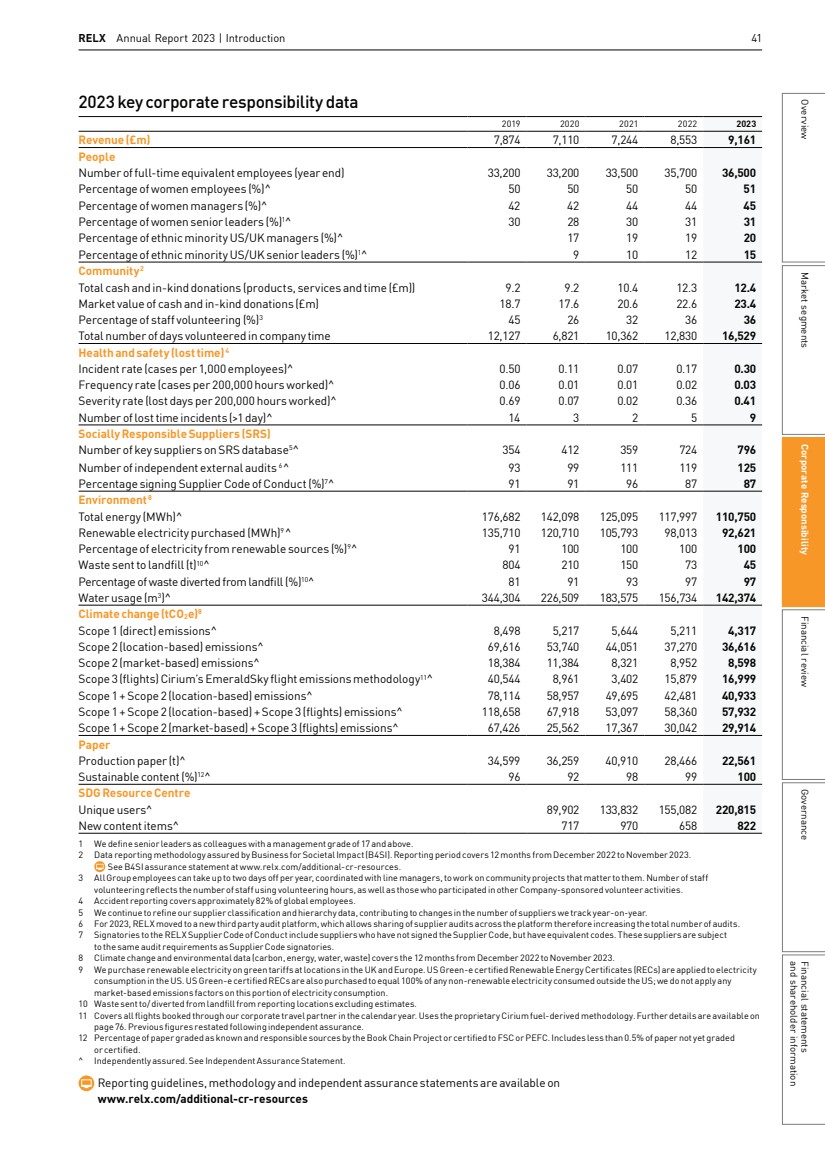
| 42 RELX Annual Report 2023 | Corporate responsibility 2023 awards for excellence Our employees, products and shows are regularly recognised for excellence. In 2023, for example: Risk Scientific, Technical & Medical Kimberly Sutherland, Vice President of Fraud and Identity at LexisNexis Risk Solutions won gold for Cybersecurity Woman of the Year at the Cybersecurity Excellence Awards LexisNexis Risk Solutions was awarded Best Practices Company of the Year for global fraud detection and prevention by Frost & Sullivan Elsevier won gold at the Employer Brand Management Awards Europe for Best Employee Experience Elsevier’s SciBite won the Innovative Practices Award at Bio-IT World Legal Exhibitions LexisNexis Legal & Professional’s US Voting Laws & Legislation Centre won the Justice Technology award at the Legalweek Leaders in Tech Law Awards LexisNexis Legal & Professional won Best Business Intelligence Solution for CaseMap Cloud and Best Legal Solution for Lexis+ at the SIIA CODiE Awards RX won four awards for Best Company Leadership, Best Career Growth, Best CEOs for Diversity and Best CEOs for Women at the Comparably Awards RX won the Greatest Trade Show award for JCK and the Best Use of Technology award for G2E Global Gaming Expo at the Trade Show Executive Gold 100 Awards 2023 ESG recognition MSCI ESG Ratings • AAA rating Sustainalytics ESG Risk Rating • Sector (media): 2nd out of 296 S&P Global Sustainability Yearbook • Included Tortoise Responsibility100 Index • 5th out of 100 Dow Jones Sustainability Index Included in • World FTSE4Good Index Included in: • FTSE4Good UK Index STOXX Global ESG Leaders Indices • Included ECPI Indices • Included CDP • Programmes: Climate, Forests, Water SOCOTEC ISO14001 • Group certification Workplace Pride Global Benchmark • Awarded Advocate status Bloomberg’s Gender-Equality Index • Included |
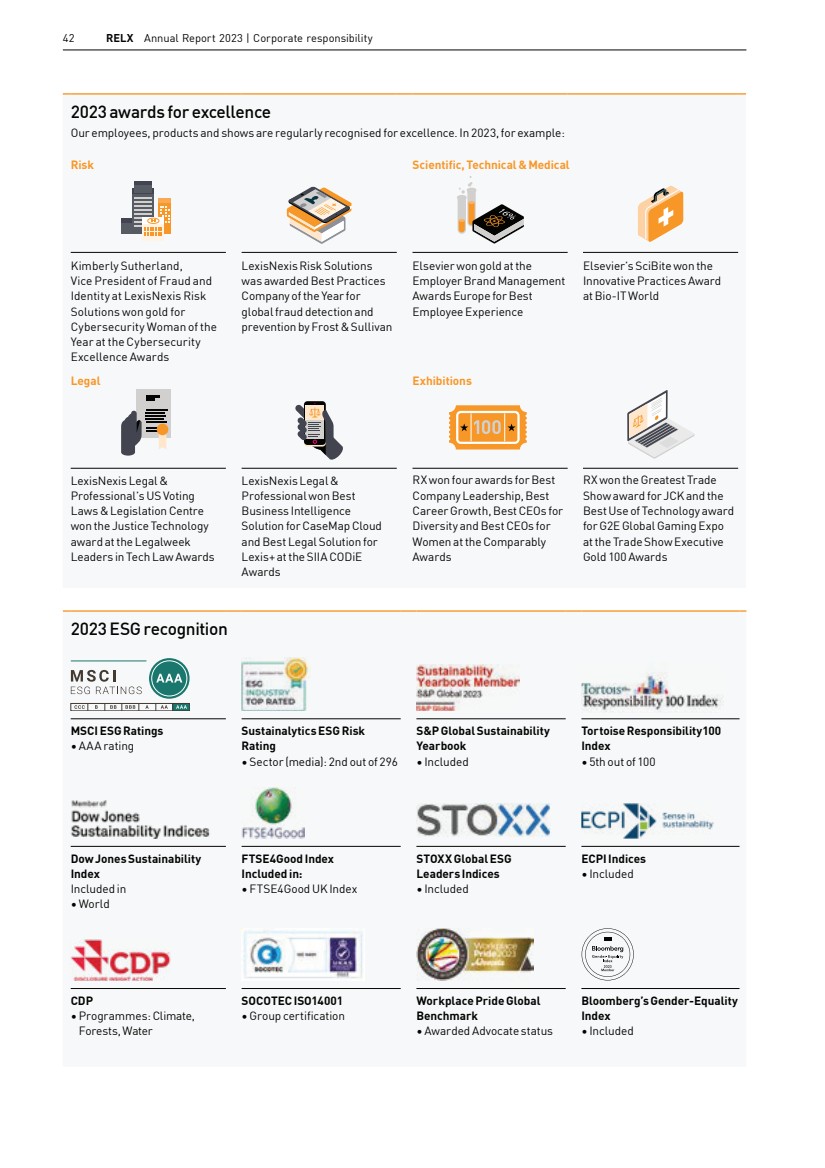
| RELX Annual Report 2023 | Introduction 43 and shareholder information Financial statements Governance Financial review Corporate Responsibility Market segments Overview Our external stakeholders Prioritising key issues To consistently understand the issues we should focus on, we consider our business priorities and engage regularly with both internal and external stakeholders. Employees are our primary internal stakeholder and we involve more than 4,400 colleagues across RELX in our CR networks, who in turn reach more people across the company. Examples of our stakeholder engagement in the year can be found at www.relx.com/additional-cr-resources. The basis of our 2024 CSRD disclosure will be a double materiality assessment (DMA) which identifies key issues for our stakeholders and those which meet a test of financial materiality, encompassing both risk and opportunity. In 2023, we engaged CR consultancy, Carnstone to assist with the DMA, supported by an internal DMA/CSRD Review Group comprised of 27 colleagues. The methodology and results of this undertaking will be part of our 2024 CSRD disclosure. For our previous stakeholder assessment Carnstone contacted over 270 stakeholders – including investors, employees and suppliers – to rank 14 issues we consider important to the company. All 14 CR priorities were rated as either significant or very significant by 26% or more of respondents (at a minimum), indicating that we are focusing on issues they believe are critical for us. Investors Government Customers NGOs Local communities Suppliers Industry networks Impact on society and the environment Impact on RELX Ranking no. Priority issues: Priority issues: 1 RELX unique contributions tosociety Having the right people 2 Access to information Data privacy and security 3 Managing environmental impacts Responding to customer needs 4 Health, safety and well-being RELX unique contributions to society 5 Responding to customer needs Governance and ethical practice 6 Having the right people Health, safety and well-being 7 Promoting diversity Editorial standards 8 Governance and ethical practice Promoting diversity 9 Transparent, comprehensive reporting Access to information 10 Data privacy and security Transparent, comprehensive reporting 11 Editorial standards Managing environmental impacts 12 Sustainable supply chain Tax, pensions and investments 13 Supporting our communities Sustainable supply chain 14 Tax, pensions and investments Supporting our communities #1 Unique contributions Ranked by stakeholders as our primary impact on society and environment #1 Having the right people Ranked by stakeholders as the primary impact forRELX |
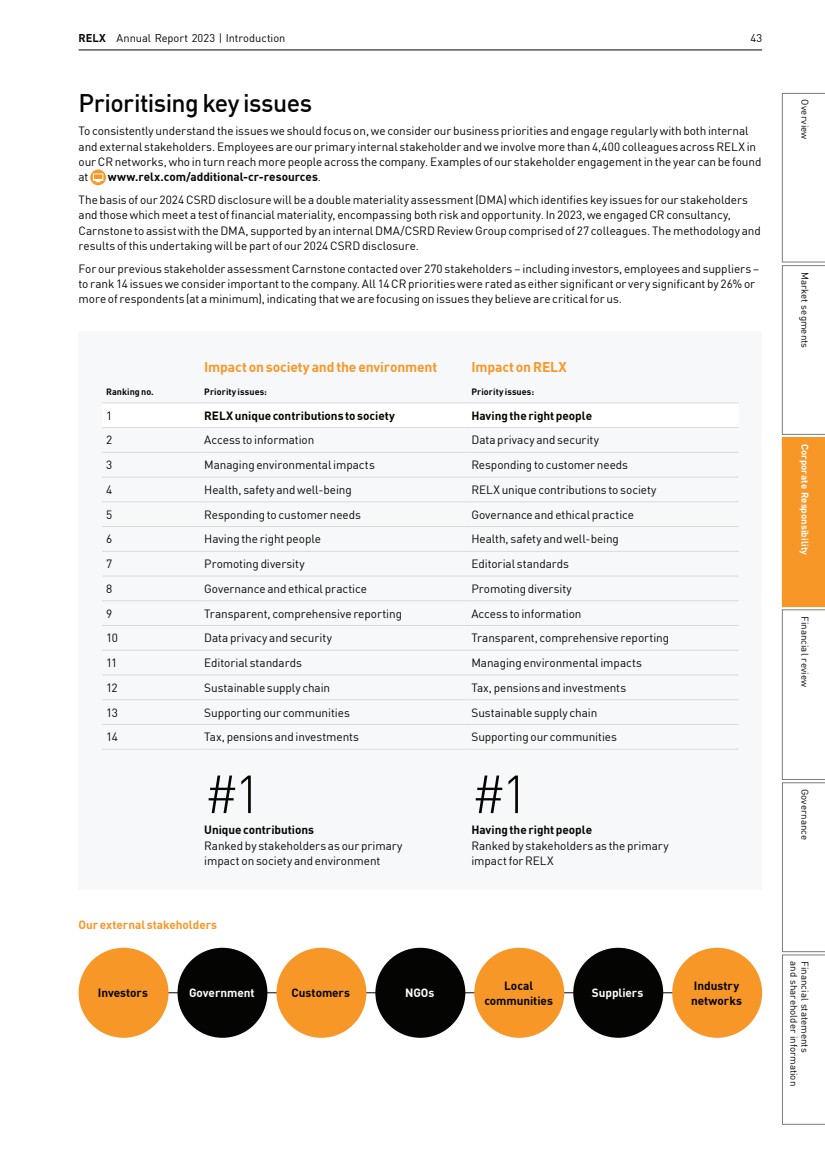
| 44 RELX Annual Report 2023 | Corporate responsibility Our internal stakeholders Commitment to the United Nations Global Compact The United Nations Global Compact (UNGC) links businesses around the world with UN agencies, labour and civil society in support of Ten Principles encompassing human rights, labour, the environment and anti-corruption. Each year, we work to furtherUNGC principles within RELX and in our supply chain. We demonstrated leadership as one of 900 early adopters of the Enhanced Communication on Progress (CoP) in 2022, among more than 20,000 signatories and completed the CoP again in 2023. We contributed to the UNGC Leaders Summit and served as a sponsor of their Transformational Governance initiative. In the year, our Chief Sustainability Officer and Global Head of Corporate Responsibility completed her three year term as Chair of the UNGC UK Network and served on the Board of the Foundation for the Global Compact, which provides financial, operational and programmatic support to the UNGC. The UNGC is a partner of the RELX SDG Resource Centre, which features UNGC content. UNGC Executive Director and UN Assistant Secretary-General, Sanda Ojiambo delivered keynote remarks during the 2023 RELX SDG Inspiration Day, which virtually brought together over 1,500 representatives from business, the investor community, academia, non-profit organisations and civil society to inspire action and collaboration to advance the global goals. For our standing with the UNGC, visit: www.unglobalcompact.org/what-is-gc/participants/7909 Accessibility Working Group Well-being Champions Mental Health First Aiders Socially Responsible Supplier Group ESG Product Risk Group SDG Champions Inclusion Council Rule of Law Working Group RX Sustainability Steering Group RELX Cares Champions Customer Quality Assurance Network Employee Resource Groups Human Rights Working Group Environmental Champions Green Teams CR for Customers Examples of our internal stakeholders Inclusion Working Group Carbon Fund Governance Group Elsevier Accessibility Guild |
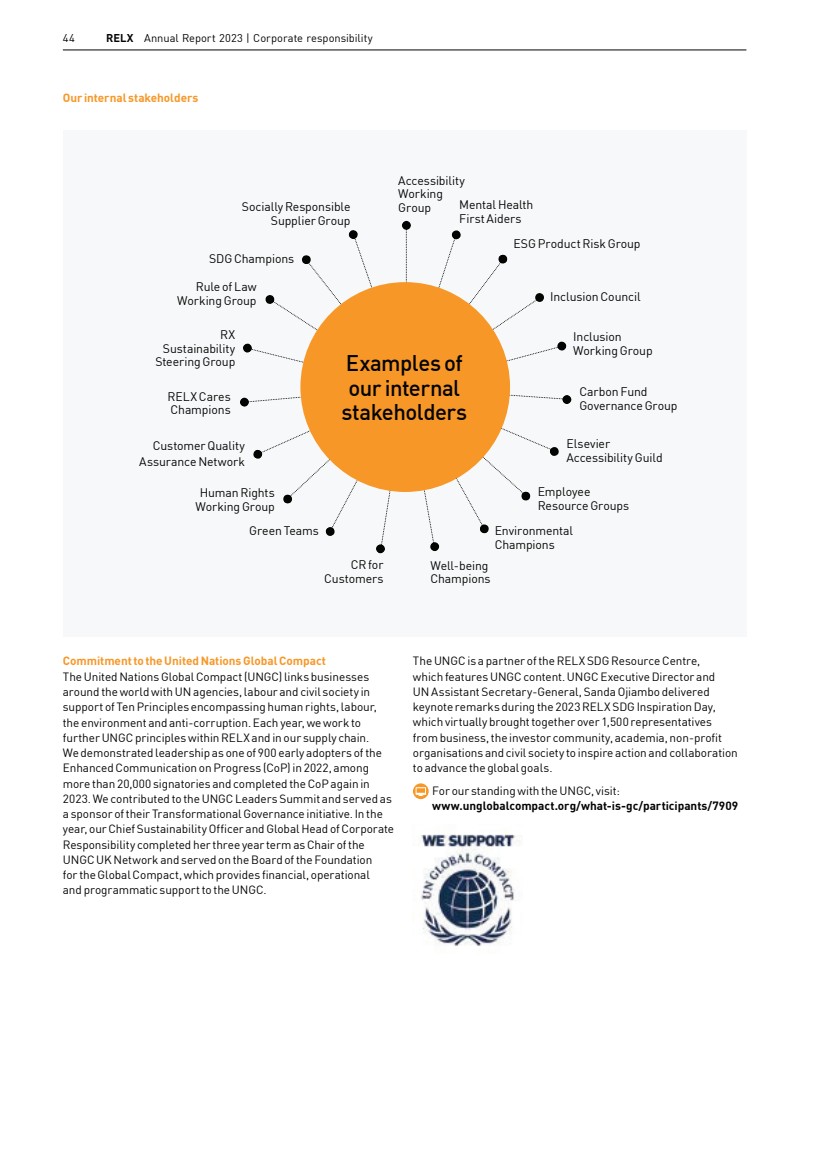
| Relevant SDGs RELX Annual Report 2023 45 Our events foster the meeting of people and ideas which is essential for finding solutions to global challenges. Our teams work to ensure our events are organised in a sustainable way: taking steps to reduce our environmental impact, promote inclusion and diversity and support local communities. The UN Sustainable Development Goals are our roadmap to shape our industry and make a difference. Anne-Manuele Herbert Portfolio and Show Director RX Our unique contributions Our unique contributions are how we make a positive impact on society in the conduct of our business. Risk LexisNexis Risk Solutions’ (LNRS) products and services align withSDG 16 (Peace, Justice and Strong Institutions) and SDG 10 (Reduced Inequalities), among others. Our products and services help protect society by detecting and preventing fraud across a range of business sectors and at US government levels, citizens access vital government benefits, and law enforcement keep communities safe. Our data privacy principles, governance structures and control programmes help ensure data privacy requirements are met and personally identifiable information is protected. We prioritise individuals’ privacy concerns across all jurisdictions where we operate. We work with established privacy advocacy groups, federal and state legislators and other interested parties and always operate within relevant legal, regulatory, ethical and best practice frameworks. A number of Risk products aim to reduce online fraud and identity theft, helping customers recognise trusted transactions and reduce fraud losses. In the year LexisNexis Financial Crime Digital Intelligence (FCDI) won Best Overall Digital Identity Solution Provider at the FinTech Breakthrough Awards. FCDI is a digital sanctions evasion intelligence tool designed to help businesses balance customer online 2023 PERFORMANCE Meaningful support of SDG 10 by expanding financial inclusion efforts in Africa and APAC, including by providing lenders with improved risk information from alternative credit data to benefit more people Financial inclusion is essential to the SDGs. With adequate wages and access to appropriate financial tools, citizens are lifted out of poverty, (SDG 1); avoid hunger (SDG 2); have better health (SDG 3); are more likely to receive quality education (SDG 4); and more women are likely to aid the financial well-being of their communities (SDG 5), among other SDGbenefits. Worldwide, the World Bank estimates that 1.4bn adults lack access to formal financial services, without access to basic transaction accounts they are excluded from financial opportunities because of a lack of a traditional credit record. Thechallenge of financial inclusion is often magnified in low-income countries, given gaps in identity verification and credit risk assessment. Risk’s DecisionTrust uses transactions across a global digital identity network giving enriched insights to help lenders better assess borrowers, ensuring consumers are not underestimated while addressing the problem of ‘making visible the historically invisible’ – people with no credit record. In 2023, Risk ran DecisionTrust tests in 15 countries in Africa, Latin America, Eastern Europe and Asia. The testing took place with fintechs, banks andlending companies, which have historically struggled toincorporate lower income populations into the regular banking system. The tests show that applications (or reapplications) for credit would be granted in approximately 20% of cases as opposed to outright rejections previously. Universal, sustainable access to information Advance of science and health Protection of society Promotion of the rule of law & access to justice Fostering communities Market segments Governance and shareholder information Financial statements Financial review Corporate Responsibility Overview |
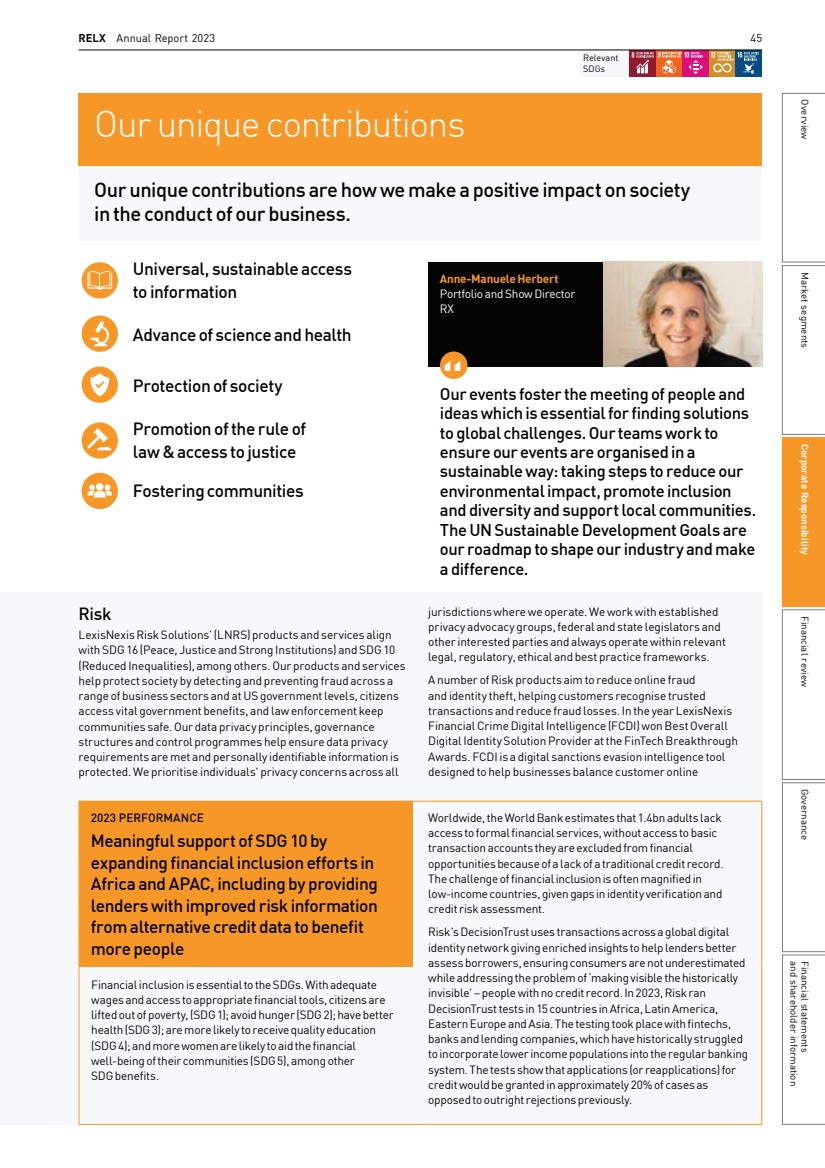
| 46 RELX Annual Report 2023 | Corporate responsibility experience with heightened digital sanctions evasion risk. LexisNexis BehavioSec uses behavioural biometrics, the habits and patterns in the behaviour of device users, to recognise trusted transactions versus fraudulent activity. Working behind digital interactions, the solution ensures genuine users have a frictionless online experience while simultaneously enabling rapid responses to real risks and user anomalies. With the increasing use of digital devices and online transactions, behavioural biometrics is becoming an essential tool for businesses and organisations to build trust and reduce fraud. The ADAM programme was developed by Risk in 2000 to help the National Center for Missing and Exploited Children (NCMEC) find missing children. ADAM technology, which is maintained and enhanced by LNRS employees, quickly distributes missing child alerts to law enforcement, hospitals, businesses and the public in specific geographic search areas. In 2023, ADAM distributed over 1.1m alerts featuring 1,670 missing children which helped NCMEC resolve 1,140 missing child cases. Scientific, Technical & Medical Elsevier plays an important role in advancing human welfare and economic progress through its science and health information, which spurs innovation and enables critical decision-making. Among others, Elsevier makes a significant contribution to SDG3 (Good Health and Well-Being), SDG 5 (GenderEquality), SDG10 (Reduced Inequalities) and SDG13 (Climate Action). In serving the global scientific research community, Elsevier published over 630,000 articles in 2023. To broaden access to its content, Elsevier supports programmes in places where resources are often scarce. Among them isResearch4Life, a partnership with UN agencies and over 200 publishers; we provide core and cutting-edge scientific information to researchers in 125 low- and middle-income countries. As a founding partner and leading contributor, Elsevier provides around 21% of the material available in Research4Life, encompassing approximately 5,200 journals and 31,900 e-books. In 2023, there were over 1.4m Research4Life downloads from ScienceDirect. In 2023, the Elsevier Foundation supported Research4Life’s Country Connectors initiative, heightening awareness and use of Research4Life content, building communities of users through national focal points in Bhutan, Ghana, Kenya, Liberia, Sierra Leone and Tanzania. Connectors have created tailored networking, promoting information skills building and empowering users to drive change in their communities. To ensure that vulnerable young people and minority groups can take control of their health through accessible HIV-related information, counselling and lifesaving care, the Elsevier Foundation continued its partnership with Aidsfonds’ Tanya Marlo project for young people tackling the HIV epidemic in Indonesia, by providing easy access to information and care. SSRN is Elsevier’s preprint and early-stage research platform. It enables researchers around the world to openly share their work so that it is freely available to others in their field and the wider research community, promoting discussion, collaboration and an exchange of ideas. In 2023, over 1,000 Elsevier journals offered researchers the opportunity to simultaneously submit a paper for publication and also post it as a preprint on SSRN. 40% Increase in Research4Life downloads from Elsevier’s ScienceDirect since 2021 2023 PERFORMANCE Meaningful support of SDG 10 and SDG 13 through global partnerships to advance an inclusive approach to climate action Elsevier works to build capacity and equity in research and health for an inclusive and sustainable future. The Elsevier Foundation’s Chemistry for Climate Action Challenge supports green and sustainable chemistry and diversity to advance climate action in the global south. Two projects were selected from 94 entrants across 47 countries, with each winning project receiving €25,000 in funding. The firstin the Philippines focuses on biodegradable packaging using agro-industrial waste supporting farming communities by providing them with an additional source of income. The second in Somalia produces methane gas from fruit waste and cow manure as a cheaper and cleaner alternative to traditional charcoal. Also in the year, we held a workshop for winners of The World Academy of Sciences-Elsevier Foundation Climate Action Grants. Among eight women-led projects focused on innovative solutions to climate change is one in Guatemala focused on food security and resilience by restoring traditional home gardens; another in Bangladesh enhancing climate-resilient groundwater supply; and one in Uganda using aquifer storage and recovery to enable local women to advance a climate resilient food supply. The Elsevier Foundation supported the Women Breakthrough Awards at the 2023 Falling Walls Science Summit in Berlin, celebrating women scientists focusing on gender equity and broader equality in science. The innovation award went to Atinuke Chineme and Marwa Shumo for their work incorporating black soldier flies into circular economy models for biowaste conversion and animal feed production; Sudeshna Das received the Gender Mainstreaming award for her work on AI to identify gender bias in school textbooks; and Simangele Shakwane won in the Empowerment category for her work in developing a culturally sensitive model for intimate care facilitation in nursing care. |
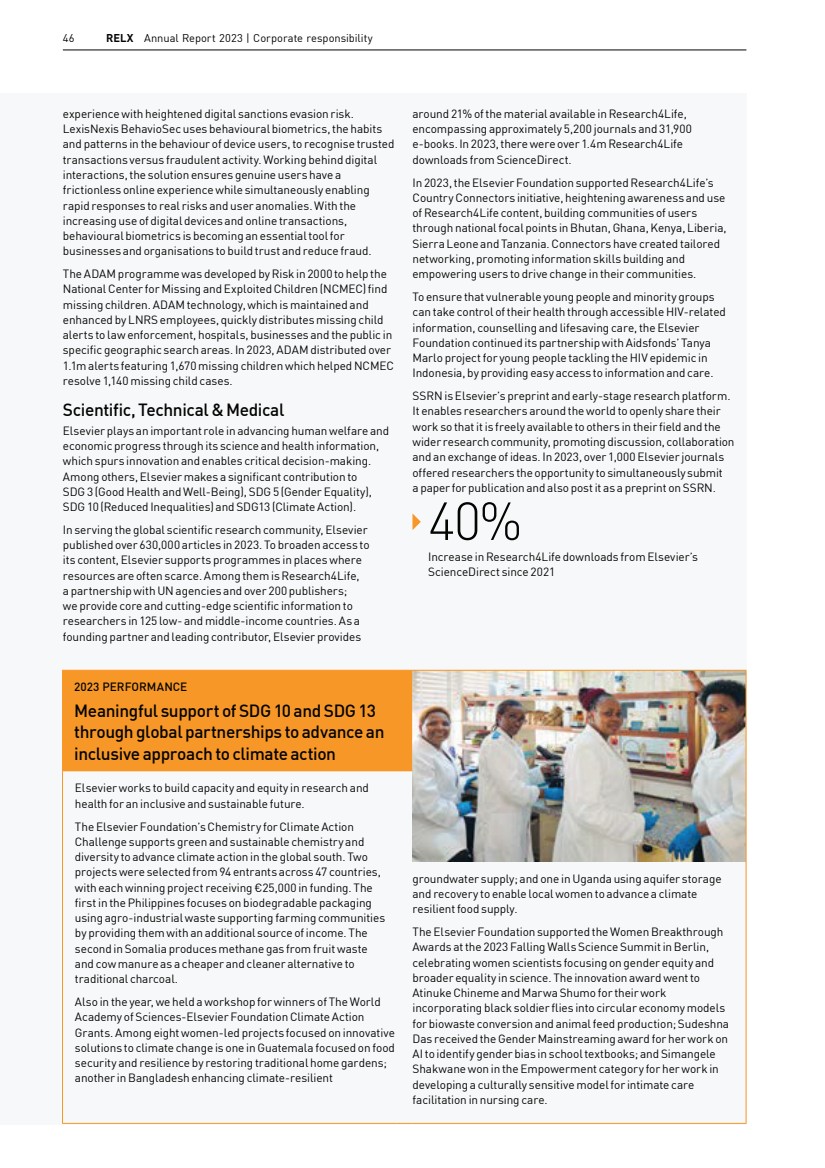
| RELX Annual Report 2023 | Our unique contributions 47 Legal LexisNexis Legal & Professional advances SDG 16 (Peace, Justice and Strong Institutions) through its products and services that promote the Rule of Law. The LexisNexis Legal & Professional global legal and news database contains 138bn documents and records providing transparency of the law in almost 150 countries and territories, with some 2.2m new legal documents added daily. Through its content, data and analytics, LexisNexis Legal & Professional supports the four components of the Rule of Law: transparency of law, equality under the law, independent judiciaries and accessible legal remedy. LexisNexis Legal & Professional partners with the International Bar Association (IBA) on the eyeWitness to Atrocities App, which allows human rights defenders to document and report human rights abuses in a secure and verifiable way so information can be used as admissible evidence in relevant forums. LexisNexis Legal & Professional utilises its data hosting capabilities to provide a secure repository for the information collected. Over 60,000 photos and videos have been captured with the app since 2015. In 2023, eyeWitness was selected as a game-changing digital solution contributing to advancing the SDGs by the United Nations Development Programme in their SDG Digital Acceleration Agenda. In 2023 the LexisNexis Legal & Professional US Voting Laws and Legislation Center won the Legalweek Leaders in Tech Law award for Justice Technology. The Center is a free resource offering public access to over 40,000 federal and state election and voting laws, including changes to laws over time, as part of an ongoing effort to advance transparency of the law. LexisNexis Legal & Professional does in-depth research and produces reports on key legal industry developments, including the LexisNexis Legal Aid Deserts report. Access to legal representation is a fundamental element of the Rule of Law, but many have neither the resources to engage a lawyer nor qualify for legal aid. The report mapped resources throughout the UK that can help those without means, particularly in areas such as criminal, family or employment law. In 2023 the LexisNexis Rule of Law Foundation (LNROLF) also launched the fourth in its series of reports on 50:50 by 2030 which seeks to achieve gender equity in the legal profession with a focus on Nigeria. In 2023, the LNROLF began work to launch a judgement writing tool for justices, judges and magistrates across the Ugandan judiciary. The tool will assist in alleviating court delays and will allow judicial officers to access information from the Uganda case management and repository systems and write judgements on templates curated from research from six different global jurisdictions. It will allow judicial officers to access this material within Microsoft Word, working offline and while away from both internet and electricity, a common occurrence in rural areas of the country. Legal team members volunteered their time and expertise in the year to support a global project to identify laws around the world that discriminate against individuals who have suffered from leprosy. Results were provided by 14 volunteers on 24 countries in partnership with the International Federation of Anti-Leprosy Associations, providing critical knowledge needed to target discriminatory laws through advocacy. Since 2008, LexisNexis Legal & Professional has partnered with industry leading associations to recognise individuals and organisations for their commitment to the Rule of Law. 2023 award honourees include Filipino lawyer Raphael Pangalangan, recipient of the IBA Outstanding Young Lawyer ofthe Year Award, jointly established by Legal and the IBA Young Lawyers Committee, to honour young lawyers who have shown excellence in their career to date, commitment to professional and ethical standards, and dedication to the community at large. Winners included Argentinian lawyer Maria Fernanda Mierez, recipient of the IBA Pro Bono Award; French lawyer Céline Bardet, recipient of the Union Internationale des Avocats/ LexisNexis Rule of Law Award; and Guyana lawyer Melinda Janki, recipient of the Commonwealth Law Conference/ LexisNexis Rule of Law Award. 300% Increase in number of photos and videos uploaded to eyewitness to Atrocities since 2021, over 60,000 photos and videos uploaded to date 2023 PERFORMANCE Meaningful support of SDG 16 by advancing the United Nations Global Compact’s SDG16 Business Framework on Inspiring Transformational Governance The United Nations Global Compact states that ‘Transformational Governance is a principles-based philosophy – not a new legal concept – that calls on business to be more accountable, ethical, inclusive and transparent to drive responsible business conduct, improve environment, social and governance performance and strengthen public institutions, laws and systems.’ During 2023, as a sponsor of the UNGC’s SDG 16 Business Framework on Inspiring Transformational Governance, we supported the creation of a Transformational Governance Corporate Toolkit, including bringing together key stakeholders at an event we hosted during 2023 UN General Assembly week in New York. It was also a theme at the RELX Rule of Law Café which we convene quarterly involving members of the legal community, bar associations, NGOs and peers. Market segments Governance and shareholder information Financial statements Financial review Corporate Responsibility Overview |
| 48 RELX Annual Report 2023 | Corporate responsibility 2023 PERFORMANCE Meaningful support of SDG 13 by progressing the Net Zero Carbon Events Initiative and developing the net zero pathway for RX shows Exhibitions RX events strengthen communities and support the SDGs, including SDG 5 (Gender Equality), SDG 9 (Industry Innovation and Infrastructure), SDG 10 (Reduced Inequalities), SDG 12 (Responsible Consumption and Production) and SDG 17 (Partnerships for the Goals). In addition, RX supports SDG 13 (Climate Action) through our Net Zero Events commitments and by using our event platforms to drive industry engagement in a net zero carbon future. RX is committed to using its event platforms to support and drive the SDG agenda by stimulating conversations and collaboration, and educating and influencing the industries it serves. RX saw a strong return to face-to-face events in 2023 across all geographies. A number of events set all-time attendance records, highlighting the importance participants place on connecting and doing business in person, allowing them to see many customers and suppliers at one time. Increasing numbers of customers took advantage of new RX digital and data analysis tools to source business solutions and suppliers, capture and qualify more leads, and analyse and improve their event performance. In 2023, as part of its five-year, $1m commitment to racial equity, RX continued to support nine global not-for-profit partners who are working to grow racial equity in RX communities. During the year, RX also announced partnerships with Black Young Professionals Network to advance the careers of black professionals in events; and Women in Exhibitions which aims to empower women in the exhibitions industry and help nurture the next generation of female leaders. At the 2023 MIPTV television market, RX France presented its fourth annual MIP SDG Award which honours media companies for their contribution to delivering the SDGs. The 2023 award was presented to Silverback for their work supporting UN goals directed at climate action and the conservation of life below water and life on land. RX France is part of the UN SDG Media Compact which seeks to inspire news and entertainment organisations to leverage their resources and talent to amplify and accelerate progress towards achieving the goals. In 2023, RX’s World Travel Market launched the inaugural Diversity and Inclusion Summit and pledged to ensure that 50% of speakers within the conference programme come from under-represented groups ensuring broad perspectives and knowledge are passed on to WTM attendees. Arabian Travel Market, hosted in Dubai, presented its new Sustainable Stand Award to Hilton for their work on engaging local suppliers in the creation of the stand and commitment to repurpose materials over the next three years. RX’s in-cosmetics published its first Global Sustainability Trends Barometer, and a second regional report on sustainability in the APAC region. Both addressed the challenges and opportunities facing the cosmetics and personal care industry in its ongoing journey to reduce its carbon footprint. MIPIM, the international property show in Cannes, launched a new Road to Zero area, combining 400 sqm of exhibition, networking and conference space, with a focus on ground-breaking methods to decarbonise the real estate industry. Across RELX Recognising that across RELX we have products, services, tools and events that advance the UN’s 17 SDGs, we created the free RELX SDG Resource Centre in 2017 to advance awareness, knowledge and implementation of the SDGs. Since 2017, we have made over 1,800 journal articles and book chapters free to access via theRELX SDG Resource Centre which would have otherwise cost nearly £4m to make open access. Highlighting the importance of industry collaboration in driving climate change action, RX partnered with Elsevier at the 2023 London Book Fair on a new Sustainability Hub, which delivered three days of programming designed to raise awareness about climate change and encourage publishers to adopt sustainable responses across the supply chain. Elsevier and RX also partnered to calculate the emissions associated with Elsevier’s exhibition stand and highlight their carbon emissions label. RX will build on this work to calculate further stand emissions and educate exhibitors on sustainable practices. In February 2023, RX published a Carbon Reduction Playbook to accelerate best practice across our event and operations teams in order to help them make more sustainable choices. To promote engagement with the Playbook, the RX Head of Sustainability undertook a roadshow and held online events that attracted 500+ attendees. This work will continue in 2024 with the publication of a Pathway to Net Zero roadmap, setting out RX’s carbon reduction strategy to achieve net zero by 2040, with key milestones for all shows. During the year, as a member of the Net Zero Carbon Events taskforce, RX participated in working group sessions to advance industry measurement of event-related carbon emissions, including event energy, waste, and production inputs. In the year, 56 venues covering 141 face-to-face events reported energy and/or waste data across RX. Additionally, we conducted carbon footprints of ten events to understand what data is available and get a fuller picture of emissions categories such as logistics and production. These footprints have formed the basis for specific event strategies to target reductions. |
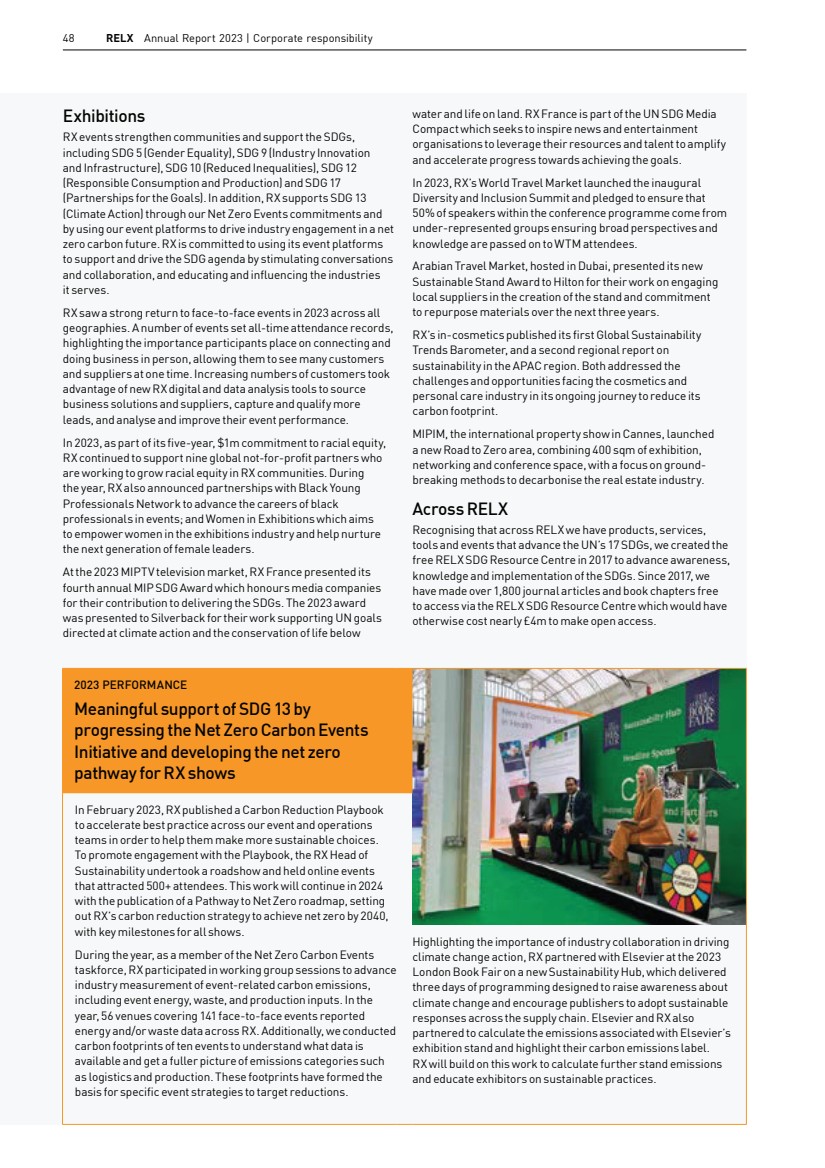
| RELX Annual Report 2023 | Our unique contributions 49 2024 objectives By 2030 Protection of society – SDG 10 (Reduced Inequalities): Complete four new financial inclusion pilots in low-income countries, working to provide lenders with improved risk information from alternative data to benefit more people Advance of science and health – SDG 10 (Reduced Inequalities) and SDG 13 (Climate Action): Advance inclusive research and health by engaging key partners and convening changemakers to advance health equity Promotion of the rule of law and access to justice – SDG 16 (Peace, Justice and Strong Institutions): Support dissemination of the United Nations Global Compact’s Transformational Governance Corporate Toolkit, including by engaging customers Fostering communities – SDG 13 (Climate Action): Launch carbon reduction action plan in support of RX’s Pathway to Net Zero Roadmap and introduce exhibitor education on sustainable stands Universal, sustainable access to information – Increase the number of unique users of the RELX SDG Resource Centre by 15% over 2023 Use our products and expertise to advance the SDGs, among them: SDG 3 (Good Health And Well-Being) SDG 10 (Reduced Inequalities) SDG 13 (Climate Action) SDG 16 (Peace, Justice and Strong Institutions) Enrich the SDG Resource Centre to ensure essential content, tools and events on the SDGs are freely available to all We held our annual RELX SDG Inspiration Day during the year with a focus on nature and biodiversity, giving thought leaders, corporate representatives, investors, governments, and NGOs a common platform to discuss challenges and opportunities for collaboration. Keynote speakers included former Secretary General of the United Nations, Ban Ki-moon, and ethologist, environmentalist and UN Messenger of Peace, Dr Jane Goodall,DBE. Since 2011, the RELX Environmental Challenge has been awarded to projects that best demonstrate how they can provide sustainable access to safe water and sanitation where itis presently at risk. In 2023 the awards were presented at Pollutec, an RX France event for innovative solutions in waste management, recycling, circular economy, water and energy. The $50,000 first prize winner was Lombrifiltro by CPlantae, a sanitary engineering firm and social enterprise based in Mexico that has developed and commercialised prefabricated vermifilters for onsite wastewater treatment, providing a solution for communities without access to a sewer system. The$25,000 second prize winner was TU Delft Water For Impactfor their development of electroagulation, a method to treat surface water using solar power. For more information see page 78. 2023 PERFORMANCE Advance the SDGs by increasing the number of unique users of the RELX SDG Resource Centre In 2023, we added 822 new content items to the RELX SDG Resource Centre bringing the total number of content items available to 4,729, an increase of 21% over 2022. We published 19 special issues in 2023 featuring curated articles, book chapters and other content on specific topics. This included a nature and biodiversity special collection to coincide with the RELX SDG Inspiration Day, providing the over 1,500 attendees, and others, with additional resources on the subject. The RELX SDG Resource Centre also features the World We Want podcast; recordings in the year included Robert Skinner, Deputy Director and Chief of Partnerships and Global Engagement in the United Nations Department of Global Communications; David Emmett, head of biodiversity partnerships at the Hempel Foundation; Dr Gabriel Filippelli, Chancellor’s Professor of Earth Sciences and Executive Director of the Indiana University Environmental Resilience Institute; and Kume Chibsa CEO & Co-Founder of Afrovalley. We closed the year with more than 220,000 unique users, a 42% increase over 2022, exceeding our target of 15%. 65% Increase in unique users of the RELX SDG Resource Centre since 2021 Market segments Governance and shareholder information Financial statements Financial review Corporate Responsibility Overview |
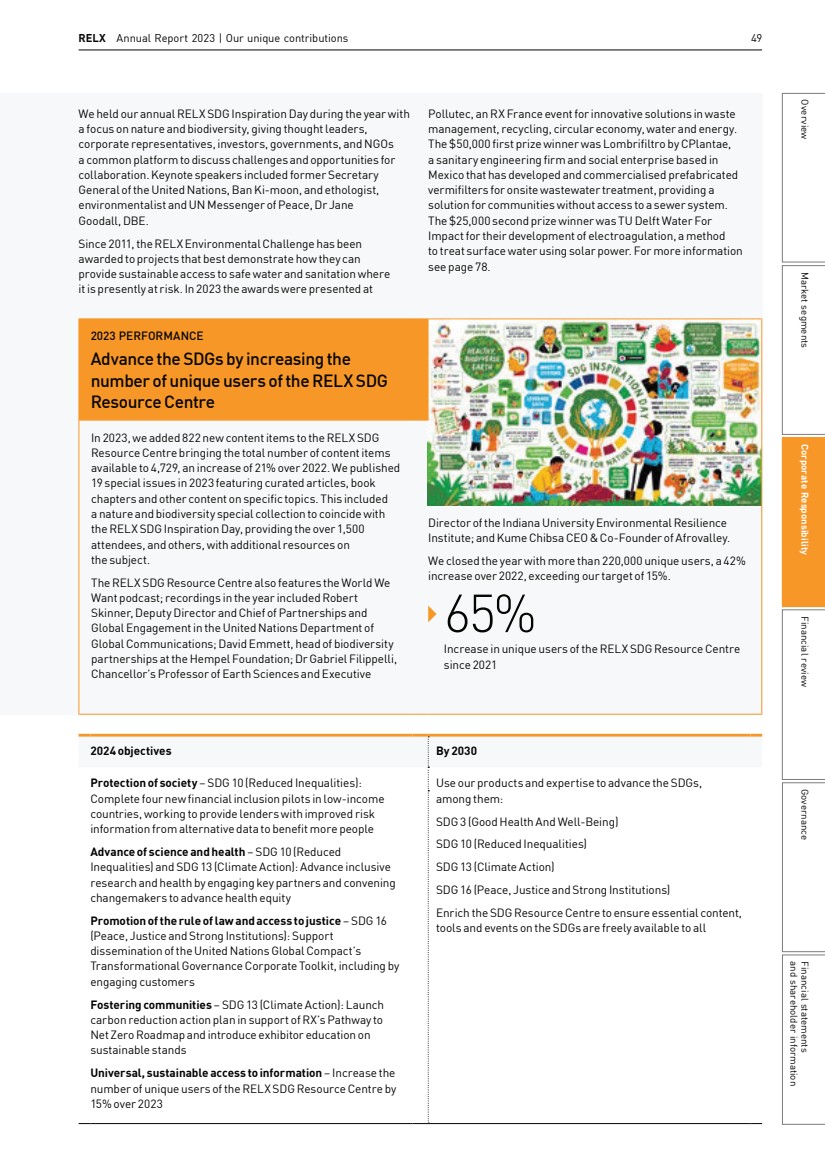
| Relevant SDGs 50 RELX Annual Report 2023 | Corporate responsibility CR Governance and reporting Our Board recognises the importance of maintaining high standards of corporate governance, which underpins our ability to deliver consistent financial performance, and value to our stakeholders, aligned with RELX’s culture of integrity. TheBoard has oversight responsibility of RELX’s corporate governance and their role and function is explained fully in the Corporate governance section (see pages 113 to 124. The Audit Committee ofthe Board regularly reviews ethics issues. In addition,theChief LegalOfficer (CLO) andCompany Secretary is responsible for ethics issues as a member of the RELX executive committee. TheChiefComplianceOfficer andCorporateGeneral Counsel reports to the CLO and presents to the Board annually on the status of our ethics policies and implementation. Governing policies set out our stance on key issues and are publicly available at www.relx.com/cr-downloads. These include the RELX Code of Ethics and Business Conduct, the Code ofEthics for Senior FinancialOfficers,the SupplierCode ofConduct, Tax Principles, Privacy Principles, Inclusion and Diversity Policy, Health and Safety Policy, Editorial Policy, Quality First Principles and Product Donation Policy. Our values We monitor the progress of each business in embedding our values. Corporate responsibility governance Good governance allows us to ensure our approach to and implementation of corporate responsibility initiatives is effective and consistent with our stated objectives, our values and culture. High quality assurance is crucial forRELX as it ensures that internal processes are operating efficiently and effectively. With a robust assurance process, we can identify potential risks and opportunities for improvement, enabling us to optimise our operations and achieve long-term objectives. Jasdeep Gill Financial and Operational Audit Manager, RELX CEO Business area CEOs CR Forum Chief Sustainability Officer and CR Team Compliance Committees RELX CR networks Board Valuing our people Innovation Boundary-lessness Passion for winning Customer focus Our CR governance framework The CEO has responsibility to the Board for CR. They and senior management, as well as the CR Forum, chaired by a senior leader and involving individuals representing key functions and business areas, set and monitor CR performance. This includes our annual and longer term CRobjectives, which reflectthe views of a range of internal and external stakeholders. More information can be found on www.relx.com/additional-cr-resources. The Chief SustainabilityOfficer andGlobalHead ofCorporateResponsibility provides formal updates to the Board and engages on key issues with senior managers, who have CR-related Key Performance Objectives (see page 132). |
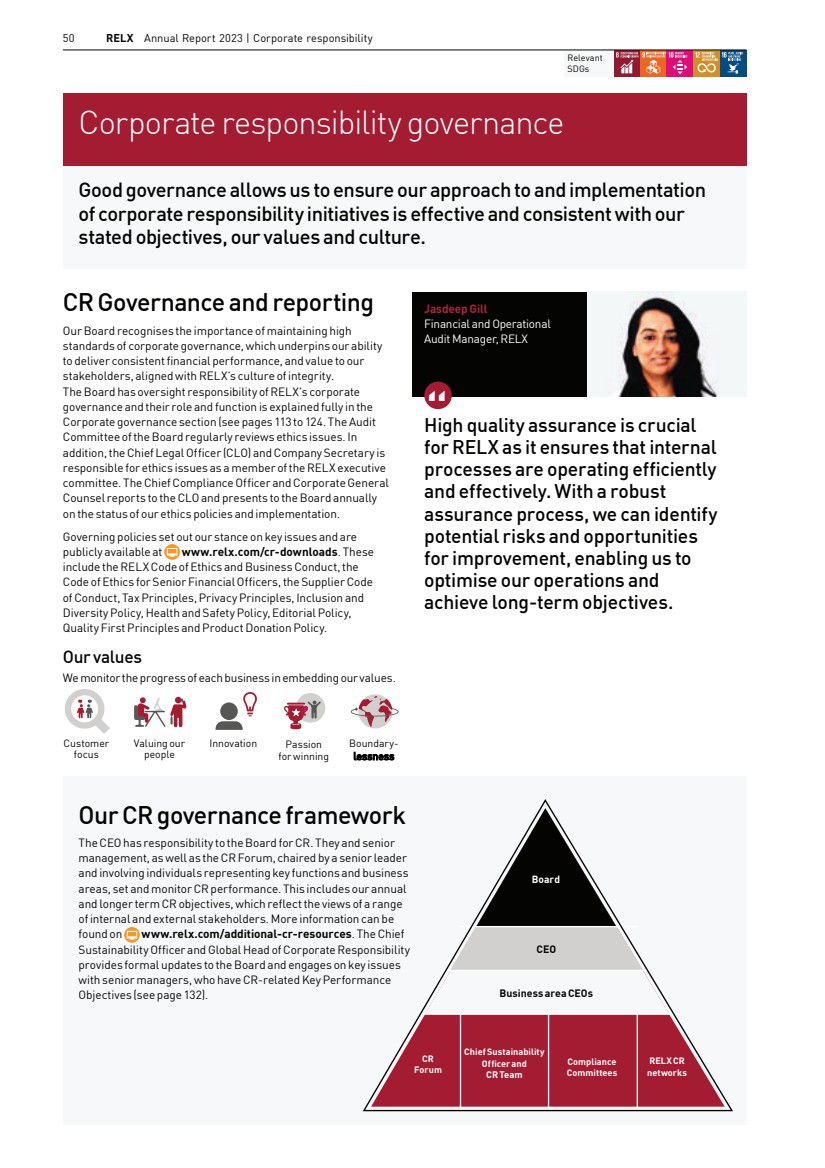
| RELX Annual Report 2023 | Corporate responsibility governance 51 We engage in policy discussions that matter to our business and our customers. Strategic decisions about policy are made at senior levels of the company to help advocate particular policies and/or to share our expertise. We strive to help policymakers around the world understand our business, innovations and contributions to the public interest. RELX employees may engage in direct advocacy. We also engage through trade associations, policy organisations and third parties. Lobbying activities done on behalf of RELX Inc. are managed by the RELX Government Affairs team, and, in coordination with our legal teams, are vetted, tracked and reported as required by law. Consistent with our commitment to fostering a culture of integrity including through good governance, RELX has a supplemental policy and training for our employees that specifically relate to engagement with government officials and agencies. The Code and a related supplemental policy also address corporate political contributions, which are strictly prohibited except in the US, where such contributions and activities are permitted in certain states within allowable limits, if they comply with stringent reporting and disclosure regulations. Corporate political contributions require senior level review and approval. Corporate contributions are reported as required by law. Contributions are made on a bipartisan basis and no funds are donated for presidential campaigns or any other federal-level campaigns. We remained diligent through the year in our ongoing efforts to comply with applicable bribery and sanctions laws and mitigate risks in these areas. Our anti-bribery and sanctions programmes include detailed, risk-based internal policies and procedures on topics such as doing business with government officials, gift and entertainment limits, gift registers, and complex sanctions requirements. Relationships with third parties and acquisition targets are evaluated for risk using one or more of the following methods, including questionnaires, references, detailed electronic searches, and Know Your Customer screening tools. Helping our people pursue the highest standards of integrity Doing the Right Thing is more than a phrase at RELX, it embodies principles that represent RELX’s culture of integrity. It includes ensuring respect for one another, incorporating ethics in all our actions; growing our business with integrity; holding ourselves and each other accountable; and taking time to ask questions and report concerns. Doing the Right Thing is underpinned by clear actions for employees, among them, being honest in our dealings with others; respecting the law, our policies and colleagues; and courageously speaking out for what is right. RELX in turn provides relevant training and resources; enables a culture where people can feel comfortable speaking up and experience no retaliation when they do; and ensures concerns are listened to and acted on in a fair and timely manner. The pillars of our compliance activities include conducting periodic compliance risk assessments; implementing effective policies, procedures, training and communications; overseeing misconduct reporting channels, investigations processes and remediation efforts; and monitoring and auditing internal controls. We engage in a legal and compliance risk assessment twice a year to identify the top legal and compliance risks to the Company. The RELX Operating and Governance Principles further describe the process, policies and controls to manage risk. OurCode ofEthics andBusinessConduct(theCode) sets the standards of behaviour for all RELX employees and is reviewed regularly. Among other topics, the Code addresses fair competition, anti-bribery, conflicts ofinterest, employment practices, data protection and appropriate use of company property and information. It also encourages reporting of violations – with an anonymous reporting option where legally permissible. We offer several reporting channels to report Code-related concerns, including an Integrity Line, available to employees, suppliers, and other reporting persons. The Integrity Line is managed by an independent third party and accessible by telephone or online 24 hours a day, 365 days a year. The Integrity Line also includes an Ask A Question feature which allows employees to seek ethical advice before taking action. Reports of violations of the Code or related policies are promptly investigated, with careful tracking and monitoring of violations and related mitigation and remediation efforts. The number of reports received is publicly available on our website www.relx.com/investors/corporate-governance/ code-of-ethics We maintain a comprehensive set of other compliance policies and procedures in support of the Code and our risk areas are reviewed and updated periodically to ensure they remain current and effective. We formally audit the compliance programme, including the Code, every three years. Our policies, including our anti-bribery policies, also comprise part of our adequate procedures for compliance with applicable laws. Full and part-time employees receive mandatory training on the Code – bothas new hires and regularly throughout their employment – ontopics such as maintaining a respectful workplace, preventing bribery and anti-competitive activity, and protecting personal and company data. Mandatory periodic training covers key Code topics and is supplemented by advanced in-person training for those in higher-risk roles or regions. Temporary staff and apprentices are also assigned training. Ethics and compliance policies, training and tracking Read our Code of Ethics and Business Conduct at www.relx.com/cr-downloads To help employees comply with applicable laws, we supplement the Code with other policies in areas critical to our business, including anti-bribery, competition, data privacy and security, trade sanctions and workplace conduct To facilitate understanding of the Code and our other policies we require cyclical mandatory training and use a range of communication tools, including video We maintain compliance committees for all RELX business areas which help set and implement compliance initiatives for each business We provide specialised training and webinars for colleagues in higher-risk roles and locations The Code stipulates protection against retaliation if a suspected violation of the Code or law is reported 99%� Completion rate for all courses within 90 days ofissuance 13 Our Code of Ethics and Business Conduct is available in 13 languages Independently assured Market segments Governance and shareholder information Financial statements Financial review Corporate Responsibility Overview |
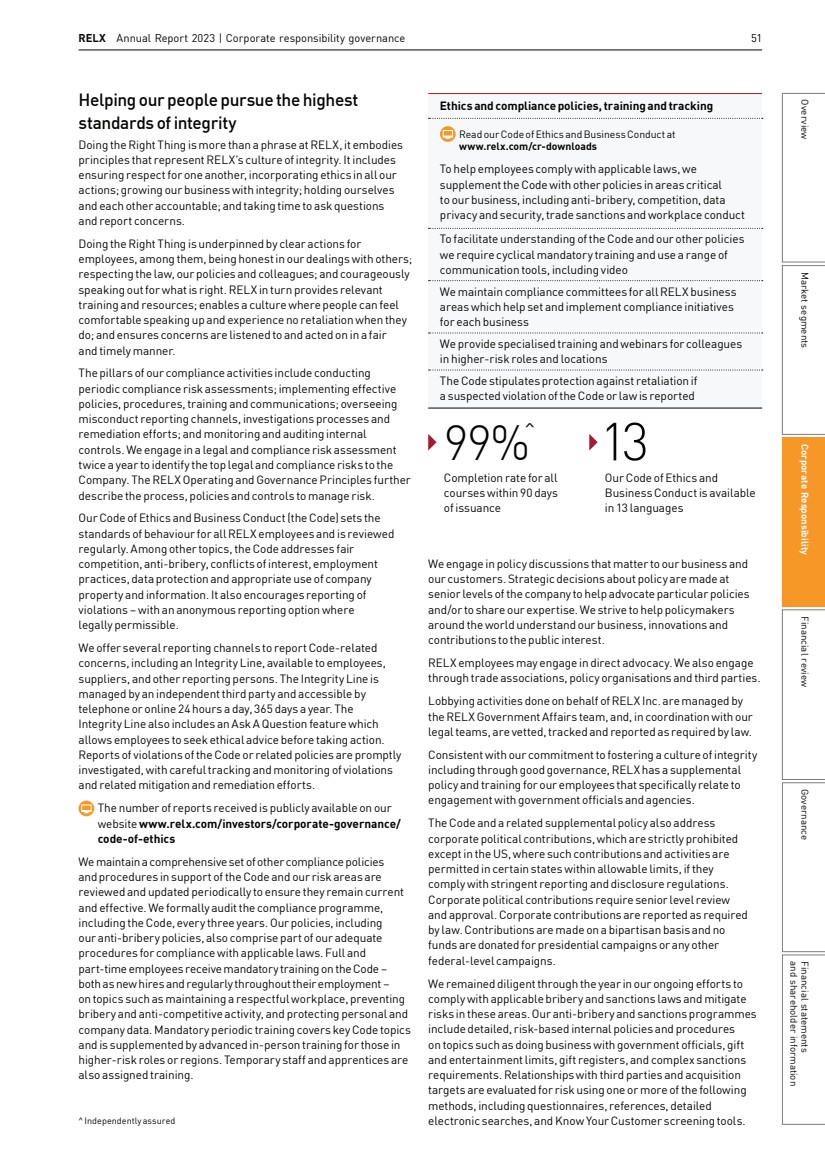
| 52 RELX Annual Report 2023 | Corporate responsibility We monitor and assess the implementation of our anti-bribery and sanctions programmes by continually reviewing and updating our policies and procedures; conducting periodic programmatic risk assessments; and conducting quality reviews and internal monitoring and audits of the operational aspects of the programmes. We engage with our employees about compliance through digital communications and other media, including videos and animation. To raise awareness during Compliance Week 2023 we held challenges and quizzes, and recognised outstanding employee contributions to our culture of integrity with Integrity Hall of Fame inductions. Our Code of Ethics and Business Conduct supports the principles oftheUnited NationsGlobalCompact(UNGC) and stresses our commitment to human rights. In accordance with the UN’s Guiding Principles on Business and Human Rights, we consider where and how we operate to avoid human trafficking and modern slavery in our direct operations and our supply chain. As stated in our Modern Slavery Act Statement, available at www.relx.com, we stand against all forms of slavery and human trafficking. We do nottolerate itin any part of our business, including our supply chain. As a UNGC signatory we uphold its Ten Principles related to human rights, fair and non-discriminatory labour practices, the environment, and anti-corruption. Our policies are also informed by the Universal Declaration of Human Rights, the OECDGuidelines for Multinational Enterprises, the UN Guiding Principles on Business and Human Rights, the ILO Declaration on Fundamental Principles and Rights at Work and the Women’s Empowerment Principles. We have consulted widely on a RELX Human Rights Policy which we will launch in 2024. Data privacy Data is integral to the solutions we provide that further our unique contributions as a business, including protecting consumers from the risk of fraud; allowing secure online transactions; improving access to financial, healthcare and government benefits; and delivering high quality medical care. Recognising concerns and sensitivities around personal data, our commitment to data privacy remained a critical RELX priority in 2023 and continues to be supported by strong governance, transparency and accountability. Dedicated privacy teams implemented requirements for compliance with personal data protection regulations around the globe. In the United States, RELX continued to advocate for clear national privacy laws that protect consumers, bolster consumer trust and allow businesses to invest in data driven activities that serve the public interest. CertainUSRELX companies have self-certified their participation in the Data Privacy Framework programme. We proactively take into account privacy concerns in developing and offering our solutions. Our Privacy Principles, available at www.relx.com/corporate-responsibility/being-a-responsible-business/privacy-principles, guide our approach to the responsible collection and use of personal data and are supplemented by internal privacy policies and guidance that are updated by our privacy offices to respond to new requirements, best practices and expectations. We undertake activities and training that deepen employee awareness about data privacy. For Data Privacy Day 2023, we organised internal panel discussions focused on privacy, AI and trust. We also celebrated the winners of the annual RELX Privacy Principles Champions Competition, which recognises the achievements of employees in protecting personal data and implementing our Privacy Principles. 2023 PERFORMANCE Support of SDG 16 by increasing efficiency in fulfilling privacy requests at scale As laws granting individuals more privacy rights continue to emerge around the world, RELX is receiving more privacy rights requests. In 2023, RELX privacy teams improved the forms and mechanisms used to intake such requests in order to increase efficiency in responding to the requests. These measures enable more streamlined services so that individuals are empowered to exercise their privacy rights as quickly and as easily as possible. Cyber security We observed Cyber Security Awareness Month with both central and business specific initiatives aimed atimproving security understanding for employees. The theme for 2023 was Get Your Cyber Priorities Straight. Events included a new Cyber Security Escape Room Challenge; educational sessions on AI and Security, webinars on cyber security for all ages, and avoiding traps on social media. We also launched our bespoke video advice series, RELXCyberSecurityExpertsSay. In the year, 100%� of employees were included in monthly phishing simulation exercises. During 2023, we continued to enhance our security efforts with additional infrastructure monitoring capabilities both internally and through third parties. In addition to more than 1,000 questionnaires and audits by our customers annually, we also engage third parties to perform independent audits on certain of our products and services. These audits help build trust and assurance in our target markets, especially where sensitive personal information is involved. For example, we have completed SOC 2 audits on our Risk US datacenters and our Lexis+ product, in addition, our UK Risk products have been ISO27001 certified. 84%of ourproduct revenue in Risk is covered by a third-party audit. 2023 PERFORMANCE Support of SDG 16 through successful completion and testing of technical resilience enhancement initiatives across the business areas We invested more than $9.3m in 2023 across our business to enhance our technical resilience posture. This included initiatives in application dependency analysis, defining triage recovery order, implementation of resilient backups, and recovery testing, both desk-based and technical. Additional efforts will follow in 2024 to expand the scope of technical resilience applications and perform robust recovery testing. Independently assured |
| RELX Annual Report 2023 | Corporate responsibility governance 53 2023 PERFORMANCE Support of SDG 16 through continued advancement of African tax law codification pilots Taxes provide governments with the essential revenue necessary for public services that benefittheir citizens. Governments need codified tax laws to know when, how much and from whom they should be collecting. Citizens need codified and transparenttax laws to understand their liabilities and to advocate for fair collection and use of their remittances. Unfortunately, in many countries around the world, itis difficultfor tax authorities and taxpayers alike to access tax law in a complete, up-to-date and consolidated form. Work is currently underway on a pioneering Rule of Law project aiming to produce and maintain a set of freely available consolidated tax laws in Africa. RELX Tax, LexisNexis South Africa and the LexisNexis Rule of Law Foundation have worked closely with the Ministry of Finance in Ethiopia and made substantial progress in 2023. The project is close to completion and targeted for publication on theEthiopia Ministry of Finance’s website in the first half of 2024. In 2023, we secured the approval from the Rwanda Revenue Authority to commence a similar project in Rwanda. 2024 objectives By 2030 Security –SDG16 (Peace, Justice andStrong Institutions): Continued enhancement of our technical resilience posture across the business and expansion of applications and products covered by independent third-party assessments Privacy –SDG16 (Peace, Justice andStrong Institutions): Enhance processes for conducting privacy and data protection impact assessments Responsible tax –SDG16 (Peace, JusticeandStrongInstitutions): Continue to advanceAfrican tax law codification pilots Continued progressive actions that advance excellence in corporate governance within our business and continue providing information, tools and analytics that promote high standards of corporate governance by our customers Pensions and investments The Statement of Investment Principles for our UK pension scheme demonstrates that the Trustee recognises that consideration of financiallymaterialfactors,includingESGandclimaterisk,is relevant at different stages of the investment process. As long-term investors, the Trustee embeds consideration of such factors in its investment decision-making as they can have a material impact on risk and return. TheTrustee has produced a Responsible Investment Policy which has been shared with all investment managers. Throughout the year, theTrustee Board received presentations fromcorporateresponsibility (CR)expertsandthe Responsible Investment Sub-Group met on a number of occasions. Furthermore,theTrusteesubmitteditsfirstTaskforceon Climate-RelatedFinancialDisclosures (TCFD) reportintheyear. CR issues are also relevant to the investment decisions made byRE Venture Partners, RELX’s corporate venture arm. REV continues to invest in ethical AI, sustainable food technology and the creation of inclusive content for language learning. A responsible taxpayer Taxation is an important issue for us as well as our stakeholders, including our shareholders, governments, customers, suppliers, employees and the global communities in which we operate. We are transparent about our approach to tax. At www.relx.com/go/TaxPrinciples we provide details about our tax principles and globaltax contribution – broken down by regions and categories – along with our tax risk control framework. There are also case studies showing how RELX has made a positive contribution in tax-related areas to benefit society as a whole. RELX is a signatory to the BTeam’s Responsible TaxPrinciples. The B Team is a group of business leaders committed to sustainability, equality and accountability. Globally, in 2023, RELX paid £619m in corporate taxes, but also paid and collected much more in payroll taxes and indirect taxes. Market segments Governance and shareholder information Financial statements Financial review Corporate Responsibility Overview |
| Relevant SDGs 54 RELX Annual Report 2023 | Corporate responsibility Our people At RELX, we understand that people value a sense of real purpose at work: knowing that their actions are contributing toward something positive for themselves, their colleagues, their customers, the environment, and society. The nature of our business means our people experience this in a number of ways, including advancing the rule of law, improving outcomes for patients, or helping customers achieve their goals; it’s at the heart of the relationship between RELX and its people. Supporting our employees is a core principle. We strive to create an inclusive, diverse and collaborative workforce and an environment which encourages employees to seek improvements in all they do. We have 130 Employee Resource Groups that allow colleagues to collaborate, advocate and engage communities, furthering inclusion and diversity at RELX. We conduct annual company-wide employee opinion surveys to understand what is working well and where we can do better to support our employees’ experience. In 2023, our employee survey received responses from approximately 88% of our global employee population. Training and Development RELX has always ensured I have the training and support to succeed in my job and progress to the next stage of my career. Suzanne Perry Group Treasurer, RELX At RELX, we provide our people with resources, tools and experiences to help them perform and grow. In 2023, we invested over $15m and more than 506,000 hours in learning and development opportunities that are regularly refreshed based on employee feedback and business impact. The effectiveness ofthese development options is tracked through our employee opinion survey, which monitors internal mobility and employee satisfaction with learning provision. In 2023, we had two key cross-RELX focus areas for skills development. Knowing that people manager capability is a factor in driving employee performance and engagement, we created the Manager CORE programme to enhance manager skills. More than 800 managers participated in 2023 and rollout will continue through 2024. As a technology-driven business, we have also continued our focus on technology skills development in the year, covering topics like artificial intelligence. Learning opportunities are designed to ensure employees do not only gain knowledge, but also have an opportunity to experiment and test their capabilities. Our CEO and executive committee members care deeply about helping our people to develop and each year work alongside other senior leaders to conduct organisational talent reviews. This is underpinned by Enabling Performance, our approach to personal development, which reviews skills and achievements and identifies opportunities for recognition and advancement. Enabling Performance encourages regular and impactful performance, development and career conversations for all employees. Many of RELX’s most senior leaders benefit from active focus on their present and future career objectives through our Management Development Process, which involves skills assessment and the creation of a personal development plan. Progress against development plans is regularly updated to ensure that career aspirations are being met and factored into succession planning, through the annual Organisation Talent Review Process, led by the CEO and Chief HR Officer. We offer a global mentorship programme, NetWorx, which is open to all on request. This digital mentoring platform recommends matches based on individual profiles and specific goals, creating six month long mentoring relationships. In 2023, the platform supported more than 1,800 active mentoring pairs. People We owe our success to RELX’s talented employees, including technologists, researchers, event directors, product managers, data scientists and many others. They are driven by a strong sense of purpose, and they count on us to create a fair, challenging, rewarding and supportive work environment where they can achieve their potential. Heather Williams Director, Product Management Elsevier We get to work on meaningful problems and contribute to important outcomes. I can go to sleep at night feeling like what I do makes a difference to the world. 2023 Comparably Best Global Company Culture list § 7th – Elsevier § 8th – LexisNexis Legal & Professional § 10th – RX § Comparably Best Work-Life Balance Award – LexisNexis Risk Solutions |
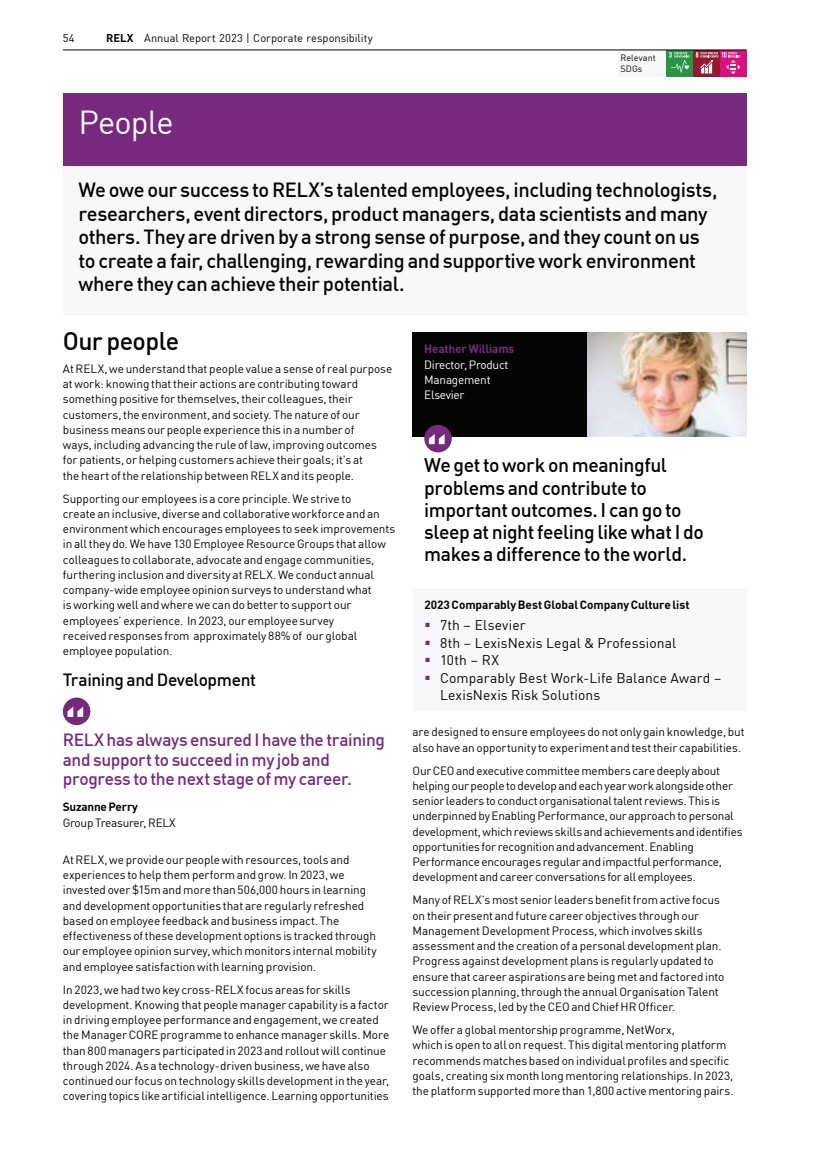
| RELX Annual Report 2023 | People 55 Inclusion and Diversity I have found true allyship here at RELX and an open, free, comforting space to be yourself. James Berry Senior Technical Writing Analyst, LexisNexis Risk Solutions At the heart of our approach to inclusion, is the belief that everybody should be able to succeed and grow in a business that values them. Feeling you work for a company, a manager and a team that really sees and embraces who you are is what inclusion is all about. Inclusion is to feel heard, to be valued, to contribute and to access opportunity equally, regardless of personal characteristics. We encourage and promote diversity of all types and believe that RELX derives competitive advantage from the breadth of backgrounds, diverse perspectives, opinions and differing ways of thinking that our people bring to everything they do. This is underpinned by our Code of Ethics and Business Conduct, where we prohibit discrimination and recruit, hire, develop, promote and provide conditions of employment without regard to race, colour, creed, religion, national origin, gender, gender identity or expression, sexual orientation, marital status, age, disability or any other category protected by law. This includes accommodating employees’ disabilities and religious beliefs and practices. RELX Employee Resource Groups (ERGs) encourage colleagues to collaborate, advocate and engage communities, furthering inclusion and diversity at RELX. ERGs help advance a culture of inclusion, and this is further supported by allowing all employees to take two days paid time-off per year for ERG-sponsored activities. In 2023, there were 130 active ERGs and employees recorded over 19,000� ERG hours. A highlight of our 2023 ERG activity was the Inspiring Inclusion series of virtual events, designed to help colleagues understand and embrace the diversity of our global business. More than 3,200 employees participated and external speakers included Makaziwe Mandela, a social and political justice advocate highlighting issues affecting African communities and trans activist Max Siegel. Our 2020-2025 inclusion goals, covering all aspects of diversity, guide our efforts and in the year we progressed them through a variety of targeted initiatives. Business area initiatives include: LexisNexis Risk Solutions’ Ignite and Accelerate is a bespoke leadership development programme with mentoring, coaching and sponsorship for over 61 high-potential women to date, to help further their career development. Since 2019, 62% of participants have been promoted, with an 83% retention rate. Elsevier’s Rising TIDE Internship Programme is an ongoing internship programme, where college students and recent graduates from diverse backgrounds received paid internships to join technology, product development, publishing, marketing, and finance teams. There were 24 participants in 2023. Elsevier was named best company for diversity by Comparably in the year. LexisNexis Legal & Professional was recognised as a Best Place to Work for Disability Inclusion in the year, receiving a top score of 100 from the Disability Equality Index. The Project Empowerment scheme continued which provides global training on how to successfully embed product accessibility. RX was awarded the Race Equality Matters’ Trailblazer status in recognition of its work to address racial inequality within the organisation through training and recruitment initiatives. It recognised RX’s actions to create a more psychologically safe environment, increase representation of people of colour in the workforce, and improve the diversity of its candidate pipeline. Gender In 2023, the gender diversity of our senior leader population was steady at 31% women senior leaders, while our women people managers increased from 44% in 2022 to 45%. In 2023, women comprised 40% of the Board. We have implemented a range of initiatives to enhance career development opportunities for women, particularly those who have the potential to grow into senior leadership roles. These vary by business area but typically involve mentoring, coaching and sponsorship to support career journeys. For example, Elsevier’s Developing Talent for Gender Equity programme started in 2019, with 220 alumni to date. Individuals who have completed the programme are more likely to appear on a succession plan, be promoted or have a job move, demonstrating improved talent outcomes. Our business relies heavily on technologists and we need to attract the best talent to support our business ambitions. We directly employ approximately 8,000 technologists, 26%� of whom are women and we aim to increase that number through a variety of initiatives including the Women in Tech Mentoring programme, Tech Talent Charter and participation in events such as the Grace Hopper conference. Employees 50% 50% 50% 50% 51% 2019 2020 2021 2022 2023 Managers 42% 42% 44% 44% 45% 2019 2020 2021 2022 2023 Senior leaders 30% 28% 30% 31% 31% 2019 2020 2021 2022 2023 Gender (% women) Independently assured Market segments Governance and shareholder information Financial statements Financial review Corporate Responsibility Overview |
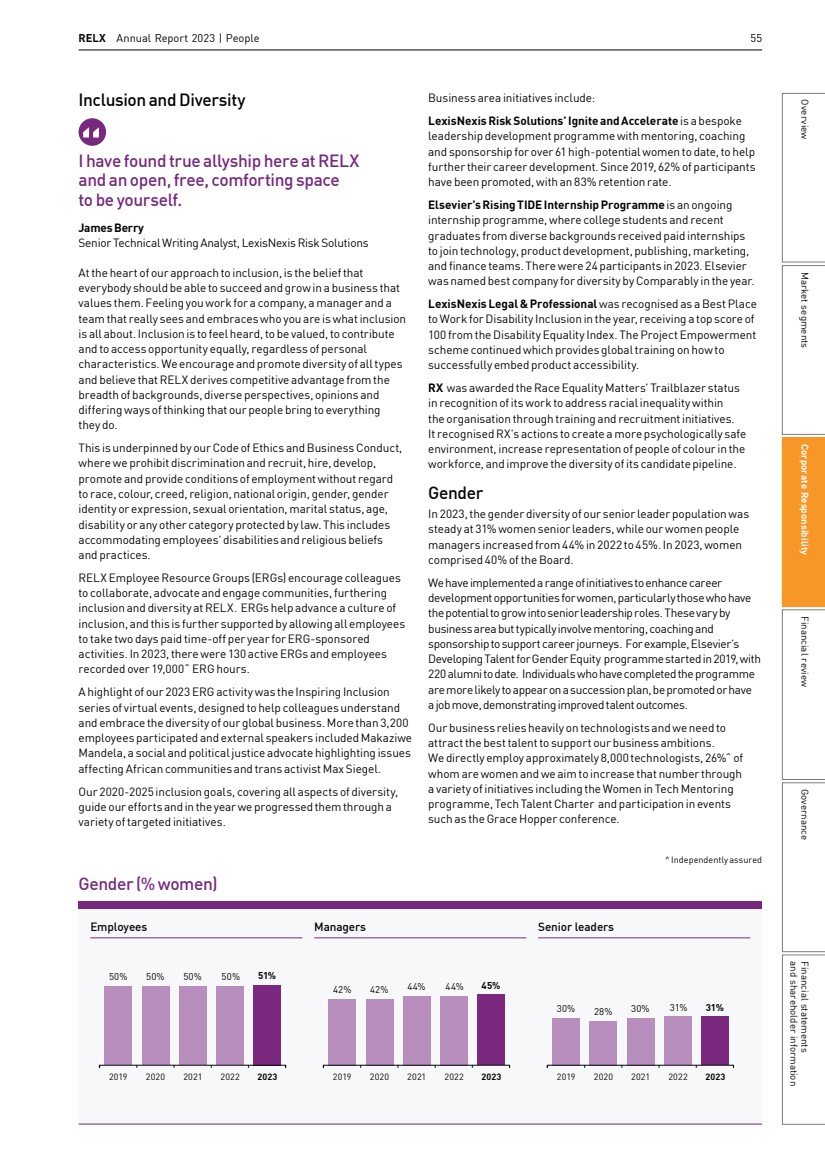
| 56 RELX Annual Report 2023 | Corporate responsibility RELX is a signatory to the Women’s Empowerment Principles, aUnited Nations Global Compact and UN initiative to help companies empower women and promote gender equality. We comply with employee-related reporting requirements, and our business areas publish UK gender pay gap reports as required by UK legislation. They can be found at www.relx.com/ corporate-responsibility/engaging-others/policies-and-downloads/local-reporting-requirements. Women Men Senior leaders* 141 31% 310 69% All employees** 18,615 51% 17,885 49% * As defined by our internal job architecture. ** Full-time equivalent. 2023 PERFORMANCE Expand the Women in Tech mentoring programme with more pairings The Women in Tech Mentoring programme aims to increase the representation of women in technology by developing their capabilities and empowering them to make conscious career decisions. The programme invites women who are interested in moving into a technology field or role to apply. They are paired with women and men with experience in technology who serve as mentors for nine months; 358 employees participated in the programme in 2023, a 44% increase over 2022. Race and ethnicity Ethnic minority representation in the US and UK was 29%, two key jurisdictions which account for approximately 56% of our employee base. Ethnic minority senior leaders increased from 12% in 2022 to 15% in the year, and ethnic minority managers also increased from 19% in 2022 to 20% in 2023. Atleast one member of our Board of Directors is from a minority ethnic background, in line with the UK Parker Review. We have a number of initiatives underway that focus on race and ethnicity and support career advancement including talent development programmes such as Risk’s Emerge and Evolve that provided 31 employees with coaching, leadership skills and enhanced visibility, preparing them for more senior roles. Our ongoing fellowship programme in partnership with the African Ancestry Network ERGand the LexisNexis Rule of Law Foundation selected 15 fellows from Historically Black College orUniversity Law School Consortium students to further develop their leadership skills with support from LexisNexis colleagues. 17% 13% <1% 3% 4% 1% 61% Employees UK 14% 9% <1% <1% 2% 6% <1% 67% Employees US 23% 7% 2% <1% 1% 1% 66% Managers 13% 5% 5% <1% <1%<1% 1% 75% Managers 3% 2% <1% Senior leaders 74% 20% <1% White Asian Black Multi-racial Other Prefer not to disclose Unknown 10% 4% 5%1% Senior leaders 79% <1%<1% White Asian Black Hispanic Multi-racial Indigenous Prefer not to disclose Unknown Ethnicity data is 98% self-reported in the US and 100% self-reported in the UK. Ethnicity |
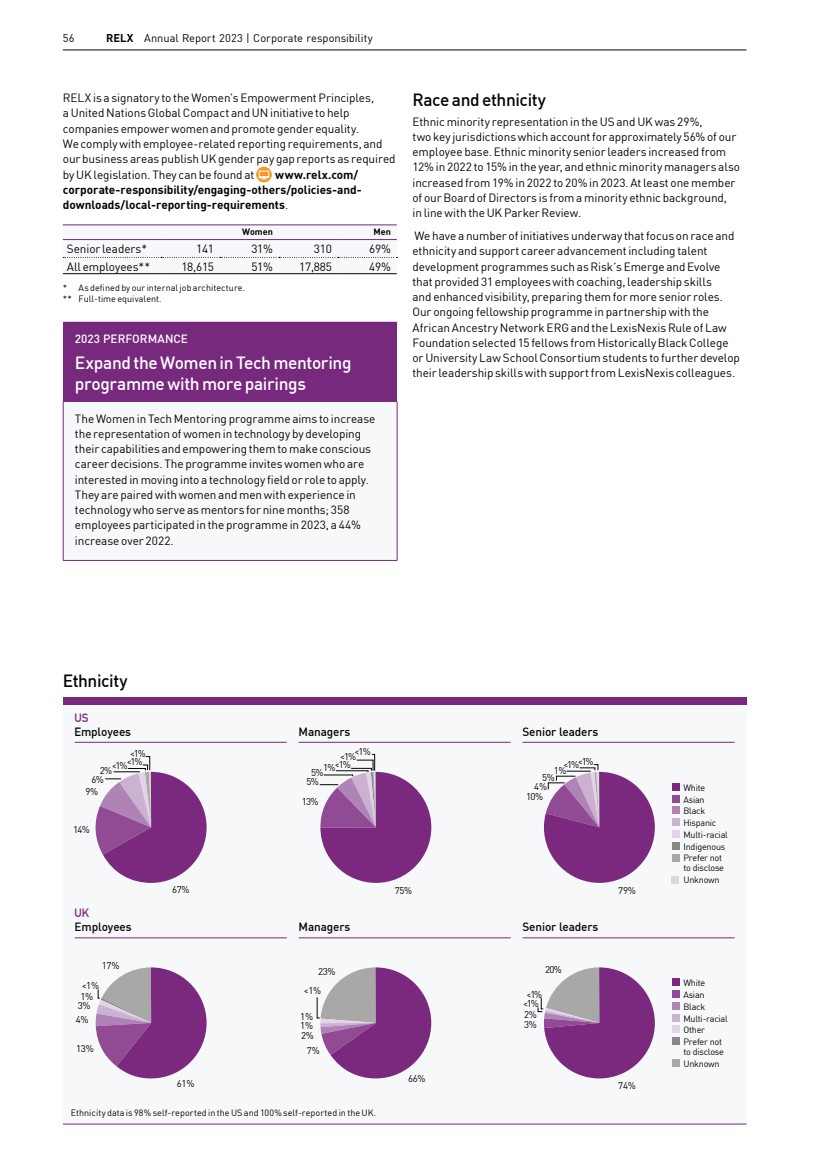
| RELX Annual Report 2023 | People 57 LGBTQ+ RELX scored 97% in the 2023 Workplace Pride Global Benchmark, receiving the Advocate designation for LGBTQ+ workplace inclusion for a fourth consecutive year. We also scored 100% in the Human Rights Campaign Foundation’s 2023 Corporate Equality Index, the national US benchmarking tool on LGBTQ+ corporate policies, practices and benefits on workplace equality. We launched the Proud to be RELX mentorship programme which brings together the LGBTQ+ community and its allies across RELX, inspiring personal growth, career development, and a greater sense of inclusion. 77 colleagues signed up for the programme, forming 38 mentoring pairs. To ensure we are recruiting diverse talent, we joined myGwork, the largest recruiting platform for the LGBTQ+ community. We are a member of the Open for Business Coalition which constructs and promotes the economic and business case for LGBTQ+ inclusion. Disability Our Enabled ERGs champion disability inclusion across our business areas through training, events and mentoring. Disability Fundamentals is our online interactive training for managers and colleagues to learn about disability awareness, disclosures and accommodations. Our CEO is a signatory to the Valuable 500, a global CEO community revolutionising disability inclusion. We continue to strengthen and embed disability inclusion for our employees. Risk launched its disability allyship track which aims to educate on what it means to be a stronger ally to the Disabled and Neurodiverse community. Elsevier launched its Enabled Mentoring Programme in 2023, a programme designed to empower individuals with disabilities and create a more inclusive work environment. Legal was recognised as a Best Place to Work for Disability Inclusion in the year, receiving a top score of 100 from the Disability Equality Index. RX partnered with health and safety and legal teams to develop an Accessible Events Survey, to help identify accessibility improvements that can be made at future RX shows. Inclusive workplace Throughout the organisation there is an ingrained culture of trust, collaboration and respect, which is exemplified by the flexible working conditions that help to ensure a comfortable work-life balance. George Spice Head of eSales, Elsevier We have developed Ways of Working policies in the US, UK and the Netherlands to establish a framework for hybrid and flexible working that balances the needs and wishes of employees with the requirements of our business and to help managers make decisions. We have established policies for parental leave across RELX. In the US our Modern Family Leave benefit offers up to 14 weeks of paid leave following the birth of a child or adoption and up to 8 weeks of paid leave to care for an eligible family member with a serious health condition. In the UK we have recently implemented a new parental leave policy across all business areas covering maternity, adoption, partner and shared parental leave. It applies to all, regardless of sexual orientation or gender and offers 26 weeks enhanced maternity leave and six weeks of partner leave. Across the business, we have provided training which encompasses inclusive leadership, unconscious bias, as well as psychological safety workshops for managers and teams. We measure how psychologically safe our employees feel through regular surveys and make intranet resources available to everyone. 2020-2025 Inclusion goals Gender: Increase women in management, senior leadership and technology roles over time Race and ethnicity: Increase the racial and ethnic diversity of our workforce over time LGBTQ+: Foster an LGBTQ+ supportive workplace tracked through employee surveys Disability: Foster a disability supportive workplace tracked through employee surveys Inclusive workplace: Establish minimum global standards in areas such as flexible working and leave benefits; continue impactful global inclusion training and track effectiveness, including through employee surveys; engagement on inclusion across RELX, with leadership involvement and grassroots employee participation, including through ERGs Our Inclusion and Diversity Policy is available at www.relx.com/cr-downloads. 41 to 50 23% 30 and under 23% 51 and over 20% 31 to 40 34% Employee age split Market segments Governance and shareholder information Financial statements Financial review Corporate Responsibility Overview |
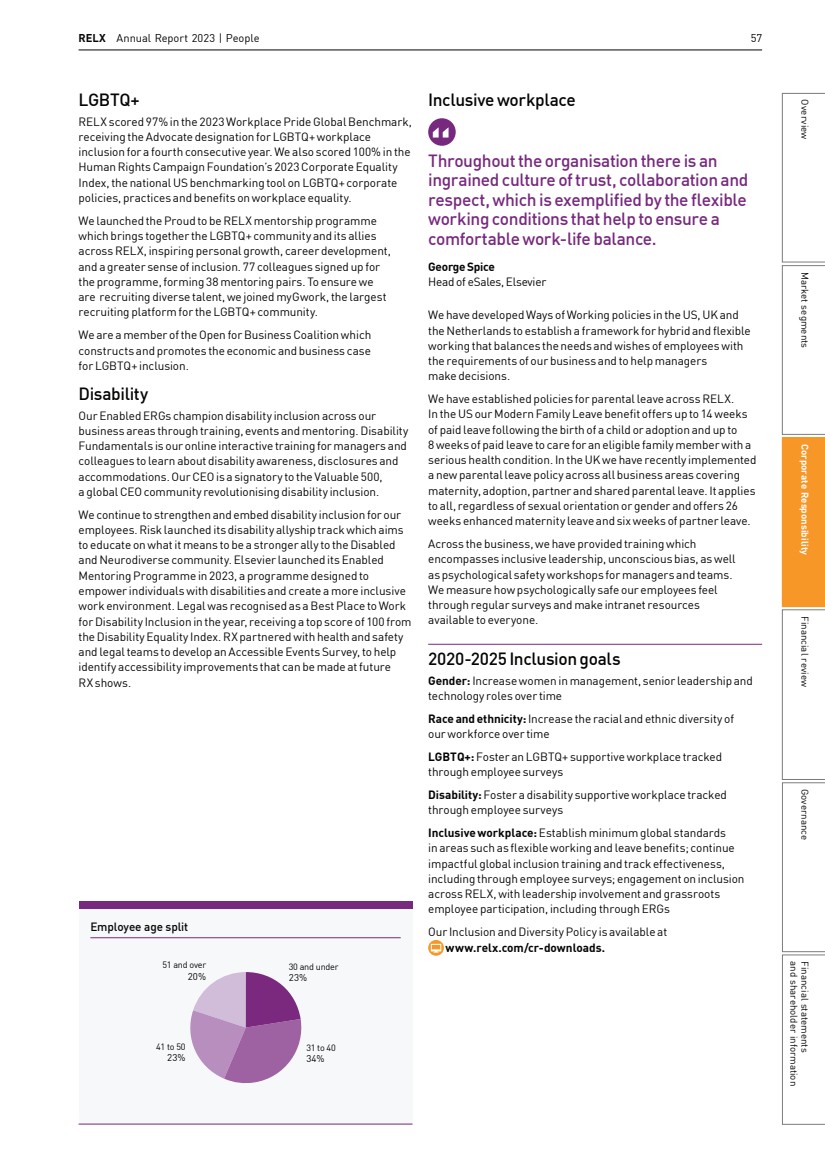
| 58 RELX Annual Report 2023 | Corporate responsibility Health and safety The importance of employee health and safety is emphasised in the RELX Code of Ethics and Business Conduct and in the RELX Health and Safety Policy, both available on www.relx.com. These documents commit us to providing a healthy and safe workplace for all employees, as well as safe products and services for customers. The CEO is responsible for health and safety on behalf of the Board. We consult with employees globally on health and safety through staff and works councils and reinforce good health and safety practice through regular communications, including a dedicated intranet site with relevant information. We also hold regular Health and Safety Committee meetings. We provide tailored health and safety training to employees and use the services of third parties to assist us in ensuring compliance with local health and safety rules and to promote best practice. This is particularly important for employees at higher risk of injury in the workplace, including those that work in our book warehouses and exhibitions. Where necessary, we engage local specialists to conduct safety reviews or air quality tests at specific locations. We also provide employee support following any incident or health concern. There were no work related deaths reported in 2023. With a number of employees continuing hybrid working arrangements (working from both an office location and home), we provide health and safety support for both office and home working, and over 5,000 employees have completed our Healthy Working programme which includes personalised risk assessments and action plans. We regularly monitor and ensure our buildings are maintained and comply with relevant health and safety legislation and standards, in conjunction with third parties and landlords, where appropriate. RX has instituted an internal programme of recording, reviewing and continual learning from health and safety-related incidents to enhance safety across our events, given the safety risks during the construction and dismantling of an exhibition event. The business regularly reviews mitigations to ensure hazards are appropriately managed, and engages with local and global exhibition industry associations, working together to drive best practice and safety standards at all our events. Health and Safety Performance 2019 2020 2021 2022 2023 0.06 0.01 0.01 0.03 0.02 Lost time incidents per 200,000 hours worked Slip trip fall 67% Use of tools or equipment 22% Manual handling/repetitive strain 11% Lost time incidents by type Accident reporting covers approximately 82% of global employees. |
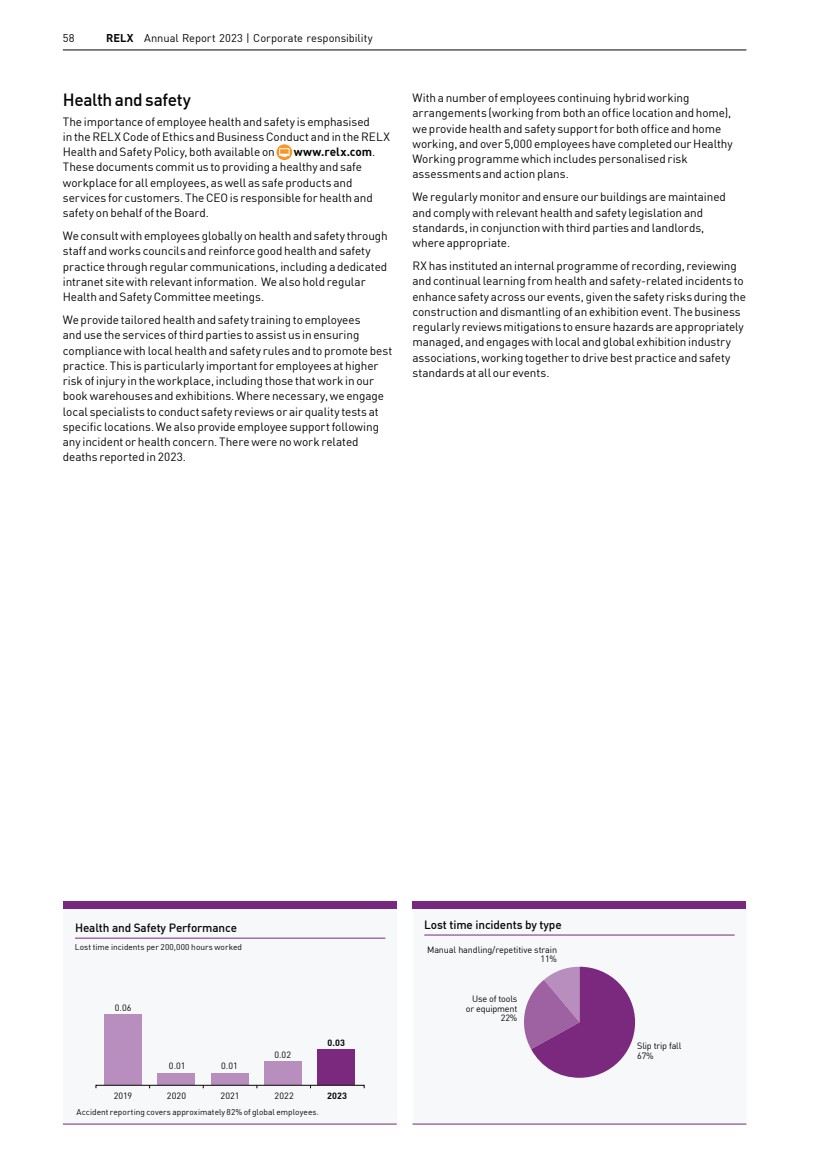
| RELX Annual Report 2023 | People 59 Well-being and support What I love about RELX’s well-being programmes is that they provide a platform for people to connect and make work a happier place. Mai Trinh Head of Tax Risk, Reporting and Reputation, RELX We support the physical and mental health of our people, with dedicated health and well-being resources available to all employees including a well-being hub with free access to the Headspace mental health app, and fitness classes, as well as training courses. Additionally, we have a network of more than 90 Well-being Champions. We offer employee assistance programmes to all our employees, providing professional counselling to help them and their family members with personal or work-related issues that may impact their health or well-being. This service is available 24 hours a day, 365 days a year. 2023 PERFORMANCE Relaunch Fit2Win global employee fitness competition In 2023 we relaunched the RELX Fit2Win competition where employees worked in teams to climb a virtual mountain by logging their activities on an app; running, cycling, swimming, or walking over a two-week period. Over 100 teams took part, with more than 400 participants logging 7,553 activity hours. The winning teams received cash donations ($1,000, $750, $500) to charitable causes of their choice, which included the Center for Animal Rescue and Enrichment of St. Louis, World Bicycle Relief and UNICEF. Reward We have robust and well-established reward mechanisms across RELX, with a strong emphasis on performance, fairness, equity and market competitiveness. We provide reward education for people managers across our four business areas which includes training on pay equity; they also have access to on-demand reward eLearning modules with content added to onboarding materials for new managers. In 2023, we continued our efforts to help employees understand more about reward practices with materials explaining market benchmarking and how we make sure rewards are competitive. RELX is a Living Wage accredited employer in the UK, certified by the Living Wage Foundation. We regularly review our global salary benchmarking data, using a variety of data sources. We make adjustments based on market competitiveness and pay equity and we formally review wages at least once a year. 2023 RELX people in numbers FTE employees 36,500 Full-time employees (%) 95% Part-time employees (%) 5% Average length of service (years) 8 Total hours worked by all employees in the year 64m Temporary workers (%) 2% Contingent workers 1,300 Employees represented by a collective bargaining agreement (%) 13% Global HR information system coverage 100% Turnover Total turnover rate 11.9% Voluntary turnover rate 8.4% Involuntary turnover rate 3.5% Training and development Investment in training $15m Training hours 506,000 Employee engagement 68% Reward Employees with variable pay opportunities 58% Employees with access to share purchase programmes (US/UK/NL) 60% Absence Absence rate (number of unscheduled absent days out of total days worked in 2023, UK and NL) 1.31% US Family Medical Leave Act requests 1,723 2024 objectives By 2030 Inclusion – SDG 10 (Reduced Inequalities): Continue to engage colleagues globally through our Inspiring Inclusion programme Pay equity – SDG 8 (Decent Work and Economic Growth): Continue to assess pay competitiveness and pay equity Well-being – SDG 3 (Good Health and Well-Being): Expand World Well-being Week activities across RELX through enhanced programming with greater reach Continued high-performing and satisfied workforce through talent development, D&I and well-being Market segments Governance and shareholder information Financial statements Financial review Corporate Responsibility Overview |
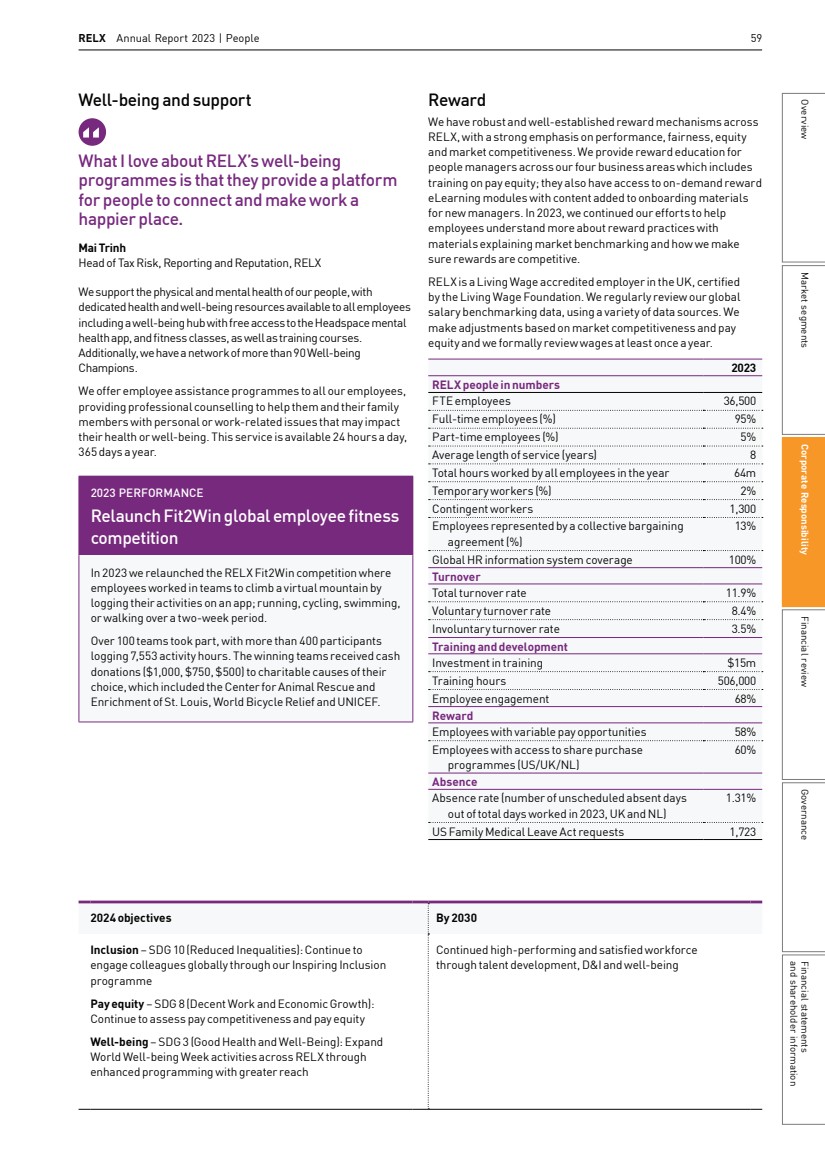
| Relevant SDGs 60 RELX Annual Report 2023 | Corporate responsibility Improving customer outcomes Our goal is to improve outcomes for our customers by providing information-based analytics and decision tools for professional and business customers that benefit their daily work. Peer Review To ensure the quality of scientific papers submitted to Elsevier, primary research journals undergo peer review. This means thatonce received from an author, editors send papers to specialist researchers in the field. In most disciplines, this is done anonymously. In some cases, the process is ‘double blind,’ where both the reviewer and the author are anonymous, to limit bias basedon an author’s gender, country of origin, academic status orprevious publication history. It may also help ensure that articles written by renowned authors are considered on the content of their papers, rather than reputation. Elsevier’s Peer Review Workbench (PRW) provides researchers and academics, upon application, access to Elsevier journal manuscript metadata to allow systematic analyses of peer review processes at scale. PRW advances transparency and evidence-based studies in the journal editorial and peer review process. Elsevier also enables the automatic sharing of peer review metadata with a feed of peer review information from our submission and peer review system Editorial Manager to Open Researcher and Contributor ID (ORCID) once the peer review process has been completed. ORCID is a not-for-profit, cross-publisher organisation that fosters trustworthy connections between researchers and their institutions. Researchers receive aunique ID they can connect to their peer review activities across journals and publishers to showcase their reviewing work. Data is supplied directly by participating publishers and cannot be entered manually ensuring reliability. Read more about peer review at www.elsevier.com/ reviewers/what-is-peer-review Editorial Standards Maintaining the integrity of what we publish is vital to the trust of customers and other stakeholders. Our Editorial Policy, available to all staff (and publicly available on www.relx.com/corporate-responsibility/engaging-others/policies-and-downloads), makes clear our respect for human rights, pluralism of sources, ideas and voices. Customers We recognise that the growth and future of our company is dependent on our ability to deliver information-based analytics and decision tools in a sustainable way to customers. The first question we ask ourselves when developing our products is, will this help our customers solve a problem? Through a continuous process of customer feedback and engagement, we gain the insights we need to ensure our solutions canhelp our customers answer questions, solve problems and planfor the future. Gemma Hersh SVP Global Academic and Government Sales Elsevier |
| RELX Annual Report 2023 | Customers 61 Digital knowledge and innovation: advancing customer goals Across RELX, we work to address customer challenges through digital innovation. In 2023, electronic products and services accounted for 83% of revenue, up from 30% in 2003. Risk ICIS, part of Risk, is a global provider of chemical and energy marketing intelligence. In 2023, ICIS launched the first Pyrolysis OilPricing Indices to address increasing consumer demand for the pricing of chemical recycling outputs. The new price series sits alongside ICIS’ comprehensive coverage of key recycling chains. Supplier Carbon Footprints, which harnesses ICIS’ understanding of chemical markets combined with carbon footprint data fromlifecycle data providers Carbon Minds, enables companies to identify, measure, and manage opportunities to reduce global supply chain emissions for chemicals and plastics, with ground-breaking GHG emission data by supplier, region and plant. For many businesses, Scope 3 emissions in particular account for most of the overall carbon footprint of a company. ICIScustomers are now able to report emissions and identify areas of focus, empowering customers tomake supply chain decisions that could significantly reduce their Scope 3 emissions. Scientific, Technical & Medical Elsevier announced Scopus AI in 2023 which provides summaries and relevant references in response to natural language questions about research topics. Scopus AI combines generative artificial intelligence with Scopus’ trusted content and data to help researchers gain deeper insights faster, facilitate collaboration, and increase the societal impact of research. Scopus AI provides summaries based on abstracts, allows navigation for extended exploration, and cites sources. Elsevier ensures that the content used in Scopus AI is rigorously vetted, based on over 29,000 academic journals from more than 7,000 publishers worldwide. Elsevierannounced an early access launch of ClinicalKey AI in the year, which helps physicians access accurate evidence-based information at the point of care, by combining Elsevier’s large corpus of trusted medical information with advanced AI technology. It features conversational search to accelerate access to evidence-based clinical information and adheres to industry data privacy and security standards and the RELX Responsible AI principles. Also in 2023, Elsevier launched EmBiology, an AI-driven research tool that provides visualisations of biological relationships, giving researchers a rapid understanding of disease biology and allowing them to focus on critical evidence. Researchers working in drug discovery and development are able to intuitively explore biological relationships and concepts to improve drug target and biomarker identification and prioritisation, enabling more confident decision making about what targets to pursue. 2023 PERFORMANCE Support of SDG 8 by rolling out the RELX Responsible AI Principles across the business areas As data science and artificial intelligence (AI) are increasingly applied across RELX to improve customer outcomes and business processes, we created the RELX Responsible AI Principles to guide their use. The Principles were published in 2022 and are publicly available at www.relx.com/ corporateresponsibility/engaging-others/policies-and-downloads. The Principles are accompanied by a RELX position paper on AI and a dedicated address that anyone can use to provide feedback or raise queries: ResponsibleAI@relx.com The Principles state: We consider the real-world impact of our solutions on people, we take action to prevent the creation or reinforcement of unfair bias, we can explain how our solutions work, we create accountability through human oversight, we respect privacy and champion robust data governance. The Responsible AI & Data Science (RAIDS) team works to implement the RELX Responsible AI Principles across the company. They are responsible for developing policy, processes, tools, resources and training to support teams working with data science, machine learning and AI in embedding the Principles in their day-to-day activities. In 2023, we published the RAIDS policy and accountability framework which is integrated into our new Data Science Project Review governance process and supported the business with rollout and adoption. The purpose of the policy is to support colleagues in implementing the RELX Responsible AI Principles in their business area, drawing on best practice from within our business and other organisations. Four primary RAIDS Champions, embedded across the company, provide ad-hoc training and support in priority areas, particularly around generative AI projects, as well as a wider network of more than 85 colleagues working on integration ofthe Principles in products and workflows. In 2023, they collectively supported more than 30 projects, held tailored workshops and training sessions and published a suite of self-service resources and training videos. Feedback from the workshops will inform a review and update to the Principles in 2024, reflecting the speed and scale at which AI is evolving. Market segments Governance and shareholder information Financial statements Financial review Corporate Responsibility Overview |
| 62 RELX Annual Report 2023 | Corporate responsibility Legal Legal introduced Lexis+ AI in 2023, a generative AI product designed to streamline legal research and drafting. The new platform delivers trusted results in an easy-to-use interface with hallucination-free, linked legal citations, combining AI technology with proprietary LexisNexis search technology. Itfeatures conversational search, intelligent legal drafting, insightful summarisation and document upload capabilities, all supported by encryption and privacy technology to keep sensitive data secure. In 2023, Legal launched InterAction+, a cloud based legal CRM solution to help lawyers manage relationships and identify opportunities and at-risk clients. With exclusive content from LexisNexis Legal and Professional, US customers can view litigation events by firm, practice area and jurisdictions of clients and prospects. Exhibitions Digital event technology continued to transform the way RX’s customers connect and do business by enabling them to create and capture more value. Emperia is RX’s badge scanning mobile app that enables exhibitors to capture and qualify leads. In 2023 60% of exhibitors used Emperia at events where it was available and at RX’s ISC West and Interphex 2023 shows adoption rates reached 100%. RX collects and uses behavioural data to help its customers make better decisions. It’s Exhibitor Dashboard brings together event data and insights in real time, allowing customers to analyse their results, improve their event performance and justify financial investment. In 2023, the dashboard was made available to over 29,000 exhibitors at 104 RX events, of which 33% used the tool. Responding to customer needs Listening to our customers allows us to deepen our understanding of their needs and drive improvements. We do this through regular surveys, customer dashboards and feedback mechanisms. With input from customer insight teams across our company, we calculated a RELX-wide customer satisfaction metric showing that in 2023, 86% of customers would recommend working withRELX. Access to information In primary research we offer two separate payment models for our science and medical journals to suit author preferences: pay-to-read articles funded by payments for reading made by individuals or institutions; and pay-to-publish (commonly known as open access) funded by payments for publishing made by authors, their institutions or funding bodies, with the research freely available to read by all upon publication. We offer a range of pay-to-read and pay-to-publish options, both subscription-based and transactional. Nearly all of Elsevier’s 2,900 journals enable open access publishing. We welcome debate in government, academic and library communities regarding the mechanisms by which scientific outputs should be openly available and continue to create new access options together with industry partners. During 2023, Elsevier announced a geographical pricing pilot to support authors in low- and middle-income countries with equitable open access publishing options. The pilot will run across 143 of Elsevier’s Gold Open Access journals and tailor pricing structures according to Gross National Income per capita. The model aims to reduce financial barriers that hinder researchers and institutions from low- and middle-income countries from publishing research in Gold Open Access Journals. Elsevier continues to waive article publishing charges for authors in the lowest economic band. 2023 PERFORMANCE Support of SDG 17 by strengthening Corporate Responsibility and Sales team engagement In 2023, we developed materials to help sales teams build awareness of our CR priorities with their customers. This included an animated video highlighting how RELX products and services impact society and contribute to advancing the SDGs. The video was featured at the RELX global senior management conference and a longer version will be part of RELX onboarding materials and a new toolkit launching in 2024. We presented our Annual RELX SDG Customer Awards during the RELX SDG Inspiration Day. These included Neste, nominated by ICIS and Proagrica, part of LexisNexis Risk Solutions. Neste is pioneering more sustainable aviation fuel and has committed to supporting customers to reduce greenhouse gas emissions by at least 20 million tonnes of CO2 e annually by 2030. Solvay, a global leader in materials, chemicals and solutions, was nominated by Elsevier for its One Planet roadmap covering three categories; climate, resources and better life, with ten measurable commitments where the company has the biggest positive impact. Panasonic, nominated by LexisNexis Legal & Professional, aims to reduce CO2 emissions by more than 300 million tonnes, or about 1% of the current total global emissions, by 2050. RX nominated Silverback Films, using the power of film-making and story-telling to reveal the urgent truth of our changing planet to a global audience. We published visual stories for internal and external audiences to mark the SDG midway point and included a summary of tools and reports from across RELX that advance the SDGs such as LexisNexis Legal and Professional’s Exploring the Global Sustainable Innovation Landscape: The Top 100 Companies and Beyond Report, Elsevier’s Biodiversity Research in the Netherlands and Worldwide Report, and The RX Sustainability Playbook. Customers are increasingly engaged in corporate responsibility matters and to address this increased interest the CR team supports sales teams in responding to customer surveys and requests for information. Such requests have increased by more than 300% since 2021. |
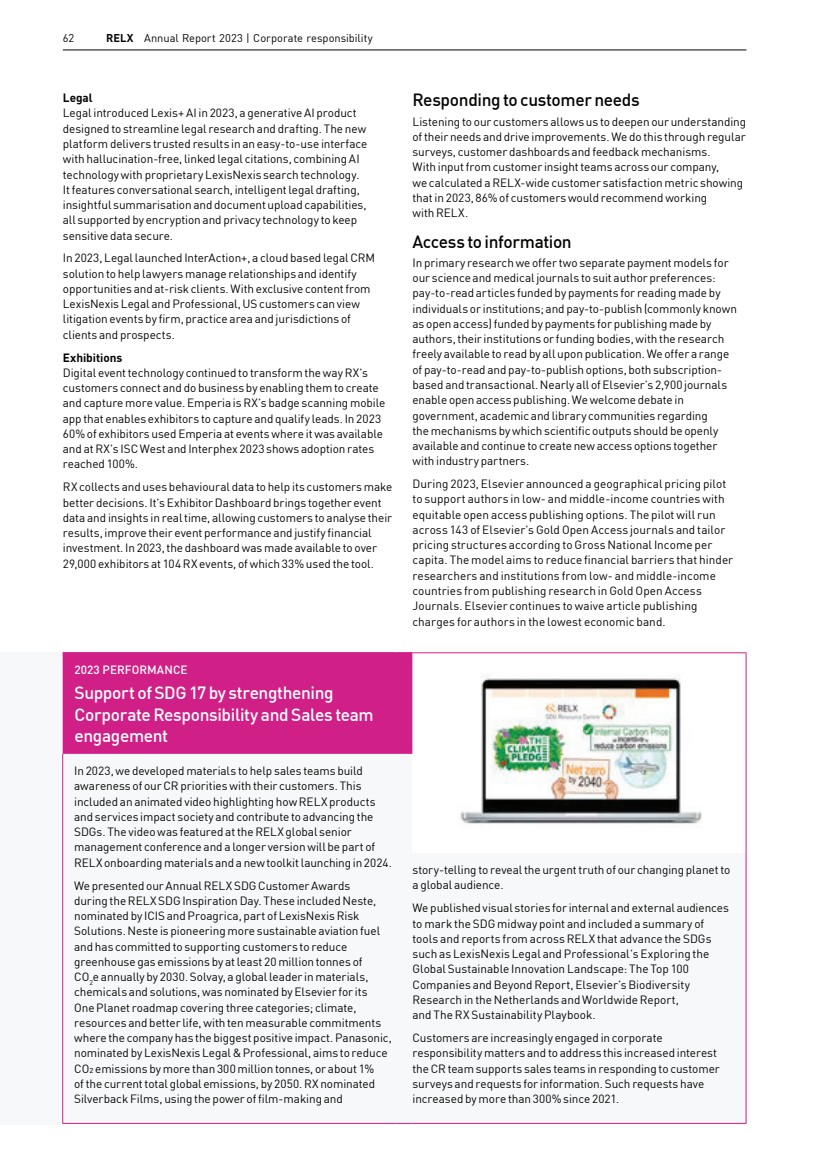
| RELX Annual Report 2023 | Customers 63 Elsevier is a partner of Clearinghouse for Open Research (CHORUS) which enables public access to funded research. CHORUS utilises publishers’ existing infrastructure for discoverability, search, archiving and preservation of scientific and medical research articles, and it is now integrated into the ScienceDirect platform. Furthermore, members of the public can read Elsevier’s peer-reviewed content through walk-in access at public and academic libraries around the world. Our ScienceDirect platform is available to the public through onsite user access from any participating university library or UK public library via the Access to Research programme. Providing access in countries with low resources is a priority for us. Through Research4Life, more than 11,500 institutions in over 125 low- and middle-income countries receive affordable access to over 200,000 peer-reviewed resources. Elsevier is a founding partner, providing around 21% of the content in Research4Life, as well as access to our abstract and citation database Scopus. Elsevier offers free media access to over 2,000 journalists through our newsroom. In addition, Patient Access provides patients and caregivers with access to individual papers related to medicine and healthcare at no cost, upon request, within 24 hours. Elsevier publishes a suite of nine journals, called Research Elements, which focus on research methods, data and equipment. Openly sharing and describing the methodologies and data generated by experiments improves the reproducibility of published research. Researchers who have published in these journals note benefits such as reaching new readers, sharing innovative technologies and making research more accessible. Bringing science into society We work closely with journalists to ensure that research findings are accurately and effectively communicated to the public, and that authors receive credit for their work. A number of journalists receive free access to all Elsevier publications via Elsevier’s Media Access programme. Researchers who published an outstanding peer-reviewed article that has significantly impacted people’s lives around the world, or has the potential to do so, are recognised with the Elsevier Atlas Award. The articles are made freely available and translated into everyday language, while author interviews are made public to encourage the dissemination or implementation of their findings. Content is linked to the SDGs and is featured on the RELX SDG Resource Centre. We provide essential resources in times of emergency, making full text articles free to access for healthcare professionals, researchers, librarians and members of the public affected by disasters. While the World Health Organisation has now ended the Public Health Emergency of International Concern categorisation for Covid-19 and Mpox, all related content published through July 2023 will remain freely available, encompassing early-stage and peer-reviewed research, as well as evidence-based clinical overviews, patient education and drug monographs. In 2023, Elsevier continued to offer free resources to Ukrainian researchers via a Ukrainian Academic Support page online where researchers can access waived and reduced author publishing charges for open access journals. They also have access to publishing resources on Researcher Academy, which provides researchers free e-learning modules developed by global experts and career advice. They can also register for free access to ScienceDirect, Scopus and SciVal as well as clinical resources such as ClinicalKey, Complete Anatomy and Osmosis. To support Ukrainian journal editors and authors, we worked with the Polish Academy and the Ukrainian Council of Young Scientists to deliver two workshop series, one for editors and another for authors. The Lancet celebrated its bicentennial in the year with a commitment to ensuring that medicine improves lives and that knowledge transforms society for the better. The Lancet affirmed its five key priorities – universal health coverage, mental health: climate health, health research, and child and adolescent health; emphasising collaboration with the medical community to advance healthcare and increase the social impact of science. Elsevier’s Library Connect programme, with a website, newsletter, events, social media offerings, as well as a new Library Connect Academy, provides library and information science professionals worldwide with opportunities for knowledge sharing. As of 2023, there were 60,000 Library and Information Science (LIS) professionals globally subscribed to the Library Connect Newsletter, a complimentary publication, covering LIS best practices, trends and technology. During 2023, the Library Connect website, containing articles, infographics, videos and other resources, received approximately 30,000 visitors. The Library Connect website is currently ranked sixth in the top 90 librarian blogs and websites for librarians by Feedspot, a content aggregator for blogs and websites. Accessibility We strive to empower all people, including persons with disabilities, by ensuring our products and services are accessible and easy to use by everyone. Our commitment to accessibility is embedded across RELX and advances our Inclusion Policy. We follow the WebContent Accessibility Guidelines (WCAG 2.1 levelAA). We maintain an Accessibility Policy that highlights industry standards and tools to embed accessibility into our products and our business operations. We apply best practice from the RELX Accessibility Policy across hundreds of digital products and websites. Our Accessibility Policy is available at www.relx.com/ cr-downloads. Risk employees continued enhancing our A11yCAT tool to help developers address accessibility bugs in real time while edition 2.0 was successfully beta tested in the year for release in 2024. It will highlight code to help developers discover errors. Elsevier empowers all learners by providing features such as full-text search, marked tables, magnifiable content, screen reader compatibility and high-contrast text. Its Health Education Systems Incorporated (HESI) Delivery Operations team continued to work with HESI testing candidates that register to take a HESI exam remotely via our remote proctoring vendors. Since 2019, the team has processed more than 800 candidate accommodation requests, ensuring that these candidates have an accessible and inclusive experience. In 2023, members of the Accessibility Working Group logged over 275 accessibility projects and Elsevier’s Global Books Digital Archive fulfilled more than 3,200 disability requests, 91% of them through AccessText.org, a service we helped establish. In 2023, Elsevier was designated a Global Certified Accessible publisher by Benetech, a non-profit organisation based in Palo Alto, California. The certification recognises publishers that meet specific accessibility criteria to support readers with disabilities and learning differences. Relevant file testing received 100% scores in all categories. In 2023, Elsevier’s ScienceDirect achieved zero errors on its homepage with the WAVE accessibility testing tool, making the research platform number one of the top 1m websites ranked in the 2023 WebAIM Million accessibility report. Market segments Governance and shareholder information Financial statements Financial review Corporate Responsibility Overview |
| 64 RELX Annual Report 2023 | Corporate responsibility 2023 PERFORMANCE Support of SDG 10 by expanding the Accessibility Champions model across RELX 2024 objectives By 2030 Customer engagement – SDG 17 (Partnership for the Goals): Create internal Sustainability Hub to support customer enquiries and engagement Quality – SDG 8 (Decent Work and Economic Growth): Update RELX Responsible AI Principles to keep pace with evolving technology Accessibility – SDG 10 (Reduced Inequalities): Develop accessibility specialist career track for RELX employees Continue to expand customer base across our four business areas through excellence in products and services, active listening and engagement, editorial and quality standards, and accessibility; a recognised advocate for responsible marketplace practices RELX is committed to creating products that are usable by everyone including people who experience some type of disability. A network of Accessibility Champions advance the RELX Accessibility Policy and encourage teams to incorporate accessibility requirements from the start and to use best practices to ensure an optimal experience for disabled users. The RELX Accessibility Leadership Advisory Board convened during the year to address challenges and approaches to accessibility. We expanded the accessibility training model across the four business areas during the year. We also released an Introduction to Accessibility video accompanied by a quick start guide for product managers, ensuring accessibility requirements are embedded in our products. In 2023, we celebrated the fifth annual RELX Accessibility Leadership Awards, introducing a new award category for team leadership. Winners received a glass award with a braille inscription and featured in an all-employee news article. We also made a donation to the charity of their choice. Nominees were honoured for product enhancements to key products which led to the two highest Web Content Accessibility Guidelines (WCAG 2.1) compliance scores in Elsevier history and for improving accessibility for internal colleagues. In 2023, Elsevier signed the UK Publishers Association Accessibility Action Group Accessible Publishing Charter and also worked closely with university disability services offices, launching a survey and interviews to understand how to better serve students with disabilities. In the sixth year of Elsevier’s Accessibility Belting programme, 85 additional colleagues received belts (more than 340 people have completed the programme since inception). Additionally, the Elsevier Digital Accessibility Team provided awareness trainings for new hires as part of onboarding. They also conducted research into automated text descriptions and sonification to help users with disabilities better understand trends in data, holding six sessions with visually impaired people to better understand how to develop useful text descriptions for speech technologies. We worked with disability services offices, procurement officials and instructors across the world to provide Voluntary Product Accessibility Template (VPAT) and Accessibility Conformance Reports. Customers can also utilise the accessibility@relx.com Inbox to connect with an accessibility expert and make VPAT and report requests. In 2023, Risk completed 26 VPATs; Legal’s Accessibility UX team resolved over 100 customer enquiries and generated VPATs for 30 products. We promoted accessibility to outside companies and vendors throughout the year. RELX accessibility teams partnered with external content providers, including Highcharts, to advance accessible solutions for public benefit. Elsevier has collaborated with Highcharts for over eight years to continually improve the accessibility of its widely used chart library. 275+ Accessibility projects logged by the Accessibility Working Group, an increase of 83% since 2021 3,200+ Elsevier’s Global Books Digital Archive fulfilled 3,235 disability requests |
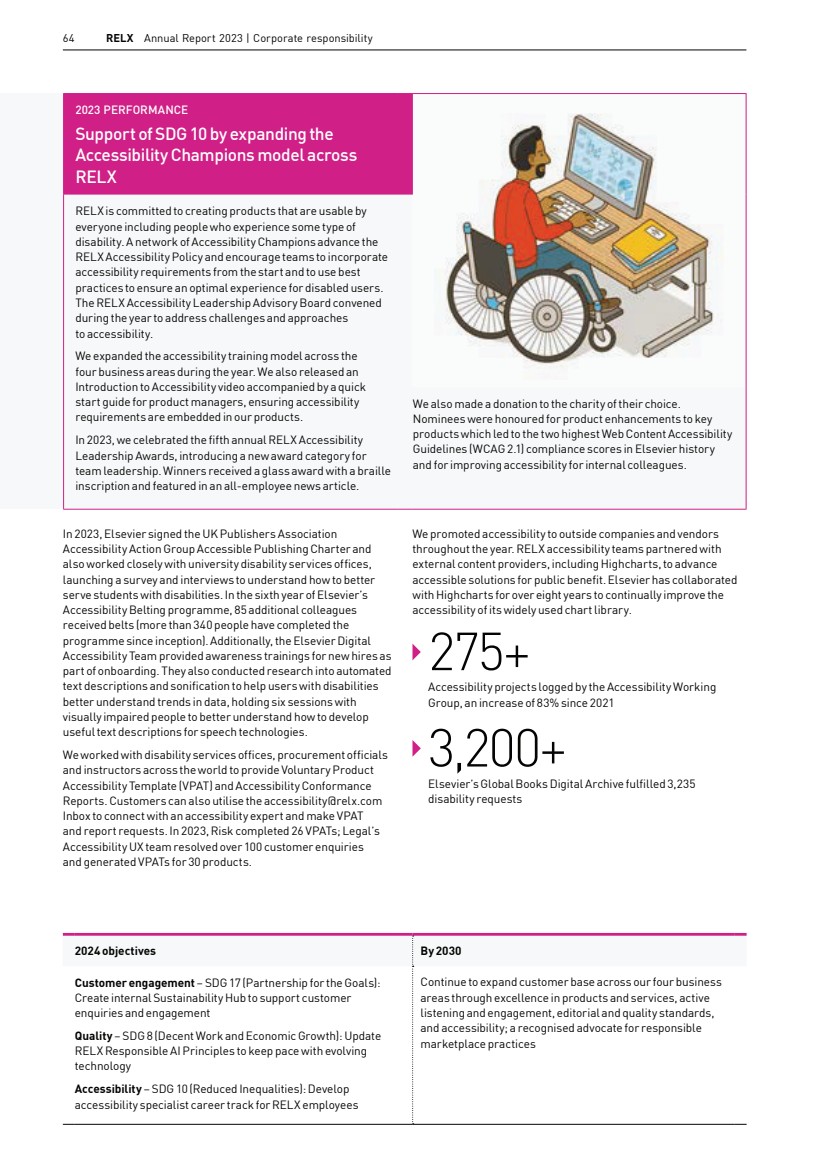
| Relevant SDGs RELX Annual Report 2023 | Community 65 RELX Cares, our global community programme, supports employee volunteering and giving that makes a positive impact on society. The mission of RELX Cares is education for disadvantaged young people that advances one or more of our unique contributions as a business. Employees have up to two days’ paid leave per year for their own community work. A network of over 245 RELX Cares Champions ensures the vibrancy of our community engagement. In 2023, we held the 13th Recognising Those Who Care Awards to highlight colleagues who have made outstanding contributions to RELX Cares. The eight winners of the individual award travelled to London to take part in volunteering projects with RELX charity partners. Two other individuals and teams were given the opportunity to make a donation to the charity of their choice. Each September, we hold RELX Cares Month to celebrate our commitment to our communities around the world. During the Month, over 3,300 colleagues across the Company took part in hundreds of volunteering and fundraising events. This included You Move, We Donate organised by Risk where colleagues were encouraged to get active in return for a company donation to charity; a mentoring activity for school and university students at Elsevier India; support for local food banks by US Legal colleagues; and preparing care packages for vulnerable women at LexisNexis South Africa. In the wake of disasters and emergencies in the year, including flooding in Libya, earthquakes in Morocco and Turkey and the war in the Middle East, we donated approximately $150,000 to Save the Children; Turkish charity Ahbap; World Central Kitchen and the British and International Red Cross. Community Contributing to our local and global communities is a responsibility and anopportunity. It is very important to help those inneed. Assisting someone or supporting a worthy cause gives me immense satisfaction to know I am making a real difference. 245+ A network of over 245 RELX Cares Champions ensures the vibrancy of our community engagement The mission of RELX Cares is education for disadvantaged young people that furthers one or more of our unique contributions as a business, including universal, sustainable access to information. Deidre Collins Executive Assistant and RELX Cares Champion LexisNexis Legal & Professional Market segments Governance and shareholder information Financial statements Financial review Corporate Responsibility Overview |
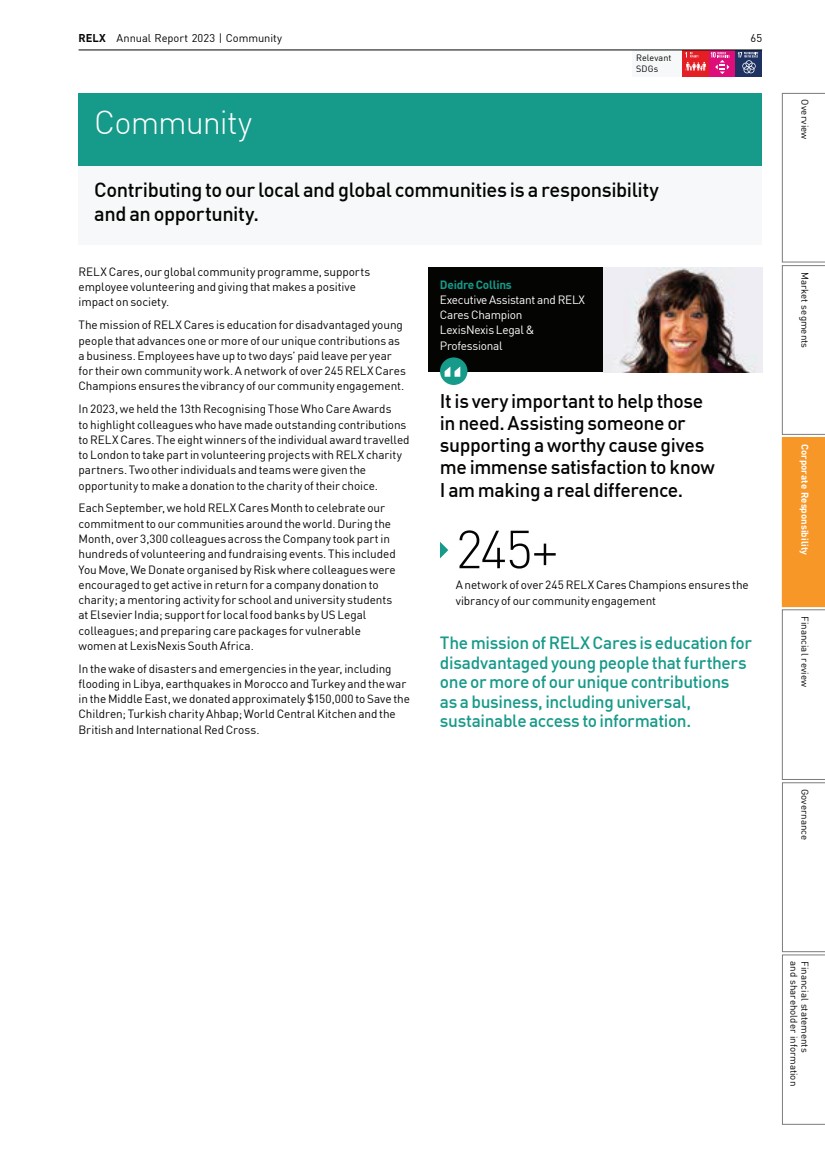
| 66 RELX Annual Report 2023 | Corporate responsibility 2023 PERFORMANCE Create new opportunities to engage remote workers in RELX cares Giving Our central donations programme aligns with the RELX Cares mission. Employees serve as sponsors for charities seeking funding, which must in turn indicate how they meet one or more ofRELX’s unique contributions as a business including protection of society and reducing inequalities, advancing science and improving health outcomes, furthering the Rule of Law and access to justice and fostering communities. RELX Cares Champions vote on submissions using decision criteria such as value to the beneficiary and opportunities for staff engagement. In 2023, RELX Cares Champions donated $317,000 to 26 charities supporting over 40,000 young people. Projects included: § Providing a programme for girls in West Bengal, India, to keep them in education and out of child marriage § Funding a Book Buzz programme to inspire pre-school children in remote indigenous communities in Australia to enjoy reading § Helping underprivileged children living in poverty-stricken areas of Quezon City in The Philippines § Expanding availability of school supplies at no cost to teachers and students in need at under funded schools in Dayton, Ohio § Offering support to vulnerable families experiencing challenges such as isolation, bereavement and financial worries in Sutton, United Kingdom § Supporting a weekly group intervention programme for pregnant and parenting teen girls in Philadelphia, Pennsylvania The LexisNexis Rule of Law Foundation’s ABCs of the Rule of Law colouring books teach children basic elements of the Rule of Law. An additional colouring book, The Rule of Law Coloring and Activity Book, was published in the year, aimed at older children to bolster their literacy skills, highlighting the main elements of the rule of law in contemporary society and throughout history. In managing community involvement, we apply the same rigour as we do to other aspects of our business. Following the B4SI methodology – a global standard for measuring and reporting corporate community investment – we conduct an annual Group Community Survey withRELX Accounting Services and RELX Cares Champions. It divides our aggregate giving into short-term charitable gifts, ongoing community investment and commercial initiatives of direct business benefit. During the year, we worked with B4SI, where we are members, to ensure we effectively apply the organisation’s methodology for valuing in-kind contributions; B4SI subsequently assured our use of the methodology. Their assurance statement is available at www.relx.com/additional-cr-resources. We donated £5.7m in cash (including through matching gifts), and £17.7m in products, services and staff time in 2023. Some 36% of employees were engaged in volunteering through RELX Cares. According to 2023 B4SI data, the average volunteering rate was 13.6% for our sector and 9.2% for all sectors. Setting up a home-based RELX Cares network has created a wonderful opportunity to get to know other Florida home-based colleagues ensuring more colleagues can take advantage of using their RELX Cares hours to make an impact in their community. Tatiana Morales Marketing Operations Manager, LexisNexis Legal & Professional We extended the RELX Cares Central Donations programme to home-based employees encouraging them to submit grants for charities that they wanted to support. Until 2023 only office-based colleagues could nominate a charity. This resulted in a number of applications, two of which we funded following a vote by RELX Cares Champions. We will continue to expand this engagement in 2024. In the year, a network of home-based Legal employees who wish to get involved in RELX Cares activities established a new network. The network is facilitated by a home-based LexisNexis Legal & Professional RELX Cares Champion. They contacted other home-based RELX employees to invite them to participate, learn about opportunities and to take part in volunteering and other RELX Cares activities. Over 230 colleagues joined the network and so far there have been two activities, including volunteering at a charity that provides grief support to children and doing a beach clean up. |
| RELX Annual Report 2023 | Community 67 In 2023, we continued to engage in skills-based volunteering, applying business knowledge and expertise to benefit communities. For example, in the US, Risk colleagues created anOnline Safety for Kids programme to educate parents and protect children. The team devoted more than 200 hours to the project which has been delivered to 467 Risk employees and approximately 1,500 parents, teachers, school administrators and community leaders. Throughout 2023, we encouraged in-kind contributions, such as product and equipment donations, aligned with our Product Donation Policy (available at www.relx.com/cr-downloads). We also contributed over 139,000 books to Book Aid International (BAI) andBooks for Africa worth over $11m. In addition, eight Risk colleagues volunteered to transcribe audio interviews that Book Aid International had collected from partners in Kenya in support of it’s new Generation Reader campaign. The 2023 Recognising Those Who Cares winners who travelled to London spent the day volunteering in the Book Aid International warehouse preparing books to be sent to partners. Engagement In 2023, we continued to provide opportunities for colleagues to get involved in RELX Cares. In monthly calls for RELX Cares Champions across the company, we shared updates about our local RELX Cares activities and featured guest speakers. Additionally, we shared RELX Cares stories in all employee communications throughout the year. For a story to launch our global RELX Cares Month in September, weinterviewed colleagues about how they used their RELX Cares hours to volunteer. This included serving as a museum trustee, volunteering at a local library and helping women and their children who have been displaced from their homes with practical support. During the Month, we ran our Global Book Drive competition. Employees donated nearly 2,000 books for local charities. Jeffrey P Mladenik and Andrew Curry-Green Memorial Scholarship As a lasting memorial to our colleagues Jeffrey Mladenik and Andrew Curry-Green, who lost their lives on 9/11, we offer scholarships in their name to children of eligible employees. Evan Robert Quering (left), son of Allison Quering, National Sales Manager for Legal in Pennsylvania, graduated from Madonna High School in Weirton, West Virginia in 2022 where he placed in the top ten of his class. Evan was also awarded several sport and academic honours during his high school career before attending the University of Pittsburgh with a major in pre-medicine. He is currently studying nursing at Robert Morris University and finished his first year earning Dean’s List status and plans to go on to complete a PhD in Nurse Anesthesia. In response to receiving the scholarship Evan said the funding was “not only an acknowledgement of my hard work and determination, but it also serves to fuel my passion for helping others in the medical field”. Carina Wang (right), daughter of Xiaoming Wang, Senior Software Engineer for Risk in Florida. Carina has a passion for using technology to address societal challenges. She served as co-president of her high school’s nationally ranked Speech and Debate team, co-president of the American Heritage robotics team that was a division finalist in the 2023 World Championships, president of the Inter-Club Council and played on the Varsity Volleyball team. She has been recognised as the National Speech and Debate Association Academic All-American, National Merit Finalist, and received the President’s Volunteer Service Award. In high school, Carina dedicated over 1,300 hours to community service including volunteering with seniors in hospice centres to write their life biographies. She later went on to design a speaker device for nursing homes. After presenting this innovation at the Global Conrad Innovation Challenge, she won Top 5 in her category and the Outstanding Presentation Award. Carina has previously interned at LexisNexis and plans to continue her education at Cornell University. In-kind 53% Cash 24% Time 23% What we contributed in 2023 (market value) Market value cash, in-kind and time donations (£m) Community involvement Market value cash, in-kind and time donations (£m) 2019 2020 2021 2022 2023 18.7 17.6 20.6 23.4 22.6 Market segments Governance and shareholder information Financial statements Financial review Corporate Responsibility Overview |
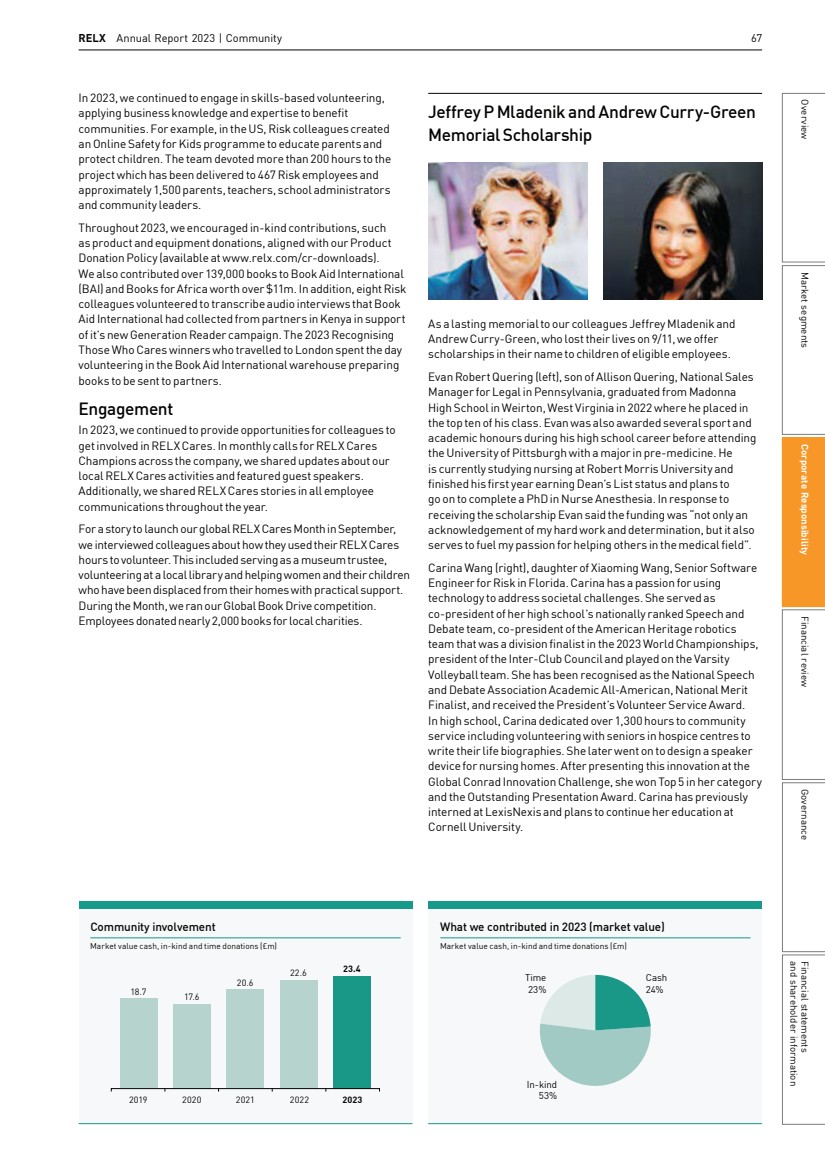
| 68 RELX Annual Report 2023 | Corporate responsibility 2023 PERFORMANCE Undertake fundraising for Save The Children to help achieve the three year target of $150,000 In 2022, we announced a new three-year partnership with Save the Children. We have committed to raising $150,000 to support their work, which includes improving nutrition and access to school meals; preventing child labour and child marriage; and supporting children’s mental health. In 2022, the most recent year for which data is available, the Save the Children global movement directly supported 48.8m children in 116 countries around the world. To date, we have raised over half of our total fundraising target. Fundraising activities included a global holiday sweater day, quiz nights and cause related marketing at an Elsevier conference in the US. We have shared communications with colleagues about how our funds are benefitting children, and in the year, a member of the Save the Children team spoke to RELX Cares Champions about the impact of their work. We have also worked with Save the Children to help focus our response to disasters and emergencies. We are hugely grateful to RELX and their continued generous support with our three-year partnership. RELX colleagues have raised an incredible amount so far which is already having an impact and helping children get the future they deserve. Alicia Wiltshire Senior Corporate Manager, Save the Children Impact In accordance with the B4SI model, we monitor the short- and long-term benefits of the projects with which we are involved. We ask beneficiaries to report on their progress to increase transparency and engagement. In addition, we survey RELX Cares volunteers on the impact the programme has on their work following each volunteer activity. In 2023, we received over 17,800 responses, 90% of respondents said their motivation and pride in the company had increased as a result of volunteering and 88% said they had experienced a positive change in behaviour or attitude as a result of volunteering. 2024 objectives By 2030 Employee community engagement – SDG 17 (Partnership for the Goals): Increase internal and external information about our global community activities Philanthropic giving – SDG 17 (Partnership for the Goals): Strengthen our cross business area philanthropic response to disasters and emergencies Through our unique contributions, and investments with partners, contribute to significant, measurable advancement of education for disadvantaged young people In 2023, for the fourth year, we supported the Ban Ki-moon Centre for Global Citizens’ Global Citizen Scholarship Program in association with the Management Centre Innsbruck benefitting 15 young African leaders. The change-makers developed their own SDG micro-projects using the RELX SDG Resource Centre to inform their work. The 2023 scholars addressed 15 SDGs and projects ranged from driving community awareness about cervical cancer in Rwanda to capturing mental health stories through photography in Kenya, and training young people to build with local construction materials for disaster risk reduction in Burkina Faso. |
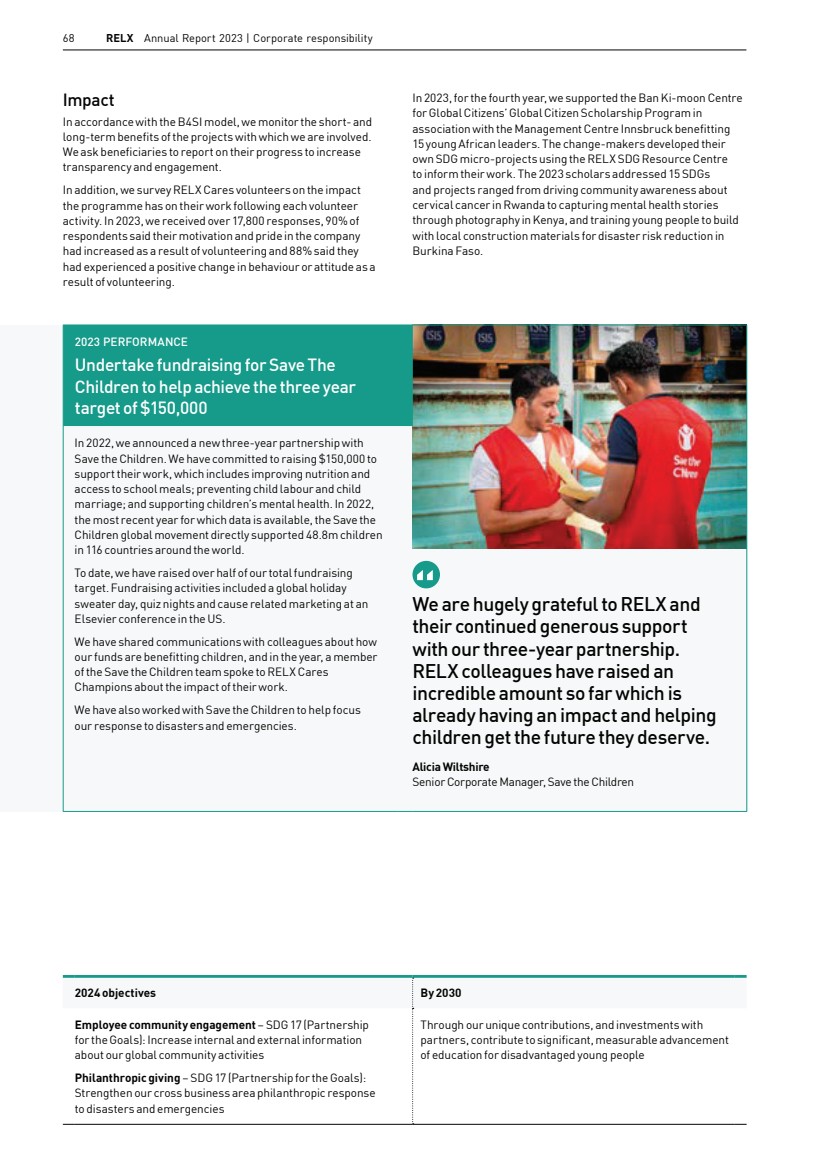
| Relevant SDGs RELX Annual Report 2023 | Supply chain 69 Managing an ethical supply chain RELX has a diverse supply chain with suppliers located in over 150 countries across multiple categories, including technology (e.g. software, cloud, hardware and telecom), indirect (e.g. consulting, marketing, contingent labour and travel), and direct (e.g. data/content and production services, print/paper/bind and distribution). Given the importance of an ethical supply chain, we maintain a Socially Responsible Supplier (SRS) programme encompassing all our business areas, supported by colleagues with expertise in operations and procurement and a dedicated SRS Director from our global procurement function. Monitoring suppliers We have a comprehensive Supplier Code of Conduct (Supplier Code), available on www.relx.com in 16 languages, which we ask suppliers to adhere to and display prominently in the workplace. It commits them to following applicable laws and best practice in areas such as human rights, labour and the environment. It also asks our suppliers to require the same standards in their supply chains, including requesting subcontractors to enter into a commitment to uphold the SupplierCode. The Supplier Code states that, where local industry standards are higher than applicable legal requirements, we expect suppliers to meet the higher standards. Our SRS programme is a key aspect of our work to prevent modern slavery and human trafficking in our supply chain as described below. Through our SRS database, we track suppliers with whom we spend more than $1m annually, suppliers identified as critical by the company, and those located in medium- and high-risk countries (as designated by our third-party developed supplier risk tool) with a spend of $100,000 or more per year for the most recent consecutive two-year period. The tool incorporates 11 indicators, including human trafficking information from the US State Department andEnvironmental Performance Index results produced by YaleUniversity and Columbia University in collaboration with the World Economic Forum. In 2023, 80% of our global spend was risk assessed utilising the supplier risk tool. Supply chain Our customers depend on us to provide them with ethically sourced and produced products and services. Therefore, our suppliers need to meet the same high standard we set for our own behaviour. Pauline Grace Cortes Socially Responsible Supplier Programme Lead RELX An ethical supply chain programme allows us to monitor the social and environmental practices of our suppliers. This helps us mitigate our impacts and ensure we conduct our business responsibly. I am proud to be part of an organisation that commits to high social standards. North America 59.9% South America 0.7% Middle East 1.0% Asia & Pacific 9.1% Europe 28.8% Africa 0.5% RELX supplier locations (% of supplier spend) Based on four quarters ending Q3 2023 Market segments Governance and shareholder information Financial statements Financial review Corporate Responsibility Overview |
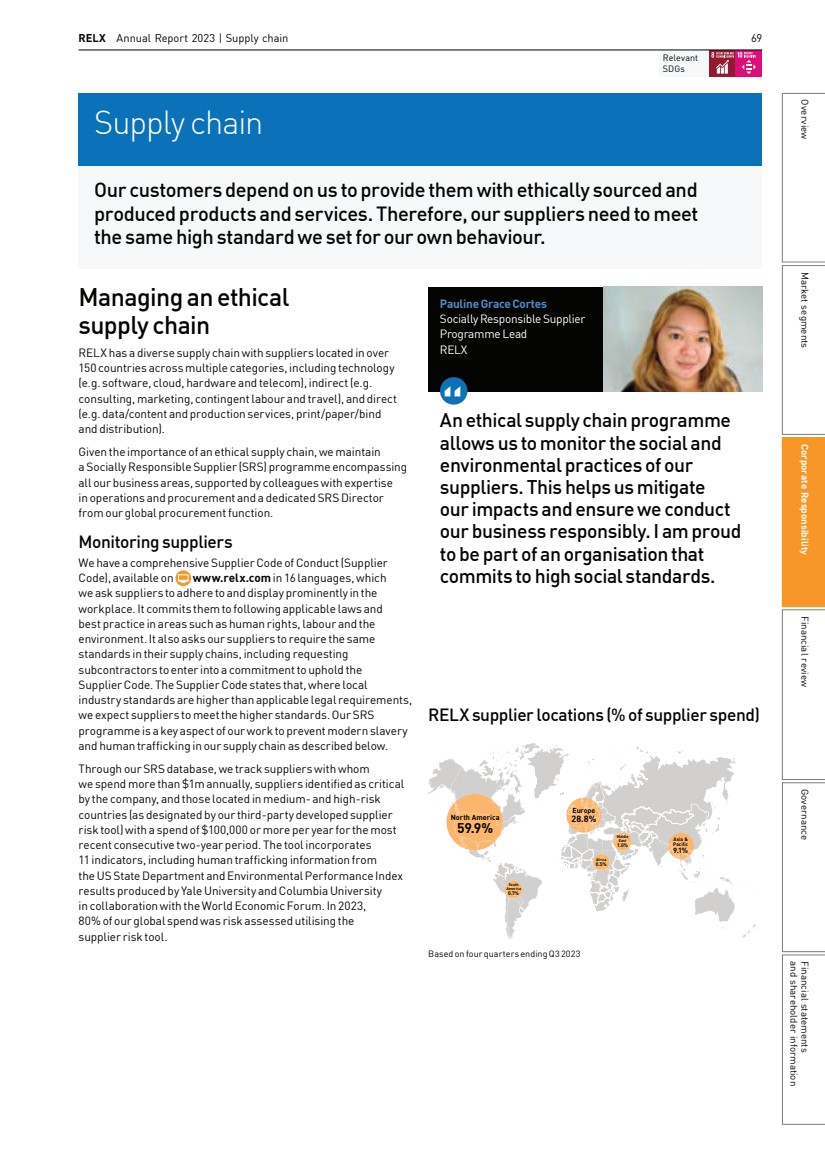
| 70 RELX Annual Report 2023 | Corporate responsibility The tracking list changes year-on-year based on the suppliers we engage to meet the needs of our business and/or changes in country risk designations within our third-party risk tool. In 2023, there were 796 suppliers on the SRS tracking list, 66 of which were in high-risk countries and 606 in medium-risk countries. 690 of the suppliers (87%) on the SRS tracking list have signed our Supplier Code, or have equivalent standards in place. The majority of non-signatories are new to the SRS tracking list and we are working with them, and other non-signatories, to gain agreement to our Code. In total, at the end of 2023 there were 5,322 signatories to our Supplier Code, or suppliers with an equivalent code, representing an increase of 19% from 4,467 signatories at the close of 2022. We engage a specialist supply chain auditor to conduct audits and assessments on our behalf using their platform. In 2023, a total of 125 external audits were conducted: 36 onsite and virtual onsite audits and 89 desktop audits. During a desktop audit, the supplier responds to an online questionnaire and uploads relevant supporting documents followed by a risk assessment using the third-party platform. For virtual onsite audits, facility representatives wear a video and audio source to allow remote interaction with a qualified auditor. The auditor can then evaluate the facility, conduct interviews, and review the necessary documentation in real time, just as if conducting an in-person audit. During an onsite audit, the auditor will select employees from a full roster to interview (and may select employees on the work floor during the facility walkthrough). Employee interviews are private and confidential and facility management is not allowed to be present. All information gathered from employee interviews is anonymised. When the auditor communicates non-compliance to facility management, they are not allowed to disclose information which could identify the employee or employees to avoid retaliation against them, which is forbidden in the Supplier Code. Incidents of non-compliance trigger continuous improvement reports summarising audit results and remediation plans. The audit covers critical dimensions of the Supplier Code such as:labour (including child/forced labour, discrimination, discipline, harassment/abuse, freedom of association, labour contracts); wages and hours (including wages and benefits and working hours); health and safety (including general work facility, emergency preparedness, occupational injury, machine safety, safety hazards, chemical and hazardous material, dormitory and canteen); management systems (including documentation and records, worker feedback and participation, audits and corrective action process); environment (including legal compliance, environmental management systems, waste and air emissions); anti-corruption and data security. During 2023 onsite and virtual onsite audit locations included Argentina, India, Italy, Philippines, Poland, Romania, Singapore, Sri Lanka, South Africa and the United Kingdom. To minimise the risks of deforestation in our production paper supply chain, we utilise the Forest Sourcing module of The Book Chain Project, a shared industry resource for sustainable paper we helped establish, to assess the forest sources of our papers. By year end 2023, 100% of RELX’s production paper was graded by The Book Chain Project as known and responsible (sustainable) sources or certified to FSC or PEFC (note: less than 0.5% not yet graded or certified). During 2023 we held RELX Supplier sessions focused on the RELX supplier audit process and our efforts to collect and reportCO2 emissions. Promoting human rights through the SupplierCode As stated above, the Supplier Code sets out expectations for our suppliers’ ethical conduct. In accordance with the UK’s Modern Slavery Act 2015, our Supplier Code specifically prohibits participation in any activity related to human trafficking, based on the American Bar Association’s Model Business Conduct Standards to Eradicate Labor Human Rights Impacts in Hiring and Supply Chain Practices. In 2023, we updated our RELX Modern Slavery Act Statement (MSA), available from www.relx.com, which states how we are working to avoid human trafficking and modern slavery in our direct operations and in our supply chain. The Supplier Code stipulates that, where required by law, suppliers will have employment contracts signed with all employees and requires mechanisms for reporting grievances. It additionally contains a provision on involuntary labour that states unequivocally that suppliers cannot directly or indirectly use, participate in, or benefit from, involuntary workers and human trafficking-related activities. Suppliers have access to Modern Slavery Awareness training through our audit provider. In addition, we asked all suppliers audited during the year to complete an e-learning course on preventing forced labour. We use a UK Government definition of modern slavery, particularly “the trafficking of people, forced labour, servitude and slavery.” We did not receive any reports or questions from employees that related to modern slavery in the year. The Supplier Code states, “Failure to comply with any RELX term, condition, requirement, policy or procedure…may result inthe cancellation of all existing orders and termination of the business relationship between RELX and supplier.” It further states suppliers must not tolerate any retaliation against any employee who makes a good faith report of abuse, intimidation, discrimination, harassment or any violation of law or of the Supplier Code or who assists in the investigation of any such report. 125 Independent audits, including onsite, virtual onsite and desktop 796 Suppliers tracked |
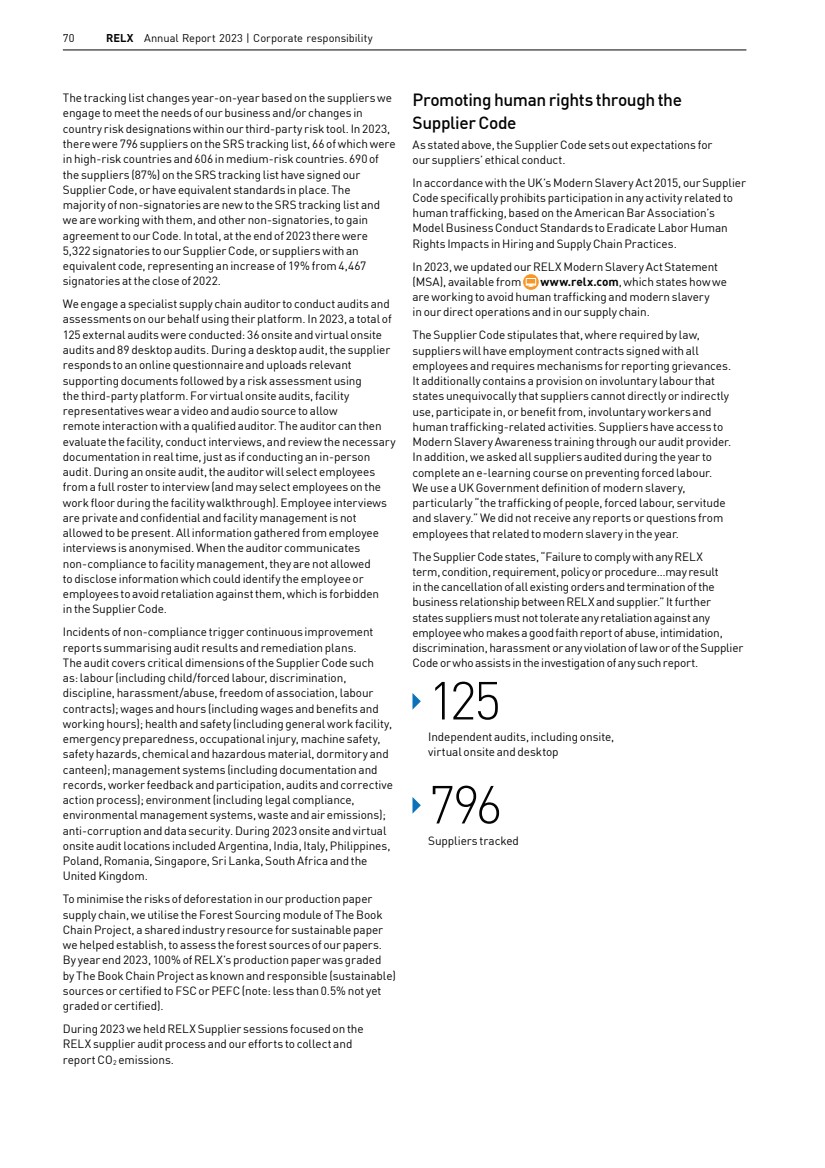
| RELX Annual Report 2023 | Supply chain 71 5,322 Suppliers who have signed the Supplier Code or have an equivalent code 3.3% US spend with veteran, minority or woman-owned businesses. Including small businesses, 14.8% of totalUSspend was with diverse suppliers 87% Suppliers on the tracking list who were either signatories to our Supplier Code or have an equivalent code, covering 97% of tracking list spend Supplier Code of Conduct signatories 2019 2020 2021 2022 2023 3,202 3,457 3,670 5,322 4,467 Responsible Supply Chain Performance Target Measure Results 2019 Actual 2020 Actual 2021 Actual 2022 Actual 2023 Actual Increase # of suppliers as Code signatories Total # of Code signatories 3,202 3,457 3,670 4,467 5,322 Total # of suppliers on tracking list 354 412 359 724 796 % of suppliers on tracking list who were Code signatories (or equivalent) 91% 91% 96% 87% 87% Continue using audits to ensure continuous improvement in supplier performance and compliance # of independent audits1 93 99 111 119 125 Onsite/virtual onsite 52 25 28 28 36 Desktop 41 74 83 91 89 Continue to advance the US Supplier Diversity and Inclusion Programme % of total US spend with diverse suppliers (Veteran, Minority, Woman-owned, and small businesses) 11.9% 12.9% 12.9% 15.4% 14.8% % of total US spend with diverse suppliers excluding small businesses 2.5% 2.8% 3.1% 3.8% 3.3% 1 For 2023, RELX moved to a new third party audit platform, which allows sharing of supplier audits across the platform therefore increasing the total number of audits. 2023 PERFORMANCE Advance Supplier Diversity and Inclusion Programme We are committed to proactive engagement with suppliers to ensure that our supply chain reflects the diversity of our communities. During 2023, we continued to focus on our supplier diversity programme through participation in a Supplier Diversity Taskforce, diversity conferences, best practice sharing and increased internal staff support. In the year, 3.3% of our US spend was with veteran, minority or woman-owned businesses. Including small businesses, 14.8% of total US spend was with diverse suppliers. We use an independent supplier diversity database to classify diverse suppliers. Diverse-owned businesses interested in working with RELX can register on the RELX Supplier Diversity Registration Portal. While registration does not provide preferred supplier status or guarantee of business, it provides visibility within RELX for suppliers who can potentially fulfil business requirements. Find out more at: https://reedelsevier.service-now.com/sdpr We aim to implement a sustainable supplier diversity and inclusion programme that creates value by: § promoting the sourcing of goods and services from high-performing, competitive diverse suppliers § monitoring and measuring the effectiveness of our efforts § participating in outreach programmes/activities to support diverse suppliers Market segments Governance and shareholder information Financial statements Financial review Corporate Responsibility Overview |
| 72 RELX Annual Report 2023 | Corporate responsibility 2024 objectives By 2030 Responsible Supply Chain – SDG 8 (Decent Work and Economic Growth): Increase number of suppliers that are Code signatories; continue using audits to ensure continuous improvement in supplier performance and compliance Supplier Diversity – SDG 10 (Reduced Inequalities): Advance Supplier Diversity and Inclusion Programme Reduce supply chain risks related to human rights, labour, the environment and anti-bribery by ensuring adherence to our Supplier Code of Conduct through training, auditing and remediation; drive supply chain innovation, quality and efficiencies through a strong, diverse network of suppliers ALIGNING WITH GOOD PARTNERS Intrust Global Intrust Global, a RELX supplier on our Socially Responsible Supplier tracking list, provides technology driven research, analytics and reporting services across industries. They maintain a robust set of policies that underpin their responsible business practice which include ethical governance, fair labour practices, community engagement and stakeholder collaboration. Intrust Global are dedicated to advancing the UN SDGs with a focus on decent work (SDG 8); quality education (SDG 4); innovation (SDG 9) and reduced inequalities (SDG 10). They foster positive change through the Sambhava Foundation, their central group’s arm for social development. Among flagship programmes are the Hunar project which empowers women aged 18 to 35 through skills training and social entrepreneurship initiatives to gain economic independence. Another is the Koshish programme which helps differently-abled women become financially independent through vocational skill building, placement support and regular assessments and feedback. As a growing company, we maintain transparent and fair business practices, meet ethical standards and help make the world a better place to live and thrive. Ravindra Nag Director, Intrust Global |
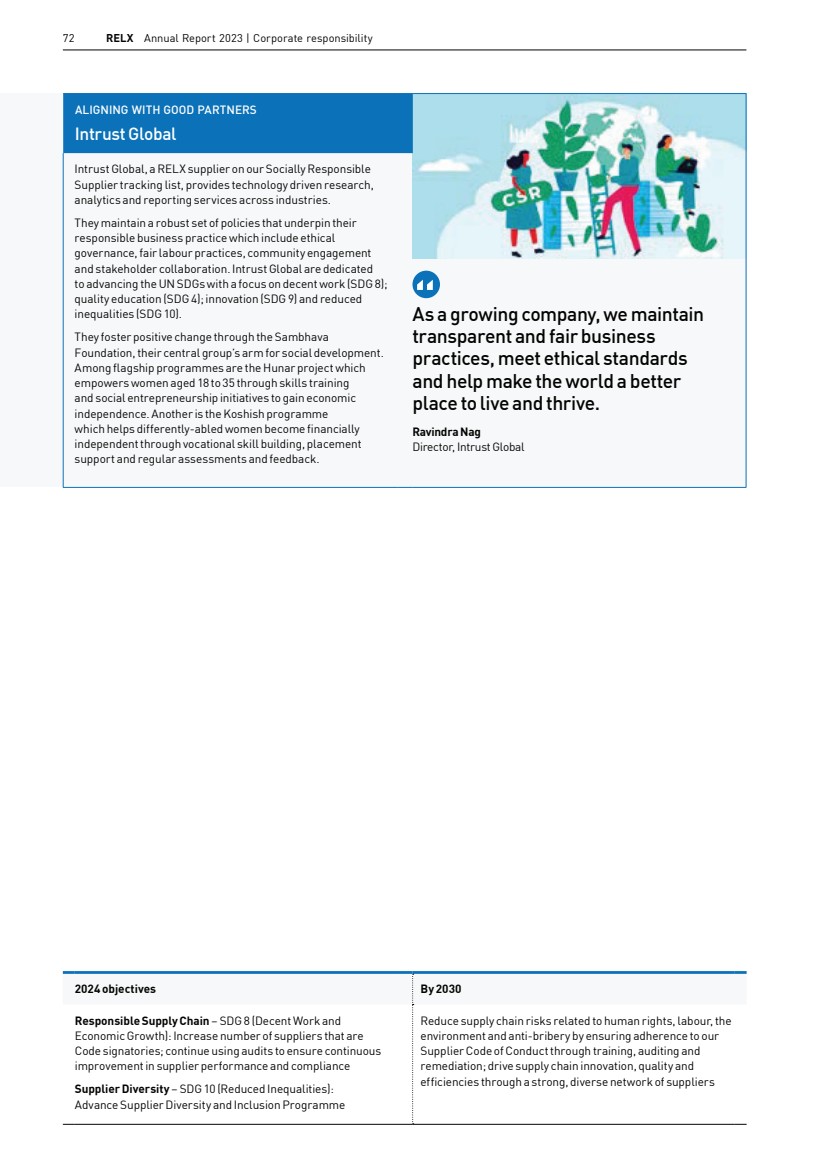
| Relevant SDGs RELX Annual Report 2023 | Environment 73 A positive environmental impact Our key environmental impact is through our products and services which help inform debate, aid decision makers and encourage research and development with regard to environmental issues. The CEO is responsible to the Board for environmental performance; the CEOs of our business areas are responsible for complying with environmental policy, legislation and regulations and the CFO is our most senior environmental advocate. Our Chief Sustainability Officer and Global Head of Corporate Responsibility engages with theBoard on environmental issues and we work with Environmental Champions and dedicated engineering, design and real estate specialists to improve efficiency wherever possible in our portfolio. In 2023, we continued our support of the Climate Pledge, aiming to achieve net zero across all carbon scopes by 2040 at the latest. We have committed to measure and report greenhouse gas emissions, implement decarbonisation strategies for emissions reductions and address residual emissions with high-quality offsets. Details of our net zero transition road map are available on pages 76 and 85 . We support progressive environmental legislation and in 2023 continued our membership in the Aldersgate Group, an alliance of leaders from business, politics and civil society, chaired by former UK Prime Minister Theresa May, that drives action for a sustainable economy. In the year, we signed a letter to the British Prime Minister confirming our support for delivering progress on the UK’s net zero commitments. We hosted an event to launch a report from UCL and the Aldersgate Group on the electrification of British industry, and continued our membership of the Net Zero Supply Chains initiative with other companies and NGO partners organised by Pineapple Partnerships. We were a Taskforce for Climate-related Financial Disclosure (TCFD) Supporter until it was disbanded in the year and have expanded our TCFD disclosure (see page 82). We remain signatories of We Are Still In, a network of more than 3,900 businesses, universities, cities, states and other organisations, committed to combatting climate change. Environment We work to increase the positive impact we have on the environment through our products and services which provide essential insight and bring stakeholders together, while also striving to reduce our environmental footprint across our company and value chain. Bosman Stramrood Pre-Sales Consultant LexisNexis Legal & Professional South Africa As a global organisation, we can make a big difference by meeting our environmental objectives, setting anexample for future generations to continue the improvements we started. It requires commitment and dedication from leadership and employees alike. 2023 Environmental Performance Absolute performance Intensity ratio (absolute/£m revenue) 2022 2023 change 2022 2023 change Scope 1 (direct emissions) tCO2e 5,211 4,317 -17% 0.61 0.47 -23% Scope 2 (location-based) emissions tCO2e 37,270 36,616 -2% 4.36 4.00 -8% Scope 2 (market-based) emissions tCO2e 8,952 8,598 -4% 1.05 0.94 -10% Scope 1 + Scope 2 (location-based) emissions tCO2e 42,481 40,933 -4% 4.97 4.47 -10% Total energy (MWh) 117,997 110,750 -6% 13.80 12.09 -12% Water (m3 ) 156,734 142,374 -9% 18.33 15.54 -15% Waste sent to landfill (t)* 73 45 -38% 0.01 <0.01 -43% Sustainable production paper (%) 99 100 1% – – - * From reporting locations only, excluding estimated data. Actual environmental data covers approximately 83% of occupied floor space based on electricity reporting. When we are unable to obtain reliable data, for example from small serviced offices, we estimate energy consumption and water usage on actual data from our portfolio. In this way, our reported data covers all operations, for which we have operational control for a 12-month period, December 2022 to November 2023. Scope 2 (location-based) emissions are calculated using grid average carbon emissions factors for all electricity sources. Scope 2 (market-based) emissions are calculated using supplier-specific carbon emissions factors (where available) for renewable energy purchases. Market segments Governance and shareholder information Financial statements Financial review Corporate Responsibility Overview |
| 74 RELX Annual Report 2023 | Corporate responsibility Our key environmental impact: environmental knowledge In creating and delivering our products and services we have an impact on the environment in areas such as carbon emissions, energy and water usage. But arguably bigger and more important is our growing portfolio of environmental research, products and services, which spread good practice, encourage debate and aid researchers and decision makers. The most recent results from Scopus show our share of citations in environmental science represented 54% of the total. Risk Climate-driven extreme weather events are increasing and pose a specific challenge to the insurance industry. In response to intensifying climate risks, insurers require data and technology to better assess risk. Combining geospatial information, imagery and historical records with predictive analytics and AI, LexisNexis Risk Solutions provides comprehensive data sets and analytics tosupport the industry to better understand and price risk. Geospatial information can provide vital information about a property’s likely susceptibility to flood, fire or storm damage. Meanwhile, aggregating comparative data can help insurers benchmark performance in certain regions to manage localisedrisk more effectively. In 2023, Cirium, a Risk business unit, advanced its flight emissions methodology powered by EmeraldSky. This advancement aims to deliver a standardised and precise overview of carbon emissions and fuel burn calculations for eachaircraft flight and seat. This data serves as the foundation for RELX’s business flight travel emissions data. Scientific, Technical & Medical The Lancet published their 2023 Countdown on health and climate change which monitors the evolving health profile of climate change and provides an independent assessment of the delivery of commitments made by governments worldwide under the Paris Agreement. The content, either open access or free to read, covers 47 indicators, drawing on the expertise of 114 scientists and health practitioners from 52 research institutions and UN agencies worldwide. Elsevier delivered the first Sustainability Hub at the London Book Fair in 2023 with a stage devoted to raising awareness of the growing climate emergency and how the publishing industry can best respond. Events included a presentation on the SDG Publishers Compact, a keynote from London Mayor Sadiq Khan about making London a more sustainable city and a session from Book Industry Communication (BIC) on designing books with recycling in mind. Elsevier worked with Smart Space, RX’s in-house design and build service, to create a prototype carbon label of its stand using four main categories from the exhibitor perspective: stand build; venue emissions and water; operations (emissions from staff travel and accommodation); and emissions associated with the products displayed. Legal Legal has extensive environmental law offerings for customers including curated daily news alerts, podcasts, law trackers and consultations. Specifically on climate change, tools show where climate change targets come from at national, European and international levels, climate reporting and disclosure frameworks, litigation and practical guidance. In 2023, the LexisNexis Legal and Professional Practical Guidance Journal featured a dedicated climate change issue covering topics such as sea level rise and how it affects public and private projects; energy security and climate change initiatives in the US Inflation Reduction Act; and climate change in M&A transactions, among others. In the year, PatentSight, which provides curated and enriched patent datasets and analysis tools to advance research and development, competitive intelligence and benchmarking, and more, released a publicly available report on sustainable technologies linked to the SDGs. It shows, for example, among the largest share of patents for SDG 7, Affordable and Clean Energy, is hybrid vehicles and biofuels; for SDG 13, Climate Action, it is for GHG emissions reductions. Exhibitions RX’s portfolio of environmental events include World Future Energy Summit. Held in Abu Dhabi in January 2023, the show focused on critical sectors shaping sustainability and driving investment globally including solar; clean energy; ecowaste; water, and smart cities. With over 200 hours of expert content, the Summit’s knowledge-sharing programme was its most extensive and diverse to date. Over 250 speakers, including government officials and 166 CEOs, presidents and founders of leading companies, shared their insights with over 30,000 investors, policy makers, business leaders, project owners and technology pioneers. The 2023 edition of Pollutec in Lyon, France, the international event for environmental and energy solutions committed to accelerating environmental innovation, showcased over 1,000 exhibitors, including 200 start-ups. 420 conference sessions were delivered, and over 42,800 attendees came to learn, network and conduct business. The 2023 Pollutec Innovation Awards highlighted 12 finalists and rewarded three winners: Grims Énergie (thermal storage), MTB(li-ion battery recycling), and Purenat (a textile capable of destroying organic pollutants in the air). All-Energy is the UK’s largest renewables and low carbon showcase, held in Glasgow. It connects clean energy suppliers and technology providers with energy industry developers, buyers, investors, and policy makers. Reflecting the urgency required to meet UK net zero emissions targets, the 2023 event broke previous attendance records. Nearly 600 speakers took part in the free-to-attend conference, which featured contributions from Scotland’s First Minister, Rt Hon Humza Yousaf and Minister for Energy, Gillian Martin. Dcarbonise, another show in the RX portfolio, supported by the Scottish government and Energy Saving Trust, offered end-users advice and technology to help them decarbonise their buildings, businesses and transport systems. |
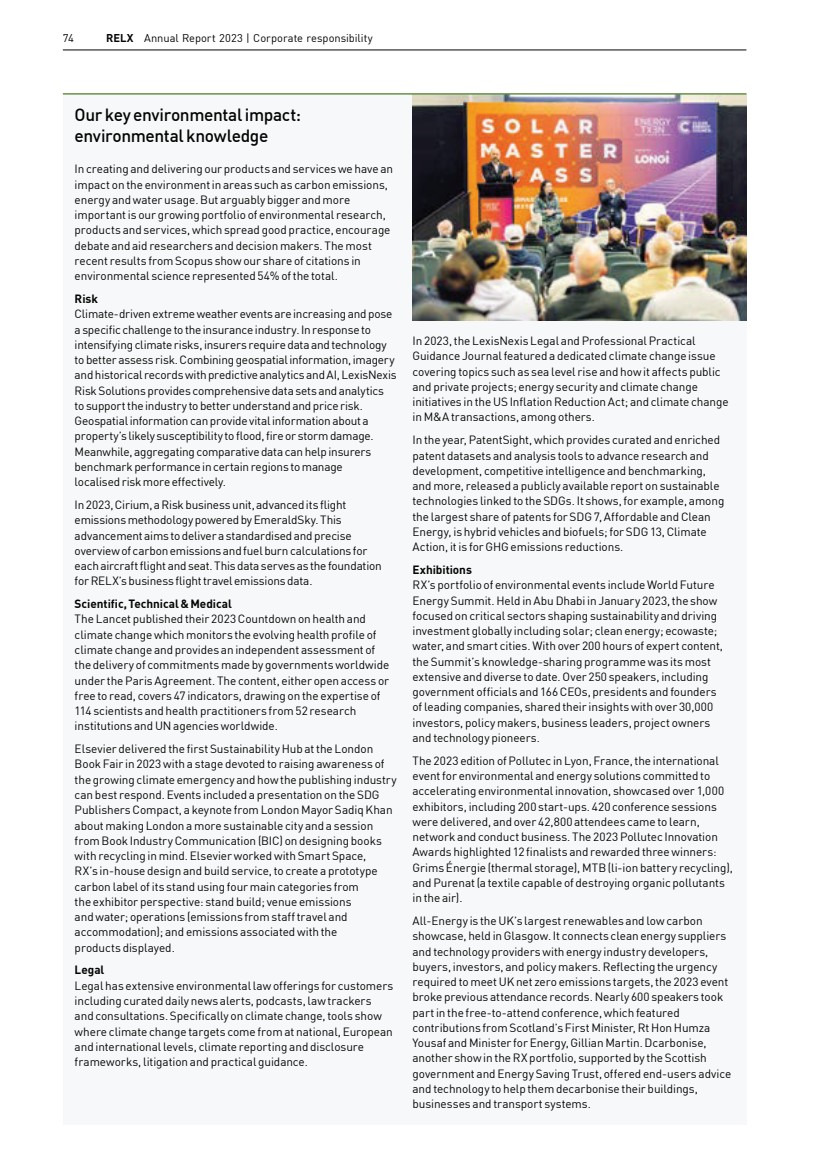
| RELX Annual Report 2023 | Environment 75 Environmental risks and opportunities The assessment, prioritisation and mitigation of environmental risks are integrated into our overall company-wide risk management process which considers current and emerging risks to achieving RELX’s strategic goals. The Board assesses the risk level and mitigation strategies and monitors implementation by senior managers. Colleagues throughout the business, as well as external stakeholders such as NGOs and investors, help us monitor and rank our environmental risks and opportunities. They are reviewed quarterly by the Environmental Checkpoint Committee, chaired by the CFO, during the year. Our Global Environmental Policy is available on www.relx. com/cr-downloads and applies to all areas of the company and states that we must consider, among other risks, those that require legislative compliance, have significant cost implications for the company and/or may affect our reputation. The Global Environment Policy is supported by a global Environmental Management System (EMS), certified to the ISO 14001 environmental standard across the group. The EMS covers the assessment of existing and emerging regulatory requirements related to climate change, including carbon pricing, taxes and additional reporting requirements. It includes transition and physical risks and has informed our TCFD report, including transitioning to a lower carbon economy and risks related to physical impacts of climate change. For more information see page86. Green Teams, employee-led environmental groups representing 53% of employees in 44 key facilities, help us implement our EMS and achieve environmental improvements at the local level. We are also aided by consistent dialogue with stakeholders including employees, government and NGOs. We participate in sector initiatives, such as the Book Chain Project, and further our understanding through environmental benchmarking activities, such as CDP. Assessing our environmental impact While as a non-manufacturing company our direct use of resources is limited, we monitor all our environmental impacts, and prioritise climate change, water, waste and paper use. Throughout 2023, we worked to reduce our direct environmental impact as well as upstream and downstream impacts as part of a lifecycle approach to our operations. Third-party verification of our environmental data gives us confidence in its reliability and improves our reporting. Group certification to ISO14001 Environmental Management System maintained in 2023 75% reduction in Scope 1 and Scope 2 (location-based) emissions since 2010 2023 PERFORMANCE Expand climate risk assessment of products by the Climate Product Working Group To avoid climate change of more than 1.5°C, we must quickly transition to a low carbon future. We aim to support our customers in carbon intensive sectors to decarbonise by providing products and services that can inform the transition to net zero. We established our Climate Product Working Group with representatives from all our business areas to better understand climate risks and opportunities in the mix of our products and services. Elsevier continues to focus its content and offerings toward scientific breakthroughs in clean energy. In 2023, Elsevier launched several new titles covering renewable energy, energy efficiency, battery technology, and decarbonisation. Of Elsevier’s 2,900 journals, four with a traditional hydrocarbon focus were repositioned with updated aims to advance the UN’s sustainable development goals and promote a pathway to a net zero future. Likewise, the Books team will only commission content that advancesthe energy transition and the reduction of CO2 emissions. Among new titles in 2023 were Design and Control of Active Power Filters towards the Decarbonisation of Smart Grid Networks; Fuel Cells for Transportation: Fundamental Principles and Applications; and Battery Technology: From Fundamentals to Thermal Behavior and Management. Elsevier remained committed to supporting innovation in clean energy and in 2023 held the Renewable Transformation Challenge, in collaboration with the International Solar Energy Society, recognising Solar Sister which helps women entrepreneurs in African rural communities run their own clean energy distribution initiatives. Market segments Governance and shareholder information Financial statements Financial review Corporate Responsibility Overview |
| 76 RELX Annual Report 2023 | Corporate responsibility Climate change Our Climate Change Statement supports the scientific community’s opinion that human activity is contributing to climate change; we support the Paris Agreement’s intention to limit climate change to 1.5°C. The RELX Climate Change Statement is available at www.relx.com/cr-downloads. Since 2020, there has been a change in how our office space isutilised. This has contributed to decreases in reported carbonemissions. To show trends, we report data over a longer time sequence. Emissions from work-related flights are calculated using EmeraldSky, a solution developed by Cirium within Risk. This innovative methodology combines comprehensive industry datasets with Cirium’s proprietary data to accurately determine the fuel consumption of individual flights. Unlike distance-based methodologies, the Cirium methodology powered by EmeraldSky recognises and highlights carbon-efficient carriers and routes, enabling businesses to effectively reduce their travel emissions. See methodology notes for full details on www.relx.com/additional-cr-resources. Total Scope 1 emissions decreased by 17% in the year due to lower fuel consumption. Car fleet emissions have decreased 82% since 2010 and overall Scope 1 emissions by 68% during the same period. Scope 2 (location-based) emissions decreased by 2% in the year due to office space consolidations, as well as lower power consumption at our data centres. Scope 3 business travel data covers all our air travel booked and collected through our travel partner, BCD, and completed within the reporting period. While further resumption of business travel in 2023 led to a 7% increase in emissions over 2022, since 2019, we have reduced travel emissions by 58%. Our Net Zero Commitment As a signatory to the Climate Pledge, we are committed to becoming net zero by 2040 at the latest. The main tenets of the initiative, a community of more than 450 organisations working to address climate change, is measuring and reporting greenhouse gas emissions and implementing decarbonisation strategies for significant emissions reductions. Since 2010, we have reduced our Scope 1 and 2 location-based carbon emissions by 75%. In 2023, our new carbon target began verification by the Science Based Targets Initiative. This aligns with the 1.5°C goal of the Paris Climate Agreement and will require us to continue reducing greenhouse gas emissions and maintain our internal carbon pricing scheme, among other measures. We compensated for emissions in Scope 1, Scope 2 and Scope 3 (work-related flights, hotels, cloud computing, home-based working and commuting) by purchasing verifiable offsets in 2023 encompassing REDD+ forestry and peatland projects in Colombia and Indonesia. We do not use offsets in our carbon performance reporting. Net Zero Road Map RELX’s emissions are aligned with the 1.5°C pathway. We aim to maintain this performance by pursuing further emissions reductions in two primary ways: 1. Company operations: We set and aim to achieve science-based reduction targets that bring us to net zero no later than 2040. Read more about our carbon reduction targets and our carbon performance on pages 73-81. 2. Value chain: We will engage with our suppliers on setting and attaining their own science-based carbon reduction targets andalso address emissions from other Scope 3 categories. Readmore about how we engage with suppliers on pages 69-72. RELX will continue to advance wider action on climate change through: 1. The continued development of leading-edge products, services and events on climate change and net zero transition 2. Industry partnerships such as the Responsible Media Forum’s Climate Pact and Net Zero Events, an initiative for the global events industry 3. Climate advocacy supporting responsible climate-related initiatives through organisations such as the United Nations Global Compact, The Aldersgate Group, and RE100 4. Sharing climate knowledge broadly through offerings such as the free RELX SDG Resource Centre www.sdgresources.relx.com We will continue to advance our net zero efforts through an internal carbon price payable by all business areas for Scope 1, 2 and select Scope 3 emissions. The 2023 price is $35/tCO2e and willincrease over time. Climate objectives are monitored by the RELX CR Forum, chaired by the Head of Corporate Affairs, which meets twice per year to agree and assess progress on sustainability targets and objectives. Read more about CR governance on page 50. Executive remuneration is linked to achieving environmental targets including our Scope 1 and 2 carbon reduction target. Read more about executive remuneration on pages 128-148. Absolute 2019 2020 2021 2022 2023 0 110 tCO2e 1,000s Intensity Scope 1 Scope 2 (location-based) emissions 2019 2020 2021 2022 2023 tCO2e per £m revenue 0 20 Scope 1 and Scope 2 emissions 2015 is our baseline year for environment targets. Data available on page 41 Data available on page 73 |
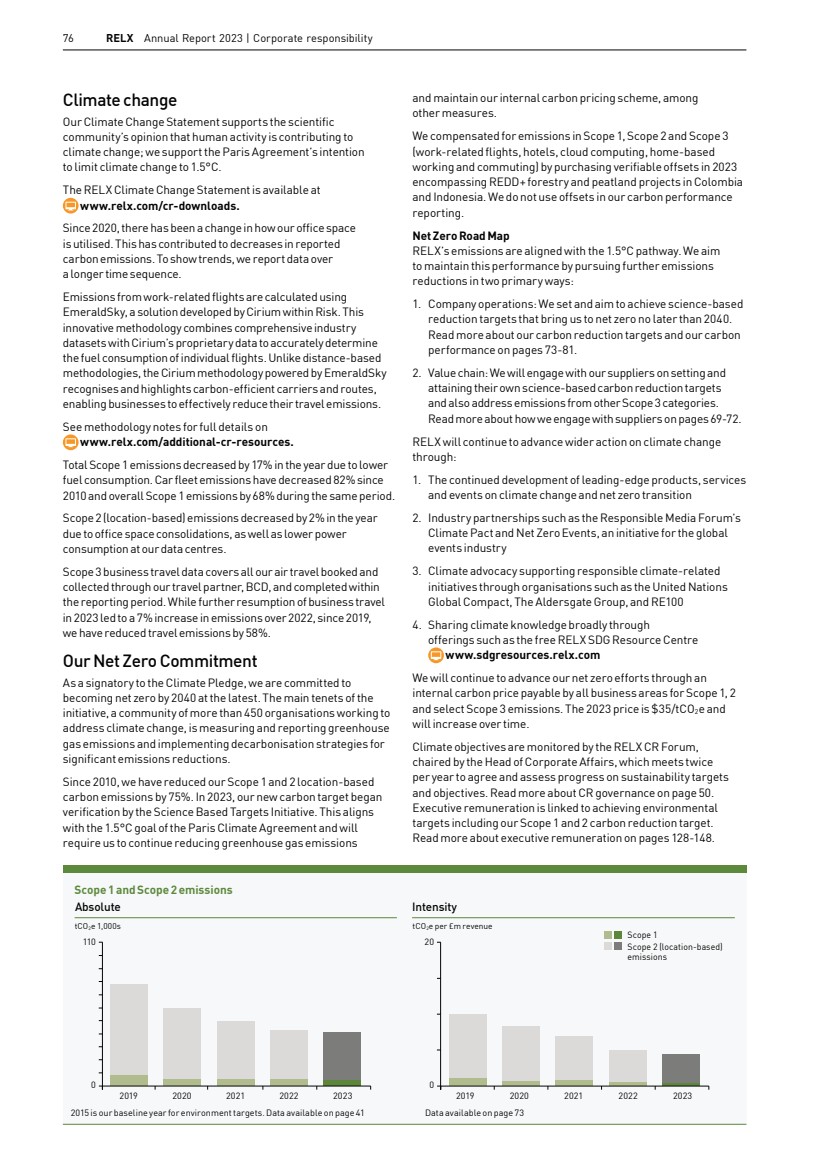
| RELX Annual Report 2023 | Environment 77 Scope 3 In 2023, we continued to advance our understanding of our Scope 3 emissions beyond business flights, identifying key areas, refining our methodology and our engagement with suppliers. We used the RELX CO2 Hub, an internal analytics platform, to help quantify our Scope 3 emissions. Supply chain We have estimated supplier emissions through an improved methodology by collecting data on key suppliers to derive carbon intensity factors. The factors are then extrapolated by spend category to cover our full supply chain. We estimate that our share of the Scope 1 and Scope 2 carbon emissions of our suppliers, excluding business travel (estimated separately), cloud computing services (see below) and events (see below), is approximately 65,000 tCO2e per annum. Cloud computing services While RELX continues to undertake energy efficiency projects at its own data centres, some of the energy and carbon reductions at these facilities have been achieved by moving content to third-party cloud services. With emissions data provided by our primary Infrastructure as a Service (laaS) cloud providers, we estimated 2023 market-based carbon emissions associated with all cloud computing services provided to RELX to be 178 tCO2e. Home-based employees Using location-specific emissions factors and office attendance data, we estimated emissions from home working in the year to be 12,498 tCO2e. Commuting Through RELX’s Environmental Standards programme, locations are encouraged to develop a local travel plan. Actions from travel plans include publishing information on public transport links, promoting commuter loan schemes and encouraging carpooling. Using daily refreshed office attendance data, we estimated emissions in 2023 to be 4,619 tCO2e. Events RX has partnered with peers on Net Zero Carbon Events. Launched at COP27, the initiative aims to develop methodologies to quantify and reduce emissions associated with the events industry. While attendance at one of our events can replace the need for multiple business trips, we are looking to better gather emissions data associated with an event’s value chain, which we expect to be a sizeable component of our Scope 3 emissions. Energy As RELX predominantly occupies leased locations with few opportunities for onsite generation, we rely on green tariffs and renewable energy certificates (RECs) to purchase renewables equal to 100% of our global electricity consumption. In 2023, Green-e certified wind RECs were purchased from sources in Texas. Energy consumption at our offices, representing around 50% ofthe total, decreased in 2023 due to ongoing office space consolidation. Data centre energy, representing around 40% of the total, decreased as we continue to move activity to the cloud. We are a member of RE100, a global initiative bringing together businesses committed to 100% renewable electricity. 61% Reduction in energy and fuels consumption since 2010 Water The majority of our sites use water from municipal supply and are in developed countries with a high capability for water adaptation and mitigation. Our water usage decreased 9% between 2022 and 2023 due to ongoing office space consolidation. We engage with internal water experts who produce water-related content for our customers. In 2023, we offered customers 24 peer-reviewed journals in water science and technology, including Water Research. 71% Reduction in water use from 2010 to 2023 Water usage 344,304 226,509 183,575 156,734 142,374 2019 2020 2021 2022 2023 Cubic metres 2023 water and energy performance Energy consumption 2019 2020 2021 2022 2023 176,682 142,098 125,095 117,997 110,750 MWh Market segments Governance and shareholder information Financial statements Financial review Corporate Responsibility Overview |
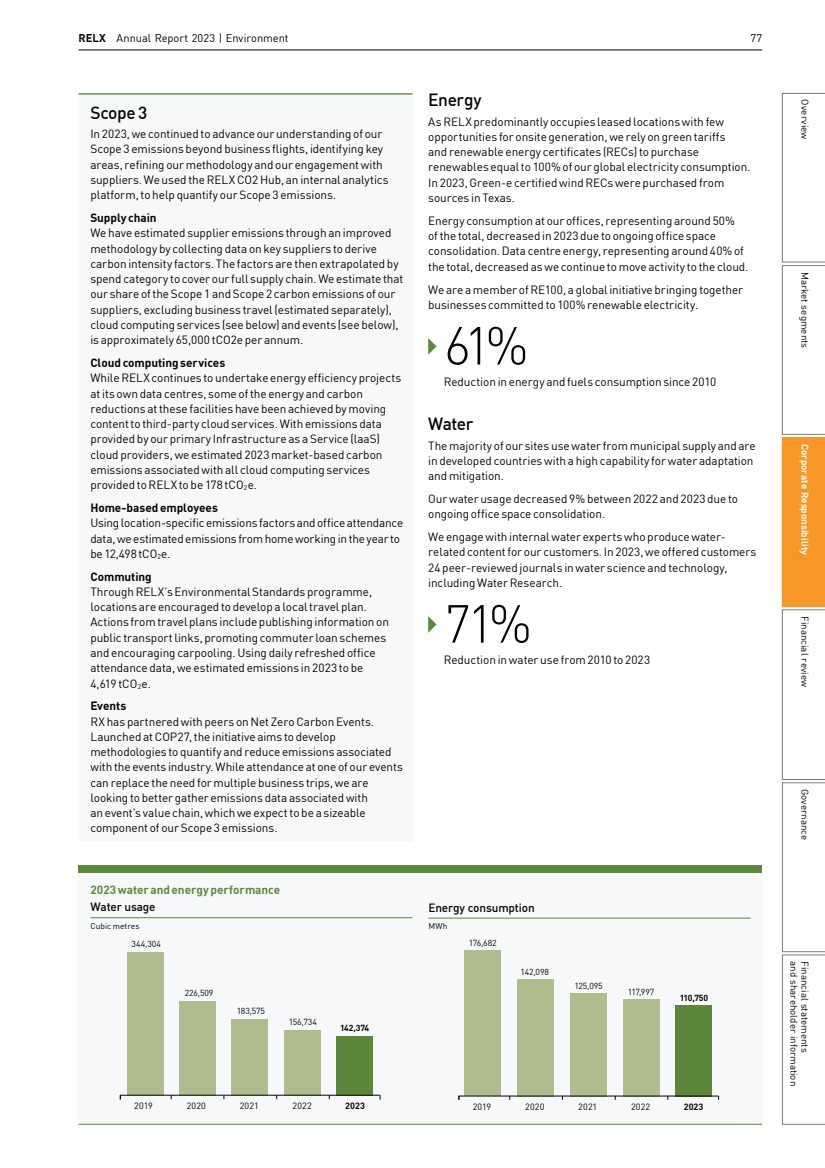
| 78 RELX Annual Report 2023 | Corporate responsibility RELX Environmental Challenge 2023 marked the thirteenth year of the RELX Environmental Challenge, a competitive grant-making scheme focused on providing improved and sustainable access to water and sanitation where it is presently at risk. The $50,000 first prize winner was Lombrifiltro by CPlantae, a sanitary engineering firm and social enterprise based in Mexico that has developed and commercialised prefabricated vermifilters for onsite wastewater treatment. The $25,000 second prize winner was TU Delft Water For Impact that has developed electrocoagulation; a method to treat surface water using solar power and removing the need for costly and often hard to access chemicals. The pilot project will test the approach and effectiveness in providing a more sustainable and less chemical intensive solution to groundwater treatment challenges in northern Ghana. The winners were recognised at Pollutec where they were invited to participate in the show’s dedicated startup space and pitch sessions. It’s more than just an award; it’s an opportunity to make a broader impact. The prize money and recognition will help us expand our reach, providing safe water and sanitation to more communities in Mexico. Cesar Maldonado Co-founder of CPlantae Waste Total waste generated by our locations decreased by 27% in 2023, primarily due to changes in how our office space is utilised. Of waste generated at our locations, we estimate 73% was recycled and 93% diverted from landfill through recycling, composting and energy generation from waste. Of the waste produced at our reporting locations, excluding estimated data, 76% was recycled. Where reliable measurements are not available, we calculate waste based on weight sampling and by counting waste containers leaving our premises. Although local municipalities most often carry out sorting and recycling, we report all waste as going to landfill unless we have robust evidence. For this reason, performance against our waste target is linked to our reporting locations. We do not produce any material amounts of hazardous waste. We continued to work toward our target to reduce waste sent to landfill from reporting locations. In 2023, waste sent to landfill from reporting locations, excluding estimated data, decreased by 38%. We work to reduce packaging waste from our physical products. In the UK, we provide information on packaging waste in line with the UK government’s Producer Responsibility Obligations (Packaging Waste) Regulations 2007. As a member of the Biffpack compliance scheme, we report the amount of obligated packaging (as defined in the Packaging Waste Regulations) we generate through selling, pack and fill and importation of our products. Waste sent to landfill (all locations) 1,608 375 280 180 121 2019 2020 2021 2022 2023 Tonnes Energy from waste 19% Landfill 3% Compost 3% Recycling 76% Waste disposal (reporting locations) Waste performance All locations includes non-reporting locations, such as serviced offices, where data is estimated. Reporting locations are those from which we were able to capture primary data in the year and excludes estimated data. |
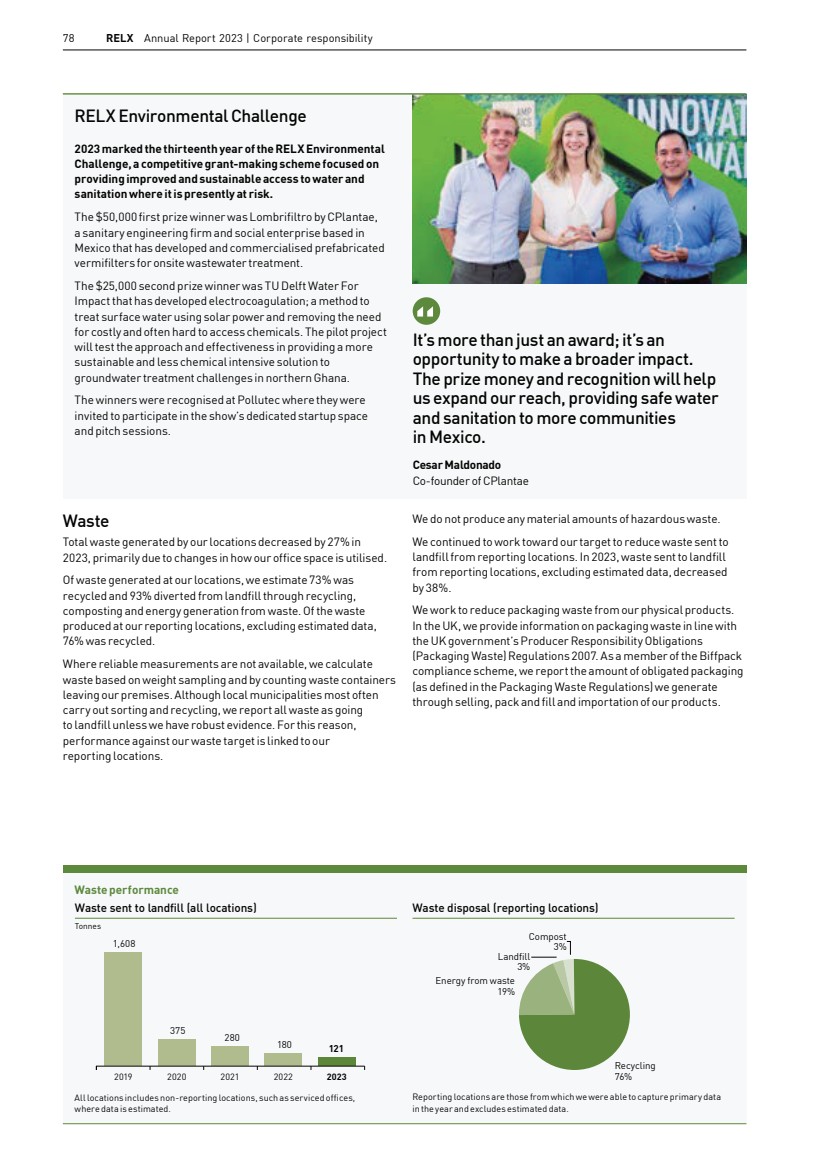
| RELX Annual Report 2023 | Environment 79 The ongoing support we receive from RELX is hugely appreciated. Camara’s mission is to equip students with the digital skills they need to enable them to secure meaningful employment or pursue further education. Aidan Tallon CEO, Camara Education A new life for old equipment We dispose of defunct hardware and other electronic waste according to local regulations and recycle only ifequipment cannot be reused. This year, we continued our partnership with Camara Education to donate equipment to provide access to computers for students in Ethiopia, Kenya, Tanzania and Zambia. Camara Education refurbishes our donated equipment and uses it, or the proceeds from selling it, to set up computer labs, train teachers and provide locally relevant educational content. Any equipment that cannot be refurbished is appropriately recycled. In 2023, Camara Education generated around £25,000 from equipment donated by RELX, enough to fully equip three new eLearning centres, impacting more than 2,000 students. Our donations saved almost 2,000 tCO2e and kept more than nine tonnes of waste from going to landfill. Asia Pacific 18% Europe 44% North America 38% Forest source of graded production papers 2023 paper performance Percentage of paper graded as known and responsible sources by the Book Chain Project or certified by FSC/PEFC. Includes less than 0.5% of paper not yet graded or certified. Paper The quantity of production paper purchased in 2023 decreased by 21% over 2022 and by 66% since 2010 as we deliver more of our products online, reflecting a circular economy approach to conducting our business. During 2023, we updated the RELX Paper Policy to highlight our commitment to avoiding deforestation and other environmental impacts through the purchase of sustainably sourced papers. 100% of RELX production papers were graded as known and responsible sources or certified to FSC or PEFC. We continue to reduce waste and the environmental impact of producing our products through measures such as smaller print runs, digital over litho printing, print on demand and lighter papers where possible. Focus on sustainable paper We are a founding member of the Bookchain Project’s paper module (PREPS) and helped create the PREPS database which identifies the pulps and forest sources of papers. Each paper is given stars according to sustainability criteria: one (unknown or unwanted material), three (known and responsible), or five (recycled, Forest Stewardship Council or Programme for the Endorsement of Forest Certification certified). The grading system was initially developed by PREPS member Egmont UK Ltd and sustainability consultants Carnstone, along with input from Greenpeace and WWF. The RELX Sustainable Production Paper Policy commits us to purchase only sustainable papers – graded three or five in Bookchain, or certified to FSC or PEFC. In 2023, we used approximately 97 tonnes of office paper. To reduce paper use at sites with higher consumption levels, we have set specific targets. Sustainable production paper 96 92 98 99 100 2019 2020 2021 2022 2023 Percentage Market segments Governance and shareholder information Financial statements Financial review Corporate Responsibility Overview |
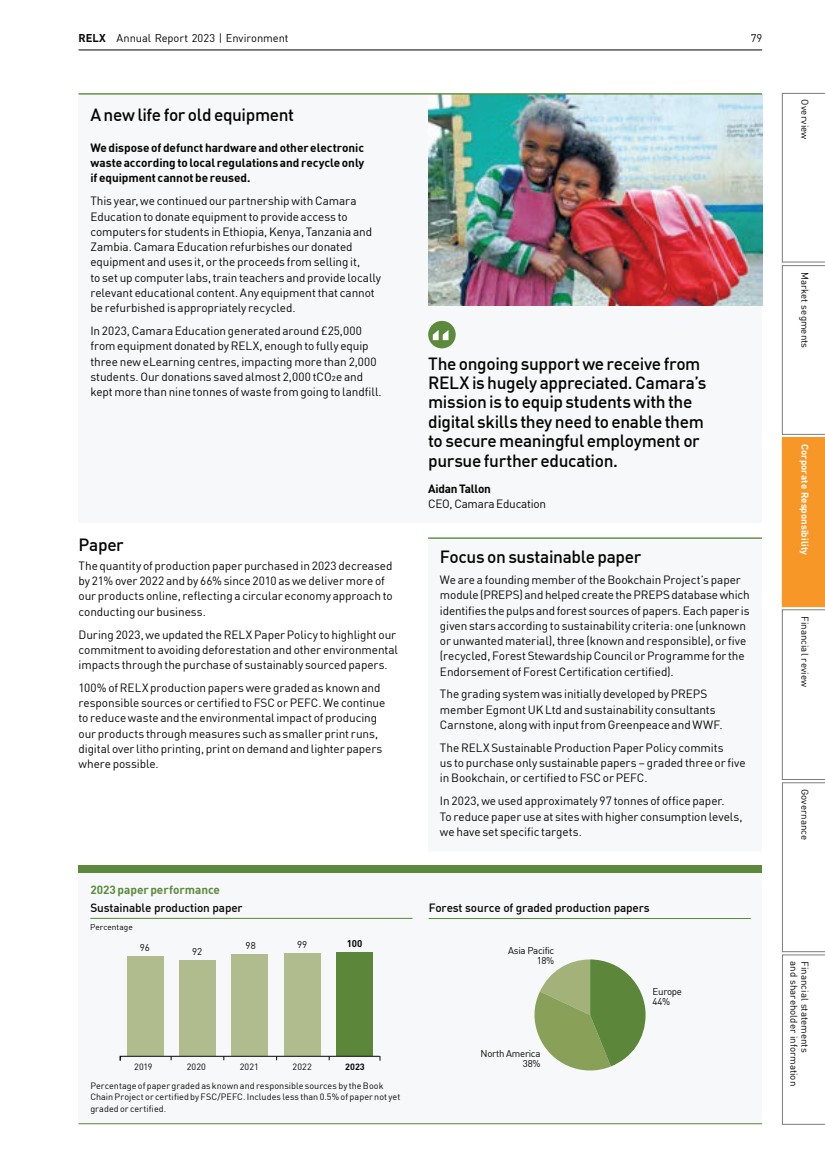
| 80 RELX Annual Report 2023 | Corporate responsibility 2023 PERFORMANCE Review global car fleet policies with the aim to move to more fuel-efficient vehicles The size of the RELX car fleet has decreased by 25% since 2015, to less than 500 vehicles across the company. Over this period, fleet emissions have reduced by 65% due to the reduction in vehicles and improvements in vehicle performance. Since 2015, the number of zero or low-emission vehicle models in the fleet has more than quadrupled and approximately 7% of the fleet is fully electric (up from 0 electric vehicles in 2015). Fleet emissions account for a minimal share of emissions of around 3% of the reported Scope 1 and Scope 2 emissions. During 2023, we conducted an analysis of approximately 80% of fleet vehicles through our primary global lease to better understand how we can best accelerate the transition to electric vehicles. A survey of the remaining vehicles highlighted areas of the business where low-emission vehicles could be more effectively incorporated. Targets and standards Our focus is on delivering continuous improvement in our environmental performance year-on-year. In 2023, we reduced our energy consumption by 6% compared to 2022, with this resulting in a reduction of 4% in our scope 1 and scope 2 (location-based) emissions as emissions factors changed in a number of countries. We also reduced our water consumption by 9%, reduced waste sent to landfill by 38% and reached 100% for our sustainable production paper metric. We also set longer term targets to reflect our ambition over time. In 2023, we achieved all the environmental targets we had set for 2025, as shown in the table to the right. We are in the process of setting new targets, out to 2030, against a 2018 baseline year, with our proposed targets currently being reviewed by the ScienceBased Targets initiative. We continue to report on our indirect Scope 3 emissions. See Climate change above for more information. We set other targets for reducing energy and fuel consumption, for the amount of renewable electricity we purchase and for decreasing the amount of waste we generate. We are a founding signatory to the Responsible Media Forum’s Media Climate Pact which requires signatories to set a science-based carbon reduction target and commit to furthering climate awareness and positive action through their content. As a signatory to the SDG Publishers Compact, we advocate for climate action in the content we publish. Environmental targets Focus area Targets – 2025 2023 performance Climate change Reduce Scope 1 and 2 (location-based) carbon emissions by 46% against a 2015 baseline -61% Energy Reduce energy and fuel consumption of our locations by 30% against a 2015 baseline -49% Energy Continue to purchase renewable electricity equivalent to 100% of RELX’s global electricity consumption 100% Waste* Decrease waste sent to landfill from reporting locations to 35% below 2015 levels -96% Production paper** 100% of RELX production papers to be graded in PREPS as ‘known and responsible sources’, or certified to FSC or PEFC by 2025 100% * From reporting locations, excluding estimated data. ** Percentage of paper graded as known and responsible sources by the Book ChainProject or certified by FSC/PEFC. Includes less than 0.5% of paper not yet graded or certified. Environmental management system Achieve Group certification to the ISO 14001 standard across the company Group certification across the company achieved in 2022 100% of new office fit-outs to achieve RELX Sustainable Fit-Out standard by 2025 RELX Sustainable Fit-Out standard developed Content Meet our responsibility under the Media Climate Pact to advance climate knowledge through our content Content to support climate awareness and positive action (see page 74) We have reported on all emission sources required under the Companies Act 2006 (Strategic Report and Directors’ Report) Regulations 2013. We have included emissions from all RELX operating companies. Environmental data covers 12 months from December 2022 through November 2023. We have used the GHG Protocol Corporate Accounting and Reporting Standard (revised edition) and the data has been assured by an independent third party. |
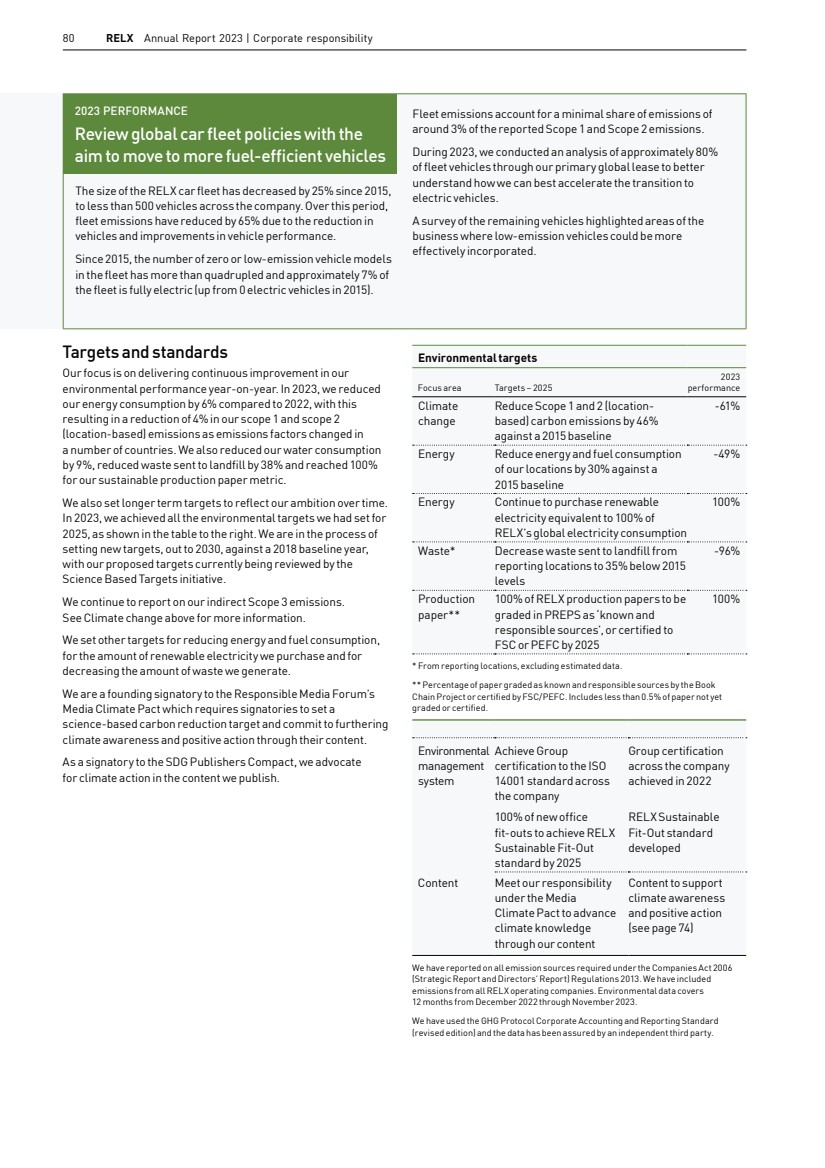
| RELX Annual Report 2023 | Environment 81 Book donations: supporting education While print is a relatively small portion of our revenue, we must continue to minimise the impact of printed product. We focus on techniques such as print on demand or print run control to better match production to demand. We donate excess product to charity partners such as BookAid International and Books for Africa to avoid waste and benefit communities. In 2023, RELX donated over 139,000 books with a value of over $11m to our charity partners. Book Aid International RELX has been a Book Aid International partner for over 30 years through regular book donations, financial support and staff fundraising and volunteering. RELX donations of medical books are critical to educating the next generation of healthcare providers around the world. In 2023, we donated 105,109 new higher education and medical books, as well as a grant to help Book Aid International and partners create an Explorer Library at Chiuzira Primary School, a poorly resourced school in a heavily populated area in central Malawi. This library will help children improve their reading and learning skills and give them the confidence to thrive. For over 30 years RELX and Book Aid International have partnered to support transformational change in libraries, schools and universities across sub-Saharan Africa and beyond. From much needed medical textbooks helping to improve patient care to creating brand new school libraries like the one at Chiuzira Primary school in Malawi, RELX has helped us reach thousands of readers. As we approach our charity’s 70th anniversary we hope that together we will continue to meet the need for books around the world. Alison Tweed, Chief Executive, Book Aid International 2024 objectives By 2030 Environmental responsibility – SDG 12 (Responsible Consumption and Production): Implement new SBTi environmental targets Carbon reduction – SDG 13 (Climate Action): Publish RELX net zero transition plan Further environmental knowledge and positive action through our products and services and, accordingly, conduct our business with the lowest environmental impact possible Market segments Governance and shareholder information Financial statements Financial review Corporate Responsibility Overview |
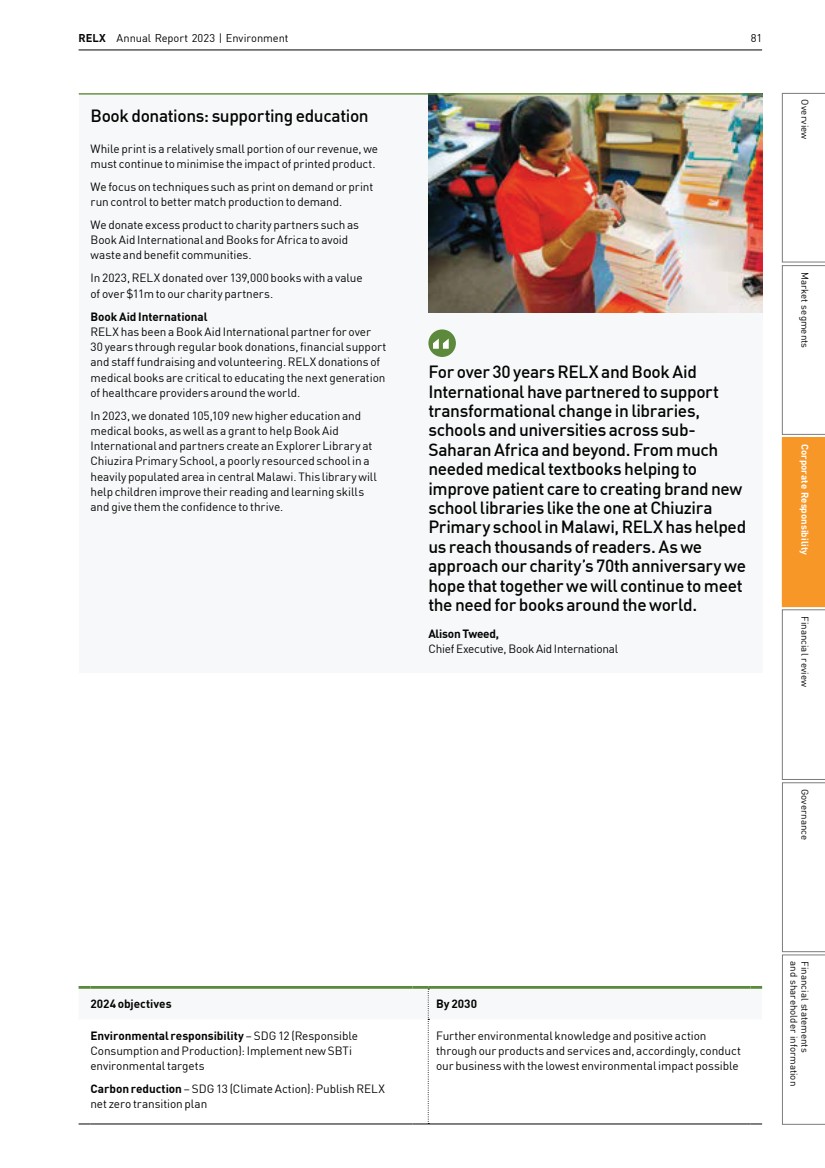
| 82 RELX Annual Report 2023 | Corporate responsibility CR Disclosure Standards 1 Taskforce on Climate-related Financial Disclosure (TCFD) RELX makes the following disclosures, consistent with the recommendations of the Taskforce on Climate-related FinancialDisclosure (TCFD) All Sector Guidance as required by the UK Listing Rules (Disclosure of Climate-Related Financial Information) (No 2) Instrument 2021. I. Governance a. Board oversight of climate-related risks and opportunities This statement has been reviewed and approved by the Board. The RELX Board oversees the internal controls and risk management practices as described on page 98. In addition, climate risk and opportunity is subject to our CR governance processes, see page 40. In the year, the Company’s approach to managing its climate change risks and opportunities was covered by the Board at multiple points including in discussions with and papers from the Chief Financial Officer (CFO), responsible to the Board for performance against climate targets; the Chief Sustainability Officer and Global Head of Corporate Responsibility (CSO); and the Head of Group Insurance and Risk, as part of the RELX Audit Committee review of the Company’s risk management process. The result of these undertakings is that the Board has found climate change has no material impact on RELX’s business in the short term and will be unlikely to have a significant impact in the medium and longer term. This is based on the review of RELX’s low sector exposure to climate change and consideration of climate change by the business in its strategy, activities, policies, annual budgets, and business plans, setting and monitoring of performance objectives, major capital expenditures, acquisitions and divestitures. Moreover, this view is predicated on strong climate action by the business in 2023 and over time to mitigate the effect of transition and physical climate change risks as described in this statement and in the Corporate Responsibility Report. b. Management’s role in assessing and managing climate-related risks and opportunities Management in each business area is responsible for identifying customer needs and developing relevant products related to climate change. This ranges from launching and advancing scientific journals with articles on climate change, energy efficiency, and other climate-related topics; providing data and analytics that support customers in reducing their environmental impact; providing information and analytics on laws and regulations related to the environment; and holding exhibitions focused on renewable energy and low carbon solutions. As RELX’s senior environmental champion, the CFO leads the RELX Environmental Checkpoint Group which sets strategy and targets for measuring and reducing the group’s own environmental impact. The group monitors performance throughout the year, tracking emissions across all scopes and performance relative to our target to reduce Scope 1 and 2 (location based) carbon emissions by 46% by 2025 against a 2015 baseline. Management in each operational area support our environmental goals. They are responsible for ensuring the continuity of the group’s operations, including resilience to events caused by extreme weather events. The Business Continuity Forum brings together specialists from across the group to identify risks, assess continuity and incident response plans, learn from incidents and spread best practice. We recognise climate change intersects with other environmental and sustainability issues. For this reason, climate change is also considered by the RELX Corporate Responsibility (CR) Forum, with oversight by the Head of Corporate Affairs, a member of the executive committee, and led by the CSO. The CR Forum meets twice per year and comprises more than 100 participants including function heads and business area leads from across the Company. Management is informed about climate-issues through quarterly business climate reporting, the certified ISO14001 Environmental Management System and by engagement with internal and external networks. II. Strategy a. Climate-related risks and opportunities in the short, medium, and long term While we are in a low carbon intensive sector, the Board and the Environmental Checkpoint Committee continued to consider our climate-related risks and opportunities based on the scenarios in section c below. Examples of our findings for various timeframes are outlined below. The long-term time horizon aligns with the timeframe of the Paris Climate Agreement and the medium-term with our ambition to achieve net zero by 2040. Short (<10 years) – Transition risks: Policy and legal requirements relative to climate change will continue to increase as they have in recent years requiring us to ensure adequate disclosure; there will be increasing stakeholder pressure requiring us to ensure our products and services help accelerate the green transition for our customers in carbon intensive and other industries. Physical risks: Variability in weather patterns and more frequent extreme weather events mean we must advance both mitigation and adaptation strategies, including through our business continuity planning. See page 86 for further information on TCFD risks. Medium (10 to 20 years) – Transition risks: There will likely be increased pricing of GHG emissions and enhanced reporting obligations, particularly in areas like supply chain emissions; reputational damage could result if we do not show medium-term results for meeting our obligations as a signatory of The Climate Pledge and similar initiatives. Physical risks: Gradual increase of average temperatures will affect businesses we operate in some locations more than others, so we are developing country and local response plans; mean temperature rise will likely affect our suppliers as well and we will continue our due diligence related to exposure in our supply chain. |
| RELX Annual Report 2023 | CR Disclosure Standards 83 Long term (20 years +) – Transition risks: Stigmatisation could result if our products and services are not seen as part of the solution to climate change; this creates an opportunity for us to increase offerings that support a lower carbon future. Physical risks: Sea level rise will be varying but worse under the business as usual scenario which will increase risk of business interruption and damage to property; we recognise that this must be part of our planning for the places where we will operate. Risks and opportunities have been identified through the risk assessment process, as described in Governance above and detailed on pages 98-105, and through working groups such as theESG Product Group, CR Forum and other networks. Our carbon action hierarchy is to first, reduce our carbon emissions; second, to purchase increasing amounts of green tariff energy as availability improves in global markets where we operate; and third, to purchase certified renewable energy certificates where necessary. Our performance reporting is based on our gross emissions, and we also purchase high-quality, verified offsets for residual emissions. We offset residual emissions in Scope 1, Scope 2 and Scope 3 (work-related flights, hotels, cloud computing, home-based working and commuting) purchasing offsets that meet strict criteria, and which are subject to certification and reporting requirements. RELX is committed to achieving net zero emissions following our carbon action hierarchy across all Scopes by 2040 at the latest, including through our participation in The Climate Pledge. b. Impact of climate-related risks and opportunities on our business, strategy, and financial planning In 2023, energy represented less than 1% of the RELX cost base. Although energy costs, and associated carbon costs, may increase substantially, the impact on RELX’s financial results is likely to remain limited and will not have a material impact on RELX financial planning as described in Governance above. While we do not believe climate risk will have a material impact on our revenue, there is careful review within the relevant businesses to assess impacts of providing products and services that help customers with their energy transition as traditional sector activities may not be viable in the longer term. We are using the climate scenarios we outline below to inform strategy and financial planning at both the Board and business area level. One example is our work with finance and other teams across the business to price carbon, which we raised to $35 tCO2e in the year (which will increase over time). Proceeds will be used for, among other measures, internal climate action projects where possible. In the year, we continued a cross-business review of climate-related product risks and opportunities. Printed and face-to-face products and events, responsible for 17% of total revenue, face more exposure to risks such as weather-related logistics disruption than do our digital offerings; see Principal Risks on page 98. We are factoring climate change into strategy planning for our portfolio as our scientific research information, analysis of environmental law, tracking of carbon and recycling markets, among other products and services, becomes increasingly important for our customers, investors and other stakeholders in their own responses to climate change. A small proportion of customers operate in carbon intensive industries, including agriculture and aviation, and we are committed to supporting them, and those in other industries, with their energy transition. There are no technology-related dependencies in realising opportunities to help customers reduce their carbon impact, though new opportunities may arise as technology advances. In Risk, products such as Cirium, which serves the aviation sector, is deploying an improved methodology for calculating flight emissions; helping airlines better plan and conduct maintenance of their fleet to ensure efficient operation; and identifying flight routes for maximum occupancy so emissions per passenger are lower. Elsevier is working to support clean energy. In 2023, it took further steps to implement its Energy with Purpose mission statement to commission only new book content that advances the energy transition and reduction of carbon emissions. Of 2,900 journals, four journals relating to hydrocarbon research remain with updated scope and aims focused on topics such as renewable energy and carbon capture and storage. Environmental science journals include a focus on renewable and clean energy. Among these are the flagship Cell Press title, One Earth, and Solar Compass, launched in conjunction with the International Solar Alliance, Joule, and new journal Nexus. The Lancet Countdown monitors the impact of climate change on global health. We also continue to review our editorial boards to ensure they include expertise in these areas and a greater representation from the global south. The Elsevier Energy Books team likewise will only commission new content that advances emissions reductions and the energy transition. Elsevier discontinued Geofacets, an earth science tool, in 2023 and plans to discontinue Gulf Professional Publishing in 2024. LexisNexis Legal & Professional provides LexisPSL Environment to help clients identify environmental liabilities, understand the commercial implications of environmental law and keep track of current developments with daily news feeds on new cases, legislation, and consultations as well as practice notes, Q&As, and legal precedents. RX holds World Future Energy Summit, a portfolio of events specifically designed to combat climate change, in line with the United Nations Sustainable Development Goals (SDGs) and the Paris Agreement. The United Arab Emirates unveiled its logo for the 28th Session of the Conference of the Parties to the UN Framework Convention on Climate Change (COP28) at 2023 World Future Energy Summit. As part of its Net Zero Carbon Events commitments requiring signatories to reach net zero by 2050 at the latest and to halve greenhouse gas emissions by 2030, RX was part of working groups to advance measurement of event-related emissions in the year and completed the carbon footprint of ten shows to better understand emissions from event energy, waste, production inputs and logistics. It published its net zero pathway report before the close of the year. All RELX business areas are contributing content to the RELX SDG Resource Centre which provides free access to news, research, tools and events on the SDGs, including SDG 7 Clean and Affordable Energy and SDG 13 Climate Action. The site also incorporates relevant content from key partners, including the UN Global Compact (UNGC). In support of COP28, we released a climate change special issue on the RELX SDG Resource Centre, a curated list of 159 journal articles and book chapters to inspire positive environmental action and further climate research. Market segments Governance and shareholder information Financial statements Financial review Corporate Responsibility Overview |
| 84 RELX Annual Report 2023 | Corporate responsibility c. Resilience of the organisation’s strategy, taking into consideration different climate-related scenarios, including a 2°C or lower scenario We have a threefold strategy to address climate-related risks: 1.Minimising our environmental impact through measures such as energy efficiency, renewable energy, reducing waste and other measures. This reduces our exposure to future legislation and the rising price of carbon 2. Providing products and services which support customers through their transition to a low-carbon economy. We anticipate demand for these offerings to continue to increase over time 3. Supporting wider action on climate change through collaboration, partnerships and initiatives such as the Digital Impact of Media Project in conjunction with the Responsible Media Forum, comprised of industry peers, and Bristol University The Board and the Audit Committee as part of robust risk control measures covering our products and operations (including our property portfolio and supply chain) ensures management of both the transition and physical risks of climate change. The Environmental Checkpoint Committee provides data on climate change metrics and advice to the Board and also engages people throughout the business. We gain and share best practice through engagement with the UNGC, the Climate Pledge, Media Climate Pact, Net Zero Carbon Events, and the Science-based Targets initiative, among others. We have considered three possible future scenarios and estimated possible timeframes. They are not exact descriptions of an expected future, but provide an outline description of each based on certain assumptions. In scenarios where extreme weather events occur more frequently, we may see increased incidents that disrupt our operations, necessitating additional measures, with some potential cost, to ensure our operational resilience. However, in the context of RELX’s overall cost base, we would not expect any such incremental cost to be significant. We believe our strategy will be resilient even in the most challenging future scenario. Scenario 1: Business as usual (RCP 8.5). In this scenario, carbon emissions continue to increase at current rates and temperature increases exceed 4°C by the year 2100. Short term: While some policies could be introduced to reduce carbon emissions, action is limited. Some countries may price carbon emissions and set standards for building and vehicle energy efficiency. Medium term: The availability of renewable energy may grow, butthe share of energy from fossil fuels will remain sizeable. With this level of warming, extreme and severe weather events will likely increase. Drought and increased precipitation will impact agriculture. Severe storms will interfere with our supply chains and logistics. The heightened need for innovation in climate adaptation infrastructure may increase demand for our environmental products and services for the scientific, technical and other communities. Long term: Rising sea levels will affect land use of coastal and low-lying regions where we may have operations, requiring investment to protect or relocate key company facilities to ensure business continuity. Significant government investment will be required to mitigate the impacts, for example in strengthening flood and coastal defences or securing reliable water supplies, with follow-on effects for places where we and future customers operate. Political instability in some regions may increase as populations compete for resources such as fresh water supplies and as large numbers of people move from regions most heavily impacted by climate change. Global economic uncertainty will likely become the norm, with limited growth at best and decline at worst. There will likely be significant health impacts as well. As impacts become more apparent, public sentiment may favour organisations such as RELX that have taken action to limit the impact of climate change. We would continue to pursue measures such as science-based carbon reductions, implementation of innovative technological solutions, carbon sequestration and (re)forestation, but without the catalyst of global government investment in these areas. Scenario 2: 2°C climate change (RCP 2.6). In this scenario, carbon emissions are halved by 2050 and climate change does not exceed 2°C by the year 2100. Short term: Countries would introduce more challenging carbon targets as they update their Nationally Determined Contributions under the 2015 Paris Climate Agreement. A range of new policies would most likely be introduced across many countries to control carbon emissions including carbon pricing, higher standards on building and vehicle energy efficiency, with increased renewable energy generation in global power grids. Such developments will be reflected in our policies and procedures, and could increase the demand for our climate-related products and services. Medium term: There would likely be public and private investmentin greater carbon sequestration, capture and storage, (re)forestation, and other measures – all of which would aid action in these areas within our business. Long term: The frequency of extreme weather events will increase but not as much as under Scenario 1. There will still be disruption to transport and logistics through storms, but sea level rise will be more limited, as will costs we may face associated with adaptation and mitigation projects. With reduced climate impacts, political and economic instability will be lessened. Climate-related migration will still be a factor but to a smaller degree than anticipated under Scenario 1. Scenario 3: 1.5°C climate change (RCP1.9). In this scenario, to achieve a 66% chance of avoiding more than 1.5°C warming by 2100, inclusive and sustainable development will be a key consideration for policy makers with high levels of international cooperation. Short term: Emissions must peak before 2025 to achieve net zero emissions by 2050, These ambitious carbon reductions would be supported by new policies (with carbon prices reaching as much or more than four times the price under the 2°C scenario) and strong regulation. Medium term: Buildings will be subject to tougher standards to achieve carbon reductions of nearly three times those under the 2°C degree scenario. Energy costs and associated carbon costs could be higher than in Scenario 1 or 2, but this is unlikely to have a major impact for RELX as energy is not a significant part of our cost base as indicated above. The transport sector will see significant change, with the majority of vehicles powered by alternative sources. Nature-based solutions to climate change, such as forestation, are also likely to play an important role. In this scenario, RELX efforts to reduce emissions, seek technology-driven carbon solutions and the pursuit of nature-based decarbonisation will be magnified. |
| RELX Annual Report 2023 | CR Disclosure Standards 85 Long term: By 2050, approximately 80% of global energy should be from renewable sources. Use of coal will decrease significantly and oil will drop to very low levels by 2060, which may impact the energy costs paid by RELX. After 2050, technologies such as bioenergy and carbon capture and storage will need to be widespread to remove excess carbon from the atmosphere to ensure emissions are net negative. III. Risk management a. Our processes for identifying and assessing climate-relatedrisks The principal and emerging risks facing the business, which have been assessed by the Audit Committee and Board, are described on pages 98-105. The Directors have considered the risk of climate change to the business, including the positive contribution that RELX makes through activities such as supporting academic research, pricing recyclable materials, and enabling customers to access our products electronically. Climate-related risks are assessed as part of the RELX risk management process. Risks are formally reviewed every six months. Each risk is assigned a significance based on the potential impact to revenue and the likelihood of that risk being realised. As part of our Environmental Management System, climate risk assessment covers transition and physical risks as described above and below, and also includes the assessment of existing and emerging regulatory requirements related to climate change. These include carbon pricing schemes, taxes and additional reporting requirements. b. Our processes for managing climate-related risks Climate change responsibilities are assigned to key roles, including the CFO at the executive level. Performance is monitored and evaluated throughout the year by the Environmental Checkpoint Group, chaired by the CFO, and new programmes are introduced as required to control climate-related transition and physical risks. On legislative and product trends, we gain insights through our Government Affairs teams, external fora such as the Aldersgate Group, and ISO 14001 environmental certification of our EMS. We speak with experts in the business, our climate-related Employee Resource Groups including Green Teams and Elsevier’s Climate Board, and learn through industry specific networks such as the Responsible Media Forum’s Climate Pact and cross-sector networks like the CR and Sustainability Council of the Conference Board, where our CSO serves on the Executive Committee. The business continuity programme, under the direction of the RELX Business Continuity Forum, oversees mitigations of climate change physical risks on our operations through business continuity plans which include remote working and detailed employee information. We mitigate potential climate-related risks on our supply chain through supplier management practices in the Global Procurement team, the Supplier Resiliency Working Group, theBusiness Continuity Forum and the Socially Responsible Supplier programme, which includes supplier engagement on their activities and policies, and a risk-based programme of supplier audits and remediation. High-level net zero roadmap RELX carbon emissions are in line with the reductions required to ensure climate change of no more than 1.5ºC. To achieve net zero across all Scopes by 2040 at the latest, we are following a broad programme of action to achieve further reductions. This will include developing products and services that support the transition to a net zero economy, alongside actions to reduce our emissions. Short term § Continue office space consolidation in line with the working preferences of colleagues § Migration from owned data centres to more energy efficient third party cloud providers § Purchase of renewable energy equal to RELX’s global electricity consumption § Continue to quantify and report on Scope 3 emissions from our supply chain and value chain § Engage suppliers to adopt 1.5ºC aligned carbon reduction targets § Purchase of high quality carbon offsets to equal our residual emissions Medium term § Transition company car fleet to zero emission (e.g. electric) vehicles § RELX renewable energy purchases in more markets § Encourage purchase of renewable energy by suppliers Longer term § Purchase of carbon neutralisation offsets for residual emissions IV. Metrics and targets We aim to provide additional insight into revenue from products and services designed for a low carbon economy in subsequent disclosures. Scope 1 and 2 (location-based) emissions reduction targets and energy reduction targets are set out on page 80 of this report. The remuneration of the CEO and the CFO is linked to the achievement of environment targets. These included in 2023, a key performance objective to reduce Scope 1 and Scope 2 (location-based) carbon emissions by 40% against a 2015 baseline, with 61% achievement and to reduce energy and fuel consumption by 27% against a 2015 baseline, with 49% achievement. See page 132 for further details. In the year, we reported performance against our $3bn committed bank facility which has pricing linked to three sustainability performance targets. In each year, the cost of the facility is reduced if two or more sustainability targets are achieved and increased if two or more of the targets are missed. The targets relate to carbon emissions reduction, as well as increasing the unique users and the amount of content available on the RELXSDG Resource Centre. All three targets were achieved. See page 49. Market segments Governance and shareholder information Financial statements Financial review Corporate Responsibility Overview |
| 86 RELX Annual Report 2023 | Corporate responsibility TCFD Risks We have considered climate-related risk areas detailed in the TCFD guidance as detailed below. While we do not believe climate-related risks will have a material impact on our business, we have highlighted risks areas which present the most opportunity for us to support the net zero transition. Risk group Type Climate-related risk Implication Opportunity Transition risks Policy and legal Increased pricing of GHG emissions: The rapid transition to a low carbon energy system could require higher energy prices and a higher carbon price to disincentivise the use offossil fuels RELX has low exposure to energy and carbon pricing (less than 1% of total spend) and has achieved significant reductions in energy consumption since 2010. For this reason, moderate to significant increases in energy costs will have a limited impact on RELX. There will be an increased need for information on energy and carbon pricing; research on energy transition and zero carbon; and events which bring stakeholders together to showcase related technological innovation are likely to increase the demand for RELXproducts and services. Enhanced emissions-reporting obligations: Anincreasing number of governments are likely to impose requirements on business to achieve the low carbon transition. New requirements are likely to include additional reporting and transparency requirements for GHGemissions RELX has processes in place for carbon reporting and disclosure aligned with various best practice frameworks. Additional reporting requirements are expected to have insignificant financialimplications. Widespread introduction of different reporting regimes in the countries where we operate could increase the risk of non-compliance (and therefore the risk of fines). However, RELXoperates an environmental management system certified to ISO 14001 which requires a compliance assessment with environmental legislation. This reduces the risk of non-compliancewith future reporting regulations. As new regulations are introduced, there will be a greater need for guidance; this could result in an increased demand for our risk, science, legal and other products and services. Mandates and regulation affecting existing products and services: New regulations may be introduced for products to support the transition to a low-carbon economy RELX delivers products and service primarily in three ways: i) online/digital; ii) printed products; iii) in-person events. Increasing regulation on products in these areas couldresult in an increased cost for providing those products and services. Online/digital: Products served by RELX-owned data centres are covered by the purchase of renewable electricity and RELX’s net zero commitment. RELX is engaging with Scope 3 suppliers for greater transparency on our share of their carbon emissions and renewable energy. Printed products: Revenue from printed products has decreased significantly since 2010 as more product offerings are made online. Paper used in RELX’s printed products complies with the RELX Sustainable Paper Policy which requires all papers are from known andsustainable sources and/or certified to a recognised standard. In person: Exhibitions is part of an events industry initiative, NetZero Carbon Events, working to achieve net zero by 2040. Thiscommitment requires significant reductions in carbon emissions and partnerships with other industries to minimise events-related emissions. A small proportion of our customers operate in carbon-intensive industries, and less than 1% of the journals we produce specifically cover content related to hydrocarbon; we continue toensure they focuson supporting relevant customers in their energy transition. New regulations on products will, in many cases, be best addressed through industry collaboration. Our convening power in the markets we serve can support such industry collaboration. Technology Substitution of existing products and services with lower emissions options RELX has largely transitioned from printed physical products to online/digital products and services. This avoids the emissions associated with the manufacture and distribution of printed products but introduces emissions associated with the use of data centres for the digital offerings. RELX-owned data centres are covered by renewable electricity and RELX’s net zero commitment. As described, we are engaging with our cloud providers for greater transparency on carbon emissions and renewable energy. Our products, services and events aid the low-carbon transition benefiting our customers and society. Costs to transition to lower emissions technology The cost implications for transitioning to new technology are primarily in our supply chain. Printed products are manufactured and distributed by suppliers onbehalf of RELX. RELX engages its suppliers through the Socially Responsible Suppliers programme andhas processes in place for reporting on its supply chain-related emissions. Detailed energy and carbon market insights we can provide through our products, services and events will allow companies to better assess the risks and costs of transitioning to lower emissions technologies. |
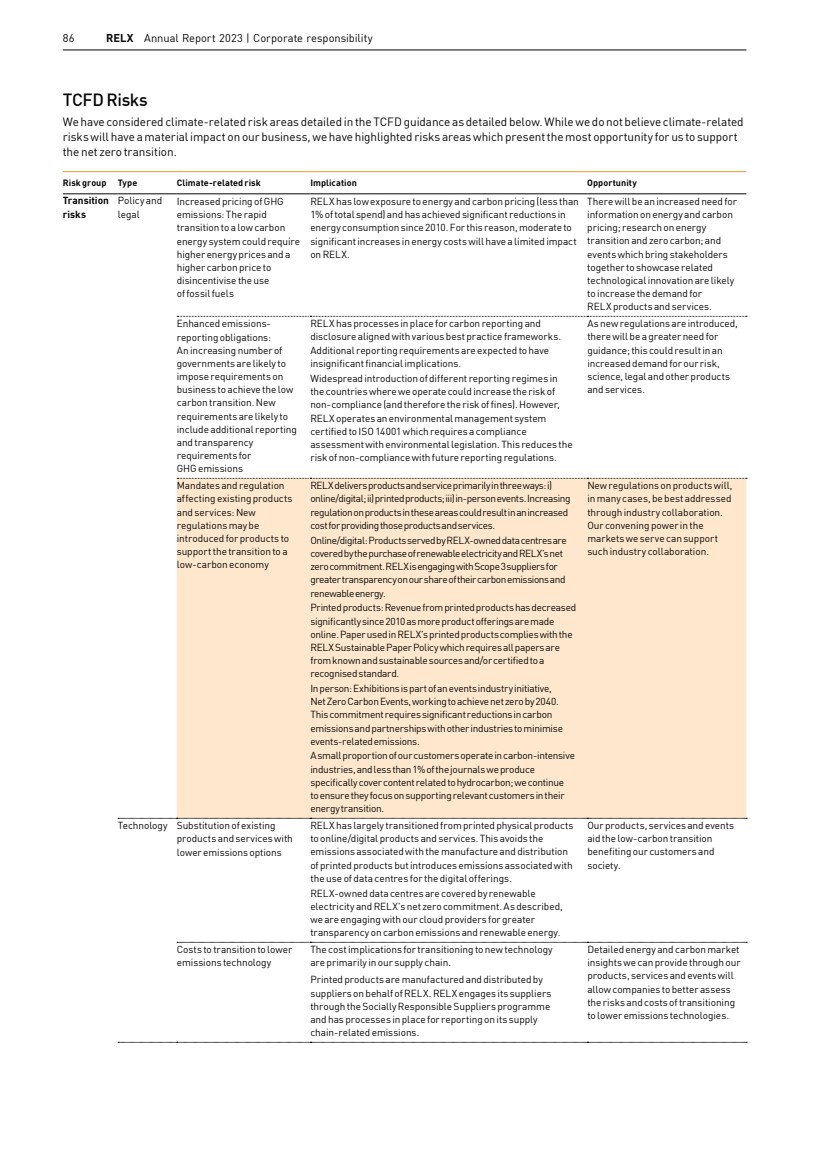
| RELX Annual Report 2023 | CR Disclosure Standards 87 Risk group Type Climate-related risk Implication Opportunity Market Changing customer behaviour Significant increases to the cost of air travel due to the factoring in of carbon charges may discourage business travel in favour of virtual meetings. This could lead to a reduction in the number of attendees at in-person events affecting our events business. We offer virtual attendance options and in-person participation allows exhibitors and attendees to hold numerous meetings during one event. The ability for an exhibitor or event attendee to maximise engagement by attending one event, for example, with customers, prospects, and suppliers, can become more valuable as the cost oftravel increases. Uncertainty in market signals As businesses take action to combat climate change, they might need to change business models or practices to ensure their success in a low-carbon economy. Some of these changes may raise questions for investors or other stakeholders and reduce visibility ofthe business’s strategy. RELX provides detailed and transparent disclosure on climate change to provide clarity to investors and other stakeholders. Businesses can develop new disclosures to effectively communicate plans with stakeholders. The demand for our products which provide company and market insights could grow as investors’ requirements for reliable information and data increases. Increased cost of rawmaterials: Low-carbon requirements on the use, and distribution, of raw materials could lead to an increase in their cost RELX does not manufacture products from raw materials. Anincrease in the cost of raw materials would primarily impact RELX via higher prices in our supply chain. Pricing insights in key supply chains such as chemicals and plastics are provided within our Risk business. If cost and price volatility increases, there could be a greater demand for such products and services. Reputation Shifts in consumer preferences Business customers may become more aware of environmental concerns and expect a high standard of performance from companies. Over time, this may lead to a decrease in demand for carbon intensive products as consumers move to low emissionalternatives. While we do not produce consumer products, we do serve a variety of industries and can support their efforts to decarbonise through our products, services and events. Stigmatisation of sector: Products and services offered to carbon-intensive industries could result in negative public reaction We offer products and services across a wide range of industries, some of which are carbon-intensive industries. We are working to support these industries in their transition to a low-carbon economy. Industries which face the greatest challenges in decarbonisation will need support, information and tools. We will continue developing new products and services to assist these industries in their decarbonisation efforts. Increased stakeholder concern or negative stakeholder feedback: Poor performance could result in negative feedback from stakeholders such as investors or colleagues RELX sets environmental targets on a five-year cycle and has a Science Based Target aligned carbon reduction target which aligns its emissions reductions with those required to meet the 1.5°C ambition of the Paris Agreement. Maintaining good environmental performance provides a reputational benefit with our stakeholders, including investors. Strong environmental performance and commitments may be reflected in improved or lower cost financing. Physical risks Acute Increased severity of extreme weather events such as cyclones and floods: severe weather could interrupt normal business operations RELX operates a comprehensive business continuity programme to ensure colleagues can work remotely and be informed should a location be impacted by severe weather conditions. This allows the business to function despite the impact of the severe weather. As risks associated with weather events increases, insurance premiums paid by RELX could increase. We provide products that help to assess and quantify insurance perils. As insurance premiums increase, demand for these products will likely grow as insurance providers seek more accurate weather-related risk assessments. Chronic Changes in precipitation patterns and extreme variability in weather patterns: Such changes could affect agricultural processes Printed products require supply of wood from sustainable forest sources. Changes in precipitation and weather patterns could disrupt the growth in forest sources known to be sustainably managed which could increase the price of sustainable paper. RELX has flexibility in the types of paper used and the forest sources of these papers which allows purchases to be made elsewhere should the need arise. As a member of the Book Chain Project, we assess the sustainability of a large number of papers, allowing us to consider alternatives. We offer products that use data analytics to help increase the efficiency of land use in areas such as water consumption. Demand for such products could grow as a response to decreasing yields due to weather. Rising mean temperatures: The gradual increase of average temperatures is a factor of climate change Climate change will affect temperatures differently in different locations. This means that, over time, the operation of some offices will become less efficient as they may need to maintain physical working conditions close to or outside the range for which they were designed. This could lead to an increase in operational costs as more energy will be required for cooling. Rising mean temperatures will require government to review, and businesses to implement, new building standards and guidelines. Our business areas would produce guidance to assist customers to interpret associated new standards and planning regimes. Rising sea levels If sea levels rise significantly there is increased risk of property damage to any RELX locations in low-lying coastal regions. This could increase insurance premiums or disrupt the working arrangements of colleagues in those locations. We have a comprehensive business continuity programme in place to mitigate such impacts and consider climate risk in the siting of our offices. We offer products that help to assess and quantify insurance perils risk. As insurance premiums increase, demand for these products could grow. Market segments Governance and shareholder information Financial statements Financial review Corporate Responsibility Overview |
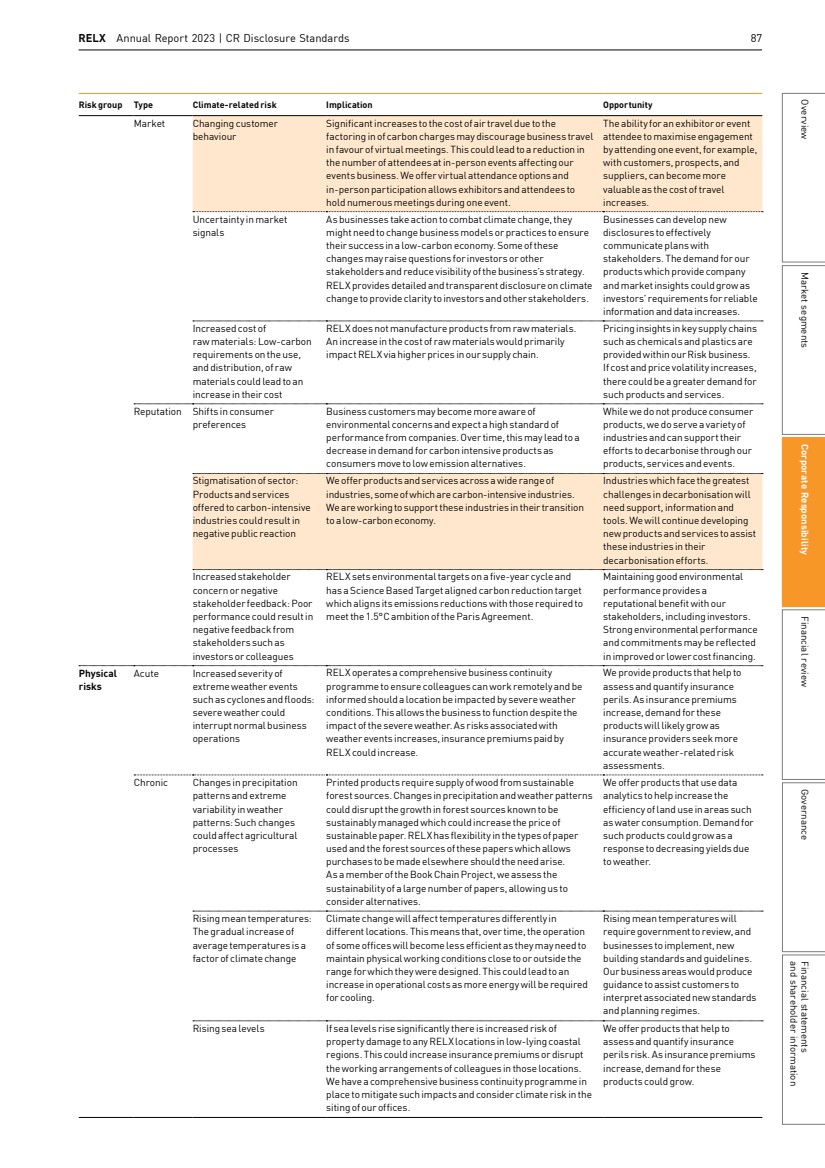
| 88 RELX Annual Report 2023 | Corporate responsibility CR Disclosure Standards 2 Sustainability AccountingStandards Board (SASB) disclosure SASB Standards enable businesses around the world to identify, manage and communicate financially material sustainability information to their investors. The SASB standards are industry specific and identify the minimal set of financially material sustainability topics and their associated metrics for the typical company in an industry SASB assigns RELX to the Professional and Commercial Services sector. The following disclosure is made according to the SASB standard for that sector. Topic Accounting metric Code Disclosure/Disclosure location Data security Description of approach to identifying and addressing data security risks SV-PS-230a.1 See page 52 Description of policies and practices relating to collection, usage and retentionof customer information SV-PS-230a.2 See page 52 (1) Number of data breaches, (2) percentage involving customers’ confidential business information (CBI) or personally identifiable information (PII), (3) number of customers affected SV-PS-230a.3 Except as a matter of public record, RELX does not disclose this information for reasons of commercial confidentiality Workforce diversity and engagement Percentage of gender and racial/ethnic group representation for (1) executive management and (2) all other employees SV-PS-330a.1 See pages 55-56 (1) Voluntary and (2) involuntary turnover rate for employees SV-PS-330a.2 See page 59 Employee engagement as a percentage SV-PS-330a.3 68% Professional integrity Description of approach to ensuring professional integrity SV-PS-510a.1 See pages 5-53 Total amount of monetary losses as a result of legal proceedings associated with professional integrity SV-PS-510a.2 Except as a matter of public record, RELX does not disclose this information for reasons of commercial confidentiality Activity metrics Number of employees by (1) full-time and part-time, (2) temporary, and (3) contract SV-PS-000.A See page 59 Employee hours worked, percentage billable SV-PS-000.B See page 59 |
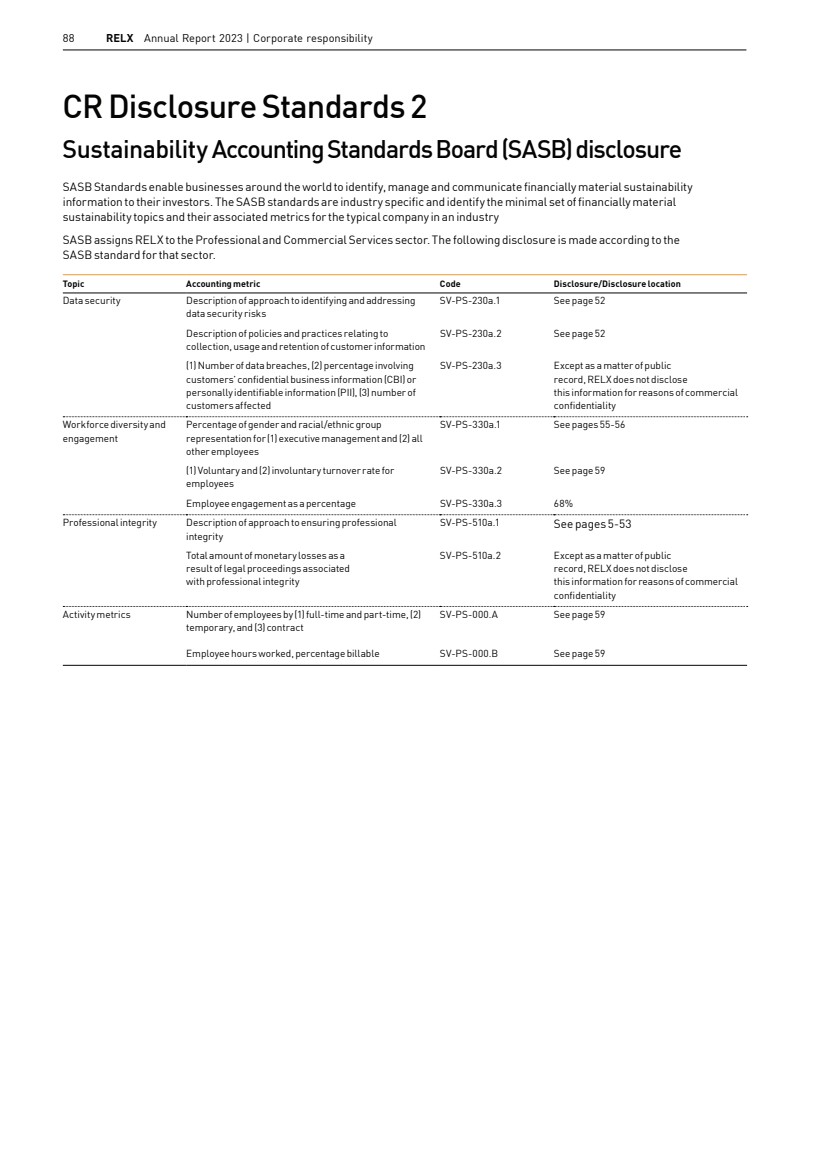
| RELX Annual Report 2023 | CR Disclosure Standards 89 CR Disclosure Standards 3 Global Reporting Initiative (GRI) Content Index and Streamlined Energy and Carbon Reporting (SECR) This report has been prepared in accordance with the GRI Standards: Core option GRI Standard Number GRI Standard Title Disclosure Title Page number GRI 102 General Disclosures Name of the organisation Title page GRI 102 General Disclosures Activities, brands, products, and services 5-37 GRI 102 General Disclosures Location of headquarters 38 GRI 102 General Disclosures Location of operations 7 GRI 102 General Disclosures Ownership and legal form 153 GRI 102 General Disclosures Markets served 7 GRI 102 General Disclosures Scale of the organisation 7 GRI 102 General Disclosures Information on employees and other workers 54-59 GRI 102 General Disclosures Supply chain 69-72 GRI 102 General Disclosures Significant changes to the organisation and its supply chain 69-72 GRI 102 General Disclosures Precautionary Principle or approach 73-87 GRI 102 General Disclosures External initiatives 44 GRI 102 General Disclosures Membership of associations 44 GRI 102 General Disclosures Statement from senior decision-maker 3-4 GRI 102 General Disclosures Values, principles, standards, and norms of behaviour 4, 50-53, 54-59 GRI 102 General Disclosures Governance structure 40, 50, 112-116 GRI 102 General Disclosures List of stakeholder groups 43-44, 113-125 GRI 102 General Disclosures Collective bargaining agreements 59 GRI 102 General Disclosures Identifying and selecting stakeholders 43-44, 119 GRI 102 General Disclosures Approach to stakeholder engagement 43-44, 119 GRI 102 General Disclosures Key topics and concerns raised 43 GRI 102 General Disclosures Entities included in the consolidated financial statements 166-169 GRI 102 General Disclosures Defining report content and topic Boundaries 29-30 GRI 102 General Disclosures List of material topics 43 GRI 102 General Disclosures Restatements of information 41 GRI 102 General Disclosures Changes in reporting 41 GRI 102 General Disclosures Reporting period 41 GRI 102 General Disclosures Date of most recent report 22/02/24 GRI 102 General Disclosures Reporting cycle Annual GRI 102 General Disclosures Contact point for questions regarding the report 38 GRI 102 General Disclosures Claims of reporting in accordance with the GRI Standards 40, 89 GRI 102 General Disclosures External assurance 90 GRI 103 Management Approach Explanation of the material topic and its Boundary 43, 80 GRI 103 Management Approach The management approach and its components 40, 113 GRI 103 Management Approach Evaluation of the management approach 40, 123 Streamlined Energy and Carbon Reporting (SECR) Absolute performance Intensity ratio (per £m revenue) 2022 2023 Change 2022 2023 Change Global Scope 1 (direct emissions) tCO2e 5,211 4,317 -17% 0.61 0.47 -23% Global Scope 2 (indirect location-based emissions) tCO2e 37,270 36,616 -2% 4.36 4.00 -8% Global energy (including vehicle fuels) MWh 123,325 115,264 -7% 14.42 12.58 -13% UK energy (including vehicle fuels) MWh 11,220 11,844 6% 1.31 1.29 -1% UK Scope 1 and Scope 2 emissions tCO2e 2,250 2,315 3% 0.26 0.25 -4% We report on all global operations for which we have operational control following the GHG Protocol Corporate Accounting and Reporting Standard (revised edition) for the reporting year December 2022 to November 2023. Market segments Governance and shareholder information Financial statements Financial review Corporate Responsibility Overview |
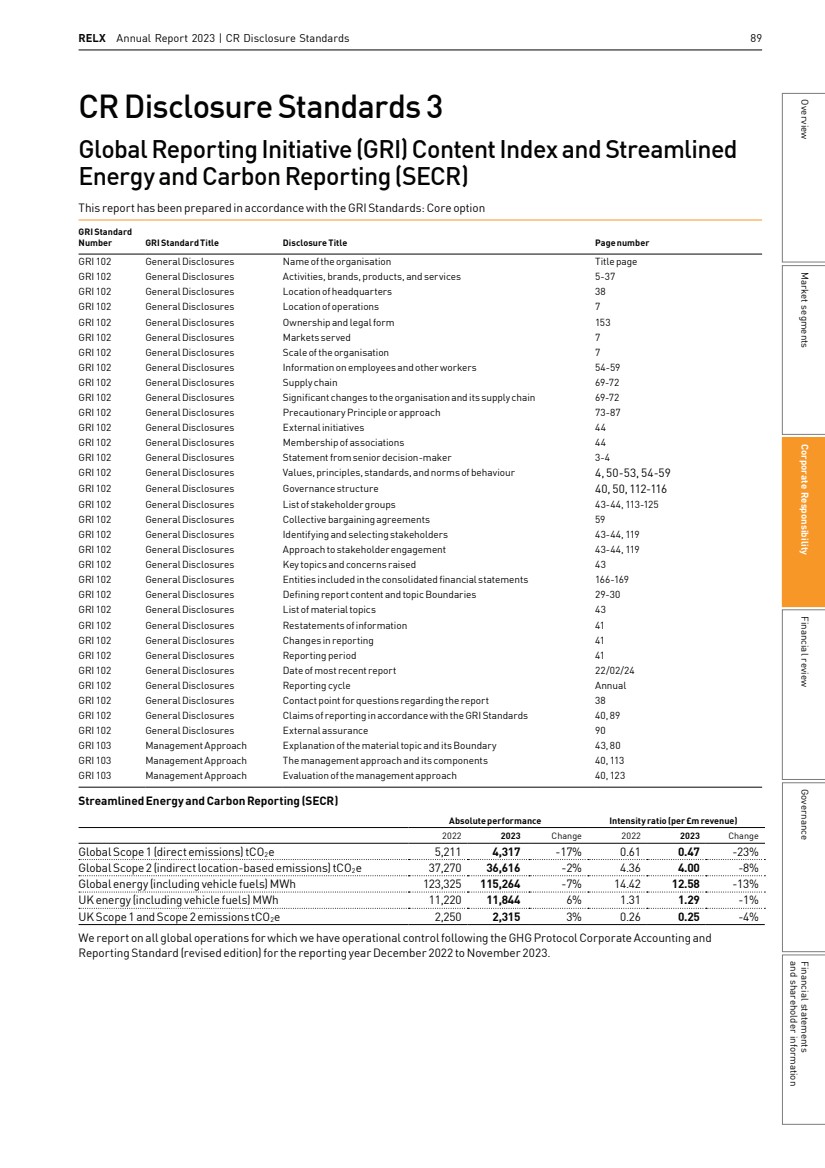
| 90 RELX Annual Report 2023 | Corporate responsibility THIS PAGE IS INTENTIONALLY BLANK |

| In this section 92 Chief Financial Officer’s report 98 Principal and emerging risks Financial review Market segments Governance and shareholder information Financial statements Financial review Corporate Responsibility Overview RELX Annual Report 2023 91 |
| 92 RELX Annual Report 2023 | Financial review 7,874 7,110 7,244 £m 8,553 9,161 Revenue 2019 2020 2021 2022 2023 £m Adjusted operating profit 2,491 2,076 2,210 2,683 3,030 2019 2020 2021 2022 2023 92 RELX Annual Report 2023 | Financial review Chief Financial Officer’s report In 2023, underlying revenue growth was 8% and underlying adjusted operating profit growth was 13%, and adjusted earnings per share grew at 11% at constant currency. Nick Luff, Chief Financial Officer Revenue Underlying revenue growth was 8%, with all four market segments contributing to underlying growth. The underlying growth rate reflects strong growth in electronic and face-to-face revenues, partially offset by continued print revenue declines. Risk continued to deliver strong growth, STM maintained its improved growth, and Legal growth continued to improve. Exhibitions saw strong growth in revenue due to higher activity levels. Acquisitions and disposals together had a broadly neutral impact on revenue, while exhibition cycling effects decreased growth, giving total revenue growth at constant currency of 7%. The impact of currency movements was broadly neutral to growth. Reported revenue, including the effects of exhibition cycling and currency movements, was £9,161m (2022: £8,553m), up 7%. Profit Underlying growth in adjusted operating profit was 13%, with growth in each of Risk, STM and Legal in line with or ahead of revenue growth, and the improvement in profitability in Exhibitions reflecting the increased activity levels and the lower cost structure. Acquisitions and disposals combined had a small negative impact on adjusted operating profit growth, giving growth at constant currency of 12%. Currency effects increased adjusted operating profit by 1%. Total adjusted operating profit, including the impact of acquisitions and disposals and currency effects, was £3,030m (2022: £2,683m), up 13%. Operating costs on an underlying basis grew 5%, reflecting investment in global technology platforms, the launch of new products and services and the increased activity levels within Exhibitions, partly offset by the benefits of continued process innovation. Actions continue to be taken across the group to improve cost-efficiency. Total adjusted operating costs, including the impact of acquisitions, disposals and currency effects, were also up 5%. The overall adjusted operating margin was 33.1% (2022: 31.4%). On an underlying basis, including cycling effects, the margin improved by 1.7 percentage points with portfolio changes reducing margins by 0.2 percentage points and currency movements improving margins by 0.2 percentage points. EBITDA margin also improved, by 1.6 percentage points, to 38.7%. Reported operating profit was £2,682m (2022: £2,323m) up 15%, primarily reflecting the increase in adjusted operating profit and a lower amortisation charge in respect of acquired intangible assets. Adjusted net interest expense was £314m (2022: £194m), with the increase primarily reflecting higher average interest rates and a charge of £26m in respect of the early redemption of bonds that were due to be repaid in August 2027. Adjusted profit before tax was £2,716m (2022: £2,489m), up 9%. Reported profit before tax was £2,295m (2022: £2,113m) also up 9%, reflecting the improvement in reported operating profit, the higher interest expense, an impairment charge for some assets held for sale within Risk and a net downward valuation of the Ventures portfolio. The amortisation charge in respect of acquired intangible assets, including the share of amortisation in joint ventures and associates, was £280m (2022: £296m). 92 RELX Annual Report 2023 | Financial review Chief Financial Officer’s report In 2023, underlying revenue growth was 8% and underlying adjusted operating profit growth was 13%, and adjusted earnings per share grew at 11% at constant currency. Nick Luff, Chief Financial Officer Revenue Underlying revenue growth was 8%, with all four market segments contributing to underlying growth. The underlying growth rate reflects strong growth in electronic and face-to-face revenues, partially offset by continued print revenue declines. Risk continued to deliver strong growth, STM maintained its improved growth, and Legal growth continued to improve. Exhibitions saw strong growth in revenue due to higher activity levels. Acquisitions and disposals together had a broadly neutral impact on revenue, while exhibition cycling effects decreased growth, giving total revenue growth at constant currency of 7%. The impact of currency movements was broadly neutral to growth. Reported revenue, including the effects of exhibition cycling and currency movements, was £9,161m (2022: £8,553m), up 7%. Profit Underlying growth in adjusted operating profit was 13%, with growth in each of Risk, STM and Legal in line with or ahead of revenue growth, and the improvement in profitability in Exhibitions reflecting the increased activity levels and the lower cost structure. Acquisitions and disposals combined had a small negative impact on adjusted operating profit growth, giving growth at constant currency of 12%. Currency effects increased adjusted operating profit by 1%. Total adjusted operating profit, including the impact of acquisitions and disposals and currency effects, was £3,030m (2022: £2,683m), up 13%. Operating costs on an underlying basis grew 5%, reflecting investment in global technology platforms, the launch of new products and services and the increased activity levels within Exhibitions, partly offset by the benefits of continued process innovation. Actions continue to be taken across the group to improve cost-efficiency. Total adjusted operating costs, including the impact of acquisitions, disposals and currency effects, were also up 5%. The overall adjusted operating margin was 33.1% (2022: 31.4%). On an underlying basis, including cycling effects, the margin improved by 1.7 percentage points with portfolio changes reducing margins by 0.2 percentage points and currency movements improving margins by 0.2 percentage points. EBITDA margin also improved, by 1.6 percentage points, to 38.7%. Reported operating profit was £2,682m (2022: £2,323m) up 15%, primarily reflecting the increase in adjusted operating profit and a lower amortisation charge in respect of acquired intangible assets. Adjusted net interest expense was £314m (2022: £194m), with the increase primarily reflecting higher average interest rates and a charge of £26m in respect of the early redemption of bonds that were due to be repaid in August 2027. Adjusted profit before tax was £2,716m (2022: £2,489m), up 9%. Reported profit before tax was £2,295m (2022: £2,113m) also up 9%, reflecting the improvement in reported operating profit, the higher interest expense, an impairment charge for some assets held for sale within Risk and a net downward valuation of the Ventures portfolio. The amortisation charge in respect of acquired intangible assets, including the share of amortisation in joint ventures and associates, was £280m (2022: £296m). RELX Annual Report 2023 | Chief Financial Officer’s report 93 Overview Market segments Corporate Responsibility Financial review Governance Financial statements and other information ADJUSTED FIGURES Change 2022 2023 at constant Change For the year ended 31 December £m £m Change currency underlying Revenue 8,553 9,161 +7% +7% +8% EBITDA 3,174 3,544 Operating profit 2,683 3,030 +13% +12% +13% Operating margin 31.4% 33.1% Net interest expense (194) (314) Profit before tax 2,489 2,716 +9% +8% Tax charge (530) (553) Net profit attributable to shareholders 1,961 2,156 +10% +9% Cash flow 2,709 2,962 +9% +9% Cash flow conversion 101% 98% Return on invested capital 12.5% 14.0% Earnings per share 102.2p 114.0p +12% +11% DIVIDEND For the year ended 31 December 2022 2023 Change Ordinary dividend per share 54.6p 58.8p +8% REPORTED FIGURES For the year ended 31 December 2022 2023 Change Revenue 8,553 9,161 +7% Operating profit 2,323 2,682 +15% Profit before tax 2,113 2,295 +9% Net profit attributable to shareholders 1,634 1,781 +9% Net margin 19.1% 19.4% Cash generated from operations 3,061 3,370 +10% Net debt 6,604 6,446 Earnings per share 85.2p 94.1p +10% Summary financial information is presented in US dollars and Euros on pages 220 and 221 respectively. RELX uses adjusted and underlying figures as additional performance measures. Adjusted figures primarily exclude the amortisation of acquired intangible assets and other items related to acquisitions and disposals, and the associated deferred tax movements. Reconciliations between the reported and adjusted figures are set out on pages 222 to 230. Underlying growth rates are calculated at constant currency, excluding the results of acquisitions until 12 months after purchase, and excluding the results of disposals and assets held for sale. Underlying revenue growth rates also exclude exhibition cycling. Constant currency growth rates are based on 2022 full-year average and hedge exchange rates. Acquisition-related costs were £56m (2022: £62m). The adjusted tax charge was £553m (2022: £530m). The adjusted effective tax rate was 20.4% (2022: 21.3%), benefitting from non-recurring tax credits arising from the resolution of certain historical tax matters. The adjusted tax charge excludes movements in deferred taxation assets and liabilities related to goodwill and acquired intangible assets, but includes the benefit of tax amortisation where available on those items. Adjusted operating profits, interest and taxation are grossed up for the equity share of interest and taxes in joint ventures and associates. The application of tax law and practice is subject to some uncertainty and amounts are provided in respect of this. Discussions with tax authorities relating to cross-border transactions and other matters are ongoing. Although the outcome of open items cannot be predicted, no significant impact on profitability is expected. The reported tax charge was £507m (2022: £481m), including tax associated with the amortisation of acquired intangible assets, disposals and other non-operating items. The adjusted net profit attributable to RELX PLC shareholders was £2,156m (2022: £1,961m), up 10%. Adjusted earnings per share was up 11% at constant currency, and after changes in exchange rates was up 12% at 114.0p (2022: 102.2p). The reported net profit attributable to shareholders was £1,781m (2022: £1,634m) up 9%. Reported earnings per share was 94.1p (2022: 85.2p) up 10%. |
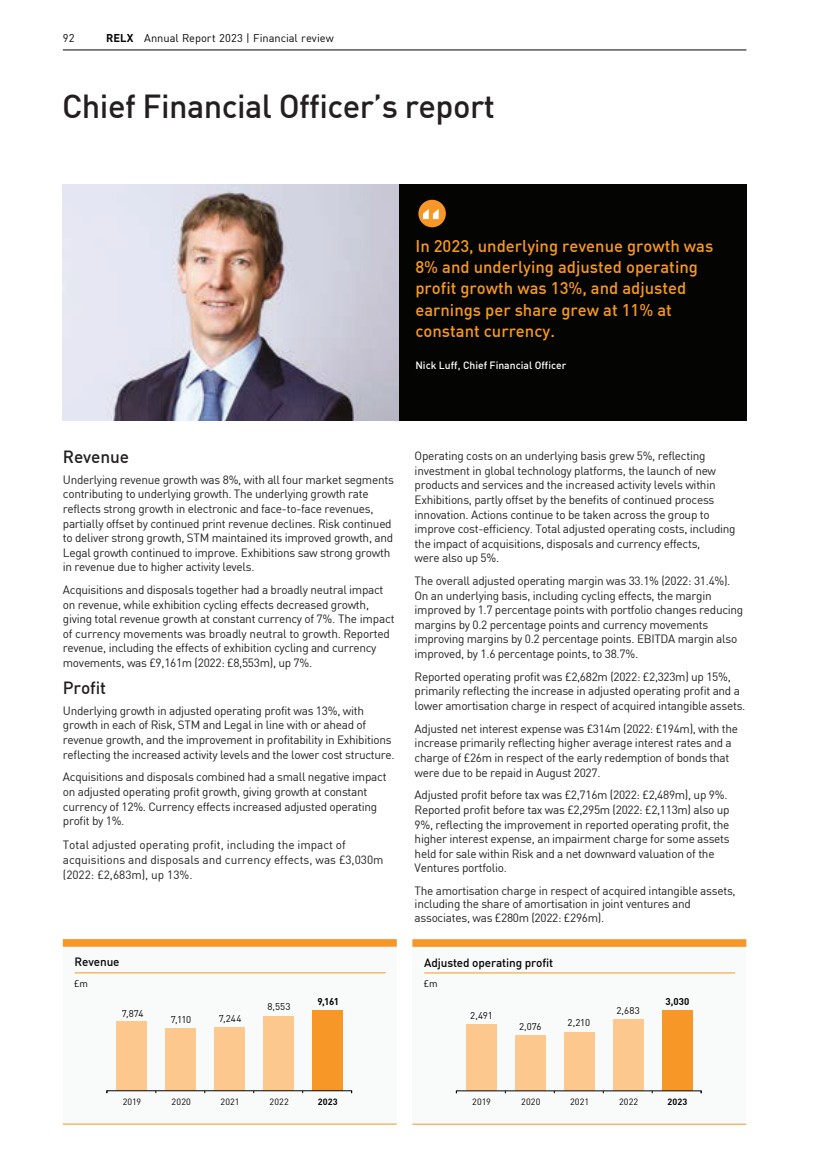
| RELX Annual Report 2023 | Chief Financial Officer’s report 93 Adjusted operating profit margin 31.6% 29.2% 30.5% 31.4% 33.1% 2019 2020 2021 2022 2023 EBITDA margin 2019 2020 2021 2022 2023 37.3% 36.1% 37.2% 37.1% 38.7% RELX Annual Report 2023 | Chief Financial Officer’s report 93 Overview Market segments Corporate Responsibility Financial review Governance Financial statements and other information ADJUSTED FIGURES Change 2022 2023 at constant Change For the year ended 31 December £m £m Change currency underlying Revenue 8,553 9,161 +7% +7% +8% EBITDA 3,174 3,544 Operating profit 2,683 3,030 +13% +12% +13% Operating margin 31.4% 33.1% Net interest expense (194) (314) Profit before tax 2,489 2,716 +9% +8% Tax charge (530) (553) Net profit attributable to shareholders 1,961 2,156 +10% +9% Cash flow 2,709 2,962 +9% +9% Cash flow conversion 101% 98% Return on invested capital 12.5% 14.0% Earnings per share 102.2p 114.0p +12% +11% DIVIDEND For the year ended 31 December 2022 2023 Change Ordinary dividend per share 54.6p 58.8p +8% REPORTED FIGURES For the year ended 31 December 2022 2023 Change Revenue 8,553 9,161 +7% Operating profit 2,323 2,682 +15% Profit before tax 2,113 2,295 +9% Net profit attributable to shareholders 1,634 1,781 +9% Net margin 19.1% 19.4% Cash generated from operations 3,061 3,370 +10% Net debt 6,604 6,446 Earnings per share 85.2p 94.1p +10% Summary financial information is presented in US dollars and Euros on pages 220 and 221 respectively. RELX uses adjusted and underlying figures as additional performance measures. Adjusted figures primarily exclude the amortisation of acquired intangible assets and other items related to acquisitions and disposals, and the associated deferred tax movements. Reconciliations between the reported and adjusted figures are set out on pages 222 to 230. Underlying growth rates are calculated at constant currency, excluding the results of acquisitions until 12 months after purchase, and excluding the results of disposals and assets held for sale. Underlying revenue growth rates also exclude exhibition cycling. Constant currency growth rates are based on 2022 full-year average and hedge exchange rates. Acquisition-related costs were £56m (2022: £62m). The adjusted tax charge was £553m (2022: £530m). The adjusted effective tax rate was 20.4% (2022: 21.3%), benefitting from non-recurring tax credits arising from the resolution of certain historical tax matters. The adjusted tax charge excludes movements in deferred taxation assets and liabilities related to goodwill and acquired intangible assets, but includes the benefit of tax amortisation where available on those items. Adjusted operating profits, interest and taxation are grossed up for the equity share of interest and taxes in joint ventures and associates. The application of tax law and practice is subject to some uncertainty and amounts are provided in respect of this. Discussions with tax authorities relating to cross-border transactions and other matters are ongoing. Although the outcome of open items cannot be predicted, no significant impact on profitability is expected. The reported tax charge was £507m (2022: £481m), including tax associated with the amortisation of acquired intangible assets, disposals and other non-operating items. The adjusted net profit attributable to RELX PLC shareholders was £2,156m (2022: £1,961m), up 10%. Adjusted earnings per share was up 11% at constant currency, and after changes in exchange rates was up 12% at 114.0p (2022: 102.2p). The reported net profit attributable to shareholders was £1,781m (2022: £1,634m) up 9%. Reported earnings per share was 94.1p (2022: 85.2p) up 10%. Market segments Governance and shareholder information Financial statements Financial review Corporate Responsibility Overview |
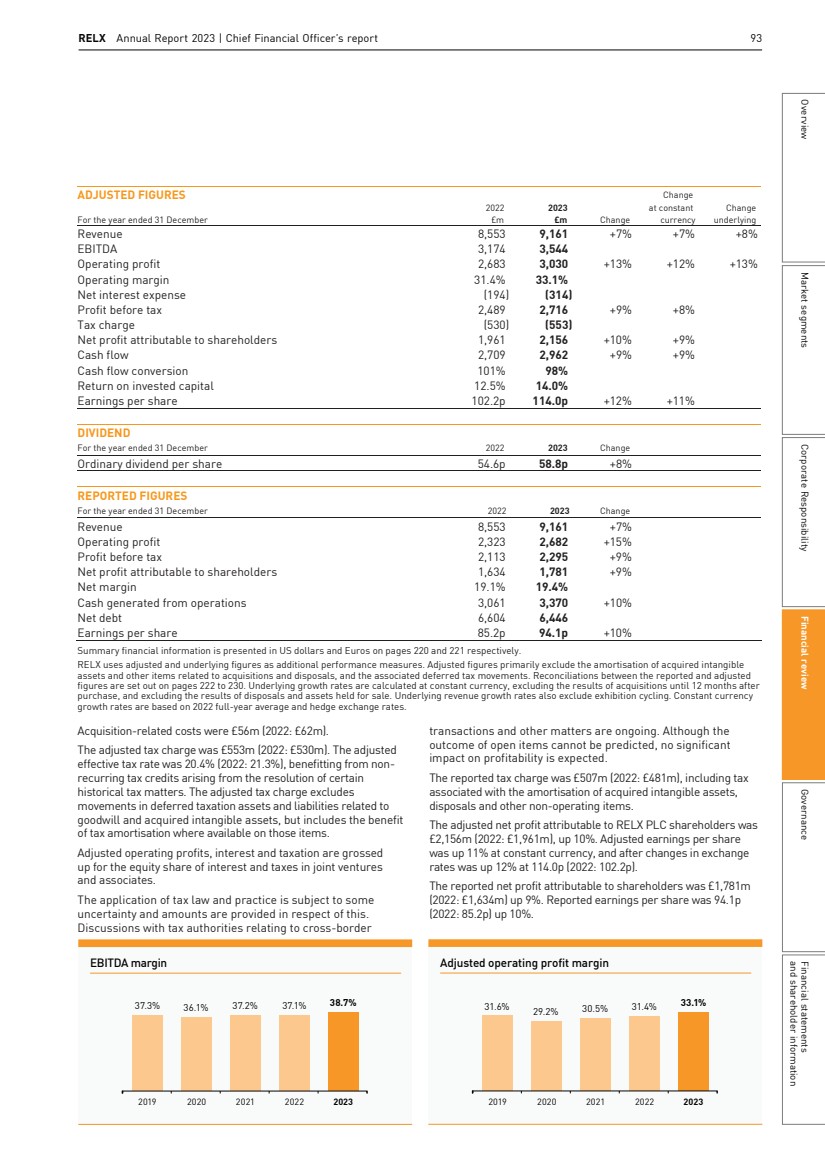
| 94 RELX Annual Report 2023 | Financial review 94 RELX Annual Report 2023 | Financial review Cash flows Adjusted cash flow was £2,962m (2022: £2,709m), up 9% compared with the prior period. The rate of conversion of adjusted operating profit to adjusted cash flow was 98% (2022: 101%). CONVERSION OF ADJUSTED OPERATING PROFIT INTO CASH YEAR TO 31 DECEMBER 2022 2023 £m £m Adjusted operating profit 2,683 3,030 Depreciation and amortisation 491 514 EBITDA 3,174 3,544 Capital expenditure (436) (477) Repayment of lease principal (net)* (78) (70) Working capital and other items 49 (35) Adjusted cash flow 2,709 2,962 Adjusted cash flow conversion 101% 98% * Net of sublease receipts. Capital expenditure was £477m (2022: £436m), including £447m (2022: £400m) in respect of capitalised development costs, reflecting sustained investment in new products. Capital expenditure was 5.2% of revenue (2022: 5.1%) and excludes pre-publication costs of £93m (2022: £94m) that were capitalised as current assets and principal lease repayments under IFRS 16 of £70m (2022: £78m). Depreciation and other amortisation charged within adjusted operating profit was £514m (2022: £491m) and represented 5.6% of revenue (2022: 5.7%). This includes amortisation of internally developed intangible assets of £330m (2022: £309m) and depreciation of property, plant and equipment of £43m (2022: £47m) which combined represent 4.1% (2022: 4.2%) of revenue. Interest paid (net) was £294m (2022: £165m), increasing as a result of higher interest rates. Tax paid of £619m (2022: £495m) was higher than the income statement charge, with the difference reflecting timing of tax payments. In 2023, the cash outflow relating to Exhibitions exceptional costs charged in 2020 was £5m (2022: £25m). Payments made in respect of acquisition-related items amounted to £56m (2022: £54m). Free cash flow before dividends was £1,988m (2022: £1,970m). Ordinary dividends paid to shareholders in the year, being the 2022 final dividend and 2023 interim dividend, amounted to £1,059m (2022: £983m). Free cash flow after dividends was £929m (2022: £987m). FREE CASH FLOW YEAR TO 31 DECEMBER 2022 2023 £m £m Adjusted cash flow 2,709 2,962 Interest paid (net) (165) (294) Cash tax paid* (495) (619) Exceptional costs in Exhibitions (25) (5) Acquisition-related items (54) (56) Free cash flow before dividends 1,970 1,988 Ordinary dividends (983) (1,059) Free cash flow after dividends 987 929 * Net of cash tax relief on acquisition-related items and including cash tax impact of disposals. RECONCILIATION OF NET DEBT YEAR-ON-YEAR YEAR TO 31 DECEMBER 2022 2023 £m £m Net debt at 1 January (6,017) (6,604) Free cash flow post dividends 987 929 Acquisitions: total consideration (443) (130) Share repurchases (500) (800) Purchase of shares by the Employee Benefit Trust (50) (50) Other* (21) 25 Currency translation (560) 184 Movement in net debt (587) 158 Net debt at 31 December (6,604) (6,446) * Includes pension deficit recovery payments, share option exercise proceeds, leases, disposals and acquisition timing effects. Total consideration on acquisitions completed in the year was £130m (2022: £443m). Cash spent on acquisitions was £132m (2022: £460m), excluding nil borrowings (2022: £3m of borrowings) in acquired businesses and including deferred consideration of £16m (2022: £21m) on past acquisitions and investments in joint ventures and associates and venture capital investments of £8m (2022: £66m). Net cash inflow from disposals after timing differences and separation and transaction costs was £12m (2022: £3m). Share repurchases in 2023 were £800m (2022: £500m) with a further £150m repurchased in 2024 as at 14 February. In addition, the Employee Benefit Trust purchased shares of RELX PLC to meet future obligations in respect of share based remuneration totalling £50m (2022: £50m). Proceeds from the exercise of share options were £41m (2022: £26m). Leverage – Net debt/EBITDA 2019 2020 2021 2022 2023 2.5x 3.3x 2.4x 2.1x 2.0x Adjusted cash flow conversion 96% 97% 101% 101% 98% 2019 2020 2021 2022 2023 |
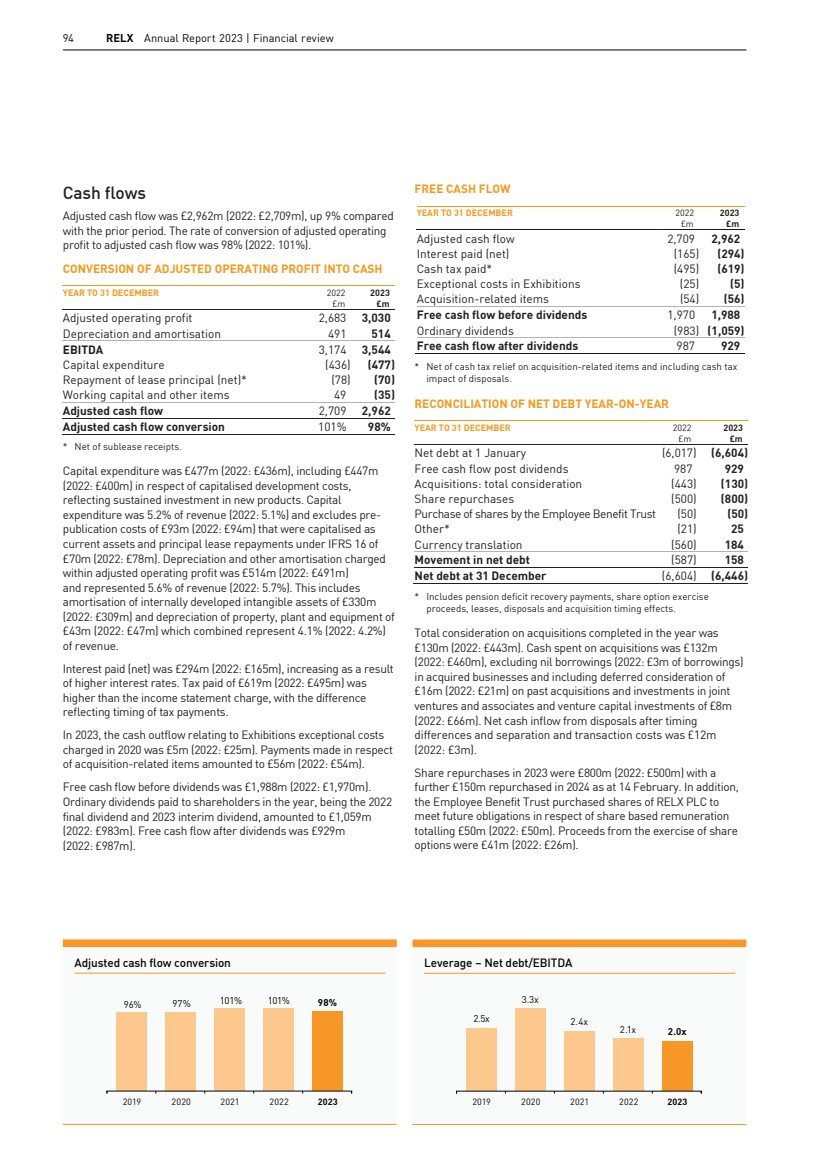
| RELX Annual Report 2023 | Chief Financial Officer’s report 95 RELX term debt maturities at 31 December 2023 819 830 885 553 950 750 830 1,053 7 1,328 2024 2025 2026 2027 2028 2029 2030 2031 2032 >2032 $m Term debt translated at 31 December 2023 exchange rates, stated at par value Return on invested capital 13.6% 10.8% 11.9% 12.5% 14.0% 2019 2020 2021 2022 2023 RELX Annual Report 2023 | Chief Financial Officer’s report 95 Overview Market segments Corporate Responsibility Financial review Governance Financial statements and other information Funding Debt Net debt at 31 December 2023 was £6,446m, a decrease of £158m since 31 December 2022. The majority of our borrowings are denominated in US dollars and euros, and as sterling was stronger against the US dollar and euro at the end of the year, our net borrowings decreased when translated into sterling. Excluding currency translation effects, net debt increased by £26m. Expressed in US dollars, net debt at 31 December 2023 was $8,251m, an increase of $260m since 31 December 2022. Gross debt of £6,497m (2022: £6,730m) is comprised of bank and bond borrowings of £6,356m (2022: £6,548m) and lease liabilities under IFRS 16 of £141m (2022: £182m). The fair value of related derivative liabilities was £108m (2022: £213m), finance lease receivables totalled £4m (2022: £5m) and cash and cash equivalents totalled £155m (2022: £334m). In aggregate, these give the net debt figure of £6,446m (2022: £6,604m). The effective interest rate on gross bank and bond borrowings was 4.6% in 2023 (2022: 2.9%). Excluding the charge relating to the early bond redemption it was 4.2%. As at 31 December 2023, gross bank and bond borrowings had a weighted average life remaining of 4.1 years and a total of 57% of them were at fixed rates, after taking into account interest rate derivatives. The ratio of net debt (including pensions) to EBITDA (adjusted earnings before interest, tax, depreciation and amortisation) was 2.0x (2022: 2.1x), calculated in US dollars. At 31 December 2023, there was a net negative accounting balance (pension assets less pension obligations) of £63m, largely unchanged from the net negative position of £55m as at 31 December 2022. Liquidity In June 2023, €750m of euro denominated term debt was issued with a coupon of 3.75% and a maturity of eight years. The Group has ample liquidity and access to debt capital markets, providing the ability to repay or refinance debt as it matures and to fund ongoing requirements. This includes access to a $3bn committed bank facility which provides security of funding for short-term debt, and which is undrawn. In March 2023 the maturity date of the facility was extended to April 2026. The facility has pricing linked to three ESG performance targets, all of which were achieved in 2023. Invested capital and returns Net capital employed decreased by £700m to £10,389m at 31 December 2023 (2022: £11,089m), primarily due to changes in exchange rates. The carrying value of goodwill and acquired intangible assets decreased by £693m due to the changes in exchange rates. An amount of £64m (2022: £125m) was capitalised in the year in respect of acquired intangible assets and £68m (2022: £269m) was recorded as goodwill. These additions were offset by amortisation and impairment of acquired intangible assets. NET CAPITAL EMPLOYED AS AT 31 DECEMBER 2022 2023 £m £m Goodwill and acquired intangible assets* 10,477 9,784 Internally developed intangible assets* 1,435 1,477 Property, plant and equipment*, right-of-use assets* and investments 557 487 Net pension obligations (55) (63) Working capital (1,325) (1,296) Net capital employed 11,089 10,389 * Net of accumulated depreciation and amortisation. The post-tax return on average invested capital in the year was 14.0% (2022: 12.5%). The increase was driven by growth in adjusted operating profit, and a lower effective tax rate. RETURN ON INVESTED CAPITAL AS AT 31 DECEMBER 2022 2023 £m £m Adjusted operating profit 2,683 3,030 Tax at adjusted effective rate (571) (618) Adjusted effective tax rate 21.3% 20.4% Adjusted operating profit after tax 2,112 2,412 Average invested capital* 16,920 17,184 Return on invested capital 12.5% 14.0% * Average of invested capital at the beginning and the end of the year, retranslated at average exchange rates for the year. Invested capital is calculated as net capital employed, adjusted to add back accumulated amortisation and impairment of acquired intangible assets and goodwill and to exclude the gross up to goodwill in respect of deferred tax, and to add back exceptional restructuring costs. Market segments Governance and shareholder information Financial statements Financial review Corporate Responsibility Overview |
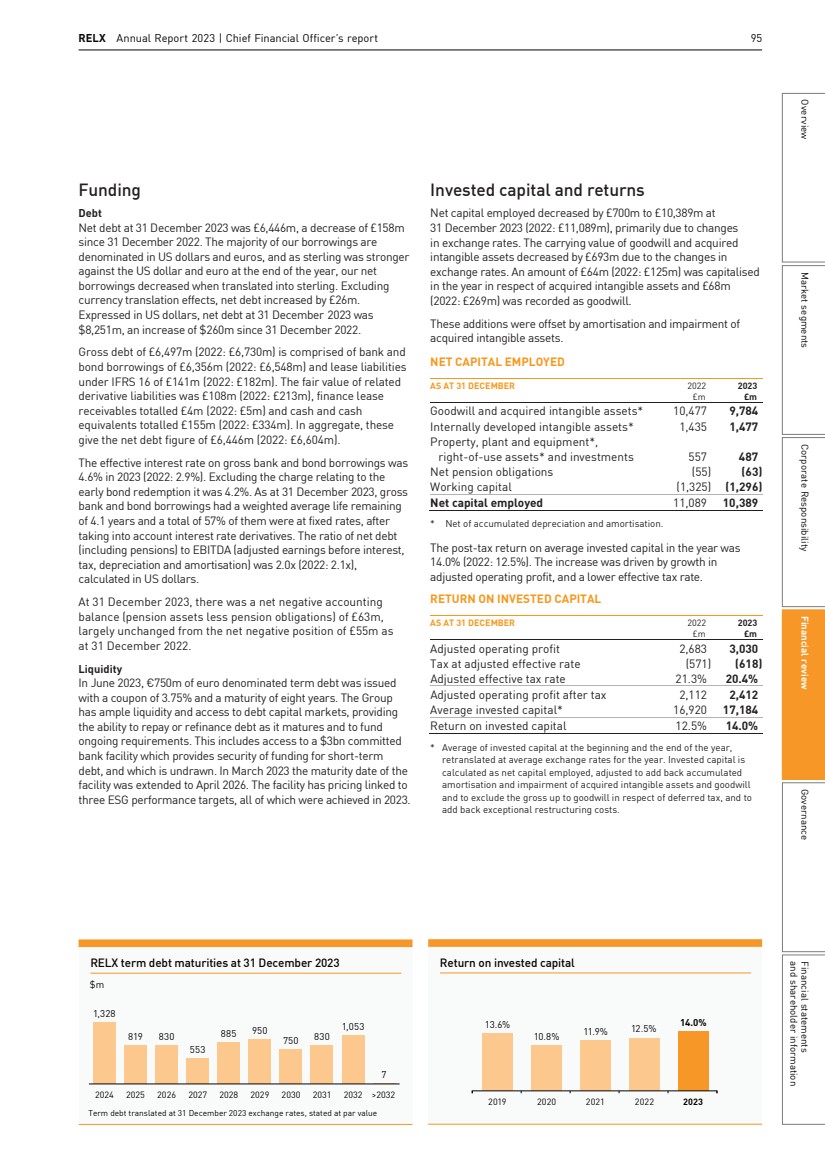
| 96 RELX Annual Report 2023 | Financial review 94 RELX Annual report and financial statements 2023 | Financial review Dividends and share repurchases 2022 2023 £m £m Change Adjusted earnings per share 102.2p 114.0p +12% Reported earnings per share 85.2p 94.1p +10% Ordinary dividend per share 54.6p 58.8p +8% The final dividend proposed by the Board is 41.8p per share. This gives total dividends for the year of 58.8p (2022: 54.6p), 8% higher than the prior year. The dividend policy of RELX PLC is, over the longer term, to grow dividends broadly in line with adjusted earnings per share, paying out approximately half of adjusted earnings in dividend each year. During 2023, a total of 30.9m RELX PLC shares were repurchased at an average price of 2,588p. Total consideration for these repurchases was £800m. A further 2.0m (2022: 2.2m) shares were purchased by the Employee Benefit Trust. As at 31 December 2023, total shares in issue, net of shares held in treasury and shares held by the Employee Benefit Trust, amounted to 1,881.5m. A further 4.6m shares have been repurchased in 2024 as at 14 February. Distributable reserves and parent company balance sheet As at 31 December 2023, RELX PLC had distributable reserves of £6.5bn (2022: £6.5bn). In line with UK legislation, distributable reserves are derived from the non-consolidated RELX PLC balance sheet. The consolidated reserves reflect adjustments such as the amortisation of acquired intangible assets that are not taken into account when calculating distributable reserves. The parent company balance sheet net assets are higher than those of the Group due to the investment in RELX Group plc being carried at a value of £18.3bn which is not reflected on the consolidated balance sheet. The parent company balance sheet can be found on page 214. Further information on the distributable reserves can be found in the parent company financial statements on page 215. Alternative performance measures RELX uses a range of alternative performance measures (APMs) in the reporting of financial information, which are not defined by generally accepted accounting principles (GAAP) such as IFRS. These APMs are used by the Board and management as they believe they provide relevant information in assessing the Group’s performance, position and cash flows, enable investors to track more clearly the core operational performance of the Group, and provide a clear basis for assessing RELX’s ability to raise debt and invest in new business opportunities. Management also uses these financial measures, along with IFRS financial measures, in evaluating the operating performance of the Group as a whole and of the individual business areas. These measures should not be considered in isolation from, or as a substitute for, financial information presented in compliance with IFRS. The measures may not be directly comparable to similarly reported measures by other companies. Definitions of alternative performance measures can be found on pages 222 to 230 Accounting policies The consolidated financial statements are prepared in accordance with UK adopted International Accounting Standards in conformity with the requirements of the Companies Act 2006 and International Financial Reporting Standards (IFRS) as issued by the International Accounting Standards Board (IASB) following the accounting policies shown in the notes to the financial statements on pages 166 to 212. The accounting policies and estimates which require the most significant judgement relate to the capitalisation of development spend and accounting for defined benefit pension schemes. Further detail is provided in the accounting policies on pages 171 and 172 and in the relevant notes to the accounts. Tax Principles Taxation is an important issue for us and our stakeholders, including our shareholders, governments, customers, suppliers, employees and the global communities in which we operate. We have set out our approach to tax in our global tax strategy. This incorporates our Tax Principles along with additional disclosures around where we pay taxes and our broader contribution to society. This is all made publicly available on our website: www.relx.com/go/taxprinciples. We maintain an open dialogue with tax authorities, and are vigilant in ensuring that we comply with current tax legislation. We have clear and consistent tax policies and tax matters are dealt with by a professional tax function, supported by external advisers. We proactively seek to agree arm’s-length pricing with tax authorities to mitigate tax risks of significant cross-border operations. We actively engage with policy makers, tax administrators, industry bodies and international institutions to provide informed input on proposed tax measures, so that we and they can understand how those proposals would affect our business. In addition, we participate in consultations with the Organisation for Economic Co-operation and Development (OECD), European bodies and the United Nations. |
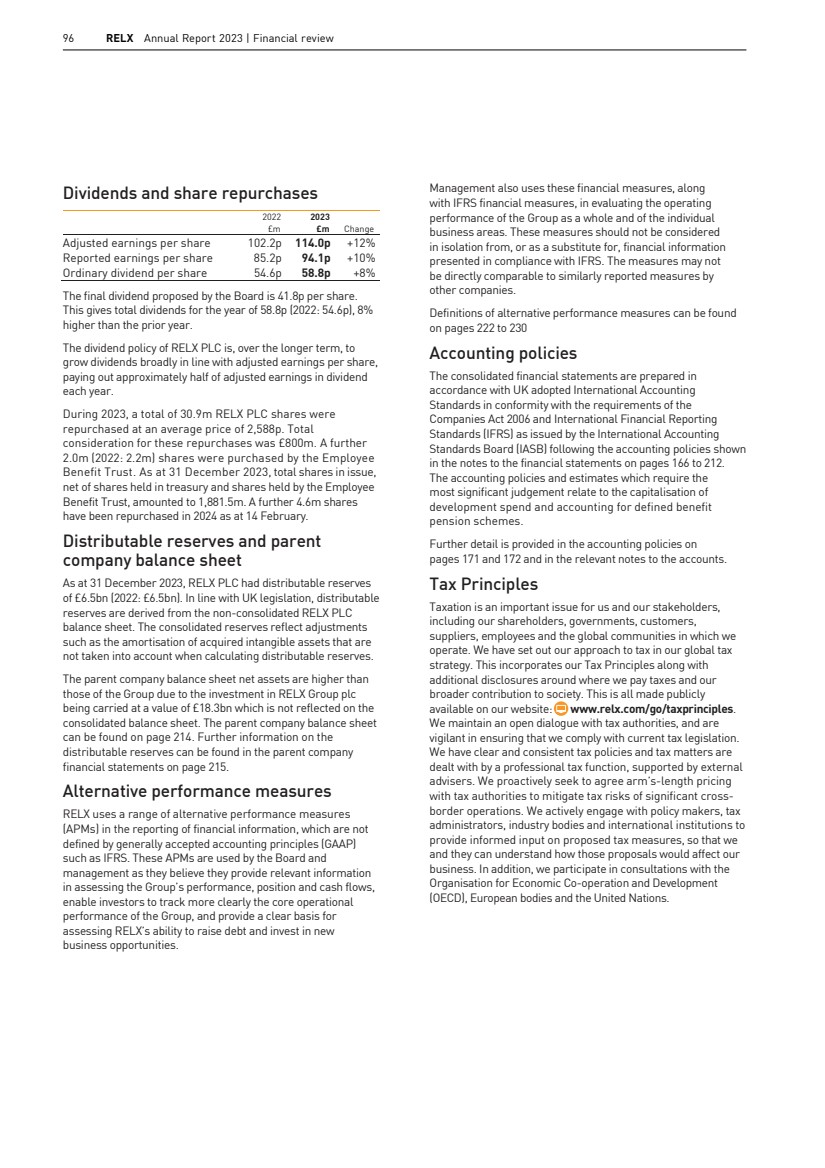
| RELX RELX Annual Report 2023 | Chief Financial Officer’s report 97 Annual Report 2023 | Chief Financial Officer’s report 95 Overview Market segments Corporate Responsibility Financial review Governance Financial statements and other information Treasury policies The Board of RELX PLC agrees policies for managing treasury risks. The key policies address security of funding requirements, the target fixed/floating interest rate exposure for debt and foreign currency hedging and place limits on counterparty exposures. A more extensive summary of these policies is provided in note 17 to the financial statements on pages 194 to 200. Financial instruments are used to finance the RELX businesses and to hedge transactions. The Group’s businesses do not enter into speculative transactions. Liquidity management The capital structure is managed to support RELX’s objective of maximising long-term shareholder value through appropriate security of funding, ready access to debt and capital markets, cost-effective borrowing and flexibility to fund business and acquisition opportunities while maintaining appropriate leverage to ensure an efficient capital structure. Over the long term, RELX seeks to maintain cash flow conversion of 90% or higher and credit rating agency metrics that are consistent with a solid investment grade credit rating. These metrics, as defined by the rating agencies, include net debt to EBITDA and various measures of cash flow as a percentage of net debt. Further detail on liquidity management is provided on pages 195 and 196. Capital management RELX uses the cash flow it generates to fund capital expenditure required to drive organic growth, to make selective acquisitions and to provide a growing dividend to shareholders, while retaining balance sheet strength to maintain access to cost-effective sources of borrowing. Share repurchases are undertaken to maintain an efficient balance sheet. Further detail on capital management is provided on pages 194 and 195. Corporate responsibility Our focus on corporate responsibility continues to underpin our activities. This included in 2023, achieving the environmental targets we had set for 2025. We continue to hold group-wide certification of our Environmental Management System. To track our environmental progress through the year, I led quarterly Environmental Checkpoint meetings with senior managers. We have established a working group to advance our Net Zero Carbon Events commitments and our Exhibitions business has published a net zero roadmap. For World Environment Day, I sent a message to all RELX staff highlighting our environmental performance and priorities, building on the work of Green Teams at 44 locations across the group focused on environmental management at the local level. Our most significant contribution to the environment-related UN Sustainable Development Goals (SDGs), including SDG 7, Clean And Affordable Energy and SDG 13, Climate Action, remains our products and services. In 2023, we deployed the EmeraldSky methodology developed by Risk’s global flight data business, Cirium, to calculate our Scope 3, business flight travel data. At Elsevier, new titles included Fuel Cells for Transportation: Fundamental Principles and Applications, and in the year, we held the 2023 Renewable Transformation Challenge along with the International Solar Energy Society (ISES). Legal’s Professional Practical Guidance Journal featured a dedicated climate change edition and RX held World Future Energy Summit 2023, with over 200 hours of expert content. We are committed to transparency. You can find more information and data in the Corporate Responsibility section on pages 38-90, including our Taskforce on Climate-Related Financial Disclosure (TCFD) on page 82. We are preparing for disclosures related to the Corporate Sustainability Reporting Directive for release in next year’s Annual Report. Nick Luff Chief Financial Officer Market segments Governance and shareholder information Financial statements Financial review Corporate Responsibility Overview |
| 98 RELX Annual Report 2023 | Financial review Principal and emerging risks Risk Identification, evaluation, and management RELX has established a well-embedded risk management framework based on the Internal Control-Integrated Framework (2013) by the Committee of Sponsoring Organisations of the Treadway Commission (COSO). Through this framework risks are identified, assessed,mitigated, and monitored in an effective and consistent way across the businesses. RELX uses the 3 Lines of Defence model and aligns its systems of risk management and internal control with the COSO framework. Business Areas are required to maintain systems of risk management and internal control which are appropriate to the nature and scale oftheir activities and address all significant strategic, operational, financial,legal and regulatory compliance and reputational risks that they face. The RELX PLC Board monitors the system of internal control and risk management and performs an annual assessment of its effectiveness. Consideration of current and emerging risks Our risk management process considers the likelihood and impact of risks,the timeline over which a risk could arise,the direction in which risks are trending and the effectiveness of our mitigation efforts. In addition to consideration of current risks, we also identify emerging risks which could impact our business in the next 3-5 years. One example of an emerging risk is the emerging regulatory environment with respecttoArtificial Intelligence. We mitigate this risk by maintaining a dialogue with the regulatory authorities,following ourResponsibleAIPrinciples and ensuring that we maintain a robust data privacy and governance structure. Another emerging risk related more specifically to generative artificialintelligence is the potentialfor invented content, or hallucinations. We mitigate this risk by ensuring subject matter experts are involved in every step of the development process, employing a robusttesting process and providing links to our trusted content through hallucination-free citations in our AI generated output. Another set of emerging risks are climate related risks which are further described on pages 38 to 90 in the Corporate Responsibility section of the 2023 Annual Report. RISK MITIGATION External Risks Data Privacy In the course of our business, we process personal data from customers, end users, employees and other sources.Certain business areas rely extensively upon content that includes personal data from public records, governmental authorities, publicly available information and media, and other information companies, including competitors.Changes in data privacy legislation, regulation, and/or enforcement could impact our ability to collect and use personal data, potentially affecting the availability and effectiveness of our products. Failure or perceived failure to comply with requirements for proper collection, use, storage,transfer and other processing of personal data may damage our reputation, diverttime and effort of management and other resources, increase cost of operations, and expose us to risk ofloss, fines and penalties,litigation, and increased regulation. We are guided by the RELX Privacy Principles and have implemented governance structures, contractual restrictions, technicalmeasures, and other controls to protect personal data and meet data privacy requirements across all jurisdictions where we operate. We have assurance programmes to monitor compliance and conduct training and awareness programmes for our employees. Our commitmentto fair, explainable, and accountableAI practices as set outin ourResponsibleArtificialIntelligence Principles helps to ensure that our AI uses of personal data are subject to robust privacy governance. Intellectual property rights Our products and services include and utilise intellectual property. We rely on trademark, copyright, patent,trade secret and other intellectual property laws to establish and protect our proprietary rights in this intellectual property. There is a risk that our proprietary rights could be challenged,limited, invalidated, infringed, or circumvented, including byAItechnologies, which may impact demand for and pricing of our products and services. Copyrightlaws are subjectto nationallegislative initiatives, as well as cross-border initiatives such as those from the European Commission and increased judicial scrutiny in several jurisdictions in which we operate. This creates additional challenges for us in protecting our proprietary rights in content delivered through the internet and electronic platforms. We actively engage in developing and promoting the legal protection of intellectual property rights. Our subscription contracts with customers contain provisions regarding the use of proprietary content including use by large language models. We are vigilant as to the use of our intellectual property and, as appropriate,take action to challenge illegal content distribution sources. |
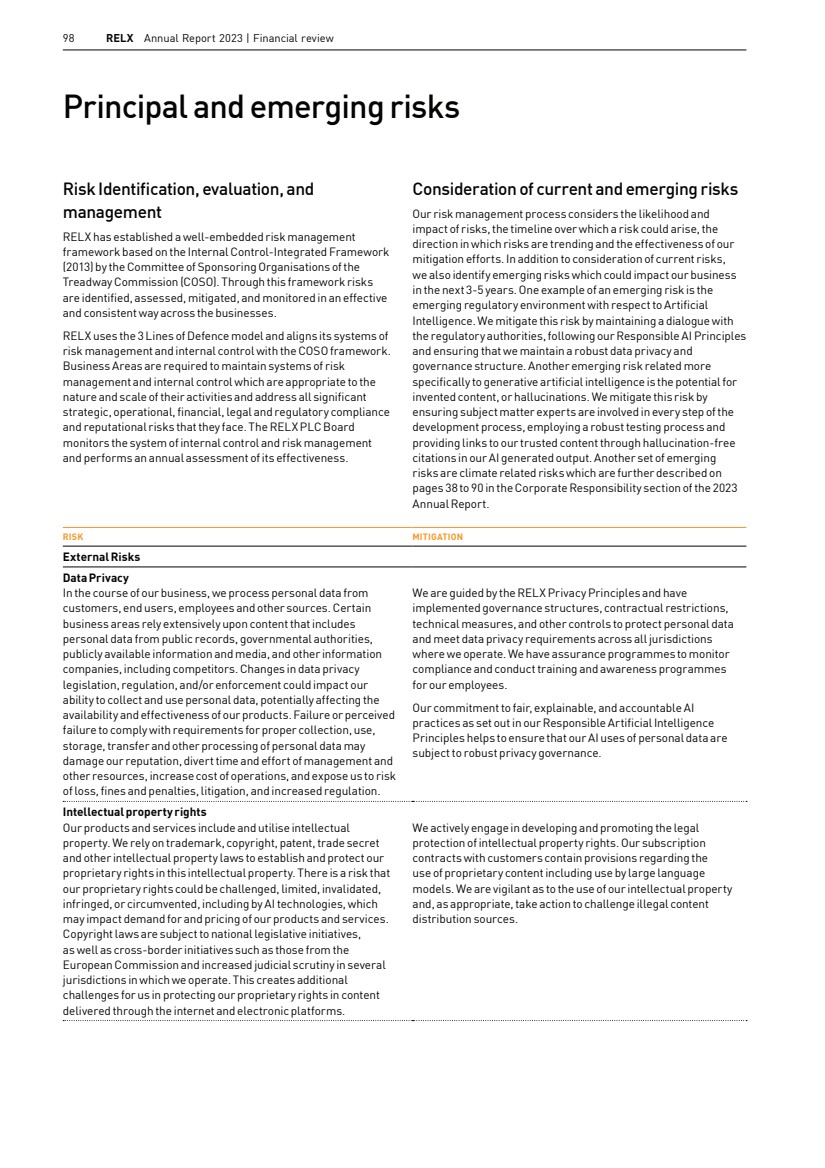
| RELX Annual Report 2023 | Principal and emerging risks 99 RISK MITIGATION Geopolitical, economic and market conditions Demand for our products and services, and our ability to operate internationally, may be adversely impacted by geopolitical, economic and market conditions beyond our control. These include acts of war and civil unrest; political conflicts and tensions; international sanctions; the impact of the effect of changes in inflation and interest rates in major economies;trading relations between theUnited States,Europe,China and other major economies; as well as levels of government and private funding for our markets. Our businesses are focused on professional markets which have generally been more resilient in periods of economic downturn. We deliver information solutions, many on a subscription and recurring revenue basis, which are importantto our customers’ effectiveness and efficiency. We operate diversified businesses in terms of sectors,markets, customers, geographies and products and services. We have multi-year contracts in place for much of the revenue base, and underlying demand drivers in many areas are not directly exposed to economic growth (e.g., scientific research, healthcare,fraud risk, financial crime compliance). Since the last major global recession after the 2008 financial crisis,RELX is significantly less dependent on revenue streams that were impacted in that period (e.g., advertising, employment screening).We have extended our position in long-term global growth markets through organic new launches supported by the selective acquisitions. We continuously monitor economic and political developments to assess their impact on our strategy which is designed tomitigate these risks. In response to specific uncertainties, our businesses engage in scenario planning and develop contingency plans where relevant and consider exiting businesses and markets that no longer fit our strategy. Payment model evolution Our Scientific, Technical & Medical(STM) primary research content publishing business operates under two payment models: ‘pay-to-read’, where readers or their institutions, as users ofthe content pay, and authors publish for free, or ‘pay-to-publish’, where authors or their institutions or funding bodies prefer to pay to publish their research, so itis freely available to read. The latter model is commonly referred to as Open Access and now represents a significant portion ofthe volume of primary research that we publish. There is continued debate in government, academic and library communities, regarding the payment models and the extent to which research content should be freely available to read, either immediately on publication or in some form after a period following publication. Rapid changes in customer choice or regulation in this area could impact the mix and overall level of revenue generated by our primary research publishing business. We engage extensively with stakeholders in the STM community to better understand their needs and deliver value to them. We provide both pay-to-read and pay-to-publish models for our services as well as combinations of the two to support our customers diverse needs and preferences. Both payment models are available on a subscription or transactional basis. We focus on the integrity and quality of research through the editorial and peer review process; we investin efficient editorial and distribution platforms and in innovation in platforms and tools to make content and data more accessible and actionable; and we develop our research systems to provide capabilities to manage different payment models. We ensure vigilance on plagiarism and the long-term preservation of research findings. Tomeet changing customer needs, we continue to launch dedicated pay-to-publish journals across a range of scientific disciplines. Market segments Governance and shareholder information Financial statements Financial review Corporate Responsibility Overview |
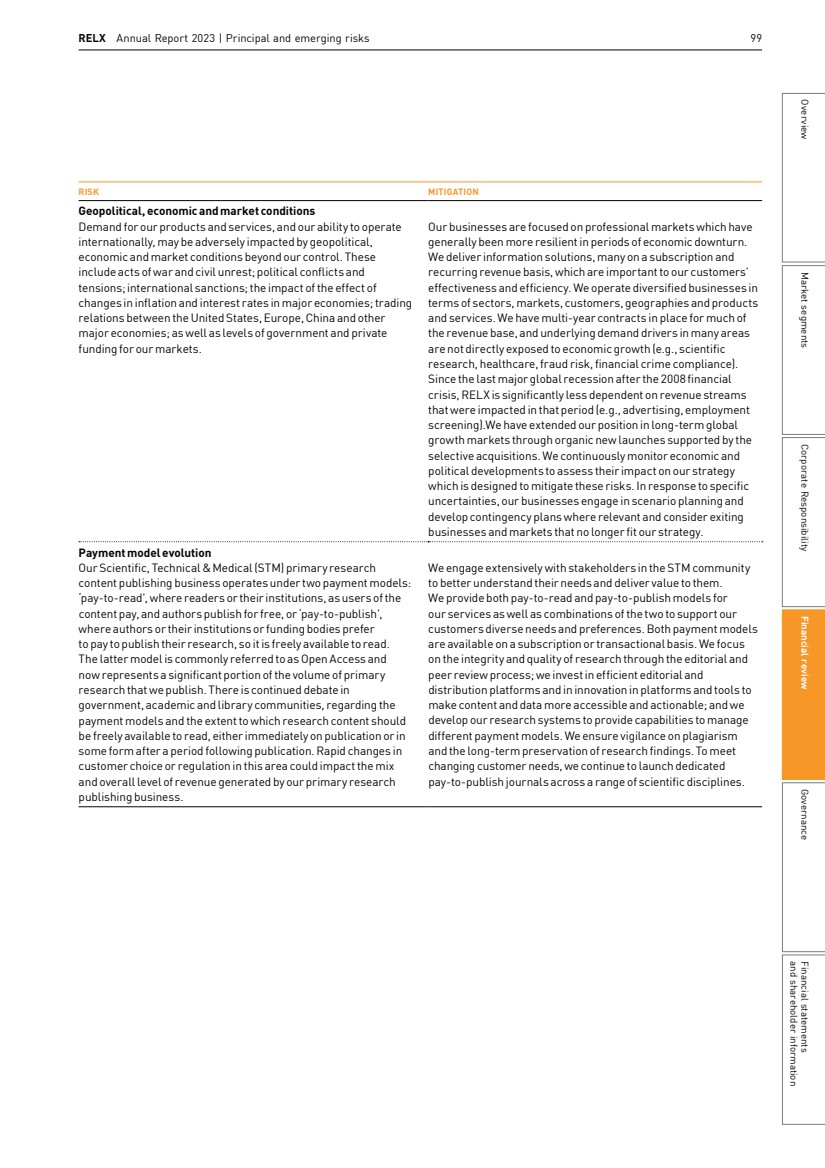
| 100 RELX Annual Report 2023 | Financial review RISK MITIGATION Strategic Execution Risks Customer acceptance ofour products Our businesses are dependent on the continued demand by our customers for our products and services and the value placed on them. We operate in highly competitive and dynamic markets, and the means of delivery, customer demand for, and the products and services themselves, continue to change in response to technologicalinnovations, such as the use of artificialintelligence, legislative and regulatory changes,the entrance of new competitors, and other factors. Failure to anticipate and quickly adaptto these changes, or to deliver enhanced value to our customers, could impact demand for our products and services and consequently adversely affect our revenue or the long-term returns from our investment in higher value add information-based analytics and decision tools. We are focused on the needs and economics of our customers. We gain insights into the markets that we serve, evolving customers’ needs,the potential application of new technologies and businessmodels, and the actions of competitors and disrupters. These insights inform our strategic and operational priorities. We continuously invest significant resources in our products and services, and the infrastructure to support them, and we have a long track record of using artificial intelligence. We leverage user centered design and development methods and customer analytics and invest in new and enhanced technologies to provide content and innovative solutions that help them achieve better outcomes and enhance productivity. Acquisitions We supplement our organic development with selected acquisitions. If we are unable to generate the anticipated benefits such as revenue growth and/or cost savings associated with these acquisitions, it could adversely affect return on invested capital and financial condition or lead to an impairment of goodwill or intangibles. Acquisitions are made within the framework of our overall strategy, which emphasises organic development. We have a wellformulated process for reviewing and executing acquisitions and for managing the post-acquisition integration. This process is underpinned with clear strategic, financial and ethical criteria. We closely monitor the integration and performance of acquisitions. Operational Risks Cyber security Our businesses maintain and use online databases and platforms delivering our products and services, which we rely on, and provide data to third parties, including customers and service providers. These databases and information are a target for compromise and face a risk of unauthorised access and use by unauthorised parties including through cyber, ransomware and phishing attacks on us or our third-party service providers. Our cyber securitymeasures, and the measures used by our third-party service providers, may not detect or prevent all attempts to compromise our systems, whichmay jeopardise the security of the data we maintain or may disrupt our systems. Failures of our cyber security measures could result in unauthorised access to our systems, misappropriation of our or our users’ data, deletion or modification of stored information or other interruption to our business operations. As techniques used to obtain unauthorised access to or to sabotage systems change frequently and may not be known until launched against us or our third-party service providers we may be unable to anticipate or implement adequate measures to protect against these attacks and our service providers and customers may likewise be unable to do so. Compromises of our or our third-party service providers’ systems could adversely affect our financial performance, damage our reputation and expose us to risk ofloss, fines and penalties, litigation and increased regulation. We have established security programmes which are constantly reviewed and updated to address developments in the threat landscape with the aim of ensuring our ability to prevent, respond to and recover from a cyber-attack or ransomware attack,that data is protected, and our business infrastructures and those of our third-party service providers continue to operate. We have governance mechanisms in place to design and monitor common policies and standards across our businesses. We invest in appropriate technological and physical controls which are applied across the enterprise in a risk-based security programme which operates atthe infrastructure, application and user levels. These controls include, but are notlimited to, infrastructure vulnerabilitymanagement, application scanning and penetration testing, network segmentation, encryption and logging and monitoring. We provide regular training and communication initiatives to establish and maintain awareness of risks at all levels of our businesses. We have appropriate incident response plans to respond to threats and attacks which include procedures to recover and restore data and applications in the event of an attack. We maintain appropriate information security policies and contractual requirements for our businesses and run programmes monitoring the application of our data security and resilience policies by third party service providers. We use independentinternal and third-party auditors to test, evaluate, and help enhance our procedures and controls. We continuously monitor the global regulatory landscape to identify emerging cybersecurity, data protection and privacy laws, and, as needed, implement plans to comply with them. We procure appropriate cybersecurity insurance to mitigate potential losses arising from a cybersecurity incident. |
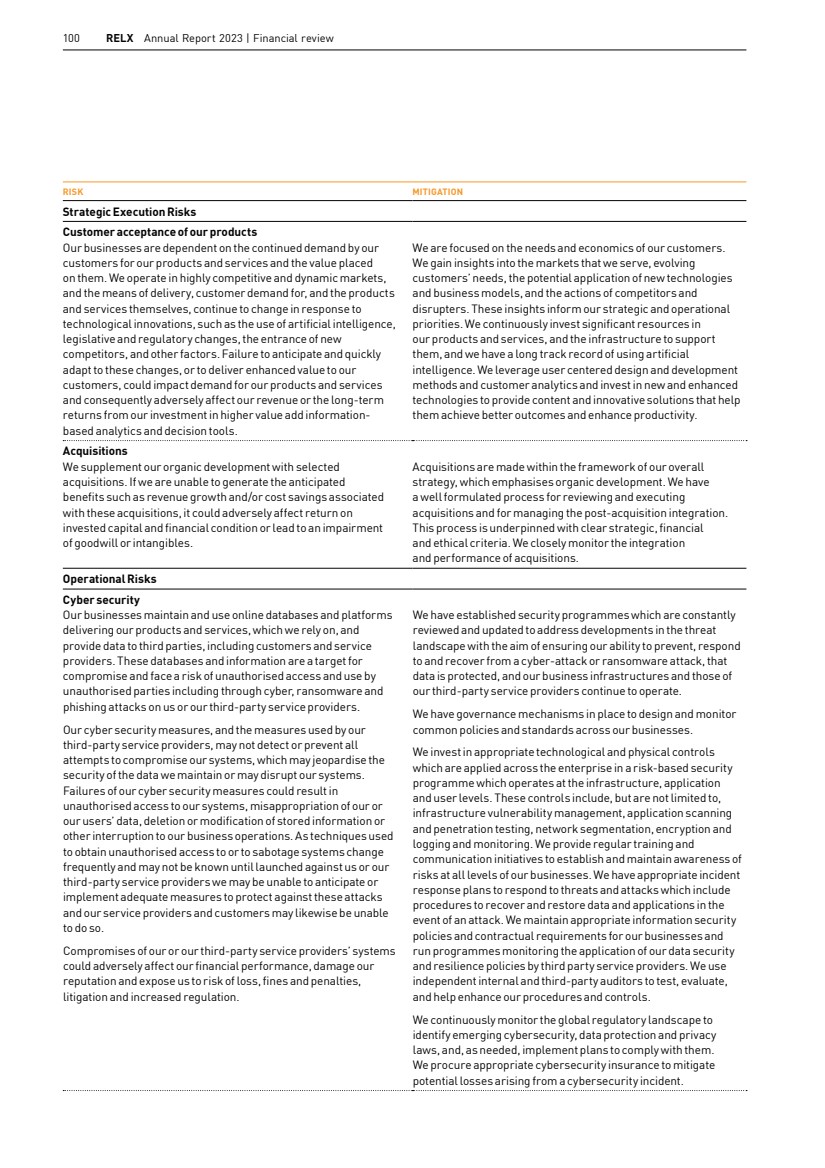
| RELX Annual Report 2023 | Principal and emerging risks 101 RISK MITIGATION Face-to-face events Face-to-face events are susceptible to economic cycles, communicable diseases, severe weather events and other natural disasters,terrorismand availability of venues.Each or any of these may impact our ability to hold face-to-face events, and exhibitors’ and visitors’ desire and ability to travelin person to events. These factors each have the potentialto reduce revenues, increase the costs of organising events and adversely affect cash flows and reputation. We operate a large number of events across a wide variety of venues in many countries, serving both domestic and international exhibitors and attendees. We actively review our ability to host events considering the availability of venues and national and local regulations including those related to health, travel, and security. We operateflexibly, rescheduling or re-locating events when necessary. We take appropriate measures at our events to ensure the well-being and safety of exhibitors, visitors and employees.Our face-to-face events are supported by enhanced digital services. Supply chain dependencies Our organisational and operational structures depend on suppliers including outsourced and offshored functions, as well as cloud service, software, and large languagemodel providers. Poor performance,failure or breach ofthird parties to whom we have contracted could adversely affect our business performance, reputation and financial condition. We source content to enable information solutions for our professional customers. The disruption or loss of data sources, either because of regulations, or because data suppliers decide notto supply them, may impose limits on our collection and use of certain kinds ofinformation and our ability to communicate, offer or make such information available or useful to our customers. We select our suppliers with care and establish contractual service levels that we closely monitor, including through key performance indicators and targeted supplier audits. We have developed business continuity plans to reduce disruption in the event of a major failure by a supplier. We have a formal supplier resilience program to identify and manage critical suppliers across the business. A risk register is used to document any unique supplier risks and associatedmitigation plans, due diligence is performed annually, regular resilience discussions are held, and our contractualterms enable us to audit supplier resilience plans/procedures. We have a multitude of data sources that we use to develop solutions for our customers and regularly monitor the market for new data sources in order to minimize dependence on any single provider. Where contentis supplied to us by third parties, we aim to have contracts which provide mutual commercial benefit. Technology and business resilience Our businesses are dependent on electronic platforms and networks, primarily the internet,for delivery of our products and services. These could be adversely affected if our electronic delivery platforms, networks or supporting infrastructure experience a significantfailure or interruption.Climate change may increase the intensity and frequency of severe weather events which increases the risk of significantfailure. We have established procedures for the protection of our businesses and technology assets. These include the development and testing of business continuity plans, including technical resilience plans and back-up delivery systems,to reduce business disruption in the event of major technology or infrastructure failure,terrorism, or adverse weather incidents. Talent The implementation and execution of our strategies and business plans depend on our ability to recruit,motivate, develop and retain a diverse population of skilled employees and management. We compete globally and across business sectors for diverse, talented management and skilled individuals, particularly those with technology and data analytics capabilities. An inability to recruit,motivate or retain such people could adversely affect our business performance. We monitor capability needs and remuneration schemes are tailored to attract and motivate the best talent available at an appropriate level of cost. We actively seek feedback from employees, which feeds into plans to enhance employee engagement, motivation, and development.Our focus on an inclusive culture results in a diverse workforce and environment that respects individuals and their contributions. Market segments Governance and shareholder information Financial statements Financial review Corporate Responsibility Overview |
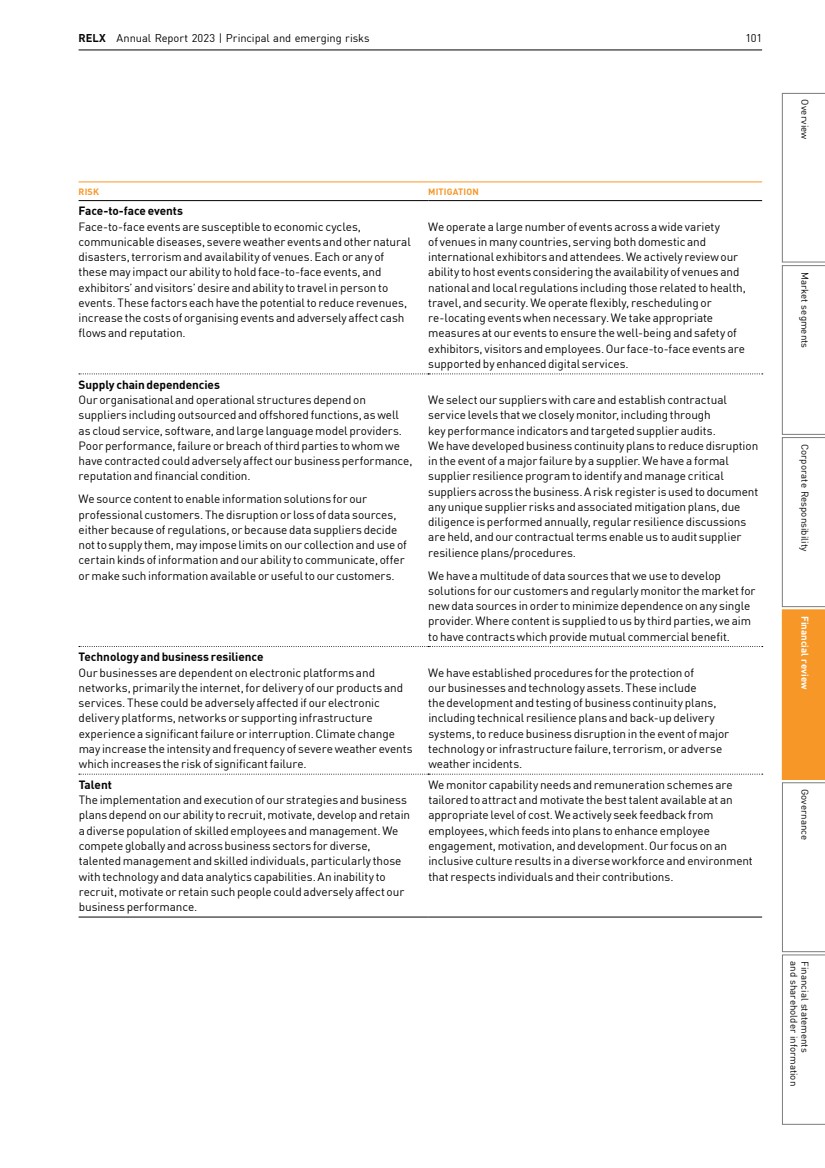
| 102 RELX Annual Report 2023 | Financial review RISK MITIGATION Financial Risks Tax Our businesses operate globally, and our profits are subject to taxation in many different jurisdictions and at differing tax rates. Tax laws that currently apply to our businesses may be amended by the relevant authorities or interpreted differently by them, and these changes could adversely affect our reported results. We maintain an open dialogue with tax authorities and are vigilant in ensuring that we comply with current tax legislation. We have clear and consistent tax policies and tax matters are dealt with by a professionaltax function, supported by external advisers.As outlined in theChief FinancialOfficer’s report on pages 92 to 97 we engage with tax authorities and international organisations. We continue to monitor legislative developments in the jurisdictions in which we operate and consider the potential impacts of proposed regulation changes under various scenarios. The principles we adopt in our approach to tax matters can be found on our website at www.relx.com/go/taxprinciples. Treasury TheRELXPLCconsolidated financial statements are expressed in pounds sterling and are subject to movements in exchange rates on the translation ofthe financialinformation of businesses whose operational currencies are other than sterling. The United States is our mostimportant market and, accordingly, significant fluctuations in theUSdollar exchange rate could significantly affect our reported results. We also earn revenues and incur costs in a range of other currencies, including the euro and the yen, and significantfluctuations in these exchange rates could also significantly impact our reported results. Macroeconomic, political and market conditions may adversely affectthe availability and terms of short and long-term funding, volatility ofinterest rates,the credit quality of our counterparties, currency exchange rates and inflation. The majority of our outstanding debtinstruments are, and any of our future debt instruments may be, publicly rated by independent rating agencies. Our borrowing costs and access to capital may be adversely affected if the credit ratings assigned to our debt are downgraded. Our approach to capital structure and funding is described in the Chief FinancialOfficer’s report on pages 92 to 97. The approach to the management oftreasury risks is described in note 17 to the consolidated financial statements. |
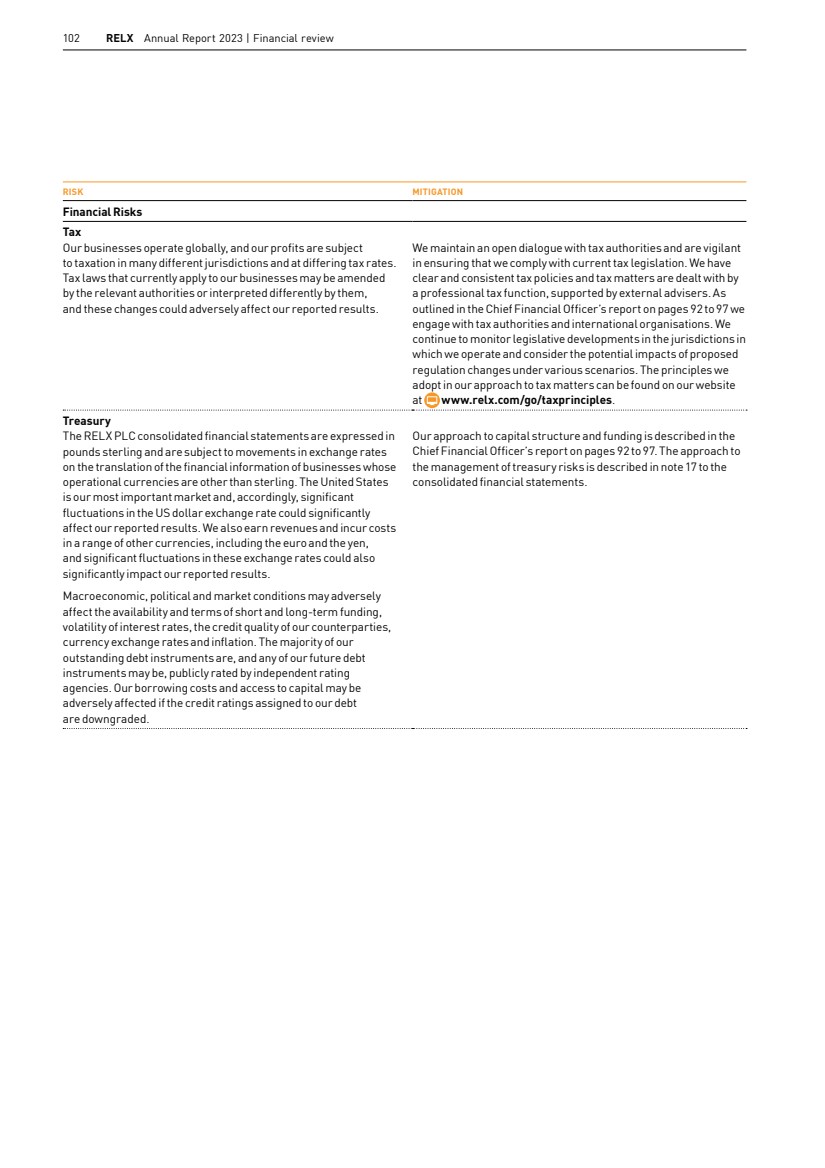
| RELX Annual Report 2023 | Principal and emerging risks 103 RISK MITIGATION Pensions We operate a number of pension schemes around the world, including local versions ofthe defined benefittype in theUnited Kingdom and the United States. The US scheme is closed to future accruals. TheUK scheme has been closed to new hires since 2010. Themembers who continue to accrue benefits now represent a small and reducing portion of the overall UK based workforce. The assets and obligations associated with these pension schemes are sensitive to changes in the market values ofthe scheme’s investments and the market-related assumptions used to value scheme liabilities.Adverse changes to asset values, discount rates,longevity assumptions or inflation could increase funding requirements. We have professional management of our pension schemes and we focus on maintaining appropriate asset allocation and plan designs. We review our funding requirements on a regular basis with the assistance of independent actuaries and ensure that the funding plans are appropriate. We seek to manage pension liabilities by reviewing pension benefits provided to staff as well as the structure of scheme arrangements. Reputational Risks Ethics As a global provider of professionalinformation solutions we, our employees and major suppliers are expected to adhere to high standards ofintegrity and ethical conduct, including those related to anti-bribery and anti-corruption,fraud, sanctions, competition and principled business conduct. Abreach of generally accepted ethical business standards or applicable laws could adversely affect our business performance, reputation and financial condition. Our Code of Ethics and Business Conduct is provided to every employee and is supported by training and communication. It encompasses such topics as competing fairly, prohibiting corrupt business practice and fair employment practices and encouraging open and principled behaviour. We have well-established processes for monitoring, reporting and investigating instances of unethical conduct. Our major suppliers are required to adhere to our Supplier Code ofConduct. Market segments Governance and shareholder information Financial statements Financial review Corporate Responsibility Overview |
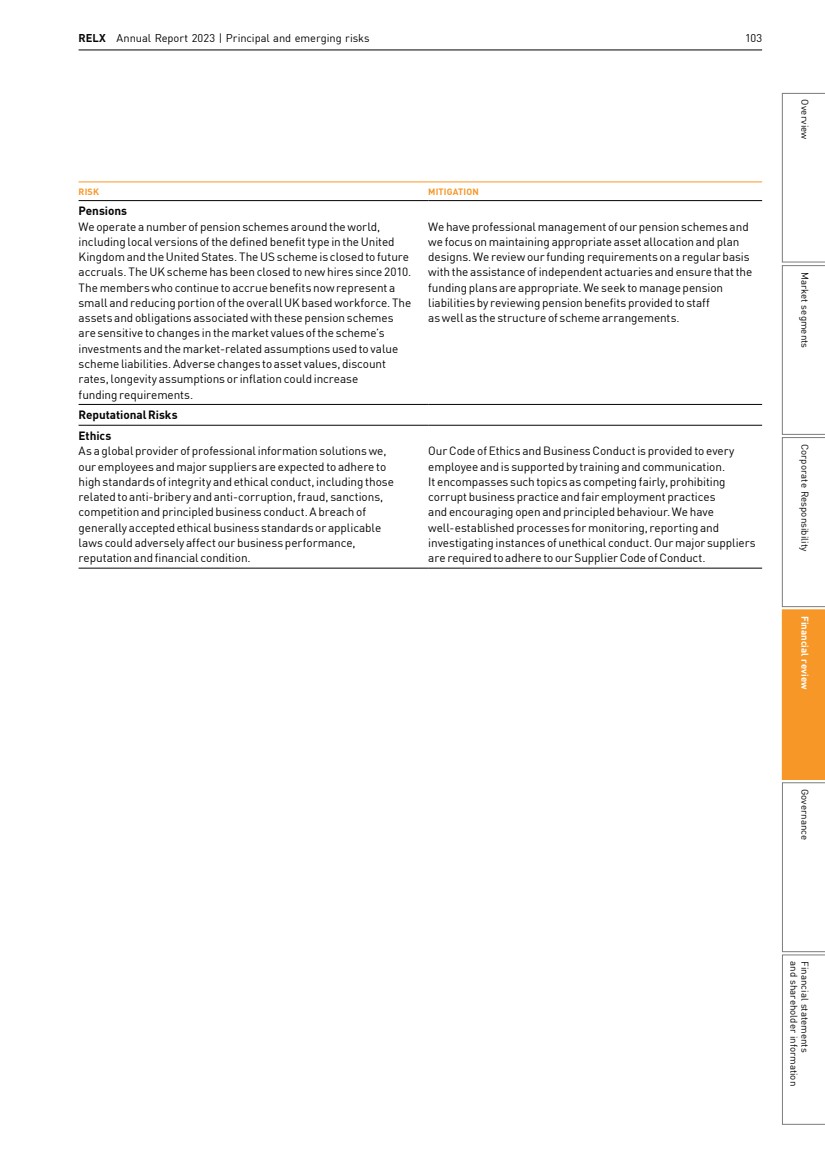
| 104 RELX Annual Report 2023 | Financial review Viability statement The UK Corporate Governance Code requires Directors to assess the viability of the Group over an appropriate period of time. The Directors have made the assessment that given the nature oftheGroup’s business with a high proportion of recurring revenue, a typical contractlength ofthree years in many of its subscription agreements and a balanced debt maturity profile, a viability period ofthree years, aligned with theGroup’s annual strategy plan, is suitable to assess the risks outlined on pages 98 to 103. Assessing the Group’s Prospects The Group develops information-based analytics and decision tools for professional and business customers in theRisk, Scientific, Technical & Medical(STM), Legal andExhibitions sectors. The Market Segments section describes each area’s businessmodel, strategic priorities, market opportunities and competition, showing how theGroup is positioned to create value for shareholders over the longer term. TheGroup’s prospects are assessed annually through the strategic planning process which includes a review of assumptions made and an assessment of each business area’s longer-term plan. The resulting three-year strategy plan forms the basis for Group and divisional targets and in-year budgets. Objectives are set with consideration given to the economic and regulatory environment, and to customer trends, as well as incorporating risks and opportunities. The most recent three-year strategy business plan was agreed by the Directors in September 2023 and updated in February 2024. Separate from the annual strategy plan,theDirectors periodically receive updates from business area management on their operations, prospects and risks. Whilst these reviews and discussions naturally focus more closely on the more immediate risks facing the business within the three-year strategy planning period, they also cover the risks described in the principal risks section on pages 98 to 103. Assessing the Group’s Viability The three-year strategy plan for our business areas includes management’s assessment ofthe anticipated operational risks affecting the business. Managementthen considered the viability ofthe business in various downside scenarios,the most severe of which assumes the simultaneous occurrence of Cyber security, Intellectual property rights and Face-to-face events risks resulting in a decline of around 30% in adjusted operating profitin each of 2024 to 2026, and the closure ofthe debt capital markets preventing the refinancing of scheduled liabilities. Itis assumed thatthe second extension option on theGroup’s undrawn $3bn revolving credit facility will be exercised in April 2024,taking the maturity toApril 2027. The resulting analysis, which assumed no share buybacks, modest acquisition activity and a growing dividend, determined thattheGroup would have sufficientliquidity to refinance all maturing term debt. We remain focused on successfully pursuing our strategic priority of organically developing increasingly sophisticated information-based analytics and decision tools that deliver enhanced value to our customers, supplemented by selective acquisitions that support our organic growth. We believe the combination of compelling structural opportunities combined with an appropriate capital structure will continue to drive long-term value. Based on this assessment and the scenario modelling that shows sufficientliquidity even with the simultaneous occurrence of principal risks and the closure of the debt capital markets,theDirectors confirmthatthey have a reasonable expectation that the Group will be able to continue its operations and meet its liabilities as they fall due over the next three years and are not aware of any longer-term operational or strategic risks that would result in a different outcome from the three-year review. |
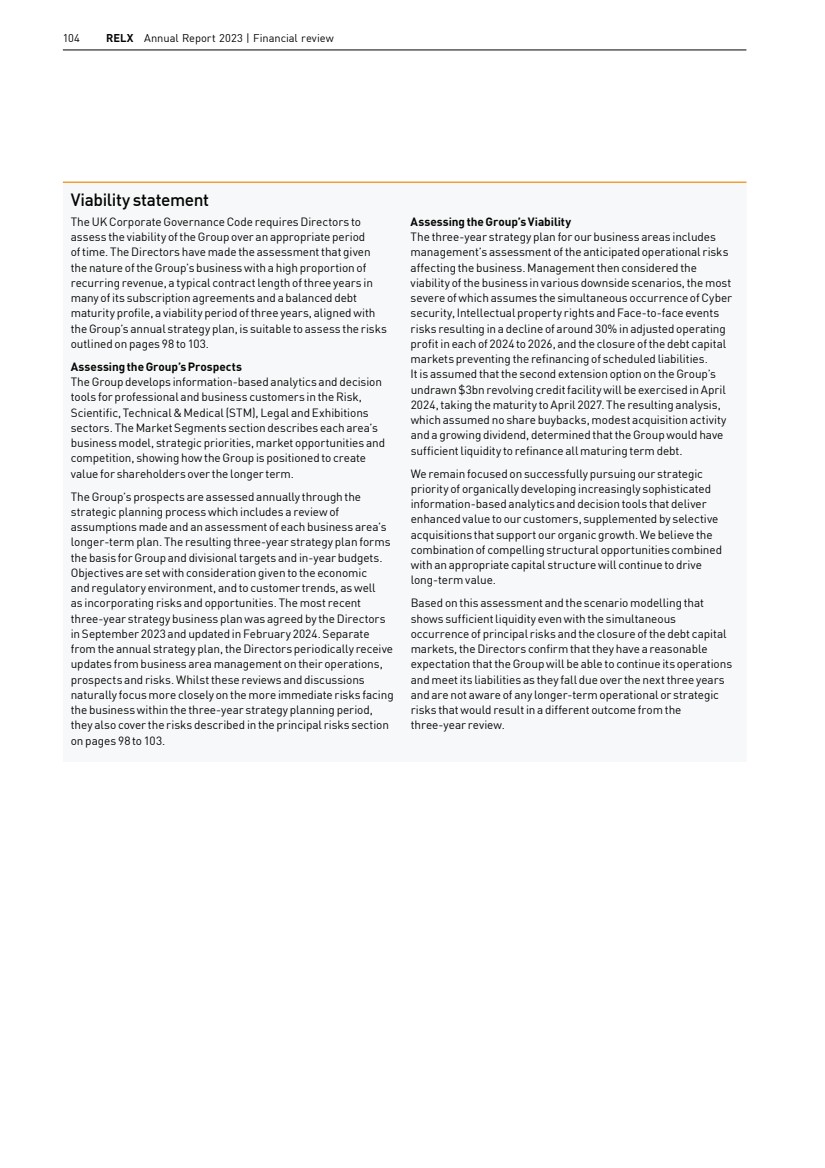
| RELX Annual Report 2023 | Principal and emerging risks 105 TheStrategicReport, as set out on pages 2 to 105 has been approved by theBoard ofRELXPLC. By order oftheBoard RegisteredOffice Henry Udow 1-3 Strand Company Secretary London 14 February 2024 WC2N 5JR Going concern The Directors have adopted the going concern basis in preparing these accounts after assessing the potential impact on the business of the principal risks over the 18 months to 30 June 2025 and during the longer period over which the Group’s viability has been assessed, as described on page 104. Managementforecasts reflect a downside scenario which includes the simultaneous occurrence of principal risks, which combined would reduce adjusted operating profit by around 30%. We have also assumed an inability to access the debt capital markets.Under this scenario,theGroup will still have substantial liquidity headroom on its undrawn $3bn revolving creditfacility (which does not contain a financial covenant).Having considered this downside scenario,the Directors believe that the Group is well-positioned to manage its business risks and that adequate resources exist for the Group to continue in operational existence for the foreseeable future. They therefore consider it is appropriate to adopt the going concern basis in preparing the 2023 financial statements. Acommentary on theGroup’s cashflows, financial position and liquidity for the year ended 31 December 2023 is set out in the Chief FinancialOfficer’s report on pages 92 to 97. This shows that after taking account of available cash resources and committed bank facilities that back up short-termborrowings, all ofthe Group’s borrowings that mature in the period to 30 June 2025 can be repaid in full. TheGroup’s policies on liquidity, capital management and management of risks relating to interest rate, foreign exchange and credit exposures are set out on pages 194 to 200. The principal risks facing the Group are set out on pages 98 to 103. Market segments Governance and shareholder information Financial statements Financial review Corporate Responsibility Overview |
| 106 RELX Annual Report 2023 In this section 108 Board Directors 110 RELX senior executives 112 Chair’s introduction to corporate governance 113 Corporate governance review 125 Report of the Nominations Committee 128 Directors’ remuneration report 149 Report of the Audit Committee 153 Directors’ report Governance |
| RELX Annual Annual Report 2023 report including corporate responsibility report and financial statements 2022 | 107 Market segments Governance and shareholder information Financial statements Financial review Corporate Responsibility Overview |
|
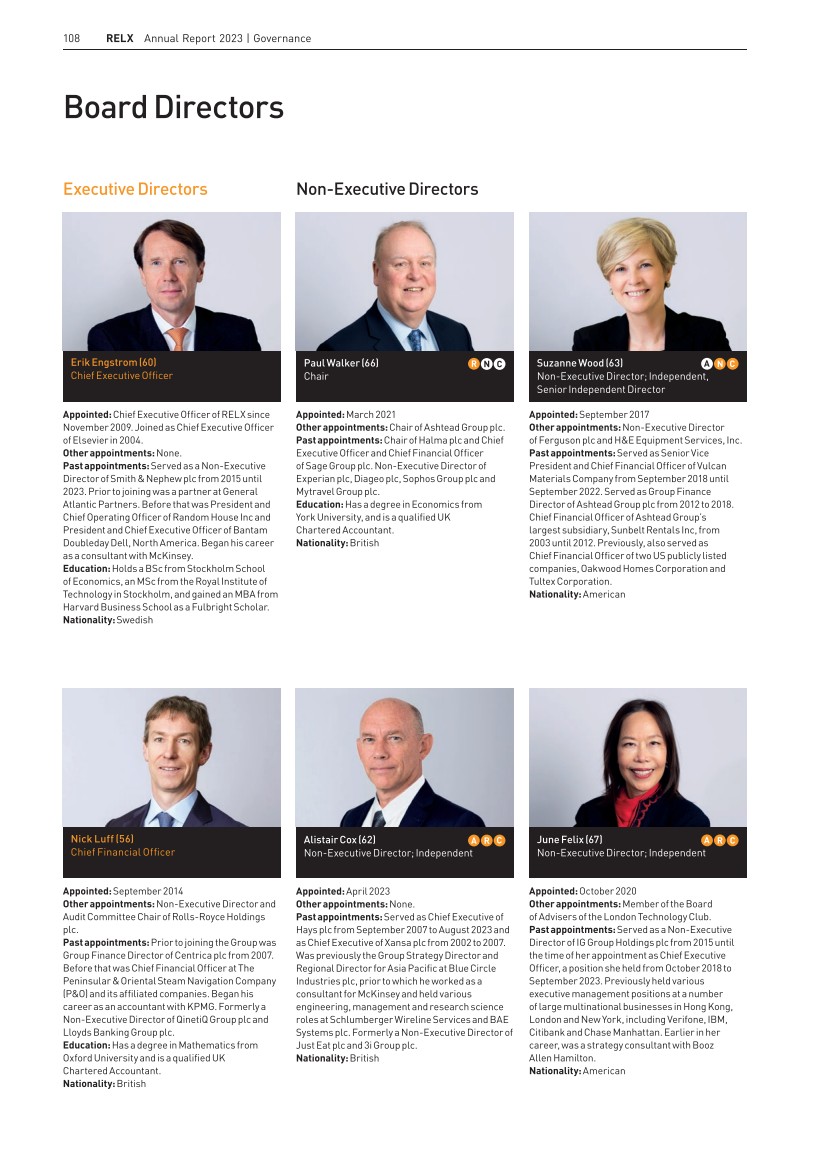
| RELX Annual Report 2023 | Board Directors 109 Board Committee membership key A Audit Committee N Nominations Committee C CorporateGovernanceCommittee R Remuneration Committee Committee Chair Andrew Sukawaty (68) A C Non-ExecutiveDirector;Independent Appointed: April 2019 Other appointments: Director ofHgCapitalLLP, Matrix 42 and Viasat. Founding Partner of Corten Capital. Past appointments: Was formerly the Chair of Inmarsat between2003 and 2023untilits acquisition by Viasat in May 2023 and was Senior IndependentDirector ofSky plc between2013 and 2018. Previously was Chair of Ziggo NV, XyratexGroupLtdand TelenetGroupholdings NV, and deputy Chair of O2 plc. Also served as aNon-Executive Director of Telefonica Europe (following its acquisition of O2 plc) and Powerwave Technologies Inc, and additionally asChief Executive ofInmarsat plc,SprintInc. and NTLGroupLtd. Nationality: American Robert MacLeod (59) R N C Non-ExecutiveDirector;Independent Appointed: April 2016 Other appointments: Non-Executive Director of Vesuvius plc. Past appointments: Was previously Chief Executive of Johnson Matthey plc for eight years afterfive years asGroupFinanceDirector.Prior to this spentfive years asGroupFinanceDirector of WSAtkins plc,having joined asGroupFinancial Controller in 2003. From 1993 to 2002, held a variety of seniorfinance and M&Aroleswith Enterprise Oil plc in the UK and US. Formerly aNon-Executive Director of Aggreko plc. Nationality: British Marike van Lier Lels (64) N C Non-ExecutiveDirector;Independent Workforce Engagement Director Appointed: July 2015 Other appointments: Member of the Supervisory Boards of NS (Dutch Railways), Dura Vermeer, PostNLand InnovationQuarter. Past appointments: Member of the Supervisory Boards of TKHGroupNV,RoyalImtechNV, Maersk BV,KPNNV,USGPeopleNV andEnecoHoldingNV, and Executive Vice President and Chief Operating Officer oftheSchipholGroup.Prior to joining SchipholGroup,was amember oftheExecutive Board of Deutsche Post Euro Express and held various senior positions with Nedlloyd. Member of various Dutch governmental advisory boards. Nationality: Dutch Charlotte Hogg (53) A C Non-ExecutiveDirector;Independent Appointed: December 2019 Other appointments: Executive Vice President and ChiefExecutiveOfficer for theEuropeanRegionof Visa Inc.ExecutiveDirector of VisaEuropeLimited. Past appointments: ChiefOperatingOfficer atthe Bank ofEngland.Before thatHead ofRetail Banking for Santander UK, Managing Director UK and Ireland forExperianplc, andheld senior roles at Morgan Stanley in New York and London. Nationality: British,Americanand Irish Market segments Governance and shareholder information Financial statements Financial review Corporate Responsibility Overview |
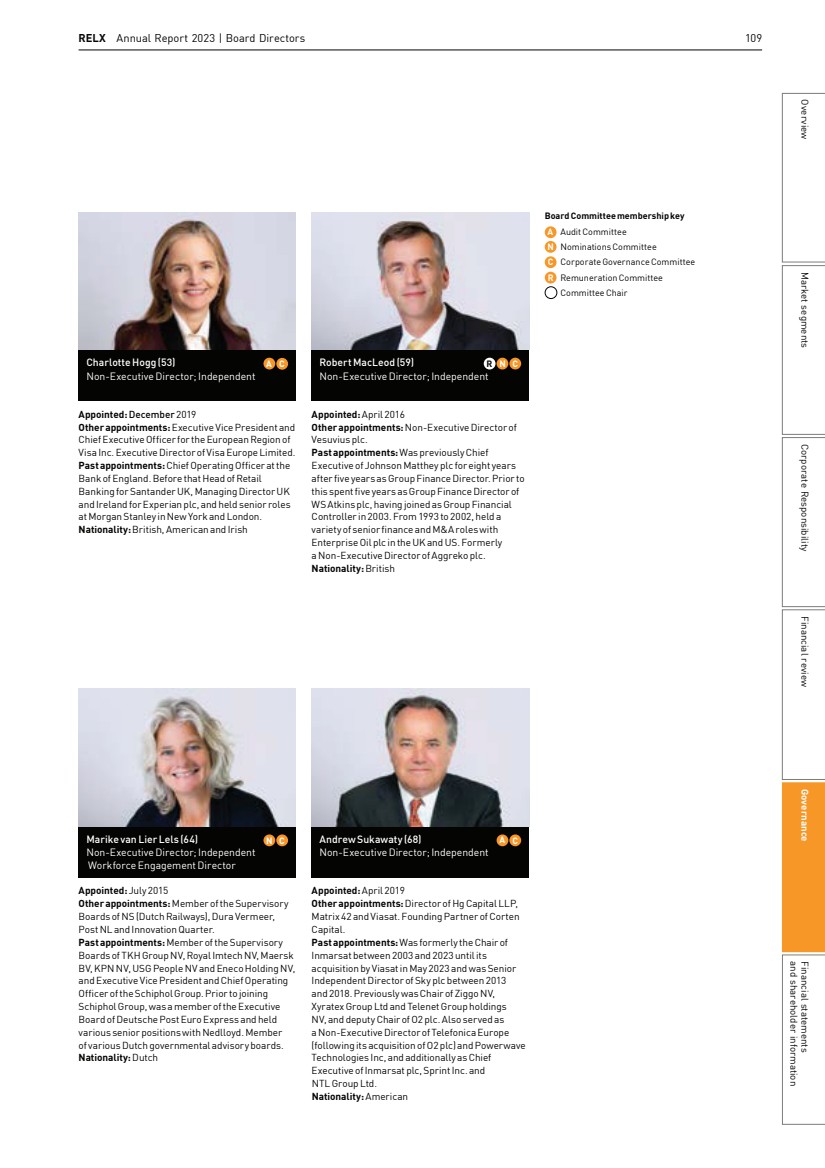
| 110 RELX Annual Report 2023 | Governance RELX Senior Executives Mark Kelsey Chief Executive Officer Risk Kumsal Bayazit Chief Executive Officer Scientific, Technical & Medical Mike Walsh Chief Executive Officer Legal Hugh M Jones IV Chief Executive Officer Exhibitions Joined in 1983. Appointed to current position in 2012. Joined in 2004. Appointed to current position in 2019. Joined in 2003. Appointed to current position in 2011. Joined in 2011. Appointed to current position in 2020. Has held a number of senior positions across the Group over the past 30 years. Previously Chief Operating Officer and then Chief Executive Officer of Reed Business Information. Studied at Liverpool University and received his MBA from Bradford University. Previously President, Exhibitions Europe, Chief Strategy Officer, RELX, Chair, RELX Technology Forum and Executive Vice President of Global Strategy and Business Development for LexisNexis. Prior to that worked with Bain & Company in New York, Los Angeles, Johannesburg and Sydney. Holds an MBA from Harvard Business School and is a graduate of the University of California at Berkeley. Previously CEO of LexisNexis US Legal Markets and Director of Strategic Business Development Home Depot. Prior to that was a practising attorney at Weil, Gotshal and Manges in Washington DC and served as a consultant with TheBoston Consulting Group. Holds a Juris Doctor degree from Harvard Law School and is a graduate of Yale University. Previously Group Managing Director, Accuity, ICIS, Cirium, and EG within Risk. Prior to that was Chief Executive Officer, Accuity. Holds an MBA from the Ross School of Business at the University of Michigan and is a graduate of Yale University. |
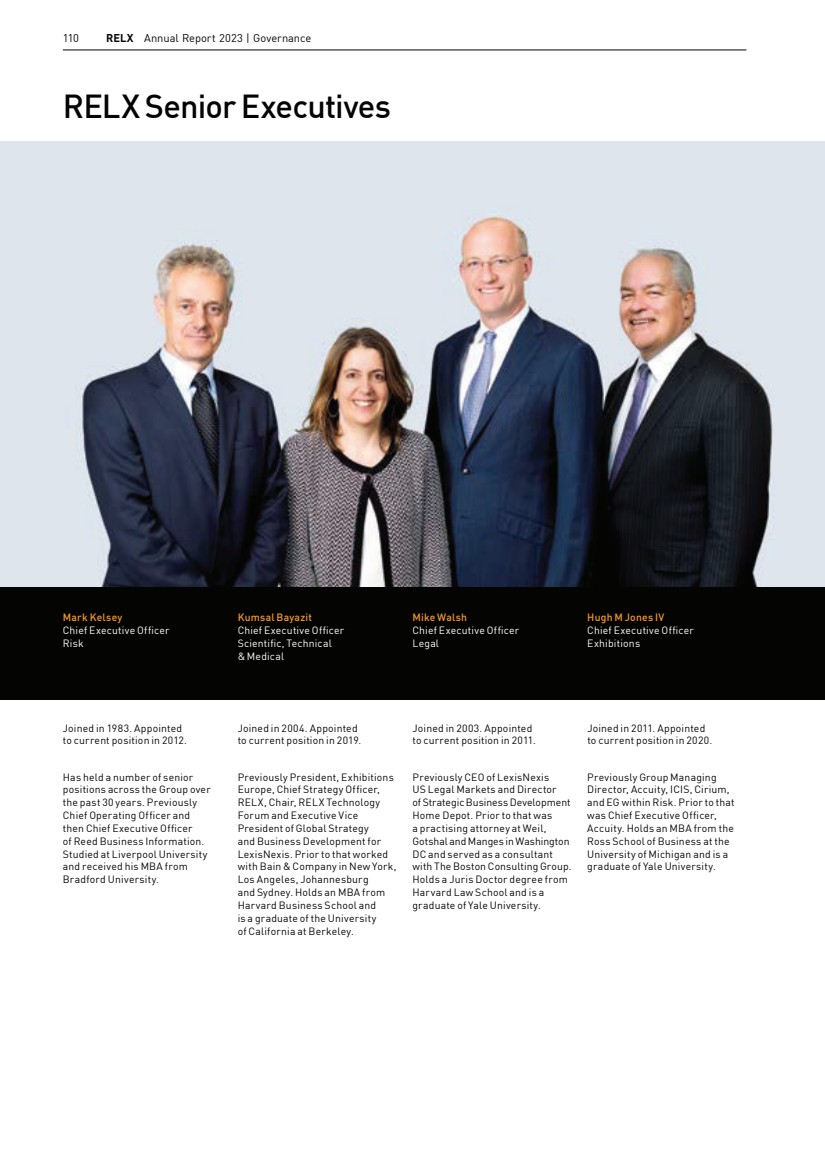
| RELX Annual Report 2023 | RELX Senior Executives 111 Rose Thomson Chief Human Resources Officer Vijay Raghavan Chair, RELX Technology Forum and Chief Technology Officer, Risk Henry Udow Chief Legal Officer and Company Secretary Jelena Sevo Chief Strategy Officer Youngsuk ‘YS’ Chi Director of RELX Corporate Affairs and Chair, Elsevier Joined in 2021. Appointed to current position at that time. Joined in 2002. Appointed to current position in 2019. Joined in 2011. Appointed to current position at that time. Joined in 2011. Appointed to current position in 2019. Joined in 2005. Appointed to current position in 2011. Previously Chief Human Resources Officer at Standard Life Aberdeen. Before that, held various senior human resources roles at Travelport International, Barclays Bank, The Coca-Cola Company, Coles Group and The Walt Disney Company. Holds an MA in business management from Macquarie University Graduate School of Management and a BA in Psychology, Macquarie University. Previously Vice President of Technology, LexisNexis Insurance Solutions. Prior technology executive positions at ChoicePoint, Paragon Solutions, Primus Knowledge Solutions, and McKesson. Holds a bachelor’s degree in electrical and electronics engineering from the Birla Institute of Technology and Science, Pilani, a master’s degree in cybersecurity from the Georgia Institute of Technology, and completed an advanced management program for executives at MIT Sloan School of Management. Previously Chief Legal Officer and Company Secretary of Cadbury plc having spent 23 years working with the company. Prior to that worked at Shearman & Sterling in New York and London. Holds a Juris Doctor degree from the University of Michigan Law School and a bachelor’s degree from the University of Rochester. Previously Director of Tax Markets for LexisNexis UK. Prior to that, various senior management roles in LexisNexis and Elsevier. Previously a consultant at Bain & Co and Booz Allen Hamilton. Holds an MBA from Harvard Business School, a master’s degree in law from Georgetown University and a degree in law from the University of Belgrade. Previously was President andChiefOperating Officer ofRandom House, founding Chairman of Random House Asia and Chief Operating Officer for Ingram Book Group. Holds an MBA from Columbia University and is a graduate of Princeton University. Market segments Governance and shareholder information Financial statements Financial review Corporate Responsibility Overview |
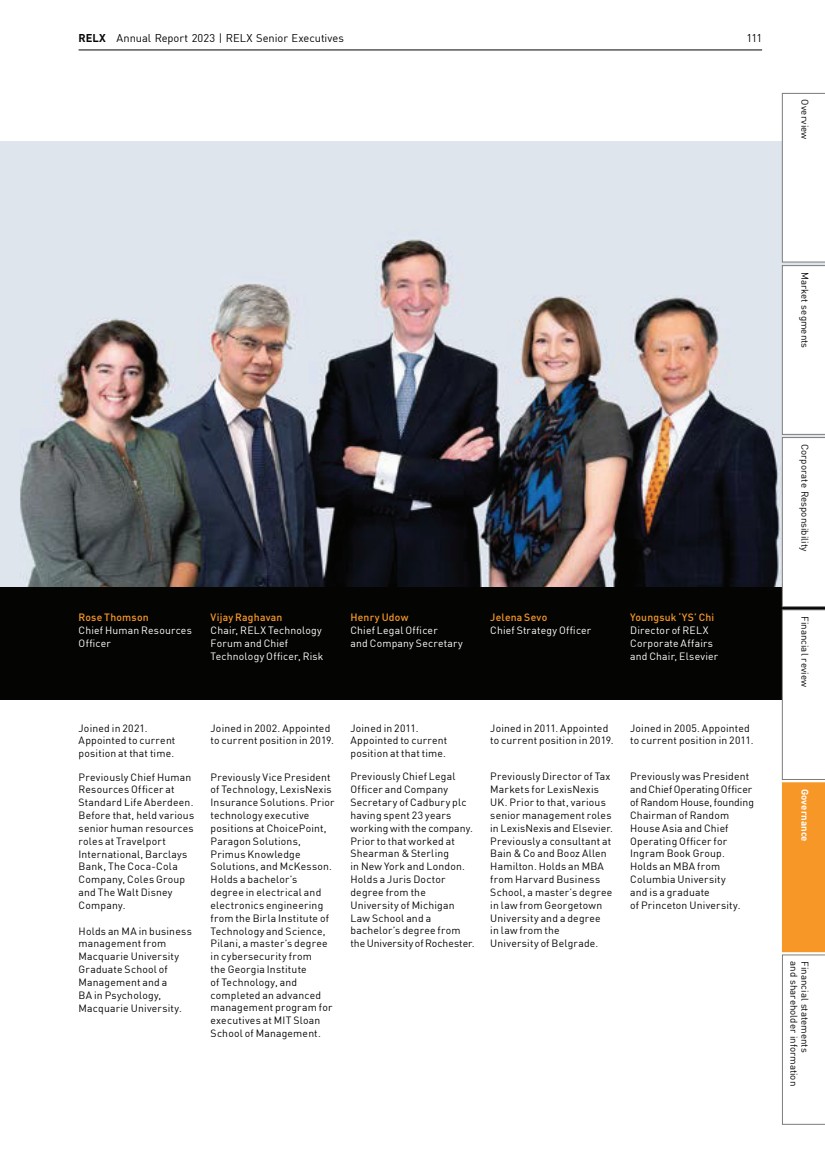
| 112 RELX Annual Report 2023 | Governance Chair’s introduction to corporate governance Stakeholder engagement and Board decision-making The views and interests of RELX’s stakeholders are a key element of the Board’s decision-making process. We are focussed on ensuring that the interests of our stakeholders are duly taken into account during Board discussions. Across RELX we engage with our stakeholders throughout the year and we rely on this engagement to ensure we continue to provide solutions and services that meet the evolving needs of our customers and continue to effectively support our workforce. This is why we actively listen to our investors, employees, customers, suppliers and the communities that we serve and in which we operate, and we have appropriate mechanisms in place to ensure that the outcomes of such engagement are available to the Board. Information about our approach to stakeholder engagement is on pages 119 to 122. Regulatory developments During 2023, the UK Government and other regulatory bodies have considered several potential governance reforms. These proposals have evolved over the course of the year and we still await their finalisation. To ensure the Board is kept apprised of developments in this regard, we established a management steering committee, reporting to the Audit Committee, tasked with assessing the Company’s preparedness to respond to and implement any UK regulatory changes should they be adopted. The Audit Committee has also attended technical briefings with our external advisers on the scope and likely impact of the proposed reforms on RELX. The Board has engaged with management in respect of further regulatory changes in the areas of sustainability and ESG reporting, which will impact RELX over the coming years. We have robust governance processes in place in respect of ESGmatters and continue to monitor developments in this area, including in relation to the European Union Sustainability Reporting Standards and the Corporate Sustainability ReportingDirective. Board effectiveness As Chair, I am responsible for ensuring that the Board operates effectively, and that the Board, its Committees and each individual Director is evaluated on an annual basis. In 2023, we engaged Manchester Square Partners to conduct an externally facilitated evaluation. The outcome of the evaluation confirmed that all of our Directors contribute effectively and continue to demonstrate commitment to their roles, and that the Board and its Committees continue to operate effectively. The evaluation process and its outcomes are explained on page 123. Paul Walker Chair 14 February 2024 Effective governance policies and practices are fundamental to RELX’s culture of acting with integrity in all that we do. Introduction On behalf of the Board, I am pleased to introduce our Corporate Governance Review for the year ended 31 December 2023. The following pages provide an overview of our corporate governance framework and of the work undertaken by the Board and its Committees during the year. Together with the reports of the Audit, Nominations and Remuneration Committees, our corporate governance review sets out our approach to effective governance and demonstrates how we have complied with the UK Corporate Governance Code. Corporate governance The Board takes seriously its responsibility for overseeing the governance of RELX. We believe that effective governance policies and practices are fundamental to RELX’s culture of acting with integrity in all that we do and support the Company’s purpose to benefit society through its unique contributions (as set out on page 45 to 49). The Board believes pursuing the highest levels of corporate responsibility and delivering excellent financial performance should be pursued in tandem, and that doing so will result in long-term sustainable shareholder value creation. It also provides confidence to our stakeholders that the governance of RELX is appropriate for its size and profile as a listed company, helps to manage our risks and opportunities, ensures that our key stakeholders are appropriately considered in the decisions that we make, and maintains our corporate reputation. Board changes and succession planning There have been a number of changes to the composition of our Board and Committees during the year. Dr Wolfhart Hauser retired following the conclusion of our annual general meeting in April after serving as a Director since 2013. We thank Dr Hauser for his valued contributions to the Board and to the various Committees on which he served over the years. Suzanne Wood succeeded Dr Hauser as our Senior Independent Director, and Robert MacLeod has taken on the role of Chair of the Remuneration Committee. We are pleased to have welcomed Alistair Cox to the Board this year. Following his appointment as a Non-Executive Director in April, Mr Cox has also joined our Audit, Remuneration and Corporate Governance Committees. In December 2023 the Company announced that Bianca Tetteroo will be joining the Board as a Non-Executive Director, with effect from 1 July 2024, subject to her election by shareholders at our AGM in April 2024. We look forward to welcoming her to the Board. Further information about our Board appointment process is available in our Nominations Committee Report on page 127. The 2024 AGM will mark the retirement of Marike van Lier Lels from the Board. Marike joined the RELX PLC Board in 2015. On behalf of the Board I would like to thank Ms van Lier Lels for her valued contributions to RELX. |
| 113 There is a clearly defined schedule of matters over which the Board retains responsibility and endorses all final decisions, which is available to view at www.relx.com/investors. Suchmatters include: § Approval of RELX’s strategy and annual budget and changes to the corporate or capital structure of the company § Approval of RELX’s risk appetite, oversight of risk management framework including principal and emerging risks and internal control systems arrangements § Corporate governance arrangements, including Board and Committee composition and terms of reference § Approval of key policies, including RELX’s Code of Ethics and Business Conduct (the Ethics Code), Tax and Dividend Policies and Inclusion and Diversity Policies § Approval of the Company’s Annual Report and periodic financial statements and trading updates § Oversight of the Ethics Code reporting channels for our workforce to raise concerns, and ensuring workplace policies and practices align with the company’s values and intended culture § Other matters deemed material to the delivery of RELX’s strategy or future financial performance, such as approval of material acquisitions, major capital expenditure and investments RELX Annual Report 2023 Corporate governance review The Board The Board determines RELX’s purpose and values and sets and oversees delivery of its strategic aims and objectives for long-term, sustainable success. The Board monitors and oversees RELX’s governance, risk management and internal controls processes and culture. Board leadership The Board is responsible for promoting the long-term sustainable success of the Company. To ensure the Board operates effectively and efficiently it has established four principal Committees to provide focused oversight, each with delegated authority to oversee and report to the Board on material and relevant matters, as appropriate. The roles and responsibilities of each Committee are set out in their individual terms of reference which are available on the Company’s website www.relx.com. A summary of the Committees’ key responsibilities is set out below. Audit Committee Reviews and monitors the integrity of financial reporting, internal control and risk management systems, the effectiveness of the internal audit process and the performance, independence and effectiveness of the external auditor. The Committee comprises only independent Non-Executive Directors. Remuneration Committee Determines, monitors and oversees the implementation of RELX’s remuneration policy for the CEO, CFO, the Chair, and Senior Executives below Board level. The Committee reviews the ongoing appropriateness of the remuneration policy. The Committee comprises only the Chair and Non-Executive Directors. Nominations Committee Keeps under review the composition of the Board and its Committees; ensures orderly succession plans are in place for the Board and senior management and ensures a diverse pipeline for such succession and procures the recruitment of new Directors. The Committee comprises only the Chair and Non-Executive Directors. Corporate Governance Committee Responsible for developing and recommending corporate governance principles to the Board; reviewing ongoing developments and best practice in corporate governance, and monitoring the structure and operation of the Board Committees. The Committee comprises only the Chair and Non-Executive Directors. Further information about the work of the Audit Committee is in its report on pages 149 to 152 The Directors’ Remuneration Report isset out on pages 128 to 148 Further information about the work of the Nominations Committee isin its report on pages 125 to 127 RELX Senior Executives To enable efficient day-to-day management of RELX’s business areas, there is a structure of delegated authorities in place from the Board to the Chief Executive Officer and a team of Senior Executives (shown on pages 110 to 111). This delegated authority framework, which is reviewed and approved by the Board each year, allows the necessary operational and management decisions to be taken by the right people, at the appropriate time to execute the company’s strategy. There are appropriate controls in place to ensure such decisions remain consistent with the risk appetite, policies and objectives established by the Board. Our governance framework Matters reserved to the Board Market segments Governance and shareholder information Financial statements Financial review Corporate Responsibility Overview |
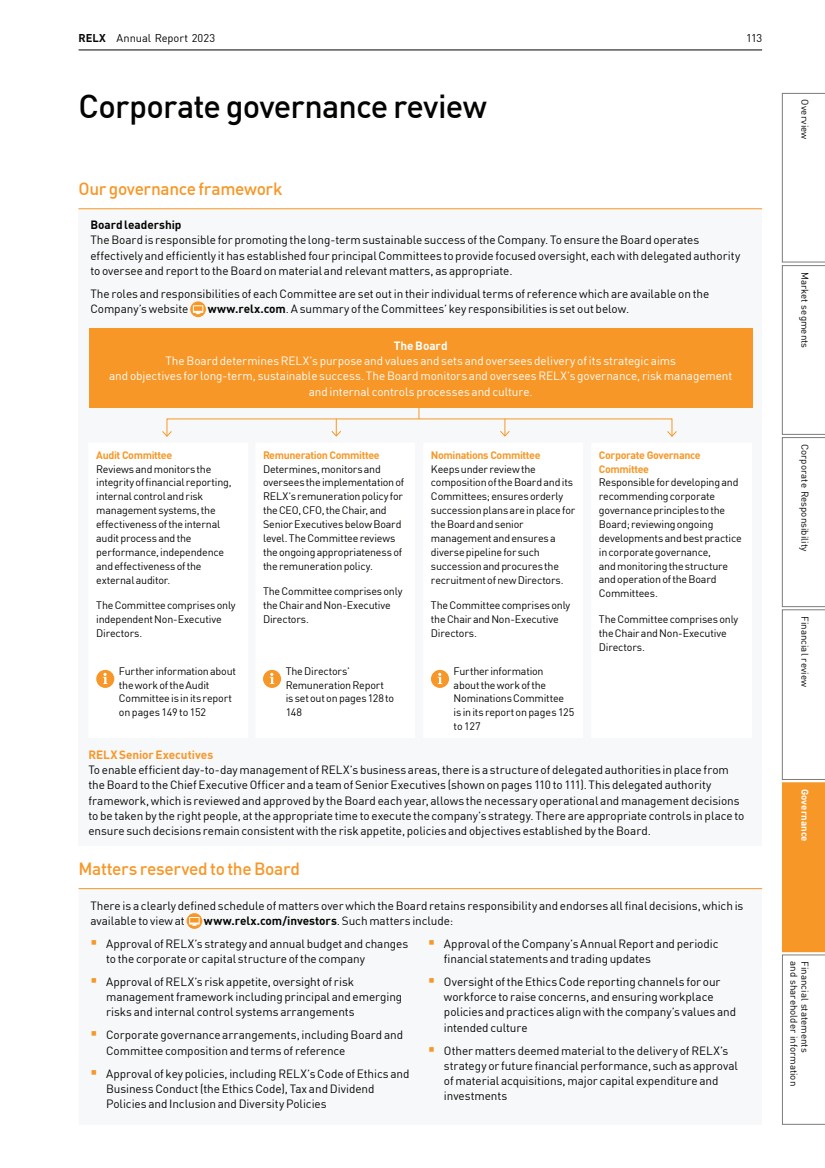
| 114 RELX Annual Report 2023 | Governance Board roles As at the date of this report, the Board comprised the Chair, two Executive Directors and seven Non-Executive Directors, who bring a wide range of skills, experience, industry expertise and professional knowledge to their roles. An overview of the gender balance, length of tenure and nationalities on the Board is provided in the Nominations Committee Report on pages 125 to 127. Division of responsibilities There is clear separation of the roles of the Chair, who leads the Board, and the Chief Executive Officer, who is responsible for the day-to-day management of RELX. The key responsibilities of each of the director roles on the Board is summarised below. Chair § Provides leadership of the Board and ensures its overall effectiveness § Ensures that all Directors are sufficiently apprised of matters to make informed judgements, through the provision of accurate, timely and clear information § Promotes high standards of corporate governance, demonstrates objective judgement and promotes a culture of openness and debate § Sets the agenda and chairs meetings of the Board § Chairs the Nominations and Corporate Governance Committees § Facilitates constructive Board relations and the effective contribution of all Directors § Ensures effective dialogue with shareholders § Ensures the performance of the Board, its Committees and individual Directors is assessed annually § Ensures effective induction and development of Directors Chief Executive Officer § Day-to-day management of RELX, within the delegated authority limits set by the Board § Develops RELX’s strategy for consideration and approval by the Board § Ensures that the decisions of the Board are implemented § Informs and advises the Chair and Nominations Committee on executive succession planning § Leads communication with shareholders § Promotes and conducts the affairs of the company with the highest standards of integrity, probity and corporate governance Chief Financial Officer § Day-to-day management of RELX’s financial affairs § Responsible for RELX’s financial planning, reporting and analysis § Ensures that a robust system of internal control and risk management is in place § Maintains high-quality reporting of financial and environmental performance internally and externally § Supports the Chief Executive Officer in developing and implementing strategy Senior Independent Director § Leads the Board’s annual assessment of the performance of the Chair § Available to meet with shareholders on matters where usual channels are deemed inappropriate § Deputises for the Chair, as necessary § Serves as a sounding board for the Chair and acts as an intermediary between the other Directors, when necessary Non-Executive Directors § Bring external perspectives and a broad range of experience to the Board § Provide constructive challenge and input to the development of strategy § Scrutinise the performance of management in meeting agreed goals and monitor the delivery of RELX’s strategy § Serve as members of Board Committees as required and Chair the Audit and Remuneration Committees Governance structure RELX’s corporate governance framework consists of leadership bodies, processes and supporting documentation to ensure that RELX is appropriately directed, led and controlled at all levels, with appropriate oversight and involvement by the Board and senior management. It is designed to safeguard and enhance the creation of long-term, sustainable shareholder value and to enable our business areas to operate with the required agility and flexibility to address effectively the needs of our customers, while taking into account all applicable statutory and regulatory requirements. The rights, responsibilities and accountabilities of those who work for and on behalf of RELX are clearly established through delegated authorities, corporate policies and codes of ethics and conduct, which promote the protection of RELX’s reputation and our commitment to acting with integrity in all that we do. The RELX Operating and Governance Principles set out the processes, policies, controls and related assurance activities that have been put in place to mitigate risk and serve as a first point of reference for management. They also provide our workforce with the corporate policies and practices with which they must comply. The Principles are regularly reviewed by the Board and are updated as required. RELX’s Ethics Code sets out the core principles and standards of professional conduct by which RELX operates and provides a framework for building and maintaining the desired culture of RELX. The Ethics Code provides all those who work for RELX with clear guidelines for how to conduct themselves in the workplace and across our broader operating environments, to inspire trust among all our stakeholders and to demonstrate commitment to our core value of ‘Do the Right Thing’. There are mechanisms in place to help our workforce to understand and comply with their obligations under the EthicsCode, which include ongoing training and established communication channels to ask questions and report concerns. We endeavour to ensure that our workplace policies are user-friendly, clear and accessible. The Ethics Code is regularly reviewed and approved by the Board and is available at, www.relx.com. Internal control and risk management arrangements are a central part of our governance framework. These are monitored by the Audit Committee and overseen by theBoard (further information is on pages 124 and 149 to 152). |
| RELX Annual Report 2023 | Corporate Governance Review 115 Compliance with the UK Corporate Governance Code RELX PLC applies the principles and provisions of the 2018 UK Corporate Governance Code (the Code), a copy of which is available on the FRC’s website, www.frc.org.uk. For the year ended 31 December 2023, the Board considers that the company fully complied with the principles and provisions of the Code. Board programme The Board met formally seven times during the year. Five meetings were held in person, in the UK and in New York. Through a structured programme of scheduled meetings, the Board oversees RELX’s financial performance and ensures its systems of risk management, internal control and corporate governance are fit for purpose and effectively underpin the delivery of its strategy. There are processes in place to manage the Board’s annual agenda, to ensure that all necessary items are submitted for its consideration at the appropriate time with sufficient supporting information, and to allow the Board adequate time to discuss and challenge strategic proposals. The Board’s annual programme and the agendas for the Committees are prepared by their respective Chairs with support from the Company Secretary. Board Committees are principally supported by theChief Executive Officer, Chief Financial Officer, Chief Legal Officer and Company Secretary, and the Chief Human Resources Officer, and other senior managers are invited to attend meetings where appropriate. Board discussions are informed through regular reports and presentations from senior management at Board and Committee meetings, and through deep-dive sessions into individual business areas, topics of strategic relevance and future developments that may impact RELX. Regular reports are provided, covering business area and overall strategies and financials, along with relevant regulatory, legislative and governance updates. RELX’s annual strategy review process comprehensively assesses its strategic position and key strategic options, considering opportunities and risks to its future success and the long-term sustainability and viability ofits business model. The Board engaged in a two-day, in-depth strategy session in September. Information and support There are processes in place to ensure that the Board and its Committees receive relevant information at the right time and with the appropriate level of detail to inform decision-making and enable effective monitoring of management’s progress in accordance with agreed strategy. The Directors are provided with papers ahead of all scheduled Board and Committee meetings, containing management updates, relevant context and market information, and other supporting information and reports, as appropriate. All the Directors have access to the advice of the Company Secretary and may also take independent professional advice at the company’s expense where they deem this to be necessary for the furtherance of their duties to the company. The Company Secretary advises the Board on all corporate governance matters and ensures that all Board procedures are followed correctly. TheDirectors also have access to other members of RELX’s management, staff and external advisers. Each of the Directors is expected to attend all meetings of the Board and of the Committees of which they are a member. However, in circumstances where a Director is unable to attend a meeting, they are provided with the relevant papers and have the opportunity to discuss any matters arising with the respective Chair and with their fellow Board and Committee members. AllDirectors are provided with a copy of the minutes of eachmeeting. Director induction Following appointment, and as required, all Directors receive a full, formal induction, that is tailored to their individual requirements, based on existing knowledge and experience. TheChair and Company Secretary are responsible for ensuring that an effective induction programme takes place for all new Directors. During the year, Alistair Cox (appointed in April 2023) was provided with a comprehensive briefing pack including detailed information about each of RELX’s business areas, governance and internal controls, and recent reporting and investor materials, together with access to historical Board papers and minutes. To provide a sufficiently in-depth and current understanding of our operations, a number of meetings were organised with senior management from RELX’s business areas and corporate functions, as well as with the external auditor. Ongoing development For Directors to effectively discharge their responsibilities, it is important that they regularly refresh and update their skills and knowledge. The Board’s annual programme is designed with this in mind and ensures that the Directors have sufficiently in-depth knowledge of RELX’s business areas and operations and are kept apprised of relevant events and changes in RELX’s operating environment and markets. In 2023, the Directors took part in a deep-dive into the Legal and Exhibitions business areas, covering financial and operational performance by segment, product development and strategic plans. The Audit Committee also attended a series of technical deep-dive briefing sessions. Further information about the work and activities of the Audit Committee is available in the Audit Committee Report 149 to 152. Market segments Governance and shareholder information Financial statements Financial review Corporate Responsibility Overview |
| 116 RELX Annual Report 2023 | Governance Purpose, strategy, values and culture RELX places significant emphasis and importance on the way we do business. We are clear and unequivocal about our commitment to do so with integrity and in accordance with the highest ethical standards. Purpose RELX is a provider of information-based analytics and decision tools for professional and business customers, enabling them to make better decisions, get better results and be more productive. Our purpose is to benefit society by developing products that help researchers advance scientific knowledge; doctors and nurses improve the lives of patients; lawyers promote the rule of law and achieve justice and fair results for their clients; businesses and governments prevent fraud; consumers access financial services and get fair prices on insurance, and customers learn about markets and complete transactions. Our purpose guides our actions beyond the products that we develop. It defines us as a company. Every day across RELX our employees are inspired to undertake initiatives that make unique contributions to society and the communities in which we operate. Strategy Our number one strategic priority is the organic development ofincreasingly sophisticated information-based analytics and decision tools that deliver enhanced value to professional and business customers. We aim to achieve leading positions in long-term global growth markets and leverage our skills, assets and resources across RELX, both to build solutions for our customers and to pursue cost efficiencies. We are systematically migrating all of our information solutions across RELX towards higher value-add decision tools, adding broader data sets, embedding more sophisticated analytics and leveraging more powerful technology, primarily through organic development. We are transforming our core business, building out new products and expanding into higher growth adjacencies and geographies. We are supplementing this organic development with selective acquisitions of targeted data sets and analytics, and assets in high-growth markets that support our organic growth strategies and are natural additions to our existing business. By focusing on evolving the fundamentals of our business we believe that, over time, we are improving our business profile and the quality of our earnings. This strategy has led to more predictable revenues through a better asset mix and geographic balance; improved returns by focusing on organic development with strong cash generation; and a higher growth profile as we expand in higher growth segments, exit from structurally challenged businesses, and gradually reduce the drag from print format declines. Values We strive to do business with integrity. Our principle ‘Do the Right Thing’ embraces behaviours such as being honest in dealing with others, respecting each other, and courageously speaking out for what is right; thereby guiding our commitment to achieve business goals in an open, honest, ethical, and principled way. We ask our suppliers to meet the same standards, and provide support for them to do so as necessary. Culture As an information-based analytics and decision tool provider, our corporate culture is fact-based, data-driven and analytical. We are transparent and non-political in our decision-making. We are passionate about making a positive impact on society through our unique contributions as a business and our employees feel a strong sense of engagement with the business and its purpose. We focus on improving customer outcomes while emphasising corporate responsibility and acting with integrity and advancing inclusiveness and diversity.Our culture encourages community engagement, environmental responsibility and the well-being of our people. How the Board monitors culture RELX’s standards and values are defined on a group-wide basis, however the Board acknowledges that cultural practices and preferred ways of working can vary across the geographies of our business areas. The Board helps to build the culture of the organisation from the top down, by ensuring that it takes decisions that are aligned to RELX’s values. The Board regularly reviews RELX’s policies and Ethics Code to ensure the right framework is in place for RELX to operate with integrity, and that its working practices effectively promote a culture of strong engagement with our business and purpose, and with the communities that we serve and in which we operate. We strive to continually improve customer outcomes through a culture that is fact-based, data-driven and analytical. The Board has appointed a Non-Executive Workforce Engagement Director to engage directly with employee representatives from across RELX and to report back to the Board (further information about this engagement is on page 120). This provides the Board with insights into how culture is embedded across RELX’s business areas and functions and any issues that need to be addressed. The views of employees are also measured through annual employee engagement surveys, and a broader triennial opinion survey, designed to gauge how employees feel about the organisation, how well they understand its direction, and their level of satisfaction and engagement with their work. An analysis of the results is presented to the Board. The Board also receives regular reports and presentations containing culture-related employee data and updates on corporate responsibility activities from across each of RELX’s business areas. Such reports include progress against our people objectives in areas such as well-being, pay equity and reducing inequalities through inclusion. This contributes to the Board’s assessment of the culture at RELX and provides a context against which the Board has taken a number of its principal decisions during the year. Through the activities of the Audit Committee, the Board receives updates on alleged and substantiated violations of the Ethics Code and significant matters raised through reporting channels, which provide insights into governance and compliance behaviours. |
| RELX Annual Report 2023 | Corporate Governance Review 117 Board activities during the year Purpose and strategy The Company’s purpose, strategy, culture and values statement is on page 116 Read more about RELX’s strategy and business model on pages 5 to 11 § At a two-day strategy session in September, the Board discussed strategic initiatives for RELX and debated and approved RELX’s three year strategic plan for 2024 to 2026. RELX’s strategic priority continues to be the promotion of organic growth. The Board reviewed RELX’s value creation, capital expenditure and areas for potential acquisitions across all four business areas, and robust operational plans for delivery across RELX’s business areas for implementation by management. § In June and September, the Directors attended presentations led by business area senior management. These included updates on strategy supplemented by presentations from subject matter experts on key products, innovations and areas of focus, and a final session for the Board to provide their feedback to senior management. § The Board conducted reviews of RELX’s invested capital and capital structure during the year, including financial performance, potential and completed acquisitions, net debt, returns on invested capital, credit ratings, forecasts and financial market conditions and approved the annual budget. § The Board reviewed the company’s purpose, strategy, values and culture statement and confirmed that it continues to represent why and how RELX operates and the standards to which those who work for and who represent RELX are held in the course of conducting our business and operations. People, culture and values Information about Board engagement with our workforce is on page 120 How we invest in and reward our workforce is on page 59 RELX’s approach to I&D and how we monitor our progress is set out on pages 54 to 57 and 126 to 127 § The Board oversaw Director succession planning arrangements during the year. On the recommendation of the Nominations Committee, the Board approved the appointment of Bianca Tetteroo who will join the Board as a Non-Executive Director on 1 July 2024, subject to shareholder approval at the 2024 AGM. § Having the right people in leadership roles is an important factor in embedding the desired culture for RELX. The Nominations Committee and the Board were updated on the ongoing leadership talent reviews undertaken by management and plans for talent development across RELX’s business and functional areas. § The RELX and Board Inclusion and Diversity policies were reviewed by the Board to ensure they remain fit for purpose and continue to align with our desired culture and effectively support our purpose and strategy. § The Board considered the results of the company-wide employee opinion survey conducted during 2023 (further information is on page 54). Environment, Social and Governance (ESG) Information about RELX’s ESG activities is available in our Corporate Responsibility Report on pages 38 to 90 § RELX’s corporate responsibility activities formed a significant part of the Board’s agenda during the year and these are overseen by the Board on an ongoing basis. Detailed information about RELX’s corporate responsibility objectives and its progress towards these, together with our TCFD disclosures, are included in the Corporate Responsibility Report within this Annual Report, as approved by the Board. § The Board reviewed and approved the company’s Modern Slavery Act Statement, which describes the steps taken by the Company and its subsidiaries to ensure that modern slavery and human trafficking were not taking place in the context of RELX’s business operations and its supply chain during the previous year. Further information about how RELX manages an ethical and socially responsible supply chain is available on pages 69 to 72. Market segments Governance and shareholder information Financial statements Financial review Corporate Responsibility Overview |
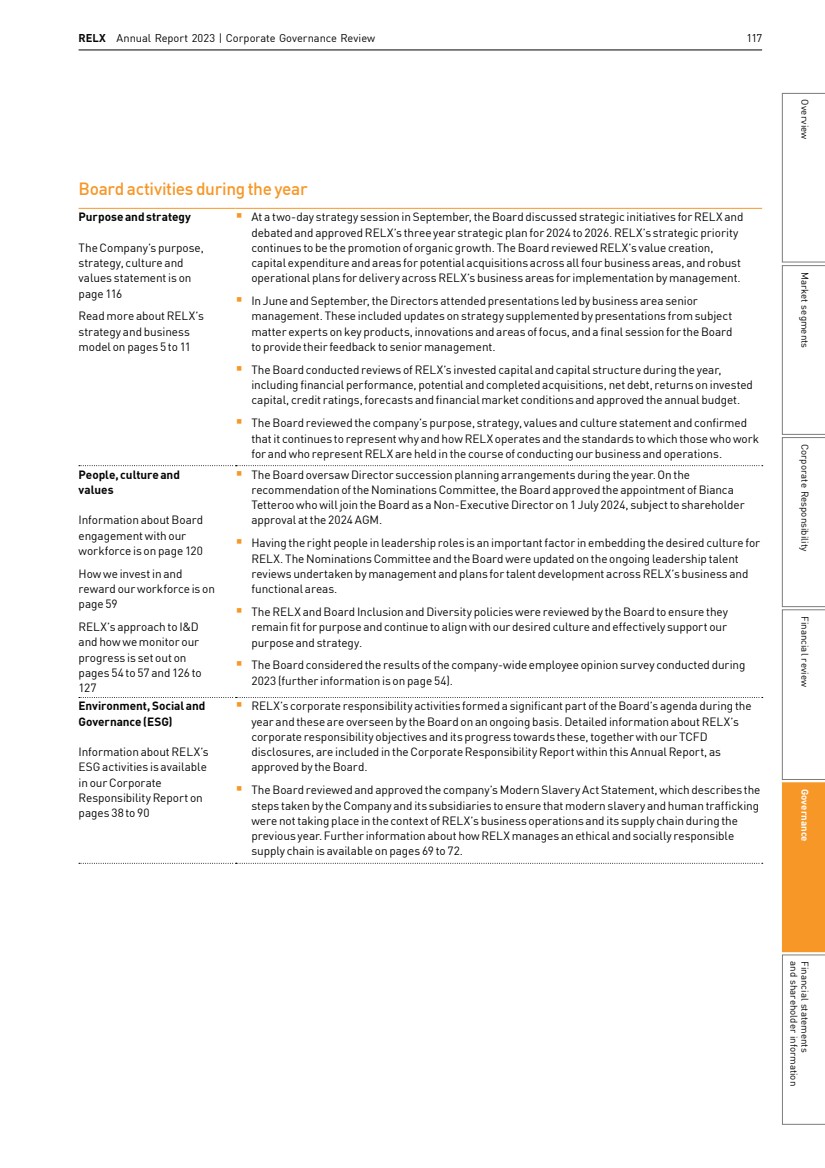
| 118 RELX Annual Report 2023 | Governance Director attendance at Board and Committee meetings The following table shows the attendance by Directors at Board and Committee meetings during the year. Attendance is expressed as the number of meetings attended by each Director out of the number of meetings they were eligible to attend. Directors Committee appointments Board (1) Audit Committee Remuneration Committee Nominations Committee Corporate Governance Committee Paul Walker (Chair) N C R 7/7 4/4 4/4 3/3 Erik Engstrom 7/7 Nick Luff 7/7 Alistair Cox (2) A R C 5/5 3/3 2/2 3/3 June Felix (3) A R C 6/7 3/4 3/4 3/3 Wolfhart Hauser (4) R N C 2/2 2/2 1/1 1/1 Charlotte Hogg A C 7/7 4/4 3/3 Robert MacLeod (5) R N C 7/7 4/4 4/4 3/3 Andrew Sukawaty A C 7/7 4/4 3/3 Marike van Lier Lels N C 7/7 4/4 3/3 Suzanne Wood(6) A A N C 7/7 4/4 3/3 3/3 Committee membership key A Audit Committee R Remuneration Committee N Nominations Committee C Corporate Governance Committee Committee Chair (1) In addition to the seven scheduled Board meetings, the Directors also attended two full-day strategy and business review meetings. (2) Alistair Cox was appointed to the Board at the conclusion of the Company’s AGM on 20 April 2023, when he also joined the Audit Committee. Mr Cox was appointed to the Remuneration and Corporate Governance Committees with effect from 8 June 2023. (3) June Felix was unable to attend the Board and Committee meetings held in July. (4) Wolfhart Hauser retired from the Board and stepped down from the Remuneration, Nominations and Corporate Governance Committees with effect from the conclusion ofthe Company’s AGM on 20 April 2023. (5) Robert MacLeod was appointed Chair of the Remuneration Committee with effect from the conclusion of the Company’s AGM on 20 April 2023. (6) Suzanne Wood joined the Nominations Committee at the conclusion of the Company’s AGM on 20 April 2023. Risk management andinternal control The Company’s principal and emerging risks and mitigation strategies are set out on pages 98 to 103 The Company’s Viability Statement is on page 104 Further information about RELX’s internal controls is on pages 98, 124 and 151 § The Audit Committee and the Board reviewed the effectiveness of the systems of risk management and internal control in operation during 2023 and determined that RELX’s control systems provided reasonable assurance against material inaccuracies or loss and have functioned properly and effectively throughout the year. § The Board, supported by the work of the Audit Committee, reviewed and agreed RELX’s principal and emerging risks and mitigation strategies. Following a robust and thorough assessment of the risks identified, together with a detailed review of RELX’s financial position, the Board considered RELX’s ongoing viability and approved the company’s Viability Statement. § Feedback from the Board’s 2022 evaluation indicated that the Board’s agenda should include further updates on RELX’s assessment of material cyber and information security risks, and approach to mitigation and information security controls, on a regular basis. The Board received regular reports from the Head of Information Security and Data Protection on these matters and further updates from management on matters of particular significance to each of the four business areas. Cybersecurity and data privacy are considered principal risks for RELX. Shareholder matters Details of the Board’s engagement with investors during the year are on page 119 Information about the Company’s dividend policy is on page 96 § The Company completed an £800m share buyback programme during 2023. 31m shares held in Treasury were cancelled on 7 December 2023. Following a robust assessment of RELX’s financial position and continued strong EBITDA, the Board approved a further share buyback programme of £150m from 2 January to 9 February 2024, as announced on 8 December 2023. § In line with RELX’s long-term dividend policy, the Board declared an increased interim dividend for the year, and recommended an increased final dividend for 2023. § The Board considered and approved the proposed resolutions to be put to shareholders at the 2023 AGM, which included the distribution of a final dividend for the year ended 31 December 2022 and an updated Directors’ Remuneration Policy. Each of the proposed resolutions was subsequently approved by shareholders at the meeting. |
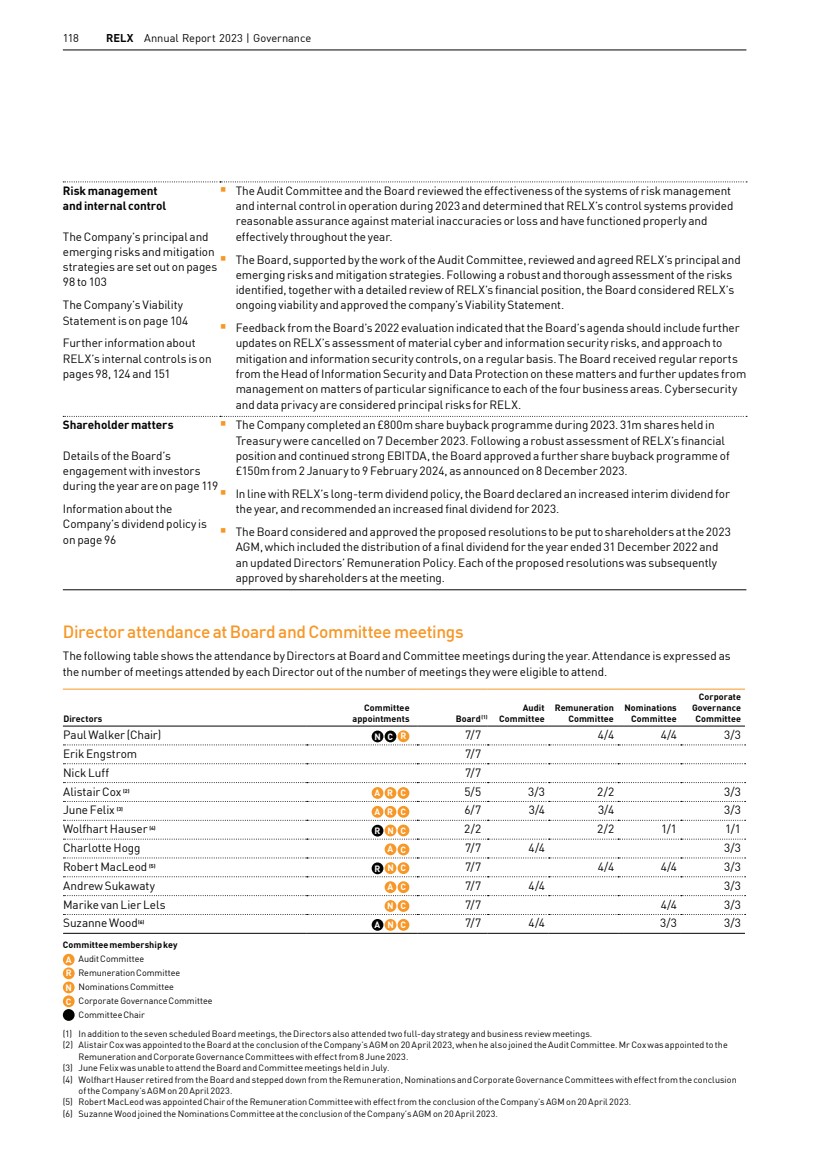
| RELX Annual Report 2023 | Corporate Governance Review 119 Stakeholder engagement During the year, the Board undertook a review of RELX’s key stakeholders and concluded that they remain unchanged from the previous year. The Board received a detailed overview of stakeholder engagement channels and activities and confirmed that it has adequate visibility of the views of key stakeholders, which are taken into consideration in its decision-making. Further information about the nature and outcomes of the RELX’s engagement with its stakeholders are detailed throughout this Annual Report and examples of theBoard’s engagement with key stakeholders are set out on the following pages. Investors Why effective engagement is important How we engage, outcomes and impact Engagement with our investors helps them to understand our strategy, performance and governance arrangements, and to make informed decisions concerning the company. It also makes clear our prioritisation of the long term in our decision-making and focus on delivery of consistent financial performance. Our investors provide us with input and feedback concerning the development and implementation of our strategy, and we consider their views when making investment decisions. Engagement with our investors is undertaken by members of the Board and at a business level by senior management and our Investor Relations, Corporate Responsibility and Treasury teams. TheBoard is updated with feedback and commentary received from investors through business engagement, investor roadshows and meetings with institutional shareholders in respect of our recent and proposed activities. The Board receives regular reports on the company’s share price and shareholder return performance and a review of analyst commentary in response to the company’s market announcements and results publications. Executive Directors and senior management gave a number of investor and analyst presentations during the year to provide further detail and context to our published results and strategy plans. During the year: § Our engagement processes confirmed that investors in the main continue to understand and support our organic growth strategy. The Board considered this when approving RELX’s three-year strategic plan for 2024 to 2026, which leaves our strategic focus, and our priorities for uses of cash generated by RELX, broadly unchanged. § In response to interest from the investment community, RELX presented a demonstration of its new Legal AI tool, Lexis+ AI, at an event attended by over 200 investors and analysts. The presentation demonstrated the strategic position of our Legal business in the AI space and the Board were provided with the feedback from attendees. Further information about Lexis+ AI is on page 10. § Senior management led an investor seminar on our Risk business, with a focus on Insurance Services. The presentation demonstrated the continued evolution of Risk, covering its markets, customers, growth trajectory and technological capabilities, and included an open Q&A session. The presentation is available at www.relx.com/investors § The Company’s AGM in 2023 was a valuable opportunity for Directors to interact directly with shareholders, to hear their views and answer questions about the business of the meeting. § RELX’s material communications to investors, including trading updates, the Annual Report and Notice of AGM were reviewed and approved by the Board prior to release. § In respect of shareholder returns, the Board considered a range of investor and analyst views, balancing the impact of returning capital to shareholders with stakeholder interests in other key RELX financial metrics, and subsequently approved the quantum of the company’s share buyback programme for 2023 and declared and recommended an interim and final dividend payment during the year. Market segments Governance and shareholder information Financial statements Financial review Corporate Responsibility Overview |
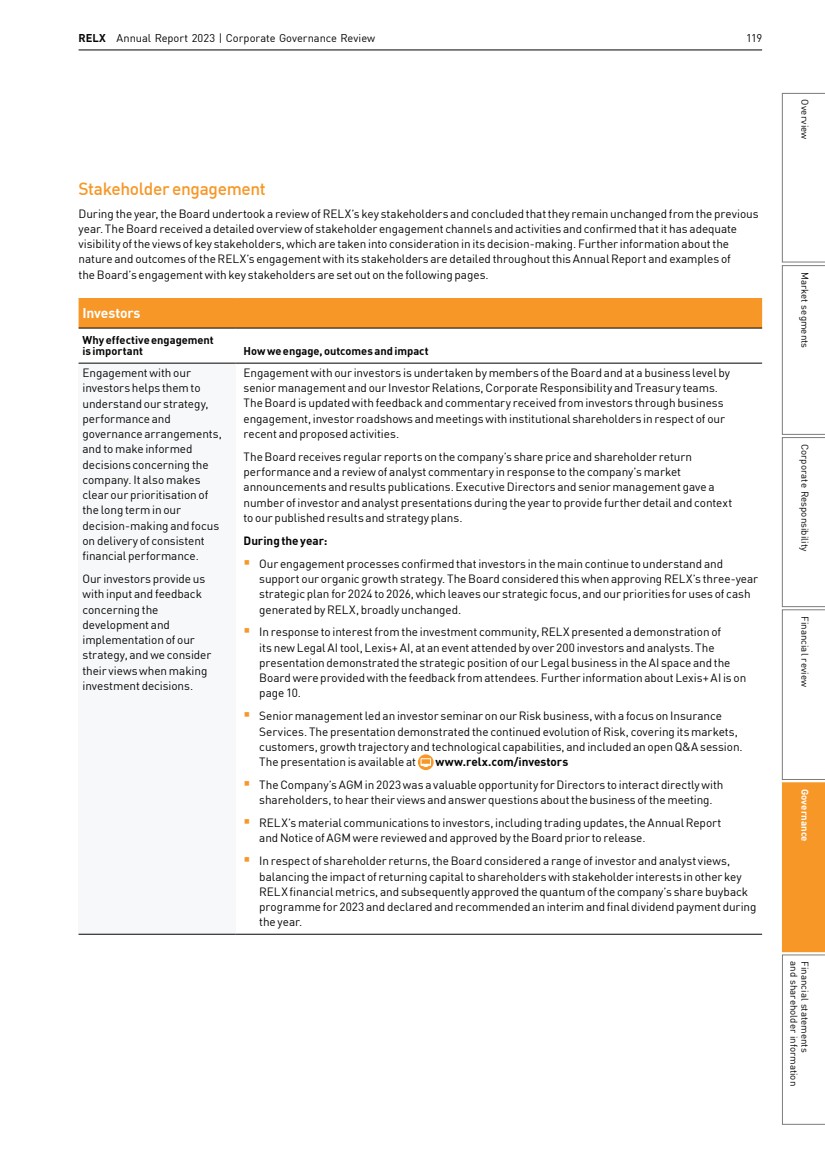
| 120 RELX Annual Report 2023 | Governance Employees Why effective engagement is important How we engage, outcomes and impact Our people’s well-being and their commitment to the work they do are essential to our future growth and our aim to successfully build long-term leading positions in global growth markets. We strive to foster an environment in which our employees feel a strong sense of engagement with our business and share a passion for making a positive impact on society through our unique contributions. RELX actively seeks feedback from employees to understand their key challenges and concerns and where we can work to address these. Hearing their views on what we do well, and what we can do better, is an important driver for improvement and enables us to take action to retain our best talent. Effective engagement helps to mitigate the risk of not being able to recruit, motivate and retain skilled employees and management, which is recognised as a principal risk (see page 101). Employee engagement routinely takes place at business level and matters of concern are cascaded up through our management framework. The Board receives regular management reports which cover employee engagement, turnover and demographic analysis, updates on workplace initiatives, progress towards I&D objectives, and concerns raised through our Ethics Code reporting channels. The Board takes time to review employee engagement and workforce data and takes this into consideration during wider discussions. RELX has a dedicated intranet for employees which is kept updated with financial and performance information, news of business developments and workforce initiatives and events (including in I&D) and other important messages from senior management. The Board has appointed Marike van Lier Lels as our Non-Executive Workforce Engagement Director to engage directly with employee representatives from across RELX and to report to theBoard on the progress of RELX’s workforce initiatives, together with the challenges, concerns and priorities of employees. This provides the Board with insight into the culture across RELX, how our working practices and initiatives have been received and highlights any issues that need to be addressed. During the year: § Ms van Lier Lels, met with workforce representatives to learn about the experiences of employees while working at RELX. Ms van Lier Lels reported to the Board on the matters discussed. These included positive feedback about RELX’s mentorship programmes, which are monitored by management to track their impact on employee performance, retention and net promoter scores. Further matters included the impact of ongoing hybrid working arrangements in different business areas, and RELX’s training programmes and opportunities. § In 2023 we undertook our annual Pulse employee opinion survey. An analysis of the results of the survey was presented to the Board in December and confirmed positive trends across all business areas in the key metrics of engagement, satisfaction, commitment and employee net promoter scores. § Board reports from the Chief Human Resources Officer highlighted the steps taken to identify, support and develop current and future leaders across the business through Organisational Talent Review and Management Development Planning processes. This focus has seen increased gender diversity across internal succession pipelines, complemented by targeted senior level recruitment. § The Board endorsed the development of a group-wide leadership framework for management and executive leaders, to unify and simplify existing frameworks and ensure leaders across our business areas continue to develop the skills and behaviours that drive our strategy, role model our values and champion our culture. § The Board reviewed the Board and RELX Inclusion and Diversity Policies and determined that these continue to be fit for purpose and effective. § The Board received a presentation from the Head of Corporate Communications on focus areas for 2023, which included consideration of the most effective methods to deliver key information about the business to the wider workforce, and for continuing to develop understanding of our purpose, strategy and values. Employee understanding and engagement with our purpose and strategy is monitored through our employee opinion survey scores over time. § Employee involvement in the company’s performance is encouraged through RELX’s employee share schemes, which were refreshed and put to shareholders for approval at the 2023 AGM. The RELX PLC Employee Share Purchase Plan was also introduced in the US to enable a greater proportion of RELX employees the opportunity to purchase ADRs at a discounted price. |
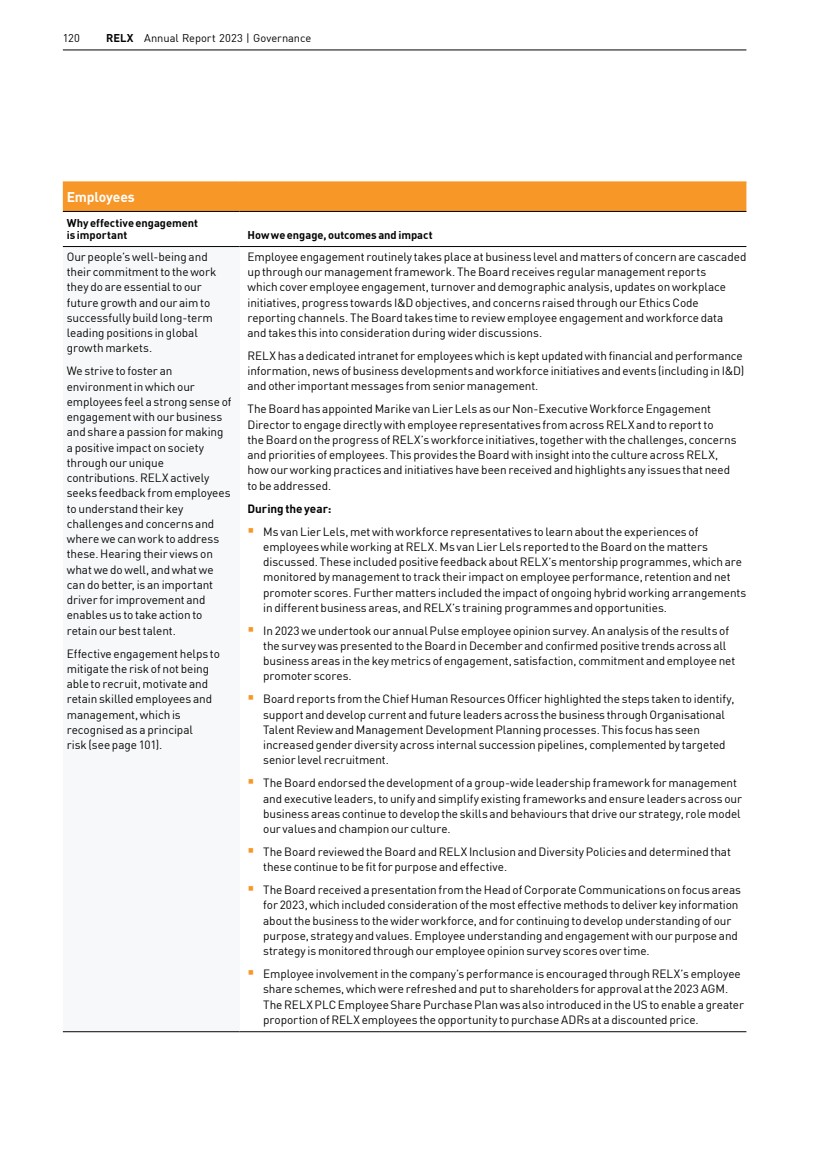
| RELX Annual Report 2023 | Corporate Governance Review 121 Customers Why effective engagement is important How we engage, outcomes and impact Our goal is to help customers make better decisions, get better results and be more productive. We do this by leveraging a deep understanding of their needs and views to create innovative solutions. Collaborating closely with our customers is crucial for us to understand where and how we can improve the quality of our services and products, and enables us to make targeted investment decisions, such as to develop new or emerging technologies or complement our existing capabilities through acquisition activity. Our engagement with customers takes place at an operational level across our business areas, through our dedicated sales and operations teams and through customer training and workshops. Material customer issues are cascaded up to the appropriate senior management. The Board received presentations during the year from customer-facing employees which detailed the nature of our customer engagement and the actions taken by the business areas as a result. In 2023, the Board received analysis of customers by sector and geography and data concerning the resilience of the markets in which we operate. The Board reviewed customer survey data, Net Promoter Scores, and customer usage volumes across our business areas. During the year: § The Board continued to monitor current and anticipated future customer demand and market activity together with customer feedback, to understand how our product offerings address customer requirements. This information informed the areas of focus for product development and acquisitions and the level of investment required. RELX made several acquisitions during the year that complement its existing product range and enhance value for our customers. More information about our acquisitions during the year can be found on pages 9, 15, 27 and 32. § Feedback from our customers informed the Board and management’s assessment of the areas in which RELX should build out new products and services, the speed at which this should be undertaken, and where it should look to expand into higher growth adjacencies and geographies over varying time horizons. Suppliers Why effective engagement is important How we engage, outcomes and impact RELX has a diverse supply chain with suppliers located in over 150 countries across multiple categories, which RELX categorises as content suppliers and non-content suppliers. Collaboration and two-way dialogue with our suppliers helps ensure that we are able to maintain and improve the quality of products and services we provide to our customers. Effective engagement underpins our ability to maintain an ethical supply chain, giving us visibility of our suppliers’ commitment to good practices. Engagement with our content suppliers, which include the companies we license content or data from, as well as authors, editors, content reviewers and product designers, takes place principally through ongoing dialogue with the relevant business area to which the content is provided. Content supplier feedback is collected through direct relationships and regular business reviews, and presented to the Board through updates from our business area leaders. Our non-content suppliers represent more typical vendor-type relationships, such as IT software and cloud service providers, or third parties to whom we have outsourced support function activities. Engagement takes place at various levels throughout RELX. Feedback is reported to theBoard by business area leaders and the Global Head of Purchasing and Property. During the year: § Outcomes of ongoing business engagement with our content suppliers, including Net Promoter Scores and the outcomes of business reviews, informed the Board’s discussions during its consideration of RELX’s three-year strategy plan for 2023 to 2026, and its assessment of mitigations in place for our principal risks of customer acceptance of products and supply chain dependencies. § Our Supplier Code of Conduct has been translated into 16 languages for use across RELX. The Board continues to support our Socially Responsible Supplier (SRS) programme (further details are on pages 69 to 72). The Board also reviewed and approved our Modern Slavery Act Statement, available from www.relx.com, which sets out the steps taken by the Company and its subsidiaries to prevent modern slavery and human trafficking in its business and supply chain. Market segments Governance and shareholder information Financial statements Financial review Corporate Responsibility Overview |
| 122 RELX Annual Report 2023 | Governance Community Why effective engagement is important How we engage, outcomes and impact Our focus on community includes those where we, our customers and suppliers work around the world, as well as the communities we serve, including in science, academia, risk, law and many other fields. We prioritise positive dialogue with our community stakeholders as we believe they, collectively, provide our ‘licence to operate’. Our efforts are informed by our commitment to the United Nations Global Compact and its ten principles, focused on human rights, labour, the environment and anti-corruption – all issues with wide societal impact. We engage with our community stakeholders through our unique contributions to society, and through our comprehensive global community programme, RELX Cares. TheRELX Cares mission is the education of disadvantaged young people. Further information about our RELX Cares projects and its contributions to the communities in which we operate is on pages 65 to 68. In accordance with the Business for Societal Impact model, we monitor the short- and long-term benefits of our community engagement. We survey RELX Cares volunteers to understand the impact of the programme on their personal development and how it affects the way they feel about working at RELX. Relevant ESG considerations are incorporated into business review and strategy papers reviewed by the Board. During the year: § The Board considered RELX’s environmental performance and supported ongoing initiatives for minimising our environmental impact, and continued to endorse our commitment to our reaching net zero by 2040. More information is in our Corporate Responsibility Report on pages 38 to 90. § The Board received comprehensive updates on community engagement during the year, including key metrics, objectives and outcomes. Board feedback and support for community engagement shapes the direction of our charitable programmes and future plans. § The Board continued to endorse RELX’s volunteering policy through which RELX employees receive two days paid leave each year to undertake community volunteering work. § The Board supported the business areas utilising their unique product offerings to support causes in their communities. External appointments and Non-Executive Director independence The Board has in place formal procedures to evaluate and review the external commitments of Directors, each of whom are required to obtain the Board’s approval prior to accepting new significant external appointments. During the year, the Board reviewed proposed external appointments of Suzanne Wood and Robert MacLeod. It was concluded that these appointments would not impact either Director’s ability to effectively perform their respective roles on the Board of RELX PLC, and accordingly theBoard gave its approval in each instance. When Directors take up new external appointments, any related commercial relationships with RELX are reviewed, and any potential conflicts of interest are dealt with following formal procedures. In accordance with the Company’s Articles of Association, Directors who are not conflicted may authorise, as appropriate, situations where a Director has an interest that conflicts, or may possibly conflict, with those of RELX, and may impose conditions on such authorisations. Supported by the Nominations Committee, the Board monitors the independence of the Non-Executive Directors in line with the relevant provisions of the UK Corporate Governance Code. An annual evaluation, led by the Nominations Committee, considered whether length of service or any other factor has or may impact the ability of any Non-Executive Director to remain independent in character and judgement in the furtherance of his or her duties to the Company. The Board determined that each of the Non-Executive Directors is considered to be independent of management and free from any business or other relationship which could materially interfere with their ability to exercise independent judgement (with the exception of the Chair, whose independence was not assessed, but who was deemed to be independent upon appointment). |
| RELX Annual Report 2023 | Corporate Governance Review 123 Board evaluation The Directors consider the evaluation of the Board and its Committees to be an important aspect of corporate governance. The Board undertakes an annual evaluation of its own effectiveness and performance, and that of its Committees and each individual Director. Actions from the 2022 Board evaluation In the 2022 Board evaluation, the Board agreed that it should continue to focus on the competitor landscape and on the key risks facing RELX, including cyber and data security. It was also noted that maintaining effective levels of engagement with RELX’s key stakeholders and continuing to promote constructive relationships between the Non-Executive Directors and management should remain priorities for the Board. As part of the 2023 evaluation, the Board members confirmed that these actions had been appropriately addressed during 2023, through regular reporting, presentations and deep dives provided by senior management. 2023 Evaluation process In 2023, the Board evaluation process was externally facilitated by an independent consultancy, Manchester Square Partners, and was supported by the Company Secretary. Manchester Square Partners has no other connections with the Company and the consultants were given full access to the Board and Committee papers for the relevant period. The evaluation consisted of a questionnaire completed by all Directors, one-to-one interviews with each member of the Board, a presentation of the final report, and facilitation of a discussion around key findings and action points to take forward. The Directors were asked to provide their feedback and commentary on the following areas: § Board composition and effectiveness § Quality of information provided by management § Boardroom culture and dynamics § Effectiveness of the Board’s oversight of strategy development, setting and monitoring the RELX’s culture and values, financial performance, market developments, stakeholder relations (including the Board’s understanding and visibility of the views of RELX’s stakeholders and how these inform its decision-making process), talent and succession, inclusion and diversity, risk and governance § The structure, leadership and overall effectiveness of each ofthe Board’s Committees Chair’s Assessment The Directors reported that the transition to a new Chair had been very smooth and successful and reported highly positive Board dynamics under Mr Walker’s leadership. The Directors felt that Mr Walker effectively enabled and encouraged challenge and contributions from the Non-Executive Directors. His demonstrably strong interest in the business areas and the amount of time he invested in preparing for meetings of the Board and in building relationships with senior management was highly regarded by the others on the Board. Individual director performance The evaluation provided opportunity for reflection on personal development and individual Director performance. The findings ofthis evaluation highlighted that each Director continues to contribute positively and effectively both within and outside Board and Committeemeetings and constructively challenges management on key issues. Through the evaluation process it was also confirmed that each Non-Executive Director remains independent and has sufficient time to devote to their respective roles on the RELXBoard. Conclusions from the 2023 Board evaluation In 2023, the externally facilitated Board evaluation concluded that the Board continues to promote good governance and oversight and provides important challenge, insight and support to management, especially around key decisions. Each of the Committees is considered to be well-chaired and to be operating effectively. Board members who are not a member of a particular Committee reported that they feel appropriately informed of its activities. The overall culture and dynamics of the Board are considered to be very positive. There is a high degree of comfort in the decision-making process, supported by well-prepared papers, that takes into account the questions and input of the Non-Executive Directors. Board and Committee meetings are well-planned, efficiently run and effectively cover the critical issues. The RELX strategy session in September was well received and the Board’s annual agenda is thought to have an appropriate balance of business and governance focus. Business and strategy materials from management are of a high quality and provide a sound basis for broad ranging debate and input from Board members. The Directors thought that the depth and breadth of capability and the diversity of thought and experience on the Board contributed to highly effective meetings. The key findings of the Board evaluation confirmed that the Board and its Committees continue to function effectively and collaboratively with an appropriate level of engagement with management. While there were no specific areas identified where significant improvement is required, the Board recognised the importance of continued focus on cyber security and its own role in the event of a significant incident. It considered that opportunities for optimising business growth should continue to feature in its future strategy discussions with management. Market segments Governance and shareholder information Financial statements Financial review Corporate Responsibility Overview |
| 124 RELX Annual Report 2023 | Governance Audit, risk and internal control Internal control and risk management The Board has overall responsibility for overseeing RELX’s systems of risk management and internal control and for monitoring the processes for identifying, assessing and managing the principal and emerging risks faced by the Company. These systems are designed to manage and mitigate, rather than totally eliminate, risks to the business. Accordingly, they can provide reasonable, but not absolute, assurance against material misstatement or loss. These processes were in place throughout the year ended 31 December 2023, and up to the date of approval ofthe 2023 Annual Report. Further details of RELX’s risk management systems and the principal and emerging risks facing the Company, together with our mitigation strategies are set out on pages 98 to 103 of this Report. Risk management and control procedures are embedded into the operations of the business and include the monitoring of progress in areas for improvement that come to management andBoard attention. To provide reasonable assurance against material inaccuracies or loss, and of the effectiveness of the systems of internal control and risk management, RELX has adopted the three lines of defence assurance model as set out below. System of Internal Control 1st line of defence RELX businesses maintain systems of internal control which are appropriate to the nature and scale of their activities and address significant strategic, operational, financial, legal and compliance risks that they face 2nd line of defence Central functions that are responsible for 1) designing policies, 2) introducing and sharingbest practice, 3) monitoring and evaluating compliance with RELX policies and relevant legislation and regulation and appropriate remediation RELX Operating and Governance Principles 3rd line of defence Internal audit provides independent assurance on the effectiveness of the 1st and 2nd lines of defence The Board and Audit Committee Note: In addition to RELX’s internal controls, RELX is also audited externally. The report of the external auditor has been included from pages 158 to 165. RELX operates authorisation and approval processes throughoutits operations. Access controls exist where processes have been automated to ensure the security of data. Management information systems have been developed to identify risks and enable the assessment of the effectiveness of internal control systems. With the close involvement of operating management and central functions, the risk management and control procedures aim to ensure that RELX is managing its business risks effectively and in a coordinated manner across the business areas with clarity on the respective responsibilities and interdependencies. Litigation, and other legal and regulatory matters, are managed by legal directors in the business areas. The Audit Committee has responsibility for monitoring RELX’s risk management and internal control procedures and reports to the Board, as appropriate. The Audit Committee receives periodic updates from RELX’s Chief Compliance Officer on alleged and substantiated violations of the Ethics Code, and related training, monitoring and communications programmes. Such updates covered the volume, type and circumstances surrounding substantiated violations, subsequent actions and lessons learnt. US certificates As required by Section 302 of the US Sarbanes-Oxley Act 2002 and by related rules issued by the US Securities and Exchange Commission (the Commission), the Chief Executive Officer and Chief Financial Officer of the Company certify in the 2023 Annual Report on Form 20-F to be filed with the Commission that they are responsible for establishing and maintaining disclosure controls and procedures and that they have: § designed such disclosure controls and procedures to ensure that material information relating to RELX is made known to them § evaluated the effectiveness of RELX’s disclosure controls and procedures § based on their evaluation, disclosed to the Audit Committee and the external auditors, all significant deficiencies in the design or operation of disclosure controls and procedures and any frauds, whether or not material, that involve management or other employees who have a significant role in RELX’s internal controls § presented in the 2023 Annual Report on Form 20-F their conclusions about the effectiveness of the disclosure controls and procedures § designed internal controls over financial reporting, or caused such internal control over financial reporting to be designed under their supervision, to provide reasonable assurance regarding the reliability of financial reporting A Disclosure Committee, comprising the Company Secretary and other senior managers, provides assurance to the Chief Executive Officer and Chief Financial Officer regarding their Section 302 certifications. Section 404 of the US Sarbanes-Oxley Act 2002 requires the ChiefExecutive Officer and Chief Financial Officer of the Company to certify in the 2023 Annual Report on Form 20-F that they are responsible for maintaining adequate internal control structures and procedures for financial reporting and to conduct an assessment of their effectiveness. The conclusions of the assessment of internal control structures and financial reporting procedures, which are unqualified, are presented in the 2023 Annual Report on Form 20-F. |
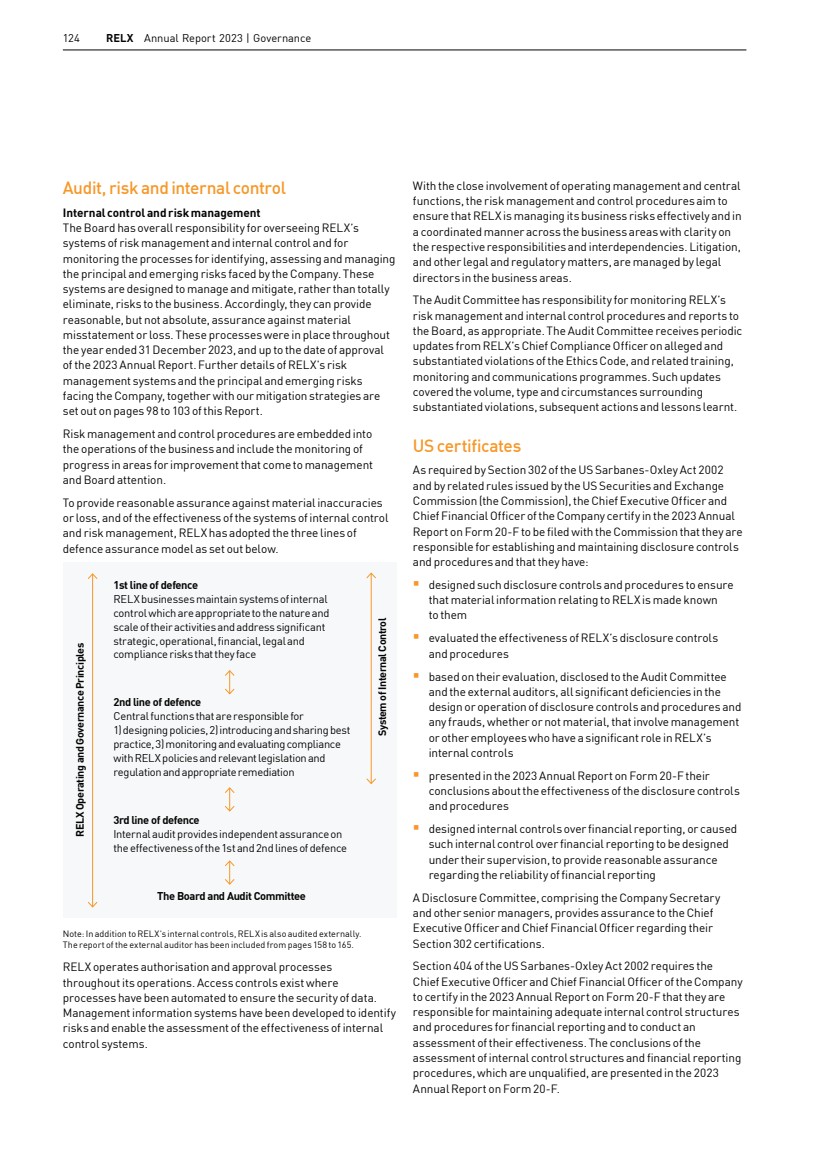
| 125 This report has been prepared by the Nominations Committee and has been approved by the Board. Membership The Nominations Committee comprises three independent Non-Executive Directors (NEDs) and the Chair of the Board. The Directors who served on the Committee during the year were: § Paul Walker (Chair of the Committee) § Wolfhart Hauser (retired 20 April 2023) § Robert MacLeod § Marike van Lier Lels § Suzanne Wood (appointed 20 April 2023) Role of the Nominations Committee The role and responsibilities of the Nominations Committee are set out in written Terms of Reference which are available on the Company’s website at www.relx.com. The principal purpose of the Committee is to assist the Board by leading the process for appointments to Board roles and overseeing a diverse pipeline for succession. The Committee’s main responsibilities are: § Reviewing the size and composition of the Board, ensuring that it comprises the appropriate balance of skills, experience, knowledge and diversity § Reviewing the external commitments of the Directors to ensure that they each have sufficient time to effectively discharge their duties to RELX § Ensuring plans are in place for orderly Board and senior management succession and to oversee a diverse pipeline for such succession § Overseeing the recruitment of new Directors and recommending candidates to the Board § To make recommendations to the Board in relation to the re-appointment of any NED at the conclusion of his/her specified term of office and the election or re-election of Directors following a review of the performance of individual Directors from the Board evaluation process § Reviewing the Board and RELX Inclusion and Diversity policies, to ensure they continue to be effective and fit for purpose § Making recommendations to the Board about the authorisation of Directors’ conflicts of interest, including any terms to be imposed in relation to a Director’s conflict of interest Activities of the Committee during the year The Committee met four times in 2023. The activities of the Committee during the year included: § Recommending to the Board the re-appointment of June Felix, Paul Walker and Suzanne Wood at the conclusion of their respective specified terms of office § Reviewing the size, composition and balance of the Board and the membership of its Committees following the retirement of Dr Wolfhart Hauser as a NED at the conclusion of the Company’s 2023 AGM, and recommending a successor for each of DrHauser’s roles as Senior Independent Director and Chair ofthe Remuneration Committee § Succession planning for a new NED § Ongoing succession planning for Board and senior management roles § Monitoring the Directors’ actual and potential conflicts ofinterest § Recommending to the Board the suitability of Directors’ external director appointments § Reviewing the Committee’s Terms of Reference and determining that they continue to be fit for purpose and effective § Recommending to the Board the inclusion of this report in the 2023 Annual Report Report of the Nominations Committee Board composition as at 31 December 2023 Balance of Executive/Non-Executive Directors Non-Executive: 7 Executive: 2 Non-Executive Chair: 1 Tenure of Non-Executive Directors (including Chair) 6–9 years: 3 0–3 years: 2 3–6 years: 3 Market segments Governance and shareholder information Financial statements Financial review Corporate Responsibility Overview RELX Annual Report 2023 |
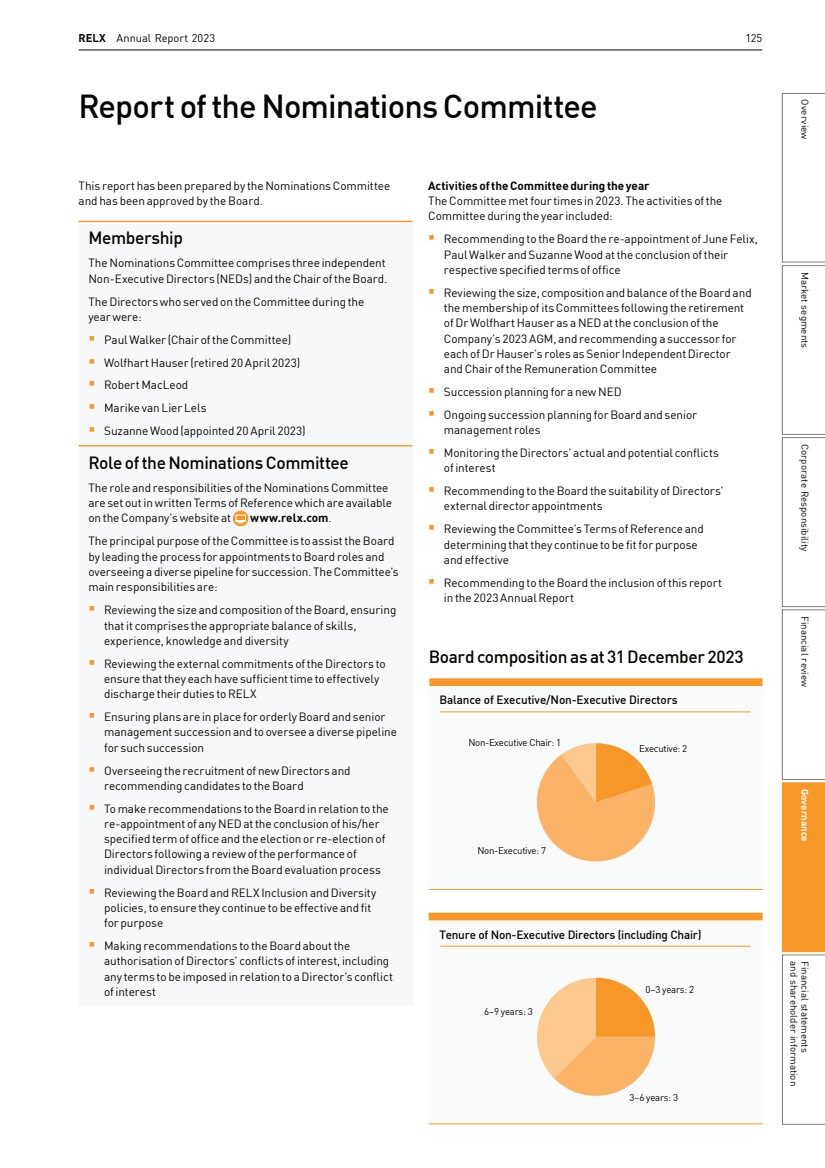
| 126 RELX Annual Report 2023 | Governance Board and Committee composition The Nominations Committee is responsible for keeping the size and composition of the Board and the membership of its Committees under review, to ensure that each has an appropriate balance of skills, knowledge and experience to effectively discharge its respective duties. The Committee considers the competencies required to support the Company’s strategy, purpose, culture and values, both now and in the future and oversees a diverse pipeline for senior leadership succession. The Board collectively has a diverse range of relevant skills and experience which includes: § Strategy and governance § Expertise in finance and technology sectors § Operational experience in RELX’s product markets § Executive and Non-executive Board and leadership experience in large, international listed groups § Audit, risk and regulatory expertise § Workforce relations management and engagement § Executive remuneration Biographical information for each of the Directors is on pages 108 to 109. Further information about the skills and experience of the Directors standing for election and re-election at the 2024 AGM is in the Notice of Meeting available at www.relx.com. Inclusion and Diversity (I&D) RELX’s Board I&D Policy aims to promote a working environment that is respectful and inclusive of individuals and their contributions, regardless of gender, ethnic origin, disability, nationality, age, sexual orientation or any other individual characteristic. The Board recognises the benefits that diversity brings to the effectiveness of Board and Committee discussions and the quality of decision-making, through the incorporation of different perspectives and ideas. Diversity is taken into consideration when evaluating the skills, knowledge and experience desirable to fill Board vacancies. The Nominations Committee monitors progress against the Board’s diversity objectives in accordance with the Board I&D Policy and keeps under review the composition of the Board and membership of its Committees, with a view to ensuring that each has the appropriate balance of skills and expertise and is supported by a strong and diverse pipeline for succession. The Committee oversees the Director recruitment process on behalf of the Board with the objective that all aspects of diversity, including but not limited to, gender and ethnicity, are carefully considered when conducting a search for a new Board appointment, together with the knowledge, experience, skills and background of each individual candidate. Our external search agencies are challenged to present a diverse and gender-balanced list of suitably qualified candidates. In accordance with the recommendations of the FCA set out in LR9.8.6(R)(9), as at 31 December 2023: § the Board comprises 40% women § the role of Senior Independent Director is held by a woman § at least one Board member is from a minority ethnic background The Nominations Committee reviews and recommends to the Board both the Board and Group I&D Policies. The Group I&D Policy is aligned with the Board I&D Policy and aims to promote a positive working environment that is inclusive, fair and equitable. It prohibits discrimination and requires that RELX recruits, trains, develops, promotes, and provides conditions of employment without regard to race, colour, creed, religion, national origin, gender, gender identity or expression, sexual orientation, marital status, age, disability, or any other characteristic protected by law. RELX relies on the contributions of individuals with a collectively broad range of experience, skills and ideas to consistently deliver on its strategic priorities and provide real innovation for customers around the world. The Company is committed to an ongoing review of policies and practices in the areas of recruitment, talent development, promotion and reward to ensure that opportunities across our business areas are fair and equitable. Nationalities on the Board British, American, Irish: 1 Swedish: 1 Dutch: 1 American: 3 British: 4 Board and Executive Management diversity characteristics as at 31 December 2023 Number of Board members Percentage of the Board No. of senior positions on the Board (CEO, CFO, SID, Chair) No. in executive management Percentage of executive management Ethnic background White 8 80% 3 7 70% Asian 1 10% – 1 10% Black – – – – – Mixed/multiple ethnicity – – – – – Other – – – 1 10% Not specified/prefer not to say 1 10% 1 1 10% Gender identity or sex Men 6 60% 3 7 70% Women 4 40% 1 3 30% Not specified/prefer not to say – – – – – |
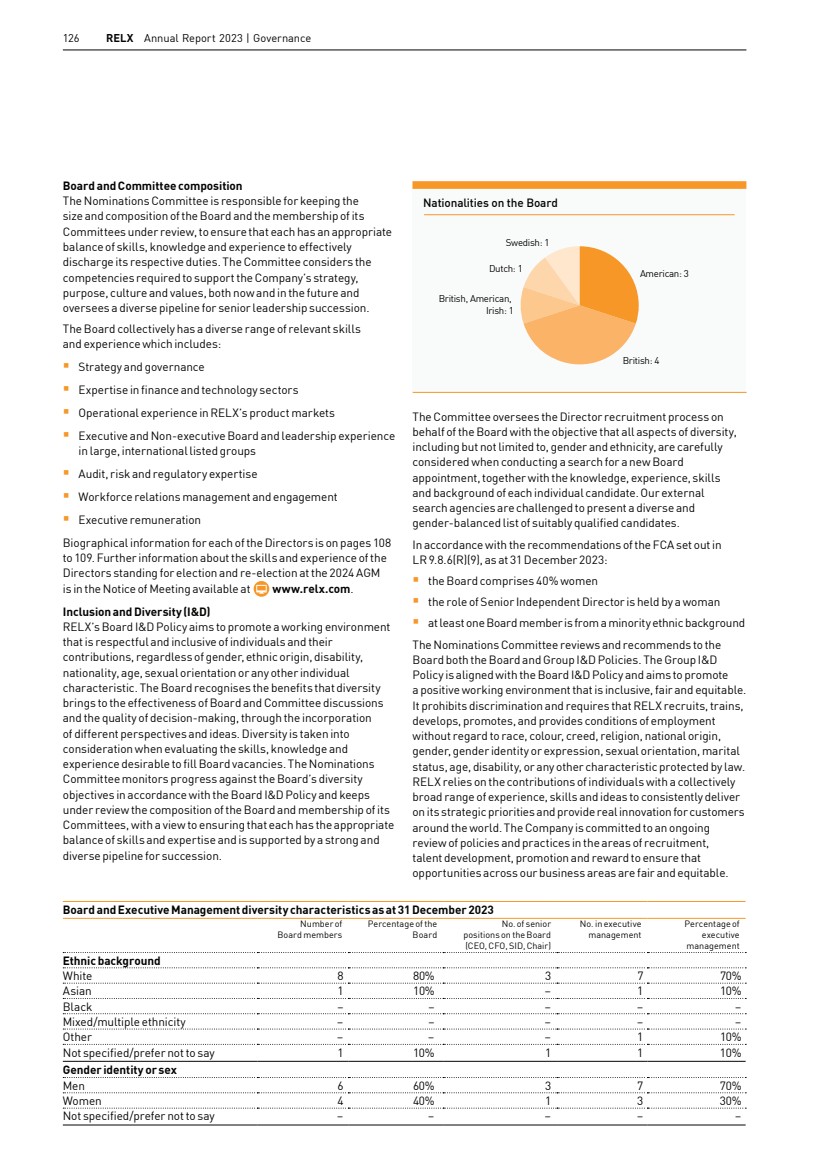
| 127 During the year, RELX has continued to implement its inclusion strategy to advance progress towards its 2020 to 2025 inclusion goals. This covers all aspects of diversity and aims to translate theGroup I&D Policy into tangible and measurable actions. Workforce policies and practices are regularly reviewed to ensure RELX is delivering on its inclusion, equity and diversity goals and effectively monitoring available diversity data. Across our business areas, we are committed to providing regular best practice and awareness training in areas such as inclusive leadership and unconscious bias and we promote and encourage inclusive networking groups and sponsorship and mentoring programmes. Details of the strategy and progress towards fulfilling our I&D initiatives is set out in our Corporate Responsibility Report on pages 54 to 59. Data for the diversity characteristics table on page 126 was drawn from HR information where consents are in place to use the data on an anonymised basis and through a survey with categories aligned to those set out in the LRs. Board and Committee succession When reviewing the composition of the Board and its Committees, the Nominations Committee considers, among other things, the length of tenure of each Director and the need for, and benefits of, membership being regularly refreshed. The Committee is cognisant of the skills and experience required for effective leadership and oversight of RELX’s strategy for success in the long term, and of the requirements of our Board I&D Policy and the UK Listing Rules designed to promote greater female and ethnic minority representation. All appointments to the RELX Board, and each of its Committees, are based primarily on merit and the suitability of an individual for any given role. Board succession planning and refreshment was a regular agenda item at the Committee’s meetings during 2023. Dr Wolfhart Hauser retired at the Company’s annual general meeting in 2023 at which time he also stepped down as Senior Independent Director (SID), Chair of the Remuneration Committee and member of the Nominations Committee. The Committee recommended to the Board that Suzanne Wood be appointed to the role of SID and to membership of the Nominations Committee, and that Robert MacLeod succeed Dr Hauser as Chair of the Remuneration Committee. The Committee’s recommendations were based on its evaluation of the specific skills and experience required for each role, together with the capacity of individual directors to take up additional duties, and with regard to our diversity objectives. The Committee also recommended the appointment of two new NEDs during the year: Alistair Cox, who joined the Board in April 2023, and Bianca Tetteroo who will join the Board in 2024, subject to her election by shareholders at the Company’s AGM, as announced on 8 December 2023. Marike van Lier Lels will retire at the Company’s AGM in 2024, having served on the Board since 2015. Director appointment process A rigorous search and appointment process was followed for each new NED, starting with the preparation of a search specification, based on the Committee’s assessment of the skills and composition of the Board and the capabilities and experience required going forward. Russell Reynolds Associates was engaged to support the search and the Board confirms that none of the Directors have any connection with executive search firms utilised by the Company. A short-list of potentially suitable individuals was considered in detail by the Committee and preferred candidates were invited to meet with Board members, including the Chair and the Chief Executive Officer, together with the Chief Legal Officer and Company Secretary. Following feedback from these sessions, the Nominations Committee made its recommendations to the Board. The Board then had a further opportunity to review and discuss the recommendations, and subsequently approved the appointments of Alistair Cox and Bianca Tetteroo. The Board may appoint Directors (subject to a maximum upper limit) to fill a vacancy at any time, although any Director so appointed shall only hold office until the following AGM of the Company, at which his or her election shall be voted upon by shareholders. Directors are then required to seek re-election by shareholders at each subsequent AGM of the Company. As a general rule, letters of appointment for NEDs provide that, subject to annual re-election by shareholders, individuals will serve for an initial period of three years, and are typically expected to be available to serve for a second three-year period. If invited to do so, they may also serve for a third three-year period. The notice period applicable to the NEDs is one month. RELX’s Non-Executive Letter of Appointment sets out the time commitment required by the Company from its Non-Executive Directors. Executive and management succession The Board is committed to recognising and nurturing talent across RELX and overseeing the development of a strong talent pipeline to senior leadership and executive roles. The Committee received detailed updates during the year from the Chief Executive Officer regarding succession plans for senior management roles. This included broad views on potential timings and implications for diversity. The Committee is satisfied that appropriate succession planning arrangements were in place during the year to facilitate appropriate and effective succession across senior management roles, supported by a strong pipeline of candidates. Conflicts of interest The Directors have a statutory duty to avoid situations in which they have, or could have, a direct or indirect interest that conflicts with the interests of the Company and, if potential for such a conflict arises, must make such situations known to the Board. In accordance with its terms of reference, the Nominations Committee considers the circumstances of any such actual or potential conflicts of interest and makes a recommendation to the Board as to whether to authorise the conflict, as permitted under the Company’s Articles. The Committee may recommend that the Board imposes certain limits or conditions in respect of the conflict. There is a procedure in place for Directors to disclose any potential conflict to the Board and each Director is required to review and confirm their actual and potential conflicts annually. During the year, the Committee conducted a formal review of the conflict of interest authorisations granted by the Board to each individual Director. Committee evaluation The evaluation of the Committee determined that it was well governed and effective in carrying out its role in accordance with its Terms of Reference. Details of the Board and Committee evaluation process are on page 123. Market segments Governance and shareholder information Financial statements Financial review Corporate Responsibility Overview RELX Annual Report 2023 | Report of the Nominations Committee |
| 128 RELX Annual Report 2023 | Governance Directors’ Remuneration Report The Directors’ Remuneration Report has been prepared by the Remuneration Committee (the Committee) in accordance with the UKCorporate Governance Code, the UK Listing Rules and Schedule 8 of the Large and Medium-sized Companies and Groups (Accounts and Reports) Regulations 2008, as amended (the UK Regulations). The Report was approved by the Board. I am pleased to present the Remuneration Report for the year ended 31 December 2023. This is my first report as Chair of the Committee, having succeeded Wolfhart Hauser who retired from the Board in April 2023. I would like to thank Wolfhart for his valuable contribution and leadership of the Committee over the years. As you will have seen earlier in the annual report, the Company delivered strong revenue and profit growth in 2023, driven by the ongoing shift in business mix towards higher growth information based analytics and decision tools that deliver enhanced value to our customers across market segments. We have been able to develop and deploy these tools across the Company for well over a decade and we are confident that our ability to leverage artificial intelligence and other technologies, as they evolve, will continue to be an important driver of customer value and growth in our business for many years to come. Underlying revenue growth was 8%, underlying adjusted operating profit growth was 13% and at constant currency, adjusted EPS growth was 11%. We are proposing an increase in the full-year dividend of 8%. Our Total Shareholder Return outperformed the FTSE 100 over the last three, five and ten year periods as shown on page 138. The purpose of RELX is to benefit society by developing products that help researchers advance scientific knowledge; doctors and nurses improve the lives of patients; lawyers promote the rule of law and achieve justice and fair results for their clients; businesses and governments prevent fraud; consumers access financial services and get fair prices on insurance; and customers learn about markets and complete transactions. Our purpose guides our actions beyond the products that we develop. It defines us as a company. Every day across RELX our employees are inspired to undertake initiatives that make unique contributions to society and the communities in which we operate. We see what we do as a company as being an integral part of our commitment to environmental, social and governance (ESG) performance. We have set sustainability objectives which reflect our focus on our unique contributions to society and align to the United Nations Sustainable Development Goals (SDGs) to do our part to advance this ambitious global agenda by 2030. We are continuing to reduce our environmental impact to meet our 2025 environmental targets. Our performance was again recognised by external rating agencies: RELX achieved a AAA ESG rating with MSCI for an eighth consecutive year, was ranked second in our sector by Sustainalytics, maintained fifth place in the Responsibility 100 Index and was a constituent of the Bloomberg Gender Equality Index for the fifth consecutive year. More information can be found on pages 38 to 90. Remuneration policy and implementation An updated Remuneration Policy was approved by shareholders at the 20 April 2023 Annual General Meeting (AGM) with 95.87% in favour. I would like to express again my gratitude for the feedback received during the shareholder engagement as we were developing the policy and for the high level of support for the policy. The policy, which applies for three years from the conclusion of the 2023 AGM is set out on pages 142 to 148 of this report. The first awards under the policy will be granted in the first quarter of 2024. The 2023 awards are subject to the policy approved by shareholders at the 2020 AGM and can be found on pages 90 to 96 of the 2019 Annual Report and Financial Statements, available on relx.com. Shareholders will be invited to vote (by way of an advisory vote) on the 2023 Annual Remuneration Report at the 2024 AGM. Our strategic direction remains unchanged: to develop increasingly sophisticated information-based analytics and decision tools that deliver enhanced value to professional and business customers across market segments. We are primarily focused on organic growth, supported by targeted acquisitions. This should lead to a higher growth profile and a positive impact on society and, when combined with our strategy of driving continuous process innovation to manage cost growth below revenue growth, result in strong earnings growth and improving returns. The performance measures in the incentive plans align with the strategy and the financial key performance indicators on page 6 of the annual report, by focusing on sustained earnings growth, return on invested capital and shareholder returns in the LTIP. The AIP is based on revenue, profit, cash flow and sustainability metrics and focuses on annual objectives and milestones and creates a platform for sustainable future performance. The performance measures are based on adjusted figures as they provide relevant information in assessing the Company’s performance, position and cash flows and we believe they track the core operational performance of RELX and how it contributes to shareholder value creation. The Annual Report includes a reconciliation of adjusted measures to IFRS measures. |
| RELX Annual Report 2023 | Directors’ Remuneration Report 129 2023 outcomes RELX delivered strong organic revenue and adjusted operating profit growth rates. These results drove an AIP payout of 87% of the maximum. Details of our targets and achievements for the year are shown on pages 131 and 132. Financial and share price performance was very strong over the past three years, with TSR outperforming our UK, US and European peer groups. As a result, the LTIP payout is 100% of the maximum. Details of our targets and achievements are shown on page 133. In determining the level of payout under the annual and the multi-year incentives, the Committee took into account RELX’s overall business performance and value created for shareholders and other relevant factors and determined that the outcomes were fair and appropriate and applied no discretion to the payouts. Broader employee considerations The Board reviews information on employee metrics and updates on employee related matters including inclusion and diversity, as well as outcomes of employee surveys conducted during the year. In addition, our designated Non-Executive Director responsible for workforce engagement, Marike van Lier Lels, continued to meet with employee representatives from Europe, US and Asia Pacific during 2023 and reported back to the Board. Further information on the workforce engagement process is provided in the Governance section on page 120. The Committee also reviews annual salary increase guidelines globally. When determining the remuneration for Executive Directors and Senior Executives, the Committee considers business and individual performance as well as other factors including broader employee reward. The Committee is satisfied that the overall remuneration for Executive Directors is appropriate and fair having considered external and internal relativities. The Committee is satisfied that the incentive schemes drive the desired behaviours to support the Company’s purpose, values and strategy. Implementation of the Remuneration Policy in 2024 The Committee has approved 2024 salary increases for the Executive Directors of 2.5%. As highlighted in the 2022 report and in accordance with the Remuneration Policy approved by shareholders at the 2023 AGM, the level of vesting for threshold performance in the LTIP will reduce from 25% of the maximum opportunity to 20% and incentives will be subject to broader malus and clawback provisions. The Committee also approved a new US clawback policy in compliance with new US listing standards adopted in June 2023, providing for the recovery of erroneously awarded incentive-based compensation by current or former executive officers, in the event the company is required to prepare an accounting restatement due to material noncompliance with any financial reporting requirement under the securities laws. Our malus and clawback policy includes broader triggers than the US clawback requirements (see page 144). Further details regarding the implementation of the policy in 2024 can be found on page 140. Robert MacLeod Chair, Remuneration Committee Market segments Governance and shareholder information Financial statements Financial review Corporate Responsibility Overview |
| 130 RELX Annual Report 2023 | Governance Annual Remuneration Report Single Total Figure of Remuneration – Executive Directors (audited) (a) (b) (c) (d) (e) (f) Annual incentive Share based awards(3) Pension(4) £’000 Salary Benefits Total (1) Cash Deferred Shares(2) Total fixed remuneration(5) Total variable remuneration(5) Erik Engstrom 2023 1,379 82 1,198 1,198 9,629 152 13,639 1,613 12,026 2022 1,345 82 1,023 1,023 4,983 141 8,597 1,568 7,029 Nick Luff 2023 812 15 706 706 4,725 89 7,052 916 6,137 2022 792 15 602 602 2,445 127 4,584 933 3,650 (1) Benefits are typically comprised of a car allowance, private medical/dental insurance and the cost of tax return preparation. (2) 50% of the AIP is paid in shares deferred for three years. Dividend equivalents accrue on these shares. (3) The 2023 figures reflect the vesting of the 2021–2023 cycle of the LTIP. As the LTIP vests after the approval date of this Report, the average share price for the last quarter of 2023 has been used to arrive at an estimated figure in respect of these awards, in line with the methodology prescribed by the UK Regulations. The estimated figures for 2022 disclosed in last year’s Report have been restated to reflect the actual amount of the 2020-2022 cycle of the LTIP vested and the actual share price, which increased the 2022 disclosed figure by £383k for theCEO and by £188k for the CFO. The vesting percentage was determined on 17 February 2023 and was in line with the one disclosed on page 127 of the 2022 Remuneration Report. For Erik Engstrom, the amount that directly reflects share price appreciation is £0.8m for 2022 and £3.4m for 2023. For Nick Luff, these numbers are £0.4m for 2022 and £1.7m for 2023. The awards are due to vest in February 2024 and the 2023 figures will be restated in next year’s report to reflect actual values at vesting. (4) Erik Engstrom and Nick Luff received cash in lieu of pension of 11% of base salary in 2023. (5) Total fixed remuneration includes base salary, benefits and pension. Total variable remuneration includes annual incentive and share based awards. Some figures and subtotals add up to different amounts than the totals due to rounding. The total remuneration for Directors is set out in note 25 to the consolidated financial statements. The AIP and LTIP performance measures and targets are shown on the following pages. |
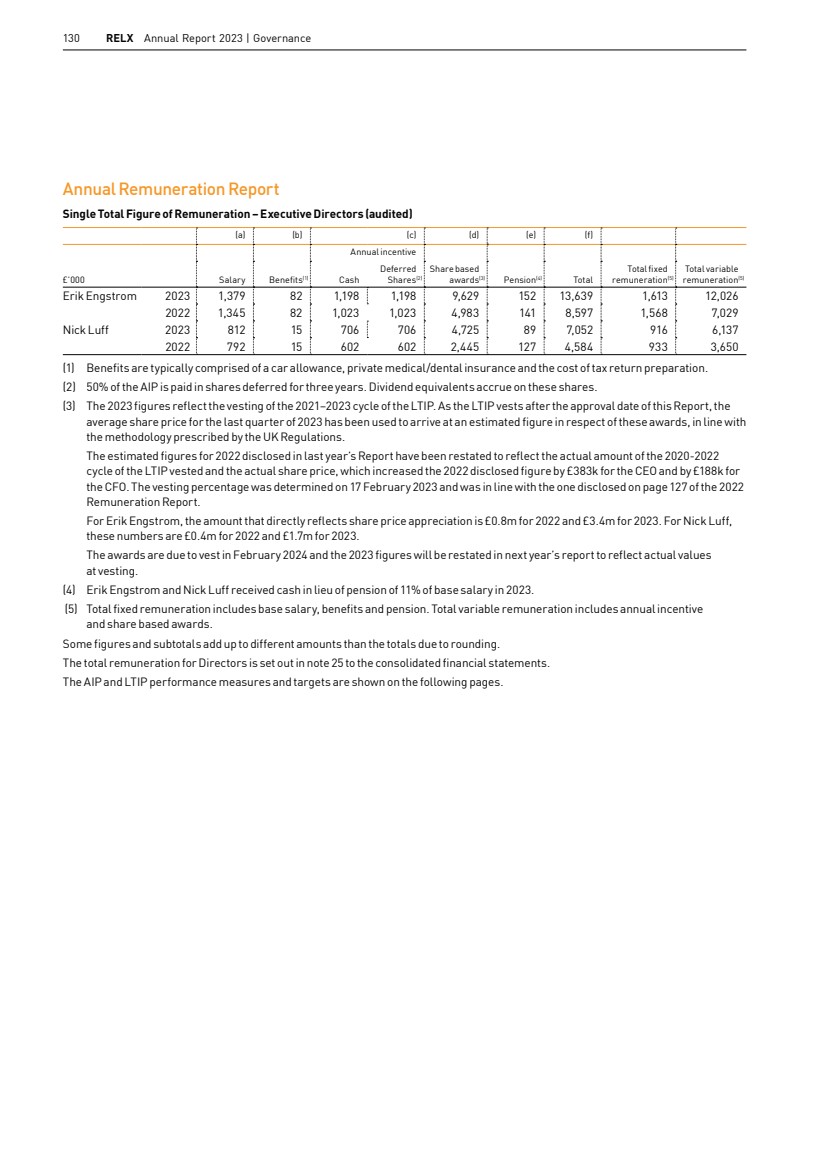
| RELX Annual Report 2023 | Directors’ Remuneration Report 131 2023 Annual Incentive Set out below is a summary of performance against each financial and non-financial measure and the resulting payout for 2023: Performance measure Relative weighting % at target Financial targets (1) Achievement Achievement % vs target Payout % vs target Payout % of max (2) Threshold Target Maximum Revenue 30.0% 8,509 9,052 9,505 9,161 101.2% 112.0% 74.7% Adjusted net profit after tax 30.0% 1,952 2,077 2,181 2,156 103.8% 138.0% 92.0% Cash flow 30.0% 2,659 2,829 2,970 2,962 104.7% 147.0% 98.0% Financial measures 90.0% 132.3% 88.2 % Non-financial measures 10% A detailed description of the non-financial measures and achievement against those is set out on the next page. 97.5% 65.0% Total 100% 128.8% 87.0% (1) Targets are set on an underlying basis for revenue and on a constant currency basis for adjusted net profit, and reflect targeted growth, with cash flow based on the targeted cash conversion. Target amounts presented in sterling reflect actual movements in exchange rates relative to their equivalent constant currency amounts. (2) The maximum for each measure is 150% of on target. The overall maximum is 200% of salary. As highlighted earlier, underlying revenue growth was 8%. Underlying adjusted operating profit growth was 13% and at constant currency, adjusted EPS growth was 11%. Some figures add up to different amounts than the totals due to rounding. 50% of the AIP will be paid in cash in Q1 2024 and the remainder is paid in Deferred Shares which will be released in Q1 2027. The release of Deferred Shares is not subject to any further performance conditions but is subject to malus and clawback. Market segments Governance and shareholder information Financial statements Financial review Corporate Responsibility Overview |
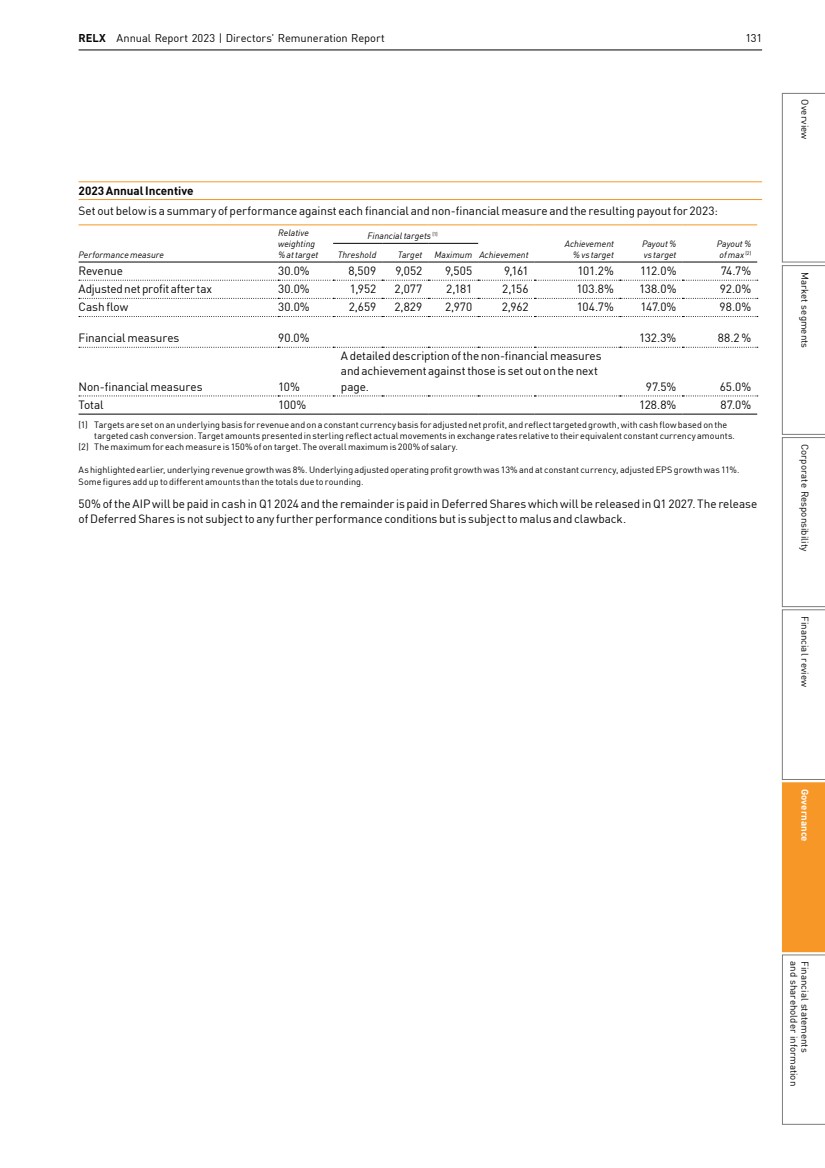
| 132 RELX Annual Report 2023 | Governance Non-financial measures We have set sustainability objectives which reflect our focus on our unique contributions to society, as well as sustainability issues more broadly. We align all our objectives to the United Nations Sustainable Development Goals (SDGs) to do our part to advance this ambitious global agenda by 2030. We have chosen to include sustainability metrics in the AIP so that we can update these metrics depending on current situation. Purchase of renewable electricity is no longer a specific measure this year as the target has been met. We will however continue to track this metric and may consider including again if relevant. We have replaced the previous metric regarding the number of strategic partners to the RELX SDG Resource centre with a metric related to the number of users of the SDG Resource centre. The Universal access to information measure therefore reflects not only the Company’s efforts to provide access to information by increasing content on the Resource centre, but also measures the use of the centre. Our environmental targets align with our 2025 targets. More information can be found on pages 73 to 80. Non-financial measures represent 10% of the AIP. Of this component, achievements and payouts were as follows: Payout for carbon reduction was capped at 90% of target in the year in recognition of the changes in office work patterns and business travel since the target was set. Non-financial measures Relative weighting Target Achievement Payout % of target Payout % of max Carbon reduction 25% § Reduce Scope 1 (direct) and Scope 2 (location-based) carbon emissions by 40% against a 2015baseline. § Reduce energy and fuel consumption by 27% against a 2015baseline. § Carbon emissions reduced by 61%. § Energy and fuel consumption reduced by 49%. 90% 60.0% Paper usage and waste 25% § Decrease total waste sent to landfill from reporting locations by 35% against a 2015 baseline. § 99% of RELX production papers, graded in PREPS, to be rated as ‘known and responsible sources’ or certified FSC or PEFC. § Total waste sent to landfill reduced by 96%. § 100% of RELX production papers graded in PREPS, rated as ‘known and responsible sources’ or certified FSC or PEFC. 100% 66.7% Socially responsible suppliers 25% § Increase the number of suppliers as Code signatories to 4,650. § Increase the number of independent external audits of suppliers to 120. § Suppliers Code signatories increased to 5,322. § 125 audits of suppliers completed. 100% 66.7% Universal access to information 25% § Increase the content on the free RELX SDG Resource Centre by 500 new content items. § Increase the number of users of SDG Resource centre to 175,000. § Content on the free RELX SDG Resource Centres increased by 822. § Number of users of SDG Resource centre increased to 220,815. 100% 66.7% Total 100% 97.5% 65.0% |
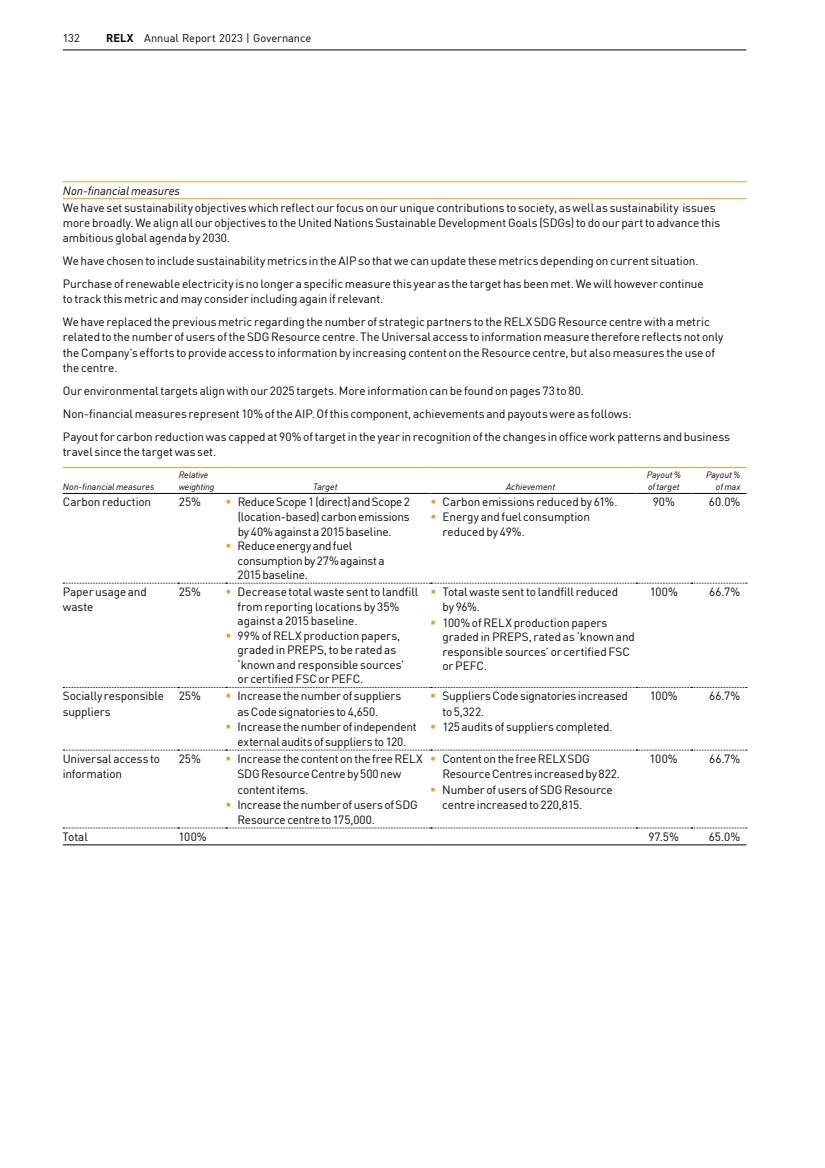
| RELX Annual Report 2023 | Directors’ Remuneration Report 133 2021–2023 LTIP Set out below is a summary of performance against each measure of the LTIP cycle 1 January 2021–31 December 2023. The targets remained unchanged from when these were set at the beginning of 2021. As noted in the Chair letter, financial performance was very strong and significant value was generated for shareholders through share price appreciation and dividends over the performance period. RELX’s TSR outperformed the UK, US and European peer groups over the period. The payout is 100% of maximum. Performance measure Weighting Performance range and vesting levels set at grant (1) Achievement against the performance range Resulting vesting percentage TSR over the three-year performance period 20% below median median upper quartile 0% 25% 100% UK group: upper quartile; European group: upper quartile; US group: upper quartile 100% Average growth in adjusted EPS over the three-year performance period (2) 40% below 5% p.a. 5% p.a. 6% p.a. 7% p.a. 8% p.a. 9% p.a. 10% p.a. 11% p.a. and above 0% 25% 50% 65% 75% 85% 92.5% 100% Above 11% p.a. 100% ROIC in the third year of the performance period (2) 40% below 11.0% 11.0% 11.5% 12.0% 12.5% 13.0% 13.5% 14.0% and above 0% 25% 50% 65% 75% 85% 92.5% 100% Above 14.0% 100% Total vesting percentage: 100% (1) Calculated on a straight-line basis for performance between the points. (2) Growth in adjusted EPS at constant currency and ROIC are calculated as set out in the Chief Financial Officer’s report and note 10 to the consolidated financial statements, with adjustments made to remove the effect on ROIC of changes in exchange rates, pension deficits and accounting standards over the three-year performance period. The performance measures used in incentive plans are based on adjusted figures as they provide relevant information in assessing the Company’s performance, position and cash flows and we believe they track the core operational performance of RELX and how it contributes to shareholder value creation. The Annual Report includes a reconciliation of adjusted measures to IFRS measures. Market segments Governance and shareholder information Financial statements Financial review Corporate Responsibility Overview |
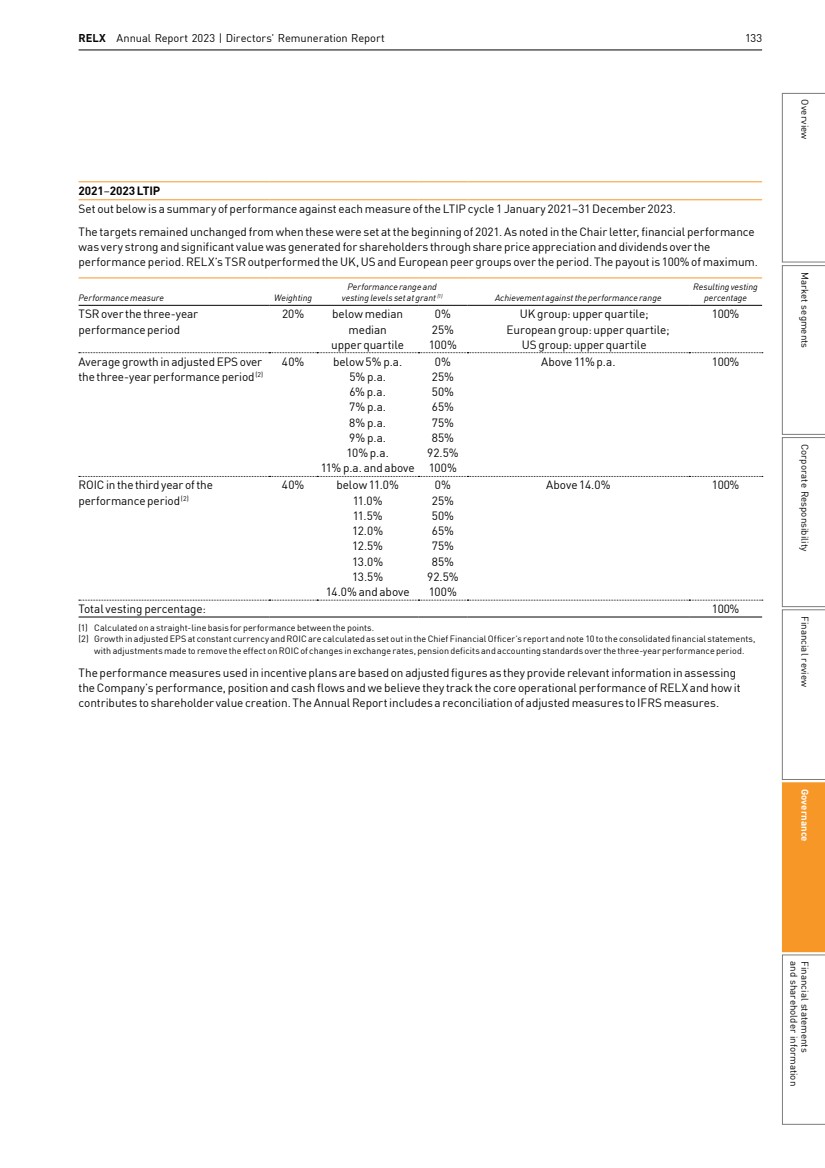
| 134 RELX Annual Report 2023 | Governance Single Total Figure of Remuneration – Non-Executive Directors (audited) Total fee Benefits(1) Total 2022 2023 2022 2023 2022 2023 Paul Walker £650,000 £650,000 £862 £879 £650,862 £650,879 Alistair Cox (2) N/A £88,776 N/A £88,776 June Felix £123,667 £125,000 £123,667 £125,000 Wolfhart Hauser (3) £164,500 £48,615 £164,500 £48,615 Charlotte Hogg £112,000 £112,000 £112,000 £112,000 Marike van Lier Lels £122,000 £122,000 £840 £840 £122,840 £122,840 Robert MacLeod (4) £122,000 £130,670 £122,000 £130,670 Andrew Sukawaty £112,000 £121,000 £112,000 £121,000 Suzanne Wood (5) £124,500 £165,744 £124,500 £165,744 (1) Benefits comprise the notional benefit of tax filing support provided to Non-Executive Directors for filings outside their home country resulting from their directorships with RELX. The incremental assessable benefit charge per tax return for 2023 was £840 (unchanged from 2022) for a UK tax return. Paul Walker’s benefits relate to private medical insurance. Further, the Company meets all reasonable travel, subsistence, accommodation and other expenses, including any tax where such expenses are deemed taxable, incurred by the Non-Executive Directors and the Chair in the course of performing their duties. (2) Appointed to the Board at the AGM on 20 April 2023. (3) Retired from the Board at the AGM on 20 April 2023. (4) Succeeded Dr Hauser as Chair of the Remuneration Committee from the AGM on 20 April 2023, having been a member of the Committee until then. (5) Succeeded Dr Hauser as Senior Independent Director and became a member of the Nomination Committee from the AGM on 20 April 2023. The total remuneration for Directors is set out in note 25 to the consolidated financial statements. Non-Executive Directors’ fees The fees in the Single Total Figure table for Non-Executive Directors reflect the following fees in 2023: Annual fee 2023 Annual fee 2024 Chair £650,000 £725,000 Non-Executive Directors £90,000 £97,500 Senior Independent Director £30,000 £40,000 Chair of: – Audit Committee £30,000 £40,000 – Remuneration Committee £30,000 £40,000 Workforce engagement fee £17,500 £25,000 Committee membership fee: – Audit Committee £17,500 £25,000 – Remuneration Committee £17,500 £25,000 – Nominations Committee £10,000 £15,000 In addition, an intercontinental travel fee of £4,500 was payable to any Non-Executive Director (excluding the Chair) in respect of each transatlantic journey made in order to attend a RELX Board or Committee meeting during 2023. Fees may be reviewed annually, although in practice they have changed on a less frequent basis. Before the changes which took effect on 1 January 2024, the Chair fee was last changed in 2018 and the NED base fee was last changed in 2020. The new fees represent a per annum increase slightly below the general UK employee salary increase guidelines of 2.5%. Other NED fees were last amended in 2016 or 2018. |
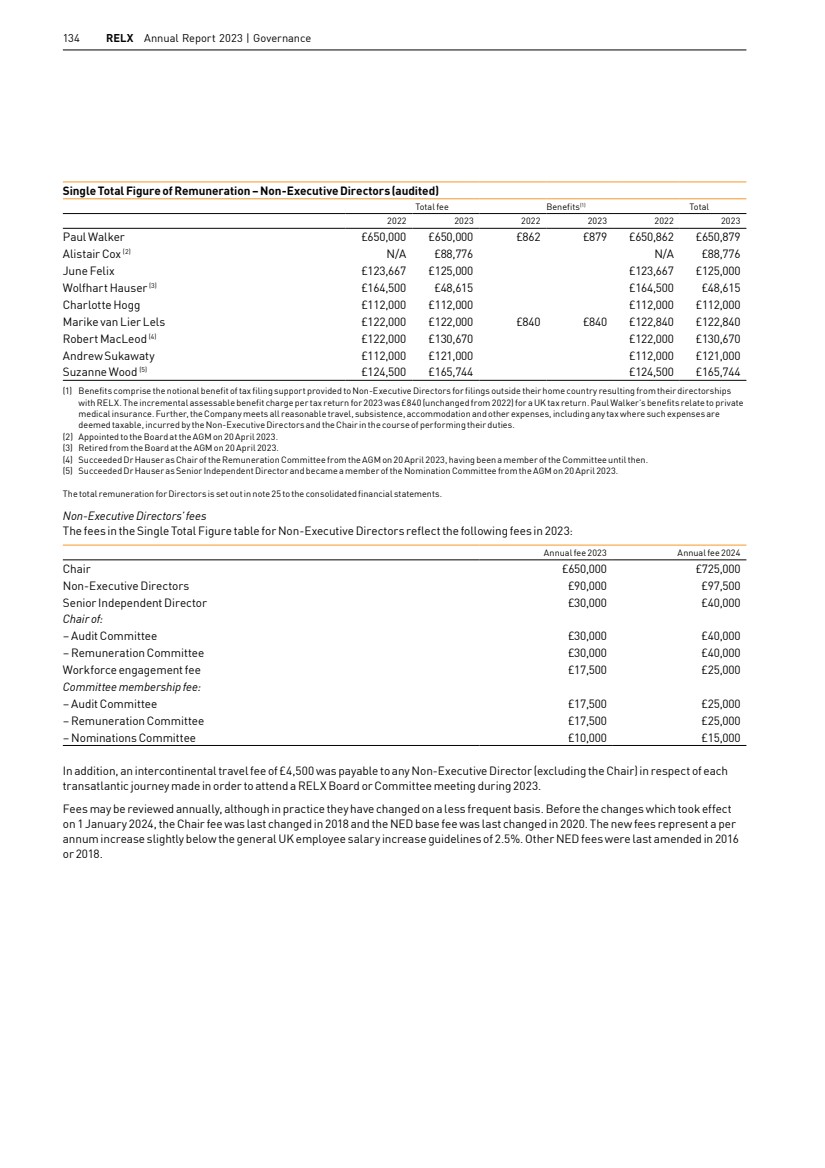
| RELX Annual Report 2023 | Directors’ Remuneration Report 135 Statement of Directors’ shareholdings and other share interests (audited) Shareholding requirement The Committee believes that a closer alignment of interests can be created between senior management and shareholders if executives build and maintain a significant personal stake in RELX. The shareholding requirements applicable to the Executive Directors are set out in the table below. Shares that count for this purpose are (i) any type of RELX security of which the Director, their spouse, civil partner or dependent child has beneficial ownership of and (ii) AIP deferred shares which are within their three-year deferral period, on a notional net (after tax) basis. There has been no change to the interests reported below between 31 December 2023 and the date of this Report. Meeting the shareholding requirement is both a vesting condition for LTIP awards granted and a requirement to maintain eligibility for future LTIP awards. On termination of employment, Executive Directors are to maintain their full shareholding requirement (or, if lower, their actual level of shareholding at the time of leaving) for two years after leaving employment. On 31 December 2023, the Executive Directors’ shareholdings were as follows: Shareholding requirement (% of 2023 annual base salary) Shareholding as at 31 December 2023 (% of 2023 annual base salary) (1) Erik Engstrom 450% 2794% Nick Luff 300% 1217% (1) Includes AIP deferred shares which are within their three-year deferral period, on a notional net (after tax) basis (63,845 for Erik Engstrom and 37,596 for Nick Luff). For disclosure purposes, any PLC ADRs held are included as ordinary shares. Share interests (number of RELX ordinary shares held) 1 January 2023 31 December 2023 Erik Engstrom 1,172,929(1) 1,174,668 Nick Luff 279,235(1) 280,365 Paul Walker 16,000 16,000 Alistair Cox(2) N/A 1,540 June Felix 6,100 6,100 Wolfhart Hauser (3) 14,633 N/A Charlotte Hogg 4,750 4,750 Marike van Lier Lels 11,718 11,718 Robert MacLeod 6,950 6,950 Andrew Sukawaty 30,000 30,000 Suzanne Wood 5,100 5,100 (1) Number excludes AIP deferred shares which are within their three-year deferral period. If these were included on a notional net (after tax) basis, the totals at 31 December 2023 would be 1,238,513 for Erik Engstrom and 317,961 for Nick Luff. (2) Appointed to the Board at the AGM on 20 April 2023. (3) Retired from the Board at the AGM on 20 April 2023. Scheme interests awarded during the financial year (audited) LTIP – PERFORMANCE SHARE AWARDS Basis on which award is made Face value of award at grant(1) Percentage of maximum vesting for threshold performance End of performance period Erik Engstrom 450% of salary £6,051,996 If each measure pays out at threshold, the overall payout is 25% 31 December 2025 Nick Luff 375% of salary £2,969,841 AIP – DEFERRED SHARES Erik Engstrom 1/2 of 2022 AIP payout £1,023,066 N/A. The release of AIP deferred shares in Q1 2026 is not subject to any Nick Luff 1/2 of 2022 AIP payout £602,441 further performance conditions, but is subject to malus and clawback. (1) The face value of the LTIP awards and AIP deferred shares granted in February 2023 was calculated using the middle market quotation of a PLC ordinary share (£24.92). This share price was used to determine the number of awards granted. The LTIP awards granted in 2023 are based on ROIC, EPS and TSR weighted 40%:40%:20% respectively and assessed independently. The targets and vesting scales applicable to these awards are set out on page 134 of the 2022 Remuneration Report. Market segments Governance and shareholder information Financial statements Financial review Corporate Responsibility Overview |
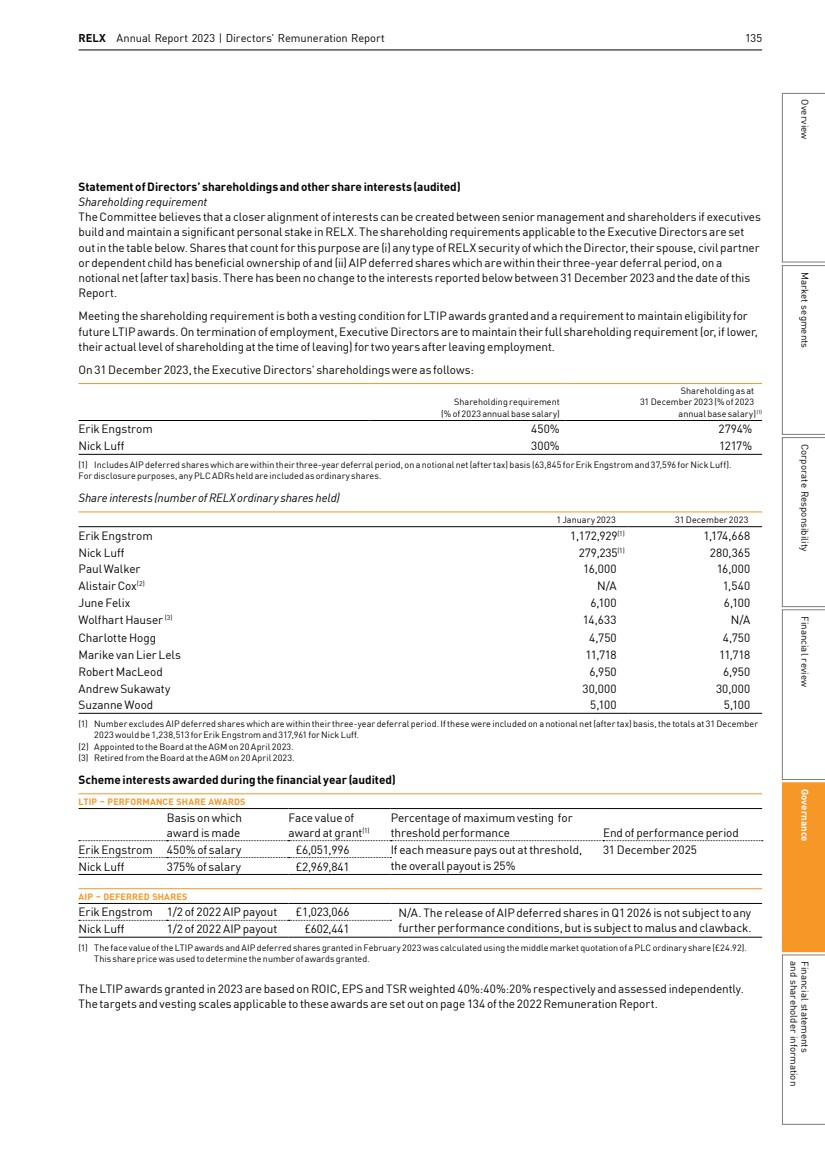
| 136 RELX Annual Report 2023 | Governance Multi-year incentive interests (audited) The tables below and on the next page set out unvested LTIP share awards, AIP deferred shares and vested but unexercised options held by the Executive Directors, including details of awards granted, vested and options exercised during the year. All outstanding LTIP share awards are subject to performance conditions. Between 31 December 2023 and the date of this Report, there have been no changes in the share awards or options held by the Executive Directors. Erik Engstrom LTIP SHARES Year of grant No. of unvested shares held on 1 Jan 2023 No. of shares awarded during 2023 Market price per share at award No. of shares vested during 2023 Market price per share at vesting No. of unvested shares held on 31 Dec 2023 End of performance period Date of vesting 2023 242,857 £24.920 242,857 Dec 2025 Feb 2026 2022 259,819 £22.725 259,819 Dec 2024 Feb 2025 2021 308,702 £18.660 308,702 Dec 2023 Feb 2024 2020 271,164 £20.725 189,001 £24.92 Total 839,685 242,857 189,001 811,378 DEFERRED SHARES (1) Year of grant No. of shares held on 1 Jan 2023 No. of shares awarded during 2023 Market price per share at award No. of shares released during 2023 Market price per share at release No. of shares held on 31 Dec 2023 Date of release 2023 41,054 £24.920 41,054 Feb 2026 2022 49,912 £22.725 49,912 Feb 2025 2021 29,498 £18.660 29,498 Feb 2024 2020 30,777 £20.725 30,777 £24.92 Total 110,187 41,054 30,777 120,464 (1) Part of the AIP is paid in deferred shares released after three years. The amount at grant was already included in the AIP in the single figure table of the relevant year. OPTIONS Year of grant No. of options held on 1 Jan 2023 No. of options granted during 2023 Option price on date of grant No. of options exercised during 2023 Market price per share at exercise No. of options held on 31 Dec 2023 Options exercisable until 2017 85,356 £14.945 85,356 27 Feb 27 90,116 €16.723 90,116 27 Feb 27 2016 101,421 £12.550 101,421 15 Mar 26 107,380 €15.285 107,380 15 Mar 26 2015 114,584 £11.520 114,584 02 Apr 25 120,886 €15.003 120,886 02 Apr 25 2014 145,604 £9.245 145,604 £24.86 158,166 €10.286 158,166 € 27.95 Total 923,513 619,743 |
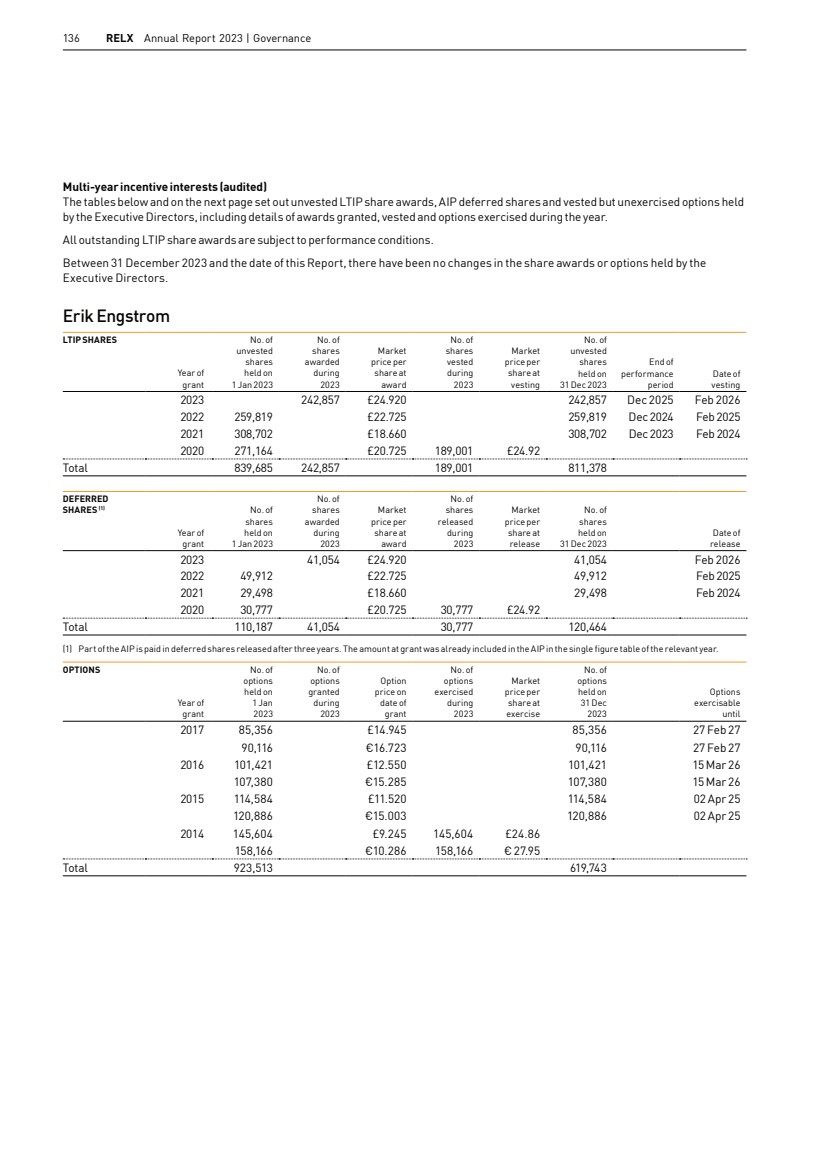
| RELX Annual Report 2023 | Directors’ Remuneration Report 137 Nick Luff LTIP SHARES Year of grant No. of unvested shares held on 1 Jan 2023 No. of shares awarded during 2023 Market price per share at award No. of shares vested during 2023 Market price per share at vesting No. of unvested shares held on 31 Dec 2023 End of performance period Date of vesting 2023 119,175 £24.920 119,175 Dec 2025 Feb 2026 2022 127,499 £22.725 127,499 Dec 2024 Feb 2025 2021 151,487 £18.660 151,487 Dec 2023 Feb 2024 2020 133,066 £20.725 92,747 £24.92 Total 412,052 119,175 92,747 398,161 DEFERRED SHARES (1) Year of grant No. of shares held on 1 Jan 2023 No. of shares awarded during 2023 Market price per share at award No. of shares released during 2023 Market price per share at release No. of shares held on 31 Dec 2023 Date of release 2023 24,175 £24.920 24,175 Feb 2026 2022 29,391 £22.725 29,391 Feb 2025 2021 17,370 £18.660 17,370 Feb 2024 2020 18,079 £20.725 18,079 £24.92 Total 64,840 24,175 18,079 70,936 (1) Part of the AIP is paid in deferred shares released after three years. The amount at grant was already included in the AIP in the single figure table of the relevant year. OPTIONS Year of grant No. of options held on 1 Jan 2023 No. of options granted during 2023 Option price on date of grant No. of options exercised during 2023 Market price per share at exercise No. of options held on 31 Dec 2023 Options exercisable until 2017 40,210 £14.945 40,210 27 Feb 27 42,452 €16.723 42,452 27 Feb 27 2016 47,778 £12.550 47,778 15 Mar 26 50,586 €15.285 50,586 15 Mar 26 2015 53,979 £11.520 53,979 02 Apr 25 56,948 €15.003 56,948 02 Apr 25 2014 65,656 £9.900 65,656 £24.71 72,228 €11.378 72,228 € 27.84 Total 429,837 291,953 Market segments Governance and shareholder information Financial statements Financial review Corporate Responsibility Overview |
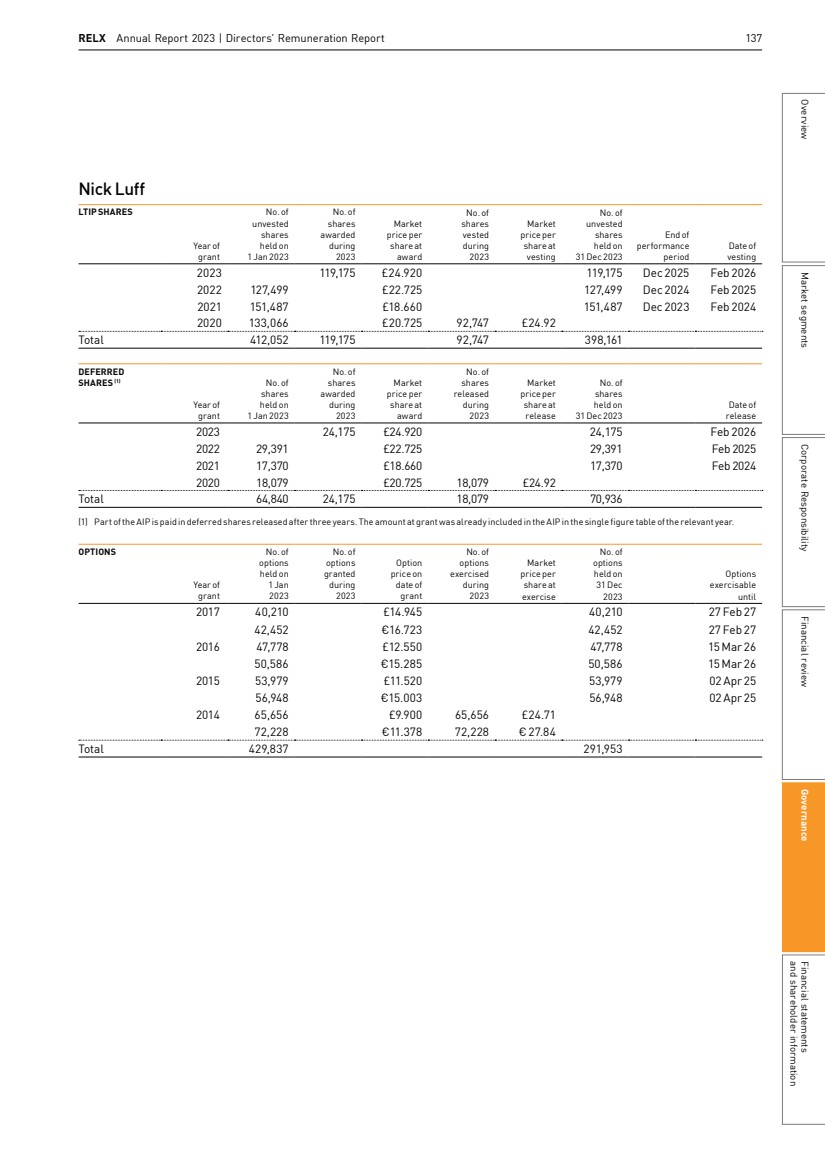
| 138 RELX Annual Report 2023 | Governance Performance graphs The graphs below show total shareholder returns for RELX calculated on the basis of the average share price in the 30 trading days before the respective year end and assuming dividends were reinvested. RELX’s performance is compared with the FTSE 100. The three-year chart covers the performance period of the 2021–2023 cycle of the LTIP. 3 years 5 years 10 years 0 25 50 75 100 125 150 175 200 225 % +30% Dec-23 RELX vs FTSE 100 – 3-YEAR TSR Dec-20 Dec-21 Dec-22 RELX FTSE 100 ∆=54% +84% % Dec-18 Dec-19 Dec-20 Dec-21 Dec-22 Dec-23 0 25 50 75 100 125 150 175 200 225 RELX FTSE 100 +33% RELX vs FTSE 100 – 5-YEAR TSR ∆=80% +113% RELX FTSE 100 Dec-13 Dec-14 Dec-15 Dec-16 Dec-17 Dec-18 Dec-19 Dec-20 Dec-21 Dec-22 Dec-23 % ∆=280% +67% 0 100 200 300 400 500 RELX vs FTSE 100 – 10-YEAR TSR +347% CEO historical pay table The table below shows the historical CEO pay over a ten-year period. £’000 2014 2015 2016 2017 2018 2019 2020 2021 2022 2023 Annualised base salary 1,104 1,131 1,160 1,189 1,218 1,249 1,280 1,312 1,345 1,379 Annual incentive payout as a % of maximum 71% 70% 68% 69% 78% 77% 65% 86% 76% 87% Multi-year incentive vesting as a % of maximum 90%(1) 97%(1) 97%(1) 92%(1) 81%(1) 81%(1) 6% 71% 70% 100% CEO total 17,447(2) 11,416(3) 11,399(4) 8,748(5) 9,141(6) 9,346(7) 3,980(8) 9,560(9) 8,597(10) 13,639(11) (1) The 2019, 2018, 2017, 2016 and 2015 percentages reflect BIP, LTIP and ESOS. The 2014 percentage reflects the final tranche of the Reed Elsevier Growth Plan (REGP), BIPand ESOS. (2) The 2014 figure includes the vesting of the second and final tranche of the REGP and includes £8.8m attributed to share price appreciation. (3) The 2015 figure includes £4.4m attributed to share price appreciation. (4) The 2016 figure includes £4.2m attributed to share price appreciation. (5) The 2017 figure includes £1.7m attributed to share price appreciation. (6) The 2018 figure includes £2.2m attributed to share price appreciation. (7) The 2019 figure includes £2.2m attributed to share price appreciation. (8) The 2020 figure includes £80k attributed to share price appreciation. (9) The 2021 figure includes £1.1m attributed to share price appreciation. (10) The 2022 figure includes £0.8m attributed to share price appreciation. The LTIP value has been updated to reflect the share price on the vesting date. (11) The 2023 figure includes £3.4m attributed to share price appreciation. |
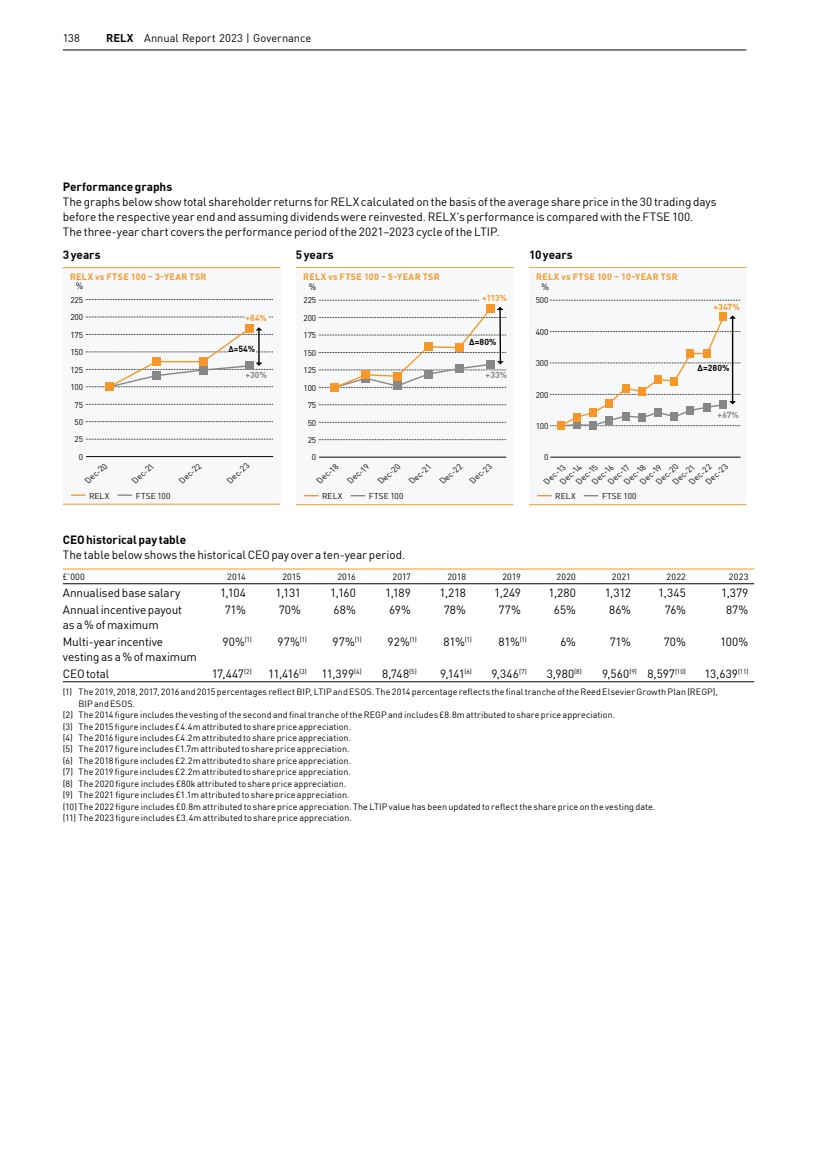
| RELX Annual Report 2023 | Directors’ Remuneration Report 139 Comparison of change in Directors’ pay with change in employee pay The UK Regulations require companies to disclose the percentage change in remuneration from 2022 to 2023 for each director compared with the employees of the listed company, excluding directors. RELX PLC has no employees and Executive Directors are the only employees of RELX Group PLC. We therefore have no data to report but have chosen to continue to report data on changes in base salary of the CEO compared with changes in base salary of a broader employee population. The salary increase for the CEO of 2.5% was below the average increase for the broader UK and US workforce, and significantly below the increases for our lower paid employees. UK pay ratios The UK Regulations require the disclosure of the ratio of total CEOremuneration to median (P50), 25th percentile (P25) and 75th percentile (P75) UK employee total remuneration (calculated on a full-time equivalent basis). UK employees represent less than 20% of our global employee population. Pay ratios for total remuneration are likely to vary, potentially significantly, over time, since the CEO’s total remuneration each year is driven largely by performance-related pay outcomes and is affected by share price movements. We have therefore also shown the UK ratios for the salary component. For the purposes of the ratios below, the CEO’s 2023 total remuneration is the total single figure and salary as disclosed on page 130. The P25, P50 and P75 were selected from the UK employee population as at 1 October 2023. Ratios for prior years are as disclosed in the respective reports. Total remuneration Pay ratios All UK employees £’000 Year Method P25 P50 P75 P25 P50 P75 2023 A 294:1 198:1 140:1 £46 £69 £97 2022 A 188:1 129:1 89:1 £44 £64 £93 2021 A 223:1 151:1 104:1 £43 £64 £92 2020 A 98:1 67:1 46:1 £40 £59 £86 2019 A 225:1 149:1 100:1 £39 £58 £86 Salary Pay ratios All UK employees £’000 Year Method P25 P50 P75 P25 P50 P75 2023 A 33:1 24:1 17:1 £42 £58 £80 2022 A 34:1 25:1 18:1 £39 £55 £76 2021 A 35:1 25:1 18:1 £38 £52 £74 2020 A 35:1 25:1 18:1 £37 £52 £72 2019 A 35:1 25:1 18:1 £35 £51 £71 Slight differences compared with ratios calculated using data shown in the tables are due to rounding. The ratios are calculated using Option A, meaning that the median, 25th and 75th percentiles were determined based on total remuneration using the single total figure valuation methodology, except for annual incentives (other than sales incentives) which are based on estimated payout as individual final payout levels are still to be finalised. We chose Option A as we believe it is the most robust and accurate way to identify the median, 25th percentile and 75th percentile UKemployee. The Committee is satisfied that the overall picture presented by the 2023 pay ratios is consistent with the pay, reward and progression policies for the Group’s UK employees. § Salaries for all UK employees, including the Executive Directors, are set based on a wide range of factors, including market practice, scope and impact of the role and experience. § The provision of certain benefits and the level of benefit provided vary depending on the role and level of seniority. § Participation in annual incentive plans varies by business and reflects the culture and the nature of the business, as well as role. § Whilst none of the comparator employees participate in the executive share plans, they do have the opportunity to receive company shares via the UK Sharesave Option Plan. A greater proportion of performance-related variable pay and share based awards applies to more senior executives, including the Executive Directors, who have a greater influence over performance outcomes. Relative importance of spend on pay The following table sets out the total employee costs for all employees, as well as the amounts paid in dividends and share repurchases. 2022 £m 2023 £m % change Employee costs(1) 2,906 3,108 7% Dividends 983 1,059 8% Share repurchases 500 800 60% (1) Employee costs include wages and salaries, social security costs, pensions and share based and related remuneration. Payments to past Directors and payments for loss of office (audited) There have been no payments for loss of office in 2023. Market segments Governance and shareholder information Financial statements Financial review Corporate Responsibility Overview |
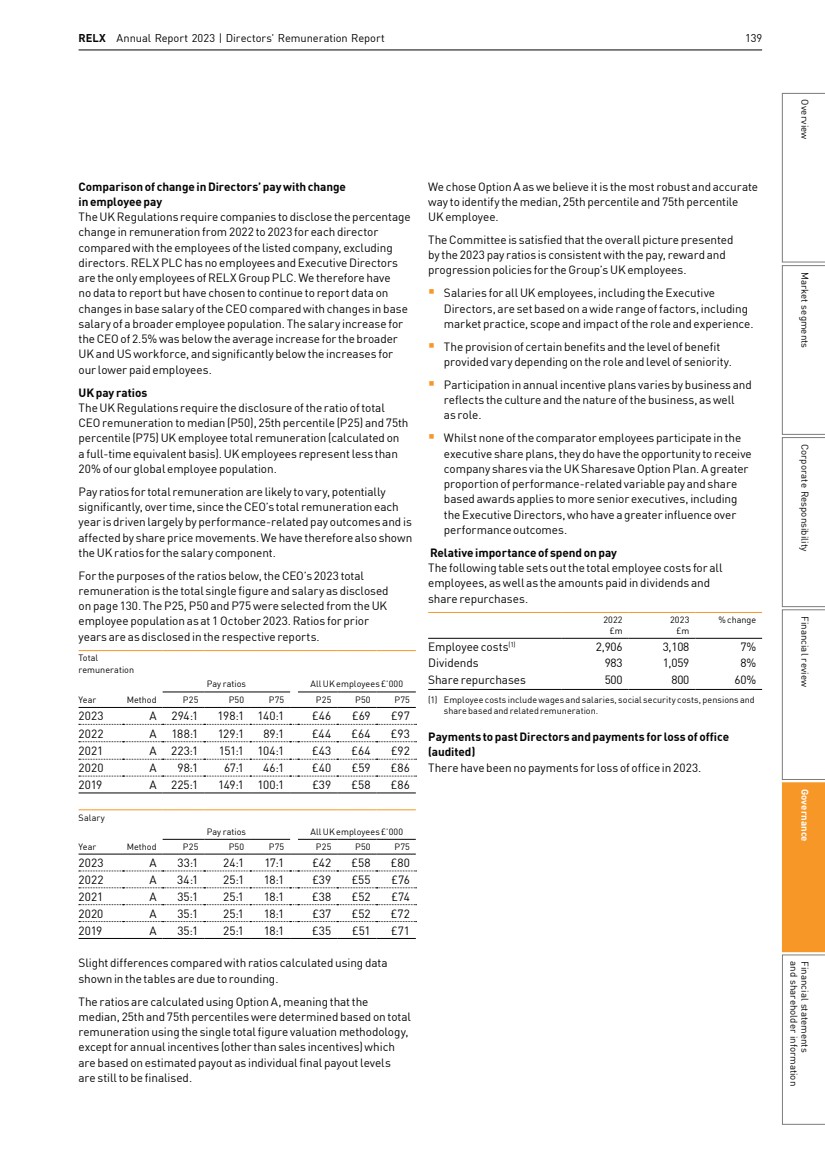
| 140 RELX Annual Report 2023 | Governance Implementation of remuneration policy in 2024 Salary: The Committee has awarded a salary increase of 2.5% to each Executive Director, which means that, from 1 January 2024, Erik Engstrom’s salary rose to £1,412,974 and Nick Luff’s salary to £832,055. Benefits: The benefits provided to the Executive Directors are unchanged for 2024. Annual incentive: The AIP payout at target performance is 135% of base salary and the maximum 200% of base salary, with 50% ofthe AIPearned deferred into shares. Revenue, adjusted net profit after tax and cash flow each have a weight of 30% and non-financial a weight of 10%. Non-financial measures are focused on sustainability metrics. Details of the 2024 annual financial targets and non-financial metrics will be disclosed in the 2024 Remuneration Report. Pension: Erik Engstrom and Nick Luff will receive cash in lieu of pension of 11% of their salary. Share based awards: As in 2023, we will be granting LTIP awards with face values of 450% of salary to Erik Engstrom and 375% to Nick Luff in 2024. The awards are subject to a three-year performance period and the net (after tax) vested shares are to be retained for a further two-year holding period. As highlighted earlier, the level of vesting for threshold performance is reduced to 20%. The following metrics, weightings, targets and vesting scales apply to LTIP awards granted in 2024 for the 2024–2026 cycle. The vesting of LTIP awards is dependent on three separate performance measures: ROIC, EPS and TSR weighted 40%:40%:20% respectively and assessed independently. The TSR measure comprises three comparators (sterling, euro and US dollar) reflecting the fact that RELX accesses equity capital markets through three exchanges – London, Amsterdam and New York – in three currency zones. RELX’s TSR performance is measured separately against each comparator group and each ranking achieved will produce a payout, if any, in respect of one-third of the TSR measure. The proportion of the TSR measure that vests will be the sum of the three payouts. The averaging period applied for TSR measurement purposes is the three months before the start of the financial year in which the award is granted and the last three months of the third financial year of the performance period. The companies for the TSR comparator groups for the 2024–2026 LTIP cycle were selected on the following basis (substantially unchanged from prior year): (a) they were in a relevant market index or were the largest listed companies on the relevant exchanges at the end of the year before the start of the performance period: the FTSE 100 for the sterling group; the Euronext100 and Dax40 for the euro group; and the S&P 500 for the USdollar group; (b) certain companies were then excluded: § those with mainly domestic or single country revenues (as they do not reflect the global nature of RELX’s customer base); § those engaged in extractive industries (as they are exposed to commodity cycles); and § financial services companies (as they have a different risk/reward profile). (c) the remaining companies were then ranked by market capitalisation and, for each comparator group, around 50 companies with market capitalisations above and below that of RELX were taken; and (d) relevant listed global peers operating in businesses similar to those of RELX, but not otherwise included, were added. Vesting percentage of each third of the TSR tranche(1) TSR ranking within the relevant TSRcomparator group 0% Below median 20% Median 100% Upper quartile (1) Vesting is on a straight-line basis for performance between the minimum and maximum levels. The calculation methodology for the EPS and ROIC measures is set out in the 2013 Notices of Annual General Meetings, which can be found on RELX’s website. The targets and vesting scales applicable to the EPS and ROIC are set out below. Vesting percentage of EPS and ROIC tranches(1) Average growth in adjusted EPS over the three-year performance period Average ROIC over the three-year performance period 0% below 5% p.a. below 11.0% 20% 5% p.a. 11.0% 50% 6% p.a. 11.5% 65% 7% p.a. 12.0% 75% 8% p.a. 12.5% 85% 9% p.a. 13.0% 92.5% 10% p.a. 13.5% 100% 11% p.a. or above 14% or above (1) Vesting is on a straight-line basis for performance between the stated average adjusted EPS growth/ROIC percentages. |
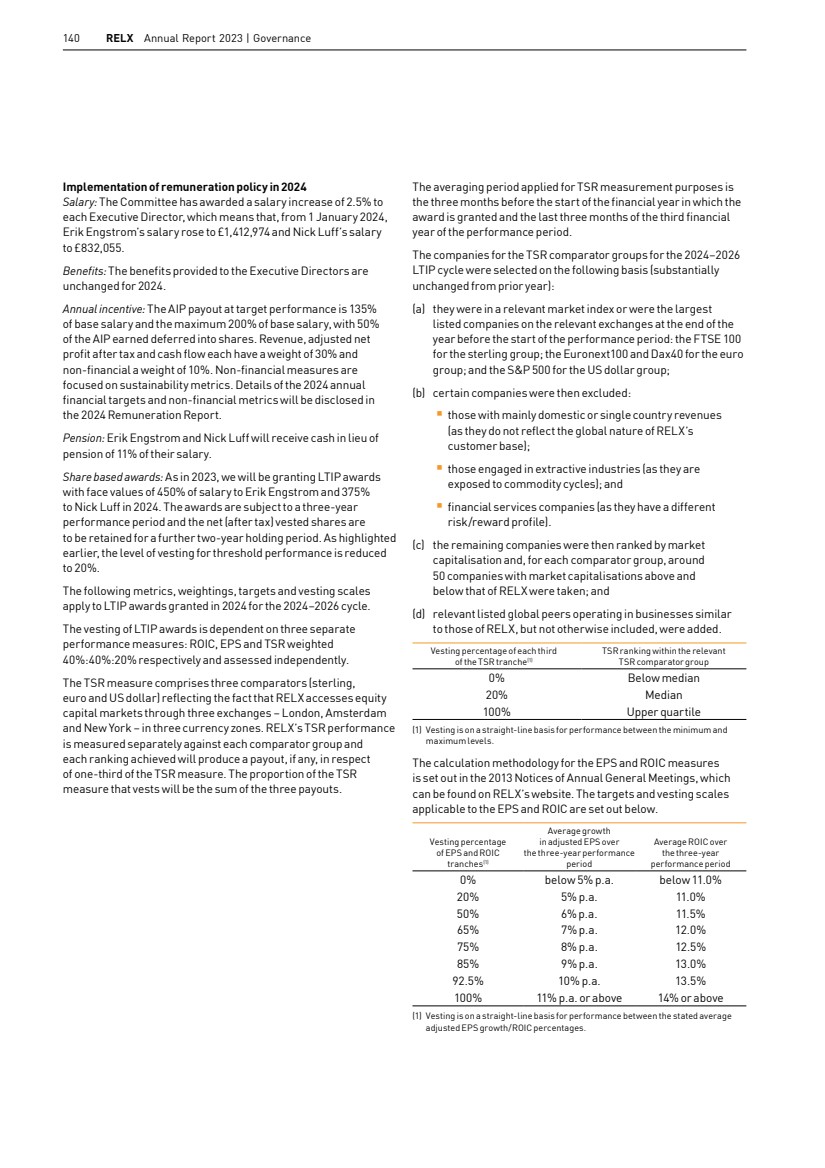
| RELX Annual Report 2023 | Directors’ Remuneration Report 141 Remuneration Committee advice The Committee consists of independent Non-Executive Directors and the Chair of RELX. Details of members and their attendance are contained in the Corporate Governance Review on page 118. The Chief Legal Officer and Company Secretary attends meetings as secretary to the Committee. At the invitation of the Chair of the Committee, the CEO attends appropriate parts of the meetings. The CEO is not in attendance during discussions about his remuneration. The Chief Human Resources Officer advised the Committee during the year. Willis Towers Watson is the external adviser, appointed by the Committee through a competitive process. Willis Towers Watson also provided actuarial and other human resources consultancy services to some RELX companies during the year. The Committee is satisfied that the firm’s advice continues to be objective and independent, and that no conflict of interest exists. The individual consultants who work with the Committee do not provide advice to the Executive Directors or act on their behalf. Willis Towers Watson is a member of the Remuneration Consultants’ Group and conducts its work in line with the UK Code of Conduct for executive remuneration consulting. During 2023, Willis Towers Watson received fees of £2,500 for advice given to the Committee, charged on a time and expense basis. Shareholder voting at 2023 Annual General Meeting At the Annual General Meeting of RELX PLC on 20 April 2023, votes cast by proxy and at the meeting in respect of the Directors’ Remuneration Report were as follows: Resolution Votes For % For Votes Against % Against Total votes cast Votes Withheld Remuneration Report (advisory) 1,525,608,555 95.70% 68,478,146 4.30% 1,594,086,701 2,334,705 At the Annual General Meeting of RELX PLC on 20 April 2023, votes cast by proxy and at the meeting in respect of the Directors’ Remuneration Policy were as follows: Resolution Votes For % For Votes Against % Against Total votes cast Votes Withheld Remuneration Policy (binding) 1,528,240,789 95.87% 65,765,933 4.13 % 1,594,006,722 2,416,183 Robert MacLeod Chair, Remuneration Committee 14 February 2024 Market segments Governance and shareholder information Financial statements Financial review Corporate Responsibility Overview |
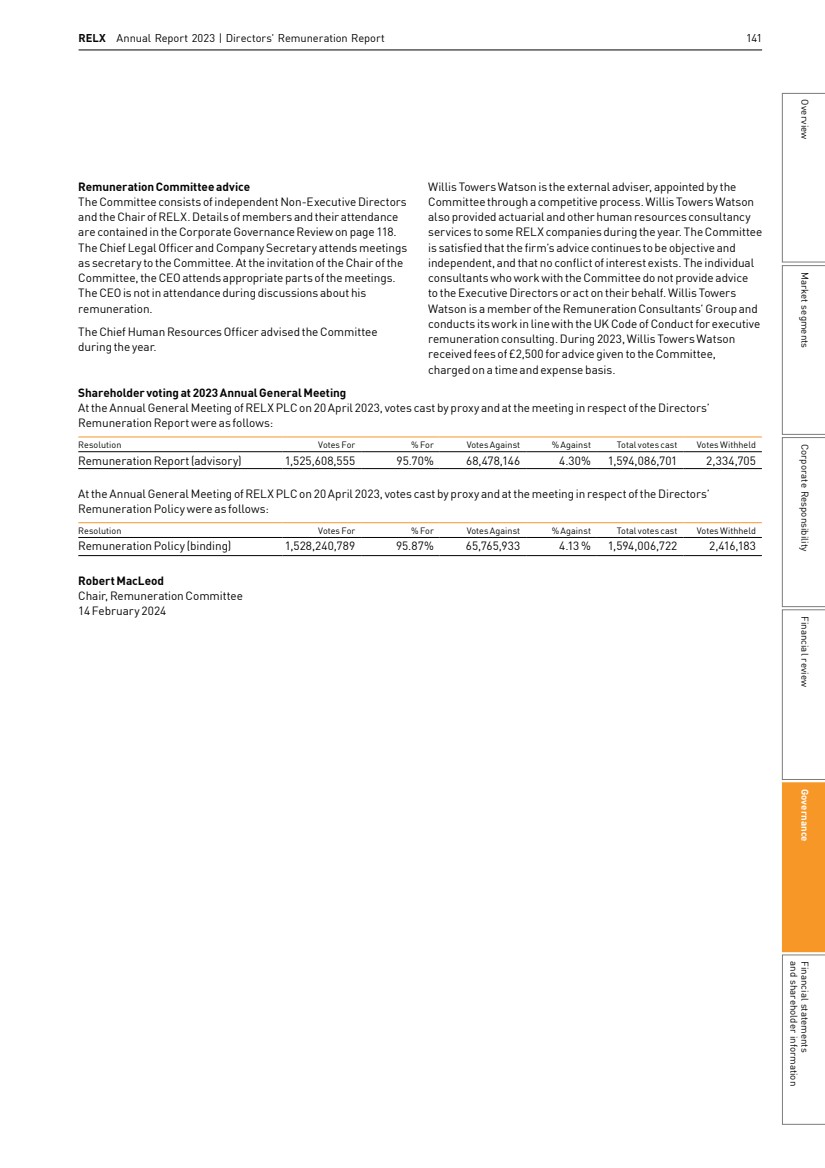
| 142 RELX Annual Report 2023 | Governance Set out in this section is the Company’s Remuneration Policy for Directors, as approved by shareholders at the 20 April 2023 Annual General Meeting, and which is intended to apply for three years from the AGM and to awards granted from the first quarter of 2024. The policy is as reported in the 2022 annual report. Remuneration policy table – Executive Directors ANNUAL BASE SALARY Purpose and link to strategy To recruit and retain the best executive talent globally to execute our strategic objectives at appropriate cost. Operation Salaries for Executive Directors are set and reviewed annually by the Remuneration Committee (the Committee) with changes typically taking effect on 1 January. In exceptional circumstances, the Committee may review salaries more frequently. When reviewing salaries, the Committee considers the executive’s role and sustained value to the Company in terms of skill, experience and overall contribution and the Company’s guidelines for salaries for all employees for the year. Periodically, competitiveness with companies which are comparable in respect of industry, size, international scope and complexity is also considered in order to ensure the Company’s ability to attract and retain executives. Performance framework N/A Maximum value Salary increases will continue to be aligned with the range of increases for the wider employee population and subject to annual all-employee guidelines. However, as for all employees, the Committee has discretion to exceed this to take account of individual circumstances such as change in responsibility, increases in scale or complexity of the business or alignment to market level. Recovery of sums paid No provision. RETIREMENT BENEFITS Purpose and link to strategy Retirement plans are part of remuneration packages designed to recruit and retain the best executive talent at appropriate cost. Operation Executive Directors receive pension benefits up to the value equivalent to the maximum level of pension benefits provided under the Company’s regular defined contribution pension plans as may be in effect or amended from time to time (currently 11% of base salary in the UK). The defined contribution pension plans are designed to be competitive and sustainable long-term. Any amount payable may be paid wholly or partly as cash in lieu. Performance framework N/A Maximum value The maximum value is equivalent to the maximum level of pension benefits provided under the Company’s regular defined contribution pension plans as may be in effect or amended from time to time (currently capped at 11% of base salary in the UK). Recovery of sums paid No provision. Remuneration Policy Report |
| RELX Annual Report 2023 | Directors’ Remuneration Report 143 OTHER BENEFITS Purpose and link to strategy To provide competitive benefits at appropriate cost. Operation Other benefits, subject to periodic review, may include private medical and dental cover, life assurance, tax return preparation costs, car benefits, directors’ and officers’ liability insurance, relocation benefits and expatriate allowances and other benefits available to employees generally, including, where appropriate, the tax on such benefits. Performance framework N/A Maximum value The maximum for ongoing benefits for Executive Directors will not normally exceed 10% of salary (excluding any one-off items, such as immigration support or relocation benefits, and any tax related charge on benefits which is met by the Company). However, the Committee may provide reasonable benefits beyond this amount in exceptional situations, such as a change in the individual’s circumstances caused by the Company, or if there is a significant increase in the cost of providing the agreed benefit. ANNUAL INCENTIVE PLAN (AIP) Purpose and link to strategy The annual incentive provides focus on the delivery of annual financial targets and the achievement of annual objectives and milestones which are chosen to align with the Company’s strategy and create a platform for sustainable future performance. The compulsory deferral of 50% of any annual incentive earned into RELX shares for three years promotes longer-term alignment of Executive Directors’ interests with shareholders’ interests, including an element of post-termination shareholding. Why performance measures are chosen and how targets are set Performance measures include a balanced set of financial measures which are appropriately weighted and which support current strategy and incentivise the Executive Directors to achieve the desired outcomes without undue risk of focusing on any one financial measure. The financial targets are designed to be challenging and are set with reference to the previous year’s performance and internal and external forecasts for the following year. Performance measures may also include non-financial measures, for example linked to sustainability. Operation The Committee reviews and sets the financial targets and, if applicable, non-financial targets, annually, taking into account internal forecasts and strategic plans. Following year end, the Committee compares actual performance with the financial targets and assesses the achievement of any non-financial targets. The targets and outcomes are fully disclosed in the Remuneration Report published after year end. 50% of any annual incentive earned is paid in cash to the Executive Director and the remaining 50% is deferred into RELX shares, which are released to the Executive Director after three years. Dividend equivalents accrued during the deferral period are payable in respect of the shares. On a change in control, the default position is that deferred shares are released to the Executive Director. Alternatively, theCommittee may determine that deferred shares will instead be exchanged for equivalent share awards in the acquiring company. Performance framework The AIP includes financial measures with a weighting of at least 85% and may also include non-financial measures with a weighting of up to 15%. Each measure is assessed separately. § The minimum payout is zero. § Each measure is assessed independently and payout for each measure at threshold is 10% of the maximum opportunity for that measure. § Payout for target performance is 135% of salary. Following an assessment of financial achievement, and scoring of any non-financial measures, the Committee agrees the overall level of earned incentive for each Executive Director. Committee discretion applies.1,2,3 Maximum value The maximum potential annual incentive is 200% of annual base salary. This includes the deferred share element but excludes dividend equivalents payable in respect of the deferred shares. Recovery of sums paid Clawback applies.4 Market segments Governance and shareholder information Financial statements Financial review Corporate Responsibility Overview |
| 144 RELX Annual Report 2023 | Governance LONG-TERM INCENTIVE PLAN (LTIP) Purpose and link to strategy The Long-Term Incentive Plan (LTIP) is designed to provide a long-term incentive for Executive Directors to achieve the key performance measures that support the Company’s strategy, and to align their interests with shareholders. Why performance measures are chosen and how targets are set Our strategic focus is on continuing to transform the core business through organic investment and the build-out of new products into adjacent markets and geographies, supplemented by selective portfolio acquisitions and divestments. The performance measures in the LTIP are chosen to support this strategy by focusing on sustained earnings growth, return on invested capital and shareholder return. Targets are set with regard to previous results and internal and external forecasts for the performance period and the strategic plan for the business. They are designed to provide exceptional reward for exceptional performance, whilst allowing a reasonable expectation that reward at the lower end of the scale is attainable, subject to robust performance. Operation Annual awards of performance shares, with vesting subject to: § performance measured over three financial years § continued employment (subject to the provisions set out in the Policy on payments for loss of office section) § meeting shareholding requirements (450% of salary for the CEO and 300% of salary for the CFO) Executive Directors are to retain their net (after tax) vested shares for a holding period of two years after vesting. Dividend equivalents accrued during the performance period are payable in respect of the performance shares that vest. On a change of control, the default position is that awards vest on a pro-rated basis, subject to an assessment of performance against targets at that time. Alternatively, the Committee may determine that the awards will not vest and will instead be exchanged for equivalent awards in the acquiring company. Performance framework The performance measures are EPS, ROIC and relative TSR, weighted 40%:40%:20% respectively and assessed independently, such that a payout can be received under any one of the measures (or, for TSR, in respect of one of the three comparator groups). § The minimum payout is zero. § Each measure is assessed independently and payout for each measure at threshold is 20% of the maximum opportunity for that measure. § Payout in line with expectations is 50% of the maximum award. Dividend equivalents are not taken into account in the above payout levels. Committee discretion applies.1,2,3 Maximum value The maximum grant in any year is up to 450% of base salary for the CEO and up to 375% of base salary for other Executive Directors (notincluding dividend equivalents). Recovery of sums paid Clawback applies.4 Notes to the Remuneration policy table (1) Discretion in respect of AIP and LTIP payout levels: In determining the level of payout under the AIP and vesting under the LTIP, the Committee takes into account RELX’s overall business performance and value created for shareholders over the period in review and other relevant factors. It has discretion to adjust the vesting and payout levels (subject always to the maximum individual limits) if it believes this would result in a fairer outcome. This discretion will only be used in exceptional circumstances and the Committee will explain in the next Remuneration Report the extent to which it has been exercised and the reasons for doing so. (2) Discretion to vary performance measures under the AIP and the LTIP: The Committee may vary the financial measures applying to a current annual incentive year and performance measures for LTIP awards already granted if a change in circumstances leads it to believe that the arrangement is no longer a fair measure of performance. Any new measures will not be materially less, or more, challenging than the original ones. (3) Discretion on termination of employment under the AIP and the LTIP: The Committee’s discretion on termination of employment is described under the ‘Policy on payments for loss of office’ section. (4) Malus and clawback under the AIP and the LTIP: Under the AIP and the LTIP, the Committee has discretion to apply malus and clawback in case of material misstatement of results or erroneous calculation in incentive payout; breach of post-termination restrictive covenants; misconduct; fraud or conduct which results in (i) significant reputational damage; (ii) material adverse effect on the financial position of the Company; or (iii) corporate failure. These apply for three years following the AIP cash payment and five years from the start of each LTIP performance period and, in the case of a breach of restrictive covenants, to the end of the restriction period. If a participant is subject to an internal investigation regarding a serious breach of any of the above matters, the vesting of their awards and the application of malus and clawback may be delayed until the outcome of that investigation. |
| RELX Annual Report 2023 | Directors’ Remuneration Report 145 (5) Explanation of differences between the Company’s policy on Executive Directors’ remuneration and the policy for other employees: Alarger percentage of Executive Directors’ remuneration is performance related than that of other employees. All managers participate in an annual incentive plan. Participation levels, measures and targets vary according to their role, seniority and local business priorities. Senior executives may also participate in multi-year equity plans. Grant levels under the plans vary according to roles and seniority. The range and level of retirement and other benefits provided to employees vary according to local market practice. Remuneration outcomes in different performance scenarios The Committee considers the level of remuneration that may be paid in the context of the performance delivered and value added for shareholders. The charts below are an illustration of how the CEO’s and CFO’s regular annual remuneration could vary under different performance scenarios. The salary, benefits and pension levels are the same in all three scenarios in each chart and are based on 2023 salary, benefits as shown in the 2022 Single Total Figure table and cash in lieu of pension of 11% of base salary. Annual incentive amounts include the portion which is subject to compulsory deferral into RELX shares for three years. The performance assumptions which have been used are as follows: Minimum means no AIP payout and no LTIP vesting. In line with expectations means AIP payout at 135% of salary (of which 50% is deferred into shares) and LTIP vesting at 50% of the award. Maximum means AIP payout at 200% of salary (of which 50% is deferred into shares) and LTIP vesting at 100% of the award. The three bars in each chart assume no share price movement. As required by the UK Regulations, assuming maximum performance achievement (as described above) and 50% share price growth over the performance period, the CEO’s maximum remuneration would increase to £13.7 m and the CFO’s maximum remuneration to £7.1m. Any dividend equivalents payable in respect of the AIP deferred shares and the LTIP are not included. CEO remuneration (£’000) LTIP AIP cash and deferred shares Salary, benefits, pension Minimum In line with expectations Maximum 100% 25% 15% 28% 47% 26% 59% 1,612 6,575 10,572 CFO remuneration (£’000) Minimum In line with expectations Maximum 100% 26% 16% 31% 43% 29% 55% 916 3,534 5,583 LTIP AIP cash and deferred shares Salary, benefits, pension Shareholding requirement The Executive Directors are subject to shareholding requirements. These are a minimum of 450% of annual base salary for the CEO and 300% of annual base salary for other Executive Directors. On joining or promotion to the Board, Executive Directors are given a period of time, typically up to five years, to build up to their requirement. On termination of employment, Executive Directors are to maintain their full shareholding requirement (or, if lower, their actual level of shareholding at the time of leaving) for two years after leaving employment. Shares which count for shareholding purposes are shares beneficially owned by the Executive Director, their spouse, civil partner or dependent child and AIP deferred shares which are within their three-year deferral period, on a notional net of tax basis. Market segments Governance and shareholder information Financial statements Financial review Corporate Responsibility Overview |
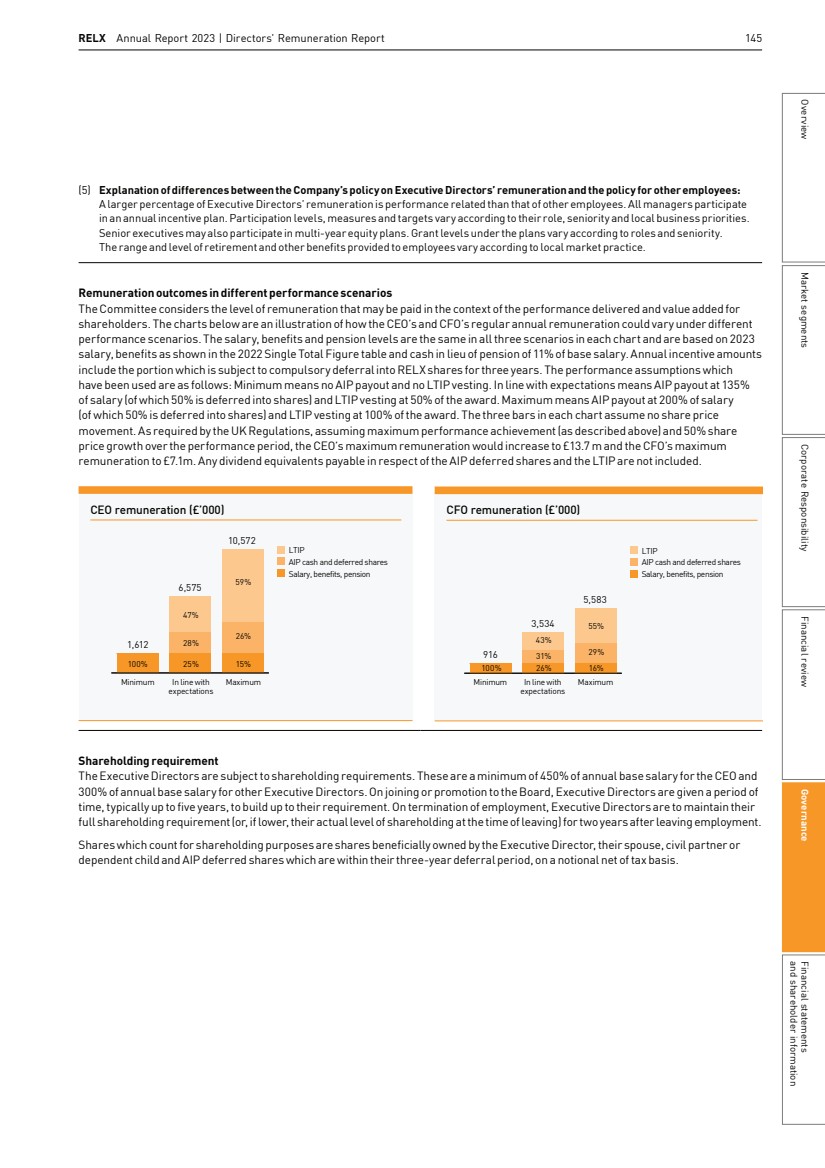
| 146 RELX Annual Report 2023 | Governance Approach to recruitment remuneration – Executive Directors When agreeing the components of a remuneration package on the appointment of a new Executive Director, or an internal promotion to the Board, the Committee would seek to align the package with the remuneration policy stated in the policy table. The Committee’s general principle on recruitment is to offer a competitive remuneration package to attract high-calibre candidates from a global talent pool. Basic salary would be set at an appropriate level for the candidate, taking into account all relevant factors. As a data analytics and technology-driven business, with over half of its revenue in the US, the Company primarily competes for talent with global information and technology companies. The various components and the Company’s approach are as follows: REMUNERATION COMPONENTS The remuneration would include base salary, retirement benefits, other benefits, AIP and LTIP in line with the policy table, taking into account the principles set out above. COMPENSATION FOR FORFEITED ENTITLEMENTS The Committee may make awards and payments on hiring an external candidate to compensate him or her for entitlements forfeited on leaving the previous employer. If such a decision is made, the Committee will attempt to reflect previous entitlements as closely as possible using a variety of tools, including cash and share based awards. Malus and clawback provisions will apply where appropriate. If necessary to facilitate the grant of awards, the Committee may rely on the one person exemption from shareholder approval in the UK Listing Rules. RELOCATION ALLOWANCES AND EXPENSES The type and size of relocation allowances and expenses will be determined by the specific circumstances of the new recruit. Policy on payments for loss of office In line with the Company’s policy, the service contracts of the existing Executive Directors contain 12-month notice periods. The circumstances in which an Executive Director’s employment is terminated will affect the Committee’s determination of any payment for loss of office, but it expects to apply the principles outlined in the table on the next page. The Committee reserves the right to depart from these principles where appropriate in light of any taxation requirements to which the Company or the Executive Director is subject (including, without limitation, section 409A of the US Internal Revenue Code), or other legal obligations. |
| RELX Annual Report 2023 | Directors’ Remuneration Report 147 Policy on payments for loss of office (continued) GENERAL(1) INCENTIVES Mutually agreed termination/termination by the Company other than for cause(2) (includes retirement with customary notice) The Executive Director would be entitled to salary, benefits and other contractual payments in the normal way up to the termination date and would be paid for any accrued but untaken holiday. Salary: Payment of up to 12 months’ salary to reflect the notice period or payment in lieu of notice. Other benefits: Where possible, benefits would be continued for up to the duration of any unworked period of notice (not exceeding the maximum stated in the policy table) or the Executive Director would receive a cash payment (not exceeding the cost to the Company of providing those benefits). Pension: Deferred or immediate pension in accordance with scheme rules, with a credit in respect of, or payment for up to, the full period of any unworked period of notice. There is provision under the defined benefit pension scheme for members leaving Company service by reason of permanent incapacity to make an application to the scheme trustee for early payment of their pension. Other: The Company may pay compensation in respect of any statutory employment rights and may make other appropriate and customary payments. The Company would have due regard to principles of mitigation ofloss. Reductions would be applied to reflect any portion of the notice period that is worked and/or spent on gardening leave. On injury, disability, ill-health or death, the Committee reserves the right to vary the treatment outlined in this section. Annual incentive: Any unpaid annual incentive for the previous year and a pro-rata payment in respect of the part of the financial year up to the termination date would generally be payable (subject to the deferral provisions), with the amount being determined by reference to the original performance criteria. However, the Committee has discretion to decide otherwise depending on the reason for termination and other specific circumstances. TheCompany would not pay any annual incentive in respect of any part of the financial year following the termination date (e.g. for any unworked period of notice). AIP deferred shares would be released to the Executive Directors in full at the end of the deferral period. The annual incentive clawback provisions would apply. LTIP: The default position is that unvested LTIP awards would be pro-rated to reflect time employed and would vest subject to performance measured at the end of the relevant performance period and subject to the Executive Director continuing to meettheir full shareholding requirement for two years after the termination date. The Committee has discretion to allow unvested LTIP awards to vest earlier and to adjust the application of time pro-rating and performance conditions, subject to the plan rules. The requirement to retain net (after tax) vested LTIP shares for a holding period of two years after vesting ceases to apply on termination of employment. Employee instigated resignation The Executive Director would not receive any payments for loss of office. The Executive Director would be entitled to salary, benefits and other contractual payments in the normal way up to the termination date and would be paid for any accrued but untaken holiday. Pension: A deferred or immediate pension would be payable in accordance with the scheme rules. Annual incentive: The Executive Director would be entitled to receive an annual incentive for a completed previous year (subject to the deferral provisions), but not a pro-rated annual incentive in respect of a part year up to the termination date, unless the Committee decides otherwise in the specific circumstances. Any AIP deferred shares would be released to the Executive Director in full at the end of the deferral period. Annual incentive clawback provisions would apply. LTIP: All outstanding LTIP awards would lapse on the date of notice. Dismissal for cause The Executive Director would be entitled to salary, benefits and other contractual payments in the normal way up to the termination date and would be paid for any accrued but untaken holiday but would not receive any payments for loss of office. Pension: A deferred or immediate pension would be payable in accordance with the scheme rules. Annual incentive: The Executive Director would not receive any unpaid annual incentive. Any AIP deferred shares lapse on the date of dismissal. LTIP: All outstanding LTIP awards would lapse on the date of dismissal. (1) In addition to what is set out in this section, on termination for any reason, Erik Engstrom will be entitled to payment of amounts held in his ‘Retirement Account’. (2) In cases where the approved leaver treatment applies, the AIP and LTIP have a default position as well as giving the Committee discretion to adjust the default treatment within certain parameters. The Committee would only expect to exercise such discretion where the Committee believes the personal circumstances of the Executive Director so require. Market segments Governance and shareholder information Financial statements Financial review Corporate Responsibility Overview |
| 148 RELX Annual Report 2023 | Governance Remuneration policy table – Non-Executive Directors FEES Purpose and link to strategy To enable RELX to recruit Non-Executive Directors with the right balance of personal skills and experience to make a major contribution to the Board and Committees of a global business which is listed in London, Amsterdam and New York. Operation RELX Chair: Receives an aggregate annual fee with no additional fees, for example, Committee Chair fees. The Committee determines the Chair’s fee on the advice of the Senior Independent Director. Other Non-Executive Directors: Receive an annual fee with additional fees payable as appropriate for specific roles and duties. These additional fees include fees for the Senior Independent Director and Committee Chairs, for membership of Board Committees, as well as a workforce engagement fee and international travel fees. In future, other fees may be payable, for example attendance fees. The Board determines the level of fees, subject to applicable law. Fees may be reviewed annually, although in practice they have changed on a less frequent basis. When reviewing fees, consideration is given to the time commitment required, the complexity of the role and the calibre of the individual. Periodically, comparative market data is also reviewed, the primary source for which is the practice of FTSE 30 companies. Maximum value The aggregate annual fee limit for fees paid to the Chair and the Non-Executive Directors is £2m. Additional fees for membership of or chairing Board Committees and assuming additional responsibilities such as acting as Senior Independent Director, are not subject to this maximum limit. OTHER BENEFITS Purpose and link to strategy To provide competitive benefits at appropriate cost. Operation Other benefits for Non-Executive Directors are reviewed periodically and may include private medical cover, tax return preparation costs, secretarial benefits, car benefits, travel and related subsistence costs, including, where appropriate, the tax on such benefits. Maximum value There is no prescribed maximum amount. Approach to recruitment remuneration – Non-Executive Directors Following recruitment, a new Non-Executive Director will be entitled to fees and other benefits in accordance with the Company’s remuneration policy. No additional remuneration is paid on recruitment. However, any reasonable expenses incurred during the recruitment process will be reimbursed. Policy on payments for loss of office – Non-Executive Directors In addition to unpaid accrued fees, the Non-Executive Directors are entitled to receive one month’s fees for loss of office if their appointment is terminated before the end of its term. Service contracts and letters of appointment There are no further obligations in the Directors’ service contracts and letters of appointment which are not otherwise disclosed in this Report which could give rise to a remuneration payment or loss of office payment. All Directors’ service contracts and letters of appointment are available for inspection at the Company’s registered office. The Executive Directors’ service contracts do not have a fixed expiry date. Consideration of employment conditions elsewhere in theCompany When the Committee reviews the Executive Directors’ salaries annually, it takes into account the Company’s guidelines for salaries for all employees in the Company’s major operating locations for the forthcoming year. The Committee also considers market practice in the FTSE 30 as well as pay practices of other global information and technology companies when determining the quantum and structure of Directors’ pay. The Committee annually reviews various aspects of workforce remuneration and related policies in order to deepen its understanding of pay structures throughout the organisation. Our designated Non-Executive Director responsible for workforce engagement meets with employees representing our global employee population in order to understand a wide range of employee views on a variety of topics. The feedback is reported back to the Board at least once per year and forms part of the Board’s discussions and decision making. As part of this process, the Non-Executive Director explains how executive remuneration aligns with wider pay policy. Consideration of shareholder views Our practice is to consult shareholders and consider their views when formulating, or changing, our policy. The Committee took into account feedback received from shareholders since the prior policy was approved when reviewing the current policy. Previous remuneration policies and prior commitments Any payments which are still to be made under arrangements made and awards granted under previous remuneration policies will be made consistent with the applicable policy. The provisions of the previous policies which relate to arrangements and awards granted under those previous policies will therefore continue to apply until all payments in relation to those arrangements and awards have been made. The Committee also reserves the right to make any remuneration or loss of office payments if the terms were agreed prior to the approval of the 2013 or 2016 policy or prior to an individual being appointed as aDirector. Minor amendments The Committee may make minor amendments for regulatory, tax or administrative purpose. |
| RELX Annual Report 2023 149 RELX Annual Report 2023 149 Overview Market segments Corporate Responsibility Financial review Governance Financial statements and other information - Report of the Audit Committee This report has been prepared by the Audit Committee and has been approved by the Board. It provides an overview of the membership, responsibilities and activities of the Committee. Membership Responsibilities The Committee comprises independent Non-Executive Directors. The members of the Committee who served during the year were: The main role and responsibility of the Committee is to assist the Board in fulfilling its oversight responsibilities regarding: Suzanne Wood (Chair) Alistair Cox June Felix Charlotte Hogg Andrew Sukawaty Of the current members of the Committee, Suzanne Wood, a Certified Public Accountant, is considered to have significant, recent and relevant financial experience. The Committee as a whole is deemed to have competence relevant to the sectors in which RELX operates. Please see pages 108 and 109 for full profiles of Audit Committee members. the integrity of the interim and full-year financial statements and financial reporting processes risk management and internal controls, and effectiveness of internal auditors the performance of the external auditors and the effectiveness of the external audit process, including monitoring the independence and objectivity of Ernst & Young LLP (EY) The Committee reports to the Board on its activities, identifying any matters in respect of which it considers that action or improvement is needed and making recommendations as to the steps to be taken. The terms of reference of the Audit Committee are reviewed annually and a copy is published on the RELX website, www.relx.com Financial reporting In discharging its responsibilities in respect of the 2023 interim and full-year financial statements, the Committee reviewed the following: AREAS OF SIGNIFICANT JUDGEMENT AND ESTIMATION NOTE AND PAGE REFERENCE IN ANNUAL REPORT Specific areas of significant accounting judgement and estimation, as set out in note 1 on page 171, reviewed and challenged by the Committee were: Capitalisation of internally developed intangible assets: The capitalisation of costs related to the development of new products and business infrastructure, together with the useful economic lives applied to the resulting assets, requires the exercise of judgement. The Committee received reports from the Group Financial Controller on the amounts capitalised and asset lives selected for major projects and outcome of impairment assessment performed. Note 14 190-192 Defined benefit pension obligation: The valuation of pension scheme liabilities is subject to judgement and estimation. The discount rate, inflation rate and mortality assumptions may have a material effect in determining the defined benefit pension obligation and costs which are reported in the financial statements. The Committee received and discussed regular reports from the Group Financial Controller on the methodology and the basis of the assumptions used. Note 6 177-181 The Committee discussed and challenged management’s assessment and was satisfied that all judgements and estimations had been appropriately made and the financial statement disclosures were appropriate. Report of the Audit Committee Market segments Governance and shareholder information Financial statements Financial review Corporate Responsibility Overview |
| 150 RELX Annual Report 2023 | Governance 150 RELX Annual Report 2023 | Governance OTHER AREAS OF FOCUS PAGE REFERENCE IN ANNUAL REPORT Other areas discussed by the Committee during the year were: Taxation: The valuation of provisions in relation to uncertain tax positions involves estimation. The Committee received and discussed reports from the Head of Tax on the potential liabilities identified and assumptions used. Carrying value of goodwill and intangible assets: The judgements and estimates in respect of asset carrying values relate to the assumptions underlying the value in use calculations such as discount rates and long-term growth assumptions. The Committee received and discussed reports from the Group Financial Controller on the methodology, the basis of assumptions used and headroom resulting from the annual impairment assessment 182-185 190-192 Acquired intangible assets: The identification of separate intangible assets on acquisition requires judgement. Estimation is required in determining the future cash flows and discount rates used to value these assets. The Committee received and discussed reports from the Group Financial Controller on the methodology and the basis of the assumptions used 190-192 Financing: Judgement is required in assessing the sufficiency and adequacy of current and future liquidity and funding requirements of the Group. The Committee received and discussed reports from the Group Treasurer on the Group’s financing including the issue of €750m euro-denominated term debt with a coupon of 3.75% and maturity of eight years, extension of the maturity date on the $3bn revolving credit facility to April 2026 and redemption of a $200m bond and related swap maturing in August 2027. See below for further information in respect of the Committee’s review of the going concern and viability assessments and related disclosure 194-198 The Committee was satisfied that all the above items had been appropriately considered and presented in the Annual Report. DISCLOSURE AND PRESENTATION PAGE REFERENCE IN ANNUAL REPORT As well as considering the Annual Report as a whole (see ‘Fair, balanced and understandable’ section below) the Committee focused on the following areas of disclosure and presentation: Reviewed the critical accounting policies and compliance with applicable accounting standards, reviewed other disclosure requirements and received regular update reports on accounting and regulatory developments 171-172 Reviewed the disclosures made in relation to internal control, risk management, the going concern statement and the viability statement. The Committee received and discussed reports from the Group Treasurer on the processes undertaken and assumptions used in formulating these disclosures 98-103 The going concern and viability statements were subject to an in-depth review, including a detailed review and challenge of the various adverse scenarios modelled to ensure that the statements made in relation to going concern and viability are robust 104-105 Considered the calculation and presentation of alternative performance measures in the Annual Report and Financial Statements and results announcement, including associated reconciliations to GAAP measures 222-230 Reviewed the disclosures made in the Annual Report which incorporates the Corporate Responsibility Report. This includes disclosures in respect of the Task Force on Climate-Related Financial Disclosures (TCFD) recommendations 38-89 The Committee was satisfied that all relevant disclosures have been appropriately made. FAIR, BALANCED AND UNDERSTANDABLE The Committee considered whether the 2023 Annual Report is fair, balanced and understandable. In making this assessment, the Committee considered the following areas: The process for preparing the Annual Report, including the contributors, the internal review process and how feedback is addressed throughout the process The business review narratives presented for each business area The discussion of reported and underlying results throughout the report The Committee was satisfied that, taken as a whole, the Annual Report is fair, balanced and understandable. This conclusion has been reported to the Board. The Committee also received detailed written reports from the external auditors on these matters and discussed all areas with both management and the external auditors. The Committee was satisfied with the explanations provided and conclusions reached. |
| RELX RELX Annual Report 2023 Annual Report 2023 | Report of the Audit Committee 151 151 Overview Market segments Corporate Responsibility Financial review Governance Financial statements and other information Risk management and internal controls With respect to their oversight of risk management and internal controls, the Committee has: received and discussed regular reports summarising the status of the Group’s risk management activities, identification of emerging risks and actions to mitigate risks, and the findings from internal audits and status of actions agreed with management. Areas of focus in 2023 included: cyber security (including the ability to prevent, respond to and recover from a cyber-attack or ransomware attack); data privacy; the operational, financial and IT control environment; the use of technology including machine learning; regulatory compliance; business continuity and resilience (including supplier resilience and plans for extreme weather events); the ability to adapt to geopolitical, economic and market conditions; integrity of published Corporate Responsibility data; and continued compliance with the requirements of Section 404 of the US Sarbanes-Oxley Act relating to the documentation and testing of internal controls over financial reporting received regular updates from the Group Financial Controller and Group Treasurer on the Group’s financial position including on liquidity, extension of maturity of the revolving credit facility to April 2026, bond issue, early redemption of a bond, credit ratings and ability to access debt capital markets, changes to the regulatory reporting landscape including the EU’s Corporate Sustainability Reporting Directive, risk management and compliance with treasury policies, and pension arrangements and funding received presentations from the Head of Tax on tax matters and the Group’s tax principles reviewed and approved the internal audit plan for 2024 and monitored execution of the 2023 plan, including progress in respect of actions agreed received presentations from the Chief Compliance Officer on the compliance programmes, including the operation of the RELX Code of Conduct, training programmes and whistleblowing arrangements received presentations from the Chief Legal Officer on legal issues and claims received an update from the Group Financial Controller in respect of the ‘Audit Committees and the External Audit: Minimum Standard’ published by the Financial Reporting Council in May 2023. The RELX Audit Committee, as it currently operates, already aligns with most of the requirements and will continue to monitor future developments in this area with respect to disclosures to be included in future reports by the Audit Committee on a ‘comply or explain basis’ participated in a series of ‘deep dive’ briefing sessions with senior management from each of the Business Areas on a range of topics received comprehensive briefings from the external auditor and RELX management on the UK Government’s proposed measures on Corporate Reform and the Financial Reporting Council’s proposed revisions to the UK Corporate Governance Code and other regulatory matters Committee meetings The Committee met four times during 2023. The Audit Committee meetings are typically attended by the Board Chair, the Chief Executive Officer, the Chief Financial Officer, the Group Financial Controller, the Chief Legal Officer, the Head of Internal Audit & Assurance (IAA), and audit partners from the external auditors. External audit effectiveness and independence The Group has a well-established policy on audit effectiveness and independence of auditors that sets out among other things: the responsibilities of the Audit Committee in the selection of auditors to be proposed for appointment or re-appointment and for agreement on the terms of their engagement, scope and remuneration; the auditor independence requirements and the policy on the provision of non-audit services; the rotation of audit partners and staff; and the conduct of meetings between the auditors and the Audit Committee. The Committee’s policy on the use of the external auditor to provide non-audit services is in accordance with applicable laws and takes into account the relevant ethical guidance for auditors. Any permissible non-audit services must be pre-approved by the Chief Financial Officer and above £50,000, by the Chair of the Audit Committee. All non-audit services provided and fees are presented to the Committee on a regular basis. The policy is available on the website, www.relx.com. The Committee has conducted its review of the performance of the external auditors and effectiveness of the external audit process for the year ended 31 December 2023. The review included: an assessment of the quality of the auditor’s reporting to and interaction with the Audit Committee review of the completion of the audit plan and changes to risks identified or work performed a discussion with EY on data analytics tools used in the audit; consideration of public reports by regulatory authorities on key EY member firms and their view on the effectiveness of EY’s audits a survey of key stakeholders across RELX evaluating the performance of each audit team The Audit Committee holds private meetings with the external auditor to encourage open and transparent feedback. The Chair of the Committee also met with the external auditors outside of Committee meetings supporting effective and timely communication. Based on this review, the Audit Committee was satisfied with the performance of the auditors and the effectiveness of the audit process. The external auditors have confirmed their independence and compliance with the policy on auditor independence to the Audit Committee. Market segments Governance and shareholder information Financial statements Financial review Corporate Responsibility Overview |
| 152 RELX Annual Report 2023 | Governance 152 RELX Annual Report 2023 | Governance Non-audit services The external auditors are precluded from engaging in non-audit services that would compromise their independence or violate any professional requirements or regulations affecting their appointment as auditors. The auditors may, however, provide non-audit services which do not conflict with their independence. The Committee has reviewed and agreed the non-audit services provided in 2023 together with the associated fees. The non-audit services provided in 2023 were very limited and, in line with the latest FRC guidance, linked to audit work such as a bond issue and corporate responsibility data assurance. The total fees payable to EY for the year ended 31 December 2023 were £9.1m of which £0.7m related to non-audit work. Further details are provided in note 4 to the financial statements. The non-audit fees remain below the 70% threshold as per the most recent FRC guidance. Auditor appointment EY were first appointed auditor of RELX PLC for the financial year ended 31 December 2016. The auditor is required to rotate the lead audit partner responsible for the engagement every five years. The year ended 31 December 2023 was the third year for the lead audit partner, Colin Brown. The Audit Committee confirms that they were in compliance with the provisions of The Statutory Audit Services for Large Companies Market Investigation (Mandatory Use of Competitive Tender Processes and Audit Committee Responsibilities) Order 2014 during the financial year ended 31 December 2023. In accordance with the terms of this Order, RELX anticipates that it will conduct a competitive tender process during 2024 with respect to the audit for the year ended 31 December 2026. The Committee believes this approach is in the best interests of shareholders and will provide sufficient time to allow for an orderly transition in the event of a change in auditor. Having considered the summary set out above relating to the effectiveness and independence of EY, the Committee was satisfied and has recommended to the Board that a Resolution to re-appoint EY as auditors for the year ending 31 December 2024 be proposed at the 2024 AGM which the Board has accepted and endorsed. Internal audit The Audit Committee’s terms of reference requires an annual review of internal audit effectiveness. RELX has an established Internal Audit function governed by a formal charter which requires an external assessment at least once every five years to consider and report on conformance with the Institute of Internal Auditors International Professional Practices Framework (IPPF) and UK Chartered Institute of Internal Auditors Internal Audit Code of Practice (CoP). An external assessment of internal audit was carried out in 2022. The assessment identified areas of enhancement related to strategy, planning, operational excellence, and talent. All recommendations have been implemented. The Audit Committee annually receives and considers a report from the Head of IAA on: the independence of the internal audit activity; a review of the IAA Charter; conformance with the mandatory elements of the IPPF and CoP; and the results of its quality assurance and improvement programme. Audit Committee effectiveness The effectiveness of the Audit Committee was reviewed as part of the 2023 evaluation of the Board which confirmed that the Committee continues to function effectively. Details of the evaluation are set out on page 112. Suzanne Wood Chair of the Audit Committee 14 February 2024 |
| RELX Annual Report 2023 153 Directors’ Report The Directors Report for the year ended 31 December 2023 has been prepared in accordance with the requirements of the Companies Act 2006 (the Act), the UK Listing Rules (the LRs) andDisclosure Guidance and Transparency Rules (the DTRs). TheDirectors’ Report, together with the Strategic Report on pages 2 to 105, forms the management report for the purposes of the Financial Conduct Authority’s Disclosure and Transparency Rules 4.1.5R(2) and 4.1.8R. For the purposes of the Directors’ Report, RELX PLC and its subsidiaries, joint ventures and associates are together known as ‘RELX’ or the ‘Group’. RELX PLC (the Company) is a public company, limited by shares, and registered in England and Wales under registered number 77536. The Company’s registered office is 1-3 Strand, London, WC2N 5JR. Other disclosures Certain information required by the Act, LRs and DTRs is disclosed elsewhere in this Annual Report and incorporated by reference into this Director’s Report in Table 1. Table 1 Disclosure Page(s) § Names of Directors during the year 118 § Corporate governance statement 112 to 124 § Dividends 96 and 189 § Financial instruments, financial risk management and hedging arrangements 194 to 200 § Future developments 2 to 37 § Employee engagement 54 to 59 and 120 § Engagement with customers, suppliers and others 60 to 72, 119 to 122 § Employment of disabled persons 57 § Greenhouse gas emissions and energy consumption 73 to 81 and 89 Articles of Association Amendment The Company’s Articles of Association (the Articles) may only be amended by a special resolution of shareholders passed at a general meeting of the Company. Directors Appointment and replacement of directors The appointment, re-appointment and replacement of Directors is governed by the Articles, the Companies Act 2006 and related legislation. Shareholders maintain their right to appoint and re-appoint Directors by way of an ordinary resolution in accordance with the Articles. The Directors may appoint additional or replacement Directors, who may only serve until the following AGM of the Company, at which time they must retire and, if appropriate, seek election by the Company’s shareholders. A Director may be removed from office by the Company as provided for by applicable law, in certain circumstances set out in the Articles, and at a general meeting of the Company by the passing of an ordinary resolution. The Articles provide for a Board of Directors consisting of not fewer than five, but not more than 20 Directors, who manage the business and affairs of the Company. Powers of directors Subject to the provisions of the Companies Act 2006, the Articles and any directions given by special resolutions, the business of the Company shall be managed by the Board which may exercise all the powers of the Company. Directors’ indemnities In accordance with its Articles, the Company has granted its Directors an indemnity, to the extent permitted by law, in respect of liabilities incurred as a result of their office. This indemnity was in place for Directors that served at any time during the 2023 financial year, and also for each serving Director as at the date of approval of this report. The Company also purchased, and maintained throughout the year, directors’ and officers’ liability insurance in respect of its Directors. Shares Share capital The Company’s issued share capital comprises a single class of ordinary shares of 14 51⁄116 p each listed on the London and Amsterdam Stock Exchanges. The Company also has securities in the form of American Depositary Shares traded on the New York Stock Exchange. All issued shares are fully paid up and rank pari passu. The Company’s share capital as at the 31 December 2023 and details of share capital movements during the year are set out in Note 23 to the consolidated financial statements. Rights and obligations The rights of holders of ordinary shares in the Company, in addition to those conferred under UK law, are set out in the Company’s Articles which are available at www.relx.com. In summary, holders of ordinary shares are entitled to: one vote for each ordinary share held; the right to attend and speak at general meetings of the Company or to appoint one or more proxies or, if they are a corporation, a corporate representative; and to exercise their voting rights. At a general meeting, on a show of hands every member who is present in person shall have one vote and every proxy present who has been duly appointed by one or more members entitled to vote on the resolution has one vote (although a proxy has one vote for and one vote against the resolution if: (i) the proxy has been duly appointed by more than one member entitled to vote on the resolution; and (ii) the proxy has been instructed by one or more of those members to vote for the resolution and by one or more other of those members to vote against it). On a vote on a resolution on a poll every member present in person or by proxy shall have one vote for every share of which he/she is the holder. Proxy appointments and voting instructions must be received by the Company’s registrars not less than 48 hours before the general meeting. Restrictions on the transfer of shares There are no restrictions on the sale or transfer of ordinary shares in the Company, or on the size of a holding. The Company is not aware of any agreements between shareholders that may result in a restriction in the transfer of shares or voting rights. Market segments Governance and shareholder information Financial statements Financial review Corporate Responsibility Overview |
| 154 RELX Annual Report 2023 | Governance Authority to purchase own shares At the Company’s 2023 AGM, shareholders passed a resolution authorising the purchase of up to 193,584,144 ordinary shares in the Company (representing approximately 10% of the issued ordinary shares) by way of market purchase. This authority will expire at the 2024 AGM, when a resolution to renew the authority to purchase Company shares will be submitted to shareholders. During the year, 30,912,126 ordinary shares of 14 51⁄116 p each (representing 1.6% of the ordinary shares in issue at 31 December 2023) were purchased by the Company for a total consideration of £800m, including expenses, and subsequently transferred to be held in treasury. A further 4,627,481 shares were purchased between 2 January 2024 and the date of this report. On 7 December 2023, the Company cancelled 31mordinary shares held in treasury. Therefore, as at 31 December 2023 there were 19,712,193 ordinary shares held in treasury, representing 1% of the ordinary shares in issue. The purpose of the share buyback programme is to reduce the capital of the Company. Share issuance At the 2023 AGM, shareholders passed a resolution authorising the Directors to issue shares for cash on a non-pre-emptive basis up to a nominal value of £13,784,103, representing approximately 5% of the Company’s issued share capital, and authorising the Directors to issue up to an additional 5% of the issued share capital for cash on a non-pre-emptive basis in connection with an acquisition or specified investment. Since the 2023 AGM, no shares have been issued under this authority. The shareholder authority also permits the Directors to issue shares in order to satisfy entitlements under employee share plans and details of such allotments are described below. During the year, 3,027,517 ordinary shares in the Company were issued in order to satisfy entitlements under employee share plans as follows: 669,028 under the UK SAYE Share Option Scheme at prices between 1,178p and 1,976p per share; 153,166 under the legacy Dutch Debenture Scheme at prices between 9.561 EUR and 19.39 EUR , which is satisfied by way of Company shares; and 2,205,323 under executive share option schemes at prices between 734.5p and 2,492p per share. Substantial share interests As at 31 December 2023, the Company had received the following notifications of interests in its share capital pursuant to Rule 5 of the Disclosure and Transparency Rules (DTRs): % of voting rights Date of notification BlackRock, Inc 9.67% 17 May 2022 Invesco Ltd. 4.99% 1 October 2019 The percentage interests stated above are as disclosed at the date on which the interests were notified to the Company and, as at the date of this report, the Company had not received any further notifications under DTR 5. These percentages do not reflect changes to the Company’s total voting rights since the date of notification or any subsequent changes to share interests not notified to the Company under DTR 5 and therefore may not reflect the interests held as at 31 December 2023, or at the date ofthis report. Employee Benefit Trust As at 31 December 2023, the Employee Benefit Trust trustee held an interest in 5,663,529 ordinary shares in the Company, representing 0.3% of the issued ordinary shares. The trustee may vote or abstain from voting any shares it holds in any way it sees fit. Other information Branches Our activities and interests are operated through subsidiaries, branches of subsidiaries, joint arrangements and associates which are subject to the laws and regulations of many different jurisdictions. Disclosures required under UK Listing Rule 9.8.4 The information required by Listing Rule 9.8.4 is set out on the pages below: Information required Page (1) Interest capitalised by the Group n/a (2) Publication of unaudited financial information n/a (4) Long-term incentive schemes n/a (5) Waiver of emoluments by a director n/a (6) Waiver of future emoluments by a director n/a (7) Non pro-rata allotments for cash (issuer) n/a (8) Non pro-rata allotments for cash (major subsidiaries) n/a (9) Parent participation in a placing by a listed subsidiary n/a (10) Contracts of significance n/a (11) Provision of services by a controlling shareholder n/a (12) Shareholder waiver of dividends 189 (13) Shareholder waiver of future dividends 189 (14) Agreements with controlling shareholders n/a Significant agreements and change of control There are a number of borrowing agreements including credit facilities that, in the event of a change of control of RELX PLC and, in some cases, a consequential credit rating downgrade to sub-investment grade may, at the option of the lenders, require repayment and/or cancellation as appropriate. There are no arrangements between the Company and its Directors or employees providing for compensation for loss of office or employment that occurs specifically because of a takeover, merger or amalgamation with the exception of provisions in the Company’s share plans which could result in options or awards vesting or becoming exercisable on a change of control. No contract existed during the year in relation to the Company’s business in which any Director was materially interested. Political donations RELX does not make donations to UK or European Union (EU) political organisations or incur UK or EU political expenditure. In the US, Group companies donated £152,366 (2022: £142,047) to political organisations. In line with US law, these donations were not made at the federal level, but only to candidates and political parties at state and local levels. |
| RELX Annual Report 2023 | Directors’ Report 155 Research and development RELX undertakes research and development activities in the areas of machine learning, natural language processing, predictive analytics, content search, and other technologies to innovate and enhance our product offering and customer experience across our business areas. 2024 AGM The next AGM of the Company will be held at 9.30 am on Thursday, 25April 2024 at Lexis House, 30 Farringdon Street, London EC4A4HH. Auditor reappointment Resolutions for the re-appointment of Ernst & Young LLP as auditor of the Company and to authorise the Audit Committee, on behalf of the Board, to determine the external auditor’s remuneration, will be put to shareholders at the Company’s 2024 AGM. Disclosure of information to auditors Each of the directors in office as at the date of this Annual Report confirms that: § so far as the Director is aware, there is no relevant audit information of which the Company’s auditors are unaware; and § he/she has taken all the steps that he/she ought to have taken as a Director to make himself/herself aware of any relevant audit information and to establish that the Company’s auditors are aware of that information. Statement of Directors’ responsibilities The Directors are responsible for preparing the Annual Report and financial statements in accordance with applicable law and regulations. Company law requires the Directors to prepare financial statements for each financial year. Under that law, the Directors have prepared consolidated financial statements in accordance with International Accounting Standards (IAS) in conformity with the requirements of the Companies Act 2006 and International Financial Reporting Standards (IFRS) as issued by the International Accounting Standards Board (IASB). The Directors have elected to prepare the individual Company financial statements in accordance with Financial Reporting Standard 101Reduced Disclosure Framework. Under company law the Directors must not approve the accounts unless they are satisfied that they give a true and fair view of the state of affairs of the Company and of the Group and of the profit or loss of the Company and of the Group for that period. In preparing the individual Company’s financial statements, the Directors are required to: § select suitable accounting policies and then apply them consistently; § make judgements and accounting estimates that are reasonable and prudent; § state whether Financial Reporting Standard 101 Reduced Disclosure Framework has been followed, subject to any material departures being disclosed and explained in the financial statements; and § prepare the financial statements on a going concern basis unless it is inappropriate to presume that the Company will continue in business. In preparing the Group financial statements, IAS 1 requires that Directors: § select suitable accounting policies and then apply them consistently; § properly select and apply accounting policies; present information, including accounting policies, in a manner that provides relevant, reliable, comparable and understandable information; § provide additional disclosures when compliance with the specific requirements of IFRS are insufficient to enable users to understand the impact of particular transactions or other events and conditions on the entity’s financial position and financial performance; and § make an assessment of the Group’s ability to continue as a going concern. The Directors are responsible for keeping adequate accounting records that are sufficient to show and explain the Group and Company’s transactions and disclose with reasonable accuracy at any time the financial position of the Group and the Company and enable them to ensure that the Annual Report and financial statements comply with the Companies Act 2006. They are also responsible for safeguarding the assets of the Company and hence for taking reasonable steps for the prevention and detection of fraud and other irregularities. The Directors are also responsible for preparing a Strategic report, Directors’ report, Annual report on remuneration, and Corporate governance report in compliance with applicable laws and regulations. The Directors are responsible for the maintenance and integrity of the Company’s website. Legislation in the United Kingdom governing the preparation and dissemination of financial statements may differ from legislation in other jurisdictions. Each of the Directors confirms that, to the best of their knowledge: § the consolidated financial statements, prepared in accordance with UK-adopted IAS in conformity with the requirements of the Companies Act 2006 and International Financial Reporting Standards (IFRS), give a true and fair view of the assets, liabilities, financial position and profit or loss of the Group; § the individual Company financial statements, prepared in accordance with Financial Reporting Standard 101 ‘Reduced Disclosure Framework’ (FRS 101), gives a true and fair view of the assets, liabilities, financial position and profit or loss of the Company; § the Strategic report includes a fair review of the development and performance of the business and the position of the Group, together with a description of the principal and emerging risks and uncertainties that it faces; and § the Annual Report and Financial Statements, taken as a whole, is fair, balanced and understandable and provides the information necessary for shareholders to assess the Company’s position and performance, business model and strategy. By order of the Board Henry Udow Company Secretary 14 February 2024 Market segments Governance and shareholder information Financial statements Financial review Corporate Responsibility Overview |
| 156 RELX Annual Report 2023 Financial statements and other information In this section 158 Independent auditor’s report 166 Consolidated financial statements 171 Notes to the consolidated financial statements 212 5 year summary |
| RELX Annual Report 2023 157 Financial review and shareholder information Financial statements Governance Corporate Responsibility Overview Market segments |
| THIS PAGE IS INTENTIONALLY BLANK 158 RELX Annual Report 2023 | Financial statements and other information |

| THIS PAGE IS INTENTIONALLY BLANK and shareholder information Financial statements Governance Market segments Financial review Corporate Responsibility Overview RELX Annual Report 2023 | Independent auditor’s report to the members of RELX PLC 159 |
| THIS PAGE IS INTENTIONALLY BLANK 160 RELX Annual Report 2023 | Financial statements and other information |

| THIS PAGE IS INTENTIONALLY BLANK and shareholder information Financial statements Governance Market segments Financial review Corporate Responsibility Overview RELX Annual Report 2023 | Independent auditor’s report to the members of RELX PLC 161 |

| THIS PAGE IS INTENTIONALLY BLANK 162 RELX Annual Report 2023 | Financial statements and other information |

| THIS PAGE IS INTENTIONALLY BLANK and shareholder information Financial statements Governance Market segments Financial review Corporate Responsibility Overview RELX Annual Report 2023 | Independent auditor’s report to the members of RELX PLC 163 |

| THIS PAGE IS INTENTIONALLY BLANK 164 RELX Annual Report 2023 | Financial statements and other information |

| THIS PAGE IS INTENTIONALLY BLANK and shareholder information Financial statements Governance Market segments Financial review Corporate Responsibility Overview RELX Annual Report 2023 | Independent auditor’s report to the members of RELX PLC 165 |