0001193125-17-174864.txt : 20170518 0001193125-17-174864.hdr.sgml : 20170518 20170518115855 ACCESSION NUMBER: 0001193125-17-174864 CONFORMED SUBMISSION TYPE: 485BPOS PUBLIC DOCUMENT COUNT: 22 FILED AS OF DATE: 20170518 DATE AS OF CHANGE: 20170518 EFFECTIVENESS DATE: 20170518 FILER: COMPANY DATA: COMPANY CONFORMED NAME: WANGER ADVISORS TRUST CENTRAL INDEX KEY: 0000929521 IRS NUMBER: 362692100 STATE OF INCORPORATION: IL FISCAL YEAR END: 1231 FILING VALUES: FORM TYPE: 485BPOS SEC ACT: 1933 Act SEC FILE NUMBER: 033-83548 FILM NUMBER: 17854121 BUSINESS ADDRESS: STREET 1: 227 WEST MONROE STREET STE 3000 CITY: CHICAGO STATE: IL ZIP: 60606 BUSINESS PHONE: 3126349200 MAIL ADDRESS: STREET 1: 227 WEST MONROE STREET STE 3000 CITY: CHICAGO STATE: IL ZIP: 60606-5016 FILER: COMPANY DATA: COMPANY CONFORMED NAME: WANGER ADVISORS TRUST CENTRAL INDEX KEY: 0000929521 IRS NUMBER: 362692100 STATE OF INCORPORATION: IL FISCAL YEAR END: 1231 FILING VALUES: FORM TYPE: 485BPOS SEC ACT: 1940 Act SEC FILE NUMBER: 811-08748 FILM NUMBER: 17854122 BUSINESS ADDRESS: STREET 1: 227 WEST MONROE STREET STE 3000 CITY: CHICAGO STATE: IL ZIP: 60606 BUSINESS PHONE: 3126349200 MAIL ADDRESS: STREET 1: 227 WEST MONROE STREET STE 3000 CITY: CHICAGO STATE: IL ZIP: 60606-5016 0000929521 S000008981 Wanger USA C000024403 Wanger USA WUSAX 0000929521 S000008982 Wanger International C000024404 Wanger International WSCAX 0000929521 S000008983 Wanger Select C000024405 Wanger Select WATWX 485BPOS 1 d358346d485bpos.htm WANGER ADVISORS TRUST Wanger Advisors Trust

As filed with the Securities and Exchange Commission on May 18, 2017

Securities Act Registration No. 33-83548

Investment Company Act File No. 811-08748


SECURITIES AND EXCHANGE COMMISSION

WASHINGTON, D.C. 20549


FORM N-1A

REGISTRATION STATEMENT UNDER THE SECURITIES ACT OF 1933

Post-Effective Amendment No. 40

and

REGISTRATION STATEMENT UNDER THE INVESTMENT COMPANY ACT OF 1940

Amendment No. 41


WANGER ADVISORS TRUST

(Registrant)

227 West Monroe Street, Suite 3000

Chicago, Illinois 60606

Telephone number: 312.634.9200


Ryan C. Larrenaga

c/o Columbia Management

Investment Advisers, LLC

225 Franklin Street

Boston, MA 02110


P. Zachary Egan    

Wanger Advisors Trust    

227 West Monroe Street,    

Suite 3000    

Chicago, Illinois 60606    


Mary C. Moynihan

Perkins Coie LLP

700 13th Street, N.W.,

Suite 600

Washington, D.C. 20005

  (Agents for service)      


It is proposed that this filing will become effective:

☒   immediately upon filing pursuant to rule 485(b)

☐   on             pursuant to rule 485(b)

☐   60 days after filing pursuant to rule 485(a)(1)

☐   on              pursuant to rule 485(a)(1)

☐   75 days after filing pursuant to rule 485(a)(2)

☐   on              pursuant to rule 485(a)(2)


SIGNATURE

Pursuant to the requirements of the Securities Act of 1933 and the Investment Company Act of 1940, the Registrant certifies that it meets all the requirements for effectiveness of this post-effective amendment pursuant to Rule 485(b) under the Securities Act of 1933 and has duly caused this registration statement to be signed on its behalf by the undersigned, thereunto duly authorized, in the City of Chicago and State of Illinois on May 18, 2017.


WANGER ADVISORS TRUST

By:


/s/ P. Zachary Egan

  P. Zachary Egan, President

Pursuant to the requirements of the Securities Act of 1933, this amendment to the registration statement has been signed below by the following persons in the capacities and on the dates indicated.


Name


Title


Date

/s/ Laura M. Born

     Trustee and Chair   )  
Laura M. Born        )  
       )  

/s/ Maureen M. Culhane

     Trustee   )  
Maureen M. Culhane        )  
       )  

/s/ Margaret M. Eisen

     Trustee   )  
Margaret M. Eisen        )  
       )  

/s/ Thomas M. Goldstein

     Trustee   )  
Thomas M. Goldstein        )  
       )  
/s/ John C. Heaton      Trustee   )  
John C. Heaton        )   May 18, 2017
       )  

/s/ Charles R. Phillips

     Trustee   )  
Charles R. Phillips        )  
       )  

/s/ David J. Rudis

     Trustee   )  
David J. Rudis        )  
       )  

/s/ P. Zachary Egan

P. Zachary Egan

     Trustee and President (principal executive officer)   )  
       )  
       )  

/s/ John M. Kunka

     Vice President and Treasurer (principal financial and accounting officer)   )  
John M. Kunka        )  


Exhibit Index


Exhibit No.


Description

EX-101.INS    XBRL Instance Document
EX-101.SCH    XBRL Taxonomy Extension Schema Document
EX-101.CAL    XBRL Taxonomy Extension Calculation Linkbase
EX-101.DEF    XBRL Taxonomy Extension Definition Linkbase
EX-101.LAB    XBRL Taxonomy Extension Labels Linkbase
EX-101.PRE    XBRL Taxonomy Extension Presentation Linkbase


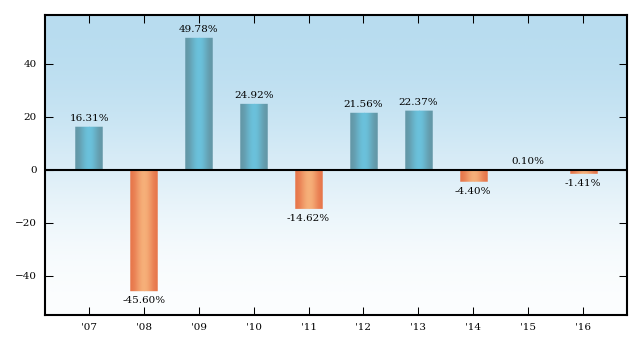
EX-101.INS 2 wat-20170428.xml XBRL INSTANCE DOCUMENT 0000929521 wat:S000008981Member 2017-05-01 2017-05-01 0000929521 2017-05-01 2017-05-01 0000929521 wat:S000008981Member wat:C000024403Member 2017-05-01 2017-05-01 0000929521 wat:S000008981Member wat:RussellTwoThousandGrowthIndexMember 2017-05-01 2017-05-01 0000929521 wat:S000008981Member wat:RussellTwoThousandIndexMember 2017-05-01 2017-05-01 0000929521 wat:S000008983Member 2017-05-01 2017-05-01 0000929521 wat:S000008982Member 2017-05-01 2017-05-01 0000929521 wat:S000008983Member wat:C000024405Member 2017-05-01 2017-05-01 0000929521 wat:S000008983Member wat:RussellTwoThousandFiveHundredGrowthIndexMember 2017-05-01 2017-05-01 0000929521 wat:S000008983Member wat:SandpMidcapFourHundredIndexMember 2017-05-01 2017-05-01 0000929521 wat:S000008982Member wat:C000024404Member 2017-05-01 2017-05-01 0000929521 wat:S000008982Member wat:MsciAcwiExusaSmallCapIndexMember 2017-05-01 2017-05-01 0000929521 wat:S000008982Member wat:MsciAcwiexUsaSmallCapGrowthIndexMember 2017-05-01 2017-05-01 pure iso4217:USD <div style="display:none">~ http://www.columbiathreadneedle.com/role/ScheduleAnnualFundOperatingExpenses000013 column period compact * ~</div> <div style="display:none">~ http://www.columbiathreadneedle.com/role/ScheduleExpenseExampleTransposed000014 column period compact * ~</div> <div style="display:none">~ http://www.columbiathreadneedle.com/role/ScheduleAverageAnnualTotalReturnsTransposed000017 column period compact * ~</div> 2017-05-01 485BPOS 2016-12-31 WANGER ADVISORS TRUST 0000929521 false 2017-04-28 2017-05-01 SUMMARY OF THE FUND <b>Investment Objective </b> Wanger USA (the Fund) seeks long-term capital appreciation. <b>Fees and Expenses of the Fund </b> This table describes the fees and expenses that you may pay as an investor in the Fund. The table does not reflect any fees or expenses imposed by your Contract or Qualified Plan, which are disclosed in your separate Contract prospectus or Qualified Plan disclosure documents. If the additional fees or expenses were reflected, the expenses set forth below would be higher. <b>Annual Fund Operating Expenses (expenses that you pay each year as a percentage of the value of your investment) </b> 0.0087 0 0.0013 0.0001 0.0101 &#8220;Total annual Fund operating expenses&#8221; include acquired fund fees and expenses (expenses the Fund incurs indirectly through its investments in other investment companies) and may be higher than &#8220;Total Net Expenses&#8221; shown in the Financial Highlights section of this prospectus because &#8220;Total Net Expenses&#8221; do not include acquired fund fees and expenses. <b>Example </b> The following example is intended to help you compare the cost of investing in the Fund with the cost of investing in other mutual funds. The example illustrates the hypothetical expenses that you would incur over the time periods indicated, and assumes that:<ul type="square"><li>you invest $10,000 in the Fund for the periods indicated,</li></ul><ul type="square"><li>your investment has a 5% return each year, and</li></ul><ul type="square"><li>the Fund&#8217;s total annual operating expenses remain the same as shown in the Annual Fund Operating Expenses table above.</li></ul>The example does not reflect any fees and expenses that apply to your Contract or Qualified Plan. Inclusion of these charges would increase expenses for all periods shown.<br /><br />Although your actual costs may be higher or lower, based on the assumptions listed above, your costs would be: 103 322 558 1236 103 322 558 1236 <b>Portfolio Turnover </b> The Fund may pay transaction costs, such as commissions, when it buys and sells securities (or &#8220;turns over&#8221; its portfolio). A higher portfolio turnover rate may indicate higher transaction costs. These costs, which are not reflected in annual fund operating expenses or in the example, affect the Fund&#8217;s performance. During the most recent fiscal year, the Fund&#8217;s portfolio turnover rate was 118% of the average value of its portfolio. 1.18 <b>Principal Investment Strategies </b> Under normal circumstances, the Fund invests at least 80% of its net assets (including the amount any borrowings for investment purposes) in U.S. companies.<br /><br />Under normal circumstances, the Fund (i) invests a majority of its net assets in the common stock of small- and mid-sized companies with market capitalizations under $5 billion at the time of initial investment (&#8220;Focus Stocks&#8221;) and (ii) may also invest in companies with market capitalizations above $5 billion, provided that immediately after that investment a majority of the Fund&#8217;s net assets would be invested in Focus Stocks. The Fund may continue to hold, and make additional investments in, Focus Stocks whose market capitalizations have grown to exceed $5 billion, regardless of whether the Fund&#8217;s investments in Focus Stocks are a majority of the Fund&#8217;s net assets.<br /><br />Columbia Wanger Asset Management, LLC, the Fund's investment adviser (the Investment Manager), believes that stocks of small- and mid-sized companies, which generally are not as well known by financial analysts as larger companies, may offer higher return potential than stocks of larger companies.<br /><br />The Investment Manager typically seeks companies with:<ul type="square"><li>A strong business franchise that offers growth potential.</li></ul><ul type="square"><li>Products and services in which the company has a competitive advantage.</li></ul><ul type="square"><li>A stock price the Investment Manager believes is reasonable relative to the assets and earning power of the company.</li></ul>The Investment Manager may sell a portfolio holding if the security reaches the Investment Manager's price target, if the company has a deterioration of fundamentals, such as failing to meet key operating benchmarks, or if the Investment Manager believes other securities are more attractive. The Investment Manager also may sell a portfolio holding to fund redemptions. <b>Principal Risks </b> An investment in the Fund involves risks, including those described below. There is no assurance that the Fund will achieve its investment objective and you may lose money. The value of the Fund&#8217;s holdings may decline, and the Fund&#8217;s net asset value (NAV) and share price may go down. An investment in the Fund is not a bank deposit and is not insured or guaranteed by the Federal Deposit Insurance Corporation or any other government agency.<br /><br /><b>Active Management Risk.</b> The Investment Manager&#8217;s active management of the Fund could cause the Fund to underperform its benchmark index and/or other funds with similar investment objectives and/or strategies.<br /><br /><b>Market Risk.</b> Market risk refers to the possibility that the market values of securities or other investments that the Fund holds will fall, sometimes rapidly or unpredictably, or fail to rise. An investment in the Fund could lose money over short or long periods.<br /><br /><b>Small- and Mid-Cap Company Securities Risk.</b> Investments in small- and mid-capitalization companies (small- and mid-cap companies) often involve greater risks than investments in larger, more established companies (larger companies) because small- and mid-cap companies tend to have less predictable earnings and may lack the management experience, financial resources, product diversification and competitive strengths of larger companies. Securities of small- and mid-cap companies may be less liquid and more volatile than the securities of larger companies.<br /><br /><b>Growth Securities Risk.</b> Growth securities typically trade at a higher multiple of earnings than other types of equity securities. Accordingly, the market values of growth securities may never reach their expected market value and may decline in price. In addition, growth securities, at times, may not perform as well as value securities or the stock market in general, and may be out of favor with investors for varying periods of time.<br /><br /><b>Issuer Risk.</b> An issuer in which the Fund invests may perform poorly, and the value of its securities may therefore decline, which would negatively affect the Fund&#8217;s performance. Poor performance may be caused by poor management decisions, competitive pressures, breakthroughs in technology, reliance on suppliers, labor problems or shortages, corporate restructurings, fraudulent disclosures, natural disasters or other events, conditions or factors.<br /><br /><b>Sector Risk.</b> At times, the Fund may have a significant portion of its assets invested in securities of companies conducting business in a related group of industries within a sector. Companies in the same sector may be similarly affected by economic, regulatory, political or market events or conditions, which may make the Fund more vulnerable to unfavorable developments in that sector than funds that invest more broadly. Generally, the more the Fund diversifies its investments, the more it spreads risk and potentially reduces the risks of loss and volatility. <b>Performance Information </b> There is no assurance that the Fund will achieve its investment objective and you may lose money. The following bar chart and table show you how the Fund has performed in the past, and can help you understand the risks of investing in the Fund. The bar chart shows how the Fund&#8217;s performance has varied for each full calendar year shown. The table below the bar chart compares the Fund&#8217;s returns for the periods shown with the Fund&#8217;s primary benchmark, the Russell 2000 Growth Index, and the Fund's former primary benchmark, the Russell 2000 Index. Effective May 1, 2017, the Fund compares its performance to that of the Russell 2000 Growth Index. Prior to this date, the Fund compared its performance to that of the Russell 2000 Index. The Investment Manager believes that the Fund's portfolio will generally be more closely aligned with the Russell 2000 Growth Index that with the former core benchmark from an investment style perspective. Information on the Russell 2000 Index will be included for a one-year transition period.<br /><br />The returns shown do not reflect any fees and expenses imposed under your Contract or Qualified Plan and would be lower if they did.<br /><br /><b>The Fund&#8217;s past performance is no guarantee of how the Fund will perform in the future.</b> Daily and month-end performance information is available by calling the Investment Manager at 888.4.WANGER (888.492.6437) or visiting columbiathreadneedle.com/us. The following bar chart and table show you how the Fund has performed in the past, and can help you understand the risks of investing in the Fund. The bar chart shows how the Fund&#8217;s performance has varied for each full calendar year shown. The table below the bar chart compares the Fund&#8217;s returns for the periods shown with the Fund&#8217;s primary benchmark, the Russell 2000 Growth Index, and the Fund's former primary benchmark, the Russell 2000 Index. 888.4.WANGER (888.492.6437) columbiathreadneedle.com/us <b>The Fund&#8217;s past performance is no guarantee of how the Fund will perform in the future.</b> The returns shown do not reflect any fees and expenses imposed under your Contract or Qualified Plan and would be lower if they did. <b>Year by Year Total Return (%)<br/>as of December 31 Each Year </b> <b>Best and Worst Quarterly Returns<br/>During the Period Shown in the Bar Chart</b><br/><br/>Best&nbsp;&nbsp;&nbsp;&nbsp;&nbsp;&nbsp;&nbsp;&nbsp;&nbsp;&nbsp;&nbsp;&nbsp;&nbsp;&nbsp;&nbsp;&nbsp;&nbsp;&nbsp;&nbsp;&nbsp;&nbsp;&nbsp;&nbsp;&nbsp;&nbsp;&nbsp;&nbsp; 3rd Quarter 2009&nbsp;&nbsp;&nbsp;&nbsp;&nbsp;&nbsp;&nbsp;&nbsp;&nbsp;&nbsp;&nbsp;&nbsp;&nbsp;&nbsp;&nbsp;&nbsp;&nbsp;&nbsp;&nbsp;&nbsp;&nbsp;&nbsp;&nbsp;&nbsp;&nbsp;&nbsp;&nbsp;&nbsp;22.90%<br/><br/>Worst&nbsp;&nbsp;&nbsp;&nbsp;&nbsp;&nbsp;&nbsp;&nbsp;&nbsp;&nbsp;&nbsp;&nbsp;&nbsp;&nbsp;&nbsp;&nbsp;&nbsp;&nbsp;&nbsp;&nbsp;&nbsp;&nbsp;&nbsp;&nbsp;&nbsp;&nbsp;4th Quarter 2008&nbsp;&nbsp;&nbsp;&nbsp;&nbsp;&nbsp;&nbsp;&nbsp;&nbsp;&nbsp;&nbsp;&nbsp;&nbsp;&nbsp;&nbsp;&nbsp;&nbsp;&nbsp;&nbsp;&nbsp;&nbsp;&nbsp;&nbsp;&nbsp;&nbsp;&nbsp;&nbsp;-27.74% <b>Average Annual Total Returns (for periods ended December 31, 2016) </b> 1995-05-03 0.1369 0.1132 0.2131 0.1371 0.1374 0.1446 0.0742 0.0776 0.0707 <div style="display:none">~ http://www.columbiathreadneedle.com/role/ScheduleAnnualFundOperatingExpenses000023 column period compact * ~</div> <div style="display:none">~ http://www.columbiathreadneedle.com/role/ScheduleExpenseExampleTransposed000024 column period compact * ~</div> <div style="display:none">~ http://www.columbiathreadneedle.com/role/ScheduleAverageAnnualTotalReturnsTransposed000027 column period compact * ~</div> 0.0539 -0.3968 0.4223 0.2335 -0.0349 0.2002 0.3375 0.0478 -0.0061 0.1369 Best 2009-09-30 0.229 Worst 2008-12-31 -0.2774 Effective May 1, 2017, the Fund compares its performance to that of the Russell 2000 Growth Index. Prior to this date, the Fund compared its performance to that of the Russell 2000 Index. The Investment Manager believes that the Fund's portfolio will generally be more closely aligned with the Russell 2000 Growth Index that with the former core benchmark from an investment style perspective. Information on the Russell 2000 Index will be included for a one-year transition period. <div style="display:none">~ http://www.columbiathreadneedle.com/role/ScheduleExpenseExampleNoRedemptionTransposed000015 column period compact * ~</div> <div style="display:none">~ http://www.columbiathreadneedle.com/role/ScheduleAnnualTotalReturnsBarChart000016 column period compact * ~</div> <div style="display:none">~ http://www.columbiathreadneedle.com/role/ScheduleAnnualFundOperatingExpenses000033 column period compact * ~</div> <div style="display:none">~ http://www.columbiathreadneedle.com/role/ScheduleExpenseExampleTransposed000034 column period compact * ~</div> <div style="display:none">~ http://www.columbiathreadneedle.com/role/ScheduleAverageAnnualTotalReturnsTransposed000037 column period compact * ~</div> SUMMARY OF THE FUND <b>Investment Objective </b> Wanger Select (the Fund) seeks long-term capital appreciation. <b>Fees and Expenses of the Fund </b> This table describes the fees and expenses that you may pay as an investor in the Fund. The table does not reflect any fees or expenses imposed by your Contract or Qualified Plan, which are disclosed in your separate Contract prospectus or Qualified Plan disclosure documents. If the additional fees or expenses were reflected, the expenses set forth below would be higher. <b>Annual Fund Operating Expenses (expenses that you pay each year as a percentage of the value of your investment) </b> 0.008 0 0.0016 0.0001 0.0097 -0.002 0.0077 &#8220;Total annual Fund operating expenses&#8221; include acquired fund fees and expenses (expenses the Fund incurs indirectly through its investments in other investment companies) and may be higher than &#8220;Total Net Expenses&#8221; shown in the Financial Highlights section of this prospectus because &#8220;Total Net Expenses&#8221; do not include acquired fund fees and expenses. April 30, 2018 <b>Example </b> The following example is intended to help you compare the cost of investing in the Fund with the cost of investing in other mutual funds. The example illustrates the hypothetical expenses that you would incur over the time periods indicated, and assumes that:<ul type="square"><li>you invest $10,000 in the Fund for the periods indicated,</li></ul><ul type="square"><li>your investment has a 5% return each year, and</li></ul><ul type="square"><li>the Fund&#8217;s total annual operating expenses remain the same as shown in the Annual Fund Operating Expenses table above.</li></ul>The example does not reflect any fees and expenses that apply to your Contract or Qualified Plan. Inclusion of these charges would increase expenses for all periods shown.<br /><br />Since the waivers and/or reimbursements shown in the Annual Fund Operating Expenses table above expire as indicated in the preceding table, they are only reflected in the 1 year example and the first year of the other examples. Although your actual costs may be higher or lower, based on the assumptions listed above, your costs would be: 79 289 517 1171 79 289 517 1171 <b>Portfolio Turnover </b> The Fund may pay transaction costs, such as commissions, when it buys and sells securities (or &#8220;turns over&#8221; its portfolio). A higher portfolio turnover rate may indicate higher transaction costs. These costs, which are not reflected in annual fund operating expenses or in the example, affect the Fund&#8217;s performance. During the most recent fiscal year, the Fund&#8217;s portfolio turnover rate was 93% of the average value of its portfolio. 0.93 <b>Principal Investment Strategies </b> SUMMARY OF THE FUND Under normal circumstances, the Fund (i) invests a majority of its net assets in the common stock of small- and mid-sized companies with market capitalizations under $20 billion at the time of initial investment (&#8220;Focus Stocks&#8221;) and (ii) may also invest in companies with market capitalizations above $20 billion, provided that immediately after that investment a majority of the Fund&#8217;s net assets would be invested in Focus Stocks. The Fund may continue to hold, and make additional investments in, Focus Stocks whose market capitalizations have grown to exceed $20 billion, regardless of whether the Fund&#8217;s investments in Focus Stocks are a majority of the Fund&#8217;s net assets.<br/><br/>Columbia Wanger Asset Management, LLC, the Fund's investment adviser (the Investment Manager), believes that stocks of small- and mid-sized companies, which generally are not as well known by financial analysts as larger companies, may offer higher return potential than stocks of larger companies.<br/><br/>The Fund invests the majority of its assets in U.S. companies, but also may invest up to 20% of its total assets in foreign companies in developed markets (for example, Japan, Canada and the United Kingdom). A portion of the Fund&#8217;s foreign exposure may also include companies in emerging markets (for example, China, India and Colombia).<br/><br/>The Fund also may invest up to 20% of its net assets in real estate investment trusts.<br/><br/>The Fund invests in a limited number of companies (generally between 20-40), offering the potential to provide above-average growth over time. In pursuit of the Fund&#8217;s objective, the portfolio managers take advantage of the research and stock-picking capabilities of the Investment Manager. The Investment Manager seeks to select investments which offer the best combination of risk and return. The Investment Manager&#8217;s efforts are generally focused on sectors, industries and companies which provide higher expected growth than the overall U.S. economy.<br/><br/>The Investment Manager typically seeks companies with:<ul type="square"><li>A strong business franchise that offers growth potential.</li></ul><ul type="square"><li>Products and services in which the company has a competitive advantage.</li></ul><ul type="square"><li>A stock price the Investment Manager believes is reasonable relative to the assets and earning power of the company.</li></ul>The Investment Manager may sell a portfolio holding if the security reaches the Investment Manager's price target, if the company has a deterioration of fundamentals, such as failing to meet key operating benchmarks, or if the Investment Manager believes other securities are more attractive. The Investment Manager also may sell a portfolio holding to fund redemptions. <b>Investment Objective </b> Wanger International (the Fund) seeks long-term capital appreciation. <b>Principal Risks </b> <b>Fees and Expenses of the Fund </b> An investment in the Fund involves risks, including those described below. There is no assurance that the Fund will achieve its investment objective and you may lose money. The value of the Fund&#8217;s holdings may decline, and the Fund&#8217;s net asset value (NAV) and share price may go down. An investment in the Fund is not a bank deposit and is not insured or guaranteed by the Federal Deposit Insurance Corporation or any other government agency.<br /><br /><b>Select Portfolio Risk.</b> Because the Fund may invest in a limited number of companies, the Fund as a whole is subject to greater risk of loss if any of its portfolio securities decline in price. In addition, the Fund&#8217;s holdings and weightings will diverge significantly from its primary benchmark&#8217;s holdings and weightings and the Fund may therefore experience greater risk and volatility relative to the benchmark. Because the Fund may invest in more than one company concentrated in a similar industry, sector or geographic region, the Fund may be even more concentrated than the number of companies it may hold would suggest.<br /><br /><b>Active Management Risk.</b> The Investment Manager&#8217;s active management of the Fund could cause the Fund to underperform its benchmark index and/or other funds with similar investment objectives and/or strategies.<br /><br /><b>Market Risk.</b> Market risk refers to the possibility that the market values of securities or other investments that the Fund holds will fall, sometimes rapidly or unpredictably, or fail to rise. An investment in the Fund could lose money over short or long periods.<br /><br /><b>Small- and Mid-Cap Company Securities Risk.</b> Investments in small- and mid-capitalization companies (small- and mid-cap companies) often involve greater risks than investments in larger, more established companies (larger companies) because small- and mid-cap companies tend to have less predictable earnings and may lack the management experience, financial resources, product diversification and competitive strengths of larger companies. Securities of small- and mid-cap companies may be less liquid and more volatile than the securities of larger companies.<br /><br /><b>Growth Securities Risk.</b> Growth securities typically trade at a higher multiple of earnings than other types of equity securities. Accordingly, the market values of growth securities may never reach their expected market value and may decline in price. In addition, growth securities, at times, may not perform as well as value securities or the stock market in general, and may be out of favor with investors for varying periods of time.<br /><br /><b>Issuer Risk.</b> An issuer in which the Fund invests may perform poorly, and the value of its securities may therefore decline, which would negatively affect the Fund&#8217;s performance. Poor performance may be caused by poor management decisions, competitive pressures, breakthroughs in technology, reliance on suppliers, labor problems or shortages, corporate restructurings, fraudulent disclosures, natural disasters or other events, conditions or factors.<br /><br /><b>Sector Risk.</b> At times, the Fund may have a significant portion of its assets invested in securities of companies conducting business in a related group of industries within a sector. Companies in the same sector may be similarly affected by economic, regulatory, political or market events or conditions, which may make the Fund more vulnerable to unfavorable developments in that sector than funds that invest more broadly. Generally, the more the Fund diversifies its investments, the more it spreads risk and potentially reduces the risks of loss and volatility.<br /><br /><b>Foreign Securities Risk.</b> Investments in or exposure to foreign securities involve certain risks not associated with investments in or exposure to securities of U.S. companies. Foreign securities subject the Fund to the risks associated with investing in the particular country of an issuer, including political, regulatory, economic, social, diplomatic and other conditions or events (including, for example, military confrontations, war and terrorism), occurring in the country or region, as well as risks associated with less developed custody and settlement practices. Foreign securities may be more volatile and less liquid than securities of U.S. companies, and are subject to the risks associated with potential imposition of economic and other sanctions against a particular foreign country, its nationals or industries or businesses within the country. In addition, foreign governments may impose withholding or other taxes on the Fund&#8217;s income, capital gains or proceeds from the disposition of foreign securities, which could reduce the Fund&#8217;s return on such securities.<br /><br />Operational and Settlement Risks of Foreign Securities. The Fund&#8217;s foreign securities are generally held outside the United States in the primary market for the securities in the custody of foreign sub-custodians. Some countries have limited governmental oversight and regulation, which increases the risk of corruption and fraud and the possibility of losses to the Fund. In particular, under certain circumstances, foreign securities may settle on a delayed delivery basis, meaning that the Fund may be required to make payment for securities before the Fund has actually received delivery of the securities or deliver securities prior to the receipt of payment. As a result, there is a risk that the security will not be delivered to the Fund or that payment will not be received. Losses can also result from lost, stolen or counterfeit securities; defaults by brokers and banks; failures or defects of the settlement system; or poor and improper record keeping by registrars and issuers.<br /><br />Share Blocking. In certain non-U.S. markets, an issuer&#8217;s securities are blocked from trading for a specified number of days before and, in certain instances, after a shareholder meeting. The blocking period can last up to several weeks. Share blocking may prevent the Fund from buying or selling securities during this period. As a consequence of these restrictions, the Investment Manager, on behalf of the Fund, may abstain from voting proxies in markets that require share blocking.<br /><br /><b>Emerging Market Securities Risk.</b> Securities issued by foreign governments or companies in emerging market countries, such as China, Russia and certain countries in Eastern Europe, the Middle East, Asia, Latin America or Africa, are more likely to have greater exposure to the risks of investing in foreign securities that are described in Foreign Securities Risk. In addition, emerging market countries are more likely to experience instability resulting, for example, from rapid changes or developments in social, political, economic or other conditions. Their economies are usually less mature and their securities markets are typically less developed with more limited trading activity (i.e., lower trading volumes and less liquidity) than more developed countries. Emerging market securities tend to be more volatile than securities in more developed markets. Many emerging market countries are heavily dependent on international trade and have fewer trading partners, which makes them more sensitive to world commodity prices and economic downturns in other countries, and some have a higher risk of currency devaluations.<br /><br />Operational and Settlement Risks of Securities in Emerging Markets. Foreign sub-custodians in emerging markets may be recently organized, lack extensive operating experience or lack effective government oversight or regulation. In addition, there may be legal restrictions or limitations on the ability of the Fund to recover assets held in custody by a foreign sub-custodian in the event of the bankruptcy of the sub-custodian. There may also be a greater risk that settlement may be delayed and that cash or securities of the Fund may be lost because of failures of or defects in the system, including fraud or corruption. Settlement systems in emerging markets also have a higher risk of failed trades.<br /><br />Risks Related to Currencies and Corporate Actions in Emerging Markets. Risks related to currencies and corporate actions are also greater in emerging market countries than in developed countries. Emerging market currencies may not have an active trading market and are subject to a higher risk of currency devaluations.<br /><br />Risks Related to Corporate and Securities Laws in Emerging Markets. Securities laws in emerging markets may be relatively new and unsettled and, consequently, there is a risk of rapid and unpredictable change in laws regarding foreign investment, securities regulation, title to securities and shareholder rights.<br /><br /><b>Liquidity and Trading Volume Risk.</b> Because the Fund may invest a percentage of its assets in foreign securities, it may be subject to the liquidity and trading volume risks associated with international investing. Due to market conditions, including uncertainty regarding the price of a security, it may be difficult for the Fund to buy or sell foreign portfolio securities at a desirable time or price, which could result in investment losses. This risk of portfolio illiquidity is heightened with respect to small- and mid-cap securities, generally, and foreign small- and mid-cap securities in particular. The Fund may have to lower the selling price, liquidate other investments, or forego another, more appealing investment opportunity as a result of illiquidity in the markets. As a result of significant and sustained reductions in emerging and developed international market trading volumes in the wake of the 2007-2009 financial crisis, it may take longer to buy or sell these securities, which can exacerbate the Fund&#8217;s exposure to volatile markets. The Fund may also be limited in its ability to execute favorable trades in foreign portfolio securities in response to changes in share prices and fundamentals, and may be forced to dispose of securities under disadvantageous circumstances and at a loss. As the Fund grows in size or, conversely, if it faces significant redemption pressure, these considerations take on increasing significance and may adversely impact performance.<br /><br /><b>Foreign Currency Risk.</b> The performance of the Fund may be materially affected positively or negatively by foreign currency strength or weakness relative to the U.S. dollar, particularly if the Fund invests a significant percentage of its assets in foreign securities or other assets denominated in currencies other than the U.S. dollar.<br /><br /><b>Real Estate-Related Investment Risk.</b> Investments in real estate investment trusts (REITs) and in securities of other companies (wherever organized) principally engaged in the real estate industry subject the Fund to, among other things, risks similar to those of direct investments in real estate and the real estate industry in general. These include risks related to general and local economic conditions, possible lack of availability of financing and changes in interest rates or property values. REITs are entities that either own properties or make construction or mortgage loans, and also may include operating or finance companies. The value of interests in a REIT may be affected by, among other factors, changes in the value of the underlying properties owned by the REIT, changes in the prospect for earnings and/or cash flow growth of the REIT itself, defaults by borrowers or tenants, market saturation, decreases in market rates for rents, and other economic, political, or regulatory matters affecting the real estate industry, including REITs. REITs and similar non-U.S. entities depend upon specialized management skills, may have limited financial resources, may have less trading volume in their securities, and may be subject to more abrupt or erratic price movements than the overall securities markets. REITs are also subject to the risk of failing to qualify for favorable tax treatment under the Internal Revenue Code of 1986, as amended. Some REITs (especially mortgage REITs) are affected by risks similar to those associated with investments in debt securities including changes in interest rates and the quality of credit extended. This table describes the fees and expenses that you may pay as an investor in the Fund. The table does not reflect any fees or expenses imposed by your Contract or Qualified Plan, which are disclosed in your separate Contract prospectus or Qualified Plan disclosure documents. If the additional fees or expenses were reflected, the expenses set forth below would be higher. <b>Annual Fund Operating Expenses (expenses that you pay each year as a percentage of the value of your investment) </b> An investment in the Fund is not a bank deposit and is not insured or guaranteed by the Federal Deposit Insurance Corporation or any other government agency. There is no assurance that the Fund will achieve its investment objective and you may lose money. An investment in the Fund is not a bank deposit and is not insured or guaranteed by the Federal Deposit Insurance Corporation or any other government agency. <b>Performance Information </b> The following bar chart and table show you how the Fund has performed in the past, and can help you understand the risks of investing in the Fund. The bar chart shows how the Fund&#8217;s performance has varied for each full calendar year shown. The table below the bar chart compares the Fund&#8217;s returns for the periods shown with the Fund&#8217;s primary benchmark, the Russell 2500 Growth Index, and the Fund's former primary benchmark, the Standard &amp; Poor's (S&amp;P) MidCap 400<sup>&#174;</sup> Index. Effective May 1, 2017, the Fund compares its performance to that of the Russell 2500 Growth Index. Prior to this date, the Fund compared its performance to that of the S&amp;P MidCap 400<sup>&#174;</sup> Index. The Investment Manager believes that the Fund's portfolio will generally be more closely aligned with the Russell 2500 Growth Index than with the former core benchmark from an investment style perspective. Information on the S&amp;P MidCap 400<sup>&#174;</sup> Index will be included for a one-year transition period.<br /><br />The returns shown do not reflect any fees and expenses imposed under your Contract or Qualified Plan and would be lower if they did.<br /><br /><b>The Fund&#8217;s past performance is no guarantee of how the Fund will perform in the future.</b> Daily and month-end performance information is available by calling the Investment Manager at 888.4.WANGER (888.492.6437) or visiting columbiathreadneedle.com/us. columbiathreadneedle.com/us <b>The Fund&#8217;s past performance is no guarantee of how the Fund will perform in the future.</b> 888.4.WANGER (888.492.6437) The following bar chart and table show you how the Fund has performed in the past, and can help you understand the risks of investing in the Fund. The bar chart shows how the Fund&#8217;s performance has varied for each full calendar year shown. The table below the bar chart compares the Fund&#8217;s returns for the periods shown with the Fund&#8217;s primary benchmark, the Russell 2500 Growth Index, and the Fund's former primary benchmark, the Standard &amp; Poor's (S&amp;P) MidCap 400<sup>&#174;</sup> Index. The returns shown do not reflect any fees and expenses imposed under your Contract or Qualified Plan and would be lower if they did. Effective May 1, 2017, the Fund compares its performance to that of the Russell 2500 Growth Index. Prior to this date, the Fund compared its performance to that of the S&amp;P MidCap 400<sup>&#174;</sup> Index. The Investment Manager believes that the Fund's portfolio will generally be more closely aligned with the Russell 2500 Growth Index than with the former core benchmark from an investment style perspective. Information on the S&amp;P MidCap 400<sup>&#174;</sup> Index will be included for a one-year transition period. <b>Year by Year Total Return (%)<br/>as of December 31 Each Year </b> <b>Best and Worst Quarterly Returns<br/>During the Period Shown in the Bar Chart</b><br/><br/>Best&nbsp;&nbsp;&nbsp;&nbsp;&nbsp;&nbsp;&nbsp;&nbsp;&nbsp;&nbsp;&nbsp;&nbsp;&nbsp;&nbsp;&nbsp;&nbsp;&nbsp;&nbsp;&nbsp;&nbsp;&nbsp;&nbsp;&nbsp;&nbsp;&nbsp;&nbsp;&nbsp; 2nd Quarter 2009&nbsp;&nbsp;&nbsp;&nbsp;&nbsp;&nbsp;&nbsp;&nbsp;&nbsp;&nbsp;&nbsp;&nbsp;&nbsp;&nbsp;&nbsp;&nbsp;&nbsp;&nbsp;&nbsp;&nbsp;&nbsp;&nbsp;&nbsp;&nbsp;&nbsp;&nbsp;&nbsp;&nbsp;27.72%<br/><br/>Worst&nbsp;&nbsp;&nbsp;&nbsp;&nbsp;&nbsp;&nbsp;&nbsp;&nbsp;&nbsp;&nbsp;&nbsp;&nbsp;&nbsp;&nbsp;&nbsp;&nbsp;&nbsp;&nbsp;&nbsp;&nbsp;&nbsp;&nbsp;&nbsp;&nbsp;&nbsp;4th Quarter 2008&nbsp;&nbsp;&nbsp;&nbsp;&nbsp;&nbsp;&nbsp;&nbsp;&nbsp;&nbsp;&nbsp;&nbsp;&nbsp;&nbsp;&nbsp;&nbsp;&nbsp;&nbsp;&nbsp;&nbsp;&nbsp;&nbsp;&nbsp;&nbsp;&nbsp;&nbsp;&nbsp;-29.52% Best 2009-06-30 0.2772 Worst 2008-12-31 -0.2952 0.0939 -0.4906 0.6619 0.2657 -0.1768 0.1846 0.3458 0.0317 0.0026 0.1331 <b>Average Annual Total Returns (for periods ended December 31, 2016) </b> 1999-02-01 0.1331 0.0973 0.2074 0.1332 0.1388 0.1533 0.0607 0.0916 0.0824 <div style="display:none">~ http://www.columbiathreadneedle.com/role/ScheduleExpenseExampleNoRedemptionTransposed000025 column period compact * ~</div> <div style="display:none">~ http://www.columbiathreadneedle.com/role/ScheduleAnnualTotalReturnsBarChart000026 column period compact * ~</div> 0.0094 0 0.0019 0.0113 <b>Example </b> The following example is intended to help you compare the cost of investing in the Fund with the cost of investing in other mutual funds. The example illustrates the hypothetical expenses that you would incur over the time periods indicated, and assumes that:<ul type="square"><li>you invest $10,000 in the Fund for the periods indicated,</li></ul><ul type="square"><li>your investment has a 5% return each year, and</li></ul><ul type="square"><li>the Fund&#8217;s total annual operating expenses remain the same as shown in the Annual Fund Operating Expenses table above. </li></ul>The example does not reflect any fees and expenses that apply to your Contract or Qualified Plan. Inclusion of these charges would increase expenses for all periods shown.<br/><br/>Although your actual costs may be higher or lower, based on the assumptions listed above, your costs would be: 115 359 622 1375 115 359 622 1375 <b>Portfolio Turnover </b> The Fund may pay transaction costs, such as commissions, when it buys and sells securities (or &#8220;turns over&#8221; its portfolio). A higher portfolio turnover rate may indicate higher transaction costs. These costs, which are not reflected in annual fund operating expenses or in the example, affect the Fund&#8217;s performance. During the most recent fiscal year, the Fund&#8217;s portfolio turnover rate was 56% of the average value of its portfolio. 0.56 <b>Principal Investment Strategies </b> Under normal circumstances, the Fund invests at least 65% of its net assets in foreign companies in developed markets (for example, Japan, Canada and the United Kingdom) and in emerging markets (for example, China, India and Brazil).<br/><br/>Under normal circumstances, the Fund (i) invests a majority of its net assets in the common stock of small- and mid-sized companies with market capitalizations under $5 billion at the time of initial investment (&#8220;Focus Stocks&#8221;) and (ii) may also invest in companies with market capitalizations above $5 billion, provided that immediately after that investment a majority of the Fund&#8217;s net assets would be invested in Focus Stocks. The Fund may continue to hold, and make additional investments in, Focus Stocks whose market capitalizations have grown to exceed $5 billion, regardless of whether the Fund&#8217;s investments in Focus Stocks are a majority of the Fund&#8217;s net assets.<br/><br/>Columbia Wanger Asset Management, LLC, the Fund's investment adviser (the Investment Manager), believes that stocks of small- and mid-sized companies, which generally are not as well known by financial analysts as larger companies, may offer higher return potential than stocks of larger companies.<br/><br/>The Investment Manager typically seeks companies with:<ul type="square"><li>A strong business franchise that offers growth potential.</li></ul><ul type="square"><li>Products and services in which the company has a competitive advantage.</li></ul><ul type="square"><li>A stock price the Investment Manager believes is reasonable relative to the assets and earning power of the company. </li></ul>The Investment Manager may sell a portfolio holding if the security reaches the Investment Manager's price target, if the company has a deterioration of fundamentals, such as failing to meet key operating benchmarks, or if the Investment Manager believes other securities are more attractive. The Investment Manager also may sell a portfolio holding to fund redemptions. <b>Principal Risks </b> An investment in the Fund involves risks, including those described below. There is no assurance that the Fund will achieve its investment objective and you may lose money. The value of the Fund&#8217;s holdings may decline, and the Fund&#8217;s net asset value (NAV) and share price may go down. An investment in the Fund is not a bank deposit and is not insured or guaranteed by the Federal Deposit Insurance Corporation or any other government agency.<br/><br/><b>Active Management Risk.</b> The Investment Manager&#8217;s active management of the Fund could cause the Fund to underperform its benchmark index and/or other funds with similar investment objectives and/or strategies.<br/><br/><b>Market Risk.</b> Market risk refers to the possibility that the market values of securities or other investments that the Fund holds will fall, sometimes rapidly or unpredictably, or fail to rise. An investment in the Fund could lose money over short or long periods.<br/><br/><b>Small- and Mid-Cap Company Securities Risk.</b> Investments in small- and mid-capitalization companies (small- and mid-cap companies) often involve greater risks than investments in larger, more established companies (larger companies) because small- and mid-cap companies tend to have less predictable earnings and may lack the management experience, financial resources, product diversification and competitive strengths of larger companies. Securities of small- and mid-cap companies may be less liquid and more volatile than the securities of larger companies.<br/><br/><b>Foreign Securities Risk.</b> Investments in or exposure to foreign securities involve certain risks not associated with investments in or exposure to securities of U.S. companies. Foreign securities subject the Fund to the risks associated with investing in the particular country of an issuer, including political, regulatory, economic, social, diplomatic and other conditions or events (including, for example, military confrontations, war and terrorism), occurring in the country or region, as well as risks associated with less developed custody and settlement practices. Foreign securities may be more volatile and less liquid than securities of U.S. companies, and are subject to the risks associated with potential imposition of economic and other sanctions against a particular foreign country, its nationals or industries or businesses within the country. In addition, foreign governments may impose withholding or other taxes on the Fund&#8217;s income, capital gains or proceeds from the disposition of foreign securities, which could reduce the Fund&#8217;s return on such securities.<br/><br/>Operational and Settlement Risks of Foreign Securities. The Fund&#8217;s foreign securities are generally held outside the United States in the primary market for the securities in the custody of foreign sub-custodians. Some countries have limited governmental oversight and regulation, which increases the risk of corruption and fraud and the possibility of losses to the Fund. In particular, under certain circumstances, foreign securities may settle on a delayed delivery basis, meaning that the Fund may be required to make payment for securities before the Fund has actually received delivery of the securities or deliver securities prior to the receipt of payment. As a result, there is a risk that the security will not be delivered to the Fund or that payment will not be received. Losses can also result from lost, stolen or counterfeit securities; defaults by brokers and banks; failures or defects of the settlement system; or poor and improper record keeping by registrars and issuers.<br/><br/>Share Blocking. In certain non-U.S. markets, an issuer&#8217;s securities are blocked from trading for a specified number of days before and, in certain instances, after a shareholder meeting. The blocking period can last up to several weeks. Share blocking may prevent the Fund from buying or selling securities during this period. As a consequence of these restrictions, the Investment Manager, on behalf of the Fund, may abstain from voting proxies in markets that require share blocking.<br/><br/><b>Emerging Market Securities Risk.</b> Securities issued by foreign governments or companies in emerging market countries, such as China, Russia and certain countries in Eastern Europe, the Middle East, Asia, Latin America or Africa, are more likely to have greater exposure to the risks of investing in foreign securities that are described in Foreign Securities Risk. In addition, emerging market countries are more likely to experience instability resulting, for example, from rapid changes or developments in social, political, economic or other conditions. Their economies are usually less mature and their securities markets are typically less developed with more limited trading activity (i.e., lower trading volumes and less liquidity) than more developed countries. Emerging market securities tend to be more volatile than securities in more developed markets. Many emerging market countries are heavily dependent on international trade and have fewer trading partners, which makes them more sensitive to world commodity prices and economic downturns in other countries, and some have a higher risk of currency devaluations.<br/><br/>Operational and Settlement Risks of Securities in Emerging Markets. Foreign sub-custodians in emerging markets may be recently organized, lack extensive operating experience or lack effective government oversight or regulation. In addition, there may be legal restrictions or limitations on the ability of the Fund to recover assets held in custody by a foreign sub-custodian in the event of the bankruptcy of the sub-custodian. There may also be a greater risk that settlement may be delayed and that cash or securities of the Fund may be lost because of failures of or defects in the system, including fraud or corruption. Settlement systems in emerging markets also have a higher risk of failed trades.<br/><br/>Risks Related to Currencies and Corporate Actions in Emerging Markets. Risks related to currencies and corporate actions are also greater in emerging market countries than in developed countries. Emerging market currencies may not have an active trading market and are subject to a higher risk of currency devaluations.<br/><br/>Risks Related to Corporate and Securities Laws in Emerging Markets. Securities laws in emerging markets may be relatively new and unsettled and, consequently, there is a risk of rapid and unpredictable change in laws regarding foreign investment, securities regulation, title to securities and shareholder rights.<br/><br/><b>Liquidity and Trading Volume Risk. </b>Due to market conditions, including uncertainty regarding the price of a security, it may be difficult for the Fund to buy or sell portfolio securities at a desirable time or price, which could result in investment losses. This risk of portfolio illiquidity is heightened with respect to small- and mid-cap securities, generally, and foreign small- and mid-cap securities in particular. The Fund may have to lower the selling price, liquidate other investments, or forego another, more appealing investment opportunity as a result of illiquidity in the markets. As a result of significant and sustained reductions in emerging and developed international market trading volumes in the wake of the 2007-2009 financial crisis, it may take longer to buy or sell securities, which can exacerbate the Fund&#8217;s exposure to volatile markets. The Fund may also be limited in its ability to execute favorable trades in portfolio securities in response to changes in share prices and fundamentals, and may be forced to dispose of securities under disadvantageous circumstances and at a loss. As the Fund grows in size or, conversely, if it faces significant redemption pressure, these considerations take on increasing significance and may adversely impact performance.<br/><br/><b>Sector Risk.</b> At times, the Fund may have a significant portion of its assets invested in securities of companies conducting business in a related group of industries within a sector. Companies in the same sector may be similarly affected by economic, regulatory, political or market events or conditions, which may make the Fund more vulnerable to unfavorable developments in that sector than funds that invest more broadly. Generally, the more the Fund diversifies its investments, the more it spreads risk and potentially reduces the risks of loss and volatility.<br/><br/><b>Foreign Currency Risk.</b> The performance of the Fund may be materially affected positively or negatively by foreign currency strength or weakness relative to the U.S. dollar, particularly if the Fund invests a significant percentage of its assets in foreign securities or other assets denominated in currencies other than the U.S. dollar.<br/><br/><b>Issuer Risk.</b> An issuer in which the Fund invests may perform poorly, and the value of its securities may therefore decline, which would negatively affect the Fund&#8217;s performance. Poor performance may be caused by poor management decisions, competitive pressures, breakthroughs in technology, reliance on suppliers, labor problems or shortages, corporate restructurings, fraudulent disclosures, natural disasters or other events, conditions or factors.<br/><br/><b>Geographic Focus Risk.</b> The Fund may be particularly susceptible to economic, political, regulatory or other events or conditions affecting issuers and countries within the specific geographic regions in which the Fund invests. The Fund&#8217;s NAV may be more volatile than the NAV of a more geographically diversified fund.<br/><br/>Asia Pacific Region. Many of the countries in the Asia Pacific region are considered underdeveloped or developing, including from a political, economic and/or social perspective, and may have relatively unstable governments and economies based on limited business, industries and/or natural resources or commodities. Events in any one country within the region may impact other countries in the region or the region as a whole. As a result, events in the region will generally have a greater effect on the Fund than if the Fund were more geographically diversified. This could result in increased volatility in the value of the Fund&#8217;s investments and losses for the Fund. Also, securities of some companies in the region can be less liquid than U.S. or other foreign securities, potentially making it difficult for the Fund to sell such securities at a desirable time and price.<br/><br/>Europe. The Fund is particularly susceptible to economic, political, regulatory or other events or conditions affecting issuers and countries in Europe. Most developed countries in Western Europe are members of the European Union (EU), and many are also members of the European Economic and Monetary Union (EMU). European countries can be significantly affected by the tight fiscal and monetary controls that the EMU imposes on its members and with which candidates for EMU membership are required to comply. In addition, the private and public sectors&#8217; debt problems of a single EU country can pose significant economic risks to the EU as a whole. Unemployment in Europe has historically been higher than in the United States and public deficits are an ongoing concern in many European countries. As a result, the Fund&#8217;s NAV may be more volatile than the NAV of a more geographically diversified fund. If securities of issuers in Europe fall out of favor, it may cause the Fund to underperform other funds that do not focus their investments in this region of the world.<br/><br/><b>Growth Securities Risk.</b> Growth securities typically trade at a higher multiple of earnings than other types of equity securities. Accordingly, the market values of growth securities may never reach their expected market value and may decline in price. In addition, growth securities, at times, may not perform as well as value securities or the stock market in general, and may be out of favor with investors for varying periods of time. An investment in the Fund is not a bank deposit and is not insured or guaranteed by the Federal Deposit Insurance Corporation or any other government agency. There is no assurance that the Fund will achieve its investment objective and you may lose money. <b>Performance Information </b> The following bar chart and table show you how the Fund has performed in the past, and can help you understand the risks of investing in the Fund. The bar chart shows how the Fund&#8217;s performance has varied for each full calendar year shown. The table below the bar chart compares the Fund&#8217;s returns for the periods shown with those of the MSCI ACWI ex USA Small Cap Index (Net), the Fund's primary benchmark, and those of the MSCI ACWI ex USA Small Cap Growth Index (Net), the Fund's secondary benchmark. &nbsp;The MSCI ACWI ex USA Small Cap Index (Net) captures small-cap representation across 22 of 23 developed markets countries (excluding the United States) and 23 emerging markets countries.&nbsp; It has 4,273 constituents (as of March 31, 2017) and covers approximately 14% of the global equity opportunity set outside the United States.&nbsp; The MSCI ACWI ex USA Small Cap Growth Index (Net) captures small cap representation across 22 of 23 developed markets countries (excluding the United States) and 23 emerging markets countries. The Investment Manager believes that the secondary benchmark provides a meaningful additional basis for comparing the Fund's performance, because the Fund&#8217;s portfolio will in general be as closely aligned with the additional growth benchmark as with the current core benchmark from an investment style perspective.<br /><br />The returns shown do not reflect any fees and expenses imposed under your Contract or Qualified Plan and would be lower if they did.<br /><br /><b>The Fund&#8217;s past performance is no guarantee of how the Fund will perform in the future.</b> Daily and month-end performance information is available by calling the Investment Manager at 888.4.WANGER (888.492.6437) or visiting columbiathreadneedle.com/us. The following bar chart and table show you how the Fund has performed in the past, and can help you understand the risks of investing in the Fund. The bar chart shows how the Fund&#8217;s performance has varied for each full calendar year shown. The table below the bar chart compares the Fund&#8217;s returns for the periods shown with those of the MSCI ACWI ex USA Small Cap Index (Net), the Fund's primary benchmark, and those of the MSCI ACWI ex USA Small Cap Growth Index (Net), the Fund's secondary benchmark. 888.4.WANGER (888.492.6437) columbiathreadneedle.com/us <b>The Fund&#8217;s past performance is no guarantee of how the Fund will perform in the future.</b> The returns shown do not reflect any fees and expenses imposed under your Contract or Qualified Plan and would be lower if they did. The MSCI ACWI ex USA Small Cap Growth Index (Net) captures small cap representation across 22 of 23 developed markets countries (excluding the United States) and 23 emerging markets countries. The Investment Manager believes that the secondary benchmark provides a meaningful additional basis for comparing the Fund's performance, because the Fund&#8217;s portfolio will in general be as closely aligned with the additional growth benchmark as with the current core benchmark from an investment style perspective. <b>Year by Year Total Return (%)<br/>as of December 31 Each Year </b> <b>Average Annual Total Returns (for periods ended December 31, 2016) </b> <b>Best and Worst Quarterly Returns<br/>During the Period Shown in the Bar Chart</b><br/><br/>Best&nbsp;&nbsp;&nbsp;&nbsp;&nbsp;&nbsp;&nbsp;&nbsp;&nbsp;&nbsp;&nbsp;&nbsp;&nbsp;&nbsp;&nbsp;&nbsp;&nbsp;&nbsp;&nbsp;&nbsp;&nbsp;&nbsp;&nbsp;&nbsp;&nbsp;&nbsp;&nbsp; 2nd Quarter 2009&nbsp;&nbsp;&nbsp;&nbsp;&nbsp;&nbsp;&nbsp;&nbsp;&nbsp;&nbsp;&nbsp;&nbsp;&nbsp;&nbsp;&nbsp;&nbsp;&nbsp;&nbsp;&nbsp;&nbsp;&nbsp;&nbsp;&nbsp;&nbsp;&nbsp;&nbsp;&nbsp;&nbsp;32.13%<br/><br/>Worst&nbsp;&nbsp;&nbsp;&nbsp;&nbsp;&nbsp;&nbsp;&nbsp;&nbsp;&nbsp;&nbsp;&nbsp;&nbsp;&nbsp;&nbsp;&nbsp;&nbsp;&nbsp;&nbsp;&nbsp;&nbsp;&nbsp;&nbsp;&nbsp;&nbsp;&nbsp;3rd Quarter 2008&nbsp;&nbsp;&nbsp;&nbsp;&nbsp;&nbsp;&nbsp;&nbsp;&nbsp;&nbsp;&nbsp;&nbsp;&nbsp;&nbsp;&nbsp;&nbsp;&nbsp;&nbsp;&nbsp;&nbsp;&nbsp;&nbsp;&nbsp;&nbsp;&nbsp;&nbsp;&nbsp;-23.14% Best 2009-06-30 0.3213 Worst 2008-09-30 -0.2314 0.1631 -0.456 0.4978 0.2492 -0.1462 0.2156 0.2237 -0.044 0.001 -0.0141 1995-05-03 -0.0141 0.0391 -0.0028 0.0701 0.0774 0.0724 0.0356 0.029 0.025 <div style="display:none">~ http://www.columbiathreadneedle.com/role/ScheduleExpenseExampleNoRedemptionTransposed000035 column period compact * ~</div> <div style="display:none">~ http://www.columbiathreadneedle.com/role/ScheduleAnnualTotalReturnsBarChart000036 column period compact * ~</div> "Total annual Fund operating expenses" include acquired fund fees and expenses (expenses the Fund incurs indirectly through its investments in other investment companies) and may be higher than "Total Net Expenses" shown in the Financial Highlights section of this prospectus because "Total Net Expenses" do not include acquired fund fees and expenses. "Total annual Fund operating expenses" are higher than "Total gross expenses" shown in the Financial Highlights section of this prospectus because "Total gross expenses" were reduced due to an extraordinary reimbursement of expenses overbilled by a third party. “Total annual Fund operating expenses” include acquired fund fees and expenses (expenses the Fund incurs indirectly through its investments in other investment companies) and may be higher than “Total Net Expenses” shown in the Financial Highlights section of this prospectus because “Total Net Expenses” do not include acquired fund fees and expenses. “Total annual Fund operating expenses” are higher than “Total gross expenses” shown in the Financial Highlights section of this prospectus because “Total gross expenses” were reduced due to an extraordinary reimbursement of expenses overbilled by a third party. Columbia Wanger Asset Management, LLC (the Investment Manager) has contractually agreed to waive 0.20% of the advisory fee otherwise payable to it by the Fund through April 30, 2018. This arrangement may only be modified or amended with approval from the Fund and the Investment Manager. EX-101.SCH 3 wat-20170428.xsd XBRL TAXONOMY EXTENSION SCHEMA 000000 - Document - Document and Entity Information {Elements} link:presentationLink link:calculationLink link:definitionLink 000011 - Document - Risk/Return Summary {Unlabeled} - Wanger USA link:presentationLink link:calculationLink link:definitionLink 000012 - Schedule - Shareholder Fees link:presentationLink link:calculationLink link:definitionLink 000013 - Schedule - Annual Fund Operating Expenses link:calculationLink link:presentationLink link:definitionLink 000014 - Schedule - Expense Example {Transposed} link:presentationLink link:calculationLink link:definitionLink 000015 - Schedule - Expense Example, No Redemption {Transposed} link:presentationLink link:calculationLink link:definitionLink 000016 - Schedule - Annual Total Returns [BarChart] link:presentationLink link:calculationLink link:definitionLink 000017 - Schedule - Average Annual Total Returns {Transposed} link:presentationLink link:calculationLink link:definitionLink 000018 - Document - Risk/Return Detail {Unlabeled} - Wanger USA link:presentationLink link:calculationLink link:definitionLink 000019 - Disclosure - Risk/Return Detail Data {Elements} - Wanger USA link:presentationLink link:calculationLink link:definitionLink 000021 - Document - Risk/Return Summary {Unlabeled} - Wanger Select link:presentationLink link:calculationLink link:definitionLink 000022 - Schedule - Shareholder Fees link:presentationLink link:calculationLink link:definitionLink 000023 - Schedule - Annual Fund Operating Expenses link:presentationLink link:calculationLink link:definitionLink 000024 - Schedule - Expense Example {Transposed} link:presentationLink link:calculationLink link:definitionLink 000025 - Schedule - Expense Example, No Redemption {Transposed} link:presentationLink link:calculationLink link:definitionLink 000026 - Schedule - Annual Total Returns [BarChart] link:presentationLink link:calculationLink link:definitionLink 000027 - Schedule - Average Annual Total Returns {Transposed} link:presentationLink link:calculationLink link:definitionLink 000028 - Document - Risk/Return Detail {Unlabeled} - Wanger Select link:presentationLink link:calculationLink link:definitionLink 000029 - Disclosure - Risk/Return Detail Data {Elements} - Wanger Select link:presentationLink link:calculationLink link:definitionLink 000031 - Document - Risk/Return Summary {Unlabeled} - Wanger International link:presentationLink link:calculationLink link:definitionLink 000032 - Schedule - Shareholder Fees link:presentationLink link:calculationLink link:definitionLink 000033 - Schedule - Annual Fund Operating Expenses link:presentationLink link:calculationLink link:definitionLink 000034 - Schedule - Expense Example {Transposed} link:presentationLink link:calculationLink link:definitionLink 000035 - Schedule - Expense Example, No Redemption {Transposed} link:presentationLink link:calculationLink link:definitionLink 000036 - Schedule - Annual Total Returns [BarChart] link:presentationLink link:calculationLink link:definitionLink 000037 - Schedule - Average Annual Total Returns {Transposed} link:presentationLink link:calculationLink link:definitionLink 000038 - Document - Risk/Return Detail {Unlabeled} - Wanger International link:presentationLink link:calculationLink link:definitionLink 000039 - Disclosure - Risk/Return Detail Data {Elements} - Wanger International link:presentationLink link:calculationLink link:definitionLink EX-101.CAL 4 wat-20170428_cal.xml XBRL TAXONOMY EXTENSION CALCULATION LINKBASE EX-101.DEF 5 wat-20170428_def.xml XBRL TAXONOMY EXTENSION DEFINITION LINKBASE EX-101.LAB 6 wat-20170428_lab.xml XBRL TAXONOMY EXTENSION LABEL LINKBASE EX-101.PRE 7 wat-20170428_pre.xml XBRL TAXONOMY EXTENSION PRESENTATION LINKBASE XML 9 R1.htm IDEA: XBRL DOCUMENT v3.7.0.1
Label Element Value
Risk/Return: rr_RiskReturnAbstract  
Document Type dei_DocumentType 485BPOS
Document Period End Date dei_DocumentPeriodEndDate Dec. 31, 2016
Registrant Name dei_EntityRegistrantName WANGER ADVISORS TRUST
Central Index Key dei_EntityCentralIndexKey 0000929521
Amendment Flag dei_AmendmentFlag false
Document Creation Date dei_DocumentCreationDate Apr. 28, 2017
Document Effective Date dei_DocumentEffectiveDate May 01, 2017
Prospectus Date rr_ProspectusDate May 01, 2017
GRAPHIC 10 BarChart1.png IDEA: XBRL DOCUMENT begin 644 BarChart1.png MB5!.1PT*&@H -24A$4@ H$ %;" 8 "J'E1L !'-"250(" @( M? ADB EP2%ES 7$0 %Q$!RB;S/P ( !)1$%4>)SLG7><%$7:QW\U ML[.[L,N2,TA022((!E04,9QB ,J9CTC*@;T$!!0D@$0%-$#13$ 1E04SWC* MG0D#R/F"H@*2PY(6EMT%=G:FWS\F]?14=U>'Z>F>>;Z?3^_.=%=XJNJIJF0@ M9 02!$$0!$'D(&0$$@1!$ 1!Y"!D!!($01 $0>0@9 02!$$0!$'D(&0$$@1! M$ 1!Y"!D!!($01 $0>0@9 02!$$0!$'D(&0$$@1!$ 1!Y"!D!!($01 $0>0@ M>9D6P CAW4A,,XM)CVV'!LG7("P0R+8ZM4-J\":7->V1KN@!*FU>A MM+F#@U55N.+$#@"2;211/&4$RM< %M:NC<+:11F41HR:8! 4%B[R/7*9!1* MFS>AM'F/;$T70&GS*I0V]V%FGP1-!Q,$01 $0>0@9 02!$$0!$'D(&0$$@1! M$ 1!Y"!D!!($01 $0>0@9 02!$$0!$'D(&0$IAGF\^'JNX:#&3S%VPM0VKP) MI+B8@# PO_;[(DC8@B"( B"(-+! MP:I*7-2M%0"@HJ("147&[")/G1-($"*$PV&,^OM -&[>$O<]_@R^?/\MK%RZ M!"W:M,=?JU:B]SG]T?OL"U+\O?/BL]BY;3,:-6N!U2N6H_\U-Z/K\2<# )YX MX XT:M8"!86%^/U_RS!DW!-HW+PE-J];@X4OST)Q25T<>72/>+A/CKP;E]]V M#UJV/=S1M!,$01"$*&0$$EG'_!F3T?KP#CA850D V+%U,VX;]2@*"FNA;-<. MW-#W&+S[OXWPYR6K?^7^?1@\^C$ P.__6XI)0V_!2XN7 P":']8.5P\9!@"8 M,WDL%KX\"[>,G(!_S9^#"ZZ^"6T[=,;(ZR]&[[,OP+>??8@V1W8B Y @"()P M-=D_X4WD%-]^]B$:-V^)([L>$[]WQ>WWH:"P%@ @' JAL%9M[EJ/Z^Y],/XY M' ZA=G&=^/>8 0@ 6S>N1]N.70 Q?7J8__>/3AXH KY!84H+]N#+Q:^B4MN MO,/VM!$$01"$G9 12&0-F]>MP"%&9@[_7&L7+K$GL01!$$0A,W0QA B:WCCGU-14U.#_(("K%[Y"[9O MWH ^YUZ("Z\?C/R" LR?,1G-6K?!F1<-4@TC' YCUH01..EOYZ/'R:=QW2Q> MM "?+W@-C[[R;M+]KSY:B)U;-^.(KL=@Y4_?X>J['L"(:R_$XW/?MS6=!$$0 M! %8WQA"(X%$UG#%'??CFKN'X_+;[L4)IY^-=AV[X+);[T$@/Q^S'Q^#(X\^ M!F=>- @KER[![M)M ("]NW?AX($J $#UH8-X>O10G'7)E>AQ\FE8\OE'J#YT M"/OV[,9G[[P6CZ?%8>VP>=WJI+CW[MZ)+]]_"Y?<=">J]I>CI'X# ,B)(P8( M@B (;T(;0XBL8^E__XT?OO@$I5LVXJ,W7L:6=6OQU4?O8@X9-FV/.E'$XLFMW]+_F9DR^[S:L^^-7;-NX#I(D8?OF#9CYX3?PY^7A MQ\6?8<>63<@+!+#VMQ6X][$927$^]\@HW#1\'!AC.+;/&9@U<23>?GXZ>IW1 M+T.Y0! $01#:T'0P01 $01"$!Z'I8((@"((@",(P9 02!$$0!$'D(&0$$@1! M$ 1!Y"!D!!($01 $0>0@M#N8R'HVE6['@8,' <8BE\\'QGR SP_F]P/,!_A] M8,P/^%CD.Q@J:T(HRO,!D@1($J1P" B'@7 H_EF*?H^YJ558B-9-FV4ZR01! M$ 2ABV>-0!:]I.C_^!?"D\3+,0VLW;0!._?NC1A_/C_@SP/+"X %\L$"^4!> M/E@@ )87B#SS10U#(&K D/P6F/K):GYZ>#XQD@;X'E M5Y(CLX&;\,>+6R^\=-5.9;@BWQE29>?=-Q._B!,K>6$V,%LZ[>1 A+/+2'JU MRD+DGH@?.S"B[W;45[-^Y?$J\U42#S8I&WGMD1TRFD$M7S/1'O'"U,L;O;;( M:-TQX\1FG=3+!EOBYN1-VMLBM7)2"U_ON9T8;8^LRF+5[N#EGX'V2!3/C@0* M5_Y,&8)J<9MM>*W^A#-J")J]'T,Y!"8JNUT_<>SJ:!F,&XO47UW6]G;2;88@E:'M\WHIEY\(NV1&=W*9'MDEW\S[8K9MBCF5^^> MV?Y(#SO;(S<8@B+A6-0MQXS <#B,<\XY!ZU;M\:<.7,@21+&C!F#_/Q\[-RY M$WW[]L7 @0.=$L=[I.O74;K(A-&MBJ 59^?TG:O2GT:\)B]A'2^6>:[41S6< M_M&1*;PH)T'*F$0B&NO5,3#%H* M-^W3P0L6+$"]>O4P:=(D+%NV#.O6K7Q]V5EY<;F@H>V+.= MZK-K[AZ.:^\9&?VF7"DJ7]4LR?Y#=A\*]UJ%KN57*TYE^$HWRC!YLLK=B!PZ M(*FX5?.K%;_H2GJ]/!9=92XBH]*=P17LO*Q5WA,*2F0U/2]@K33R_-I1EJ(Z M(RHS3X]Y>B.B3VIQ:KGCR:(6KUZ^*1')*RTYM?15K7X;D5$DKY0R*LM73<>@ M\TP9IHCLO+)02Z.H;%#YKHR/Y]9*6Z1VGY9/>UPI?[ M%=4G-1G-M&6B_:">WAK1)RC<:KGAR:[5=HJTP\!KSTS!O*?_]]S)T[%S4U->C8;34.PLK(2Q<7% M (!W?EZ/PMI%"A>1C&,^'_Q^OPD)S6Z'LA*F5H74JTQFGXG(9"8^+40;)[OS M'UC\TP_8N;=,_YQ ?P#(LWY.X.G']S*89IA(MY4R2H<^ >KZ*M)PFLT'+:SJ MDY5\=")^N\/3^J&6KK9(5"X[VZ-TUDLWD\XV6+1M,/+<#GU2,["T9-(+WPQ6 M]4E"*!2"%$XUUPY656)@S[8 @(J*"A05*>TB;1S;&/+))Y]@T:)%6+]^/9Y_ M_GG<>NNM^-___H>''WX8NW;MPJ1)DPR-!.8% L@+!&R6,AT5WNCH N^>5AAF MGIF12=2O%7\9;G!MCSZ=:;921NG6)R/Z:\2-4:R&:24?G8C?[O!$RM=NW=%[ M9M6O63_99/S%R$1[Y'1;I'PFTK\:#=\,UML"OS\/X(QM6;6#'#,"^_7KAW[] M^B7=FSAQHE/1 T@=[-6:R# 2EMTH!ZF-Q&M4+KO3D:[XE8/G:<%,AAL@T_IE M9_Q:S]-:1@;"5W/GB"X)H">'U73:A96RSB:=Y[G+M [%,*K37NHGM/I#O>=N M:HO <2LO-]YS)_#N8=&P_AO0[&\$*_$;(1V_K>QP;W=XHNZ9XK_=X7,'L'BU MUD)\F=8O.^-/QWBQ*$9U1NU^IL=[].2PFDZ[2-IC^=25Q/.L$YI8.@2 (@B#T\/1(($&D';?, M]Q"$RY D"0_=>@4Z=3\.-<%J;%CS!_XQZ5FL^?47+'SU>73I>0+^6K421QS5 M#9?\_8X4_U-'#,'V31MB@6'+AG6X:_P3..G,<_'TF/NPZ:_5<;>#!@_%<:>> M@AN$Y=''GT,3CEG/X @&DC[\*@6^]%RW:'.Y)V@L@6R @D""T, M&H!D+Q*Y1)<>)^#*.^X' #QR]XWX_-W7T;+MX;CBMJ'HT*T'#AT\@ N[M4*_ MRZY%[>(Z27Y[]CX=I_>/O"I4DB2,O.$2]#K]' ! @R9-$:2GQ+9K_(OI? M?1/:=NB,X===A%/.Z8]O/EV$-D=V(@.0($Q 1B"1]5B:HC4X$DC3P42NP!B+ M&X"A4 @[MF["84=GSD-@4 X5 8 ZZ[!86U:J-.W?HHW[L'!P]4H:"P$.5E>_#%PC?Q M\,QY:4XM060G9 0268_IT3D34\$T$DCD&C]_^Q]\,'-.C8_>> 6CGIX3_W[F19>C;<>CX/?[\<'UY M7'S#8"QX809^_F8Q;ADQ <\].@HW/3 6;\^>@0-5%>C9NR^Z'G=2VM)*$-D& M;0PA"#5X&T,(@DBB9^^^&#MK/DKJ-\3TT4/C]Z^\_3Y,F;\(LQ\?@U^7?J_J M?]7RG]"N8Q?4*BJ.WSN\2[?X@?_'G'P:?OYF,0"@J$X)KA\Z"C?<-QKK?O\5 M[3IVP>[2;3ATL K7W3,2KS[U6)I221#9"1F!!*$%S>\2!)>-:_[ #XL_C7]O MV:8]-J];C0]?>PD'*BL 1 ZR;=2T!3:O7P, V+M[%PX>J$H*Y[V79^&B&P8G MW7O^L3'QSUO6K4&K=D MP]K?5@"2A+6K5N".T8]AS:H5^.?XX6C=O@/*=N] XV8M<.: R\$ S)DR%D=V M/08#KKD9 +!UPSH4UJJ%1DV:)85=L:\,?=B;^.7XDWGIN.DXZHU]ZZI\7R].)$X@S>:SJNZ/O M#K:*_-W!'ZS<@EJ2+'RV\.Q@2$#;V[N S3^BE*0]!$ 1!V,&!JDH, MZ-H2@+EW!]/8.9'UF'YC"$$0!$%D,60$$@1!$ 1!Y"!D!!)9CZ7U#IY9+$$0 M!$$0QB CD,AZ3,_R.K++@R (@B R@V=W!^N1CLU<9L*,^9';$G;*963#HMGP MS:8YW7Y$,1VN#0*9V3QG-B_25=[IT%UEF$[FD]/AND5.WD9G& Q#+WP J#AP M *%P*'&'L4CORPXO^PPZ'=^$T$=^.[1:_<$)^7VG.GVR)YN&[IP])MY]!T,$'$ M$*E-M$:0(-('U2^"!B@7B.@YW)9G;I/'ZU!^ MIH^<[ ?2B!OR*ZMW!XN$X2FT]LQ+.F[,Q(7DL!COO!NY%S=,G=JYI]YD.+;J M%4OZET!VC@%3NK>K_)7GB?#.CG%#F9O ;77?;?((H7>>D!E,Z!/CQ.F*M@A( M3WW,)$REB'GM4;KZ(I%^T$-DVH[QK!%HBQ7H143.@K$S7XR<;^.6\K!+#K.- MBA/YH'6.@9WIUPO7+65.9 8KY9_.#MM->IFN^N@FU-JC=/5%Z3P3S6M83'/. M3@<3.8392N+!7Y4$01 $(0H9@43V8\68,W-4/D'D,J)U@#=JY,3)^@1!Q"$C MD"#LA$8/"<('9-( .3_4A46[F>["/9C=$%7[Q=$5IO-E2+ MR\QSI0QZ,JK=D^>!2)[QPO'HZENS&$PN4ULX;3MFRT.IQQ+GF=IWM;!X]^5A M\\(U\EPK?#/ZJ)4'6G$I_6M]-Q)N.M/ RVLKWWDR*+#2/)C("AHL= -FVB.M MW6=Z?9E>>/)[,>SNC^7/TVU7J,>7NQM# "1GN-XVM5A&JZTN5=OV*E=LM;D* MM4*TTKGQPN'GAVFRL&@Q"$G9O MI,%2"B2Z"EM-;^1YI*73:N'&GJN%+P^;ER%:SWFRJ>DEKZRU\DOI5^NYQ'FN MUG;(95'ZY[F5AZM6ECRYE$8?3QZU>JFE;Z+&-N]SJNR\W;KI(A*77D>JU<&: M;2>T.G_>9ZUXU)[QVG^CAI,H:GU5#"V]XOD1[4MY;88R#)&^72U\95S*L+2> MZ\G*DTFD+S72/\?NJCLWIU MW$AX1ML($7]&.FP1MWP9A'\(J?T^4!-#,R[1\C)3%[0PDD]FZCO/OTA],X-1 M^8S6.;/MD1%=U7-OM#TR*ZN=[9'=.IL,K0DDLA[3(Q,,F;,C"<*C"-" MR%4L30>;@.H;D;BLRF< C"JUC4?YH.)K(> MX0$'FGHB",LX68W(_B,(:WAW)) @!!'N*'@.7305O'WS1LR>-!9'=NV._7O+ M4%FQ'W>/FX+_^_$[O/?*FOU7&W5]X^%,?W.1.;_EJ#=UZ:B>*2NNAX M= ^!I33&0U]*.+(#*.9XU F@4@',%%:P(K]I:A M[_D7H4^_ 0" !ZX?B"_>?QOU&C3$5;U1+G#_H6M0NKI/D M/WCH$&X=/A9-FK?$AC5_XJY+S\:942.P89-FN.^1)U/B_&#>B[CHVIO1KD-G MW'_-A>C3KS^^_F01VAW9&:W) "0X6/K1E<[X""(+R=TU@03A!"X:K3BR:W<< MV;5[_+L4#J-V43%...VL^+TMZ_]"LU:'H;!V48K_*7.W%NTZ'A7_7EE1 MCOG/3D5>?C["H1 NOOY6%-:JC9)Z]5%>M@<'#U2AH+ 6]I7MP6?OO8$)S\U/ M4RJ)G,9%]8T@<@$R @DBAD@'Y))AAU^7_8C"VK5QRMGGQ^_-?W8JEBS^#/=- MG :?C[_<-UA=C9>?>@R__/ M[ADW)7[_;Q<-0OM.1\'O]^.]5V?CB9'W8/13 MLS'P[X/QYNP96/K-8@P>.0'_G#@*MPX?AS>>?QH'*BMQ["E]T>WXD]*>7B(+ M(8./(#(.;0PA""U<>&[9[[\LPX=OO(*'9KR4=/_J.^_'4Z]_B)F//H052[_G M^@WDY^.6!Q[&8W/>PIC!UV#KQG4 @"./Z@:_WP\ Z'GR:5CVS6( 0%&=$MQX MWRC<=/]H_/7[2K3OU 6[2K?AT($#^/O0D7CYR4?3F%(BJTGOBQ (@A# LT8@ MHXLNP4L80XZU@TG7M?3K+_'Y>V]A^.1GX/?[\=^/%N*#>2_B0&4%&(! ((#& MS9IC\U]KP #LV[T+APY4@0%X:_:,>#@E=>NA5E$Q2C=O @,PZ]'1\6=;UJU! MJW9'),6[=]=.?/[>6QAT\Q!4[2]'W08-(L]\OHR7+UWNNIPFT^FEBZY,7U:@ MZ6""\ A_KOP?QMQV#3IU[XE[K^P/2!*.[-H=AW?V0\]3^X# "C? M6X;G)XU%K:(B_/7[;WC@\1E)<3\[\4$,'CD>C#$-4&@)@@I' +"832M7Q_GG'AB9A-,$!G$4GV#!(2IOA&$* >J*M&ODE03@'U3A[WH4I_H/5U?CG(Z/1L&DS;-NX'F=?<@6Z MGW R*O>78^J#0]&^\U&H/G0(VS:NQWV/3$.MVD78]-<:O#UG)NJ4U$7';CW0 M)_J6ETD/#,%5MP]USR'?GEF(1!#9"QF!1-8C;)C9T"E1OT;(*=];AK[G7833 MSHV\Y678=0/Q[X5O([^@ *5;-F'T4\\C% KAFM./1;?C3T*#QDV2_"]X:1:* MZI3@FCON0T7Y/MQX[BF8OW@9#AXX@*['G8A+KK\% #!UU%"\]<(_O/EF$=AV<>:,MVA,=/.V2!J,AF'4O]P-3VYE7EA9)&=U$E^T7)*?V]JOV#;49R8O MM,I%>4^IQV9U6>N[B'\S8:CY,ZK+6L^-W#>:+PD_';IVCQN $-8"J-6<3&^ M_>(3''U<+P" W^]'AZ['X(?__CLE]N^^^ 1''WBFN9*Z];$O^I:7_.A;7CY]]TUQED"!!38D9 $DCHYB*P1 )-Q$3@[8QD7#/CT'=KS)\ MN3R2BANM,+0KCUX8R5(K96**IU#-H^3GRI@2<1DWT,PVO :"5MZ3"ZDC,)/] MU8I"2KF3&AVOK)+UC.'+I4NQ8Z]B)Z8_+[H3,P#XHSLQ_7F /P_P^0#F0TB2 MX&< "X<1#H6 4! (!B,[,6N"D9V8H2!04Q/?B=FD?GV<<>QQJEF3FDHUG51/ M:2LVP"OCFG)F?"5:&=2W<9D2-09?GOTZ[(?4*M6$4X]^P*\ M/^]%U"XNB;NI75P'9;MVILAO7X9ZQ MD3? 7'KC8+SQ_ PL_7HQ[GAP(IZ=. J#1XS%Z\_-P,&J"AQWRNDXFON6%UX[ MH=18O;;$>J=D')8B+T]JM:J;W-89CSOYOYX[M>]Z8=EO"/)Z&JWR3?VN[/.2 M9>#WB7PY170IM8[:'X9Z.)$GR>V1OE\S;1%?SF2?L?9(K[\1P;-&()#(6%X& M)[LS$J:Z/[VNW8Q=K^U&Y(X=\9AWJY=':3#57(_5,M!NHI+O5=<$<2@8C!J! M82 L@4D 8SXPY@,0BASHS'P "T?J"HLT/R%) L)A2.$PI% 8",6.YJB)7_+C M.(+!H$#Y&M=9/3=FZK>:#W-U-+6=2$=PTJG=6 MMF%RR%[4=,K%MD@4T?J2SO;=CK[++IVULSTRTQ9I/T]NCZSJK7>G@QE== E> M5C#8,4E(8SJLI,VN]8Z9+DL/7C]]_24^>^]-C'CB63"_#XL_6HC>?SLO\FH_ M!M2$:K#ZUU_0J^_? :4[=F%@P>K :<\K?SL&)9Q-W^\KW8NVO5 MZ'S,L;CGB@L@21(Z=.V.NQYZ#*M__04O3GT$^\IV8_#(\?%-(<\]_C Z'GT, M+K[N%@R\X38\.W$47IX^"=NW;,+H)Y]'?D$!=F[?BKL'78#V'3MCV/67 @#J M-VJ,LRZ\+![WC DC9A!5Y+H;R7S>DGW ?I'T%D'#(""2)&K@TI4*=+N W228)P ME+1/!V_8L $C1HQ SYX]L6?/'I27EV/&C!E@C&',F#'(S\_'SIT[T;=O7PP< M.##=XA"$.OSS;%+/22 (@B"(+"#M1N">/7MPV667X9)++@$ G'ONN7CMM==0 M6%B(#1LV8.[44-&W:5"A<6@M"V Y/H40=./M, @ $E$ M053>)RP0C"LQN0:+(-(&Z21!&,*J_J?=".S1HP=Z].@1_QX.AU&G3AV\^^Z[ MZ-V[-X#(B?D]>_;$)Y]\@NNOOUXL8+(""27G\>7EY MN?!4, #TZWJ8ZK,;AX[ S?<]:%Y8(KMPLE.1'#XBQDID1J?=&-G3=K&I= >V MERE>]Y<7B+[N+Q_(B[WN+P#DY47;\DDX2N<#+TR=ASI./VQZN(T;@YY]_C@\__! OOO@B MPN$P%BQ8@ $#!F#APH48/'@P:FIJL'SYF#9M&I8O7XZ''WX8NW;MPJ1)DPR- M!.8% L@+!-(H.9$M"'>"'CRWS%(';_25>![(#R+SF/[190+222)7\/LC2T.4 M6+6#TFX$]NS9$Q45%=QG$R=.M!1V;"!#WN9(LF=N0BFG57<\MT;\FB5;XD@W MV9Q'=NJQ6\M:JVZI/>.U/9;39\?K_CC3^':73U+^F/W1%;OGLMW!;M514;*E MS3;;WQFQ"=Q8UCR9Y&U.SKXQA"G^R^^[K1 !N4QJTC'-I_R0&.>)U5795EU9 MSWV[R\^;Z^:T0[$E#H.!1-*F5O/4@K:J[YF!UZXD?V;Q2YXC6OY,(;*K6R\( MCGN[VR-E6^0>W-<>.8V[VB,STB37L\1=K9JG]*T5?\*%&\M:3>+$?VM2>_;= MP9$>R8U%)H)VPVO,OY:*&,6N_'17N0CWF79,3P$VZJ5 . YFM12/3\P03&!5 MW]V.\70P*SIB=+2,04V11;.\: M@01A-S9-3Q&$;7BT7Q)"Y T]!&& '=NVXH6ICV#%LA_P^N*E ("?EWR#!2_- MPM'']<+JWU:@0]?NN.+F.[G^/W]_ ;9OWHCJZFK\_-U7F/3BZR@NJ8LO/UR( MG[Y9C):'M<6ZU;_CKC&/H%Z#1MCXUVJ\^>),U"FIBT[=>J#ON0, (_^XTY< M>\=0M&Y_A&-I-XMGC4"W3OL2[L.2GIA8G^2D7CH=%]4YNQ!4+!L.^7:M3MH@ M%'/Q1#3A//_WXW! \=Q'5WWH?.W7OBX($#.+-3S;LPN31]Z#14O_1'Y! 1;.FX,9 M$T;AH2>?PWNOOHA+K[L%[3MVQEU7#L#IYP[ ?S[^ .T[=L9A#AF .;LFD"#$ M,5E-/&'UN%Y P@HBJSUT[4FG=40P/EM&_&C8D$CPMPLO1:'BZ+@3^YZ%SMU[ M @ VK_\+S5NUX1XO]Z^WYZ-V<1V\/OL9/#]E(C:O7X>\0 #;-V]"<4E=Y!<4 M !:MFV/G[Y:# HJ5B^M AW#7Z0]34U.#Z,F:'-$!P2KJU&Z=3.:MFB%%4M_0,7^R(LN M!MUT.^;/>AH_?KT8=XV>B.GC'\2=#X[#_%G34559B>-/[8MC3CC9Z:0:PK-& MH"<&:0B78*%3,K%&*9OU,IO3ELVXLMQX6ZGIC2&$1=2VK=TPY!^XYK9[<,/Y MIZ'6(U/1_?B3DIX7UZF+%D>U 0,0R,M#I^X]\+_OOT'GHX_!]/D+\>ZK+Z!Q MT^8H*JZ#YJT/ P-07*<$MPT;#0#XXL/W<$2GH[!K^W8 M??-#1])K%N].!RMWA_,:E&RYE.GEI1&*SV[+ Z5\CL9MLIKPO(D$930O1/QH MA>4DHOKH]8N7)KT\$ DC_LSA$5P[\T7Y61F^6<7DC;R+I-5*&M3*+E=CBT;U\?];=^\*;*Q@P'!X"'<,7(L+KOQ-M2I6Q?G7WYUDAQ[=N_$Q^^^ M@:MNNPL5%?M0KT%#@"$RXFA7&:FEW2*>'0D$P,^@;$19X+QT*BNTV\BH?"8[ M7!O.:.-B:UY8"(#!O$'!^Y]-B-8QT3II[&$"MTW9:^6!7>$;2K.)R'.EWQ#! M[7FA)Y]"'W_\:C$^_V !]NTMP\M/3\$EU]V,0$$^IHX9AK9'=,">G3O0I'E+ M]+MX$ #@V4C>^#2&V[!>9=>A;_^6(7GIDQ$L/H0CNEU,DXYJQ\ X*7I M4]"\56LT:MH

I#N&[(_4EB3!\W$G>-F@#&&$X\[2P\^?!PS/WGDSCE;^?: MGP?*^Q;+S+-&(,]()HA,X_1N14MQT=1;!A',?#7CTL5+%(3CLN5=W1+I)!&G M5Y_3T:O/Z4GW!@RZ%@,&7)V23E"2ZX9N[(,.XW !'B@"TW4@>ZL. M0;@6,@*)K,=2IZ3L=%W640FGS: Q:RDN@C"+#7I*$(0X-!U,$%IDRY2I3<:L M*].62Y@XMLCY)0J"L8DX$T@KZ221R]!TL!IN:!G<( -AK0O,YC)T8]K<()/= M,K@A/ ?SU=*(L1O*GR =^BB S)X=B10:"@P1PJ1T,'!,F",.1^?"';-Y#J1 M-C?4&3<8;FH8+,NX4>90O@KKI&T1.AL=D4.X0;?2;.=XU@B,V("QE?LB*_@E MQ7V[US?)PS43AU9:].*4QZOE5_2Y6GZJI