UNITED STATES
SECURITIES AND EXCHANGE COMMISSION
Washington, D.C. 20549
FORM
(Mark One)
REGISTRATION STATEMENT PURSUANT TO SECTION 12(b) OR (g) OF THE SECURITIES EXCHANGE ACT OF 1934 | |
|
|
OR | |
|
|
ANNUAL REPORT PURSUANT TO SECTION 13 OR 15(d) OF THE SECURITIES EXCHANGE ACT OF 1934 | |
|
|
OR | |
|
|
TRANSITION REPORT PURSUANT TO SECTION 13 OR 15(d) OF THE SECURITIES EXCHANGE ACT OF 1934 | |
|
|
OR | |
|
|
SHELL COMPANY REPORT PURSUANT TO SECTION 13 OR 15(d) OF THE SECURITIES EXCHANGE ACT OF 1934 |
DATE OF EVENT REQUIRING THIS SHELL COMPANY REPORT
FOR THE TRANSACTION PERIOD FORM TO
Commission file number:
华能国际电力股份有限公司
(Exact name of Registrant as specified in its charter)
PEOPLE’S REPUBLIC OF
(Jurisdiction of incorporation or organization)
(Address of principal executive offices)
Tel: +
(Name, Telephone, Email and/or Facsimile number and Address of Company Contact Person)
Securities registered or to be registered pursuant to Section 12(b) of the Act.
Title of Each Class |
| Trading Symbol(s) |
| Name of each exchange on which registered |
|
| |||
|
|
|
*Not for trading, but only in connection with the registration of our American Depositary Shares
Securities registered or to be registered pursuant to Section 12(g) of the Act.
NONE
(Title of Class)
_____________________
Securities for which there is a reporting obligation pursuant to Section 15(d) of the Act.
NONE
(Title of Class)
_____________________
Indicate the number of outstanding shares of each of the issuer’s classes of capital or common stock as of the close of the period covered by the annual report:
Domestic A Shares with Par Value of RMB1.00 Per Share | |
Overseas Listed Shares with Par Value of RMB1.00 Per Share |
Indicate by check mark if the registrant is a well-known seasoned issuer, as defined in Rule 405 of the Securities Act.
If this report is an annual or transition report, indicate by check mark if the registrant is not required to file reports pursuant to Section 13 or 15(d) of the Securities Exchange Act of 1934.
Yes ☐
Note - Checking the box above will not relieve any registrant required to file reports pursuant to Section 13 or 15(d) of the Securities Exchange Act of 1934 from their obligations under those Sections.
Indicate by check mark whether the registrant (1) has filed all reports required to be filed by Section 13 or 15(d) of the Securities Exchange Act of 1934 during the preceding 12 months (or for such shorter period that the registrant was required to file such reports), and (2) has been subject to such filing requirements for the past 90 days.
Indicate by check mark whether the registrant has submitted electronically every Interactive Data File required to be submitted pursuant to Rule 405 of Regulation S-T (§232.405 of this chapter) during the preceding 12 months (or for such shorter period that the registrant was required to submit such files).
Indicate by check mark whether the registrant is a large accelerated filer, an accelerated filer, a non-accelerated filer or an emerging growth company. See the definitions of “large accelerated filer,” “accelerated filer” and “emerging growth company” in Rule 12b-2 of the Exchange Act.
Accelerated filer ☐ | |
Non-accelerated filer ☐ | Emerging growth company |
(Do not check if a smaller reporting company)
If an emerging growth company that prepares its financial statements in accordance with U.S. GAAP, indicate by check mark if the registrant has elected not to use the extended transition period for complying with any new or revised financial accounting standards† provided pursuant to Section 13(a) of the Exchange Act.☐
† The term “new or revised financial accounting standard” refers to any update issued by the Financial Accounting Standards Board to its Accounting Standards Codification after April 5, 2012.
Indicate by check mark whether the registrant has filed a report on and attestation to its management’s assessment of the effectiveness of its internal control over financial reporting under Section 404(b) of the Sarbanes-Oxley Act (15 U.S.C. 7262(b)) by the registered public accounting firm that prepared or issued its audit report.
Indicate by check mark which basis of accounting the registrant has used to prepare the financial statements included in this filing:
U.S. GAAP ☐ | by the International Accounting Standards Board ☒ | Other ☐ |
If “Other” has been checked in response to the previous question, indicate by check mark which financial statement item the registrant has elected to follow.
Item 17 ☐ Item 18 ☐
If this is an annual report, indicate by check mark whether the registrant is a shell company (as defined in Rule 12b-2 of the Exchange Act).
Yes
(APPLICABLE ONLY TO ISSUERS INVOLVED IN BANKRUPTCY PROCEEDINGS DURING THE PAST FIVE YEARS)
Indicate by check mark whether the registrant has filed all documents and reports required to be filed by Sections 12, 13 or 15(d) of the Securities Exchange Act of 1934 subsequent to the distribution of securities under a plan confirmed by a court.
Yes ☐ No ☐
TABLE OF CONTENTS
1 | ||||
2 | ||||
3 | ||||
3 | ||||
3 | ||||
3 | ||||
17 | ||||
90 | ||||
90 | ||||
116 | ||||
122 | ||||
131 | ||||
131 | ||||
132 | ||||
145 | ||||
149 | ||||
151 | ||||
151 | ||||
MATERIAL MODIFICATIONS TO THE RIGHTS OF SECURITY HOLDERS AND USE OF PROCEEDS | 151 | |||
151 | ||||
151 | ||||
151 | ||||
152 | ||||
152 | ||||
153 | ||||
PURCHASES OF EQUITY SECURITY BY THE ISSUER AND AFFILIATED PURCHASERS | 153 | |||
153 | ||||
154 | ||||
156 | ||||
156 | ||||
156 | ||||
157 |
i
INTRODUCTION
We maintain our accounts in Renminbi Yuan (“Renminbi” or “RMB”), the lawful currency of the People’s Republic of China (the “PRC” or “China”). References herein to “US$” or “U.S. dollars” are to United States Dollars, references to “HK$” are to Hong Kong Dollars, and references to “S$” are to Singapore Dollars. References to ADRs and ADSs are to American Depositary Receipts and American Depositary Shares, respectively. Translations of amounts from Renminbi to U.S. Dollars are solely for the convenience of the reader. Unless otherwise indicated, any translations from Renminbi to U.S. Dollars or from U.S. Dollars to Renminbi were translated at the middle exchange rate announced by the People’s Bank of China (the “PBOC Rate”) on December 31, 2021 of US$1.00 to RMB 6.3757. No representation is made that the Renminbi or U.S. Dollar amounts referred to herein could have been or could be converted into U.S. Dollars or Renminbi, as the case may be, at the PBOC Rate or at all.
References to “A Shares” are to common tradable shares issued to PRC domestic shareholders.
References to the “central government” are to the national government of the PRC and its various ministries, agencies and commissions.
References to the “Company,” “we,” “our” and “us” include, unless the context requires otherwise, Huaneng Power International, Inc. and the operations of our power plants and our construction projects.
References to “HIPDC” are to Huaneng International Power Development Corporation and, unless the context requires otherwise, include the operations of the Company prior to the formation of the Company on June 30, 1994.
References to “Huaneng Group” are to China Huaneng Group Co., Ltd.
References to “local governments” in the PRC are to governments at all administrative levels below the central government, including provincial governments, governments of municipalities directly under the central government, municipal and city governments, county governments and township governments.
References to “our power plants” are to the power plants that are wholly owned by the Company or to the power plants in which the Company owns majority equity interests.
References to the “PRC Government” include the central government and local governments.
References to “provinces” include provinces, autonomous regions and municipalities directly under the central government.
References to “Singapore” are to the Republic of Singapore.
References to “tons” are to metric tons.
Previously, the Overseas Listed Foreign Shares were also referred to as the “Class N Ordinary Shares” or “N Shares.” Since January 21, 1998, the date on which the Overseas Listed Foreign Shares were listed on The Stock Exchange of Hong Kong Limited by way of introduction, the Overseas Listed Foreign Shares have been also referred to as “H Shares.”
1
GLOSSARY
availability factor | For any period, the ratio (expressed as a percentage) of a power plant’s available hours to the total number of hours in such period. |
available hours | For a power plant for any period, the total number of hours in such period less the total number of hours attributable to scheduled maintenance and planned overhauls as well as to forced outages, adjusted for partial capacity outage hours. |
capacity factor | The ratio (expressed as a percentage) of the gross amount of electricity generated by a power plant in a given period to the product of (i) the number of hours in the given period multiplied by (ii) the power plant’s installed capacity. |
demand | For an integrated power system, the amount of power demanded by consumers of energy at any point in time. |
dispatch | The schedule of production for all the generating units on a power system, generally varying from moment to moment to match production with power requirements. As a verb, to dispatch a plant means to direct the plant to operate. |
GW | Gigawatt. One million kilowatts. |
GWh | Gigawatt-hour. One million kilowatt-hours. GWh is typically used as a measure for the annual energy production of large power plants. |
installed capacity | The manufacturers’ rated power output of a generating unit or a power plant, usually denominated in MW. |
kV | Kilovolt. One thousand volts. |
kW | Kilowatt. One thousand watts. |
kWh | Kilowatt-hour. The standard unit of energy used in the electric power industry. One kilowatt-hour is the amount of energy that would be produced by a generator producing one thousand watts for one hour. |
MW | Megawatt. One million watts. The installed capacity of power plants is generally expressed in MW. |
MWh | Megawatt-hour. One thousand kilowatt-hours. |
peak load | The maximum demand on a power plant or power system during a specific period of time. |
transmission losses | Electric energy that is lost in transmission lines and therefore is unavailable for use. |
2
PART I
ITEM 1. IDENTITY OF DIRECTORS, SENIOR MANAGEMENT AND ADVISERS
Not applicable.
ITEM 2. OFFER STATISTICS AND EXPECTED TIMETABLE
Not applicable.
ITEM 3. KEY INFORMATION
A. | [Reserved] |
B. | Capitalization and indebtedness |
Not applicable.
C. | Reasons for the offer and use of proceeds |
Not applicable.
D. | Risk factors |
Risks relating to our business and the PRC’s power industry
Government regulation of power tariffs and other aspects of the power industry may adversely affect our business
Similar to electric power companies in other countries, we are subject to governmental and electric grid regulations in virtually all aspects of our operations, including the amount and timing of electricity generations, the setting of tariffs, the performance of scheduled maintenance, and the compliance with power grid control and dispatch directives as well as environment protection regulations. There can be no assurance that these regulations will not change in the future in a manner which could adversely affect our business.
The tariffs for our planned output are subject to a review and approval process involving the National Development and Reform Commission (“NDRC”) and the relevant provincial government. Since April 2001, the PRC Government has been implementing a tariff-setting mechanism based on the operating terms of power plants as well as the average costs of comparable power plants. Pursuant to the NDRC circular issued in June 2004, the tariffs for our newly built power generating units commencing operation from June 2004 have been set on the basis of the average cost of comparable units adding tax and reasonable return in the regional grid. Any future reductions in our tariffs, or our inability to raise tariffs (for example, to cover any increased costs we may have to incur) as a result of the new tariff-setting mechanism, may adversely affect our revenue and profits.
In addition, the PRC Government started a program in 1999 to effect power sales through competitive bidding in some of the provinces where we operate our power plants. The tariffs for power sold through competitive bidding are generally lower than the pre-approved tariffs for planned output. In the more recent few years, power sales through competitive bidding only accounted for a portion of our overall power sales.
Nevertheless, the PRC Government is seeking to expand the program. Any increased power sales through competitive bidding may reduce our tariffs and may adversely affect our revenue and profits.
3
Furthermore, the PRC Government started in 2009 to promote the practice of direct power purchase by large power end-users. Pursuant to the circular jointly issued by NDRC, the State Electricity Regulatory Commission (“SERC”) and China National Energy Administration in June 2009, the direct transaction price shall include the direct transaction price, the grid transmitting price and the governmental fund and additional charges, of which the direct transaction price shall be freely determined through negotiation between the power generation company and the large power end-user. The price of direct power purchase shall be subject to the demand in the power market. Furthermore, the scale and mode of the transaction are also subject to the structure and level of development of local economy. In terms of power generation companies engaged in direct power purchase, direct power sales constitute a portion of the total power sales, thus affecting the power sales of the Company. For the past few years, the PRC Government continued the reform in the area of direct power purchase by large power end-users. In 2013, China National Energy Administration officially launched the direct power purchase program in seven provinces where we have power plants and the program has been steadily rolled out in other provinces.
The tariff-setting mechanism is evolving with the reforming of the PRC electric power industry. The PRC government announced a number of development and reform plans for the power market in 2016, covering areas including laws and regulations, comprehensive pilot plans, power transmission and distribution prices and supply side dynamics, the establishment of the power exchanges, rules and market administration committees, and opening up incremental distribution business. In 2017, the development and reform plans have been further expanded to the nationwide scale, with multiple issuances made by the PRC government governing power development plan, electricity transmission and distribution price, opening up of the electricity generation and consumption plans, supply side dynamics, electricity power spot and ancillary market development, electricity exchange rules, market supervision and clean energy consumption, etc. In 2018, the development and reform entered into an implementation stage, reflected in the areas of distribution price reform, establishment of the power exchanges and ancillary market and the incremental distribution network reform, etc. In 2019, the development and reform entered into a “deep-water zone” with long- and mid-term power exchange markets, power commodity exchange markets and ancillary service exchange markets established and relevant rules and policies adopted. In 2020, MOF, NDRC and China National Energy Administration (“NEA”) issued Several Opinions on Promoting the Healthy Development of Non-Hydro Renewable Energy Power Generation to clarify the responsibilities of consuming renewable energy power for each provisional administrative region. In 2021, NDRC and NEA issued Notice on Further Deepening the Market-Based Reform of the Electricity Tariff for Coal-fired Power and Notice on Further Developing Time-of-Use Pricing Regime to provide further guidance on tariff pricing. Currently, the percentage of the direct power purchase accounts for more than 80% of our total power sales, which may have an adverse effect over our operating results basing on the relatively lower tariffs generally for this portion.
There is no assurance that government regulations on the industry will not change in a manner which could adversely affect our business and impact our results of operations, that we will be afforded sufficient time to adjust the operation of our business in answering to the promulgation of such changes and amendments before they come into effect and apply to our business operations, or that such adjustment measures we take can effectively help us to navigate the new regulatory environment and ease the negative impacts brought by such new changes and amendments on our business operation. See “Item 4 Information of the Company – B. Business Overview – Pricing Policy” for example. As a result, any such regulations and the adjustments we make in answering thereto may lead to changes to the way we operate our business, including without limitation how we formulate our production plan under a new industry regime with respect to dispatch and pricing, and how we manage our operating costs in relation thereto, which may in return have a negative impact on our business and cause the price of our ADSs to incline.
We may not be able to sell all electricity generated by us as expected
Our profitability depends, in part, upon each of our power plants generating electricity to meet our electricity generation plan established based on electricity purchase agreements we enter with our customers. We compete with other power generation companies for opportunities to enter into such electricity purchase agreements and manage our generation plan accordingly. No assurance can be given that we will be able to enter into electricity purchase agreements that will utilize full or most of our generation capacilities, or if we can enter into such agreements, such agreements can be carried out by our customers pursuant to the terms thereto. A reduction in the amount of electric power sold relative to a power plant’s expected generation could have an adverse effect on the profitability of our operations.
4
PRC government authorities have been adopting regulations and rules promoting a market-based dispatch regime with priority of new energy power generation consumption. In August 2007, the General Office of the State Council issued a notice, promoting the energy saving electricity dispatch policy, which provides dispatching priority to electricity generated from renewable resources over electricity generated from unrenewable resources. In 2013, the government made continuous effort to encourage energy-saving power distribution. In 2014, the NDRC issued Guidance on Strengthening and Improving the Operation of Power Management Regulation. In 2015, the NDRC and NEA jointly issued Guidelines on Improving Electric Power Operations and Deepening Clean Energy Generation confirming a system ensuring the full-priced purchasing of renewable energy, and requests furthering the electric power differentiation system on coal-fired units. In 2016, the NDRC and China National Energy Administration issued Notice on Issuing the Measures for the Administration of the Guaranteed Buyout of Electricity Generated by Renewable Energy Resources, Directive on the Measures for the Administration of the Guaranteed Buyout of Electricity Generated by Solar, Wind Energy Resources and Provisionary, Measures for Priority Dispatch of Renewable Peaking Power Generation Units and Notice on Power Supply and Notice on the Measures on the Consumption of Renewable Energy in Tri-North Area. In 2017, NDRC and NEA issued Circular on Orderly Opening Up the Electricity Generation and Consumption Plans, Interim Measures for Guaranteeing the Safe Consumption of Nuclear Power, Pilot Rules on Inter-regional Spare Renewable Energy Electricity Power Stock Trading, Circular on the Establishment of Pilot Electricity Power Stock Exchange, Circular on Promoting Hydropower Consumption in Southwest China, and Solutions to Abandoning Hydro, Wind and Solar Energy, to promote the development of the power stock exchange and renewable power consumption. In 2018, NDRC and NEA issued the Circular on Promoting the Capability to Adjust the Power System and Plan for Consumption of Clean Energy (2018-2020) to further direct the development of the clean energy and push for the reform of the power market. The NEA also solicited for public opinions on the Circular on the Renewable Power Quota System, proposing a coordination between the power suppliers and users to take responsibilities under quota system. In 2019, NDRC and NEA issued the Notice on Regulating the Management of Priority Generation and Priority Purchase Plan to prioritize the purchase of the renewable energy power, the Notice on Establishing and Perfecting Renewable Energy Power Consumption Guarantee Mechanism to promote the consumption of the renewable energy power. NDRC also issued the Notice on Full Release of Power Generation and Utilization Plan for Operating Power Users to further open up the utilization plan of operating power users to promote the renewable energy power consumption. In 2020, NDRC and NEA issued Notice on the Responsibility of Renewable Energy Power Consumption in Each Provincial Administrative Region in 2020, requesting provincial governmental authorities to prepare implementation plans for consumption of renewable power. In 2021, NDRC and NEA issued Measures for the Management and Supervision of Power Suppliers, Notice on Further Implementing the Work of the Establishment of the Electricity Spot Market and Notices on the Weight of Responsibilities and Related Matters on Renewable Energy Power Consumption in 2021 on power market and dispatch plans.
We cannot assure you that the implementation of such regulations or administrative measures will not result in any decrease in the amount of the power sold and dispatched by any of our power plants, or that we will have sufficient time to effectively adjust and optimize our power generation and production plan under any dispatch regime established by new regulations and adiministrative measures or amendments thereto to ease any negative impacts brought thereby on our operations. If our power sold and dispatch amount stays at a level lower than what we desire, our profitability may be adversely and materially impacted, and the price of our ADSs may decline.
The power industry reform may affect our business
The PRC Government in 2002 announced and started to implement measures to further reform the power industry, with the ultimate goal of creating a more open and fair power market. As part of the reform, five power generation companies, including Huaneng Group, were created or restructured to take over all the power generation assets originally belonging to the State Power Corporation of China. In addition, two grid companies were created to take over the power transmission and distribution assets originally belonging to the State Power Corporation of China. An independent power supervisory commission, the SERC, was created to regulate the power industry. There might be further reforms, and it is uncertain how these reform measures and any further reforms will be implemented and impact our business. In December 2012, the PRC Government issued a notice to further reform the coal pricing mechanism, which mandated (1) the termination of all key coal purchase contracts between power generation companies and coal suppliers, and the abolition of national guidance of the railway transportation capacity plan, and (2) the cancellation of the dual-track coal pricing system, effective from January 1, 2013. For a detailed discussion of the reform, see “Item 4 Information on the Company – B. Business overview – Pricing policy.” There can be no assurance that such coal pricing reform will not adversely affect our results of operation. In 2013, the PRC Government continued the reform in power industry. In July 2013, China National Energy Administration issued the Notice on Direct Purchases between Power End-users and Power Generation Companies, which officially implemented the direct purchases programs by large end-users.
5
In 2017, the PRC Government issued various measures to further reform the power industry, including: (i) establishing the national power development plan covering the consumption share of the non-fossil fuel, heating system reform based on “coal to gas,” “coal to electricity” and renewable energy development, and new technology programs; (ii) speeding up the reform of electricity transmission and distribution price; (iii) orderly opening up the electricity generation and consumption plans; (vi) establishing the union of power exchanges and speeding up the electricity stock and ancillary service market development; (v) enhancing the development of the electricity power supply side reform; (vi) issuing the rules for monthly inter-region electricity power trade in South China; and (vii) furthering the development of the power-related credit system.
In 2018, NDRC and NEA issued Circular on Promoting the Capability to Adjust the Power System and Plan for Consumption of Clean Energy (2018-2020), Circular on the Renewable Power Quota System and Notice on Actively Promoting Market-oriented Power Exchange and Further Improving the Trading Mechanism to further promote the consumption of renewable energy and increase the utilization rate of the renewable energy. From 2018, users from coal, steel, non-ferrous metal and construction materials industries, among others, shall participate in the market-oriented power exchange process instead of applying the catalog price. Users are encouraged to negotiate with power generating enterprises to establish the “baseline with floating adjustment” pricing mechanism.
In 2019, NDRC and NEA, jointly and individually, issued multiple circulars, measures and notices to further facilitate the development and reform of the power market, including, among others, Notice on Establishing and Perfecting Renewable Energy Power Consumption Guarantee Mechanism and Guiding Opinions on Deepening the Reform of the On-grid Tariff Formation Mechanism for Coal-fired Power. Such circulars, measures and notices provide that (i) a renewable energy power consumption guarantee mechanism shall be established in 2020, (ii) the operating power users shall be given more discretion in pricing when negotiating with power generation entities, (iii) multiple measure on tariff formation mechanism shall be adopted, and (iv) the establishment power commodity exchange markets shall be sped up.
In 2020, NDRC, MOF and NEA, jointly and individually, issued multiple circulars, measures and notices to further facilitate the development and reform of the power market, including, among others, Notice on the Responsibility of Renewable Energy Power Consumption in Each Provincial Administrative Region in 2020 and Several Opinions on Promoting the Healthy Development of Non-Hydro Renewable Energy Power Generation to (i) request provincial governmental authorities to prepare implementation plans for consumption of renewable power, (ii) fully open up power consumption plan for commercial power users, (iii) promote consumption of renewable energy and (iv) deepen reform of incremental power distribution business.
In 2021, NDRC and NEA have successively issued multiple guidances, notices and rules to further facilitate the development and reform of the power market, including, among others, Notice on Further Deepening the Market-Based Reform of the Electricity Tariff for Coal-fired Power, Notice on Further Developing Time-of-Use Pricing Regime, Measures for the Management and Supervision of Power Suppliers, Notice on Further Implementing the Work of the Establishment of the Electricity Spot Market, Notices on the Weight of Responsibilities and Related Matters on Renewable Energy Power Consumption in 2021, Guiding Opinions on Accelerating the Development of New Energy Storage, and Measures for Pricing of Electricity Transmission for Inter-provincial and Inter-regional Special Projects to accelerate the process of deepening the reform of the power markets regulatory regime, further develop the power market system, effectively improve the consumption capacity of renewable energy, accelerate the development in a green and low-carbon approach, and ensure that the carbon peak and carbon neutrality goals be achieved as scheduled.
These reform actions will have a profound impact on the operations of power generation companies by intensifying competition, promoting renewable energy power generation and establishing a market-based tariff pricing regime, which may cause us to incur more operating costs and expenses, focus more on renewable energy power generation and sell electricity at a price less favourable to us, and in turn may negatively impact our results of operations and profitablity.
We are effectively controlled by Huaneng Group and HIPDC, whose interests may differ from those of our other shareholders
Huaneng Group, directly or indirectly holds 46.23% of our total outstanding shares, and HIPDC directly holds 32.28% of our total outstanding shares. As Huaneng Group is HIPDC’s parent company, they may exert effective control over us acting in concert. Their interests may sometimes conflict with those of our other minority shareholders. There is no assurance that Huaneng Group and HIPDC will always vote their shares, or direct the directors nominated by them to act in a way that will benefit our other minority shareholders.
6
Disruption in fuel supply and its transportation as well as increase in fuel price may adversely affect the normal operation of our thermal power plants
A substantial majority of our power plants are fueled by coal. The coal supply for our power plants is arranged through free negotiation between power companies, coal suppliers, and railway authorities. Thus, any material disruption in coal supply and its transportation may adversely affect our operations. To date, we have not experienced shutdowns or reduced electricity generation caused by inadequate coal supply or transportation services.
In addition, our results of operations are sensitive to the fluctuation of coal price. During the few years before 2016, the Chinese coal market was showing a surplus in production, resulting in a significantly decreased coal price. However, the policies of reducing overcapacity of the Chinese coal producers implemented in early 2016 led to a rebalancing of coal supply and demand which to some extent increased possibilites of coal price upward trend in the Chinese coal market. Therefore, the coal prices may fluctuate upon demand and supply of coal. We have witnessed a sharp increase in fuel cost in 2021. Also, there is no assurance that we will be able to adjust our power tariff to pass on the increase in the coal price in time.
Operation of certain of our power plants may be influenced by weather conditions
We own and operate certain photovoltaic power plants and wind power plants. The performance of wind power stations is dependent upon meteorological and atmospheric conditions, and the performance of photovoltaic power stations is highly dependent on suitable solar conditions and associated weather conditions and air pollution, both of which fluctuate over time and are beyond our control. If we experience continuous unfavorable weather, the operation results of our photovoltaic power plants and wind power plants may be materially and adversely impacted.
Power plant development, acquisition and construction are a complex and time-consuming process, the delay of which may negatively affect the implementation of our growth strategy
We develop, construct, manage and operate large power plants. Our success depends upon our ability to secure all required PRC Government approvals, power sales and dispatch agreements, construction contracts, fuel supply and transportation and electricity transmission arrangements. Delay or failure to secure any of these could increase cost or delay or prevent commercial operation of the affected power plant. Although each of our power plants in operation and the power plants under construction received all required PRC Government approvals in a timely fashion, no assurances can be given that all the future projects will receive approvals in a timely fashion or at all. In addition, due to national policies and related regulations promoting environment-friendly energy, the approval requirements and procedures for power plant are becoming increasingly stringent, which may negatively affect the approval process of our new projects.
We have generally acted as, and intend to continue to act as, the general contractor for the construction of our power plants. As with any major infrastructure construction effort, the construction of a power plant involves many risks, including shortages of equipment, material and labor, labor disturbances, accidents, inclement weather, unforeseen engineering, environmental, geological, delays and other problems and unanticipated cost increases, any of which could give rise to delays or cost overruns. Construction delays may result in loss of revenues. Failure to complete construction according to specifications may result in liabilities, decrease power plant efficiency, increase operating costs and reduce earnings. Although the construction of each of our power plants was completed on or ahead of schedule and within its budget, no assurance can be given that construction of future projects will be completed on schedule or within budget.
In addition, from time to time, we may acquire existing power plants from HIPDC, Huaneng Group or other parties. The timing and the likelihood of the consummation of any such acquisitions will depend, among other things, on our ability to obtain financing and relevant PRC Government approvals and to negotiate relevant agreements for terms acceptable to us.
7
Substantial capital is required for investing in or acquiring new power plants and failure to obtain capital on reasonable commercial terms will increase our finance cost and cause delay in our expansion plans
An important component of our growth strategy is to develop new power plants and acquire operating power plants and related development rights from HIPDC, Huaneng Group or other companies on commercially reasonable terms. Our ability to arrange financing and the cost of such financing depend on numerous factors, including general economic and capital market conditions, credit availability from banks or other lenders, investor confidence in us and the continued success of our power plants. Although we have not been materially affected by inflation in the past, there is no assurance that we would not be affected in the future. The Chinese government is expected to implement active fiscal policies and sound monetary policies. The fiscal policies would be focused on reducing taxes and other fiscal levies with the view to addressing, in collaboration with the implementation of monetary polies, funding difficulties and prohibitive funding prices encountered by business enterprises. The sound monetary policies would be implemented to underscore overall economic stability, strengthen counter-cyclical monetary administration, optimize credit structure, and maintain reasonably adequate liquidity. The interest bearing debts of the Company are mostly denominated in Renminbi, changes in benchmark lending interest rate published by the PBOC will have a direct impact on the Company’s cost of debt. As the debts denominated in other currencies represent a small percentage in our total debts, the change of interest rates of foreign currencies are not expected to have material effect on the Company. Though the finance costs are expected to be consistent, we may not be able to carry out our expansion plans due to the failure to obtain financing or increased financing costs. Furthermore, although we have historically been able to obtain financing on terms acceptable to us, there can be no assurance that financing for future power plant developments and acquisitions will be available on terms acceptable to us or, in the event of an equity offering, that such offering will not result in substantial dilution to existing shareholders.
Operation of power plants involves many risks and we may not have enough insurance to cover the economic losses if any of our power plants’ ordinary operation is interrupted
The operation of power plants involves many risks and hazards, including breakdown, failure or substandard performance of equipment, improper installation or operation of equipment, labor disturbances, natural disasters, environmental hazards and industrial accidents. The occurrence of material operational problems, including but not limited to the above events, may adversely affect the profitability of a power plant.
Our power plants in the PRC currently maintain insurance coverage that is typical in the electric power industry in the PRC and in amounts that we believe to be adequate. Such insurance, however, may not provide adequate coverage in certain circumstances. In particular, in accordance with industry practice in the PRC, our power plants in the PRC do not generally maintain business interruption insurance, or any third party liability insurance other than that included in construction all-risks insurance or erection all-risks insurance to cover claims in respect of bodily injury or property or environment damage arising from accidents on our property or relating to our operation. Although each of our power plants has a good record of safe operation, there is no assurance that the afore-mentioned accidents will not occur in the future.
If the PRC Government adopts new and stricter environmental laws and additional capital expenditure is required for complying with such laws, the operation of our power plants may be adversely affected and we may be required to make more investment in compliance with these environmental laws
Most of our power plants, being coal-fired power plants, discharge pollutants into the environment. We are subject to central and local government environmental protection laws and regulations. The Environmental Protection Tax Law of People’s Republic of China came into effect in 2018 and imposes base-level environmental protection tax for various polluting substances. In addition, such environmental protection laws and regulations also set up the goal for the overall control on the discharge volume of key polluting substances. These laws and regulations impose fines for violations of laws, regulations or decrees and provide for the possible closure by the central government or local government of any power plant which fails to comply with orders requiring it to cease or cure certain activities causing environmental damage. Also, the PRC Government requires thermal power plants to equip all units with desulphurization and denitrification facilities, and sets higher anti-dust standards. The Chinese government is working on a pollution prevention and control campaign, which shall subject us to more stringent standards for our air pollution control, waste water pollution control and ecological environmental protection efforts. Such stringent standards, together with the environmental protection tax, will result in the increases in the environmental protection expenditure and operating costs of power plants and may have an adverse impact on our operating results.
8
We attach great importance to the environmental related matters of our existing power plants and our power plants under construction. We have implemented a system that is designed to control pollution caused by our power plants, including the establishment of an environmental protection administration system at each power plant, adoption of relevant control and evaluation procedures and the installation and maintenance of certain pollution control equipment. We also upgraded the ultra-low emission facilities on our coal-fired units. Currently, we have completed the ultra-low emission upgrade on more than 99% of our coal-fired units in PRC and stabilized the emission of main smoke and dust pollutants to an ultra-low level. We have also initiated the environment protection upgrade projects, covering wastewater emission and ash field management, for our plants in key regions. We believe our environmental protection systems and facilities for the power plants are adequate for us to comply with applicable central government and local government environmental protection laws and regulations. However, the PRC Government may impose new, stricter laws and regulations on environmental protection, which may establish higher environment protection standards for us to follow, the compliance with which may lead to higher costs, interruption of our operations for the installation or upgrading of environment protection facilities or even shutdown of certain power plants which fail to meet the standards, and in turn adversely affect our operations.
The PRC is a party to the Framework Convention on Climate Change (“Climate Change Convention”), which is intended to limit or capture emissions of “greenhouse” gases, such as carbon dioxide. Ceilings on such emissions could limit the production of electricity from fossil fuels, particularly coal, or increase the costs of such production. At present, ceilings on the emissions of “greenhouse” gases have not been assigned to developing countries under the Climate Change Convention. Therefore, the Climate Change Convention would not have a major effect on us in the short term because the PRC as a developing country is not obligated to reduce its emissions of “greenhouse” gases at present, and the PRC Government has not adopted relevant control standards and policies. If the PRC were to agree to such ceilings, or otherwise reduce its reliance on coal-fired power plants, our business prospects could be adversely affected.
In addition, China is taking multiple measures to address the climate change challenges, including adjusting industrial structure, improving energy efficiency, optimizing energy structure, strengthening ecosystem adaptability, and promoting carbon trading markets, and the new initiatives of China’s carbon peak in 2030 and carbon neutral in 2060. The adoption of such measures, especially the establishment of the carbon trading markets, may increase the operating costs and expenses of our power plants, and therefore have negative impact on our operations and financial results.
Our business benefits from certain PRC Government tax incentives. Expiration of, or changes to, the incentives could adversely affect our operating results
Prior to January 1, 2008, according to the relevant income tax law, domestic enterprises were, in general, subject to statutory income tax of 33% (30% enterprise income tax and 3% local income tax). If these enterprises are located in certain specified locations or cities, or are specifically approved by State Administration of Taxation, a lower tax rate would be applied. Effective from January 1, 1999, in accordance with the practice notes on the PRC income tax laws applicable to foreign invested enterprises investing in energy and transportation infrastructure businesses, a reduced enterprise income tax rate of 15% (after the approval of State Administration of Taxation) was applicable across the country. We applied this rule to all of our wholly owned operating power plants after obtaining the approval of State Administration of Taxation. In addition, certain power plants were exempted from enterprise income tax for two years starting from the first profit-making year, after offsetting all tax losses carried forward from the previous years (at most of five years), followed by a 50% reduction of the applicable tax rate for the next three years. The statutory income tax was assessed individually based on each of their results of operations.
On March 16, 2007, the Enterprise Income Tax Law of PRC, or the New Enterprise Income Tax Law, was enacted, and became effective on January 1, 2008 and was amended on February 24, 2017. The New Enterprise Income Tax Law imposes a uniform income tax rate of 25% for domestic enterprises and foreign invested enterprises. Therefore, our power plants subject to a 33% income tax rate prior to January 1, 2008 are subject to a lower tax rate of 25% starting on January 1, 2008. With regard to our power plants entitled to a reduced enterprise income tax rate of 15% prior to January 1, 2008, their effective tax rate gradually increased to 25% within a five-year transition period commencing on January 1, 2008. Accordingly, the effective tax rate of our wholly owned power plants has increased over time. In addition, although our power plants entitled to tax exemption and reduction under the income tax laws and regulations that are effective prior to the New Enterprise Income Tax Law will continue to enjoy such preferential treatments until the expiration of the same, newly established power plants will not be able to benefit from such tax incentives, unless they can satisfy specific qualifications, if any, provided by then effective laws and regulations on preferential tax treatment.
9
The increase of applicable income tax rate and elimination of the preferential tax treatment with regard to certain of our power plants may adversely affect our financial condition and results of operations. Moreover, our historical operating results may not be indicative of our operating results for future periods as a result of the expiration of the tax benefits currently available to us.
In addition, according to the New Enterprise Income Tax Law and its implementation rules, any dividends derived from the distributable profits accumulated from January 1, 2008 and paid to the shareholders who are non-resident enterprises in the PRC will be subject to the PRC withholding tax at the rate of 10%. The withholding tax will be exempted if such dividends are derived from the distributable profits accumulated before January 1, 2008. Under a notice issued by the State Administration of Taxation of the PRC on November 6, 2008, we are required to withhold PRC income tax at the rate of 10% on annual dividends paid for 2008 and later years payable to our H Share investors who are non-resident enterprises.
The coronavirus outbreak could materially and adversely affect our business
The World Health Organization declared the COVID-19 pandemic a global epidemic on March 11, 2020. Since then, there have been rapid and widespread increases in new infections in the United States, Europe and other parts of the world and increased fatality rates in many countries. Many countries have declared states of emergency, closed their borders to international travelers, and restricted the movements of their citizens with a view to contain the epidemic and there is no assurance that such measures will be effective. Citizens in many affected countries and areas are being advised or required to stay at their homes subject to limited exceptions. Reduced consumption, commercial activities and industrial production in the affected countries will severely disrupt their economies and the global supply chain and may result in recessions in these economies.
Even though China has made significant achievements in control and prevention of COVID-19 (including its variants) pandemic, continuous pandemic control efforts have been made in multiple cities due to regional spread of COVID-19 variant(s) in early 2022, and we cannot assure you that there will not be an outbreak in China again. There is significant uncertainty relating to the severity of the near-term or long-term impact of the global COVID-19 pandemic on Chinese economics, and the continuous negative impact on our business operation. The outbreak of the coronavirus and other adverse public health developments have had and may continue to have certain adverse impacts for a period of time on our normal operating activities, including disruptions from the temporary closure of offices, suspension of business travel or other disruptions on our normal working schedules, which, in aggregate, may have significant impacts on our business, financial condition and results of operations. We have taken measures in response to the outbreak, including the adoption of more stringent workplace sanitation measures, which may have negative impact on our results of operations and financial status. While such measures are expected to be temporary, the duration of the business disruption and related financial impact cannot be reasonably estimated at this time. The extent to which this outbreak impacts our results will depend on future developments of many highly uncertain and unpredictable factors and events, including new information which may emerge concerning the severity of this outbreak and the actions to contain this outbreak or treat its impact, among others.
Risks relating to doing business in the PRC
China’s economic, political and social conditions as well as government policies could significantly affect our business
As of the end of the reporting period, the majority of our business, assets and operations are located in China. The economy of China differs from the economies of most developed countries in many respects, including government involvement, control of foreign exchange, and allocation of resources.
The economy of China has been transitioning from a planned economy to a more market-oriented economy. After multiple years of strenuous and sustained economic restructuring reforms, China has become a leading player in the global economy and a major contributing force to the economic revival and growth worldwide. The PRC Government has implemented economic reform measures emphasizing utilization of market forces in the development of the economy of China and a higher level of autonomy for the private sector. Some of these measures will benefit the overall economy of China, but may have a negative effect on us for a short term. For example, our operating results and financial condition may be adversely affected by changes in power tariff for our power plants, cost of fuels, increasingly stringent environment protection policies, and changes in State policies affecting the power industry. Furthermore, due to the complicated international macro-political and economic situations, China’s economic growth is slowing down in recent years, which may lead to tougher competition environment and certain economic adjustment measures. If we cannot adjust our operating strategies accordingly, our business, financial status and operating results may be negatively and materially impacted.
10
In addition, the economy of China may be impacted by other factors beyond control of PRC Government. There have also been concerns about the relationship between China and other countries, including the surrounding Asian countries, which may potentially have economic effects, and negative changes to the international economic and socio-political environments in general, including without limitation the monetary policies adopted and carried out by major economies, wars, regional conflicts and other economic and socio-political instabilities. In particular, there is significant uncertainty about the future relationship between the United States and China with respect to trade policies, treaties, government regulations and tariffs. Economic conditions in China are sensitive to global economic conditions, as well as changes in domestic economic and political policies and the expected or perceived overall economic growth rate in China. Any severe or prolonged slowdown in the global or Chinese economy may materially and adversely affect our business, results of operations and financial condition.
Changes in government regulations and legislation may limit our activities and affect our business operations and the price of our ADSs, and result in risks that affect our future financing plans and securities offerings, the liquidity of our investors, and the enforcement of court judgment and shareholders’ rights.
As a company established and operating in China, we are required to comply with PRC laws and regulations. The PRC legal system is based on written statutes and their interpretation by the Supreme People’s Court. Prior court decisions may be cited for reference but are not considered as binding precedents. In addition, in light of the dynamic nature of the Chinese economy and the continuing evolvement of the PRC legal system, the PRC authorities may promulgate new laws and regulations regulating the power industry, or overall investment and market activities in general, and may influence the implementation of our established business plans and operation strategies. While certain legislative changes are required by law to go through review and comment procedures open to certain market participants or the general public, and to the extent that such changes are made to regulate our business operation, we may have the opportunity to participate in such review and comment procedures during the policy and rule-making process, we cannot assure you that the rules or policies finally adopted will be in our favor. The new regulations and policies or the amendment to the current ones may subject us to enhanced compliance scrutiny, result in more compliance costs and expenses, or otherwise adversely affect our business by requiring adjustments to our business plans and operations. For example, there may be more stringent environmental protection laws and regulations, the compliance with which may require us to shift the operation focus of our business to renewable energy power generation, incur more costs and expenses to upgrade our facilities and to implement more sophisticated pre-emission treatment procedures, and trim down our plan of business expansion. As a result of those new or amended rules and policies, we may not have control over the timing or outcome of approvals of certain of our planned projects, and may encounter significant constraints on our ability to implement our business strategies, to develop or expand our business operations or to maximize our profitability, which could in turn adversely affect our operations by raising our operating costs and lowering our profits or otherwise impeding our efforts to improve our operation efficiency and profitability, and further adversely affect the market expectations of our business operations. Depending on the extent to which our operations are so affected, the value of our ADSs may significantly decline.
In addition, as a PRC company with equity securities listed in PRC, Hong Kong and U.S., we are required to obtain the approval of the China Securities Regulatory Commission (the “CSRC”) for any public offering of equity securities. We have received from the CSRC the approval for our public offerings of ADSs in U.S. in the past, however, we cannot assure you that we will timely receive such approval if we wish to make any new equity offerings in the future. If we fail to obtain the requisite approvals with respect to future offerings of our equity securities to foreign investors, or if we inadvertently conclude that such approvals are not required any more, our ability to execute our financing and equity offering plans may be significantly limited or completely hindered. In the absence of alternative sources of financing, this could impede our efforts to improve our liquidity or expand our business operation, and we cannot assure you there will not be material negative impacts on our financial conditions and result of operations, or a significant decline in the value of our ADSs.
Furthermore, foreign exchange transactions under the capital account, including principal payments in respect of foreign currency-denominated obligations, continue to be subject to significant foreign exchange controls and require the approval of the State Administration of Foreign Exchange. While we have not been denied of our applications for foreign exchange for the payment of our dividends, we cannot rule out the possibility that such control and limitation could affect our ability to obtain foreign exchange to pay cash dividends declared on our H shares (including ADSs representing our H shares). Consequently, we cannot assure you that your investment will not be subject to foreign exchange payment risks as a result of these foreign exchange control measures.
11
In addition to PRC Companies Laws, we are subject to certain PRC regulations governing PRC companies that are listed overseas. These regulations contain certain provisions that are required to be included in the articles of association of these PRC companies and are intended to regulate the internal affairs of these companies. As the PRC regulations are constantly evolving with the goal of better protecting shareholder’s interests, we may face greater uncertainties in the interpretation of PRC laws and regulations. Furthermore, the PRC regulations for protection of shareholder’s rights are different from those applicable in the United States and/or exchanges where we are listed. Therefore we made it our policy to adopt the strictest standards of any listing rules potentially applicable to us. Some of these standards are incorporated in our articles of association and bylaws with the view to providing most protection for the interests of our shareholders. As a result, the primary sources of our shareholder rights are our articles of association, the PRC Companies Law, the Listing Rules of the New York Stock Exchange and the Listing Rules of the Hong Kong Stock Exchange, which, among other things, impose certain standards of conduct, fairness and disclosure on us, our directors and our controlling shareholder. In general, the protection of our shareholder’s rights and access to information adopted pursuant to such provisions are not all the same as those applicable to companies incorporated in the United States and other Western countries, and are constantly evolving. Furthermore, while China has become a signatory to various treaties providing for the recognition and enforcement of certain foreign judgments in general, whether a specific judgment issued by a foreign court is capable of being recognized or enforced in China is still subject to uncertainties. Therefore, our investors may be faced with risks associated with the enforcement of court judgements and shareholders rights.
Risks relating to our operations in Singapore
Our operations in Singapore are subject to a number of risks, including, among others, risks relating to electricity pricing, dispatching, fuel supply, project development, capital expenditure, environmental regulations, government policies, and Singapore’s economic, political and social conditions. Any of these risks could materially and adversely affect our business, prospects, financial condition and results of operations.
Fluctuation in demand and intensified competition may adversely affect Tuas Power’s business and results of operations.
Our operations in Singapore depend on market demand and are subject to competition. Overall power system demand increased 5.07% in 2021 over 2020 due to the recovery from COVID-19 pandemic. The future growth is highly dependent on a sustained recovery in the Singapore and global economies. The liberalization of Singapore’s power market and the further deregulation of its power industry have resulted in more intense competition among the power generation companies in Singapore. Tuas Power Group, or Tuas Power, one of our wholly owned business units, is one of the three largest power generation companies in Singapore. If Tuas Power is unable to compete successfully against other power generation companies in Singapore, its business, prospects, financial condition and results of operations may be adversely affected.
An electricity futures market was established in 2015 through an incentive scheme by the authority to market makers (MM) in the futures market. This has attracted independent retailers which are expected to exert some price competition in the retail market. A Demand Response (DR) scheme has been established which could potentially introduce further price competition in the wholesale generation market in Singapore. Furthermore, the Singapore government has announced plans to frontload the deployment of solar and target to achieve 1.5 GWp of solar by 2025 and at least 2GWp by 2030 as well as importation of up to 100 megawatts of electricity imports through the Lao PDR, Thailand, Malaysia, Singapore – Power Integration Project (LTMS-PIP) targeting commencement in 2022 with import until 2023, and another 100 megawatts from electricity imports trial with Malaysia over a period of two years which was awarded to YTL PowerSeraya Pte Ltd and targeted to commence early 2022. EMA is also embarking on a pilot with a consortium led by power generation company PacificLight Power Pte Ltd (PLP) to import 100 MW equivalent of non-intermittent electricity from a solar farm in Pulau Bulan, Indonesia. Electricity will be supplied via a new interconnector that directly connects a solar farm in Pulau Bulan to PLP’s power station in Singapore. The pilot is expected to be commissioned by around 2024-2025. The Energy Market Authority (EMA) has stated its intention to issue two Requests for Proposal (RFP) for up to a total of 4 gigawatts (GW) of low-carbon electricity imports into Singapore by 2035, as part of Singapore’s efforts to decarbonize its power sector and enhance energy security by diversifying energy supply sources. This is expected to make up around 30% of Singapore’s electricity supply in 2035. The remaining supply will continue to come from various sources, ranging from the current natural gas-fired power plants to solar and waste-to-energy sources. The first RFP for up to 1.2GW by 2027 was launched on November 12, 2021, while the second RFP is expected to be issued in the second quarter of 2022.
12
TP Utilities Pte Ltd (“TPU”), an entity in Tuas Power Group, sells utilities, such as steam, industrial water and demineralized water to industrial customers for their direct consumption. The timing of potential customers of TPU to site their premises, if at all, is subject to microeconomic situations. The demand of the utilities by these customers may vary as well. Despite Tuas Power’s efforts to develop its facilities in stages and/or in modules to provide sufficient capacity matching the demand, and require customers to pay minimum capacity payment charges to mitigate the demand risk, its business and results of operations may be adversely affected by fluctuation in demand.
Regulatory changes of the vesting regime in Singapore could expose Tuas Power to electricity price volatility and adversely affect its business and results of operations
Tuas Power derives its revenue mainly from sale of electricity to the National Electricity Market of Singapore (the “NEMS”) through a bidding process and vesting contracts under which a significant portion of power sales is predetermined by the Energy Market Authority (“EMA”). The vesting contract regime in Singapore is targeted at mitigation of market power in the wholesale electricity spot market. The regime achieves this objective by assigning a quantity of vesting contracts to generation companies, thereby limiting their incentives to exercise whatever level of market power they may possess. Vesting contracts are a form of bilateral contract imposed/vested on the major power generation companies in Singapore. Vesting contract price is set by the EMA, which is Singapore’s power market regulator. Vesting contract price is set at the long run marginal cost of the most efficient base-loaded technology plant employed in Singapore and is reviewed every two years. On a quarterly basis, the EMA allows for vesting contract quantity to be adjusted to account for changes in demand (due to seasonality) and the vesting contract price to be adjusted to account for inflation and changes in fuel prices. Such a mechanism helps protect the profit margins of the power generation companies in the Singapore market, such as Tuas Power, to a large degree. The quantity of vesting contract allocated to the power generation company depends on the proportion of such power generation company’s capacity to the total licensed or planned generation capacity at the commencement of the vesting contracts regime. A portion of the volume under the Vesting Contract Scheme has also been allocated to the LNG Vesting Scheme - an incentive scheme where players who have committed to an initial tranche of LNG for Singapore are allocated electricity sale contracts. The volume allocated to the generation companies under the LNG vesting scheme is fixed for a period of 10 years until 2023. Following EMA’s review of the Vesting Contract Regime in 2016, it is determined that the vesting contract level shall be maintained at 25% until the end of the first half of 2018 and it shall be reduced to LNG vesting level by the second half of 2019. The vesting contract regime will be phased out by 2023 when the LNG vesting contract expires, which could lead to volatility in electricity prices and adversely affect our business, financial condition and results of operation.
In July 2018, EMA issued a determination paper to allow vesting contract holders with steam turbine generation plants, i.e., Tuas Power, Senoko Energy and YTL PowerSeraya, to retain their allocated vesting quantities irrespective of whether the steam turbine generation plants are retired. This will facilitate the three generation companies in making commercial decisions on whether and when to retire their steam turbine generation plants so as to reduce overhead costs and free up resources.
In June 2019, EMA embarked on an industry consultation process on the implementation of a Forward Capacity Market (“FCM”). EMA indicated that it planned to develop and implement a FCM, which would function together with the current real-time wholesale spot energy market with ancillary services, to meet the objectives of (i) maintaining resource adequacy by providing adequate incentives to the existing and new generation capacity and ensuring that the power sector is sustainable and (ii) maximizing economic efficiency to minimise long-run costs to consumers. EMA announced on November 2,2021 that “will therefore defer the implementation of the FCM. EMA will continue to monitor market conditions and technological developments, and review the introduction of the FCM in the future.”
13
The fuel cost of Tuas Power is exposed to volatility of international fuel price and foreign currency risk
The fuel for Tuas Power consists of natural gas, coal, biomass, fuel oil and diesel oil. Since the procurement price of natural gas is closely linked to oil price and the procurement price of coal and biomass is linked to a coal index, the fuel cost of Tuas Power is exposed to the volatility of international oil and coal prices. The prices of oil continued to be volatile on an upward trend in year 2021 and Tuas Power’s natural gas fuel cost increased. The price of coal was also moving upward trend gradually over the first half in year 2021 and sharp increased in Q4 2021 due to a surge demand for coal fired plants arising from global energy crisis. Despite high coal fuel cost, TMUC’s profitability was not affected as the increment of coal indices was passed through to the utilities sales to customers. The purchase of fuel is denominated in U.S. dollars, which exposes Tuas Power to foreign currency risk. Any increase in fuel price and/or appreciation of the U.S. dollar against the Singapore dollar will translate into an increase in fuel cost for Tuas Power. Part of this increase can be passed through electricity sale contracts and utilities sale contracts, while fuel and foreign exchange hedging strategies done appropriately will mitigate the impact of such increase. Tuas Power is highly dependent upon the import of gas via pipelines from Indonesia. Despite a major supply disruption from Indonesia upstream in Q4 2021, this risk was mitigated through Tuas Power’s LNG contract to cover its incremental needs. In the absence of insufficient LNG coverage, diesel oil was supplemented to sustain Tuas Power’s reliable operations.
Tuas Power is facing the potential risk from Singapore’s carbon tax rate increase
Singapore’s Carbon Pricing Act (CPA) and its accompanying regulations came into operation in January 1, 2019. Under the CPA, both Tuas Power Generation Pte Ltd (TPG) and TP Utilities Pte Ltd (TPU) are registered as taxable facilities as the annual direct greenhouse gas (GHG) emissions exceed the threshold of 25,000 ton of carbon dioxide equivalent. The annual direct GHG emission is taxable in the form of Carbon Tax by the Singapore Government. These taxable emissions are a result of fuel input to the plant to provide process steam to surrounding industrial customers and electricity to the grid. Carbon tax are included in the electricity and steam prices. Carbon tax rate is fixed at S$5/tCO2e from 2019 to 2023 and will be raised to S$25/tCO2e in 2024 and 2025, and S$45/tCO2e in 2026 and 2027, with a view to reaching S$50-80/tCO2e by 2030.
Risks relating to our operations in Pakistan
Our operations in Pakistan are subject to a number of risks, including, among others, risks relating to enforcement of the existing agreements and governmental policies on tariff pricing and power dispatching. Any of these risks could materially and adversely affect the business, prospects, financial condition and results of operations of our Sahiwal Power Plant.
Any change to, or breach of, the current agreement with the NEPRA may have adverse impact on Sahiwal Power Plant’s business and result of operations
Pursuant to the agreement entered into between Sahiwal Power Plant and the National Electric Power Regulatory Authority (the “NEPRA”) of Pakistan, power generated by Sahiwal Power Plant shall be sold to Central Power Purchasing Agency (the “CPPA”) of Pakistan at the upfront tariff rate pre-established according to the relevant pricing Decision of the Authority issued by the NEPRA and the abovementioned agreement between Sahiwal Power Plant and NEPRA. The upfront tariff, consisting of energy purchase price and capacity purchase price, to a large extent reflects the investment made, and costs incurred, by us for the construction and operation of Sahiwal Power Plant, and subject us to relatively low operating risks relating to Sahiwal Power Plant.
However, we cannot assure you that the NEPRA or the CPPA will not change such agreement in the future, or that the terms and conditions of such agreement will be duly followed or enforced. If current agreement with the NEPRA is changed or breached, the operation, financial status and financial and operating results of Sahiwal Power Plant may be materially and adversely impacted.
Any change to the current governmental policy on tariff pricing and power dispatching may have adverse impact on Sahiwal Power Plant’s business and results of operations
By a Decision of the Authority released in January 2019, the NEPRA provided to Sahiwal Power Plant with the approved tariff structure and the pricing details as well as dispatch criteria, which were based on the current upfront tariff structure, pricing methods and power purchase regime as provided by the relevant governmental rules and policies. If any of such rules and policies is changed, the NEPRA or the CPPA may be forced to change, or even terminate, the current tariff pricing and dispatching regime applicable to our Sahiwal Power Plant, which may have material and adverse impact on its operation and financial performance.
14
Risks Related to Our American Depositary Shares
Fluctuations in exchange rates could have an adverse effect on our results of operations and your investment
As a power producer operating mainly in China, we collect most of our revenues in Renminbi and have to convert Renminbi into foreign currencies to (i) repay some of our borrowings which are denominated in foreign currencies, (ii) purchase foreign made equipment and parts for repairs and maintenance, (iii) purchase fuel from overseas suppliers, and (iv) pay out dividend to our overseas shareholders.
The value of the Renminbi against the U.S. dollar and other currencies may fluctuate and is affected by, among other things, changes in China’s political and economic conditions. The conversion of Renminbi into foreign currencies, including U.S. dollars, is based on rates set by the PBOC. On July 21, 2005, the PRC government introduced a floating exchange rate system to allow the value of Renminbi to fluctuate within a regulated band based on market supply and demand and by reference to a basket of foreign currencies. Renminbi appreciated by more than 20% against the U.S. dollar between July 2005 and July 2008. Between July 2008 and June 2010, this appreciation halted and the exchange rate between the Renminbi and the U.S. dollar remained within a narrow band. On June 19, 2010, the PBOC decided to further promote the reform of the Renminbi exchange rate formation mechanism, and improve the flexibility of Renminbi exchange rate. The Company and its subsidiaries (both domestic and overseas) have debts denominated in foreign currencies, fluctuations in the exchange rates of Renminbi and Singapore dollar into foreign currencies create exchange risk for the Company. With the internationalization process and RMB joining the SDR, RMB exchange rate may continue to fluctuate in the future. In August 2015, the PBOC further improved its midpoint rate determination mechanism, which led to a 2% depreciation of Renminbi against the U.S. dollar. With effect from October 1, 2016, RMB is determined to be a freely usable currency and will be included in the SDR basket as a fifth currency. In the fourth quarter of 2016, the RMB has depreciated significantly in the backdrop of a surging U.S. dollar and persistent capital outflows of China.
In 2017, the RMB has appreciated significantly in the backdrop of a weak U.S. dollar, robust Chinese economy in 2017 and stringent foreign exchange regulation. In the first quarter of 2018, the RMB continued to appreciate. However, the RMB depreciated significantly in the remaining quarters of 2018. However, it is difficult to predict how market forces or PRC or U.S. government policy may impact the exchange rate between the Renminbi and the U.S. dollar in the future. There remains significant international pressure on the PRC Government to further liberalize its currency policy, which could result in further fluctuations in the value of the Renminbi against the U.S. dollar. However, there is no assurance that there will not be a devaluation of Renminbi in the future. If there is such devaluation, our debt servicing cost will increase and the return to our overseas investors may decrease.
Our revenues from SinoSing Power Pte. Ltd. (“SinoSing Power”) and its subsidiaries are collected in Singapore dollars. However, commencing from 2008, the operating results of SinoSing Power and its subsidiaries were consolidated into our financial statements, which use Renminbi as the presentation currency. The situation of our Pakistan operation is similar after we consolidate our business in Pakistan since December 2018. As a result, we are exposed to foreign exchange fluctuations between Renminbi and the Singapore dollar or Pakistan Rupee. Appreciation of Renminbi against the Singapore dollar or Pakistan Rupee may cause an adverse impact on our operation results and foreign translation difference.
The PCAOB is currently unable to inspect our auditor in relation to their audit work performed for our financial statements and the inability of the PCAOB to conduct inspections over our auditor deprives our investors with the benefits of such inspections.
Our auditor, the independent registered public accounting firm that issues the audit report included elsewhere in this annual report, as an auditor of companies that are traded publicly in the United States and a firm registered with the Public Company Accounting Oversight Board (United States), or the PCAOB, is subject to laws in the United States pursuant to which the PCAOB conducts regular inspections to assess its compliance with the applicable professional standards. Since our auditor is located in China, a jurisdiction where the PCAOB has been unable to conduct inspections without the approval of the Chinese authorities, our auditor is not currently inspected by the PCAOB. As a result, we and investors in our ADSs are deprived of the benefits of such PCAOB inspections. The inability of the PCAOB to conduct inspections of auditors in China makes it more difficult to evaluate the effectiveness of our independent registered public accounting firm’s audit procedures or quality control procedures as compared to auditors outside of China that are subject to the PCAOB inspections, which could cause investors and potential investors in our ADSs to lose confidence in our audit procedures and reported financial information and the quality of our financial statements.
15
Our ADSs will be prohibited from trading in the United States under the Holding Foreign Companies Accountable Act, or the HFCAA, in 2024 if the PCAOB is unable to inspect or fully investigate auditors located in China, or as early as 2023 if proposed changes to the law are enacted. The delisting of our ADSs, or the threat of their being delisted, may materially and adversely affect the value of your investment.
The Holding Foreign Companies Accountable Act, or the HFCAA, was signed into law on December 18, 2020. The HFCAA states if the SEC determines that we have filed audit reports issued by a registered public accounting firm that has not been subject to inspection for the PCAOB for three consecutive years beginning in 2021, the SEC shall prohibit our shares or ADSs from being traded on a national securities exchange or in the over-the-counter trading market in the United States. On December 16, 2021, the PCAOB issued a report to notify the SEC of its determination that the PCAOB is unable to inspect or investigate completely registered public accounting firms headquartered in mainland China and Hong Kong. The PCAOB identified our auditor as one of the registered public accounting firms that the PCAOB is unable to inspect or investigate completely.
Whether the PCAOB will be able to conduct inspections of our auditor before the issuance of our financial statements on Form 20-F for the year ending December 31, 2023, which is due by April 30, 2024, or at all, is subject to substantial uncertainty and depends on a number of factors out of our, and our auditor’s, control. If our shares and ADSs are prohibited from trading in the United States, there is no certainty that we will be able to list on a non-U.S. exchange or that a market for our shares will develop outside of the United States. Such a prohibition would substantially impair your ability to sell or purchase our ADSs when you wish to do so, and the risk and uncertainty associated with delisting would have a negative impact on the price of our ADSs. Also, such a prohibition would significantly affect our ability to raise capital on terms acceptable to us, or at all, which would have a material adverse impact on our business, financial condition, and prospects.
On June 22, 2021, the U.S. Senate passed a bill which would reduce the number of consecutive non-inspection years required for triggering the prohibitions under the HFCAA from three years to two. On February 4, 2022, the U.S. House of Representatives passed a bill which contained, among other things, an identical provision. If this provision is enacted into law and the number of consecutive non-inspection years required for triggering the prohibitions under the HFCAA is reduced from three years to two, then our shares and ADSs could be prohibited from trading in the United States as early as 2023.
Forward-looking information may prove inaccurate
This document contains certain forward-looking statements and information relating to us that are based on the beliefs of our management as well as assumptions made by and information currently available to our management. When used in this document, the words “anticipate,” “believe,” “estimate,” “expect,” “going forward” and similar expressions, as they relate to us or our management, are intended to identify forward-looking statement. Such statements reflect the current views of our management with respect to future events and are subject to certain risks, uncertainties and assumptions, including the risk factors described in this document. Should one or more of these risks or uncertainties materialize, or should underlying assumptions prove incorrect, actual results may vary materially from those described herein as anticipated, believed, estimated or expected. We do not intend to update these forward-looking statements.
We are a foreign private issuer within the meaning of the rules under the Exchange Act, and as such we are exempt from certain provisions applicable to U.S. domestic public companies
Because we qualify as a foreign private issuer under the Exchange Act, we are exempt from certain provisions of the securities rules and regulations in the United States that are applicable to U.S. domestic issuers, including:
● | the rules under the Exchange Act requiring the filing with the SEC of quarterly reports on Form 10-Q or current reports on Form 8-K; |
● | the sections of the Exchange Act regulating the solicitation of proxies, consents, or authorizations in respect of a security registered under the Exchange Act; |
● | the sections of the Exchange Act requiring insiders to file public reports of their stock ownership and trading activities and liability for insiders who profit from trades made in a short period of time; and |
● | the selective disclosure rules by issuers of material nonpublic information under Regulation FD. |
16
We are required to file an annual report on Form 20-F within four months of the end of each fiscal year. Press releases relating to our financial results and material events will also be furnished to the SEC on Form 6-K. However, the information we are required to file with or furnish to the SEC will be less extensive and less timely compared to that required to be filed with the SEC by U.S. domestic issuers. As a result, you may not be afforded the same protections or information that would be made available to you were you investing in a U.S. domestic issuer.
There can be no assurance that we will not be a passive foreign investment company, or PFIC, for United States federal income tax purposes for any taxable year, which could subject United States investors in the ADSs or our H Shares to significant adverse United States income tax consequences
We will be a “passive foreign investment company,” or “PFIC,” if, in the case of any particular taxable year, either (a) 75% or more of our gross income for such year consists of certain types of “passive” income or (b) 50% or more of the value of our assets (generally determined on the basis of a quarterly average) during such year produce or are held for the production of passive income (the “asset test”). For United States federal income tax purposes, and based upon our income and assets, we do not believe that we were classified as a PFIC for the taxable year ended December 31, 2021, and do not anticipate becoming one in the foreseeable future.
While we do not expect to become a PFIC, because the value of our assets for purposes of the asset test may be determined by reference to the market price of the ADSs, fluctuations in the market price of the ADSs may cause us to become a PFIC for the current or subsequent taxable years. The determination of whether we will be or become a PFIC will also depend, in part, on the composition of our income and assets. Under circumstances where we determine not to deploy significant amounts of cash for active purposes, our risk of being a PFIC may substantially increase. Because PFIC status is a factual determination made annually after the close of each taxable year, there can be no assurance that we will not be a PFIC for the current taxable year or any future taxable year.
If we are a PFIC in any taxable year, a U.S. Holder (as defined in “Item 10. Additional Information—E. Taxation—United States federal income tax considerations”) may incur significantly increased United States income tax on gain recognized on the sale or other disposition of the ADSs or H Shares and on the receipt of distributions on the ADSs or H Shares to the extent such gain or distribution is treated as an “excess distribution” under the United States federal income tax rules and such holders may be subject to burdensome reporting requirements. Further, if we are a PFIC for any year during which a U.S. Holder holds the ADSs or our H Shares, we generally will continue to be treated as a PFIC for all succeeding years during which such U.S. Holder holds the ADSs or our H Shares. For more information see “Item 10. Additional Information—E. Taxation—United States federal income tax considerations—Passive Foreign Investment Company Rules.”
ITEM 4. INFORMATION ON THE COMPANY
A. | History and development of the Company |
Our legal and commercial name is Huaneng Power International, Inc. Our head office is at Huaneng Building, 6 Fuxingmennei Street, Xicheng District, Beijing, People’s Republic of China and our telephone number is (8610) 63226999. We were established in June 1994 as a company limited by shares organized under the laws of the People’s Republic of China.
The SEC maintains an Internet website that contains reports, proxy and information statements, and other information regarding us that filed electronically with the SEC, which can be accessed at http://www.sec.gov. Information about the Company and documents the Company submitted to the SEC are available on our website: http://www.hpi.com.cn/sites/english/Pages/default.aspx.
We completed our initial global public offering of 1,250,000,000 overseas listed foreign shares in October 1994, which were listed on the New York Stock Exchange (Stock Code: HNP) in the United States by issuing 31,250,000 ADSs. In January 1998, the foreign shares of the Company were listed on The Stock Exchange of Hong Kong Limited by way of introduction (Stock Code: 902). Subsequently, in March 1998, the Company successfully completed a global placing of 250,000,000 foreign shares along with a private placing of 400,000,000 domestic shares. In November 2001, the Company successfully completed the issuance of 350,000,000 A Shares (Stock Code: 600011) in the PRC, of which 250,000,000 domestic public shares were listed on the Shanghai Stock Exchange. In December 2010, the Company completed the non-public issuance of 1,500,000,000 A Shares and 500,000,000 H Shares. In November 2014, the Company completed the non-public issuance of 365,000,000 H Shares. In November 2015, the Company completed the non-public issuance of 780,000,000 H Shares. In October 2018, the Company completed the non-public issuance of 497,709,919 A Shares. Currently, the total share capital of the Company amounts to approximately 15.7 billion shares.
17
As resolved at the second meeting of the 8th session of the board of the Company on October 13, 2014 and adopted at the third extraordinary general meeting of the Company, we entered into the Huaneng Group Interests Transfer Agreement with Huaneng Group, and the HIPDC Interests Transfer Agreement and the Chaohu Power Interests Transfer Agreement with HIPDC. Pursuant to these transfer agreements, we acquired from Huaneng Group 91.8% interests of Hainan Power, 75% interests of Yangluo Power, 53.45% interests of Suzhou Thermal Power, 97% interests of Dalongtan Hydropower and 100% interests of Hualiangting Hydropower at a total price of RMB7.338 billion, and acquire from HIPDC 60% interests of Chaohu Power, 100% interests of Ruijin Power, 100% interests of Anyuan Power, 100% interests of Jingmen Thermal Power and 100% interest of Yingcheng Thermal Power Interests at a total price of RMB1.938 billion. The total consideration is RMB9.647 billion after adjustment of the profits generated from the date of valuation to the acquisition date in accordance with the equity transfer agreements. The transaction was completed in January 2015.
On October 14, 2016, the Company signed the Agreement for the Transfer of Equity Interests in Certain Companies with Huaneng Group (the “Transfer Agreement”). Pursuant to the Transfer Agreement, the Company shall accept the transfer of (i) 80% equity interest of Huaneng Shandong Power Limited; (ii) 100% equity interest of Huaneng Jilin Power Limited; (iii) 100% equity interest of Huaneng Heilongjiang Power Limited; and (iv) 90% equity interest of Huaneng Henan Zhongyuan Gas Power Generation Co., Ltd. from Huaneng Group for the consideration of RMB15,501 million after certain adjustment of the profits generated from the date of valuation to the acquisition date in accordance with the equity transfer agreements. This transaction was considered and approved at the 21st meeting of the Eighth Session of the Board held on October 14, 2016, and was considered and approved at the 2016 Second Extraordinary General Meeting held on November 30, 2016. The acquisition was completed on January 1, 2017, and the total consideration has been settled in cash by December 31, 2017 after netting off with the receivables due from Huaneng Group.
On July 31, 2018, Shandong Power (a subsidiary of the Company) and Taishan Power entered into the Transfer Agreement, pursuant to which Shandong Power shall acquire from Taishan Power (i) 75% interests in the registered capital of Shandong Huaneng Liaocheng Thermal Power Company Limited (“Liaocheng Thermal Power”), (ii) 80% interests in the registered capital of Shandong Huaneng Laizhou Wind Power Generation Company Limited (“Laizhou Wind Power”), (iii) 80% interests in the registered capital of Shandong Huaneng Laiwu Thermal Power Company Limited (“Laiwu Thermal Power”), and (iv) 15% interests in the registered capital of Huaneng Laiwu Power Generation Limited (“Laiwu Power Generation”) at the consideration of RMB1,800,020,000. Upon completion of the Transfer, Liaocheng Thermal Power, Laizhou Wind Power and Laiwu Thermal Power became subsidiaries of Shandong Power.
On July 31, 2018, Huaneng Shandong Power Generation Co., Ltd. (“Shandong Power Generation”) and Huaneng Taishan Electric Power Co., Ltd. (“HTEP”), both of which were holding subsidiaries of the Company, entered into the Transfer Agreement on Certain Company Interests Between Huaneng Taishan Electric Power Co., Ltd. and Huaneng Shandong Power Generation Co., Ltd. In December 2018, as certain wind turbines of Laizhou Wind Power were demolished at the request of the local government, according to the provisions of the above agreement, Shandong Power Generation had transferred back 80% of the interests in Laizhou Wind Power to Huaneng Energy and Transportation Industrial Holdings Ltd., the designated third party of Taishan Power, in December 2019.
See “Item 5 Operating and Financial Reviews and Prospects – Liquidity and Cash Resources” for a description of our principal capital expenditures since the beginning of the last three financial years.
18
B. | Business overview |
The core business of the Company is, by making use of modern technology and equipment and also financial resources available domestically and internationally, to develop, construct and operate large scale power plants. As a power generation enterprise, the Company has been insisting on innovations in technologies, structure, and management since its incorporation. On aspects regarding the advancement in power technologies and construction and management of power plants, the Company has been the pioneer and has created various milestones within the PRC domestic power industry, which facilitated the great leap development of the power business and technological advancement of the power station equipment manufacturing industry in China, and also significantly contributed to the improvement of technical and management standards of the PRC domestic power generation enterprises. The Company was the first to introduce a 600 MW supercritical generating unit into China and we also started operating the first domestically built single 1,000 MW ultra-supercritical coal-fired generating unit, and the first digitalized 1,000 MW ultra-supercritical coal-fired generating unit in China. The Company completed the construction of the first 1,000 MW generating unit in the world using sea water desulphurization facilities and the construction of the first double reheat ultra-supercritical coal-fired generating unit, and developed the technology for synergistic treatment of fuel gas of coal-fired power plants, which was widely applied in environmental protection renovation and newly-constructed projects. The Company’s self-developed safe and intelligent DCS/DEH integrated distributed control system, the first set of major technical equipment completely produced in China, was put into operation in a 1,000 MW ultra-supercritical high-efficiency double reheat generating unit, and widely applied in coal-fired generating units and gas turbine. The Company was the first to realize mass production of wind turbine of 5 MW in China, and invested and operated the most advanced gas turbine with the largest generation capacity and heat supplying capacity in China. The Company also completed the first major energy project in the China-Pakistan Economic Corridor, creating China’s best overseas power construction project in terms of safety, quality and speed. The technical and economic indicators as well as the overall manpower efficiency of the Company have been remaining at the forefront in China’s power industry. The Company constantly optimizes the power structure and regional distribution, and accelerates development of new energy while consolidating its leading position in conventional energy, aiming to enhance industrial synergy effect. Furthermore, it has expanded the service range for power distribution and sales to achieve an overall improvement in operation, quality and corporate vigour.
As of December 31, 2021, we had controlling generating capacity of 118,695 MW, and total generating capacity of 103,875 MW on equity-ownership basis.
Operations in China
We are engaged in developing, constructing, operating and managing large scale coal-fired and gas turbine power plants, new energy power projects and related facilities, including ports, marine transportation and power distribution. Our domestic power plants are located in 26 provinces, autonomous regions and provincial-level municipalities. We wholly own a power company in Singapore and invests in a power company in Pakistan.
In 2021, new generating units with a total installed capacity of 5,232.45 MW were put into operation. In 2021, our total domestic power generation from all operating power plants on a consolidated basis amounted to 457.336 billion kWh, representing an increase of 13.20% from 2020. The annual average utilization hours of our domestic generating units reached 4,058 hours. Our fuel cost per unit of power sold by domestic power plants increased by 51.32% from the previous year to RMB316.36 per MWh.
We believe our significant capability in the development and construction of power projects, as exemplified in the completion of our projects under construction ahead of schedule, and our experience gained in the successful acquisitions of power assets in recent years will enable us to take full advantage of the opportunities presented in China’s power market.
With respect to the acquisition or development of any project, we will consider, among other factors, changes in power market conditions, and adhere to prudent commercial principles in the evaluation of the feasibility of the project. In addition to business development strategies, we will continue to enhance our profitability by further strengthening our cost control, especially in respect of fuel costs and construction costs, so as to hedge against fluctuations in fuel price and increase competitiveness in the power market.
19
Operations in Singapore
Tuas Power, one of our wholly owned business units, operates in Singapore and is engaged in the business of generation, wholesale and retail of power and other relating utilities. Tuas Power is comprised of Tuas Power Ltd (“TPL”), the investment holding company, and seven subsidiaries. Among these subsidiaries, Tuas Power Generation Pte. Ltd. (“TPG”) is the electricity generation company that owns 100% of Tuas Power Supply Pte Ltd (“TPS”), which is the retail arm of TPG. Separately, TP Utilities (“TPU”), a wholly owned subsidiary of TPL is engaged in the business of production and supply of utilities to industrial customers at Tembusu, Jurong Island in Singapore, as well as the generation of electricity dispatched to the electricity wholesale market. TPL, through a joint venture company, is currently building Singapore’s fifth desalination plant under a Develop-Build-Own-Operate (DBOO) scheme and is target for completion in 2022.
We have consolidated Tuas Power’s results of operations since March 2008. The total assets and revenue of Singapore operations represented approximately 5.41% and 7.98%, respectively, of our consolidated total assets and revenue as of and for the year ended December 31, 2021. In 2021, the power generated by Tuas Power in Singapore accounted for 19.2% of the total power generated in Singapore, lower than 2020.
Operations in Pakistan
We engaged in the business of generation, wholesale and retail of power and other relating utilities through our subsidiaries, Huaneng Shandong Ruyi (Pakistan) Energy (Private) Co., Ltd. (“Ruyi Pakistan Energy”) and Shandong Huatai Electric Power Operation & Maintenance (Private) Co., Ltd. (“Huatai Power”) and their subsidiaries. We have consolidated results of operations of Ruyi Pakistan Energy and Huatai Power since December 31, 2018. The total assets and revenue of Pakistan operations represented approximately 2.68% and 2.56%, respectively, of our consolidated total assets and revenue as of and for the year ended December 31, 2021.
Development of power plants
The process of identifying potential sites for power plants, obtaining government approvals, completing construction and commencing commercial operations is usually lengthy. However, because of our significant experience in developing and constructing power plants, we have been able to identify promising power plant projects in China and to obtain all required PRC Government approvals in a timely manner.
Opportunity identification and feasibility study
We initially identify an area in which additional electric power is needed by determining its existing installed capacity and projected demand for electric power. The initial assessment of a proposed power plant involves a preliminary feasibility study. The feasibility study examines the proposed power plant’s land use requirements, access to a power grid, fuel supply arrangements, availability of water, conditions of wind and sunlight, local requirements for permits and licenses and the ability of potential customers to afford the proposed power tariff. To determine projected demand, factors such as economic growth, population growth and industrial expansion are used. To gauge the expected supply of electricity, the capacities of existing plants and plants under construction or development are studied.
Approval process
Prior to July 2004, any project proposal and supporting documents for new power plants had to first be submitted to the NDRC for approval and then be submitted to the State Council. In July 2004, the State Council of the PRC reformed the fixed asset investment regulatory system in China. Under the new system, new projects in the electric power industry that do not use government funds will no longer be subject to the examination and approval procedure. Instead, they will only be subject to a confirmation and registration process. Coal-fired projects will be subject to confirmation by the NDRC. Wind power projects with installed capacity of 50 MW or above shall be subject to confirmation and registration with the relevant department of the central government, while wind power projects with an installed capacity lower than 50 MW shall be subject to confirmation and registration with relevant local government departments. Wind power projects confirmed by local government departments at provincial level shall also be filed with the NDRC and China National Energy Administration.
20
In November 2014, pursuant to the Catalogue of Investment Projects Approved by the Government (2014 Version) issued by the State Council, administrative approval power for certain activities in the energy sector has been delegated to a lower level. The administrative approval power for thermal power stations has been delegated to the provincial level (with coal-fired thermal power station projects being subject to national-level administrative approval based on state-promulgated constructions plans limited by total volume), the administrative approval power for heat power stations has been delegated to the local level (with condensing steam heat power station projects being subject to provincial-level administrative approval based on state-promulgated constructions plans limited by total volume), and the administrative approval power for wind power plants delegated to the local level subject to state-promulgated constructions plans limited by total volume as well as the scope as set out in the annual developmental guides. The Interim Measures for Supervision and Administration of Photovoltaic Power Station Projects issued by China National Energy Administration in 2013 requires that photovoltaic power station projects be regulated by on a filing-based system by the provincial-level energy supervisory departments in accordance with regulations related to investment projects issued by the State Council. The same administrative approval standard was again re-affirmed in December 2016 pursuant to the Catalogue of Investment Projects Approved by the Government (2016 Version) issued by the State Council.
Joint venture power projects are subject to additional governmental approvals. Approval by Ministry of Commerce is also required when foreign investment is involved.
From 2014, China National Energy Administration has placed the stringent control on coal-fired projects within the Beijing-Tianjin-Hebei region, the Yangtze River Delta Region and the Pearl River Delta Region. All new coal-fired generating projects, other than those involving co-generation, were prohibited from being approved. Multi coal-fired generating units may be reconstructed into large capacity units based on the principles of an equivalent replacement for coal but the reduction in replacement pollutant emission.
From 2016, to counter the issue of overcapacity in the coal-fired power sector, China National Energy Administration strengthened the approval of coal-fired projects nationwide, a number of new coal-fired generating projects, other than those involving co-generation, were canceled, postponed or terminated. Considering the increasingly limited availability of prime locations and decreasing subsidies, China National Energy Administration also suspended approval of new wind power plants and photovoltaic power station projects in provinces with wind curtailment rate over 20% and solar curtailment rate over 5%. It is expected that the overcapacity countering policy will be continued in the future.
Permits and contracts
In developing a new power plant, we, like other players in the industry, are required to obtain permits before commencement of the project. Such permits include operating licenses and similar approvals related to plant site, land use, construction, and environment. To encourage the cooperation and support of the local governments of the localities of the power plants, it has been and will be our policy to seek investment in such power plants by the relevant local governments.
Power plant construction
We have generally acted as the general contractor for the construction of our power plants. Equipment procurement and installation, site preparation and civil works are subcontracted to subcontractors through a competitive bidding process. All of our power plants were completed on or ahead of schedule, enabling certain units to enter service and begin generating income earlier than the estimated in-service date.
Plant start-up and operation
We have historically operated and intend to continue to operate our power plants. Our power plants have established management structures based on well-developed management techniques. We select the superintendent for a new power plant from the senior management of our operating plants early in the construction phase of the new plant, invest in the training of operational personnel, adopt management techniques that improve efficiency and structure our plant bonus program to reward efficient and cost-effective operation of the plant in order to ensure the safety, stability and high availability factor of each power plant. Our senior management meets several times a year with the superintendents of the power plants as a group, fostering a team approach to operations, and conducts annual plant performance reviews with the appropriate superintendent, during which opportunities to enhance the power plant’s performance and profitability are evaluated.
21
After a coal-fired generating unit is constructed, the contractor tests its installation and systems. Following such tests, the contractor puts the unit through a continuous 168-hour trial run at full load. After successfully passing the continuous 168-hour test and obtaining approval from the local governments, the unit may commence its commercial operation. Trial run of a wind power project consists of two phases: (i) trial run of single wind power generating unit and (ii) trial run of the entire wind power project as a whole. After successfully passing the trial run, the wind power project may commence its commercial operation.
Development of power plants in Singapore
The Singapore electricity industry had traditionally been vertically integrated and owned by the government. Since 1995, steps have been taken to liberalize the power industry, including the incorporation of the Public Utilities Board (PUB) in 1995, establishment of Singapore Electricity Pool (SEP) in 1998, formation of Energy Market Authority (EMA) in 2001, and the evolvement of the SEP into the New Electricity Market of Singapore (NEMS) in 2003. The EMA is a statutory body responsible for the economic, technical and competition regulation of the gas and electricity industry in Singapore. In carrying out its functions as the regulator of the power sector, EMA is empowered under the Electricity Act to issue and enforce licenses, codes of practices and performance standards. Energy Market Company Pte Ltd. (the “EMC”) is the market company licensed to operate the wholesale market, or the NEMS.
In Singapore, a company is required to hold a generation license issued by the EMA if it generates electricity by means of one or more generating units with capacity of 10 MW or above. If connected to the power grid, the generating unit(s) must be registered with the EMC and will have to compete with other power generation companies to secure dispatch in the NEMS.
To ensure adequate electricity supply in Singapore, the EMA targets a minimum reserve margin (the excess of generating capacity over peak electricity demand) of 27% based on a loss of load hours (which represents the expected number of hours per year when available generating capacity is insufficient to serve the hourly demand across all hours of the year) of three hours per year. The 27% required reserve margin is to cater for scheduled maintenance as well as forced outages of generating units in the system. If the reserve margin falls below the required 27% due to demand growth and/or plant retirements, it would be an indication that new generation investments in generation units are needed to maintain system security.
The EMA intends to keep the increase and decrease in generating capacity commercially driven as far as practicable. As a precaution against the risk of insufficient generating capacity in the system, the EMA has planned to implement a competitive auction-based mechanism, i.e. Forward Capacity Market (FCM), to maintain the reserve margin at no less than 27% by providing adequate incentives to existing generation capacity and new investment. FCM also aims to facilitate orderly entry and exit of the generation capacity by taking into account of the FCM auction outcomes, up to 4 years in advance. The EMA announced on November 2, 2021 that “will therefore defer the implementation of the FCM. EMA will continue to monitor market conditions and technological developments, and review the introduction of the FCM in the future.”
By most measures of market power, the Singapore market is highly concentrated, as the three largest power generation companies account for approximately 60% of total power capacity. Since December 2002, EMA has imposed a licensed capacity cap (in MW) on these three power generation companies to prevent them from increasing their market dominance/power. Following a review of the vesting contract regime in 2016, EMA imposed a 25% cap on capacity market share to all generation licensees to prevent structural increases in market concentration/power. With regard to the three largest power generation companies, the cap imposed by EMA is the higher of either the 25% capacity market share cap or their respective licensed capacity cap, until the expiry of their respective generation license. This provides an option for the three largest power generation companies to increase their generation capacities beyond their current generation license up to 25% capacity market share cap.
Existing competitors who have had invested in new generating capacity or repowering of existing plants to take advantage of the LNG Vesting Scheme commencing in 2013, have impacted the market negatively as these new capacities compete for market share as they attempt to overcome the gas take-or-pay penalties arising out of an oversupplied market.
The EMA has issued a Singapore Electricity Market Outlook (“SEMO”) 2021, which provides a long-term outlook of the energy market, such as the projected supply and demand conditions to facilitate power generation investment decisions. Based on the data provided by EMA, annual system demand and system peak demand are projected to grow at a CAGR of 2.8 – 3.2% over the next 10 years (2022 to 2032) due to growing demand from new high-growth sectors such as data centres and transport (through electrification of vehicles). A net increase of about 400MW of generation capacity, through solar and electricity imports, is projected in 2022.
22
We have developed the Tembusu Multi-Utilities Complex (the “TMUC”) in Singapore. The TMUC was developed in two phases. Phase 1 consists of 1 x 450 t/h coal-biomass co-fired circulated fluidized bed boiler, 2 x 200 t/h diesel/natural gas-fired boilers and 1 x 101MW steam turbine-generator, and other components of the plant. Phase 2 consists of 1 x 450 t/h coal-biomass co-fired circulated fluidized bed boiler, 1 x 200 t/h diesel/natural gas-fired boiler and 1 x 32.5MW steam turbine-generator, and other components of the plant. Phase 1 and Phase 2 commenced commercial operations in March 2013 and June 2014 respectively. The first train of 62.5 m3/h wastewater treatment facility commenced commercial operation in September 2015. TPL owns 100% equity interest in this project.
TPL collaborated with ST Engineering Marine Ltd. (ST Marine), an affiliate of Singapore Temasek Holdings, to participate in the tender for Singapore’s Public Utilities Board (PUB)’s fifth desalination plant project under a Develop-Build-Own-Operate (DBOO) scheme on July 6, 2017. The capacity of the desalination plant is 30 MIGD (137,000 cubic meter per day). The desalination plant is located at Tembusu Jurong Island, adjacent to TMUC in order to achieve synergy. TPL and ST Marine incorporated a concession company, TP-STM Water Resources Pte. Ltd. (TP-STM Water Resources), on November 1, 2017 and executed the Water Purchase Agreement (WPA) with PUB on November 6, 2017. TPL owns 60% equity interests in TP-STM Water Resources. The construction of the desalination plant commenced in August 2018. The project commercial operation date (PCOD) was originally scheduled for June 2020 but has been delayed due to the impact of the COVID-19 pandemic. The term of concession is 25 years from the PCOD.
Pricing policy
Pricing policy in China
Prior to April 2001, the on-grid tariffs for our planned output were designed to enable us to recover all operating and debt servicing costs and to earn a fixed rate of return. Since April 2001, however, the PRC Government has gradually implemented a new on-grid tariff-setting mechanism based on the operating terms of power plants as well as the average costs of comparable power plants.
On July 3, 2003, the State Council approved the tariff reform plan and made it clear that the long-term objective of the reform is to establish a standardized and transparent tariff-setting mechanism.
Pursuant to the NDRC circular issued in June 2004, on-grid tariffs for newly built power generating units commencing operation from June 2004 should be set on the basis of the average cost of comparable units adding tax and reasonable return in the regional grid. It provides challenges and incentives for power generation companies to control costs for building new generating units.
On March 28, 2005, the NDRC issued the Interim Measures on Regulation of On-grid Tariff, the Interim Measures on Regulation of Transmission and Distribution Tariff, and the Interim Measures on Regulation of End-user Tariff, or collectively the “Interim Measures,” to provide guidance for the reform of tariff-setting mechanism in the transition period. Under the Interim Measures, the tariff is classified into on-grid tariff, transmission and distribution tariff and end-user tariff. Transmission and distribution tariff will be instituted by the government. The end-user tariff will be based on on-grid tariff and transmission and distribution tariff. The government is responsible for regulating and supervising power tariffs based on the principles of promoting efficiency, encouraging investment and improving affordability.
In December 2004, the NDRC proposed and the State Council approved the establishment of a linkage mechanism between coal and power prices, pursuant to which, the NDRC may adjust power tariffs if the change of the average coal price reaches 5% within a period of six months compared with the preceding same period. The change in a period, if less than 5%, will be carried forward to the future periods until the accumulated amounts reach 5%. With a goal to encourage power generation companies to reduce cost and improve efficiency, only around 70% of coal price increases will be allowed to pass to end-users through an increase of power tariffs, and power generation companies will bear the remaining 30%. In May 2005, the NDRC activated the coal-electricity price linkage mechanism for the first time to increase on-grid tariffs and end-user tariffs in the northeastern region, central region, eastern region, northwestern region and southern region. We accordingly increased the on-grid tariffs of our power plants in the northeastern region, central region, eastern region and northwestern region on May 1, 2005 and in the southern region on July 15, 2005. In June 2006, the coal-electricity price linkage mechanism was reactivated by the NDRC to increase on-grid tariffs and end-user tariffs in the northeastern region, central region, eastern region, northwestern region and southern region. We accordingly increased the on-grid tariffs of most of our power plants in the same regions on June 30, 2006.
23
In May 2007, NDRC and the State Environment Protection Administration jointly promulgated Interim Administrative Measures on Electricity Price of Coal-fired Generating Units installed with Desulphurization Facilities and the Operations of Such Facilities, which provided that a premium for desulphurization may be charged on the price of the electricity generated by generating units installed with desulphurization facilities on and from the date on which such desulphurization facilities are tested and accepted by a relevant environment protection regulator. Such pricing policy is also applicable to the old generating units which are installed with desulphurization facilities. The new measures are more stringent on the regulation of the coal-fired power plants with desulphurization facilities, setting forth the categories under which the price including a desulphurization premium will be offset or otherwise penalized based on the ratio of utilization of the relevant desulphurization facilities on an annual basis. As of December 31, 2013, all of our existing coal-fired generating units have installed and operated the desulphurization facilities and enjoyed the desulphurization premium.
In June 2008, NDRC issued Notice of Raising the Power Tariff, pursuant to which, the power tariff in provincial grids nationwide was increased by an average of RMB0.025 per kWh. In August 2008, NDRC issued Notice of Raising the On-grid Tariffs of the Thermal Power Plants, pursuant to which, the on-grid tariff of thermal power plants, including plants fueled by coal, oil, gas and co-generation, was increased by an average of RMB0.02 per kWh.
On February 25, 2009, NDRC, SERC and China National Energy Administration jointly promulgated the Notice regarding Cleaning up the Concessional Tariff Scheme, pursuant to which, (i) the concessional tariff scheme at the local level is banned, and (ii) certain measures, such as direct purchase by large end-users and adopting peak and off-peak power pricing policy, will be carried out to reduce enterprises’ power cost. In addition, the notice emphasizes the supervision and inspection over the setting of power tariffs. For wind power plants located in a specific wind source area, a unified wind power tariff shall be applied. On October 11, 2009, in order to promote a fair market condition and the optimization of electric power resources, NDRC, SERC and China National Energy Administration jointly promulgated the Circular on Regulating the Administration of Electric Power Transaction Tariff to regulate the tariff-setting mechanism for the on-grid tariff, transmission and distribution tariff and end-user tariff and clean up the local preferential power tariffs provided to high energy consumption companies. Pursuant to a notice issued by NDRC, with effect from November 20, 2009, certain adjustments on the on-grid tariffs have been made in various regions of China in order to resolve the inconsistencies in tariffs, rationalize the tariff structure and promote the development of renewable energy.
In 2010, the PRC Government started to implement the direct power purchase policy. As of December 31, 2013, some of the provinces where we operate power plants are approved by the NDRC to implement the direct power purchase by large power end-users. In addition, during 2010 SERC issued several circulars and notices to regulate the trans-provincial and interregional transaction of power and/or power generation right, in which the power purchase price shall be freely determined by negotiation through the market pricing mechanism. In December 2012, SERC issued another circular to further regulate the trans-provincial and interregional transaction of power and/or power generation right.
In May 2011, NDRC issued a notice, increasing the on-grid tariffs of thermal power plants to partially compensate the increased costs incurred by thermal power plants resulting from increases in coal prices. Different adjustments on tariffs were made in different provinces. In November 2011, PRC Government made further nationwide adjustments on power tariffs, including an average of RMB0.026 per kWh increase in on-grid tariff for thermal power plants. In December 2012, NDRC issued a notice, which provided that, from January 1, 2013, NDRC would provide an RMB0.008 per kWh denitrification premium for all coal-fired generating units equipped with denitrification facilities that are inspected and accepted by authorized national or provincial authority.
24
In March 2012, the PRC Government issued a notice, which mandated the confirmation method for the power generation projects, subsidy standards and fund appropriation standards relating to the application for a subsidy for renewable energy power price of power generation projects. In December 2012, the PRC Government issued the Notice on the Guidelines of Enhancing the Reform of Marketization of Coal Used for Power Generation to further reform the coal pricing mechanism. Effective January 1, 2013, all key coal purchase contracts between power generation companies and coal suppliers were terminated and contracts are directly negotiated between power generation companies and coal suppliers without the interference of local governments. According to the notice, the NDRC will no longer issue inter-provincial guidance on the railway transportation capacity plan. In addition, the dual-track coal pricing system, which included the government regulated mandatory annual contract pricing and spot market prices for the remaining coal production output of each coal supplier, was abolished due to the narrowing gap between the government regulated coal contract price and the spot market price. Pursuant to the notice, future coal contract prices will be determined by the market and freely negotiated between power generation companies and coal suppliers. Furthermore, the coal-electricity price linkage mechanism will continue to be implemented and constantly improved. Once the coal price fluctuates for more than 5% on an annual basis, the on-grid tariff would be adjusted accordingly. The notice also mandates that power generation companies absorb 10% of the coal price fluctuations as compared to 30% prior to 2013. Given the narrow gap between the key contract coal price and the spot market price, the overall on-grid tariff was not adjusted.
In September 2013, NDRC issued the Notice on the Adjustment of Power Tariff for Power Generation Companies and Related Matters, pursuant to which the on-grid tariffs for coal-fired generating units were lowered, by a national average of RMB0.013 per kWh, and the on-grid tariff for gas turbine power plants was slightly increased. The Notice also increased the power tariff for power-generating companies that are equipped with denitrification facilities and dust-removal facilities.
In March 2014, the NDRC and the Ministry of Environmental Protection jointly issued the Measures to Monitor the Operation of Environmental Protection Tariffs and Facilities Regarding Coal-fired Generating Units, under which the standard on-grid electricity tariff incorporating environmental protection element will no longer be applicable to coal-fired generating units unless the coal-fired power generating enterprise has completed renovation for environmental protection acceptable after testing. In August 2014, the NDRC issued the Notice to Further Resolve Conflicts Regarding Environmental Protection Tariff, under which the standard on-grid tariff for coal-fired power generating units is lowered with the view to resolve the environmental protection tariffs conflicts such as denitrification and dedusting of coal-fired power generation enterprises, and setting the tariff subsidy for denitrification and dedusting at RMB0.01/kWh and RMB0.002/kWh, respectively. In December 2014, the NDRC issued the Notice Regarding Adjusting Standard On-grid Tariff for Onshore Wind Powers, under which the standard on-grid tariff for each of Class I, Class II and Class III wind powers is lowered by RMB0.02, and the tariff for Class IV wind power remains unchanged at RMB0.61/kWh. In December 2014, the NDRC issued the Notice Regarding Certain issues of On-grid Tariff of Natural Gas Powers, defining the principles to formulate and modify the tariff of electricity generated by natural gas, aiming to regulate on-grid tariff administration and used facilitate healthy and orderly growth of natural gas power generating sector in China.
In April 2015, the NDRC issued the Notice on Reducing On-grid Tariff for Coal-fired Power and Commercial and Industrial Power Tariff in order to guide on tariffs for natural gas and for companies that utilize denitration or dedusting techniques or with extremely low emissions, to lower commercial and industrial power tariff, and to moderately lower on-grid tariff for coal-fired power, the power tariff in provincial grids nationwide was decreased by an average of RMB0.02 per kWh.
In December 2015, the NDRC issued the Notice on Issues of Perfecting the Mechanism of Coal-electricity Price Linkage, confirming the annual cycle of the mechanism, the NDRC’s leading role in implementing the mechanism, and provinces and cities’ executor role in implementing the mechanism. The coal-electricity prices with which the mechanism of coal-electricity price linkage is in line are indexed to the national thermal coal price index. The benchmark coal price is the provincial average price in China’s thermal coal price index of 2014. And the benchmark tariff is in principle the on-grid tariff in line with the benchmark coal price. In December 2015, the NDRC also issued the Notice on Improving On-grid Tariff Policy for Wind Power and Photovoltaic Power, which established a policy that the benchmark on-grid tariffs for wind power and photovoltaic power decrease in line with the development of these two types of power plants. To further indicate the investment expectation, the Notice confirmed the benchmark on-grid tariffs for wind power of 2016 and 2018. The 2016 benchmark on-grid tariff for photovoltaic power has been confirmed, yet that of 2017 and onward will be confirmed at a later stage.
25
On January 1, 2016, after the annual review based on the calculations prescribed in the mechanism of coal-electricity price linkage, the NDRC adjusted on-grid tariff for coal-fired power and commercial and industrial power tariff. National on-grid tariffs for coal power decreased by an average of RMB0.03 per kWh, based on the relevant regulations, RMB0.01 per kWh of which shall be contributed to a specialized corporate restructuring fund with the purpose of supporting placement of personnel laid off during the supply-side reform. The NDRC also increased on-grid tariff for renewable power by RMB0.004 per kWh in order to replenish the renewable energy fund and to support emission reduction efforts of coal-fired power generation enterprises and to resolve conflicts regarding environmental protection tariffs.
In December 2016, in order to implement General Office of the State Council’s Energy Development Strategic Action Plan (2014-2020) about achieving equal on-grid tariff for wind and solar power with coal power to encourage the orderly development of wind and solar power by properly guiding investments in these areas, the NDRC issued the Announcement on the Adjustment of Standard On-Grid Tariff for Solar and Onshore Wind Power. From January 1, 2017, standard on-grid tariffs for Class I, Class II and Class III solar powers were adjusted to RMB0.65 per kWh, RMB0.75 per kWh and RMB0.85 per kWh, respectively, which is RMB0.15 per kWh, RMB0.13 per kWh and RMB0.13 per kWh lower than the corresponding tariff in 2016. Such standard on-grid tariff will be adjusted annually. 2018 standard on-grid tariff for Class I, Class II and Class III onshore wind power decreased by RMB0.04 per kWh, RMB0.02 per kWh, RMB0.01 per kWh, respectively. Yunnan Province has been recategorized as Class II from Class IV, which meant the standard on-grid tariff for wind power generated in Yunnan province will decrease by an additional RMB0.12 per kWh.
In June 2017, NDRC issued Circular on Canceling or Reducing Governmental Funds and Additional Charges and Reasonably Adjusting On-Grid Tariff Structure, which cancels the special fund for industrial restructuring charged to the power generating enterprises and reduces major water conservancy project construction fund and large and medium-sized reservoir resettlement support fund by 25% to relieve power generation enterprises from its difficulties in daily operations.
In December 2017, NDRC issued Circular on the Pricing Policy of Photovoltaic Projects in 2018, From January 1, 2018, standard on-grid tariffs for Class I, Class II and Class III solar powers were adjusted to RMB0.55 per kWh, RMB0.65 per kWh and RMB0.75 per kWh, respectively (tax included). All distributed photovoltaic projects commencing operation after January 1, 2018, adopting “Self Generate, Self Consume, with Spare Power Put On-grid” model, shall apply a subsidy of RMB0.37 per kWh. All distributed photovoltaic projects adopting “All Power Put On-grid” model shall apply the price set by the region they locate at.
In May 2018, the NDRC, NEA and MOF issued Circular on the Issues related to Photovoltaic Projects in 2018, reducing the standard on-grid tariffs by RMB0.05 for each of Class I, Class II and Class III solar powers. All distributed photovoltaic projects commencing operation after the issuance of the circular, adopting “Self Generate, Self Consume, with Spare Power Put On-grid” model, shall apply a subsidy of RMB0.32 per kWh. All distributed photovoltaic projects adopting “All Power Put On-grid” model shall apply the price set by the region they locate at. In June 2018, the NDRC, NEA and MOF issued the Notice on Releasing the Catalogue of Additional Subsidies for Renewable Energy Tariff (the Seventh Group), which provides that on-grid renewable energy projects incorporated in the catalogue shall not receive the subsidy from the fund of additional subsidies for renewable energy tariff.
In 2019, NDRC and NEA successively issued, among others, Notice on Regulating the Management of Priority Generation and Priority Purchase Plan, Notice on Establishing and Perfecting Renewable Energy Power Consumption Guarantee Mechanism, Notice on Full Release of Power Generation and Utilization Plan for Operating Power Users, and Guidance on Deepening the Reform of the On-grid Tariff Formation Mechanism for Coal-fired Power to guarantee the purchase of clean energy such as wind power and solar power, increase the utilization rate of renewable energy, and reduce the amount of abandoned wind and solar power. In principle, the power generation and utilization plans for operating power users are all opened up with scope of power transactions further expanded. The tariff benchmark mechanism had been changed to the market pricing mechanism of “floating around base price,” and the previous coal-power price linkage mechanism has been cancelled.
In 2021, NDRC and NEA have successively issued, among others, Notice on Further Deepening the Market-Based Reform of the Electricity Tariff for Coal-fired Power, Notice on Further Developing Time-of-Use Pricing Regime, Measures for the Management and Supervision of Power Suppliers, and Measures for Pricing of Electricity Transmission for Inter-provincial and Inter-regional Special Projects to accelerate the process of deepening the reform of the power markets regulatory regime and further develop the power market system, effectively improve the consumption capacity of renewable energy, accelerate the development in a green and low-carbon approach, and ensure that the carbon peak and carbon neutrality goals be achieved as scheduled.
26
Pricing Policy in Singapore
Pricing Policy of Electricity in Singapore
All licensed power plants in Singapore sell their plant output into the NEMS under a half-hourly competitive bidding process, during which a clearing price is determined based on the projected system demand. All successful bids/power plants that are cleared in each half hour will be dispatched automatically by control signals from the Power System Operator, a division of the EMA, and in turn will receive the cleared price as determined earlier. The cleared price paid to the power plants is the nodal price at their point of injection, and the Market Clearing Engine, the computer software that creates dispatch schedules and determines market clearing prices, automatically produces a different price at each node on the network. A Demand Response scheme is being introduced where demand could be curtailed in response to high prices in return for a share of the total savings arising out of lower prices as a result of demand being reduced.
As there is no certainty in the price or the dispatch levels for any power plants, operators of power plants may enter into short- or long-term financial arrangements with other counterparties or their own subsidiary company involved in the electricity retail market (to end consumers of electricity) to secure stability in their revenue stream and manage the commercial risks associated with operations in a competitive market.
In addition, the major power generation companies, including Tuas Power, are obliged to hold vesting contracts. Vesting contracts are a form of the bilateral contract imposed/vested on the generation companies who had been licensed by the EMA before the establishment of NEMS. Market Support Services Licensee is the counterparty to all of the vesting contracts, and the vesting contracts are settled between the parties through the EMC’s settlement system. The quantity of vesting contract allocated to the power generation company depends on the proportion of such power generation company’s capacity to the total licensed or planned generation capacity at the commencement of the vesting contract regime. Vesting contract price is set by the EMA at the long-run marginal cost and is adjusted by the EMA on a periodic basis for changes in the long-run marginal cost and on a quarterly basis for inflation and changes in fuel prices and electricity demand. Such mechanism helps protect the profit margins of the power generation companies in the Singapore market. The contract quantity and price are currently recalculated every three months. Following the review of vesting contract regime by EMA in 2016, it is determined that the vesting contract level will maintain at 25% until the end of first half of 2018 and reduce to LNG vesting level by the second half of 2019. The vesting contract regime will be phased out by 2023 when the LNG vesting contracts expire. There will be increased exposure to pool prices which are volatile in nature. The authority has introduced a demand response scheme where loads can choose to participate in peak load shaving and share in part of the consumer surplus and an Electricity Futures Market which attracts independent retailers to enter the Singapore market. We continue to monitor closely and evaluate the impact of such markets on our business.
The gross pool design adopted in NEMS means all quantity sold by retailers to consumers has to be in turn purchased from the pool. The retailers pay for their electricity purchases at the Uniform Singapore Energy Price, which is a weighted average of nodal prices and is determined on a half-hourly basis in the NEMS.
Pricing Policy of Utilities in Singapore
Utilities supply to industrial customers is based on long-term contracts. The pricing of utilities has both fixed and variable components.
Pricing Policy of Desalinated Water in Singapore
The supply of desalinated water to PUB, target to commence in 2022, is based on long-term WPA with PUB. The pricing of desalinated water has both fixed and variable components.
27
Pricing Policy in Pakistan
In 2013, the NEPRA reviewed a proposal from Private Power Infrastructure Board for determination of upfront tariff for power generating enterprises based on imported as well as local coal other than Thar coal. Such proposal was based on data gathered from different sources, including feasibility studies of Engro Group, Applied Energy Services and certain tariff determinations of the NEPRA. After due process, determination in the matter of upfront tariff for the Project on Imported/Local Coal (Other than Thar Coal) was issued on June 6, 2013. Later, Government of Pakistan, through Ministry of Energy (formerly known as Ministry of Water & Power), filed a request dated February 11, 2014 for reconsideration of the aforementioned decision determining the upfront tariff for coal power projection. The NEPRA admitted the Government’s reconsideration request and issued a new decision in June 2014. Power generating entities can choose to opt such determined upfront tariff. Huaneng Shandong Ruyi (Pakistan) Energy (Private) Limited, the operating entity of the Sahiwal Power Plant, opted the upfront tariff in 2015 and applied for the adjustment of the element components of such tariff in 2018. The modification was approved in 2019.
Power sales
Each of our power plants has entered into a written agreement with the local grid companies for the sales of its planned power output. Generally, the agreement has a fixed term of one year and provides that the annual utilization hours of the power plant will be determined with reference to the average annual utilization hours of the similar generating units connected to the same grid.
In 2003, SERC and the State Administration of Commerce and Industry jointly promulgated a model contract form (the “Model Contract Form”) for use by power grid companies and power generation companies in connection with electricity sale and purchase transactions. The Model Contract Form contains provisions on the parties’ rights and obligations, amount of electricity subject to purchase, payment method and liabilities for breach of contract, etc. We believe that the publication of the Model Contract Form has facilitated the negotiation and execution of electricity purchase contracts between power grid companies and power generation companies in a fair, transparent and efficient manner. In 2016, a majority of the agreements entered into between our power plants and the local grid companies were based on the Model Contract Form. In 2018, our power plants, large power end-users and electric power companies/grid companies started to sign tripartite contracts.
From 2015, several rules have been issued to implement the plan for power market reform, including Regulation on Market Access and Exit of Electric Power Company, Several Opinions on Further Deepening the Reform of the Electric Power System, Regulations on Orderly Opening Up Electricity Distribution Business, Basic Rules for Mid- to Long- Term Electricity Trade (Interim), Circulate on Orderly Opening Up Power Generation and Consumption Plans, Response regarding Approving Regulation on Pilot Inter-Region Incremental Renewable Energy Power Trade (Interim), Circular on Establishment of Pilot Electricity Power Stock Exchange, Notice on Actively Promoting Market-oriented Power Exchange and Further Improving the Trading Mechanism, and Implementing Rules on Allocating the Distribution Region of the Incremental Distribution Business, etc. to further the reform of electricity market and the establishment of the electricity exchange.
Starting from 2016, two nationwide and 33 provincial level electricity exchanges have been established, and we have invested in the electricity exchanges established in Chongqing, Shanxi and Hubei, holding 3%, 5% and 5% equity interests, respectively. In 2018, the NDRC and NEA issued Circular on Promoting the Standardization of the Power Exchanges, which provides the power exchanges shall pursue the variety of shareholders and demands a non-grid capital involvement of more than 20%. More than 20 market administration committees have been established, and we have participated in the market administration committees established in areas such as Beijing, Guangzhou, Jiangsu, Shanxi, Liaoning, Shanghai, Henan, Hubei, Chongqing, Jilin and Shandong.
At the end of 2018, all municipalities, autonomous regions and provinces, except for Tibet, have finished their approval of electricity distribution price. We have established 20 provincial level energy sales companies and 13 municipal level energy sales companies, taking a meaningful market share.
In 2018, all municipalities, autonomous regions and provinces, except for Tibet, have developed direct purchase programs. We participated in direct purchase programs in all regions where we have control over power plants, other than Hainan, and obtained market shares similar to our capacity shares.
28
In 2019, with the continuous deepening of power system reform, the Chinese government has adopted the following regimes for power market management and tariff formation: (i) the power generation of power plants consists of base power generation and market trading power generation, the plan of the former is formulated and issued by the government authority and the amount and price of the latter are determined by various market players through bilateral negotiation and platform bidding process. The Chinese government will continue to advance the reform of power system, further strengthen the construction of the power market, and vigorously promote the medium and long-term power exchanges, spot trading market, market-oriented auxiliary service trading market, etc., to improve the efficiency of resource allocation.
In 2021, China’s power market reform further continued to strengthen the establishment of the power markets with the goals of carbon peaking and carbon neutrality and to vigorously and synchronously promote the establishment of medium- and long-term electricity trading markets, electricity spot markets, and auxiliary service markets. In 2021, China (i) further improved the time-of-use tariff pricing regime to better guide users to consume electricity power in an optimized approach, improve the balance of electricity supply and demand, and promote the consumption of new energy power; (ii) further deepened the market-oriented reform of tariff pricing system for coal-fired power by, in principle, having all electricity generatated by coal-firing power plants priced within a 20% floating range around the base price (with high-energy-consuming enterprises not subject to the 20% limitations); and (iii) with the purpose to establish an unified power market system, actively and steadily promoted the interprovincial electricity spot trade, continuously expanded the scope of transactions conducted in the power markets, gradually guided major electricity users and electricity suppliers to make direct power market transactions, and promoted with priority direct transactions between renewable energy power plants and electricity users having demands on green electricity. Governmental authorities in China also issued multiple guidance and notices and take certain measures on the consumption of renewable energy generated electricity.
In general, establishing liberalized power markets represents the general trend in China’s power market reform, which is conducive to creating a competitive environment that is fair, transparent and equitable. Currently, all electricity generated by coal-firing power plants shall in principle be traded in the power markets, where the market participants shall determine the trading price and volume through bilateral negotiations and platform bidding process, while electricity generated by renewable energy power plants shall be purchased through both guaranteed procurement regime and power market transactions, with the volume to be purchased under guaranteed procurement regime to be determined by the governmental authorities.
Power sales in Singapore
According to EMC, the total registered capacity in commercial operation for 2021 in Singapore was 12,149 MW, of which 10,512 MW belonged to CCGT/Cogen/Trigen facilities. In 2021, the peak demand for electricity was 7,315 MW against 2020’s 7,034 MW. The power market in Singapore is competitive, and power generation companies compete to sell their power output into NEMS through a bidding process with hedging via vesting contracts and retail sales. The Vesting Contract Scheme has dropped to LNG vesting level in second half of 2019. The decrease in allocated vesting contract volumes will have to be made up through increased retail sales or increased exposure to pool prices which are volatile in nature.
The volatility in the sales price of the revenue associated with the sale of electricity in the NEMS is effectively managed via vesting contracts and direct retail sales which is carried out through a Tuas Power’s subsidiary. The effective tariffs Tuas Power received for its electricity output are thus largely dependent on the vesting contract prices and volumes as well as prices secured under retail sales. The EMA has launched the Open Electricity Market (previously known as Full Retail Contestability) in April 2018 progressively based on geographical zones and the nationwide launch of the Open Electricity Market was completed.
Utility sales in Singapore
In 2021, TMUC sold 2,126,111MT of steam to customers, a decrease of 9% as compared to 2,336,645MT in 2020 amid COVID-19 pandemic.
29
Power sales in Pakistan
In 2015, the CPPA assumed the business of National Transmission and Dispatch Company pertaining to the market operations and presently functioning as the market operator in accordance with Rule-5 of the NEPRA Market Operator (Registration, Standards and Procedure) Rules, 2015. The CPPA’s functions includes, among others, procurement of power on behalf of distribution companies (the “DISCOs”). Power generating entities such as Sahiwal Power Plant sell power to CPPA directly, which shall sell power to DISCOs for their further distribution and selling of powers to users.
Fuel supply arrangements
The majority of our power plants in capacity are thermal plants, which are fueled by coal, gas and oil.
Coal
Our coal supply for our coal-fired power plants is mainly obtained from numerous coal producers in Shanxi Province, Inner Mongolia Autonomous Region and Shaanxi Province. We also obtain coal from overseas suppliers.
In 2019, we purchased 183 million tons of coal and consumed 182 million tons of coal. Of our total coal purchases, 62% was purchased under annual contracting arrangements and the remainder was purchased on the open market. The coal purchase price for our Company, including transportation costs and miscellaneous expenses, averaged approximately RMB505.12 per ton in 2019, representing a decrease of 8.38% compared to 2018. Our average unit fuel cost in 2019 decreased by 5.77% from that in 2018.
In 2020, we purchased 171 million tons of coal and consumed 174 million tons of coal. Of our total coal purchases, 53% was purchased under annual contracting arrangements and the remainder was purchased on the open market. The coal purchase price for our Company, including transportation costs and miscellaneous expenses, averaged approximately RMB479.11 per ton in 2020, representing a decrease of 5.15% compared to 2019. Our unit fuel cost of our domestic power plants in 2020 decreased by 6.34% from that in 2019.
In 2021, we purchased 202.84 million tons of coal and consumed 197.9 million tons of coal. Of our total coal purchases, 55.15% was purchased under annual contracting arrangements and the remainder was purchased on the open market. The coal purchase price for our Company, including transportation costs and miscellaneous expenses, averaged approximately RMB770.67 per ton in 2021, representing an increase of 60.9% compared to 2020. Our unit fuel cost of our domestic power plants in 2021 increased by 51.32% from that in 2020.
Singapore’s Tuas Power used coal as primary fuel for its TMUC’s cogeneration plants. Coal is procured from coal producers in Indonesia via two long-term coal supply contracts with 10-year and 15-year terms respectively, and short-term contracts. The prices are indexed to the Global Coal Newcastle Index and HBA (Coal Reference Price which is regulated by Indonesia Government) Index. In 2021, Tuas Power purchased partial volume from the open market to lower the increased long term coal prices, and achieved some cost savings in this spot purchase.
Gas
Currently, the Company has 11 Combined Cycle Gas Turbine Power Plants (“CCGT”) in China, including:
● | Huaneng Shanghai Combined Cycle Gas Turbine Power Plant (“Shanghai CCGT”) with gas supply transported through the pipeline of “West-East Gas Transport Project”; |
● | Huaneng Jiangsu Jinling Combined Cycle Gas Turbine Power Plant (“Jinling CCGT”) with gas supply transported through the pipeline of “West-East Gas Transport Project”; |
● | Huaneng Beijing Co-generation CCGT Power Plant (“Beijing Co-generation CCGT”) with gas supply transported through Shaanxi-Beijing Pipeline; |
30
● | Huaneng Zhejiang Tongxiang Combined Cycle Gas Turbine Power Plant (“Tongxiang CCGT”), with gas supply transported through the pipeline of “West-East Gas Transport Project”; |
● | Huaneng Chongqing Liangjiang Combined Cycle Gas Turbine Power Plant (“Liangjiang CCGT”) with gas supply transported through the pipeline of “West-East Gas Transport Project”; |
● | Huaneng Tianjin Lingang Combined Cycle Gas Turbine Co-generation Power Plant (“Lingang CCGT Co-generation”) with gas supply by CNOOC Tianjin Trading Branch and Petro China Tianjin Trading Branch; |
● | Huaneng Shanxi Dongshan Combined Cycle Gas Turbine Power Plant (“Dongshan CCGT”) with gas supply transported through Shaanxi-Beijing Pipeline II; |
● | Huaneng Hainan Nanshan Combined Cycle Gas Turbine Power Plant (“Nanshan CCGT”) with gas supply by CNOOC Hainan Branch; |
● | Huaneng Zhongyuan Combined Cycle Gas Turbine Power Plant (“Zhongyuan CCGT”) with gas supply transported through the pipeline of “West-East Gas Transport Project”; |
● | Huaneng Jiangsu Suzhou Combined Cycle Gas Turbine Co-generation Power Plant (“Suzhou CCGT Co-generation”) with gas supply transported through the pipeline of “West-East Gas Transport Project”; and |
● | Huaneng Guangxi Guilin Distributed Energy Project (“Guilin Distributed Energy”) with gas supply by Petro China Nanning Branch. |
In addition, Tuas Power in Singapore has five gas-fired combined cycle generating units and three gas-fired backup boilers. The piped gas for Tuas Power is provided by Pavilion Energy Singapore Pte Ltd and Sembcorp Gas Pte Ltd., whereas LNG is provided by Shell Gas Marketing Pte Ltd.
Repairs and maintenance
Each of our power plants shall conduct repairs and maintenance as per the repairs and maintenance plan issued by the regional grid company. The daily repairs and maintenance procedure of generating units shall comply with the relevant rules and technical specifications of the Company.
We arrange our annual repairs and maintenance plan based on the operating status and equivalent operating hours (“EOH”) of generating units:
● | for imported units of and above 300MW, and domestically-built units of and above 600MW, we arrange an A-grade repairs and maintenance after 60,000 EOH, after which, we arrange a B-grade repairs and maintenance after 30,000 EOH each; |
● | for domestically-built units below 600MW, we arrange an A-grade repairs and maintenance after 40,000 EOH, after which we arrange a B-grade repairs and maintenance after 20,000 EOH each, provided, that a C-grade repairs and maintenance shall be conducted after 10,000 EOH or 18 months, whichever is longer; |
● | for all units not scheduled for any A-grade, B-grade or C-grade repairs and maintenance within a calendar year, a D-grade repairs and maintenance shall be arranged; |
● | for all high backpressure heating units and circulating fluidized bed boilers, we arrange a separate D-grade repairs and maintenance each calendar year; |
● | in principle, we arrange no C-grade or above repairs and maintenance for units newly put into operations, but only one D-grade repairs and maintenance for every two units; and |
31
● | for CCGT units, we arrange repairs and maintenance pursuant to the long-term servicing agreement. |
C. | Organizational structure |
We are 32.28% owned by HIPDC, which in turn is a subsidiary of Huaneng Group. Huaneng Group was established in 1988 with the approval of the State Council. Huaneng Group also holds a 13.94% equity interest in us in addition to HIPDC’s ownership. In 2002, Huaneng Group was restructured as one of the five independent power generation group companies to take over the power generation assets originally belonging to the State Power Corporation of China. Huaneng Group has a registered capital of RMB34.9 billion and is controlled and managed by the central government. Huaneng Group is principally engaged in the development, investment, construction, operation and management of power plants; organizing the generation and sale of power (and heat); and the development, investment, construction, production and sale of products in relation to energy, transportation, new energy and environmental protection industries.
HIPDC was established in 1985 as a joint venture controlled by Huaneng Group. HIPDC is engaged in developing, investing, operating and constructing power plants in China. Some of the power plants currently owned and operated by us were originally built and later transferred to us by HIPDC. Both Huaneng Group and HIPDC have agreed to give us preferential rights in the power development business and power assets transfers. See “Item 7.A. Major shareholders” for details.
The following organizational chart sets forth the organizational structure of HIPDC and us as of March 31, 2022:
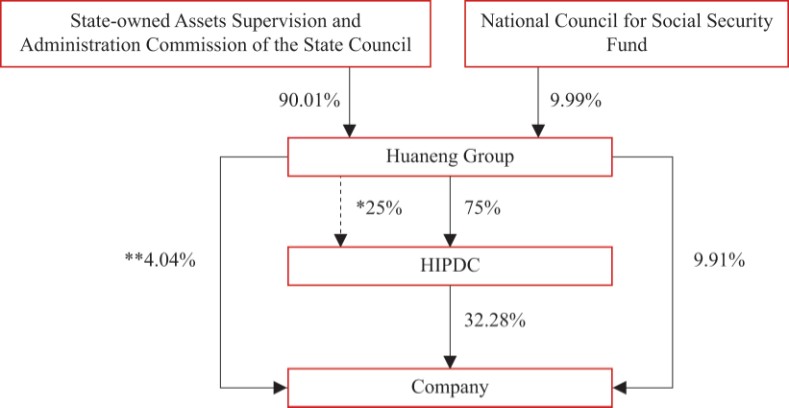
Notes:
* | Huaneng Group indirectly holds 100% equity interests in Pro-Power Investment Limited through its wholly owned subsidiary, China Hua Neng Hong Kong Company Limited, and Pro-Power Investment Limited in turn holds 25% equity interests in HIPDC. As a result, Huaneng Group beneficially holds 100% of equity interests in HIPDC. |
** | 3.01% was held by Huaneng Group through its wholly owned subsidiary, China Hua Neng Hong Kong Company Limited, 0.84% was held by China Huaneng Group Treasury Management (Hong Kong) Limited and the remaining approximately 0.19% was held by Huaneng Group through its subsidiary, China Huaneng Finance Corporation Limited. |
For a detailed discussion of the Company’s subsidiaries, see Note 9 to the Financial Statements.
32
D. | Property, plants and equipment |
The following table presents certain summary information on our power plants as of December 31, 2021.
|
| Current |
|
| ||||||
Actual In-service | Installed | Attributable | Type | |||||||
Plant or Expansion | Date | Capacity | Ownership | Capacity | of Fuel | |||||
(Names as defined below) | (MW) | % | MW | |||||||
Heilongjiang Province |
|
|
|
|
| |||||
Xinhua Power Plant | Unit I: Sep. 1979 | 1 x 200 | 70% | 140 | Coal | |||||
Unit II: Sep. 2005 | 1 x 330 | 70% | 231 | |||||||
Hegang Power Plant | Unit I: Nov. 1998 | 1x 300 | 64% | 192 | Coal | |||||
Unit II: Nov. 1999 | 1x 300 | 64% | 192 | |||||||
Unit III: Apr. 2007 | 1 x 600 | 64% | 384 | |||||||
Daqing Co-generation | Unit I: Jun. 2013 | 1 x 350 | 100% | 350 | Coal | |||||
Unit II: Aug. 2013 | 1 x 350 | 100% | 350 | |||||||
Yichun Co-generation | Unit I: Sep. 2015 | 1 x 350 | 100% | 350 | Coal | |||||
Unit II: Dec. 2015 | 1 x 350 | 100% | 350 | |||||||
Sanjiangkou Wind Power | 66 turbines: Feb. 2010 | 99 | 82.85% | 82.02 | Wind | |||||
Linjiang Jiangsheng Wind Power | 66 turbines: Oct. 2015 | 99 | 82.85% | 82.02 | Wind | |||||
Daqing Heping Aobao Wind Power | 32 turbines: Dec. 2011 | 96 | 100% | 96 | Wind | |||||
32 turbines: May 2012 | 96 | 100% | 96 | |||||||
32 turbines: Dec. 2013 | 96 | 100% | 96 | |||||||
Zhaodong Dechang Photovoltaic | Dec. 2017 | 20 | 100% | 20 | Solar | |||||
Shuangyu Photovoltaic |
|
|
|
|
| |||||
Shuangyu Photovoltaic | Jul. 2018 | 20 | 100% | 20 | Solar | |||||
Xinhua Photovoltaic | Jun. 2018 | 20 | 100% | 20 | Solar | |||||
Donghai Photovoltaic | Jul. 2018 | 20 | 100% | 20 | Solar | |||||
Xinken (Luobei) Wind Power | 64 turbines: Q3 2021 | 60 x 3.2 | 100% | 200 | Wind | |||||
Jilin Province |
|
|
|
|
| |||||
Jiutai Power Plant | Unit I: Oct. 2009 | 1 x 670 | 100% | 670 | Coal | |||||
Unit II: Dec. 2009 | 1 x 670 | 100% | 670 | |||||||
Changchun Co-generation | Unit I: Dec. 2009 | 1 x 350 | 100% | 350 | Coal | |||||
Unit II: Apr. 2010 | 1 x 350 | 100% | 350 | |||||||
Nongan Biomass | ||||||||||
Phase I | Dec. 2011 | 1 x 25 | 100% | 25 | Biomass | |||||
Phase II | Dec. 2020 | 1 x 35 | 100% | 35 | Biomass | |||||
Linjiang Jubao Hydropower | Sep. 2004 | 2 x 10 | 100% | 20 | Solar | |||||
Zhenlai Wind Power | 33 turbines: Jun. 2009 | 49.5 | 100% | 49.5 | Wind | |||||
33 turbines: Dec. 2011 | 49.5 | 100% | 49.5 | |||||||
Siping Wind Power | 50 turbines: Oct. 2010 | 75 | 100% | 75 | Wind | |||||
25 turbines: Nov. 2010 | 50 | 100% | 50 | |||||||
50 turbines: Dec. 2010 | 75 | 100% | 75 | |||||||
2 turbines: 2019 | 6 | 100% | 6 | |||||||
64 turbines: Q3 2021 | 13 x 3 | 100% | 41.5 | Wind | ||||||
Tongyu Tuanjie Wind Power | 74 turbines: Dec. 2015 | 148 | 100% | 148 | Wind | |||||
Linjiang Jubao Photovoltaic | Jun. 2017 | 15 | 100% | 15 | Solar | |||||
Zhenlai Photovoltaic | Jun. 2018 | 20 | 50% | 10 | Solar | |||||
Shuilongshan Photovoltaic | Q3 2020 | 100 | 100% | 100 | Solar | |||||
Liangjingzi Wind Power | 108 turbines: Q4 2021 | 68 x 4 | 100% | 400 | Wind | |||||
Liaoning Province |
|
|
|
|
| |||||
Dalian Power Plan |
|
|
|
|
| |||||
Phase I | Unit I: Sep. 1988 | 2 x 350 | 100% | 700 | Coal | |||||
Unit II: Dec. 1988 | ||||||||||
Phase II | Unit III: Jan. 1999 | 2 x 350 | 100% | 700 | Coal | |||||
Unit IV: Jan. 1999 | ||||||||||
Dandong Power Plant | Unit I: Jan. 1999 | 2 x 350 | 100% | 700 | Coal | |||||
Unit II: Jan. 1999 | ||||||||||
Yingkou Power Plant |
|
|
|
|
|
33
Phase I | Unit I: Jan. 1996 | 2 x 320 | 100% | 640 | Coal | |||||
Unit II: Dec. 1996 | ||||||||||
Phase II | Unit III: Aug. 2007 | 2 x 600 | 100% | 1,200 | Coal | |||||
Unit IV: Oct. 2007 | ||||||||||
Yingkou Co-generation | Unit I: Dec. 2009 | 2 x 330 | 100% | 660 | Coal | |||||
Unit II: Dec. 2009 | ||||||||||
Wafangdian Wind Power | 24 turbines: Jun. 2011 | 48 | 100% | 48 | Wind | |||||
Changtu Wind Power | 33 turbines: Nov. 2012 | 97.5 | 100% | 97.5 | Wind | |||||
24 turbines: Oct. 2014 | ||||||||||
Suzihe Hydropower | 2012 | 3 x 12.5 | 100% | 37.5 | Hydro | |||||
Dandong Photovoltaic | May. 2016 | 9.864 | 100% | 9.864 | Solar | |||||
Yingkou Co-generation Photovoltaic | Jun. 2016 and Q4 2021 | 15.7 | 100% | 15.7 | Solar | |||||
Yingkou Co-generation Wind Power | May 2019 | 12.5 | 100% | 12.5 | Wind | |||||
Yingkou Xianrendao Co-generation Power | Mar. 2017 | 2*50 | 100% | 100 | Coal | |||||
Jianchang Bashihan Photovoltaic |
|
|
|
|
| |||||
Phase I | Aug. 2017 | 22.03 | 100% | 22.03 | Solar | |||||
Phase II | Aug. 2017 | 22.03 | 100% | 22.03 | Solar | |||||
Xiao Deyingzi Photovoltaic | Aug. 2017 | 15.56 | 100% | 15.56 | Solar | |||||
Chaoyang Heiniuyingzi Photovoltaic | Aug. 2017 | 18.79 | 100% | 18.79 | Solar | |||||
Dalian Co-generation | Unit I: Jun. 2020 | 2 x 50 | 100% | 100 | Coal | |||||
Unit II: June. 2020 | ||||||||||
Dandong Distributed Wind Power | 4 turbines: Q4 2020 | 4 x 3 | 100% | 12 | Wind | |||||
Dalian Distributed Wind Power | 5 turbines: Q4 2021 | 5 x 3 | 100% | 15 | Wind | |||||
Yingkou Photovoltaic | Q4 2021 | 5.7 | 100% | 5.7 | Solar | |||||
Xianrendao Co-generation Photovoltaic | Q4 2021 | 5.99 | 100% | 5.99 | Solar | |||||
Inner Mongolia Autonomous Region |
|
|
|
|
| |||||
Huade Wind Power |
|
|
|
|
| |||||
Phase I | 33 turbines: Dec. 2009 | 49.5 | 100% | 49.5 | Wind | |||||
Phase II | 33 turbines: Jun. 2011 | 49.5 | 100% | 49.5 | Wind | |||||
Naren Wind Power | 58 turbines: Q4 2020 | 58 x 3 | 100% | 174 | Wind | |||||
Hebei Province |
|
|
|
|
| |||||
Shang’ an Power Plant | Unit I: Aug. 1990 | 2 x 350 | 100% | 700 | Coal | |||||
Phase I | Unit II: Dec. 1990 |
|
|
|
| |||||
Phase II | Unit III: Oct. 1997 | 2 x 330 | 100% | 660 | Coal | |||||
Unit IV: Oct. 1997 | ||||||||||
Phase III | Unit V: Jul. 2008 | 2 x 600 | 100% | 1,200 | Coal | |||||
Unit VI: Aug. 2008 | ||||||||||
Kangbao Wind Power |
|
|
|
|
| |||||
Phase I | 33 turbines: Jan. 2011 | 49.5 | 100% | 49.5 | Wind | |||||
Phase II | 44 turbines | 40 x 2.2 | 100% | 96 | Wind | |||||
Kangbao Xitan Photovoltaic | Jun. 2016 | 20 | 100% | 20 | Solar | |||||
Zhuolu Dabao Wind Power | 24 turbines: Mar. 2017 | 48 | 100% | 48 | Wind | |||||
Phase II | 15 turbines: Q2 2021 | 15 x 32 | 100% | 48 | Wind | |||||
Shang’an Dianchanghuichang Photovoltaic | Dec. 2017 | 17 | 100% | 17 | Solar | |||||
Shangyi Guolang Photovoltaic | Q3 2021 | 100 | 100% | 100 | Solar | |||||
Weixian Zeen Photovoltaic | Q3 2021 | 88 | 100% | 88 | Solar | |||||
Luquan Distributed Photovoltaic | Q4 2021 | 0.8 | 100% | 0.8 | Solar | |||||
Gansu Province |
|
|
|
|
| |||||
Pingliang Power Plant |
|
|
|
|
| |||||
Phase I | Unit I: Sep. 2000 | 3 x 325 | 65% | 633.75 | Coal | |||||
Unit II: Jun. 2001 | ||||||||||
Unit III: Jun. 2003 | ||||||||||
Unit IV: Nov. 2003 | 1 x 330 | 65% | 214.5 | Coal | ||||||
Unit V: Feb. 2010 | 2 x 600 | 65% | 780 | Coal | ||||||
Unit VI: March 2010 | ||||||||||
Ganhekoubei II Wind Power | 156 turbines | 111 x 15 | 100% | 249.5 | Wind | |||||
20 x 2.2 | ||||||||||
3 x 2 | ||||||||||
Qiaowan III Wind Power | 91 turbines | 67 x 1.5 | 100% | 148.5 | Wind | |||||
24 x 2 | ||||||||||
Qiaowan IV Wind Power | 136 turbines | 101 x 1.5 | 100% | 5.7 | Wind | |||||
Anbei III Wind Power | 259 turbines | 200 x 2 | 100% | 60 | Wind | |||||
56 x 3.4 |
34
3 x 3.2 | ||||||||||
Yigang Wind Power | 96 turbines: Dec. 2015 | 192 | 100% | 192 | Wind | |||||
Ningxia Autonomous Region |
|
|
|
|
| |||||
Ruyi Helan Rooftop Photovoltaic | Jun. 2017 | 19.8 | 40% | 7.92 | Solar | |||||
Beijing Municipality |
|
|
|
|
| |||||
Beijing Co-generation |
|
|
|
|
| |||||
Phase I | Unit I: Jan. 1998 | 2 x 165 | 41% | 135.3 | Coal | |||||
Unit II: Jan. 1998 | ||||||||||
Unit III: Dec. 1998 | 2 x 220 | 41% | 180.4 | Coal | ||||||
Unit IV: Jun. 1999 | ||||||||||
Unit V: Apr. 2004 | 1 x 75 | 41% | 30.75 | Coal | ||||||
Beijing Co-generation CCGT |
|
|
|
|
| |||||
Phase II | Unit VI: Dec. 2011 | 2 x 306.9 | 41% | 251.66 | Gas | |||||
Unit VII: Dec. 2011 | ||||||||||
Unit VIII: Dec. 2011 | 1 x 309.6 | 41% | 126.936 | Gas | ||||||
Beijing Co-generation CCGT |
|
|
|
|
| |||||
Phase III | Unit IX: Nov. 2017 | 2 x 343 | 41% | 281.26 | Gas | |||||
Unit X: Nov. 2017 | ||||||||||
Unit XI: Nov. 2017 | 1 x 312 | 41% | 127.92 | Gas | ||||||
Tianjin Municipality |
|
|
|
|
| |||||
Yangliuqing Co-generation | Unit I: Dec. 1998 | 4 x 300 | 55% | 660 | Coal | |||||
Unit II: Sep. 1999 | ||||||||||
Unit III: Dec. 2006 | ||||||||||
Unit IV: May 2007 | ||||||||||
Lingang Co-generation CCGT | Unit I: Dec. 2014 | 1 x 313 | 100% | 463 | Gas | |||||
1 x 150 | ||||||||||
Chenxi Photovoltaic | Jun. 2017 | 2.2 | 55% | 1.21 | Solar | |||||
Longye Photovoltaic | 9.74 | 100% | 9.74 | Solar | ||||||
Shanxi Province |
|
|
|
|
| |||||
Yushe Power Plant | Unit III: Oct. 2004 | 2 x 300 | 100% | 600 | Coal | |||||
Unit IV: Nov. 2004 | ||||||||||
Zuoquan Power Plant | Unit I: Dec. 2011 | 2 x 673 | 80% | 1,076.8 | Coal | |||||
Unit II: Jan. 2012 | ||||||||||
Dongshan CCGT | Unit I: Oct. 2015 | 2 x297.7 | 82% | 488.23 | Gas | |||||
Unit II: Oct. 2015 | ||||||||||
Unit III: Oct. 2015 | 263.6 | 82% | 216.25 | Gas | ||||||
Yushe Photovoltaic | Jun. 2017 | 50 | 100% | 50 | Solar | |||||
Yushe Fupin Photovoltaic | Aug. 2018 | 10.5 | 90% | 9.45 | Solar | |||||
Ruicheng Monan Photovoltaic | 2019 | 150 | 100% | 150 | Solar | |||||
Pinglu Zhangguiyao Wind Power | 35 turbines: Q4 2020 | 35 x 2 | 51% | 35.7 | Wind | |||||
Wuzhai Lufeng Wind Power | 28 turbines: 2021 | 17 x 3.6 | 51% | 48.81 | Wind | |||||
Fanchi Pangu Wind Power | 50 turbines: 2021 | 50 x 2 | 51% | 51 | Wind | |||||
Changzhi Photovoltaic | 2019 | 250 | 49% | 122.5 | Solar | |||||
Ruicheng Ximo Photovoltaic | 2020 | 150 | 51% | 76.5 | Solar | |||||
Yangjiao Wind Power | 21 turbines | 16 x 2.5 | 100% | 51 | Wind | |||||
5 x 2.2 | ||||||||||
Shandong Province |
|
|
|
|
| |||||
Dezhou Power Plant |
|
|
|
|
| |||||
Phase I | Unit I: 1992 | 1 x 330 | 100% | 330 | Coal | |||||
Unit II: 1992 | 1 x 320 | 100% | 320 | Coal | ||||||
Phase II | Unit III: Jun. 1994 | 1 x 330 | 100% | 330 | Coal | |||||
Unit IV: May 1995 | 1 x 320 | 100% | 320 | Coal | ||||||
Phase III | Unit V: Jun. 2002 | 2 x 700 | 100% | 1,400 | Coal | |||||
Unit VI: Oct. 2002 | ||||||||||
Jining Power Plant |
|
|
|
|
| |||||
Circulating fluidized bed boiler | Unit V: Jul. 2003 | 2 x 135 | 100% | 270 | Coal | |||||
Unit VI: Aug. 2003 | ||||||||||
Co-generation | Unit I: Nov. 2009 | 2 x 350 | 100% | 700 | Coal | |||||
Unit II: Dec. 2009 |
35
Xindian Power Plant |
|
|
|
|
| |||||
Phase III | Unit V: Sep 2006 | 2 x 300 | 95% | 570 | Coal | |||||
Unit VI: Nov. 2006 | ||||||||||
Weihai Power Plant |
|
|
|
|
| |||||
Phase II | Unit III: Mar. 1998 | 2 x 320 | 60% | 384 | Coal | |||||
Unit IV: Nov. 1998 | ||||||||||
Phase III | Unit V: Dec. 2012 | 2 x 680 | 60% | 816 | Coal | |||||
Unit VI: Dec. 2012 | ||||||||||
Rizhao Power Plant |
|
|
|
|
| |||||
Phase I | Unit I: Sep. 1999 | 1 x 350 | 88.8% | 311 | Coal | |||||
Unit II: Jan. 2003 | 1 x 350 | 88.8% | 311 | |||||||
Phase II | Dec. 2008 | 2 x 680 | 100% | 1,360 | Coal | |||||
Zhanhua Co-generation | Jul. 2005 | 2 x 165 | 100% | 330 | Coal | |||||
Baiyanghe Power Plant | Unit I: Oct. 2003 | 1 x 145 | 80% | 116 | Coal | |||||
Unit II: Oct. 2003 | 1 x 145 | 80% | 116 | |||||||
Unit III: Dec. 2009 | 1 x 300 | 80% | 240 | |||||||
Unit IV: Dec. 2009 | 1 x 300 | 80% | 240 | |||||||
Jiaxiang Power Plant | Unit I: Oct. 2006 | 1 x 330 | 40% | 132 | Coal | |||||
Unit II: May. 2007 | 1 x 330 | 40% | 132 | |||||||
Jining Co-generation | Unit I: Apr. 2004 | 1 x 30 | 40% | 12 | Coal | |||||
Unit II: Jul. 2004 | 1 x 30 | 40% | 12 | |||||||
Qufu Co-generation | Unit I: Feb. 2009 | 1 x 225 | 40% | 90 | Coal | |||||
Unit II: Sep. 2009 | 1 x 225 | 40% | 90 | |||||||
Huangtai Power Plant | Unit I: Nov. 1987 | 1 x 330 | 72% | 237.6 | Coal | |||||
Unit II: Jan. 2011 | 1 x 350 | 72% | 252 | |||||||
Unit III: Jan. 2011 | 1 x 350 | 72% | 252 | |||||||
Yantai Power Plant | Unit I: Apr. 1996 | 1 x 110 | 80% | 88 | Coal | |||||
Unit II: Oct. 2005 | 1 x 160 | 80% | 128 | |||||||
Unit III: Dec. 2005 | 1 x 160 | 80% | 128 | |||||||
Unit IV: Oct. 2006 | 1 x 160 | 80% | 128 | |||||||
Linyi Power Plant | Unit I: Dec. 2012 | 1 x 350 | 60% | 210 | Coal | |||||
Unit II: Oct. 2013 | 1 x 350 | 60% | 210 | |||||||
Unit III: Dec. 1997 | 1 x 140 | 60% | 84 | |||||||
Unit IV: Apr. 2003 | 1 x 140 | 60% | 84 | |||||||
Unit V: Sep. 2003 | 1 x 140 | 60% | 84 | |||||||
Unit VI: Apr. 2005 | 1 x 140 | 60% | 84 | |||||||
Jining Yunhe Power Plant | Unit I: Jul. 2000 | 1 x 145 | 78.68% | 114.09 | Coal | |||||
Unit II: Nov. 2000 | 1 x 145 | 78.68% | 114.09 | |||||||
Unit III: Sep. 2003 | 1 x 145 | 78.68% | 114.09 | |||||||
Unit IV: Feb. 2004 | 1 x 145 | 78.68% | 114.09 | |||||||
Unit V: Sep. 2006 | 1 x 330 | 78.68% | 259.64 | |||||||
Unit VI: Mar. 2006 | 1 x 330 | 78.68% | 259.64 | |||||||
Liaocheng Co-generation | Unit I: Jan. 2006 | 1 x 330 | 60% | 198 | Coal | |||||
Unit II: Sep. 2006 | 1 x 330 | 60% | 198 | |||||||
2 x 140 | 60% | 168 | ||||||||
Zhongtai Power Plant | Unit I: May. 2007 | 1 x 150 | 80% | 120 | Coal | |||||
Unit II: Dec. 2007 | 1 x 150 | 80% | 120 | |||||||
Laiwu Power Plant | Unit I: Dec. 2015 | 1 x 1000 | 74.32% | 743.2 | Coal | |||||
Unit II: Nov. 2016 | 1 x 1000 | 74.32% | 743.2 | |||||||
Muping Wind Power | 28 turbines: Dec. 2010 | 42 | 80% | 33.6 | Wind | |||||
Penglai Wind Power | 24 turbines: Sep. 2014 | 48 | 80% | 38.4 | Wind | |||||
1 turbine: Sep. 2014 | 1.8 | 80% | 1.44 | |||||||
24 turbines: Oct. 2016 | 48 | 80% | 38.4 | |||||||
1 turbine: Oct. 2016 | 1.8 | 80% | 1.44 | |||||||
Rushan Wind Power | 8 turbines: Sep. 2014 | 12 | 80% | 9.6 | Wind | |||||
11 turbines: Sep. 2014 | 16.5 | 80% | 13.2 | |||||||
2 turbines: Oct. 2016 | 3 | 80% | 2.4 | |||||||
7 turbines: Oct. 2016 | 10.5 | 80% | 8.4 | |||||||
Rongcheng Wind Power | 1 turbine: Jan. 2006 | 1.5 | 48% | 0.72 | Wind | |||||
1 turbine: Jan. 2006 | 1.5 | 48% | 0.72 | |||||||
2 turbines: Feb. 2006 | 3 | 48% | 1.44 | |||||||
3 turbines: Mar. 2006 | 4.5 | 48% | 2.16 | |||||||
Dongying Wind Power | 32 turbines: Dec. 2009 | 48 | 56% | 26.88 | Wind | |||||
Boshan Photovoltaic | May. 2016 | 12 | 80% | 9.6 | Solar | |||||
Sishui Photovoltaic | Jun. 2015 | 20 | 80% | 16 | Solar |
36
Gaozhuang Photovoltaic | May. 2016 | 20 | 80% | 16 | Solar | |||||
Jining Co-generation Photovoltaic | Feb. 2017 | 20 | 80% | 16 | Solar | |||||
Zhanhua Qingfenghu Wind Power | 50 turbines: Dec. 2017 | 100 | 80% | 80 | Wind | |||||
Jining Photovoltaic | Feb. 2017 | 20 | 80% | 16 | Solar | |||||
Laiwu Niuquan Photovoltaic | Apr. 2017 | 20 | 80% | 16 | Solar | |||||
Furuite Rooftop Photovoltaic | Jun. 2017 | 6.3 | 95% | 5.99 | Solar | |||||
Zhanhua Hufenghu Photovoltaic | Jun. 2017 | 100 | 46% | 46 | Solar | |||||
Weihai Haibu Photovoltaic | Jun. 2017 | 19.75 | 80% | 15.8 | Solar | |||||
Jining Weishan Zhaozhuang Photovoltaic | Dec. 2017 | 80 | 40% | 32 | Solar | |||||
Jiyang Biomass | Dec. 2020 | 30 | 80% | 24 | Biomass | |||||
Haiyang Offshore Wind Power | 58 turbines: Q4 2021 | 58 x 5.2 | 60% | 180.96 | Wind | |||||
Dezhou Dingzhuang Photovoltaic | Q4 2021 | 200 | 80% | 160 | Solar | |||||
Yantai Bajiao Power | 2019 | 2 x 670 | 80% | 1,072 | Coal | |||||
Laiwu Co-generation | 2 x 330 | 74.32% | 490.51 | Coal | ||||||
Sishui Biomass | 30 | 80% | 24 | Biomass | ||||||
Dezhou Dingzhuang Wind Power | 25 turbines | 25 x 4 | 80% | 80 | Wind | |||||
Laizhou Wind Power | 37 turbines | 28 x 1.5 | 80% | 42.6 | Wind | |||||
9 x 1.25 | ||||||||||
Heze Dongming Wind Power | 26 turbines | 10 x 3.2 | 100% | 80 | Wind | |||||
16 x 3 | ||||||||||
Qixia Wind Power | 20 turbines | 20 x 2.5 | 80% | 40 | Wind | |||||
Xintai Photovoltaic | 100 | 65.78% | 65.78 | Solar | ||||||
Henan Province |
|
|
|
|
| |||||
Qinbei Power Plant |
|
|
|
|
| |||||
Phase I | Unit I: Nov. 2004 | 2 x 600 | 60% | 720 | Coal | |||||
Unit II: Dec. 2004 | ||||||||||
Phase II | Unit III: Nov. 2007 | 2 x 600 | 60% | 720 | Coal | |||||
Unit IV: Nov. 2007 | ||||||||||
Phase III | Unit V: Mar. 2012 | 2 x 1000 | 60% | 1,200 | Coal | |||||
Unit VI: Feb. 2013 | ||||||||||
Zhongyuan CCGT | Unit I: Aug. 2007 | 2 x 390 | 90% | 702 | Coal | |||||
Unit II: Jan. 2008 | ||||||||||
Luoyang Co-generation Power Plant | Unit I: May. 2015 | 2 x 350 | 80% | 560 | Coal | |||||
Unit II: Jun. 2015 | ||||||||||
Mianchi Co-generation | Unit I: Dec. 2016 | 2 x 350 | 60% | 420 | Coal | |||||
Unit II: Dec. 2016 | ||||||||||
Zhumadian Wind Power | 16 turbines: Dec. 2016 | 32 | 90% | 28.8 | Wind | |||||
Qinbei Dianchanghuichang |
|
|
|
|
| |||||
Photovoltaic | Jun. 2017 | 20 | 60% | 12 | Solar | |||||
Tangyin Wind Power | 69 turbines: Dec. 2018 | 151.8 | 100% | 151.8 | Wind | |||||
40 turbines | 40 x 2.5 | 100% | 100 | |||||||
Zhenyao Wind Power | 24 turbines: 2019 | 84 | 95.00% | 79.8 | Wind | |||||
Mianchi Wind Power | 27 turbines: 2019 | 27 x 2 | 80% | 122 | Wind | |||||
3 turbines: 2019 | 6 x 3 | |||||||||
20 turbines | 20 x 2.5 | |||||||||
Puyang Wind Power | 200 turbines | 200 x 2.5 | 100% | 650 | Wind | |||||
60 turbines | 60 x 2.5 | |||||||||
Xiayi Wind Power | 20 turbines | 20 x 2.5 | 100% | 50 | Wind | |||||
Taiqian Wind Power | 16 turbines: 2020 | 16 x 2.6 | 51% | 20.4 | Wind | |||||
Koumen Jianshan Wind Power | 32 turbines | 15 x 3 | 90% | 85.5 | Wind | |||||
16 x 3 | ||||||||||
1 x 2 | ||||||||||
Tangyin Distributed Wind Power | 16 turbines | 16 x 2.5 | 100% | 40 | Wind | |||||
Puyang Distributed Wind Power | 6 turbines | 6 x 2.5 | 100% | 15 | Wind | |||||
Taiqian Distributed Wind Power | 4 turbines | 4 x 2.5 | 51% | 5.1 | Wind | |||||
Zhenping Wind Power | 16 turbines | 16 x 2.5 | 100% | 40 | Wind | |||||
Xincai Chendian Wind Power | 19 turbines | 19 x 2.65 | 100% | 50.35 | Wind | |||||
Jiangsu Province |
|
|
|
|
| |||||
Nanjing Power Plant | Unit I: Mar. 1994 | 2 x 320 | 100% | 640 | Coal | |||||
Unit II: Oct. 1994 | ||||||||||
Taicang Power Plant |
|
|
|
|
| |||||
Phase I | Unit I: Dec. 1999 | 2 x 320 | 75% | 480 | Coal | |||||
Unit II: Apr. 2000 | ||||||||||
Phase II | Unit III: Jan. 2006 | 2 x 630 | 75% | 945 | Coal | |||||
Unit IV: Feb. 2006 | ||||||||||
Taicang Dianchanghuichang Photovoltaic | Jun. 2018 | 50 | 75% | 37.5 | Solar |
37
Huaiyin Power Plant |
|
|
|
|
| |||||
Phase II | Unit III: Jan. 2005 | 2 x 330 | 63.64% | 420 | Coal | |||||
Unit IV: Mar. 2005 | ||||||||||
Phase III | Unit V: May 2006 | 2 x 330 | 63.64% | 420 | Coal | |||||
Unit VI: Sep. 2006 | ||||||||||
Huaiyin Dianchang Photovoltaic | Jun. 2018 | 30 | 100% | 30 | Solar | |||||
Jinling Power Plant |
|
|
|
|
| |||||
CCGT | Unit I: Dec. 2006 | 2 x 390 | 60% | 468 | Gas | |||||
Unit II: Mar. 2007 | ||||||||||
CCGT-Cogeneration | Unit I: April 2013 | 191.3 | 57.4% | 109.8 | Gas | |||||
Unit II: May 2013 | 191.3 | 57.4% | 109.8 | |||||||
Jinling Coal-Fired | Unit III: Dec. 2009 | 2 x 1,030 | 60% | 1,236 | Coal | |||||
Unit IV: Aug. 2012 | ||||||||||
Suzhou Co-generation | Unit I: Aug. 2006 | 2 x 60 | 53.45% | 64.14 | Coal | |||||
Unit II: Oct. 2006 | ||||||||||
Nanjing Chemical Industry Park Co-generation | Unit I: Apr. 2016 | 50 | 70% | 35 | Coal | |||||
Unit II: Dec. 2016 | 50 | 70% | 35 | |||||||
Qidong Wind Power |
|
|
|
|
| |||||
Phase I | 61 turbines: Mar. 2009 | 91.5 | 65% | 59.475 | Wind | |||||
Phase II | 25 turbines: Jan. 2011 | 50 | 65% | 32.5 | Wind | |||||
22 turbines: Jun. 2012 | 44 | 65% | 28.6 | Wind | ||||||
Rudong Wind Power | 24 turbines: Nov. 2013 | 48 | 90% | 43.2 | Wind | |||||
Tongshan Wind Power |
|
|
|
|
| |||||
Phase I | 25 turbines: Mar. 2016 | 50 | 70% | 35 | Wind | |||||
Phase II | 24 turbines: Dec. 2017 | 48 | 70% | 33.6 | Wind | |||||
Luhe Wind Power | 25 turbines: Dec. 2016 | 50 | 100% | 50 | Wind | |||||
Rudong Offshore Wind Power | 26 turbines: Mar, 2017 | 106.4 | 70% | 211.68 | Wind | |||||
44 turbines: Sep. 2017 | 196 | |||||||||
Guanyun Power | Unit I: Dec. 2017 | 2 x 25 | 100% | 50 | Coal | |||||
Unit II: Dec. 2017 | ||||||||||
Suzhou CCGT | Unit I: Jul. 2017 | 178 | 53.45% | 241.59 | Gas | |||||
Unit II: Jul. 2017 | 48 | |||||||||
Unit III: Sep. 2017 | 178 | |||||||||
Unit IV: Sep. 2017 | 48 | |||||||||
Yizheng Wind Power |
|
|
|
|
| |||||
Phase I | 21 turbines: Dec. 2017 | 46.2 | 100% | 46.2 | Wind | |||||
Phase II | 6 turbines: Jul. 2018 | 13.8 | 100% | 13.8 | Wind | |||||
Guanyun Photovoltaic | Jun. 2017 | 14.1 | 100% | 14.1 | Solar | |||||
Dafeng Offshore Wind Power | 48 turbines: 2019 | 405.1 | 100% | 405.1 | Wind | |||||
20 turbines: 2019 | ||||||||||
Jiangyin CCGT | Unit I: Nov. 2020 | 878.6 | 51% | 878.6 | Gas | |||||
Unit II: Dec. 2020 | ||||||||||
Taicang Changle Distributed Photovoltaic | Q4 2021 | 5.1 | 75% | 3.83 | Solar | |||||
Nanyang Chuanbo Distributed Photovoltaic | Q4 2021 | 1.97 | 70% | 1.38 | Solar | |||||
Taicang Gonganju Distributed Photovoltaic | Q4 2021 | 0.4 | 53.5% | 0.21 | Solar | |||||
Jinlin Co-Generation Photovoltaic | Q4 2021 | 2.6 | 57.4% | 1.49 | Solar | |||||
Nanjing Co-generation | 2 x 390 | 57.39% | 447.64 | Coal | ||||||
Shengdong Rudong Offshore Wind Power | 80 turbines | 34 x 5 | 79% | 316 | Wind | |||||
46 x 5 | ||||||||||
Guanyun Offshore Wind Power | 48 turbines | 2 x 3 | 100% | 302.7 | Wind | |||||
46 x 6.45 | ||||||||||
Huaiyin Sihong Photovoltaic | 109.4 | 100% | 109.4 | Solar | ||||||
Shanghai Municipality |
|
|
|
|
| |||||
Shidongkou I | Unit I: Feb. 1988 | 4 x 325 | 100% | 1,300 | Coal | |||||
Unit II: Dec. 1988 | ||||||||||
Unit III: Sep. 1989 | ||||||||||
Unit IV: May 1990 | ||||||||||
Shidongkou II | Unit I: Jun. 1992 | 2 x 600 | 100% | 1,200 | Coal | |||||
Unit II: Dec. 1992 | ||||||||||
Shidongkou Power | Unit I: Oct. 2011 | 2 x 660 | 50% | 660 | Coal | |||||
Unit II: Oct. 2011 | ||||||||||
Shanghai CCGT | Unit I: May 2006 | 3 x 390 | 70% | 819 | Gas | |||||
Unit II: Jun. 2006 | ||||||||||
Unit III: Jul. 2006 | ||||||||||
Luojing Photovoltaic | 22.16 | 100% | 22.16 | Solar |
38
Chongqing Municipality |
|
|
|
|
| |||||
Luohuang Power Plant |
|
|
|
|
| |||||
Phase I | Unit I: Sep. 1991 | 2 x 360 | 60% | 432 | Coal | |||||
Unit II: Feb. 1992 | ||||||||||
Phase II | Unit III: Dec. 1998 | 2 x 360 | 60% | 432 | Coal | |||||
Unit IV: Dec. 1998 | ||||||||||
Phase III | Unit V: Dec. 2006 | 2 x 600 | 60% | 720 | Coal | |||||
Unit VI: Jan. 2007 | ||||||||||
Liangjiang CCGT | Unit I: Oct. 2014 | 2 x 467 | 75% | 701.1 | Gas | |||||
Unit II: Dec. 2014 | ||||||||||
Fengjie Jinfengshan Wind Power | 55 turbines: Dec. 2018 | 110 | 100% | 110 | Wind | |||||
Wushan Wind Power | 17 turbines: Q4 2021 | 15 x 3 | 75% | 37.5 | Wind | |||||
Zhejiang Province |
|
|
|
|
| |||||
Changxing Power Plant | Unit I: Dec. 2014 | 2 x 660 | 100% | 1320 | Coal | |||||
Unit II: Dec. 2014 | ||||||||||
Yuhuan Power Plant |
|
|
|
|
| |||||
Phase I | Unit I: Nov. 2006 | 1,055 | 100% | 2,055 | Coal | |||||
Unit II: Dec. 2006 | 1,000 | |||||||||
Phase II | Unit III: Nov. 2007 | 1,055 | 100% | 2,055 | Coal | |||||
Unit IV: Nov. 2007 | 1,000 | |||||||||
Tongxiang CCGT | 2 x 178.1 | 95% | 435.48 | Gas | ||||||
1 x 80.3 | ||||||||||
1 x 21.9 | ||||||||||
Changxing Photovoltaic | Dec. 2014 | 5 | 100% | 5 | Solar | |||||
Mar. 2015 | 5 | 100% | 5 | Solar | ||||||
Changxing Hongqiao Photovoltaic | Sep. 2016 | 30 | 100% | 30 | Solar | |||||
Huzhou Distributed Photovoltaic | Jun. 2017 | 16.13 | 100% | 20 | Solar | |||||
Dec. 2017 | 3.87 | |||||||||
Jiapu Photovoltaic | 2019 | 1.03 | 100% | 1.03 | Solar | |||||
Xitang Photovoltaic | 2019 | 1.77 | 100% | 1.77 | Solar | |||||
Pinghu Offshore Wind Power | 50 turbines: Q4 2021 | 50 x 6 | 100% | 300 | Wind | |||||
Sian Photovoltaic | 10 | 100% | 10 | Solar | ||||||
Hunan Province |
|
|
|
|
| |||||
Yueyang Power Plant |
|
|
|
|
| |||||
Phase I | Unit I: Sep. 1991 | 2 x 362.5 | 55% | 398.75 | Coal | |||||
Unit II: Dec. 1991 | ||||||||||
Phase II | Unit III: Mar. 2006 | 2 x 300 | 55% | 330 | Coal | |||||
Unit IV: May 2006 | ||||||||||
Phase III | Unit V: Jan. 2011 | 2 x 600 | 55% | 660 | Coal | |||||
Unit VI: Aug. 2012 | ||||||||||
Xiangqi Hydropower | Unit I: Dec. 2011 | 4 x 20 | 100% | 80 | Hydro | |||||
Unit II: May 2012 | ||||||||||
Unit III: Jul. 2012 | ||||||||||
Unit IV: Aug. 2012 | ||||||||||
Subaoding Wind Power | 40 turbines: Dec. 2014 | 80 | 100% | 80 | Wind | |||||
35 turbines: May. 2015 | 70 | 100% | 70 | Wind | ||||||
Guidong Wind Power | 42 turbines: Aug. 2015 | 84 | 100% | 84 | Wind | |||||
18 turbines: Sep. 2015 | 36 | 100% | 36 | Wind | ||||||
Yueyang Xingang Photovoltaic | May. 2017 | 10 | 55% | 5.5 | Solar | |||||
Yueyang Leigutai Photovoltaic | Jun. 2017 | 20 | 55% | 11 | Solar | |||||
Lianping Wind Power | 1 turbine: 2019 | 3.6 | 80% | 2.88 | Wind | |||||
13 turbines: 2019 | 44.2 | 80% | 35.36 | |||||||
1 turbine: 2019 | 3.2 | 80% | 2.56 | |||||||
7 turbines: 2019 | 14 | 80% | 11.2 | |||||||
Yueyang Sanhui Photovltaic | 2019 | 20 | 55% | 11 | Solar | |||||
Hubei Province |
|
|
|
|
| |||||
Enshi Maweigou Hydropower | Dec. 2011 | 3 x 5 | 98.01% | 15 | Hydro | |||||
Dec. 2015 | 2 x 20 | 98.01% | 40 | Hydro | ||||||
Dalongtan Hydropower | Unit I: May 2006 | 12 | 98.01 | 11.76 | Hydro | |||||
Unit II: Aug. 2005 | 12 | 98.01 | 11.76 | Hydro | ||||||
Unit III: Mar. 2006 | 12 | 98.01 | 11.76 |
39
Unit IV: Oct. 2008 | 1 x 1.6 | 98.01 | 1.57 | Hydro | ||||||
Yangluo Power Plant |
|
|
|
|
| |||||
Phase I | Unit I: Jun. 1993 | 600 | 75% | 450 | Coal | |||||
Unit II: Jan. 1994 | ||||||||||
Phase II | Unit III: May 1997 | 660 | 75% | 495 | Coal | |||||
Unite IV: Dec. 1997 | ||||||||||
Phase III | Unit V: Oct. 2006 | 1,200 | 75% | 900 | Coal | |||||
Unit VI: Dec. 2006 | ||||||||||
Jingmen Co-generation | Unit I: Nov. 2014 | 2 x 350 | 100% | 700 | Coal | |||||
Unit II: Oct. 2014 | ||||||||||
Yingcheng Co-generation | Unit II: Jan. 2015 | 1 x 350 | 100% | 350 | Coal | |||||
Unit I: Jun. 2016 | 1 x 50 | 100% | 50 | Coal | ||||||
Jieshan Wind Power |
|
|
|
|
| |||||
Phase I | 24 turbines: Jun. 2015 | 48 | 100% | 48 | Wind | |||||
Phase II | 36 turbines: Aug. 2016 | 72 | 100% | 72 | Wind | |||||
Zhongxiang Hujiawan Wind Power | 12 turbines: Dec. 2017 | 24 | 100% | 24 | Wind | |||||
63 turbines: Aug. 2018 | 126 | 100% | 126 | Wind | ||||||
Suizhou Zengdufuhe Photovoltaic | Sep. 2017 | 16.7 | 100% | 20 | Solar | |||||
Oct. 2017 | 3.3 | |||||||||
Jiangxi Province |
|
|
|
|
| |||||
Jinggangshan Power Plant |
|
|
|
|
| |||||
Phase I | Unit I: Dec. 2000 | 2 x 300 | 100% | 600 | Coal | |||||
Unit II: Aug. 2001 | ||||||||||
Phase II | Unit III: Nov. 2009 | 2 x 660 | 100% | 1,320 | Coal | |||||
Unit IV: Dec. 2009 | ||||||||||
Jianggongling Wind Power | 24 turbines: Dec. 2014 | 48 | 100% | 48 | Wind | |||||
13 turbines: Dec. 2016 | 26 | 100% | 26 | Wind | ||||||
Ruijin Power Plant | Unit I: May 2008 | 2 x 350 | 50% | 350 | Coal | |||||
Unit II: Aug. 2008 | 2 x 1,000 | 50% | 1,000 | Coal | ||||||
Anyuan Power Plant | Unit I: Jun. 2015 | 2 x 660 | 100% | 1,320 | Coal | |||||
Unit II: Aug. 2015 | ||||||||||
Hushazui Wind Power | 13 turbines: Dec. 2016 | 26 | 100% | 26 | Wind | |||||
Linghuashan Wind Power | 26 turbines: Jun. 2017 | 52 | 100% | 100 | Wind | |||||
24 Turbines: Sep. 2017 | 48 | |||||||||
Gaolongshan Wind Power | 36 turbines: Nov. 2018 | 100 | 100% | 100 | Wind | |||||
Daguzhai Wind Power | 28 turbines: 2019 | 84 | 100% | 84 | Wind | |||||
4 turbines: 2019 | 10 | 100% | 10 | |||||||
Shangrao Poyang Photovoltaic | 2019 | 264 | 51% | 134.64 | Solar | |||||
Baijiashe Wind Power | 22 turbines | 20 x 3.2 | 100% | 70 | Wind | |||||
2 x 3 | ||||||||||
Sandonghu Photovoltaic | 75 | 100% | 75 | Solar | ||||||
Litian Xicun Photovoltaic | 31.03 | 100% | 31.03 | Solar | ||||||
Anhui Province |
|
|
|
|
| |||||
Chaohu Power Plant | Unit I: May 2008 | 2 x 600 | 60% | 720 | Coal | |||||
Unit II: Aug. 2008 | ||||||||||
Hualiangting Hydropower Phase I | Unit I: Oct. 1981 | 2 x 10 | 100% | 20 | Hydro | |||||
Unit II: Nov. 1981 | ||||||||||
Phase II | Unit III: Nov. 1987 | 2 x 10 | 100% | 20 | Hydro | |||||
Unit IV: Nov. 1987 | ||||||||||
Huaining Wind Power | 25 turbines: Jun. 2016 | 50 | 100% | 50 | Wind | |||||
45 turbines: Dec. 2017 | 99 | 100% | 99 | Wind | ||||||
Mengcheng Xiaojian Wind Power | 47 turbines | 2 x 3.6 | 100% | 150 | Wind | |||||
39 x 3.2 | ||||||||||
6 x 3 | ||||||||||
Mengcheng Xutong Wind Power | 16 turbines | 10 x 3.2 | 100% | 50 | Wind | |||||
6 x 3 | ||||||||||
Shitai Xiaohe Wind Power | 9 turbines | 4 x 3.2 | 100% | 25 | Wind | |||||
4 x 2.5 | ||||||||||
1 x 2.2 | ||||||||||
Fujian Province |
|
|
|
|
| |||||
Fuzhou Power Plant |
|
|
|
|
| |||||
Phase I | Unit I: Sep. 1988 | 2 x 350 | 100% | 700 | Coal | |||||
Unit II: Dec. 1988 | ||||||||||
Phase II | Unit III: Oct. 1999 | 2 x 350 | 100% | 700 | Coal |
40
Unit IV: Oct. 1999 | ||||||||||
Phase III | Unit V: Jul. 2010 | 2 x 660 | 100% | 1,320 | Coal | |||||
Unit VI: Oct. 2011 | ||||||||||
Luoyuan Power | 2 x 660 | 100% | 1,320 | Coal | ||||||
Changle Photovoltaic | Jun. 2017 | 10 | 100% | 10 | Solar | |||||
Gantang Photovoltaic | Q4 2021 | 2.69 | 100% | 2.69 | Solar | |||||
Guangdong Province |
|
|
|
|
| |||||
Shantou Power Plant |
|
|
|
|
| |||||
Phase I | Unit VI: Oct. 2011 | 2 x 300 | 100% | 600 | Coal | |||||
Unit I: Jan. 1997 | ||||||||||
Unit II: Jan. 1997 | ||||||||||
Phase II | Unit III: Oct. 2005 | 1 x 600 | 100% | 600 | Coal | |||||
Haimen Power | Unit I: Jul. 2009 | 2 x 1,036 | 100% | 2,072 | Coal | |||||
Unit II: Oct. 2009 | ||||||||||
Unit III: Mar. 2013 | 2 x 1,036 | 80% | 1,657.6 | Coal | ||||||
Unit IV: Mar. 2013 | ||||||||||
Shantou Photovoltaic | Sep. 2016 | 17 | 100% | 17 | Solar | |||||
Dongguan CCGT | Unit I: Jun. 2020 | 945.04 | 80% | 756.03 | Gas | |||||
Unit II: Aug. 2020 | ||||||||||
Yunnan Province |
|
|
|
|
| |||||
Diandong Energy |
|
|
|
|
| |||||
Phase I | Unit I: Feb. 2006 | 2 x 600 | 100% | 1,200 | Coal | |||||
Unit II: Jul. 2006 | ||||||||||
Phase II | Unit III: Nov. 2006 | 2 x 600 | 100% | 1,200 | Coal | |||||
Unit IV: May 2007 | ||||||||||
Yuwang Energy |
|
|
|
|
| |||||
Phase I | Unit I: Jul. 2009 | 2 x 600 | 100% | 1,200 | Coal | |||||
Unit II: Feb. 2010 | ||||||||||
Fuyuan Wind Power |
|
|
|
|
| |||||
Wenbishan Wind Power | 20 turbines: Oct. 2014 | 88 | 100% | 88 | Wind | |||||
Yibasan Wind Power | 24 turbines: Dec. 2015 | 48 | 100% | 48 | Wind | |||||
Shengjing Wind Power | 24 turbines: Dec. 2016 | 48 | 100% | 48 | Wind | |||||
Guangliangzi Wind Power | 24 turbines: Oct. 2017 | 48 | 100% | 48 | Wind | |||||
Yuwang Changdi Hydropower | 2019 | 4 x 4 | 100% | 16 | Hydro | |||||
Hainan Province |
|
|
|
|
| |||||
Haikou Power Plant | Unit | |||||||||
VIII: Apr. 2006 | 2 x 330 | 91.8% | 605.88 | Coal | ||||||
Unit IX: May 2007 | ||||||||||
Dongfang Power Plant |
|
|
|
|
| |||||
Phase I | Unit I: Jun. 2009 | 2 x 350 | 91.8% | 642.6 | Coal | |||||
Unit II: Dec. 2009 | ||||||||||
Phase II | Unit III: May 2012 | 2 x 350 | 91.8% | 642.6 | Coal | |||||
Unit IV: Dec. 2012 | ||||||||||
Nanshan Co-generation | Unit I: Apr. 1995 | 2 x 50 | 91.8% | 91.8 | Gas | |||||
Unit II: Apr. 1995 | ||||||||||
Unit III: Oct. 2003 | 2 x 16 | 91.8% | 29.376 | Gas | ||||||
Unit IV: Oct. 2003 | ||||||||||
Gezhen Hydropower | Unit I: Nov. 2009 | 2 x 40 | 91.8% | 73.44 | Hydro | |||||
Unit II: Nov. 2009 | ||||||||||
Unit III: Dec. 2009 | 2 x 1 | 91.8% | 1.836 | Hydro | ||||||
Unit IV: Dec. 2009 | ||||||||||
Wenchang Wind Power | 34 turbines: Jan. 2009 | 51.5 | 91.8% | 47.277 | Wind | |||||
Dongfang Photovoltaic | Jul. 2016 | 12 | 91.8% | 11.016 | Solar | |||||
Chengmai Photovoltaic | Jun. 2017 | 12.5 | 91.8% | 11.475 | Solar | |||||
Sep. 2017 | 12.5 | 91.8% | 11.475 | |||||||
Sep. 2018 | 40 | 91.8% | 36.72 | Solar | ||||||
Guizhou Province |
|
|
|
|
| |||||
Panzhou Wind Power Dapashan Wind Power | 12 turbines: Dec. 2015 | 24 | 100% | 48 | Wind | |||||
9 turbines: Nov. 2017 | 18 | 100% | Wind | |||||||
3 turbines: Dec. 2017 | 6 | |||||||||
Jiaoziding Wind Power | 16 turbines: Nov. 2017 | 32 | 100% | 48 | Wind | |||||
8 turbines: Dec. 2017 | 16 | |||||||||
Dapashan Booster Station Photovoltaic | 2019 | 0.52 | 100% | 0.52 | Solar | |||||
Jiaoziding Booster Station Photovoltaic | 2019 | 0.4 | 100% | 0.4 | Solar |
41
Guanlinggang Wulonggu Photovoltaic | 2019 | 80 | 100% | 80 | Solar | |||||
Xixiu Distributed Photovoltaic | 2019 | 8.2 | 100% | 8.2 | Solar | |||||
Luodian Photovoltaic | 2021 | 150 | 100% | 150 | Solar | |||||
Zhenning Photovoltaic | 2021 | 200 | 100% | 200 | Solar | |||||
Wangmo Yangshi Photovoltaic | 2021 | 30 | 100% | 30 | Solar | |||||
Dewohaizhuang Photovoltaic | 60 | 51% | 30.6 | Solar | ||||||
Xindianhuayue Photovoltaic | 120 | 51% | 61.2 | Solar | ||||||
Guangxi Autonomous Region |
|
|
|
|
| |||||
Guilin Distributed Energy | Unit I: Dec. 2017 | 3 x 70 | 80% | 168 | Gas | |||||
Unit II: Dec. 2017 | ||||||||||
Unit III: Dec. 2017 | ||||||||||
Guigang Qixingling Wind Power | 6 turbines : 2019 | 13.8 | 100% | 60 | Wind | |||||
21 turbines : 2019 | 46.2 | |||||||||
Guigang Zhenlongshan Wind Power | 17 turbines | 17 x 3 | 100% | 51 | Wind | |||||
Singapore |
|
|
|
|
| |||||
Tuas Power | Unit III: Nov. 2001 | 4 x 367.5 | 100% | 1,470 | Gas | |||||
Unit IV: Jan. 2002 | ||||||||||
Unit V: Feb. 2005 | ||||||||||
Unit VI: Sep. 2005 | ||||||||||
Unit VII: Dec. 2013 | 405.9 | 100% | 405.9 | Gas | ||||||
TMUC |
|
|
|
|
| |||||
Phase I | Feb. 2013 | 1 x 101 | 100% | 101 | Coal | |||||
Phase IIA | Jun. 2014 | 1 x 32.5 | 100% | 32.5 | Coal | |||||
Pakistan |
|
|
|
|
| |||||
Sahiwal | 2017 | 1320 | 40% | 528 | Coal |
The following table presents the availability factors and the capacity factors of our coal-fired operating power plants in China for the years ended December 31, 2019, 2020 and 2021.
Coal-fired Power Plant | Availability Factor (%) | Capacity Factor (%) | ||||||||||
| 2019 |
| 2020 |
| 2021 |
| 2019 |
| 2020 |
| 2021 | |
Heilongjiang Province |
|
|
|
|
|
| ||||||
Xinhua Power Plant |
| 87.13 |
| 90.90 |
| 88.14 |
| 46.99 |
| 48.56 |
| 42.71 |
Hegang Power Plant |
| 93.77 |
| 96.05 |
| 90.85 |
| 41.43 |
| 43.03 |
| 41.25 |
Daqing Co-generation |
| 93.27 |
| 96.05 |
| 91.67 |
| 50.85 |
| 50.52 |
| 50.81 |
Yichun Co-generation |
| 91.85 |
| 93.33 |
| 92.46 |
| 48.93 |
| 48.01 |
| 45.46 |
Jilin Province |
|
|
|
|
|
|
|
| ||||
Jiutai Power Plant |
| 95.32 |
| 95.90 |
| 92.92 |
| 49.04 |
| 51.24 |
| 37.20 |
Changchun Co-generation |
| 90.57 |
| 93.31 |
| 91.43 |
| 53.39 |
| 57.62 |
| 52.10 |
Liaoning Province |
|
|
|
|
|
|
|
| ||||
Dalian |
| 91.55 |
| 95.90 |
| 93.14 |
| 45.21 |
| 45.54 |
| 45.48 |
Dandong |
| 93.97 |
| 97.00 |
| 94.63 |
| 45.15 |
| 45.14 |
| 48.65 |
Yingkou |
| 97.10 |
| 98.04 |
| 94.04 |
| 46.67 |
| 43.62 |
| 45.67 |
Yingkou Co-generation |
| 98.01 |
| 89.24 |
| 93.25 |
| 45.17 |
| 43.94 |
| 49.44 |
Hebei Province |
|
|
|
|
|
|
|
| ||||
Shang’an |
| 89.97 |
| 92.78 |
| 95.20 |
| 56.36 |
| 51.86 |
| 47.71 |
Gansu Province |
|
|
|
|
|
|
|
| ||||
Pingliang |
| 91.95 |
| 96.40 |
| 98.86 |
| 42.80 |
| 49.05 |
| 57.47 |
Beijing Municipality |
|
|
|
|
|
|
|
| ||||
Beijing Cogeneration |
| 90.37 |
| 91.62 |
| 96.19 |
| 35.43 |
| 35.30 |
| 36.72 |
Tianjin Municipality |
|
|
|
|
|
|
|
| ||||
Yangliuqing |
| 93.93 |
| 90.09 |
| 92.99 |
| 51.38 |
| 48.39 |
| 50.92 |
Shanxi Province |
|
|
|
|
|
|
|
| ||||
Yushe |
| 95.94 |
| 97.85 |
| 100.00 |
| 52.32 |
| 53.76 |
| 41.96 |
Zuoquan |
| 95.97 |
| 91.03 |
| 96.23 |
| 53.81 |
| 44.87 |
| 39.72 |
Shandong Province |
|
|
|
|
|
|
|
| ||||
Dezhou |
| 93.16 |
| 96.76 |
| 94.56 |
| 50.76 |
| 46.13 |
| 55.34 |
Jining |
| 98.16 |
| 92.18 |
| 100.00 |
| 46.35 |
| 30.33 |
| 18.89 |
Weihai |
| 94.26 |
| 95.86 |
| 94.26 |
| 52.18 |
| 47.82 |
| 56.26 |
Xindian |
| 90.55 |
| 91.53 |
| 91.76 |
| 53.79 |
| 49.58 |
| 63.27 |
Rizhao Power |
| 94.20 |
| 93.89 |
| 87.03 |
| 56.62 |
| 45.20 |
| 50.81 |
Rizhao II |
| 94.20 |
| 96.18 |
| 87.03 |
| 56.62 |
| 54.28 |
| 53.39 |
Zhanhua Co-generation |
| 97.78 |
| 100.00 |
| 100.00 |
| 39.10 |
| 28.47 |
| 20.28 |
42
Laiwu Power Plant |
| 90.29 |
| 93.41 |
| 95.76 |
| 54.05 |
| 50.38 |
| 49.20 |
Baiyanghe Power Plant |
| 90.29 |
| 97.02 |
| 92.31 |
| 46.78 |
| 38.70 |
| 43.41 |
Huangtai Power Plant |
| 91.42 |
| 89.71 |
| 94.12 |
| 58.83 |
| 54.30 |
| 55.28 |
Yantai Power Plant |
| 97.97 |
| 97.67 |
| 89.69 |
| 53.45 |
| 47.54 |
| 50.08 |
Liaocheng Co-generation |
| 88.53 |
| 91.30 |
| 88.94 |
| 48.28 |
| 45.72 |
| 44.52 |
Linyi Power Plant |
| 96.29 |
| 94.33 |
| 93.43 |
| 52.2 |
| 46.97 |
| 46.85 |
Jining Yunhe Power Plant |
| 95.95 |
| 94.72 |
| 88.20 |
| 43.04 |
| 33.61 |
| 41.24 |
Qufu Co-generation |
| 97.08 |
| 97.83 |
| 83.73 |
| 54.67 |
| 46.80 |
| 59.71 |
Jiaxiang Power Plant |
| 95.32 |
| 94.63 |
| 91.42 |
| 52.69 |
| 46.75 |
| 53.99 |
Jining Co-generation |
| 95.33 |
| 97.22 |
| 100.00 |
| 71.26 |
| 66.14 |
| 32.00 |
Zhongtai Power Plant |
| 83.12 |
| 82.62 |
| 91.11 |
| 39.80 |
| 31.84 |
| 36.24 |
Henan Province |
|
|
|
|
|
|
|
| ||||
Qinbei |
| 91.22 |
| 92.79 |
| 89.94 |
| 40.89 |
| 37.55 |
| 38.09 |
Luoyang Cogeneration Power Plant |
| 85.95 |
| 94.40 |
| 94.56 |
| 43.08 |
| 41.55 |
| 47.11 |
Mianchi Co-generation |
| 100.00 |
| 96.58 |
| 97.00 |
| 41.65 |
| 39.31 |
| 45.62 |
Jiangsu Province |
|
|
|
|
|
|
|
| ||||
Nantong |
| 95.95 |
| 96.13 |
| 94.59 |
| 42.16 |
| 29.51 |
| 25.64 |
Nanjing |
| 93.99 |
| 93.44 |
| 75.67 |
| 51.42 |
| 49.55 |
| 46.14 |
Taicang |
| 95.09 |
| 94.90 |
| 98.40 |
| 58.89 |
| 55.76 |
| 69.79 |
Huaiyin |
| 97.29 |
| 97.40 |
| 99.18 |
| 39.33 |
| 35.67 |
| 47.38 |
Jinling Coal-fired |
| 83.66 |
| 95.25 |
| 98.23 |
| 53.7 |
| 55.34 |
| 60.06 |
Suzhou Co-generation |
| 94.68 |
| 97.38 |
| 97.34 |
| 72.94 |
| 74.73 |
| 63.22 |
Shanghai Municipality |
|
|
|
|
|
|
|
| ||||
Shidongkou I |
| 97.14 |
| 100.00 |
| 98.51 |
| 38.04 |
| 38.76 |
| 50.54 |
Shidongkou II |
| 92.23 |
| 94.09 |
| 93.40 |
| 50.97 |
| 52.18 |
| 64.73 |
Zhejiang Province |
|
|
|
|
|
|
|
|
|
| ||
Changxing |
| 94.1 |
| 94.25 |
| 93.56 |
| 52.24 |
| 52.23 |
| 65.98 |
Yuhuan |
| 96.19 |
| 95.79 |
| 95.92 |
| 54.33 |
| 52.86 |
| 60.05 |
Chongqing Municipality |
|
|
|
|
|
|
|
| ||||
Luohuang |
| 94.24 |
| 96.30 |
| 93.78 |
| 35.86 |
| 33.32 |
| 47.62 |
Hunan Province |
|
|
|
|
|
|
|
| ||||
Yueyang |
| 92.97 |
| 97.01 |
| 94.00 |
| 47.32 |
| 42.06 |
| 52.40 |
Hubei Province |
|
|
|
|
|
|
|
| ||||
Yangluo Power |
| 92.04 |
| 95.41 |
| 97.74 |
| 58.92 |
| 43.30 |
| 52.90 |
Jingmen Thermal Power |
| 96.07 |
| 95.57 |
| 92.54 |
| 60.03 |
| 45.36 |
| 50.78 |
Yingcheng Thermal Power |
| 93.75 |
| 95.12 |
| 85.86 |
| 65.84 |
| 54.63 |
| 57.87 |
Jiangxi Province |
|
|
|
|
|
|
|
| ||||
Jinggangshan |
| 89.55 |
| 96.65 |
| 90.97 |
| 56.58 |
| 58.78 |
| 59.55 |
Ruijin Power |
| 89.61 |
| 92.07 |
| 98.68 |
| 58.24 |
| 55.99 |
| 62.35 |
Anyuan Power Plant |
| 91.92 |
| 90.74 |
| 89.85 |
| 61.26 |
| 61.37 |
| 59.33 |
Anhui Province |
|
|
|
|
|
|
|
| ||||
Chaohu Power |
| 94.33 |
| 95.28 |
| 95.84 |
| 52.67 |
| 47.76 |
| 52.05 |
Fujian Province |
|
|
|
|
|
|
|
| ||||
Fuzhou |
| 93.03 |
| 96.48 |
| 92.54 |
| 46.32 |
| 51.05 |
| 54.53 |
Guangdong Province |
|
|
|
|
|
|
|
| ||||
Shantou |
| 93.89 |
| 93.45 |
| 93.37 |
| 48.9 |
| 47.69 |
| 60.98 |
Haimen |
| 97.36 |
| 93.83 |
| 92.29 |
| 47.43 |
| 48.79 |
| 62.26 |
Yunnan Province |
|
|
|
|
|
|
|
| ||||
Diandong |
| 96.92 |
| 85.85 |
| 68.75 |
| 15.6 |
| 23.86 |
| 26.31 |
Yuwang |
| 99.89 |
| 94.63 |
| 100.00 |
| 4.06 |
| 21.06 |
| 31.82 |
Hainan Province |
|
|
|
|
|
|
|
| ||||
Haikou |
| 96.05 |
| 98.62 |
| 92.31 |
| 60.85 |
| 56.78 |
| 44.19 |
Dongfang |
| 94.39 |
| 94.94 |
| 93.96 |
| 61.06 |
| 56.72 |
| 62.96 |
The details of our operating power plants, construction projects and related projects as of December 31, 2021 are described below.
Power Plants in Heilongjiang Province
Xinhua Power Plant
Huaneng Xinhua Power Plant (“Xinhua Power Plant”) is located in the city of Daqing in Heilongjiang Province. Xinhua Power Plant, including Phase I and Phase II, has an installed capacity of 530 MW and consists of one 200 MW coal-fired generating unit and one 330 MW coal-fired generating unit and which commenced operations in 1979 and 2005 respectively. We hold 70% equity interest in Xinhua Power Plant.
43
In 2021, Xinhua Power Plant obtained 97.48% of its total consumption of coal from annual contracts and the remainder from the open market. The average coal purchase price for Xinhua Power Plant in 2021 was RMB392.15 (2020: RMB375.17) per ton.
Xinhua Power Plant sells its electricity to Heilongjiang Electric Power Company.
Hegang Power Plant
Huaneng Hegang Power Plant (“Hegang Power Plant”) is located in the city of Hegang in Heilongjiang Province. Hegang Power Plant, including Phases I to III, has an installed capacity of 1,200 MW and consists of two 300 MW coal-fired generating unit and one 600 MW coal-fired generating unit and which commenced operations in 1998, 1999 and 2007 respectively. We hold 64% equity interest in Hegang Power Plant.
In 2021, Hegang Power Plant obtained 58.99% of its total consumption of coal from annual contracts and the remainder from the open market. The average coal purchase price for Hegang Power Plant in 2021 was RMB516.75 (2020: RMB438.59) per ton.
Hegang Power Plant sells its electricity to Heilongjiang Electric Power Company.
Daqing Co-generation
Huaneng Daqing Co-generation Power Plant (“Daqing Co-generation”) is located in the city of Daqing in Heilongjiang Province. Daqing Co-generation, including Phase I and Phase II, has an installed capacity of 700 MW and consists of two 350 MW coal-fired generating units which commenced operations in 2003. We hold 100% equity interest in Daqing Co-generation.
In 2021, Daqing Co-generation obtained 99.23% of its total consumption of coal from annual contracts and the remainder from the open market. The average coal purchase price for Daqing Co-generation in 2021 was RMB384.09 (2020: RMB366.19) per ton.
Daqing Co-generation sells its electricity to Heilongjiang Electric Power Company.
Yichun Co-generation
Huaneng Yichun Co-generation Power Plant (“Yichun Co-generation”) is located in the city of Yichun in Heilongjiang Province. Yichun Co-generation, including Phase I and Phase II, has an installed capacity of 700 MW and consists of two 350 MW coal-fired generating units which commenced operations in 2015. We hold 100% equity interest in Yichun Co-generation.
In 2021, Yichun Co-generation obtained 54.38% of its total consumption of coal from annual contracts and the remainder from the open market. The average coal purchase price for Yichun Co-generation in 2021 was RMB529.77 (2020: RMB438.69) per ton.
Yichun Co-generation sells its electricity to Heilongjiang Electric Power Company.
Sanjiangkou Wind Power
Huaneng Shanjiangkou Wind Power Plant (“Sanjiangkou Jiangsheng Wind Power”) is located in the city of Jiamusi in Heilongjiang Province. The installed capacity of Sanjiangkou Wind Power Plant is 99 MW and consists of 66 turbines. It commenced operation in February 2010. We hold 82.85% equity interest in Sanjiangkou Wind Power.
Sanjiangkou Wind Power sells its electricity to Heilongjiang Electric Power Company.
44
Linjiang Jiangsheng Wind Power
Linjiang Jiangsheng Wind Power Plant (“Linjiang Jiangsheng Wind Power”) is located in the city of Jiamusi in Heilongjiang Province. The installed capacity of Linjiang Jiangsheng Wind Power Plant is 99 MW and consists of 66 turbines. It commenced operation in October 2015. We hold 82.85% equity interest in Linjiang Jiangsheng Wind Power.
Linjiang Jiangsheng Wind Power sells its electricity to Heilongjiang Electric Power Company.
Daqing Heping Aobao Wind Power
Daqing Heping Aobao Wind Power Plant (“Daqing Heping Aobao Wind Power”) is located in the city of Jiamusi in Heilongjiang Province. Phase I of the Daqing Heping Aobao Wind Power commenced operation in December 2011, with an installed capacity of 96 MW, consisting of 32 wind power turbines of 3 MW each. Phase II of the Daqing Heping Aobao Wind Power commenced operation in May 2012, with an installed capacity of 96 MW, consisting of 32 wind power turbines of 3 MW each. Phase III of the Daqing Heping Aobao Wind Power commenced operation in December, with an installed capacity of 96 MW, consisting of 32 wind power turbines of 3 MW each. We hold 100% of the equity interest in Daqing Heping Aobao Wind Power.
Daqing Heping Aobao Wind Power sells its electricity to Heilongjiang Electric Power Company.
Zhaodong Dechang Photovoltaic
Zhaodong Dechang 20 MW Photovoltaic Power Plant (“Zhaodong Dechang Photovoltaic”) is located in the city of Zhaodong in Heilongjiang Province. Zhaodong Dechang Photovoltaic commenced operation in December 2017, with an installed capacity of 20 MW. We hold 100% of the equity interest in Zhaodong Dechang Photovoltaic.
Zhaodong Dechang Photovoltaic sells its electricity to Heilongjiang Electric Power Company.
Shuangyu Photovoltaic
Daqing Huaneng Shuangyu Solar Power Plant (“Shuangyu Photovoltaic”), in which we hold 100% equity interest, consists of Xinhua Photovoltaic, Donghai Photovoltaic and Shuangyu Photovoltaic. Xinhua Photovoltaic with an installed capacity of 20 MW, commenced commercial operation in June 2018. Donghai Photovoltaic and Shuangyu Photovoltaic, both with an installed capacity of 20 MW, commenced commercial operation in July 2018. Daqing Huaneng Shuangyu, Donghai Photovoltaic and Shuangyu Photovoltaic are located in Daqing city, Heilongjiang.
Xinken (Luobei) Wind Power
Huaneng Xinken (Luobei) Wind Power Plant (“Xinken (Luobei) Wind Power”) is located in the county of Luobei in Heilongjiang Province. Xinken (Luobei) Wind Power commenced operation in Q3 2021, with an installed capacity of 200 MW, consisting of 60 wind power turbines of 3.2 MW each and 4 wind power turbines of 2 MW each. We hold 100% of the equity interest in Xinken (Luobei) Wind Power.
Power Plants in Jilin Province
Jiutai Power Plant
Huaneng Jiutai Power Plant (“Jiutai Power Plant”) is located in the city of Changchun in Jilin Province. Jiutai Power Plant, including Phase I and Phase II, has an installed capacity of 1,340 MW and consists of two 670 MW coal-fired generating units which commenced operations in 2009. We hold 100% equity interest in Jiutai Power Plant.
In 2021, Jiutai Power Plant obtained 36.58% of its total consumption of coal from annual contracts and the remainder from the open market. The average coal purchase price for Jiutai Power Plant in 2021 was RMB490.68 (2020: RMB426.34) per ton.
Jiutai Power Plant sells its electricity to Jilin Electric Power Company.
45
Changchun Co-generation
Huaneng Changchun Co-generation Power Plant (“Changchun Co-generation”) is located in the city of Changchun in Jilin Province. Changchun Co-generation, including Phase I and Phase II, has an installed capacity of 700 MW and consists of two 350 MW coal-fired generating units which commenced operations in 2009. We hold 100% equity interest in Changchun Co-generation.
In 2021, Changchun Co-generation obtained 52.77% of its total consumption of coal from annual contracts and the remainder from the open market. The average coal purchase price for Changchun Co-generation in 2021 was RMB429.19 (2020: RMB402.21) per ton.
Changchun Co-generation sells its electricity to Jilin Electric Power Company.
Nongan Biomass
Huaneng Nongan Biomass Power Plant (“Nongan Biomass”) is located in the city of Changchun in Jilin Province. The installed capacity of Nongan Biomass phase I is 25 MW and consists of one 25 MW generating unit, which commenced operation in December 2011. The installed capcity of nongan Biomass phase II is 35MW and consists of one 35 MW generating unit, which commenced operation in December 2020. We hold 100% equity interest in Nongan Biomass.
Nongan Biomass also uses coal to meet part of its fuel needs.
Nongan Biomass sells its electricity to Jilin Electric Power Company.
Linjiang Jubao Hydropower
Huaneng Linjiang Jubao Hydropower Station (“Linjiang Jubao Hydropower”) is located in the city of Baishan of Jilin Province. Linjiang Jubao Hydropower consists of four 20 MW hydraulic generating units with a total installed capacity of 80 MW. In December 2011, Unit I of Linjiang Jubao Hydropower with an installed capacity of 20 MW passed a trial run. Unit I and Unit II of Linjiang Jubao Hydropower with an installed capacity of 20 MW each commenced operation in December 2011 and May 2012, respectively. Unit III and Unit IV of Linjiang Jubao Hydropower with an installed capacity of 20 MW commenced operation in May and August 2012, respectively. We hold 100% equity interest in Linjiang Jubao Hydropower.
Linjiang Jubao Hydropower sells its electricity to Jilin Electric Power Company.
Zhenlai Wind Power
Huaneng Zhenlai Mali Wind Power Plant (“Zhenlai Wind Power”) is located in the city of Baicheng in Jilin Province. Phase I of the Zhenlai Wind Power commenced operation in June 2009, with an installed capacity of 49.5 MW, consisting of 33 wind power turbines of 1.5 MW each. Phase II of the Zhenlai Wind Power commenced operation in December 2011, with an installed capacity of 49.5 MW, consisting of 33 wind power turbines of 1.5 MW each. We hold 100% of the equity interest in Zhenlai Wind Power.
Zhenlai Wind Power sells its electricity to Jilin Electric Power Company.
Siping Wind Power
Huaneng Siping Wind Power Plant (“Siping Wind Power”) is located in the city of Siping in Jilin Province. Phase I of the Siping Wind Power commenced operation in October 2010, with an installed capacity of 75 MW, consisting of 50 wind power turbines of 1.5 MW each. Phase II of the Siping Wind Power commenced operation in November 2010, with an installed capacity of 50 MW, consisting of 25 wind power turbines of 2 MW each. Phase III of the Siping Wind Power commenced operation in December 2010, with an installed capacity of 75 MW, consisting of 50 wind power turbines of 1.5 MW each. In 2019, two wind power turbines of 3MW each commenced operation. In 2020, 13 wind turbines of 3MW each and one wind turbine of 0.5MW commenced operation. We hold 100% of the equity interest in Siping Wind Power.
46
Siping Wind Power sells its electricity to Jilin Electric Power Company.
Tongyu Tuanjie Wind Power
Huaneng Jilin Tongyu Tuanjie Wind Power Plant (“Tongyu Tuanjie Wind Power”) is located in the city of Baicheng in Jilin Province. Tongyu Tuanjie Wind Power commenced operation in December 2015, with an installed capacity of 148 MW, consisting of 74 wind power turbines of 2 MW each. We hold 100% of the equity interest in Tongyu Tuanjie Wind Power.
Tongyu Tuanjie Wind Power sells its electricity to Jilin Electric Power Company.
Linjiang Jubao Photovoltaic
Linjiang Jubao 15 MW Photovoltaic Power Plant (“Linjiang Jubao Photovoltaic”) is located in the city of Linjiang in Jilin Province. Linjiang Jubao Photovoltaic commenced operation in June 2017, with an installed capacity of 15 MW. We hold 100% of the equity interest in Linjiang Jubao Photovoltaic.
Linjiang Jubao Photovoltaic sells its electricity to Jilin Electric Power Company.
Zhenlai Photovoltaic
Zhenlai Wind Power Photovoltaic Power Plant (“Zhenlai Photovoltaic”) is located in Baicheng city in Jilin Province. Zhenlai Photovoltaic commenced operation in June 2018, with an installed capacity of 20 MW. We hold 50% of the equity interest in Zhenlai Photovoltaic.
Shuilongshan Photovoltaic
Shuilongshan Photovoltaic Power Plant (“Shuilongshan Photovoltaic”) is located in the city of Baicheng in Jilin Province. Shuilongshan Photovoltaic commenced operation in Q3 2020, with an installed capacity of 100 MW. We hold 100% of the equity interest in Shuilongshan Photovoltaic.
Liangjingzi Wind Power
Huaneng Liangjingzi Wind Power Plant (“Liangjingzi Wind Power”) is located in the city of Baicheng in Jilin Province. Liangjingzi Wind Power commenced operation in Q4 2021, with an installed capacity of 400 MW, consisting of 68 wind power turbines of 4 MW each and 40 wind power turbines of 3.2 MW each. We hold 100% of the equity interest in Liangjingzi Wind Power.
Power Plants in Liaoning Province
Dalian Power Plant
Huaneng Dalian Power Plant (“Dalian Power Plant”) is located on the outskirts of Dalian, on the coast of Bohai Bay. Dalian Power Plant, including Phase I and Phase II, has an installed capacity of 1,400 MW and consists of four 350 MW coal-fired generating units which commenced operations in 1988 and 1999 respectively. We hold 100% equity interest in Dalian Power Plant.
In 2021, Dalian Power Plant obtained 48.16% of its total consumption of coal from annual contracts and the remainder from the open market. The average coal purchase price for Dalian Power Plant in 2021 was RMB792.96 (2020: RMB490.42) per ton.
Dalian Power Plant sells its electricity to Liaoning Electric Power Company.
47
Dandong Power Plant
Huaneng Dandong Power Plant (“Dandong Power Plant”) is located on the outskirts of the city of Dandong in Liaoning. Dandong Power Plant had originally been developed by HIPDC which, pursuant to the Reorganization Agreement, transferred all its rights and interests therein to us effective December 31, 1994. In March 1997, we began the construction of Dandong Power Plant, which comprises two 350 MW coal-fired generating units. We hold 100% equity interest in Dandong Power Plant.
In 2021, Dandong Power Plant obtained 38.39% of its total consumption of coal from annual contracts and the remainder from the open market. The average coal purchase price for Dandong Power Plant in 2021 was RMB790.88 (2020: RMB434.98) per ton.
Dandong Power Plant sells its electricity to Liaoning Electric Power Company.
Yingkou Power Plant
Huaneng Yingkou Power Plant (“Yingkou Power Plant”) is located in Yingkou City in Liaoning Province. Yingkou Power Plant Phase I has an installed capacity of 640 MW and consists of two 320 MW supercritical coal-fired generating units which commenced operations in January and December 1996, respectively. Yingkou Power Plant Phase II has an installed capacity of 1,200MW and consists of two 600 MW coal-fired generating units which commenced operations in August and October 2007, respectively. We hold 100% equity interest in Yingkou Power Plant.
In 2021, Yingkou Power Plant obtained 33.44% of its total consumption of coal from annual contracts and the remainder from the open market. The average coal purchase price for Yingkou Power Plant in 2021 was RMB748.36 (2020: RMB461.37) per ton.
Yingkou Power Plant sells its electricity to Liaoning Electric Power Company.
Yingkou Co-generation
Huaneng Yingkou Co-generation Power Plant (“Yingkou Co-generation”) is located in Yingkou City in Liaoning Province. Yingkou Co-generation has an installed capacity of 660 MW and consists of two 330 MW generating units which commenced operation in December 2009. We hold 100% equity interest in Yingkou Co-generation.
In 2021, Yingkou Co-generation obtained 88.96% of its total consumption of coal from annual contracts. The average coal purchase price for Yingkou Co-generation in 2021 was RMB487.45 (2020: RMB419.62) per ton.
Yingkou Co-generation sells its electricity to Liaoning Electric Power Company.
Wafangdian Wind Power
Dalian Wafangdian Wind Power Plant (“Wafangdian Wind Power”) is located in Dalian City in Liaoning Province. The installed capacity of phase I of Wafangdian Wind Power is 48 MW and consists of 24 turbines. It commenced operation in June 2011. We hold 100% equity interest in Wafangdian Wind Power.
Wafangdian Wind Power sells its electricity to Liaoning Electric Power Company.
Suzihe Hydropower
Liaoning Suzihe Hydropower Plant (“Suzihe Hydropower”) is located in Liaoning Province. The installed capacity of Suzihe Hydropower is 37.5 MW and consists of three 12.5 MW generating units. Unit I (12.5 MW) of Suzihe Hydropower commenced operation in August 2012. We hold 100% equity interest in Suzihe Hydropower.
48
Changtu Wind Power
Huaneng Liaoning Changtu Wind Power Plant (“Changtu Wind Power”) is located in Liaoning Province. Phase I of the Changtu Wind Power commenced operation in November 2012, with an installed capacity of 49.5 MW, consisting of 33 wind power turbines of 1.5 MW each. Phase II of the Changtu Wind Power commenced operation in October 2014, with an installed capacity of 48 MW, consisting of 24 wind power turbines of 2 MW each. We hold 100% of the equity interest in Changtu Wind Power.
Dandong Photovoltaic
Dandong 10 MW Photovoltaic Power Plant (“Dandong Photovoltaic”) is located in Liaoning Province. Dandong Photovoltaic commenced operation in May 2016, with an installed capacity of 9.864 MW. We hold 100% of the equity interest in Dandong Photovoltaic.
Dandong Photovoltaic sells its electricity to Liaoning Electric Power Company.
Yingkou Co-generation Photovoltaic
Yingkou Co-generation 10 MW Photovoltaic Power Plant (“Yingkou Co-generation Photovoltaic”) is located in Liaoning Province. Yingkou Co-generation Photovoltaic commenced operation in June 2016, with an installed capacity of 15.7 MW. We hold 100% of the equity interest in Yingkou Co-generation Photovoltaic.
Yingkou Co-generation Photovoltaic sells its electricity to Liaoning Electric Power Company.
Yingkou Co-generation Wind Power
Yinkou Co-generation Wind Power Plant (“Yinkou Co-generation Wind Power”) is located in Liaoning Province. Yinkou Co-generation Wind Power commenced operation in 2019, with an installed capacity of 12.5 MW, consisting of 5 wind power turbines of 2.5 MW each. We hold 100% of the equity interest in Yingkou Co-generation Wind Power.
Yingkou Co-generation Wind Power sells its electricity to Liaoning Electric Power Company.
Yingkou Xianrendao Co-generation Power
Yingkou Xianrendao Co-generation Power Plant (“Yingkou Xianrendao Co-generation Power”) is located in the city of Yingkou of Liaoning Provinces. Yingkou Xianrenao Co-generation Power commenced operation in March 2017, with two sets of generating units of 50 MW each. We hold 100% equity interest in Yingkou Xianrendao Co-generation Power.
In 2021, Yingkou Xianrendao Co-generation Power obtained none of its total consumption of coal from annual contracts. The average coal purchase price for Yingkou Xianrendao Co-generation Power in 2021 was RMB656.75 (2020: RMB363.09) per ton.
Yingkou Xianrendao Co-generation Power sells its electricity to Liaoning Electric Power Company.
Jianchang Bashihan Photovoltaic
Jianchang Bashihan 20 MW Photovoltaic Power Plant (“Jianchang Bashihan Photovoltaic”) is located in the city of Huludao of Liaoning Province. Jianchang Bashihan Photovoltaic commenced operation in August 2017, with an installed capacity of 22.03 MW. We hold 100% of the equity interest in Jianchang Bashihan Photovoltaic.
Jianchang Bashihan Photovoltaic sells its electricity to Liaoning Electric Power Company.
49
Jianchang Bashihan Photovoltaic Phase II
Jianchang Bashihan 20 MW Photovoltaic Phase II Power Plant (“Jianchang Bashihan Photovoltaic Phase II”) is located in the city of Huludao of Liaoning Province. Jianchang Bashihan Photovoltaic Phase II commenced operation in August 2017, with an installed capacity of 22.03 MW. We hold 100% of the equity interest in Jianchang Bashihan Photovoltaic Phase II.
Jianchang Bashihan Photovoltaic Phase II sells its electricity to Liaoning Electric Power Company.
Xiao Deyingzi Photovoltaic
Xiao Deyingzi 15 MW Photovoltaic Power Plant (“Xiao Deyingzi Photovoltaic”) is located in the city of Huludao of Liaoning Province. Xiao Deyingzi Photovoltaic commenced operation in August 2017, with an installed capacity of 15.56 MW. We hold 100% of the equity interest in Xiao Deyingzi Photovoltaic.
Xiao Deyingzi Photovoltaic sells its electricity to Liaoning Electric Power Company.
Chaoyang Heiniuyingzi Photovoltaic
Chaoyang Heiniuyingzi 17 MW Photovoltaic Power Plant (“Chaoyang Heiniuyingzi Photovoltaic”) is located in the city of Chaoyang of Liaoning Province. Chaoyang Heiniuyingzi Photovoltaic commenced operation in August 2017, with an installed capacity of 18.79 MW. We hold 100% of the equity interest in Chaoyang Heiniuyingzi Photovoltaic.
Chaoyang Heiniuyingzi Photovoltaic sells its electricity to Liaoning Electric Power Company.
Dalian Co-generation
Huaneng Dalian Co-generation Power Plant (“Dalian Co-generation”) is located in Dalian City in Liaoning Province. Dalian Co-generation has an installed capacity of 700 MW and consists of two 350 MW generating units which commenced operation in June and August 2020. We hold 100% equity interest in Dalian Co-generation.
In 2021, Dalian Co-generation obtained 44.81% of its total consumption of coal from annual contracts. The average coal purchase price for Dalian Co-generation in 2021 was RMB832.29 per ton.
Dalian Co-generation sells its electricity to Liaoning Electric Power Company.
Dandong Distributed Wind Power
Huaneng Dandong Distributed Wind Power Plant (“Dandong Distributed Wind Power”) is located in the city of Dandong in Liaoning Province. Dandong Distributed Wind Power commenced operation in Q4 2020, with an installed capacity of 12 MW, consisting of 4 wind power turbines of 3MW each. We hold 100% of the equity interest in Dandong Distributed Wind Power.
Dalian Distributed Wind Power
Huaneng Dalian Distributed Wind Power Plant (“Dalian Distributed Wind Power”) is located in the city of Dalian in Liaoning Province. Dalian Distributed Wind Power commenced operation in Q4 2021, with an installed capacity of 15 MW, consisting of 5 wind power turbines of 3MW each. We hold 100% of the equity interest in Dalian Distributed Wind Power.
Yingkou Photovoltaic
Yingkou Photovoltaic Power Plant (“Yingkou Photovoltaic”) is located in the city of Yingkou in Liaoning Province. Yingkou Photovoltaic commenced operation in Q4 2021, with an installed capacity of 5.7 MW. We hold 100% of the equity interest in Yingkou Photovoltaic.
50
Xianrendao Co-generation Photovoltaic
Xianrendao Co-generation Photovoltaic Power Plant (“Xianrendao Co-generation Photovoltaic”) is located in the city of Xianrendao in Liaoning Province. Yingkou Photovoltaic commenced operation in Q4 2021, with an installed capacity of 5.99 MW. We hold 100% of the equity interest in Xianrendao Co-generation Photovoltaic.
Power Plant in Inner Mongolia Autonomous Region
Huade Wind Power
Huaneng Huade Wind Power Plant (“Huade Wind Power”) is located in Huade, Inner Mongolia Autonomous Region. Phase I of Huade Wind Power has an installed capacity of 49.5 MW and consists of 33 wind power turbines which commenced operation in 2009. Phase II of Huade Wind Power has an installed capacity of 49.5 MW and consists of 33 wind power turbines which commenced operation in June 2011. We hold 100% equity interest in Huade Wind Power.
Huade Wind Power sells its electricity to Inner Mongolia Power (Group) Co., Ltd.
Naren Wind Power
Huaneng Naren Distributed Wind Power Plant (“Naren Wind Power”) is located in Xilinguole in Inner Mongolia Autonomous Region. Naren Wind Power commenced operation in Q4 2020, with an installed capacity of 174 MW, consisting of 58 wind power turbines of 3MW each. We hold 100% of the equity interest in Naren Wind Power.
Power Plants in Hebei Province
Shang’an Power Plant
Huaneng Shang’an Power Plant (“Shang’an Power Plant”) is located on the outskirts of Shijiazhuang. Shang’an Power Plant has been developed in three separate expansion phases. The Shang’an Power Plant Phase I has an installed capacity of 700 MW and consists of two 350 MW coal-fired generating units which commenced operations in 1990. Shang’an Power Plant Phase II shares with the Shang’an Power Plant Phase I certain facilities, such as coal storage facilities and effluence pipes, which have been built to accommodate the requirements of plant expansions.
The Shang’an Power Plant Phase II utilizes two 330 MW coal-fired generating units, which commenced operation in 1997. The Shang’an Power Plant Phase III has an installed capacity of 1,200 MW and consists of two 600 MW supercritical coal-fired generating units which commenced operations in July and August 2008, respectively. Unit 5 of Shang’an Power Plant is the first 600MW supercritical air-cooling unit which commenced operation in the PRC. We hold 100% equity interest in Shang’an Power Plant.
In 2021, Shang’an Power Plant obtained 92.42% of its total consumption of coal from annual contracts and the remainder from the open market. The average coal purchase price for Shang’an Power Plant in 2021 was RMB681.37 (2020: RMB413.52) per ton.
Shang’an Power Plant sells its electricity to Hebei Electric Power Company.
Kangbao Wind Power
Huaneng Kangbao Wind Power Plant (“Kangbao Wind Power”) consists of 77 wind power turbines with a total installed capacity of 145 MW. We hold 100% equity interest in Kangbao Wind Power.
Kangbao Wind Power sells its electricity to Hebei Electric Power Company.
51
Kangbao Xitan Photovoltaic
Kangbao Xitan Photovoltaic (“Kangbao Xitan Photovoltaic”) is located in Kangbao, Zhangjiakou, Hebei. Kangbao Xitan Photovoltaic commenced operation in June 2016, with an installed capacity of 20 MW. We hold 100% equity interest in Kangbao Xitan Photovoltaic.
Kangbao Xitan Photovoltaic sells its electricity to Hebei Electric Power Company.
Zhuolu Dabao Wind Power
Zhuolu Dabao Wind Power Plant (“Zhuolu Dabao Wind Power”) consists of 39 wind power turbines with a total installed capacity of 96 MW, consisting of 24 wind power turbines of 2MW each and 15 wind power turbines of 3.2MW each. Zhuolu Dabao Wind Power commenced operation in March 2017. We hold 100% equity interest in Zhuolu Dabao Wind Power.
Zhuolu Dabao Wind Power sells its electricity to Hebei Electric Power Company.
Shang’an Dianchanghuichang Photovoltaic
Shang’an Dianchanhuichang 18 MW Photovoltaic Power Plant (“Shang’an Dianchanhuichang Photovoltaic”) is located in the city of Shijiazhuang of Hebei Province. Shang’an Dianchanghuichang Photovoltaic commenced operation in December 2017, with an installed capacity of 17 MW. We hold 100% of the equity interest in Shang’an Dianchanhuichang Photovoltaic.
Shang’an Dianchanghuichang Photovoltaic sells its electricity to Hebei Electric Power Company.
Shangyi Guolang Photovoltaic
Shangyi Guolang Photovoltaic Power Plant (“Shangyi Guolang Photovoltaic”) is located in the city of Zhangjiakou in Hebei Province. Shangyi Guolang Photovoltaic commenced operation in Q3 2021, with an installed capacity of 100 MW. We hold 100% of the equity interest in Shangyi Guolang Photovoltaic.
Weixian Zeen Photovoltaic
Weixian Zeen Photovoltaic Power Plant (“Weixian Zeen Photovoltaic”) is located in the county of Wei in Hebei Province. Weixian Zeen Photovoltaic commenced operation in Q3 2021, with an installed capacity of 88 MW. We hold 100% of the equity interest in Weixian Zeen Photovoltaic.
Luquan Distributed Photovoltaic
Luquan Distributed Photovoltaic Power Plant (“Luquan Distributed Photovoltaic”) is located in the city of Shijiazhuang in Hebei Province. Luquan Distributed Photovoltaic commenced operation in Q4 2021, with an installed capacity of 0.8 MW. We hold 100% of the equity interest in Luquan Distributed Photovoltaic.
Power Plant in Gansu Province
Pingliang Power Plant
Huaneng Pingliang Power Plant (“Pingliang Power Plant”) is located in Pingliang City of Gansu Province. Pingliang Power Plant consists of three 325 MW and one 330 MW coal-fired generating units which commenced operation in 2000, 2001 and June and November 2003 respectively. The installed capacity of Unit I, Unit II and Unit III of Pingliang Power Plant were expanded from 300 MW to 325 MW in January 2010, respectively. The installed capacity of Unit IV of Pingliang Power Plant was expanded from 300 MW to 330 MW in January 2011. Pingliang Power Plant Phase II consists of two 600 MW generating units with a total installed capacity of 1200 MW, which commenced operation in February 2010 and March 2010, respectively. We hold 65% equity interest in Pingliang Power Plant.
52
In 2021, Pingliang Power Plant obtained 85.06% of its coal supplies from annual contracts and the remainder from the open market. The average coal purchase price for Pingliang Power Plant in 2021 was RMB445.54 (2020: RMB347.63) per ton.
Pingliang Power Plant sells its electricity to Gansu Electric Power Company.
Ganhekoubei II Wind Power
Huaneng Ganhekoubei II Wind Power Plant (“Ganhekoubei II Wind Power”) is located in the city of Jiuquan in Gansu Province. Ganhekoubei II Wind Power has an installed capacity of 249.5 MW, consisting of 156 wind power turbines. We hold 100% of the equity interest in Ganhekoubei II Wind Power.
Qiaowan III Wind Power
Huaneng Qiaowan III Wind Power Plant (“Qiaowan III Wind Power”) is located in the city of Yumen in Gansu Province. Qiaowan III Wind Power has an installed capacity of 148.5 MW, consisting of 91 wind power turbines. We hold 100% of the equity interest in Qiaowan III Wind Power.
Qiaowan IV Wind Power
Huaneng Qiaowan IV Wind Power Plant (“Qiaowan III Wind Power”) is located in the city of Yumen in Gansu Province. Qiaowan IV Wind Power has an installed capacity of 5.7 MW, consisting of 136 wind power turbines. We hold 100% of the equity interest in Qiaowan IV Wind Power.
Anbei III Wind Power
Huaneng Anbei III Wind Power Plant (“Anbei III Wind Power”) is located in the city of Jiuquan in Gansu Province. Anbei III Wind Power has an installed capacity of 60 MW, consisting of 259 wind power turbines. We hold 100% of the equity interest in Anbei III Wind Power.
Yigang Wind Power
Yigang Wind Power (“Yigang Wind Power”) is located in Gansu Province. This plant commenced operation in December 2015, with an installed capacity of 192 MW, consisting of 96 wind power turbines of 2 MW each. We hold 100% equity interest in Yigang Wind Power.
Yigang Wind Power sells its electricity to Gansu Electric Power Company.
Power Plant in Beijing Municipality
Beijing Co-generation
Huaneng Beijing Co-generation Power Plant (“Beijing Co-generation”) is located in Beijing Municipality. Beijing Co-generation has an installed capacity of 845 MW and consists of two 165 MW generating units, two 220 MW generating units and one 75 MW generating units which commenced operation in January 1998, December 1998, June 1999 and April 2004, respectively. We hold 41% equity interest in Beijing Co--generation and believe we exercise effective control over Beijing Co-generation.
In 2021, Beijing Co-generation obtained 77.22% of its total consumption of coal from annual contracts. The average coal purchase price for Beijing Co-generation in 2021 was RMB931.77 (2020: RMB594.85) per ton.
Beijing Co-generation sells its electricity to Beijing Electric Power Company.
53
Beijing Co-generation CCGT
Beijing Co-generation CCGT consists of one set of “two on one” F-grade gas and steam combined cycle generating units with a power generation capacity of 923.4 MW, heat supply capacity of 650 MW and heat supply area of approximately 13,000,000 square meters. High-standard denitrification, noise reduction, water treatment and other environmental protection facilities were constructed concurrently. In December 2011, Beijing Co-generation CCGT completed its trial run. Beijing Co-generation CCGT sells its electricity to North China Electric Company.
Being the first project commencing construction among the four major co-generation centers in Beijing, Beijing Co-generation CCGT firstly introduced the most efficient world-class F-grade gas turbine in the PRC, thus setting a new record of the maximum heat supply capacity, minimum power consumption for power generation and highest annual thermal efficiency for the same type of generating units in the PRC and attaining a leading and international class design standard in the PRC.
Beijing Co-generation Phase III
Beijing Co-generation Phase III consists of two sets of F-grade gas and steam combined cycle generating units with a power generation capacity of 998 MW. Beijing Co-generation Phase III commenced operation in November 2017. We hold 41% equity interest in Beijing Co-generation Phase III.
Beijing Co-generation CCGT sells its electricity to Beijing Electric Company.
Power Plant in Tianjin Municipality
Yangliuqing Co-generation
Tianjin Huaneng Yangliuqing Co-generation Power Plant (“Yangliuqing Co-generation”) is located in Tianjin Municipality. Yangliuqing Co-generation has an installed capacity of 1,200 MW and consists of four 300 MW coal-fired co-generation units which commenced operation in December 1998, September 1999, December 2006 and May 2007, respectively. We hold 55% equity interest in Yangliuqing Co-generation.
In 2021, Yangliuqing Co-generation obtained 77.00% of its total consumption of coal from annual contracts and the remainder from the open market. The average coal purchase price for Yangliuqing Co-generation in 2021 was RMB782.83 (2020: RMB497.76) per ton.
Yangliuqing Co-generation sells its electricity to Tianjin Electric Company.
Lingang Co-generation CCGT
Lingang Co-generation CCGT is located in Tianjin Municipality. The first set of generating units of Lingang Co-generation CCGT commenced operation in December 2014, with an installed capacity of 463 KW. We hold 100% equity interest in the Lingang Co-generation CCGT. The gas supply for Lingang Co-generation CCGT is transported through the pipeline of “Shaanxi-Gansu-Ningxia Transport Project.”
Lingang Co-generation CCGT sells its electricity to Tianjin Electric Company.
Chenxi Photovoltaic
Chenxi 2.2 MW Photovoltaic Power Plant (“Chenxi Photovoltaic”) is located in the city of Tianjin. Chengxi Photovoltaic commenced operation in June 2017, with an installed capacity of 2.2 MW. We hold 55% of the equity interest in Chenxi Photovoltaic.
Chenxi Photovoltaic sells its electricity to Tianjin Electric Power Company.
54
Power Plant in Shanxi Province
Yushe Power Plant
Huaneng Yushe Power Plant (“Yushe Power Plant”) is located in Yushe County of Shanxi Province. Yushe Power Plant Phase I has an installed capacity of 200 MW and consists of two 100 MW coal-fired generating units which commenced operations in August and December 1994, respectively. Two 300 MW coal-fired generating units of Yushe Power Plant Phase II commenced operations in October and November 2004, respectively. Yushe Power Plant Phase I was shut down in 2011. We hold 100% equity interest in Yushe Power Plant.
In 2021, Yushe Power Plant obtained approximately 77.25% of its total consumption of coal from annual contracts and the remainder from the open market. The average coal purchase price for Yushe Power Plant in 2021 was RMB499.90 (2020: RMB256.67) per ton.
Yushe Power Plant sells its electricity to Shanxi Electric Power Company.
Zuoquan Power Plant
Shanxi Huaneng Zuoquan Power Plant (“Zuoquan Power Plant”) is located in Zuoquan County of Shanxi Province. Zuoquan Power Plant has an installed capacity of 1,200 MW and consists of two 600 MW coal-fired generating units which commenced operations in December 2011 and January 2012, respectively. We hold 80% equity interest in Zuoquan Power Plant.
In 2021, Zuoquan Power Plant obtained approximately 55.20% of its total consumption of coal from annual contracts and the remainders from the open market. The average coal purchase price for Zuoquan Power Plant in 2021 was RMB648.08 (2020: RMB277.53) per ton.
Zuoquan Power Plant sells its electricity to Shanxi Electric Power Company.
Dongshan Combined Cycle Gas Turbine Power Plant
Dongshan Combined Cycle Gas Turbine Power Project (“Dongshan CCGT”) is located at Taiyuan City of Shanxi Province. Dongshan CCGT commenced operation in October 2015 with an installed capacity of 859 KW, consisting of one 2×F Class gas-steam combined cycle co-generating unit. We hold 82% equity interest in the plant.
Dongshan CCGT sells its electricity to Shanxi Electric Power Company.
Yushe Photovoltaic
Yushe 50 MW Photovoltaic Power Plant (“Yushe Photovoltaic”) is located in the city of Jinzhong of Shanxi Province. Yushe Photovoltaic commenced operation in June 2017, with an installed capacity of 50 MW. We hold 100% of the equity interest in Yushe Photovoltaic.
Yushe Fupin Photovoltaic
Yushe 10.5 MW Fupin Photovoltaic (“Yushe Fupin Photovoltaic”) is located in the city of Jinzhong of Shanxi Province. Yushe Fupin Photovoltaic commenced operation in August 2018, with an installed capacity of 10.5 MW. We hold 90% of the equity interest in Yushe Fupin Photovoltaic.
Ruicheng Monan Photovoltaic
Ruicheng Monan Photovoltaic Power Plant (“Ruicheng Monan Photovoltaic”) is located in the city of Yunchen of Shanxi Province. Ruicheng Monan Photovoltaic commenced operation in 2019, with an installed capacity of 150 MW. We hold 100% of the equity interest in Ruicheng Monan Photovoltaic.
55
Pinglu Zhangguiyao Wind Power
Huaneng Pinglu Zhanghuiyao Wind Power Plant (“Pinglu Zhangguiyao Wind Power”) is located in the city of Shuozhou in Shanxi Province. Pinglu Zhangguiyao Wind Power commenced operation in Q4 2020, with an installed capacity of 70 MW, consisting of 35 wind power turbines of 2MW each. We hold 51% of the equity interest in Pinglu Zhangguiyao Wind Power.
Wuzhai Lufeng Wind Power
Huaneng Wuzhai Lufeng Wind Power Plant (“Wuzhai Lufeng Wind Power”) is located in the county of Wuzhai in Shanxi Province. Wuzhai Lufeng Wind Power commenced operation in 2021, with an installed capacity of 95.7 MW. We hold 51% of the equity interest in Dalian Wuzhai Wind Power.
Changzhi Photovoltaic
Changzhi Photovoltaic Power Plant (“Changzhi Photovoltaic”) is located in the city of Changzhi in Shanxi Province. Changzhi Photovoltaic commenced operation in 2019, with an installed capacity of 250 MW. We hold 49% of the equity interest in Changzhi Photovoltaic.
Ruicheng Ximo Photovoltaic
Ruicheng Ximo Photovoltaic Power Plant (“Ruicheng Ximo Photovoltaic”) is located in the city of Ruicheng in Shanxi Province. Ruicheng Ximo commenced operation in 2020, with an installed capacity of 150 MW. We hold 51% of the equity interest in Ruicheng Ximo Photovoltaic.
Yangjiao Wind Power
Huaneng Yangjiao Wind Power Plant (“Yangjiao Wind Power”) is located in the city of Zuoquan in Shanxi Province. Yangjiao Wind Power has an installed capacity of 51 MW, consisting of 21 wind power turbines. We hold 100% of the equity interest in Yangjiao Wind Power.
Power Plants in Shandong Province
Dezhou Power Plant
Huaneng Dezhou Power Plant (“Dezhou Power Plant”) is located in Dezhou City, near the border between Shandong and Hebei Provinces, close to an industrial zone that is an important user of electric power for industrial and commercial purposes. Dezhou Power Plant is comprised of three phases, with Phase I consisting of one 320MW and one 330MW coal-fired generating units, Phase II consisting of one 330MW and one 320MW coal-fired generating units, and Phase III consisting of two 700 MW coal-fired generating units. The installed capacity of Unit IV was upgraded from 300 MW to 320 MW in January 2009. We hold 100% equity interest in Dezhou Power Plant.
In 2021, Dezhou Power Plant obtained approximately 67.22% of its total consumption of coal from annual contracts and the remainder from the open market. The average coal purchase price for Dezhou Power Plant in 2021 was RMB797.55 (2020: RMB465.12) per ton. The plant is connected to the main trunk rail line at Dezhou by a dedicated 3.5 km spur line owned by us.
Dezhou Power Plant sells its electricity to State Grid Shandong Electric Power Company.
Dezhou Dingzhuang Wind Power
Dezhou Dingzhuang Wind Power Plant (“Dezhou Dingzhuang Wind Power”) is located in the city of Dezhou in Shandong Province. Dezhou Dingzhuang Wind Power Plant consists of 13 wind power turbines of 4 MW each. We hold 80% equity interest in Dezhou Dingzhuang Wind Power.
56
Jining Power Plant
Huaneng Jining Power Plant (“Jining Power Plant”) is located in Jining City, near the Jining load center and near numerous coal mines.
Jining Power Plant currently consists of two coal-fired generating units, with an aggregate installed capacity of 270 MW. In addition, Jining Power Plant (Co-generation) has an installed capacity of 700 MW and consists of two 350 MW generating units which commenced operation in November and December 2009, respectively. We hold 100% equity interest in Jining Power Plant.
In 2021, Jining Power Plant obtained approximately 0.78% of its total consumption of coal from annual contracts and the remainder from the open market. The average coal purchase price for Jining Power Plant in 2021 was RMB 1,168.71 (2020: RMB468.64) per ton.
Jining Power Plant sells its electricity to State Grid Shandong Electric Power Company.
Xindian Power Plant
Huaneng Xindian Power Plant (“Xindian Power Plant”) is located in Zibo City of Shandong Province. Xindian Power Plant has an installed capacity of 450 MW and consists of two 225 MW coal-fired generating units which commenced operations in December 2001 and January 2002, respectively, and were shut down in September 2009. Xindian Power Plant Phase III consists of two 300 MW generating units with a total installed capacity of 600 MW, which were put into operation in September and November 2006, respectively. We hold 95% equity interest in Xindian Power Plant Phase III.
In 2021, Xindian Power Plant obtained 36.41% of its total consumption of coal from annual contracts and the remainder from the open market. The average coal purchase price for Xindian Power Plant in 2021 was RMB869.73 (2020: RMB519.38) per ton.Xindian Power Plant sells its electricity to State Grid Shandong Electric Power Company.
Furuite Rooftop Photovoltaic
Furuite 6.3MW Photovoltaic Power Plant (“Furuite Photovoltaic”) is located in the city of Zibo of Shandong Province. Furuite Photovoltaic commenced its operation in June 2017 and has an installed capacity of 6.3 MW. We hold 95% equity interest in Furuite Photovoltaic.
Furuite Photovoltaic sells its electricity to State Grid Shandong Electric Power Company.
Weihai Power Plant
Huaneng Weihai Power Plant (“Weihai Power Plant”) is located approximately 16 km southeast of Weihai City, on the shore of the Bohai Gulf. Its location provides access to cooling water for operations and transportation of coal as well as ash and slag disposal facilities. We hold 60% equity interest in Weihai Power Plant, the remaining 40% interest of which is owned by Weihai Power Development Bureau (“WPDB”).
Weihai Power Plant Phase I consists of two 125 MW generating units (Units I and II), and Phase II consists of two 320 MW generating units (Units III and IV). Unit I began commercial operation in May 1994 and was shut down in December 2008, and Unit II began commercial operation in January 1995 and was shut down in November 2008. Unit III and Unit IV commenced operation in March and November 1998, respectively. Each of the Units III and IV was upgraded from 300 MW to 320 MW in January 2009. Weihai Power Plant Phase III consists of two 680 MW generating units which commenced operations in December 2012.
In 2021, Weihai Power Plant obtained approximately 57.60% of its total consumption of coal from annual contracts and the remainder from the open market. The average coal purchase price for Weihai Power Plant in 2021 was RMB969.98 (2020: RMB527.19) per ton.
Weihai Power Plant sells its electricity to State Grid Shandong Electric Power Company.
57
Rizhao Power Plant
Huaneng Rizhao Power Plant (“Rizhao Power Plant”) is located in Rizhao City of Shandong Province. Rizhao Power Plant currently has an aggregate installed capacity of 2,060 MW. Rizhao Power Plant Phase I has an installed capacity of 700 MW and consists of two 350 MW coal-fired generating units which both commenced operations in April 2000. We hold 88.8% equity interests in Phase I of Rizhao Power Plant.
We hold 100% equity interest in Phase II of Rizhao Power Plant, which commenced operation in December 2008 and consists of two 680 MW supercritical coal-fired generating units.
In 2021, Phase II of Rizhao Power Plant obtained 21.09% of its total consumption of coal from annual contracts and the remainder from the open market. The average coal purchase price for Phase II of Rizhao Power Plant in 2021 was RMB1,006.86 (2020: RMB528.58) per ton.
Rizhao Power Plant sells its electricity to State Grid Shandong Electric Power Company.
Zhanhua Co-generation
Shandong Zhanhua Co-generation Limited Company (“Zhanhua Co-generation”) is located in Zhanhua City of Shandong Province. Zhanhua Co-generation currently has an aggregate installed capacity of 330 MW, consisting of two generating units which commenced operations in July 2005. We hold 100% equity interest in Zhanhua Co-generation.
In 2021, Zhanhua Co-generation obtained none of its total consumption of coal from annual contracts and the remainder from the open market. The average coal purchase price for Zhanhua Co-generation in 2021 was RMB987.82 (2020: RMB510.47) per ton.
Zhanhua Co-generation sells its electricity to State Grid Shandong Electric Power Company.
Baiyanghe Power Plant
Huaneng Shandong Zibo Baiyanghe Power Plant (“Baiyanghe Power Plant”) is located in the city of Zibo in Shandong Province. Baiyanghe Power Plant currently has an aggregate installed capacity of 890 MW. Baiyanghe Power Plant Phase I has an installed capacity of 290 MW and consists of two 145 MW coal-fired generating units which commenced operations in October 2003. Baiyanghe Power Plant Phase II has an installed capacity of 600 MW and consists of two 300 MW coal-fired generating units which commenced operations in December 2009. We hold 80% equity interests in Baiyanghe Power Plant.
In 2021, Baiyanghe Power Plant obtained 27.21% of its total consumption of coal from annual contracts and the remainder from the open market. The average coal purchase price for Baiyanghe Power Plant in 2021 was RMB866.01 (2020: RMB495.04) per ton.
Baiyanghe Power Plant sells its electricity to State Grid Shandong Electric Power Company.
Jiaxiang Power Plant
Huaneng Jiaxiang Power Plant (“Jiaxiang Power Plant”) is located in the city of Jining in Shandong Province. Jiaxiang Power Plant currently has an aggregate installed capacity of 660 MW which consists of two 330 MW coal-fired generating units which commenced operations in September 1999 and January 2003, respectively. We hold 40% equity interests in Jiaxiang Power Plant.
In 2021, Jiaxiang Power Plant obtained 73.76% of its total consumption of coal from annual contracts and the remainder from the open market. The average coal purchase price for Jiaxiang Power Plant in 2021 was RMB648.49 (2020: RMB431.95) per ton.
Jiaxiang Power Plant sells its electricity to State Grid Shandong Electric Power Company.
58
Jining Co-generation
Huaneng Jining Co-generation Power Plant (“Jining Co-generation”) is located in the city of Jining in Shandong Province. Jining Co-generation currently has an aggregate installed capacity of 60 MW which consists of two 30 MW coal-fired generating units which commenced operations in April and July 2004, respectively. We hold 40% equity interests in Jining Co-generation.
In 2021, Jining Co-generation obtained 91.08% of its total consumption of coal from annual contracts and the remainder from the open market. The average coal purchase price for Jining Co-generation in 2021 was RMB495.02 (2020: RMB425.68) per ton.
Jining Co-generation sells its electricity to State Grid Shandong Electric Power Company.
Qufu Co-generation
Huaneng Qufu Shengcheng Co-generation Power Plant (“Qufu Co-generation”) is located in the city of Jining in Shandong Province. Qufu Co-generation currently has an aggregate installed capacity of 450 MW which consists of one 225 MW coal-fired generating unit which commenced operations in February 2009 and one 225 MW coal-fired generating unit which commenced operations in September 2009. We hold 40% equity interests in Qufu Co-generation.
In 2021, Qufu Co-generation obtained 88.33% of its total consumption of coal from annual contracts and the remainder from the open market. The average coal purchase price for Qufu Co-generation in 2021 was RMB595.00 (2020: RMB438.34) per ton.
Qufu Co-generation sells its electricity to State Grid Shandong Electric Power Company.
Huangtai Power Plant
Huaneng Jinan Huangtai Power Plant (“Huangtai Power Plant”) is located in the city of Jinan in Shandong Province. Huangtai Power Plant currently has an aggregate installed capacity of 680 MW which consists of one 330 MW coal-fired generating unit which commenced operations in November 1987 and one 350 MW coal-fired generating unit which commenced operations in January 2011. We hold 72% equity interests in Huangtai Power Plant.
In 2021, Huangtai Power Plant obtained 43.29% of its total consumption of coal from annual contracts and the remainder from the open market. The average coal purchase price for Huangtai Power Plant in 2021 was RMB892.54 (2020: RMB512.74) per ton.
Huangtai Power Plant sells its electricity to State Grid Shandong Electric Power Company.
Yantai Power Plant
Huaneng Yantai Power Plant (“Yantai Power Plant”) is located in the city of Yantai in Shandong Province. Yantai Power Plant currently has an aggregate installed capacity of 590 MW which consists of one 110 MW and three 160 MW coal-fired generating units. The 110 MW unit commenced operations in April 1996, and the three 160 MW units commenced operation in October 2005, December 2005 and October 2006 respectively. We hold 80% equity interest in Yantai Power Plant.
In 2021, Yantai Power Plant obtained 61.64% of its total consumption of coal from annual contracts and the remainder from the open market. The average coal purchase price for Yantai Power Plant in 2021 was RMB815.33 (2020: RMB561.22) per ton.
Yantai Power Plant sells its electricity to State Grid Shandong Electric Power Company.
Linyi Power Plant
Huaneng Linyi Power Plant (“Linyi Power Plant”) is located in the city of Linyi in Shandong Province. Linyi Power Plant currently has an aggregate installed capacity of 1,260 MW which consists of four 140 MW and two 350 MW coal-fired generating units. The 350 MW units commenced operations in December 2012 and October 2013, respectively, and the four 140 MW units commenced operation in December 1997, April 2003, September 2003 and April 2005, respectively. We hold 60% equity interest in Linyi Power Plant.
59
In 2021, Linyi Power Plant obtained 18.51% of its total consumption of coal from annual contracts and the remainder from the open market. The average coal purchase price for Linyi Power Plant in 2021 was RMB1,013.32 (2020: RMB538.42) per ton.
Linyi Power Plant sells its electricity to State Grid Shandong Electric Power Company.
Jining Yunhe Power Plant
Huaneng Jining Yunhe Power Plant (“Jining Yunhe Power Plant”) is located in the city of Jining in Shandong Province. Jining Yunhe Power Plant currently has an aggregate installed capacity of 1,240 MW which consists of four 145 MW and two 330 MW coal-fired generating units. The 330 MW units commenced operations in March and September 2006, respectively, and the four 145 MW units commenced operation in July 2000, November 2000, September 2003 and February 2004, respectively. We hold 78.68% equity interest in Jining Yunhe Power Plant.
In 2021, Jining Yunhe Power Plant obtained 82.37% of its total consumption of coal from annual contracts and the remainder from the open market from the open market. The average coal purchase price for Jining Yunhe Power Plant in 2021 was RMB619.56 (2020: RMB463.66) per ton.
Jining Yunhe Power Plant sells its electricity to State Grid Shandong Electric Power Company.
Liaocheng Co-generation
Huaneng Liaocheng Co-generation Power Plant (“Liaocheng Co-generation”) is located in the city of Liaocheng in Shandong Province. Liaocheng Co-generation currently has an aggregate installed capacity of 660 MW which consists of two 330 MW coal-fired generating unit which commenced operations in January and September 2006, respectively. We hold 60% equity interests in Liaocheng Co-generation.
In 2021, Liaogcheng Co-generation obtained 50.17% of its total consumption of coal from annual contracts and the remainder from the open market. The average coal purchase price for Liaogcheng Co-generation in 2021 was RMB876.94 (2020: RMB488.61) per ton.
Liaogcheng Co-generation sells its electricity to State Grid Shandong Electric Power Company.
Zhongtai Power Plant
Huaneng Taian Zhongtai Power Plant (“Zhongtai Power Plant”) is located in the city of Taian in Shandong Province. Taian Power Plant currently has an aggregate installed capacity of 300 MW which consists of two 150 MW coal-fired generating units, which commenced operations in May and December 2007, respectively. We hold 80% equity interest in Zhongtai Power Plant.
In 2021, Zhongtai Power Plant obtained 64.00% of its total consumption of coal from annual contracts and the remainder from the open market from the open market. The average coal purchase price for Zhongtai Power Plant in 2021 was RMB636.13 (2020: RMB367.32) per ton.
Zhongtai Power Plant sells its electricity to State Grid Shandong Electric Power Company.
Laiwu Power Plant
Huaneng Laiwu Power Plant (“Laiwu Power Plant”) is located in the city of Laiwu in Shandong Province. Laiwu Power Plant currently has an aggregate installed capacity of 2,000 MW which consists of two 1,000 MW coal-fired generating units, which commenced operations in December 2015 and November 2016, respectively. We hold 76% equity interest in Laiwu Power Plant.
In 2021, Laiwu Power Plant obtained 15.07% of its total consumption of coal from annual contracts and the remainder from the open market from the open market. The average coal purchase price for Laiwu Power Plant in 2021 was RMB934.28 (2020: RMB565.43) per ton.
60
Laiwu Power Plant sells its electricity to State Grid Shandong Electric Power Company.
Muping Wind Power
Muping Wind Power Plant (“Muping Wind Power”) is located in the city of Yantai in Shandong Province. Muping Wind Power Plant consists of 28 wind power turbines of 1.5 MW each. We hold 80% equity interest in Muping Wind Power.
Muping Wind Power sells its electricity to State Grid Shandong Electric Power Company.
Penglai Wind Power
Huaneng Penglai Daliuhang Wind Power Plant (“Penglai Wind Power”) is located in the city of Yantai in Shandong Province. Penglai Wind Power Plant consists of 48 wind power turbines of 2 MW each and 2 wind power turbines of 1.8 MW each. We hold 80% equity interest in Penglai Wind Power.
Penglai Wind Power sells its electricity to State Grid Shandong Electric Power Company.
Rushan Wind Power
Huaneng Rushan Wind Power Plant (“Rushan Wind Power”) is located in the city of Weihai in Shandong Province. Rushan Wind Power Plant consists of 28 wind power turbines of 1.5 MW each. We hold 80% equity interest in Rushan Wind Power.
Rushan Wind Power sells its electricity to State Grid Shandong Electric Power Company.
Rongcheng Wind Power
Huaneng Rongcheng Wind Power Plant (“Rongcheng Wind Power”) is located in the city of Weihai in Shandong Province. Rongcheng Wind Power Plant consists of 10 wind power turbines of 1.5 MW each. We hold 48% equity interest in Rongcheng Wind Power.
Rongcheng Wind Power sells its electricity to State Grid Shandong Electric Power Company.
Dongying Wind Power
Huaneng Dongying Wind Power Plant (“Dongying Wind Power”) is located in the city of Dongying in Shandong Province. Dongying Wind Power Plant consists of 32 wind power turbines of 1.5 MW each. We hold 56% equity interest in Dongying Wind Power.
Dongying Wind Power sells its electricity to State Grid Shandong Electric Power Company.
Boshan Photovoltaic
Boshan Photovoltaic Power Plant (“Boshan Photovoltaic”) is located in Zibo City. Boshan Photovoltaic commenced its operation in May 2016 and has an installed capacity of 12 MW. We hold 80% equity interest in Boshan Photovoltaic.
Boshan Photovoltaic sells its electricity to State Grid Shandong Electric Power Company.
Gaozhuang Photovoltaic
Gaozhuang Photovoltaic Power Plant (“Gaozhuang Photovoltaic”) is located in Laiwu City. Gaozhuang Photovoltaic commenced its operation in May 2016 and has an installed capacity of 20 MW. We hold 80% equity interest in Gaozhuang Photovoltaic.
Gaozhuang Photovoltaic sells its electricity to State Grid Shandong Electric Power Company.
61
Jining Co-generation Photovoltaic
Jining Co-generation Photovoltaic Project (“Jining Co-generation Photovoltaic”) is located in Jining City. The project commenced its operation in February 2017 and has an installed capacity of 20 MW. We hold 80% equity interest in this project.
Jining Co-generation Photovoltaic sells its electricity to State Grid Shandong Electric Power Company.
Zhanhua Qingfenghu Wind Power
Zhanhua Qingfenghu Wind Power Plant (“Zhanhua Qingfenghu Wind Power”) is located in the city of Binzhou in Shandong Province. Zhanhua Qingfenghu Wind Power Plant commenced operation in December 2017 with an installed capacity of 100 MW, including 50 wind power turbines of 2 MW each. We hold 80% equity interest in Zhanhua Qingfenghu Wind Power.
Zhanhua Qingfenghu Wind Power sells its electricity to State Grid Shandong Electric Power Company.
Jining Photovoltaic
Jining 20 MW Photovoltaic Power Plant (“Jining Photovoltaic”) is located in the city of Jining of Shandong Province. Jining Photovoltaic commenced its operation in February 2017 and has an installed capacity of 20 MW. We hold 80% equity interest in Jining Photovoltaic.
Jining Photovoltaic sells its electricity to State Grid Shandong Electric Power Company.
Laiwu Niuquan Photovoltaic
Laiwu Niuquan 20 MW Photovoltaic Power Plant (“Laiwu Niuquan Photovoltaic”) is located in the city of Laiwu of Shandong Province. Laiwu Niuquan Photovoltaic commenced its operation in April 2017 and has an installed capacity of 20 MW. We hold 80% equity interest in Laiwu Niuquan Photovoltaic
Laiwu Niuquan Photovoltaic sells its electricity to State Grid Shandong Electric Power Company.
Zhanhua Qingfenghu Photovoltaic
Zhanhua Qingfenghu 100MW Photovoltaic Power Plant (“Zhanhua Qingfenghu Photovoltaic”) is located in the city of Binzhou of Shandong Province. Zhanhua Qingfenghu Photovoltaic commenced its operation in June 2017 and has an installed capacity of 100 MW. We hold 46% equity interest in Zhanhua Qingfenghu Photovoltaic.
Zhanhua Qingfenghu Photovoltaic sells its electricity to State Grid Shandong Electric Power Company.
Weihai Haibu Photovoltaic
Weihai Haibu 19.8MW Photovoltaic Power Plant (“Weihai Haibu Photovoltaic”) is located in the city of Weihai of Shandong Province. Weihai Haibu Photovoltaic commenced its operation in June 2017 and has an installed capacity of 19.75 MW. We hold 80% equity interest in Weihai Haibu Photovoltaic.
Weihai Haibu Photovoltaic sells its electricity to State Grid Shandong Electric Power Company.
Jining Weishan Zhaozhuang Photovoltaic
Jining Weishan Zhaozhuang 80MW Photovoltaic Power Plant (“Jining Weishan Zhaozhuang Photovoltaic”) is located in the city of Jining of Shandong Province. Jining Weishan Zhaozhuang Photovoltaic commenced its operation in December 2017 and has an installed capacity of 80MW. We hold 40% equity interest in Jining Weishan Zhaozhuang Photovoltaic.
62
Jining Weishan Zhaozhuang Photovoltaic sells its electricity to State Grid Shandong Electric Power Company.
Jiyang Biomass
Huaneng Jiyang Biomass Power Plant (“Jiyang Biomass”) is located in the Jiyang District of Jinan City of Shandong Province. Jiyang Biomass commenced its operation in December 2020 and has an installed capacity of 30MW. We hold 80% equity interest in Jiyang biomass.
Haiyang Offshore Wind Power
Haiyang Offshore Wind Power Plant (“Haiyang Offshore Wind Power”) is located in the offshore region near Haiyang in Shandong Province. Haiyang Offshore Wind Power commenced operation in Q4 2021, with an installed capacity of 301.6 MW. We hold 60% of the equity interest in Haiyang Offshore Wind Power.
Dezhou Dingzhuang Photovoltaic
Dezhou Dingzhuang Photovoltaic Power Plant (“Dezhou Dingzhuang Photovoltaic”) is located in the city of Dezhou in Shandong Province. Dezhou Dingzhuang Photovoltaic commenced operation in 2021, with an installed capacity of 200 MW. We hold 80% of the equity interest in Dezhou Dingzhuang Photovoltaic.
Yantai Bajiao Power Plant
Huaneng Yantai Bajiao Power Plant (“Yantai Bajiao Power Plant”) is located in the city of Yantai in Shandong Province. Yantai Bajiao Plant currently has an aggregate installed capacity of 1,340 MW which consists of two 670 MW coal-fired generating units. We hold 80% equity interest in Yantai Bajiao Power Plant.
In 2021, Yantai Bajiao Power Plant obtained 41.44% of its total consumption of coal from annual contracts and the remainder from the open market from the open market. The average coal purchase price for Yantai Bajiao Power Plant in 2021 was RMB921.68 (2020: 558.49) per ton.
Laiwu Co-generation
Huaneng Laiwu Co-generation (“Laiwu Co-generation”) is located in the city of Laiwu in Shandong Province. Laiwu Co-generation currently has an aggregate installed capacity of 660 MW which consists of two 330 MW coal-fired generating units. We hold 74.32% equity interest in Laiwu Co-generation.
Sishui Biomass
Huaneng Sishui Biomass Power Plant (“Sishui Biomass”) is located in the city of Sishui in Shandong Province. Sishui Biomass currently has an aggregate installed capacity of 30 MW. We hold 80% equity interest in Sishui Biomass.
Laizhou Wind Power
Huaneng Laizhou Wind Power Plant (“Laizhou Wind Power”) is located in the city of Laizhou in Shandong Province. Laizhou Wind Power has an installed capacity of 53.25 MW, consisting of 37 wind power turbines. We hold 80% of the equity interest in Laizhou Wind Power.
Heze Dongming Wind Power
Huaneng Heze Dongming Power Plant (“Heze Dongming Wind Power”) is located in the city of Heze in Shandong Province. Heze Dongming Wind Power has an installed capacity of 80 MW, consisting of 26 wind power turbines. We hold 100% of the equity interest in Heze Dongming Wind Power.
63
Qixia Wind Power
Huaneng Qixia Power Plant (“Qixia Wind Power”) is located in the city of Qixia in Shandong Province. Qixia Wind Power has an installed capacity of 50 MW, consisting of 20 wind power turbines. We hold 80% of the equity interest in Qixia Wind Power.
Xintai Photovoltaic
Huaneng Xintai Photovoltaic Power Plant (“Xintai Photovoltaic”) is located in the city of Xintai of Shandong Province. Xintai Photovoltaic has an installed capacity of 100 MW. We hold 65.78% equity interest in Xintai Photovoltaic.
Power Plants and Projects in Henan Province
Qinbei Power Plant
Huaneng Qinbei Power Plant (“Qinbei Power Plant”) is located in Jiyuan City of Henan Province. Its installed capacity is 2,400 MW which consists of four 600 MW supercritical coal-fired generating units. Two units commenced operations in November and December 2004, and the other two units commenced operation in November 2007. In March 2012 and February 2013, two 1,000 MW domestic ultra-supercritical coal-fired generating units of Phase III of Qinbei Power Plant commenced operation, respectively. We hold 60% equity interest in Qinbei Power Plant.
In 2021, Qinbei Power Plant obtained 56.17% of its total consumption of coal from annual contracts and the remainder from the open market. The average coal purchase price for Qinbei Power Plant in 2021 was RMB716.68 (2020: RMB436.56) per ton.
Qinbei Power Plant sells its electricity to Henan Electric Power Company.
Luoyang Co-generation Power Plant
Luoyang Co-generation Power Plant (“Luoyang Co-generation”) is located at Luoyang City of Henan Province. The project has an installed capacity of 700 MW, consisting of two sets of 350MW coal-fired generation units, which commenced operation in May and June 2015, respectively. We hold 80% equity interest in this plant.
In 2021, Luoyang Co-generation obtained 63.23% of its total consumption of coal from annual contracts and the remainder from the open market. The average coal purchase price for Luoyang Co-generation in 2021 was RMB628.26 (2020: RMB425.50) per ton.
Luoyang Co-generation sells its electricity to Henan Electric Power Company.
Mianchi Wind Power
Mianchi Wind Power Plant (“Mianchi Wind Power”) is located in Mianchi City of Henan Province. The project has an installed capacity of 122 MW, consisting of 27 wind turbines of 2MW each and 6 wind turbines of 3MW each, and 20 wind turbines of 2.5MW each. We hold 100% equity interest in this plant.
Zhenyao Wind Power
Zhenyao Wind Power Plant (“Zhenyao Wind Power”) is located in Pingdingshan City of Henan Province. The project has an installed capacity of 84 MW, consisting of 24 wind turbines of 2MW each and 12 wind turbines of 3MW each. We hold 95.00% equity interest in this plant.
Xiayi Wind Power
Xiayi Wind Power Plant (“Xiayi Wind Power”) is located in Shangqiu City of Henan Province. The project has an installed capacity of 50 MW, consisting of 20 wind turbines of 2.5MW each. We hold 100% equity interest in this plant.
64
Puyang Wind Power
Puyang Wind Power Plant (“Puyang Wind Power”) is located in Puyang City of Henan Province. The project has an installed capacity of 650 MW, consisting of 260 wind turbines of 2.5MW each. We hold 100% equity interest in this plant.
Mianchi Co-generation
Mianchi Co-generation Power Plant (“Mianchi Co-generation”) is located in Mianchi City of Henan Province. The project has an installed capacity of 700 MW, consisting of two sets of 350MW coal-fired generation units, which commenced operation in December 2016. We hold 60% equity interest in this plant.
In 2021, Mianchi Co-generation obtained 47.03% of its total consumption of coal from annual contracts. The average coal purchase price for Luoyang Co-generation Power Plant in 2021 was RMB521.68 (2020: RMB346.20) per ton.
Mianchi Co-generation sells its electricity to Henan Electric Power Company.
Zhumadian Wind Power
Zhumadian Wind Power (“Zhumadian Wind Power”) is located in Zhumadian City of Henan Province. The project has an installed capacity of 32 MW, consisting of sixteen 2MW wind turbines, which commenced operation in December 2016. We hold 90% equity interest in this plant.
Zhumadian Wind Power sells its electricity to Henan Electric Power Company.
Qinbei Dianchanghuichang Photovoltaic
Qinbei Dianchanghuichang 20MW Photovoltaic Power Plant (“Qinbei Dianchanghuichang Photovoltaic”) is located in the city of Jiyuan of Henan Province. Qinbei Dianchanghuichang Photovoltaic commenced its operation in June 2017 and has an installed capacity of 20MW. We hold 60% equity interest in Qinbei Dianchanghuichang Photovoltaic.
Qinbei Dianchanghuichang Photovoltaic sells its electricity to Henan Electric Power Company.
Tangyin Wind Power
Tangyin Wind Power is located in Anyang City of Henan Province. The project has an installed capacity of 251.8 MW, consisting of 69 2MW wind turbines and 40 2.5MW wind turbines. We hold 100% equity interest in this plant.
Taiqian Wind Power
Huaneng Taiqian Wind Power Plant (“Taiqian Wind Power”) is located in the county of Taiqian in Henan Province. Taiqian Wind Power has an installed capacity of 40 MW, consisting of 16 wind power turbines. We hold 51% of the equity interest in Taiqian Wind Power.
Koumen Jianshan Wind Power
Huaneng Koumen Jianshan Wind Power Plant (“Koumen Jianshan Wind Power”) is located in the city of Zhumadian in Henan Province. Koumen Jianshan Wind Power has an installed capacity of 95 MW, consisting of 32 wind power turbines. We hold 90% of the equity interest in Koumen Jianshan Wind Power.
Puyang Distributed Wind Power
Huaneng Puyang Distributed Wind Power Plant (“Puyang Distributed Wind Power”) is located in the city of Puyang in Henan Province. Puyang Distributed Wind Power has an installed capacity of 15 MW, consisting of 6 wind power turbines. We hold 100% of the equity interest in Puyang Distributed Wind Power.
65
Taiqian Distributed Wind Power
Huaneng Taiqian Distributed Power Plant (“Taiqian Distributed Wind Power”) is located in the county of Taiqian in Henan Province. Taiqian Distributed Wind Power has an installed capacity of 5.1 MW, consisting of 4 wind power turbines. We hold 51% of the equity interest in Taiqian Distributed Wind Power.
Zhenping Wind Power
Huaneng Zhenping Power Plant (“Zhenping Wind Power”) is located in the county of Zhenping in Henan Province. Zhenping Wind Power has an installed capacity of 40 MW, consisting of 16 wind power turbines. We hold 100% of the equity interest in Zhenping Wind Power.
Xincai Chendian Wind Power
Huaneng Xincai Chendian Power Plant (“Xincai Chendian Wind Power”) is located in the county of Xincai in Henan Province. Xincai Chendian Wind Power has an installed capacity of 50.35 MW, consisting of 19 wind power turbines. We hold 100% of the equity interest in Xincai Chendian Wind Power.
Power Plants and Projects in Jiangsu Province
Nanjing Power Plant
Huaneng Nanjing Power Plant (“Nanjing Power Plant”) has an installed capacity of 640 MW consisting of two 320 MW coal-fired generating units which commenced operations in March and October 1994, respectively. We hold 100% equity interest in Nanjing Power Plant.
In 2021, Nanjing Power Plant obtained approximately 77.20% of its total consumption of coal from annual contracts and the remainder from the open market. The average coal purchase price for Nanjing Power Plant in 2021 was RMB1,017.55 (2020: RMB542.73) per ton.
Nanjing Power Plant sells its electricity to Jiangsu Electric Power Company.
Taicang Power Plant
Huaneng Taicang Power Plant (“Taicang Power Plant”) is located in the vicinity of Suzhou, Wuxi and Changzhou, which is the most affluent area in Jiangsu Province. Taicang Power Plant is an ancillary facility of the China-Singapore Suzhou Industrial Park. Taicang Power Plant Phase I consists of two 300 MW coal-fired generating units, which commenced operations in December 1999 and April 2000 respectively. Taicang Phase II Expansion consists of two 600 MW coal-fired generating units, which commenced operations in January and February 2006, respectively. In April 2008, the installed capacities of the four units of Taicang Power Plant were upgraded to 320 MW, 320 MW, 630 MW and 630 MW, respectively, which increased the total installed capacity of Taicang Power Plant to 1,900 MW. We hold 75% equity interest in Taicang Power Plant.
In 2021, Taicang Power Plant obtained approximately 51.32% of its total consumption of coal from annual contracts and the remainder from the open market. The average coal purchase price for Taicang Power Plant in 2021 was RMB846.67 (2020: RMB438.62) per ton.
Taicang Power Plant sells its electricity to Jiangsu Electric Power Company.
66
Huaiyin Power Plant
Huaneng Huaiyin Power Plant (“Huaiyin Power Plant”) is located in the Center of the Northern Jiangsu Power Grid. The plant’s two 220 MW coal-fired generating units commenced operation in November 1993 and August 1994, respectively. In order to reduce energy consumption and increase capacity, one generating unit of Huaiyin Power Plant was upgraded in October 2001, which increased the maximum generating capacity of that unit to 220 MW. In 2002, upgrading of the second generating unit was completed, and the actual generating capacity of Huaiyin Power Plant is 440 MW. The other two 330 MW coal-fired generating units of Huaiyin Power Plant Phase II Expansion commenced operations in January and March 2005, respectively. Huaiyin Power Plant Phase III consists of two 330 MW coal-fired generating units, and which were put into operation in May and September 2006, respectively. We hold 100% equity interest in Phase I and 63.64% equity interest in Phase II and Phase III of Huaiyin Power Plant. Unit I and Unit II of Huaiyin Power Plant were shut down in December 2007 and January 2009, respectively.
In 2021 Huaiyin Power Plant obtained approximately 16.09% of its total consumption of coal from annual contracts and the remainder from the open market. The average coal purchase price for Huaiyin Power Plant in 2021 was RMB1,011.93 (2020: RMB543.07) per ton.
Huaiyin Power Plant sells its electricity to Jiangsu Electric Power Company.
Jinling Power Plant
Huaneng Nanjing Jinling Power Plant (“Jinling Power Plant”) is located in Nanjing, Jiangsu. Jinling Power Plant consists of two 1,030 MW gas-fired generating units, which commenced operation in December 2009 and August 2012, respectively. We hold 60% equity interest in Jinling Power Plant.
Jinling Power Plant (Coal-fired) consists of two 1,030 MW domestic ultra-supercritical coal-fired generating units, which commenced operation in December 2009 and August 2012, respectively. We hold 60% equity interest in Phase I and Phase II of Jinling Power Plant (Coal-fired).
In 2021, Jinling Power Plant (Coal-fired) obtained approximately 42.11% of its total consumption of coal from annual contracts and the remainder from the open market. The average coal purchase price for Jinling Power Plant (Coal-fired) in 2021 was RMB778.89 (2020: RMB488.69) per ton.
Jinling Power Plant sells its electricity to Jiangsu Electric Power Company.
Qidong Wind Power
Huaneng Qidong Wind Power Plant (“Qidong Wind Power”) is located in Nantong City, Jiangsu. Qidong Wind Power Phase I has an installed capacity of 91.5 MW and commenced operation in March 2009. The first stage and second stage of the Phase II Project of Qidong Wind Power with a total generation capacity of 50 MW and 44 MW respectively commenced operation in January 2011 and June 2012, respectively. We hold 65% equity interest in Qidong Wind Power.
Qidong Wind Power Plant sells its electricity to Jiangsu Electric Power Company.
Jinling CCGT Co-generation
Jinling CCGT Co-generation is located in Nanjing, Jiangsu. The plant comprises of two 390 MW (F grade) CCGT unites and two 191 MW class (E grade) CCGT units and the corresponding support facilities. The two F grades commenced operation in December 2006 and March 2007, while two E grade units commenced operation in April 2013 and May 2013, respectively. We hold 57% equity interest in Jinling CCGT Co-generation. The gas supply for this plant is transported through the pipeline of “West-East Gas Transport Project.”
Jinling CCGT Co-generation sells its electricity to Jiangsu Electric Power Company.
67
Rudong Wind Power
Rudong Wind Power Plant (“Rudong Wind Power”) is located in Rudong, Jiangsu. Phase I of the plant has a total installed generation capacity of 48MW. It commenced operations in November 2013. We hold 90% equity interest in Rudong Wind Power.
Rudong Wind Power sells its electricity to Jiangsu Electric Power Company.
Tongshan Wind Power
Tongshan Wind Power Plant (“Tongshan Wind Power”) is located in Xuzhou, Jiangsu Province. Phase I of the plant has an installed capacity of 50 MW. It commenced operation in March 2016. The phase II commenced operation in December 2017, and has an installed capacity of 48MW, consisting of 24 wind turbines of 2MW each. We hold 70% equity interest in Tongshan Wind Power.
Tongshan Wind Power sells its electricity to Jiangsu Electric Power Company.
Suzhou Co-generation
Huaneng Suzhou Co-generation Power Plant (“Suzhou Co-generation”) is located in Suzhou City in Jiangsu Province. Suzhou Co-generation has an installed capacity of 120 MW and consists of two 60 MW coal-fired generating units which commenced operation in 2006. We hold 53.45% equity interest in Suzhou Co-generation. We acquired the power plant in January, 2015 from Huaneng Group.
In 2021, Suzhou Co-generation obtained 31.77% of its total consumption of coal from annual contracts and the remainder from the open market. The average coal purchase price for Suzhou Co-generation in 2021 was RMB596.00 (2020: RMB447.07) per ton.
Suzhou Co-generation sells its electricity to Jiangsu Electric Power Company.
Taicang Coal Pier Project
Suzhou Port Taicang Terminal Zone Huaneng Coal Pier (“Taicang Coal Pier Project”) is located in Taicang, Suzhou. The Taicang Coal Pier Project has one berth of 100,000 dead weight tonnage (“DWT”) and one berth of 50,000 DWT for coal discharging, four berths of 5,000 DWT each and six berths of 1,000 DWT each for coal loading. The above facilities have commenced trial operation in 2013. We hold 100% equity interest in this project.
Nanjing Chemical Industry Park Co-generation Power Plant
Nanjing Chemical Industry Park Co-generation Power Plant (“Nanjing Chemical Industry Park Co-Generation”) is located in the city of Nanjing in Jiangsu Province. It has an installed capacity of 100MW consisting of two sets of extraction back-pressure turbines of 50 MW each, which commenced operation in April and December 2016, respectively. We hold 70% equity interest in Nanjing Chemical Industry Park Co-Generation Power Plant.
In 2021, Nanjing Co-generation obtained 92.97% of its total consumption of coal from annual contracts and the remainder from the open market. The average coal purchase price for Nanjing Chemical Industry Park Co-generation in 2021 was RMB844.83 (2020: RMB549.62) per ton.
Nanjing Chemical Industry Park Co-generation Power Plant sells its electricity to Jiangsu Electric Power Company.
Luhe Wind Power
Luhe Wind Power (“Luhe Wind Power”) is located in Nanjing, Jiangsu. It has an installed capacity of 50 MW, consisting of 25 wind power turbines of 2 MW each, which commenced operation in December 2016. We hold 100% equity interest in Luhe Wind Power.
Luhe Wind Power sells its electricity to Jiangsu Electric Power Company.
68
Guanyun Co-generation Power
Guanyun Co-generation Power Plant (“Guanyun Co-generation Power”) is located in the city of Lianyungang of Jiangsu Province, with an installed capacity of 50 MW consisting of two 25 MW coal-fired generating units which commenced operations in December 2017. We hold 100% equity interest in Guanyun Co-generation Power.
In 2021, Guanyun Co-generation obtained none of its total consumption of coal from annual contracts and the remainder from the open market. The average coal purchase price for Guanyun Co-generation in 2021 was RMB928.47 per ton.
Guanyun Co-generation Power sells its electricity to Jiangsu Electric Power Company.
Suzhou CCGT
Suzhou Gas-fired Co-generation Power Plant (“Suzhou CCGT”) is located in the city of Lianyungang of Jiangsu Province, with an installed capacity of 452 MW consisting of two (E-class) combined cycle gas turbine cogeneration units which commenced operations in July and September 2017, respectively. We hold 53.45% equity interest in Suzhou CCGT.
Suzhou CCGT sells its electricity to Jiangsu Electric Power Company.
Rudong Offshore Wind Power
Rudong Offshore Wind Power (“Rudong Offshore Wind Power”) is located in the county of Rudong, the city of Nantong of Jiangsu
Province. It has an installed capacity of 302.4 MW, consisting of 38 wind power turbines of 4 MW each, 12 wind power turbines of 4.2 MW each, and 20 wind power turbines of 5 MW each, which commenced operation in March and September 2017. We hold 70% equity interest in Rudong Offshore Wind Power.
Rudong Offshore Wind Power sells its electricity to Jiangsu Electric Power Company.
Yizheng Wind Power
Yicheng Wind Power (“Yicheng Wind Power”) is located in the city of Yizheng of Jiangsu Province. It has an installed capacity of 60 MW, consisting of 21 wind power turbines of 2.2 MW each and 6 wind power turbines of 2.3 MW each, which commenced operation in December 2017 and July 2018, respectively. We hold 100% equity interest in Yizheng Wind Power.
Yizheng Wind Power sells its electricity to Jiangsu Electric Power Company.
Taicang Dianchanghuichang Photovoltaic
Taicang Dianchanghuichang 40MW Photovoltaic Power Plant (“Taicang Dianchanghuichang Photovoltaic”) is located in the city of Taicang of Jiangsu Province. Taicang Dianchanghuichang Photovoltaic commenced its production of 40MW in April 2017 and commenced its production of 10 MW in June 2018, respectively. We hold 75% equity interest in Taicang Dianchanghuichang Photovoltaic.
Taicang Dianchanghuichang Photovoltaic sells its electricity to Jiangsu Electric Power Company.
Guanyun Photovoltaic
Guanyun 14.1MW Photovoltaic Power Plant (“Guanyun Photovoltaic”) is located in the city of Lianyungang of Jiangsu Province. Guanyun Photovoltaic commenced its operation in June 2017 and has an installed capacity of 14.1MW. We hold 100% equity interest in Guanyun Photovoltaic.
Guanyun Photovoltaic sells its electricity to Jiangsu Electric Power Company.
69
Huaiyin Dianchang Photovoltaic
Huaiyin Dianchang Photovoltaic is located in Huaian City of Jiangsu Province. Huaiyin Dianchang Photovoltaic commenced its operation in June 2018 and has an installed capacity of 30 MW. We hold 100% equity interest in Huaiyin Dianchang Photovoltaic.
Dafeng Offshore Wind Power
Dafeng Offshore Wind Power Plant (“Dafeng Offshore Wind Power”) is located in the offshore region east to Yancheng of Jiangsu Province. It has an installed capacity of 301.6 MW, consisting of 44 wind power turbines of 2.2 MW each and 20 wind power turbines of 5 MW each, which commenced operation in 2019, respectively. We hold 100% equity interest in Dafeng Offshore Wind Power.
Jiangyin CCGT
Huaneng Jiangyin CCGT (“Jiangyin CCGT”) is located in the Jiangyin City of Jiangsu Province, which consists of two sets of F-grade gas and steam combined cycle generating units with a power generation capacity of 440 MW each. Jiangyin CCGT commenced operation in November and December 2020, respectively for each unit. We hold 100% equity interest in Jiangyin CCGT.
Taicang Changle Distributed Photovoltaic
Taicang Changle Distributed Photovoltaic Power Plant (“Taicang Changle Photovoltaic”) is located in the city of Taichang in Jiangsu Province. Taicang Changle Photovoltaic commenced operation in Q4 2021, with an installed capacity of 5.1 MW. We hold 75% of the equity interest in Taicang Changle Photovoltaic.
Nanyang Chuanbo Distributed Photovoltaic
Nanyang Chuanbo Distributed Photovoltaic Power Plant (“Nanyang Chuanbo Photovoltaic”) is located in the city of Jingjiang in Jiangsu Province. Nanyang Chuanbo Photovoltaic commenced operation in Q4 2021, with an installed capacity of 1.97 MW. We hold 70% of the equity interest in Nanyang Chuanbo Photovoltaic.
Taicang Gonganju Distributed Photovoltaic
Taicang Gonganju Distributed Photovoltaic Power Plant (“Taicang Gonganju Photovoltaic”) is located in the city of Taichang in Jiangsu Province. Taicang Gonganju Photovoltaic commenced operation in Q4 2021, with an installed capacity of 0.4 MW. We hold 53.5% of the equity interest in Taicang Gonganju Photovoltaic.
Jinling Co-Generation Photovoltaic
Jinling Co-Generation Photovoltaic Power Plant (“Jinling Co-Generation Photovoltaic”) is located in the city of Jinling in Jiangsu Province. Jinling Co-Generation Photovoltaic commenced operation in Q4 2021, with an installed capacity of 2.6 MW. We hold 57.4% of the equity interest in Jinling Co-Generation Photovoltaic.
Nanjing Co-generation
Huaneng Nanjing Co-generation (“Nanjing Co-generation”) is located in the city of Nanjing in Jiangsu Province. Nanjing Co-generation currently has an aggregate installed capacity of 780 MW which consists of two 390 MW coal-fired generating units. We hold 57.39% equity interest in Nanjing Co-generation.
Shengdong Rudong Offshore Wind Power
Huaneng Shengdong Rudong Offshore Power Plant (“Shengdong Rudong Offshore”) is located in the offshore region near Shengdong in Jiangsu Province. Shengdong Rudong Offshore currently has an aggregate installed capacity of 40 MW. We hold 79% equity interest in Shengdong Rudong Offshore Wind Power.
70
Guanyun Offshore Wind Power
Huaneng Guanyun Offshore Wind Power Plant (“Guanyun Offshore Wind Power”) is located in the city of Guanyun in Jiangsu Province. Guanyun Wind Power has an installed capacity of 302.7 MW, consisting of 48 wind power turbines. We hold 100% of the equity interest in Guanyun Offshore Wind Power.
Huaiyin Sihong Photovoltaic
Huaneng Huaiyin Sihong Photovoltaic Power Plant (“Huaiyin Sihong Photovoltaic”) is located in the city of Huaiyin in Jiangsu Province. Huaiyin Sihong Photovoltaic has an installed capacity of 109.4 MW. We hold 100% of the equity interest in Huaiyin Sihong Photovoltaic.
Power Plants in Shanghai Municipality
Shidongkou I
Huaneng Shanghai Shidongkou First Power Plant (“Shidongkou I”) is located in the northern region of the Shanghai Power Grid. The plant comprises four 325 MW coal-fired generating units, which commenced operation in February and December 1988, September 1989 and May 1990 respectively, and has a total installed capacity of 1,300 MW. The installed capacities of Unit II and Unit III were expanded from 300 MW to 325 MW in September 2007 and January 2008, respectively. The installed capacities of Unit I and Unit V were expanded from 300 MW and 320 MW to 325 MW and 325 MW in January 2010, respectively. We hold 100% equity interest in Shidongkou I.
In 2021, Shidongkou I obtained 37.18% of its total consumption of coal from annual contracts and the remainder from the open market. The average coal purchase price for Shidongkou I in 2021 was RMB736.45 (2020: RMB363.10) per ton.
Shidongkou I sells its electricity to State Grid Shanghai Municipal Electric Power Company.
Shidongkou II
Huaneng Shanghai Shidongkou Second Power Plant (“Shidongkou II”) is located in the northern suburbs of Shanghai. Shidongkou II has an installed capacity of 1,200 MW and consists of two 600 MW coal-fired super-critical units which commenced operations in June and December 1992, respectively. We hold 100% equity interest in Phase I of Shidongkou II. Phase II of Shidongkou II has an installed capacity of 1,320 MW and consists of two 660 MW coal-fired super-critical units which commenced operations in October 2011. We hold 50% equity interest in Phase II of Shidongkou II.
In 2021, Shidongkou II obtained 43.28% of its total consumption of coal from annual contracts and the remainder from the open market. The average coal purchase price for Shidongkou II in 2021 was RMB682.41 (2020: RMB377.83) per ton.
Shidongkou II sells its electricity to State Grid Shanghai Municipal Electric Power Company.
Shanghai CCGT
Shanghai CCGT is located in Baoshan District of Shanghai Municipality. Shanghai CCGT consists of three 390 MW gas-fired combined-cycle generating units with a total installed capacity of 1,170 MW, which were put into operation in May, June and July 2006, respectively. We hold 70% equity interest in Shanghai CCGT.
The gas supply for Shanghai CCGT is transported through the pipeline of “West-East Gas Transport Project.” Shanghai CCGT generates electricity during the peak load periods and sells its electricity to State Grid Shanghai Municipal Electric Power Company.
Luojing Photovoltaic
Huaneng Luojing Photovoltaic Power Plant (“Luojing Photovoltaic”) is located in Shanghai Municipalitiy. Luojing Photovoltaic has an installed capacity of 22.16 MW. We hold 100% of the equity interest in Luojing Photovoltaic.
71
Power Plant in Chongqing Municipality
Luohuang Power Plant
Huaneng Luohuang Power Plant (“Luohuang Power Plant”) is located in Chongqing Municipality. Each of Phase I and Phase II of Luohuang Power Plant has an installed capacity of 720 MW and consists of two 360 MW coal-fired generating units. The two units in Phase I commenced operation in September 1991 and February 1992 respectively, and the two units in Phase II commenced operation in December 1998. Luohuang Power Plant Phase III consist of two 600 MW coal-fired generating units with an installed capacity of 1,200 MW, which were put into operation in December 2006 and January 2007, respectively. We hold 60% equity interest in Luohuang Power Plant.
In 2021, Luohuang Power Plant obtained 87.36% of its coal supplies from annual contracts and the remainder from the open market. The average coal purchase price for Luohuang Power Plant in 2021 was RMB798.36 (2020: RMB532.66) per ton.
Luohuang Power Plant sells its electricity to Chongqing Municipal Electric Power Company
Liangjiang CCGT
Liangjiang CCGT is located in Chongqing Municipality. Two generating units of this plant commenced operation in October and December 2014, respectively, with an installed capacity of 934 MW. We hold 75% equity interest in Liangjiang CCGT. The gas supply for Liangjiang CCGT is transported through pipeline of “West-East Gas Transport Project.”
Liangjing CCGT sells its electricity to State Grid Chongqing Municipal Electric Power Company.
Fengjie Jinfengshan Wind Power
Fengjie Jinfengshan Wind Power is located in Fengjie County of Chongqing Municipality. Fengjie Jinfengshan Wind Power commenced its operation in December 2018 and has an installed capacity of 110 MW, consisting of 55 2MW wind turbines. We hold 100% equity interest in Fengjie Jinfengshan Wind Power.
Wushan Wind Power
Huaneng Wushan Wind Power Plant (“Wushan Wind Power”) is located in the city of Wushan in Chongqing Municipality. Wushan Wind Power commenced operation in Q4 2021, with an installed capacity of 50 MW. We hold 75% of the equity interest in Wushan Offshore Wind Power.
Power Plants in Zhejiang Province
Yuhuan Power Plant
Huaneng Yuhuan Power Plant (“Yuhuan Power Plant”) is located in Taizhou of Zhejiang Province. Yuhuan Power Plant Phase I consists of two 1,000 MW ultra-supercritical coal-fired generating units with a total installed capacity of 2,000 MW. Unit I and Unit II were put into operation in November 2006 and December 2006, respectively. Yuhuan Power Plant Phase II consists of two 1,000 MW ultra-supercritical coal-fired generating units with a total installed capacity of 2,000 MW, which commenced operations in November 2007. We hold 100% equity interest in Yuhuan Power Plant. We have received approval from the government authorities to increase the rating of Unit I (Phase I) and Unit III (Phase II) to 1,055MW.
In 2021, Yuhuan Power Plant obtained 98.76% of its total consumption of coal from annual contracts and the remainder from the open market. The average coal purchase price for Yuhuan Power Plant in 2021 was RMB798.02 (2020: RMB527.38) per ton.
Yuhuan Power Plant sells its electricity to State Grid Zhejiang Electric Power Company.
72
Changxing Power Plant
Changxing Power Plant “Replacing Small Units with Large Ones” Project (“Changxing Power Plant”) is located in Changxing County of Zhejiang Province. Changxing “Replacing Small Units with Large Ones” Project commenced operation in December 2014, with an installed capacity of 1,320 MW. This is the first project of ultra-supercritical coal-fired generating units of the Company. We hold 100% equity interest in the project.
In 2021, Changxing Power Plant obtained 55.46% of its total consumption of coal from annual contracts and the remainder from the open market. The average coal purchase price for Changxing Power Plant in 2021 was RMB895.21 (2020: RMB548.00) per ton.
Tongxiang CCGT
Tongxiang CCGT is located in Tongxiang City of Zhejiang Province. The plant commenced operation in September 2014 with an installed capacity of 458.4 MW. We hold 5% equity interest in the Tongxiang CCGT. The gas supply for Tongxiang CCGT is transported through pipeline of “West-East Gas Transport Project.”
Tongxiang CCGT sells its electricity to State Grid Zhejiang Electric Power Company.
Changxing Photovoltaic
Si’an 10MW Distributed Photovoltaic Power Project (“Changxing Photovoltaic”) is located in Changxing County of Zhejiang Province. Part of the project commenced operation in December 2014, with an installed capacity of 5 MW. In March 2015, the rest of the project commenced operation in March 2015, with an installed capacity of 5 MW. We hold 100% equity interest in Changxing Photovoltaic.
Changxing Hongqiao Photovoltaic
Changxing Hongqiao Photovoltaic Power Project (“Changxing Hongqiao Photovoltaic”) is located in Changxing Country of Zhejiang Province. It commenced operation in September 2016, with an installed capacity of 30 MW. We hold 100% equity interest in this project.
Huzhou Distributed Photovoltaic
Huzhou Distributed Photovoltaic Power Project (“Huzhou Distributed Photovoltaic”) is located in the city of Huzhou of Zhejiang Province. It commenced operation in June and December 2017, with an installed capacity of 20 MW. We hold 100% equity interest in Huzhou Distributed Photovoltaic.
Huzhou Distributed Photovoltaic sells its electricity to Zhejiang Electric Power Company.
Jiapu Photovoltaic
Jiapu Photovoltaic Power Project (“Jiapu Photovoltaic”) is located in the city of Huzhou of Zhejiang Province. It commenced operation in 2019, with an installed capacity of 1.03 MW. We hold 100% equity interest in Jiapu Photovoltaic.
Xitang Photovoltaic
Xitang Photovoltaic Power Project (“Xitang Photovoltaic”) is located in the city of Jiaxing of Zhejiang Province. It commenced operation in 2019, with an installed capacity of 1.77 MW. We hold 100% equity interest in Xitang Photovoltaic.
Sian Photovoltaic
Huaneng Sian Photovoltaic Power Plant (“Sian Photovoltaic”) is located in the county of Changxing in Zhejiang Province. Sian Photovoltaic has an installed capacity of 10MW. We hold 100% of the equity interest in Sian Photovoltaic.
73
Power Plant in Hunan Province
Yueyang Power Plant
Huaneng Yueyang Power Plant (“Yueyang Power Plant”) is located in Yueyang City of Hunan Province. Yueyang Power Plant Phase I has an installed capacity of 725 MW and consists of two 362.5 MW sub-critical coal-fired generating units which commenced operation in September and December 1991 respectively. Yueyang Power Plant Phase II consists of two 300MW coal-fired generating units with installed capacity of 600 MW, which were put into operation in March and May 2006, respectively. Huaneng Yueyang Power Plant Phase III (“Yueyang Power Plant Phase III”) consists of two 600 MW generating units with a total installed capacity of 1,200 MW. In January 2011 and August 2012, Unit 5 and Unit 6 of Yueyang Power Plant Phase III, two 600MW coal-fired generating units, commenced operation, respectively. We hold 55% equity interest in Yueyang Power Plant.
In 2021, Yueyang Power Plant obtained 64.29% of its total consumption of coal from annual contracts and the remainder from the open market. The average coal purchase price for Yueyang Power Plant in 2021 was RMB1,004.59 (2020: RMB580.06) per ton.
Yueyang Power Plant sells its electricity to State Grid Hunan Electric Power Company.
Xiangqi Hydropower
Huaneng Yongzhou Xiangqi Hydropower Station (“Xiangqi Hydropower”) is located in Xiangqi County of Hunan Province. Xiangqi Hydropower consists of four 20 MW hydraulic generating units with a total installed capacity of 80 MW. In December 2011, Unit I of Xiangqi Hydropower with an installed capacity of 20 MW passed a trial run. Unit I and Unit II of Yongzhou Xiangqi Hydropower with an installed capacity of 20 MW each commenced operation in December 2011 and May 2012, respectively. Unit III and Unit IV of Xiangqi Hydropower with an installed capacity of 20 MW commenced operation in May and August 2012, respectively. We hold 100% equity interest in Xiangqi Hydropower.
Xiangqi Hydropower sells its electricity to Hunan Electric Power Company.
Subaoding Wind Power
Subaoding Wind Power (“Subaoding Wind Power”) is located between Hongjiang City and Dongkou County in Hunan. Part of the Subaoding Wind Power commenced operation in December 2014, with an installed capacity of 80MW, consisting of 40 wind power turbines of 2 MW. The rest of the Subaoding Wind Power commenced operation in March 2015, with an installed capacity of 70 MW, consisting of 35 wind power turbine of 2 MW each. As of the date of this report, all of the wind power turbines have commenced operation with a total installed capacity of 150 MW. We hold 100% equity interest in the Subaoding Wind Power.
Subaoding Wind Power sells its electricity to Hunan Electric Power Company.
Guidong Wind Power
Guidong Wind Power (“Guidong Wind Power”) is located at Guidong County of Hunan Province. Guidong Wind Power commenced operation in 2015, with an installed capacity of 84 MW, consisting of 42 wind power turbines of 2 MW each. We hold 100% equity interest in this plant.
Guidong Wind Power sells its electricity to Hunan Electric Power Company.
Yueyang Xingang Photovoltaic
Yueyang Xingang 10MW Distributed Photovoltaic Power Project (“Yueyang Xingang Photovoltaic”) is located in the city of Yueyang of Hunan Province. Yueyang Xingang Photovoltaic commenced operation in May 2017, with an installed capacity of 10 MW. We hold 55% equity interest in Yueyang Xingang Photovoltaic.
Yueyang Xingang Photovoltaic sells its electricity to Hunan Electric Power Company.
74
Yueyang Leigutai Photovoltaic
Yueyang Leigutai 20MW Distributed Photovoltaic Power Project (“Yueyang Leigutai Photovoltaic”) is located in the city of Yueyang of Hunan Province. Yueyang Liangang Photovoltaic commenced operation in June 2017, with an installed capacity of 20 MW. We hold 55% equity interest in Yueyang Leigutai Photovoltaic.
Yueyang Leigutai Photovoltaic sells its electricity to Hunan Electric Power Company.
Yueyang Sanhuihu Photovoltaic
Yueyang Sanhuihu Photovoltaic Power Project (“Yueyang Sanhuihu Photovoltaic”) is located in the city of Yueyang of Hunan Province. Yueyang Sanhuihu Photovoltaic commenced operation in 2019, with an installed capacity of 20 MW. We hold 55% equity interest in Yueyang Sanhuihu Photovoltaic.
Lianping Wind Power
Lianping Wind Power Plant (“Lianping Wind Power”) is located at the city of Pinzhou of Hunan Province. Lianping Wind Power commenced operation in 2019, with an installed capacity of 65 MW, consisting of 13 wind power turbines of 3.4 MW each, 1 wind power turbine of 3.6 MW, 1 wind power turbine of 3.2 MW and 7 wind power turbine of 2 MW each. We hold 80% equity interest in this plant.
Power Plant in Hubei Province
Enshi Maweigou Hydropower
Hubei Enshi Maweigou Hydropower Station (“Enshi Maweigou Hydropower”) is located in Enshi City of Hubei Province. We entered into an equity transfer agreement to acquire Enshi Maweigou Hydropower on September 30, 2011. Enshi Maweigou Hydropower consists of three 5 MW hydraulic generating units and two 20 MW hydraulic generating units with a total installed capacity of 55 MW. We hold 98.01% equity interest in Enshi Maweigou Hydropower.
Enshi Maweigou Hydropower sells its electricity to Hubei Electric Power Company.
Yangluo Power Plant
Huaneng Yangluo Power Plant (“Yangluo Power Plant”) is located in Wuhan City in Hubei Province. Wuhan Power Plant has an installed capacity of 2,460 MW and consists of two 300 MW coal-fired generating units which commenced operation in 1993 and 1994, two 330 MW coal-fired generating units which commenced operation in 1997, and two 600 MW coal-fired generating units which commenced operation in 2006. We hold 75% equity interest in Yangluo Power Plant. We acquired the power plant in January 2015 from Huaneng Group.
In 2021, Yangluo Power Plant obtained 49.06% of its total consumption of coal from annual contracts and the remainder from the open market. The average coal purchase price for Yangluo Power Plant in 2021 was RMB926.95 (2020: RMB575.09) per ton.
Yangluo Power Plant sells its electricity to Hubei Electric Power Company.
Dalongtan Hydropower
Huaneng Dalongtan Hydropower Station (“Dalongtan Hydropower”) is located in Enshi City of Hubei Province. Dalongtan Hydropower has an installed capacity of 37.6 MW. We hold 98.01% equity interest in Dalongtan Hydropower. We acquired the power plant in January, 2015 from Huaneng Group.
Dalongtan Hydropower sells its electricity to Hubei Electric Power Company.
75
Jingmen Co-generation
Huaneng Jingmen Co-generation Power Plant (“Jingmen Co-generation” or “Jingmen Thermal Power”) is located in Jingmen City in Hubei Province. Jingmen Co-generation has an installed capacity of 700 MW and consists of two 350 MW coal-fired generating units which commenced operation in 2014. We hold 100% equity interest in Jingmen Co-generation. We acquired the power plant in January, 2015 from HIPDC.
In 2021 Jingmen Co-generation obtained 56.96% of its total consumption of coal from annual contracts and the remainder from the open market. The average coal purchase price for Jingmen Co-generation in 2021 was RMB933.79 (2020: RMB541.37) per ton.
Jingmen Co-generation sells its electricity to Hubei Electric Power Company.
Yingcheng Co-generation
Huaneng Yingcheng Co-generation Power Plant (“Yingcheng Co-generation”) is located in Yingcheng City in Hubei Province. Unit II of Yingcheng Co-generation has an installed capacity of 350 MW which commenced operation in January 2015. Unit I of Yingcheng Co-generation has an installed capacity of 50 MW, which commenced operation in June 2016. We hold 100% equity interest in Yingcheng Co-generation. We acquired the power plant in January, 2015 from HIPDC.
In 2021, Yingcheng Co-generation obtained 72.66% of its total consumption of coal from the open market. The average coal purchase price for Yingcheng Co-generation in 2021 was RMB915.47 (2020: RMB587.16) per ton.
Yingcheng Co-generation sells its electricity to Hubei Electric Power Company.
Jieshan Wind Power
Jieshan Wind Power Plant (“Jieshan Wind Power”) is located at Suixian County of Hubei Province. The Phase I of Jieshan Wind Power commenced operation in June 2015, with an installed capacity of 48 MW, consisting of 24 wind power turbines of 2 MW. Phase II of Jieshan Wind Power commenced operation in August 2016, with an installed capacity of 72 MW, consisting of 36 wind power turbines of 2 MW. We hold 100 equity interest in the Jieshan Wind Power.
Jieshan Wind Power sells its electricity to Hubei Electric Power Company.
Zhongxiang Hujiawan Wind Power
Zhongxiang Hujiawan Wind Power (“Zhongxiang Hujiawan Wind Power”) is located in the city of Jingmen of Hubei Province. Zhongxiang Hujiawan Wind Power commenced operation in December 2017 and August 2018, with an installed capacity of 24 MW and 126 MW, respectively, consisting of totally 75 wind power turbines of 2 MW each. We hold 100% equity interest in this plant.
Zhongxiang Hujiawan Wind Power sells its electricity to Hubei Electric Power Company.
Suizhou Zengdufuhe Photovoltaic
Suizhou Zengdufuhe 20MW Photovoltaic Power Project (“Suizhou Zengdufuhe Photovoltaic”) is located in the city of Suizhou of Hubei Province. Suizhou Zengdufuhe Photovoltaic commenced operation in September and December 2017, with an installed capacity of 20 MW. We hold 100% equity interest in Suizhou Zengdufuhe Photovoltaic.
Suizhou Zengdufuhe Photovoltaic sells its electricity to Hubei Electric Power Company.
76
Power Plant in Jiangxi Province
Jinggangshan Power Plant
Huaneng Jinggangshan Power Plant (“Jinggangshan Power Plant”) is located in Ji’an City of Jiangxi Province. Jinggangshan Power Plant has an installed capacity of 1,920 MW and consists of two 300 MW coal-fired generating units which commenced operation in December 2000 and August 2001 respectively, and two 660 MW generating units which commenced operation in November and December 2009, respectively. We hold 100% equity interest in Jinggangshan Power Plant.
In 2021, Jinggangshan Power Plant obtained 42.44% of its total coal consumption from annual contracts and the remainder from the open market. The average coal purchase price for Jinggangshan Power Plant in 2021 was RMB994.52 (2020: RMB687.50) per ton.
Jinggangshan Power Plant sells its electricity to Jiangxi Electric Power Company.
Jianggongling Wind Power
Jianggongling Wind Power Plant (“Jianggongling Wind Power”) is located in Jiujiang Municipality of Jiangxi Province. Jianggongling Wind Power commenced operation in December 2014 (Phase I), with an installed capacity of 48 MW, consisting of 24 wind power turbine of 2 MW, and in December 206 (Phase II), with an installed capacity of 26 MW, consisting of 13 wind power turbines of 2 MW. We hold 100% equity interest in the Jianggongling Wind Power.
Ruijin Power Plant
Huaneng Ruijin Power Plant (“Ruijin Power Plant”) is located in Ruijin City in Jiangxi Province. Ruijin Power Plant has an installed capacity of 700 MW and consists of two 350 MW coal-fired generating units which commenced operation in 2008. We hold 100% equity interest in Ruijin Power Plant. We acquired the power plant in January, 2015 from HIPDC.
In 2021, Ruijin Power Plant obtained 24.99% of its total consumption of coal from annual contracts and the remainder from the open market. The average coal purchase price for Ruijin Power Plant in 2021 was RMB1,190.84 (2020: RMB646.49) per ton.
Ruijin Power Plant sells its electricity to Jiangxi Electric Power Company.
Anyuan Power Plant
Anyuan Power Plant “Replacing Small Units with Large Ones” Project (“Anyuan Power Plant”) is located at Pingxiang City of Jiangxi Province. The plant has a total installed capacity of 1,320 MW, consisting of two ultra-supercritical units with second reheat cycle of 660 MW each. Anyuan Power Plant is the first project equipped with 660MW ultra supercritical unit with second reheat cycle. We acquired 100% equity interest in the power plant in January 2015.
In 2021, Anyuan Power Plant obtained 40.60% of its total consumption of coal from annual contracts and the remainder from the open market. The average coal purchase price for Ruijin Power Plant in 2021 was RMB1,011.80 (2020: RMB674.41) per ton.
Anyuan Power Plant sells its electricity to Jiangxi Electric Power Company.
Linghuashan Wind Power
Linghuashan Wind Power Plant (“Linghuashan Wind Power”) is located in the city of Ji’an of Jiangxi Province. Linghuashan Wind Power has a total installed capacity of 100 MW, consisting of 50 turbines of 2MW each, which commenced operation in June and September 2017. We hold 100% equity interest in Linghuashan Wind Power.
Linghuashan Wind Power sells its electricity to Jiangxi Electric Power Company.
77
Gaolongshan Wind Power
Gaolongshan Wind Power is located in the city of Ji’an of Jiangxi Province. Gaolongshan Wind Power has a total installed capacity of 80 MW, consisting of 28 wind turbines of 2.2 MW each and 8 wind turbines of 2.3 MW each, which commenced operation in November 2018. We hold 100% equity interest in Gaolongshan Wind Power.
Daguzhai Wind Power
Daguzhai Wind Power Plant (“Daguzhai Wind Power”) is located in the city of Fuzhou of Jiangxi Province. Daguzhai Wind Power has a total installed capacity of 94 MW, consisting of 28 wind turbines of 3 MW each and 4 wind turbines of 2.5 MW each, which commenced operation in 2018. We hold 100% equity interest in Daguzhai Wind Power.
Shangrao Poyang Photovoltaic
Shangrao Poyang Photovoltaic Power Project (“Shangrao Poyang Photovoltaic”) is located in the city of Shangrao of Jiangxi Province. Shangrao Poyang Photovoltaic commenced operation in 2019, with an installed capacity of 264 MW. We hold 51% equity interest in Shangrao Poyang Photovoltaic.
Baijiashe Wind Power
Huaneng Baijiashe Wind Power Plant (“Baijiashe Wind Power”) is located in the county of Baijiashe in Jiangxi Province. Baijiashe Wind Power has an installed capacity of 70 MW, consisting of 22 wind power turbines. We hold 100% of the equity interest in Baijiashe Wind Power.
Sandonghu Photovoltaic
Huaneng Sandonghu Photovoltaic Power Plant (“Sandonghu Photovoltaic”) is located in the county of Nanchang in Jiangxi Province. Sandonghu Photovoltaic has an installed capacity of 75 MW. We hold 100% of the equity interest in Sandonghu Photovoltaic.
Litian Yangxi Photovoltaic
Huaneng Litian Yangxi Photovoltaic Power Plant (“Litian Yangxi Photovoltaic”) is located in the county of Litian in Jiangxi Province. Litian Yangxi Photovoltaic has an installed capacity of 31.03 MW. We hold 100% of the equity interest in Litian Yangxi Photovoltaic.
Power Plant in Anhui Province
Chaohu Power Plant
Huaneng Chaohu Power Plant (“ Chaohu Power Plant”) is located in Chaohu City in Anhui Province. Chaohu Power Plant has an installed capacity of 1,200 MW and consists of two 600 MW coal-fired generating units which commenced operation in 2008. We hold 60% equity interest in Chaohu Power Plant. We acquired the power plant in January, 2015 from HIPDC.
In 2021, Chaohu Power Plant obtained 48.36% of its total consumption of coal from annual contracts and the remainder from the open market. The average coal purchase price for Chaohu Power Plant in 2021 was RMB958.54 (2020: RMB587.40) per ton.
Chaohu Power Plant sells its electricity to Anhui Electric Power Company.
Hualiangting Hydropower
Huaneng Hualiangting Hydropower Plant (“Hualiangting Hydropower”) is located in Anqing City in Anhui Province. Hualiangting Hydropower has an installed capacity of 40 MW which commenced operation in 1981 and 1987. We hold 100% equity interest in Hualiangting Hydropower. We acquired the power plant in January 2015 from Huaneng Group.
78
Hualiangting Hydropower sells its electricity to Anhui Electric Power Company.
Huaining Wind Power
Shijing Wind Power Plant in Huaining Country (“Huaining Wind Power”) is located in Huaining Country, Anhui Province. Huaining Wind Power has a total installed capacity of 50 MW, consisting of 25 turbines of 2MW each, which commenced operation in June 2016. We hold 100% equity interest in the plant.
Huaining Wind Power sells its electricity to Anhui Electric Power Company.
Huaining Longchi Wind Power
Huaining Longchi Wind Power Plant (“Huaining Longchi Wind Power”) is located in the city of the county of Huaining of Anhui Province. Huaining Longchi Wind Power has a total installed capacity of 99 MW, consisting of 45 turbines of 2.2MW each. We hold 100% equity interest in Huaining Longchi Wind Power.
Huaining Longchi Wind Power sells its electricity to Anhui Electric Power Company.
Mengcheng Xiaojian Wind Power
Huaneng Mengcheng Xiaojian Wind Power Plant (“Mengcheng Xiaojian Wind Power”) is located in the county of Mengcheng in Anhui Province. Mengcheng Xiaojian Wind Power has an installed capacity of 150 MW, consisting of 47 wind power turbines. We hold 100% of the equity interest in Mengcheng Xiaojian Wind Power.
Mengcheng Xutong Wind Power
Huaneng Mengcheng Xutong Wind Power Plant (“Mengcheng Xutong Wind Power”) is located in the county of Mengcheng in Anhui Province. Mengcheng Xutong Wind Power has an installed capacity of 50 MW. We hold 100% of the equity interest in Mengcheng Xutong Wind Power.
Shitai Xiaohe Wind Power
Huaneng Shitai Xiaohe Wind Power Plant (“Shitai Xiaohe Wind Power”) is located in the county of Litian in Jiangxi Province. Shitai Xiaohe Wind Power has an installed capacity of 25 MW. We hold 100% of the equity interest in Shitai Xiaohe Wind Power.
Power Plant in Fujian Province
Fuzhou Power Plant
Huaneng Fuzhou Power Plant (“Fuzhou Power Plant”) is located on the south bank of the Min River, southeast of the city of Fuzhou. Fuzhou Power Plant has been developed in three phases. The Fuzhou Power Plant Phase I and Phase II utilize four 350 MW coal-fired generating units with an installed capacity of 1,400 MW, and commenced operations in 1988 and 1999, respectively. The Fuzhou Power Plant Phase III consists of two 600 MW generating units with a total installed capacity of 1,200 MW, and commenced operations in 2010 and 2011, respectively. The capacity of Unit V and Unit VI of the Fuzhou Power Plant Phase III was expanded to 660 MW per unit since January 2012. We hold 100% equity interest in Fuzhou Power Plant.
In 2021, the Fuzhou Power Plant obtained 44.32% of its total consumption of coal from annual contracts and the remainder from the open market. The average coal purchase price for Fuzhou Power Plant in 2021 was RMB794.20 (2020: RMB513.93) per ton.
Fuzhou Power Plant sells its electricity to Fujian Electricity Power Company.
79
Luoyuan Power Plant
Huaneng Luoyuan Power Plant (“Luoyuan Power Plant”) is located in the county in Luoyuan in Fujian Province. Luoyuan Power Plant currently has an aggregate installed capacity of 1,320 MW which consists of two 660 MW coal-fired generating units. We hold 100% equity interest in Luoyuan Power Plant.
In 2021, Luoyuan Power Plant obtained 51.28% of its total consumption of coal from annual contracts and the remainder from the open market from the open market. The average coal purchase price for Luoyuan Power Plant in 2021 was RMB710.93 (2020: 504.24) per ton.
Changle Photovoltaic
Changle 10 MW Photovoltaic Power Plant (“Changle Photovoltaic”) is located in the city of Fuzhou of Fujian Province. It has an installed capacity of 10 MW, which commenced operation in June 2017. We hold 100% equity interest in Changle Photovoltaic.
Changle Photovoltaic sells its electricity to Fujian Electric Power Company.
Gantang Photovoltaic
Gantang Photovoltaic Power Plant (“Gantang Photovoltaic”) is located in the city of Ningde in Fujian Province. Gantang Photovoltaic commenced operation in Q4 2021, with an installed capacity of 2.69 MW. We hold 100% of the equity interest in Gantang Photovoltaic.
Power Plants in Guangdong Province
Shantou Power Plant
Huaneng Shantou Coal-Fired Power Plant (“Shantou Power Plant”) had originally been developed and constructed by HIPDC which transferred all its rights and interests therein to us effective on December 31, 1994. Located on the outskirts of the city of Shantou, Shantou Power Plant was set up with the support of the Shantou municipal government and the Guangdong provincial government. Shantou Power Plant Phase I consists of two 300 MW coal-fired generating units with boilers, which commenced operation in January 1997. Shantou Power Plant Phase II consists of one 600 MW coal-fired generating unit and commenced operation in October 2005. We hold 100% equity interest in Shantou Power Plant.
In 2021, the Shantou Power Plant obtained 29.16% of its total consumption of coal from annual contracts and the remainder from the open market. The average coal purchase price for Shantou Power Plant in 2021 was RMB930.44 (2020: RMB500.55) per ton.
Shantou Power Plant sells its electricity to Guangdong Electric Power Company.
Haimen Power Plant
Huaneng Haimen Power Plant is located in Shantou City, Guangdong Province. Haimen Power Plant has an installed capacity of 4,144 MW and consists of four 1,036 MW generating units. The first two generating units (“Haimen”) commenced operation in July 2009 and October 2009, respectively. We hold 100% equity interest in the first two generating units. The other two generation units commenced operation at the beginning of 2013 (“Haimen Power”). We hold 80% equity interest in the other two generating units.
In 2021, Haimen Power Plant obtained 91.58% of its total consumption of coal from annual contracts and the remainder from the open market. The average coal purchase price for Haimen Power Plant in 2021 was RMB719.3 (2020: RMB522.25) per ton.
Haimen Power Plant sells its electricity to Guangdong Electric Power Company.
80
Shantou Photovoltaic
Shantou Power Plant 17 MW Photovoltaic Power Plant (“Shantou Photovoltaic”) is located in Shantou City, Guangdong Province. It has an installed capacity of 17 MW, which commenced operation in September 2016. We hold 100% equity interest in the Project.
Shantou Photovoltaic sells its electricity to Guangdong Electric Power Company.
Dongguan CCGT
Huaneng Dongguan CCGT (“Dongguan CCGT”) is located in the Dongguan City of Guangdong Province, which consists of two sets of F-grade gas and steam combined cycle generating units with a power generation capacity of 472.5 MW each. Dongguan CCGT commenced operation in June and August 2020, respectively for each unit. We hold 80% equity interest in Jiangyin CCGT.
Power Plants in Yunnan Province
Diandong Energy
Yunnan Diandong Energy Limited Company (“Diandong Energy”) is located in Qujing City, Yunnan Province. Diandong Energy has an installed capacity of 2,400 MW and consists of four 600 MW generating units which commenced operation in February 2006, July 2006, November 2006 and May 2007, respectively. We hold 100% equity interest in Diandong Energy.
In 2021, Diandong Energy obtained none of its total consumption of coal from annual contracts and the remainder from the open market. The average coal purchase price for Diandong Energy in 2021 was RMB404.25 (2020: RMB441.07) per ton.
Diandong Energy sells its electricity to Yunnan Electric Power Company.
Yuwang Energy
Yunnan Diandong Yuwang Energy Limited Company (“Yuwang Energy”) is located in Qujing City, Yunnan Province. Yuwang Energy has an installed capacity of 1,200 MW and consists of two 600 MW generating units which commenced operation in July 2009 and February 2010, respectively. We hold 100% equity interest in Yuwang Energy.
In 2021, Yuwang Energy obtained none of its total consumption of coal from annual contracts and the remainder from the open market. The average coal purchase price of coal for Yuwang Energy in 2021 was RMB404.20 (2020: RMB450.65) per ton.
Yuwang Energy sells its electricity to Yunnan Electric Power Company.
Yuwang Changdi Hydropower Plant
Yuwang Changdi Hydropower Plant (“Yuwang Changdi Hydropower Plant”) is located in Qujing City in Yunnan Province. Yuwang Changdi Hydropower Plant has an installed capacity of 16 MW which commenced operation in 2019. We hold 100% equity interest in Yuwang Changdi Hydropower Plant.
Fuyuan Wind Power
Fuyuan Wind Power Plant (“Fuyuan Wind Power”) is located in the Fuyuan County of Qujing Municipality of Yunnan Province. Fuyuan Wind Power consists of Wenbishan Wind Power, which commenced operation in November 2014 with 20 wind power turbines of 2 MW each, Yibasan Wind Power, which commenced operation in 2014 with 24 wind power turbines of 2 MW each, and Shengjing Wind Power, which commenced operation in December 2016 with 24 wind power turbines of 2 MW each. A new project with an installed capacity of 48 MW commenced operation in October and November 2017, consisting of 24 wind power turbines of 2 MW each. We hold 100% equity interest in Fuyuan Wind Power.
Fuyuan Wind Power sells its electricity to Yunnan Electric Power Company.
81
Power Plants in Hainan Province
Haikou Power Plant
Huaneng Haikou Power Plant (“Haikou Power Plant”) is located in Haikou City in Hainan Province. Haikou Power Plant has an installed capacity of 936 MW and consists of two 138 MW coal-fired generating units which commenced operation in 1999, 2000, and two 330 MW coal-fired generating units which commenced operation in 2006. We hold 91.8% equity interest in Haikou Power Plant. We acquired the power plant in January 2015 from Huaneng Group. We have shut down two 138MW units of Haikou Power Plant in October 2020.
In 2021, Haikou Power Plant obtained 26.38% of its total consumption of coal from annual contracts and the remainder from the open market. The average coal purchase price of coal for Haikou Power Plant in 2021 was RMB610.87 (2020: RMB408.16) per ton.
Haikou Power Plant sells its electricity to Hainan Electric Power Company.
Dongfang Power Plant
Huaneng Dongfang Power Plant (“Dongfang Power Plant”) is located in Dongfang City in Hainan Province. Dongfang Power Plant has an installed capacity of 1,400 MW and consists of four 350 MW coal-fired generating units which commenced operation in 2009 and 2012. We hold 91.8% equity interest in Dongfang Power Plant. We acquired the power plant in January 2015 from Huaneng Group.
In 2021, Dongfang Power Plant obtained 26.25% of its total consumption of coal from annual contracts and the remainder from the open market. The average coal purchase price of coal for Dongfang Power Plant in 2021 was RMB655.54 (2020: RMB415.30) per ton.
Dongfang Power Plant sells its electricity to Hainan Electric Power Company.
Nanshan Co-generation
Huaneng Nanshan Co-generation Power Plant (“Nanshan Co-generation”) is located in Sanya City in Hainan Province. Nanshan Co-generation has an installed capacity of 132 MW which commenced operation in 2003. We hold 91.8% equity interest in Nanshan Co-generation. We acquired the power plant in January 2015 from Huaneng Group.
Nanshan Co-generation sells its electricity to Hainan Electric Power Company.
Gezhen Hydropower Plant
Huaneng Gezhen Hydropower Plant (“Gezhen Hydropower Plant”) is located in Dongfang City in Hainan Province. Gezhen Hydropower Plant has an installed capacity of 82 MW which commenced operation in 2009. We hold 91.8% equity interest in Gezhen Hydropower Plant. We acquired the power plant in January 2015 from Huaneng Group.
Gezhen Hydropower Plant sells its electricity to Hainan Electric Power Company.
Wenchang Wind Power
Huaneng Wenchang Wind Power Plant (“Wenchang Wind Power”) is located in Wenchang City in Hainan Province. Wenchang Wind Power has an installed capacity of 51.5 MW and consists of 33 turbines with each capacity of 1.5 MW which commenced operation in 2008, and one turbine with a capacity of 2 MW which commenced operation in 2015. We hold 91.8% equity interest in Wenchang Wind Power. We acquired the power plant in January 2015 from Huaneng Group.
Wenchang Wind Power sells its electricity to Hainan Electric Power Company.
82
Dongfang Photovoltaic
Dongfang Photovoltaic Power Plant (“Dongfang Photovoltaic”) is located in Dongfang City in Hainan Province. Dongfang Photovoltaic has an installed capacity of 12 MW which commenced operation in July 2016. We hold 91.8% equity interest in Dongfang Power Plant.
Dongfang Photovoltaic sells its electricity to Hainan Electric Power Company.
Chengmai Photovoltaic
Chengmai Photovoltaic Power Plant (“Chengmai Photovoltaic”) is located in the county of Chengmai of Hainan Province. Chengmai Photovoltaic has an installed capacity of 25 MW and 40 MW which commenced operation in June 2017 and September 2018, respectively. We hold 91.8% equity interest in Chengmai Photovoltaic.
Chengmai Photovoltaic sells its electricity to Hainan Electric Power Company.
Power Plant in Guangxi Autonomous Region
Guilin Distributed Energy
Guilin Distributed Energy Power Plant (“Guilin Distributed Energy”) is located in the city of Guilin of Guangxi Autonomous Region. Guilin Distributed Energy has an installed capacity of 210 MW which commenced operation in December 2017. We hold 80% equity interest in Guilin Distributed Energy.
Guilin Distributed Energy sells its electricity to Hainan Electric Power Company.
Guigang Qixingling Wind Power
Guigang Qixingling Wind Power Plant (“Guigang Qixingling Wind Power”) is located at the city of Guigang of Guangxi Autonomous Region. It commenced operation in 2019, with an installed capacity of 60 MW, consisting of 6 wind power turbine of 2.3 MW each and 21 wind power turbine of 2.2 MW each. We hold 100 % equity interest in Guigang Qixingling Wind Power.
Guigang Zhenlongshan Wind Power
Guigang Zhenlongshan Wind Power Plant (“Guigang Zhenlongshan Wind Power”) is located at the city of Guigang of Guangxi Autonomous Region. It has an installed capacity of 41 MW, consisting of 17 wind power turbine. We hold 100 % equity interest in Guigang Zhenlongshan Wind Power.
Power Plant in Guizhou
Panxian Wind Power
Panxian Wind Power (“Panxian Wind Power”) is located at Panxian county of Guizhou Province. It commenced operation in December 2015, with an installed capacity of 24 MW, consisting of 12 wind power turbine of 2 MW each. We hold 100 % equity interest in Panxian Wind Power.
Panxian Wind Power sells its electricity to Guizhou Electric Power Company.
Panxian Dapashan Wind Power
Panxian Dapashan Wind Power Plant (“Panxian Dapashan Wind Power”) is located in the county of Pan of Guizhou Province. Panxian Dapashan Wind Power has an installed capacity of 24 MW and consists of 12 turbines with each capacity of 2 MW which commenced operation in November and December 2017. We hold 100% equity interest in Panxian Dapashan Wind Power.
83
Panxian Dapashan Wind Power sells its electricity to Guizhou Electric Power Company.
Panxian Jiaoziding Wind Power
Panxian Jiaoziding Wind Power Plant (“Panxian Jiaoziding Wind Power”) is located in the county of Pan of Guizhou Province. Panxian Jiaoziding Wind Power has an installed capacity of 48 MW and consists of 24 turbines with each capacity of 2 MW which commenced operation in November and December 2017. We hold 100% equity interest in Panxian Jiaoziding Wind Power.
Panxian Jiaoziding Wind Power sells its electricity to Guizhou Electric Power Company.
Dapashan Boost Station Photovoltai
Dapashan Boost Station Photovoltaic Power Project (“Dapashan Boost Station Photovoltaic”) is located in the city of Bijie of Guizhou Province. Dapashan Boost Station Photovoltaic has an installed capacity of 0.25 MW which commenced operation in 2019. We hold 100% equity interest in Dapashan Boost Station Photovoltaic.
Jiaoziding Boost Station Rooftop Photovoltaic
Jiaoziding Boost Station Rooftop Photovoltaic Power Project (“Jiaoziding Boost Station Rooftop Photovoltaic”) is located in the county of Pan of Guizhou Province. Jiaoziding Boost Station Rooftop Photovoltaic has an installed capacity of 0.4 MW which commenced operation in 2019. We hold 100% equity interest in Jiaoziding Boost Station Rooftop Photovoltaic.
Guanlinggang Wulonggu Photovoltaic
Guanlinggang Wulonggu Photovoltaic Power Project (“Guanlinggang Wulonggu Photovoltaic”) is located in the county of Guanling of Guizhou Province. Guanlinggang Wulonggu Photovoltaic has an installed capacity of 80 MW which commenced operation in 2019. We hold 100% equity interest in Guanlinggang Wulonggu Photovoltaic.
Xixiu Distributed Photovoltaic
Xixiu Distributed Photovoltaic Power Project (“Xixiu Distributed Photovoltaic”) is located in the city of Anshun of Guizhou Province. Xixiu Distributed Photovoltaic has an installed capacity of 8.2 MW which commenced operation in 2019. We hold 100% equity interest in Xixiu Distributed Photovoltaic.
Luodian Photovoltaic
Luodian Agricultural Photovoltaic Power Plant (“Luodian Photovoltaic”) is located in the county of Luodian in Guizhou Province. Luodian Photovoltaic commenced operation in 2021, with an installed capacity of 150 MW. We hold 100% of the equity interest in Luodian Photovoltaic.
Zhenning Photovoltaic
Zhenning Agricultural Photovoltaic Power Plant (“Zhenning Photovoltaic”) is located in the county of Zhenning in Guizhou Province. Zhenning Photovoltaic commenced operation in 2021, with an installed capacity of 200MW. We hold 100% of the equity interest in Zhenning Photovoltaic.
Wangmo Yangshi Photovoltaic
Wangmo Yangshi Agricultural Photovoltaic Power Plant (“Wangmo Yangshi Photovoltaic”) is located in the county of Wangmo in Guizhou Province. Wangmo Yangshi Photovoltaic commenced operation in 2021, with an installed capacity of 30MW. We hold 100% of the equity interest in Wangmo Yangshi Photovoltaic.
84
Dewohaizhuang Photovoltaic
Huaneng Dewohaizhuang Agricultrual Photovoltaic Power Plant (“Dewohaizhuang Photovoltaic”) is located in the county of Dewo in Guizhou Province. Dewohaizhuang Photovoltaic has an installed capacity of 60 MW. We hold 51% of the equity interest in Dewohaizhuang Photovoltaic.
Xindianhuayue Photovoltaic
Huaneng Xingianhuayue Agricultural Photovoltaic Power Plant (“Xindianhuayue Photovoltaic”) is located in the county of Puan in Guizhou Province. Xindianhuayue Photovoltaic has an installed capacity of 120 MW. We hold 51% of the equity interest in Xindianhuayue Photovoltaic.
Power Plant in Ningxia
Ruyi Helan Rooftop Photovoltaic
Ruyi Helan Rooftop Photovoltaic Power Plant (“Ruyi Helan Rooftop Photovoltaic”) is located in the county of Helan of Ningxia Autonomous Region. Ruyi Helan Rooftop Photovoltaic has an installed capacity of 19.8 MW which commenced operation in June 2017. We hold 40% equity interest in Ruyi Helan Rooftop Photovoltaic.
Ruyi Helan Rooftop Photovoltaic sells its electricity to Ningxia Electric Power Company.
Power Plant in Singapore
Tuas Power
With a licensed generating capacity of 2,670MW, Tuas Power is one of the three largest power generation companies in Singapore. It currently has an installed operation generating capacity of 2,009MW, comprising of 1,876 MW gas-fired combined cycle generating units and 133 MW of coal-biomass fired steam turbine generating units. We have shut down the 600 MW oil-fired steam generating unit of Tuas Power.
Supply of coal is procured from coal producers in Indonesia via two long-term coal supply contracts with 10 years and 15 years term respectively, and short-term contracts. Supply of gas is obtained from Pavilion Gas Pte Ltd, Sembcorp Gas Pte Ltd and Shell Gas Marketing Pte Ltd (formally known as BG Singapore Gas Marketing Pte Ltd). Oil supply, if required, is obtained through the spot market.
Power Plant in Pakistan
Sahiwal Power Plant
Sahiwal Power Plant is located near the city of Sahiwal in Punjab Province. It commenced operation of two 660 MW coal-biomass fired steam turbines in 2017. We indirectly hold 40% equity interest in Sahiwal Power Plant.
Competition and Dispatch
All power plants in China are subject to dispatch conducted by various dispatch centers. A dispatch center is required to dispatch electricity pursuant to the Regulations on the Administration of Electric Power Dispatch Networks and Grids, issued by the State Council with effect from November 1, 1993, and in accordance with its agreements with power plants subject to its dispatch. Power generation companies are also required to enter into on-grid dispatch agreements with power grid companies. As a result, there is competition for favorable dispatch treatment in the PRC electric power industry, especially during the off-peak load periods. More efficient power plants usually operate at higher output than less efficient power plants. We believe that in order to increase system stability, large and efficient power plants such as ours will be preferred as base load plants to generate power for the grids to which they connect. We believe that our dispatch arrangements with the local power corporations and dispatch centers, superior quality equipment, lower coal consumption rate, higher efficiency of plant operation, lower emission levels and larger capacity represent competitive advantages in the markets in which we operate.
85
Since 2002, we have been facing competition from four other major power generation groups: China Datang Corporation Ltd., China Huadian Power Corporation, CHN Energy (established through the merge of China Guodian Corporation and Shenhua Group Corporation Limited) and State Power Investment Corporation (formerly known as China Power Investment Corporation), which were created following the break-up of the former State Electric Corporation in 2002.
As power generation companies were separated from power grid companies and more competitors entered into the market, the SERC issued the Interim Measures Regarding Promotion of Openness, Fairness and Equitableness of Power Dispatch, requiring power dispatch centers to treat all competitors indiscriminately in respect of dispatch administration and information disclosure, except in cases where safe and stable operation of the electric power system requires different treatment.
In 2008, with the purpose of improving energy usage efficiency, the government implemented an electricity-optimized dispatch policy in Henan Province, Sichuan Province, Jiangsu Province, Guangdong Province and Guizhou Province on a pilot basis, and plans to roll out to others if the trial operation is successful. In addition, as of December 31, 2014, in all regions in which we operate power plants, the government’s power administrative departments make power generation plan policies with the aim to improve the planned utilization hours of the environment-protecting and energy-saving units. In 2015, the NDRC and China Energy Administration jointly issued the Guidelines on Improving Electric Power Operations and Deepening Clean Energy Generation, which confirms a system that aims to ensure the full-priced acquisitions of renewable energy and ensure that the hours of usage for high-efficiency energy-saving generators be significantly higher than that for coal-fired generators. The Guidelines also demand, within a certain time period, an increase of the hours of usage for coal-fired generators, of which the emission level is close to or reaches the cap level of gas turbine.
In 2016, China National Energy Administration issued Guidelines on Improving Clean Energy Consumption and Distribution in Northern China, Notice on Issuing the Measures for the Administration of the Guaranteed Buyout of Electricity Generated by Renewable Energy Resources, Pilot Program of Local Clean Energy Consumption and Distribution in Gansu, Inner Mongolia and Jilin, and Provisionary Measures for Priority Dispatch of Renewable Peaking Power Generation Units, which require an improvement on clean energy consumption and distribution.
In 2017, NDRC and NEA issued Circular on Orderly Opening Up the Electricity Generation and Consumption Plans, Interim Measures for Guaranteeing the Safe Consumption of Nuclear Power, Pilot Rules on Inter-regional Spare Renewable Energy Electricity Power Stock Trading, Circular on the Establishment of Pilot Electricity Power Stock Exchange, Circular on Promoting Hydropower Consumption in Southwest China, and Solutions to Abandoning Hydro, Wind and Solar Energy, to promote the development of the power stock exchange and renewable power consumption and emphasize the low-carbon energy scheduling.
In 2018, NDRC and NEA issued Circular on Promoting the Capability to Adjust the Power System and Plan for Consumption of Clean Energy (2018-2020), Circular on the Renewable Power Quota System and Notice on Actively Promoting Market-oriented Power Exchange and Further Improving the Trading Mechanism to further promote the consumption of renewable energy and increase the utilization rate of the renewable energy. From 2018, users from coal, steel, non-ferrous metal and construction materials industries, among others, shall participate in the market-oriented power exchange process instead of applying the catalog price. Users are encouraged to negotiate with power generating enterprises to establish the “baseline with floating adjustment” pricing mechanism.
In 2019, NDRC and NEA issued the Notice on Regulating the Management of Priority Generation and Priority Purchase Plan to prioritize the purchase of the renewable energy power, the Notice on Establishing and Perfecting Renewable Energy Power Consumption Guarantee Mechanism to promote the consumption of the renewable energy power, and Guiding Opinions on Deepening the Reform of the On-grid Tariff Formation Mechanism for Coal-fired Power to promote the reform of tariff pricing mechanism. The NDRC also issued the Notice on Full Release of Electricity Generation Plan for Operating Power Users to further open up the plan of operating power users to promote the renewable energy power consumption.
In 2020, NDRC issued Implementation Opinions on Promoting the Independent and Standardized Operation of Electricity Trading Institutions, which provides that dispatch institutions shall actively take responsibilities on organizing transactions on power markets and improving information sharing and power supply safeguard regimes.
In 2021, the dispatch regime further developed into a full market-competition-based dispatch model, and all electricity generation companies need to compete for opportunities to enter into electricity purchase agreements with customers.
86
Competition and Dispatch in Singapore
Following the introduction of LNG into Singapore, new players as well as incumbents have invested in new gas-fired generating capacities to compete in the Singapore electricity market. Tuas Power competes in the NEMS using its portfolio of gas-fired and coal-biomass fired generating units. It was able to maintain a market share of approximately 19.2% in the NEMS for 2021. Its major competitors include Senoko Energy (formerly Senoko Power) which is owned by a Japanese/French consortium led by Marubeni Group, YTL PowerSeraya that is owned by YTL Group of Malaysia, SembCorp Cogen and Keppel Merlimau Cogen and PacificLight Power Pte Ltd. Tuaspring, which entered the market in 2015, has sold its only CCP to YTL PowerSeraya in 2020. Tuas Power’s portfolio of generating units allows it to maintain its leadership position in Singapore’s power industry.
In the NEMS, power generation companies compete to generate and sell electricity every half-hour by offering their capacity (specifying price/quantity pairs). The EMC, the operator of Singapore’s wholesale electricity market, determines the least-cost dispatch quantities and the corresponding market-clearing or spot prices based on the offers made by power generation companies. The spot prices in the NEMS reflect the least-cost market solution for the dispatch of energy and provision of operating reserves. In general, this means that each power generation company that submitted an offer below the spot price will be dispatched, and a power generation company that submitted an offer above the spot price will not be dispatched. The spot price that a power generation company receives is a nodal price, which may vary according to their location on the network to reflect the cost of transmission losses or network constraints.
Environmental Regulation
We are subject to the PRC Environmental Protection Law, and relevant laws and regulations (collectively the “National Environmental Laws”) and the environmental rules promulgated by the Local Governments in whose jurisdictions our various power plants are located (the “Local Environmental Rules”). According to the National Environmental Laws, the Ministry of Ecology and Environment sets national environmental protection standards and local environmental protection bureaus may set stricter local standards. Enterprises are required to comply with the stricter of the two standards.
At present, new projects are subject to the environmental evaluation approval. The project proposal is required to be submitted to the Ministry of Ecology and Environment for approval, save for those projects can be approved by local governments.
Effective July 1, 2003, all power plants in China became subject to the pollutant discharge levy system, pursuant to which discharge fees are levied based on the actual amount of pollutants discharged. In 2018, the Environmental Protection Tax Law of People’s Republic of China came into effect, and all of our plants have been paying the environmental protection tax since. Under the Environmental Protection Tax Law, the unit tax(fee) rates rise significantly in various regions. We took the low emission modification and other measures and actively sought tax deduction treatments, which helped us to cut our environmental protection tax liabilities in the amount of RMB50 million. In 2021, we paid environmental protection tax and fees in the amount of RMB 250 million.
In 2011, the PRC Government promulgated a New Emission Standards of Air Pollutants for Thermal Power Plants, which implement more stringent standards on discharge of polluting substances by thermal power plants. These restrictive standards govern both the total sulfur dioxide and nitrous oxide emissions from the power plant and the emission density of each chimney.
In September 2013, the State Council issued the Air Pollution Prevention Action Plan (the “Plan”), setting forth stricter requirements for air pollution prevention and control. Local government departments have released local rules and regulations under the Plan, some of which require higher emission standards than the national ones. In September 2014, the NDRC, the Ministry of Ecology and Environment and China National Energy Administration jointly issued the 2014-2020 Action Plan for Energy Saving, Emission Reduction and Renovation of Coal-fired Generation Units, imposing more strict requirements for efficient and clean development of coal-fired generating plants. In December 2016, the State Council issued the Comprehensive Work Plan for Conserving Energy and Reducing Emissions for the 13th Five-Year, putting forward new goals and requirements for energy saving and emission reduction. All of our plants in east coastal regions have completed the renovation.
87
In order to meet the requirements of the New Emission Standards, we have installed flue gas desulphurization (“FGD”) facilities and denitrification facilities with all of our newly constructed generating units. We have also carried out sulfur disposal reform on the existing generating units. As of the end of 2012, we have installed and operated desulphurization facilities on all our existing coal-fired generating units. By the end of 2014, all coal-fired generating units of the Company have been renovated to include denitrification facilities. By the end of 2021, we have completed the ultra-low emission modification for 99% of our generating units. In 2021, we also completed water saving and wastewater treatment projects for six power plants, and launched water saving and wastewater treatment projects for our power plants in other regions.
In order to reduce fly ash, we use very high-efficiency electrostatic precipitators and conduct efficiency improvement and renovations according to increasingly strict state and local emission standards. Currently most power plants are also equipped with watersaving and wastewater treatment facilities so as to reduce to the maximum extent, and even prevent, the emission. We pay discharge fees on the basis of measurements made at discharge points of each plant where waste is released. All of the disposal equipment and facilities for sulfur dioxide, nitrogen oxides, smoke dust, wastewater and noise in our existing power plants completely satisfy the existing national standards.
We believe we have implemented systems that are adequate to control environmental pollution caused by our facilities. In addition to the measures identified above, each power plant has its own environment protection staff responsible for monitoring and operating the environmental protection equipment. The environmental protection departments of the local governments monitor the level of emissions, sometimes through online monitoring devices recognized by such local governments, and base their fee assessments on the results of their tests.
We believe our environmental protection systems and facilities for the power plants are adequate for us to comply with the currently effective national and local environmental protection regulations. It is expected that the PRC Government will impose additional and stricter regulations to implement the emission plan which would require additional expenditure in compliance with environmental regulations.
Environmental Regulation in Singapore
Tuas Power’s generation operations are subject to Singapore’s Environmental Protection and Management Act and Environmental Public Health Act. The former sets out requirements pertaining to control of pollution and management of hazardous substance while the latter focuses mainly on proper waste management.
Tuas Power Station
To address the environmental concerns and regulatory requirements, Tuas Power Station has put in place an environmental management system, which is certified to ISO14001 standard. All generating units are equipped with pollution control facilities. The combined-cycle plants burn natural gas and are fitted with low-nitrogen oxides (NOx) burners to control nitrogen oxides (NOx) emissions. Source emission tests are conducted annually by National Environment Agency (NEA) accredited contractors and the results are submitted to NEA Pollution Control Department.
Tuas Power Station has a dedicated oily wastewater treatment plant and chemical wastewater treatment plant to respectively treat its oily wastewater and process wastewater prior to discharge into the sea. Critical parameters are being monitored during the treatments to prevent accidental adverse discharge. Trade effluent testing is performed annually and the results are shared with the Pollution Control Department.
Land contamination is prevented through well-designed storage and containment procedures. Specific areas for storage of waste and hazardous substances are designated within the power plant.
Waste generated in Tuas Power Station plants is identified and managed accordingly. Waste with residual value, such as waste oil, is resold to licensed collectors for reuse while other waste is disposed through licensed disposal contractors.
88
Hazardous substances which have potential to cause environmental pollution are controlled within the power plant compound. A hazardous substance permit, issued by the Pollution Control Department, is required to store the hazardous substances in the premises. Our personnel who handle these chemicals are properly trained and our storage facility for hazardous substances are specifically designed to prevent and mitigate the likelihood and impact of any abnormal releases. Regular audits are conducted to ensure these hazardous substances are managed properly and the findings and recommendations for improvements are reported to the Pollution Control Department.
TMUC
TMUC utilizes an efficient cogeneration process where up to 80% of the useful energy from the plant is used to produce steam for industrial customers and the remaining energy is converted to electricity for internal use and transmission to the national grid. In 2021, the energy split between heat and power is 46.9% and 53.1% respectively, and the overall plant efficiency averaged at 58.6%.
The TMUC plant is designed to comply with stringent environmental standards set by the local authority. TMUC has put in place a robust environmental management system and it is certified to ISO14001 standard. TMUC had also achieved ISO50001 certification and is committed to promote resource conservation, sustainability and create awareness in environmental protection and energy conservation. TMUC adopts the circulating fluidized bed boiler technology that enables use of high percentage of carbon neutral biomass (palm kernel shell and woodchips) co-fired with clean coal (low sulphur and low ash) to reduce carbon footprint significantly to the same level as oil-fired plant and with lower sulphur and nitrogen oxides emission. High efficiency bag filters are installed to ensure low particulates emission.
Coal, biomass and ash handling, transfer and storage systems at TMUC are fully enclosed to prevent any fugitive dust during unloading, storage and handling operation. Coal and ash are stored in silo while biomass is stored in enclosed warehouse.
Fly ash and bed ash generated from the CFB boilers are fully recycled and processed for industrial use in cement and concrete applications.
Oily wastewater, coal/ash washing wastewater and industrial wastewater received from customers are treated prior to discharge. Online monitoring of oil-in-water, suspended solids (through turbidity meter) and chemical oxygen demand (COD) are carried out for oily wastewater, coal/ash washing wastewater and industrial wastewater respectively to ensure compliance with environmental regulation. Chemical/regeneration wastewater is neutralized prior to discharge. Online monitoring of pH is conducted to prevent accidental discharge. Stop-gates are strategically installed at drain to prevent accidental discharge of poor-quality effluent/water to the sea.
Insurance
We currently maintain property all-risks insurance and machinery-breakdown insurance for all of our power plants, and construction all-risks insurance or erection all-risks insurance for all of our newly built and expansion projects as well as large-scaled upgrading projects. In 2021 we renewed the liabilities insurance for our directors and officers with coverage of US$10 million.
We do not maintain any third-party liability insurance to cover claims in respect of bodily injury or property or environment damage arising from accidents on our property or relating to our operation other than the third-party additional risk insurance included in construction all-risk insurance or erection all-risk insurance. We do not usually carry business interruption insurance either, which is not customarily carried by power companies in the PRC. We believe that our insurance coverage is adequate and is standard for the power industry in China. Please refer to the section entitled “Risk factors – Risks relating to our business and the PRC’s power industry – Operation of power plants involves many risks and we may not have enough insurance to cover the economic losses if any of our power plant’s ordinary operation is interrupted.”
Tuas Power purchases key insurance policies, such as industrial all-risks insurance (including business interruption insurance coverage), public and products liability insurance, directors’ and officers’ liability insurance, pollution legal liability insurance and marine cargo insurance. Total insured value under the industrial all-risks insurance is approximately US$2.3 billion for 2022.
89
ITEM 4A UNRESOLVED STAFF COMMENTS
None.
ITEM 5. OPERATING AND FINANCIAL REVIEWS AND PROSPECTS
A. | General |
The principal activities of the Company are development in and construction, operation and management of power plants in China. The Company provides consistent and reliable electricity supply to customers through grid operators where its operating plants are located. The Company is committed to scientific development through increasing economic efficiency, enhancing returns for shareholders, conserving resources and protecting the environment. The Company also attaches importance to social responsibilities and makes an active contribution to the building of a harmonious society.
Since its incorporation, the Company has continued to expand its operational scale. The Company has been a leader in its industry in terms of competitiveness, resource utilization efficiency and environmental protection. The Company is one of the Asia’s largest listed power producer and China’s most dynamic power generator. Its power generation operations are widely located with coverage in the Northeast China Grid, the Northern China Grid, the Northwest China Grid, the Eastern China Grid, the Central China Grid, the Southern China Grid, and the overseas market in Singapore.
In 2021, facing up to the impacts and test of epidemic and the market environment of significant price increase in the coal market, the Company made all-out efforts to coordinate the work of epidemic prevention and control, production and operation, and transformation and development, thus the safety production and supply of electric power and thermal power maintained stable, the pace of transformation and upgrading accelerated, and innovation made a new progress. We completed the major objectives of the year and continued to fulfill the responsibility of providing sufficient, reliable and eco-friendly energy to the community.
Critical accounting estimates
The Company’s consolidated financial statements are prepared in accordance with IFRS as issued by the IASB. The preparation of our consolidated financial statements requires us to make estimates and assumptions that affect the reported amount of assets and liabilities, disclosure of contingent assets and liabilities at the date of our financial statements, and the reported amount of revenue and expenses during the reported periods. There can be no assurance that actual results will not differ from those estimates. The Company and its subsidiaries have identified certain estimates as critical to our business operations and the understanding of our results of operations. For a detailed discussion on these estimates and our selection of critical accounting policies, see Note 4 and Note 2 to the Financial Statements in Item 18 of this annual report on Form 20-F.
New accounting pronouncements
For a detailed discussion of new accounting pronouncements, see Note 2(af) to the Financial Statements.
B. | Operating results |
Our financial statements are prepared under IFRS as issued by IASB. The following management’s discussion and analysis is based on the financial information prepared under IFRS.
90
Year ended December 31, 2021 compared with year ended December 31, 2020
| For the Year Ended December 31, |
| |||||
| Increased/ |
| |||||
2021 | 2020 | (Decreased) |
| ||||
| RMB’000 |
| RMB’000 |
| % | ||
Operating revenue |
| 204,605,083 |
| 169,446,338 |
| 20.75 | |
Tax and levies on operations |
| (1,686,341) |
| (1,794,004) |
| (6.00) | |
Operating expenses |
|
|
|
|
|
| |
Fuel |
| (146,539,362) |
| (88,966,304) |
| 64.71 | |
Maintenance |
| (4,503,584) |
| (5,001,982) |
| (9.96) | |
Depreciation |
| (22,270,421) |
| (22,146,316) |
| 0.56 | |
Labor |
| (16,107,285) |
| (14,503,290) |
| 11.06 | |
Service fees on transmission and transformer facilities of HIPDC |
| (47,947) |
| (95,894) |
| (50.00) | |
Purchase of electricity |
| (9,114,851) |
| (4,720,261) |
| 93.10 | |
Others |
| (11,702,778) |
| (20,300,072) |
| (42.35) | |
Total operating expenses |
| (210,286,228) |
| (155,734,119) |
| 35.03 | |
(Loss)/profit from operations |
| (7,367,486) |
| 11,918,215 |
| (161.82) | |
Interest income |
| 288,291 |
| 292,724 |
| (1.51) | |
Financial expenses, net |
|
|
|
|
|
| |
Interest expense |
| (8,798,200) |
| (9,200,612) |
| (4.37) | |
Exchange (loss)/gain and bank charges , net |
| (40,290) |
| 100,643 |
| (140.03) | |
Total financial expenses, net |
| (8,838,490) |
| (9,099,969) |
| (2.87) | |
Share of profits less losses of associates and joint ventures |
| 804,386 |
| 1,774,322 |
| (54.67) | |
Loss on fair value changes of financial assets / liabilities |
| — |
| (1,566) |
| (100.00) | |
Other investment loss |
| (7,345) |
| (109,990) |
| (93.32) | |
(Loss)/profit before income tax expense |
| (15,120,644) |
| 4,773,736 |
| (416.75) | |
Income tax expense |
| 1,929,755 |
| (2,163,173) |
| (189.21) | |
Net (loss)/profit |
| (13,190,889) |
| 2,610,563 |
| (605.29) | |
Attributable to: |
|
|
|
|
|
| |
-Equity holders of the Company |
| (10,636,194) |
| 2,377,851 |
| (547.30) | |
-Non-controlling interests |
| (2,554,695) |
| 232,712 |
| (1,197.79) |
Total power generated by the Company’s domestic operating power plants for the year on consolidated basis amounted to 457.336 billion kWh, representing an increase of 13.20% year-on-year. The electricity sold amounted to 430.165 billion kWh, representing an increase of 13.23% year-on-year. The increase in the Company’s electricity sold was mainly attributable to the following factors: (1) the electricity consumption of the whole society in the year 2021 stayed at a high level, which led to a sharp increase in the power generation on the supply side, among which the power generation by our plants in Chongqing, Guangdong, Zhejiang, Shanghai, Fujian, Hunan, Jiangsu, Gansu and Hubei experienced a significant increase, (2) given the hydro-power generation was lower than expected, coal-fired power generation, which accounted for a substantial portion of the Company’s power generation capacity, maintained a high rate increase; meanwhile, the Company’s coal-fired power plants operated at high load during the winter peak hours, which further led to the increase of our power generation, and (3) the Company has been making further efforts on promoting green and low carbon operation, and the Company’s new energy power generation increased significantly.
The annual average utilization hours of the Company’s domestic power plants reached 4,058 hours. In most of the areas where the Company’s coal-fired power plants are located, the utilization hours of the Company were in a leading position within those areas.
The power generation of the Company’s domestic power plants for the year ended December 31, 2021 is listed below (in billion kWh):
Power Generation | Electricity Sold |
| |||||||
Region | 2021 | Change | 2021 | Change |
| ||||
Heilongjiang Province |
| 13.741 |
| (2.73) | % | 12.846 |
| (2.96) | % |
Coal-fired |
| 12.224 |
| (4.89) | % | 11.389 |
| (5.00) | % |
Wind-power |
| 1.386 |
| 21.79 | % | 1.327 |
| 18.83 | % |
91
PV |
| 0.131 |
| (2.96) | % | 0.130 |
| (2.15) | % |
Jilin Province |
| 9.485 |
| (14.56) | % | 8.805 |
| (15.21) | % |
Coal-fired |
| 7.563 |
| (20.50) | % | 7.013 |
| (21.03) | % |
Wind-power |
| 1.213 |
| 6.31 | % | 1.145 |
| 5.66 | % |
Hydro-power |
| 0.070 |
| (7.89) | % | 0.070 |
| (6.60) | % |
PV |
| 0.266 |
| 83.45 | % | 0.246 |
| 72.08 | % |
Biomass power |
| 0.373 |
| 63.60 | % | 0.331 |
| 63.89 | % |
Liaoning Province |
| 19.743 |
| 5.18 | % | 18.370 |
| 5.24 | % |
Coal-fired |
| 19.140 |
| 5.22 | % | 17.777 |
| 5.30 | % |
Wind-power |
| 0.421 |
| 11.97 | % | 0.415 |
| 11.38 | % |
Hydro-power |
| 0.030 |
| (28.57) | % | 0.029 |
| (28.41) | % |
PV |
| 0.151 |
| (7.36) | % | 0.148 |
| (6.80) | % |
Inner Mongolia |
| 0.669 |
| 215.57 | % | 0.553 |
| 165.66 | % |
Wind-power |
| 0.669 |
| 215.57 | % | 0.553 |
| 165.66 | % |
Hebei Province |
| 11.403 |
| (6.34) | % | 10.608 |
| (6.64) | % |
Coal-fired |
| 10.739 |
| (7.91) | % | 9.976 |
| (8.16) | % |
Wind-power |
| 0.534 |
| 16.85 | % | 0.511 |
| 14.58 | % |
PV |
| 0.129 |
| 130.36 | % | 0.122 |
| 120.78 | % |
Gansu Province |
| 15.209 |
| 15.65 | % | 14.382 |
| 15.09 | % |
Coal-fired |
| 12.611 |
| 16.84 | % | 11.912 |
| 16.79 | % |
Wind-power |
| 2.598 |
| 10.18 | % | 2.470 |
| 7.53 | % |
Ningxia |
| 0.022 |
| (4.35) | % | 0.022 |
| (4.02) | % |
PV |
| 0.022 |
| (4.35) | % | 0.022 |
| (4.02) | % |
Beijing |
| 8.900 |
| 3.74 | % | 8.484 |
| 3.25 | % |
Coal-fired |
| 1.458 |
| 47.72 | % | 1.294 |
| 48.71 | % |
Combined Cycle |
| 7.442 |
| (1.96) | % | 7.190 |
| (2.14) | % |
Tianjin |
| 6.959 |
| 3.20 | % | 6.509 |
| 2.70 | % |
Coal-fired |
| 5.348 |
| 4.84 | % | 4.941 |
| 4.23 | % |
Combined Cycle |
| 1.597 |
| (1.90) | % | 1.554 |
| (1.78) | % |
PV |
| 0.014 |
| (6.67) | % | 0.013 |
| (8.14) | % |
Shanxi Province |
| 10.186 |
| (6.64) | % | 9.491 |
| (6.33) | % |
Coal-fired |
| 6.892 |
| (15.32) | % | 6.319 |
| (15.31) | % |
Combined Cycle |
| 2.055 |
| (5.56) | % | 1.997 |
| (5.70) | % |
Wind-power |
| 0.395 |
| 1,096.97 | % | 0.340 |
| 5,630.21 | % |
PV |
| 0.845 |
| 50.09 | % | 0.836 |
| 52.53 | % |
Shandong Province |
| 87.939 |
| 7.45 | % | 81.879 |
| 7.41 | % |
Coal-fired |
| 85.737 |
| 6.51 | % | 79.687 |
| 6.30 | % |
Wind-power |
| 1.452 |
| 75.15 | % | 1.393 |
| 83.29 | % |
PV |
| 0.567 |
| 10.74 | % | 0.520 |
| 3.29 | % |
Biomass power |
| 0.183 |
| 4,475.00 | % | 0.278 |
| —— | |
Henan Province |
| 23.022 |
| 8.37 | % | 21.704 |
| 8.79 | % |
Coal-fired |
| 19.291 |
| (1.01) | % | 18.039 |
| (1.36) | % |
Combined Cycle |
| 0.225 |
| (63.11) | % | 0.218 |
| (63.30) | % |
Wind-power |
| 3.481 |
| 209.70 | % | 3.423 |
| 227.37 | % |
PV |
| 0.025 |
| 8.70 | % | 0.024 |
| 5.78 | % |
Jiangsu Province |
| 45.022 |
| 19.29 | % | 42.717 |
| 19.96 | % |
Coal-fired |
| 34.297 |
| 11.46 | % | 32.335 |
| 11.33 | % |
Combined Cycle |
| 6.238 |
| 48.98 | % | 6.109 |
| 55.94 | % |
Wind-power |
| 4.217 |
| 61.94 | % | 4.010 |
| 61.84 | % |
PV |
| 0.270 |
| 50.84 | % | 0.264 |
| 56.05 | % |
Shanghai |
| 21.406 |
| 22.54 | % | 20.190 |
| 22.45 | % |
Coal-fired |
| 20.056 |
| 25.54 | % | 18.874 |
| 25.53 | % |
Combined Cycle |
| 1.319 |
| (10.70) | % | 1.286 |
| (10.71) | % |
PV |
| 0.031 |
| 106.67 | % | 0.030 |
| 142.29 | % |
Chongqing |
| 13.974 |
| 49.37 | % | 13.064 |
| 49.96 | % |
Coal-fired |
| 11.116 |
| 43.86 | % | 10.274 |
| 44.20 | % |
Combined Cycle |
| 2.587 |
| 86.79 | % | 2.525 |
| 86.96 | % |
Wind-power |
| 0.271 |
| 11.52 | % | 0.264 |
| 11.94 | % |
Zhejiang Province |
| 32.976 |
| 31.02 | % | 31.649 |
| 31.21 | % |
Coal-fired |
| 31.718 |
| 30.07 | % | 30.526 |
| 30.72 | % |
Combined Cycle |
| 1.063 |
| 45.42 | % | 1.039 |
| 45.34 | % |
Wind-power |
| 0.137 |
| — |
| 0.028 |
| — | |
PV |
| 0.058 |
| 9.43 | % | 0.055 |
| 4.20 | % |
Hubei Province |
| 17.645 |
| 14.73 | % | 16.574 |
| 14.73 | % |
Coal-fired |
| 16.682 |
| 15.18 | % | 15.632 |
| 15.19 | % |
Wind-power |
| 0.668 |
| 21.01 | % | 0.656 |
| 20.99 | % |
Hydro-power |
| 0.273 |
| (15.22) | % | 0.264 |
| (15.17) | % |
92
PV |
| 0.022 |
| — | % | 0.022 |
| 1.81 | % |
Hunan Province |
| 12.561 |
| 22.19 | % | 11.717 |
| 22.14 | % |
Coal-fired |
| 11.607 |
| 24.43 | % | 10.775 |
| 24.36 | % |
Wind-power |
| 0.626 |
| 5.21 | % | 0.620 |
| 7.07 | % |
Hydro-power |
| 0.280 |
| (10.54) | % | 0.275 |
| (10.51) | % |
PV |
| 0.048 |
| 9.09 | % | 0.047 |
| 9.50 | % |
Jiangxi Province |
| 23.857 |
| 10.53 | % | 22.313 |
| 7.97 | % |
Coal-fired |
| 22.544 |
| 9.77 | % | 21.025 |
| 7.01 | % |
Wind-power |
| 0.876 |
| 6.70 | % | 0.857 |
| 6.38 | % |
PV |
| 0.437 |
| 91.67 | % | 0.430 |
| 102.29 | % |
Anhui Province |
| 6.419 |
| 12.77 | % | 6.135 |
| 13.14 | % |
Coal-fired |
| 5.470 |
| 6.63 | % | 5.196 |
| 6.34 | % |
Wind-power |
| 0.817 |
| 81.15 | % | 0.807 |
| 90.08 | % |
Hydro-power |
| 0.132 |
| 17.86 | % | 0.132 |
| 18.05 | % |
Fujian Province |
| 21.118 |
| 22.45 | % | 20.116 |
| 22.79 | % |
Coal-fired |
| 21.106 |
| 22.46 | % | 20.104 |
| 22.81 | % |
PV |
| 0.012 |
| — | % | 0.012 |
| 3.51 | % |
Guangdong Province |
| 32.472 |
| 32.88 | % | 31.197 |
| 34.84 | % |
Coal-fired |
| 28.322 |
| 25.18 | % | 27.128 |
| 25.35 | % |
Combined Cycle |
| 4.125 |
| 130.45 | % | 4.044 |
| 174.92 | % |
PV |
| 0.025 |
| 8.70 | % | 0.025 |
| 6.26 | % |
Guangxi Province |
| 0.774 |
| 8.25 | % | 0.747 |
| 9.82 | % |
Combined Cycle |
| 0.453 |
| 2.26 | % | 0.435 |
| 2.06 | % |
Wind-power |
| 0.321 |
| 18.01 | % | 0.313 |
| 22.82 | % |
Yunnan Province |
| 8.955 |
| 14.03 | % | 8.239 |
| 13.60 | % |
Coal-fired |
| 8.436 |
| 16.34 | % | 7.756 |
| 16.32 | % |
Wind-power |
| 0.469 |
| (17.14) | % | 0.455 |
| (17.19) | % |
Hydro-power |
| 0.051 |
| 41.67 | % | 0.028 |
| (20.01) | % |
Guizhou Province |
| 0.610 |
| 102.66 | % | 0.541 |
| 86.74 | % |
Wind-power |
| 0.188 |
| (14.93) | % | 0.185 |
| (15.18) | % |
PV |
| 0.421 |
| 426.25 | % | 0.355 |
| 399.97 | % |
Hainan Province |
| 12.136 |
| 1.85 | % | 11.312 |
| 2.26 | % |
Coal-fired |
| 11.361 |
| 0.51 | % | 10.554 |
| 0.87 | % |
Combined Cycle |
| 0.483 |
| 46.81 | % | 0.470 |
| 47.11 | % |
Wind-power |
| 0.096 |
| 39.13 | % | 0.094 |
| (14.89) | % |
Hydro-power |
| 0.089 |
| (21.24) | % | 0.088 |
| 29.71 | % |
PV |
| 0.107 |
| 5.94 | % | 0.106 |
| 5.28 | % |
Total |
| 457.336 |
| 13.20 | % | 430.165 |
| 13.23 | % |
For the year ended December 31, 2021, the accumulated power generation of Tuas Power Ltd., the Company’s wholly owned subsidiary in Singapore, accounted for a market share of 19.2% in Singapore, representing an decrease of 2.2% compared to the same period last year of 21.4%.
In respect of tariff, the Company’s domestic average tariff (inclusive of taxes) for the year ended December 31, 2021 was RMB431.88 per MWh, increase by 4.41% from last year (while average tariff (exclusive of taxes) for the same period increase by 4.41% to RMB382.19 per MWh). SinoSing Power’s average tariff for 2021 was RMB594.46 per MWh, representing an increase by 12.03% from last year.
In respect of fuel costs, due to the sharp increase in thermal coal prices, the Company’s fuel cost per unit of power sold by domestic power plants increase by 51.32% to RMB316.36 per MWh from last year.
Influenced by the forgoing factors, for the year ended December 31, 2021, the Company recorded an operating revenue of RMB204,605 million, representing an increase of 20.75% from RMB169,446 million of last year. The operating expenses of the Company amounted to RMB210,286 million, representing an increase of 35.03% from RMB155,734 million of last year, and the pre-tax loss of the Company amounted to RMB15,121 million, representing a decreased of 416.74% from RMB4,774 million of last year.
For the year ended December 31, 2021, the profit attributable to equity holders of the Company from domestic operations decreased by RMB13,016 million, mainly due to the sharp increase in the thermal coal purchase price. The net profit attributable to equity holders of the Company from its operations in Singapore was RMB123 million, representing a decrease of profit of RMB15 million from RMB138 million for the same period last year. The operations in Pakistan was included in the consolidated statement of the Company as of December 31, 2018, and the net profit attributable to equity holders of the Company from its operations in Pakistan in 2021 was RMB305 million.
93
Operating revenue and tax and levies on operations
Operating revenue mainly consists of revenue from electricity sold. For the year ended December 31, 2021, the consolidated operating revenue of the Company and its subsidiaries amounted to RMB204.605 billion, representing an increase of 20.75% from RMB169.446 billion for the year ended December 31, 2020. The operating revenue from domestic operations of the Company increased by RMB28.679 billion over the same period of last year, while the operating revenue generated from newly acquired entities and newly operated generating units was RMB7.7 billion. The increase of operating revenue from the domestic operations of our existing generating units of RMB20.979 billion was mainly due to the simultaneous increase of our electricity sold within China and domestic average tariff.
The operating revenue from the operations of the Company in Singapore increased by RMB5.368 billion over the same period of last year, representing a 48.94% increase, which was mainly attributed to to the increase in the tariff.
The operating revenue from the operations of the Company in Pakistan increased by RMB1.112 billion, representing an increase of 26.93% compared to the same period last year, mainly due to the increase in the power generation by 24.92% led by the increase in the domestic electricity demand in Pakistan.
The following table sets forth the average tariff rate of the Company, as well as percentage changes from 2020 to 2021.
Average tariff rate (VAT inclusive) (RMB/MWh) |
| ||||||
Region/type of power generation |
| 2021 |
| 2020 |
| Change |
|
Heilongjiang Province |
|
|
|
|
|
| |
Coal-fired |
| 381.50 |
| 379.26 |
| 0.59 | % |
Wind-power |
| 453.07 |
| 526.17 |
| (13.89) | % |
PV |
| 693.91 |
| 710.02 |
| (2.27) | % |
Jilin Province |
|
|
|
| |||
Coal-fired |
| 383.48 |
| 371.86 |
| 3.12 | % |
Wind-power |
| 484.74 |
| 490.3 |
| (1.13) | % |
Hydro-power |
| 413.29 |
| 412.18 |
| 0.27 | % |
PV |
| 446.55 |
| 587.14 |
| (23.95) | % |
Biomass power |
| 746.82 |
| 749.99 |
| (0.42) | % |
Liaoning Province |
|
|
|
| |||
Coal-fired |
| 404.26 |
| 391.23 |
| 3.33 | % |
Wind-power |
| 549.54 |
| 539.05 |
| 1.95 | % |
Hydro-power |
| 362.04 |
| 362.04 |
| — | % |
PV |
| 841.78 |
| 874.25 |
| (3.71) | % |
Inner Mongolia |
|
|
|
| |||
Wind-power |
| 465.05 |
| 454.91 |
| 2.23 | % |
Hebei Province |
|
|
|
| |||
Coal-fired |
| 366.77 |
| 361.80 |
| 1.37 | % |
Wind-power |
| 495.71 |
| 495.03 |
| 0.14 | % |
PV |
| 488.52 |
| 723.65 |
| (32.49) | % |
Gansu Province |
|
|
|
| |||
Coal-fired |
| 318.85 |
| 312.40 |
| 2.06 | % |
Wind-power |
| 362.06 |
| 343.69 |
| 5.35 | % |
Ningxia |
|
|
|
| |||
PV |
| 800.00 |
| 800.00 |
| — | % |
Beijing |
|
|
|
| |||
Coal-fired |
| 550.97 |
| 478.58 |
| 15.13 | % |
Combined Cycle |
| 624.87 |
| 620.27 |
| 0.74 | % |
Tianjin |
|
|
|
| |||
Coal-fired |
| 370.40 |
| 365.79 |
| 1.26 | % |
Combined Cycle |
| 604.19 |
| 597.85 |
| 1.06 | % |
PV |
| 645.51 |
| 634.61 |
| 1.72 | % |
Shanxi Province |
|
|
|
| |||
Coal-fired |
| 344.43 |
| 314.39 |
| 9.56 | % |
Combined Cycle |
| 558.72 |
| 612.51 |
| (8.78) | % |
Wind-power |
| 521.25 |
| 600.00 |
| (13.12) | % |
PV |
| 538.39 |
| 628.78 |
| (14.38) | % |
Shandong Province |
|
|
|
| |||
Coal-fired |
| 414.22 |
| 408.18 |
| 1.48 | % |
Wind-power |
| 599.15 |
| 598.67 |
| 0.08 | % |
PV |
| 827.67 |
| 850.98 |
| (2.74) | % |
Biomass power |
| 700.14 |
| — |
| — |
94
Henan Province |
|
|
|
| |||
Coal-fired |
| 389.03 |
| 360.81 |
| 7.82 | % |
Combined Cycle |
| 1,909.57 |
| 960.30 |
| 98.85 | % |
Wind-power |
| 578.98 |
| 585.94 |
| (1.19) | % |
PV |
| 357.90 |
| 361.70 |
| (1.05) | % |
Jiangsu Province |
|
|
|
| |||
Coal-fired |
| 423.84 |
| 395.57 |
| 7.15 | % |
Combined Cycle |
| 636.93 |
| 632.45 |
| 0.71 | % |
Wind-power |
| 792.78 |
| 757.19 |
| 4.70 | % |
PV |
| 620.08 |
| 734.74 |
| (15.61) | % |
Shanghai |
|
|
|
| |||
Coal-fired |
| 425.80 |
| 406.49 |
| 4.75 | % |
Combined Cycle |
| 897.46 |
| 871.34 |
| 3.00 | % |
PV |
| 819.95 |
| 521.50 |
| 57.23 | % |
Chongqing |
|
|
|
| |||
Coal-fired |
| 417.92 |
| 406.68 |
| 2.76 | % |
Combined Cycle |
| 587.99 |
| 724.30 |
| (18.82) | % |
Wind-power |
| 607.68 |
| 607.05 |
| 0.10 | % |
Zhejiang Province |
|
|
|
| |||
Coal-fired |
| 420.71 |
| 406.53 |
| 3.49 | % |
Combined Cycle |
| 679.45 |
| 828.89 |
| (18.03) | % |
Wind-power |
| 850.00 |
| — |
| — | |
PV |
| 1,061.46 |
| 1,121.06 |
| (5.32) | % |
Hubei Province |
|
|
|
| |||
Coal-fired |
| 420.49 |
| 408.17 |
| 3.02 | % |
Wind-power |
| 605.75 |
| 610.02 |
| (0.70) | % |
Hydro-power |
| 378.66 |
| 375.18 |
| 0.93 | % |
PV |
| 880.18 |
| 880.00 |
| 0.02 | % |
Hunan Province |
|
|
|
| |||
Coal-fired |
| 463.82 |
| 447.29 |
| 3.70 | % |
Wind-power |
| 561.27 |
| 558.50 |
| 0.50 | % |
Hydro-power |
| 327.67 |
| 332.02 |
| (1.31) | % |
PV |
| 800.46 |
| 837.84 |
| (4.46) | % |
Jiangxi Province |
|
|
|
| |||
Coal-fired |
| 429.88 |
| 410.66 |
| 4.68 | % |
Wind-power |
| 597.15 |
| 604.41 |
| (1.20) | % |
PV |
| 667.39 |
| 736.44 |
| (9.38) | % |
Anhui Province |
|
|
|
| |||
Coal-fired |
| 384.63 |
| 361.38 |
| 6.43 | % |
Wind-power |
| 590.88 |
| 602.33 |
| (1.90) | % |
Hydro-power |
| 421.59 |
| 421.63 |
| (0.01) | % |
Fujian Province |
|
|
|
| |||
Coal-fired |
| 401.48 |
| 395.20 |
| 1.59 | % |
PV |
| 978.64 |
| 980.00 |
| (0.14) | % |
Guangdong Province |
|
|
|
| |||
Coal-fired |
| 426.68 |
| 408.00 |
| 4.58 | % |
Conbined Cycle |
| 600.62 |
| 568.04 |
| 5.74 | % |
PV |
| 980.00 |
| 980.00 |
| — | % |
Guangxi Province |
|
|
|
| |||
Combined Cycle |
| 721.49 |
| 718.25 |
| 0.45 | % |
Wind-power |
| 562.11 |
| 591.98 |
| (5.05) | % |
Yunnan Province |
|
|
|
| |||
Coal-fired |
| 364.97 |
| 350.97 |
| 3.99 | % |
Wind-power |
| 481.82 |
| 472.26 |
| 2.02 | % |
Hydro-power |
| 246.00 |
| 246.00 |
| — | % |
Guizhou Province |
|
|
|
| |||
Wind-power |
| 598.33 |
| 586.98 |
| 1.93 | % |
PV |
| 454.26 |
| 512.54 |
| (11.37) | % |
Hainan Province |
|
|
|
| |||
Coal-fired |
| 445.89 |
| 441.75 |
| 0.94 | % |
Combined Cycle |
| 523.57 |
| 580.13 |
| (9.75) | % |
Wind-power |
| 603.00 |
| 604.58 |
| (0.26) | % |
Hydro-power |
| 387.86 |
| 382.76 |
| 1.33 | % |
PV |
| 897.93 |
| 908.98 |
| (1.22) | % |
Domestic total | 431.88 | 413.63 | 4.41 | % | |||
SinoSing Power |
| 594.46 |
| 530.61 |
| 12.03 | % |
95
Tax and levies on operations mainly consist of surcharges of value-added tax. According to relevant administrative regulations, these surcharges include City Construction Tax and Education Surcharges calculated at prescribed percentages on the amounts of the value-added tax paid. For the year ended December 31, 2021, the tax and levies on operations of the Company and its subsidiaries were RMB1.686 billion, representing a decrease of RMB108 million from RMB1.794 billion for the same period of last year, of which the tax and levies on operations attributable to newly acquired entities and new generating units accounted for RMB18 million.
Operating expenses
For the year ended December 31, 2021, the total operating expenses of the Company and its subsidiaries was RMB210.286 billion, representing an increase of 35.03% from the same period last year. The operating expenses in domestic operations of the Company increased by RMB47.988 billion, or 33.72%, from the same period last year, of which the newly acquired entities and the new generating units accounted for RMB4.407 billion; the costs attributable to the existing entities increased by RMB43.581 billion, which was primarily attributable to the increase in the fuel cost led by the sharp increase in thermal coal purchase price.
The operating expenses from the operations in Singapore increased by RMB5.215 billion, or 48.66%, from the same period last year, which was mainly due to the increase in the tariff in Singapore, which in turn increase the operating cost of purchasing electricity. The operating expenses from the operations in Pakistan increased by RMB1.349 billion, which was mainly due to increase in fuel costs led by the increase in coal purchase price.
Fuel costs
Fuel costs account for the majority of the operating expenses for the Company and its subsidiaries. For the year ended December 31, 2021, fuel costs of the Company and its subsidiaries increased by 64.71% to RMB146.539 billion from RMB88.966 billion for the year ended December 31, 2020. The fuel costs from domestic operations of the Company and its subsidiaries increased by RMB57.197 billion, which was primarily attributable to the sharp increase in thermal coal purchase price. The fuel costs of the newly acquired entities and new generating units were RMB2.740 billion and the fuel costs of the existing generating units increased by RMB54.457 billion from same period last year. Fuel costs in Singapore increased by RMB0.376 billion from the same period last year, mainly due to increased fuel costs as a result of increased natural gas price. The fuel cost per unit of power sold by the Company’s domestic power plants increased by 51.32% to RMB316.36/MWh from RMB209.07/MWh in 2020.
Maintenance
For the year ended December 31, 2021, the maintenance expenses of the Company and its subsidiaries amounted to RMB4.504 billion, representing a decrease of RMB498 million from RMB5.002 billion for the year ended December 31, 2020. The maintenance expenses of the Company’s domestic operations decreased by RMB481 million compared to the same period last year. The maintenance expenses of operations in Singapore decreased by RMB17 million compared to the same period last year.
Depreciation
For the year ended December 31, 2021, depreciation expenses of the Company and its subsidiaries stayed stably at RMB22.270 billion, compared to RMB22.146 billion in the year ended December 31, 2020. The depreciation expenses of domestic operations increased by RMB283 million compared to the same period last year, of which the depreciation costs incurred by the newly acquired entities and new generating units was RMB1.326 billion. The depreciation expenses of the operations in Singapore decreased by RMB159 million compared to the same time last year, mainly due to the maturity of certain assets in the year of 2021.
Labor
Labor costs consist of salaries to employees and contributions payable for employees’ housing funds, medical insurance, pension and unemployment insurance, as well as training costs. For the year ended December 31, 2021, the labor costs of the Company and its subsidiaries amounted to RMB16.107 billion, representing an increase of RMB1.604 billion from RMB14.503 billion for the year ended December 31, 2020. This is mainly attributable to implementation of social security fee reduction in various regions in 2020 due to the COVID-19, and the increase of average social wage and social security contribution base in 2021, which resulted in a year-on-year increase in social security related expenses in 2021. Labor costs for Singapore operations increased by RMB14 million compared to the same time last year.
96
Other operating expenses (including electricity power purchase costs and service fees paid to HIPDC)
Other operating expenses include environmental protection expenses, insurance premiums, office expenses, amortization, Tuas Power’s electricity power purchase costs, impairment losses, government subsidies and net losses on disposal of properties, plant and equipment. For the year ended December 31, 2021, other operating expenses of the Company and its subsidiaries was RMB20.866 billion, representing a decrease of RMB4.251 billion from RMB25.117 billion for the year ended December 31, 2020. The other operating expenses from the Company’s domestic operations decreased by RMB10.601 billion due to the the decreased impairment recorded for the period, detailed information for which can be found in Note 6, 7 and 14 to the financial statements prepared in accordance with IFRS of this annual report.
Other operating expenses of the operations in Singapore increased by RMB5.001 billion compared to the same period last year. Other operating expenses of the operations in Pakistan increased by RMB1.349 billion compared to the same period last year, mainly due to the increased fuel costs led by the increase in coal price.
Financial expenses, net
Net financial expenses consist of interest expense, bank charges and net exchange differences.
Interest expenses
For the year ended December 31, 2021, the interest expenses of the Company and its subsidiaries were RMB8.798 billion, representing a decrease of 4.37% from RMB9.201 billion for the year ended December 31, 2020. The interest expenses from the Company’s domestic operations decreased by RMB186 million. The interest expenses from the newly acquired entities and new generating units were RMB836 million and those incurred by the existing entities in China decreased by RMB1,022 million, which is largely attributable to lower funding costs and decrease in debts.
The interest expenses of Singapore operations decreased by RMB88 million compared to the same period last year.
Net exchange differences and bank charges
For the year ended December 31, 2021, the Company and its subsidiaries recorded a net loss of RMB40 million from net exchange difference and bank charges, representing an increase of RMB141 million in loss compared with the net gain of RMB101 million for the year ended December 31, 2020.
The operations in Singapore recorded net loss of RMB88 million in exchange changes and bank charges, representing an increase of RMB227 million in loss form the net gain of RMB189 million for the year ended December 31, 2020, mainly due to increase in US dollar-to-Singapore dollar exchange rates. The operations in Pakistan recorded recorded net gain of RMB51 million in exchange losses and bank charges in 2021, representing an increase in net gain of RMB140 million as compared to a net loss of RMB89 million in 2020.
Share of profits less losses of associates and joint ventures
For the year ended December 31, 2021, the share of profits less losses of associates and joint ventures was RMB0.804 billion, representing a decrease of RMB970 million from RMB1.774 billion of last year, mainly due to the decreased profits of one of our associates, Shenzhen Energy Group Co., Ltd.
Income tax expenses
For the year ended December 31, 2021, the Company and its subsidiaries recognized income tax expenses of minus RMB1.930 billion, representing a decrease of RMB4,093 million from RMB2.163 billion for the year ended December 31, 2020. The income tax expenses for the domestic operations decreased by RMB4.133 billion due to the loss incurred for our domestic operations.
The income tax expenses of the operations in Singapore increased by RMB43 million.
97
Net loss, net loss attributable to the equity holders of the Company and non-controlling interests
For the year ended December 31, 2021, the Company and its subsidiaries achieved a net loss of RMB13.191 billion, representing a decrease of RMB15.802 billion, or 605.2%, from RMB2.611 billion for the year ended December 31, 2020; the net loss attributable to equity holders of the Company was RMB10.636 billion, representing a decrease of RMB13.014 billion from RMB2.378 billion for the year ended December 31, 2020.
The profit attributable to equity holders of the Company from its domestic operations increased by RMB13,016 million, mainly due to the sharp increase in the thermal coal purchase price. The net profit attributable to equity holders of the Company from its operations in Singapore was RMB123 million, representing a decrease of RMB15 million from same period last year. The profit attributable to equity holders of the Company from its operation in Pakistan in 2021 was RMB305 million, representing an increase of RMB17 million.
The Company’s recorded profit from its non-controlling interests decreased to a loss of RMB2,555 million for the year ended December 31, 2021 as compared to the profit of RMB233 million for the year ended 31 December 2020, mainly attributable to the decline in net profit and increase in net loss of the Company’s non-wholly owned subsidiaries.
Year ended December 31, 2020 compared with year ended December 31, 2019
For the Year Ended December 31, | ||||||
|
| Increased/ | ||||
2020 | 2019 | (Decreased) | ||||
RMB’000 | RMB’000 | % | ||||
Operating revenue | 169,446,338 | 174,009,401 | (2.62) | |||
Tax and levies on operations | (1,794,004) | (1,832,975) | (2.13) | |||
Operating expenses |
|
|
| |||
Fuel | (88,966,304) | (97,686,799) | (8.93) | |||
Maintenance | (5,001,982) | (4,606,171) | 8.59 | |||
Depreciation | (22,146,316) | (21,864,903) | 1.29 | |||
Labor | (14,503,290) | (13,514,752) | 7.31 | |||
Service fees on transmission and transformer facilities of HIPDC | (95,894) | (95,067) | 0.87 | |||
Purchase of electricity | (4,720,261) | (5,151,578) | (8.37) | |||
Others | (20,300,072) | (16,879,425) | 20.27 | |||
Total operating expenses | (155,734,119) | (159,798,695) | (2.54) | |||
Profit from operations | 11,918,215 | 12,377,731 | (3.71) | |||
Interest income | 292,724 | 264,554 | 10.65 | |||
Financial expenses, net |
|
|
| |||
Interest expense | (9,200,612) | (10,762,718) | (14.51) | |||
Exchange gain / (loss) and bank charges , net | 100,643 | (210,422) | (147.83) | |||
Total financial expenses, net | (9,099,969) | (10,973,140) | (17.07) | |||
Share of profits less losses of associates and joint ventures | 1,774,322 | 1,185,622 | 49.65 | |||
(loss) / gain on fair value changes of financial assets / liabilities | (1,566) | 36,667 | (104.27) | |||
Other investment (loss) / income | (109,990) | 228,026 | (148.24) | |||
Profit before income tax expense | 4,773,736 | 3,119,460 | 53.03 | |||
Income tax expense | (2,163,173) | (2,011,255) | 7.55 | |||
Net Profit | 2,610,563 | 1,108,205 | 135.57 | |||
Attributable to: |
|
|
| |||
-Equity holders of the Company | 2,377,851 | 766,345 | 210.28 | |||
-Non-controlling interests | 232,712 | 341,860 | (31.93) |
Total power generated by the Company’s domestic operating power plants for the year on consolidated basis amounted to 404.016 billion kWh, representing a decrease of 0.24% year-on-year. The electricity sold amounted to 379.894 billion kWh, representing a decrease of 2.14% year-on-year. The decrease in the Company’s power generation was mainly attributable to the following factors: (1) the overall electricity consumption nation-wide in the first half of 2020 declined sharply due to the COVID-19 pandemic, which led to a decrease of 0.24% in annual power generation even though the Company achieved growth in both the third and the fourth quarters;
98
(2) new energy generating units such as wind power and photovoltaic units commenced operation in 2020 on a large scale, which, together with the increased rainfall in summer and enhanced efforts on the consumption of clean energy, caused further decline in the demand of thermal power; and (3) new thermal power units commenced operation in the area where the Company operates, leading to the decrease in the average local utilization hours, which in turn led to the decrease in the occupation of the capacity of the Company’s power generation unites given the number of thermal power units of the Company only increased slightly.
The annual average utilization hours of the Company’s domestic power plants reached 3,744 hours. In most of the areas where the Company’s coal-fired power plants are located, the utilization hours of the Company were in a leading position within those areas.
The power generation of the Company’s domestic power plants for the year ended December 31, 2020 is listed below (in billion kWh):
Power Generation | Electricity Sold |
| |||||||
---|---|---|---|---|---|---|---|---|---|
Region |
| 2020 |
| Change |
| 2020 |
| Change |
|
Heilongjiang Province |
| 14.126 |
| 1.10 | % | 13.238 |
| 1.19 | % |
Coal-fired |
| 12.853 |
| 1.57 | % | 11.988 |
| 1.70 | % |
Wind-power |
| 1.138 |
| (4.09) | % | 1.117 |
| (4.07) | % |
PV |
| 0.135 |
| 2.95 | % | 0.133 |
| 2.53 | % |
Jilin Province |
| 11.102 |
| 6.85 | % | 10.385 |
| 6.04 | % |
Coal-fired |
| 9.513 |
| 5.24 | % | 8.881 |
| 4.55 | % |
Wind-power |
| 1.141 |
| 11.93 | % | 1.084 |
| 9.50 | % |
Hydro-power |
| 0.076 |
| 80.49 | % | 0.075 |
| 82.22 | % |
PV |
| 0.145 |
| 137.25 | % | 0.143 |
| 137.18 | % |
Biomass power |
| 0.228 |
| (0.45) | % | 0.202 |
| (2.28) | % |
Liaoning Province |
| 18.771 |
| (2.05) | % | 17.455 |
| (2.17) | % |
Coal-fired |
| 18.191 |
| (2.19) | % | 16.882 |
| (2.33) | % |
Wind-power |
| 0.376 |
| (0.12) | % | 0.373 |
| (0.22) | % |
Hydro-power |
| 0.042 |
| 44.53 | % | 0.041 |
| 46.96 | % |
PV |
| 0.163 |
| 1.63 | % | 0.159 |
| 1.90 | % |
Inner Mongolia |
| 0.212 |
| (3.74) | % | 0.208 |
| (4.39) | % |
Wind-power |
| 0.212 |
| (3.74) | % | 0.208 |
| (4.39) | % |
Hebei Province |
| 12.175 |
| (5.70) | % | 11.363 |
| (5.79) | % |
Coal-fired |
| 11.661 |
| (7.73) | % | 10.862 |
| (8.05) | % |
Wind-power |
| 0.457 |
| 107.90 | % | 0.446 |
| 127.39 | % |
PV |
| 0.056 |
| 4.16 | % | 0.055 |
| 5.22 | % |
Gansu Province |
| 13.151 |
| 15.04 | % | 12.496 |
| 15.27 | % |
Coal-fired |
| 10.793 |
| 14.93 | % | 10.199 |
| 15.13 | % |
Wind-power |
| 2.358 |
| 15.54 | % | 2.297 |
| 15.92 | % |
Ningxia |
| 0.023 |
| 1.63 | % | 0.023 |
| 1.20 | % |
PV |
| 0.023 |
| 1.63 | % | 0.023 |
| 1.20 | % |
Beijing |
| 8.579 |
| 1.36 | % | 8.218 |
| 2.20 | % |
Coal-fired |
| 0.987 |
| (32.19) | % | 0.870 |
| (32.57) | % |
Combined Cycle |
| 7.591 |
| 8.33 | % | 7.347 |
| 8.85 | % |
Tianjin |
| 6.743 |
| (2.85) | % | 6.338 |
| (2.84) | % |
Coal-fired |
| 5.101 |
| (5.56) | % | 4.741 |
| (5.71) | % |
Combined Cycle |
| 1.628 |
| 5.91 | % | 1.583 |
| 6.03 | % |
PV |
| 0.015 |
| 390.71 | % | 0.015 |
| 365.47 | % |
Shanxi Province |
| 10.911 |
| (3.99) | % | 10.133 |
| (4.36) | % |
Coal-fired |
| 8.139 |
| (10.51) | % | 7.461 |
| (11.04) | % |
Combined Cycle |
| 2.176 |
| 2.74 | % | 2.118 |
| 2.72 | % |
Wind-power |
| 0.033 |
| — |
| 0.006 |
| — | |
PV |
| 0.563 |
| 270.47 | % | 0.548 |
| 275.47 | % |
Shandong Province |
| 81.839 |
| (4.77) | % | 76.227 |
| (8.45) | % |
Coal-fired |
| 80.494 |
| (5.02) | % | 74.963 |
| (8.70) | % |
Wind-power |
| 0.829 |
| 6.34 | % | 0.760 |
| 1.60 | % |
PV |
| 0.512 |
| 24.25 | % | 0.504 |
| 23.48 | % |
Biomass power |
| 0.004 |
| — |
| — |
| — | |
Henan Province |
| 21.244 |
| (3.48) | % | 19.951 |
| (3.78) | % |
Coal-fired |
| 19.487 |
| (7.64) | % | 18.287 |
| (7.95) | % |
Combined Cycle |
| 0.610 |
| 43.85 | % | 0.595 |
| 44.10 | % |
Wind-power |
| 1.124 |
| 142.78 | % | 1.046 |
| 142.33 | % |
PV |
| 0.023 |
| (7.04) | % | 0.023 |
| (5.63) | % |
Jiangsu Province |
| 37.742 |
| (4.41) | % | 35.609 |
| (4.76) | % |
Coal-fired |
| 30.772 |
| (7.28) | % | 29.045 |
| (7.08) | % |
Combined Cycle |
| 4.187 |
| (7.25) | % | 3.917 |
| (11.49) | % |
Wind-power |
| 2.604 |
| 56.49 | % | 2.478 |
| 55.87 | % |
PV |
| 0.179 |
| 53.03 | % | 0.169 |
| 47.24 | % |
Shanghai |
| 17.468 |
| (0.78) | % | 16.488 |
| (0.89) | % |
Coal-fired |
| 15.976 |
| 2.52 | % | 15.036 |
| 2.53 | % |
Combined Cycle |
| 1.477 |
| (26.95) | % | 1.440 |
| (26.99) | % |
PV |
| 0.015 |
| — |
| 0.012 |
| — | |
Chongqing |
| 9.355 |
| (5.53) | % | 8.712 |
| (5.60) | % |
99
Power Generation | Electricity Sold |
| |||||||
---|---|---|---|---|---|---|---|---|---|
Region |
| 2020 |
| Change |
| 2020 |
| Change |
|
Coal-fired |
| 7.727 |
| (6.82) | % | 7.125 |
| (6.97) | % |
Combined Cycle |
| 1.385 |
| 0.61 | % | 1.351 |
| 0.63 | % |
Wind-power |
| 0.243 |
| 4.15 | % | 0.236 |
| 3.85 | % |
Zhejiang Province |
| 25.169 |
| (2.24) | % | 24.121 |
| (2.37) | % |
Coal-fired |
| 24.385 |
| (2.76) | % | 23.353 |
| (2.91) | % |
Combined Cycle |
| 0.731 |
| 20.02 | % | 0.715 |
| 19.91 | % |
PV |
| 0.053 |
| (10.90) | % | 0.053 |
| (10.77) | % |
Hubei Province |
| 15.380 |
| (23.22) | % | 14.446 |
| (23.32) | % |
Coal-fired |
| 14.484 |
| (24.77) | % | 13.571 |
| (24.93) | % |
Wind-power |
| 0.552 |
| (4.40) | % | 0.542 |
| (4.33) | % |
Hydro-power |
| 0.322 |
| 79.07 | % | 0.312 |
| 78.92 | % |
PV |
| 0.022 |
| (1.74) | % | 0.021 |
| (2.00) | % |
Hunan Province |
| 10.280 |
| (9.47) | % | 9.593 |
| (9.81) | % |
Coal-fired |
| 9.328 |
| (10.87) | % | 8.664 |
| (11.22) | % |
Wind-power |
| 0.595 |
| 12.65 | % | 0.579 |
| 10.92 | % |
Hydro-power |
| 0.313 |
| (6.61) | % | 0.307 |
| (6.68) | % |
PV |
| 0.044 |
| 63.27 | % | 0.043 |
| 66.17 | % |
Jiangxi Province |
| 21.585 |
| 4.00 | % | 20.666 |
| 4.08 | % |
Coal-fired |
| 20.537 |
| 1.81 | % | 19.648 |
| 1.88 | % |
Wind-power |
| 0.821 |
| 40.38 | % | 0.806 |
| 41.17 | % |
PV |
| 0.228 |
| — |
| 0.213 |
| — | |
Anhui Province |
| 5.692 |
| (3.88) | % | 5.423 |
| (3.86) | % |
Coal-fired |
| 5.130 |
| (7.34) | % | 4.886 |
| (7.05) | % |
Wind-power |
| 0.451 |
| 49.67 | % | 0.425 |
| 42.32 | % |
Hydro-power |
| 0.112 |
| 31.23 | % | 0.111 |
| 31.71 | % |
Fujian Province |
| 17.246 |
| 56.10 | % | 16.382 |
| 15.26 | % |
Coal-fired |
| 17.235 |
| 56.17 | % | 16.371 |
| 15.28 | % |
PV |
| 0.012 |
| (3.20) | % | 0.012 |
| (1.12) | % |
Guangdong Province |
| 24.438 |
| 9.20 | % | 23.136 |
| 8.13 | % |
Coal-fired |
| 22.625 |
| 1.19 | % | 21.642 |
| 1.25 | % |
Combined Cycle |
| 1.790 |
| — |
| 1.471 |
| — | |
PV |
| 0.023 |
| 5.68 | % | 0.023 |
| 5.33 | % |
Guangxi Province |
| 0.715 |
| 84.36 | % | 0.680 |
| 84.96 | % |
Combined Cycle |
| 0.443 |
| 62.34 | % | 0.426 |
| 63.46 | % |
Wind-power |
| 0.272 |
| 136.64 | % | 0.255 |
| 137.14 | % |
Yunnan Province |
| 7.853 |
| 80.19 | % | 7.253 |
| 81.07 | % |
Coal-fired |
| 7.251 |
| 95.60 | % | 6.668 |
| 97.69 | % |
Wind-power |
| 0.566 |
| (5.89) | % | 0.550 |
| (5.84) | % |
Hydro-power |
| 0.036 |
| (27.62) | % | 0.035 |
| (28.40) | % |
Guizhou Province |
| 0.301 |
| 38.72 | % | 0.290 |
| 36.50 | % |
Wind-power |
| 0.221 |
| 2.46 | % | 0.219 |
| 2.99 | % |
PV |
| 0.080 |
| — |
| 0.071 |
| — | |
Hainan Province |
| 11.915 |
| (8.23) | % | 11.062 |
| (8.10) | % |
Coal-fired |
| 11.303 |
| (9.55) | % | 10.464 |
| (9.48) | % |
Combined Cycle |
| 0.329 |
| 89.12 | % | 0.320 |
| 89.07 | % |
Wind-power |
| 0.113 |
| 15.03 | % | 0.110 |
| 15.12 | % |
Hydro-power |
| 0.069 |
| (37.43) | % | 0.068 |
| (37.48) | % |
PV |
| 0.101 |
| (3.47) | % | 0.100 |
| (3.53) | % |
Total |
| 404.016 |
| (0.24) | % | 379.894 |
| (2.14) | % |
For the year ended December 31, 2020, the accumulated power generation of Tuas Power Ltd., the Company’s wholly owned subsidiary in Singapore, accounted for a market share of 21.4% in Singapore, representing an increase of 0.7% compared to the same period last year of 20.7%.
In respect of tariff, the Company’s domestic average tariff (inclusive of taxes) for the year ended December 31, 2020 was RMB413.63 per MWh, decreased by 0.81% from last year (while average tariff (exclusive of taxes) for the same period decreased by 0.15% to RMB366.04 per MWh). SinoSing Power’s average tariff for 2020 was RMB530.61 per MWh, representing a decrease by 16.60% from last year.
In respect of fuel costs, due to the decrease in fuel prices, the Company’s fuel cost per unit of power sold by domestic power plants decreased by 6.34% to RMB209.07 per MWh from last year.
Combining the forgoing factors, for the year ended December 31, 2020, the Company recorded an operating revenue of RMB169,446 million, representing a decrease of 2.62% from RMB174,009 million of last year. The operating expenses of the Company amounted to RMB155,734 million, representing a decrease of 2.54% from RMB159,799 million of last year, and the pre-tax profit of the Company amounted to RMB4,774 million, representing an increase of 53.03% from RMB3,119 million of last year.
100
For the year ended December 31, 2020, the net profit attributable to equity holders of the Company from domestic operations was RMB1.952 billion, representing an increase of RMB1.003 billion from RMB0.949 billion for the same period last year. The increase was primarily attributable to the significant increase in the Company’s profits as a result of the significant year-on-year decrease of domestic coal purchase price and financial expenses, which was partially offset by the decrease in power sales and average tariff as well as impairments of certain units caused by estimated increase of fuel price, insufficient demands and lack of competitive strength. The net profit attributable to equity holders of the Company from its operations in Singapore was RMB138 million, representing an increase of profit of RMB615 million from loss of RMB477 million for the same period last year, which is largely due to the year-on-year decrease of financial expenses, the increased profit from electricity sold and the increased government subsidies received. The operations in Pakistan was included in the consolidated statement of the Company as of December 31, 2018, and its equity profit in 2020 was RMB288 million, substantially remaining the same compared to the same period last year.
Operating revenue and tax and levies on operations
Operating revenue mainly consists of revenue from electricity sold. For the year ended December 31, 2020, the consolidated operating revenue of the Company and its subsidiaries amounted to RMB169,446 million, representing a decrease of 2.62% from RMB174,009 million for the year ended December 31, 2019. The operating revenue from domestic operations of the Company decreased by RMB1,525 million over the same period of last year, while the operating revenue generated from newly acquired entities and newly operated generating units was RMB3,463 million.
The operating revenue from the operations of the Company in Singapore decreased by RMB2.358 billion over the same period of last year, representing a 17.70% decrease, which was mainly attributed to the decrease in the tariff.
The operating revenue from the operations of the Company in Pakistan decreased by RMB679 million, representing a decrease of 14.13% compared to the same period last year, mainly due to the decrease in power sales as a result of COVID-19.
The following table sets forth the average tariff rate of the Company, as well as percentage changes from 2019 to 2020.
| Average tariff rate (VAT inclusive) (RMB/MWh) | ||||||
---|---|---|---|---|---|---|---|
Region/type of power generation | 2020 | 2019 | Change | ||||
Heilongjiang Province |
|
|
|
|
|
|
|
Coal-fired |
| 379.26 |
| 390.22 |
| (2.81) | % |
Wind-power |
| 526.17 |
| 517.30 |
| 1.71 | % |
PV |
| 710.02 |
| 703.98 |
| 0.86 | % |
Jilin Province |
|
|
|
|
|
| |
Coal-fired |
| 371.86 |
| 383.72 |
| (3.09) | % |
Wind-power |
| 490.3 |
| 509.88 |
| (3.84) | % |
Hydro-power |
| 412.18 |
| 417.48 |
| (1.27) | % |
PV |
| 587.14 |
| 789.62 |
| (25.64) | % |
Biomass power |
| 749.99 |
| 749.98 |
| 0.00 | % |
Liaoning Province |
|
|
|
|
|
| |
Coal-fired |
| 391.23 |
| 400.36 |
| (2.28) | % |
Wind-power |
| 539.05 |
| 523.50 |
| 2.97 | % |
Hydro-power |
| 362.04 |
| 366.41 |
| (1.19) | % |
PV |
| 874.25 |
| 892.83 |
| (2.08) | % |
Inner Mongolia |
|
|
|
|
|
| |
Wind-power |
| 454.91 |
| 441.31 |
| 3.08 | % |
Hebei Province |
|
|
|
|
|
| |
Coal-fired |
| 361.80 |
| 362.71 |
| (0.25) | % |
Wind-power |
| 495.03 |
| 512.27 |
| (3.36) | % |
PV |
| 723.65 |
| 734.80 |
| (1.52) | % |
Gansu Province |
|
|
|
|
|
| |
Coal-fired |
| 312.40 |
| 303.30 |
| 3.00 | % |
Wind-power |
| 343.69 |
| 381.33 |
| (9.87) | % |
Ningxia |
|
|
|
|
|
| |
PV |
| 800.00 |
| 801.85 |
| (0.23) | % |
Beijing |
|
|
|
|
|
| |
Coal-fired |
| 478.58 |
| 461.00 |
| 3.81 | % |
Combined Cycle |
| 620.27 |
| 640.10 |
| (3.10) | % |
Tianjin |
|
|
|
|
|
| |
Coal-fired |
| 365.79 |
| 371.28 |
| (1.48) | % |
Combined Cycle |
| 597.85 |
| 684.92 |
| (12.71) | % |
PV |
| 634.61 |
| 874.51 |
| (27.43) | % |
101
| Average tariff rate (VAT inclusive) (RMB/MWh) | ||||||
---|---|---|---|---|---|---|---|
Region/type of power generation | 2020 | 2019 | Change | ||||
Shanxi Province |
|
|
|
|
|
| |
Coal-fired |
| 314.39 |
| 318.55 |
| (1.31) | % |
Combined Cycle |
| 612.51 |
| 667.58 |
| (8.25) | % |
Wind-power |
| 600.00 |
| — |
| — | |
PV |
| 628.78 |
| 860.36 |
| (26.92) | % |
Shandong Province |
|
|
|
|
|
|
|
Coal-fired |
| 408.18 |
| 407.28 |
| 0.22 | % |
Wind-power |
| 598.67 |
| 600.76 |
| (0.35) | % |
PV |
| 850.98 |
| 855.00 |
| (0.47) | % |
Henan Province |
|
|
|
|
|
|
|
Coal-fired |
| 360.81 |
| 363.89 |
| (0.85) | % |
Combined Cycle |
| 960.30 |
| 1,202.96 |
| (20.17) | % |
Wind-power |
| 585.94 |
| 602.96 |
| (2.82) | % |
PV |
| 361.70 |
| 375.77 |
| (3.74) | % |
Jiangsu Province |
|
|
|
|
|
| |
Coal-fired |
| 395.57 |
| 383.08 |
| 3.26 | % |
Combined Cycle |
| 632.45 |
| 619.77 |
| 2.05 | % |
Wind-power |
| 757.19 |
| 730.35 |
| 3.67 | % |
PV |
| 734.74 |
| 902.65 |
| (18.60) | % |
Shanghai |
|
|
|
|
|
| |
Coal-fired |
| 406.49 |
| 400.91 |
| 1.39 | % |
Combined Cycle |
| 871.34 |
| 804.57 |
| 8.30 | % |
PV |
| 521.50 |
| — |
| — | |
Chongqing |
|
|
|
|
|
| |
Coal-fired |
| 406.68 |
| 405.74 |
| 0.23 | % |
Combined Cycle |
| 724.30 |
| 734.49 |
| (1.39) | % |
Wind-power |
| 607.05 |
| 608.77 |
| (0.28) | % |
Zhejiang Province |
|
|
|
|
|
| |
Coal-fired |
| 406.53 |
| 416.57 |
| (2.41) | % |
Combined Cycle |
| 828.89 |
| 951.91 |
| (12.92) | % |
PV |
| 1,121.06 |
| 1,075.33 |
| 4.25 | % |
Hubei Province |
|
|
|
|
|
| |
Coal-fired |
| 408.17 |
| 421.50 |
| (3.16) | % |
Wind-power |
| 610.02 |
| 620.52 |
| (1.69) | % |
Hydro-power |
| 375.18 |
| 376.60 |
| (0.38) | % |
PV |
| 880.00 |
| 880.00 |
| 0.00 | % |
Hunan Province |
|
|
|
|
|
| |
Coal-fired |
| 447.29 |
| 451.70 |
| (0.98) | % |
Wind-power |
| 558.50 |
| 604.75 |
| (7.65) | % |
Hydro-power |
| 332.02 |
| 353.05 |
| (5.96) | % |
PV |
| 837.84 |
| 896.94 |
| (6.59) | % |
Jiangxi Province |
|
|
|
|
|
| |
Coal-fired |
| 410.66 |
| 415.37 |
| (1.13) | % |
Wind-power |
| 604.41 |
| 606.28 |
| (0.31) | % |
PV |
| 736.44 |
| — |
| — | |
Anhui Province |
|
|
|
|
|
| |
Coal-fired |
| 361.38 |
| 370.68 |
| (2.51) | % |
Wind-power |
| 602.33 |
| 610.00 |
| (1.26) | % |
Hydro-power |
| 421.63 |
| 423.31 |
| (0.40) | % |
Fujian Province |
|
|
|
|
|
| |
Coal-fired |
| 395.20 |
| 403.49 |
| (2.05) | % |
PV |
| 980.00 |
| 979.78 |
| 0.02 | % |
Guangdong Province |
|
|
|
|
|
| |
Coal-fired |
| 408.00 |
| 428.00 |
| (4.67) | % |
Conbined Cycle |
| 568.04 |
| — |
| — | |
PV |
| 980.00 |
| 976.77 |
| 0.33 | % |
Guangxi Province |
|
|
|
|
|
| |
Combined Cycle |
| 718.25 |
| 647.57 |
| 10.92 | % |
Wind-power |
| 591.98 |
| 607.75 |
| (2.59) | % |
Yunnan Province |
|
|
|
|
|
| |
Coal-fired |
| 350.97 |
| 462.29 |
| (24.08) | % |
Wind-power |
| 472.26 |
| 475.62 |
| (0.71) | % |
Hydro-power |
| 246.00 |
| 245.39 |
| 0.25 | % |
Guizhou Province |
|
|
|
|
|
| |
Wind-power |
| 586.98 |
| 593.15 |
| (1.04) | % |
PV |
| 512.54 |
| — |
| — |
102
| Average tariff rate (VAT inclusive) (RMB/MWh) | ||||||
---|---|---|---|---|---|---|---|
Region/type of power generation | 2020 | 2019 | Change | ||||
Hainan Province |
|
|
|
|
|
| |
Coal-fired |
| 441.75 |
| 439.63 |
| 0.48 | % |
Combined Cycle |
| 580.13 |
| 680.48 |
| (14.75) | % |
Wind-power |
| 604.58 |
| 606.45 |
| (0.31) | % |
Hydro-power |
| 382.76 |
| 392.71 |
| (2.53) | % |
PV |
| 908.98 |
| 897.12 |
| 1.32 | % |
Domestic total |
| 413.63 |
| 417.00 |
| (0.81) | % |
SinoSing Power |
| 530.61 |
| 636.24 |
| (16.60) | % |
Tax and levies on operations mainly consist of surcharges of value-added tax. According to relevant administrative regulations, these surcharges include City Construction Tax and Education Surcharges calculated at prescribed percentages on the amounts of the value-added tax paid. For the year ended December 31, 2020, the tax and levies on operations of the Company and its subsidiaries were RMB1.794 billion, representing a decrease of RMB39 million from RMB1.833 billion for the same period of last year, of which the tax and levies on operations attributable to newly acquired entities and new generating units accounted for RMB8 million.
Operating expenses
For the year ended December 31, 2020, the total operating expenses of the Company and its subsidiaries was RMB155.734 billion, representing a decrease of 2.54% from the same period last year. The operating expenses in domestic operations of the Company decreased by RMB0.776 billion, or 0.54%, from the same period last year, of which the newly acquired entities and the new generating units accounted for RMB2.016 billion; the costs attributable to the existing entities decreased by RMB2.792 billion, which was primarily attributable to the reduced fuel costs for domestic operations in China.
The operating expenses from the operations in Singapore decreased by RMB2.784 billion, or 20.62%, from the same period last year, which was mainly due to the decreased fuel costs. The operating expenses from the operations in Pakistan decreased by RMB0.504 billion, which was mainly due to decrease in power generation as a result of COVID-19.
Fuel costs
Fuel costs account for the majority of the operating expenses for the Company and its subsidiaries. For the year ended December 31, 2020, fuel costs of the Company and its subsidiaries decreased by 8.93% to RMB88.966 billion from RMB97.687 billion for the year ended December 31, 2019. The fuel costs from domestic operations of the Company and its subsidiaries decreased by RMB7.217 billion, which was primarily attributable to the decline of fuel price. The fuel costs of the newly acquired entities and new generating units were RMB0.795 billion and the fuel costs of the existing generating units decreased by RMB8.012 billion from same period last year. Fuel costs in Singapore decreased by RMB1.503 billion from the same period last year, mainly due to decreased natural gas costs. For the year ended December 31, 2020, the average price (inclusive of taxes) of natural fuel coal consumed of the Company and its domestic subsidiaries was RMB479.11 per ton, representing a 5.15% decrease from the RMB505.12 per ton for the year ended 31 December 2019. The fuel cost per unit of power sold by the Company’s domestic power plants decreased by 6.34% to RMB209.07/MWh from RMB223.22/MWh in 2019.
Maintenance
For the year ended December 31, 2020, the maintenance expenses of the Company and its subsidiaries amounted to RMB5.002 billion, representing an increase of RMB396 million from RMB4.606 billion for the year ended December 31, 2019. The maintenance expenses of the Company’s domestic operations increased by RMB370 million compared to the same period last year. The maintenance expenses of operations in Singapore increased by RMB26 million compared to the same period last year.
103
Depreciation
For the year ended December 31, 2020, depreciation expenses of the Company and its subsidiaries increased by 1.29% to RMB22.146 billion, compared to RMB21.865 billion in the year ended December 31, 2019; the increase was mainly due to entities and new generating units put into operation of last year and this year. The depreciation expenses of domestic operations increased by RMB275 million compared to the same period last year, of which the depreciation costs incurred by the newly acquired entities and new generating units was RMB684 million. The depreciation expenses of the operations in Singapore increased by RMB6 million compared to the same time last year.
Labor
Labor costs consist of salaries to employees and contributions payable for employees’ housing funds, medical insurance, pension and unemployment insurance, as well as training costs. For the year ended December 31, 2020, the labor costs of the Company and its subsidiaries amounted to RMB14.503 billion, representing an increase of RMB988 million from RMB13.515 billion for the year ended December 31, 2019. This is mainly attributable to the good operating performance of the Company which resulted in the increase of payroll as well as the welfare fees, labour union funds, employee training fees and etc. Labor costs for Singapore operations increased by RMB20 million compared to the same time last year.
Other operating expenses (including electricity power purchase costs and service fees paid to HIPDC)
Other operating expenses include environmental protection expenses, insurance premiums, office expenses, amortization, Tuas Power’s electricity power purchase costs, impairment losses, government subsidies and net losses on disposal of properties, plant and equipment. For the year ended December 31, 2020, other operating expenses of the Company and its subsidiaries was RMB25.116 billion, representing an increase of RMB2.990 billion from RMB22.126 billion for the year ended December 31, 2019. The other operating expenses from the Company’s domestic operations increased by RMB4.823 billion due to the increase in asset impairments as a result of higher feul costs, lower demands and low installed capacity in relation to certain of our plants. Details please refer to Notes 6, 7 and 14 to the financial statements.
Other operating expenses of the operations in Singapore decreased by RMB1.333 billion compared to the same period last year. Other operating expenses of the operations in Pakistan decreased by RMB0.500 billion compared to the same period last year.
Financial expenses, net
Net financial expenses consist of interest expense, bank charges and net exchange differences.
Interest expenses
For the year ended December 31, 2020, the interest expenses of the Company and its subsidiaries were RMB9.201 billion, representing a decrease of 14.51% from RMB10.763 billion for the year ended December 31, 2019. The interest expenses from the Company’s domestic operations decreased by RMB1.233 billion. The interest expenses from the newly acquired entities and new generating units were RMB537 million and those incurred by the existing entities in China decreased by RMB1.771 billion, which is largely attributable to lower funding costs and decrease in debts.
The interest expenses of Singapore operations decreased by RMB154 million compared to the same period last year.
Net exchange differences and bank charges
For the year ended December 31, 2020, the Company and its subsidiaries recorded a net gain of RMB101 million from net exchange difference and bank charges, representing an increase of RMB311 million compared with the net loss of RMB210 million for the year ended December 31, 2019.
The operations in Singapore recorded net gain of RMB189 million in exchange changes and bank charges, representing an increase of RMB226 million from the net loss of RMB37 million for the year ended December 31, 2019, mainly due to decrease in US dollar-to-Singapore dollar exchange rates. The operations in Pakistan recorded net loss of RMB90 million in exchange losses and bank charges in 2020.
104
Share of profits less losses of associates and joint ventures
For the year ended December 31, 2020, the share of profits less losses of associates and joint ventures was RMB1.774 billion, representing an increase of RMB588 million from RMB1.186 billion of last year, mainly due to the increase in profit of Shenzhen Energy Corporation (“Shenzhen Energy”), an associate of the Company.
Income tax expenses
For the year ended December 31, 2020, the Company and its subsidiaries recognized income tax expenses of RMB2.163 billion, representing an increase of RMB152 million from RMB2.011 billion for the year ended December 31, 2019. The income tax expenses for the domestic operations increased by RMB54 million.
The income tax expenses of the operations in Singapore increased by RMB84 million.
Net profit, net profit attributable to the equity holders of the Company and non-controlling interests
For the year ended December 31, 2020, the Company and its subsidiaries achieved a net profit of RMB2.611 billion, representing an increase of RMB1.503 billion, or 135.57%, from RMB1.108 billion for the year ended December 31, 2019; the net profit attributable to equity holders of the Company was RMB2.378 billion, representing an increase of RMB1.612 billion from RMB0.766 billion for the year ended December 31, 2019.
The profit attributable to equity holders of the Company from its domestic operations increased by RMB1,003 million, mainly because of the year-on-year decrease in domestic coal purchase prices and financial expenses, which was partially offset by the decrease in power sales and average tariff as well as impairments on certain units caused by estimated increase of fuel price, insufficient demands and lack of competitive strength. The net profit attributable to equity holders of the Company from its operations in Singapore was RMB138 million, representing an increase of RMB615 million from same period last year, mainly due to the year-on-year decrease of financial expenses, the increased profit from electricity sold and the increased government subsidies received. The profit attributable to equity holders of the Company from its operation in Pakistan in 2020 was RMB288 million, substantially remaining the same compared to the same period last year.
The Company’s recorded profit from its non-controlling interests decreased to RMB233 million for the year ended December 31, 2020 from RMB342 million for the year ended December 31, 2019, mainly attributable to the decline in net profit of the Company’s non-wholly owned subsidiaries.
C. | Financial Position |
Comparison of asset items
As of December 31, 2021, consolidated total assets of the Company and its subsidiaries was RMB500.771 billion, increased by 11.31% from RMB449.905 billion as of December 31, 2020; total assets of the domestic operations increased by RMB50.498 billion to RMB460.280 billion, including a net increase of RMB20.952 billion in non-current assets, which is mainly attributable to new construction outweighing the depreciation and leading to an increase in assets, a net increase in inventory of RMB9.993 billion, which is mainly attributable to the increased coal price and the increased replenished coal inventory of some power plants controlled by the Company, aiming to guarantee coal supply during seasons and to meet the demand of stable energy supply as instructed by NDRC policy, and a net increase in account receivables of RMB4.721 billion, which was mainly attributable to increases in revenues and receivables of renewable energy subsidies.
As of December 31, 2021, total assets of the operations in Singapore were RMB27.088 billion, representing an increase of RMB222 million from the same period last year. Non-current assets decreased by RMB1.239 billion to RMB22.567 billion.
As of December 31, 2021, total assets of the operations in Pakistan were RMB13.403 billion, representing an increase of RMB146 million from the same period last year. Non-current assets decreased by RMB755 million from last year to RMB8.298 billion.
105
Comparison of liability items
As of December 31, 2021, consolidated total liabilities of the Company and its subsidiaries were RMB367.213 billion, representing an increase of 23.11% from RMB298.288 billion as of December 31, 2020.
As of December 31, 2021, interest-bearing debts of the Company and its subsidiaries totaled RMB297.703 billion. The interest-bearing debts consist of long-term loans (including those maturing within a year), bonds payable (including those maturing within a year), short-term borrowings, short-term bonds payable and lease liabilities (including those maturing within a year).
As of December 31, 2021, the total liabilities of the operations in Singapore were RMB15.200 billion, representing an increase of 0.72% from RMB15.092 billion as of December 31, 2020. As of December 31, 2021, the total liabilities of the operations in Pakistan were RMB9.596 billion, representing a decrease of 1.40% from RMB9.732 billion as of December 31, 2020.
Comparison of equity items
Total equity attributable to the equity holders of the Company decreased by RMB16.798 billion as of December 31, 2021, resulting from a decrease of RMB10.934 billion arising from comprehensive net loss, a decrease of RMB2.826 billion arising from dividends, a decrease of RMB2.139 billion arising from the payments of interests for other equity instruments and a decrease of RMB899 million due to other reasons. Non-controlling interests decreased by RMB1,260 million in 2021.
Major financial position ratios
| 2021 |
| 2020 | |
Current ratio | 0.50 | 0.43 | ||
Quick ratio | 0.41 | 0.39 | ||
Ratio of liability to equity holders’ equity |
| 3.25 |
| 2.30 |
Multiples of interest earned |
| (0.63) |
| 1.38 |
Formula of the financial ratios:
Current ratio = balance of current assets as of the year end / balance of current liabilities as of the year end
Quick ratio = (balance of current assets as of the year end – net inventories as of the year end) / balance of current liabilities as of the year end
Ratio of liabilities to equity holders’ equity = balance of liabilities as of the year end / balance of equity holders’ equity (excluding non-controlling interests) as of the year end
Multiples of interest earned = (profit before tax + interest expense) / interest expenditure (inclusive of capitalized interest)
The current ratio and quick ratio as of December 31, 2021 increased due to the increase of current assets as of the year end outweighing the increase of current liabilities, and the increase of current assets resulted from the increase in the operating revenue and accounts receivable led by the increase in the receivables of new energy subsidies, as well as the increased coal price and the increased replenished coal inventory of some power plants controlled by the Company, aiming to guarantee coal supply during seasons and to meet the demand of stable energy supply as instructed by NDRC policy. The ratio of liabilities to shareholder’s equity as of December 31, 2021 increased due to the substantial decrease of net cashflow provided by operating activities and increase in debts for the purpose of our operation and construction activities in the ordinary course of our business. The multiples of interest earned was negative mainly attributable to the increased coal price, thus leading to the operating loss of domestic market.
D. | Liquidity and capital resources |
The primary sources of funding for the Company and its subsidiaries have been cash provided by internal funds from operating activities, short-term and long-term loans and proceeds from issuances of bonds, and the primary use of funds have been for working capital, capital expenditure and repayments of short-term and long-term borrowings.
106
Cash flows from operating activities
For the Year Ended December 31, | ||||||
| 2021 |
| 2020 |
| 2019 | |
RMB’000 | RMB’000 | RMB’000 | ||||
Cash flows from operating activities |
|
|
| |||
Profit before income tax expense |
| (15,120,644) |
| 4,773,736 |
| 3,119,460 |
Non-cash items adjustments |
| 28,933,717 |
| 38,476,806 |
| 37,008,902 |
Changes in working capital |
| (6,406,311) |
| 1,719,398 |
| (932,474) |
Interest received |
| 288,291 |
| 292,724 |
| 264,554 |
Income tax expense paid |
| (1,662,212) |
| (3,275,626) |
| (2,136,249) |
Net cash provided by operating activities |
| 6,032,841 |
| 41,987,038 |
| 37,324,193 |
For the year ended December 31, 2021, net cash provided by operating activities of the Company and its subsidiaries was RMB6.033 billion, representing a decrease of 85.63% from last year, mainly attributable to the increased coal price, thus leading to the operating loss of domestic market, which in turn led to a substantial decrease in cash inflow provided by operation activities. The net cash provided by operating activities in Singapore was RMB1,751 million. The net cash provided by operating activities in Pakistan was RMB605 million.
For the year ended December 31, 2020, net cash provided by operating activities of the Company and its subsidiaries was RMB41.987 billion, representing an increase of 12.49% from last year, mainly attributable to the decrease of fuel cost. The net cash provided by operating activities in Singapore was RMB749 million. The net cash provided by operating activities in Pakistan was RMB1,472 million.
For the year ended December 31, 2019, net cash provided by operating activities of the Company and its subsidiaries was RMB37.324 billion, representing an increase of 29.92% from last year, mainly attributable to reduced fuel costs, increased electricity tariff and inclusion of operations in Pakistan in the consolidated statements. The net cash provided by operating activities in Singapore was RMB790 million. The net cash provided by operating activities in Pakistan was RMB1,736 million.
Cash flows used in investing activities
For the Year Ended December 31, | ||||||
| 2021 |
| 2020 |
| 2019 | |
RMB’000 | RMB’000 | RMB’000 | ||||
Cash flows used in investing activities |
|
|
| |||
Payment for the purchase of property, plant and equipment |
| (43,055,805) |
| (42,558,250) |
| (31,382,657) |
Proceeds from disposal of property, plant and equipment, land use rights and other non-current assets |
| 514,525 |
| 454,470 |
| 464,542 |
Payment for the purchase of other non-current assets |
| (47,087) |
| (72,699) |
| (113,124) |
Cash dividend received |
| 796,168 |
| 554,614 |
| 668,906 |
Capital injections for investments in associates and joint ventures |
| (643,428) |
| (586,261) |
| (313,197) |
Cash paid for acquiring other equity instrument investments |
| (111,313) |
| (61,713) |
| (7,450) |
Cash paid for acquiring subsidiaries, net of cash acquired |
| — |
| (206,414) |
| (71,696) |
Cash received from disposal of other equity instrument investments |
| — |
| — |
| 1,250,000 |
Cash received from recovery of entrusted loans | 302,640 | — | — | |||
Net outflow of cash and cash equivalents in respect of the disposal of subsidiaries |
| — |
| — |
| (29,350) |
Others |
| (31,659) |
| 239,121 |
| 500,041 |
Net cash used in investing activities |
| (42,275,959) |
| (42,237,132) |
| (29,033,985) |
The net cash used in investing activities was RMB42.276 billion for the year ended 31 December 2021, representing an increase of 0.09% from last year, mainly due to the increase in the construction investments, including purchase of non-current assets, construction expenditure and construction material procurement.
107
The net cash used in investing activities was RMB42.237 billion for the year ended December 31, 2020, representing an increase of 45.47% from last year, mainly due to the increase of construction expenditures including the purchase of fixed assets, construction materials and etc.
The net cash used in investing activities was RMB29.034 billion for the year ended December 31, 2019, representing an increase of 42.49% from last year, mainly due to increased expenditure in renewable energy infrastructure in 2019.
Cash flows from financing activities
For the Year Ended December 31, | ||||||
| 2021 |
| 2020 |
| 2019 | |
RMB’000 | RMB’000 | RMB’000 | ||||
Cash flows from financing activities |
|
|
| |||
Issuance of short-term bonds |
| 43,200,000 |
| 20,000,000 |
| 30,000,000 |
Repayments of short-term bonds |
| (40,000,000) |
| (24,000,000) |
| (32,500,000) |
Proceeds from short-term loans |
| 139,416,406 |
| 116,458,227 |
| 92,890,098 |
Repayments of short-term loans |
| (113,866,543) |
| (117,354,380) |
| (87,001,921) |
Proceeds from long-term loans |
| 62,464,866 |
| 52,219,578 |
| 27,408,223 |
Repayments of long-term loans |
| (39,279,532) |
| (54,593,490) |
| (43,915,444) |
Issuance of long-term bonds |
| 15,680,393 |
| 4,217,730 |
| 5,300,000 |
Repayment of long-term bonds |
| (12,000,000) |
| (2,800,000) |
| (4,000,000) |
Interest paid |
| (12,274,217) |
| (11,586,250) |
| (11,641,439) |
Net proceeds from the issuance of other equity instruments |
| — |
| 25,457,450 |
| 14,982,165 |
Redemption of other equity instruments | — | (2,500,000) | — | |||
Net capital injection from non-controlling interests of the subsidiaries |
| 1,876,784 |
| 1,155,556 |
| 1,016,150 |
Dividends paid to shareholders of the Company |
| (2,825,657) |
| (2,119,243) |
| (1,569,809) |
Dividends paid to non-controlling interests of the subsidiaries |
| (673,859) |
| (1,702,511) |
| (1,436,574) |
Lease payments/finance lease rental payments |
| (1,860,532) |
| (1,297,746) |
| (488,015) |
Cash paid for acquisition of non-controlling interests of a subsidiary | (186,189) | — | (6,802) | |||
Others |
| (285,954) |
| 248,895 |
| (364,815) |
Net cash provided by / (used in) financing activities |
| 39,385,966 |
| 1,803,816 |
| (11,328,183) |
The net cash provided by financing activities was RMB39.386 billion for the year ended December 31, 2021, representing an increase of 2,083.26% from the last year, which was mainly due to the increase of net financing amounts of the Company for the year.
The net cash provided by financing activities was RMB1.804 billion for the year ended December 31, 2020, representing an increase of RMB13.132 billion from the net cash outflow of RMB11.328 billion in last year. This was mainly due to the increase of net financing.
The net cash used by financing activities was RMB11.328 billion for the year ended December 31, 2019, representing an increase of RMB9.085 billion from the net cash outflow of RMB2.243 billion in last year. This was mainly due to the increase of repayments of loans and bonds issued by the Company and its subsidiaries in 2019 compared to the same period last year.
Cash and cash equivalents
For the Year Ended December 31, | ||||||
| 2021 |
| 2020 |
| 2019 | |
RMB’000 | RMB’000 | RMB’000 | ||||
Effect of foreign exchange rate changes, net | (845,915) | (739,088) | 63,551 | |||
Net increase/(decrease) in cash and cash equivalents |
| 2,296,933 |
| 814,634 |
| (2,974,424) |
Cash and cash equivalents as at beginning of the year |
| 13,257,892 |
| 12,443,258 |
| 15,417,682 |
Cash and cash equivalents as at end of the year |
| 15,554,825 |
| 13,257,892 |
| 12,443,258 |
As of December 31, 2021, the cash and cash equivalents of the Company and its subsidiaries denominated in RMB, Singapore dollar, U.S. dollar and other currencies were RMB13.879 billion, RMB699 million, RMB822 million, and RMB155 million, respectively.
108
As of December 31, 2020, the cash and cash equivalents of the Company and its subsidiaries denominated in RMB, Singapore dollar and U.S. dollar were RMB12.201 billion, RMB777 million and RMB463 million, respectively.
As of December 31, 2019, the cash and cash equivalents of the Company and its subsidiaries denominated in RMB, Singapore dollar and U.S. dollar were RMB11.280 billion, RMB1,243 million and RMB716 million, respectively.
Material cash requirement
Capital expenditures for infrastructure construction and renovation projects
The actual capital expenditure of the Company in 2021 was RMB43.874 billion, which was mainly used for capital construction and renovation expenditures, including RMB3.788 billion for Zhuanghe Wind-power, RMB3.363 billion for Yantai New Energy, RMB3.288 for Clean Energy Tongyu, RMB2.018 billion for Pinghu Offshore, RMB1.651 billion for Ruijin Power, RMB1.402 billion for Jiutai Power, RMB1.284 billion for Shidongkou I, RMB1.233 billion for Qingdao Co-generation, RMB1.165 billion for Daqing Ranghulu, RMB1.078 for Dalian Cogeneration, RMB1.070 billion for Da’an Clean Energy, RMB921 million for Zhejiang Cangnan Offshore, RMB851 million for Yangpu Co-generation, RMB821 million for Jiuquan Wind-power, RMB791 million for Poyang Luohong, RMB761 million for Shengdong Rudong Offshore, RMB644 million for Dalian Chuanbo, RMB572 million for Anhui Mengcheng Wind-power, RMB569 million for Yuhuan Power, RMB498 million for Fengcheng New Energy, RMB467 million for Diandong Kuangye, RMB462 million for Dezhou New Energy, RMB451 million for Diandong Energy, RMB446 million for Luobei Wind-power, and RMB435 million for Jiangxi Clean Energy. Capital construction and renovation expenditures for other projects were RMB13.845 billion.
The above capital expenditures are sourced mainly from internal capital, cash flows provided by operating activities, and debt and equity financing. In the next few years, the Company will maintain its leading position in clean and efficient traditional energy, make further efforts to develop new energy and promote structural adjustment. It is expected that there will still be significant capital expenditures. The Company expects to finance the above capital expenditures through internal capital, cash flows provided by operating activities, and debt and equity financing.
The Company expects to have significant capital expenditures in the next few years. During the course, the Company will make active efforts to improve project planning process on a commercially viable basis. The Company will also actively develop newly planned projects to pave the way for its long-term growth. The Company expects to finance the above capital expenditures through internal capital, cash flows provided by operating activities, and debt and equity financing.
The cash requirements, usage plans and cash resources of the Company for the next year are as following:
Capital | ||||||
expenditure Plan | ||||||
for 2022 (RMB100 | ||||||
Capital Expenditure Project |
| million) |
| Cash resources arrangements |
| Financing costs and note on use |
Thermal power projects | 60.46 | Including internal cash resources and bank loans | Within the floating range of benchmark lending interest rates of PBOC | |||
Hydropower projects | — | Including internal cash resources and bank loans | Within the floating range of benchmark lending interest rates of PBOC | |||
Wind power projects | 126.49 | Including internal cash resources and bank loans | Within the floating range of benchmark lending interest rates of PBOC | |||
Coal mining projects |
| 10.62 |
| Including internal cash resources and bank loans |
| Within the floating range of benchmark lending interest rates of PBOC |
Photovoltaic power projects |
| 186.09 |
| Including internal cash resources and bank loans |
| Within the floating range of benchmark lending interest rates of PBOC |
Ports |
| 0.2 |
| Including internal cash resources and bank loans |
| Within the floating range of benchmark lending interest rates of PBOC |
Technology renovation etc. |
| 74.39 |
| Including internal cash resources and bank loans |
| Within the floating range of benchmark lending interest rates of PBOC |
Cash resources and anticipated financing costs
The Company expects to finance its capital expenditure and acquisition costs primarily with internal capital, cash flow provided by operating activities, and debt and equity financing.
109
Good operating results and sound credit status provide the Company with strong financing capabilities. As of December 31, 2021, the undrawn banking facilities available to the Company and its subsidiaries amount more than RMB300.0 billion, which are granted by Bank of China, China Construction Bank and Industrial and Commercial Bank of China.
The Company completed issuances of unsecured super short-term bonds in 18 installments on January 20, January 25, February 25, April 26, April 29, July 9, July 16, July 22, August 6, August 30, September 3, September 10, October 15, October 22, October 27, November 4, December 13, and December 29, at principal amount of RMB2 billion, 3 billion, 3 billion, 2 billion, 3 billion, 2 billion, 3 billion, 2.5 billion, 1.5 billion, 2 billion, 3 billion, 1.5 billion, 1.5 billion, 3 billion, 2 billion, 5 billion, 3 billion and 200 million, with nominal annual interest rates of 2.2%, 2.3%, 2.4%, 2.1%, 2.1%, 2.1%, 2.1%, 2.0%, 2.0%, 2.1%, 2.1%, 2.0%, 2.1%, 2.2%, 2.1%, 2.4%, 2.2% and 2.6%, respectively. Each installment of the notes was denominated in RMB, issued at par value, and would successively mature in 37 days, 30 days, 41 days, 37 days, 36 days, 29 days, 29 days, 36 days, 54 days, 54 days, 54 days, 54 days, 29 days, 29 days, 36 days, 98 days, 29 days and 270 days from the value date.
As of December 31, 2021, short-term loans of the Company and its subsidiaries were RMB91.897 billion (2020: RMB66.311 billion). Loans from banks were charged at interest rates ranging from 2.00% to 11.35% per annum (2020: 2.15% to 4.90%).
As of December 31, 2021, short-term bonds payable by the Company and its subsidiaries were RMB8.223 billion (2020: RMB5.003 billion).
As of December 31, 2021, the Company and its subsidiaries’ long-term loans (including long-term loans due within one year) totaled RMB154.072 billion (2020: RMB131.886 billion), including RMB loans of RMB138.436 billion (2020: 114.350 billion), USD loans of USD1.376 billion (2020: USD1.480 billion), EUR loans of EUR7 million (2020: EUR11 million), SGD loans of SGD1.456 billion (2020: SGD1.551 billion), JPY loans of 2.151 billion yen (2020: 2.266 billion yen). Among them, US dollar loans and Singapore dollar loans are floating rate loans, and other foreign currency loans are fixed rate loans. For the fiscal year ended December 31, 2021, the annual interest rate of long-term bank borrowings is 0.75% to 4.98% (2020: 0.75% to 6.55%). The Company and its subsidiaries will closely monitor any change in the exchange rate and interest rate markets and cautiously assess the currency rate and interest rate risks.
Combining the current development of the power generation industry and the growth of the Company growth, the Company will make continuous efforts to not only meet cash requirements of daily operations, constructions and acquisitions, but also establish an optimal capital structure to minimize the cost of capital and manage financial risks through effective financial management activities, thus maintaining sustainable and stable returns to the equity holders.
Other financing requirements
Pursuant to the memorandum and articles of the Company, given the negative realized net profit attributable to the equity holders of the Company and considering the need for future investments in accordance with the Company’s transformational development plans and the increased debt-asset ratio of the Company’s in year 2021, the board of directors proposed that the Company pay no dividends in year 2021. The proposal has been reviewed and approved by the board of directors and the board of supervisors of the Company, subject to the approval at annual general meeting for year 2021.
Loans, Bonds and Other Material Contracutal Obligations
The following table sets forth the maturity profile of the Company’s borrowings as of December 31, 2021.
Maturity Profile | ||||||||||
(RMB 100 million) |
| 2022 |
| 2023 |
| 2024 |
| 2025 |
| 2026 |
Principal amount planned for repayment | 1,234.45 | 256.49 | 446.69 | 153.28 | 139.90 | |||||
Interest amount planned for repayment | 76.77 | 62.17 | 50.28 | 38.83 | 32.88 | |||||
Total | 1,311.22 | 318.66 | 496.97 | 192.11 | 172.78 |
Note: The amount of principle to be paid in 2022 is relatively large because this includes expected repayment of short-term loans and short-term bonds.
110
A summary of payments due by period of our contractual obligations and commercial commitments as of December 31, 2021 is shown in the tables below. A more complete description of these obligations and commitments is included in the Notes to Financial Statements as referenced below.
Contractual Cash Obligations (RMB in millions) |
| 2022 |
| 2023-2024 |
| 2025-2026 |
| Thereafter |
| Total |
Long-term loans from Huaneng Group and its subsidiaries(1) | 1,203 | 4,946 | 1,448 | 1,887 | 9,484 | |||||
Long-term bank loans and other loans(1) | 16,011 | 54,775 | 24,722 | 49,080 | 144,588 | |||||
Long-term bonds(2) | 6,506 | 10,597 | 3,147 | 16,322 | 36,572 | |||||
Interest payments | 7,555 | 11,245 | 7,172 | 16,813 | 42,785 |
Other commercial commitments (RMB in millions) |
| 2022 |
| 2023-2024 |
| 2025-2026 |
| Thereafter |
| Total |
Long – term gas purchase contract(3) |
| 5,538 | 10,977 | 10,937 | 9,069 | 36,521 | ||||
Lease liabilities(4) |
| 785 | 1,635 | 1,194 | 3,325 | 6,939 |
Capital commitments (RMB in millions) |
| Total |
Contracted, but not provided(5) |
| 25,771 |
(1) | See Note 23 to the Financial Statements, “Long-term Loans.” |
(2) | See Note 24 to the Financial Statements, “Long-term Bonds.” |
(3) | The numbers shown in the table above were calculated based on the minimum purchases stipulated in the long-term gas contracts disclosed in Note 38 to the Financial Statements. |
(4) | See Note 40 to the Financial Statements, “Lease liabilities.” |
(5) | See Note 38 (a) to the Financial Statements, “Capital commitments.” |
The Company and its subsidiaries have various defined contribution plans in accordance with the local conditions and practices in the provinces in which they operate. The Company and its subsidiaries pay fixed contributions into separate entities (funds) and will have no further payment obligations if the funds do not hold sufficient assets to pay all employee benefits relating to employee service in the current and prior periods.
Disclosures of the pension plans, including the contribution amounts, are included in Note 36 to the Financial Statements.
E. | Trend information |
General economy
Focusing on the general trend of national economic development and based on the principle of “priority on stabilization, and advancement from stabilization,” the Central Economic Work Conference proposed several key goals as the fundamental principles and action guidance to follow for the national economy development in year 2022 and longer terms thereafter, such as to implement stable and effective macroeconomic policies, continue to stimulate the vitality of market entities, smoothen the national economic cycle, solidly implement science and technology policies, and stimulate developments by implementing reform and opening-up policies, and enhance the balance and coordination of the regional developments and securing the basic goals for residents’ livelihood. The Conference also proposed that correct understanding of the essence of the carbon peak and carbon neutralization should be established, and the gradual withdrawal of traditional energy should be based on the safe and reliable substitution of new energy. Based on the basic national conditions of coal, we should pay attention to the clean and efficient utilization of coal, increase the consumption capacity of new energy, and promote the optimal combination of coal and new energy. At the same time, the Conference proposed that renewable energy and raw material energy consumption should not be calculated into the total energy consumption control.
111
The major trend of the electricity power market
In terms of the electricity supply and demand, according to the analysis and forecast of the China Electricity Council, with the considerations such as the domestic and international economic situation, the steady increasement of electrification driven by electric power replacement, statistic comparison base of last year, as well as the uncertainty resulting from the epidemic and other the external events, it is estimated that the electricity consumption of the whole society will have a year-on-year increase of 5%-6% in year 2022, a growth rate that is four percentage points lower as compared to that in year 2021. It is estimated that in year 2022, the newly installed power generation capacity nationwide will be about 230 million kilowatts, a record high over the years, while the utilization hours for thermal units will decrease slightly on a year-onyear basis.
In terms of electricity market, on January 18, 2022, the NDRC and the National Energy Administration jointly issued Guidance on accelerating the construction of a national unified power market system, aiming to realize the sharing, mutual assistance and optimal allocation of power resources across the country, and accelerate the formation of a unified, open, orderly, safe and efficient power market system with efficient governance. As all coal-fired electricity shall totally enter into trade within the electricity grid market as stipulated by principle, the transaction ratio of the total amount of electricity generated demonstrate an upward growth. And considering the combined effects of the fluctuations of coal market prices, the inter-provincial negotiation over electrovalence for outbound transactions, the spot electrovalence fluctuating with coal prices, and the electrovalence of pumped-hydroelectricity being set by the government, the rising range of the price of coal-fired electricity is expected to be less than 20%. Affected by the increase in the number of new energy parity projects putting into operation, the prices of wind and photovoltaics have decreased compared with year 2021, while the price of hydropower electricity remains the same as that of year 2021. In respect of carbon market, China Carbon Emission Trade Exchange (CCETE) was officially launched in year 2021, with the first fulfilment cycle during year 2019 to year 2020 closed smoothly. Carbon emission quota is expected to be tightened under the background of relevant national policy switching from “dual energy consumption control” to” dual control of carbon emission amount and emission intensity.”
The trend of the fuel supply
In terms of the coal market, the CPC Central Committee currently attaches great importance to the safe supply of coal production, and the relevant governmental authorities issued multiple industry policies to stabilize the supply and demand of coal market. On February 24, 2022, the NDRC issued the Notice on Further Improving the Coal Market Price Formation Mechanism, specifying that midand long-term coal supply contracts should adopt the reasonable price range between RMB570 to RMB770 per ton (tax inclusive) and making it clear that pricing adjustment measures regarding coal price will be made pursuant to the Pricing Law. Such measures are expected to facilitate the normalization of thermal coal price. On the coal consumption side, given the establishment of the policy on controlling the increase of coal consumption during the “Fourteenth Five-Year” period and the scale development of the renewable energy section, it is expected that the increase of the coal demand shall slowdown in year 2022. While on the supply side, the advanced production capability has been gradually released domestically, which, together with the fact that coal exportation by Indonesia restored at a normal level, shall improve the supply situation of the thermal coal market. With the supply-demand situation significantly improved as compared to 2021, it is expected that the coal price will fall into a more reasonable range.
The trend of capital market
In terms of the capital market, the monetary policy in 2022 is expected to be prudent with proper flexibilities, which will increase the intensity of crosscycle adjustment, give full play to the dual functions of the total amount and structure of monetary policy tools, and focus on sufficient effectuation, precise effectuation, and forward effectuation, aiming to meet the reasonable and effective financing needs of the real economy without having “flooding irrigation” effects, and focus on increasing financial support for key areas and weak links of the economy, so as to achieve a better goal combining the stabilized total volume with an optimized structure and maintain a reasonably abundant liquidity.
F. | Employee benefits |
As of December 31, 2021, the Company and its subsidiaries had 57,513 employees within and outside the PRC. The Company and its subsidiaries provide employees with competitive remuneration and link such remuneration to operating results to provide incentives for the employees. Currently, the Company and its subsidiaries do not have any stock or option based incentive plan.
112
All employees of the Company have entered into labor contracts with the Company. The Company’s standard contract includes description of the position, responsibilities, compensations and causes of termination. The terms of the labor contracts vary and they generally range from one to five years. The contracts are typically renewable upon expiration by mutual agreement of the Company and the relevant employee.
The Company is unionized, both at its head office and with respect to all power plants. Labor unions are intended to protect the rights of employees, while allowing the Company to achieve economic objectives. They encourage employees’ participation in the Company’s decision-making process, and serve as mediators in any dispute between the Company and its employees. The Company has experienced no occurrence of any strike or labor dispute which has impact upon the Company’s operations. The Company believes that the Company and its employees are in a good relationship.
Compensation of our employees consists of salaries, bonuses and allowances. Compensation is linked to performance of the Company as well as the individual employees. Our employees are also entitled to certain education, healthcare and other benefits and allowances provided by the Company.
The Company maintains social security schemes for its employees pursuant to government regulations. These social security benefits are subject to changes in the relevant law and policy.
Based on the development plans of the Company and its subsidiaries and the requirements of individual positions, together with the consideration of specific characteristics of individual employees, the Company and its subsidiaries tailored various training programs for their employees on management, technology and the skills. These programs have enhanced the comprehensive skills of the employees.
G. | Guarantees for loans and restricted assets |
As of December 31, 2021, the Company provides guarantee to long-term bank loans of Tuas Power Ltd of RMB6.257 billion (2020: RMB7.053 billion).
As of December 31, 2021, pledge and mortgage loans of the Company were RMB12.333 billion (2020: RMB11.105 billion).
As of December 31, 2021, short-term loans of RMB829 million (2020: RMB1,317 million) represented the notes receivable that were discounted with recourse. As these notes receivable had not yet matured, the proceeds received were recorded as short-term loans.
As of December 31, 2021, long-term loans of RMB4.595 billion (2020: RMB3.322 billion) of the Company and its subsidiaries were secured by certain property, plant and equipment with net book value of approximately RMB5.025 billion (2020: RMB3.400 billion).
As of December 31, 2021, long-term loans of approximately RMB4.516 billion (2020: RMB7.435 billion) were secured by future electricity revenue of the Company and its subsidiaries. Long-term loans of approximately RMB2.814 billion (December 31, 2020: nil) were secured by equity interests of a subsidiary of the Company. Long-term loans of approximately RMB20 million were secured by carbon emission trading rights (December 31, 2020: nil).
As at December 31, 2021, certain land use right with net book value of RMB17 million (December 31, 2020: nil) was in a state of seizure due to pre-litigation preservation.
As of December 31, 2021, the restricted bank deposits of the Company and its subsidiaries were RMB796 million (2020: RMB614 million).
H. | Off-balance sheet arrangements |
As of December 31, 2021, there were no off-balance sheet arrangements which have or are reasonably likely to have a material current or future effect on our financial condition, changes in financial condition, revenues or expenses, results of operations, liquidity, cash requirements or capital resources.
113
I. | Performance of significant investments and their prospects |
The Company acquired 25% equity interest in Shenzhen Energy Group for RMB2.39 billion on April 22, 2003. In 2011, Shenzhen Energy Group divided into a remainder company of the same name and a new company Shenzhen Energy Management Company (“SE Management”), and the Company holds 25% equity interests in each of the two successors. The Company acquired 200 million shares from Shenzhen Energy Corporation (“Shenzhen Energy”), a subsidiary of Shenzhen Energy Group in December 2007. Shenzhen Energy allotted shares with its capital surplus in 2011. In February 2013, Shenzhen Energy merged SE Management through the combination of directional seasoned offering and cash payment to shareholders of SE management, Shenzhen State-owned Assets Administration Commission and the Company. After the merger, the Company held 661 million shares of Shenzhen Energy, representing 25.02% of its equity interests. In 2021, Shenzhen Energy distributed RMB0.50 of cash dividend and a two-share share dividend out of every 10 shares to its shareholders, and the Company held 1,190 million shares of Shenzhen Energy by December 31, 2021. These investments brought a net profit attributable to the equity and perpetual corporate bonds holders of the Company of RMB331 million for the year ended December 31, 2021 under IFRS. This investment is expected to provide steady returns to the Company.
The Company held 60% direct equity interest in Huaneng Sichuan Energy Development Co., Ltd.(“Sichuan Energy Development”) as of December 31, 2006. In January 2007, Huaneng Group increased its capital investment in Sichuan Energy Development by RMB615 million, thus reducing the Company’s equity interest in Sichuan Energy Development to 49% and making Huaneng Group the controlling shareholder of Sichuan Energy Development. This investment brought a net profit attributable to the equity and perpetual corporate bonds holders of the Company of RMB201 million for the year ended December 31, 2021 under IFRS.
This investment is expected to provide steady returns to the Company.
J. | Impairment sensitivity analysis |
Goodwill impairment
The Company and its subsidiaries conduct impairment test on each individually recognized goodwill every year. There were no impairment losses provided for the goodwill for the year ended December 31, 2021. Details please refer to Note 14 to the Financial Statements.
Impairment of other non-current assets
The Company and its subsidiaries will test its property, plant and equipment, land use rights and mining rights suffered any impairment whenever an impairment indication exists.
In 2021, impairment losses for certain property, plant and equipment of approximately RMB28.9 million have been recognized. Details please refer to Note 7 to the Financial Statements.
K. | Prospects for 2022 |
In 2022, the Company will continue to promote the implementation of the development strategy, actively respond to changes in the electricity, coal and capital markets, and strive to complete the annual production and operation tasks.
In terms of electric power construction, adhering to the green development concept, the Company will spend much effort to develop clean energy, optimize thermal power structure and speed up transformation and upgrading to achieve high-quality development by centering efficiency by means of modern management, under the support of science and technology innovation and on the basis of safe development.
114
In terms of electric power generation, the Company earnestly implements the regulations and policies in the field of safety production, and constantly optimizes management to prevent safety accidents. The Company conducts appraisal for the generator sets to comprehensively improve the lean level of facility management. While operating and maintaining the clean energy power generation system, the Company attaches importance to the basic and adjusting roles of existing thermal power generating unit in the energy safety system of the society, actively conducts life extension appraisal and transformation, and maintains the health level of standby set for emergency. The Company always focuses on the economy and flexibility of the power generation assembly and meet the new market demands through technical transformation; actively develops the heat supply industry to upgrade integrated energy services; deeply studies the application prospect of biomass coupled power generation and grasps the market opportunities; and earnestly governs the environment protection well as demanded by the ecological civilization construction of various regions.
In terms of electric power marketing, the Company will take the principle of maximizing the overall benefit, strengthen market analysis, insist on quantity and price coordination, make every effort to conduct market transactions, and strive to generate more and more efficient power. The Company will actively respond to the market reform of electricity, promote the construction of institutional mechanism and strengthen the training of market trading talents. The Company will fully develop the electricity sales market, improve the operation level of the energy sales company, and further promote the optimization of carbon market transactions, striving to achieve an annual domestic power generation of 465 billion kWh approximately.
In terms of fuel, the Company will closely track the changes in policies and domestic and international coal markets, and strive to promote the signing of medium and long-term coal contracts to ensure strict compliance. The Company will continue to optimize the supply structure and achieve the best procurement cost by taking into account factors such as resource origin, transportation mode and coal type matching. The Company will strengthen inventory management, play the role of light storage and high consumption, buy low and use high, and strive to reduce procurement costs.
In terms of capital, the Company will keep an eye on changes in the international and domestic capital markets and give full play to its credit and management advantages, seize opportunities brought by the green finance policy, ensure the smooth main credit financing channel, increase the issuance in the interbank market, actively explore innovative financing tools in the capital market, broaden financing channels, and strive to reduce capital costs while ensuring capital security.
The Company will further enhance the awareness of opportunities and risks, seize the development opportunities, effectively deal with challenges, maintain strategic determination, make concerted efforts to overcome difficulties, coordinate safety and security, quality and efficiency improvement, transformation and upgrading, reform and innovation, and accelerate the pace of creating an international first-class listed power generation company.
115
ITEM 6. DIRECTORS, SENIOR MANAGEMENT AND EMPLOYEES
A. | Directors, members of the supervisory committee and senior management |
Directors
The table below sets forth certain information concerning our directors as of March 31, 2022. The current term for all of our directors is three years commencing from the signing of the director service contracts.
Name |
| Age |
| Position with us |
Zhao Keyu | 55 | Chairman of the Board of Directors | ||
Zhao Ping | 59 | Director and President | ||
Huang Jian |
| 59 |
| Director |
Wang Kui |
| 54 |
| Director |
Lu Fei |
| 57 |
| Director |
Teng Yu |
| 58 |
| Director |
Mi Dabin |
| 53 |
| Director |
Cheng Heng |
| 58 |
| Director |
Li Haifeng |
| 42 |
| Director |
Lin Chong |
| 58 |
| Director |
Xu Mengzhou | 71 | Independent Director | ||
Liu Jizhen | 70 | Independent Director | ||
Xu Haifeng | 66 | Independent Director | ||
Zhang Xianzhi |
| 64 |
| Independent Director |
Xia Qing |
| 64 |
| Independent Director |
ZHAO Keyu, aged 55, is the Chairman and Party Secretary of the Company. He was the Chief of the Planning and Development Department, Chief of Office, Director and Secretary of the Party Office of Huaneng Group, the President and Deputy Party Secretary of the Company. He graduated from Wuhan University, majoring in software engineering, and is postgraduate with a master’s degree in engineering. He is a senior economist.
ZHAO Ping, aged 59, is the Director, the President and the Deputy Party Secretary of the Company. He was the Vice President and the Deputy Party Secretary of the Company. He graduated from Tsinghua University, majoring in thermal engineering, is a postgraduate with a master’s degree in science. He is a professor-level senior engineer. He is receiving special government allowance of the State Council.
HUANG Jian, aged 59, is a Director of the Company, a dedicated Director and Supervisor of Huaneng Group, a dedicated director of HIPDC, a dedicated director of Shandong Power Generation Co., Ltd. He was an assistant to the President of Huaneng Group and Chairman of Huaneng Capital Services Co., Ltd. Mr. Huang graduated from the Department of Accounting of Institute of Fiscal Science of the Ministry of Finance with a postgraduate degree of master in economics. He is a professor-level senior accountant.
WANG Kui, aged 54, is the Director of the Company, the Deputy Chief Economist and the Chief of the Planning and Development Department of Huaneng Group and the Director of North United Power Co., Ltd. He previously served as the Chief of the Planning and Development Department of Huaneng Group. He graduated from Beijing University of Economics with a major in quantitative economics. He holds an EMBA degree from Guanghua School of Management of Peking University. He is a professor-level senior engineer.
LU Fei, aged 57, is the Director of the Company, the Deputy Chief Economist of Huaneng Group and Chairman of the Supervisory Board of Huaneng Renewables Corporation Limited. He previously served as the Director of Operation Coordination Department, the Director of Sales and Marketing Department and the Director of Budget and Comprehensive Planning Department of Huaneng Group. He graduated from Zhejiang University with a major in thermal power engineering, and holds an EMBA degree from School of Economics and Management of Tsinghua University. He is a professor-level senior engineer.
116
TENG Yu, aged 58, is the Director of the Company, the Deputy Chief Accountant of Huaneng Group, the Director of China Huaneng Finance Corporation Limited, the Director of Huaneng Capital Services Co., Ltd. and the Director of North United Power Co., Ltd. He also served as the Director of Finance Department of Huaneng Group. He graduated from the Party School of the Central Committee of Communist Party with a degree majoring in economic management. He is a professor-level senior accountant.
MI Dabin, aged 53, is the Director of the Company, Vice Chairman, the President, Deputy Party Secretary of Hebei Construction & Investment Group Co., Ltd., and the Chairman of Huihai Financing and Leasing Co., Ltd. He was the President and Chairman of Hebei Construction& Energy Investment Co., Ltd., the Chief Engineer, Vice President and President of Qinhuangdao Power Generation Co., Ltd., the President of Qinhuangdao Thermal Power Generation Co., Ltd., the Chairman of Hebei Xingtai Power Generation Limited, an assistant to the President and the Head of Production and Operation Department of Hebei Construction & Investment Group Co., Ltd., the President of Qinhuangdao Power Generation Co., Ltd. and the President of Qinhuangdao Thermal Power Generation Co., Ltd. He graduated from North China Electric Power University, majoring in power engineering, and holds a master’s degree. He is a senior engineer.
CHENG Heng, aged 58, is a Director of the Company, the Vice President (group department president level) of the Energy Department of Jiangsu Guoxin Investment Group Limited, the Vice Chairman of Jiangsu Changshu Electric Power Generating Company Limited, the Vice Chairman of Jiangsu Ligang Electric Power Co., Ltd., and the Vice Chairman of Yangcheng International Electric Power Co., Ltd. He previously served as the deputy manager of the Planning Department of Jiangsu International Trust and Investment Corporation, Vice President of Changshu Power Generation Co., Ltd., President of Energy Investment Division 2 of Jiangsu Provincial Investment Management Co., Ltd., and the Vice President of Jiangsu Provincial Investment Management Co., Ltd. He is a university graduate with College education and an economist.
LI Haifeng, aged 42, is a Director of the Company, the secretary of the party committee and chairman of Liaoning Energy Investment (Group) Co., Ltd. He previously served as the deputy secretary of the party committee, deputy chairman and president of Liaoning Energy Investment (Group) Co., Ltd. He graduated from Tsinghua University, majoring in materials science and engineering, postgraduate qualification, and a doctorate degree in engineering. He is a professorlevel senior engineer.
LIN Chong, aged 58, is a Director of the Company, a Member of Party Committee and the Vice President of Fujian Investment & Development Group Co., Ltd., the Vice Chairman of Fujian Sanming Nuclear Power Co., Ltd., the Vice Chairman of Chinalco Southeast Copper Co., Ltd., the director of Fujian Motor Industry Group Co., Ltd. and the director of Fujian Fuqing Nuclear Power Co., Ltd. He also served as the Chairman of Fujian Zhongmin Energy Investment Co., Ltd., the Vice Chairman of CNOOC Fujian Natural Gas Co. Ltd., the Vice Chairman of Zhonghai Mintou (Fujian) Natural Gas Pipeline Co., Ltd., the Vice Chairman of CNOOC Fujian Zhangzhou Natural Gas Company Limited and the director of King Long Motor Group. He graduated from Chongqing University where he majored in electric power system and its automation and holds a master’s degree of science in engineering (postgraduate diploma). Mr. Lin is a senior engineer.
XU Mengzhou, aged 71, is an Independent Director of the Company, an Independent Director of Shandong Hualu-Hengsheng Chemical Co., Ltd., an Independent Director of iHandy Group (non-listed company), and vice chairman of the Banking Law Research Institute of China Law Society. He served as a professor of Law School of Renmin University of China (RUC). He graduated from the RUC, with a doctor’s degree in Economic Laws.
LIU Jizhen, aged 70, is an Independent Director of the Company, an academician of the Chinese Academy of Engineering, a Director of the National Key Laboratory of New Energy Power System of North China Electric Power University, a chief scientist of the 973 Program, the Vice President of the China Electricity Council, a fellow of the Institution of Engineering and Technology (FIET) and an independent director of Datang International Power Generation Co., Ltd. Mr. Liu was formerly the President of Wuhan University of Hydraulic and Electrical Engineering, the President of North China Electric Power University, the Vice President of the Chinese Society for Electrical Engineering and the Vice President of the Chinese Society of Power Engineering. He is a professor and a doctoral supervisor.
117
XU Haifeng, aged 66, is an Independent Director of the Company. He successively served as the Chairman and President of China Railway Express Co., Ltd., the director and Vice President of Beijing-Shanghai High Speed Railway Co., Ltd., the Managing Commander-in-Chief of the General Headquarters for the Construction of Beijing-Shanghai High Speed Railway of the Ministry of Railways, and the Vice Chairman and President of Beijing-Shanghai High Speed Railway Co., Ltd. He graduated from Beijing Jiaotong University where he majored in transportation organization and automation. He has an EMBA degree from the Guanghua School of Management of Peking University and holds a master’s degree.
ZHANG Xianzhi, aged 64, is an Independent Director of the Company, a professor and a doctoral supervisor of Dongbei University of Finance and Economics and a national level outstanding teacher. He is serving concurrently as a managerial accounting consultant to the Ministry of Finance, independent director at Yingkou Port Liability Co., Ltd. and Lingyuan Iron & Steel Co., Ltd. Mr. Zhang was formerly an accountant of Dalian City Transportation Bureau, a researcher of Dalian Economic Commission, vice dean of the accounting school of Dongbei University of Finance and Economics, and director of Sino- German Management and Control Research Centre, etc. He graduated from Dongbei University of Finance and Economics and holds a bachelor’s degree and master’s degree in accounting and holds a doctorate degree in industrial economics.
XIA Qing, aged 64, is currently an Independent Director of the Company, a professor in Tsinghua University, Member of the China Energy Research Council, the Expert of the National Electricity Exchange Agency Alliance, the Expert of China Southern Power Grid Corporation, the Expert of China Datang Power Generation Group, the Expert of State Grid NARI Group, the Deputy Director of the Power Market Special Committee of China Electrical Engineering Society, the Deputy Chairman of China Power Reform Forum, the Deputy Chairman of the Energy Storage Committee of the China Energy Research Association, the Independent Director of Tellhow Sci-tech Co., Ltd., the Independent Director of State Grid Yingda Co., Ltd. and the Independent Director of Beijing E-techstar Co.,Ltd. He previously served as the Independent Director of the Eighth Session of Board of Directors of the Company. He graduated from Tsinghua University with a doctoral degree in power system and automation.
Supervisors
The table below sets forth certain information concerning our supervisors as of March 31, 2022. The current term for all of our supervisors is three years, commencing from the appointments.
Name |
| Age |
| Position with us |
Li Shuqing | 58 | Chairman of the Board of Supervisors | ||
Mu Xuan | 46 | Vice Chairman of the Board of Supervisors | ||
Gu Jianguo |
| 55 |
| Supervisor |
Xia Aidong |
| 53 |
| Supervisor |
Xu Jianping |
| 53 |
| Supervisor |
Zhu Tong |
| 50 |
| Supervisor |
LI Shuqing, aged 58, is currently the Chairman of the Supervisory Committee of the Company, the Deputy Chief Engineer of Huaneng Group, the Chairman and the Secretary of Communist Party Committee of HIPDC. He previously served as the Vice President of the Company, the Executive Director and the President of Huaneng Hulunbuir Energy Development Co., Ltd., the Chairman and the Secretary of Communist Party Committee of Huaneng Shandong Power Generation Co., Ltd. He holds an EMBA degree from Guanghua School of Management of Peking University. He is a professor-level senior engineer.
MU Xuan, aged 46, is the Vice Chairman of the Supervisory Committee of the Company, the Vice President and a Member of Party Committee of Dalian City Investment Holding Group Co., Ltd., the Chairman and President of Dalian LNG Pipeline Co., Ltd. He was the assistant to the President of Dalian Construction Investment Co., Ltd. and the assistant to the President of Dalian Construction Investment Group Co., Ltd. He graduated from Dongbei University of finance and Economics, majoring in technical economy and management. He is a master degree postgraduate and a registered accountant.
GU Jianguo, aged 55, is a Supervisor of the Company, the Chairman of Nantong Investment & Management Limited Company, and Vice Chairman and the President of Nantong Industries Holdings Group Limited. He was the Chief of Nantong Investment Management Centre, Director and President of Nantong Investment & Management Liited Company. He graduated from Nanjing University of Aeronautics and Astronautics with a bachelor’s degree. He is an economist. He holds a Master of Business Administration from Antai College of Economics and Management (ACEM) at Shanghai Jiao Tong University.
118
XIA Aidong, aged 53, is a Supervisor of the Company, the Director of the Audit Department and the Audit Center of Huaneng Group, the Chairman of the Supervisory Committee of Huaneng Capital Services Co., Ltd., a director of China Huaneng Finance Corporation Limited, a supervisor of North United Power Co., Ltd., the Chairman of the Supervisory Committee of Huaneng Lancang River Hydroppwer Inc. and a supervisor of Guangdong Energy Group Co., Ltd. He previously served as the manager of the Budget Department of the Company and the Deputy Chief of the Budget and Comprehensive Planning Department of Huaneng Group. He graduated from Beijing Business School, majoring in accounting and obtained a bachelor’s degree in Economics. He is a professorlevel senior accountant.
XU Jianping, aged 53, is a Supervisor and an assistant to the President of the Company. He previously served as deputy manager, manager and director of the Human Resources Department and a director of the Party Work Department (Human Resources Department) of the Company. He graduated from Huazhong University of Science and Technology, majoring in thermal power engineering, and obtained a Master’s degree in Economics in Finance from Zhongnan University of Economics and Law. He is a senior engineer.
ZHU Tong, aged 50, is currently a Supervisor, the Director of the Party Work Department (Human Resources Department) of the Company. He served as Chief of the Personnel Division of the Human Resources Department of the Company, and Deputy Director of the Party Work Department (Human Resources Department). He graduated from North China Electric Power University with a master degree in industrial engineering. He is a senior engineer.
Other Executive Officers
HUANG Lixin, aged 55, is currently the Chief accountant and a Member of Party Committee of the Company. He was the deputy manager and manager of the Finance Department of the Company and the director of Finance Department of Huaneng Group. He graduated from the Economic Management School of Tsinghua University with an EMBA degree. He is a professor-level senior accountant.
DUAN Rui, aged 54, is the secretary of the Discipline & Inspection Commission and the member of the Party Committee of the Company. He was leader of the Inspection Team of Huaneng Group and deputy director of the Department of Supervision, a member of the Discipline Inspection Group of Party Group, deputy secretary of directly affiliated party committee, the secretary of the Discipline Inspection Commission, a member of the party committee of HIPDC and secretary of the Discipline Inspection Commission. He majored in the economic management and graduated from the Party School of the Inner Mongolia Autonomous Region with a master degree. He is a senior political engineer.
HUANG Chaoquan, aged 56, is currently the Vice President, a Member of Party Committee, the Secretary to the Board of the Company. He was the Manager of the Corporate Management Department and director of the Administration Department of the Company. He graduated from Harbin University of Science and Technology with a postgraduate degree in Management Engineering. He is a professor-level senior economist.
LIU Wei, aged 58, is currently the chief engineer and a member of the Party Committee of the Company. He was the Party Secretary, Chairman of Xi’ an Thermal Power Research Institute Co., Ltd., Executive Director and Director of Huaneng Group Technology Innovation Center Co., Ltd. He graduated from a Northeast Electric Power University of power plant engineering major with post-graduate degree, master of engineering, EMBA of the Cheung Kong Graduate School of Business. He is a researcher-level senior engineer. He is receiving a special government allowance of the State Council.
CHEN Shuping, aged 58, is currently the Vice President and a Member of Party committee of the Company. He was the Director of Material Department, Director of Purchasing Department and Director of Construction Department of Huaneng Group. He graduated from water conservancy and hydropower engineering construction major of Dalian University of Technology with a college degree, bachelor of engineering. He is a professor-level senior engineer.
FU Qiyang, aged 58, is currently the Chief Economist and Member of Party Committee of the Company. He was the Manager of Marketing Department of the Company, President and Party Secretary of Huaneng Hunan Branch. He graduated from the business and administration Major of University of Science and Technology Beijing, and the University of Texas at Arlington with an EMBA degree. He is a professor-level senior accountant.
119
B. | Compensation for Directors, Supervisors and Executive Officers |
The table below sets forth the compensation on individual basis for the directors, supervisors and other executive officers for the year ended December 31, 2021:
Pre-tax Remuneration | ||||
Paid by the Company | ||||
Name |
| Position with the Company |
| in 2021(1) |
(RMB in thousand) | ||||
Directors | ||||
Zhao Keyu |
| Chairman of the Board Director | 1,279.7 | |
Zhao Ping |
| Director and President | 1,270.6 | |
Huang Jian |
| Director | — | |
Wang Kui |
| Director | — | |
Lu Fei |
| Director | — | |
Teng Yu |
| Director | — | |
Mi Dabin |
| Director | — | |
Cheng Heng |
| Director | — | |
Li Haifeng |
| Director | — | |
Lin Chong |
| Director | — | |
Xu Mengzhou |
| Independent Director | 300.0 | |
Liu Jizhen |
| Independent Director | 300.0 | |
Xu Haifeng |
| Independent Director | 300.0 | |
Zhang Xianzhi |
| Independent Director | 300.0 | |
Xia Qing |
| Independent Director | 300.0 | |
Sub-total |
| 4,050.3 | ||
Supervisors | ||||
Li Shuqing |
| Chairman of the Board of Supervisors | — | |
Mu Xuan |
| Vice Chairman of the Board of Supervisors | — | |
Xia Aidong(2) |
| Supervisor | — | |
Gu Jianguo |
| Supervisor | — | |
Xu Jianping |
| Supervisor | 1,129.9 | |
Zhu Tong(3) | Supervisor | 485.8 | ||
Zhang Xiaojun(4) |
| Former Supervisor | 451.6 | |
Ye Cai(5) |
| Former Supervisor | — | |
Sub-total |
| 2,067.3 | ||
Other Executive officers |
| |||
Huang Lixin |
| Chief Accountant | 1,119.1 | |
Duan Rui |
| Secretary of the Discipline & | 648.4 | |
Huang Chaoquan |
| Vice President and Secretary to the Board of Directors | 1,107.2 | |
Liu Wei | Chief Engineer | 1,003.8 | ||
Chen Shuping | Vice President | 1,072.3 | ||
Fu Qiyang | Chief Economist | 895.9 | ||
Sub-total |
| 5,846.7 | ||
Total |
| 11,964.3 |
(1) | The remuneration paid by the Company in 2021 includes fees, basic salaries, performance salaries and pension. Please see Note 37 to the Item 18 Financial Statements, “Directors’, supervisors’ and senior management’s emoluments.” |
(2) | Mr. Xia Aidong was elected on June 22, 2021 |
(3) | Mr. Zhu Tong was elected on June 9, 2021. |
(4) | Ms. Zhang Xiaojun ceased to be a supervisor on June 9, 2021. |
(5) | Mr. Ye Cai ceased to be a supervisor on June 22, 2021. |
120
The total remuneration paid to our directors, supervisors and executive officers is comprised of basic salaries, performance salaries and pension. Of these, performance salaries account for approximately 55% of the total remuneration. In addition, directors and supervisors who are also officers or employees of the Company receive certain other benefits, such as subsidized or free health care services, housing and transportation, which are customarily provided by large enterprises in the PRC to their employees. Each of the Company’s independent directors receives annual after-tax cash compensation of RMB300,000. We do not have any service contract with any director that provides for benefits upon termination of employment. The Company does not grant options or the stock-based incentive awards to its directors, supervisors and executive officers.
C. | Board practice |
We, in accordance with the resolutions passed at a shareholders’ general meeting, have set up four board committees, namely, the Audit Committee, the Strategy Committee, the Nomination Committee, and the Remuneration and Appraisal Committee, and formulated the working regulations for each committee in accordance with relevant rules and regulations. All committees operate in accordance with the working rules and utilize their members’ specific backgrounds, experience and industry expertise to provide advice to the board, so as to enhance our operation efficiency and to make the decision-making process better informed.
The main duties of the Audit Committee are to assist our board in performing its statutory and fiduciary duties of supervising our accounting, financial reporting, internal control and compliance, including but not limited to, assisting our board in ensuring (i) the authenticity of our financial statements; (ii) our compliance with the applicable laws and regulations; (iii) the qualification and independence of our independent auditors; (iv) the performances of our independent auditors and internal auditing department and (v) the control and management of the related-party transactions of the Company.
The main duties of the Strategy Committee are to advise on, and conduct research in relation to, our long-term development strategies and decisions regarding significant investments.
The main duties of the Nomination Committee are to conduct research and provide advice in relation to the requirements for selection of directors and managers and the relevant procedures based on the actual need of our operation, to search for qualified candidates for the positions of director and manager, to examine the candidates for the positions of director and manager and to advise matters in relation thereto.
The main duties of the Remuneration and Appraisal Committee are to conduct research on the appraisal guidelines for directors and managers, to carry out performance appraisals and provide advice accordingly, and to conduct research on the remuneration policies and proposals regarding the directors and senior management.
The members of Audit Committee are Mr. Zhang Xianzhi (Chairman), Mr. Xu Mengzhou, Mr. Liu Jizhen, Mr. Xu Haifeng and Mr. Xia Qing.
The members of Strategy Committee are Mr. Zhao Keyu (Chairman), Mr. Zhao Ping, Mr. Huang Jian, Mr. Wang Kui, Mr. Lu Fei, Mr. Liu Jizhen and Mr. Xu Haifeng.
The members of Nomination Committee are Mr. Liu Jizhen (Chairman), Mr. Zhao Keyu, Mr. Mi Dabin, Mr. Lin Chong, Mr. Xu Mengzhou, Mr. Zhang Xianzhi and Mr. Xia Qing.
The members of Remuneration and Appraisal Committee are Mr. Xu Mengzhou (Chairman), Mr. Zhao Ping, Mr. Cheng Heng, Mr. Li Haifeng, Mr. Liu Jizhen, Mr. Zhang Xianzhi and Mr. Xu Haifeng.
D. | Employees |
As of December 31, 2021, we had 57,513 employees. Of these, 171 were headquarters management staff, 18,986 were management and technical staff of our subsidiaries, and the remainder was workers, ancillary service personnel and others. Approximately 81% of our work force graduated from university or technical college. As of December 31, 2019 and 2020, we had 58,263 and 57,874 employees, respectively.
121
We conduct continuing education programs for our employees at our head office and at each power plant. We provide training in foreign language, computer, operating and other areas to our managerial professionals and technicians in their relevant fields. Employees are trained in accordance with the different requirements for professional and managerial positions.
Our labor force is employed through individual labor contracts. Currently, all employees are employed under labor contracts, which specify the employee’s position, responsibilities, remuneration and grounds for termination. Short-term labor contracts have fixed terms of typically one to five years, at the end of which they may be renewed by agreement of both the Company and the employee.
The contract system imposes discipline, provides incentives to adopt better work methods, and provides us with a greater degree of management control over our work force. We believe that, by linking remuneration to productivity, the contract system has also improved employee morale.
Each of our power plants has a trade union and the employees of our headquarters are also members of a trade union. These trade unions protect employees’ rights, aim to fulfill our economic objectives, encourage employees to participate in management decisions and mediate disputes between us and union members. We have not been subject to any strikes or other labor disturbances interfering with our operations, and we believe that our relationships with our employees are good.
Total remuneration of our employees includes salaries, bonuses and allowances. The remuneration level of each employee is linked to the performance of our company as well as the individual employee himself/herself. The employees also receive certain benefits in the form of education and health services subsidized by the Company and other miscellaneous subsidies.
In compliance with the relevant regulations, we and our employees participate in the local government pension plan under which all the employees are entitled to pension payments upon retirement. See Note 36 to the Financial Statements. The Company also participates in the social insurance program administered by the social security institution, under which all employees are entitled to certain social insurance benefits, subject to adjustments in accordance with relevant PRC regulations. The Company is in compliance with all social insurance regulations and has no overdue obligations for any social insurance contribution.
E. | Share ownership |
None of our directors, supervisors or senior management owns any of our shares.
ITEM 7. MAJOR SHAREHOLDERS AND RELATED PARTY TRANSACTIONS
A. | Major shareholders |
Our outstanding ordinary shares consist of A Shares and H Shares, each with a par value of RMB1.00 per share. The following table sets forth certain information regarding our major shareholders as of December 31, 2021.
Approximate | Approximate | ||||||
percentage | percentage | ||||||
in the total | in the total | ||||||
issued domestic | issued | ||||||
Shareholder |
| Number of shares |
| share capital % |
| share capital % | |
Huaneng International Power Development Corporation | 5,066,662,118 | 46.07 | % | 32.28 | % | ||
China Huaneng Group Co. Ltd.(1) |
| 2,188,714,748 |
| 14.41 | % | 13.94 | % |
(1) | Of the 2,188,714,748 shares, 29,994,199 domestic shares through its controlling subsidiary, Huaneng Finance Corporation Limited, 472,000,000 H shares held through its wholly-owned subsidiary, China Hua Neng Group Hong Kong Limited, and 131,596,000 H shares through its indirect wholly-owned subsidiary, China Huaneng Group Treasury Management (Hong Kong) Limited. |
In 2006, all of our shareholders of non-tradable domestic shares except HIPDC transferred a total of approximately 1.1 billion shares to Huaneng Group, representing 9.24% of our total issued shares. Among others, HPCIC transferred approximately 301 million shares to Huaneng Group, and decreased its shareholdings in the Company to 5.00%.
122
On April 19, 2006, we carried out our reform plan to convert all non-tradable domestic shares into tradable domestic shares. According to the plan, Huaneng Group and HIPDC transferred a total of 150 million A Shares to our shareholders. As a result, the direct shareholdings of Huaneng Group and HIPDC decreased to 8.75% and 42.03%, respectively.
In June and July of 2008, through its wholly owned subsidiary, China Hua Neng Hong Kong Company Limited, Huaneng Group acquired 20 million H Shares from the open market. As a result, the shareholding of Huaneng Group increased to 8.92%.
In 2010, we increased our share capital through non-public issuances of new shares, including A shares and H Shares. With the approval of shareholders and relevant PRC governmental authorities, we were authorized to issue (i) not exceeding 1,500 million new A shares by way of placement to not more than 10 designated investors, including Huaneng Group, which would subscribe for no more than 500 million new A shares, and (ii) no more than 500 million new H Shares to China Hua Neng Hong Kong Company Limited (“Hua Neng HK”). On December 23, 2010, we completed the non-public issuance of 1,500 million new A shares (ordinary shares with a par value of RMB1 per share) to 10 designated investors, including Huaneng Group, at the issuance price of RMB5.57 per share. The shares subscribed by Huaneng Group are subject to a lock-up period of 36 months.
On December 28, 2010, we completed the placement of 500 million H Shares (ordinary shares with a par value of RMB1 per share) to Hua Neng HK at the subscription price of HK$4.73 per share.
On November 13, 2014, we completed the placement of 365 million H Shares at the price of HK$8.60 per share.
On November 20, 2015, we completed the placement of 780 million H Shares at the price of HK$7.32 per share.
On October 15, 2018, we completed the non-public issuance of 497,709,919 A Shares at the price of RMB6.55 per share.
Before we were established in 1994, HIPDC and seven other promoters entered into the Shareholders’ Agreement dated May 31, 1994 (the “Shareholders’ Agreement”) which, among other things, grants to HIPDC the right to vote all the shares owned by each of the other promoters so as to enable HIPDC to have majority voting rights in general meetings for so long as we are in existence. In addition, directors designated by HIPDC will have majority representation on our board of directors and each of the other promoters will have one representative designated by it appointed as a member of our board of directors. The Shareholders’ Agreement also provides that for so long as we are in existence (i) HIPDC and the other signatories to the Shareholders’ Agreement will maintain their combined shareholdings to ensure their collective majority control of the Company, (ii) HIPDC has certain priority rights to purchase the shares held by the other signatories to the Shareholders’ Agreement, (iii) if HIPDC does not exercise its priority rights to purchase such shares, each of the signatories to the Shareholders’ Agreement other than HIPDC shall have a priority right to purchase such shares on a pro rata basis, and (iv) no shares may be sold or transferred unless their transferees agree to abide by the terms of the Shareholders’ Agreement. As a result of the Shareholders’ Agreement, HIPDC holds 70.09% of the total voting rights of the outstanding shares and, subject to the Shareholders’ Agreement, has the power to control the election of all of our directors and to direct our management and policies.
On May 12, 2006, HIPDC and other promoters (including the shareholders who assumed the rights and obligations of original promoters as a result of share transfer) entered into an amendment to the Shareholders’ Agreement, pursuant to which each promoter shall be entitled to exercise its own voting rights at the shareholders’ general meeting. Consequently, HIPDC currently holds 32.28% of our total voting rights. Since HIPDC’s parent company, Huaneng Group, currently holds, directly or indirectly, additional 14.14% of our total voting rights, HIPDC is able to exert control over us when acting in concert with Huaneng Group.
123
Huaneng Group and HIPDC had previously given a non-compete undertaking to us during our initial public offering of A shares in 2001, in order to support our business development, to integrate relevant quality assets and to avoid business competition. In September 2010, we received from Huaneng Group an undertaking on relevant matters for further avoidance of business competition. While Huaneng Group will continue to perform its undertakings previously given, Huaneng Group further undertakes that: (i) it shall treat us as the only platform for ultimate integration of the conventional energy business of Huaneng Group; (ii) with respect to the conventional energy business assets of Huaneng Group located in Shandong Province, Huaneng Group undertakes that it will take approximately 5 years to improve the profitability of such assets and when the terms become appropriate, it will invest those assets into us. We have a right of first refusal to acquire from Huaneng Group the newly developed, acquired or invested projects which are engaged in the conventional energy business of Huaneng Group located in Shandong Province; (iii) with respect to the other non-listed conventional energy business assets of Huaneng Group located in other provincial administrative regions, Huaneng Group undertakes that it will take approximately 5 years, and upon such assets meeting the conditions for listing, it will invest such assets into us in order to support our sustainable and stable development; and (iv) Huaneng Group will continue to perform each of its undertakings to support the development of its subordinated listed companies.
On June 28, 2014, pursuant to Guideline No. 4 for the Supervision of Listed Companies No.4 - Commitments and Their Fulfillment by Listed Companies and Their Actual Controllers, Shareholders, Related Parties and Acquirers issued by CSRC, Huaneng Group strengthened its aforementioned non-competing undertaking in the following ways: (i) it shall treat us as the only platform for integrating the conventional energy business of Huaneng Group; (ii) with respect to the conventional energy business assets of Huaneng Group located in Shandong Province, Huaneng Group undertakes that by the end of 2016, it will inject such assets into the our Company when the profitability of such assets has been improved and meets our internal requirements for the listing of our assets, which include clear delineation of assets and shares ownership between our Company and Huaneng Group, absence of decrease in earnings per share of the Company after the injection and any unlawful events of significance, appreciation of state-owned assets, and certain waivers of shareholder rights by Huaneng Group; (iii) with respect to the other non-listed conventional energy business assets of Huaneng Group in other provincial administrative regions, Huaneng Group undertook that by the end of 2016, upon such assets meeting the our aforementioned internal requirements, the Group will inject such assets into the Company, with a view to supporting the Company’s continuous and stable development; and (iv) Huaneng Group will continue to perform each of its undertakings to support the development of its subordinated listed companies. The period of such undertakings is between June 28, 2014 and December 31, 2016.
Huaneng Group has diligently examined and analyzed its performance on the 2014 undertakings, of which items (i) and (iv) are long-term undertaking and are being currently performed.
As of December 31, 2016, all coal-fired generation assets of Huaneng Group located in Shandong region under the scope of undertakings had been injected into the Company, thus performance of the undertaking item (ii) was completed within the term of the undertaking period.
As of December 31, 2016, all other non-listed coal-fired power generation assets of Huaneng Group located in provincial administrative regions other than Shandong which met the conditions had been injected into the Company, thus performance of the undertaking item (iii) was completed.
Huaneng Group continued to perform the undertaking as made previously that it would procure relevant parties such as Huaneng Energy and Transportation (Holding) Company Limited to inject non-listed conventional energy assets located in Shandong to the Company after completion of the asset disposal transaction announced on September 30, 2017 by Shandong Xinneng Taishan Power Generation Co., Ltd. On July 31, 2018, Shandong Company (a subsidiary of the Company) and Taishan Power (a subsidiary of Huaneng Energy and Transportation (Holding) Company Limited) entered into an agreement, pursuant to which Shandong Company acquired from Taishan Power its power assets which were formerly purchased from Shandong Xinneng Taishan Power Generation Co Ltd. Huaneng Group. Therefore our abovementioned undertaking has been fulfilled.
124
B. | Related party transactions |
Guarantees
The table below sets forth information on guarantees provided by Huaneng Group, and the Company to the related parties in 2021 for the purposes of financing their operation, construction and renovation.
Largest Amount Outstanding in | Amount Outstanding as of | |||||||
Guarantor |
| Guarantee |
| Interest Rate |
| 2021 |
| December 31,2021 |
% | (RMB) | (RMB) | ||||||
Huaneng Group | Yangliuqing Power Company(1) | 2.15 | 80,688,675.02 | 43,554,992.75 | ||||
The Company | Tuas Power Company(1) | SIBOR+1.65% | 6,151,245,397.76 | 5,457,083,392.80 | ||||
Tuas Power Company(1) | SIBOR+1.65% | 902,064,928.06 | 800,267,786.42 | |||||
| SinoSing Power(1) |
| 2.25 | 1,963,163,813.41 |
| 1,920,795,306.45 | ||
SinoSing Power(1) | 2.63 | 1,957,722,358.41 | 1,915,196,965.16 |
(1) | These entities are subsidiaries of the Company. |
Loans
The table below sets forth the loans made by Huaneng Group and subsidiaries of Huaneng Group, and the Company to the related parties in 2021 for the purposes of financing their operation, construction and renovation.
Largest Amount Outstanding | Outstanding Balance as of | |||||||
Lender |
| Borrower |
| Interest Rate |
| in 2021 |
| December 31, 2021 |
% | (RMB) | (RMB) | ||||||
Huaneng Finance | Qinbei Power | 3.60 | 200,000,000.00 | 200,000,000.00 | ||||
Huaneng Finance | Qinbei Power | 3.60 | 100,000,000.00 | 100,000,000.00 | ||||
Huaneng Finance |
| Luoyang Co-generation |
| 3.94 | 200,000,000.00 | 200,000,000.00 | ||
Huaneng Finance |
| Jiangxi Clean Energy |
| 3.71 | 40,000,000.00 | 40,000,000.00 | ||
Huaneng Finance |
| Jiangxi Clean Energy |
| 3.71 | 20,000,000.00 | 20,000,000.00 | ||
Huaneng Finance |
| Jiangxi Clean Energy |
| 3.71 | 35,000,000.00 | 35,000,000.00 | ||
Huaneng Finance |
| Nanchang Tongshang |
| 3.71 | 50,000,000.00 | 50,000,000.00 | ||
Huaneng Finance |
| Nanchang Tongshang |
| 3.71 | 40,000,000.00 | 40,000,000.00 | ||
Huaneng Finance |
| Diandong Energy |
| 4.40 | 210,000,000.00 | 210,000,000.00 | ||
Huaneng Finance |
| Panzhou Wind Power |
| 3.71 | 17,000,000.00 | 17,000,000.00 | ||
Huaneng Finance |
| Panzhou Wind Power |
| 3.71 | 18,000,000.00 | 18,000,000.00 | ||
Huaneng Finance |
| Panzhou Wind Power |
| 3.71 | 3,000,000.00 | 3,000,000.00 | ||
Huaneng Finance |
| Panzhou Wind Power |
| 3.71 | 51,000,000.00 | 51,000,000.00 | ||
Huaneng Finance |
| Panzhou Wind Power |
| 3.71 | 8,000,000.00 | 8,000,000.00 | ||
Huaneng Finance |
| Panzhou Wind Power |
| 3.71 | 4,000,000.00 | 4,000,000.00 | ||
Huaneng Finance |
| Panzhou Wind Power |
| 3.71 | 28,000,000.00 | 24,000,000.00 | ||
Huaneng Finance |
| Panzhou Wind Power |
| 3.71 | 71,000,000.00 | 67,000,000.00 | ||
Huaneng Finance |
| Taiyuan Dongshan Combined Cycle |
| 3.60 | 200,000,000.00 | 200,000,000.00 | ||
Huaneng Finance |
| Taiyuan Dongshan Combined Cycle |
| 3.60 | 95,000,000.00 | 95,000,000.00 | ||
Huaneng Finance |
| Zhongxiang Wind Power |
| 3.71 | 157,000,000.00 | 143,000,000.00 | ||
Huaneng Finance |
| Lingang Co-generation CCGT |
| 3.60 | 80,000,000.00 | 58,000,000.00 | ||
Huaneng Finance |
| Lingang Co-generation CCGT |
| 3.60 | 70,000,000.00 | 70,000,000.00 | ||
Huaneng Finance |
| Lingang Co-generation CCGT |
| 3.60 | 50,000,000.00 | 50,000,000.00 | ||
Huaneng Finance |
| Mianchi Clean Energy |
| 3.71 | 270,000,000.00 | 270,000,000.00 | ||
Huaneng Finance |
| Jianchang Photovoltaic Power Generation |
| 3.87 | 25,000,000.00 | 25,000,000.00 | ||
Huaneng Finance |
| Chaoyang Photovoltaic Power Generation |
| 3.87 | 10,000,000.00 | 10,000,000.00 | ||
Huaneng Finance |
| Xinhua Power |
| 3.94 | 50,000,000.00 | 50,000,000.00 | ||
Huaneng Finance |
| Xinhua Power |
| 3.94 | 50,000,000.00 | 50,000,000.00 | ||
Huaneng Finance |
| Lvyuan Wind Power Generation |
| 3.97 | 50,000,000.00 | 50,000,000.00 | ||
Huaneng Finance |
| Luobei Wind Power |
| 3.71 | 5,000,000.00 | 5,000,000.00 | ||
Huaneng Finance |
| Luobei Wind Power |
| 3.71 | 5,000,000.00 | 5,000,000.00 | ||
Huaneng Finance |
| JiLin Power |
| 3.94 | 200,000,000.00 | 200,000,000.00 | ||
Huaneng Finance |
| Shandong Power |
| 3.00 | 300,000,000.00 | 300,000,000.00 |
125
Huaneng Finance |
| Penglai Wind Power |
| 4.41 | 43,000,000.00 | 43,000,000.00 | ||
Huaneng Finance |
| Penglai Wind Power |
| 4.41 | 50,000,000.00 | 50,000,000.00 | ||
Huaneng Finance |
| Penglai Wind Power |
| 4.41 | 63,500,000.00 | 63,500,000.00 | ||
Huaneng Finance |
| Weishan New Energy |
| 4.26 | 93,000,000.00 | 91,000,000.00 | ||
Huaneng Finance |
| Helan New Energy |
| 3.71 | 71,100,000.00 | 69,900,000.00 | ||
Huaneng Finance |
| Liaocheng Co-generation |
| 3.60 | 100,000,000.00 | 100,000,000.00 | ||
Huaneng Finance |
| Zhongyuan CCGT |
| 3.94 | 150,000,000.00 | 150,000,000.00 | ||
Huaneng Finance |
| Abagaqi Clean Energy |
| 3.71 | 162,000,000.00 | 162,000,000.00 | ||
Huaneng Finance |
| Shanxi Comprehensive Energy |
| 3.60 | 151,650,000.00 | 151,650,000.00 | ||
Huaneng Finance |
| Yingheng Clean Energy |
| 3.71 | 300,000,000.00 | 300,000,000.00 | ||
Huaneng Finance |
| Anshun Comprehensive Energy |
| 4.26 | 10,000,000.00 | 9,200,000.00 | ||
Huaneng Finance |
| (Heze Dongming) New Energy |
| 3.71 | 50,000,000.00 | 50,000,000.00 | ||
Huaneng Finance |
| Jiangkou Wind Power |
| 3.71 | 127,000,000.00 | 127,000,000.00 | ||
Huaneng Finance |
| Henan Clean Energy |
| 4.17 | 50,000,000.00 | 50,000,000.00 | ||
Huaneng Finance |
| Qidong Wind Power |
| 4.28 | 30,000,000.00 | 30,000,000.00 | ||
Huaneng Finance |
| Luhe Wind Power |
| 4.51 | 50,000,000.00 | 20,000,000.00 | ||
Huaneng Finance |
| Yizheng Wind Power |
| 4.28 | 35,000,000.00 | 35,000,000.00 | ||
Huaneng Finance |
| Yancheng Dafeng New Energy |
| 4.16 | 50,000,000.00 | 50,000,000.00 | ||
Huaneng Finance |
| Yancheng Dafeng New Energy |
| 4.16 | 233,000,000.00 | 233,000,000.00 | ||
Huaneng Finance |
| Sheyang New Energy |
| 4.16 | 470,000,000.00 | 470,000,000.00 | ||
Huaneng Finance | Guanyun Clean Energy | 3.71 | 369,000,000.00 | 369,000,000.00 | ||||
Huaneng Finance | (Zhejiang) Energy Development | 3.60 | 200,000,000.00 | 200,000,000.00 | ||||
Huaneng Finance | Changxing Photovoltaic | 3.52 | 35,000,000.00 | 35,000,000.00 | ||||
Huaneng Finance | Weihai Power | 3.25 | 50,000,000.00 | 50,000,000.00 | ||||
Huaneng Finance | Qinbei Power | 3.25 | 300,000,000.00 | 300,000,000.00 | ||||
Huaneng Finance | Qinbei Power | 3.25 | 200,000,000.00 | 200,000,000.00 | ||||
Huaneng Finance | Yushe Power | 3.53 | 160,000,000.00 | 160,000,000.00 | ||||
Huaneng Finance | Yueyang Power | 3.25 | 150,000,000.00 | 150,000,000.00 | ||||
Huaneng Finance | Pingliang Power | 3.53 | 100,000,000.00 | 100,000,000.00 | ||||
Huaneng Finance | Pingliang Power | 3.53 | 50,000,000.00 | 50,000,000.00 | ||||
Huaneng Finance | Pingliang Power | 3.53 | 150,000,000.00 | 150,000,000.00 | ||||
Huaneng Finance | Yangliuqing Co-generation | 3.25 | 200,000,000.00 | 200,000,000.00 | ||||
Huaneng Finance | Zuoquan Coal-fired | 3.46 | 200,000,000.00 | 200,000,000.00 | ||||
Huaneng Finance | Tongxiang CCGT | 3.53 | 200,000,000.00 | 200,000,000.00 | ||||
Huaneng Finance | Luoyang Co-generation | 3.85 | 48,000,000.00 | 48,000,000.00 | ||||
Huaneng Finance | Luoyang Co-generation | 3.85 | 95,000,000.00 | 95,000,000.00 | ||||
Huaneng Finance | Luoyang Co-generation | 3.85 | 150,000,000.00 | 150,000,000.00 | ||||
Huaneng Finance | Qingdao Port | 3.25 | 200,000,000.00 | 200,000,000.00 | ||||
Huaneng Finance | Qingdao Co-generation | 3.46 | 50,000,000.00 | 50,000,000.00 | ||||
Huaneng Finance |
| Qingdao Co-generation |
| 3.46 | 13,928,817.00 | 13,928,817.00 | ||
Huaneng Finance |
| Diandong Energy |
| 3.00 | 90,000,000.00 | 90,000,000.00 | ||
Huaneng Finance | Taiyuan Dongshan Combined Cycle | 3.00 | 30,000,000.00 | 30,000,000.00 | ||||
Huaneng Finance | Mianchi Co-generation | 3.85 | 200,000,000.00 | 200,000,000.00 | ||||
Huaneng Finance | Mianchi Co-generation | 3.85 | 100,000,000.00 | 100,000,000.00 | ||||
Huaneng Finance | Mianchi Co-generation | 3.85 | 50,000,000.00 | 50,000,000.00 | ||||
Huaneng Finance | Guilin Gas Energy | 3.53 | 240,000,000.00 | 240,000,000.00 | ||||
Huaneng Finance | Lingang Co-generation CCGT | 3.00 | 20,000,000.00 | 20,000,000.00 | ||||
Huaneng Finance | Lingang Co-generation CCGT | 3.25 | 130,000,000.00 | 130,000,000.00 | ||||
Huaneng Finance | Jingmen Thermal Power | 3.25 | 100,000,000.00 | 100,000,000.00 | ||||
Huaneng Finance | Jingmen Thermal Power | 3.25 | 95,000,000.00 | 95,000,000.00 | ||||
Huaneng Finance | Yingcheng Thermal Power | 3.46 | 50,000,000.00 | 50,000,000.00 | ||||
Huaneng Finance | Yingcheng Thermal Power | 3.46 | 100,000,000.00 | 100,000,000.00 | ||||
Huaneng Finance | Chaohu Power | 3.25 | 100,000,000.00 | 100,000,000.00 | ||||
Huaneng Finance | Chaohu Power | 3.25 | 50,000,000.00 | 50,000,000.00 | ||||
Huaneng Finance | Wuhan Power | 3.25 | 50,000,000.00 | 50,000,000.00 | ||||
Huaneng Finance | Enshi Qingjiang Dalongtan Hydropwer Development | 4.10 | 28,000,000.00 | 28,000,000.00 | ||||
Huaneng Finance | Enshi Qingjiang Dalongtan Hydropwer Development | 4.10 | 20,000,000.00 | 20,000,000.00 | ||||
Huaneng Finance | Anyuan Power | 3.46 | 100,000,000.00 | 100,000,000.00 | ||||
Huaneng Finance | Ruijin Power Generation | 3.46 | 100,000,000.00 | 100,000,000.00 | ||||
Huaneng Finance | Tongwei Wind Power | 3.53 | 60,000,000.00 | 60,000,000.00 | ||||
Huaneng Finance | Hegang Power | 3.53 | 70,000,000.00 | 70,000,000.00 |
126
Huaneng Finance | Hegang Power | 3.53 | 100,000,000.00 | 100,000,000.00 | ||||
Huaneng Finance | Hegang Power | 3.53 | 47,527,266.39 | 47,527,266.39 | ||||
Huaneng Finance | Hegang Power | 3.53 | 100,000,000.00 | 100,000,000.00 | ||||
Huaneng Finance | Xinhua Power | 3.53 | 16,570,000.00 | 16,570,000.00 | ||||
Huaneng Finance | Xinhua Power | 3.53 | 33,430,000.00 | 33,430,000.00 | ||||
Huaneng Finance | Shandong Power | 3.25 | 400,000,000.00 | 400,000,000.00 | ||||
Huaneng Finance | Muping Wind Power | 3.52 | 20,000,000.00 | 20,000,000.00 | ||||
Huaneng Finance | Yantai Power Plant | 3.25 | 50,000,000.00 | 50,000,000.00 | ||||
Huaneng Finance | Yantai Power Plant | 3.25 | 100,000,000.00 | 100,000,000.00 | ||||
Huaneng Finance | Yantai Power Plant | 3.25 | 140,000,000.00 | 140,000,000.00 | ||||
Huaneng Finance | Yantai Power Plant | 3.25 | 100,000,000.00 | 100,000,000.00 | ||||
Huaneng Finance | Yantai Power Plant | 3.25 | 50,000,000.00 | 50,000,000.00 | ||||
Huaneng Finance | Yantai Power Plant | 3.25 | 22,000,000.00 | 22,000,000.00 | ||||
Huaneng Finance | Penglai Wind Power | 3.73 | 65,000,000.00 | 65,000,000.00 | ||||
Huaneng Finance | Baiyanghe Power Plant | 3.25 | 70,000,000.00 | 70,000,000.00 | ||||
Huaneng Finance | Boshan Photovoltaic | 3.73 | 25,000,000.00 | 25,000,000.00 | ||||
Huaneng Finance | Weihai Port Photovoltaic | 3.38 | 20,000,000.00 | 20,000,000.00 | ||||
Huaneng Finance | Laiwu Power | 3.25 | 50,000,000.00 | 50,000,000.00 | ||||
Huaneng Finance | Jiaxiang Power | 4.00 | 50,000,000.00 | 50,000,000.00 | ||||
Huaneng Finance | Jiaxiang Power | 3.68 | 50,000,000.00 | 50,000,000.00 | ||||
Huaneng Finance | Jiaxiang Power | 3.68 | 100,000,000.00 | 100,000,000.00 | ||||
Huaneng Finance | Jiaxiang Power | 3.68 | 91,640,192.62 | 91,640,192.62 | ||||
Huaneng Finance | Jiaxiang Power | 3.68 | 28,359,807.38 | 28,359,807.38 | ||||
Huaneng Finance | Qufu Co-generation | 3.53 | 50,000,000.00 | 50,000,000.00 | ||||
Huaneng Finance | Qufu Co-generation | 3.85 | 22,000,000.00 | 22,000,000.00 | ||||
Huaneng Finance | Qufu Co-generation | 3.53 | 20,000,000.00 | 20,000,000.00 | ||||
Huaneng Finance | Qufu Co-generation | 3.53 | 8,000,000.00 | 8,000,000.00 | ||||
Huaneng Finance | Qufu Co-generation | 3.53 | 40,000,000.00 | 40,000,000.00 | ||||
Huaneng Finance | Qufu Co-generation | 3.53 | 50,000,000.00 | 50,000,000.00 | ||||
Huaneng Finance | Qufu Co-generation | 3.53 | 25,000,000.00 | 25,000,000.00 | ||||
Huaneng Finance | Jining Yunhe | 3.67 | 40,000,000.00 | 40,000,000.00 | ||||
Huaneng Finance | Linyi Power | 3.25 | 100,000,000.00 | 100,000,000.00 | ||||
Huaneng Finance | Linyi Power | 3.25 | 90,000,000.00 | 90,000,000.00 | ||||
Huaneng Finance | Linyi Power | 3.25 | 100,000,000.00 | 100,000,000.00 | ||||
Huaneng Finance | Liaocheng Changrun | 3.53 | 100,000,000.00 | 100,000,000.00 | ||||
Huaneng Finance | Yantai 500 Heating | 3.53 | 10,000,000.00 | 10,000,000.00 | ||||
Huaneng Finance | Liaocheng Co-generation | 3.25 | 100,000,000.00 | 100,000,000.00 | ||||
Huaneng Finance | Liaocheng Co-generation | 3.25 | 70,000,000.00 | 70,000,000.00 | ||||
Huaneng Finance | Liaocheng Co-generation | 3.25 | 30,000,000.00 | 30,000,000.00 | ||||
Huaneng Finance | Zhanhua Photovoltaic | 3.17 | 50,000,000.00 | 50,000,000.00 | ||||
Huaneng Finance | Rizhao Power | 3.00 | 150,000,000.00 | 150,000,000.00 | ||||
Huaneng Finance | Zhongyuan CCGT | 3.53 | 50,000,000.00 | 50,000,000.00 | ||||
Huaneng Finance | Luodian New Energy Power | 2.90 | 8,000,000.00 | 8,000,000.00 | ||||
Huaneng Finance | Jiangsu Energy Development | 3.00 | 100,000,000.00 | 100,000,000.00 | ||||
Huaneng Finance | Huaiyin II Power | 3.25 | 100,000,000.00 | 100,000,000.00 | ||||
Huaneng Finance | Huaiyin II Power | 3.25 | 50,000,000.00 | 50,000,000.00 | ||||
Huaneng Finance | Suzhou Industrial Park | 3.25 | 50,000,000.00 | 50,000,000.00 | ||||
Huaneng Finance | Taicang Power | 3.25 | 100,000,000.00 | 100,000,000.00 | ||||
Huaneng Finance | Taicang Power | 3.25 | 185,000,000.00 | 185,000,000.00 | ||||
Huaneng Finance | Taicang Port | 3.25 | 25,000,000.00 | 25,000,000.00 | ||||
Huaneng Finance | Suzhou Thermal Power | 3.25 | 50,000,000.00 | 50,000,000.00 | ||||
Huaneng Finance | (Zhejiang) Energy Development | 3.25 | 300,000,000.00 | 300,000,000.00 | ||||
Huaneng Finance | Luohuang Power | 3.57 | 100,000,000.00 | 100,000,000.00 | ||||
Huaneng Finance | Luohuang Power | 3.25 | 100,000,000.00 | 100,000,000.00 | ||||
Huaneng Finance | Luohuang Power | 3.25 | 200,000,000.00 | 200,000,000.00 | ||||
Huaneng Finance | Yingkou Xianrendao Co-generation | 3.85 | 100,000,000.00 | 100,000,000.00 | ||||
Huaneng Finance | Yingkou Xianrendao Co-generation | 3.85 | 50,000,000.00 | 50,000,000.00 | ||||
Huaneng Finance | Yingkou Xianrendao Co-generation | 3.85 | 100,000,000.00 | 100,000,000.00 | ||||
Huaneng Finance | Yingkou Xianrendao Co-generation | 3.53 | 100,000,000.00 | 100,000,000.00 | ||||
Huaneng Group | The Company | 4.75 | 24,530,000.00 | 24,530,000.00 | ||||
Huaneng Group | The Company | 4.75 | 640,694,600.00 | 640,694,600.00 | ||||
Huaneng Group | The Company | 4.65 | 100,000,000.00 | 100,000,000.00 | ||||
Huaneng Group | Subaoding Wind Power | 3.86 | 60,000,000.00 | 60,000,000.00 |
127
Huaneng Group | Guidong Wind Power | 3.86 | 70,000,000.00 | 70,000,000.00 | ||||
Huaneng Group | Huaining Wind Power | 3.86 | 31,000,000.00 | 31,000,000.00 | ||||
Huaneng Group | Jingxing Photovoltaic | 3.86 | 40,000,000.00 | 40,000,000.00 | ||||
Huaneng Group | Chongqing Fengjie Wind Power | 3.86 | 42,000,000.00 | 42,000,000.00 | ||||
Huaneng Group | Handan Heating | 3.86 | 80,000,000.00 | 80,000,000.00 | ||||
Huaneng Group | JiLin Power | 3.85 | 465,000,000.00 | 465,000,000.00 | ||||
Huaneng Group | Guigang Clean Energy | 3.86 | 100,000,000.00 | 100,000,000.00 | ||||
Huaneng Group | Shanxi Comprehensive Energy | 3.86 | 67,000,000.00 | 67,000,000.00 | ||||
Huaneng Group | Anhui Mengcheng Wind Power | 3.86 | 63,000,000.00 | 63,000,000.00 | ||||
Huaneng Group | (Fujian) Port | 3.86 | 40,000,000.00 | 40,000,000.00 | ||||
Huaneng Group | Yingkou Xianrendao Co-generation | 3.86 | 217,000,000.00 | 217,000,000.00 | ||||
Huaneng Group | Xiangqi Hydropower | 3.58 | 53,000,000.00 | 53,000,000.00 | ||||
Huaneng Group | Kangbao Wind Power | 3.58 | 80,000,000.00 | 80,000,000.00 | ||||
Huaneng Group | Qingdao Co-generation | 3.58 | 60,000,000.00 | 60,000,000.00 | ||||
Huaneng Group | Diandong Yuwang | 3.58 | 340,000,000.00 | 340,000,000.00 | ||||
Huaneng Group | Diandong Energy | 3.58 | 660,000,000.00 | 660,000,000.00 | ||||
Huaneng Group | Tongwei Wind Power | 4.02 | 90,000,000.00 | 90,000,000.00 | ||||
Huaneng Group | Heilongjiang Power | 4.16 | 200,000,000.00 | 200,000,000.00 | ||||
Huaneng Group | Heilongjiang Power | 4.02 | 100,000,000.00 | 100,000,000.00 | ||||
Huaneng Group | Muping Wind Power | 4.02 | 200,000,000.00 | 200,000,000.00 | ||||
Huaneng Group | Shanxi Comprehensive Energy | 4.02 | 96,000,000.00 | 96,000,000.00 | ||||
Huaneng Group | Ruicheng Comprehensive Energy | 4.02 | 11,000,000.00 | 11,000,000.00 | ||||
Huaneng Group | Dalian Chuanbo | 4.16 | 180,000,000.00 | 180,000,000.00 | ||||
Huaneng Group | Anshun Comprehensive Energy | 4.26 | 18,000,000.00 | 18,000,000.00 | ||||
Huaneng Group | Luhe Wind Power | 4.26 | 203,000,000.00 | 203,000,000.00 | ||||
Hong Kong Asset Management | Muping Wind Power | 4.28 | 175,882,606.07 | 175,882,606.07 | ||||
Hong Kong Asset Management | Muping Wind Power | 4.51 | 1,043,984,000.00 | 1,020,112,000.00 | ||||
Tiancheng Financial Leasing | Diandong Energy | 4.28 | 40,000,000.00 | 40,000,000.00 | ||||
Tiancheng Financial Leasing | Diandong Energy | 4.16 | 150,000,000.00 | 150,000,000.00 | ||||
Tiancheng Financial Leasing | Zhumadian Wind Power | 4.16 | 81,355,848.39 | 81,355,848.39 | ||||
Tiancheng Financial Leasing | Hengtai Power | 4.41 | 71,732,410.21 | 71,732,410.21 | ||||
Tiancheng Financial Leasing | Hengtai Power | 4.21 | 218,267,589.79 | 218,267,589.79 | ||||
Tiancheng Financial Leasing | Younaite Guangmei New Energy | 4.26 | 31,831,160.00 | 31,831,160.00 | ||||
Tiancheng Financial Leasing | Xingtai Comprehensive Energy | 4.51 | 10,350,000.00 | 10,350,000.00 | ||||
Tiancheng Financial Leasing | Shunyi New Energy | 4.75 | 2,008,750.00 | 2,008,750.00 | ||||
Tiancheng Financial Leasing | Hanhao New Energy | 4.75 | 5,000,000.00 | 5,000,000.00 | ||||
Tiancheng Financial Leasing | Ruicheng Comprehensive Energy | 4.90 | 813,123.00 | 813,123.00 | ||||
Tiancheng Financial Leasing | Ruicheng Comprehensive Energy | 2.30 | 16,654,456.53 | 16,654,456.53 | ||||
Tiancheng Financial Leasing | Ruicheng Comprehensive Energy | 4.77 | 11,586,548.67 | 11,586,548.67 | ||||
Tiancheng Financial Leasing | Ruicheng Comprehensive Energy | 4.69 | 5,454,747.48 | 5,454,747.48 | ||||
Tiancheng Financial Leasing | Ruicheng Comprehensive Energy | 4.69 | 54,057.88 | 54,057.88 | ||||
Tiancheng Financial Leasing | Ruicheng Comprehensive Energy | 4.69 | 432,463.01 | 432,463.01 | ||||
Tiancheng Financial Leasing | Ruicheng Comprehensive Energy | 4.15 | 489,083.76 | 489,083.76 | ||||
Tiancheng Financial Leasing | Ruicheng Comprehensive Energy | 4.69 | 2,306,657.55 | 2,306,657.55 | ||||
Tiancheng Financial Leasing | Ruicheng Comprehensive Energy | 4.15 | 643,628.32 | 643,628.32 | ||||
Tiancheng Financial Leasing | Ruicheng Comprehensive Energy | 4.69 | 1,614,660.27 | 1,614,660.27 | ||||
Tiancheng Financial Leasing | Ruicheng Comprehensive Energy | 4.69 | 497,012.38 | 497,012.38 | ||||
Tiancheng Financial Leasing | Guanling New Energy | 4.42 | 75,000,000.00 | 75,000,000.00 | ||||
Tiancheng Financial Leasing | Weixian Zeen Vegetable Planting | 4.42 | 270,000,000.00 | 270,000,000.00 |
Below set forth certain related party transactions entered into or carried out by the Company for the year ended December 31, 2021. Terms not defined in this annual report shall have meanings ascribed to it in the current reports on Form 6-Ks furnished by the Company with respect to such transactions.
128
Transactions with Huaneng Group
On November 5, 2020, the Company entered into the Huaneng Group Framework Agreement with Huaneng Group, its ultimate controlling shareholder, for a term commencing on January 1, 2021 and expiring on December 31, 2021. Pursuant to the Huaneng Group Framework Agreement, the Company will conduct (among other things) the following transactions with Huaneng Group and its subsidiaries and associates: (i) purchase of ancillary equipment and parts; (ii) purchase of fuel and transportation services; (iii) leasing of facilities, land and office spaces; (iv) purchase and provision of technical services, engineering contracting services and other services; (v) provision of entrusted sale services; (vi) sales of products; (vii) purchase of electricity; and (viii) sales of heat. On September 28, 2021, the Company entered into the Supplemental Agreement to Huaneng Group Framework Agreement with Huaneng Group, pursuant to which the transaction amount for the purchase of fuel and transporation services by the Company and its subsidiaries from Huaneng Group and its Subsidiaries and associates for the period from January 1, 2021 to December 31, 2021 was increased from RMB50 billion to RMB85 billion.
Transactions with Tiancheng Leasing
On November 1, 2019, the Company entered into the Tiancheng Leasing Framework Agreement with Tiancheng Leasing for the purpose of governing the conduct of continuing connected transactions between the Company and Tiancheng Leasing from 2020 to 2022. Tiancheng Leasing Framework Agreement shall be effective from January 1, 2020 to December 31, 2022. Under the Tiancheng Leasing Framework Agreement, the finance lease business conducted by the Company and its subsidiaries with Tiancheng Leasing includes direct lease and sale-and-leaseback.
Transactions with Huaneng Finance
On November 1, 2019, the Company and Huaneng Finance entered into the Huaneng Finance Framework Agreement, with a term commencing on January 1, 2020 and ending on December 31, 2022. The Huaneng Finance Framework Agreement will constitute the entire framework agreement between the Company and Huaneng Finance with respect to deposit, note discounting and loan. On October 26, 2021, the Company and Huaneng Finance entered into the Huaneng Finance Framework Agreement to adjust and continue to carry out the deposits, note discounting and loans matters between the Company the Huaneng Finance from January 1, 2022 to December 31, 2024, which constitutes the entire framework agreement between the parties with respect to the above mentioned matters.
Formation of Wushan Company
On April 27, 2021, the Company entered into the Investment Agreement with Pro-Power Investment, a subsidiary of Hua Neng HK, pursuant to which the parties shall jointly establish Wuhan Company. The Company shall contribute no more than RMB81 million. After the completion of the transaction, the Company will hold 75% in Wushan Company and consolidate the financial statements of Wushan Company.
Capital Increase in Clean Energy Institute
On June 22, 2021, the Company entered into the Capital Increase Agreement with Huaneng Group, Xi’an Institue, New Energy Co., Northern Co., Mongolia Eastern Co. and Clean Energy Institute, pursuant to which the Company shall subscribe part of the new registered capital of Clean Energy Institute in an amount of RMB389.6 million, after the completion of which the Company shall hold 30% in Clean Energy Institue.
Amendment to the Joint Venture Agreement for Hanfeng Power Plant
On June 22, 2021, the Company entered into the Amendment to Joint Venture Contract with Jiantou Energy and Widewin Investment, pursuant to which the parties proposed to change the term of operation of Hanfeng Power Plant into perpetual operation, and the Company and Jiantou Energy would make RMB65.3 million and RMB32.7 million, respectively, to Widewin Investment for the difference in its investment.
129
Formation of Fengcheng Company
On July 27, 2021, Huaneng Clean Energy, a subsidiary of the Company, entered into the Joint Venture Agreement with Pro-Power Investment, pursuant to which both parties will joinly establish Fencheng Company. Huaneng Clean Energy will subscribe for the registered capital of no more than RMB924 million. Upon completion of the transaction, Huaneng Clean Energy will hold 70% in Fengcheng Company and consolidate the financial statements of Fengcheng Company.
Formation of Daishan Wind Power
On August 31, 2021, Zhejiang Company, a subsidiary of the Company, Huaneng Treasury, Daishan Communications Investment, CC Third Harbour and Shanghai Electric Wind entered into a Cooperation Agreement, pursuant to which the parties will jointly establish Daishan Wind Power. Zhejiang Company will contribute RMB600 million to Daishan Wind Power, and upon the completion the transaction, Zhejiang Company will hold 40% in Daishan Wind Power and consolidate the financial statements of Daishan Wind Power.
Formation of Project Companies
On November 3, 2021, Shandong Company, a controlling subsidiary of the Company, and Huaneng Shandong (HK) Investment Limited, a subsidiary of Shandong Company, entered into the Joint Venture Agreement of Guan County New Energy Project and the Joint Venture Agreement of Weifang Binhai District New Energy Project with Huaneng Treasury. On the same day, Shandong Company and Huaneng Treasury Entered into the Joint Venture Agreement of Fushan Photovoltaic Power Generation Project, the Joint Venture Agreement of Haiyang New Energy Project and the Joint Venture Agreement of Dongming County Matou Town MW Agricultural Photovoltaic Power Generation Project. The total investment in the formation of relevant project companies is RMB2,587.6 million. Following the completion of the transactions, Shandong Company will hold 29% in Guan County New Energy Project, 20% in Weifang Binhai District New Energy Project, 65% in Fushan Photovoltaic Power Generation Project, 65% in Haiyang New Energy Project and 65% in Dongming County Matou Town 100 MW Agricultural Photovoltaic Power Generation Project, and Huaneng Shandong (HK) Investment Limited will hold 36% in Guan County New Energy Project and 45% in Weifang Binhai District New Energy Project, and the financial statements of those project companies will be consoliated by Shandong Company.
Formation of Caofeidian Clean Energy
On December 29, 2021, Huaneng Hebei Clean Energy Co., Ltd., or Hebei Company, a subsidiary of the Company, entered into a Joint Venture Agreement with Huaneng Treasury, pursuant to which both parties shall joinly establish Huaneng Tangshan Caofeidian Clean Energy Co., Ltd. (tentative named subject to the final approval of the registration authorities), or Caofeidian Clean Energy. Hebei Company will contribute RMB119.616 million and Huaneng Treasury will contribute in US dollars equivalent of RMB51.264 million. After the completion of the transaction, Hebei Company will hold 70% of Caofeidian Clean Energy, and consolidate the financial statements of Caofeidian Clean Energy.
Increase in Share Capital in Zhanyi Company
On December 29, 2021, Yuwang Energy, a subsidiary of the Company, entered into the Capital Increase Agreement with Huaneng Treasuary, the existing shareholder of Huaneng Clean Energy (Qujing Zhanyi) Co., Ltd., or Zhanyi Company, pursuant to which both parties shall inject new capital by way of cash in accordance with their respective shareholding ratios. Yuwang Energy shall use its own internal fund to pay Zhanyi Company not more than RMB117 million as the consideration for the capital increase, upon the completion of which Yuwang Energy’s shareholding ratio in Zhanyi Company will remain unchaged at 75%.
For a detailed discussion of related party transactions, see Note 35 to the Financial Statements.
C. | Interests of experts and counsel |
Not applicable.
130
ITEM 8. FINANCIAL INFORMATION
A. | Consolidated statements and other financial information |
See pages F-1 to F-169.
Legal proceedings
As of December 31, 2021, we are not a defendant in any material litigation or arbitration and no litigation or claim of material importance is known to us or any member of the Board of directors of us to be pending or threatened against us.
Dividend distribution policy
Our articles of association clearly define our cash dividend policy, i.e. when our earnings and accumulative undistributable profits for the current year are positive, and on the condition that our cash flow can satisfy our normal operation and sustainable development, we shall adopt a cash dividend appropriation policy on the principle that the cash dividend payout will not be less than 50% of the distributable profit realized in the then-current year’s consolidated financial statement.
Our Board of Directors will determine the payment of dividends, if any, with respect to our shares on a per share basis. Any final dividend for a financial year shall be subject to shareholders’ approval. The Board may declare interim and special dividends at any time under general authorization by a shareholders’ ordinary resolution. A decision to declare or to pay any dividends in the future, and the amount of any dividends, will depend on our results of operations, cash flows, financial condition, future prospects and other factors which our Directors may determine as important.
For holders of our H Shares, cash dividend payments, if any, shall be declared by our Board of Directors in Renminbi and paid in HK Dollars. The depositary will convert the HK Dollar dividend payments and distribute them to holders of ADSs in U.S. dollars, less expenses of conversion.
Dividends may be paid only out of our distributable profits (less allocation to the statutory funds of 10% of our net income determined in accordance with PRC GAAP) and may be subject to any applicable PRC withholding tax. Our Articles of Association limit our distributable profits to the lower of the amounts determined in accordance with PRC GAAP, and IFRS. Subject to the above, we expect to carry a positive, balanced and stable dividend distribution policy.
On March 23, 2021, the Board of Directors proposed a cash dividend of RMB0.18 per share, which was approved by the shareholders at the annual general meeting of 2020 on June 22, 2021, and declared on the following day.
B.Significant changes
Except as disclosed elsewhere in this annual report, we have not experienced any significant changes since the date of our audited consolidated financial statements included in this annual report.
ITEM 9 . THE OFFER AND LISTING
A. | Offer and listing details and markets |
The Company’s ADSs have been listed on the New York Stock Exchange since October 6, 1994. Each ADS represents 40 H Shares. As of March 31, 2022, there were 91registered holders of American Depositary Receipts evidencing ADS.
On January 21, 1998, we listed our H Shares on the Hong Kong Stock Exchange. On February 26, 1998, we placed 250 million H Shares at the price of HK$4.40 per H Share or US$22.73 per ADS. In May 2004, we effected a two-for-one stock split by way of a stock dividend for all our outstanding shares including H Shares. As of March 31, 2022, there were 397 registered holders of H Shares.
131
ITEM 10 . ADDITIONAL INFORMATION
A. | Share capital |
Not applicable.
B. | Memorandum and articles of association |
The following is a brief summary of certain provisions of our Articles of Association, as amended, the Company Law and certain other applicable laws and regulations of the PRC. Such summary does not purport to be complete. For further information, you and your advisors should refer to the text of our Articles of Association, as amended, and to the texts of the applicable laws and regulations.
Objects and Purposes
We are a joint stock limited company established in accordance with the Standard Opinion for Joint Stock Limited Companies (the “Standard Opinion”) and certain other relevant laws and regulations of the PRC. We are registered with the PRC State Administration for Industry and Commerce with business license number 91110000625905205U. Article 11 of our Articles of Association provides that our scope of businesses includes, among other things, investment, construction, operation and management of power plants; development, investment and operation of other export-oriented enterprises related to power plants; production and sale of thermal heat and electricity.
Directors
Our directors shall be elected at our shareholders’ general meeting. Our directors shall be elected for a term of three years and may serve consecutive terms upon re-election, except that independent directors may only serve a maximum of two consecutive terms of six years. Our directors are not required to hold any shares in us, and there is no age limit requirement for the retirement or non-retirement of our directors.
Where a director is materially interested, directly or indirectly, in a contract, transaction or arrangement (including any proposed contract, transaction or arrangement) with us, he or she shall declare the nature and extent of his or her interests to the board of directors at the earliest opportunity, whether or not such contract, transaction or arrangement is otherwise subject to the approval of the board. A director shall not vote, and shall not be counted in the quorum of the meeting, on any resolution concerning any contract, transaction or arrangement where the director owns material rights or interests therein. A director is deemed to be interested in a contract, transaction or arrangement in which his associate (as defined by Article 137 of the Articles of Association) is interested.
Unless the interested director discloses his interests to the board and the contract, transaction or arrangement in which the director is materially interested is approved by the board at a meeting in which the director neither votes nor is counted in the quorum, such contract, transaction or arrangement may be revoked by us except with respect to a bona fide party thereto who does not have notice of the director’s interests.
We are prohibited from making loans or providing guarantees to our directors and their associates except where such loan or guarantee is made or provided under a service contract as approved by our shareholders at the shareholders’ general meeting and to meet expenditure requirement incurred or to be incurred by the director for the purposes of the Company or for the purpose of enabling the director to perform his or her duties properly.
Matters relating to the remuneration of our directors shall be determined by the shareholders’ general meeting.
Dividends
Distribution of dividends may be proposed by our board of directors for approval by an ordinary resolution of our shareholders at the shareholders’ general meeting. The Articles of Association allows for cash dividends, stock dividends and combination of cash and stock dividends.
132
Dividends may only be distributed after allowance has been made for:
● | recovery of losses, if any; |
● | allocations to the statutory surplus reserve fund; and |
● | allocations to a discretionary surplus reserve fund. |
The allocation to the statutory surplus reserve fund is 10% of our net income determined in accordance with the PRC accounting rules. Where the accumulated statutory surplus reserve fund has reached 50% or more of our registered capital, no allocation is needed.
The Articles of Association require that cash dividends and other distribution with respect of H Shares be declared in Renminbi and paid by the Company in U.S. dollars or Hong Kong dollar in terms of the H Shares listed on the Hong Kong Stock Exchange. The Articles of Association further stipulate that for dividends and other distributions paid in currencies other than Renminbi, we shall use an exchange rate equal to the median closing exchange rate of Renminbi for such currencies announced by the PBOC for two working days in the week preceding the date on which such dividends or other distributions are declared.
We will appoint receiving agents to receive, on behalf of the holders of H Shares, any dividend distributions and all other money owing by us in respect of such shares (Receiving Agents). The Receiving Agents will comply with the laws and regulations of the applicable stock exchanges on which our shares are listed. Any Receiving Agent appointed on behalf of the holders of H Shares listed on the Hong Kong Stock Exchange will be a company registered as a trust corporation under the Trustee Ordinance of Hong Kong.
Dividends payments may be subject to PRC withholding tax.
Voting Rights and Shareholders’ Meetings
Our board of directors shall convene a shareholders’ annual general meeting once every year and within six months from the end of the preceding financial year. Our board shall convene an extraordinary general meeting within two months after the occurrence of any one of the following events:
● | where the number of directors is less than the number required by the PRC Company Law or two-thirds of the number specified in our Articles of Association; |
● | where our unrecovered losses reach one-third of the total amount of our share capital; |
● | where shareholder(s) holding 10% or more of our issued shares so request(s); |
● | whenever our board deems necessary or our supervisory committee so requests; or |
● | other circumstances as provided in the Articles of Association. |
Resolutions proposed by shareholder(s) holding 3% or more of the total number of voting shares shall be included in the agenda for the relevant annual general meeting if (i) they are submitted to the board of directors no later than 10 days before the annual general meeting is to be held and (ii) they are matters which fall within the scope of the functions and powers of shareholders’ general meeting and have clear subject and concrete terms to be voted upon. The board of directors shall publish a supplementary notice of annual general meeting specifying the resolutions proposed to other shareholders. Upon publication of the supplementary notice, no alteration to the proposed resolutions or addition of other proposed resolutions will be accepted.
133
All shareholders’ meetings must be convened by our board by written notice given to shareholders not less than 45 days before the meeting. Based on the written replies received by us 20 days before a shareholders’ meeting, we shall calculate the number of voting shares represented by shareholders who have indicated that they intend to attend the meeting. When the number of voting shares represented by those shareholders amounts to more than one-half of our total voting shares, we shall convene the shareholders’ general meeting. Otherwise, we shall, within five days before holding the shareholders’ general meeting, inform the shareholders again of the motions to be considered and the date and venue of the meeting by way of a public announcement. After the announcement is made, the shareholders’ meeting may be convened. The accidental omission by us to give notice of a meeting to, or the non-receipt of notice of a meeting by, a shareholder will not invalidate the proceedings at that shareholders’ meeting.
Shareholders at meetings have the power, among other things, to examine and approve our profit distribution plans and plans to recover losses, the annual budget, an increase or reduction of registered share capital, the reports of our board of directors and supervisory committee, the issuance of debentures, and the plans for merger, division, dissolution or liquidation; to elect or remove our directors and supervisors who are not elected as employees’ representatives; and to review and amend our Articles of Association. In addition, the rights of a class of shareholders may not be modified or abrogated, unless approved by a special resolution of shareholders at a general shareholders’ meeting and by a special resolution of shareholders of that class of shares at a separate meeting. Our Articles of Association enumerate, without limitation, certain amendments which would be deemed to be a modification or abrogation of the rights of a class of shareholders, including increasing or decreasing the number of shares of such class or the number of shares of a class with voting or distribution rights or privileges equal or superior to the shares of such class, removing or reducing rights to receive dividends in a particular currency, and creating shares with voting or distribution rights or privileges equal or superior to the shares of such class.
Each share is entitled to one vote on all such matters submitted to a vote of our shareholders at the shareholders’ general meetings, except for meetings of a special class of shareholders where only holders of shares of the affected class are entitled to vote on the basis of one vote per share of the affected class.
Shareholders are entitled to attend and vote at meetings either in person or by proxy. Proxies must be in writing and deposited at our legal address, or such other place as is specified in the meeting notice, not less than 24 hours before the start of the meeting at which the proxy proposes to vote or the time appointed for the passing of the relevant resolution(s). When the instrument appointing a proxy is executed by the shareholder’s attorney-in-fact, such proxy when deposited must be accompanied by a notary-certified copy of the relevant power of attorney or other authority under which the proxy was executed.
Except for those actions discussed below which require supermajority votes (“special resolutions”), resolutions of the shareholders are passed by a simple majority of the voting shares held by shareholders who are present in person or by proxy. Special resolutions must be passed by more than two-thirds of the voting shares held by shareholders who are present in person or by proxy.
The following decisions must be adopted by special resolution:
● | an increase or reduction of our registered share capital or the issuance of shares, including stock distributions, of any class, warrants and other similar securities; |
● | issuance of debentures; |
● | our division, merger, dissolution, liquidation and change of the legal form; |
● | amendments to our Articles of Association; |
● | acquisition or disposal of material assets or providing a guarantee in the amount exceeding 30% of our most recent audited total assets within one year; |
● | adjustments to our profit distribution policy; and |
● | any other matters our shareholders have resolved by way of an ordinary resolution at a general meeting to be of a nature which may have a material impact on us and should be adopted by special resolution. |
134
In addition, amendments to the Articles of Association require the approval and consent of the relevant PRC authorities.
All other actions taken by the shareholders, including the appointment and removal of our directors and supervisors and the declaration of cash dividend payments, will be decided by an ordinary resolution of the shareholders.
Any shareholder resolution which is in violation of any laws or regulations of the PRC will be null and void.
Liquidation Rights
In the event of our liquidation, the ordinary shares held by overseas shareholders will rank pari passu with the ordinary shares held by the domestic shareholders, and any of our assets remaining after payments (in order of priority) of (a) the costs of liquidation (b) wages and social insurance fees payable to or for our employees for the past three years prior to the date of liquidation; (c) overdue taxes and tax surcharges, funds and other amounts payable pursuant to the applicable administrative regulations; and (d) bank loans, corporate bonds and other debts, will be divided among our shareholders in accordance with the class of shares and their proportional shareholdings.
Further Capital Call
Shareholders are not liable to make any further contribution to the share capital other than according to the terms, which were agreed to by the subscriber of the relevant shares at the time of subscription.
Increases in Share Capital and Preemptive Rights
The Articles of Association require the approval by a special resolution of the shareholders prior to authorizing, allotting, issuing or granting shares, securities convertible into shares or options, warrants or similar rights to subscribe for any shares or such convertible securities. New issues of shares must also be approved by the relevant PRC authorities.
Shareholders do not have preemptive rights with respect to new issues of shares of the Company.
Reduction of Share Capital and Purchase by Us of Our Shares and General Mandate to Repurchase Shares
We may reduce our registered share capital only upon obtaining the approval of the shareholders by a special resolution and, in certain circumstances, of relevant PRC authorities. The number of H Shares which may be purchased is subject to the Hong Kong Takeovers and Share Repurchase Codes.
Restrictions on Large or Controlling Shareholders
Our Articles of Association provide that, in addition to any obligation imposed by laws and administration regulations or required by the listing rules of the stock exchanges on which our shares are listed, a controlling shareholder shall not exercise his voting rights in a manner prejudicial to the interests of the shareholders generally or of some part of the shareholders:
● | to relieve a director or supervisor from his or her duty to act honestly in our best interests; |
● | to approve the expropriation by a director or supervisor (for his or her own benefit or for the benefit of another person) of our assets in any way, including, without limitation, opportunities which may benefit us; or |
● | to approve the expropriation by a director or supervisor (for his or her own benefit or for the benefit of another person) of the individual rights of other shareholders, including, without limitation, rights to distributions and voting rights (save according to a restructuring of our company which has been submitted for approval by the shareholders in a general meeting in accordance with our articles of association). |
135
A controlling shareholder, however, will not be precluded by our Articles of Association or any laws and administrative regulations or the listing rules of the stock exchanges on which our shares are listed from voting on these matters.
A controlling shareholder is defined by our Articles of Association as a shareholder whose capital contribution represents 50% or more of the total capital of our Company, or a shareholder whose shares represent 50% or more of the total issued share capital of our Company, or a shareholder whose capital contribution or shares are less than 50% but obtains significant voting rights to influence the result of the shareholder’s general meeting or the resolutions passed thereby.
Disclosure
The Listing Agreement imposes a requirement on us to keep the Hong Kong Stock Exchange, our shareholders and other holders of our listed securities informed as soon as reasonably practicable of any information relating to us and our subsidiaries, including information on any major new developments which are not public knowledge, which:
● | is necessary to enable them and the public to appraise the position of us and our subsidiaries; |
● | is necessary to avoid the establishment of a false market in its securities; and |
● | might be reasonably expected to materially affect market activity in and the price of its securities. |
There are also requirements under the Listing Rules for us to obtain prior shareholders’ approval and/or to disclose to shareholders details of certain acquisitions or disposals of assets and other transactions (including transactions with controlling shareholders).
Sources of Shareholders’ Rights
The PRC’s legal system is based on written statutes and is a system in which decided legal cases have little precedent value. Prior to the effectiveness of the Company Law, the PRC did not have a comprehensive body of laws governing joint stock limited companies. The rights and obligations of our shareholders are principally contained in our constitutive documents and the Standard Opinion, under which we were established. In December 1993, the Standing Committee of the 8th National People’s Congress adopted the PRC Company Law, which superseded the Standard Opinion. In accordance with Article 229 of the Company Law, we must comply with the relevant requirements of the Company Law within an unspecified time period. As a result, we amended our Articles of Association pursuant to the Company Law on June 6, 1995. The Company Law was amended by the Standing Committee in 2005, 2013 and 2018.
Currently, the primary sources of shareholder’s rights are our Articles of Association, as amended, the PRC Company Law and the Listing Rules of the Hong Kong Stock Exchange, which, among other things, impose certain standards of conduct, fairness and disclosure on us, our directors and our controlling shareholders. To facilitate the offering and listing of shares of PRC companies overseas, and to regulate the behavior of companies whose shares are listed overseas, the State Council Securities Committee and the State Commission for Restructuring the Economic System issued on August 27, 1994 the Mandatory Provisions for Articles of Association of Company Listing Overseas (the “Mandatory Provisions”). These Mandatory Provisions become entrenched in that, once they are incorporated into the Articles of Association of a PRC Company, any amendment to those provisions will only become effective after approval by the State-owned Assets Supervision and Administration Commission of the State Council. The Listing Rules require a number of additional provisions to the Mandatory Provisions to be included in the Articles of Association of PRC companies listing H Shares on the Hong Kong Stock Exchange (the “Additional Provisions”). The Mandatory Provisions and the Additional Provisions have been incorporated into our Articles of Association.
In addition, upon the listing of and for so long as the H Shares are listed on the Hong Kong Stock Exchange, we are subject to the relevant ordinances, rules and regulations applicable to companies listed on the Hong Kong Stock Exchange, including the Listing Rules of the Hong Kong Stock Exchange, the Securities (Disclosure of Interests) Ordinance (the “SDI Ordinance”), the Securities (Insider Dealing) Ordinance and the Hong Kong Codes on Takeovers and Mergers and Share Repurchases (the “Hong Kong Takeovers and Repurchase Codes”).
136
Enforceability of Shareholders’ Rights
There has not been any public disclosure in relation to the enforcement by holders of H Shares of their rights under constitutive documents of joint stock limited companies or the Company Law or in the application or interpretation of the PRC or Hong Kong regulatory provisions applicable to the PRC joint stock limited companies.
The Company Law, as amended in 2018, has granted shareholders with the rights to bring derivative suits. Within the Company Law, shareholders holding more than 1 percent of the shares of the company for more than 180 consecutive days are entitled to request the supervisory committee (in terms of directors and senior management) or the board of directors (in terms of supervisors) to bring legal proceedings, or bring legal proceedings in their own name on behalf of the company where it is in emergency and the company will be subject to irreparable loss if not to do so, against directors, supervisors or senior management who fail to comply with the laws and regulations or the company’s Articles of Association in the course of performing their duties and cause loss to the company;
Our Articles of Association provide that all differences or claims:
● | between a holder of H Shares and us; |
● | between a holder of H Shares and any of our directors, supervisors, general managers or other senior officers; or |
● | between a holder of H Shares and a holder of domestic ordinary shares, arising from any provision of our Articles of Association, any right or obligation conferred or imposed by the Company Law or any other relevant law or administrative regulation which concerns our affairs must, with certain exceptions, be referred to arbitration at either the China International Economic and Trade Arbitration Commission in the PRC or the Hong Kong International Arbitration Center. Our Articles of Association provide that such arbitration will be final and conclusive. In June 1999, an arrangement was made between the People’s Courts of the PRC and the courts of Hong Kong to mutually enforce arbitration rewards rendered in the PRC and Hong Kong according to their respective laws. This new arrangement was approved by the Supreme Court of the PRC and the Hong Kong Legislative Council and became effective on February 1, 2000. |
The holders of H Shares will not be able to bring actions on the basis of violations of the Listing Rules and must rely on the Hong Kong Stock Exchange to enforce its rules. The SDI Ordinance establishes certain obligations in relation to disclosure of shareholder’s interests in Hong Kong listed companies, the violation of which is subject to prosecution by the Securities and Futures Commission of Hong Kong. The Hong Kong Takeovers and Repurchase Codes do not have the force of law and are the only standards of commercial conduct considered acceptable for takeover and merger transactions and share repurchases in Hong Kong as established by the Securities and Futures Commission and the securities and futures industry in Hong Kong.
As the PRC does not have treaties providing for the reciprocal recognition and enforcement of judgments of courts within the United States, the United Kingdom, Japan or most other of the Organization for Economic Cooperation and Development countries, administrative actions brought by regulatory authorities, such as the Commission, and other actions which result in foreign court judgments, could (assuming such actions are not required by PRC law and the Articles of Association to be arbitrated) only be enforced in the PRC on a reciprocal basis or according to relevant international treaties to which China is a party if such judgments or rulings do not violate the basic principles of the law of the PRC or the sovereignty, security and public interest of the society of the PRC, as determined by a People’s Court of the PRC which has the jurisdiction for recognition and enforcement of judgments. We have been advised by our PRC counsel, Haiwen & Partners, that there is uncertainty as to the enforceability in the PRC of actions to enforce judgments of United States courts arising out of or based on the ownership of H Shares or ADSs, including judgments arising out of or based on the civil liability provisions of United States federal or state securities laws.
Restrictions on Transferability and the Share Register
As provided in the Articles of Associations we may refuse to register a transfer of H Shares listed on Hong Kong Stock Exchange unless:
● | a fee (for each instrument of transfer) of HK dollar 2.50, or any higher fee as agreed by the Hong Kong Stock Exchange, has been paid to us; |
137
● | the instrument of transfer only involves H Shares; |
● | the stamp duty chargeable on the instrument of transfer has been paid; |
● | the relevant share certificate and upon the reasonable request of the board of directors, any evidence in relation to the right of the transferor to transfer the shares have been submitted; |
● | if it is intended to transfer the shares to joint owners, then the maximum number of joint owners must not exceed four; |
● | we do not have any lien on the relevant shares. |
We are required to maintain an original share register for holders of H Shares in Hong Kong and a copy of the register at our legal address. Shareholders have the right to inspect and, for a reasonable charge, to copy the share register. No transfers of ordinary shares shall be recorded in our share register within 20 days prior to the date of a shareholders’ general meeting or within 5 days prior to the record date established for the purpose of distributing a dividend.
We have appointed Hong Kong Registrars Limited to act as the registrar of our H Shares. This registrar maintains our register of holders of H Shares in Hong Kong and enters transfers of shares in such register upon the presentation of the documents described above.
C. | Material contracts |
See “Item 7. Major Shareholders and Related Party Transactions — B. Related Party Transactions” for certain arrangements we have entered into with HIPDC and Huaneng Group.
D. | Exchange controls |
The existing foreign exchange regulations have significantly reduced government foreign exchange controls for transactions under the current account, including trade and service related foreign exchange transactions and payment of dividends. We may undertake current account foreign exchange transactions without prior approval from the State Administration of Foreign Exchange or its local branch offices. The PRC Government has stated publicly that it intends to make the Renminbi freely convertible in the future. However, we cannot predict whether the PRC Government will continue its existing foreign exchange policy and when the PRC Government will allow free conversion of Renminbi to foreign currency.
Foreign exchange transactions under the capital account, under most circumstances, including principal payments in respect of foreign currency-denominated obligations, continue to be subject to significant foreign exchange controls and require the approval of the State Administration of Foreign Exchange or its local branch offices. These limitations could affect our ability to obtain foreign exchange through debt or equity financing, or to obtain foreign exchange for capital expenditures.
138
The conversion of Renminbi into foreign currencies, including U.S. dollars, is based on rates set by the PBOC. On July 21, 2005, the PRC government introduced a floating exchange rate system to allow the value of Renminbi to fluctuate within a regulated band based on market supply and demand and by reference to a basket of foreign currencies. Renminbi appreciated by more than 20% against the U.S. dollar between July 2005 and July 2008. Between July 2008 and June 2010, this appreciation halted and the exchange rate between the Renminbi and the U.S. dollar remained within a narrow band. On June 19, 2010, the PBOC decided to further promote the reform of the Renminbi exchange rate formation mechanism, and improve the flexibility of the Renminbi exchange rate. Since June 2010, Renminbi has regained steady appreciation against the U.S. dollar, which was reversed by slight depreciation of the Renminbi against the U.S. dollar at the turn to and early 2014. On March 15, 2014, the PBOC announced to further widen the Renminbi’s daily trading band against the U.S. dollar from 1% to 2% on either side of the daily reference rate, allowing for greater fluctuations of the exchange rate. It is difficult to predict how market forces or PRC or U.S. government policy may impact the exchange rate between the Renminbi and the U.S. dollar in the future. On August 11, 2015, the PBOC decided to further improve the mechanism of RMB’s central parity rate against the US dollar. Any fluctuation of exchange rate of the Renminbi against US dollars and Hong Kong dollars may have an effect on our revenues and financial condition, and the value of, and any dividends payable on, our ADSs in foreign currency terms. There remains significant international pressure on the PRC Government to further liberalize its currency policy, which could result in further fluctuations in the value of the Renminbi against the U.S. dollar. However, there is no assurance that there will not be a devaluation of Renminbi in the future. If there is such a devaluation, our debt servicing cost will increase and the return to our overseas investors may decrease.
E. | Taxation |
The following is a summary of (i) certain tax consequences from acquiring, owning and disposing of the H Shares and ADSs based on tax laws of the PRC, the United States and the Income Tax Treaty between the PRC and the United States (the “Tax Treaty”) as in effect on the date of this annual report, and is subject to changes in PRC or United States law, including changes that could have retroactive effect, and (ii) the principal PRC taxes to which we are subject. The following summary does not take into account or discuss the tax laws of any countries or regions other than the PRC and the United States, nor does it take into account the individual circumstances of an investor. This summary does not purport to be a complete technical analysis or examination of all potential tax effects relevant to an investment in the H Shares or ADSs and current and prospective investors in all jurisdictions of the H Shares or ADSs are advised to consult their tax advisors as to PRC, United States or other tax consequences of the purchase, ownership and disposition of the H Shares or ADSs. This summary also does not purport to be a complete technical analysis or examination of all potential PRC taxes that may be levied upon us.
PRC tax considerations
Tax on dividends
Individual investors
According to the current PRC tax regulations, dividends paid by PRC companies to individual investors are ordinarily subject to a PRC withholding tax levied at a flat rate of 20%. For a foreign individual who has no domicile or does not stay in the territory of China or who has no domicile but has stayed in the territory of China for less than one year, the receipt of dividends from a company in China is normally subject to a withholding tax of 20% unless reduced or exempted by applicable laws and tax treaties.
139
Enterprises
In accordance with the New Enterprise Income Tax Law that became effective on January 1, 2008, dividends derived from the revenues accumulated from January 1, 2008 and as amended on February 24, 2017 and paid by PRC companies to non-resident enterprises are generally subject to a PRC withholding tax levied at a rate of 10% unless exempted or reduced pursuant to an applicable double-taxation treaty or other exemptions. Dividends paid by PRC companies to resident enterprises, including enterprises established under the laws of non-PRC jurisdictions but whose “de facto management body” is located in the PRC, are not subject to any PRC withholding tax, unless the dividends are derived from the publicly traded shares which have not been held continuously by the resident enterprises for twelve months. According to the Notice on the Issues Concerning Withholding the Enterprise Income Tax on the Dividends Paid by Chinese Resident Enterprise to H Share Holders Which Are Overseas Non-resident Enterprises issued by the State Administration of Taxation on November 6, 2008, Chinese resident enterprises are required to withhold PRC enterprise income tax at the rate of 10% on dividends paid for 2008 and later years payable to their respective H Shares holders who are non-resident enterprises.
Capital gains tax on sales of shares
In accordance with the New Enterprise Income Tax Law, capital gains realized by foreign enterprises which are non-resident enterprises in China upon the sale of overseas shares are generally subject to a PRC withholding tax levied at a rate of 10%, unless exempted or reduced pursuant to an applicable double-taxation treaty or other exemptions. The capital gains realized by resident enterprises, including enterprises established under the laws of non-PRC jurisdictions but whose “de facto management body” is located in the PRC, upon the sales of overseas shares are subject to the PRC enterprise income tax.
Tax treaties
Non-PRC Investors residing in countries which have entered into double-taxation treaties with the PRC may be entitled to a reduction of the withholding tax imposed on the payment of dividends to such Foreign Holders of us. The PRC currently has double-taxation treaties with a number of countries, including Australia, Canada, France, Germany, Japan, Malaysia, the Netherlands, Singapore, the United Kingdom and the United States.
Stamp tax
Under the Provisional Regulations of The People’s Republic of China Concerning Stamp Tax, which became effective in October 1988 and was amended in January 2011, PRC stamp tax should not be imposed on the transfer of H Shares or ADSs of PRC publicly traded companies.
Taxation of the Company
Income tax
Prior to January 1, 2008, according to the relevant income tax law, foreign invested enterprises were, in general, subject to a statutory income tax of 33% (30% enterprise income tax and 3% local income tax). If these enterprises are located in certain specified locations or cities, or are specifically approved by the State Administration of Taxation, a lower tax rate would be applied. Effective from January 1, 1999, in accordance with the practice notes on the PRC income tax laws applicable to foreign invested enterprises investing in energy and transportation infrastructure businesses, a reduced enterprise income tax rate of 15% (after the approval of State Administration of Taxation) was applicable across the country. We applied this rule to all of our wholly owned operating power plants after obtaining the approval of the State Administration of Taxation. In addition, certain power plants were exempted from the enterprise income tax for two years starting from the first profit-making year, after offsetting all tax losses carried forward from the previous years (at most of five years), followed by a 50% reduction of the applicable tax rate for the next three years. The statutory income tax was assessed individually based on each of their results of operations.
140
On March 16, 2007, the Enterprise Income Tax Law of PRC, or the New Enterprise Income Tax Law, was enacted, and became effective on January 1, 2008, and was later amended in December 2018. The New Enterprise Income Tax Law imposes a uniform income tax rate of 25% for domestic enterprises and foreign invested enterprises. Therefore, our power plants that were subject to a 33% income tax rate prior to January 1, 2008 are subject to a lower tax rate of 25% starting on January 1, 2008. With regard to our power plants entitled to a reduced enterprise income tax rate of 15% prior to January 1, 2008, their effective tax rate is being gradually increased to 25% within a five-year transition period commencing on January 1, 2008. Accordingly, the effective tax rate of our wholly owned power plants will increase over time. In addition, although our power plants entitled to tax exemption and reduction under the income tax laws and regulations that are effective prior to the New Enterprise Income Tax Law will continue to enjoy such preferential treatments until the expiration of the same, newly established power plants will not be able to benefit from such tax incentives, unless they can satisfy specific qualifications, if any, provided by then effective laws and regulations on preferential tax treatment.
Pursuant to Measures for the Collection and Administration of Consolidated Payment of Enterprises Income Tax on Trans-Regional Operation, effective on January 1, 2013, the Company and its branches calculate and pay income tax on a combined basis according to relevant tax laws and regulations. The income tax of subsidiaries remains to be calculated individually based on their individual operating results.
Value-added tax
Since January 1, 1994, the government has implemented a turnover tax system applicable to FIEs. Under the turnover tax provisions, we have to collect from our electricity customers and pay to the PRC tax authorities a value-added tax (“VAT”) on our sales. The tax rate on sales of electricity by us is 17% of total sales. The amount of VAT payable by us is the VAT on sales reduced by the VAT paid by us on our purchases of coal, fuel and other inputs.
Effective from January 1, 2009, VAT payers are allowed to credit against output VAT in respect of input VAT on fixed assets purchased or self-manufactured based on the relevant VAT credit receipts in accordance with the revised VAT regulations and its implementation rules.
In addition, effective from August 1, 2012, according to the relevant regulations of Ministry of Finance of PRC and State Administration of Taxation, nine pilot regions including Shanghai, Beijing, Tianjin, Jiangsu Province, Anhui Province, Zhejiang Province, Fujian Province, Hubei Province and Guangdong Province have been under the pilot program for the transformation from Business Tax to VAT since January 1, 2012 and all other regions have been since August 1, 2013 for specified industry. The applicable tax rate of VAT for the Company and its subsidiaries in respect of the lease of tangible movable properties, transportation industry and other modern services industries are 17%, 11% and 6%, respectively.
On March 23, 2016, the Ministry of Finance of PRC and the State Administration of Taxation issued the Circular of Full Implementation of Business Tax to VAT Reform which confirms that business tax will be completely replaced by VAT from May 1, 2016. With effect from May 1, 2016, our income is only subject to VAT and not business tax.
141
United States federal income tax considerations
The following discussion is a summary of United States federal income tax considerations relating to the ownership and disposition of our H Shares or ADSs by a U.S. Holder (as defined below). This discussion is based upon existing United States federal income tax law, which is subject to differing interpretations or change, possibly with retroactive effect. This discussion does not address all aspects of United States federal income taxation which may be important to particular holders in light of their particular circumstances, such as holders subject to special tax rules including: banks or other financial institutions, insurance companies, broker-dealers, traders in securities that elect mark-to-market treatment, partnerships and their partners, regulated investment companies, real estate investment trusts, cooperatives, pension plans, tax-exempt organizations (including private foundations), holders who are not U.S. Holders, holders who own (directly, indirectly, or constructively) 10% or more of the voting power or value of our stock, holders that hold H Shares or ADSs as part of a straddle, hedge, conversion, constructive sale, or other integrated transaction for United States federal income tax purposes, holders who acquired their ADSs or H Shares pursuant to any employee share option or otherwise as compensation, or holders that have a functional currency other than the United States dollar, all of whom may be subject to tax rules that differ significantly from those summarized below. In addition, this discussion does not address any state, local, non-United States, non-income tax (such as the United States federal gift and estate tax), or alternative minimum tax considerations or the Medicare tax. This discussion only addresses holders that hold their H Shares or ADSs as “capital assets” (generally, property held for investment) under the United States Internal Revenue Code of 1986, as amended (the “Code”). U.S. Holders are urged to consult their tax advisors regarding the United States federal, state, local, and non-United States income and other tax considerations relating to the ownership and disposition of our H Shares or ADSs.
For purposes of this summary, a U.S. Holder is a beneficial owner of H Shares or ADSs that is, for United States federal income tax purposes:
● | an individual who is a citizen or resident of the United States; |
● | a corporation (or other entity treated as a corporation for United States federal income tax purposes) created in or organized under the laws of the United States or any State thereof or the District of Columbia; |
● | an estate the income of which is includible in gross income for United States federal income tax purposes regardless of its source; or |
● | a trust (a) the administration of which is subject to the primary supervision of a United States court and which has one or more United States persons who have the authority to control all substantial decisions of the trust or (b) that has otherwise elected to be treated as a United States person under the Code. |
If a partnership (including any entity treated as a partnership for United States federal income tax purposes) is a beneficial owner of H Shares or ADSs, the tax treatment of a partner in such partnership will depend upon the status of the partner and the activities of the partnership. Partnerships and partners of a partnership holding our H Shares or ADSs are urged to consult their tax advisors regarding the United States federal income tax considerations relating to the ownership and disposition of our H Shares or ADSs.
For United States federal income tax purposes, it is generally expected that a U.S. Holder of ADSs will be treated as the beneficial owner of the underlying shares represented by the ADSs. The remainder of this discussion assumes that a holder of ADSs will be treated in this manner. Accordingly, deposits or withdrawals of H Shares for ADSs will generally not be subject to United States federal income tax.
Passive Foreign Investment Company Considerations
A non-United States corporation, such as our Company, will be a “passive foreign investment company” (a “PFIC”), for United States federal income tax purposes for any taxable year, if either (a) 75% or more of its gross income for such year consists of certain types of “passive” income or (b) 50% or more of the value of its assets (generally determined on the basis of a quarterly average) during such year produce or are held for the production of passive income. For this purpose, cash and assets readily convertible into cash are categorized as passive assets and the Company’s unbooked intangibles are taken into account for determining the value of its assets. We will be treated as owning a proportionate share of the assets and earning a proportionate share of the income of any other corporation in which we own, directly or indirectly, 25% or more (by value) of the stock.
142
We do not believe that we were classified as a PFIC for the taxable year ended December 31, 2021, and do not anticipate becoming one in the foreseeable future. The determination of whether we will be or become a PFIC will depend, in part, upon the composition of our income and our assets (which are subject to change from year to year) and the market price of our ADSs (of which we cannot control). Although we do not expect that our business plans will change in a manner that will affect our PFIC status, no assurance can be given in this regard. Because PFIC status is a fact-intensive determination made on an annual basis, no assurance may be given with respect to our PFIC status for any taxable year.
The discussion below under “Dividends” and “Sale or Other Disposition of H Shares or ADSs” assumes that we will not be classified as a PFIC for United States federal income tax purposes. See the discussion below under the heading “Passive Foreign Investment Company Rules” for a brief summary of the PFIC rules.
Dividends
The gross amount of any cash distributions (including the amount of any tax withheld) paid on our H Shares or ADSs out of our current or accumulated earnings and profits, as determined under United States federal income tax principles, will be subject to tax as dividend income on the day actually or constructively received by a U.S. Holder, in the case of H Shares, or by the depositary bank, in the case of ADSs. Because we do not intend to determine our earnings and profits on the basis of United States federal income tax principles, any distribution paid will generally be reported as a “dividend” for United States federal income tax purposes. A non-corporate recipient of dividend income will generally be subject to tax on dividend income from a “qualified foreign corporation” at a reduced capital gains rate rather than the marginal tax rates generally applicable to ordinary income provided that certain holding period requirements are met.
A non-U.S. corporation (other than a corporation that is classified as a PFIC for the taxable year in which the dividend is paid or the preceding taxable year) generally will be considered to be a qualified foreign corporation (i) if it is eligible for the benefits of a comprehensive tax treaty with the United States which the Secretary of Treasury of the United States determines is satisfactory for purposes of this provision and which includes an exchange of information program or (ii) with respect to any dividend it pays on stock which is readily tradable on an established securities market in the United States. There is currently a tax treaty in effect between the United States and the People’s Republic of China (the “Tax Treaty”) which the Secretary of Treasury of the United States determined is satisfactory for these purposes and we believe that we are eligible for the benefits of such treaty. Additionally, our ADSs (but not our H Shares) trade on the New York Stock Exchange, an established securities market in the United States, and the ADSs are expected to be readily tradable for so long as they continue to be listed on the New York Stock Exchange. Thus, while we presently believe that we are a qualified foreign corporation for purposes of the reduced tax rate, there can be no assurance that the dividends we pay on our H Shares or ADSs will meet the conditions required for the reduced tax rate in the current taxable year or future taxable years. Dividends received on H Shares or ADSs will not be eligible for the dividends received deduction allowed to corporations. U.S. Holders are urged to consult their tax advisors regarding the rate of tax that will apply to them with respect to dividends (if any) received from us.
Dividends paid in non-United States currency will be includible in income in a United States dollar amount based on the exchange rate prevailing at the time of receipt of such dividends by the depositary, in the case of ADSs, or by the U.S. Holder, in the case of H Shares held directly by such U.S. Holder, regardless of whether the non-United States currency is actually converted into United States dollars at that time. Gain or loss, if any, recognized on a subsequent sale, conversion or other disposition of the non-United States currency will generally be United States source income or loss.
Dividends received on H Shares or ADSs will generally be treated, for United States foreign tax credit purposes, as foreign source income and generally will constitute passive category income. A U.S. Holder may be eligible, subject to a number of complex limitations, to claim a foreign tax credit in respect of any non-United States withholding taxes imposed on dividends received on H Shares or ADSs. U.S. Holders who do not elect to claim a foreign tax credit for foreign income tax withheld may instead claim a deduction, for United States federal income tax purposes, in respect of such withholdings, but only for a year in which the U.S. Holder elects to do so for all creditable foreign income taxes. U.S. Holders are urged to consult their tax advisors regarding the availability of the foreign tax credit under their particular circumstances.
143
Sale or Other Disposition of H Shares or ADSs
A U.S. Holder will generally recognize capital gain or loss upon the sale or other disposition of H Shares or ADSs in an amount equal to the difference between the amount realized upon the disposition and the U.S. Holder’s adjusted tax basis in such H Shares or ADSs. The deductibility of a capital loss may be subject to limitations. Any capital gain or loss will be long-term if the H Shares or ADSs have been held for more than one year and will generally be United States source gain or loss for United States foreign tax credit purposes, which may limit the ability to receive a foreign tax credit. If any PRC tax were to be imposed on any gain from the disposition of H Shares or ADSs, however, a U.S. Holder that is eligible for the benefits of the Tax Treaty may elect to treat the gain as non-United States source gain or loss. Pursuant to recently issued Treasure Regulations, however, if a U.S. Holder is not eligible for the benefits of the Tax Treaty or does not elect to apply the Tax Treaty, then such holder may not be able to claim a foreign tax credit rising from any PRC tax imposed on the disposition of H Shares or ADSs. The rules governing the foreign tax credit are complex and their outcome depends in large part on the U.S. Holder’s individual facts and circumstances. Accordingly, U.S. Holders should consult their tax advisors regarding the availability of the foreign tax credit under their particular circumstances, including their eligibility for benefits under the Tax Treaty and the potential impact of the recently issued Treasury Regulations.
U.S. Holders that receive currency other than the United States dollar upon the sale or other disposition of H Shares will realize an amount equal to the United States dollar value of the non-United States currency on the date of such sale or other disposition, or if the shares are traded on an established securities market, in the case of cash basis and electing accrual basis taxpayers, the settlement date. U.S. Holders will recognize currency gain or loss if the United States dollar value of the currency received on the settlement date differs from the amount realized. U.S. Holders will have a tax basis in the currency received equal to the United States dollar amount at the spot rate on the settlement date. Generally, any gain or loss realized by U.S. Holders on a subsequent conversion or disposition of such currency will be United States source ordinary income or loss.
Passive Foreign Investment Company Rules
If we were to be classified as a PFIC in any taxable year, a special tax regime will apply to both (a) any “excess distribution” by us to a U.S. Holder (generally, the U.S. Holder’s ratable portion of distributions in any year which are greater than 125% of the average annual distribution received by such U.S. Holder in the shorter of the three preceding years or the U.S. Holder’s holding period for our H Shares or ADSs) and (b) any gain realized on the sale or other disposition of the H Shares or ADSs. Under this regime, any excess distribution and realized gain will be treated as ordinary income and will be subject to tax as if (a) the excess distribution or gain had been realized ratably over the U.S. Holder’s holding period, (b) the amount deemed realized in each year had been subject to tax in each year of that holding period at the highest marginal rate for such year (other than income allocated to the current period or any taxable period before we became a PFIC, which would be subject to tax at the U.S. Holder’s regular ordinary income rate for the current year and would not be subject to the interest charge discussed below), and (c) the interest charge generally applicable to underpayments of tax had been imposed on the taxes deemed to have been payable in those years. In addition, dividends made to a U.S. Holder will not qualify for the lower rates of taxation applicable to long-term capital gains discussed above under “Dividends.”
The above results may be eliminated if a “mark-to-market” election is available and a U.S. Holder validly makes such an election. If the election is made, such holder generally will be required to take into account the difference, if any, between the fair market value and its adjusted tax basis in H Shares or ADSs at the end of each taxable year as ordinary income or ordinary loss (to the extent of any net mark-to-market gain previously included in income). In addition, any gain from a sale or other disposition of H Shares or ADSs will be treated as ordinary income, and any loss will be treated as ordinary loss (to the extent of any net mark-to-market gain previously included in income).
We do not intend to provide information necessary for U.S. Holders to make qualified electing fund elections, which, if available, would result in tax treatment different from (and generally less adverse than) the general tax treatment for PFICs described above.
As discussed above under “Dividends,” dividends that we pay on the ADSs or our H Shares will not be eligible for the reduced tax rate that applies to qualified dividend income if we are a PFIC for the taxable year in which the dividend is paid or the preceding taxable year. In addition, if a U.S. Holder owns the ADSs or our H Shares during any taxable year that we are a PFIC, such holder would generally be required to file an annual IRS Form 8621. Each U.S. Holder is advised to consult its tax advisors regarding the potential tax consequences to such holder if we are or become a PFIC, including the possibility of making a mark-to-market election.
144
Information Reporting
U.S. Holders may be subject to information reporting to the United States Internal Revenue Service with respect to dividends on and proceeds from the sale or other disposition of our H Shares or ADSs. U.S. Holders are urged to consult their tax advisors regarding the application of the United States information reporting rules to their particular circumstances.
Certain U.S. Holders who hold “specified foreign financial assets,” including stock of a non-U.S. corporation that is not held in an account maintained by a U.S. “financial institution,” whose aggregate value exceeds $50,000 during the tax year, may be required to attach to their tax returns for the year certain specified information. An individual who fails to timely furnish the required information may be subject to a penalty. U.S. Holders are urged to consult their tax advisors regarding their reporting obligations under this legislation.
F. | Dividends and paying agents |
Not applicable.
G. | Statement by experts |
Not applicable.
H. | Documents on display |
We are subject to the information reporting requirements of the Securities Exchange Act of 1934 (the “Exchange Act”) and, in accordance with the Act, file certain reports and other information with the SEC. You may read and copy any report, statement or other information filed by us at the SEC’s public reference rooms in Washington, D.C., New York and Chicago, Illinois. Please call the SEC at 1-800-0330 for further information on the public reference rooms. Our reports and other information filed with the SEC are also available to the public from commercial document retrieval services and the website maintained by the SEC at http://www.sec.gov.
I. | Subsidiary information |
Not applicable.
ITEM 11 . QUANTITATIVE AND QUALITATIVE DISCLOSURES ABOUT MARKET RISK
Our primary market risk exposures are fluctuations of fuel prices, foreign exchange rates and interest rates.
Equity price risk
The Company and its subsidiaries are exposed to fuel price risk on fuel purchases. In particular, SinoSing Power and its subsidiaries use fuel oil swap to hedge against such a risk and designate them as cash flow hedges. Please refer to Note 13 to the financial statements for details.
145
Foreign exchange rate risk
The exchange rate of Renminbi to foreign currencies may fluctuate and is affected by, among other things, changes in China’s political and economic conditions. The conversion of Renminbi into foreign currencies, including U.S. dollars, is based on rates set by the PBOC. On July 21, 2005, the PRC government introduced a floating exchange rate system to allow the value of Renminbi to fluctuate within a regulated band based on market supply and demand and by reference to a basket of foreign currencies. Renminbi appreciated by more than 20% against the U.S. dollar between July 2005 and July 2008. Between July 2008 and June 2010, this appreciation halted and the exchange rate between the Renminbi and the U.S. dollar remained within a narrow band. On June 19, 2010, the PBOC decided to further promote the reform of the Renminbi exchange rate formation mechanism, and improve the flexibility of the Renminbi exchange rate. Since June 2010, the Renminbi has regained steady appreciation against the U.S. dollar, which was reversed by a slight depreciation of Renminbi against the U.S. dollar at the turn to and early 2014. On March 15, 2014, the PBOC announced to further widen the Renminbi’s daily trading band against the U.S. dollar from 1% to 2% on either side of the daily reference rate, allowing for greater fluctuations of the exchange rate. It is difficult to predict how market forces or PRC or U.S. government policy may impact the exchange rate between the Renminbi and the U.S. dollar in the future. There remains significant international pressure on the PRC Government to further liberalize its currency policy. We cannot assure you that any future movements in the exchange rate of the Renminbi against the U.S. dollar and other currencies will not adversely affect our results of operations and financial conditions.
SinoSing Power and its subsidiaries are exposed to foreign exchange risk on fuel purchases that is denominated primarily in U.S. dollars. They use forward exchange contracts to hedge almost all of their estimated foreign exchange exposure in respect of forecast fuel purchases over the following three months. The Company and its subsidiaries account for their forward foreign currency contracts as cash flow hedges.
The following table provides information, by maturity date, regarding our foreign currency sensitive financial instruments, which consist of bank balances and cash, short-term and long-term debt obligations, capital commitments and forward exchange contracts as of December 31, 2021 and average interest rates for the year ended December 31, 2021.
(RMB expressed in millions, except interest rate and exchange rate)
As of December 31, 2021 | ||||||||||||||||
Expected Maturity Date | Total | Fair Value | ||||||||||||||
| 2022 | 2023 |
| 2024 |
| 2025 |
| 2026 |
| Thereafter |
|
| ||||
On-balance sheet financial instruments | ||||||||||||||||
Bank balances and cash: | ||||||||||||||||
In U.S. Dollar |
| 1,339 | — | — |
| — |
| — | — | 1,339 | 1,339 | |||||
In Japanese Yen |
| 0.15 | — | — |
| — |
| — | — | 0.15 | 0.15 | |||||
In Pakistan Rupee |
| 155 | — | — |
| — |
| — | — | 155 | 155 | |||||
Debts |
| |||||||||||||||
Japanese Yen |
| 6 | 6 | 6 | 6 | 6 | 89 | 119 | 69 | |||||||
Average interest rate |
| 0.75 | 0.75 | 0.75 | 0.75 | 0.75 | 0.75 | — | — | |||||||
Euro |
| 31 | 16 | 1 | — | — | — | 48 | 47 | |||||||
Average interest rate |
| 2.171 | 1.235 | 2.005 | — | — | — | — | — | |||||||
U.S. Dollar |
| 1,157 | 1,964 | 941 | 803 | 843 | 2,886 | 8,594 | 8,594 | |||||||
Average interest rate |
| 3.877 | 3.877 | 3.877 | 3.877 | 3.877 | 4.630 | — | — | |||||||
Gas purchase commitments (U.S. Dollar) |
| 5,538 | 5,472 | 5,505 | 5,520 | 5,417 | 9,069 | 36,521 | — | |||||||
Forward exchange contracts |
| |||||||||||||||
(Receive US $ / Pay S$) |
| |||||||||||||||
Contract amount |
| 1,831 | 345 | 141 | 1,990 | 50 | 1,913 | 6,270 | 8 | |||||||
Average Contractual Exchange Rate |
| 1.36 | 1.36 | 1.35 | 1.34 | 1.35 | 1.32 | — | — |
146
As of December 31, 2020 | ||||||||||||||||
Expected Maturity Date | Total | Fair Value | ||||||||||||||
| 2021 |
| 2022 |
| 2023 |
| 2024 |
| 2025 |
| Thereafter |
|
| |||
On-balance sheet financial instruments | ||||||||||||||||
Bank balances and cash: | ||||||||||||||||
In U.S. Dollar |
| 412 | — | — |
| — |
| — |
| — |
| 412 |
| 412 | ||
In Japanese Yen |
| 0.18 | — | — |
| — |
| — |
| — |
| 0.18 |
| 0.18 | ||
In Pakistan Rupee |
| 431 | — | — |
| — |
| — |
| — |
| 431 |
| 431 | ||
Debts |
|
|
|
|
|
|
|
|
|
|
|
|
|
| ||
Japanese Yen |
| 7 |
| 7 |
| 7 |
| 7 |
| 7 |
| 108 |
| 143 |
| 81 |
Average interest rate |
| 0.75 |
| 0.75 |
| 0.75 |
| 0.75 |
| 0.75 |
| 0.75 |
| — |
| — |
Euro |
| 35 |
| 34 |
| 17 |
| 2 |
| — |
| — |
| 88 |
| 84 |
Average interest rate | 2.137 | 2.135 | 1.231 | 2.005 | — | — | — | — | ||||||||
U.S. Dollar | 1,218 | 1,143 | 926 | 757 | 795 | 3,771 | 8,610 | 8,610 | ||||||||
Average interest rate |
| 4.335 |
| 3.824 |
| 4.584 |
| 4.730 |
| 4.730 |
| 20.112 |
| — |
| — |
Gas purchase commitments (U.S. Dollar) |
| 3,897 |
| 4,024 |
| 2,102 |
| 683 |
| 686 |
| 1,898 |
| 13,290 |
| — |
Forward exchange contracts |
|
|
|
|
|
|
|
| ||||||||
(Receive US $ / Pay S$) |
|
|
|
|
|
|
|
| ||||||||
Contract amount |
| 2,534 |
| 594 |
| 141 |
| 10 |
| — |
| — |
| 3,279 |
| (69) |
Average Contractual Exchange Rate |
| 1.36 |
| 1.36 |
| 1.37 |
| 1.35 |
| — |
| — |
| — |
| — |
The outstanding balance of the Company’s loans denominated in foreign currencies has changed continually as a result of repayments of the loans by the Company according to agreed-upon repayment schedules. The loans denominated in U.S. dollars decreased from RMB9.765 billion as of December 31, 2020 to RMB8.594 billion as of December 31, 2021. The loans denominated in Euros decreased from RMB88 million as of December 31, 2020 to RMB48 million as of December 31, 2021.
Interest rate risk
We are exposed to interest rate risk primarily resulting from fluctuations in interest rates on our debts. Upward fluctuations in interest rates increase the cost of new variable rate debts and the interest cost of outstanding floating rate borrowings.
In 2009, Tuas Power completed its refinancing, through which all of its outstanding loans denominated in U.S. dollars were refinanced through loans denominated in Singapore dollars, matching the functional currency of its operation. The loans borrowed by Tuas Power were denominated in Singapore dollars, and the majority of them are with floating interest rates, which subjects the finance cost of the Company to the fluctuation of market interest rates. In 2012 and 2013, TPG also entered into a number of floating-to-fixed interest rate swap agreements to hedge against the cash flow interest rate risk of the loan. According to these interest rate swap agreements, TPG agrees with the counterparty to settle the difference between fixed contract rates and floating rate interest amounts calculated by reference to the agreed notional amount semi-annually until 2020. The notional amount of the outstanding interest rate swap at December 31, 2021 was S$139 million.
The table below provides information about the Company and its subsidiaries’ derivative financial instruments and other financial instruments that are sensitive to changes in interest rates, including interest rate swaps and debt obligations. For debt obligations, the table presents principal cash flows and related weighted average interest rates by expected maturity dates. For interest rate swaps, the table presents notional amounts and weighted average interest rates by expected (contractual) maturity dates. Notional amounts are used to calculate the contractual payments to be exchanged under the contract. Weighted average variable rates are based on implied forward rates in the yield curve at the reporting date.
147
(RMB expressed in millions, except interest rate and exchange rate)
As of December 31, 2021 | ||||||||||||||||
Expected Maturity Date | Total | Fair Value | ||||||||||||||
| 2022 |
| 2023 |
| 2024 |
| 2025 |
| 2026 |
| Thereafter |
|
| |||
Debts | ||||||||||||||||
Shareholder’s, bank and other loans | 114,478 | 30,589 | 38,266 | 16,539 | 15,333 | 65,696 | 280,901 | 245,716 | ||||||||
Average interest rate |
| 2.04 | 3.05 | 2.99 | 3.21 | 3.17 | 21.60 | — | — | |||||||
|
| |||||||||||||||
Short-term bonds |
| 8,433 | — |
| — |
| — |
| — |
| — | 8,433 | 8,223 | |||
Average interest rate |
| 2.56 | — |
| — |
| — |
| — |
| — | — |
| — | ||
|
|
|
|
|
|
| ||||||||||
Long-term bonds |
| 8,458 | 1,277 | 11,431 | 2,672 | 1,945 | 18,405 | 44,188 | 36,789 | |||||||
Average interest rate |
| 5.336 | 3.794 | 3.242 | 3.861 | 4.095 | 12.764 | — |
| — |
As of December 31, 2021 | ||||||||||||||||
Expected Maturity Date | Total | Fair Value | ||||||||||||||
| 2022 |
| 2023 |
| 2024 |
| 2025 |
| 2026 |
| Thereafter |
|
| |||
Debts | ||||||||||||||||
Interest Rate Derivatives (S$) |
|
|
|
|
|
|
|
| ||||||||
Variable to Fixed |
| 17 | 11 | 15 | 10 | 10 | 109 | 172 | 161 | |||||||
Average receive rate |
| 0.58 | % | 1.37 | % | 1.38 | % | 1.92 | % | 1.92 | % | 1.72 | % | 1.48 | % | — |
Average pay rate |
| 3.15 | % | 3.15 | % | 3.15 | % | 3.15 | % | 3.15 | % | 3.15 | % | 3.15 | % | — |
As of December 31, 2020 | ||||||||||||||||
Expected Maturity Date | Total | Fair Value | ||||||||||||||
| 2021 |
| 2022 |
| 2023 |
| 2024 |
| 2025 |
| Thereafter |
|
| |||
Debts | ||||||||||||||||
Shareholder’s, bank and other loans | 92,444 | 19,015 | 22,882 | 13,733 | 21,151 | 75,686 | 244,911 | 198,028 | ||||||||
Average interest rate |
| 2.59 |
| 2.93 |
| 2.78 |
| 2.76 |
| 2.56 |
| 35.23 |
| — |
| — |
Short-term bonds |
| 5,006 |
| — |
| — |
| — |
| — |
| — |
| 5,006 |
| 5,006 |
Average interest rate |
| 1.42 |
| — |
| — |
| — |
| — |
| — |
| — |
| — |
|
| |||||||||||||||
Long-term bonds |
| 13,792 |
| 7,225 |
| 566 |
| 2,034 |
| 3,614 |
| 10,496 |
| 37,727 |
| 33,122 |
Average interest rate |
| 3.367 |
| 3.547 |
| 4.075 |
| 3.883 |
| 3.773 |
| 13.606 |
| — |
| — |
As of December 31, 2020 | ||||||||||||||||
Expected Maturity Date | Total | Fair Value | ||||||||||||||
| 2021 |
| 2022 |
| 2023 |
| 2024 |
| 2025 |
| Thereafter |
|
| |||
Debts | ||||||||||||||||
Interest Rate Derivatives (S$) |
|
|
|
|
|
|
|
| ||||||||
Variable to Fixed |
| 12 |
| 3,941 |
| 19 |
| 20 |
| 21 |
| 610 |
| 4,623 |
| (181) |
Average receive rate |
| 0.08 | % | 0.94 | % | 0.19 | % | 0.58 | % | 0.78 | % | 1.19 | % | 1.35 | % | — |
Average pay rate |
| 1.58 | % | 2.84 | % | 1.58 | % | 3.15 | % | 3.15 | % | 3.15 | % | 2.84 | % | — |
As of December 31, 2021, the Company’s loans denominated in foreign currency amounted to RMB15,784 million, most of which were denominated in U.S. dollars. In addition, SinoSing Power’s loans denominated in Singapore dollars amounted to RMB6,874 million as of December 31, 2021.
As the debts denominated in other currencies represent a small percentage in our total debts, the change of interest rates of foreign currencies is not expected to have material effect on the Company. We will closely watch the changes in domestic and overseas capital markets, and maintain its good reputation on the capital markets, make reasonable financing arrangements, timely adjust our financing strategy, explore new financing methods, manage the exchange rate fluctuation risks, and strive to control financing costs.
148
Commodity price risk
We are exposed to fuel price risk on fuel purchases. SinoSing Power and its subsidiaries use fuel oil swap to hedge against such risk. The table below provides information about the fuel swap contracts that are sensitive to changes in fuel prices, including contract volumes, the weighted average contract prices, and the total contract amount by expected maturity dates.
(RMB expressed in millions)
As of December 31, 2021 | ||||||||||||||||
Expected Maturity Date | Total | Fair Value | ||||||||||||||
| 2022 |
| 2023 |
| 2024 |
| 2025 |
| 2026 |
| Thereafter |
|
| |||
Fuel Swap contracts | ||||||||||||||||
Contract Volumes (MT) |
| 979,945 | 82,030 | 10,170 | — | — | — | 1,072,145 | — | |||||||
Weighted Average Price (US$/MT) |
| 344 | 388 | 436 | — | — | — | — | — | |||||||
Contract Amount (RMB million) |
| 2,149 | 203 | 28 | — | — | — | 2,380 | 633 | |||||||
Contract Volumes (BBL) |
| 43,590 | — | — | — | — | — | 43,590 | — | |||||||
Weighted Average Price (US$/BBL) |
| 344 | — | — | — | — | — | — | — | |||||||
Contract Amount (RMB million)) |
| 95 | — | — | — | — | — | 95 | 20 |
As of December 31, 2020 | ||||||||||||||||
Expected Maturity Date | Total | Fair Value | ||||||||||||||
| 2021 |
| 2022 |
| 2023 |
| 2024 |
| 2025 |
| Thereafter |
|
| |||
Fuel Swap contracts | ||||||||||||||||
Contract Volumes (MT) | 724,715 |
| 485,980 |
| 3,990 |
| — |
| — |
| — |
| 1,214,685 |
| — | |
Weighted Average Price (US$/MT) | 272 |
| 261 |
| 266 |
| — |
| — |
| — |
| — |
| — | |
Contract Amount (RMB million) | 1,358 |
| 874 |
| 7 |
| — |
| — |
| — |
| 2,239 |
| 131 | |
Contract Volumes (BBL) | 41,594 |
| 14,930 |
| — |
| — |
| — |
| — |
| 56,524 |
| — | |
Weighted Average Price (US$/BBL) | 252 |
| 229 |
| — |
| — |
| — |
| — |
| — |
| — | |
Contract Amount (RMB million)) | 9,260 |
| — |
| — |
| — |
| — |
| — |
| 9,260 |
| 8 |
For other detailed information of the market risk, please refer to the Note 3(a)(i) to the “Financial Statements.”
ITEM 12 . DESCRIPTION OF SECURITIES OTHER THAN EQUITY SECURITIES
A. | Debt Securities |
Not applicable.
B. | Warrants and Rights |
Not applicable.
C. | Other Securities |
Not applicable.
149
D. | American Depositary Shares |
Depositary Fees and Charges
Under the terms of the Amended and Restated Deposit Agreement dated Auguest 19, 2003, among Huaneng Power International, Inc.(the “Company”), The Bank of New York Mellon (the “Depositary”) and Owners and Beneficial Owners of American Depositary Receipts (ADRs) (evidenced by the Company’s American Depositary Shares (ADSs) issued thereunder), an ADS holder may have to pay the following services fees to the Depositary:
Services |
| Fees | |
Issuance of ADSs | $ | 5.00 (or less) per 100 ADSs (or portion of 100 ADSs) issued | |
Cancellation of ADSs | $ | 5.00 (or less) per 100 ADSs (or portion of 100 ADSs) canceled | |
Distribution of cash dividends or other cash distributions | $ | 2.00 (or less) per 100 ADSs (or portion of 100 ADSs) held | |
Distribution of ADSs pursuant to stock dividends, free stock distributions or exercises | $ | 5.00 (or less) per 100 ADSs (or portion of 100 ADSs) of rights held | |
Distribution of securities other than ADSs or rights to purchase additional ADSs | $ | 5.00 (or less) per 100 ADSs (or portion of 100 ADSs) held |
An ADS holder will also be responsible to pay certain fees and expenses incurred by the Depositary and certain taxes and governmental charges such as:
● | taxes and other governmental charges; |
● | such registration fees as may from time to time be in effect for the registration of transfers of H Shares generally on the H Share register of the Company or Foreign Registrar and applicable to transfers of H Shares to the name of the Depositary or its nominee or the Custodian or its nominee on the making of deposits or withdrawals; |
● | such cable, telex and facsimile transmission expenses as are expressly provided in the Deposit Agreement; |
● | such expenses as are incurred by the Depositary in the conversion of foreign currency; and |
● | any other charge payable by the Depositary, any of the Depositary’s agents, including the Custodian, or the agents of the Depositary’s agents in connection with the servicing of H Shares or other Deposited Securities. |
Depositary Payments for the Year 2021
In 2021, the Bank of New York Mellon, the Depositary for our ADR program, agreed to the reimbursement of our expenses related to investors’ relation activities and listing of our securities in the amount of US$92,762.93, and made relevant payments to certain other services providers engaged by us directly.
150
PART II
ITEM 13 . DEFAULTS, DIVIDEND ARREARAGES AND DELINQUENCIES
None.
ITEM 14 . MATERIAL MODIFICATIONS TO THE RIGHTS OF SECURITY HOLDERS AND USE OF PROCEEDS
None.
ITEM 15 . CONTROLS AND PROCEDURES
Disclosure Controls and Procedures
Our management, with the participation of our principal executive officer and principal financial officer, has evaluated the effectiveness of our disclosure controls and procedures (as defined in Rules 13a-15(e) and 15d-15(e) of the U.S. Securities Exchange Act of 1934, as amended (the “Exchange Act”)) as of December 31, 2021 (the “Evaluation Date”), the end of the fiscal year covered by this annual report. Based on this evaluation, our principal executive officer and principal financial officer have concluded that, as of the Evaluation Date, our disclosure controls and procedures were effective.
Management’s Report on Internal Control over Financial Reporting
According to Sarbanes-Oxley Act Section 404, our management is responsible for establishing and maintaining adequate internal control over financial reporting, as defined in the Exchange Act Rules 13a-15(f). The Company conducted an evaluation of the effectiveness of the design and implementation of our internal control over financial reporting based upon the framework in Internal Control-Integrated Framework (2013) issued by the Committee of Sponsoring Organizations of the Treadway Commission (COSO) as of the end of the period covered by this annual report. The evaluation is conducted under the supervision and with the participation of our management including principal executive officer and principal financial officer of the Company. Based on that evaluation, our management has concluded that our internal control over financial reporting was effective as of December 31, 2021. The effectiveness of the Company’s internal control over financial reporting as of December 31, 2021 has been audited by Ernst & Young Hua Ming LLP, an independent registered public accounting firm, as stated in their report, which appears on page F-5 of this annual report on Form 20-F.
Because of its inherent limitations, internal control over financial reporting may only provide reasonable assurance for preventing or detecting misstatements. In addition, projections of any evaluation of effectiveness of our internal control over financial reporting to future periods are subject to the risk that controls may become inadequate because of changes in conditions, or that the degree of compliance with the policies and procedures may deteriorate.
Changes in Internal Control over Financial Reporting
During the year ended December 31, 2021, no changes occurred in our internal controls over financial reporting that materially affected, or is reasonably likely to materially affect, our internal controls over financial reporting.
ITEM 16. RESERVED
ITEM 16A AUDIT COMMITTEE FINANCIAL EXPERT
The Board of Directors has determined that Mr. Zhang Xianzhi qualify as Audit Committee Financial Experts in accordance with the terms of Item 16A of Form 20-F. See “Item 6 Directors, Senior Management and Employees – A. Directors, members of the supervisory committee and senior management.”
151
ITEM 16B CODE OF ETHICS
Although, as of the date of this annual report, we do not have, in form, a code of ethics that applies to the Company’s principal executive officer, principal financial officer and principal accounting officer (collectively, the “Senior Corporate Officers”), we believe that, as a substantive matter, the Senior Corporate Officers are subject to a set of written requirements under the PRC law that are substantially similar to the ethical standards described under Item 16B (b) of Form 20-F. Joint stock companies that are incorporated in China and listed on both PRC and foreign stock exchanges are heavily regulated by the central government. To a large extent, these requirements, which are designed to promote honest and ethical conduct and compliance with applicable laws and regulations by the directors and senior executives of such companies, are not merely ethical requirements, but more importantly, statutory obligations that are legally binding on these individuals under the PRC Company Law, relevant rules and regulations promulgated by China Securities Regulatory Commission and the Mandatory Provisions of Articles of Association of Overseas Listed Companies.
ITEM 16C PRINCIPAL ACCOUNTANT FEES AND SERVICES
Ernst & Young Hua Ming LLP has served as our independent registered public accounting firm for the fiscal year ended December 31, 2020 and 2021, for which audited consolidated financial statements appear in this annual report on Form 20-F.
|
| |||
For the Year Ended December 31, | ||||
(RMB million) | 2020 | 2021 | ||
Audit fees | 28.19 | 28.73 | ||
Audit-related fees |
| 1.87 |
| 1.77 |
Tax fees |
| 0.65 |
| 0.51 |
All other fees |
| 1.02 |
| 0.50 |
Total |
| 31.73 |
| 31.51 |
Tax Fees
Services provided primarily consist of permissible tax compliance services.
Audit-related Fees
Audit-related services include those other assurances and related services provided by auditors, but not restricted to those that can only reasonably be provided by the external auditors signing the auditors’ report, that are reasonably related to the performance of the audit or review of the Company’s financial statements. The audit-related fees in 2021 were related to audit service for overseas subsidiaries and special purposes. The audit-related fees in 2020 were related to audit service for overseas subsidiaries and special purposes.
All Other Fees
Other fees include services provided for other permissible services including bond offering services and agreed-upon procedures services.
Audit Committee Pre-approval Policies and Procedures
The Audit Committee of the Company’s Board of Directors is responsible, among other things, for the oversight of the external auditors subject to the requirements of the PRC Law and the Company’s Articles of Association. The Audit Committee has adopted a policy regarding pre-approval of audit and permissible non-audit services to be provided by our independent auditors (the “Policy”). Under the Policy, proposed services either (i) may be pre-approved by the Audit Committee without consideration of specific case-by-case services (“general pre-approval”); or (ii) require the specific pre-approval of the Audit Committee (“specific pre-approval”). General pre-approval applies to services of recurring and predictable nature. These types of services, once approved by the Audit Committee in the beginning, will not require further approval in the future, except when actual fees and expenses exceed pre-approved budget levels. In such a case, the Audit Committee may authorize one of its members to approve budget increases subject to the requirement that such member provides a report on his decision to approve or deny an application for budget increases to the Audit Committee at an Audit Committee meeting held immediately after such member grants or denies the approval.
152
Specific pre-approval applies to all other services. These services must be approved by the Audit Committee on a case-by-case basis after an application including proposed budget and scope of services to be provided by our independent auditors is submitted to the Audit Committee.
For 2021, all of the services provided by Ernst & Young Hua Ming LLP were pre-approved by the Audit Committee.
ITEM 16D EXEMPTIONS FROM THE LISTING STANDARDS FOR AUDIT COMMITTEES
Not applicable.
ITEM 16E PURCHASES OF EQUITY SECURITY BY THE ISSUER AND AFFILIATED PURCHASERS
Not applicable.
ITEM 16F CHANGE IN REGISTRANT’S CERTIFYING ACCOUNTANT
Not applicable.
153
ITEM 16G CORPORATE GOVERNANCE
Comparison of New York Stock Exchange corporate governance rules and China corporate governance rules for listed companies: under the amended Corporate Governance Rules of New York Stock Exchange (“NYSE”), foreign issuers (including the Company) listed on the NYSE are required to disclose a summary of the significant differences between their domestic corporate governance rules and NYSE corporate governance rules that would apply to a U.S. domestic issuer. A summary of such differences is listed below:
NYSE corporate governance rules |
| Corporate governance rules applicable to the domestically listed companies in China and the Company’s governance practices |
---|---|---|
|
| |
A listed company must have a majority of independent directors on its board of directors. No director qualifies as “independent” unless the board of directors affirmatively determines that the director has no material relationship with the listed company (either directly or as a partner, shareholder or officer of an organization that has a relationship with the company). In addition, a director must meet certain standards to be deemed independent. For example, a director is not independent if the director is, or has been within the last three years, an employee of the listed company, or an immediate family member is, or has been within the last three years, an executive officer of the listed company, or if the director has received, or has an immediate family member who has received, during any twelve-month period within the last three years, more than US$120,000 in direct compensation from the listed company, other than director and committee fees and pension or other forms of deferred compensation for prior service (provided such compensation is not contingent in any way on continued service). |
| It is required in China that any domestically listed company must establish an independent director system and set forth specific requirements for the qualification of independent directors. For example, an independent director shall not hold any other position in the listed Company other than being a member of the special committee established by the board of directors and shall not be influenced by the main shareholders or the controlling persons of the listed company, or by any other entities or persons with whom the listed company has a significant relationship. The Company has complied with the relevant Chinese corporate governance rules and has implemented internal rules governing the independence and responsibilities of independent directors. The Company determines the independence of independent directors every year. |
To empower non-management directors to serve as a more effective check on management, the non-management directors of each listed company must meet at regularly scheduled executive sessions without management. |
| No similar requirements |
Nominating/Corporate Governance Committee |
|
|
Listed companies must have a nominating/corporate governance committee composed entirely of independent directors. |
| The board of directors of a domestically listed company may establish a nominating committee composed entirely of directors, of which the independent directors shall be the majority and the convener. The Company has established a nominating committee. |
The nominating/corporate governance committee must have a written charter that addresses the committee’s purposes and responsibilities which, at minimum, must be to: search for eligible people for the board of directors, select and nominate directors for the next session of the shareholders’ annual meeting, study and propose corporate governance guidelines, supervise the evaluation of the board of directors and management, and evaluate the performance of the committee every year. |
| Relevant responsibilities of the nominating/corporate governance committee are similar to those stipulated by the NYSE rules, but the main responsibilities do not include the research and recommendation of corporate governance guidelines, the supervision of the evaluation of the board of directors and management, or the annual evaluation of the committee. |
Compensation Committee |
|
|
Listed companies must have a compensation committee composed entirely of independent directors. |
| The board of directors of a listed company can have a compensation and evaluation committee composed entirely of directors, of whom the independent directors are the majority and act as the convener. |
154
NYSE corporate governance rules |
| Corporate governance rules applicable to the domestically listed companies in China and the Company’s governance practices |
---|---|---|
The compensation committee must have a written charter that addresses, at least, the following purposes and responsibilities: (1) review and approve the corporate goals associated with CEO’s compensation, evaluate the performance of the CEO in fulfilling these goals, and, either as a committee or together with the other independent directors (as directed by the board) based on such evaluation, determine and approve the CEO’s compensation level; (2) make recommendations to the board with respect to non-CEO executive officer compensation, and incentive-compensation and equity-based plans that are subject to board approval; (3) produce a committee report on executive compensation as required by the SEC to be included in the annual proxy statement or annual report filed with the SEC. |
| The board of directors of a listed company can have a compensation and evaluation committee composed entirely of directors, of whom the independent directors are the majority and act as the convener. The responsibilities are similar to those stipulated by the NYSE rules, but the committee is not required to produce a report on the executive compensation or make an annual performance evaluation of the committee. The board of directors of the Company has established a compensation and evaluation committee composed mainly of independent directors who act as the convener, and the committee has a written charter. |
The charter must also include the requirement for an annual performance evaluation of the compensation committee. The compensation committee may, in its sole discretion, retain or consult a compensation consultant, independent legal counsel or other advisor. The compensation committee shall be directly responsible for the appointment, compensation and oversight of the work of such advisor. A listed company must provide for appropriate funding for payment of reasonable compensation to such advisor. The compensation committee may select such advisor to the compensation committee only after taking into consideration all factors relevant to that person’s independence from management. |
|
|
Audit Committee |
|
|
Listed companies must have an audit committee that satisfies the requirements of Rule 10A-3 of Exchange Act. It must have a minimum of three members, and all audit committee members must satisfy the requirements for independence set forth in Section 303A.02 of NYSE Corporate Governance Rules as well as the requirements of Rule 10A-3 (b)(1) of the Exchange Act. |
| The board of directors of a domestically listed company must establish an audit committee composed entirely of directors, of which the independent directors are the majority and act as the convener, and the convener shall be an accounting professional. |
The audit committee must have a written charter that specifies the purpose of the audit committee is, at minimum, to assist the board oversight of the integrity of financial statements, the Company’s compliance with legal and regulatory requirements, qualifications and independence of independent auditors and the performance of the listed company’s internal audit function and independent auditors. The written charter must also require the audit committee to prepare an audit committee report as required by the SEC to be included in the listed company’s annual proxy statement as well as an annual performance evaluation of the audit committee. The written charter must also specify the duties and responsibilities of the audit committee, which, at a minimum, must include those set out in Rules 10A-3(b)(2), (3), (4) and (5) of the Exchange Act, as well as other duties and responsibilities, such as to obtain and review a report by the independent auditor at least annually, meet to review and discuss the listed company’s annual audited financial statements and quarterly financial statements with management and independent auditor. |
| The board of directors of a domestically listed company must establish an audit committee composed entirely of directors, of which the independent directors are the majority and act as the convener, and the convener shall be an accounting professional. The board of directors of a domestically listed company needs to establish the audit committee and make a written rules of procedure. The domestically listed company shall disclose the audit committee’s performance of the duty along with the annual report, including the disclosure of all audit committee meetings. |
155
NYSE corporate governance rules |
| Corporate governance rules applicable to the domestically listed companies in China and the Company’s governance practices |
---|---|---|
Each listed company must have an internal audit department. |
| China has a similar regulatory provision, and the Company has an internal audit department |
Shareholder approval of equity compensation plan |
|
|
Shareholders must be given the opportunity to vote on all equity-compensation plans and material revisions thereto, except for, among others, plans that are made available to shareholders generally, such as typical dividend reinvestment plan, certain awards and plans in the context of mergers and acquisitions. |
| The relevant regulations of China provide that the shareholders’ meeting shall approve the compensation of the directors and supervisors. The compensation plan of executive officers shall be approved by the board and announced at the shareholders’ meeting and disclosed to the public. |
Corporate governance guidelines |
|
|
Listed companies must adopt and disclose corporate governance guidelines, involving director qualification standards, director responsibilities, director compensation, director continuing education, annual performance evaluation of the board of directors, etc. |
| CSRC has issued the Corporate Governance Rules, providing specific rules regarding the process of director election, the duty of directors, the composition and duty of the board of directors and the rules of performance review, with which the Company has complied. |
Code of ethics for directors, officers and employees |
|
|
Listed companies must adopt and disclose a code of business conduct and ethics for directors, officers and employees, and promptly disclose any waivers of the code for directors or executive officers. Each code of business conduct and ethics must require that any waiver of the code for executive officers or directors may be made only by the board or a board committee. |
| China does not have such requirement for a code of ethics. But, the directors and officers must perform their legal responsibilities in accordance with the Company Law of PRC, relative requirements of CSRC and Mandatory Provisions to the Charter of Companies Listed Overseas |
Each listed company’s CEO must certify to the NYSE each year that he or she is not aware of any violation by the listed company of NYSE corporate governance listing standards and he or she must promptly notify the NYSE in writing of any non-compliance with any applicable provisions of Section 303A. |
| No similar requirements. |
ITEM 16H MINE SAFETY DISCLOSURE
Not applicable.
ITEM 17 . FINANCIAL STATEMENTS
Not applicable.
ITEM 18 . FINANCIAL STATEMENTS
See page F-1 through F-169 following Item 19.
156
ITEM 19 . EXHIBITS
1.1 | |
2.1 | |
3.1 | Shareholders’ Agreement dated May 31, 1994, incorporated by reference to Exhibit 9.1 of our Registration Statement on Form F-1, filed with the SEC on August 24, 1994. Amendment to Shareholders’ Agreement dated May 12, 2006, incorporated by reference to Exhibit 3.1 of our annual report on Form 20-F for the year ended December 31, 2006, filed with the SEC on April 16, 2007. |
8.1* | |
12.1* | |
12.2* | |
13.1** | |
101.INS* | Inline XBRL Instance Document -this instance document does not appear in the Interactive Data File because its XBRL tags embedded within the Inline XBRL document |
101.SCH* | Inline XBRL Taxonomy Extension Schema Document. |
101.CAL* | Inline XBRL Taxonomy Extension Calculation Linkbase Document. |
101.DEF* | Inline XBRL Taxonomy Extension Definition Linkbase Document. |
101.LAB* | Inline XBRL Taxonomy Extension Labels Linkbase Document. |
101.PRE* | Inline XBRL Taxonomy Extension Presentation Linkbase Document. |
104* | Cover Page Interactive Data File (embedded within the Inline XBRL document) |
* | Filed herewith |
** | Furnished herewith |
157
Signature
The registrant hereby certifies that it meets all of the requirements for filing on Form 20-F and it has duly caused and authorized the undersigned to sign this annual report on its behalf.
Date: April 21, 2022 | Huaneng Power International, Inc. | |
By: | /s/ Huang Chaoquan | |
Name: Huang Chaoquan | ||
Title: Secretary to the Board |
158
HUANENG POWER INTERNATIONAL, INC.
INDEX TO CONSOLIDATED FINANCIAL STATEMENTS
F-1
REPORT OF INDEPENDENT REGISTERED PUBLIC ACCOUNTING FIRM
To the Shareholders and the Board of Directors of Huaneng Power International, Inc.
Opinion on the Financial Statements
We have audited the accompanying consolidated statements of financial position of Huaneng Power International, Inc. (the “Group”) as of 31 December 2021 and 2020, the related consolidated statements of comprehensive income, changes in equity and cash flows for each of the three years in the period ended 31 December 2021, and the related notes (collectively referred to as the “consolidated financial statements”). In our opinion, the consolidated financial statements present fairly, in all material respects, the financial position of the Group at 31 December 2021 and 2020, and the results of its operations and its cash flows for each of the three years in the period ended 31 December 2021, in conformity with International Financial Reporting Standards as issued by the International Accounting Standards Board.
We also have audited, in accordance with the standards of the Public Company Accounting Oversight Board (United States) (PCAOB), the Group’s internal control over financial reporting as of 31 December 2021, based on criteria established in Internal Control-Integrated Framework issued by the Committee of Sponsoring Organizations of the Treadway Commission (2013 framework) and our report dated 21 April 2022, expressed an unqualified opinion thereon.
Basis for Opinion
These financial statements are the responsibility of the Group’s management. Our responsibility is to express an opinion on the Group’s financial statements based on our audits. We are a public accounting firm registered with the PCAOB and are required to be independent with respect to the Group in accordance with the U.S. federal securities laws and the applicable rules and regulations of the Securities and Exchange Commission and the PCAOB.
We conducted our audits in accordance with the standards of the PCAOB. Those standards require that we plan and perform the audit to obtain reasonable assurance about whether the financial statements are free of material misstatement, whether due to error or fraud. Our audits included performing procedures to assess the risks of material misstatement of the financial statements, whether due to error or fraud, and performing procedures that respond to those risks. Such procedures included examining, on a test basis, evidence regarding the amounts and disclosures in the financial statements. Our audits also included evaluating the accounting principles used and significant estimates made by management, as well as evaluating the overall presentation of the financial statements. We believe that our audits provide a reasonable basis for our opinion.
Critical Audit Matters
The critical audit matters communicated below are matters arising from the current period audit of the financial statements that were communicated or required to be communicated to the audit committee and that: (1) relate to accounts or disclosures that are material to the financial statements and (2) involved our especially challenging, subjective, or complex judgments. The communication of the critical audit matters does not alter in any way our opinion on the consolidated financial statements, taken as a whole, and we are not, by communicating the critical audit matters below, providing separate opinions on the critical audit matters or on the accounts or disclosures to which they relate.
F-2
Impairment of property, plant and equipment | ||
|
| |
Description of the Matter |
| At 31 December 2021, the Group held property, plant and equipment (“PPE”) with the amount of RMB320,590 million, contributed 78.5% of the Group’s total non-current assets. As described in Notes 2(g), 2(l), 4(b) and 7 to the consolidated financial statements, the Group is required to review PPE for impairment whenever events or changes in circumstances indicate that their carrying amounts may not be recoverable. Management performed an impairment assessment on such PPE by determining the recoverable amounts of the cash-generating units (“CGUs”) that the PPE are allocated to. As a result of the impairment assessment, impairment losses of RMB29 million were recognized for the year ended 31 December 2021. |
|
| Auditing management’s impairment assessment of PPE was complex due to the significant estimates and judgments involved in the projections of future cash flows, including the future sales volumes, fuel prices and discount rates applied to these forecasted future cash flows. These estimates and judgments may be significantly affected by changes in future market or economic conditions. |
How We Addressed the Matter in Our Audit |
| We obtained an understanding, evaluated the design, and tested the operating effectiveness of controls over the PPE impairment assessment process including tests of controls over management’s review of the significant assumptions used in the impairment assessment. Among other audit procedures performed, we evaluated management’s assessment of impairment indicators, compared the methodology used by the Group to industry practice and tested the completeness and accuracy of the underlying data used in the projections. We also assessed the significant assumptions used in the calculations, which included, amongst others, the future sales volumes, fuel prices, and discount rates. We compared fuel prices to external industry outlook reports and analyzed the history of management’s estimates. In addition, we involved our valuation specialists to assist us with assessing the valuation methodologies and the assumptions used, including the discount rates. We evaluated the sensitivity of the significant assumptions described above by assessing the changes to the recoverable amounts of the CGUs resulting from changes in these assumptions. We also assessed the adequacy of the Group’s disclosures regarding the impairment assessment. |
|
| Impairment of goodwill |
Description of the Matter |
| At 31 December 2021, the Group’s goodwill was RMB14,276 million. As described in Notes 2(k), 2(l), 4(a) and 14 to the consolidated financial statements, the Group is required to, at least annually, perform impairment assessments of goodwill. Goodwill was allocated to each CGU or groups of CGUs. A goodwill impairment loss is recognized if the carrying amount of the CGU exceeds its recoverable amount. As a result of the impairment assessment, no impairment losses were recognized for the year ended 31 December 2021. Auditing management’s goodwill impairment assessment was complex because the determination of the recoverable amount of the underlying CGUs involves significant estimates and judgments, including the future sales volumes, fuel prices, gross margin and terminal growth rate used to estimate future cash flows and discount rates applied to these forecasted future cash flows of the underlying CGUs. These estimates and judgments may be significantly affected by changes in future market or economic conditions. |
How We Addressed the Matter in Our Audit | We obtained an understanding, evaluated the design, and tested the operating effectiveness of controls over the impairment assessment process, including testing controls over management’s review of the key assumptions used in the goodwill impairment assessment. Among other audit procedures performed, we compared the methodology used by the Group to industry practice, and tested the completeness and accuracy of the underlying data used in the forecast. We evaluated management’s key assumptions used in the calculations, which included, amongst others, the future sales volumes, fuel prices, gross margin, terminal growth rate, and discount rates. We compared fuel prices to external industry outlook reports and analyzed the history of management’s estimates. In addition, we involved our valuation specialists to assist us with assessing the valuation methodologies and the assumptions used, including the discount rates. | |
| We evaluated the sensitivity of the key assumptions described above by assessing the changes to the recoverable amounts of the underlying CGUs resulting from changes in these assumptions. We also assessed the adequacy of the Group’s disclosures regarding the impairment assessment. |
F-3
|
| Recognition of deferred tax assets |
Description of the Matter |
| At 31 December 2021, the Group had deferred tax assets of RMB6,302 million from deductible temporary differences and tax losses carried forward before offsetting. At 31 December 2021, the Group did not recognize deferred tax assets related to deductible temporary differences of RMB16,076 million and unused tax losses of RMB19,919 million. As described in Notes 2(w)(iii), 4(c) and 30 to the consolidated financial statements, the Group recognized deferred tax assets to the extent that it is probable that future taxable profits and taxable temporary difference will be available to utilize the deductible temporary differences and tax losses carried forward. Auditing management’s recognition of deferred tax assets is complex because it requires significant estimation and judgment to evaluate management’s significant assumptions, including future taxable profits, future tax rates, the reversal of deductible and taxable temporary differences, and the possible utilization of tax losses carried forward that could be significantly affected by changes in tax law framework and future market or economic conditions. |
How We Addressed the Matter in Our Audit |
| We obtained an understanding, evaluated the design, and tested the operating effectiveness of controls over the recognition of deferred tax assets, including testing controls over management’s review of the significant assumptions used in the taxable profit forecast. Among other audit procedures performed, we compared the future tax rates, the deductible and taxable temporary differences, and the possible utilization of tax losses carried forward, with the tax law framework. We recalculated the Group’s utilization of tax losses carried forward and reversal of deductible temporary differences in management’s calculation and compared these amounts to the taxable profit and taxable temporary differences for the respective year. Further, we evaluated management’s significant assumptions in determining the future available taxable profits, for example, the future sales volumes, and fuel prices. We compared fuel prices to external industry outlook reports and analyzed the history of management’s estimates. We also tested the completeness and accuracy of the underlying data used in the taxable profit forecast, and compared management’s assumptions described above to the assumptions that management used to perform the impairment assessment of PPE and goodwill. In addition, we involved our tax professionals to assist us in evaluating the technical merits from a tax perspective of management’s analysis. We also assessed the adequacy of the Group’s disclosures regarding the deferred tax assets. |
/s/
We have served as the Group’s auditor since 2019.
21 April 2022
F-4
REPORT OF INDEPENDENT REGISTERED PUBLIC ACCOUNTING FIRM
To the Shareholders and the Board of Directors of Huaneng Power International, Inc.
Opinion on Internal Control Over Financial Reporting
We have audited Huaneng Power International, Inc.’s internal control over financial reporting as of 31 December 2021, based on criteria established in Internal Control-Integrated Framework issued by the Committee of Sponsoring Organizations of the Treadway Commission (2013 framework) (the COSO criteria). In our opinion, Huaneng Power International, Inc. (the “Group”) maintained, in all material respects, effective internal control over financial reporting as of 31 December 2021, based on the COSO criteria.
We also have audited, in accordance with the standards of the Public Company Accounting Oversight Board (United States) (PCAOB), the consolidated statements of financial position of the Group as of 31 December 2021 and 2020, the related consolidated statements of comprehensive income, changes in equity and cash flows for each of the three years in the period ended 31 December 2021, and the related notes and our report dated 21 April 2022 expressed an unqualified opinion thereon.
Basis for Opinion
The Group’s management is responsible for maintaining effective internal control over financial reporting and for its assessment of the effectiveness of internal control over financial reporting included in the accompanying Management’s Report on Internal Control over Financial Reporting. Our responsibility is to express an opinion on the Group’s internal control over financial reporting based on our audit. We are a public accounting firm registered with the PCAOB and are required to be independent with respect to the Group in accordance with the U.S. federal securities laws and the applicable rules and regulations of the Securities and Exchange Commission and the PCAOB.
We conducted our audit in accordance with the standards of the PCAOB. Those standards require that we plan and perform the audit to obtain reasonable assurance about whether effective internal control over financial reporting was maintained in all material respects.
Our audit included obtaining an understanding of internal control over financial reporting, assessing the risk that a material weakness exists, testing and evaluating the design and operating effectiveness of internal control based on the assessed risk, and performing such other procedures as we considered necessary in the circumstances. We believe that our audit provides a reasonable basis for our opinion.
Definition and Limitations of Internal Control Over Financial Reporting
A company’s internal control over financial reporting is a process designed to provide reasonable assurance regarding the reliability of financial reporting and the preparation of financial statements for external purposes in accordance with generally accepted accounting principles. A company’s internal control over financial reporting includes those policies and procedures that (1) pertain to the maintenance of records that, in reasonable detail, accurately and fairly reflect the transactions and dispositions of the assets of the company; (2) provide reasonable assurance that transactions are recorded as necessary to permit preparation of financial statements in accordance with generally accepted accounting principles, and that receipts and expenditures of the company are being made only in accordance with authorizations of management and directors of the company; and (3) provide reasonable assurance regarding prevention or timely detection of unauthorized acquisition, use, or disposition of the company’s assets that could have a material effect on the financial statements.
Because of its inherent limitations, internal control over financial reporting may not prevent or detect misstatements. Also, projections of any evaluation of effectiveness to future periods are subject to the risk that controls may become inadequate because of changes in conditions, or that the degree of compliance with the policies or procedures may deteriorate.
/s/
Beijing, the People’s Republic of China
21 April 2022
F-5
Huaneng Power International, Inc.
Consolidated Statements of Comprehensive Income
For the years ended 31 December 2021, 2020 and 2019
(Prepared in accordance with International Financial Reporting Standards)
(Amounts expressed in thousands of RMB, except per share data)
For the year ended 31 December | ||||||||
| Note |
| 2021 |
| 2020 |
| 2019 | |
RMB | RMB | RMB | ||||||
Operating revenue |
| 5 |
| |
| |
| |
Tax and levies on operations |
| ( |
| ( |
| ( | ||
Operating expenses, net |
|
|
|
|
|
|
| |
Fuel |
|
| ( |
| ( |
| ( | |
Maintenance |
| ( |
| ( |
| ( | ||
Depreciation |
| 6 |
| ( |
| ( |
| ( |
Labor |
| 36 |
| ( |
| ( |
| ( |
Service fees on transmission and transformer facilities of HIPDC |
| ( |
| ( |
| ( | ||
Purchase of electricity |
| ( |
| ( |
| ( | ||
Others, net |
| 6 |
| ( |
| ( |
| ( |
Total operating expenses |
| ( |
| ( |
| ( | ||
(Loss)/profit from operations |
| ( |
| |
| | ||
Interest income |
| |
| |
| | ||
Financial expenses, net |
|
|
|
|
|
|
| |
Interest expense |
| 6 |
| ( |
| ( |
| ( |
Exchange (loss)/gain and bank charges, net |
| ( |
| |
| ( | ||
Total financial expenses, net |
| ( |
| ( |
| ( | ||
Share of profits less losses of associates and joint ventures |
| 8 |
| |
| |
| |
(Loss)/gain on fair value changes of financial assets/liabilities |
| 6 |
| — |
| ( |
| |
Other investment (loss)/income |
|
| ( |
| ( |
| | |
(Loss)/profit before income tax expense |
| 6 |
| ( |
| |
| |
Income tax expense |
| 32 |
| |
| ( |
| ( |
Net (loss)/profit |
| ( |
| |
| |
The accompanying notes are an integral part of these consolidated financial statements.
F-6
Huaneng Power International, Inc.
Consolidated Statements of Comprehensive Income (Continued)
For the years ended 31 December 2021, 2020 and 2019
(Prepared in accordance with International Financial Reporting Standards)
(Amounts expressed in thousands of RMB, except per share data)
For the year ended 31 December | ||||||||
| Note |
| 2021 |
| 2020 |
| 2019 | |
RMB | RMB | RMB | ||||||
Other comprehensive (loss)/income, net of tax |
|
|
|
|
|
|
|
|
Items that will not be reclassified to profit or loss: |
|
|
|
|
|
|
|
|
Fair value changes of other equity instrument investments |
| ( |
| ( |
| ( | ||
Share of other comprehensive (loss)/income of joint ventures and associates |
| ( |
| ( |
| | ||
Income tax effect |
| |
| |
| | ||
Items that may be reclassified subsequently to profit or loss |
|
|
|
|
|
|
|
|
Share of other comprehensive (loss)/income of joint ventures and associates |
| ( |
| ( |
| | ||
Cash flow hedges: |
|
|
|
|
|
|
| |
Effective portion of changes in fair value of hedging instruments arising during the year |
| |
| ( |
| | ||
Reclassification adjustments for (losses)/gains included in profit or loss |
| ( |
| |
| ( | ||
Exchange differences on translation of foreign operations |
| ( |
| ( |
| | ||
Income tax effect |
| ( |
| ( |
| ( | ||
Other comprehensive (loss)/income, net of tax |
| ( |
| ( |
| | ||
Total comprehensive (loss)/income |
| ( |
| |
| | ||
Net (loss)/profit attributable to: |
|
|
|
|
| |||
- Equity holders of the Company |
| ( |
| |
| | ||
- Non-controlling interests |
| ( |
| |
| | ||
| ( |
| |
| | |||
Total comprehensive (loss)/income attributable to: |
|
|
|
|
| |||
- Equity holders of the Company |
| ( |
| |
| | ||
- Non-controlling interests |
| ( |
| |
| | ||
| ( |
| |
| | |||
(Losses)/earnings per share attributable to the shareholders of the Company (expressed in RMB per share) |
|
|
|
|
|
|
| |
- Basic and diluted |
| 33 |
| ( |
| |
| |
The accompanying notes are an integral part of these consolidated financial statements.
F-7
Huaneng Power International, Inc.
Consolidated Statements of Financial Position
As at 31 December 2021 and 2020
(Prepared in accordance with International Financial Reporting Standards)
(Amounts expressed in thousands of RMB)
As at 31 December | ||||||
| Note |
| 2021 |
| 2020 | |
ASSETS |
|
|
|
|
|
|
Non-current assets |
|
|
|
|
|
|
Property, plant and equipment |
| 7 |
| |
| |
Right-of-use assets |
| 40 |
| |
| |
Investments in associates and joint ventures |
| 8 |
| |
| |
Investment properties |
| |
| | ||
Other equity instrument investments |
| 10 |
| |
| |
Power generation licenses |
| 11 |
| |
| |
Mining rights |
| 12 |
| |
| |
Deferred income tax assets |
| 30 |
| |
| |
Derivative financial assets |
| 13 |
| |
| |
Goodwill |
| 14 |
| |
| |
Other non-current assets |
| 15 |
| |
| |
Total non-current assets |
| |
| | ||
Current assets |
|
|
|
|
| |
Inventories |
| 16 |
| |
| |
Other receivables and assets |
| 17 |
| |
| |
Accounts and notes receivable |
| 18 |
| |
| |
Contract assets |
| 5(c) |
| |
| |
Derivative financial assets |
| 13 |
| |
| |
Bank balances and cash |
| 34 |
| |
| |
Total current assets |
| |
| | ||
Total assets |
| |
| |
The accompanying notes are an integral part of these consolidated financial statements.
F-8
Huaneng Power International, Inc.
Consolidated Statements of Financial Position (Continued)
As at 31 December 2021 and 2020
(Prepared in accordance with International Financial Reporting Standards)
(Amounts expressed in thousands of RMB)
As at 31 December | ||||||
| Note |
| 2021 |
| 2020 | |
EQUITY AND LIABILITIES |
|
|
|
|
|
|
Capital and reserves attributable to equity holders of the Company |
|
|
|
|
|
|
Share capital |
| 19 |
| |
| |
Other equity instruments |
| 20 |
| |
| |
Capital surplus |
|
| |
| | |
Surplus reserves |
| 21 |
| |
| |
Currency translation differences |
|
| ( |
| ( | |
Retained earnings |
|
| |
| | |
|
| |
| | ||
Non-controlling interests |
| 39 |
| |
| |
Total equity |
|
| |
| | |
Non-current liabilities |
|
|
|
|
| |
Long-term loans |
| 23 |
| |
| |
Long-term bonds |
| 24 |
| |
| |
Lease liabilities |
| 40 |
| |
| |
Deferred income tax liabilities |
| 30 |
| |
| |
Derivative financial liabilities |
| 13 |
| |
| |
Other non-current liabilities |
| 25 |
| |
| |
Total non-current liabilities |
| |
| |
The accompanying notes are an integral part of these consolidated financial statements.
F-9
Huaneng Power International, Inc.
Consolidated Statements of Financial Position (Continued)
As at 31 December 2021 and 2020
(Prepared in accordance with International Financial Reporting Standards)
(Amounts expressed in thousands of RMB)
As at 31 December | ||||||
| Note |
| 2021 |
| 2020 | |
EQUITY AND LIABILITIES (Continued) |
|
|
|
|
|
|
Current liabilities |
|
|
|
|
|
|
Accounts payable and other liabilities |
| 26 |
| |
| |
Contract liabilities |
| 5(c) |
| |
| |
Taxes payable |
| 27 |
| |
| |
Dividends payable |
|
| |
| | |
Derivative financial liabilities |
| 13 |
| |
| |
Short-term bonds |
| 28 |
| |
| |
Short-term loans |
| 29 |
| |
| |
Current portion of long-term loans |
| 23 |
| |
| |
Current portion of long-term bonds |
| 24 |
| |
| |
Current portion of lease liabilities |
| 40 |
| |
| |
Current portion of other non-current liabilities |
| 25 |
| |
| |
Total current liabilities |
| |
| | ||
Total liabilities |
| |
| | ||
Total equity and liabilities |
| |
| |
These financial statements were approved for issue by the Board of Directors on 21 April 2022 and were signed on its behalf.
Zhao Keyu | Zhao Ping |
Director | Director |
The accompanying notes are an integral part of these consolidated financial statements.
F-10
Huaneng Power International, Inc.
Consolidated Statements of Changes in Equity
For the years ended 31 December 2021, 2020 and 2019
(Prepared in accordance with International Financial Reporting Standards)
(Amounts expressed in thousands of RMB)
Attributable to equity holders of the Company |
|
|
|
| ||||||||||||||||||||||||
Capital surplus | ||||||||||||||||||||||||||||
Fair value | ||||||||||||||||||||||||||||
reserve | ||||||||||||||||||||||||||||
of financial assets | ||||||||||||||||||||||||||||
at fair value | Other reserve | |||||||||||||||||||||||||||
through other | in other | Other | Currency | Non- | ||||||||||||||||||||||||
Share | Other equity | Share | Hedging | comprehensive | comprehensive | capital | Surplus | translation | Retained | controlling | ||||||||||||||||||
| capital |
| instruments |
| premium |
| reserve |
| loss |
| loss |
| reserve |
| Subtotal |
| reserves |
| differences |
| earnings |
| Total |
| interests |
| Total equity | |
Balance as at 31 December 2020 | | | | ( | | ( | | | | ( | | | | | ||||||||||||||
Profit/(loss) for the year ended 31 December 2021 |
| — |
| |
| — |
| — |
| — |
| — |
| — |
| — |
| — |
| — |
| ( |
| ( |
| ( |
| ( |
Other comprehensive income/(loss): |
|
|
|
|
|
|
|
|
|
|
|
|
|
| ||||||||||||||
Fair value changes of other equity investment instruments, net of tax |
| — |
| — |
| — |
| — |
| ( |
| — |
| — |
| ( |
| — |
| — |
| — |
| ( |
| |
| ( |
Share of other comprehensive loss of investees – accounted for under the equity method, net of tax |
| — |
| — |
| — |
| — |
| ( |
| ( |
| — |
| ( |
| — |
| — |
| — |
| ( |
| — |
| ( |
Changes in fair value of effective portion and reclassification of cash flow hedges, net of tax |
| — |
| — |
| — |
| |
| — |
| — |
| — |
| |
| — |
| — |
| — |
| |
| |
| |
Currency translation differences |
| — |
| — |
| — |
| — |
| — |
| — |
| — |
| — |
| — |
| ( |
| — |
| ( |
| ( |
| ( |
Total comprehensive income/(loss) for the year ended 31 December 2021 |
| — |
| |
| — |
| |
| ( |
| ( |
| — |
| |
| — |
| ( |
| ( |
| ( |
| ( |
| ( |
2020 dividends (Note 22) |
| — |
| — |
| — |
| — |
| — |
| — |
| — |
| — |
| — |
| — |
| ( |
| ( |
| ( |
| ( |
Cumulative distribution of other equity instruments (Note 20) |
| — |
| ( |
| — |
| — |
| — |
| — |
| — |
| — |
| — |
| — |
| — |
| ( |
| — |
| ( |
Net capital injection from non-controlling interests of subsidiaries |
| — |
| — |
| — |
| — |
| — |
| — |
| |
| |
| — |
| — |
| — |
| |
| |
| |
Share of other capital reserve of investees accounted for under the equity method |
| — |
| — |
| — |
| — |
| — |
| — |
| |
| |
| — |
| — |
| — |
| |
| — |
| |
Acquisition of non-controlling interests of subsidiaries |
| — |
| — |
| — |
| — |
| — |
| — |
| ( |
| ( |
| — |
| — |
| — |
| ( |
| |
| ( |
Deregistration of a subsidiary |
| — |
| — |
| — |
| — |
| — |
| — |
| — |
| — |
| — |
| — |
| — |
| — |
| ( |
| ( |
Others |
| — |
| — |
| — |
| — |
| — |
| — |
| — |
| — |
| — |
| — |
| |
| |
| ( |
| |
Balance as at 31 December 2021 |
| |
| |
| |
| |
| |
| ( |
| |
| |
| |
| ( |
| |
| |
| |
| |
The notes are an integral part of these consolidated financial statements.
F-11
Huaneng Power International, Inc.
Consolidated Statements of Changes in Equity (Continued)
For the years ended 31 December 2021, 2020 and 2019
(Prepared in accordance with International Financial Reporting Standards)
(Amounts expressed in thousands of RMB)
Attributable to equity holders of the Company |
|
|
|
| ||||||||||||||||||||||||
Capital surplus | ||||||||||||||||||||||||||||
Fair value | ||||||||||||||||||||||||||||
reserve | ||||||||||||||||||||||||||||
of financial | ||||||||||||||||||||||||||||
assets at fair | ||||||||||||||||||||||||||||
value through | Other reserve | |||||||||||||||||||||||||||
other | in other | Other | Currency | Non- | ||||||||||||||||||||||||
Share | Other equity | Share | Hedging | comprehensive | comprehensive | capital | Surplus | translation | Retained | controlling | ||||||||||||||||||
| capital |
| instruments |
| premium |
| reserve |
| income |
| income |
| reserve |
| Subtotal |
| reserves |
| differences |
| earnings |
| Total |
| interests |
| Total equity | |
Balance as at 31 December 2019 | ( | ( | ( | |||||||||||||||||||||||||
Profit for the year ended 31 December 2020 |
| — |
| |
| — |
| — |
| — |
| — |
| — |
| — |
| — |
| — |
| |
| |
| |
| |
Other comprehensive income/(loss): |
|
|
|
|
|
|
|
|
|
|
|
|
|
|
|
|
|
|
|
|
|
|
|
|
|
|
|
|
Fair value changes of other equity investment instruments, net of tax |
| — |
| — |
| — |
| — |
| ( |
| — |
| — |
| ( |
| — |
| — |
| — |
| ( |
| ( |
| ( |
Shares of other comprehensive loss of investees – accounted for under the equity method, net of tax |
| — |
| — |
| — |
| — |
| ( |
| ( |
| — |
| ( |
| — |
| — |
| — |
| ( |
| — |
| ( |
Changes in fair value of effective portion and reclassification of cash flow hedges, net of tax |
| — |
| — |
| — |
| |
| — |
| — |
| — |
| |
| — |
| — |
| — |
| |
| ( |
| |
Currency translation differences |
| — |
| — |
| — |
| — |
| — |
| — |
| — |
| — |
| — |
| ( |
| — |
| ( |
| ( |
| ( |
Total comprehensive income/(loss) for the year ended 31 December 2020 |
| — |
| |
| — |
| |
| ( |
| ( |
| — |
| ( |
| — |
| ( |
| |
| |
| |
| |
Issue of other equity instruments |
| — |
| |
| — |
| — |
| — |
| — |
| — |
| — |
| — |
| — |
| — |
| |
| — |
| |
Redemption of other equity instruments |
| — |
| ( |
| — |
| — |
| — |
| — |
| — |
| — |
| — |
| — |
| ( |
| ( |
| — |
| ( |
2019 dividends |
| — |
| — |
| — |
| — |
| — |
| — |
| — |
| — |
| — |
| — |
| ( |
| ( |
| ( |
| ( |
Cumulative distribution of other equity instruments |
| — |
| ( |
| — |
| — |
| — |
| — |
| — |
| — |
| — |
| — |
| — |
| ( |
| — |
| ( |
Net capital injection from non-controlling interests of subsidiaries |
| — |
| — |
| — |
| — |
| — |
| — |
| |
| |
| — |
| — |
| — |
| |
| |
| |
Business combination |
| — |
| — |
| — |
| — |
| — |
| — |
| — |
| — |
| — |
| — |
| — |
| — |
| |
| |
Share of other capital reserve of investees accounted for under the equity method |
| — |
| — |
| — |
| — |
| — |
| — |
| |
| |
| — |
| — |
| — |
| |
| — |
| |
Others |
| — |
| — |
| — |
| — |
| — |
| — |
| — |
| — |
| — |
| — |
| ( |
| ( |
| |
| |
Balance as at 31 December 2020 |
| |
| |
| |
| ( |
| |
| ( |
| |
| |
| |
| ( |
| |
| |
| |
| |
The notes are an integral part of these consolidated financial statements.
F-12
Huaneng Power International, Inc.
Consolidated Statements of Changes in Equity (Continued)
For the years ended 31 December 2021, 2020 and 2019
(Prepared in accordance with International Financial Reporting Standards)
(Amounts expressed in thousands of RMB)
Attributable to equity holders of the Company |
|
|
|
| ||||||||||||||||||||||||
Capital surplus | ||||||||||||||||||||||||||||
Fair value | ||||||||||||||||||||||||||||
reserve | ||||||||||||||||||||||||||||
of financial | ||||||||||||||||||||||||||||
assets at fair | ||||||||||||||||||||||||||||
value through | Other reserve | |||||||||||||||||||||||||||
other | in other | Other | Currency | Non- | ||||||||||||||||||||||||
Share | Other equity | Share | Hedging | comprehensive | comprehensive | capital | Surplus | translation | Retained | controlling | ||||||||||||||||||
| capital |
| instruments |
| premium |
| reserve |
| income |
| income |
| reserve |
| Subtotal |
| reserves |
| differences |
| earnings |
| Total |
| interests |
| Total equity | |
Balance as at 31 December 2018 | | | | ( | | ( | | | | ( | | | | | ||||||||||||||
Profit for the year ended 31 December 2019 | — | | — | — | — | — | — | — | — | — | | | | | ||||||||||||||
Other comprehensive income/(loss): | ||||||||||||||||||||||||||||
Fair value changes of other equity investment instruments -net of tax | — | — | — | — | ( | — | — | ( | — | — | — | ( | | ( | ||||||||||||||
Shares of other comprehensive income of investees – accounted for under the equity method, net of tax | — | — | — | — | | | — | | — | — | — | | — | | ||||||||||||||
Changes in fair value of effective portion and reclassification of cash flow hedges, net of tax | — | — | — | | — | — | — | | — | — | — | | ( | | ||||||||||||||
Currency translation differences |
| — |
| — |
| — |
| — |
| — |
| — |
| — |
| — |
| — |
| |
| — |
| |
| ( |
| |
Total comprehensive income for the year ended 31 December 2019 |
| — |
| |
| — |
| |
| |
| |
| — |
| |
| — |
| |
| |
| |
| |
| |
Issue of other equity instruments |
| — |
| |
| — |
| — |
| — |
| — |
| — |
| — |
| — |
| — |
| — |
| |
| — |
| |
2018 dividends |
| — |
| — |
| — |
| — |
| — |
| — |
| — |
| — |
| — |
| — |
| ( |
| ( |
| ( |
| ( |
Cumulative distribution of other equity instruments |
| — |
| ( |
| — |
| — |
| — |
| — |
| — |
| — |
| — |
| — |
| — |
| ( |
| — |
| ( |
Net capital injection from non-controlling interests of subsidiaries |
| — |
| — |
| — |
| — |
| — |
| — |
| |
| |
| — |
| — |
| — |
| |
| |
| |
Acquisition of non-controlling interests of subsidiaries |
| — |
| — |
| — |
| — |
| — |
| — |
| ( |
| ( |
| — |
| — |
| — |
| ( |
| |
| ( |
Disposal of a subsidiary |
| — |
| — |
| — |
| — |
| — |
| — |
| — |
| — |
| — |
| — |
| — |
| — |
| |
| |
Deregistration of a subsidiary |
| — |
| — |
| — |
| — |
| — |
| — |
| — |
| — |
| — |
| — |
| — |
| — |
| |
| |
Disposal of equity investments at fair value through other comprehensive income |
| — |
| — |
| — |
| — |
| ( |
| — |
| — |
| ( |
| — |
| — |
| |
| — |
| — |
| — |
Balance as at 31 December 2019 |
| |
| |
| |
| ( |
| |
| ( |
| |
| |
| |
| ( |
| |
| |
| |
| |
The accompanying notes are an integral part of these consolidated financial statements.
F-13
Huaneng Power International, Inc.
Consolidated Statements of Cash Flows
For the years ended 31 December 2021, 2020 and 2019
(Prepared in accordance with International Financial Reporting Standards)
(Amounts expressed in thousands of RMB)
For the Year ended 31 December | ||||||||
| Note |
| 2021 |
| 2020 |
| 2019 | |
RMB | RMB | RMB | ||||||
OPERATING ACTIVITIES | ||||||||
(Loss)/profit before income tax expense |
| ( |
| |
| | ||
Adjustments to reconcile (loss)/profit before income tax expense to net cash provided by operating activities: |
|
|
|
|
|
|
| |
Depreciation of property, plant and equipment |
| 6 |
| | | | ||
Depreciation of investment properties | 6 | | | | ||||
Depreciation of right-of-use assets |
| 6 |
| | | | ||
Provision for impairment losses on property, plant and equipment |
| 6 |
| | | | ||
Provision for impairment on goodwill |
| 6 |
| — | | — | ||
Provision for impairment on other non-current assets |
| 6 |
| | | | ||
Amortization of other non-current assets |
| 6 |
| | | | ||
Recognition of provision for loss allowance of receivables |
| 6 |
| | | | ||
(Reversal)/recognition of provision for inventory obsolescence |
| 6 |
| ( | | | ||
Loss/(gain) on fair value changes of financial assets/liabilities |
| 6 |
| — | | ( | ||
Other investment (gain)/loss |
| ( | ( | | ||||
Net (gain)/loss on disposals of non-current assets |
| 6 |
| ( | | ( | ||
Net gain on disposal of subsidiaries |
| 6 |
| — | — | ( | ||
Share of profits less losses of associates and joint ventures |
| 8 | ( | ( | ( | |||
Interest income |
| ( | ( | ( | ||||
Interest expense |
| 6 |
| | | | ||
Others |
| ( | ( | ( | ||||
Changes in working capital: |
|
|
|
|
|
|
| |
Inventories |
| ( | | | ||||
Other receivables and assets |
| ( | | | ||||
Accounts and notes receivable |
| ( | ( | ( | ||||
Contract assets |
| ( | ( | ( | ||||
Restricted cash |
| | ( | ( | ||||
Accounts payable and other liabilities |
| | | ( | ||||
Contract liabilities |
| | | | ||||
Taxes payable |
| | | | ||||
Interest received |
| | | | ||||
Income tax expense paid |
| ( | ( | ( | ||||
Net cash provided by operating activities |
| | | |
The accompanying notes are an integral part of these consolidated financial statements.
F-14
Huaneng Power International, Inc.
Consolidated Statements of Cash Flows (Continued)
For the years ended 31 December 2021, 2020 and 2019
(Prepared in accordance with International Financial Reporting Standards)
(Amounts expressed in thousands of RMB)
For the Year ended 31 December | ||||||||
| Note |
| 2021 |
| 2020 |
| 2019 | |
RMB | RMB | RMB | ||||||
INVESTING ACTIVITIES | ||||||||
Payment for the purchase of property, plant and equipment |
| ( |
| ( |
| ( | ||
Proceeds from disposal of property, plant and equipment, land use rights and other non-current assets |
| |
| |
| | ||
Payment for the purchase of other non-current assets |
| ( |
| ( |
| ( | ||
Cash dividends received |
| |
| |
| | ||
Capital injections for investments in associates and joint ventures |
| ( |
| ( |
| ( | ||
Cash paid for acquiring other equity instrument investments |
| 3(b) | ( |
| ( |
| ( | |
Cash paid for acquiring subsidiaries, net of cash acquired |
|
| — |
| ( |
| ( | |
Cash received from disposal of other equity instrument investments |
| — |
| — |
| | ||
Cash received from recovery of entrusted loans | | — | — | |||||
Net outflow of cash and cash equivalents in respect of the disposal of subsidiaries |
| — |
| — |
| ( | ||
Others |
| ( |
| |
| | ||
Net cash used in investing activities |
| ( |
| ( |
| ( |
The accompanying notes are an integral part of these consolidated financial statements.
F-15
Huaneng Power International, Inc.
Consolidated Statements of Cash Flows (Continued)
For the years ended 31 December 2021, 2020 and 2019
(Prepared in accordance with International Financial Reporting Standards)
(Amounts expressed in thousands of RMB)
For the year ended 31 December | ||||||||
| Note |
| 2021 |
| 2020 |
| 2019 | |
RMB | RMB | RMB | ||||||
FINANCING ACTIVITIES | ||||||||
Issuance of short-term bonds |
| |
| |
| | ||
Repayments of short-term bonds |
| ( |
| ( |
| ( | ||
Proceeds from short-term loans |
| |
| |
| | ||
Repayments of short-term loans |
| ( |
| ( |
| ( | ||
Proceeds from long-term loans |
| |
| |
| | ||
Repayments of long-term loans |
| ( |
| ( |
| ( | ||
Issuance of long-term bonds |
| |
| |
| | ||
Repayments of long-term bonds |
| ( |
| ( |
| ( | ||
Interest paid |
| ( |
| ( |
| ( | ||
Net proceeds from the issuance of other equity instruments |
| — |
| |
| | ||
Redemption of other equity instruments |
| — |
| ( |
| — | ||
Net capital injection from non-controlling interests of subsidiaries |
| |
| |
| | ||
Dividends paid to shareholders of the Company |
| ( |
| ( |
| ( | ||
Dividends paid to non-controlling interests of subsidiaries |
| ( |
| ( |
| ( | ||
Lease payments |
| ( |
| ( |
| ( | ||
Cash paid for acquisition of non-controlling interests of a subsidiary |
| ( |
| — |
| ( | ||
Others |
| ( |
| |
| ( | ||
Net cash provided by/(used in) financing activities |
| |
| |
| ( | ||
Effect of foreign exchange rate changes, net |
| ( |
| ( |
| | ||
NET INCREASE/(DECREASE) IN CASH AND CASH EQUIVALENTS |
| |
| |
| ( | ||
Cash and cash equivalents as at beginning of the year |
| |
| |
| | ||
CASH AND CASH EQUIVALENTS AS AT END OF THE YEAR |
| 34 |
| |
| |
| |
The accompanying notes are an integral part of these consolidated financial statements.
F-16
Huaneng Power International, Inc.
Notes to the Financial Statements
For the years ended 31 December 2021, 2020 and 2019
(Prepared in accordance with International Financial Reporting Standards)
(Amounts expressed in thousands of RMB unless otherwise stated)
1 | Company organization and principal activities |
Huaneng Power International, Inc. (the “Company”) was incorporated in the People’s Republic of China (the “PRC”) as a Sino-foreign joint stock limited company on 30 June 1994. The registered address of the Company is Huaneng Building, 6 Fuxingmennei Street, Xicheng District, Beijing, the PRC. The Company and its subsidiaries (collectively, the “Group”) are principally engaged in the generation and sale of electric power to the respective regional or provincial grid companies in the PRC, the Republic of Singapore (“Singapore”) and the Islamic Republic of Pakistan (“Pakistan”). The Company conducts its business in Singapore through SinoSing Power Pte Ltd. (“SinoSing Power”) and its subsidiaries and in Pakistan through Huaneng Shandong Ruyi (Hong Kong) Energy Co., Ltd. (“Hong Kong Energy”) and its subsidiaries.
The directors consider Huaneng International Power Development Corporation (“HIPDC”) and China Huaneng Group Co., Ltd. (“Huaneng Group”) as controlling shareholders of the Company, with HIPDC being the parent company and Huaneng Group being the ultimate parent company of the Company, respectively. Both HIPDC and Huaneng Group are incorporated in the PRC. HIPDC does not produce financial statements available for public use.
2 | Principal accounting policies |
The principal accounting policies adopted in the preparation of these financial statements are set out below. These policies have been consistently applied to all the years presented, unless otherwise stated.
(a) | Basis of preparation |
These financial statements have been prepared in accordance with International Financial Reporting Standards (“IFRSs”) as issued by the International Accounting Standards Board (the “IASB”) and the disclosure requirements of the Hong Kong Companies Ordinance. These financial statements have been prepared under the historical cost convention, except for the financial assets at fair value through other comprehensive income, financial assets at fair value through profit or loss and derivative financial assets and liabilities.
The preparation of financial statements in conformity with IFRSs requires the use of certain critical accounting estimates. It also requires management to exercise its judgement in the process of applying the Group’ accounting policies. The areas involving a higher degree of judgement or complexity, or areas where assumptions and estimates are significant to the financial statements are disclosed in Note 4.
As at 31 December 2021, the Group had net current liabilities of approximately RMB
Therefore, the directors of the Company are of the opinion that the Group will be able to meet its liabilities as and when they fall due within the next twelve months and accordingly, these consolidated financial statements are prepared on a going concern basis.
The IASB has issued certain new and revised IFRSs that are first effective or available for early adoption for the current accounting period of the Group. Note 2(b) provides information on any changes in accounting policies resulting from initial application of these developments to the extent that they are relevant to the Group for the current and prior accounting periods reflected in these financial statements.
F-17
Huaneng Power International, Inc.
Notes to the Financial Statements
For the years ended 31 December 2021, 2020 and 2019
(Prepared in accordance with International Financial Reporting Standards)
(Amounts expressed in thousands of RMB unless otherwise stated)
2 Principal accounting policies (continued)
(b) | Changes in accounting policies |
The Group has adopted the following revised IFRSs for the first time for the current year’s consolidated financial statements.
Amendments to IFRS 9, | |
IAS 39, IFRS 7, | |
IFRS 4 and IFRS 16 | Interest Rate Benchmark Reform - Phase 2 |
Amendment to IFRS 16 | Covid-19-Related Rent Concessions beyond 30 June 2021 (early adopted) |
The nature and the impact of the revised IFRSs are described below:
(i) | Amendments to IFRS 9, IAS 39, IFRS 7, IFRS 4 and IFRS 16 Interest Rate Benchmark Reform - Phase 2 |
Amendments to IFRS 9, IAS 39, IFRS 7, IFRS 4 and IFRS 16 address issues not dealt with in the previous amendments which affect financial reporting when an existing interest rate benchmark is replaced with an alternative risk-free rate (“RFR”). The amendments provide a practical expedient to allow the effective interest rate to be updated without adjusting the carrying amount of financial assets and liabilities when accounting for changes in the basis for determining the contractual cash flows of financial assets and liabilities, if the change is a direct consequence of the interest rate benchmark reform and the new basis for determining the contractual cash flows is economically equivalent to the previous basis immediately preceding the change. In addition, the amendments permit changes required by the interest rate benchmark reform to be made to hedge designations and hedge documentation without the hedging relationship being discontinued. Any gains or losses that could arise on transition are dealt with through the normal requirements of IFRS 9 to measure and recognize hedge ineffectiveness. The amendments also provide a temporary relief to entities from having to meet the separately identifiable requirement when an RFR is designated as a risk component. The relief allows an entity, upon designation of the hedge, to assume that the separately identifiable requirement is met, provided the entity reasonably expects the RFR risk component to become separately identifiable within the next 24 months. Furthermore, the amendments require an entity to disclose additional information to enable users of financial statements to understand the effect of interest rate benchmark reform on an entity’s financial instruments and risk management strategy. These amendments had no material impact on the consolidated financial statements of the Group.
F-18
Huaneng Power International, Inc.
Notes to the Financial Statements
For the years ended 31 December 2021, 2020 and 2019
(Prepared in accordance with International Financial Reporting Standards)
(Amounts expressed in thousands of RMB unless otherwise stated)
2 Principal accounting policies (continued)
(b) | Changes in accounting policies (continued) |
(ii) | Amendment to IFRS 16 Covid-19-Related Rent Concessions beyond 30 June 2021 (early adopted) |
Amendment to IFRS 16 issued in April 2021 extends the availability of the practical expedient for lessees to elect not to apply lease modification accounting for rent concessions arising as a direct consequence of the covid-19 pandemic by 12 months. Accordingly, the practical expedient applies to rent concessions for which any reduction in lease payments affects only payments originally due on or before 30 June 2022, provided the other conditions for applying the practical expedient are met. The amendment is effective retrospectively for annual periods beginning on or after 1 April 2021 with any cumulative effect of initially applying the amendment recognized as an adjustment to the opening balance of retained profits at the beginning of the current accounting period. Earlier application is permitted. The amendment did not have any impact on the financial position and performance of the Group as there were no lease payments reduced or waived by the lessors as a result of the covid-19 pandemic during the year.
(c) | Consolidation |
The consolidated financial statements include the financial statements of the Company and all of its subsidiaries.
Subsidiaries are investees over which the Group has the power to exercise control. The Group controls an entity when it is exposed, or has rights to variable returns from their involvement with the entity and has the ability to affect those returns through their power over the entity. In assessing whether the Group has power, only substantive rights (held by the Group and other parties) are considered.
When the Group has, directly or indirectly, less than a majority of the voting or similar rights of an investee, the Group considers all relevant facts and circumstances in assessing whether it has power over an investee, including:
(a) | the contractual arrangement with the other vote holders of the investee; |
(b) | rights arising from other contractual arrangements; and |
(c) | the Group’s voting rights and potential voting rights. |
When there is any inconsistency on the accounting policies or financial period adopted between subsidiaries and the Company, the financial statements of subsidiaries are adjusted according to the accounting policies or financial period adopted by the Company.
Subsidiaries are consolidated from the date when control is transferred to the Group. They are de-consolidated from the date when control ceases. Intra-group balances, transactions and cash flows, and any unrealized income and expenses arising from intra-group transactions, are eliminated in full in preparing the consolidated financial statements. Unrealized gains arising from transactions with equity accounted investees are eliminated against the investment to the extent of the Group’s interest in the investee. Unrealized losses are eliminated in the same way as unrealized gains, but only to the extent that there is no evidence of impairment. The portion of the shareholders’ equity of the subsidiaries, which is not attributable directly or indirectly to the parent company, is separately presented as non-controlling interests in the shareholders’ equity in the consolidated financial statements.
The Group reassesses whether or not it controls an investee if facts and circumstances indicate that there are changes to one or more of the three elements of control described above. A change in the ownership interest of a subsidiary, without a loss of control, is accounted for as an equity transaction.
F-19
Huaneng Power International, Inc.
Notes to the Financial Statements
For the years ended 31 December 2021, 2020 and 2019
(Prepared in accordance with International Financial Reporting Standards)
(Amounts expressed in thousands of RMB unless otherwise stated)
2 Principal accounting policies (continued)
(c) Consolidation (continued)
If the Group loses control over a subsidiary, it derecognizes (i) the assets (including goodwill) and liabilities of the subsidiary, (ii) the carrying amount of any non-controlling interest and (iii) the cumulative translation differences recorded in equity; and recognizes (i) the fair value of the consideration received, (ii) the fair value of any investment retained and (iii) any resulting surplus or deficit in profit or loss. The Group’s share of components previously recognized in other comprehensive income is reclassified to profit or loss or retained profits, as appropriate, on the same basis as would be required if the Group had directly disposed of the related assets or liabilities.
(i) | Business combinations |
The acquisition method is used to account for the business combinations of the Group (including business combinations under common controls). The consideration transferred for the acquisition of a subsidiary is the fair values of the assets transferred, the liabilities incurred to the former owners of the acquiree and the equity interests issued by the Group. Any contingent consideration is measured at fair value at the date of acquisition. If an obligation to pay contingent consideration that meets the definition of a financial instrument is classified as equity, then it is not remeasured and settlement is accounted for within equity. Otherwise, other contingent consideration is remeasured at fair value at each reporting date and subsequent changes in the fair value of the contingent consideration are recognized in profit or loss. Acquisition-related costs are expensed as incurred. Identifiable assets acquired and liabilities and contingent liabilities assumed in a business combination are measured initially at their fair values at the acquisition date. On an acquisition-by-acquisition basis, the Group recognizes any non-controlling interests in the acquiree either at fair value or at the non-controlling interest’s proportionate share of the recognized amounts of acquiree’s identifiable net assets. The excess of the consideration transferred, the amount of any non-controlling interest in the acquiree and the acquisition-date fair value of any previous equity interest in the acquiree over the fair value of the identifiable net assets acquired is recorded as goodwill (Note 2(k)). If this consideration is lower than the fair value of the net assets of the subsidiary acquired, the difference is recognized in profit or loss. In a business combination achieved in stages, the acquirer shall remeasure its previously held equity interest in the acquiree at its acquisition-date fair value and recognize the resulting gain or loss, if any, in profit or loss or other comprehensive income, as appropriate. In prior reporting periods, the acquirer may have recognized changes in the value of its equity interest in the acquiree in other comprehensive income. If so, the amount that was recognized in other comprehensive income shall be recognized on the same basis as would be required if the acquirer had directly disposed of the previously held equity interest.
The Group determines that it has acquired a business when the acquired set of activities and assets includes an input and a substantive process that together significantly contribute to the ability to create outputs. The Group may elect to apply, or not apply, an optional test (the concentration test) to permit a simplified assessment of whether an acquired set of activities and assets is not a business, and the Group makes such an election separately for each transaction or other event. The concentration test is met if substantially all of the fair value of the gross assets acquired is concentrated in a single identifiable asset or group of similar identifiable assets. If the concentration test is met, the set of activities and assets is determined not to be a business and no further assessment is needed. If the concentration test is not met, or if the entity elects not to apply the test, the Group then perform further assessment to determine whether an acquisition meet the minimum requirements to be a business.
When an acquisition does not constitute an integrated set of activities and assets that is capable of being conducted and managed for the purpose of providing goods or services to customers, generating investment income (such as dividends or interest) or generating other income from ordinary activities, it is not defined as a business and therefore is identified as an asset acquisition.
F-20
Huaneng Power International, Inc.
Notes to the Financial Statements
For the years ended 31 December 2021, 2020 and 2019
(Prepared in accordance with International Financial Reporting Standards)
(Amounts expressed in thousands of RMB unless otherwise stated)
2 Principal accounting policies (continued)
(c) Consolidation (continued)
(ii) | Changes in ownership interests in subsidiaries |
Transactions with non-controlling interests that do not result in loss of control are accounted for as equity transactions – that is, as transactions with the equity owners in their capacity as owners. The difference between fair value of any consideration paid and the relevant share acquired of the carrying value of net assets of the subsidiary is recorded in equity. Gains or losses on disposals to non-controlling interests are also recorded in equity.
When the Group loses control of a subsidiary, it is accounted for as a disposal of the entire interest in that subsidiary, with a resulting gain or loss being recognized in profit or loss. Any interest retained in that former subsidiary at the date when control is lost is recognized at fair value and this amount is regarded as the fair value on initial recognition of a financial asset (Note 2(m)) or, when appropriate, the cost on initial recognition of an investment in an associate or joint venture (Note 2(c)(iii)).
(iii) | Associates and joint ventures |
Associates are investees over which the Group has significant influence on the financial and operating decisions. A joint venture is an arrangement whereby the Group and other parties contractually agree to share control of the arrangement, and have rights to the net assets of the arrangement.
Investments in associates and joint ventures are initially recognized at cost and are subsequently measured using the equity method of accounting, unless it is classified as held for sale (or included in a disposal group that is classified as held for sale). The excess of the initial investment cost over the proportionate share of the fair value of identifiable net assets of investee acquired is included in the initial investment cost (Note 2(k)). Any shortfall of the initial investment cost to the proportionate share of the fair value of identifiable net assets of investee acquired is recognized in the current period profit or loss and long-term investment cost is adjusted accordingly.
When applying the equity method, the Group adjusts net profit or loss of the investees, including the fair value adjustments on the net identifiable assets of the associates and joint ventures and the adjustments to align with the accounting policies of the Company and the Company’s financial reporting periods. The current period investment income is then recognized based on the proportionate share of the Group in the investees’ net profit or loss. Net losses of investees are recognized to the extent of the carrying value of long-term equity investments and any other constituting long-term equity investments in investees that in substance form part of the investments in the investees. The Group continues to recognize investment losses and provision if they bear additional obligations which meet the recognition criteria.
The Group adjusts the carrying amount of the investment and directly recognizes it into related other comprehensive income based on the proportionate share on the movements of the investees’ other comprehensive income.
When the investees appropriate profit or declare dividends, the carrying value of long-term equity investments is reduced correspondingly by the proportionate share of the distribution.
F-21
Huaneng Power International, Inc.
Notes to the Financial Statements
For the years ended 31 December 2021, 2020 and 2019
(Prepared in accordance with International Financial Reporting Standards)
(Amounts expressed in thousands of RMB unless otherwise stated)
2 Principal accounting policies (continued)
(c) Consolidation (continued)
(iii) Associates and joint ventures (continued)
The Group determines at each reporting date whether there is any objective evidence that the investment in the associate or the joint venture is impaired. If this is the case, the Group calculates the amount of impairment as the difference between the recoverable amount of the associate or the joint venture and its carrying value and recognizes the amount in the consolidated statement of comprehensive income.
Profits or losses resulting from transactions between the Group and the associates and joint ventures are recognized in the Group’s financial statements only to the extent of the unrelated third party investor’s interests in the associates and joint ventures. Loss from transactions between the Group and the associates and joint ventures is fully recognized and not eliminated when there is evidence for asset impairment.
If an investment in an associate becomes an investment in a joint venture or vice versa, retained interest is not remeasured. Instead, the investment continues to be accounted for under the equity method.
Gains and losses arising from dilution of investments in associates and joint ventures are recognized in the consolidated statement of comprehensive income.
In the Company’s statement of financial position, investments in associates and joint ventures are stated at cost less provision for impairment losses (Note 2(l)) unless classified as held for sale (or included in a disposal group that is classified as held for sale). Investment income from investments in associates and joint ventures is accounted for by the Company based on dividends received and receivable.
In all other cases, when the Group ceases to have significant influence over an associate or joint control over a joint venture, it is accounted for as a disposal of the entire interest in that investee, with a resulting gain or loss being recognized in profit or loss. Any interest retained in that former investee at the date when significant influence or joint control is lost is recognized at fair value and this amount is regarded as the fair value on initial recognition of a financial asset (Note 2(m)).
(d) | Separate financial statements of the Company |
Investments in subsidiaries are accounted for at cost less impairment unless classified as held for sale (or included in a disposal group that is classified as held for sale). Cost also includes direct attributable costs of investment. Investment income is recognized when the subsidiaries declare dividend.
(e) | Segment reporting |
The Group determines the operating segment based on the internal organization structure, management requirement and internal reporting system for purposes of presenting reportable segment information.
F-22
Huaneng Power International, Inc.
Notes to the Financial Statements
For the years ended 31 December 2021, 2020 and 2019
(Prepared in accordance with International Financial Reporting Standards)
(Amounts expressed in thousands of RMB unless otherwise stated)
2 Principal accounting policies (continued)
(e) | Segment reporting (continued) |
An operating segment represents a component of the Group that meets all the conditions below: (i) the component earns revenue and incurs expenses in its daily operating activities; (ii) chief operating decision maker of the Group regularly reviews the operating results of the component in order to make decisions on allocating resources and assessing performance; (iii) the financial position, operating results, cash flows and other related financial information of the component are available. When two or more operating segments exhibit similar economic characteristics and meet certain conditions, the Group combines them as one reportable segment.
(f) | Foreign currency translation |
(i) | Functional and presentation currency |
Items included in the financial statements of each of the Group are measured using the currency of the primary economic environment in which the entity operates (the “functional currency”). The consolidated financial statements are presented in Renminbi (“RMB”), which is the Company’s functional and presentation currency.
(ii) | Transactions and balances |
Foreign currency transactions are translated into the functional currency using the spot exchange rate on the transaction dates. As at the end of reporting period, foreign currency monetary items are translated into functional currency at the spot exchange rate as at the end of reporting period. Exchange differences are directly expensed in current period profit or loss unless they arise from foreign currency loans borrowed for purchasing or construction of qualifying assets which is eligible for capitalization or they arise from monetary items that qualify as hedging instruments in cash flow hedges which are recorded in other comprehensive income to the extent that the hedge is effective.
(iii) | Foreign subsidiaries |
The operating results and financial position of the foreign subsidiaries are translated into presentation currency as follows:
Asset and liability items in each statement of financial position of foreign operations are translated at the closing rates at the end of reporting period; equity items excluding retained earnings are translated at the spot exchange rates at the date of the transactions. Income and expense items in the statement of comprehensive income of the foreign operations are translated at exchange rates that approximate to those prevailing at the dates of the transactions. All resulting translation differences are recognized in other comprehensive income.
The cash flows denominated in foreign currencies and cash flows of overseas subsidiaries are translated at average exchange rates approximating the rates at the dates when cash flows incurred. The effect of the foreign currency translation on the cash and cash equivalents is presented in the statement of cash flows separately.
On the disposal of a foreign operation (that is, a disposal of the Group’s entire interest in a foreign operation, or a disposal involving loss of control over a subsidiary that includes a foreign operation, a disposal involving loss of joint control over a joint ventures that includes a foreign operation, or a disposal involving loss of significant influence over an associate that includes a foreign operation), all of the exchange differences accumulated in equity in respect of that operation attributable to the equity holders of the Company are reclassified to profit or loss.
F-23
Huaneng Power International, Inc.
Notes to the Financial Statements
For the years ended 31 December 2021, 2020 and 2019
(Prepared in accordance with International Financial Reporting Standards)
(Amounts expressed in thousands of RMB unless otherwise stated)
2 Principal accounting policies (continued)
(f) Foreign currency translation (continued)
(iii) | Foreign subsidiaries (continued) |
In the case of a partial disposal that does not result in the Group losing control over a subsidiary that includes a foreign operation, the proportionate share of accumulated exchange differences is re-attributed to non-controlling interests and are not recognized in profit or loss. For all other partial disposals (that is, reductions in the Group’s ownership interest in associates or joint venture that includes a foreign operation that do not result in the Group losing significant influence or joint control), the proportionate share of the accumulated exchange differences is reclassified to profit or loss.
(g) | Property, plant and equipment |
Property, plant and equipment consists of dams, port facilities, buildings, electric utility plant in service, transportation facilities, others and construction-in-progress (“CIP”). Property, plant and equipment acquired or constructed are initially recognized at cost and carried at the net value of cost less accumulated depreciation and accumulated impairment loss, unless classified as held for sale (or included in a disposal group that is classified as held for sale).
Cost of CIP comprises construction expenditures, other expenditures necessary for the purpose of preparing the CIP for its intended use, those borrowing costs incurred before the assets are ready for intended use that are eligible for capitalization. CIP is not depreciated until such time as the relevant asset is completed and ready for its intended use.
Subsequent costs about property, plant and equipment are included in the asset’s carrying amount only when it is probable that future economic benefits associated with the item will flow to the Group and the cost of the item can be measured reliably. The carrying amount of the replaced part is derecognized. Other subsequent expenditures not qualified for capitalization are charged in the current period profit or loss when they are incurred.
Depreciation of property, plant and equipment is provided based on book value of the asset less estimated residual value over the estimated useful life using straight-line method. For those impaired property, plant and equipment, depreciation is provided based on book value after deducting impairment provision over the estimated useful life of the asset. The estimated useful lives are as follows:
| Estimated useful lives |
| |
|
| ||
Dams |
| years | |
Port facilities |
| years | |
Buildings |
| years | |
Electric utility plant in service |
| years | |
Transportation facilities |
| years | |
Others |
| years |
Where parts of an item of property, plant and equipment have different useful lives, the cost of the item is allocated on a reasonable basis between the parts and each part is depreciated separately. At the end of each year, the Group reviews the estimated useful lives, residual values and the depreciation method of the property, plant and equipment and make adjustment when necessary.
F-24
Huaneng Power International, Inc.
Notes to the Financial Statements
For the years ended 31 December 2021, 2020 and 2019
(Prepared in accordance with International Financial Reporting Standards)
(Amounts expressed in thousands of RMB unless otherwise stated)
2 Principal accounting policies (continued)
(g) Property, plant and equipment (continued)
Property, plant and equipment is derecognized when it is disposed of, or is not expected to bring economic benefit through use or disposal. The amount of disposal proceeds arising from sale, transfer, disposal or write-off of the property, plant and equipment less book value and related tax expenses is recorded in ‘operating expenses – others’ in the statement of comprehensive income.
The carrying amount of property, plant and equipment is written down immediately to their recoverable amount when their carrying amount is greater than their recoverable amount (Note 2(l)).
(h) | Investment property |
Investment properties are land and/or buildings which are owned or held under a leasehold interest (Note 2(ab)), including the leasehold property held as a right-of-use asset to earn rental income and/or for capital appreciation. These include land held for a currently undetermined future use and property that is being constructed or developed for future use as investment property.
Investment properties are stated at cost. Rental income from investment properties is accounted for as described in Note 2(z).
(i) | Power generation licenses |
The Group acquired the power generation license as part of the business combination with Tuas Power Ltd. (“Tuas Power”). The power generation license is initially recognized at fair value at the acquisition date. The license has an indefinite useful life and is not amortized. The assessment that the license has an indefinite useful life is based on the expected renewal of power generation license without significant restriction and cost, together with the consideration on related future cash flows generated and the expectation of continuous operations. It is tested annually for impairment and carried at cost less accumulated impairment loss. The useful life of the power generation license is reviewed by the Group each financial period to determine whether events and circumstances continue to support the indefinite useful life assessment.
(j) | Mining rights |
Mining rights are stated at cost less accumulated amortization and impairment losses (Note 2(l)) and are amortized based on the units of production method utilizing only recoverable coal reserves as the depletion base, unless the mining rights are classified as held for sale (or included in a disposal group that is classified as held for sale).
(k) | Goodwill |
Goodwill is initially measured at cost, being the excess of the consideration transferred, the amount of any non-controlling interest in the acquiree and the acquisition-date fair value of any previous equity interest in the acquiree over the fair value of the identifiable net assets acquired and liabilities assumed of the acquiree at the date of acquisition. If the sum of this consideration and other items is lower than the fair value of the net assets acquired, the difference is, after reassessment, recognized in profit or loss as a gain on bargain purchase.
F-25
Huaneng Power International, Inc.
Notes to the Financial Statements
For the years ended 31 December 2021, 2020 and 2019
(Prepared in accordance with International Financial Reporting Standards)
(Amounts expressed in thousands of RMB unless otherwise stated)
2 Principal accounting policies (continued)
(k) | Goodwill (continued) |
After initial recognition, goodwill is measured at cost less accumulated impairment losses. Goodwill arising on a business combination is allocated to each cash-generating unit, or groups of cash generating units, that is expected to benefit from the synergies of the combination and is tested for impairment annually or more frequent if events or changes in circumstances indicate that the carrying value may be impaired (Note 2(l)).
On disposal of a cash-generating unit during the year, any attributable amount of purchased goodwill is included in the calculation of the profit or loss on disposal.
(l) | Impairment of non-financial assets |
The carrying amounts of property, plant and equipment, mining rights, intangible assets, right-of-use assets with definite useful lives and long-term equity investments not accounted for as financial assets are reviewed at each reporting date to determine whether there is any indication of impairment. If any such indication exists, then the asset’s recoverable amount is estimated. Goodwill, indefinite life intangible assets and intangible assets not yet available for use are tested for impairment annually regardless of whether there are indications of impairment or more frequently if events or changes in circumstances indicate a potential impairment. An impairment loss is recognized if the carrying amount of an asset or cash-generating unit (“CGU”) exceeds its recoverable amount.
The recoverable amount of an asset or CGU is the greater of its value in use and its fair value less cost to sell. For impairment testing, assets are grouped together into the smallest group of assets that generates cash inflows from continuing use that are largely independent of the cash inflows of other assets or CGUs. In testing a CGU for impairment, a portion of the carrying amount of a corporate asset (e.g., a headquarters building) is allocated to an individual CGU if it can be allocated on a reasonable and consistent basis or, otherwise, to the smallest group of CGUs.
Subject to an operating segment ceiling test, CGUs to which goodwill has been allocated are aggregated so that the level at which impairment testing is performed reflects the lowest level at which goodwill is monitored for internal reporting purposes.
Goodwill acquired in a business combination is allocated to groups of CGUs that are expected to benefit from the synergies of the combination.
Impairment losses are recognized in profit or loss. Impairment losses recognized in respect of CGUs are allocated first to reduce the carrying amount of any goodwill allocated to the CGU (group of CGUs), and then to reduce the carrying amounts of the other assets in the CGU (group of CGUs) on a pro rata basis, except that the carrying value of an asset will not be reduced below its individual fair value less costs of disposal (if measurable) or value in use (if determinable).
An impairment loss in respect of goodwill is not reversed. Except for goodwill, all impaired non-financial assets are subject to review for possible reversal of impairment at each reporting date. A reversal of an impairment loss is limited to the asset’s carrying amount that would have been determined had no impairment loss been recognized in prior years. Reversals of impairment losses are credited to profit or loss in the year in which the reversals are recognized.
F-26
Huaneng Power International, Inc.
Notes to the Financial Statements
For the years ended 31 December 2021, 2020 and 2019
(Prepared in accordance with International Financial Reporting Standards)
(Amounts expressed in thousands of RMB unless otherwise stated)
2 Principal accounting policies (continued)
(m) | Financial instruments |
(i) | Recognition and initial measurement |
All financial assets and financial liabilities are initially recognized when the Group becomes a party to the contractual provisions of the instrument.
A financial asset (unless it is a receivable without a significant financing component) or financial liability is initially measured at fair value plus, for an item not at FVTPL, transaction costs that are directly attributable to its acquisition or issue. A receivable without a significant financing component is initially measured at the transaction price.
(ii) | Classification and subsequent measurement of financial assets |
(1) | Classification of financial assets |
On initial recognition, the Group categorizes financial assets into three principal classification categories: measured at amortized cost, at fair value through other comprehensive income (FVOCI) and at fair value through profit or loss (FVTPL) based on the business model under which the financial asset is managed and its contractual cash flow characteristics.
Financial assets are not reclassified subsequent to their initial recognition unless the Group changes its business model for managing financial assets, in which case all affected financial assets are reclassified on the first day of the first reporting period following the change in the business model.
An entity’s business model refers to how an entity manages its financial assets in order to generate cash flows. The entity’s business model determines whether cash flows will result from collecting contractual cash flows, selling financial assets or both. The Group determines the business model for managing the financial assets according to the facts and based on the specific business objective determined by the Group’s key management personnel.
On initial recognition of an equity investment that is not held for trading, the Group may make an irrevocable election to designate the investment at FVOCI (non-recycling) such that subsequent changes in fair value are recognized in other comprehensive income. Such elections are made on an instrument-by-instrument basis, but may only be made if the investment meets the definition of equity from the issuer’s perspective.
The Group assesses the contractual cash flow characteristics of an financial asset whether contractual cash flows are solely payments of principal and interest(“SPPI”). Principal is defined as the fair value of the financial asset on initial recognition. Interest is defined as consideration for the time value of money and for the credit risk associated with the principal amount outstanding during a particular period of time and for other basic lending risks and costs, as well as a profit margin. The Group assesses whether the financial assets contains a contractual term that could change the timing or amount of contractual cash flows such that it would not meet this condition. Financial assets with cash flows that are SPPI are classified and measured at amortized cost.
F-27
Huaneng Power International, Inc.
Notes to the Financial Statements
For the years ended 31 December 2021, 2020 and 2019
(Prepared in accordance with International Financial Reporting Standards)
(Amounts expressed in thousands of RMB unless otherwise stated)
2 Principal accounting policies (continued)
(m) | Financial instruments (continued) |
(ii) | Classification and subsequent measurement of financial assets (continued) |
(1) | Classification of financial assets (continued) |
All financial assets not classified as measured at amortized cost or FVOCI as described in the above are measured at FVTPL. On initial recognition, the Group may irrevocably designate a financial asset that otherwise meets the requirements to be measured at amortized cost or at FVOCI or at FVTPL if doing so eliminates or significantly reduces an accounting mismatch that would otherwise arise.
(2) | Subsequent measurement of financial assets |
- | Financial assets at FVTPL |
These assets are subsequently measured at fair value. Net gains and losses, including any interest or dividend income, are recognized in profit or loss, unless the financial assets are part of a hedging relationship.
- | Financial assets at amortized cost |
These assets are subsequently measured at amortized cost using the effective interest method. A gain or loss on a financial asset that is measured at amortized cost and is not part of a hedging relationship shall be recognized in profit or loss when the financial asset is derecognized, through the amortization process or in order to recognize impairment gains or losses.
- | Debt investments at FVOCI |
These assets are subsequently measured at fair value. Interest income calculated using the effective interest method, impairment and foreign exchange gains and losses are recognized in profit or loss. Other net gains and losses are recognized in other comprehensive income. On derecognition, gains and losses accumulated in other comprehensive income are reclassified to profit or loss.
- | Equity investments at FVOCI |
These assets are subsequently measured at fair value. Dividends are recognized as income in profit or loss. Other net gains and losses are recognized in other comprehensive income and are transferred to retained earnings on derecognition.
(iii) | Classification and subsequent measurement of financial liabilities |
Financial liabilities are classified as measured at FVTPL or measured at amortized cost.
- | Financial liabilities at FVTPL |
A financial liability is classified as at FVTPL if it is classified as held-for-trading (including derivative financial liability) or it is designated as such on initial recognition.
These liabilities are subsequently measured at fair value and net gains and losses, including any interest expense, are recognized in profit or loss, unless the financial liabilities are part of a hedging relationship.
F-28
Huaneng Power International, Inc.
Notes to the Financial Statements
For the years ended 31 December 2021, 2020 and 2019
(Prepared in accordance with International Financial Reporting Standards)
(Amounts expressed in thousands of RMB unless otherwise stated)
2 Principal accounting policies (continued)
(m) | Financial instruments (continued) |
(iii) | Classification and subsequent measurement of financial liabilities (continued) |
- | Financial liabilities at amortized cost |
These liabilities are subsequently measured at amortized cost using the effective interest method.
(iv) | Offsetting |
Financial assets and financial liabilities are separately presented in the statement of financial position without offsetting. However, financial assets and financial liabilities are offset when, and only when the Group:
- | currently has a legally enforceable right to set off the amounts; |
- | intends either to settle them on a net basis or to realize the asset and settle the liability simultaneously. |
(v) | Derecognition |
The Group derecognizes a financial asset when one of the following conditions is met:
- | the contractual rights to the cash flows from the financial asset expire; |
- | the Group transfers the rights to receive the contractual cash flows in a transaction in which substantially all of the risks and rewards of ownership of the financial asset are transferred; and |
- | the Group transfers the rights to receive the contractual cash flows in a transaction in which the Group neither transfers nor retains substantially all of the risks and rewards of ownership and does not retain control of the financial asset. |
On derecognition of a financial asset in its entirety, the difference between the two amounts below is recognized in profit or loss:
- | the carrying amount of the financial asset transferred (measured at the date of derecognition); and |
- | the consideration received, along with the cumulative gain or loss previously recognized in other comprehensive income, for the part derecognized. |
The Group derecognizes a financial liability (or part of it) when, and only when, its contractual obligation (or part of it) is discharged or cancelled, or expire.
Continuing involvement that takes the form of a guarantee over the transferred asset is measured at the lower of the original carrying amount of the asset and the maximum amount of consideration that the Group could be required to repay.
F-29
Huaneng Power International, Inc.
Notes to the Financial Statements
For the years ended 31 December 2021, 2020 and 2019
(Prepared in accordance with International Financial Reporting Standards)
(Amounts expressed in thousands of RMB unless otherwise stated)
2 Principal accounting policies (continued)
(m) | Financial instruments (continued) |
(vi) | Credit losses |
The Group recognizes loss allowance for expected credit losses (“ECLs”) on the following items:
- | financial assets measured at amortized cost; |
- | contract assets as defined in IFRS 15; |
- | lease receivables; and |
- | debt investments measured at FVOCI. |
Financial assets measured at fair value, including debt investments or equity investments measured at FVTPL, other equity investments designated at FVOCI (non-recycling) and derivative financial assets, are not subject to the ECL assessment.
Measurement of ECLs
ECLs are a probability-weighted estimate of credit losses. Credit losses are measured as the present value of all expected cash shortfalls (i.e. the difference between the cash flows due to the Group in accordance with the contract and the cash flows that the Group expects to receive).
The maximum period considered when estimating ECLs is the maximum contractual period over which the Group is exposed to credit risk.
In measuring ECLs, the Group takes into account reasonable and supportable information that is available without undue cost or effort. This includes information about past events, current conditions and forecasts of future economic conditions.
ECLs are measured on either of the following bases:
- | 12-month ECLs: these are losses that are expected to result from possible default events within the 12 months after the reporting date; and |
- | lifetime ECLs: these are losses that are expected to result from all possible default events over the expected lives of the items to which the ECL model applies. |
Loss allowances for accounts receivable, lease receivables and contract assets are always measured at an amount equal to lifetime ECLs. ECLs on these financial assets are estimated using a provision matrix based on the Group’s historical credit loss experience, adjusted for factors that are specific to the debtors and an assessment of both the current and forecast general economic conditions at the reporting date.
For all other financial instruments, the Group recognizes a loss allowance equal to 12-month ECLs unless there has been a significant increase in credit risk of the financial instrument since initial recognition or the financial instrument is not determined to have low credit risk at the reporting date, in which cases the loss allowance is measured at an amount equal to lifetime ECLs.
F-30
Huaneng Power International, Inc.
Notes to the Financial Statements
For the years ended 31 December 2021, 2020 and 2019
(Prepared in accordance with International Financial Reporting Standards)
(Amounts expressed in thousands of RMB unless otherwise stated)
2 Principal accounting policies (continued)
(m) | Financial instruments (continued) |
(vi) | Credit losses (continued) |
Low credit risk
If the financial instrument has a low risk of default, the borrower has a strong capacity to meet its contractual cash flow obligations in the near term and adverse changes in economic and business conditions in the longer term may, but will not necessarily, reduce the ability of the borrower to fulfil its contractual cash flow obligations, the credit risk on a financial instrument is considered low.
Significant increases in credit risk
In assessing whether the credit risk of a financial instrument has increased significantly since initial recognition, the Group compares the risk of default occurring on the financial instrument assessed at the reporting date with that assessed at the date of initial recognition. The Group considers both quantitative and qualitative information that is reasonable and supportable, including historical experience and forward-looking information that is available without undue cost or effort.
In particular, the following information is taken into account when assessing whether credit risk has increased significantly since initial recognition:
- | failure to make payments of principal or interest on their contractually due dates; |
- | an actual or expected significant deterioration in a financial instrument’s external or internal credit rating (if available); |
- | an actual or expected significant deterioration in the operating results of the debtor; and |
- | existing or forecast changes in the technological, market, economic or legal environment that have a significant adverse effect on the debtor’s ability to meet its obligation to the Group. |
Depending on the nature of the financial instruments, the assessment of a significant increase in credit risk is performed on either an individual basis or a collective basis. When the assessment is performed on a collective basis, the financial instruments are grouped based on shared credit risk characteristics, such as past due status and credit risk ratings.
The Group assumes that the credit risk on a financial asset has increased significantly if it is more than 30 days past due, unless the Group has reasonable and supportable information that is available without undue cost or effort, that demonstrates that the credit risk has not increased significantly since initial recognition even though the contractual payments are more than 30 days past due.
The Group considers a financial asset to be in default when the borrower is unlikely to pay its credit obligations to the Group in full, without recourse by the Group to actions such as realising security (if any is held).
Credit-impaired financial assets
At each reporting date, the Group assesses whether financial assets carried at amortized cost and debt investments at FVOCI are credit-impaired. A financial asset is credit-impaired when one or more events that have a detrimental impact on the estimated future cash flows of the financial asset have occurred.
F-31
Huaneng Power International, Inc.
Notes to the Financial Statements
For the years ended 31 December 2021, 2020 and 2019
(Prepared in accordance with International Financial Reporting Standards)
(Amounts expressed in thousands of RMB unless otherwise stated)
2 | Principal accounting policies (continued) |
(m) | Financial instruments (continued) |
(vi) | Credit losses (continued) |
Credit-impaired financial assets (continued)
Evidence that a financial asset is credit-impaired includes the following observable events:
- | significant financial difficulties of the debtor; |
- | a breach of contract, such as a default or delinquency in interest or principal payments; |
- | for economic or contractual reasons relating to the borrower’s financial difficulty, the Group having granted to the borrower a concession that would not otherwise consider; |
- | it becoming probable that the borrower will enter into bankruptcy or other financial reorganization; and |
- | the disappearance of an active market for that financial asset because of financial difficulties of the issuer. |
Presentation of allowance for ECLs
ECLs are remeasured at each reporting date to reflect changes in the financial instrument’s credit risk since initial recognition. Any change in the ECL amount is recognized as an impairment gain or loss in profit or loss.
The Group recognizes an impairment gain or loss for all financial instruments with a corresponding adjustment to their carrying amount through a loss allowance account, except for debt investments that are measured at FVOCI (recycling), for which the loss allowance is recognized in other comprehensive income.
Write-off policy
The gross carrying amount of a financial asset is written off (either partially or in full) to the extent that there is no realistic prospect of recovery. A write-off constitutes a derecognition event. This is generally the case when the Group determines that the debtor does not have assets or sources of income that could generate sufficient cash flows to repay the amounts subject to the write-off. However, financial assets that are written off could still be subject to enforcement activities in order to comply with the Group’s procedures for recovery of amounts due.
Subsequent recoveries of an asset that was previously written off are recognized as a reversal of impairment in profit or loss in the period in which the recovery occurs.
(vii) | Cash flow hedge |
Cash flow hedge is a hedge of the exposure to variability in cash flows that is attributable to a particular risk associated with all, or a component of, a recognized asset or liability or a highly probable forecast transaction, and could affect profit or loss.
The hedged items of cash flow hedge are the designated items with respect to the risks associated with future cash flow changes, and can be reliably measurable. Hedging instruments are designated financial instruments for cash flow hedge whose cash flows are expected to offset changes in the cash flows of a hedged item.
F-32
Huaneng Power International, Inc.
Notes to the Financial Statements
For the years ended 31 December 2021, 2020 and 2019
(Prepared in accordance with International Financial Reporting Standards)
(Amounts expressed in thousands of RMB unless otherwise stated)
2 | Principal accounting policies (continued) |
(m) | Financial instruments (continued) |
(vii) | Cash flow hedge (continued) |
When designating a hedging relationship and on an ongoing basis, the Group shall analyze the sources of hedge ineffectiveness that are expected to affect the hedging relationship during its term. If a hedging relationship ceases to meet the hedging effectiveness requirement relating to the hedge ratio, but the risk management objective for that designated hedging relationship remains the same, the Group shall adjust the hedge ratio of the hedging relationship, so that it meets the qualifying criteria again, which is referred to as rebalancing.
When a derivative is designated as a cash flow hedging instrument, the effective portion of changes in the fair value of the derivative is recognized in other comprehensive income and accumulated in the cash flow hedge reserve. The cash flow hedge reserve is adjusted to the lower of the following:
- | the cumulative gain or loss on the hedging instrument from inception of the hedge; and |
- | the present value of the cumulative change in the hedged expected future cash flows from inception of the hedge. |
The portion of the gain or loss on the hedging instrument that is determined to be an effective hedge shall be recognized in other comprehensive income. Any remaining gain or loss on the hedging instrument is hedge ineffectiveness that shall be recognized in profit or loss.
On rebalancing, the hedge ineffectiveness of the hedging relationship is determined and recognized immediately before adjusting the hedging relationship. Adjusting the hedge ratio allows an entity to respond to changes in the relationship between the hedging instrument and the hedged item that arise from their underlying or risk variables. The Group adjusts the hedge ratio by increasing the volume of the hedged items or hedging instruments. Hence, increases in volumes refer to the quantities that are part of the hedging relationship, and decreases in volumes are not part of the hedging relationship.
The amount accumulated in the hedging reserve and the cost of hedging reserve is reclassified to profit or loss in the same period or periods during which the hedged expected future cash flows affect profit or loss.
When the hedged forecast transaction subsequently results in the recognition of a non-financial item, the amount accumulated in the hedging reserve and the cost of hedging reserve is included directly in the initial cost of the non-financial item when it is recognized.
If the amount that has been accumulated in the cash flow hedge reserve is a loss and the Group expects that all or a portion of that loss will not be recovered in one or more future periods, the Group immediately reclassifies the amount that is not expected to be recovered in profit or loss.
F-33
Huaneng Power International, Inc.
Notes to the Financial Statements
For the years ended 31 December 2021, 2020 and 2019
(Prepared in accordance with International Financial Reporting Standards)
(Amounts expressed in thousands of RMB unless otherwise stated)
2Principal accounting policies (continued)
(m) | Financial instruments (continued) |
(vii) | Cash flow hedge (continued) |
When the Group discontinues hedge accounting for a cash flow hedge, the Group accounts for the amount that has been accumulated in the cash flow hedge reserve as follows:
- | if the hedged future cash flows are still expected to occur, that amount shall remain in the cash flow hedge reserve until the future cash flows occur. |
- | if the hedged future cash flows are no longer expected to occur, that amount shall be immediately reclassified from the cash flow hedge reserve to profit or loss. A hedged future cash flow that is no longer highly probable to occur may still be expected to occur. |
When the future cash flows occur, the amounts accumulated in the hedging reserve of the effective portion are reclassified to profit or loss or included directly in the initial cost of the non-financial item. If the hedged future cash flows are no longer expected to occur, then the amounts that have been accumulated in the hedging reserve and the cost of hedging reserve are immediately reclassified to profit or loss.
(n) | Dividend distribution |
Dividend distribution to the shareholders of the Group is recognized as a liability in the period when the dividend is approved in the shareholders’ meeting.
(o) | Inventories |
Inventories include fuel for power generation, materials for repairs and maintenance and spare parts, and are stated at lower of cost and net realizable values.
Inventories are initially recorded at cost and are charged to fuel costs or repairs and maintenance, respectively when used, or capitalized to property, plant and equipment when installed, as appropriate, using weighted average cost basis. Cost of inventories includes costs of purchase and transportation costs.
When the forecast transaction that is hedged results in the recognition of the inventory, the gains and losses previously deferred in equity are transferred from equity and included in the initial measurement of the cost of the inventory.
Provision for inventory obsolescence is determined by the excess of cost over net realizable value. Net realizable values are determined based on the estimated selling price less estimated conversion costs during power generation, selling expenses and related taxes in the ordinary course of business.
(p) | Related parties |
A party is considered to be related to the Group if:
(a) | the party is a person or a close member of that person’s family and that person |
(i) | has control or joint control over the Group; |
(ii) | has significant influence over the Group; or |
F-34
Huaneng Power International, Inc.
Notes to the Financial Statements
For the years ended 31 December 2021, 2020 and 2019
(Prepared in accordance with International Financial Reporting Standards)
(Amounts expressed in thousands of RMB unless otherwise stated)
2Principal accounting policies (continued)
(p) | Related parties (continued) |
(iii) | is a member of the key management personnel of the Group or of a parent of the Group; |
or
(b) | the party is an entity where any of the following conditions applies: |
(i) | the entity and the Group are members of the same group; |
(ii) | one entity is an associate or joint venture of the other entity (or of a parent, subsidiary or fellow subsidiary of the other entity); |
(iii) | the entity and the Group are joint ventures of the same third party; |
(iv) | one entity is a joint venture of a third entity and the other entity is an associate of the third entity; |
(v) | the entity is a post-employment benefit plan for the benefit of employees of either the Group or an entity related to the Group; |
(vi) | the entity is controlled or jointly controlled by a person identified in (a); |
(vii) | a person identified in (a)(i) has significant influence over the entity or is a member of the key management personnel of the entity (or of a parent of the entity); and |
(viii) | the entity, or any member of a group of which it is a part, provides key management personnel services to the Group or to the parent of the Group. |
(q) | Cash and cash equivalents |
Cash and cash equivalents listed in the statement of cash flows represents cash in hand, call deposits held with banks and other financial institutions, and other short-term (3 months or less), highly-liquid investments that are readily convertible to known amounts of cash and are subject to an insignificant risk of changes in value. Bank overdrafts that are repayable on demand and form an integral part of the cash management are also included as a component of cash and cash equivalents for the purpose of the consolidated statement of cash flows.
(r) | Borrowings |
Borrowings are recognized initially at fair value less transaction costs and subsequently measured at amortized cost using the effective interest method. Borrowings are classified as current liabilities unless the Group has an unconditional right to defer settlement of the liability for at least 12 months after the end of the reporting period.
(s) | Borrowing costs |
General and specific borrowing costs directly attributable to the acquisition, construction or production of qualifying assets, which are assets that necessarily take a substantial period of time to get ready for their intended use or sale, are added to the cost of those assets. The capitalization of borrowing costs as part of the cost of a qualifying asset commences when expenditure for the asset is being incurred, borrowing costs are being incurred and activities that are necessary to prepare the asset for its intended use or sale are in progress. Capitalization of borrowing costs is suspended or ceases when substantially all the activities necessary to prepare the qualifying asset for its intended use or sale are interrupted or complete.
The amount of specific borrowing costs capitalized is net of the investment income on any temporary investment of the funds pending expenditure on the asset.
All other borrowing costs are recognized in profit or loss in the period in which they are incurred.
F-35
Huaneng Power International, Inc.
Notes to the Financial Statements
For the years ended 31 December 2021, 2020 and 2019
(Prepared in accordance with International Financial Reporting Standards)
(Amounts expressed in thousands of RMB unless otherwise stated)
2Principal accounting policies (continued)
(t) | Share capital |
Ordinary shares are classified as equity. Incremental costs directly attributable to the issue of new shares are shown in equity as a deduction, net of tax, from the proceeds.
(u) | Other equity instruments |
Perpetual corporate bonds and other equity instruments are classified as equity if they are non-redeemable, or redeemable only at the Company’s option, and any interests or dividends are discretionary. Interests or dividends on such instruments classified as equity are recognized as distributions within equity. When these equity instruments are redeemed according to the contractual terms, the redemption price is charged to equity.
(v) | Payables |
Payables primarily include accounts payable and other liabilities, and are recognized initially at fair value and subsequently measured at amortized cost using the effective interest method.
F-36
Huaneng Power International, Inc.
Notes to the Financial Statements
For the years ended 31 December 2021, 2020 and 2019
(Prepared in accordance with International Financial Reporting Standards)
(Amounts expressed in thousands of RMB unless otherwise stated)
2 | Principal accounting policies (continued) |
(w) | Taxation |
(i) | Value-added tax (“VAT”) |
The domestic sales of power, heat and goods of the Group are subject to VAT. VAT payable is determined by applying
(ii) | Goods and service tax (“GST”) |
The power sales of the subsidiaries in Singapore are subject to goods and service tax of the country where they operate. GST payable is determined by applying
The subsidiaries in Pakistan are subject to goods and service tax of the country where they operate. The applicable tax rates in respect of capacity payment, operation and maintenance services and sales of power are
(iii) | Current and deferred income tax |
The income tax expense for the period comprises current and deferred income tax. Income tax expense is recognized in profit or loss, except to the extent that it relates to items recognized in other comprehensive income or directly in equity. In this case, the tax is also recognized in other comprehensive income or directly in equity, respectively.
Deferred income tax assets and liabilities are recognized based on the differences between tax bases of assets and liabilities and respective book values (temporary differences). For deductible tax losses or tax credit that can be brought forward in accordance with tax law requirements for deduction of taxable income in subsequent years, it is considered as temporary differences and related deferred income tax assets are recognized.
The Group recognizes deferred income tax assets to the extent that it is probable that taxable profit will be available to offset the deductible temporary difference, deductible tax loss and tax credit.
At the end of the reporting period, deferred income tax assets and liabilities are measured at the tax rates that are expected to apply to the period when the asset is realized or liability is settled, based on tax rates (and tax laws) that have been enacted or substantively enacted by the end of the reporting period.
F-37
Huaneng Power International, Inc.
Notes to the Financial Statements
For the years ended 31 December 2021, 2020 and 2019
(Prepared in accordance with International Financial Reporting Standards)
(Amounts expressed in thousands of RMB unless otherwise stated)
2 | Principal accounting policies (continued) |
(w) | Taxation (continued) |
(iii) | Current and deferred income tax (continued) |
The carrying amount of a deferred tax asset is reviewed at the end of each reporting period and is reduced to the extent that it is no longer probable that sufficient taxable profits will be available to allow the related tax benefit to be utilized. Any such reduction is reversed to the extent that it becomes probable that sufficient taxable profits will be available.
Deferred income tax assets and deferred income tax liabilities are offset when all the conditions below are met:
(1) | The Group has the legally enforceable right to offset current income tax assets and current income tax liabilities; |
(2) | Deferred income tax assets and deferred income tax liabilities are related to the income tax levied by the same tax authority of the Group. |
(x)Employee benefits
Employee benefits include all expenditures relating to the employees for their services. The Group recognizes employee benefits as liabilities during the accounting period when employees render services and allocate to related cost of assets and expenses based on different beneficiaries.
In connection with pension obligations, the Group operates various defined contribution plans in accordance with the local conditions and practices in the countries and provinces in which it operate. A defined contribution plan is a pension plan under which the Group pays fixed contributions into a separate publicly administered pension insurance plan on mandatory and voluntary bases. The Group has no legal or constructive obligations to pay further contributions if the fund does not hold sufficient assets to pay all employees the benefits relating to employee service in the current and prior periods. The contributions are recognized as employee benefits when incurred. Prepaid contributions are recognized as assets to the extent that a cash refund or a reduction in the future payment is available.
(y) | Government grants |
Government grants are recognized when the Group fulfils the conditions attached to them and they are probable to be received. When government grants are received in the form of monetary assets, they are measured at the amount received or receivable. When the grant is in the form of non-monetary assets, it is measured at fair value. When fair value cannot be measured reliably, a nominal amount is assigned.
Asset-related government grant is recognized as deferred income and is amortized evenly in profit or loss over the useful lives of related assets.
Income-related government grant that is used to compensate subsequent related expenses or losses of the Group is recognized as deferred income and recorded in profit or loss when related expenses or losses are incurred. When the grant is used to compensate expenses or losses that were already incurred, they are directly recognized in the current period profit or loss.
F-38
Huaneng Power International, Inc.
Notes to the Financial Statements
For the years ended 31 December 2021, 2020 and 2019
(Prepared in accordance with International Financial Reporting Standards)
(Amounts expressed in thousands of RMB unless otherwise stated)
2 | Principal accounting policies (continued) |
(z) | Revenue and other income |
Income is increases in economic benefits during the accounting period in the form of inflows or enhancements of assets or decreases of liabilities that result in an increase in equity, other than those relating to contributions from equity participants.
Revenue is recognized when (or as) the Group satisfies a performance obligation in the contract by transferring the control over a promised good or service to a customer.
When two or more performance obligations are identified, the Group allocates the transaction price to each performance obligation identified in the contract on a relative stand-alone selling price basis at contract inception and recognizes as revenue the amount of the transaction price that is allocated to that performance obligation.
Transaction price is the amount of consideration to which the Group expects to be entitled in exchange for transferring promised goods or services to a customer, excluding amounts collected on behalf of third parties. Revenue is only recognized to the extent that it is highly probable that a significant reversal in the amount of cumulative revenue recognized will not occur. The Group recognizes a refund liability if the entity receives consideration from a customer and expects to refund some or all of that consideration to the customer. Where the contract contains a significant financing component, the Group recognizes revenue at an amount that reflects the price that a customer would have paid for the promised goods or services if the customer had paid cash for those goods or services when (or as) they transfer to the customer. The difference between the promised amount of consideration and its present value is amortized using the effective interest rate. The Group will not adjust the promised amount of consideration for the effects of a significant financing component if the Group expects, at contract inception, that the period between when the Group transfers a promised good or service to a customer and when the customer pays for that good or service will be one year or less.
A performance obligation is satisfied over time if one of the following criteria is met:
- | When the customer simultaneously receives and consumes the benefits provided by the Group’s performance, as the Group performs; |
- | When the Group’s performance creates or enhances an asset that the customer controls as the asset is created or enhanced; |
- | When the Group’s performance does not create an asset with an alternative use to the entity and the Group has an enforceable right to payment for performance completed to date. |
For performance obligations satisfied over time, revenue is recognized on the basis of direct measurements of the value to the customer of the goods or services transferred to date relative to the remaining goods or services promised under the contract. When the outcome of the contract cannot be reasonably measured, revenue is recognized only to the extent of contract costs incurred that are expected to be recovered.
For performance obligations satisfied at a point in time, revenue is recognized when the customer obtains control of the promised good or service in the contract. The Group considers indicators of the transfer of control, which include, but are not limited to, the following:
- | The Group has a present right to payment for the asset; |
- | The Group has transferred physical possession of the asset; |
- | The customer has legal title to the asset or the significant risks and rewards of ownership of the asset; or |
- | The customer has accepted the asset. |
F-39
Huaneng Power International, Inc.
Notes to the Financial Statements
For the years ended 31 December 2021, 2020 and 2019
(Prepared in accordance with International Financial Reporting Standards)
(Amounts expressed in thousands of RMB unless otherwise stated)
2 | Principal accounting policies (continued) |
(z) | Revenue and other income (continued) |
A contract asset is the Group’s right to consideration in exchange for goods or services that the Group has transferred to a customer when that right is conditional on something other than the passage of time and an impairment of a contract asset is measured using the ECL model (Note 2(m)(vi)). The Group presents any unconditional rights to consideration separately as a receivable. The Group’s obligation to transfer goods or services to a customer for which the Group has received consideration (or the amount is due) from the customer is present as a contract liability.
Further details of revenue and income recognition policies are as follows:
(i) | Sale of power |
Revenue is recognized upon transmission of electricity to the power grid when the control of the electricity is transferred at the same time.
(ii) | Sale of heat |
Revenue is recognized upon transmission of heat to the customers when the control of the heat is transferred at the same time.
(iii) | Service revenue |
Service revenue refers to amounts received from port service, transportation service, maintenance service and heating pipeline service that is recognized over time during the provision of service, using an input method to measure progress towards complete satisfaction of the service, because the customer simultaneously receives and consumes the benefits provided by the Group. Revenue is recognized on a straight-line basis because the entity’s inputs are expended evenly throughout the performance period.
(iv) | Coal and raw material sales revenue |
Revenue is recognized when the control of the fuel and materials is transferred to the customers.
(v) | Rental income from operating leases |
Rental income receivable under operating leases is recognized in profit or loss in equal instalments over the periods covered by the lease term, except where an alternative basis is more representative of the pattern of benefits to be derived from the use of the leased asset. Lease incentives granted are recognized in profit or loss as an integral part of the aggregate net lease payments receivable. Contingent rentals are recognized as income in the accounting period in which they are earned.
(vi) | Dividend income |
Dividend income is recognized when the shareholders’ right to receive payment has been established, it is probable that the economic benefits associated with the dividend will flow to the Group and the amount of the dividend can be measured reliably.
F-40
Huaneng Power International, Inc.
Notes to the Financial Statements
For the years ended 31 December 2021, 2020 and 2019
(Prepared in accordance with International Financial Reporting Standards)
(Amounts expressed in thousands of RMB unless otherwise stated)
2 | Principal accounting policies (continued) |
(z) | Revenue and other income (continued) |
(vii) | Interest income |
Interest income from deposits is recognized on a time proportion basis using the effective interest method. Interest income from finance leases is recognized on a basis that reflects a constant periodic rate of return on the net investment in the finance lease.
(aa) | Contract cost |
Contract costs are either the incremental costs of obtaining a contract with a customer or the costs to fulfil a contract with a customer.
Incremental costs of obtaining a contract are those costs that the Group incurs to obtain a contract with a customer that it would not have incurred if the contract had not been obtained e.g. an incremental sales commission. Incremental costs of obtaining a contract are capitalized when incurred if the costs relate to revenue which will be recognized in a future reporting period and the costs are expected to be recovered. Other costs of obtaining a contract are expensed when incurred.
If the costs incurred in fulfilling a contract with a customer are not within the scope of another Standard such as IAS 2 Inventories, the Group recognizes an asset from the costs incurred to fulfil a contract only if those costs meet all of the following criteria:
- | the costs relate directly to an existing contract or to a specifically identifiable anticipated contract, including direct labor, direct materials, allocations of costs, costs that are explicitly chargeable to the customer and other costs that are incurred only because the Group entered into the contract; |
- | the costs generate or enhance resources that will be used to provide goods or services in the future; and |
- | the costs are expected to be recovered. |
Amortization of capitalized contract costs is charged to profit or loss when the revenue to which the asset relates is recognized. The accounting policy for revenue recognition is set out in Note 2(z). Contract costs are recognized as an expense when incurred if the amortization period of the asset that the Group otherwise would have recognized is one year or less.
Impairment losses are recognized to the extent that the carrying amount of the contract cost asset exceeds the net of:
(i) | remaining amount of consideration that the Group expects to receive in exchange for the goods or services to which the asset relates, less |
(ii) | any costs that relate directly to providing those goods or services that have not yet been recognized as expenses. |
(ab) | Leases |
The Group assesses at contract inception whether a contract is, or contains, a lease. A contract is, or contains, a lease if the contract conveys the right to control the use of an identified asset for a period of time in exchange for consideration.
F-41
Huaneng Power International, Inc.
Notes to the Financial Statements
For the years ended 31 December 2021, 2020 and 2019
(Prepared in accordance with International Financial Reporting Standards)
(Amounts expressed in thousands of RMB unless otherwise stated)
2 | Principal accounting policies (continued) |
(ab) Leases (continued)
Group as a lessee
The Group applies a single recognition and measurement approach for all leases, except for short-term leases and leases of low-value assets. The Group recognizes lease liabilities to make lease payments and right-of-use assets representing the right to use the underlying assets.
At inception or on reassessment of a contract that contains a lease component and non-lease component(s), the Group adopts the practical expedient not to separate non-lease component(s) and to account for the lease component and the associated non-lease component(s) (e.g., property management services for leases of properties) as a single lease component.
(i) | Right-of-use assets |
Right-of-use assets are recognized at the commencement date of the lease (that is the date the underlying asset is available for use). Right-of-use assets are measured at cost, less any accumulated depreciation and any impairment losses, and adjusted for any remeasurement of lease liabilities. The cost of right-of-use assets includes the amount of lease liabilities recognized, initial direct costs incurred, and lease payments made at or before the commencement date less any lease incentives received. Right-of-use assets are depreciated on a straight-line basis over the shorter of the lease terms and the estimated useful lives of the assets as follows:
Buildings |
| years | |
Electric utility plant in service | years | ||
Transportation facilities |
| years | |
Land use rights |
| years | |
Others |
| years |
If ownership of the leased asset transfers to the Group by the end of the lease term or the cost reflects the exercise of a purchase option, depreciation is calculated using the estimated useful life of the asset.
(ii) | Lease liabilities |
Lease liabilities are recognized at the commencement date of the lease at the present value of lease payments to be made over the lease term. The lease payments include fixed payments (including in-substance fixed payments) less any lease incentives receivable, variable lease payments that depend on an index or a rate, and amounts expected to be paid under residual value guarantees. The lease payments also include the exercise price of a purchase option reasonably certain to be exercised by the Group and payments of penalties for termination of a lease, if the lease term reflects the Group exercising the option to terminate the lease. The variable lease payments that do not depend on an index or a rate are recognized as an expense in the period in which the event or condition that triggers the payment occurs.
F-42
Huaneng Power International, Inc.
Notes to the Financial Statements
For the years ended 31 December 2021, 2020 and 2019
(Prepared in accordance with International Financial Reporting Standards)
(Amounts expressed in thousands of RMB unless otherwise stated)
2 | Principal accounting policies (continued) |
(ab) Leases (continued)
Group as a lessee (continued)
(ii) | Lease liabilities (continued) |
In calculating the present value of lease payments, the Group uses its incremental borrowing rate at the lease commencement date because the interest rate implicit in the lease is not readily determinable. After the commencement date, the amount of lease liabilities is increased to reflect the accretion of interest and reduced for the lease payments made. In addition, the carrying amount of lease liabilities is remeasured if there is a modification, a change in the lease term, a change in lease payments (e.g., a change to future lease payments resulting from a change in an index or rate) or a change in assessment of an option to purchase the underlying asset.
(iii) | Short-term leases and leases of low-value assets |
The Group has elected not to recognize right-of-use assets and lease liabilities for its short-term leases (elected by class of underlying asset) of certain offices and apartments for employees (that is those leases that have a lease term of 12 months or less from the commencement date and do not contain a purchase option). It also applies the recognition exemption for leases of low-value assets (elected on a lease by lease basis) to leases of office equipment that is considered to be of low value (i.e., below RMB
Group as a lessor
When the Group acts as a lessor, it classifies at lease inception (or when there is a lease modification) each of its leases as either an operating lease or a finance lease.
Leases in which the Group does not transfer substantially all the risks and rewards incidental to ownership of an asset are classified as operating leases. When a contract contains lease and non-lease components, the Group allocates the consideration in the contract to each component on a relative stand-alone selling price basis. Rental income is accounted for on a straight-line basis over the lease terms and is included in revenue in the statement of comprehensive income due to its operating nature. Initial direct costs incurred in negotiating and arranging an operating lease are added to the carrying amount of the leased asset and recognized over the lease term on the same basis as rental income. Contingent rents are recognized as revenue in the period in which they are earned.
Leases that transfer substantially all the risks and rewards incidental to ownership of an underlying asset to the lessee are accounted for as finance leases. At the commencement date, the cost of the leased asset is capitalized at the present value of the lease payments and related payments (including the initial direct costs), and presented as a receivable at an amount equal to the net investment in the lease. The finance income of such leases is recognized in the statement of comprehensive income so as to provide a constant periodic rate of charge over the lease terms.
(ac) | Contingencies |
Contingent liabilities are not recognized in the financial statements. They are disclosed unless the possibility of an outflow of resources embodying economic benefits is remote. Contingent assets are not recognized in the financial statements but disclosed when an inflow of economic benefit is probable.
F-43
Huaneng Power International, Inc.
Notes to the Financial Statements
For the years ended 31 December 2021, 2020 and 2019
(Prepared in accordance with International Financial Reporting Standards)
(Amounts expressed in thousands of RMB unless otherwise stated)
2 Principal accounting policies (continued)
(ad) | Fair value management |
The Group measures its equity investments at fair value at the end of each reporting period. Fair value is the price that would be received to sell an asset or paid to transfer a liability in an orderly transaction between market participants at the measurement date. The fair value measurement is based on the presumption that the transaction to sell the asset or transfer the liability takes place either in the principal market for the asset or liability, or in the absence of a principal market, in the most advantageous market for the asset or liability. The principal or the most advantageous market must be accessible by the Group. The fair value of an asset or a liability is measured using the assumptions that market participants would use when pricing the asset or liability, assuming that market participants act in their economic best interest.
A fair value measurement of a non-financial asset takes into account a market participant’s ability to generate economic benefits by using the asset in its highest and best use or by selling it to another market participant that would use the asset in its highest and best use.
The Group uses valuation techniques that are appropriate in the circumstances and for which sufficient data are available to measure fair value, maximizing the use of relevant observable inputs and minimizing the use of unobservable inputs.
All assets and liabilities for which fair value is measured or disclosed in the financial statements are categorized within the fair value hierarchy, described as follows, based on the lowest level input that is significant to the fair value measurement as a whole:
Level 1 – based on quoted prices (unadjusted) in active markets for identical assets or liabilities
Level 2 – based on valuation techniques for which the lowest level input that is significant to the fair value measurement is observable, either directly or indirectly
Level 3 – based on valuation techniques for which the lowest level input that is significant to the fair value measurement is unobservable
For assets and liabilities that are recognized in the financial statements on a recurring basis, the Group determines whether transfers have occurred between levels in the hierarchy by reassessing categorization (based on the lowest level input that is significant to the fair value measurement as a whole) at the end of each reporting period.
(ae) | Research and development costs |
All research costs are charged to the statement of profit or loss as incurred.
Expenditure incurred on projects to develop new products is capitalized and deferred only when the Group can demonstrate the technical feasibility of completing the intangible asset so that it will be available for use or sale, its intention to complete and its ability to use or sell the asset, how the asset will generate future economic benefits, the availability of resources to complete the project and the ability to measure reliably the expenditure during the development. Product development expenditure which does not meet these criteria is expensed when incurred.
F-44
Huaneng Power International, Inc.
Notes to the Financial Statements
For the years ended 31 December 2021, 2020 and 2019
(Prepared in accordance with International Financial Reporting Standards)
(Amounts expressed in thousands of RMB unless otherwise stated)
2 Principal accounting policies (continued)
(af) | Issued but not yet effective International Financial Reporting Standards |
The new and amended standards and interpretations that are issued, but not yet effective, up to the date of issuance of the Group’s financial statements are disclosed below. The Group intends to adopt these new and amended standards and interpretations, if applicable, when they become effective.
Amendments to IAS 1 | Classification of Liabilities as Current or Non-current |
Amendments to IFRS 3 | Reference to the Conceptual Framework |
Amendments to IAS 16 | Property, Plant and Equipment: Proceeds before Intended Use |
Amendments to IAS 37 | Onerous Contracts - Cost of Fulfilling a Contract |
Amendments to IFRS 10 | Sale or Contribution of Assets between an Investor and IAS 28 |
Amendments to IAS 8 | Definition of Accounting Estimates |
Amendments to IAS 1 | |
Statement 2 | Disclosure of Accounting Policies |
Amendments to IAS 12 | Deferred Tax related to Assets and Liabilities arising from a Single Transaction |
Annual Improvements to IFRSs 2018-2020 | Amendments to IFRS 1, IFRS 9, Illustrative |
(i) | Amendments to IAS 1 Classification of Liabilities as Current or Non-current |
In January 2020, the IASB issued amendments to paragraphs 69 to 76 of IAS 1 to specify the requirements for classifying liabilities as current or non-current. The amendments clarify:
- | What is meant by a right to defer settlement |
- | That a right to defer must exist at the end of the reporting period |
- | That classification is unaffected by the likelihood that an entity will exercise its deferral right |
- | That only if an embedded derivative in a convertible liability is itself an equity instrument would the terms of a liability not impact its classification |
The amendments are effective for annual reporting periods beginning on or after 1 January 2023 and must be applied retrospectively. The Group is currently assessing the impact that the amendments will have on current practice and whether existing loan agreements may require renegotiation.
F-45
Huaneng Power International, Inc.
Notes to the Financial Statements
For the years ended 31 December 2021, 2020 and 2019
(Prepared in accordance with International Financial Reporting Standards)
(Amounts expressed in thousands of RMB unless otherwise stated)
2 Principal accounting policies (continued)
(af) | Issued but not yet effective International Financial Reporting Standards (continued) |
(ii) | Amendments to IFRS 3 Reference to the Conceptual Framework |
Amendments to IFRS 3 are intended to replace a reference to the previous Framework for the Preparation and Presentation of Financial Statements with a reference to the Conceptual Framework for Financial Reporting issued in March 2018 without significantly changing its requirements. The amendments also add to IFRS 3 an exception to its recognition principle for an entity to refer to the Conceptual Framework to determine what constitutes an asset or a liability. The exception specifies that, for liabilities and contingent liabilities that would be within the scope of IAS 37 or IFRIC 21 if they were incurred separately rather than assumed in a business combination, an entity applying IFRS 3 should refer to IAS 37 or IFRIC 21 respectively instead of the Conceptual Framework. Furthermore, the amendments clarify that contingent assets do not qualify for recognition at the acquisition date. The amendments are effective for annual reporting periods beginning on or after 1 January 2022 and apply prospectively. The Group expects to adopt the amendments prospectively from 1 January 2022. Since the amendments apply prospectively to business combinations for which the acquisition date is on or after the date of first application, the Group will not be affected by these amendments on the date of transition.
(iii) | Amendments to IAS 16 Property, Plant and Equipment: Proceeds before Intended Use |
In May 2020, the IASB issued Property, Plant and Equipment: Proceeds before Intended Use, which prohibit entities deducting from the cost of an item of property, plant and equipment any proceeds from selling items produced while bringing that asset to the location and condition necessary for it to be capable of operating in the manner intended by management. Instead, an entity recognizes the proceeds from selling such items, and the costs of producing those items, in profit or loss.
The amendments are effective for annual reporting periods beginning on or after 1 January 2022 and must be applied retrospectively to items of property, plant and equipment made available for use on or after the beginning of the earliest period presented when the entity first applies the amendments. The Group is currently assessing the impact that the amendments will have on current practice.
(iv) | Amendments to IAS 37 Onerous Contracts – Cost of Fulfilling a Contract |
In May 2020, the IASB issued amendments to IAS 37 to specify which costs an entity needs to include when assessing whether a contract is onerous or loss-making.
The amendments apply a “directly related cost approach”. The costs that relate directly to a contract to provide goods or services include both incremental costs and an allocation of costs directly related to contract activities. General and administrative costs do not relate directly to a contract and are excluded unless they are explicitly chargeable to the counterparty under the contract.
The amendments are effective for annual reporting periods beginning on or after 1 January 2022. The Group will apply these amendments to contracts for which it has not yet fulfilled all its obligations at the beginning of the annual reporting period in which it first applies the amendments. The Group is currently assessing the impact that the amendments will have on current practice.
F-46
Huaneng Power International, Inc.
Notes to the Financial Statements
For the years ended 31 December 2021, 2020 and 2019
(Prepared in accordance with International Financial Reporting Standards)
(Amounts expressed in thousands of RMB unless otherwise stated)
2 Principal accounting policies (continued)
(af) | Issued but not yet effective International Financial Reporting Standards (continued) |
(v) | Amendments to IFRS 10 and IAS 28 Sale or Contribution of Assets between an Investor and its Associate or Joint Venture |
The amendments address an inconsistency between the requirements in IFRS 10 and in IAS 28 in dealing with the sale or contribution of assets between an investor and its associate or joint venture. The amendments require a full recognition of a gain or loss resulting from a downstream transaction when the sale or contribution of assets between an investor and its associate or joint venture constitutes a business. For a transaction involving assets that do not constitute a business, a gain or loss resulting from the transaction is recognized in the investor’s profit or loss only to the extent of the unrelated investor’s interest in that associate or joint venture. The mandatory effective date for these amendments is not yet determined but early adoption is permitted. The Group is currently assessing the impact that the amendments will have on current practice.
(vi) | Amendments to IAS 8 Definition of Accounting Estimates |
In February 2021, the IASB issued amendments to IAS 8, in which it introduces a definition of ‘accounting estimates’. The amendments clarify the distinction between changes in accounting estimates and changes in accounting policies and the correction of errors. Also, they clarify how entities use measurement techniques and inputs to develop accounting estimates.
The amendments are effective for annual reporting periods beginning on or after 1 January 2023 and apply to changes in accounting policies and changes in accounting estimates that occur on or after the start of that period. Earlier application is permitted as long as this fact is disclosed.
The Group is currently assessing the impact that the amendments will have on current practice.
(vii) | Amendments to IAS 1 and IFRS Practice Statement 2 Disclosure of Accounting Policies |
In February 2021, the IASB issued amendments to IAS 1 and IFRS Practice Statement 2 Making Materiality Judgements, in which it provides guidance and examples to help entities apply materiality judgements to accounting policy disclosures. The amendments aim to help entities provide accounting policy disclosures that are more useful by replacing the requirement for entities to disclose their ‘significant’ accounting policies with a requirement to disclose their ‘material’ accounting policies and adding guidance on how entities apply the concept of materiality in making decisions about accounting policy disclosures.
The amendments to IAS 1 are applicable for annual periods beginning on or after 1 January 2023 with earlier application permitted. Since the amendments to the Practice Statement 2 provide non-mandatory guidance on the application of the definition of material to accounting policy information, an effective date for these amendments is not necessary.
The Group is currently assessing the impact that the amendments will have on current practice.
F-47
Huaneng Power International, Inc.
Notes to the Financial Statements
For the years ended 31 December 2021, 2020 and 2019
(Prepared in accordance with International Financial Reporting Standards)
(Amounts expressed in thousands of RMB unless otherwise stated)
2 Principal accounting policies (continued)
(af) | Issued but not yet effective International Financial Reporting Standards (continued) |
(viii) | Amendments to IAS 12 Deferred Tax related to Assets and Liabilities arising from a Single Transaction |
Amendments to IAS 12 narrow the scope of the initial recognition exception so that it no longer applies to transactions that give rise to equal taxable and deductible temporary differences, such as leases and decommissioning obligations. Therefore, entities are required to recognize a deferred tax asset and a deferred tax liability for temporary differences arising from these transactions. The amendments are effective for annual reporting periods beginning on or after 1 January 2023 and shall be applied to transactions related to leases and decommissioning obligations at the beginning of the earliest comparative period presented, with any cumulative effect recognized as an adjustment to the opening balance of retained profits or other component of equity as appropriate at that date. In addition, the amendments shall be applied prospectively to transactions other than leases and decommissioning obligations. Earlier application is permitted. The Group is currently assessing the impact that the amendments will have on current practice.
(ix) | Annual Improvements to IFRSs 2018-2020 Amendments to IFRS 1, IFRS 9 and Illustrative Examples accompanying IFRS 16, and IAS 41 |
Annual Improvements to IFRSs 2018-2020 sets out amendments to IFRS 1, IFRS 9, Illustrative Examples accompanying IFRS 16, and IAS 41. Details of the amendments that are expected to be applicable to the Group are as follows:
IFRS 9 Financial Instruments: clarifies the fees that an entity includes when assessing whether the terms of a new or modified financial liability are substantially different from the terms of the original financial liability. These fees include only those paid or received between the borrower and the lender, including fees paid or received by either the borrower or lender on the other’s behalf. An entity applies the amendment to financial liabilities that are modified or exchanged on or after the beginning of the annual reporting period in which the entity first applies the amendment. The amendment is effective for annual periods beginning on or after 1 January 2022. Earlier application is permitted. The Group is currently assessing the impact that the amendments will have on current practice.
IFRS 16 Leases removes the illustration of payments from the lessor relating to leasehold improvements in Illustrative Example 13 accompanying IFRS 16. This removes potential confusion regarding the treatment of lease incentives when applying IFRS 16. The Group is currently assessing the impact that the amendments will have on current practice.
F-48
Huaneng Power International, Inc.
Notes to the Financial Statements
For the years ended 31 December 2021, 2020 and 2019
(Prepared in accordance with International Financial Reporting Standards)
(Amounts expressed in thousands of RMB unless otherwise stated)
3 | Financial and capital risks management |
(a) | Financial risk management |
Risk management, including the management of financial risks, is carried out under the instructions of the Strategic Committee of the Board of Directors and the Risk Management Team. The Group works out general principles for overall management as well as management policies covering specific areas. In considering the importance of risks, the Group identifies and evaluates risks at head office and individual power plant level, and requires analysis and proper communication of the information collected periodically.
SinoSing Power and its subsidiaries and Huaneng Shandong Ruyi (Pakistan) Energy (Private) Co., Ltd. (“Ruyi Pakistan Energy”) and Shandong Huatai Electric Power Operation & Maintenance (Private) Co., Ltd. (“Huatai Power”), the subsidiaries of Hong Kong Energy, are subject to financial risks that are different from the entities operating within the PRC. They have a series of controls in place to maintain the cost of risks occurring and the cost of managing the risks at an acceptable level. Management continually monitors the risk management process to ensure that an appropriate balance between risk and control is achieved. SinoSing Power and its subsidiaries, Ruyi Pakistan Energy and Huatai Power have their written policies and financial authorization limits in place which are reviewed periodically. These financial authorization limits seek to mitigate and eliminate operational risks by setting approval thresholds required for entering into contractual obligations and investments.
(i) | Market risk |
(1) | Foreign exchange risk |
Foreign exchange risk of the entities operating within the PRC primarily arises from loans denominated in foreign currencies of the Group. SinoSing Power and its subsidiaries are exposed to foreign exchange risk on bank balances, accounts receivable, other receivables and assets, accounts payable, long-term bonds and other liabilities that are denominated primarily in US$, a currency other than the Singapore dollar (“S$”), their functional currency. Ruyi Pakistan Energy is exposed to foreign exchange risk on bank balances, financial lease receivables, accounts payable and other liabilities and long-term loans that are denominated primarily in US$, a currency other than Pakistan rupee (“PKR”), their functional currency. The Group manages exchange risk through closely monitoring the interest and exchange market.
As at 31 December 2021, if RMB had weakened/strengthened by 5% (2020: 5%) against US$ and 3% (2020: 3%) against EUR (“€”) with all other variables constant, the Group would further recognize an exchange loss/gain amounting to RMB
As at 31 December 2021, if S$ had weakened/strengthened by 10% (2020:10%) against US$ with all other variables constant, SinoSing Power and its subsidiaries would further recognize exchange loss/gain amounting to RMB
SinoSing Power and its subsidiaries also are exposed to foreign exchange risk on fuel purchases that are denominated primarily in US$. They substantially hedge their estimated foreign currency exposure in respect of forecast fuel purchases over the next three months using primarily foreign currency contracts.
F-49
Huaneng Power International, Inc.
Notes to the Financial Statements
For the years ended 31 December 2021, 2020 and 2019
(Prepared in accordance with International Financial Reporting Standards)
(Amounts expressed in thousands of RMB unless otherwise stated)
3 Financial and capital risks management (continued)
(a) | Financial risk management (continued) |
(i) | Market risk (continued) |
(1) | Foreign exchange risk (continued) |
As at 31 December 2021, if PKR had weakened/strengthened by 5% (2020: 5%) against US$ with all other variables constant, Ruyi Pakistan Energy would further recognize an exchange gain/loss amounting to RMB
Ruyi Pakistan Energy is exposed to foreign exchange risk on payments of long-term loans that are denominated primarily in US$. Ruyi Pakistan Energy entered into an agreement on a tariff adjustment mechanism with Central Power Purchasing Agency (Guarantee) Limited (“CPPA-G”) and the tariff adjustment mechanism was approved by the National Electric Power Regulatory Authority. The mechanism mitigates foreign exchange risk by decreasing or increasing electricity tariff when PKR strengthens or weakens against US$.
(2) | Price risk |
The other equity instrument investments of the Group designated as at FVTOCI are exposed to equity security price risk.
Detailed information relating to the other equity instrument investments is disclosed in Note 10. The Group closely monitors the pricing trends in the open market in determining its long-term strategic stakeholding decisions.
The Group is exposed to fuel price risk on fuel purchases. In particular, SinoSing Power and its subsidiaries use fuel oil swaps to hedge against such a risk and designate them as cash flow hedges. Please refer to Note 13 for details.
(3) | Cash flow interest rate risk |
The interest rate risk of the Group primarily arises from loans. Loans borrowed at variable rates expose the Group to cash flow interest rate risk. The exposures of these risks are disclosed in Notes 23 and 29 to the financial statements. The Group has entered into interest rate swap agreements with banks to hedge against a portion of cash flow interest rate risk.
As at 31 December 2021, if interest rates on RMB-denominated borrowings had been 50 basis points higher/lower with all other variables held constant, interest expense for the year would have been RMB
F-50
Huaneng Power International, Inc.
Notes to the Financial Statements
For the years ended 31 December 2021, 2020 and 2019
(Prepared in accordance with International Financial Reporting Standards)
(Amounts expressed in thousands of RMB unless otherwise stated)
3 | Financial and capital risks management (continued) |
(a) | Financial risk management (continued) |
(i) | Market risk (continued) |
(3) Cash flow interest rate risk (continued)
TP-STM Water Resources Pte. Ltd. (“TPSTMWR”) also entered into a number of floating-to-fixed interest rate swap agreements to hedge against cash flow interest rate risk of loans.
According to the interest rate swap agreements, TPSTMWR agrees with the counterparty to settle the difference between fixed contract rates and floating-rate interest amounts calculated by reference to the agreed notional amount quarterly until 2044. Please refer to Note 13 for details.
(ii) | Credit risk |
Credit risk arises from bank deposits, accounts receivable, contract assets, other receivables and assets and other non-current assets. The maximum exposures of contract assets, other non-current assets, other receivables and assets, accounts receivable and bank deposits are disclosed in Notes 5(c), 15, 17, 18 and 34 to the financial statements, respectively.
Bank deposits are placed with reputable banks and financial institutions. In addition, a significant portion is deposited with a non-bank financial institution which is a related party of the Group. The Group has a director on the Board of this non-bank financial institution and exercises influence. Corresponding maximum exposures of these bank deposits are disclosed in Note 35 (a)(i) to the financial statements.
The majority of the power plants of the Group operating within the PRC sell electricity generated to their sole customers, the power grid companies of their respective provinces or regions where the power plants operate. These power plants communicate with their individual grid companies periodically and believe that adequate provision for loss allowance on accounts receivable has been made in the financial statements.
Pursuant to Cai Jian [2020] No. 4 Opinions on the Promotion of Healthy Development over Non-water Renewable Energy Power Generation jointly issued by the Ministry of Finance, the National Development and Reform Commission and the National Energy Administration in January 2020, the application process of renewable energy tariff premium has been further simplified to file the project tariff supplementary information on the National Renewable Energy Information Management Platform. The tariff premium receivables are settled in accordance with prevailing government policies and prevalent payment trends of the Ministry of Finance. The directors are of the opinion that the application process will be completed in due course and these trade receivables from tariff premium are fully recoverable considering there were no bad debt experiences with the grid companies in the past and such tariff premium is funded by the PRC government. On 20 January 2020, the Ministry of Finance, the National Development and Reform Commission and the National Energy Administration jointly issued Cai Jian [2020] No. 5 Notice on the Measures for Administration of Funds for Tariff Premium of Renewable Energy and abolished the Notice on the Interim Measures for Administration of Subsidy Funds for Tariff Premium of Renewable Energy issued in 2012. The new measures clarified that the total amount of funds for tariff premium will be determined by the Ministry of Finance in accordance with the principle of determining expenditure by revenue, and the capacity of newly installed renewable energy projects within the premium scope will be determined by the National Development and Reform Commission and the Energy Administration. At the same time, the stock projects included in the annual construction plan could be enrolled in the list of subsidies after approved by the power grid company.
F-51
Huaneng Power International, Inc.
Notes to the Financial Statements
For the years ended 31 December 2021, 2020 and 2019
(Prepared in accordance with International Financial Reporting Standards)
(Amounts expressed in thousands of RMB unless otherwise stated)
3 | Financial and capital risks management (continued) |
(a) | Financial risk management (continued) |
(ii) | Credit risk (continued) |
Singapore subsidiaries derive revenue mainly from the sale of electricity to the National Electricity Market of Singapore operated by Energy Market Company Pte. Ltd., which does not have high credit risk. Singapore subsidiaries also derive revenue mainly from retailing electricity to consumers with monthly consumption of more than
Ruyi Pakistan Energy derives revenue from the sale of electricity to CPPA-G, which is measured on the basis of lifetime ECLs. The loss allowances recognized during the year were RMB
Finance lease receivables are mainly from a domestic related party, business enterprises in Singapore and CPPA-G in Pakistan. As the related party and Singapore local enterprises have a good track of records and no historical losses have been incurred, the Group concluded that these receivables have low credit risk and remote possibility of default. The finance lease receivables from CPPA-G are secured against the sovereign guarantee issued by the Government of Pakistan pursuant to the designated agreement. The ECLs of the finance lease receivables are measured on the basis of lifetime ECLs, and a
F-52
Huaneng Power International, Inc.
Notes to the Financial Statements
For the years ended 31 December 2021, 2020 and 2019
(Prepared in accordance with International Financial Reporting Standards)
(Amounts expressed in thousands of RMB unless otherwise stated)
3 | Financial and capital risks management (continued) |
(a) | Financial risk management (continued) |
(ii) | Credit risk (continued) |
The Group measures loss allowances for accounts receivable and contract assets at an amount equal to lifetime ECLs, which is calculated using a provision matrix. As at 31 December 2021, for accounts receivable amounting to RMB
| Gross carrying |
| ||||
As at 31 December 2021 |
| amount |
| ECL |
| Loss allowance |
Receivables from domestic sales of power |
| | | % | — | |
Receivables from domestic sales of heat | | | % | — | ||
Receivables from overseas sales of power |
| | | % | | |
Receivables from domestic sales of others |
| | | % | — | |
Receivables from overseas sales of others |
| | | % | — | |
|
| |||||
| |
The Group measures loss allowances for other receivables at an amount equal to 12-month ECLs unless there has been a significant increase in credit risk.
| Gross carrying |
| ||
Other receivables | amount |
| Loss allowance | |
| ||||
Current (not past due) |
| |
| |
Within 1 year past due |
| — |
| — |
1 - 3 years past due |
| — |
| — |
More than 3 years past due |
| |
| |
| |
| |
Expected loss rates are based on actual loss experience over the past 5 years. These rates are adjusted to reflect differences between economic conditions during the period over which the historic data has been collected, the current conditions, and the Group’s view of economic conditions over the expected lives of the receivables.
F-53
Huaneng Power International, Inc.
Notes to the Financial Statements
For the years ended 31 December 2021, 2020 and 2019
(Prepared in accordance with International Financial Reporting Standards)
(Amounts expressed in thousands of RMB unless otherwise stated)
3 | Financial and capital risks management (continued) |
(a) | Financial risk management (continued) |
(iii) | Liquidity risk |
Liquidity risk management is to primarily ensure the ability of the Group to meet its liabilities as and when they are fall due. The liquidity reserve comprises the undrawn borrowing facility and cash and cash equivalents available as at each month end in meeting the Group’s liabilities.
The Group maintains flexibility in funding by cash generated by their operating activities and availability of committed credit facilities.
Financial liabilities due within 12 months are presented as current liabilities in the statement of financial position. The cash flows of derivative financial liabilities and repayment schedules of the long-term loans, long-term bonds, other non-current liabilities and lease liabilities are disclosed in Notes 13, 23, 24, 25 and 40, respectively.
(b) | Fair value estimation |
(i) | Fair value measurements |
The following table presents the assets and liabilities that are measured at fair value at 31 December 2021 on a recurring basis.
| Level 1 |
| Level 2 |
| Level 3 |
| Total | |
Recurring fair value measurements |
|
|
|
| ||||
Assets | ||||||||
Accounts receivable at fair value through other comprehensive income (Note 18) |
| — |
| |
| — |
| |
Derivatives used for hedging (Note 13) |
| — |
| |
| — |
| |
Other equity instrument investments (Note 10) |
| |
| — |
| |
| |
Total assets |
| |
| |
| |
| |
Liabilities |
|
|
|
| ||||
Derivatives used for hedging (Note 13) |
| — |
| |
| — |
| |
Total liabilities |
| — |
| |
| — |
| |
F-54
Huaneng Power International, Inc.
Notes to the Financial Statements
For the years ended 31 December 2021, 2020 and 2019
(Prepared in accordance with International Financial Reporting Standards)
(Amounts expressed in thousands of RMB unless otherwise stated)
3 | Financial and capital risks management (continued) |
(b) | Fair value estimation (continued) |
(i) | Fair value measurements (continued) |
The following table presents the assets and liabilities that are measured at fair value at 31 December 2020 on a recurring basis.
| Level 1 |
| Level 2 |
| Level 3 |
| Total | |
Recurring fair value measurements | ||||||||
Assets | ||||||||
Accounts receivable at fair value through other comprehensive income (Note 18) |
| — |
| |
| — |
| |
Derivatives used for hedging (Note 13) |
| — |
| |
| — |
| |
Other equity instrument investments (Note 10) |
| |
| — |
| |
| |
Total assets |
| |
| |
| |
| |
Liabilities |
|
|
|
|
|
|
|
|
Derivatives used for hedging (Note 13) |
| — |
| |
| — |
| |
Total liabilities |
| — |
| |
| — |
| |
The fair value of financial instruments traded in active markets is based on quoted market prices at the end of the reporting period. A market is regarded as active if quoted prices are readily and regularly available from an exchange, dealer, broker, industry group, pricing service, or regulatory agency, and those prices represent actual and regularly occurring market transactions on an arm’s length basis. The quoted market price used for financial assets held by the Group is the current bid price. These instruments are included in level 1. As at 31 December 2021, instruments included in level 1 were equity instruments in listed securities designated as financial assets measured at fair value through other comprehensive income.
The fair value of financial instruments that are not traded in an active market is determined by using valuation techniques. These valuation techniques maximize the use of relevant observable inputs and minimize the use of unobservable inputs. If all significant inputs required to fair value an instrument are observable, the instrument is included in level 2.
If one or more of the significant inputs is not based on observable market data, the instrument is included in level 3.
Specific valuation techniques used to value financial instruments include:
● | The forward exchange contracts and fuel oil swaps are both valued using quoted market prices or dealer quotes for similar instruments. |
● | The fair value of interest rate swaps is calculated as the present value of the estimated future cash flows based on observable yield curves. |
● | The fair values of accounts receivable at fair value through other comprehensive income were measured using the discounted cash flow model. The model incorporates various market observable inputs including the annualized yields of similar securitization products and interest rate curves. The carrying amounts of accounts receivable are the same as their fair values. |
F-55
Huaneng Power International, Inc.
Notes to the Financial Statements
For the years ended 31 December 2021, 2020 and 2019
(Prepared in accordance with International Financial Reporting Standards)
(Amounts expressed in thousands of RMB unless otherwise stated)
3 | Financial and capital risks management (continued) |
(b) | Fair value estimation (continued) |
(i) | Fair value measurements (continued) |
● | The material other equity instrument investments in unlisted securities are valued using a market-base valuation technique based on assumptions that are not supported by observable market prices or rates. The Group determines comparable public companies based on industry, size, leverage and strategy and calculates an appropriate price multiple, such as price to book (“P/B”) multiple for each comparable company identified. |
Below is a summary of significant unobservable inputs to the valuation of financial instruments together with a quantitative sensitivity analysis as at 31 December 2021:
|
| Significant |
|
| ||||
Valuation technique | Unobservable input | Range |
| Sensitivity of fair value to the input | ||||
Unlisted equity investments |
| Valuation multiples |
| Average P/B |
|
| ||
|
| Discount for lack of marketability |
The discount for lack of marketability represents the amounts of premiums and discounts determined by the Group that market participants would take into account when pricing the investments.
During the years ended 31 December 2021 and 2020, there were
The movements during the year in the balance of the level 3 fair value measurements are as follows:
As at 31 December | ||||
| 2021 |
| 2020 | |
Contingent consideration |
|
|
|
|
Beginning of the year |
| — |
| |
Movements: |
|
|
| |
Profit compensation received from Huaneng Group |
| — |
| ( |
End of the year |
| — |
| — |
Total gains for the year included in profit or loss for assets held at the end of the reporting period |
| — |
| — |
F-56
Huaneng Power International, Inc.
Notes to the Financial Statements
For the years ended 31 December 2021, 2020 and 2019
(Prepared in accordance with International Financial Reporting Standards)
(Amounts expressed in thousands of RMB unless otherwise stated)
3 | Financial and capital risks management (continued) |
(b) | Fair value estimation (continued) |
(i) | Fair value measurements (continued) |
As at 31 December | ||||
| 2021 |
| 2020 | |
Other equity instrument investments |
|
|
|
|
Beginning of the year |
| |
| |
Addition |
| |
| |
Disposal |
| ( |
| — |
Fair value changes |
| ( |
| ( |
End of the year |
| |
| |
Changes in fair value recognized in other comprehensive income for the year |
| ( |
| ( |
(ii) | Fair value disclosures |
The carrying value less provision for loss allowances on accounts receivable, other receivables and assets, accounts payable and other liabilities, short-term bonds and short-term loans approximated to their fair values. The fair value of financial liabilities for disclosure purposes is estimated by discounting the future contractual cash flows at the current market interest rate that is available to the Group for similar financial instruments.
The estimated fair values of long-term loans and long-term bonds (both including current maturities) were approximately RMB
(c) | Capital risk management |
The objectives of the Group for managing capital are to safeguard the ability of the Group in continuing as a going concern in order to provide returns for shareholders and benefits for other stakeholders and to maintain an optimal capital structure to reduce the cost of capital.
The Group monitors capital by using debt ratio analysis. This ratio is calculated as total liabilities (sum of current liabilities and non-current liabilities) divided by total assets as shown in the consolidated statement of financial position. During 2021, the strategy of the Group’s capital management remained unchanged from 2020. The debt ratio of the Group as at 31 December 2021 was
F-57
Huaneng Power International, Inc.
Notes to the Financial Statements
For the years ended 31 December 2021, 2020 and 2019
(Prepared in accordance with International Financial Reporting Standards)
(Amounts expressed in thousands of RMB unless otherwise stated)
4 | Critical accounting estimates and judgements |
Estimates and judgements are continually evaluated and are based on historical experience and other factors, including xpectations of future events that are believed to be reasonable under the circumstances.
The Group makes estimates and assumptions concerninjg the future. The resulting accounting estimates will, by definition, seldom equal the related actual results. The estimates and assumptions that have a significant risk of causing a material adjustment to the carrying amounts of assets and liabilities within the next financial year are discussed below.
(a) | Accounting estimates on impairment of goodwill |
In accordance with the accounting policies stated in Note 2(l), the Group performs annual tests on whether goodwill has suffered any impairment or more frequently if events or changes in circumstances indicate that the carrying value may be impaired. The recoverable amounts of CGU or CGUs to which goodwill has been allocated are determined based on value-in-use calculations. The annual goodwill impairment assessment is complex because the determination of the recoverable amount of the underlying CGUs involves significant estimates and judgements, including the future sales volumes, fuel prices, gross margin and terminal growth rate used to estimate future cash flows and discount rates applied to these forecasted future cash flows of the underlying CGUs. These estimates and judgements may be significantly affected by changes in future market or economic conditions.
(b) | Accounting estimates on impairment of property, plant and equipment |
In accordance with the accounting policies stated in Note 2(l), the Group reviews at each reporting date to determine whether there is any indication of impairment on property, plant and equipment. If any such indication exists, then the recoverable amount of property, plant and equipment is estimated. The impairment assessment is by determining the recoverable amounts of the CGUs that the PPE are allocated to. The impairment assessment of property, plant and equipment was complex due to the significant estimates and judgements involved in the projections of future cash flows, including the future sales volumes, fuel prices, and discount rates applied to these forecasted future cash flows. These estimates and judgements may be significantly affected by changes in future market or economic conditions.
(c) | Deferred tax assets |
The Group recognizes the deferred tax assets to the extent that it is probable that future taxable profit and taxable temporary differences will be available against which the deductible temporary differences and tax losses carried forward can be utilized, using tax rates that are expected to be applied in the period when the asset is recovered. Recognition of deferred tax assets was complex because it requires significant estimation and judgement, and it involves significant assumptions, including future taxable profits, future tax rates, the reversal of deductible and taxable temporary differences, and the possible utilization of tax losses carried forward that could be significantly affected by changes in the tax law framework and future market or economic conditions.
F-58
Huaneng Power International, Inc.
Notes to the Financial Statements
For the years ended 31 December 2021, 2020 and 2019
(Prepared in accordance with International Financial Reporting Standards)
(Amounts expressed in thousands of RMB unless otherwise stated)
5 | Revenue and segment information |
(a) | Disaggregation of revenue |
In the following table, revenue is disaggregated by major products and/or service lines of revenue recognition. The table also includes a reconciliation of the disaggregated operating revenue to the Group’s reportable segments (Note 5 (b)).
| PRC power |
| Overseas |
| All other |
| Inter-segment |
| ||
For the year ended 31 December 2021 | segment | segment | segments | revenue | Total | |||||
Note i |
|
|
| |||||||
-Sales of power and heat |
| |
| |
| — |
| — |
| |
-Sales of coal and raw materials |
| |
| |
| |
| ( |
| |
-Port service |
| — |
| — |
| |
| ( |
| |
-Transportation service |
| — |
| — |
| |
| ( |
| |
-Lease income |
| |
| |
| — |
| — |
| |
-Others |
| |
| |
| |
| ( |
| |
Total |
| |
| |
| |
| ( |
| |
Revenue: |
|
|
|
|
|
|
|
|
| |
-From contracts with customers within the scope of IFRS 15 |
|
|
|
|
|
|
|
|
| |
-From other sources |
|
|
|
|
|
|
|
|
| |
F-59
Huaneng Power International, Inc.
Notes to the Financial Statements
For the years ended 31 December 2021, 2020 and 2019
(Prepared in accordance with International Financial Reporting Standards)
(Amounts expressed in thousands of RMB unless otherwise stated)
5 | Revenue and segment information (continued) |
(a) | Disaggregation of revenue (continued) |
| PRC power |
| Overseas |
| All other |
| Inter-segment |
| ||
For the year ended 31 December 2020 | segment | segment | segments | revenue | Total | |||||
|
| Note i |
|
|
| |||||
-Sales of power and heat | | — | — | |||||||
-Sales of coal and raw materials |
| |
| |
| — |
| — |
| |
-Port service |
| — |
| — |
| |
| ( |
| |
-Transportation service |
| — |
| — |
| |
| ( |
| |
-Lease income |
| |
| |
| — |
| — |
| |
-Others |
| |
| |
| |
| ( |
| |
Total |
| |
| |
| |
| ( |
| |
Revenue: |
|
|
|
|
|
|
|
|
|
|
-From contracts with customers within the scope of IFRS 15 |
|
|
|
|
|
|
|
|
| |
-From other sources |
|
|
|
|
|
|
|
|
| |
| PRC power |
| Overseas |
| All other |
| Inter-segment |
| ||
For the year ended 31 December 2019 | segment | segment | segments | revenue | Total | |||||
| Note i | |||||||||
-Sales of power and heat |
| |
| |
| — |
| — |
| |
-Sales of coal and raw materials |
| |
| |
| — |
| — |
| |
-Port service |
| — |
| — |
| |
| ( |
| |
-Transportation service |
| — |
| — |
| |
| ( |
| |
-Lease income | | | — | — | | |||||
-Others |
| |
| |
| |
| ( |
| |
Total |
| |
| |
| |
| ( |
| |
Revenue: |
|
|
|
|
|
|
|
|
|
|
-From contracts with |
|
|
|
|
|
|
|
|
|
|
customers within the scope of IFRS 15 |
|
|
|
|
|
|
|
|
| |
-From other sources |
|
|
|
|
|
|
|
|
| |
Note i: The overseas segment mainly consists of the operations in Singapore and Pakistan.
The revenue from the sale of power and heat and the sale of coal and raw materials is recognized at the point in time upon the transfer of products, whereas the revenue from port service, transportation service, maintenance service, and heating pipeline service is recognized over time during the provision of such services. Lease income is recognized over the lease term.
F-60
Huaneng Power International, Inc.
Notes to the Financial Statements
For the years ended 31 December 2021, 2020 and 2019
(Prepared in accordance with International Financial Reporting Standards)
(Amounts expressed in thousands of RMB unless otherwise stated)
5 | Revenue and segment information (continued) |
(b) | Segment information |
Directors and certain senior management of the Company perform the function as the chief operating decision maker (collectively referred to as the “senior management”). The senior management reviews the internal reporting of the Group in order to assess performance and allocate resources. The Company has determined the operating segments based on these reports. The reportable segments of the Group are the PRC power segment, overseas segment and all other segments (mainly including port and transportation operations). No operating segments have been aggregated to form a reportable segment.
Senior management assesses the performance of the operating segments based on a measure of profit before income tax expense under China Accounting Standards for Business Enterprises (“PRC GAAP”) excluding dividend income received from other equity instrument investments, share of profits of China Huaneng Finance Co., Ltd. (“Huaneng Finance”) and operating results of the centrally managed and resource allocation functions of headquarters (“segment results”). Other information provided, except as noted below, to the senior management of the Company is measured under PRC GAAP.
Segment assets exclude prepaid income tax, deferred income tax assets, other equity instrument investments, investment in Huaneng Finance and assets related to the centrally managed and resource allocation functions of the headquarters that are not attributable to any operating segment (“corporate assets”). Segment liabilities exclude current income tax liabilities, deferred income tax liabilities and liabilities related to the centrally managed and resource allocation functions of the headquarters that are not attributable to any operating segment (“corporate liabilities”). These are part of the reconciliation to total assets and liabilities of the consolidated statement of financial position.
All sales among the operating segments have been eliminated as internal transactions when preparing the consolidated financial statements.
(Under PRC GAAP)
|
| PRC power |
| Overseas |
| All other |
| |
| segment | segment | segments |
| Total | |||
For the year ended 31 December 2021 |
|
|
| |||||
Total revenue |
| |
| |
| |
| |
Intersegment revenue |
| — |
| — |
| ( |
| ( |
External revenue |
| |
| |
| |
| |
Segment results |
| ( |
| |
| |
| ( |
Interest income |
| |
| |
| |
| |
Interest expense |
| ( |
| ( |
| ( |
| ( |
Impairment loss |
| ( |
| |
| — |
| ( |
Credit loss |
| ( |
| ( |
| — |
| ( |
Depreciation and amortization |
| ( |
| ( |
| ( |
| ( |
Net gain on disposal of non-current assets |
| |
| |
| |
| |
Share of profits less losses of associates and joint ventures |
| |
| — |
| |
| |
Income tax expense |
| |
| ( |
| ( |
| |
F-61
Huaneng Power International, Inc.
Notes to the Financial Statements
For the years ended 31 December 2021, 2020 and 2019
(Prepared in accordance with International Financial Reporting Standards)
(Amounts expressed in thousands of RMB unless otherwise stated)
5 | Revenue and segment information (continued) |
(b) | Segment information (continued) |
(Under PRC GAAP)
|
| PRC power |
| Overseas |
| All other |
| |
| segment |
| segment |
| segments |
| Total | |
For the year ended 31 December 2020 | ||||||||
Total revenue | | | | | ||||
Intersegment revenue |
| — |
| — |
| ( |
| ( |
External revenue |
| |
| |
| |
| |
Segment results |
| |
| |
| |
| |
Interest income |
| |
| |
| |
| |
Interest expense |
| ( |
| ( |
| ( |
| ( |
Impairment loss |
| ( |
| |
| — |
| ( |
Credit loss |
| ( |
| ( |
| — |
| ( |
Depreciation and amortization |
| ( |
| ( |
| ( |
| ( |
Net (loss)/income on disposal of non-current assets |
| ( |
| |
| ( |
| ( |
Share of profits less losses of associates and joint ventures |
| |
| — |
| |
| |
Income tax expense |
| ( |
| ( |
| ( |
| ( |
| ||||||||
| PRC power |
| Overseas |
| All other | |||
| segment | segment | segments | Total | ||||
| ||||||||
For the year ended 31 December 2019 (Restated*) |
|
|
|
| ||||
Total revenue |
| |
| |
| |
| |
Intersegment revenue |
| — |
| — |
| ( |
| ( |
External revenue |
| |
| |
| |
| |
Segment results |
| |
| |
| ( |
| |
Interest income |
| |
| |
| |
| |
Interest expense |
| ( |
| ( |
| ( |
| ( |
Impairment loss |
| ( |
| ( |
| ( |
| ( |
Credit loss |
| ( |
| ( |
| — |
| ( |
Depreciation and amortization |
| ( |
| ( |
| ( |
| ( |
Net gain/(loss) on disposal of non-current assets |
| |
| |
| ( |
| |
Share of profits less losses of associates and joint ventures |
| |
| — |
| |
| |
Income tax expense |
| ( |
| |
| ( |
| ( |
F-62
Huaneng Power International, Inc.
Notes to the Financial Statements
For the years ended 31 December 2021, 2020 and 2019
(Prepared in accordance with International Financial Reporting Standards)
(Amounts expressed in thousands of RMB unless otherwise stated)
5 | Revenue and segment information (continued) |
(b) | Segment information (continued) |
(Under PRC GAAP)
| PRC power | Overseas | All other | |||||
| segment |
| segment |
| segments | Total | ||
31 December2021 |
|
|
|
| ||||
Segment assets |
| |
| |
| |
| |
Including: | ||||||||
Additions to non-current assets (excluding financial assets and deferred income tax assets) |
| |
| |
| |
| |
Investments in associates |
| |
| — |
| |
| |
Investments in joint ventures |
| |
| — |
| |
| |
Segment liabilities |
| ( |
| ( |
| ( |
| ( |
| PRC power |
| Overseas |
| All other |
|
| |
segment | segment | segments | Total | |||||
31 December 2020 |
|
|
|
|
|
|
|
|
Segment assets |
| |
| |
| |
| |
Including: |
|
|
|
| ||||
Additions to non-current assets (excluding financial assets and deferred income tax assets) |
| |
| |
| |
| |
Investments in associates |
| |
| — |
| |
| |
Investments in joint ventures |
| |
| — |
| |
| |
Segment liabilities |
| ( |
| ( |
| ( |
| ( |
A reconciliation of external revenue to operating revenue is provided as follows:
For the year ended 31 December | ||||||
|
| 2021 |
| 2020 |
| 2019(Restated*) |
External revenue (PRC GAAP) |
| |
| |
| |
Reconciling items: |
|
|
|
|
|
|
Impact of restatement under PRC GAAP in relation to business combination under common control* |
| — |
| ( |
| ( |
Impact of recognition of build-operate-transfer (BOT) related revenue under IFRSs |
| — |
| |
| |
Operating revenue per IFRS consolidated statement of comprehensive income |
| |
| |
| |
F-63
Huaneng Power International, Inc.
Notes to the Financial Statements
For the years ended 31 December 2021, 2020 and 2019
(Prepared in accordance with International Financial Reporting Standards)
(Amounts expressed in thousands of RMB unless otherwise stated)
5 | Revenue and segment information (continued) |
(b) | Segment information (continued) |
(Under PRC GAAP)
A reconciliation of segment results to profit before income tax expense is provided as follows:
For the year ended 31 December | ||||||
|
| 2021 |
| 2020 |
| 2019 (Restated*) |
Segment results (PRC GAAP) | ( | | | |||
Reconciling items: |
| |||||
Loss related to the headquarters |
| ( |
| ( |
| ( |
Share of profits of Huaneng Finance |
| |
| |
| |
Dividend income of other equity instrument investments |
| |
| |
| |
Impact of restatement under PRC GAAP in relation to business combination under common control* |
| — |
| ( |
| |
Impact of IFRS adjustments** |
| ( |
| ( |
| ( |
(Loss)/profit before income tax expense per IFRS consolidated statement of comprehensive income |
| ( |
| |
| |
Reportable segments’ assets are reconciled to total assets as follows:
As at 31 December | ||||
|
| 2021 |
| 2020 |
Total segment assets (PRC GAAP) |
| |
| |
Reconciling items: |
|
| ||
Investment in Huaneng Finance |
| |
| |
Deferred income tax assets |
| |
| |
Prepaid income tax |
| |
| |
Other equity instrument investments |
| |
| |
Corporate assets |
| |
| |
Impact of IFRS adjustments** | | | ||
Total assets per IFRS consolidated statement of financial position |
| |
| |
Reportable segments’ liabilities are reconciled to total liabilities as follows:
As at 31 December | ||||
|
| 2021 |
| 2020 |
Total segment liabilities (PRC GAAP) |
| ( |
| ( |
Reconciling items: | ||||
Current income tax liabilities |
| ( |
| ( |
Deferred income tax liabilities |
| ( |
| ( |
Corporate liabilities |
| ( |
| ( |
Impact of IFRS adjustments** |
| ( |
| ( |
Total liabilities per IFRS consolidated statement of financial position |
| ( |
| ( |
F-64
Huaneng Power International, Inc.
Notes to the Financial Statements
For the years ended 31 December 2021, 2020 and 2019
(Prepared in accordance with International Financial Reporting Standards)
(Amounts expressed in thousands of RMB unless otherwise stated)
5 | Revenue and segment information (continued) |
(b) | Segment information (continued) |
Other material items:
|
|
|
| Impact of |
|
| ||||||
restatement under | ||||||||||||
PRC GAAP in | ||||||||||||
relation to | ||||||||||||
Share of | business | |||||||||||
profits of | combination under | Impact of | ||||||||||
Reportable | Huaneng |
| common | IFRS | ||||||||
segment total | Headquarters | Finance |
| control* | adjustments** | Total | ||||||
For the year ended 31 December 2021 | ||||||||||||
Total revenue |
| |
| — |
| — |
| — |
| — |
| |
Interest expense |
| ( |
| ( |
| — |
| — |
| — |
| ( |
Depreciation and amortization |
| ( |
| ( |
| — |
| — |
| ( |
| ( |
Impairment loss |
| ( |
| — |
| — |
| — |
| ( |
| ( |
Credit loss |
| ( |
| — |
| — |
| — |
| — |
| ( |
Share of profits less losses of associates and joint ventures |
| |
| — |
| |
| — |
| ( |
| |
Net gain on disposal of non-current assets |
| |
| — |
| — |
| — |
| ( |
| |
Income tax expense |
| |
| — |
| — |
| — |
| |
| |
| ||||||||||||
For the year ended 31 December 2020 | ||||||||||||
Total revenue |
| |
| — |
| — |
| ( |
| |
| |
Interest expense |
| ( |
| ( |
| — |
| |
| — |
| ( |
Depreciation and amortization |
| ( |
| ( |
| — |
| |
| ( |
| ( |
Impairment loss |
| ( |
| — |
| — |
| — |
| ( |
| ( |
Credit loss |
| ( |
| — |
| — |
| — |
| ( |
| ( |
Share of profits less losses of associates and joint ventures |
| |
| — |
| |
| — |
| ( |
| |
Net loss on disposal of non-current assets |
| ( |
| — |
| — |
| — |
| ( |
| ( |
Income tax expense |
| ( |
| — |
| — |
| |
| |
| ( |
For the year ended 31 December 2019(Restated*) |
|
|
|
|
|
|
|
|
|
|
|
|
Total revenue |
| |
| — |
| — |
| ( |
| |
| |
Interest expense |
| ( |
| ( |
| — |
| |
| — |
| ( |
Depreciation and amortization |
| ( |
| ( |
| — |
| |
| ( |
| ( |
Impairment loss |
| ( |
| — |
| — |
| |
| ( |
| ( |
Credit loss |
| ( |
| — |
| — |
| — |
| — |
| ( |
Share of profits less losses of associates and joint ventures |
| |
| — |
| |
| — |
| ( |
| |
Net gain/(loss) on disposal of non-current assets |
| |
| — |
| — |
| — |
| ( |
| |
Income tax expense |
| ( |
| — |
| — |
| |
| |
| ( |
* | The Group completed the acquisitions of equity interests of certain companies in 2020. As the acquisitions were business combinations under common control, the transactions were accounted for using the pooling of interests method under PRC GAAP. The assets and liabilities acquired in business combinations were measured at the carrying amounts of the acquirees in the consolidated financial statements of the ultimate controlling party on the acquisition date. The operating results for all periods presented were retrospectively restated as if the current structure and operations resulting from the acquisitions had been in existence from the date when the acquirees first became under the control of the same ultimate controlling party. Therefore, the relevant comparative figures in the segment information were restated under PRC GAAP as the acquisitions were accounted for using the acquisition method under IFRSs. |
F-65
Huaneng Power International, Inc.
Notes to the Financial Statements
For the years ended 31 December 2021, 2020 and 2019
(Prepared in accordance with International Financial Reporting Standards)
(Amounts expressed in thousands of RMB unless otherwise stated)
5 | Revenue and segment information (continued) |
(b) | Segment information (continued) |
** | IFRS adjustments above primarily represented the reclassification adjustments and adjustments related to business combination and borrowing cost. Other than the reclassification adjustments, the differences will be gradually eliminated following subsequent depreciation and amortization of related assets or the extinguishment of liabilities. |
Geographical information (Under IFRSs):
(i) | External revenue generated from the following countries: |
For the year ended 31 December | ||||||
|
| 2021 |
| 2020 |
| 2019 |
PRC |
| |
| |
| |
Overseas |
| |
| |
| |
Total |
| |
| |
| |
The geographical location of customers is based on the location at which the electricity was transferred, goods were delivered, and services were provided.
(ii) | Non-current assets (excluding financial assets and deferred income tax assets) are located in the following countries: |
As at 31 December | ||||
|
| 2021 |
| 2020 |
PRC |
| |
| |
Overseas |
| |
| |
Total |
| |
| |
The non-current asset information above is based on the locations of the assets.
The information on sales to major customers of the Group which accounted for 10% or more of external revenue is as follows:
In 2021, the revenue from grid companies under common control of State Grid Corporation of China within the PRC power segment in total accounted for
For the year ended 31 December |
| ||||||||||||
2021 | 2020 | 2019 |
| ||||||||||
|
| Amount |
| Proportion |
| Amount |
| Proportion |
| Amount |
| Proportion |
|
State Grid Shandong Electric Power Company |
| | | % | |
| | % | |
| | % |
F-66
Huaneng Power International, Inc.
Notes to the Financial Statements
For the years ended 31 December 2021, 2020 and 2019
(Prepared in accordance with International Financial Reporting Standards)
(Amounts expressed in thousands of RMB unless otherwise stated)
5 | Revenue and segment information (continued) |
(c) | Contract balances |
The contract assets primarily relate to the Group’s rights to consideration for service completed but not billed at the reporting date. The contract assets are transferred to receivables when the rights become unconditional according to the contract.
The contract liabilities primarily relate to the advance received from customers for heat sales and heating pipeline upfront fees. The contract liabilities of RMB
(i) | The transaction prices allocated to remaining performance obligations (unsatisfied or partially unsatisfied) are as follows: |
|
| As at 31 December | ||
2021 |
| 2020 | ||
Within 1 year | | | ||
Over 1 year |
| |
| |
Total (Note 25) |
| |
| |
The transaction prices allocated to the above remaining performance obligations expected to be recognized in more than one year relate to the provision of heating pipeline services, of which the performance obligations are to be satisfied
(ii) | Performance obligations |
The Group has elected the practical expedient of not disclosing the remaining obligation excluding heating pipeline upfront fees. As allowed by IFRS 15, no information is provided about the performance obligations at 31 December 2021 that have an original expected duration of one year or less.
F-67
Huaneng Power International, Inc.
Notes to the Financial Statements
For the years ended 31 December 2021, 2020 and 2019
(Prepared in accordance with International Financial Reporting Standards)
(Amounts expressed in thousands of RMB unless otherwise stated)
6 | (Loss)/profit before income tax expense |
(Loss)/profit before income tax expense was determined after charging/(crediting) the following:
For the year ended 31 December | ||||||
|
| 2021 |
| 2020 |
| 2019 |
Total interest expense on borrowing |
| |
| |
| |
Less: amounts capitalized in property, plant and equipment |
| |
| |
| |
Interest expenses charged to consolidated statement of comprehensive income |
| |
| |
| |
Including: Interest expenses on lease liabilities |
| |
| |
| |
Depreciation of property, plant and equipment |
| |
| |
| |
Depreciation of investment properties | | | | |||
Depreciation of right-of-use assets |
| |
| |
| |
Included in other investment (income)/loss |
|
|
|
|
|
|
-Dividends on other equity instrument investments |
| ( |
| ( |
| ( |
-Gains on disposal of subsidiaries |
| — |
| — |
| ( |
-Investment loss/(income) of derivative financial instruments | — | | ( | |||
-Other | ( | ( | | |||
Included in loss/(gain) on fair value changes of financial assets/liabilities |
|
|
|
|
|
|
-Contingent consideration of the business combination |
| — |
| — |
| ( |
-Loss/(gain) on fair value changes of trading derivatives |
| — |
| |
| ( |
F-68
Huaneng Power International, Inc.
Notes to the Financial Statements
For the years ended 31 December 2021, 2020 and 2019
(Prepared in accordance with International Financial Reporting Standards)
(Amounts expressed in thousands of RMB unless otherwise stated)
6(Loss)/profit before income tax expense (continued)
For the year ended 31 December | ||||||
| 2021 |
| 2020 |
| 2019 | |
Included in other operating expenses: |
|
|
|
|
|
|
- Operating expense of Ruyi Pakistan Energy |
| | | | ||
- Service concession construction cost |
| | | | ||
- Other materials expense |
| | | | ||
- Electricity charges |
| | | | ||
- Cost of sales of raw materials |
| | | | ||
- Water charges |
| | | | ||
- Insurance expense |
| | | | ||
- Cleaning, greening and fire protection expense |
| | | | ||
- Purchase of power generation quota |
| | | | ||
- Transportation allowance |
| | | | ||
- Pollutant charge |
| | | | ||
- Water conservancy fund and disabled security fund |
| | | | ||
- Test and inspection expense |
| | | | ||
- Service charge |
| | | | ||
- Heating pipeline related cost |
| | | | ||
- Auditors’ remuneration audit services |
| | | | ||
- Other consulting expense |
| | | | ||
- Office expense |
| | | | ||
- Minimum lease payments under operating leases, lease payments not included in the measurement of lease liabilities |
| | | | ||
- Amortization of other non-current assets |
| | | | ||
- Property management expense |
| | | | ||
- Information technology maintenance expense |
| | | | ||
- Travel expense |
| | | | ||
- Business entertainment expense |
| | | | ||
- Research and development expenditure |
| | | | ||
- Net loss on disposal of materials and supplies |
| | | | ||
- Net (gain)/loss on disposal of non-current assets |
| ( | | ( | ||
- Recognition of loss allowance for receivables* |
| | | | ||
- (Reversal)/recognition of provision for inventory obsolescence (Note 16) |
| ( | | | ||
- Impairment loss of property, plant and equipment (Note 7) |
| | | | ||
- Impairment loss of goodwill (Note 14) |
| — | | — | ||
- Impairment loss on other non-current assets* |
| | | | ||
- Gain of Three Supplies and Property Management |
| ( | ( | ( | ||
- Government grants** |
| ( | ( | ( | ||
- Penalties |
| | | | ||
- Donations |
| | | | ||
- Others |
| | | | ||
Total |
| | | |
* | The loss allowance for receivables included in other non-current assets was recorded in the item of “Recognition of loss allowance for receivables”. |
** | For the year ended 31 December 2021, among the government grants, there were standby compensation of Huaneng Power International, Inc. Jining Power Plant, heating subsidies, VAT refund and coal guarantee fund amounting to RMB |
F-69
Huaneng Power International, Inc.
Notes to the Financial Statements
For the years ended 31 December 2021, 2020 and 2019
(Prepared in accordance with International Financial Reporting Standards)
(Amounts expressed in thousands of RMB unless otherwise stated)
7 | Property, plant and equipment |
|
|
|
| Electric utility |
| Transport- |
|
|
| |||||||
| Dams |
| Port facilities |
| Buildings |
| plant in service |
| ation facilities |
| Others |
| CIP |
| Total | |
As at 1 January 2020 |
|
|
|
|
|
|
|
| ||||||||
Cost |
| |
| |
| |
| |
| |
| |
| |
| |
Accumulated depreciation |
| ( |
| ( |
| ( |
| ( |
| ( |
| ( |
| — |
| ( |
Accumulated impairment losses |
| ( |
| ( |
| ( |
| ( |
| ( |
| ( |
| ( |
| ( |
Net book value |
| |
| |
| |
| |
| |
| |
| |
| |
Year ended 31 December 2020 |
|
|
|
|
|
|
|
|
|
|
|
|
|
|
|
|
Beginning of the year |
| |
| |
| |
| |
| |
| |
| |
| |
Acquisition |
| — |
| — |
| |
| |
| — |
| |
| |
| |
Additions |
| — |
| — |
| |
| |
| — |
| |
| |
| |
Transfer from CIP | | | | | | | ( | — | ||||||||
Other additions |
| — |
| — |
| |
| |
| — |
| |
| — |
| |
Reclassification to investment property |
| — |
| — |
| ( |
| — |
| — |
| — |
| — |
| ( |
Disposals/write-off |
| — |
| — |
| ( |
| ( |
| ( |
| ( |
| — |
| ( |
Depreciation charge |
| ( |
| ( |
| ( |
| ( |
| ( |
| ( |
| — |
| ( |
Impairment charge |
| ( |
| — |
| ( |
| ( |
| — |
| ( |
| ( |
| ( |
Reclassification | ( | — | | | ( | ( | — | — | ||||||||
Other decrease |
| — |
| — |
| — |
| ( |
| — |
| — |
| — |
| ( |
Currency translation differences |
| — |
| — |
| — |
| ( |
| — |
| ( |
| ( |
| ( |
End of the year |
| |
| |
| |
| |
| |
| |
| |
| |
As at 1 January 2021 |
|
|
|
|
|
|
|
| ||||||||
Cost |
| |
| |
| |
| |
| |
| |
| |
| |
Accumulated depreciation |
| ( |
| ( |
| ( |
| ( |
| ( |
| ( |
| — |
| ( |
Accumulated impairment losses |
| ( |
| ( |
| ( |
| ( |
| ( |
| ( |
| ( |
| ( |
Net book value |
| |
| |
| |
| |
| |
| |
| |
| |
Year ended 31 December 2021 | ||||||||||||||||
Beginning of the year | | | | | | | | | ||||||||
Acquisition | — | — | | | — | | — | | ||||||||
Additions | — | — | | | | | | | ||||||||
Transfer from CIP | | | | | | | ( | — | ||||||||
Other additions | — | — | | | | | — | | ||||||||
Reclassification to investment property | — | — | ( | — | — | — | — | ( | ||||||||
Disposals/write-off | — | ( | ( | ( | — | ( | — | ( | ||||||||
Depreciation charge | ( | ( | ( | ( | ( | ( | — | ( | ||||||||
Impairment charge | — | — | — | ( | — | ( | — | ( | ||||||||
Reclassification | | — | | ( | | | — | — | ||||||||
Other decrease | — | — | ( | ( | — | ( | — | ( | ||||||||
Currency translation differences | — | — | — | ( | — | ( | ( | ( | ||||||||
End of the year | | | | | | | | | ||||||||
As at 31 December 2021 | ||||||||||||||||
Cost | | | | | | | | | ||||||||
Accumulated depreciation | ( | ( | ( | ( | ( | ( | — | ( | ||||||||
Accumulated impairment losses | ( | ( | ( | ( | ( | ( | — | ( | ||||||||
Net book value | | | | | | | | |
Interest capitalization
Interest expense of approximately RMB
F-70
Huaneng Power International, Inc.
Notes to the Financial Statements
For the years ended 31 December 2021, 2020 and 2019
(Prepared in accordance with International Financial Reporting Standards)
(Amounts expressed in thousands of RMB unless otherwise stated)
7 | Property, plant and equipment (continued) |
Security
As at 31 December 2021 and 2020, certain property, plant and equipment were pledged to banks as collateral for short-term (Note 29) and long-term loans (Note 23).
Buildings without ownership certificates
At 31 December 2021, the Group was in the process of applying for the ownership certificates for certain buildings (buildings for power generation were included in electric utility plant in service) with an aggregate net book value of RMB
Impairment
For the year ended 31 December 2021, the Group recognized impairment loss on property, plant and equipment amounting to RMB
8 | Investments in associates and joint ventures |
|
| 2021 |
| 2020 |
Beginning of the year |
| |
| |
Capital injections in associates and joint ventures |
| |
| |
Share of net profit less loss |
| |
| |
Share of other comprehensive loss |
| ( |
| ( |
Share of other capital reserve of equity-method investees |
| |
| |
Dividends |
| ( |
| ( |
End of the year |
| |
| |
F-71
Huaneng Power International, Inc.
Notes to the Financial Statements
For the years ended 31 December 2021, 2020 and 2019
(Prepared in accordance with International Financial Reporting Standards)
(Amounts expressed in thousands of RMB unless otherwise stated)
8 | Investments in associates and joint ventures (continued) |
As at 31 December 2021, investments in associates and joint ventures of the Group are unlisted except for Shenzhen Energy Corporation Limited (“SECL”), which is listed on the Shenzhen Stock Exchange. The following list contains only the particulars of material associates and joint ventures:
| Country of |
|
| Business nature and scope of |
| Percentage of equity interest held |
| ||||
Name |
| incorporation |
| Registered capital |
| operation |
| Direct |
| Indirect1 |
|
Associates: | |||||||||||
Huaneng Sichuan Energy Development Co., Ltd.(“Sichuan Energy Development”) |
|
| RMB |
|
| | % | — | |||
SECL* |
|
| RMB |
|
| | % | — | |||
Hebei Hanfeng Power Generation Limited Liability Company (“Hanfeng Power”) |
|
| RMB |
|
| | % | — | |||
Huaneng Finance |
|
| RMB |
|
| | % | — | |||
China Huaneng Group Fuel Co., Ltd. (“Huaneng Group Fuel Company”) ** |
|
| RMB |
|
| | % | — | |||
Hainan Nuclear Power Limited Liability Company (“Hainan Nuclear”) |
|
| RMB |
|
| | % | — | |||
Joint ventures: |
|
|
|
|
|
|
|
|
|
| |
Shanghai Time Shipping Co., Ltd. (“Shanghai Time Shipping”) |
|
| RMB |
|
| | % | — | |||
Jiangsu Nantong Power Generation Co., Ltd. (“Jiangsu Nantong Power”)1 |
|
| RMB |
|
| — |
| | % |
1 | The indirect percentage of equity interest held represents the effective ownership interest of the Group. |
* | As at 31 December 2021, the fair value of the Group’s shares in SECL was RMB |
** | In accordance with the articles of association of the investee, the Group could only exercise significant influence on the investee and therefore accounted for the investment under the equity method. |
F-72
Huaneng Power International, Inc.
Notes to the Financial Statements
For the years ended 31 December 2021, 2020 and 2019
(Prepared in accordance with International Financial Reporting Standards)
(Amounts expressed in thousands of RMB unless otherwise stated)
8 | Investments in associates and joint ventures (continued) |
All the above associates and joint ventures are accounted for under the equity method in the consolidated financial statements.
Summarized financial information of the material associates, adjusted for any differences in accounting policies and acquisition adjustments, and reconciliation to the carrying amounts in the consolidated financial statements, are disclosed below:
Huaneng Group | |||||||||||||||||||||||||
| Sichuan Energy Development | SECL | Huaneng Finance | Hanfeng Power | Fuel Company | Hainan Nuclear | |||||||||||||||||||
| 2021 |
| 2020 |
| 2021 |
| 2020 |
| 2021 |
| 2020 |
| 2021 |
| 2020 |
| 2021 |
| 2020 |
| 2021 |
| 2020 |
| |
Gross amounts of the associates’ | |||||||||||||||||||||||||
Current assets |
| |
| |
| |
| |
| |
| |
| |
| |
| |
| |
| |
| | |
Non-current assets |
| |
| |
| |
| |
| |
| |
| |
| |
| |
| |
| |
| | |
Current liabilities |
| ( |
| ( |
| ( |
| ( |
| ( |
| ( |
| ( |
| ( |
| ( |
| ( |
| ( |
| ( | |
Non-current liabilities |
| ( |
| ( |
| ( |
| ( |
| ( |
| ( |
| ( |
| ( |
| ( |
| ( |
| ( |
| ( | |
Equity |
| |
| |
| |
| |
| |
| |
| |
| |
| |
| |
| |
| | |
-Equity attributable to shareholders |
| |
| |
| |
| |
| |
| |
| |
| |
| |
| |
| |
| | |
-Non-controlling interests |
| |
| |
| |
| |
| — |
| — |
| — |
| — |
| |
| |
| — |
| — | |
Revenue |
| |
| |
| |
| |
| |
| |
| |
| |
| |
| |
| |
| | |
Gross profit/(loss) |
| |
| |
| |
| |
| |
| |
| ( |
| |
| |
| |
| |
| | |
Net profit/(loss) |
| |
| |
| |
| |
| |
| |
| ( |
| |
| |
| |
| |
| | |
Profit/(loss) from continuing operations attributable to shareholders |
| |
| |
| |
| |
| |
| |
| ( |
| |
| ( |
| |
| |
| | |
Other comprehensive loss attributable to shareholders |
| — |
| — |
| ( |
| ( |
| — |
| ( |
| — |
| — |
| ( |
| ( |
| — |
| — | |
Total comprehensive income/(loss) attributable to shareholders |
| |
| |
| |
| |
| |
| |
| ( |
| |
| ( |
| |
| |
| | |
Dividend received from the associates |
| |
| |
| |
| |
| |
| |
| — |
| — |
| |
| |
| — |
| — | |
Reconciled to the interests in the associates |
|
|
|
|
|
|
|
|
|
|
|
| |||||||||||||
Gross amounts of net assets attributable to shareholders of the associates |
| |
| |
| |
| |
| |
| |
| |
| |
| |
| |
| |
| | |
The Group’s effective interest |
| | % | | % | | % | | % | | % | | % | | % | | % | | % | | % | | % | | % |
The Group’s share of net assets attributable to shareholders of the associates |
| |
| |
| |
| |
| |
| |
| |
| |
| |
| |
| |
| | |
Impact of adjustments |
| |
| |
| |
| |
| — |
| — |
| |
| |
| |
| |
| |
| | |
Carrying amount in the consolidated financial statements |
| |
| |
| |
| |
| |
| |
| |
| |
| |
| |
| |
| |
F-73
Huaneng Power International, Inc.
Notes to the Financial Statements
For the years ended 31 December 2021, 2020 and 2019
(Prepared in accordance with International Financial Reporting Standards)
(Amounts expressed in thousands of RMB unless otherwise stated)
8 | Investments in associates and joint ventures (continued) |
Summarized financial information of material joint ventures adjusted for any differences in accounting policies and acquisition adjustment, and reconciliation to the carrying amount in the consolidated financial statements, are disclosed below:
Shanghai Time Shipping | Jiangsu Nantong Power |
| |||||||
|
| 2021 |
| 2020 |
| 2021 |
| 2020 |
|
|
| ||||||||
Gross amounts of joint ventures’ | |||||||||
Current assets |
| |
| |
| |
| | |
Non-current assets |
| |
| |
| |
| | |
Current liabilities |
| ( |
| ( |
| ( |
| ( | |
Non-current liabilities |
| ( |
| — |
| ( |
| ( | |
Equity |
| |
| |
| |
| | |
Revenue |
| |
| |
| |
| | |
Gross profit/(loss) |
| |
| |
| ( |
| | |
Net profit/(loss) |
| |
| |
| ( |
| | |
Total comprehensive income/(loss) |
| |
| |
| ( |
| | |
Dividend received in cash from the joint ventures |
| |
| — |
| |
| | |
Reconciled to the interests in the joint ventures: | |||||||||
Gross amounts of net assets |
| |
| |
| |
| | |
The Group’s effective interest rates |
| | % | | % | | % | | % |
The Group’s share of net assets |
| |
| |
| |
| | |
Impact of adjustments |
| |
| |
| — |
| — | |
Carrying amount in the consolidated financial statements |
| |
| |
| |
| |
Aggregate information of associates and joint ventures that are not individually material:
| 2021 |
| 2020 | |
Aggregate carrying amount of individually immaterial associates and joint ventures in the consolidated financial statements |
| |
| |
Aggregate amounts of the Company and its subsidiaries’ share of those associates and joint ventures |
|
| ||
Profit from continuing operations | | | ||
Total comprehensive income |
| |
| |
As at 31 December 2021, the Group’s share of losses of associates exceeded its interests in the associates and the unrecognized further losses amounted to RMB
As at 31 December 2021, there were
F-74
Huaneng Power International, Inc.
Notes to the Financial Statements
For the years ended 31 December 2021, 2020 and 2019
(Prepared in accordance with International Financial Reporting Standards)
(Amounts expressed in thousands of RMB unless otherwise stated)
9 | Investments in subsidiaries |
As at 31 December 2021, the investments in subsidiaries of the Group, all of which are unlisted, are as follows:
(i) | Subsidiaries acquired through establishment or investment |
Business nature | Percentage of equity |
| |||||||||||
Country of | Type of | Registered | and scope | interest held |
| ||||||||
Name of subsidiary |
| incorporation |
| interest held |
| capital |
| of operations |
| Interest |
| Voting |
|
Huaneng International Power Fuel Limited Liability Company | RMB | | % | | % | ||||||||
Huaneng Nantong Power Generation Limited Liability Company |
|
|
| RMB |
|
| | % | | % | |||
Huaneng Yingkou Co-generation Limited Liability Company |
|
|
| RMB |
|
| | % | | % | |||
Huaneng Hunan Xiangqi Hydropower Co., Ltd. |
|
|
| RMB |
|
| | % | | % | |||
Huaneng Zuoquan Coal-fired Power Generation Limited Liability Company |
|
|
| RMB |
|
| | % | | % | |||
Huaneng Kangbao Wind Power Utilization Limited Liability Company |
|
|
| RMB |
|
| | % | | % | |||
Huaneng Jiuquan Wind Power Generation Co., Ltd. |
|
|
| RMB |
|
| | % | | % | |||
Huaneng Rudong Wind Power Generation Co., Ltd. |
|
|
| RMB |
|
| | % | | % | |||
Huaneng Guangdong Haimen Port Limited Liability Company |
|
|
| RMB |
|
| | % | | % | |||
Huaneng Taicang Port Limited Liability Company |
|
|
| RMB |
|
| | % | | % | |||
Huaneng Taicang Power Generation Co., Ltd. |
|
|
| RMB |
|
| | % | | % | |||
Huaneng Huaiyin II Power Generation Limited Company |
|
|
| RMB |
|
| | % | | % | |||
Huaneng Xindian Power Generation Co., Ltd. |
|
|
| RMB |
|
| | % | | % | |||
Huaneng Shanghai Combined Cycle Power Limited Liability Company |
|
|
| RMB |
|
| | % | | % |
F-75
Huaneng Power International, Inc.
Notes to the Financial Statements
For the years ended 31 December 2021, 2020 and 2019
(Prepared in accordance with International Financial Reporting Standards)
(Amounts expressed in thousands of RMB unless otherwise stated)
9 | Investments in subsidiaries (continued) |
(i) | Subsidiaries acquired through establishment or investment (continued) |
Business nature | Percentage of equity |
| |||||||||||
Country of | Type of | Registered | and scope | interest held |
| ||||||||
Name of subsidiary |
| incorporation |
| interest held |
| capital |
| of operations |
| Interest |
| Voting |
|
| |||||||||||||
Huaneng Yumen Wind Power Generation Co., Ltd. | RMB | | % | | % | ||||||||
Huaneng Qingdao Co-generation Limited Company |
|
|
| RMB |
|
| | % | | % | |||
Huaneng Tongxiang Combined Cycle Co-generation Co., Ltd. |
|
|
| RMB |
|
| | % | | % | |||
Huaneng Shantou Haimen Power Generation Limited Liability Company |
|
|
| RMB |
|
| | % | | % | |||
Huaneng Chongqing Liangjiang Power Generation Limited Liability Company |
|
|
| RMB |
|
| | % | | % | |||
Huaneng Yunnan Fuyuan Wind Power Generation Co., Ltd. |
|
|
| RMB |
|
| | % | | % | |||
Huaneng Guizhou Panzhou State City Wind Power Co., Ltd. |
|
|
| RMB |
|
| | % | | % | |||
Huaneng Jiangxi Clean Energy Limited Liability Company |
|
|
| RMB |
|
| | % | | % | |||
Huaneng Hunan Subaoding Wind Power Generation Co., Ltd. |
|
|
| RMB |
|
| | % | | % | |||
Huaneng Suixian Jieshan Wind Power Generation Co., Ltd. |
|
|
| RMB |
|
| | % | | % | |||
Huaneng Taiyuan Dongshan Combined Cycle Co-generation Co., Ltd. |
|
|
| RMB |
|
| | % | | % | |||
Huaneng Xuzhou Tongshan Wind Power Generation Co., Ltd. |
|
|
| RMB |
|
| | % | | % |
F-76
Huaneng Power International, Inc.
Notes to the Financial Statements
For the years ended 31 December 2021, 2020 and 2019
(Prepared in accordance with International Financial Reporting Standards)
(Amounts expressed in thousands of RMB unless otherwise stated)
9 | Investments in subsidiaries (continued) |
(i) | Subsidiaries acquired through establishment or investment (continued) |
Business nature | Percentage of equity |
| |||||||||||
Country of | Type of | Registered | and scope | interest held |
| ||||||||
Name of subsidiary |
| incorporation |
| interest held |
| capital |
| of operations |
| Interest |
| Voting |
|
Huaneng Nanjing Co-generation Co., Ltd. | RMB | | % | | % | ||||||||
Huaneng Hunan Guidong Wind Power Generation Co., Ltd. |
|
|
| RMB |
|
| | % | | % | |||
Huaneng Nanjing Luhe Wind Power Generation Co., Ltd. |
|
|
| RMB |
|
| | % | | % | |||
Huaneng Luoyuan Power Generation Co., Ltd. |
|
|
| RMB |
|
| | % | | % | |||
Huaneng Lingang (Tianjin) Gas Co-generation Co., Ltd. |
|
|
| RMB |
|
| | % | | % | |||
Huaneng Lingang (Tianjin) Heat Co-generation Co., Ltd. |
|
|
| RMB |
|
| | % | | % | |||
Huaneng Anhui Huaining Wind Power Generation Co., Ltd. |
|
|
| RMB |
|
| | % | | % | |||
Huaneng Mianchi Co-generation Limited Liability Company |
|
|
| RMB |
|
| | % | | % | |||
Huaneng Yingkou Xianrendao Co-generation Co., Ltd. |
|
|
| RMB |
|
| | % | | % | |||
Huaneng Nanjing Xingang Comprehensive Energy Co., Ltd. |
|
|
| RMB |
|
| | % | | % | |||
Huaneng Changxing Photovoltaic Power Generation Limited Liability Company |
|
|
| RMB |
|
| | % | | % | |||
Huaneng Rudong Baxianjiao Offshore Wind Power Generation Co., Ltd. |
|
|
| RMB |
|
| | % | | % | |||
Huaneng Guilin Gas Distributed Energy Co., Ltd. |
|
|
| RMB |
|
| | % | | % | |||
Huaneng (Dalian) Co-generation Co., Ltd. |
|
|
| RMB |
|
| | % | | % |
F-77
Huaneng Power International, Inc.
Notes to the Financial Statements
For the years ended 31 December 2021, 2020 and 2019
(Prepared in accordance with International Financial Reporting Standards)
(Amounts expressed in thousands of RMB unless otherwise stated)
9 | Investments in subsidiaries (continued) |
(i) | Subsidiaries acquired through establishment or investment (continued) |
Business nature | Percentage of equity |
| |||||||||||
| Country of | Type of | Registered | and scope | interest held |
| |||||||
Name of subsidiary |
| incorporation |
| interest held |
| capital |
| of operations |
| Interest |
| Voting |
|
Huaneng Zhongxiang Wind Power Generation Co., Ltd. | RMB | | % | | % | ||||||||
Huaneng International Power Hong Kong Limited Company |
|
|
|
|
| | % | | % | ||||
Tuas Power Generation Pte. Ltd. (“TPG”) |
|
|
| S$ |
|
| | % | | % | |||
TP Utilities Pte. Ltd. |
|
|
| S$ |
|
| | % | | % | |||
TPSTMWR |
|
|
| S$ |
|
| | % | | % | |||
TP-STM Water Services Pte. Ltd. |
|
|
| S$ |
|
| | % | | % | |||
Huaneng Mianchi Clean Energy Limited Liability Company |
|
|
| RMB |
|
| | % | | % | |||
Huaneng Zhuolu Clean Energy Limited Liability Company |
|
|
| RMB |
|
| | % | | % | |||
Huaneng Tongwei Wind Power Generation Limited Liability Company |
|
|
| RMB |
|
| | % | | % | |||
Huaneng Yizheng Wind Power Generation Limited Liability Company |
|
|
| RMB |
|
| | % | | % | |||
Huaneng Yancheng Dafeng New Energy Power Generation Limited Liability Company |
|
|
| RMB |
|
| | % | | % | |||
Huaneng Shanyin Power Generation Limited Liability Company |
|
|
| RMB |
|
| | % | | % |
F-78
Huaneng Power International, Inc.
Notes to the Financial Statements
For the years ended 31 December 2021, 2020 and 2019
(Prepared in accordance with International Financial Reporting Standards)
(Amounts expressed in thousands of RMB unless otherwise stated)
9 | Investments in subsidiaries (continued) |
(i) | Subsidiaries acquired through establishment or investment (continued) |
Business nature | Percentage of equity |
| |||||||||||
Country of | Type of | Registered | and scope | interest held |
| ||||||||
Name of subsidiary |
| incorporation |
| interest held |
| capital |
| of operations |
| Interest |
| Voting |
|
Huaneng Jiangsu Comprehensive Energy Service Co., Ltd. |
|
|
| RMB |
|
| | % | | % | |||
Huaneng Liaoning Energy Sales Limited Liability Company |
|
|
| RMB |
|
| | % | | % | |||
Huaneng Guangdong Energy Sales Limited Liability Company |
|
|
| RMB |
|
| | % | | % | |||
Huaneng Suizhou Power Generation Limited Liability Company |
|
|
| RMB |
|
| | % | | % | |||
Huaneng Fuzhou Changle Photovoltaic Power Generation Limited Liability Company |
|
|
| RMB |
|
| | % | | % | |||
Huaneng Longyan Wind Power Generation Limited Liability Company |
|
|
| RMB |
|
| | % | | % | |||
Huaneng Dandong Comprehensive Energy Service Co., Ltd. |
|
|
| RMB |
|
| | % | | % | |||
Huaneng Dongguan Combined Cycle Co-generation Limited Liability Company |
|
|
| RMB |
|
| | % | | % | |||
Huaneng Chongqing Fengjie Wind Power Generation Limited Liability Company |
|
|
| RMB |
|
| | % | | % | |||
Huaneng Jingxing Photovoltaic Power Generation Limited Liability Company |
|
|
| RMB |
|
| | % | | % | |||
Huaneng Shanxi Energy Sales Limited Liability Company |
|
|
| RMB |
|
| | % | | % |
F-79
Huaneng Power International, Inc.
Notes to the Financial Statements
For the years ended 31 December 2021, 2020 and 2019
(Prepared in accordance with International Financial Reporting Standards)
(Amounts expressed in thousands of RMB unless otherwise stated)
9 | Investments in subsidiaries (continued) |
(i) | Subsidiaries acquired through establishment or investment (continued) |
Business nature | Percentage of equity |
| |||||||||||
Country of | Type of | Registered | and scope | interest held |
| ||||||||
Name of subsidiary |
| incorporation |
| interest held |
| capital |
| of operations |
| Interest |
| Voting |
|
Huaneng Chongqing Energy Sales Limited Liability Company | RMB | | % | | % | ||||||||
Huaneng Chongqing Luohuang Energy Sales Limited Liability Company |
|
|
| RMB |
|
| | % | | % | |||
Huaneng Chongqing Tongliang Energy Sales Limited Liability Company |
|
|
| RMB |
|
| | % | | % | |||
Huaneng Hunan Energy Sales Limited Liability Company |
|
|
| RMB |
|
| | % | | % | |||
Huaneng Jiangxi Energy Sales Limited Liability Company |
|
|
| RMB |
|
| | % | | % | |||
Huaneng Hebei Energy Sales Limited Liability Company |
|
|
| RMB |
|
| | % | | % | |||
Huaneng Henan Energy Sales Limited Liability Company |
|
|
| RMB |
|
| | % | | % | |||
Huaneng Handan Heating Limited Liability Company |
|
|
| RMB |
|
| | % | | % | |||
Huaneng (Huzhou Development Zone) Photovoltaic Power Generation Limited Liability Company |
|
|
| RMB |
|
| | % | | % | |||
Huaneng Fujian Energy Sales Limited Liability Company |
|
|
| RMB |
|
| | % | | % | |||
Huaneng Hubei Energy Sales Limited Liability Company |
|
|
| RMB |
|
| | % | | % | |||
Huaneng (Sanming) Clean Energy Limited Liability Company |
|
|
| RMB |
|
| | % | | % | |||
Huaneng Yueyang Xingang Photovoltaic Power Generation Limited Liability Company |
|
|
| RMB |
|
| | % | | % | |||
Huaneng Shanghai Energy Sales Limited Liability Company |
|
|
| RMB |
|
| | % | | % | |||
Huaneng Anhui Energy Sales Limited Liability Company |
|
|
| RMB |
|
| | % | | % |
F-80
Huaneng Power International, Inc.
Notes to the Financial Statements
For the years ended 31 December 2021, 2020 and 2019
(Prepared in accordance with International Financial Reporting Standards)
(Amounts expressed in thousands of RMB unless otherwise stated)
9 | Investments in subsidiaries (continued) |
(i) | Subsidiaries acquired through establishment or investment (continued) |
Business nature | Percentage of equity |
| |||||||||||
Country of | Type of | Registered | and scope | interest held |
| ||||||||
Name of subsidiary |
| incorporation |
| interest held |
| capital |
| of operations |
| Interest |
| Voting |
|
Huaneng (Shanghai) Power Maintenance Limited Liability Company | RMB | | % | | % | ||||||||
Huaneng Guanyun Clean Energy Power Limited Liability Company |
|
|
| RMB |
|
| | % | | % | |||
Huaneng Jianchang Photovoltaic Power Generation Limited Liability Company |
|
|
| RMB |
|
| | % | | % | |||
Huaneng Chaoyang Photovoltaic Power Generation Limited Liability Company |
|
|
| RMB |
|
| | % | | % | |||
Huaneng (Fujian) Port Limited Company |
|
|
| RMB |
|
| | % | | % | |||
Huaneng Shijiazhuang Energy Limited Liability Company |
|
|
| RMB |
|
| | % | | % | |||
Huaneng Jiangyin Combined Cycle Co-generation Limited Liability Company | RMB |
| | % | | % | |||||||
Huaneng Anyang Energy Limited Liability Company | RMB |
| | % | | % | |||||||
Huaneng Shanxi Comprehensive Energy Limited Liability Company | RMB |
| | % | | % | |||||||
Zhaodong Huaneng Dechang Solar Power Generation Limited Company | RMB |
| | % | | % |
F-81
Huaneng Power International, Inc.
Notes to the Financial Statements
For the years ended 31 December 2021, 2020 and 2019
(Prepared in accordance with International Financial Reporting Standards)
(Amounts expressed in thousands of RMB unless otherwise stated)
9 | Investments in subsidiaries (continued) |
(i) | Subsidiaries acquired through establishment or investment (continued) |
Business nature | Percentage of equity |
| |||||||||||
Country of | Type of | Registered | and scope | interest held |
| ||||||||
Name of subsidiary |
| incorporation |
| interest held |
| capital |
| of operations |
| Interest |
| Voting |
|
Huaneng Mingguang Wind Power Generation Limited Liability Company | RMB |
| | % | | % | |||||||
Huaneng Guangxi Energy Sales Limited Liability Company | RMB |
| | % | | % | |||||||
Huaneng Hunan Lianping Wind Power Generation Limited Liability Company | RMB |
| | % | | % | |||||||
Huaneng Abagaqi Clean Energy Limited Liability Company | RMB |
| | % | | % | |||||||
Huaneng Jiashan Photovoltaic Power Generation Limited Liability Company | RMB |
| | % | | % | |||||||
Huaneng Zhejiang Energy Sales Limited Liability Company | RMB |
| | % | | % | |||||||
Huaneng Guangdong Shantou Power Generation Limited Liability Company | RMB |
| | % | | % | |||||||
Huaneng Shantou Photovoltaic Power Generation Limited Liability Company | RMB |
| | % | | % | |||||||
Huaneng Guigang Clean Energy Limited Liability Company | RMB |
| | % | | % | |||||||
Huaneng Changxing Jiapu Photovoltaic Power Generation Limited Liability Company | RMB |
| | % | | % | |||||||
Huaneng Hainan Energy Sales Limited Liability Company (i) | RMB |
| | % | | % |
F-82
Huaneng Power International, Inc.
Notes to the Financial Statements
For the years ended 31 December 2021, 2020 and 2019
(Prepared in accordance with International Financial Reporting Standards)
(Amounts expressed in thousands of RMB unless otherwise stated)
9 | Investments in subsidiaries (continued) |
(i) | Subsidiaries acquired through establishment or investment (continued) |
Business nature | Percentage of equity |
| |||||||||||
Country of | Type of | Registered | and scope | interest held |
| ||||||||
Name of subsidiary |
| incorporation |
| interest held |
| capital |
| of operations |
| Interest |
| Voting |
|
Huaneng Yangpu Co-generation Limited Company (i) | RMB | | % | | % | ||||||||
Huaneng Zhejiang Pinghu Offshore Wind Power Generation Co., Ltd. |
|
|
| RMB |
|
| | % | | % | |||
Huaneng Liaoning Clean Energy Limited Liability Company | RMB |
| | % | | % | |||||||
Jiangsu Huaneng Zhongyang New Energy Power Generation Co., Ltd. | RMB |
| | % | | % | |||||||
Huaneng Henan Puyang Clean Energy Limited Liability Company | RMB |
| | % | | % | |||||||
Huaneng Guizhou Energy Sales Co., Ltd. | RMB |
| | % | | % | |||||||
Huaneng Guangdong Shantou Offshore Wind Power Generation Co., Ltd. | RMB |
| | % | | % | |||||||
Jiyuan Huaneng Energy Sales Co., Ltd. (“Jiyuan Energy Sales”)(xi) | RMB |
| | % | | % | |||||||
Huaneng Yushe Poverty Relief Energy Co., Ltd. | RMB |
| | % | | % | |||||||
Huaneng Anhui Mengcheng Wind Power Co., Ltd. | RMB |
| | % | | % | |||||||
Huaneng Anshun Comprehensive Energy Co., Ltd. | RMB |
| | % | | % | |||||||
Huaneng Shengdong Rudong Offshore Wind Power Co., Ltd. | RMB |
| | % | | % |
F-83
Huaneng Power International, Inc.
Notes to the Financial Statements
For the years ended 31 December 2021, 2020 and 2019
(Prepared in accordance with International Financial Reporting Standards)
(Amounts expressed in thousands of RMB unless otherwise stated)
9 | Investments in subsidiaries (continued) |
Business nature | Percentage of equity |
| |||||||||||
Country of | Type of | Registered | and scope | interest held |
| ||||||||
Name of subsidiary |
| incorporation |
| interest held |
| capital |
| of operations |
| Interest |
| Voting |
|
Huaneng Zhejiang Cangnan Offshore Wind Power Co., Ltd. | RMB | | % | | % | ||||||||
Huaneng Zhejiang Ruian Offshore Wind Power Co., Ltd. | RMB |
| | % | | % | |||||||
Huaneng (Shanghai) Photovoltaic Power Co., Ltd. | RMB |
| | % | | % | |||||||
Sinosing Services PTE.Ltd. | USD |
| | % | | % | |||||||
Huaneng Yangqu Wind Power Co., Ltd. | RMB |
| | % | | % | |||||||
Huaneng Ruicheng Comprehensive Energy Co., Ltd. | RMB |
| | % | | % | |||||||
Huaneng Xiayi Wind Power Co., Ltd. | RMB |
| | % | | % | |||||||
Huaneng (Anhui Shitai) Wind Power Co., Ltd. | RMB |
| | % | | % | |||||||
Huaneng (Tianjin) Energy Sales Co., Ltd. | RMB |
| | % | | % | |||||||
Huaneng Qingneng Tongyu Power Co., Ltd. | RMB |
| | % | | % |
F-84
Huaneng Power International, Inc.
Notes to the Financial Statements
For the years ended 31 December 2021, 2020 and 2019
(Prepared in accordance with International Financial Reporting Standards)
(Amounts expressed in thousands of RMB unless otherwise stated)
9 | Investments in subsidiaries (continued) |
(i) | Subsidiaries acquired through establishment or investment (continued) |
Business nature | Percentage of equity |
| |||||||||||
Country of | Type of | Registered | and scope | interest held |
| ||||||||
Name of subsidiary |
| incorporation |
| interest held |
| capital |
| of operations |
| Interest |
| Voting |
|
Huaneng Guanling New Energy Power Generation Co., Ltd. | RMB | | % | | % | ||||||||
Huaneng Luobei Wind Power Co., Ltd. | RMB |
| | % | | % | |||||||
Huaneng Sihong New Energy Co., Ltd. | RMB |
| | % | | % | |||||||
Huaneng Taiqian Wind Power Co., Ltd. | RMB |
| | % | | % | |||||||
Huaneng Zhenping Clean Energy Co., Ltd. | RMB |
| | % | | % | |||||||
Huaneng (Heze Dongming) New Energy Co., Ltd. | RMB |
| | % | | % | |||||||
Huaneng Jiangkou Wind Power Co., Ltd. | RMB |
| | % | | % | |||||||
Chongqing Huaqing Energy Co., Ltd. (i) | RMB | | % | | % | ||||||||
Shengdong Rudong Offshore Wind Power Co., Ltd. (i) | RMB | | % | | % | ||||||||
Huaneng Zhanhua Photovoltaic Power Generation Limited Company (i) | RMB | | % | | % | ||||||||
Huaneng Dezhou New Energy Limited Company (i) | RMB | | % | | % | ||||||||
Huaneng Jiyang Biomass Thermal Power Co., Ltd. (i) | RMB | | % | | % | ||||||||
Huaneng (Liaocheng Gaotang) New Energy Co., Ltd. (i) | RMB | | % | | % | ||||||||
Huaneng Yantai New Energy Co., Ltd. (i) | RMB | | % | | % | ||||||||
Huaneng Shanghai Shidongkou Power Generation Limited Liability Company (“Shidongkou Power”) (ii) | RMB | | % | | % | ||||||||
Huaneng Nanjing Combined Cycle Co-generation Co., Ltd. (“Nanjing Combined Cycle Co-generation”) (iii) | RMB | | % | | % | ||||||||
Huaneng Weishan New Energy Limited Company (“Weishan New Energy”) (iv) | RMB | | % | | % | ||||||||
Huaneng Ruyi (Helan) New Energy Limited Company (“Helan New Energy”) (iv) | RMB | | % | | % | ||||||||
Huaneng Wulian New Energy Limited Company (“Wulian New Energy”)(iv) | RMB | | % | | % | ||||||||
Huaneng Zhenlai Photovoltaic Power Generation Co., Ltd. (“Zhenlai Photovoltaic Power”) (v) | RMB | | % | | % | ||||||||
Huaneng Ruzhou Clean Energy Limited Liability Company | RMB | | % | | % | ||||||||
Huaneng Sheyang New Energy Power Generation Co., Ltd. (“Sheyang New Energy”) (xii) | RMB | | % | | % | ||||||||
Huaneng (Jinxiang) New Energy Co., Ltd. (i) | RMB | | % | | % | ||||||||
Huaneng Zuoquan Yangjiao Wind Power Co., Ltd. | RMB | | % | | % |
F-85
Huaneng Power International, Inc.
Notes to the Financial Statements
For the years ended 31 December 2021, 2020 and 2019
(Prepared in accordance with International Financial Reporting Standards)
(Amounts expressed in thousands of RMB unless otherwise stated)
9 | Investments in subsidiaries (continued) |
(i) Subsidiaries acquired through establishment or investment (continued)
Percentage of equity |
| ||||||||||||
Country of | Type of | Registered | Business nature and | interest held |
| ||||||||
Name of subsidiary |
| incorporation |
| interest held |
| capital |
| scope of operations |
| Interest | Voting |
| |
Huaneng (Zhuanghe) Wind Power Co., Ltd. |
|
|
| RMB |
|
| | % | | % | |||
Huaneng (Zhuanghe) Clean Energy Co., Ltd. |
|
|
| RMB |
|
| | % | | % | |||
Huaneng Zaoyang New Energy Co., Ltd. |
|
|
| RMB |
|
| | % | | % | |||
Huaneng Zhenning New Energy Power Generation Co., Ltd. |
|
|
| RMB |
|
| | % | | % | |||
Huaneng Luodian New Energy Power Generation Co., Ltd. |
|
|
| RMB |
|
| | % | | % | |||
Huaneng Wangmo New Energy Power Generation Co., Ltd. |
|
|
| RMB |
|
| | % | | % | |||
Guizhou Huajin Clean Energy Co., Ltd. |
|
|
| RMB |
|
| | % | | % | |||
Huaneng Daqing Clean Energy Co., Ltd. |
|
|
| RMB |
|
| | % | | % | |||
Huaneng Zhaodong Biomass Power Generation Co., Ltd. |
|
|
| RMB |
|
| | % | | % |
Huaneng Siping Wind Power Co., Ltd. |
|
| RMB |
|
| | % | | % | ||||
Huaneng Tongyu Tuanjie Wind Power Co., Ltd. |
|
|
| RMB |
|
| | % | | % | |||
Huaneng Henan Clean Energy Co., Ltd. |
|
|
| RMB |
|
| | % | | % | |||
Huaneng Yingcheng New Energy Co., Ltd. |
|
|
| RMB |
|
| | % | | % | |||
Huaneng (Fujian) Energy Development Co., Ltd. |
|
|
| RMB |
|
| | % | | % | |||
Huaneng Power International Jiangsu Energy Development Co., Ltd. ("Jiangsu Energy Development") |
|
|
| RMB |
|
| | % | | % | |||
Huaneng (Guangdong) Energy Development Co., Ltd. |
|
|
| RMB |
|
| | % | | % | |||
Huaneng (Zhejiang) Energy Development Co., Ltd. |
|
|
| RMB |
|
| | % | | % | |||
Huaneng Nantong Combined Cycle Power Limited Company |
|
|
| RMB |
|
| | % | | % |
F-86
Huaneng Power International, Inc.
Notes to the Financial Statements
For the years ended 31 December 2021, 2020 and 2019
(Prepared in accordance with International Financial Reporting Standards)
(Amounts expressed in thousands of RMB unless otherwise stated)
9 | Investments in subsidiaries (continued) |
(i) Subsidiaries acquired through establishment or investment (continued)
|
|
|
| Business nature |
|
| |||||||
Country of | Type of | Registered | and scope | Percentage of equity |
| ||||||||
Name of subsidiary |
| incorporation |
| interest held |
| capital |
| of operations |
| interest held |
| ||
Interest | Voting |
| |||||||||||
Huaneng Smart Energy (Jiaxiang) Co., Ltd. (i) |
|
|
| RMB |
|
| | % | | % | |||
Huaneng Yantai Bajiao Thermal Power Co., Ltd.* (i) |
|
|
| RMB |
|
| | % | | % | |||
Huaneng (Dashiqiao) Power New Energy Co., Ltd.* |
|
|
| RMB |
|
| | % | | % | |||
Huaneng (Haiyang) Guangfu New Energy Co., Ltd.* (i) |
|
|
| RMB |
|
| | % | | % | |||
Huaneng (Laizhou) New Energy Technology Co., Ltd.* (i) |
|
|
| RMB |
|
| % | | % | ||||
Huaneng (Liaocheng Guanxian) New Energy Development Limited Company* (i) |
|
|
| RMB |
|
| | % | | % | |||
Huaneng (Shantou Jinping) New Energy Co., Ltd.* |
|
|
| RMB |
|
| | % | | % | |||
Huaneng (Weifang Binhai District) New Energy Limited Company* (i) |
|
|
| RMB |
|
| | % | | % | |||
Huaneng (Yingkou) Electric Power New Energy Development Co., Ltd.* |
|
|
| RMB |
|
| | % | | % |
F-87
Huaneng Power International, Inc.
Notes to the Financial Statements
For the years ended 31 December 2021, 2020 and 2019
(Prepared in accordance with International Financial Reporting Standards)
(Amounts expressed in thousands of RMB unless otherwise stated)
9 | Investments in subsidiaries (continued) |
(i) Subsidiaries acquired through establishment or investment (continued)
Business nature | |||||||||||||
Country of | Type of | Registered | and scope | Percentage of equity |
| ||||||||
Name of subsidiary |
| incorporation |
| interest held |
| capital |
| of operations |
| interest held |
| ||
Interest | Voting |
| |||||||||||
Huaneng (Zhejiang Daishan) Offshore Wind Power Co., Ltd.* (“Daishan Wind Power”) (xiii) |
|
|
| RMB |
|
| | % | | % | |||
Huaneng Beibu Gulf (Guangxi) New Energy Development Co., Ltd.* |
|
|
| RMB |
|
| | % | | % | |||
Huaneng Cixian Comprehensive Energy Co., Ltd.* |
|
|
| RMB |
|
| | % | | % | |||
Huaneng Daan Clean Energy Power Co., Ltd.* (i) |
|
|
| RMB |
|
| | % | | % | |||
Huaneng Daqing Ranghulu District Clean Energy Co., Ltd.* |
|
|
| RMB |
|
| | % | | % | |||
Huaneng Guangxi Clean Energy Co., Ltd.* |
|
|
| RMB |
|
| | % | | % | |||
Huaneng Hebei Clean Energy Co., Ltd.* |
|
|
| RMB |
|
| | % | | % | |||
Huaneng Hubei New Energy Co., Ltd.* |
|
|
| RMB |
|
| | % | | % | |||
Huaneng Hualiangting (Tongling) Clean Energy Co., Ltd.* |
|
|
| RMB |
|
| | % | | % | |||
Huaneng Lindian Clean Energy Co., Ltd.* | RMB | | % | | % | ||||||||
Huaneng Linxiang New Energy Co., Ltd.* | RMB | | % | | % | ||||||||
Huaneng Pingshan Clean Energy Co., Ltd.* | RMB | | % | % | |||||||||
Huaneng Puyang Longyuan Clean Energy Co., Ltd.* | RMB | | % | % |
F-88
Huaneng Power International, Inc.
Notes to the Financial Statements
For the years ended 31 December 2021, 2020 and 2019
(Prepared in accordance with International Financial Reporting Standards)
(Amounts expressed in thousands of RMB unless otherwise stated)
9 | Investments in subsidiaries (continued) |
(i) Subsidiaries acquired through establishment or investment (continued)
Business nature | |||||||||||||
Country of | Type of | Registered | and scope | Percentage of equity |
| ||||||||
Name of subsidiary |
| incorporation |
| interest held |
| capital |
| of operations |
| interest held |
| ||
Interest | Voting |
| |||||||||||
Huaneng Clean Energy (Qujing Fuyuan) Co., Ltd.* |
|
|
| RMB |
|
| | % | | % | |||
Huaneng Clean Energy (Qujing Zhanyi) Co., Ltd.* |
|
|
| RMB |
|
| | % | | % | |||
Huaneng Tangshan Caofeidian District Clean Energy Co., Ltd.* |
|
|
| RMB |
|
| | % | | % | |||
Huaneng Xingtai Comprehensive Energy Co., Ltd.* |
|
|
| RMB |
|
| | % | | % | |||
Huaneng Chongqing Wushan Wind Power Co., Ltd.* |
|
|
| RMB |
|
| | % | | % | |||
Shangyi Guolang New Energy Co., Ltd.* |
|
|
| RMB |
|
| | % | | % | |||
Zhangjiakou Guolang New Energy Co., Ltd.* |
|
|
| RMB |
|
| | % | | % | |||
Shijiazhuang Yujun New Energy Technology Co., Ltd.* (“Yujun New Energy”) (xv) |
|
|
| RMB |
|
| | % | | % | |||
Xinhe Hanhao New Energy Technology Co., Ltd.* (“Hanhao New Energy”) (xv) |
|
|
| RMB |
|
| | % | | % |
Business nature | |||||||||||||
Country of | Type of | Registered | and scope | Percentage of equity |
| ||||||||
Name of subsidiary |
| incorporation |
| interest held |
| capital |
| of operations |
| interest held |
| ||
Interest | Voting |
| |||||||||||
Huaneng (Chaozhou Chaoan) New Energy Co., Ltd.* |
|
|
| RMB |
|
| | % | | % | |||
Huaneng (Pucheng) Clean Energy Co., Ltd.* |
|
|
| RMB |
|
| | % | | % | |||
Huaneng Shanxi Energy Service Co., Ltd.* |
|
|
| RMB |
|
| | % | | % | |||
Hengshui Huaqing New Energy Technology Co., Ltd.* (“Huaqing New Energy”) (xvi) |
|
|
| RMB |
|
| | % | | % | |||
Shenzhen Shunyi New Energy Technology Co., Ltd.* (“Shunyi New Energy”) (xvi) |
|
|
| RMB |
|
| | % | | % |
* These companies were newly established in 2021.
F-89
Huaneng Power International, Inc.
Notes to the Financial Statements
For the years ended 31 December 2021, 2020 and 2019
(Prepared in accordance with International Financial Reporting Standards)
(Amounts expressed in thousands of RMB unless otherwise stated)
9 | Investments in subsidiaries (continued) |
(ii) Subsidiaries acquired from business combinations under common control
Business nature | Percentage of equity |
| |||||||||||
Country of | Type of | Registered | and scope | interest held |
| ||||||||
Name of subsidiary |
| incorporation |
| interest held |
| capital |
| of operations |
| Interest |
| Voting |
|
Huaneng (Suzhou Industrial Park) Power Generation Co., Ltd. | RMB | | % | | % | ||||||||
Huaneng Qinbei Power Generation Co., Ltd. (“Qinbei Power”) | RMB |
| | % | | % | |||||||
Huaneng Yushe Power Generation Co., Ltd. | RMB |
| | % | | % | |||||||
Huaneng Hunan Yueyang Power Generation Limited Liability Company | RMB |
| | % | | % | |||||||
Huaneng Chongqing Luohuang Power Generation Limited Liability Company (“Luohuang Power”) | RMB |
| | % | | % | |||||||
Huaneng Pingliang Power Generation Co., Ltd. | RMB |
| | % | | % | |||||||
Huaneng Nanjing Jinling Power Generation Co., Ltd. | RMB |
| | % | | % | |||||||
Huaneng Qidong Wind Power Generation Co., Ltd. | RMB |
| | % | | % | |||||||
Tianjin Huaneng Yangliuqing Co-generation Limited Liability Company (“Yangliuqing Co-generation”) | RMB |
| | % | | % | |||||||
Huaneng Wuhan Power Generation Co., Ltd. (“Wuhan Power”) | RMB |
| | % | | % | |||||||
Huaneng Anyuan Power Generation Co., Ltd. | RMB |
| | % | | % | |||||||
Huaneng Hualiangting Hydropower Co., Ltd. | RMB |
| | % | | % |
F-90
Huaneng Power International, Inc.
Notes to the Financial Statements
For the years ended 31 December 2021, 2020 and 2019
(Prepared in accordance with International Financial Reporting Standards)
(Amounts expressed in thousands of RMB unless otherwise stated)
9 | Investments in subsidiaries (continued) |
(ii) Subsidiaries acquired from business combinations under common control (continued)
Business nature | Percentage of equity |
| |||||||||||
Country of | Type of | Registered | and scope | interest held |
| ||||||||
Name of subsidiary |
| incorporation |
| interest held |
| capital |
| of operations |
| Interest |
| Voting |
|
Huaneng Jingmen Thermal Power Co., Ltd. | RMB | | % | | % | ||||||||
Enshi Qingjiang Dalongtan Hydropwer Development Co., Ltd. | RMB |
| | % | | % | |||||||
Huaneng Hainan Power Generation Limited Company | RMB |
| | % | | % | |||||||
Huaneng Yingcheng Thermal Power Co., Ltd. | RMB |
| | % | | % | |||||||
Huaneng Heilongjiang Power Generation Limited Company | RMB |
| | % | | % | |||||||
Huaneng Hegang Power Generation Limited Company | RMB |
| | % | | % | |||||||
Huaneng Xinhua Power Generation Limited Liability Company | RMB |
| | % | | % | |||||||
Huaneng Tongjiang Wind Power Generation Limited Company | RMB |
| | % | | % |
F-91
Huaneng Power International, Inc.
Notes to the Financial Statements
For the years ended 31 December 2021, 2020 and 2019
(Prepared in accordance with International Financial Reporting Standards)
(Amounts expressed in thousands of RMB unless otherwise stated)
9 | Investments in subsidiaries (continued) |
(ii) Subsidiaries acquired from business combinations under common control (continued)
Business nature | Percentage of equity |
| |||||||||||
Country of | Type of | Registered | and scope | interest held |
| ||||||||
Name of subsidiary |
| incorporation |
| interest held |
| capital |
| of operations |
| Interest |
| Voting |
|
Huaneng Daqing Thermal Power Limited Company | RMB | % | % | ||||||||||
Daqing Lvyuan Wind Power Generation Limited Company | RMB | % | % | ||||||||||
Huaneng Yichun Thermal Power Limited Company (“Yichun Thermal Power”) | RMB | % | % | ||||||||||
Huaneng Heilongjiang Energy Sales Limited Company | RMB | | % | | % | ||||||||
Zhaodong Huaneng Thermal Power Limited Company | RMB |
| | % | | % | |||||||
Huaneng Jilin Power Generation Limited Company (“Jilin Power”) | RMB |
| | % | | % | |||||||
Huaneng Linjiang Jubao Hydropower Limited Company | RMB |
| | % | | % | |||||||
Huaneng Jilin Energy Sales Limited Company | RMB |
| | % | | % | |||||||
Huaneng Shandong Power Generation Co., Ltd. (“Shandong Power”) | RMB |
| | % | | % | |||||||
Huaneng Henan Zhongyuan Gas Power Generation Co., Ltd. | RMB |
| | % | | % | |||||||
Huaneng Zibo Boshan Photovoltaic Power Limited Company (i) | RMB |
| | % | | % | |||||||
Huaneng Jining New Energy Limited Company (i) | RMB |
| | % | | % | |||||||
Huaneng Rizhao Thermal Power Limited Company (i) | RMB |
| | % | | % | |||||||
Huaneng Laiwu New Energy Limited Company (i) | RMB | % | % | ||||||||||
Huaneng Shandong Sishui New Energy Limited Company (i) |
|
|
| RMB |
|
| | % | | % |
F-92
Huaneng Power International, Inc.
Notes to the Financial Statements
For the years ended 31 December 2021, 2020 and 2019
(Prepared in accordance with International Financial Reporting Standards)
(Amounts expressed in thousands of RMB unless otherwise stated)
9 | Investments in subsidiaries (continued) |
(ii) Subsidsiaries acquired from business combinations under common control (continued)
Business nature | Percentage of equity |
| |||||||||||
Country of | Type of | Registered | and scope | interest held |
| ||||||||
Name of subsidiary |
| incorporation |
| interest held |
| capital |
| of operations |
| Interest |
| Voting |
|
Huaneng Shandong Electric and Thermal Power Marketing Limited Company (i) | RMB | | % | | % | ||||||||
Huaneng Shandong Information Technology Limited Company (i) | RMB | | % | | % | ||||||||
Huaneng Zhanhua New Energy Limited Company (i) | RMB | | % | | % | ||||||||
Huaneng Weihai Port Photovoltaic Power Generation Limited Company (i) | RMB | | % | | % | ||||||||
Huaneng Jinan Huangtai Power Limited Company (“Huangtai Power”) (i) | RMB | | % | | % | ||||||||
Huaneng Dezhou Thermal Power Limited Company (i) | RMB | | % | | % | ||||||||
Huaneng Dongying New Energy Limited Company (i) | RMB | | % | | % | ||||||||
Huaneng Shandong (Hong Kong) Investment Limited Company (“Hong Kong Investment”) (i) | | % | | % | |||||||||
Shandong Silk Road International Power Limited Company (i) | RMB | | % | | % | ||||||||
Huaneng Jining Yunhe Power Generation Co., Ltd. (“Yunhe Power”) (i) | RMB | | % | | % | ||||||||
Huaneng Linyi Power Generation Limited Company (“Linyi Power”) (i) | RMB | | % | | % | ||||||||
Liaocheng Changrun National Electric Heating Limited Company (i) |
|
|
| RMB |
|
| | % | | % | |||
Linyi Lantian Thermal Power Limited Company (i) |
|
|
| RMB |
|
| | % | | % | |||
Yantai 500 Heating Limited Company (i) | RMB | % | % | ||||||||||
Huaneng Shandong Taifeng Renewable Energy Co., Ltd. (i) | RMB | % | % | ||||||||||
Huaneng Laiwu Power Generation Limited Company (i) | RMB | % | % | ||||||||||
Huaneng Shandong Ruyi Coal Power Limited Company (“Ruyi Coal Power”) (iv) | RMB | % | % | ||||||||||
Huaneng Rongcheng New Energy Co., Ltd. (i)3 | RMB | % | % | ||||||||||
Huaneng Liaocheng Co-generation Limited Company (“Liaocheng Co-generation”) (i) | RMB | % | % | ||||||||||
Huaneng Jiaxiang Power Generation Limited Company (“Jiaxiang Power”) (iv) |
|
|
| RMB |
|
| | % | | % |
F-93
Huaneng Power International, Inc.
Notes to the Financial Statements
For the years ended 31 December 2021, 2020 and 2019
(Prepared in accordance with International Financial Reporting Standards)
(Amounts expressed in thousands of RMB unless otherwise stated)
9 | Investments in subsidiaries (continued) |
(ii) Subsidiaries acquired from business combinations under common control (continued)
Business nature | Percentage of equity |
| |||||||||||
Country of | Type of | Registered | and scope | interest held |
| ||||||||
Name of subsidiary |
| incorporation |
| interest held |
| capital |
| of operations |
| Interest |
| Voting |
|
Huaneng Qufu Co-generation Limited Company (“Qufu Co-generation”) (iv) | RMB | | % | % | |||||||||
Huaneng Jining Hi-Tech Zone Co-generation Limited Company (“Jining Co-generation”) (iv) | RMB | | % | % | |||||||||
Huaneng Shandong Electric Power Fuel Limited Company (“Shandong Fuel Company”) (iv) | RMB | | % | % | |||||||||
Huaneng Shandong Power Generation Maintenance Technology Limited Company (“Shandong Maintenance Company”) (iv) | RMB |
| | % | | % | |||||||
Shandong Rizhao Power Generation Limited Company (“Rizhao Power”) (iv) | RMB |
| | % | | % | |||||||
Huaneng Beijing Co-generation Limited Liability Company (“Beijing Co-generation”) (vi) | RMB |
| | % | | % | |||||||
Huaneng Chaohu Power Generation Co., Ltd. (“Chaohu Power”) (vii) | RMB |
| | % | | % | |||||||
Huaneng Suzhou Thermal Power Co., Ltd. (“Suzhou Thermal Power”) (viii) | RMB |
| | % | | % | |||||||
Huaneng Qinmei Ruijin Power Generation Co., Ltd. (“Qinmei Ruijin Power Generation”) (x) | RMB | | % | | % | ||||||||
Tianjin Longye New Energy Co., Ltd. | RMB | | % | | % |
The subsidiaries above and the Group are all controlled by Huaneng Group before and after the acquisitions.
F-94
Huaneng Power International, Inc.
Notes to the Financial Statements
For the years ended 31 December 2021, 2020 and 2019
(Prepared in accordance with International Financial Reporting Standards)
(Amounts expressed in thousands of RMB unless otherwise stated)
9 | Investments in subsidiaries (continued) |
(iii) Subsidiaries acquired from business combinations not under common control
| |||||||||||||
Business nature | Percentage of equity |
| |||||||||||
| Country of |
| Type of |
| Registered |
| and scope |
| interest held |
| |||
Name of subsidiary |
| incorporation |
| interest held |
| capital |
| of operations |
| Interest |
| Voting | |
Huaneng Weihai Power Generation Limited Liability Company (“Weihai Power”) | RMB | | % | | % | ||||||||
Huaneng Huaiyin Power Generation Co., Ltd. | RMB |
| | % | | % | |||||||
Huade County Daditaihong Wind Power Utilization Limited Liability Company | RMB |
| | % | | % | |||||||
Huaneng Zhanhua Co-generation Limited Company | RMB |
| | % | | % | |||||||
Shandong Hualu Sea Transportation Limited Company | RMB |
| | % | | % | |||||||
Huaneng Qingdao Port Limited Company | RMB |
| | % | | % | |||||||
Huaneng Yunnan Diandong Energy Limited Liability Company | RMB |
| | % | | % | |||||||
Yunnan Diandong Yuwang Energy Limited Company | RMB |
| | % | | % | |||||||
Huaneng Luoyang Co-generation Limited Liability Company | RMB |
| | % | | % |
F-95
Huaneng Power International, Inc.
Notes to the Financial Statements
For the years ended 31 December 2021, 2020 and 2019
(Prepared in accordance with International Financial Reporting Standards)
(Amounts expressed in thousands of RMB unless otherwise stated)
9Investments in subsidiaries (continued)
(iii) Subsidiaries acquired from business combinations not under common control (continued)
Business nature | Percentage of equity | ||||||||||||
Country of | Type of | Registered | and scope | interest held | |||||||||
Name of subsidiary |
| incorporation |
| interest held |
| capital |
| of operations |
| Interest |
| Voting |
|
Huaneng Zhumadian Wind Power Generation Co., Ltd. | RMB |
| | % | | % | |||||||
SinoSing Power | US$ | % | % | ||||||||||
Tuas Power | S$ | % | % | ||||||||||
Tuas Power Supply Pte. Ltd. | S$ | % | % | ||||||||||
TP Asset Management Pte. Ltd. | S$ | % | % | ||||||||||
TPGS Green Energy Pte. Ltd. | S$ | % | % | ||||||||||
Ruzhou Wind Power Generation Co., Ltd. | RMB | % | % | ||||||||||
Hong Kong Energy (iv) | US$ | % | % | ||||||||||
Huatai Power (iv) | PKR | % | % | ||||||||||
Ruyi Pakistan Energy (iv) | US$ | % | % | ||||||||||
Shanxi Xiaoyi Economic Development Zone Huaneng Energy Service Co., Ltd. (“Shanxi Xiaoyi Energy”) (ix) | RMB | % | % | ||||||||||
Huaneng Shandong Power Design Co., Ltd.** (“Shandong Power Design”) (iv) | RMB | % | % | ||||||||||
Chongqing Tuobo Water Affairs Co., Ltd.** (i) | RMB | % | % |
** These companies were newly acquired in 2021. The consideration of acquisition of these companies was zero, these business combinations were immaterial, both individually and in the aggregate, therefore, no further information was disclosed.
F-96
Huaneng Power International, Inc.
Notes to the Financial Statements
For the years ended 31 December 2021, 2020 and 2019
(Prepared in accordance with International Financial Reporting Standards)
(Amounts expressed in thousands of RMB unless otherwise stated)
9 | Investments in subsidiaries (continued) |
(iv) Subsidiaries acquired from asset acquisitions
Percentage of equity |
| ||||||||||||
| Country of |
| Business nature |
| interest held |
| |||||||
Name of subsidiary |
| incorporation |
| Type of interest held |
| Registered capital |
| and scope of operations |
| Interest |
| Voting | |
Shangrao Hongyuan Power Co., Ltd | RMB | | % | | % | ||||||||
Poyang Luohong Power Co., Ltd. |
|
|
| RMB |
|
| | % | | % | |||
Shuozhou Taizhong Wind Power Limited Company |
|
|
| RMB |
|
| | % | | % | |||
Wuzhai Taizhong New Energy Wind Power Limited Company |
|
|
| RMB |
|
| | % | | % |
Xian Xvheng New Energy Limited Company |
|
|
| RMB |
|
| | % | | % | |||
Licheng Yingheng Clean Energy Limited Company | RMB |
| | % | | % | |||||||
Ruicheng Yaosheng Power Development Co., Ltd. | RMB |
| | % | | % | |||||||
Ruicheng Ningsheng New Energy Co., Ltd. | RMB |
| | % | | % | |||||||
Fanshi Nengyu Wind Power Co., Ltd. | RMB |
| | % | | % | |||||||
Dalian Chuanbo Haizhuang New Energy Co., Ltd. (i) | RMB |
| | % | | % | |||||||
Henan Juhe New Energy Technology Co., Ltd. | RMB |
| | % | | % | |||||||
Xincai Juhe Wind Power Co., Ltd. | RMB |
| | % | | % | |||||||
Nanchang Tongshang New Energy Co., Ltd. | RMB |
| | % | | % |
F-97
Huaneng Power International, Inc.
Notes to the Financial Statements
For the years ended 31 December 2021, 2020 and 2019
(Prepared in accordance with International Financial Reporting Standards)
(Amounts expressed in thousands of RMB unless otherwise stated)
9 | Investments in subsidiaries (continued) |
(iv)Subsidiaries acquired from asset acquisitions (continued)
Percentage of |
| ||||||||||||
Country of | Type of interest | Registered | Business nature and | equity interest held |
| ||||||||
Name of subsidiary |
| incorporation |
| held |
| capital |
| scope of operations |
| Interest |
| Voting |
|
Dashiqiao Baoneng Wind Power Generation Co., Ltd. *** |
|
|
| RMB |
|
| | % | | % | |||
| |||||||||||||
Dashiqiao Hongjing Wind Power Generation Co., Ltd. *** | RMB |
| | % | | % | |||||||
| |||||||||||||
Dashiqiao Guancheng New Energy Co., Ltd. *** | RMB |
| | % | | % | |||||||
| |||||||||||||
Dashiqiao Xintai New Energy Co., Ltd. *** | RMB |
| | % | | % | |||||||
Dandong Kangyi Power Co., Ltd. *** |
|
|
| RMB |
|
| | % | | % | |||
Hengfeng Jingluo Power Co., Ltd. *** | RMB | | % | | % | ||||||||
Huaneng (Loudi) New Energy Co., Ltd. *** | RMB | | % | | % | ||||||||
Huaneng Fengcheng New Energy Co., Ltd. *** | RMB | | % | | % | ||||||||
Huanggang Huangmei Xiaochi Jingsheng Power Generation Co., Ltd. *** | RMB | | % | | % | ||||||||
Huanggang Huangmei Xiaochi Yuyang New Energy Development Co., Ltd. *** | RMB | | % | | % | ||||||||
Huanghua Yongyao New Energy Co., Ltd. *** | RMB | | % | | % | ||||||||
Huanghua Younaite Guangmei New Energy Co., Ltd. *** | RMB | | % | | % | ||||||||
Weixian Zeen Vegetable Planting Co., Ltd. *** | RMB | | % | | % | ||||||||
Yingkou Changhao New Energy Co., Ltd. *** | RMB | | % | | % | ||||||||
Yingkou Shangdian New Energy Co., Ltd. *** | RMB | | % | | % | ||||||||
Hangzhou Hengyang Power Co., Ltd. *** (“Hangzhou Hengyang”) (xiv) | RMB | | % | | % | ||||||||
Xishui Hengtai Power Co., Ltd. *** (“Hengtai Power”) (xiv) | RMB | | % | | % |
*** These companies were newly acquired in 2021.
F-98
Huaneng Power International, Inc.
Notes to the Financial Statements
For the years ended 31 December 2021, 2020 and 2019
(Prepared in accordance with International Financial Reporting Standards)
(Amounts expressed in thousands of RMB unless otherwise stated)
9 | Investments in subsidiaries (continued) |
Notes:
(i) | These companies are subsidiaries of the non-wholly owned subsidiaries controlled by the Company, so the voting right percentage of these companies are bigger than the interest percentage held by the Group. |
(ii) | According to its articles of association, the other shareholder who holds the remaining equity interests of Shidongkou Power entrusts the Group to exercise all its voting rights in relation to the operation and financial policies of Shidongkou Power. Accordingly, the Group has control over Shidongkou Power. |
(iii) | According to the voting in concert agreement entered into between the Group and another shareholder with |
(iv) | These companies are subsidiaries of Shandong Power. The Company holds |
According to the voting in concert agreement entered into among Shandong Power and another equity holder of Ruyi Coal Power, the other equity holder agreed to vote the same in respect of significant financial and operating decisions made by Shandong Power. As a result, the Company has control over Ruyi Coal Power.
Jiaxiang Power, Qufu Co-generation, Jining Co-generation, Weishan New Energy and Helan New Energy are wholly-owned subsidiaries of Ruyi Coal Power, a
Shandong Power directly holds
The Company directly holds
According to the voting in concert agreement entered into between Hong Kong Investment, who holds
F-99
Huaneng Power International, Inc.
Notes to the Financial Statements
For the years ended 31 December 2021, 2020 and 2019
(Prepared in accordance with International Financial Reporting Standards)
(Amounts expressed in thousands of RMB unless otherwise stated)
9 | Investments in subsidiaries (continued) |
Notes: (continued)
(v) | According to the investment cooperation agreement and articles of association signed by Jilin Power and another shareholder of Zhenlai Photovoltaic Power, the shareholder enjoys fixed operating income and waives all management rights within a certain operating period. Therefore, the Group has control over Zhenlai Photovoltaic Power. |
(vi) | Pursuant to an agreement entered into between the Company and another shareholder of Beijing Co-generation, the Company is entrusted to vote the |
(vii) | According to the voting in concert agreement entered into between the Group and one shareholder with |
(viii) | According to the voting in concert agreement entered into between the Group and the other two shareholders of Suzhou Thermal Power, the shareholders agreed to vote the same in respect of significant financial and operating decisions made by the Group. As a result, the Group has control over Suzhou Thermal Power. |
(ix) | In 2016, the Group accounted for the investment in Shanxi Xiaoyi Energy as a joint venture. On 15 February 2017, the Group entered into an agreement with the other shareholder with |
(x) | In 2019, the Company’s equity interest in Qinmei Ruijin Power Generation decreased from |
(xi) | According to the voting in concert agreement entered into between the Group and another shareholder with |
F-100
Huaneng Power International, Inc.
Notes to the Financial Statements
For the years ended 31 December 2021, 2020 and 2019
(Prepared in accordance with International Financial Reporting Standards)
(Amounts expressed in thousands of RMB unless otherwise stated)
9 | Investments in subsidiaries (continued) |
Notes: (continued)
(xii) | According to the articles of association signed by Jiangsu Energy Development, a wholly owned subsidiary of the Company, and other shareholders of Sheyang New Energy, Jiangsu Energy Development enjoys |
(xiii) | According to the voting in concert agreement entered into between the Group and one shareholder with |
(xiv) | According to the voting in concert agreement entered into between the Group and another shareholder with |
(xv) | The investment purpose of the other shareholder of Yujun New Energy with |
(xvi) | The investment purpose of the other shareholder of Huaqing New Energy with |
10 | Other equity instrument investments |
31 December 2021 | 31 December 2020 | |||
Equity securities designated at FVOCI (non-recycling) |
|
| ||
Listed equity investments at fair value | | | ||
Unlisted equity investments at fair value |
|
| ||
7.89% of Ganlong Double-track Railway Co., Ltd. | | | ||
Others | | | ||
Subtotal | | | ||
Total | | |
The above equity investments were irrevocably designated as at fair value through other comprehensive income as the Group considers these investments to be strategic in nature.
F-101
Huaneng Power International, Inc.
Notes to the Financial Statements
For the years ended 31 December 2021, 2020 and 2019
(Prepared in accordance with International Financial Reporting Standards)
(Amounts expressed in thousands of RMB unless otherwise stated)
11 | Power generation licenses |
The movements in the carrying amount of power generation license during the years are as follows:
| 2021 |
| 2020 | |
Beginning of the year |
| |
| |
| ||||
Movement: |
|
| ||
Currency translation differences |
| ( |
| ( |
| ||||
End of the year |
| |
| |
The Group acquired the power generation license in connection with the acquisition of Tuas Power. The power generation license was initially recognized at fair value at the acquisition date. Tuas Power operates power plants in Singapore pursuant to the license granted by the Energy Market Authority for a period of 30 years from 2003 until 2032. The license was extended to 2044 during 2011 with minimal costs and is subject to further renewal. The Group expects that the applicable rules and regulations surrounding the renewal can be complied with based on the current market framework. The Group assessed the useful life of the power generation license at 31 December 2021 to be indefinite and therefore the license is not amortized.
Impairment test of a power generation license
The power generation license belongs to and has been assigned to Tuas Power, a CGU. There was
12 | Mining rights |
The movements in the carrying amount of mining rights during the years are as follows:
| 2021 |
| 2020 | |
Beginning of the year |
|
|
|
|
Cost |
| |
| |
Accumulated impairment losses |
| ( |
| ( |
|
| |||
Net book value |
| |
| |
| ||||
Movements: |
|
| ||
Addition |
| — |
| |
|
|
| ||
End of the year | ||||
|
|
| ||
Cost | ||||
Accumulated impairment losses |
| ( |
| ( |
|
|
| ||
Net book value |
In 2021,
F-102
Huaneng Power International, Inc.
Notes to the Financial Statements
For the years ended 31 December 2021, 2020 and 2019
(Prepared in accordance with International Financial Reporting Standards)
(Amounts expressed in thousands of RMB unless otherwise stated)
13 | Derivative financial instruments |
Details of derivative financial instruments are as follows:
As at 31 December | ||||
| 2021 |
| 2020 | |
Derivative financial assets |
|
| ||
- Hedging instruments for cash flow hedge (fuel swap contracts) | | | ||
- Hedging instruments for cash flow hedge (exchange forward contracts) | | | ||
| ||||
Total | | | ||
| ||||
Less: non-current portion | ||||
- Hedging instruments for cash flow hedge (fuel swap contracts) | | | ||
- Hedging instruments for cash flow hedge (exchange forward contracts) | | | ||
| ||||
Total non-current portion | | | ||
| ||||
Current portion | | | ||
| ||||
Derivative financial liabilities | ||||
- Hedging instruments for cash flow hedge (fuel swap contracts) | ||||
- Hedging instruments for cash flow hedge (exchange forward contracts) | | | ||
- Hedging instruments for cash flow hedge (interest rate swap contracts) | | | ||
| ||||
Total | | | ||
| ||||
Less: non-current portion | ||||
- Hedging instruments for cash flow hedge (fuel swap contracts) | ||||
- Hedging instruments for cash flow hedge (exchange forward contracts) | | | ||
- Hedging instruments for cash flow hedge (interest rate swap contracts) | | | ||
| ||||
Total non-current portion | | | ||
| ||||
Total current portion | | |
For the years ended 31 December 2021 and 2020,
TPG uses foreign currency forward contracts which are designated as hedging instruments in cash flow hedges of purchase in USD. It also uses fuel oil swap contracts to hedge its fuel price risk arising from highly probable forecast purchases of fuel purchases.
F-103
Huaneng Power International, Inc.
Notes to the Financial Statements
For the years ended 31 December 2021, 2020 and 2019
(Prepared in accordance with International Financial Reporting Standards)
(Amounts expressed in thousands of RMB unless otherwise stated)
13 | Derivative financial instruments (continued) |
TPG uses various interest rate swap contracts to hedge floating semi-annual interest payments on borrowings with maturity dates up to 2021. TPSTMWR also uses various interest rate swap contracts to hedge floating quarterly interest payments on borrowings with maturity dates up to 2044. The notional principal amount of these outstanding interest rate swap contracts at 31 December 2021 was S$
There is an economic relationship between the hedged items and the hedging instruments as the terms of the exchange forward contracts, fuel swap contracts and interest rate swap contracts match the terms of the expected highly probable forecast transactions and borrowings (i.e., notional amount and expected payment date). The Group has established a hedge ratio of
The hedge ineffectiveness can arise from:
(a) | Differences in the timing of the cash flows of the hedged items and the hedging instruments. |
(b) | Different indexes (and accordingly different curves) linked to the hedged risk of the hedged items and hedging instruments. |
(c) | The counterparties’ credit risk differently impacting the fair value movements of the hedging instruments and hedged items. |
(d) | Changes to the forecasted amount of cash flows of hedged items and hedging instruments. |
F-104
Huaneng Power International, Inc.
Notes to the Financial Statements
For the years ended 31 December 2021, 2020 and 2019
(Prepared in accordance with International Financial Reporting Standards)
(Amounts expressed in thousands of RMB unless otherwise stated)
13 | Derivative financial instruments (continued) |
The analysis of contractual cash inflows/(outflows) of major derivative financial instruments is as follows:
Maturity | ||||||||||
Carrying | Contractual | Between 1 and | ||||||||
| amounts |
| cash flows |
| Within 1 year |
| 5 years |
| After 5 years | |
As at 31 December 2021 |
|
|
|
|
| |||||
Derivative financial assets |
|
|
|
|
|
|
|
|
|
|
Fuel derivatives used for hedging (net settlement) |
| | | | | — | ||||
| ||||||||||
Forward exchange contracts used for hedging |
| |||||||||
- inflows |
| | | | — | |||||
- outflows |
| ( | ( | ( | — | |||||
| ||||||||||
|
| | | | | — | ||||
| ||||||||||
Derivative financial liabilities |
| |||||||||
Fuel derivatives used for hedging (net settlement) | ( | ( | ( | ( | — | |||||
|
| |||||||||
Forward exchange contracts used for hedging |
| |||||||||
- inflows | — | |||||||||
- outflows |
| ( | ( | ( | — | |||||
|
| |||||||||
|
| ( | ( | ( | ( | — | ||||
|
| |||||||||
Net-settled interest rate swaps used for hedging |
| |||||||||
- net cash outflows |
| ( | ( | ( | ( | ( |
F-105
Huaneng Power International, Inc.
Notes to the Financial Statements
For the years ended 31 December 2021, 2020 and 2019
(Prepared in accordance with International Financial Reporting Standards)
(Amounts expressed in thousands of RMB unless otherwise stated)
13 | Derivative financial instruments (continued) |
The analysis of contractual cash inflows/(outflows) of major derivative financial instruments are as follows (continued):
Maturity | ||||||||||
Carrying | Contractual | Between 1 and | ||||||||
| amounts |
| cash flows |
| Within 1 year |
| 5 years |
| After 5 years | |
As at 31 December 2020 |
|
|
|
|
| |||||
Derivative financial assets |
|
|
|
|
|
|
|
|
| |
Fuel derivatives used for hedging (net settlement) |
| |
| |
| |
| |
| — |
| ||||||||||
Forward exchange contracts used for hedging |
|
|
|
|
| |||||
- inflows |
| |
| |
| |
| — | ||
- outflows |
| ( |
| ( |
| ( |
| — | ||
| ||||||||||
|
| |
| |
| |
| |
| — |
| ||||||||||
Derivative financial liabilities |
|
|
|
|
| |||||
Fuel derivatives used for hedging (net settlement) | ( | ( | ( | ( | — | |||||
|
|
|
|
|
| |||||
Forward exchange contracts used for hedging |
|
|
|
|
| |||||
- inflows | | | | — | ||||||
- outflows |
|
| ( |
| ( |
| ( |
| — | |
|
|
|
|
| ||||||
|
| ( | ( |
| ( |
| ( |
| — | |
|
|
|
|
|
| |||||
Net-settled interest rate swaps used for hedging |
|
|
|
|
| |||||
- net cash outflows |
| ( |
| ( |
| ( |
| ( |
| ( |
F-106
Huaneng Power International, Inc.
Notes to the Financial Statements
For the years ended 31 December 2021, 2020 and 2019
(Prepared in accordance with International Financial Reporting Standards)
(Amounts expressed in thousands of RMB unless otherwise stated)
14 | Goodwill |
The movements of goodwill during the years are as follows:
| 2021 |
| 2020 | |
Beginning of the year |
|
|
|
|
|
|
| ||
Cost |
| |
| |
Accumulated impairment losses |
| ( |
| ( |
|
| |||
Net book value |
| |
| |
| ||||
Movements: |
|
| ||
Business combination |
| — |
| |
Impairment charge for the year |
| — |
| ( |
Currency translation differences - cost |
| ( |
| ( |
Currency translation differences - impairment |
| |
| |
|
|
| ||
End of the year |
| |
| |
| ||||
Cost |
| |
| |
Accumulated impairment losses | ( | ( | ||
|
|
| ||
Net book value |
| |
| |
Impairment tests for goodwill
In the impairment assessment of the Group, goodwill is allocated to a CGU or CGUs that are expected to benefit from the synergies of the business combination and is allocated to the relevant CGUs based on operating areas. The CGUs are consistent with those used on the purchase dates and in the impairment tests in previous years. The carrying amounts of the major goodwill allocated to individual CGUs are as follows:
| 2021 |
| 2020 | |
PRC power segment: |
|
|
|
|
Yunhe Power |
| |
| |
Linyi Power |
| |
| |
Wuhan Power |
| |
| |
Liaocheng Co-generation |
| |
| |
Overseas segment: |
|
|
|
|
Tuas Power |
| |
| |
F-107
Huaneng Power International, Inc.
Notes to the Financial Statements
For the years ended 31 December 2021, 2020 and 2019
(Prepared in accordance with International Financial Reporting Standards)
(Amounts expressed in thousands of RMB unless otherwise stated)
14 | Goodwill (continued) |
Impairment tests for goodwill (continued)
The recoverable amount of a CGU is determined based on value-in-use calculations. The cash flow projections of CGUs are based on management’s forecasted cash flows in the next five years. Based on existing production capacity, the domestic subsidiaries of the Company expect cash flows beyond such periods will be similar to that in the 5th year and thus a
Pre-tax discount rates used for value-in-use calculations:
| 2021 |
| 2020 | ||
Yunhe Power |
| | % | | % |
Linyi Power |
| | % | | % |
Wuhan Power |
| | % | | % |
Liaocheng Co-generation |
| | % | | % |
Tuas Power | | % | | % |
Key assumptions used for value-in-use calculations:
For goodwill of domestic CGUs, the key assumptions applied in the impairment tests include the expected future sales volumes (power generation hours), fuel prices and discount rate. Management determined these assumptions based on past performance and its expectations on market development. The discount rates used reflect specific risks relating to individual CGUs. Based on the impairment assessment,
For the goodwill allocated to Tuas Power, the key assumptions applied in the impairment model include the expected future sales volume, gross margin, terminal growth rate and discount rate. Management determined these key assumptions based on past performance and its expectations on market development.
The EMA released its Singapore Electricity Market Outlook (“SEMO 2021”) on 10 November 2021, stating that the annual system demand and system peak demand are projected to grow at a CAGR of between 2.80% and 3.2% over the next 10 years, from 2022 to 2032, taking into account various factors including demographic, climate and economic impacts as well as projected demand from new high-growth sectors such as data centres. According to SEMO 2021 report, the compound annual growth rate of the electricity market from 2009 to 2020 was about 2.2%. The market share of Singapore Tuas Power in Singapore has remained stable, with the market share ratios being
F-108
Huaneng Power International, Inc.
Notes to the Financial Statements
For the years ended 31 December 2021, 2020 and 2019
(Prepared in accordance with International Financial Reporting Standards)
(Amounts expressed in thousands of RMB unless otherwise stated)
14 | Goodwill (continued) |
Key assumptions used for value-in-use calculations (continued):
Management used the after-tax discount rate for the power generation industry for 2021 and 2022 published by the EMA in November 2020 to calculate the pre-tax discount rate used for value-in-use calculations of Tuas Power, which is
According to the impairment assessment, there was
For the goodwill allocated to the CGU in Singapore, management has assessed that one of the most sensitive key assumptions is the pre-tax discount rate which was arrived at based on weighted average cost of capital. An absolute increase in the pre-tax discount rate of
For the goodwill allocated to CGUs in the PRC, management has assessed that two of the most sensitive key assumptions are future sales volume and fuel price. If future sales volume had decreased by 1% or 5% from management’s estimates, while other variables stay constant with the expectations, the Group would have to recognize impairment against goodwill by approximately RMB
F-109
Huaneng Power International, Inc.
Notes to the Financial Statements
For the years ended 31 December 2021, 2020 and 2019
(Prepared in accordance with International Financial Reporting Standards)
(Amounts expressed in thousands of RMB unless otherwise stated)
15 | Other non-current assets |
Details of other non-current assets are as follows:
As at 31 December | ||||
| 2021 |
| 2020 | |
Finance lease receivables (i) (note 40) | | | ||
VAT recoverable | | | ||
Prepayments for pre-construction cost | | | ||
Intangible assets (ii) | | | ||
Prepaid connection fees | | | ||
Contract assets | | | ||
Others(iii) | | | ||
| ||||
Total | | |
Notes:
(i) | Ruyi Pakistan Energy entered into a power purchase agreement with CPPA-G to sell all of the electricity produced with a regulated tariff mechanism approved by the National Electric Power Regulatory Authority. In accordance with the power purchase agreement and tariff mechanism, almost all the risks and rewards in relation to the power assets were in substance transferred to CPPA-G and therefore were accounted for as a finance lease to CPPA-G. Please refer to Note 40 for other details of finance lease receivables. |
(ii) | The intangible assets primarily consist of software, patented technologies, etc. In 2021, there was |
(iii) | Included in others, there was an asset amounting to RMB |
Included in others, there was an asset amounting to RMB
According to the property right transfer agreement signed in December 2008 between Shandong Power and Shandong Luneng Development Group (“Shandong Luneng”) and the corresponding approval from the State-owned Assets Supervision and Administration Commission of the State Council in February 2009 (“State-owned Assets Right [2009] No.70”), Shandong Power acquired
F-110
Huaneng Power International, Inc.
Notes to the Financial Statements
For the years ended 31 December 2021, 2020 and 2019
(Prepared in accordance with International Financial Reporting Standards)
(Amounts expressed in thousands of RMB unless otherwise stated)
16 | Inventories |
Inventories comprised:
As at 31 December | ||||
| 2021 |
| 2020 | |
Fuel for power generation | | | ||
Material and supplies |
| |
| |
| ||||
|
| |
| |
Less: provision for inventory obsolescence |
| |
| |
| ||||
Total |
| |
| |
Movements of provision for inventory obsolescence during the years are analyzed as follows:
| 2021 |
| 2020 | |
Beginning of the year |
| ( |
| ( |
Provision |
| ( |
| ( |
Reversal |
| |
| |
Write off* |
| |
| |
Currency translation differences |
| |
| |
End of the year |
| ( |
| ( |
* In 2021, approximately RMB
F-111
Huaneng Power International, Inc.
Notes to the Financial Statements
For the years ended 31 December 2021, 2020 and 2019
(Prepared in accordance with International Financial Reporting Standards)
(Amounts expressed in thousands of RMB unless otherwise stated)
17 | Other receivables and assets |
Other receivables and assets comprised the following:
As at 31 December | ||||
| 2021 |
| 2020 | |
Prepayments for inventories |
| |
| |
Prepaid income tax |
| |
| |
Others |
| |
| |
| ||||
Subtotal of prepayments |
| |
| |
| ||||
Less: Loss allowance |
| |
| |
| ||||
Total prepayments, net |
| |
| |
| ||||
Dividends receivable |
| |
| |
Receivables from sales of fuel |
| |
| |
Others (Note i) |
| |
| |
|
| |||
Subtotal of other receivables | ||||
|
| |||
Less: Loss allowance | ||||
|
| |||
Total other receivables, net | ||||
|
|
| ||
VAT recoverable |
| |
| |
Finance lease receivables (Note 40) |
| |
| |
Designated loan to joint ventures |
| |
| |
Others |
|
| ||
Subtotal other assets | ||||
Less: Loss allowance | | |||
Total other assets, net | ||||
Gross total |
|
| ||
|
| |||
Net total |
| 14,698,932 | 7,308,077 |
F-112
Huaneng Power International, Inc.
Notes to the Financial Statements
For the years ended 31 December 2021, 2020 and 2019
(Prepared in accordance with International Financial Reporting Standards)
(Amounts expressed in thousands of RMB unless otherwise stated)
17 | Other receivables and assets (continued) |
Note i: Included in others, there were advances amounting to RMB
Please refer to Note 35 for details of other receivables and assets due from the related parties. The Group does not hold any collateral or other credit enhancements over its other receivables. The other receivables are non-interest-bearing.
The gross amounts of other receivables are denominated in the following currencies:
As at 31 December | ||||
| 2021 |
| 2020 | |
RMB |
| |
| |
S$(RMB equivalent) |
| |
| |
US$(RMB equivalent) |
| |
| |
PKR (RMB equivalent) |
| |
| |
Total |
| |
| |
Movements of provision for loss allowance during the years are analyzed as follows:
| 2021 |
| 2020 | |
Beginning of the year |
| ( | ( | |
Provision |
| ( | ( | |
Reversal |
| | | |
Write-off | | | ||
Others | — | ( | ||
Currency translation differences | | | ||
End of the year |
| ( | ( |
F-113
Huaneng Power International, Inc.
Notes to the Financial Statements
For the years ended 31 December 2021, 2020 and 2019
(Prepared in accordance with International Financial Reporting Standards)
(Amounts expressed in thousands of RMB unless otherwise stated)
18 | Accounts and notes receivable |
Accounts and notes receivable comprised the following:
As at 31 December | ||||
| 2021 |
| 2020 | |
Accounts receivable |
| |
| |
Notes receivable |
| |
| |
| ||||
|
| |
| |
| ||||
Less: Loss allowance |
| |
| |
| ||||
Total |
| |
| |
| ||||
Analyzed into: |
|
| ||
Accounts receivable |
|
| ||
- At amortized cost |
| |
| |
- At fair value through other comprehensive income |
|
| ||
| ||||
Notes receivable |
|
| ||
- At amortized cost |
|
| |
In November 2020, the Group’s subsidiary, Shandong Power, entered into two agreements of single assets management plans (the “Assets Management Plans”) with Yingda Securities Co., Ltd. Under the Assets Management Plans, the Group is not exposed to default risks of the accounts receivable after the transfer. Subsequent to the transfer, the Group did not retain any rights on the use of the accounts receivable, including the sale, transfer or pledge of the accounts receivable to any other third parties.As at 31 December 2021, one of the Assets Management Plans expired. The original carrying value in aggregate of the accounts receivable transferred and derecognized under the arrangement that have not been settled as at 31 December 2021 was RMB
During the year ended 31 December 2021, the Group recognized RMB
The gross amounts of accounts receivable and notes receivable are denominated in the following currencies:
As at 31 December | ||||
| 2021 |
| 2020 | |
RMB |
| |
| |
S$(RMB equivalent) |
| |
| |
US$(RMB equivalent) |
| |
| |
PKR (RMB equivalent) |
| |
| |
Total |
| |
| |
F-114
Huaneng Power International, Inc.
Notes to the Financial Statements
For the years ended 31 December 2021, 2020 and 2019
(Prepared in accordance with International Financial Reporting Standards)
(Amounts expressed in thousands of RMB unless otherwise stated)
18 | Accounts and notes receivable (continued) |
The Group usually grants credit periods of about one month to domestic local power grid customers
As at 31 December 2021,
The Group, except for Singapore subsidiaries, does not hold any collateral or other credit enhancements over its accounts receivable. The accounts receivable are non-interest-bearing.
For the collateral of notes receivable, please refer to Note 26 for details.
Movements of loss allowance during the years are analyzed as follows:
| 2021 |
| 2020 | |
Beginning of the year |
| ( |
| ( |
Provision |
| ( |
| ( |
Reversal |
| |
| |
Write-off |
| |
| |
Others | — | | ||
Currency translation differences |
| |
| |
End of the year |
| ( |
| ( |
An ageing analysis of accounts and notes receivable based on the invoice date was as follows:
As at 31 December | ||||
| 2021 |
| 2020 | |
Within 1 year |
| |
| |
Between 1 to 2 years |
| |
| |
Between 2 to 3 years |
| |
| |
Over 3 years |
| |
| |
Total |
| |
| |
As at 31 December 2021, the maturity period of the notes receivable ranged from
F-115
Huaneng Power International, Inc.
Notes to the Financial Statements
For the years ended 31 December 2021, 2020 and 2019
(Prepared in accordance with International Financial Reporting Standards)
(Amounts expressed in thousands of RMB unless otherwise stated)
19 Share capital
2021 | 2020 | |||||||
| Number of shares |
| Share capital |
| Number of shares |
| Share capital | |
| RMB ’000 |
| RMB ’000 | |||||
As at 1 January |
|
|
|
|
|
|
|
|
A shares |
| |
| |
| |
| |
Overseas listed foreign shares |
| |
| |
| |
| |
Subtotal |
| |
| |
| |
| |
Issuance of new shares |
| |
| |
| |
| |
As at 31 December |
|
|
|
|
|
|
|
|
A shares |
| |
| |
| |
| |
Overseas listed foreign shares |
| |
| |
| |
| |
Total |
| |
| |
| |
| |
20 | Other equity instruments |
(a) | Other equity instruments as at 31 December 2021 |
|
|
| Initial |
|
|
|
|
|
| |||||||||
Type of | Issuance | Distribution | Conversion | Conversion | ||||||||||||||
Instruments |
| Date |
| Category |
| Rate |
| Issue Price |
| Number |
| Par Value |
| Initial Period |
| Condition |
| Result |
|
|
| RMB ’000 |
|
|
| RMB ’000 |
|
|
|
|
|
| |||||
Bond B |
|
|
| | % | |
| |
| |
|
|
| |||||
Yingda Insurance Financing Plan (1st) |
|
|
| | % | — |
| — |
| |
|
|
| |||||
Yingda Insurance Financing Plan (2nd) |
|
|
| | % | — |
| — |
| |
|
|
| |||||
Yingda Insurance Financing Plan (3rd) |
|
|
| | % | — |
| — |
| |
|
|
| |||||
China Life Financing Plan (1st) |
|
|
| | % | — |
| — |
| |
|
|
| |||||
PICC Financing Plan (1st) |
|
|
| | % | — |
| — |
| |
|
|
| |||||
2019 medium-term notes (2nd) |
|
|
| | % | |
| |
| |
|
|
| |||||
2019 medium-term notes (3rd) |
|
|
| | % | |
| |
| |
|
|
| |||||
China Life Financing Plan (2nd) |
|
|
| | % | — |
| — |
| |
|
|
| |||||
PICC Financing Plan (2nd) |
|
|
| | % | — |
| — |
| |
|
|
| |||||
2019 medium-term notes (4th) |
|
|
| | % | |
| |
| |
|
|
| |||||
2019 medium-term notes (4th) |
|
|
| | % | |
| |
| |
|
|
| |||||
Bond C | | % | | | | |||||||||||||
Bond D | | % | | | | |||||||||||||
2020 medium-term notes (1st) | | % | | | | |||||||||||||
China Life Financing Plan (3rd) | | % | — | — | | |||||||||||||
PICC Financing Plan (3rd) | | % | — | — | | |||||||||||||
Bond E | | % | | | | |||||||||||||
2020 medium-term notes (2nd) | | % | | | | |||||||||||||
2020 medium-term notes (3rd) | | % | | | | |||||||||||||
PICC Financing Plan (4th) | | % | — | — | | |||||||||||||
Bond F | | % | | | | |||||||||||||
2020 medium-term notes (4th) | | % | | | | |||||||||||||
Total |
|
|
|
|
|
|
|
|
|
| |
|
|
|
|
|
|
F-116
Huaneng Power International, Inc.
Notes to the Financial Statements
For the years ended 31 December 2021, 2020 and 2019
(Prepared in accordance with International Financial Reporting Standards)
(Amounts expressed in thousands of RMB unless otherwise stated)
20Other equity instruments (continued)
(b) | Major provisions |
In 2017, the Company issued two tranches of perpetual corporate bonds with net proceeds of approximately RMB
In 2018, the Company issued three tranches of Yingda Insurance Financing Plan (the “Yingda plan”) with aggregate proceeds of RMB
In 2019, the Company issued two tranches of China Life Financing Plan (the “China Life plan”) with aggregate proceeds of RMB
F-117
Huaneng Power International, Inc.
Notes to the Financial Statements
For the years ended 31 December 2021, 2020 and 2019
(Prepared in accordance with International Financial Reporting Standards)
(Amounts expressed in thousands of RMB unless otherwise stated)
20 | Other equity instruments (continued) |
(b) | Major provisions (continued) |
In 2019, the Company issued two tranches of PICC Financing Plan (“the PICC plan”) with aggregate proceeds of RMB
In October 2019, the Company issued two tranches of medium-term notes with net proceeds of approximately RMB
In November 2019, the Company issued two tranches of medium-term notes with net proceeds of approximately RMB
In March 2020, the Company issued two tranches of perpetual corporate bonds with net proceeds of approximately RMB
F-118
Huaneng Power International, Inc.
Notes to the Financial Statements
For the years ended 31 December 2021, 2020 and 2019
(Prepared in accordance with International Financial Reporting Standards)
(Amounts expressed in thousands of RMB unless otherwise stated)
20 | Other equity instruments (continued) |
(b) | Major provisions (continued) |
In April 2020, the Company issued medium-term notes with net proceeds of approximately RMB
In April 2020, the Company issued China Life Financing Plan (“the China Life plan”) with proceeds of RMB
In April 2020, the Company issued the third tranche of the PICC plan with proceeds of RMB
In April 2020, the Company issued a perpetual corporate bond with net proceeds of approximately RMB
F-119
Huaneng Power International, Inc.
Notes to the Financial Statements
For the years ended 31 December 2021, 2020 and 2019
(Prepared in accordance with International Financial Reporting Standards)
(Amounts expressed in thousands of RMB unless otherwise stated)
20 | Other equity instruments (continued) |
(b) | Major provisions (continued) |
In June 2020, the Company issued medium-term notes with net proceeds of approximately RMB
In August 2020 and September 2020, the Company issued two tranches of medium-term notes with net proceeds of approximately RMB
In August 2020, the Company issued the fourth tranche of the PICC plan with proceeds of RMB
In September 2020, the Company issued a perpetual corporate bond with net proceeds of approximately RMB
F-120
Huaneng Power International, Inc.
Notes to the Financial Statements
For the years ended 31 December 2021, 2020 and 2019
(Prepared in accordance with International Financial Reporting Standards)
(Amounts expressed in thousands of RMB unless otherwise stated)
20 | Other equity instruments (continued) |
(b) | Major provisions (continued) |
The perpetual corporate bonds, financing plans and medium-term notes were recorded as equity in the consolidated financial statements. During the year ended 31 December 2021, the profit attributable to holders of other equity instruments, based on the applicable distribution rate, was RMB
(c) | Changes of other equity instruments during 2021 |
As at 1 January 2021 | Issuance | Cumulative distributions | As at 31 December 2021 | |||||||||||||||||
Accrued | Distribution | Redemption | Redemption | |||||||||||||||||
Type of instruments |
| Number |
| Amount |
| Number |
| Amount |
| distribution |
| payment |
| value |
| difference |
| Number |
| Amount |
| RMB ’000 |
| RMB ’000 | RMB ’000 | RMB ’000 | RMB ’000 | RMB ’000 |
| RMB ’000 | |||||||||||
Bond B |
| |
| |
| — |
| — |
| |
| |
| — | — | |
| | ||
Yingda Insurance Financing Plan (1st) |
| — |
| |
| — |
| — |
| |
| |
| — | — | — |
| | ||
Yingda Insurance Financing Plan (2nd) |
| — |
| |
| — |
| — |
| |
| |
| — | — | — |
| | ||
Yingda Insurance Financing Plan (3rd) |
| — |
| |
| — |
| — |
| |
| |
| — | — | — |
| | ||
China Life Financing Plan (1st) |
| — |
| |
| — |
| — |
| |
| |
| — | — | — |
| | ||
PICC Financing Plan (1st) |
| — |
| |
| — |
| — |
| |
| |
| — | — | — |
| | ||
2019 medium-term notes (2nd) |
| |
| |
| — |
| — |
| |
| |
| — | — | |
| | ||
2019 medium-term notes (3rd) |
| |
| |
| — |
| — |
| |
| |
| — | — | |
| | ||
China Life Financing Plan (2nd) |
| — |
| |
| — |
| — |
| |
| |
| — | — | — |
| | ||
PICC Financing Plan (2nd) |
| — |
| |
| — |
| — |
| |
| |
| — | — | — |
| | ||
2019 medium-term notes (4th) |
| |
| |
| — |
| — |
| |
| |
| — | — | |
| | ||
2019 medium-term notes (4th) |
| |
| |
| — |
| — |
| |
| |
| — | — | |
| | ||
Bond C | | | — | — | | | — | — | | | ||||||||||
Bond D | | | — | — | | | — | — | | | ||||||||||
2020 medium-term notes (1st) | | | — | — | | | — | — | | | ||||||||||
China Life Financing Plan (3rd) | — | | — | — | | | — | — | — | | ||||||||||
PICC Financing Plan (3rd) | — | | — | — | | | — | — | — | | ||||||||||
Bond E | | | — | — | | | — | — | | | ||||||||||
2020 medium-term notes (2nd) | | | — | — | | | — | — | | | ||||||||||
2020 medium-term notes (3rd) | | | — | — | | | — | — | | | ||||||||||
PICC Financing Plan (4th) | — | | — | — | | | — | — | — | | ||||||||||
Bond F | | | — | — | | | — | — | | | ||||||||||
2020 medium-term notes (4th) | | | — | — | | | — | — | | | ||||||||||
Total |
|
| |
|
|
| — |
| |
| |
| — | — |
|
| |
F-121
Huaneng Power International, Inc.
Notes to the Financial Statements
For the years ended 31 December 2021, 2020 and 2019
(Prepared in accordance with International Financial Reporting Standards)
(Amounts expressed in thousands of RMB unless otherwise stated)
21Surplus reserves
| As at | |
1 January | ||
2021 and | ||
31 December | ||
2021 | ||
Surplus reserves |
| |
According to the Company Law of the PRC, the Company’s articles of association and board resolutions, the Company appropriates 10% of each year’s net profit under PRC GAAP to the statutory surplus reserve. The Company has the option to cease making provision for such reserve when it reaches 50% of the registered share capital. Upon the approval from the relevant authorities, this reserve can be used to make up any losses incurred or to increase share capital. Except for offsetting against losses, this reserve cannot fall below 25% of the registered share after being used to increase share capital.
As the statutory surplus reserve reaches
Appropriation of discretionary surplus reserve is proposed by the Board of Directors, and approved by the general meeting of shareholders. This reserve can be used to make up any losses incurred in prior years or to increase the share capital after obtaining relevant approvals. For the years ended 31 December 2021 and 2020,
According to the articles of association, in distributing the Company’s profits after tax for the relevant accounting year, the lower of the amounts determined in accordance with PRC GAAP and IFRSs shall be adopted. As at 31 December 2021, in accordance with PRC GAAP and IFRSs, the balances of retained earnings for the Group amounted to approximately RMB
22 | Dividends of ordinary shares and cumulative distribution of other equity instruments |
(a) | Dividends of ordinary shares |
On 22 June 2021, upon the approval from the annual general meeting of the shareholders, the Company declared the 2020 final dividend of RMB
On 21 March 2022, the Board of Directors proposed
(b) | Cumulative distribution of other equity instruments |
The other equity instruments were recorded as equity in the consolidated financial statements. For the year ended 31 December 2021, the net profit attributable to holders of other equity instruments, based on the applicable rate, was RMB
F-122
Huaneng Power International, Inc.
Notes to the Financial Statements
For the years ended 31 December 2021, 2020 and 2019
(Prepared in accordance with International Financial Reporting Standards)
(Amounts expressed in thousands of RMB unless otherwise stated)
23 | Long-term loans |
Long-term loans comprised the following:
As at 31 December | ||||
| 2021 |
| 2020 | |
Loans from Huaneng Group and its subsidiaries (a) |
| |
| |
Bank loans and other loans (b) |
| |
| |
| |
| | |
Less: Current portion of long-term loans |
| |
| |
Total |
| |
| |
F-123
Huaneng Power International, Inc.
Notes to the Financial Statements
For the years ended 31 December 2021, 2020 and 2019
(Prepared in accordance with International Financial Reporting Standards)
(Amounts expressed in thousands of RMB unless otherwise stated)
23 | Long-term loans (continued) |
(a) | Loans from Huaneng Group and its subsidiaries |
Details of loans from Huaneng Group and its subsidiaries are as follows:
As at 31 December 2021 |
| ||||||||||
| Original |
| RMB |
| Less: Current |
| Non-current |
| Annual |
| |
currency | equivalent | portion | portion | interest rate |
| ||||||
’000 |
|
|
|
| |||||||
Loans from Huaneng Group |
|
|
|
|
|
|
|
|
|
| |
Unsecured |
|
|
|
|
|
|
|
|
|
| |
RMB |
|
|
|
|
|
|
|
|
|
| |
- Variable rate |
|
|
|
|
| % | |||||
- Fixed rate | % | ||||||||||
Loans from Huaneng Finance |
|
|
|
|
|
| |||||
Unsecured |
|
|
|
|
|
| |||||
RMB |
|
|
|
|
|
| |||||
- Fixed rate |
|
|
|
|
| % | |||||
- Variable rate |
| % | |||||||||
Loans from Huaneng Tiancheng Financial Leasing Co., Ltd. (“Tiancheng Financial Leasing”) |
|
|
|
|
|
| |||||
Secured |
|
|
|
|
|
| |||||
RMB |
|
|
|
|
|
| |||||
- Variable rate |
|
|
|
|
| % | |||||
- Fixed rate |
| % | |||||||||
Loans from Hong Kong Asset Management Co., Ltd. (“Hong Kong Asset Management”) | |||||||||||
Unsecured | |||||||||||
US$ | |||||||||||
- Variable rate | |||||||||||
% | |||||||||||
Total |
|
|
|
|
|
|
| ||||
F-124
Huaneng Power International, Inc.
Notes to the Financial Statements
For the years ended 31 December 2021, 2020 and 2019
(Prepared in accordance with International Financial Reporting Standards)
(Amounts expressed in thousands of RMB unless otherwise stated)
23 | Long-term loans (continued) |
(a) | Loans from Huaneng Group and its subsidiaries (continued) |
As at 31 December 2020 |
| ||||||||||
| Original |
| RMB |
| Less: Current |
| Non-current |
| Annual |
| |
currency | equivalent | portion | portion | interest rate |
| ||||||
’000 |
|
|
|
| |||||||
Loans from Huaneng Group |
|
|
|
|
|
|
|
|
|
| |
Unsecured |
|
|
|
|
|
|
|
|
|
| |
RMB |
|
|
|
|
|
|
|
|
|
| |
- Variable rate |
| |
| |
| |
| |
| % | |
Loans from Huaneng Finance |
|
|
|
|
| ||||||
Unsecured |
|
|
|
|
| ||||||
RMB |
|
|
|
|
| ||||||
- Variable rate |
| |
| |
| |
| |
| % | |
- Fixed rate |
| |
| |
| |
| |
| % | |
Loans from Tiancheng Financial Leasing |
|
|
|
|
| ||||||
Secured |
|
|
|
|
| ||||||
RMB |
|
|
|
|
| ||||||
- Variable rate |
| |
| |
| |
| |
| % | |
- Fixed rate |
| |
| |
| — |
| |
| % | |
Loans from Hong Kong Asset Management | |||||||||||
Unsecured | |||||||||||
US$ | |||||||||||
- Variable rate | | | — | | % | ||||||
Total |
|
|
| |
| |
| |
|
|
F-125
Huaneng Power International, Inc.
Notes to the Financial Statements
For the years ended 31 December 2021, 2020 and 2019
(Prepared in accordance with International Financial Reporting Standards)
(Amounts expressed in thousands of RMB unless otherwise stated)
23 | Long-term loans (continued) |
(b) | Bank loans and other loans |
Details of bank loans and other loans are as follows:
As at 31 December 2021 | |||||||||||
Original | Less: Current | Non-current | Annual | ||||||||
| currency |
| RMB equivalent |
| portion |
| portion |
| interest rate | ||
| ’000 | ||||||||||
Secured |
|
|
|
|
| ||||||
RMB |
|
|
|
|
|
|
|
|
|
| |
- Fixed rate |
| |
| |
| |
| |
| % | |
- Variable rate |
| |
| |
| |
| |
| % | |
S$ |
|
|
|
|
| ||||||
- Variable rate |
| |
| |
| |
| |
| % | |
Unsecured |
|
|
|
|
| ||||||
RMB |
|
|
|
|
| ||||||
- Fixed rate |
| |
| |
| |
| |
| % | |
- Variable rate |
| |
| |
| |
| |
| % | |
US$ |
|
|
|
|
| ||||||
- Variable rate |
| |
| |
| |
| |
| % | |
S$ |
|
|
|
|
| ||||||
- Variable rate |
| |
| |
| |
| |
| % | |
€ |
|
|
|
|
| ||||||
- Fixed rate |
| |
| |
| |
| |
| % | |
JPY |
|
|
|
|
| ||||||
- Fixed rate |
| |
| |
| |
| |
| % | |
Total |
|
|
| |
| |
| |
|
|
F-126
Huaneng Power International, Inc.
Notes to the Financial Statements
For the years ended 31 December 2021, 2020 and 2019
(Prepared in accordance with International Financial Reporting Standards)
(Amounts expressed in thousands of RMB unless otherwise stated)
23 | Long-term loans (continued) |
(b) | Bank loans and other loans (continued) |
As at 31 December 2020 | |||||||||||
Original | Less: Current | Non-current | Annual | ||||||||
| currency |
| RMB equivalent |
| portion |
| portion |
| interest rate | ||
| ’000 | ||||||||||
Secured |
|
|
|
|
| ||||||
RMB |
|
|
|
|
|
|
|
|
|
| |
- Fixed rate |
| |
| |
| — |
| |
| % | |
- Variable rate |
| |
| |
| |
| |
| % | |
S$ |
|
|
|
|
| ||||||
- Variable rate |
| |
| |
| |
| |
| % | |
Unsecured |
|
|
|
|
| ||||||
RMB |
|
|
|
|
| ||||||
- Fixed rate |
| |
| |
| |
| |
| % | |
- Variable rate |
| |
| |
| |
| |
| % | |
US$ |
|
|
|
|
| ||||||
- Variable rate |
| |
| |
| |
| |
| % | |
S$ |
|
|
|
|
| ||||||
- Variable rate |
| |
| |
| — |
| |
| % | |
€ |
|
|
|
|
| ||||||
- Fixed rate |
| |
| |
| |
| |
| % | |
JPY |
|
|
|
|
| ||||||
- Fixed rate |
| |
| |
| |
| |
| % | |
Total |
|
|
| |
| |
| |
|
|
As at 31 December 2021, long-term loans of approximately RMB
As at 31 December 2021, long-term loans of RMB
Certain subsidiaries of the Group had sales and leaseback agreements with Tiancheng Financial Leasing and other financial leasing companies. According to the agreements, these subsidiaries have an option to buy back the equipment at a nominal price (RMB
F-127
Huaneng Power International, Inc.
Notes to the Financial Statements
For the years ended 31 December 2021, 2020 and 2019
(Prepared in accordance with International Financial Reporting Standards)
(Amounts expressed in thousands of RMB unless otherwise stated)
23 | Long-term loans (continued) |
(b) | Bank loans and other loans (continued) |
As at 31 December 2021, long-term loans of approximately RMB
As at 31 December 2021, the Company provided guarantees for long-term loans of approximately RMB
As at 31 December 2021, long-term loans of approximately RMB
As at 31 December 2021,
As at 31 December 2021, long-term loans of approximately RMB
F-128
Huaneng Power International, Inc.
Notes to the Financial Statements
For the years ended 31 December 2021, 2020 and 2019
(Prepared in accordance with International Financial Reporting Standards)
(Amounts expressed in thousands of RMB unless otherwise stated)
23 | Long-term loans (continued) |
(b) | Bank loans and other loans (continued) |
The maturity of long-term loans is as follows:
Loans from | ||||||||
Huaneng Group | Bank loans | |||||||
and its subsidiaries | and other loans | |||||||
As at 31 December | As at 31 December | |||||||
| 2021 |
| 2020 |
| 2021 |
| 2020 | |
Within 1 year | | | | | ||||
After 1 year but within 2 years |
| |
| |
| |
| |
After 2 years but within 5 years |
| |
| |
| |
| |
After 5 years |
| |
| |
| |
| |
| |
| |
| |
| | |
Less: amount due within 1 year included under current liabilities |
| |
| |
| |
| |
Total |
| |
| |
| |
| |
The maturity profile of the Group’s long-term loans as at the end of the reporting period, based on the contractual undiscounted payments, is as follows:
| As at 31 December | |||
2021 |
| 2020 | ||
Within 1 year |
| |
| |
After 1 year but within 2 years |
| |
| |
After 2 years but within 5 years |
| |
| |
After 5 years |
| |
| |
| |
| |
F-129
Huaneng Power International, Inc.
Notes to the Financial Statements
For the years ended 31 December 2021, 2020 and 2019
(Prepared in accordance with International Financial Reporting Standards)
(Amounts expressed in thousands of RMB unless otherwise stated)
24 | Long-term bonds |
Outstanding corporate bonds, medium-term notes and debt financing instrument of the Group as at 31 December 2021 are summarized as follows:
Foreign | ||||||||||||||||||||||||||||||
Initial | Balance as at | Foreign | Currency | Balance as at | ||||||||||||||||||||||||||
Issuance | Initial | Distribution | Effective | 31 December | Issued | Exchange | Transition | Interest | 31 December | |||||||||||||||||||||
Type of Instruments | Face Value | Date | Period | Rate | Rate | Issue Price | 2020 | Amount | Amortization | Interest | Repayment | Gain | Differences | Payable | 2021 | |||||||||||||||
RMB’000 | RMB’000 | RMB’000 | RMB’000 | RMB’000 | RMB’000 | RMB’000 | RMB’000 | RMB’000 | RMB’000 | RMB’000 | ||||||||||||||||||||
2016 corporate bonds (5 years) |
| |
|
|
| | % | | % | |
| |
| — |
| ( |
| |
| ( | — | — | — |
| | |||||
2016 corporate bonds (10 years) |
| |
|
|
| | % | | % | |
| |
| — |
| |
| |
| ( | — | — | |
| | |||||
2017 medium-term notes (5 years) |
| |
|
|
| | % | | % | |
| |
| — |
| |
| |
| ( | — | — | |
| | |||||
2018 corporate bonds (3 years) |
| |
|
|
| | % | | % | |
| |
| — |
| ( |
| |
| ( | — | — | — |
| — | |||||
2018 medium-term notes (3 years) |
| |
|
|
| | % | | % | |
| |
| — |
| |
| |
| ( | — | — | — |
| — | |||||
2018 medium-term notes (3 years) |
| |
|
|
| | % | | % | |
| |
| — |
| |
| |
| ( | — | — | — |
| | |||||
2018 debt financing instrument (3 years) |
| |
|
|
| | % | | % | |
| |
| — |
| |
| |
| ( | — | — | — |
| — | |||||
2018 corporate bonds (10 years) |
| |
|
|
| | % | | % | |
| |
| — |
| |
| |
| ( | — | — | |
| | |||||
2019 corporate bonds (10 years) |
| |
|
|
| | % | | % | |
| |
| — |
| |
| |
| ( | — | — | |
| | |||||
2019 corporate bonds (3 years) |
| |
|
|
| | % | | % | |
| |
| — |
| |
| |
| ( | — | — | |
| | |||||
2019 medium-term notes (3 years) |
| |
|
|
| | % | | % | |
| |
| — |
| |
| |
| ( | — | — | |
| | |||||
2019 medium-term notes (5 years) |
| |
|
|
| | % | | % | |
| |
| — |
| |
| |
| ( | — | — | |
| | |||||
2020 corporate bonds (5 years) |
| |
|
|
| | % | | % | |
| |
| |
| |
| |
| ( | | ( | |
| | |||||
2020 corporate bonds (10 years) |
| |
|
|
| | % | | % | |
| |
| |
| |
| |
| ( | | ( | |
| | |||||
2021 medium-term notes (3 years) | | | % | | % | | — | | ( | | — | — | — | | | |||||||||||||||
2021 corporate bonds (3 years) | | | % | | % | | — | | | | — | — | — | | | |||||||||||||||
2021 corporate bonds (10 years) |
| |
|
|
| | % | | % | |
| — |
| |
| ( |
| |
| — | — | — | |
| | |||||
2021 corporate bonds (3 years) | | | % | | % | | — | | | | — | — | — | | | |||||||||||||||
2021 corporate bonds (10 years) | | | % | | % | | — | | ( | | — | — | — | | | |||||||||||||||
2021 corporate bonds (3 years) | | | % | | % | | — | | ( | | — | — | — | | | |||||||||||||||
2021 corporate bonds (3 years) | | | % | | % | | — | | | | — | — | — | | | |||||||||||||||
2021 medium-term bonds (3 years) | | | % | | % | | — | | — | | — | — | — | | | |||||||||||||||
Total | | | | | | ( | | ( | | |
F-130
Huaneng Power International, Inc.
Notes to the Financial Statements
For the years ended 31 December 2021, 2020 and 2019
(Prepared in accordance with International Financial Reporting Standards)
(Amounts expressed in thousands of RMB unless otherwise stated)
24 | Long-term bonds (continued) |
Outstanding corporate bonds, medium-term notes and debt financing instrument of the Group as at 31 December 2020 are summarized as follows:
Foreign | ||||||||||||||||||||||||||||||
Initial | Balance as at | Foreign | Currency | Balance as at | ||||||||||||||||||||||||||
Issuance | Initial | Distribution | Effective | 31 December | Issued | Exchange | Transition | Interest | 31 December | |||||||||||||||||||||
Type of Instruments | Face Value | Date | Period | Rate | Rate | Issue Price | 2019 | Amount | Amortization | Interest | Repayment | Gain | Differences | Payable | 2020 | |||||||||||||||
RMB’000 | RMB’000 | RMB’000 | RMB’000 | RMB’000 | RMB’000 | RMB’000 | RMB’000 | RMB’000 | RMB’000 | RMB’000 | ||||||||||||||||||||
2016 corporate bonds (5 years) |
| |
|
|
| | % | | % | |
| |
| — |
| | |
| — |
| — | — | |
| | |||||
2016 corporate bonds (10 years) |
| |
|
|
| | % | | % | |
| |
| — |
| | |
| — |
| — | — | |
| | |||||
2017 medium-term notes (5 years) |
| |
|
|
| | % | | % | |
| |
| — |
| | |
| — |
| — | — | |
| | |||||
2017 debt financing instrument (3 years) |
| |
|
|
| | % | | % | |
| |
| — |
| | |
| ( |
| — | — | — |
| — | |||||
2017 corporate bonds (3 years) |
| |
|
|
| | % | | % | |
| |
| — |
| | |
| ( |
| — | — | — |
| — | |||||
2018 corporate bonds (3 years) |
| |
|
|
| | % | | % | |
| |
| — |
| | |
| — |
| — | — | |
| | |||||
2018 medium-term notes (3 years) |
| |
|
|
| | % | | % | |
| |
| — |
| | |
| — |
| — | — | |
| | |||||
2018 medium-term notes (3 years) |
| |
|
|
| | % | | % | |
| |
| — |
| | |
| — |
| — | — | |
| | |||||
2018 debt financing instrument (3 years) |
| |
|
|
| | % | | % | |
| |
| — |
| | |
| — |
| — | — | |
| | |||||
2018 corporate bonds (10 years) |
| |
|
|
| | % | | % | |
| |
| — |
| | |
| — |
| — | — | |
| | |||||
2019 corporate bonds (10 years) |
| |
|
|
| | % | | % | |
| |
| — |
| | |
| — |
| — | — | |
| | |||||
2019 corporate bonds (3 years) |
| |
|
|
| | % | | % | |
| |
| — |
| | |
| — |
| — | — | |
| | |||||
2019 medium-term notes (3 years) |
| |
|
|
| | % | | % | |
| |
| — |
| | |
| — |
| — | — | |
| | |||||
2019 medium-term notes (5 years) |
| |
|
|
| | % | | % | |
| |
| — |
| | |
| — |
| — | — | |
| | |||||
2020 corporate bonds (5 years) | | | % | | % | | — | | ( | | — | ( | ( | | | |||||||||||||||
2020 corporate bonds (10 years) | | | % | | % | | — | | ( | | — | ( | ( | | | |||||||||||||||
Total |
|
|
|
|
|
|
|
|
|
|
| |
| |
| |
| ( | |
| ( |
| ( | ( | |
| |
As at 31 December 2021, the Company provided guarantees for long-term bonds of approximately RMB
The maturity profile of the Group’s long-term bonds as at the end of the reporting period, based on the contractual undiscounted payments, is as follows:
| As at 31 December | |||
| 2021 |
| 2020 | |
Within 1 year |
| |
| |
After 1 year but within 2 years |
| |
| |
After 2 years but within 5 years |
| |
| |
After 5 years |
| |
| |
| |
| |
F-131
Huaneng Power International, Inc.
Notes to the Financial Statements
For the years ended 31 December 2021, 2020 and 2019
(Prepared in accordance with International Financial Reporting Standards)
(Amounts expressed in thousands of RMB unless otherwise stated)
25 | Other non-current liabilities |
As at 31 December | ||||
| 2021 |
| 2020 | |
Government grants |
|
|
| |
-Environmental subsidies (a) |
| | | |
-Other government grants (b) |
| | | |
Contract liabilities |
| | | |
Other deferred income |
| | | |
Others (c) |
| | | |
Subtotal |
| | | |
Current portion of other non-current liabilities |
| ( | ( | |
Subtotal |
| ( | ( | |
Total |
| | |
(a) | This primarily represented subsidies for the construction of desulphurization equipment and other environmental protection projects. |
(b) | As at 31 December 2021, among other government grants, there was standby compensation of Huaneng Power International, Inc. Jining Power Plant amounting to RMB |
(c) | As at 31 December 2021, included in others, there were financial liabilities amounting to RMB |
The maturity profile of the Group’s other non-current financial liabilities as at the end of the reporting period, based on the contractual undiscounted payments, is as follows:
| As at 31 December | |||
2021 | 2020 | |||
Within 1 year |
| |
| |
After 1 year but within 2 years |
| |
| |
After 2 years but within 5 years |
| |
| |
After 5 years |
| |
| |
| |
| |
F-132
Huaneng Power International, Inc.
Notes to the Financial Statements
For the years ended 31 December 2021, 2020 and 2019
(Prepared in accordance with International Financial Reporting Standards)
(Amounts expressed in thousands of RMB unless otherwise stated)
26 | Accounts payable and other liabilities |
Accounts payable and other liabilities comprised:
As at 31 December | ||||
| 2021 |
| 2020 | |
Accounts and notes payable | | | ||
Payables to contractors for construction |
| |
| |
Retention payables to contractors |
| |
| |
Consideration payables for business acquisition |
| |
| |
Others |
| |
| |
Total |
| |
| |
Please refer to Note 35(a)(iv) for details of accounts payable and other liabilities due to the related parties.
As at 31 December 2021, there were notes payable amounting to RMB
As at 31 December 2021 and 31 December 2020, the accounts and notes payables and other liabilities are non-interest-bearing.
The carrying amounts of accounts payable and other liabilities are denominated in the following currencies:
As at 31 December | ||||
| 2021 |
| 2020 | |
RMB | | | ||
S$ (RMB equivalent) |
| |
| |
US$ (RMB equivalent) |
| |
| |
JPY (RMB equivalent) |
| |
| |
EUR (RMB equivalent) |
| — |
| |
PKR (RMB equivalent) |
| |
| |
Total |
| |
| |
The ageing analysis of accounts and notes payable was as follows:
As at 31 December | ||||
| 2021 |
| 2020 | |
| ||||
Within 1 year | | | ||
Between 1 to 2 years |
| |
| |
Over 2 years |
| |
| |
Total |
| |
| |
F-133
Huaneng Power International, Inc.
Notes to the Financial Statements
For the years ended 31 December 2021, 2020 and 2019
(Prepared in accordance with International Financial Reporting Standards)
(Amounts expressed in thousands of RMB unless otherwise stated)
27 | Taxes payable |
Taxes payable comprise:
As at 31 December | ||||
| 2021 |
| 2020 | |
| ||||
VAT payable | | | ||
Income tax payable |
| |
| |
Others |
| |
| |
Total |
| |
| |
28 | Short-term bonds |
Outstanding short-term bonds as at 31 December 2021 are summarized as follows:
|
| Issuance |
|
|
| Coupon |
| Balance as at 31 |
| Issued |
|
|
|
| Balance as at 31 | |||||||
Type of Instruments | Face Value | Date | Maturity | Issue Price | Rate | December 2020 | Amount | Interest | Amortization | Repayment |
| December 2021 | ||||||||||
RMB’000 | RMB’000 | RMB’000 | RMB’000 | RMB’000 | RMB’000 | RMB’000 |
| RMB’000 | ||||||||||||||
Super short-term bond (2020 8th) |
| |
|
|
| |
| | % | |
| — |
| |
| ( |
| ( | — | |||
Super short-term bond (2020 9th) |
| |
|
|
| |
| | % | |
| — |
| |
| |
| ( | — | |||
Super short-term bond (2021 1st) |
| |
|
|
| |
| | % | — |
| |
| |
| — |
| ( | — | |||
Super short-term bond (2021 2nd) |
| |
|
|
| |
| | % | — |
| |
| |
| — |
| ( | — | |||
Super short-term bond (2021 3rd) |
| |
|
|
| |
| | % | — |
| |
| |
| — |
| ( | — | |||
Super short-term bond (2021 4th) |
| |
|
|
| |
| | % | — |
| |
| |
| — |
| ( | — | |||
Super short-term bond (2021 5th) |
| |
|
|
| |
| | % | — |
| |
| |
| — |
| ( | — | |||
Super short-term bond (2021 6th) |
| |
|
|
| |
| | % | — |
| |
| |
| — |
| ( | — | |||
Super short-term bond (2021 7th) |
| |
|
|
| |
| | % | — |
| |
| |
| — |
| ( | — | |||
Super short-term bond (2021 8th) |
| |
|
|
| |
| | % | — |
| |
| |
| — |
| ( | — | |||
Super short-term bond (2021 9th) |
| |
|
|
| |
| | % | — |
| |
| |
| — |
| ( | — | |||
Super short-term bond (2021 10th) |
| |
|
|
| |
| | % | — |
| |
| |
| — |
| ( | — | |||
Super short-term bond (2021 11th) | | | | % | — | | | — | ( | — | ||||||||||||
Super short-term bond (2021 12th) | | | | % | — | | | — | ( | — | ||||||||||||
Super short-term bond (2021 13th) | | | | % | — | | | — | ( | — | ||||||||||||
Super short-term bond (2021 14th) | | | | % | — | | | — | ( | — | ||||||||||||
Super short-term bond (2021 15th) | | | | % | — | | | — | ( | — | ||||||||||||
Super short-term bond (2021 16th) | | | | % | — | | | | — | | ||||||||||||
Super short-term bond (2021 17th) | | | | % | — | | | | — | | ||||||||||||
Super short-term bond (JiangSu2021 1st) | | | | % | — | | | — | — | | ||||||||||||
Total |
|
|
|
| |
| |
| |
| |
| |
| ( | |
Outstanding short-term bonds as at 31 December 2020 are summarized as follows:
Issuance | Coupon | Balance as at 31 | Issued | Balance as at 31 | ||||||||||||||||||
Type of Instruments | Face Value | Date | Maturity | Issue Price | Rate | December 2019 | Amount | Interest | Amortization | Repayment | December 2020 | |||||||||||
RMB’000 | RMB’000 | RMB’000 | RMB’000 | RMB’000 | RMB’000 | RMB’000 | RMB’000 | |||||||||||||||
Super short-term bond (2019 9th) | | | % | | — | | ( | ( | — | |||||||||||||
Super short-term bond (2019 10th) |
| |
|
|
| |
| | % | |
| — |
| |
| ( |
| ( |
| — | ||
Super short-term bond (2019 11th) |
| |
|
|
| |
| | % | |
| — |
| |
| ( |
| ( |
| — | ||
Super short-term bond (2020 1st) |
| |
|
|
| |
| | % | — |
| |
| |
| — |
| ( |
| — | ||
Super short-term bond (2020 2nd) |
| |
|
|
| |
| | % | — |
| |
| |
| — |
| ( |
| — | ||
Super short-term bond (2020 3rd) |
| |
|
|
| |
| | % | — |
| |
| |
| — |
| ( |
| — | ||
Super short-term bond (2020 4th) |
| |
|
|
| |
| | % | — |
| |
| |
| — |
| ( |
| — | ||
Super short-term bond (2020 5th) |
| |
|
|
| |
| | % | — |
| |
| |
| — |
| ( |
| — | ||
Super short-term bond (2020 6th) |
| |
|
|
| |
| | % | — |
| |
| |
| — |
| ( |
| — | ||
Super short-term bond (2020 7th) |
| |
|
|
| |
| | % | — |
| |
| |
| — |
| ( |
| — | ||
Super short-term bond (2020 8th) |
| |
|
|
| |
| | % | — |
| |
| |
| |
| — |
| | ||
Super short-term bond (2020 9th) |
| |
|
|
| |
| | % |
| |
| |
| ( |
| — |
| | |||
| ||||||||||||||||||||||
Total |
| | | | | ( | ( | |
F-134
Huaneng Power International, Inc.
Notes to the Financial Statements
For the years ended 31 December 2021, 2020 and 2019
(Prepared in accordance with International Financial Reporting Standards)
(Amounts expressed in thousands of RMB unless otherwise stated)
29 | Short-term loans |
Short-term loans are as follows:
As at 31 December 2021 | As at 31 December 2020 | |||||||||||
Original | RMB | Annual | Original | RMB | Annual | |||||||
| currency |
| equivalent |
| interest rate |
| currency |
| equivalent |
| interest rate | |
‘000 | ‘000 | |||||||||||
Secured |
|
|
|
|
|
| ||||||
RMB |
|
|
|
|
|
|
| |||||
- Fixed rate | | | | | ||||||||
- Variable rate | | | | | ||||||||
Unsecured | ||||||||||||
RMB | ||||||||||||
- Fixed rate | | | | | ||||||||
- Variable rate | | | | | ||||||||
US$ | ||||||||||||
- Fixed rate | — | — | | | ||||||||
PKR |
|
| ||||||||||
- Variable rate | | | — | — | ||||||||
Total |
| |
|
| |
|
As at 31 December 2021, short-term loans of RMB
As at 31 December 2021,
As at 31 December 2021, short-term loans borrowed from Huaneng Finance amounted to RMB
F-135
Huaneng Power International, Inc.
Notes to the Financial Statements
For the years ended 31 December 2021, 2020 and 2019
(Prepared in accordance with International Financial Reporting Standards)
(Amounts expressed in thousands of RMB unless otherwise stated)
30 | Deferred income tax assets and liabilities |
The deferred income tax assets and liabilities are as follows:
At 31 December | ||||
| 2021 |
| 2020 | |
Deferred income tax assets before offsetting |
| |
| |
Offset amount |
| ( |
| ( |
Deferred income tax assets after offsetting |
| |
| |
Deferred income tax liabilities before offsetting |
| ( |
| ( |
Offset amount |
| |
| |
Deferred income tax liabilities after offsetting |
| ( |
| ( |
| |
| ( |
The gross movements in the deferred income tax accounts are as follows:
| 2021 |
| 2020 | |
Beginning of the year |
| ( |
| ( |
Business combination |
| — |
| ( |
Credited to profit or loss (Note 32) |
| |
| |
(Charged) /credited to other comprehensive income |
| ( |
| |
Currency translation differences |
| |
| |
End of the year |
| |
| ( |
F-136
Huaneng Power International, Inc.
Notes to the Financial Statements
For the years ended 31 December 2021, 2020 and 2019
(Prepared in accordance with International Financial Reporting Standards)
(Amounts expressed in thousands of RMB unless otherwise stated)
30 | Deferred income tax assets and liabilities (continued) |
The movements in deferred income tax assets and liabilities during the year, without taking into consideration the offsetting of balances within the same tax jurisdictions, are as follows:
Deferred income tax assets:
|
|
|
|
|
|
| VAT refunds |
|
|
|
| |||||||||||
on purchases of | ||||||||||||||||||||||
Fair | Amortization | Provision for | domestically | |||||||||||||||||||
Hedging | value | of land use | impairment | Accrued | manufactured | Unused | Lease | |||||||||||||||
reserve | losses | rights | loss | Depreciation | expenses | equipment | tax losses | liabilities | Others | Total | ||||||||||||
As at 1 January 2020 |
| |
| |
| |
| |
| |
| |
| |
| |
| |
| |
| |
(Charged)/credited to profit or loss |
| — |
| — |
| ( |
| ( |
| |
| ( |
| ( |
| ( |
| |
| ( |
| ( |
(Charged)/credited to other comprehensive income |
| ( |
| |
| — |
| — |
| — |
| — |
| — |
| — |
| — |
| — |
| |
Currency translation differences |
| ( |
| — |
| — |
| ( |
| — |
| — |
| — |
| — |
| — |
| ( |
| ( |
As at 31 December 2020 |
| |||||||||||||||||||||
(Charged)/credited to profit or loss |
| — |
| — | ( | ( | ( | ( | ( | | | ( | | |||||||||
(Charged)/credited to other comprehensive income |
| |
| |
| — |
| — |
| — |
| — |
| — |
| — |
| — |
| — |
| |
Currency translation differences |
| |
| — |
| — |
| ( |
| — |
| — |
| — |
| — |
| — |
| ( |
| ( |
|
|
|
|
|
|
|
|
| ||||||||||||||
As at 31 December 2021 |
|
|
Deferred income tax liabilities:
|
| Amortization |
|
| Power |
|
| Territorial |
|
|
| |||||||||
Hedging | Fair value | of land use | generation | Mining | water | Right-of- | ||||||||||||||
reserve | gains | rights | Depreciation | license | rights | use right | use assets | Others | Total | |||||||||||
As at 1 January 2020 | — | ( | ( | ( | ( | ( | ( | ( | ( | ( | ||||||||||
Business combination | — | — |
| — |
| ( |
| — |
| — |
| — |
| — |
| — |
| ( | ||
Credited to profit or loss | — | — |
| |
| |
| — |
| — |
| — |
| ( |
| |
| | ||
Charged to other comprehensive income | — | |
| — |
| — |
| — |
| — |
| — |
| — |
| — |
| | ||
Currency translation differences | — | — |
| ( |
| |
| |
| — |
| — |
| — |
| — |
| | ||
As at 31 December 2020 | — | ( |
| ( |
| ( |
| ( |
| ( |
| ( |
| ( |
| ( |
| ( | ||
Credited to profit or loss | — | — |
| |
| |
| — |
| — |
| |
| ( |
| ( |
| | ||
Charged to other comprehensive income | ( | |
| — |
| — |
| — |
| — |
| — |
| — |
| — |
| ( | ||
Currency translation differences | — | — |
| — |
| |
| |
| — |
| — |
| — |
| — |
| | ||
As at 31 December 2021 | ( | ( |
| ( |
| ( |
| ( |
| ( |
| — |
| ( |
| ( |
| ( |
As at 31 December 2021 and 2020, taxable temporary differences relating to interest in equity method investees amounted to RMB
As at 31 December 2021 and 2020, taxable temporary differences relating to the interest of foreign subsidiaries amounted to RMB
F-137
Huaneng Power International, Inc.
Notes to the Financial Statements
For the years ended 31 December 2021, 2020 and 2019
(Prepared in accordance with International Financial Reporting Standards)
(Amounts expressed in thousands of RMB unless otherwise stated)
30 | Deferred income tax assets and liabilities (continued) |
In accordance with the accounting policy set out in Note 2(w), the Group did not recognize deferred income tax assets in respect of certain deductible temporary differences and accumulated tax losses that can be carried forward against future taxable income as follows:
As at 31 December | ||||
| 2021 |
| 2020 | |
Deductible temporary differences |
| |
| |
Unused tax losses |
| |
| |
Total |
| |
| |
The expiry dates of the tax losses of the Group for which no deferred income tax assets were recognized are summarized as follows:
As at 31 December | ||||
| 2021 |
| 2020 | |
Year of expiry |
|
|
|
|
2021 |
| — |
| |
2022 |
| |
| |
2023 |
| |
| |
2024 |
| |
| |
2025 |
| |
| |
2026 |
| |
| — |
| ||||
Total |
| |
| |
31 | Additional financial information to the consolidated statement of financial position |
As at 31 December 2021, the net current liabilities of the Group amounted to approximately RMB
32 | Income tax expense |
For the year ended 31 December | ||||||
| 2021 |
| 2020 |
| 2019 | |
Current income tax expense |
| |
| |
| |
Deferred income tax (Note 30) |
| ( |
| ( |
| ( |
| ||||||
Total |
| ( |
| |
| |
F-138
Huaneng Power International, Inc.
Notes to the Financial Statements
For the years ended 31 December 2021, 2020 and 2019
(Prepared in accordance with International Financial Reporting Standards)
(Amounts expressed in thousands of RMB unless otherwise stated)
32 Income tax expense (continued)
The Company and its PRC branches and subsidiaries are subject to income tax at
The income tax rate applicable to Singapore subsidiaries is
The reconciliation of the effective income tax rate from the notional income tax rate is as follows:
For the year ended 31 December |
| ||||||
| 2021 |
| 2020 |
| 2019 |
| |
PRC statutory enterprise income tax rate |
| | % | | % | | % |
Effect of different tax rates of certain subsidiaries |
| | % | ( | % | ( | % |
Utilization of previously unrecognized tax losses and deductible temporary differences |
| | % | ( | % | ( | % |
Unrecognized tax losses for the year |
| ( | % | | % | | % |
Unrecognized deductible temporary differences |
| ( | % | | % | | % |
Effect of non-taxable income |
| | % | ( | % | ( | % |
Effect of non-deductible expenses |
| ( | % | | % | | % |
Others |
| | % | | % | ( | % |
|
| ||||||
Effective tax rate |
| | % | | % | | % |
F-139
Huaneng Power International, Inc.
Notes to the Financial Statements
For the years ended 31 December 2021, 2020 and 2019
(Prepared in accordance with International Financial Reporting Standards)
(Amounts expressed in thousands of RMB unless otherwise stated)
33 | (Losses)/earnings per share |
The basic earnings per share is calculated by dividing the consolidated net profit attributable to the equity holders of the Company excluding cumulative distribution of other equity instruments by the weighted average number of the Company’s outstanding ordinary shares during the year:
For the year ended 31 December | ||||||
| 2021 |
| 2020 |
| 2019 | |
Consolidated net (loss)/profit attributable to equity holders of the Company |
| ( |
| |
| |
Less: cumulative distribution of other equity instruments |
| |
| |
| |
|
| |||||
Consolidated net (loss)/profit attributable to ordinary shareholders of the Company |
| ( |
| |
| |
|
| |||||
Weighted average number of the Company’s outstanding ordinary shares (’000) * |
| |
| |
| |
|
| |||||
Basic and diluted (losses)/earnings per share (RMB) |
| ( |
| |
| |
*Weighted average number of ordinary shares:
| 2021 |
| 2020 |
| 2019 | |
’000 | ’000 | ’000 | ||||
Issued ordinary shares at 1 January |
| | | | ||
Weighted average number of ordinary shares at 31 December |
| | | |
There was
34 | Notes to the consolidated statement of cash flows |
Bank balances and cash comprise the following:
As at 31 December | ||||||
| 2021 |
| 2020 |
| 2019 | |
Total bank balances and cash |
| | | |||
Less: Restricted cash |
| |
| |
| |
|
|
| ||||
Cash and cash equivalents as at year end |
| |
| |
| |
F-140
Huaneng Power International, Inc.
Notes to the Financial Statements
For the years ended 31 December 2021, 2020 and 2019
(Prepared in accordance with International Financial Reporting Standards)
(Amounts expressed in thousands of RMB unless otherwise stated)
34 | Notes to consolidated statement of cash flows (continued) |
The bank balances and cash of the Group are denominated in the following currencies:
As at 31 December | ||||||
| 2021 |
| 2020 |
| 2019 | |
RMB |
| |
| |
| |
S$(RMB equivalent) |
| |
| |
| |
US$(RMB equivalent) |
| |
| |
| |
Others |
| |
| |
| |
| ||||||
Total |
| |
| | |
During the year, the Group had non-cash additions to right-of-use assets and lease liabilities of RMB
F-141
Huaneng Power International, Inc.
Notes to the Financial Statements
For the years ended 31 December 2021, 2020 and 2019
(Prepared in accordance with International Financial Reporting Standards)
(Amounts expressed in thousands of RMB unless otherwise stated)
34 | Notes to the consolidated statement of cash flows (continued) |
The table below details changes in the Group’s liabilities from financing activities, including both cash and non-cash changes. Liabilities arising from financing activities are liabilities for which cash flows were, or future cash flows will be, classified in the Group’s consolidated statement of cash flows as cash flows from financing activities:
Cumulative | ||||||||||
distribution of | ||||||||||
other equity | Lease | |||||||||
Loans | Bonds | instruments | liabilities | Dividends | ||||||
Items |
| (Notes 23, 29) |
| (Notes 24, 28) |
| (Note 20) |
| (Note 40) |
| payable |
As at 1 January 2021 |
| |
| |
| |
| | | |
(a) Business combination |
| — |
| — |
| — |
| — |
| — |
(b) Changes from financing cash flows: |
|
|
|
|
| |||||
Proceeds from new bank loans |
| |
| — |
| — |
| — |
| — |
Repayment of bank loans | ( | — | — | — | — | |||||
Proceeds from new bonds | — | | — | — | — | |||||
Repayment of bonds |
| — |
| ( |
| — |
| — |
| — |
Payment of lease liabilities |
| — |
| — |
| — |
| ( |
| — |
Interest paid |
| ( |
| ( |
| ( |
| — |
| — |
Dividends paid to shareholders of the Company |
| — |
| — |
| — |
| — |
| ( |
Dividends paid to non-controlling interests of the subsidiaries |
| — |
| — |
| — |
| — |
| ( |
Others | — | ( | — | — | — | |||||
(c) Exchange adjustments |
| ( | ( |
| — |
| ( | — | ||
(d) Other changes: |
|
|
|
|
|
|
|
|
|
|
New leases |
| — |
| — |
| — |
| |
| — |
Interest expenses |
| | |
| — |
| |
| — | |
Accrued cumulative distribution of other equity instrument investments |
| — |
| — |
| |
| — |
| — |
Capitalized borrowing costs |
| |
| — |
| — |
| |
| — |
2020 dividends |
| — |
| — |
| — |
| — |
| |
Early termination of lease |
| — |
| — |
| — |
| ( |
| — |
As at 31 December 2021 |
| | |
| | |
| |
F-142
Huaneng Power International, Inc.
Notes to the Financial Statements
For the years ended 31 December 2021, 2020 and 2019
(Prepared in accordance with International Financial Reporting Standards)
(Amounts expressed in thousands of RMB unless otherwise stated)
34Notes to the consolidated statement of cash flows (continued)
Cumulative | ||||||||||||
distribution of | ||||||||||||
other equity | Lease | |||||||||||
Loans | Bonds | Accrued | instruments | liabilities | Dividends | |||||||
Items |
| (Notes 23,29) |
| (Notes 24,28) |
| interests |
| (Note 20) |
| (Note 40) |
| payable |
As at 1 January 2020 |
| |
| |
| |
| | | | ||
(a) Business combination |
| |
| — |
| — |
| — |
| |
| — |
(b) Changes from financing cash flows: |
|
|
|
|
|
|
|
|
|
|
|
|
Proceeds from loans | | — | — | — | — | — | ||||||
Repayment of loans |
| ( |
| — |
| — |
| — |
| — |
| — |
Proceeds from new bonds |
| — |
| |
| — |
| — |
| — |
| — |
Repayment of bonds |
| — |
| ( |
| — |
| — |
| — |
| — |
Payment of lease liabilities |
| — |
| — |
| — |
| — |
| ( |
| — |
Interest paid |
| ( |
| ( |
| ( |
| ( |
| — |
| — |
Dividends paid to shareholders of the Company |
| — |
| — |
| — |
| — |
| — |
| ( |
Dividends paid to non-controlling interests of the subsidiaries |
| — |
| — |
| — |
| — |
| — |
| ( |
Others |
| — |
| ( |
| — |
| — |
| — |
| — |
(c) Exchange adjustments |
| ( |
| ( |
| — |
| — |
| ( |
| — |
| ||||||||||||
(d) Other changes: |
|
|
|
|
|
|
|
|
|
| ||
New leases |
| — |
| — |
| — |
| — |
| |
| — |
Interest expenses |
| |
| |
| — |
| — |
| |
| — |
Accrued cumulative distribution of other equity instrument investments |
| — |
| — |
| — |
| |
| — |
| — |
Capitalized borrowing costs |
| |
| — |
| — |
| — |
| |
| — |
2019 dividends |
| — |
| — |
| — |
| — |
| — |
| |
Early termination of lease |
| — |
| — |
| — |
| — |
| ( |
| — |
Other | — | ( | — | — | ( | — | ||||||
As at 31 December 2020 |
| |
| |
| — |
| | | |
F-143
Huaneng Power International, Inc.
Notes to the Financial Statements
For the years ended 31 December 2021, 2020 and 2019
(Prepared in accordance with International Financial Reporting Standards)
(Amounts expressed in thousands of RMB unless otherwise stated)
34Notes to the consolidated statement of cash flows (continued)
| Loans in | Cumulative | Finance lease | |||||||||||
Loans |
| disposal |
| Bonds |
| distribution |
| payables/Lease |
| |||||
(Notes | group held | (Notes | Accrued | of other equity | liabilities | Dividends | ||||||||
Items | 23,29) | for sale | 24,28) | interests | instruments | (Note 40) | payable | |||||||
| ||||||||||||||
As at 31 December 2018 |
| |
| |
| | |
| |
| |
| | |
Effect of adoption of IFRS 16 |
| — |
| — |
| — | — |
| — |
| |
| — | |
As at 1 January 2019 (restated) |
| |
| |
| | |
| |
| |
| | |
|
|
|
|
|
| |||||||||
(a) Asset acquisitions | | — | — | — | — | | — | |||||||
|
|
|
|
|
|
|
|
|
|
|
|
| ||
(b) Changes from financing cash flows: |
|
|
|
|
|
|
|
|
|
|
|
| ||
Proceeds from loans |
| |
| |
| — | — |
| — |
| — |
| — | |
Repayment of loans |
| ( |
| ( |
| — | — |
| — |
| — |
| — | |
Proceeds from new bonds |
| — |
| — |
| | — |
| — |
| — |
| — | |
Repayment of bonds |
| — |
| — |
| ( | — |
| — |
| — |
| — | |
Payment of lease liabilities |
| — |
| — |
| — | — |
| — |
| ( |
| — | |
Interest paid |
| — |
| — |
| ( | ( |
| ( |
| — |
| — | |
Dividends paid to shareholders of the Company |
| — |
| — |
| — | — |
| — |
| — |
| ( | |
Dividends paid to non-controlling interests of the subsidiaries |
| — |
| — |
| — | — |
| — |
| — |
| ( | |
Others | — | — | ( | — | — | — | — | |||||||
|
|
|
|
|
|
|
|
|
|
|
|
| ||
(c) Exchange adjustments |
| |
| — |
| — | — |
| — |
| ( |
| — | |
|
|
|
|
|
|
|
|
|
|
|
|
| ||
(d) Other changes: |
|
|
|
|
|
|
|
|
|
|
|
| ||
New leases |
| — |
| — |
| — | — |
| — |
| |
| — | |
Interest expenses |
| — |
| — |
| | |
| — |
| |
| — | |
Accrued cumulative distribution of other equity instrument investments |
| — |
| — |
| — | — |
| |
| — |
| — | |
Capitalized borrowing costs |
| — |
| — |
| — | |
| — |
| — |
| — | |
Dividends relating to 2018 |
| — |
| — |
| — | — |
| — |
| — |
| | |
Disposal group held for sale |
| — |
| ( |
| — | — |
| — |
| — |
| — | |
Others |
| |
| — |
| ( | — |
| — |
| — |
| — | |
|
|
|
|
|
|
|
|
|
|
|
|
| ||
As at 31 December 2019 |
| |
| — |
| | |
| |
| |
| |
F-144
Huaneng Power International, Inc.
Notes to the Financial Statements
For the years ended 31 December 2021, 2020 and 2019
(Prepared in accordance with International Financial Reporting Standards)
(Amounts expressed in thousands of RMB unless otherwise stated)
34Notes to the consolidated statement of cash flows (continued)
The total cash outflow for leases included in the consolidated statement of cash flows is as follows:
For the year ended 31 December | ||||
| 2021 | 2020 | ||
Within financing activities* |
| | | |
Total |
| | |
* During the year, the principal portion of lease liabilities paid was RMB
F-145
Huaneng Power International, Inc.
Notes to the Financial Statements
For the years ended 31 December 2021, 2020 and 2019
(Prepared in accordance with International Financial Reporting Standards)
(Amounts expressed in thousands of RMB unless otherwise stated)
35 | Related party balances and transactions |
The related parties of the Group that had transactions with the Group are as follows:
Names of related parties |
| Nature of relationship |
|
Huaneng Group | |||
HIPDC | |||
Huaneng Group Fuel Company and its subsidiaries | |||
Huaneng Finance | |||
Huaneng Clean Energy Research Institute | |||
Huaneng Changjiang Environmental Protection Technology Co., Ltd. | |||
Hanfeng Power | |||
Huaneng (Tianjin) Coal Gasification Power Generation Co., Ltd. | |||
Huaneng Xiapu Nuclear Power Co., Ltd. | |||
Huaneng Shidao Bay Nuclear Power Development Co., Ltd. | |||
Tiancheng Financial Leasing | |||
Shanxi Lu’an Group Zuoquan Wulihou Coal Industry Co., Ltd. | |||
Chongqing Luoyu Environmental Protection Technology Co., Ltd. | |||
Suzhou Sugao Renewables Service Co. Ltd. | |||
Shanghai Time Shipping | |||
Huaneng Yingkou Port Limited Liability Company | |||
Jiangsu Nantong Power | |||
Yantai Gangneng Bulk Cargo Terminal Co., Ltd. | |||
Shandong Luyi Power International Limited Company | |||
Huaneng (Zhangzhou, Fujian) Energy Co., Ltd. | |||
Jining Huayuan Thermal Power Co., Ltd. | |||
Huaneng Renewables Corporation Limited | |||
Huaneng Nuclear Power Development Co., Ltd. and its subsidiaries | |||
Huaneng Energy & Communications Holdings Co., Ltd. and its subsidiaries | |||
Huaneng Coal Business Sector Co., Ltd. and its subsidiaries | |||
Huaneng Capital Services and its subsidiaries | |||
Huaneng Group Technology Innovation Center | |||
Huaneng Real Estate Co., Ltd. and its subsidiaries | |||
North United Power Corporation and its subsidiaries | |||
Huaneng Lancangjiang Hydropower Co., Inc. and its subsidiaries | |||
Huaneng Inner Mongolia Eastern Energy Co., Ltd and its subsidiaries | |||
Sichuan Energy Development and its subsidiaries | |||
Huaneng Shanxi Power Generation Limited and its subsidiaries | |||
Huaneng Ningxia Energy Company Ltd. and its subsidiaries | |||
Huaneng Gansu Energy Development Company Ltd. and its subsidiaries | |||
Huaneng Tibet Yarlung Zangbo River Hydropower Development & Investment Company Ltd. and its subsidiaries | |||
China Hua Neng Group Hong Kong Limited and its subsidiaries |
F-146
Huaneng Power International, Inc.
Notes to the Financial Statements
For the years ended 31 December 2021, 2020 and 2019
(Prepared in accordance with International Financial Reporting Standards)
(Amounts expressed in thousands of RMB unless otherwise stated)
35Related party balances and transactions (continued)
The related parties of the Group that had transactions with the Group are as follows:(continued)
Names of related parties |
| Nature of relationship | |
Xi’an Thermal Power Research Institute Co., Ltd. and its subsidiaries | |||
Hong Kong Asset Management | |||
Huaneng Integrated Industry Co., Ltd and its subsidiaries | |||
Tianjin Huaneng Yangliuqing Thermal Power Industrial Co., Ltd and its subsidiaries | |||
Huaneng Gongrong No.1 (Tianjin) Equity Investment Fund Partnership (Limited Partnership) and its subsidiaries | |||
Huaneng Songyuan Power Co., Ltd. | |||
Huaneng Tendering Co., Ltd. | |||
Huaneng Caofeidian Port Co., Ltd | |||
Beijing Changping Huaneng Training Center | |||
Huaneng Overseas Enterprise Management Limited | |||
Huaneng (Dalian) Energy And Heat Co., Ltd | |||
Huaneng Nuclear Technology Research Institute Co., Ltd | |||
Huangtai #8 Power Plant | |||
Other government-related enterprises** |
* | Transactions with subsidiaries of Huaneng Group which also are associates of the Group are presented as transactions with subsidiaries of Huaneng Group for Note 35(a) and 35(b). |
** | Huaneng Group is a state-owned enterprise. In accordance with the revised IAS 24 Related Party Disclosures, government-related enterprises, other than entities under Huaneng Group, which the PRC government has control, joint control or significant influence over, are also considered as related parties of the Group (“other government-related enterprises”). |
The majority of the business activities of the Group are conducted with other government-related enterprises. For the purpose of the disclosure of the related party balances and transactions, the Group has established procedures to determine, to the extent possible, the identification of the ownership structure of its customers and suppliers as to whether they are government-related enterprises. However, many government-related enterprises have a multi-layered corporate structure and the ownership structures change over time as a result of transfers and privatization programs. Nevertheless, management believes that all material related party balances and transactions with other government-related enterprises have been adequately disclosed.
In addition to the related party information shown elsewhere in these financial statements, the following is a summary of significant related party transactions entered into in the ordinary course of business between the Group and their related parties during the year and significant balances arising from related party transactions as at the year end.
All transactions with related parties were conducted at prices and on terms mutually agreed by the parties involved, and are based on normal commercial terms or better and with reference to the prevailing local market conditions.
F-147
Huaneng Power International, Inc.
Notes to the Financial Statements
For the years ended 31 December 2021, 2020 and 2019
(Prepared in accordance with International Financial Reporting Standards)
(Amounts expressed in thousands of RMB unless otherwise stated)
35Related party balances and transactions (continued)
(a) | Related party balances |
(i) | Cash deposits in related parties |
As at 31 December | ||||
| 2021 |
| 2020 | |
Deposits in Huaneng Finance - Savings deposits |
| |
| |
For the year ended 31 December 2021, the annual interest rates for these savings deposits ranged from
(ii) | As described in Notes 23 and 29, certain loans of the Group were borrowed from Huaneng Group, Huaneng Finance, Tiancheng Financial Leasing and Hong Kong Asset Management. |
(iii) | Except for those disclosed in Notes 23 and 29, the majority of the balances with Huaneng Group, HIPDC, subsidiaries of Huaneng Group, associates, joint ventures and other related parties are unsecured and repayable within one year. As at and for the years ended 31 December 2021 and 2020, |
Accounts receivable, other receivables and assets, property, plant and equipment and other non-current assets comprise the following balances due from related parties:
As at 31 December | ||||
| 2021 |
| 2020 | |
Due from Huaneng Group |
| |
| |
Due from HIPDC |
| |
| — |
Due from associates |
| |
| — |
Due from joint ventures |
| |
| |
Due from subsidiaries of Huaneng Group |
| |
| |
Due from Huangtai #8 Power Plant* |
| |
| |
| ||||
Total |
| |
| |
* | Please refer to Note 15 for details of the provision of Huangtai #8 Power Plant. |
(iv) | Accounts payable and other liabilities, lease liabilities and other non-current liabilities comprise the following balances due to related parties: |
As at 31 December | ||||
| 2021 |
| 2020 | |
Due to Huaneng Group |
| |
| |
Due to HIPDC |
| |
| |
Due to associates | | — | ||
Due to joint ventures |
| |
| |
Due to subsidiaries of Huaneng Group |
| |
| |
Total |
| |
| |
F-148
Huaneng Power International, Inc.
Notes to the Financial Statements
For the years ended 31 December 2021, 2020 and 2019
(Prepared in accordance with International Financial Reporting Standards)
(Amounts expressed in thousands of RMB unless otherwise stated)
35 | Related party balances and transactions (continued) |
(a) | Related party balances (continued) |
(v) | As at 31 December 2021, included in long-term loans (including current portion) and short-term loans are loans payable to other government-related enterprises amounting to RMB |
The balances with government-related enterprises also included substantially all the accounts receivable due from domestic power plants of government-related power grid companies, the bank deposits placed with government-related financial institutions as well as accounts payable and other payables arising from the purchases of coal and property, plant and equipment construction and related labor service provided by other government-related enterprises. Except for bank deposits, these balances are unsecured and the majority of the balances are receivable/repayable within one year.
(b) | Related party transactions |
(i) | Procurement of goods and receiving services |
For the year ended 31 December | ||||||
| 2021 |
| 2020 |
| 2019 | |
Huaneng Group |
|
|
|
|
|
|
Other purchases |
| |
| |
| |
Subsidiaries of Huaneng Group |
|
|
|
|
| |
Purchase of coal and transportation services |
| |
| |
| |
Technical services and engineering contracting services |
| |
| |
| |
Purchase of equipment |
| |
| |
| |
Purchase of heat |
| |
| |
| |
Other purchases |
| |
| |
| |
Joint ventures of the Group |
|
|
|
| ||
Purchase of coal and transportation services |
| |
| |
| |
Entrusting other parties for power generation |
| — |
| |
| — |
Associates of the Group |
|
|
|
|
|
|
Purchase of equipment |
| — |
| |
| |
Purchase of coal and transportation services |
| |
| |
| |
Other purchases |
| — |
| — |
| |
F-149
Huaneng Power International, Inc.
Notes to the Financial Statements
For the years ended 31 December 2021, 2020 and 2019
(Prepared in accordance with International Financial Reporting Standards)
(Amounts expressed in thousands of RMB unless otherwise stated)
35Related party balances and transactions (continued)
(b) | Related party transactions (continued) |
(ii) | Sales of goods and providing services |
For the year ended 31 December | ||||||
| 2021 |
| 2020 |
| 2019 | |
Huaneng Group |
|
|
|
|
|
|
Services provided |
| |
| |
| |
HIPDC |
|
|
| |||
Services provided |
| |
| |
| |
Subsidiaries of Huaneng Group |
|
|
| |||
Service provided |
| |
| |
| |
Sales of heat |
| |
| — |
| — |
Other sales |
| |
| |
| |
Sales of coal |
| |
| — |
| — |
Joint ventures of the Group |
|
|
|
|
|
|
Service provided |
| |
| |
| |
Other sales |
| |
| |
| |
Associates of the Group |
|
|
| |||
Other sales |
| |
| — |
| — |
F-150
Huaneng Power International, Inc.
Notes to the Financial Statements
For the years ended 31 December 2021, 2020 and 2019
(Prepared in accordance with International Financial Reporting Standards)
(Amounts expressed in thousands of RMB unless otherwise stated)
35Related party balances and transactions (continued)
(b) | Related party transactions (continued) |
(iii) | Other related party transactions |
For the year ended 31 December | ||||||
| 2021 |
| 2020 |
| 2019 | |
(1) Rental charge paid |
|
|
|
|
|
|
|
| |||||
HIPDC | |
| | | ||
Subsidiaries of Huaneng Group | |
| |
| | |
Huaneng Group | — | | — | |||
(2) Rental income received |
|
|
|
|
| |
A joint venture of the Group |
| |
| |
| |
Subsidiaries of Huaneng Group |
| |
| |
| |
Huangtai #8 Power Plant | | | | |||
(3) Net loans received from/(repaid to) |
|
|
|
|
| |
Subsidiaries of Huaneng Group |
| | |
| ( | |
Huaneng Group | | — | — | |||
A joint venture of the Group |
| — | — |
| | |
(4) Interest expense on loans |
|
|
|
|
| |
Huaneng Group |
| | |
| | |
A joint venture of the Group |
| | |
| | |
Subsidiaries of Huaneng Group |
| | |
| | |
(5) Interest income on loans |
|
|
|
|
| |
Joint ventures of the Group |
| | |
| | |
(6) Provide entrusted loans | ||||||
A joint venture of the Group | | | — | |||
(7) Recover the entrusted loans |
|
|
|
|
| |
A joint venture of the Group |
| |
| — |
| — |
F-151
Huaneng Power International, Inc.
Notes to the Financial Statements
For the years ended 31 December 2021, 2020 and 2019
(Prepared in accordance with International Financial Reporting Standards)
(Amounts expressed in thousands of RMB unless otherwise stated)
35 | Related party balances and transactions (continued) |
(b) | Related party transactions (continued) |
(iii) | Other related party transactions (continued) |
For the year ended 31 December | ||||||
| 2021 |
| 2020 |
| 2019 | |
(8) Capital injection from a subsidiary of Huaneng Group |
|
|
|
|
|
|
A subsidiary of Huaneng Group |
| | | | ||
(9) Capital injection to |
|
|
|
|
|
|
Subsidiaries of Huaneng Group | | | | |||
Associates of the Group | | | | |||
Joint ventures of the Group |
| | | | ||
(10) Entrusted management fee |
|
|
| |||
Huaneng Group |
| | | | ||
(11) Trusteeship management income |
|
|
| |||
Huaneng Group | | | | |||
Huangtai #8 Power Plant |
| | | — | ||
(12) Net proceeds received from an investee with significant influence |
|
|
| |||
Huangtai #8 Power Plant |
| ( |
| |
| |
(13) Profit compensation received |
|
|
| |||
Huaneng Group |
| — |
| |
| |
(14) Acquisition consideration |
|
|
|
| ||
Subsidiaries of Huaneng Group |
| — |
| |
| — |
(15) Disposal consideration |
|
|
|
|
| |
Subsidiaries of Huaneng Group |
| — |
| — |
| |
F-152
Huaneng Power International, Inc.
Notes to the Financial Statements
For the years ended 31 December 2021, 2020 and 2019
(Prepared in accordance with International Financial Reporting Standards)
(Amounts expressed in thousands of RMB unless otherwise stated)
35 | Related party balances and transactions (continued) |
(b) | Related party transactions (continued) |
(iii) | Other related party transactions (continued) |
Transactions with government-related enterprises
For the years ended 31 December 2021 and 2020, apart from overseas segment, the Group sold substantially all its products to local government-related power grid companies. Please refer to Note 5 for details of sales information to major power grid companies.
For the years ended 31 December 2021 and 2020, other collectively-significant transactions with government-related enterprises also included a large portion of domestic fuel purchases, property, plant and equipment construction and related labor employed.
(c) | Balance of Guarantees |
As at 31 December | ||||
| 2021 |
| 2020 | |
(i) Long-term loans guaranteed by |
|
|
|
|
- Huaneng Group |
| |
| |
(ii) Short-term loans guaranteed by |
|
|
| |
- Joint ventures of the Group |
| |
| — |
(d) | Pre-tax benefits and social insurance of key management personnel |
For the year ended 31 December | ||||||
| 2021 |
| 2020 |
| 2019 | |
Salaries |
| | |
| | |
Pension |
| | |
| | |
Total |
| | |
| |
(e) | Related party commitments |
Related party commitments which were contracted but not recognized in the consolidated statement of financial position as at the end of the reporting period are as follows:
(i) | Capital commitments |
As at 31 December | ||||
| 2021 |
| 2020 | |
Subsidiaries of Huaneng Group |
| |
| |
F-153
Huaneng Power International, Inc.
Notes to the Financial Statements
For the years ended 31 December 2021, 2020 and 2019
(Prepared in accordance with International Financial Reporting Standards)
(Amounts expressed in thousands of RMB unless otherwise stated)
35 | Related party balances and transactions (continued) |
(e) | Related party commitments (continued) |
(ii) | Fuel purchase and transportation commitments |
As at 31 December | ||||
| 2021 |
| 2020 | |
Subsidiaries of Huaneng Group | |
| | |
A joint venture of the Group | |
| |
(f) | Applicability of the Listing Rules relating to connected transactions |
The related party transactions with HIPDC, Huaneng Group and its subsidiaries in respect of the purchase of coal and transportation services, equipment, technical services and engineering contracting services, leasing rental and interest expenses incurred by the Group as disclosed in Note 35(b) constitute connected transactions or continuing connected transactions as defined in Chapter 14A of the Listing Rules. The disclosures required by Chapter 14A of the Listing Rules are provided in the section “Connected transactions” of the Directors’ Report of the Group for the year ended 31 December 2021.
F-154
Huaneng Power International, Inc.
Notes to the Financial Statements
For the years ended 31 December 2021, 2020 and 2019
(Prepared in accordance with International Financial Reporting Standards)
(Amounts expressed in thousands of RMB unless otherwise stated)
36 | Labor cost |
Other than the salaries and staff welfare, the labor cost of the Group mainly comprises the following:
All PRC employees of the Group are entitled to a monthly pension upon their retirements. The PRC government is responsible for the pension liability to these employees on retirement. The Group is required to make contributions to the publicly administered retirement plan for its PRC employees at a specified rate, currently set at
In addition, the Group has also implemented a supplementary defined contribution retirement scheme for PRC employees. Under this scheme, the employees are required to make a specified contribution based on the number of years of service with the Group, and the Group is required to make a contribution equal to two to four times the employees’ contributions. The employees will receive the total contributions upon their retirement. For the year ended 31 December 2021, the contributions to the supplementary defined contribution retirement scheme paid by the Group amounted to approximately RMB
SinoSing Power and its subsidiaries in Singapore appropriate what at a specified rate, currently set at
The Group has no further obligation for post-retirement benefits beyond the annual contributions made above.
In addition, the Group also makes contributions of housing funds and social insurance to the social security institutions at specified rates of the basic salary and no more than the upper limit. The housing funds and social insurance contributions paid by the Group and its subsidiaries amounted to approximately RMB
F-155
Huaneng Power International, Inc.
Notes to the Financial Statements
For the years ended 31 December 2021, 2020 and 2019
(Prepared in accordance with International Financial Reporting Standards)
(Amounts expressed in thousands of RMB unless otherwise stated)
37 | Directors’, supervisors’ and senior management’s emoluments |
(a) | Pre-tax benefits and social insurance of directors and supervisors |
The remuneration of every director and supervisor of the Company for the year ended 31 December 2021 is set out below:
| Fees |
| Basic salaries |
| Performance bonuses |
| Pension |
| Total | |
| ||||||||||
Name of director |
|
|
|
|
|
|
|
|
|
|
Mr. Zhao Keyu1 |
| — |
| |
| |
| |
| |
Mr. Zhaoping1 |
| — |
| |
| |
| |
| |
Mr. Huang Jian |
| — |
| — |
| — |
| — |
| — |
Mr. Wang Kui |
| — |
| — |
| — |
| — |
| — |
Mr. Lu Fei |
| — |
| — |
| — |
| — |
| — |
Mr. Teng Yu |
| — |
| — |
| — |
| — |
| — |
Mr. Mi Dabin |
| — |
| — |
| — |
| — |
| — |
Mr. Cheng Heng |
| — |
| — |
| — |
| — |
| — |
Mr. Li Haifeng |
| — |
| — |
| — |
| — |
| — |
Mr. Lin Chong |
| — |
| — |
| — |
| — |
| — |
Mr. Xu Mengzhou |
| |
| — |
| — |
| — |
| |
Mr. Liu Jizhen |
| |
| — |
| — |
| — |
| |
Mr. Xu Haifeng |
| |
| — |
| — |
| — |
| |
Mr. Zhang Xianzhi |
| |
| — |
| — |
| — |
| |
Mr. Xia Qing |
| |
| — |
| — |
| — |
| |
|
|
|
|
|
|
|
|
|
|
|
Sub-total |
| |
| |
| |
| |
| |
|
|
|
|
|
|
|
|
|
|
|
Name of supervisor |
|
|
|
|
|
|
|
|
|
|
Mr. Li Shuqing |
| — |
| — |
| — |
| — |
| — |
Mr. Mu Xuan |
| — |
| — |
| — |
| — |
| — |
Mr. Ye Cai2 |
| — |
| — |
| — |
| — |
| — |
Mr. Gu Jianguo |
| — |
| — |
| — |
| — |
| — |
Ms. Zhang Xiaojun3 |
| — |
| |
| |
| |
| |
Mr. Xu Jianping |
| — |
| |
| |
| |
| |
Mr. Zhu Tong4 | — | | | | | |||||
Mr. Xia Aidong5 |
| — |
| — |
| — |
| — |
| — |
|
|
|
|
|
|
|
|
|
|
|
Sub-total |
| — |
| |
| |
| |
| |
|
|
|
|
|
|
|
|
|
|
|
Total |
| |
| |
| |
| |
| |
F-156
Huaneng Power International, Inc.
Notes to the Financial Statements
For the years ended 31 December 2021, 2020 and 2019
(Prepared in accordance with International Financial Reporting Standards)
(Amounts expressed in thousands of RMB unless otherwise stated)
37 | Directors’, supervisors’ and senior management’s emoluments (continued) |
(a) | Pre-tax benefits and social insurance of directors and supervisors (continued) |
The remuneration of every director and supervisor of the Company for the year ended 31 December 2020 is set out below:
Performance | ||||||||||
| Fees |
| Basic salaries |
| bonuses |
| Pension |
| Total | |
Name of director |
|
|
|
|
|
|
|
|
|
|
Mr. Zhao Keyu |
| — |
| |
| |
| |
| |
Mr. Zhaoping |
| — |
| |
| |
| |
| |
Mr. Huang Jian |
| — |
| — |
| — |
| — |
| — |
Mr. Wang Kui |
| — |
| — |
| — |
| — |
| — |
Mr. Lu Fei |
| — |
| — |
| — |
| — |
| — |
Mr. Teng Yu |
| — |
| — |
| — |
| — |
| — |
Mr. Mi Dabin |
| — |
| — |
| — |
| — |
| — |
Mr. Cheng Heng |
| — |
| — |
| — |
| — |
| — |
Mr. Li Haifeng |
| — |
| — |
| — |
| — |
| — |
Mr. Lin Chong |
| — |
| — |
| — |
| — |
| — |
Mr. Xu Mengzhou |
| |
| — |
| — |
| — |
| |
Mr. Liu Jizhen |
| |
| — |
| — |
| — |
| |
Mr. Xu Haifeng |
| |
| — |
| — |
| — |
| |
Mr. Zhang Xianzhi |
| |
| — |
| — |
| — |
| |
Mr. Xia Qing | | — | — | — | | |||||
Mr. Shu Yinbiao6 | — | — | — | — | — | |||||
Mr. Wang Yongxiang7 | — | — | — | — | — | |||||
Mr. Guo Hongbo8 | — | — | — | — | — | |||||
Mr. Yue Heng7 | | — | — | — | | |||||
| ||||||||||
Sub-total |
| |
| |
| |
| |
| |
Name of supervisor |
|
|
|
|
|
|
|
|
|
|
Mr. Li Shuqing |
| — |
| — |
| — |
| — |
| — |
Mr. Mu Xuan |
| — |
| — |
| — |
| — |
| — |
Mr. Ye Cai |
| — |
| — |
| — |
| — |
| — |
Mr. Gu Jianguo |
| — |
| — |
| — |
| — |
| — |
Ms. Zhang Xiaojun |
| — |
| |
| |
| |
| |
Mr. Xu Jianping |
| — |
| |
| |
| |
| |
Mr. Ye Xiangdong7 | — | — | — | — | — | |||||
Ms. Zhang Mengjiao7 |
| — |
| — |
| — |
| — |
| — |
Mr. Zhang Xiancheng7 | — | |||||||||
| ||||||||||
Sub-total | — | | | |||||||
| ||||||||||
Total |
| |
| |
| |
| |
| |
F-157
Huaneng Power International, Inc.
Notes to the Financial Statements
For the years ended 31 December 2021, 2020 and 2019
(Prepared in accordance with International Financial Reporting Standards)
(Amounts expressed in thousands of RMB unless otherwise stated)
37 | Directors’, supervisors’ and senior management’s emoluments (continued) |
(a) | Pre-tax benefits and social insurance of directors and supervisors (continued) |
The remuneration of every director and supervisor of the Company for the year ended 31 December 2019 is set out below:
Performance | ||||||||||
| Fees |
| Basic salaries |
| bonuses |
| Pension |
| Total | |
Name of director |
|
|
|
|
|
|
|
|
|
|
Mr. Zhao Keyu |
| — |
| — |
| — |
| — |
| — |
Mr. Shu Yinbiao |
| — |
| — |
| — |
| — |
| — |
Mr. Cao Peixi |
| — |
| — |
| — |
| — |
| — |
Mr. Huang Jian |
| — |
| — |
| — |
| — |
| — |
Mr. Wang Yongxiang |
| — |
| — |
| — |
| — |
| — |
Mr. Mi Dabin |
| — |
| — |
| — |
| — |
| — |
Mr. Guo Hongbo |
| — |
| — |
| — |
| — |
| — |
Mr. Cheng Heng |
| — |
| — |
| — |
| — |
| — |
Mr. Lin Chong |
| — |
| — |
| — |
| — |
| — |
Mr. Yue Heng |
| |
| — |
| — |
| — |
| |
Mr. Xu Mengzhou |
| |
| — |
| — |
| — |
| |
Mr. Liu Jizhen |
| |
| — |
| — |
| — |
| |
Mr. Xu Haifeng |
| |
| — |
| — |
| — |
| |
Mr. Zhang Xianzhi |
| |
| — |
| — |
| — |
| |
Sub-total | — |
| — |
| — | |||||
|
| |||||||||
Name of supervisor | ||||||||||
Mr. Ye Xiangdong |
| — |
| — | — | — | — | |||
Mr. Mu Xuan |
| — |
| — | — | — | — | |||
Ms. Zhang Mengjiao |
| — |
| — | — | — | — | |||
Mr. Gu Jianguo |
| — |
| — | — | — | — | |||
Ms. Zhang Xiaojun |
| — |
| |
| |
| |
| |
Mr. Zhang Xiancheng | — | |
| |
| |
| | ||
Sub-total | — | | | | | |||||
|
| |||||||||
Total | |
| |
| |
| |
| |
1 | Remuneration for the whole year ended 31 December 2021 |
2 | Appointed on 16 June 2020 and resigned on 22 June 2021 |
3 | Resigned on 9 June 2021 |
4 | Appointed on 9 June 2021 |
5 | Appointed on 22 June 2021 |
6 | Resigned on 5 March 2020 |
7 | Resigned on 16 June 2020 |
8 | Resigned on 22 December 2020 |
F-158
Huaneng Power International, Inc.
Notes to the Financial Statements
For the years ended 31 December 2021, 2020 and 2019
(Prepared in accordance with International Financial Reporting Standards)
(Amounts expressed in thousands of RMB unless otherwise stated)
37 | Directors’, supervisors’ and senior management’s emoluments (continued) |
(a) | Pre-tax benefits and social insurance of directors and supervisors (continued) |
During the year,
During the year,
(b) | Five highest paid individuals |
The five individuals whose emoluments were the highest in the Group for the year included
For the year ended 31 December | ||||||
| 2021 |
| 2020 |
| 2019 | |
Basic salaries |
| | |
| | |
Performance bonuses |
| | |
| | |
Pension |
| | |
| | |
Total |
| | |
| |
38 | Commitments |
(a) | Capital commitments |
Capital commitments mainly relate to the construction of new power projects, certain ancillary facilities and renovation projects for existing power plants. Details of such commitments are as follows:
As at 31 December | ||||
| 2021 |
| 2020 | |
Contracted, but not provided |
| |
| |
F-159
Huaneng Power International, Inc.
Notes to the Financial Statements
For the years ended 31 December 2021, 2020 and 2019
(Prepared in accordance with International Financial Reporting Standards)
(Amounts expressed in thousands of RMB unless otherwise stated)
38 | Commitments (continued) |
(b) | Fuel purchase commitments |
As at 31 December 2021, the Group has entered into major fuel purchase commitment amounting to approximately RMB
The Group has entered into various long-term fuel supply agreements with various suppliers in securing fuel supply for various periods. All the agreements require minimum, maximum or forecasted volume purchases and subject to certain termination provisions. Related purchase commitments are as follows:
As at 31 December 2021 | ||||||
| Periods |
| Purchase quantities |
| Estimated unit costs (RMB) | |
A government-related enterprise |
|
|
| |||
| ||||||
A government-related enterprise |
|
|
| |||
|
|
|
| |||
|
|
|
| |||
A government-related enterprise |
|
|
| |||
|
|
|
|
| ||
Other suppliers |
|
|
| |||
|
|
| ||||
|
|
| ||||
|
|
| ||||
F-160
Huaneng Power International, Inc.
Notes to the Financial Statements
For the years ended 31 December 2021, 2020 and 2019
(Prepared in accordance with International Financial Reporting Standards)
(Amounts expressed in thousands of RMB unless otherwise stated)
38 | Commitments (continued) |
(b) | Fuel purchase commitments (continued) |
As at 31 December 2020 | ||||||
| Periods |
| Purchase quantities |
| Estimated unit costs (RMB) | |
A government-related enterprise |
|
|
| |||
A government-related enterprise |
|
|
| |||
|
|
| ||||
|
|
| ||||
A government-related enterprise |
|
|
| |||
Other suppliers |
|
|
| |||
|
|
| ||||
|
|
| ||||
|
|
| ||||
|
|
|
*
**
F-161
Huaneng Power International, Inc.
Notes to the Financial Statements
For the years ended 31 December 2021, 2020 and 2019
(Prepared in accordance with International Financial Reporting Standards)
(Amounts expressed in thousands of RMB unless otherwise stated)
39 | Non-controlling interests |
The following table summarizes the information relating to each subsidiary of the Group that has material non-controlling interests (“NCI”):
Other |
| |||||||||||||||||||||
individually |
| |||||||||||||||||||||
Beijing Co- | Luohuang | Yueyang | Shidongkou | Yangliuqing | Shandong | immaterial | ||||||||||||||||
| Qinbei Power |
| generation |
| Power |
| Weihai Power |
| Jinling Power |
| Power |
| Power |
| Co-generation |
| Power |
| subsidiaries |
| Total | |
| ||||||||||||||||||||||
NCI percentage |
| | % | | % | | % | | % | | % | | % | | % | | % | | % | |||
31 December 2021 | ||||||||||||||||||||||
Non-current assets |
| |
| |
| |
| |
| |
| |
| |
| |
| | ||||
Current assets |
| |
| |
| |
| |
| |
| |
| |
| |
| | ||||
Non-current liabilities |
| ( |
| ( |
| ( |
| ( |
| ( |
| ( |
| ( |
| ( |
| ( | ||||
Current liabilities |
| ( |
| ( |
| ( |
| ( |
| ( |
| ( |
| ( |
| ( |
| ( |
| |||
Net assets |
| |
| |
| |
| |
| |
| |
| |
| |
| |
| |||
Carrying amount of NCI | | | | | | | | | | | | |||||||||||
|
|
|
|
|
|
|
|
|
| |||||||||||||
Revenue |
| |
| |
| |
| |
| |
| |
| |
| |
| | ||||
Net (loss)/profit |
| ( |
| |
| |
| ( |
| ( |
| ( |
| ( |
| ( |
| ( | ||||
Total comprehensive (loss)/ income |
| ( |
| |
| |
| ( |
| ( |
| ( |
| ( |
| ( |
| ( | ||||
(Loss)/profit allocated to NCI |
| ( |
| |
| |
| ( |
| ( |
| ( |
| ( |
| ( |
| ( | ( | ( | ||
Other comprehensive loss allocated to NCI | — | — | — | — | — | — | — | — | ( | ( | ( | |||||||||||
| ||||||||||||||||||||||
Cash flows from operating activities | | | ( | ( | ( | ( | ( | ( | ( | |||||||||||||
Cash flows from investment activities | ( | ( | | ( | ( | ( | ( | ( | ( | |||||||||||||
Cash flows from financing activities | | ( | | | | | | | | |||||||||||||
Net increase/(decrease) in cash and cash equivalents | | ( | | ( | | ( | ( | ( | | |||||||||||||
Dividends paid to NCI | — | | | | | — | | — | |
Other | ||||||||||||||||||||||
individually | ||||||||||||||||||||||
Qinbei | Beijing | Luohuang | Weihai | Jinling | Yueyang | Shidongkou | Yangliuqing | Shandong | immaterial | |||||||||||||
| Power |
| Co-generation |
| Power |
| Power |
| Power |
| Power |
| Power |
| Co-generation |
| Power |
| subsidiaries |
| Total | |
NCI percentage |
| | % | | % | | % | | % | | % | | % | | % | | % | | % |
|
|
|
31 December 2020 |
|
|
|
|
|
|
|
|
|
|
|
|
|
|
|
|
|
|
|
|
|
|
Non-current assets |
| |
| |
| |
| |
| |
| |
| |
| |
| |
|
|
|
|
Current assets |
| |
| |
| |
| |
| |
| |
| |
| |
| |
|
|
|
|
Non-current liabilities |
| ( |
| ( |
| ( |
| ( |
| ( |
| ( |
| ( |
| ( |
| ( |
|
|
|
|
Current liabilities |
| ( |
| ( |
| ( |
| ( |
| ( |
| ( |
| ( |
| ( |
| ( |
|
|
|
|
Net assets |
| |
| |
| |
| |
| |
| |
| |
| |
| |
|
|
|
|
Carrying amount of NCI |
| |
| |
| |
| |
| |
| |
| |
| |
| |
| |
| |
| ||||||||||||||||||||||
Revenue |
| |
| |
| |
| |
| |
| |
| |
| |
| |
|
| ||
Net (loss)/profit |
| ( |
| |
| |
| |
| |
| |
| |
| |
| ( |
|
| ||
Total comprehensive (loss)/ income |
| ( |
| |
| |
| |
| |
| |
| |
| |
| ( |
|
| ||
(Loss)/profit allocated to NCI |
| ( |
| |
| |
| |
| |
| |
| |
| |
| ( |
| |
| |
Other comprehensive loss allocated to NCI |
| - |
| — |
| — |
| — |
| — |
| — |
| — |
| — |
| ( |
| ( |
| ( |
| ||||||||||||||||||||||
Cash flows from operating activities |
| |
| |
| |
| |
| |
| |
| |
| |
| |
|
|
|
|
Cash flows from investment activities |
| ( |
| ( |
| ( |
| ( |
| ( |
| |
| ( |
| ( |
| ( |
|
|
|
|
Cash flows from financing activities |
| ( |
| ( |
| ( |
| ( |
| ( |
| ( |
| ( |
| ( |
| ( |
|
|
|
|
Net increase/(decrease) in cash and cash equivalents |
| |
| ( |
| |
| |
| ( |
| |
| ( |
| ( |
| |
|
|
|
|
Dividends paid to NCI |
| — |
| |
| |
| — |
| |
| |
| |
| — |
| |
|
|
|
|
F-162
Huaneng Power International, Inc.
Notes to the Financial Statements
For the years ended 31 December 2021, 2020 and 2019
(Prepared in accordance with International Financial Reporting Standards)
(Amounts expressed in thousands of RMB unless otherwise stated)
39Non-controlling interests (continued)
The following table summarizes the information relating to each subsidiary of the Group that has material non-controlling interests (“NCI”): (continued)
Other | ||||||||||||||||||||||
individually | ||||||||||||||||||||||
Qinbei | Beijing | Luohuang | Weihai | Jinling | Yueyang | Shidongkou | Yangliuqing | Shandong | immaterial | |||||||||||||
| Power |
| Co-generation |
| Power |
| Power |
| Power |
| Power |
| Power |
| Co-generation |
| Power |
| subsidiaries |
| Total | |
NCI percentage |
| | % | | % | | % | | % | | % | | % | | % | | % | | % |
|
|
|
31 December 2019 |
|
|
|
|
|
|
|
|
|
|
|
|
|
|
|
|
|
|
|
| ||
Non-current assets |
| |
| |
| |
| |
| |
| |
| |
| |
| |
|
|
|
|
Current assets |
| |
| |
| |
| |
| |
| |
| |
| |
| |
|
|
|
|
Non-current liabilities |
| ( |
| ( |
| ( |
| ( |
| ( |
| ( |
| ( |
| ( |
| ( |
|
|
|
|
Current liabilities |
| ( |
| ( |
| ( |
| ( |
| ( |
| ( |
| ( |
| ( |
| ( |
|
|
|
|
Net assets |
| |
| |
| |
| |
| |
| |
| |
| |
| |
|
|
|
|
Carrying amount of NCI |
| |
| |
| |
| |
| |
| |
| |
| |
| |
| |
| |
Revenue |
| |
| |
| |
| |
| |
| |
| |
| |
| |
|
|
|
|
Net profit/(loss) |
| |
| |
| |
| |
| |
| |
| |
| |
| ( |
|
|
|
|
Total comprehensive income/(loss) |
| |
| |
| |
| |
| |
| |
| |
| |
| ( |
|
|
|
|
Profit/(loss) allocated to NCI |
| |
| |
| |
| |
| |
| |
| |
| |
| ( |
| ( |
| |
Other comprehensive loss allocated to NCI |
| — |
| — |
| — |
| — |
| — |
| — |
| — |
| — |
| ( |
| ( |
| ( |
Cash flows from operating activities |
| |
| |
| |
| |
| |
| |
| |
| |
| |
|
|
|
|
Cash flows from investment activities |
| ( |
| ( |
| ( |
| ( |
| ( |
| ( |
| ( |
| ( |
| ( |
|
|
|
|
Cash flows from financing activities |
| ( |
| ( |
| ( |
| ( |
| ( |
| ( |
| ( |
| ( |
| ( |
|
|
|
|
Net (decrease)/increase in cash and cash equivalents |
| ( |
| |
| |
| ( |
| ( |
| |
| ( |
| ( |
| ( |
|
|
|
|
Dividends paid to NCI |
| — |
| |
| — |
| |
| |
| |
| |
| |
| |
|
|
|
|
F-163
Huaneng Power International, Inc.
Notes to the Financial Statements
For the years ended 31 December 2021, 2020 and 2019
(Prepared in accordance with International Financial Reporting Standards)
(Amounts expressed in thousands of RMB unless otherwise stated)
40 | Leases |
The Group as a lessee
(a) | Right-of-use assets |
The carrying amounts of the Group’s right-of-use assets and the movements during the year are as follows:
Right-of-use assets | ||||||||||||
|
| Electric |
| Trans- |
|
|
| |||||
utility plant | portation | Land use | ||||||||||
Buildings |
| in service |
| facilities | rights* | Others | Total | |||||
As at 1 January 2021 |
| |
| |
| |
| |
| |
| |
Additions |
| |
| |
| |
| |
| |
| |
Depreciation charge |
| ( |
| ( |
| ( |
| ( |
| ( |
| ( |
Disposals/write-off |
| — |
| ( |
| — |
| ( |
| ( |
| ( |
Early termination |
| ( |
| ( |
| — |
| ( |
| — |
| ( |
Currency translation differences |
| ( |
| ( |
| ( |
| ( |
| — |
| ( |
As at 31 December 2021 |
| |
| |
| |
| |
| |
| |
Right-of-use assets | ||||||||||||
Electric utility | Trans- | |||||||||||
plant in | portation | Land use | ||||||||||
| Buildings |
| service |
| facilities |
| rights* |
| Others |
| Total | |
As at 1 January 2020 |
| |
| |
| |
| |
| |
| |
Additions |
| |
| |
| — |
| |
| |
| |
Business Combination |
| — |
| — |
| — |
| |
| — |
| |
Depreciation charge |
| ( |
| ( |
| ( |
| ( |
| ( |
| ( |
Disposals/write-off | — | ( | — | ( | — | ( | ||||||
Early termination | ( | ( | — | — | ( | ( | ||||||
Reclassification |
| — |
| ( |
| — |
| |
| ( |
| — |
Currency translation differences |
| ( |
| ( |
| ( |
| ( |
| — |
| ( |
As at 31 December 2020 |
| |
| |
| |
| |
| |
| |
* Land use rights without ownership certificates
As at 31 December 2021, the Group was in the process of applying for the ownership certificates for certain land use rights with an aggregate net book value of RMB
As at 31 December 2021, certain land use right with net book value of RMB
F-164
Huaneng Power International, Inc.
Notes to the Financial Statements
For the years ended 31 December 2021, 2020 and 2019
(Prepared in accordance with International Financial Reporting Standards)
(Amounts expressed in thousands of RMB unless otherwise stated)
40Leases (continued)
The Group as a lessee (continued)
(b) | Lease liabilities |
The carrying amount of lease liabilities and the movements during the year are as follows:
As at 31 | ||||
December | ||||
| 2021 | 2020 | ||
Carrying amount at 1 January |
| | | |
New leases |
| | | |
Business Combination | — | | ||
Accretion of interest recognized during the year |
| | | |
Currency translation differences |
| ( | ( | |
Payments |
| ( | ( | |
Early termination | ( | ( | ||
Carrying amount at 31 December |
| | | |
Analyzed into: |
| |||
Current portion |
| | | |
Non-current portion |
| | |
The maturity profile of the Group’s lease liabilities as at the end of the reporting period, based on the contractual undiscounted payments, is as follows:
As at 31 December | ||||
| 2021 | 2020 | ||
Within 1 year |
| | | |
After 1 year but within 2 years |
| | | |
After 2 years but within 3 years |
| | | |
After 3 years |
| | | |
Subtotal | ||||
Unrecognized finance fees | ||||
Total |
| | |
F-165
Huaneng Power International, Inc.
Notes to the Financial Statements
For the years ended 31 December 2021, 2020 and 2019
(Prepared in accordance with International Financial Reporting Standards)
(Amounts expressed in thousands of RMB unless otherwise stated)
40Leases (continued)
The Group as a lessee (continued)
(b) | Lease liabilities (continued) |
The amounts recognized in profit or loss in relation to leases are as follows:
As at 31 | ||||
December | ||||
| 2021 | 2020 | ||
Interest on lease liabilities |
| | | |
Depreciation charge of right-of-use assets |
| | | |
Expense relating to short-term leases |
| | | |
Expense relating to leases of low-value assets |
| | | |
Total amount recognized in profit |
| | |
(c) | Extension and termination options |
The Group has several lease contracts that include extension and termination options. These options are negotiated by management to provide flexibility in managing the leased-asset portfolio and they are aligned with the Group’s business needs. As at 31 December 2021, there were neither extension options that the Group does not expect to exercise nor significant termination options that the Group expects to exercise.
(d) | Variable lease payments |
The Group does not have variable lease payments that depend on an index or a rate, and amounts expected to be paid under residual value guarantees.
(e) | The total cash outflow for leases is disclosed in note 34 to these financial statements. |
The Group as a lessor
(a) | Finance lease |
The Group’s finance lease is mainly related to Ruyi Pakistan Energy, SinoSing Power and Shandong Maintenance Company.
Ruyi Pakistan Energy entered into a power purchase agreement with CPPA-G to sell all of the electricity produced with a regulated tariff mechanism approved by the Pakistan National Electric Power Regulatory Authority. In accordance with the power purchase agreement and tariff mechanism, almost all the risks and rewards in relation to the power assets were in substance transferred to CPPA-G and therefore the assets were accounted for as a finance lease to CPPA-G.
SinoSing Power’s subsidiary, Tuas Group, entered into two build-to-suit agreements with third parties, which involve sale and leaseback arrangements and the provision of operation maintenance services.
F-166
Huaneng Power International, Inc.
Notes to the Financial Statements
For the years ended 31 December 2021, 2020 and 2019
(Prepared in accordance with International Financial Reporting Standards)
(Amounts expressed in thousands of RMB unless otherwise stated)
40 | Leases (continued) |
The Group as a lessor (continued)
(a) | Finance lease (continued) |
Shandong Maintenance Company entered into the Energy Management Contract with Huangtai #8 Power Plant to provide energy saving equipment construction services. Pursuant to the agreement, all the risk and rewards in relation to the energy saving equipment were in substance transferred to Huangtai#8 Power Plant as the benefit could be reliably estimated during the contract period.
Total finance lease income recognized by the Group for the year ended 31 December 2021 was RMB
As at 31 December 2021, the maturity analysis of the Group’s finance lease receivables is as follows:
As at 31 December | ||||
| 2021 | 2020 | ||
Within 1 year |
| | | |
After 1 year but within 2 years |
| | | |
After 2 years but within 3 years |
| | | |
After 3 years but within 4 years |
| | | |
After 4 years but within 5 years |
| | | |
After 5 years |
| | | |
Total undiscounted finance lease payments |
| | | |
Unearned finance income |
| ( | ( | |
Allowance for ECL |
| ( | ( | |
Total finance lease receivables as at 31 December (note 15 and 17) |
| | |
(b) | Operating lease |
The Group leases certain property, plant and equipment under operating lease arrangements. Rental income recognized by the Group for the year ended 31 December 2021 was RMB
F-167
Huaneng Power International, Inc.
Notes to the Financial Statements
For the years ended 31 December 2021, 2020 and 2019
(Prepared in accordance with International Financial Reporting Standards)
(Amounts expressed in thousands of RMB unless otherwise stated)
40 | Leases (continued) |
The Group as a lessor (continued)
(b) | Operating lease (Continued) |
As at 31 December 2020 and 2021, the undiscounted lease payments receivable by the Group in future periods under non-cancellable operating leases with its tenants are as follows:
As at 31 December | ||||
| 2021 | 2020 | ||
Within 1 year |
| | | |
After 1 year but within 2 years |
| | | |
After 2 years but within 3 years |
| | | |
After 3 years but within 4 years |
| | | |
After 4 years but within 5 years |
| | | |
After 5 years |
| | | |
Total |
| | |
F-168
Huaneng Power International, Inc.
Notes to the Financial Statements
For the years ended 31 December 2021, 2020 and 2019
(Prepared in accordance with International Financial Reporting Standards)
(Amounts expressed in thousands of RMB unless otherwise stated)
41 | Subsequent events |
Up to the annual report date, there was no material subsequent event.
These financial statements were approved for issue by the Board of Directors on 21 April 2022 and were signed on its behalf.
Zhao Keyu | Zhao Ping |
Director | Director |
F-169