FYFALSE20200000926326us-gaap:AccountingStandardsUpdate201613MemberP1YP1Yus-gaap:AccruedLiabilitiesCurrentus-gaap:AccruedLiabilitiesCurrent0.0102751P1YP1YP1Y3252500009263262020-01-012020-12-31iso4217:USD00009263262020-06-30xbrli:shares00009263262021-02-1700009263262020-12-3100009263262019-12-31iso4217:USDxbrli:shares0000926326us-gaap:ProductMember2020-01-012020-12-310000926326us-gaap:ProductMember2019-01-012019-12-310000926326us-gaap:ProductMember2018-01-012018-12-310000926326us-gaap:ServiceMember2020-01-012020-12-310000926326us-gaap:ServiceMember2019-01-012019-12-310000926326us-gaap:ServiceMember2018-01-012018-12-3100009263262019-01-012019-12-3100009263262018-01-012018-12-310000926326us-gaap:CommonStockMember2017-12-310000926326us-gaap:TreasuryStockMember2017-12-310000926326us-gaap:AdditionalPaidInCapitalMember2017-12-310000926326us-gaap:RetainedEarningsMember2017-12-310000926326us-gaap:AccumulatedOtherComprehensiveIncomeMember2017-12-3100009263262017-12-310000926326us-gaap:RetainedEarningsMember2018-01-012018-12-310000926326us-gaap:AccumulatedOtherComprehensiveIncomeMember2018-01-012018-12-310000926326us-gaap:CommonStockMember2018-01-012018-12-310000926326us-gaap:AdditionalPaidInCapitalMember2018-01-012018-12-310000926326us-gaap:CommonStockMember2018-12-310000926326us-gaap:TreasuryStockMember2018-12-310000926326us-gaap:AdditionalPaidInCapitalMember2018-12-310000926326us-gaap:RetainedEarningsMember2018-12-310000926326us-gaap:AccumulatedOtherComprehensiveIncomeMember2018-12-3100009263262018-12-310000926326us-gaap:RetainedEarningsMember2019-01-012019-12-310000926326us-gaap:AccumulatedOtherComprehensiveIncomeMember2019-01-012019-12-310000926326us-gaap:CommonStockMember2019-01-012019-12-310000926326us-gaap:AdditionalPaidInCapitalMember2019-01-012019-12-310000926326us-gaap:CommonStockMember2019-12-310000926326us-gaap:TreasuryStockMember2019-12-310000926326us-gaap:AdditionalPaidInCapitalMember2019-12-310000926326us-gaap:RetainedEarningsMember2019-12-310000926326us-gaap:AccumulatedOtherComprehensiveIncomeMember2019-12-310000926326us-gaap:RetainedEarningsMember2020-01-012020-12-310000926326us-gaap:AccumulatedOtherComprehensiveIncomeMember2020-01-012020-12-310000926326us-gaap:AdditionalPaidInCapitalMember2020-01-012020-12-310000926326us-gaap:CommonStockMember2020-01-012020-12-310000926326us-gaap:TreasuryStockMember2020-01-012020-12-310000926326srt:CumulativeEffectPeriodOfAdoptionAdjustmentMemberus-gaap:RetainedEarningsMember2019-12-310000926326srt:CumulativeEffectPeriodOfAdoptionAdjustmentMember2019-12-310000926326us-gaap:CommonStockMember2020-12-310000926326us-gaap:TreasuryStockMember2020-12-310000926326us-gaap:AdditionalPaidInCapitalMember2020-12-310000926326us-gaap:RetainedEarningsMember2020-12-310000926326us-gaap:AccumulatedOtherComprehensiveIncomeMember2020-12-31omcl:segmentxbrli:pure0000926326omcl:TenLargestGroupPurchasingOrganizationsGPOsMemberus-gaap:SalesRevenueNetMemberus-gaap:CustomerConcentrationRiskMember2020-01-012020-12-310000926326srt:MinimumMember2020-01-012020-12-310000926326srt:MaximumMember2020-01-012020-12-310000926326omcl:LeaseReceivableMemberomcl:U.S.GovernmentHospitalsMemberus-gaap:CustomerConcentrationRiskMember2020-01-012020-12-310000926326omcl:PrimarySupplierMember2020-12-310000926326omcl:PrimarySupplierMember2020-01-012020-12-310000926326omcl:PrimarySupplierMember2019-01-012019-12-310000926326omcl:PrimarySupplierMember2018-01-012018-12-310000926326us-gaap:ShippingAndHandlingMemberus-gaap:SellingGeneralAndAdministrativeExpensesMember2020-01-012020-12-310000926326us-gaap:ShippingAndHandlingMemberus-gaap:SellingGeneralAndAdministrativeExpensesMember2019-01-012019-12-310000926326us-gaap:ShippingAndHandlingMemberus-gaap:SellingGeneralAndAdministrativeExpensesMember2018-01-012018-12-310000926326srt:MinimumMemberus-gaap:ComputerEquipmentMember2020-01-012020-12-310000926326srt:MaximumMemberus-gaap:ComputerEquipmentMember2020-01-012020-12-310000926326us-gaap:FurnitureAndFixturesMembersrt:MinimumMember2020-01-012020-12-310000926326us-gaap:FurnitureAndFixturesMembersrt:MaximumMember2020-01-012020-12-310000926326srt:MinimumMemberus-gaap:EquipmentMember2020-01-012020-12-310000926326srt:MaximumMemberus-gaap:EquipmentMember2020-01-012020-12-310000926326omcl:InternalUseSoftwareandSoftwareDevelopmentCostsMember2020-01-012020-12-310000926326us-gaap:PropertyPlantAndEquipmentMemberomcl:InternalUseSoftwareandSoftwareDevelopmentCostsMember2020-01-012020-12-310000926326us-gaap:PropertyPlantAndEquipmentMemberomcl:InternalUseSoftwareandSoftwareDevelopmentCostsMember2019-01-012019-12-310000926326us-gaap:OtherAssetsMember2020-01-012020-12-310000926326us-gaap:OtherAssetsMember2019-01-012019-12-31omcl:reportingUnit0000926326omcl:A340BLinkBusinessMember2020-10-012020-10-010000926326omcl:A340BLinkBusinessMember2020-10-010000926326us-gaap:CustomerRelationshipsMemberomcl:A340BLinkBusinessMember2020-10-012020-10-010000926326us-gaap:TechnologyBasedIntangibleAssetsMemberomcl:A340BLinkBusinessMember2020-10-012020-10-010000926326us-gaap:TradeNamesMemberomcl:A340BLinkBusinessMember2020-10-012020-10-010000926326us-gaap:NoncompeteAgreementsMemberomcl:A340BLinkBusinessMember2020-10-012020-10-0100009263262020-10-012020-10-010000926326omcl:MeasurementInputRoyaltyRateMemberus-gaap:TechnologyBasedIntangibleAssetsMemberomcl:A340BLinkBusinessMember2020-10-010000926326us-gaap:TradeNamesMemberomcl:MeasurementInputRoyaltyRateMemberomcl:A340BLinkBusinessMember2020-10-010000926326us-gaap:MeasurementInputDiscountRateMemberomcl:A340BLinkBusinessMember2020-10-010000926326omcl:A340BLinkBusinessMember2020-01-012020-12-310000926326omcl:A340BLinkBusinessMember2020-10-012020-12-310000926326omcl:A340BLinkBusinessMember2019-01-012019-12-310000926326omcl:ConnectedDevicesSoftwareLicensesAndOtherMember2020-01-012020-12-310000926326omcl:ConnectedDevicesSoftwareLicensesAndOtherMember2019-01-012019-12-310000926326omcl:ConnectedDevicesSoftwareLicensesAndOtherMember2018-01-012018-12-310000926326omcl:TechnicalServicesMember2020-01-012020-12-310000926326omcl:TechnicalServicesMember2019-01-012019-12-310000926326omcl:TechnicalServicesMember2018-01-012018-12-310000926326omcl:ConsumablesMember2020-01-012020-12-310000926326omcl:ConsumablesMember2019-01-012019-12-310000926326omcl:ConsumablesMember2018-01-012018-12-310000926326omcl:HardwareAndSoftwareMember2020-01-012020-12-310000926326omcl:HardwareAndSoftwareMember2019-01-012019-12-310000926326omcl:HardwareAndSoftwareMember2018-01-012018-12-310000926326country:US2020-01-012020-12-310000926326country:US2019-01-012019-12-310000926326country:US2018-01-012018-12-310000926326us-gaap:NonUsMember2020-01-012020-12-310000926326us-gaap:NonUsMember2019-01-012019-12-310000926326us-gaap:NonUsMember2018-01-012018-12-310000926326us-gaap:RestrictedStockMember2020-01-012020-12-310000926326us-gaap:RestrictedStockMember2019-01-012019-12-310000926326us-gaap:RestrictedStockMember2018-01-012018-12-310000926326omcl:ConvertibleDebtSecuritiesAndWarrantsMember2020-01-012020-12-310000926326omcl:ConvertibleDebtSecuritiesAndWarrantsMember2019-01-012019-12-310000926326omcl:ConvertibleDebtSecuritiesAndWarrantsMember2018-01-012018-12-310000926326us-gaap:ConvertibleDebtMemberomcl:ConvertibleSeniorNotesMember2020-12-310000926326us-gaap:InterestRateSwapMember2016-06-300000926326us-gaap:InterestRateSwapMemberus-gaap:LondonInterbankOfferedRateLIBORMember2016-06-300000926326us-gaap:OtherCurrentAssetsMember2020-12-310000926326us-gaap:AccumulatedTranslationAdjustmentMember2018-12-310000926326us-gaap:AccumulatedNetUnrealizedInvestmentGainLossMember2018-12-310000926326us-gaap:AccumulatedTranslationAdjustmentMember2019-01-012019-12-310000926326us-gaap:AccumulatedNetUnrealizedInvestmentGainLossMember2019-01-012019-12-310000926326us-gaap:AccumulatedTranslationAdjustmentMember2019-12-310000926326us-gaap:AccumulatedNetUnrealizedInvestmentGainLossMember2019-12-310000926326us-gaap:AccumulatedTranslationAdjustmentMember2020-01-012020-12-310000926326us-gaap:AccumulatedNetUnrealizedInvestmentGainLossMember2020-01-012020-12-310000926326us-gaap:AccumulatedTranslationAdjustmentMember2020-12-310000926326us-gaap:AccumulatedNetUnrealizedInvestmentGainLossMember2020-12-310000926326us-gaap:EquipmentMember2020-12-310000926326us-gaap:EquipmentMember2019-12-310000926326us-gaap:FurnitureAndFixturesMember2020-12-310000926326us-gaap:FurnitureAndFixturesMember2019-12-310000926326us-gaap:LeaseholdImprovementsMember2020-12-310000926326us-gaap:LeaseholdImprovementsMember2019-12-310000926326us-gaap:SoftwareAndSoftwareDevelopmentCostsMember2020-12-310000926326us-gaap:SoftwareAndSoftwareDevelopmentCostsMember2019-12-310000926326us-gaap:ConstructionInProgressMember2020-12-310000926326us-gaap:ConstructionInProgressMember2019-12-310000926326country:US2020-12-310000926326country:US2019-12-310000926326us-gaap:NonUsMember2020-12-310000926326us-gaap:NonUsMember2019-12-310000926326us-gaap:CustomerRelationshipsMember2020-12-310000926326us-gaap:CustomerRelationshipsMember2020-01-012020-12-310000926326us-gaap:CustomerRelationshipsMembersrt:MinimumMember2020-01-012020-12-310000926326us-gaap:CustomerRelationshipsMembersrt:MaximumMember2020-01-012020-12-310000926326us-gaap:TechnologyBasedIntangibleAssetsMember2020-12-310000926326us-gaap:TechnologyBasedIntangibleAssetsMember2020-01-012020-12-310000926326srt:MinimumMemberus-gaap:TechnologyBasedIntangibleAssetsMember2020-01-012020-12-310000926326srt:MaximumMemberus-gaap:TechnologyBasedIntangibleAssetsMember2020-01-012020-12-310000926326us-gaap:OrderOrProductionBacklogMember2020-12-310000926326us-gaap:OrderOrProductionBacklogMember2020-01-012020-12-310000926326us-gaap:TradeNamesMember2020-12-310000926326us-gaap:TradeNamesMember2020-01-012020-12-310000926326us-gaap:TradeNamesMembersrt:MinimumMember2020-01-012020-12-310000926326us-gaap:TradeNamesMembersrt:MaximumMember2020-01-012020-12-310000926326us-gaap:PatentsMember2020-12-310000926326us-gaap:PatentsMember2020-01-012020-12-310000926326us-gaap:PatentsMembersrt:MinimumMember2020-01-012020-12-310000926326us-gaap:PatentsMembersrt:MaximumMember2020-01-012020-12-310000926326us-gaap:NoncompeteAgreementsMember2020-12-310000926326us-gaap:NoncompeteAgreementsMember2020-01-012020-12-310000926326us-gaap:CustomerRelationshipsMember2019-12-310000926326us-gaap:CustomerRelationshipsMember2019-01-012019-12-310000926326us-gaap:CustomerRelationshipsMembersrt:MinimumMember2019-01-012019-12-310000926326us-gaap:CustomerRelationshipsMembersrt:MaximumMember2019-01-012019-12-310000926326us-gaap:TechnologyBasedIntangibleAssetsMember2019-12-310000926326us-gaap:TechnologyBasedIntangibleAssetsMember2019-01-012019-12-310000926326srt:MinimumMemberus-gaap:TechnologyBasedIntangibleAssetsMember2019-01-012019-12-310000926326srt:MaximumMemberus-gaap:TechnologyBasedIntangibleAssetsMember2019-01-012019-12-310000926326us-gaap:OrderOrProductionBacklogMember2019-12-310000926326us-gaap:OrderOrProductionBacklogMember2019-01-012019-12-310000926326us-gaap:TradeNamesMember2019-12-310000926326us-gaap:TradeNamesMember2019-01-012019-12-310000926326us-gaap:TradeNamesMembersrt:MinimumMember2019-01-012019-12-310000926326us-gaap:TradeNamesMembersrt:MaximumMember2019-01-012019-12-310000926326us-gaap:PatentsMember2019-12-310000926326us-gaap:PatentsMember2019-01-012019-12-310000926326us-gaap:PatentsMembersrt:MinimumMember2019-01-012019-12-310000926326us-gaap:PatentsMembersrt:MaximumMember2019-01-012019-12-310000926326us-gaap:LineOfCreditMemberomcl:WellsFargoBankNationalAssociationMemberus-gaap:SecuredDebtMember2016-01-050000926326us-gaap:LineOfCreditMemberus-gaap:RevolvingCreditFacilityMemberomcl:WellsFargoBankNationalAssociationMember2016-01-052016-01-050000926326us-gaap:LineOfCreditMemberus-gaap:RevolvingCreditFacilityMemberomcl:WellsFargoBankNationalAssociationMember2016-01-050000926326us-gaap:LineOfCreditMemberomcl:TermLoanFacilityMemberomcl:WellsFargoBankNationalAssociationMember2016-01-052016-01-050000926326us-gaap:LineOfCreditMemberomcl:TermLoanFacilityMemberomcl:WellsFargoBankNationalAssociationMember2016-01-050000926326us-gaap:LetterOfCreditMemberomcl:WellsFargoBankNationalAssociationMember2016-01-050000926326omcl:WellsFargoBankNationalAssociationMemberus-gaap:BridgeLoanMember2016-01-050000926326us-gaap:LineOfCreditMembersrt:MinimumMemberomcl:CreditAgreementInterestRateOptionOneMemberomcl:WellsFargoBankNationalAssociationMemberus-gaap:SecuredDebtMemberus-gaap:LondonInterbankOfferedRateLIBORMember2016-01-052016-01-050000926326us-gaap:LineOfCreditMembersrt:MaximumMemberomcl:CreditAgreementInterestRateOptionOneMemberomcl:WellsFargoBankNationalAssociationMemberus-gaap:SecuredDebtMemberus-gaap:LondonInterbankOfferedRateLIBORMember2016-01-052016-01-050000926326us-gaap:LineOfCreditMemberus-gaap:FederalFundsEffectiveSwapRateMemberomcl:CreditAgreementInterestRateOptionTwoMemberomcl:WellsFargoBankNationalAssociationMemberus-gaap:SecuredDebtMember2016-01-052016-01-050000926326us-gaap:LineOfCreditMembersrt:MinimumMemberomcl:CreditAgreementInterestRateOptionTwoMemberomcl:WellsFargoBankNationalAssociationMemberus-gaap:SecuredDebtMemberus-gaap:LondonInterbankOfferedRateLIBORMember2016-01-052016-01-050000926326us-gaap:LineOfCreditMembersrt:MaximumMemberomcl:CreditAgreementInterestRateOptionTwoMemberomcl:WellsFargoBankNationalAssociationMemberus-gaap:SecuredDebtMemberus-gaap:LondonInterbankOfferedRateLIBORMember2016-01-052016-01-050000926326us-gaap:LineOfCreditMembersrt:MinimumMemberus-gaap:RevolvingCreditFacilityMemberomcl:WellsFargoBankNationalAssociationMember2016-01-052016-01-050000926326us-gaap:LineOfCreditMembersrt:MaximumMemberus-gaap:RevolvingCreditFacilityMemberomcl:WellsFargoBankNationalAssociationMember2016-01-052016-01-050000926326us-gaap:LineOfCreditMemberus-gaap:RevolvingCreditFacilityMemberomcl:WellsFargoBankNationalAssociationMember2017-12-260000926326omcl:WellsFargoBankNationalAssociationMember2017-12-012017-12-310000926326us-gaap:LineOfCreditMemberomcl:WellsFargoSecuritiesLLCCitizensBankNAAndJPMorganChaseBankNAMemberus-gaap:RevolvingCreditFacilityMember2019-11-152019-11-150000926326us-gaap:LineOfCreditMemberomcl:WellsFargoSecuritiesLLCCitizensBankNAAndJPMorganChaseBankNAMemberus-gaap:RevolvingCreditFacilityMember2019-11-150000926326us-gaap:LineOfCreditMemberomcl:WellsFargoSecuritiesLLCCitizensBankNAAndJPMorganChaseBankNAMemberomcl:IncrementalLoanFacilityMember2019-11-150000926326us-gaap:LineOfCreditMemberus-gaap:LetterOfCreditMemberomcl:WellsFargoSecuritiesLLCCitizensBankNAAndJPMorganChaseBankNAMember2019-11-150000926326us-gaap:LineOfCreditMemberomcl:WellsFargoSecuritiesLLCCitizensBankNAAndJPMorganChaseBankNAMemberus-gaap:BridgeLoanMember2019-11-150000926326us-gaap:LineOfCreditMemberomcl:TermLoanFacilityMember2019-11-152019-11-150000926326us-gaap:LineOfCreditMemberus-gaap:RevolvingCreditFacilityMember2019-11-152019-11-150000926326us-gaap:LineOfCreditMemberomcl:WellsFargoSecuritiesLLCCitizensBankNAAndJPMorganChaseBankNAMembersrt:MinimumMemberus-gaap:LondonInterbankOfferedRateLIBORMember2019-11-152019-11-150000926326us-gaap:LineOfCreditMemberomcl:WellsFargoSecuritiesLLCCitizensBankNAAndJPMorganChaseBankNAMembersrt:MaximumMemberus-gaap:LondonInterbankOfferedRateLIBORMember2019-11-152019-11-150000926326us-gaap:LineOfCreditMemberus-gaap:FederalFundsEffectiveSwapRateMemberomcl:WellsFargoSecuritiesLLCCitizensBankNAAndJPMorganChaseBankNAMember2019-11-152019-11-150000926326us-gaap:LineOfCreditMemberomcl:WellsFargoSecuritiesLLCCitizensBankNAAndJPMorganChaseBankNAMemberus-gaap:LondonInterbankOfferedRateLIBORMember2019-11-152019-11-150000926326us-gaap:LineOfCreditMemberomcl:WellsFargoSecuritiesLLCCitizensBankNAAndJPMorganChaseBankNAMembersrt:MinimumMemberomcl:LondonInterbankOfferingRateLIBORPlus100Member2019-11-152019-11-150000926326us-gaap:LineOfCreditMemberomcl:WellsFargoSecuritiesLLCCitizensBankNAAndJPMorganChaseBankNAMembersrt:MaximumMemberomcl:LondonInterbankOfferingRateLIBORPlus100Member2019-11-152019-11-150000926326us-gaap:LineOfCreditMemberomcl:WellsFargoSecuritiesLLCCitizensBankNAAndJPMorganChaseBankNAMembersrt:MinimumMember2019-11-152019-11-150000926326us-gaap:LineOfCreditMemberomcl:WellsFargoSecuritiesLLCCitizensBankNAAndJPMorganChaseBankNAMembersrt:MaximumMember2019-11-152019-11-150000926326us-gaap:LineOfCreditMemberomcl:WellsFargoSecuritiesLLCCitizensBankNAAndJPMorganChaseBankNAMemberus-gaap:RevolvingCreditFacilityMemberomcl:DebtInstrumentCovenantPeriod1Member2020-09-220000926326us-gaap:LineOfCreditMemberomcl:WellsFargoSecuritiesLLCCitizensBankNAAndJPMorganChaseBankNAMemberus-gaap:RevolvingCreditFacilityMemberomcl:DebtInstrumentCovenantPeriod2Member2020-09-220000926326us-gaap:LineOfCreditMemberomcl:WellsFargoSecuritiesLLCCitizensBankNAAndJPMorganChaseBankNAMember2019-11-152019-11-150000926326us-gaap:LineOfCreditMemberomcl:WellsFargoSecuritiesLLCCitizensBankNAAndJPMorganChaseBankNAMember2020-09-222020-09-220000926326us-gaap:LineOfCreditMember2020-01-012020-12-310000926326us-gaap:LineOfCreditMember2019-01-012019-12-310000926326us-gaap:LineOfCreditMember2018-01-012018-12-310000926326us-gaap:LineOfCreditMemberus-gaap:RevolvingCreditFacilityMember2019-12-310000926326us-gaap:LineOfCreditMemberus-gaap:RevolvingCreditFacilityMember2020-01-012020-12-310000926326us-gaap:LineOfCreditMemberus-gaap:RevolvingCreditFacilityMember2020-12-310000926326us-gaap:LineOfCreditMember2019-12-310000926326us-gaap:LineOfCreditMember2020-12-310000926326us-gaap:ConvertibleDebtMemberomcl:ConvertibleSeniorNotesMember2020-09-250000926326us-gaap:ConvertibleDebtMemberomcl:ConvertibleSeniorNotesMember2020-09-252020-09-25omcl:day0000926326us-gaap:DebtInstrumentRedemptionPeriodOneMemberus-gaap:ConvertibleDebtMemberomcl:ConvertibleSeniorNotesMember2020-09-252020-09-250000926326us-gaap:ConvertibleDebtMemberus-gaap:DebtInstrumentRedemptionPeriodTwoMemberomcl:ConvertibleSeniorNotesMember2020-09-252020-09-250000926326us-gaap:ConvertibleDebtMemberomcl:ConvertibleSeniorNotesMember2020-01-012020-12-310000926326omcl:ConvertibleNoteHedgeRightsMember2020-09-2500009263262020-09-252020-09-250000926326us-gaap:StockOptionMember2020-09-250000926326us-gaap:WarrantMember2020-09-250000926326srt:MinimumMember2020-12-310000926326srt:MaximumMember2020-12-310000926326us-gaap:AssetsLeasedToOthersMember2020-12-310000926326us-gaap:AssetsLeasedToOthersMember2019-12-310000926326us-gaap:AssetsLeasedToOthersMember2020-01-012020-12-310000926326us-gaap:AssetsLeasedToOthersMember2019-01-012019-12-310000926326us-gaap:AssetsLeasedToOthersMember2018-01-012018-12-310000926326us-gaap:EmployeeStockMemberomcl:A1997EmployeeStockPurchasePlanMember2020-12-310000926326us-gaap:EmployeeStockMemberomcl:A1997EmployeeStockPurchasePlanMember2020-01-012020-12-310000926326omcl:A2009PlanMember2020-12-310000926326us-gaap:EmployeeStockOptionMemberomcl:A2009PlanMember2020-01-012020-12-310000926326us-gaap:EmployeeStockOptionMemberus-gaap:ShareBasedCompensationAwardTrancheOneMemberomcl:A2009PlanMember2020-01-012020-12-310000926326us-gaap:ShareBasedCompensationAwardTrancheTwoMemberus-gaap:EmployeeStockOptionMemberomcl:A2009PlanMember2020-01-012020-12-310000926326us-gaap:RestrictedStockUnitsRSUMemberomcl:A2009PlanMember2020-01-012020-12-310000926326us-gaap:RestrictedStockUnitsRSUMemberus-gaap:ShareBasedCompensationAwardTrancheOneMemberomcl:A2009PlanMember2020-01-012020-12-310000926326us-gaap:CostOfSalesMember2020-01-012020-12-310000926326us-gaap:CostOfSalesMember2019-01-012019-12-310000926326us-gaap:CostOfSalesMember2018-01-012018-12-310000926326us-gaap:ResearchAndDevelopmentExpenseMember2020-01-012020-12-310000926326us-gaap:ResearchAndDevelopmentExpenseMember2019-01-012019-12-310000926326us-gaap:ResearchAndDevelopmentExpenseMember2018-01-012018-12-310000926326us-gaap:SellingGeneralAndAdministrativeExpensesMember2020-01-012020-12-310000926326us-gaap:SellingGeneralAndAdministrativeExpensesMember2019-01-012019-12-310000926326us-gaap:SellingGeneralAndAdministrativeExpensesMember2018-01-012018-12-310000926326omcl:A2009PlanMember2020-01-012020-12-310000926326omcl:A2009PlanMember2019-01-012019-12-310000926326omcl:A2009PlanMember2018-01-012018-12-310000926326us-gaap:EmployeeStockOptionMember2020-01-012020-12-310000926326us-gaap:EmployeeStockOptionMember2019-01-012019-12-310000926326us-gaap:EmployeeStockOptionMember2018-01-012018-12-310000926326srt:MinimumMemberus-gaap:EmployeeStockMemberomcl:A1997EmployeeStockPurchasePlanMember2020-01-012020-12-310000926326srt:MaximumMemberus-gaap:EmployeeStockMemberomcl:A1997EmployeeStockPurchasePlanMember2020-01-012020-12-310000926326srt:MinimumMemberus-gaap:EmployeeStockMemberomcl:A1997EmployeeStockPurchasePlanMember2019-01-012019-12-310000926326srt:MaximumMemberus-gaap:EmployeeStockMemberomcl:A1997EmployeeStockPurchasePlanMember2019-01-012019-12-310000926326srt:MinimumMemberus-gaap:EmployeeStockMemberomcl:A1997EmployeeStockPurchasePlanMember2018-01-012018-12-310000926326srt:MaximumMemberus-gaap:EmployeeStockMemberomcl:A1997EmployeeStockPurchasePlanMember2018-01-012018-12-310000926326us-gaap:EmployeeStockMemberomcl:A1997EmployeeStockPurchasePlanMember2019-01-012019-12-310000926326us-gaap:EmployeeStockMemberomcl:A1997EmployeeStockPurchasePlanMember2018-01-012018-12-310000926326us-gaap:EmployeeStockOptionMemberomcl:A2009PlanMember2019-12-310000926326us-gaap:EmployeeStockOptionMemberomcl:A2009PlanMember2019-01-012019-12-310000926326us-gaap:EmployeeStockOptionMemberomcl:A2009PlanMember2020-12-310000926326us-gaap:EmployeeStockOptionMemberomcl:A2009PlanMember2018-01-012018-12-310000926326us-gaap:RestrictedStockUnitsRSUMemberomcl:A2009PlanMember2019-12-310000926326us-gaap:RestrictedStockUnitsRSUMemberomcl:A2009PlanMember2019-01-012019-12-310000926326us-gaap:RestrictedStockUnitsRSUMemberomcl:A2009PlanMember2020-12-310000926326us-gaap:RestrictedStockUnitsRSUMemberomcl:A2009PlanMember2018-01-012018-12-310000926326us-gaap:RestrictedStockMemberomcl:A2009PlanMember2019-12-310000926326us-gaap:RestrictedStockMemberomcl:A2009PlanMember2020-01-012020-12-310000926326us-gaap:RestrictedStockMemberomcl:A2009PlanMember2020-12-310000926326us-gaap:RestrictedStockMemberomcl:A2009PlanMember2019-01-012019-12-310000926326us-gaap:RestrictedStockMemberomcl:A2009PlanMember2018-01-012018-12-310000926326srt:OfficerMemberus-gaap:PerformanceSharesMember2019-01-012019-12-310000926326srt:OfficerMemberus-gaap:PerformanceSharesMember2020-01-012020-12-310000926326us-gaap:PerformanceSharesMember2020-02-132020-02-130000926326us-gaap:PerformanceSharesMember2019-02-132019-02-130000926326us-gaap:PerformanceSharesMemberomcl:A2018PerformanceBasedRestrictedStockUnitsMember2019-03-052019-03-050000926326us-gaap:PerformanceSharesMemberomcl:A2018PerformanceBasedRestrictedStockUnitsMember2020-12-310000926326omcl:A2019PerformanceBasedRestrictedStockUnitsMemberus-gaap:PerformanceSharesMember2020-03-032020-03-030000926326omcl:A2019PerformanceBasedRestrictedStockUnitsMemberus-gaap:PerformanceSharesMember2020-12-310000926326us-gaap:PerformanceSharesMemberomcl:A2009PlanMember2019-12-310000926326us-gaap:PerformanceSharesMemberomcl:A2009PlanMember2020-01-012020-12-310000926326us-gaap:PerformanceSharesMemberomcl:A2009PlanMember2020-12-310000926326us-gaap:PerformanceSharesMemberomcl:A2009PlanMember2019-01-012019-12-310000926326us-gaap:PerformanceSharesMemberomcl:A2009PlanMember2018-01-012018-12-310000926326us-gaap:EmployeeStockOptionMember2020-12-310000926326omcl:RestrictedStockAwardsRSAsAndRestrictedStockUnitsRSUsMember2020-12-310000926326omcl:FuturegrantsandawardsMember2020-12-310000926326us-gaap:EmployeeStockMember2020-12-310000926326us-gaap:OtherPostretirementBenefitPlansDefinedBenefitMemberomcl:OmnicellPlanMember2020-01-012020-12-310000926326us-gaap:OtherPostretirementBenefitPlansDefinedBenefitMemberomcl:OmnicellPlanMember2019-01-012019-12-310000926326us-gaap:OtherPostretirementBenefitPlansDefinedBenefitMemberomcl:OmnicellPlanMember2018-01-012018-12-310000926326us-gaap:ShareBasedCompensationAwardTrancheTwoMemberus-gaap:RestrictedStockUnitsRSUMemberomcl:A2009PlanMember2020-01-012020-12-310000926326omcl:A2016RepurchaseProgramMember2016-08-020000926326omcl:A2014ShareRepurchaseProgramMember2014-11-040000926326omcl:A2016and2014ShareRepurchaseProgramsMember2020-12-310000926326omcl:OneTimeStockRepurchaseSeptember2020Member2020-09-170000926326omcl:OneTimeStockRepurchaseSeptember2020Member2020-09-172020-09-170000926326omcl:A2016and2014ShareRepurchaseProgramsMember2018-01-012018-12-310000926326omcl:A2016and2014ShareRepurchaseProgramsMember2020-01-012020-12-310000926326omcl:A2016and2014ShareRepurchaseProgramsMember2019-01-012019-12-310000926326omcl:DistributionAgreementMember2017-11-032017-11-030000926326omcl:DistributionAgreementMember2018-01-012018-12-310000926326omcl:DistributionAgreementMember2018-12-310000926326omcl:DistributionAgreementMember2019-01-012019-12-310000926326omcl:DistributionAgreementMember2019-12-310000926326us-gaap:StateAndLocalJurisdictionMember2020-12-310000926326us-gaap:ForeignCountryMember2020-12-310000926326us-gaap:DomesticCountryMemberus-gaap:ResearchMember2020-12-310000926326us-gaap:StateAndLocalJurisdictionMemberus-gaap:ResearchMember2020-12-310000926326us-gaap:EmployeeSeveranceMemberomcl:Q1Q22020RestructuringPlanMember2020-01-012020-12-310000926326omcl:Q1Q22020RestructuringPlanMember2020-12-310000926326omcl:Q42018RestructuringPlanMember2018-01-012018-12-310000926326omcl:Q12018RestructuringPlanMemberMember2018-01-012018-12-310000926326us-gaap:AccountsReceivableMember2017-12-310000926326us-gaap:AccountsReceivableMember2018-01-012018-12-310000926326us-gaap:AccountsReceivableMember2018-12-310000926326omcl:ContractWithCustomerAssetUnbilledReceivablesNoncurrentMember2017-12-310000926326omcl:ContractWithCustomerAssetUnbilledReceivablesNoncurrentMember2018-01-012018-12-310000926326omcl:ContractWithCustomerAssetUnbilledReceivablesNoncurrentMember2018-12-310000926326omcl:NetInvestmentInSalesTypeLeasesMember2017-12-310000926326omcl:NetInvestmentInSalesTypeLeasesMember2018-01-012018-12-310000926326omcl:NetInvestmentInSalesTypeLeasesMember2018-12-310000926326us-gaap:AccountsReceivableMember2019-01-012019-12-310000926326us-gaap:AccountsReceivableMember2019-12-310000926326omcl:ContractWithCustomerAssetUnbilledReceivablesNoncurrentMember2019-01-012019-12-310000926326omcl:ContractWithCustomerAssetUnbilledReceivablesNoncurrentMember2019-12-310000926326omcl:NetInvestmentInSalesTypeLeasesMember2019-01-012019-12-310000926326omcl:NetInvestmentInSalesTypeLeasesMember2019-12-310000926326us-gaap:AccountsReceivableMember2020-01-012020-12-310000926326us-gaap:AccountsReceivableMember2020-12-310000926326omcl:ContractWithCustomerAssetUnbilledReceivablesNoncurrentMember2020-01-012020-12-310000926326omcl:ContractWithCustomerAssetUnbilledReceivablesNoncurrentMember2020-12-310000926326omcl:NetInvestmentInSalesTypeLeasesMember2020-01-012020-12-310000926326omcl:NetInvestmentInSalesTypeLeasesMember2020-12-31
UNITED STATES
SECURITIES AND EXCHANGE COMMISSION
Washington, D.C. 20549
____________________________________________________________________________
FORM 10-K
| | | | | |
| (Mark One) | |
| ☒ | ANNUAL REPORT PURSUANT TO SECTION 13 OR 15(d) OF THE SECURITIES EXCHANGE ACT OF 1934 |
For the fiscal year ended December 31, 2020
| | | | | |
| OR |
| ☐ | TRANSITION REPORT PURSUANT TO SECTION 13 OR 15(d) OF THE SECURITIES EXCHANGE ACT OF 1934 |
| For the transition period from to |
Commission File No. 000-33043
OMNICELL, INC.
(Exact name of registrant as specified in its charter)
| | | | | |
| Delaware | 94-3166458 |
(State or other jurisdiction of
incorporation or organization) | (IRS Employer
Identification No.) |
590 East Middlefield Road
Mountain View, CA 94043
(Address of registrant’s principal executive offices, including zip code)
(650) 251-6100
(Registrant’s telephone number, including area code)
Securities registered pursuant to Section 12(b) of the Act:
| | | | | | | | | | | | | | |
| Title of each class | | Trading Symbol | | Name of each exchange on which registered |
| Common Stock, $0.001 par value | | OMCL | | NASDAQ Global Select Market |
Securities registered pursuant to Section 12(g) of the Act: None
Indicate by check mark if the registrant is a well-known seasoned issuer, as defined in Rule 405 of the Securities Act. Yes ý No o
Indicate by check mark if the registrant is not required to file reports pursuant to Section 13 or Section 15(d) of the Act. Yes o No ý
Indicate by check mark whether the registrant (1) has filed all reports required to be filed by Section 13 or 15(d) of the Securities Exchange Act of 1934 during the preceding 12 months (or for such shorter period that the registrant was required to file such reports), and (2) has been subject to such filing requirements for the past 90 days. Yes ý No o
Indicate by check mark whether the registrant has submitted electronically every Interactive Data File required to be submitted pursuant to Rule 405 of Regulation S-T (§ 232.405 of this chapter) during the preceding 12 months (or for such shorter period that the registrant was required to submit and post such files). Yes ý No o
Indicate by check mark whether the registrant is a large accelerated filer, an accelerated filer, a non-accelerated filer, a smaller reporting company, or emerging growth company. See the definitions of “large accelerated filer,” “accelerated filer,” “smaller reporting company,” and “emerging growth company” in Rule 12b-2 of the Exchange Act.
| | | | | | | | | | | | | | | | | | | | | | | | | | | | | |
| Large Accelerated Filer | ☒ | Accelerated filer | ☐ | Non-accelerated filer | ☐ | Smaller reporting company | ☐ | Emerging growth company | ☐ |
If an emerging growth company, indicate by check mark if the registrant has elected not to use the extended transition period for complying with any new or revised financial accounting standards provided pursuant to Section 13(a) of the Exchange Act. o
Indicate by check mark whether the registrant has filed a report on and attestation to its management's assessment of the effectiveness of its internal controls over financial reporting under Section 404(b) of the Sarbanes-Oxley Act (15 U.S.C. 7262(b)) by the registered public accounting firm that prepared or issued its audit report. ☒
Indicate by check mark whether the registrant is a shell company (as defined in Rule 12b-2 of the Exchange Act). Yes ☐ No ý
The aggregate market value of the registrant’s common stock, $0.001 par value, held by non-affiliates of the registrant as of June 30, 2020 was $3.0 billion (based upon the closing sales price of such stock as reported on the NASDAQ Global Select Market on such date) which excludes an aggregate of 571,294 shares of the registrant’s common stock held by officers, directors and affiliated stockholders. For purposes of determining whether a stockholder was an affiliate of the registrant at June 30, 2020, the registrant has assumed that a stockholder was an affiliate of the registrant at June 30, 2020 if such stockholder (i) beneficially owned 10% or more of the registrant’s common stock and/or (ii) was affiliated with an executive officer or director of the registrant at June 30, 2020. Exclusion of such shares should not be construed to indicate that any such person possesses the power, direct or indirect, to direct or cause the direction of the management or policies of the registrant or that such person is controlled by or under common control with the registrant.
As of February 17, 2021, there were 43,041,554 shares of the registrant’s common stock, $0.001 par value, outstanding.
DOCUMENTS INCORPORATED BY REFERENCE
Portions of the registrant’s definitive Proxy Statement for the 2021 Annual Meeting of Stockholders to be filed with the United States Securities and Exchange Commission pursuant to Regulation 14A not later than 120 days after the end of the fiscal year covered by this Form 10-K are incorporated by reference in Part III, Items 10-14 of this Form 10-K.
OMNICELL, INC.
TABLE OF CONTENTS
FORWARD-LOOKING STATEMENTS AND FACTORS THAT MAY AFFECT FUTURE RESULTS
This annual report on Form 10-K contains forward-looking statements within the meaning of the Private Securities Litigation Reform Act of 1995, Section 27A of the Securities Act of 1933 (the "Securities Act"), and Section 21E of the Securities Exchange Act of 1934 (the "Exchange Act"). The forward-looking statements are contained throughout this report including in the sections entitled “Risk Factors” and “Management’s Discussion and Analysis of Financial Condition and Results of Operations.” Forward-looking statements include, but are not limited to, statements about:
•our expectations about the continuing impact of the ongoing global novel coronavirus (COVID-19) pandemic (including efforts to contain the spread of the pandemic) on our workforce and operations, as well as the continuing impacts on our customers and suppliers, and the anticipated continuing effects of the pandemic and associated containment measures on our business, financial condition, liquidity, and results of operations;
•our expectations regarding our future sales pipeline and product bookings;
•the extent and timing of future revenues, including the amounts of our current backlog;
•the size or growth of our market or market share;
•our beliefs about drivers of demand for our solutions, market opportunities in certain product categories, and continued expansion in these product categories, as well as our belief that our technology, services, and solutions within these categories position us well to address the needs of retail, acute, and post-acute pharmacy providers;
•our ability to acquire companies, businesses, products, or technologies on commercially reasonable terms and integrate such acquisitions effectively;
•our goal of advancing our platform with new product introductions annually;
•our ability to deliver on the autonomous pharmacy vision, as well as our plan to integrate our current offerings and technologies on a cloud infrastructure and invest in broadening our solutions across certain key areas as we execute on this vision;
•continued investment in the autonomous pharmacy vision, our beliefs about the anticipated benefits of such investments, and our expectations regarding continued growth in subscription and cloud-based offerings as we execute on this vision;
•our belief that our solutions and vision for fully autonomous medication management are strongly aligned with long-term trends in the healthcare market and well-positioned to address the evolving needs of the healthcare institutions;
•planned new products and services;
•the bookings, revenue, and margin opportunities presented by new products, emerging markets, and international markets;
•our ability to align our cost structure and headcount with our current business expectations;
•the outcome of any legal proceedings to which we are a party;
•the bookings, revenues, non-GAAP EBITDA, operating margin, or non-GAAP earnings per share goals we may set;
•our projected target long-term revenues and revenue growth rates, long-term non-GAAP operating margin targets, long-term non-GAAP EBITDA margin targets, and free cash flow conversion;
•our ability to protect our intellectual property and operate our business without infringing, misappropriating, or otherwise violating the intellectual property rights of others;
•the expected impacts of new accounting standards or changes to existing accounting standards;
•our expected future uses of cash, including our expected uses for the remaining proceeds of our convertible senior notes, and the sufficiency of our sources of funding; and
•our ability to generate cash from operations and our estimates regarding the sufficiency of our cash resources.
In some cases, you can identify forward-looking statements by terms such as “anticipates,” “believes,” “could,” “estimates,” “expects,” “intends,” “seeks,” “may,” “plans,” “potential,” “predicts,” “projects,” “should,” “will,” “would,” and variations of these terms and similar expressions. Forward-looking statements are based on our current expectations and assumptions, and are subject to known and unknown risks and uncertainties, which may cause our actual results, performance, or achievements to be materially different from those expressed or implied in the forward-looking statements. Such risks and uncertainties include those described throughout this annual report, including in Part I - Section 1A. “Risk Factors” and Part II - Item 7. "Management's Discussion and Analysis of Financial Condition and Results of Operations" below. Given these risks and uncertainties, you should not place undue reliance on these forward-looking statements. You should carefully read this annual report and the documents that we reference in this annual report and have filed as exhibits, as well as other documents we file from time to time with the United States Securities and Exchange Commission, with the understanding that our actual future results may be materially different from what we expect. The forward-looking statements in this annual report represent our estimates and assumptions only as of the date of this annual report. Except as required by law, we assume no obligation to update any forward-looking statements publicly, or to update the reasons actual results could differ materially from those expressed or implied in any forward-looking statements, even if new information becomes available in the future.
All references in this report to “Omnicell,” “our,” “us,” “we,” or the “Company” collectively refer to Omnicell, Inc., a Delaware corporation, and its subsidiaries. The term “Omnicell, Inc.” refers only to Omnicell, Inc., excluding its subsidiaries.
We own various registered and unregistered trademarks and service marks used in our business, some of which appear in this report. The most important of these marks include Omnicell® and the Omnicell logo. This report may also include the trademarks and service marks of other companies. Such trademarks and service marks are the marks of their respective owners.
PART I
ITEM 1. BUSINESS
Overview
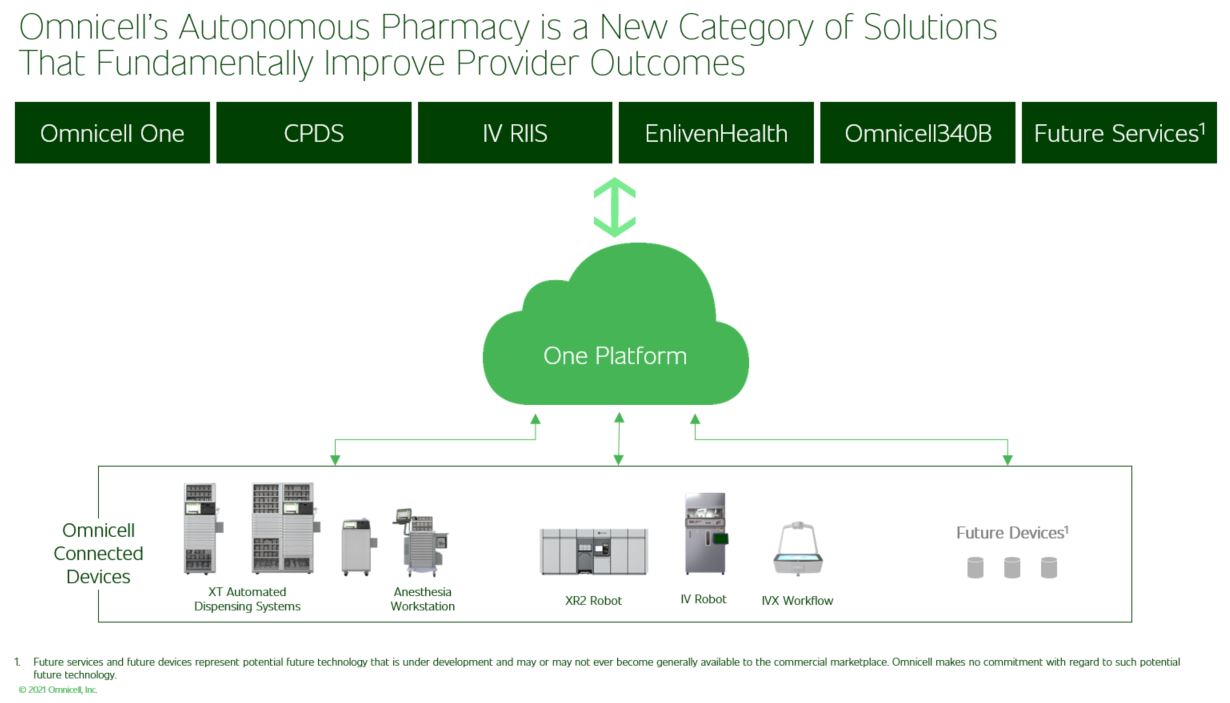
We are a leader in transforming the pharmacy care delivery model. Our medication management automation solutions and adherence tools empower healthcare systems and pharmacies to focus on clinical care, rather than administrative tasks. Our solutions support the vision of a fully autonomous pharmacy, a roadmap designed to improve operational efficiencies through a fully automated, medication management infrastructure. Our vision is to transform the pharmacy care delivery model through automation designed to replace manual, error-prone processes, combined with a single, cloud-based platform and advanced services offerings. We believe our connected devices, products, and solutions will help our customers harness the power of data and analytics, and deliver improved patient outcomes.
In 2019, several pharmacy leaders published a framework that validates the need for greater automation of pharmacy workflows and outlines the levels to progress towards the fully autonomous pharmacy. Through our medication management automation platform that spans the continuum of care, we are advancing the vision for the autonomous pharmacy. By delivering a combination of automation, intelligence, and advanced services, to be powered by a single, cloud-based platform, we believe we are helping to empower healthcare and pharmacy providers to increase healthcare value and improve patient outcomes.

We believe our robust customer base and channel within the pharmacy automation market enable us to bring new solutions and innovations to market. Over 7,000 facilities worldwide use our automation and analytics solutions which are designed to improve pharmacy workflows, increase operational efficiency, reduce medication errors, deliver actionable intelligence, and improve patient safety. More than 50,000 institutional and retail pharmacies across North America and the United Kingdom leverage our innovative medication adherence and population health solutions to improve patient engagement, and adherence to prescriptions and vaccine scheduling, helping to reduce costly hospital readmissions.
We believe our broad portfolio of products and services, combined with innovation, align us with the long-term trends of the healthcare market to manage patients across the continuum of care while helping to control costs and improve patient outcomes.
Operating Segments
We manage our operations as a single segment for the purposes of assessing performance and making operating decisions. Our Chief Operating Decision Maker ("CODM") is our Chief Executive Officer. The CODM allocates resources and evaluates the performance of Omnicell at the consolidated level using information about our revenues, gross profit, income from operations, and other key financial data. All significant operating decisions are based upon an analysis of Omnicell as one operating segment, which is the same as our reporting segment.
Business Strategy
We are committed to being the care provider’s most trusted partner and executing on the vision of the autonomous pharmacy by delivering automation, intelligence, and advanced services, powered by a single, cloud-based platform. We believe there are significant challenges in pharmacy practice including, but not limited to, medication errors, drug shortages, medication loss due to drug diversion, significant medication waste and expiration costs, a high level of manual steps in the medication management automation process, complexity around compliance requirements, high pharmacy employee turnover rates, hospitalizations from adverse drug events in outpatient settings, high variability in outcomes, and limited inventory visibility. We believe that these significant challenges in pharmacy practice drive the demand for increased digitization and virtualization, and that our solutions enable this and represent large opportunities in four market categories:
•Point of Care. As a market leader, we expect to continue expansion of this product category as customers increase use of our dispensing systems in more areas within their hospitals. In addition, we are early in the replacement, upgrade, and expansion cycle of our XT Series automated dispensing systems which we believe is a significant market opportunity and we expect to continue to focus on further penetrating markets through competitive conversions. We believe our current portfolio within the Point of Care market and new innovation and services will continue to drive improved outcomes and lower costs for our customers.
•Central Pharmacy. This market represents the beginning of the medication management process in acute care settings, and, we believe, the next big automation opportunity to replace manual and repetitive processes which are common in the pharmacy today. Manual processes are prone to significant errors, and products such as IVX Workflow, our IV sterile compounding solutions, and the XR2 Automated Central Pharmacy system automate
these manual processes and are designed to reduce the risk of error for our healthcare partners. We believe new products and innovations, including Omnicell One™, in the Central Pharmacy market create opportunities to replace prior generation Central Pharmacy robotics and carousels. The Central Pharmacy also represents an opportunity to provide technology-enabled services designed to reduce the administrative burden on the pharmacy and allow clinicians to operate at the top of their license.
•340B Software-Enabled Services. This market is targeted to covered entities participating in Section 340B of the Public Health Services Act. The act requires pharmaceutical manufacturers participating in Medicaid to sell outpatient drugs at discounted prices to health care organizations that care for many uninsured and low-income patients and results in a complex compliance environment. We believe that there are significant opportunities for health systems to improve participation benefits and maximize program savings through software-enabled services and solutions. Our Omnicell 340B platform of technology-enabled services includes split billing software, contract pharmacy administration, specialty contract pharmacy administration, and drug discount access solutions.
•Retail, Institutional, and Payer. We believe the Retail, Institutional, and Payer market represents a large opportunity as the majority of drugs are distributed in the non-acute sector. New technology and updated state board regulations are leading to innovation at traditional retail providers, which, combined with the move to value-based care, we believe will incentivize the market to adopt solutions to help providers and payers engage patients in new ways that lower the total cost of care. We believe adoption of our EnlivenHealth (formerly Population Health Solutions) portfolio of software products and services, along with medication adherence packaging, will increase adherence performance rates, increase prescription volume for our customers, and reduce hospital and emergency room visits due to improved adherence. As retail pharmacies play an increasingly vital role in population health following the onset of the COVID-19 pandemic, EnlivenHealth has extended solutions to assist with vaccination programs, testing protocols, and patient engagement efforts. There are three main areas of focus:
◦CareScheduler is an exclusive digital solution that automates the scheduling, reporting, and patient outreach for administering the COVID-19 vaccine and other vaccines and testing procedures.
◦Medication Synchronization is an appointment-based solution that aligns a patient's medications to a single refill date, designed to improve medication adherence and reduce hospital readmissions.
◦Medication Therapy Management is a platform that offers intuitive workflow with high-level decision support for efficiently completing CMS-compliant Comprehensive Medication Reviews using pharmacy claims data.
We believe our technology, services, and solutions within these market categories position us well to address the needs of retail, acute, and post-acute pharmacy providers.
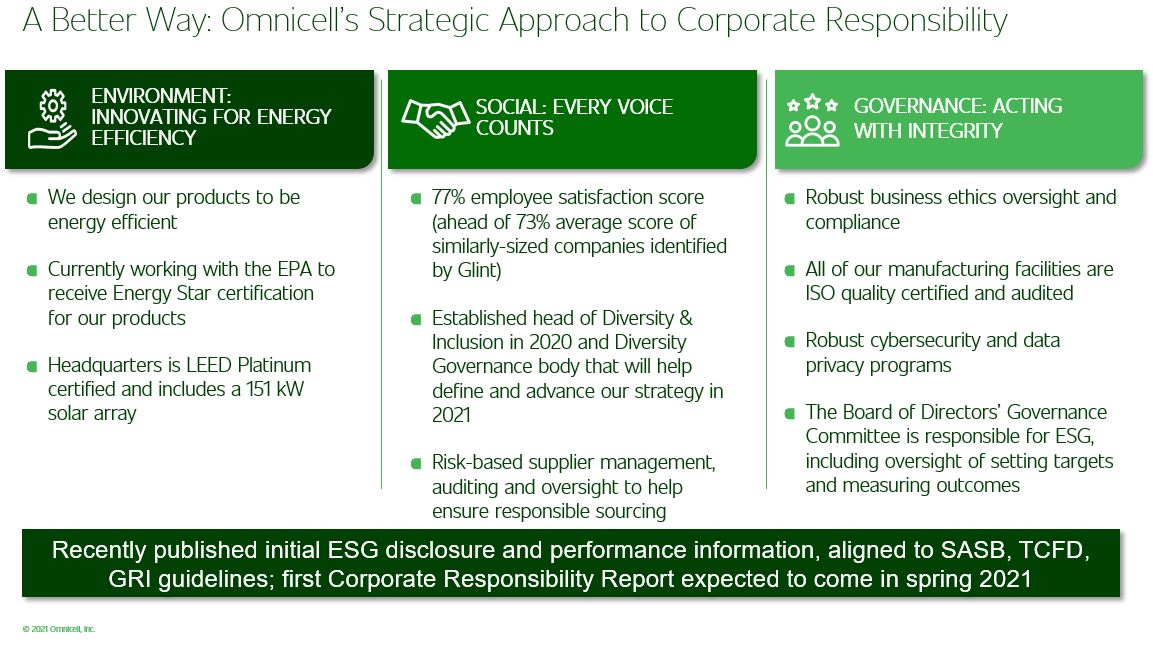
Environmental, Social, and Governance Initiatives
We view Omnicell as a company with a social mission: Our focus on reinventing the pharmacy care delivery model is designed to dramatically improve health outcomes and lower healthcare costs. Our teams are motivated by knowing that our work to improve medication management has a tangible, real-world impact on healthcare workers, patients, and communities.
We recognize that we are accountable not only to our customers and shareholders, but also to the global community. In December 2020, we published initial ESG disclosure and performance information, aligned to Sustainability Accounting Standards Board, Task Force on Climate-related Financial Disclosures, and Global Reporting Initiative guidelines. We are focused on innovating to drive sustainability across our business; ethically and responsibly sourcing materials by adhering to internationally-recognized Organisation for Economic Co-operation and Development guidance; and elevating our diversity and inclusion initiatives.
Industry Background and Market
We believe our solutions support the vision for the fully autonomous pharmacy and are strongly aligned with trends in the healthcare market, and well positioned to address the evolving needs of healthcare institutions.
The healthcare industry continues to experience a significant degree of consolidation, with healthcare providers combining to create larger healthcare delivery organizations to achieve greater market power. We believe this trend has increased the market need for more integrated medication management automation solutions on a single platform to help improve patient and financial outcomes for both inpatient and outpatient settings. Our portfolio of connected devices, products, and services, combined with innovation, are designed with this objective in mind.
In addition, healthcare providers and facilities are affected by significant economic pressures. Annual prescription drug expenditures in the United States were approximately $508 billion in 2019, according to the IQVIA National Sales Perspective database. Also, based on a 2018 report by the Health Care Cost Institute, the largest growth in spending for professional services—defined as payments to physicians and other clinical care team members for services provided in physician offices and hospitals—occurred among administered drugs, which accounted for the biggest share, at 39%, of the total increase in professional services spending from 2014 to 2018. Rising costs of labor, prescription drugs, and new medical technology all contribute to increased spending. Governmental pressures surrounding healthcare reform and compliance have led to increased scrutiny of the cost and efficiency with which healthcare providers deliver their services. These factors, combined with continuing consolidation in the healthcare industry, have increased the need for the efficient delivery of healthcare in order to control costs, and have elevated the strategic importance of medication management and pharmacy automation across the continuum of care.
Furthermore, over time, complexities in medication management have increased along with the volume of patients and medications, but many manual processes are still used, resulting in inefficient tracking and delivery of medications and supplies. Many clinical staff are burdened with administrative tasks. According to a survey conducted by the American Society of Health-System Pharmacists in 2019, approximately 75% of pharmacist activities are non-clinical in nature. In addition, many existing healthcare information systems are unable to support the modernization of healthcare delivery processes or address mandated patient safety initiatives. These factors contribute to medical errors and unnecessary process costs across the healthcare sector including in medication management.
Legislation and industry guidelines, such as those issued by the U.S. Food and Drug Administration (the "FDA"), The Joint Commission, the U.S. Pharmacopeial Convention and the Institute for Safe Medication Practices in the areas of medication management—including storage, security, and labeling—have created an environment of increased patient safety awareness and regulatory control. Against this backdrop, healthcare organizations, desiring to improve quality and avoid
liability, have been driven to prioritize investments in capital equipment, including pharmacy automation, which is a standard of care, to improve patient safety. While the overall storage and security of medications in hospitals have improved, there had been an increased focus on controlled substance management in recent years, particularly in light of the opioid crisis in the United States. According to a research report published by the Butler Center for Research in 2015, studies in the United States have shown that 10% to 15% of healthcare professionals will misuse substances during their lifetime, with significantly higher levels of opioid abuse in particular. Joint Commission surveyors are seeking more documentation from hospitals demonstrating that their medication policies and procedures are adequate.
Medication non-adherence is widely recognized as a common and costly problem. Poor adherence results in increased hospital readmissions, deteriorated treatment outcomes, and avoidable healthcare costs. The estimated annual cost of prescription drug-related morbidity and mortality resulting from non-optimized medication therapy, including medication non-adherence, was $528 billion in 2016, according to a study published in the Annals of Pharmacotherapy in 2018. In addition, a 2017 study published in the Journal of the American Pharmacists Association found that medication issues are responsible for 26% of hospital readmissions. With more than 40 million Americans taking five or more maintenance medications routinely (based on statistics published by the National Center for Health Statistics in 2018), pharmacists need ways to support the arduous task of keeping patients compliant. According to a 2011 article by the World Health Organization, “although these medications are effective in combating disease, their full benefits are often not realized because approximately 50% of patients do not take their medications as prescribed.” Medication adherence can be improved through attitudinal and behavioral changes, which pharmacists can encourage and help facilitate by providing interventional support, including adherence tools such as blister cards, reminders, prescription synchronization, and patient engagement tools. We believe our EnlivenHealth portfolio has the potential to reduce hospitalizations and emergency department visits, and improve patient health by increasing medication adherence.
Government Regulation
Our operations are global and are affected by complex state, federal, and international laws and regulations. These laws and regulations relate to healthcare, privacy and security, product compliance, import, export, trade, healthcare fraud and abuse (including anti-kickback and false claims laws), environmental standards, anti-corruption, anti-bribery, labor and employment, as well as other areas.
We receive, store, and process personal information and other data from and about our customers, in addition to our employees and service providers, and our customers use our solutions to obtain and store personal information, including personal health information. As a result, we are subject to various laws and regulations related to privacy, data protection, and information security. In the United States, these include federal health information privacy laws (such as the Health Information Portability and Accountability Act of 1996 ("HIPAA"), various state and federal security breach notification laws, consumer protection laws, as well as state laws addressing privacy and security. Internationally, various foreign jurisdictions in which we operate have established, or are developing, their own data privacy and security legal framework with which we or our customers must comply, including the European Union’s General Data Protection Regulation (“GDPR”).
In addition, while the manufacture and sale of most of our current products are not regulated by the FDA or the Drug Enforcement Administration, through our acquisition of Aesynt Incorporated, we have both Class I and Class II, 510(k) exempt medical devices which are subject to FDA regulation and require compliance with the FDA Quality System Regulation as well as medical device reporting.
Furthermore, our operations are impacted by trade regulations in many countries that govern the import of raw materials and finished products, and we are also subject to laws and regulations that seek to prevent corruption and bribery in the marketplace (including the U.S. Foreign Corrupt Practices Act and the United Kingdom Bribery Act) as well as laws and regulations pertaining to healthcare fraud and abuse, including state and federal anti-kickback and false claims laws in the United States.
Since we manufacture and sell our products outside of the United States, certain products of a local nature and variations of product lines must also meet other local regulatory requirements. Additional risks are inherent in conducting business outside the United States, including more robust information governance and environmental regulations in the European Union, expropriation, nationalization, and other governmental action. Demand for many of our existing and new products is, and will continue to be, affected by the extent to which local regulatory requirements increase our risk and/or expense to do business in those countries.
Compliance with the laws and regulations applicable to our global operations is costly and requires sufficient resources to actively maintain various governance, risk, and compliance systems in several areas, including FDA, quality, information governance and security, and environmental, health and safety, to enable Omnicell to keep abreast of the constantly evolving
regulatory landscape both in the United States and abroad. Any failure to comply with these laws and regulations could result in a range of fines, penalties, and/or other sanctions.
Products and Services
As we continue to execute on the vision of the autonomous pharmacy, we plan to integrate our current offerings and technologies on a cloud infrastructure, and invest in broadening our solutions across three key areas:
Automation
We provide a range of advanced automation, including robotics designed to digitize and streamline workflows and reduce human error in central pharmacy and clinical areas, and to support medication adherence initiatives in retail pharmacies. Our automation products and technology-enabled services include central pharmacy automation solutions for both dispensing and IV compounding systems, medication and supply dispensing systems at the point of care, as well as medication adherence solutions which are used by retail, community, and outpatient pharmacies to help improve patient engagement and adherence to prescriptions.
Point of Care
Our point of care automation solutions are designed to improve clinician workflows in patient care areas of the healthcare system, such as nursing units, patient wards, operating rooms, and emergency departments. Automated dispensing systems are an essential part of medication management because they safeguard medications - including controlled substances - and automatically track inventory. We strive to continually develop new innovations for our automated dispensing systems to close gaps in safety and help enable clinicians to spend less time managing medications and more time caring for patients.
Our XT Series automated dispensing systems for medications and supplies used in nursing units and other clinical areas of the hospital can be customized with various software and hardware options. Our interoperability solutions integrate our automated dispensing systems with key electronic health record systems to help streamline workflow and increase accuracy. We also offer specialized automated dispensing systems for the operating room.
Central Pharmacy
An efficient central pharmacy operation is vital to delivering exceptional patient care. With pharmacist and technician labor requirements increasing over the years, it is critical for pharmacies to find new ways of increasing productivity. Our broad medication management platform offers a range of automated hardware and software solutions. Our central pharmacy automation solutions are designed to empower healthcare providers to increase staff efficiency, reduce inventory costs, prevent
medication errors, improve compliance, and strengthen security of controlled substances. By automating manual, error-prone processes, our technology helps enable pharmacy staff to work more efficiently and directly contribute to clinical care.
Our central pharmacy automation solutions include: automated storage and retrieval systems, including our XR2 Automated Central Pharmacy System – an important building block of the autonomous pharmacy vision; IV compounding robots and workflow management systems; inventory management software; and controlled substance management systems.
Medication Adherence
Our medication adherence solutions are used by retail, community, and outpatient pharmacies, as well as by institutional pharmacies serving long-term care and other sites outside the acute care hospital, and are designed to improve patient engagement and adherence to prescriptions.
We offer automated systems to aid pharmacies in more accurately and efficiently filling our multimed adherence packaging based on individual patient medication orders. These machines interface with pharmacy information systems to obtain prescription information for each patient receiving the medication blister cards. In addition to robotic automation, we offer software that guides the user through the manual filling process to streamline workflow and increase packing accuracy.
Our single dose automation solutions fill and label a variety of patient-specific, single-dose medication blister packaging based on incoming prescriptions. Our semi-automated filling equipment is designed specifically for the long-term care institutional pharmacy with enough order volume to warrant pre-packaging frequently-used medications. Our automated solutions interface with pharmacy information systems to obtain prescription information.
We also offer a wide range of medication blister card packaging and packaging supplies designed to enhance medication adherence in a variety of non-acute care settings. These products include multimed blister cards (adherence packaging) distributed by retail, community, and outpatient pharmacies to help patients manage their medication regimens at home. These cards organize multiple drugs into a single blister cavity for each dosing time, helping to make it easier for patients on complex regimens to comply with their therapy. For environments where a caregiver is present, institutional and retail pharmacies use our single dose blister cards, which provide up to 90-day doses of a specific single medication.
Other Automation Products and Services
Omnicell® Interface Software provides interface and integration between our medication-use products or our supply products and a healthcare facility’s in-house information management systems.
Customer service includes customer education and training, and post-installation technical support with phone support, on-site service, parts, and access to software upgrades. Product support is available through fixed-period service contracts and on a time and materials basis. On-site service is provided by our field service team.
Retail Pharmacy and Hospital Automation Outside the United States
Additional products sold outside the United States include robotic dispensing systems used in hospitals and retail pharmacies for handling the stocking and retrieval of boxed medications. For management of medical supplies, a specialized cabinet that uses radio frequency identification is also available.
Intelligence
Leveraging data analytics and predictive intelligence, we provide actionable insights to help customers better understand their medication usage and improve pharmacy supply chain management. We offer specialized services and analytics software designed to help healthcare facilities improve their bottom line and patient care by harnessing data from automation and other systems. Our Omnicell One (formerly Performance Center) solution, a technology-enabled service, combines a cloud-based predictive intelligence platform with expert services designed to drive enterprise improvements in medication inventory optimization, medication waste reduction, and drug diversion monitoring.
Our comprehensive 340B solution provides a combination of software, deep knowledge of the 340B program, and software-enabled services, to help deliver superior outcomes in both savings and compliance, optimizing the 340B program for eligible entities. The suite of offerings includes split billing software, contract pharmacy administration, specialty contract pharmacy administration, and drug discount access solutions.
EnlivenHealth™ offers a portfolio of medication management tools designed to help improve health outcomes. EnlivenHealth Patient Engagement is a web-based nexus of solutions designed to comprehensively support improvement in health outcomes related to medication use. EnlivenHealth Patient Engagement includes clinical solutions such as Medication Synchronization, Immunization and Scheduling, Targeted Patient Interventions, Medication Therapy Management, and Opioid Mitigation Solution, and patient communications such as hosted Interactive Voice Response (IVR), Outbound
Communications, and Mobile App, which enable tailoring of patient contact to individual preferences. Combined with advanced analytics to stratify populations and prioritize patient interventions, these solutions support improved performance for both pharmacies and health plans, helping them to succeed in value-based healthcare by driving health outcomes - better care, better health, and lower costs.
Technology-Enabled Services
We provide technology-enabled services that serve as an extension of pharmacy operations to support improved efficiency, regulatory compliance, and patient outcomes. Our technology-enabled services provide comprehensive, customer-centric, outcome-based adoption services to help ensure successful adoption of our technology.
Our Central Pharmacy IV Compounding Service offers a comprehensive service model inclusive of IV robotic technology, data analytic tools, and clinical support for insourced sterile compounding programs. Our Central Pharmacy Dispensing Service is a turnkey, full service central pharmacy automation solution designed to improve inventory control, compliance, safety, and efficiency through automation, supported by operational staff, maintenance, and optimization services.
We also offer Professional Services, as the introduction of new innovations within our health system customers has become increasingly complex, with greater organizational impacts. We view our customers as partners in the pursuit of better health outcomes for patients and improved satisfaction for the clinicians who serve them. Every engagement is an opportunity for us to help customers reach their clinical and business objectives.
Acquisitions
In addition to our own development, we have, from time to time, acquired businesses and technologies that expand our product lines and are a strategic fit for our business.
On October 1, 2020, we completed the acquisition of the 340B Link business (the “340B Link Business”) of Pharmaceutical Strategies Group, LLC. The acquisition adds to our portfolio a comprehensive and differentiated suite of software-enabled services and solutions used by certain eligible hospitals, health systems, clinics, and entities to manage compliance and capture 340B drug cost savings on outpatient prescriptions filled through the eligible entity’s pharmacy or a contracted pharmacy partner.
Sales and Distribution
We sell our solutions primarily in the United States. Approximately 89% of our revenue was generated in this market for the year ended December 31, 2020. Our sales force is organized by geographic region in the United States and Canada,
where our sales are primarily made direct to end-user customers with the exception of some distribution of medication adherence consumables. Outside the United States and Canada, we field direct sales employees in the United Kingdom, France, Germany, the United Arab Emirates, Belgium, and Australia. For other geographies, we generally sell through distributors and resellers. Our foreign operations are discussed in Note 3, Revenues, and Note 7, Property and Equipment, of the Notes to Consolidated Financial Statements and Item 7, Management's Discussion and Analysis of Financial Condition and Results of Operations, of this annual report on Form 10-K. Our combined direct, corporate, and international distribution sales teams consisted of approximately 370 staff members as of December 31, 2020. Nearly all of our direct sales team members have hospital capital equipment, services, or clinical systems experience.
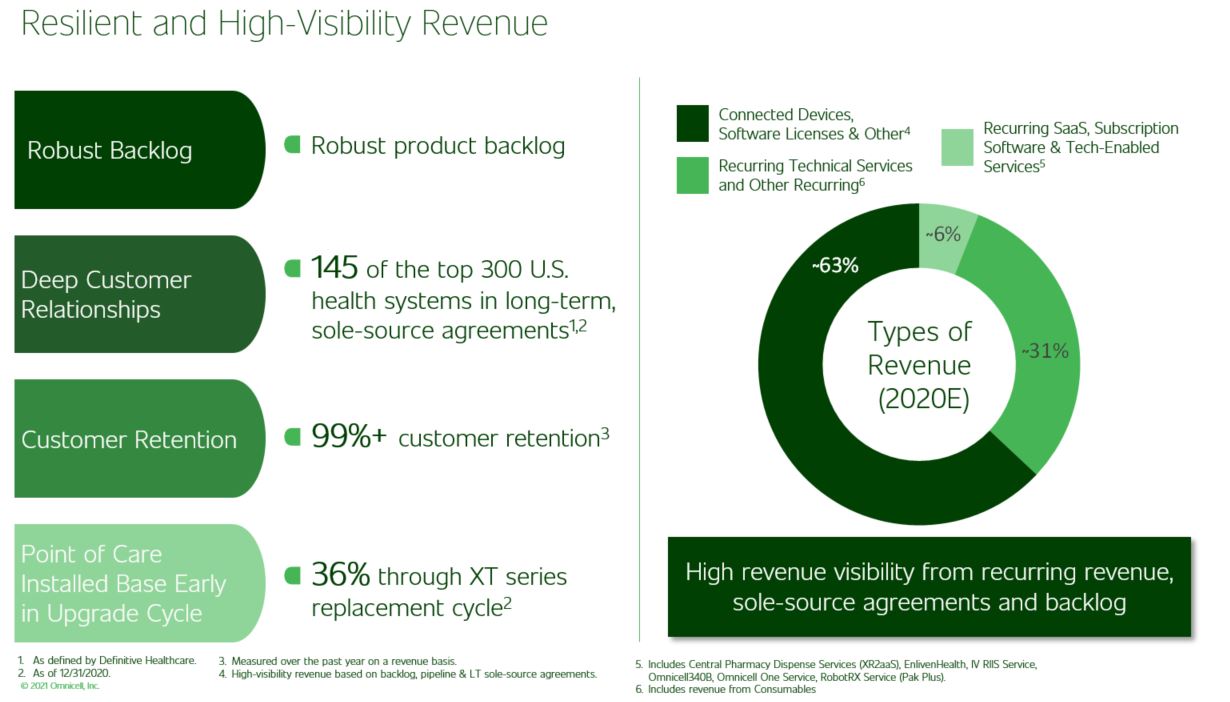
As of December 31, 2020, we have 145 long-term, sole-source agreements with the top 300 U.S. health systems. The sales cycle for our automation systems, from the initial sales meeting to completion of installation, can take in excess of 12 to 24 months. This is due in part to the relative cost of our systems and the number of people within each healthcare facility involved in the purchasing decision and installation process. To initiate the selling process, the sales representative generally targets the director of pharmacy, the director of nursing, the director of materials management, or other decision makers, and educates each group within the healthcare facility about the economic, safety, and compliance benefits of our solutions relative to competing methods of managing medications or medical and surgical supplies.
We contract with Group Purchasing Organizations (“GPOs”), each of which functions as a purchasing agent on behalf of member hospitals and other healthcare providers. Pursuant to the terms of GPO agreements, each member contracts directly with us and can purchase our product at pre-negotiated contract terms and pricing. These GPO contracts are typically for multiple years with options to renew or extend for up to two years and some of which can be terminated by either party at any time. Our current most significant GPO contracts include Vizient, Inc., Premier Inc., and HealthTrust Purchasing Group. We also have a Federal Supply Schedule contract with the Department of Veterans Affairs (the "GSA Contract"), allowing the Department of Veterans Affairs, the Department of Defense, and other Federal government customers to purchase or lease our products. Some of our contracts with these organizations are terminable at the convenience of either party. The accounts receivable balances are with individual members of the GPOs and Federal agencies that purchase under the GSA Contract, and therefore no significant concentration of credit risk exists. During our fiscal year ended December 31, 2020, sales to members of the ten largest GPOs and Federal agencies that purchase under the GSA Contract accounted for approximately 60% of total consolidated revenues.
We offer multi-year, non-cancelable lease payment terms to assist healthcare organizations in purchasing our systems by reducing their cash flow requirements. We sell the majority of our multi-year lease receivables to third-party leasing finance companies.
Our field operations representatives support our sales force by providing operational and clinical expertise prior to the close of a sale and during installation of our automation systems. This group assists the customer with the technical implementation of our automation systems, including configuring our systems to address the specific needs of each individual customer. After the systems are installed, on-site support is provided by our field service team and technical support group.
We offer telephone technical support through our technical support centers in Illinois, Florida, Pennsylvania, and North Carolina. Our support centers are staffed 24 hours a day, 365 days a year. We have found that a majority of our customers’ service issues can be addressed either over the phone or by our support center personnel using their remote diagnostics tools. In addition, we use remote dial-in software that monitors customer conditions on a daily basis. We offer a suite of remote monitoring features, which proactively monitors system status and alerts service personnel to potential problems before they lead to system failure.
In addition, our international team handles direct sales, installation, and service to healthcare facilities in the United Kingdom, France, and Germany, and to non-acute customers in Australia. Sales, installation, and service to healthcare facilities is handled through distribution partners in other parts of Europe, Asia, Australia, the Middle East, South Africa, and South America. Our products are available in a variety of languages including Traditional Chinese, Simplified Chinese, Japanese, Korean, French, Swedish, Dutch, Spanish, and German.
Manufacturing and Inventory
The manufacturing process for our automation products allows us to configure hardware and software in unique combinations to meet a wide variety of individual customer needs. The automation product manufacturing process primarily consists of the final assembly of components and testing of the completed product. Many of the sub-assemblies and components we use are provided by third-party contract manufacturers or other suppliers. A portion of these contract manufacturers and other suppliers are based in Asia. We and our partners test these sub-assemblies and perform inspections to assure the quality and reliability of our products. While many components of our systems are standardized and available from multiple sources, certain components or subsystems are fabricated by a sole supplier according to our specifications and schedule requirements,
or are only available from limited sources. Our medication adherence product manufacturing process consists of fabrication and assembly of equipment and mechanized process manufacturing of consumables. We rely on a limited number of suppliers for the raw material that are necessary in the production of our consumable medication packages.
Our arrangements with our contract manufacturers generally set forth quality, cost, and delivery requirements, as well as manufacturing process terms, such as continuity of supply, inventory management, capacity flexibility, quality and cost management, oversight of manufacturing, and conditions for the use of our intellectual property.
Our manufacturing organization procures components and schedules production based on the backlog of customer orders. Installation of equipment and software typically occurs between two weeks and twelve months after the initial order is received, depending upon the customer’s particular needs. We deploy a key operational strategy of operating with backlog levels that approximate the average installation cycle of our customers, which allows us to more efficiently manage our installation teams, improve production efficiencies, reduce inventory scrap, and lower shipping costs. Shipment of consumables typically occurs between one and four weeks after an order is received.
Competition
The markets in which we operate are intensely competitive. We compete directly with a number of companies in the medication management automations solutions market, as well as the medication adherence solutions market, on the basis of many factors, including price, quality, customer outcome and cost of operation, innovation, product features and capabilities, installation and service, reputation and brand recognition, size of installed base, range of solutions, distribution, and promotion. We expect continued and increased competition from current and future competitors in the markets in which we operate, and are affected by evolving and new technologies, changes in industry standards, and dynamic customer requirements.
We believe our products and services compare favorably with the offerings of our competitors, particularly with respect to proprietary technological advancements, system performance, system reliability, installation, applications training, service response time, and service repair quality.
Intellectual Property and Proprietary Technology
We rely on a combination of patents, trademarks, copyright and trade secret laws, confidentiality procedures, contractual restrictions, and licensing arrangements to protect our intellectual property rights.
We pursue patent protection in the United States and foreign jurisdictions for technology that we believe to be proprietary and that offers a potential competitive advantage for our products. Our issued patents expire on various dates between 2021 and 2038. We intend to seek and obtain additional United States and foreign patents on our technology.
All of our product software is subject to copyright protection under applicable United States and foreign copyright laws. We have also obtained United States and, for certain marks, foreign registrations of various marks, and we intend to seek and obtain additional registrations of our trademarks in the United States and foreign jurisdictions.
Trade secrets and other confidential information are also important to our business. We protect our trade secrets through a combination of contractual restrictions and confidentiality and licensing agreements.
Research and Development
Our research and development efforts begin with customer collaboration. The insight that we gain through this collaboration helps us to develop solutions to address the unmet needs and challenges faced by our customers. We continue to make significant investments in the vision of the autonomous pharmacy, in particular, in our cloud-based platform, in the further development of technology-enabled software and services, and in the evolution of our robotic automation capabilities, while continuing to enhance the other elements of our product and service portfolio. The results of our research and development efforts will further drive the advancement of our cloud-based offerings and amplify the vision of the autonomous pharmacy.
Human Capital Management
As of December 31, 2020, we had approximately 2,860 employees worldwide (with approximately 2,470 in the United States and Canada), excluding individuals who are classified as temporary or contractors. We regularly conduct employee engagement surveys, most recently via the Glint platform. Through continued investment in talent processes and acting on employee feedback, we have achieved an overall employee satisfaction (ESAT) score of 77, which exceeds the average score of similarly-sized companies identified by Glint that use the Glint platform by four points. We believe this reflects our positive employee relations and that Omnicell is viewed by our employees as a good place to work.
Compensation and Benefits
•We embrace a strong pay-for-performance total rewards philosophy that we believe is competitive, performance-based, and cost-effective. We offer market-competitive pay and a comprehensive benefits package.
•Our quarterly bonus program is designed to incentivize our employees to focus on work that will further our strategic priorities.
•We offer reward and recognition programs that embed our core values into our culture and everything we do, allowing for peer-to-peer recognition and motivating our employees to continually work to advance our mission, vision, and values.
Health and Wellness
We offer a comprehensive wellness program designed to promote a healthy lifestyle, including exercise challenges, on-site gym facilities, virtual workouts, and health coaching. In addition to making physical health a priority, we offer mental health counseling and resources, financial coaching, and Teladoc Health services.
Learning and Development
•Our Talent and Leadership development function plays a strategic role in helping us attract and retain talent. We strive to develop career growth capabilities while delivering a consistent learning experience irrespective of role, function, or location.
•We invest in our employees’ learning through robust training programs including Omnicell University, our Core Values in Action training, our New Employee Orientation and our Leading at Omnicell training.
•Our People Manager Talent Development curriculum creates one unique global Omnicell approach to talent development. It is designed to enable our organizational transformation by aligning how we lead across all levels.
Diversity, Equity, and Inclusion
Relationships Matter is one of our core values and that means we are people who care. We value the whole person, not just the work person. At Omnicell, we have always prohibited discrimination on the basis of any protected characteristic and make employment decisions on the basis of merit. We strive to create and maintain a positive, supportive, inclusive, and diverse work environment. Our different backgrounds, education, cultures, and experiences all contribute to the advancement of our business.
We realize we have an opportunity to take more action and that our journey to improve diversity, equity, and inclusion (“DEI”) at Omnicell will continue to evolve. A focus on understanding our related data will be critical to our success. With a continued commitment to DEI, we are taking the steps to build a truly diverse and inclusive culture and plan to create and launch a more comprehensive strategy that we anticipate publicizing in 2021.
Business under Government Contracts
A number of our U.S. government-owned or government-run hospital customers sign five-year leases, with payment terms that are subject to one-year government budget funding cycles. Failure of any of our U.S. government customers to receive their annual funding could impair our ability to sell to these customers, or to collect payments on our existing unsold leases. For additional information regarding these leases, see the section titled “Risk Factors” under Part I, Item 1A below.
Financing Practices Relating to Working Capital
We assist healthcare facilities in financing their cash outlay requirements for the purchase of our systems by offering multi-year, non-cancelable sales contracts. For additional information regarding these financing activities, refer to Note 1, Organization and Summary of Significant Accounting Policies, of the Notes to Consolidated Financial Statements in this annual report on Form 10-K.
Product Backlog
Product backlog is the dollar amount of medication management automation solutions and adherence tools for which we have purchase orders from our customers and for which we believe the majority we will install, bill, and gain customer acceptance within one year. Due to industry practice that allows customers to change order configurations with limited advance notice prior to shipment and occasional customer changes in installation schedules, we do not believe that backlog as of any particular date is necessarily indicative of future sales. However, we do believe that backlog is an indication of a customer’s
willingness to install our solutions. Our product backlog was $924 million and $588 million as of December 31, 2020 and 2019, respectively.
Available Information
We file reports and other information with the United States Securities and Exchange Commission (“SEC”) including annual reports on Form 10-K, quarterly reports on Form 10-Q, current reports on Form 8-K, and proxy or information statements. Those reports and statements as well as all amendments to those documents filed or furnished pursuant to Section 13(a) or 15(d) of the Exchange Act are available (1) at the SEC’s Internet site (www.sec.gov) and (2) free of charge through our website as soon as reasonably practicable after electronic filing with, or furnishing to, the SEC. Our website address is www.omnicell.com. Information posted on or accessible through these websites is not incorporated by reference nor otherwise included in this report, and any references to these websites are intended to be inactive textual references only.
Information About Our Executive Officers
The following table sets forth certain information about our executive officers as of the date of this annual report on Form 10-K:
| | | | | | | | | | | | | | |
| Name | | Age | | Position |
| Randall A. Lipps | | 63 | | President, Chief Executive Officer, and Chairman of the Board of Directors |
| Dan S. Johnston | | 57 | | Executive Vice President and Chief Legal and Administrative Officer |
| | | | |
| Peter J. Kuipers | | 49 | | Executive Vice President and Chief Financial Officer |
| | | | |
| Scott P. Seidelmann | | 45 | | Executive Vice President and Chief Commercial Officer |
| | | | |
Randall A. Lipps was named Chief Executive Officer and President of Omnicell in October 2002. Mr. Lipps has served as Chairman of the Board and a Director of Omnicell since founding Omnicell in September 1992. Mr. Lipps received both a B.S. in economics and a B.B.A. from Southern Methodist University.
Dan S. Johnston joined Omnicell in November 2003 as Vice President and General Counsel. In March 2012, Mr. Johnston was named Executive Vice President and General Counsel. In February 2015, Mr. Johnston was named Executive Vice President and Chief Legal and Administrative Officer. From April 1999 to November 2003, Mr. Johnston was Vice President and General Counsel at Be, Inc., a software company. From September 1994 to March 1999, Mr. Johnston was an attorney with the law firm Cooley LLP. Mr. Johnston received a B.S. in computer information systems from Humboldt State University and a J.D. from the Santa Clara University School of Law.
Peter J. Kuipers joined Omnicell in August 2015 as Executive Vice President and Chief Financial Officer. Prior to Omnicell, Mr. Kuipers served as Senior Vice President and Chief Financial Officer of Quantcast Corp., a global technology company that specializes in digital audience measurement and real-time advertising. From May 2013 to December 2014, Mr. Kuipers served as Executive Vice President and Chief Financial Officer of The Weather Company, a media and global technology leader operating The Weather Channel, weather.com, wunderground.com and its professional services division WSI. From September 2009 to April 2013, Mr. Kuipers served in various financial management positions at Yahoo! Inc., a global internet technology company, most recently as Vice President, Finance for the Americas region. Prior to Yahoo! Inc., Mr. Kuipers held financial leadership roles at Altera Corporation, General Electric Company, and Akzo Nobel. He started his career with Ernst & Young and worked in both the Netherlands and Seattle, Washington. Mr. Kuipers received a Master’s Degree in Economics and Business Administration from Maastricht University and is a Chartered Accountant in the Netherlands.
Scott P. Seidelmann joined Omnicell in April 2018 as Executive Vice President and Chief Commercial Officer. Prior to joining Omnicell, from January 2015 to August 2017, Mr. Seidelmann served as founder and Chief Executive Officer of Candescent Health, Inc., a cloud-based radiology workflow and analytics provider. From 2005 to 2014, Mr. Seidelmann served as co-founder and Chief Executive Officer of Radisphere, Inc., a national radiology practice, prior to its acquisition by Sheridan Healthcare. Earlier in his career, Mr. Seidelmann held positions with Merrill Lynch and Ericsson Venture Partners. Mr. Seidelmann received a B.A. from Cornell University.
ITEM 1A. RISK FACTORS
We have identified the following risks and uncertainties that may have a material adverse effect on our business, financial condition or results of operations. Our business faces significant risks and the risks described below may not be the only risks we face. Additional risks not presently known to us or that we currently believe are immaterial may also significantly impair our business operations. If any of these risks occur, our business, results of operations, or financial condition could suffer and the market price of our common stock could decline.
In assessing these risks, you should also refer to other information contained in this annual report on Form 10-K, including the section entitled “Management’s Discussion and Analysis of Financial Condition and Results of Operations” and our Consolidated Financial Statements and related Notes.
Risk Factors Related to our Business and Industry
We face risks related to adverse public health epidemics, including the ongoing global COVID-19 pandemic, which had an adverse effect on and, depending on the severity and duration of the pandemic, could continue to adversely affect our business, financial condition, and results of operations.
The continued spread of COVID-19, concerns over the pandemic, and related containment measures have adversely impacted our workforce and operations, as well as those of our customers and suppliers, and had an adverse effect on and, depending on the severity and duration of the ongoing COVID-19 pandemic, could continue to adversely affect our business, financial condition, and results of operations.
In response to the ongoing pandemic, the vast majority of our non-manufacturing and non-customer facing personnel continues to work from home. If significant or critical portions of our workforce are unable to work effectively as a result of the COVID-19 pandemic, including because of illness, quarantines, facility closures, ineffective remote work arrangements, or technology failures or limitations, our operations would be materially adversely impacted.
Demand for our solutions, many of which involve a significant initial financial commitment from our customers, is largely dependent on our customers’ financial strength and capital and operating budgets. As a result of the pandemic, health systems have faced financial pressures which we believe led our customers to delay or defer purchasing decisions and/or installations of our solutions during the first half of 2020. However, starting in the third quarter of 2020, we began to see our customers returning to pre-pandemic purchasing patterns consistent with long-term strategic investments. However, any future decisions by our customers to cancel, defer or delay capital expenditure projects, generally reduced capital expenditures by healthcare facilities, and financial losses sustained by health systems as a result of the COVID-19 pandemic, could again decrease demand for our products and related services, resulting in decreased revenue and lower revenue growth rates, which would adversely affect our operating results, perhaps materially.
In addition, although we have not experienced any material disruptions to our supply chain to date, any future prolonged disruption to our suppliers as a result of the COVID-19 pandemic and associated containment measures could significantly disrupt our supply chain and impact our ability to produce our products, which would negatively impact our sales and operating results.
Furthermore, the COVID-19 pandemic has significantly increased economic and demand uncertainty and has led to disruption and volatility in the global capital markets, which could increase the cost of capital and adversely impact access to capital not only for us, but also for our customers and suppliers. Weak economic conditions and inability to access capital in a timely manner, or at all, could reduce our customers’ demand for our products and services, which would adversely affect our operating results, perhaps materially.
The global COVID-19 pandemic continues to rapidly evolve, and the full extent to which COVID-19 will continue to impact our business, results of operations, and financial position will depend on future developments, which remain highly uncertain and cannot be predicted with confidence, such as the severity, resurgences, and duration of the outbreak, travel restrictions, business closures or disruptions, and the effectiveness of actions taken to contain and treat the disease, including the timeline for distribution of vaccinations.
To the extent the COVID-19 pandemic continues to adversely affect our business and financial results, it may also have the effect of heightening certain other risks described in this “Risk Factors” section, including, but not limited to, those relating to unfavorable economic and market conditions, our ability to develop new products or enhance existing products, the need to compete successfully against new product or service entrants, our need to generate sufficient cash flows to service our indebtedness, our tax rates, and our international operations.
Unfavorable economic and market conditions and a decreased demand in the capital equipment market could adversely affect our operating results.
Customer demand for our products is significantly linked to the strength of the economy. If decreases in demand for capital equipment caused by weak economic conditions and decreased corporate and government spending, any effects of fiscal budget balancing at the federal level, proposed legislative changes or other uncertainties in connection with the change in administration, deferrals or delays of capital equipment projects, longer timeframes for capital equipment purchasing decisions, or generally reduced expenditures for capital solutions occurs, we will experience decreased revenues and lower revenue growth rates, and our operating results could be materially and adversely affected.
We may fail to develop new solutions or enhance existing solutions to react to changes in technology and customer requirements in a timely and cost-effective manner, or our new or enhanced solutions may not achieve market acceptance.
We must develop new products or enhance existing products to react to evolving technologies and industry standards, and meet changing demands of our customers. This process can be time-consuming, costly, and complex, and usually requires us to accurately anticipate technological innovations and market trends. Our ability to fund product development and enhancements partially depends on our ability to generate revenues from our existing products.
New product and service developments, or product enhancements, may be late, have technical problems (including software defects, errors, or bugs), fail to meet customer or market specifications, not be competitive with other products using alternative technologies that offer comparable performance and functionality, or not be accepted in new or existing markets, which, in any case, could damage our reputation or otherwise harm our business, financial condition, and results of operations.
Our ability to execute successfully on our vision of a fully digitized and autonomous pharmacy depends on our ability to continue to develop and introduce new products or product enhancements, and integrate new products with existing offerings, in furtherance of this vision in a timely manner and on a cost-effective basis. If we fail to do so, we may be unable to achieve the vision of the autonomous pharmacy, we may not realize the anticipated benefits of our investments in support of this vision, and this could have a material adverse effect on our business, financial condition, and results of operations.
We operate in highly competitive markets, and we may be unable to compete successfully.
The markets in which we operate are intensely competitive. We expect continued and increased competition from current and future competitors, in the medication management automation solutions market and the medication adherence solutions market, many of which have significantly greater financial, technical, marketing, and other resources than we do.
The competitive challenges we face in the markets in which we operate include, but are not limited to, the following:
•current or future competitors may offer or have the ability to offer a broader range of solutions than us, develop alternative solutions that provide a better customer outcome or lower cost of operation, develop new features or capabilities for their products that could compete with ours, or devote greater resources to the development, promotion, and sale of their products than we do;
•competitive pressures could result in increased price competition for our products and services, fewer customer orders, and reduced gross margins;
•current and potential competitors may make strategic acquisitions or establish cooperative relationships among themselves or with third parties, including larger, more established healthcare supply companies, thereby increasing their ability to develop and offer a broader suite of products and services;
•our industry has recently experienced a significant degree of consolidation which could lead to competitors developing new business models that require us to adapt how we market, sell, or distribute our products;
•certain competitors have greater brand name recognition and a more extensive installed base than we do, and such advantages could be used to increase their market share;
•certain competitors may have existing business relationships with our current and potential customers, which may cause these customers to purchase competing products and services from these competitors; and
•our competitors may secure products and services from suppliers on more favorable terms or secure exclusive arrangements with suppliers or buyers that may impede the sales of our products and services.
If we fail to compete successfully against new entrants and established companies, it could materially adversely affect our business, financial condition, results of operations, and cash flows.
Any reduction in the demand for or adoption of our medication management automation solutions, medication packaging systems, or related services would reduce our revenues.
A significant portion of domestic and international healthcare facilities still use traditional approaches to medication and/or supply management in some form that do not include fully-automated methods of medication management. As a result, we must continuously educate existing and prospective customers about the advantages of our medication management automation solutions and medication packaging systems, which requires significant sales efforts and can cause longer sales cycles. Despite our significant efforts and extensive time commitments in sales to healthcare facilities, we cannot be assured that our efforts will result in sales to these customers.
In addition, our medication management automation solutions and our more complex automated packaging systems typically represent a sizable initial capital expenditure for healthcare organizations. Changes in the budgets of these organizations and the timing of spending under these budgets can have a significant effect on the demand for our medication management automation solutions, medication packaging systems, and related services. These budgets are often supported by cash flows that can be negatively affected by declining investment income and influenced by limited resources, increased operational and financing costs, macroeconomic conditions, and conflicting spending priorities among different departments. Any decrease in expenditures by healthcare facilities or increased financing costs (including as a result of the impacts of public health crises such as the ongoing COVID-19 pandemic) could decrease demand for our medication management automation solutions, medication packaging systems, and related services, and reduce our revenues.
Also, the continuing gradual transition to value-based reimbursement could shift more of the burden for financial risk onto healthcare provider organizations and could decrease utilization of healthcare per patient. Value-based reimbursement could also cause a shift in care from traditional venues, such as hospitals and clinics, to the home, and could impact our revenues.
We have incurred substantial debt, which could impair our flexibility and access to capital and adversely affect our financial position.
On November 15, 2019, we refinanced our existing senior secured credit facility pursuant to an amended and restated agreement with certain lenders, and Wells Fargo Bank, National Association, as administrative agent (as amended, the “A&R Credit Agreement”). The A&R Credit Agreement provides for a five-year revolving credit facility of $500.0 million and an uncommitted incremental loan facility of up to $250.0 million. As of December 31, 2020, there were no outstanding balances under the A&R Credit Agreement.
In addition, on September 25, 2020, we issued $575.0 million aggregate principal amount of 0.25% Convertible Senior Notes due 2025 (the “Notes”), pursuant to an indenture, dated September 25, 2020 (the “Indenture”), between us and U.S. Bank National Association, as trustee. We used a portion of the proceeds from the issuance of the Notes to repay all outstanding borrowings under the revolving credit facility.
Our debt may limit our ability to borrow additional funds or use our existing cash flow for working capital, capital expenditures, acquisitions, or other general business purposes; limit our flexibility to plan for, or react to, changes in our business and industry; place us at a competitive disadvantage compared to our less leveraged competitors; and increase our vulnerability to the impact of adverse economic and industry conditions.
Our ability to make scheduled payments of the principal of, to pay interest on, or to refinance our indebtedness, including the Notes, depends on our future performance, which is subject to economic, financial, competitive, and other factors beyond our control. Our business may not continue to generate cash flow from operations in the future sufficient to service our debt and make necessary capital expenditures. If we are unable to generate such cash flow, we may be required to adopt one or more alternatives, such as borrowing more money, selling assets, restructuring debt, or obtaining additional equity capital on terms that may be onerous or highly dilutive. Our ability to refinance our indebtedness will depend on the capital markets and our financial condition at such time. We may not be able to engage in any of these activities or do so on desirable terms, which could result in a default on our debt obligations. In addition, as more fully described below in the risk factor captioned "Covenants in our A&R Credit Agreement restrict our business and operations in many ways, and if we do not effectively manage our compliance with these covenants, our financial conditions and results of operations could be adversely affected," the A&R Credit Agreement includes customary restrictive covenants that impose operating and financial restrictions on us.
In addition, borrowings under the A&R Credit Agreement bear interest based on the London Interbank Offered Rate (“LIBOR”). LIBOR is the subject of recent national, international, and other regulatory guidance and proposals for reform. These reforms and other pressures may cause LIBOR to disappear entirely or to perform differently than in the past. The consequences of these developments cannot be entirely predicted, but could include an increase in the cost of borrowings under the A&R Credit Agreement and other financial contracts that we may enter into that are indexed to LIBOR.
The transition to selling more products which include a software as a service or solution as a service subscription presents a number of risks.
We currently offer our IV compounding robots, PakPlus-Rx service, and XR2 Automated Central Pharmacy System together with personnel to operate the equipment and expert services to optimize utilization through subscription agreements. We also offer Omnicell One (formerly Performance Center), EnlivenHealth Patient Engagement, 340B, and certain other products and solutions as a subscription and/or service. IVX Workflow also contains a payment stream as part of the license fees in its pricing structure. As we continue to execute on the autonomous pharmacy vision and grow subscription and cloud-based offerings, we may offer additional products and services on a subscription basis. The transition to selling more products and services on a subscription basis presents a number of risks. The shift requires an investment of technical, financial,
compliance, and sales resources, and we cannot guarantee that we will recoup the costs of such investments, or that these investments will improve our long-term growth and results of operations. If adoption of subscription solutions takes place faster than anticipated, the shift to subscription revenues will change the timing of revenue recognition and we may experience a temporary reduction of revenues. In addition, our cash flows may be impacted by the timing of invoicing of our subscription solutions. If any of our subscription solutions do not substantially meet customer requirements, contracts may be modified, causing a decline in revenue. Customers may elect not to renew their subscriptions upon expiration, or they may attempt to renegotiate pricing or other contractual terms at or prior to renewal on terms that are less favorable to us. In addition, since revenues are generally recognized over the term of the subscription, any decrease in customer purchases of our subscription-based products and services will not be fully reflected in our operating results until future periods, and it will also be more difficult for us to rapidly increase our revenues through additional subscription sales in any one period.
Delays in installations of our medication management automation solutions or our more complex medication packaging systems could harm our competitive position, results of operations, and financial condition.
The purchase of our medication management automation solutions or our more complex medication packaging systems is often part of a customer’s larger initiative to re-engineer its pharmacy and their distribution and materials management systems. The purchase of our systems often entails larger strategic purchases by customers that generally require more complex and stringent contractual requirements, involve a significant commitment of management attention and resources by prospective customers, and require the input and approval of many decision-makers. In addition, new product announcements can cause a delay in our customers’ decisions to purchase our products or convert pending orders for our older products to those of our newer products. For these and other reasons, the sales cycle associated with sales of our systems is often lengthy and subject to a number of delays over which we have little or no control. A delay in, or loss of, sales of these systems (including as a result of the impacts of public health crises such as the ongoing COVID-19 pandemic) could have an adverse effect upon our operating results and could harm our business.
In addition, and in part as a result of the complexities inherent in larger transactions, the time between the purchase and installation of our systems can generally range from two weeks to one year. Delays in installation can occur for reasons that are often outside of our control. We have also experienced fluctuations in our customer and transaction size mix, which makes our ability to forecast our product bookings more difficult. Because we recognize revenues for our medication management automation solutions and our more complex medication packaging systems only upon installation at a customer’s site, any delay in installation (including as a result of the impacts of public health crises such as the ongoing COVID-19 pandemic) will also cause a delay in the recognition of the revenues for those systems.
We are subject to laws, regulations, and other legal obligations related to privacy, data protection, and information security, and the costs of compliance with, and potential liability associated with, our actual or perceived failure to comply with such obligations could harm our business.
We receive, store, and process personal information and other data from and about customers, in addition to our employees and services providers. In addition, our customers use our solutions to obtain and store personal information, including personal health information. For example, our customers use our EnlivenHealth Patient Engagement platform to guide and track patient notes, interventions, and appointments, which involves the collection of personal health information of patients. Our handling of data is subject to a variety of laws and regulations by state, local, and foreign agencies, as well as contractual obligations and industry standards. Regulatory focus on data privacy and security concerns continues to increase globally, and laws and regulations concerning the collection, use, and disclosure of personal information are expanding and becoming more complex. In the United States, these include federal health information privacy laws (such as the Health Insurance Portability and Accountability Act of 1996 ("HIPAA"), discussed below), security breach notification laws, and consumer protection laws, as well as state laws addressing privacy and data security (such as the California Consumer Privacy Act of 2018 and the California Privacy Rights Act of 2020).
Internationally, various foreign jurisdictions in which we operate have established, or are developing, their own data privacy and security legal framework with which we or our customers must comply. In certain cases, these international laws and regulations are more restrictive than many regulations in the United States. For example, within the European Union, the General Data Protection Regulation (“GDPR”) imposes more stringent data protection requirements on U.S.-based companies, such as ours, which receive or process personal information from EU residents, and establishes greater penalties for non-compliance. Violations of the GDPR can result in penalties up to the greater of €20.0 million or 4% of global annual revenues, and may also lead to damages claims by data controllers and data subjects. Such penalties are in addition to any civil litigation claims by data controllers, customers, and data subjects.
In addition to government regulation, privacy advocates and industry groups may propose new and different self-regulatory standards that may legally or contractually apply to us, and other regulatory protections, such as Privacy Shield, may lose their applicability to our business as regulations and legal proceedings continue to evolve globally. We also expect that
there will continue to be new proposed laws, regulations, and industry standards relating to privacy, data protection, and information security, including in the United Kingdom, where we have business operations, as a result of Brexit. We cannot predict the scope of any such future laws, regulations, and standards that may be applicable to us, or how courts, agencies, or data protection authorities might interpret current ones. It is possible that these laws and other obligations may be interpreted and applied in a manner that is inconsistent with our existing data management practices or the functionality of our solutions.
Compliance with privacy, data protection, and information security laws, regulations, and other obligations is costly, and we may encounter difficulties, delays, or significant expenses in connection with our compliance, or because of our customers’ need to comply or our customers’ interpretation of their own legal requirements. In addition, any failure or perceived failure by us to comply with laws, regulations, policies, legal or contractual obligations, industry standards, or regulatory guidance relating to privacy or data security could result in governmental investigations and enforcement actions, litigation, fines and penalties, exposure to indemnification obligations or other liabilities, and adverse publicity, all of which could have an adverse effect on our reputation, as well as our business, financial condition, and results of operations. For example, as discussed further in the section entitled “Legal Proceedings” in Note 13, Commitments and Contingencies, of the Notes to Consolidated Financial Statements included in this annual report on Form 10-K, we are currently and have in the past been subject to certain class action lawsuits asserting, among other allegations, claims of violation of the Illinois Biometric Information Privacy Act.
If we experience a significant disruption in our information technology systems, breaches of data security, or cyber-attacks on our systems or solutions, our business could be adversely affected.
We rely on information technology (IT) systems to keep financial records and corporate records, communicate with staff and external parties, and operate other critical functions, including sales and manufacturing processes. We also utilize third-party cloud services in connection with our operations. Our IT systems and third-party cloud services are potentially vulnerable to disruption due to breakdown, malicious intrusion and computer viruses, public health crises such as the ongoing COVID-19 pandemic, other catastrophic events or environmental impact. Any prolonged system disruption in our IT systems or third-party cloud services could negatively impact the coordination of our sales, planning, and manufacturing activities, which could harm our business. In addition, in order to maximize our information technology efficiency, we have physically consolidated our primary corporate data and computer operations. This concentration, however, exposes us to a greater risk of disruption to our internal IT systems. Although we maintain offsite back-ups of our data, a disruption of operations at our facilities could materially disrupt our business if we are not capable of restoring function within an acceptable time frame.
Our IT systems and third-party cloud services are potentially vulnerable to cyber-attacks or other data security breaches, by employees or others, which may expose sensitive data to unauthorized persons. Such data security breaches could lead to the loss of trade secrets or other intellectual property, or to the public exposure of sensitive and confidential information of our employees, customers, suppliers, and others, any of which could have a material adverse effect on our business, financial condition, and results of operations. Moreover, a security breach or privacy violation that leads to disclosure or modification of, or prevents access to, patient information, including personally identifiable information or protected health information, could harm our reputation, result in litigation, compel us to comply with federal and/or state breach notification laws, subject us to mandatory corrective action, require us to verify the correctness of database contents, and otherwise subject us to liability under laws and regulations that protect personal data, resulting in increased costs or loss of revenues.
In addition, we sell certain solutions that receive, store, and process our customers’ data. For example, our Omnicell One (formerly Performance Center) solution combines a cloud-based predictive intelligence platform with expert services designed to monitor pharmacy operations and recommend opportunities to help improve efficiency, regulatory compliance, and patient outcomes. As another example, our EnlivenHealth Patient Engagement platform is a private cloud-based solution that supports improving patient adherence goals through a single web-based platform that hosts functionality to guide and track patient notes, interventions, and appointments. An effective attack on our solutions could disrupt the proper functioning of our solutions, allow unauthorized access to sensitive and confidential information of our customers (including protected health information), and disrupt our customers’ operations. Any of these events could cause our solutions to be perceived as having security vulnerabilities and reduce demand for our solutions, which could have a material adverse effect on our business, financial condition, and results of operations. These risks are likely to increase as we continue to grow our cloud-based offerings, including in support of the autonomous pharmacy vision, and as we receive, store, and process more of our customers’ data.
While we have implemented a number of security measures designed to protect our systems and data, including firewalls, antivirus and malware detection tools, patches, log monitors, routine back-ups, system audits, routine password modifications, and disaster recovery procedures, and have designed certain security features into our solutions, such measures may not be adequate or implemented properly to prevent or fully address the adverse effect of such events, and in some cases we may be unaware of an incident or its magnitude and effects as breaches and other inappropriate access can be difficult to detect, and any delay in identifying them may lead to increased harm. Additionally, we use third-party cloud providers in
connection with certain of our cloud-based offerings or third-party providers to host our own data, in which case we rely on the processes, controls, and security such third parties have in place to protect the infrastructure. We also may acquire companies, products, services, and technologies and inherit such risks when we integrate these acquisitions within Omnicell.
Any failure to prevent such security breaches or privacy violations, or implement satisfactory remedial measures, could require us to expend significant resources to remediate any damage, disrupt our operations or the operations of our customers, damage our reputation, or expose us to a risk of financial loss, litigation, regulatory penalties, contractual indemnification obligations, or other liability.
We may fail to realize the potential benefits of acquired businesses, including the 340B Link Business, which could negatively affect our business, financial condition, and operating results.
We have in the past acquired businesses, and expect to continue to seek to acquire businesses, technologies, or products in the future. For example, we acquired Aesynt Incorporated ("Aesynt") and ateb, Inc. ("Ateb") in 2016, Dixie Drawl, LLC d/b/a InPharmics ("InPharmics") in 2017 and the 340B Link Business in October 2020. We cannot provide assurance that any acquisition or future transaction we complete will result in long-term benefits to us or our stockholders, or that we will be able to effectively integrate or manage the acquired businesses, including the 340B Link Business.
These transactions may involve significant challenges, uncertainties, and risks, including:
•difficulties in combining previously separate businesses into a single unit and the complexity of managing a more dispersed organization as sites are acquired;
•difficulties in right-sizing organizations and gaining synergies across acquired operations;
•complying with regulatory requirements, such as those of the FDA, that we were not previously subject to;
•failure to understand and compete effectively in markets in which we have limited previous experience;
•substantial costs and diversion of management’s attention when evaluating and negotiating such transactions and then integrating an acquired business, including any unforeseen delays and expenditures that may result;
•discovery, after completion of the acquisition, of liabilities assumed in acquisitions that are broader in scope and magnitude or are more difficult to manage than originally assumed;
•difficulties assimilating and retaining key personnel of an acquired business;
•failure to achieve anticipated benefits such as revenue enhancements and operational and cost efficiencies;
•difficulties in integrating newly-acquired products and solutions in our offerings, or inability or failure to expand product bookings and sales or effectively coordinate sales and marketing efforts of the combined company;
•inability to maintain business relationships with customers and suppliers of newly-acquired companies due to post-acquisition disruption; and
•inability or failure to successfully integrate financial reporting and information technology systems.
If we are not able to successfully integrate or manage the acquired businesses and their operations, or if there are delays in combining the businesses, the anticipated benefits of the acquisition may not be realized fully or at all or may take longer to realize than expected and our business, financial condition, and operating results may be negatively impacted.
If goodwill or other intangible assets that we recorded in connection with the Aesynt, Ateb, InPharmics, and 340B Link Business acquisitions, or other prior acquisitions, become impaired, we could be required to take significant charges against earnings.
In connection with the accounting for the Aesynt and Ateb acquisitions in 2016, the InPharmics acquisition in 2017, and the 340B Link Business acquisition in October 2020, we recorded a significant amount of goodwill and other intangible assets, and we maintain significant goodwill and other intangible assets relating to prior acquisitions, such as our acquisitions of MTS Medication Technologies, Inc., Avantec Healthcare Limited, and Mach4 Automatisierungstechnik GmbH. As of December 31, 2020, we had recorded approximately $666.0 million net, in goodwill and intangible assets, in connection with past acquisitions. Under U.S. generally accepted accounting principles, we must assess, at least annually and potentially more frequently, whether the value of goodwill and other indefinite-lived intangible assets has been impaired. Intangible assets subject to amortization will be assessed for impairment in the event of an impairment indicator. Any reduction or impairment of the value of goodwill or other intangible assets will result in a charge against earnings, which could materially adversely affect our results of operations and shareholders’ equity in future periods.
The healthcare industry is subject to legislative and regulatory changes, as well as financial constraints and consolidation, which could adversely affect the demand for our products and services.
The healthcare industry has faced, and will likely continue to face, significant financial constraints. U.S. government legislation and program rulemaking may cause customers to postpone purchases of our products due to reductions in federal healthcare program reimbursement rates and/or needed changes to their operations in order to meet the requirements of legislation or in anticipation of future rulemaking. Our automation solutions often involve a significant financial commitment from our customers and, as a result, our ability to grow our business is largely dependent on our customers’ capital and operating budgets. To the extent current or proposed legislation and program rules promote spending on other initiatives or healthcare providers’ spending declines or increases more slowly than we anticipate, demand for our products and services could decline.
Healthcare providers have consolidated to create larger healthcare delivery organizations in order to achieve economies of scale and/or greater market power. If this consolidation continues, it would increase the size of certain target customers, which could increase the cost, effort, and difficulty in selling our products to such customers, or could cause our existing or potential customers to begin utilizing our competitors’ products if such customers are acquired by healthcare providers that prefer our competitors’ products to ours. In addition, the resulting organizations could have greater bargaining power, which may lead to price erosion.
Government regulation of the healthcare industry could reduce demand for our products, or substantially increase the cost to produce our products.
The manufacture and sale of most of our current products are not regulated by the FDA, or the Drug Enforcement Administration (“DEA”). Through our acquisition of Aesynt, we have both Class I and Class II, 510(k) exempt medical devices which are subject to FDA regulation and require compliance with the FDA Quality System Regulation as well as medical device reporting. Additional products may be regulated in the future by the FDA, DEA, or other federal agencies due to future legislative and regulatory initiatives or reforms. Direct regulation of our business and products by the FDA, DEA, or other federal agencies could substantially increase the cost to produce our products and increase the time required to bring those products to market, reduce the demand for our products, and reduce our revenues. In addition, our customers include healthcare providers and facilities subject to regulation by the DEA, pharmacies subject to regulation by individual state boards of pharmacy and hospitals subject to accreditation by accrediting organizations approved by the Centers for Medicare & Medicaid Services, such as the Joint Commission, and the rules, regulations, and standards of such regulators and accrediting organizations. Any failure of our customers to comply with the applicable rules, regulations, and standards could reduce demand for our products and harm our competitive position, results of operations, and financial condition.
While we have implemented a Privacy and Use of Information Policy and adhere to established privacy principles, use of customer information guidelines, and related federal and state statutes, we cannot assure you that we will be in compliance with all federal and state healthcare information privacy and security laws that we are directly or indirectly subject to, including, without limitation, HIPAA. Under HIPAA, we are considered a “business associate” in relation to many of our customers that are covered entities, and, as such, most of these customers have required that we enter into written agreements governing the way we handle and safeguard certain patient health information we may encounter in providing our products and services, and may impose liability on us for failure to meet our contractual obligations. Further, pursuant to changes in HIPAA under the American Recovery and Reinvestment Act of 2009, we are covered under HIPAA similar to other covered entities and, in some cases, subject to the same civil and criminal penalties as a covered entity. A number of states and countries have also enacted privacy and security statutes and regulations that, in some cases, are more stringent than HIPAA and may also apply directly to us. If our past or present operations are found to violate any of these laws, we may be subject to fines, penalties, and other sanctions.
In addition, we cannot predict the potential impact of future privacy standards and other federal, state, and international privacy and security laws that may be enacted at any time on our customers or on Omnicell. These laws could restrict the ability of Omnicell and/or our customers to obtain, use, or disseminate patient information, which could reduce the demand for our products or force us to redesign our products in order to meet regulatory requirements.
Our international operations may subject us to additional risks that can adversely affect our operating results.
We currently have operations outside of the United States, including sales efforts centered in Canada, Europe, the Middle East, and the Asia-Pacific regions, and supply chain efforts in Asia. We intend to continue to expand our international operations, particularly in certain markets that we view as strategic, including the Middle East. Our international operations subject us to a variety of risks, including:
•our reliance on distributors for the sale of our medication management automation solutions outside the United States, Canada, the United Kingdom, France, and Germany;
•the difficulty of managing an organization operating in various countries;
•reduced protection for intellectual property rights in certain jurisdictions;
•the imposition of, or adverse changes in, international laws and regulations, including privacy and security, labor, import, export, trade, environmental standards, product compliance, tax, anti-bribery, and employment laws;
•fluctuations in currency exchange rates and difficulties in repatriating funds from certain countries;
•additional investment, coordination, and lead-time necessary to successfully interface our automation solutions with the existing information systems of our customers or potential customers outside of the United States;
•political unrest, terrorism, and other potential hostilities in areas in which we have facilities or operations; and
•epidemics, pandemics, or other major public health crises, such as the ongoing COVID-19 pandemic.
If we are unable to anticipate and address these risks properly, our business or operating results will be harmed.
Furthermore, changes in export or import regulation and other trade barriers and uncertainties may have an adverse effect on our business. For example, in recent years, the U.S. government advocated greater restrictions on trade generally and tariff increases on certain goods imported into the United States, particularly from China. We cannot predict what actions may ultimately be taken with respect to tariffs or trade relations between the United States and other countries (including China), what products may be subject to such actions, or what actions may be taken by the other countries in retaliation. The adoption and expansion of trade restrictions, the occurrence of a trade war, other governmental action related to tariffs or trade agreements or policies, or the related uncertainties, has the potential to adversely impact our supply chain and costs, which could, in turn, adversely affect our business, financial condition, and results of operations.
Covenants in our A&R Credit Agreement restrict our business and operations in many ways, and if we do not effectively manage our compliance with these covenants, our financial conditions and results of operations could be adversely affected.
The A&R Credit Agreement contains various customary covenants that limit our ability and/or our subsidiaries’ ability to, among other things, incur or assume liens or additional debt or provide guarantees in respect of obligations of other persons; issue redeemable preferred stock; pay dividends or distributions or redeem or repurchase capital stock; prepay, redeem, or repurchase certain debt; make loans, investments, acquisitions, and capital expenditures; enter into agreements that restrict distributions from our subsidiaries; sell assets and capital stock of our subsidiaries; enter into certain transactions with affiliates; and consolidate or merge with or into, or sell substantially all of our assets to, another person.
The A&R Credit Agreement also includes financial covenants requiring us (i) not to exceed a maximum consolidated secured net leverage ratio of 3.50:1 for the calendar quarters ending September 30, 2020, December 31, 2020 and March 31, 2021 and 3.00:1 for the calendar quarters ending thereafter and (ii) to maintain a minimum interest coverage ratio of 3.00:1. Our ability to comply with these financial covenants may be affected by events beyond our control. Our failure to comply with any of the covenants under the A&R Credit Agreement could result in a default under the terms of the A&R Credit Agreement, which could permit the administrative agent or the lenders to declare all or part of any outstanding borrowings to be immediately due and payable, or to refuse to permit additional borrowings under the revolving credit facility, which could restrict our operations, particularly our ability to respond to changes in our business or to take specified actions to take advantage of certain business opportunities that may be presented to us. In addition, if we are unable to repay those amounts, the administrative agent and the lenders under the A&R Credit Agreement could proceed against the collateral granted to them to secure that debt, which would seriously harm our business.
Our success is dependent on our ability to recruit and retain skilled and motivated personnel.
Our success is highly dependent upon the continuing contributions of our key management, sales, technical, and engineering staff, and on our ability to attract, train, and retain highly-skilled and motivated personnel. As more of our products are installed in increasingly complex environments, greater technical expertise will be required. As our installed base of customers increases, we will require additional resources to meet increased demands on our customer service and support personnel. Furthermore, as we execute on the autonomous pharmacy vision and grow our cloud-based software as a service and solution as a service offerings, more specialized expertise will be required. Competition for such personnel can be intense, and we may not be successful in attracting and retaining qualified personnel. Competitors have in the past attempted, and may in the future attempt, to recruit our employees. In addition, since equity compensation is a key component of our employee compensation program, any failure to receive stockholder approval for future proposed increases to the number of shares reserved for issuance under our equity incentive plans could prevent us from granting equity compensation at competitive levels and make it more difficult to attract, retain, and motivate employees, including key employees of acquired businesses. Failure to attract and retain key personnel could harm our competitive position, results of operations, and financial condition.
Our failure to protect our intellectual property rights could negatively affect our ability to compete.
Our success depends in part on our ability to obtain patent protection for technology and processes, and our ability to preserve our trademarks, copyrights, and trade secrets. We have pursued patent protection in the United States and foreign jurisdictions for technology that we believe to be proprietary and for technology that offers us a potential competitive advantage for our products. We intend to continue to pursue such protection in the future. Our issued patents relate to various features of our medication management automation solutions and medication packaging systems. We cannot assure you that we will file any patent applications in the future and that any of our patent applications will result in issued patents, or that, if issued, such patents will provide significant protection for our technology and processes. Furthermore, we cannot assure you that others will not design around the patents we own. All of our system software is copyrighted and subject to the protection of applicable copyright laws. Despite our efforts to protect our proprietary rights, unauthorized parties may attempt to copy aspects of our products or obtain and use information that we regard as proprietary, which could harm our competitive position.
If we are unable to maintain our relationships with group purchasing organizations (“GPOs”) or other similar organizations, we may have difficulty selling our products and services to customers represented by these organizations.
A number of GPOs have negotiated standard contracts for our products on behalf of their member healthcare organizations. Members of these GPOs may purchase under the terms of these contracts, which obligate us to pay the GPO a fee. We also have a Federal Supply Schedule contract with the Department of Veterans Affairs, allowing the Department of Veterans Affairs, the Department of Defense, and other Federal government customers to purchase or lease our products. These contracts enable us to more readily sell our products and services to customers represented by these organizations. Some of our contracts with these organizations are terminable at the convenience of either party. The loss of any of these relationships could impact the breadth of our customer base and could impair our ability to meet our revenue targets or increase our revenues. These organizations may not renew our contracts on similar terms, if at all, and they may choose to terminate our contracts before they expire, any of which could cause our revenues to decline.
If we are unable to meet the demands of, or maintain our relationships with, our institutional and retail pharmacy customers, our revenue from sales of medication packages and other consumables may decline.
Approximately 8% of our revenues during the year ended December 31, 2020 were generated from the sale of consumable medication packages, most of which are produced in our St. Petersburg, Florida facility on a continuous basis and are shipped out to fulfill the demands of our institutional and retail pharmacy customers domestically and abroad. The demands placed on institutional and retail pharmacies by their customers represent real time requirements of those customers. Our customer agreements for the sale of consumable medication packages are typically short-term in nature and typically do not impose volume commitments on the customer. If we are unable to supply quality packaging to our customers in a timely manner, they may use alternative methods of distributing medications to their customers, including consumable medication packaging sold by our competitors, and our revenues will decline. Any disruption in the production capabilities of our St. Petersburg facilities will adversely affect our ability to ship our consumable medication packages globally and would reduce our revenues.
In addition, the institutional pharmacy market consists of significant national suppliers of medications to non-acute care facilities, smaller regional suppliers, and very small local suppliers. If we are unable to maintain our relationships with the major institutional pharmacies we do business with, they may purchase consumable blister card components from alternative sources, or choose to use alternatives to blister cards for medication control, and our revenues would decline.
We depend on a limited number of suppliers for our products, and our business may suffer if we were required to change suppliers to obtain an adequate supply of components, equipment, and raw materials on a timely basis.
Although we generally use parts and components for our products with a high degree of modularity, certain components are presently available only from a single source or limited sources. We rely on a limited number of suppliers for the raw materials necessary to produce our consumable medication packages. While we have generally been able to obtain adequate supplies of all components and raw materials in a timely manner from existing sources, or where necessary, from alternative sources, we entered into relationships with new suppliers in connection with the launch of our XT Series products. We engage multiple single source third-party manufacturers to build several of our sub-assemblies. The risks associated with changing to alternative vendors, if necessary, for any of the numerous components used to manufacture our products could limit our ability to manufacture our products and harm our business. Due to our reliance on a few single source partners to build our hardware sub-assemblies and on a limited number of suppliers for the raw materials that are necessary in the production of our consumable medication packages, a reduction or interruption in supply from our partners or suppliers, or a significant increase in the price of one or more components could have an adverse impact on our business, results of operations, and financial condition. In certain circumstances, the failure of any of our suppliers or us to perform adequately could result in quality control issues affecting end users’ acceptance of our products, which could damage customer relationships and harm our business.
The United Kingdom’s withdrawal from the European Union (“Brexit”) could adversely affect us.
The United Kingdom (the “UK”) left the European Union (the “EU”) on January 31, 2020. The transition period provided for in the withdrawal agreement entered into by the UK and the EU ended on December 31, 2020 (the “Brexit Transition Period”). In December 2020, the UK and the EU agreed on a trade and cooperation agreement that will apply provisionally after the end of the transition period until it is ratified by the parties to the agreement. On December 31, 2020, the UK passed legislation giving effect to the trade and cooperation agreement, with the EU expected to formally adopt the agreement in early 2021. The trade and cooperation agreement covers the general objectives and framework of the relationship between the United Kingdom and the European Union, including as it relates to trade, transport, visas, judicial, law enforcement, and security matters, and provides for continued participation in community programs and mechanisms for dispute resolution. The effects of Brexit have been and are expected to continue to be far-reaching. Brexit and the perceptions as to its impact may adversely affect business activity and economic conditions in Europe and globally, continue to contribute to uncertainty regarding the regulation of data protection in the UK, disrupt the free movement of goods, services, and people between the UK and the EU, and lead to legal uncertainty and potentially divergent national laws and regulations for the UK. We are currently in the process of evaluating our own risks and uncertainty related to ascertaining what financial, trade, regulatory, and legal implications this new Brexit trade deal could have on our UK and European business operations. This uncertainty also includes the impact on our customers’ business operations and capital planning as well as the overall impact on the healthcare industry. We have not experienced any direct material financial impact since the 2016 referendum, and while we cannot predict its future implications, we do not currently expect Brexit and its related effects to have an adverse impact on our consolidated financial position and results of operations.
Our U.S. government lease agreements are subject to annual budget funding cycles and mandated unilateral changes, which may affect our ability to enter into such leases or to recognize revenues, and sell receivables based on these leases.
U.S. government customers that lease our equipment typically sign contracts with five-year payment terms that are subject to one-year government budget funding cycles. Further, the government has in certain circumstances mandated unilateral changes in its Federal Supply Services contract that could render our lease terms with the government less attractive. In our judgment and based on our history with these accounts, we believe these receivables are collectible. However, in the future, the failure of any of our U.S. government customers to receive their annual funding, or the government mandating changes to the Federal Supply Services contract could impair our ability to sell lease equipment to these customers or to sell our U.S. government receivables to third-party leasing companies. In addition, the ability to collect payments on unsold receivables could be impaired and may result in a write-down of our unsold receivables from U.S. government customers. The balance of our unsold leases to U.S. government customers was $23.8 million as of December 31, 2020.
If we fail to manage our inventory properly, our revenue, gross margin, and profitability could suffer.
Managing our inventory of components and finished products is a complex task. A number of factors, including, but not limited to, the need to maintain a significant inventory of certain components that are in short supply or that must be purchased in bulk to obtain favorable pricing, the general unpredictability of demand for specific products and customer requests for quick delivery schedules, may result in us maintaining large amounts of inventory. Other factors, including changes in market demand, customer requirements, and technology, may cause our inventory to become obsolete. Any excess or obsolete inventory could result in inventory write-downs, which in turn could harm our business and results of operations.
Intellectual property claims against us could harm our competitive position, results of operations, and financial condition.
We expect that developers of medication management automation solutions and medication packaging systems will be increasingly subject to infringement claims as the number of products and competitors in our industry grows and the functionality of products in different industry segments overlaps. In the future, third parties may claim that we have infringed upon, misappropriated, or otherwise violated their intellectual property rights with respect to current or future products. We do not carry special insurance that covers intellectual property infringement claims; however, such claims may be covered under our traditional insurance policies. These policies contain terms, conditions, and exclusions that make recovery for intellectual property infringement claims difficult to guarantee. Any infringement claims, with or without merit, could be time-consuming to defend, result in costly litigation, divert management’s attention and resources, cause product shipment delays or require us to enter into royalty or licensing agreements. These royalty or licensing agreements, if required, may not be available on terms acceptable to us, or at all, which could harm our competitive position, results of operations, and financial condition.
Product liability claims against us could harm our competitive position, results of operations, and financial condition.
Our products include medication management automation solutions and medication adherence products and services for healthcare systems and pharmacies. Despite the presence of healthcare and pharmacy professionals as intermediaries between our products and patients, if our products fail to provide accurate and timely information or operate as designed, customers, patients, or their family members could assert claims against us for product liability. Moreover, failure of health care
facility and pharmacy employees to use our products for their intended purposes could result in product liability claims against us. Litigation with respect to product liability claims, regardless of any outcome, could result in substantial cost to us, divert management’s attention from operations, and decrease market acceptance of our products. We possess a variety of insurance policies that include coverage for general commercial liability and technology errors and omissions liability. We attempt to mitigate these risks through contractual terms negotiated with our customers. However, these policies and protective contractual terms may not be adequate against product liability claims and in the past we have been subject to certain lawsuits asserting, among other allegations, claims of product liability. A successful claim brought against us, or any claim or product recall that results in negative publicity about us, could harm our competitive position, results of operations, and financial condition. Also, in the event that any of our products is defective, we may be required to recall or redesign those products.
We are dependent on technologies provided by third-party vendors, the loss of which could negatively and materially affect our ability to market, sell, or distribute our products.
Some of our products incorporate technologies owned by third parties that are licensed to us for use, modification, and distribution. For example, we entered into a reseller agreement with Kit Check, Inc. to offer Bluesight for Controlled Substances diversion prevention software to our customers. If we lose access to third-party technologies, such as our ability to distribute Bluesight for Controlled Substances, or we lose the ongoing rights to modify and distribute these technologies with our products, we will have to devote resources to independently develop, maintain, and support the technologies ourselves, pay increased license costs, or transition to another vendor. Any independent development, maintenance, or support of these technologies by us or the transition to alternative technologies could be costly, time consuming, and could delay our product releases and upgrade schedules. These factors could negatively and materially affect our ability to market, sell, or distribute our products.
Risks Related to Ownership of our Common Stock
The market price of our common stock may continue to be highly volatile.
Our common stock traded between $54.24 and $125.00 per share during the year ended December 31, 2020. The market price of our common stock has been and may continue to be highly volatile in response to various factors, many of which are beyond our control, including:
•actual or anticipated changes in our operating results, and whether our operating results or forecasts meet the expectations of securities analysts or investors;
•changes in the ratings of our common stock by securities analysts or changes in their earnings estimates;
•developments in our customer relationships;
•announcements by us or our competitors of technological innovations or new products;
•mergers, acquisitions, combinations, and other significant transactions involving us or our competitors;
•level of demand for our common stock, and actions by stockholders or short sellers of our common stock;
•epidemics, pandemics, or other major public health crises, such as the ongoing COVID-19 pandemic; or
•general economic and market conditions.
Furthermore, the stock market in general, and the market for technology companies in particular, have experienced extreme price and volume fluctuations. These broad market fluctuations may cause the market price of our common stock to decline irrespective of our performance. In addition, sales of substantial amounts of our common stock in the public market, or the perception that such sales could occur, could lower the market price of our common stock.
In addition, stockholders have initiated class action lawsuits against companies following periods of volatility in the market prices of these companies’ stock. For example, in July 2019, a putative class action lawsuit was filed against Omnicell and certain of our officers alleging that the defendants violated federal securities laws by making certain materially false and misleading statements. While this action was concluded in December 2019 following the lead plaintiff's voluntary dismissal as to all defendants, we may in the future be subject to other class action lawsuits, especially following periods of volatility in our stock price.
Our quarterly operating results may fluctuate and may cause our stock price to decline.
Our quarterly operating results may vary in the future. In addition to other factors discussed in this “Risk Factors” section, factors that may cause our quarterly operating results to fluctuate include, but are not limited to, the following:
•the size, product mix, and timing of orders for our products, and their installation and integration;
•our ability to successfully install our products on a timely basis and meet other contractual obligations necessary to recognize revenue;
•fluctuations in customer demand for our products, including due to changes in our customers’ budgets;
•our ability to control costs, including operating expenses, and continue cost reduction efforts;
•changes in pricing policies by us or our competitors;
•the number, timing, and significance of product enhancements and new product announcements by us or our competitors;
•the timing and significance of any acquisition or business development transactions that we may consider or negotiate and the revenues, costs, and earnings that may be associated with these transactions;
•the relative proportions of revenues we derive from products and services;
•our ability to generate cash from our accounts receivable on a timely basis;
•changes in, and our ability to successfully execute on, our business strategy; and
•macroeconomic and political conditions, including fluctuations in interest rates, tax increases, availability of credit markets, and trade and tariff actions.
Due to all of these factors, our quarterly revenues and operating results are difficult to predict and may fluctuate, which in turn may cause the market price of our stock to decline.
Raising additional capital may cause dilution to our existing stockholders, restrict our operations or harm our business, financial condition, and results of operations.
We may seek additional capital through a variety of means, including through private and public equity offerings and debt financings. To the extent that we raise additional capital through the sale of equity or convertible debt securities, the ownership interest will be diluted, and the terms may include liquidation or other preferences that adversely affect the rights of our stockholders. Debt financing, if available, may involve agreements that include covenants limiting or restricting our ability to take certain actions, such as incurring additional debt, making capital expenditures, entering into licensing arrangements, or declaring dividends. If we raise additional funds from third parties, we may have to relinquish valuable rights to our technologies, or grant licenses on terms that are not favorable to us.
If we are unable to raise additional funds through equity or debt financing when needed, our ability to market, sell, or distribute our products may be negatively impacted and could harm our business, financial condition, and results of operations.
Certain provisions in our charter documents and under Delaware law may delay or prevent an acquisition of us and limit our stockholders’ ability to obtain a favorable judicial forum for certain disputes.
Certain anti-takeover provisions of Delaware law and our charter documents may make a change in control of our Company more difficult, even if a change in control would be beneficial to the stockholders. Our certificate of incorporation provides that stockholders' meetings may only be called by our Board of Directors. Our bylaws provide that stockholders may not take action by written consent, and require that stockholders comply with advance notice procedures to nominate director candidates for election or to propose matters to be acted upon at a meeting of our stockholders. Delaware law also prohibits corporations from engaging in a business combination with any holders of 15% or more of their capital stock until the holder has held the stock for three years unless, among other possibilities, our Board of Directors approves the transaction. Our Board of Directors may use these provisions to prevent changes in the management and control of our Company. Also, under applicable Delaware law, our Board of Directors may adopt additional anti-takeover measures in the future including, without limitation, a stockholder rights plan.
In addition, our bylaws also establish the Delaware Court of Chancery as the exclusive forum for certain legal actions, including certain stockholder disputes, and establish the federal district courts of the United States of America as the exclusive forum for any action asserting a cause of action arising under the Securities Act of 1933, as amended, which exclusive forum provisions may limit the ability of our stockholders to bring a claim in a judicial forum that such stockholders find favorable for disputes with us or our directors, officers, or other employees.
Risk Factors Related to our Notes
Conversion of the Notes may dilute the ownership interest of our stockholders, depress the price of our common stock or, if the conditional conversion feature of the Notes is triggered, adversely affect our financial condition and operating results.
The Notes are convertible at the option of the holders on or after May 15, 2025 and, in certain circumstances, prior to May 15, 2025. The initial conversion rate for the Notes is 10.2751 shares of our common stock per $1,000 principal amount of Notes, subject to adjustment under certain circumstances in accordance with the terms of the Indenture. The conversion of some or all of the Notes may dilute the ownership interests of our stockholders. Upon conversion of the Notes, we have the option to pay or deliver, as the case may be, cash, shares of our common stock, or a combination of cash and shares of our common stock. If we elect to settle our conversion obligation in shares of our common stock or a combination of cash and shares of our common stock, any sales in the public market of our common stock issuable upon such conversion could adversely affect prevailing market prices of our common stock. In addition, the existence of the Notes may encourage short selling of our common stock by market participants because the conversion of the Notes could be used to satisfy short positions, or the anticipated conversion of the Notes into shares of our common stock could depress the price of our common stock.
Prior to May 15, 2025, if a circumstance that permits early conversion occurs, holders of the Notes will be entitled to convert their Notes at any time during specified periods at their option. If one or more holders elect to convert their Notes, unless we elect to satisfy our conversion obligation by delivering solely shares of our common stock (other than paying cash in lieu of delivering any fractional share), we would be required to settle a portion or all of our conversion obligation through the payment of cash, which could adversely affect our liquidity. In addition, even if holders do not elect to convert their Notes, we could be required under applicable accounting rules to reclassify all or a portion of the outstanding principal of the Notes as a current rather than long-term liability, which would result in a material reduction of our net working capital.
The accounting method for convertible debt securities that may be settled in cash, such as the Notes, could have a material effect on our reported financial results.
Under Accounting Standards Codification ("ASC") 470-20, Debt with Conversion and Other Options, an entity must separately account for the liability and equity components of convertible debt instruments (such as the Notes) that may be settled entirely or partially in cash upon conversion in a manner that reflects the issuer’s economic interest cost. The effect of ASC 470-20 on the accounting for the Notes is that the equity component is required to be included in the additional paid-in capital section of stockholders’ equity on our consolidated balance sheet at issuance, and the value of the equity component is treated as a discount for purposes of accounting for the debt component of the Notes. As a result, we are required to record a greater amount of non-cash interest expense as a result of the amortization of the discounted carrying value of the Notes to their face amount over the term of the Notes. We report larger net losses or lower net income in our financial results because ASC 470-20 requires interest to include both the amortization of the debt discount and the instrument’s coupon interest rate, which could adversely affect our reported or future financial results.
In addition, under certain circumstances, convertible debt instruments (such as the Notes) that may be settled entirely or partly in cash may be accounted for utilizing the treasury stock method for earnings per share purposes, the effect of which is that the shares issuable upon conversion of the Notes are not included in the calculation of diluted earnings per share except to the extent that the conversion value of the Notes exceeds their principal amount. Under the treasury stock method, for diluted earnings per share purposes, the transaction is accounted for as if the number of shares of common stock that would be necessary to settle such excess, if we elected to settle such excess in shares, are issued. We cannot assure you that we will be eligible, or will continue to be eligible, to account for the Notes using the treasury stock method.
In August 2020, the FASB published an Accounting Standards Update ("ASU") 2020-06, which amends these accounting standards by reducing the number of accounting models for convertible instruments and limiting instances of separate accounting for the debt and equity or a derivative component of the convertible debt instruments. ASU 2020-06 also will no longer allow the use of the treasury stock method for convertible instruments and instead require application of the “if- converted” method. Under that method, diluted earnings per share will generally be calculated assuming that all of the Notes were converted solely into shares of common stock at the beginning of the reporting period, unless the result would be anti-dilutive, which could adversely affect our diluted earnings per share. These amendments will be effective for public companies for fiscal years beginning after December 15, 2021, with early adoption permitted, but no earlier than fiscal years beginning after December 15, 2020. The adoption of these amendments would have a material impact on our accounting for the Notes, which may impact our reported financial results.
The convertible note hedge and warrant transactions may affect the value of our common stock.
In connection with the offering of the Notes, we entered into convertible note hedge transactions with an affiliate of one of the initial purchasers of the Notes and certain other financial institutions (the “option counterparties”). We also entered into warrant transactions with the option counterparties. The convertible note hedge transactions are expected generally to
reduce the potential dilution to our common stock upon any conversion of Notes and/or offset any cash payments we are required to make in excess of the principal amount of converted Notes, as the case may be. However, the warrant transactions could separately have a dilutive effect on our common stock to the extent that the market price per share of our common stock exceeds the strike price of the warrants. In addition, the option counterparties or their respective affiliates may modify their hedge positions by entering into or unwinding various derivatives with respect to our common stock and/or purchasing or selling our common stock or other securities of ours in secondary market transactions prior to the maturity of the Notes (and are likely to do so in connection with any conversion of the Notes or redemption or repurchase of the Notes), which could cause or avoid an increase or a decrease in the market price of our common stock.
We will also be subject to the risk that these option counterparties may default under the convertible note hedge transactions. Our exposure to the credit risk of the option counterparties will not be secured by any collateral. If an option counterparty becomes subject to insolvency proceedings, we will become an unsecured creditor in those proceedings with a claim equal to our exposure at that time under the convertible note hedge transactions with such option counterparty. Our exposure will depend on many factors but, generally, an increase in our exposure will be correlated to an increase in the market price and in the volatility of our common stock. In addition, upon a default by an option counterparty, we may suffer adverse tax consequences and more dilution than we currently anticipate with respect to our common stock. We can provide no assurances as to the financial stability or viability of the option counterparties.
General Risk Factors
Changes in our tax rates, exposure to additional tax liabilities, or the adoption of new tax legislation could adversely affect our business and financial condition.
We are subject to taxes in the United States and foreign jurisdictions. Our future effective tax rates could be affected by several factors, many of which are outside of our control, including: changes in the mix of earnings with differing statutory tax rates, changes in the valuation of deferred tax assets and liabilities, changes in federal, state, and international tax laws or their interpretation, adjustments to income tax expense upon the finalization of tax returns, changes in tax attributes, or changes in accounting principles. We regularly assess the likelihood of adverse outcomes to determine the adequacy of our provision for taxes. We are also subject to examination of our income tax returns by the Internal Revenue Service and other tax authorities. There can be no assurance that the outcomes from these examinations will not materially adversely affect our financial condition and operating results. Forecasting our estimated annual effective tax rate is complex and subject to uncertainty, and there may be a material difference between the forecasted and the accrued effective tax rates, especially due to the volatility and uncertainty of global economic conditions resulting from the COVID-19 pandemic. Any increase in our effective tax rate would reduce our profitability.
Catastrophic events may disrupt our business and harm our operating results.
We rely on our network infrastructure, data centers, enterprise applications, and technology systems for the development, marketing, support, and sales of our products, and for the internal operation of our business. These systems are susceptible to disruption or failure in the event of a major earthquake, fire, flood, ice and snow storms, cyber-attack, terrorist attack, telecommunications failure, epidemic or pandemic (such as the ongoing COVID-19 pandemic), or other catastrophic event. Many of these systems are housed or supported in or around our corporate headquarters located in Northern California, near major earthquake faults, and where a significant portion of our research and development activities and other critical business operations take place. Other critical systems, including our manufacturing facilities for our consumable medication packages, are housed in St. Petersburg, Florida, in communities that have been subject to significant tropical storms. Disruptions to or the failure of any of these systems, and the resulting loss of critical data, which is not quickly recoverable by the effective execution of disaster recovery plans designed to reduce such disruption, could cause delays in our product development, prevent us from fulfilling our customers’ orders, and could severely affect our ability to conduct normal business operations, the result of which would adversely affect our operating results.
Failure to maintain effective internal control over financial reporting in accordance with Section 404 of the Sarbanes-Oxley Act of 2002 could cause our stock price to decline.
Section 404 of the Sarbanes-Oxley Act of 2002 and the related rules and regulations of the United States Securities and Exchange Commission (“SEC”) require annual management assessments of the effectiveness of our internal control over financial reporting, and a report by our independent registered public accounting firm attesting to the effectiveness of internal control. If we fail to maintain effective internal control over financial reporting, as such standards are modified, supplemented, or amended from time to time, we may not be able to ensure that we can conclude on an ongoing basis that we have effective internal control over financial reporting.
ITEM 1B. UNRESOLVED STAFF COMMENTS
There are currently no unresolved issues with respect to any SEC staff’s written comments.
ITEM 2. PROPERTIES
Our headquarters are located in a leased facility in Mountain View, California. The following is a list of our material leased facilities and their primary functions:
| | | | | | | | | | | | | | |
| Site | | Major Activity | | Approximate Square Footage |
| St. Petersburg, Florida | | Administration, marketing, research and development, sales, and manufacturing | | 167,700 |
| Cranberry Township, Pennsylvania | | Administration, marketing, research and development, sales, technical support, and training | | 119,400 |
| Warrendale, Pennsylvania | | Manufacturing and administration | | 107,400 |
| Mountain View, California | | Administration, marketing, and research and development | | 99,900 |
| Raleigh, North Carolina | | Administration, sales, marketing, and research and development | | 65,700 |
| Irlam, United Kingdom | | Administration, sales, marketing, and distribution center | | 61,000 |
| Milpitas, California | | Manufacturing | | 46,300 |
| Waukegan, Illinois | | Technical services, support, training, and repair center | | 38,500 |
| Plano, Texas | | Administration, sales, marketing, and research and development | | 23,500 |
| Bochum, Germany | | Administration, sales, marketing, distribution, and manufacturing center | | 19,000 |
| | | | |
| | | | |
| | | | |
| | | | |
We also have smaller rented facilities in Strongsville, Ohio; Germany; France; Italy; the People’s Republic of China; the United Arab Emirates; Australia; and the United Kingdom.
We believe that these facilities are sufficient for our current operational needs and that suitable additional space will be available on commercially reasonable terms to accommodate expansion of our operations, if necessary.
For additional information regarding our obligations pursuant to operating leases, refer to Note 12, Lessee Leases, of the Notes to Consolidated Financial Statements in this annual report on Form 10-K.
ITEM 3. LEGAL PROCEEDINGS
Refer to the information set forth under “Legal Proceedings” in Note 13, Commitments and Contingencies, of the Notes to Consolidated Financial Statements included in this annual report on Form 10-K.
ITEM 4. MINE SAFETY DISCLOSURES
Not applicable.
PART II
ITEM 5. MARKET FOR REGISTRANT’S COMMON EQUITY, RELATED STOCKHOLDER MATTERS, AND ISSUER PURCHASES OF EQUITY SECURITIES
Market for Our Common Stock
Our common stock is traded on the NASDAQ Global Select Market under the symbol “OMCL.”
Stockholders
There were 81 registered stockholders of record as of February 17, 2021. A substantially greater number of stockholders are beneficial holders, whose shares of record are held by banks, brokers, and other financial institutions.
Dividend Policy
We have never declared or paid any cash dividends on our common stock. We currently expect to retain any future earnings for use in the operation and expansion of our business and do not anticipate paying any cash dividends on our common stock in the foreseeable future.
Performance Graph
The following graph compares total stockholder returns for Omnicell’s common stock for the past five years to three indexes: the NASDAQ Composite Index, the NASDAQ Health Care Index, and the NASDAQ Health Services Index. The graph assumes $100 was invested in each of Omnicell’s common stock, the NASDAQ Composite Index, the NASDAQ Health Care Index, and the NASDAQ Health Services Index as of the market close on December 31, 2015. The total return for Omnicell’s common stock and for each index assumes the reinvestment of all dividends, although cash dividends have never been declared on Omnicell’s common stock, and is based on the returns of the component companies weighted according to their capitalization as of the end of each annual period.
The NASDAQ Composite Index tracks the aggregate price performance of equity securities traded on The NASDAQ Stock Market. The NASDAQ Health Care Index and NASDAQ Health Services Index tracks the aggregate price performance of health care and health services equity securities. Omnicell’s common stock is traded on The NASDAQ Global Select Market and is a component of both indexes. The stock price performance shown on the graph is based on historical results and is not necessarily indicative of future price performance.
COMPARISON OF 5 YEAR CUMULATIVE TOTAL RETURN (1) (2)
Among Omnicell, Inc., the NASDAQ Composite Index, the NASDAQ Health Care Index, and
the NASDAQ Health Services Index
_________________________________________________
(1)$100 invested on December 31, 2015 in stock or index, including reinvestment of dividends.
(2)This section is not deemed “soliciting material” or to be “filed” with the SEC and is not to be incorporated by reference into any filing of Omnicell, Inc. under the Securities Act or the Exchange Act, whether made before or after the date hereof and irrespective of any general incorporation language in any such filing.
| | | | | | | | | | | | | | | | | | | | | | | | | | | | | | | | | | | |
| Year Ended December 31, |
| 2015 | | 2016 | | 2017 | | 2018 | | 2019 | | 2020 |
| Omnicell, Inc. | $ | 100.00 | | | $ | 109.07 | | | $ | 156.05 | | | $ | 197.04 | | | $ | 262.93 | | | $ | 386.16 | |
| NASDAQ Composite | 100.00 | | | 108.87 | | | 141.13 | | | 137.12 | | | 187.44 | | | 271.64 | |
| NASDAQ Health Care | 100.00 | | | 83.07 | | | 104.46 | | | 102.81 | | | 124.72 | | | 156.88 | |
| NASDAQ Health Services | 100.00 | | | 78.91 | | | 90.89 | | | 108.53 | | | 151.08 | | | 242.42 | |
Stock Repurchase Program
On September 17, 2020, the Board of Directors authorized a one-time stock repurchase transaction providing for the repurchase of up to $75.0 million of our common stock in privately negotiated transactions concurrently with the issuance of the convertible senior notes, described in Note 10, Convertible Senior Notes, of the Notes to Consolidated Financial Statements in this annual report on Form 10-K. In September 2020, we repurchased 749,300 shares of our common stock from purchasers of the convertible senior notes in the offering in privately negotiated transactions effected through one of the initial purchasers or its affiliate at an average price of $70.78 per share for an aggregate purchase price of approximately $53.0 million. There will be no further repurchases under this one-time authorization. There were no other repurchases of our outstanding common stock
during the year ended December 31, 2020, including under our current stock repurchase programs. Refer to Note 15, Stock Repurchase Program, of the Notes to Consolidated Financial Statements in this annual report on Form 10-K for additional information.
Equity Offerings
For the year ended December 31, 2020, we did not sell any of our common stock under our Distribution Agreement. Refer to Note 16, Equity Offerings, of the Notes to Consolidated Financial Statements in this annual report on Form 10-K for additional information.
ITEM 6. SELECTED FINANCIAL DATA
The following selected consolidated financial data is derived from our Consolidated Financial Statements. This data should be read in conjunction with our Consolidated Financial Statements and related Notes included in this annual report on Form 10-K and with Item 7, Management's Discussion and Analysis of Financial Condition and Results of Operations. Historical results may not be indicative of future results.
| | | | | | | | | | | | | | | | | | | | | | | | | | | | | |
| Year Ended December 31, |
| 2020 (1) | | 2019 | | 2018 | | 2017 (2) (4) | | 2016 (3) (4) |
| | | | | | | | | |
| (In thousands, except per share amounts) |
| Consolidated Statements of Operations Data | | | | | | | | | |
| Total revenues | $ | 892,208 | | | $ | 897,027 | | | $ | 787,309 | | | $ | 712,714 | | | $ | 695,908 | |
| Gross profit | 413,292 | | | 436,912 | | | 372,330 | | | 318,637 | | | 317,085 | |
| Income from operations | 35,526 | | | 78,352 | | | 44,392 | | | 11,145 | | | 21,405 | |
| Net income | $ | 32,194 | | | $ | 61,338 | | | $ | 37,729 | | | $ | 30,518 | | | $ | 9,756 | |
| Net income per share: | | | | | | | | | |
| Basic | $ | 0.76 | | | $ | 1.48 | | | $ | 0.96 | | | $ | 0.81 | | | $ | 0.27 | |
| Diluted | $ | 0.74 | | | $ | 1.43 | | | $ | 0.93 | | | $ | 0.79 | | | $ | 0.26 | |
| Shares Used in Per Share Calculations | | | | | | | | | |
| Basic | 42,583 | | | 41,462 | | | 39,242 | | | 37,483 | | | 36,156 | |
| Diluted | 43,743 | | | 42,943 | | | 40,559 | | | 38,712 | | | 36,864 | |
| | | | | | | | | | | | | | | | | | | | | | | | | | | | | |
| December 31, |
| 2020 (1) | | 2019 | | 2018 | | 2017 (2) (4) | | 2016 (3) (4) |
| | | | | | | | | |
| (In thousands) |
| Consolidated Balance Sheet Data | | | | | | | | | |
| Total assets | $ | 1,824,504 | | | $ | 1,240,810 | | | $ | 1,081,242 | | | $ | 1,016,362 | | | $ | 966,884 | |
Long-term debt (5) | 467,201 | | | 50,000 | | | 135,417 | | | 194,917 | | | 245,731 | |
| Total liabilities | 857,001 | | | 395,556 | | | 401,625 | | | 462,021 | | | 508,048 | |
| Total stockholders’ equity | $ | 967,503 | | | $ | 845,254 | | | $ | 679,617 | | | $ | 554,341 | | | $ | 458,836 | |
__________________________________________________
(1) Includes 340B Link Business financial results as of October 2020, the acquisition date.
(2) Includes InPharmics financial results as of April 2017, the acquisition date.
(3) Includes Aesynt and Ateb financial results as of the acquisition dates of January 2016 and December 2016, respectively.
(4) As adjusted for full retrospective adoption of Accounting Standards Codification 606, Revenue from Contracts with Customers.
(5) Consists of the revolving credit facility and convertible senior notes, net.
ITEM 7. MANAGEMENT’S DISCUSSION AND ANALYSIS OF FINANCIAL CONDITION AND RESULTS OF OPERATIONS
The following discussion and analysis should be read in conjunction with our Consolidated Financial Statements and related Notes in this annual report on Form 10-K. This may contain forward-looking statements based upon current expectations that involve risks and uncertainties. Our actual results and the timing of selected events could differ materially from those anticipated in these forward-looking statements as a result of several factors, including those set forth under
Item 1A “Risk Factors” and elsewhere in this annual report on Form 10-K. Unless otherwise stated, references in this report to particular years or quarters refer to our fiscal year and the associated quarters of those fiscal years.
We have elected to omit discussion of the earliest of the three years covered by the Consolidated Financial Statements presented. Such omitted discussion can be found under Item 7, Management’s Discussion and Analysis of Financial Condition and Results of Operations, located in our annual report on Form 10-K for the fiscal year ended December 31, 2019, filed with the SEC on February 26, 2020, for reference to discussion of the fiscal year ended December 31, 2018, the earliest of the three fiscal years presented.
OVERVIEW
Our Business
We are a leader in transforming the pharmacy care delivery model. Our medication management automation solutions and adherence tools empower healthcare systems and pharmacies to focus on clinical care, rather than administrative tasks. Our solutions support the vision of a fully autonomous pharmacy, a roadmap designed to improve operational efficiencies through a fully automated, medication management infrastructure. Our vision is to transform the pharmacy care delivery model through automation designed to replace manual, error-prone processes, combined with a single, cloud-based platform and advanced services offerings. We believe our connected devices, products, and solutions will help our customers harness the power of data and analytics, and deliver improved patient outcomes.
Over 7,000 facilities worldwide use our automation and analytics solutions which are designed to improve pharmacy workflows, increase operational efficiency, reduce medication errors, deliver actionable intelligence, and improve patient safety. More than 50,000 institutional and retail pharmacies across North America and the United Kingdom leverage our innovative medication adherence and population health solutions to improve patient engagement, and adherence to prescriptions and vaccine scheduling, helping to reduce costly hospital readmissions. We sell our product and consumable solutions together with related service offerings. Revenues generated in the United States represented 89% of our total revenues for the year ended December 31, 2020.
Over the past several years, our business has expanded from a single-point solution to a platform of products and services that will help to further advance the vision of the autonomous pharmacy. This has resulted in larger deal sizes across multiple products, services, and implementations for customers and, we believe, more comprehensive, valuable, and enduring relationships.
We utilize product bookings as an indicator of the success of our business. Product bookings generally consist of all firm orders other than for technical services and other less significant items, as evidenced generally by a non-cancelable contract and purchase order for equipment and software products, and by a purchase order for consumables. The majority of connected devices and software license product bookings are installable within twelve months of booking, and are recorded as revenue upon customer acceptance of the installation or receipt of goods. Revenues from software-as-a-service (“SaaS”), subscription software, and technology-enabled services product bookings are recorded over the contractual term. Product bookings increased by 23%, from $813 million in 2019 to $1.002 billion in 2020, driven by the success of our growth strategies in our comprehensive platform and differentiated products, as well as expanding our customer portfolio.
In addition to product solution sales, we provide services to our customers. We provide installation planning and consulting as part of most product sales which is generally included in the initial price of the solution. To help assure the maximum availability of our systems, our customers typically purchase maintenance and support contracts in increments of one to five years. As a result of the growth of our installed base of customers and expanded service offerings, our service revenues have also grown.
The following table summarizes each revenue category:
| | | | | | | | | | | | | | | | | | | | |
Revenue Category | | Revenue Type (1) | | Income Statement Classification | | Included in Product Bookings |
Connected devices, software licenses, and other | | High visibility/ Nonrecurring | | Product | | Yes (2) |
Technical services | | High visibility/ Recurring | | Service | | No |
Consumables | | High visibility/ Recurring | | Product | | Yes |
SaaS, subscription software, and technology-enabled services | | High visibility/ Recurring | | Service | | Yes |
_________________________________________________
(1) All revenue types are highly visible from long-term, sole-source agreements, backlog, or the recurring nature of the revenue stream.
(2) Freight revenue and certain other insignificant revenue streams are not included in product bookings.
Our full-time headcount of approximately 2,860 on December 31, 2020, an increase of approximately 160 from December 31, 2019, reflects our efforts to grow our operations, while driving profitability and optimizing resource allocation.
Operating Segments
We manage our operations as a single segment for the purposes of assessing performance and making operating decisions. Our Chief Operating Decision Maker ("CODM") is our Chief Executive Officer. The CODM allocates resources and evaluates the performance of Omnicell at the consolidated level using information about our revenues, gross profit, income from operations, and other key financial data. All significant operating decisions are based upon an analysis of Omnicell as one operating segment, which is the same as our reporting segment.
Strategy
We are committed to being the care provider’s most trusted partner and executing on the vision of the autonomous pharmacy by delivering automation, intelligence, and advanced services, powered by a single, cloud-based platform. We believe there are significant challenges in pharmacy practice including, but not limited to, medication errors, drug shortages, medication loss due to drug diversion, significant medication waste and expiration costs, a high level of manual steps in the medication management automation process, complexity around compliance requirements, high pharmacy employee turnover rates, hospitalizations from adverse drug events in outpatient settings, high variability in outcomes, and limited inventory visibility. We believe that these significant challenges in pharmacy practice drive the demand for increased digitization and virtualization, and that our solutions enable this and represent large opportunities in four market categories:
•Point of Care. As a market leader, we expect to continue expansion of this product category as customers increase use of our dispensing systems in more areas within their hospitals. In addition, we are early in the replacement, upgrade, and expansion cycle of our XT Series automated dispensing systems which we believe is a significant market opportunity and we expect to continue to focus on further penetrating markets through competitive conversions. We believe our current portfolio within the Point of Care market and new innovation and services will continue to drive improved outcomes and lower costs for our customers.
•Central Pharmacy. This market represents the beginning of the medication management process in acute care settings, and, we believe, the next big automation opportunity to replace manual and repetitive processes which are common in the pharmacy today. Manual processes are prone to significant errors, and products such as IVX Workflow, our IV sterile compounding solutions, and the XR2 Automated Central Pharmacy system automate these manual processes and are designed to reduce the risk of error for our healthcare partners. We believe new products and innovations, including Omnicell One, in the Central Pharmacy market create opportunities to replace prior generation Central Pharmacy robotics and carousels. The Central Pharmacy also represents an opportunity to provide technology-enabled services designed to reduce the administrative burden on the pharmacy and allow clinicians to operate at the top of their license.
•340B Software-Enabled Services. This market is targeted to covered entities participating in Section 340B of the Public Health Services Act. The act requires pharmaceutical manufacturers participating in Medicaid to sell outpatient drugs at discounted prices to health care organizations that care for many uninsured and low-income patients and results in a complex compliance environment. We believe that there are significant opportunities for health systems to improve participation benefits and maximize program savings through software-enabled services
and solutions. Our Omnicell 340B platform of technology-enabled services includes split billing software, contract pharmacy administration, specialty contract pharmacy administration, and drug discount access solutions.
•Retail, Institutional, and Payer. We believe the Retail, Institutional, and Payer market represents a large opportunity as the majority of drugs are distributed in the non-acute sector. New technology and updated state board regulations are leading to innovation at traditional retail providers, which, combined with the move to value-based care, we believe will incentivize the market to adopt solutions to help providers and payers engage patients in new ways that lower the total cost of care. We believe adoption of our EnlivenHealth (formerly Population Health Solutions) portfolio of software products and services, along with medication adherence packaging, will increase adherence performance rates, increase prescription volume for our customers, and reduce hospital and emergency room visits due to improved adherence. As retail pharmacies play an increasingly vital role in population health following the onset of the COVID-19 pandemic, EnlivenHealth has extended solutions to assist with vaccination programs, testing protocols, and patient engagement efforts. There are three main areas of focus:
◦CareScheduler is an exclusive digital solution that automates the scheduling, reporting, and patient outreach for administering the COVID-19 vaccine and other vaccines and testing procedures.
◦Medication Synchronization is an appointment-based solution that aligns a patient's medications to a single refill date, designed to improve medication adherence and reduce hospital readmissions.
◦Medication Therapy Management is a platform that offers intuitive workflow with high-level decision support for efficiently completing CMS-compliant Comprehensive Medication Reviews using pharmacy claims data.
We believe our technology, services, and solutions within these market categories position us well to address the needs of retail, acute, and post-acute pharmacy providers.
COVID-19 Update
Keeping in mind our role in the healthcare industry, we are continuing to closely monitor the COVID-19 pandemic. As a result of the COVID-19 pandemic, health systems have faced financial pressures which we believe led our customers to delay or defer purchasing decisions and/or implementation of our solutions during the first half of 2020. However, starting in the third quarter of 2020, we began to see our customers returning to pre-pandemic purchasing patterns consistent with long-term strategic investments. We believe that the challenges that our customers have faced during the COVID-19 pandemic, including the need for robust visibility throughout their pharmacy supply chains, have increased the strategic relevance of our products and services. Though we expect to continue to face challenges and opportunities brought on by the COVID-19 pandemic, we remain confident in the overall health of our business and in our ability to navigate through these unusual times.
Acquisitions
On October 1, 2020, we completed the acquisition of the 340B Link business (the “340B Link Business”) of Pharmaceutical Strategies Group, LLC pursuant to the terms and conditions of the Equity Purchase Agreement, dated August 11, 2020, as amended, by and among the Company, PSGH, LLC, BW Apothecary Holdings, LLC, the sellers identified therein and the seller’s representative for total cash consideration of $225.0 million. The acquisition adds a comprehensive and differentiated suite of software-enabled services and solutions used by certain eligible hospitals, health systems, clinics, and entities to manage compliance and capture 340B drug cost savings on outpatient prescriptions filled through the eligible entity’s pharmacy or a contracted pharmacy partner. The results of the operations of the 340B Link Business have been included in our consolidated results of operations beginning October 1, 2020.
CRITICAL ACCOUNTING POLICIES AND ESTIMATES
Our discussion and analysis of our financial condition and results of operations are based on our Consolidated Financial Statements, which have been prepared in accordance with U.S. Generally Accepted Accounting Principles (“GAAP”). The preparation of these financial statements requires us to make certain estimates and assumptions that affect the reported amounts of assets and liabilities, disclosure of any contingent assets and liabilities at the date of the financial statements, and the reported amounts of revenues and expenses during the reporting periods. We regularly review our estimates and assumptions, which are based on historical experience and various other factors that are believed to be reasonable under the circumstances, the results of which form the basis for making judgments about the carrying values of certain assets and liabilities that are not readily apparent from other sources. Actual results may differ from these estimates and assumptions. We believe the following critical accounting policies are affected by significant judgments and estimates used in the preparation of our Consolidated Financial Statements:
Revenue Recognition
We earn revenues from sales of our products and related services, which are sold in the healthcare industry, our principal market.
Prior to recognizing revenue, we identify the contract, performance obligations, and transaction price, and allocate the transaction price to the performance obligations. All identified contracts meet the following required criteria:
Parties to the contract have approved the contract (in writing, orally, or in accordance with other customary business practices) and are committed to perform their respective obligations. A majority of our contracts are evidenced by a non-cancelable written agreement. Contracts for consumable products are generally evidenced by an order placed via phone or a purchase order.
Entity can identify each party’s rights regarding the goods or services to be transferred. Contract terms are documented within the written agreements. Where a written contract does not exist, such as for consumable products, the rights of each party are understood as following our standard business process and terms.
The entity can identify the payment terms for the goods or services to be transferred. Payment terms are documented within the agreement and are generally net 30 to 60 days from shipment of tangible product or services performed for customers in the United States. Where a written contract does not exist, our standard payment terms are net 30 day terms.
The contract has commercial substance (that is the risk, timing, or amount of the entity’s future cash flows is expected to change as a result of the contract). Our agreements are an exchange of cash for a combination of products and services which result in changes in the amount of our future cash flows.
It is probable the entity will collect the consideration to which it will be entitled in exchange for the goods or services that will be transferred to the customer. We perform a credit check for all significant customers or transactions and where collectability is not probable, payment in full or a substantial down payment is typically required to help assure the full agreed upon contract price will be collected.
Distinct goods or services are identified as performance obligations. A series of distinct goods or services that are substantially the same and that have the same pattern of transfer to the customer are considered a single performance obligation. Where a good or service is determined not to be distinct, we combine the good or service with other promised goods or services until a bundle of goods or services that is distinct is identified. To identify our performance obligations, we consider all of the products or services promised in the contract regardless of whether they are explicitly stated or are implied by customary business practices. When performance obligations are included in separate contracts, we consider an entire customer arrangement to determine if separate contracts should be considered combined for the purposes of revenue recognition. Most of our sales, other than renewals of support and maintenance, contain multiple performance obligations, with a combination of hardware systems, consumables and software products, support and maintenance, and professional services.
The transaction price of a contract is determined based on the fixed consideration, net of an estimate for variable consideration such as various discounts or rebates provided to customers. As a result of our commercial selling practices, contract prices are generally fixed with minimal, if any, variable consideration.
The transaction price is allocated to separate performance obligations proportionally based on the standalone selling price of each performance obligation. Standalone selling price is best evidenced by the price we charge for the good or service when selling it separately in similar circumstances to similar customers. Other than for the renewal of annual support services contracts, our products and services are not generally sold separately. We use an amount discounted from the list price as a best estimated selling price.
We recognize revenue when the performance obligation has been satisfied by transferring a promised good or service to a customer. The good or service is transferred when or as the customer obtains control of the good or service. Determining when control transfers requires management to make judgments that affect the timing of revenues recognized. Generally, for products requiring a complex implementation, control passes when the product is installed and ready for use. For all other products, control generally passes when product has been shipped and title has passed. For maintenance contracts and certain other services provided on a subscription basis, control passes to the customer over time, generally ratably over the service term as we provide a stand-ready service to service the customer’s equipment. Time and material services transfer control to the customer at the time the services are provided. The portion of the transaction price allocated to our unsatisfied performance obligations are recorded as deferred revenues.
Revenues, contract assets, and contract liabilities are recorded net of associated taxes.
We often enter into change orders which modify the product to be received by the customer pursuant to certain contracts. Changes to any contract are accounted for as a modification of the existing contract to the extent the goods and services to be delivered as part of the contract are generally consistent with the nature and type of those to be provided under the terms of the original contract. Examples of such change orders include the addition or removal of units of equipment or changes to the configuration of the equipment where the overall nature of the contract remains intact. Our change orders generally result in the change being accounted for as modifications of existing contracts given the nature of the impacted orders.
In the normal course of business, we typically do not accept product returns unless the item is defective as manufactured or the configuration of the product is incorrect. We establish provisions for estimated returns based on historical product returns. The allowance for sales returns is not material to our Consolidated Financial Statements for any periods presented.
Lessor Leases
We determine if an arrangement is a lease at inception. The transaction price is allocated to separate performance obligations, generally consisting of hardware and software products, installation, and post-installation technical support, proportionally based on the standalone selling price of each performance obligation. Standalone selling price is best evidenced by the price we charge for the good or service when selling it separately in similar circumstances to similar customers. Other than for the renewal of annual support services contracts, our products and services are not generally sold separately. We use an amount discounted from the list price as a best estimated selling price.
Sales-Type Leases
We enter into non-cancelable sales-type lease arrangements, most of which do not have an option to extend the lease term. At the end of the lease term, the customer must either return the equipment or negotiate a new agreement, resulting in a new purchase or lease transaction. Failure of the customer to either return the equipment or negotiate a new agreement results in the contract becoming a month-to-month rental. Certain sales-type leases automatically renew for successive one year periods at the end of each lease term with written notice from the customer. Our sales-type lease agreements do not contain any material residual value guarantees.
For sales-type leases, we recognize revenues for our hardware and software products, net of lease execution costs, post-installation product maintenance, and technical support, at the net present value of the lease payment stream upon customer acceptance. We recognize service revenues associated with sales-type leases ratably over the term of the agreement in service revenues in the Consolidated Statements of Operations. We recognize interest income from sales-type leases using the effective interest method. Both hardware and software revenues, and interest income from sales-types leases are recorded in product revenues in the Consolidated Statements of Operations.
We optimize cash flows by selling a majority of our non-U.S. government sales-type leases to third-party leasing finance companies on a non-recourse basis. We have no obligation to the leasing company once the lease has been sold. Some of our sales-type leases, mostly those relating to U.S. government hospitals, are retained in-house.
Allowance for Credit Losses
We are exposed to credit losses primarily through sales of our products and services, as well as our sales-type leasing arrangements. We perform credit evaluations of our customers’ financial condition in order to assess each customer’s ability to pay. These evaluations require significant judgment and are based on a variety of factors including, but not limited to, current economic trends, payment history, and a financial review of the customer. We continue to monitor customers’ creditworthiness on an ongoing basis.
We maintain an allowance for credit losses for accounts receivable, unbilled receivables, and net investment in sales-type leases based on expected credit losses resulting from the inability of our customers to make required payments. The allowance for credit losses is measured using a loss rate method, considering factors such as customers’ credit risk, historical loss experience, current conditions, and forecasts. The allowance for credit losses is measured on a collective (pool) basis by aggregating customer balances with similar risk characteristics. We also record a specific allowance based on an analysis of individual past due balances or customer-specific information, such as a decline in creditworthiness or bankruptcy. Actual collection losses may differ from management’s estimates, and such differences could be material to our financial position and results of operations.
Inventory
Inventories are stated at the lower of cost, computed using the first-in, first-out method, and net realizable value. Inbound shipping costs are included in cost of inventory. We regularly monitor inventory quantities on hand and record write-downs for excess and obsolete inventories based on our estimate of demand for our products, potential obsolescence of
technology, product life cycles, and whether pricing trends or forecasts indicate that the carrying value of inventory exceeds its estimated selling price. These factors are impacted by market and economic conditions, technology changes, and new product introductions and require estimates that may include elements that are uncertain. Actual demand may differ from forecasted demand and may have a material effect on gross margins. If inventory is written down, a new cost basis is established that cannot be increased in future periods. Shipments from suppliers or contract manufacturers before we receive them are recorded as in-transit inventory when title and the significant risks and rewards of ownership have passed to us.
Software Development Costs
We capitalize certain software development costs in accordance with Accounting Standards Codification ("ASC") 985-20, Costs of Software to Be Sold, Leased, or Marketed, under which those costs incurred subsequent to the establishment of technological feasibility may be capitalized and amortized over the estimated lives of the related products. We establish technological feasibility when we complete a detail program design or a working model. We amortize development costs over the estimated lives of the related products, which is generally five years. All development costs prior to the completion of a detail program design or a working model are recognized as research and development expense.
Lessee Leases
We determine if an arrangement is a lease at inception. Operating lease right-of-use assets and liabilities are recognized at the commencement date based on the present value of lease payments over the lease term. As most of our lease contracts do not provide an implicit rate, we use our incremental borrowing rate based on information available at the commencement date in determining the present value of the lease payments. Lease expense is recognized on a straight-line basis over the lease term. We do not recognize a right-of-use asset and a lease liability for leases with an initial term of 12 months or less. We elected the practical expedient to not separate lease components from nonlease components and applied that practical expedient to all material classes of leased assets.
Many of our operating leases include an option to extend the lease. The specific terms and conditions of the extension options vary from lease to lease, but are consistent with standard industry practices in each area that we operate. We review each of our lease options at a time required by the terms of the lease contract, and notify the lessor if we choose to exercise the lease renewal option. Until we are reasonably certain that we will extend the lease contract, the renewal option periods will not be recognized as right-of-use assets or lease liabilities.
Certain leases include provisions for early termination, which allow the contract parties to terminate their obligations under the lease contract. The terms and conditions of the termination options vary by contract. When we have made a decision to exercise an early termination option, the right-of-use assets and associated lease liabilities are remeasured in accordance with the present value of the remaining cash flows under the lease contract.
Certain building lease agreements include rental payments subject to change annually based on fluctuations in various indexes (i.e. Consumer Price Index (“CPI”), Retail Price Index, and other international indexes). Certain data center lease agreements include rental payments subject to change based on usage and CPI fluctuations. The changes based on usage and indexes are treated as variable lease costs and recognized in the period in which the obligation for those payments was incurred.
Business Combinations
We use the acquisition method of accounting under the authoritative guidance on business combinations. Each acquired company’s operating results are included in our Consolidated Financial Statements starting on the date of acquisition. The purchase price is equivalent to the fair value of consideration transferred. Tangible and identifiable intangible assets acquired and liabilities assumed as of the date of acquisition are recorded at the acquisition date fair value. Goodwill is recognized for the excess of purchase price over the net fair value of assets acquired and liabilities assumed.
Amounts allocated to assets and liabilities are based upon fair values. Such valuations require management to make significant estimates and assumptions, especially with respect to the identifiable intangible assets. Management makes estimates of fair value based upon assumptions believed to be reasonable and that of a market participant. These estimates are based on historical experience and information obtained from the management of the acquired companies and the estimates are inherently uncertain. The separately identifiable intangible assets generally include customer relationships, acquired technology, backlog, trade names, and non-compete agreements.
Goodwill and Acquired Intangible Assets
Goodwill
We review goodwill for impairment on an annual basis on the first day of the fourth quarter of each year at the reporting unit level. This assessment is also performed whenever there is a change in circumstances that indicates the carrying value of goodwill may be impaired. We have one reporting unit, which is the same as our operating segment. A qualitative assessment is initially made to determine whether it is necessary to perform quantitative testing. A qualitative assessment includes, among others, consideration of: (i) past, current, and projected future earnings and equity; (ii) recent trends and market conditions; and (iii) valuation metrics involving similar companies that are publicly-traded and acquisitions of similar companies, if available. If this qualitative assessment indicates that it is more likely than not that impairment exists, or if we decide to bypass this option, we proceed to the quantitative assessment. The quantitative assessment involves a comparison between the estimated fair value of our reporting unit with its carrying amount including goodwill. If the carrying value exceeds estimated fair value, we will record an impairment charge based on that difference. The impairment charge will be limited to the amount of goodwill.
To determine the reporting unit’s fair value under the quantitative approach, we use a combination of income and market approaches, equally weighting the two approaches, such as estimated discounted future cash flows of the reporting unit, multiples of earnings or revenues, and analysis of recent sales or offerings of comparable entities. We also consider our market capitalization on the date of the analysis to ensure the reasonableness of our reporting unit's fair value.
Intangible Assets
In connection with our acquisitions, we generally recognize assets for customer relationships, acquired technology, backlog, trade names, and non-compete agreements. Intangible assets are carried at cost less accumulated amortization. Such amortization is provided on a straight-line basis or on an accelerated basis based on a pattern of economic benefit that is expected to be obtained over the estimated useful lives of the respective assets, generally from one to 30 years. Amortization for acquired technology and backlog is recognized in cost of revenues, and amortization for customer relationships, trade names, non-compete agreements, and patents is recognized in selling, general, and administrative expenses.
We assess the impairment of identifiable intangible assets whenever events or changes in circumstances indicate that an asset’s carrying amount may not be recoverable. Recoverability of an asset is measured by the comparison of the carrying amount to the sum of the undiscounted estimated future cash flows the asset is expected to generate, offset by estimated future costs to dispose of the product to which the asset relates. If an asset is considered to be impaired, the amount of such impairment would be measured as the difference between the carrying amount of the asset and its fair value. Our cash flow assumptions are based on historical and forecasted future revenue, operating costs, and other relevant factors. Assumptions and estimates about the remaining useful lives of our intangible assets are subjective and are affected by changes to our business strategies. If management’s estimates of future operating results change, or if there are changes to other assumptions, the estimate of the fair value of our assets could change significantly. Such change could result in impairment charges in future periods, which could have a significant impact on our operating results and financial condition.
Convertible Debt
We account for convertible debt and related transactions in accordance with ASC 470-20, Debt with Conversion and Other Options, ASC 815, Derivatives and Hedging, and ASC 480, Distinguishing Liabilities from Equity. We evaluate convertible debt instruments and related transactions at inception to determine if those contracts or embedded components of those contracts qualify as derivatives to be separately accounted for. Convertible debt instruments that may be settled in cash are separated into liability and equity components. The allocation to the liability component is based on the fair value of a similar instrument that does not contain an equity conversion option. Based on this debt-to-equity ratio, debt issuance costs are then allocated to the liability and equity components in a similar manner. The difference between the principal amount of the convertible debt instruments and the liability component, inclusive of issuance costs, represents the debt discount, which is amortized to interest expense over the term of instruments. The determination of the discount rate requires certain estimates and assumptions.
Convertible note hedge and warrant transactions associated with convertible debt instruments are accounted for as equity instruments, and are recorded in additional paid-in capital in the Consolidated Balance Sheets.
Valuation of Share-Based Compensation
We account for share-based compensation in accordance with ASC 718, Stock Compensation. We recognize compensation expense related to share-based compensation based on the grant date estimated fair value.
The fair value of stock options (“options”) on the grant date is estimated using the Black-Scholes option pricing model, which requires the following inputs: expected life, expected volatility, risk-free interest rate, expected dividend yield rate, exercise price, and closing price of our common stock on the date of grant. The expected volatility is based on a combination of historical and market-based implied volatility, and the expected life of the awards is based on our historical experience of employee stock option exercises, including forfeitures. Expense is recognized on a straight-line basis over the requisite service period.
The fair value of restricted stock units (“RSUs”) is based on the stock price on the grant date. The fair value of restricted stock awards (“RSAs”) is their intrinsic value, which is the difference between the fair value of the underlying stock at the measurement date and the purchase price. The RSUs and RSAs are subject to a service vesting condition and are recognized on a straight-line basis over the requisite service period.
The fair value of performance-based stock unit awards (“PSUs”) with service and market conditions is estimated using a Monte Carlo simulation model applying multiple awards approach. Expense is recognized when it is probable that the performance condition will be met using the accelerated attribution method over the requisite service period.
Forfeiture rates are estimated based on our historical experience with equity awards that were granted and forfeited prior to vesting. The valuation assumptions used in estimating the fair value of employee share-based awards may change in future periods.
Accounting for Income Taxes
We record an income tax provision for (benefit from) the anticipated tax consequences of the reported results of operations. In accordance with ASC 740, Income Taxes, the provision for (benefit from) income taxes is computed using the asset and liability method, which requires the recognition of deferred tax assets and liabilities for the expected future tax consequences of events that have been included in the financial statements. Under this method, deferred tax assets and liabilities are determined on the basis of the differences between the financial statement and tax bases of assets and liabilities, and for operating losses and tax credit carryforwards. Deferred tax assets and liabilities are measured using the enacted tax rates in effect for the periods in which those tax assets and liabilities are expected to be realized or settled. In the event that these tax rates change, we will incur a benefit or detriment on our income tax expense in the period of change. If we were to determine that all or part of the net deferred tax assets are not realizable in the future, we will record a valuation allowance that would be charged to earnings in the period such determination is made.
In accordance with ASC 740, we recognize the tax benefit from an uncertain tax position if it is more likely than not that the tax position will be sustained on examination by the taxing authorities, based on the technical merits of the position. The tax benefits recognized in the financial statements from such positions are then measured based on the largest benefit that has a greater than 50% likelihood of being realized upon ultimate settlement. The calculation of tax liabilities involves significant judgment in estimating the impact of uncertainties in the application of ASC 740 and complex tax laws. Resolution of these uncertainties in a manner inconsistent with management’s expectations could have a material impact on our financial condition and operating results.
Recently Issued Authoritative Guidance
Refer to Note 1, Organization and Summary of Significant Accounting Policies, of the Notes to Consolidated Financial Statements in this annual report on Form 10-K for a description of recently issued accounting pronouncements, including the expected dates of adoption and estimated effects on our results of operations, financial position, and cash flows.
RESULTS OF OPERATIONS
Total Revenues
| | | | | | | | | | | | | | | | | | | | | | | | | | | | | |
| Year Ended December 31, | | Change in | | | | |
| 2020 | | 2019 | | $ | | % | | | | | | |
| | | | | | | | | | | | | |
| (Dollars in thousands) |
| Product revenues | $ | 636,031 | | | $ | 659,602 | | | $ | (23,571) | | | (4)% | | | | | | |
| Percentage of total revenues | 71% | | 74% | | | | | | | | | | |
| Services and other revenues | 256,177 | | | 237,425 | | | 18,752 | | | 8% | | | | | | |
| Percentage of total revenues | 29% | | 26% | | | | | | | | | | |
| Total revenues | $ | 892,208 | | | $ | 897,027 | | | $ | (4,819) | | | (1)% | | | | | | |
Product revenues represented 71% and 74% of total revenues for the years ended December 31, 2020 and 2019, respectively. Product revenues decreased by $23.6 million, primarily due to the impact of the COVID-19 pandemic as health systems were focusing resources on COVID-19 essential activities during the second and third quarters of 2020.
Services and other revenues represented 29% and 26% of total revenues for the years ended December 31, 2020 and 2019, respectively. Services and other revenues include revenues from technical services, SaaS, subscription software, and technology-enabled services, and other services. Services and other revenues increased by $18.8 million, primarily due to revenues of $10.2 million from the newly-acquired 340B Link Business, as well as continued growth in our installed customer base.
Our international sales represented 11% and 10% of total revenues for the years ended December 31, 2020 and 2019, respectively, and are expected to be affected by foreign currency exchange rate fluctuations. We are unable to predict the extent to which revenues in future periods will be impacted by changes in foreign currency exchange rates.
Our ability to continue to grow revenues is dependent on our ability to continue to obtain orders from customers, our ability to produce quality products and consumables to fulfill customer demand, the volume of installations we are able to complete, our ability to meet customer needs by providing a quality installation experience, and our flexibility in manpower allocations among customers to complete installations on a timely basis. The timing of our product revenues for equipment is primarily dependent on when our customers’ schedules allow for installations.
The effects of the COVID-19 pandemic have had an adverse impact on our revenues for the year ended December 31, 2020. During the first half of 2020, we experienced delays in implementations and lower product bookings compared to management’s expectations prior to the COVID-19 outbreak. Starting in the third quarter of 2020, we began to see our customers returning to pre-pandemic purchasing patterns consistent with long-term strategic investments. Future developments with respect to the COVID-19 pandemic remain uncertain and may impact future periods.
Cost of Revenues and Gross Profit
Cost of revenues is primarily comprised of three general categories: (i) standard product costs which account for the majority of the product cost of revenues that are provided to customers, and are inclusive of purchased material, labor to build the product and overhead costs associated with production; (ii) installation costs as we install our equipment at the customer site and include costs of the field installation personnel, including labor, travel expenses, and other expenses; and (iii) other costs, including variances in standard costs and overhead, scrap costs, rework, warranty, provisions for excess and obsolete inventory, and amortization of software development costs and intangibles.
| | | | | | | | | | | | | | | | | | | | | | | | | | | | | |
| Year Ended December 31, | | Change in | | | | |
| 2020 | | 2019 | | $ | | % | | | | | | |
| | | | | | | | | | | | | |
| (Dollars in thousands) |
| Cost of revenues: | | | | | | | | | | | | | |
| Cost of product revenues | $ | 354,004 | | | $ | 344,914 | | | $ | 9,090 | | | 3% | | | | | | |
| As a percentage of related revenues | 56% | | 52% | | | | | | | | | | |
| Cost of services and other revenues | 124,912 | | | 115,201 | | | 9,711 | | | 8% | | | | | | |
| As a percentage of related revenues | 49% | | 49% | | | | | | | | | | |
| Total cost of revenues | $ | 478,916 | | | $ | 460,115 | | | $ | 18,801 | | | 4% | | | | | | |
| As a percentage of total revenues | 54% | | 51% | | | | | | | | | | |
| | | | | | | | | | | | | |
| Gross profit | $ | 413,292 | | | $ | 436,912 | | | $ | (23,620) | | | (5)% | | | | | | |
| Gross margin | 46% | | 49% | | | | | | | | | | |
Cost of revenues for the year ended December 31, 2020 compared to the year ended December 31, 2019 increased by $18.8 million, of which $9.1 million was attributed to the increase in cost of product revenues and $9.7 million was attributed to the increase in cost of services and other revenues.
The increase in cost of product revenues is reflective of investments made to drive the customer experience and support expected annual revenue levels which were impacted by the COVID-19 pandemic. While product revenues decreased by $23.6 million for the year ended December 31, 2020 compared to the year ended December 31, 2019, cost of product revenues increased by $9.1 million primarily due to certain fixed costs, such as labor and overhead. The increase in cost of product revenues was also driven by an increase of $4.1 million of amortization of capitalized software development costs for
external use and an increase of $2.0 million in employee-related expenses related to restructuring initiatives, partially offset by cost-saving initiatives.
The increase in cost of services and other revenues was primarily driven by the increase in services and other revenues of $18.8 million, including incremental revenues from the newly-acquired 340B Link Business, for the year ended December 31, 2020 compared to the year ended December 31, 2019, as well as additional investments in our service business to support new product offerings, an increase of $1.4 million of amortization of capitalized software development costs for external use, and an increase of $0.6 million in employee-related expenses related to restructuring initiatives.
The overall decrease in gross margin primarily relates to lower revenues during the year ended December 31, 2020 due to the impact of the COVID-19 pandemic, employee-related expenses related to restructuring initiatives, and additional investments in our business, including increased amortization of capitalized software development costs for external use, partially offset by lower costs associated with cost-saving initiatives. Our gross profit for the year ended December 31, 2020 was $413.3 million compared to $436.9 million for the year ended December 31, 2019.
The effects of the COVID-19 pandemic have had an adverse impact on our cost of revenues and gross margins for the year ended December 31, 2020. Future developments with respect to the COVID-19 pandemic remain uncertain and may impact future periods.
Operating Expenses and Interest and Other Income (Expense), Net
| | | | | | | | | | | | | | | | | | | | | | | | | | | | | | | |
| Year Ended December 31, | | Change in | | | | | | |
| 2020 | | 2019 | | $ | | % | | | | | | | | |
| | | | | | | | | | | | | | | |
| (Dollars in thousands) |
| Operating expenses: | | | | | | | | | | | | | | | |
| Research and development | $ | 70,161 | | | $ | 68,644 | | | $ | 1,517 | | | 2% | | | | | | | | |
| As a percentage of total revenues | 8% | | 8% | | | | | | | | | | | | |
| Selling, general, and administrative | 307,605 | | | 289,916 | | | 17,689 | | | 6% | | | | | | | | |
| As a percentage of total revenues | 34% | | 32% | | | | | | | | | | | | |
| | | | | | | | | | | | | | | |
| Total operating expenses | $ | 377,766 | | | $ | 358,560 | | | $ | 19,206 | | | 5% | | | | | | | | |
| As a percentage of total revenues | 42% | | 40% | | | | | | | | | | | | |
| | | | | | | | | | | | | | | |
| | | | | | | | | | | | | | | |
| | | | | | | | | | | | | | | |
| | | | | | | | | | | | | | | |
| | | | | | | | | | | | | | | |
| | | | | | | | | | | | | | | |
| | | | | | | | | | | | | | | |
| | | | | | | | | | | | | | | |
| | | | | | | | | | | | | | | |
| | | | | | | | | | | | | | | |
| Interest and other income (expense), net | $ | (6,177) | | | $ | (4,419) | | | $ | (1,758) | | | 40% | | | | | | | | |
Research and Development. Research and development expenses increased by $1.5 million for the year ended December 31, 2020 compared to the year ended December 31, 2019. The increase was primarily attributed to an increase of $3.7 million in employee-related expenses related to restructuring initiatives as well as timing of projects, partially offset by lower consulting expenses and reduced travel costs.
Selling, General, and Administrative. Selling, general, and administrative expenses increased $17.7 million for the year ended December 31, 2020 compared to the year ended December 31, 2019, primarily due to overall growth of operations and increase in overall headcount. The increase was primarily due to an increase of $26.1 million in employee-related expenses primarily related to increased headcount, including the incremental headcount from the 340B Link Business acquisition, an increase of $3.7 million in employee-related expenses related to restructuring initiatives, and an increase of $6.5 million in acquisition-related expenses, partially offset by approximately $18.2 million of certain cost savings, including reduced travel, meetings, trade shows, and commission expenses.
In response to the COVID-19 pandemic, we implemented cost reduction initiatives in all aspects of our business and remain mindful of the uncertainty related to the pandemic.
Interest and Other Income (Expense), Net. Interest and other income (expense), net, changed by $1.8 million for the year ended December 31, 2020 compared to the year ended December 31, 2019, primarily driven by a $1.6 million increase in other expenses. The increase in other expenses is primarily due to $5.1 million of amortization of discount and interest expense incurred on our convertible senior notes issued in September 2020, partially offset by a decrease of $3.1 million in interest expense on our credit facilities as a result of a lower outstanding balances during the year ended December 31, 2020 as compared to the year ended December 31, 2019, as well as favorable foreign currency fluctuations during the period.
Provision for (Benefit from) Income Taxes
| | | | | | | | | | | | | | | | | | | | | | | | | | | | | |
| Year Ended December 31, | | Change in | | | | |
| 2020 | | 2019 | | $ | | % | | | | | | |
| | | | | | | | | | | | | |
| (Dollars in thousands) |
| Provision for (benefit from) income taxes | $ | (2,845) | | | $ | 12,595 | | | $ | (15,440) | | | (123)% | | | | | | |
| Effective tax rate on earnings | (10)% | | 17% | | | | | | | | | | |
We recorded a benefit for income taxes of $2.8 million and had a negative effective tax rate of 10% for the year ended December 31, 2020 compared to an income tax expense of $12.6 million and an effective tax rate of 17% for the year ended December 31, 2019. The 2020 annual effective tax rate differed from the statutory tax rate of 21%, and resulted in a decrease as compared to the 2019 annual effective tax rate, primarily due to a favorable impact of the excess tax benefit from equity-based compensation and research and development credits, partially offset by an unfavorable impact from non-deductible compensation and equity charges.
Refer to Note 17, Income Taxes, of the Notes to Consolidated Financial Statements included in this annual report on Form 10-K for more details.
LIQUIDITY AND CAPITAL RESOURCES
We had cash and cash equivalents of $485.9 million at December 31, 2020, compared to $127.2 million at December 31, 2019. All of our cash and cash equivalents are invested in bank accounts and money market funds held in sweep accounts with major financial institutions.
Our cash position and working capital at December 31, 2020 and 2019 were as follows:
| | | | | | | | | | | |
| December 31, |
| 2020 | | 2019 |
| | | |
| (In thousands) |
| Cash | $ | 485,928 | | | $ | 127,210 | |
| | | |
| | | |
| Working Capital | $ | 552,991 | | | $ | 246,242 | |
Our ratio of current assets to current liabilities was 3.0:1 at December 31, 2020 and 2.0:1 at December 31, 2019.
Sources of Cash
Credit Facilities
On January 5, 2016, we entered into a $400.0 million senior secured credit facility pursuant to a credit agreement with certain lenders, Wells Fargo Securities, LLC as sole lead arranger, and Wells Fargo Bank, National Association, as administrative agent (as subsequently amended as discussed below, the “Prior Credit Agreement”). The Prior Credit Agreement provided for a $200.0 million term loan facility (the “Prior Term Loan Facility”), and prior to the amendment discussed below, a $200.0 million revolving credit facility (the “Prior Revolving Credit Facility” and, together with the Prior Term Loan Facility, the “Prior Facilities”). In addition, the Prior Credit Agreement included a letter of credit sub-limit of up to $10.0 million and a swing line loan sub-limit of up to $10.0 million.
On April 11, 2017 and December 26, 2017, we entered into amendments to the Prior Credit Agreement. Under these amendments, the Prior Revolving Credit Facility was increased from $200.0 million to $315.0 million and certain other modifications were made.
On November 15, 2019, we refinanced the Prior Credit Agreement and entered into an Amended and Restated Credit Agreement (as subsequently amended, as discussed below, the “A&R Credit Agreement”) with the lenders from time to time party thereto, Wells Fargo Securities, LLC, Citizens Bank, N.A., and JPMorgan Chase Bank, N.A., as joint lead arrangers and Wells Fargo Bank, National Association, as administrative agent. The A&R Credit Agreement replaced the Prior Credit Agreement and provides for (a) a five-year revolving credit facility of $500.0 million (the “Current Revolving Credit Facility”) and (b) an uncommitted incremental loan facility of up to $250.0 million. In addition, the A&R Credit Agreement includes a letter of credit sub-limit of up to $15.0 million and a swing line loan sub-limit of up to $25.0 million. On November 15, 2019, the $80.0 million outstanding term loan balance under the Prior Facilities was transferred to the Current Revolving Credit Facility.
On September 22, 2020, the parties entered into an amendment (the “Amendment”) to the A&R Credit Agreement to, among other changes, permit the issuance of the convertible senior notes and the purchase of the convertible note hedge transactions described below, expand our flexibility to repurchase our common stock and make other restricted payments and replace the total net leverage covenant with a new secured net leverage covenant that requires us to maintain a consolidated secured net leverage ratio not to exceed 3.50:1 for the calendar quarters ending September 30, 2020, December 31, 2020, and March 31, 2021 and 3.00:1 for the calendar quarters ending thereafter.
As of December 31, 2020, there was no outstanding balance for the Current Revolving Credit Facility and we were in full compliance with all covenants. Refer to Note 9, Debt and Credit Agreements, of the Notes to Consolidated Financial Statements included in this annual report on Form 10-K. We expect to use future loans under the Current Revolving Credit Facility, if any, for working capital, potential acquisitions, and other general corporate purposes.
Convertible Senior Notes
On September 25, 2020, we completed a private offering of $575.0 million aggregate principal amount of 0.25% convertible senior notes (the “Notes”), including the exercise in full of the initial purchasers’ option to purchase up to an additional $75.0 million principal amount of the Notes. We received proceeds from the issuance of the Notes of $559.7 million, net of $15.3 million of transaction fees and other debt issuance costs. The Notes bear interest at a rate of 0.25% per year, payable semiannually in arrears on March 15 and September 15 of each year, beginning on March 15, 2021. The Notes are general senior, unsecured obligations of the Company and will mature on September 15, 2025, unless earlier redeemed, repurchased, or converted. Refer to Note 10, Convertible Senior Notes, of the Notes to Consolidated Financial Statements included in this annual report on Form 10-K.
We used approximately $49.3 million of the net proceeds from the offering to pay the cost of the convertible note hedge transactions (partially offset by proceeds to the Company from the sale of the warrant transactions), approximately $53.0 million of the net proceeds to repurchase shares of our common stock from purchasers of the Notes, $150.0 million of the net proceeds to pay down outstanding borrowings under the Current Revolving Credit Facility, and $225.0 million for the acquisition of the 340B Link Business. We intend to use the remainder of the net proceeds from this offering for working capital and other general corporate purposes, which may include potential acquisitions, strategic transactions, and potential future repurchases of our common stock.
Distribution Agreement
On November 3, 2017, we entered into a Distribution Agreement (the “Distribution Agreement”) with J.P. Morgan Securities LLC, Wells Fargo Securities, LLC, and HSBC Securities (USA) Inc., as our sales agents, pursuant to which we may offer and sell from time to time through the sales agents up to $125.0 million maximum aggregate offering price of our common stock. Sales of the common stock pursuant to the Distribution Agreement may be made in negotiated transactions or transactions that are deemed to be “at the market” offerings as defined in Rule 415 under the Securities Act of 1933, including sales made directly on the Nasdaq Stock Market, or sales made to or through a market maker other than on an exchange. The registration statement under which the shares that could have been sold pursuant to the Distribution Agreement expired on November 3, 2020 and, accordingly, no additional sales will be made pursuant to the Distribution Agreement.
For the year ended December 31, 2019, we received gross proceeds of $38.5 million from sales of our common stock under the Distribution Agreement and incurred issuance costs of $0.7 million on sales of approximately 460,000 shares of our common stock at an average price of approximately $83.81 per share.
For the year ended December 31, 2020, we did not sell any of our common stock under the Distribution Agreement.
Uses of Cash
Our future uses of cash are expected to be primarily for working capital, capital expenditures, and other contractual obligations. We also expect a continued use of cash for potential acquisitions and acquisition-related activities, as well as repurchases of our common stock.
Our stock repurchase programs have a total of $54.9 million remaining for future repurchases as of December 31, 2020, which may result in additional use of cash. Refer to Note 15, Stock Repurchase Program, of the Notes to Consolidated Financial Statements included in this annual report on Form 10-K. In September 2020, we repurchased 749,300 shares of our common stock from purchasers of the Notes in the offering in privately negotiated transactions effected through one of the initial purchasers or its affiliate at an average price of $70.78 per share for an aggregate purchase price of approximately $53.0 million. The repurchases were made concurrently with the issuance of the Notes. The repurchases were separately authorized by the Board of Directors, and did not impact the total remaining for future purchases under the previously authorized stock purchase programs. There were no stock repurchases during the years ended December 31, 2020 and 2019
including under our stock repurchase programs, other than the separately-authorized one-time stock repurchase concurrent with the offering of the Notes in September 2020.
Based on our current business plan and product backlog, we believe that our existing cash and cash equivalents, our anticipated cash flows from operations, cash generated from the exercise of employee stock options and purchases under our employee stock purchase plan, along with the availability of funds under the Current Revolving Credit Facility will be sufficient to meet our cash needs for working capital, capital expenditures, potential acquisitions, and other contractual obligations for at least the next twelve months. For periods beyond the next twelve months, we also anticipate that our net operating cash flows plus existing balances of cash and cash equivalents will suffice to fund the continued growth of our business.
We believe that our current financial position and resources will allow us to manage the anticipated impact of the COVID-19 pandemic on our business for the foreseeable future, including any potential changes in timing of revenue recognition or potential extensions in customer payments. However, the future impact of COVID-19 cannot be predicted with certainty and may increase our borrowing costs and other costs of capital and otherwise adversely affect our business, results of operations, financial condition, and liquidity.
Cash Flows
The following table summarizes, for the periods indicated, selected items in our Consolidated Statements of Cash Flows:
| | | | | | | | | | | | | |
| Year Ended December 31, |
| 2020 | | 2019 | | |
| | | | | |
| (In thousands) |
| Net cash provided by (used in): | | | | | |
| Operating activities | $ | 185,870 | | | $ | 145,008 | | | |
| Investing activities | (279,866) | | | (61,664) | | | |
| Financing activities | 456,269 | | | (23,479) | | | |
| Effect of exchange rate changes on cash and cash equivalents | 437 | | | 153 | | | |
| Net increase in cash and cash equivalents | $ | 362,710 | | | $ | 60,018 | | | |
Operating Activities
We expect cash from our operating activities to fluctuate in future periods as a result of a number of factors, including the timing of our billings and collections, our operating results, and the timing of other liability payments.
Net cash provided by operating activities was $185.9 million for 2020, primarily consisting of net income of $32.2 million adjusted for non-cash items of $116.4 million and changes in assets and liabilities of $37.3 million. The non-cash items primarily consisted of depreciation and amortization expense of $61.1 million, share-based compensation expense of $44.7 million, amortization of operating lease right-of-use assets of $10.5 million, amortization of debt issuance costs of $1.6 million, amortization of discount on convertible senior notes of $4.8 million, and a change in deferred income taxes of $6.5 million. Changes in assets and liabilities include cash inflows from (i) a decrease in accounts receivable and unbilled receivables of $36.8 million primarily due to higher collections in the fourth quarter of 2020, (ii) a decrease in inventories of $12.4 million primarily due to timing of shipments and a focus on supply chain efficiencies, (iii) an increase in accrued compensation of $11.6 million primarily due to an increase in accrued commissions, as well as timing of payroll, (iv) an increase in deferred revenues of $7.6 million primarily due to the timing of shipments in order to meet customers’ implementation schedules and recognition of revenues for products requiring installation, (v) an increase in other long-term liabilities of $7.5 million primarily due to the deferral of certain payroll taxes related to the CARES Act, and (vi) an increase in accrued liabilities of $4.4 million. These cash inflows were partially offset by (i) a decrease in operating lease liabilities of $9.5 million, (ii) an increase in prepaid commissions of $8.1 million primarily due to an increase in bookings, (iii) an increase in other long-term assets of $7.7 million primarily due to an increase in unbilled receivables, (iv) an increase in other current assets of $6.4 million, (v) a decrease in accounts payables of $6.3 million primarily due to an overall decrease in spending, as well as timing of payments, (vi) an increase in investment in sales-type leases of $2.9 million, and (vii) an increase in prepaid expenses of $2.1 million.
Net cash provided by operating activities was $145.0 million for 2019, primarily consisting of net income of $61.3 million adjusted for non-cash items of $99.5 million offset by changes in assets and liabilities of $15.8 million. The non-cash items primarily consisted of depreciation and amortization expense of $53.6 million, share-based compensation expense of $34.0 million, amortization of operating lease right-of-use assets of $10.6 million, amortization of debt issuance costs of
$2.2 million, and a change in deferred income taxes of $1.3 million. Changes in assets and liabilities include cash outflows from (i) an increase in accounts receivable and unbilled receivables of $21.5 million due to increased billings and the timing of billings and collections, (ii) a decrease in operating lease liabilities of $10.0 million, (iii) an increase in inventories of $8.1 million for inventory buildup in support of forecasted sales, (iv) an increase in investment in sales-type leases of $3.7 million, (v) an increase in prepaid commissions of $2.7 million, and (vi) an increase in other current assets of $2.0 million. These cash outflows were partially offset by (i) an increase in accounts payables of $7.9 million due to increased spending with vendors and increased consulting costs, (ii) an increase in other long-term liabilities of $6.0 million, (iii) an increase in deferred revenues of $5.4 million, (iv) a decrease in other long-term assets of $4.5 million, (v) an increase in accrued liabilities of $3.0 million, (vi) a decrease in prepaid expenses of $2.9 million, and (vii) an increase in accrued compensation of $2.5 million.
Investing Activities
Net cash used in investing activities was $279.9 million for 2020, which consisted of $225.0 million consideration paid for the acquisition of the 340B Link Business, capital expenditures of $22.8 million for property and equipment, and $32.0 million for costs of software development for external use.
Net cash used in investing activities was $61.7 million for 2019, which consisted of capital expenditures of $15.9 million for property and equipment, and $45.8 million for costs of software development for external use.
Financing Activities
Net cash provided by financing activities was $456.3 million for 2020, primarily due to proceeds of $559.7 million from the issuance of the Notes, net of issuance costs, proceeds of approximately $51.3 million from the sale of warrants in connection with the issuance of the Notes, $150.0 million of proceeds under the Current Revolving Credit Facility, $54.3 million in proceeds from employee stock option exercises and employee stock plan purchases, and a net increase in the customer funds balances of $4.0 million, partially offset by repayments of $200.0 million under the Current Revolving Credit Facility, $100.6 million for the purchase of the convertible note hedge in connection with the issuance of the Notes, $53.0 million for repurchases of our stock, $8.7 million in employees’ taxes paid related to restricted stock unit vesting, and payments for debt issuance costs related to the Current Revolving Credit Facility of $0.6 million.
Net cash used in financing activities was $23.5 million for 2019, primarily due to the repayment of $90.0 million of the Prior Facilities and the Current Revolving Credit Facility, $9.7 million in employees’ taxes paid related to restricted stock unit vesting, and payments of debt issuance costs of $2.3 million, partially offset by $40.7 million in proceeds from employee stock option exercises and employee stock plan purchases, and $37.8 million proceeds from sales of our common stock under the Distribution Agreement.
Contractual Obligations
Contractual obligations as of December 31, 2020 were as follows:
| | | | | | | | | | | | | | | | | | | | | | | | | | | | | |
| Payments Due by Period |
| Total | | 2021 | | 2022 - 2023 | | 2024 - 2025 | | 2026 and thereafter |
| | | | | | | | | |
| (In thousands) |
Operating leases (1) | $ | 72,532 | | | $ | 15,290 | | | $ | 24,327 | | | $ | 15,493 | | | $ | 17,422 | |
Purchase obligations (2) | 72,751 | | | 69,893 | | | 2,338 | | | 479 | | | 41 | |
Convertible senior notes (3) | 582,148 | | | 1,398 | | | 2,875 | | | 577,875 | | | — | |
| | | | | | | | | |
Total (4) | $ | 727,431 | | | $ | 86,581 | | | $ | 29,540 | | | $ | 593,847 | | | $ | 17,463 | |
_________________________________________________
(1)Commitments under operating leases relate primarily to leased office buildings, data centers, office equipment, and vehicles. Refer to Note 12, Lessee Leases, of the Notes to Consolidated Financial Statements included in this annual report on Form 10-K.
(2)We purchase components from a variety of suppliers and use contract manufacturers to provide manufacturing services for our products. During the normal course of business, we issue purchase orders with estimates of our requirements several months ahead of the delivery dates. These amounts are associated with agreements that are enforceable and legally binding. The amounts under such contracts are included in the table above because we believe that cancellation of these contracts is unlikely and we expect to make future cash payments according to the contract terms or in similar amounts for similar materials.
(3)We issued convertible senior notes in September 2020 that are due in September 2025. The obligations presented above include both principal and interest for these notes. Although these notes mature in 2025, they may be converted into cash and shares of our common stock prior to maturity if certain conditions are met. Any conversion prior to maturity can result in repayment of the principal amounts sooner than the scheduled repayment as indicated in the table above. Refer to Note 10, Convertible Senior Notes, of the Notes to Consolidated Financial Statements included in this annual report on Form 10-K.
(4)Refer to Note 13, Commitments and Contingencies, of the Notes to Consolidated Financial Statements included in this annual report on Form 10-K.
Off-Balance Sheet Arrangements
As of December 31, 2020, we had no off-balance sheet arrangements as defined under Regulation S-K 303(a)(4) of the Exchange Act and the instructions thereto.
ITEM 7A. QUANTITATIVE AND QUALITATIVE DISCLOSURES ABOUT MARKET RISK
We are exposed to market risks related to fluctuations in foreign currency exchange rates and interest rates.
Foreign Currency Exchange Risk
We operate in foreign countries which expose us to market risk associated with foreign currency exchange rate fluctuations between the U.S. dollar and various foreign currencies, the most significant of which are the British Pound and the Euro. In order to manage foreign currency risk, at times we enter into foreign exchange forward contracts to mitigate risks associated with changes in spot exchange rates of mainly non-functional currency denominated assets or liabilities of our foreign subsidiaries. In general, the market risk related to these contracts is offset by corresponding gains and losses on the hedged transactions. By working only with major banks and closely monitoring current market conditions, we seek to limit the risk that counterparties to these contracts may be unable to perform. We do not enter into derivative contracts for trading purposes. As of December 31, 2020, we did not have any outstanding foreign exchange forward contracts.
Interest Rate Fluctuation Risk
We are exposed to interest rate risk through our borrowing activities. As of December 31, 2020, there was no outstanding balance under the A&R Credit Agreement, and the net carrying amount under our convertible senior notes was $467.2 million. Although our convertible senior notes are based on a fixed rate, changes in interest rates could impact the fair value of such notes. As of December 31, 2020, the fair market value of our convertible senior notes was $782.3 million. Refer to Note 10, Convertible Senior Notes, of the Notes to Consolidated Financial Statements included in this annual report on Form 10-K.
We have used interest rate swap agreements to protect against adverse fluctuations in interest rates by reducing our exposure to variability in cash flows relating to interest payments on a portion of our outstanding debt. Our interest rate swaps, which were designated as cash flow hedges, involved the receipt of variable amounts from counterparties in exchange for us
making fixed-rate payments over the life of the agreements. We do not hold or issue any derivative financial instruments for speculative trading purposes. As of December 31, 2020, we did not have any outstanding interest rate swap agreements. Our interest rate swap agreement matured during the second quarter of 2019.
ITEM 8. FINANCIAL STATEMENTS AND SUPPLEMENTARY DATA
The following tables presenting our unaudited quarterly results of operations should be read in conjunction with the Consolidated Financial Statements and related Notes included in Part IV, Item 15 of this annual report on Form 10-K and are incorporated by reference into this Item 8. We have prepared the unaudited information on the same basis as our audited Consolidated Financial Statements. Our operating results for any quarter are not necessarily indicative of results for any future quarters or for a full year.
SUPPLEMENTARY CONSOLIDATED FINANCIAL DATA (UNAUDITED)
| | | | | | | | | | | | | | | | | | | | | | | |
| Quarter Ended |
| December 31, 2020 | | September 30, 2020 | | June 30, 2020 | | March 31, 2020 |
| | | | | | | |
| (In thousands, except per share data) |
| 2020 Consolidated Statements of Operations Data |
| Total revenues | $ | 249,202 | | | $ | 213,699 | | | $ | 199,621 | | | $ | 229,686 | |
| Gross profit | 123,654 | | | 96,791 | | | 83,225 | | | 109,622 | |
| Income (loss) from operations | 20,214 | | | 10,152 | | | (6,991) | | | 12,151 | |
| Net income (loss) | $ | 16,377 | | | $ | 8,805 | | | $ | (4,299) | | | $ | 11,311 | |
| Net income (loss) per share: | | | | | | | |
| Basic | $ | 0.39 | | | $ | 0.21 | | | $ | (0.10) | | | $ | 0.27 | |
| Diluted | $ | 0.37 | | | $ | 0.20 | | | $ | (0.10) | | | $ | 0.26 | |
| | | | | | | | | | | | | | | | | | | | | | | |
| Quarter Ended |
| December 31, 2019 | | September 30, 2019 | | June 30, 2019 | | March 31, 2019 |
| | | | | | | |
| (In thousands, except per share data) |
| 2019 Consolidated Statements of Operations Data |
| Total revenues | $ | 248,292 | | | $ | 228,805 | | | $ | 217,413 | | | $ | 202,517 | |
| Gross profit | 123,603 | | | 112,147 | | | 104,045 | | | 97,117 | |
| Income from operations | 22,182 | | | 24,646 | | | 18,763 | | | 12,761 | |
| Net income | $ | 22,095 | | | $ | 19,983 | | | $ | 15,976 | | | $ | 3,284 | |
| Net income per share: | | | | | | | |
| Basic | $ | 0.53 | | | $ | 0.48 | | | $ | 0.39 | | | $ | 0.08 | |
| Diluted | $ | 0.51 | | | $ | 0.46 | | | $ | 0.37 | | | $ | 0.08 | |
ITEM 9. CHANGES IN AND DISAGREEMENTS WITH ACCOUNTANTS ON ACCOUNTING AND FINANCIAL DISCLOSURE
None.
ITEM 9A. CONTROLS AND PROCEDURES
Evaluation of Disclosure Controls and Procedures
Our management, with the participation of our chief executive officer and chief financial officer, evaluated the effectiveness of our disclosure controls and procedures (as defined in Rule 13a-15(e) or 15d-15(e) under the Exchange Act) as of the end of the period covered by this annual report on Form 10-K. In designing and evaluating the disclosure controls and procedures, management recognized that any controls and procedures, no matter how well designed and operated, can provide only reasonable assurance of achieving the desired control objectives. In addition, the design of disclosure controls and procedures must reflect the fact that there are resource constraints and that management is required to apply its judgment in evaluating the benefits of possible controls and procedures relative to their costs.
Based on that evaluation, our chief executive officer and chief financial officer concluded that our disclosure controls and procedures were effective as of December 31, 2020 to provide reasonable assurance that information we are required to disclose in reports that we file or submit under the Exchange Act is recorded, processed, summarized and reported within the time periods specified in SEC rules and forms, and that such information is accumulated and communicated to our management, including our chief executive officer and chief financial officer, as appropriate, to allow timely decisions regarding required disclosure.
Management’s Report on Internal Control over Financial Reporting
Our management is responsible for establishing and maintaining adequate internal control over financial reporting (as such term is defined in Rules 13a-15(f) and 15d-15(f) under the Exchange Act). Our internal control system is designed to provide reasonable assurance regarding the preparation and fair presentation of financial statements for external purposes in accordance with U.S. generally accepted accounting principles. All internal control systems, no matter how well designed, have inherent limitations and can provide only reasonable assurance that the objectives of the internal control system are met.
Under the supervision and with the participation of our management, including our principal executive officer and principal financial officer, we conducted an evaluation of the effectiveness of our internal control over financial reporting as of December 31, 2020 using the criteria for effective internal control over financial reporting as described in “Internal Control—Integrated Framework,” issued by the Committee of Sponsoring Organization of the Treadway Commission (2013 framework) (the COSO Criteria). Based on this assessment, management concluded that our internal control over financial reporting was effective as of December 31, 2020.
Deloitte & Touche LLP, an independent registered public accounting firm, has issued its attestation report on our internal control over financial reporting as of December 31, 2020, which is included in Part IV, Item 15 of this annual report on Form 10-K.
Changes in Internal Control over Financial Reporting
There have been no changes in our internal control over financial reporting (as such term is defined in Rules 13a-15(f) and 15d-15(f) under the Exchange Act) that have materially affected, or are reasonably likely to materially affect, our internal control over financial reporting during the year ended December 31, 2020.
ITEM 9B. OTHER INFORMATION
None.
PART III
Certain information required by Part III is omitted from this annual report on Form 10-K because the registrant will file with the United States Securities and Exchange Commission a definitive proxy statement pursuant to Regulation 14A in connection with the solicitation of proxies for Omnicell’s Annual Meeting of Stockholders expected to be held in May 2021 (the “Proxy Statement”) not later than 120 days after the end of the fiscal year covered by this annual report on Form 10-K, and certain information included therein is incorporated herein by reference.
ITEM 10. DIRECTORS, EXECUTIVE OFFICERS AND CORPORATE GOVERNANCE
The information required by this Item with respect to directors and executive officers may be found under the heading “Information About Our Executive Officers” in Part I, Item 1 of this annual report on Form 10-K, and in the sections entitled “Board and Corporate Governance Matters—Election of Directors” and “Board and Corporate Governance Matters—Information about our Directors and Nominees” appearing in the Proxy Statement. Such information is incorporated herein by reference.
The information required by this Item with respect to our audit committee and audit committee financial expert may be found in the section entitled “Board and Corporate Governance Matters—Information Regarding Committees of the Board of Directors—Audit Committee” appearing in the Proxy Statement. Such information is incorporated herein by reference.
The information required by this Item with respect to compliance with Section 16(a) of the Securities Exchange Act of 1934 may be found in the sections entitled “Delinquent Section 16(a) Reports” appearing in the Proxy Statement. Such information is incorporated herein by reference.
Our written Code of Conduct applies to all of our directors and employees, including executive officers, including without limitation our principal executive officer, principal financial officer, principal accounting officer or controller, or persons performing similar functions. The Code of Conduct is available on our website at www.omnicell.com under the hyperlink titled “Corporate Governance.” Changes to or waivers of the Code of Conduct will be disclosed on the same website. We intend to satisfy the disclosure requirement under Item 5.05 of Form 8-K regarding any amendment to, or waiver of, any provision of the Code of Conduct by disclosing such information on the same website.
ITEM 11. EXECUTIVE COMPENSATION
The information required by this Item with respect to director and executive officer compensation is incorporated by reference to the sections of our Proxy Statement entitled “Executive Compensation” and “Board and Corporate Governance Matters—Director Compensation.”
The information required by this Item with respect to Compensation Committee interlocks and insider participation is incorporated herein by reference to the section of our Proxy Statement entitled “Board and Corporate Governance Matters—Information Regarding Committees of the Board of Directors—Compensation Committee—Compensation Committee Interlocks and Insider Participation.”
The information required by this Item with respect to our Compensation Committee’s review and discussion of the Compensation Discussion and Analysis included in the Proxy Statement is incorporated herein by reference to the section of our Proxy Statement entitled “Executive Compensation—Compensation Committee Report.”
ITEM 12. SECURITY OWNERSHIP OF CERTAIN BENEFICIAL OWNERS AND MANAGEMENT AND RELATED STOCKHOLDER MATTERS
The information required by this Item with respect to security ownership of certain beneficial owners and management is incorporated herein by reference to the section of our Proxy Statement entitled “Stock Ownership—Security Ownership of Certain Beneficial Owners and Management.”
The information required by this Item with respect to securities authorized for issuance under our equity compensation plans is incorporated herein by reference to the section of our Proxy Statement entitled “Equity Plan Information—Equity Compensation Plan Information.”
ITEM 13. CERTAIN RELATIONSHIPS, RELATED TRANSACTIONS AND DIRECTOR INDEPENDENCE
The information required by this Item with respect to related party transactions is incorporated herein by reference to the section of our Proxy Statement entitled “Board and Corporate Governance Matters—Certain Relationships and Related Transactions.”
The information required by this Item with respect to director independence is incorporated herein by reference to the section of our Proxy Statement entitled “Board and Corporate Governance Matters—Independence of the Board of Directors.”
ITEM 14. PRINCIPAL ACCOUNTANT FEES AND SERVICES
The information required by this Item is incorporated herein by reference to the section of our Proxy Statement entitled “Audit Matters—Ratification of Selection of Independent Registered Public Accounting Firm—Principal Accountant Fees and Services.”
PART IV
ITEM 15. EXHIBITS AND FINANCIAL STATEMENT SCHEDULE
The following documents are included as part of this annual report on Form 10-K:
(1) Consolidated Financial Statements:
| | | | | | | | |
| Index to Financial Statements | | Page |
| | |
| | |
| | |
| | |
| | |
| | |
| | |
| | |
| | |
| | |
| | |
| | |
| | |
| | |
| | |
| | |
(2) Exhibits: The information required by this item is set forth on the exhibit index which precedes the signature page of this report.
ITEM 16. FORM 10-K SUMMARY
None.
REPORT OF INDEPENDENT REGISTERED PUBLIC ACCOUNTING FIRM
To the stockholders and the Board of Directors of Omnicell, Inc.
Opinion on the Financial Statements
We have audited the accompanying consolidated balance sheets of Omnicell, Inc. and subsidiaries (the "Company") as of December 31, 2020 and 2019, the related consolidated statements of operations, comprehensive income, stockholders' equity, and cash flows, for each of the three years in the period ended December 31, 2020, and the related notes and the schedule listed in the Index at Item 15 (collectively referred to as the "financial statements"). In our opinion, the financial statements present fairly, in all material respects, the financial position of the Company as of December 31, 2020 and 2019, and the results of its operations and its cash flows for each of the three years in the period ended December 31, 2020, in conformity with accounting principles generally accepted in the United States of America.
We have also audited, in accordance with the standards of the Public Company Accounting Oversight Board (United States) (PCAOB), the Company's internal control over financial reporting as of December 31, 2020, based on criteria established in Internal Control — Integrated Framework (2013) issued by the Committee of Sponsoring Organizations of the Treadway Commission and our report dated February 24, 2021, expressed an unqualified opinion on the Company's internal control over financial reporting.
Change in Accounting Principle
Effective January 1, 2019, the Company changed its method of accounting for leases due to the adoption of ASC Topic 842, Leases.
Basis for Opinion
These financial statements are the responsibility of the Company's management. Our responsibility is to express an opinion on the Company's financial statements based on our audits. We are a public accounting firm registered with the PCAOB and are required to be independent with respect to the Company in accordance with the U.S. federal securities laws and the applicable rules and regulations of the Securities and Exchange Commission and the PCAOB.
We conducted our audits in accordance with the standards of the PCAOB. Those standards require that we plan and perform the audit to obtain reasonable assurance about whether the financial statements are free of material misstatement, whether due to error or fraud. Our audits included performing procedures to assess the risks of material misstatement of the financial statements, whether due to error or fraud, and performing procedures that respond to those risks. Such procedures included examining, on a test basis, evidence regarding the amounts and disclosures in the financial statements. Our audits also included evaluating the accounting principles used and significant estimates made by management, as well as evaluating the overall presentation of the financial statements. We believe that our audits provide a reasonable basis for our opinion.
Critical Audit Matters
The critical audit matters communicated below are matters arising from the current-period audit of the financial statements that were communicated or required to be communicated to the audit committee and that (1) relate to accounts or disclosures that are material to the financial statements and (2) involved our especially challenging, subjective, or complex judgments. The communication of critical audit matters does not alter in any way our opinion on the financial statements, taken as a whole, and we are not, by communicating the critical audit matters below, providing separate opinions on the critical audit matters or on the accounts or disclosures to which they relate.
Inventory Valuation - Refer to Note 1 to the financial statements
Critical Audit Matter Description
The Company records write-downs for excess and slow-moving inventory based on the Company’s estimate of demand for its products, potential obsolescence of technology, product life cycles, and whether pricing trends or forecasts indicate that the carrying value of inventory exceeds its estimated selling price. These estimates require management judgment and are impacted by market and economic conditions, technology changes, and new product introductions. The Company's consolidated inventory balance is $96.3 million as of December 31, 2020.
We identified the inventory valuation as a critical audit matter because of the assumptions and judgments made by management to estimate the excess and slow-moving inventory, especially considering the presence of various inventory types and evolving product life cycles, which includes new product development. The analysis of inventory valuation required a high degree of auditor judgment when performing audit procedures to evaluate qualitative and quantitative factors considered and the reasonableness of the relevant management judgments.
How the Critical Audit Matter Was Addressed in the Audit
Our audit procedures over the inventory valuation included the following, among others:
•We tested the effectiveness of controls over inventory for valuation.
•We evaluated the appropriateness of management’s method, assumptions, and judgments used in developing their estimate of the excess and slow-moving inventory, which included consideration of demand for its products, potential obsolescence of technology, product life cycles, and pricing trends.
•We tested certain underlying data used and considered in the excess and obsolete inventory assessment, including the amount of inventory on hand, forecasted demand, and historical sales.
•We compared actual inventory usage and write-off activity in the current year to the excess and obsolete estimate by management in the prior year to evaluate management’s ability to make accurate estimates.
•We evaluated the valuation of excess and obsolete inventory for understatement by making selections of individual inventory items and evaluating the appropriateness of the inventory valuation and management judgments based on relevant product specific information. These procedures also included certain inquiries of production planning and supply chain employees.
•We evaluated whether the excess and obsolete inventory may be understated by evaluating write-off activity of inventory subsequent to December 31, 2020.
Capitalized Software - Software Development Costs for External Use — Refer to Notes 1 and 6 to the financial statements
Critical Audit Matter Description
The Company capitalizes certain costs for software that is to be sold, leased, or otherwise marketed once technological feasibility has been established and amortizes these costs over the estimated lives of the related products. The determination of whether a project’s software development costs are capitalized or expensed could have a significant impact on the financial statements. The Company capitalized $32.0 million of software development costs in the year ended December 31, 2020 and had total external capitalized software development costs, net of accumulated amortization, of $94.0 million as of December 31, 2020.
We identified management’s determination of capitalized software development costs to be a critical audit matter. Evaluating the Company’s determination of the project and related software development activities to be capitalized under relevant accounting guidance, including the extent to which software development costs incurred were capitalized, required subjective auditor judgment.
How the Critical Audit Matter Was Addressed in the Audit
Our audit procedures to assess the appropriateness of capitalized software development costs included the following, among others:
•We tested the effectiveness of management’s capitalized software development cost controls.
•We obtained an understanding of management’s process for evaluating software development costs and the nature of software development costs capitalized.
•We tested management’s method of calculating capitalized software development costs. For a sample of projects, we performed audit procedures to agree capitalized labor costs to time records and made certain inquiries of project members to further assess the reasonableness of time allocated to the selected projects.
•For a sample of software development projects, we obtained an understanding of the new software enhancements and features planned for development by reviewing management’s project documentation and inquiring of project managers and engineers.
•For a sample of software development projects, we tested the timing of software development cost recognition as either a capitalized or an expensed development cost, depending on which stage of project development the cost was incurred. We also inquired of project managers and engineers regarding the date technological feasibility was reached and observed the new features developed in the working model.
/s/ DELOITTE & TOUCHE LLP
San Jose, California
February 24, 2021
We have served as the Company’s auditor since 2014.
REPORT OF INDEPENDENT REGISTERED PUBLIC ACCOUNTING FIRM
To the stockholders and the Board of Directors of Omnicell, Inc.
Opinion on Internal Control over Financial Reporting
We have audited the internal control over financial reporting of Omnicell, Inc. and subsidiaries (the “Company”) as of December 31, 2020, based on criteria established in Internal Control — Integrated Framework (2013) issued by the Committee of Sponsoring Organizations of the Treadway Commission (COSO). In our opinion, the Company maintained, in all material respects, effective internal control over financial reporting as of December 31, 2020, based on criteria established in Internal Control — Integrated Framework (2013) issued by COSO.
We have also audited, in accordance with the standards of the Public Company Accounting Oversight Board (United States) (PCAOB), the consolidated financial statements as of and for the year ended December 31, 2020, of the Company and our report dated February 24, 2021, expressed an unqualified opinion on those financial statements and included an explanatory paragraph regarding the Company’s change in its method of accounting for leases in fiscal year 2019 due to the adoption of ASC Topic 842, Leases.
Basis for Opinion
The Company’s management is responsible for maintaining effective internal control over financial reporting and for its assessment of the effectiveness of internal control over financial reporting, included in the accompanying Management's Report on Internal Control Over Financial Reporting. Our responsibility is to express an opinion on the Company’s internal control over financial reporting based on our audit. We are a public accounting firm registered with the PCAOB and are required to be independent with respect to the Company in accordance with the U.S. federal securities laws and the applicable rules and regulations of the Securities and Exchange Commission and the PCAOB.
We conducted our audit in accordance with the standards of the PCAOB. Those standards require that we plan and perform the audit to obtain reasonable assurance about whether effective internal control over financial reporting was maintained in all material respects. Our audit included obtaining an understanding of internal control over financial reporting, assessing the risk that a material weakness exists, testing and evaluating the design and operating effectiveness of internal control based on the assessed risk, and performing such other procedures as we considered necessary in the circumstances. We believe that our audit provides a reasonable basis for our opinion.
Definition and Limitations of Internal Control over Financial Reporting
A company’s internal control over financial reporting is a process designed to provide reasonable assurance regarding the reliability of financial reporting and the preparation of financial statements for external purposes in accordance with generally accepted accounting principles. A company’s internal control over financial reporting includes those policies and procedures that (1) pertain to the maintenance of records that, in reasonable detail, accurately and fairly reflect the transactions and dispositions of the assets of the company; (2) provide reasonable assurance that transactions are recorded as necessary to permit preparation of financial statements in accordance with generally accepted accounting principles, and that receipts and expenditures of the company are being made only in accordance with authorizations of management and directors of the company; and (3) provide reasonable assurance regarding prevention or timely detection of unauthorized acquisition, use, or disposition of the company’s assets that could have a material effect on the financial statements.
Because of its inherent limitations, internal control over financial reporting may not prevent or detect misstatements. Also, projections of any evaluation of effectiveness to future periods are subject to the risk that controls may become inadequate because of changes in conditions, or that the degree of compliance with the policies or procedures may deteriorate.
/s/ DELOITTE & TOUCHE LLP
San Jose, California
February 24, 2021
OMNICELL, INC.
CONSOLIDATED BALANCE SHEETS
| | | | | | | | | | | |
| December 31, |
| 2020 | | 2019 |
| | | |
| (In thousands, except par value) |
| ASSETS |
| Current assets: | | | |
| Cash and cash equivalents | $ | 485,928 | | | $ | 127,210 | |
Accounts receivable and unbilled receivables, net of allowances of $4,286 and $3,227, respectively | 190,117 | | | 218,362 | |
| Inventories | 96,298 | | | 108,011 | |
| Prepaid expenses | 16,027 | | | 14,478 | |
| Other current assets | 41,044 | | | 15,177 | |
| Total current assets | 829,414 | | | 483,238 | |
| Property and equipment, net | 59,073 | | | 54,246 | |
| Long-term investment in sales-type leases, net | 22,156 | | | 19,750 | |
| Operating lease right-of-use assets | 55,114 | | | 56,130 | |
| Goodwill | 499,309 | | | 336,539 | |
| Intangible assets, net | 168,211 | | | 124,867 | |
| Long-term deferred tax assets | 15,019 | | | 14,142 | |
| Prepaid commissions | 56,919 | | | 48,862 | |
| Other long-term assets | 119,289 | | | 103,036 | |
| Total assets | $ | 1,824,504 | | | $ | 1,240,810 | |
| | | |
| LIABILITIES AND STOCKHOLDERS’ EQUITY |
| Current liabilities: | | | |
| Accounts payable | $ | 40,309 | | | $ | 46,380 | |
| Accrued compensation | 55,750 | | | 44,155 | |
| Accrued liabilities | 80,311 | | | 55,567 | |
| | | |
| Deferred revenues, net | 100,053 | | | 90,894 | |
| Total current liabilities | 276,423 | | | 236,996 | |
| Long-term deferred revenues | 5,673 | | | 7,083 | |
| Long-term deferred tax liabilities | 39,633 | | | 39,090 | |
| Long-term operating lease liabilities | 48,897 | | | 50,669 | |
| Other long-term liabilities | 19,174 | | | 11,718 | |
| Revolving credit facility | — | | | 50,000 | |
| Convertible senior notes, net | 467,201 | | | — | |
| Total liabilities | 857,001 | | | 395,556 | |
| Commitments and contingencies (Note 13) | | | |
| Stockholders’ equity: | | | |
Preferred stock, $0.001 par value, 5,000 shares authorized; no shares issued | — | | | — | |
Common stock, $0.001 par value, 100,000 shares authorized; 52,677 and 51,277 shares issued; 42,783 and 42,132 shares outstanding, respectively | 53 | | | 51 | |
Treasury stock at cost, 9,894 and 9,145 shares outstanding, respectively | (238,109) | | | (185,074) | |
| Additional paid-in capital | 920,359 | | | 780,931 | |
| Retained earnings | 290,722 | | | 258,792 | |
| Accumulated other comprehensive loss | (5,522) | | | (9,446) | |
| Total stockholders’ equity | 967,503 | | | 845,254 | |
| Total liabilities and stockholders’ equity | $ | 1,824,504 | | | $ | 1,240,810 | |
The accompanying notes are an integral part of these Consolidated Financial Statements.
OMNICELL, INC.
CONSOLIDATED STATEMENTS OF OPERATIONS
| | | | | | | | | | | | | | | | | |
| Year Ended December 31, |
| 2020 | | 2019 | | 2018 |
| | | | | |
| (In thousands, except per share data) |
| Revenues: | | | | | |
| Product revenues | $ | 636,031 | | | $ | 659,602 | | | $ | 569,595 | |
| Services and other revenues | 256,177 | | | 237,425 | | | 217,714 | |
| Total revenues | 892,208 | | | 897,027 | | | 787,309 | |
| Cost of revenues: | | | | | |
| Cost of product revenues | 354,004 | | | 344,914 | | | 312,360 | |
| Cost of services and other revenues | 124,912 | | | 115,201 | | | 102,619 | |
| Total cost of revenues | 478,916 | | | 460,115 | | | 414,979 | |
| Gross profit | 413,292 | | | 436,912 | | | 372,330 | |
| Operating expenses: | | | | | |
| Research and development | 70,161 | | | 68,644 | | | 64,843 | |
| Selling, general, and administrative | 307,605 | | | 289,916 | | | 263,095 | |
| | | | | |
| Total operating expenses | 377,766 | | | 358,560 | | | 327,938 | |
| Income from operations | 35,526 | | | 78,352 | | | 44,392 | |
| Interest and other income (expense), net | (6,177) | | | (4,419) | | | (8,776) | |
| Income before provision for income taxes | 29,349 | | | 73,933 | | | 35,616 | |
| Provision for (benefit from) income taxes | (2,845) | | | 12,595 | | | (2,113) | |
| Net income | $ | 32,194 | | | $ | 61,338 | | | $ | 37,729 | |
| Net income per share: | | | | | |
| Basic | $ | 0.76 | | | $ | 1.48 | | | $ | 0.96 | |
| Diluted | $ | 0.74 | | | $ | 1.43 | | | $ | 0.93 | |
| Weighted-average shares outstanding: | | | | | |
| Basic | 42,583 | | | 41,462 | | | 39,242 | |
| Diluted | 43,743 | | | 42,943 | | | 40,559 | |
The accompanying notes are an integral part of these Consolidated Financial Statements.
OMNICELL, INC.
CONSOLIDATED STATEMENTS OF COMPREHENSIVE INCOME
| | | | | | | | | | | | | | | | | |
| Year Ended December 31, |
| 2020 | | 2019 | | 2018 |
| | | | | |
| (In thousands) |
| Net income | $ | 32,194 | | | $ | 61,338 | | | $ | 37,729 | |
| Other comprehensive income (loss), net of reclassification adjustments: | | | | | |
| | | | | |
| Unrealized loss on interest rate swap contracts, net of tax | — | | | (420) | | | (421) | |
| Foreign currency translation adjustments | 3,924 | | | 1,828 | | | (4,320) | |
| Other comprehensive income (loss) | 3,924 | | | 1,408 | | | (4,741) | |
| Comprehensive income | $ | 36,118 | | | $ | 62,746 | | | $ | 32,988 | |
The accompanying notes are an integral part of these Consolidated Financial Statements.
OMNICELL, INC.
CONSOLIDATED STATEMENTS OF STOCKHOLDERS’ EQUITY
| | | | | | | | | | | | | | | | | | | | | | | | | | | | | | | | | | | | | | | | | | | | | | | |
| Common Stock | | Treasury Stock | | Additional Paid-In Capital | | Accumulated Earnings | | Accumulated Other Comprehensive Income (Loss) | | Stockholders’ Equity |
| Shares | | Amount | | Shares | | Amount | | | | |
| | | | | | | | | | | | | | | |
| (In thousands) |
| Balances as of December 31, 2017 | 47,577 | | | $ | 48 | | | (9,145) | | | $ | (185,074) | | | $ | 585,755 | | | $ | 159,725 | | | $ | (6,113) | | | $ | 554,341 | |
| Net income | — | | | — | | | — | | | — | | | — | | | 37,729 | | | — | | | 37,729 | |
| Other comprehensive loss | — | | | — | | | — | | | — | | | — | | | — | | | (4,741) | | | (4,741) | |
| At the market equity offering, net of costs | 557 | | | 1 | | | — | | | — | | | 39,566 | | | — | | | — | | | 39,567 | |
| Share-based compensation | — | | | — | | | — | | | — | | | 28,885 | | | — | | | — | | | 28,885 | |
| Issuance of common stock under employee stock plans | 1,346 | | | 1 | | | — | | | — | | | 30,610 | | | — | | | — | | | 30,611 | |
| Tax payments related to restricted stock units | — | | | — | | | — | | | — | | | (6,775) | | | — | | | — | | | (6,775) | |
| | | | | | | | | | | | | | | |
| | | | | | | | | | | | | | | |
| Balances as of December 31, 2018 | 49,480 | | | 50 | | | (9,145) | | | (185,074) | | | 678,041 | | | 197,454 | | | (10,854) | | | 679,617 | |
| Net income | — | | | — | | | — | | | — | | | — | | | 61,338 | | | — | | | 61,338 | |
| | | | | | | | | | | | | | | |
| Other comprehensive income | — | | | — | | | — | | | — | | | — | | | — | | | 1,408 | | | 1,408 | |
| At the market equity offering, net of costs | 460 | | | — | | | — | | | — | | | 37,806 | | | — | | | — | | | 37,806 | |
| | | | | | | | | | | | | | | |
| Share-based compensation | — | | | — | | | — | | | — | | | 34,049 | | | — | | | — | | | 34,049 | |
| Issuance of common stock under employee stock plans | 1,337 | | | 1 | | | — | | | — | | | 40,705 | | | — | | | — | | | 40,706 | |
| Tax payments related to restricted stock units | — | | | — | | | — | | | — | | | (9,670) | | | — | | | — | | | (9,670) | |
| | | | | | | | | | | | | | | |
| | | | | | | | | | | | | | | |
| Balances as of December 31, 2019 | 51,277 | | | 51 | | | (9,145) | | | (185,074) | | | 780,931 | | | 258,792 | | | (9,446) | | | 845,254 | |
| Net income | — | | | — | | | — | | | — | | | — | | | 32,194 | | | — | | | 32,194 | |
| Other comprehensive income | — | | | — | | | — | | | — | | | — | | | — | | | 3,924 | | | 3,924 | |
| | | | | | | | | | | | | | | |
| | | | | | | | | | | | | | | |
| Share-based compensation | — | | | — | | | — | | | — | | | 44,697 | | | — | | | — | | | 44,697 | |
| Issuance of common stock under employee stock plans | 1,400 | | | 2 | | | — | | | — | | | 54,268 | | | — | | | — | | | 54,270 | |
| Tax payments related to restricted stock units | — | | | — | | | — | | | — | | | (8,738) | | | — | | | — | | | (8,738) | |
| Stock repurchases | — | | | — | | | (749) | | | (53,035) | | | — | | | — | | | — | | | (53,035) | |
| Equity component of convertible senior note issuance, net of issuance costs | — | | | — | | | — | | | — | | | 97,830 | | | — | | | — | | | 97,830 | |
| Purchase of convertible note hedge | — | | | — | | | — | | | — | | | (100,625) | | | — | | | — | | | (100,625) | |
| Sale of warrants | — | | | — | | | — | | | — | | | 51,290 | | | — | | | — | | | 51,290 | |
| Tax benefits related to convertible senior notes and convertible note hedge | — | | | — | | | — | | | — | | | 706 | | | — | | | — | | | 706 | |
| Cumulative effect of a change in accounting principle related to credit losses | — | | | — | | | — | | | — | | | — | | | (264) | | | — | | | (264) | |
| | | | | | | | | | | | | | | |
| | | | | | | | | | | | | | | |
| Balances as of December 31, 2020 | 52,677 | | | $ | 53 | | | (9,894) | | | $ | (238,109) | | | $ | 920,359 | | | $ | 290,722 | | | $ | (5,522) | | | $ | 967,503 | |
The accompanying notes are an integral part of these Consolidated Financial Statements.
OMNICELL, INC.
CONSOLIDATED STATEMENTS OF CASH FLOWS
| | | | | | | | | | | | | | | | | |
| Year Ended December 31, |
| 2020 | | 2019 | | 2018 |
| | | | | |
| (In thousands) |
| Operating Activities | | | | | |
| Net income | $ | 32,194 | | | $ | 61,338 | | | $ | 37,729 | |
| Adjustments to reconcile net income to net cash provided by operating activities: | | | | | |
| Depreciation and amortization | 61,067 | | | 53,559 | | | 51,350 | |
| Loss on disposal of property and equipment | 267 | | | 445 | | | 133 | |
| | | | | |
| | | | | |
| | | | | |
| Share-based compensation expense | 44,697 | | | 34,049 | | | 28,885 | |
| | | | | |
| Deferred income taxes | (6,546) | | | (1,339) | | | (5,705) | |
| Amortization of operating lease right-of-use assets | 10,528 | | | 10,562 | | | — | |
| Amortization of debt issuance costs | 1,597 | | | 2,204 | | | 2,292 | |
| Amortization of discount on convertible senior notes | 4,766 | | | — | | | — | |
| Changes in operating assets and liabilities: | | | | | |
| Accounts receivable and unbilled receivables | 36,842 | | | (21,540) | | | (6,192) | |
| Inventories | 12,359 | | | (8,123) | | | (6,763) | |
| Prepaid expenses | (2,081) | | | 2,909 | | | (308) | |
| Other current assets | (6,408) | | | (2,010) | | | 1,170 | |
| Investment in sales-type leases | (2,882) | | | (3,699) | | | (1,680) | |
| Prepaid commissions | (8,057) | | | (2,719) | | | (4,711) | |
| Other long-term assets | (7,675) | | | 4,528 | | | (7,077) | |
| Accounts payable | (6,300) | | | 7,893 | | | (9,154) | |
| Accrued compensation | 11,595 | | | 2,495 | | | 14,419 | |
| Accrued liabilities | 4,374 | | | 3,045 | | | 8,223 | |
| Deferred revenues | 7,620 | | | 5,445 | | | 3,020 | |
| Operating lease liabilities | (9,543) | | | (10,040) | | | — | |
| Other long-term liabilities | 7,456 | | | 6,006 | | | (1,665) | |
| Net cash provided by operating activities | 185,870 | | | 145,008 | | | 103,966 | |
| Investing Activities | | | | | |
| | | | | |
| Software development for external use | (32,024) | | | (45,770) | | | (30,677) | |
| Purchases of property and equipment | (22,842) | | | (15,894) | | | (23,697) | |
| Business acquisition | (225,000) | | | — | | | — | |
| Net cash used in investing activities | (279,866) | | | (61,664) | | | (54,374) | |
| Financing Activities | | | | | |
| Proceeds from revolving credit facility | 150,000 | | | — | | | — | |
| Repayment of debt and revolving credit facility | (200,000) | | | (90,000) | | | (77,000) | |
| Payments for debt issuance costs for revolving credit facility | (550) | | | (2,321) | | | — | |
| Proceeds from issuance of convertible senior notes, net of issuance costs | 559,665 | | | — | | | — | |
| Purchase of convertible note hedge | (100,625) | | | — | | | — | |
| Proceeds from sale of warrants | 51,290 | | | — | | | — | |
| | | | | |
| At the market equity offering, net of offering costs | — | | | 37,806 | | | 39,567 | |
| Proceeds from issuances under stock-based compensation plans | 54,270 | | | 40,706 | | | 30,611 | |
| Employees’ taxes paid related to restricted stock units | (8,738) | | | (9,670) | | | (6,775) | |
| Stock repurchases | (53,035) | | | — | | | — | |
| Change in customer funds, net | 3,992 | | | — | | | — | |
| Net cash provided by (used in) financing activities | 456,269 | | | (23,479) | | | (13,597) | |
| Effect of exchange rate changes on cash and cash equivalents | 437 | | | 153 | | | (1,227) | |
| Net increase in cash, cash equivalents, and restricted cash | 362,710 | | | 60,018 | | | 34,768 | |
| Cash, cash equivalents, and restricted cash at beginning of period | 127,210 | | | 67,192 | | | 32,424 | |
| Cash, cash equivalents, and restricted cash at end of period | $ | 489,920 | | | $ | 127,210 | | | $ | 67,192 | |
| | | | | |
| | | | | |
| | | | | |
| | | | | |
| | | | | |
| | | | | |
| | | | | |
| | | | | |
| | | | | |
| | | | | |
The accompanying notes are an integral part of these Consolidated Financial Statements.
OMNICELL, INC.
CONSOLIDATED STATEMENTS OF CASH FLOWS (CONTINUED)
| | | | | | | | | | | | | | | | | |
| Year Ended December 31, |
| 2020 | | 2019 | | 2018 |
| | | | | |
| (In thousands) |
| Reconciliation of cash, cash equivalents, and restricted cash to the Consolidated Balance Sheets: | | | | | |
| Cash and cash equivalents | $ | 485,928 | | | $ | 127,210 | | | $ | 67,192 | |
| Restricted cash included in Other current assets | 3,992 | | | — | | | — | |
| Cash, cash equivalents, and restricted cash at end of period | $ | 489,920 | | | $ | 127,210 | | | $ | 67,192 | |
| | | | | |
| Supplemental cash flow information | | | | | |
| Cash paid for interest | $ | 522 | | | $ | 3,582 | | | $ | 7,487 | |
| Cash paid for taxes, net of refunds | $ | 10,343 | | | $ | 7,761 | | | $ | 3,489 | |
| | | | | |
| Supplemental disclosure of non-cash activities | | | | | |
| | | | | |
| Unpaid purchases of property and equipment | $ | 405 | | | $ | 913 | | | $ | 1,123 | |
| Transfers between inventory and property and equipment, net | $ | — | | | $ | 1,552 | | | $ | 2,032 | |
| Transfers from prepaid expenses to property and equipment | $ | — | | | $ | 3,313 | | | $ | — | |
| | | | | |
| Balance transfer from term loan to revolving credit facility | $ | — | | | $ | 80,000 | | | $ | — | |
The accompanying notes are an integral part of these Consolidated Financial Statements.
OMNICELL, INC.
NOTES TO CONSOLIDATED FINANCIAL STATEMENTS
Note 1. Organization and Summary of Significant Accounting Policies
Business
Omnicell, Inc. was incorporated in California in 1992 under the name Omnicell Technologies, Inc. and reincorporated in Delaware in 2001 as Omnicell, Inc. The Company’s major products are medication management automation solutions and adherence tools for healthcare systems and pharmacies, which are sold in its principal market, the healthcare industry. The Company’s market is primarily located in the United States and Europe. “Omnicell” or the “Company” collectively refer to Omnicell, Inc. and its subsidiaries.
Basis of Presentation
The accompanying Consolidated Financial Statements have been prepared in accordance with U.S. Generally Accepted Accounting Principles (“GAAP”) and include all adjustments necessary for the fair presentation of the Company’s consolidated financial position, results of operations, and cash flows for the periods presented.
Principles of Consolidation
The Consolidated Financial Statements include the accounts of the Company and its wholly owned subsidiaries. All intercompany accounts and transactions have been eliminated in consolidation.
On October 1, 2020, the Company completed its acquisition of the 340B Link business (the “340B Link Business”) of Pharmaceutical Strategies Group, LLC. The Consolidated Financial Statements include the results of operations of this recently acquired company, commencing as of the acquisition date. The significant accounting policies of the acquired business have been aligned to conform to the accounting policies of Omnicell.
Reclassifications and Adjustments
Certain prior-year amounts have been reclassified to conform with current-period presentation. These reclassifications include (i) a change in the presentation of certain items in the disaggregation of revenues for the years ended December 31, 2020, 2019, and 2018 in Note 3, Revenues, and (ii) a change in the presentation of certain items in the reconciliation of the provision for (benefit from) income taxes for the years ended December 31, 2019 and 2018 in Note 17, Income Taxes. These changes were not deemed material and were included to conform with current-period classification and presentation.
Use of Estimates
The preparation of financial statements in accordance with U.S. GAAP requires management to make estimates and assumptions that affect the amounts reported in the Company’s Consolidated Financial Statements and accompanying Notes. Management bases its estimates on historical experience and various other assumptions believed to be reasonable, including any potential impacts from the COVID-19 pandemic. Although these estimates are based on management’s best knowledge of current events and actions that may impact the Company in the future, actual results may be different from the estimates. The Company’s critical accounting policies are those that affect its financial statements materially and involve difficult, subjective, or complex judgments by management. Those policies are revenue recognition; accounts receivable, unbilled receivables, and notes receivable from investment in sales-type leases; operating lease right-of-use assets and liabilities; inventory valuation; capitalized software development costs; impairment of goodwill; purchased intangibles and long-lived assets; fair value of assets acquired and liabilities assumed in business combinations; convertible senior notes; share-based compensation; and accounting for income taxes. As of December 31, 2020, the Company is not aware of any events or circumstances that would require an update to its estimates, judgments, or revisions to the carrying value of its assets or liabilities. Given the ongoing uncertainty surrounding the COVID-19 pandemic, events or circumstances may arise that could result in a change in estimates, judgments, or revisions to the carrying value of the Company’s assets or liabilities.
Segment Reporting
The Company manages its operations as a single segment for the purposes of assessing performance and making operating decisions. The Company's Chief Operating Decision Maker ("CODM") is its Chief Executive Officer. The CODM allocates resources and evaluates the performance of the Company at the consolidated level using information about its revenues, gross profit, income from operations, and other key financial data. All significant operating decisions are based upon an analysis of the Company as one operating segment, which is the same as its reporting segment.
Foreign Currency Translation and Remeasurement
Most of the Company’s foreign subsidiaries use the local currency of their respective countries as their functional currency. The Company translates the assets and liabilities of such non-U.S. dollar functional currency subsidiaries into U.S. dollars using exchange rates in effect at the end of each period. Revenue and expenses for these subsidiaries are translated using rates that approximate those in effect during the period. Gains and losses from these translations are recorded as foreign currency translation adjustments and included in accumulated other comprehensive income (loss) in stockholders’ equity.
Assets and liabilities denominated in a currency other than the functional currency are remeasured into the respective entity’s functional currency. Monetary assets and liabilities are remeasured at exchange rates in effect at the end of each period, and non-monetary assets and liabilities are remeasured at historical rates. Gains and losses from foreign currency remeasurement of monetary assets and liabilities are recorded in interest and other income (expense), net.
Revenue Recognition
The Company earns revenues from sales of its products and related services, which are sold in the healthcare industry, its principal market. The Company’s customer arrangements typically include one or more of the following revenue categories:
Connected devices, software licenses, and other. Software-enabled connected devices and software licenses that manage and regulate the storage and dispensing of pharmaceuticals, consumables blister cards, and packaging equipment and other supplies. This revenue category is often sold through long-term, sole-source agreements with multi-year co-development plans. Solutions in this category include, but are not limited to, XT Series automated dispensing systems, the XR2 Automated Central Pharmacy system, and IV compounding automation solutions.
Technical services. Post-installation technical support and other related services, including phone support, on-site service, parts, and access to unspecified software updates and enhancements, if and when available. This revenue category is often supported by multi-year or annual contractual agreements.
Consumables. Medication adherence packaging, labeling, and other one-time use packaging including multimed adherence packaging and single dose blister cards which are used by retail, community, and outpatient pharmacies, as well as by institutional pharmacies serving long-term care and other sites outside the acute care hospital, and are designed to improve patient engagement and adherence to prescriptions.
Software-as-a-service (“SaaS”), subscription software, and technology-enabled services. Emerging software and service solutions which are offered on a subscription basis with fees typically based either on transaction volume or a fee over a specified period of time. Solutions in this category include, but are not limited to, EnlivenHealth (formerly Population Health Solutions), 340B solutions, and services associated with Omnicell One (formerly Performance Center), Central Pharmacy Compounding Services, including the XR2 Automated Central Pharmacy system, and Central Pharmacy Compounding Services, including IV compounding automation solutions.
The following table summarizes revenue recognition for each revenue category which is further discussed below:
| | | | | | | | | | | | | | | | |
Revenue Category | | | | Timing of Revenue Recognition | | Income Statement Classification |
Connected devices, software licenses, and other | | | | Point in time, as transfer of control occurs, generally upon installation and acceptance by the customer | | Product |
Technical services | | | | Over time, as services are provided, typically ratably over the service term | | Service |
Consumables | | | | Point in time, as transfer of control occurs, generally upon shipment to or receipt by customer | | Product |
SaaS, subscription software, and technology-enabled services | | | | Over time, as services are provided | | Service |
Prior to recognizing revenue, the Company identifies the contract, performance obligations, and transaction price, and allocates the transaction price to the performance obligations. All identified contracts meet the following required criteria:
Parties to the contract have approved the contract (in writing, orally, or in accordance with other customary business practices) and are committed to perform their respective obligations. A majority of the Company’s contracts are evidenced by a non-cancelable written agreement. Contracts for consumable products are generally evidenced by an order placed via phone or a purchase order.
Entity can identify each party’s rights regarding the goods or services to be transferred. Contract terms are documented within the written agreements. Where a written contract does not exist, such as for consumable products, the rights of each party are understood as following the Company’s standard business process and terms.
The entity can identify the payment terms for the goods or services to be transferred. Payment terms are documented within the agreement and are generally net 30 to 60 days from shipment of tangible product or services performed for customers in the United States. Where a written contract does not exist, the Company’s standard payment terms are net 30 day terms.
The contract has commercial substance (that is the risk, timing, or amount of the entity’s future cash flows is expected to change as a result of the contract). The Company’s agreements are an exchange of cash for a combination of products and services which result in changes in the amount of the Company’s future cash flows.
It is probable the entity will collect the consideration to which it will be entitled in exchange for the goods or services that will be transferred to the customer. The Company performs a credit check for all significant customers or transactions and where collectability is not probable, payment in full or a substantial down payment is typically required to help assure the full agreed upon contract price will be collected.
Distinct goods or services are identified as performance obligations. A series of distinct goods or services that are substantially the same and that have the same pattern of transfer to the customer are considered a single performance obligation. Where a good or service is determined not to be distinct, the Company combines the good or service with other promised goods or services until a bundle of goods or services that is distinct is identified. To identify its performance obligations, the Company considers all of the products or services promised in the contract regardless of whether they are explicitly stated or are implied by customary business practices. When performance obligations are included in separate contracts, the Company considers an entire customer arrangement to determine if separate contracts should be considered combined for the purposes of revenue recognition. Most of the Company’s sales, other than renewals of support and maintenance, contain multiple performance obligations, with a combination of hardware systems, consumables and software products, support and maintenance, and professional services.
The transaction price of a contract is determined based on the fixed consideration, net of an estimate for variable consideration such as various discounts or rebates provided to customers. As a result of the Company’s commercial selling practices, contract prices are generally fixed with minimal, if any, variable consideration.
The transaction price is allocated to separate performance obligations proportionally based on the standalone selling price of each performance obligation. Standalone selling price is best evidenced by the price the Company charges for the good or service when selling it separately in similar circumstances to similar customers. Other than for the renewal of annual support services contracts, the Company’s products and services are not generally sold separately. The Company uses an amount discounted from the list price as a best estimated selling price.
The Company recognizes revenue when the performance obligation has been satisfied by transferring a promised good or service to a customer. The good or service is transferred when or as the customer obtains control of the good or service. Determining when control transfers requires management to make judgments that affect the timing of revenues recognized. Generally, for products requiring a complex implementation, control passes when the product is installed and ready for use. For all other products, control generally passes when product has been shipped and title has passed. For maintenance contracts and certain other services provided on a subscription basis, control passes to the customer over time, generally ratably over the service term as the Company provides a stand-ready service to service the customer’s equipment. Time and material services transfer control to the customer at the time the services are provided. The portion of the transaction price allocated to the Company’s unsatisfied performance obligations recorded as deferred revenues, net of deferred cost of goods sold, at December 31, 2020 and 2019 were $105.7 million and $98.0 million, respectively, of which $100.1 million and $90.9 million, respectively, are expected to be completed within one year and are presented as current deferred revenues, net on the Consolidated Balance Sheets. Remaining performance obligations primarily relate to maintenance contracts and are recognized ratably over the remaining term of the contract, generally not more than five years.
Revenues, contract assets, and contract liabilities are recorded net of associated taxes.
The Company generally invoices customers for products upon shipment. Invoicing associated with the service portion of agreements are generally periodic and are billed on a monthly, quarterly, or annual basis. In certain circumstances, multiple years are billed at one time.
The amount invoiced for equipment and software is typically reflected in both accounts receivable and deferred revenues, net. The Company typically recognizes product revenue, and correspondingly reduces deferred revenues, net, for equipment and software upon written customer acceptance of installation. Consumables are recorded as revenue upon shipment to or receipt by the customer, depending upon contract terms. The portion of deferred revenues, net, not expected to be recognized as revenue within twelve months of the balance sheet date are included in long-term deferred revenues on the Consolidated Balance Sheets.
The Company often enters into change orders which modify the product to be received by the customer pursuant to certain contracts. Changes to any contract are accounted for as a modification of the existing contract to the extent the goods and services to be delivered as part of the contract are generally consistent with the nature and type of those to be provided under the terms of the original contract. Examples of such change orders include the addition or removal of units of equipment or changes to the configuration of the equipment where the overall nature of the contract remains intact. The Company’s change orders generally result in the change being accounted for as modifications of existing contracts given the nature of the impacted orders.
In the normal course of business, the Company typically does not accept product returns unless the item is defective as manufactured or the configuration of the product is incorrect. The Company establishes provisions for estimated returns based on historical product returns. The allowance for sales returns is not material to the Consolidated Financial Statements for any periods presented.
The Company contracts with Group Purchasing Organizations (“GPOs”), each of which functions as a purchasing agent on behalf of member hospitals and other healthcare providers. The Company also has a Federal Supply Schedule contract with the Department of Veterans Affairs (the "GSA Contract"), allowing the Department of Veterans Affairs, the Department of Defense, and other Federal government customers to purchase or lease the Company's products. Pursuant to the terms of GPO agreements and the GSA Contract, each member or agency contracts directly with Omnicell and can purchase the Company’s products at pre-negotiated contract terms and pricing. GPOs are often owned fully or in part by the Company’s customers, and the Company pays fees to the GPO on completed contracts. The Company also pays the Industrial Funding Fee ("IFF") to the Department of Veterans Affairs under the GSA Contract. The Company considers these fees consideration paid to customers and records them as reductions to revenue. Fees to GPOs and the IFF were $9.7 million, $11.1 million, and $8.7 million for the years ended December 31, 2020, 2019, and 2018, respectively. The accounts receivable balances are with individual members of the GPOs and Federal agencies that purchase under the GSA Contract, and therefore no significant concentration of credit risk exists. During the year ended December 31, 2020, sales to members of the ten largest GPOs and Federal agencies that purchase under the GSA Contract accounted for approximately 60% of total consolidated revenues.
Contract Assets and Contract Liabilities
A contract asset is a right to consideration in exchange for goods or services that the Company has transferred to a customer when that right is conditional and is not just subject to the passage of time. A receivable will be recorded on the balance sheet when the Company has unconditional rights to consideration. A contract liability is an obligation to transfer goods or services for which the Company has received consideration, or for which an amount of consideration is due from the customer. Contract liabilities include customer deposits under non-cancelable contracts, and current and non-current deferred revenue balances. The Company’s contract balances are reported in a net contract asset or liability position on a contract-by-contract basis at the end of each reporting period.
Significant changes in the contract assets and the contract liabilities balances during the period are the result of the issuance of invoices and recognition of deferred revenues in the normal course of business. As a result of the right to invoice for the transaction consideration becoming unconditional, unbilled contract assets as of December 31, 2019 which were invoiced during the year ended December 31, 2020 were not material. The contract modifications entered into during the year ended December 31, 2020 did not have a significant impact on the Company’s contract assets or deferred revenues.
Contract Costs
The Company has determined that certain incentive portions of its sales commission plans require capitalization since these payments are directly related to sales achieved during a time period. These commissions are earned on the basis of the total purchase order value of new product bookings. Since there are no commensurate commissions earned on renewal of the service bookings, the Company concluded that the capitalized asset is related to services provided under both the initial contract and renewal periods. The Company applies a practical expedient to account for the incremental costs of obtaining a contract as part of a portfolio of contracts with similar characteristics as the Company expects the effect on the financial statements of applying the practical expedient would not differ materially from applying the accounting guidance to the individual contracts within the portfolio. A pool of contracts is defined as all contracts booked in a particular quarter. The amortization for the capitalized asset is an estimate of the pool’s original contract term, generally one to five years, plus an estimate of future customer renewal periods resulting in a total amortization period of ten years. Costs to obtain a contract are allocated amongst performance obligations and recognized as sales and marketing expense consistent with the pattern of revenue recognition. Capitalized costs are periodically reviewed for impairment. In accordance with U.S. GAAP, while certain compensation elements are expensed as incurred, a portion of the pool’s capitalized asset is recorded as an expense over the first two quarters after booking, which represents the estimated period during which the product revenue associated with the contract is recorded. The remaining capitalized contract costs are recorded as expense ratably over the ten year estimated initial and renewal service periods. The Company recognized contract cost expense of $22.1 million, $24.4 million, and $21.1 million during the years
ended December 31, 2020, 2019, and 2018, respectively. The commission expenses paid or due to be paid as of the consolidated balance sheet date to be recognized in future periods are recorded in long-term prepaid commissions on the Consolidated Balance Sheets. There was no impairment loss recorded related to capitalized prepaid commissions as of and for the year ended December 31, 2020.
Lessor Leases
The Company determines if an arrangement is a lease at inception. The transaction price is allocated to separate performance obligations, generally consisting of hardware and software products, installation, and post-installation technical support, proportionally based on the standalone selling price of each performance obligation. Standalone selling price is best evidenced by the price the Company charges for the good or service when selling it separately in similar circumstances to similar customers. Other than for the renewal of annual support services contracts, the Company’s products and services are not generally sold separately. The Company uses an amount discounted from the list price as a best estimated selling price.
Sales-Type Leases
The Company enters into non-cancelable sales-type lease arrangements, most of which do not have an option to extend the lease term. At the end of the lease term, the customer must either return the equipment or negotiate a new agreement, resulting in a new purchase or lease transaction. Failure of the customer to either return the equipment or negotiate a new agreement results in the contract becoming a month-to-month rental. Certain sales-type leases automatically renew for successive one year periods at the end of each lease term with written notice from the customer. The Company’s sales-type lease agreements do not contain any material residual value guarantees.
For sales-type leases, the Company recognizes revenues for its hardware and software products, net of lease execution costs, post-installation product maintenance, and technical support, at the net present value of the lease payment stream upon customer acceptance. The Company recognizes service revenues associated with sales-type leases ratably over the term of the agreement in service revenues in the Consolidated Statements of Operations. The Company recognizes interest income from sales-type leases using the effective interest method. Both hardware and software revenues, and interest income from sales-types leases are recorded in product revenues in the Consolidated Statements of Operations.
The Company optimizes cash flows by selling a majority of its non-U.S. government sales-type leases to third-party leasing finance companies on a non-recourse basis. The Company has no obligation to the leasing company once the lease has been sold. Some of the Company's sales-type leases, mostly those relating to U.S. government hospitals which comprise approximately 67% of the lease receivable balance, are retained in-house.
Operating Leases
The Company entered into certain leasing agreements that were classified as operating leases prior to the adoption of Accounting Standards Codification ("ASC") 842, Leases. Those agreements in place prior to January 1, 2019 continue to be treated as operating leases, however, any leasing agreements entered into on or after January 1, 2019 under these programs are classified and accounted for as sales-type leases in accordance with ASC 842. The operating lease arrangements entered into prior to January 1, 2019 are non-cancelable, and most automatically renew for successive one year periods at the end of each lease term absent written notice from the customer. The Company’s operating lease agreements do not contain any material residual value guarantees.
For operating leases, rental income is generally recognized on a straight-line basis over the term of the associated lease, and recorded in services and other revenues in the Consolidated Statements of Operations. Leased assets under operating leases are carried at amortized cost net of accumulated depreciation in property and equipment, net on the Consolidated Balance Sheets. The depreciation expense of the leased assets is recognized on a straight-line basis over the contractual term of the associated lease, and recorded in cost of revenues in the Consolidated Statements of Operations.
Allowance for Credit Losses
The Company is exposed to credit losses primarily through sales of its products and services, as well as its sales-type leasing arrangements. The Company performs credit evaluations of its customers’ financial condition in order to assess each customer’s ability to pay. These evaluations require significant judgment and are based on a variety of factors including, but not limited to, current economic trends, payment history, and a financial review of the customer. The Company continues to monitor customers’ creditworthiness on an ongoing basis.
The Company maintains an allowance for credit losses for accounts receivable, unbilled receivables, and net investment in sales-type leases based on expected credit losses resulting from the inability of its customers to make required payments. The allowance for credit losses is measured using a loss rate method, considering factors such as customers’ credit risk, historical loss experience, current conditions, and forecasts. The allowance for credit losses is measured on a collective
(pool) basis by aggregating customer balances with similar risk characteristics. The Company also records a specific allowance based on an analysis of individual past due balances or customer-specific information, such as a decline in creditworthiness or bankruptcy. Actual collection losses may differ from management’s estimates, and such differences could be material to the Company’s financial position and results of operations.
The allowance for credit losses is presented in the Consolidated Balance Sheets as a deduction from the respective asset balance. The following table summarizes the Company’s allowance for credit losses by asset type:
| | | | | | | | | | | |
| December 31, |
| 2020 | | 2019 |
| | | |
| (In thousands) |
| Allowance for credit losses: | | | |
| Accounts receivable and unbilled receivables | $ | 4,286 | | | $ | 3,227 | |
Long-term unbilled receivables (1) | 30 | | | — | |
Net investment in sales-type leases (2) | 265 | | | 225 | |
_________________________________________________
(1) Included in other long-term assets in the Consolidated Balance Sheets.
(2) Includes both current and long-term portions presented in other current assets and long-term investment in sales-type leases, net, respectively.
Funds Held for Customers and Customer Fund Liabilities
With the acquisition of the 340B Link Business, the Company now offers certain products and services in which it is customary for pharmacies to owe funds to the Company which are collected on behalf of, and, after a short holding period, disbursed to, the Company’s customers. The Company presents amounts due from pharmacies and amounts due to be disbursed to customers on a gross basis within other current assets and accrued liabilities, respectively, in the Consolidated Balance Sheets, as such amounts are expected to be settled within one year. Any funds received from the pharmacies that are held by the Company are segregated from its other corporate cash accounts. These funds are classified as restricted cash as the Company is contractually obligated to disburse these amounts to customers.
Sales of Accounts Receivable
The Company records the sale of its accounts receivables in accordance with accounting guidance for transfers and servicing of financial assets. The Company transferred non-recourse accounts receivable totaling $58.8 million, $48.3 million, and $46.6 million during the years ended December 31, 2020, 2019, and 2018, respectively, which approximated fair value, to leasing companies on a non-recourse basis. Accounts receivable balance included approximately $7.8 million and $4.6 million due from third-party leasing companies for transferred non-recourse accounts receivable as of December 31, 2020 and 2019, respectively.
Cash and Cash Equivalents
The Company classifies all highly-liquid investments with original maturities of three months or less as cash equivalents. The Company’s cash and cash equivalent balances include bank accounts and highly-liquid U.S. Government money market funds held in sweep accounts with financial institutions of high credit quality. The Company continuously monitors the credit worthiness of the financial institutions in which it invests. The Company has not experienced any credit losses from its cash equivalents. Cash and cash equivalents were $485.9 million and $127.2 million as of December 31, 2020 and 2019, respectively. As of December 31, 2020, cash equivalents were $447.2 million, which consisted of money market funds held in sweep accounts, and as of December 31, 2019, the Company had no cash equivalents.
Financial Instruments
For assets and liabilities measured at fair value, the amounts are based on an expected exit price representing the amount that would be received from the sale of an asset or paid to transfer a liability in a transaction between market participants. The fair value may be based on assumptions that market participants would use in pricing an asset or liability. ASC 820, Fair Value Measurement, establishes a consistent framework for measuring fair value on either a recurring or nonrecurring basis whereby inputs used in valuation techniques are assigned a hierarchical level, as follows:
Level 1 – Observable inputs, such as quoted prices in active markets for identical instruments;
Level 2 – Quoted prices for similar instruments in active markets, or quoted prices for identical instruments in inactive markets; and
Level 3 – Unobservable inputs for financial instruments reflecting Company’s assumptions.
Interest Rate Swap Agreements
The Company uses interest rate swap agreements to protect the Company against adverse fluctuations in interest rates by reducing its exposure to variability in cash flows relating to interest payments on a portion of its outstanding debt. The Company does not hold or issue any derivative financial instruments for speculative trading purposes.
The Company's interest rate swap agreements qualify as cash flow hedging instruments in accordance with ASC 815, Derivatives and Hedging. The Company records its interest rate swap agreements on its Consolidated Balance Sheets at fair value. The effective portion of changes in fair value are recorded in accumulated other comprehensive loss and subsequently reclassified into earnings in the period that the hedged forecasted transaction affects earnings. Any ineffective portion is recognized in earnings. On a quarterly basis, the Company performs a qualitative assessment to determine effectiveness. For further information, refer to Note 5, Fair Value of Financial Instruments. As of December 31, 2020, the Company did not have any outstanding interest rate swap agreements.
Inventory
Inventories are stated at the lower of cost, computed using the first-in, first-out method, and net realizable value. Inbound shipping costs are included in cost of inventory. The Company regularly monitors inventory quantities on hand and records write-downs for excess and obsolete inventories based on the Company’s estimate of demand for its products, potential obsolescence of technology, product life cycles, and whether pricing trends or forecasts indicate that the carrying value of inventory exceeds its estimated selling price. These factors are impacted by market and economic conditions, technology changes, and new product introductions and require estimates that may include elements that are uncertain. Actual demand may differ from forecasted demand and may have a material effect on gross margins. If inventory is written down, a new cost basis is established that cannot be increased in future periods. Shipments from suppliers or contract manufacturers before the Company receives them are recorded as in-transit inventory when title and the significant risks and rewards of ownership have passed to the Company.
The Company has a supply agreement with one primary supplier for construction and supply of several sub-assemblies and inventory management of sub-assemblies used in its hardware products. There are no minimum purchase requirements. The contract with the Company’s supplier may be terminated by either the supplier or by the Company without cause and at any time upon delivery of six months’ notice. Purchases from this supplier were $76.3 million, $75.1 million, and $54.8 million for the years ended December 31, 2020, 2019, and 2018, respectively.
Shipping Costs
Outbound freight billed to customers is recorded as product revenue. The related shipping and handling costs are expensed as part of selling, general, and administrative expense. Shipping and handling expenses were $15.6 million, $15.9 million, and $14.1 million for the years ended December 31, 2020, 2019, and 2018, respectively.
Property and Equipment
Property and equipment less accumulated depreciation are stated at historical cost. The Company’s expenditures for property and equipment are primarily for computer equipment and software used in the administration of its business, and for leasehold improvements to its leased facilities. The Company also develops molds and dies used in long-term manufacturing arrangements with suppliers and for production automation equipment used in the manufacturing of consumable blister card components. Depreciation and amortization is computed by use of the straight-line method over the estimated useful lives of the assets as stated below:
| | | | | |
| Computer equipment and related software | 3 - 5 years |
| Leasehold and building improvements | Shorter of the lease term or the estimated useful life |
| Furniture and fixtures | 5 - 7 years |
| Equipment | 2 - 12 years |
The Company capitalizes costs related to computer software developed or obtained for internal use in accordance with ASC 350-40, Internal-Use Software. Software obtained for internal use includes enterprise-level business and finance software that the Company customizes to meet its specific operational needs, as well as certain costs for the development of its subscription and cloud-based offerings sold to its customers. Costs incurred in the application development phase are capitalized and amortized over their useful lives, which is generally five years. Costs recognized in the preliminary project phase and the post-implementation phase are expensed as incurred. The Company capitalized $6.8 million and $0.3 million of
costs related to the application development of enterprise-level software and its subscription and cloud-based offerings that were included in property and equipment during the years ended December 31, 2020 and 2019, respectively.
Software Development Costs
The Company capitalizes certain software development costs in accordance with ASC 985-20, Costs of Software to Be Sold, Leased, or Marketed, under which those costs incurred subsequent to the establishment of technological feasibility may be capitalized and amortized over the estimated lives of the related products. The Company establishes technological feasibility when it completes a detail program design or a working model. The Company amortizes development costs over the estimated lives of the related products, which is generally five years. The Company capitalized software development costs of $32.0 million and $45.8 million, which are included in other long-term assets as of December 31, 2020 and 2019, respectively. The Company recorded $23.1 million, $17.5 million, and $12.5 million to cost of revenues for amortization of capitalized software development costs for the years ended December 31, 2020, 2019, and 2018, respectively. All development costs prior to the completion of a detail program design or a working model are recognized as research and development expense.
Lessee Leases
The Company determines if an arrangement is a lease at inception. Operating lease right-of-use assets and liabilities are recognized at the commencement date based on the present value of lease payments over the lease term. As most of its lease contracts do not provide an implicit rate, the Company uses its incremental borrowing rate based on information available at the commencement date in determining the present value of the lease payments. Lease expense is recognized on a straight-line basis over the lease term. The Company does not recognize a right-of-use asset and a lease liability for leases with an initial term of 12 months or less. The Company elected the practical expedient to not separate lease components from nonlease components and applied that practical expedient to all material classes of leased assets.
Many of the Company’s operating leases include an option to extend the lease. The specific terms and conditions of the extension options vary from lease to lease, but are consistent with standard industry practices in each area that the Company operates. The Company reviews each of its lease options at a time required by the terms of the lease contract, and notifies the lessor if it chooses to exercise the lease renewal option. Until the Company is reasonably certain that it will extend the lease contract, the renewal option periods will not be recognized as right-of-use assets or lease liabilities.
Certain leases include provisions for early termination, which allow the contract parties to terminate their obligations under the lease contract. The terms and conditions of the termination options vary by contract. When the Company has made a decision to exercise an early termination option, the right-of-use assets and associated lease liabilities are remeasured in accordance with the present value of the remaining cash flows under the lease contract.
Certain building lease agreements include rental payments subject to change annually based on fluctuations in various indexes (i.e. Consumer Price Index (“CPI”), Retail Price Index, and other international indexes). Certain data center lease agreements include rental payments subject to change based on usage and CPI fluctuations. The changes based on usage and indexes are treated as variable lease costs and recognized in the period in which the obligation for those payments was incurred.
The Company’s operating lease agreements do not contain any material residual value guarantees, restrictions, or restriction covenants.
Business Combinations
The Company uses the acquisition method of accounting under ASC 805, Business Combinations. Each acquired company’s operating results are included in the Company's Consolidated Financial Statements starting on the date of acquisition. The purchase price is equivalent to the fair value of consideration transferred. Tangible and identifiable intangible assets acquired and liabilities assumed as of the date of acquisition are recorded at the acquisition date fair value. Goodwill is recognized for the excess of purchase price over the net fair value of assets acquired and liabilities assumed.
Amounts allocated to assets and liabilities are based upon fair values. Such valuations require management to make significant estimates and assumptions, especially with respect to the identifiable intangible assets. Management makes estimates of fair value based upon assumptions believed to be reasonable and that of a market participant. These estimates are based on historical experience and information obtained from the management of the acquired companies and the estimates are inherently uncertain. The separately identifiable intangible assets generally include customer relationships, acquired technology, backlog, trade names, and non-compete agreements.
Goodwill and Acquired Intangible Assets
Goodwill
The Company reviews goodwill for impairment on an annual basis on the first day of the fourth quarter of each year at the reporting unit level. This assessment is also performed whenever there is a change in circumstances that indicates the carrying value of goodwill may be impaired. The Company has one reporting unit, which is the same as its operating segment. A qualitative assessment is initially made to determine whether it is necessary to perform quantitative testing. A qualitative assessment includes, among others, consideration of: (i) past, current, and projected future earnings and equity; (ii) recent trends and market conditions; and (iii) valuation metrics involving similar companies that are publicly-traded and acquisitions of similar companies, if available. If this qualitative assessment indicates that it is more likely than not that impairment exists, or if the Company decides to bypass this option, it proceeds to the quantitative assessment. The quantitative assessment involves a comparison between the estimated fair value of the Company’s reporting unit with its carrying amount including goodwill. If the carrying value exceeds estimated fair value, the Company will record an impairment charge based on that difference. The impairment charge will be limited to the amount of goodwill.
To determine the reporting unit’s fair value under the quantitative approach, the Company uses a combination of income and market approaches, equally weighting the two approaches, such as estimated discounted future cash flows of the reporting unit, multiples of earnings or revenues, and analysis of recent sales or offerings of comparable entities. The Company also considers its market capitalization on the date of the analysis to ensure the reasonableness of its reporting unit's fair value.
The Company performed a qualitative impairment assessment analysis as of October 1, 2020 for its reporting unit taking into consideration past, current, and projected future earnings, recent trends, and market conditions, and valuation metrics involving similar companies that are publicly-traded. Based on the result of this analysis, an impairment does not exist as of December 31, 2020, and there were no accumulated impairment losses.
Intangible Assets
In connection with its acquisitions, the Company generally recognizes assets for customer relationships, acquired technology, backlog, trade names, and non-compete agreements. Intangible assets are carried at cost less accumulated amortization. Such amortization is provided on a straight-line basis or on an accelerated basis based on a pattern of economic benefit that is expected to be obtained over the estimated useful lives of the respective assets, generally from one to 30 years. Amortization for acquired technology and backlog is recognized in cost of revenues, and amortization for customer relationships, trade names, non-compete agreements, and patents is recognized in selling, general, and administrative expenses.
The Company assesses the impairment of identifiable intangible assets whenever events or changes in circumstances indicate that an asset’s carrying amount may not be recoverable. Recoverability of an asset is measured by the comparison of the carrying amount to the sum of the undiscounted estimated future cash flows the asset is expected to generate, offset by estimated future costs to dispose of the product to which the asset relates. If an asset is considered to be impaired, the amount of such impairment would be measured as the difference between the carrying amount of the asset and its fair value. The Company’s cash flow assumptions are based on historical and forecasted future revenue, operating costs, and other relevant factors. Assumptions and estimates about the remaining useful lives of the Company’s intangible assets are subjective and are affected by changes to its business strategies. If management’s estimates of future operating results change, or if there are changes to other assumptions, the estimate of the fair value of the Company’s assets could change significantly. Such change could result in impairment charges in future periods, which could have a significant impact on the Company’s operating results and financial condition. For the years ended December 31, 2020 and 2019, there were no events or changes in circumstances to indicate that intangible assets carrying amounts may not be recoverable.
Convertible Debt
The Company accounts for convertible debt and related transactions in accordance with ASC 470-20, Debt with Conversion and Other Options, ASC 815, Derivatives and Hedging, and ASC 480, Distinguishing Liabilities from Equity. The Company evaluates convertible debt instruments and related transactions at inception to determine if those contracts or embedded components of those contracts qualify as derivatives to be separately accounted for. Convertible debt instruments that may be settled in cash are separated into liability and equity components. The allocation to the liability component is based on the fair value of a similar instrument that does not contain an equity conversion option. Based on this debt-to-equity ratio, debt issuance costs are then allocated to the liability and equity components in a similar manner. The difference between the principal amount of the convertible debt instruments and the liability component, inclusive of issuance costs, represents the debt discount, which is amortized to interest expense over the term of instruments. The determination of the discount rate requires certain estimates and assumptions.
Convertible note hedge and warrant transactions associated with convertible debt instruments are accounted for as equity instruments, and are recorded in additional paid-in capital in the Consolidated Balance Sheets.
Valuation of Share-Based Compensation
The Company accounts for share-based compensation in accordance with ASC 718, Stock Compensation. The Company recognizes compensation expense related to share-based compensation based on the grant date estimated fair value.
The fair value of stock options (“options”) on the grant date is estimated using the Black-Scholes option pricing model, which requires the following inputs: expected life, expected volatility, risk-free interest rate, expected dividend yield rate, exercise price, and closing price of its common stock on the date of grant. The expected volatility is based on a combination of historical and market-based implied volatility, and the expected life of the awards is based on the Company’s historical experience of employee stock option exercises, including forfeitures. Expense is recognized on a straight-line basis over the requisite service period.
The fair value of restricted stock units (“RSUs”) is based on the stock price on the grant date. The fair value of restricted stock awards (“RSAs”) is their intrinsic value, which is the difference between the fair value of the underlying stock at the measurement date and the purchase price. The RSUs and RSAs are subject to a service vesting condition and are recognized on a straight-line basis over the requisite service period.
The fair value of performance-based stock unit awards (“PSUs”) with service and market conditions is estimated using a Monte Carlo simulation model applying multiple awards approach. Expense is recognized when it is probable that the performance condition will be met using the accelerated attribution method over the requisite service period.
Forfeiture rates are estimated based on the Company's historical experience with equity awards that were granted and forfeited prior to vesting. The valuation assumptions used in estimating the fair value of employee share-based awards may change in future periods.
Accounting for Income Taxes
The Company records an income tax provision for (benefit from) the anticipated tax consequences of the reported results of operations. In accordance with ASC 740, Income Taxes, the provision for (benefit from) income taxes is computed using the asset and liability method, which requires the recognition of deferred tax assets and liabilities for the expected future tax consequences of events that have been included in the financial statements. Under this method, deferred tax assets and liabilities are determined on the basis of the differences between the financial statement and tax bases of assets and liabilities and for operating losses and tax credit carryforwards. Deferred tax assets and liabilities are measured using the enacted tax rates in effect for the periods in which those tax assets and liabilities are expected to be realized or settled. In the event that these tax rates change, the Company will incur a benefit or detriment on its income tax expense in the period of change. If the Company were to determine that all or part of the net deferred tax assets are not realizable in the future, it will record a valuation allowance that would be charged to earnings in the period such determination is made.
In accordance with ASC 740, the Company recognizes the tax benefit from an uncertain tax position if it is more likely than not that the tax position will be sustained on examination by the taxing authorities, based on the technical merits of the position. The tax benefits recognized in the financial statements from such positions are then measured based on the largest benefit that has a greater than 50% likelihood of being realized upon ultimate settlement. The calculation of tax liabilities involves significant judgment in estimating the impact of uncertainties in the application of ASC 740 and complex tax laws. Resolution of these uncertainties in a manner inconsistent with management’s expectations could have a material impact on the Company’s financial condition and operating results.
Recently Adopted Authoritative Guidance
In August 2018, the Financial Accounting Standards Board (“FASB”) issued Accounting Standards Update (“ASU”) 2018-15, Intangibles-Goodwill and Other-Internal-Use Software (Subtopic 350-40): Customer’s Accounting for Implementation Costs Incurred in a Cloud Computing Arrangement That Is a Service Contract, to align the requirements for capitalizing implementation costs incurred in a hosting arrangement that is a service contract with the requirements for capitalizing implementation costs incurred to develop or obtain internal-use software (and hosting arrangements that include an internal-use software license). The Company adopted ASU 2018-15 on January 1, 2020 on a prospective basis. The adoption of this guidance did not have a material impact on the Company’s Consolidated Financial Statements.
In June 2016, the FASB issued ASU 2016-13, Financial Instruments-Credit Losses (Topic 326), Measurement of Credit Losses on Financial Instruments, that modifies or replaces existing models for trade and other receivables, debt securities, loans, and certain other financial instruments. For instruments measured at amortized cost, including trade and lease receivables, loans, and held-to-maturity debt securities, the standard replaced the current “incurred loss” approach with an
“expected loss” model. Entities are required to estimate expected credit losses over the life of the instrument, considering available relevant information about the collectibility of cash flows, including information about past events, current conditions, and reasonable and supportable forecasts. The Company adopted the new standard on January 1, 2020 using the modified retrospective transition method, which resulted in the recognition of an immaterial cumulative-effect adjustment to retained earnings.
Recently Issued Authoritative Guidance
In December 2019, the FASB issued ASU 2019-12, Income Taxes (Topic 740) Simplifying the Accounting for Income Taxes. The update simplifies the accounting for income taxes by removing certain exceptions to the general principles in ASC 740, as well as improves consistent application of and simplifies the guidance for other areas of ASC 740 by clarifying and amending existing guidance. ASU 2019-12 will be effective for the Company beginning January 1, 2021. The Company does not expect ASU 2019-12 to have a material impact on its Consolidated Financial Statements.
In August 2020, the FASB issued ASU 2020-06, Debt-Debt with Conversion and Other Options (Subtopic 470-20) and Derivatives and Hedging-Contracts in Entity’s Own Equity (Subtopic 815-40). The update simplifies the accounting for convertible debt instruments by reducing the number of accounting models and the number of embedded conversion features that could be recognized separately from the primary contract. ASU 2020-06 also enhances transparency and improves disclosures for convertible instruments and earnings per share guidance. This update permits the use of either the modified retrospective or fully retrospective method of transition. ASU 2020-06 will be effective for the Company beginning January 1, 2022. Early adoption is permitted, but no earlier than fiscal years beginning after December 15, 2020, including interim periods within those fiscal years. The Company is currently evaluating the impact ASU 2020-06 will have on its Consolidated Financial Statements.
There was no other recently issued and effective authoritative guidance that is expected to have a material impact on the Company’s Consolidated Financial Statements through the reporting date.
Note 2. Business Combinations
340B Link Business Acquisition
On October 1, 2020, the Company completed the acquisition of all of the outstanding equity of the 340B Link Business pursuant to the terms and conditions of the Equity Purchase Agreement, dated August 11, 2020, as amended, by and among the Company, PSGH, LLC, BW Apothecary Holdings, LLC, the sellers identified therein and the sellers’ representative for total cash consideration of $225.0 million. The 340B Link Business acquisition adds a comprehensive and differentiated suite of software-enabled services and solutions used by certain eligible hospitals, health systems, clinics, and entities to manage compliance and capture 340B drug cost savings on outpatient prescriptions filled through the eligible entity’s pharmacy or a contracted pharmacy partner. The results of the 340B Link Business' operations have been included in the Company's consolidated results of operations, commencing as of the acquisition date.
The Company accounted for the acquisition of the 340B Link Business in accordance with ASC 805. The tangible and intangible assets acquired and liabilities assumed were recorded at fair value on the acquisition date. The preliminary fair values assume management's best estimates based on information available at the acquisition date and may change over the measurement period, which will end no later than one year form the acquisition date, as additional information is received. The following table represents the preliminary allocation of the purchase price to the assets acquired and the liabilities assumed by the Company as part of the acquisition reconciled to the purchase price transferred included in the Company's Consolidated Balance Sheets:
| | | | | |
| 340B Link Business
(Preliminary) |
| |
| (In thousands) |
| |
| Accounts receivable and unbilled receivables | $ | 8,197 | |
| Prepaid expenses | 232 | |
| Other current assets | 22,747 | |
| Total current assets | 31,176 | |
| Property and equipment | 531 | |
| Operating lease right-of-use assets | 3,138 | |
| Goodwill | 161,117 | |
| Intangible assets | 62,800 | |
| Total assets | 258,762 | |
| Accounts payable | 568 | |
| Accrued liabilities | 23,787 | |
| Long-term deferred tax liabilities | 6,818 | |
| Long-term operating lease liabilities | 2,589 | |
| Total liabilities | 33,762 | |
| Total purchase price | $ | 225,000 | |
| |
The $161.1 million of goodwill arising from the 340B Link Business acquisition is primarily attributed to sales of future software-enabled services and solutions and the 340B Link Business’ assembled workforce. Goodwill that is expected to be deductible for tax purposes is approximately $93.9 million.
Intangible assets eligible for recognition separate from goodwill were those that satisfied either the contractual/legal criterion or the separability criterion in the accounting guidance. The identifiable intangible assets acquired and their estimated useful lives for amortization are as follows:
| | | | | | | | | | | |
| 304B Link Business |
| Fair value | | Useful life
(years) |
| | | |
| (In thousands, except for years) |
| Customer relationships | $ | 53,000 | | | 21 |
| Acquired technology | 9,000 | | | 5 |
| | | |
| Trade names | 200 | | | 1 |
| Non-compete agreements | 600 | | | 3 |
| | | |
| Total purchased intangible assets | $ | 62,800 | | | |
The customer relationships intangible asset represents the fair value of the underlying relationships and agreements with the 340B Link Business’ customers. The acquired technology intangible asset represents the fair value of the 340B Link Business' portfolio of software and solutions that have reached technological feasibility and were part of the 340B Link Business’ offerings at the date of acquisition. The trade names intangible asset represents the fair value of brand and name recognition associated with the marketing of the 340B Link Business' software-enabled services and solutions. The non-compete agreements intangible asset represents the fair value of non-compete agreements with former key members of the 340B Link Business' management.
The fair value of the customer relationships intangible asset was determined based on the excess earnings method; the fair values of the acquired technology and trade names intangible assets were determined based on the relief-from-royalty
method; and the fair value of the non-compete agreements intangible asset was determined based on the lost profits method. The key assumptions used in estimating the fair values of intangible assets included forecasted financial information; customer attrition rates; royalty rates of 10.0% and 0.5% for the acquired technology and trade names intangible assets, respectively; discount rate of 14.0% for all intangible assets; and certain other assumptions.
The customer relationships and acquired technology intangible assets are being amortized using a double-declining method of amortization as such method better represents the economic benefits to be obtained. The trade names and non-compete agreements are being amortized over their estimated useful lives using the straight-line method of amortization.
The Company believes that the fair value assigned to the assets acquired and liabilities assumed are based on reasonable assumptions and estimates that market participants would use. Actual results may differ from these estimates and assumptions.
The Company incurred approximately $6.5 million in acquisition-related costs related to the 340B Link Business acquisition during the year ended December 31, 2020. These costs were expensed as incurred, and are included in selling, general, and administrative expenses in the Company's Consolidated Statements of Operations.
Revenues and earnings from the 340B Link Business operations since the acquisition date through December 31, 2020 were $10.2 million and $1.3 million, respectively.
Pro Forma Financial Information
The following table presents certain unaudited pro forma information for illustrative purposes only, for the years ended December 31, 2020 and 2019 as if this acquisition had been completed on January 1, 2019. The pro forma information is not indicative of what would have occurred had the acquisition taken place on January 1, 2019. The unaudited pro forma information combines the historical results of the acquisition with the Company’s consolidated historical results and includes certain adjustments including, but not limited to, amortization and depreciation of intangible assets and property and equipment acquired; imputed interest, interest expense, and amortization of debt issuance costs for the indebtedness incurred to complete the acquisition; and acquisition-related costs incurred.
| | | | | | | | | | | |
| Year Ended December 31, |
| 2020 | | 2019 |
| | | |
| (In thousands, except per share data) |
| Pro forma revenues | $ | 920,314 | | | $ | 929,106 | |
| Pro forma net income | $ | 37,559 | | | $ | 56,897 | |
| | | |
| | | |
| | | |
Note 3. Revenues
Disaggregation of Revenues
The following table summarizes the Company’s revenues disaggregated by revenue type for the years ended December 31, 2020, 2019, and 2018:
| | | | | | | | | | | | | | | | | |
| Year Ended December 31, |
| 2020 | | 2019 | | 2018 |
| | | | | |
| (In thousands) |
| Connected devices, software licenses, and other | $ | 560,368 | | | $ | 573,844 | | | $ | 483,414 | |
| Technical services | 202,383 | | | 194,183 | | | 183,202 | |
| Consumables | 75,663 | | | 85,758 | | | 86,182 | |
| SaaS, subscription software, and technology-enabled services | 53,794 | | | 43,242 | | | 34,511 | |
| Total revenues | $ | 892,208 | | | $ | 897,027 | | | $ | 787,309 | |
The following table summarizes the Company’s revenues disaggregated by geographic region, which is determined based on customer location, for the years ended December 31, 2020, 2019, and 2018:
| | | | | | | | | | | | | | | | | |
| Year Ended December 31, |
| 2020 | | 2019 | | 2018 |
| | | | | |
| (In thousands) |
| United States | $ | 797,602 | | $ | 806,900 | | $ | 685,881 |
| | | | | |
Rest of world (1) | 94,606 | | 90,127 | | 101,428 |
| | | | | |
| Total revenues | $ | 892,208 | | $ | 897,027 | | $ | 787,309 |
_________________________________________________
(1) No individual country represented more than 10% of total revenues.
Contract Assets and Contract Liabilities
The following table reflects the Company’s contract assets and contract liabilities:
| | | | | | | | | | | |
| December 31, |
| 2020 | | 2019 |
| | | |
| (In thousands) |
Short-term unbilled receivables, net (1) | $ | 13,895 | | | $ | 11,707 | |
Long-term unbilled receivables, net (2) | 17,205 | | | 12,260 | |
| Total contract assets | $ | 31,100 | | | $ | 23,967 | |
| | | |
Short-term deferred revenues, net | $ | 100,053 | | | $ | 90,894 | |
Long-term deferred revenues | 5,673 | | | 7,083 | |
| Total contract liabilities | $ | 105,726 | | | $ | 97,977 | |
_________________________________________________
(1) Included in accounts receivable and unbilled receivables in the Consolidated Balance Sheets.
(2) Included in other long-term assets in the Consolidated Balance Sheets.
Short-term deferred revenues of $100.1 million and $90.9 million include deferred revenues from product sales and service contracts, net of deferred cost of sales of $21.0 million and $13.1 million, as of December 31, 2020 and 2019, respectively. The short-term deferred revenues from product sales relate to delivered and invoiced products, pending installation and acceptance, expected to occur within the next twelve months. During the year ended December 31, 2020, the Company recognized revenues of $84.0 million that were included in the corresponding gross short-term deferred revenue balance of $104.0 million as of December 31, 2019.
Long-term deferred revenues include deferred revenues from service contracts of $5.7 million and $7.1 million as of December 31, 2020 and 2019, respectively. Remaining performance obligations primarily relate to maintenance contracts and are recognized ratably over the remaining term of the contract, generally not more than five years.
Significant Customers
There were no customers that accounted for more than 10% of the Company’s total revenues for the years ended December 31, 2020, 2019, and 2018. Also, there were no customers that accounted for more than 10% of the Company’s accounts receivable balance as of December 31, 2020 and 2019.
Note 4. Net Income Per Share
Basic net income per share is computed by dividing net income for the period by the weighted-average number of shares outstanding during the period. In periods of net loss, all potential common shares are anti-dilutive, so diluted net loss per share equals the basic net loss per share. In periods of net income, diluted net income per share is computed by dividing net income for the period by the basic weighted-average number of shares plus any dilutive potential common stock outstanding during the period, using the treasury stock method. Potential common stock includes the effect of outstanding dilutive stock options, restricted stock awards, and restricted stock units, as well as shares the Company could be obligated to issue from its convertible senior notes and warrants, as described in Note 10, Convertible Senior Notes. Any anti-dilutive weighted-average dilutive shares related to stock award plans, convertible senior notes, and warrants are excluded from the computation of the diluted net income per share.
The basic and diluted net income per share calculations for the years ended December 31, 2020, 2019, and 2018 were as follows:
| | | | | | | | | | | | | | | | | |
| Year Ended December 31, |
| 2020 | | 2019 | | 2018 |
| | | | | |
| (In thousands, except per share data) |
| Net income | $ | 32,194 | | | $ | 61,338 | | | $ | 37,729 | |
| Weighted-average shares outstanding - basic | 42,583 | | | 41,462 | | | 39,242 | |
| Effect of dilutive securities from stock award plans | 1,160 | | | 1,481 | | | 1,317 | |
| Effect of convertible senior notes and warrants | — | | | — | | | — | |
| Weighted-average shares outstanding - diluted | 43,743 | | | 42,943 | | | 40,559 | |
| Net income per share - basic | $ | 0.76 | | | $ | 1.48 | | | $ | 0.96 | |
| Net income per share - diluted | $ | 0.74 | | | $ | 1.43 | | | $ | 0.93 | |
| | | | | |
| Anti-dilutive weighted-average shares related to stock award plans | 2,054 | | | 926 | | | 1,279 | |
| Anti-dilutive weighted-average shares related to convertible senior notes and warrants | 11,816 | | | — | | | — | |
Note 5. Fair Value of Financial Instruments
Fair Value Hierarchy
The Company measures its financial instruments at fair value. The Company’s cash, cash equivalents, and restricted cash are classified within Level 1 of the fair value hierarchy as they are valued primarily using quoted market prices utilizing market observable inputs. The Company's interest rate swap contracts and credit facilities are classified within Level 2 as the valuation inputs are based on quoted prices or market observable data of similar instruments. The Company's convertible senior notes are classified within Level 2 as the valuation inputs are based on quoted prices in an inactive market on the last day in the reporting period. As of December 31, 2020, the fair value of the convertible senior notes was $782.3 million, compared to their carrying value of $467.2 million, which is net of unamortized discount and debt issuance costs and excludes amounts classified within additional paid-in capital. Refer to Note 9, Debt and Credit Agreements, for further information regarding the Company’s credit facilities and Note 10, Convertible Senior Notes, for further information regarding the Company’s convertible senior notes.
Interest Rate Swap Contracts
During 2016, the Company entered into an interest rate swap agreement with a combined notional amount of $100.0 million with one counterparty that became effective on June 30, 2016 and matured on April 30, 2019. The swap agreement required the Company to pay a fixed rate of 0.8% and provided that the Company receive a variable rate based on the one month LIBOR rate subject to a LIBOR floor of 0.0%. Amounts payable by or due to the Company were net settled with the respective counterparty on the last business day of each month, commencing July 31, 2016. The Company’s interest rate swap agreement matured during the second quarter of 2019, and, as of December 31, 2020, the Company did not have any outstanding interest rate swap agreements.
Note 6. Balance Sheet Components
Balance sheet details as of December 31, 2020 and 2019 are presented in the tables below:
| | | | | | | | | | | |
| December 31, |
| 2020 | | 2019 |
| | | |
| (In thousands) |
| Inventories: | | | |
| Raw materials | $ | 28,205 | | | $ | 31,331 | |
| Work in process | 7,973 | | | 7,620 | |
| Finished goods | 60,120 | | | 69,060 | |
| Total inventories | $ | 96,298 | | | $ | 108,011 | |
| | | |
| Other current assets: | | | |
Funds held for customers, including restricted cash (1) | $ | 18,164 | | | $ | — | |
| Net investment in sales-type leases, current portion | 10,246 | | | 9,770 | |
| Prepaid income taxes | 10,095 | | | 4,347 | |
| Other current assets | 2,539 | | | 1,060 | |
| Total other current assets | $ | 41,044 | | | $ | 15,177 | |
| | | |
| | | |
| | | |
| | | |
| | | |
| | | |
| | | |
| | | |
| | | |
| | | |
| | | |
| Other long-term assets: | | | |
| Capitalized software, net | $ | 94,027 | | | $ | 85,070 | |
| Unbilled receivables, net | 17,205 | | | 12,260 | |
| Deferred debt issuance costs | 4,253 | | | 4,700 | |
| Other long-term assets | 3,804 | | | 1,006 | |
| Total other long-term assets | $ | 119,289 | | | $ | 103,036 | |
| | | |
| Accrued liabilities: | | | |
| Operating lease liabilities, current portion | $ | 12,197 | | | $ | 10,058 | |
| Customer fund liabilities | 18,164 | | | — | |
| Advance payments from customers | 6,981 | | | 4,006 | |
| Rebates and lease buyouts | 21,815 | | | 14,911 | |
| Group purchasing organization fees | 4,412 | | | 5,934 | |
| Taxes payable | 3,520 | | | 3,744 | |
| Other accrued liabilities | 13,222 | | | 16,914 | |
| Total accrued liabilities | $ | 80,311 | | | $ | 55,567 | |
_________________________________________________
(1) Includes $4.0 million of restricted cash.
The following table summarizes the changes in accumulated balances of other comprehensive income (loss) for the years ended December 31, 2020 and 2019:
| | | | | | | | | | | | | | | | | | |
| Foreign currency translation adjustments | | Unrealized gain (loss) on interest rate swap hedges | | Total | |
| | | | | | |
| (In thousands) | |
| Balance as of December 31, 2018 | $ | (11,274) | | | $ | 420 | | | $ | (10,854) | | |
| Other comprehensive income (loss) before reclassifications | 1,828 | | | 148 | | | 1,976 | | |
| Amounts reclassified from other comprehensive income (loss), net of tax | — | | | (568) | | | (568) | | |
| Net current-period other comprehensive income (loss), net of tax | 1,828 | | | (420) | | | 1,408 | | |
| Balance as of December 31, 2019 | (9,446) | | | — | | | (9,446) | | |
| Other comprehensive income (loss) before reclassifications | 3,924 | | | — | | | 3,924 | | |
| Amounts reclassified from other comprehensive income (loss), net of tax | — | | | — | | | — | | |
| Net current-period other comprehensive income (loss), net of tax | 3,924 | | | — | | | 3,924 | | |
| Balance as of December 31, 2020 | $ | (5,522) | | | $ | — | | | $ | (5,522) | | |
Note 7. Property and Equipment
The following table represents the property and equipment balances as of December 31, 2020 and 2019:
| | | | | | | | | | | |
| December 31, |
| 2020 | | 2019 |
| | | |
| (In thousands) |
| Equipment | $ | 81,034 | | | $ | 88,569 | |
| Furniture and fixtures | 7,498 | | | 7,925 | |
| Leasehold improvements | 19,517 | | | 18,979 | |
| Software | 50,230 | | | 48,309 | |
| Construction in progress | 7,095 | | | 6,179 | |
Property and equipment, gross (1) | 165,374 | | | 169,961 | |
Accumulated depreciation and amortization (1) | (106,301) | | | (115,715) | |
| Total property and equipment, net | $ | 59,073 | | | $ | 54,246 | |
_________________________________________________
(1) The change in balances between periods is primarily due to the disposal of certain fully depreciated property and equipment, partially offset by additions, and depreciation and amortization.
Depreciation and amortization expense of property and equipment was $18.3 million, $17.2 million, and $15.1 million for the years ended December 31, 2020, 2019, and 2018, respectively.
The geographic location of the Company's property and equipment, net, is based on the physical location in which it is located. The following table summarizes the geographic information for property and equipment, net, as of December 31, 2020 and 2019:
| | | | | | | | | | | |
| December 31, |
| 2020 | | 2019 |
| | | |
| (In thousands) |
| United States | $ | 53,203 | | | $ | 48,769 | |
| | | |
Rest of world (1) | 5,870 | | | 5,477 | |
| | | |
| Total property and equipment, net | $ | 59,073 | | | $ | 54,246 | |
_________________________________________________
(1) No individual country represented more than 10% of the total property and equipment, net.
Note 8. Goodwill and Intangible Assets
Goodwill
The following table represents changes in the carrying amount of goodwill:
| | | | | | | | | |
| | | | | (In thousands) |
| Balance as of December 31, 2018 | | | | | $ | 335,887 | |
| Additions | | | | | — | |
| Foreign currency exchange rate fluctuations | | | | | 652 | |
| Balance as of December 31, 2019 | | | | | 336,539 | |
Additions (1) | | | | | 161,117 | |
| Foreign currency exchange rate fluctuations | | | | | 1,653 | |
| Balance as of December 31, 2020 | | | | | $ | 499,309 | |
_________________________________________________
(1) Additions represent the preliminary value assigned to goodwill in connection with the 340B Link Business acquisition in October 2020.
Intangible Assets, Net
The carrying amounts and useful lives of intangible assets as of December 31, 2020 and 2019 were as follows:
| | | | | | | | | | | | | | | | | | | | | | | | | | | | | |
| December 31, 2020 |
| Gross carrying amount (1) | | Accumulated
amortization | | Foreign currency exchange
rate fluctuations | | Net carrying
amount | | Useful life
(years) |
| | | | | | | | | |
| (In thousands, except for years) |
| Customer relationships | $ | 187,889 | | | $ | (64,254) | | | $ | (777) | | | $ | 122,858 | | | 10 - 30 |
| Acquired technology | 86,029 | | | (44,851) | | | 6 | | | 41,184 | | | 3 - 20 |
| Backlog | 1,150 | | | (1,078) | | | — | | | 72 | | | 4 |
| Trade names | 7,850 | | | (5,794) | | | 14 | | | 2,070 | | | 1 - 12 |
| Patents | 2,930 | | | (1,455) | | | 2 | | | 1,477 | | | 2 - 20 |
| Non-compete agreements | 600 | | | (50) | | | — | | | 550 | | | 3 |
| | | | | | | | | |
| Total intangibles assets, net | $ | 286,448 | | | $ | (117,482) | | | $ | (755) | | | $ | 168,211 | | | |
| | | | | | | | | | | | | | | | | | | | | | | | | | | | | |
| December 31, 2019 |
| Gross carrying amount (1) | | Accumulated
amortization | | Foreign currency exchange
rate fluctuations | | Net carrying
amount | | Useful life
(years) |
| | | | | | | | | |
| (In thousands, except for years) |
| Customer relationships | $ | 135,234 | | | $ | (54,860) | | | $ | (1,058) | | | $ | 79,316 | | | 10 - 30 |
| Acquired technology | 77,142 | | | (36,194) | | | 5 | | | 40,953 | | | 3 - 20 |
| Backlog | 1,150 | | | (791) | | | — | | | 359 | | | 4 |
| Trade names | 7,650 | | | (5,037) | | | 11 | | | 2,624 | | | 6 - 12 |
| Patents | 3,217 | | | (1,603) | | | 1 | | | 1,615 | | | 2 - 20 |
| | | | | | | | | |
| | | | | | | | | |
| Total intangibles assets, net | $ | 224,393 | | | $ | (98,485) | | | $ | (1,041) | | | $ | 124,867 | | | |
_________________________________________________
(1) The differences in gross carrying amounts between periods are primarily due to additions of intangible assets in connection with the 340B Link Business acquisition, partially offset by the write-off of certain fully amortized intangible assets.
Amortization expense of intangible assets was $19.7 million, $18.9 million, and $23.8 million for the years ended December 31, 2020, 2019, and 2018, respectively.
The estimated future amortization expenses for amortizable intangible assets were as follows:
| | | | | |
| December 31,
2020 |
| |
| (In thousands) |
| 2021 | $ | 23,948 | |
| 2022 | 21,134 | |
| 2023 | 19,113 | |
| 2024 | 12,825 | |
| 2025 | 11,616 | |
| Thereafter | 79,575 | |
| Total | $ | 168,211 | |
Note 9. Debt and Credit Agreements
2016 Senior Credit Facility
On January 5, 2016, the Company entered into a $400.0 million senior secured credit facility pursuant to a credit agreement with certain lenders, Wells Fargo Securities, LLC as sole lead arranger, and Wells Fargo Bank, National Association as administrative agent (as subsequently amended as discussed below, the “Prior Credit Agreement”). The Prior Credit Agreement provided for (a) a five-year revolving credit facility of $200.0 million, which was subsequently increased pursuant to the amendment discussed below (the “Prior Revolving Credit Facility”) and (b) a five-year $200.0 million term loan facility (the “Prior Term Loan Facility” and, together with the Prior Revolving Credit Facility, the “Prior Facilities”). In addition, the Prior Credit Agreement included a letter of credit sub-limit of up to $10.0 million and a swing line loan sub-limit of up to $10.0 million. The Prior Credit Agreement had an expiration date of January 5, 2021, upon which date all remaining outstanding borrowings were due and payable.
Loans under the Prior Facilities bore interest, at the Company’s option, at a rate equal to either (a) the LIBOR Rate, plus an applicable margin ranging from 1.50% to 2.25% per annum based on the Company’s consolidated total net leverage ratio (as defined in the Prior Credit Agreement), or (b) an alternate base rate equal to the highest of (i) the prime rate, (ii) the federal funds rate plus 0.50%, and (iii) LIBOR for an interest period of one month, plus an applicable margin ranging from 0.50% to 1.25% per annum based on the Company’s consolidated total net leverage ratio (as defined in the Prior Credit Agreement). Undrawn commitments under the Prior Revolving Credit Facility were subject to a commitment fee ranging from 0.20% to 0.35% per annum based on the Company’s consolidated total net leverage ratio on the average daily unused portion of the Prior Revolving Credit Facility.
On each of April 11, 2017 and December 26, 2017, the parties entered into amendments to the Prior Credit Agreement. Under these amendments, the Prior Revolving Credit Facility was increased from $200.0 million to $315.0 million and certain other modifications were made. In connection with the December 2017 amendment, the Company incurred and capitalized an additional $2.1 million of debt issuance costs.
2019 Revolving Credit Facility
On November 15, 2019, the Company refinanced the Prior Credit Agreement and entered into an Amended and Restated Credit Agreement (the “A&R Credit Agreement”) with the lenders from time to time party thereto, Wells Fargo Securities, LLC, Citizens Bank, N.A., and JPMorgan Chase Bank, N.A., as joint lead arrangers and Wells Fargo Bank, National Association, as administrative agent. The A&R Credit Agreement replaced the Prior Credit Agreement and provides for (a) a five-year revolving credit facility of $500.0 million (the “Current Revolving Credit Facility”) and (b) an uncommitted incremental loan facility of up to $250.0 million (the “Incremental Facility”). In addition, the A&R Credit Agreement includes a letter of credit sub-limit of up to $15.0 million and a swing line loan sub-limit of up to $25.0 million. The A&R Credit Agreement has an expiration date of November 15, 2024, upon which date all remaining outstanding borrowings will be due and payable.
On November 15, 2019, the $80.0 million outstanding term loan balance under the Prior Facilities was transferred to the Current Revolving Credit Facility.
Loans under the Current Revolving Credit Facility bear interest, at the Company’s option, at a rate equal to either (a) the LIBOR Rate, plus an applicable margin ranging from 1.25% to 2.00% per annum based on the Company’s Consolidated Total Net Leverage Ratio (as defined in the A&R Credit Agreement), or (b) an alternate base rate equal to the highest of (i) the
prime rate, (ii) the federal funds rate plus 0.50%, and (iii) LIBOR for an interest period of one month plus 1.00%, plus an applicable margin ranging from 0.25% to 1.00% per annum based on the Company’s Consolidated Total Net Leverage Ratio. Undrawn commitments under the Current Revolving Credit Facility are subject to a commitment fee ranging from 0.15% to 0.30% per annum based on the Company’s Consolidated Total Net Leverage Ratio on the average daily unused portion of the Current Revolving Credit Facility. The applicable margin for and certain other terms of any term loans under the Incremental Facility will be determined prior to the incurrence of such loans. The Company is permitted to make voluntary prepayments at any time without payment of a premium or penalty.
On September 22, 2020, the parties entered into an amendment (the “Amendment”) to the A&R Credit Agreement to, among other changes, permit the issuance of the convertible senior notes and the purchase of the convertible note hedge transactions as described in Note 10, Convertible Senior Notes, expand the Company’s flexibility to repurchase its common stock and make other restricted payments, and replace the total net leverage covenant with a new secured net leverage covenant that requires the Company to maintain a consolidated secured net leverage ratio not to exceed 3.50:1 for the calendar quarters ending September 30, 2020, December 31, 2020, and March 31, 2021 and 3.00:1 for the calendar quarters ending thereafter.
The A&R Credit Agreement contains customary representations and warranties and customary affirmative and negative covenants applicable to the Company and its subsidiaries, including, among other things, restrictions on indebtedness, liens, investments, mergers, dispositions, dividends, and other distributions. The A&R Credit Agreement contains financial covenants that require the Company and its subsidiaries to not exceed a maximum consolidated total net leverage ratio and maintain a minimum interest coverage ratio. In addition, the A&R Credit Agreement contains certain customary events of default including, but not limited to, failure to pay interest, principal, and fees or other amounts when due, material misrepresentations or misstatements in any representation or warranty, covenant defaults, certain cross defaults to other material indebtedness, certain judgment defaults, and events of bankruptcy. The Company’s obligations under the A&R Credit Agreement and any swap obligations and banking services obligations owing to a lender (or an affiliate of a lender) are guaranteed by certain of its domestic subsidiaries and secured by substantially all of its and such subsidiary guarantors’ assets. In connection with entering into the A&R Credit Agreement, and as a condition precedent to borrowing loans thereunder, the Company and certain of the Company’s other direct and indirect subsidiaries have entered into certain ancillary agreements, including, but not limited to, a reaffirmation agreement, which amends certain terms of the existing collateral agreement and reaffirms their obligations under the existing guaranty agreement. The Company was in full compliance with all covenants as of December 31, 2020.
The refinancing of the Prior Credit Agreement was evaluated in accordance with ASC 470-50, Debt - Modifications and Extinguishments. In determining whether the refinancing was to be accounted for as a debt extinguishment or a debt modification, the Company considered whether lenders within the syndicate remained the same or changed and whether the changes in debt terms were substantial. This assessment was performed on an individual lender basis within the syndicate. As a result, the refinancing was accounted for as a modification with the exception of certain lenders that exited the syndicate. The exit of certain lenders resulted in an immaterial write-off of existing unamortized debt issuance costs. The remaining unamortized debt issuance costs related to debt modification, along with the new deferred costs, will be amortized over the remaining term of the A&R Credit Agreement.
In connection with the A&R Credit Agreement, the Company incurred and capitalized an additional $2.3 million of debt issuance costs. In connection with the Amendment on September 22, 2020, the Company incurred and capitalized an additional $0.6 million of debt issuance costs. The debt issuance costs are being amortized to interest expense using the straight-line method through 2024. Amortization expense related to debt issuance costs was approximately $1.0 million, $2.2 million, and $2.3 million for the years ended December 31, 2020, 2019, and 2018, respectively.
Interest expense (exclusive of fees and debt issuance cost amortization) was approximately $0.5 million, $3.6 million, and $7.5 million for the years ended December 31, 2020, 2019, and 2018, respectively.
The following table represents changes in the carrying amount of the Company's debt obligations:
| | | | | | | | | |
| | | Current Revolving Credit Facility | | |
| | | | | |
| | | (In thousands) |
| Balance as of December 31, 2019 | | | $ | 50,000 | | | |
| Proceeds | | | 150,000 | | | |
| Repayments | | | (200,000) | | | |
| | | | | |
| Balance as of December 31, 2020 | | | $ | — | | | |
The following table represents changes in the balance of the Company's deferred debt issuance costs:
| | | | | |
| (In thousands) |
| Balance as of December 31, 2019 | $ | 4,700 | |
| Additions | 550 | |
| Amortization | (997) | |
| Balance as of December 31, 2020 | $ | 4,253 | |
Note 10. Convertible Senior Notes
0.25% Convertible Senior Notes due 2025
On September 25, 2020, the Company completed a private offering of $575.0 million aggregate principal amount of 0.25% convertible senior notes (the “Notes”), including the exercise in full of the initial purchasers’ option to purchase up to an additional $75.0 million principal amount of the Notes. The Company received proceeds from the issuance of the Notes of $559.7 million, net of $15.3 million of transaction fees and other debt issuance costs. The Notes bear interest at a rate of 0.25% per year, payable semiannually in arrears on March 15 and September 15 of each year, beginning on March 15, 2021. The Notes were issued pursuant to an indenture, dated September 25, 2020 (the “Indenture”), between the Company and U.S. Bank National Association, as trustee. The Notes are general senior, unsecured obligations of the Company and will mature on September 15, 2025, unless earlier redeemed, repurchased, or converted.
The Notes are convertible at the option of the holders at any time prior to the close of business on the business day immediately preceding May 15, 2025, only under the following circumstances: (i) during any fiscal quarter commencing after the fiscal quarter ended on December 31, 2020 (and only during such fiscal quarter), if the last reported sale price of the Company’s common stock for at least 20 trading days (whether or not consecutive) during a period of 30 consecutive trading days ending on, and including, the last trading day of the immediately preceding fiscal quarter is greater than or equal to 130% of the conversion price for the Notes on each applicable trading day; (ii) during the five business day period after any ten consecutive trading day period (the “measurement period”) in which the trading price (as defined in the Indenture) per $1,000 principal amount of the Notes for each trading day of the measurement period was less than 98% of the product of the last reported sale price of the Company’s common stock and the conversion rate for the Notes on each such trading day; (iii) if the Company calls such Notes for redemption, at any time prior to the close of business on the scheduled trading day immediately preceding the redemption date, but only with respect to the Notes called (or deemed called) for redemption; and (iv) upon the occurrence of specified corporate events, as specified in the Indenture. On or after May 15, 2025 until the close of business on the second scheduled trading day immediately preceding the maturity date, holders of the Notes may convert all or any portion of their Notes at any time, regardless of the foregoing conditions.
Upon conversion, the Company may satisfy its conversion obligation by paying or delivering, as the case may be, cash, shares of its common stock, or a combination of cash and shares of its common stock, at the Company’s election, in the manner and subject to the terms and conditions provided in the Indenture. The initial conversion rate for the Notes is 10.2751 shares of the Company’s common stock per $1,000 principal amount of Notes, which is equivalent to an initial conversion price of approximately $97.32 per share of the Company’s common stock, subject to adjustment under certain circumstances in accordance with the terms of the Indenture. In addition, following certain corporate events that occur prior to the maturity date of the Notes or if the Company delivers a notice of redemption in respect of the Notes, the Company will, under certain circumstances, increase the conversion rate of the Notes for a holder who elects to convert its Notes (or any portion thereof) in connection with such a corporate event or convert its Notes called (or deemed called) for redemption during the related redemption period (as defined in the Indenture), as the case may be.
If the Company undergoes a fundamental change, holders may require, subject to certain exceptions, the Company to repurchase for cash all or any portion of their Notes at a fundamental change repurchase price equal to 100% of the principal amount of the Notes to be repurchased, plus accrued and unpaid interest to, but excluding, the fundamental change repurchase date. As of December 31, 2020, none of the criteria for a fundamental change or a conversion rate adjustment had been met.
The Company may not redeem the Notes prior to September 20, 2023. The Company may redeem for cash all or any portion of the Notes, at its option, on or after September 20, 2023, if the last reported sale price of the Company’s common stock has been at least 130% of the conversion price for the Notes then in effect for at least 20 trading days (whether or not consecutive) during any 30 consecutive trading day period (including the last trading day of such period) ending on, and including, the trading day immediately preceding the date on which the Company provides notice of redemption at a redemption price equal to 100% of the principal amount of the Notes to be redeemed, plus accrued and unpaid interest to, but excluding, the redemption date. If the Company redeems less than all the outstanding Notes, at least $150.0 million aggregate
principal amount of Notes must be outstanding and not subject to redemption as of the date of the relevant notice of redemption. No sinking fund is provided for in the Notes.
Convertible debt instruments that may be settled in cash are required to be separated into liability and equity components. The allocation to the liability component is based on the fair value of a similar instrument that does not contain an equity conversion option. Based on this debt-to-equity ratio, debt issuance costs are then allocated to the liability and equity components in a similar manner. Accordingly, at issuance, the Company allocated $461.8 million to the debt liability and $72.7 million to additional paid in capital, net of applicable issuance costs and deferred taxes. The difference between the principal amount of the Notes and the liability component, inclusive of issuance costs, represents the debt discount, which the Company will amortize to interest expense over the term of the Notes using an effective interest rate of 4.18%. The determination of the discount rate required certain estimates and assumptions. As of December 31, 2020, the remaining life of the Notes and the related debt discount and issuance cost accretion is approximately 4.7 years.
The maximum number of shares issuable upon conversion, including the effect of a fundamental change and subject to other conversion rate adjustments, would be 8.1 million shares.
The Notes consisted of the following balances reported in the Consolidated Balance Sheets as of December 31, 2020:
| | | | | |
| December 31,
2020 |
| |
| (In thousands) |
| Liability: | |
| Principal amount | $ | 575,000 | |
| Unamortized discount | (95,744) | |
| Unamortized debt issuance costs | (12,055) | |
| Convertible senior notes, liability component | $ | 467,201 | |
| |
| Equity: | |
| Embedded conversion option | $ | 100,510 | |
| Debt issuance costs | (2,680) | |
| Deferred tax impact | (25,098) | |
Convertible senior notes, equity component (1) | $ | 72,732 | |
_________________________________________________
(1) Included in additional paid-in capital in the Consolidated Balance Sheets.
The following table summarizes the components of interest expense resulting from the Notes recognized in interest and other income (expense), net in the Consolidated Statements of Operations for the year ended December 31, 2020:
| | | | | | | | | | | |
| Year Ended
December 31,
2020 | | |
| | | | |
| | | | | | | |
| (In thousands) |
| Contractual coupon interest | $ | 379 | | | | | | | |
| Amortization of discount | $ | 4,766 | | | | | | | |
| Amortization of debt issuance costs | $ | 600 | | | | | | | |
Convertible Note Hedge and Warrant Transactions
In connection with the issuance of the Notes, the Company entered into convertible note hedge and warrant transactions with an affiliate of one of the initial purchasers of the Notes and certain other financial institutions (the “option counterparties”) with respect to the Company’s common stock.
The convertible note hedge consists of an option for the Company to purchase up to approximately 5.9 million shares of the Company’s common stock, which is equal to the number of shares of the Company’s common stock underlying the Notes, at an initial strike price of approximately $97.32 per share. The convertible note hedge will expire upon the maturity of the Notes, if not earlier exercised or terminated. The cost of the convertible note hedge was approximately $100.6 million and was accounted for as an equity instrument, which was recorded in additional paid-in capital in the Consolidated Balance Sheets. The Company recorded a deferred tax asset of $25.8 million at issuance related to the convertible note hedge transaction. The
convertible note hedge is expected generally to reduce the potential dilution to the Company’s common stock upon any conversion of Notes and/or offset any cash payments the Company is required to make in excess of the principal amount of converted Notes.
Separately from the convertible note hedge, the Company entered into warrant transactions to sell to the option counterparties warrants to acquire, subject to customary anti-dilution adjustments, up to approximately 5.9 million shares of its common stock in the aggregate at an initial strike price of $141.56 per share. The warrants require net share or net cash settlement upon the Company’s election. The Company received aggregate proceeds of approximately $51.3 million for the issuance of the warrants, which was recorded in additional paid in capital at issuance in the Consolidated Balance Sheets. The warrants could separately have a dilutive effect to the Company’s common stock to the extent that the market price per share of its common stock exceeds the strike price of the warrants.
Note 11. Lessor Leases
Sales-Type Leases
On a recurring basis, the Company enters into multi-year, sales-type lease agreements with the majority varying in length from one to five years. The following table presents the Company’s income recognized from sales-type leases for the years ended December 31, 2020, 2019, and 2018:
| | | | | | | | | | | | | | | | | |
| Year Ended December 31, |
| 2020 | | 2019 | | 2018 |
| | | | | |
| (In thousands) |
| Sales-type lease revenues | $ | 26,040 | | | $ | 37,175 | | | $ | 39,167 | |
| Cost of sales-type lease revenues | (10,624) | | | (14,985) | | | (16,185) | |
| Selling profit on sales-type lease revenues | $ | 15,416 | | | $ | 22,190 | | | $ | 22,982 | |
| | | | | |
| Interest income on sales-type lease receivables | $ | 1,933 | | | $ | 1,756 | | | $ | 1,296 | |
The receivables as a result of these types of transactions are collateralized by the underlying equipment leased and consist of the following components at December 31, 2020 and 2019:
| | | | | | | | | | | |
| December 31, |
| 2020 | | 2019 |
| | | |
| (In thousands) |
| Net minimum lease payments to be received | $ | 35,331 | | | $ | 32,360 | |
| Less: Unearned interest income portion | (2,929) | | | (2,840) | |
| Net investment in sales-type leases | 32,402 | | | 29,520 | |
Less: Current portion (1) | (10,246) | | | (9,770) | |
| Long-term investment in sales-type leases, net | $ | 22,156 | | | $ | 19,750 | |
_________________________________________________
(1) The current portion of the net investment in sales-type leases is included in other current assets in the Consolidated Balance Sheets.
The carrying amount of the Company’s sales-type lease receivables is a reasonable estimate of fair value.
The maturity schedule of future minimum lease payments under sales-type leases retained in-house and the reconciliation to the net investment in sales-type leases reported on the Consolidated Balance Sheets was as follows:
| | | | | |
| December 31,
2020 |
| |
| (In thousands) |
| 2021 | $ | 11,312 | |
| 2022 | 9,499 | |
| 2023 | 7,334 | |
| 2024 | 4,535 | |
| 2025 | 2,616 | |
| Thereafter | 35 | |
| Total future minimum sales-type lease payments | 35,331 | |
| Present value adjustment | (2,929) | |
| Total net investment in sales-type leases | $ | 32,402 | |
Operating Leases
The Company entered into certain leasing agreements that were classified as operating leases prior to the adoption of ASC 842, Leases. These agreements in place prior to January 1, 2019 continue to be treated as operating leases, however any leasing agreements entered into on or after January 1, 2019 under these programs are classified and accounted for as sales-type leases in accordance with ASC 842. The operating lease arrangements generally have initial terms of one to seven years. The following table represents the Company’s income recognized from operating leases for the years ended December 31, 2020, 2019, and 2018:
| | | | | | | | | | | | | | | | | |
| Year Ended December 31, |
| 2020 | | 2019 | | 2018 |
| | | | | |
| (In thousands) |
| Rental income | $ | 11,668 | | | $ | 12,660 | | | $ | 12,207 | |
The net carrying value of the leased equipment under operating leases was $1.4 million and $2.1 million, which includes accumulated depreciation of $2.5 million and $1.6 million, as of December 31, 2020 and 2019, respectively. Depreciation expense of the leased equipment for the years ended December 31, 2020, 2019, and 2018 was $0.6 million, $0.7 million, and $0.5 million, respectively.
The maturity schedule of future minimum lease payments under operating leases was as follows:
| | | | | |
| December 31, 2020 |
| |
| (In thousands) |
| 2021 | $ | 8,848 | |
| 2022 | 4,816 | |
| 2023 | 2,910 | |
| 2024 | 852 | |
| 2025 | 256 | |
| Thereafter | 89 | |
| Total future minimum operating lease payments | $ | 17,771 | |
Note 12. Lessee Leases
The Company has operating leases for office buildings, data centers, office equipment, and vehicles. The Company’s leases have initial terms of one to 12 years. As of December 31, 2020, the Company did not have any additional material operating leases that were entered into, but not yet commenced.
The maturity schedule of future minimum lease payments under operating leases and the reconciliation to the operating lease liabilities reported on the Consolidated Balance Sheets was as follows:
| | | | | |
| December 31, 2020 |
| |
| (In thousands) |
| 2021 | $ | 15,290 | |
| 2022 | 14,106 | |
| 2023 | 10,221 | |
| 2024 | 8,922 | |
| 2025 | 6,571 | |
| Thereafter | 17,422 | |
| Total operating lease payments | 72,532 | |
| Present value adjustment | (11,438) | |
Total operating lease liabilities (1) | $ | 61,094 | |
_________________________________________________
(1) Amount consists of a current and long-term portion of operating lease liabilities of $12.2 million and $48.9 million, respectively. The short-term portion of the operating lease liabilities is included in accrued liabilities in the Consolidated Balance Sheets.
Operating lease costs were $14.3 million and $14.6 million for the years ended December 31, 2020 and 2019, respectively. Short-term lease costs and variable lease costs were immaterial for the years ended December 31, 2020 and 2019, respectively.
The following table summarizes supplemental cash flow information related to the Company’s operating leases for the years ended December 31, 2020 and 2019:
| | | | | | | | | | | |
| Year Ended December 31, |
| 2020 | | 2019 |
| | | |
| (In thousands) |
| Cash paid for amounts included in the measurement of lease liabilities | $ | 14,490 | | | $ | 14,636 | |
| Right-of-use assets obtained in exchange for new lease liabilities, including leases obtained from recent acquisitions | $ | 10,025 | | | $ | 1,204 | |
The following table summarizes the weighted-average remaining lease term and weighted-average discount rate related to the Company’s operating leases as of December 31, 2020 and 2019:
| | | | | | | | | | | |
| December 31, |
| 2020 | | 2019 |
| Weighted-average remaining lease term, years | 5.9 | | 6.4 |
| Weighted-average discount rate, % | 5.8 | % | | 6.4 | % |
Note 13. Commitments and Contingencies
Purchase Obligations
In the ordinary course of business, the Company issues purchase orders based on its current manufacturing needs. As of December 31, 2020, the Company had non-cancelable purchase commitments of $72.8 million, of which $69.9 million are expected to be paid within the next twelve months.
Legal Proceedings
The Company is currently involved in various legal proceedings.
A class action lawsuit was filed against the Company, on June 5, 2019, in the Circuit Court of Cook County, Illinois, Chancery Division, captioned Corey Heard, individually and on behalf of all others similarly situated, v. Omnicell, Inc., Case No. 2019-CH-06817. The complaint seeks class certification, monetary damages in the form of statutory damages for willful and/or reckless or, in the alternative, negligent violation of the Illinois Biometric Information Privacy Act (“BIPA”), and certain declaratory, injunctive, and other relief based on causes of action directed to allegations of violation of BIPA by the Company.
The complaint was served on the Company on June 13, 2019. On July 31, 2019, the Company filed a motion to stay or consolidate the case with the action Yana Mazya, et al. v. Northwestern Lake Forest Hospital, et al., Case No. 2018-CH-07161, pending in the Circuit Court of Cook County, Illinois, Chancery Division (the “Mazya Action”). The Court subsequently, on October 10, 2019, denied the motion, without prejudice, as being moot in view of the Company’s dismissal from the Mazya Action. The Company filed a motion to dismiss the complaint on October 31, 2019. The hearing on the Company’s motion to dismiss was held on September 2, 2020. The Court ruled from the bench and dismissed the complaint without prejudice giving plaintiff leave to file an amended complaint by September 30, 2020. Plaintiff filed an amended complaint on September 30, 2020 and the Company subsequently filed a motion to dismiss the complaint on October 28, 2020. The Company's motion to dismiss is now fully briefed and the Court has scheduled oral argument on the motion for June 4, 2021. The Company intends to defend the lawsuit vigorously.
On December 21, 2020, Becton, Dickinson and Company (“BD”) filed a complaint against the Company in the United States District Court for the Middle District of North Carolina, asserting claims of misappropriation under the Defend Trade Secrets Act, misappropriation under the North Carolina Trade Secrets Protection Act, unfair competition, and unfair/deceptive trade practices in violation of North Carolina law (the “Omnicell Complaint”). This action was commenced in relation to another action brought by BD, in the same Court, (the “Related Matter”) against a former BD employee who is also a former Company employee (the “Former Employee”) alleging that the Former Employee had violated the Former Employee’s legal obligations to BD regarding BD’s confidential and trade secret information when the Former Employee allegedly downloaded certain documents from BD’s information technology system following the end of the Former Employee’s employment with BD. In connection with the Related Matter, BD, the Former Employee, and the Company entered into a protocol to facilitate the return to BD of any BD documents that may have been resident, as a result of the Former Employee’s actions, on any devices belonging to the Former Employee or the Company. The Omnicell Complaint seeks injunctive relief and monetary damages in the form of compensatory, punitive, and exemplary damages, attorneys’ fees and costs, and pre-judgment and post-judgment interest. BD has not yet served the Omnicell Complaint on the Company, and, therefore, there are no response dates pending. The Company intends to defend the lawsuit vigorously.
As required under ASC 450, Contingencies, the Company accrues for contingencies when it believes that a loss is probable and that it can reasonably estimate the amount of any such loss. The Company has not recorded any material accrual for contingent liabilities associated with the legal proceedings described above based on its belief that any potential loss, while reasonably possible, is not probable. Further, any possible range of loss in these matters cannot be reasonably estimated at this time or is not deemed material. The Company believes that it has valid defenses with respect to these legal proceedings pending against it. However, litigation is inherently unpredictable, and it is possible that cash flows or results of operations could be materially affected in any particular period by the unfavorable resolution of any of these legal proceedings or because of the diversion of management’s attention and the creation of significant expenses.
Guarantees
Under the Company’s certificate of incorporation and bylaws, the Company has agreed to indemnify its directors and executive officers to the fullest extent not prohibited by Delaware and other applicable law, subject to certain exceptions. The Company has entered into individual indemnification agreements with its directors and officers. The term of the indemnification period is for the entirety of the director’s or officer’s service to the Company and continues so long as the director or officer may be subject to any claim, action, or proceeding, and there is no limit on the potential amount of future payments that the Company could be required to make under these indemnification agreements. The Company has purchased a directors’ and officers’ liability insurance policy that may enable it to recover a portion of any future payments that it may be required to make under these indemnification agreements. Assuming the applicability of coverage and the willingness of the insurer to assume coverage and subject to certain retention, loss limits, and other policy provisions, the Company believes it is unlikely that the Company will be required to pay any material amounts pursuant to these indemnification obligations. However, no assurances can be given that the insurers will not attempt to dispute the validity, applicability, or amount of coverage without expensive and time-consuming litigation against the insurers.
Additionally, the Company undertakes indemnification obligations in its ordinary course of business in connection with, among other things, the licensing of its products and the provision of its support services. In the ordinary course of the Company’s business, the Company has in the past and may in the future agree to indemnify another party, generally its business affiliates or customers, against certain losses suffered or incurred by the indemnified party in connection with various types of claims, which may include, without limitation, claims of intellectual property infringement, certain tax liabilities, its gross negligence or intentional acts in the performance of support services, and violations of laws. The term of these indemnification obligations is generally perpetual. In general, the Company attempts to limit the maximum potential amount of future payments that it may be required to make under these indemnification obligations to the amounts paid to it by a customer, but in some cases the obligation may not be so limited.
In addition, the Company has in the past and may in the future warrant to its customers that its products will conform to functional specifications for a limited period of time following the date of installation (generally not exceeding 30 days) or that its software media is free from material defects. Sales contracts for certain of the Company’s medication packaging systems often include limited warranties for up to six months, but the periodic activity and ending warranty balances the Company records have historically been immaterial.
From time to time, the Company may also warrant that its professional services will be performed in a good and workmanlike manner or in a professional manner consistent with industry standards. The Company generally seeks to disclaim most warranties, including any implied or statutory warranties such as warranties of merchantability, fitness for a particular purpose, title, quality, and non-infringement, as well as any liability with respect to incidental, consequential, special, exemplary, punitive, or similar damages. In some states, such disclaimers may not be enforceable. If necessary, the Company would provide for the estimated cost of product and service warranties based on specific warranty claims and claim history. The Company has not been subject to any significant claims for such losses and has not incurred any material costs in defending or settling claims related to these indemnification obligations. Accordingly, the Company believes it is unlikely that the Company will be required to pay any material amounts pursuant to these indemnification obligations or potential warranty claims and, therefore, no material liabilities have been recorded for such indemnification obligations as of December 31, 2020 and 2019.
Note 14. Employee Benefits and Share-Based Compensation
Stock Purchase Plan
1997 Employee Stock Purchase Plan
The Company has an Employee Stock Purchase Plan (“ESPP”), under which employees can purchase shares of its common stock based on a percentage of their compensation, but not greater than 15% of their earnings; provided, however, an eligible employee’s right to purchase shares of the Company’s common stock may not accrue at a rate which exceeds $25,000 of the fair market value of such shares for each calendar year in which such rights are outstanding. The purchase price per share must be equal to the lower of 85% of the fair value of the common stock at the beginning of a 24-month offering period or the end of each six-month purchasing period.
There was a total of 1.2 million shares reserved for future issuance under the ESPP as of December 31, 2020.
Stock Award Plans
2009 Equity Incentive Plan
The 2009 Equity Incentive Plan (“2009 Plan”), as amended, provides for the issuance of incentive stock options, RSAs, RSUs, PSUs, and other stock awards to the Company’s employees, directors, and consultants. There were 5.9 million shares of common stock reserved for future issuance under the 2009 Plan as of December 31, 2020.
Options granted under the 2009 Plan generally become exercisable over periods of up to four years, with one-fourth of the shares vesting one year from the vesting commencement date with respect to initial grants, and the remaining shares vesting in 36 equal monthly installments thereafter. The exercise prices of the options is the fair market value of common stock on the date of grant. RSUs generally vest over periods of up to four years, with one-fourth of the shares vesting one year from the vesting commencement date with respect to initial grants, and the remaining shares vesting in 12 equal quarterly installments thereafter. Awards of restricted stock to non-employee directors are granted on the date of the annual meeting of stockholders and vest in full on the date of the next annual meeting of stockholders, provided such non-employee director remains a director on such date. The fair value of the awards on the date of issuance is amortized to expense from the date of grant to the date of vesting and are expensed ratably on a straight-line basis over the vesting period. PSUs granted to the Company’s executives might include performance and market conditions. PSUs become eligible for vesting when certain market or performance conditions are met.
Share-Based Compensation Expense
The following table sets forth the total share-based compensation expense recognized in the Company’s Consolidated Statements of Operations:
| | | | | | | | | | | | | | | | | |
| Year Ended December 31, |
| 2020 | | 2019 | | 2018 |
| | | | | |
| (In thousands) |
| Cost of product and service revenues | $ | 7,469 | | | $ | 5,648 | | | $ | 4,634 | |
| Research and development | 6,497 | | | 6,604 | | | 5,746 | |
| Selling, general, and administrative | 30,731 | | | 21,797 | | | 18,505 | |
| Total share-based compensation expense | $ | 44,697 | | | $ | 34,049 | | | $ | 28,885 | |
The Company did not capitalize any share-based compensation as inventory as such amounts were not material for the years ended December 31, 2020 and 2019. Income tax benefits realized from share-based compensation were $10.3 million, $11.0 million, and $6.5 million, for the years ended December 31, 2020, 2019, and 2018, respectively.
Stock Options and ESPP Shares
The following assumptions were used to value stock options and ESPP shares granted pursuant to the Company’s equity incentive plans for the years ended December 31, 2020, 2019, and 2018:
| | | | | | | | | | | | | | | | | |
| Year Ended December 31, |
| 2020 | | 2019 | | 2018 |
| | | | | |
| Stock options | | | | | |
| Expected life, years | 4.7 | | 4.4 | | 4.8 |
| Expected volatility, % | 39.4 | % | | 33.7 | % | | 31.1 | % |
| Risk-free interest rate, % | 0.7 | % | | 2.0 | % | | 2.8 | % |
| Estimated forfeiture rate, % | 5.7 | % | | 7.2 | % | | 6.9 | % |
| Dividend yield, % | — | % | | — | % | | — | % |
| | | | | | | | | | | | | | | | | |
| Year Ended December 31, |
| 2020 | | 2019 | | 2018 |
| | | | | |
| Employee stock purchase plan shares | | | | | |
| Expected life, years | 0.5 - 2.0 | | 0.5 - 2.0 | | 0.5 - 2.0 |
| Expected volatility, % | 30.4% - 53.5% | | 28.2% - 39.9% | | 28.1% - 33.8% |
| Risk-free interest rate, % | 0.1% - 2.7% | | 1.3% - 2.7% | | 0.8% - 2.7% |
| Dividend yield, % | — | % | | — | % | | — | % |
Stock Options Activity
The following table summarizes the share option activity under the Company’s 2009 Plan during the year ended December 31, 2020:
| | | | | | | | | | | | | | | | | | | | | | | |
| Number of Shares | | Weighted-Average Exercise Price | | Weighted-Average Remaining Years | | Aggregate Intrinsic Value |
| | | | | | | |
| (In thousands, except per share data) |
| Outstanding at December 31, 2019 | 3,902 | | | $ | 52.75 | | | 7.7 | | $ | 113,198 | |
| Granted | 1,351 | | | 78.83 | | | | | |
| Exercised | (891) | | | 42.67 | | | | | |
| Expired | (19) | | | 59.65 | | | | | |
| Forfeited | (411) | | | 66.65 | | | | | |
| Outstanding at December 31, 2020 | 3,932 | | | $ | 62.50 | | | 7.8 | | $ | 226,160 | |
| Exercisable at December 31, 2020 | 1,556 | | | $ | 45.49 | | | 6.2 | | $ | 115,949 | |
| Vested and expected to vest at December 31, 2020 and thereafter | 3,755 | | | $ | 61.86 | | | 7.7 | | $ | 218,379 | |
The weighted-average fair value per share of options granted during the years ended December 31, 2020, 2019, and 2018 was $26.48, $23.54, and $17.22, respectively. The intrinsic value of options exercised during the years ended December 31, 2020, 2019, and 2018 was $39.8 million, $32.8 million, and $20.1 million, respectively. The tax benefit realized from stock options exercised was $7.1 million, $6.3 million, and $3.6 million, for the years ended December 31, 2020, 2019, and 2018, respectively.
As of December 31, 2020, total unrecognized compensation cost related to unvested stock options was $52.7 million, which is expected to be recognized over a weighted-average vesting period of 2.8 years.
Employee Stock Purchase Plan Activity
For the years ended December 31, 2020 and 2019, employees purchased approximately 333,000 and 374,000 shares of common stock, respectively, under the ESPP at a weighted-average price of $48.77 and $41.44, respectively. As of December 31, 2020, the unrecognized compensation cost related to the shares to be purchased under the ESPP was approximately $4.1 million and is expected to be recognized over a weighted-average period of 1.3 years.
Restricted Stock Units (RSUs) and Restricted Stock Awards (RSAs)
Summaries of the restricted stock activity under the 2009 Plan are presented below for the year ended December 31, 2020:
| | | | | | | | | | | | | | | | | | | | | | | |
| Number of Shares | | Weighted-Average Grant Date Fair Value | | Weighted-Average Remaining Years | | Aggregate Intrinsic Value |
| | | | | | | |
| (In thousands, except per share data) |
| Restricted stock units | | | | | | | |
| Outstanding at December 31, 2019 | 544 | | | $ | 66.65 | | | 1.6 | | $ | 44,492 | |
| Granted (Awarded) | 343 | | | 74.52 | | | | | |
| Vested (Released) | (183) | | | 61.30 | | | | | |
| Forfeited | (124) | | | 67.16 | | | | | |
| Outstanding and unvested at December 31, 2020 | 580 | | | $ | 72.87 | | | 1.6 | | $ | 69,670 | |
The weighted-average grant date fair value per share of RSUs granted during the years ended December 31, 2020, 2019, and 2018 was $74.52, $78.49, and $59.52, respectively. The total fair value of RSUs that vested in the years ended December 31, 2020, 2019, and 2018 was $11.2 million, $10.6 million, and $7.9 million, respectively.
As of December 31, 2020, total unrecognized compensation cost related to RSUs was $40.5 million, which is expected to be recognized over the remaining weighted-average vesting period of 3.1 years.
| | | | | | | | | | | | | | | | | | |
| Number of Shares | | Weighted-Average Grant Date Fair Value | | | | | | | |
| | | | | | | | | | |
| (In thousands, except per share data) |
| Restricted stock awards | | | | | | | | | | |
| Outstanding at December 31, 2019 | 17 | | | $ | 81.92 | | | | | | | | |
| Granted (Awarded) | 21 | | | 68.11 | | | | | | | | |
| Vested (Released) | (17) | | | 81.92 | | | | | | | | |
| | | | | | | | | | |
| Outstanding and unvested at December 31, 2020 | 21 | | | $ | 68.11 | | | | | | | | |
| | | | | | | | | | |
The weighted-average grant date fair value per share of RSAs granted during the years ended December 31, 2020, 2019, and 2018 was $68.11, $81.86, and $46.60, respectively. The total fair value of RSAs that vested in the years ended December 31, 2020, 2019, and 2018 was $1.4 million, $1.0 million, and $1.0 million, respectively.
As of December 31, 2020, total unrecognized compensation cost related to RSAs was $0.5 million, which is expected to be recognized over the remaining weighted-average vesting period of 0.4 years.
Performance-Based Restricted Stock Units (PSUs)
In 2019, the Company granted 61,098 PSUs to its executive officers, all of which became eligible for vesting upon the achievement of a certain level of shareholder return. In 2020, the Company granted 62,759 PSUs to its executive officers, all, none, or a portion of which may become eligible for vesting depending on the level of shareholder return for the period from March 1, 2020 through March 1, 2021.
The fair value of PSU awards to executive officers is determined using a Monte Carlo simulation model. The number of shares that vest at the end of the performance period depends on the percentile ranking of the total shareholder return for Omnicell stock over the performance period relative to the total shareholder return of each of the other companies in the NASDAQ Healthcare Index (the “Index”).
For PSUs granted on February 13, 2020, stock price appreciation is calculated based on the trailing 20-day average stock price just prior to the first trading day of March 2020, compared to the trailing 20-day average stock price just prior to the first trading day of March 2021. For PSUs granted on February 13, 2019, stock price appreciation is calculated based on the trailing 20-day average stock price just prior to the first trading day of March 2019, compared to the trailing 20-day average stock price just prior to the first trading day of March 2020.
On March 5, 2019, the Compensation Committee confirmed the Company's total stockholder return at the 90th percentile rank of the Index. This resulted in 100% of the 2018 PSUs, or 110,432 shares, as eligible for further time-based vesting. The eligible PSUs will vest as follows: 25% of the shares vested immediately on March 5, 2019 with the remaining shares vesting on a semi-annual basis period of 36 months commencing on June 15, 2019. Vesting is contingent upon continued service. Of the 110,432 shares eligible for time-based vesting under the 2018 PSUs, 67,066 shares, net of forfeitures, have vested as of December 31, 2020.
On March 3, 2020, the Compensation Committee confirmed the Company's total stockholder return at the 70th percentile rank of the Index. This resulted in 100% of the 2019 PSUs, or 61,098 shares, as eligible for further time-based vesting. The eligible PSUs will vest as follows: 25% of the shares vested immediately on March 3, 2020 with the remaining shares vesting on a semi-annual basis period of 36 months commencing on June 15, 2020. Vesting is contingent upon continued service. Of the 61,098 shares eligible for time-based vesting under the 2019 PSUs, 30,548 shares, net of forfeitures, have vested as of December 31, 2020.
In addition to executive officers' PSU awards, from time to time, the Company may grant PSUs with specific performance and service conditions to certain employees on an ad hoc basis. Historically such grants have not been material.
A summary of the performance-based restricted stock activity under the 2009 Plan is presented below for the year ended December 31, 2020:
| | | | | | | | | | | |
| Number of Shares | | Weighted-Average Grant Date Fair Value Per Unit |
| | | |
| (In thousands, except per share data) |
| Outstanding at December 31, 2019 | 134 | | | $ | 55.82 | |
| Granted | 99 | | | 82.17 | |
| Vested | (73) | | | 50.54 | |
| Forfeited | (5) | | | 81.72 | |
| Outstanding and unvested at December 31, 2020 | 155 | | | $ | 74.26 | |
The weighted-average grant date fair value per share of PSUs granted during the years ended December 31, 2020, 2019, and 2018 was $82.17, $73.38, and $38.03, respectively. The total fair value of PSUs that vested in the years ended December 31, 2020, 2019, and 2018 was $3.7 million, $3.5 million, and $3.2 million, respectively.
As of December 31, 2020, total unrecognized compensation cost related to PSUs was approximately $5.6 million, which is expected to be recognized over the remaining weighted-average period of 1.4 years.
Summary of Shares Reserved for Future Issuance under Equity Incentive Plans
The Company had the following ordinary shares reserved for future issuance under its equity incentive plans as of December 31, 2020:
| | | | | |
| Number of Shares |
| |
| (In thousands) |
| Share options outstanding | 3,932 | |
| Non-vested restricted stock awards | 756 | |
| Shares authorized for future issuance | 1,250 | |
| ESPP shares available for future issuance | 1,206 | |
| Total shares reserved for future issuance | 7,144 | |
401(k) Plan
The Company has established a pre-tax savings plan under Section 401(k) of the Internal Revenue Code of 1986, as amended. The 401(k) Plan allows eligible employees in the United States to voluntarily contribute a portion of their pre-tax salary, subject to a maximum limit specified in the Internal Revenue Code. The Company matches 50% of employee contributions up to $3,000, annually. The Company’s contributions under this plan were $5.7 million, $5.1 million, and $4.6 million in the years ended December 31, 2020, 2019, and 2018, respectively.
Note 15. Stock Repurchase Program
On August 2, 2016, the Company’s Board of Directors (the “Board”) authorized a stock repurchase program providing for the repurchase of up to $50.0 million of the Company’s common stock (the “2016 Repurchase Program”). The 2016 Repurchase Program is in addition to the stock repurchase program approved by the Board on November 4, 2014 providing for the repurchase of up to $50.0 million of the Company’s common stock (the “2014 Repurchase Program”). As of December 31, 2020, the maximum dollar value of shares that may yet be purchased under the two repurchase programs was $54.9 million.
The timing, price, and volume of repurchases are to be based on market conditions, relevant securities laws, and other factors. The stock repurchases may be made from time to time on the open market, in privately negotiated transactions, or pursuant to a Rule 10b-18 plan, subject to the terms and conditions of that certain A&R Credit Agreement, as amended. The stock repurchase programs do not obligate the Company to repurchase any specific number of shares, and the Company may terminate or suspend the repurchase programs at any time.
On September 17, 2020, the Board authorized a one-time stock repurchase transaction providing for the repurchase of up to $75.0 million of the Company’s common stock in privately negotiated transactions concurrently with the issuance of the Notes, described in Note 10, Convertible Senior Notes. In September 2020, the Company repurchased 749,300 shares of its common stock from purchasers of the Notes in the offering in privately negotiated transactions effected through one of the
initial purchasers or its affiliate at an average price of $70.78 per share for an aggregate purchase price of approximately $53.0 million. There will be no further repurchases under this one-time authorization.
During the years ended December 31, 2020, 2019, and 2018, the Company did not repurchase any of its outstanding common stock, including under the 2014 Repurchase Program or the 2016 Repurchase Program, other than the separately-authorized one-time stock repurchase concurrent with the offering of the Notes in September 2020.
Note 16. Equity Offerings
On November 3, 2017, the Company entered into a Distribution Agreement (the “Distribution Agreement”) with J.P. Morgan Securities LLC, Wells Fargo Securities, LLC, and HSBC Securities (USA) Inc., as its sales agents, pursuant to which the Company was able to offer and sell from time to time through the sales agents up to $125.0 million maximum aggregate offering price of the Company’s common stock. Sales of the common stock pursuant to the Distribution Agreement may be made in negotiated transactions or transactions that are deemed to be “at the market” offerings as defined in Rule 415 under the Securities Act of 1933, including sales made directly on the Nasdaq Stock Market, or sales made to or through a market maker other than on an exchange.
For the year ended December 31, 2018, the Company received gross proceeds of $40.3 million from sales of its common stock under the Distribution Agreement and incurred issuance costs of $0.7 million on sales of approximately 557,000 shares of its common stock at an average price of approximately $72.40 per share.
For the year ended December 31, 2019, the Company received gross proceeds of $38.5 million from sales of its common stock under the Distribution Agreement and incurred issuance costs of $0.7 million on sales of approximately 460,000 shares of its common stock at an average price of approximately $83.81 per share.
For the year ended December 31, 2020, the Company did not sell any of its common stock under the Distribution Agreement.
The registration statement under which the shares that could have been sold pursuant to the Distribution Agreement expired on November 3, 2020, and, accordingly, no additional sales will be made pursuant to the Distribution Agreement.
Note 17. Income Taxes
The following is a geographical breakdown of income (loss) before the provision for income taxes:
| | | | | | | | | | | | | | | | | |
| Year Ended December 31, |
| 2020 | | 2019 | | 2018 |
| | | | | |
| (In thousands) |
| Domestic | $ | 34,714 | | | $ | 81,641 | | | $ | 46,528 | |
| Foreign | (5,365) | | | (7,708) | | | (10,912) | |
| Income (loss) before provision for income taxes | $ | 29,349 | | | $ | 73,933 | | | $ | 35,616 | |
The provision for (benefit from) income taxes consisted of the following:
| | | | | | | | | | | | | | | | | |
| Year Ended December 31, |
| 2020 | | 2019 | | 2018 |
| | | | | |
| (In thousands) |
| Current: | | | | | |
| Federal | $ | 1,874 | | | $ | 8,006 | | | $ | 1,404 | |
| State | 1,733 | | | 4,549 | | | 1,832 | |
| Foreign | 647 | | | 1,240 | | | 768 | |
| Total current income taxes | 4,254 | | | 13,795 | | | 4,004 | |
| Deferred: | | | | | |
| Federal | (3,868) | | | (1,292) | | | 5,455 | |
| State | (2,494) | | | (1,609) | | | (909) | |
| Foreign | (737) | | | 1,701 | | | (10,663) | |
| Total deferred income taxes | (7,099) | | | (1,200) | | | (6,117) | |
| Total provision for (benefit from) income taxes | $ | (2,845) | | | $ | 12,595 | | | $ | (2,113) | |
The provision for (benefit from) income taxes differs from the amount computed by applying the statutory federal tax rate as follows:
| | | | | | | | | | | | | | | | | |
| Year Ended December 31, |
| 2020 | | 2019 | | 2018 |
| | | | | |
| (In thousands) |
| U.S. federal tax provision at statutory rate | $ | 6,163 | | | $ | 15,525 | | | $ | 7,479 | |
| State taxes | (601) | | | 2,258 | | | 651 | |
| Section 162(m) limitation | 2,550 | | | 2,279 | | | 738 | |
| Non-deductible expenses | 325 | | | 619 | | | 686 | |
| | | | | |
| Uncertain tax positions | (394) | | | (2,472) | | | (412) | |
| Share-based compensation tax benefit | (6,929) | | | (7,892) | | | (4,005) | |
| Research tax credits | (4,038) | | | (3,805) | | | (3,230) | |
| | | | | |
| Restructuring impact | — | | | 7,432 | | | (4,205) | |
| Foreign derived intangible income deduction | (204) | | | (449) | | | (349) | |
| | | | | |
| | | | | |
| Foreign rate differential | (102) | | | (1,424) | | | 561 | |
| | | | | |
| | | | | |
| | | | | |
| Other | 385 | | | 524 | | | (27) | |
| Total provision for (benefit from) income taxes | $ | (2,845) | | | $ | 12,595 | | | $ | (2,113) | |
As a result of global operational centralization activities during the year ended December 31, 2018, the Company recognized $4.2 million of tax benefit associated with making a check-the-box election to treat Aesynt Holding Coöperatief U.A. (Netherlands) as the U.S. disregarded entity beginning in the first quarter of 2018. Subsequently, during the year ended December 31, 2019, the Company recognized gain on the sale of certain intellectual property rights by Aesynt B.V. to Omnicell, Inc. and by Mach4 Automatisierungstechnik GmbH ("Mach4") to Omnicell, Inc., which resulted in a tax expense, net of tax benefit, of $7.4 million. As the Company continued with global operational centralization activities during the year ended December 31, 2020, Aesynt B.V. merged with and into Aesynt Holding B.V., with Aesynt Holding B.V. surviving and changing its name to Omnicell B.V., Aesynt Holding Coöperatief U.A. liquidated into Omnicell, Inc., and Omnicell GmbH merged with and into Mach4, with Mach4 surviving and changing its name to Omnicell GmbH. During the year ended December 31, 2020, the Company also recognized a gain on Omnicell Limited’s transferring shares of Omnicell GmbH to Omnicell International, LLC, which resulted in an immaterial tax expense.
On March 27, 2020, the Coronavirus Aid, Relief and Economic Security Act (the “CARES Act”) was signed into law in response to the COVID-19 pandemic. The CARES Act, among other provisions, includes provisions related to refundable payroll tax credits, deferment of the employer portion of certain payroll taxes, net operating losses carryback periods, alternative minimum tax credit refunds, modification to the net interest expense deduction limitation, and technical amendments to tax depreciation methods for qualified improvement property placed in service after December 31, 2017. The provisions of the CARES Act did not have a material impact on the Company’s income taxes.
Significant components of the Company’s deferred tax assets (liabilities) were as follows:
| | | | | | | | | | | |
| December 31, |
| 2020 | | 2019 |
| | | |
| (In thousands) |
| Deferred tax assets (liabilities): | | | |
| Deferred revenues | $ | 5,910 | | | $ | 4,129 | |
| Share-based compensation | 8,094 | | | 6,483 | |
| Inventory-related items | 4,953 | | | 3,507 | |
| Tax credit carryforwards | 12,105 | | | 13,472 | |
| Reserves and accruals | 8,160 | | | 5,712 | |
| Loss carryforwards | 8,461 | | | 9,484 | |
| Lease liability | 15,465 | | | 15,471 | |
| Other, net | 1,578 | | | 543 | |
| Gross deferred tax assets | 64,726 | | | 58,801 | |
| Valuation allowance | (1,199) | | | (1,186) | |
| Total net deferred tax assets | 63,527 | | | 57,615 | |
| | | |
| Intangibles | (22,010) | | | (18,941) | |
| Depreciation and amortization | (36,528) | | | (35,941) | |
| | | |
| Prepaid expenses | (15,654) | | | (13,395) | |
| | | |
| Right-of-use assets | (13,949) | | | (14,286) | |
| Total deferred tax liabilities | (88,141) | | | (82,563) | |
| | | |
| Net deferred tax liabilities | $ | (24,614) | | | $ | (24,948) | |
Deferred income tax assets (liabilities) are provided for temporary differences that will result in future tax deductions or future taxable income, as well as the future benefit of tax credit carryforwards. The Company recognizes deferred tax assets to the extent that it believes these assets are more likely than not to be realized. In making such a determination, the Company considers all available positive and negative evidence, including future reversals of existing temporary differences, projected future taxable income, tax planning strategies, and results of recent operations. On the basis of this evaluation, as of December 31, 2020, $1.2 million of valuation allowance was recorded on certain foreign net operating losses carried forward, as the Company believes that such deferred tax assets are not more likely than not to be realized.
As of December 31, 2020, the Company had $6.0 million of state net operating loss carryforwards expiring at various dates beginning in 2024, and $29.7 million of foreign net operating losses carried forward indefinitely. For income tax purposes, the Company has federal and California research tax credits carryforwards of $1.3 million and $17.0 million, respectively. Federal research tax credit carryforwards from prior years will begin to expire in 2035. California credits are available indefinitely to reduce cash taxes payable.
It is the Company's practice and intention to reinvest the earnings of its non-U.S. subsidiaries in those operations. As of December 31, 2020, the Company has not made a provision for U.S. federal income, withholding, and state income taxes on the outside basis difference related to certain foreign subsidiaries because earnings are intended to be indefinitely reinvested in operations outside the U.S.
The Company files income tax returns in the United States and various state and foreign jurisdictions. In the normal course of business, the Company is subject to examination by taxing authorities, including major jurisdictions such as the United States, Germany, Italy, Netherlands, and the United Kingdom. With few exceptions, as of December 31, 2020, the Company was no longer subject to U.S., state, and foreign examination for years before 2017, 2016, and 2016, respectively.
The aggregate change in the balance of gross unrecognized tax benefits, which excludes interest and penalties, for the three years ended December 31, 2020 was as follows:
| | | | | |
| (In thousands) |
| Balance as of December 31, 2017 | $ | 10,741 | |
| Increases related to tax positions taken during a prior period | 19 | |
| Decreases related to tax positions taken during the prior period | (1,257) | |
| Increases related to tax positions taken during the current period | 870 | |
| Decreases related to settlements | — | |
| Decreases related to expiration of statute of limitations | (412) | |
| Balance as of December 31, 2018 | 9,961 | |
| Increases related to tax positions taken during a prior period | 10 | |
| Decreases related to tax positions taken during the prior period | (6) | |
| Increases related to tax positions taken during the current period | 9,282 | |
| Decreases related to settlements | — | |
| Decreases related to expiration of statute of limitations | (2,472) | |
| Balance as of December 31, 2019 | 16,775 | |
| Increases related to tax positions taken during a prior period | 88 | |
| Decreases related to tax positions taken during the prior period | — | |
| Increases related to tax positions taken during the current period | 2,294 | |
| Decreases related to settlements | — | |
| Decreases related to expiration of statute of limitations | (911) | |
| Balance as of December 31, 2020 | $ | 18,246 | |
The total amounts of gross unrecognized tax benefit that, if realized, would favorably affect the Company's effective income tax rate in future periods, was $18.2 million and $16.8 million as of December 31, 2020 and 2019, respectively. The Company recognizes interest and/or penalties related to uncertain tax positions in interest and other income (expense), net in the Consolidated Statements of Operations, accruing $0.4 million, $0.5 million, and $0.5 million for the years ended December 31, 2020, 2019, and 2018, respectively. Accrued interest and penalties are included within other long-term liabilities on the Consolidated Balance Sheets. The combined amount of cumulative accrued interest and penalties was approximately $1.4 million, $1.0 million, and $1.4 million for the years ended December 31, 2020, 2019, and 2018, respectively. The Company does not believe there will be any significant changes in its unrecognized tax positions over the next twelve months.
Note 18. Restructuring Expenses
In the first quarter of 2020, the Company announced a company-wide organizational realignment initiative in order to more effectively align its organizational infrastructure and operations with the strategic vision of the autonomous pharmacy. In the second quarter of 2020, the Company continued its organizational realignment initiative, as well as initiated a restructuring plan to help mitigate the adverse impact of the COVID-19 pandemic on its business and financial results. During the year ended December 31, 2020, the Company incurred and accrued $10.0 million of employee severance costs and related expenses. As of December 31, 2020, the unpaid balance related to this restructuring plan was $0.6 million.
In the fourth quarter of 2018, the Company announced a company-wide organizational realignment initiative in order to align its organizational infrastructure for future expected growth. During the year ended December 31, 2018, the Company accrued and paid out $1.3 million of restructuring expenses, which includes severance and consulting-related expenses.
On March 2, 2018, the Company initiated the realignment of its Automation and Analytics commercial group in North America and France. During the year ended December 31, 2018, the Company accrued and paid out $3.0 million of employee severance costs and related expenses.
The following table summarizes the total restructuring expenses recognized in the Company’s Consolidated Statements of Operations for the years ended December 31, 2020, 2019, and 2018:
| | | | | | | | | | | | | | | | | |
| Year Ended December 31, |
| 2020 | | 2019 | | 2018 |
| | | | | |
| (In thousands) |
| Cost of product and service revenues | $ | 2,564 | | | $ | — | | | $ | 186 | |
| Research and development | 3,716 | | | — | | | — | |
| Selling, general, and administrative | 3,681 | | | — | | | 4,160 | |
| Total restructuring expenses | $ | 9,961 | | | $ | — | | | $ | 4,346 | |
SCHEDULE II
VALUATION AND QUALIFYING ACCOUNTS
| | | | | | | | | | | | | | | | | | | | | | | | | | | | | | | | | | | |
| Balance at Beginning of Period (1) | | Charged (Credited) to Costs and Expenses (2) | | Debited (Credited) to Other Accounts (3) | | Amounts Written Off (4) | | Other Adjustments (5) | | Balance at End of Period (1) |
| | | | | | | | | | | |
| (In thousands) |
| Year ended December 31, 2018 | | | | | | | | | | | |
| Accounts receivable and unbilled receivables | $ | 5,738 | | | $ | (127) | | | $ | 12 | | | $ | (3,010) | | | $ | (31) | | | $ | 2,582 | |
| Long-term unbilled receivables | — | | | — | | | — | | | — | | | — | | | — | |
| Net investment in sales-type leases | 192 | | | 10 | | | 12 | | | — | | | — | | | 214 | |
| Total allowances deducted from assets | $ | 5,930 | | | $ | (117) | | | $ | 24 | | | $ | (3,010) | | | $ | (31) | | | $ | 2,796 | |
| | | | | | | | | | | |
| Year ended December 31, 2019 | | | | | | | | | | | |
| Accounts receivable and unbilled receivables | $ | 2,582 | | | $ | 2,488 | | | $ | — | | | $ | (1,986) | | | $ | 143 | | | $ | 3,227 | |
| Long-term unbilled receivables | — | | | — | | | — | | | — | | | — | | | — | |
| Net investment in sales-type leases | 214 | | | 11 | | | — | | | — | | | — | | | 225 | |
| Total allowances deducted from assets | $ | 2,796 | | | $ | 2,499 | | | $ | — | | | $ | (1,986) | | | $ | 143 | | | $ | 3,452 | |
| | | | | | | | | | | |
| Year ended December 31, 2020 | | | | | | | | | | | |
| Accounts receivable and unbilled receivables | $ | 3,227 | | | $ | 1,095 | | | $ | — | | | $ | (535) | | | $ | 499 | | | $ | 4,286 | |
| Long-term unbilled receivables | — | | | — | | | — | | | — | | | 30 | | | 30 | |
| Net investment in sales-type leases | 225 | | | 40 | | | — | | | — | | | — | | | 265 | |
| Total allowances deducted from assets | $ | 3,452 | | | $ | 1,135 | | | $ | — | | | $ | (535) | | | $ | 529 | | | $ | 4,581 | |
__________________________________________________
(1)Allowance for credit losses.
(2)Represents amounts charged and credited for provisions for credit losses.
(3)Represents amounts debited to receivables as recoveries, increasing the allowance.
(4)Represents amounts written off from the allowance and receivable.
(5)Represents other adjustments, such as foreign currency translation, adoption of new accounting guidance, and purchase price accounting adjustments in connection with acquisitions.
INDEX TO EXHIBITS
| | | | | | | | | | | | | | | | | | | | | | | | | | | | | | | | |
| | | | Incorporated By Reference |
| Exhibit Number | | Exhibit Description | | Form | | File No. | | Exhibit | | Filing Date |
| | | | | | | | | | |
| 2.1 | | Securities Purchase Agreement, dated October 29, 2015, by and among Omnicell International, Inc., Omnicell, Inc., Aesynt Holding, L.P., Aesynt, Ltd., and Aesynt Holding Coöperatief U.A. | | 8-K | | 000-33043 | | 2.1 | | 10/29/2015 |
| | | | | | | | | | |
| 2.2 | | | | 8-K | | 000-33043 | | 2.1 | | 11/29/2016 |
| | | | | | | | | | |
| 2.3 | | | | 8-K | | 000-33043 | | 2.1 | | 8/12/2020 |
| | | | | | | | | | |
| 2.4 | | | | 10-Q | | 000-33043 | | 2.2 | | 10/30/2020 |
| | | | | | | | | | |
| 3.1 | | | | 10-Q | | 000-33043 | | 3.1 | | 9/20/2001 |
| | | | | | | | | | |
| 3.2 | | | | 10-Q | | 000-33043 | | 3.2 | | 8/9/2010 |
| | | | | | | | | | |
| 3.3 | | | | 10-K | | 000-33043 | | 3.2 | | 3/28/2003 |
| | | | | | | | | | |
| 3.4 | | | | 8-K | | 000-33043 | | 3.1 | | 8/12/2020 |
| | | | | | | | | | |
| 4.1 | | Reference is made to Exhibits 3.1, 3.2, 3.3, and 3.4 | | | | | | | | |
| | | | | | | | | | |
| 4.2 | | | | S-1/A | | 333-57024 | | 4.1 | | 7/24/2001 |
| | | | | | | | | | |
| 4.3 | | | | 10-K | | 000-33043 | | 4.7 | | 2/26/2020 |
| | | | | | | | | | |
| 4.4 | | | | 8-K | | 000-33043 | | 4.1 | | 9/25/2020 |
| | | | | | | | | | |
| 4.5 | | | | 8-K | | 000-33043 | | 4.2 | | 9/25/2020 |
| | | | | | | | | | |
| 10.1* | | | | S-8 | | 333-205465 | | 99.2 | | 7/2/2015 |
| | | | | | | | | | |
| 10.2* | | | | S-8 | | 333-231669 | | 99.1 | | 5/22/2019 |
| | | | | | | | | | |
| 10.3* | | | | 10-K | | 000-33043 | | 10.17 | | 3/11/2011 |
| | | | | | | | | | |
| 10.4* | | | | 10-Q | | 000-33043 | | 10.4 | | 8/9/2012 |
| | | | | | | | | | |
| 10.5* | | | | 10-Q | | 000-33043 | | 10.5 | | 8/9/2012 |
| | | | | | | | | | |
| 10.6* | | | | S-8 | | 333-225179 | | 99.4 | | 5/24/2018 |
| | | | | | | | | | |
| 10.7* | | | | 8-K | | 000-33043 | | 10.1 | | 3/8/2019 |
| | | | | | | | | | |
| 10.8* | | | | 10-Q | | 000-33043 | | 10.1 | | 7/31/2020 |
| | | | | | | | | | |
| | | | | | | | | | | | | | | | | | | | | | | | | | | | | | | | |
| | | | Incorporated By Reference |
| Exhibit Number | | Exhibit Description | | Form | | File No. | | Exhibit | | Filing Date |
| | | | | | | | | | |
10.9*+ | | | | | | | | | | |
| | | | | | | | | | |
10.10*+ | | | | | | | | | | |
| | | | | | | | | | |
| 10.11* | | | | 8-K | | 000-33043 | | 10.1 | | 3/17/2010 |
| | | | | | | | | | |
| 10.12* | | | | 10-Q | | 000-33043 | | 10.1 | | 5/5/2017 |
| | | | | | | | | | |
| 10.13* | | | | 10-K | | 000-33043 | | 10.34 | | 2/26/2020 |
| | | | | | | | | | |
| 10.14* | | | | S-1 | | 333-57024 | | 10.12 | | 3/14/2001 |
| | | | | | | | | | |
| 10.15* | | | | 10-Q | | 000-33043 | | 10.4 | | 11/6/2015 |
| | | | | | | | | | |
| 10.16* | | | | 10-K | | 000-33043 | | 10.26 | | 3/8/2004 |
| | | | | | | | | | |
| 10.17* | | | | 10-K | | 000-33043 | | 10.14 | | 3/11/2011 |
| | | | | | | | | | |
| 10.18* | | | | 10-K | | 000-33043 | | 10.29 | | 2/24/2009 |
| | | | | | | | | | |
| 10.19* | | | | 10-Q | | 000-33043 | | 10.3 | | 11/6/2015 |
| | | | | | | | | | |
| 10.20* | | | | 10-K | | 000-33043 | | 10.41 | | 2/27/2019 |
| | | | | | | | | | |
| 10.21 | | | | 10-K | | 000-33043 | | 10.9 | | 3/8/2012 |
| | | | | | | | | | |
10.22+ | | | | | | | | | | |
| | | | | | | | | | |
| 10.23 | | | | 10-Q | | 000-33043 | | 10.3 | | 5/6/2016 |
| | | | | | | | | | |
10.24+ | | | | | | | | | | |
| | | | | | | | | | |
10.25+ | | | | | | | | | | |
| | | | | | | | | | |
10.26+ | | | | | | | | | | |
| | | | | | | | | | |
10.27+ | | | | | | | | | | |
| | | | | | | | | | |
| 10.28 | | | | 10-Q | | 000-33043 | | 10.3 | | 5/5/2017 |
| | | | | | | | | | |
| 10.29 | | | | 10-K | | 000-33043 | | 10.39 | | 2/26/2020 |
| | | | | | | | | | |
| | | | | | | | | | | | | | | | | | | | | | | | | | | | | | | | |
| | | | Incorporated By Reference |
| Exhibit Number | | Exhibit Description | | Form | | File No. | | Exhibit | | Filing Date |
| | | | | | | | | | |
| 10.30 | | | | 8-K | | 000-33043 | | 1.1 | | 11/3/2017 |
| | | | | | | | | | |
| 10.31 | | | | 8-K | | 000-33043 | | 10.1 | | 11/18/2019 |
| | | | | | | | | | |
| 10.32 | | | | 8-K | | 000-33043 | | 10.1 | | 9/22/2020 |
| | | | | | | | | | |
| 10.33 | | | | 8-K | | 000-33043 | | 10.1 | | 9/25/2020 |
| | | | | | | | | | |
| 10.34 | | | | 8-K | | 000-33043 | | 10.2 | | 9/25/2020 |
| | | | | | | | | | |
21.1+ | | | | | | | | | | |
| | | | | | | | | | |
23.1+ | | | | | | | | | | |
| | | | | | | | | | |
24.1+ | | | | | | | | | | |
| | | | | | | | | | |
31.1+ | | | | | | | | | | |
| | | | | | | | | | |
31.2+ | | | | | | | | | | |
| | | | | | | | | | |
32.1+ | | | | | | | | | | |
| | | | | | | | | | |
101.INS+ | | Inline XBRL Instance Document - The instance document does not appear in the Interactive Data File because its XBRL tags are embedded within the Inline XBRL document. | | | | | | | | |
| | | | | | | | | | |
101.SCH+ | | Inline XBRL Taxonomy Extension Schema Document | | | | | | | | |
| | | | | | | | | | |
101.CAL+ | | Inline XBRL Taxonomy Extension Calculation Linkbase Document | | | | | | | | |
| | | | | | | | | | |
101.DEF+ | | Inline XBRL Taxonomy Extension Definition Linkbase Document | | | | | | | | |
| | | | | | | | | | |
101.LAB+ | | Inline XBRL Taxonomy Extension Labels Linkbase Document | | | | | | | | |
| | | | | | | | | | |
101.PRE+ | | Inline XBRL Taxonomy Extension Presentation Linkbase Document | | | | | | | | |
| | | | | | | | | | |
104+ | | Cover Page Interactive Data File (formatted as inline XBRL with applicable taxonomy extension information contained in Exhibits 101). | | | | | | | | |
_________________________________________________
* Indicates a management contract, compensation plan, or arrangement.
+ Filed herewith.
SIGNATURES
Pursuant to the requirements of Section 13 or 15(d) of the Securities Exchange Act of 1934, the registrant has duly caused this report to be signed on its behalf by the undersigned, thereunto duly authorized.
| | | | | | | | | | | | | | |
| | OMNICELL, INC. |
| Date: | February 24, 2021 | By: | | /s/ PETER J. KUIPERS |
| | | | Peter J. Kuipers,
Executive Vice President & Chief Financial Officer |
POWER OF ATTORNEY
KNOW ALL PERSONS BY THESE PRESENTS, that each of the persons whose signature appears below hereby constitutes and appoints Randall A. Lipps and Peter J. Kuipers, each of them acting individually, as his or her attorney-in-fact, each with the full power of substitution, for him or her in any and all capacities, to sign any and all amendments to this Annual Report on Form 10-K, and to file the same, with all exhibits thereto and other documents in connection therewith, with the Securities and Exchange Commission, granting unto said attorneys-in-fact, and each of them, full power and authority to do and perform each and every act and thing requisite and necessary to be done in and about the premises as fully to all intents and purposes as he or she might or could do in person, hereby ratifying and confirming our signatures as they may be signed by our said attorney-in-fact and any and all amendments to this Annual Report on Form 10-K.
Pursuant to the requirements of the Securities Exchange Act of 1934, this report has been signed below by the following persons on behalf of the registrant and in the capacities and on the dates indicated.
| | | | | | | | | | | | | | |
| Signature | | Title | | Date |
| | | | |
| /s/ RANDALL A. LIPPS | | Chief Executive Officer, President and Chairman of the Board (Principal Executive Officer) | | February 24, 2021 |
| Randall A. Lipps | | | |
| | | | |
| /s/ PETER J. KUIPERS | | Executive Vice President & Chief Financial Officer
(Principal Financial Officer) | | February 24, 2021 |
| Peter J. Kuipers | | | |
| | | | |
| /s/ JOSEPH B. SPEARS | | Senior Vice President, Chief Accounting Officer and Corporate Controller (Principal Accounting Officer) | | February 24, 2021 |
| Joseph B. Spears | | | |
| | | | |
| /s/ JOANNE B. BAUER | | | | February 24, 2021 |
| Joanne B. Bauer | | Director | | |
| | | | |
| /s/ JAMES T. JUDSON | | | | February 24, 2021 |
| James T. Judson | | Director | | |
| | | | |
| /s/ VANCE B. MOORE | | | | February 24, 2021 |
| Vance B. Moore | | Director | | |
| | | | |
| /s/ MARK W. PARRISH | | | | February 24, 2021 |
| Mark W. Parrish | | Director | | |
| | | | |
| /s/ ROBIN G. SEIM | | | | February 24, 2021 |
| Robin G. Seim | | Director | | |
| | | | |
| /s/ BRUCE E. SCOTT | | | | February 24, 2021 |
| Bruce E. Scott | | Director | | |
| | | | |
| /s/ BRUCE D. SMITH | | | | February 24, 2021 |
| Bruce D. Smith | | Director | | |
| | | | |
| /s/ SARA J. WHITE | | | | February 24, 2021 |
| Sara J. White | | Director | | |