UNITED STATES
SECURITIES AND EXCHANGE COMMISSION
Washington, D.C. 20549
FORM N-CSR
CERTIFIED SHAREHOLDER REPORT OF REGISTERED MANAGEMENT
INVESTMENT COMPANIES
Investment Company Act File Number 811-08572
Bishop Street Funds
(Exact name of registrant as specified in charter)
SEI Investments
One Freedom Valley Drive
Oaks, PA 19456
(Address of principal executive offices)
SEI Investments
One Freedom Valley Drive
Oaks, PA 19456
(Name and address of agent for service)
Registrant’s telephone number, including area code: 1-800-262-9565
Date of fiscal year end: December 31, 2017
Date of reporting period: December 31, 2017
| Item 1. Reports | to Stockholders. |
The registrant’s schedules as of the close of the reporting period, as set forth in §§ 210.12-12 through 210.12-14 of Regulation S-X [17 CFR §§ 210-12.12-12.14], are attached hereto.
The Funds file their complete schedules of portfolio holdings with the Securities and Exchange Commission (the “Commission”) for the first and third quarters of each fiscal year on Form N-Q within sixty days after the end of the period. The Funds’ Forms N-Q are available on the Commission’s website at http://www.sec.gov, and may be reviewed and copied at the Commission’s Public Reference Room in Washington, DC. Information on the operation of the Public Reference Room may be obtained by calling 1-800-SEC-0330.
A description of the policies and procedures that the Funds use to determine how to vote proxies (if any) relating to portfolio securities is available without charge, by calling 1-800-262-9565 or by visiting the Commission’s website at http://www.sec.gov. Information regarding how the Funds voted proxies relating to portfolio securities during the most recent twelve-month period ended June 30 is available without charge, by calling 1-800-262-9565 or by visiting the Funds’ website at http://www.bishopstreetfunds.com or the website of the Securities and Exchange Commission.
| 2 | ||||
| Definitions of Comparative Indices | 4 | |||
| Dividend Value Fund | ||||
| 6 | ||||
| 10 | ||||
| High Grade Bond Fund | ||||
| 14 | ||||
| 17 | ||||
| Hawaii Municipal Bond Fund | ||||
| 26 | ||||
| 29 | ||||
| 39 | ||||
| 40 | ||||
| 41 | ||||
| 44 | ||||
| 48 | ||||
| 60 | ||||
| 61 | ||||
| 64 | ||||
| 66 | ||||
1

Dear Shareholder:
2017 Market Review
U.S. equity markets continued their steady march higher helped by strong corporate earnings and revenue growth, synchronized global economic expansion, low volatility, and the expected passage of U.S. tax cuts. The S&P 500 finished the year up over 21.8%, its sixth best annual performance over the past two decades. Additionally, the S&P 500 posted positive returns every calendar month of the year, the first time this has ever happened.
From a factor perspective, Growth beat Value handily in 2017. The Russell 1000 Growth index outperformed its Value counterpart by 16.6% over the year (+30.2% versus +13.6%). Large capitalization stocks outperformed Small capitalization stocks as the Russell 1000 rose 21.7% for the year while the Russell 2000 gained 14.6% for the same period. A key characteristic of equity markets in 2017 was extraordinary low volatility as the VIX (a measure of implied volatility) is well below its long-term median.
Interest rates in the U.S. rose modestly during the year. The yield on the benchmark 10-year U.S. Treasury note finished the year at 2.41%, ending just below where it closed in 2016 (2.45%). The 2-year yield closed out the year at 1.89%, recording its largest calendar year increase in over a decade. The spread between 2-year and 10-year Treasury yields continued to compress, reaching its flattest level since 2007. The flattening of the yield curve occurred mainly due to rising short-term rates largely driven by better economic data, rather than a decrease in long-term bond yields. As a result, fixed income performance for the year was mixed with short duration indices underperforming long duration indices.
Municipal bonds faced tax reform uncertainty at the end of the year. The recently passed Tax Cuts and Jobs Reform Act is expected to have mixed effects on the municipal bond market. The change in personal income rates is not large enough to have a meaningful impact on the market while the decrease in corporate tax rates is expected to reduce demand for municipals from certain corporations, namely banks and insurance companies. Limiting state and local tax deductions could increase demand for in-state municipal in high tax states while the elimination of advance refunding bonds could modestly reduce supply over time. Advance refunding bonds comprise a
| Bishop Street Funds |
2

significant portion of outstanding municipal debt in Hawaii. Nationally, issuance of advance refunding bonds spiked going into year-end, but the market absorbed it well.
Investment Outlook
Although we believe we are in the late innings of the economic recovery, a recession still does not appear imminent and in the meantime the market should benefit from a roughly 3-5% increase in after-tax corporate cash flows due to the tax cut package. Despite the low volatility of the market, however, it is not a time for complacency. High valuations make stock prices vulnerable to higher interest rates if inflation turns out to be higher than consensus expectations.
Under these circumstances, we believe that portfolio diversification is prudent and remain confident the Bishop Street Fund family will provide you with strategies to create a value-added investment portfolio.
As always, thank you for your continued trust and confidence.
Sincerely,

Ken Miller, CFA
Chairman, Chief Executive Officer and Chief Investment Officer
Bishop Street Capital Management
February 7, 2018
The performance data quoted represents past performance. Past performance does not guarantee future results. Index returns are for illustrative purposes only and do not represent actual Fund performance. Index performance returns do not reflect any management fees, transaction costs or expenses. Indexes are unmanaged and one cannot invest directly in an index.
Investing involves risk including possible loss of principal. Diversification does not protect against market loss.
| December 31, 2017 | www.bishopstreetfunds.com |
3
Definitions of Comparative Indices
Bloomberg Barclays U.S. Government/Credit Index is a widely-recognized, market value weighted index of U.S. Treasury securities, U.S. government agency obligations, corporate debt backed by the U.S. government and fixed-rate non-convertible corporate debt securities issued or guaranteed by foreign governments and agencies. All securities in the Index are rated investment grade (BBB) or higher, with maturities of at least one year.
Bloomberg Barclays Municipal Bond Index is a widely-recognized index of municipal bonds with maturities of at least one year.
Lipper Corporate A – Rated Debt Funds Objective – Funds that invest primarily in corporate debt issues rated “A” or better or government issues.
Lipper Large-Cap Core Funds Classification – Funds that, by portfolio practice, invest at least 75% of their equity assets in companies with market capitalizations (on a three-year weighted basis) above Lipper’s USDE large-cap floor. Large-cap core funds have more latitude in the companies in which they invest. These funds typically have an average price-to-earnings ratio, price-to-book ratio, and three-year sales-per-share growth value, compared to the S&P 500 Index.
Lipper Other States Municipal Debt Funds Objective – Funds that invest in municipal debt issues with dollar-weighted average maturities of five to ten years and are exempt from taxation on a specified city or state basis.
The Russell 1000 Growth Index measures the performance of the large-cap growth segment of the U.S. equity universe. It includes those Russell 1000 Index companies with higher price-to-book ratios and higher forecasted growth values. The Russell 1000 Growth Index is constructed to provide a comprehensive and unbiased barometer for the large cap growth segment. The Russell 1000 Growth Index is completely reconstituted annually to ensure new and growing equities are included and that the represented companies continue to reflect growth characteristics.
The Russell 1000 Value Index measures the performance of the large-cap value segment of the U.S. equity universe. It includes those Russell 1000 companies with lower price-to-book ratios and lower expected growth values. The Russell 1000 Value Index is constructed to provide a comprehensive and unbiased barometer for the large-cap value segment. The Index is completely reconstituted annually to ensure new and growing equities are included and that the represented companies continue to reflect value characteristics.
| Bishop Street Funds |
4
The Standard & Poor’s 500 Index (S&P 500 Index) is an unmanaged list of common stocks which includes 500 large companies.
The Russell 1000® Index measures the performance of the large-cap segment of the U.S. equity universe. It is a subset of the Russell 3000® Index and includes approximately 1,000 of the largest securities based on a combination of their market cap and current index membership. The Russell 1000 represents approximately 92% of the Russell 3000 Index. The Russell 1000 Index is constructed to provide a comprehensive and unbiased barometer for the large-cap segment and is completely reconstituted annually to ensure new and growing equities are reflected.
The Russell 2000® Index measures the performance of the small-cap segment of the U.S. equity universe. The Russell 2000 Index is a subset of the Russell 3000® Index representing approximately 8% of the total market capitalization of that index. It includes approximately 2,000 of the smallest securities based on a combination of their market cap and current index membership. The Russell 2000 is constructed to provide a comprehensive and unbiased small-cap barometer and is completely reconstituted annually to ensure larger stocks do not distort the performance and characteristics of the true small-cap opportunity set.
| December 31, 2017 | www.bishopstreetfunds.com |
5
Dividend Value Fund
2017 was a robust year for equity markets. In several respects, 2017 seemed like a perfect investment environment. U.S. equity markets rose steadily through 2017, with major benchmark indexes hitting numerous record highs. Stocks, as measured by the S&P 500 Index, advanced every single month for the first time ever for a calendar year. Nine of the 11 economic sectors within the S&P 500 Index produced double-digit positive returns for the year, with only energy and telecommunications services posting small negative results. We’re at full employment, and the economic recovery that began in 2009 has notched yet another year. Even though the U.S. Federal Reserve is withdrawing stimulus that has helped equity prices, central banks in Europe and Japan have committed to stimulus that kept global demand high for financial assets. Volatility remained near historic lows despite lingering uncertainties that include conflict with North Korea, global debt, and lack of progress on key U.S. policy changes that have helped support market confidence since late 2016.
One key policy change that did materialize was long-awaited tax reform that became law when the Tax Cuts and Jobs Act was signed three days before Christmas. As expected, the legislation boosted equity markets. In particular, investors applauded a cut in the corporate tax rate to 21% and a change making it less costly for U.S. companies to repatriate profits earned abroad. Especially welcome was the fact that the changes would take effect at the start of 2018.
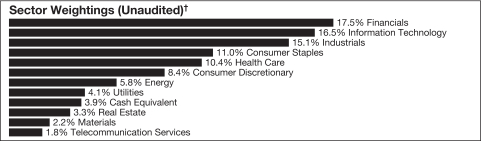
For the year ended December 31, 2017, the Dividend Value Fund returned 21.70%. The fund produced strong real returns and outperformed its benchmark, the Russell 1000 Value Index, which returned 13.66% for the year. The leading sector contributors to the Russell 1000 Value Index were Financials, Information Technology and Health Care, accounting for more than half of the Index’s return. The Energy and Telecommunication Services sectors lagged and posted negative returns. Positive sector contribution for the fund was driven by information Technology and industrials sectors. Equity selection was strong in these sectors. An underweight to the underperforming Energy sector also proved beneficial. Semiconductor capital equipment names, including Lam Research and Texas Instruments, produced favorable results. Both companies are well positioned to benefit from the proliferation of semiconductors in a broad range
| Bishop Street Funds |
6
of products. Lam benefits from the increased demand for memory and Texas Instruments from the expanded use of semiconductors in automobiles and industrial applications. An outsized position in Microsoft aided relative results for the year and generated solid gains. The company continues to execute well on its cloud strategy, as its Azure gained ground against Amazon’s AWS. The company also continued to generate free cash flow.
A big part of the strategy’s success in the industrials sector was what it did not own and from a strategic point of view, our emphasis on cash flow in assessing the long-term potential of dividend payers. The 2016 sale of General Electric (GE) and the subsequent purchase of 3M and Stanley Black & Decker shares are good examples. GE is a big benchmark position, and it continued to decline throughout 2017. Also in the industrials sector, Boeing and Union Pacific were strong relative contributors. Boeing, which is not in the index, had a very strong year. Cash flow improved, dividend growth was strong, and the company has a very solid outlook. As the economy strengthened and tax reform looked like it would pass Congress, railways benefited in general, and Union Pacific benefited specifically because of its superior operating results.
In terms of detractors, our positioning in Financials hurt relative results. The sector was a strong performer and, despite positive stock selection, the strategy’s underweight accounted for the lag. Financials are more than 28% of the index, a sizeable position that seems imprudent for the strategy. Within financials, we did well with positions in BlackRock and T. Rowe Price. We believe that both are well run companies with strong franchises and clean balance sheets. However, the strategy had no exposure to credit card companies and lack of exposure to Berkshire Hathaway hurt results, as the stock generated a solid gain for the year. The company does not pay a dividend and is not a candidate for the portfolio.
Additionally, the Fund did not keep pace in the Materials sector for the year as our positioning in the containers & packaging and chemicals industries detracted modestly from relative results.
Outlook
After a multi-year run — and a particularly strong 2017 — stock market valuations are elevated, and we continue to believe it is prudent to focus on quality and maintain a diversified portfolio as this bull market ages. We plan to remain disciplined in our
| December 31, 2017 | www.bishopstreetfunds.com |
7
BISHOP STREET
MANAGEMENT DISCUSSION
FUNDS
approach, seeking companies with clean balance sheets and the potential for growth in free cash flow and for raising their dividends over time. As the margin for safety has narrowed, we believe that any miss on expectations is likely to be punished, which makes careful stock selection more important than ever.
The performance data quoted represents past performance. Past performance does not guarantee future results. The investment return and principal value of an investment will fluctuate so that an investor’s shares, when redeemed, may be worth more or less than their original cost and current performance may be higher or lower than the performance quoted. For performance data current to the most recent month end, please visit www.bishopstreetfunds.com or call 1-800-262-9565.
Index returns are for illustrative purposes only and do not represent actual Fund performance. Index performance returns do not reflect any management fees, transaction costs or expenses. Indexes are unmanaged and one cannot invest directly in an index.
This material represents an assessment of the market environment at a specific time and is not intended to be a forecast of future events or a guarantee of future results. This information should not be relied upon by the reader as research or investment advice regarding the funds or any security in particular.
Investing involves risk including possible loss of principal. Diversification does not protect against market loss.
A company may reduce or eliminate its dividend, causing losses to the fund.
| Bishop Street Funds |
8
| Dividend Value Fund |
Performance Comparison
Comparison of Change in the Value of a $10,000 Investment in
the Dividend Value Fund, Class I, versus the Russell 1000 Value Index
and the Lipper Large-Cap Core Funds Classification.
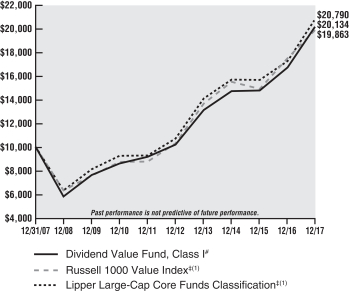
# Account value if you reinvested income and capital gains.
‡ Performance begins on April 30, 2006.
(1) See page 4 for definitions of comparative indices.
| Average Annual Total Returns† | ||||||||||||||||||
| One Year Return |
Annualized 3 Year Return |
Annualized 5 Year Return |
Annualized 10 Year Return |
|||||||||||||||
| 20.47 | % | 11.04 | % | 14.61 | % | 7.25 | % | Dividend Value Fund, Class I* | ||||||||||
| 13.66 | % | 8.65 | % | 14.04 | % | 7.10 | % | Russell 1000 Value Index | ||||||||||
| 20.65 | % | 9.81 | % | 14.26 | % | 7.50 | % | Lipper Large-Cap Core Funds Classification | ||||||||||
| * | Commenced operations on 05/03/06. |
| † | Returns shown do not reflect the deduction of taxes that a shareholder would pay on Fund distributions or the redemption of Fund shares. Fee waivers are in effect; if they had not been in effect, performance would have been lower. |
| December 31, 2017 | www.bishopstreetfunds.com |
9
| Dividend Value Fund |
Top Ten Equity Holdings (Unaudited)†
| Percentage of Investments |
||||||||
|
|
||||||||
| 1. | Microsoft | 4.5% | ||||||
|
|
||||||||
| 2. | JPMorgan Chase | 3.8% | ||||||
|
|
||||||||
| 3. | Johnson & Johnson | 3.3% | ||||||
|
|
||||||||
| 4. | Apple | 3.0% | ||||||
|
|
||||||||
| 5. | ExxonMobil | 2.8% | ||||||
|
|
||||||||
| 6. | Home Depot | 2.8% | ||||||
|
|
||||||||
| 7. | Comcast Cl A | 2.3% | ||||||
|
|
||||||||
| 8. | Honeywell International | 2.2% | ||||||
|
|
||||||||
| 9. | Philip Morris International | 2.1% | ||||||
|
|
||||||||
| 10. | Lockheed Martin | 2.0% | ||||||
| † | Percentages based on total investments. Top ten holdings do not include short-term investments. |
| Shares |
Value (000) |
|||||||
| COMMON STOCK — 96.0% | ||||||||
| Consumer Discretionary — 8.4% |
||||||||
| 24,479 | Comcast Cl A | $ | 980 | |||||
| 6,148 | Home Depot | 1,165 | ||||||
| 2,473 | McDonald’s | 426 | ||||||
| 4,013 | Time Warner | 367 | ||||||
| 4,160 | TJX | 318 | ||||||
| 2,721 | Walt Disney | 293 | ||||||
|
|
|
|||||||
| 3,549 | ||||||||
|
|
|
|||||||
| Bishop Street Funds |
10
| Dividend Value Fund |
Schedule of Investments
(continued)
| Shares |
Value (000) |
|||||||
| Consumer Staples — 11.0% |
||||||||
| 8,571 | Altria Group | $ | 612 | |||||
| 4,498 | Coca-Cola Enterprises | 179 | ||||||
| 4,608 | CVS Health | 334 | ||||||
| 5,763 | General Mills | 342 | ||||||
| 6,302 | Kellogg | 428 | ||||||
| 2,236 | Kimberly-Clark | 270 | ||||||
| 6,144 | PepsiCo | 737 | ||||||
| 8,218 | Philip Morris International | 868 | ||||||
| 4,644 | Procter & Gamble | 427 | ||||||
| 4,536 | Wal-Mart Stores | 448 | ||||||
|
|
|
|||||||
| 4,645 | ||||||||
|
|
|
|||||||
| Energy — 5.8% |
||||||||
| 4,850 | Chevron | 607 | ||||||
| 14,042 | ExxonMobil | 1,175 | ||||||
| 8,258 | Suncor Energy | 303 | ||||||
| 3,786 | Valero Energy | 348 | ||||||
|
|
|
|||||||
| 2,433 | ||||||||
|
|
|
|||||||
| Financials — 17.5% |
||||||||
| 17,006 | Bank of America | 502 | ||||||
| 6,251 | BB&T | 311 | ||||||
| 1,163 | BlackRock | 598 | ||||||
| 4,690 | Chubb | 685 | ||||||
| 4,363 | CME Group | 637 | ||||||
| 14,800 | JPMorgan Chase | 1,583 | ||||||
| 8,101 | Marsh & McLennan | 659 | ||||||
| 3,795 | Northern Trust | 379 | ||||||
| 4,814 | PNC Financial Services Group | 695 | ||||||
| 3,460 | T Rowe Price Group | 363 | ||||||
| 7,938 | US Bancorp | 425 | ||||||
| 9,252 | Wells Fargo | 561 | ||||||
|
|
|
|||||||
| 7,398 | ||||||||
|
|
|
|||||||
| Health Care — 10.4% |
||||||||
| 5,899 | AbbVie | 570 | ||||||
| 2,815 | Bristol-Myers Squibb | 173 | ||||||
| 2,102 | Eli Lilly | 178 | ||||||
| 9,874 | Johnson & Johnson | 1,380 | ||||||
| 2,998 | Medtronic PLC | 242 | ||||||
| 13,952 | Merck | 785 | ||||||
| 21,786 | Pfizer | 789 | ||||||
| 1,225 | UnitedHealth Group | 270 | ||||||
|
|
|
|||||||
| 4,387 | ||||||||
|
|
|
|||||||
| December 31, 2017 | www.bishopstreetfunds.com |
11
| Dividend Value Fund |
Schedule of Investments
(continued)
| Shares |
Value (000) |
|||||||
| Industrials — 15.1% |
||||||||
| 2,558 | 3M | $ | 602 | |||||
| 1,521 | Boeing | 449 | ||||||
| 1,741 | Cummins | 307 | ||||||
| 3,617 | General Dynamics | 736 | ||||||
| 6,033 | Honeywell International | 925 | ||||||
| 3,676 | Ingersoll-Rand PLC | 328 | ||||||
| 2,677 | Lockheed Martin | 859 | ||||||
| 1,892 | Parker Hannifin | 378 | ||||||
| 2,150 | Stanley Black & Decker | 365 | ||||||
| 5,640 | Union Pacific | 756 | ||||||
| 1,804 | United Technologies | 230 | ||||||
| 4,995 | Waste Management | 431 | ||||||
|
|
|
|||||||
| 6,366 | ||||||||
|
|
|
|||||||
| Information Technology — 16.5% |
||||||||
| 1,681 | Accenture PLC Cl A | 257 | ||||||
| 7,531 | Apple | 1,274 | ||||||
| 4,488 | Automatic Data Processing | 526 | ||||||
| 2,329 | Broadcom | 598 | ||||||
| 21,433 | Cisco Systems | 821 | ||||||
| 13,993 | Intel | 646 | ||||||
| 2,297 | Kla-Tencor | 241 | ||||||
| 22,029 | Microsoft | 1,885 | ||||||
| 6,709 | Texas Instruments | 701 | ||||||
|
|
|
|||||||
| 6,949 | ||||||||
|
|
|
|||||||
| Materials — 2.2% |
||||||||
| 5,868 | DowDuPont | 418 | ||||||
| 1,703 | International Paper | 99 | ||||||
| 1,757 | LyondellBasell Industries NV Cl A | 194 | ||||||
| 4,164 | Sonoco Products | 221 | ||||||
|
|
|
|||||||
| 932 | ||||||||
|
|
|
|||||||
| Real Estate — 3.3% |
||||||||
| 875 | American Tower‡ | 125 | ||||||
| 382 | AvalonBay Communities‡ | 68 | ||||||
| 1,931 | Crown Castle International‡ | 214 | ||||||
| 2,514 | Digital Realty Trust‡ | 286 | ||||||
| 4,503 | Duke Realty‡ | 123 | ||||||
| 1,211 | Equity LifeStyle Properties‡ | 108 | ||||||
| 525 | Essex Property Trust‡ | 127 | ||||||
| 1,610 | Public Storage ‡ | 336 | ||||||
|
|
|
|||||||
| 1,387 | ||||||||
|
|
|
|||||||
| Bishop Street Funds |
12
| Dividend Value Fund |
Schedule of Investments
(concluded)
| Shares |
Value (000) |
|||||||
| Telecommunication Services — 1.8% |
||||||||
| 19,518 | AT&T | $ | 759 | |||||
|
|
|
|||||||
| Utilities — 4.0% |
||||||||
| 4,611 | American Electric Power | 339 | ||||||
| 5,890 | CMS Energy | 279 | ||||||
| 2,572 | Dominion Resources | 208 | ||||||
| 3,819 | Eversource Energy | 241 | ||||||
| 1,897 | NextEra Energy | 297 | ||||||
| 5,178 | WEC Energy Group | 344 | ||||||
|
|
|
|||||||
| 1,708 | ||||||||
|
|
|
|||||||
| TOTAL COMMON STOCK (Cost $25,028) | 40,513 | |||||||
|
|
|
|||||||
| CASH EQUIVALENT — 4.0% | ||||||||
| 1,662,379 | BlackRock FedFund, Institutional Shares, 1.170% (A) (Cost $1,662) | 1,662 | ||||||
|
|
|
|||||||
| TOTAL INVESTMENTS (Cost $26,690) — 100.0% | $ | 42,175 | ||||||
|
|
|
|||||||
Percentages are based on Net Assets of $42,196 (000).
| ‡ | Real Estate Investment Trust |
| (A) | The rate reported is the 7-day effective yield as of December 31, 2017. |
Cl — Class
PLC — Public Limited Company
Cost figures are shown in thousands.
As of December 31, 2017, all of the Funds’ investments in securities were considered Level 1, in accordance with the authoritative guidance on fair value measurements and disclosure under U.S. GAAP.
For the year ended December 31, 2017, there have been no transfers between Level 1, Level 2 and Level 3 assets and liabilities. Transfers, if any, between levels are considered to have occurred at the end of the period.
There were no Level 3 investments during the year ended December 31, 2017.
The accompanying notes are an integral part of the financial statements.
| December 31, 2017 | www.bishopstreetfunds.com |
13
High Grade Income Fund
In 2017, the U.S. Federal Reserve increased the Federal Funds rate from 0.50% to 1.25%, a larger increase than the fixed income markets were expecting. This resulted in a large increase in yields in shorter maturity securities (0 to 4 years). This volatility was not seen at the longer maturities, the 10 year U.S Treasury benchmark was largely unchanged and yields decreased at longer maturities. This may imply that over the longer term the market now sees growth and inflation to be lower than previously thought.
Due to the changes in the yield curve, longer maturity assets outperformed shorter maturity assets. On a sector specific basis, fixed income assets with exposure to risk continued to outperform. For example, Corporate Credit securities outperformed U.S. Government securities. Along the same lines, lower quality assets outperformed their higher quality counterparts, BBB rated securities outperformed A rated securities.
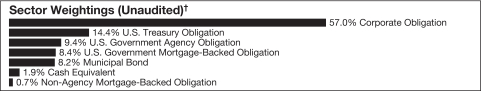
In this environment, the Bishop Street High Grade Income Fund Institutional Class returned 3.56% and underperformed the Bloomberg Barclays U.S. Government/Credit Index which finished the year up 4.00%. Positive drivers of the fund’s performance were an overweight sector allocation to Corporate Credit and Taxable Municipal Bonds. Detractors to performance included short duration positioning in the portfolio’s Treasury allocation.
| Bishop Street Funds |
14
The performance data quoted represents past performance. Past performance does not guarantee future results. The investment return and principal value of an investment will fluctuate so that an investor’s shares, when redeemed, may be worth more or less than their original cost and current performance may be higher or lower than the performance quoted. For performance data current to the most recent month end, please visit www.bishopstreetfunds.com or call 1-800-262-9565.
Index returns are for illustrative purposes only and do not represent actual Fund performance. Index performance returns do not reflect any management fees, transaction costs or expenses. Indexes are unmanaged and one cannot invest directly in an index.
This material represents an assessment of the market environment at a specific time and is not intended to be a forecast of future events or a guarantee of future results. This information should not be relied upon by the reader as research or investment advice regarding the funds or any security in particular.
Investing involves risk including possible loss of principal. Diversification does not protect against market loss.
| December 31, 2017 | www.bishopstreetfunds.com |
15
| High Grade Income Fund |
Performance Comparison
Comparison of Change in the Value of a $10,000 Investment in the High Grade Income Fund, Class I, versus the Bloomberg Barclays Capital U.S. Government/Credit Index and the Lipper Corporate A-Rated Debt Funds Objective.
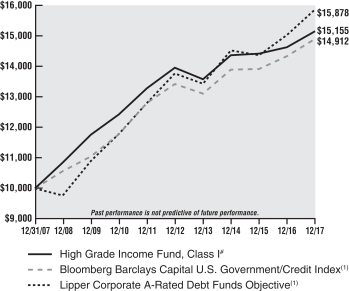
# Account value if you reinvested income and capital gains.
(1) See page 4 for definitions of comparative indices.
| Average Annual Total Returns† | ||||||||||||||||
| One Year Return |
Annualized 3 Year Return |
Annualized 5 Year Return |
Annualized 10 Year Return |
|||||||||||||
| 3.56 | % | 1.79 | % | 1.65 | % | 4.24 | % | High Grade Income Fund, Class I | ||||||||
| 4.00 | % | 2.38 | % | 2.13 | % | 4.08 | % | Bloomberg Barclays Capital U.S. Government/Credit Index | ||||||||
| 5.49 | % | 2.95 | % | 2.83 | % | 4.62 | % | Lipper Corporate A-Rated Debt Funds Objective | ||||||||
| † | Returns shown do not reflect the deduction of taxes that a shareholder would pay on Fund distributions or the redemption of Fund shares. Fee waivers are in effect; if they had not been in effect, performance would have been lower. |
| Bishop Street Funds |
16
| High Grade Income Fund |
Top Ten Holdings (Unaudited)†
| Coupon Rate |
Maturity Date |
Percentage of Investments |
||||||||||||||
|
|
||||||||||||||||
| 1. | U.S. Treasury Bond | 4.500% | 08/15/39 | 3.2% | ||||||||||||
|
|
||||||||||||||||
| 2. | FHLMC, Ser 2011-3970, Cl KC | 3.500% | 03/15/33 | 3.1% | ||||||||||||
|
|
||||||||||||||||
| 3. | U.S. Treasury Bond | 6.000% | 02/15/26 | 2.0% | ||||||||||||
|
|
||||||||||||||||
| 4. | U.S. Treasury Bond | 4.375% | 05/15/41 | 1.9% | ||||||||||||
|
|
||||||||||||||||
| 5. | U.S. Treasury Bond | 5.375% | 02/15/31 | 1.9% | ||||||||||||
|
|
||||||||||||||||
| 6. | U.S. Treasury Bond | 2.250% | 08/15/46 | 1.8% | ||||||||||||
|
|
||||||||||||||||
| 7. | Amazon.com | 4.800% | 12/05/34 | 1.5% | ||||||||||||
|
|
||||||||||||||||
| 8. | GNMA, Ser 2012-91, Cl QL | 2.000% | 09/20/41 | 1.4% | ||||||||||||
|
|
||||||||||||||||
| 9. | Home Depot | 5.875% | 12/16/36 | 1.3% | ||||||||||||
|
|
||||||||||||||||
| 10. | FHLMC MTN | 1.500% | 08/25/19 | 1.3% | ||||||||||||
| † | Percentages based on total investments. Top ten holdings do not include short-term investments. |
| Face Amount (000) |
Value (000) |
|||||||
| CORPORATE OBLIGATIONS — 56.6% | ||||||||
| Consumer Discretionary — 10.1% |
||||||||
| Amazon.com | ||||||||
| $ | 650 | 4.800%, 12/05/34 | $ | 763 | ||||
| Anheuser-Busch InBev Worldwide | ||||||||
| 350 | 7.750%, 01/15/19 | 370 | ||||||
| CBS | ||||||||
| 350 | 3.500%, 01/15/25 | 351 | ||||||
| Comcast | ||||||||
| 250 | 3.600%, 03/01/24 | 261 | ||||||
| December 31, 2017 | www.bishopstreetfunds.com |
17
| High Grade Income Fund |
Schedule of Investments
(continued)
| Face Amount (000) |
Value (000) |
|||||||
| Consumer Discretionary — (continued) |
||||||||
| $ | 350 | 3.150%, 03/01/26 | $ | 353 | ||||
| Discovery Communications LLC | ||||||||
| 300 | 3.250%, 04/01/23 | 299 | ||||||
| George Washington University | ||||||||
| 225 | 4.363%, 09/15/43 | 242 | ||||||
| Home Depot | ||||||||
| 500 | 5.875%, 12/16/36 | 677 | ||||||
| McDonald’s MTN | ||||||||
| 500 | 4.600%, 05/26/45 | 558 | ||||||
| Starbucks | ||||||||
| 495 | 2.450%, 06/15/26 | 477 | ||||||
| Unilever Capital | ||||||||
| 375 | 2.100%, 07/30/20 | 374 | ||||||
| Walt Disney MTN | ||||||||
| 425 | 1.850%, 07/30/26 | 389 | ||||||
|
|
|
|||||||
| 5,114 | ||||||||
|
|
|
|||||||
| Consumer Staples — 3.7% |
||||||||
| Campbell Soup | ||||||||
| 500 | 4.250%, 04/15/21 | 524 | ||||||
| Coca-Cola | ||||||||
| 250 | 2.875%, 10/27/25 | 250 | ||||||
| 200 | 2.450%, 11/01/20 | 201 | ||||||
| Colgate-Palmolive MTN | ||||||||
| 300 | 1.950%, 02/01/23 | 292 | ||||||
| CVS Health | ||||||||
| 250 | 2.875%, 06/01/26 | 240 | ||||||
| Hershey | ||||||||
| 125 | 2.625%, 05/01/23 | 125 | ||||||
| Walgreens Boots Alliance | ||||||||
| 250 | 3.300%, 11/18/21 | 254 | ||||||
|
|
|
|||||||
| 1,886 | ||||||||
|
|
|
|||||||
| Energy — 5.5% |
||||||||
| Apache Finance Canada | ||||||||
| 475 | 7.750%, 12/15/29 | 624 | ||||||
| BP Capital Markets PLC | ||||||||
| 300 | 3.814%, 02/10/24 | 316 | ||||||
| ConocoPhillips | ||||||||
| 450 | 3.350%, 11/15/24 | 463 | ||||||
| Kinder Morgan Energy Partners LP | ||||||||
| 300 | 4.300%, 05/01/24 | 312 | ||||||
| Occidental Petroleum | ||||||||
| Bishop Street Funds |
18
| High Grade Income Fund |
Schedule of Investments
(continued)
| Face Amount (000) |
Value (000) |
|||||||
| Energy — (continued) |
||||||||
| $ | 400 | 2.700%, 02/15/23 | $ | 400 | ||||
| Schlumberger Investment SA | ||||||||
| 400 | 3.650%, 12/01/23 | 421 | ||||||
| Shell International Finance BV | ||||||||
| 250 | 1.875%, 05/10/21 | 246 | ||||||
|
|
|
|||||||
| 2,782 | ||||||||
|
|
|
|||||||
| Financials — 15.9% |
||||||||
| Aflac | ||||||||
| 500 | 3.625%, 11/15/24 | 523 | ||||||
| Aon PLC | ||||||||
| 440 | 4.450%, 05/24/43 | 460 | ||||||
| Bank of America MTN | ||||||||
| 450 | 4.000%, 04/01/24 | 476 | ||||||
| Bank of New York Mellon MTN | ||||||||
| 500 | 4.150%, 02/01/21 | 525 | ||||||
| Capital One Financial | ||||||||
| 550 | 3.750%, 03/09/27 | 556 | ||||||
| Citigroup | ||||||||
| 400 | 3.875%, 10/25/23 | 418 | ||||||
| Discover Bank | ||||||||
| 400 | 4.200%, 08/08/23 | 420 | ||||||
| Goldman Sachs Group MTN | ||||||||
| 250 | 7.500%, 02/15/19 | 264 | ||||||
| 500 | 2.762%, VAR ICE LIBOR USD 3 Month+1.300% 11/23/24 | 506 | ||||||
| JPMorgan Chase | ||||||||
| 250 | 6.400%, 05/15/38 | 344 | ||||||
| 500 | 2.250%, 01/23/20 | 500 | ||||||
| Lincoln National | ||||||||
| 250 | 8.750%, 07/01/19 | 273 | ||||||
| MetLife | ||||||||
| 250 | 6.817%, 08/15/18 | 257 | ||||||
| Morgan Stanley MTN | ||||||||
| 500 | 3.875%, 01/27/26 | 521 | ||||||
| MUFG Americas Holdings | ||||||||
| 250 | 2.250%, 02/10/20 | 249 | ||||||
| Prudential Financial MTN | ||||||||
| 320 | 7.375%, 06/15/19 | 344 | ||||||
| Royal Bank of Canada MTN | ||||||||
| 300 | 2.150%, 03/06/20 | 299 | ||||||
| 300 | 1.500%, 07/29/19 | 296 | ||||||
| US Bancorp MTN | ||||||||
| 500 | 3.000%, 03/15/22 | 510 | ||||||
| December 31, 2017 | www.bishopstreetfunds.com |
19
| High Grade Income Fund |
Schedule of Investments
(continued)
| Face Amount (000) |
Value (000) |
|||||||
| Financials — (continued) |
||||||||
| Wells Fargo | ||||||||
| $ | 300 | 2.150%, 01/15/19 | $ | 300 | ||||
|
|
|
|||||||
| 8,041 | ||||||||
|
|
|
|||||||
| Health Care — 4.4% |
||||||||
| AbbVie | ||||||||
| 500 | 2.900%, 11/06/22 | 501 | ||||||
| Amgen | ||||||||
| 350 | 5.700%, 02/01/19 | 363 | ||||||
| 150 | 4.950%, 10/01/41 | 174 | ||||||
| Celgene | ||||||||
| 250 | 3.875%, 08/15/25 | 259 | ||||||
| Gilead Sciences | ||||||||
| 500 | 4.500%, 04/01/21 | 533 | ||||||
| Merck Sharp & Dohme | ||||||||
| 400 | 5.000%, 06/30/19 | 417 | ||||||
|
|
|
|||||||
| 2,247 | ||||||||
|
|
|
|||||||
| Industrials — 4.9% |
||||||||
| FedEx | ||||||||
| 250 | 2.625%, 08/01/22 | 250 | ||||||
| General Electric MTN | ||||||||
| 400 | 2.588%, VAR ICE LIBOR USD 3 Month+1.000% 03/15/23 | 405 | ||||||
| Norfolk Southern | ||||||||
| 400 | 2.900%, 06/15/26 | 393 | ||||||
| Northrop Grumman | ||||||||
| 400 | 4.750%, 06/01/43 | 462 | ||||||
| Raytheon | ||||||||
| 475 | 2.500%, 12/15/22 | 474 | ||||||
| United Technologies | ||||||||
| 500 | 3.100%, 06/01/22 | 509 | ||||||
|
|
|
|||||||
| 2,493 | ||||||||
|
|
|
|||||||
| Information Technology — 7.1% |
||||||||
| Apple | ||||||||
| 500 | 2.850%, 05/06/21 | 508 | ||||||
| Applied Materials | ||||||||
| 500 | 3.900%, 10/01/25 | 531 | ||||||
| Intel | ||||||||
| 500 | 3.300%, 10/01/21 | 518 | ||||||
| International Business Machines | ||||||||
| 350 | 8.375%, 11/01/19 | 389 | ||||||
| Bishop Street Funds |
20
| High Grade Income Fund |
Schedule of Investments
(continued)
| Face Amount (000) |
Value (000) |
|||||||
| Information Technology — (continued) |
||||||||
| Juniper Networks | ||||||||
| $ | 350 | 4.500%, 03/15/24 | $ | 364 | ||||
| KLA-Tencor | ||||||||
| 400 | 4.650%, 11/01/24 | 434 | ||||||
| Microsoft | ||||||||
| 500 | 3.625%, 12/15/23 | 527 | ||||||
| NetApp | ||||||||
| 300 | 3.375%, 06/15/21 | 306 | ||||||
|
|
|
|||||||
| 3,577 | ||||||||
|
|
|
|||||||
| Materials — 1.5% |
||||||||
| Mosaic | ||||||||
| 400 | 5.625%, 11/15/43 | 431 | ||||||
| Sherwin-Williams | ||||||||
| 300 | 3.125%, 06/01/24 | 302 | ||||||
|
|
|
|||||||
| 733 | ||||||||
|
|
|
|||||||
| Telecommunication Services — 0.7% |
||||||||
| Ameritech Capital Funding | ||||||||
| 300 | 6.875%, 10/15/27 | 355 | ||||||
|
|
|
|||||||
| Transportation — 1.0% |
||||||||
| Burlington Northern Santa Fe LLC |
||||||||
| 470 | 4.450%, 03/15/43 | 530 | ||||||
|
|
|
|||||||
| Utilities — 1.8% |
||||||||
| Berkshire Hathaway Energy | ||||||||
| 463 | 6.125%, 04/01/36 | 619 | ||||||
| Xcel Energy | ||||||||
| 300 | 3.300%, 06/01/25 | 304 | ||||||
|
|
|
|||||||
| 923 | ||||||||
|
|
|
|||||||
| TOTAL CORPORATE OBLIGATIONS (Cost $27,970) | 28,681 | |||||||
|
|
|
|||||||
| U.S. TREASURY OBLIGATIONS — 14.3% | ||||||||
| U.S. Treasury Bond | ||||||||
| 800 | 6.000%, 02/15/26 | 1,014 | ||||||
| 720 | 5.375%, 02/15/31 | 957 | ||||||
| 350 | 4.750%, 02/15/37 | 466 | ||||||
| 1,250 | 4.500%, 08/15/39 | 1,633 | ||||||
| 750 | 4.375%, 05/15/41 | 970 | ||||||
| 1,000 | 2.250%, 08/15/46 | 902 | ||||||
| December 31, 2017 | www.bishopstreetfunds.com |
21
| High Grade Income Fund |
Schedule of Investments
(continued)
| Face Amount (000) |
Value (000) |
|||||||
| U.S. TREASURY OBLIGATIONS — (continued) | ||||||||
| U.S. Treasury Note | ||||||||
| $ | 350 | 3.625%, 02/15/21 | $ | 367 | ||||
| 250 | 3.500%, 05/15/20 | 259 | ||||||
| 180 | 2.375%, 08/15/24 | 181 | ||||||
| 525 | 2.000%, 11/15/26 | 508 | ||||||
|
|
|
|||||||
| TOTAL U.S. TREASURY OBLIGATIONS (Cost $7,043) | 7,257 | |||||||
|
|
|
|||||||
| U.S. GOVERNMENT AGENCY OBLIGATIONS — 9.3% | ||||||||
| FFCB | ||||||||
| 300 | 2.670%, 04/18/24 | 299 | ||||||
| 600 | 2.000%, 06/01/21 | 590 | ||||||
| 500 | 1.750%, 08/01/22 | 483 | ||||||
| 500 | 1.240%, 11/29/19 | 492 | ||||||
| FHLB | ||||||||
| 475 | 4.750%, 03/10/23 | 533 | ||||||
| 500 | 3.750%, 12/14/18 | 509 | ||||||
| FHLMC MTN | ||||||||
| 550 | 2.050%, 08/26/22 | 539 | ||||||
| 650 | 1.600%, 09/30/21 | 632 | ||||||
| 675 | 1.500%, 08/25/19 (A) | 662 | ||||||
|
|
|
|||||||
| TOTAL U.S. GOVERNMENT AGENCY OBLIGATIONS (Cost $4,793) | 4,739 | |||||||
|
|
|
|||||||
| U.S. GOVERNMENT MORTGAGE-BACKED OBLIGATIONS — 8.3% | ||||||||
| FHLMC, Ser 2011-3970, Cl KC | ||||||||
| 1,500 | 3.500%, 03/15/33 | 1,536 | ||||||
| FHLMC, Ser 2015-4425, Cl BY | ||||||||
| 597 | 2.000%, 01/15/45 | 500 | ||||||
| FHLMC, Ser G12710 | ||||||||
| 64 | 5.500%, 07/01/22 | 66 | ||||||
| FNMA, Ser 2003-58, Cl D | ||||||||
| 44 | 3.500%, 07/25/33 | 44 | ||||||
| FNMA, Ser 2012-84, Cl JB | ||||||||
| 324 | 3.000%, 05/25/42 | 321 | ||||||
| FNMA, Ser 2013-92, Cl MT | ||||||||
| 52 | 4.000%, 07/25/41 | 54 | ||||||
| FNMA, Ser 889958 | ||||||||
| 30 | 5.000%, 10/01/23 | 32 | ||||||
| GNMA, Ser 2011-112, Cl JP | ||||||||
| 129 | 2.000%, 02/20/40 | 127 | ||||||
| GNMA, Ser 2012-101, Cl KL | ||||||||
| 687 | 2.000%, 09/20/41 | 640 | ||||||
| Bishop Street Funds |
22
| High Grade Income Fund |
Schedule of Investments
(continued)
| Face Amount (000)/Shares |
Value (000) |
|||||||
| U.S. GOVERNMENT MORTGAGE-BACKED OBLIGATIONS — (continued) | ||||||||
| GNMA, Ser 2012-91, Cl QL | ||||||||
| $ | 765 | 2.000%, 09/20/41 | $ | 690 | ||||
| GNMA, Ser 2013-4, Cl CN | ||||||||
| 220 | 2.000%, 10/16/42 | 212 | ||||||
|
|
|
|||||||
| TOTAL U.S. GOVERNMENT MORTGAGE-BACKED OBLIGATIONS (Cost $4,241) | 4,222 | |||||||
|
|
|
|||||||
| MUNICIPAL BONDS — 8.2% | ||||||||
| California State, GO | ||||||||
| 560 | 6.509%, 04/01/39 | 638 | ||||||
| Central Puget Sound Regional Transit Authority, RB | ||||||||
| 300 | 5.491%, 11/01/39 | 384 | ||||||
| Hawaii State, Department of Budget & Finance, Pacific Health Project, Ser A, RB | ||||||||
| 500 | 5.500%, 07/01/43 | 569 | ||||||
| Houston, Independent School District, GO | ||||||||
| 250 | 6.125%, 02/15/28 | 262 | ||||||
| Hudson County, Improvement Authority, RB, AGM Insured | ||||||||
| 525 | 7.400%, 12/01/25 | 603 | ||||||
| Napa Valley, Unified School District, GO | ||||||||
| 225 | 6.507%, 08/01/43 | 307 | ||||||
| Oklahoma County, Finance Authority, RB | ||||||||
| 375 | 6.600%, 09/01/22 | 427 | ||||||
| Oklahoma State, Development Finance Authority, RB | ||||||||
| 100 | 3.200%, 06/01/27 | 99 | ||||||
| San Antonio, Texas Water System Revenue, RB | ||||||||
| 250 | 5.502%, 05/15/29 | 297 | ||||||
| Stockton, Public Financing Authority, RB, BAM Insured | ||||||||
| 500 | 7.942%, 10/01/38 | 547 | ||||||
|
|
|
|||||||
| TOTAL MUNICIPAL BONDS (Cost $4,018) | 4,133 | |||||||
|
|
|
|||||||
| NON-AGENCY MORTGAGE-BACKED OBLIGATION — 0.7% | ||||||||
| GSR Mortgage Loan Trust, Ser 2004-4, Cl 3A2 | ||||||||
| 390 | 2.600%, VAR US Treas Yield Curve Rate T Note Const Mat 1 Yr+1.750% 04/25/32 (Cost $359) | 371 | ||||||
|
|
|
|||||||
| CASH EQUIVALENT — 1.9% | ||||||||
| 944,950 | BlackRock FedFund, Institutional Shares, 1.170% (B) (Cost $945) | 945 | ||||||
|
|
|
|||||||
| TOTAL INVESTMENTS (Cost $49,369) — 99.3% | $ | 50,348 | ||||||
|
|
|
|||||||
| December 31, 2017 | www.bishopstreetfunds.com |
23
| High Grade Income Fund |
Schedule of Investments
(continued)
Percentages are based on Net Assets of $50,693 (000).
| (A) | Step Bond — The rate reflected on the Schedule of Investments is the effective yield on December 31, 2017. The coupon on a step bond changes on a specified date. |
| (B) | The rate reported is the 7-day effective yield as of December 31, 2017. |
AGM — Assured Guaranty Municipal Corp.
BAM — Build America Mutual
Cl — Class
FFCB — Federal Farm Credit Bank
FHLB — Federal Home Loan Bank
FHLMC — Federal Home Loan Mortgage Corporation
FNMA — Federal National Mortgage Corporation
GNMA — Government National Mortgage Corporation
GO — General Obligation
ICE — Intercontinental Exchange
LIBOR — London Interbank Offered Rate
LLC — Limited Liability Corporation
MTN — Medium Term Note
PLC — Public Limited Company
RB — Revenue Bond
Ser — Series
VAR — Variable
Cost figures are shown in thousands.
| Bishop Street Funds |
24
| High Grade Income Fund |
Schedule of Investments
(concluded)
The following is a summary of the inputs used as of December 31, 2017, in valuing the Fund’s investments carried at value (000):
| High Grade Income Fund | ||||||||||||||||
| Investments in Securities | Level 1 | Level 2 | Level 3 | Total | ||||||||||||
| Corporate Obligations |
$ | — | $ | 28,681 | $ | — | $ | 28,681 | ||||||||
| U.S. Treasury Obligations |
— | 7,257 | — | 7,257 | ||||||||||||
| U.S. Government Agency Obligations |
— | 4,739 | — | 4,739 | ||||||||||||
| U.S. Government Mortgage-Backed Obligations |
— | 4,222 | — | 4,222 | ||||||||||||
| Municipal Bonds |
— | 4,133 | — | 4,133 | ||||||||||||
| Non-Agency Mortgage-Backed Obligation |
— | 371 | — | 371 | ||||||||||||
| Cash Equivalent |
945 | — | — | 945 | ||||||||||||
|
|
|
|||||||||||||||
| Total Investments in Securities |
$ | 945 | $ | 49,403 | $ | — | $ | 50,348 | ||||||||
|
|
|
|||||||||||||||
For the year ended December 31, 2017, there have been no transfers between Level 1, Level 2 and Level 3 assets and liabilities. Transfers, if any, between levels are considered to have occurred at the end of the period.
There were no Level 3 investments during the year ended December 31, 2017.
Amounts designated as “—” are $0.
The accompanying notes are an integral part of the financial statements.
| December 31, 2017 | www.bishopstreetfunds.com |
25
Hawaii Municipal Bond Fund
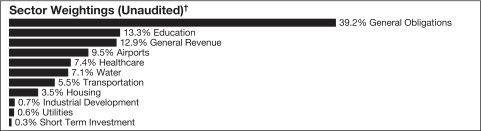
Contrary to expectations, the bond market produced positive returns in 2017. Municipal bond performance was strong, outperforming their taxable counterparts in the long and shorter strategies. Performance was driven by the rally on the long end of the curve as 22+year bonds returned a solid 8.19% for the year. The municipal yield curve flattened in concert with treasuries as interest rates on the long end of the curve declined while interest rates on the short end of the curve rose. Revenue bonds outperformed general obligation bonds led by hospital and leasing bonds as investors sought additional yield and were comfortable with taking on a modest degree of additional risk.
Despite a brutal hurricane season, three interest rate hikes by the Fed, and the passage of a sweeping tax reform bill, the municipal market posted four consecutive quarters of positive return in 2017. New issuance was down by approximately 30% for the year with less refinancing activity as interest rates moved modestly higher but demand continued to be robust. Although investors were faced with uncertainties about tax reform going into the fourth quarter, the market rallied following the passage of the Tax Cuts and Jobs Reform Act as investors expect a net negative supply to be met with higher demand.
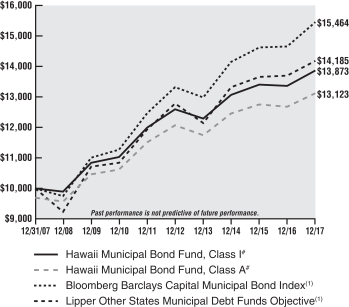
For the year, the Bishop Street Hawaii Municipal Bond Fund Institutional Class returned 3.74% relative to the Bloomberg Barclays Municipal Bond Index return of 5.45%. The Fund’s duration was short to the Index partly as a function of the lack of many longer duration Hawaii bonds in general. Hawaii general obligation bonds are restricted to a maturity of no longer than 25 years but typically debt is issued out to 20 years while bonds in the Index extend out to 30 years.
Looking ahead, the portfolio may continue to perform well given its short duration relative to the Index and the probability of a rise in interest rates in the months ahead.
| Bishop Street Funds |
26
The performance data quoted represents past performance. Past performance does not guarantee future results. The investment return and principal value of an investment will fluctuate so that an investor’s shares, when redeemed, may be worth more or less than their original cost and current performance may be higher or lower than the performance quoted. For performance data current to the most recent month end, please visit www.bishopstreetfunds.com or call 1-800-262-9565.
Index returns are for illustrative purposes only and do not represent actual Fund performance. Index performance returns do not reflect any management fees, transaction costs or expenses. Indexes are unmanaged and one cannot invest directly in an index.
This material represents an assessment of the market environment at a specific time and is not intended to be a forecast of future events or a guarantee of future results. This information should not be relied upon by the reader as research or investment advice regarding the funds or any security in particular.
Investing involves risk including possible loss of principal. Diversification does not protect against market loss.
| December 31, 2017 | www.bishopstreetfunds.com |
27
| Hawaii Municipal Bond Fund |
Performance Comparison
Comparison of Change in the Value of a $10,000 Investment in the Hawaii Municipal
Bond Fund, Class I or Class A, versus the Bloomberg Barclays Capital Municipal Bond Index
and the Lipper Other States Municipal Debt Funds Objective.
# Account value if you reinvested income and capital gains.
(1) See page 4 for definitions of comparative indices.
| Average Annual Total Returns† | ||||||||||||||||||
| One Year Return |
Annualized 3 Year Return |
Annualized 5 Year Return |
Annualized 10 Year Return |
|||||||||||||||
| 3.74 | % | 2.00 | % | 1.94 | % | 3.33 | % | Hawaii Municipal Bond Fund, Class I | ||||||||||
| 3.46 | % | 1.74 | % | 1.68 | % | 3.07 | % | Hawaii Municipal Bond Fund, Class A | ||||||||||
| 0.39 | % | 0.70 | % | 1.07 | % | 2.75 | % | Hawaii Municipal Bond Fund, Class A, with load** | ||||||||||
| 5.45 | % | 2.98 | % | 3.02 | % | 4.46 | % | Bloomberg Barclays Capital Municipal Bond Index | ||||||||||
| 3.49 | % | 2.08 | % | 2.06 | % | 3.45 | % | Lipper Other States Municipal Debt Funds Objective | ||||||||||
| ** | Reflects 3.00% sales charge. |
| † | Returns shown do not reflect the deduction of taxes that a shareholder would pay on Fund distributions or the redemption of Fund shares. Fee waivers are in effect; if they had not been in effect, performance would have been lower. |
| Bishop Street Funds |
28
| Hawaii Municipal Bond Fund |
Top Ten Holdings (Unaudited)†
| Coupon Rate |
Maturity Date |
Percentage of Investments |
||||||||||||||
|
|
||||||||||||||||
| 1. | Hawaii State, Department of Budget & Finance, Ser 2009 | 6.500% | 07/01/39 | 3.4% | ||||||||||||
|
|
||||||||||||||||
| 2. | Hawaii State, Department of Transportation, Airports Division Lease Revenue, AMT | 5.000% | 08/01/27 | 3.1% | ||||||||||||
|
|
||||||||||||||||
| 3. | Hawaii State, Department of Budget & Finance, Ser A | 5.000% | 07/01/35 | 3.0% | ||||||||||||
|
|
||||||||||||||||
| 4. | Hawaii State, Airports System Authority, Ser A, AMT | 5.000% | 07/01/45 | 2.2% | ||||||||||||
|
|
||||||||||||||||
| 5. | University of Hawaii, Ser F | 5.000% | 10/01/35 | 2.1% | ||||||||||||
|
|
||||||||||||||||
| 6. | Hawaii State, Department of Transportation, Airports Division Lease Revenue, AMT | 5.000% | 08/01/21 | 2.1% | ||||||||||||
|
|
||||||||||||||||
| 7. | Hawaii State, Airports System Authority, Ser A | 5.250% | 07/01/27 | 2.0% | ||||||||||||
|
|
||||||||||||||||
| 8. | Hawaii State, Ser FK | 5.000% | 05/01/29 | 1.8% | ||||||||||||
|
|
||||||||||||||||
| 9. | Hawaii State, Airports System Authority, AMT | 5.000% | 07/01/24 | 1.6% | ||||||||||||
|
|
||||||||||||||||
| 10. | Hawaii State, Department of Budget & Finance, Ser A | 5.000% | 07/01/27 | 1.6% | ||||||||||||
| † | Percentages based on total investments. Top ten holdings do not include short-term investments. |
| Face Amount (000) |
Value (000) |
|||||||
| MUNICIPAL BONDS — 98.4% | ||||||||
| Alabama — 0.2% |
||||||||
| Huntsville, Electric System Revenue, RB | ||||||||
| $ | 225 | 5.250%, 12/01/21, Pre-Refunded @ 100 (A) | $ | 254 | ||||
|
|
|
|||||||
| December 31, 2017 | www.bishopstreetfunds.com |
29
| Hawaii Municipal Bond Fund |
Schedule of Investments
(continued)
| Face Amount (000) |
Value (000) |
|||||||
| Alaska — 0.6% |
||||||||
| Alaska State, Housing Finance, Ser A, RB | ||||||||
| $ | 175 | 5.000%, 12/01/33 | $ | 197 | ||||
| Alaska State, Ser A, GO | ||||||||
| 525 | 5.000%, 08/01/34 | 606 | ||||||
|
|
|
|||||||
| 803 | ||||||||
|
|
|
|||||||
| California — 5.3% |
||||||||
| California State, GO | ||||||||
| 1,000 | 5.000%, 09/01/23 | 1,170 | ||||||
| 1,650 | 5.000%, 09/01/31 | 1,997 | ||||||
| 5 | 4.500%, 08/01/30 | 5 | ||||||
| Orange County, Water District, Ser A, RB | ||||||||
| 1,000 | 5.000%, 08/15/31 | 1,165 | ||||||
| Sacramento City, Unified School District, GO | ||||||||
| 500 | 5.000%, 07/01/23 | 581 | ||||||
| Sonoma County, Junior College District, GO | ||||||||
| 1,000 | 5.000%, 08/01/27 | 1,170 | ||||||
| University of California, Ser AF, RB | ||||||||
| 215 | 5.000%, 05/15/23, Pre-Refunded @ 100 (A) | 249 | ||||||
| 785 | 5.000%, 05/15/36 | 899 | ||||||
|
|
|
|||||||
| 7,236 | ||||||||
|
|
|
|||||||
| Florida — 0.1% |
||||||||
| Miami-Dade County, School Board, Ser D, COP | ||||||||
| 150 | 5.000%, 02/01/27 | 179 | ||||||
|
|
|
|||||||
| Hawaii — 82.9% |
||||||||
| Hawaii County, Ser A, GO | ||||||||
| 500 | 5.000%, 09/01/20 | 543 | ||||||
| 500 | 5.000%, 07/15/18, Pre-Refunded @ 100 (A) | 509 | ||||||
| 250 | 5.000%, 09/01/22 | 285 | ||||||
| 300 | 5.000%, 09/01/26 | 366 | ||||||
| 1,000 | 5.000%, 09/01/31 | 1,197 | ||||||
| 500 | 4.000%, 03/01/20, Pre-Refunded @ 100 (A) | 525 | ||||||
| 1,500 | 4.000%, 09/01/35 | 1,637 | ||||||
| Hawaii County, Ser B, GO | ||||||||
| 200 | 5.000%, 09/01/22 | 229 | ||||||
| Hawaii County, Ser D, GO | ||||||||
| 450 | 5.000%, 09/01/25 | 546 | ||||||
| Hawaii State, Airports System Authority, RB, AGM Insured | ||||||||
| 1,000 | 5.250%, 07/01/27 | 1,086 | ||||||
| Hawaii State, Airports System Authority, Ser A, RB | ||||||||
| 250 | 5.250%, 07/01/23 | 271 | ||||||
| Bishop Street Funds |
30
| Hawaii Municipal Bond Fund |
Schedule of Investments
(continued)
| Face Amount (000) |
Value (000) |
|||||||
| Hawaii — (continued) |
||||||||
| $ | 2,500 | 5.250%, 07/01/27 | $ | 2,712 | ||||
| 1,000 | 5.250%, 07/01/28 | 1,085 | ||||||
| 900 | 5.250%, 07/01/30 | 976 | ||||||
| 420 | 5.000%, 07/01/39 | 449 | ||||||
| 2,635 | 5.000%, 07/01/45 | 3,015 | ||||||
| Hawaii State, Airports System Authority, RB, AMT | ||||||||
| 2,000 | 5.000%, 07/01/24 | 2,202 | ||||||
| 1,000 | 4.125%, 07/01/24 | 1,048 | ||||||
| Hawaii State, Airports System Revenue, COP, AMT | ||||||||
| 500 | 5.250%, 08/01/25 | 578 | ||||||
| Hawaii State, Department of Budget & Finance, Mid Pacific Institute, RB, AGC Insured | ||||||||
| 920 | 5.000%, 01/01/26 | 921 | ||||||
| Hawaii State, Department of Budget & Finance, Pacific Health Project, Ser A, RB | ||||||||
| 425 | 6.000%, 07/01/33 | 502 | ||||||
| 710 | 4.625%, 07/01/21 | 759 | ||||||
| Hawaii State, Department of Budget & Finance, RB | ||||||||
| 325 | 5.125%, 07/01/31 | 368 | ||||||
| 500 | 4.000%, 03/01/37 | 522 | ||||||
| 350 | 3.250%, 01/01/25 | 364 | ||||||
| Hawaii State, Department of Budget & Finance, Ser 2009, RB | ||||||||
| 4,260 | 6.500%, 07/01/39 | 4,564 | ||||||
| Hawaii State, Department of Budget & Finance, Ser A, RB | ||||||||
| 100 | 5.000%, 07/01/22 | 113 | ||||||
| 575 | 5.000%, 07/01/26 | 659 | ||||||
| 1,800 | 5.000%, 07/01/27 | 2,134 | ||||||
| 525 | 5.000%, 07/01/30 | 615 | ||||||
| 3,500 | 5.000%, 07/01/35 | 4,043 | ||||||
| Hawaii State, Department of Budget & Finance, Ser B, RB | ||||||||
| 775 | 5.000%, 07/01/28 | 882 | ||||||
| Hawaii State, Department of Hawaiian Home Lands, Kapolie Office Facilities, Ser A, COP, AGM Insured | ||||||||
| 500 | 5.000%, 11/01/26 | 616 | ||||||
| Hawaii State, Department of Hawaiian Home Lands, RB | ||||||||
| 500 | 5.000%, 04/01/27 | 615 | ||||||
| Hawaii State, Department of Transportation, Airports Division Lease Revenue, COP, AMT | ||||||||
| 2,525 | 5.000%, 08/01/21 | 2,796 | ||||||
| 3,675 | 5.000%, 08/01/27 | 4,173 | ||||||
| 1,000 | 5.000%, 08/01/28 | 1,132 | ||||||
| December 31, 2017 | www.bishopstreetfunds.com |
31
| Hawaii Municipal Bond Fund |
Schedule of Investments
(continued)
| Face Amount (000) |
Value (000) |
|||||||
| Hawaii — (continued) |
||||||||
| Hawaii State, Harbor System Revenue, Ser A, RB | ||||||||
| $ | 220 | 5.000%, 07/01/25 | $ | 235 | ||||
| 1,125 | 4.250%, 07/01/21 | 1,186 | ||||||
| Hawaii State, Highway Authority, Ser A, RB | ||||||||
| 700 | 5.000%, 01/01/23 | 807 | ||||||
| 1,450 | 5.000%, 01/01/30 | 1,699 | ||||||
| 1,000 | 5.000%, 01/01/31 | 1,170 | ||||||
| 1,000 | 5.000%, 01/01/33 | 1,164 | ||||||
| Hawaii State, Housing Finance & Development, Kuhio Park Terrace Multi-Family Housing, Ser A, RB, FHLMC Insured | ||||||||
| 200 | 3.900%, 04/01/22 | 212 | ||||||
| 115 | 3.750%, 04/01/21 | 121 | ||||||
| 180 | 3.500%, 04/01/20 | 186 | ||||||
| Hawaii State, Housing Finance & Development, Rental Housing System, Ser B, RB, AGM Insured | ||||||||
| 2,000 | 6.500%, 07/01/33 | 2,098 | ||||||
| Hawaii State, Housing Finance & Development, Single-Family Housing, Ser B, RB, GNMA/FNMA/FHLMC Insured | ||||||||
| 445 | 3.450%, 01/01/22 | 460 | ||||||
| Hawaii State, Housing Finance & Development, Wilikina Apartments Project, Ser A, RB | ||||||||
| 1,000 | 5.000%, 05/01/34 | 1,025 | ||||||
| Hawaii State, Ser DQ, GO | ||||||||
| 35 | 5.000%, 06/01/19, Pre-Refunded @ 100 (A) | 37 | ||||||
| Hawaii State, Ser DR, GO | ||||||||
| 1,000 | 5.000%, 06/01/19 | 1,047 | ||||||
| Hawaii State, Ser DT, GO | ||||||||
| 270 | 5.000%, 11/01/19 | 286 | ||||||
| Hawaii State, Ser DY, GO | ||||||||
| 500 | 5.000%, 02/01/19 | 519 | ||||||
| Hawaii State, Ser DZ, GO | ||||||||
| 100 | 5.000%, 12/01/20 | 109 | ||||||
| 1,895 | 5.000%, 12/01/21, Pre-Refunded @ 100 (A) | 2,117 | ||||||
| Hawaii State, Ser EA, GO | ||||||||
| 935 | 5.000%, 12/01/21 | 1,049 | ||||||
| 1,700 | 5.000%, 12/01/22 | 1,915 | ||||||
| Hawaii State, Ser EE-2017, GO | ||||||||
| 315 | 5.000%, 11/01/27 | 362 | ||||||
| 85 | 5.000%, 11/01/22, Pre-Refunded @ 100 (A) | 97 | ||||||
| Hawaii State, Ser EF, GO | ||||||||
| 300 | 5.000%, 11/01/23 | 346 | ||||||
| Hawaii State, Ser EH, GO (D) | ||||||||
| 200 | 5.000%, 08/01/23 | 233 | ||||||
| Bishop Street Funds |
32
| Hawaii Municipal Bond Fund |
Schedule of Investments
(continued)
| Face Amount (000) |
Value (000) |
|||||||
| Hawaii — (continued) |
||||||||
| $ | 165 | 5.000%, 08/01/24 | $ | 193 | ||||
| 855 | 5.000%, 08/01/30 | 985 | ||||||
| 195 | 5.000%, 08/01/32 | 224 | ||||||
| 5 | 5.000%, 08/01/23, Pre-Refunded @ 100 (A) | 6 | ||||||
| Hawaii State, Ser EH-2017, GO (D) | ||||||||
| 85 | 5.000%, 08/01/23 | 99 | ||||||
| Hawaii State, Ser EO, GO | ||||||||
| 1,000 | 5.000%, 08/01/29 | 1,179 | ||||||
| 1,000 | 5.000%, 08/01/30 | 1,175 | ||||||
| 1,000 | 5.000%, 08/01/33 | 1,167 | ||||||
| Hawaii State, Ser EP, GO | ||||||||
| 1,000 | 5.000%, 08/01/22 | 1,140 | ||||||
| 325 | 5.000%, 08/01/26 | 385 | ||||||
| Hawaii State, Ser ET, GO | ||||||||
| 300 | 5.000%, 10/01/24 | 359 | ||||||
| Hawaii State, Ser EY, GO | ||||||||
| 140 | 5.000%, 10/01/26 | 170 | ||||||
| 1,000 | 5.000%, 10/01/27 | 1,210 | ||||||
| Hawaii State, Ser FE, GO | ||||||||
| 285 | 5.000%, 10/01/27 | 351 | ||||||
| Hawaii State, Ser FG, GO | ||||||||
| 500 | 4.000%, 10/01/36 | 547 | ||||||
| Hawaii State, Ser FK, GO | ||||||||
| 2,000 | 5.000%, 05/01/29 | 2,464 | ||||||
| Hawaii State, Ser FN, GO | ||||||||
| 1,000 | 5.000%, 10/01/23 | 1,172 | ||||||
| 500 | 5.000%, 10/01/24 | 598 | ||||||
| 85 | 5.000%, 10/01/30 | 105 | ||||||
| Honolulu Hawaii City & County, Board of Water Supply, Ser A, RB | ||||||||
| 1,050 | 5.000%, 07/01/19 | 1,102 | ||||||
| 600 | 5.000%, 07/01/23 | 685 | ||||||
| 400 | 5.000%, 07/01/24 | 475 | ||||||
| 600 | 5.000%, 07/01/27 | 707 | ||||||
| Honolulu Hawaii City & County, Ser A, GO (D) | ||||||||
| 275 | 5.250%, 08/01/31, Pre-Refunded @ 100 (A) | 308 | ||||||
| 700 | 5.000%, 10/01/19 | 740 | ||||||
| 680 | 5.000%, 11/01/21 | 763 | ||||||
| 500 | 5.000%, 11/01/22 | 573 | ||||||
| 500 | 5.000%, 11/01/22, Pre-Refunded @ 100 (A) | 573 | ||||||
| 725 | 5.000%, 09/01/27 | 906 | ||||||
| 1,000 | 5.000%, 10/01/27 | 1,211 | ||||||
| 325 | 5.000%, 10/01/29 | 390 | ||||||
| 225 | 5.000%, 10/01/39 | 264 | ||||||
| December 31, 2017 | www.bishopstreetfunds.com |
33
| Hawaii Municipal Bond Fund |
Schedule of Investments
(continued)
| Face Amount (000) |
Value (000) |
|||||||
| Hawaii — (continued) |
||||||||
| $ | 1,000 | 5.000%, 09/01/41 | $ | 1,200 | ||||
| 700 | 4.000%, 11/01/19 | 729 | ||||||
| 325 | 4.000%, 08/01/21, Pre-Refunded @ 100 (A) | 350 | ||||||
| 425 | 4.000%, 09/01/38 | 464 | ||||||
| Honolulu Hawaii City & County, Ser B, GO | ||||||||
| 375 | 5.000%, 08/01/21 | 418 | ||||||
| 350 | 5.000%, 08/01/22 | 389 | ||||||
| 1,200 | 5.000%, 11/01/24 | 1,376 | ||||||
| 300 | 5.000%, 08/01/26 | 333 | ||||||
| 1,525 | 5.000%, 10/01/26 | 1,849 | ||||||
| 500 | 4.000%, 10/01/19 | 520 | ||||||
| Honolulu Hawaii City & County, Ser C, GO | ||||||||
| 750 | 5.000%, 10/01/23 | 881 | ||||||
| 1,000 | 5.000%, 10/01/28 | 1,206 | ||||||
| Honolulu Hawaii City & County, Ser D, GO | ||||||||
| 400 | 5.250%, 09/01/19, Pre-Refunded @ 100 (A) | 424 | ||||||
| Honolulu Hawaii City & County, Ser E, GO | ||||||||
| 325 | 5.000%, 09/01/28 | 405 | ||||||
| Honolulu Hawaii City & County, Ser Junior A, RB | ||||||||
| 450 | 4.000%, 07/01/25 | 473 | ||||||
| Honolulu Hawaii City & County, Wastewater System Authority, Ser A, RB (D) | ||||||||
| 440 | 5.000%, 07/01/20 | 462 | ||||||
| 500 | 5.000%, 07/01/24 | 592 | ||||||
| 250 | 5.000%, 07/01/21, Pre-Refunded @ 100 (A) | 277 | ||||||
| 100 | 5.000%, 07/01/22, Pre-Refunded @ 100 (A) | 114 | ||||||
| 500 | 5.000%, 07/01/38 | 548 | ||||||
| Honolulu Hawaii City & County, Wastewater System Authority, Ser B, RB | ||||||||
| 1,575 | 5.000%, 07/01/23 | 1,831 | ||||||
| Honolulu Hawaii City & County, Wastewater System Revenue, Ser A, RB | ||||||||
| 500 | 5.000%, 07/01/36 | 593 | ||||||
| Kauai County, Ser A, GO | ||||||||
| 250 | 5.000%, 08/01/21 | 278 | ||||||
| 150 | 5.000%, 08/01/23 | 171 | ||||||
| 250 | 4.000%, 08/01/24 | 273 | ||||||
| 250 | 3.250%, 08/01/23 | 262 | ||||||
| Kauai County, Ser A, GO, NATL FGIC Insured | ||||||||
| 415 | 5.000%, 08/01/21 | 416 | ||||||
| Maui County, GO | ||||||||
| 250 | 5.000%, 06/01/20 | 270 | ||||||
| 150 | 5.000%, 06/01/21 | 166 | ||||||
| Bishop Street Funds |
34
| Hawaii Municipal Bond Fund |
Schedule of Investments
(continued)
| Face Amount (000) |
Value (000) |
|||||||
| Hawaii — (continued) |
||||||||
| Maui County, Ser B, GO | ||||||||
| $ | 500 | 4.000%, 06/01/21 | $ | 527 | ||||
| University of Hawaii, Ser A, RB, NATL Insured | ||||||||
| 350 | 3.500%, 07/15/28 | 350 | ||||||
| University of Hawaii, Ser A, RB | ||||||||
| 100 | 6.000%, 10/01/38 | 108 | ||||||
| University of Hawaii, Ser A-2, RB | ||||||||
| 1,030 | 4.000%, 10/01/18 | 1,049 | ||||||
| University of Hawaii, Ser B, RB | ||||||||
| 1,500 | 5.000%, 10/01/34 | 1,765 | ||||||
| 1,000 | 4.000%, 10/01/23 | 1,115 | ||||||
| University of Hawaii, Ser E, RB | ||||||||
| 1,400 | 5.000%, 10/01/25 | 1,700 | ||||||
| 1,350 | 5.000%, 10/01/32 | 1,618 | ||||||
| University of Hawaii, Ser F, RB | ||||||||
| 2,425 | 5.000%, 10/01/35 | 2,905 | ||||||
|
|
|
|||||||
| 114,150 | ||||||||
|
|
|
|||||||
| Illinois — 0.1% |
||||||||
| Lake County, Community Consolidated School District No. 102 Aptakisic-Tripp, GO | ||||||||
| 200 | 3.250%, 11/01/33 | 206 | ||||||
|
|
|
|||||||
| Indiana — 0.1% |
||||||||
| Indiana State, Housing & Community Development Authority, Ser C, RB, GNMA/FNMA/FHLMC Insured | ||||||||
| 70 | 4.100%, 06/01/27 | 73 | ||||||
|
|
|
|||||||
| Maine — 0.6% |
||||||||
| Maine State, Health & Higher Educational Facilities Authority, Ser A, RB | ||||||||
| 750 | 5.250%, 07/01/31 | 806 | ||||||
|
|
|
|||||||
| Maryland — 0.4% |
||||||||
| Maryland State, GO | ||||||||
| 575 | 5.000%, 03/01/22 | 616 | ||||||
|
|
|
|||||||
| Mississippi — 0.3% |
||||||||
| Southaven, Water & Sewer System Revenue, RB | ||||||||
| 370 | 5.000%, 02/01/26 | 444 | ||||||
|
|
|
|||||||
| New York — 1.5% |
||||||||
| New York & New Jersey, Port Authority, RB | ||||||||
| 350 | 5.000%, 11/15/47 | 419 | ||||||
| New York City, Trust for Cultural Resources, Ser S, RB | ||||||||
| 1,000 | 5.000%, 07/01/41 | 1,163 | ||||||
| December 31, 2017 | www.bishopstreetfunds.com |
35
| Hawaii Municipal Bond Fund |
Schedule of Investments
(continued)
| Face Amount (000) |
Value (000) |
|||||||
| New York — (continued) |
||||||||
| New York, Ser H, GO | ||||||||
| $ | 500 | 5.000%, 08/01/20 | $ | 542 | ||||
|
|
|
|||||||
| 2,124 | ||||||||
|
|
|
|||||||
| Ohio — 1.1% |
||||||||
| Akron, Income Tax Revenue, RB | ||||||||
| 1,000 | 5.000%, 12/01/33 | 1,135 | ||||||
| Ohio State, Ser 2011-B, GO | ||||||||
| 300 | 5.000%, 08/01/22 | 343 | ||||||
|
|
|
|||||||
| 1,478 | ||||||||
|
|
|
|||||||
| Oklahoma — 0.5% |
||||||||
| Oklahoma City, Water Utilities Trust, RB | ||||||||
| 125 | 5.000%, 07/01/40 | 137 | ||||||
| Tulsa County, Industrial Authority, RB | ||||||||
| 500 | 5.000%, 09/01/26 | 598 | ||||||
|
|
|
|||||||
| 735 | ||||||||
|
|
|
|||||||
| Oregon — 0.9% |
||||||||
| Clackamas County, School District No. 12, Ser B, GO, SCH BD GTY Insured | ||||||||
| 1,000 | 5.000%, 06/15/37 | 1,201 | ||||||
|
|
|
|||||||
| Tennessee — 0.4% |
||||||||
| Memphis, Ser A, GO | ||||||||
| 500 | 5.000%, 04/01/26 | 598 | ||||||
|
|
|
|||||||
| Texas — 2.3% |
||||||||
| Arlington, Higher Education Finance, Ser 2014-A, RB, PSF-GTD Insured | ||||||||
| 750 | 5.000%, 08/15/27 | 869 | ||||||
| Clifton, Higher Education Finance, Ser 2014, RB, PSF-GTD Insured | ||||||||
| 500 | 5.000%, 08/15/26 | 589 | ||||||
| Mesquite, Refinance & Improvements, GO | ||||||||
| 1,000 | 5.000%, 02/15/27 | 1,191 | ||||||
| Midland County, Fresh Water Supply District No. 1, Ser A, RB (B) | ||||||||
| 1,000 | 4.789%, 09/15/37 (B) | 455 | ||||||
|
|
|
|||||||
| 3,104 | ||||||||
|
|
|
|||||||
| Utah — 0.2% |
||||||||
| Central Utah, Water Conservancy District, Ser B, GO | ||||||||
| 200 | 5.250%, 04/01/23 | 222 | ||||||
|
|
|
|||||||
| Bishop Street Funds |
36
| Hawaii Municipal Bond Fund |
Schedule of Investments
(continued)
| Face Amount (000)/Shares |
Value (000) |
|||||||
| Washington — 0.9% |
||||||||
| Port of Seattle Washington, Ser A, RB | ||||||||
| $ | 750 | 5.000%, 08/01/26 | $ | 845 | ||||
| Washington State, Housing Finance Commission, RB, FANNIE MAE Insured | ||||||||
| 300 | 4.750%, 07/15/29 | 331 | ||||||
|
|
|
|||||||
| 1,176 | ||||||||
|
|
|
|||||||
| TOTAL MUNICIPAL BONDS (Cost $133,731) | 135,405 | |||||||
|
|
|
|||||||
| CASH EQUIVALENT — 0.3% | ||||||||
| 372,806 | BlackRock FedFund, Institutional Shares, 1.170% (C) (Cost $373) | 373 | ||||||
|
|
|
|||||||
| TOTAL INVESTMENTS (Cost $134,104) — 98.7% | $ | 135,778 | ||||||
|
|
|
|||||||
Percentages are based on Net Assets of $137,620 (000).
| (A) | Pre-Refunded Security — The maturity date shown is the pre-refunded date. |
| (B) | Zero coupon security. The rate reported on the Schedule of Investments is the effective yield at time of purchase. |
| (C) | The rate reported is the 7-day effective yield as of December 31, 2017. |
| (D) | Security is escrowed to maturity. |
AGC — American Guarantee Corporation
AGM — Assured Guaranty Municipal Corp.
AMT — Alternative Minimum Tax
COP — Certificate of Participation
FGIC — Financial Guarantee Insurance Corporation
FHLMC — Federal Home Loan Mortgage Corporation
FNMA — Federal National Mortgage Corporation
GNMA — Government National Mortgage Corporation
GO — General Obligation
NATL — National Public Finance Guarantee Corporation
PSF-GTD — Guaranteed by Permanent School Fund
RB — Revenue Bond
SCH BD GTY — School Board Guaranteed
Ser — Series
Cost figures are shown in thousands.
| December 31, 2017 | www.bishopstreetfunds.com |
37
| Hawaii Municipal Bond Fund |
Schedule of Investments
(concluded)
The following is a summary of the inputs used as of December 31, 2017, in valuing the Fund’s investments carried at value (000):
| Hawaii Municipal Bond Fund | ||||||||||||||||
| Investments in Securities | Level 1 | Level 2 | Level 3 | Total | ||||||||||||
| Municipal Bonds |
$ | — | $ | 135,405 | $ | — | $ | 135,405 | ||||||||
| Cash Equivalent |
373 | — | — | 373 | ||||||||||||
|
|
|
|||||||||||||||
| Total Investments in Securities |
$ | 373 | $ | 135,405 | $ | — | $ | 135,778 | ||||||||
|
|
|
|||||||||||||||
For the year ended December 31, 2017, there have been no transfers between Level 1, Level 2 and Level 3 assets and liabilities. Transfers, if any, between levels are considered to have occurred at the end of the period.
There were no Level 3 investments during the year ended December 31, 2017.
Amounts designated as “—” are $0.
The accompanying notes are an integral part of the financial statements.
| Bishop Street Funds |
38
| Bishop Street Funds |
Statements of Assets and Liabilities (000)
December 31, 2017
| Dividend Value Fund |
High Grade Income Fund |
Hawaii Municipal Bond Fund |
||||||||||
| Assets: |
||||||||||||
| Investments, at Cost |
$ | 26,690 | $ | 49,369 | $ | 134,104 | ||||||
|
|
||||||||||||
| Investments, at Value |
$ | 42,175 | $ | 50,348 | $ | 135,778 | ||||||
| Cash |
2 | 10 | — | |||||||||
| Dividends and Interest Receivable |
68 | 416 | 2,150 | |||||||||
| Reclaim Receivable |
1 | 1 | — | |||||||||
| Receivable for Fund Shares Sold |
— | — | 6 | |||||||||
| Prepaid Expenses |
2 | 11 | 8 | |||||||||
|
|
||||||||||||
| Total Assets |
42,248 | 50,786 | 137,942 | |||||||||
|
|
||||||||||||
| Liabilities: |
||||||||||||
| Advisory Fees Payable |
20 | 12 | 17 | |||||||||
| Administrative Fees Payable |
5 | 5 | 9 | |||||||||
| Shareholder Servicing Fees Payable |
4 | 4 | 12 | |||||||||
| Chief Compliance Officer Fees Payable |
1 | 1 | 2 | |||||||||
| Income Distribution Payable |
— | 36 | 210 | |||||||||
| Payable for Fund Shares Redeemed |
— | 7 | — | |||||||||
| Other Accrued Expenses Payable |
22 | 28 | 72 | |||||||||
|
|
||||||||||||
| Total Liabilities |
52 | 93 | 322 | |||||||||
|
|
||||||||||||
| Net Assets |
$ | 42,196 | $ | 50,693 | $ | 137,620 | ||||||
|
|
||||||||||||
| Paid-in Capital |
$ | 25,920 | $ | 49,683 | $ | 135,868 | ||||||
| Undistributed Net Investment Income |
5 | 1 | 68 | |||||||||
| Accumulated Net Realized Gain on Investments |
786 | 30 | 10 | |||||||||
| Net Unrealized Appreciation on Investments |
15,485 | 979 | 1,674 | |||||||||
|
|
||||||||||||
| Net Assets |
$ | 42,196 | $ | 50,693 | $ | 137,620 | ||||||
|
|
||||||||||||
| Class I Shares: |
||||||||||||
| Net Assets |
$ | 42,196 | $ | 50,693 | $ | 117,285 | ||||||
| Outstanding Shares of Beneficial Interest |
2,630 | 5,257 | 11,080 | |||||||||
| Net Asset Value, Offering and Redemption Price Per Share — Class I (Net Assets / Shares Outstanding) |
$ | 16.05 | * | $ | 9.64 | $ | 10.58 | * | ||||
|
|
||||||||||||
| Class A Shares: |
||||||||||||
| Net Assets |
N/A | N/A | $ | 20,335 | ||||||||
| Outstanding Shares of Beneficial Interest |
N/A | N/A | 1,921 | |||||||||
| Net Asset Value, Offering and Redemption Price Per Share — Class A (Net Assets / Shares Outstanding) |
N/A | N/A | $ | 10.58 | * | |||||||
|
|
||||||||||||
| Maximum Offering Price Per Shares — Class A ($10.58/ 97.00%) |
N/A | N/A | $ | 10.91 | ||||||||
|
|
||||||||||||
| * | Difference in net asset value recalculation and net asset value stated is caused by rounding differences. |
N/A – Not Applicable. Share class currently not offered.
Amounts designated as “—” are either $0 or have been rounded to $0.
The accompanying notes are an integral part of the financial statements.
| December 31, 2017 | www.bishopstreetfunds.com |
39
| Bishop Street Funds |
Statements of Operations (000)
For the year ended December 31, 2017
| Dividend Value Fund |
High Grade Income Fund |
Hawaii Municipal Bond Fund |
||||||||||
| Investment Income: |
||||||||||||
| Dividend Income |
$ | 1,081 | $ | — | $ | — | ||||||
| Interest Income |
— | 1,749 | 4,120 | |||||||||
|
|
||||||||||||
| Total Investment Income |
1,081 | 1,749 | 4,120 | |||||||||
|
|
||||||||||||
| Expenses: |
||||||||||||
| Investment Adviser Fees |
308 | 314 | 490 | |||||||||
| Shareholder Servicing Fees |
104 | 143 | 350 | |||||||||
| Administrative Fees |
83 | 114 | 280 | |||||||||
| Chief Compliance Officer Fees |
3 | 4 | 9 | |||||||||
| Distribution Fees, Class A |
— | — | 53 | |||||||||
| Transfer Agent Fees |
43 | 49 | 104 | |||||||||
| Audit Fees |
16 | 19 | 52 | |||||||||
| Printing Fees |
13 | 18 | 44 | |||||||||
| Legal Fees |
11 | 15 | 36 | |||||||||
| Trustees’ Fees |
8 | 12 | 28 | |||||||||
| Custody Fees |
5 | 5 | 7 | |||||||||
| Pricing Fees |
4 | 12 | 26 | |||||||||
| Registration Fees |
2 | 22 | 11 | |||||||||
| Miscellaneous Expenses |
6 | 8 | 20 | |||||||||
|
|
||||||||||||
| Total Expenses |
606 | 735 | 1,510 | |||||||||
|
|
||||||||||||
| Less Waivers: |
||||||||||||
| Investment Adviser Fees |
(87 | ) | (186 | ) | (338 | ) | ||||||
| Shareholder Servicing Fees |
(62 | ) | (86 | ) | (210 | ) | ||||||
| Administrative Fees |
(21 | ) | (28 | ) | (139 | ) | ||||||
|
|
||||||||||||
| Total Waivers |
(170 | ) | (300 | ) | (687 | ) | ||||||
|
|
||||||||||||
| Total Net Expenses |
436 | 435 | 823 | |||||||||
|
|
||||||||||||
| Net Investment Income |
645 | 1,314 | 3,297 | |||||||||
|
|
||||||||||||
| Net Realized Gain on Investments |
2,805 | 566 | 133 | |||||||||
| Net Change in Unrealized Appreciation on Investments |
4,259 | 161 | 1,756 | |||||||||
|
|
||||||||||||
| Net Realized and Unrealized Gain on Investments |
7,064 | 727 | 1,889 | |||||||||
|
|
||||||||||||
| Increase in Net Assets Resulting from Operations |
$ | 7,709 | $ | 2,041 | $ | 5,186 | ||||||
|
|
||||||||||||
Amounts designated as “—” are either $0 or have been rounded to $0.
The accompanying notes are an integral part of the financial statements.
| Bishop Street Funds |
40
| Bishop Street Funds |
Statements of Changes in Net Assets (000)
For the years ended December 31,
| Dividend Value Fund |
High Grade Income Fund |
|||||||||||||||
| 2017 | 2016 | 2017 | 2016 | |||||||||||||
| Investment Activities from Operations: |
||||||||||||||||
| Net Investment Income |
$ | 645 | $ | 741 | $ | 1,314 | $ | 1,504 | ||||||||
| Net Realized Gain on Investments |
2,805 | 5,496 | 566 | 600 | ||||||||||||
| Net Change in Unrealized Appreciation (Depreciation) on Investments |
4,259 | (860 | ) | 161 | (692 | ) | ||||||||||
|
|
||||||||||||||||
| Increase in Net Assets Resulting from Operations |
7,709 | 5,377 | 2,041 | 1,412 | ||||||||||||
|
|
||||||||||||||||
| Dividends and Distributions to Shareholders: |
||||||||||||||||
| Net Investment Income: |
||||||||||||||||
| Class I Shares |
(646 | ) | (746 | ) | (1,292 | ) | (1,478 | ) | ||||||||
| Capital Gains: |
||||||||||||||||
| Class I Shares |
(3,422 | ) | (694 | ) | (681 | ) | (514 | ) | ||||||||
|
|
||||||||||||||||
| Total Dividends and Distributions to Shareholders |
(4,068 | ) | (1,440 | ) | (1,973 | ) | (1,992 | ) | ||||||||
|
|
||||||||||||||||
| Capital Share Transactions: |
||||||||||||||||
| Proceeds from Shares Issued |
740 | 102 | 2,889 | 3,317 | ||||||||||||
| Reinvestments of Cash Distributions |
2,425 | 873 | 1,278 | 1,374 | ||||||||||||
| Cost of Shares Redeemed |
(4,252 | ) | (11,516 | ) | (14,746 | ) | (15,158 | ) | ||||||||
|
|
||||||||||||||||
| Net Decrease in Net Assets from Capital Share Transactions |
(1,087 | ) | (10,541 | ) | (10,579 | ) | (10,467 | ) | ||||||||
|
|
||||||||||||||||
| Total Increase (Decrease) in Net Assets |
2,554 | (6,604 | ) | (10,511 | ) | (11,047 | ) | |||||||||
|
|
||||||||||||||||
| Net Assets: |
||||||||||||||||
| Beginning of Year |
39,642 | 46,246 | 61,204 | 72,251 | ||||||||||||
|
|
||||||||||||||||
| End of Period |
$ | 42,196 | $ | 39,642 | $ | 50,693 | $ | 61,204 | ||||||||
|
|
||||||||||||||||
| Undistributed Net Investment Income |
$ | 5 | $ | 1 | $ | 1 | $ | 1 | ||||||||
|
|
||||||||||||||||
| Share Transactions: |
||||||||||||||||
| Shares Issued |
48 | 7 | 297 | 330 | ||||||||||||
| Shares Issued in Lieu of Cash Distributions |
153 | 60 | 131 | 139 | ||||||||||||
| Shares Redeemed |
(268 | ) | (808 | ) | (1,512 | ) | (1,499 | ) | ||||||||
|
|
||||||||||||||||
| Net Decrease in Shares Outstanding from Share Transactions |
(67 | ) | (741 | ) | (1,084 | ) | (1,030 | ) | ||||||||
|
|
||||||||||||||||
The accompanying notes are an integral part of the financial statements.
| December 31, 2017 | www.bishopstreetfunds.com |
41
| Bishop Street Funds |
Statements of Changes in Net Assets (000)
For the years ended December 31,
| Hawaii Municipal Bond Fund |
||||||||
| 2017 | 2016 | |||||||
| Investment Activities from Operations: |
||||||||
| Net Investment Income |
$ | 3,297 | $ | 3,621 | ||||
| Net Realized Gain on Investments |
133 | 578 | ||||||
| Net Change in Unrealized Appreciation (Depreciation) on Investments |
1,756 | (4,551 | ) | |||||
|
|
||||||||
| Increase (Decrease) in Net Assets Resulting from Operations |
5,186 | (352 | ) | |||||
|
|
||||||||
| Dividends and Distributions to Shareholders: |
||||||||
| Net Investment Income: |
||||||||
| Class I Shares |
(2,830 | ) | (3,091 | ) | ||||
| Class A Shares |
(448 | ) | (508 | ) | ||||
| Capital Gains: |
||||||||
| Class I Shares |
(69 | ) | (658 | ) | ||||
| Class A Shares |
(12 | ) | (121 | ) | ||||
|
|
||||||||
| Total Dividends and Distributions to Shareholders |
(3,359 | ) | (4,378 | ) | ||||
|
|
||||||||
| Capital Share Transactions: |
||||||||
| Class I Shares: |
||||||||
| Proceeds from Shares Issued |
8,926 | 9,032 | ||||||
| Reinvestments of Cash Distributions |
427 | 572 | ||||||
| Cost of Shares Redeemed |
(14,503 | ) | (12,434 | ) | ||||
|
|
||||||||
| Total Class I Capital Share Transactions |
(5,150 | ) | (2,830 | ) | ||||
|
|
||||||||
| Class A Shares: |
||||||||
| Proceeds from Shares Issued |
775 | 1,745 | ||||||
| Reinvestments of Cash Distributions |
326 | 483 | ||||||
| Cost of Shares Redeemed |
(3,426 | ) | (2,071 | ) | ||||
|
|
||||||||
| Total Class A Capital Share Transactions |
(2,325 | ) | 157 | |||||
|
|
||||||||
| Net Decrease in Net Assets from Capital Share Transactions |
(7,475 | ) | (2,673 | ) | ||||
|
|
||||||||
| Total Decrease in Net Assets |
(5,648 | ) | (7,403 | ) | ||||
|
|
||||||||
| Net Assets: |
||||||||
| Beginning of Year |
143,268 | 150,671 | ||||||
|
|
||||||||
| End of Year |
$ | 137,620 | $ | 143,268 | ||||
|
|
||||||||
| Undistributed Net Investment Income |
$ | 68 | $ | 49 | ||||
|
|
||||||||
| Share Transactions: |
||||||||
| Class I Shares: |
||||||||
| Shares Issued |
841 | 825 | ||||||
| Shares Issued in Lieu of Cash Distributions |
40 | 53 | ||||||
| Shares Redeemed |
(1,368 | ) | (1,139 | ) | ||||
|
|
||||||||
| Total Class I Transactions |
(487 | ) | (261 | ) | ||||
|
|
||||||||
| Class A Shares: |
||||||||
| Shares Issued |
73 | 160 | ||||||
| Shares Issued in Lieu of Cash Distributions |
31 | 45 | ||||||
| Shares Redeemed |
(324 | ) | (191 | ) | ||||
|
|
||||||||
| Total Class A Transactions |
(220 | ) | 14 | |||||
|
|
||||||||
| Net Decrease in Shares Outstanding from Share Transactions |
(707 | ) | (247 | ) | ||||
|
|
||||||||
The accompanying notes are an integral part of the financial statements.
| Bishop Street Funds |
42
This page intentionally left blank.
| Bishop Street Funds |
Financial Highlights
For a share outstanding throughout the period ended December 31,
| Investment Activities | Total Investment Activities from Operations |
Dividends and Distributions from |
Net Asset Value, End of Period | |||||||||||||||||||||||||||||||||||||
| Net Asset Value, Beginning of Period |
Net Investment Income (Loss)(1) |
Net Realized and Unrealized Gain(Loss) on Investments |
Net Investment Income |
Capital Gains |
Total Dividends and Distributions |
|||||||||||||||||||||||||||||||||||
| DIVIDEND VALUE FUND | ||||||||||||||||||||||||||||||||||||||||
|
Class I Shares: |
|
|||||||||||||||||||||||||||||||||||||||
| 2017 |
$ | 14.70 | $ | 0.24 | $ | 2.69 | $ | 2.93 | $ | (0.24 | ) | $ | (1.34 | ) | $ | (1.58 | ) | $ | 16.05 | |||||||||||||||||||||
| 2016 |
13.45 | 0.24 | 1.52 | 1.76 | (0.25 | ) | (0.26 | ) | (0.51 | ) | 14.70 | |||||||||||||||||||||||||||||
| 2015 |
13.62 | 0.22 | (0.17 | ) | 0.05 | (0.22 | ) | — | (0.22 | ) | 13.45 | |||||||||||||||||||||||||||||
| 2014 |
12.43 | 0.29 | 1.20 | 1.49 | (0.30 | ) | — | (0.30 | ) | 13.62 | ||||||||||||||||||||||||||||||
| 2013 |
9.83 | 0.21 | 2.61 | 2.82 | (0.22 | ) | — | (0.22 | ) | 12.43 | ||||||||||||||||||||||||||||||
| HIGH GRADE INCOME FUND |
||||||||||||||||||||||||||||||||||||||||
|
Class I Shares: |
|
|||||||||||||||||||||||||||||||||||||||
| 2017 |
$ | 9.65 | $ | 0.22 | $ | 0.12 | $ | 0.34 | $ | (0.22 | ) | $ | (0.13 | ) | $ | (0.35 | ) | $ | 9.64 | |||||||||||||||||||||
| 2016 |
9.80 | 0.22 | (0.07 | ) | 0.15 | (0.22 | ) | (0.08 | ) | (0.30 | ) | 9.65 | ||||||||||||||||||||||||||||
| 2015 |
10.05 | 0.23 | (0.19 | ) | 0.04 | (0.23 | ) | (0.06 | ) | (0.29 | ) | 9.80 | ||||||||||||||||||||||||||||
| 2014 |
9.78 | 0.23 | 0.33 | 0.56 | (0.23 | ) | (0.06 | ) | (0.29 | ) | 10.05 | |||||||||||||||||||||||||||||
| 2013 |
10.51 | 0.22 | (0.50 | ) | (0.28 | ) | (0.22 | ) | (0.23 | ) | (0.45 | ) | 9.78 | |||||||||||||||||||||||||||
| (1) | Per share net investment income calculated using average shares. |
| † | Total return is for the period indicated and has not been annualized. Returns shown do not reflect the deduction of taxes that a shareholder would pay on Fund distributions or the redemption of Fund shares. Fee waivers are in effect; if they had not been in effect, performance would have been lower. |
Amounts designated as “—” are either $0 or have been rounded to $0.
| Bishop Street Funds |
44
| Total Return† |
Net Assets End of Period (000) |
Ratio of Expenses to Average Net Assets |
Ratio of Expenses to Average Net Assets (Excluding Waivers) |
Ratio of Net Investments Income (Loss) to Average Net Assets |
Portfolio Turnover Rate | ||||||||||||||||||||||||
| 20.47 | % | $ | 42,196 | 1.05 | % | 1.46 | % | 1.55 | % | 11 | % | ||||||||||||||||||
| 13.16 | 39,642 | 1.05 | 1.43 | 1.70 | 17 | ||||||||||||||||||||||||
| 0.44 | 46,246 | 1.05 | 1.38 | 1.62 | 24 | ||||||||||||||||||||||||
| 12.08 | 55,665 | 1.05 | 1.37 | 2.27 | 21 | ||||||||||||||||||||||||
| 28.84 | 61,460 | 1.05 | 1.38 | 1.87 | 13 | ||||||||||||||||||||||||
| 3.56 | % | $ | 50,693 | 0.76 | % | 1.29 | % | 2.30 | % | 33 | % | ||||||||||||||||||
| 1.47 | 61,204 | 0.76 | 1.25 | 2.20 | 27 | ||||||||||||||||||||||||
| 0.37 | 72,251 | 0.76 | 1.21 | 2.31 | 24 | ||||||||||||||||||||||||
| 5.77 | 74,642 | 0.76 | 1.20 | 2.32 | 28 | ||||||||||||||||||||||||
| (2.69 | ) | 74,007 | 0.76 | 1.21 | 2.18 | 35 | |||||||||||||||||||||||
The accompanying notes are an integral part of the financial statements.
| December 31, 2017 | www.bishopstreetfunds.com |
45
| Bishop Street Funds |
Financial Highlights
For a share outstanding throughout the period ended December 31,
| Investment Activities | Total Investment Activities from Operations |
Dividends and Distributions from |
||||||||||||||||||||||||||||||||||||||
| Net Asset Value, Beginning of Period |
Net Investment Income (Loss)(1) |
Net Realized and Unrealized Gain(Loss) on Investments |
Net Investment Income |
Capital Gains |
Total Dividends and Distributions |
Net Asset Value, End of Period | ||||||||||||||||||||||||||||||||||
| HAWAII MUNICIPAL BOND FUND |
||||||||||||||||||||||||||||||||||||||||
|
Class I Shares: |
|
|||||||||||||||||||||||||||||||||||||||
| 2017 |
$ | 10.45 | $ | 0.25 | $ | 0.14 | $ | 0.39 | $ | (0.25 | ) | $ | (0.01 | ) | $ | (0.26 | ) | $ | 10.58 | |||||||||||||||||||||
| 2016 |
10.80 | 0.27 | (0.30 | ) | (0.03 | ) | (0.26 | ) | (0.06 | ) | (0.32 | ) | 10.45 | |||||||||||||||||||||||||||
| 2015 |
10.88 | 0.29 | (0.01 | ) | 0.28 | (0.29 | ) | (0.07 | ) | (0.36 | ) | 10.80 | ||||||||||||||||||||||||||||
| 2014 |
10.52 | 0.29 | 0.38 | 0.67 | (0.29 | ) | (0.02 | ) | (0.31 | ) | 10.88 | |||||||||||||||||||||||||||||
| 2013 |
11.13 | 0.29 | (0.57 | ) | (0.28 | ) | (0.29 | ) | (0.04 | ) | (0.33 | ) | 10.52 | |||||||||||||||||||||||||||
| Class A Shares: |
|
|||||||||||||||||||||||||||||||||||||||
| 2017 |
$ | 10.45 | $ | 0.23 | $ | 0.13 | $ | 0.36 | $ | (0.22 | ) | $ | (0.01 | ) | $ | (0.23 | ) | $ | 10.58 | |||||||||||||||||||||
| 2016 |
10.80 | 0.24 | (0.29 | ) | (0.05 | ) | (0.24 | ) | (0.06 | ) | (0.30 | ) | 10.45 | |||||||||||||||||||||||||||
| 2015 |
10.88 | 0.26 | (0.01 | ) | 0.25 | (0.26 | ) | (0.07 | ) | (0.33 | ) | 10.80 | ||||||||||||||||||||||||||||
| 2014 |
10.52 | 0.26 | 0.38 | 0.64 | (0.26 | ) | (0.02 | ) | (0.28 | ) | 10.88 | |||||||||||||||||||||||||||||
| 2013 |
11.13 | 0.27 | (0.57 | ) | (0.30 | ) | (0.27 | ) | (0.04 | ) | (0.31 | ) | 10.52 | |||||||||||||||||||||||||||
| (1) | Per share net investment income calculated using average shares. |
| † | Total return is for the period indicated and has not been annualized. Returns shown do not reflect the deduction of taxes that a shareholder would pay on Fund distributions or the redemption of Fund shares. Fee waivers are in effect; if they had not been in effect, performance would have been lower. |
| Bishop Street Funds |
46
| Total Return† |
Net Assets End of Period (000) |
Ratio of Expenses to Average Net Assets |
Ratio of Expenses to Average Net Assets (Excluding Waivers) |
Ratio of Net Investments Income (Loss) to Average Net Assets |
Portfolio Turnover Rate | |||||||||||||||||||||||
| 3.74 | % | $ | 117,285 | 0.55 | % | 1.04 | % | 2.39 | % | 25 | % | |||||||||||||||||
| (0.32 | ) | 120,894 | 0.55 | 1.02 | 2.45 | 26 | ||||||||||||||||||||||
| 2.61 | 127,712 | 0.55 | 0.98 | 2.64 | 28 | |||||||||||||||||||||||
| 6.36 | 132,540 | 0.55 | 0.99 | 2.66 | 27 | |||||||||||||||||||||||
| (2.47 | ) | 126,289 | 0.55 | 1.01 | 2.72 | 29 | ||||||||||||||||||||||
| 3.46 | % | $ | 20,335 | 0.80 | % | 1.29 | % | 2.14 | % | 25 | % | |||||||||||||||||
| (0.57 | ) | 22,374 | 0.80 | 1.27 | 2.20 | 26 | ||||||||||||||||||||||
| 2.36 | 22,959 | 0.80 | 1.23 | 2.39 | 28 | |||||||||||||||||||||||
| 6.10 | 22,324 | 0.80 | 1.24 | 2.41 | 27 | |||||||||||||||||||||||
| (2.72 | ) | 24,359 | 0.80 | 1.26 | 2.47 | 29 | ||||||||||||||||||||||
The accompanying notes are an integral part of the financial statements.
| December 31, 2017 | www.bishopstreetfunds.com |
47
| Bishop Street Funds |
Notes to Financial Statements
December 31, 2017
The amounts included in the Notes to Financial Statements are in thousands unless otherwise noted.
| 1. | ORGANIZATION |
The Bishop Street Funds (the “Trust”) are registered under the Investment Company Act of 1940, as amended, as an open-end, management investment company. The Bishop Street Funds consist of a series of three funds (each a Fund, collectively the “Funds”) which includes Dividend Value Fund, High Grade Income Fund, and the Hawaii Municipal Bond Fund. Each Fund is diversified, with the exception of Hawaii Municipal Bond Fund, which is non-diversified. Class A Shares of the Hawaii Municipal Bond Fund are subject to a sales load as disclosed in the prospectus. The assets of each Fund are segregated, and a shareholder’s interest is limited to the Fund in which shares are held. The Funds’ prospectus provides a description of each Fund’s investment objectives, policies and strategies. On April 7, 2017, the Bishop Street Strategic Growth Fund ceased operations and liquidated all remaining assets on a pro rata basis to the shareholders. In addition, on November 15, 2017, the Bishop Street Short Duration Bond Fund ceased operations and liquidated all remaining assets on a pro rata basis to the shareholders.
| 2. | SIGNIFICANT ACCOUNTING POLICIES |
The following are significant accounting policies, which are consistently followed in the preparation of the financial statements of the Funds. The Funds are investment companies that apply the accounting and reporting guidance issued in Topic 946 by the U.S. Financial Accounting Standards Board (“FASB”).
Use of Estimates in the Preparation of Financial Statements
The preparation of financial statements in conformity with U.S. GAAP requires management to make estimates and assumptions that affect the fair value of assets, the reported amount of assets and liabilities and disclosure of contingent assets and liabilities at the date of the financial statements and the reported amounts of increases and decreases in net assets from operations during the reporting period. Actual results could differ from those estimates and such differences could be material.
Security Valuation
The Funds’ investments in equity securities listed on a securities exchange, market or automated quotation system for which quotations are readily available (except for securities traded on NASDAQ) including securities traded over the counter, are valued at the last quoted sale price on an exchange or market (foreign or domestic) on which they are traded on valuation date (or at approximately 4:00 pm ET if a security’s primary exchange is normally open at that time), or, if there is no such reported sale on the valuation date, at the most recent quoted bid price. For securities traded on NASDAQ, the NASDAQ Official Closing Price will be used. Debt securities are priced based upon valuations provided by independent, third-party pricing agents, if available.
| Bishop Street Funds |
48
Such values generally reflect the last reported sales price in the most advantageous market, if the security is actively traded. The third-party pricing agents may also value debt securities at an evaluated bid price by employing methodologies that utilize actual market transactions, broker-supplied valuations, or other methodologies designed to identify the fair value for such securities. Such methodologies typically include matrix systems which reflect such factors as security prices, yields, maturities and ratings. Debt obligations with remaining maturities of sixty days or less may be valued at their amortized cost, which approximates market value provided that it is determined the amortized cost continues to approximate fair value. Should existing credit, liquidity or interest rate conditions in the relevant markets and issuer specific circumstances suggest that amortized cost does not approximate fair value, then the amortized cost method may not be used. Prices for most securities held in the Funds are provided daily by recognized independent pricing agents.
If a security price cannot be obtained from an independent, third-party pricing agent, the Funds seek to obtain a bid price from at least one independent broker.
Securities for which market prices are not “readily available” are valued in accordance with Fair Value Procedures established by the Funds’ Board of Trustees (the “Board”). The Funds’ Fair Value Procedures are implemented through a Fair Value Pricing Committee (the “Committee”) designated by the Funds’ Board. Some of the more common reasons that may necessitate that a security be valued using Fair Value Procedures include: the security’s trading has been halted or suspended; the security has been delisted from a national exchange; the security’s primary trading market is temporarily closed at a time when under normal conditions it would be open; or the security’s primary pricing source is not able or willing to provide a price. When a security is valued in accordance with the Fair Value Procedures, the Committee will determine the value after taking into consideration relevant information reasonably available to the Committee.
In accordance with the authoritative guidance on fair value measurement under U.S. GAAP, the Funds disclose fair value of their investments in a hierarchy that prioritizes the inputs to valuation techniques used to measure the fair value. The objective of a fair value measurement is to determine the price that would be received to sell an asset or paid to transfer a liability in an orderly transaction between market participants at the measurement date (an exit price). Accordingly, the fair value hierarchy gives the highest priority to quoted prices (unadjusted) in active markets for identical assets or liabilities (Level 1) and the lowest priority to unobservable inputs (Level 3). The three levels of the fair value hierarchy are described below:
| • | Level 1 — Unadjusted quoted prices in active markets for identical, unrestricted assets or liabilities that the Funds have the ability to access at the measurement date; |
| December 31, 2017 | www.bishopstreetfunds.com |
49
| Bishop Street Funds |
| • | Level 2 — Other significant observable inputs (including quoted prices for similar securities, interest rates, prepayment speeds, credit risk, referenced indices, quoted prices in inactive markets, adjusted quoted prices in active markets, etc.); and |
| • | Level 3 — Prices, inputs or exotic modeling techniques which are both significant to the fair value measurement and unobservable (supported by little or no market activity). |
Investments are classified within the level of the lowest significant input considered in determining fair value. Investments classified within Level 3 whose fair value measurement considers several inputs may include Level 1 or Level 2 inputs as components of the overall fair value measurement.
For the year ended December 31, 2017, there have been no changes to the Funds’ fair value methodologies.
Federal Income Taxes
It is each Fund’s intention to continue to qualify as a regulated investment company for Federal income tax purposes by complying with the appropriate provisions of Subchapter M of the Internal Revenue Code of 1986, as amended, and to distribute substantially all of its income to shareholders. Accordingly, no provision for Federal income taxes has been made in the financial statements.
The Funds evaluate tax positions taken or expected to be taken in the course of preparing the Funds’ tax returns to determine whether it is “more-likely-than- not” (i.e., greater than 50-percent) that each tax position will be sustained upon examination by a taxing authority based on the technical merits of the position. Tax positions not deemed to meet the more-likely-than-not threshold are recorded as a tax benefit or expense in the current year. The Funds did not record any tax provision in the current period. However, management’s conclusions regarding tax positions taken may be subject to review and adjustment at a later date based on factors including, but not limited to, examination by tax authorities (i.e., the last 3 open tax year ends, as applicable), on-going analysis of and changes to tax laws, regulations and interpretations thereof.
Security Transactions and Investment Income
Security transactions are accounted for on trade date. Costs used in determining net realized capital gains and losses on the sale of securities are on the basis of specific identification. Interest income is recorded on the accrual basis from settlement date and dividend income is recorded on ex-dividend date.
Discounts and premiums are accreted or amortized using the effective interest method over the life of each security and are recorded as interest income. Realized gains (losses) on paydowns of mortgage-backed and asset-backed securities are recorded as an adjustment to interest income.
| Bishop Street Funds |
50
Classes
Class-specific expenses are borne by the applicable class of shares. Income, realized and unrealized gains/losses and non-class-specific expenses are allocated to the respective class on the basis of relative daily net assets. Distribution fees are the only class-specific expense.
Expenses
Expenses that are directly related to one of the Funds are charged directly to that Fund. Other operating expenses of the Trust are prorated to each of the Funds on the basis of relative net assets.
Dividends and Distributions to Shareholders
The Dividend Value Fund declare and pay dividends from net investment income, if available, on a quarterly basis. Dividends from net investment income are declared daily and paid on a monthly basis for the High Grade Income and Hawaii Municipal Bond. Any net realized capital gains will be distributed at least annually for all Funds. Distributions to shareholders are recorded on the ex-dividend date.
Front-End Sales Commission
Front-end sales commissions (the “sales charges”) are not recorded as expenses of the Hawaii Municipal Bond Fund. Sales charges are deducted from proceeds from the sales of Hawaii Municipal Bond Fund shares prior to investment in Class A shares.
Cash Overdraft Charges
Per the terms of the agreement with MUFG Union Bank, N.A., the custodian of the Funds (the “Custodian”), if a Fund has a cash overdraft on a given day, it will be assessed an overdraft charge of the Prime Rate plus 4.00%. Cash overdraft charges are included in miscellaneous expenses on the Statements of Operations. For the year ended December 31, 2017, there were no cash overdraft charges.
| 3. | INVESTMENT ADVISORY AGREEMENT |
Investment advisory services are provided to the Funds by Bishop Street Capital Management (the “Adviser”), a registered adviser and wholly owned subsidiary of First Hawaiian Bank. First Hawaiian Bank is a subsidiary of BancWest Corporation, itself a subsidiary of BNP Paribas. The Adviser is entitled to receive an annual fee of 0.74% of the average daily net assets of the Dividend Value Fund, 0.55% of the average daily net assets of the High Grade Income Fund, and 0.35% of the average daily net assets of the Hawaii Municipal Bond Fund. The Adviser has contractually agreed, through April 30, 2018, to waive a portion of its advisory fee (excluding interest, taxes, brokerage commissions, acquired fund fees and expenses, and extraordinary expenses (collectively,
| December 31, 2017 | www.bishopstreetfunds.com |
51
| Bishop Street Funds |
excluded expenses)) to the extent necessary to keep operating expenses at or below certain percentages of the respective average daily net assets. The contractual expense limitations are as follows:
| Dividend Value Fund, Class I Shares |
1.05 | % | ||
| High Grade Income Fund, Class I Shares |
0.76 | % | ||
| Hawaii Municipal Bond Fund, Class I Shares |
0.55 | % | ||
| Hawaii Municipal Bond Fund, Class A Shares |
0.80 | % |
If at any point it becomes unnecessary for the Adviser to reduce fees and make expense reimbursements, the Board may permit the Adviser to retain the difference between the Total Annual Fund Operating Expenses and contractual expense limitations to recapture all or a portion of its prior expense reductions or reimbursements made during the preceding three year period during which this agreement was in place. During the year ended December 31, 2017, the Adviser did not recapture any previously waived fees.
As of December 31, 2017, fees which were previously waived by the Investment Manager which may be subject to possible future reimbursement to the Adviser were as follows:
| Dividend Value Fund |
High Grade Income Fund |
Hawaii Municipal Bond Fund |
Total | Expires | ||||||||||||||
| 52 | 160 | 236 | 448 | 12/31/2018 | ||||||||||||||
| 73 | 191 | 319 | 583 | 12/31/2019 | ||||||||||||||
| 87 | 186 | 338 | 611 | 12/31/2020 | ||||||||||||||
Columbia Management Investment Advisers, LLC (“Columbia”) serves as the investment sub-adviser for the Dividend Value Fund, pursuant to a sub-adviser agreement. Columbia is entitled to receive from the Adviser a fee, computed daily and paid monthly, at the annual rate based on the average daily net assets of the Dividend Value Fund, under the following fee schedule: 0.360% on the first $75 million; 0.350% on the next $75 million; 0.325% on the next $100 million; 0.300% on the next $250 million; and 0.250% on assets over $500 million.
| 4. | ADMINISTRATIVE, CUSTODIAN, TRANSFER AGENT, DISTRIBUTION AND SHAREHOLDER SERVICES |
The Funds and the Administrator are parties to an Administration Agreement under which the Administrator provides administrative services to the Funds. For these services, the Administrator is paid an asset based fee which will vary depending on the number of share classes and the average daily net assets of the Funds. The Administrator
| Bishop Street Funds |
52
has voluntarily agreed to waive 0.08% of its administrative fee on each of the Funds’ average daily net assets excluding the Hawaii Municipal Bond Fund for which the Administrator is waiving 0.13% of its fee. These fee waivers are voluntary and may be discontinued at any time. For the year ended December 31, 2017, the Funds were charged as follows for these services: $83 in the Dividend Value Fund, $114 in the High Grade Income Fund, and $280 in the Hawaii Municipal Bond Fund. For the year ended December 31, 2017, the Funds waived as follows for these services: $21 in the Dividend Value Fund, $28 in the High Grade Income Fund, and $139 in the Hawaii Municipal Bond Fund. These fees and waivers are labeled as “Administrative Fees/Waivers” on the Statement of Operations.
MUFG Union Bank, N.A. acts as custodian for the Funds. The Custodian plays no role in determining the investment policies of the Funds or which securities are to be purchased or sold by the Funds. These fees are labeled on the Statement of Operations as “Custody Fees.”
DST Systems, Inc. (“DST”) acts as the Transfer Agent of the Funds. As such, DST provides transfer agency, dividend disbursing and shareholder services to the Funds. These fees are disclosed on the Statement of Operations as “Transfer Agent Fees.”
SEI Investments Distribution Co. (“SIDCO”), the “Distributer” a wholly owned subsidiary of SEI Investments Company, acts as the Trust’s Distributor pursuant to the distribution agreement. The Funds have adopted a Distribution Plan (the “Plan”) on behalf of Class A Shares pursuant to Rule 12b-1 under the Investment Company Act of 1940. The Plan provides that Class A Shares will bear the cost of their distribution expenses. SIDCO, as compensation for its services under the Plan, receives a distribution fee, computed daily and payable monthly, of 0.25% of the average daily net assets attributable to each Fund’s Class A Shares. This fee is disclosed as “Distribution Fees, Class A” on the Statement of Operations.
The Trust has adopted and entered into a shareholder service plan and agreement with SIDCO. Each Fund pays to SIDCO a shareholder servicing fee not to exceed an annual rate of 0.25% of the average daily net asset value of all shares of each fund, which is computed daily and paid monthly. Under the shareholder service plan, SIDCO may perform, or may compensate other service providers for performing various shareholder and administrative services. SIDCO may also retain as profit any difference between the fee it receives and amount it pays to third parties. For the year, SIDCO paid the entire amount of fees received under the shareholder service plan to First Hawaiian Bank, the Parent Company of Bishop Street Capital Management, for shareholder services performed by First Hawaiian Bank on behalf of SIDCO for the benefit of certain shareholders to the Funds. SIDCO has voluntarily agreed to waive 0.15% of its shareholder servicing fee to the extent necessary to keep operating expenses at or below certain
| December 31, 2017 | www.bishopstreetfunds.com |
53
| Bishop Street Funds |
percentages of the respective average daily net assets. These fees and waivers are represented as “Shareholder Servicing Fees/Waivers” on the Statement of Operations.
| 5. | TRANSACTIONS WITH AFFILIATES |
Certain officers of the Trust are also officers of SEI Investments Global Funds Services (the “Administrator”), a wholly owned subsidiary of SEI Investments Company, and/or SIDCO. Such officers are paid no fees by the Trust other than the Chief Compliance Officer (“CCO”) as described below, for serving as officers of the Trust.
A portion of the services provided by the CCO and his staff, who are employees of the Administrator, are paid for by the Trust as incurred. The services include regulatory oversight of the Trust’s Advisers and service providers as required by SEC regulations. The CCO’s services and expenses have been approved by and are reviewed by the Board. These fees are disclosed on the Statement of Operations as “Chief Compliance Officer Fees.”
| 6. | INVESTMENT TRANSACTIONS |
The cost of security purchases and the proceeds from the sale and maturities of securities, other than short-term investments, for the year ended December 31, 2017 are presented below (in thousands) for the Funds.
| Dividend Value Fund |
High Grade Income Fund |
Hawaii Municipal Bond Fund |
||||||||||
| Purchases |
||||||||||||
| U.S. Government Securities |
$ | — | $ | 6,540 | $ | — | ||||||
| Other |
4,461 | 11,255 | 33,970 | |||||||||
| Sales and Maturities |
||||||||||||
| U.S. Government Securities |
$ | — | $ | 8,070 | $ | — | ||||||
| Other |
10,156 | 19,079 | 39,520 | |||||||||
| 7. | FEDERAL TAX INFORMATION |
The timing and characterization of certain income and capital gains distributions are determined annually in accordance with Federal tax regulations which may differ from U.S. GAAP.
As a result, net investment income (loss) and net realized gain (loss) on investment transactions for the reporting period may differ from distributions during such period. These book/tax differences may be temporary or permanent in nature. To the extent
| Bishop Street Funds |
54
these differences are permanent, they are charged or credited to undistributed net investment income/(loss), paid-in capital or accumulated net realized gain/(loss), as appropriate, in the period that the differences arise.
Accordingly, the following permanent differences, primarily attributable to investments in paydown gains and losses, and REIT adjustments have been reclassified:
| Paid in Capital |
Undistributed Net Investment Income |
Accumulated Net Realized Loss |
||||||||||
| Dividend Value Fund |
$ | — | $ | 5 | $ | (5 | ) | |||||
| High Grade Income Fund |
— | (22 | ) | 22 | ||||||||
The tax character of dividends and distributions declared during the years ended December 31, 2017 and 2016 were as follows:
| Ordinary Income |
Tax Exempt Income |
Long Term Capital Gain |
Total | |||||||||||||
| Dividend Value Fund |
||||||||||||||||
| 2017 |
$ | 676 | $ | — | $ | 3,392 | $ | 4,068 | ||||||||
| 2016 |
746 | — | 694 | 1,440 | ||||||||||||
| High Grade Income Fund |
||||||||||||||||
| 2017 |
$ | 1,314 | $ | — | $ | 659 | $ | 1,973 | ||||||||
| 2016 |
1,647 | — | 345 | 1,992 | ||||||||||||
| Hawaii Municipal Bond Fund |
||||||||||||||||
| 2017 |
$ | 1 | $ | 3,277 | $ | 81 | $ | 3,359 | ||||||||
| 2016 |
163 | 3,599 | 616 | 4,378 | ||||||||||||
As of December 31, 2017, the components of Distributable Earnings (Accumulated Losses) on a tax basis were as follows (000):
| Dividend Value Fund |
High Grade Income Fund |
Hawaii Municipal Bond Fund |
||||||||||
| Undistributed Ordinary Income |
$ | 12 | $ | 3 | $ | 5 | ||||||
| Undistributed Long-Term Capital Gain Income |
795 | 28 | 11 | |||||||||
| Unrealized Appreciation |
15,466 | 994 | 1,735 | |||||||||
| Other Temporary Differences |
3 | (15 | ) | 1 | ||||||||
|
|
|
|
|
|
|
|||||||
| Total Distributable Earnings |
$ | 16,276 | $ | 1,010 | $ | 1,752 | ||||||
|
|
|
|
|
|
|
|||||||
| December 31, 2017 | www.bishopstreetfunds.com |
55
| Bishop Street Funds |
Post-October losses represent losses realized on investment transactions from November 1, 2017 through December 31, 2017 that, in accordance with Federal income tax regulations, the Funds have elected to defer and treat as having arisen in the following fiscal year.
For Federal income tax purposes, capital losses incurred may be carried forward and applied against future capital gains. Under the Regulated Investment Company Modernization Act of 2010, Funds are permitted to carry forward capital losses incurred in taxable years beginning after December 22, 2010 for an unlimited period. Additionally, post enactment capital losses that are carried forward will retain their character as either short-term or long-term capital losses rather than being considered all short-term as under previous law.
For the year ended December 31, 2017, there were no Capital loss carryforwards that were not subject to expiration.
For Federal income tax purposes, the cost of securities owned at December 31, 2017, and the net realized gains or losses on securities sold for the period were not materially different from amounts reported for financial reporting purposes. These differences are primarily due to wash sales which cannot be used for Federal income tax purposes in the current year and have been deferred for use in future years. The aggregate gross unrealized appreciation and depreciation of securities held by the Dividend Value, High Grade Income, and Hawaii Municipal Bond Funds for Federal income tax purposes at December 31, 2017 were as follows (000):
| Dividend Value Fund |
High Grade Income Fund |
Hawaii Municipal Bond Fund |
||||||||||
| Federal Tax Cost |
$ | 26,709 | $ | 49,354 | $ | 134,043 | ||||||
|
|
|
|
|
|
|
|||||||
| Gross Unrealized Appreciation |
15,566 | 1,424 | 2,411 | |||||||||
| Gross Unrealized Depreciation |
(100 | ) | (430 | ) | (676 | ) | ||||||
|
|
|
|
|
|
|
|||||||
| Net Unrealized Appreciation |
$ | 15,466 | $ | 994 | $ | 1,735 | ||||||
|
|
|
|
|
|
|
|||||||
| 8. | RISKS |
The Hawaii Municipal Bond Fund invests primarily in debt instruments in the state of Hawaii. The issuers’ ability to meet their obligations may be affected by economic developments in that state. In addition, each Fund’s investments in debt securities are subject to “credit risk,” which is the risk that an issuer will be unable, or will be perceived to be unable, to repay its obligations at maturity and “interest rate risk” which is the potential for fluctuations in bond prices due to changing interest rates. Funds that invest primarily in high quality debt securities generally are subject to less credit risk than funds that invest in lower quality debt securities.
| Bishop Street Funds |
56
Certain debt securities are backed by credit enhancements from various financial institutions and financial guarantee assurance agencies. These credit enhancements reinforce the credit quality of the individual securities; however, if any of the financial institutions or financial guarantee assurance agencies’ credit quality should deteriorate, it could cause the individual security’s credit quality to change. Additionally, if any of the Funds concentrate their credit enhancements in any one financial institution, the risk of credit quality deterioration increases. The following table provides detail on the approximate percentage of Hawaii Municipal Bond Fund’s investments in securities with these types of enhancements, as well as the name of the entity providing the largest proportion of enhancements in the Fund.
| Hawaii Municipal Bond Fund | ||
| % of investments in securities with credit enhancements or liquidity enhancements |
6.53% | |
| Largest % of investments in securities with credit enhancements or liquidity enhancements from a single institution |
2.35% (Assured Guaranty Municipal Corporation) |
The value of asset-backed securities may be affected by the credit risk of the servicing agent for the pool, the originator of the loans or receivables, or the financial institution(s) providing the credit support. In addition to credit risk, asset-backed securities and other securities with early redemption features are subject to pre-payment risk. During periods of declining interest rates, prepayment of loans underlying asset-backed securities can be expected to accelerate or an issuer may retire an outstanding bond early to reduce interest costs. A Fund’s ability to maintain positions in such securities will be affected by reductions in the principal amount of such securities resulting from prepayments, and its ability to reinvest the returns of principal at comparable yields is subject to the general prevailing interest rates at that time.
The market value of the Funds’ investments in fixed income securities may change in response to interest rate changes and other factors. During periods of falling interest rates, the values of fixed income securities generally rise. Conversely, during periods of rising interest rates, the values of such securities generally decline. Changes by recognized rating agencies in the ratings of any fixed income security and in the ability of an issuer to make payments of interest and principal may also affect the value of these investments.
In the normal course of business, the Funds enter into contracts that provide general indemnifications. The Funds’ maximum exposure under these arrangements is dependent on future claims that may be made against the Funds and, therefore, cannot be established; however, based on experience, the risk of loss from such claims is considered remote.
| December 31, 2017 | www.bishopstreetfunds.com |
57
| Bishop Street Funds |
Dividend Value Fund invest solely in equity securities. Purchases of equity securities are subject to the risk that stock prices will fall over short or extended periods of time. Historically, the equity markets have moved in cycles, and the value of the Fund’s equity securities may fluctuate drastically from day to day. Individual companies may report poor results or be negatively affected by industry and/or economic trends and developments. The prices of securities issued by such companies may suffer a decline in response. These factors contribute to price volatility, which is the principal risk of investing in the Fund’s.
| 9. | LINE OF CREDIT |
Through October 30, 2018, the Funds, which are not jointly liable, had entered into an agreement which enabled them to participate in a $5 million unsecured committed revolving line of credit on a first come, first served basis, with MUFG Union Bank, N.A. (the “Bank”). The proceeds from the borrowings were used to finance the Funds’ short term general working capital requirements, including the funding of shareholder redemptions.
For the year ended December 31, 2017, the Funds had the following borrowings under the line of credit:
| Average Borrowings |
Borrowing Costs |
Number of Days Outstanding |
Weighted Average Interest Rate |
|||||||||||||
| Dividend Value Fund |
$ | 1 | $ | — | 2 | 4.25 | % | |||||||||
| Hawaii Municipal Bond Fund |
1 | — | 5 | 3.95 | % | |||||||||||
| 10. | OTHER |
At December 31, 2017, the percentage of total shares outstanding held by shareholders owning 10% or greater of total shares outstanding of each Fund, which comprised omnibus accounts that were held on behalf of several individual shareholders, was as follows:
| Number of Shareholders |
% of Outstanding Shares |
|||||||
| Dividend Value Fund, Class I Shares |
2 | 97.78 | ||||||
| High Grade Income Fund, Class I Shares* |
3 | 91.78 | ||||||
| Hawaii Municipal Bond Fund, Class I Shares |
1 | 62.89 | ||||||
| Hawaii Municipal Bond Fund, Class A Shares |
— | — | ||||||
| *Includes | one unaffiliated shareholder, all other shareholders in the above table are affiliated. |
| Bishop Street Funds |
58
| 11. | REGULATORY MATTERS |
In October 2016, the U.S. Securities and Exchange Commission adopted new rules and amended existing rules (together, final rules) intended to modernize the reporting and disclosure of information by registered investment companies. In part, the final rules amended Regulation S-X and require standardized, enhanced disclosures about derivatives in investment company financial statements, as well as other amendments. As of August 1, 2017, management has implemented the amendments to Regulation S-X, which did not have a material impact on the Fund’s financial statements and related disclosures or impact the Fund’s net assets or results of operations.
| 12. | SUBSEQUENT EVENTS |
The Funds have evaluated the need for additional disclosures and/or adjustments resulting from subsequent events through the date the financial statements were issued. Based on this evaluation, no additional disclosures and/or adjustments were required to the financial statements.
| December 31, 2017 | www.bishopstreetfunds.com |
59
| Bishop Street Funds |
Report of Independent Registered Public Accounting Firm
To the Board of Trustees of
Bishop Street Funds and Shareholders of
Dividend Value Fund
High Grade Income Fund and
Hawaii Municipal Bond Fund:
Opinions on the Financial Statements
We have audited the accompanying statements of assets and liabilities, including the schedules of investments, of Dividend Value Fund, High Grade Income Fund and Hawaii Municipal Bond Fund (constituting Bishop Street Funds, hereafter collectively referred to as the “Funds”) as of December 31, 2017, the related statements of operations for the year ended December 31, 2017, the statements of changes in net assets for each of the two years in the period ended December 31, 2017, including the related notes, and the financial highlights for each of the five years in the period ended December 31, 2017 (collectively referred to as the “financial statements”). In our opinion, the financial statements present fairly, in all material respects, the financial position of each of the Funds as of December 31, 2017, the results of each of their operations for the year then ended, the changes in each of their net assets for each of the two years in the period ended December 31, 2017 and each of the financial highlights for each of the five years in the period ended December 31, 2017 in conformity with accounting principles generally accepted in the United States of America.
Basis for Opinions
These financial statements are the responsibility of the Funds’ management. Our responsibility is to express an opinion on the Funds’ financial statements based on our audits. We are a public accounting firm registered with the Public Company Accounting Oversight Board (United States) (“PCAOB”) and are required to be independent with respect to the Funds in accordance with the U.S. federal securities laws and the applicable rules and regulations of the Securities and Exchange Commission and the PCAOB.
We conducted our audits of these financial statements in accordance with the standards of the PCAOB. Those standards require that we plan and perform the audit to obtain reasonable assurance about whether the financial statements are free of material misstatement, whether due to error or fraud.
Our audits included performing procedures to assess the risks of material misstatement of the financial statements, whether due to error or fraud, and performing procedures that respond to those risks. Such procedures included examining, on a test basis, evidence regarding the amounts and disclosures in the financial statements. Our audits also included evaluating the accounting principles used and significant estimates made by management, as well as evaluating the overall presentation of the financial statements. Our procedures included confirmation of securities owned as of December 31, 2017 by correspondence with the custodian. We believe that our audits provide a reasonable basis for our opinions.
/s/PricewaterhouseCoopers LLP
Philadelphia, Pennsylvania
February 27, 2018
We have served as the auditor of one or more investment companies in Bishop Street Capital Management since 1998.
| Bishop Street Funds |
60
| Bishop Street Funds | (unaudited) |
Disclosure of Fund Expenses
All mutual funds have operating expenses. As a shareholder of a mutual fund you incur two types of costs: (1) transaction costs, including applicable sales charges (loads); and (2) ongoing costs, which include (among others) costs for portfolio management, administrative services, distribution and service (12b-1), shareholder service fees, and shareholder reports like this one. It is important for you to understand the impact of these costs on your investment returns.
Operating expenses such as these are deducted from a mutual fund’s gross income and directly reduce its final investment return. These expenses are expressed as a percentage of the mutual fund’s average net assets; this percentage is known as the mutual fund’s expense ratio.
The following examples use the expense ratio and are intended to help you understand the ongoing costs (in dollars) of investing in your Fund and to compare these costs with those of other mutual funds. The examples are based on an investment of $1,000 made at the beginning of the period shown and held for the entire period from July 1, 2017 to December 31, 2017.
The table on the next page illustrates your Fund’s costs in two ways:
| • | Actual Fund Return. This section helps you to estimate the actual expenses after fee waivers that your Fund incurred over the period. The “Expenses Paid During Period” column shows the actual dollar expense cost incurred by a $1,000 investment in the Fund, and the “Ending Account Value” number is derived from deducting that expense cost from the Fund’s gross investment return. |
You can use this information, together with the actual amount you invested in the Fund, to estimate the expenses you paid over that period. Simply divide your actual account value by $1,000 to arrive at a ratio (for example, an $8,600 account value divided by $1,000 = 8.6), then multiply that ratio by the number shown for your Fund under “Expenses Paid During Period.”
| • | Hypothetical 5% Return. This section helps you compare your Fund’s costs with those of other mutual funds. It assumes that the Fund had an annual 5% return before expenses during the year, but that the expense ratio (Column 3) for the period is unchanged. This example is useful in making comparisons because the Securities and Exchange Commission requires all mutual funds to make this 5% calculation. You can assess your Fund’s comparative cost by comparing the hypothetical result for your Fund in the “Expenses Paid During Period” column with those that appear in the same charts in the shareholder reports for other funds. |
Note: Because the return is set at 5% for comparison purposes — NOT your Fund’s actual return — the account values shown may not apply to your specific investment.
| December 31, 2017 | www.bishopstreetfunds.com |
61
| Bishop Street Funds | (unaudited) |
| Beginning Account Value 7/1/17 |
Ending Account Value 12/31/17 |
Annualized Expense Ratios |
Expenses Paid During Period* |
|||||||||||||
| Dividend Value Fund — Class I |
|
|||||||||||||||
|
|
||||||||||||||||
| Actual Fund Return |
$ | 1,000.00 | $ | 1,114.60 | 1.05 | % | $ | 5 .60 | ||||||||
| Hypothetical 5% Return |
1,000.00 | 1,019.91 | 1.05 | 5 .35 | ||||||||||||
|
|
||||||||||||||||
| High Grade Income Fund — Class I |
|
|||||||||||||||
|
|
||||||||||||||||
| Actual Fund Return |
$ | 1,000.00 | $ | 1,012.30 | 0.76 | % | $ | 3 .85 | ||||||||
| Hypothetical 5% Return |
1,000.00 | 1,021.37 | 0.76 | 3 .87 | ||||||||||||
|
|
||||||||||||||||
| Hawaii Municipal Bond Fund — Class I |
|
|||||||||||||||
|
|
||||||||||||||||
| Actual Fund Return |
$ | 1,000.00 | $ | 1,008.60 | 0.55 | % | $ | 2 .78 | ||||||||
| Hypothetical 5% Return |
1,000.00 | 1,022.43 | 0.55 | 2 .80 | ||||||||||||
|
|
||||||||||||||||
| Hawaii Municipal Bond Fund — Class A |
|
|||||||||||||||
|
|
||||||||||||||||
| Actual Fund Return |
$ | 1,000.00 | $ | 1,007.20 | 0.80 | % | $ | 4 .05 | ||||||||
| Hypothetical 5% Return |
1,000.00 | 1,021.17 | 0.80 | 4 .08 | ||||||||||||
|
|
||||||||||||||||
| * | Expenses are equal to the Fund’s annualized expense ratio multiplied by the average account value over the period, multiplied by 184/365 (to reflect the one-half year period). |
| Bishop Street Funds |
62
This page intentionally left blank.
| Bishop Street Funds | (unaudited) |
Notice to Shareholders of Bishop Street Funds
For shareholders that do not have a December 31, 2017 taxable year end, this notice is for informational purposes only. For shareholders with a December 31, 2017 tax year end, please consult your tax adviser as to the pertinence of this notice.
| Fund |
(A)* Long Term Capital Gains Distributions (Tax Basis) |
(B)* Ordinary Income Distributions (Tax Basis) |
(C)* Tax Exempt Interest |
(A+B+C) (D) Total Distributions (Tax Basis) |
||||||||||||
| Dividend Value Fund |
83.38 | % | 16.62 | % | 0.00 | % | 100.00 | % | ||||||||
| High Grade Income Fund |
33.39 | % | 66.61 | % | 0.00 | % | 100.00 | % | ||||||||
| Hawaii Municipal Bond Fund(6) |
2.40 | % | 0.02 | % | 97.58 | % | 100.00 | % | ||||||||
| * | Items (A), (B) and (C) are based on the percentage of each fund’s total distribution. |
| (1) | Qualifying dividends represent dividends which qualify for the corporate dividends received deduction and is reflected as a percentage of ordinary income distributions (the total of short-term capital gain and net investment income distributions). |
| (2) | The percentage in this column represents the amount of “Qualifying Dividend Income” as created by the Jobs and Growth Tax Relief Reconciliation Act of 2003 and is reflected as a percentage of “Ordinary Income Distributions” (the total of short term capital gain and net investment income distributions). It is the intention of the Fund to designate the maximum amount permitted by the law. |
| (3) | “U.S. Government Interest” represents the amount of interest that was derived from direct U.S. Government Obligations and distributed during the fiscal year. This amount is reflected as a percentage of total ordinary income distributions (the total of short term capital gain and net investment income distributions). Generally, interest from direct U.S. Government Obligations is exempt from state income tax. However, for residents of California, Connecticut and New York, the statutory threshold requirements were not satisfied to permit exemption of these amounts from state income. |
| Bishop Street Funds |
64
| (unaudited) |
For the fiscal year ended December 31, 2017, each fund has designated the following items with regard to distributions paid during the year.
| Qualifying for Corporate Dividends Receivable Deduction(1) |
Qualifying Dividend Income(2) |
U.S. Government Interest(3) |
Interest Related Dividends(4) |
Short-Term Capital Gain Dividends(5) |
||||||||||||||
| 100.00 | % | 100.00 | % | 0.00 | % | 0.00 | % | 100.00 | % | |||||||||
| 0.00 | % | 0.00 | % | 16.80 | % | 98.22 | % | 100.00 | % | |||||||||
| 0.00 | % | 0.00 | % | 0.00 | % | 0.00 | % | 0.00 | % | |||||||||
| (4) | The percentage in this column represents the amount of “Interest Related Dividends” as created by the American Jobs Creation Act of 2004 and is reflected as a percentage of net investment income distributions that is exempt from U.S. withholding tax when paid to foreign investors. |
| (5) | The percentage in this column represents the amount of “Short-Term Capital Gain Dividends” as created by the American Jobs Creation Act of 2004 and is reflected as a percentage of short-term capital gain distributions that is exempt from U.S. withholding tax when paid to foreign investors. |
| (6) | For California income tax purposes, for the fiscal year ended December 31, 2017, the Hawaii Municipal Bond Fund designated 3.77% of their distributions paid from net investment income as exempt interest dividends under Section 17145 of the California Revenue and Taxation Code. |
| December 31, 2017 | www.bishopstreetfunds.com |
65
| Bishop Street Funds |
Board of Trustees and Officers
Set forth below are the names, years of birth, position with the Trust and length of time served, and the principal occupations and other directorships held during at least the last five years of each of the persons currently serving as a Trustee. Trustees who are deemed not to be “interested persons” of the Trust are referred to as “Independent Board Members.” Messrs. Nesher and Doran are Trustees who may be deemed to be “interested” persons of the Trust as
| Name and Year of Birth | Position with Trust and Length of Time Served1 |
Principal Occupations in the Past 5 Years | ||
| INTERESTED TRUSTEES3,4 | ||||
| ROBERT NESHER (Born: 1946) |
Chairman of the Board of Trustees (Since 1998) |
SEI employee 1974 to present; currently performs various services on behalf of SEI Investments for which Mr. Nesher is compensated. | ||
| WILLIAM M. DORAN (Born: 1940) |
Trustee (Since 2006) |
Self-Employed Consultant since 2003. Partner at Morgan, Lewis & Bockius LLP (law firm) from 1976 to 2003. Counsel to the Trust, SEI Investments, SIMC, the Administrator and the Distributor. | ||
| INDEPENDENT TRUSTEES4 | ||||
| JOHN K. DARR (Born: 1944) |
Trustee (Since 2008) |
Retired. Chief Executive Officer, Office of Finance, Federal Home Loan Banks, from 1992 to 2007. | ||
| JOSEPH T. GRAUSE, JR. (Born: 1952) |
Trustee (Since 2011) |
Self-employed Consultant since January 2012. Director of Endowments and Foundations, Morningstar Investment Management, Morningstar, Inc., 2010 to 2011. Director of International Consulting and Chief Executive Officer of Morningstar Associates Europe Limited, Morningstar, Inc., 2007 to 2010. Country Manager — Morningstar UK Limited, Morningstar, Inc., 2005 to 2007. | ||
| 1 | Each Trustee shall hold office during the lifetime of this trust until the election and qualification of his or her successor, or until he or she sooner dies, resigns, or is removed in accordance with the Trust’s Declaration of Trust. |
| 2 | Directorships of Companies required to report to the Securities and Exchange Commission under the Securities Exchange Act of 1934 (i.e. “public companies”) or other investment companies under the 1940 Act. |
| 3 | Denotes Trustees who may be deemed to be “interested” persons of the Fund as that term is defined in the 1940 Act by virtue of their affiliation with the Distributor and/or its affiliates |
| 4 | Trustees oversee 3 funds in the Bishop Street Funds. |
| Bishop Street Funds |
66
| (unaudited) |
that term is defined in the 1940 Act by virtue of their affiliation with the Trust’s Distributor. The Trust’s Statement of Additional Information (“SAI”) includes additional information about the Trustees and Officers. The SAI may be obtained without charge by calling 1-800-262-9565. The following chart lists Trustees and Officers as of December 31, 2017.
| Other Directorships Held in the Past 5 Years2 |
| Current Directorships: Trustee of The Advisors’ Inner Circle Fund, The Advisors’ Inner Circle Fund II, The KP Funds, SEI Daily Income Trust, SEI Institutional International Trust, SEI Institutional Investments Trust, SEI Institutional Managed Trust, SEI Asset Allocation Trust, SEI Tax Exempt Trust, Adviser Managed Trust, New Covenant Funds, SEI Insurance Products Trust and SEI Catholic Values Trust. Director of SEI Structured Credit Fund, LP, SEI Global Master Fund plc, SEI Global Assets Fund plc, SEI Global Investments Fund plc, SEI Investments — Global Funds Services, Limited, SEI Investments Global, Limited, SEI Investments (Europe) Ltd., SEI Investments — Unit Trust Management (UK) Limited, SEI Multi-Strategy Funds PLC and SEI Global Nominee Ltd.
Former Directorships: Trustee of SEI Liquid Asset Trust to 2016. |
| Current Directorships: Trustee of The Advisors’ Inner Circle Fund, The Advisors’ Inner Circle Fund II, The KP Funds, The Advisors’ Inner Circle Fund III, Winton Diversified Opportunities Fund (closed-end investment company), Gallery Trust, Schroder Series Trust, Schroder Global Series Trust, SEI Daily Income Trust, SEI Institutional International Trust, SEI Institutional Investments Trust, SEI Institutional Managed Trust, SEI Asset Allocation Trust, SEI Tax Exempt Trust, Adviser Managed Trust, New Covenant Funds, SEI Insurance Products Trust and SEI Catholic Values Trust. Director of SEI Investments, SEI Investments (Europe), Limited, SEI Investments — Global Funds Services, Limited, SEI Investments Global, Limited, SEI Investments (Asia), Limited, SEI Global Nominee Ltd. and SEI Investments — Unit Trust Management (UK) Limited. Director of the Distributor.
Former Directorships: Trustee of O’Connor EQUUS (closed-end investment company) to 2016. Trustee of SEI Liquid Asset Trust to 2016. Trustee of Winton Series Trust to 2017. Liquid Asset Trust to 2016. |
| Current Directorships: Trustee of The Advisors’ Inner Circle Fund, The Advisors’ Inner Circle Fund II and The KP Funds. Director of Federal Home Loan Bank of Pittsburgh, Meals on Wheels, Lewes/Rehoboth Beach and West Rehoboth Land Trust. |
| Current Directorships: Trustee of The Advisors’ Inner Circle Fund, The Advisors’ Inner Circle Fund II and The KP Funds. Director of The Korea Fund, Inc. |
| December 31, 2017 | www.bishopstreetfunds.com |
67
| Bishop Street Funds |
| Name and Year of Birth | Position(s) Held and Length of Time Served1 |
Principal Occupation(s) During the Past 5 Years | ||
| INDEPENDENT TRUSTEES3 (continued) |
||||
| MITCHELL A. JOHNSON (Born: 1942) |
Trustee (Since 2006) |
Retired. Private Investor since 1994. | ||
| BETTY L. KRIKORIAN (Born: 1943) |
Trustee (Since 2006) |
Vice President, Compliance, AARP Financial Inc., from 2008 to 2010. Self-Employed Legal and Financial Services Consultant since 2003. Counsel (in-house) for State Street Bank from 1995 to 2003. | ||
| BRUCE R. SPECA (Born: 1956) |
Trustee (Since 2011) |
Global Head of Asset Allocation, Manulife Asset Management (subsidiary of Manulife Financial), 2010 to 2011. Executive Vice President — Investment Management Services, John Hancock Financial Services (subsidiary of Manulife Financial), 2003 to 2010. | ||
| GEORGE J. SULLIVAN, JR. (Born: 1942) |
Retired since 2012. Self-Employed Consultant, Newfound Consultants Inc., 1997 to 2011. |
Retired since 2012. Self-Employed Consultant, Newfound Consultants Inc., 1997 to 2011. | ||
| 1 | Each Trustee shall hold office during the lifetime of this trust until the election and qualification of his or her successor, or until he or she sooner dies, resigns, or is removed in accordance with the Trust’s Declaration of Trust. |
| 2 | Directorships of Companies required to report to the Securities and Exchange Commission under the Securities Exchange Act of 1934 (i.e. “public companies”) or other investment companies under the 1940 Act. |
| 3 | Trustees oversee 3 funds in the Bishop Street Funds. |
| Bishop Street Funds |
68
| (unaudited) |
| Other Directorships Held in the Past 5 Years2 |
| Current Directorships: Trustee of The Advisors’ Inner Circle Fund, The Advisors’ Inner Circle Fund II, The KP Funds, SEI Asset Allocation Trust, SEI Daily Income Trust, SEI Institutional International Trust, SEI Institutional Managed Trust, SEI Institutional Investments Trust, SEI Tax Exempt Trust, Adviser Managed Trust, New Covenant Funds, SEI Insurance Products Trust and SEI Catholic Values Trust. Director of Federal Agricultural Mortgage Corporation (Farmer Mac) since 1997.
Former Directorships: Trustee of SEI Liquid Asset Trust to 2016. |
| Current Directorships: Trustee of The Advisors’ Inner Circle Fund, The Advisors’ Inner Circle Fund II and The KP Funds. |
| Current Directorships: Trustee of The Advisors’ Inner Circle Fund, The Advisors’ Inner Circle Fund II and The KP Funds. Director of Stone Harbor Investments Funds, Stone Harbor Emerging Markets Income Fund (closed-end fund) and Stone Harbor Emerging Markets Total Income Fund (closed-end fund). |
| Current Directorships: Trustee/ Director of State Street Navigator Securities Lending Trust, The Advisors’ Inner Circle Fund, The Advisors’ Inner Circle Fund II, The KP Funds, SEI Structured Credit Fund, LP, SEI Daily Income Trust, SEI Institutional International Trust, SEI Institutional Investments Trust, SEI Institutional Managed Trust, SEI Asset Allocation Trust, SEI Tax Exempt Trust, Adviser Managed Trust, New Covenant Funds, SEI Insurance Products Trust and SEI Catholic Values Trust.
Former Directorships: Director of SEI Opportunity Fund, L.P. to 2010. Director of SEI Alpha Strategy Portfolios, LP to 2013. Trustee of SEI Liquid Asset Trust to 2016. Member of the independent review committee for SEI’s Canadian-registered mutual funds. |
| December 31, 2017 | www.bishopstreetfunds.com |
69
| Bishop Street Funds |
| Name and Year of Birth | Position(s) Held with the Trust and Length of Time Served |
Principal Occupation(s) During the Past 5 Years | ||
| OFFICERS | ||||
| MICHAEL BEATTIE (Born: 1965) |
President (Since 2011) |
Director of Client Service, SEI Investments, since 2004. | ||
| JOHN BOURGEOIS (Born: 1973) |
Assistant Treasurer (since 2017) |
Fund Accounting Manager, SEI Investments, since 2000. | ||
| STEPHEN CONNORS (Born: 1984) |
Treasurer, Controller and Chief Financial Officer (since 2015) |
Director, SEI Investments, Fund Accounting since 2014. Audit Manager, Deloitte & Touche LLP, from 2011 to 2014. | ||
| DIANNE M. DESCOTEAUX (Born: 1977) |
Vice President and Secretary (Since 2011) |
Counsel at SEI Investments since 2010. | ||
| RUSSELL EMERY (Born: 1962) |
Chief Compliance Officer (since 2006) |
Chief Compliance Officer of SEI Structured Credit Fund, LP since June 2007. Chief Compliance Officer of The Advisors’ Inner Circle Fund, The Advisors’ Inner Circle Fund II, Bishop Street Funds, The KP Funds, The Advisors’ Inner Circle Fund III, Winton Diversified Opportunities Fund (closed-end investment company), Gallery Trust, Schroder Series Trust, Schroder Global Series Trust, SEI Institutional Managed Trust, SEI Asset Allocation Trust, SEI Institutional International Trust, SEI Institutional Investments Trust, SEI Daily Income Trust, SEI Tax Exempt Trust, Adviser Managed Trust, New Covenant Funds, SEI Insurance Products Trust and SEI Catholic Values Trust. Chief Compliance Officer of O’Connor EQUUS (closed-end investment company) to 2016. Chief Compliance Officer of SEI Liquid Asset Trust to 2016. Chief Compliance Officer of Winton Series Trust to 2017. |
| Bishop Street Funds |
70
| (unaudited) |
| Other Directorships Held in the Past 5 Years |
| None. |
| None. |
| None. |
| None. |
| None. |
| December 31, 2017 | www.bishopstreetfunds.com |
71
| Bishop Street Funds |
| Name and Year of Birth | Position(s) Held and Length of Time Served |
Principal Occupation(s) During the Past 5 Years | ||
| OFFICERS (continued) | ||||
| ROBERT MORROW (Born: 1968) |
Vice President (since 2017) |
Attorney, SEI Investments (2014-present). Associate, Stradley Ronon Stevens & Young, LLP (2009 – 2014). | ||
| BRIDGET E. SUDALL (Born: 1980) |
Anti-Money Laundering Compliance Officer and Privacy Officer (since 2015) |
Senior Associate and AML Officer, Morgan Stanley Alternative Investment Partners from April 2011 to March 2015. | ||
| LISA WHITTAKER (Born: 1978) |
Vice President and Assistant Secretary (since 2013) |
Attorney, SEI Investments (2012-present). Associate Counsel and Compliance Officer, The Glenmede Trust Company, N.A. (2011 – 2012). |
| Bishop Street Funds |
72
| (unaudited) |
| Other Directorships Held in the Past 5 Years |
| None. |
| None. |
| None. |
| December 31, 2017 | www.bishopstreetfunds.com |
73
INVESTMENT ADVISER
BISHOP STREET CAPITAL MANAGEMENT
HONOLULU, HI 96813
ADMINISTRATOR
SEI INVESTMENTS GLOBAL FUNDS SERVICES
ONE FREEDOM VALLEY DRIVE
OAKS, PA 19456
DISTRIBUTOR
SEI INVESTMENTS DISTRIBUTION CO.
ONE FREEDOM VALLEY DRIVE
OAKS, PA 19456
TRANSFER AGENT
DST SYSTEMS, INC.
KANSAS CITY, MO 64121
CUSTODIAN
MUFG UNION BANK, N.A.
SAN FRANCISCO, CA 94101
LEGAL COUNSEL
MORGAN, LEWIS & BOCKIUS LLP
PHILADELPHIA, PA 19103
INDEPENDENT REGISTERED PUBLIC ACCOUNTING FIRM
PRICEWATERHOUSECOOPERS LLP
PHILADELPHIA, PA 19103

FOR MORE INFORMATION ABOUT BISHOP STREET FUNDS, CALL 1-800-262-9565 OR YOUR INVESTMENT SPECIALIST
VISIT US ONLINE AT WWW.BISHOPSTREETFUNDS.COM
|
|
BISHOP STREET FUNDS P.O. BOX 219721 KANSAS CITY, MO 64121-9721 |
THIS REPORT AND THE FINANCIAL STATEMENTS CONTAINED HEREIN ARE SUBMITTED FOR THE GENERAL INFORMATION OF BISHOP STREET FUNDS’ SHAREHOLDERS. THIS REPORT IS NOT AUTHORIZED FOR DISTRIBUTION TO PROSPECTIVE INVESTORS UNLESS PRECEDED OR ACCOMPANIED BY AN EFFECTIVE PROSPECTUS.
SHARES OF BISHOP STREET FUNDS ARE NOT DEPOSITS OR OBLIGATIONS OF, OR GUARANTEED BY FIRST HAWAIIAN BANK OR ANY OF ITS AFFILIATES. SUCH SHARES ARE ALSO NOT FEDERALLY INSURED BY THE FEDERAL DEPOSIT INSURANCE CORPORATION, THE FEDERAL RESERVE BOARD, OR ANY OTHER AGENCY. INVESTMENT IN SHARES OF MUTUAL FUNDS INVOLVES RISK, INCLUDING THE POSSIBLE LOSS OF PRINCIPAL. THE BISHOP STREET FUNDS ARE DISTRIBUTED BY SEI INVESTMENTS DISTRIBUTION CO., WHICH IS NOT AFFILIATED WITH FIRST HAWAIIAN BANK, BANK OF THE WEST OR BANCWEST CORPORATION. BANCWEST CORPORATION IS A WHOLLY-OWNED SUBSIDIARY OF BNP PARIBAS.
BSF-AR-006-2300
| Item 2. | Code of Ethics. |
The Registrant has adopted a code of ethics that applies to the registrant’s principal executive officer, principal financial officer, controller or principal accounting officer, and any person who performs a similar function. There have been no amendments to or waivers granted to this code of ethics during the past fiscal year.
| Item 3. | Audit Committee Financial Expert. |
(a)(1) The registrant’s board of trustees has determined that the registrant has at least one audit committee financial expert serving on the audit committee.
(a) (2) The audit committee financial expert is George Sullivan, and is independent as defined in Form N-CSR Item 3 (a) (2).
| Item 4. | Principal Accountant Fees and Services. |
Fees billed by PricewaterhouseCoopers (PwC LLP) Related to the Trust
PwC LLP billed the Trust aggregate fees for services rendered to the Trust for the last two fiscal years as follows:
| 2017 | 2016 | |||||||||||||
| All fees and services to the Trust that were pre-approved |
All fees and services to service affiliates that were pre-approved |
All other fees and services to service affiliates that did not require pre-approval |
All fees and services to the Trust that were pre-approved |
All fees and services to service affiliates that were pre-approved |
All other fees and services to service affiliates that did not require pre-approval | |||||||||
| (a) |
Audit Fees(1) | $78,200 | N/A | N/A | $124,900 | N/A | N/A | |||||||
| (b) |
Audit-Related Fees | N/A | N/A | N/A | N/A | N/A | N/A | |||||||
| (c) |
Tax Fees | N/A | N/A | N/A | N/A | N/A | N/A | |||||||
| (d) |
All Other Fees | N/A | N/A | N/A | N/A | N/A | N/A | |||||||
Notes:
| (1) | Audit fees include amounts related to the audit of the registrant’s annual financial statements and services normally provided by the accountant in connection with statutory and regulatory filings. |
(e)(1)
(e)(1) The Trust’s Audit Committee has adopted and the Board of Trustees has ratified an Audit and Non-Audit Services Pre-Approval Policy (the “Policy”), which sets forth the procedures and the conditions pursuant to which services proposed to be performed by the independent auditor of the Funds may be pre-approved.
The Policy provides that all requests or applications for proposed services to be provided by the independent auditor must be submitted to the Registrant’s Chief Financial Officer (“CFO”) and must include a detailed description of the services proposed to be rendered. The CFO will determine whether such services:
(1) require specific pre-approval; (2) are included within the list of services that have received the general pre-approval of the Audit Committee pursuant to the Policy; or (3) have been previously pre-approved in connection with the independent auditor’s annual engagement letter for the applicable year or otherwise. In any instance where services require pre-approval, the Audit Committee will consider whether such services are consistent with SEC’s rules and whether the provision of such services would impair the auditor’s independence.
Requests or applications to provide services that require specific pre-approval by the Audit Committee will be submitted to the Audit Committee by the CFO. The Audit Committee will be informed by the CFO on a quarterly basis of all services rendered by the independent auditor. The Audit Committee has delegated specific pre-approval authority to either the Audit Committee Chair or financial expert, provided that the estimated fee for any such proposed pre-approved service does not exceed $100,000 and any pre-approval decisions are reported to the Audit Committee at its next regularly scheduled meeting.
Services that have received the general pre-approval of the Audit Committee are identified and described in the Policy. In addition, the Policy sets forth a maximum fee per engagement with respect to each identified service that has received general pre-approval.
All services to be provided by the independent auditor shall be provided pursuant to a signed written engagement letter with the Registrant, the investment advisor or applicable control affiliate (except that matters as to which an engagement letter would be impractical because of timing issues or because the matter is small may not be the subject of an engagement letter) that sets forth both the services to be provided by the independent auditor and the total fees to be paid to the independent auditor for those services.
In addition, the Audit Committee has determined to take additional measures on an annual basis to meet its responsibility to oversee the work of the independent auditor and to assure the auditor’s independence from the Registrant, such as reviewing a formal written statement from the independent auditor delineating all relationships between the independent auditor and the Registrant, and discussing with the independent auditor its methods and procedures for ensuring independence.
(e)(2) Percentage of fees billed applicable to non-audit services approved pursuant to the “de minimis” exception of Rule 2-01(c)(7)(i)(C) were as follows:
| 2017 | 2016 | |||
| Audit-Related Fees |
N/A | N/A | ||
| Tax Fees |
N/A | N/A | ||
| All Other Fees |
N/A | N/A |
(f) Not applicable.
(g) The aggregate non-audit fees and services billed by PwC for services rendered to the Registrant, and rendered to the Registrant’s investment adviser (not including any sub-adviser whose role is primarily portfolio management and is subcontracted with or overseen by another investment adviser), and any entity controlling, controlled by, or under common control with the adviser that provides ongoing services to the Registrant for the last two fiscal years were $0 and $0 for 2017 and 2016, respectively.
(h) During the past fiscal year, all non-audit services provided by Registrant’s principal accountant to either Registrant’s investment adviser or to any entity controlling, controlled by, or under common control with Registrant’s investment adviser that provides ongoing services to Registrant were pre-approved by the audit committee of Registrant’s Board of Trustees. Included in the audit committee’s pre-approval was the review and consideration as to whether the provision of these non-audit services is compatible with maintaining the principal accountant’s independence.
| Item 5. | Audit Committee of Listed Registrants. |
Not applicable to open-end management investment companies.
| Item 6. | Schedule of Investments |
Schedule of Investments is included as part of the Report to Shareholders filed
under Item 1 of this form.
| Item 7. | Disclosure of Proxy Voting Policies and Procedures for Closed-End Management Investment Companies. |
Not applicable to open-end management investment companies.
| Item 8. | Portfolio Managers of Closed-End Management Investment Companies |
Not applicable. Effective for closed-end management investment companies for fiscal years ending on or after December 31, 2005
| Item 9. | Purchases of Equity Securities by Closed-End Management Company and Affiliated Purchasers. |
Not applicable to open-end management investment companies.
| Item 10. | Submission of Matters to a Vote of Security Holders. |
Not applicable.
| Item 11. | Controls and Procedures. |
((a) The Registrant’s principal executive and principal financial officers, or persons performing similar functions have concluded that the Registrant’s disclosure controls and procedures, as defined in Rule 30a-3(c) under the Act (17 CFR 270.30a-3(c)) as of a date within 90 days of the
filing date of the report, are effective based on the evaluation of these controls and procedures required by Rule 30a-3(b) under the Act (17 CFR 270.30a-3(b)) and Rules 13a-15(b) or 15d-15(b) under the Exchange Act (17 CFR 270.30a-15(b)) or 240.15d-15(b)).
(b) There has been no change in the Registrant’s internal control over financial reporting (as defined in Rule 30a-3(d) under the Act (17CFR 270.3a-3(d)) that occurred during the last fiscal quarter of the period covered by this report that has materially affected, or is reasonably likely to materially affect, the Registrant’s internal control over financial reporting.
| Items 12. | Disclosure of Securities Lending Activities for Closed-End Management Investment Companies. |
Not applicable.
| Items 13. | Exhibits. |
(a)(1) Code of Ethics attached hereto.
(a)(2) A separate certification for the principal executive officer and the principal financial officer of the registrant as required by Rule 30a-2(a) under the Investment Company Act of 1940, as amended (17 CFR 270.30a-2(a)), is filed herewith.
(b) Officer certifications as required by Rule 30a-2(b) under the Investment Company Act of 1940, as amended (17 CFR 270.30a-2(b)) also accompany this filing as an exhibit.
SIGNATURES
Pursuant to the requirements of the Securities Exchange Act of 1934 and the Investment Company Act of 1940, the registrant has duly caused this report to be signed on its behalf by the undersigned, thereunto duly authorized.
| (Registrant) | Bishop Street Funds | |||||
| By (Signature and Title)* | /s/ Michael Beattie | |||||
| Michael Beattie, President | ||||||
| Dated: March 9, 2018 | ||||||
Pursuant to the requirements of the Securities Exchange Act of 1934 and the Investment Company Act of 1940, this report has been signed below by the following persons on behalf of the registrant and in the capacities and on the dates indicated.
| By (Signature and Title)* | /s/ Michael Beattie | |||||
| Michael Beattie, President | ||||||
| Dated: March 9, 2018 |
| By (Signature and Title)* |
/s/ Stephen Connors | |||||
| Stephen Connors, Treasurer, Controller & CFO | ||||||
| Dated: March 9, 2018 |
* Print the name and title of each signing officer under his or her signature.