SECURITIES AND EXCHANGE COMMISSION
Washington, D.C. 20549
FORM 6-K
Report of Foreign Private Issuer
Pursuant to Rule 13a -16 or 15d -16 of
the Securities Exchange Act of 1934
Report on Form 6-K dated July 25, 2019
(Commission File No. 1-13202)
Nokia Corporation
Karaportti 7
FI-02610 Espoo
Finland
(Name and address of registrant’s principal executive office)
|
Indicate by check mark whether the registrant files or will file annual reports under cover of Form 20-F or Form 40-F: | ||
|
|
|
|
|
Form 20-F: x |
|
Form 40-F: o |
|
|
|
|
|
Indicate by check mark if the registrant is submitting the Form 6-K in paper as permitted by Regulation S-T Rule 101(b)(1): | ||
|
|
|
|
|
Yes: o |
|
No: x |
|
|
|
|
|
Indicate by check mark if the registrant is submitting the Form 6-K in paper as permitted by Regulation S-T Rule 101(b)(7): | ||
|
|
|
|
|
Yes: o |
|
No: x |
|
|
|
|
|
Indicate by check mark whether the registrant by furnishing the information contained in this form is also thereby furnishing the information to the Commission pursuant to Rule 12g3-2(b) under the Securities Exchange Act of 1934. | ||
|
|
|
|
|
Yes: o |
|
No: x |
Enclosures:
Financial Report for Q2 and Half Year 2019: Strong Q2 driven by end-to-end 5G demand and improved operational execution; Full year 2019 guidance maintained
|
|
HALF YEAR FINANCIAL REPORT |
|
|
|
|
|
July 25, 2019 |
Nokia Corporation Financial Report for Q2 and Half Year 2019
Nokia Corporation
Half Year Financial Report
July 25, 2019 at 08:00 (CET +1)
Nokia Corporation Financial Report for Q2 and Half Year 2019
Strong Q2 driven by end-to-end 5G demand and improved operational execution; Full year 2019 guidance maintained
This is a summary of the Nokia Corporation financial report for Q2 and half year 2019 published today. The complete financial report for Q2 and half year 2019 with tables is available at www.nokia.com/financials. Investors should not rely on summaries of our interim reports only, but should review the complete interim reports with tables.
RAJEEV SURI, PRESIDENT AND CEO, ON Q2 2019 RESULTS
Nokia delivered a strong second quarter, driven by 5G demand, a competitive end-to-end portfolio and strengthened operational execution. Given these compelling results, we are confirming our full-year 2019 guidance.
In the quarter, we saw good year-on-year growth, meaningful improvements in profitability, robust progress in our strategic expansion areas of Software and Enterprise and excellent momentum in our IP Routing business. We also continued to enhance our position in 5G, and now have 45 commercial 5G deals and 9 live networks.
Risks remain in the year, including execution demands in the second half, trade-related uncertainty and challenges in the China market. Given these risks, we will continue to focus on tight operational discipline, delivering on our EUR 700 million cost-savings program, improving working capital management and advancing the implementation of our strategy.
Overall, I am pleased with Nokia’s performance in the second quarter and our continued progress in executing our strategy.
Q2 2019 and January-June 2019 reported and non-IFRS results. Refer to note 1, “Basis of Preparation”, note 2, “Non-IFRS to reported reconciliation” and note 13, “Performance measures”, in the “Financial statement information” section for details.
|
EUR million (except for EPS in |
|
Q2’19 |
|
Q2’18 |
|
YoY |
|
Constant |
|
Q1-Q2’19 |
|
Q1- |
|
YoY |
|
Constant |
|
|
Net sales |
|
5 694 |
|
5 313 |
|
7 |
% |
5 |
% |
10 726 |
|
10 237 |
|
5 |
% |
2 |
% |
|
Operating profit/(loss) |
|
(57 |
) |
(221 |
) |
|
|
|
|
(581 |
) |
(557 |
) |
|
|
|
|
|
Operating margin % |
|
(1.0 |
)% |
(4.2 |
)% |
320 |
bps |
|
|
(5.4 |
)% |
(5.4 |
)% |
0 |
bps |
|
|
|
EPS, diluted |
|
(0.03 |
) |
(0.05 |
) |
|
|
|
|
(0.11 |
) |
(0.11 |
) |
|
|
|
|
|
Operating profit/(loss) (non-IFRS) |
|
451 |
|
334 |
|
35 |
% |
|
|
391 |
|
573 |
|
(32 |
)% |
|
|
|
Operating margin % (non-IFRS) |
|
7.9 |
% |
6.3 |
% |
160 |
bps |
|
|
3.6 |
% |
5.6 |
% |
(200 |
)bps |
|
|
|
EPS, diluted (non-IFRS) |
|
0.05 |
|
0.03 |
|
67 |
% |
|
|
0.02 |
|
0.04 |
|
(50 |
)% |
|
|
|
Net cash and current financial investments(1) |
|
502 |
|
2 146 |
|
(77 |
)% |
|
|
502 |
|
2 146 |
|
(77 |
)% |
|
|
(1)Net cash and current financial investments does not include lease liabilities.
· Net sales in Q2 2019 were EUR 5.7bn, compared to EUR 5.3bn in Q2 2018. On a constant currency basis, net sales increased 5%. Our strong topline performance was driven by improved industry demand and the competitiveness of our end-to-end portfolio, with growth across four out of six regions and all customer types.
· Non-IFRS diluted EPS in Q2 2019 was EUR 0.05, compared to EUR 0.03 in Q2 2018, primarily driven by solid operational execution, which yielded gross profit improvements across Networks, Nokia Software and Nokia Technologies.
· Reported diluted EPS in Q2 2019 was negative EUR 0.03, compared to negative EUR 0.05 in Q2 2018, primarily driven by higher gross profit, partially offset by a net negative fluctuation in financial income and expenses.
· In Q2 2019, net cash and current financial investments decreased sequentially by approximately EUR 1.5bn. This decrease was primarily due to anticipated cash outflows including the payment of 2018 performance-related incentives to employees, payment of the quarterly dividend, as well as restructuring and associated cash outflows, which together totaled approximately EUR 900 million. In addition, approximately EUR 350 million of the decline was temporary in nature and is expected to reverse in the second half of 2019.
· Full year 2019 guidance maintained, with seasonality characterized by weaker first and third quarters and stronger second and fourth quarters, with a particularly weak Q1 and an expected particularly strong Q4.
DIVIDEND
Beginning with the distribution for the financial year 2018, Nokia has started paying dividends in quarterly instalments. Under the authorization by the Annual General Meeting held on May 21, 2019, the Board of Directors may resolve an aggregate maximum annual distribution of EUR 0.20 per share to be paid quarterly during the authorization period, unless the Board decides otherwise for a justified reason. On the same day, the Board resolved to distribute EUR 0.05 per share as the first instalment of the dividend.
On July 25, 2019, the Board resolved to distribute EUR 0.05 per share as the second instalment of the dividend. The dividend record date is on July 30, 2019 and the dividend is expected to be paid on or around August 8, 2019. The actual dividend payment date outside Finland will be determined by the practices of the intermediary banks transferring the dividend payments. Following this announced distribution, the Board’s remaining distribution authorization for the financial year 2018 is a maximum of EUR 0.10 per share.
The payment of the second instalment of the dividend, as well as the payment of the withholding taxes related to the first instalment of the dividend, are expected to total approximately EUR 300 million in Q3 2019.
OUTLOOK
|
Metric |
|
Full Year 2019 |
|
Full Year 2020 |
|
Non-IFRS diluted earnings per share |
|
EUR 0.25 - 0.29 |
|
EUR 0.37 - 0.42 |
|
Non-IFRS operating margin |
|
9 - 12% |
|
12 - 16% |
|
Recurring free cash flow(1) |
|
Slightly positive |
|
Clearly positive |
Annual distribution to shareholders: Over the long term, Nokia targets to deliver an earnings-based growing dividend by distributing approximately 40% to 70% of non-IFRS diluted EPS, taking into account Nokia’s cash position and expected cash flow generation. The annual distribution would be paid as quarterly dividends.
(1)Free cash flow = net cash from operating activities - capital expenditures + proceeds from sale of property, plant and equipment and intangible assets - purchase of non-current financial investments + proceeds from sale of non-current financial investments.
Key drivers of Nokia’s outlook
Net sales and operating margin for Networks and Nokia Software are expected to be influenced by factors including:
· Our expectation that we will outperform our primary addressable market in full year 2019 and over the longer-term, driven by our strategy, which includes competing in 5G more effectively due to our strong end-to-end portfolio, focusing on targeted growth opportunities in attractive adjacent markets and building a strong network agnostic software business. On a constant currency basis, we expect our primary addressable market to grow slightly in full year 2019, and for growth to continue in full year 2020. (This is an update to our earlier commentary for our primary addressable market to be flattish in full year 2019 and to grow in full year 2020.);
· The slow start to 2019 and weak overall first half puts significant pressure on execution in the second half;
· The timing of completions and acceptances of certain projects, particularly related to 5G. Based on the evolving readiness of the 5G ecosystem and the staggered nature of 5G rollouts in lead countries, we expect full year 2019 will have seasonality characterized by a particularly weak first quarter, a strong second quarter, an expected soft third quarter and an expected particularly strong fourth quarter (This is an update, providing additional quarterly details);
· Competitive intensity could increase in some accounts as some competitors seek to take share in the early phases of 5G;
· Some customers are reassessing their vendors in light of security concerns, creating near-term pressure to invest in order to secure long-term benefits;
· Our expectation that we will improve our R&D productivity and reduce support function costs through the successful execution of our cost savings program;
· Potential mergers or acquisitions by our customers;
· Our product and regional mix; and
· Macroeconomic, industry and competitive dynamics.
Net sales and operating margin for Nokia Technologies is expected to be influenced by factors including:
· The timing and value of new and existing patent licensing agreements with smartphone vendors, automotive companies and consumer electronics companies;
· Results in brand and technology licensing;
· Costs to protect and enforce our intellectual property rights; and
· The regulatory landscape.
Additionally, our outlook is based on the following assumptions:
· Nokia’s recurring free cash flow is expected to improve over the longer-term due to lower cash outflows related to restructuring and network equipment swaps and improved operational results over time;
· Non-IFRS financial income and expenses to be an expense of approximately EUR 350 million in full year 2019 and over the longer-term (This is an update to earlier commentary for non-IFRS financial income and expenses to be an expense of approximately EUR 300 million.);
· Non-IFRS income taxes at a rate of approximately 28% in full year 2019 and approximately 25% over the longer-term, subject to the absolute level of profits, regional profit mix and changes to our operating model;
· Cash outflows related to income taxes of approximately EUR 450 million in full year 2019 and over the longer term until our US or Finnish deferred tax assets are fully utilized; and
· Capital expenditures of approximately EUR 700 million in full year 2019 and approximately EUR 600 million over the longer-term.
NOKIA FINANCIAL RESULTS
|
EUR million (except for EPS in EUR) |
|
Q2’19 |
|
Q2’18 |
|
YoY |
|
Constant |
|
Q1- |
|
Q1- |
|
YoY |
|
Constant |
|
|
Net sales |
|
5 694 |
|
5 313 |
|
7 |
% |
5 |
% |
10 726 |
|
10 237 |
|
5 |
% |
2 |
% |
|
Networks |
|
4 393 |
|
4 081 |
|
8 |
% |
5 |
% |
8 336 |
|
7 864 |
|
6 |
% |
3 |
% |
|
Nokia Software |
|
678 |
|
612 |
|
11 |
% |
8 |
% |
1 221 |
|
1 153 |
|
6 |
% |
3 |
% |
|
Nokia Technologies |
|
383 |
|
361 |
|
6 |
% |
4 |
% |
753 |
|
726 |
|
4 |
% |
2 |
% |
|
Group Common and Other |
|
263 |
|
280 |
|
(6 |
)% |
(6 |
)% |
484 |
|
532 |
|
(9 |
)% |
(9 |
)% |
|
Non-IFRS exclusions |
|
(2 |
) |
(5 |
) |
(60 |
)% |
|
|
(27 |
) |
(9 |
) |
200 |
% |
|
|
|
Gross profit |
|
2 065 |
|
1 860 |
|
11 |
% |
|
|
3 646 |
|
3 666 |
|
(1 |
)% |
|
|
|
Operating profit/(loss) |
|
(57 |
) |
(221 |
) |
(74 |
)% |
|
|
(581 |
) |
(557 |
) |
4 |
% |
|
|
|
Networks |
|
119 |
|
34 |
|
250 |
% |
|
|
(135 |
) |
80 |
|
(269 |
)% |
|
|
|
Nokia Software |
|
137 |
|
40 |
|
243 |
% |
|
|
130 |
|
42 |
|
210 |
% |
|
|
|
Nokia Technologies |
|
324 |
|
292 |
|
11 |
% |
|
|
626 |
|
566 |
|
11 |
% |
|
|
|
Group Common and Other |
|
(129 |
) |
(33 |
) |
|
|
|
|
(230 |
) |
(116 |
) |
|
|
|
|
|
Non-IFRS exclusions |
|
(508 |
) |
(555 |
) |
|
|
|
|
(972 |
) |
(1 129 |
) |
|
|
|
|
|
Operating margin % |
|
(1.0 |
)% |
(4.2 |
)% |
320 |
bps |
|
|
(5.4 |
)% |
(5.4 |
)% |
0 |
bps |
|
|
|
Gross profit (non-IFRS) |
|
2 117 |
|
2 038 |
|
4 |
% |
|
|
3 758 |
|
3 979 |
|
(6 |
)% |
|
|
|
Operating profit/(loss) (non-IFRS) |
|
451 |
|
334 |
|
35 |
% |
|
|
391 |
|
573 |
|
(32 |
)% |
|
|
|
Operating margin % (non-IFRS) |
|
7.9 |
% |
6.3 |
% |
160 |
bps |
|
|
3.6 |
% |
5.6 |
% |
(200 |
)bps |
|
|
|
Financial income and expenses |
|
(173 |
) |
(56 |
) |
209 |
% |
|
|
(228 |
) |
(164 |
) |
39 |
% |
|
|
|
Income taxes |
|
46 |
|
10 |
|
360 |
% |
|
|
188 |
|
104 |
|
81 |
% |
|
|
|
Profit/(loss) for the period |
|
(191 |
) |
(271 |
) |
(30 |
)% |
|
|
(632 |
) |
(625 |
) |
1 |
% |
|
|
|
EPS, diluted |
|
(0.03 |
) |
(0.05 |
) |
(40 |
)% |
|
|
(0.11 |
) |
(0.11 |
) |
0 |
% |
|
|
|
Financial income and expenses (non-IFRS) |
|
(86 |
) |
(84 |
) |
2 |
% |
|
|
(178 |
) |
(200 |
) |
(11 |
)% |
|
|
|
Income taxes (non-IFRS) |
|
(101 |
) |
(106 |
) |
(5 |
)% |
|
|
(60 |
) |
(143 |
) |
(58 |
)% |
|
|
|
Profit/(loss) for the period (non-IFRS) |
|
258 |
|
139 |
|
86 |
% |
|
|
142 |
|
223 |
|
(36 |
)% |
|
|
|
EPS, diluted (non-IFRS) |
|
0.05 |
|
0.03 |
|
67 |
% |
|
|
0.02 |
|
0.04 |
|
(50 |
)% |
|
|
Results are as reported and relate to continuing operations unless otherwise specified. The financial information in this report is unaudited. Non-IFRS results exclude costs related to the acquisition of Alcatel-Lucent and related integration, goodwill impairment charges, intangible asset amortization and other purchase price fair value adjustments, restructuring and associated charges and certain other items that may not be indicative of Nokia’s underlying business performance. For details, please refer to note 2, “Non-IFRS to reported reconciliation”, in the notes to the Financial statement information in this report. Change in net sales at constant currency excludes the effect of changes in exchange rates in comparison to euro, our reporting currency. For more information on currency exposures, please refer to note 1, “Basis of Preparation”, in the “Financial statement information” section in this report.
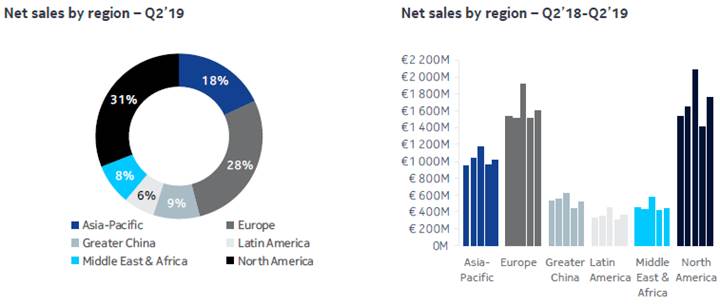
Net sales by region
|
EUR million |
|
Q2’19 |
|
Q2’18 |
|
YoY |
|
Constant |
|
Q1-Q2’19 |
|
Q1-Q2’18 |
|
YoY |
|
Constant |
|
|
Asia-Pacific |
|
1 012 |
|
932 |
|
9 |
% |
5 |
% |
1 975 |
|
1 842 |
|
7 |
% |
3 |
% |
|
Europe |
|
1 611 |
|
1 548 |
|
4 |
% |
4 |
% |
3 111 |
|
3 054 |
|
2 |
% |
1 |
% |
|
Greater China |
|
515 |
|
524 |
|
(2 |
)% |
0 |
% |
949 |
|
1 003 |
|
(5 |
)% |
(6 |
)% |
|
Latin America |
|
359 |
|
308 |
|
17 |
% |
15 |
% |
664 |
|
605 |
|
10 |
% |
8 |
% |
|
Middle East & Africa |
|
441 |
|
447 |
|
(1 |
)% |
(2 |
)% |
855 |
|
878 |
|
(3 |
)% |
(5 |
)% |
|
North America |
|
1 755 |
|
1 554 |
|
13 |
% |
7 |
% |
3 172 |
|
2 855 |
|
11 |
% |
4 |
% |
|
Total |
|
5 694 |
|
5 313 |
|
7 |
% |
5 |
% |
10 726 |
|
10 237 |
|
5 |
% |
2 |
% |
Net sales by customer type
|
EUR million |
|
Q2’19 |
|
Q2’18 |
|
YoY |
|
Constant |
|
Q1-Q2’19 |
|
Q1-Q2’18 |
|
YoY |
|
Constant |
|
|
Communication service providers |
|
4 755 |
|
4 398 |
|
8 |
% |
6 |
% |
8 962 |
|
8 478 |
|
6 |
% |
2 |
% |
|
Enterprise |
|
318 |
|
295 |
|
8 |
% |
6 |
% |
577 |
|
540 |
|
7 |
% |
4 |
% |
|
Licensees |
|
383 |
|
352 |
|
9 |
% |
6 |
% |
753 |
|
701 |
|
7 |
% |
5 |
% |
|
Other(1) |
|
238 |
|
268 |
|
(11 |
)% |
(12 |
)% |
433 |
|
519 |
|
(17 |
)% |
(16 |
)% |
|
Total |
|
5 694 |
|
5 313 |
|
7 |
% |
5 |
% |
10 726 |
|
10 237 |
|
5 |
% |
2 |
% |
(1) Includes net sales of Alcatel Submarine Networks (ASN) and Radio Frequency Systems (RFS), both of which are being managed as separate entities, and certain other items, such as eliminations of inter-segment revenues and certain items related to purchase price allocation. ASN and RFS net sales include also revenue from communications service providers and enterprise customers.
Our Nokia Enterprise business is performing well. Net sales to enterprise customers, excluding the third party integration business that we are exiting, grew 7% on a reported basis and 5% on a
constant currency basis in Q2 2019, and grew 8% on a reported basis and 5% on a constant currency basis in the first six months of 2019.
Nokia, Q2 2019 compared to Q2 2018, non-IFRS
Nokia non-IFRS net sales grew 7%. On a constant currency basis, Nokia non-IFRS net sales grew 5%.
Nokia non-IFRS net sales, excluding approximately EUR 30 million of one-time licensing net sales in Q2 2019 and EUR 10 million in Q2 2018, grew 7%, as our customers added network capacity in preparation for the continued rise in broadband traffic driven by 5G. Our strong topline performance in Q2 2019 reflected improved industry demand and the competitiveness of our end-to-end portfolio, with growth across four out of six regions and all customer types. In Q2 2019, we continued to make progress with our strategy to diversify and grow, with strong results in Nokia Software and continued solid performance with enterprise customers.
The strong growth in Nokia Software net sales was due to both applications and core networks benefitting from its improved go-to-market capabilities, as well as the timing of completions and acceptances of certain projects.
The growth in net sales to enterprise customers was primarily due to strong demand for our market-leading IP routing and optical networks portfolio and, to a lesser extent, strong percentage growth in private wireless networks for industrial and public sector applications. We continue to see strong momentum in industries like utilities, transportation, mining, manufacturing, as well as the public sector.
The increase in Nokia non-IFRS gross profit was driven by strong net sales and operational execution that was solid and broad-based across Networks, Nokia Software and Nokia Technologies, partially offset by lower gross profit in Group Common and other.
The increase in Nokia non-IFRS operating profit was driven by the higher non-IFRS gross profit, as well as continued progress related to Nokia’s cost savings program, partially offset by lower gains in Nokia’s venture fund investments and a net negative impact related to foreign exchange hedging.
Nokia, January-June 2019 compared to January-June 2018, reported
Nokia net sales grew 5% in the first six months of 2019 as our customers added network capacity in preparation for the continued rise in broadband traffic driven by 5G. On a constant currency basis, Nokia net sales grew 2% in the first six months of 2019.
Nokia net sales, excluding approximately EUR 70 million of one-time licensing net sales in the first six months of 2019 and EUR 20 million in the first six months of 2018, grew 4%.
Our strong topline performance in the first six months 2019 reflected improved industry demand and the competitiveness of our end-to-end portfolio, with growth across four out of six regions and all customer types. In the first six months of 2019, we continued to make progress with our strategy to diversify and grow, with strong results in Nokia Software and continued solid performance with enterprise customers.
The decrease in Nokia gross profit in the first six months of 2019 was driven by a particularly weak Q1 2019, partially offset by improved operational execution in Q2 2019.
The slight increase in Nokia operating loss in the first six months of 2019 was driven by lower gross profit and higher restructuring and associated charges, partially offset by continued progress related to Nokia’s cost savings program.
CASH AND CASH FLOW IN Q2 2019
During the second quarter of 2019 Nokia’s free cash flow was negative EUR 1 041 million driven by:
· Cash outflows related to net working capital, primarily due to the payment of 2018 performance-related incentives to employees, as well as: a) an increase in receivables, including EUR 350 million of timing related increases that are temporary in nature and expected to reverse in the second half of 2019, b) a decrease in accounts payable, reflecting lower purchase volumes during the quarter and c) elevated inventory levels, primarily due to our decision to ensure sufficient flexibility to deliver higher levels of equipment sales, particularly related to 5G, and an increase in work in progress inventories related to certain large 5G deployments;
· Continued cash outflows related to restructuring and network equipment swaps; and
· Income taxes and capital expenditures.
Nokia has established a free cash flow program to ensure company-wide focus on free cash flow and release of working capital, including project asset optimization, review of contract terms & conditions, as well as supply chain and inventory optimization. Senior leaders of Nokia have significant part of their incentives tied to free cash flow improvement targets in 2019 and beyond.
|
EUR million, at end of period |
|
Q2’19 |
|
Q1’19 |
|
QoQ |
|
Q4’18 |
|
YTD |
|
|
Total cash and current financial investments |
|
4 788 |
|
6 394 |
|
(25 |
)% |
6 873 |
|
(30 |
)% |
|
Net cash and current financial investments(1) |
|
502 |
|
1 991 |
|
(75 |
)% |
3 053 |
|
(84 |
)% |
(1) Net cash and current financial investments does not include lease liabilities. For details, please refer to note 7, “Net cash and current financial investments”, and note 13, “Performance measures”, in the “Financial statement information” section in this report.
During the second quarter 2019, Nokia’s total cash and current financial investments (“total cash”) decreased by EUR 1 606 million and Nokia’s net cash and current financial investments (“net cash”) decreased by EUR 1 489 million.
Approximately EUR 900 million of the decline in total cash and net cash was driven by the following three cash outflows, in line with our expectations: a) payment of 2018 performance-related incentives to employees, b) payment of the first quarterly instalment of the dividend and c) restructuring and associated cash outflows. In addition, approximately EUR 350 million of the decline in total cash and net cash was temporary in nature and is expected to reverse in the second half of 2019.
Foreign exchange rates had an approximately EUR 60 million negative impact on net cash.
In the second quarter 2019, net cash used in operating activities was EUR 916 million:
· Nokia’s adjusted profit before changes in net working capital was EUR 553 million in the second quarter 2019.
· In the second quarter 2019, Nokia generated a decrease in net cash related to net working capital of approximately EUR 1.3 billion. Excluding approximately EUR 110 million of restructuring and associated cash outflows, Nokia generated an approximately EUR 1.2 billion decrease in net cash related to net working capital due to a decrease in liabilities, an increase in receivables and an increase in inventories.
· The increase in receivables was approximately EUR 260 million, and was primarily due to the timing of approximately EUR 350 million of receivables. The EUR 350 million of timing related increases is temporary in nature and expected to reverse in the second half of 2019.
· The increase in inventories was approximately EUR 110 million, and was primarily due to our decision to ensure sufficient flexibility to deliver higher levels of equipment sales, particularly related to 5G, and an increase in work in progress inventories related to certain large 5G deployments.
· The decrease in liabilities was approximately EUR 830 million, and was primarily due to payment of 2018 performance-related incentives to employees, amounting to approximately EUR 530 million, and a decrease in accounts payable, amounting to approximately EUR 260 million.
· In addition, cash taxes amounted to an outflow of approximately EUR 160 million.
· The implementation of IFRS 16 positively impacted our net cash used in operating activities and negatively impacted our net cash from financing activities, both by approximately EUR 60 million.
In the second quarter 2019, net cash used in investing activities primarily related to capital expenditures of approximately EUR 130 million.
In the second quarter 2019, net cash used in financing activities primarily related to paying the first quarterly instalment of the dividend, amounting to approximately EUR 250 million and leasing payments of approximately EUR 60 million following the implementation of IFRS 16.
COST SAVINGS PROGRAM
We expect our most recent cost savings program to result in a net EUR 700 million reduction of non-IFRS operating expenses and production overheads in full year 2020 compared to full year 2018, of which EUR 500 million is expected to come from operating expenses and EUR 200 million is expected to come from cost of sales. The related restructuring charges are expected to total EUR 900 million.
The following table summarizes the financial information related to our cost savings program as of the end of the second quarter 2019.
|
In EUR million, approximately(1) |
|
Q2’19 |
|
|
Balance of restructuring and associated liabilities for prior programs |
|
660 |
|
|
+ Charges in the quarter |
|
200 |
|
|
- Cash outflows in the quarter |
|
110 |
|
|
= Ending balance of restructuring and associated liabilities |
|
750 |
|
|
of which restructuring provisions |
|
570 |
|
|
of which other associated liabilities |
|
180 |
|
|
|
|
|
|
|
Total expected restructuring and associated charges, related to our most recent cost savings program (rounded to the nearest EUR 50 million) |
|
900 |
|
|
- Cumulative recorded |
|
360 |
|
|
= Charges remaining to be recorded |
|
540 |
|
|
|
|
|
|
|
Total expected restructuring and associated cash outflows (rounded to the nearest EUR 50 million) |
|
1 550 |
|
|
- Cumulative recorded |
|
240 |
|
|
= Cash outflows remaining to be recorded |
|
1 310 |
|
(1)Balances related to previous restructuring and cost savings programs have been included as part of this cost savings program. At the beginning of Q1 2019, the balance of restructuring and associated liabilities related to prior cost savings programs was approximately EUR 630 million. This amount is included in the total expected restructuring and associated cash outflows of EUR 1 550 million, rounded to the nearest EUR 50 million, in addition to the approximately EUR 900 million of expected cash outflows related to our most recent cost savings program.
The below table includes future expectations related to our most recent cost savings program, as well as the remaining cash outflows related to our previous programs and network equipment swaps.
|
|
|
Expected amounts for |
| ||||||
|
In EUR million, approximately |
|
FY 2019 |
|
FY 2020 |
|
Beyond |
|
Total |
|
|
Recurring annual cost savings |
|
200 |
|
500 |
|
— |
|
700 |
|
|
- operating expenses |
|
150 |
|
350 |
|
— |
|
500 |
|
|
- cost of sales |
|
50 |
|
150 |
|
— |
|
200 |
|
|
Restructuring and associated charges |
|
550 |
|
350 |
|
— |
|
900 |
|
|
Restructuring and associated cash outflows |
|
700 |
|
350 |
|
500 |
|
1 550 |
|
|
Charges related to network equipment swaps |
|
150 |
|
— |
|
— |
|
150 |
|
|
Cash outflows related to network equipment swaps |
|
150 |
|
— |
|
— |
|
150 |
|
OPERATIONAL HIGHLIGHTS
Nokia showed strong momentum in the second quarter across its key markets and around the globe, particularly in 5G, where Nokia’s technology is now present in all regions in the world.
In the first pillar of our strategy, leading in high-performance, end-to-end networks with communication service providers:
Nokia signed multiple 5G commercial agreements during the period and the total number of 5G commercial agreements is now 45. Around half of those include portfolio beyond 5G New Radio. Nine of those networks are now live, and these include both mid-band and mmWave solutions. SoftBank Corp. in Japan selected Nokia as a strategic partner to drive its commercial 5G offering with the Nokia AirScale solution. Under a three-year deal, Zain Saudi Arabia will roll out its 5G network using Nokia’s end-to-end portfolio, including radio, microwave transport, security and turnkey services solutions. Nokia and U Mobile in Malaysia signed a three-year contract to deploy a Nokia Single RAN network as well as microwave and IP-based mobile transport technologies; the deal also includes the Nokia 7705 Service Aggregation Routers and 7750 Service Routers for mobile access and aggregation. Nokia and U Mobile also announced they will collaborate on a 5G live network trial later this year. In Denmark, Telia Company initiated its first live 5G tests in cooperation with Nokia and the TT-network. Nokia also announced that China Mobile will adopt its new AirScale mMIMO Adaptive Antenna, created specifically for the massive bandwidth and coverage requirements of the Chinese market as it transitions to 5G.
To address the critical security needs of 5G end-to-end networks, Nokia unveiled DFSEC 2.0, an enhanced security program, and established the “Future X Security” Laboratory, an advanced security testing and verification laboratory. In addition, researchers at Nokia Bell Labs and AMBER, the SFI Centre for Advanced Materials and BioEngineering Research, announced a new formula for battery composition that makes batteries more powerful by packing 2.5 times the battery life than anything currently on the market. Nokia also announced its 5G virtual testing environment, designed to make 5G deployments faster and more cost-efficient.
After Q2 closed, Nokia announced that China Unicom chose Nokia’s optical fronthaul solution to power its 4G and 5G networks in Beijing, supporting the operator’s commitment to deliver 5G in the 2019 timeframe. In addition, Nokia announced that Taiwan Star Telecom will deploy Nokia’s AirScale eNodeB solution, IP routing, packet core and policy and charging solution to expand its LTE services and prepare for 5G migration.
In Optical, TIM (Telecom Italia) achieved a wavelength speed of 550 Gb/s using the Nokia “Photonic Service Engine 3” (PSE-3), a new European record for data transmission over a long-distance backbone network. Nokia and Polish service provider Netia conducted the first field trial of the PSE-3 super coherent technology over a live production network.
In Fixed Access, India’s Netplus will deploy Nokia’s GPON technology to meet growing demand for more capacity, faster speeds and superior quality of broadband services. Nokia announced that Altibox will deploy its Gainspeed Unified Cable Access solution to significantly increase network capacity.
Nokia announced that Cellcom Israel will deploy Sensing as a Service, creating the first real-time and dense environmental data offering in Israel. Environmental sensors will be placed on existing radio base station sites, and Cellcom Israel’s customers in enterprise, transport, healthcare, cities and utilities can subscribe to the data for monetization opportunities.
In the second pillar of our strategy, expanding network sales to select vertical markets needing high-performing, secure networks:
Nokia signed a two-year co-operation agreement with Kalmar and Ukkoverkot to build a wireless digitalization infrastructure for port and terminal R&D in the move toward increasingly intelligent cargo handling solutions. Deutsche Telekom announced the conclusion of its field test with Nokia and the Hamburg Port Authority, which tested new features of the 5G standard with different applications in the Port of Hamburg.
SP Telecom and Nokia are collaborating to enable faster go-to-market solutions for 5G deployment in Singapore, with the addition of Nokia’s FP4-based Service Router, optical transport, cloud software solutions and service automation and network orchestration application suite into SP Telecom’s infrastructure.
Cleco selected Nokia to modernize its microwave communications network, which supports 290,000 customers through Cleco’s retail and wholesale power business in Louisiana and Mississippi.
In the Middle East and Africa (MEA), Gulf Bridge International chose Nokia’s Nuage Networks SD-WAN 2.0 solution to provide connectivity for its customers with international operations.
At Hannover Messe 2019, Nokia showcased the second generation of its Factory in a Box in collaboration with several industry ecosystem partners. The proof of concept demonstrates how Industry 4.0 solutions can be packed, transported and brought back into service in a matter of hours, including full over-the-air connectivity. After the quarter ended, Nokia’s 5G “factory of the future” in Oulu, Finland was selected by McKinsey and the World Economic Forum as an Advanced 4th Industrial Revolution Lighthouse.
Nokia announced it has joined ConectarAGRO, an initiative of eight agribusiness and high technology companies, to bring access for over 500,000 Brazilian farmers to IoT and Agriculture 4.0 technologies.
Etteplan, Nokia and Ukkoverkot announced that they will join forces to provide industrial customers with solutions based on private LTE/4G or NR 5G radio networks. Daiwabo Information System was signed as Nokia’s first distributor in Japan, and will sell Nokia’s IP, optical, LTE and other wireless solutions through its network of about 19,000 sales partners.
In the third pillar of our strategy, developing a strong software business at scale:
Ooredoo Qatar selected Nokia to build a 5G cloud native core network to support delivery of enhanced mobile broadband services. The Nokia AirFrame, CloudBand, voice and Cloud Packet Core VNFs and Nuage Networks software-defined network solution are being deployed in the core network.
Nokia announced that Ooredoo Algeria successfully deployed North Africa’s first virtualized Mobile Gateway, a crucial step for the migration of core network elements to the cloud and the transformation of the core network to support next generation mobile network technology. In addition, Vodafone Egypt is deploying the Nokia Subscriber Data Management over telco cloud for faster rollout of LTE services.
In the fourth pillar of our strategy, now focused primarily on licensing:
Nokia announced that Jenni Lukander would succeed Maria Varsellona as president of Nokia Technologies and become a GLT member, effective 1 August. In addition, Nokia announced an agreement with GE Licensing to enable commercialization of breakthrough technologies in new markets.
RISKS AND FORWARD-LOOKING STATEMENTS
It should be noted that Nokia and its businesses are exposed to various risks and uncertainties and certain statements herein that are not historical facts are forward-looking statements. These forward-looking statements reflect Nokia’s current expectations and views of future developments and include statements regarding: A) expectations, plans or benefits related to our strategies and growth management; B) expectations, plans or benefits related to future performance of our businesses and any expected future dividends; C) expectations and targets regarding financial performance, results, the timing of receivables, operating expenses, taxes, currency exchange rates, hedging, cost savings and competitiveness, as well as results of operations including targeted synergies and those related to market share, prices, net sales, income and margins; D) expectations, plans or benefits related to changes in organizational and operational structure; E) expectations regarding market developments, general economic conditions and structural change globally and in national and regional markets, such as China; F) our ability to integrate acquired businesses into our operations and achieve the targeted business plans and benefits, including targeted benefits, synergies, cost savings and efficiencies; G) expectations, plans or benefits related to any future collaboration or to business collaboration agreements or patent license agreements or arbitration awards, including income to be received under any collaboration or partnership, agreement or award; H) timing of the deliveries of our products and services, including our short term and longer term expectations around the rollout of 5G and our ability to capitalize on such rollout; and the overall readiness of the 5G ecosystem; I) expectations and targets regarding collaboration and partnering arrangements, joint ventures or the creation of joint ventures, and the related administrative, legal, regulatory and other conditions, as well as our expected customer reach; J) outcome of pending and threatened litigation, arbitration, disputes, regulatory proceedings or investigations by authorities; K) expectations regarding restructurings, investments, capital structure optimization efforts, uses of proceeds from transactions, acquisitions and divestments and our ability to achieve the financial and operational targets set in connection with any such restructurings, investments, capital structure optimization efforts, divestments and acquisitions, including our current cost savings program; L) expectations, plans or benefits related to future capital expenditures, temporary incremental expenditures or other R&D expenditures to develop or rollout of software and other new products, including 5G; and M) statements preceded by or including “believe”, “expect”, “expectations”, “commit”, “anticipate”, “foresee”, “see”, “target”, “estimate”, “designed”, “aim”, “plan”, “intend”, “influence”, “assumption”, “focus”, “continue”, “project”, “should”, “is to”, “will” or similar expressions. These forward-looking statements are subject to a number of risks and uncertainties, many of which are beyond our control, which could cause actual results to differ materially from such statements. These statements are based on management’s best assumptions and beliefs in light of the information currently available to it. These forward-looking statements are only predictions based upon our current expectations and views of future events and developments and are subject to risks and uncertainties that are difficult to
predict because they relate to events and depend on circumstances that will occur in the future. Factors, including risks and uncertainties that could cause these differences include, but are not limited to: 1) our strategy is subject to various risks and uncertainties and we may be unable to successfully implement our strategic plans, sustain or improve the operational and financial performance of our business groups, correctly identify or successfully pursue business opportunities or otherwise grow our business; 2) general economic and market conditions and other developments in the economies where we operate, including the timeline for the deployment of 5G and our ability to successfully capitalize on that deployment; 3) competition and our ability to effectively and profitably invest in existing and new high-quality products, services, upgrades and technologies and bring them to market in a timely manner; 4) our dependence on the development of the industries in which we operate, including the cyclicality and variability of the information technology and telecommunications industries and our own R&D capabilities and investments; 5) our dependence on a limited number of customers and large multi-year agreements, as well as external events impacting our customers including mergers and acquisitions; 6) our ability to maintain our existing sources of intellectual property-related revenue through our intellectual property, including through licensing, establish new sources of revenue and protect our intellectual property from infringement; 7) our ability to manage and improve our financial and operating performance, cost savings, competitiveness and synergies generally, expectations and timing around our ability to recognize any net sales and our ability to implement changes to our organizational and operational structure efficiently; 8) our global business and exposure to regulatory, political or other developments in various countries or regions, including emerging markets and the associated risks in relation to tax matters and exchange controls, among others; 9) our ability to achieve the anticipated benefits, synergies, cost savings and efficiencies of acquisitions; 10) exchange rate fluctuations, as well as hedging activities; 11) our ability to successfully realize the expectations, plans or benefits related to any future collaboration or business collaboration agreements and patent license agreements or arbitration awards, including income to be received under any collaboration, partnership, agreement or arbitration award; 12) Nokia Technologies’ ability to protect its IPR and to maintain and establish new sources of patent, brand and technology licensing income and IPR-related revenues, particularly in the smartphone market, which may not materialize as planned, 13) our dependence on IPR technologies, including those that we have developed and those that are licensed to us, and the risk of associated IPR-related legal claims, licensing costs and restrictions on use; 14) our exposure to direct and indirect regulation, including economic or trade policies, and the reliability of our governance, internal controls and compliance processes to prevent regulatory penalties in our business or in our joint ventures; 15) our reliance on third-party solutions for data storage and service distribution, which expose us to risks relating to security, regulation and cybersecurity breaches; 16) inefficiencies, breaches, malfunctions or disruptions of information technology systems, or our customers’ security concerns; 17) our exposure to various legal frameworks regulating corruption,
fraud, trade policies, and other risk areas, and the possibility of proceedings or investigations that result in fines, penalties or sanctions; 18) adverse developments with respect to customer financing or extended payment terms we provide to customers; 19) the potential complex tax issues, tax disputes and tax obligations we may face in various jurisdictions, including the risk of obligations to pay additional taxes; 20) our actual or anticipated performance, among other factors, which could reduce our ability to utilize deferred tax assets; 21) our ability to retain, motivate, develop and recruit appropriately skilled employees; 22) disruptions to our manufacturing, service creation, delivery, logistics and supply chain processes, and the risks related to our geographically-concentrated production sites; 23) the impact of litigation, arbitration, agreement-related disputes or product liability allegations associated with our business; 24) our ability to re-establish investment grade rating or maintain our credit ratings; 25) our ability to achieve targeted benefits from, or successfully implement planned transactions, as well as the liabilities related thereto; 26) our involvement in joint ventures and jointly-managed companies; 27) the carrying amount of our goodwill may not be recoverable; 28) uncertainty related to the amount of dividends and equity return we are able to distribute to shareholders for each financial period; 29) pension costs, employee fund-related costs, and healthcare costs; 30) our ability to successfully complete and capitalize on our order backlogs and continue converting our sales pipeline into net sales; and 31) risks related to undersea infrastructure, as well as the risk factors specified on pages 60 to 75 of our 2018 annual report on Form 20-F published on March 21, 2019 under “Operating and financial review and prospects-Risk factors” and in our other filings or documents furnished with the U.S. Securities and Exchange Commission. Other unknown or unpredictable factors or underlying assumptions subsequently proven to be incorrect could cause actual results to differ materially from those in the forward-looking statements. We do not undertake any obligation to publicly update or revise forward-looking statements, whether as a result of new information, future events or otherwise, except to the extent legally required.
This financial report was authorized for issue by management on July 25, 2019.
· Nokia plans to publish its third quarter and January-September 2019 results on October 24, 2019.
Media Enquiries:
Nokia
Communications
Tel. +358 (0) 10 448 4900
Email: press.services@nokia.com
Jon Peet, Vice President, Corporate Communications
Investor Enquiries:
Nokia Investor Relations
Tel. +358 4080 3 4080
Email: investor.relations@nokia.com
About Nokia
We create the technology to connect the world. We develop and deliver the industry’s only end-to-end portfolio of network equipment, software, services and licensing that is available globally. Our customers include communications service providers whose combined networks support 6.1 billion subscriptions, as well as enterprises in the private and public sector that use our network portfolio to increase productivity and enrich lives.
Through our research teams, including the world-renowned Nokia Bell Labs, we are leading the world to adopt end-to-end 5G networks that are faster, more secure and capable of revolutionizing lives, economies and societies. Nokia adheres to the highest ethical business standards as we create technology with social purpose, quality and integrity. www.nokia.com
![]()
Financial Report for Q2 and Half Year 2019
Strong Q2 driven by end-to-end 5G demand and improved operational execution; Full year 2019 guidance maintained
Rajeev Suri, President and CEO, on Q2 2019 results
Nokia delivered a strong second quarter, driven by 5G demand, a competitive end-to-end portfolio and strengthened operational execution. Given these compelling results, we are confirming our full-year 2019 guidance.
In the quarter, we saw good year-on-year growth, meaningful improvements in profitability, robust progress in our strategic expansion areas of Software and Enterprise and excellent momentum in our IP Routing business. We also continued to enhance our position in 5G, and now have 45 commercial 5G deals and 9 live networks.
Risks remain in the year, including execution demands in the second half, trade-related uncertainty and challenges in the China market. Given these risks, we will continue to focus on tight operational discipline, delivering on our EUR 700 million cost-savings program, improving working capital management and advancing the implementation of our strategy.
Overall, I am pleased with Nokia’s performance in the second quarter and our continued progress in executing our strategy.
Q2 2019 and January-June 2019 reported and non-IFRS results. Refer to note 1, “Basis of Preparation”, note 2, “Non-IFRS to reported reconciliation” and note 13, “Performance measures”, in the “Financial statement information” section for details.
|
EUR million (except for EPS in |
|
Q2’19 |
|
Q2’18 |
|
YoY |
|
Constant |
|
Q1-Q2’19 |
|
Q1- |
|
YoY |
|
Constant |
|
|
Net sales |
|
5 694 |
|
5 313 |
|
7 |
% |
5 |
% |
10 726 |
|
10 237 |
|
5 |
% |
2 |
% |
|
Operating profit/(loss) |
|
(57 |
) |
(221 |
) |
|
|
|
|
(581 |
) |
(557 |
) |
|
|
|
|
|
Operating margin % |
|
(1.0 |
)% |
(4.2 |
)% |
320 |
bps |
|
|
(5.4 |
)% |
(5.4 |
)% |
0 |
bps |
|
|
|
EPS, diluted |
|
(0.03 |
) |
(0.05 |
) |
|
|
|
|
(0.11 |
) |
(0.11 |
) |
|
|
|
|
|
Operating profit/(loss) (non-IFRS) |
|
451 |
|
334 |
|
35 |
% |
|
|
391 |
|
573 |
|
(32 |
)% |
|
|
|
Operating margin % (non-IFRS) |
|
7.9 |
% |
6.3 |
% |
160 |
bps |
|
|
3.6 |
% |
5.6 |
% |
(200 |
)bps |
|
|
|
EPS, diluted (non-IFRS) |
|
0.05 |
|
0.03 |
|
67 |
% |
|
|
0.02 |
|
0.04 |
|
(50 |
)% |
|
|
|
Net cash and current financial investments(1) |
|
502 |
|
2 146 |
|
(77 |
)% |
|
|
502 |
|
2 146 |
|
(77 |
)% |
|
|
(1)Net cash and current financial investments does not include lease liabilities.
· Net sales in Q2 2019 were EUR 5.7bn, compared to EUR 5.3bn in Q2 2018. On a constant currency basis, net sales increased 5%. Our strong topline performance was driven by improved industry demand and the competitiveness of our end-to-end portfolio, with growth across four out of six regions and all customer types.
July 25, 2019
· Non-IFRS diluted EPS in Q2 2019 was EUR 0.05, compared to EUR 0.03 in Q2 2018, primarily driven by solid operational execution, which yielded gross profit improvements across Networks, Nokia Software and Nokia Technologies.
· Reported diluted EPS in Q2 2019 was negative EUR 0.03, compared to negative EUR 0.05 in Q2 2018, primarily driven by higher gross profit, partially offset by a net negative fluctuation in financial income and expenses.
· In Q2 2019, net cash and current financial investments decreased sequentially by approximately EUR 1.5bn. This decrease was primarily due to anticipated cash outflows including the payment of 2018 performance-related incentives to employees, payment of the quarterly dividend, as well as restructuring and associated cash outflows, which together totaled approximately EUR 900 million. In addition, approximately EUR 350 million of the decline was temporary in nature and is expected to reverse in the second half of 2019.
· Full year 2019 guidance maintained, with seasonality characterized by weaker first and third quarters and stronger second and fourth quarters, with a particularly weak Q1 and an expected particularly strong Q4.
Dividend
Beginning with the distribution for the financial year 2018, Nokia has started paying dividends in quarterly instalments. Under the authorization by the Annual General Meeting held on May 21, 2019, the Board of Directors may resolve an aggregate maximum annual distribution of EUR 0.20 per share to be paid quarterly during the authorization period, unless the Board decides otherwise for a justified reason. On the same day, the Board resolved to distribute EUR 0.05 per share as the first instalment of the dividend.
On July 25, 2019, the Board resolved to distribute EUR 0.05 per share as the second instalment of the dividend. The dividend record date is on July 30, 2019 and the dividend is expected to be paid on or around August 8, 2019. The actual dividend payment date outside Finland will be determined by the practices of the intermediary banks transferring the dividend payments. Following this announced distribution, the Board’s remaining distribution authorization for the financial year 2018 is a maximum of EUR 0.10 per share.
The payment of the second instalment of the dividend, as well as the payment of the withholding taxes related to the first instalment of the dividend, are expected to total approximately EUR 300 million in Q3 2019.
Outlook
|
Metric |
|
Full Year 2019 |
|
Full Year 2020 |
|
|
Non-IFRS diluted earnings per share |
|
EUR 0.25 - 0.29 |
|
EUR 0.37 - 0.42 |
|
|
Non-IFRS operating margin |
|
9 - 12% |
|
12 - 16% |
|
|
Recurring free cash flow(1) |
|
Slightly positive |
|
Clearly positive |
|
Annual distribution to shareholders: Over the long term, Nokia targets to deliver an earnings-based growing dividend by distributing approximately 40% to 70% of non-IFRS diluted EPS, taking into account Nokia’s cash position and expected cash flow generation. The annual distribution would be paid as quarterly dividends.
(1)Free cash flow = net cash from operating activities - capital expenditures + proceeds from sale of property, plant and equipment and intangible assets - purchase of non-current financial investments + proceeds from sale of non-current financial investments.
Key drivers of Nokia’s outlook
Net sales and operating margin for Networks and Nokia Software are expected to be influenced by factors including:
· Our expectation that we will outperform our primary addressable market in full year 2019 and over the longer-term, driven by our strategy, which includes competing in 5G more effectively due to our strong end-to-end portfolio, focusing on targeted growth opportunities in attractive adjacent markets and building a strong network agnostic software business. On a constant currency basis, we expect our primary addressable market to grow slightly in full year 2019, and for growth to continue in full year 2020. (This is an update to our earlier commentary for our primary addressable market to be flattish in full year 2019 and to grow in full year 2020.);
· The slow start to 2019 and weak overall first half puts significant pressure on execution in the second half;
· The timing of completions and acceptances of certain projects, particularly related to 5G. Based on the evolving readiness of the 5G ecosystem and the staggered nature of 5G rollouts in lead countries, we expect full year 2019 will have seasonality characterized by a particularly weak first quarter, a strong second quarter, an expected soft third quarter and an expected particularly strong fourth quarter (This is an update, providing additional quarterly details);
· Competitive intensity could increase in some accounts as some competitors seek to take share in the early phases of 5G;
· Some customers are reassessing their vendors in light of security concerns, creating near-term pressure to invest in order to secure long-term benefits;
· Our expectation that we will improve our R&D productivity and reduce support function costs through the successful execution of our cost savings program;
· Potential mergers or acquisitions by our customers;
· Our product and regional mix; and
· Macroeconomic, industry and competitive dynamics.
Net sales and operating margin for Nokia Technologies is expected to be influenced by factors including:
· The timing and value of new and existing patent licensing agreements with smartphone vendors, automotive companies and consumer electronics companies;
· Results in brand and technology licensing;
· Costs to protect and enforce our intellectual property rights; and
· The regulatory landscape.
Additionally, our outlook is based on the following assumptions:
· Nokia’s recurring free cash flow is expected to improve over the longer-term due to lower cash outflows related to restructuring and network equipment swaps and improved operational results over time;
· Non-IFRS financial income and expenses to be an expense of approximately EUR 350 million in full year 2019 and over the longer-term (This is an update to earlier commentary for non-IFRS financial income and expenses to be an expense of approximately EUR 300 million.);
· Non-IFRS income taxes at a rate of approximately 28% in full year 2019 and approximately 25% over the longer-term, subject to the absolute level of profits, regional profit mix and changes to our operating model;
· Cash outflows related to income taxes of approximately EUR 450 million in full year 2019 and over the longer term until our US or Finnish deferred tax assets are fully utilized; and
· Capital expenditures of approximately EUR 700 million in full year 2019 and approximately EUR 600 million over the longer-term.
Nokia financial results

|
EUR million (except for EPS in EUR) |
|
Q2’19 |
|
Q2’18 |
|
YoY |
|
Constant |
|
Q1- |
|
Q1- |
|
YoY |
|
Constant |
|
|
Net sales |
|
5 694 |
|
5 313 |
|
7 |
% |
5 |
% |
10 726 |
|
10 237 |
|
5 |
% |
2 |
% |
|
Networks |
|
4 393 |
|
4 081 |
|
8 |
% |
5 |
% |
8 336 |
|
7 864 |
|
6 |
% |
3 |
% |
|
Nokia Software |
|
678 |
|
612 |
|
11 |
% |
8 |
% |
1 221 |
|
1 153 |
|
6 |
% |
3 |
% |
|
Nokia Technologies |
|
383 |
|
361 |
|
6 |
% |
4 |
% |
753 |
|
726 |
|
4 |
% |
2 |
% |
|
Group Common and Other |
|
263 |
|
280 |
|
(6 |
)% |
(6 |
)% |
484 |
|
532 |
|
(9 |
)% |
(9 |
)% |
|
Non-IFRS exclusions |
|
(2 |
) |
(5 |
) |
(60 |
)% |
|
|
(27 |
) |
(9 |
) |
200 |
% |
|
|
|
Gross profit |
|
2 065 |
|
1 860 |
|
11 |
% |
|
|
3 646 |
|
3 666 |
|
(1 |
)% |
|
|
|
Operating profit/(loss) |
|
(57 |
) |
(221 |
) |
(74 |
)% |
|
|
(581 |
) |
(557 |
) |
4 |
% |
|
|
|
Networks |
|
119 |
|
34 |
|
250 |
% |
|
|
(135 |
) |
80 |
|
(269 |
)% |
|
|
|
Nokia Software |
|
137 |
|
40 |
|
243 |
% |
|
|
130 |
|
42 |
|
210 |
% |
|
|
|
Nokia Technologies |
|
324 |
|
292 |
|
11 |
% |
|
|
626 |
|
566 |
|
11 |
% |
|
|
|
Group Common and Other |
|
(129 |
) |
(33 |
) |
|
|
|
|
(230 |
) |
(116 |
) |
|
|
|
|
|
Non-IFRS exclusions |
|
(508 |
) |
(555 |
) |
|
|
|
|
(972 |
) |
(1 129 |
) |
|
|
|
|
|
Operating margin % |
|
(1.0 |
)% |
(4.2 |
)% |
320 |
bps |
|
|
(5.4 |
)% |
(5.4 |
)% |
0 |
bps |
|
|
|
Gross profit (non-IFRS) |
|
2 117 |
|
2 038 |
|
4 |
% |
|
|
3 758 |
|
3 979 |
|
(6 |
)% |
|
|
|
Operating profit/(loss) (non-IFRS) |
|
451 |
|
334 |
|
35 |
% |
|
|
391 |
|
573 |
|
(32 |
)% |
|
|
|
Operating margin % (non-IFRS) |
|
7.9 |
% |
6.3 |
% |
160 |
bps |
|
|
3.6 |
% |
5.6 |
% |
(200 |
)bps |
|
|
|
Financial income and expenses |
|
(173 |
) |
(56 |
) |
209 |
% |
|
|
(228 |
) |
(164 |
) |
39 |
% |
|
|
|
Income taxes |
|
46 |
|
10 |
|
360 |
% |
|
|
188 |
|
104 |
|
81 |
% |
|
|
|
Profit/(loss) for the period |
|
(191 |
) |
(271 |
) |
(30 |
)% |
|
|
(632 |
) |
(625 |
) |
1 |
% |
|
|
|
EPS, diluted |
|
(0.03 |
) |
(0.05 |
) |
(40 |
)% |
|
|
(0.11 |
) |
(0.11 |
) |
0 |
% |
|
|
|
Financial income and expenses (non-IFRS) |
|
(86 |
) |
(84 |
) |
2 |
% |
|
|
(178 |
) |
(200 |
) |
(11 |
)% |
|
|
|
Income taxes (non-IFRS) |
|
(101 |
) |
(106 |
) |
(5 |
)% |
|
|
(60 |
) |
(143 |
) |
(58 |
)% |
|
|
|
Profit/(loss) for the period (non-IFRS) |
|
258 |
|
139 |
|
86 |
% |
|
|
142 |
|
223 |
|
(36 |
)% |
|
|
|
EPS, diluted (non-IFRS) |
|
0.05 |
|
0.03 |
|
67 |
% |
|
|
0.02 |
|
0.04 |
|
(50 |
)% |
|
|
Results are as reported and relate to continuing operations unless otherwise specified. The financial information in this report is unaudited. Non-IFRS results exclude costs related to the acquisition of Alcatel-Lucent and related integration, goodwill impairment charges, intangible asset amortization and other purchase price fair value adjustments, restructuring and associated charges and certain other items that may not be indicative of Nokia’s underlying business performance. For details, please refer to note 2, “Non-IFRS to reported reconciliation”, in the notes to the Financial statement information in this report. Change in net sales at constant currency excludes the effect of changes in exchange rates in comparison to euro, our reporting currency. For more information on currency exposures, please refer to note 1, “Basis of Preparation”, in the “Financial statement information” section in this report.
Amounts related to licensing and Nokia Bell Labs allocated 85% to Networks and 15% to Nokia Software
Nokia is providing additional adjusted financial disclosure for its Networks and Nokia Software reportable segments, with amounts related to licensing and Nokia Bell Labs allocated 85% to Networks and 15% to Nokia Software. In addition to Nokia’s primary financial disclosures, this reflects Nokia’s strategy, organizational structure and the way it evaluates operational performance and allocates resources, is in accordance with industry practice and improves comparability with peer companies.
If we would report amounts related to licensing and Nokia Bell Labs as part of Networks and Nokia Software, our Q2 2019 Networks operating margin would have been 7.4% instead of 2.7%, and our Q2 2019 Nokia Software operating margin would have been 24.2% instead of 20.2%.
|
|
|
Q2’19 |
|
Allocations |
|
Q2’19 |
|
Q2’18 |
| ||
|
|
|
Before |
|
Licensing |
|
Nokia Bell Labs |
|
After |
|
After allocations |
|
|
Net sales (EUR million) |
|
|
|
|
|
|
|
|
|
|
|
|
Networks |
|
4 393 |
|
326 |
|
3 |
|
4 721 |
|
4 382 |
|
|
Nokia Software |
|
678 |
|
57 |
|
|
|
736 |
|
665 |
|
|
Nokia Technologies |
|
383 |
|
(383 |
) |
|
|
0 |
|
9 |
|
|
Group Common and Other |
|
263 |
|
|
|
(3 |
) |
260 |
|
278 |
|
|
Eliminations |
|
(21 |
) |
|
|
|
|
(21 |
) |
(15 |
) |
|
Non-IFRS total |
|
5 696 |
|
0 |
|
0 |
|
5 696 |
|
5 318 |
|
|
Operating Profit (EUR million) |
|
|
|
|
|
|
|
|
|
|
|
|
Networks |
|
119 |
|
275 |
|
(46 |
) |
348 |
|
244 |
|
|
Nokia Software |
|
137 |
|
49 |
|
(8 |
) |
178 |
|
77 |
|
|
Nokia Technologies |
|
324 |
|
(324 |
) |
|
|
0 |
|
(5 |
) |
|
Group Common and Other |
|
(129 |
) |
|
|
54 |
|
(75 |
) |
17 |
|
|
Non-IFRS total |
|
451 |
|
0 |
|
0 |
|
451 |
|
334 |
|
|
Operating Margin % |
|
|
|
|
|
|
|
|
|
|
|
|
Networks |
|
2.7 |
% |
|
|
|
|
7.4 |
% |
5.6 |
% |
|
Nokia Software |
|
20.2 |
% |
|
|
|
|
24.2 |
% |
11.6 |
% |
|
Nokia Technologies |
|
84.6 |
% |
|
|
|
|
|
|
|
|
|
Group Common and Other |
|
(49.0 |
)% |
|
|
|
|
(28.8 |
)% |
6.1 |
% |
|
Non-IFRS total |
|
7.9 |
% |
|
|
|
|
7.9 |
% |
6.3 |
% |
Net sales by region
|
EUR million |
|
Q2’19 |
|
Q2’18 |
|
YoY |
|
Constant |
|
Q1-Q2’19 |
|
Q1-Q2’18 |
|
YoY |
|
Constant |
|
|
Asia-Pacific |
|
1 012 |
|
932 |
|
9 |
% |
5 |
% |
1 975 |
|
1 842 |
|
7 |
% |
3 |
% |
|
Europe |
|
1 611 |
|
1 548 |
|
4 |
% |
4 |
% |
3 111 |
|
3 054 |
|
2 |
% |
1 |
% |
|
Greater China |
|
515 |
|
524 |
|
(2 |
)% |
0 |
% |
949 |
|
1 003 |
|
(5 |
)% |
(6 |
)% |
|
Latin America |
|
359 |
|
308 |
|
17 |
% |
15 |
% |
664 |
|
605 |
|
10 |
% |
8 |
% |
|
Middle East & Africa |
|
441 |
|
447 |
|
(1 |
)% |
(2 |
)% |
855 |
|
878 |
|
(3 |
)% |
(5 |
)% |
|
North America |
|
1 755 |
|
1 554 |
|
13 |
% |
7 |
% |
3 172 |
|
2 855 |
|
11 |
% |
4 |
% |
|
Total |
|
5 694 |
|
5 313 |
|
7 |
% |
5 |
% |
10 726 |
|
10 237 |
|
5 |
% |
2 |
% |
Net sales by customer type
|
EUR million |
|
Q2’19 |
|
Q2’18 |
|
YoY |
|
Constant |
|
Q1-Q2’19 |
|
Q1-Q2’18 |
|
YoY |
|
Constant |
|
|
Communication service providers |
|
4 755 |
|
4 398 |
|
8 |
% |
6 |
% |
8 962 |
|
8 478 |
|
6 |
% |
2 |
% |
|
Enterprise |
|
318 |
|
295 |
|
8 |
% |
6 |
% |
577 |
|
540 |
|
7 |
% |
4 |
% |
|
Licensees |
|
383 |
|
352 |
|
9 |
% |
6 |
% |
753 |
|
701 |
|
7 |
% |
5 |
% |
|
Other(1) |
|
238 |
|
268 |
|
(11 |
)% |
(12 |
)% |
433 |
|
519 |
|
(17 |
)% |
(16 |
)% |
|
Total |
|
5 694 |
|
5 313 |
|
7 |
% |
5 |
% |
10 726 |
|
10 237 |
|
5 |
% |
2 |
% |
(1) Includes net sales of Alcatel Submarine Networks (ASN) and Radio Frequency Systems (RFS), both of which are being managed as separate entities, and certain other items, such as eliminations of inter-segment revenues and certain items related to purchase price allocation. ASN and RFS net sales include also revenue from communications service providers and enterprise customers.
Our Nokia Enterprise business is performing well. Net sales to enterprise customers, excluding the third party integration business that we are exiting, grew 7% on a reported basis and 5% on a constant currency basis in Q2 2019, and grew 8% on a reported basis and 5% on a constant currency basis in the first six months of 2019.
Nokia, Q2 2019 compared to Q2 2018, non-IFRS
The following table summarizes the year-on-year changes between the second quarter 2019 and the second quarter 2018.
|
EUR million |
|
Net |
|
% |
|
% change |
|
Gross |
|
(R&D) |
|
(SG&A) |
|
Other |
|
Operating |
|
Financial |
|
Income |
|
Profit/(loss) |
|
|
Networks |
|
312 |
|
8 |
% |
5 |
% |
17 |
|
38 |
|
42 |
|
(12 |
) |
85 |
|
|
|
|
|
|
|
|
Nokia Software |
|
66 |
|
11 |
% |
8 |
% |
75 |
|
6 |
|
4 |
|
11 |
|
97 |
|
|
|
|
|
|
|
|
Nokia Technologies |
|
22 |
|
6 |
% |
4 |
% |
24 |
|
6 |
|
0 |
|
1 |
|
32 |
|
|
|
|
|
|
|
|
Group Common and Other |
|
(17 |
) |
(6 |
)% |
(6 |
)% |
(37 |
) |
(12 |
) |
(20 |
) |
(27 |
) |
(96 |
) |
|
|
|
|
|
|
|
Eliminations |
|
(6 |
) |
40 |
% |
|
|
0 |
|
0 |
|
0 |
|
0 |
|
0 |
|
|
|
|
|
|
|
|
Nokia non-IFRS |
|
378 |
|
7 |
% |
5 |
% |
79 |
|
38 |
|
26 |
|
(27 |
) |
117 |
|
(2 |
) |
5 |
|
119 |
|
Nokia non-IFRS net sales grew 7%. On a constant currency basis, Nokia non-IFRS net sales grew 5%.
Nokia non-IFRS net sales, excluding approximately EUR 30 million of one-time licensing net sales in Q2 2019 and EUR 10 million in Q2 2018, grew 7%, as our customers added network capacity in preparation for the continued rise in broadband traffic driven by 5G. Our strong topline performance in Q2 2019 reflected improved industry demand and the competitiveness of our end-to-end portfolio, with growth across four out of six regions and all customer types. In Q2
2019, we continued to make progress with our strategy to diversify and grow, with strong results in Nokia Software and continued solid performance with enterprise customers.
The strong growth in Nokia Software net sales was due to both applications and core networks benefitting from its improved go-to-market capabilities, as well as the timing of completions and acceptances of certain projects.
The growth in net sales to enterprise customers was primarily due to strong demand for our market-leading IP routing and optical networks portfolio and, to a lesser extent, strong percentage growth in private wireless networks for industrial and public sector applications. We continue to see strong momentum in industries like utilities, transportation, mining, manufacturing, as well as the public sector.
The increase in Nokia non-IFRS gross profit was driven by strong net sales and operational execution that was solid and broad-based across Networks, Nokia Software and Nokia Technologies, partially offset by lower gross profit in Group Common and other.
The increase in Nokia non-IFRS operating profit was driven by the higher non-IFRS gross profit, as well as continued progress related to Nokia’s cost savings program, partially offset by lower gains in Nokia’s venture fund investments and a net negative impact related to foreign exchange hedging.
Nokia, January-June 2019 compared to January-June 2018, reported
The following table summarizes the year-on-year changes between the first six months of 2019 and the first six months of 2018.
|
EUR million |
|
Net |
|
% |
|
% change |
|
Gross |
|
(R&D) |
|
(SG&A) |
|
Other |
|
Operating |
|
Financial |
|
Income |
|
Profit/(loss) |
|
|
Networks |
|
472 |
|
6 |
% |
3 |
% |
(239 |
) |
24 |
|
55 |
|
(56 |
) |
(215 |
) |
|
|
|
|
|
|
|
Nokia Software |
|
68 |
|
6 |
% |
3 |
% |
62 |
|
16 |
|
14 |
|
(4 |
) |
88 |
|
|
|
|
|
|
|
|
Nokia Technologies |
|
27 |
|
4 |
% |
2 |
% |
26 |
|
19 |
|
14 |
|
0 |
|
60 |
|
|
|
|
|
|
|
|
Group Common and Other |
|
(48 |
) |
(9 |
)% |
(9 |
)% |
(71 |
) |
(21 |
) |
(32 |
) |
9 |
|
(114 |
) |
|
|
|
|
|
|
|
Eliminations |
|
(14 |
) |
52 |
% |
|
|
0 |
|
0 |
|
0 |
|
0 |
|
0 |
|
|
|
|
|
|
|
|
Non-IFRS exclusions |
|
(18 |
) |
200 |
% |
|
|
200 |
|
10 |
|
23 |
|
(77 |
) |
157 |
|
(86 |
) |
1 |
|
74 |
|
|
Nokia total |
|
489 |
|
5 |
% |
2 |
% |
(20 |
) |
50 |
|
73 |
|
(127 |
) |
(24 |
) |
(64 |
) |
84 |
|
(7 |
) |
Nokia net sales grew 5% in the first six months of 2019 as our customers added network capacity in preparation for the continued rise in broadband traffic driven by 5G. On a constant currency basis, Nokia net sales grew 2% in the first six months of 2019.
Nokia net sales, excluding approximately EUR 70 million of one-time licensing net sales in the first six months of 2019 and EUR 20 million in the first six months of 2018, grew 4%.
Our strong topline performance in the first six months 2019 reflected improved industry demand and the competitiveness of our end-to-end portfolio, with growth across four out of six regions and all customer types. In the first six months of 2019, we continued to make progress with our strategy to diversify and grow, with strong results in Nokia Software and continued solid performance with enterprise customers.
The decrease in Nokia gross profit in the first six months of 2019 was driven by a particularly weak Q1 2019, partially offset by improved operational execution in Q2 2019.
The slight increase in Nokia operating loss in the first six months of 2019 was driven by lower gross profit and higher restructuring and associated charges, partially offset by continued progress related to Nokia’s cost savings program.
Cash and cash flow in Q2 2019
During the second quarter of 2019 Nokia’s free cash flow was negative EUR 1 041 million driven by:
· Cash outflows related to net working capital, primarily due to the payment of 2018 performance-related incentives to employees, as well as: a) an increase in receivables, including EUR 350 million of timing related increases that are temporary in nature and expected to reverse in the second half of 2019, b) a decrease in accounts payable, reflecting lower purchase volumes during the quarter and c) elevated inventory levels, primarily due to our decision to ensure sufficient flexibility to deliver higher levels of equipment sales, particularly related to 5G, and an increase in work in progress inventories related to certain large 5G deployments;
· Continued cash outflows related to restructuring and network equipment swaps; and
· Income taxes and capital expenditures.
Nokia has established a free cash flow program to ensure company-wide focus on free cash flow and release of working capital, including project asset optimization, review of contract terms & conditions, as well as supply chain and inventory optimization. Senior leaders of Nokia have significant part of their incentives tied to free cash flow improvement targets in 2019 and beyond.
|
EUR million, at end of period |
|
Q2’19 |
|
Q1’19 |
|
QoQ change |
|
Q4’18 |
|
YTD change |
|
|
Total cash and current financial investments |
|
4 788 |
|
6 394 |
|
(25 |
)% |
6 873 |
|
(30 |
)% |
|
Net cash and current financial investments(1) |
|
502 |
|
1 991 |
|
(75 |
)% |
3 053 |
|
(84 |
)% |
(1) Net cash and current financial investments does not include lease liabilities. For details, please refer to note 7, “Net cash and current financial investments”, and note 13, “Performance measures”, in the “Financial statement information” section in this report.
EUR billion
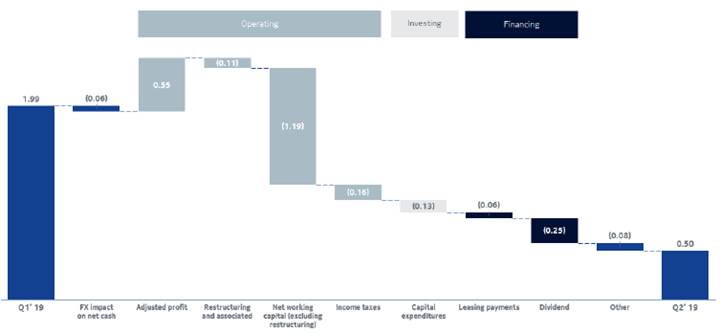
During the second quarter 2019, Nokia’s total cash and current financial investments (“total cash”) decreased by EUR 1 606 million and Nokia’s net cash and current financial investments (“net cash”) decreased by EUR 1 489 million.
Approximately EUR 900 million of the decline in total cash and net cash was driven by the following three cash outflows, in line with our expectations: a) payment of 2018 performance-related incentives to employees, b) payment of the first quarterly instalment of the dividend and c) restructuring and associated cash outflows. In addition, approximately EUR 350 million of the decline in total cash and net cash was temporary in nature and is expected to reverse in the second half of 2019.
Foreign exchange rates had an approximately EUR 60 million negative impact on net cash.
In the second quarter 2019, net cash used in operating activities was EUR 916 million:
· Nokia’s adjusted profit before changes in net working capital was EUR 553 million in the second quarter 2019.
· In the second quarter 2019, Nokia generated a decrease in net cash related to net working capital of approximately EUR 1.3 billion. Excluding approximately EUR 110 million of restructuring and associated cash outflows, Nokia generated an approximately EUR 1.2 billion decrease in net cash related to net working capital due to a decrease in liabilities, an increase in receivables and an increase in inventories.
· The increase in receivables was approximately EUR 260 million, and was primarily due to the timing of approximately EUR 350 million of receivables. The EUR 350 million of timing related increases is temporary in nature and expected to reverse in the second half of 2019.
· The increase in inventories was approximately EUR 110 million, and was primarily due to our decision to ensure sufficient flexibility to deliver higher levels of equipment sales, particularly related to 5G, and an increase in work in progress inventories related to certain large 5G deployments.
· The decrease in liabilities was approximately EUR 830 million, and was primarily due to payment of 2018 performance-related incentives to employees, amounting to approximately EUR 530 million, and a decrease in accounts payable, amounting to approximately EUR 260 million.
· In addition, cash taxes amounted to an outflow of approximately EUR 160 million.
· The implementation of IFRS 16 positively impacted our net cash used in operating activities and negatively impacted our net cash from financing activities, both by approximately EUR 60 million.
In the second quarter 2019, net cash used in investing activities primarily related to capital expenditures of approximately EUR 130 million.
In the second quarter 2019, net cash used in financing activities primarily related to paying the first quarterly instalment of the dividend, amounting to approximately EUR 250 million and leasing payments of approximately EUR 60 million following the implementation of IFRS 16.
Cost savings program
We expect our most recent cost savings program to result in a net EUR 700 million reduction of non-IFRS operating expenses and production overheads in full year 2020 compared to full year 2018, of which EUR 500 million is expected to come from operating expenses and EUR 200 million is expected to come from cost of sales. The related restructuring charges are expected to total EUR 900 million.
The following table summarizes the financial information related to our cost savings program as of the end of the second quarter 2019.
|
In EUR million, approximately(1) |
|
Q2’19 |
|
|
Balance of restructuring and associated liabilities for prior programs |
|
660 |
|
|
+ Charges in the quarter |
|
200 |
|
|
- Cash outflows in the quarter |
|
110 |
|
|
= Ending balance of restructuring and associated liabilities |
|
750 |
|
|
of which restructuring provisions |
|
570 |
|
|
of which other associated liabilities |
|
180 |
|
|
|
|
|
|
|
Total expected restructuring and associated charges, related to our most recent cost savings program (rounded to the nearest EUR 50 million) |
|
900 |
|
|
- Cumulative recorded |
|
360 |
|
|
= Charges remaining to be recorded |
|
540 |
|
|
|
|
|
|
|
Total expected restructuring and associated cash outflows (rounded to the nearest EUR 50 million) |
|
1 550 |
|
|
- Cumulative recorded |
|
240 |
|
|
= Cash outflows remaining to be recorded |
|
1 310 |
|
(1)Balances related to previous restructuring and cost savings programs have been included as part of this cost savings program. At the beginning of Q1 2019, the balance of restructuring and associated liabilities related to prior cost savings programs was approximately EUR 630 million. This amount is included in the total expected restructuring and associated cash outflows of EUR 1 550 million, rounded to the nearest EUR 50 million, in addition to the approximately EUR 900 million of expected cash outflows related to our most recent cost savings program.
The below table includes future expectations related to our most recent cost savings program, as well as the remaining cash outflows related to our previous programs and network equipment swaps.
|
|
|
Expected amounts for |
| ||||||
|
In EUR million, approximately |
|
FY 2019 |
|
FY 2020 |
|
Beyond |
|
Total |
|
|
Recurring annual cost savings |
|
200 |
|
500 |
|
— |
|
700 |
|
|
- operating expenses |
|
150 |
|
350 |
|
— |
|
500 |
|
|
- cost of sales |
|
50 |
|
150 |
|
— |
|
200 |
|
|
Restructuring and associated charges |
|
550 |
|
350 |
|
— |
|
900 |
|
|
Restructuring and associated cash outflows |
|
700 |
|
350 |
|
500 |
|
1 550 |
|
|
Charges related to network equipment swaps |
|
150 |
|
— |
|
— |
|
150 |
|
|
Cash outflows related to network equipment swaps |
|
150 |
|
— |
|
— |
|
150 |
|
Operational highlights
Nokia showed strong momentum in the second quarter across its key markets and around the globe, particularly in 5G, where Nokia’s technology is now present in all regions in the world.
In the first pillar of our strategy, leading in high-performance, end-to-end networks with communication service providers:
Nokia signed multiple 5G commercial agreements during the period and the total number of 5G commercial agreements is now 45. Around half of those include portfolio beyond 5G New Radio. Nine of those networks are now live, and these include both mid-band and mmWave solutions. SoftBank Corp. in Japan selected Nokia as a strategic partner to drive its commercial 5G offering with the Nokia AirScale solution. Under a three-year deal, Zain Saudi Arabia will roll out its 5G network using Nokia’s end-to-end portfolio, including radio, microwave transport, security and turnkey services solutions. Nokia and U Mobile in Malaysia signed a three-year contract to deploy a Nokia Single RAN network as well as microwave and IP-based mobile transport technologies; the deal also includes the Nokia 7705 Service Aggregation Routers and 7750 Service Routers for mobile access and aggregation. Nokia and U Mobile also announced they will collaborate on a 5G live network trial later this year. In Denmark, Telia Company initiated its first live 5G tests in cooperation with Nokia and the TT-network. Nokia also announced that China Mobile will adopt its new AirScale mMIMO Adaptive Antenna, created specifically for the massive bandwidth and coverage requirements of the Chinese market as it transitions to 5G.
To address the critical security needs of 5G end-to-end networks, Nokia unveiled DFSEC 2.0, an enhanced security program, and established the “Future X Security” Laboratory, an advanced security testing and verification laboratory. In addition, researchers at Nokia Bell Labs and AMBER, the SFI Centre for Advanced Materials and BioEngineering Research, announced a new formula for battery composition that makes batteries more powerful by packing 2.5 times the battery life than anything currently on the market. Nokia also announced its 5G virtual testing environment, designed to make 5G deployments faster and more cost-efficient.
After Q2 closed, Nokia announced that China Unicom chose Nokia’s optical fronthaul solution to power its 4G and 5G networks in Beijing, supporting the operator’s commitment to deliver 5G in the 2019 timeframe. In addition, Nokia announced that Taiwan Star Telecom will deploy Nokia’s AirScale eNodeB solution, IP routing, packet core and policy and charging solution to expand its LTE services and prepare for 5G migration.
In Optical, TIM (Telecom Italia) achieved a wavelength speed of 550 Gb/s using the Nokia “Photonic Service Engine 3” (PSE-3), a new European record for data transmission over a long-distance backbone network. Nokia and Polish service provider Netia conducted the first field trial of the PSE-3 super coherent technology over a live production network.
In Fixed Access, India’s Netplus will deploy Nokia’s GPON technology to meet growing demand for more capacity, faster speeds and superior quality of broadband services. Nokia announced that Altibox will deploy its Gainspeed Unified Cable Access solution to significantly increase network capacity.
Nokia announced that Cellcom Israel will deploy Sensing as a Service, creating the first real-time and dense environmental data offering in Israel. Environmental sensors will be placed on existing radio base station sites, and Cellcom Israel’s customers in enterprise, transport, healthcare, cities and utilities can subscribe to the data for monetization opportunities.
In the second pillar of our strategy, expanding network sales to select vertical markets needing high-performing, secure networks:
Nokia signed a two-year co-operation agreement with Kalmar and Ukkoverkot to build a wireless digitalization infrastructure for port and terminal R&D in the move toward increasingly intelligent cargo handling solutions. Deutsche Telekom announced the conclusion of its field test with Nokia and the Hamburg Port Authority, which tested new features of the 5G standard with different applications in the Port of Hamburg.
SP Telecom and Nokia are collaborating to enable faster go-to-market solutions for 5G deployment in Singapore, with the addition of Nokia’s FP4-based Service Router, optical transport, cloud software solutions and service automation and network orchestration application suite into SP Telecom’s infrastructure.
Cleco selected Nokia to modernize its microwave communications network, which supports 290,000 customers through Cleco’s retail and wholesale power business in Louisiana and Mississippi.
In the Middle East and Africa (MEA), Gulf Bridge International chose Nokia’s Nuage Networks SD-WAN 2.0 solution to provide connectivity for its customers with international operations.
At Hannover Messe 2019, Nokia showcased the second generation of its Factory in a Box in collaboration with several industry ecosystem partners. The proof of concept demonstrates how Industry 4.0 solutions can be packed, transported and brought back into service in a matter of hours, including full over-the-air connectivity. After the quarter ended,
Nokia’s 5G “factory of the future” in Oulu, Finland was selected by McKinsey and the World Economic Forum as an Advanced 4th Industrial Revolution Lighthouse.
Nokia announced it has joined ConectarAGRO, an initiative of eight agribusiness and high technology companies, to bring access for over 500,000 Brazilian farmers to IoT and Agriculture 4.0 technologies.
Etteplan, Nokia and Ukkoverkot announced that they will join forces to provide industrial customers with solutions based on private LTE/4G or NR 5G radio networks. Daiwabo Information System was signed as Nokia’s first distributor in Japan, and will sell Nokia’s IP, optical, LTE and other wireless solutions through its network of about 19,000 sales partners.
In the third pillar of our strategy, developing a strong software business at scale:
Ooredoo Qatar selected Nokia to build a 5G cloud native core network to support delivery of enhanced mobile broadband services. The Nokia AirFrame, CloudBand, voice and Cloud Packet Core VNFs and Nuage Networks software-defined network solution are being deployed in the core network.
Nokia announced that Ooredoo Algeria successfully deployed North Africa’s first virtualized Mobile Gateway, a crucial step for the migration of core network elements to the cloud and the transformation of the core network to support next generation mobile network technology. In addition, Vodafone Egypt is deploying the Nokia Subscriber Data Management over telco cloud for faster rollout of LTE services.
In the fourth pillar of our strategy, now focused primarily on licensing:
Nokia announced that Jenni Lukander would succeed Maria Varsellona as president of Nokia Technologies and become a GLT member, effective 1 August. In addition, Nokia announced an agreement with GE Licensing to enable commercialization of breakthrough technologies in new markets.
Networks, Q2 2019 compared to Q2 2018
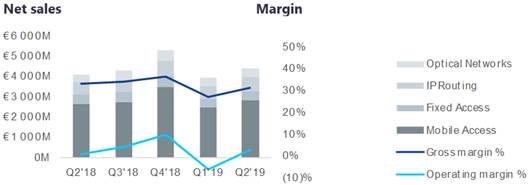
|
EUR million |
|
Q2’19 |
|
Q2’18 |
|
YoY |
|
Constant |
|
Q1-Q2’19 |
|
Q1-Q2’18 |
|
YoY |
|
Constant |
|
|
Net sales |
|
4 393 |
|
4 081 |
|
8 |
% |
5 |
% |
8 336 |
|
7 864 |
|
6 |
% |
3 |
% |
|
Mobile Access |
|
2 824 |
|
2 634 |
|
7 |
% |
5 |
% |
5 297 |
|
5 060 |
|
5 |
% |
1 |
% |
|
Fixed Access |
|
447 |
|
490 |
|
(9 |
)% |
(11 |
)% |
872 |
|
935 |
|
(7 |
)% |
(10 |
)% |
|
IP Routing |
|
715 |
|
592 |
|
21 |
% |
18 |
% |
1 360 |
|
1 141 |
|
19 |
% |
15 |
% |
|
Optical Networks |
|
407 |
|
365 |
|
12 |
% |
9 |
% |
807 |
|
727 |
|
11 |
% |
8 |
% |
|
Gross profit |
|
1 367 |
|
1 350 |
|
1 |
% |
|
|
2 428 |
|
2 667 |
|
(9 |
)% |
|
|
|
Gross margin % |
|
31.1 |
% |
33.1 |
% |
(200 |
)bps |
|
|
29.1 |
% |
33.9 |
% |
(480 |
)bps |
|
|
|
R&D |
|
(746 |
) |
(784 |
) |
(5 |
)% |
|
|
(1 525 |
) |
(1 549 |
) |
(2 |
)% |
|
|
|
SG&A |
|
(474 |
) |
(516 |
) |
(8 |
)% |
|
|
(992 |
) |
(1 047 |
) |
(5 |
)% |
|
|
|
Other income and expenses |
|
(28 |
) |
(16 |
) |
|
|
|
|
(46 |
) |
10 |
|
|
|
|
|
|
Operating profit/(loss) |
|
119 |
|
34 |
|
250 |
% |
|
|
(135 |
) |
80 |
|
(269 |
)% |
|
|
|
Operating margin % |
|
2.7 |
% |
0.8 |
% |
190 |
bps |
|
|
(1.6 |
)% |
1.0 |
% |
(260 |
)bps |
|
|
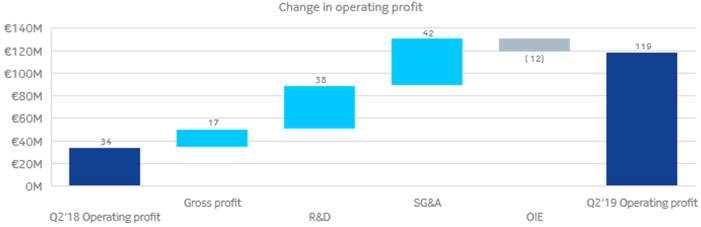
Networks net sales grew 8%. On a constant currency basis, Networks net sales grew 5%.
The growth in Networks net sales was primarily due to Mobile Access, IP Routing and, to a lesser extent, Optical Networks, partially offset by a decrease in Fixed Access.
The growth in Mobile Access was primarily due to network deployment services and 5G radio technologies, partially offset by decreases in legacy radio technologies. The growth in IP Routing and Optical Networks was primarily due to our market-leading portfolio. In IP routing, growth was also driven by significantly improved supply chain execution. The decrease in Fixed Access was primarily due to broadband access and digital home.
The increase in Networks gross profit was primarily due to IP Routing and Optical Networks, partially offset by Fixed Access and Mobile Access. The increase in IP Routing gross profit was due to higher net sales and higher gross margin. The increase in Optical Networks gross profit was due to higher gross margin and higher net sales. The decrease in Fixed Access gross profit was due to lower gross margin and lower net sales. The decrease in Mobile Access gross profit was primarily due to lower gross margin, partially offset by higher net sales.
The higher gross margin in both IP Routing and Optical Networks was primarily due to cost erosion exceeding price erosion. The lower gross margin in Fixed Access was primarily due to broadband access and digital home. The lower gross margin in Mobile Access was primarily due to broad-based declines across nearly all product categories and an unfavorable mix, with a greater proportion of network deployment services net sales, partially offset by improvements across all services categories. From a products perspective, the Mobile Access gross margin decline was particularly due to legacy radio technologies. From a services perspective, the Mobile Access gross margin benefitted from improved operational execution.
The decrease in Networks R&D expenses was primarily due to continued progress related to Nokia’s cost savings program, partially offset by higher 5G investments in Mobile Access.
The decrease in Networks SG&A expenses was primarily due to Mobile Access, reflecting continued progress related to Nokia’s cost savings program.
The net negative fluctuation in other income and expenses was primarily due to foreign exchange hedging, partially offset by lower loss allowances on trade receivables.
Nokia Software, Q2 2019 compared to Q2 2018

|
EUR million |
|
Q2’19 |
|
Q2’18 |
|
YoY |
|
Constant |
|
Q1-Q2’19 |
|
Q1-Q2’18 |
|
YoY |
|
Constant |
|
|
Net sales |
|
678 |
|
612 |
|
11 |
% |
8 |
% |
1 221 |
|
1 153 |
|
6 |
% |
3 |
% |
|
Gross profit |
|
357 |
|
282 |
|
27 |
% |
|
|
576 |
|
514 |
|
12 |
% |
|
|
|
Gross margin % |
|
52.7 |
% |
46.1 |
% |
660 |
bps |
|
|
47.2 |
% |
44.6 |
% |
260 |
bps |
|
|
|
R&D |
|
(117 |
) |
(123 |
) |
(5 |
)% |
|
|
(236 |
) |
(252 |
) |
(6 |
)% |
|
|
|
SG&A |
|
(100 |
) |
(104 |
) |
(4 |
)% |
|
|
(201 |
) |
(215 |
) |
(7 |
)% |
|
|
|
Other income and expenses |
|
(3 |
) |
(14 |
) |
(79 |
)% |
|
|
(10 |
) |
(6 |
) |
67 |
% |
|
|
|
Operating profit/(loss) |
|
137 |
|
40 |
|
243 |
% |
|
|
130 |
|
42 |
|
210 |
% |
|
|
|
Operating margin % |
|
20.2 |
% |
6.5 |
% |
1 370 |
bps |
|
|
10.6 |
% |
3.6 |
% |
700 |
bps |
|
|
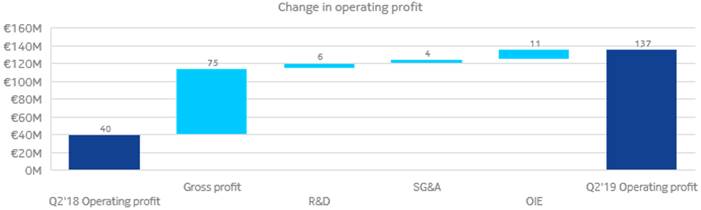
Nokia Software net sales grew 11%. On a constant currency basis, Nokia Software net sales grew 8%.
The strong growth in Nokia Software net sales was due to both applications and core networks benefitting from improved go-to-market capabilities, as well as the timing of completions and acceptances of certain projects. In applications, growth was driven by broad-based strength across our market-leading cloud-native digital experience, digital operations and digital intelligence portfolios. In core networks, growth was primarily driven by several projects going live. From a regional perspective, growth was particularly driven by strong execution in North America, Asia-Pacific and Europe.
The increase in Nokia Software gross profit was primarily due to higher gross margin in both core networks and applications, as well as higher net sales.
The decrease in Nokia Software R&D expenses was primarily due to an increase in R&D productivity, achieved through our investments in a Common Software Foundation.
The decrease in Nokia Software SG&A expenses was primarily due to the integration and streamlining of core networks into our existing specialized software salesforce.
Having completed the integration of core networks into Nokia Software, we are in the process of transforming the core networks business to support growth and higher returns. As we drive this, we expect overall operating expenses for Nokia Software to continue at similar or slightly higher levels as in Q2 2019.
The net positive fluctuation in other income and expenses was primarily due to foreign exchange.
Nokia Technologies, Q2 2019 compared to Q2 2018
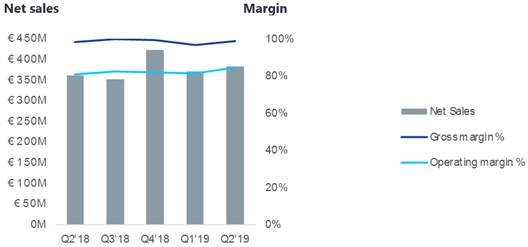
|
EUR million |
|
Q2’19 |
|
Q2’18 |
|
YoY change |
|
Constant |
|
Q1-Q2’19 |
|
Q1-Q2’18 |
|
YoY change |
|
Constant |
|
|
Net sales |
|
383 |
|
361 |
|
6 |
% |
4 |
% |
753 |
|
726 |
|
4 |
% |
2 |
% |
|
Gross profit |
|
378 |
|
354 |
|
7 |
% |
|
|
735 |
|
709 |
|
4 |
% |
|
|
|
Gross margin % |
|
98.7 |
% |
98.1 |
% |
60 |
bps |
|
|
97.6 |
% |
97.7 |
% |
(10 |
)bps |
|
|
|
R&D |
|
(30 |
) |
(36 |
) |
(17 |
)% |
|
|
(59 |
) |
(78 |
) |
(24 |
)% |
|
|
|
SG&A |
|
(25 |
) |
(25 |
) |
0 |
% |
|
|
(50 |
) |
(64 |
) |
(22 |
)% |
|
|
|
Other income and expenses |
|
0 |
|
(1 |
) |
|
|
|
|
(1 |
) |
(1 |
) |
|
|
|
|
|
Operating profit/(loss) |
|
324 |
|
292 |
|
11 |
% |
|
|
626 |
|
566 |
|
11 |
% |
|
|
|
Operating margin % |
|
84.6 |
% |
80.9 |
% |
370 |
bps |
|
|
83.1 |
% |
78.0 |
% |
510 |
bps |
|
|
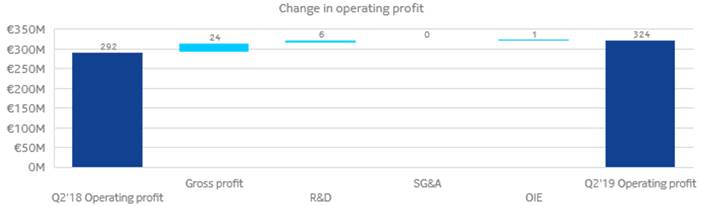
Nokia Technologies net sales grew 6%. On a constant currency basis, Nokia Technologies net sales grew 4%.
The EUR 383 million of net sales in the second quarter 2019 related entirely to licensing. Of the EUR 361 million of net sales in the second quarter 2018, EUR 352 million related to licensing and EUR 9 million related to digital health products. We sold our digital health business in May 2018.
The growth in Nokia Technologies net sales was primarily due to higher one-time and recurring licensing net sales, partially offset by the sale of our digital health business in May 2018. One-time net sales amounted to approximately EUR 30 million in the second quarter 2019 and approximately EUR 10 million in the second quarter 2018.
The decrease in Nokia Technologies R&D expenses was primarily due to the absence of costs related to digital health, following the sale of our digital health business in May 2018.
Group Common and Other, Q2 2019 compared to Q2 2018
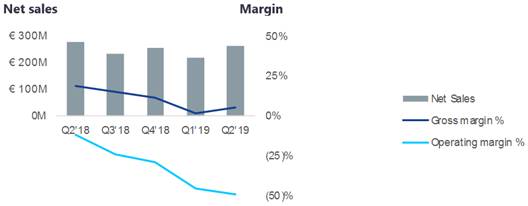
|
EUR million |
|
Q2’19 |
|
Q2’18 |
|
YoY change |
|
Constant |
|
Q1-Q2’19 |
|
Q1-Q2’18 |
|
YoY change |
|
Constant |
|
|
Net sales |
|
263 |
|
280 |
|
(6 |
)% |
(6 |
)% |
484 |
|
532 |
|
(9 |
)% |
(9 |
)% |
|
Gross profit |
|
15 |
|
52 |
|
(71 |
)% |
|
|
18 |
|
89 |
|
(80 |
)% |
|
|
|
Gross margin % |
|
5.7 |
% |
18.6 |
% |
(1 290 |
)bps |
|
|
3.7 |
% |
16.7 |
% |
(1 300 |
)bps |
|
|
|
R&D |
|
(85 |
) |
(73 |
) |
16 |
% |
|
|
(168 |
) |
(147 |
) |
14 |
% |
|
|
|
SG&A |
|
(70 |
) |
(50 |
) |
40 |
% |
|
|
(134 |
) |
(102 |
) |
31 |
% |
|
|
|
Other income and expenses |
|
11 |
|
38 |
|
|
|
|
|
54 |
|
45 |
|
|
|
|
|
|
Operating profit/(loss) |
|
(129 |
) |
(33 |
) |
|
|
|
|
(230 |
) |
(116 |
) |
|
|
|
|
|
Operating margin % |
|
(49.0 |
)% |
(11.8 |
)% |
(3 720 |
)bps |
|
|
(47.5 |
)% |
(21.8 |
)% |
(2 570 |
)bps |
|
|
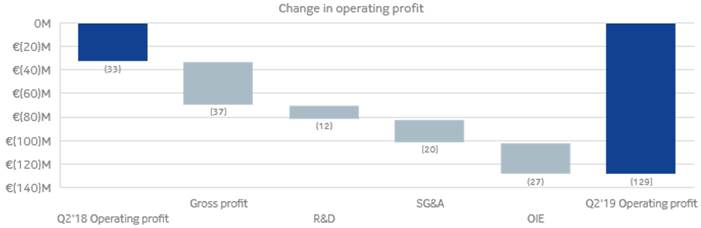
Group Common and Other net sales decreased 6% on both a reported and constant currency basis.
The decrease in Group Common and Other net sales was primarily due to Radio Frequency Systems, partially offset by growth in Alcatel Submarine Networks. The decrease in Radio Frequency Systems was primarily due to the absence of a large customer roll-out which benefitted the year-ago quarter. The increase in Alcatel Submarine Networks was primarily due to the ramp-up of new projects.
The decrease in Group Common and Other gross profit was primarily due to lower gross margin in Radio Frequency Systems and Alcatel Submarine Networks and, to a lesser extent, lower net sales in Radio Frequency Systems.
The increase in Group Common and Other R&D and SG&A expenses was primarily due to longer-term investments to drive digitalization for the future.
The net negative fluctuation in other income and expenses was primarily due to lower gains in Nokia’s venture fund investments.
Shares
The total number of Nokia shares on June 30, 2019, equaled 5 635 968 159. On June 30, 2019, Nokia and its subsidiary companies owned 37 258 065 Nokia shares, representing approximately 0.7% of the total number of Nokia shares and voting rights.
Financial statement information
Consolidated income statement (condensed, unaudited)
|
|
|
Reported |
|
Reported |
|
Reported |
|
Reported |
|
Non-IFRS |
|
Non-IFRS |
|
Non-IFRS |
|
Non-IFRS |
|
|
EUR million |
|
Q2’19 |
|
Q2’18 |
|
Q1-Q2’19 |
|
Q1-Q2’18 |
|
Q2’19 |
|
Q2’18 |
|
Q1-Q2’19 |
|
Q1-Q2’18 |
|
|
Net sales (notes 2, 3, 4) |
|
5 694 |
|
5 313 |
|
10 726 |
|
10 237 |
|
5 696 |
|
5 318 |
|
10 753 |
|
10 246 |
|
|
Cost of sales |
|
(3 629 |
) |
(3 453 |
) |
(7 080 |
) |
(6 571 |
) |
(3 579 |
) |
(3 279 |
) |
(6 995 |
) |
(6 268 |
) |
|
Gross profit (notes 2, 3) |
|
2 065 |
|
1 860 |
|
3 646 |
|
3 666 |
|
2 117 |
|
2 038 |
|
3 758 |
|
3 979 |
|
|
Research and development expenses |
|
(1 126 |
) |
(1 165 |
) |
(2 282 |
) |
(2 332 |
) |
(978 |
) |
(1 016 |
) |
(1 987 |
) |
(2 027 |
) |
|
Selling, general and administrative expenses |
|
(763 |
) |
(813 |
) |
(1 587 |
) |
(1 660 |
) |
(669 |
) |
(695 |
) |
(1 377 |
) |
(1 427 |
) |
|
Other income and expenses |
|
(234 |
) |
(103 |
) |
(358 |
) |
(231 |
) |
(20 |
) |
7 |
|
(3 |
) |
48 |
|
|
Operating (loss)/profit (notes 2, 3) |
|
(57 |
) |
(221 |
) |
(581 |
) |
(557 |
) |
451 |
|
334 |
|
391 |
|
573 |
|
|
Share of results of associated companies and joint ventures |
|
(6 |
) |
(4 |
) |
(11 |
) |
(8 |
) |
(6 |
) |
(4 |
) |
(11 |
) |
(8 |
) |
|
Financial income and expenses |
|
(173 |
) |
(56 |
) |
(228 |
) |
(164 |
) |
(86 |
) |
(84 |
) |
(178 |
) |
(200 |
) |
|
(Loss)/profit before tax (note 2) |
|
(237 |
) |
(281 |
) |
(820 |
) |
(729 |
) |
359 |
|
246 |
|
202 |
|
365 |
|
|
Income tax benefit/(expense) |
|
46 |
|
10 |
|
188 |
|
104 |
|
(101 |
) |
(106 |
) |
(60 |
) |
(143 |
) |
|
(Loss)/profit from continuing operations (note 2) |
|
(191 |
) |
(271 |
) |
(632 |
) |
(625 |
) |
258 |
|
139 |
|
142 |
|
223 |
|
|
(Loss)/profit attributable to equity holders of the parent |
|
(190 |
) |
(267 |
) |
(634 |
) |
(618 |
) |
258 |
|
144 |
|
140 |
|
230 |
|
|
Non-controlling interests |
|
(1 |
) |
(4 |
) |
1 |
|
(7 |
) |
(1 |
) |
(4 |
) |
1 |
|
(7 |
) |
|
(Loss)/profit from discontinued operations |
|
(3 |
) |
1 |
|
(6 |
) |
163 |
|
0 |
|
0 |
|
0 |
|
0 |
|
|
(Loss)/profit attributable to equity holders of the parent |
|
(3 |
) |
1 |
|
(6 |
) |
163 |
|
0 |
|
0 |
|
0 |
|
0 |
|
|
Non-controlling interests |
|
0 |
|
0 |
|
0 |
|
0 |
|
0 |
|
0 |
|
0 |
|
0 |
|
|
(Loss)/profit for the period |
|
(194 |
) |
(271 |
) |
(638 |
) |
(462 |
) |
258 |
|
139 |
|
142 |
|
223 |
|
|
(Loss)/profit attributable to equity holders of the parent |
|
(193 |
) |
(266 |
) |
(639 |
) |
(454 |
) |
258 |
|
144 |
|
140 |
|
230 |
|
|
Non-controlling interests |
|
(1 |
) |
(4 |
) |
1 |
|
(7 |
) |
(1 |
) |
(4 |
) |
1 |
|
(7 |
) |
|
|
|
|
|
|
|
|
|
|
|
|
|
|
|
|
|
|
|
|
Earnings per share, EUR (for profit/(loss) attributable to equity holders of the parent) |
|
|
|
|
|
|
|
|
|
|
|
|
|
|
|
|
|
|
Basic earnings per share |
|
|
|
|
|
|
|
|
|
|
|
|
|
|
|
|
|
|
Continuing operations |
|
(0.03 |
) |
(0.05 |
) |
(0.11 |
) |
(0.11 |
) |
0.05 |
|
0.03 |
|
0.03 |
|
0.04 |
|
|
Discontinued operations |
|
0.00 |
|
0.00 |
|
0.00 |
|
0.03 |
|
0.00 |
|
0.00 |
|
0.00 |
|
0.00 |
|
|
(Loss)/profit for the period |
|
(0.03 |
) |
(0.05 |
) |
(0.11 |
) |
(0.08 |
) |
0.05 |
|
0.03 |
|
0.03 |
|
0.04 |
|
|
Diluted earnings per share |
|
|
|
|
|
|
|
|
|
|
|
|
|
|
|
|
|
|
Continuing operations |
|
(0.03 |
) |
(0.05 |
) |
(0.11 |
) |
(0.11 |
) |
0.05 |
|
0.03 |
|
0.02 |
|
0.04 |
|
|
Discontinued operations |
|
0.00 |
|
0.00 |
|
0.00 |
|
0.03 |
|
0.00 |
|
0.00 |
|
0.00 |
|
0.00 |
|
|
(Loss)/profit for the period |
|
(0.03 |
) |
(0.05 |
) |
(0.11 |
) |
(0.08 |
) |
0.05 |
|
0.03 |
|
0.02 |
|
0.04 |
|
|
Average number of shares (‘000 shares) |
|
|
|
|
|
|
|
|
|
|
|
|
|
|
|
|
|
|
Basic |
|
|
|
|
|
|
|
|
|
|
|
|
|
|
|
|
|
|
Continuing operations |
|
5 598 710 |
|
5 587 556 |
|
5 597 426 |
|
5 585 599 |
|
5 598 710 |
|
5 587 556 |
|
5 597 426 |
|
5 585 599 |
|
|
Discontinued operations |
|
5 598 710 |
|
5 587 556 |
|
5 597 426 |
|
5 585 599 |
|
5 598 710 |
|
5 587 556 |
|
5 597 426 |
|
5 585 599 |
|
|
(Loss)/profit for the period |
|
5 598 710 |
|
5 587 556 |
|
5 597 426 |
|
5 585 599 |
|
5 598 710 |
|
5 587 556 |
|
5 597 426 |
|
5 585 599 |
|
|
Diluted |
|
|
|
|
|
|
|
|
|
|
|
|
|
|
|
|
|
|
Continuing operations |
|
5 598 710 |
|
5 587 556 |
|
5 597 426 |
|
5 585 599 |
|
5 620 597 |
|
5 603 494 |
|
5 623 864 |
|
5 605 036 |
|
|
Discontinued operations |
|
5 598 710 |
|
5 603 494 |
|
5 597 426 |
|
5 605 036 |
|
5 620 597 |
|
5 603 494 |
|
5 623 864 |
|
5 605 036 |
|
|
(Loss)/profit for the period |
|
5 598 710 |
|
5 587 556 |
|
5 597 426 |
|
5 585 599 |
|
5 620 597 |
|
5 603 494 |
|
5 623 864 |
|
5 605 036 |
|
The above condensed consolidated income statement should be read in conjunction with accompanying notes.
Consolidated statement of comprehensive income (condensed, unaudited)
|
|
|
Reported |
|
Reported |
|
Reported |
|
Reported |
|
|
EUR million |
|
Q2’19 |
|
Q2’18 |
|
Q1-Q2’19 |
|
Q1-Q2’18 |
|
|
|
|
|
|
|
|
|
|
|
|
|
Loss for the period |
|
(194 |
) |
(271 |
) |
(638 |
) |
(462 |
) |
|
|
|
|
|
|
|
|
|
|
|
|
Other comprehensive income |
|
|
|
|
|
|
|
|
|
|
Items that will not be reclassified to profit or loss: |
|
|
|
|
|
|
|
|
|
|
Remeasurements of defined benefit pensions |
|
(32 |
) |
193 |
|
(244 |
) |
434 |
|
|
Income tax related to items that will not be reclassified to profit or loss |
|
10 |
|
(41 |
) |
71 |
|
(113 |
) |
|
Items that may be reclassified subsequently to profit or loss: |
|
|
|
|
|
|
|
|
|
|
Translation differences |
|
(226 |
) |
555 |
|
110 |
|
270 |
|
|
Net investment hedges |
|
58 |
|
(145 |
) |
(37 |
) |
(52 |
) |
|
Cash flow and other hedges |
|
19 |
|
(51 |
) |
7 |
|
(82 |
) |
|
Financial assets at fair value through other comprehensive income |
|
10 |
|
(22 |
) |
0 |
|
(42 |
) |
|
Other changes, net |
|
0 |
|
3 |
|
(1 |
) |
3 |
|
|
Income tax related to items that may be reclassified subsequently to profit or loss |
|
(17 |
) |
41 |
|
6 |
|
33 |
|
|
|
|
|
|
|
|
|
|
|
|
|
Other comprehensive (loss)/income, net of tax |
|
(177 |
) |
533 |
|
(87 |
) |
451 |
|
|
|
|
|
|
|
|
|
|
|
|
|
Total comprehensive (loss)/income |
|
(371 |
) |
262 |
|
(725 |
) |
(11 |
) |
|
|
|
|
|
|
|
|
|
|
|
|
Attributable to: |
|
|
|
|
|
|
|
|
|
|
Equity holders of the parent |
|
(369 |
) |
266 |
|
(727 |
) |
(4 |
) |
|
Non-controlling interests |
|
(2 |
) |
(4 |
) |
2 |
|
(7 |
) |
|
|
|
(371 |
) |
262 |
|
(725 |
) |
(11 |
) |
|
|
|
|
|
|
|
|
|
|
|
|
Attributable to equity holders of the parent: |
|
|
|
|
|
|
|
|
|
|
Continuing operations |
|
(366 |
) |
266 |
|
(721 |
) |
(167 |
) |
|
Discontinued operations |
|
(3 |
) |
0 |
|
(6 |
) |
163 |
|
|
|
|
(369 |
) |
266 |
|
(727 |
) |
(4 |
) |
|
|
|
|
|
|
|
|
|
|
|
|
Attributable to non-controlling interests: |
|
|
|
|
|
|
|
|
|
|
Continuing operations |
|
(2 |
) |
(4 |
) |
2 |
|
(7 |
) |
|
Discontinued operations |
|
0 |
|
0 |
|
0 |
|
0 |
|
|
|
|
(2 |
) |
(4 |
) |
2 |
|
(7 |
) |
The above condensed consolidated statement of comprehensive income should be read in conjunction with accompanying notes.
Consolidated statement of financial position (condensed, unaudited)
|
EUR million |
|
June 30, |
|
June 30, |
|
December |
|
|
ASSETS |
|
|
|
|
|
|
|
|
Goodwill |
|
5 477 |
|
5 384 |
|
5 452 |
|
|
Other intangible assets |
|
2 889 |
|
3 646 |
|
3 353 |
|
|
Property, plant and equipment |
|
1 782 |
|
1 782 |
|
1 790 |
|
|
Right-of-use assets (note 12) |
|
864 |
|
0 |
|
0 |
|
|
Investments in associated companies and joint ventures |
|
142 |
|
122 |
|
145 |
|
|
Non-current financial investments (note 8) |
|
748 |
|
673 |
|
690 |
|
|
Deferred tax assets (note 6) |
|
5 266 |
|
4 875 |
|
4 911 |
|
|
Other non-current financial assets (note 8) |
|
409 |
|
345 |
|
373 |
|
|
Defined benefit pension assets (note 5) |
|
4 400 |
|
4 248 |
|
4 224 |
|
|
Other non-current assets |
|
265 |
|
307 |
|
308 |
|
|
Non-current assets |
|
22 242 |
|
21 383 |
|
21 246 |
|
|
Inventories |
|
3 606 |
|
2 937 |
|
3 168 |
|
|
Trade receivables (note 8) |
|
4 777 |
|
4 847 |
|
4 856 |
|
|
Contract assets |
|
1 712 |
|
1 727 |
|
1 875 |
|
|
Prepaid expenses and accrued income |
|
1 138 |
|
1 109 |
|
1 024 |
|
|
Social security, VAT and other indirect taxes |
|
652 |
|
575 |
|
514 |
|
|
Divestment related receivables |
|
47 |
|
75 |
|
67 |
|
|
Other |
|
439 |
|
460 |
|
443 |
|
|
Current income tax assets |
|
364 |
|
492 |
|
227 |
|
|
Other current financial assets (note 8) |
|
287 |
|
245 |
|
243 |
|
|
Current financial investments (note 8) |
|
95 |
|
867 |
|
612 |
|
|
Cash and cash equivalents (note 8) |
|
4 693 |
|
4 993 |
|
6 261 |
|
|
Current assets |
|
16 673 |
|
17 218 |
|
18 266 |
|
|
Assets held for sale |
|
8 |
|
40 |
|
5 |
|
|
Total assets |
|
38 923 |
|
38 642 |
|
39 517 |
|
|
|
|
June 30, |
|
June 30, |
|
December |
|
|
SHAREHOLDERS’ EQUITY AND LIABILITIES |
|
|
|
|
|
|
|
|
Share capital |
|
246 |
|
246 |
|
246 |
|
|
Share issue premium |
|
428 |
|
417 |
|
436 |
|
|
Treasury shares |
|
(368 |
) |
(417 |
) |
(408 |
) |
|
Translation differences |
|
(506 |
) |
(704 |
) |
(592 |
) |
|
Fair value and other reserves |
|
891 |
|
1 062 |
|
1 063 |
|
|
Reserve for invested unrestricted equity |
|
15 596 |
|
15 589 |
|
15 606 |
|
|
Accumulated deficit |
|
(1 988 |
) |
(1 174 |
) |
(1 062 |
) |
|
Total capital and reserves attributable to equity holders of the parent |
|
14 298 |
|
15 020 |
|
15 289 |
|
|
Non-controlling interests |
|
79 |
|
70 |
|
82 |
|
|
Total equity |
|
14 377 |
|
15 089 |
|
15 371 |
|
|
Long-term interest-bearing liabilities (notes 8, 10) |
|
3 949 |
|
2 768 |
|
2 826 |
|
|
Long-term lease liabilities (note 12) |
|
748 |
|
3 |
|
2 |
|
|
Deferred tax liabilities (note 6) |
|
294 |
|
399 |
|
350 |
|
|
Defined benefit pension and post-retirement liabilities (note 5) |
|
4 755 |
|
4 275 |
|
4 327 |
|
|
Contract liabilities |
|
1 007 |
|
1 168 |
|
1 113 |
|
|
Deferred revenue and other long-term liabilities |
|
787 |
|
1 667 |
|
852 |
|
|
Deferred revenue |
|
692 |
|
847 |
|
770 |
|
|
Other (note 8) |
|
95 |
|
820 |
|
82 |
|
|
Provisions (note 9) |
|
592 |
|
688 |
|
572 |
|
|
Non-current liabilities |
|
12 133 |
|
10 967 |
|
10 042 |
|
|
Short-term interest-bearing liabilities (notes 8, 10) |
|
337 |
|
946 |
|
994 |
|
|
Short-term lease liabilities (note 12) |
|
223 |
|
0 |
|
0 |
|
|
Other financial liabilities (note 8) |
|
819 |
|
249 |
|
891 |
|
|
Current income tax liabilities |
|
207 |
|
288 |
|
268 |
|
|
Trade payables (note 8) |
|
3 894 |
|
3 900 |
|
4 773 |
|
|
Contract liabilities |
|
2 606 |
|
2 454 |
|
2 383 |
|
|
Accrued expenses, deferred revenue and other liabilities |
|
3 488 |
|
3 764 |
|
3 940 |
|
|
Deferred revenue |
|
155 |
|
155 |
|
155 |
|
|
Salaries, wages and social charges |
|
1 213 |
|
1 215 |
|
1 426 |
|
|
Other |
|
2 120 |
|
2 394 |
|
2 359 |
|
|
Provisions (note 9) |
|
838 |
|
985 |
|
855 |
|
|
Current liabilities |
|
12 412 |
|
12 585 |
|
14 104 |
|
|
Total shareholders’ equity and liabilities |
|
38 923 |
|
38 642 |
|
39 517 |
|
|
|
|
|
|
|
|
|
|
|
Interest-bearing liabilities, EUR million |
|
4 286 |
|
3 714 |
|
3 820 |
|
|
Shareholders’ equity per share, EUR |
|
2.55 |
|
2.69 |
|
2.73 |
|
|
Number of shares (1 000 shares, excluding treasury shares) |
|
5 598 710 |
|
5 587 554 |
|
5 593 162 |
|
June 30, 2018 comparative statement of financial position presented for the adoption of IFRS 15, Revenues from Contracts with Customers, has been revised from that presented in the second quarter 2018 interim report. Refer to note 1, “Basis of preparation”.
The above condensed consolidated statement of financial position should be read in conjunction with accompanying notes.
Consolidated statement of cash flows (condensed, unaudited)
|
EUR million |
|
Q2’19 |
|
Q2’18 |
|
Q1-Q2’19 |
|
Q1-Q2’18 |
|
|
Cash flow from operating activities |
|
|
|
|
|
|
|
|
|
|
Loss for the period |
|
(194 |
) |
(271 |
) |
(638 |
) |
(462 |
) |
|
Adjustments |
|
747 |
|
525 |
|
1 198 |
|
886 |
|
|
Depreciation and amortization |
|
413 |
|
360 |
|
820 |
|
732 |
|
|
Restructuring charges |
|
193 |
|
24 |
|
319 |
|
155 |
|
|
Financial income and expenses |
|
174 |
|
70 |
|
228 |
|
84 |
|
|
Income tax benefit |
|
(46 |
) |
(12 |
) |
(187 |
) |
(177 |
) |
|
Other |
|
13 |
|
83 |
|
18 |
|
92 |
|
|
Change in net working capital |
|
|
|
|
|
|
|
|
|
|
(Increase)/decrease in receivables(1) |
|
(255 |
) |
(179 |
) |
126 |
|
372 |
|
|
Increase in inventories |
|
(113 |
) |
(135 |
) |
(392 |
) |
(303 |
) |
|
Decrease in non-interest-bearing liabilities(1) |
|
(932 |
) |
(665 |
) |
(1 567 |
) |
(1 075 |
) |
|
Cash used in operations |
|
(747 |
) |
(725 |
) |
(1 273 |
) |
(582 |
) |
|
Interest received |
|
10 |
|
18 |
|
26 |
|
42 |
|
|
Interest paid |
|
(15 |
) |
(27 |
) |
(75 |
) |
(116 |
) |
|
Income taxes paid, net |
|
(164 |
) |
(100 |
) |
(341 |
) |
(288 |
) |
|
Net cash used in operating activities |
|
(916 |
) |
(834 |
) |
(1 663 |
) |
(944 |
) |
|
Cash flow from investing activities |
|
|
|
|
|
|
|
|
|
|
Purchase of property, plant and equipment and intangible assets |
|
(131 |
) |
(104 |
) |
(306 |
) |
(364 |
) |
|
Proceeds from sale of property, plant and equipment and intangible assets |
|
11 |
|
8 |
|
11 |
|
20 |
|
|
Acquisition of businesses, net of cash acquired |
|
0 |
|
(19 |
) |
0 |
|
(31 |
) |
|
Proceeds from disposal of businesses, net of disposed cash |
|
10 |
|
0 |
|
19 |
|
0 |
|
|
Purchase of current financial investments |
|
(44 |
) |
(343 |
) |
(349 |
) |
(1 179 |
) |
|
Proceeds from maturities and sale of current financial investments |
|
477 |
|
799 |
|
869 |
|
1 219 |
|
|
Purchase of non-current financial investments |
|
(57 |
) |
(29 |
) |
(77 |
) |
(48 |
) |
|
Proceeds from sale of non-current financial investments |
|
52 |
|
32 |
|
81 |
|
61 |
|
|
Payment of other long-term loans receivable |
|
(22 |
) |
0 |
|
(22 |
) |
0 |
|
|
Other |
|
3 |
|
(2 |
) |
3 |
|
0 |
|
|
Net cash from/(used in) investing activities |
|
299 |
|
342 |
|
229 |
|
(322 |
) |
|
Cash flow from financing activities |
|
|
|
|
|
|
|
|
|
|
Purchase of equity instruments of subsidiaries |
|
0 |
|
0 |
|
(1 |
) |
0 |
|
|
Proceeds from long-term borrowings |
|
250 |
|
45 |
|
999 |
|
75 |
|
|
Repayment of long-term borrowings |
|
(534 |
) |
(5 |
) |
(765 |
) |
(17 |
) |
|
Proceeds/(repayment of) short-term borrowings |
|
104 |
|
(99 |
) |
85 |
|
(100 |
) |
|
Payment of lease liabilities |
|
(63 |
) |
0 |
|
(127 |
) |
0 |
|
|
Dividends paid |
|
(248 |
) |
(935 |
) |
(249 |
) |
(950 |
) |
|
Net cash used in financing activities |
|
(491 |
) |
(994 |
) |
(58 |
) |
(992 |
) |
|
Translation differences |
|
(61 |
) |
(76 |
) |
(76 |
) |
(118 |
) |
|
Net decrease in cash and cash equivalents |
|
(1 169 |
) |
(1 562 |
) |
(1 568 |
) |
(2 376 |
) |
|
Cash and cash equivalents at beginning of period |
|
5 862 |
|
6 555 |
|
6 261 |
|
7 369 |
|
|
Cash and cash equivalents at end of period |
|
4 693 |
|
4 993 |
|
4 693 |
|
4 993 |
|
(1) Comparatives for Q2’18 have been adjusted to reflect the revision to the adoption of IFRS 15, Revenue from Contracts with Customers, in the third quarter 2018.
Consolidated statement of cash flows combines cash flows from both the continuing and the discontinued operations. The figures in the consolidated statement of cash flows cannot be directly traced from the statement of financial position without additional information as a result of acquisitions and disposals of subsidiaries and net foreign exchange differences arising on consolidation.
The above condensed consolidated statement of cash flows should be read in conjunction with accompanying notes.
Consolidated statement of changes in shareholders’ equity (condensed, unaudited)
|
EUR million |
|
Share |
|
Share |
|
Treasury |
|
Translation |
|
Fair value |
|
Reserve for |
|
(Accumulated |
|
Attributable |
|
Non-controlling |
|
Total equity |
|
|
January 1, 2018 |
|
246 |
|
447 |
|
(1 480 |
) |
(932 |
) |
843 |
|
15 616 |
|
1 345 |
|
16 083 |
|
80 |
|
16 163 |
|
|
Remeasurements of defined benefit pension plans, net of tax |
|
0 |
|
0 |
|
0 |
|
0 |
|
317 |
|
0 |
|
0 |
|
317 |
|
0 |
|
317 |
|
|
Translation differences |
|
0 |
|
0 |
|
0 |
|
270 |
|
0 |
|
0 |
|
0 |
|
270 |
|
1 |
|
271 |
|
|
Net investment hedges, net of tax |
|
0 |
|
0 |
|
0 |
|
(42 |
) |
0 |
|
0 |
|
0 |
|
(42 |
) |
0 |
|
(42 |
) |
|
Cash flow hedges, net of tax |
|
0 |
|
0 |
|
0 |
|
0 |
|
(65 |
) |
0 |
|
0 |
|
(65 |
) |
0 |
|
(65 |
) |
|
Financial assets at fair value through other comprehensive income, net of tax |
|
0 |
|
0 |
|
0 |
|
0 |
|
(36 |
) |
0 |
|
0 |
|
(36 |
) |
0 |
|
(36 |
) |
|
Other increase, net |
|
0 |
|
0 |
|
0 |
|
0 |
|
5 |
|
0 |
|
1 |
|
6 |
|
0 |
|
6 |
|
|
Loss for the period |
|
0 |
|
0 |
|
0 |
|
0 |
|
0 |
|
0 |
|
(454 |
) |
(454 |
) |
(7 |
) |
(462 |
) |
|
Total comprehensive loss |
|
0 |
|
0 |
|
0 |
|
229 |
|
220 |
|
0 |
|
(453 |
) |
(4 |
) |
(7 |
) |
(11 |
) |
|
Share-based payment |
|
0 |
|
24 |
|
0 |
|
0 |
|
0 |
|
0 |
|
0 |
|
24 |
|
0 |
|
24 |
|
|
Excess tax benefit on share-based payment |
|
0 |
|
3 |
|
0 |
|
0 |
|
0 |
|
0 |
|
0 |
|
3 |
|
0 |
|
3 |
|
|
Settlement of performance and restricted shares |
|
0 |
|
(57 |
) |
63 |
|
0 |
|
0 |
|
(26 |
) |
0 |
|
(21 |
) |
0 |
|
(21 |
) |
|
Cancellation of treasury shares |
|
0 |
|
0 |
|
1 000 |
|
0 |
|
0 |
|
0 |
|
(1 000 |
) |
0 |
|
0 |
|
0 |
|
|
Dividends |
|
0 |
|
0 |
|
0 |
|
0 |
|
0 |
|
0 |
|
(1 063 |
) |
(1 063 |
) |
(4 |
) |
(1 068 |
) |
|
Acquisition of non-controlling interests |
|
0 |
|
0 |
|
0 |
|
0 |
|
0 |
|
0 |
|
(1 |
) |
(1 |
) |
1 |
|
0 |
|
|
Total of other equity movements |
|
0 |
|
(30 |
) |
1 063 |
|
0 |
|
0 |
|
(26 |
) |
(2 065 |
) |
(1 059 |
) |
(3 |
) |
(1 063 |
) |
|
June 30, 2018 |
|
246 |
|
417 |
|
(417 |
) |
(704 |
) |
1 062 |
|
15 589 |
|
(1 174 |
) |
15 020 |
|
70 |
|
15 089 |
|
|
|
|
|
|
|
|
|
|
|
|
|
|
|
|
|
|
|
|
|
|
|
|
|
December 31, 2018 |
|
246 |
|
436 |
|
(408 |
) |
(592 |
) |
1 063 |
|
15 606 |
|
(1 062 |
) |
15 289 |
|
82 |
|
15 371 |
|
|
Adoption of IFRS 16(1) |
|
0 |
|
0 |
|
0 |
|
0 |
|
0 |
|
0 |
|
(5 |
) |
(5 |
) |
0 |
|
(5 |
) |
|
January 1, 2019 |
|
246 |
|
436 |
|
(408 |
) |
(592 |
) |
1 063 |
|
15 606 |
|
(1 067 |
) |
15 284 |
|
82 |
|
15 366 |
|
|
Remeasurements of defined benefit pension plans, net of tax |
|
0 |
|
0 |
|
0 |
|
0 |
|
(173 |
) |
0 |
|
0 |
|
(173 |
) |
0 |
|
(173 |
) |
|
Translation differences |
|
0 |
|
0 |
|
0 |
|
109 |
|
0 |
|
0 |
|
0 |
|
109 |
|
0 |
|
109 |
|
|
Net investment hedges, net of tax |
|
0 |
|
0 |
|
0 |
|
(24 |
) |
(5 |
) |
0 |
|
0 |
|
(29 |
) |
0 |
|
(29 |
) |
|
Cash flow hedges, net of tax |
|
0 |
|
0 |
|
0 |
|
0 |
|
6 |
|
0 |
|
0 |
|
6 |
|
0 |
|
6 |
|
|
Other decrease, net |
|
0 |
|
0 |
|
0 |
|
0 |
|
0 |
|
0 |
|
(1 |
) |
(1 |
) |
0 |
|
(1 |
) |
|
Loss for the period |
|
0 |
|
0 |
|
0 |
|
0 |
|
0 |
|
0 |
|
(639 |
) |
(639 |
) |
1 |
|
(638 |
) |
|
Total comprehensive loss |
|
0 |
|
0 |
|
0 |
|
85 |
|
(172 |
) |
0 |
|
(640 |
) |
(727 |
) |
2 |
|
(725 |
) |
|
Share-based payment |
|
0 |
|
40 |
|
0 |
|
0 |
|
0 |
|
0 |
|
0 |
|
40 |
|
0 |
|
40 |
|
|
Settlement of performance and restricted shares |
|
0 |
|
(48 |
) |
40 |
|
0 |
|
0 |
|
(10 |
) |
0 |
|
(17 |
) |
0 |
|
(17 |
) |
|
Dividends |
|
0 |
|
0 |
|
0 |
|
0 |
|
0 |
|
0 |
|
(280 |
) |
(280 |
) |
(5 |
) |
(284 |
) |
|
Acquisition of non-controlling interests |
|
0 |
|
0 |
|
0 |
|
0 |
|
0 |
|
0 |
|
(1 |
) |
(1 |
) |
0 |
|
0 |
|
|
Other movements |
|
0 |
|
0 |
|
0 |
|
0 |
|
0 |
|
0 |
|
(1 |
) |
(1 |
) |
0 |
|
(1 |
) |
|
Total of other equity movements |
|
0 |
|
(8 |
) |
40 |
|
0 |
|
0 |
|
(10 |
) |
(282 |
) |
(259 |
) |
(4 |
) |
(263 |
) |
|
June 30, 2019 |
|
246 |
|
428 |
|
(368 |
) |
(506 |
) |
891 |
|
15 596 |
|
(1 988 |
) |
14 298 |
|
79 |
|
14 377 |
|
The above condensed consolidated statement of changes in shareholders’ equity should be read in conjunction with accompanying notes.
(1) Equity impact relating to opening balance of subleases arising from the difference between right-of-use assets and lease receivables on adoption of IFRS 16, Leases, as of January 1, 2019.
Notes to Financial statements
1. BASIS OF PREPARATION (unaudited)
This unaudited and condensed consolidated financial statement information of Nokia has been prepared in accordance with IAS 34, Interim Financial Reporting, and it should be read in conjunction with the consolidated financial statements for 2018 prepared in accordance with IFRS as published by the IASB and adopted by the EU. The same accounting policies, methods of computation and applications of judgment are followed in this financial statement information as was followed in the consolidated financial statements for 2018 with the exception of changes resulting from adoption of IFRS 16, Leases as described in note 12, “New accounting standards”.
This financial report was authorized for issue by management on July 25, 2019.
Nokia presents financial information on reported, non-IFRS and constant currency basis. Non-IFRS measures presented in this document exclude costs related to the acquisition of Alcatel-Lucent and related integration, goodwill impairment charges, intangible asset amortization and other purchase price fair value adjustments, restructuring and associated charges and certain other items that may not be indicative of Nokia’s underlying business performance. In order to allow full visibility on determining non-IFRS results, information on non-IFRS exclusions is presented separately for each of the components of profit or loss.
Constant currency reporting provides additional information on change in financial measures on a constant currency basis in order to better reflect the underlying business performance. Therefore, change in financial measures at constant currency excludes the impact of changes in exchange rates in comparison to euro, our reporting currency.
Non-IFRS or constant currency financial measures should not be considered in isolation from, or as a substitute for, financial information presented in compliance with IFRS, and either of these financial measures as used by Nokia may not be comparable to similarly titled measures used by other companies or persons.
In 2017, Nokia and China Huaxin Post & Telecommunication Economy Development Center (China Huaxin) commenced operations of the joint venture Nokia Shanghai Bell (NSB). As part of the transaction, China Huaxin obtained the right to fully transfer its ownership interest in NSB to Nokia in exchange for a future cash settlement. To reflect its conditional obligation to China Huaxin, Nokia derecognized the non-controlling interest and records the present value of the expected future cash settlement as a financial liability within current liabilities in line with the option exercise period. The unwinding of the present value discount on the financial liability is recorded as interest expense and any changes in the estimated future cash settlement are recorded within financial income and expense.
Management identified its geographic areas as the relevant category to present disaggregated revenue. Nokia’s primary customer base consists of companies that operate on a country specific or a regional basis and are subject to macroeconomic conditions specific to those geographic areas. Further, although Nokia’s technology cycle is similar around the world, each country or region is inherently in a different stage of that cycle, often influenced by macroeconomic conditions. Each reportable segment, as described in note 3, “Segment Information”, operates in every geographic area as described in note 4 “Net Sales”. No reportable segment has a specific revenue concentration in any geographic area other than Nokia Technologies, which is included within Europe. Each type of customer, as disclosed in note 4, “Net Sales”, operates in all geographic areas.
June 30, 2018 comparative statement of financial position presented for the adoption of IFRS 15, Revenues from Contracts with Customers, has been revised from that presented in the second quarter 2018 interim report as follows [increase/(decrease)]: Current assets EUR 98 million - Trade receivables EUR (31) million, Contract assets EUR 197 million and Prepaid expenses and accrued income EUR (68) million; Current liabilities EUR 98 million - Accrued expenses, deferred revenue and other liabilities EUR 685 million and Contract liabilities EUR (587) million. EUR 17 million was reclassified from Non-current contract liabilities to Deferred revenue and other long-term liabilities. As disclosed in our third quarter 2018 interim report, management completed its evaluation of transactions and balances underlying contract assets, contract liabilities and other items impacted by the adoption of IFRS 15. As a result of these procedures, management has revised its June 30, 2018 comparative statement of financial position. These adjustments had no impact on the full year 2018 or 2017 consolidated financial statements.
Percentages and figures presented herein may include rounding differences and therefore may not add up precisely to the totals presented and may vary from previously published financial information.
New and amended standards and interpretations
On January 1, 2019, Nokia adopted IFRS 16, Leases. The nature of the new standard, impact of adoption on Nokia’s consolidated financial statements and changes to Nokia’s accounting policies resulting from the adoption are described in detail in note 12, “New accounting standards”. Other amendments and interpretations that became effective on January 1, 2019, did not have a material impact on Nokia’s consolidated financial statements.
New standards or amendments to existing standards issued by the IASB that are not yet effective are not expected to have a material impact on the consolidated financial statements of Nokia when adopted.
Currency exposures, approximately
|
|
|
Q2’19 |
|
Q2’18 |
|
Q4’18 |
| ||||||
|
|
|
Net sales |
|
Total costs |
|
Net sales |
|
Total costs |
|
Net sales |
|
Total costs |
|
|
EUR |
|
~25 |
% |
~25 |
% |
~25 |
% |
~30 |
% |
~25 |
% |
~30 |
% |
|
USD |
|
~50 |
% |
~45 |
% |
~45 |
% |
~45 |
% |
~45 |
% |
~45 |
% |
|
CNY |
|
~5 |
% |
~10 |
% |
~10 |
% |
~10 |
% |
~10 |
% |
~10 |
% |
|
Other |
|
~20 |
% |
~20 |
% |
~20 |
% |
~15 |
% |
~20 |
% |
~15 |
% |
|
Total |
|
100 |
% |
100 |
% |
100 |
% |
100 |
% |
100 |
% |
100 |
% |
End of Q2’19 balance sheet rate 1 EUR = 1.14 USD, end of Q2’18 balance sheet rate 1 EUR = 1.17 USD and end of Q4’18 balance sheet rate 1 EUR = 1.15 USD
Exchange rates
Nokia is a company with global operations and net sales derived from various countries and invoiced in various currencies. Therefore, our business and results from operations are exposed to changes in exchange rates between the euro, our reporting currency, and other currencies, such as the US dollar and the Chinese yuan. To mitigate the impact of changes in exchange rates on our results, we hedge operative forecasted net foreign exchange exposures, typically within a 12-month horizon, and apply hedge accounting in the majority of cases.
2. NON-IFRS TO REPORTED RECONCILIATION (unaudited)
In addition to information on our reported IFRS results, Nokia provides certain information on a non-IFRS, or underlying business performance, basis. Non-IFRS measures presented in this document exclude costs related to the acquisition of Alcatel-Lucent and related integration, goodwill impairment charges, intangible asset amortization and other purchase price fair value adjustments, restructuring and associated charges and certain other items that may not be indicative of Nokia’s underlying business performance. Nokia believes that the non-IFRS results provide meaningful supplemental information to both management and investors regarding Nokia’s underlying business performance by excluding the above-described items. These non-IFRS financial measures should not be viewed in isolation or as substitutes to the equivalent IFRS measure(s), but should be used in conjunction with the most directly comparable IFRS measure(s) in the reported results.
Q2’19
|
EUR million |
|
Net |
|
Cost of |
|
Research and |
|
Selling, |
|
Other |
|
Operating |
|
Financial |
|
Income |
|
Profit/(loss) |
|
Attributable to |
|
Attributable |
|
|
Non-IFRS |
|
5 696 |
|
(3 579 |
) |
(978 |
) |
(669 |
) |
(20 |
) |
451 |
|
(86 |
) |
(101 |
) |
258 |
|
258 |
|
(1 |
) |
|
Release of acquisition-related fair value adjustments to deferred revenue and inventory |
|
(2 |
) |
|
|
|
|
|
|
1 |
|
(2 |
) |
|
|
1 |
|
(1 |
) |
(1 |
) |
|
|
|
Amortization and depreciation of acquired intangible assets and property, plant and equipment |
|
|
|
|
|
(142 |
) |
(88 |
) |
|
|
(230 |
) |
|
|
53 |
|
(177 |
) |
(177 |
) |
|
|
|
Transaction and related costs, including integration costs |
|
|
|
|
|
|
|
(6 |
) |
|
|
(7 |
) |
|
|
1 |
|
(6 |
) |
(6 |
) |
|
|
|
Restructuring and associated charges |
|
|
|
(18 |
) |
|
|
|
|
(211 |
) |
(229 |
) |
|
|
45 |
|
(184 |
) |
(184 |
) |
|
|
|
Product portfolio strategy costs |
|
|
|
(32 |
) |
(5 |
) |
|
|
|
|
(37 |
) |
|
|
7 |
|
(30 |
) |
(30 |
) |
|
|
|
Impairment of assets, net of impairment reversals |
|
|
|
|
|
|
|
|
|
9 |
|
9 |
|
|
|
(3 |
) |
5 |
|
5 |
|
|
|
|
Costs associated with contract exit |
|
|
|
|
|
|
|
|
|
|
|
0 |
|
(65 |
) |
13 |
|
(52 |
) |
(52 |
) |
|
|
|
Change in financial liability to acquire NSB non-controlling interest |
|
|
|
|
|
|
|
|
|
|
|
0 |
|
(23 |
) |
|
|
(23 |
) |
(23 |
) |
|
|
|
Operating model integration |
|
|
|
|
|
|
|
|
|
(12 |
) |
(12 |
) |
|
|
30 |
|
19 |
|
19 |
|
|
|
|
Total non-IFRS exclusions |
|
(2 |
) |
(50 |
) |
(147 |
) |
(95 |
) |
(214 |
) |
(508 |
) |
(88 |
) |
147 |
|
(448 |
) |
(448 |
) |
0 |
|
|
Reported |
|
5 694 |
|
(3 629 |
) |
(1 126 |
) |
(763 |
) |
(234 |
) |
(57 |
) |
(173 |
) |
46 |
|
(191 |
) |
(190 |
) |
(1 |
) |
Q2’18
|
|
|
|
|
|
|
|
|
|
|
|
|
|
|
|
|
|
|
|
|
|
|
|
|
|
EUR million |
|
Net |
|
Cost of |
|
Research and |
|
Selling, |
|
Other |
|
Operating |
|
Financial |
|
Income |
|
Profit/(loss) |
|
Attributable to |
|
Attributable |
|
|
Non-IFRS |
|
5 318 |
|
(3 279 |
) |
(1 016 |
) |
(695 |
) |
7 |
|
334 |
|
(84 |
) |
(106 |
) |
139 |
|
144 |
|
(4 |
) |
|
Release of acquisition-related fair value adjustments to deferred revenue and inventory |
|
(5 |
) |
|
|
|
|
|
|
|
|
(5 |
) |
|
|
2 |
|
(3 |
) |
(3 |
) |
|
|
|
Amortization and depreciation of acquired intangible assets and property, plant and equipment |
|
|
|
(1 |
) |
(142 |
) |
(88 |
) |
|
|
(232 |
) |
|
|
51 |
|
(181 |
) |
(181 |
) |
|
|
|
Transaction and related costs, including integration costs |
|
|
|
(3 |
) |
|
|
(29 |
) |
|
|
(32 |
) |
|
|
7 |
|
(25 |
) |
(25 |
) |
|
|
|
Restructuring and associated charges |
|
|
|
|
|
|
|
|
|
(34 |
) |
(34 |
) |
|
|
7 |
|
(27 |
) |
(27 |
) |
|
|
|
Product portfolio strategy costs |
|
|
|
(169 |
) |
(7 |
) |
|
|
|
|
(176 |
) |
|
|
35 |
|
(141 |
) |
(141 |
) |
|
|
|
Impairment of assets |
|
|
|
|
|
|
|
|
|
(16 |
) |
(16 |
) |
|
|
4 |
|
(13 |
) |
(13 |
) |
|
|
|
Divestment of businesses |
|
|
|
|
|
|
|
|
|
(18 |
) |
(18 |
) |
|
|
|
|
(18 |
) |
(18 |
) |
|
|
|
Fair value changes of legacy IPR fund |
|
|
|
|
|
|
|
|
|
(42 |
) |
(42 |
) |
|
|
10 |
|
(32 |
) |
(32 |
) |
|
|
|
Change in financial liability to acquire NSB non-controlling interest |
|
|
|
|
|
|
|
|
|
|
|
0 |
|
9 |
|
|
|
9 |
|
9 |
|
|
|
|
Release of cumulative exchange differences related to abandonment of foreign operations |
|
|
|
|
|
|
|
|
|
|
|
0 |
|
19 |
|
1 |
|
20 |
|
20 |
|
|
|
|
Total non-IFRS exclusions |
|
(5 |
) |
(173 |
) |
(149 |
) |
(117 |
) |
(110 |
) |
(555 |
) |
28 |
|
116 |
|
(411 |
) |
(411 |
) |
0 |
|
|
Reported |
|
5 313 |
|
(3 453 |
) |
(1 165 |
) |
(813 |
) |
(103 |
) |
(221 |
) |
(56 |
) |
10 |
|
(271 |
) |
(267 |
) |
(4 |
) |
Q1-Q2’19
|
EUR million |
|
Net |
|
Cost of |
|
Research and |
|
Selling, |
|
Other |
|
Operating |
|
Financial |
|
Income |
|
Profit/(loss) |
|
Attributable to |
|
Attributable |
|
|
Non-IFRS |
|
10 753 |
|
(6 995 |
) |
(1 987 |
) |
(1 377 |
) |
(3 |
) |
391 |
|
(178 |
) |
(60 |
) |
142 |
|
140 |
|
1 |
|
|
Release of acquisition-related fair value adjustments to deferred revenue and inventory |
|
(5 |
) |
|
|
|
|
|
|
3 |
|
(2 |
) |
|
|
|
|
(1 |
) |
(1 |
) |
|
|
|
Amortization and depreciation of acquired intangible assets and property, plant and equipment |
|
|
|
|
|
(284 |
) |
(175 |
) |
|
|
(460 |
) |
|
|
107 |
|
(353 |
) |
(353 |
) |
|
|
|
Transaction and related costs, including integration costs |
|
|
|
(1 |
) |
|
|
(33 |
) |
|
|
(34 |
) |
|
|
7 |
|
(27 |
) |
(27 |
) |
|
|
|
Restructuring and associated charges |
|
(22 |
) |
(21 |
) |
|
|
(1 |
) |
(348 |
) |
(392 |
) |
|
|
78 |
|
(314 |
) |
(314 |
) |
|
|
|
Product portfolio strategy costs |
|
|
|
(65 |
) |
(10 |
) |
|
|
|
|
(75 |
) |
|
|
15 |
|
(60 |
) |
(60 |
) |
|
|
|
Impairment of assets, net of impairment reversals |
|
|
|
|
|
|
|
|
|
3 |
|
3 |
|
|
|
(2 |
) |
1 |
|
1 |
|
|
|
|
Divestment of businesses |
|
|
|
(1 |
) |
|
|
|
|
(1 |
) |
(2 |
) |
|
|
|
|
(2 |
) |
(2 |
) |
|
|
|
Costs associated with contract exit |
|
|
|
1 |
|
|
|
|
|
(1 |
) |
0 |
|
(65 |
) |
13 |
|
(52 |
) |
(52 |
) |
|
|
|
Change in financial liability to acquire NSB non-controlling interest |
|
|
|
|
|
|
|
|
|
|
|
0 |
|
15 |
|
|
|
15 |
|
15 |
|
|
|
|
Operating model integration |
|
|
|
|
|
|
|
|
|
(12 |
) |
(12 |
) |
|
|
30 |
|
19 |
|
19 |
|
|
|
|
Total non-IFRS exclusions |
|
(27 |
) |
(86 |
) |
(295 |
) |
(210 |
) |
(355 |
) |
(972 |
) |
(50 |
) |
248 |
|
(774 |
) |
(774 |
) |
0 |
|
|
Reported |
|
10 726 |
|
(7 080 |
) |
(2 282 |
) |
(1 587 |
) |
(358 |
) |
(581 |
) |
(228 |
) |
188 |
|
(632 |
) |
(634 |
) |
1 |
|
Q1-Q2’18
|
EUR million |
|
Net |
|
Cost of |
|
Research and |
|
Selling, |
|
Other |
|
Operating |
|
Financial |
|
Income |
|
Profit/(loss) |
|
Attributable to |
|
Attributable |
|
|
Non-IFRS |
|
10 246 |
|
(6 268 |
) |
(2 027 |
) |
(1 427 |
) |
48 |
|
573 |
|
(200 |
) |
(143 |
) |
223 |
|
230 |
|
(7 |
) |
|
Release of acquisition-related fair value adjustments to deferred revenue and inventory |
|
(9 |
) |
|
|
|
|
|
|
|
|
(9 |
) |
|
|
3 |
|
(6 |
) |
(6 |
) |
|
|
|
Amortization and depreciation of acquired intangible assets and property, plant and equipment |
|
|
|
(3 |
) |
(290 |
) |
(181 |
) |
|
|
(474 |
) |
|
|
110 |
|
(364 |
) |
(364 |
) |
|
|
|
Transaction and related costs, including integration costs |
|
|
|
(4 |
) |
|
|
(51 |
) |
|
|
(55 |
) |
|
|
12 |
|
(43 |
) |
(43 |
) |
|
|
|
Restructuring and associated charges |
|
|
|
|
|
|
|
(1 |
) |
(187 |
) |
(188 |
) |
|
|
39 |
|
(149 |
) |
(149 |
) |
|
|
|
Product portfolio strategy costs |
|
|
|
(297 |
) |
(15 |
) |
|
|
|
|
(312 |
) |
|
|
63 |
|
(249 |
) |
(249 |
) |
|
|
|
Impairment of assets |
|
|
|
|
|
|
|
|
|
(31 |
) |
(31 |
) |
|
|
7 |
|
(24 |
) |
(24 |
) |
|
|
|
Divestment of businesses |
|
|
|
|
|
|
|
|
|
(18 |
) |
(18 |
) |
|
|
|
|
(18 |
) |
(18 |
) |
|
|
|
Fair value changes of legacy IPR fund |
|
|
|
|
|
|
|
|
|
(42 |
) |
(42 |
) |
|
|
10 |
|
(32 |
) |
(32 |
) |
|
|
|
Change in financial liability to acquire NSB non-controlling interest |
|
|
|
|
|
|
|
|
|
|
|
0 |
|
16 |
|
|
|
16 |
|
16 |
|
|
|
|
Release of cumulative exchange differences related to abandonment of foreign operations |
|
|
|
|
|
|
|
|
|
|
|
0 |
|
19 |
|
1 |
|
20 |
|
20 |
|
|
|
|
Deferred tax valuation allowance |
|
|
|
|
|
|
|
|
|
|
|
0 |
|
|
|
(12 |
) |
(12 |
) |
(12 |
) |
|
|
|
Operating model integration |
|
|
|
|
|
|
|
|
|
|
|
0 |
|
|
|
13 |
|
13 |
|
13 |
|
|
|
|
Total non-IFRS exclusions |
|
(9 |
) |
(304 |
) |
(305 |
) |
(233 |
) |
(278 |
) |
(1 129 |
) |
36 |
|
246 |
|
(848 |
) |
(848 |
) |
0 |
|
|
Reported |
|
10 237 |
|
(6 571 |
) |
(2 332 |
) |
(1 660 |
) |
(231 |
) |
(557 |
) |
(164 |
) |
104 |
|
(625 |
) |
(618 |
) |
(7 |
) |
3. SEGMENT INFORMATION (unaudited)
Nokia has three reportable segments for financial reporting purposes: (1) Networks, (2) Nokia Software and (3) Nokia Technologies. Segment-level information for Group Common and Other is also presented.
Networks reportable segment consists of four aggregated operating segments: (1) Mobile Networks, (2) Global Services, (3) Fixed Networks and (4) IP/Optical Networks. The aggregated operating segments have similar economic characteristics, such as long-term margins; have similar products, production processes, distribution methods and customers; and operate in a similar regulatory environment.
In addition, Nokia provides net sales disclosure for the following businesses within Networks reportable segment: (i) Mobile Access (comprises Mobile Networks and Global Services operating segments), (ii) Fixed Access (comprises Fixed Networks operating segment), (iii) IP Routing (comprises part of IP/Optical Networks operating segment) and (iv) Optical Networks (comprises part of IP/Optical Networks operating segment).
Nokia adopted its current operational and reporting structure on January 1, 2019. The reporting structure was revised to better reflect Nokia’s strategy, organizational structure and the way the management evaluates operational performance and allocates resources. Previously Nokia had two businesses: Nokia’s Networks business and Nokia Technologies, and four reportable segments for financial reporting purposes: (1) Ultra Broadband Networks, (2) Global Services and (3) IP Networks and Applications within Nokia’s Networks business; and (4) Nokia Technologies. Furthermore, Ultra Broadband Networks was comprised of two aggregated operating segments: Mobile Networks and Fixed Networks, and IP Networks and Applications was comprised of two aggregated operating segments: IP/Optical Networks and Nokia Software. The most significant changes to the operational and reporting structure are the following: Nokia Software operating segment was moved from within IP Networks and Applications reportable segment into a separate reportable segment and activities related to the Cloud Core software portfolio were reclassified from the Mobile Networks and Global Services operating segments to the Nokia Software reportable segment. Additionally, the Mobile Networks, Global Services, Fixed Networks and IP/Optical Networks operating segments were aggregated into one reportable segment called Networks.
The President and CEO is the chief operating decision maker and monitors the operating results of operating and reportable segments for the purpose of making decisions about resource allocation and performance assessment. Key financial performance measures of the segments include primarily net sales and operating profit. The evaluation of segment performance and allocation of resources is based on non-IFRS operating profit.
Accounting policies of the segments are the same as those described in note 2, “Significant accounting policies”, of our Annual Report for 2018. Inter-segment revenues and transfers are accounted for as if the revenues were to third parties, that is, at current market prices. Non-IFRS exclusions are not allocated to the segments.
Networks
Networks comprises Mobile Networks, Global Services, Fixed Networks and IP/Optical Networks operating segments.
The Mobile Networks operating segment focuses on mobile radio including macro radio, small cells and cloud native radio solutions for communications service providers and enterprises.
Global Services operating segment provides a wide range of professional services with multi-vendor capabilities, covering network planning and optimization, network implementation, systems integration as well as company-wide managed services.
The Fixed Networks operating segment provides copper and fiber access products, solutions and services. The portfolio allows for a customized combination of technologies that brings fiber to the most economical point for the customer.
The IP/Optical Networks operating segment provides IP routing and optical transport systems, each with their own software and services to build high capacity network infrastructure for the internet and global connectivity.
Nokia Software
The Nokia Software operating segment offers the Cloud Core software portfolio in addition to software applications spanning customer experience management, network operations and management, communications and collaboration, policy and charging, as well as Cloud, IoT, security, and analytics platforms that enable digital services providers and enterprises to accelerate innovation, monetize services, and optimize their customer experience.
Nokia Technologies
The Nokia Technologies operating segment, building on decades of innovation and R&D leadership in technologies used in virtually all mobile devices used today, is expanding Nokia patent licensing business, reintroducing the Nokia brand to smartphones through brand licensing, and establishing a technology licensing business. The majority of net sales and related costs and expenses attributable to licensing and patenting the separate patent portfolios of Nokia Technologies, Nokia’s Networks business, and Nokia Bell Labs are recorded in Nokia Technologies. Each reportable segment continues to separately record its own research and development expenses.
Group Common and Other
Group Common and Other includes Alcatel Submarine Networks and Radio Frequency Systems, both of which are being managed as separate entities. In addition, Group Common and Other includes Nokia Bell Labs’ operating expenses, as well as certain corporate-level and centrally managed operating expenses.
|
Q2’19 |
|
Networks(1) |
|
Nokia Software |
|
Nokia |
|
Group Common |
|
Eliminations |
|
Non-IFRS total |
|
Non-IFRS exclusions(2) |
|
Nokia Total |
|
|
Net sales |
|
4 393 |
|
678 |
|
383 |
|
263 |
|
(21 |
) |
5 696 |
|
(2 |
) |
5 694 |
|
|
Cost of sales |
|
(3 026 |
) |
(321 |
) |
(5 |
) |
(249 |
) |
21 |
|
(3 579 |
) |
(50 |
) |
(3 629 |
) |
|
Gross profit |
|
1 367 |
|
357 |
|
378 |
|
15 |
|
0 |
|
2 117 |
|
(52 |
) |
2 065 |
|
|
% of net sales |
|
31.1 |
% |
52.7 |
% |
98.7 |
% |
5.7 |
% |
|
|
37.2 |
% |
|
|
36.3 |
% |
|
Research and development expenses |
|
(746 |
) |
(117 |
) |
(30 |
) |
(85 |
) |
0 |
|
(978 |
) |
(147 |
) |
(1 126 |
) |
|
Selling, general and administrative expenses |
|
(474 |
) |
(100 |
) |
(25 |
) |
(70 |
) |
0 |
|
(669 |
) |
(95 |
) |
(763 |
) |
|
Other income and expenses |
|
(28 |
) |
(3 |
) |
0 |
|
11 |
|
0 |
|
(20 |
) |
(214 |
) |
(234 |
) |
|
Operating profit/(loss) |
|
119 |
|
137 |
|
324 |
|
(129 |
) |
0 |
|
451 |
|
(508 |
) |
(57 |
) |
|
% of net sales |
|
2.7 |
% |
20.2 |
% |
84.6 |
% |
(49.0 |
)% |
|
|
7.9 |
% |
|
|
(1.0 |
)% |
|
Depreciation and amortization |
|
(141 |
) |
(21 |
) |
(7 |
) |
(13 |
) |
0 |
|
(183 |
) |
(230 |
) |
(413 |
) |
|
Share of results of associated companies and joint ventures |
|
(6 |
) |
0 |
|
0 |
|
0 |
|
0 |
|
(6 |
) |
0 |
|
(6 |
) |
|
EBITDA |
|
254 |
|
159 |
|
331 |
|
(117 |
) |
0 |
|
627 |
|
(278 |
) |
349 |
|
(1) Mobile Access net sales of EUR 2 824 million, Fixed Access net sales of EUR 447 million, IP Routing net sales of EUR 715 million and Optical Networks net sales of EUR 407 million.
(2) Non-IFRS results exclude costs related to the Alcatel-Lucent transaction and related integration, goodwill impairment charges, intangible asset amortization and purchase price related items, restructuring and associated charges, and certain other items that may not be indicative of Nokia’s underlying business performance.
|
Q2’18 |
|
Networks(1) |
|
Nokia Software |
|
Nokia |
|
Group Common |
|
Eliminations |
|
Non-IFRS total |
|
Non-IFRS exclusions(2) |
|
Nokia Total |
|
|
Net sales |
|
4 081 |
|
612 |
|
361 |
|
280 |
|
(15 |
) |
5 318 |
|
(5 |
) |
5 313 |
|
|
Cost of sales |
|
(2 730 |
) |
(330 |
) |
(7 |
) |
(227 |
) |
15 |
|
(3 279 |
) |
(173 |
) |
(3 453 |
) |
|
Gross profit |
|
1 350 |
|
282 |
|
354 |
|
52 |
|
0 |
|
2 038 |
|
(178 |
) |
1 860 |
|
|
% of net sales |
|
33.1 |
% |
46.1 |
% |
98.1 |
% |
18.6 |
% |
|
|
38.3 |
% |
|
|
35.0 |
% |
|
Research and development expenses |
|
(784 |
) |
(123 |
) |
(36 |
) |
(73 |
) |
0 |
|
(1 016 |
) |
(149 |
) |
(1 165 |
) |
|
Selling, general and administrative expenses |
|
(516 |
) |
(104 |
) |
(25 |
) |
(50 |
) |
0 |
|
(695 |
) |
(117 |
) |
(813 |
) |
|
Other income and expenses |
|
(16 |
) |
(14 |
) |
(1 |
) |
38 |
|
0 |
|
7 |
|
(110 |
) |
(103 |
) |
|
Operating profit/(loss) |
|
34 |
|
40 |
|
292 |
|
(33 |
) |
0 |
|
334 |
|
(555 |
) |
(221 |
) |
|
% of net sales |
|
0.8 |
% |
6.5 |
% |
80.9 |
% |
(11.8 |
)% |
|
|
6.3 |
% |
|
|
(4.2 |
)% |
|
Depreciation and amortization |
|
(96 |
) |
(19 |
) |
(5 |
) |
(8 |
) |
0 |
|
(128 |
) |
(232 |
) |
(360 |
) |
|
Share of results of associated companies and joint ventures |
|
(3 |
) |
0 |
|
0 |
|
0 |
|
0 |
|
(4 |
) |
0 |
|
(4 |
) |
|
EBITDA |
|
127 |
|
59 |
|
297 |
|
(24 |
) |
0 |
|
458 |
|
(323 |
) |
135 |
|
(1) Mobile Access net sales of EUR 2 634 million, Fixed Access net sales of EUR 490 million, IP Routing net sales of EUR 592 million and Optical Networks net sales of EUR 365 million.
(2) Non-IFRS results exclude costs related to the Alcatel-Lucent transaction and related integration, goodwill impairment charges, intangible asset amortization and purchase price related items, restructuring and associated charges, and certain other items that may not be indicative of Nokia’s underlying business performance.
|
Q1-Q2’19 |
|
Networks(1) |
|
Nokia Software |
|
Nokia |
|
Group Common |
|
Eliminations |
|
Non-IFRS total |
|
Non-IFRS exclusions(2) |
|
Nokia Total |
|
|
Net sales |
|
8 336 |
|
1 221 |
|
753 |
|
484 |
|
(41 |
) |
10 753 |
|
(27 |
) |
10 726 |
|
|
Cost of sales |
|
(5 908 |
) |
(644 |
) |
(18 |
) |
(465 |
) |
41 |
|
(6 995 |
) |
(86 |
) |
(7 080 |
) |
|
Gross profit |
|
2 428 |
|
576 |
|
735 |
|
18 |
|
0 |
|
3 758 |
|
(113 |
) |
3 646 |
|
|
% of net sales |
|
29.1 |
% |
47.2 |
% |
97.6 |
% |
3.7 |
% |
|
|
34.9 |
% |
|
|
34.0 |
% |
|
Research and development expenses |
|
(1 525 |
) |
(236 |
) |
(59 |
) |
(168 |
) |
0 |
|
(1 987 |
) |
(295 |
) |
(2 282 |
) |
|
Selling, general and administrative expenses |
|
(992 |
) |
(201 |
) |
(50 |
) |
(134 |
) |
0 |
|
(1 377 |
) |
(210 |
) |
(1 587 |
) |
|
Other income and expenses |
|
(46 |
) |
(10 |
) |
(1 |
) |
54 |
|
0 |
|
(3 |
) |
(355 |
) |
(358 |
) |
|
Operating profit/(loss) |
|
(135 |
) |
130 |
|
626 |
|
(230 |
) |
0 |
|
391 |
|
(972 |
) |
(581 |
) |
|
% of net sales |
|
(1.6 |
)% |
10.6 |
% |
83.1 |
% |
(47.5 |
)% |
|
|
3.6 |
% |
|
|
(5.4 |
)% |
|
Depreciation and amortization |
|
(279 |
) |
(41 |
) |
(15 |
) |
(25 |
) |
0 |
|
(361 |
) |
(460 |
) |
(820 |
) |
|
Share of results of associated companies and joint ventures |
|
(11 |
) |
0 |
|
0 |
|
0 |
|
0 |
|
(11 |
) |
0 |
|
(11 |
) |
|
EBITDA |
|
133 |
|
171 |
|
641 |
|
(204 |
) |
0 |
|
741 |
|
(513 |
) |
228 |
|
(1) Mobile Access net sales of EUR 5 297 million, Fixed Access net sales of EUR 872 million, IP Routing net sales of EUR 1 360 million and Optical Networks net sales of EUR 807 million.
(2) Non-IFRS results exclude costs related to the Alcatel-Lucent transaction and related integration, goodwill impairment charges, intangible asset amortization and purchase price related items, restructuring and associated charges, and certain other items that may not be indicative of Nokia’s underlying business performance.
|
Q1-Q2’18 |
|
Networks(1) |
|
Nokia Software |
|
Nokia |
|
Group Common |
|
Eliminations |
|
Non-IFRS total |
|
Non-IFRS exclusions(2) |
|
Nokia Total |
|
|
Net sales |
|
7 864 |
|
1 153 |
|
726 |
|
532 |
|
(27 |
) |
10 246 |
|
(9 |
) |
10 237 |
|
|
Cost of sales |
|
(5 197 |
) |
(638 |
) |
(17 |
) |
(443 |
) |
27 |
|
(6 268 |
) |
(304 |
) |
(6 571 |
) |
|
Gross profit |
|
2 667 |
|
514 |
|
709 |
|
89 |
|
0 |
|
3 979 |
|
(313 |
) |
3 666 |
|
|
% of net sales |
|
33.9 |
% |
44.6 |
% |
97.7 |
% |
16.7 |
% |
|
|
38.8 |
% |
|
|
35.8 |
% |
|
Research and development expenses |
|
(1 549 |
) |
(252 |
) |
(78 |
) |
(147 |
) |
0 |
|
(2 027 |
) |
(305 |
) |
(2 332 |
) |
|
Selling, general and administrative expenses |
|
(1 047 |
) |
(215 |
) |
(64 |
) |
(102 |
) |
0 |
|
(1 427 |
) |
(233 |
) |
(1 660 |
) |
|
Other income and expenses |
|
10 |
|
(6 |
) |
(1 |
) |
45 |
|
0 |
|
48 |
|
(278 |
) |
(231 |
) |
|
Operating profit/(loss) |
|
80 |
|
42 |
|
566 |
|
(116 |
) |
0 |
|
573 |
|
(1 129 |
) |
(557 |
) |
|
% of net sales |
|
1.0 |
% |
3.6 |
% |
78.0 |
% |
(21.8 |
)% |
|
|
5.6 |
% |
|
|
(5.4 |
)% |
|
Depreciation and amortization |
|
(192 |
) |
(36 |
) |
(10 |
) |
(21 |
) |
0 |
|
(258 |
) |
(474 |
) |
(732 |
) |
|
Share of results of associated companies and joint ventures |
|
(8 |
) |
0 |
|
0 |
|
0 |
|
0 |
|
(8 |
) |
0 |
|
(8 |
) |
|
EBITDA |
|
264 |
|
77 |
|
576 |
|
(95 |
) |
0 |
|
823 |
|
(656 |
) |
167 |
|
(1) Mobile Access net sales of EUR 5 060 million, Fixed Access net sales of EUR 935 million, IP Routing net sales of EUR 1 141 million and Optical Networks net sales of EUR 727 million.
(2) Non-IFRS results exclude costs related to the Alcatel-Lucent transaction and related integration, goodwill impairment charges, intangible asset amortization and purchase price related items, restructuring and associated charges, and certain other items that may not be indicative of Nokia’s underlying business performance.
4. NET SALES (unaudited)
Net sales by geographic area
|
EUR million |
|
Q2’19 |
|
Q2’18 |
|
YoY change |
|
Q1-Q2’19 |
|
Q1-Q2’18 |
|
YoY |
|
|
Asia-Pacific |
|
1 012 |
|
932 |
|
9 |
% |
1 975 |
|
1 842 |
|
7 |
% |
|
Europe |
|
1 611 |
|
1 548 |
|
4 |
% |
3 111 |
|
3 054 |
|
2 |
% |
|
Greater China |
|
515 |
|
524 |
|
(2 |
)% |
949 |
|
1 003 |
|
(5 |
)% |
|
Latin America |
|
359 |
|
308 |
|
17 |
% |
664 |
|
605 |
|
10 |
% |
|
Middle East & Africa |
|
441 |
|
447 |
|
(1 |
)% |
855 |
|
878 |
|
(3 |
)% |
|
North America |
|
1 755 |
|
1 554 |
|
13 |
% |
3 172 |
|
2 855 |
|
11 |
% |
|
Total |
|
5 694 |
|
5 313 |
|
7 |
% |
10 726 |
|
10 237 |
|
5 |
% |
Net sales by customer type
|
EUR million |
|
Q2’19 |
|
Q2’18 |
|
YoY change |
|
Q1-Q2’19 |
|
Q1-Q2’18 |
|
YoY |
|
|
Communication service providers |
|
4 755 |
|
4 398 |
|
8 |
% |
8 962 |
|
8 478 |
|
6 |
% |
|
Enterprise |
|
318 |
|
295 |
|
8 |
% |
577 |
|
540 |
|
7 |
% |
|
Licensees |
|
383 |
|
352 |
|
9 |
% |
753 |
|
701 |
|
7 |
% |
|
Other(1) |
|
238 |
|
268 |
|
(11 |
)% |
433 |
|
519 |
|
(17 |
)% |
|
Total |
|
5 694 |
|
5 313 |
|
7 |
% |
10 726 |
|
10 237 |
|
5 |
% |
(1) Includes net sales of Alcatel Submarine Networks (ASN) and Radio Frequency Systems (RFS), both of which are being managed as separate entities, and certain other items, such as eliminations of inter-segment revenues and certain items related to purchase price allocation. ASN and RFS net sales include also revenue from communications service providers and enterprise customers.
5. PENSIONS AND OTHER POST-EMPLOYMENT BENEFITS (unaudited)
Nokia operates a number of post-employment plans in various countries including both defined contribution and defined benefit plans. Defined benefit plans include pension plans and post-retirement welfare benefit plans, providing post-retirement healthcare benefits and life insurance coverage. Defined benefit plans expose Nokia to actuarial risks such as investment risk, interest rate risk, and life expectancy risk. The characteristics and associated risks of the defined benefit plans vary depending on legal, fiscal, and economic requirements in each country.
95% of Nokia’s defined benefit obligation and 97% of plan assets fair values were remeasured as of June 30, 2019. Nokia’s pension and post-retirement plans in the United States have been remeasured by updated valuations from an external actuary and the main pension plans outside of the U.S. (in Germany, United Kingdom, Switzerland and Belgium) have been remeasured based upon updated asset valuations and changes in the discount rates during the reporting period. The impact of not remeasuring other pension and post-employment obligations is considered not material.
Change in pension and post-retirement net asset/(liability) recognized
|
|
|
June 30, 2019 |
|
June 30, 2018 |
|
December 31, 2018 |
| ||||||||||||
|
EUR million |
|
Pension |
|
Post- |
|
Total |
|
Pension |
|
Post- |
|
Total |
|
Pension |
|
Post- |
|
Total |
|
|
Net asset/(liability) recognized at January 1 |
|
1 884 |
|
(1 987 |
) |
(103 |
) |
1 525 |
|
(1 986 |
) |
(461 |
) |
1 525 |
|
(1 986 |
) |
(461 |
) |
|
Current service cost |
|
(77 |
) |
0 |
|
(77 |
) |
(90 |
) |
0 |
|
(90 |
) |
(162 |
) |
0 |
|
(162 |
) |
|
Net interest income/(expense) |
|
33 |
|
(36 |
) |
(3 |
) |
26 |
|
(32 |
) |
(6 |
) |
48 |
|
(64 |
) |
(16 |
) |
|
Curtailment |
|
(19 |
) |
(1 |
) |
(20 |
) |
(21 |
) |
0 |
|
(21 |
) |
(43 |
) |
0 |
|
(43 |
) |
|
Pension and healthcare plan amendments |
|
0 |
|
0 |
|
0 |
|
0 |
|
0 |
|
0 |
|
(12 |
) |
0 |
|
(12 |
) |
|
Business combinations |
|
0 |
|
0 |
|
0 |
|
0 |
|
0 |
|
0 |
|
(1 |
) |
0 |
|
(1 |
) |
|
Total expense recognized in the income statement |
|
(63 |
) |
(37 |
) |
(100 |
) |
(85 |
) |
(32 |
) |
(117 |
) |
(170 |
) |
(64 |
) |
(234 |
) |
|
Actuarial (losses)/gain for the period |
|
(78 |
) |
(137 |
) |
(215 |
) |
351 |
|
178 |
|
529 |
|
326 |
|
144 |
|
470 |
|
|
Change in asset ceiling, excluding amounts included in net interest (expense) |
|
(29 |
) |
0 |
|
(29 |
) |
(95 |
) |
0 |
|
(95 |
) |
(82 |
) |
0 |
|
(82 |
) |
|
Total recognized in other comprehensive income |
|
(107 |
) |
(137 |
) |
(244 |
) |
256 |
|
178 |
|
434 |
|
244 |
|
144 |
|
388 |
|
|
Exchange differences |
|
14 |
|
(11 |
) |
3 |
|
77 |
|
(51 |
) |
26 |
|
118 |
|
(87 |
) |
31 |
|
|
Contributions and benefits paid |
|
94 |
|
3 |
|
97 |
|
103 |
|
(5 |
) |
98 |
|
181 |
|
6 |
|
187 |
|
|
Other movements(2) |
|
(3 |
) |
(5 |
) |
(8 |
) |
(1 |
) |
(6 |
) |
(7 |
) |
(14 |
) |
0 |
|
(14 |
) |
|
Net asset/(liability) recognized at the end of the period |
|
1 819 |
|
(2 174 |
) |
(355 |
) |
1 875 |
|
(1 902 |
) |
(27 |
) |
1 884 |
|
(1 987 |
) |
(103 |
) |
|
of which: |
|
|
|
|
|
|
|
|
|
|
|
|
|
|
|
|
|
|
|
|
- Defined benefit pension assets |
|
4 400 |
|
0 |
|
4 400 |
|
4 248 |
|
0 |
|
4 248 |
|
4 224 |
|
0 |
|
4 224 |
|
|
- Defined benefit pension and post-retirement liabilities |
|
(2 581 |
) |
(2 174 |
) |
(4 755 |
) |
(2 373 |
) |
(1 902 |
) |
(4 275 |
) |
(2 340 |
) |
(1 987 |
) |
(4 327 |
) |
(1) Includes pensions, retirement indemnities and other post-employment plans.
(2) Includes Section 420 transfers, medicare subsidies, acquisition through business combinations and other transfers.
|
Weighted average discount rates |
|
June 30, |
|
June 30, |
|
December 31, |
|
|
U.S. Pension |
|
3.1 |
|
3.9 |
|
3.9 |
|
|
U.S. Post-retirement healthcare and other |
|
2.8 |
|
3.7 |
|
3.7 |
|
|
U.S. Post-retirement group life |
|
3.2 |
|
4.0 |
|
4.0 |
|
|
Euro - Pension(1) |
|
0.9 |
|
1.5 |
|
1.5 |
|
|
U.K. - Pension |
|
2.2 |
|
2.7 |
|
2.7 |
|
(1) Includes pensions, retirement indemnities and end-of service gratuities.
|
Funded status |
|
June 30, |
|
June 30, |
|
December |
|
|
Defined benefit obligation |
|
(25 455 |
) |
(24 276 |
) |
(23 955 |
) |
|
Fair value of plan assets |
|
25 772 |
|
24 869 |
|
24 479 |
|
|
Funded status |
|
317 |
|
593 |
|
524 |
|
|
Impact of the asset ceiling |
|
(672 |
) |
(620 |
) |
(627 |
) |
|
Net liability recognized at end of period |
|
(355 |
) |
(27 |
) |
(103 |
) |
6. DEFERRED TAXES (unaudited)
At June 30, 2019, Nokia had recognized deferred tax assets of EUR 5.3 billion. The deferred tax assets are recognized to the extent it is probable that taxable profit will be available against which the tax losses, tax credits and deductible temporary differences can be utilized in the relevant jurisdictions. The majority of Nokia’s recognized deferred tax assets relate to unused tax losses, tax credits and deductible temporary differences in Finland (EUR 2.7 billion) and the United States (EUR 1.3 billion). Based on the recent years’ profitability in Finland and the United States, excluding certain integration costs in Finland related to the acquisition of Alcatel Lucent in 2016, and the latest forecasts of future financial performance, Nokia has been able to establish a pattern of sufficient tax profitability in Finland and the United States to conclude that it is probable that Nokia will be able to utilize the tax losses, tax credits and deductible temporary differences in the foreseeable future.
At June 30, 2019, Nokia had unrecognized deferred tax assets of approximately EUR 5 billion related to unused tax losses, tax credits and deductible temporary differences. The majority of the unrecognized deferred tax assets relate to France (approximately EUR 4 billion). These deferred tax assets have not been recognized due to uncertainty regarding their utilization. A significant portion of the French unrecognized deferred tax assets are indefinite in nature and available against future French tax liabilities, subject to a limitation of 50% of annual taxable profits.
At June 30, 2019, Nokia had deferred tax liabilities of EUR 0.3 billion. The majority of the deferred tax liabilities relate to the fair value adjustments on the purchase accounting of Alcatel-Lucent acquisition.
7. NET CASH AND CURRENT FINANCIAL INVESTMENTS (unaudited)
|
EUR million |
|
June 30, |
|
June 30, |
|
March 31, |
|
December 31, |
|
|
Current financial investments |
|
95 |
|
867 |
|
532 |
|
612 |
|
|
Cash and cash equivalents |
|
4 693 |
|
4 993 |
|
5 862 |
|
6 261 |
|
|
Total cash and current financial investments |
|
4 788 |
|
5 861 |
|
6 394 |
|
6 873 |
|
|
Long-term interest-bearing liabilities(1) |
|
3 949 |
|
2 768 |
|
3 650 |
|
2 826 |
|
|
Short-term interest-bearing liabilities(1) |
|
337 |
|
946 |
|
753 |
|
994 |
|
|
Interest-bearing liabilities |
|
4 286 |
|
3 714 |
|
4 403 |
|
3 820 |
|
|
Net cash and current financial investments |
|
502 |
|
2 146 |
|
1 991 |
|
3 053 |
|
(1) Lease liabilities are not included in interest-bearing liabilities.
8. FAIR VALUE OF FINANCIAL INSTRUMENTS (unaudited)
Financial assets and liabilities recorded at fair value are categorized based on the amount of unobservable inputs used to measure their fair value. Three hierarchical levels are based on an increasing amount of judgment associated with the inputs used to derive fair valuation for these assets and liabilities; Level 1 being market values for exchange traded products, Level 2 being primarily based on quotes from third-party pricing services and Level 3 requiring most management judgment. For more information about the valuation methods and principles, refer to note 2, “Significant accounting policies” and note 24, “Fair value of financial instruments”, of our Annual Report for 2018. Items carried at fair value in the following table are measured at fair value on a recurring basis.
|
|
|
Carrying amounts |
|
|
| ||||||||||||||
|
EURm |
|
|
|
Fair value through profit or loss |
|
Fair value through other |
|
|
|
Fair value |
| ||||||||
|
At June 30, 2019 |
|
Amortized cost |
|
Level 1 |
|
Level 2 |
|
Level 3 |
|
Level 1 |
|
Level 2 |
|
Level 3 |
|
Total |
|
Total |
|
|
Non-current financial investments |
|
0 |
|
0 |
|
0 |
|
748 |
|
0 |
|
0 |
|
0 |
|
748 |
|
748 |
|
|
Other non-current financial assets |
|
203 |
|
0 |
|
111 |
|
6 |
|
0 |
|
89 |
|
0 |
|
409 |
|
394 |
|
|
Other current financial assets including derivatives |
|
42 |
|
0 |
|
199 |
|
0 |
|
0 |
|
46 |
|
0 |
|
287 |
|
287 |
|
|
Trade receivables |
|
0 |
|
0 |
|
0 |
|
0 |
|
0 |
|
4 777 |
|
0 |
|
4 777 |
|
4 777 |
|
|
Current financial investments |
|
9 |
|
0 |
|
45 |
|
0 |
|
0 |
|
41 |
|
0 |
|
95 |
|
95 |
|
|
Cash and cash equivalents |
|
3 169 |
|
0 |
|
1 524 |
|
0 |
|
0 |
|
0 |
|
0 |
|
4 693 |
|
4 693 |
|
|
Total financial assets |
|
3 423 |
|
0 |
|
1 879 |
|
754 |
|
0 |
|
4 953 |
|
0 |
|
11 009 |
|
10 994 |
|
|
Long-term interest-bearing liabilities |
|
3 949 |
|
0 |
|
0 |
|
0 |
|
0 |
|
0 |
|
0 |
|
3 949 |
|
3 993 |
|
|
Other long-term financial liabilities |
|
0 |
|
0 |
|
0 |
|
22 |
|
0 |
|
0 |
|
0 |
|
22 |
|
22 |
|
|
Short-term interest-bearing liabilities |
|
337 |
|
0 |
|
0 |
|
0 |
|
0 |
|
0 |
|
0 |
|
337 |
|
337 |
|
|
Other short-term financial liabilities including derivatives |
|
0 |
|
0 |
|
117 |
|
702 |
|
0 |
|
0 |
|
0 |
|
819 |
|
819 |
|
|
Trade payables |
|
3 894 |
|
0 |
|
0 |
|
0 |
|
0 |
|
0 |
|
0 |
|
3 894 |
|
3 894 |
|
|
Total financial liabilities |
|
8 180 |
|
0 |
|
117 |
|
724 |
|
0 |
|
0 |
|
0 |
|
9 021 |
|
9 065 |
|
|
|
|
Carrying amounts |
|
|
| ||||||||||||||
|
EURm |
|
|
|
Fair value through profit or loss |
|
Fair value through other |
|
|
|
Fair value |
| ||||||||
|
At December 31, 2018 |
|
Amortized cost |
|
Level 1 |
|
Level 2 |
|
Level 3 |
|
Level 1 |
|
Level 2 |
|
Level 3 |
|
Total |
|
Total |
|
|
Non-current financial investments |
|
0 |
|
8 |
|
0 |
|
682 |
|
0 |
|
0 |
|
0 |
|
690 |
|
690 |
|
|
Other non-current financial assets |
|
188 |
|
0 |
|
94 |
|
6 |
|
0 |
|
85 |
|
0 |
|
373 |
|
357 |
|
|
Other current financial assets including derivatives |
|
20 |
|
0 |
|
131 |
|
0 |
|
0 |
|
92 |
|
0 |
|
243 |
|
243 |
|
|
Trade receivables |
|
0 |
|
0 |
|
0 |
|
0 |
|
0 |
|
4 856 |
|
0 |
|
4 856 |
|
4 856 |
|
|
Current financial investments |
|
106 |
|
0 |
|
52 |
|
0 |
|
0 |
|
454 |
|
0 |
|
612 |
|
612 |
|
|
Cash and cash equivalents |
|
4 531 |
|
0 |
|
1 730 |
|
0 |
|
0 |
|
0 |
|
0 |
|
6 261 |
|
6 261 |
|
|
Total financial assets |
|
4 845 |
|
8 |
|
2 007 |
|
688 |
|
0 |
|
5 487 |
|
0 |
|
13 035 |
|
13 019 |
|
|
Long-term interest-bearing liabilities |
|
2 826 |
|
0 |
|
0 |
|
0 |
|
0 |
|
0 |
|
0 |
|
2 826 |
|
2 818 |
|
|
Other long-term financial liabilities |
|
0 |
|
0 |
|
0 |
|
14 |
|
0 |
|
0 |
|
0 |
|
14 |
|
14 |
|
|
Short-term interest-bearing liabilities |
|
994 |
|
0 |
|
0 |
|
0 |
|
0 |
|
0 |
|
0 |
|
994 |
|
997 |
|
|
Other short-term financial liabilities including derivatives |
|
0 |
|
0 |
|
198 |
|
693 |
|
0 |
|
0 |
|
0 |
|
891 |
|
891 |
|
|
Trade payables |
|
4 773 |
|
0 |
|
0 |
|
0 |
|
0 |
|
0 |
|
0 |
|
4 773 |
|
4 773 |
|
|
Total financial liabilities |
|
8 593 |
|
0 |
|
198 |
|
707 |
|
0 |
|
0 |
|
0 |
|
9 498 |
|
9 493 |
|
Lease liabilities are not included in the fair value of financial instruments.
Level 3 Financial assets include a large number of investments in unlisted equities and unlisted venture funds, including investments managed by Nokia Growth Partners specializing in growth-stage investing.
Level 3 Financial liabilities include a conditional obligation to China Huaxin related to Nokia Shanghai Bell.
Reconciliation of the opening and closing balances on level 3 financial assets and liabilities:
|
EURm |
|
Level 3 |
|
Level 3 |
|
|
Balance at December 31, 2018 |
|
688 |
|
(707 |
) |
|
Net gains/(losses) in income statement |
|
42 |
|
(18 |
) |
|
Additions |
|
62 |
|
0 |
|
|
Deductions |
|
(37 |
) |
0 |
|
|
Other movements |
|
(1 |
) |
1 |
|
|
Balance at June 30, 2019 |
|
754 |
|
(724 |
) |
The gains and losses from venture fund and similar investments categorized in level 3 are included in other operating income and expenses. The gains and losses from other level 3 financial assets and liabilities are recorded in financial income and expenses. A net gain of EUR 27 million (net loss of EUR 96 million in 2018) related to level 3 financial instruments held at June 30, 2019, was included in the profit and loss during 2019.
9. PROVISIONS (unaudited)
|
EUR million |
|
Restructuring |
|
Divestment |
|
Warranty |
|
Project |
|
Litigation |
|
Environmental |
|
Material |
|
Other |
|
Total |
|
|
At January 1, 2019 |
|
493 |
|
66 |
|
195 |
|
55 |
|
109 |
|
108 |
|
72 |
|
329 |
|
1 427 |
|
|
Translation differences |
|
0 |
|
1 |
|
0 |
|
0 |
|
1 |
|
1 |
|
0 |
|
3 |
|
6 |
|
|
Reclassification(1) |
|
(53 |
) |
0 |
|
0 |
|
0 |
|
0 |
|
0 |
|
0 |
|
(11 |
) |
(64 |
) |
|
Charged to income statement |
|
319 |
|
(13 |
) |
41 |
|
(4 |
) |
7 |
|
1 |
|
14 |
|
6 |
|
371 |
|
|
Additional provisions |
|
344 |
|
1 |
|
61 |
|
0 |
|
14 |
|
5 |
|
29 |
|
27 |
|
481 |
|
|
Changes in estimates |
|
(25 |
) |
(14 |
) |
(20 |
) |
(4 |
) |
(7 |
) |
(4 |
) |
(15 |
) |
(21 |
) |
(110 |
) |
|
Utilized during period(2) |
|
(189 |
) |
0 |
|
(50 |
) |
0 |
|
(16 |
) |
(2 |
) |
(12 |
) |
(41 |
) |
(310 |
) |
|
At June 30, 2019 |
|
570 |
|
54 |
|
186 |
|
51 |
|
101 |
|
108 |
|
74 |
|
286 |
|
1 430 |
|
(1)The reclass in restructuring provisions is based on adoption of IFRS 16.
(2)The utilization of restructuring provision includes items transferred to accrued expenses, of which EUR 27 million remained in accrued expenses as of June 30, 2019.
10. INTEREST-BEARING LIABILITIES (unaudited)
|
|
|
|
|
|
|
Nominal |
|
|
|
Carrying amount (EUR million) |
| ||||
|
Issuer/Borrower |
|
Instrument |
|
Currency |
|
(million) |
|
Final maturity |
|
June 30, 2019 |
|
June 30, 2018 |
|
December 31, 2018 |
|
|
Nokia Corporation |
|
6.75% Senior Notes(1) |
|
EUR |
|
231 |
|
February 2019 |
|
0 |
|
236 |
|
232 |
|
|
Nokia Corporation |
|
5.375% Senior Notes(2) |
|
USD |
|
581 |
|
May 2019 |
|
0 |
|
498 |
|
507 |
|
|
Nokia Corporation |
|
1.00% Senior Notes |
|
EUR |
|
500 |
|
March 2021 |
|
499 |
|
498 |
|
499 |
|
|
Nokia Corporation |
|
3.375% Senior Notes |
|
USD |
|
500 |
|
June 2022 |
|
438 |
|
409 |
|
423 |
|
|
Nokia Corporation |
|
2.00% Senior Notes |
|
EUR |
|
750 |
|
March 2024 |
|
768 |
|
744 |
|
750 |
|
|
Nokia Corporation |
|
2.00% Senior Notes(3) |
|
EUR |
|
750 |
|
March 2026 |
|
766 |
|
0 |
|
0 |
|
|
Nokia Corporation |
|
4.375% Senior Notes |
|
USD |
|
500 |
|
June 2027 |
|
444 |
|
399 |
|
415 |
|
|
Nokia of America Corporation |
|
6.50% Senior Notes |
|
USD |
|
74 |
|
January 2028 |
|
65 |
|
64 |
|
65 |
|
|
Nokia of America Corporation |
|
6.45% Senior Notes |
|
USD |
|
206 |
|
March 2029 |
|
183 |
|
179 |
|
182 |
|
|
Nokia Corporation |
|
6.625% Senior Notes |
|
USD |
|
500 |
|
May 2039 |
|
497 |
|
434 |
|
455 |
|
|
Nokia Corporation |
|
NIB R&D Loan(4) |
|
EUR |
|
250 |
|
May 2025 |
|
250 |
|
0 |
|
0 |
|
|
Nokia Corporation |
|
Revolving Credit Facility(5) |
|
EUR |
|
1500 |
|
June 2024 |
|
0 |
|
0 |
|
0 |
|
|
Nokia Corporation |
|
EIB R&D Loan Facility(6) |
|
EUR |
|
500 |
|
|
|
0 |
|
0 |
|
0 |
|
|
Nokia Corporation and various subsidiaries |
|
Other liabilities |
|
|
|
|
|
|
|
376 |
|
253 |
|
292 |
|
|
Total |
|
|
|
|
|
|
|
|
|
4 286 |
|
3 714 |
|
3 820 |
|
(1)Nokia repaid its EUR 231 million 6.75% Senior Notes in February 2019.
(2)Nokia repaid its USD 581 million 5.375% Senior Notes in May 2019.
(3)Nokia issued EUR 750 million 2.00% Senior Notes due 2026 under its EUR 5 billion Euro Medium-Term Note Programme in March 2019.
(4)Nokia drew an amortizing loan from Nordic Investment Bank (NIB) in May 2019. The loan is repayable in three equal annual installments in 2023, 2024 and 2025.
(5)In June 2019, Nokia refinanced its EUR 1 579 million revolving credit facility maturing in June 2020 with EUR 1 500 million five-year revolving credit facility with two one-year extension options.
(6)The loan facility of EUR 500 million with the European Investment Bank (EIB) has not yet been disbursed and will have an average maturity of approximately five years after disbursement. The availability period of the loan facility ends in February 2020.
All borrowings presented above are senior unsecured and have no financial covenants.
11. COMMITMENTS AND CONTINGENCIES (unaudited)
|
EUR million |
|
June 30, 2019 |
|
June 30, 2018 |
|
December 31, 2018 |
|
|
Contingent liabilities on behalf of Group companies(1) |
|
|
|
|
|
|
|
|
Guarantees issued by financial institutions |
|
1 648 |
|
1 596 |
|
1 570 |
|
|
Other guarantees |
|
351 |
|
504 |
|
505 |
|
|
Contingent liabilities on behalf of other companies |
|
|
|
|
|
|
|
|
Other guarantees |
|
25 |
|
28 |
|
25 |
|
|
Financing commitments |
|
|
|
|
|
|
|
|
Customer finance commitments |
|
362 |
|
468 |
|
313 |
|
|
Financing commitments to associated companies |
|
20 |
|
20 |
|
20 |
|
|
Venture fund commitments |
|
270 |
|
375 |
|
314 |
|
(1) In contingent liabilities on behalf of Group companies Nokia reports guarantees that have been given to third parties in the normal course of business. These are mainly guarantees given by financial institutions to Nokia’s customers for the performance of Nokia’s obligations under supply agreements, including tender bonds, performance bonds, and warranty bonds issued by financial institutions on behalf of Nokia. Additionally, Nokia has issued corporate guarantees with primary obligation given directly to customers with these guarantees amounting to EUR 1 033 million (EUR 1 052 million at June 30, 2018 and EUR 1 041 million at December 31, 2018). In Other guarantees Nokia reports guarantees related to non-commercial contracts that support Nokia’s business activities. As a result of internal policies and active management of outstanding guarantee exposure, Nokia has not been subject to any material guarantee claims during recent years.
The amounts represent the maximum principal amount of commitments and contingencies.
12. NEW ACCOUNTING STANDARDS (unaudited)
IFRS 16 Leases
IFRS 16, Leases, (IFRS 16) was issued in January 2016 and sets out the requirements for the recognition, measurement, presentation and disclosure of leases. IFRS 16 provides a single lessee accounting model, requiring lessees to recognize right-of-use assets and lease liabilities for most leases, excluding short-term leases, in the consolidated statement of financial position.
Nokia adopted IFRS 16 on the effective date of January 1, 2019 using the cumulative catch-up transition method. In accordance with the IFRS 16 transition guidance, comparative information is not restated. Key judgments and estimates used under IFRS 16 primarily relate to the evaluation of lease terms and the use of discount rates.
Use of practical expedients
IFRS 16 allows for entities to elect a number of practical expedients to simplify the initial adoption of IFRS 16 as well as the ongoing application of IFRS 16.
Nokia elected to adopt the following practical expedients upon adoption of IFRS 16:
· Nokia applied IFRS 16 to contracts that were previously identified as leases applying IAS 17, Leases, and IFRIC 4, Determining whether an Arrangement contains a Lease;
· Nokia adjusted the right-of-use assets by the amount of onerous lease contract provisions recognized in the consolidated statement of financial position in accordance with IAS 37, Provisions, Contingent Liabilities and Contingent Assets; and
· Nokia excluded initial direct costs related to the execution of lease contracts from the measurement of the right-of-use assets.
· Nokia applied hindsight to estimate the lease term for all lease contracts existing on the effective date of January 1, 2019.
Nokia elected to adopt the following practical expedients on an ongoing basis:
· Nokia will not separate non-lease components from lease components and will instead account for each lease component and associated non-lease component as a single lease component; and
· Nokia will not recognize any short-term leases on the consolidated statement of financial position where the lease term is 12 months or less at the lease commencement date. Instead, Nokia will recognize the lease payments associated with short-term leases as an expense recognized on a basis representative of the pattern of the lease’s benefit.
In accordance with the requirements of the previous accounting standard, IAS 17 Leases, Nokia disclosed non-cancellable operating lease commitments of EUR 1 099 million within Note 30 of the 2018 annual report. As of January 1, 2019, Nokia recorded lease liabilities in accordance with IFRS 16 of EUR 1 092 million for leases which had previously been classified as operating leases under the requirements of IAS 17. These lease liabilities were measured at the present value of remaining lease payments, using a discount rate based on Nokia’s estimated incremental borrowing rate. As of January 1, 2019, the weighted average discount rate was 2.6%. The IFRS 16 lease liabilities were at a similar level to the IAS 17 non-cancellable operating lease commitments due to offsetting impacts from the following accounting policy changes related to the adoption of IFRS 16:
· IFRS 16 lease liabilities were higher than the IAS 17 non-cancellable operating lease commitments due to:
· Inclusion of IFRS 16 lease liabilities for onerous lease contracts whereas the IAS 17 disclosure excluded such lease commitments
· Inclusion of renewal option periods in the estimated lease term for certain IFRS 16 lease contracts whereas the IAS 17 disclosure included only lease commitments over the non-cancellable lease term
· Application of the practical expedient under IFRS 16 which allows for the inclusion of certain non-lease components in the determination of the IFRS 16 lease liabilities
· IFRS 16 lease liabilities were lower than the IAS 17 non-cancellable operating lease commitments due to:
· Exclusion of lease contracts from the determination of the IFRS 16 lease liabilities where the commencement date was subsequent to January 1, 2019
· Application of the practical expedient under IFRS 16 which allows for the exemption of short-term leases from lease accounting
· The effect from discounting the future lease payments in the determination of the present value of the IFRS 16 lease liabilities
IFRS 16 opening balance sheet impact
On adoption, all lease liabilities were recorded with an equal amount recorded for the related right-of-use assets. The right-of-use assets were then adjusted for onerous lease contract provisions and accrued lease payments recognized in the statement of financial position immediately before adoption and for sublease receivables recognized upon adoption. The following table depicts the opening balances recorded upon adoption of IFRS 16 on January 1, 2019:
|
EUR million |
|
January 1, 2019 |
|
|
Right-of-use assets |
|
993 |
|
|
Lease liabilities, long-term and short-term |
|
1 092 |
|
The adoption of IFRS 16 slightly reduced operating loss in the first six months of 2019 as the interest component on the lease payments is recognized as interest expense of EUR 12 million within financial income and expenses. In the consolidated statement of cash flows, cash flow from operating activities increased in the first six months of 2019 as the principal component of lease payments of EUR 127 million was recorded within cash flow from financing activities. Nokia’s activities as a lessor are not material and hence Nokia does not expect any material impact on the consolidated financial statements related to such activities.
13. PERFORMANCE MEASURES (unaudited)
In the reporting of financial information, Nokia has adopted various performance measures of historical or future financial performance, position or cash flows other than those defined or specified under International Financial Reporting Standards (IFRS). These measures are not defined by IFRS and therefore may not be directly comparable with financial measures used by other companies, including those in Nokia’s industry. The following table provides summarized information on the performance measures included in this interim report.
|
Performance measure |
|
Definition |
|
Purpose |
|
Key performance measures |
|
| ||
|
Non-IFRS measures |
|
Non-IFRS measures exclude costs related to the acquisition of Alcatel-Lucent and related integration, goodwill impairment charges, intangible asset amortization and other purchase price fair value adjustments, restructuring and associated charges and certain other items that may not be indicative of Nokia’s underlying business performance. Refer to note 2, “Non-IFRS to reported reconciliation”. |
|
We believe that our non-IFRS results provide meaningful supplemental information to both management and investors regarding Nokia’s underlying business performance by excluding the non-IFRS items that may not be indicative of Nokia’s business operating results. Non-IFRS operating profit is used in determining management remuneration. |
|
Constant currency measures |
|
When financial measures are reported on a constant currency basis, exchange rates used to translate the amounts in local currencies to euro, our reporting currency, are the average actual periodic exchange rates for the comparative financial period. Therefore, the constant currency measures exclude the impact of changes in exchange rates during the current period in comparison to euro. |
|
We provide additional information on a constant currency basis in order to better reflect the underlying business performance. |
|
Other performance measures |
|
| ||
|
Recurring/One-time measures |
|
Recurring measures, such as recurring net sales, are based on revenues that are likely to continue in the future. Recurring measures exclude e.g. the impact of catch-up net sales relating to prior periods. One-time measures, such as one-time net sales, reflect the revenues that are not likely to continue in the future. |
|
We use recurring/one-time measures to improve comparability between financial periods. |
|
Total cash and current financial investments |
|
Total cash and current financial investments consist of cash and cash equivalents and current financial investments. |
|
Total cash and current financial investments is used to indicate funds available to Nokia to run its current and invest in future business activities as well as provide return for security holders. |
|
Net cash and current financial investments |
|
Net cash and current financial investments equals total cash and current financial investments less long-term and short-term interest-bearing liabilities. Lease liabilities are not included in interest-bearing liabilities. Refer to note 7, “Net cash and current financial investments”. |
|
Net cash and current financial investments is used to indicate Nokia’s liquidity position after cash required to settle the interest-bearing liabilities. |
|
EBITDA |
|
Operating profit/(loss) before depreciations and amortizations and adjusted for share of results of associated companies and joint ventures. |
|
We use EBITDA as a measure of Nokia’s operating performance. |
|
Adjusted profit/(loss) before changes in net working capital |
|
Profit/(loss) for the period adjusted for the movements in non-cash items before changes in net working capital. |
|
We use adjusted profit/(loss) before changes in net working capital to provide a structured presentation of cash flows. |
|
Free cash flow |
|
Net cash from operating activities - purchases of property, plant and equipment and intangible assets (capital expenditures) + proceeds from sale of property, plant and equipment and intangible assets — purchase of non-current financial investments + proceeds from sale of non-current financial investments. |
|
Free cash flow is the cash that Nokia generates after net investments to tangible, intangible and non-current financial investments and it represents the cash available for distribution among its security holders. It is a measure of cash generation, working capital efficiency and capital discipline of the business. |
|
Capital expenditure |
|
Purchases of property, plant and equipment and intangible assets (excluding assets acquired under business combinations). |
|
We use capital expenditure to describe investments in profit generating activities in the future. |
|
Recurring annual cost savings |
|
Reduction in cost of sales and operating expenses resulting from the cost savings program and the impact of which is considered recurring in nature. |
|
We use recurring annual cost savings measure to monitor the progress of our cost savings program established after the Alcatel-Lucent transaction against plan. |
|
Restructuring and associated charges, liabilities and cash outflows |
|
Charges, liabilities and cash outflows related to activities that either meet the strict definition of restructuring under IFRS or are closely associated with such activities. |
|
We use restructuring and associated charges, liabilities and cash outflows to measure the progress of our integration and transformation activities. |
|
Charges and cash outflows related to network equipment swaps |
|
Charges and cash outflows related to product portfolio integration for key customers. |
|
We use charges and cash outflows related to network equipment swaps to measure the progress of our integration and transformation activities. |
RISKS AND FORWARD-LOOKING STATEMENTS
It should be noted that Nokia and its businesses are exposed to various risks and uncertainties and certain statements herein that are not historical facts are forward-looking statements. These forward-looking statements reflect Nokia’s current expectations and views of future developments and include statements regarding: A) expectations, plans or benefits related to our strategies and growth management; B) expectations, plans or benefits related to future performance of our businesses and any expected future dividends; C) expectations and targets regarding financial performance, results, the timing of receivables, operating expenses, taxes, currency exchange rates, hedging, cost savings and competitiveness, as well as results of operations including targeted synergies and those related to market share, prices, net sales, income and margins; D) expectations, plans or benefits related to changes in organizational and operational structure; E) expectations regarding market developments, general economic conditions and structural change globally and in national and regional markets, such as China; F) our ability to integrate acquired businesses into our operations and achieve the targeted business plans and benefits, including targeted benefits, synergies, cost savings and efficiencies; G) expectations, plans or benefits related to any future collaboration or to business collaboration agreements or patent license agreements or arbitration awards, including income to be received under any collaboration or partnership, agreement or award; H) timing of the deliveries of our products and services, including our short term and longer term expectations around the rollout of 5G and our ability to capitalize on such rollout; and the overall readiness of the 5G ecosystem; I) expectations and targets regarding collaboration and partnering arrangements, joint ventures or the creation of joint ventures, and the related administrative, legal, regulatory and other conditions, as well as our expected customer reach; J) outcome of pending and threatened litigation, arbitration, disputes, regulatory proceedings or investigations by authorities; K) expectations regarding restructurings, investments, capital structure optimization efforts, uses of proceeds from transactions, acquisitions and divestments and our ability to achieve the financial and operational targets set in connection with any such restructurings, investments, capital structure optimization efforts, divestments and acquisitions, including our current cost savings program; L) expectations, plans or benefits related to future capital expenditures, temporary incremental expenditures or other R&D expenditures to develop or rollout of software and other new products, including 5G; and M) statements preceded by or including “believe”, “expect”, “expectations”, “commit”, “anticipate”, “foresee”, “see”, “target”, “estimate”, “designed”, “aim”, “plan”, “intend”, “influence”, “assumption”, “focus”, “continue”, “project”, “should”, “is to”, “will” or similar expressions. These forward-looking statements are subject to a number of risks and uncertainties, many of which are beyond our control, which could cause actual results to differ materially from such statements. These statements are based on management’s best assumptions and beliefs in light of the information currently available to it. These forward-looking statements are only predictions based upon our current expectations and views of future events and developments and are subject to risks and uncertainties that are difficult to predict because they relate to events and depend on circumstances that will occur in the future. Factors, including risks and uncertainties that could cause these differences include, but are not limited to: 1) our strategy is subject to various risks and uncertainties and we may be unable to successfully implement our strategic plans, sustain or improve the operational and financial performance of our business groups, correctly identify or successfully pursue business opportunities or otherwise grow our business; 2) general economic and market conditions and other developments in the economies where we operate, including the timeline for the deployment of 5G and our ability to successfully capitalize on that deployment; 3) competition and our ability to effectively and profitably invest in existing and new high-quality products, services, upgrades and technologies and bring them to market in a timely manner; 4) our dependence on the development of the industries in which we operate, including the cyclicality and variability of the information technology and telecommunications industries and our own R&D capabilities and investments; 5) our dependence on a limited number of customers and large multi-year agreements, as well as external events impacting our customers including mergers and acquisitions; 6) our ability to maintain our existing sources of intellectual property-related revenue through our intellectual property, including through licensing, establish new sources of revenue and protect our intellectual property from infringement; 7) our ability to manage and improve our financial and operating performance, cost savings, competitiveness and synergies generally, expectations and timing around our ability to recognize any net sales and our ability to implement changes to our organizational and operational structure efficiently; 8) our global business and exposure to regulatory, political or other developments in various countries or regions, including emerging markets and the associated risks in relation to tax matters and exchange controls, among others; 9) our ability to achieve the anticipated benefits, synergies, cost savings and efficiencies of acquisitions; 10) exchange rate fluctuations, as well as hedging activities; 11) our ability to successfully realize the expectations, plans or benefits related to any future collaboration or business collaboration agreements and patent license agreements or arbitration awards, including income to be received under any collaboration, partnership, agreement or arbitration award; 12) Nokia Technologies’ ability to protect its IPR and to maintain and establish new sources of patent, brand and technology licensing income and IPR-related revenues, particularly in the smartphone market, which may not materialize as planned, 13) our dependence on IPR technologies, including those that we have developed and those that are licensed to us, and the risk of associated IPR-related legal claims, licensing costs and restrictions on use; 14) our exposure to direct and indirect regulation, including economic or trade policies, and the reliability of our governance,
internal controls and compliance processes to prevent regulatory penalties in our business or in our joint ventures; 15) our reliance on third-party solutions for data storage and service distribution, which expose us to risks relating to security, regulation and cybersecurity breaches; 16) inefficiencies, breaches, malfunctions or disruptions of information technology systems, or our customers’ security concerns; 17) our exposure to various legal frameworks regulating corruption, fraud, trade policies, and other risk areas, and the possibility of proceedings or investigations that result in fines, penalties or sanctions; 18) adverse developments with respect to customer financing or extended payment terms we provide to customers; 19) the potential complex tax issues, tax disputes and tax obligations we may face in various jurisdictions, including the risk of obligations to pay additional taxes; 20) our actual or anticipated performance, among other factors, which could reduce our ability to utilize deferred tax assets; 21) our ability to retain, motivate, develop and recruit appropriately skilled employees; 22) disruptions to our manufacturing, service creation, delivery, logistics and supply chain processes, and the risks related to our geographically-concentrated production sites; 23) the impact of litigation, arbitration, agreement-related disputes or product liability allegations associated with our business; 24) our ability to re-establish investment grade rating or maintain our credit ratings; 25) our ability to achieve targeted benefits from, or successfully implement planned transactions, as well as the liabilities related thereto; 26) our involvement in joint ventures and jointly-managed companies; 27) the carrying amount of our goodwill may not be recoverable; 28) uncertainty related to the amount of dividends and equity return we are able to distribute to shareholders for each financial period; 29) pension costs, employee fund-related costs, and healthcare costs; 30) our ability to successfully complete and capitalize on our order backlogs and continue converting our sales pipeline into net sales; and 31) risks related to undersea infrastructure, as well as the risk factors specified on pages 60 to 75 of our 2018 annual report on Form 20-F published on March 21, 2019 under “Operating and financial review and prospects-Risk factors” and in our other filings or documents furnished with the U.S. Securities and Exchange Commission. Other unknown or unpredictable factors or underlying assumptions subsequently proven to be incorrect could cause actual results to differ materially from those in the forward-looking statements. We do not undertake any obligation to publicly update or revise forward-looking statements, whether as a result of new information, future events or otherwise, except to the extent legally required.
This financial report was authorized for issue by management on July 25, 2019.
Media and Investor Contacts:
Communications, tel. +358 10 448 4900 email: press.services@nokia.com
Investor Relations, tel. +358 4080 3 4080 email: investor.relations@nokia.com
· Nokia plans to publish its third quarter and January-September 2019 results on October 24, 2019.
SIGNATURE
Pursuant to the requirements of the Securities Exchange Act of 1934, the registrant, Nokia Corporation, has duly caused this report to be signed on its behalf by the undersigned, thereunto duly authorized.
|
Date: July 25, 2019 |
Nokia Corporation | ||
|
|
| ||
|
|
By: |
/s/ Esa Niinimäki | |
|
|
|
Name: |
Esa Niinimäki |
|
|
|
Title: |
Vice President, Corporate Legal |