UNITED STATES
SECURITIES AND EXCHANGE COMMISSION
Washington, D.C. 20549
FORM N-CSR
CERTIFIED SHAREHOLDER REPORT OF REGISTERED MANAGEMENT
INVESTMENT COMPANIES
Investment Company Act file number File No. 811-08520
TIAA SEPARATE ACCOUNT VA-1
(Exact name of Registrant as specified in charter)
730 Third Avenue, New York, New York 10017-3206
(Address of principal executive offices) (Zip code)
Stewart P. Greene, Esq.
c/o TIAA-CREF
730 Third Avenue
New York, New York 10017-3206
(Name and address of agent for service)
Registrant’s telephone number, including area code: 212-490-9000
Date of fiscal year end: December 31
Date of reporting period: December 31, 2011
Item 1. Reports to Stockholders.
Understanding this report
This annual report contains information about the TIAA Separate Account VA-1 and describes the account’s results for the twelve months ended December 31, 2011. The report contains three main sections:
| • | The account performance section compares the account’s investment returns with those of its benchmark index. |
| • | The summary portfolio of investments lists the industries and types of securities in which the account had investments as of December 31, 2011. |
| • | The financial statements provide detailed information about the operations and financial condition of the account. |
As always, you should carefully consider the investment objectives, risks, charges and expenses of any account before investing. For a prospectus that contains this and other important information, please visit our website at tiaa-cref.org, or call 800 223-1200. We urge you to read the prospectus carefully before investing.
| Contents | ||||||||
|
|
1 | |||||||
|
|
2 | |||||||
|
|
3 | |||||||
|
|
||||||||
| 4 | ||||||||
|
|
7 | |||||||
|
|
||||||||
| 11 | ||||||||
|
|
12 | |||||||
|
|
13 | |||||||
|
|
14 | |||||||
|
|
15 | |||||||
|
|
21 | |||||||
|
|
22 | |||||||
|
|
Inside back cover | |||||||

Information for contractowners
Portfolio holdings
The TIAA Separate Account VA-1’s summary portfolio of investments begins on page 7 of this report.
You can obtain a complete list of the portfolio holdings of the TIAA Separate Account VA-1 (Schedule of Investments) as of the most recently completed fiscal quarter in the following ways:
• By visiting our website at tiaa-cref.org; or
• By calling us at 800 842-2252 to request a copy free of charge.
You can also obtain a complete list of the portfolio holdings of the account as of the most recently completed fiscal quarter, and for prior quarter-ends, from our Securities and Exchange Commission (SEC) Form N-CSR and Form N-Q filings. Form N-CSR filings are as of December 31 or June 30; Form N-Q filings are as of March 31 or September 30. Copies of these forms are available:
• Through the Electronic Data Gathering and Retrieval System (EDGAR) on the SEC’s website at www.sec.gov; or
• From the SEC’s Office of Investor Education and Advocacy. (Call 202 551-8090 for more information.)
Proxy voting
The TIAA Separate Account VA-1’s ownership of stock gives it the right to vote on proxy issues of companies in which it invests. A description of our proxy voting policies and procedures can be found on our website at tiaa-cref.org or on the SEC’s website at www.sec.gov. You may also call us at 800 223-1200 to request a free copy. A report of how the account voted during the most recently completed twelve-month period ended June 30 can be found on our website or on Form N-PX at www.sec.gov.
Contacting TIAA-CREF
There are three easy ways to contact us: by email, using the Contact Us link at the top of our home page; by mail at TIAA-CREF, 730 Third Avenue, New York, NY 10017–3206; or by phone at 800 223-1200.
Account management
The TIAA Separate Account VA-1 is managed by a portfolio management team of Teachers Advisors, Inc. The members of this team are responsible for the day-to-day investment management of the account.
TIAA Separate Account VA-1 ¡ 2011 Annual Report 1
Important information about expenses
As a TIAA Separate Account VA-1 contractowner, you incur only one of two potential types of costs.
| • | You do not incur transaction costs, including sales charges (loads) on purchases. There are also no redemption fees or exchange fees. |
| • | However, you do incur ongoing costs, including investment advisory fees, administrative expenses, and mortality and expense risk charges. |
The TIAA Separate Account VA-1 is the underlying investment vehicle for Teachers Personal Annuity contracts issued by Teachers Insurance and Annuity Association of America. Premium taxes may apply to certain contracts. Because of this additional charge, the cost to investors may be higher than the figures shown in the expense example. Information about this additional charge can be found in the prospectus.
The expense example that appears in the table on page 3 is intended to help you understand your ongoing costs (in U.S. dollars) of investing in the account. The example is also designed to help you compare these costs with the ongoing costs of investing in other variable annuity accounts and mutual funds.
The example is based on an investment of $1,000 invested at the beginning of the six-month period and held for the entire period (July 1, 2011–December 31, 2011).
Actual expenses
The first line in the table uses the account’s actual expenses and its actual rate of return. You may use the information in this line, together with the amount you invested, to estimate the expenses that you paid over the six-month period.
Simply divide your account value by $1,000 (for example, an $8,600 account value divided by $1,000 = 8.6), then multiply the result by the number in the first line under the heading “Expenses paid during period” to estimate the expenses you paid during the six-month period.
Hypothetical example for comparison purposes
The second line in the table shows hypothetical account values and expenses based on the account’s actual expense ratio for the six-month period and an assumed 5% per year rate of return before expenses. This was not the account’s actual return.
This hypothetical example cannot be used to estimate the actual expenses you paid for the period but rather allows you to compare the ongoing costs of investing in the account with the costs of other accounts. To do so, compare our 5% hypothetical example with the 5% hypothetical examples that appear in the shareholder reports of other variable annuity accounts and mutual funds.
2 2011 Annual Report ¡ TIAA Separate Account VA-1
Important information about expenses
Expense example
| Six months ended December 31, 2011 | ||||||||||||
| Stock Index Account |
Beginning |
Ending account value |
Expenses paid (7/1/11–12/31/11) |
|||||||||
| Actual return |
$1,000.00 | $ | 946.82 | $3.68 | ||||||||
| 5% annual hypothetical return |
1,000.00 | 1,021.42 | 3.82 | |||||||||
| * | “Expenses paid during period” is based on the account’s actual expense ratio for the most recent fiscal half-year, multiplied by the average account value over the six-month period, multiplied by 184/365. There were 184 days in the six months ended December 31, 2011. The account’s annualized six-month expense ratio for that period was 0.75%. The total annual expense ratio reflects a voluntary agreement by the account’s investment adviser to waive a portion of its fee. Without such waiver, the account’s total annual expense ratio would have been 0.90%. Although TIAA reserves the right to increase the account’s mortality and expense risk charge to a maximum of 1.00% of average daily net assets per year, the total annual expense ratio will never exceed 1.50%. |
The account’s benchmark is the Russell 3000® Index, which measures the performance of the stocks of the 3,000 largest publicly traded U.S. companies, based on market capitalization. The index measures the performance of about 98% of the total market capitalization of the publicly traded U.S. equity market.
You cannot invest directly in an index. Index returns do not include a deduction for fees or expenses.
Russell 3000 is a trademark and service mark of Russell Investment Group. TIAA-CREF products are not promoted or sponsored by, or affiliated with, Russell Investment Group.
TIAA Separate Account VA-1 ¡ 2011 Annual Report 3
Performance for the twelve months ended December 31, 2011
The Stock Index Account returned 0.37% for the year, compared with the 1.03% return of its benchmark, the Russell 3000® Index.
For the period, the account’s return trailed that of its benchmark because of the effect of expenses. The account’s return includes a deduction for expenses, while the benchmark’s does not. The account had a risk profile similar to that of its benchmark.
After gaining 16.93% in 2010, U.S. stocks continued to generate solid gains during the first half of 2011, rising 6.35%, as measured by the Russell 3000 Index. However, stocks fell sharply in the third quarter because of concerns about a slowing global economy and the intensifying debt crisis in Europe. A strong rally in October lifted the Russell index 11.51%, enabling it to post a positive return for the year.
During the twelve months, large-cap stocks gained 1.50%, while mid-cap and small-cap issues fell 1.55% and 4.18%, respectively. Growth stocks within the Russell 3000 outperformed value issues, 2.18% to –0.10%. (Returns by investment style and market capitalization are based on the Russell indexes.)
Consumer staples and health care shine
For the period, five of the nine industry sectors of the Russell 3000 generated positive returns, with three scoring double-digit gains. Strong advances from consumer staples (up 14.2%) and health care (up 10.9%) drove the index’s return. Together these two sectors made up one-fifth of the benchmark’s market capitalization on December 31, 2011. Solid contributions from the utilities (up 12.5%) and consumer discretionary (up 4.2%) sectors also helped.
These gains slightly offset weakness in the benchmark’s largest sector—financial services—which fell 11.9%. U.S. banks and financial companies continued to struggle with the housing slump at home and Europe’s debt problems.
It was an excellent year for many mega-cap issues, and four of the five largest stocks in the Russell 3000 posted robust double-digit gains. IBM and Apple led the way, rising 27.4% and 25.6%, respectively. Chevron was next with a 20.3% return. Exxon Mobil, the benchmark’s largest issue in terms of market capitalization, advanced 18.7%. In contrast, Microsoft fell 4.5%.
4 2011 Annual Report ¡ TIAA Separate Account VA-1
Stock Index Account
| Performance as of December 31, 2011 | ||||||||||||||||
| Total return |
Average annual total return |
|||||||||||||||
| Inception date | 1 year | 5 years | 10 years | |||||||||||||
|
Stock Index Account |
11/1/1994 | 0.37 | % | –0.60 | % | 2.92 | % | |||||||||
|
Russell 3000 Index |
— | 1.03 | –0.01 | 3.51 | ||||||||||||
The returns in this report show past performance, which is no guarantee of future results. Returns and the principal value of your investment will fluctuate. The account’s performance reflects a fee waiver, which is currently in place. Without such waiver, the expenses of the account would have been higher and its performance lower. Current performance may be higher or lower than that shown, and you may have a gain or a loss when you redeem your accumulation units. For current performance information, including performance to the most recent month-end, please visit tiaa-cref.org.
You cannot invest directly in an index. Index returns do not include a deduction for fees or expenses.
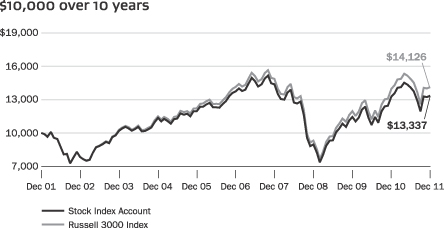
For the purpose of comparison, the graph also shows the change in the value of the account’s benchmark during the same period.
TIAA Separate Account VA-1 ¡ 2011 Annual Report 5
Stock Index Account
Portfolio composition
|
Sector |
% of net assets as of 12/31/2011 | |||
| Information technology |
18.2 | |||
| Financials |
15.3 | |||
| Health care |
11.8 | |||
| Consumer discretionary |
11.6 | |||
| Industrials |
11.2 | |||
| Energy |
11.2 | |||
| Consumer staples |
9.9 | |||
| Materials |
4.0 | |||
| Utilities |
3.9 | |||
| Telecommunication services |
2.8 | |||
| Short-term investments |
1.9 | |||
| Other assets & liabilities, net |
–1.8 | |||
|
Total |
100.0 | |||
Holdings by company size
|
Market capitalization |
% of equity investments as of 12/31/2011 | |||
| Over $50 billion |
40.7 | |||
| $15 billion–$50 billion |
24.5 | |||
| $2 billion–$15 billion |
27.3 | |||
| Under $2 billion |
7.5 | |||
|
Total |
100.0 | |||
6 2011 Annual Report ¡ TIAA Separate Account VA-1
| Summary portfolio of investments |
Stock Index Account § December 31, 2011
| Shares | Company | Value (000) |
% of net assets |
|||||||||||
| COMMON STOCKS | ||||||||||||||
| AUTOMOBILES & COMPONENTS | $ | 6,275 | 0.9 | % | ||||||||||
|
|
|
|||||||||||||
| BANKS | ||||||||||||||
| 95,123 | US Bancorp | 2,573 | 0.4 | |||||||||||
| 242,938 | Wells Fargo & Co | 6,695 | 1.0 | |||||||||||
| Other | 12,228 | 1.7 | ||||||||||||
|
|
|
|||||||||||||
| 21,496 | 3.1 | |||||||||||||
|
|
|
|||||||||||||
| CAPITAL GOODS | ||||||||||||||
| 35,096 | 3M Co | 2,868 | 0.4 | |||||||||||
| 36,405 | Boeing Co | 2,670 | 0.4 | |||||||||||
| 32,023 | Caterpillar, Inc | 2,901 | 0.4 | |||||||||||
| 523,942 | General Electric Co | 9,384 | 1.3 | |||||||||||
| 45,164 | United Technologies Corp | 3,301 | 0.5 | |||||||||||
| Other | 36,878 | 5.3 | ||||||||||||
|
|
|
|||||||||||||
| 58,002 | 8.3 | |||||||||||||
|
|
|
|||||||||||||
| COMMERCIAL & PROFESSIONAL SERVICES | 6,835 | 1.0 | ||||||||||||
|
|
|
|||||||||||||
| CONSUMER DURABLES & APPAREL | 9,122 | 1.3 | ||||||||||||
|
|
|
|||||||||||||
| CONSUMER SERVICES | ||||||||||||||
| 51,238 | McDonald’s Corp | 5,141 | 0.8 | |||||||||||
| Other | 11,758 | 1.7 | ||||||||||||
|
|
|
|||||||||||||
| 16,899 | 2.5 | |||||||||||||
|
|
|
|||||||||||||
| DIVERSIFIED FINANCIALS | ||||||||||||||
| 499,790 | Bank of America Corp | 2,779 | 0.4 | |||||||||||
| 143,418 | Citigroup, Inc | 3,773 | 0.6 | |||||||||||
| 40,000 | e | iShares Russell 3000 Index Fund | 2,967 | 0.4 | ||||||||||
| 196,259 | JPMorgan Chase & Co | 6,526 | 0.9 | |||||||||||
| Other | 22,313 | 3.2 | ||||||||||||
|
|
|
|||||||||||||
| 38,358 | 5.5 | |||||||||||||
|
|
|
|||||||||||||
| ENERGY | ||||||||||||||
| 99,334 | Chevron Corp | 10,569 | 1.5 | |||||||||||
| 65,688 | ConocoPhillips | 4,787 | 0.7 | |||||||||||
| 244,135 | Exxon Mobil Corp | 20,693 | 3.0 | |||||||||||
| 40,396 | Occidental Petroleum Corp | 3,785 | 0.5 | |||||||||||
| 67,006 | Schlumberger Ltd | 4,577 | 0.7 | |||||||||||
| Other | 34,012 | 4.8 | ||||||||||||
|
|
|
|||||||||||||
| 78,423 | 11.2 | |||||||||||||
|
|
|
|||||||||||||
| FOOD & STAPLES RETAILING | ||||||||||||||
| 66,873 | CVS Corp | 2,727 | 0.4 | |||||||||||
| 87,907 | Wal-Mart Stores, Inc | 5,253 | 0.8 | |||||||||||
| Other | 6,436 | 0.9 | ||||||||||||
|
|
|
|||||||||||||
| 14,416 | 2.1 | |||||||||||||
|
|
|
|||||||||||||
| See notes to financial statements | TIAA Separate Account VA-1 § 2011 Annual Report | 7 |
| Summary portfolio of investments | continued |
Stock Index Account § December 31, 2011
| Shares | Company | Value (000) |
% of net assets |
|||||||||||
| FOOD, BEVERAGE & TOBACCO | ||||||||||||||
| 103,678 | Altria Group, Inc | $ | 3,074 | 0.4 | % | |||||||||
| 97,591 | Coca-Cola Co | 6,828 | 1.0 | |||||||||||
| 81,903 | Kraft Foods, Inc (Class A) | 3,060 | 0.4 | |||||||||||
| 78,051 | PepsiCo, Inc | 5,179 | 0.7 | |||||||||||
| 87,849 | Philip Morris International, Inc | 6,894 | 1.0 | |||||||||||
| Other | 13,957 | 2.0 | ||||||||||||
|
|
|
|||||||||||||
| 38,992 | 5.5 | |||||||||||||
|
|
|
|||||||||||||
| HEALTH CARE EQUIPMENT & SERVICES | ||||||||||||||
| 53,540 | UnitedHealth Group, Inc | 2,713 | 0.4 | |||||||||||
| Other | 27,261 | 3.9 | ||||||||||||
|
|
|
|||||||||||||
| 29,974 | 4.3 | |||||||||||||
|
|
|
|||||||||||||
| HOUSEHOLD & PERSONAL PRODUCTS | ||||||||||||||
| 138,323 | Procter & Gamble Co | 9,228 | 1.3 | |||||||||||
| Other | 6,330 | 0.9 | ||||||||||||
|
|
|
|||||||||||||
| 15,558 | 2.2 | |||||||||||||
|
|
|
|||||||||||||
| INSURANCE | ||||||||||||||
| 86,469 | * | Berkshire Hathaway, Inc (Class B) | 6,598 | 1.0 | ||||||||||
| Other | 19,071 | 2.7 | ||||||||||||
|
|
|
|||||||||||||
| 25,669 | 3.7 | |||||||||||||
|
|
|
|||||||||||||
| MATERIALS | 28,014 | 4.0 | ||||||||||||
|
|
|
|||||||||||||
| MEDIA | ||||||||||||||
| 136,055 | Comcast Corp (Class A) | 3,226 | 0.5 | |||||||||||
| 93,266 | Walt Disney Co | 3,497 | 0.5 | |||||||||||
| Other | 15,123 | 2.1 | ||||||||||||
|
|
|
|||||||||||||
| 21,846 | 3.1 | |||||||||||||
|
|
|
|||||||||||||
| PHARMACEUTICALS, BIOTECHNOLOGY & LIFE SCIENCES | ||||||||||||||
| 76,734 | Abbott Laboratories | 4,315 | 0.6 | |||||||||||
| 43,387 | Amgen, Inc | 2,786 | 0.4 | |||||||||||
| 84,135 | Bristol-Myers Squibb Co | 2,965 | 0.4 | |||||||||||
| 135,431 | Johnson & Johnson | 8,882 | 1.3 | |||||||||||
| 152,423 | Merck & Co, Inc | 5,746 | 0.8 | |||||||||||
| 390,322 | Pfizer, Inc | 8,447 | 1.2 | |||||||||||
| Other | 18,941 | 2.7 | ||||||||||||
|
|
|
|||||||||||||
| 52,082 | 7.4 | |||||||||||||
|
|
|
|||||||||||||
| REAL ESTATE | 21,691 | 3.1 | ||||||||||||
|
|
|
|||||||||||||
| RETAILING | ||||||||||||||
| 17,945 | * | Amazon.com, Inc | 3,106 | 0.5 | ||||||||||
| 79,374 | Home Depot, Inc | 3,337 | 0.5 | |||||||||||
| Other | 20,506 | 2.8 | ||||||||||||
|
|
|
|||||||||||||
| 26,949 | 3.8 | |||||||||||||
|
|
|
|||||||||||||
| 8 | 2011 Annual Report § TIAA Separate Account VA-1 | See notes to financial statements |
| Summary portfolio of investments | continued |
Stock Index Account § December 31, 2011
| Shares | Company | Value (000) |
% of net assets |
|||||||||||
| SEMICONDUCTORS & SEMICONDUCTOR EQUIPMENT | ||||||||||||||
| 261,878 | Intel Corp | $ | 6,351 | 0.9 | % | |||||||||
| Other | 11,557 | 1.7 | ||||||||||||
|
|
|
|||||||||||||
| 17,908 | 2.6 | |||||||||||||
|
|
|
|||||||||||||
| SOFTWARE & SERVICES | ||||||||||||||
| 12,441 | * | Google, Inc (Class A) | 8,036 | 1.2 | ||||||||||
| 59,851 | International Business Machines Corp | 11,005 | 1.6 | |||||||||||
| 366,653 | Microsoft Corp | 9,518 | 1.4 | |||||||||||
| 189,696 | Oracle Corp | 4,866 | 0.7 | |||||||||||
| 25,816 | Visa, Inc (Class A) | 2,621 | 0.4 | |||||||||||
| Other | 27,225 | 3.8 | ||||||||||||
|
|
|
|||||||||||||
| 63,271 | 9.1 | |||||||||||||
|
|
|
|||||||||||||
| TECHNOLOGY HARDWARE & EQUIPMENT | ||||||||||||||
| 45,850 | * | Apple, Inc | 18,569 | 2.7 | ||||||||||
| 271,589 | Cisco Systems, Inc | 4,910 | 0.7 | |||||||||||
| 82,432 | Qualcomm, Inc | 4,509 | 0.7 | |||||||||||
| Other | 17,994 | 2.5 | ||||||||||||
|
|
|
|||||||||||||
| 45,982 | 6.6 | |||||||||||||
|
|
|
|||||||||||||
| TELECOMMUNICATION SERVICES | ||||||||||||||
| 292,582 | AT&T, Inc | 8,848 | 1.3 | |||||||||||
| 139,704 | Verizon Communications, Inc | 5,605 | 0.8 | |||||||||||
| Other | 5,289 | 0.7 | ||||||||||||
|
|
|
|||||||||||||
| 19,742 | 2.8 | |||||||||||||
|
|
|
|||||||||||||
| TRANSPORTATION | ||||||||||||||
| 36,458 | United Parcel Service, Inc (Class B) | 2,668 | 0.4 | |||||||||||
| Other | 10,943 | 1.5 | ||||||||||||
|
|
|
|||||||||||||
| 13,611 | 1.9 | |||||||||||||
|
|
|
|||||||||||||
| UTILITIES | 27,144 | 3.9 | ||||||||||||
|
|
|
|||||||||||||
| TOTAL COMMON STOCKS | (Cost $528,701) | 698,259 | 99.9 | |||||||||||
|
|
|
|||||||||||||
| PREFERRED STOCKS | ||||||||||||||
| RETAILING | 0 | ^ | 0.0 | |||||||||||
|
|
|
|||||||||||||
| TOTAL PREFERRED STOCKS | (Cost $1) | 0 | ^ | 0.0 | ||||||||||
|
|
|
|||||||||||||
| RIGHTS/WARRANTS | ||||||||||||||
| ENERGY | 0 | ^ | 0.0 | |||||||||||
|
|
|
|||||||||||||
| TOTAL RIGHTS/WARRANTS | (Cost $0) | 0 | ^ | 0.0 | ||||||||||
|
|
|
|||||||||||||
| See notes to financial statements | TIAA Separate Account VA-1 § 2011 Annual Report | 9 |
| Summary portfolio of investments | concluded |
Stock Index Account § December 31, 2011
| Shares | Company | Value (000) |
% of net assets |
|||||||||||
| SHORT-TERM INVESTMENTS | ||||||||||||||
| INVESTMENTS IN REGISTERED INVESTMENT COMPANIES | ||||||||||||||
| 13,605,970 | c |
TIAA-CREF Short Term Lending Portfolio of the State Street Navigator Securities Lending Trust | $ | 13,606 | 1.9 | % | ||||||||
|
|
|
|||||||||||||
| 13,606 | 1.9 | |||||||||||||
|
|
|
|||||||||||||
| TOTAL SHORT-TERM INVESTMENTS | (Cost $13,606) | 13,606 | 1.9 | |||||||||||
|
|
|
|||||||||||||
| TOTAL PORTFOLIO | (Cost $542,308) | 711,865 | 101.8 | |||||||||||
| OTHER ASSETS & LIABILITIES, NET | (12,783 | ) | (1.8 | ) | ||||||||||
|
|
|
|||||||||||||
| NET ASSETS | $ | 699,082 | 100.0 | % | ||||||||||
|
|
|
|||||||||||||
| ^ | Amount represents less than $1,000. |
| * | Non-income producing. |
| c | Investments made with cash collateral received from securities on loan. |
| e | All or a portion of these securities are out on loan. The aggregate value of securities on loan is $13,165,000. |
“Other” securities represent the aggregate value, by category, of securities that are not among the 50 largest holdings and, in total for any issuer, represent 1% or less of net assets.
Cost amounts are in thousands.
For ease of presentation, a number of classification categories have been grouped together in the Summary Portfolio of Investments. Note that the Account uses more specific categories in following its investment limitations on investment concentrations.
| 10 | 2011 Annual Report § TIAA Separate Account VA-1 | See notes to financial statements |
| Statement of assets and liabilities |
TIAA Separate Account VA-1 § December 31, 2011
| (amounts in thousands, except accumulation unit value) | Stock Index Account |
|||||
| ASSETS |
||||||
| Portfolio investments, at value*^ |
$ | 711,865 | ||||
| Cash |
9 | |||||
| Receivable from securities transactions |
387 | |||||
| Dividends receivable |
1,078 | |||||
| Other |
32 | |||||
| Total assets |
713,371 | |||||
| LIABILITIES |
||||||
| Due to affiliates |
651 | |||||
| Payable for collateral for securities loaned |
13,606 | |||||
| Other |
32 | |||||
| Total liabilities |
14,289 | |||||
| NET ASSETS |
||||||
| Accumulation Fund |
$ | 699,082 | ||||
|
| ||||||
| Accumulation units outstanding |
7,875 | |||||
|
| ||||||
| Accumulation unit value |
$88.77 | |||||
|
| ||||||
| * Portfolio Investments, at cost |
$ | 542,308 | ||||
| ^ Includes securities loaned of |
$ | 13,165 | ||||
| See notes to financial statements | TIAA Separate Account VA-1 § 2011 Annual Report | 11 |
| Statement of operations |
TIAA Separate Account VA-1 § For the year ended December 31, 2011
| (amounts in thousands) | Stock Index Account |
|||||
| INVESTMENT INCOME |
||||||
| Dividends* |
$ | 14,251 | ||||
| Income from securities lending |
106 | |||||
| Interest |
8 | |||||
| Total income |
14,365 | |||||
| EXPENSES |
||||||
| Administrative |
1,466 | |||||
| Investment Advisory |
2,200 | |||||
| Mortality and expense risk charges |
2,933 | |||||
| Total expenses |
6,599 | |||||
| Less: Expense waiver by investment advisor |
(1,100 | ) | ||||
| Net expenses |
5,499 | |||||
| Net investment income (loss) |
8,866 | |||||
| NET REALIZED AND UNREALIZED GAIN (LOSS) ON TOTAL INVESTMENTS |
||||||
| Realized gain (loss): |
||||||
| Portfolio investments |
14,869 | |||||
| Futures transactions |
28 | |||||
| Net realized gain (loss) on total investments |
14,897 | |||||
| Change in unrealized appreciation (depreciation) on: |
||||||
| Portfolio investments |
(20,555 | ) | ||||
| Net change in unrealized appreciation (depreciation) on total investments |
(20,555 | ) | ||||
| Net realized and unrealized gain (loss) on total investments |
(5,658 | ) | ||||
| Net increase (decrease) from operations |
$ | 3,208 | ||||
|
| ||||||
| * Net of foreign withholding taxes of |
$ | (17 | ) | |||
| 12 | 2011 Annual Report § TIAA Separate Account VA-1 | See notes to financial statements |
| Statement of changes in net assets |
TIAA Separate Account VA-1 § For the year ended
| Stock Index Account | ||||||||||
| (amounts in thousands) | December 31, 2011 |
December 31, 2010 |
||||||||
| OPERATIONS |
||||||||||
| Net investment income (loss) |
$ | 8,866 | $ | 8,252 | ||||||
| Net realized gain (loss) on total investments |
14,897 | 12,679 | ||||||||
| Net change in unrealized appreciation (depreciation) on total investments |
(20,555 | ) | 83,372 | |||||||
| Net increase (decrease) from operations |
3,208 | 104,303 | ||||||||
| FROM CONTRACTOWNER TRANSACTIONS |
||||||||||
| Premiums |
27,309 | 27,248 | ||||||||
| Withdrawals and death benefits |
(76,724 | ) | (65,821 | ) | ||||||
| Net increase (decrease) in net assets resulting from contractowner transactions |
(49,415 | ) | (38,573 | ) | ||||||
| Net increase (decrease) in net assets |
(46,207 | ) | 65,730 | |||||||
| NET ASSETS |
||||||||||
| Beginning of period |
745,289 | 679,559 | ||||||||
| End of period |
$ | 699,082 | $ | 745,289 | ||||||
|
| ||||||||||
| ACCUMULATION UNITS |
||||||||||
| Units purchased |
302 | 344 | ||||||||
| Units sold |
(854 | ) | (838 | ) | ||||||
| OUTSTANDING |
||||||||||
| Beginning of period |
8,427 | 8,921 | ||||||||
| End of period |
7,875 | 8,427 | ||||||||
|
| ||||||||||
| See notes to financial statements | TIAA Separate Account VA-1 § 2011 Annual Report | 13 |
| Financial highlights |
TIAA Separate Account VA-1 § For the year ended
| Stock Index Account | ||||||||||||||||||||||
| 12/31/11 | 12/31/10 | 12/31/09 | 12/31/08 | 12/31/07 | ||||||||||||||||||
| FOR AN ACCUMULATION UNIT OUTSTANDING THROUGHOUT EACH YEAR |
|
|||||||||||||||||||||
| Investment income(a) |
$ | 1.754 | $ | 1.542 | $ | 1.413 | $ | 1.758 | $ | 1.750 | ||||||||||||
| Expenses(a) |
0.671 | 0.591 | 0.452 | 0.484 | 0.575 | |||||||||||||||||
| Net investment income(a) |
1.083 | 0.951 | 0.961 | 1.274 | 1.175 | |||||||||||||||||
| Net realized and unrealized gain (loss) on total investments |
(0.755 | ) | 11.319 | 15.456 | (37.166 | ) | 2.979 | |||||||||||||||
| Net change in accumulation |
0.328 | 12.270 | 16.417 | (35.892 | ) | 4.154 | ||||||||||||||||
| Accumulation Unit Value: |
||||||||||||||||||||||
| Beginning of period |
88.441 | 76.171 | 59.754 | 95.646 | 91.492 | |||||||||||||||||
| End of period |
$ | 88.769 | $ | 88.441 | $ | 76.171 | $ | 59.754 | $ | 95.646 | ||||||||||||
|
| ||||||||||||||||||||||
| TOTAL RETURN(b) |
0.37% | 16.11% | 27.48% | (37.53)% | 4.54% | |||||||||||||||||
| RATIOS TO AVERAGE NET ASSETS |
|
|||||||||||||||||||||
| Ratio of expense to average net assets before expense waiver |
0.90% | 0.90% | 0.90% | 0.90% | 0.90% | |||||||||||||||||
| Ratio of expense to average net assets after expense waiver |
0.75% | 0.75% | 0.71% | 0.67% | 0.67% | |||||||||||||||||
| Ratio of net investment income to average net assets |
1.21% | 1.21% | 1.50% | 1.58% | 1.19% | |||||||||||||||||
| SUPPLEMENTAL DATA |
||||||||||||||||||||||
| Portfolio turnover rate |
6% | 10% | 6% | 7% | 6% | |||||||||||||||||
| Accumulation units outstanding at the end period(c) |
7,875 | 8,427 | 8,921 | 9,488 | 10,345 | |||||||||||||||||
| Net assets at the end of period(c) |
$ | 699,082 | $ | 745,289 | $ | 679,559 | $ | 566,938 | $ | 989,292 | ||||||||||||
| (a) | Based upon average accumulation units outstanding. |
| (b) | Based on per accumulation data. |
| (c) | Thousands. |
| 14 | 2011 Annual Report § TIAA Separate Account VA-1 | See notes to financial statements |
| Notes to financial statements |
TIAA Separate Account VA-1
Note 1—organization and significant accounting policies
TIAA Separate Account VA-1 (“VA-1”) is a segregated investment account of Teachers Insurance and Annuity Association of America (“TIAA”) and was organized on February 16, 1994, under the insurance laws of the State of New York for the purpose of issuing and funding individual variable annuity contracts. The variable annuity contracts were issued by TIAA. VA-1 is registered with the Securities and Exchange Commission as an open-end management investment company under the Investment Company Act of 1940, as amended (“1940 Act”). VA-1 consists of a single investment portfolio, the Stock Index Account (“Account”).
The accompanying financial statements were prepared in accordance with accounting principles generally accepted in the United States of America (“U.S. GAAP”) which may require the use of estimates made by management and the evaluation of subsequent events. Actual results may differ from those estimates. Certain prior year amounts have been reclassified to conform to current year presentation. The Accumulation Unit Value (“AUV”) for financial reporting purposes may differ from the AUV for processing transactions. The AUV for financial reporting purposes includes security and contractowner transactions through the date of the report. Total return is computed based on the AUV used for processing transactions. The following is a summary of the significant accounting policies consistently followed by the Account.
Security valuation: The Account’s investments in securities are recorded at their estimated fair value as described in the valuation of investments note to the financial statements.
Investments and investment income: Securities transactions are accounted for as of the trade date for financial reporting purposes. Interest income is recorded as earned and includes accretion of discounts and amortization of premiums using the effective yield method. Dividend income is recorded on the ex-dividend date. Realized gains and losses on securities transactions are based upon the specific identification method. Distributions received on securities that represent a return of capital or capital gain are recorded as a reduction of cost of investments and/or as a realized gain. The Account estimates the components of distributions received that may be considered return of capital distributions or capital gain distributions.
Income taxes: VA-1 is a separate account of TIAA, which is taxed as a life insurance company under Subchapter L of the Internal Revenue Code. VA-1 should incur no federal income tax liability. Under the rules of taxation applicable to life insurance companies, VA-1’s Accumulation Account for contractowners will generally be treated as life insurance reserves; therefore, any increase in such reserves will be deductible. Management has analyzed the Account’s tax positions taken for all open federal income tax years (2007–2011) and has concluded that no provision for federal income tax is required in the Account’s financial statements.
Management Committee compensation: The Management Committee (“Committee”), all of whom are independent, receive certain remuneration for their services, plus travel and other expenses. Managers may elect to participate in a
| TIAA Separate Account VA-1 § 2011 Annual Report | 15 |
| Notes to financial statements |
deferred compensation plan and defer all or a portion of their compensation. In addition, managers participate in a long-term compensation plan. Amounts deferred are retained by the Account until paid. The investment of deferred amounts and the offsetting payable to the managers are included in other assets and other liabilities in the accompanying Statement of Assets and Liabilities.
Note 2—valuation of investments
Portfolio investments are valued at fair value utilizing various valuation methods approved by the Committee. U.S. GAAP establishes a hierarchy that prioritizes market inputs to valuation methods. The three levels of inputs are:
| • | Level 1—quoted prices in active markets for identical securities |
| • | Level 2—other significant observable inputs (including quoted prices for similar securities, interest rates, credit risk, etc.) |
| • | Level 3—significant unobservable inputs (including the Account’s own assumptions in determining the fair value of investments) |
The availability of observable inputs can vary from security to security and is affected by a wide variety of factors, including, for example, the type of security, whether the security is new and not yet established in the marketplace, the liquidity of markets, and other characteristics particular to the security. To the extent that valuation is based on models or inputs that are less observable or unobservable in the market, the determination of fair value requires more judgment. Accordingly, the degree of judgment exercised in determining fair value is greatest for instruments categorized in Level 3. The inputs or methodology used for valuing securities are not necessarily an indication of the risk associated with investing in those securities.
A description of the valuation techniques applied to the Account’s major categories of assets and liabilities measured at fair value follows:
Exchange-traded equity securities, common and preferred stock: Equity securities listed or traded on a national market or exchange are valued based on their sale price on such market or exchange at the close of business on the date of valuation, or at the mean of the closing bid and asked prices if no sale is reported. To the extent these securities are actively traded and valuation adjustments are not applied, they are categorized in Level 1 of the fair value hierarchy. Foreign investments are valued at the last sale price or official closing price reported on the exchange where traded and converted to U.S. dollars at the prevailing rates of exchange on the date of valuation. For events affecting the value of foreign securities between the time when the exchange on which they are traded closes and the time when the Account’s net assets are calculated, such securities will be valued at fair value in accordance with procedures adopted by the Committee. Foreign securities are generally categorized in Level 2 of the fair value hierarchy.
Debt securities: Debt securities will generally be valued using prices provided by a pricing service that may employ various indications of value including but not limited to broker-dealer quotations. Certain debt securities, other than money
| 16 | 2011 Annual Report § TIAA Separate Account VA-1 |
| continued |
market instruments, are valued based on the most recent bid price or the equivalent quoted yield for such securities (or those of comparable maturity, quality and type). Debt securities are generally categorized in Level 2 of the fair value hierarchy; in instances where prices, yields, or any other key inputs are unobservable, they are categorized in Level 3 of the hierarchy.
Short-term investments: Short-term investments excluding investments in registered investment companies, with maturities of 60 days or less are valued at amortized cost. Short-term investments with maturities in excess of 60 days are valued in the same manner as debt securities. Short-term investments are generally categorized in Level 2 of the fair value hierarchy.
Investments in registered investment companies: These investments are valued at their net asset value on the valuation date. These investments are categorized in Level 1 of the fair value hierarchy.
Futures contracts: Stock and bond index futures and options, which are traded on commodities exchanges, are valued at the last sale price as of the close of such commodities exchanges and are categorized in Level 1 of the fair value hierarchy.
Any portfolio security for which market quotations are not readily available or for which the above valuation procedures are deemed not to reflect fair value are valued at fair value, as determined in good faith using procedures approved by the Committee. To the extent the inputs are observable and timely, the values would be categorized in Level 2 of the fair value hierarchy; otherwise they would be categorized as Level 3.
Transfers between levels are recognized at the end of the reporting period. For the year ended December 31, 2011, there were no significant transfers between levels by the Account.
As of December 31, 2011, the Account held a Level 3 security valued at zero. All other investments were valued based on Level 1 inputs.
Note 3—derivative instruments
As defined by U.S. GAAP, a derivative is a financial instrument whose value is derived from an underlying security price, foreign exchange rate, interest rate, index of prices or rates, or other variables. Derivatives require little or no initial investment and permit or require net settlement. The Account values derivatives at fair value.
For the year ended December 31, 2011, the effect of derivative contracts on the Account’s Statement of Operations was as follows (amounts in thousands):
| Derivative contracts | Location | |
Realized gain (loss |
) |
|
Change in unrealized appreciation (depreciation |
) | |||||
| Equity contracts |
Futures transactions | $ | 28 | $ | — |
| TIAA Separate Account VA-1 § 2011 Annual Report | 17 |
| Notes to financial statements |
Futures contracts: The Account is subject to equity price risk in the normal course of pursuing its investment objectives. The Account uses futures contracts to manage exposure to the equity markets and for cash management purposes to remain highly invested in these markets while minimizing transaction costs. Buying futures contracts tends to increase exposure to the underlying instrument/index, while selling futures contracts tends to decrease exposure to the underlying instrument/index or hedge other investments. Initial margin deposits are made upon entering into a futures contract, and variation margin payments are made or received reflecting daily changes in the value of the futures contracts. The receivable and/or payable for the variation margin are reflected in the Statement of Assets and Liabilities. Daily changes in the value of such contracts are reflected in net unrealized gains and losses. Gains or losses are realized upon the expiration or closing of the futures contracts or if the counterparties do not perform in accordance with contractual provisions. With futures, there is minimal counterparty credit risk to the Account since futures are exchange-traded and the exchange’s clearinghouse, as counterparty to all exchange traded funds, guarantees the futures against default. During the year ended December 31, 2011, the Account had exposure to equity futures contracts, based on underlying notional values, generally between 0% and 1% of net assets. At December 31, 2011, the Account did not hold any futures contracts.
Note 4—investment adviser and affiliates
Teachers Advisors, Inc. (“Advisors”), a wholly owned subsidiary of TIAA and a registered investment adviser, provides investment advisory services for VA-1 pursuant to an Investment Management Agreement among TIAA, Advisors and VA-1. TIAA provides all administrative services for VA-1 pursuant to an Administrative Services Agreement with VA-1. The contracts are distributed primarily by Teachers Personal Investors Services, Inc. (“TPIS”) and, in some instances, by TIAA-CREF Individual & Institutional Services, LLC (“Services”). TPIS and Services are wholly owned subsidiaries of TIAA. The Investment Management Agreement sets the investment advisory charge at an annual rate of 0.30% of the average daily net assets of the Account. Advisors has agreed to waive a portion of such fee, so that the daily deduction is equivalent to an annual charge of 0.15% of the average daily net assets of the Account. The Administrative Services Agreement sets the administrative expense charge at an annual rate of 0.20% of the average daily net assets of the Account. TIAA also imposes a daily charge for bearing certain mortality and expense risks in connection with the contracts, equivalent to an annual rate of 0.40% of the average daily net assets of the Account. Although TIAA reserves the right to increase the Account’s mortality and expense risk charge to a maximum of 1.00% per year, the total expense ratio should never exceed 1.50% per year.
The Account may purchase or sell investment securities in transactions with affiliated entities under procedures adopted by the Committee, pursuant to the 1940 Act. These transactions are effected at market rates without incurring broker commissions.
| 18 | 2011 Annual Report § TIAA Separate Account VA-1 |
| continued |
Note 5—investments
Securities lending: The Account may lend its securities to qualified institutional borrowers to earn additional income. The Account receives collateral (in the form of cash, Treasury securities, or other collateral permitted by applicable law) against the loaned securities and maintains collateral in an amount not less than 100% of the market value of loaned securities during the period of the loan. Cash collateral received by the Account will generally be invested in high-quality short-term instruments or in one or more funds maintained by the securities lending agent for the purpose of investing cash collateral. The value of the loaned securities and the liability to return the cash collateral received are reflected in the Statement of Assets and Liabilities. Securities lending income, net of rebates, represents the income earned on investing cash collateral, less expenses associated with the loan. Such income is reflected separately in the Statement of Operations. In lending its securities, the Account bears the market risk with respect to the collateral investment as well as the securities loaned and also bears the risk that the counterparty may default on its obligations to the Account.
Restricted securities: Restricted securities held by the Account, if any, may not be sold except in exempt transactions or in a public offering registered under the Securities Act of 1933. The risk of investing in such securities is generally greater than the risk of investing in securities that are widely held and publicly traded.
Net unrealized appreciation (depreciation): At December 31, 2011, net unrealized appreciation (depreciation) based on the aggregate cost of portfolio investments was $169,557,000, consisting of gross unrealized appreciation of $268,925,000 and gross unrealized depreciation of $(99,368,000).
Purchases and Sales: Purchases and sales of portfolio securities, excluding short-term instruments, for the year ended December 31, 2011 were $42,508,000 and $82,593,000, respectively.
Note 6—line of credit
The Account participates in a $1.5 billion unsecured revolving credit facility that can be used for temporary purposes, including, without limitation, the funding of contractowner withdrawals. Certain affiliated accounts and mutual funds, each of which is managed by Advisors, or an affiliate of Advisors, also participate in this facility. An annual commitment fee for the credit facility is borne by the participating accounts and mutual funds on a pro rata basis. Interest associated with any borrowing under the facility is charged to the borrowing account at a specified rate of interest. The Account is not liable for borrowings under the facility by other affiliated accounts or mutual funds. Prior to June 28, 2011, the unsecured revolving credit facility was $1.0 billion. For the year ended December 31, 2011, there were no borrowings under this credit facility by the Account.
Note 7—indemnification
In the normal course of business, the Account enters into contracts that contain a variety of representations and warranties and that provide general indemnities. The
| TIAA Separate Account VA-1 § 2011 Annual Report | 19 |
| Notes to financial statements | concluded |
Account’s maximum exposure under these arrangements is unknown, as this would involve future claims against the Account that have not yet occurred. Also, under the Account’s organizational documents, the managers and officers of the Account are indemnified against certain liabilities that may arise out of their duties to the Account. However, based on experience, the Account expects the risk of loss due to these warranties and indemnities to be unlikely.
| 20 | 2011 Annual Report § TIAA Separate Account VA-1 |
| Report of independent registered public accounting firm |
To the Management Committee and Contract owners of the TIAA Separate Account VA-1:
In our opinion, the accompanying statements of assets and liabilities, including the summary portfolio of investments, and the related statements of operations and of changes in net assets and the financial highlights present fairly, in all material respects, the financial position of the Stock Index Account of TIAA Separate Account VA-1 (hereafter referred to as “VA-1”) at December 31, 2011, the results of its operations for the year then ended, the changes in its net assets for each of the two years in the period then ended and the financial highlights for each of the five years in the period then ended, in conformity with accounting principles generally accepted in the United States of America. These financial statements and financial highlights (hereafter referred to as “financial statements”) are the responsibility of VA-1’s management; our responsibility is to express an opinion on these financial statements based on our audits. We conducted our audits of these financial statements in accordance with the standards of the Public Company Accounting Oversight Board (United States). Those standards require that we plan and perform the audit to obtain reasonable assurance about whether the financial statements are free of material misstatement. An audit includes examining, on a test basis, evidence supporting the amounts and disclosures in the financial statements, assessing the accounting principles used and significant estimates made by management, and evaluating the overall financial statement presentation. We believe that our audits, which included confirmation of securities at December 31, 2011 by correspondence with the custodian and brokers, provide a reasonable basis for our opinion.

PricewaterhouseCoopers LLP
Boston, Massachusetts
February 16, 2012
| TIAA Separate Account VA-1 § 2011 Annual Report | 21 |
| Management committee members and officers (unaudited) |
TIAA Separate Account VA-1 § December 31, 2011
Members
| Name, Address and Date of Birth (“DOB”) |
Position(s) held with account |
Term of office and length of time served |
Principal occupation(s) during past 5 years |
Number of portfolios in fund complex overseen by trustee |
Other directorship(s) held by trustee | |||||
| Forrest Berkley c/o Corporate Secretary 730 Third Avenue New York, NY 10017-3206 DOB: 4/25/54 |
Member | Indefinite term. Member since 2006. | Retired Partner (since 2006), Former Partner (1990–2005) and Head of Global Product Management (2003–2005), GMO (formerly, Grantham, Mayo, Van Otterloo & Co.) (investment management); and member of asset allocation portfolio management team, GMO (2003–2005). | 76 | Director of GMO; Director, the Maine Coast Heritage Trust; Investment Committee member, Maine Community Foundation, the Butler Conservation Fund, Inc. and the Elmina B. Sewall Foundation. | |||||
| Nancy A. Eckl c/o Corporate Secretary 730 Third Avenue New York, NY 10017-3206 DOB: 10/6/62 |
Member | Indefinite term. Trustee since 2007. | Former Vice President (1990–2006), American Beacon Advisors, Inc., and Vice President of certain funds advised by American Beacon Advisors, Inc. | 76 | Independent Director, The Lazard Funds, Inc., Lazard Retirement Series, Inc., Lazard Global Total Return and Income Fund, Inc. and Lazard World Dividend & Income Fund, Inc.; Independent Member of the Boards of Lazard Alternative Strategies Fund, LLC and Lazard Alternative Strategies 1099 Fund. | |||||
| Michael A. Forrester c/o Corporate Secretary 730 Third Avenue New York, NY 10017-3206 DOB: 11/05/67 |
Member | Indefinite term. Trustee since 2007. | Chief Operating Officer, Copper Rock Capital Partners, LLC (since 2007); Chief Operating Officer, DDJ Capital Management (2003–2006). | 76 | Director of Copper Rock Capital Partners, LLC (investment adviser). |
| 22 | 2011 Annual Report § TIAA Separate Account VA-1 |
| Howell E. Jackson c/o Corporate Secretary 730 Third Avenue New York, NY 10017-3206 DOB: 1/4/54 |
Member | Indefinite term. Member since 2005. | James S. Reid, Jr. Professor of Law (since 2004), Acting Dean (2009), Vice Dean for Budget (2003–2006) and on the faculty (since 1989) of Harvard Law School. | 76 | Director, D2D Fund. | |||||
| Nancy L. Jacob c/o Corporate Secretary 730 Third Avenue New York, NY 10017-3206 DOB: 1/15/43 |
Member | Indefinite term. Member since 2001. | President and Founder (since 2006) of NLJ Advisors, Inc. (investment adviser); President and Managing Principal, Windermere Investment Associates (1997–2006). | 76 | None | |||||
| Thomas J. Kenny c/o Corporate Secretary 730 Third Avenue New York, NY 10017-3206 DOB: 3/27/63 |
Member | Indefinite term. Member since 2011. | Partner (2004–2010), Managing Director (2002–2010), Goldman Sachs Asset Management. | 76 | Investment committee member, College of Mount Saint Vincent; Member, United States Olympics Paralympics Advisory Committee, University of California at Santa Barbara Arts and Lectures Advisory Council; Trustee and Treasurer, Crane County Day School. | |||||
| Bridget A. Macaskill c/o Corporate Secretary 730 Third Avenue New York, NY 10017-3206 DOB: 8/5/48 |
Member | Indefinite term. Member since 2003. | Chief Executive Officer (since 2010), President and Chief Operating Officer (since 2009), First Eagle Investment Management; Principal, BAM Consulting LLC (2003–2009); Independent Consultant for Merrill Lynch (2003–2009). | 76 | Director, Arnhold and S. Bleichroeder Holdings; First Eagle Investment Management; American Legacy Foundation (Investment Committee); University of Edinburgh (Campaign Board); and North Shore Land Alliance. |
| TIAA Separate Account VA-1 § 2011 Annual Report | 23 |
| Management committee members and officers (unaudited) | continued |
TIAA Separate Account VA-1 § December 31, 2011
Members—concluded
| Name, Address and Date of Birth (“DOB”) |
Position(s) held with account |
Term of office and length of time served |
Principal occupation(s) during past 5 years |
Number of portfolios in fund complex overseen by trustee |
Other directorship(s) held by trustee | |||||
| James M. Poterba c/o Corporate Secretary 730 Third Avenue New York, NY 10017-3206 DOB: 7/13/58 |
Member | Indefinite term. Member since 2006. | President and Chief Executive Officer, National Bureau of Economic Research (“NBER”) (since 2008); Mitsui Professor of Economics, Massachusetts Institute of Technology (“MIT”) (since 1996), Former Head (2006–2008) and Associate Head (1994–2000 and 2001–2006), Economics Department of MIT; and Former Program Director, NBER (1990–2008). | 76 | Director, The Alfred P. Sloan Foundation and National Bureau of Economic Research; Member, Congressional Budget Office Panel of Economic Advisers. | |||||
| Maceo K. Sloan c/o Corporate Secretary 730 Third Avenue New York, NY 10017-3206 DOB: 10/18/49 |
Chairman of the Management Committee and Member | Indefinite term as Trustee; Chairman for term ending June 30, 2012. Member since 2001. Chairman since 2009. | Chairman, President and Chief Executive Officer, Sloan Financial Group, Inc. (since 1991); Chairman, Chief Executive Officer and Chief Investment Officer, NCM Capital Management Group, Inc. (since 1991); Chairman and Chief Executive Officer and Chief Investment Officer, NCM Capital Advisers Inc. (since 2003); and Chairman, President and Principal Executive Officer, NCM Capital Investment Trust (since 2007). | 76 | Director, SCANA Corporation (energy holding company) and NCM Capital Investment Trust; Member, Duke Children’s Hospital and Health Center National Board of Advisors. |
| 24 | 2011 Annual Report § TIAA Separate Account VA-1 |
| Laura T. Starks c/o Corporate Secretary 730 Third Avenue New York, NY 10017-3206 DOB: 2/17/50 |
Member | Indefinite term. Member since 2006. | Associate Dean for Research (since 2011), McCombs School of Business, University of Texas at Austin (“McCombs”), and Director, AIM Investment Center at McCombs (since 2000). Charles E. and Sarah M. Seay Regents Chair in Finance (since 2002); Professor, University of Texas at Austin (since 1987). Former Chairman, Department of Finance, University of Texas at Austin (2002–2011). | 76 | Member of the Governing Council, Independent Directors Council (an association for mutual fund directors), and Investment Advisory Committee, Employees Retirement System of Texas. |
| TIAA Separate Account VA-1 § 2011 Annual Report | 25 |
| Management committee members and officers (unaudited) | continued |
TIAA Separate Account VA-1 § December 31, 2011
Officers
| Name, Address and Date of Birth (“DOB”) |
Position(s) held with account |
Term of office and length of time served |
Principal occupation(s) during past 5 years | |||
| Brandon Becker TIAA-CREF 730 Third Avenue New York, NY 10017-3206 DOB: 3/19/54 |
Executive Vice President and Chief Legal Officer | One year term. Executive Vice President and Chief Legal Officer since 2009. | Executive Vice President and Chief Legal Officer of Teachers Insurance and Annuity Association of America (“TIAA”), and College Retirement Equities Fund (“CREF”), TIAA Separate Account VA-1, TIAA-CREF Funds, and TIAA-CREF Life Funds (collectively, the “TIAA-CREF Fund Complex”) (since 2009). Former Partner, Wilmer Cutler Pickering Hale & Dorr LLP (1996–2009). | |||
| Richard S. Biegen TIAA-CREF 730 Third Avenue New York, NY 10017-3206 DOB: 5/8/62 |
Chief Compliance Officer | One-year term. Chief Compliance Officer since 2008. |
Chief Compliance Officer of the TIAA-CREF Fund Complex and TIAA Separate Accounts VA-1 and VA-3 (since 2008). Vice President, Senior Compliance Officer (2008–2011) and Managing Director, Senior Compliance Officer (since 2011) of Asset Management Compliance of TIAA. Chief Compliance Officer of TIAA-CREF Investment Management, LLC (“Investment Management”) (since 2008). Former Chief Compliance Officer (2008), Vice President, Senior Compliance Officer (2008–2011) and Managing Director, Senior Compliance Officer (since 2011) of Teachers Advisors, Inc. (“Advisors”). Former Managing Director/Director of Global Compliance, AIG Investments (2000–2008). | |||
| Scott C. Evans TIAA-CREF 730 Third Avenue New York, NY 10017-3206 DOB: 5/11/59 |
Executive Vice President | One-year term. Executive Vice President since 1997. | President and Principal Executive Officer of the TIAA-CREF Funds and TIAA-CREF Life Funds (since 2007); and Executive Vice President of CREF and TIAA Separate Account VA-1 (since 1997). Executive Vice President, President of Asset Management (since 2011); Former Executive Vice President, Asset Management (2010–2011), Executive Vice President, Investments, Research Institute & Strategy (2009–2010), Executive Vice President, Head of Asset Management (2006–2009), and Executive Vice President and Chief Investment Officer (2004–2006) of TIAA. Former CIO of TIAA-CREF Fund Complex (2004–2006). Director of Advisors (since 2004). President and Chief Executive Officer of Investment Management and Advisors and Manager of Investment Management (since 2004). Director of TIAA-CREF Asset Management (“TCAM”) (since 10/2011) (Note: TCAM was formerly known as TIAA-CREF Enterprises, Inc. (“Enterprises”) until change of name 9/2011). Former Manager of TIAA Realty Capital Management, LLC (2004–2006). Former Director of TIAA-CREF Life Insurance Company (“T-C Life”) (1997–2006). Former Director of Teachers Personal Investors Services, Inc. (“TPIS”) (2006–2008). |
| 26 | 2011 Annual Report § TIAA Separate Account VA-1 |
| Roger W. Ferguson, Jr. TIAA-CREF 730 Third Avenue New York, NY 10017-3206 DOB: 10/28/51 |
President and Chief Executive Officer | One-year term. President and Chief Executive Officer since 2008. | President and Chief Executive Officer of TIAA, CREF and TIAA Separate Account VA-1 (since 2008). Director of Covariance Capital Management, Inc. (“Covariance”) (since 2010). Former Chairman, Head of Financial Services and Member of the Executive Committee, Swiss Re America Holding Corporation (2006–2008); Vice Chairman and Member of the Board of Governors of the United States Federal Reserve System (1997–2006). | |||
| Eugene Flood, Jr. TIAA-CREF 730 Third Avenue 10017-3206 DOB: 10/31/55 |
Executive Vice President | One-year term. Executive Vice President since 2011. | Executive Vice President, President of Diversified Financial Services of TIAA and Executive Vice President of the TIAA-CREF Fund Complex (since 2011). President, Chief Executive Officer, Manager and Chairman of TIAA-CREF Redwood, LLC (“Redwood”) (since 2011). Director and Chairman of Covariance (since 2011). Manager and Chairman of Kaspick & Company LLC (since 2011). Director and Chairman of T-C Life (since 2011). Former President and Chief Executive Officer (2000–2010) and Director (1994–2010), Smith Breeden Associates, Inc., an investment adviser. Former Trustee of the TIAA-CREF Fund Complex (2005–2011). Dean’s Advisory Committee, Massachusetts Institute of Technology’s Sloan School of Management (since 2000). | |||
| Phillip G. Goff TIAA-CREF 730 Third Avenue New York, NY 10017-3206 DOB: 11/22/63 |
Chief Financial Officer, Principal Accounting Officer and Treasurer since 2009 | One-year term. Chief Financial Officer, Principal Accounting Officer and Treasurer since 2009. |
Treasurer of CREF (since 2008); Principal Financial Officer, Principal Accounting Officer and Treasurer of the TIAA-CREF Funds and TIAA-CREF Life Funds (since 2007) and Chief Financial Officer and Principal Accounting Officer (since 2009) and Treasurer (since 2008) of TIAA Separate Account VA-1. Director of Advisors (since 2008). Director of TCAM (since 2011). Senior Vice President (since 2010) and Funds Treasurer (since 2007) of Advisors and Investment Management. Former Chief Financial Officer, Van Kampen Funds (2005–2006). | |||
| Stephen Gruppo TIAA-CREF 730 Third Avenue New York, NY 10017-3206 DOB: 9/25/59 |
Executive Vice President | One-year term. Executive Vice President since 2009. | Executive Vice President, Head of Risk Management of TIAA and Executive Vice President of the TIAA-CREF Fund Complex (since 2009). Executive Vice President, Risk Management (since 2009), Senior Managing Director of Advisors and Investment Management (2006–2009) and Head of Credit Risk Management of Advisors and Investment Management (2005–2006) of Advisors and Investment Management. Former Senior Managing Director, Acting Head of Risk Management of TIAA and Senior Managing Director of the TIAA-CREF Fund Complex (2008–2009). Former Senior Managing Director, Chief Credit Risk Officer (2004–2008) of TIAA. Former Director of T-C Life (2006–2008). Former Director of TPIS, Advisors and Investment Management (2008). | |||
| William Mostyn III TIAA-CREF 730 Third Avenue New York, NY 10017-3206 DOB: 1/1/48 |
Senior Vice President and Corporate Secretary | One-year term. Senior Vice President since 2010 and Corporate Secretary since 2008. | Senior Vice President (since 2010), Vice President (2008–2010) and Corporate Secretary (since 2008) of TIAA and the TIAA-CREF Fund Complex. Former Deputy General Counsel and Corporate Secretary, Bank of America (2005–2008). |
| TIAA Separate Account VA-1 § 2011 Annual Report | 27 |
| Management committee members and officers (unaudited) | concluded |
TIAA Separate Account VA-1 § December 31, 2011
Officers—concluded
| Name, Address and Date of Birth (“DOB”) |
Position(s) held with account |
Term of office and length of time served |
Principal occupation(s) during past 5 years | |||
| Dermot J. O’Brien TIAA-CREF 730 Third Avenue New York, NY 10017-3206 DOB: 3/13/66 |
Executive Vice President | One-year term. Executive Vice President since 2003. | Executive Vice President, Human Resources (since 2010, 2005–2007) and Former Executive Vice President of Human Resources and Corporate Services (2007–2010) of TIAA, and Executive Vice President of the TIAA-CREF Fund Complex (since 2003). Director, T-C Life (2003–2006). | |||
| Edward D. Van Dolsen TIAA-CREF 730 Third Avenue New York, NY 10017-3206 DOB: 4/21/58 |
Executive Vice President | One-year term. Executive Vice President since 2006. | Executive Vice President, President of Retirement and Individual Services (since 2011) of TIAA, and Executive Vice President (since 2008) of the TIAA-CREF Fund Complex. Former Chief Operating Officer (2010–2011), Executive Vice President, Product Development and Management (2009–2010), Executive Vice President, Institutional Client Services (2006–2009), Executive Vice President, Product Management (2005–2006), and Senior Vice President, Pension Products (2003–2005) of TIAA. Director of Covariance (since 2010). Director of TCT Holdings, Inc. (since 2007). Former Director (2007–2011) and Former Executive Vice President (2008–2010) of TCAM. Manager (since 2006), Former President and CEO (2006–2010) of Redwood. Former Director of Tuition Financing (2008–2009) and Former Executive Vice President of T-C Life (2009–2010). | |||
| Constance K. Weaver TIAA-CREF 730 Third Avenue New York, NY 10017-3206 DOB: 9/26/52 |
Executive Vice President | One-year term. Executive Vice President since 2010. |
Executive Vice President, Chief Marketing Officer of TIAA and Executive Vice President of the TIAA-CREF Fund Complex (since 2010); Former Chief Communications Officer of TIAA (2010–2011). Former Senior Vice President, The Hartford Financial Services Group, Inc. (2008–2010). Former Executive Vice President and Chief Marketing Officer, BearingPoint (2005–2008). |
Please note that the Account’s Statement of Additional Information (SAI) includes additional information about the Account’s members and is available, without charge, through our website, tiaa-cref.org, or by telephone at 800 223-1200.
| 28 | 2011 Annual Report § TIAA Separate Account VA-1 |
[This page intentionally left blank.]
[This page intentionally left blank.]
[This page intentionally left blank.]
[This page intentionally left blank.]
©2012 Teachers Insurance and Annuity Association—College Retirement Equities Fund (TIAA-CREF), 730 Third Avenue, New York, NY 10017-3206.

Item 2. Code of Ethics.
2(a) The Management Committee of TIAA Separate Account VA-1 (the “Registrant”) has adopted a code of ethics for senior financial officers, including the Registrant’s principal executive officer, principal financial officer, principal accounting officer, or controller, and persons performing similar functions, in conformity with rules promulgated under the Sarbanes-Oxley Act of 2002.
2(b) No response required.
2(c) During the reporting period, there were no amendments to the code of ethics.
2(d) During the reporting period, there were no implicit or explicit waivers granted by the Registrant from any provision of the code of ethics.
2(e) Not applicable.
2(f) A copy of the current code of ethics is filed as an exhibit to this Form N-CSR.
Item 3. Audit Committee Financial Expert.
3(a)(1) The Registrant’s Management Committee has determined that the Registrant has at least one audit committee financial expert serving on its Audit Committee.
3(a)(2) Nancy A. Eckl is the Registrant’s audit committee financial expert for the reporting period and is “independent” for purposes of Item 3 of Form N-CSR.
Item 4. Principal Accountant Fees and Services.
PricewaterhouseCoopers LLP (“PwC”) performs independent audits of the Registrant’s financial statements. To maintain auditor independence and avoid the appearance of conflicts of interest, the Registrant, as a policy, does not engage PwC for management advisory or consulting services.
4(a) Audit Fees.
For the fiscal years ended December 31, 2011 and December 31, 2010, PwC’s aggregate fees for the audit of the Registrant’s annual financial statements were $113,000 and $122,800, respectively.
4(b) Audit Related Fees.
For the fiscal years ended December 31, 2011 and December 31, 2010, PwC’s aggregate fees for services related to the performance of the audit of the Registrant’s annual financial statements were $0 and $0, respectively.
For the fiscal years ended December 31, 2011 and December 31, 2010, the Audit-Related Fees billed by PwC to Teachers Advisors, Inc. (“Advisors”) or to any entity controlling, controlled by or under common control with Advisors that provides ongoing services to the Registrant (collectively, “Fund Service Providers”) were $0 and $0, respectively.
4(c) Tax Fees.
For the fiscal years ended December 31, 2011 and December 31, 2010, PwC’s aggregate fees for tax services billed to the Registrant were $0 and $0, respectively.
For the fiscal years ended December 31, 2011 and December 31, 2010, PwC’s aggregate fees for tax services billed to the Fund Service Providers were $0 and $0, respectively.
4(d) All Other Fees.
For the fiscal years ended December 31, 2011 and December 31, 2010, PwC’s aggregate fees for all other services billed to the Registrant were $8,400 and $0, respectively.
For the fiscal years ended December 31, 2011 and December 31, 2010, PwC’s aggregate fees for all other services billed to the Fund Service Providers were $0 and $0, respectively.
4(e)(1) Preapproval Policy.
The Registrant’s audit committee (“Audit Committee”) has adopted a Preapproval Policy for External Audit Firm Services (the “Policy”). The Policy describes the types of services that may be provided by the independent auditor to the Registrant and certain of its affiliates without impairing the auditor’s independence. Under the Policy, the Audit
Committee is required to preapprove all services to be performed by the Registrant’s independent auditor in order to ensure that such services do not impair the auditor’s independence.
The Policy requires the Audit Committee to: (i) appoint the independent auditor to perform the financial statements audit for the Registrant and certain of its affiliates, including approving the terms of the engagement, and (ii) preapprove the audit, audit-related, tax and other services to be provided by the independent auditor to the Registrant and certain of its affiliates and the fees to be charged for provision of such services from year to year.
4(e)(2) Services provided pursuant to paragraph (c)(7)(i)(C) of Rule 2-01 of Regulation S-X (the “de minimis exception”):
Audit-Related Fees:
There were no amounts that were approved by the Audit Committee pursuant to the de minimis exception for the fiscal years ended December 31, 2011 and December 31, 2010 on behalf of the Registrant.
There were no amounts that were approved by the Audit Committee pursuant to the de minimis exception for the fiscal years ended December 31, 2011 and December 31, 2010 on behalf of the Fund Service Providers that relate directly to the operations and financial reporting of the Registrant.
Tax Fees:
There were no amounts that were approved by the Audit Committee pursuant to the de minimis exception for the fiscal years ended December 31, 2011 and December 31, 2010 on behalf of the Registrant.
There were no amounts that were approved by the Audit Committee pursuant to the de minimis exception for the fiscal years ended December 31, 2011 and December 31, 2010 on behalf of the Fund Service Providers that relate directly to the operations and financial reporting of the Registrant.
All Other Fees:
There were no amounts that were approved by the Audit Committee pursuant to the de minimis exception for the fiscal years ended December 31, 2011 and December 31, 2010 on behalf of the Registrant.
There were no amounts that were approved by the Audit Committee pursuant to the de minimis exception for the fiscal years ended December 31, 2011and December 31, 2010 on behalf of the Fund Service Providers that relate directly to the operations and financial reporting of the Registrant.
4(f) The percentage of hours expended by PwC’s engagement to audit the Registrant’s financial statements for the most recent fiscal year attributable to work performed by persons other than PwC’s full-time, permanent employees was less than 50%.
4(g) Non-Audit Fees for Related Entities.
For the fiscal years ended December 31, 2011 and December 31, 2010, aggregate non-audit fees billed to the Registrant and to its Fund Service Providers by PwC were $256,730 and $245,730, respectively.
4(h) The Registrant’s Audit Committee has considered whether the non-audit services that were rendered by PwC to the Registrant’s Fund Service Providers that were not pre-approved pursuant to paragraph (c)(7)(ii) of Rule 2-01 of Regulation S-X are compatible with maintaining PwC’s independence.
Item 5. Audit Committee of Listed Registrants.
Not Applicable.
Item 6. Schedule of Investments.
TIAA SEPARATE ACCOUNT VA-1 - Stock Index Account
TIAA SEPARATE ACCOUNT VA-1
STOCK INDEX ACCOUNT
SCHEDULE OF INVESTMENTS
December 31, 2011
|
SHARES |
COMPANY |
VALUE (000) |
||||||
| COMMON STOCKS - 99.9% |
||||||||
| AUTOMOBILES & COMPONENTS - 0.9% |
||||||||
| 1,434 |
* | American Axle & Manufacturing Holdings, Inc |
$ | 14 | ||||
| 1,306 |
* | Amerigon, Inc (Class A) |
19 | |||||
| 4,380 |
Autoliv, Inc |
234 | ||||||
| 5,531 |
* | BorgWarner, Inc |
353 | |||||
| 2,813 |
Cooper Tire & Rubber Co |
39 | ||||||
| 6,440 |
* | Dana Holding Corp |
78 | |||||
| 612 |
* | Dorman Products, Inc |
23 | |||||
| 1,013 |
* | Drew Industries, Inc |
25 | |||||
| 3,666 |
* | Exide Technologies |
10 | |||||
| 996 |
* | Federal Mogul Corp (Class A) |
15 | |||||
| 183,583 |
* | Ford Motor Co |
1,976 | |||||
| 735 |
* | Fuel Systems Solutions, Inc |
12 | |||||
| 37,745 |
* | General Motors Co |
765 | |||||
| 6,807 |
Gentex Corp |
201 | ||||||
| 12,196 |
* | Goodyear Tire & Rubber Co |
173 | |||||
| 11,945 |
Harley-Davidson, Inc |
464 | ||||||
| 33,573 |
Johnson Controls, Inc |
1,050 | ||||||
| 5,308 |
Lear Corp |
211 | ||||||
| 2,342 |
* | Modine Manufacturing Co |
22 | |||||
| 598 |
*,e | Motorcar Parts of America, Inc |
4 | |||||
| 1,983 |
Spartan Motors, Inc |
10 | ||||||
| 1,021 |
Standard Motor Products, Inc |
20 | ||||||
| 1,336 |
* | Stoneridge, Inc |
11 | |||||
| 1,205 |
Superior Industries International, Inc |
20 | ||||||
| 3,166 |
* | Tenneco, Inc |
94 | |||||
| 2,598 |
*,e | Tesla Motors, Inc |
74 | |||||
| 1,719 |
Thor Industries, Inc |
47 | ||||||
| 312 |
* | Tower International, Inc |
3 | |||||
| 5,142 |
* | TRW Automotive Holdings Corp |
168 | |||||
| 2,580 |
* | Visteon Corp |
129 | |||||
| 1,507 |
*,e | Winnebago Industries, Inc |
11 | |||||
|
|
|
|||||||
| TOTAL AUTOMOBILES & COMPONENTS |
6,275 | |||||||
|
|
|
|||||||
| BANKS - 3.1% |
||||||||
| 810 |
1st Source Corp |
21 | ||||||
| 1,172 |
* | 1st United Bancorp, Inc |
6 | |||||
| 243 |
Alliance Financial Corp |
7 | ||||||
| 1,244 |
* | Ameris Bancorp |
13 | |||||
| 387 |
Ames National Corp |
8 | ||||||
| 575 |
e | Arrow Financial Corp |
13 | |||||
| 8,748 |
Associated Banc-Corp |
98 | ||||||
| 4,208 |
Astoria Financial Corp |
36 | ||||||
| 520 |
Bancfirst Corp |
20 | ||||||
| 1,517 |
Banco Latinoamericano de Exportaciones S.A. (Class E) |
24 | ||||||
| 182 |
*,m | Bancorp Rhode Island, Inc |
7 | |||||
| 4,426 |
e | Bancorpsouth, Inc |
49 | |||||
| 2,688 |
Bank Mutual Corp |
9 | ||||||
| 2,204 |
Bank of Hawaii Corp |
98 | ||||||
| 291 |
Bank of Kentucky Financial Corp |
6 | ||||||
| 288 |
Bank of Marin Bancorp |
11 | ||||||
| 1,276 |
Bank of the Ozarks, Inc |
38 | ||||||
| 1,044 |
BankFinancial Corp |
6 | ||||||
| 824 |
Banner Corp |
14 | ||||||
| 34,649 |
BB&T Corp |
872 | ||||||
| 3,505 |
* | BBCN Bancorp, Inc |
33 | |||||
| 1,950 |
* | Beneficial Mutual Bancorp, Inc |
16 | |||||
| 853 |
Berkshire Hills Bancorp, Inc |
19 | ||||||
| 384 |
* | BofI Holding, Inc |
6 | |||||
1
TIAA SEPARATE ACCOUNT VA-1 - Stock Index Account
|
SHARES |
COMPANY |
VALUE (000) |
||||||
| 1,051 |
BOK Financial Corp |
$ | 58 | |||||
| 3,543 |
Boston Private Financial Holdings, Inc |
28 | ||||||
| 354 |
Bridge Bancorp, Inc |
7 | ||||||
| 475 |
* | Bridge Capital Holdings |
5 | |||||
| 3,126 |
Brookline Bancorp, Inc |
26 | ||||||
| 397 |
Bryn Mawr Bank Corp |
8 | ||||||
| 460 |
Camden National Corp |
15 | ||||||
| 582 |
* | Cape Bancorp, Inc |
5 | |||||
| 831 |
Capital City Bank Group, Inc |
8 | ||||||
| 17,063 |
CapitalSource, Inc |
114 | ||||||
| 7,090 |
Capitol Federal Financial |
82 | ||||||
| 1,503 |
Cardinal Financial Corp |
16 | ||||||
| 3,968 |
Cathay General Bancorp |
59 | ||||||
| 645 |
Center Bancorp, Inc |
6 | ||||||
| 1,148 |
Centerstate Banks of Florida, Inc |
8 | ||||||
| 764 |
*,e | Central Pacific Financial Corp |
10 | |||||
| 152 |
Century Bancorp, Inc |
4 | ||||||
| 1,616 |
Chemical Financial Corp |
34 | ||||||
| 10,154 |
* | CIT Group, Inc |
354 | |||||
| 533 |
Citizens & Northern Corp |
10 | ||||||
| 923 |
e | City Holding Co |
31 | |||||
| 2,242 |
City National Corp |
99 | ||||||
| 875 |
Clifton Savings Bancorp, Inc |
8 | ||||||
| 498 |
CNB Financial Corp |
8 | ||||||
| 1,740 |
CoBiz, Inc |
10 | ||||||
| 2,091 |
Columbia Banking System, Inc |
40 | ||||||
| 10,048 |
Comerica, Inc |
259 | ||||||
| 3,480 |
Commerce Bancshares, Inc |
133 | ||||||
| 1,740 |
Community Bank System, Inc |
48 | ||||||
| 1,003 |
Community Trust Bancorp, Inc |
30 | ||||||
| 2,461 |
Cullen/Frost Bankers, Inc |
130 | ||||||
| 4,428 |
CVB Financial Corp |
44 | ||||||
| 1,609 |
Dime Community Bancshares |
20 | ||||||
| 860 |
*,e | Eagle Bancorp, Inc |
12 | |||||
| 7,706 |
East West Bancorp, Inc |
152 | ||||||
| 406 |
* | Encore Bancshares, Inc |
5 | |||||
| 301 |
Enterprise Bancorp, Inc |
4 | ||||||
| 828 |
Enterprise Financial Services Corp |
12 | ||||||
| 559 |
ESB Financial Corp |
8 | ||||||
| 1,035 |
ESSA Bancorp, Inc |
11 | ||||||
| 399 |
Federal Agricultural Mortgage Corp (Class C) |
7 | ||||||
| 46,393 |
Fifth Third Bancorp |
590 | ||||||
| 664 |
Financial Institutions, Inc |
11 | ||||||
| 720 |
First Bancorp (NC) |
8 | ||||||
| 498 |
First Bancorp, Inc |
8 | ||||||
| 3,831 |
First Busey Corp |
19 | ||||||
| 285 |
First Citizens Bancshares, Inc (Class A) |
50 | ||||||
| 4,700 |
First Commonwealth Financial Corp |
25 | ||||||
| 680 |
First Community Bancshares, Inc |
8 | ||||||
| 510 |
First Defiance Financial Corp |
7 | ||||||
| 3,063 |
First Financial Bancorp |
51 | ||||||
| 1,650 |
e | First Financial Bankshares, Inc |
55 | |||||
| 590 |
First Financial Corp |
20 | ||||||
| 889 |
First Financial Holdings, Inc |
8 | ||||||
| 13,105 |
First Horizon National Corp |
105 | ||||||
| 654 |
First Interstate Bancsystem, Inc |
9 | ||||||
| 1,238 |
First Merchants Corp |
10 | ||||||
| 3,929 |
First Midwest Bancorp, Inc |
40 | ||||||
| 15,128 |
First Niagara Financial Group, Inc |
131 | ||||||
| 288 |
First of Long Island Corp |
8 | ||||||
| 412 |
First Pactrust Bancorp, Inc |
4 | ||||||
| 3,719 |
* | First Republic Bank |
114 | |||||
| 5,568 |
FirstMerit Corp |
84 | ||||||
| 9,933 |
* | Flagstar Bancorp, Inc |
5 | |||||
| 1,645 |
Flushing Financial Corp |
21 | ||||||
2
TIAA SEPARATE ACCOUNT VA-1 - Stock Index Account
|
SHARES |
COMPANY |
VALUE (000) |
||||||
| 6,390 |
FNB Corp |
$ | 72 | |||||
| 752 |
Fox Chase Bancorp, Inc |
9 | ||||||
| 689 |
* | Franklin Financial Corp |
8 | |||||
| 10,086 |
Fulton Financial Corp |
99 | ||||||
| 602 |
German American Bancorp, Inc |
11 | ||||||
| 3,468 |
Glacier Bancorp, Inc |
42 | ||||||
| 500 |
Great Southern Bancorp, Inc |
12 | ||||||
| 3,706 |
Hancock Holding Co |
118 | ||||||
| 930 |
* | Hanmi Financial Corp |
7 | |||||
| 928 |
Heartland Financial USA, Inc |
14 | ||||||
| 1,007 |
* | Heritage Commerce Corp |
5 | |||||
| 534 |
Heritage Financial Corp |
7 | ||||||
| 1,128 |
Home Bancshares, Inc |
29 | ||||||
| 821 |
Home Federal Bancorp, Inc |
8 | ||||||
| 24,956 |
Hudson City Bancorp, Inc |
156 | ||||||
| 754 |
Hudson Valley Holding Corp |
16 | ||||||
| 43,722 |
Huntington Bancshares, Inc |
240 | ||||||
| 1,370 |
IBERIABANK Corp |
68 | ||||||
| 1,031 |
e | Independent Bank Corp |
28 | |||||
| 2,385 |
International Bancshares Corp |
44 | ||||||
| 2,538 |
* | Investors Bancorp, Inc |
34 | |||||
| 1,441 |
Kearny Financial Corp |
14 | ||||||
| 48,073 |
Keycorp |
370 | ||||||
| 1,076 |
Lakeland Bancorp, Inc |
9 | ||||||
| 734 |
Lakeland Financial Corp |
19 | ||||||
| 6,243 |
M&T Bank Corp |
477 | ||||||
| 731 |
MainSource Financial Group, Inc |
6 | ||||||
| 2,798 |
MB Financial, Inc |
48 | ||||||
| 273 |
Merchants Bancshares, Inc |
8 | ||||||
| 249 |
* | Meridian Interstate Bancorp, Inc |
3 | |||||
| 9,426 |
*,e | MGIC Investment Corp |
35 | |||||
| 265 |
Midsouth Bancorp, Inc |
3 | ||||||
| 357 |
National Bankshares, Inc |
10 | ||||||
| 6,208 |
National Penn Bancshares, Inc |
52 | ||||||
| 1,807 |
NBT Bancorp, Inc |
40 | ||||||
| 22,289 |
New York Community Bancorp, Inc |
276 | ||||||
| 1,192 |
e | Northfield Bancorp, Inc |
17 | |||||
| 4,572 |
Northwest Bancshares, Inc |
57 | ||||||
| 741 |
OceanFirst Financial Corp |
10 | ||||||
| 3,925 |
* | Ocwen Financial Corp |
57 | |||||
| 3,801 |
Old National Bancorp |
44 | ||||||
| 700 |
* | OmniAmerican Bancorp, Inc |
11 | |||||
| 2,272 |
Oriental Financial Group, Inc |
28 | ||||||
| 2,816 |
Oritani Financial Corp |
36 | ||||||
| 345 |
Orrstown Financial Services, Inc |
3 | ||||||
| 220 |
*,e | Pacific Capital Bancorp |
6 | |||||
| 991 |
Pacific Continental Corp |
9 | ||||||
| 1,486 |
PacWest Bancorp |
28 | ||||||
| 688 |
e | Park National Corp |
45 | |||||
| 1,481 |
* | Park Sterling Bank |
6 | |||||
| 221 |
e | Penns Woods Bancorp, Inc |
9 | |||||
| 720 |
* | Pennsylvania Commerce Bancorp, Inc |
6 | |||||
| 595 |
Peoples Bancorp, Inc |
9 | ||||||
| 18,870 |
People’s United Financial, Inc |
242 | ||||||
| 1,766 |
* | Pinnacle Financial Partners, Inc |
29 | |||||
| 26,072 |
PNC Financial Services Group, Inc |
1,504 | ||||||
| 52,615 |
* | Popular, Inc |
73 | |||||
| 3,026 |
PrivateBancorp, Inc |
33 | ||||||
| 2,398 |
Prosperity Bancshares, Inc |
97 | ||||||
| 3,163 |
Provident Financial Services, Inc |
42 | ||||||
| 2,753 |
Provident New York Bancorp |
18 | ||||||
| 5,521 |
e | Radian Group, Inc |
13 | |||||
| 63,145 |
Regions Financial Corp |
272 | ||||||
| 1,026 |
Renasant Corp |
15 | ||||||
| 612 |
Republic Bancorp, Inc (Class A) |
14 | ||||||
3
TIAA SEPARATE ACCOUNT VA-1 - Stock Index Account
|
SHARES |
COMPANY |
VALUE (000) |
||||||
| 1,513 |
Rockville Financial, Inc |
$ | 16 | |||||
| 629 |
e | Roma Financial Corp |
6 | |||||
| 1,211 |
e | S&T Bancorp, Inc |
24 | |||||
| 615 |
e | S.Y. Bancorp, Inc |
13 | |||||
| 1,250 |
Sandy Spring Bancorp, Inc |
22 | ||||||
| 605 |
SCBT Financial Corp |
18 | ||||||
| 3,679 |
* | Seacoast Banking Corp of Florida |
6 | |||||
| 370 |
e | Sierra Bancorp |
3 | |||||
| 2,123 |
* | Signature Bank |
127 | |||||
| 905 |
Simmons First National Corp (Class A) |
25 | ||||||
| 874 |
Southside Bancshares, Inc |
19 | ||||||
| 740 |
* | Southwest Bancorp, Inc |
4 | |||||
| 856 |
State Bancorp, Inc |
10 | ||||||
| 1,614 |
* | State Bank & Trust Co |
24 | |||||
| 1,347 |
StellarOne Corp |
15 | ||||||
| 1,199 |
Sterling Bancorp |
10 | ||||||
| 1,362 |
* | Sterling Financial Corp |
23 | |||||
| 513 |
Suffolk Bancorp |
6 | ||||||
| 1,927 |
* | Sun Bancorp, Inc |
5 | |||||
| 25,848 |
SunTrust Banks, Inc |
458 | ||||||
| 7,913 |
Susquehanna Bancshares, Inc |
66 | ||||||
| 2,032 |
* | SVB Financial Group |
97 | |||||
| 41,390 |
e | Synovus Financial Corp |
58 | |||||
| 607 |
*,e | Taylor Capital Group, Inc |
6 | |||||
| 8,057 |
TCF Financial Corp |
83 | ||||||
| 700 |
Territorial Bancorp, Inc |
14 | ||||||
| 1,877 |
* | Texas Capital Bancshares, Inc |
57 | |||||
| 4,208 |
* | TFS Financial Corp |
38 | |||||
| 1,165 |
* | The Bancorp, Inc |
8 | |||||
| 429 |
Tompkins Trustco, Inc |
17 | ||||||
| 528 |
Tower Bancorp, Inc |
15 | ||||||
| 1,219 |
e | TowneBank |
15 | |||||
| 726 |
e | Trico Bancshares |
10 | |||||
| 5,202 |
Trustco Bank Corp NY |
29 | ||||||
| 3,370 |
Trustmark Corp |
82 | ||||||
| 1,489 |
UMB Financial Corp |
55 | ||||||
| 5,809 |
Umpqua Holdings Corp |
72 | ||||||
| 814 |
Union Bankshares Corp |
11 | ||||||
| 2,414 |
e | United Bankshares, Inc |
68 | |||||
| 983 |
*,e | United Community Banks, Inc |
7 | |||||
| 1,056 |
United Financial Bancorp, Inc |
17 | ||||||
| 792 |
Univest Corp of Pennsylvania |
12 | ||||||
| 95,123 |
US Bancorp |
2,573 | ||||||
| 9,067 |
e | Valley National Bancorp |
112 | |||||
| 1,734 |
ViewPoint Financial Group |
23 | ||||||
| 1,010 |
* | Virginia Commerce Bancorp |
8 | |||||
| 568 |
* | Walker & Dunlop, Inc |
7 | |||||
| 835 |
Washington Banking Co |
10 | ||||||
| 5,275 |
Washington Federal, Inc |
74 | ||||||
| 881 |
Washington Trust Bancorp, Inc |
21 | ||||||
| 3,466 |
Webster Financial Corp |
71 | ||||||
| 242,938 |
Wells Fargo & Co |
6,695 | ||||||
| 1,213 |
WesBanco, Inc |
24 | ||||||
| 997 |
West Bancorporation, Inc |
10 | ||||||
| 992 |
* | West Coast Bancorp |
15 | |||||
| 1,286 |
Westamerica Bancorporation |
56 | ||||||
| 3,132 |
* | Western Alliance Bancorp |
20 | |||||
| 1,313 |
Westfield Financial, Inc |
10 | ||||||
| 2,922 |
* | Wilshire Bancorp, Inc |
11 | |||||
| 1,580 |
Wintrust Financial Corp |
44 | ||||||
| 320 |
WSFS Financial Corp |
11 | ||||||
| 9,288 |
Zions Bancorporation |
151 | ||||||
|
|
|
|||||||
| TOTAL BANKS |
21,496 | |||||||
|
|
|
|||||||
4
TIAA SEPARATE ACCOUNT VA-1 - Stock Index Account
|
SHARES |
COMPANY |
VALUE (000) |
||||||
| CAPITAL GOODS - 8.3% |
||||||||
| 35,096 |
3M Co |
$ | 2,868 | |||||
| 1,795 |
A.O. Smith Corp |
72 | ||||||
| 3,857 |
*,e | A123 Systems, Inc |
6 | |||||
| 851 |
Aaon, Inc |
17 | ||||||
| 2,061 |
AAR Corp |
39 | ||||||
| 2,045 |
* | Accuride Corp |
14 | |||||
| 1,483 |
Aceto Corp |
10 | ||||||
| 4,155 |
*,e | Active Power, Inc |
3 | |||||
| 2,862 |
Actuant Corp (Class A) |
65 | ||||||
| 2,189 |
Acuity Brands, Inc |
116 | ||||||
| 6,029 |
* | Aecom Technology Corp |
124 | |||||
| 1,981 |
* | Aegion Corp |
30 | |||||
| 873 |
* | Aerovironment, Inc |
27 | |||||
| 4,798 |
* | AGCO Corp |
206 | |||||
| 2,801 |
Aircastle Ltd |
36 | ||||||
| 374 |
Alamo Group, Inc |
10 | ||||||
| 1,443 |
Albany International Corp (Class A) |
33 | ||||||
| 1,638 |
Alliant Techsystems, Inc |
94 | ||||||
| 1,557 |
* | Altra Holdings, Inc |
29 | |||||
| 909 |
* | Ameresco, Inc |
12 | |||||
| 569 |
* | American Railcar Industries, Inc |
14 | |||||
| 373 |
American Science & Engineering, Inc |
25 | ||||||
| 2,155 |
*,e | American Superconductor Corp |
8 | |||||
| 475 |
American Woodmark Corp |
6 | ||||||
| 7,830 |
Ametek, Inc |
330 | ||||||
| 475 |
Ampco-Pittsburgh Corp |
9 | ||||||
| 1,479 |
Apogee Enterprises, Inc |
18 | ||||||
| 2,206 |
Applied Industrial Technologies, Inc |
78 | ||||||
| 420 |
Argan, Inc |
6 | ||||||
| 988 |
* | Armstrong World Industries, Inc |
43 | |||||
| 2,979 |
* | ArvinMeritor, Inc |
16 | |||||
| 1,044 |
* | Astec Industries, Inc |
34 | |||||
| 525 |
* | Astronics Corp |
19 | |||||
| 723 |
AZZ, Inc |
33 | ||||||
| 5,952 |
* | Babcock & Wilcox Co |
144 | |||||
| 779 |
Badger Meter, Inc |
23 | ||||||
| 2,603 |
Barnes Group, Inc |
63 | ||||||
| 4,904 |
* | BE Aerospace, Inc |
190 | |||||
| 2,410 |
* | Beacon Roofing Supply, Inc |
49 | |||||
| 2,388 |
Belden CDT, Inc |
79 | ||||||
| 2,508 |
* | Blount International, Inc |
36 | |||||
| 36,405 |
Boeing Co |
2,670 | ||||||
| 2,584 |
Brady Corp (Class A) |
82 | ||||||
| 2,463 |
Briggs & Stratton Corp |
38 | ||||||
| 4,873 |
*,e | Broadwind Energy, Inc |
3 | |||||
| 2,524 |
*,e | Builders FirstSource, Inc |
5 | |||||
| 531 |
* | CAI International, Inc |
8 | |||||
| 12,740 |
*,e | Capstone Turbine Corp |
15 | |||||
| 3,097 |
Carlisle Cos, Inc |
137 | ||||||
| 344 |
Cascade Corp |
16 | ||||||
| 32,023 |
Caterpillar, Inc |
2,901 | ||||||
| 1,257 |
* | Ceradyne, Inc |
34 | |||||
| 1,341 |
* | Chart Industries, Inc |
72 | |||||
| 4,806 |
Chicago Bridge & Iron Co NV |
182 | ||||||
| 990 |
CIRCOR International, Inc |
35 | ||||||
| 2,552 |
Clarcor, Inc |
128 | ||||||
| 1,332 |
* | CNH Global NV |
48 | |||||
| 428 |
* | Coleman Cable, Inc |
4 | |||||
| 1,273 |
*,e | Colfax Corp |
36 | |||||
| 1,162 |
* | Columbus McKinnon Corp |
15 | |||||
| 2,009 |
Comfort Systems USA, Inc |
22 | ||||||
| 1,268 |
* | Commercial Vehicle Group, Inc |
11 | |||||
| 8,024 |
Cooper Industries plc |
435 | ||||||
| 2,466 |
Crane Co |
115 | ||||||
5
TIAA SEPARATE ACCOUNT VA-1 - Stock Index Account
|
SHARES |
COMPANY |
VALUE (000) |
||||||
| 828 |
Cubic Corp |
$ | 36 | |||||
| 9,746 |
Cummins, Inc |
858 | ||||||
| 2,088 |
Curtiss-Wright Corp |
74 | ||||||
| 27,252 |
Danaher Corp |
1,282 | ||||||
| 20,788 |
Deere & Co |
1,608 | ||||||
| 1,344 |
* | DigitalGlobe, Inc |
23 | |||||
| 3,834 |
Donaldson Co, Inc |
261 | ||||||
| 932 |
Douglas Dynamics, Inc |
14 | ||||||
| 9,123 |
Dover Corp |
530 | ||||||
| 636 |
Ducommun, Inc |
8 | ||||||
| 430 |
* | DXP Enterprises, Inc |
14 | |||||
| 1,870 |
* | Dycom Industries, Inc |
39 | |||||
| 757 |
Dynamic Materials Corp |
15 | ||||||
| 16,718 |
Eaton Corp |
728 | ||||||
| 3,412 |
EMCOR Group, Inc |
91 | ||||||
| 37,032 |
Emerson Electric Co |
1,725 | ||||||
| 840 |
Encore Wire Corp |
22 | ||||||
| 1,511 |
*,e | Energy Recovery, Inc |
4 | |||||
| 2,547 |
* | EnerSys |
66 | |||||
| 908 |
* | EnPro Industries, Inc |
30 | |||||
| 1,380 |
ESCO Technologies, Inc |
40 | ||||||
| 886 |
* | Essex Rental Corp |
3 | |||||
| 1,554 |
* | Esterline Technologies Corp |
87 | |||||
| 9,299 |
* | Exelis, Inc |
84 | |||||
| 13,638 |
Fastenal Co |
595 | ||||||
| 3,085 |
Federal Signal Corp |
13 | ||||||
| 2,307 |
* | Flow International Corp |
8 | |||||
| 2,819 |
Flowserve Corp |
280 | ||||||
| 8,521 |
Fluor Corp |
428 | ||||||
| 7,798 |
* | Fortune Brands Home & Security, Inc |
133 | |||||
| 898 |
Franklin Electric Co, Inc |
39 | ||||||
| 635 |
* | Freightcar America, Inc |
13 | |||||
| 4,152 |
*,e | FuelCell Energy, Inc |
4 | |||||
| 2,145 |
* | Furmanite Corp |
14 | |||||
| 2,642 |
Gardner Denver, Inc |
204 | ||||||
| 2,370 |
GATX Corp |
103 | ||||||
| 1,806 |
* | GenCorp, Inc |
10 | |||||
| 1,246 |
* | Generac Holdings, Inc |
35 | |||||
| 2,638 |
* | General Cable Corp |
66 | |||||
| 16,438 |
General Dynamics Corp |
1,092 | ||||||
| 523,942 |
General Electric Co |
9,384 | ||||||
| 1,077 |
* | GeoEye, Inc |
24 | |||||
| 1,633 |
* | Gibraltar Industries, Inc |
23 | |||||
| 809 |
* | Global Power Equipment Group, Inc |
19 | |||||
| 6,179 |
Goodrich Corp |
764 | ||||||
| 795 |
Gorman-Rupp Co |
22 | ||||||
| 3,066 |
Graco, Inc |
125 | ||||||
| 6,478 |
* | GrafTech International Ltd |
88 | |||||
| 604 |
Graham Corp |
13 | ||||||
| 1,832 |
Granite Construction, Inc |
43 | ||||||
| 3,079 |
Great Lakes Dredge & Dock Corp |
17 | ||||||
| 869 |
* | Greenbrier Cos, Inc |
21 | |||||
| 2,356 |
Griffon Corp |
22 | ||||||
| 1,293 |
* | H&E Equipment Services, Inc |
17 | |||||
| 4,082 |
Harsco Corp |
84 | ||||||
| 2,104 |
e | Heico Corp |
123 | |||||
| 5,110 |
* | Hexcel Corp |
124 | |||||
| 39,099 |
Honeywell International, Inc |
2,125 | ||||||
| 800 |
Houston Wire & Cable Co |
11 | ||||||
| 2,996 |
Hubbell, Inc (Class B) |
200 | ||||||
| 2,459 |
* | Huntington Ingalls |
77 | |||||
| 316 |
* | Hurco Cos, Inc |
7 | |||||
| 4,026 |
IDEX Corp |
149 | ||||||
| 2,800 |
* | II-VI, Inc |
51 | |||||
| 22,092 |
Illinois Tool Works, Inc |
1,032 | ||||||
6
TIAA SEPARATE ACCOUNT VA-1 - Stock Index Account
|
SHARES |
COMPANY |
VALUE (000) |
||||||
| 16,314 |
Ingersoll-Rand plc |
$ | 497 | |||||
| 916 |
Insteel Industries, Inc |
10 | ||||||
| 1,758 |
* | Interline Brands, Inc |
27 | |||||
| 4,649 |
ITT Corp |
90 | ||||||
| 6,034 |
* | Jacobs Engineering Group, Inc |
245 | |||||
| 1,665 |
John Bean Technologies Corp |
26 | ||||||
| 5,106 |
Joy Global, Inc |
383 | ||||||
| 888 |
* | Kadant, Inc |
20 | |||||
| 1,371 |
Kaman Corp |
37 | ||||||
| 1,677 |
Kaydon Corp |
51 | ||||||
| 7,682 |
KBR, Inc |
214 | ||||||
| 3,920 |
Kennametal, Inc |
143 | ||||||
| 953 |
* | KEYW Holding Corp |
7 | |||||
| 1,860 |
* | Kratos Defense & Security Solutions, Inc |
11 | |||||
| 5,143 |
L-3 Communications Holdings, Inc |
343 | ||||||
| 300 |
Lawson Products, Inc |
5 | ||||||
| 990 |
* | Layne Christensen Co |
24 | |||||
| 659 |
LB Foster Co (Class A) |
19 | ||||||
| 2,159 |
Lennox International, Inc |
73 | ||||||
| 4,259 |
Lincoln Electric Holdings, Inc |
167 | ||||||
| 700 |
Lindsay Manufacturing Co |
38 | ||||||
| 533 |
* | LMI Aerospace, Inc |
9 | |||||
| 13,046 |
Lockheed Martin Corp |
1,055 | ||||||
| 1,293 |
LSI Industries, Inc |
8 | ||||||
| 853 |
* | Lydall, Inc |
8 | |||||
| 5,104 |
Manitowoc Co, Inc |
47 | ||||||
| 18,960 |
Masco Corp |
199 | ||||||
| 2,813 |
* | Mastec, Inc |
49 | |||||
| 901 |
Met-Pro Corp |
8 | ||||||
| 445 |
* | Michael Baker Corp |
9 | |||||
| 947 |
* | Middleby Corp |
89 | |||||
| 614 |
Miller Industries, Inc |
10 | ||||||
| 2,290 |
* | Moog, Inc (Class A) |
101 | |||||
| 2,247 |
MSC Industrial Direct Co (Class A) |
161 | ||||||
| 1,988 |
Mueller Industries, Inc |
76 | ||||||
| 8,122 |
Mueller Water Products, Inc (Class A) |
20 | ||||||
| 881 |
* | MYR Group, Inc |
17 | |||||
| 271 |
Nacco Industries, Inc (Class A) |
24 | ||||||
| 206 |
e | National Presto Industries, Inc |
19 | |||||
| 3,660 |
* | Navistar International Corp |
139 | |||||
| 926 |
* | NCI Building Systems, Inc |
10 | |||||
| 822 |
* | NN, Inc |
5 | |||||
| 3,046 |
Nordson Corp |
125 | ||||||
| 12,828 |
Northrop Grumman Corp |
750 | ||||||
| 625 |
* | Northwest Pipe Co |
14 | |||||
| 2,339 |
* | Orbital Sciences Corp |
34 | |||||
| 1,499 |
* | Orion Marine Group, Inc |
10 | |||||
| 4,565 |
* | Oshkosh Truck Corp |
98 | |||||
| 5,833 |
* | Owens Corning, Inc |
168 | |||||
| 18,461 |
Paccar, Inc |
692 | ||||||
| 5,872 |
Pall Corp |
336 | ||||||
| 7,455 |
Parker Hannifin Corp |
568 | ||||||
| 4,970 |
Pentair, Inc |
165 | ||||||
| 1,399 |
* | Perini Corp |
17 | |||||
| 1,025 |
* | Pike Electric Corp |
7 | |||||
| 762 |
*,e | PMFG, Inc |
15 | |||||
| 1,969 |
* | Polypore International, Inc |
87 | |||||
| 458 |
* | Powell Industries, Inc |
14 | |||||
| 940 |
* | PowerSecure International, Inc |
5 | |||||
| 7,110 |
Precision Castparts Corp |
1,172 | ||||||
| 96 |
Preformed Line Products Co |
6 | ||||||
| 1,320 |
Primoris Services Corp |
20 | ||||||
| 1,987 |
Quanex Building Products Corp |
30 | ||||||
| 10,886 |
* | Quanta Services, Inc |
235 | |||||
| 1,083 |
Raven Industries, Inc |
67 | ||||||
7
TIAA SEPARATE ACCOUNT VA-1 - Stock Index Account
|
SHARES |
COMPANY |
VALUE (000) |
||||||
| 17,651 |
Raytheon Co |
$ | 854 | |||||
| 1,025 |
* | RBC Bearings, Inc |
43 | |||||
| 1,983 |
Regal-Beloit Corp |
101 | ||||||
| 2,000 |
Robbins & Myers, Inc |
97 | ||||||
| 7,092 |
Rockwell Automation, Inc |
520 | ||||||
| 7,492 |
Rockwell Collins, Inc |
415 | ||||||
| 4,700 |
Roper Industries, Inc |
408 | ||||||
| 3,415 |
*,e | RSC Holdings, Inc |
63 | |||||
| 1,703 |
* | Rush Enterprises, Inc (Class A) |
36 | |||||
| 2,893 |
*,e | SatCon Technology Corp |
2 | |||||
| 294 |
* | Sauer-Danfoss, Inc |
11 | |||||
| 16 |
* | Seaboard Corp |
33 | |||||
| 576 |
SeaCube Container Leasing Ltd |
9 | ||||||
| 3,695 |
* | Shaw Group, Inc |
99 | |||||
| 1,742 |
Simpson Manufacturing Co, Inc |
59 | ||||||
| 2,942 |
Snap-On, Inc |
149 | ||||||
| 5,621 |
* | Spirit Aerosystems Holdings, Inc (Class A) |
117 | |||||
| 2,579 |
SPX Corp |
155 | ||||||
| 800 |
Standex International Corp |
27 | ||||||
| 8,490 |
Stanley Works |
574 | ||||||
| 701 |
* | Sterling Construction Co, Inc |
8 | |||||
| 1,027 |
Sun Hydraulics Corp |
24 | ||||||
| 1,019 |
TAL International Group, Inc |
29 | ||||||
| 3,948 |
* | Taser International, Inc |
20 | |||||
| 1,000 |
* | Tecumseh Products Co (Class A) |
5 | |||||
| 1,872 |
* | Teledyne Technologies, Inc |
103 | |||||
| 1,004 |
Tennant Co |
39 | ||||||
| 4,464 |
* | Terex Corp |
60 | |||||
| 590 |
e | Textainer Group Holdings Ltd |
17 | |||||
| 13,969 |
Textron, Inc |
258 | ||||||
| 513 |
* | Thermon Group Holdings |
9 | |||||
| 2,627 |
* | Thomas & Betts Corp |
143 | |||||
| 4,280 |
Timken Co |
166 | ||||||
| 2,128 |
e | Titan International, Inc |
41 | |||||
| 784 |
* | Titan Machinery, Inc |
17 | |||||
| 1,313 |
Toro Co |
80 | ||||||
| 2,358 |
* | TransDigm Group, Inc |
226 | |||||
| 714 |
* | Trex Co, Inc |
16 | |||||
| 1,303 |
* | Trimas Corp |
23 | |||||
| 4,029 |
Trinity Industries, Inc |
121 | ||||||
| 1,904 |
Triumph Group, Inc |
111 | ||||||
| 562 |
e | Twin Disc, Inc |
20 | |||||
| 23,004 |
Tyco International Ltd |
1,075 | ||||||
| 3,113 |
* | United Rentals, Inc |
92 | |||||
| 45,164 |
United Technologies Corp |
3,301 | ||||||
| 979 |
Universal Forest Products, Inc |
30 | ||||||
| 3,591 |
* | URS Corp |
126 | |||||
| 3,497 |
*,e | USG Corp |
36 | |||||
| 3,104 |
*,e | Valence Technology, Inc |
3 | |||||
| 1,173 |
Valmont Industries, Inc |
106 | ||||||
| 1,023 |
Vicor Corp |
8 | ||||||
| 2,775 |
W.W. Grainger, Inc |
519 | ||||||
| 3,406 |
* | Wabash National Corp |
27 | |||||
| 3,395 |
* | WABCO Holdings, Inc |
147 | |||||
| 1,468 |
Watsco, Inc |
96 | ||||||
| 1,513 |
Watts Water Technologies, Inc (Class A) |
52 | ||||||
| 2,219 |
* | WESCO International, Inc |
118 | |||||
| 2,441 |
Westinghouse Air Brake Technologies Corp |
171 | ||||||
| 3,108 |
Woodward Governor Co |
127 | ||||||
| 418 |
* | Xerium Technologies, Inc |
3 | |||||
| 9,299 |
Xylem, Inc |
239 | ||||||
|
|
|
|||||||
| TOTAL CAPITAL GOODS |
58,002 | |||||||
|
|
|
|||||||
8
TIAA SEPARATE ACCOUNT VA-1 - Stock Index Account
|
SHARES |
COMPANY |
VALUE (000) |
||||||
| COMMERCIAL & PROFESSIONAL SERVICES - 1.0% |
||||||||
| 2,600 |
ABM Industries, Inc |
$ | 54 | |||||
| 2,171 |
* | Acacia Research (Acacia Technologies) |
79 | |||||
| 2,726 |
* | ACCO Brands Corp |
26 | |||||
| 1,159 |
Administaff, Inc |
29 | ||||||
| 637 |
* | Advisory Board Co |
47 | |||||
| 928 |
American Ecology Corp |
17 | ||||||
| 2,166 |
* | American Reprographics Co |
10 | |||||
| 508 |
* | AT Cross Co |
6 | |||||
| 5,401 |
Avery Dennison Corp |
155 | ||||||
| 383 |
Barrett Business Services, Inc |
8 | ||||||
| 2,433 |
Brink’s Co |
65 | ||||||
| 1,375 |
* | Casella Waste Systems, Inc (Class A) |
9 | |||||
| 2,695 |
* | CBIZ, Inc |
16 | |||||
| 669 |
CDI Corp |
9 | ||||||
| 3,345 |
* | Cenveo, Inc |
11 | |||||
| 5,360 |
Cintas Corp |
187 | ||||||
| 2,372 |
* | Clean Harbors, Inc |
151 | |||||
| 493 |
* | Consolidated Graphics, Inc |
24 | |||||
| 2,669 |
* | Copart, Inc |
128 | |||||
| 1,871 |
Corporate Executive Board Co |
71 | ||||||
| 5,493 |
* | Corrections Corp of America |
112 | |||||
| 1,115 |
* | CoStar Group, Inc |
74 | |||||
| 594 |
Courier Corp |
7 | ||||||
| 5,871 |
Covanta Holding Corp |
80 | ||||||
| 717 |
* | CRA International, Inc |
14 | |||||
| 2,529 |
Deluxe Corp |
58 | ||||||
| 1,664 |
* | Dolan Media Co |
14 | |||||
| 2,510 |
Dun & Bradstreet Corp |
188 | ||||||
| 860 |
* | Encore Capital Group, Inc |
18 | |||||
| 4,206 |
* | EnergySolutions, Inc |
13 | |||||
| 1,037 |
*,e | EnerNOC, Inc |
11 | |||||
| 1,357 |
Ennis, Inc |
18 | ||||||
| 6,277 |
Equifax, Inc |
243 | ||||||
| 641 |
* | Exponent, Inc |
29 | |||||
| 691 |
* | Franklin Covey Co |
6 | |||||
| 2,087 |
* | FTI Consulting, Inc |
89 | |||||
| 1,063 |
* | Fuel Tech, Inc |
7 | |||||
| 989 |
G & K Services, Inc (Class A) |
29 | ||||||
| 3,286 |
* | Geo Group, Inc |
55 | |||||
| 645 |
* | GP Strategies Corp |
9 | |||||
| 3,373 |
Healthcare Services Group |
60 | ||||||
| 1,202 |
Heidrick & Struggles International, Inc |
26 | ||||||
| 218 |
* | Heritage-Crystal Clean, Inc |
4 | |||||
| 3,007 |
Herman Miller, Inc |
56 | ||||||
| 1,422 |
* | Hill International, Inc |
7 | |||||
| 2,339 |
HNI Corp |
61 | ||||||
| 1,656 |
* | Hudson Highland Group, Inc |
8 | |||||
| 1,154 |
* | Huron Consulting Group, Inc |
45 | |||||
| 892 |
* | ICF International, Inc |
22 | |||||
| 5,063 |
* | ICO Global Communications Holdings Ltd |
13 | |||||
| 2,500 |
* | IHS, Inc (Class A) |
215 | |||||
| 1,402 |
*,e | Innerworkings, Inc |
13 | |||||
| 2,666 |
Interface, Inc (Class A) |
31 | ||||||
| 462 |
Intersections, Inc |
5 | ||||||
| 9,202 |
Iron Mountain, Inc |
283 | ||||||
| 1,460 |
* | KAR Auction Services, Inc |
20 | |||||
| 1,394 |
Kelly Services, Inc (Class A) |
19 | ||||||
| 1,774 |
* | Kforce, Inc |
22 | |||||
| 1,737 |
Kimball International, Inc (Class B) |
9 | ||||||
| 2,470 |
Knoll, Inc |
37 | ||||||
| 2,433 |
* | Korn/Ferry International |
42 | |||||
| 3,935 |
Manpower, Inc |
141 | ||||||
| 1,316 |
McGrath RentCorp |
38 | ||||||
| 1,459 |
* | Metalico, Inc |
5 | |||||
9
TIAA SEPARATE ACCOUNT VA-1 - Stock Index Account
|
SHARES |
COMPANY |
VALUE (000) |
||||||
| 1,391 |
Mine Safety Appliances Co |
$ | 46 | |||||
| 757 |
* | Mistras Group, Inc |
19 | |||||
| 2,280 |
* | Mobile Mini, Inc |
40 | |||||
| 514 |
Multi-Color Corp |
13 | ||||||
| 2,873 |
* | Navigant Consulting, Inc |
33 | |||||
| 3,800 |
* | Nielsen Holdings NV |
113 | |||||
| 563 |
NL Industries, Inc |
7 | ||||||
| 3,322 |
*,e | Odyssey Marine Exploration, Inc |
9 | |||||
| 1,673 |
* | On Assignment, Inc |
19 | |||||
| 9,189 |
e | Pitney Bowes, Inc |
170 | |||||
| 734 |
* | Portfolio Recovery Associates, Inc |
50 | |||||
| 1,273 |
e | Quad |
18 | |||||
| 9,373 |
e | R.R. Donnelley & Sons Co |
135 | |||||
| 15,900 |
Republic Services, Inc |
438 | ||||||
| 2,774 |
Resources Connection, Inc |
29 | ||||||
| 7,414 |
Robert Half International, Inc |
211 | ||||||
| 3,219 |
Rollins, Inc |
72 | ||||||
| 489 |
* | RPX Corp |
6 | |||||
| 977 |
Schawk, Inc (Class A) |
11 | ||||||
| 913 |
* | School Specialty, Inc |
2 | |||||
| 672 |
* | Standard Parking Corp |
12 | |||||
| 3,734 |
Steelcase, Inc (Class A) |
28 | ||||||
| 4,155 |
* | Stericycle, Inc |
324 | |||||
| 2,192 |
* | SYKES Enterprises, Inc |
34 | |||||
| 1,110 |
* | Team, Inc |
33 | |||||
| 3,264 |
* | Tetra Tech, Inc |
71 | |||||
| 648 |
* | TMS International Corp |
6 | |||||
| 2,896 |
Towers Watson & Co |
174 | ||||||
| 896 |
* | TRC Cos, Inc |
5 | |||||
| 2,350 |
* | TrueBlue, Inc |
33 | |||||
| 664 |
Unifirst Corp |
38 | ||||||
| 2,404 |
United Stationers, Inc |
78 | ||||||
| 5,594 |
* | Verisk Analytics, Inc |
225 | |||||
| 1,084 |
Viad Corp |
19 | ||||||
| 205 |
VSE Corp |
5 | ||||||
| 5,431 |
Waste Connections, Inc |
180 | ||||||
| 23,488 |
Waste Management, Inc |
768 | ||||||
| 668 |
* | WCA Waste Corp |
3 | |||||
|
|
|
|||||||
| TOTAL COMMERCIAL & PROFESSIONAL SERVICES |
6,835 | |||||||
|
|
|
|||||||
| CONSUMER DURABLES & APPAREL - 1.3% |
||||||||
| 1,931 |
American Greetings Corp (Class A) |
24 | ||||||
| 653 |
* | Arctic Cat, Inc |
15 | |||||
| 3,225 |
* | Ascena Retail Group, Inc |
96 | |||||
| 2,994 |
*,e | Beazer Homes USA, Inc |
7 | |||||
| 116 |
Blyth, Inc |
7 | ||||||
| 3,909 |
Brunswick Corp |
71 | ||||||
| 3,430 |
Callaway Golf Co |
19 | ||||||
| 2,483 |
* | Carter’s, Inc |
99 | |||||
| 379 |
* | Cavco Industries, Inc |
15 | |||||
| 442 |
Cherokee, Inc |
5 | ||||||
| 715 |
* | Clarus Corp |
5 | |||||
| 14,409 |
Coach, Inc |
880 | ||||||
| 562 |
e | Columbia Sportswear Co |
26 | |||||
| 4,300 |
* | CROCS, Inc |
63 | |||||
| 269 |
CSS Industries, Inc |
5 | ||||||
| 1,873 |
* | Deckers Outdoor Corp |
142 | |||||
| 351 |
* | Delta Apparel, Inc |
7 | |||||
| 14,140 |
DR Horton, Inc |
178 | ||||||
| 14,610 |
*,e | Eastman Kodak Co |
10 | |||||
| 1,299 |
e | Ethan Allen Interiors, Inc |
31 | |||||
| 2,570 |
* | Fossil, Inc |
204 | |||||
| 2,907 |
* | Furniture Brands International, Inc |
4 | |||||
| 5,437 |
e | Garmin Ltd |
217 | |||||
| 811 |
* | G-III Apparel Group Ltd |
20 | |||||
10
TIAA SEPARATE ACCOUNT VA-1 - Stock Index Account
|
SHARES |
COMPANY |
VALUE (000) |
||||||
| 4,868 |
* | Hanesbrands, Inc |
$ | 106 | ||||
| 3,541 |
Harman International Industries, Inc |
135 | ||||||
| 6,090 |
Hasbro, Inc |
194 | ||||||
| 1,630 |
* | Helen of Troy Ltd |
50 | |||||
| 2,297 |
*,e | Hovnanian Enterprises, Inc (Class A) |
3 | |||||
| 3,571 |
* | Iconix Brand Group, Inc |
58 | |||||
| 1,204 |
*,e | iRobot Corp |
36 | |||||
| 857 |
Jakks Pacific, Inc |
12 | ||||||
| 4,490 |
Jarden Corp |
134 | ||||||
| 232 |
* | Johnson Outdoors, Inc |
4 | |||||
| 4,415 |
Jones Apparel Group, Inc |
47 | ||||||
| 4,044 |
e | KB Home |
27 | |||||
| 500 |
* | Kenneth Cole Productions, Inc (Class A) |
5 | |||||
| 1,430 |
*,e | K-Swiss, Inc (Class A) |
4 | |||||
| 2,552 |
* | La-Z-Boy, Inc |
30 | |||||
| 1,909 |
* | Leapfrog Enterprises, Inc |
11 | |||||
| 7,227 |
Leggett & Platt, Inc |
167 | ||||||
| 7,949 |
e | Lennar Corp (Class A) |
156 | |||||
| 847 |
* | Libbey, Inc |
11 | |||||
| 362 |
Lifetime Brands, Inc |
4 | ||||||
| 3,068 |
*,e | Liz Claiborne, Inc |
26 | |||||
| 862 |
* | M/I Homes, Inc |
8 | |||||
| 1,202 |
* | Maidenform Brands, Inc |
22 | |||||
| 1,066 |
* | Marine Products Corp |
5 | |||||
| 17,016 |
Mattel, Inc |
472 | ||||||
| 1,887 |
e | MDC Holdings, Inc |
33 | |||||
| 1,694 |
* | Meritage Homes Corp |
39 | |||||
| 2,686 |
* | Mohawk Industries, Inc |
161 | |||||
| 817 |
Movado Group, Inc |
15 | ||||||
| 14,687 |
Newell Rubbermaid, Inc |
237 | ||||||
| 17,586 |
Nike, Inc (Class B) |
1,695 | ||||||
| 233 |
* | NVR, Inc |
160 | |||||
| 733 |
Oxford Industries, Inc |
33 | ||||||
| 804 |
* | Perry Ellis International, Inc |
11 | |||||
| 2,991 |
Phillips-Van Heusen Corp |
211 | ||||||
| 3,290 |
Polaris Industries, Inc |
184 | ||||||
| 2,439 |
Pool Corp |
74 | ||||||
| 14,507 |
* | Pulte Homes, Inc |
92 | |||||
| 6,801 |
* | Quiksilver, Inc |
25 | |||||
| 2,959 |
Ralph Lauren Corp |
409 | ||||||
| 444 |
RG Barry Corp |
5 | ||||||
| 2,334 |
e | Ryland Group, Inc |
37 | |||||
| 2,732 |
*,e | Sealy Corp |
5 | |||||
| 1,898 |
* | Skechers U.S.A., Inc (Class A) |
23 | |||||
| 442 |
Skyline Corp |
2 | ||||||
| 2,979 |
* | Smith & Wesson Holding Corp |
13 | |||||
| 5,166 |
*,e | Standard-Pacific Corp |
16 | |||||
| 288 |
* | Steinway Musical Instruments, Inc |
7 | |||||
| 1,788 |
* | Steven Madden Ltd |
62 | |||||
| 957 |
Sturm Ruger & Co, Inc |
32 | ||||||
| 633 |
* | Summer Infant, Inc |
4 | |||||
| 3,418 |
* | Tempur-Pedic International, Inc |
180 | |||||
| 6,926 |
* | Toll Brothers, Inc |
142 | |||||
| 1,435 |
* | True Religion Apparel, Inc |
50 | |||||
| 3,152 |
Tupperware Corp |
176 | ||||||
| 1,864 |
* | Under Armour, Inc (Class A) |
134 | |||||
| 489 |
* | Unifi, Inc |
4 | |||||
| 787 |
* | Universal Electronics, Inc |
13 | |||||
| 1,001 |
*,e | Vera Bradley, Inc |
32 | |||||
| 4,278 |
VF Corp |
543 | ||||||
| 2,341 |
* | Warnaco Group, Inc |
117 | |||||
| 378 |
Weyco Group, Inc |
9 | ||||||
| 3,754 |
Whirlpool Corp |
178 | ||||||
| 2,109 |
Wolverine World Wide, Inc |
75 | ||||||
11
TIAA SEPARATE ACCOUNT VA-1 - Stock Index Account
|
SHARES |
COMPANY |
VALUE (000) |
||||||
| 1,005 |
*,e | Zagg, Inc |
$ | 7 | ||||
|
|
|
|||||||
| TOTAL CONSUMER DURABLES & APPAREL |
9,122 | |||||||
|
|
|
|||||||
| CONSUMER SERVICES - 2.5% |
||||||||
| 1,322 |
* | AFC Enterprises |
19 | |||||
| 1,219 |
Ambassadors Group, Inc |
5 | ||||||
| 960 |
*,e | American Public Education, Inc |
41 | |||||
| 1,644 |
Ameristar Casinos, Inc |
28 | ||||||
| 5,514 |
* | Apollo Group, Inc (Class A) |
297 | |||||
| 641 |
*,e | Archipelago Learning, Inc |
6 | |||||
| 860 |
* | Ascent Media Corp (Series A) |
44 | |||||
| 2,180 |
* | Bally Technologies, Inc |
86 | |||||
| 896 |
* | BJ’s Restaurants, Inc |
41 | |||||
| 1,536 |
Bob Evans Farms, Inc |
52 | ||||||
| 179 |
* | Boyd Gaming Corp |
1 | |||||
| 987 |
* | Bravo Brio Restaurant Group, Inc |
17 | |||||
| 910 |
*,e | Bridgepoint Education, Inc |
21 | |||||
| 4,290 |
Brinker International, Inc |
115 | ||||||
| 937 |
* | Buffalo Wild Wings, Inc |
63 | |||||
| 846 |
* | Cambium Learning Group, Inc |
3 | |||||
| 888 |
* | Capella Education Co |
32 | |||||
| 3,103 |
* | Career Education Corp |
25 | |||||
| 404 |
* | Caribou Coffee Co, Inc |
6 | |||||
| 21,086 |
Carnival Corp |
688 | ||||||
| 620 |
* | Carrols Restaurant Group, Inc |
7 | |||||
| 1,126 |
CBRL Group, Inc |
57 | ||||||
| 1,153 |
CEC Entertainment, Inc |
40 | ||||||
| 2,924 |
* | Cheesecake Factory |
86 | |||||
| 1,535 |
* | Chipotle Mexican Grill, Inc (Class A) |
518 | |||||
| 1,471 |
Choice Hotels International, Inc |
56 | ||||||
| 533 |
Churchill Downs, Inc |
28 | ||||||
| 1,574 |
*,e | Coinstar, Inc |
72 | |||||
| 4,659 |
*,e | Corinthian Colleges, Inc |
10 | |||||
| 6,914 |
Darden Restaurants, Inc |
315 | ||||||
| 6,036 |
* | Denny’s Corp |
23 | |||||
| 3,362 |
DeVry, Inc |
129 | ||||||
| 858 |
* | DineEquity, Inc |
36 | |||||
| 2,637 |
* | Domino’s Pizza, Inc |
90 | |||||
| 1,270 |
*,e | Dunkin Brands Group, Inc |
32 | |||||
| 1,956 |
*,e | Education Management Corp |
55 | |||||
| 289 |
Einstein Noah Restaurant Group, Inc |
5 | ||||||
| 1,754 |
* | Gaylord Entertainment Co |
42 | |||||
| 1,646 |
* | Grand Canyon Education, Inc |
26 | |||||
| 15,463 |
H&R Block, Inc |
252 | ||||||
| 3,288 |
Hillenbrand, Inc |
73 | ||||||
| 2,300 |
* | Hyatt Hotels Corp |
87 | |||||
| 14,926 |
International Game Technology |
257 | ||||||
| 1,433 |
International Speedway Corp (Class A) |
36 | ||||||
| 2,163 |
* | Interval Leisure Group, Inc |
29 | |||||
| 1,142 |
* | Isle of Capri Casinos, Inc |
5 | |||||
| 1,384 |
*,e | ITT Educational Services, Inc |
79 | |||||
| 2,527 |
* | Jack in the Box, Inc |
53 | |||||
| 3,249 |
* | Jamba, Inc |
4 | |||||
| 1,265 |
* | K12, Inc |
23 | |||||
| 2,917 |
* | Krispy Kreme Doughnuts, Inc |
19 | |||||
| 19,471 |
* | Las Vegas Sands Corp |
832 | |||||
| 2,155 |
* | Life Time Fitness, Inc |
101 | |||||
| 870 |
Lincoln Educational Services Corp |
7 | ||||||
| 638 |
Mac-Gray Corp |
9 | ||||||
| 1,242 |
Marcus Corp |
16 | ||||||
| 12,864 |
Marriott International, Inc (Class A) |
375 | ||||||
| 1,390 |
* | Marriott Vacations Worldwide Corp |
24 | |||||
| 1,582 |
Matthews International Corp (Class A) |
50 | ||||||
| 51,238 |
McDonald’s Corp |
5,141 | ||||||
12
TIAA SEPARATE ACCOUNT VA-1 - Stock Index Account
|
SHARES |
COMPANY |
VALUE (000) |
||||||
| 16,324 |
* | MGM Mirage |
$ | 170 | ||||
| 604 |
* | Monarch Casino & Resort, Inc |
6 | |||||
| 1,158 |
* | Morgans Hotel Group Co |
7 | |||||
| 1,276 |
* | Multimedia Games, Inc |
10 | |||||
| 386 |
National American University Holdings, Inc |
3 | ||||||
| 1,279 |
* | O’Charleys, Inc |
7 | |||||
| 4,684 |
* | Orient-Express Hotels Ltd (Class A) |
35 | |||||
| 1,428 |
* | Panera Bread Co (Class A) |
202 | |||||
| 997 |
* | Papa John’s International, Inc |
38 | |||||
| 650 |
*,e | Peet’s Coffee & Tea, Inc |
41 | |||||
| 3,437 |
* | Penn National Gaming, Inc |
131 | |||||
| 1,227 |
PF Chang’s China Bistro, Inc |
38 | ||||||
| 3,407 |
* | Pinnacle Entertainment, Inc |
35 | |||||
| 705 |
*,e | Princeton Review, Inc |
0 | ^ | ||||
| 490 |
* | Red Lion Hotels Corp |
3 | |||||
| 666 |
* | Red Robin Gourmet Burgers, Inc |
18 | |||||
| 2,615 |
Regis Corp |
43 | ||||||
| 6,827 |
Royal Caribbean Cruises Ltd |
169 | ||||||
| 3,070 |
* | Ruby Tuesday, Inc |
21 | |||||
| 1,588 |
* | Ruth’s Chris Steak House, Inc |
8 | |||||
| 2,868 |
* | Scientific Games Corp (Class A) |
28 | |||||
| 12,090 |
Service Corp International |
129 | ||||||
| 2,802 |
* | Shuffle Master, Inc |
33 | |||||
| 2,098 |
Six Flags Entertainment Corp |
87 | ||||||
| 3,411 |
* | Sonic Corp |
23 | |||||
| 3,535 |
Sotheby’s (Class A) |
101 | ||||||
| 819 |
Speedway Motorsports, Inc |
13 | ||||||
| 36,915 |
Starbucks Corp |
1,698 | ||||||
| 9,797 |
Starwood Hotels & Resorts Worldwide, Inc |
470 | ||||||
| 85 |
* | Steak N Shake Co |
31 | |||||
| 636 |
* | Steiner Leisure Ltd |
29 | |||||
| 4,084 |
Stewart Enterprises, Inc (Class A) |
23 | ||||||
| 605 |
e | Strayer Education, Inc |
59 | |||||
| 3,228 |
Texas Roadhouse, Inc (Class A) |
48 | ||||||
| 1,064 |
* | Town Sports International Holdings, Inc |
8 | |||||
| 1,448 |
* | Universal Technical Institute, Inc |
18 | |||||
| 1,845 |
Vail Resorts, Inc |
78 | ||||||
| 1,452 |
e | Weight Watchers International, Inc |
80 | |||||
| 15,922 |
Wendy’s |
85 | ||||||
| 2,997 |
* | WMS Industries, Inc |
62 | |||||
| 8,592 |
Wyndham Worldwide Corp |
325 | ||||||
| 3,957 |
Wynn Resorts Ltd |
437 | ||||||
| 23,052 |
Yum! Brands, Inc |
1,360 | ||||||
|
|
|
|||||||
| TOTAL CONSUMER SERVICES |
16,899 | |||||||
|
|
|
|||||||
| DIVERSIFIED FINANCIALS - 5.5% |
||||||||
| 3,111 |
Advance America Cash Advance Centers, Inc |
28 | ||||||
| 2,630 |
* | Affiliated Managers Group, Inc |
252 | |||||
| 17,707 |
* | American Capital Ltd |
119 | |||||
| 51,899 |
American Express Co |
2,448 | ||||||
| 11,069 |
Ameriprise Financial, Inc |
549 | ||||||
| 9,666 |
Apollo Investment Corp |
62 | ||||||
| 10,143 |
Ares Capital Corp |
157 | ||||||
| 1,707 |
e | Artio Global Investors, Inc |
8 | |||||
| 499,790 |
Bank of America Corp |
2,779 | ||||||
| 61,033 |
Bank of New York Mellon Corp |
1,215 | ||||||
| 3,857 |
BGC Partners, Inc (Class A) |
23 | ||||||
| 2,986 |
BlackRock Kelso Capital Corp |
24 | ||||||
| 4,261 |
BlackRock, Inc |
759 | ||||||
| 3,645 |
*,e | Broadpoint Securities Group, Inc |
6 | |||||
| 1,288 |
Calamos Asset Management, Inc (Class A) |
16 | ||||||
| 22,696 |
Capital One Financial Corp |
960 | ||||||
| 147 |
Capital Southwest Corp |
12 | ||||||
| 1,482 |
Cash America International, Inc |
69 | ||||||
| 2,668 |
CBOE Holdings, Inc |
69 | ||||||
13
TIAA SEPARATE ACCOUNT VA-1 - Stock Index Account
|
SHARES |
COMPANY |
VALUE (000) |
||||||
| 52,189 |
Charles Schwab Corp |
$ | 588 | |||||
| 143,418 |
Citigroup, Inc |
3,773 | ||||||
| 3,332 |
CME Group, Inc |
812 | ||||||
| 1,086 |
e | Cohen & Steers, Inc |
31 | |||||
| 1,682 |
Compass Diversified Trust |
21 | ||||||
| 5,330 |
* | Cowen Group, Inc |
14 | |||||
| 302 |
* | Credit Acceptance Corp |
25 | |||||
| 118 |
Diamond Hill Investment Group, Inc |
9 | ||||||
| 26,865 |
Discover Financial Services |
645 | ||||||
| 2,202 |
* | Dollar Financial Corp |
40 | |||||
| 1,551 |
Duff & Phelps Corp |
22 | ||||||
| 12,665 |
* | E*Trade Financial Corp |
101 | |||||
| 6,232 |
e | Eaton Vance Corp |
147 | |||||
| 737 |
Epoch Holding Corp |
16 | ||||||
| 986 |
Evercore Partners, Inc (Class A) |
26 | ||||||
| 2,322 |
* | Ezcorp, Inc (Class A) |
61 | |||||
| 2,692 |
* | FBR Capital Markets Corp |
6 | |||||
| 4,555 |
e | Federated Investors, Inc (Class B) |
69 | |||||
| 3,389 |
e | Fifth Street Finance Corp |
32 | |||||
| 1,926 |
*,e | Financial Engines, Inc |
43 | |||||
| 1,630 |
* | First Cash Financial Services, Inc |
57 | |||||
| 3,742 |
*,e | First Marblehead Corp |
4 | |||||
| 7,098 |
Franklin Resources, Inc |
682 | ||||||
| 352 |
Friedman Billings Ramsey Group, Inc (Class A) |
8 | ||||||
| 950 |
e | FXCM, Inc |
9 | |||||
| 349 |
GAMCO Investors, Inc (Class A) |
15 | ||||||
| 3,928 |
GFI Group, Inc |
16 | ||||||
| 1,256 |
Gladstone Capital Corp |
10 | ||||||
| 1,326 |
Gladstone Investment Corp |
10 | ||||||
| 25,711 |
Goldman Sachs Group, Inc |
2,325 | ||||||
| 404 |
e | Golub Capital BDC, Inc |
6 | |||||
| 1,122 |
*,e | Green Dot Corp |
35 | |||||
| 1,492 |
e | Greenhill & Co, Inc |
54 | |||||
| 1,395 |
* | Harris & Harris Group, Inc |
5 | |||||
| 2,227 |
Hercules Technology Growth Capital, Inc |
21 | ||||||
| 1,489 |
* | HFF, Inc (Class A) |
15 | |||||
| 891 |
* | Imperial Holdings, Inc |
2 | |||||
| 2,025 |
Interactive Brokers Group, Inc (Class A) |
30 | ||||||
| 3,717 |
* | IntercontinentalExchange, Inc |
448 | |||||
| 675 |
* | International Assets Holding Corp |
16 | |||||
| 1,945 |
* | Internet Capital Group, Inc |
15 | |||||
| 23,335 |
Invesco Ltd |
469 | ||||||
| 2,567 |
* | Investment Technology Group, Inc |
28 | |||||
| 40,000 |
e | iShares Russell 3000 Index Fund |
2,967 | |||||
| 9,425 |
Janus Capital Group, Inc |
59 | ||||||
| 6,156 |
e | Jefferies Group, Inc |
85 | |||||
| 822 |
JMP Group, Inc |
6 | ||||||
| 196,259 |
JPMorgan Chase & Co |
6,526 | ||||||
| 1,881 |
KBW, Inc |
29 | ||||||
| 5,321 |
* | Knight Capital Group, Inc (Class A) |
63 | |||||
| 1,010 |
Kohlberg Capital Corp |
6 | ||||||
| 5,033 |
* | Ladenburg Thalmann Financial Services, Inc |
12 | |||||
| 5,598 |
Lazard Ltd (Class A) |
146 | ||||||
| 7,519 |
Legg Mason, Inc |
181 | ||||||
| 9,840 |
Leucadia National Corp |
224 | ||||||
| 700 |
* | LPL Investment Holdings, Inc |
21 | |||||
| 1,017 |
Main Street Capital Corp |
22 | ||||||
| 1,518 |
MarketAxess Holdings, Inc |
46 | ||||||
| 3,668 |
MCG Capital Corp |
15 | ||||||
| 872 |
Medallion Financial Corp |
10 | ||||||
| 594 |
Medley Capital Corp |
6 | ||||||
| 9,845 |
Moody’s Corp |
331 | ||||||
| 76,013 |
Morgan Stanley |
1,150 | ||||||
| 6,067 |
* | MSCI, Inc (Class A) |
200 | |||||
| 1,507 |
MVC Capital, Inc |
17 | ||||||
14
TIAA SEPARATE ACCOUNT VA-1 - Stock Index Account
|
SHARES |
COMPANY |
VALUE (000) |
||||||
| 5,892 |
* | Nasdaq Stock Market, Inc |
$ | 144 | ||||
| 1,305 |
Nelnet, Inc (Class A) |
32 | ||||||
| 1,400 |
*,e | Netspend Holdings, Inc |
11 | |||||
| 354 |
New Mountain Finance Corp |
5 | ||||||
| 959 |
* | NewStar Financial, Inc |
10 | |||||
| 1,181 |
NGP Capital Resources Co |
8 | ||||||
| 489 |
e | Nicholas Financial, Inc |
6 | |||||
| 10,627 |
Northern Trust Corp |
421 | ||||||
| 13,136 |
NYSE Euronext |
343 | ||||||
| 448 |
Oppenheimer Holdings, Inc |
7 | ||||||
| 2,314 |
PennantPark Investment Corp |
23 | ||||||
| 2,946 |
* | PHH Corp |
31 | |||||
| 1,198 |
* | Pico Holdings, Inc |
25 | |||||
| 935 |
* | Piper Jaffray Cos |
19 | |||||
| 3,632 |
e | Prospect Capital Corp |
34 | |||||
| 5,235 |
Raymond James Financial, Inc |
162 | ||||||
| 1,299 |
* | Safeguard Scientifics, Inc |
21 | |||||
| 870 |
Sanders Morris Harris Group, Inc |
6 | ||||||
| 6,909 |
SEI Investments Co |
120 | ||||||
| 25,584 |
SLM Corp |
343 | ||||||
| 305 |
Solar Capital Ltd |
7 | ||||||
| 375 |
Solar Senior Capital Ltd |
6 | ||||||
| 15,000 |
SPDR Trust Series 1 |
1,883 | ||||||
| 24,748 |
State Street Corp |
998 | ||||||
| 2,739 |
* | Stifel Financial Corp |
88 | |||||
| 1,726 |
SWS Group, Inc |
12 | ||||||
| 12,829 |
T Rowe Price Group, Inc |
731 | ||||||
| 11,051 |
TD Ameritrade Holding Corp |
173 | ||||||
| 456 |
THL Credit, Inc |
6 | ||||||
| 1,245 |
TICC Capital Corp |
11 | ||||||
| 925 |
Triangle Capital Corp |
18 | ||||||
| 354 |
* | Virtus Investment Partners, Inc |
27 | |||||
| 4,362 |
Waddell & Reed Financial, Inc (Class A) |
108 | ||||||
| 1,146 |
Walter Investment Management Corp |
24 | ||||||
| 322 |
Westwood Holdings Group, Inc |
12 | ||||||
| 616 |
* | World Acceptance Corp |
45 | |||||
|
|
|
|||||||
| TOTAL DIVERSIFIED FINANCIALS |
38,358 | |||||||
|
|
|
|||||||
| ENERGY - 11.2% |
||||||||
| 4,200 |
*,e | Abraxas Petroleum Corp |
14 | |||||
| 783 |
Alon USA Energy, Inc |
7 | ||||||
| 10,621 |
* | Alpha Natural Resources, Inc |
217 | |||||
| 885 |
*,e | Amyris Biotechnologies, Inc |
10 | |||||
| 24,513 |
Anadarko Petroleum Corp |
1,871 | ||||||
| 18,972 |
Apache Corp |
1,718 | ||||||
| 460 |
e | APCO Argentina, Inc |
38 | |||||
| 546 |
*,e | Approach Resources, Inc |
16 | |||||
| 10,893 |
Arch Coal, Inc |
158 | ||||||
| 896 |
*,e | ATP Oil & Gas Corp |
7 | |||||
| 2,862 |
* | Atwood Oceanics, Inc |
114 | |||||
| 21,576 |
Baker Hughes, Inc |
1,049 | ||||||
| 1,205 |
* | Basic Energy Services, Inc |
24 | |||||
| 2,676 |
Berry Petroleum Co (Class A) |
112 | ||||||
| 2,422 |
* | Bill Barrett Corp |
83 | |||||
| 4,811 |
*,e | BPZ Energy, Inc |
14 | |||||
| 1,671 |
Bristow Group, Inc |
79 | ||||||
| 5,129 |
Cabot Oil & Gas Corp |
389 | ||||||
| 4,578 |
* | Cal Dive International, Inc |
10 | |||||
| 1,294 |
* | Callon Petroleum Co |
6 | |||||
| 12,062 |
* | Cameron International Corp |
593 | |||||
| 971 |
e | CARBO Ceramics, Inc |
120 | |||||
| 1,963 |
* | Carrizo Oil & Gas, Inc |
52 | |||||
| 3,135 |
* | Cheniere Energy, Inc |
27 | |||||
| 32,556 |
Chesapeake Energy Corp |
726 | ||||||
| 99,334 |
Chevron Corp |
10,569 | ||||||
15
TIAA SEPARATE ACCOUNT VA-1 - Stock Index Account
|
SHARES |
COMPANY |
VALUE (000) |
||||||
| 4,254 |
Cimarex Energy Co |
$ | 263 | |||||
| 326 |
* | Clayton Williams Energy, Inc |
25 | |||||
| 2,252 |
*,e | Clean Energy Fuels Corp |
28 | |||||
| 1,710 |
* | Cloud Peak Energy, Inc |
33 | |||||
| 5,980 |
* | Cobalt International Energy, Inc |
93 | |||||
| 3,986 |
* | Complete Production Services, Inc |
134 | |||||
| 2,095 |
* | Comstock Resources, Inc |
32 | |||||
| 5,242 |
* | Concho Resources, Inc |
491 | |||||
| 65,688 |
ConocoPhillips |
4,787 | ||||||
| 11,445 |
Consol Energy, Inc |
420 | ||||||
| 582 |
* | Contango Oil & Gas Co |
34 | |||||
| 1,662 |
*,e | Continental Resources, Inc |
111 | |||||
| 2,156 |
Core Laboratories NV |
246 | ||||||
| 2,304 |
Crosstex Energy, Inc |
29 | ||||||
| 4,444 |
* | CVR Energy, Inc |
83 | |||||
| 474 |
* | Dawson Geophysical Co |
19 | |||||
| 683 |
Delek US Holdings, Inc |
8 | ||||||
| 20,375 |
* | Denbury Resources, Inc |
308 | |||||
| 20,953 |
Devon Energy Corp |
1,299 | ||||||
| 2,362 |
DHT Maritime, Inc |
2 | ||||||
| 3,453 |
Diamond Offshore Drilling, Inc |
191 | ||||||
| 4,037 |
* | Dresser-Rand Group, Inc |
202 | |||||
| 1,762 |
* | Dril-Quip, Inc |
116 | |||||
| 38,251 |
El Paso Corp |
1,016 | ||||||
| 1,867 |
*,e | Endeavour International Corp |
16 | |||||
| 3,525 |
Energen Corp |
176 | ||||||
| 1,505 |
* | Energy Partners Ltd |
22 | |||||
| 3,786 |
* | Energy XXI Bermuda Ltd |
121 | |||||
| 13,377 |
EOG Resources, Inc |
1,318 | ||||||
| 6,781 |
Equitable Resources, Inc |
372 | ||||||
| 668 |
* | Evolution Petroleum Corp |
5 | |||||
| 7,607 |
EXCO Resources, Inc |
79 | ||||||
| 3,340 |
* | Exterran Holdings, Inc |
30 | |||||
| 244,135 |
Exxon Mobil Corp |
20,693 | ||||||
| 11,824 |
* | FMC Technologies, Inc |
618 | |||||
| 4,741 |
* | Forest Oil Corp |
64 | |||||
| 2,722 |
e | Frontline Ltd |
12 | |||||
| 2,612 |
* | FX Energy, Inc |
13 | |||||
| 2,282 |
* | Gastar Exploration Ltd |
7 | |||||
| 523 |
*,e | Geokinetics, Inc |
1 | |||||
| 1,015 |
* | Georesources, Inc |
30 | |||||
| 277 |
*,e | Gevo, Inc |
2 | |||||
| 933 |
* | Global Geophysical Services, Inc |
6 | |||||
| 1,351 |
*,e | GMX Resources, Inc |
2 | |||||
| 2,142 |
Golar LNG Ltd |
95 | ||||||
| 1,342 |
*,e | Goodrich Petroleum Corp |
18 | |||||
| 827 |
* | Green Plains Renewable Energy, Inc |
8 | |||||
| 727 |
Gulf Island Fabrication, Inc |
21 | ||||||
| 1,244 |
* | Gulfmark Offshore, Inc |
52 | |||||
| 1,969 |
* | Gulfport Energy Corp |
58 | |||||
| 45,016 |
Halliburton Co |
1,554 | ||||||
| 1,747 |
*,e | Harvest Natural Resources, Inc |
13 | |||||
| 5,489 |
* | Helix Energy Solutions Group, Inc |
87 | |||||
| 4,822 |
Helmerich & Payne, Inc |
281 | ||||||
| 5,516 |
* | Hercules Offshore, Inc |
25 | |||||
| 15,186 |
Hess Corp |
863 | ||||||
| 9,634 |
Holly Corp |
225 | ||||||
| 1,230 |
* | Hornbeck Offshore Services, Inc |
38 | |||||
| 928 |
*,e | Houston American Energy Corp |
11 | |||||
| 7,914 |
*,e | Hyperdynamics Corp |
19 | |||||
| 6,522 |
* | ION Geophysical Corp |
40 | |||||
| 61 |
* | Isramco, Inc |
5 | |||||
| 1,514 |
*,e | James River Coal Co |
10 | |||||
| 6,661 |
* | Key Energy Services, Inc |
103 | |||||
| 8,627 |
e | Kinder Morgan, Inc |
278 | |||||
16
TIAA SEPARATE ACCOUNT VA-1 - Stock Index Account
|
SHARES |
COMPANY |
VALUE (000) |
||||||
| 1,036 |
Knightsbridge Tankers Ltd |
$ | 14 | |||||
| 9,022 |
* | Kodiak Oil & Gas Corp |
86 | |||||
| 1,661 |
* | Kosmos Energy LLC |
20 | |||||
| 843 |
* | L&L Energy, Inc |
2 | |||||
| 1,347 |
Lufkin Industries, Inc |
91 | ||||||
| 5,602 |
*,e | Magnum Hunter Resources Corp |
30 | |||||
| 35,215 |
Marathon Oil Corp |
1,031 | ||||||
| 17,542 |
Marathon Petroleum Corp |
584 | ||||||
| 1,545 |
* | Matrix Service Co |
15 | |||||
| 11,755 |
* | McDermott International, Inc |
135 | |||||
| 4,297 |
*,e | McMoRan Exploration Co |
63 | |||||
| 738 |
*,e | Miller Petroleum, Inc |
2 | |||||
| 507 |
* | Mitcham Industries, Inc |
11 | |||||
| 9,694 |
Murphy Oil Corp |
540 | ||||||
| 14,433 |
* | Nabors Industries Ltd |
250 | |||||
| 20,967 |
National Oilwell Varco, Inc |
1,426 | ||||||
| 714 |
* | Natural Gas Services Group, Inc |
10 | |||||
| 6,825 |
* | Newfield Exploration Co |
257 | |||||
| 4,752 |
* | Newpark Resources, Inc |
45 | |||||
| 8,752 |
Noble Energy, Inc |
826 | ||||||
| 2,356 |
e | Nordic American Tanker Shipping |
28 | |||||
| 2,245 |
*,e | Northern Oil And Gas, Inc |
54 | |||||
| 3,020 |
*,e | Oasis Petroleum, Inc |
88 | |||||
| 40,396 |
Occidental Petroleum Corp |
3,785 | ||||||
| 5,485 |
Oceaneering International, Inc |
253 | ||||||
| 2,591 |
* | Oil States International, Inc |
198 | |||||
| 1,191 |
e | Overseas Shipholding Group, Inc |
13 | |||||
| 246 |
* | OYO Geospace Corp |
19 | |||||
| 2,542 |
*,e | Pacific Asia Petroleum, Inc |
3 | |||||
| 447 |
Panhandle Oil and Gas, Inc (Class A) |
15 | ||||||
| 6,555 |
* | Parker Drilling Co |
47 | |||||
| 3,067 |
* | Patriot Coal Corp |
26 | |||||
| 7,817 |
Patterson-UTI Energy, Inc |
156 | ||||||
| 13,732 |
Peabody Energy Corp |
455 | ||||||
| 2,491 |
Penn Virginia Corp |
13 | ||||||
| 1,000 |
* | Petroleum Development Corp |
35 | |||||
| 2,768 |
*,e | Petroquest Energy, Inc |
18 | |||||
| 882 |
* | PHI, Inc |
22 | |||||
| 2,681 |
* | Pioneer Drilling Co |
26 | |||||
| 5,942 |
Pioneer Natural Resources Co |
532 | ||||||
| 7,131 |
* | Plains Exploration & Production Co |
262 | |||||
| 8,936 |
Questar Market Resources, Inc |
262 | ||||||
| 5,994 |
*,e | Quicksilver Resources, Inc |
40 | |||||
| 8,023 |
Range Resources Corp |
497 | ||||||
| 11,466 |
*,e | Rentech, Inc |
15 | |||||
| 2,024 |
*,e | Resolute Energy Corp |
22 | |||||
| 1,826 |
*,e | Rex Energy Corp |
27 | |||||
| 303 |
* | Rex Stores Corp |
7 | |||||
| 298 |
* | RigNet, Inc |
5 | |||||
| 2,800 |
* | Rosetta Resources, Inc |
122 | |||||
| 6,060 |
* | Rowan Cos, Inc |
184 | |||||
| 2,193 |
e | RPC, Inc |
40 | |||||
| 18,950 |
* | SandRidge Energy, Inc |
155 | |||||
| 67,006 |
Schlumberger Ltd |
4,577 | ||||||
| 1,279 |
* | Scorpio Tankers, Inc |
6 | |||||
| 891 |
* | SEACOR Holdings, Inc |
79 | |||||
| 2,320 |
* | SemGroup Corp |
60 | |||||
| 2,365 |
e | Ship Finance International Ltd |
22 | |||||
| 550 |
*,e | Solazyme, Inc |
7 | |||||
| 6,300 |
Southern Union Co |
265 | ||||||
| 17,583 |
* | Southwestern Energy Co |
562 | |||||
| 32,161 |
Spectra Energy Corp |
989 | ||||||
| 3,213 |
St. Mary Land & Exploration Co |
235 | ||||||
| 2,334 |
* | Stone Energy Corp |
62 | |||||
| 5,389 |
Sunoco, Inc |
221 | ||||||
17
TIAA SEPARATE ACCOUNT VA-1 - Stock Index Account
|
SHARES |
COMPANY |
VALUE (000) |
||||||
| 4,018 |
*,e | Superior Energy Services |
$ | 114 | ||||
| 2,133 |
* | Swift Energy Co |
63 | |||||
| 3,388 |
*,e | Syntroleum Corp |
3 | |||||
| 840 |
Targa Resources Investments, Inc |
34 | ||||||
| 2,102 |
Teekay Corp |
56 | ||||||
| 2,124 |
e | Teekay Tankers Ltd (Class A) |
7 | |||||
| 1,600 |
* | Tesco Corp |
20 | |||||
| 7,249 |
* | Tesoro Corp |
169 | |||||
| 3,896 |
* | Tetra Technologies, Inc |
36 | |||||
| 2,548 |
Tidewater, Inc |
126 | ||||||
| 367 |
*,e | Triangle Petroleum Corp |
2 | |||||
| 7,732 |
* | Ultra Petroleum Corp |
229 | |||||
| 500 |
* | Union Drilling, Inc |
3 | |||||
| 2,117 |
* | Unit Corp |
98 | |||||
| 3,239 |
*,e | Uranerz Energy Corp |
6 | |||||
| 2,636 |
*,e | Uranium Energy Corp |
8 | |||||
| 4,901 |
*,e | Uranium Resources, Inc |
4 | |||||
| 5,321 |
* | Ur-Energy, Inc |
5 | |||||
| 5,759 |
*,e | USEC, Inc |
7 | |||||
| 2,578 |
* | Vaalco Energy, Inc |
16 | |||||
| 28,824 |
Valero Energy Corp |
607 | ||||||
| 4,769 |
* | Vantage Drilling Co |
6 | |||||
| 1,482 |
* | Venoco, Inc |
10 | |||||
| 2,249 |
*,e | Voyager Oil & Gas, Inc |
6 | |||||
| 1,693 |
W&T Offshore, Inc |
36 | ||||||
| 3,436 |
* | Warren Resources, Inc |
11 | |||||
| 2,614 |
* | Western Refining, Inc |
35 | |||||
| 510 |
* | Westmoreland Coal Co |
6 | |||||
| 5,933 |
* | Whiting Petroleum Corp |
277 | |||||
| 2,395 |
* | Willbros Group, Inc |
9 | |||||
| 28,869 |
Williams Cos, Inc |
953 | ||||||
| 3,096 |
World Fuel Services Corp |
130 | ||||||
|
|
|
|||||||
| TOTAL ENERGY |
78,423 | |||||||
|
|
|
|||||||
| FOOD & STAPLES RETAILING - 2.1% |
||||||||
| 962 |
Andersons, Inc |
42 | ||||||
| 66 |
Arden Group, Inc (Class A) |
6 | ||||||
| 1,705 |
Casey’s General Stores, Inc |
88 | ||||||
| 21,498 |
Costco Wholesale Corp |
1,791 | ||||||
| 66,873 |
CVS Corp |
2,727 | ||||||
| 1,424 |
* | Fresh Market, Inc |
57 | |||||
| 700 |
Ingles Markets, Inc (Class A) |
11 | ||||||
| 29,482 |
Kroger Co |
714 | ||||||
| 656 |
Nash Finch Co |
19 | ||||||
| 1,214 |
* | Pantry, Inc |
15 | |||||
| 655 |
Pricesmart, Inc |
46 | ||||||
| 29,531 |
* | Rite Aid Corp |
37 | |||||
| 2,157 |
Ruddick Corp |
92 | ||||||
| 17,888 |
Safeway, Inc |
376 | ||||||
| 1,382 |
Spartan Stores, Inc |
26 | ||||||
| 11,240 |
e | Supervalu, Inc |
91 | |||||
| 233 |
* | Susser Holdings Corp |
5 | |||||
| 28,896 |
Sysco Corp |
847 | ||||||
| 2,446 |
* | United Natural Foods, Inc |
98 | |||||
| 424 |
Village Super Market (Class A) |
12 | ||||||
| 45,392 |
Walgreen Co |
1,501 | ||||||
| 87,907 |
Wal-Mart Stores, Inc |
5,253 | ||||||
| 180 |
Weis Markets, Inc |
7 | ||||||
| 7,589 |
Whole Foods Market, Inc |
528 | ||||||
| 2,891 |
* | Winn-Dixie Stores, Inc |
27 | |||||
|
|
|
|||||||
| TOTAL FOOD & STAPLES RETAILING |
14,416 | |||||||
|
|
|
|||||||
| FOOD, BEVERAGE & TOBACCO - 5.5% |
||||||||
| 246 |
Alico, Inc |
5 | ||||||
| 5,454 |
* | Alliance One International, Inc |
15 | |||||
18
TIAA SEPARATE ACCOUNT VA-1 - Stock Index Account
|
SHARES |
COMPANY |
VALUE (000) |
||||||
| 103,678 |
Altria Group, Inc |
$ | 3,074 | |||||
| 32,242 |
Archer Daniels Midland Co |
922 | ||||||
| 1,189 |
B&G Foods, Inc (Class A) |
29 | ||||||
| 7,798 |
Beam, Inc |
399 | ||||||
| 400 |
*,e | Boston Beer Co, Inc (Class A) |
43 | |||||
| 4,967 |
Brown-Forman Corp (Class B) |
400 | ||||||
| 7,283 |
Bunge Ltd |
417 | ||||||
| 555 |
e | Calavo Growers, Inc |
14 | |||||
| 803 |
Cal-Maine Foods, Inc |
29 | ||||||
| 8,910 |
Campbell Soup Co |
296 | ||||||
| 3,635 |
*,e | Central European Distribution Corp |
16 | |||||
| 2,584 |
* | Chiquita Brands International, Inc |
22 | |||||
| 263 |
Coca-Cola Bottling Co Consolidated |
15 | ||||||
| 97,591 |
Coca-Cola Co |
6,828 | ||||||
| 16,433 |
Coca-Cola Enterprises, Inc |
424 | ||||||
| 20,123 |
ConAgra Foods, Inc |
531 | ||||||
| 9,178 |
* | Constellation Brands, Inc (Class A) |
190 | |||||
| 3,860 |
Corn Products International, Inc |
203 | ||||||
| 5,911 |
* | Darling International, Inc |
79 | |||||
| 9,678 |
* | Dean Foods Co |
108 | |||||
| 1,154 |
e | Diamond Foods, Inc |
37 | |||||
| 1,712 |
*,e | Dole Food Co, Inc |
15 | |||||
| 11,190 |
Dr Pepper Snapple Group, Inc |
442 | ||||||
| 616 |
e | Farmer Bros Co |
5 | |||||
| 5,476 |
Flowers Foods, Inc |
104 | ||||||
| 2,084 |
Fresh Del Monte Produce, Inc |
52 | ||||||
| 31,624 |
General Mills, Inc |
1,278 | ||||||
| 6,210 |
*,e | Green Mountain Coffee Roasters, Inc |
279 | |||||
| 149 |
Griffin Land & Nurseries, Inc (Class A) |
4 | ||||||
| 15,785 |
H.J. Heinz Co |
853 | ||||||
| 1,798 |
* | Hain Celestial Group, Inc |
66 | |||||
| 3,538 |
Hansen Natural Corp |
326 | ||||||
| 4,668 |
*,e | Heckmann Corp |
31 | |||||
| 7,424 |
Hershey Co |
459 | ||||||
| 6,945 |
Hormel Foods Corp |
203 | ||||||
| 740 |
e | Imperial Sugar Co |
3 | |||||
| 800 |
J&J Snack Foods Corp |
43 | ||||||
| 5,817 |
J.M. Smucker Co |
455 | ||||||
| 12,157 |
Kellogg Co |
615 | ||||||
| 81,903 |
Kraft Foods, Inc (Class A) |
3,060 | ||||||
| 975 |
Lancaster Colony Corp |
68 | ||||||
| 2,402 |
Lance, Inc |
54 | ||||||
| 443 |
e | Limoneira Co |
7 | |||||
| 6,614 |
Lorillard, Inc |
754 | ||||||
| 6,693 |
McCormick & Co, Inc |
337 | ||||||
| 10,062 |
Mead Johnson Nutrition Co |
692 | ||||||
| 621 |
Mgp Ingredients, Inc |
3 | ||||||
| 6,834 |
Molson Coors Brewing Co (Class B) |
298 | ||||||
| 621 |
National Beverage Corp |
10 | ||||||
| 996 |
* | Omega Protein Corp |
7 | |||||
| 78,051 |
PepsiCo, Inc |
5,179 | ||||||
| 87,849 |
Philip Morris International, Inc |
6,894 | ||||||
| 2,432 |
*,e | Pilgrim’s Pride Corp |
14 | |||||
| 617 |
*,e | Primo Water |
2 | |||||
| 2,656 |
* | Ralcorp Holdings, Inc |
227 | |||||
| 16,551 |
Reynolds American, Inc |
685 | ||||||
| 1,203 |
Sanderson Farms, Inc |
60 | ||||||
| 29,550 |
Sara Lee Corp |
559 | ||||||
| 365 |
* | Seneca Foods Corp |
9 | |||||
| 3,778 |
* | Smart Balance, Inc |
20 | |||||
| 6,686 |
* | Smithfield Foods, Inc |
162 | |||||
| 4,200 |
*,e | Star Scientific, Inc |
9 | |||||
| 889 |
*,e | Synutra International, Inc |
5 | |||||
| 1,187 |
e | Tootsie Roll Industries, Inc |
28 | |||||
| 1,794 |
* | TreeHouse Foods, Inc |
117 | |||||
19
TIAA SEPARATE ACCOUNT VA-1 - Stock Index Account
|
SHARES |
COMPANY |
VALUE (000) |
||||||
| 14,985 |
Tyson Foods, Inc (Class A) |
$ | 309 | |||||
| 1,060 |
Universal Corp |
49 | ||||||
| 2,514 |
e | Vector Group Ltd |
45 | |||||
|
|
|
|||||||
| TOTAL FOOD, BEVERAGE & TOBACCO |
38,992 | |||||||
|
|
|
|||||||
| HEALTH CARE EQUIPMENT & SERVICES - 4.3% |
||||||||
| 1,214 |
* | Abaxis, Inc |
34 | |||||
| 1,811 |
* | Abiomed, Inc |
33 | |||||
| 2,035 |
*,e | Accretive Health, Inc |
47 | |||||
| 3,073 |
* | Accuray, Inc |
13 | |||||
| 18,770 |
Aetna, Inc |
792 | ||||||
| 467 |
* | Air Methods Corp |
39 | |||||
| 3,127 |
* | Align Technology, Inc |
74 | |||||
| 1,316 |
* | Alliance Imaging, Inc |
2 | |||||
| 9,620 |
* | Allscripts Healthcare Solutions, Inc |
182 | |||||
| 380 |
* | Almost Family, Inc |
6 | |||||
| 2,729 |
* | Alphatec Holdings, Inc |
5 | |||||
| 1,533 |
* | Amedisys, Inc |
17 | |||||
| 608 |
* | American Dental Partners, Inc |
11 | |||||
| 2,201 |
* | Amerigroup Corp |
130 | |||||
| 13,773 |
AmerisourceBergen Corp |
512 | ||||||
| 2,008 |
* | AMN Healthcare Services, Inc |
9 | |||||
| 1,528 |
* | Amsurg Corp |
40 | |||||
| 639 |
Analogic Corp |
37 | ||||||
| 1,310 |
* | Angiodynamics, Inc |
19 | |||||
| 3,605 |
*,e | Antares Pharma, Inc |
8 | |||||
| 1,336 |
* | Arthrocare Corp |
42 | |||||
| 1,106 |
Assisted Living Concepts, Inc (A Shares) |
17 | ||||||
| 1,737 |
*,e | athenahealth, Inc |
85 | |||||
| 716 |
* | AtriCure, Inc |
8 | |||||
| 86 |
Atrion Corp |
21 | ||||||
| 4,151 |
Bard (C.R.), Inc |
355 | ||||||
| 28,286 |
Baxter International, Inc |
1,400 | ||||||
| 10,845 |
Becton Dickinson & Co |
810 | ||||||
| 1,446 |
*,e | Biolase Technology, Inc |
4 | |||||
| 1,242 |
*,e | Bio-Reference Labs, Inc |
20 | |||||
| 2,298 |
* | BioScrip, Inc |
13 | |||||
| 74,361 |
* | Boston Scientific Corp |
397 | |||||
| 4,927 |
* | Brookdale Senior Living, Inc |
86 | |||||
| 711 |
Cantel Medical Corp |
20 | ||||||
| 1,396 |
* | Capital Senior Living Corp |
11 | |||||
| 17,180 |
Cardinal Health, Inc |
698 | ||||||
| 1,317 |
* | CardioNet, Inc |
3 | |||||
| 10,828 |
* | CareFusion Corp |
275 | |||||
| 1,830 |
* | Catalyst Health Solutions, Inc |
95 | |||||
| 1,586 |
* | CBaySystems Holdings Ltd |
15 | |||||
| 2,518 |
* | Centene Corp |
100 | |||||
| 6,928 |
* | Cerner Corp |
424 | |||||
| 1,975 |
* | Cerus Corp |
5 | |||||
| 1,072 |
Chemed Corp |
55 | ||||||
| 671 |
* | Chindex International, Inc |
6 | |||||
| 13,313 |
Cigna Corp |
559 | ||||||
| 4,283 |
* | Community Health Systems, Inc |
75 | |||||
| 590 |
Computer Programs & Systems, Inc |
30 | ||||||
| 1,671 |
* | Conceptus, Inc |
21 | |||||
| 1,595 |
* | Conmed Corp |
41 | |||||
| 2,129 |
Cooper Cos, Inc |
150 | ||||||
| 467 |
* | Corvel Corp |
24 | |||||
| 7,375 |
* | Coventry Health Care, Inc |
224 | |||||
| 24,537 |
Covidien plc |
1,104 | ||||||
| 2,234 |
* | Cross Country Healthcare, Inc |
12 | |||||
| 1,413 |
* | CryoLife, Inc |
7 | |||||
| 1,543 |
* | Cyberonics, Inc |
52 | |||||
| 475 |
* | Cynosure, Inc (Class A) |
6 | |||||
| 4,725 |
* | DaVita, Inc |
358 | |||||
20
TIAA SEPARATE ACCOUNT VA-1 - Stock Index Account
|
SHARES |
COMPANY |
VALUE (000) |
||||||
| 1,929 |
*,e | Delcath Systems, Inc |
$ | 6 | ||||
| 7,111 |
Dentsply International, Inc |
249 | ||||||
| 3,382 |
* | DexCom, Inc |
31 | |||||
| 493 |
* | DynaVox, Inc |
2 | |||||
| 5,544 |
* | Edwards Lifesciences Corp |
392 | |||||
| 1,554 |
*,e | Emeritus Corp |
27 | |||||
| 2,539 |
* | Endologix, Inc |
29 | |||||
| 711 |
Ensign Group, Inc |
17 | ||||||
| 327 |
*,e | ePocrates, Inc |
3 | |||||
| 408 |
* | Exactech, Inc |
7 | |||||
| 1,376 |
* | EXamWorks, Inc |
13 | |||||
| 24,334 |
* | Express Scripts, Inc |
1,088 | |||||
| 1,637 |
* | Five Star Quality Care, Inc |
5 | |||||
| 2,421 |
* | Gen-Probe, Inc |
143 | |||||
| 1,497 |
* | Gentiva Health Services, Inc |
10 | |||||
| 1,370 |
* | Greatbatch, Inc |
30 | |||||
| 1,049 |
* | Haemonetics Corp |
64 | |||||
| 1,683 |
* | Hanger Orthopedic Group, Inc |
32 | |||||
| 1,438 |
* | Hansen Medical, Inc |
4 | |||||
| 5,563 |
* | HCA Holdings, Inc |
123 | |||||
| 11,279 |
* | Health Management Associates, Inc (Class A) |
83 | |||||
| 4,553 |
* | Health Net, Inc |
139 | |||||
| 4,886 |
* | Healthsouth Corp |
86 | |||||
| 3,431 |
* | Healthspring, Inc |
187 | |||||
| 797 |
* | HealthStream, Inc |
15 | |||||
| 1,788 |
* | Healthways, Inc |
12 | |||||
| 605 |
*,e | HeartWare International, Inc |
42 | |||||
| 4,577 |
* | Henry Schein, Inc |
295 | |||||
| 3,194 |
Hill-Rom Holdings, Inc |
108 | ||||||
| 4,287 |
* | HMS Holdings Corp |
137 | |||||
| 13,090 |
* | Hologic, Inc |
229 | |||||
| 8,295 |
Humana, Inc |
727 | ||||||
| 632 |
* | ICU Medical, Inc |
28 | |||||
| 2,704 |
* | Idexx Laboratories, Inc |
208 | |||||
| 2,329 |
*,e | Insulet Corp |
44 | |||||
| 1,114 |
* | Integra LifeSciences Holdings Corp |
34 | |||||
| 1,946 |
* | Intuitive Surgical, Inc |
901 | |||||
| 1,548 |
Invacare Corp |
24 | ||||||
| 4,435 |
* | Inverness Medical Innovations, Inc |
102 | |||||
| 904 |
* | IPC The Hospitalist Co, Inc |
41 | |||||
| 1,079 |
* | IRIS International, Inc |
10 | |||||
| 520 |
* | Kensey Nash Corp |
10 | |||||
| 2,539 |
* | Kindred Healthcare, Inc |
30 | |||||
| 4,882 |
* | Laboratory Corp of America Holdings |
420 | |||||
| 498 |
Landauer, Inc |
26 | ||||||
| 735 |
* | LHC Group, Inc |
9 | |||||
| 2,636 |
* | LifePoint Hospitals, Inc |
98 | |||||
| 4,122 |
Lincare Holdings, Inc |
106 | ||||||
| 1,359 |
* | Magellan Health Services, Inc |
67 | |||||
| 1,614 |
*,e | MAKO Surgical Corp |
41 | |||||
| 2,657 |
* | Masimo Corp |
50 | |||||
| 12,388 |
McKesson Corp |
965 | ||||||
| 2,281 |
* | MedAssets, Inc |
21 | |||||
| 19,897 |
* | Medco Health Solutions, Inc |
1,112 | |||||
| 873 |
* | Medical Action Industries, Inc |
5 | |||||
| 975 |
* | Medidata Solutions, Inc |
21 | |||||
| 53,018 |
Medtronic, Inc |
2,028 | ||||||
| 2,504 |
* | Merge Healthcare, Inc |
12 | |||||
| 2,066 |
Meridian Bioscience, Inc |
39 | ||||||
| 1,836 |
* | Merit Medical Systems, Inc |
25 | |||||
| 2,331 |
* | Metropolitan Health Networks, Inc |
17 | |||||
| 1,080 |
* | Molina Healthcare, Inc |
24 | |||||
| 620 |
* | MWI Veterinary Supply, Inc |
41 | |||||
| 516 |
National Healthcare Corp |
22 | ||||||
| 1,662 |
* | Natus Medical, Inc |
16 | |||||
21
TIAA SEPARATE ACCOUNT VA-1 - Stock Index Account
|
SHARES |
COMPANY |
VALUE (000) |
||||||
| 1,314 |
* | Neogen Corp |
$ | 40 | ||||
| 4,406 |
* | Neoprobe Corp |
12 | |||||
| 2,136 |
* | NuVasive, Inc |
27 | |||||
| 2,243 |
* | NxStage Medical, Inc |
40 | |||||
| 5,865 |
Omnicare, Inc |
202 | ||||||
| 1,729 |
* | Omnicell, Inc |
29 | |||||
| 2,901 |
* | OraSure Technologies, Inc |
26 | |||||
| 1,010 |
* | Orthofix International NV |
36 | |||||
| 3,228 |
Owens & Minor, Inc |
90 | ||||||
| 1,140 |
* | Palomar Medical Technologies, Inc |
11 | |||||
| 5,222 |
Patterson Cos, Inc |
154 | ||||||
| 2,180 |
* | Pediatrix Medical Group, Inc |
157 | |||||
| 1,726 |
* | PharMerica Corp |
26 | |||||
| 617 |
* | Providence Service Corp |
9 | |||||
| 2,792 |
* | PSS World Medical, Inc |
68 | |||||
| 1,960 |
e | Quality Systems, Inc |
73 | |||||
| 7,808 |
Quest Diagnostics, Inc |
453 | ||||||
| 1,220 |
*,e | Quidel Corp |
18 | |||||
| 1,541 |
*,e | RadNet, Inc |
3 | |||||
| 7,735 |
* | Resmed, Inc |
196 | |||||
| 804 |
*,e | Rockwell Medical Technologies, Inc |
7 | |||||
| 3,216 |
* | RTI Biologics, Inc |
14 | |||||
| 2,500 |
* | Select Medical Holdings Corp |
21 | |||||
| 2,401 |
* | Sirona Dental Systems, Inc |
106 | |||||
| 973 |
* | Skilled Healthcare Group, Inc (Class A) |
5 | |||||
| 3,016 |
* | Solta Medical, Inc |
9 | |||||
| 766 |
* | SonoSite, Inc |
41 | |||||
| 1,958 |
* | Spectranetics Corp |
14 | |||||
| 16,210 |
St. Jude Medical, Inc |
556 | ||||||
| 1,741 |
* | Staar Surgical Co |
18 | |||||
| 2,299 |
*,e | Stereotaxis, Inc |
2 | |||||
| 2,985 |
STERIS Corp |
89 | ||||||
| 15,528 |
Stryker Corp |
772 | ||||||
| 758 |
* | Sun Healthcare Group, Inc |
3 | |||||
| 2,773 |
* | Sunrise Senior Living, Inc |
18 | |||||
| 900 |
* | SurModics, Inc |
13 | |||||
| 2,964 |
* | SXC Health Solutions Corp |
167 | |||||
| 1,974 |
* | Symmetry Medical, Inc |
16 | |||||
| 1,090 |
* | Synergetics USA, Inc |
8 | |||||
| 768 |
* | Synovis Life Technologies, Inc |
21 | |||||
| 1,351 |
* | Team Health Holdings, Inc |
30 | |||||
| 2,032 |
Teleflex, Inc |
125 | ||||||
| 21,306 |
* | Tenet Healthcare Corp |
109 | |||||
| 2,999 |
* | Thoratec Corp |
101 | |||||
| 520 |
* | Tornier BV |
9 | |||||
| 360 |
* | Transcend Services, Inc |
9 | |||||
| 979 |
* | Triple-S Management Corp (Class B) |
20 | |||||
| 2,569 |
* | Unilife Corp |
8 | |||||
| 53,540 |
UnitedHealth Group, Inc |
2,713 | ||||||
| 1,661 |
* | Universal American Corp |
21 | |||||
| 4,561 |
Universal Health Services, Inc (Class B) |
177 | ||||||
| 1,051 |
*,e | Uroplasty, Inc |
4 | |||||
| 701 |
US Physical Therapy, Inc |
14 | ||||||
| 5,917 |
* | Varian Medical Systems, Inc |
397 | |||||
| 937 |
* | Vascular Solutions, Inc |
10 | |||||
| 4,351 |
* | VCA Antech, Inc |
86 | |||||
| 2,758 |
* | Volcano Corp |
66 | |||||
| 2,154 |
* | WellCare Health Plans, Inc |
113 | |||||
| 17,137 |
WellPoint, Inc |
1,135 | ||||||
| 1,778 |
West Pharmaceutical Services, Inc |
67 | ||||||
| 2,200 |
* | Wright Medical Group, Inc |
36 | |||||
| 233 |
Young Innovations, Inc |
7 | ||||||
| 9,374 |
* | Zimmer Holdings, Inc |
501 | |||||
| 1,200 |
* | Zoll Medical Corp |
76 | |||||
|
|
|
|||||||
| TOTAL HEALTH CARE EQUIPMENT & SERVICES |
29,974 | |||||||
|
|
|
|||||||
22
TIAA SEPARATE ACCOUNT VA-1 - Stock Index Account
|
SHARES |
COMPANY |
VALUE (000) |
||||||
| HOUSEHOLD & PERSONAL PRODUCTS - 2.2% |
||||||||
| 21,664 |
Avon Products, Inc |
$ | 378 | |||||
| 3,024 |
* | Central Garden and Pet Co (Class A) |
25 | |||||
| 6,930 |
Church & Dwight Co, Inc |
317 | ||||||
| 6,594 |
Clorox Co |
439 | ||||||
| 24,099 |
Colgate-Palmolive Co |
2,226 | ||||||
| 1,265 |
* | Elizabeth Arden, Inc |
47 | |||||
| 3,326 |
* | Energizer Holdings, Inc |
258 | |||||
| 5,567 |
Estee Lauder Cos (Class A) |
625 | ||||||
| 867 |
e | Female Health Co |
4 | |||||
| 5,990 |
Herbalife Ltd |
310 | ||||||
| 735 |
Inter Parfums, Inc |
11 | ||||||
| 19,388 |
Kimberly-Clark Corp |
1,426 | ||||||
| 721 |
*,e | Medifast, Inc |
10 | |||||
| 83 |
* | Nature’s Sunshine Products, Inc |
1 | |||||
| 2,584 |
Nu Skin Enterprises, Inc (Class A) |
126 | ||||||
| 602 |
* | Nutraceutical International Corp |
7 | |||||
| 255 |
Oil-Dri Corp of America |
5 | ||||||
| 2,523 |
* | Prestige Brands Holdings, Inc |
28 | |||||
| 138,323 |
Procter & Gamble Co |
9,228 | ||||||
| 575 |
* | Revlon, Inc (Class A) |
9 | |||||
| 630 |
* | Schiff Nutrition International, Inc |
7 | |||||
| 956 |
* | Spectrum Brands, Inc |
26 | |||||
| 312 |
*,e | USANA Health Sciences, Inc |
9 | |||||
| 886 |
WD-40 Co |
36 | ||||||
|
|
|
|||||||
| TOTAL HOUSEHOLD & PERSONAL PRODUCTS |
15,558 | |||||||
|
|
|
|||||||
| INSURANCE - 3.7% |
||||||||
| 16,698 |
ACE Ltd |
1,171 | ||||||
| 23,310 |
Aflac, Inc |
1,008 | ||||||
| 285 |
*,e | Alleghany Corp |
81 | |||||
| 1,944 |
Allied World Assurance Co Holdings Ltd |
122 | ||||||
| 25,606 |
Allstate Corp |
702 | ||||||
| 3,620 |
American Equity Investment Life Holding Co |
38 | ||||||
| 3,950 |
American Financial Group, Inc |
146 | ||||||
| 21,619 |
* | American International Group, Inc |
502 | |||||
| 355 |
American National Insurance Co |
26 | ||||||
| 622 |
* | American Safety Insurance Holdings Ltd |
14 | |||||
| 915 |
* | Amerisafe, Inc |
21 | |||||
| 1,200 |
Amtrust Financial Services, Inc |
29 | ||||||
| 16,387 |
AON Corp |
767 | ||||||
| 6,298 |
* | Arch Capital Group Ltd |
234 | |||||
| 1,611 |
Argo Group International Holdings Ltd |
47 | ||||||
| 5,455 |
Arthur J. Gallagher & Co |
182 | ||||||
| 3,581 |
Aspen Insurance Holdings Ltd |
95 | ||||||
| 4,871 |
Assurant, Inc |
200 | ||||||
| 9,283 |
Assured Guaranty Ltd |
122 | ||||||
| 6,234 |
Axis Capital Holdings Ltd |
199 | ||||||
| 422 |
Baldwin & Lyons, Inc (Class B) |
9 | ||||||
| 86,469 |
* | Berkshire Hathaway, Inc (Class B) |
6,598 | |||||
| 5,834 |
Brown & Brown, Inc |
132 | ||||||
| 14,531 |
Chubb Corp |
1,006 | ||||||
| 7,387 |
Cincinnati Financial Corp |
225 | ||||||
| 2,162 |
* | Citizens, Inc (Class A) |
21 | |||||
| 1,391 |
CNA Financial Corp |
37 | ||||||
| 11,225 |
* | Conseco, Inc |
71 | |||||
| 1,190 |
Crawford & Co (Class B) |
7 | ||||||
| 2,444 |
Delphi Financial Group, Inc (Class A) |
108 | ||||||
| 406 |
Donegal Group, Inc (Class A) |
6 | ||||||
| 1,474 |
* | eHealth, Inc |
22 | |||||
| 168 |
EMC Insurance Group, Inc |
3 | ||||||
| 1,950 |
Employers Holdings, Inc |
35 | ||||||
| 2,054 |
Endurance Specialty Holdings Ltd |
79 | ||||||
| 395 |
* | Enstar Group Ltd |
39 | |||||
| 1,505 |
Erie Indemnity Co (Class A) |
118 | ||||||
| 2,121 |
Everest Re Group Ltd |
178 | ||||||
23
TIAA SEPARATE ACCOUNT VA-1 - Stock Index Account
|
SHARES |
COMPANY |
VALUE (000) |
||||||
| 881 |
FBL Financial Group, Inc (Class A) |
$ | 30 | |||||
| 11,312 |
Fidelity National Title Group, Inc (Class A) |
180 | ||||||
| 5,526 |
First American Financial Corp |
70 | ||||||
| 2,488 |
Flagstone Reinsurance Holdings Ltd |
21 | ||||||
| 22,188 |
* | Genworth Financial, Inc (Class A) |
145 | |||||
| 1,491 |
* | Greenlight Capital Re Ltd (Class A) |
35 | |||||
| 368 |
* | Hallmark Financial Services |
3 | |||||
| 2,267 |
Hanover Insurance Group, Inc |
79 | ||||||
| 657 |
e | Harleysville Group, Inc |
37 | |||||
| 21,920 |
Hartford Financial Services Group, Inc |
356 | ||||||
| 5,658 |
HCC Insurance Holdings, Inc |
156 | ||||||
| 2,378 |
* | Hilltop Holdings, Inc |
20 | |||||
| 2,010 |
Horace Mann Educators Corp |
28 | ||||||
| 357 |
e | Independence Holding Co |
3 | |||||
| 632 |
Infinity Property & Casualty Corp |
36 | ||||||
| 212 |
Kansas City Life Insurance Co |
7 | ||||||
| 2,516 |
Kemper Corp |
73 | ||||||
| 15,830 |
Lincoln National Corp |
307 | ||||||
| 15,604 |
Loews Corp |
587 | ||||||
| 2,909 |
Maiden Holdings Ltd |
25 | ||||||
| 450 |
* | Markel Corp |
187 | |||||
| 27,173 |
Marsh & McLennan Cos, Inc |
859 | ||||||
| 4,600 |
Max Capital Group Ltd |
109 | ||||||
| 7,809 |
*,e | MBIA, Inc |
91 | |||||
| 2,850 |
Meadowbrook Insurance Group, Inc |
30 | ||||||
| 1,373 |
Mercury General Corp |
63 | ||||||
| 40,788 |
Metlife, Inc |
1,272 | ||||||
| 3,129 |
Montpelier Re Holdings Ltd |
56 | ||||||
| 2,320 |
* | National Financial Partners Corp |
31 | |||||
| 224 |
National Interstate Corp |
6 | ||||||
| 56 |
National Western Life Insurance Co (Class A) |
8 | ||||||
| 636 |
* | Navigators Group, Inc |
30 | |||||
| 12,729 |
Old Republic International Corp |
118 | ||||||
| 1,314 |
OneBeacon Insurance Group Ltd (Class A) |
20 | ||||||
| 3,479 |
PartnerRe Ltd |
223 | ||||||
| 7,094 |
* | Phoenix Cos, Inc |
12 | |||||
| 1,669 |
Platinum Underwriters Holdings Ltd |
57 | ||||||
| 1,106 |
Presidential Life Corp |
11 | ||||||
| 1,054 |
Primerica, Inc |
25 | ||||||
| 16,236 |
Principal Financial Group |
399 | ||||||
| 1,464 |
ProAssurance Corp |
117 | ||||||
| 30,555 |
Progressive Corp |
596 | ||||||
| 4,503 |
Protective Life Corp |
102 | ||||||
| 23,859 |
Prudential Financial, Inc |
1,196 | ||||||
| 3,586 |
Reinsurance Group of America, Inc (Class A) |
187 | ||||||
| 2,614 |
RenaissanceRe Holdings Ltd |
194 | ||||||
| 697 |
RLI Corp |
51 | ||||||
| 678 |
Safety Insurance Group, Inc |
27 | ||||||
| 999 |
SeaBright Insurance Holdings, Inc |
8 | ||||||
| 2,700 |
Selective Insurance Group, Inc |
48 | ||||||
| 2,292 |
Stancorp Financial Group, Inc |
84 | ||||||
| 913 |
State Auto Financial Corp |
12 | ||||||
| 1,214 |
Stewart Information Services Corp |
14 | ||||||
| 3,411 |
Symetra Financial Corp |
31 | ||||||
| 5,237 |
Torchmark Corp |
227 | ||||||
| 1,864 |
Tower Group, Inc |
38 | ||||||
| 3,162 |
Transatlantic Holdings, Inc |
173 | ||||||
| 20,725 |
Travelers Cos, Inc |
1,226 | ||||||
| 746 |
* | United America Indemnity Ltd |
15 | |||||
| 1,337 |
United Fire & Casualty Co |
27 | ||||||
| 587 |
Universal Insurance Holdings, Inc |
2 | ||||||
| 15,052 |
UnumProvident Corp |
317 | ||||||
| 3,894 |
Validus Holdings Ltd |
123 | ||||||
| 5,770 |
W.R. Berkley Corp |
198 | ||||||
| 313 |
White Mountains Insurance Group Ltd |
142 | ||||||
| 15,619 |
XL Capital Ltd |
309 | ||||||
|
|
|
|||||||
| TOTAL INSURANCE |
25,669 | |||||||
|
|
|
|||||||
24
TIAA SEPARATE ACCOUNT VA-1 - Stock Index Account
|
SHARES |
COMPANY |
VALUE (000) |
||||||
| MATERIALS - 4.0% |
||||||||
| 1,675 |
A. Schulman, Inc |
$ | 35 | |||||
| 226 |
* | AEP Industries, Inc |
6 | |||||
| 10,394 |
Air Products & Chemicals, Inc |
885 | ||||||
| 3,941 |
Airgas, Inc |
308 | ||||||
| 5,809 |
e | AK Steel Holding Corp |
48 | |||||
| 4,572 |
Albemarle Corp |
235 | ||||||
| 52,542 |
Alcoa, Inc |
454 | ||||||
| 5,557 |
Allegheny Technologies, Inc |
266 | ||||||
| 4,499 |
* | Allied Nevada Gold Corp |
136 | |||||
| 1,252 |
AMCOL International Corp |
34 | ||||||
| 928 |
American Vanguard Corp |
12 | ||||||
| 3,382 |
Aptargroup, Inc |
177 | ||||||
| 4,098 |
Ashland, Inc |
234 | ||||||
| 1,365 |
Balchem Corp |
55 | ||||||
| 8,482 |
Ball Corp |
303 | ||||||
| 4,932 |
Bemis Co, Inc |
148 | ||||||
| 5,292 |
Boise, Inc |
38 | ||||||
| 1,200 |
* | Brush Engineered Materials, Inc |
29 | |||||
| 1,757 |
Buckeye Technologies, Inc |
59 | ||||||
| 3,319 |
Cabot Corp |
107 | ||||||
| 2,978 |
* | Calgon Carbon Corp |
47 | |||||
| 2,419 |
Carpenter Technology Corp |
125 | ||||||
| 1,087 |
*,e | Castle (A.M.) & Co |
10 | |||||
| 7,889 |
Celanese Corp (Series A) |
349 | ||||||
| 3,364 |
* | Century Aluminum Co |
29 | |||||
| 3,530 |
CF Industries Holdings, Inc |
512 | ||||||
| 340 |
Chase Corp |
5 | ||||||
| 3,627 |
* | Chemtura |
41 | |||||
| 1,060 |
* | Clearwater Paper Corp |
38 | |||||
| 6,943 |
Cleveland-Cliffs, Inc |
433 | ||||||
| 4,438 |
* | Coeur d’Alene Mines Corp |
107 | |||||
| 6,046 |
Commercial Metals Co |
84 | ||||||
| 1,615 |
Compass Minerals International, Inc |
111 | ||||||
| 8,215 |
* | Crown Holdings, Inc |
276 | |||||
| 2,481 |
Cytec Industries, Inc |
111 | ||||||
| 567 |
Deltic Timber Corp |
34 | ||||||
| 2,090 |
Domtar Corp |
167 | ||||||
| 57,962 |
Dow Chemical Co |
1,667 | ||||||
| 45,783 |
Du Pont (E.I.) de Nemours & Co |
2,096 | ||||||
| 2,311 |
Eagle Materials, Inc |
59 | ||||||
| 7,190 |
Eastman Chemical Co |
281 | ||||||
| 14,627 |
Ecolab, Inc |
846 | ||||||
| 4,514 |
* | Ferro Corp |
22 | |||||
| 2,562 |
*,e | Flotek Industries, Inc |
26 | |||||
| 3,623 |
FMC Corp |
312 | ||||||
| 46,868 |
Freeport-McMoRan Copper & Gold, Inc (Class B) |
1,724 | ||||||
| 954 |
FutureFuel Corp |
12 | ||||||
| 2,908 |
* | General Moly, Inc |
9 | |||||
| 1,622 |
* | Georgia Gulf Corp |
32 | |||||
| 2,406 |
Glatfelter |
34 | ||||||
| 2,943 |
Globe Specialty Metals, Inc |
39 | ||||||
| 1,426 |
Gold Resource Corp |
30 | ||||||
| 461 |
*,e | Golden Minerals Co |
3 | |||||
| 12,807 |
* | Golden Star Resources Ltd |
21 | |||||
| 8,058 |
* | Graphic Packaging Holding Co |
34 | |||||
| 1,790 |
Greif, Inc (Class A) |
82 | ||||||
| 2,571 |
H.B. Fuller Co |
59 | ||||||
| 459 |
Hawkins, Inc |
17 | ||||||
| 750 |
Haynes International, Inc |
41 | ||||||
| 2,769 |
* | Headwaters, Inc |
6 | |||||
| 14,157 |
Hecla Mining Co |
74 | ||||||
| 2,056 |
* | Horsehead Holding Corp |
18 | |||||
| 9,393 |
Huntsman Corp |
94 | ||||||
| 1,126 |
Innophos Holdings, Inc |
55 | ||||||
25
TIAA SEPARATE ACCOUNT VA-1 - Stock Index Account
|
SHARES |
COMPANY |
VALUE (000) |
||||||
| 1,190 |
* | Innospec, Inc |
$ | 33 | ||||
| 4,077 |
International Flavors & Fragrances, Inc |
214 | ||||||
| 22,081 |
International Paper Co |
654 | ||||||
| 2,641 |
* | Intrepid Potash, Inc |
60 | |||||
| 4,439 |
*,e | Jaguar Mining, Inc |
28 | |||||
| 620 |
Kaiser Aluminum Corp |
28 | ||||||
| 2,023 |
* | Kapstone Paper and Packaging Corp |
32 | |||||
| 329 |
KMG Chemicals, Inc |
6 | ||||||
| 1,077 |
Koppers Holdings, Inc |
37 | ||||||
| 1,610 |
* | Kraton Polymers LLC |
33 | |||||
| 1,114 |
Kronos Worldwide, Inc |
20 | ||||||
| 1,289 |
* | Landec Corp |
7 | |||||
| 6,361 |
* | Louisiana-Pacific Corp |
51 | |||||
| 901 |
* | LSB Industries, Inc |
25 | |||||
| 15,822 |
LyondellBasell Industries AF S.C.A |
514 | ||||||
| 2,306 |
e | Martin Marietta Materials, Inc |
174 | |||||
| 8,578 |
MeadWestvaco Corp |
257 | ||||||
| 566 |
* | Metals USA Holdings Corp |
6 | |||||
| 3,984 |
*,e | Midway Gold Corp |
8 | |||||
| 998 |
Minerals Technologies, Inc |
56 | ||||||
| 2,837 |
*,e | Molycorp, Inc |
68 | |||||
| 26,411 |
Monsanto Co |
1,851 | ||||||
| 13,646 |
Mosaic Co |
688 | ||||||
| 1,570 |
Myers Industries, Inc |
19 | ||||||
| 1,075 |
Neenah Paper, Inc |
24 | ||||||
| 469 |
NewMarket Corp |
93 | ||||||
| 23,952 |
Newmont Mining Corp |
1,437 | ||||||
| 1,121 |
Noranda Aluminium Holding Corp |
9 | ||||||
| 15,457 |
Nucor Corp |
612 | ||||||
| 4,182 |
Olin Corp |
82 | ||||||
| 529 |
Olympic Steel, Inc |
12 | ||||||
| 1,636 |
* | OM Group, Inc |
37 | |||||
| 2,250 |
* | Omnova Solutions, Inc |
10 | |||||
| 8,262 |
* | Owens-Illinois, Inc |
160 | |||||
| 5,162 |
Packaging Corp of America |
130 | ||||||
| 5,999 |
*,e | Paramount Gold and Silver Corp |
13 | |||||
| 4,735 |
PolyOne Corp |
55 | ||||||
| 7,741 |
PPG Industries, Inc |
646 | ||||||
| 15,039 |
Praxair, Inc |
1,608 | ||||||
| 610 |
Quaker Chemical Corp |
24 | ||||||
| 3,642 |
Reliance Steel & Aluminum Co |
177 | ||||||
| 1,196 |
* | Revett Minerals, Inc |
6 | |||||
| 3,144 |
Rock-Tenn Co (Class A) |
182 | ||||||
| 2,609 |
* | Rockwood Holdings, Inc |
103 | |||||
| 2,701 |
Royal Gold, Inc |
182 | ||||||
| 6,583 |
RPM International, Inc |
162 | ||||||
| 1,496 |
* | RTI International Metals, Inc |
35 | |||||
| 1,183 |
Schnitzer Steel Industries, Inc (Class A) |
50 | ||||||
| 663 |
Schweitzer-Mauduit International, Inc |
44 | ||||||
| 2,344 |
e | Scotts Miracle-Gro Co (Class A) |
109 | |||||
| 8,412 |
Sealed Air Corp |
145 | ||||||
| 2,106 |
* | Senomyx, Inc |
7 | |||||
| 2,628 |
Sensient Technologies Corp |
100 | ||||||
| 4,351 |
Sherwin-Williams Co |
388 | ||||||
| 6,098 |
Sigma-Aldrich Corp |
381 | ||||||
| 2,495 |
Silgan Holdings, Inc |
96 | ||||||
| 6,548 |
* | Solutia, Inc |
113 | |||||
| 5,028 |
Sonoco Products Co |
166 | ||||||
| 8,637 |
Southern Copper Corp (NY) |
261 | ||||||
| 1,508 |
* | Spartech Corp |
7 | |||||
| 10,635 |
Steel Dynamics, Inc |
140 | ||||||
| 417 |
Stepan Co |
33 | ||||||
| 2,345 |
* | Stillwater Mining Co |
25 | |||||
| 5,055 |
Temple-Inland, Inc |
160 | ||||||
| 1,109 |
Texas Industries, Inc |
34 | ||||||
26
TIAA SEPARATE ACCOUNT VA-1 - Stock Index Account
|
SHARES |
COMPANY |
VALUE (000) |
||||||
| 668 |
* | Texas Petrochemicals, Inc |
$ | 16 | ||||
| 7,152 |
* | Thompson Creek Metals Co, Inc |
50 | |||||
| 4,523 |
Titanium Metals Corp |
68 | ||||||
| 1,281 |
Tredegar Corp |
28 | ||||||
| 66 |
* | United States Lime & Minerals, Inc |
4 | |||||
| 6,927 |
e | United States Steel Corp |
183 | |||||
| 391 |
* | Universal Stainless & Alloy |
15 | |||||
| 1,179 |
* | US Energy Corp Wyoming |
3 | |||||
| 5,285 |
*,e | US Gold Corp |
18 | |||||
| 4,845 |
Valspar Corp |
189 | ||||||
| 3,459 |
*,e | Vista Gold Corp |
11 | |||||
| 6,530 |
e | Vulcan Materials Co |
257 | |||||
| 3,151 |
Walter Energy, Inc |
191 | ||||||
| 2,666 |
Wausau Paper Corp |
22 | ||||||
| 893 |
Westlake Chemical Corp |
36 | ||||||
| 297 |
* | WHX Corp |
3 | |||||
| 2,913 |
Worthington Industries, Inc |
48 | ||||||
| 3,834 |
* | WR Grace & Co |
176 | |||||
| 1,145 |
Zep, Inc |
16 | ||||||
| 1,635 |
* | Zoltek Cos, Inc |
12 | |||||
|
|
|
|||||||
| TOTAL MATERIALS |
28,014 | |||||||
|
|
|
|||||||
| MEDIA - 3.1% |
||||||||
| 924 |
AH Belo Corp (Class A) |
4 | ||||||
| 2,662 |
* | AMC Networks, Inc |
100 | |||||
| 1,425 |
Arbitron, Inc |
49 | ||||||
| 4,724 |
Belo (A.H.) Corp (Class A) |
30 | ||||||
| 10,909 |
Cablevision Systems Corp (Class A) |
155 | ||||||
| 33,018 |
CBS Corp (Class B) |
896 | ||||||
| 1,854 |
*,e | Central European Media Enterprises Ltd (Class A) Nasdaq |
12 | |||||
| 3,035 |
* | Charter Communications, Inc |
173 | |||||
| 3,438 |
Cinemark Holdings, Inc |
64 | ||||||
| 2,051 |
* | Clear Channel Outdoor Holdings, Inc (Class A) |
26 | |||||
| 136,055 |
Comcast Corp (Class A) |
3,226 | ||||||
| 1,802 |
*,e | Crown Media Holdings, Inc (Class A) |
2 | |||||
| 1,191 |
* | Cumulus Media, Inc (Class A) |
4 | |||||
| 1,322 |
* | Digital Generation, Inc |
16 | |||||
| 34,810 |
* | DIRECTV |
1,489 | |||||
| 13,701 |
* | Discovery Communications, Inc (Class A) |
561 | |||||
| 10,000 |
DISH Network Corp (Class A) |
285 | ||||||
| 3,607 |
*,e | DreamWorks Animation SKG, Inc (Class A) |
60 | |||||
| 1,252 |
*,e | Entercom Communications Corp (Class A) |
8 | |||||
| 2,637 |
Entravision Communications Corp (Class A) |
4 | ||||||
| 1,802 |
* | EW Scripps Co (Class A) |
14 | |||||
| 354 |
* | Fisher Communications, Inc |
10 | |||||
| 11,774 |
Gannett Co, Inc |
157 | ||||||
| 629 |
* | Global Sources Ltd |
3 | |||||
| 1,804 |
* | Gray Television, Inc |
3 | |||||
| 2,075 |
Harte-Hanks, Inc |
19 | ||||||
| 24,665 |
Interpublic Group of Cos, Inc |
240 | ||||||
| 2,263 |
John Wiley & Sons, Inc (Class A) |
101 | ||||||
| 2,807 |
* | Journal Communications, Inc (Class A) |
12 | |||||
| 1,587 |
* | Knology, Inc |
23 | |||||
| 3,031 |
*,e | Lamar Advertising Co (Class A) |
83 | |||||
| 13,980 |
* | Liberty Global, Inc (Class A) |
574 | |||||
| 5,786 |
* | Liberty Interactive LLC |
452 | |||||
| 1,798 |
* | Lin TV Corp (Class A) |
8 | |||||
| 1,860 |
*,e | Lions Gate Entertainment Corp |
15 | |||||
| 7,613 |
* | Live Nation, Inc |
63 | |||||
| 3,359 |
* | Madison Square Garden, Inc |
96 | |||||
| 1,522 |
e | Martha Stewart Living Omnimedia, Inc (Class A) |
7 | |||||
| 3,219 |
*,e | McClatchy Co (Class A) |
8 | |||||
| 14,921 |
McGraw-Hill Cos, Inc |
671 | ||||||
| 1,288 |
MDC Partners, Inc |
17 | ||||||
| 1,908 |
e | Meredith Corp |
62 | |||||
27
TIAA SEPARATE ACCOUNT VA-1 - Stock Index Account
|
SHARES |
COMPANY |
VALUE (000) |
||||||
| 1,117 |
Morningstar, Inc |
$ | 66 | |||||
| 2,278 |
National CineMedia, Inc |
28 | ||||||
| 6,951 |
*,e | New York Times Co (Class A) |
54 | |||||
| 113,907 |
News Corp (Class A) |
2,032 | ||||||
| 542 |
* | Nexstar Broadcasting Group, Inc (Class A) |
4 | |||||
| 13,848 |
Omnicom Group, Inc |
617 | ||||||
| 660 |
Outdoor Channel Holdings, Inc |
5 | ||||||
| 490 |
* | ReachLocal, Inc |
3 | |||||
| 4,340 |
e | Regal Entertainment Group (Class A) |
52 | |||||
| 475 |
* | Rentrak Corp |
7 | |||||
| 1,378 |
Scholastic Corp |
41 | ||||||
| 4,520 |
Scripps Networks Interactive (Class A) |
192 | ||||||
| 3,111 |
Sinclair Broadcast Group, Inc (Class A) |
35 | ||||||
| 197,997 |
*,e | Sirius XM Radio, Inc |
360 | |||||
| 18,552 |
Thomson Corp |
495 | ||||||
| 16,524 |
Time Warner Cable, Inc |
1,050 | ||||||
| 49,393 |
Time Warner, Inc |
1,785 | ||||||
| 2,478 |
*,e | Valassis Communications, Inc |
48 | |||||
| 98 |
e | Value Line, Inc |
1 | |||||
| 27,209 |
Viacom, Inc (Class B) |
1,236 | ||||||
| 15,373 |
Virgin Media, Inc |
329 | ||||||
| 93,266 |
Walt Disney Co |
3,497 | ||||||
| 253 |
e | Washington Post Co (Class B) |
95 | |||||
| 1,281 |
e | World Wrestling Entertainment, Inc (Class A) |
12 | |||||
|
|
|
|||||||
| TOTAL MEDIA |
21,846 | |||||||
|
|
|
|||||||
| PHARMACEUTICALS, BIOTECHNOLOGY & LIFE SCIENCES - 7.4% |
||||||||
| 76,734 |
Abbott Laboratories |
4,315 | ||||||
| 1,983 |
*,e | Achillion Pharmaceuticals, Inc |
15 | |||||
| 2,044 |
* | Acorda Therapeutics, Inc |
49 | |||||
| 376 |
* | Aegerion Pharmaceuticals, Inc |
6 | |||||
| 1,787 |
* | Affymax, Inc |
12 | |||||
| 4,200 |
* | Affymetrix, Inc |
17 | |||||
| 17,156 |
* | Agilent Technologies, Inc |
599 | |||||
| 2,860 |
* | Akorn, Inc |
32 | |||||
| 1,600 |
* | Albany Molecular Research, Inc |
5 | |||||
| 9,120 |
* | Alexion Pharmaceuticals, Inc |
652 | |||||
| 5,209 |
* | Alkermes PLC |
90 | |||||
| 15,100 |
Allergan, Inc |
1,325 | ||||||
| 4,202 |
* | Allos Therapeutics, Inc |
6 | |||||
| 2,039 |
* | Alnylam Pharmaceuticals, Inc |
17 | |||||
| 1,109 |
* | AMAG Pharmaceuticals, Inc |
21 | |||||
| 43,387 |
Amgen, Inc |
2,786 | ||||||
| 1,022 |
* | Ampio Pharmaceuticals, Inc |
4 | |||||
| 6,228 |
* | Amylin Pharmaceuticals, Inc |
71 | |||||
| 826 |
* | Anthera Pharmaceuticals, Inc |
5 | |||||
| 803 |
* | Ardea Biosciences, Inc |
14 | |||||
| 7,276 |
*,e | Arena Pharmaceuticals, Inc |
14 | |||||
| 6,680 |
* | Ariad Pharmaceuticals, Inc |
82 | |||||
| 2,640 |
* | Arqule, Inc |
15 | |||||
| 3,660 |
* | Array Biopharma, Inc |
8 | |||||
| 2,656 |
* | Astex Pharmaceuticals |
5 | |||||
| 2,455 |
* | Auxilium Pharmaceuticals, Inc |
49 | |||||
| 6,354 |
*,e | AVANIR Pharmaceuticals, Inc |
13 | |||||
| 1,342 |
*,e | AVEO Pharmaceuticals, Inc |
23 | |||||
| 4,441 |
*,e | AVI BioPharma, Inc |
3 | |||||
| 1,205 |
*,e | BioCryst Pharmaceuticals, Inc |
3 | |||||
| 12,041 |
* | Biogen Idec, Inc |
1,325 | |||||
| 5,472 |
* | BioMarin Pharmaceuticals, Inc |
188 | |||||
| 723 |
*,e | BioMimetic Therapeutics, Inc |
2 | |||||
| 1,030 |
* | Bio-Rad Laboratories, Inc (Class A) |
99 | |||||
| 3,493 |
*,e | Biosante Pharmaceuticals, Inc |
2 | |||||
| 215 |
* | Biospecifics Technologies Corp |
4 | |||||
| 1,108 |
*,e | Biotime, Inc |
6 | |||||
| 84,135 |
Bristol-Myers Squibb Co |
2,965 | ||||||
| 4,265 |
* | Bruker BioSciences Corp |
53 | |||||
28
TIAA SEPARATE ACCOUNT VA-1 - Stock Index Account
|
SHARES |
COMPANY |
VALUE (000) |
||||||
| 1,890 |
*,e | Cadence Pharmaceuticals, Inc |
$ | 7 | ||||
| 1,815 |
* | Cambrex Corp |
13 | |||||
| 22,930 |
* | Celgene Corp |
1,550 | |||||
| 8,448 |
*,e | Cell Therapeutics, Inc |
10 | |||||
| 1,638 |
* | Celldex Therapeutics, Inc |
4 | |||||
| 2,745 |
* | Cepheid, Inc |
94 | |||||
| 2,608 |
* | Charles River Laboratories International, Inc |
71 | |||||
| 2,651 |
*,e | Chelsea Therapeutics International, Inc |
14 | |||||
| 1,143 |
*,e | Cleveland Biolabs, Inc |
3 | |||||
| 442 |
* | Codexis, Inc |
2 | |||||
| 3,725 |
*,e | Columbia Laboratories, Inc |
9 | |||||
| 2,926 |
*,e | Combinatorx, Inc |
4 | |||||
| 523 |
*,e | Complete Genomics, Inc |
2 | |||||
| 1,326 |
*,e | Corcept Therapeutics, Inc |
4 | |||||
| 318 |
* | Cornerstone Therapeutics, Inc |
2 | |||||
| 3,087 |
* | Covance, Inc |
141 | |||||
| 2,930 |
* | Cubist Pharmaceuticals, Inc |
116 | |||||
| 3,574 |
*,e | Curis, Inc |
17 | |||||
| 2,389 |
* | Cytori Therapeutics, Inc |
5 | |||||
| 7,690 |
*,e | Dendreon Corp |
58 | |||||
| 2,984 |
* | Depomed, Inc |
15 | |||||
| 3,494 |
* | Durect Corp |
4 | |||||
| 1,240 |
* | Dusa Pharmaceuticals, Inc |
5 | |||||
| 4,970 |
* | Dyax Corp |
7 | |||||
| 5,843 |
*,e | Dynavax Technologies Corp |
19 | |||||
| 50,588 |
Eli Lilly & Co |
2,102 | ||||||
| 1,234 |
* | Emergent Biosolutions, Inc |
21 | |||||
| 5,765 |
* | Endo Pharmaceuticals Holdings, Inc |
199 | |||||
| 748 |
* | Endocyte, Inc |
3 | |||||
| 1,864 |
* | Enzo Biochem, Inc |
4 | |||||
| 2,632 |
* | Enzon Pharmaceuticals, Inc |
18 | |||||
| 2,888 |
* | eResearch Technology, Inc |
14 | |||||
| 2,644 |
* | Exact Sciences Corp |
21 | |||||
| 6,457 |
* | Exelixis, Inc |
31 | |||||
| 318 |
* | Fluidigm Corp |
4 | |||||
| 13,935 |
* | Forest Laboratories, Inc |
422 | |||||
| 512 |
* | Furiex Pharmaceuticals Inc |
9 | |||||
| 810 |
* | Genomic Health, Inc |
21 | |||||
| 6,445 |
* | Geron Corp |
10 | |||||
| 39,020 |
* | Gilead Sciences, Inc |
1,597 | |||||
| 971 |
*,e | GTx, Inc |
3 | |||||
| 3,942 |
* | Halozyme Therapeutics, Inc |
37 | |||||
| 1,104 |
* | Harvard Bioscience, Inc |
4 | |||||
| 458 |
* | Hi-Tech Pharmacal Co, Inc |
18 | |||||
| 8,495 |
* | Hospira, Inc |
258 | |||||
| 9,905 |
* | Human Genome Sciences, Inc |
73 | |||||
| 2,733 |
*,e | Idenix Pharmaceuticals, Inc |
20 | |||||
| 6,175 |
* | Illumina, Inc |
188 | |||||
| 3,568 |
*,e | Immunogen, Inc |
41 | |||||
| 3,543 |
*,e | Immunomedics, Inc |
12 | |||||
| 3,365 |
* | Impax Laboratories, Inc |
68 | |||||
| 4,807 |
*,e | Incyte Corp |
72 | |||||
| 1,026 |
*,e | Infinity Pharmaceuticals, Inc |
9 | |||||
| 2,480 |
* | Inhibitex, Inc |
27 | |||||
| 1,268 |
* | Insmed, Inc |
4 | |||||
| 2,471 |
* | InterMune, Inc |
31 | |||||
| 1,000 |
* | Ironwood Pharmaceuticals, Inc |
12 | |||||
| 5,202 |
* | Isis Pharmaceuticals, Inc |
38 | |||||
| 1,307 |
* | ISTA Pharmaceuticals, Inc |
9 | |||||
| 1,109 |
* | Jazz Pharmaceuticals, Inc |
43 | |||||
| 135,431 |
Johnson & Johnson |
8,882 | ||||||
| 2,721 |
*,e | Keryx Biopharmaceuticals, Inc |
7 | |||||
| 2,515 |
*,e | KV Pharmaceutical Co (Class A) |
3 | |||||
| 832 |
* | Lannett Co, Inc |
4 | |||||
| 10,577 |
* | Lexicon Pharmaceuticals, Inc |
14 | |||||
29
TIAA SEPARATE ACCOUNT VA-1 - Stock Index Account
|
SHARES |
COMPANY |
VALUE (000) |
||||||
| 9,034 |
* | Life Technologies Corp |
$ | 352 | ||||
| 925 |
* | Ligand Pharmaceuticals, Inc (Class B) |
11 | |||||
| 2,138 |
* | Luminex Corp |
45 | |||||
| 2,990 |
*,e | MannKind Corp |
7 | |||||
| 1,093 |
* | MAP Pharmaceuticals, Inc |
14 | |||||
| 1,801 |
* | Maxygen, Inc |
10 | |||||
| 2,495 |
* | Medicines Co |
46 | |||||
| 3,195 |
Medicis Pharmaceutical Corp (Class A) |
106 | ||||||
| 1,640 |
* | Medivation, Inc |
76 | |||||
| 388 |
* | Medtox Scientific, Inc |
6 | |||||
| 152,423 |
Merck & Co, Inc |
5,746 | ||||||
| 1,320 |
* | Metabolix, Inc |
6 | |||||
| 1,572 |
* | Mettler-Toledo International, Inc |
232 | |||||
| 4,244 |
*,e | Micromet, Inc |
31 | |||||
| 1,926 |
* | Momenta Pharmaceuticals, Inc |
34 | |||||
| 22,115 |
* | Mylan Laboratories, Inc |
475 | |||||
| 4,340 |
* | Myriad Genetics, Inc |
91 | |||||
| 2,384 |
* | Nabi Biopharmaceuticals |
4 | |||||
| 4,982 |
*,e | Nektar Therapeutics |
28 | |||||
| 1,326 |
*,e | Neostem, Inc |
1 | |||||
| 2,526 |
* | Neurocrine Biosciences, Inc |
21 | |||||
| 4,336 |
* | Novavax, Inc |
5 | |||||
| 2,860 |
* | NPS Pharmaceuticals, Inc |
19 | |||||
| 1,040 |
* | Nymox Pharmaceutical Corp |
9 | |||||
| 1,070 |
* | Obagi Medical Products, Inc |
11 | |||||
| 511 |
* | OncoGenex Pharmaceutical, Inc |
6 | |||||
| 2,102 |
*,e | Oncothyreon, Inc |
16 | |||||
| 3,387 |
* | Onyx Pharmaceuticals, Inc |
149 | |||||
| 4,791 |
*,e | Opko Health, Inc |
23 | |||||
| 1,463 |
*,e | Optimer Pharmaceuticals, Inc |
18 | |||||
| 1,180 |
* | Orexigen Therapeutics, Inc |
2 | |||||
| 807 |
*,e | Osiris Therapeutics, Inc |
4 | |||||
| 1,723 |
* | Pacific Biosciences of California, Inc |
5 | |||||
| 1,792 |
* | Pain Therapeutics, Inc |
7 | |||||
| 1,830 |
* | Par Pharmaceutical Cos, Inc |
60 | |||||
| 3,098 |
* | Parexel International Corp |
64 | |||||
| 5,458 |
e | PDL BioPharma, Inc |
34 | |||||
| 2,716 |
* | Peregrine Pharmaceuticals, Inc |
3 | |||||
| 5,700 |
PerkinElmer, Inc |
114 | ||||||
| 4,194 |
Perrigo Co |
408 | ||||||
| 390,322 |
Pfizer, Inc |
8,447 | ||||||
| 1,960 |
*,e | Pharmacyclics, Inc |
29 | |||||
| 3,644 |
* | Pharmasset, Inc |
467 | |||||
| 1,715 |
*,e | PharmAthene, Inc |
2 | |||||
| 1,425 |
* | Pozen, Inc |
6 | |||||
| 1,419 |
* | Progenics Pharmaceuticals, Inc |
12 | |||||
| 10,977 |
*,e | Qiagen N.V. (NASDAQ) |
152 | |||||
| 2,696 |
* | Questcor Pharmaceuticals, Inc |
112 | |||||
| 533 |
* | Raptor Pharmaceutical Corp |
3 | |||||
| 3,683 |
* | Regeneron Pharmaceuticals, Inc |
204 | |||||
| 3,471 |
* | Rigel Pharmaceuticals, Inc |
27 | |||||
| 345 |
*,e | Sagent Pharmaceuticals |
7 | |||||
| 3,014 |
* | Salix Pharmaceuticals Ltd |
144 | |||||
| 2,157 |
*,e | Sangamo Biosciences, Inc |
6 | |||||
| 2,882 |
* | Santarus, Inc |
10 | |||||
| 3,562 |
*,e | Savient Pharmaceuticals, Inc |
8 | |||||
| 1,987 |
* | Sciclone Pharmaceuticals, Inc |
9 | |||||
| 4,880 |
*,e | Seattle Genetics, Inc |
82 | |||||
| 4,993 |
*,e | Sequenom, Inc |
22 | |||||
| 1,470 |
*,e | SIGA Technologies, Inc |
4 | |||||
| 2,652 |
* | Spectrum Pharmaceuticals, Inc |
39 | |||||
| 620 |
*,e | Sucampo Pharmaceuticals, Inc (Class A) |
3 | |||||
| 1,092 |
*,e | Synta Pharmaceuticals Corp |
5 | |||||
| 1,257 |
* | Targacept, Inc |
7 | |||||
| 1,700 |
Techne Corp |
116 | ||||||
30
TIAA SEPARATE ACCOUNT VA-1 - Stock Index Account
|
SHARES |
COMPANY |
VALUE (000) |
||||||
| 3,469 |
*,e | Theravance, Inc |
$ | 77 | ||||
| 18,954 |
* | Thermo Electron Corp |
852 | |||||
| 2,600 |
* | United Therapeutics Corp |
123 | |||||
| 1,501 |
* | Vanda Pharmaceuticals, Inc |
7 | |||||
| 10,327 |
* | Vertex Pharmaceuticals, Inc |
343 | |||||
| 3,055 |
*,e | Vical, Inc |
13 | |||||
| 3,526 |
* | Viropharma, Inc |
97 | |||||
| 4,243 |
*,e | Vivus, Inc |
41 | |||||
| 8,575 |
* | Warner Chilcott plc |
130 | |||||
| 4,630 |
* | Waters Corp |
343 | |||||
| 6,402 |
* | Watson Pharmaceuticals, Inc |
386 | |||||
| 1,508 |
* | Xenoport, Inc |
6 | |||||
| 2,912 |
*,e | ZIOPHARM Oncology, Inc |
13 | |||||
|
|
|
|||||||
| TOTAL PHARMACEUTICALS, BIOTECHNOLOGY & LIFE SCIENCES |
52,082 | |||||||
|
|
|
|||||||
| REAL ESTATE - 3.1% |
||||||||
| 2,117 |
Acadia Realty Trust |
43 | ||||||
| 505 |
Agree Realty Corp |
12 | ||||||
| 104 |
Alexander’s, Inc |
38 | ||||||
| 2,762 |
Alexandria Real Estate Equities, Inc |
190 | ||||||
| 21,441 |
AMB Property Corp |
613 | ||||||
| 1,470 |
American Assets Trust,Inc |
30 | ||||||
| 3,566 |
American Campus Communities, Inc |
150 | ||||||
| 11,331 |
American Capital Agency Corp |
318 | ||||||
| 47,027 |
Annaly Capital Management, Inc |
751 | ||||||
| 6,519 |
Anworth Mortgage Asset Corp |
41 | ||||||
| 6,369 |
Apartment Investment & Management Co (Class A) |
146 | ||||||
| 867 |
Apollo Commercial Real Estate Finance, Inc |
11 | ||||||
| 2,517 |
ARMOUR Residential REIT, Inc |
18 | ||||||
| 2,185 |
Ashford Hospitality Trust, Inc |
17 | ||||||
| 2,073 |
Associated Estates Realty Corp |
33 | ||||||
| 4,387 |
AvalonBay Communities, Inc |
573 | ||||||
| 454 |
*,e | Avatar Holdings, Inc |
3 | |||||
| 7,185 |
BioMed Realty Trust, Inc |
130 | ||||||
| 7,352 |
Boston Properties, Inc |
732 | ||||||
| 7,051 |
Brandywine Realty Trust |
67 | ||||||
| 3,765 |
BRE Properties, Inc (Class A) |
190 | ||||||
| 3,481 |
Camden Property Trust |
217 | ||||||
| 1,900 |
Campus Crest Communities, Inc |
19 | ||||||
| 3,499 |
Capital Lease Funding, Inc |
14 | ||||||
| 3,918 |
Capstead Mortgage Corp |
49 | ||||||
| 7,851 |
CBL & Associates Properties, Inc |
123 | ||||||
| 15,013 |
* | CBRE Group, Inc |
229 | |||||
| 2,712 |
Cedar Shopping Centers, Inc |
12 | ||||||
| 464 |
Chatham Lodging Trust |
5 | ||||||
| 1,642 |
Chesapeake Lodging Trust |
25 | ||||||
| 51,853 |
Chimera Investment Corp |
130 | ||||||
| 2,241 |
Cogdell Spencer, Inc |
10 | ||||||
| 4,203 |
Colonial Properties Trust |
88 | ||||||
| 1,674 |
Colony Financial, Inc |
26 | ||||||
| 378 |
Consolidated-Tomoka Land Co |
10 | ||||||
| 800 |
Coresite Realty |
14 | ||||||
| 3,601 |
Corporate Office Properties Trust |
77 | ||||||
| 4,773 |
Cousins Properties, Inc |
31 | ||||||
| 2,905 |
CreXus Investment Corp |
30 | ||||||
| 4,966 |
CubeSmart |
53 | ||||||
| 1,400 |
CYS Investments, Inc |
18 | ||||||
| 12,464 |
DCT Industrial Trust, Inc |
64 | ||||||
| 11,153 |
DDR Corp |
136 | ||||||
| 8,158 |
DiamondRock Hospitality Co |
79 | ||||||
| 4,811 |
Digital Realty Trust, Inc |
321 | ||||||
| 6,476 |
Douglas Emmett, Inc |
118 | ||||||
| 12,782 |
Duke Realty Corp |
154 | ||||||
| 2,984 |
DuPont Fabros Technology, Inc |
72 | ||||||
| 2,046 |
Dynex Capital, Inc |
19 | ||||||
31
TIAA SEPARATE ACCOUNT VA-1 - Stock Index Account
|
SHARES |
COMPANY |
VALUE (000) |
||||||
| 1,377 |
EastGroup Properties, Inc |
$ | 60 | |||||
| 3,632 |
Education Realty Trust, Inc |
37 | ||||||
| 2,472 |
Entertainment Properties Trust |
108 | ||||||
| 1,377 |
Equity Lifestyle Properties, Inc |
92 | ||||||
| 2,074 |
Equity One, Inc |
35 | ||||||
| 14,683 |
Equity Residential |
837 | ||||||
| 1,645 |
Essex Property Trust, Inc |
231 | ||||||
| 803 |
Excel Trust, Inc |
10 | ||||||
| 4,748 |
Extra Space Storage, Inc |
115 | ||||||
| 3,147 |
Federal Realty Investment Trust |
286 | ||||||
| 6,309 |
* | FelCor Lodging Trust, Inc |
19 | |||||
| 3,935 |
* | First Industrial Realty Trust, Inc |
40 | |||||
| 2,547 |
First Potomac Realty Trust |
33 | ||||||
| 6,922 |
* | Forest City Enterprises, Inc (Class A) |
82 | |||||
| 1,790 |
* | Forestar Real Estate Group, Inc |
27 | |||||
| 3,639 |
Franklin Street Properties Corp |
36 | ||||||
| 28,469 |
General Growth Properties, Inc |
428 | ||||||
| 1,193 |
Getty Realty Corp |
17 | ||||||
| 498 |
Gladstone Commercial Corp |
9 | ||||||
| 5,029 |
Glimcher Realty Trust |
46 | ||||||
| 1,600 |
Government Properties Income Trust |
36 | ||||||
| 4,020 |
Hatteras Financial Corp |
106 | ||||||
| 20,499 |
HCP, Inc |
849 | ||||||
| 9,660 |
Health Care REIT, Inc |
527 | ||||||
| 3,664 |
Healthcare Realty Trust, Inc |
68 | ||||||
| 7,134 |
Hersha Hospitality Trust |
35 | ||||||
| 3,786 |
Highwoods Properties, Inc |
112 | ||||||
| 2,096 |
Home Properties, Inc |
121 | ||||||
| 6,635 |
Hospitality Properties Trust |
152 | ||||||
| 34,558 |
Host Marriott Corp |
510 | ||||||
| 1,086 |
* | Howard Hughes Corp |
48 | |||||
| 3,368 |
HRPT Properties Trust |
56 | ||||||
| 1,133 |
Hudson Pacific Properties |
16 | ||||||
| 4,699 |
Inland Real Estate Corp |
36 | ||||||
| 4,043 |
Invesco Mortgage Capital, Inc |
57 | ||||||
| 3,940 |
Investors Real Estate Trust |
29 | ||||||
| 5,389 |
* | iStar Financial, Inc |
29 | |||||
| 2,166 |
Jones Lang LaSalle, Inc |
133 | ||||||
| 1,173 |
Kennedy-Wilson Holdings, Inc |
13 | ||||||
| 2,878 |
Kilroy Realty Corp |
110 | ||||||
| 20,553 |
Kimco Realty Corp |
334 | ||||||
| 2,891 |
Kite Realty Group Trust |
13 | ||||||
| 4,298 |
LaSalle Hotel Properties |
104 | ||||||
| 6,009 |
Lexington Corporate Properties Trust |
45 | ||||||
| 5,687 |
Liberty Property Trust |
176 | ||||||
| 1,314 |
LTC Properties, Inc |
41 | ||||||
| 6,802 |
Macerich Co |
344 | ||||||
| 4,389 |
Mack-Cali Realty Corp |
117 | ||||||
| 2,548 |
* | Maguire Properties, Inc |
5 | |||||
| 6,789 |
Medical Properties Trust, Inc |
67 | ||||||
| 18,015 |
MFA Mortgage Investments, Inc |
121 | ||||||
| 1,850 |
Mid-America Apartment Communities, Inc |
116 | ||||||
| 1,230 |
Mission West Properties, Inc |
11 | ||||||
| 2,597 |
Monmouth Real Estate Investment Corp (Class A) |
24 | ||||||
| 1,400 |
National Health Investors, Inc |
62 | ||||||
| 4,835 |
National Retail Properties, Inc |
128 | ||||||
| 3,788 |
Newcastle Investment Corp |
18 | ||||||
| 3,670 |
NorthStar Realty Finance Corp |
17 | ||||||
| 2,098 |
NRDC Acquisition Corp |
25 | ||||||
| 5,124 |
Omega Healthcare Investors, Inc |
99 | ||||||
| 567 |
One Liberty Properties, Inc |
9 | ||||||
| 946 |
Parkway Properties, Inc |
9 | ||||||
| 2,560 |
Pebblebrook Hotel Trust |
49 | ||||||
| 2,924 |
Pennsylvania Real Estate Investment Trust |
31 | ||||||
| 1,391 |
Pennymac Mortgage Investment Trust |
23 | ||||||
32
TIAA SEPARATE ACCOUNT VA-1 - Stock Index Account
|
SHARES |
COMPANY |
VALUE (000) |
||||||
| 8,735 |
Piedmont Office Realty Trust, Inc |
$ | 149 | |||||
| 8,182 |
Plum Creek Timber Co, Inc |
299 | ||||||
| 2,516 |
Post Properties, Inc |
110 | ||||||
| 2,094 |
Potlatch Corp |
65 | ||||||
| 903 |
PS Business Parks, Inc |
50 | ||||||
| 7,096 |
Public Storage, Inc |
954 | ||||||
| 1,737 |
RAIT Investment Trust |
8 | ||||||
| 1,967 |
Ramco-Gershenson Properties |
19 | ||||||
| 6,157 |
Rayonier, Inc |
275 | ||||||
| 5,513 |
Realty Income Corp |
193 | ||||||
| 4,253 |
Redwood Trust, Inc |
43 | ||||||
| 4,546 |
Regency Centers Corp |
171 | ||||||
| 1,355 |
Resource Capital Corp |
8 | ||||||
| 1,385 |
RLJ Lodging Trust |
23 | ||||||
| 1,246 |
Sabra Healthcare REIT, Inc |
15 | ||||||
| 330 |
Saul Centers, Inc |
12 | ||||||
| 7,177 |
Senior Housing Properties Trust |
161 | ||||||
| 14,751 |
Simon Property Group, Inc |
1,902 | ||||||
| 4,148 |
SL Green Realty Corp |
276 | ||||||
| 1,302 |
Sovran Self Storage, Inc |
56 | ||||||
| 3,295 |
* | St. Joe Co |
48 | |||||
| 828 |
STAG Industrial, Inc |
9 | ||||||
| 4,726 |
Starwood Property Trust, Inc |
87 | ||||||
| 8,848 |
* | Strategic Hotels & Resorts, Inc |
48 | |||||
| 1,510 |
Summit Hotel Properties, Inc |
14 | ||||||
| 1,069 |
Sun Communities, Inc |
39 | ||||||
| 6,003 |
* | Sunstone Hotel Investors, Inc |
49 | |||||
| 4,276 |
Tanger Factory Outlet Centers, Inc |
125 | ||||||
| 2,937 |
Taubman Centers, Inc |
182 | ||||||
| 790 |
* | Tejon Ranch Co |
19 | |||||
| 400 |
Terreno Realty Corp |
6 | ||||||
| 3,700 |
Two Harbors Investment Corp |
34 | ||||||
| 9,785 |
UDR, Inc |
246 | ||||||
| 507 |
UMH Properties, Inc |
5 | ||||||
| 1,095 |
Universal Health Realty Income Trust |
43 | ||||||
| 1,407 |
Urstadt Biddle Properties, Inc (Class A) |
25 | ||||||
| 12,824 |
Ventas, Inc |
707 | ||||||
| 8,538 |
Vornado Realty Trust |
656 | ||||||
| 3,217 |
Washington Real Estate Investment Trust |
88 | ||||||
| 5,688 |
Weingarten Realty Investors |
124 | ||||||
| 27,322 |
Weyerhaeuser Co |
510 | ||||||
| 965 |
Winthrop Realty Trust |
10 | ||||||
|
|
|
|||||||
| TOTAL REAL ESTATE |
21,691 | |||||||
|
|
|
|||||||
| RETAILING - 3.8% |
||||||||
| 1,264 |
* | 1-800-FLOWERS.COM, Inc (Class A) |
3 | |||||
| 2,441 |
* | 99 Cents Only Stores |
54 | |||||
| 3,952 |
Aaron’s, Inc |
105 | ||||||
| 4,405 |
Abercrombie & Fitch Co (Class A) |
215 | ||||||
| 3,568 |
Advance Auto Parts, Inc |
248 | ||||||
| 3,048 |
* | Aeropostale, Inc |
47 | |||||
| 17,945 |
* | Amazon.com, Inc |
3,106 | |||||
| 10,078 |
American Eagle Outfitters, Inc |
154 | ||||||
| 580 |
* | America’s Car-Mart, Inc |
23 | |||||
| 2,306 |
* | Ann Taylor Stores Corp |
57 | |||||
| 1,089 |
* | Asbury Automotive Group, Inc |
24 | |||||
| 1,206 |
* | Audiovox Corp (Class A) |
10 | |||||
| 2,054 |
*,e | Autonation, Inc |
76 | |||||
| 1,298 |
* | Autozone, Inc |
422 | |||||
| 1,455 |
*,e | Barnes & Noble, Inc |
21 | |||||
| 1,533 |
Bebe Stores, Inc |
13 | ||||||
| 12,332 |
* | Bed Bath & Beyond, Inc |
715 | |||||
| 14,627 |
Best Buy Co, Inc |
342 | ||||||
| 1,412 |
Big 5 Sporting Goods Corp |
15 | ||||||
| 3,272 |
* | Big Lots, Inc |
124 | |||||
33
TIAA SEPARATE ACCOUNT VA-1 - Stock Index Account
|
SHARES |
COMPANY |
VALUE (000) |
||||||
| 672 |
*,e | Blue Nile, Inc |
$ | 27 | ||||
| 578 |
* | Body Central Corp |
14 | |||||
| 447 |
e | Bon-Ton Stores, Inc |
2 | |||||
| 2,300 |
Brown Shoe Co, Inc |
20 | ||||||
| 1,313 |
e | Buckle, Inc |
54 | |||||
| 968 |
* | Build-A-Bear Workshop, Inc |
8 | |||||
| 2,068 |
* | Cabela’s, Inc |
53 | |||||
| 11,175 |
* | Carmax, Inc |
341 | |||||
| 2,260 |
* | Casual Male Retail Group, Inc |
8 | |||||
| 966 |
Cato Corp (Class A) |
23 | ||||||
| 6,044 |
* | Charming Shoppes, Inc |
30 | |||||
| 8,858 |
Chico’s FAS, Inc |
99 | ||||||
| 1,325 |
* | Children’s Place Retail Stores, Inc |
70 | |||||
| 2,493 |
Christopher & Banks Corp |
6 | ||||||
| 836 |
* | Citi Trends, Inc |
7 | |||||
| 1,463 |
* | Coldwater Creek, Inc |
2 | |||||
| 3,407 |
* | Collective Brands, Inc |
49 | |||||
| 679 |
* | Conn’s, Inc |
8 | |||||
| 638 |
Core-Mark Holding Co, Inc |
25 | ||||||
| 950 |
* | Cost Plus, Inc |
9 | |||||
| 476 |
Destination Maternity Corp |
8 | ||||||
| 4,676 |
Dick’s Sporting Goods, Inc |
172 | ||||||
| 1,493 |
e | Dillard’s, Inc (Class A) |
67 | |||||
| 4,748 |
* | Dollar General Corp |
195 | |||||
| 6,033 |
* | Dollar Tree, Inc |
501 | |||||
| 1,024 |
DSW, Inc (Class A) |
45 | ||||||
| 4,900 |
Expedia, Inc |
142 | ||||||
| 2,330 |
* | Express Parent LLC |
46 | |||||
| 5,903 |
Family Dollar Stores, Inc |
340 | ||||||
| 2,617 |
Finish Line, Inc (Class A) |
50 | ||||||
| 7,550 |
Foot Locker, Inc |
180 | ||||||
| 2,092 |
Fred’s, Inc (Class A) |
30 | ||||||
| 6,924 |
* | GameStop Corp (Class A) |
167 | |||||
| 17,724 |
Gap, Inc |
329 | ||||||
| 1,189 |
* | Genesco, Inc |
73 | |||||
| 7,650 |
Genuine Parts Co |
468 | ||||||
| 1,288 |
e | Group 1 Automotive, Inc |
67 | |||||
| 1,700 |
* | Groupon, Inc |
35 | |||||
| 3,453 |
Guess?, Inc |
103 | ||||||
| 1,232 |
Haverty Furniture Cos, Inc |
14 | ||||||
| 892 |
*,e | HHgregg, Inc |
13 | |||||
| 1,477 |
* | Hibbett Sports, Inc |
67 | |||||
| 79,374 |
Home Depot, Inc |
3,337 | ||||||
| 2,222 |
Hot Topic, Inc |
15 | ||||||
| 2,163 |
HSN, Inc |
78 | ||||||
| 8,352 |
JC Penney Co, Inc |
294 | ||||||
| 1,456 |
* | JOS A Bank Clothiers, Inc |
71 | |||||
| 891 |
* | Kirkland’s, Inc |
12 | |||||
| 13,394 |
Kohl’s Corp |
661 | ||||||
| 29,611 |
* | Liberty Media Holding Corp (Interactive A) |
480 | |||||
| 12,451 |
Limited Brands, Inc |
502 | ||||||
| 1,111 |
Lithia Motors, Inc (Class A) |
24 | ||||||
| 7,568 |
* | LKQ Corp |
228 | |||||
| 64,515 |
Lowe’s Companies, Inc |
1,637 | ||||||
| 1,022 |
* | Lumber Liquidators, Inc |
18 | |||||
| 21,007 |
Macy’s, Inc |
676 | ||||||
| 1,129 |
* | MarineMax, Inc |
7 | |||||
| 2,734 |
Men’s Wearhouse, Inc |
89 | ||||||
| 1,144 |
Monro Muffler, Inc |
44 | ||||||
| 2,655 |
* | NetFlix, Inc |
184 | |||||
| 888 |
* | New York & Co, Inc |
2 | |||||
| 8,242 |
Nordstrom, Inc |
410 | ||||||
| 1,665 |
e | Nutri/System, Inc |
21 | |||||
| 6,966 |
* | Office Depot, Inc |
15 | |||||
| 943 |
* | OfficeMax, Inc |
4 | |||||
34
TIAA SEPARATE ACCOUNT VA-1 - Stock Index Account
|
SHARES |
COMPANY |
VALUE (000) |
||||||
| 1,309 |
* | Orbitz Worldwide, Inc |
$ | 5 | ||||
| 88 |
* | Orchard Supply Hardware Stores Corp |
0 | ^ | ||||
| 6,746 |
* | O’Reilly Automotive, Inc |
539 | |||||
| 840 |
*,e | Overstock.com, Inc |
7 | |||||
| 2,275 |
*,e | Pacific Sunwear Of California, Inc |
4 | |||||
| 2,259 |
Penske Auto Group, Inc |
44 | ||||||
| 2,583 |
PEP Boys - Manny Moe & Jack |
28 | ||||||
| 1,182 |
e | PetMed Express, Inc |
12 | |||||
| 5,722 |
Petsmart, Inc |
294 | ||||||
| 4,168 |
* | Pier 1 Imports, Inc |
58 | |||||
| 2,439 |
* | Priceline.com, Inc |
1,141 | |||||
| 5,358 |
RadioShack Corp |
52 | ||||||
| 3,215 |
Rent-A-Center, Inc |
119 | ||||||
| 11,884 |
Ross Stores, Inc |
565 | ||||||
| 769 |
*,e | Rue21, Inc |
17 | |||||
| 5,829 |
*,e | Saks, Inc |
57 | |||||
| 5,024 |
* | Sally Beauty Holdings, Inc |
106 | |||||
| 1,956 |
*,e | Sears Holdings Corp |
62 | |||||
| 2,125 |
* | Select Comfort Corp |
46 | |||||
| 517 |
* | Shoe Carnival, Inc |
13 | |||||
| 1,500 |
* | Shutterfly, Inc |
34 | |||||
| 4,387 |
Signet Jewelers Ltd |
193 | ||||||
| 2,027 |
e | Sonic Automotive, Inc (Class A) |
30 | |||||
| 210 |
* | Sourceforge, Inc |
4 | |||||
| 1,811 |
Stage Stores, Inc |
25 | ||||||
| 34,995 |
Staples, Inc |
486 | ||||||
| 1,440 |
* | Stein Mart, Inc |
10 | |||||
| 461 |
* | Systemax, Inc |
8 | |||||
| 3,432 |
*,e | Talbots, Inc |
9 | |||||
| 34,188 |
Target Corp |
1,751 | ||||||
| 6,456 |
Tiffany & Co |
428 | ||||||
| 19,114 |
TJX Companies, Inc |
1,234 | ||||||
| 3,651 |
Tractor Supply Co |
256 | ||||||
| 4,900 |
* | TripAdvisor, Inc |
124 | |||||
| 1,789 |
* | Tuesday Morning Corp |
6 | |||||
| 2,292 |
* | Ulta Salon Cosmetics & Fragrance, Inc |
149 | |||||
| 6,051 |
* | Urban Outfitters, Inc |
167 | |||||
| 658 |
* | US Auto Parts Network, Inc |
3 | |||||
| 2,104 |
*,e | Valuevision International, Inc (Class A) |
4 | |||||
| 1,261 |
* | Vitamin Shoppe, Inc |
50 | |||||
| 640 |
* | West Marine, Inc |
7 | |||||
| 5,043 |
* | Wet Seal, Inc (Class A) |
16 | |||||
| 5,095 |
Williams-Sonoma, Inc |
196 | ||||||
| 133 |
Winmark Corp |
8 | ||||||
| 1,626 |
*,e | Zale Corp |
6 | |||||
| 933 |
* | Zumiez, Inc |
26 | |||||
|
|
|
|||||||
| TOTAL RETAILING |
26,949 | |||||||
|
|
|
|||||||
| SEMICONDUCTORS & SEMICONDUCTOR EQUIPMENT - 2.6% |
||||||||
| 2,343 |
* | Advanced Analogic Technologies, Inc |
14 | |||||
| 2,226 |
* | Advanced Energy Industries, Inc |
24 | |||||
| 31,059 |
* | Advanced Micro Devices, Inc |
168 | |||||
| 15,906 |
Altera Corp |
590 | ||||||
| 4,798 |
*,e | Amkor Technology, Inc |
21 | |||||
| 478 |
* | Amtech Systems, Inc |
4 | |||||
| 3,097 |
* | Anadigics, Inc |
7 | |||||
| 14,698 |
Analog Devices, Inc |
526 | ||||||
| 65,306 |
Applied Materials, Inc |
699 | ||||||
| 3,650 |
* | Applied Micro Circuits Corp |
24 | |||||
| 22,988 |
* | Atmel Corp |
186 | |||||
| 1,604 |
* | ATMI, Inc |
32 | |||||
| 9,665 |
Avago Technologies Ltd |
279 | ||||||
| 5,359 |
* | Axcelis Technologies, Inc |
7 | |||||
| 1,469 |
* | AXT, Inc |
6 | |||||
| 26,514 |
Broadcom Corp (Class A) |
778 | ||||||
35
TIAA SEPARATE ACCOUNT VA-1 - Stock Index Account
|
SHARES |
COMPANY |
VALUE (000) |
||||||
| 3,308 |
Brooks Automation, Inc |
$ | 34 | |||||
| 806 |
* | Cabot Microelectronics Corp |
38 | |||||
| 2,448 |
* | Cavium Networks, Inc |
70 | |||||
| 1,230 |
*,e | Ceva, Inc |
37 | |||||
| 3,363 |
* | Cirrus Logic, Inc |
53 | |||||
| 1,302 |
Cohu, Inc |
15 | ||||||
| 5,075 |
* | Cree, Inc |
112 | |||||
| 1,601 |
* | Cymer, Inc |
80 | |||||
| 7,650 |
* | Cypress Semiconductor Corp |
129 | |||||
| 1,921 |
* | Diodes, Inc |
41 | |||||
| 1,224 |
* | DSP Group, Inc |
6 | |||||
| 6,714 |
* | Entegris, Inc |
59 | |||||
| 1,108 |
* | Entropic Communications, Inc |
6 | |||||
| 2,444 |
* | Exar Corp |
16 | |||||
| 6,623 |
* | Fairchild Semiconductor International, Inc |
80 | |||||
| 3,006 |
* | First Solar, Inc |
101 | |||||
| 2,618 |
* | Formfactor, Inc |
13 | |||||
| 2,182 |
*,e | Freescale Semiconductor Holdings Ltd |
28 | |||||
| 1,543 |
* | FSI International, Inc |
6 | |||||
| 1,030 |
* | GSI Technology, Inc |
5 | |||||
| 6,373 |
*,e | GT Solar International, Inc |
46 | |||||
| 1,313 |
* | Hittite Microwave Corp |
65 | |||||
| 1,024 |
* | Inphi Corp |
12 | |||||
| 6,477 |
* | Integrated Device Technology, Inc |
35 | |||||
| 1,216 |
* | Integrated Silicon Solution, Inc |
11 | |||||
| 261,878 |
Intel Corp |
6,351 | ||||||
| 3,528 |
* | International Rectifier Corp |
68 | |||||
| 6,580 |
Intersil Corp (Class A) |
69 | ||||||
| 1,231 |
* | IXYS Corp |
13 | |||||
| 8,488 |
Kla-Tencor Corp |
410 | ||||||
| 4,206 |
* | Kopin Corp |
16 | |||||
| 3,600 |
* | Kulicke & Soffa Industries, Inc |
33 | |||||
| 6,321 |
* | Lam Research Corp |
234 | |||||
| 5,950 |
* | Lattice Semiconductor Corp |
35 | |||||
| 11,504 |
Linear Technology Corp |
345 | ||||||
| 27,928 |
* | LSI Logic Corp |
166 | |||||
| 2,408 |
* | LTX-Credence Corp |
13 | |||||
| 25,651 |
* | Marvell Technology Group Ltd |
355 | |||||
| 14,328 |
Maxim Integrated Products, Inc |
373 | ||||||
| 383 |
* | MaxLinear, Inc |
2 | |||||
| 12,002 |
*,e | MEMC Electronic Materials, Inc |
47 | |||||
| 2,455 |
Micrel, Inc |
25 | ||||||
| 9,163 |
e | Microchip Technology, Inc |
336 | |||||
| 42,944 |
* | Micron Technology, Inc |
270 | |||||
| 4,543 |
* | Microsemi Corp |
76 | |||||
| 1,664 |
* | Mindspeed Technologies, Inc |
8 | |||||
| 2,847 |
* | MIPS Technologies, Inc |
13 | |||||
| 2,658 |
MKS Instruments, Inc |
74 | ||||||
| 1,520 |
* | Monolithic Power Systems, Inc |
23 | |||||
| 1,391 |
*,e | MoSys, Inc |
6 | |||||
| 1,014 |
* | Nanometrics, Inc |
19 | |||||
| 3,449 |
* | Netlogic Microsystems, Inc |
171 | |||||
| 3,472 |
* | Novellus Systems, Inc |
143 | |||||
| 258 |
*,e | NVE Corp |
14 | |||||
| 29,569 |
* | Nvidia Corp |
410 | |||||
| 2,767 |
* | Omnivision Technologies, Inc |
34 | |||||
| 22,681 |
* | ON Semiconductor Corp |
175 | |||||
| 1,181 |
* | PDF Solutions, Inc |
8 | |||||
| 1,447 |
* | Pericom Semiconductor Corp |
11 | |||||
| 2,703 |
* | Photronics, Inc |
16 | |||||
| 1,628 |
* | PLX Technology, Inc |
5 | |||||
| 11,786 |
* | PMC - Sierra, Inc |
65 | |||||
| 1,292 |
e | Power Integrations, Inc |
43 | |||||
| 4,553 |
* | Rambus, Inc |
34 | |||||
| 13,977 |
* | RF Micro Devices, Inc |
75 | |||||
36
TIAA SEPARATE ACCOUNT VA-1 - Stock Index Account
|
SHARES |
COMPANY |
VALUE (000) |
||||||
| 782 |
* | Rubicon Technology, Inc |
$ | 7 | ||||
| 1,464 |
* | Rudolph Technologies, Inc |
14 | |||||
| 3,192 |
* | Semtech Corp |
79 | |||||
| 1,525 |
* | Sigma Designs, Inc |
9 | |||||
| 1,816 |
* | Silicon Image, Inc |
9 | |||||
| 2,178 |
*,e | Silicon Laboratories, Inc |
95 | |||||
| 9,357 |
* | Skyworks Solutions, Inc |
152 | |||||
| 2,527 |
* | Spansion, Inc |
21 | |||||
| 1,279 |
* | Standard Microsystems Corp |
33 | |||||
| 1,361 |
* | STR Holdings, Inc |
11 | |||||
| 2,241 |
*,e | SunPower Corp |
14 | |||||
| 145 |
* | Supertex, Inc |
3 | |||||
| 9,372 |
* | Teradyne, Inc |
128 | |||||
| 2,769 |
* | Tessera Technologies, Inc |
46 | |||||
| 57,593 |
Texas Instruments, Inc |
1,677 | ||||||
| 8,183 |
* | Triquint Semiconductor, Inc |
40 | |||||
| 928 |
* | Ultra Clean Holdings |
6 | |||||
| 1,279 |
* | Ultratech, Inc |
31 | |||||
| 2,021 |
*,e | Veeco Instruments, Inc |
42 | |||||
| 1,235 |
* | Volterra Semiconductor Corp |
32 | |||||
| 12,863 |
Xilinx, Inc |
412 | ||||||
|
|
|
|||||||
| TOTAL SEMICONDUCTORS & SEMICONDUCTOR EQUIPMENT |
17,908 | |||||||
|
|
|
|||||||
| SOFTWARE & SERVICES - 9.1% |
||||||||
| 2,523 |
* | Accelrys, Inc |
17 | |||||
| 31,807 |
Accenture plc |
1,693 | ||||||
| 1,790 |
* | ACI Worldwide, Inc |
51 | |||||
| 607 |
*,e | Active Network, Inc |
8 | |||||
| 21,290 |
Activision Blizzard, Inc |
262 | ||||||
| 2,448 |
* | Actuate Corp |
14 | |||||
| 3,603 |
* | Acxiom Corp |
44 | |||||
| 24,695 |
* | Adobe Systems, Inc |
698 | |||||
| 1,656 |
* | Advent Software, Inc |
40 | |||||
| 9,598 |
* | Akamai Technologies, Inc |
310 | |||||
| 2,494 |
* | Alliance Data Systems Corp |
259 | |||||
| 8,870 |
* | Amdocs Ltd |
253 | |||||
| 764 |
American Software, Inc (Class A) |
7 | ||||||
| 1,605 |
*,e | Ancestry.com, Inc |
37 | |||||
| 4,500 |
* | Ansys, Inc |
258 | |||||
| 5,610 |
* | AOL, Inc |
85 | |||||
| 4,883 |
* | Ariba, Inc |
137 | |||||
| 4,286 |
* | Aspen Technology, Inc |
74 | |||||
| 11,543 |
* | Autodesk, Inc |
350 | |||||
| 24,628 |
Automatic Data Processing, Inc |
1,330 | ||||||
| 2,369 |
Blackbaud, Inc |
66 | ||||||
| 8,499 |
* | BMC Software, Inc |
279 | |||||
| 1,196 |
* | Booz Allen Hamilton Holding Co |
21 | |||||
| 1,713 |
* | Bottomline Technologies, Inc |
40 | |||||
| 6,224 |
Broadridge Financial Solutions, Inc |
140 | ||||||
| 1,143 |
*,e | BroadSoft, Inc |
35 | |||||
| 18,633 |
CA, Inc |
377 | ||||||
| 1,266 |
* | CACI International, Inc (Class A) |
71 | |||||
| 14,290 |
* | Cadence Design Systems, Inc |
149 | |||||
| 1,555 |
*,e | Callidus Software, Inc |
10 | |||||
| 2,159 |
* | Cardtronics, Inc |
58 | |||||
| 437 |
Cass Information Systems, Inc |
16 | ||||||
| 3,700 |
* | Ciber, Inc |
14 | |||||
| 9,265 |
* | Citrix Systems, Inc |
563 | |||||
| 643 |
*,m | Clinical Data, Inc |
1 | |||||
| 15,063 |
* | Cognizant Technology Solutions Corp (Class A) |
969 | |||||
| 2,159 |
* | Commvault Systems, Inc |
92 | |||||
| 7,822 |
Computer Sciences Corp |
185 | ||||||
| 760 |
* | Computer Task Group, Inc |
11 | |||||
| 11,006 |
* | Compuware Corp |
92 | |||||
| 1,622 |
* | comScore, Inc |
34 | |||||
| 2,256 |
* | Concur Technologies, Inc |
115 | |||||
37
TIAA SEPARATE ACCOUNT VA-1 - Stock Index Account
|
SHARES |
COMPANY |
VALUE (000) |
||||||
| 1,503 |
*,e | Constant Contact, Inc |
$ | 35 | ||||
| 5,243 |
* | Convergys Corp |
67 | |||||
| 629 |
* | Convio, Inc |
7 | |||||
| 577 |
*,e | Cornerstone OnDemand, Inc |
11 | |||||
| 1,795 |
* | CSG Systems International, Inc |
26 | |||||
| 2,053 |
* | DealerTrack Holdings, Inc |
56 | |||||
| 1,002 |
* | Deltek, Inc |
10 | |||||
| 412 |
*,e | Demand Media, Inc |
3 | |||||
| 1,654 |
* | DemandTec, Inc |
22 | |||||
| 2,464 |
* | Dice Holdings, Inc |
20 | |||||
| 2,001 |
* | Digital River, Inc |
30 | |||||
| 335 |
* | DMRC Corp |
8 | |||||
| 1,703 |
DST Systems, Inc |
78 | ||||||
| 5,728 |
Earthlink, Inc |
37 | ||||||
| 56,768 |
* | eBay, Inc |
1,722 | |||||
| 1,521 |
e | Ebix, Inc |
34 | |||||
| 539 |
*,e | Echo Global Logistics, Inc |
9 | |||||
| 16,785 |
* | Electronic Arts, Inc |
346 | |||||
| 993 |
* | Envestnet, Inc |
12 | |||||
| 1,587 |
EPIQ Systems, Inc |
19 | ||||||
| 206 |
* | ePlus, Inc |
6 | |||||
| 2,338 |
* | Equinix, Inc |
237 | |||||
| 2,804 |
* | Euronet Worldwide, Inc |
52 | |||||
| 863 |
* | ExlService Holdings, Inc |
19 | |||||
| 2,331 |
Factset Research Systems, Inc |
203 | ||||||
| 2,007 |
Fair Isaac Corp |
72 | ||||||
| 2,479 |
* | FalconStor Software, Inc |
6 | |||||
| 13,376 |
Fidelity National Information Services, Inc |
356 | ||||||
| 4,905 |
* | First American Corp |
63 | |||||
| 6,984 |
* | Fiserv, Inc |
410 | |||||
| 850 |
* | FleetCor Technologies, Inc |
25 | |||||
| 471 |
* | Forrester Research, Inc |
16 | |||||
| 6,047 |
* | Fortinet, Inc |
132 | |||||
| 4,737 |
* | Gartner, Inc |
165 | |||||
| 6,359 |
* | Genpact Ltd |
95 | |||||
| 1,221 |
*,e,m | Gerber Scientific, Inc |
0 | ^ | ||||
| 2,712 |
* | Global Cash Access, Inc |
12 | |||||
| 4,051 |
Global Payments, Inc |
192 | ||||||
| 2,157 |
*,e | Glu Mobile, Inc |
7 | |||||
| 12,441 |
* | Google, Inc (Class A) |
8,036 | |||||
| 680 |
* | Guidance Software, Inc |
4 | |||||
| 1,547 |
* | Hackett Group, Inc |
6 | |||||
| 1,893 |
Heartland Payment Systems, Inc |
46 | ||||||
| 1,560 |
*,e | Higher One Holdings, Inc |
29 | |||||
| 3,483 |
IAC/InterActiveCorp |
148 | ||||||
| 1,449 |
*,e | iGate Corp |
23 | |||||
| 5,344 |
* | Informatica Corp |
197 | |||||
| 2,218 |
* | Infospace, Inc |
24 | |||||
| 803 |
* | Interactive Intelligence, Inc |
18 | |||||
| 3,256 |
* | Internap Network Services Corp |
19 | |||||
| 59,851 |
International Business Machines Corp |
11,005 | ||||||
| 14,216 |
Intuit, Inc |
748 | ||||||
| 2,389 |
j2 Global, Inc |
67 | ||||||
| 4,357 |
Jack Henry & Associates, Inc |
146 | ||||||
| 2,111 |
* | JDA Software Group, Inc |
68 | |||||
| 1,328 |
* | Kenexa Corp |
35 | |||||
| 941 |
Keynote Systems, Inc |
19 | ||||||
| 1,804 |
*,e | KIT Digital, Inc |
15 | |||||
| 1,667 |
* | Knot, Inc |
14 | |||||
| 4,363 |
Lender Processing Services, Inc |
66 | ||||||
| 3,363 |
*,e | Limelight Networks, Inc |
10 | |||||
| 450 |
*,e | LinkedIn Corp |
28 | |||||
| 3,304 |
* | Lionbridge Technologies |
8 | |||||
| 947 |
* | Liquidity Services, Inc |
35 | |||||
| 2,686 |
* | Liveperson, Inc |
34 | |||||
38
TIAA SEPARATE ACCOUNT VA-1 - Stock Index Account
|
SHARES |
COMPANY |
VALUE (000) |
||||||
| 1,024 |
* | LogMeIn, Inc |
$ | 39 | ||||
| 833 |
* | LoopNet, Inc |
15 | |||||
| 3,399 |
* | Magma Design Automation, Inc |
24 | |||||
| 849 |
* | Manhattan Associates, Inc |
34 | |||||
| 1,171 |
Mantech International Corp (Class A) |
37 | ||||||
| 1,311 |
e | Marchex, Inc (Class B) |
8 | |||||
| 5,282 |
Mastercard, Inc (Class A) |
1,969 | ||||||
| 1,366 |
MAXIMUS, Inc |
57 | ||||||
| 5,422 |
* | Mentor Graphics Corp |
74 | |||||
| 4,046 |
* | Micros Systems, Inc |
188 | |||||
| 366,653 |
Microsoft Corp |
9,518 | ||||||
| 425 |
* | MicroStrategy, Inc (Class A) |
46 | |||||
| 2,352 |
ModusLink Global Solutions, Inc |
13 | ||||||
| 587 |
* | MoneyGram International, Inc |
10 | |||||
| 1,800 |
* | Monotype Imaging Holdings, Inc |
28 | |||||
| 4,617 |
* | Monster Worldwide, Inc |
37 | |||||
| 1,841 |
*,e | Motricity, Inc |
2 | |||||
| 2,146 |
* | Move, Inc |
14 | |||||
| 390 |
* | NCI, Inc (Class A) |
5 | |||||
| 1,792 |
* | Netscout Systems, Inc |
32 | |||||
| 1,383 |
* | NetSuite, Inc |
56 | |||||
| 3,728 |
* | NeuStar, Inc (Class A) |
127 | |||||
| 3,206 |
* | NIC, Inc |
43 | |||||
| 12,038 |
* | Nuance Communications, Inc |
303 | |||||
| 1,193 |
*,e | OpenTable, Inc |
47 | |||||
| 4,315 |
* | Openwave Systems, Inc |
7 | |||||
| 721 |
Opnet Technologies, Inc |
26 | ||||||
| 189,696 |
Oracle Corp |
4,866 | ||||||
| 6,032 |
* | Parametric Technology Corp |
110 | |||||
| 16,218 |
Paychex, Inc |
488 | ||||||
| 792 |
e | Pegasystems, Inc |
23 | |||||
| 1,252 |
* | Perficient, Inc |
13 | |||||
| 958 |
* | PRG-Schultz International, Inc |
6 | |||||
| 3,430 |
* | Progress Software Corp |
66 | |||||
| 1,099 |
* | PROS Holdings, Inc |
16 | |||||
| 400 |
* | QAD, Inc (Class A) |
4 | |||||
| 3,549 |
* | QLIK Technologies, Inc |
86 | |||||
| 2,811 |
* | Quest Software, Inc |
52 | |||||
| 1,192 |
* | QuinStreet, Inc |
11 | |||||
| 5,131 |
* | Rackspace Hosting, Inc |
221 | |||||
| 1,085 |
RealNetworks, Inc |
8 | ||||||
| 1,540 |
* | RealPage, Inc |
39 | |||||
| 9,757 |
* | Red Hat, Inc |
403 | |||||
| 487 |
* | Responsys, Inc |
4 | |||||
| 1,137 |
* | RightNow Technologies, Inc |
49 | |||||
| 560 |
* | Rosetta Stone, Inc |
4 | |||||
| 5,671 |
* | Rovi Corp |
139 | |||||
| 2,512 |
* | S1 Corp |
24 | |||||
| 1,356 |
* | Saba Software, Inc |
11 | |||||
| 14,297 |
* | SAIC, Inc |
176 | |||||
| 6,646 |
* | Salesforce.com, Inc |
674 | |||||
| 5,190 |
Sapient Corp |
65 | ||||||
| 611 |
* | Sciquest, Inc |
9 | |||||
| 1,446 |
* | Seachange International, Inc |
10 | |||||
| 492 |
*,e | ServiceSource International LLC |
8 | |||||
| 1,583 |
* | Smith Micro Software, Inc |
2 | |||||
| 2,865 |
* | SolarWinds, Inc |
80 | |||||
| 3,564 |
Solera Holdings, Inc |
159 | ||||||
| 1,445 |
*,e | Sourcefire, Inc |
47 | |||||
| 262 |
* | SPS Commerce, Inc |
7 | |||||
| 470 |
* | SRS Labs, Inc |
3 | |||||
| 620 |
* | SS&C Technologies Holdings, Inc |
11 | |||||
| 510 |
* | Stamps.com, Inc |
13 | |||||
| 3,981 |
* | SuccessFactors, Inc |
159 | |||||
| 2,697 |
* | SupportSoft, Inc |
6 | |||||
39
TIAA SEPARATE ACCOUNT VA-1 - Stock Index Account
|
SHARES |
COMPANY |
VALUE (000) |
||||||
| 37,307 |
* | Symantec Corp |
$ | 584 | ||||
| 1,334 |
* | Synchronoss Technologies, Inc |
40 | |||||
| 6,909 |
* | Synopsys, Inc |
188 | |||||
| 744 |
Syntel, Inc |
35 | ||||||
| 1,633 |
* | TA Indigo Holding Corp |
10 | |||||
| 3,743 |
* | Take-Two Interactive Software, Inc |
51 | |||||
| 2,022 |
* | Taleo Corp (Class A) |
78 | |||||
| 598 |
* | TechTarget, Inc |
3 | |||||
| 1,946 |
* | TeleCommunication Systems, Inc (Class A) |
5 | |||||
| 834 |
* | TeleNav, Inc |
7 | |||||
| 1,647 |
* | TeleTech Holdings, Inc |
27 | |||||
| 8,229 |
* | Teradata Corp |
399 | |||||
| 3,557 |
*,e | THQ, Inc |
3 | |||||
| 8,177 |
* | TIBCO Software, Inc |
195 | |||||
| 5,735 |
* | TiVo, Inc |
51 | |||||
| 1,534 |
* | TNS, Inc |
27 | |||||
| 8,268 |
Total System Services, Inc |
162 | ||||||
| 285 |
*,e | Travelzoo, Inc |
7 | |||||
| 1,686 |
*,e | Tyler Technologies, Inc |
51 | |||||
| 1,323 |
* | Ultimate Software Group, Inc |
86 | |||||
| 2,353 |
* | Unisys Corp |
46 | |||||
| 4,557 |
United Online, Inc |
25 | ||||||
| 4,321 |
* | Valueclick, Inc |
70 | |||||
| 1,577 |
* | Vasco Data Security International |
10 | |||||
| 5,078 |
* | VeriFone Systems, Inc |
180 | |||||
| 1,073 |
* | Verint Systems, Inc |
30 | |||||
| 8,653 |
VeriSign, Inc |
309 | ||||||
| 2,063 |
*,e | VirnetX Holding Corp |
52 | |||||
| 620 |
* | Virtusa Corp |
9 | |||||
| 25,816 |
Visa, Inc (Class A) |
2,621 | ||||||
| 1,682 |
*,e | VistaPrint Ltd |
51 | |||||
| 4,280 |
* | VMware, Inc (Class A) |
356 | |||||
| 792 |
* | Vocus, Inc |
18 | |||||
| 4,167 |
*,e | Wave Systems Corp |
9 | |||||
| 2,978 |
* | WebMD Health Corp (Class A) |
112 | |||||
| 2,294 |
* | Websense, Inc |
43 | |||||
| 1,494 |
* | Website Pros, Inc |
17 | |||||
| 31,734 |
Western Union Co |
579 | ||||||
| 1,956 |
* | Wright Express Corp |
106 | |||||
| 64,852 |
* | Yahoo!, Inc |
1,046 | |||||
| 3,311 |
* | Zix Corp |
9 | |||||
|
|
|
|||||||
| TOTAL SOFTWARE & SERVICES |
63,271 | |||||||
|
|
|
|||||||
| TECHNOLOGY HARDWARE & EQUIPMENT - 6.6% |
||||||||
| 2,135 |
*,e | 3D Systems Corp |
31 | |||||
| 2,645 |
* | Acme Packet, Inc |
82 | |||||
| 3,005 |
Adtran, Inc |
91 | ||||||
| 1,334 |
* | Agilysys, Inc |
11 | |||||
| 8,883 |
Amphenol Corp (Class A) |
403 | ||||||
| 1,061 |
* | Anaren, Inc |
18 | |||||
| 1,463 |
* | Anixter International, Inc |
87 | |||||
| 45,850 |
* | Apple, Inc |
18,569 | |||||
| 6,732 |
* | Arris Group, Inc |
73 | |||||
| 5,741 |
* | Arrow Electronics, Inc |
215 | |||||
| 4,318 |
* | Aruba Networks, Inc |
80 | |||||
| 1,355 |
* | Avid Technology, Inc |
12 | |||||
| 7,723 |
* | Avnet, Inc |
240 | |||||
| 2,526 |
AVX Corp |
32 | ||||||
| 995 |
* | AX Holding Corp |
10 | |||||
| 674 |
Bel Fuse, Inc (Class B) |
13 | ||||||
| 3,073 |
* | Benchmark Electronics, Inc |
41 | |||||
| 973 |
Black Box Corp |
27 | ||||||
| 2,165 |
* | Blue Coat Systems, Inc |
55 | |||||
| 1,815 |
*,e | Bookham, Inc |
5 | |||||
| 3,698 |
* | Brightpoint, Inc |
40 | |||||
40
TIAA SEPARATE ACCOUNT VA-1 - Stock Index Account
|
SHARES |
COMPANY |
VALUE (000) |
||||||
| 23,844 |
* | Brocade Communications Systems, Inc |
$ | 124 | ||||
| 1,907 |
* | Calix Networks, Inc |
12 | |||||
| 2,124 |
* | Checkpoint Systems, Inc |
23 | |||||
| 4,899 |
* | Ciena Corp |
59 | |||||
| 271,589 |
Cisco Systems, Inc |
4,910 | ||||||
| 2,099 |
Cognex Corp |
75 | ||||||
| 1,347 |
* | Coherent, Inc |
70 | |||||
| 997 |
Comtech Telecommunications Corp |
29 | ||||||
| 77,658 |
Corning, Inc |
1,008 | ||||||
| 1,943 |
* | Cray, Inc |
13 | |||||
| 1,799 |
CTS Corp |
17 | ||||||
| 2,087 |
Daktronics, Inc |
20 | ||||||
| 591 |
DDi Corp |
6 | ||||||
| 80,832 |
* | Dell, Inc |
1,183 | |||||
| 3,297 |
Diebold, Inc |
99 | ||||||
| 1,490 |
* | Digi International, Inc |
17 | |||||
| 2,346 |
* | Dolby Laboratories, Inc (Class A) |
72 | |||||
| 2,969 |
* | Dot Hill Systems Corp |
4 | |||||
| 1,039 |
* | DTS, Inc |
28 | |||||
| 1,837 |
* | Echelon Corp |
9 | |||||
| 1,973 |
* | EchoStar Corp (Class A) |
41 | |||||
| 1,000 |
Electro Rent Corp |
17 | ||||||
| 1,450 |
* | Electro Scientific Industries, Inc |
21 | |||||
| 2,122 |
* | Electronics for Imaging, Inc |
30 | |||||
| 805 |
*,e | eMagin Corp |
3 | |||||
| 101,603 |
* | EMC Corp |
2,189 | |||||
| 4,555 |
* | EMCORE Corp |
4 | |||||
| 3,637 |
* | Emulex Corp |
25 | |||||
| 4,537 |
* | Extreme Networks, Inc |
13 | |||||
| 4,066 |
* | F5 Networks, Inc |
432 | |||||
| 1,026 |
* | Fabrinet |
14 | |||||
| 910 |
* | FARO Technologies, Inc |
42 | |||||
| 2,013 |
* | FEI Co |
82 | |||||
| 3,991 |
* | Finisar Corp |
67 | |||||
| 8,113 |
Flir Systems, Inc |
203 | ||||||
| 1,197 |
* | Globecomm Systems, Inc |
16 | |||||
| 1,328 |
* | GSI Group, Inc |
14 | |||||
| 5,307 |
* | Harmonic, Inc |
27 | |||||
| 5,725 |
Harris Corp |
206 | ||||||
| 3,340 |
* | Harris Stratex Networks, Inc (Class A) |
6 | |||||
| 98,253 |
Hewlett-Packard Co |
2,531 | ||||||
| 1,552 |
* | Imation Corp |
9 | |||||
| 1,615 |
* | Immersion Corp |
8 | |||||
| 5,305 |
* | Infinera Corp |
33 | |||||
| 7,896 |
* | Ingram Micro, Inc (Class A) |
144 | |||||
| 2,496 |
* | Insight Enterprises, Inc |
38 | |||||
| 2,201 |
e | InterDigital, Inc |
96 | |||||
| 2,592 |
* | Intermec, Inc |
18 | |||||
| 1,163 |
* | Intevac, Inc |
9 | |||||
| 1,382 |
* | IPG Photonics Corp |
47 | |||||
| 2,131 |
* | Itron, Inc |
76 | |||||
| 1,708 |
* | Ixia |
18 | |||||
| 9,514 |
Jabil Circuit, Inc |
187 | ||||||
| 11,409 |
* | JDS Uniphase Corp |
119 | |||||
| 26,203 |
* | Juniper Networks, Inc |
535 | |||||
| 758 |
* | KVH Industries, Inc |
6 | |||||
| 852 |
* | LeCroy Corp |
7 | |||||
| 3,991 |
Lexmark International, Inc (Class A) |
132 | ||||||
| 1,154 |
Littelfuse, Inc |
50 | ||||||
| 522 |
* | Loral Space & Communications, Inc |
34 | |||||
| 1,385 |
*,e | Maxwell Technologies, Inc |
22 | |||||
| 742 |
* | Measurement Specialties, Inc |
21 | |||||
| 1,540 |
* | Mercury Computer Systems, Inc |
20 | |||||
| 559 |
*,e | Meru Networks, Inc |
2 | |||||
| 2,035 |
Methode Electronics, Inc |
17 | ||||||
41
TIAA SEPARATE ACCOUNT VA-1 - Stock Index Account
|
SHARES |
COMPANY |
VALUE (000) |
||||||
| 4,736 |
*,e | Microvision, Inc |
$ | 2 | ||||
| 6,577 |
e | Molex, Inc |
157 | |||||
| 12,794 |
* | Motorola Mobility Holdings, Inc |
496 | |||||
| 14,864 |
Motorola, Inc |
688 | ||||||
| 860 |
MTS Systems Corp |
35 | ||||||
| 555 |
* | Multi-Fineline Electronix, Inc |
11 | |||||
| 4,591 |
National Instruments Corp |
119 | ||||||
| 8,029 |
* | NCR Corp |
132 | |||||
| 18,185 |
* | NetApp, Inc |
660 | |||||
| 1,861 |
* | Netgear, Inc |
62 | |||||
| 2,159 |
* | Newport Corp |
29 | |||||
| 1,922 |
* | Novatel Wireless, Inc |
6 | |||||
| 496 |
* | Numerex Corp |
4 | |||||
| 2,560 |
*,e | OCZ Technology Group, Inc |
17 | |||||
| 1,210 |
* | Oplink Communications, Inc |
20 | |||||
| 1,144 |
* | OpNext, Inc |
1 | |||||
| 970 |
* | OSI Systems, Inc |
47 | |||||
| 1,164 |
Park Electrochemical Corp |
30 | ||||||
| 143 |
PC Connection, Inc |
2 | ||||||
| 2,432 |
Plantronics, Inc |
87 | ||||||
| 1,613 |
* | Plexus Corp |
44 | |||||
| 8,460 |
* | Polycom, Inc |
138 | |||||
| 3,047 |
* | Power-One, Inc |
12 | |||||
| 1,461 |
*,e | Powerwave Technologies, Inc |
3 | |||||
| 581 |
* | Procera Networks, Inc |
9 | |||||
| 5,284 |
* | QLogic Corp |
79 | |||||
| 82,432 |
Qualcomm, Inc |
4,509 | ||||||
| 11,444 |
* | Quantum Corp |
27 | |||||
| 1,782 |
*,e | Rackable Systems, Inc |
20 | |||||
| 1,200 |
* | Radisys Corp |
6 | |||||
| 1,970 |
*,e | RealD, Inc |
16 | |||||
| 717 |
Richardson Electronics Ltd |
9 | ||||||
| 630 |
Rimage Corp |
7 | ||||||
| 7,755 |
* | Riverbed Technology, Inc |
182 | |||||
| 1,445 |
* | Rofin-Sinar Technologies, Inc |
33 | |||||
| 644 |
* | Rogers Corp |
24 | |||||
| 11,904 |
* | SanDisk Corp |
586 | |||||
| 4,084 |
* | Sanmina-SCI Corp |
38 | |||||
| 1,430 |
* | Scansource, Inc |
51 | |||||
| 1,902 |
* | SCM Microsystems, Inc |
4 | |||||
| 2,605 |
* | ShoreTel, Inc |
17 | |||||
| 11,025 |
* | Sonus Networks, Inc |
26 | |||||
| 2,145 |
* | STEC, Inc |
18 | |||||
| 954 |
*,e | Stratasys, Inc |
29 | |||||
| 1,355 |
* | Super Micro Computer, Inc |
21 | |||||
| 1,033 |
* | Sycamore Networks, Inc |
19 | |||||
| 2,360 |
* | Symmetricom, Inc |
13 | |||||
| 1,327 |
* | Synaptics, Inc |
40 | |||||
| 1,272 |
* | SYNNEX Corp |
39 | |||||
| 1,958 |
* | Tech Data Corp |
97 | |||||
| 2,804 |
Technitrol, Inc |
8 | ||||||
| 3,400 |
* | Tekelec |
37 | |||||
| 18,322 |
Tellabs, Inc |
74 | ||||||
| 6,200 |
* | Trimble Navigation Ltd |
269 | |||||
| 2,608 |
* | TTM Technologies, Inc |
29 | |||||
| 1,939 |
*,e | Universal Display Corp |
71 | |||||
| 1,758 |
* | Viasat, Inc |
81 | |||||
| 128 |
* | Viasystems Group, Inc |
2 | |||||
| 7,643 |
* | Vishay Intertechnology, Inc |
69 | |||||
| 654 |
* | Vishay Precision Group, Inc |
10 | |||||
| 2,690 |
* | Westell Technologies, Inc |
6 | |||||
| 11,793 |
* | Western Digital Corp |
365 | |||||
| 68,581 |
Xerox Corp |
546 | ||||||
| 1,720 |
* | X-Rite, Inc |
8 | |||||
| 1,580 |
Xyratex Ltd |
21 | ||||||
42
TIAA SEPARATE ACCOUNT VA-1 - Stock Index Account
|
SHARES |
COMPANY |
VALUE (000) |
||||||
| 2,804 |
* | Zebra Technologies Corp (Class A) |
$ | 100 | ||||
| 1,176 |
* | Zygo Corp |
21 | |||||
|
|
|
|||||||
| TOTAL TECHNOLOGY HARDWARE & EQUIPMENT |
45,982 | |||||||
|
|
|
|||||||
| TELECOMMUNICATION SERVICES - 2.8% |
||||||||
| 3,067 |
*,e | 8x8, Inc |
10 | |||||
| 1,168 |
* | AboveNet, Inc |
76 | |||||
| 2,394 |
e | Alaska Communications Systems Group, Inc |
7 | |||||
| 19,627 |
* | American Tower Corp (Class A) |
1,178 | |||||
| 292,582 |
AT&T, Inc |
8,848 | ||||||
| 490 |
Atlantic Tele-Network, Inc |
19 | ||||||
| 662 |
* | Cbeyond Communications, Inc |
5 | |||||
| 30,405 |
CenturyTel, Inc |
1,131 | ||||||
| 10,048 |
* | Cincinnati Bell, Inc |
30 | |||||
| 7,934 |
* | Clearwire Corp (Class A) |
15 | |||||
| 2,389 |
* | Cogent Communications Group, Inc |
40 | |||||
| 1,438 |
Consolidated Communications Holdings, Inc |
27 | ||||||
| 14,487 |
* | Crown Castle International Corp |
649 | |||||
| 1,092 |
*,e | Fairpoint Communications, Inc |
5 | |||||
| 49,615 |
Frontier Communications Corp |
256 | ||||||
| 2,090 |
* | General Communication, Inc (Class A) |
20 | |||||
| 3,822 |
*,e | Globalstar, Inc |
2 | |||||
| 705 |
HickoryTech Corp |
8 | ||||||
| 609 |
IDT Corp (Class B) |
6 | ||||||
| 1,613 |
* | inContact, Inc |
7 | |||||
| 1,786 |
*,e | Iridium Communications, Inc |
14 | |||||
| 3,287 |
* | Leap Wireless International, Inc |
31 | |||||
| 7,503 |
* | Level 3 Communications, Inc |
128 | |||||
| 757 |
* | Lumos Networks Corp |
12 | |||||
| 14,039 |
* | MetroPCS Communications, Inc |
122 | |||||
| 1,751 |
* | Neutral Tandem, Inc |
19 | |||||
| 8,600 |
* | NII Holdings, Inc (Class B) |
183 | |||||
| 757 |
NTELOS Holdings Corp |
15 | ||||||
| 3,214 |
* | Premiere Global Services, Inc |
27 | |||||
| 5,606 |
* | SBA Communications Corp (Class A) |
241 | |||||
| 854 |
Shenandoah Telecom Co |
9 | ||||||
| 150,341 |
* | Sprint Nextel Corp |
352 | |||||
| 4,126 |
e | Telephone & Data Systems, Inc |
107 | |||||
| 1,746 |
*,e | Towerstream Corp |
4 | |||||
| 7,497 |
* | tw telecom inc (Class A) |
145 | |||||
| 432 |
* | US Cellular Corp |
19 | |||||
| 1,177 |
USA Mobility, Inc |
16 | ||||||
| 139,704 |
Verizon Communications, Inc |
5,605 | ||||||
| 7,062 |
* | Vonage Holdings Corp |
17 | |||||
| 28,704 |
Windstream Corp |
337 | ||||||
|
|
|
|||||||
| TOTAL TELECOMMUNICATION SERVICES |
19,742 | |||||||
|
|
|
|||||||
| TRANSPORTATION - 1.9% |
||||||||
| 2,669 |
* | Air Transport Services Group, Inc |
13 | |||||
| 1,608 |
* | Alaska Air Group, Inc |
121 | |||||
| 2,122 |
Alexander & Baldwin, Inc |
87 | ||||||
| 376 |
* | Allegiant Travel Co |
20 | |||||
| 407 |
* | Amerco, Inc |
36 | |||||
| 1,342 |
Arkansas Best Corp |
26 | ||||||
| 1,336 |
* | Atlas Air Worldwide Holdings, Inc |
51 | |||||
| 4,223 |
* | Avis Budget Group, Inc |
45 | |||||
| 684 |
Baltic Trading Ltd |
3 | ||||||
| 1,483 |
Celadon Group, Inc |
17 | ||||||
| 8,284 |
CH Robinson Worldwide, Inc |
578 | ||||||
| 2,731 |
Con-Way, Inc |
80 | ||||||
| 1,404 |
Copa Holdings S.A. (Class A) |
82 | ||||||
| 54,983 |
CSX Corp |
1,158 | ||||||
| 42,755 |
* | Delta Air Lines, Inc |
346 | |||||
| 1,521 |
* | Dollar Thrifty Automotive Group, Inc |
107 | |||||
| 2,567 |
*,e | Eagle Bulk Shipping, Inc |
2 | |||||
| 2,166 |
*,e | Excel Maritime Carriers Ltd |
3 | |||||
43
TIAA SEPARATE ACCOUNT VA-1 - Stock Index Account
|
SHARES |
COMPANY |
VALUE (000) |
||||||
| 10,605 |
Expeditors International Washington, Inc |
$ | 434 | |||||
| 15,739 |
FedEx Corp |
1,314 | ||||||
| 1,526 |
Forward Air Corp |
49 | ||||||
| 1,322 |
*,e | Genco Shipping & Trading Ltd |
9 | |||||
| 1,775 |
* | Genesee & Wyoming, Inc (Class A) |
108 | |||||
| 2,405 |
* | Hawaiian Holdings, Inc |
14 | |||||
| 1,514 |
Heartland Express, Inc |
22 | ||||||
| 12,337 |
* | Hertz Global Holdings, Inc |
145 | |||||
| 1,468 |
* | Hub Group, Inc (Class A) |
48 | |||||
| 357 |
International Shipholding Corp |
7 | ||||||
| 4,679 |
J.B. Hunt Transport Services, Inc |
211 | ||||||
| 9,209 |
* | JetBlue Airways Corp |
48 | |||||
| 5,349 |
* | Kansas City Southern Industries, Inc |
364 | |||||
| 2,711 |
* | Kirby Corp |
178 | |||||
| 3,018 |
Knight Transportation, Inc |
47 | ||||||
| 2,387 |
Landstar System, Inc |
114 | ||||||
| 952 |
Marten Transport Ltd |
17 | ||||||
| 17,486 |
Norfolk Southern Corp |
1,274 | ||||||
| 2,205 |
* | Old Dominion Freight Line |
89 | |||||
| 2,338 |
* | Pacer International, Inc |
13 | |||||
| 421 |
* | Park-Ohio Holdings Corp |
8 | |||||
| 309 |
* | Patriot Transportation Holding, Inc |
7 | |||||
| 748 |
* | Quality Distribution, Inc |
8 | |||||
| 1,080 |
* | RailAmerica, Inc |
16 | |||||
| 2,007 |
*,e | Republic Airways Holdings, Inc |
7 | |||||
| 437 |
* | Roadrunner Transportation Services Holdings, Inc |
6 | |||||
| 2,596 |
Ryder System, Inc |
138 | ||||||
| 900 |
* | Saia, Inc |
11 | |||||
| 2,935 |
Skywest, Inc |
37 | ||||||
| 40,590 |
Southwest Airlines Co |
347 | ||||||
| 804 |
*,e | Spirit Airlines, Inc |
13 | |||||
| 2,046 |
* | Swift Transportation Co, Inc |
17 | |||||
| 16,771 |
* | UAL Corp |
317 | |||||
| 931 |
*,e | Ultrapetrol Bahamas Ltd |
3 | |||||
| 24,222 |
Union Pacific Corp |
2,566 | ||||||
| 36,458 |
United Parcel Service, Inc (Class B) |
2,668 | ||||||
| 200 |
Universal Truckload Services, Inc |
4 | ||||||
| 7,760 |
*,e | US Airways Group, Inc |
39 | |||||
| 4,454 |
UTI Worldwide, Inc |
59 | ||||||
| 2,203 |
Werner Enterprises, Inc |
53 | ||||||
| 512 |
* | Zipcar, Inc |
7 | |||||
|
|
|
|||||||
| TOTAL TRANSPORTATION |
13,611 | |||||||
|
|
|
|||||||
| UTILITIES - 3.9% |
||||||||
| 33,954 |
* | AES Corp |
402 | |||||
| 5,564 |
AGL Resources, Inc |
235 | ||||||
| 1,612 |
Allete, Inc |
68 | ||||||
| 5,609 |
Alliant Energy Corp |
247 | ||||||
| 12,180 |
Ameren Corp |
403 | ||||||
| 23,927 |
American Electric Power Co, Inc |
988 | ||||||
| 980 |
American States Water Co |
34 | ||||||
| 8,445 |
American Water Works Co, Inc |
269 | ||||||
| 6,719 |
Aqua America, Inc |
148 | ||||||
| 366 |
Artesian Resources Corp |
7 | ||||||
| 3,383 |
e | Atlantic Power Corp |
48 | |||||
| 4,565 |
Atmos Energy Corp |
152 | ||||||
| 2,915 |
Avista Corp |
75 | ||||||
| 2,076 |
Black Hills Corp |
70 | ||||||
| 727 |
* | Cadiz, Inc |
7 | |||||
| 2,026 |
California Water Service Group |
37 | ||||||
| 18,309 |
* | Calpine Corp |
299 | |||||
| 20,864 |
Centerpoint Energy, Inc |
419 | ||||||
| 616 |
Central Vermont Public Service Corp |
22 | ||||||
| 779 |
CH Energy Group, Inc |
45 | ||||||
| 551 |
Chesapeake Utilities Corp |
24 | ||||||
| 2,955 |
Cleco Corp |
113 | ||||||
44
TIAA SEPARATE ACCOUNT VA-1 - Stock Index Account
|
SHARES |
COMPANY |
VALUE (000) |
||||||
| 12,756 |
CMS Energy Corp |
$ | 282 | |||||
| 518 |
Connecticut Water Service, Inc |
14 | ||||||
| 14,375 |
Consolidated Edison, Inc |
892 | ||||||
| 892 |
e | Consolidated Water Co, Inc |
8 | |||||
| 9,416 |
Constellation Energy Group, Inc |
374 | ||||||
| 28,492 |
Dominion Resources, Inc |
1,512 | ||||||
| 8,310 |
DTE Energy Co |
452 | ||||||
| 66,075 |
Duke Energy Corp |
1,454 | ||||||
| 5,930 |
*,e | Dynegy, Inc (Class A) |
16 | |||||
| 16,156 |
Edison International |
669 | ||||||
| 1,646 |
El Paso Electric Co |
57 | ||||||
| 2,106 |
Empire District Electric Co |
44 | ||||||
| 8,767 |
Entergy Corp |
640 | ||||||
| 32,687 |
Exelon Corp |
1,418 | ||||||
| 20,676 |
FirstEnergy Corp |
916 | ||||||
| 609 |
* | Genie Energy Ltd |
5 | |||||
| 7,294 |
Great Plains Energy, Inc |
159 | ||||||
| 4,806 |
Hawaiian Electric Industries, Inc |
127 | ||||||
| 2,260 |
Idacorp, Inc |
96 | ||||||
| 3,951 |
Integrys Energy Group, Inc |
214 | ||||||
| 2,482 |
ITC Holdings Corp |
188 | ||||||
| 1,170 |
Laclede Group, Inc |
47 | ||||||
| 9,539 |
MDU Resources Group, Inc |
205 | ||||||
| 817 |
MGE Energy, Inc |
38 | ||||||
| 813 |
Middlesex Water Co |
15 | ||||||
| 3,755 |
National Fuel Gas Co |
209 | ||||||
| 2,008 |
New Jersey Resources Corp |
99 | ||||||
| 20,663 |
NextEra Energy, Inc |
1,258 | ||||||
| 13,829 |
NiSource, Inc |
329 | ||||||
| 8,929 |
Northeast Utilities |
322 | ||||||
| 1,034 |
Northwest Natural Gas Co |
49 | ||||||
| 1,907 |
NorthWestern Corp |
68 | ||||||
| 11,948 |
* | NRG Energy, Inc |
216 | |||||
| 4,877 |
NSTAR |
229 | ||||||
| 12,419 |
NV Energy, Inc |
203 | ||||||
| 4,951 |
OGE Energy Corp |
281 | ||||||
| 5,388 |
Oneok, Inc |
467 | ||||||
| 919 |
e | Ormat Technologies, Inc |
17 | |||||
| 1,956 |
Otter Tail Corp |
43 | ||||||
| 233 |
Pennichuck Corp |
7 | ||||||
| 11,070 |
Pepco Holdings, Inc |
225 | ||||||
| 19,496 |
PG&E Corp |
804 | ||||||
| 3,691 |
Piedmont Natural Gas Co, Inc |
125 | ||||||
| 5,160 |
Pinnacle West Capital Corp |
249 | ||||||
| 4,395 |
PNM Resources, Inc |
80 | ||||||
| 3,801 |
Portland General Electric Co |
96 | ||||||
| 28,315 |
PPL Corp |
833 | ||||||
| 14,443 |
Progress Energy, Inc |
809 | ||||||
| 24,715 |
Public Service Enterprise Group, Inc |
816 | ||||||
| 8,950 |
Questar Corp |
178 | ||||||
| 40,583 |
* | RRI Energy, Inc |
106 | |||||
| 5,822 |
SCANA Corp |
262 | ||||||
| 11,813 |
Sempra Energy |
650 | ||||||
| 678 |
SJW Corp |
16 | ||||||
| 1,513 |
South Jersey Industries, Inc |
86 | ||||||
| 42,028 |
Southern Co |
1,946 | ||||||
| 2,406 |
Southwest Gas Corp |
102 | ||||||
| 10,875 |
TECO Energy, Inc |
208 | ||||||
| 5,632 |
UGI Corp |
166 | ||||||
| 2,273 |
UIL Holdings Corp |
80 | ||||||
| 1,902 |
Unisource Energy Corp |
70 | ||||||
| 597 |
Unitil Corp |
17 | ||||||
| 4,285 |
Vectren Corp |
130 | ||||||
| 5,819 |
Westar Energy, Inc |
167 | ||||||
| 2,570 |
WGL Holdings, Inc |
114 | ||||||
45
TIAA SEPARATE ACCOUNT VA-1 - Stock Index Account
|
SHARES |
COMPANY |
VALUE (000) |
||||||
| 11,258 |
Wisconsin Energy Corp |
$ | 394 | |||||
| 23,575 |
Xcel Energy, Inc |
652 | ||||||
| 672 |
York Water Co |
12 | ||||||
|
|
|
|||||||
| TOTAL UTILITIES |
27,144 | |||||||
|
|
|
|||||||
| TOTAL COMMON STOCKS (Cost $528,701) |
698,259 | |||||||
|
|
|
|||||||
| PREFERRED STOCKS - 0.0% |
||||||||
| RETAILING - 0.0% |
||||||||
| 88 |
* | Orchard Supply Hardware Stores Corp |
0 | ^ | ||||
|
|
|
|||||||
| TOTAL RETAILING |
0 | ^ | ||||||
|
|
|
|||||||
| TOTAL PREFERRED STOCKS (Cost $1) |
0 | ^ | ||||||
|
|
|
|||||||
| RIGHTS / WARRANTS - 0.0% |
||||||||
| ENERGY - 0.0% |
||||||||
| 559 |
*,e,m | Magnum Hunter Resources Corp |
0 | ^ | ||||
|
|
|
|||||||
| TOTAL ENERGY |
0 | ^ | ||||||
|
|
|
|||||||
| TOTAL RIGHTS / WARRANTS (Cost $0) |
0 | ^ | ||||||
|
|
|
|||||||
| SHORT-TERM INVESTMENTS - 1.9% |
||||||||
| INVESTMENTS IN REGISTERED INVESTMENT COMPANIES - 1.9% |
||||||||
| 13,605,970 |
c | TIAA-CREF Short Term Lending Portfolio of the State Street Navigator Securities Lending Trust |
13,606 | |||||
|
|
|
|||||||
| TOTAL INVESTMENTS IN REGISTERED INVESTMENT COMPANIES |
13,606 | |||||||
|
|
|
|||||||
| TOTAL SHORT-TERM INVESTMENTS (Cost $13,606) |
13,606 | |||||||
|
|
|
|||||||
| TOTAL INVESTMENTS - 101.8% (Cost $542,308) |
711,865 | |||||||
| OTHER ASSETS & LIABILITIES, NET - (1.8)% |
(12,783 | ) | ||||||
|
|
|
|||||||
| NET ASSETS - 100.0% | $ | 699,082 | ||||||
|
|
|
|||||||
Abbreviation(s):
| REIT | Real Estate Investment Trust |
| SPDR | Standard & Poor’s Depository Receipts |
| * | Non-income producing. |
| ^ | Amount represents less than $1,000. |
| c | Investments made with cash collateral received from securities on loan. |
| e | All or a portion of these securities are out on loan. The value of securities on loan is $13,165,000. |
| m | Indicates a security that has been deemed illiquid. |
Cost amounts are in thousands.
46
Report of Independent Registered Public Accounting Firm
To the Management Committee and Contract owners of TIAA Separate Account VA-1:
We have audited, in accordance with the standards of the Public Company Accounting Oversight Board (United States), the financial statements of the Stock Index Account of TIAA Separate Account VA-1 (hereafter referred to as “VA-1”) as of December 31, 2011, and for the year then ended, and have issued our unqualified report thereon dated February 16, 2012 (which report and financial statements are included in Item 1 of this Certified Shareholder Report on Form N-CSR). Our audit included an audit of VA-1’s schedule of investments in securities (the “Schedule”) as of December 31, 2011 appearing in Item 6 of this Form N-CSR. The Schedule is the responsibility of the VA-1’s management. Our responsibility is to express an opinion on this Schedules based on our audits.
In our opinion, the Schedule referred to above, when read in conjunction with the financial statements of VA-1 referred to above, presents fairly, in all material respects, the information set forth therein.
/s/ PricewaterhouseCoopers LLP
PricewaterhouseCoopers LLP
Boston, Massachusetts
February 16, 2012
47
Item 7. Disclosure of Proxy Voting Policies and Procedures for Closed-End Management Investment Companies.
Not Applicable.
Item 8. Portfolio Managers of Closed-End Management Investment Companies.
Not Applicable.
Item 9. Purchases of Equity Securities by Closed-End Management Investment Company and Affiliated Purchasers.
Not Applicable.
Item 10. Submission of Matters to a Vote of Security Holders.
There were no material changes to the procedures by which shareholders may recommend nominees to the Registrant’s Management Committee.
Item 11. Controls and Procedures.
(a) An evaluation was performed within 90 days from the date hereof under the supervision of the Registrant’s management, including the principal executive officer and principal financial officer, of the effectiveness of the design and operation of the Registrant’s disclosure controls and procedures. Based on that evaluation, the Registrant’s management, including the principal executive officer and principal financial officer, concluded that the Registrant’s disclosure controls and procedures were effective for this annual reporting period.
(b) Disclose any change in the Registrant’s internal control over financial reporting (as defined in Rule 30a-3(d) under the Act (17 CFR 270.30a-3(d) that occurred during the second fiscal quarter of the period covered by this report that has materially affected, or is reasonably likely to materially affect, the Registrant’s internal control over financial reporting.
Item 12. Exhibits.
12(a)(1) Copy of current SOX code of ethics for Senior Financial Officers
12(a)(2)(i) Section 302 certification of the principal executive officer
12(a)(2)(ii) Section 302 certification of the principal financial officer
12(b) Section 906 certification of principal executive officer and principal financial officer
SIGNATURES
Pursuant to the requirements of the Securities Exchange Act of 1934 and the Investment Company Act of 1940, the Registrant has duly caused this report to be signed on its behalf by the undersigned, thereunto duly authorized.
| TIAA SEPARATE ACCOUNT VA-1 | ||||||
| Dated: February 16, 2012 |
By: | /s/ Roger W. Ferguson, Jr. | ||||
| Roger W. Ferguson, Jr. | ||||||
| President and Chief Executive Officer | ||||||
Pursuant to the requirements of the Securities Exchange Act of 1934 and the Investment Company Act of 1940, this report has been signed below by the following persons on behalf of the Registrant and in the capacities and on the dates indicated.
| Dated: February 16, 2012 | By: | /s/ Roger W. Ferguson, Jr. | ||||
| Roger W. Ferguson, Jr. | ||||||
| President and Chief Executive Officer | ||||||
| (principal executive officer) |
| Dated: February 16, 2012 | By: | /s/ Phillip G. Goff | ||||
| Phillip G. Goff | ||||||
| Principal Financial Officer, Principal Accounting | ||||||
| Officer and Treasurer | ||||||
| (principal financial officer) |
EXHIBIT INDEX
Item 12. Exhibits.
12(a)(1) Copy of current SOX code of ethics for Senior Financial Officers
12(a)(2)(i) Section 302 certification of the principal executive officer
12(a)(2)(ii) Section 302 certification of the principal financial officer
12(b) Section 906 certification