Exhibit 99.1
July 18, 2013
FOR IMMEDIATE RELEASE
| Contacts: | |
| |
|
| ANALYSTS | |
| |
MEDIA |
| Alan Greer | |
Bruce MacPherson | |
Cynthia Williams |
| Executive Vice President | |
Vice President | |
Senior Executive Vice President |
| Investor Relations | |
Investor Relations | |
Corporate Communications |
| (336) 733-3021 | |
(336) 733-3058 | |
(336) 733-1478 |
BB&T reports record earnings
EPS totals $0.77, up 6.9%
WINSTON-SALEM, N.C. -- BB&T Corporation (NYSE:
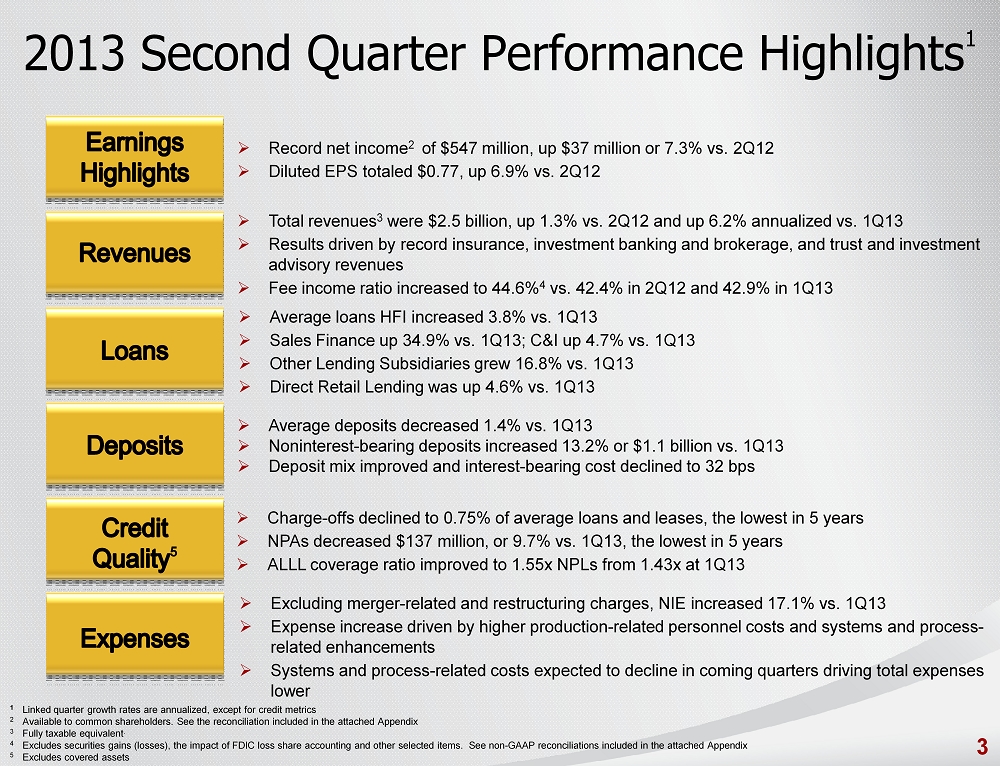
BBT) today reported second quarter 2013 net income available to common shareholders of $547 million, a record for quarterly earnings.
EPS totaled $0.77 per diluted share, an increase of 6.9% compared with the second quarter of 2012. Net income available to common
shareholders increased 7.3% compared to the same period last year.
Second quarter earnings produced an annualized
return on average assets of 1.27% and an annualized return on average common shareholders’ equity of 11.39%.
“We are pleased to report the strongest
quarterly earnings in our history, supported by continued improvement in diversification strategies,” said Chairman and Chief
Executive Officer Kelly S. King. “Our earnings were driven by 6% annualized growth in revenues compared with last quarter,
including an 18% annualized increase in noninterest income. These results reflect record performances from our insurance, investment
banking and brokerage, and trust and investment advisory businesses.
“Improvement in credit quality accelerated
this quarter and resulted in our best credit quality levels in five years,” said King. “Nonperforming assets declined
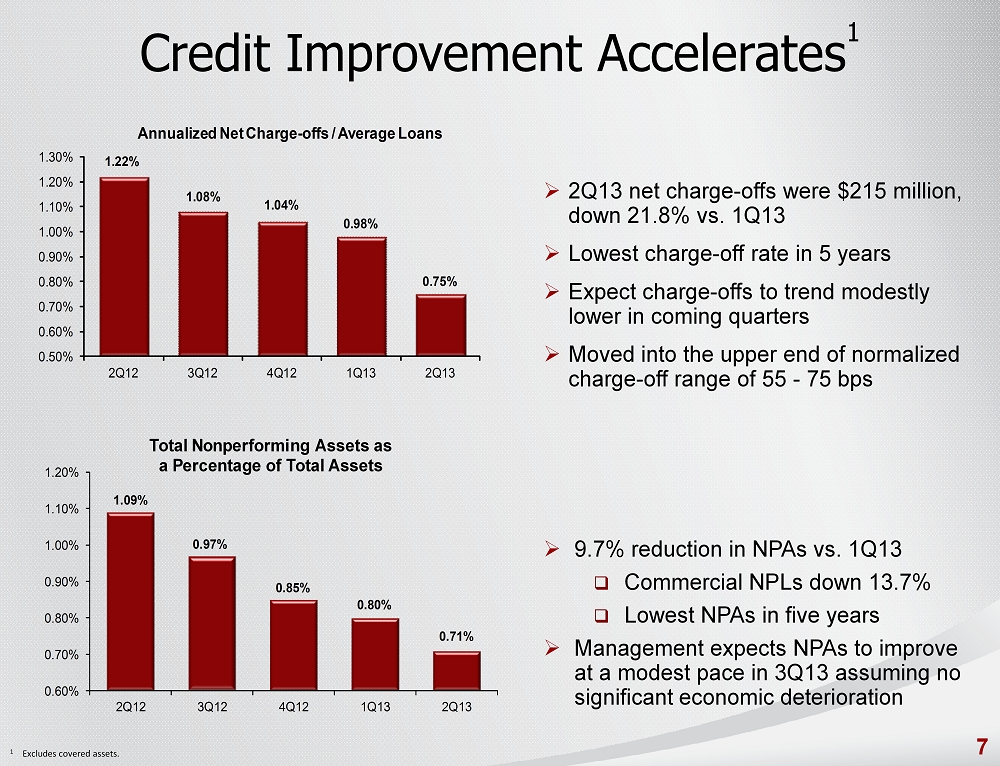
10% and loan charge-offs decreased significantly to 0.75% of average loans and leases, down from 0.98% last quarter, excluding
covered loans. This improvement led to a decrease in our loan loss provision and other credit-related costs this quarter.
“Average loans grew 3.8% annualized compared
with last quarter led by strong performances in sales finance automobile lending, up 35%; other lending subsidiaries, up 17%; and
C&I and direct retail lending, which both reflected almost 5% growth.”
“Noninterest
expense increased compared to last quarter; however much of this was driven by merger-related
and restructuring charges following our community bank reorganization and other systems and project-related charges. As these costs
fall in coming quarters, we expect noninterest expense to decline as well,” said King.
For the first six months of 2013, BB&T reported
net income available to common shareholders of $757 million, including the impact of a $281 million adjustment related to a disputed
tax liability announced last quarter. Earnings per diluted common share, including the tax adjustment, totaled $1.06 for the first
six months of 2013.
Second Quarter 2013 Performance Highlights
| · | Average total loans and leases held for investment increased 3.8% on an annualized basis compared to the first quarter of 2013 |
| o | Average C&I loans increased 4.7% |
| o | Average sales finance loans increased 34.9% |
| o | Average loans in the other lending subsidiaries group increased 16.8% |
| o | Average direct retail lending increased 4.6% |
| · | Revenues were $2.5 billion for the second quarter, an annualized increase of 6.2% compared with the first quarter of 2013 |
| o | Net interest income was $7 million lower primarily due to covered loan run-off |
| o | Insurance income increased $61 million, driven by seasonally stronger performance |
| o | Investment banking and brokerage produced a record performance, up $5 million compared with the first quarter of 2013 |
| o | Mortgage banking income was down $12 million as margins declined to more normal levels, offsetting record originations |
| · | Asset quality improvement accelerated |
| o | Nonperforming assets decreased $137 million, or 9.7%, excluding covered assets |
| o | Net charge-offs, excluding covered, totaled 0.75% of average loans for the quarter, down from 0.98% in the first quarter of
2013 and 1.22% in the second quarter of 2012 |
| o | Allowance for loan losses (excluding covered loans) as a percentage of nonperforming loans HFI increased from 1.43% in the
first quarter of 2013 to 1.55% in the second quarter of 2013 |
| · | Noninterest expense was up $82 million or 23.3% annualized from the first quarter of 2013 |
| o | Noninterest expense included $27 million in restructuring costs |
| o | Personnel expense was up $27 million primarily due to production-related compensation. Full-time equivalent employees and headcount
were down slightly |
| o | Professional services was up $11 million primarily due to project-related expenses |
| o | Foreclosed property expense totaled $12 million, down $6 million |
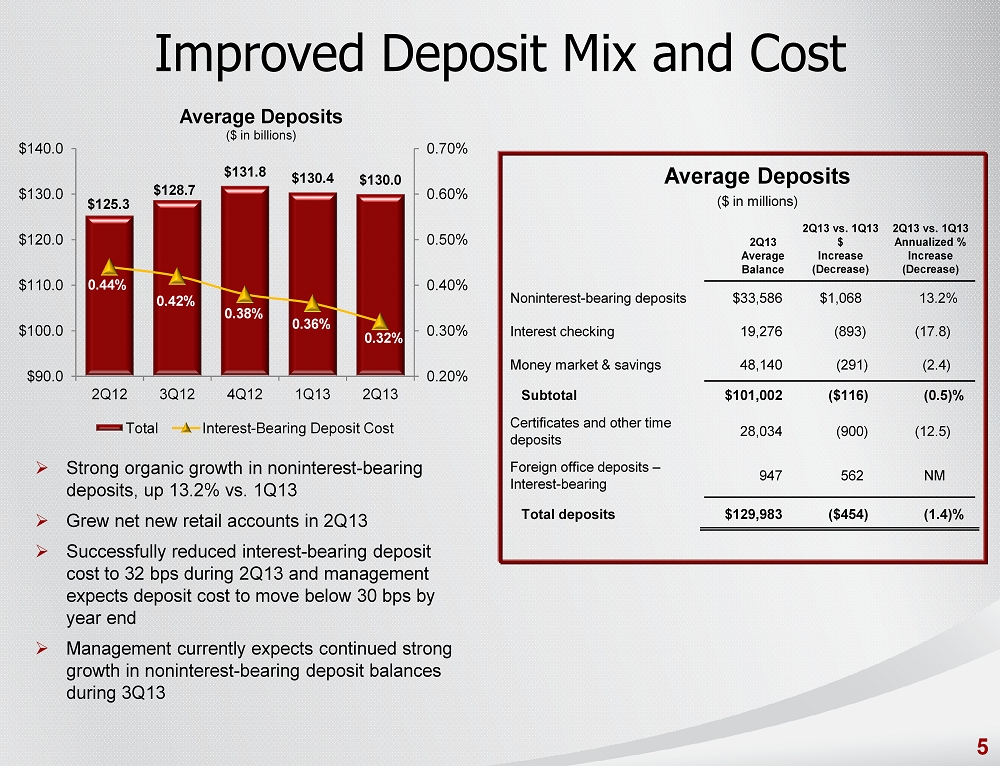
| · | Average noninterest-bearing deposits increased $1.1 billion, or 13.2% on an annualized linked quarter basis |
| o | Average interest-bearing deposit costs fell to 0.32% this quarter compared to 0.36% in the first quarter |
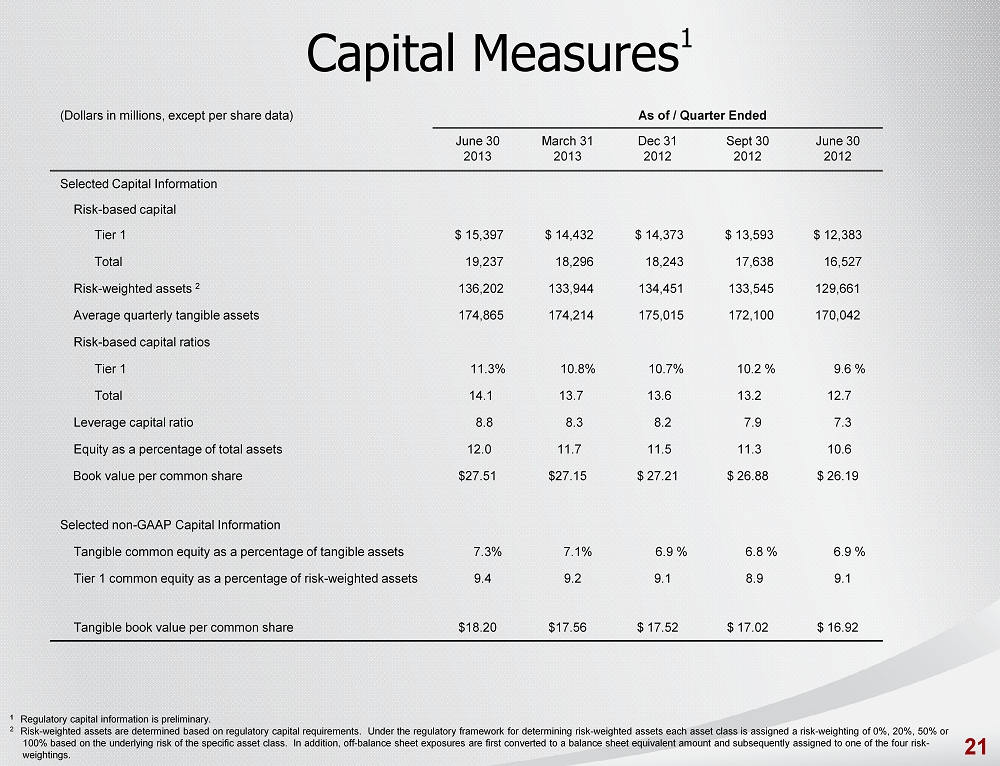
| · | Capital levels improved across the board |
| o | Tier 1 common equity to tangible assets was 7.3% |
| o | Tier 1 common equity to risk-weighted assets was 9.4% |
| o | Tier 1 risk-based capital was 11.3% |
| o | Leverage capital remained strong at 8.8% |
#-#-#
| EARNINGS HIGHLIGHTS |
|
|
|
|
|
|
|
|
|
Change |
|
Change |
| (dollars in millions, except per share data) |
Q2 |
|
Q1 |
|
Q2 |
|
Q2 13 vs. |
|
Q2 13 vs. |
| |
|
|
2013 |
|
2013 |
|
2012 |
|
Q1 13 |
|
Q2 12 |
| Net income available to common shareholders |
$ |
547 |
|
$ |
210 |
|
$ |
510 |
|
$ |
337 |
|
$ |
37 |
| Diluted earnings per common share |
|
0.77 |
|
|
0.29 |
|
|
0.72 |
|
|
0.48 |
|
|
0.05 |
| |
|
|
|
|
|
|
|
|
|
|
|
|
|
|
|
|
| Net interest income - taxable equivalent |
$ |
1,452 |
|
$ |
1,459 |
|
$ |
1,500 |
|
$ |
(7) |
|
$ |
(48) |
| Noninterest income |
|
1,046 |
|
|
1,001 |
|
|
966 |
|
|
45 |
|
|
80 |
| |
Total revenue |
$ |
2,498 |
|
$ |
2,460 |
|
$ |
2,466 |
|
$ |
38 |
|
$ |
32 |
| |
|
|
|
|
|
|
|
|
|
|
|
|
|
|
|
|
| Return on average assets (%) |
|
1.27 |
|
|
0.57 |
|
|
1.22 |
|
|
0.70 |
|
|
0.05 |
| Return on average risk-weighted assets (%) |
|
1.71 |
|
|
0.77 |
|
|
1.69 |
|
|
0.94 |
|
|
0.02 |
| Return on average common shareholders' equity (%) |
|
11.39 |
|
|
4.44 |
|
|
11.21 |
|
|
6.95 |
|
|
0.18 |
| Return on average tangible common shareholders' |
|
|
|
|
|
|
|
|
|
|
|
|
|
|
| |
equity (%) |
|
19.12 |
|
|
7.87 |
|
|
18.85 |
|
|
11.25 |
|
|
0.27 |
| Net interest margin - taxable equivalent (%) |
|
3.70 |
|
|
3.76 |
|
|
3.95 |
|
|
(0.06) |
|
|
(0.25) |
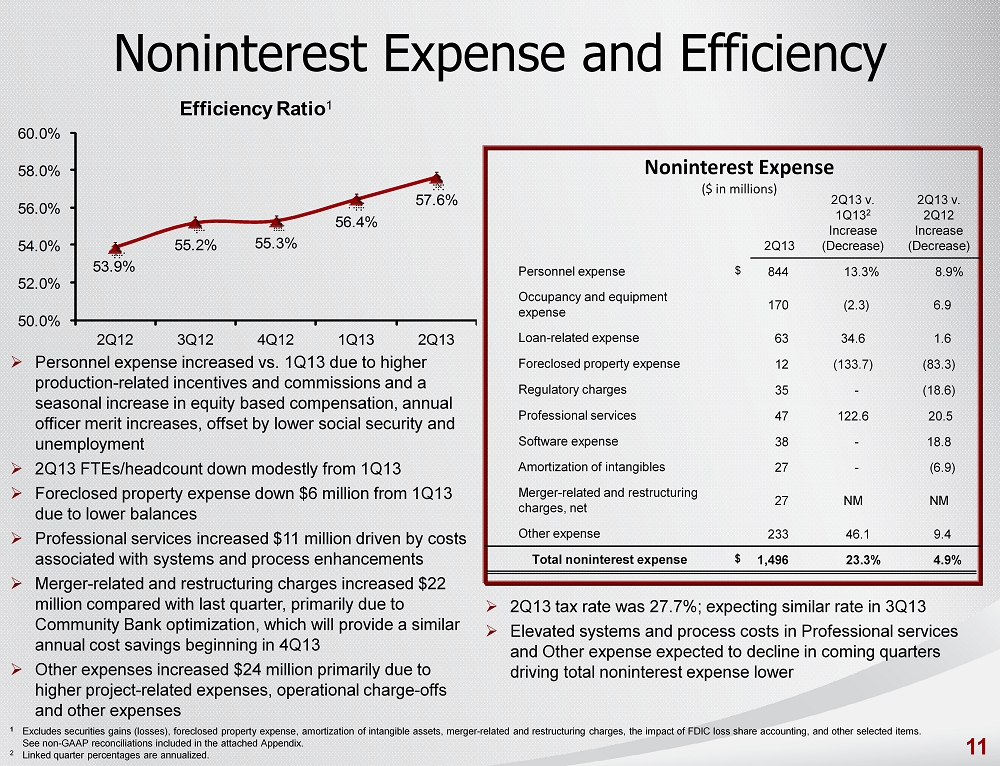
| Efficiency ratio (1) (%) |
|
57.6 |
|
|
56.4 |
|
|
53.9 |
|
|
1.2 |
|
|
3.7 |
(1) Excludes securities gains (losses), foreclosed property expense,
amortization of intangible assets, merger-related and restructuring charges, the impact of FDIC loss share accounting, and other
selected items. See non-GAAP reconciliations in the Quarterly Performance Summary.
Second Quarter 2013 compared to First Quarter 2013
Consolidated net income available to common
shareholders for the second quarter of 2013 was $547 million, an increase of $337 million, compared to $210 million earned during
the first quarter of 2013. Financial results for the first quarter of 2013 were negatively impacted by a $281 million adjustment
to the provision for income taxes. This occurred following a February 11, 2013 opinion by the U.S. Tax Court with respect to a
case between the Bank of New York Mellon and the IRS involving a transaction with a structure similar to a financing transaction
entered into by BB&T in 2002. BB&T is currently in litigation with the IRS and no decision has been rendered by the court.
Closing arguments in the trial are scheduled for later this month.
On a diluted per common share basis, earnings
for the second quarter of 2013 were $0.77 compared to $0.29 ($0.69 excluding the tax adjustment) earned in the first quarter of
2013. BB&T’s results of operations for the second quarter of 2013 produced an annualized return on average assets of
1.27%, an annualized return on average risk-weighted assets of 1.71% and an annualized return on average common shareholders’
equity of 11.39% compared to prior quarter ratios of 0.57% (1.20% adjusted), 0.77% (1.62% adjusted) and 4.44% (10.34% adjusted),
respectively. BB&T’s return on average tangible common shareholders’ equity was 19.12% for the second quarter of
2013 compared to 7.87% (17.48% adjusted) for the prior quarter.
On April 23, 2013, BB&T’s shareholders
approved a plan that modified the record date and payment date of preferred stock dividends to align with the record and payment
date practices associated with common stock dividends. This action was undertaken in order to achieve administrative and Board-level
efficiencies and reduce the costs associated with multiple record dates and multiple payment dates. The implementation of this
plan resulted in the declaration of
dividends on all classes of preferred stock totaling $13 million,
which represented dividend payments for the period from May 1 to May 31, 2013. Based on the number of shares of preferred stock
outstanding at June 30, 2013, future quarterly preferred stock dividends are expected to total approximately $37 million if declared
by the Board of Directors.
Total revenues were $2.5 billion for the second
quarter of 2013, up $38 million compared to the first quarter of 2013. The increase in total revenues included a $45 million increase
in noninterest income, partially offset by a $7 million decrease in taxable-equivalent net interest income. The increase in noninterest
income was primarily driven by a $61 million increase in insurance income, and smaller increases in investment banking and brokerage
commissions and fees, bankcard fees and merchant discounts, and checkcard fees, partially offset by decreases in FDIC loss share
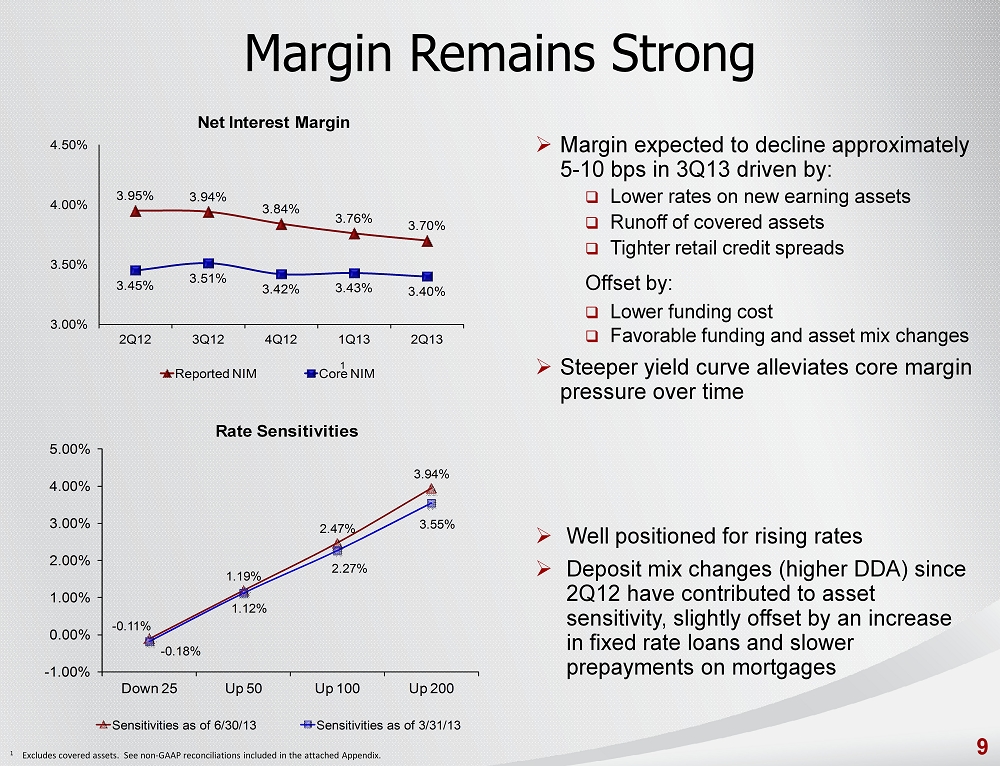
income and mortgage banking income. Net interest margin was 3.70% for the second quarter of 2013, down six basis points compared
to the prior quarter. This decline is largely attributable to lower yields on new loans and covered loan run-off.
The provision for credit losses, excluding
covered loans, for the second quarter of 2013 was $179 million, a decrease of $68 million compared to the first quarter of 2013,
as a result of continued improvements in credit quality. Net charge-offs, excluding covered loans, for the second quarter of 2013
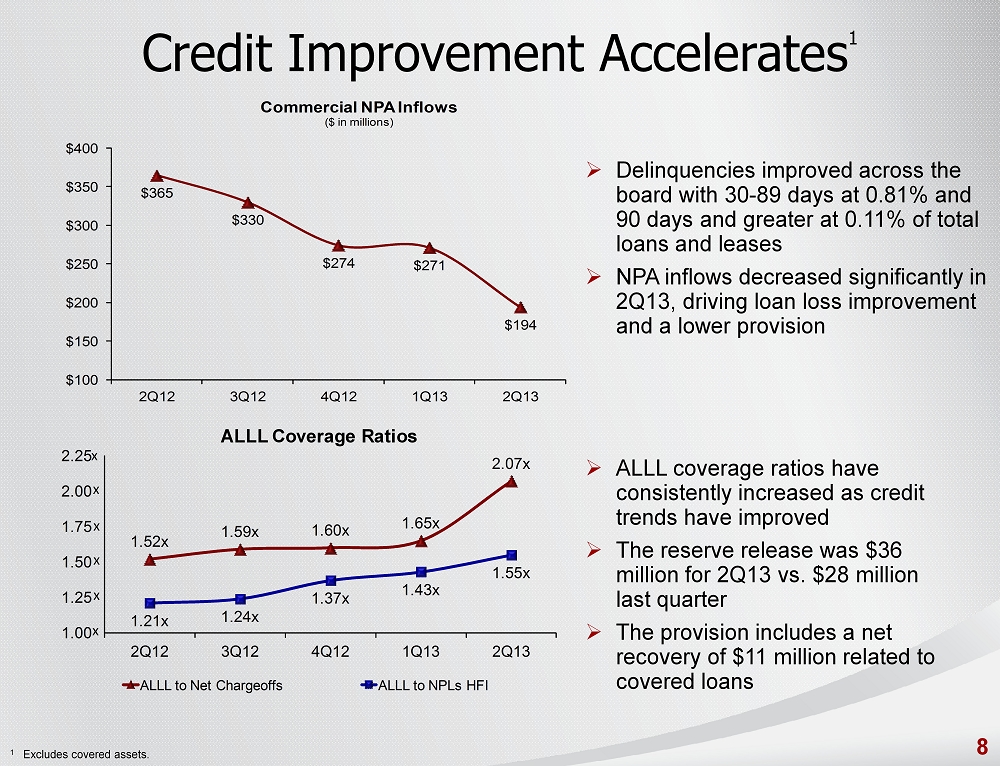
were $215 million, or $60 million lower than the first quarter of 2013. This resulted in a reserve release of $36 million for the
second quarter of 2013 compared to $28 million in the first quarter.
Noninterest expense was $1.5 billion for the
second quarter of 2013, an increase of $82 million compared to the first quarter of 2013. The increase in noninterest expense included
increases in personnel expense, merger-related and restructuring charges and other expense totaling $27 million, $22 million and
$24 million, respectively. The increase in personnel expense was largely attributable to higher production-related incentives and
commissions, while the increase in merger-related and restructuring charges primarily related to optimization activities related
to the Community Bank initiated during the second quarter. The increase in other expense was attributable to project-related expenses,
higher operating charge-offs, franchise taxes and other various expenses.
The provision for income taxes was $221 million
for the second quarter of 2013, compared to $481 million for the first quarter of 2013. This produced an effective tax rate for
the second quarter of 2013 of 27.7% compared to 65.3% for the prior quarter. The decrease in the effective tax rate was due to
the $281 million adjustment to the income tax provision described previously. Excluding the impact of this adjustment, the effective
tax rate for the first quarter of 2013 was 27.1%.
Second Quarter 2013 compared to Second Quarter 2012
Consolidated net income available to common
shareholders for the second quarter of 2013 was $547 million, up 7.3%, compared to $510 million earned during the same period in
2012. On a diluted per common share basis, earnings for the second quarter of 2013 were $0.77, up 6.9% compared to $0.72 for the
same period in 2012. BB&T’s results of operations for the second quarter of 2013 produced an annualized return on average
assets of 1.27%, an annualized return
on average risk-weighted assets of 1.71% and an annualized return
on average common shareholders’ equity of 11.39% compared to prior year ratios of 1.22%, 1.69% and 11.21%, respectively.
BB&T’s return on average tangible common shareholders’ equity was 19.12% for the second quarter of 2013, compared
to 18.85% for the same quarter of the prior year.
Total revenues were $2.5 billion for the second
quarter of 2013, an increase of $32 million compared to the second quarter of 2012. The increase in total revenues included an
$80 million increase in noninterest income and a $48 million decrease in taxable-equivalent net interest income. The decrease in
taxable-equivalent net interest income reflects an $87 million decrease in interest income, primarily driven by lower yields on
new loans and securities, which is reflective of the low interest rate environment, and covered loan run-off, partially offset
by a $39 million decrease in funding costs compared to the same quarter of the prior year. Net interest margin was 3.70%, down
25 basis points compared to the second quarter of 2012.
The increase in noninterest income includes
a $33 million increase in insurance income, a $25 million increase in net securities gains, and a $17 million increase in other
income, partially offset by a $14 million decrease in mortgage banking income. The increase in insurance income was primarily attributable
to firming market conditions for insurance premiums. Net securities gains for the second quarter of 2013 totaled $23 million compared
to a net securities loss of $2 million in the second quarter of the prior year. The increase in other income was primarily due
to $20 million in higher income related to assets for certain post-employments benefits, which was offset in personnel costs. The
$14 million decrease in mortgage banking income was the result of a decrease in gains on saleable residential mortgage loans, as
record volume was more than offset by tighter margins, and a decrease in the net mortgage servicing rights valuation.
The provision for credit losses, excluding
covered loans, declined $80 million, or 30.9%, compared to the second quarter of 2012, as improving credit quality resulted in
lower provision expense. Net charge-offs, excluding covered loans, for the second quarter of 2013 were $110 million lower than
the second quarter of 2012, a decline of 33.8%. The reserve release was $36 million for the second quarter of 2013 compared to
$66 million in the earlier quarter.
Noninterest expense was $1.5 billion for the
second quarter of 2013, an increase of $70 million, or 4.9%, compared to the second quarter of 2012. This increase was primarily
attributable to a $69 million increase in personnel expense, a $25 million increase in merger-related and restructuring charges,
and a $20 million increase in other expense, which were partially offset by decreased foreclosed property expense. The increase
in personnel expense was driven by the BankAtlantic acquisition in the 3rd quarter of 2012, an increase in other post-employment
benefits, which is offset in other income, and higher production-based incentives and commissions. The increase in merger-related
and restructuring charges primarily related to optimization activities related to Community Banking that began during the second
quarter, and the increase in other expense was attributable to project-related expenses, higher operating charge-offs, franchise
taxes and other various expenses. Foreclosed property expense decreased $60 million, which was the result of lower write-downs,
losses and carrying costs associated with foreclosed property.
The provision for income taxes was $221 million
for the second quarter of 2013, compared to $191 million for the second quarter of 2012. The effective tax rate for the second
quarter of 2013 was 27.7%, compared to 26.2% for the prior year’s second quarter. This increase in the effective tax rate
was the result of a $12 million income tax benefit recorded in the second quarter of 2012 related to the termination of a leveraged
lease.
| REVENUE, NET OF PROVISION, IMPACT |
|
|
|
|
|
|
|
|
|
Change |
|
Change |
| |
FROM COVERED ASSETS (1) |
Q2 |
|
Q1 |
|
Q2 |
|
Q2 13 vs. |
|
Q2 13 vs. |
| (dollars in millions) |
2013 |
|
2013 |
|
2012 |
|
Q1 13 |
|
Q2 12 |
| Interest income ― covered loans |
$ |
121 |
|
$ |
135 |
|
$ |
200 |
|
$ |
(14) |
|
$ |
(79) |
| Interest income ― covered securities |
|
34 |
|
|
37 |
|
|
46 |
|
|
(3) |
|
|
(12) |
| |
Total interest income |
|
155 |
|
|
172 |
|
|
246 |
|
|
(17) |
|
|
(91) |
| Provision for covered loans |
|
11 |
|
|
(25) |
|
|
(14) |
|
|
36 |
|
|
25 |
| FDIC loss share income, net |
|
(85) |
|
|
(59) |
|
|
(74) |
|
|
(26) |
|
|
(11) |
| |
Net revenue after provision for covered loans |
$ |
81 |
|
$ |
88 |
|
$ |
158 |
|
$ |
(7) |
|
$ |
(77) |
| |
|
|
|
|
|
|
|
|
|
|
|
|
|
|
|
|
| FDIC loss share income, net |
|
|
|
|
|
|
|
|
|
|
|
|
|
|
| |
Offset to provision for covered loans |
$ |
(9) |
|
$ |
20 |
|
$ |
11 |
|
$ |
(29) |
|
$ |
(20) |
| |
Accretion due to credit loss improvement |
|
(66) |
|
|
(67) |
|
|
(67) |
|
|
1 |
|
|
1 |
| |
Accretion for securities |
|
(10) |
|
|
(12) |
|
|
(18) |
|
|
2 |
|
|
8 |
| |
|
|
$ |
(85) |
|
$ |
(59) |
|
$ |
(74) |
|
$ |
(26) |
|
$ |
(11) |
(1) Presents amounts related to covered loans, covered securities
and the FDIC loss sharing asset recognized in the Colonial acquisition. Excludes all amounts related to other assets acquired and
liabilities assumed in the acquisition.
Second Quarter 2013 compared to First Quarter 2013
Interest income on covered loans and securities
for the second quarter of 2013 was $17 million lower than the first quarter of 2013, primarily due to lower average covered loan
balances. The yield on covered loans for the second quarter of 2013 was 16.95%, down slightly compared to 17.49% in the prior quarter.
At June 30, 2013, the accretable yield balance on these loans was $663 million. Accretable yield represents the excess of expected
future cash flows above the current net carrying amount of loans and will be recognized in income over the remaining life of the
covered loans.
The provision for covered loans was a net recovery
totaling $11 million in the second quarter of 2013, compared to a provision for covered loans of $25 million in the prior quarter.
The improvement in the provision for covered loans was primarily the result of improvement in the cash flows from certain residential
mortgage loan pools based on the quarterly reassessment process.
FDIC loss share income, net was a negative
$85 million for the second quarter of 2013, $26 million worse than the first quarter of 2013, primarily due to the offset to the
provision for covered loans recovery recorded in the second quarter.
Second Quarter 2013 compared to Second Quarter 2012
Interest income on covered loans and securities
for the second quarter of 2013 decreased $91 million compared to the second quarter of 2012, primarily due to decreased interest
income on covered loans of $79 million. The decline in covered interest income primarily reflects lower average covered loan balances
and a lower yield. The yield on covered loans for the second quarter of 2013 was 16.95% compared to 19.01% in 2012. The decline
in yield is primarily the result of changes in loan mix. Interest income on covered securities in the current quarter was $12 million
lower than the second quarter of 2012 primarily due to duration adjustments in each quarter.
The provision for covered loans was a net recovery
totaling $11 million in the second quarter of 2013, an improvement of $25 million compared to the same quarter of the prior year.
The improvement in the provision for covered loans was primarily the result of improvements in the cash flows from certain residential
mortgage loan pools based on the quarterly reassessment process.
FDIC loss share income, net was a negative
$85 million for the second quarter of 2013, $11 million worse than the second quarter of 2012, which reflects the offset to the
provision for covered loans, partially offset by lower accretion due to the duration adjustments on covered securities.
| NONINTEREST INCOME |
|
|
|
|
|
|
|
|
|
% Change |
|
% Change |
| (dollars in millions) |
Q2 |
|
Q1 |
|
Q2 |
|
Q2 13 vs. |
|
Q2 13 vs. |
| |
|
|
2013 |
|
2013 |
|
2012 |
|
Q1 13 |
|
Q2 12 |
| |
|
|
|
|
|
|
|
|
|
|
|
(annualized) |
|
|
|
| Insurance income |
$ |
426 |
|
$ |
365 |
|
$ |
393 |
|
|
67.0 |
|
|
8.4 |
| Mortgage banking income |
|
168 |
|
|
180 |
|
|
182 |
|
|
(26.7) |
|
|
(7.7) |
| Service charges on deposits |
|
143 |
|
|
138 |
|
|
138 |
|
|
14.5 |
|
|
3.6 |
| Investment banking and brokerage fees and |
|
|
|
|
|
|
|
|
|
|
|
|
|
|
| |
commissions |
|
99 |
|
|
94 |
|
|
88 |
|
|
21.3 |
|
|
12.5 |
| Bankcard fees and merchant discounts |
|
65 |
|
|
59 |
|
|
59 |
|
|
40.8 |
|
|
10.2 |
| Checkcard fees |
|
51 |
|
|
47 |
|
|
45 |
|
|
34.1 |
|
|
13.3 |
| Trust and investment advisory revenues |
|
49 |
|
|
48 |
|
|
46 |
|
|
8.4 |
|
|
6.5 |
| Income from bank-owned life insurance |
|
26 |
|
|
28 |
|
|
27 |
|
|
(28.6) |
|
|
(3.7) |
| FDIC loss share income, net |
|
(85) |
|
|
(59) |
|
|
(74) |
|
|
176.8 |
|
|
14.9 |
| Securities gains (losses), net |
|
23 |
|
|
23 |
|
|
(2) |
|
|
― |
|
|
NM |
| Other income |
|
81 |
|
|
78 |
|
|
64 |
|
|
15.4 |
|
|
26.6 |
| |
Total noninterest income |
$ |
1,046 |
|
$ |
1,001 |
|
$ |
966 |
|
|
18.0 |
|
|
8.3 |
| |
|
|
|
|
|
|
|
|
|
|
|
|
|
|
|
|
| NM - not meaningful. |
Second Quarter 2013 compared to First Quarter 2013
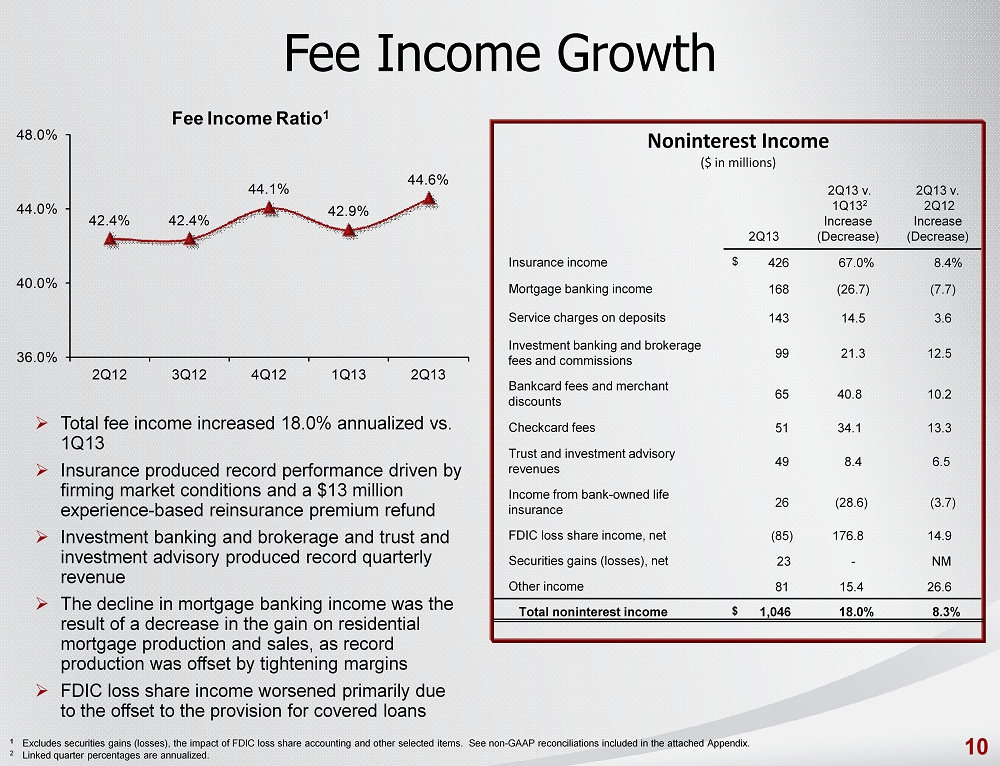
Noninterest income for the second quarter of
2013 increased $45 million, or 18.0% annualized, compared to the first quarter of 2013. Insurance income was $61 million higher
than the prior quarter, primarily the result of firming market conditions for insurance premiums and
an experience-based refund of reinsurance premiums totaling $13
million. Investment banking and brokerage fees and commissions, bankcard fees and merchant discounts, checkcard fees and service
charges on deposits also contributed to the increase in noninterest income, with these categories of noninterest income reflecting
annualized growth rates of 21.3%, 40.8%, 34.1% and 14.5%, respectively. The increases in noninterest income described above were
partially offset by a decline in mortgage banking income and FDIC loss share income totaling $12 million and $26 million, respectively.
The decline in mortgage banking income was the result of a decrease in the gain on residential mortgage loan production and sales,
as record production was more than offset by tightening margins.
Second Quarter 2013 compared to Second Quarter 2012
Noninterest income was $1.0 billion for the
second quarter of 2013, an increase of $80 million, or 8.3%, compared to the second quarter of 2012. Insurance income was $33 million
higher, primarily due to firming market conditions for insurance premiums and an experience-based refund of reinsurance premiums
totaling $13 million. Net securities gains for the second quarter of 2013 totaled $23 million, compared to a net securities loss
of $2 million in the same quarter of the prior year. Other income and investment banking and brokerage fees and commissions increased
$17 million and $11 million, respectively, compared to the same quarter of the prior year. The increase in other income was primarily
attributable to $20 million in higher income related to assets for certain post-employment benefits, which was offset by higher
personnel expense, while the increase in investment banking and brokerage fees and commissions was primarily the result of higher
retail investment commission income driven by an increase in assets under management. Mortgage banking income decreased $14 million
due to a $7 million decrease in gains on residential mortgage loan production and sales due to tighter margins, and a $5 million
decrease in the net mortgage servicing rights valuation.
| NONINTEREST EXPENSE |
|
|
|
|
|
|
|
|
|
% Change |
|
% Change |
| (dollars in millions) |
Q2 |
|
Q1 |
|
Q2 |
|
Q2 13 vs. |
|
Q2 13 vs. |
| |
|
|
2013 |
|
2013 |
|
2012 |
|
Q1 13 |
|
Q2 12 |
| |
|
|
|
|
|
|
|
|
|
|
|
(annualized) |
|
|
|
| Personnel expense |
$ |
844 |
|
$ |
817 |
|
$ |
775 |
|
|
13.3 |
|
|
8.9 |
| Occupancy and equipment expense |
|
170 |
|
|
171 |
|
|
159 |
|
|
(2.3) |
|
|
6.9 |
| Loan-related expense |
|
63 |
|
|
58 |
|
|
62 |
|
|
34.6 |
|
|
1.6 |
| Foreclosed property expense |
|
12 |
|
|
18 |
|
|
72 |
|
|
(133.7) |
|
|
(83.3) |
| Regulatory charges |
|
35 |
|
|
35 |
|
|
43 |
|
|
― |
|
|
(18.6) |
| Professional services |
|
47 |
|
|
36 |
|
|
39 |
|
|
122.6 |
|
|
20.5 |
| Software expense |
|
38 |
|
|
38 |
|
|
32 |
|
|
― |
|
|
18.8 |
| Amortization of intangibles |
|
27 |
|
|
27 |
|
|
29 |
|
|
― |
|
|
(6.9) |
| Merger-related and restructuring charges, net |
|
27 |
|
|
5 |
|
|
2 |
|
|
NM |
|
|
NM |
| Other expense |
|
233 |
|
|
209 |
|
|
213 |
|
|
46.1 |
|
|
9.4 |
| |
Total noninterest expense |
$ |
1,496 |
|
$ |
1,414 |
|
$ |
1,426 |
|
|
23.3 |
|
|
4.9 |
| |
|
|
|
|
|
|
|
|
|
|
|
|
|
|
|
|
| NM - not meaningful. |
Second Quarter 2013 compared to First Quarter 2013
Noninterest expense was $1.5 billion for the
second quarter of 2013, an increase of $82 million compared to the first quarter of 2013. Personnel expense increased $27 million
compared to the prior quarter, primarily the result of higher production-related incentives and commissions, seasonally higher
equity-based compensation for retirement eligible employees and annual merit increases for officers. These increases were partially
offset by lower fringe benefits expense as a result of certain employees meeting the annual thresholds on social security and unemployment
taxes. Merger-related and restructuring charges were $22 million higher than the prior quarter, primarily the result of optimization
activities related to the Community Bank that started in the second quarter. Other expense was $24 million higher than the first
quarter of 2013, which primarily reflects higher project-related expenses, operating charge-offs and other similar expenses. Professional
fees increased $11 million compared to the first quarter, driven by systems and process-related enhancements. Foreclosed property
expense was $12 million, or $6 million lower compared to the first quarter of 2013, the lowest level in five years. The decrease
in foreclosed property expense was the result of lower write-downs, losses and carrying costs associated with foreclosed property.
Second Quarter 2013 compared to Second Quarter 2012
Noninterest expense was $1.5 billion for the
second quarter of 2013, an increase of $70 million, or 4.9%, compared to the second quarter of 2012. This increase was primarily
attributable to a $69 million increase in personnel expense, a $25 million increase in merger-related and restructuring charges,
and a $20 million increase in other expense, which were partially offset by decreased foreclosed property expense. The increase
in personnel expense was primarily attributable to the BankAtlantic acquisition in the third quarter of 2012, an increase in other
post-employment benefits, which is offset in other income, and higher production-based incentives and commissions. The increase
in merger-related and restructuring charges primarily relates to optimization activities related to Community Banking that began
during the second quarter, and the increase in other expense was attributable to higher project-related expenses, operating charge-offs
and various other expenses. Foreclosed property expense decreased $60 million, which was the result of lower write-downs, losses
and carrying costs associated with foreclosed property.
| LOANS AND LEASES - average balances |
|
|
% Change |
|
% Change |
| (dollars in millions) |
Q2 |
|
Q1 |
|
Q2 |
|
Q2 13 vs. |
|
Q2 13 vs. |
| |
|
|
2013 |
|
2013 |
|
2012 |
|
Q1 13 |
|
Q2 12 |
| |
|
|
|
|
|
|
|
|
|
|
|
(annualized) |
|
|
| Commercial and industrial |
$ |
38,359 |
|
$ |
37,916 |
|
$ |
36,293 |
|
4.7 |
|
5.7 |
| Commercial real estate - other |
|
11,411 |
|
|
11,422 |
|
|
10,578 |
|
(0.4) |
|
7.9 |
| Commercial real estate - residential ADC |
|
1,121 |
|
|
1,238 |
|
|
1,744 |
|
(37.9) |
|
(35.7) |
| Direct retail lending |
|
15,936 |
|
|
15,757 |
|
|
15,071 |
|
4.6 |
|
5.7 |
| Sales finance |
|
8,520 |
|
|
7,838 |
|
|
7,690 |
|
34.9 |
|
10.8 |
| Revolving credit |
|
2,268 |
|
|
2,279 |
|
|
2,178 |
|
(1.9) |
|
4.1 |
| Residential mortgage |
|
23,391 |
|
|
23,618 |
|
|
22,114 |
|
(3.9) |
|
5.8 |
| Other lending subsidiaries |
|
10,407 |
|
|
9,988 |
|
|
9,370 |
|
16.8 |
|
11.1 |
| |
Total, excluding covered loans |
|
111,413 |
|
|
110,056 |
|
|
105,038 |
|
4.9 |
|
6.1 |
| Covered |
|
2,858 |
|
|
3,133 |
|
|
4,211 |
|
(35.2) |
|
(32.1) |
| |
Total loans and leases held for investment |
$ |
114,271 |
|
$ |
113,189 |
|
$ |
109,249 |
|
3.8 |
|
4.6 |
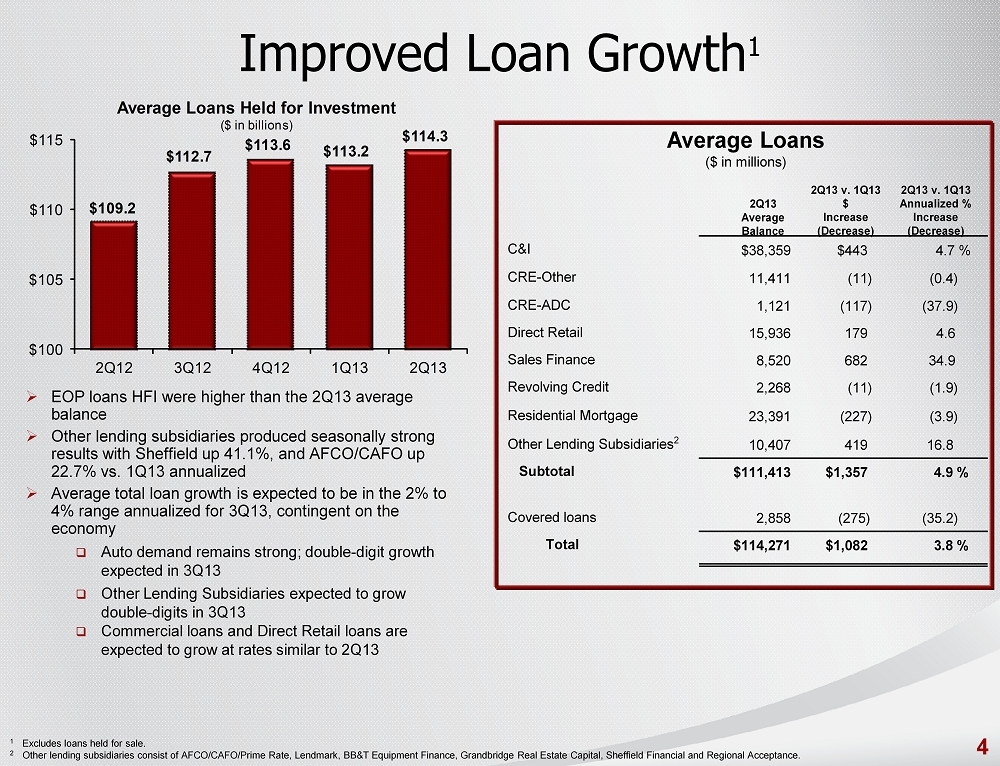
Average loans held for investment for the second
quarter of 2013 increased $1.1 billion, or an annualized 3.8%, compared to the first quarter of 2013. The increase in average loans
and leases was driven by strong growth in the sales finance and other lending subsidiary portfolios, which reflected annualized
growth rates of 34.9% and 16.8%, respectively, along with steady growth in the commercial and industrial and direct retail lending
portfolios of 4.7% and 4.6% on an annualized basis. This growth was partially offset by expected declines in the commercial real
estate – residential ADC, residential mortgage and covered loan portfolios, which declined $117 million, $227 million and
$275 million, respectively.
Growth in the average sales finance loan portfolio
totaled $682 million based on the strength of demand in both the consumer and wholesale segments of the prime automobile lending
market. Average loans in other lending subsidiaries increased $419 million primarily the result of continued growth in small ticket
consumer finance and seasonal growth in the insurance premium financing loan portfolio. The commercial and industrial and direct
retail lending portfolios increased $443 million and $179 million, respectively, compared to the first quarter. Growth in the commercial
and industrial portfolio was driven by increased market penetration in certain geographical areas including Texas, Florida and
Alabama, an increase in tax-exempt financing to hospitals and other non-profit entities, and continued growth in asset-based lending.
The increase in the direct retail lending portfolio was driven by higher levels of first lien refinance transactions.
Average residential mortgage loans decreased
$227 million, or an annualized 3.9%, compared to the prior quarter, as the majority of residential mortgage loan production is
directed to the held for sale portfolio. Average commercial real estate – residential ADC and the covered loan portfolio
declined 37.9% and 35.2% on an annualized basis, respectively, due to continued weakness in the ADC market and runoff of covered
loans.
| DEPOSITS - average balances |
|
|
|
|
|
|
|
|
|
% Change |
|
% Change |
| (dollars in millions) |
Q2 |
|
Q1 |
|
Q2 |
|
Q2 13 vs. |
|
Q2 13 vs. |
| |
|
|
2013 |
|
2013 |
|
2012 |
|
Q1 13 |
|
Q2 12 |
| |
|
|
|
|
|
|
|
|
|
|
(annualized) |
|
|
|
| Noninterest-bearing deposits |
$ |
33,586 |
|
$ |
32,518 |
|
$ |
27,643 |
|
|
13.2 |
|
|
21.5 |
| Interest checking |
|
19,276 |
|
|
20,169 |
|
|
19,911 |
|
|
(17.8) |
|
|
(3.2) |
| Money market and savings |
|
48,140 |
|
|
48,431 |
|
|
46,557 |
|
|
(2.4) |
|
|
3.4 |
| Certificates and other time deposits |
|
28,034 |
|
|
28,934 |
|
|
31,205 |
|
|
(12.5) |
|
|
(10.2) |
| Foreign office deposits - interest-bearing |
|
947 |
|
|
385 |
|
|
32 |
|
|
NM |
|
|
NM |
| |
Total deposits |
$ |
129,983 |
|
$ |
130,437 |
|
$ |
125,348 |
|
|
(1.4) |
|
|
3.7 |
| |
|
|
|
|
|
|
|
|
|
|
|
|
|
|
| NM - not meaningful. |
|
|
|
|
|
|
|
|
|
|
|
|
Average deposits for the second quarter of
2013 decreased $454 million, or 1.4% on an annualized basis, compared to the first quarter of 2013. While total average deposits
declined during the quarter, the mix of the portfolio has continued to improve as average noninterest-bearing deposits grew $1.1
billion while average certificates and other time deposits decreased $900 million during the quarter. Average noninterest-bearing
deposits represented 25.8% of total average deposits for the second quarter of 2013, compared to 24.9% for the prior quarter.
Average noninterest-bearing deposits for commercial
and retail accounts increased $1.2 billion, and were partially offset by public funds accounts that decreased $180 million. Average
interest-checking and money market and savings accounts were down $1.2 billion compared to the prior quarter, which reflects a
decrease in public funds and commercial accounts totaling $991 million and $406 million, respectively. These declines were partially
offset by an increase of $212 million in retail accounts. Foreign office deposits increased $562 million compared to the first
quarter, which partially offset the declines in interest checking, money market and savings, and certificates and other time deposits.
The cost of interest-bearing deposits was 0.32%
for the second quarter of 2013, a decrease of four basis points compared to the prior quarter.
| SEGMENT RESULTS |
|
|
|
|
|
|
|
|
|
|
Change |
|
Change |
| (dollars in millions) |
|
Q2 |
|
Q1 |
|
Q2 |
|
Q2 13 vs. |
|
Q2 13 vs. |
| Segment Net Income |
|
2013 |
|
2013 |
|
2012 |
|
Q1 13 |
|
Q2 12 |
| Community Banking |
|
$ |
209 |
|
$ |
229 |
|
$ |
169 |
|
$ |
(20) |
|
$ |
40 |
| Residential Mortgage Banking |
|
|
78 |
|
|
103 |
|
|
70 |
|
|
(25) |
|
|
8 |
| Dealer Financial Services |
|
|
59 |
|
|
40 |
|
|
63 |
|
|
19 |
|
|
(4) |
| Specialized Lending |
|
|
68 |
|
|
53 |
|
|
67 |
|
|
15 |
|
|
1 |
| Insurance Services |
|
|
66 |
|
|
30 |
|
|
66 |
|
|
36 |
|
|
― |
| Financial Services |
|
|
71 |
|
|
70 |
|
|
65 |
|
|
1 |
|
|
6 |
| Other, Treasury and Corporate |
|
|
25 |
|
|
(269) |
|
|
38 |
|
|
294 |
|
|
(13) |
| |
Total net income |
|
$ |
576 |
|
$ |
256 |
|
$ |
538 |
|
$ |
320 |
|
$ |
38 |
| |
|
|
|
|
|
|
|
|
|
|
|
|
|
|
|
|
Second Quarter 2013 compared to First Quarter 2013
Community Banking
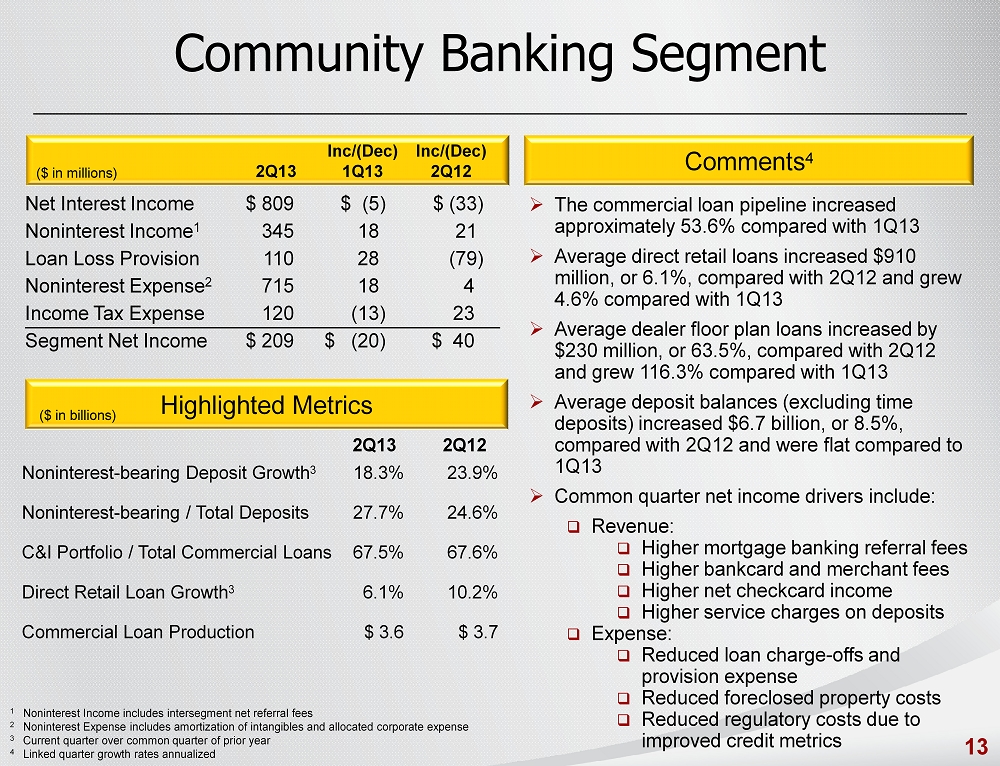
Community Banking serves individual and business
clients by offering a variety of loan and deposit products and other financial services. The segment is primarily responsible for
acquiring and maintaining client relationships. The results for Community Banking have included the results of BankAtlantic since
its systems conversion in October 2012.
Community Banking net income was $209 million
in the second quarter of 2013, a $20 million decrease from the prior quarter. The allocated provision for loan and lease losses
increased $28 million, primarily due to loan growth in the current quarter and favorable reserve rate adjustments in the prior
quarter driven by improvements in loss frequency in the CRE portfolios and improved TDR loss factors in the direct retail portfolio.
The $19 million increase in noninterest expense was primarily attributable to an $18 million restructuring charge related to regional
restructuring and branch optimization. Segment net interest income decreased $5 million, primarily due to tighter funding spreads
earned on deposits, partially offset by changes in deposit mix as a result of growth in noninterest-bearing and lower cost deposits,
coupled with a reduction in certificates of deposits. Noninterest income increased $22 million, primarily due to higher bankcard
fees, merchant discounts, service charges on deposits, and checkcard fees.
Residential Mortgage Banking
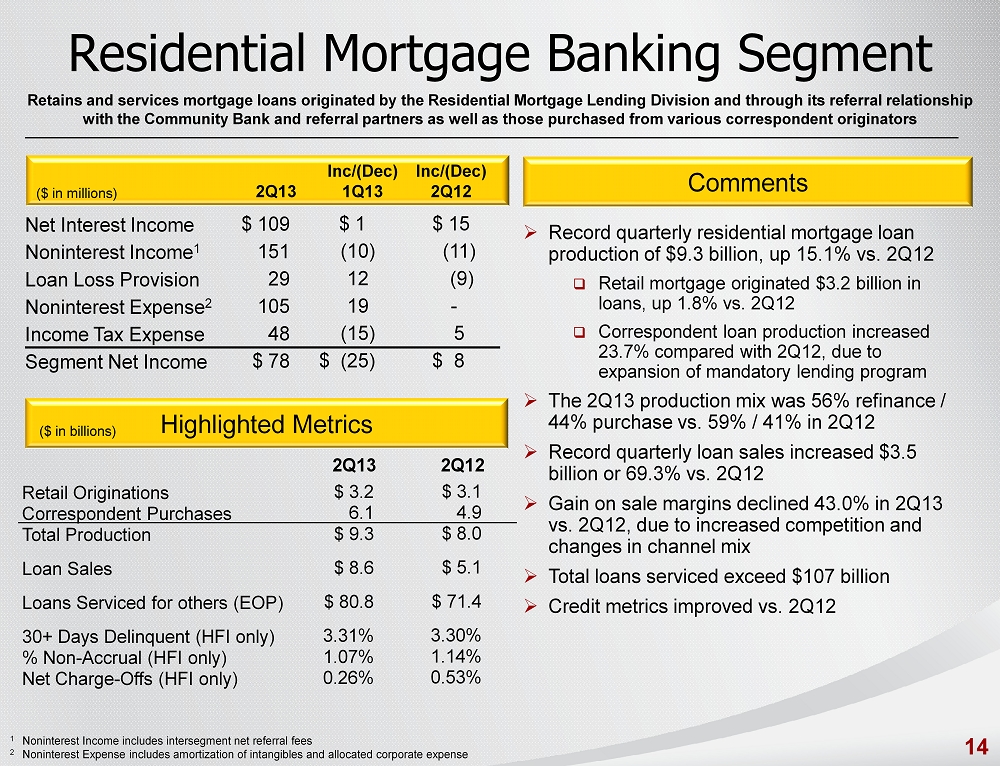
Residential Mortgage Banking retains and services
mortgage loans originated by BB&T as well as those purchased from various correspondent originators. Mortgage loan products
include fixed and adjustable-rate government guaranteed and conventional loans for the purpose of constructing, purchasing, or
refinancing residential properties. Substantially all of the properties are owner-occupied.
Residential Mortgage Banking net income was $78
million in the second quarter of 2013, a decrease of $25 million from the prior quarter. Noninterest expense increased $18 million
primarily due to higher expense associated with mortgage repurchase reserves and higher salary and incentive costs. The allocated
provision for loan and lease losses increased $12 million driven by higher TDR loss factors. Noninterest income decreased $10 million,
driven by lower gains on mortgage loan production and sales as pricing tightened due to competitive factors. This decrease was
partially offset by an increase in the fair value of net mortgage servicing rights and higher net servicing income. The provision
for income taxes decreased by $15 million primarily due to lower pre-tax income.
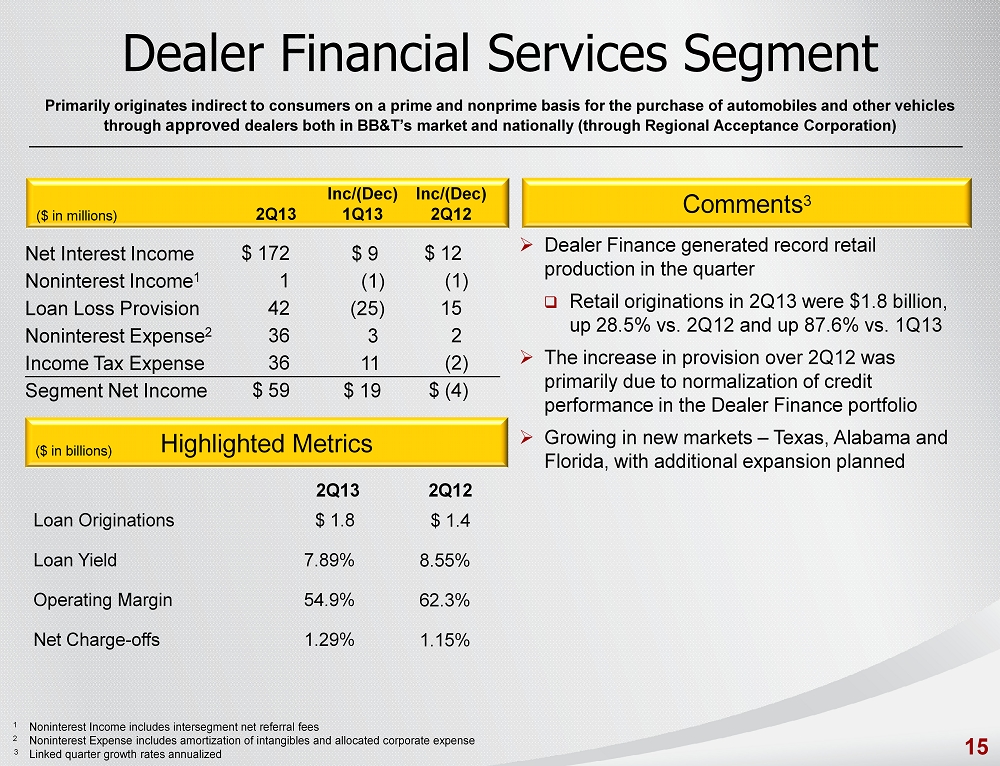
Dealer Financial Services
Dealer Financial Services primarily originates
loans to consumers for the purchase of automobiles. These loans are originated on an indirect basis through approved franchised
and independent automobile dealers throughout BB&T’s market area through BB&T Dealer Finance, and on a national basis
through Regional Acceptance Corporation. Dealer Financial Services also
originates loans for the purchase of recreational and marine vehicles
and provides financing and servicing to dealers for their inventories.
Dealer Financial Services net income was $59
million in the second quarter of 2013, an increase of $19 million over the prior quarter. The allocated provision for loan and
lease losses decreased $25 million, primarily the result of lower seasonal charge-offs related to the Regional Acceptance loan
portfolio. Segment net interest income increased $9 million, primarily due to annualized loan growth of 22.9% compared to the prior
quarter.
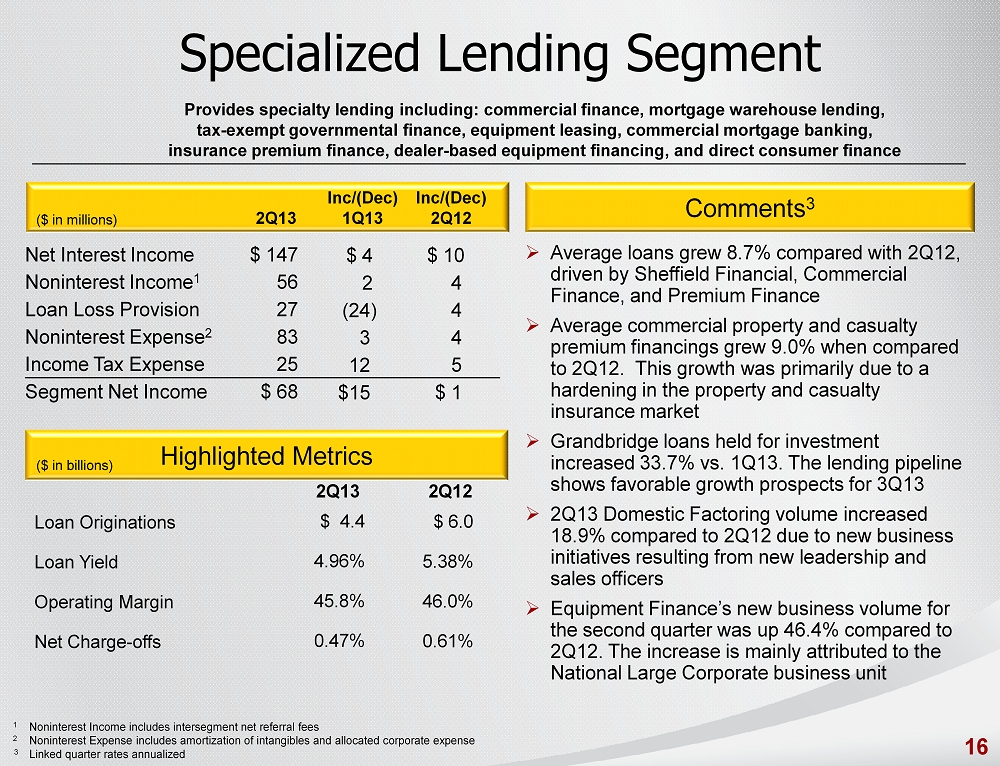
Specialized Lending
BB&T’s Specialized Lending segment
consists of businesses that provide specialty finance alternatives to commercial and consumer clients including: commercial finance,
mortgage warehouse lending, tax-exempt financing for local governments and special-purpose districts, equipment leasing, full-service
commercial mortgage banking, commercial and retail insurance premium finance, dealer-based financing of equipment for consumers
and small businesses, and direct consumer finance.
Specialized Lending net income was $68 million
in the second quarter of 2013, an increase of $15 million over the prior quarter. The allocated provision for loan and lease losses
decreased $24 million, primarily driven by lower charge-offs associated with the commercial finance portfolio. The provision for
income taxes increased $12 million primarily due to higher pre-tax income.
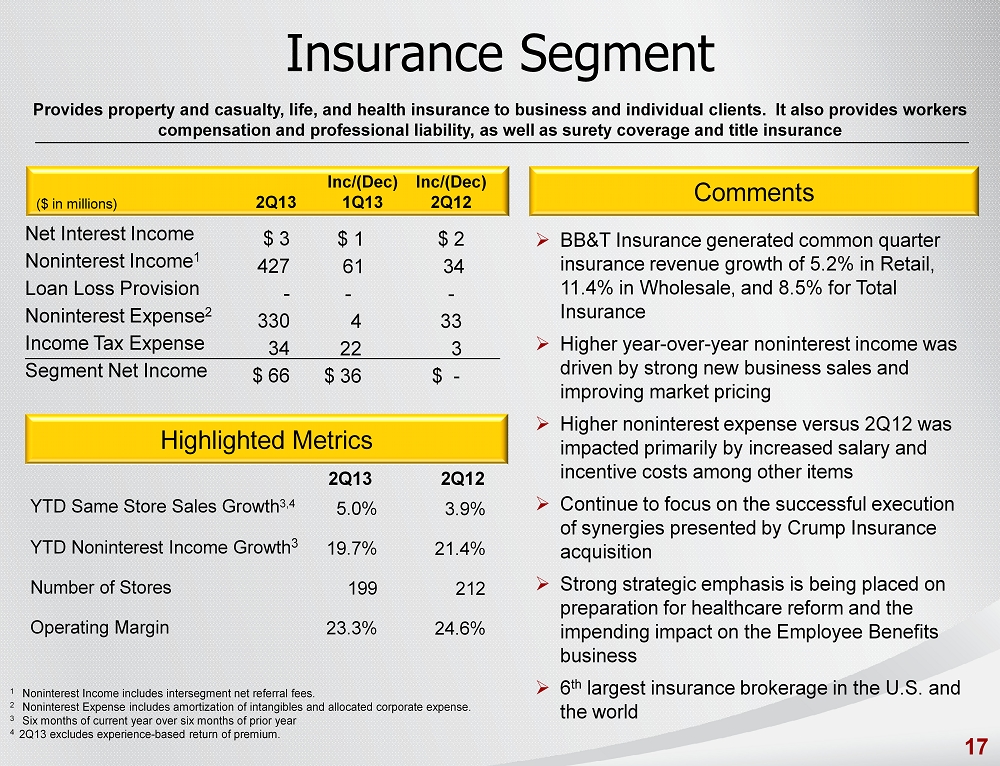
Insurance Services
BB&T’s insurance agency / brokerage
network is the sixth largest in the United States and in the world. Insurance Services provides property and casualty, life, and
health insurance to business and individual clients. It also provides small business and corporate products, such as workers compensation
and professional liability, as well as surety coverage and title insurance. In addition, Insurance Services underwrites a limited
amount of property and casualty coverage.
Insurance Services net income was $66 million
in the second quarter of 2013, a $36 million increase over the prior quarter. Insurance Service’s noninterest income was
up $61 million primarily the result of firming market conditions for insurance premiums and an experience-based refund of reinsurance
premiums totaling $13 million. The provision for income taxes was $22 million higher than the earlier quarter primarily due
to higher pre-tax income.
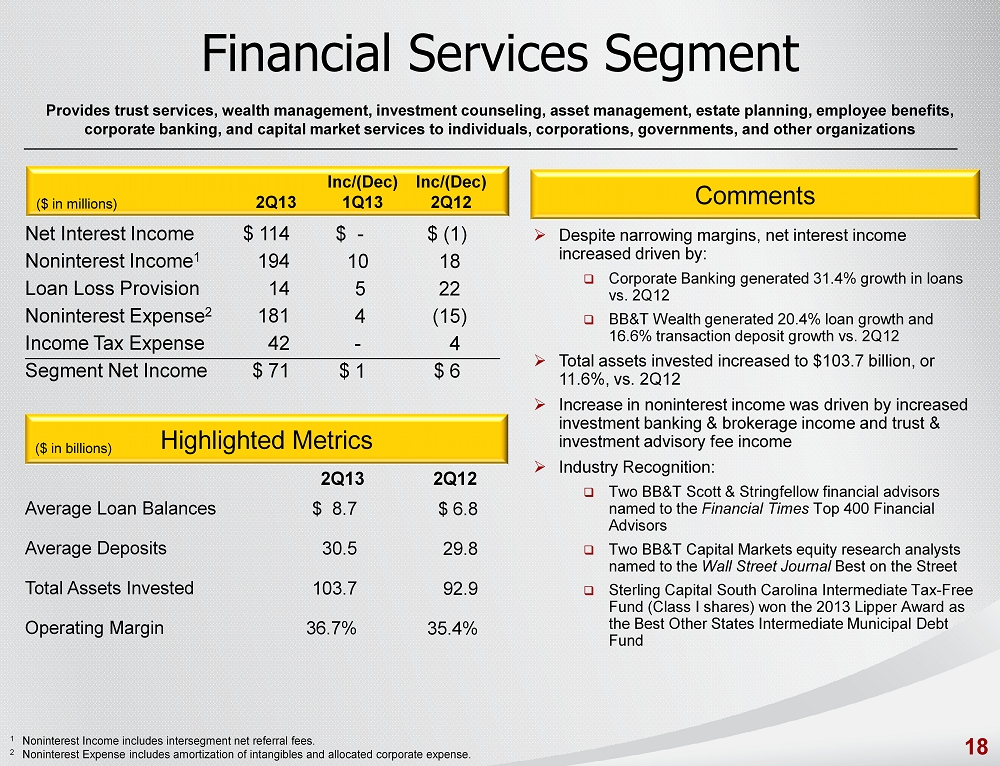
Financial Services
Financial Services provides personal trust administration,
estate planning, investment counseling, wealth management, asset management, employee benefits services, corporate banking and
corporate trust services to individuals, corporations, institutions, foundations and government entities. In addition, Financial
Services offers clients investment alternatives, including discount brokerage services, equities, fixed-rate and variable-rate
annuities, mutual funds and governmental and municipal bonds through BB&T Investment Services, Inc. The
segment also includes BB&T Securities, a full-service brokerage
and investment banking firm, and the Corporate Banking Division, which originates and services large corporate relationships, syndicated
lending relationships, and client derivatives.
Financial Services net income was $71 million,
an increase of $1 million over the prior quarter. Noninterest income increased $7 million driven by higher investment banking and
brokerage fees and commissions and trust and investment advisory fees. The allocated provision for loan and lease losses increased
$5 million, primarily due to higher reserves related to the expansion of the large corporate loan portfolio. Financial Services
continues to generate significant loan growth, with Corporate Banking’s average loan balances increasing $330 million or
19.1% on an annualized basis over the prior period, while BB&T Wealth’s average loan balances increased $96 million or
30.2% on an annualized basis.
Other, Treasury & Corporate
Net income in Other, Treasury & Corporate
can vary due to changing needs of the Corporation, including the size of the investment portfolio, the need for wholesale funding,
and income received from derivatives used to hedge the balance sheet. In the second quarter of 2013, Other, Treasury & Corporate
generated net income of $25 million. Prior quarter results include the $281 million adjustment to the income tax provision related
to an unresolved disputed tax liability previously discussed. Excluding this adjustment, net income for the first quarter of 2013
was $12 million. In the second quarter of 2013, the allocated provision for loan and lease losses decreased $100 million, primarily
due to a reduction in the unallocated allowance for credit losses based on continued improvement in credit trends, and lower provision
for covered loans primarily the result of improvement in estimated cash flows from certain residential mortgage loan pools. Noninterest
income decreased $36 million, driven by lower FDIC loss share income. Noninterest expense increased $34 million, primarily due
to higher personnel and project-related expenses. Segment net interest income decreased $17 million, primarily attributable to
runoff in the covered loan portfolio.
Second Quarter 2013 compared to Second Quarter 2012
Community Banking
Community Banking net income was $209 million
in the second quarter of 2013, an increase of $40 million over the second quarter of 2012. The allocated provision for loan and
lease losses decreased $79 million. The decrease in provision expense was primarily attributable to lower business and consumer
loan charge-offs, partially offset by loan growth during the quarter. Noninterest income increased $21 million, primarily due to
higher bankcard fees, merchant discounts, checkcard fees and service charges on deposits. Net interest income decreased $33 million,
primarily due to tighter funding spreads on deposits, partially offset by improvements in deposit mix as a result of growth in
noninterest-bearing, money market, and savings deposits, coupled with a decrease in certificates of deposits. The provision for
income taxes was $23 million higher for the second quarter of 2013 compared to the earlier quarter as a result of higher pre-tax
income.
Residential Mortgage Banking
Residential Mortgage Banking net income was $78
million in the second quarter of 2013, an increase of $8 million over the second quarter of 2012. Segment net interest income increased
$15 million, which was driven by growth in average residential mortgage loans and higher credit spreads to funding costs when compared
to the second quarter of 2012. The allocated provision for loan and lease losses decreased $9 million, primarily the result of
lower charge-offs. Noninterest income decreased $11 million, driven by lower gains on mortgage loan production and sales as record
production was offset by tighter spreads, and a decrease in the fair value of net mortgage servicing rights, partially offset by
higher residential mortgage loan origination fee income.
Dealer Financial Services
Dealer Financial Services net income was $59
million in the second quarter of 2013, a decrease of $4 million from the second quarter of 2012. The allocated provision for loan
and lease losses increased $15 million, primarily the result of an increase in the loss frequency estimates to a more normalized
level. Segment net interest income increased $12 million, primarily due to wider credit spreads and loan growth in the Regional
Acceptance Corporation portfolio. Dealer Financial Services grew average loans by 7.5% compared to the second quarter of 2012.
Specialized Lending
Specialized Lending net income was $68 million
in the second quarter of 2013, an increase of $1 million over the second quarter of 2012.
Insurance Services
Insurance Services
net income was $66 million in the second quarter of 2013, flat when compared to the second quarter of 2012. Noninterest income
growth of $34 million was driven by organic growth in wholesale and retail property and casualty insurance operations as market
conditions improved and insurance pricing continued to firm and an experience-based refund
of reinsurance premiums totaling $13 million. Higher noninterest income growth was offset by a $32 million increase in noninterest
expense, in part the result of higher salary and incentive costs, among other items.
Financial Services
Financial Services net income was $71 million,
an increase of $6 million over the second quarter of 2012. Noninterest income increased $13 million, driven by higher investment
banking fees and commissions and trust and investment advisory fees. Growth in these fees was attributable to improved financial
market conditions and increased market volume of assets under management. Noninterest expense decreased $17 million, primarily
due to an operating charge-off in the prior year. The allocated provision for loan and lease losses increased $22 million, primarily
due to higher reserves related to the expansion of the large corporate loan
portfolio. Financial Services continues to generate significant
loan growth, with Corporate Banking’s average loan balances increasing $1.7 billion or 31.4% over the prior period, while
BB&T Wealth’s average loan balances increased $232 million or 20.4%.
Other, Treasury & Corporate
The Other, Treasury & Corporate segment generated
net income of $25 million in the second quarter of 2013, compared to net income of $38 million in the second quarter of 2012. Segment
net interest income decreased $52 million, primarily attributable to continued runoff in the covered loan portfolio, while the
$48 million increase in noninterest expense was driven by higher personnel expense, project-related costs, and restructuring expense.
The allocated provision for loan and lease losses decreased $58 million, primarily due to a reduction in the unallocated allowance
for credit losses based on continued improvement in credit trends. Noninterest income increased $20 million, driven by securities
gains on the investment portfolio.
| CAPITAL RATIOS (1) |
|
|
|
|
|
|
|
|
|
| |
Q2 |
|
Q1 |
|
Q4 |
|
Q3 |
|
Q2 |
| |
2013 |
|
2013 |
|
2012 |
|
2012 |
|
2012 |
| Risk-based |
|
|
|
|
|
|
|
|
|
| |
Tier 1 (%) |
11.3 |
|
10.8 |
|
10.7 |
|
10.2 |
|
9.6 |
| |
Total (%) |
14.1 |
|
13.7 |
|
13.6 |
|
13.2 |
|
12.7 |
| Leverage (%) |
8.8 |
|
8.3 |
|
8.2 |
|
7.9 |
|
7.3 |
| Tier 1 common equity to tangible assets (%) (2) |
7.3 |
|
7.1 |
|
6.9 |
|
6.8 |
|
6.9 |
| Tier 1 common equity to risk-weighted assets (%) (2) |
9.4 |
|
9.2 |
|
9.1 |
|
8.9 |
|
9.1 |
(1) Regulatory capital ratios are preliminary.
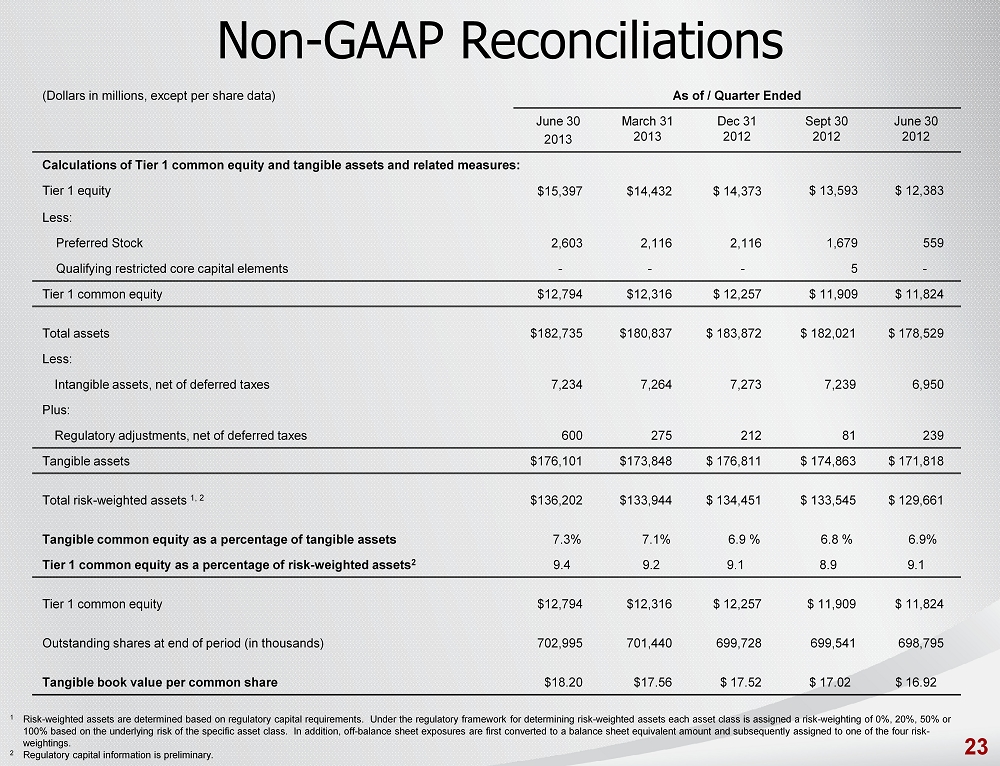
(2) Tier 1 common equity and related ratios are non-GAAP measures.
BB&T uses the Tier 1 common equity definition used in the SCAP assessment to calculate these ratios. See the calculations and
management's reasons for using these measures in the Capital Information – Five Quarter Trend of the Quarterly Performance
Summary.
BB&T’s capital levels remained strong
at June 30, 2013. BB&T declared total common dividends of $0.23 during the second quarter of 2013, which resulted in a dividend
payout ratio of 29%. The increases in the regulatory risk-based capital and leverage ratios were primarily due to the issuance
of $500 million of Tier 1 qualifying non-cumulative perpetual preferred stock during the second quarter of 2013.
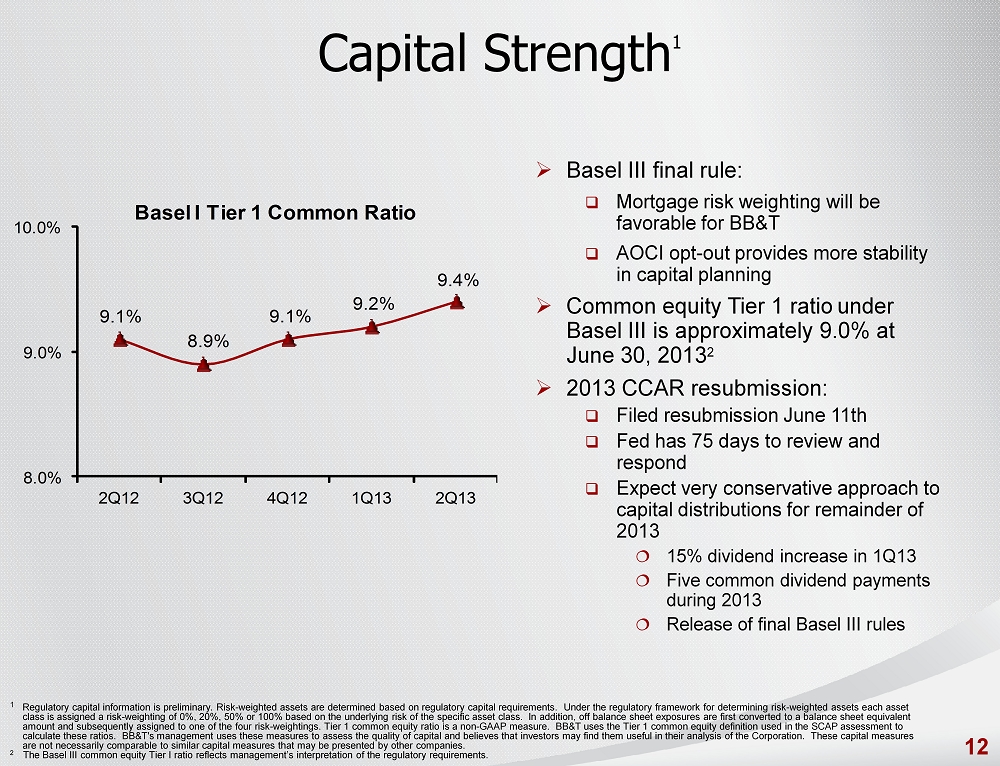
On March 14, 2013, the Board of Governors of
the Federal Reserve System informed BB&T that it objected to certain elements of its capital plan. However, based on the quantitative
results of the stress test, BB&T does not believe these objections were related to the Company’s capital strength, earnings
power or financial condition. The CCAR resubmission was submitted on June 11, 2013 and the regulators have up to 75 days to review.
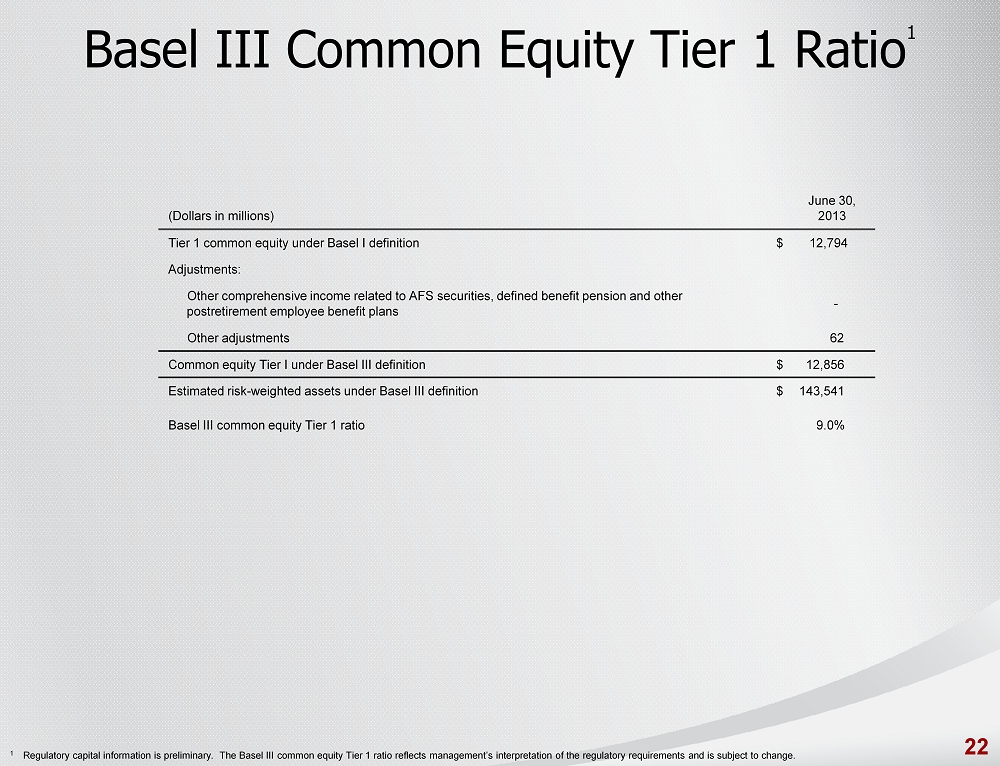
BB&T’s common equity Tier 1
ratio under Basel III was approximately 9.0% at June 30, 2013, based on management’s interpretation of the final rules
adopted July 2, 2013, by the Federal Reserve Board that established a new comprehensive capital framework for U.S. banking
organizations. The minimum required common equity Tier 1 ratio, including the capital
conservation buffer, will gradually
increase from 4.5% on January 1, 2015 to 7.0% on January 1, 2019.
| ASSET QUALITY (1) |
|
|
|
|
|
|
|
|
|
Change |
|
Change |
| (dollars in millions) |
Q2 |
|
Q1 |
|
Q2 |
|
Q2 13 vs. |
|
Q2 13 vs. |
| |
|
2013 |
|
2013 |
|
2012 |
|
Q1 13 |
|
Q2 12 |
| Total nonperforming assets |
$ |
1,276 |
|
$ |
1,413 |
|
$ |
1,897 |
|
$ |
(137) |
|
$ |
(621) |
| Total loans 90 days past due and still accruing |
|
123 |
|
|
138 |
|
|
147 |
|
|
(15) |
|
|
(24) |
| Total loans 30-89 days past due |
|
940 |
|
|
956 |
|
|
907 |
|
|
(16) |
|
|
33 |
| Allowance for loan and lease losses |
|
1,775 |
|
|
1,836 |
|
|
1,987 |
|
|
(61) |
|
|
(212) |
| Total performing TDRs |
|
1,313 |
|
|
1,289 |
|
|
1,052 |
|
|
24 |
|
|
261 |
| |
|
|
|
|
|
|
|
|
|
|
|
|
|
|
|
| Nonperforming loans and leases as a percentage of total |
|
|
|
|
|
|
|
|
|
|
|
|
|
|
| |
loans and leases (%) |
|
0.99 |
|
|
1.12 |
|
|
1.50 |
|
|
(0.13) |
|
|
(0.51) |
| Nonperforming assets as a percentage of total assets (%) |
|
0.71 |
|
|
0.80 |
|
|
1.09 |
|
|
(0.09) |
|
|
(0.38) |
| Allowance for loan and lease losses as a percentage of |
|
|
|
|
|
|
|
|
|
|
|
|
|
|
| |
loans and leases held for investment (%) |
|
1.57 |
|
|
1.65 |
|
|
1.86 |
|
|
(0.08) |
|
|
(0.29) |
| Net charge-offs as a percentage of average loans and |
|
|
|
|
|
|
|
|
|
|
|
|
|
|
| |
leases (%) annualized |
|
0.75 |
|
|
0.98 |
|
|
1.22 |
|
|
(0.23) |
|
|
(0.47) |
| Ratio of allowance for loan and lease losses to net |
|
|
|
|
|
|
|
|
|
|
|
|
|
|
| |
charge-offs (times) annualized |
|
2.07 |
|
|
1.65 |
|
|
1.52 |
|
|
0.42 |
|
|
0.55 |
| Ratio of allowance for loan and lease losses to |
|
|
|
|
|
|
|
|
|
|
|
|
|
|
| |
nonperforming loans and leases held for |
|
|
|
|
|
|
|
|
|
|
|
|
|
|
| |
investment (times) |
|
1.55 |
|
|
1.43 |
|
|
1.21 |
|
|
0.12 |
|
|
0.34 |
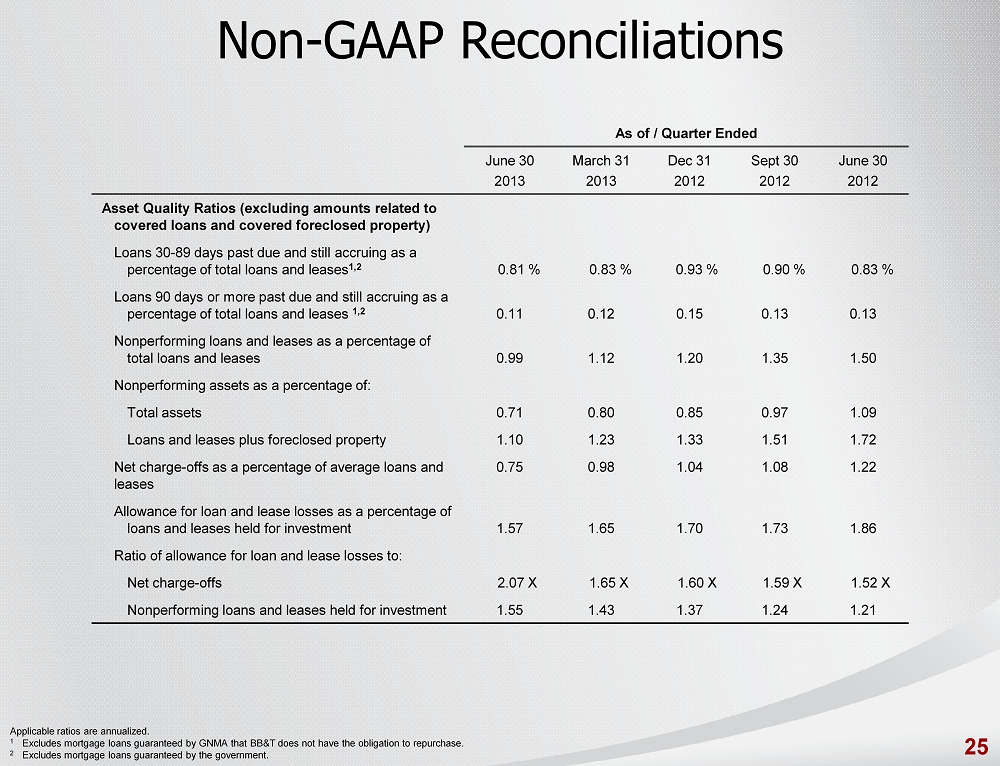
(1) Excludes amounts related to covered
assets and government guaranteed loans. See footnotes on the Credit Quality pages of the Quarterly Performance Summary for
additional information.
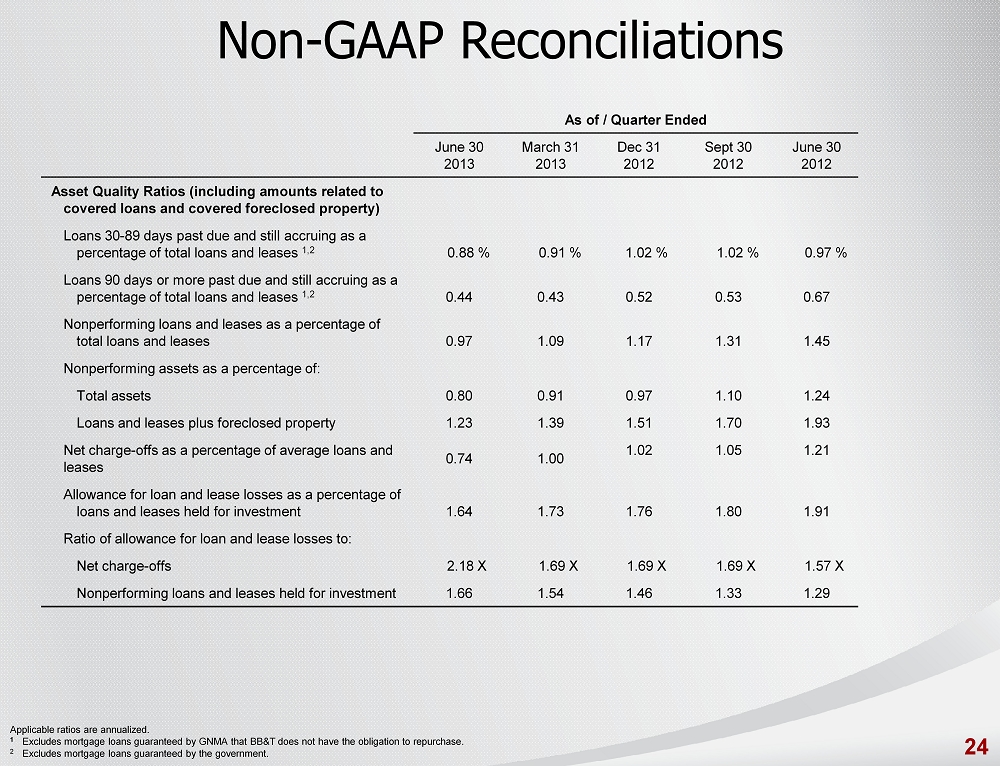
Nonperforming assets, excluding covered foreclosed
real estate, decreased $137 million compared to March 31, 2013. This decrease was primarily driven by a $134 million reduction
in nonperforming loans and leases. At June 30, 2013, nonperforming loans and leases represented 0.99% of total loans and leases,
excluding covered assets, which is at its lowest level since the first quarter of 2008.
Loan delinquencies continued to improve during
the second quarter of 2013. Loans 30-89 days past due and still accruing, excluding loans guaranteed by the government, totaled
$940 million at June 30, 2013, a decrease of $16 million compared to March 31, 2013, while loans 90 days past due and still accruing,
excluding loans guaranteed by the government, totaled $123 million at June 30, 2013, a decrease of $15 million compared to March
31, 2013.
Total performing troubled debt restructurings
(“TDRs”), excluding loans guaranteed by the government, were $1.3 billion at June 30, 2013, an increase of $24 million
compared to March 31, 2013.
Excluding covered loans, net charge-offs during
the second quarter of 2013 totaled $215 million and were an annualized 0.75% of average loans and leases, compared to $275 million
and 0.98%, respectively, during the first quarter of 2013. Net charge-offs, excluding covered loans, were at the lowest level since
the second quarter of 2008.
As of June 30, 2013, the allowance for loan
and lease losses was 1.57% of total loans and leases held for investment, excluding covered loans, compared to 1.65% at March 31,
2013, and 1.86% at June 30, 2012. The decline in the allowance as a percentage of total loans reflects improvement in the overall
quality of the loan portfolio. The allowance for loan and lease losses was 155% of nonperforming loans and leases held for investment,
excluding covered loans, compared to 143% at March 31, 2013 and 121% at June 30, 2012.
Earnings presentation and Quarterly Performance Summary
To listen to BB&T’s live second
quarter 2013 earnings conference call at 8 a.m. (ET) today, please call 888-632-5009 and enter the participant code 5184622. A
presentation will be used during the earnings conference call and is available on our website at www.bbt.com.
Replays of the conference call will be available by dialing 888-203-1112 (access code 4313363) until August 18, 2013.
To access the presentation, including an appendix
reconciling non-GAAP disclosures, go to www.bbt.com, click on “About” and
proceed to “Investor Relations.” The presentation can be found under “View Recent Presentations.”
BB&T’s second quarter 2013 Quarterly
Performance Summary, which contains detailed financial schedules, is available on BB&T’s website at www.bbt.com/financials.html.
About BB&T
As of June 30, 2013, BB&T is one of the
largest financial services holding companies in the U.S. with $182.7 billion in assets and market capitalization of $23.8 billion.
Based in Winston-Salem, N.C., the company operates 1,851 financial centers in 12 states and Washington, D.C., and offers a full
range of consumer and commercial banking, securities brokerage, asset management, mortgage and insurance products and services.
A Fortune 500 company, BB&T is consistently recognized for outstanding client satisfaction by J.D. Power and Associates, the
U.S. Small Business Administration, Greenwich Associates and others. More information about BB&T and its full line of products
and services is available at www.bbt.com.
#-#-#
Capital ratios are preliminary. Credit quality
data excludes covered and government guaranteed loans where applicable.
This news release contains financial information
and performance measures determined by methods other than in accordance with accounting principles generally accepted in the United
States of America (“GAAP”). BB&T’s management uses these “non-GAAP” measures in their analysis
of the Corporation’s performance and the efficiency of its operations. Management believes that these non-GAAP measures provide
a greater understanding of ongoing operations and enhance comparability of results with prior periods as well as demonstrating
the effects of significant gains and charges in the current period. The company believes that a meaningful analysis of its financial
performance requires an understanding of the factors underlying that performance. BB&T’s management believes that investors
may use these non-GAAP financial measures to analyze financial performance without the impact of unusual items that may obscure
trends in the company’s underlying performance. These disclosures should not be viewed as a substitute for financial measures
determined in accordance with GAAP, nor are they necessarily comparable to non-GAAP performance measures that may be presented
by other companies. Below is a listing of the types of non-GAAP measures used in this news release:
| · | Tier 1 common equity and related ratios are non-GAAP measures. BB&T uses the Tier 1 common
equity definition used in the SCAP assessment to calculate these ratios. The Basel III common equity Tier I ratio reflects management’s
interpretation of the regulatory requirements, which is subject to change. BB&T's management uses these measures to assess
the quality of capital and believes that investors may find them useful in their analysis of the Corporation. |
| · | Asset quality ratios have been adjusted to remove the impact of acquired loans and foreclosed
property covered by FDIC loss sharing agreements from the numerator and denominator of these ratios. Management believes that their
inclusion may result in distortion of these ratios, such that they might not be comparable to other periods presented or to other
portfolios that were not impacted by purchase accounting. |
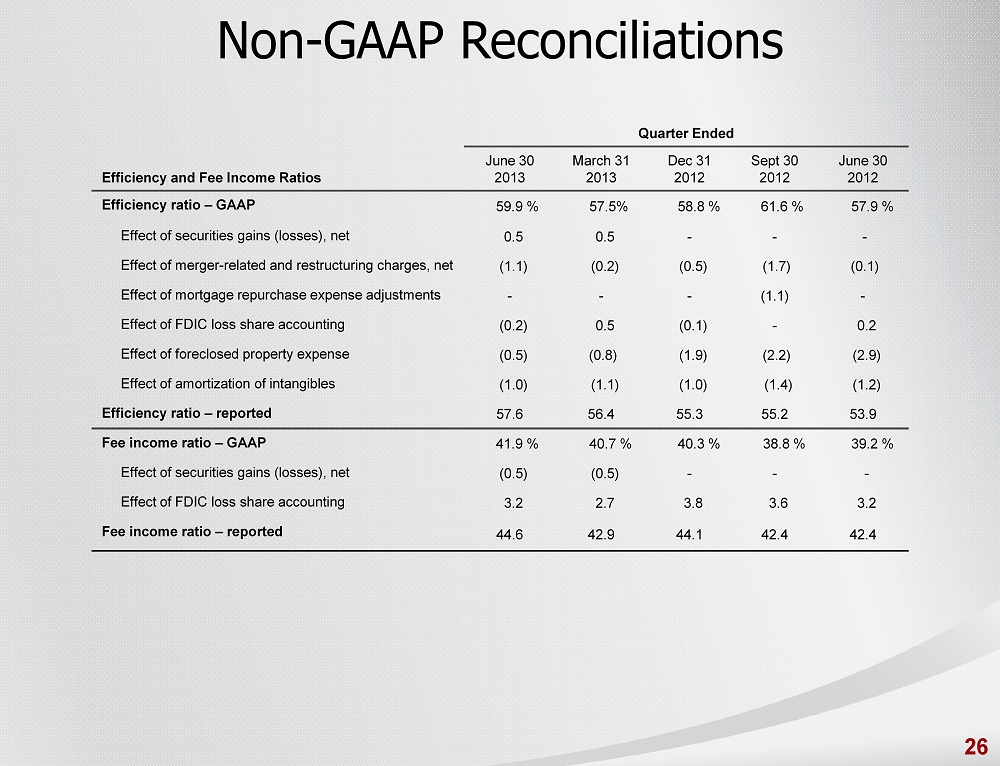
| · | Fee income and efficiency ratios are non-GAAP in that they exclude securities gains (losses),
foreclosed property expense, amortization of intangible assets, merger-related and restructuring charges, the impact of FDIC loss
share accounting and other selected items. BB&T’s management uses these measures in their analysis of the Corporation’s
performance. BB&T’s management believe these measures provide a greater understanding of ongoing operations and enhance
comparability of results with prior periods, as well as demonstrating the effects of significant gains and charges. |
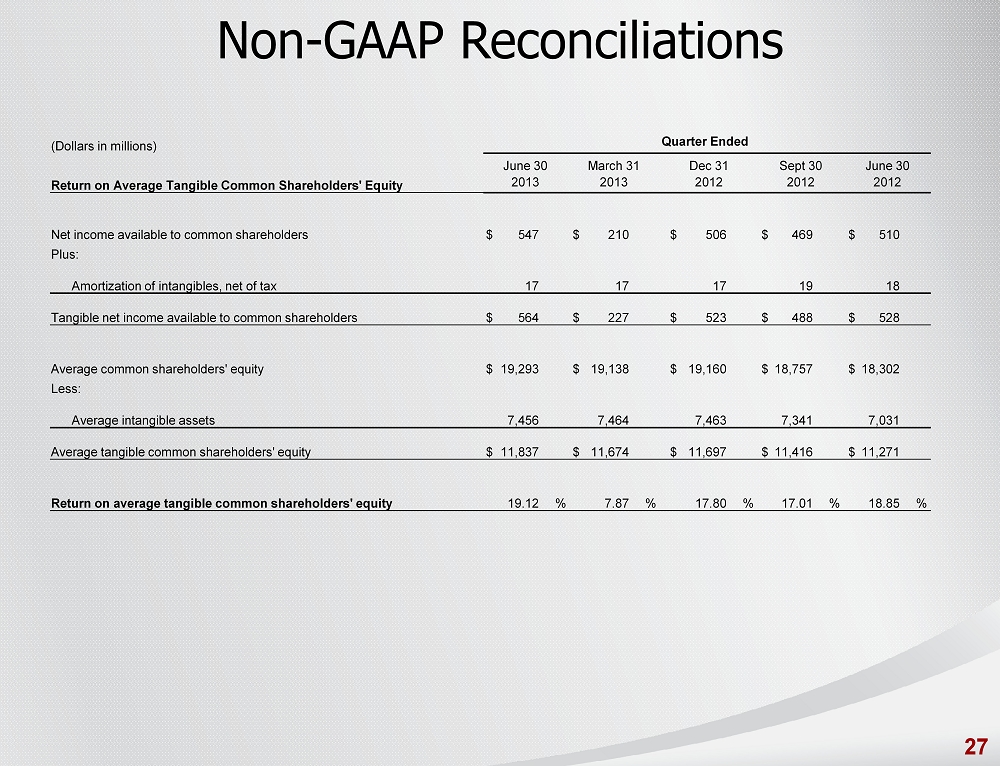
| · | Return on average tangible common shareholders’ equity is a non-GAAP measure that calculates
the return on average common shareholders’ equity without the impact of intangible assets and their related amortization.
This measure is useful for evaluating the performance of a business consistently, whether acquired or developed internally. |
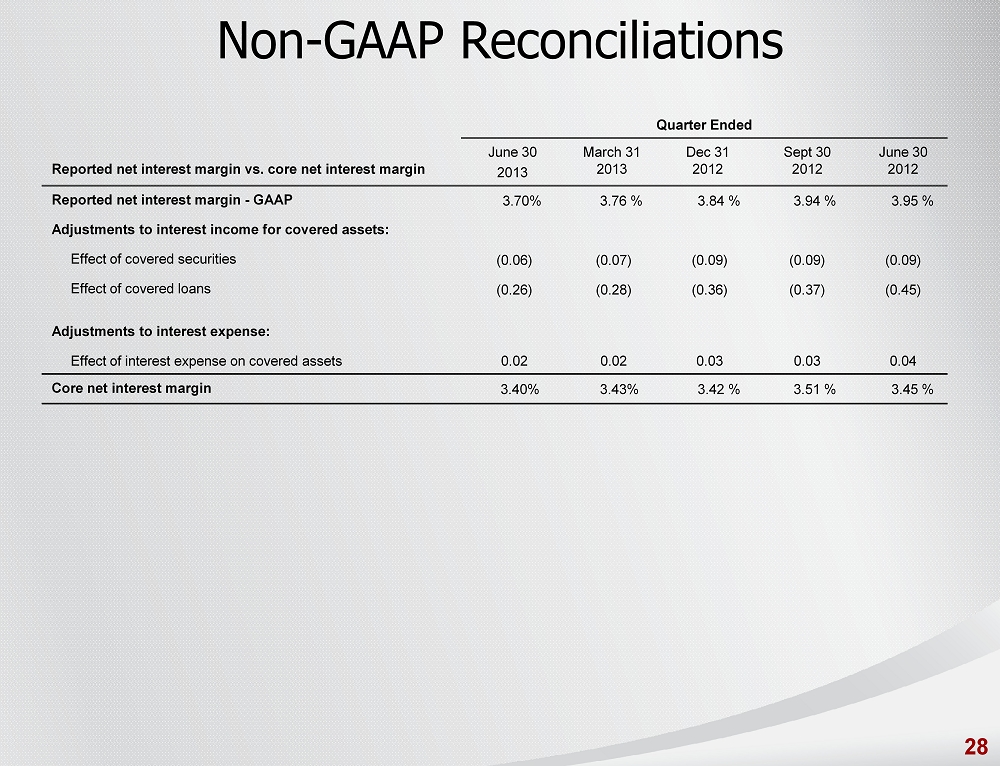
| · | Core net interest margin is a non-GAAP measure that adjusts net interest margin to exclude
the impact of interest income and funding costs associated with loans and securities acquired in the Colonial acquisition. BB&T’s
management believes that the exclusion of the generally higher yielding assets acquired in the Colonial acquisition from the calculation
of net interest margin provides investors with useful information related to the relative performance of the remainder of BB&T’s
earning assets. |
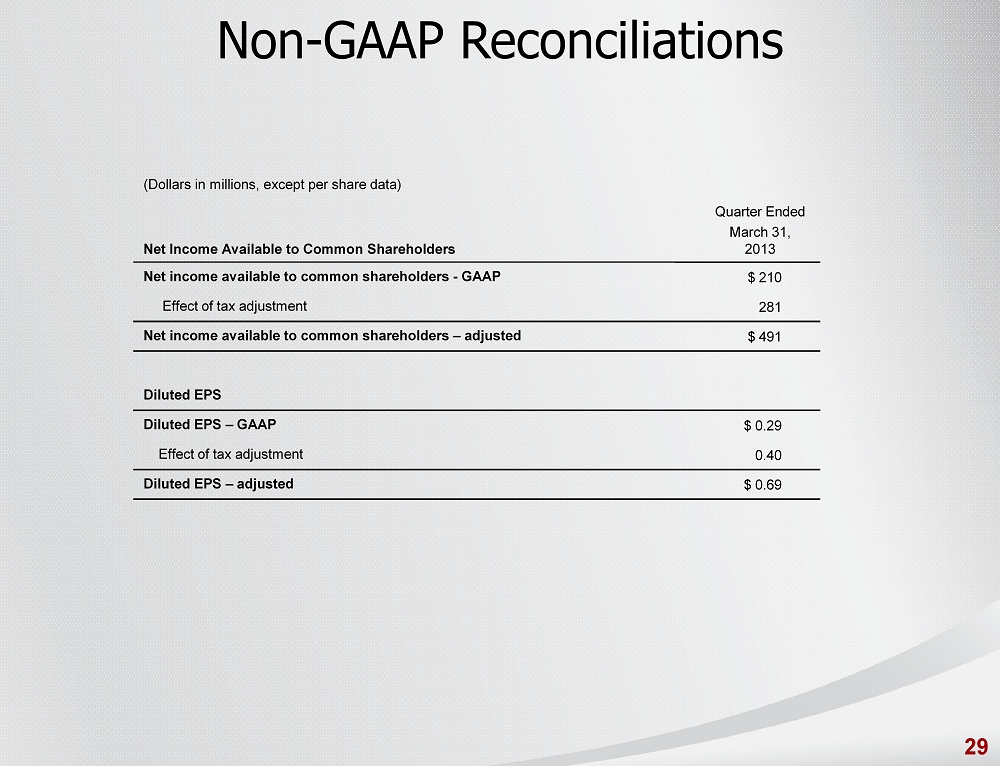
| · | Net income available to common shareholders and diluted EPS have been adjusted to exclude the
impact of the $281 million tax adjustment that was recorded in the first quarter of 2013. BB&T management believes these adjustments
increase comparability of period-to-period results and uses these measures to assess performance and believes investors may find
them useful in their analysis of the Corporation. |
A reconciliation of these non-GAAP measures
to the most directly comparable GAAP measure is included on the Investor Relations section of BB&T’s website and in
BB&T’s Second Quarter 2013 Quarterly Performance Summary, which is available on BB&T’s website at www.bbt.com/financials.html.
This news release contains certain forward-looking
statements as defined in the Private Securities Litigation Reform Act of 1995. These statements may address issues that involve
significant risks, uncertainties, estimates and assumptions made by management. Actual results may differ materially from current
projections. Please refer to BB&T’s filings with the Securities and Exchange Commission for a summary of important factors
that may affect BB&T’s forward-looking statements. BB&T undertakes no obligation to revise these statements following
the date of this news release.
-
20 -