UNITED STATES
SECURITIES AND EXCHANGE COMMISSION
Washington, D.C. 20549
Form 8-K
Current Report
Pursuant to Section 13 or 15(d)
of the Securities Exchange Act of 1934
October 20, 2011
Date of Report (Date of earliest event reported)
BB&T Corporation
(Exact name of registrant as specified in its charter)
Commission file number : 1-10853
North Carolina | 56-0939887 |
(State of incorporation) | (I.R.S. Employer Identification No.) |
200 West Second Street | |
Winston-Salem, North Carolina | 27101 |
(Address of principal executive offices) | (Zip Code) |
(336) 733-2000
(Registrant's telephone number, including area code)
Check the appropriate box below if the Form 8-K filing is intended to simultaneously satisfy the filing obligation of the registrant under any of the following provisions (see General Instruction A.2. below):
[ ] Written communications pursuant to Rule 425 under the Securities Act (17 CFR 230.425)
[ ] Soliciting material pursuant to Rule 14a-12 under the Exchange Act (17 CFR 240.14a-12)
[ ] Pre-commencement communications pursuant to Rule 14d-2(b) under the Exchange Act (17 CFR 240.14d-2(b))
[ ] Pre-commencement communications pursuant to Rule 13e-4(c) under the Exchange Act (17 CFR 240.13e-4(c))
ITEM 2.02 | Results of Operations and Financial Condition |
On October 20, 2011, BB&T Corporation issued a press release reporting third quarter 2011 results, and posted on its website its third quarter 2011 Earnings Release, Quarterly Performance Summary and Earnings Release Presentation. The materials contain forward-looking statements regarding BB&T and include a cautionary statement identifying important factors that could cause actual results to differ materially from those anticipated. The Earnings Release, Quarterly Performance Summary and Earnings Release Presentation are furnished as Exhibit 99.1, 99.2 and 99.3, respectively.
ITEM 9.01 | Financial Statements and Exhibits |
Exhibit No. | Description of Exhibit |
99.1 | BB&T Corporation's Earnings Release issued October 20, 2011. |
99.2 | BB&T Corporation's Quarterly Performance Summary issued October 20, 2011. |
99.3 | BB&T Corporation's Earnings Release Presentation issued October 20, 2011. |
S I G N A T U R E
Pursuant to the requirements of the Securities Exchange Act of 1934, the registrant has duly caused this report to be signed on its behalf by the undersigned hereunto duly authorized.
BB&T CORPORATION |
(Registrant) |
By: /S/ Cynthia B. Powell |
Cynthia B. Powell |
Executive Vice President and Corporate Controller |
(Principal Accounting Officer) |
Date: October 20, 2011
Exhibit 99.1 | ||||
October 20, 2011 | ||||
FOR IMMEDIATE RELEASE | ||||
Contacts: | ||||
ANALYSTS | MEDIA | |||
Tamera Gjesdal | Alan Greer | Cynthia Williams | ||
Senior Vice President | Executive Vice President | Executive Vice President | ||
Investor Relations | Investor Relations | Corporate Communications | ||
(336) 733-3058 | (336) 733-3021 | (336) 733-1478 |
BB&T posts EPS of $0.52, up 73%
Net income increases 69%
Average total loans up an annualized 4%
Nonperforming assets 11% lower
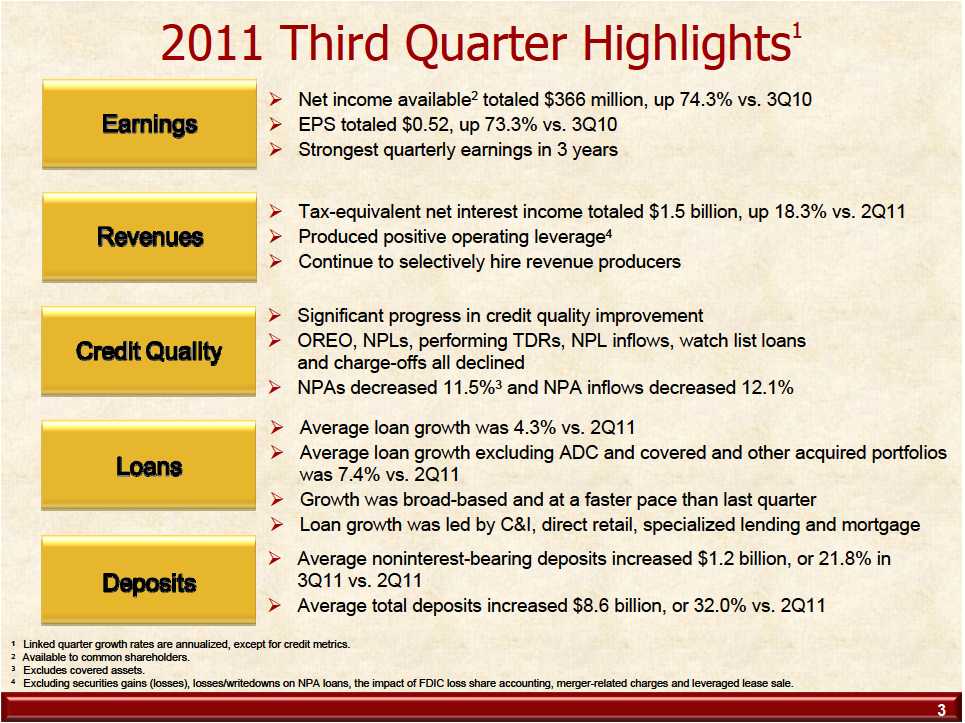
WINSTON-SALEM, N.C. -- BB&T Corporation (NYSE: BBT) today reported third quarter net income of $371 million, an increase of 69% compared to $219 million reported in the third quarter last year. Net income available to common shareholders was $366 million, or $0.52 per diluted common share, compared with $210 million, or $0.30 per diluted common share, earned in the third quarter of 2010. These results reflect increases of 74% and 73%, respectively.
“We are very pleased to report our strongest earnings quarter in three years,” said Chairman and Chief Executive Officer Kelly S. King. “The increase was driven by significantly improved credit quality and improved net interest income. Net revenues totaled $2.1 billion this quarter, led by taxable-equivalent net interest income of $1.5 billion, up 8% compared to last year.
“BB&T also posted very healthy, broad-based loan growth,” King said. “BB&T’s average loans held for investment grew an annualized 4%, and, excluding our covered and residential ADC portfolios, increased an annualized 7%. Further, all our leading indicators for loan growth are positive, with robust pipelines and solid momentum as we enter the fourth quarter.
“We continue to see impressive growth rates in low-cost deposits and to improve our deposit mix,” King said. “Average deposits increased 32% on an annualized basis compared to the second quarter, and noninterest-bearing deposits and interest checking increased 22% and 14%, respectively. We have reduced the average cost of interest-bearing deposits from 0.72% last quarter to 0.65% this quarter.”
“We have reduced nonperforming assets by approximately $900 million in the last two quarters to the lowest level in two and a half years. We continue to make meaningful progress in all credit areas,” King said. “In particular, nonperforming assets decreased 11% in the quarter and inflows of new nonperforming assets decreased 12%.
“Finally, our net interest margin remained a very strong 4.09% in the third quarter compared to 4.15% last quarter,” King said. “The slight reduction results mainly from securities being a larger percentage of earning assets.”
Third Quarter 2011 Performance Highlights
Average total loans and leases held for investment increased 4.3% on an annualized basis compared to the second quarter | ||
o |
Average C&I loans increased 7.5% | |
o |
Average loans in the specialized lending group increased 30.8% | |
o |
Average mortgage loans increased 11.0% | |
o |
Average sales finance loans increased 2.8% | |
o |
Average revolving credit loans increased 7.5% | |
o |
Average direct retail loans increased 3.6% | |
o |
Average total loans held for investment, excluding the impact of ADC and covered and other acquired loan runoff, increased 7.4% | |
o |
Average residential ADC loans declined 48.3% | |
The net interest margin remained strong | ||
o |
The net interest margin was 4.09% for the third quarter, flat compared to the third quarter of 2010 and down 6 basis points compared to last quarter | |
The pace of improvement in problem assets remained strong in the quarter | ||
o |
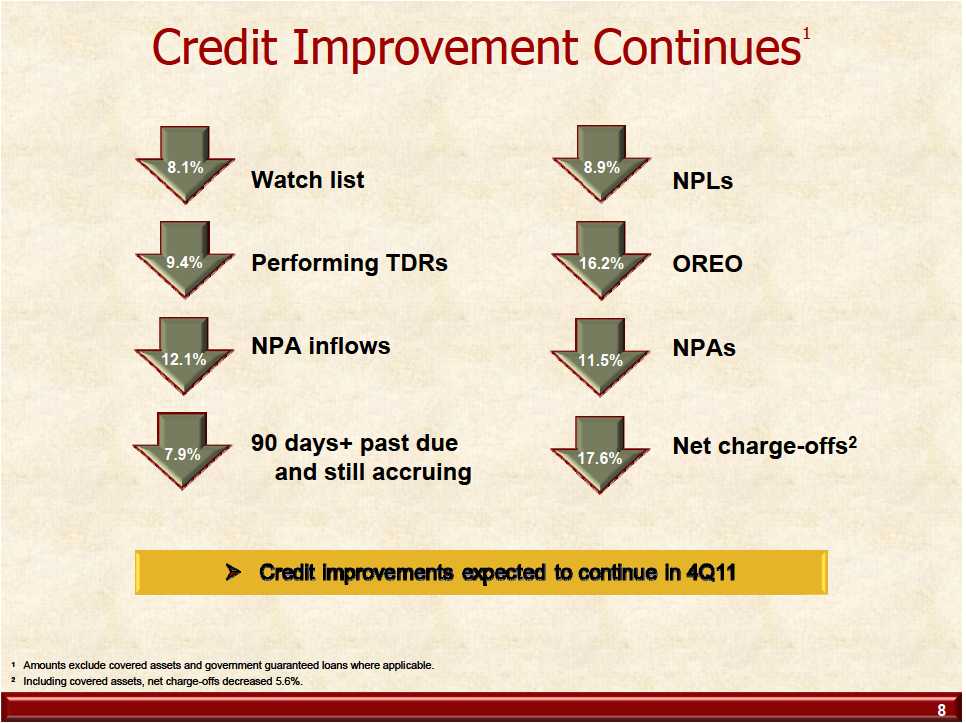
NPAs decreased 11.5% excluding covered assets, the 6th consecutive quarter with lower NPAs | |
o |
Performing TDRs, excluding government guaranteed loans, decreased 9.4% | |
o |
NPA inflows decreased 12.1% | |
o |
Loans 90 days or more past due and still accruing interest decreased 7.9%, excluding covered and government guaranteed loans | |
o |
Loans 30-89 days past due and still accruing increased 5.7% due to seasonal factors in the specialized lending and mortgage portfolios | |
o |
Net charge-offs totaled 1.44% of average loans for the quarter, excluding covered loans, down from 1.80% last quarter | |
Average deposits increased $8.6 billion, or 32.0% on an annualized linked quarter basis | ||
o |
Average noninterest-bearing deposits increased $1.2 billion, or 21.8% | |
o |
Average interest checking deposits increased $667 million, or 14.4% | |
o |
Average money market and savings deposits were up $2.8 billion, or 28.1% | |
o |
Average certificates and other time deposits increased $4.2 billion, or 63.6% | |
o |
Average interest-bearing deposit costs were reduced to 0.65% compared to 0.72% in the second quarter |
2
Capital levels further improved during the quarter | ||
o |
Tangible common equity remained strong at 7.1% | |
o |
Tier 1 common equity improved to 9.8% | |
o |
Tier 1 risk-based capital improved to 12.5% | |
o |
Leverage capital remained strong at 9.2% | |
o |
Total capital remained strong at 16.1% |
. | |||||||||||||
#-#-# | |||||||||||||
EARNINGS HIGHLIGHTS | Change | Change | |||||||||||
(dollars in millions, except per share data) | Q3 | Q2 | Q3 | Q3 11 vs. | Q3 11 vs. | ||||||||
2011 | 2011 | 2010 | Q2 11 | Q3 10 | |||||||||
Net income available to common shareholders | $ | 366 | $ | 307 | $ | 210 | $ | 59 | $ | 156 | |||
Diluted earnings per common share | 0.52 | 0.44 | 0.30 | 0.08 | 0.22 | ||||||||
Net interest income-taxable equivalent | $ | 1,454 | $ | 1,390 | $ | 1,347 | $ | 64 | $ | 107 | |||
Noninterest income | 690 | 787 | 1,110 | (97 | ) | (420 | ) | ||||||
Total revenue | $ | 2,144 | $ | 2,177 | $ | 2,457 | $ | (33 | ) | $ | (313 | ) | |
Return on average assets (%) | 0.89 | 0.83 | 0.56 | 0.06 | 0.33 | ||||||||
Return on average common shareholders' equity (%) | 8.30 | 7.25 | 4.91 | 1.05 | 3.39 | ||||||||
Net interest margin - taxable equivalent (%) | 4.09 | 4.15 | 4.09 | (0.06 | ) | - | |||||||
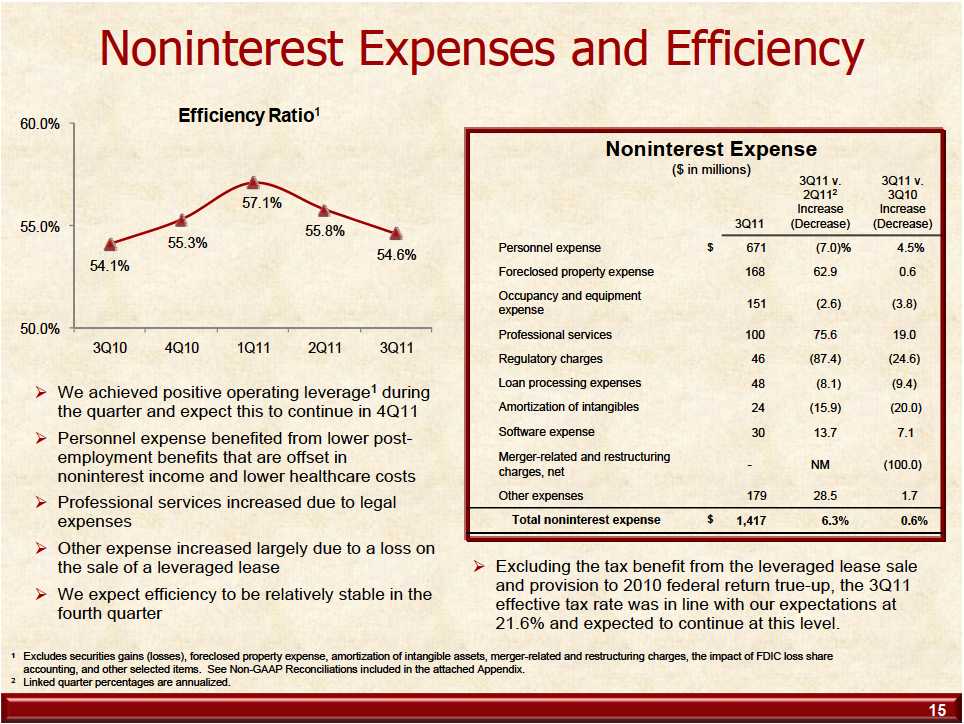
Efficiency ratio (1) (%) | 54.6 | 55.8 | 54.1 | (1.2 | ) | 0.5 |
(1) Excludes securities gains (losses), foreclosed property expense, amortization of intangible assets, merger-related and restructuring charges, the impact of FDIC loss share accounting, and other selected items. See Non-GAAP reconciliations on page 20 of the Quarterly Performance Summary.
Third Quarter 2011 compared to Third Quarter 2010
Consolidated net income available to common shareholders for the third quarter of 2011 of $366 million was up 74.3% compared to $210 million earned during the same period in 2010. On a diluted per common share basis, earnings for the third quarter of 2011 were $0.52, up 73.3% compared to $0.30 for the same period in 2010. BB&T’s results of operations for the third quarter of 2011 produced an annualized return on average assets of 0.89% and an annualized return on average common shareholders’ equity of 8.30% compared to prior year ratios of 0.56% and 4.91%, respectively.
Total revenues were $2.1 billion for the third quarter of 2011, down $313 million compared to the third quarter of 2010. The decrease in total revenues was due to a decline of $420 million in noninterest income offset by higher net interest income. The decline in noninterest income was primarily the result of a decrease in net securities gains of $278 million compared to the prior year. Noninterest income included $239 million in net securities gains during the third quarter of 2010 compared to a net loss of $39 million in the current quarter. In addition,
3
mortgage banking income for the third quarter of 2011 decreased $61 million primarily as a result of lower revenues from residential mortgage loans. FDIC loss share income, net was an expense of $104 million for the third quarter of 2011, or a $61 million decrease, due primarily to improved performance from covered loans. The net interest income increase was due to lower deposit costs and a more favorable funding mix. The net interest margin was flat compared to the third quarter of 2010.
The provision for credit losses, excluding covered loans, for the third quarter of 2011 declined $500 million, or 67.3%, compared to the third quarter of 2010, as improving credit quality resulted in lower provision expense. The provision for covered loans decreased $20 million, which was offset by a corresponding $16 million decrease in FDIC loss share income. Net charge-offs, excluding covered loans, for the third quarter of 2011 were $507 million lower than the third quarter of 2010. The prior year's quarter included $431 million of charge-offs related to losses on the transfer of problem commercial loans to loans held for sale. The level of nonperforming assets, loan delinquencies and the outlook for future credit losses improved significantly during 2011.
A $68 million provision for income taxes was recorded for the third quarter of 2011 compared to $27 million for the third quarter of 2010. This resulted in an effective tax rate for the third quarter of 2011 of 15.5% compared to 11.0% for the prior year’s third quarter. The increase in the effective tax rate was primarily due to higher levels of pre-tax earnings in 2011 compared to 2010. The current quarter includes a $26 million tax benefit related to the sale of leveraged leases.
Third Quarter 2011 compared to Second Quarter 2011
Consolidated net income available to common shareholders for the third quarter of 2011 of $366 million was up $59 million, or an annualized 76.2% compared to $307 million earned during the second quarter of 2011. On a diluted per common share basis, earnings for the third quarter of 2011 were $0.52, up $0.08, or an annualized 72.1%, compared to the amount earned in the second quarter of 2011. BB&T’s results of operations for the third quarter of 2011 produced an annualized return on average assets of 0.89% and an annualized return on average common shareholders’ equity of 8.30% compared to prior quarter ratios of 0.83% and 7.25%, respectively.
Total revenues were $2.1 billion for the third quarter of 2011, down $33 million compared to the second quarter of 2011. The decrease in total revenues was the result of higher net interest income that was more than offset by lower noninterest income in the third quarter of 2011 compared to the prior quarter. Noninterest income was down $97 million compared to the second quarter of 2011. The decrease in noninterest income included a $58 million decrease in insurance income, increased securities losses of $37 million and a decrease of $23 million in FDIC loss share income. These decreases in noninterest income were partially offset by an increase of $40 million in mortgage banking income. Fully taxable equivalent net interest income increased $64 million compared to the second quarter of 2011, primarily due to higher average earning assets.
4
The provision for credit losses, excluding covered loans, for the third quarter of 2011 declined $70 million compared to the second quarter of 2011 due to improving credit trends. The provision for covered loans decreased $8 million, which was offset by a corresponding $6 million decrease in FDIC loss share income. Net charge-offs, excluding covered loans, for the third quarter of 2011 were $78 million lower than the second quarter of 2011.
The provision for income taxes was $68 million for the third quarter of 2011 compared to $91 million for the second quarter of 2011. This produced an effective tax rate for the third quarter of 2011 of 15.5% compared to 21.8% for the prior quarter. The current quarter includes a $26 million tax benefit related to the sale of leveraged leases.
REVENUE, NET OF PROVISION IMPACT | Change | Change | |||||||||||||
FROM ACQUIRED ASSETS (1) | Q3 | Q2 | Q3 | Q3 11 vs. | Q3 11 vs | ||||||||||
(dollars in millions) | 2011 | 2011 | 2010 | Q2 11 | Q3 10 | ||||||||||
Interest income - loans | $ | 277 | $ | 279 | $ | 261 | $ | (2 | ) | $ | 16 | ||||
Interest income - securities | 45 | 43 | 23 | 2 | 22 | ||||||||||
Total interest income | 322 | 322 | 284 | - | 38 | ||||||||||
Provision for covered loans | (7 | ) | (15 | ) | (27 | ) | 8 | 20 | |||||||
FDIC loss share income, net | (104 | ) | (81 | ) | (43 | ) | (23 | ) | (61 | ) | |||||
Net revenue after provision for covered loans | $ | 211 | $ | 226 | $ | 214 | $ | (15 | ) | $ | (3 | ) | |||
FDIC loss share income, net | |||||||||||||||
Offset to provision for covered loans | $ | 6 | $ | 12 | $ | 22 | $ | (6 | ) | $ | (16 | ) | |||
Accretion due to credit loss improvement | (96 | ) | (80 | ) | (69 | ) | (16 | ) | (27 | ) | |||||
Accretion for securities | (14 | ) | (13 | ) | 4 | (1 | ) | (18 | ) | ||||||
$ | (104 | ) | $ | (81 | ) | $ | (43 | ) | $ | (23 | ) | $ | (61 | ) |
(1) Presents amounts related to covered and acquired loans, covered securities and the FDIC loss sharing asset recognized in the Colonial acquisition. Excludes all amounts related to other assets acquired and liabilities assumed in the acquisition.
Third Quarter 2011 compared to Third Quarter 2010
Interest income for the third quarter of 2011 on loans and securities acquired in the Colonial acquisition increased $38 million compared to the third quarter of 2010, which is offset by a decrease in FDIC loss share income. Interest income on acquired loans increased $16 million reflecting higher expected cash flows based on the quarterly cash flow reassessment process required by acquisition accounting. The yield on covered and other acquired loans for the third quarter of 2011 was 20.41% compared to 14.77% in 2010. At September 30, 2011, the accretable yield balance on these loans was $2.1 billion. Accretable yield represents the excess of expected future cash flows above the current net carrying amount of loans and will be recognized into income over the remaining life of the covered and acquired loans. Interest income related to covered securities increased $22 million due primarily to security duration adjustments in the prior year, which is offset in FDIC loss share income.
5
The provision for covered loans was $7 million in the current quarter, a decrease of $20 million compared to the third quarter of 2010. The third quarter of 2011 reassessment showed some decreases in expected cash flows in certain loan pools that were partially offset by recoveries in other previously impaired loan pools.
FDIC loss share income, net was a negative $104 million, resulting in a reduction in revenue of $61 million compared to the third quarter of 2010. Of the $61 million, $16 million related to the 80% offset of lower provision expense and $18 million was due to higher interest income on covered securities. The remaining $27 million is principally due to the cumulative impact of cash flow reassessments.
Third Quarter 2011 compared to Second Quarter 2011
Interest income on loans and securities acquired in the Colonial acquisition was flat in the third quarter of 2011 compared to the second quarter. The yield on covered and other acquired loans for the third quarter of 2011 was 20.41%, up slightly compared to 19.61% in the earlier quarter as a result of the third quarter reassessment.
The provision for covered loans was $7 million in the third quarter of 2011. This was offset by a corresponding $6 million increase in FDIC loss share income.
FDIC loss share income, net decreased $23 million primarily as a result of the cumulative impact of cash flow reassessments. The negative accretion related to the improvement in credit losses is recognized on a level yield basis over the life of the related FDIC loss share asset, which has a shorter weighted average life than the corresponding loans.
6
NONINTEREST INCOME | % Change | % Change | |||||||||||
(dollars in millions) | Q3 | Q2 | Q3 | Q3 11 vs. | Q3 11 vs. | ||||||||
2011 | 2011 | 2010 | Q2 11 | Q3 10 | |||||||||
(annualized) | |||||||||||||
Insurance income | $ | 241 | $ | 299 | $ | 252 | (77.0 | ) | (4.4 | ) | |||
Service charges on deposits | 141 | 145 | 147 | (10.9 | ) | (4.1 | ) | ||||||
Mortgage banking income | 123 | 83 | 184 | 191.2 | (33.2 | ) | |||||||
Investment banking and brokerage fees and | |||||||||||||
commissions | 81 | 90 | 85 | (39.7 | ) | (4.7 | ) | ||||||
Checkcard fees | 78 | 79 | 70 | (5.0 | ) | 11.4 | |||||||
Other nondeposit fees and commissions | 71 | 66 | 74 | 30.1 | (4.1 | ) | |||||||
Bankcard fees and merchant discounts | 51 | 52 | 45 | (7.6 | ) | 13.3 | |||||||
Trust and investment advisory revenues | 43 | 45 | 40 | (17.6 | ) | 7.5 | |||||||
Income from bank-owned life insurance | 33 | 29 | 30 | 54.7 | 10.0 | ||||||||
FDIC loss share income, net | (104 | ) | (81 | ) | (43 | ) | 112.7 | 141.9 | |||||
Securities gains (losses), net | (39 | ) | (2 | ) | 239 | NM | (116.3 | ) | |||||
Other income, net | (29 | ) | (18 | ) | (13 | ) | NM | 123.1 | |||||
Total noninterest income | $ | 690 | $ | 787 | $ | 1,110 | (48.9 | ) | (37.8 | ) |
NM - not meaningful.
Third Quarter 2011 compared to Third Quarter 2010
Noninterest income was $690 million for third quarter of 2011 compared to $1.1 billion for the third quarter of 2010. Mortgage banking income declined $61 million, or 33.2%, compared to the same period of 2010. The decrease in mortgage banking income was primarily the result of a $58 million decrease in residential mortgage production income due to lower volumes and pricing. Checkcard fees were up $8 million, or 11.4%, and bankcard fees and merchant discounts were up $6 million, or 13.3%, largely due to higher volumes. FDIC loss share income decreased $61 million, or 141.9% primarily as a result of cash flow reassessments and the offset to the provision for covered loans. Net securities gains decreased $278 million compared to the prior year quarter, $241 million from fewer gains during the current quarter and $37 million in higher other-than-temporary impairments. Other income declined $16 million compared to the third quarter of 2010, primarily as a result of $12 million of lower income on trading assets associated with certain post-employment benefits, which is offset in personnel costs, and $9 million in higher losses and writedowns recorded on commercial loans held for sale in connection with management’s nonperforming asset disposition strategy. These were offset by $10 million in lower credit losses on client derivatives.
Third Quarter 2011 compared to Second Quarter 2011
Noninterest income for the third quarter of 2011 was down $97 million compared to the second quarter of 2011. Insurance income decreased $58 million, or an annualized 77.0%, compared to the second quarter of 2011, primarily due to a seasonally stronger second quarter. Mortgage banking income was up $40 million compared to the prior quarter due to a $32 million
7
increase resulting from positive hedge performance of the mortgage servicing asset. This was partially offset by an increase of $17 million in the write-down of residential mortgage servicing rights due to higher realization of expected cash flows as a result of increased refinancing activity. In addition, residential mortgage production revenues were up $23 million due to higher volumes. Investment banking and brokerage fees and commissions were down $9 million, or 39.7% annualized, due to lower activity in the fixed income offering market. FDIC loss share income was down $23 million compared to the second quarter of 2011 primarily as a result of the impact of cash flow reassessments and the offset to the provision for covered loans. Securities gains were $37 million lower due to $21 million in higher other-than-temporary impairment in the current quarter and $16 million in gains on securities sold in the prior quarter. Other income decreased $11 million compared to the second quarter of 2011. The decrease in other income includes higher losses and writedowns of $10 million on commercial loans held for sale and $16 million of lower income on trading assets for certain post-employment benefits, which is offset in personnel costs, and $12 million in higher income on venture capital investments.
NONINTEREST EXPENSE | % Change | % Change | ||||||||
(dollars in millions) | Q3 | Q2 | Q3 | Q3 11 vs. | Q3 11 vs. | |||||
2011 | 2011 | 2010 | Q2 11 | Q3 10 | ||||||
(annualized) | ||||||||||
Personnel expense | $ | 671 | $ | 683 | $ | 642 | (7.0 | ) | 4.5 | |
Foreclosed property expense | 168 | 145 | 167 | 62.9 | 0.6 | |||||
Occupancy and equipment expense | 151 | 152 | 157 | (2.6 | ) | (3.8 | ) | |||
Professional services | 100 | 84 | 84 | 75.6 | 19.0 | |||||
Regulatory charges | 46 | 59 | 61 | (87.4 | ) | (24.6 | ) | |||
Loan processing expenses | 48 | 49 | 53 | (8.1 | ) | (9.4 | ) | |||
Amortization of intangibles | 24 | 25 | 30 | (15.9 | ) | (20.0 | ) | |||
Software expense | 30 | 29 | 28 | 13.7 | 7.1 | |||||
Merger-related and restructuring charges, net | - | 2 | 10 | NM | (100.0 | ) | ||||
Other expenses | 179 | 167 | 176 | 28.5 | 1.7 | |||||
Total noninterest expense | $ | 1,417 | $ | 1,395 | $ | 1,408 | 6.3 | 0.6 |
NM - not meaningful.
Third Quarter 2011 compared to Third Quarter 2010
Noninterest expense was $1.4 billion for third quarter of 2011, a slight increase of $9 million, or 0.6%, compared to the same quarter of 2010. Personnel expense increased $29 million, or 4.5%, compared to the same quarter of last year. This includes an increase of $16 million in salaries primarily due to hiring and customary salary increases, $20 million in higher incentive expense largely from better performance and production-related businesses and a decrease of $12 million related to certain post retirement benefits that were offset through lower noninterest income. Professional services expense increased $16 million, or 19.0%, compared to the same quarter of 2010, largely as a result of higher legal fees. Regulatory charges decreased $15 million, or 24.6%, due to lower deposit insurance premiums. Amortization of intangibles
8
decreased $6 million, or 20.0%, as these are amortized on an accelerated basis. There were no merger-related and restructuring charges for the third quarter of 2011 which was down $10 million compared to the same period of 2010, as the prior year’s third quarter included charges related to the acquisition of Colonial. Other noninterest expense was up $3 million compared to the prior year. The current year’s third quarter includes a loss of $16 million from the sale of leveraged leases. This loss was partially offset by tighter expense controls resulting in decreases in telephone, advertising and other operating expenses.
Third Quarter 2011 compared to Second Quarter 2011
Noninterest expense for the third quarter of 2011 was up $22 million, or an annualized 6.3%, compared to the second quarter of 2011. Personnel expense decreased $12 million, or an annualized 7.0%. This decrease primarily relates to a $16 million reduction for post-employment benefits expenses that are offset by lower noninterest income. Foreclosed property expense increased $23 million, or an annualized 62.9%, largely due to an increase in writedowns and losses as management has adopted a more aggressive approach to reduce foreclosed real estate. Professional services increased $16 million, or an annualized 75.6%, due primarily to legal fees. Regulatory charges decreased $13 million, or 87.4% annualized, as a result of improved credit quality which has led to lower deposit insurance premiums. Other noninterest expense was up $12 million, or an annualized 28.5%, compared to the second quarter of 2011. The increase in other noninterest expense includes a loss on sale of leveraged leases of $16 million that occurred in the third quarter of 2011.
LOANS AND LEASES - average balances | % Change | % Change | |||||||||
(dollars in millions) | Q3 | Q2 | Q3 | Q3 11 vs. | Q3 11 vs. | ||||||
2011 | 2011 | 2010 | Q2 11 | Q3 10 | |||||||
(annualized) | |||||||||||
Commercial and industrial | $ | 34,280 | $ | 33,647 | $ | 32,174 | 7.5 | 6.5 | |||
Commercial real estate—other | 11,069 | 11,287 | 12,052 | (7.7 | ) | (8.2 | ) | ||||
Commercial real estate—residential ADC | 2,576 | 2,933 | 4,394 | (48.3 | ) | (41.4 | ) | ||||
Direct retail lending | 13,754 | 13,629 | 13,867 | 3.6 | (0.8 | ) | |||||
Sales finance loans | 7,234 | 7,184 | 6,906 | 2.8 | 4.7 | ||||||
Revolving credit loans | 2,109 | 2,070 | 2,048 | 7.5 | 3.0 | ||||||
Residential mortgage loans | 18,818 | 18,311 | 15,828 | 11.0 | 18.9 | ||||||
Specialized lending | 8,652 | 8,029 | 8,046 | 30.8 | 7.5 | ||||||
Other acquired loans | 48 | 53 | 73 | (37.4 | ) | (34.2 | ) | ||||
Total loans and leases held for investment | |||||||||||
(excluding covered loans) | 98,540 | 97,143 | 95,388 | 5.7 | 3.3 | ||||||
Covered loans | 5,342 | 5,625 | 6,957 | (20.0 | ) | (23.2 | ) | ||||
Total loans and leases held for investment | $ | 103,882 | $ | 102,768 | $ | 102,345 | 4.3 | 1.5 |
Third Quarter 2011 compared to Third Quarter 2010
Average loans held for investment for the third quarter of 2011 was $103.9 billion, up $1.5 billion compared to the corresponding period of 2010. Average commercial and industrial loans
9
increased $2.1 billion, or 6.5%, compared to the third quarter of 2010. The growth in average commercial and industrial loans reflects management’s focused efforts at growing this component of the loan portfolio. Average commercial real estate – residential ADC and commercial real estate – other declined 41.4% and 8.2%, respectively, compared to third quarter of 2010 as management has intentionally lowered exposures to higher-risk real estate lending during the economic downturn. Average mortgage loans increased $3.0 billion, or 18.9%, compared to the third quarter of 2010, due to the decision to retain a portion of the 10 to 15 year fixed-rate and adjustable rate mortgage production beginning in the third quarter of 2010. Average loans originated in specialized lending were up $606 million, or 7.5%, compared to the third quarter of 2010, as the majority of these niche businesses experienced growth. Total average loans held for investment includes a decline of $1.6 billion, or 23.3%, in average covered and other acquired loans compared to the third quarter of 2010.
Third Quarter 2011 compared to Second Quarter 2011
Average loans held for investment for the third quarter of 2011 was up $1.1 billion, or an annualized 4.3%, compared to the second quarter of 2011. Average commercial and industrial loans and leases increased $633 million, or an annualized 7.5%, compared to the second quarter of 2011, due to focused efforts to grow this component of the loan portfolio. Average commercial real estate – residential ADC and commercial real estate – other declined an annualized 48.3% and 7.7%, respectively, compared to second quarter of 2011 due to management’s objective of diversifying the mix of the commercial lending portfolio and lowering exposure to higher-risk real estate lending. Average direct retail lending loans were up an annualized 3.6%, or $125 million, compared to the second quarter of 2011 as a result of continued demand for home equity loans and an increase in originations of small business loans. Average mortgage loans were up $507 million, or an annualized 11.0%, compared to the second quarter of 2011, as management continues to retain certain mortgage loans in the held for investment portfolio. Average loans originated in specialized lending were up $623 million, or an annualized 30.8%, compared to the second quarter of 2011, largely as a result of seasonal growth in insurance premium financing and expansion in small ticket consumer finance lending. Total average loans held for investment includes a decline of $288 million, or an annualized 20.1%, in average covered and other acquired loans compared to the second quarter of 2011.
LOANS HELD FOR SALE - end of period | % Change | % Change | ||||||||
(dollars in millions) | Q3 | Q2 | Q3 | Q3 11 vs. | Q3 11 vs. | |||||
2011 | 2011 | 2010 | Q2 11 | Q3 10 | ||||||
(annualized) | ||||||||||
Residential mortgage | $ | 2,347 | $ | 1,745 | $ | 2,846 | 136.9 | (17.5 | ) | |
Commercial mortgage | 373 | 104 | 163 | NM | 128.8 | |||||
Commercial | 26 | 116 | 824 | NM | (96.8 | ) | ||||
Total loans held for sale | $ | 2,746 | $ | 1,965 | $ | 3,833 | 157.7 | (28.4 | ) | |
NM - not meaningful. |
10
Third Quarter 2011 compared to Third Quarter 2010
As of September 30, 2011, loans held for sale totaled $2.7 billion, a decrease of $1.1 billion compared to $3.8 billion at September 30, 2010.
A total of $1.9 billion in unpaid principal balances in commercial loans were transferred into loans held for sale under the nonperforming asset disposition strategy during 2010. Of this amount, only $89 million remains to be sold at September 30, 2011 with a carrying value of $26 million, as this initiative has essentially been completed. The life-to-date loss percentage on commercial loans that were part of this strategy was 54%.
Third Quarter 2011 compared to Second Quarter 2011
As of September 30, 2011, loans held for sale totaled $2.7 billion, an increase of $781 million compared to $2.0 billion at June 30, 2011. The increase in loans held for sale compared to the prior quarter includes a reduction of $90 million of commercial loans that were held for sale in connection with management’s nonperforming asset disposition strategy. Residential mortgages held for sale increased $602 million compared to the balance at June 30, 2011 as the demand for mortgage loans returned due to the favorable interest rate environment. In addition, commercial mortgage loans held for sale increased $269 million.
DEPOSITS - average balances | % Change | % Change | ||||||||||
(dollars in millions) | Q3 | Q2 | Q3 | Q3 11 vs. | Q3 11 vs. | |||||||
2011 | 2011 | 2010 | Q2 11 | Q3 10 | ||||||||
(annualized) | ||||||||||||
Noninterest-bearing deposits | $ | 23,370 | $ | 22,151 | $ | 20,099 | 21.8 | 16.3 | ||||
Interest checking | 19,004 | 18,337 | 15,704 | 14.4 | 21.0 | |||||||
Money market and savings | 42,174 | 39,388 | 34,717 | 28.1 | 21.5 | |||||||
Certificates and other time deposits | 30,140 | 25,977 | 32,353 | 63.6 | (6.8 | ) | ||||||
Foreign deposits - interest-bearing | 368 | 613 | 632 | (158.6 | ) | (41.8 | ) | |||||
Total deposits | $ | 115,056 | $ | 106,466 | $ | 103,505 | 32.0 | 11.2 |
Third Quarter 2011 compared to Third Quarter 2010
Average deposits for the third quarter of 2011 increased $11.6 billion, or 11.2%, compared to the same period in 2010. The mix of the portfolio has continued to improve with growth in noninterest-bearing and lower-cost deposits and declines in certificates of deposits. Growth in noninterest-bearing deposits was led by commercial accounts, which contributed $2.4 billion of the growth in this category. In addition, noninterest-bearing deposits for retail accounts and public funds grew $539 million and $343 million, respectively. Growth in interest-bearing deposits was also led by commercial accounts, which contributed $8.7 billion of the growth in this category, followed by public funds, which grew $4.1 billion. Retail interest-bearing deposits declined $4.3 billion, as higher cost certificates were not renewed. The costs of interest-bearing deposits was 0.65% for the third quarter of 2011, a decrease of 42 basis points compared to the same period of 2010.
11
Third Quarter 2011 compared to Second Quarter 2011
Average deposits for the third quarter of 2011 increased $8.6 billion, or 32.0% on an annualized basis, compared to the second quarter of 2011. This included growth of $1.2 billion, or an annualized 21.8%, in noninterest-bearing deposits. Average interest-checking and average money market and savings deposits increased $667 million, or an annualized 14.4%, and $2.8 billion, or an annualized 28.1%, respectively, compared to second quarter of 2011. Certificates and other time deposits also increased $4.2 billion, or an annualized 63.6%, while cost for these products declined 25 basis points. The increase in deposits was primarily related to commercial accounts, which contributed $1.1 billion of the growth in noninterest-bearing deposits and $7.7 billion of the growth in interest-bearing deposits. Overall the costs of interest-bearing deposits decreased 7 basis points during the third quarter of 2011.
CAPITAL RATIOS (1) | 2011 | 2010 | |||
Q3 | Q2 | Q1 | Q4 | Q3 | |
Risk-based | |||||
Tier 1 (%) | 12.5 | 12.4 | 12.1 | 11.8 | 11.7 |
Total (%) | 16.1 | 16.1 | 15.8 | 15.5 | 15.7 |
Leverage (%) | 9.2 | 9.5 | 9.3 | 9.1 | 9.3 |
Tangible common equity (%) (2) | 7.1 | 7.2 | 7.2 | 7.1 | 7.0 |
Tier 1 common equity to risk-weighted assets (%) (2) | 9.8 | 9.6 | 9.3 | 9.1 | 9.0 |
(1) Current quarter regulatory capital ratios are preliminary.
(2) Tangible common equity and Tier 1 common equity ratios are Non-GAAP measures. BB&T uses the Tier 1 common equity definition used in the SCAP assessment to calculate these ratios. See the calculations and management's reasons for using these measures on page 18 of the Quarterly Performance Summary.
BB&T’s capital levels at September 30, 2011 remained strong. The Tier 1 risk-based capital ratio and Tier 1 common equity to risk-weighted assets ratio were 12.5% and 9.8%, respectively, compared to 12.4% and 9.6%, respectively, at June 30, 2011. The improvement in these ratios was largely driven by an increase in retained earnings. BB&T declared total dividends of $0.16 during the third quarter of 2011. The $0.16 quarterly dividend reflects a dividend payout ratio of 31% for the current quarter.
BB&T’s Tier 1 common capital ratio under the currently proposed Basel III capital standards was estimated to be 8.8% at September 30, 2011 compared to 8.3% at June 30, 2011. The improvement in this measure was driven by an increase in retained earnings, an increase in accumulated other comprehensive income due to improvement in the market value of available-for-sale securities, and a lower impact for mortgage servicing assets and deferred tax assets as a result of the decline in interest rates, which reduced the value of mortgage servicing assets.
12
ASSET QUALITY (1) | Change | Change | ||||||||||||||
(dollars in millions) | Q3 | Q2 | Q3 | Q3 11 vs. | Q3 11 vs. | |||||||||||
2011 | 2011 | 2010 | Q2 11 | Q3 10 | ||||||||||||
Total nonperforming assets | $ | 2,969 | $ | 3,353 | $ | 4,147 | $ | (384 | ) | $ | (1,178 | ) | ||||
Total loans 90 days past due and still accruing | 187 | 203 | 286 | (16 | ) | (99 | ) | |||||||||
Total loans 30-89 days past due | 1,057 | 1,000 | 1,638 | 57 | (581 | ) | ||||||||||
Allowance for loan and lease losses | 2,242 | 2,357 | 2,567 | (115 | ) | (325 | ) | |||||||||
Total performing TDRs | 1,067 | 1,178 | 1,639 | (111 | ) | (572 | ) | |||||||||
Nonperforming loans and leases as a percentage of total | ||||||||||||||||
loans and leases (%) | 1.94 | 2.18 | 2.82 | (0.24 | ) | (0.88 | ) | |||||||||
Nonperforming assets as a percentage of total assets (%) | 1.83 | 2.18 | 2.76 | (0.35 | ) | (0.93 | ) | |||||||||
Allowance for loan and lease losses as a percentage of | ||||||||||||||||
loans and leases held for investment (%) | 2.25 | 2.41 | 2.69 | (0.16 | ) | (0.44 | ) | |||||||||
Net charge-offs as a percentage of average loans and | ||||||||||||||||
leases (%) annualized | 1.44 | 1.80 | 3.54 | (0.36 | ) | (2.10 | ) | |||||||||
Ratio of allowance for loan and lease losses to net | ||||||||||||||||
charge-offs (times) annualized | 1.55 | 1.32 | 0.74 | 0.23 | 0.81 | |||||||||||
Ratio of allowance for loan and lease losses to | ||||||||||||||||
nonperforming loans and leases held for | ||||||||||||||||
investment (times) | 1.15 | 1.14 | 1.30 | 0.01 | (0.15 | ) |
(1) Excludes amounts related to covered assets and government guaranteed loans. See footnotes related to Credit Quality beginning on page 12 of the Quarterly Performance Summary for additional information.
Asset quality continued to improve during the third quarter of 2011. Total nonperforming assets were just under $3.0 billion at September 30, 2011, a decrease of $384 million, or 11.5%, compared to June 30, 2011 due to a 12.1% decrease of inflows into nonaccrual status. This is the sixth consecutive quarterly decline in nonperforming assets and the amount is the lowest since the first quarter of 2009.
Total performing troubled debt restructurings (“TDRs”), excluding loans guaranteed by the government, were $1.1 billion at September 30, 2011, a decrease of $111 million, or 9.4%, compared to June 30, 2011. Commercial performing TDRs represented the majority of the decrease and were down $115 million compared to June 30, 2011.
Loan delinquencies were relatively stable during the third quarter of 2011. Loans 30-89 days past due and still accruing, excluding loans guaranteed by the government, totaled $1.1 billion at September 30, 2011, an increase of $57 million compared to June 30, 2011 due principally to normal seasonal increase in specialized lending. Loans 90 days past due and still accruing, excluding loans guaranteed by the government, were $187 million at September 30, 2011, a decrease of $16 million, or 7.9%, compared to June 30, 2011 reflecting continued improvement.
13
Net charge-offs during the third quarter of 2011 were 1.44% of average loans and leases, excluding covered loans, compared to 1.80% during the second quarter of 2011 and 3.54 % during the third quarter of 2010. The second quarter of 2011 includes $87 million of charge-offs related to the sale of residential mortgage loans. Net charge-offs were $419 million for the third quarter of 2011, which includes $53 million in charge-offs associated with covered loans. The third quarter of 2010 included $431 million in net charge-offs associated with the nonperforming asset disposition strategy.
As of September 30, 2011, the allowance for loan and lease losses was 2.25% of total loans and leases held for investment, excluding covered loans, compared to 2.41% at June 30, 2011, and 2.69% at September 30, 2010. The decline in the allowance as a percentage of total loans reflects the improvement in the overall quality of the loan portfolio. The allowance for loan and lease losses was 115% of nonperforming loans and leases held for investment, excluding covered loans, essentially flat compared to 114% at June 30, 2011.
BB&T Insurance Services expands through two acquisitions
During the quarter, BB&T expanded its insurance operations through the acquisition of Liberty Benefit Insurance Services of San Jose, California. Liberty is a full-service employee benefits broker that partners with large commercial clients to help them manage rising health care costs, changing regulations and complex benefits administration.
BB&T also entered into the metro Baltimore area through the acquisition of Atlantic Risk Management Corporation of Columbia, Md. Atlantic Risk Management is a commercial property and casualty and employee benefits broker that provides risk management consulting and a full array of business insurance products and services.
Earnings webcast, presentation and Quarterly Performance Summary
To hear a live webcast of BB&T’s third quarter 2011 earnings conference call at 8 a.m. (ET) today, please visit our website at www.BBT.com. A presentation will be used during the earnings conference call and is available on our website. Replays of the conference call will be available on the BB&T website until Friday, Nov. 4, 2011, or by dialing 1-888-203-1112 (access code 4313363) until Oct. 25, 2011.
To access the webcast and presentation, including an appendix reconciling non-GAAP disclosures, go to www.BBT.com and click on “About BB&T” and proceed to “Investor Relations.” The webcast link can be found under “Webcasts” and the presentation can be found under “View Recent Presentations.”
BB&T’s third quarter 2011 Quarterly Performance Summary, which contains detailed financial schedules, is available on BB&T’s website at www.BBT.com/financials.html.
About BB&T
As of September 30, 2011, BB&T is one of the largest financial services holding companies in the U.S. with $168 billion in assets and market capitalization of $14.9 billion. Based in
14
Winston-Salem, N.C., the company operates approximately 1,800 financial centers in 12 states and Washington, D.C., and offers a full range of consumer and commercial banking, securities brokerage, asset management, mortgage and insurance products and services. A Fortune 500 company, BB&T is consistently recognized for outstanding client satisfaction by J.D. Power and Associates, the U.S. Small Business Administration, Greenwich Associates and others. More information about BB&T and its full line of products and services is available at www.BBT.com.
#-#-#
Current quarter capital ratios are preliminary. Credit quality data excludes covered and government guaranteed loans where applicable.
This news release contains financial information and performance measures determined by methods other than in accordance with accounting principles generally accepted in the United States of America (“GAAP”). BB&T’s management uses these “non-GAAP” measures in their analysis of the corporation’s performance. BB&T’s management uses these measures to evaluate the underlying performance and efficiency of its operations. It believes that these non-GAAP measures provide a greater understanding of ongoing operations and enhance comparability of results with prior periods as well as demonstrating the effects of significant gains and charges in the current period. The company believes that a meaningful analysis of its financial performance requires an understanding of the factors underlying that performance. BB&T’s management believes that investors may use these non-GAAP financial measures to analyze financial performance without the impact of unusual items that may obscure trends in the company’s underlying performance. These disclosures should not be viewed as a substitute for financial measures determined in accordance with GAAP, nor are they necessarily comparable to non-GAAP performance measures that may be presented by other companies. Tangible common equity and Tier 1 common equity ratios are non-GAAP measures. BB&T uses the Tier 1 common equity definition used in the SCAP assessment to calculate these ratios. BB&T's management uses these measures to assess the quality of capital and believes that investors may find them useful in their analysis of the corporation. These capital measures are not necessarily comparable to similar capital measures that may be presented by other companies. Asset quality ratios have been adjusted to remove the impact of acquired loans and foreclosed property covered by the FDIC loss sharing agreements as management believes their inclusion results in distortion of those ratios and may not be comparable to other periods presented or to other portfolios that were not impacted by purchase accounting.
This news release contains certain forward-looking statements as defined in the Private Securities Litigation Reform Act of 1995. These statements may address issues that involve significant risks, uncertainties, estimates and assumptions made by management. Actual results may differ materially from current projections. Please refer to BB&T’s filings with the Securities and Exchange Commission for a summary of important factors that may affect BB&T’s forward-looking statements. BB&T undertakes no obligation to revise these statements following the date of this news release.
15
Exhibit 99.2
BB&T Corporation
Quarterly Performance Summary
Third Quarter 2011
BB&T Corporation
Quarterly Performance Summary
Table of Contents
BB&T Corporation Financial Highlights (Dollars in millions, except per share data, shares in thousands) |
|
Quarter Ended | Year-to-Date | |||||||||||||||||
September 30 | % | September 30 | % | |||||||||||||||
2011 | 2010 | Change | 2011 | 2010 | Change | |||||||||||||
Summary Income Statement | ||||||||||||||||||
Interest income | $ | 1,788 | $ | 1,796 | (0.4 | ) % | $ | 5,228 | $ | 5,461 | (4.3 | ) % | ||||||
Interest expense | 334 | 449 | (25.6 | ) | 1,063 | 1,375 | (22.7 | ) | ||||||||||
Net interest income - taxable equivalent | 1,454 | 1,347 | 7.9 | 4,165 | 4,086 | 1.9 | ||||||||||||
Less: Taxable-equivalent adjustment | 38 | 33 | 15.2 | 110 | 98 | 12.2 | ||||||||||||
Net interest income | 1,416 | 1,314 | 7.8 | 4,055 | 3,988 | 1.7 | ||||||||||||
Provision for credit losses | 250 | 770 | (67.5 | ) | 918 | 1,995 | (54.0 | ) | ||||||||||
Net interest income after provision for credit losses | 1,166 | 544 | 114.3 | 3,137 | 1,993 | 57.4 | ||||||||||||
Noninterest income | 690 | 1,110 | (37.8 | ) | 2,191 | 2,993 | (26.8 | ) | ||||||||||
Noninterest expense | 1,417 | 1,408 | 0.6 | 4,184 | 4,249 | (1.5 | ) | |||||||||||
Income before income taxes | 439 | 246 | 78.5 | 1,144 | 737 | 55.2 | ||||||||||||
Provision for income taxes | 68 | 27 | 151.9 | 212 | 100 | 112.0 | ||||||||||||
Net income | 371 | 219 | 69.4 | 932 | 637 | 46.3 | ||||||||||||
Noncontrolling interest | 5 | 9 | (44.4 | ) | 34 | 29 | 17.2 | |||||||||||
Net income available to common shareholders | 366 | 210 | 74.3 | 898 | 608 | 47.7 | ||||||||||||
Per Common Share Data | ||||||||||||||||||
Earnings | ||||||||||||||||||
Basic | $ | 0.52 | $ | 0.30 | 73.3 | % | $ | 1.29 | $ | 0.88 | 46.6 | % | ||||||
Diluted | 0.52 | 0.30 | 73.3 | 1.27 | 0.87 | 46.0 | ||||||||||||
Cash dividends declared (1) | 0.16 | 0.15 | 6.7 | 0.49 | 0.45 | 8.9 | ||||||||||||
Book value | 25.07 | 24.11 | 4.0 | 25.07 | 24.11 | 4.0 | ||||||||||||
Tangible book value (2) | 16.42 | 15.25 | 7.7 | 16.42 | 15.25 | 7.7 | ||||||||||||
End of period shares outstanding (in thousands) | 697,101 | 693,560 | 0.5 | 697,101 | 693,560 | 0.5 | ||||||||||||
Weighted average shares (in thousands) | ||||||||||||||||||
Basic | 697,052 | 693,017 | 0.6 | 696,335 | 691,982 | 0.6 | ||||||||||||
Diluted | 705,604 | 701,535 | 0.6 | 704,910 | 700,551 | 0.6 | ||||||||||||
Performance Ratios | ||||||||||||||||||
Return on average assets | 0.89 | % | 0.56 | % | 0.78 | % | 0.53 | % | ||||||||||
Return on average common shareholders' equity | 8.30 | 4.91 | 7.05 | 4.84 | ||||||||||||||
Net interest margin - taxable equivalent | 4.09 | 4.09 | 4.08 | 4.03 | ||||||||||||||
Fee income ratio (3) | 39.3 | 42.3 | 40.1 | 40.7 | ||||||||||||||
Efficiency ratio (3) | 54.6 | 54.1 | 55.8 | 53.4 | ||||||||||||||
Credit Quality (including amounts related to covered loans and covered foreclosed property) | ||||||||||||||||||
Nonperforming assets as a percentage of | ||||||||||||||||||
Total assets | 1.98 | % | 2.81 | % | 1.98 | % | 2.81 | % | ||||||||||
Loans and leases plus foreclosed property | 3.05 | 4.11 | 3.05 | 4.11 | ||||||||||||||
Net charge-offs as a percentage of average | ||||||||||||||||||
loans and leases | 1.57 | 3.31 | 1.61 | 2.55 | ||||||||||||||
Allowance for loan and lease losses as a percentage | ||||||||||||||||||
of loans and leases held for investment | 2.25 | 2.56 | 2.25 | 2.56 | ||||||||||||||
Ratio of allowance for loan and lease losses to | ||||||||||||||||||
nonperforming loans and leases held for investment | 1.20 | X | 1.32 | X | 1.20 | X | 1.32 | X | ||||||||||
Average Balances | ||||||||||||||||||
Total assets | $ | 165,520 | $ | 155,666 | 6.3 | % | $ | 160,092 | $ | 159,723 | 0.2 | % | ||||||
Total securities (4) | 31,567 | 23,277 | 35.6 | 27,919 | 28,156 | (0.8 | ) | |||||||||||
Loans and leases | 105,658 | 104,755 | 0.9 | 105,099 | 104,396 | 0.7 | ||||||||||||
Deposits | 115,056 | 103,505 | 11.2 | 109,080 | 107,171 | 1.8 | ||||||||||||
Shareholders' equity | 17,551 | 17,035 | 3.0 | 17,102 | 16,864 | 1.4 | ||||||||||||
Period-End Balances | ||||||||||||||||||
Total assets | $ | 167,677 | $ | 157,230 | 6.6 | % | $ | 167,677 | $ | 157,230 | 6.6 | % | ||||||
Total securities (4) | 32,784 | 24,497 | 33.8 | 32,784 | 24,497 | 33.8 | ||||||||||||
Loans and leases | 107,449 | 106,014 | 1.4 | 107,449 | 106,014 | 1.4 | ||||||||||||
Deposits | 117,567 | 106,419 | 10.5 | 117,567 | 106,419 | 10.5 | ||||||||||||
Shareholders' equity | 17,541 | 16,787 | 4.5 | 17,541 | 16,787 | 4.5 | ||||||||||||
Capital Ratios (5) | ||||||||||||||||||
Risk-based | ||||||||||||||||||
Tier 1 | 12.5 | % | 11.7 | % | 12.5 | % | 11.7 | % | ||||||||||
Total | 16.1 | 15.7 | 16.1 | 15.7 | ||||||||||||||
Leverage | 9.2 | 9.3 | 9.2 | 9.3 | ||||||||||||||
Tangible common equity (2) | 7.1 | 7.0 | 7.1 | 7.0 | ||||||||||||||
Tier 1 common equity to risk-weighted assets (2) | 9.8 | 9.0 | 9.8 | 9.0 |
(1) |
BB&T Corporation declared a special one-time dividend of $0.01 per common share in the first quarter of 2011. |
(2) |
Tangible common equity and Tier 1 common equity ratios are Non-GAAP measures. BB&T uses the Tier 1 common equity definition used in the SCAP assessment to calculate these ratios. See the calculations and management's reasons for using these measures on page 18 of this supplement. |
(3) |
Excludes securities gains (losses), foreclosed property expense, amortization of intangible assets, merger-related and restructuring charges, the impacts of FDIC loss share accounting, and other selected items as detailed on page 19 of this supplement. See Non-GAAP reconciliations. |
(4) |
Total securities includes securities available for sale (AFS) and securities held to maturity (HTM). Average balances reflect both AFS and HTM securities at amortized cost. Period-end balances reflect AFS securities at fair value and HTM securities at amortized cost. |
(5) |
Current quarter regulatory capital information is preliminary. |
1
BB&T Corporation Financial Highlights - Five Quarter Trend (Dollars in millions, except per share data, shares in thousands) |
|
Quarter Ended | |||||||||||||||
Sept. 30 | June 30 | March 31 | Dec. 31 | Sept. 30 | |||||||||||
2011 | 2011 | 2011 | 2010 | 2010 | |||||||||||
Summary Income Statement | |||||||||||||||
Interest income | $ | 1,788 | $ | 1,727 | $ | 1,713 | $ | 1,793 | $ | 1,796 | |||||
Interest expense | 334 | 337 | 392 | 424 | 449 | ||||||||||
Net interest income - taxable equivalent | 1,454 | 1,390 | 1,321 | 1,369 | 1,347 | ||||||||||
Less: Taxable-equivalent adjustment | 38 | 36 | 36 | 37 | 33 | ||||||||||
Net interest income | 1,416 | 1,354 | 1,285 | 1,332 | 1,314 | ||||||||||
Provision for credit losses | 250 | 328 | 340 | 643 | 770 | ||||||||||
Net interest income after provision for credit losses | 1,166 | 1,026 | 945 | 689 | 544 | ||||||||||
Noninterest income | 690 | 787 | 714 | 964 | 1,110 | ||||||||||
Noninterest expense | 1,417 | 1,395 | 1,372 | 1,421 | 1,408 | ||||||||||
Income before income taxes | 439 | 418 | 287 | 232 | 246 | ||||||||||
Provision for income taxes | 68 | 91 | 53 | 15 | 27 | ||||||||||
Net income | 371 | 327 | 234 | 217 | 219 | ||||||||||
Noncontrolling interest | 5 | 20 | 9 | 9 | 9 | ||||||||||
Net income available to common shareholders | 366 | 307 | 225 | 208 | 210 | ||||||||||
Per Common Share Data | |||||||||||||||
Earnings | |||||||||||||||
Basic | $ | 0.52 | $ | 0.44 | $ | 0.32 | $ | 0.30 | $ | 0.30 | |||||
Diluted | 0.52 | 0.44 | 0.32 | 0.30 | 0.30 | ||||||||||
Cash dividends declared (1) | 0.16 | 0.16 | 0.17 | 0.15 | 0.15 | ||||||||||
Book value | 25.07 | 24.37 | 23.86 | 23.67 | 24.11 | ||||||||||
Tangible book value (2) | 16.42 | 15.95 | 15.59 | 15.43 | 15.25 | ||||||||||
End of period shares outstanding (in thousands) | 697,101 | 696,894 | 696,285 | 694,381 | 693,560 | ||||||||||
Weighted average shares (in thousands) | |||||||||||||||
Basic | 697,052 | 696,625 | 695,309 | 693,993 | 693,017 | ||||||||||
Diluted | 705,604 | 704,969 | 704,101 | 702,781 | 701,535 | ||||||||||
Performance Ratios | |||||||||||||||
Return on average assets | 0.89 | % | 0.83 | % | 0.60 | % | 0.54 | % | 0.56 | % | |||||
Return on average common shareholders' equity | 8.30 | 7.25 | 5.48 | 4.88 | 4.91 | ||||||||||
Net interest margin - taxable equivalent | 4.09 | 4.15 | 4.01 | 4.04 | 4.09 | ||||||||||
Fee income ratio (3) | 39.3 | 40.8 | 40.1 | 41.8 | 42.3 | ||||||||||
Efficiency ratio (3) | 54.6 | 55.8 | 57.1 | 55.3 | 54.1 | ||||||||||
Credit Quality (including amounts related to covered | |||||||||||||||
loans and covered foreclosed property) | |||||||||||||||
Nonperforming assets as a percentage of | |||||||||||||||
Total assets | 1.98 | % | 2.32 | % | 2.69 | % | 2.73 | % | 2.81 | % | |||||
Loans and leases plus foreclosed property | 3.05 | 3.46 | 3.97 | 3.94 | 4.11 | ||||||||||
Net charge-offs as a percentage of average | |||||||||||||||
loans and leases | 1.57 | 1.71 | 1.56 | 2.02 | 3.31 | ||||||||||
Allowance for loan and lease losses as a percentage | |||||||||||||||
of loans and leases held for investment | 2.25 | 2.43 | 2.58 | 2.62 | 2.56 | ||||||||||
Ratio of allowance for loan and lease losses to | |||||||||||||||
nonperforming loans and leases held for investment | 1.20 | X | 1.22 | X | 1.09 | X | 1.26 | X | 1.32 | X | |||||
Average Balances | |||||||||||||||
Total assets | $ | 165,520 | $ | 157,730 | $ | 156,931 | $ | 159,464 | $ | 155,666 | |||||
Total securities (4) | 31,567 | 27,060 | 25,059 | 25,988 | 23,277 | ||||||||||
Loans and leases | 105,658 | 104,341 | 105,294 | 105,946 | 104,755 | ||||||||||
Deposits | 115,056 | 106,466 | 105,614 | 105,592 | 103,505 | ||||||||||
Shareholders' equity | 17,551 | 17,072 | 16,673 | 16,951 | 17,035 | ||||||||||
Period-End Balances | |||||||||||||||
Total assets | $ | 167,677 | $ | 159,310 | $ | 157,039 | $ | 157,081 | $ | 157,230 | |||||
Total securities (4) | 32,784 | 27,961 | 26,220 | 23,169 | 24,497 | ||||||||||
Loans and leases | 107,449 | 105,350 | 104,887 | 107,264 | 106,014 | ||||||||||
Deposits | 117,567 | 108,064 | 106,913 | 107,213 | 106,419 | ||||||||||
Shareholders' equity | 17,541 | 17,049 | 16,670 | 16,498 | 16,787 | ||||||||||
Capital Ratios (5) | |||||||||||||||
Risk-based | |||||||||||||||
Tier 1 | 12.5 | % | 12.4 | % | 12.1 | % | 11.8 | % | 11.7 | % | |||||
Total | 16.1 | 16.1 | 15.8 | 15.5 | 15.7 | ||||||||||
Leverage | 9.2 | 9.5 | 9.3 | 9.1 | 9.3 | ||||||||||
Tangible common equity (2) | 7.1 | 7.2 | 7.2 | 7.1 | 7.0 | ||||||||||
Tier 1 common equity to risk-weighted assets (2) | 9.8 | 9.6 | 9.3 | 9.1 | 9.0 |
(1) |
BB&T Corporation declared a special one-time dividend of $0.01 per common share in the first quarter of 2011. |
(2) |
Tangible common equity and Tier 1 common equity ratios are Non-GAAP measures. BB&T uses the Tier 1 common equity definition used in the SCAP assessment to calculate these ratios. See the calculations and management's reasons for using these measures on page 18 of this supplement. |
(3) |
Excludes securities gains (losses), foreclosed property expense, amortization of intangible assets, merger-related and restructuring charges, the impacts of FDIC loss share accounting, and other selected items as detailed on page 19 of this supplement. See Non-GAAP reconciliations. |
(4) |
Total securities includes securities available for sale (AFS) and securities held to maturity (HTM). Average balances reflect both AFS and HTM securities at amortized cost. Period-end balances reflect AFS securities at fair value and HTM securities at amortized cost. |
(5) |
Current regulatory capital information is preliminary. |
2
BB&T Corporation Consolidated Statements of Income (Dollars in millions, except per share data, shares in thousands) |
|
Quarter Ended | Year-to-Date | ||||||||||||||||||
Sept. 30 | Change | Sept. 30 | Change | ||||||||||||||||
2011 | 2010 | $ | % | 2011 | 2010 | $ | % | ||||||||||||
Interest Income | |||||||||||||||||||
Interest and fees on loans and leases | $ | 1,546 | $ | 1,549 | $ | (3 | ) | (0.2 | ) % | $ | 4,589 | $ | 4,514 | $ | 75 | 1.7 | % | ||
Interest and dividends on securities | 199 | 207 | (8 | ) | (3.9 | ) | 512 | 834 | (322 | ) | (38.6 | ) | |||||||
Interest on other earning assets | 5 | 6 | (1 | ) | (16.7 | ) | 15 | 12 | 3 | 25.0 | |||||||||
Total interest income | 1,750 | 1,762 | (12 | ) | (0.7 | ) | 5,116 | 5,360 | (244 | ) | (4.6 | ) | |||||||
Interest Expense | |||||||||||||||||||
Interest on deposits | 150 | 225 | (75 | ) | (33.3 | ) | 473 | 725 | (252 | ) | (34.8 | ) | |||||||
Interest on federal funds purchased, securities sold under repurchase agreements and short-term borrowed funds | 3 | 5 | (2 | ) | (40.0 | ) | 10 | 16 | (6 | ) | (37.5 | ) | |||||||
Interest on long-term debt | 181 | 218 | (37 | ) | (17.0 | ) | 578 | 631 | (53 | ) | (8.4 | ) | |||||||
Total interest expense | 334 | 448 | (114 | ) | (25.4 | ) | 1,061 | 1,372 | (311 | ) | (22.7 | ) | |||||||
Net interest income | 1,416 | 1,314 | 102 | 7.8 | 4,055 | 3,988 | 67 | 1.7 | |||||||||||
Provision for credit losses | 250 | 770 | (520 | ) | (67.5 | ) | 918 | 1,995 | (1,077 | ) | (54.0 | ) | |||||||
Net interest income after provision for credit loss | 1,166 | 544 | 622 | 114.3 | 3,137 | 1,993 | 1,144 | 57.4 | |||||||||||
Noninterest income | |||||||||||||||||||
Insurance income | 241 | 252 | (11 | ) | (4.4 | ) | 790 | 792 | (2 | ) | (0.3 | ) | |||||||
Service charges on deposits | 141 | 147 | (6 | ) | (4.1 | ) | 421 | 475 | (54 | ) | (11.4 | ) | |||||||
Mortgage banking income | 123 | 184 | (61 | ) | (33.2 | ) | 301 | 383 | (82 | ) | (21.4 | ) | |||||||
Investment banking and brokerage fees and commissions | 81 | 85 | (4 | ) | (4.7 | ) | 258 | 255 | 3 | 1.2 | |||||||||
Checkcard fees | 78 | 70 | 8 | 11.4 | 229 | 201 | 28 | 13.9 | |||||||||||
Other nondeposit fees and commissions | 71 | 74 | (3 | ) | (4.1 | ) | 204 | 202 | 2 | 1.0 | |||||||||
Bankcard fees and merchant discounts | 51 | 45 | 6 | 13.3 | 149 | 130 | 19 | 14.6 | |||||||||||
Trust and investment advisory revenues | 43 | 40 | 3 | 7.5 | 131 | 117 | 14 | 12.0 | |||||||||||
Income from bank-owned life insurance | 33 | 30 | 3 | 10.0 | 92 | 92 | - | - | |||||||||||
FDIC loss share income, net | (104 | ) | (43 | ) | (61 | ) | 141.9 | (243 | ) | (116 | ) | (127 | ) | 109.5 | |||||
Securities gains (losses), net | (39 | ) | 239 | (278 | ) | (116.3 | ) | (41 | ) | 455 | (496 | ) | (109.0 | ) | |||||
Other income, net | (29 | ) | (13 | ) | (16 | ) | 123.1 | (100 | ) | 7 | (107 | ) | NM | ||||||
Total noninterest income | 690 | 1,110 | (420 | ) | (37.8 | ) | 2,191 | 2,993 | (802 | ) | (26.8 | ) | |||||||
Noninterest Expense | |||||||||||||||||||
Personnel expense | 671 | 642 | 29 | 4.5 | 2,048 | 1,937 | 111 | 5.7 | |||||||||||
Foreclosed property expense | 168 | 167 | 1 | 0.6 | 456 | 585 | (129 | ) | (22.1 | ) | |||||||||
Occupancy and equipment expense | 151 | 157 | (6 | ) | (3.8 | ) | 457 | 453 | 4 | 0.9 | |||||||||
Professional services | 100 | 84 | 16 | 19.0 | 255 | 242 | 13 | 5.4 | |||||||||||
Regulatory charges | 46 | 61 | (15 | ) | (24.6 | ) | 166 | 152 | 14 | 9.2 | |||||||||
Loan processing expenses | 48 | 53 | (5 | ) | (9.4 | ) | 150 | 135 | 15 | 11.1 | |||||||||
Amortization of intangibles | 24 | 30 | (6 | ) | (20.0 | ) | 75 | 94 | (19 | ) | (20.2 | ) | |||||||
Software expense | 30 | 28 | 2 | 7.1 | 85 | 87 | (2 | ) | (2.3 | ) | |||||||||
Merger-related and restructuring charges, net | - | 10 | (10 | ) | (100.0 | ) | - | 65 | (65 | ) | (100.0 | ) | |||||||
Other expenses | 179 | 176 | 3 | 1.7 | 492 | 499 | (7 | ) | (1.4 | ) | |||||||||
Total noninterest expense | 1,417 | 1,408 | 9 | 0.6 | 4,184 | 4,249 | (65 | ) | (1.5 | ) | |||||||||
Earnings | |||||||||||||||||||
Income before income taxes | 439 | 246 | 193 | 78.5 | 1,144 | 737 | 407 | 55.2 | |||||||||||
Provision for income taxes | 68 | 27 | 41 | 151.9 | 212 | 100 | 112 | 112.0 | |||||||||||
Net Income | 371 | 219 | 152 | 69.4 | 932 | 637 | 295 | 46.3 | |||||||||||
Noncontrolling interest | 5 | 9 | (4 | ) | (44.4 | ) | 34 | 29 | 5 | 17.2 | |||||||||
Net income available to common shareholders | $ | 366 | $ | 210 | $ | 156 | 74.3 | % | $ | 898 | $ | 608 | $ | 290 | 47.7 | % | |||
Earnings Per Common Share | |||||||||||||||||||
Basic | $ | 0.52 | $ | 0.30 | $ | 0.22 | 73.3 | % | $ | 1.29 | $ | 0.88 | $ | 0.41 | 46.6 | % | |||
Diluted | 0.52 | 0.30 | 0.22 | 73.3 | 1.27 | 0.87 | 0.40 | 46.0 | |||||||||||
Weighted Average Shares Outstanding | |||||||||||||||||||
Basic | 697,052 | 693,017 | 4,035 | 0.6 | 696,335 | 691,982 | 4,353 | 0.6 | |||||||||||
Diluted | 705,604 | 701,535 | 4,069 | 0.6 | 704,910 | 700,551 | 4,359 | 0.6 | |||||||||||
NM - not meaningful. |
3
BB&T Corporation Consolidated Statements of Income - Five Quarter Trend (Dollars in millions, except per share data, shares in thousands) |
|
Quarter Ended | |||||||||||||||
Sept. 30 | June 30 | March 31 | Dec. 31 | Sept. 30 | |||||||||||
2011 | 2011 | 2011 | 2010 | 2010 | |||||||||||
Interest Income | |||||||||||||||
Interest and fees on loans and leases | $ | 1,546 | $ | 1,523 | $ | 1,520 | $ | 1,566 | $ | 1,549 | |||||
Interest and dividends on securities | 199 | 163 | 150 | 185 | 207 | ||||||||||
Interest on other earning assets | 5 | 4 | 6 | 4 | 6 | ||||||||||
Total interest income | 1,750 | 1,690 | 1,676 | 1,755 | 1,762 | ||||||||||
Interest Expense | |||||||||||||||
Interest on deposits | 150 | 152 | 171 | 192 | 225 | ||||||||||
Interest on federal funds purchased, securities sold under | |||||||||||||||
repurchase agreements and short-term borrowed funds | 3 | 3 | 4 | 6 | 5 | ||||||||||
Interest on long-term debt | 181 | 181 | 216 | 225 | 218 | ||||||||||
Total interest expense | 334 | 336 | 391 | 423 | 448 | ||||||||||
Net interest income | 1,416 | 1,354 | 1,285 | 1,332 | 1,314 | ||||||||||
Provision for credit losses | 250 | 328 | 340 | 643 | 770 | ||||||||||
Net interest income after provision for credit loss | 1,166 | 1,026 | 945 | 689 | 544 | ||||||||||
Noninterest income | |||||||||||||||
Insurance income | 241 | 299 | 250 | 249 | 252 | ||||||||||
Service charges on deposits | 141 | 145 | 135 | 143 | 147 | ||||||||||
Mortgage banking income | 123 | 83 | 95 | 138 | 184 | ||||||||||
Investment banking and brokerage fees and commissions | 81 | 90 | 87 | 97 | 85 | ||||||||||
Checkcard fees | 78 | 79 | 72 | 73 | 70 | ||||||||||
Other nondeposit fees and commissions | 71 | 66 | 67 | 68 | 74 | ||||||||||
Bankcard fees and merchant discounts | 51 | 52 | 46 | 47 | 45 | ||||||||||
Trust and investment advisory revenues | 43 | 45 | 43 | 42 | 40 | ||||||||||
Income from bank-owned life insurance | 33 | 29 | 30 | 31 | 30 | ||||||||||
FDIC loss share income, net | (104 | ) | (81 | ) | (58 | ) | - | (43 | ) | ||||||
Securities gains (losses), net | (39 | ) | (2 | ) | - | 99 | 239 | ||||||||
Other income, net | (29 | ) | (18 | ) | (53 | ) | (23 | ) | (13 | ) | |||||
Total noninterest income | 690 | 787 | 714 | 964 | 1,110 | ||||||||||
Noninterest Expense | |||||||||||||||
Personnel expense | 671 | 683 | 694 | 679 | 642 | ||||||||||
Foreclosed property expense | 168 | 145 | 143 | 162 | 167 | ||||||||||
Occupancy and equipment expense | 151 | 152 | 154 | 155 | 157 | ||||||||||
Professional services | 100 | 84 | 71 | 92 | 84 | ||||||||||
Regulatory charges | 46 | 59 | 61 | 59 | 61 | ||||||||||
Loan processing expenses | 48 | 49 | 53 | 45 | 53 | ||||||||||
Amortization of intangibles | 24 | 25 | 26 | 28 | 30 | ||||||||||
Software expense | 30 | 29 | 26 | 30 | 28 | ||||||||||
Merger-related and restructuring charges, net | - | 2 | (2 | ) | 4 | 10 | |||||||||
Other expenses | 179 | 167 | 146 | 167 | 176 | ||||||||||
Total noninterest expense | 1,417 | 1,395 | 1,372 | 1,421 | 1,408 | ||||||||||
Earnings | |||||||||||||||
Income before income taxes | 439 | 418 | 287 | 232 | 246 | ||||||||||
Provision for income taxes | 68 | 91 | 53 | 15 | 27 | ||||||||||
Net Income | 371 | 327 | 234 | 217 | 219 | ||||||||||
Noncontrolling interest | 5 | 20 | 9 | 9 | 9 | ||||||||||
Net income available to common shareholders | $ | 366 | $ | 307 | $ | 225 | $ | 208 | $ | 210 | |||||
Earnings Per Common Share | |||||||||||||||
Basic | $ | 0.52 | $ | 0.44 | $ | 0.32 | $ | 0.30 | $ | 0.30 | |||||
Diluted | 0.52 | 0.44 | 0.32 | 0.30 | 0.30 | ||||||||||
Weighted Average Shares Outstanding | |||||||||||||||
Basic | 697,052 | 696,625 | 695,309 | 693,993 | 693,017 | ||||||||||
Diluted | 705,604 | 704,969 | 704,101 | 702,781 | 701,535 |
4
As of September 30 | Change | ||||||||||
2011 | 2010 | $ | % | ||||||||
Assets | |||||||||||
Cash and due from banks | $ | 1,312 | $ | 1,225 | $ | 87 | 7.1 | % | |||
Interest-bearing deposits with banks | 2,907 | 944 | 1,963 | NM | |||||||
Federal funds sold and securities purchased under | |||||||||||
resale agreements or similar arrangements | 185 | 285 | (100 | ) | (35.1 | ) | |||||
Segregated cash due from banks | 19 | 269 | (250 | ) | (92.9 | ) | |||||
Trading securities at fair value | 428 | 568 | (140 | ) | (24.6 | ) | |||||
Securities available for sale at fair value (1) | 24,649 | 24,497 | 152 | 0.6 | |||||||
Securities held to maturity | 8,135 | - | 8,135 | NM | |||||||
Loans and leases: | |||||||||||
Commercial loans and leases | |||||||||||
Commercial and industrial | 34,817 | 32,591 | 2,226 | 6.8 | |||||||
Commercial real estate—other | 10,931 | 11,729 | (798 | ) | (6.8 | ) | |||||
Commercial real estate—residential ADC (2) | 2,414 | 3,811 | (1,397 | ) | (36.7 | ) | |||||
Direct retail lending | 13,882 | 13,828 | 54 | 0.4 | |||||||
Sales finance loans | 7,265 | 6,972 | 293 | 4.2 | |||||||
Revolving credit loans | 2,128 | 2,065 | 63 | 3.1 | |||||||
Residential mortgage loans | 19,361 | 16,316 | 3,045 | 18.7 | |||||||
Specialized lending | 8,636 | 8,047 | 589 | 7.3 | |||||||
Other acquired loans | 47 | 69 | (22 | ) | (31.9 | ) | |||||
Total loans and leases held for investment (excluding covered loans) | 99,481 | 95,428 | 4,053 | 4.2 | |||||||
Covered loans | 5,222 | 6,753 | (1,531 | ) | (22.7 | ) | |||||
Total loans and leases held for investment | 104,703 | 102,181 | 2,522 | 2.5 | |||||||
Loans held for sale | 2,746 | 3,833 | (1,087 | ) | (28.4 | ) | |||||
Total loans and leases | 107,449 | 106,014 | 1,435 | 1.4 | |||||||
Allowance for loan and lease losses | (2,355 | ) | (2,611 | ) | 256 | (9.8 | ) | ||||
FDIC loss share receivable | 1,221 | 1,924 | (703 | ) | (36.5 | ) | |||||
Premises and equipment | 1,864 | 1,831 | 33 | 1.8 | |||||||
Goodwill | 6,016 | 6,013 | 3 | - | |||||||
Core deposit and other intangible assets | 433 | 535 | (102 | ) | (19.1 | ) | |||||
Residential mortgage servicing rights at fair value | 573 | 585 | (12 | ) | (2.1 | ) | |||||
Other assets (3) | 14,841 | 15,151 | (310 | ) | (2.0 | ) | |||||
Total assets | $ | 167,677 | $ | 157,230 | $ | 10,447 | 6.6 | % | |||
Liabilities and Shareholders' Equity | |||||||||||
Deposits: (4) | |||||||||||
Noninterest-bearing deposits | $ | 24,557 | $ | 20,607 | $ | 3,950 | 19.2 | % | |||
Interest checking | 18,971 | 15,672 | 3,299 | 21.1 | |||||||
Money market and savings | 43,858 | 35,911 | 7,947 | 22.1 | |||||||
Certificates and other time deposits | 30,142 | 29,844 | 298 | 1.0 | |||||||
Foreign deposits - interest-bearing | 39 | 4,385 | (4,346 | ) | (99.1 | ) | |||||
Total deposits | 117,567 | 106,419 | 11,148 | 10.5 | |||||||
Fed funds purchased, repos and other borrowings | 3,953 | 5,820 | (1,867 | ) | (32.1 | ) | |||||
Long-term debt | 22,153 | 22,111 | 42 | 0.2 | |||||||
Other liabilities | 6,463 | 6,093 | 370 | 6.1 | |||||||
Total liabilities | 150,136 | 140,443 | 9,693 | 6.9 | |||||||
Shareholders' equity: | |||||||||||
Common stock | 3,486 | 3,468 | 18 | 0.5 | |||||||
Additional paid-in capital | 5,856 | 5,753 | 103 | 1.8 | |||||||
Retained earnings | 8,493 | 7,833 | 660 | 8.4 | |||||||
Accumulated other comprehensive loss | (356 | ) | (335 | ) | (21 | ) | 6.3 | ||||
Noncontrolling interest | 62 | 68 | (6 | ) | (8.8 | ) | |||||
Total shareholders' equity | 17,541 | 16,787 | 754 | 4.5 | |||||||
Total liabilities and shareholders' equity | $ | 167,677 | $ | 157,230 | $ | 10,447 | 6.6 | % |
(1) | Includes $1.7 billion and $1.5 billion at September 30, 2011 and 2010, respectively, covered by FDIC loss sharing agreements. |
(2) | Commercial real estate - residential ADC represents residential acquisition, development and construction loans. |
(3) | Includes $387 million and $314 million of foreclosed property and other assets covered by FDIC loss sharing agreements at September 30, 2011 and 2010, respectively. |
(4) | Deposit categories were revised during the third quarter of 2011. Prior period amounts were reclassified to conform to the current period presentation. |
NM | - not meaningful. |
5
As of | |||||||||||||||
Sept. 30 | June 30 | March 31 | Dec. 31 | Sept. 30 | |||||||||||
2011 | 2011 | 2011 | 2010 | 2010 | |||||||||||
Assets | |||||||||||||||
Cash and due from banks | $ | 1,312 | $ | 1,199 | $ | 1,030 | $ | 1,127 | $ | 1,225 | |||||
Interest-bearing deposits with banks | 2,907 | 1,337 | 865 | 931 | 944 | ||||||||||
Federal funds sold and securities purchased under | |||||||||||||||
resale agreements or similar arrangements | 185 | 250 | 305 | 327 | 285 | ||||||||||
Segregated cash due from banks | 19 | 19 | 153 | 309 | 269 | ||||||||||
Trading securities at fair value | 428 | 564 | 730 | 633 | 568 | ||||||||||
Securities available for sale at fair value (1) | 24,649 | 19,409 | 17,887 | 23,169 | 24,497 | ||||||||||
Securities held to maturity | 8,135 | 8,552 | 8,333 | - | - | ||||||||||
Loans and leases: | |||||||||||||||
Commercial loans and leases | |||||||||||||||
Commercial and industrial | 34,817 | 34,166 | 33,587 | 34,050 | 32,591 | ||||||||||
Commercial real estate—other | 10,931 | 11,134 | 11,277 | 11,439 | 11,729 | ||||||||||
Commercial real estate—residential ADC | 2,414 | 2,689 | 3,061 | 3,397 | 3,811 | ||||||||||
Direct retail lending | 13,882 | 13,679 | 13,612 | 13,749 | 13,828 | ||||||||||
Sales finance loans | 7,265 | 7,236 | 7,121 | 7,050 | 6,972 | ||||||||||
Revolving credit loans | 2,128 | 2,091 | 2,063 | 2,127 | 2,065 | ||||||||||
Residential mortgage loans | 19,361 | 18,372 | 18,228 | 17,550 | 16,316 | ||||||||||
Specialized lending | 8,636 | 8,464 | 7,767 | 7,953 | 8,047 | ||||||||||
Other acquired loans | 47 | 50 | 56 | 58 | 69 | ||||||||||
Total loans and leases held for investment (excluding covered loans) | 99,481 | 97,881 | 96,772 | 97,373 | 95,428 | ||||||||||
Covered loans | 5,222 | 5,504 | 5,803 | 6,194 | 6,753 | ||||||||||
Total loans and leases held for investment | 104,703 | 103,385 | 102,575 | 103,567 | 102,181 | ||||||||||
Loans held for sale | 2,746 | 1,965 | 2,312 | 3,697 | 3,833 | ||||||||||
Total loans and leases | 107,449 | 105,350 | 104,887 | 107,264 | 106,014 | ||||||||||
Allowance for loan and lease losses | (2,355 | ) | (2,516 | ) | (2,641 | ) | (2,708 | ) | (2,611 | ) | |||||
FDIC loss share receivable | 1,221 | 1,446 | 1,580 | 1,922 | 1,924 | ||||||||||
Premises and equipment | 1,864 | 1,846 | 1,830 | 1,840 | 1,831 | ||||||||||
Goodwill | 6,016 | 6,016 | 6,014 | 6,008 | 6,013 | ||||||||||
Core deposit and other intangible assets | 433 | 457 | 483 | 508 | 535 | ||||||||||
Residential mortgage servicing rights at fair value | 573 | 879 | 928 | 830 | 585 | ||||||||||
Other assets (2) | 14,841 | 14,502 | 14,655 | 14,921 | 15,151 | ||||||||||
Total assets | $ | 167,677 | $ | 159,310 | $ | 157,039 | $ | 157,081 | $ | 157,230 | |||||
Liabilities and Shareholders' Equity | |||||||||||||||
Deposits: | |||||||||||||||
Noninterest-bearing deposits | $ | 24,557 | $ | 22,507 | $ | 21,864 | $ | 20,637 | $ | 20,607 | |||||
Interest checking | 18,971 | 18,660 | 17,701 | 17,908 | 15,672 | ||||||||||
Money market and savings | 43,858 | 39,356 | 40,388 | 36,964 | 35,911 | ||||||||||
Certificates and other time deposits | 30,142 | 26,865 | 25,952 | 27,167 | 29,844 | ||||||||||
Foreign deposits - interest-bearing | 39 | 676 | 1,008 | 4,537 | 4,385 | ||||||||||
Total deposits | 117,567 | 108,064 | 106,913 | 107,213 | 106,419 | ||||||||||
Fed funds purchased, repos and other borrowings | 3,953 | 4,842 | 5,186 | 5,673 | 5,820 | ||||||||||
Long-term debt | 22,153 | 23,380 | 22,591 | 21,730 | 22,111 | ||||||||||
Other liabilities | 6,463 | 5,975 | 5,679 | 5,967 | 6,093 | ||||||||||
Total liabilities | 150,136 | 142,261 | 140,369 | 140,583 | 140,443 | ||||||||||
Shareholders' equity: | |||||||||||||||
Common stock | 3,486 | 3,484 | 3,481 | 3,472 | 3,468 | ||||||||||
Additional paid-in capital | 5,856 | 5,830 | 5,794 | 5,776 | 5,753 | ||||||||||
Retained earnings | 8,493 | 8,241 | 8,042 | 7,935 | 7,833 | ||||||||||
Accumulated other comprehensive loss | (356 | ) | (574 | ) | (706 | ) | (747 | ) | (335 | ) | |||||
Noncontrolling interest | 62 | 68 | 59 | 62 | 68 | ||||||||||
Total shareholders' equity | 17,541 | 17,049 | 16,670 | 16,498 | 16,787 | ||||||||||
Total liabilities and shareholders' equity | $ | 167,677 | $ | 159,310 | $ | 157,039 | $ | 157,081 | $ | 157,230 |
(1) |
Includes $1.7 billion, $1.7 billion, $1.7 billion, $1.5 billion and $1.5 billion at September 30, 2011, June 30, 2011, March 31, 2011, December 31, 2010 and September 30, 2010, respectively, covered by FDIC loss sharing agreements. |
(2) |
Includes $387 million, $390 million, $401 million, $360 million and $314 million of foreclosed property and other assets covered by FDIC loss sharing agreements at September 30, 2011, June 30, 2011, March 31, 2011, December 31, 2010 and September 30, 2010, respectively. |
6
Quarter Ended | Year-to-Date | |||||||||||||||||
September 30 | Change | September 30 | Change | |||||||||||||||
2011 | 2010 | $ | % | 2011 | 2010 | $ | % | |||||||||||
Assets | ||||||||||||||||||
Total securities, at amortized cost (1) | ||||||||||||||||||
U.S. government-sponsored entities (GSE) | $ | 236 | $ | 54 | $ | 182 | NM | % | $ | 146 | $ | 742 | $ | (596 | ) | (80.3 | ) % | |
Mortgage-backed securities issued by GSE | 27,104 | 18,636 | 8,468 | 45.4 | 23,368 | 22,729 | 639 | 2.8 | ||||||||||
States and political subdivisions | 1,864 | 2,019 | (155 | ) | (7.7 | ) | 1,907 | 2,067 | (160 | ) | (7.7 | ) | ||||||
Non-agency mortgage-backed securities | 511 | 1,152 | (641 | ) | (55.6 | ) | 551 | 1,225 | (674 | ) | (55.0 | ) | ||||||
Other securities | 598 | 209 | 389 | 186.1 | 695 | 201 | 494 | NM | ||||||||||
Covered securities | 1,254 | 1,207 | 47 | 3.9 | 1,252 | 1,192 | 60 | 5.0 | ||||||||||
Total securities | 31,567 | 23,277 | 8,290 | 35.6 | 27,919 | 28,156 | (237 | ) | (0.8 | ) | ||||||||
Other earning assets | 4,034 | 2,951 | 1,083 | 36.7 | 3,286 | 2,913 | 373 | 12.8 | ||||||||||
Loans and leases | ||||||||||||||||||
Commercial loans and leases | ||||||||||||||||||
Commercial and industrial | 34,280 | 32,174 | 2,106 | 6.5 | 33,789 | 31,791 | 1,998 | 6.3 | ||||||||||
Commercial real estate—other | 11,069 | 12,052 | (983 | ) | (8.2 | ) | 11,240 | 12,190 | (950 | ) | (7.8 | ) | ||||||
Commercial real estate—residential ADC | 2,576 | 4,394 | (1,818 | ) | (41.4 | ) | 2,928 | 5,043 | (2,115 | ) | (41.9 | ) | ||||||
Direct retail lending | 13,754 | 13,867 | (113 | ) | (0.8 | ) | 13,685 | 14,008 | (323 | ) | (2.3 | ) | ||||||
Sales finance loans | 7,234 | 6,906 | 328 | 4.7 | 7,166 | 6,682 | 484 | 7.2 | ||||||||||
Revolving credit loans | 2,109 | 2,048 | 61 | 3.0 | 2,088 | 2,013 | 75 | 3.7 | ||||||||||
Residential mortgage loans | 18,818 | 15,828 | 2,990 | 18.9 | 18,355 | 15,625 | 2,730 | 17.5 | ||||||||||
Specialized lending | 8,652 | 8,046 | 606 | 7.5 | 8,162 | 7,725 | 437 | 5.7 | ||||||||||
Other acquired loans | 48 | 73 | (25 | ) | (34.2 | ) | 53 | 93 | (40 | ) | (43.0 | ) | ||||||
Total loans and leases held for investment | ||||||||||||||||||
(excluding covered loans) | 98,540 | 95,388 | 3,152 | 3.3 | 97,466 | 95,170 | 2,296 | 2.4 | ||||||||||
Covered loans | 5,342 | 6,957 | (1,615 | ) | (23.2 | ) | 5,629 | 7,251 | (1,622 | ) | (22.4 | ) | ||||||
Total loans and leases held for investment | 103,882 | 102,345 | 1,537 | 1.5 | 103,095 | 102,421 | 674 | 0.7 | ||||||||||
Loans held for sale | 1,776 | 2,410 | (634 | ) | (26.3 | ) | 2,004 | 1,975 | 29 | 1.5 | ||||||||
Total loans and leases | 105,658 | 104,755 | 903 | 0.9 | 105,099 | 104,396 | 703 | 0.7 | ||||||||||
Total earning assets | 141,259 | 130,983 | 10,276 | 7.8 | 136,304 | 135,465 | 839 | 0.6 | ||||||||||
Nonearning assets | 24,261 | 24,683 | (422 | ) | (1.7 | ) | 23,788 | 24,258 | (470 | ) | (1.9 | ) | ||||||
Total assets | $ | 165,520 | $ | 155,666 | $ | 9,854 | 6.3 | % | $ | 160,092 | $ | 159,723 | $ | 369 | 0.2 | % | ||
Liabilities and Shareholders' Equity | ||||||||||||||||||
Deposits | ||||||||||||||||||
Noninterest-bearing deposits | $ | 23,370 | $ | 20,099 | $ | 3,271 | 16.3 | % | $ | 22,179 | $ | 19,309 | $ | 2,870 | 14.9 | % | ||
Interest checking | 19,004 | 15,704 | 3,300 | 21.0 | 18,326 | 16,424 | 1,902 | 11.6 | ||||||||||
Money market and savings | 42,174 | 34,717 | 7,457 | 21.5 | 40,108 | 34,472 | 5,636 | 16.3 | ||||||||||
Certificates and other time deposits | 30,140 | 32,353 | (2,213 | ) | (6.8 | ) | 27,657 | 35,593 | (7,936 | ) | (22.3 | ) | ||||||
Foreign deposits - interest-bearing | 368 | 632 | (264 | ) | (41.8 | ) | 810 | 1,373 | (563 | ) | (41.0 | ) | ||||||
Total deposits | 115,056 | 103,505 | 11,551 | 11.2 | 109,080 | 107,171 | 1,909 | 1.8 | ||||||||||
Fed funds purchased, repos and other borrowings | 4,307 | 7,355 | (3,048 | ) | (41.4 | ) | 5,682 | 8,879 | (3,197 | ) | (36.0 | ) | ||||||
Long-term debt | 22,347 | 21,833 | 514 | 2.4 | 22,448 | 21,573 | 875 | 4.1 | ||||||||||
Other liabilities | 6,259 | 5,938 | 321 | 5.4 | 5,780 | 5,236 | 544 | 10.4 | ||||||||||
Total liabilities | 147,969 | 138,631 | 9,338 | 6.7 | 142,990 | 142,859 | 131 | 0.1 | ||||||||||
Shareholders' equity | 17,551 | 17,035 | 516 | 3.0 | 17,102 | 16,864 | 238 | 1.4 | ||||||||||
Total liabilities and shareholders' equity | $ | 165,520 | $ | 155,666 | $ | 9,854 | 6.3 | % | $ | 160,092 | $ | 159,723 | $ | 369 | 0.2 | % |
Average balances exclude basis adjustments for fair value hedges. | |
(1) | Total securities include securities available for sale and securities held to maturity. |
NM | - not meaningful. |
7
Quarter Ended | ||||||||||
Sept. 30 | June 30 | March 31 | Dec. 31 | Sept. 30 | ||||||
2011 | 2011 | 2011 | 2010 | 2010 | ||||||
Assets | ||||||||||
Total securities, at amortized cost (1) | ||||||||||
U.S. government-sponsored entities (GSE) | $ | 236 | $ | 106 | $ | 93 | $ | 52 | $ | 54 |
Mortgage-backed securities issued by GSE | 27,104 | 22,516 | 20,409 | 21,067 | 18,636 | |||||
States and political subdivisions | 1,864 | 1,889 | 1,969 | 1,987 | 2,019 | |||||
Non-agency mortgage-backed securities | 511 | 547 | 595 | 1,025 | 1,152 | |||||
Other securities | 598 | 745 | 750 | 641 | 209 | |||||
Covered securities | 1,254 | 1,257 | 1,243 | 1,216 | 1,207 | |||||
Total securities | 31,567 | 27,060 | 25,059 | 25,988 | 23,277 | |||||
Other earning assets | 4,034 | 2,834 | 2,978 | 2,995 | 2,951 | |||||
Loans and leases | ||||||||||
Commercial loans and leases | ||||||||||
Commercial and industrial | 34,280 | 33,647 | 33,433 | 32,733 | 32,174 | |||||
Commercial real estate—other | 11,069 | 11,287 | 11,368 | 11,661 | 12,052 | |||||
Commercial real estate—residential ADC | 2,576 | 2,933 | 3,281 | 3,650 | 4,394 | |||||
Direct retail lending | 13,754 | 13,629 | 13,672 | 13,770 | 13,867 | |||||
Sales finance loans | 7,234 | 7,184 | 7,080 | 7,015 | 6,906 | |||||
Revolving credit loans | 2,109 | 2,070 | 2,082 | 2,086 | 2,048 | |||||
Residential mortgage loans | 18,818 | 18,311 | 17,926 | 16,974 | 15,828 | |||||
Specialized lending | 8,652 | 8,029 | 7,797 | 7,937 | 8,046 | |||||
Other acquired loans | 48 | 53 | 57 | 63 | 73 | |||||
Total loans and leases held for investment (excluding covered loans) | 98,540 | 97,143 | 96,696 | 95,889 | 95,388 | |||||
Covered loans | 5,342 | 5,625 | 5,927 | 6,488 | 6,957 | |||||
Total loans and leases held for investment | 103,882 | 102,768 | 102,623 | 102,377 | 102,345 | |||||
Loans held for sale | 1,776 | 1,573 | 2,671 | 3,569 | 2,410 | |||||
Total loans and leases | 105,658 | 104,341 | 105,294 | 105,946 | 104,755 | |||||
Total earning assets | 141,259 | 134,235 | 133,331 | 134,929 | 130,983 | |||||
Nonearning assets | 24,261 | 23,495 | 23,600 | 24,535 | 24,683 | |||||
Total assets | $ | 165,520 | $ | 157,730 | $ | 156,931 | $ | 159,464 | $ | 155,666 |
Liabilities and Shareholders' Equity | ||||||||||
Deposits | ||||||||||
Noninterest-bearing deposits | $ | 23,370 | $ | 22,151 | $ | 20,990 | $ | 21,027 | $ | 20,099 |
Interest checking | 19,004 | 18,337 | 17,622 | 16,628 | 15,704 | |||||
Money market and savings | 42,174 | 39,388 | 38,724 | 36,341 | 34,717 | |||||
Certificates and other time deposits | 30,140 | 25,977 | 26,815 | 28,085 | 32,353 | |||||
Foreign deposits - interest-bearing | 368 | 613 | 1,463 | 3,511 | 632 | |||||
Total deposits | 115,056 | 106,466 | 105,614 | 105,592 | 103,505 | |||||
Fed funds purchased, repos and other borrowings | 4,307 | 5,486 | 7,286 | 9,446 | 7,355 | |||||
Long-term debt | 22,347 | 23,114 | 21,879 | 21,890 | 21,833 | |||||
Other liabilities | 6,259 | 5,592 | 5,479 | 5,585 | 5,938 | |||||
Total liabilities | 147,969 | 140,658 | 140,258 | 142,513 | 138,631 | |||||
Shareholders' equity | 17,551 | 17,072 | 16,673 | 16,951 | 17,035 | |||||
Total liabilities and shareholders' equity | $ | 165,520 | $ | 157,730 | $ | 156,931 | $ | 159,464 | $ | 155,666 |
Average balances exclude basis adjustments for fair value hedges. | |
(1) | Total securities include securities available for sale and securities held to maturity. |
8
Quarter Ended | |||||||||||||||
September 30, 2011 | June 30, 2011 | ||||||||||||||
(1) | Interest | (2) | (1) | Interest | (2) | ||||||||||
Average | Income/ | Yields/ | Average | Income/ | Yields/ | ||||||||||
Balances | Expense | Rates | Balances | Expense | Rates | ||||||||||
Assets | |||||||||||||||
Total securities, at amortized cost (3) | |||||||||||||||
U.S. government-sponsored entities (GSE) | $ | 236 | $ | 1 | 0.88 | % | $ | 106 | $ | - | 1.91 | % | |||
Mortgage-backed securities issued by GSE | 27,104 | 129 | 1.89 | 22,516 | 95 | 1.69 | |||||||||
States and political subdivisions | 1,864 | 26 | 5.78 | 1,889 | 28 | 5.74 | |||||||||
Non-agency mortgage-backed securities | 511 | 9 | 6.90 | 547 | 8 | 6.44 | |||||||||
Other securities | 598 | 2 | 1.55 | 745 | 3 | 1.49 | |||||||||
Covered securities | 1,254 | 45 | 14.21 | 1,257 | 43 | 13.66 | |||||||||
Total securities | 31,567 | 212 | 2.68 | 27,060 | 177 | 2.62 | |||||||||
Other earning assets | 4,034 | 6 | 0.51 | 2,834 | 4 | 0.62 | |||||||||
Loans and leases | |||||||||||||||
Commercial loans and leases | |||||||||||||||
Commercial and industrial | 34,280 | 363 | 4.21 | 33,647 | 356 | 4.25 | |||||||||
Commercial real estate—other | 11,069 | 105 | 3.78 | 11,287 | 107 | 3.79 | |||||||||
Commercial real estate—residential ADC | 2,576 | 23 | 3.53 | 2,933 | 26 | 3.56 | |||||||||
Direct retail lending | 13,754 | 177 | 5.10 | 13,629 | 175 | 5.15 | |||||||||
Sales finance loans | 7,234 | 87 | 4.78 | 7,184 | 90 | 4.99 | |||||||||
Revolving credit loans | 2,109 | 46 | 8.77 | 2,070 | 45 | 8.75 | |||||||||
Residential mortgage loans | 18,818 | 228 | 4.83 | 18,311 | 219 | 4.80 | |||||||||
Specialized lending | 8,652 | 246 | 11.28 | 8,029 | 233 | 11.68 | |||||||||
Other acquired loans | 48 | 4 | 33.74 | 53 | 5 | 34.52 | |||||||||
Total loans and leases held for investment | |||||||||||||||
(excluding covered loans) | 98,540 | 1,279 | 5.16 | 97,143 | 1,256 | 5.19 | |||||||||
Covered loans | 5,342 | 273 | 20.29 | 5,625 | 274 | 19.47 | |||||||||
Total loans and leases held for investment | 103,882 | 1,552 | 5.94 | 102,768 | 1,530 | 5.97 | |||||||||
Loans held for sale | 1,776 | 18 | 3.98 | 1,573 | 16 | 4.01 | |||||||||
Total loans and leases | 105,658 | 1,570 | 5.91 | 104,341 | 1,546 | 5.94 | |||||||||
Total earning assets | 141,259 | 1,788 | 5.03 | 134,235 | 1,727 | 5.16 | |||||||||
Nonearning assets | 24,261 | 23,495 | |||||||||||||
Total assets | $ | 165,520 | $ | 157,730 | |||||||||||
Liabilities and Shareholders' Equity | |||||||||||||||
Interest-bearing deposits | |||||||||||||||
Interest checking | $ | 19,004 | 8 | 0.16 | $ | 18,337 | 8 | 0.16 | |||||||
Money market and savings | 42,174 | 30 | 0.29 | 39,388 | 35 | 0.35 | |||||||||
Certificates and other time deposits | 30,140 | 112 | 1.47 | 25,977 | 111 | 1.72 | |||||||||
Foreign deposits - interest-bearing | 368 | - | 0.04 | 613 | (2) | (0.97 | ) | ||||||||
Total interest-bearing deposits | 91,686 | 150 | 0.65 | 84,315 | 152 | 0.72 | |||||||||
Fed funds purchased, repos and other borrowings | 4,307 | 3 | 0.31 | 5,486 | 4 | 0.22 | |||||||||
Long-term debt | 22,347 | 181 | 3.22 | 23,114 | 181 | 3.14 | |||||||||
Total interest-bearing liabilities | 118,340 | 334 | 1.12 | 112,915 | 337 | 1.19 | |||||||||
Noninterest-bearing deposits | 23,370 | 22,151 | |||||||||||||
Other liabilities | 6,259 | 5,592 | |||||||||||||
Shareholders' equity | 17,551 | 17,072 | |||||||||||||
Total liabilities and shareholders' equity | $ | 165,520 | $ | 157,730 | |||||||||||
Average interest-rate spread | 3.91 | 3.97 | |||||||||||||
Net interest income/ net interest margin | $ | 1,454 | 4.09 | % | $ | 1,390 | 4.15 | % | |||||||
Taxable-equivalent adjustment | $ | 38 | $ | 36 |
Applicable ratios are annualized. | |
(1) |
Excludes basis adjustments for fair value hedges. |
(2) |
Yields are on a fully taxable-equivalent basis. |
(3) |
Total securities include securities available for sale and securities held to maturity. |
9
Quarter Ended | ||||||||||||||||||||
March 31, 2011 | December 31, 2010 | September 30, 2010 | ||||||||||||||||||
(1) | Interest | (2) | (1) | Interest | (2) | (1) | Interest | (2) | ||||||||||||
Average | Income/ | Yields/ | Average | Income/ | Yields/ | Average | Income/ | Yields/ | ||||||||||||
Balances | Expense | Rates | Balances | Expense | Rates | Balances | Expense | Rates | ||||||||||||
Assets | ||||||||||||||||||||
Total securities, at amortized cost (3) | ||||||||||||||||||||
U.S. government-sponsored entities (GSE) | $ | 93 | $ | 1 | 2.41 | % | $ | 52 | $ | 1 | 4.60 | % | $ | 54 | $ | - | 4.65 | % | ||
Mortgage-backed securities issued by GSE | 20,409 | 84 | 1.65 | 21,067 | 102 | 1.95 | 18,636 | 150 | 3.22 | |||||||||||
States and political subdivisions | 1,969 | 27 | 5.55 | 1,987 | 27 | 5.58 | 2,019 | 29 | 5.55 | |||||||||||
Non-agency mortgage-backed securities | 595 | 10 | 6.38 | 1,025 | 15 | 5.93 | 1,152 | 17 | 5.90 | |||||||||||
Other securities | 750 | 3 | 1.56 | 641 | 4 | 1.91 | 209 | 1 | 2.74 | |||||||||||
Covered securities | 1,243 | 37 | 12.06 | 1,216 | 50 | 16.45 | 1,207 | 23 | 7.61 | |||||||||||
Total securities | 25,059 | 162 | 2.59 | 25,988 | 199 | 3.07 | 23,277 | 220 | 3.78 | |||||||||||
Other earning assets | 2,978 | 6 | 0.80 | 2,995 | 4 | 0.56 | 2,951 | 6 | 0.54 | |||||||||||
Loans and leases | ||||||||||||||||||||
Commercial loans and leases | ||||||||||||||||||||
Commercial and industrial | 33,433 | 359 | 4.35 | 32,733 | 370 | 4.48 | 32,174 | 364 | 4.49 | |||||||||||
Commercial real estate—other | 11,368 | 108 | 3.84 | 11,661 | 111 | 3.78 | 12,052 | 115 | 3.78 | |||||||||||
Commercial real estate—residential ADC | 3,281 | 28 | 3.50 | 3,650 | 33 | 3.60 | 4,394 | 38 | 3.40 | |||||||||||
Direct retail lending | 13,672 | 174 | 5.17 | 13,770 | 181 | 5.23 | 13,867 | 184 | 5.26 | |||||||||||
Sales finance loans | 7,080 | 91 | 5.23 | 7,015 | 97 | 5.48 | 6,906 | 100 | 5.73 | |||||||||||
Revolving credit loans | 2,082 | 46 | 8.90 | 2,086 | 46 | 8.62 | 2,048 | 44 | 8.64 | |||||||||||
Residential mortgage loans | 17,926 | 223 | 4.97 | 16,974 | 218 | 5.14 | 15,828 | 213 | 5.39 | |||||||||||
Specialized lending | 7,797 | 227 | 11.76 | 7,937 | 231 | 11.53 | 8,046 | 229 | 11.33 | |||||||||||
Other acquired loans | 57 | 4 | 31.68 | 63 | 5 | 28.84 | 73 | 3 | 18.97 | |||||||||||
Total loans and leases held for investment | ||||||||||||||||||||
(excluding covered loans) | 96,696 | 1,260 | 5.27 | 95,889 | 1,292 | 5.35 | 95,388 | 1,290 | 5.38 | |||||||||||
Covered loans | 5,927 | 262 | 17.96 | 6,488 | 271 | 16.59 | 6,957 | 258 | 14.72 | |||||||||||
Total loans and leases held for investment | 102,623 | 1,522 | 6.00 | 102,377 | 1,563 | 6.06 | 102,345 | 1,548 | 6.01 | |||||||||||
Loans held for sale | 2,671 | 23 | 3.48 | 3,569 | 27 | 3.09 | 2,410 | 22 | 3.56 | |||||||||||
Total loans and leases | 105,294 | 1,545 | 5.94 | 105,946 | 1,590 | 5.96 | 104,755 | 1,570 | 5.96 | |||||||||||
Total earning assets | 133,331 | 1,713 | 5.19 | 134,929 | 1,793 | 5.28 | 130,983 | 1,796 | 5.45 | |||||||||||
Nonearning assets | 23,600 | 24,535 | 24,683 | |||||||||||||||||
Total assets | $ | 156,931 | $ | 159,464 | $ | 155,666 | ||||||||||||||
Liabilities and Shareholders' Equity | ||||||||||||||||||||
Interest-bearing deposits | ||||||||||||||||||||
Interest checking | $ | 17,622 | 7 | 0.17 | $ | 16,628 | 7 | 0.16 | $ | 15,704 | 6 | 0.16 | ||||||||
Money market and savings | 38,724 | 40 | 0.42 | 36,341 | 41 | 0.45 | 34,717 | 42 | 0.48 | |||||||||||
Certificates and other time deposits | 26,815 | 124 | 1.88 | 28,085 | 144 | 2.03 | 32,353 | 177 | 2.16 | |||||||||||
Foreign deposits - interest-bearing | 1,463 | - | (0.26 | ) | 3,511 | - | 0.03 | 632 | - | (0.49 | ) | |||||||||
Total interest-bearing deposits | 84,624 | 171 | 0.82 | 84,565 | 192 | 0.90 | 83,406 | 225 | 1.07 | |||||||||||
Fed funds purchased, repos and other borrowings | 7,286 | 5 | 0.30 | 9,446 | 7 | 0.29 | 7,355 | 6 | 0.32 | |||||||||||
Long-term debt | 21,879 | 216 | 3.97 | 21,890 | 225 | 4.10 | 21,833 | 218 | 3.98 | |||||||||||
Total interest-bearing liabilities | 113,789 | 392 | 1.39 | 115,901 | 424 | 1.45 | 112,594 | 449 | 1.58 | |||||||||||
Noninterest-bearing deposits | 20,990 | 21,027 | 20,099 | |||||||||||||||||
Other liabilities | 5,479 | 5,585 | 5,938 | |||||||||||||||||
Shareholders' equity | 16,673 | 16,951 | 17,035 | |||||||||||||||||
Total liabilities and shareholders' equity | $ | 156,931 | $ | 159,464 | $ | 155,666 | ||||||||||||||
Average interest-rate spread | 3.80 | 3.83 | 3.87 | |||||||||||||||||
Net interest income/ net interest margin | $ | 1,321 | 4.01 | % | $ | 1,369 | 4.04 | % | $ | 1,347 | 4.09 | % | ||||||||
Taxable-equivalent adjustment | $ | 36 | $ | 37 | $ | 33 |
Applicable ratios are annualized. | |
(1) |
Excludes basis adjustments for fair value hedges. |
(2) |
Yields are on a fully taxable-equivalent basis. |
(3) |
Total securities include securities available for sale and securities held to maturity. |
10
Year-to-Date | |||||||||||||||
September 30, 2011 | September 30, 2010 | ||||||||||||||
(1) | Interest | (2) | (1) | Interest | (2) | ||||||||||
Average | Income/ | Yields/ | Average | Income/ | Yields/ | ||||||||||
Balances | Expense | Rates | Balances | Expense | Rates | ||||||||||
Assets | |||||||||||||||
Total securities, at amortized cost (3) | |||||||||||||||
U.S. government-sponsored entities (GSE) | $ | 146 | $ | 2 | 1.45 | % | $ | 742 | $ | 20 | 3.65 | % | |||
Mortgage-backed securities issued by GSE | 23,368 | 308 | 1.76 | 22,729 | 621 | 3.64 | |||||||||
States and political subdivisions | 1,907 | 81 | 5.69 | 2,067 | 85 | 5.46 | |||||||||
Non-agency mortgage-backed securities | 551 | 27 | 6.56 | 1,225 | 54 | 5.85 | |||||||||
Other securities | 695 | 8 | 1.53 | 201 | 3 | 2.44 | |||||||||
Covered securities | 1,252 | 125 | 13.31 | 1,192 | 92 | 10.27 | |||||||||
Total securities | 27,919 | 551 | 2.63 | 28,156 | 875 | 4.14 | |||||||||
Other earning assets | 3,286 | 16 | 0.63 | 2,913 | 13 | 0.55 | |||||||||
Loans and leases | |||||||||||||||
Commercial loans and leases | |||||||||||||||
Commercial and industrial | 33,789 | 1,078 | 4.27 | 31,791 | 1,057 | 4.44 | |||||||||
Commercial real estate—other | 11,240 | 320 | 3.81 | 12,190 | 354 | 3.89 | |||||||||
Commercial real estate—residential ADC | 2,928 | 77 | 3.53 | 5,043 | 138 | 3.65 | |||||||||
Direct retail lending | 13,685 | 526 | 5.14 | 14,008 | 556 | 5.31 | |||||||||
Sales finance loans | 7,166 | 268 | 5.00 | 6,682 | 300 | 6.00 | |||||||||
Revolving credit loans | 2,088 | 137 | 8.80 | 2,013 | 132 | 8.79 | |||||||||
Residential mortgage loans | 18,355 | 670 | 4.86 | 15,625 | 641 | 5.47 | |||||||||
Specialized lending | 8,162 | 706 | 11.56 | 7,725 | 661 | 11.44 | |||||||||
Other acquired loans | 53 | 13 | 33.26 | 93 | 9 | 13.58 | |||||||||
Total loans and leases held for investment | |||||||||||||||
(excluding covered loans) | 97,466 | 3,795 | 5.20 | 95,170 | 3,848 | 5.40 | |||||||||
Covered loans | 5,629 | 809 | 19.21 | 7,251 | 662 | 12.20 | |||||||||
Total loans and leases held for investment | 103,095 | 4,604 | 5.97 | 102,421 | 4,510 | 5.89 | |||||||||
Loans held for sale | 2,004 | 57 | 3.77 | 1,975 | 63 | 4.23 | |||||||||
Total loans and leases | 105,099 | 4,661 | 5.93 | 104,396 | 4,573 | 5.85 | |||||||||
Total earning assets | 136,304 | 5,228 | 5.12 | 135,465 | 5,461 | 5.38 | |||||||||
Nonearning assets | 23,788 | 24,258 | |||||||||||||
Total assets | $ | 160,092 | $ | 159,723 | |||||||||||
Liabilities and Shareholders' Equity | |||||||||||||||
Interest-bearing deposits | |||||||||||||||
Interest checking | $ | 18,326 | 23 | 0.16 | $ | 16,424 | 22 | 0.18 | |||||||
Money market and savings | 40,108 | 105 | 0.35 | 34,472 | 134 | 0.52 | |||||||||
Certificates and other time deposits | 27,657 | 347 | 1.68 | 35,593 | 571 | 2.14 | |||||||||
Foreign deposits - interest-bearing | 810 | (2) | (0.39 | ) | 1,373 | (2) | (0.22 | ) | |||||||
Total interest-bearing deposits | 86,901 | 473 | 0.73 | 87,862 | 725 | 1.10 | |||||||||
Fed funds purchased, repos and other borrowings | 5,682 | 12 | 0.28 | 8,879 | 19 | 0.28 | |||||||||
Long-term debt | 22,448 | 578 | 3.44 | 21,573 | 631 | 3.91 | |||||||||
Total interest-bearing liabilities | 115,031 | 1,063 | 1.23 | 118,314 | 1,375 | 1.55 | |||||||||
Noninterest-bearing deposits | 22,179 | 19,309 | |||||||||||||
Other liabilities | 5,780 | 5,236 | |||||||||||||
Shareholders' equity | 17,102 | 16,864 | |||||||||||||
Total liabilities and shareholders' equity | $ | 160,092 | $ | 159,723 | |||||||||||
Average interest-rate spread | 3.89 | 3.83 | |||||||||||||
Net interest income/ net interest margin | $ | 4,165 | 4.08 | % | $ | 4,086 | 4.03 | % | |||||||
Taxable-equivalent adjustment | $ | 110 | $ | 98 |
Applicable ratios are annualized. | |
(1) |
Excludes basis adjustments for fair value hedges. |
(2) |
Yields are on a fully taxable-equivalent basis. |
(3) |
Total securities include securities available for sale and securities held to maturity. |
11
As of/For the Quarter Ended | ||||||||||
Sept. 30 | June 30 | March 31 | Dec. 31 | Sept. 30 | ||||||
2011 | 2011 | 2011 | 2010 | 2010 | ||||||
Nonperforming assets (1) | ||||||||||
Nonaccrual loans and leases | ||||||||||
Commercial loans and leases | ||||||||||
Commercial and industrial | $ | 579 | $ | 611 | $ | 594 | $ | 508 | $ | 491 |
Commercial real estate—other | 438 | 467 | 508 | 405 | 328 | |||||
Commercial real estate—residential ADC | 428 | 460 | 568 | 513 | 454 | |||||
Direct retail lending | 151 | 172 | 182 | 191 | 216 | |||||
Sales finance loans | 7 | 7 | 9 | 6 | 6 | |||||
Residential mortgage loans (6) | 298 | 292 | 511 | 466 | 416 | |||||
Specialized lending | 56 | 52 | 55 | 60 | 62 | |||||
Total nonaccrual loans and leases held for investment | 1,957 | 2,061 | 2,427 | 2,149 | 1,973 | |||||
Loans held for sale | 26 | 116 | 189 | 521 | 826 | |||||
Total nonaccrual loans and leases | 1,983 | 2,177 | 2,616 | 2,670 | 2,799 | |||||
Foreclosed real estate (2) | 950 | 1,147 | 1,211 | 1,259 | 1,309 | |||||
Other foreclosed property | 36 | 29 | 36 | 42 | 39 | |||||
Total nonperforming assets (excluding covered assets) (2) | $ | 2,969 | $ | 3,353 | $ | 3,863 | $ | 3,971 | $ | 4,147 |
Performing troubled debt restructurings (TDRs) (3) | ||||||||||
Commercial loans and leases | ||||||||||
Commercial and industrial | $ | 64 | $ | 100 | $ | 125 | $ | 205 | $ | 260 |
Commercial real estate—other | 124 | 153 | 233 | 280 | 300 | |||||
Commercial real estate—residential ADC | 55 | 105 | 120 | 172 | 316 | |||||
Direct retail lending | 141 | 143 | 146 | 141 | 131 | |||||
Sales finance loans | 6 | 6 | 5 | 5 | - | |||||
Revolving credit loans | 63 | 62 | 62 | 62 | 62 | |||||
Residential mortgage loans (7) | 568 | 570 | 587 | 585 | 566 | |||||
Specialized lending | 46 | 39 | 31 | 26 | 4 | |||||
Total performing TDRs (7) | $ | 1,067 | $ | 1,178 | $ | 1,309 | $ | 1,476 | $ | 1,639 |
Loans 90 days or more past due and still accruing | ||||||||||
Commercial loans and leases | ||||||||||
Commercial and industrial | $ | 1 | $ | 4 | $ | 6 | $ | 8 | $ | 7 |
Commercial real estate—other | 2 | 4 | 20 | 4 | 3 | |||||
Commercial real estate—residential ADC | - | - | 5 | 8 | 10 | |||||
Direct retail lending | 52 | 59 | 59 | 76 | 69 | |||||
Sales finance loans | 19 | 21 | 23 | 27 | 27 | |||||
Revolving credit loans | 15 | 16 | 18 | 20 | 21 | |||||
Residential mortgage loans (8)(10) | 91 | 90 | 124 | 143 | 137 | |||||
Specialized lending | 5 | 7 | 6 | 6 | 7 | |||||
Other acquired loans | 2 | 2 | 2 | 3 | 5 | |||||
Total loans 90 days past due and still accruing (excluding covered loans) (4)(8)(10) | $ | 187 | $ | 203 | $ | 263 | $ | 295 | $ | 286 |
Loans 30-89 days past due | ||||||||||
Commercial loans and leases | ||||||||||
Commercial and industrial | $ | 76 | $ | 72 | $ | 137 | $ | 163 | $ | 213 |
Commercial real estate—other | 27 | 35 | 54 | 68 | 171 | |||||
Commercial real estate—residential ADC | 27 | 25 | 40 | 84 | 151 | |||||
Direct retail lending | 148 | 154 | 166 | 189 | 181 | |||||
Sales finance loans | 67 | 68 | 67 | 95 | 99 | |||||
Revolving credit loans | 23 | 22 | 24 | 28 | 28 | |||||
Residential mortgage loans (9)(11) | 445 | 426 | 444 | 532 | 551 | |||||
Specialized lending | 243 | 198 | 166 | 248 | 242 | |||||
Other acquired loans | 1 | - | 1 | 1 | 2 | |||||
Total loans 30-89 days past due (excluding covered loans) (5)(9)(11) | $ | 1,057 | $ | 1,000 | $ | 1,099 | $ | 1,408 | $ | 1,638 |
(1) |
Covered and other acquired loans are considered to be performing due to the application of the accretion method. Covered loans that are contractually past due are noted in the footnotes below. |
(2) |
Excludes foreclosed real estate totaling $355 million, $348 million, $362 million, $313 million and $276 million at September 30, 2011, June 30, 2011, March 31, 2011, December 31, 2010 and September 30, 2010, respectively, that are covered by FDIC loss sharing agreements. |
(3) |
Excludes TDRs that are nonperforming totaling $319 million, $381 million, $479 million, $479 million and $489 million at September 30, 2011, June 30, 2011, March 31, 2011, December 31, 2010 and September 30, 2010, respectively. These amounts are included in total nonperforming assets. |
(4) |
Excludes loans past due 90 days or more that are covered by FDIC loss sharing agreements totaling $872 million, $935 million, $1.2 billion, $1.1 billion and $1.3 billion at September 30, 2011, June 30, 2011, March 31, 2011, December 31, 2010 and September 30, 2010, respectively. |
(5) |
Excludes loans past due 30-89 days that are covered by FDIC loss sharing agreements totaling $211 million, $308 million, $252 million, $363 million and $329 million at September 30, 2011, June 30, 2011, March 31, 2011, December 31, 2010 and September 30, 2010, respectively. |
(6) |
Includes a reduction of $231 million in mortgage loans during the second quarter of 2011 in connection with BB&T's NPA disposition strategy. |
(7) |
Excludes restructured mortgage loans that are government guaranteed totaling $214 million, $184 million, $148 million, $129 million, and $153 million at September 30, 2011, June 30, 2011, March 31, 2011, December 31, 2010 and September 30, 2010, respectively. Includes mortgage loans held for sale. |
(8) |
Excludes mortgage loans past due 90 days or more that are government guaranteed totaling $185 million, $162 million, $187 million, $153 million and $119 million at September 30, 2011, June 30, 2011, March 31, 2011, December 31, 2010 and September 30, 2010, respectively. Includes past due mortgage loans held for sale. |
(9) |
Excludes mortgage loans past due 30-89 days that are government guaranteed totaling $82 million, $78 million, $71 million, $83 million and $74 million at September 30, 2011, June 30, 2011, March 31, 2011, December 31, 2010 and September 30, 2010, respectively. Includes past due mortgage loans held for sale. |
(10) |
Excludes mortgage loans guaranteed by GNMA that BB&T does not have the obligation to repurchase that are past due 90 days or more totaling $389 million, $389 million, $406 million, $425 million and $403 million at September 30, 2011, June 30, 2011, March 31, 2011, December 31, 2010 and September 30, 2010, respectively. |
(11) |
Excludes mortgage loans guaranteed by GNMA that BB&T does not have the obligation to repurchase that are past due 30-89 days totaling $7 million, $7 million, $6 million, $7 million and $7 million at September 30, 2011, June 30, 2011, March 31, 2011, December 31, 2010 and September 30, 2010, respectively. |
12
As of/For the Quarter Ended | |||||||||||||||
Sept. 30 | June 30 | March 31 | Dec. 31 | Sept. 30 | |||||||||||
2011 | 2011 | 2011 | 2010 | 2010 | |||||||||||
Allowance for credit losses | |||||||||||||||
Beginning balance | $ | 2,575 | $ | 2,691 | $ | 2,755 | $ | 2,650 | $ | 2,753 | |||||
Provision for credit losses (excluding covered loans) | 243 | 313 | 340 | 543 | 743 | ||||||||||
Provision for covered loans | 7 | 15 | - | 100 | 27 | ||||||||||
Charge-offs | |||||||||||||||
Commercial loans and leases (1) | |||||||||||||||
Commercial and industrial | (102 | ) | (62 | ) | (78 | ) | (103 | ) | (143 | ) | |||||
Commercial real estate—other | (64 | ) | (81 | ) | (68 | ) | (125 | ) | (244 | ) | |||||
Commercial real estate—residential ADC | (61 | ) | (78 | ) | (71 | ) | (107 | ) | (285 | ) | |||||
Direct retail lending | (74 | ) | (66 | ) | (78 | ) | (87 | ) | (83 | ) | |||||
Sales finance loans | (7 | ) | (7 | ) | (10 | ) | (12 | ) | (10 | ) | |||||
Revolving credit loans | (23 | ) | (24 | ) | (27 | ) | (28 | ) | (28 | ) | |||||
Residential mortgage loans (2) | (41 | ) | (129 | ) | (54 | ) | (58 | ) | (52 | ) | |||||
Specialized lending | (42 | ) | (43 | ) | (52 | ) | (57 | ) | (56 | ) | |||||
Covered loans | (53 | ) | - | - | - | - | |||||||||
Total charge-offs | (467 | ) | (490 | ) | (438 | ) | (577 | ) | (901 | ) | |||||
Recoveries | |||||||||||||||
Commercial loans and leases (1) | |||||||||||||||
Commercial and industrial | 9 | 9 | 4 | 4 | 4 | ||||||||||
Commercial real estate—other | 6 | 6 | 3 | 4 | - | ||||||||||
Commercial real estate—residential ADC | 9 | 7 | 4 | 6 | 4 | ||||||||||
Direct retail lending | 10 | 8 | 9 | 8 | 7 | ||||||||||
Sales finance loans | 2 | 3 | 2 | 2 | 2 | ||||||||||
Revolving credit loans | 4 | 5 | 5 | 4 | 4 | ||||||||||
Residential mortgage loans (2) | 1 | 1 | 1 | 1 | 1 | ||||||||||
Specialized lending | 7 | 7 | 6 | 10 | 6 | ||||||||||
Total recoveries | 48 | 46 | 34 | 39 | 28 | ||||||||||
Net charge-offs | (419 | ) | (444 | ) | (404 | ) | (538 | ) | (873 | ) | |||||
Ending balance | $ | 2,406 | $ | 2,575 | $ | 2,691 | $ | 2,755 | $ | 2,650 | |||||
Allowance for credit losses | |||||||||||||||
Allowance for loan and lease losses (excluding covered loans) | $ | 2,242 | $ | 2,357 | $ | 2,497 | $ | 2,564 | $ | 2,567 | |||||
Allowance for covered loans | 113 | 159 | 144 | 144 | 44 | ||||||||||
Reserve for unfunded lending commitments | 51 | 59 | 50 | 47 | 39 | ||||||||||
Total | $ | 2,406 | $ | 2,575 | $ | 2,691 | $ | 2,755 | $ | 2,650 | |||||
As of/For the | |||||||||||||||
Nine Months Ended | |||||||||||||||
September 30 | |||||||||||||||
2011 | 2010 | ||||||||||||||
Allowance for credit losses | |||||||||||||||
Beginning balance | $ | 2,755 | $ | 2,672 | |||||||||||
Provision for credit losses (excluding covered loans) | 896 | 1,951 | |||||||||||||
Provision for covered loans | 22 | 44 | |||||||||||||
Charge-offs | |||||||||||||||
Commercial loans and leases (1) | |||||||||||||||
Commercial and industrial | (242 | ) | (270 | ) | |||||||||||
Commercial real estate—other | (213 | ) | (345 | ) | |||||||||||
Commercial real estate—residential ADC | (210 | ) | (558 | ) | |||||||||||
Direct retail lending | (218 | ) | (251 | ) | |||||||||||
Sales finance loans | (24 | ) | (36 | ) | |||||||||||
Revolving credit loans | (74 | ) | (90 | ) | |||||||||||
Residential mortgage loans (2) | (224 | ) | (336 | ) | |||||||||||
Specialized lending | (137 | ) | (195 | ) | |||||||||||
Covered loans | (53 | ) | - | ||||||||||||
Total charge-offs | (1,395 | ) | (2,081 | ) | |||||||||||
Recoveries | |||||||||||||||
Commercial loans and leases (1) | |||||||||||||||
Commercial and industrial | 22 | 14 | |||||||||||||
Commercial real estate—other | 15 | 1 | |||||||||||||
Commercial real estate—residential ADC | 20 | 8 | |||||||||||||
Direct retail lending | 27 | 25 | |||||||||||||
Sales finance loans | 7 | 7 | |||||||||||||
Revolving credit loans | 14 | 12 | |||||||||||||
Residential mortgage loans (2) | 3 | 3 | |||||||||||||
Specialized lending | 20 | 21 | |||||||||||||
Total recoveries | 128 | 91 | |||||||||||||
Net charge-offs | (1,267 | ) | (1,990 | ) | |||||||||||
Other changes | - | (27 | ) | ||||||||||||
Ending balance | $ | 2,406 | $ | 2,650 |
(1) |
Includes net charge-offs of $26 million, $431 million and $7 million in commercial loans and leases during the fourth, third and second quarters of 2010, respectively, in connection with BB&T's NPA disposition strategy. |
(2) |
Includes net charge-offs of $87 million and $141 million in mortgage loans during the second quarters of 2011 and 2010, respectively, in connection with BB&T's NPA disposition strategy. |
13
As of/For the Quarter Ended | ||||||||||
Sept. 30 | June 30 | March 31 | Dec. 31 | Sept. 30 | ||||||
2011 | 2011 | 2011 | 2010 | 2010 | ||||||
Asset Quality Ratios (including amounts related to covered loans | ||||||||||
and covered foreclosed property) | ||||||||||
Loans 30-89 days past due and still accruing as a | ||||||||||
percentage of total loans and leases (1)(2) | 1.18 | % | 1.24 | % | 1.29 | % | 1.65 | % | 1.86 | % |
Loans 90 days or more past due and still accruing | ||||||||||
as a percentage of total loans and leases (1)(2) | 0.99 | 1.08 | 1.36 | 1.34 | 1.53 | |||||
Nonperforming loans and leases as a | ||||||||||
percentage of total loans and leases | 1.85 | 2.07 | 2.49 | 2.49 | 2.64 | |||||
Nonperforming assets as a percentage of: | ||||||||||
Total assets | 1.98 | 2.32 | 2.69 | 2.73 | 2.81 | |||||
Loans and leases plus foreclosed property | 3.05 | 3.46 | 3.97 | 3.94 | 4.11 | |||||
Net charge-offs as a percentage of average loans and leases | 1.57 | 1.71 | 1.56 | 2.02 | 3.31 | |||||
Allowance for loan and lease losses as a percentage of | ||||||||||
loans and leases held for investment | 2.25 | 2.43 | 2.58 | 2.62 | 2.56 | |||||
Ratio of allowance for loan and lease losses to: | ||||||||||
Net charge-offs | 1.42 | X | 1.41 | X | 1.61 | X | 1.27 | X | 0.75 | X |
Nonperforming loans and leases held for investment | 1.20 | 1.22 | 1.09 | 1.26 | 1.32 | |||||
Asset Quality Ratios (excluding amounts related to covered loans | ||||||||||
and covered foreclosed property) (3) | ||||||||||
Loans 30-89 days past due and still accruing as a | ||||||||||
percentage of total loans and leases (1)(2) | 1.03 | % | 1.00 | % | 1.11 | % | 1.39 | % | 1.65 | % |
Loans 90 days or more past due and still accruing | ||||||||||
as a percentage of total loans and leases (1)(2) | 0.18 | 0.20 | 0.27 | 0.29 | 0.29 | |||||
Nonperforming loans and leases as a | ||||||||||
percentage of total loans and leases | 1.94 | 2.18 | 2.64 | 2.64 | 2.82 | |||||
Nonperforming assets as a percentage of: | ||||||||||
Total assets | 1.83 | 2.18 | 2.56 | 2.64 | 2.76 | |||||
Loans and leases plus foreclosed property | 2.88 | 3.32 | 3.85 | 3.88 | 4.12 | |||||
Net charge-offs as a percentage of average loans and leases (4) | 1.44 | 1.80 | 1.65 | 2.15 | 3.54 | |||||
Allowance for loan and lease losses as a percentage of | ||||||||||
loans and leases held for investment | 2.25 | 2.41 | 2.58 | 2.63 | 2.69 | |||||
Ratio of allowance for loan and lease losses to: | ||||||||||
Net charge-offs | 1.55 | X | 1.32 | X | 1.52 | X | 1.20 | X | 0.74 | X |
Nonperforming loans and leases held for investment | 1.15 | 1.14 | 1.03 | 1.19 | 1.30 | |||||
As of/For the | ||||||||||
Nine Months Ended | ||||||||||
September 30 | ||||||||||
2011 | 2010 | |||||||||
Asset Quality Ratios | ||||||||||
Including covered loans: | ||||||||||
Net charge-offs as a percentage of average loans and leases | 1.61 | % | 2.55 | % | ||||||
Ratio of allowance for loan and lease losses to net charge-offs | 1.39 | X | 0.98 | X | ||||||
Excluding covered loans: | ||||||||||
Net charge-offs as a percentage of average loans and leases (4) | 1.63 | % | 2.74 | % | ||||||
Ratio of allowance for loan and lease losses to net charge-offs | 1.38 | X | 0.96 | X |
Applicable ratios are annualized. | |
(1) |
Excludes mortgage loans guaranteed by GNMA that BB&T does not have the obligation to repurchase. Refer to the footnotes on page 12 of this supplement for amounts related to these loans. |
(2) |
Excludes mortgage loans guaranteed by the government. Refer to the footnotes on page 12 of this supplement for amounts related to these loans. |
(3) |
These asset quality ratios have been adjusted to remove the impact of covered loans and covered foreclosed property. Appropriate adjustments to the numerator and denominator have been reflected in the calculation of these ratios. Management believes the inclusion of covered loans in certain asset quality ratios that include nonperforming assets, past due loans or net charge-offs in the numerator or denominator results in distortion of these ratios and they may not be comparable to other periods presented or to other portfolios that were not impacted by purchase accounting. |
(4) |
Excluding the impact of losses and balances associated with BB&T's NPA disposition strategy, the adjusted net charge-offs ratio would have been 1.46%, 2.07% and 1.80% for the second quarter of 2011, and the fourth and third quarters of 2010. The adjusted net charge-off ratio would have been 1.52% and 1.94% for the nine months ended September 30, 2011 and 2010, respectively. |
14
BB&T Corporation Credit Quality - Supplemental Schedules (Dollars in millions, except average loan and average client size) |
|
SUPPLEMENTAL COMMERCIAL REAL ESTATE LOAN PORTFOLIO INFORMATION (1)(2) | |||||||||||
RESIDENTIAL ACQUISITION, DEVELOPMENT, AND CONSTRUCTION LOANS (ADC) | |||||||||||
As of/For the Period Ended September 30, 2011 | |||||||||||
Builder / | Land / Land | Condos / | |||||||||
Construction | Development | Townhomes | Total ADC | ||||||||
Total loans outstanding | $ | 647 | $ | 1,653 | $ | 114 | $ | 2,414 | |||
Average loan size (in thousands) | 208 | 496 | 877 | 367 | |||||||
Average client size (in thousands) | 575 | 784 | 1,930 | 730 | |||||||
Nonaccrual loans and leases as a percentage of category | 17.07 | % | 18.10 | % | 16.01 | % | 17.72 | % | |||
Gross charge-offs as a percentage of category: | |||||||||||
Year-to-Date | 7.24 | 10.95 | 6.38 | 9.71 | |||||||
Quarter-to-Date | 3.29 | 11.95 | 6.90 | 9.39 | |||||||
As of/For the Period Ended September 30, 2011 | |||||||||||
Nonaccrual as a | Gross Charge-Offs as a Percentage of | ||||||||||
RESIDENTIAL ACQUISITION, DEVELOPMENT, AND | Total | Percentage of | Outstandings | ||||||||
CONSTRUCTION LOANS (ADC) BY STATE OF ORIGINATION | Outstandings | Outstandings | Year-to-Date | Quarter-to-Date | |||||||
North Carolina | $ | 1,076 | 19.34 | % | 11.55 | % | 7.96 | % | |||
Virginia | 481 | 6.15 | 2.32 | 4.26 | |||||||
South Carolina | 207 | 19.09 | 13.34 | 24.29 | |||||||
Georgia | 186 | 18.61 | 12.15 | 12.67 | |||||||
Florida | 131 | 21.30 | 11.42 | 10.32 | |||||||
Washington, D.C. | 74 | 1.80 | 14.00 | - | |||||||
Tennessee | 69 | 35.30 | 9.98 | 12.77 | |||||||
West Virginia | 61 | 60.85 | 14.87 | 31.85 | |||||||
Kentucky | 57 | 11.73 | 4.94 | 7.89 | |||||||
Maryland | 43 | 3.35 | 0.24 | - | |||||||
Alabama | 29 | 59.71 | 5.44 | - | |||||||
Total | $ | 2,414 | 17.72 | % | 9.71 | % | 9.39 | % | |||
OTHER COMMERCIAL REAL ESTATE LOANS (3) | |||||||||||
As of/For the Period Ended September 30, 2011 | |||||||||||
Permanent | |||||||||||
Commercial | Income | Total Other | |||||||||
Commercial | Land / | Producing | Commercial | ||||||||
Construction | Development | Properties | Real Estate | ||||||||
Total loans outstanding | $ | 892 | $ | 1,112 | $ | 8,935 | $ | 10,939 | |||
Average loan size (in thousands) | 1,016 | 607 | 508 | 539 | |||||||
Average client size (in thousands) | 1,392 | 718 | 774 | 795 | |||||||
Nonaccrual loans and leases as a percentage of category | 2.69 | % | 10.53 | % | 3.33 | % | 4.01 | % | |||
Gross charge-offs as a percentage of category: | |||||||||||
Year-to-Date | 1.86 | 7.72 | 2.00 | 2.64 | |||||||
Quarter-to-Date | 3.44 | 5.59 | 1.79 | 2.32 | |||||||
As of/For the Period Ended September 30, 2011 | |||||||||||
Nonaccrual as a | Gross Charge-Offs as a Percentage of | ||||||||||
OTHER COMMERCIAL REAL ESTATE LOANS BY STATE OF | Total | Percentage of | Outstandings | ||||||||
ORIGINATION (3) | Outstandings | Outstandings | Year-to-Date | Quarter-to-Date | |||||||
North Carolina | $ | 3,331 | 3.77 | % | 1.87 | % | 2.19 | % | |||
Virginia | 1,858 | 1.56 | 0.90 | 0.99 | |||||||
Georgia | 1,617 | 6.31 | 4.68 | 2.30 | |||||||
South Carolina | 809 | 10.14 | 6.88 | 5.87 | |||||||
Florida | 737 | 6.25 | 7.67 | 8.15 | |||||||
Washington, D.C. | 597 | 1.62 | 1.24 | 0.39 | |||||||
Maryland | 559 | 0.70 | 0.27 | 0.09 | |||||||
Kentucky | 442 | 1.31 | 0.31 | 0.48 | |||||||
West Virginia | 438 | 0.38 | 0.27 | 0.04 | |||||||
Tennessee | 342 | 8.85 | 1.74 | 3.31 | |||||||
Alabama | 111 | 1.91 | 0.50 | 0.06 | |||||||
Other | 98 | - | - | - | |||||||
Total | $ | 10,939 | 4.01 | % | 2.64 | % | 2.32 | % |
Applicable ratios are annualized. | |
(1) |
Commercial real estate loans (CRE) are defined as loans to finance non-owner occupied real property where the primary repayment source is the sale or rental/lease of the real property. Definition is based on internal classification. Excludes covered loans and in process items. |
(2) |
Includes net charge-offs and average balances related to loans transferred to held for sale while they were held for investment. Loans transferred to held for sale are excluded from total loans outstanding. As of September 30, 2011, there were $11 million ADC loans and $11 million other CRE loans held for sale. All of the held for sale ADC and Other CRE loans are on nonaccrual status. |
(3) |
C&I loans secured by real property are excluded. |
15
BB&T Corporation Credit Quality - Supplemental Schedules (Dollars in millions, except average loan size) |
|
SUPPLEMENTAL RESIDENTIAL MORTGAGE PORTFOLIO INFORMATION (1) | ||||||||||||||
As of/For the Period Ended September 30, 2011 | ||||||||||||||
Construction / | ||||||||||||||
RESIDENTIAL MORTGAGE LOANS | Prime | ALT-A | Permanent | Subprime (2) | Total | |||||||||
Total loans outstanding | $ | 16,880 | $ | 1,777 | $ | 444 | $ | 428 | $ | 19,529 | ||||
Average loan size (in thousands) | 193 | 299 | 280 | 59 | 191 | |||||||||
Average refreshed credit score (3) | 729 | 699 | 728 | 578 | 723 | |||||||||
Percentage that are first mortgages | 100 | % | 100 | % | 99 | % | 81 | % | 99 | % | ||||
Average loan to value at origination | 74 | 68 | 73 | 74 | 73 | |||||||||
Nonaccrual loans and leases as a percentage of category | 1.10 | 3.69 | 6.58 | 8.06 | 1.62 | |||||||||
Gross charge-offs as a percentage of category: | ||||||||||||||
Year-to-Date | 1.13 | 4.72 | 2.97 | 5.99 | 1.68 | |||||||||
Quarter-to-Date | 0.65 | 1.68 | 3.18 | 6.10 | 0.94 | |||||||||
As of/For the Period Ended September 30, 2011 | ||||||||||||||
Nonaccrual as a | Gross Charge-Offs as a | |||||||||||||
Total | Percentage of | Percentage of Outstandings | ||||||||||||
RESIDENTIAL MORTGAGE LOANS BY STATE | Outstandings | Outstandings | Year-to-Date | Quarter-to-Date | ||||||||||
North Carolina | $ | 4,737 | 1.34 | % | 1.08 | % | 0.62 | % | ||||||
Virginia | 3,206 | 1.07 | 1.22 | 0.46 | ||||||||||
Florida | 2,378 | 3.30 | 4.05 | 2.46 | ||||||||||
Maryland | 1,832 | 1.49 | 1.39 | 0.37 | ||||||||||
South Carolina | 1,808 | 1.77 | 1.81 | 0.84 | ||||||||||
Georgia | 1,701 | 1.79 | 2.73 | 2.45 | ||||||||||
Texas | 553 | 0.01 | 0.04 | - | ||||||||||
Kentucky | 517 | 1.08 | 0.45 | 0.14 | ||||||||||
Tennessee | 412 | 1.96 | 1.00 | 0.26 | ||||||||||
West Virginia | 380 | 1.23 | 0.55 | 0.61 | ||||||||||
Alabama | 305 | 0.58 | 0.65 | 0.16 | ||||||||||
Washington, D.C. | 251 | 1.11 | 1.08 | 0.51 | ||||||||||
Missouri | 193 | 0.43 | 0.29 | - | ||||||||||
Indiana | 129 | 0.38 | 0.27 | 0.10 | ||||||||||
Other | 1,127 | 2.23 | 1.60 | 0.87 | ||||||||||
Total | $ | 19,529 | 1.62 | % | 1.68 | % | 0.94 | % | ||||||
SUPPLEMENTAL DIRECT RETAIL 1-4 FAMILY AND LOT/LAND REAL ESTATE PORTFOLIO INFORMATION (4) | ||||||||||||||
As of/For the Period Ended September 30, 2011 | ||||||||||||||
Residential | Home Equity | Home Equity | ||||||||||||
DIRECT RETAIL 1-4 FAMILY AND LOT/LAND REAL ESTATE LOANS & LINES | Lot/Land Loans | Loans | Lines | Total | ||||||||||
Total loans outstanding | $ | 1,132 | $ | 6,355 | $ | 5,294 | $ | 12,781 | ||||||
Average loan size (in thousands) (5) | 56 | 47 | 35 | 42 | ||||||||||
Average refreshed credit score (6) | 725 | 726 | 763 | 748 | ||||||||||
Percentage that are first mortgages | 100 | % | 80 | % | 29 | % | 61 | % | ||||||
Average loan to value at origination | 78 | 62 | 63 | 64 | ||||||||||
Nonaccrual loans and leases as a percentage of category | 3.83 | 1.23 | 0.53 | 1.17 | ||||||||||
Gross charge-offs as a percentage of category: | ||||||||||||||
Year-to-Date | 7.95 | 1.46 | 1.37 | 2.06 | ||||||||||
Quarter-to-Date | 7.03 | 1.47 | 1.63 | 2.05 | ||||||||||
As of/For the Period Ended September 30, 2011 | ||||||||||||||
Nonaccrual as a | Gross Charge-Offs as a | |||||||||||||
DIRECT RETAIL 1-4 FAMILY AND LOT/LAND REAL ESTATE LOANS AND | Total | Percentage of | Percentage of Outstandings | |||||||||||
LINES BY STATE OF ORIGINATION | Outstandings | Outstandings | Year-to-Date | Quarter-to-Date | ||||||||||
North Carolina | $ | 4,306 | 1.33 | % | 2.10 | % | 2.03 | % | ||||||
Virginia | 2,905 | 0.66 | 0.99 | 1.11 | ||||||||||
South Carolina | 1,189 | 1.63 | 2.57 | 2.05 | ||||||||||
Georgia | 1,013 | 1.44 | 3.66 | 4.06 | ||||||||||
Maryland | 825 | 0.94 | 1.65 | 1.82 | ||||||||||
West Virginia | 772 | 0.96 | 1.04 | 1.24 | ||||||||||
Florida | 669 | 1.74 | 5.54 | 5.04 | ||||||||||
Kentucky | 589 | 1.14 | 1.04 | 1.18 | ||||||||||
Tennessee | 344 | 1.18 | 2.62 | 2.73 | ||||||||||
Washington, D.C. | 87 | 0.97 | 2.56 | 2.29 | ||||||||||
Other | 82 | 0.62 | 0.67 | 0.10 | ||||||||||
Total | $ | 12,781 | 1.17 | % | 2.06 | % | 2.05 | % | ||||||
Applicable ratios are annualized. | |
(1) |
Excludes mortgage loans held for sale, covered loans, mortgage loans guaranteed by GNMA that BB&T does not have the obligation to repurchase and in process items. |
(2) |
Includes $307 million in loans originated by Lendmark Financial Services, which are disclosed as a part of the specialized lending category. |
(3) |
Weighted based on outstanding balance. |
(4) |
Direct retail 1-4 family and lot/land real estate loans are originated through the BB&T Community Banking network. Excludes covered loans and in process items. |
(5) |
Home equity lines without an outstanding balance are excluded from this calculation. |
(6) |
Based on number of accounts. |
16
SUPPLEMENTAL TROUBLED DEBT RESTRUCTURINGS INFORMATION | ||||||||||||||
As of September 30, 2011 | ||||||||||||||
Past Due 30-89 | Past Due 90+ | |||||||||||||
Current Status | Days | Days | Total | |||||||||||
Performing restructurings: (1) | ||||||||||||||
Commercial loans | ||||||||||||||
Commercial and industrial | $ | 64 | 100.0 | % | $ | - | - | % | $ | - | - | % | $ | 64 |
Commercial real estate—other | 123 | 99.2 | - | - | 1 | 0.8 | 124 | |||||||
Commercial real estate—residential ADC | 53 | 96.4 | 2 | 3.6 | - | - | 55 | |||||||
Direct retail lending | 131 | 92.9 | 8 | 5.7 | 2 | 1.4 | 141 | |||||||
Sales finance loans | 5 | 83.3 | - | - | 1 | 16.7 | 6 | |||||||
Revolving credit loans | 50 | 79.4 | 7 | 11.1 | 6 | 9.5 | 63 | |||||||
Residential mortgage loans (2) | 470 | 82.7 | 88 | 15.5 | 10 | 1.8 | 568 | |||||||
Specialized lending | 41 | 89.1 | 4 | 8.7 | 1 | 2.2 | 46 | |||||||
Total performing restructurings | 937 | 87.8 | 109 | 10.2 | 21 | 2.0 | 1,067 | |||||||
Nonperforming restructurings (3) | 98 | 30.7 | 41 | 12.9 | 180 | 56.4 | 319 | |||||||
Total restructurings (2) | $ | 1,035 | 74.7 | % | $ | 150 | 10.8 | % | $ | 201 | 14.5 | % | $ | 1,386 |
(1) |
Past due performing restructurings are included in past due disclosures. |
(2) |
Excludes restructured mortgage loans that are government guaranteed totaling $214 million. |
(3) |
Nonperforming restructurings are included in nonaccrual loan disclosures. |
17
BB&T Corporation Capital Information - Five Quarter Trend (Dollars in millions, except per share data, shares in thousands) |
|
As of / Quarter Ended | ||||||||||||||||
Sept. 30 | June 30 | March 31 | Dec. 31 | Sept. 30 | ||||||||||||
2011 | 2011 | 2011 | 2010 | 2010 | ||||||||||||
Selected Capital Information (1) | ||||||||||||||||
Risk-based capital | ||||||||||||||||
Tier 1 | $ | 14,696 | $ | 14,363 | $ | 14,100 | $ | 13,959 | $ | 13,828 | ||||||
Total | 18,839 | 18,641 | 18,389 | 18,319 | 18,465 | |||||||||||
Risk-weighted assets (2) | 117,182 | 116,041 | 116,484 | 118,131 | 117,894 | |||||||||||
Average quarterly tangible assets | 159,268 | 151,677 | 151,049 | 153,349 | 149,253 | |||||||||||
Risk-based capital ratios | ||||||||||||||||
Tier 1 | 12.5 | % | 12.4 | % | 12.1 | % | 11.8 | % | 11.7 | % | ||||||
Total | 16.1 | 16.1 | 15.8 | 15.5 | 15.7 | |||||||||||
Leverage capital ratio | 9.2 | 9.5 | 9.3 | 9.1 | 9.3 | |||||||||||
Equity as a percentage of total assets | 10.5 | 10.7 | 10.6 | 10.5 | 10.7 | |||||||||||
Book value per common share | $ | 25.07 | $ | 24.37 | $ | 23.86 | $ | 23.67 | $ | 24.11 | ||||||
Selected Non-GAAP Capital Information (3) | ||||||||||||||||
Tangible common equity as a percentage of tangible assets | 7.1 | % | 7.2 | % | 7.2 | % | 7.1 | % | 7.0 | % | ||||||
Tier 1 common equity as a percentage of risk-weighted assets | 9.8 | 9.6 | 9.3 | 9.1 | 9.0 | |||||||||||
Tangible book value per common share | $ | 16.42 | $ | 15.95 | $ | 15.59 | $ | 15.43 | $ | 15.25 | ||||||
Calculations of Tier 1 common equity and tangible assets and related measures: | ||||||||||||||||
Tier 1 equity | $ | 14,696 | $ | 14,363 | $ | 14,100 | $ | 13,959 | $ | 13,828 | ||||||
Less: | ||||||||||||||||
Qualifying restricted core capital elements | 3,249 | 3,249 | 3,248 | 3,248 | 3,255 | |||||||||||
Tier 1 common equity | $ | 11,447 | $ | 11,114 | $ | 10,852 | $ | 10,711 | $ | 10,573 | ||||||
Total assets | $ | 167,677 | $ | 159,310 | $ | 157,039 | $ | 157,081 | $ | 157,230 | ||||||
Less: | ||||||||||||||||
Intangible assets, net of deferred taxes | 6,330 | 6,353 | 6,374 | 6,391 | 6,419 | |||||||||||
Plus: | ||||||||||||||||
Regulatory adjustments, net of deferred taxes | 99 | 389 | 572 | 636 | 207 | |||||||||||
Tangible assets | $ | 161,446 | $ | 153,346 | $ | 151,237 | $ | 151,326 | $ | 151,018 | ||||||
Total risk-weighted assets (2) | $ | 117,182 | $ | 116,041 | $ | 116,484 | $ | 118,131 | $ | 117,894 | ||||||
Tangible common equity as a percentage of tangible assets | 7.1 | % | 7.2 | % | 7.2 | % | 7.1 | % | 7.0 | % | ||||||
Tier 1 common equity as a percentage of risk-weighted assets | 9.8 | 9.6 | 9.3 | 9.1 | 9.0 | |||||||||||
Tier 1 common equity | $ | 11,447 | $ | 11,114 | $ | 10,852 | $ | 10,711 | $ | 10,573 | ||||||
Outstanding shares at end of period (in thousands) | 697,101 | 696,894 | 696,285 | 694,381 | 693,560 | |||||||||||
Tangible book value per common share | $ | 16.42 | $ | 15.95 | $ | 15.59 | $ | 15.43 | $ | 15.25 |
(1) |
Current quarter regulatory capital information is preliminary. |
(2) |
Risk-weighted assets are determined based on regulatory capital requirements. Under the regulatory framework for determining risk-weighted assets each asset class is assigned a risk-weighting of 0%, 20%, 50% or 100% based on the underlying risk of the specific asset class. In addition, off balance sheet exposures are first converted to a balance sheet equivalent amount and subsequently assigned to one of the four risk-weightings. |
(3) |
Tangible common equity and Tier 1 common equity ratios are Non-GAAP measures. BB&T uses the Tier 1 common equity definition used in the SCAP assessment to calculate these ratios. BB&T's management uses these measures to assess the quality of capital and believes that investors may find them useful in their analysis of the Corporation. These capital measures are not necessarily comparable to similar capital measures that may be presented by other companies. |
18
Favorable (Unfavorable) | |||||||
Selected Items | Pre-Tax | After-Tax | |||||
Third Quarter 2011 | |||||||
Losses/write-downs related to NPA disposition strategy | Other noninterest income | $ | (37 | ) | $ | (23 | ) |
Leveraged lease sale | Other noninterest expense | (16 | ) | 10 | |||
Second Quarter 2011 | |||||||
Losses/write-downs related to NPA disposition strategy | Other noninterest income | (27 | ) | (17 | ) | ||
First Quarter 2011 | |||||||
Losses/write-downs related to NPA disposition strategy | Other noninterest income | (74 | ) | (46 | ) | ||
Fourth Quarter 2010 | |||||||
Losses/write-downs related to NPA disposition strategy | Other noninterest income | (62 | ) | (39 | ) | ||
Third Quarter 2010 | |||||||
Losses/write-downs related to NPA disposition strategy | Other noninterest income | (28 | ) | (17 | ) | ||
Second Quarter 2010 | |||||||
No selected items noted | |||||||
First Quarter 2010 | |||||||
Colonial premises and equipment adjustment | Occupancy and equipment expense | 16 | 10 | ||||
Contingency reserve adjustment | Other noninterest expense | 11 | 7 |
As of / Quarter Ended | ||||||||||||||||
Sept. 30 | June 30 | March 31 | Dec. 31 | Sept. 30 | ||||||||||||
2011 | 2011 | 2011 | 2010 | 2010 | ||||||||||||
Selected Mortgage Banking Information | ||||||||||||||||
Income statement impact of mortgage servicing rights valuation | ||||||||||||||||
MSRs fair value increase (decrease) | $ | (299 | ) | $ | (61 | ) | $ | 41 | $ | 191 | $ | (101 | ) | |||
MSRs hedge gains (losses) | 329 | 59 | (39 | ) | (176 | ) | 132 | |||||||||
Net | $ | 30 | $ | (2 | ) | $ | 2 | $ | 15 | $ | 31 | |||||
Residential mortgage loan originations | $ | 5,549 | $ | 3,888 | $ | 5,802 | $ | 8,406 | $ | 6,656 | ||||||
Residential mortgage servicing portfolio (1) | ||||||||||||||||
Loans serviced for others | 66,305 | 65,872 | 64,894 | 61,795 | 60,207 | |||||||||||
Bank-owned loans serviced | 22,413 | 20,956 | 21,174 | 21,680 | 20,258 | |||||||||||
Total servicing portfolio | 88,718 | 86,828 | 86,068 | 83,475 | 80,465 | |||||||||||
Weighted-average coupon rate | 5.10 | % | 5.14 | % | 5.17 | % | 5.26 | % | 5.37 | % | ||||||
Weighted-average servicing fee | 0.341 | 0.344 | 0.346 | 0.350 | 0.354 | |||||||||||
Selected Miscellaneous Information | ||||||||||||||||
Derivatives notional amount | $ | 67,403 | $ | 58,060 | $ | 57,160 | $ | 65,386 | $ | 67,201 | ||||||
Fair value of derivatives | 207 | (29 | ) | (77 | ) | (69 | ) | 277 | ||||||||
Accumulated comprehensive income related to securities, | ||||||||||||||||
net of tax (2) | 159 | (128 | ) | (307 | ) | (333 | ) | 49 | ||||||||
Common stock prices | ||||||||||||||||
High | 27.36 | 27.81 | 29.60 | 27.57 | 28.69 | |||||||||||
Low | 18.92 | 25.24 | 25.95 | 22.15 | 21.72 | |||||||||||
End of period | 21.33 | 26.84 | 27.45 | 26.29 | 24.08 | |||||||||||
Banking offices | 1,780 | 1,778 | 1,781 | 1,782 | 1,790 | |||||||||||
ATMs | 2,484 | 2,475 | 2,476 | 2,481 | 2,494 | |||||||||||
FTEs | 31,684 | 31,617 | 31,365 | 31,354 | 31,331 |
(1) |
Amounts reported are unpaid principal balance. |
(2) |
Includes the impact of the FDIC loss sharing agreements on the covered securities. |
19
Quarter Ended | |||||||||||
Sept. 30 | June 30 | March 31 | Dec. 31 | Sept. 30 | |||||||
NON-GAAP Reconciliation Table | 2011 | 2011 | 2011 | 2010 | 2010 | ||||||
Efficiency ratio - GAAP | 66.1 | % | 64.1 | % | 67.4 | % | 60.9 | % | 57.3 | % | |
Effect of securities gains (losses), net | (1.0 | ) | - | - | 2.4 | 5.6 | |||||
Effect of merger-related and restructuring charges, net | - | (0.1 | ) | 0.1 | (0.2 | ) | (0.4 | ) | |||
Effect of losses/write-downs on NPA disposition loans | (0.9 | ) | (0.7 | ) | (2.1 | ) | (1.5 | ) | (0.6 | ) | |
Effect of FDIC loss share accounting | 0.1 | 0.3 | - | 2.0 | 0.6 | ||||||
Effect of foreclosed property expense | (7.8 | ) | (6.6 | ) | (7.0 | ) | (7.1 | ) | (7.1 | ) | |
Effect of leveraged lease sale | (0.8 | ) | - | - | - | - | |||||
Effect of amortization of intangibles | (1.1 | ) | (1.2 | ) | (1.3 | ) | (1.2 | ) | (1.3 | ) | |
Efficiency ratio - reported | 54.6 | 55.8 | 57.1 | 55.3 | 54.1 | ||||||
Fee income ratio - GAAP | 32.2 | % | 36.1 | % | 35.1 | % | 41.3 | % | 45.2 | % | |
Effect of securities gains (losses), net | 1.1 | - | - | (2.5 | ) | (5.8 | ) | ||||
Effect of losses/write-downs on NPA disposition loans | 1.1 | 0.7 | 2.2 | 1.6 | 0.6 | ||||||
Effect of FDIC loss share accounting | 4.9 | 4.0 | 2.8 | 1.4 | 2.3 | ||||||
Fee income ratio - reported | 39.3 | 40.8 | 40.1 | 41.8 | 42.3 | ||||||
Year-to-Date Sept. 30, | |||||||||||
NON-GAAP Reconciliation Table | 2011 | 2010 | |||||||||
Efficiency ratio - GAAP | 65.8 | % | 60.0 | % | |||||||
Effect of securities gains (losses), net | (0.4 | ) | 3.6 | ||||||||
Effect of merger-related and restructuring charges, net | - | (0.9 | ) | ||||||||
Effect of contingency reserve | - | 0.2 | |||||||||
Effect of losses/write-downs on NPA disposition loans | (1.2 | ) | (0.2 | ) | |||||||
Effect of Colonial premises and equipment adjustments | - | 0.3 | |||||||||
Effect of FDIC loss share accounting | 0.2 | 0.3 | |||||||||
Effect of foreclosed property expense | (7.1 | ) | (8.5 | ) | |||||||
Effect of leveraged lease sale | (0.3 | ) | - | ||||||||
Effect of amortization of intangibles | (1.2 | ) | (1.4 | ) | |||||||
Efficiency ratio - reported | 55.8 | 53.4 | |||||||||
Fee income ratio - GAAP | 34.5 | % | 42.3 | % | |||||||
Effect of securities gains (losses), net | 0.4 | (3.9 | ) | ||||||||
Effect of losses/write-downs on NPA disposition loans | 1.3 | 0.2 | |||||||||
Effect of FDIC loss share accounting | 3.9 | 2.1 | |||||||||
Fee income ratio - reported | 40.1 | 40.7 |
20
Exhibit 99.3