UNITED STATES
SECURITIES AND EXCHANGE COMMISSION
Washington, D.C. 20549
Form 8-K
Current Report
Pursuant to Section 13 or 15(d)
of the Securities Exchange Act of 1934
April 21, 2011
Date of Report (Date of earliest event reported)
BB&T Corporation
(Exact name of registrant as specified in its charter)
Commission file number : 1-10853
North Carolina | 56-0939887 |
(State of incorporation) | (I.R.S. Employer Identification No.) |
200 West Second Street | |
Winston-Salem, North Carolina | 27101 |
(Address of principal executive offices) | (Zip Code) |
(336) 733-2000
(Registrant's telephone number, including area code)
Check the appropriate box below if the Form 8-K filing is intended to simultaneously satisfy the filing obligation of the registrant under any of the following provisions (see General Instruction A.2. below):
[ ] Written communications pursuant to Rule 425 under the Securities Act (17 CFR 230.425)
[ ] Soliciting material pursuant to Rule 14a-12 under the Exchange Act (17 CFR 240.14a-12)
[ ] Pre-commencement communications pursuant to Rule 14d-2(b) under the Exchange Act (17 CFR 240.14d-2(b))
[ ] Pre-commencement communications pursuant to Rule 13e-4(c) under the Exchange Act (17 CFR 240.13e-4(c))
ITEM 2.02 Results of Operations and Financial Condition
On April 21, 2011, BB&T Corporation issued a press release reporting first quarter 2011 results, and posted on its website its first quarter 2011 Earnings Release, Quarterly Performance Summary and Earnings Release Presentation. The release contains forward-looking statements regarding BB&T and includes a cautionary statement identifying important factors that could cause actual results to differ materially from those anticipated. The Earnings Release, Quarterly Performance Summary and Earnings Release Presentation are furnished as Exhibit 99.1, 99.2 and 99.3, respectively.
ITEM 9.01 Financial Statements and Exhibits
Exhibit No. | Description of Exhibit |
99.1 |
BB&T Corporation's Earnings Release issued April 21, 2011. |
99.2 |
BB&T Corporation's Quarterly Performance Summary issued April 21, 2011. |
99.3 |
BB&T Corporation's Earnings Release Presentation issued April 21, 2011. |
S I G N A T U R E
Pursuant to the requirements of the Securities Exchange Act of 1934, the registrant has duly caused this report to be signed on its behalf by the undersigned hereunto duly authorized.
BB&T CORPORATION |
(Registrant) |
By: /S/ Cynthia B. Powell |
Cynthia B. Powell |
Executive Vice President and Corporate Controller |
(Principal Accounting Officer) |
Date: April 21, 2011
Exhibit 99.1
April 21, 2011
FOR IMMEDIATE RELEASE
Contacts: | ||||
ANALYSTS | MEDIA | |||
Tamera Gjesdal | Alan Greer | Cynthia Williams | ||
Senior Vice President | Executive Vice President | Executive Vice President | ||
Investor Relations | Investor Relations | Corporate Communications | ||
(336) 733-3058 | (336) 733-3021 | (336) 733-1478 |
BB&T reports 21% increase in net income
EPS totals $.32, up 19%
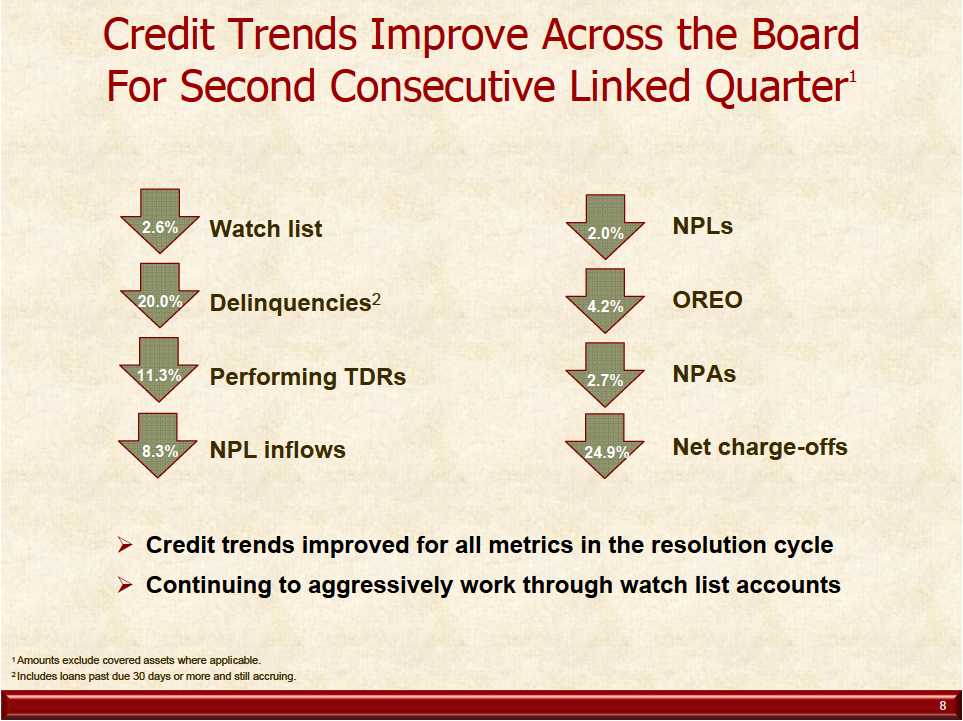
Credit trends improve across the board for second consecutive quarter
C&I loans up 8.7%
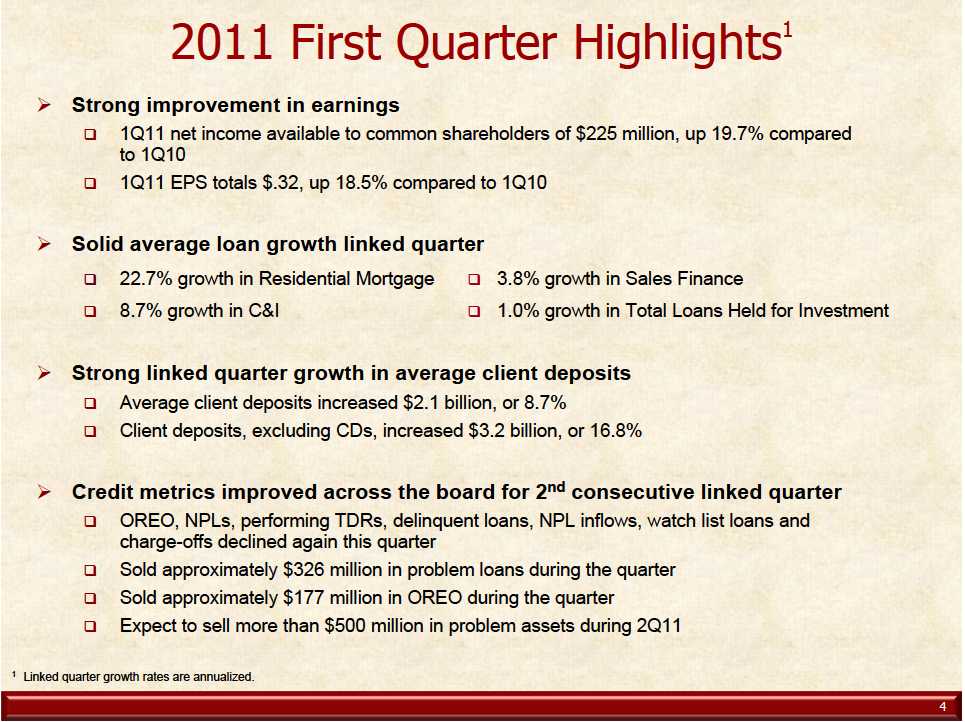
WINSTON-SALEM, N.C. -- BB&T Corporation (NYSE: BBT) today reported earnings for the first quarter of 2011. Net income totaled $234 million, an increase of 20.6% compared to $194 million reported in the first quarter last year. Net income available to common shareholders was $225 million, or $.32 per diluted common share, compared with $188 million, or $.27 per diluted common share, earned during the first quarter of 2010. These results reflect increases of 19.7% and 18.5%, respectively.
“BB&T posted solid first quarter results as our credit costs continued to decline and economic conditions improved,” said Chairman and Chief Executive Officer Kelly S. King. “For the second consecutive quarter, we saw improvements in all measures of credit quality. In particular, we experienced significant declines in past due loans, to our lowest level in three years.
“We continue to make progress in the diversification of our balance sheet. We experienced healthy growth in average C&I loans of 8.7% on an annualized basis compared with last quarter and we further reduced our exposure to higher-risk real estate,” said King. “We also saw growth in total loans this quarter, including the mortgage and auto loan portfolios.
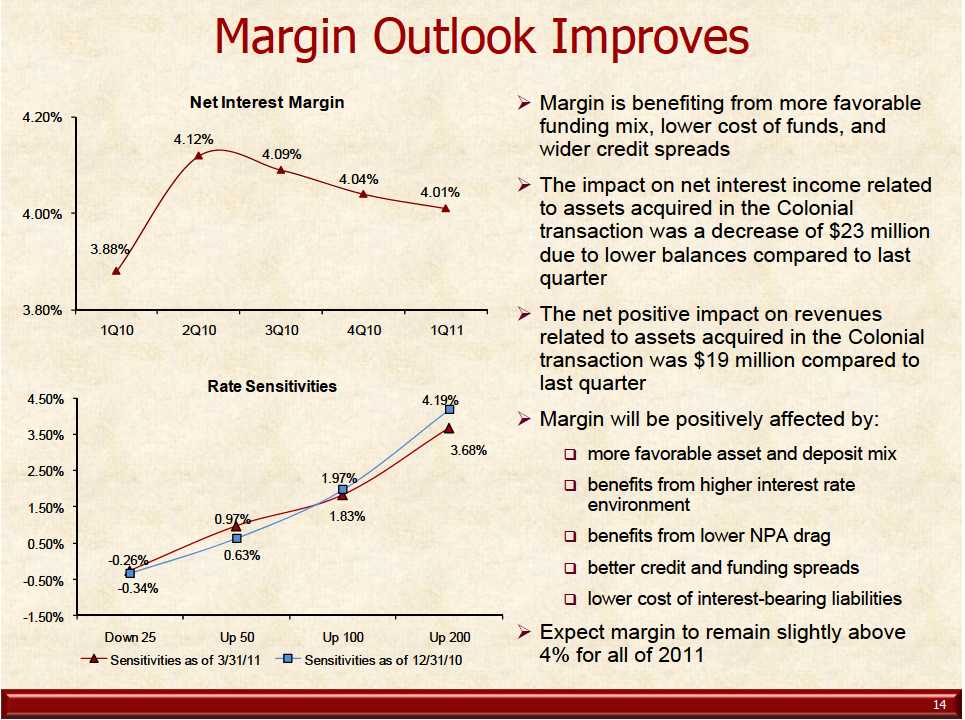
“Our net interest margin declined only slightly to 4.01% for the quarter compared with 4.04% for the prior quarter,” said King. “Our outlook for the margin has improved compared to last quarter and we believe we will remain slightly above 4% throughout 2011. Our margin is benefiting from a more favorable funding mix, a lower cost of funds and wider credit spreads.
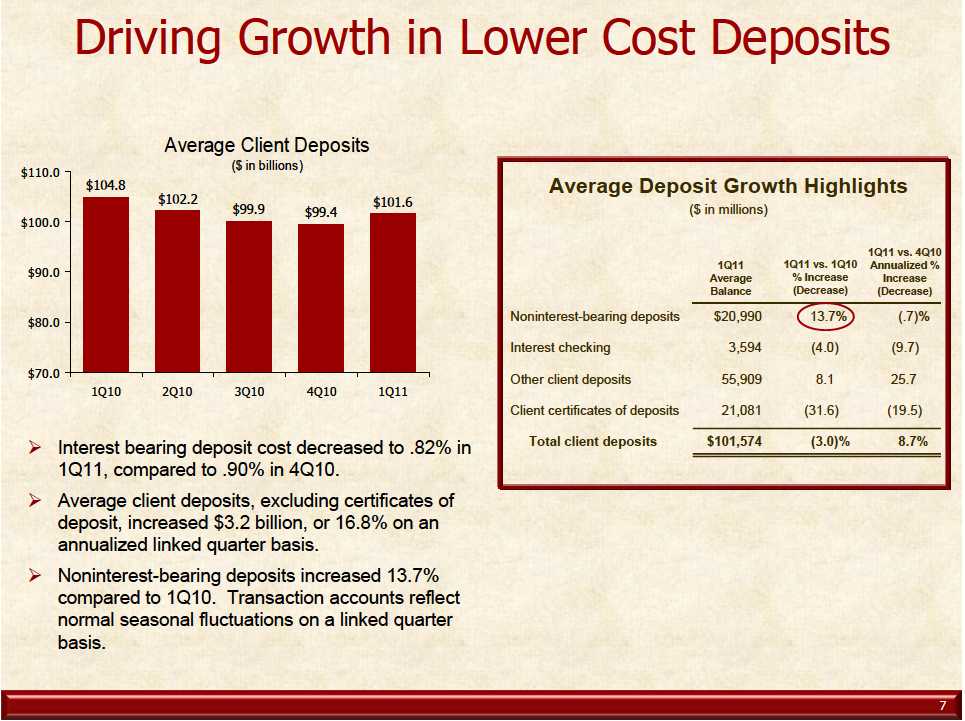
“We enjoyed strong growth in client deposits this quarter,” said King. “Average client deposits increased $2.1 billion, or 8.7% on an annualized linked quarter basis. Excluding certificates of deposit, client deposits increased $3.2 billion in the quarter, or 16.8% annualized, despite a reduction in deposit costs from .90% in the fourth quarter last year to .82% this quarter.
“Our outlook is positive for continued reductions in problem assets and related credit costs as we are on track with our asset disposition strategy,” continued King. “We sold approximately $500 million of problem assets during the quarter and expect that we will exceed that amount in the second quarter. As we near the conclusion of our disposition strategy, our execution has successfully preserved shareholder value.
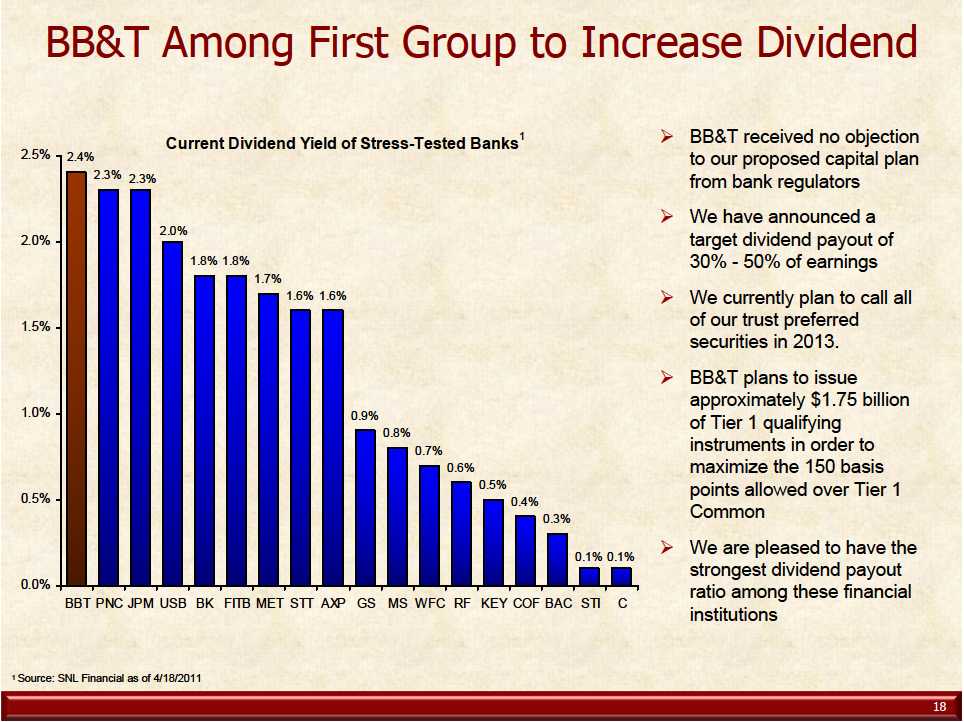
“Finally, we were pleased to be the first large bank to announce an increase in our dividend,” remarked King. “Among the 19 financial institutions included in the Fed’s comprehensive capital analysis and review, BB&T currently has the highest dividend yield and the highest dividend payout ratio.”
Performance Highlights Include:
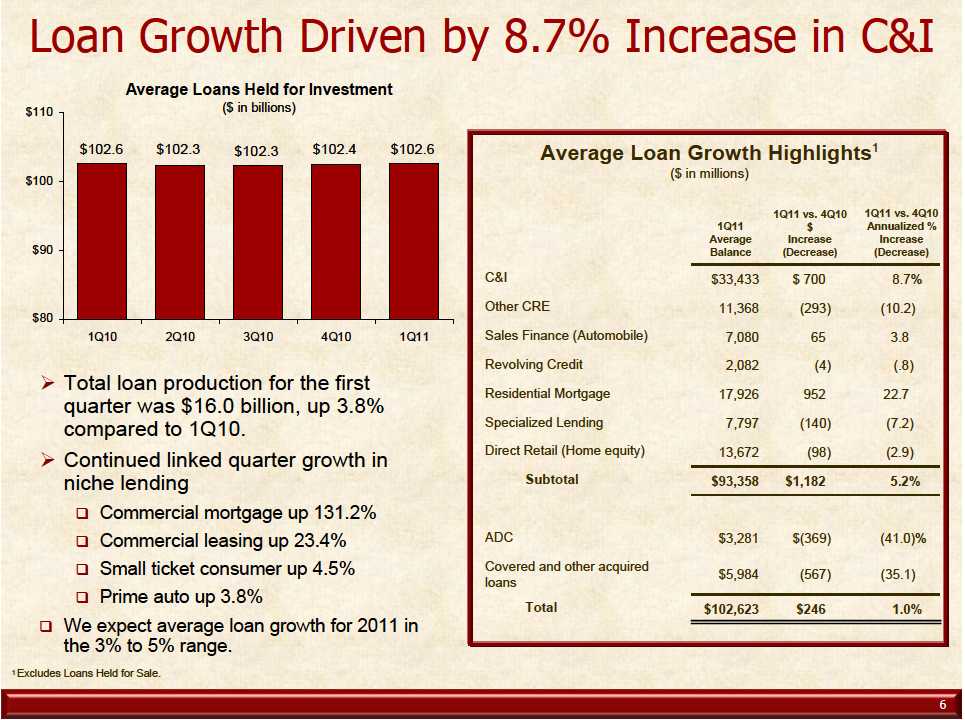
Average C&I loans increased 8.7% annualized linked quarter | ||
o |
Average total loans and leases held for investment, excluding the impact of ADC and covered and other acquired loan runoff, increased $1.2 billion, or 5.2% on an annualized basis | |
o |
Annualized linked quarter loan growth includes a 22.7% increase in average mortgage loans and a 3.8% increase in average sales finance loans | |
o |
Average total loans increased 1.0% | |
o |
Average ADC loans declined 41.0% | |
Average client deposits increased $2.1 billion, or 8.7% on an annualized linked quarter basis | ||
o |
Client deposits, excluding CDs, increased $3.2 billion, or 16.8% | |
o |
Deposit costs were reduced to .82% in the first quarter compared to .90% in the fourth quarter last year | |
Linked quarter credit metrics improved across the board | ||
o |
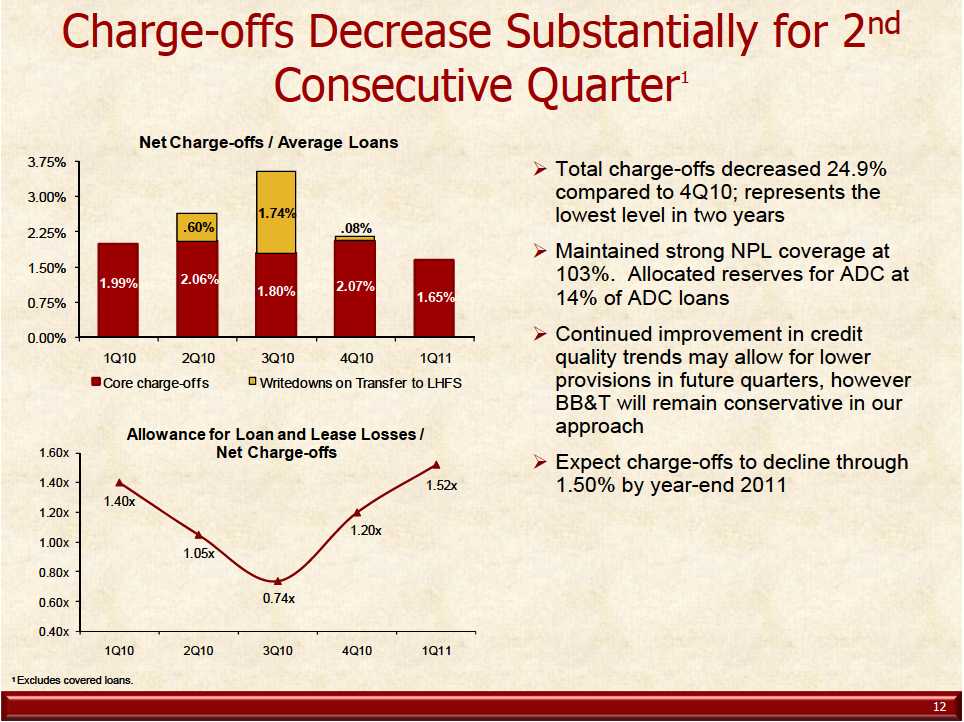
Net charge-offs decreased 24.9% and totaled 1.65% of average loans, excluding covered loans, for the quarter compared with 2.15% last quarter | |
o |
Lowest level of net charge-offs in two years | |
o |
NPAs, excluding covered assets, decreased 2.7%, the fourth consecutive quarter with lower NPAs | |
o |
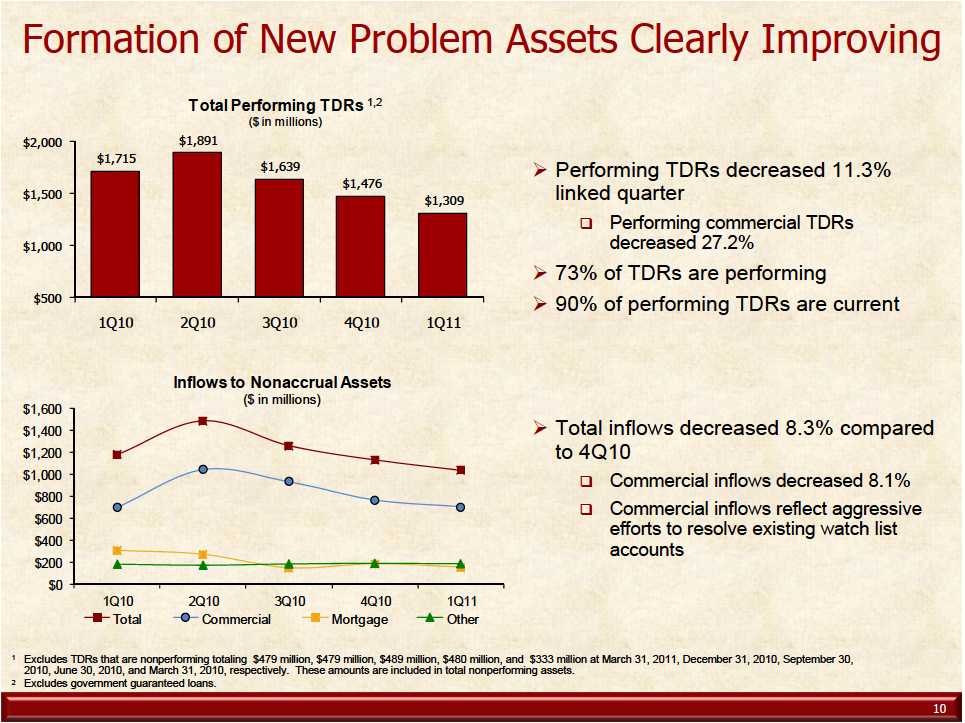
Performing TDRs decreased 11.3% | |
o |
NPA inflows decreased 8.3% on a linked quarter basis | |
o |
Delinquent loans decreased 20.0%, excluding covered and government guaranteed loans – lowest balances of delinquencies in three years | |
o |
BB&T sold approximately $500 million of problem assets during the quarter |
2
Capital levels further improved during the quarter | ||
o |
Tangible common equity improved to 7.2% | |
o |
Tier 1 common equity improved to 9.3% | |
o |
Tier 1 risk-based capital improved to 12.1% | |
o |
Leverage capital improved to 9.3% | |
o |
Total capital improved to 15.8% | |
Net interest margin remained healthy | ||
o |
The net interest margin was 4.01% for the first quarter, a 13 basis point increase compared to the first quarter of 2010 and a decrease of 3 basis points compared to last quarter |
EARNINGS HIGHLIGHTS | Change | Change | ||||||||||
(dollars in millions, except per share data) | Q1 | Q4 | Q1 | Q1 11 vs. | Q1 11 vs. | |||||||
2011 | 2010 | 2010 | Q4 10 | Q1 10 | ||||||||
Net income available to common shareholders | $ | 225 | $ | 208 | $ | 188 | $ | 17 | $ | 37 | ||
Diluted earnings per common share | .32 | .30 | .27 | .02 | .05 | |||||||
Net interest income-taxable equivalent | $ | 1,321 | $ | 1,369 | $ | 1,347 | $ | (48 | ) | $ | (26 | ) |
Noninterest income | 714 | 964 | 844 | (250 | ) | (130 | ) | |||||
Total revenue | $ | 2,035 | $ | 2,333 | $ | 2,191 | $ | (298 | ) | $ | (156 | ) |
Return on average assets (%) | .60 | .54 | .48 | .06 | .12 | |||||||
Return on average common shareholders' equity (%) | 5.48 | 4.88 | 4.59 | .60 | .89 | |||||||
Net interest margin - taxable equivalent (%) | 4.01 | 4.04 | 3.88 | (.03 | ) | .13 | ||||||
Efficiency ratio (1) (%) | 57.10 | 55.30 | 52.40 | 1.80 | 4.70 |
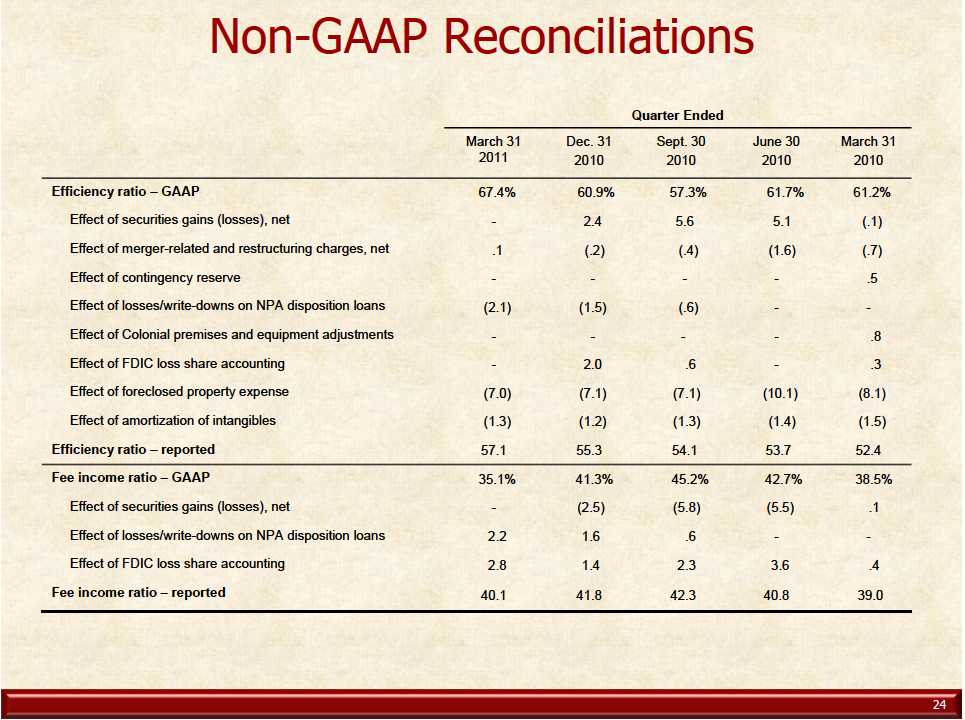
(1) Excludes securities gains (losses), foreclosed property expense, amortization of intangible assets, merger-related and restructuring charges, the impact of FDIC loss share accounting, and other selected items. See Non-GAAP reconciliations on page 22 of the Quarterly Performance Summary.
First Quarter 2011 compared to First Quarter 2010
Consolidated net income available to common shareholders for the first quarter of 2011 of $225 million was up 19.7% compared to $188 million earned during the same period in 2010. On a diluted per common share basis, earnings for the first quarter of 2011 were $.32, up 18.5% compared to $.27 for the same period in 2010. BB&T’s results of operations for the first quarter of 2011 produced an annualized return on average assets of .60% and an annualized return on average common shareholders’ equity of 5.48% compared to prior year ratios of .48% and 4.59%, respectively.
Total revenues were $2.0 billion for the first quarter of 2011, down $156 million compared to the first quarter of 2010. The decrease in total revenues included declines of $130 million in noninterest income and $26 million in fully taxable equivalent net interest income. The decline
3
in noninterest income included $74 million in losses related to commercial loans held for sale in connection with management’s asset disposition strategy. In addition, the first quarter of 2011 included a $63 million reduction from the FDIC loss share asset, which is offset by additional interest income on the loans and securities and lower provisions for credit losses compared to the first quarter of 2010. Excluding these items, noninterest income was relatively flat compared to the first quarter of 2010. The decline in net interest income was primarily the result of a decline in average earning assets of $6.8 billion as a result of the balance sheet deleverage strategy that was executed in the second quarter of 2010, which was partially offset by a higher net interest margin. The net interest margin improved 13 basis points compared to the first quarter of 2010, as a result of higher yields on loans acquired in the Colonial acquisition and lower deposit costs.
The provision for credit losses for the first quarter of 2011 declined $235 million, or 40.9%, compared to the first quarter of 2010, as improving credit resulted in lower provision expense. Net charge-offs for the first quarter of 2011 were $71 million lower than the first quarter of 2010 and the level of nonperforming assets, loan delinquencies and the outlook for future credit losses continued to improve.
A $53 million provision for income taxes was recorded for the first quarter of 2011 compared to $48 million for the first quarter of 2010. This resulted in an effective tax rate for the first quarter of 2011 of 18.5% compared to 19.8% for the prior year’s first quarter.
First Quarter 2011 compared to Fourth Quarter 2010
Consolidated net income available to common shareholders for the first quarter of 2011 of $225 million was up $17 million, or an annualized 33.1% compared to $208 million earned during the fourth quarter of 2010. On a diluted per common share basis, earnings for the first quarter of 2011 were $.32, up $.02, or an annualized 27.0%, compared to the amount earned in the fourth quarter of 2010. BB&T’s results of operations for the first quarter of 2011 produced an annualized return on average assets of .60% and an annualized return on average common shareholders’ equity of 5.48% compared to prior quarter ratios of .54% and 4.88%, respectively.
Total revenues were $2.0 billion for the first quarter of 2011, down $298 million compared to the fourth quarter of 2010. The decline in total revenues was primarily the result of lower noninterest income in the first quarter of 2011 compared to the prior quarter. Noninterest income was down $250 million compared to the fourth quarter of 2010. The decline in noninterest income included a decrease of $99 million in net securities gains, a decrease of $58 million from the FDIC loss share asset, a $43 million decrease in mortgage banking revenues and $12 million of additional losses and writedowns on commercial loans held for sale compared to the fourth quarter of 2010. Fully taxable equivalent net interest income declined $48 million compared to the fourth quarter of 2010, primarily due to a decline of $1.6 billion in average earning assets and a 3 basis point drop in the net interest margin.
The provision for credit losses, excluding covered loans, for the first quarter of 2011 declined $203 million compared to the fourth quarter of 2010 due to improving credit. The provision for covered loans decreased $100 million, which was offset by a corresponding $80
4
million decrease in FDIC loss share income. Net charge-offs for the first quarter of 2011 were $134 million lower than the fourth quarter of 2010.
The provision for income taxes was $53 million for the first quarter of 2011 compared to $15 million for the fourth quarter of 2010. This produced an effective tax rate for the first quarter of 2011 of 18.5% compared to 6.5% for the prior quarter. The increase in the effective tax rate compared to the fourth quarter of 2010 was primarily due to adjustments made in the fourth quarter of 2010 to align the actual effective tax rate for the year.
REVENUE, NET OF PROVISION IMPACT | Change | Change | |||||||||||||
FROM ACQUIRED ASSETS (1) | Q1 | Q4 | Q1 | Q1 11 vs. | Q1 11 vs. | ||||||||||
(dollars in millions) | 2011 | 2010 | 2010 | Q4 10 | Q1 10 | ||||||||||
Interest income – loans | $ | 266 | $ | 276 | $ | 165 | $ | (10 | ) | $ | 101 | ||||
Interest income – securities | 37 | 50 | 34 | (13 | ) | 3 | |||||||||
Total interest income | 303 | 326 | 199 | (23 | ) | 104 | |||||||||
Provision for covered loans | -- | (100 | ) | (19 | ) | 100 | 19 | ||||||||
FDIC loss share income, net | (58 | ) | -- | 5 | (58 | ) | (63 | ) | |||||||
Net revenue after provision for covered loans | $ | 245 | $ | 226 | $ | 185 | $ | 19 | $ | 60 |
(1) Presents amounts related to covered and acquired loans, covered securities and the FDIC loss sharing asset recognized in the Colonial acquisition. Excludes all amounts related to other assets acquired and liabilities assumed in the acquisition.
First Quarter 2011 compared to First Quarter 2010
Interest income for the first quarter of 2011 on loans and securities acquired in the Colonial acquisition increased $104 million compared to the first quarter of 2010, which is partially offset by a decrease in FDIC loss share income. The vast majority of the increase is related to loans and reflects higher expected cash flows based on the quarterly cash flow reassessment process required by acquisition accounting. The net interest margin on covered and other acquired loans for the first quarter of 2011 was 18.09% compared to 8.66% in 2010. At March 31, 2011, the accretable yield balance on these loans was $2.3 billion. Accretable yield represents the excess of future cash flows above the current net carrying amount of loans and will be recognized into income over the remaining life of the covered and acquired loans.
There was no provision for covered loans in the current quarter, a decrease of $19 million compared to the first quarter of 2010. The first quarter of 2011 reassessment showed decreases in expected cash flows in certain loan pools that resulted in additional provisions that were fully offset by recoveries in other previously impaired loan pools.
FDIC loss share income, net decreased $63 million compared to the first quarter of 2010 primarily as a result of the impact of cash flow reassessments that resulted in additional interest income and a reduction in the offset related to the provision for covered loans.
5
First Quarter 2011 compared to Fourth Quarter 2010
Interest income on loans and securities acquired in the Colonial acquisition decreased $23 million in the first quarter of 2011 compared to the fourth quarter. The net interest margin on covered and other acquired loans for the first quarter of 2011 was 18.09%, up slightly compared to 16.71% in the earlier quarter as a result of the first quarter reassessment. The higher yield was more than offset by lower loan balances that resulted in the net decrease. The decrease of $13 million in interest income on covered securities is primarily due to the impact of changes in the expected duration of the underlying investments that were made in the fourth quarter of 2010. The majority of the interest income decrease is offset in the FDIC loss share income.
There was no provision for covered loans in the first quarter of 2011, resulting in a decrease of $100 million compared to the fourth quarter of 2010. This decrease was offset by a corresponding $80 million decrease in FDIC loss share income.
FDIC loss share income, net decreased $58 million primarily as the result of the impact of cash flow reassessment and fourth quarter changes in securities’ durations that resulted in lower first quarter interest income and provision for covered loans.
NONINTEREST INCOME | % Change | % Change | |||||||||||
(dollars in millions) | Q1 | Q4 | Q1 | Q1 11 vs. | Q1 11 vs. | ||||||||
2011 | 2010 | 2010 | Q4 10 | Q1 10 | |||||||||
(annualized) | |||||||||||||
Insurance income | $ | 250 | $ | 249 | $ | 253 | 1.6 | (1.2 | ) | ||||
Service charges on deposits | 135 | 143 | 164 | (22.7 | ) | (17.7 | ) | ||||||
Mortgage banking income | 95 | 138 | 89 | (126.4 | ) | 6.7 | |||||||
Investment banking and brokerage fees and | |||||||||||||
commissions | 87 | 97 | 79 | (41.8 | ) | 10.1 | |||||||
Checkcard fees | 72 | 73 | 61 | (5.6 | ) | 18.0 | |||||||
Other nondeposit fees and commissions | 67 | 68 | 65 | (6.0 | ) | 3.1 | |||||||
Bankcard fees and merchant discounts | 46 | 47 | 40 | (8.6 | ) | 15.0 | |||||||
Trust and investment advisory revenues | 43 | 42 | 38 | 9.7 | 13.2 | ||||||||
Income from bank-owned life insurance | 30 | 31 | 31 | (13.1 | ) | (3.2 | ) | ||||||
FDIC loss share income, net | (58 | ) | -- | 5 | NM | NM | |||||||
Securities gains (losses), net | -- | 99 | (3 | ) | NM | (100.0 | ) | ||||||
Other income, net | (53 | ) | (23 | ) | 22 | NM | NM | ||||||
Total noninterest income | $ | 714 | $ | 964 | $ | 844 | (105.2 | ) | (15.4 | ) |
NM - not meaningful.
First Quarter 2011 compared to First Quarter 2010
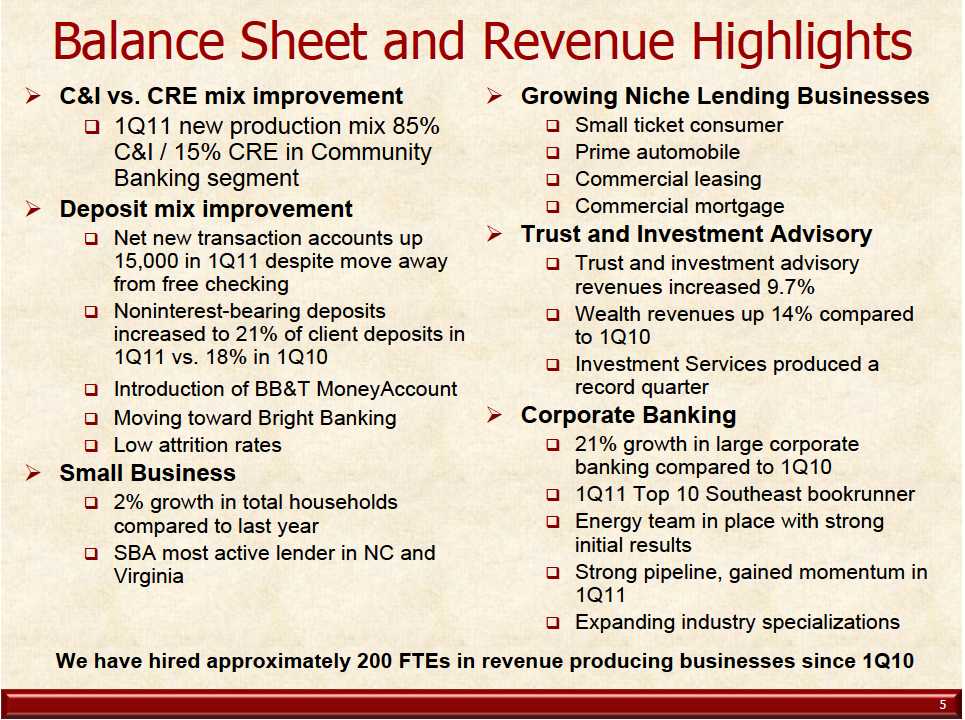
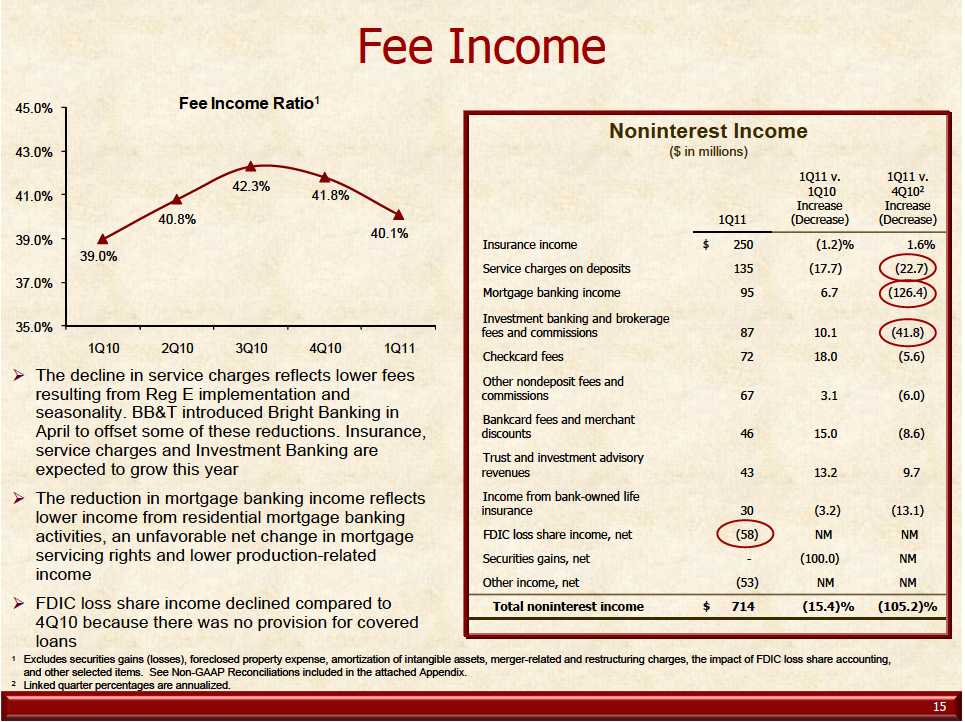
Noninterest income was $714 million for first quarter of 2011 compared to $844 million for the first quarter of 2010. Service charges on deposits declined $29 million, or 17.7%, primarily due to changes to BB&T’s overdraft policies that were implemented during the third quarter of
6
2010 that were partially in response to regulatory changes. Mortgage banking income was up $6 million, or 6.7%, compared to the same period of 2010. The increase in mortgage banking income was driven by a $13 million, or 162.5%, increase from commercial mortgage banking activities due to improving market conditions, partially offset by lower revenues from residential mortgage banking activities. Investment banking and brokerage fees and commissions for the first quarter of 2011 were $87 million, up $8 million, or 10.1%, compared to the same period of 2010. The increase in investment banking and brokerage fees and commissions was largely driven by increased commission income from investment services. Checkcard fees were up $11 million, or 18.0%, and bankcard fees and merchant discounts were up $6 million, or 15.0%, largely due to higher volumes. Trust and investment advisory revenues benefited from improved market conditions and were up $5 million, or 13.2%, compared to the first quarter of 2010. FDIC loss share income was down $63 million primarily due to improvements in forecasted cash flows related to covered loans that resulted in additional interest income but negatively impacted FDIC loss share income as these gains reduce what the FDIC pays BB&T. Other income declined $75 million compared to the first quarter of 2010, primarily as a result of $74 million of losses and writedowns recorded on commercial loans held for sale during the current quarter in connection with management’s nonperforming asset disposition strategy. In addition, other income included a $10 million increase due to market-related increases on trading assets for post-employment benefits that is offset by a similar increase in personnel expense and a $12 million decrease in other trading and hedging activities.
First Quarter 2011 compared to Fourth Quarter 2010
Noninterest income for the first quarter of 2011 was down $250 million compared to the fourth quarter of 2010. Service charges on deposits declined $8 million, or an annualized 22.7%, primarily due to lower revenues from overdrafts as a result of seasonality. Mortgage banking income was down $43 million, compared to the prior quarter, due to a decline in income from residential mortgage banking activities of $40 million, which reflects an unfavorable net change of $13 million in the valuation of mortgage servicing rights and related hedging activities and a decline of $31 million due to lower production-related income from loans originated for sale. Investment banking and brokerage fees and commissions decreased $10 million, or an annualized 41.8%, compared to the prior quarter. The decrease in investment banking and brokerage fees and commissions was the result of lower equity and fixed-income offerings following record performance in the fourth quarter of 2010. FDIC loss share income was down $58 million compared to the fourth quarter of 2010 primarily due to the amount of provision for credit losses recoverable from the FDIC, which was down $80 million compared to the prior quarter. Net securities gains decreased $99 million compared to the prior quarter, $96 million from fewer sales during the current quarter and $3 million in higher other-than-temporary impairments. Other income decreased $30 million compared to the fourth quarter of 2010. The decrease in other income includes decreases of $12 million from higher losses and writedowns on commercial loans held for sale, $10 million due to lower sales volume and higher credit losses related to client derivative activities and $9 million due to other trading and hedging activities.
7
NONINTEREST EXPENSE | % Change | % Change | |||||||||
(dollars in millions) | Q1 | Q4 | Q1 | Q1 11 vs. | Q1 11 vs. | ||||||
2011 | 2010 | 2010 | Q4 10 | Q1 10 | |||||||
(annualized) | |||||||||||
Personnel expense | $ | 694 | $ | 679 | $ | 646 | 9.0 | 7.4 | |||
Foreclosed property expense | 143 | 162 | 178 | (47.6 | ) | (19.7 | ) | ||||
Occupancy and equipment expense | 154 | 155 | 138 | (2.6 | ) | 11.6 | |||||
Professional services | 71 | 92 | 72 | (92.6 | ) | (1.4 | ) | ||||
Regulatory charges | 61 | 59 | 45 | 13.7 | 35.6 | ||||||
Loan processing expenses | 53 | 45 | 35 | 72.1 | 51.4 | ||||||
Amortization of intangibles | 26 | 28 | 32 | (29.0 | ) | (18.8 | ) | ||||
Software expense | 26 | 30 | 29 | (54.1 | ) | (10.3 | ) | ||||
Merger-related and restructuring charges, net | (2 | ) | 4 | 17 | NM | (111.8 | ) | ||||
Other expenses | 146 | 167 | 149 | (51.0 | ) | (2.0 | ) | ||||
Total noninterest expense | $ | 1,372 | $ | 1,421 | $ | 1,341 | (14.0 | ) | 2.3 |
NM - not meaningful.
First Quarter 2011 compared to First Quarter 2010
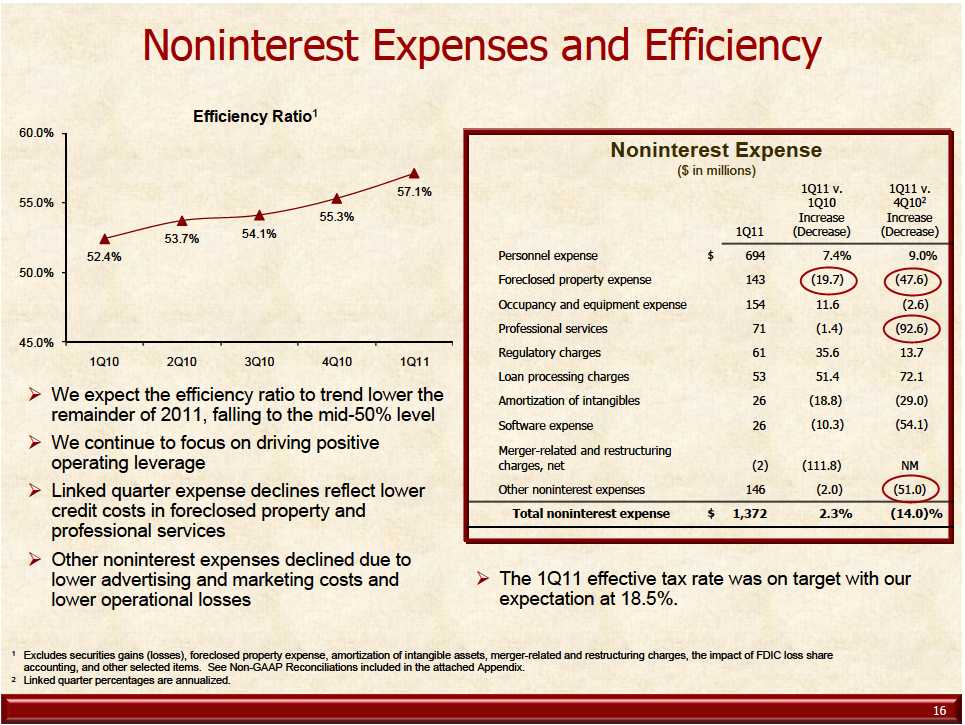
Noninterest expense was $1.4 billion for first quarter of 2011, an increase of $31 million, or 2.3%, compared to the same quarter of 2010. Personnel expense increased $48 million, or 7.4%, compared to the same quarter of last year. This includes an increase of $20 million resulting from incentive expense largely from production-related businesses and an increase of $8 million related to equity-based compensation expense, primarily due to changes in forfeiture assumptions. In addition, personnel expense increased $11 million related to post-employment benefits that is offset through higher noninterest income. Foreclosed property expense decreased $35 million, or 19.7%, compared to the same quarter of 2010, largely as a result of decreased losses and write-downs on foreclosed properties. Occupancy and equipment expense was up $16 million compared to the first quarter of 2010, primarily as a result of an adjustment of $16 million in the first quarter of last year related to changes in the estimated occupancy expenses associated with properties acquired from the FDIC in the Colonial acquisition. Regulatory charges increased $16 million, or 35.6%, due to higher deposit and supervisory-related costs. Loan processing expenses were higher by $18 million, or 51.4%, primarily due to costs associated with problem loan workouts. Amortization of intangibles was down $6 million, or 18.8%, compared to the first quarter of 2010 as intangibles are amortized on an accelerated schedule. Merger-related and restructuring charges for the first quarter of 2011 were also down $19 million compared to the same period of 2010, as prior year’s first quarter included charges related to the acquisition of Colonial.
First Quarter 2011 compared to Fourth Quarter 2010
Noninterest expense for the first quarter of 2011 was down $49 million, or an annualized 14.0%, compared to the fourth quarter of 2010. Personnel expense increased $15 million, or an annualized 9.0%. This includes an increase of $20 million related to social security and other
8
payroll taxes, primarily due to the annual reset of FICA tax. In addition, pension plan expense increased $6 million compared to the fourth quarter of 2010. These increases in personnel expense were partially offset by a decrease of $11 million for production related incentive compensation compared with the fourth quarter of 2010. Foreclosed property expense decreased $19 million, or an annualized 47.6%, compared to the fourth quarter of 2010, largely as a result of lower losses and write-downs on foreclosed properties. Professional services expense for the first quarter of 2011 was down $21 million, or an annualized 92.6%, compared to the fourth quarter of 2010, primarily due to lower costs related to problem loan workouts and lower costs for outsourced services. Other noninterest expense was down $21 million, or an annualized 51.0%, compared to the fourth quarter of 2010. The decline in other noninterest expense includes a reduction of $9 million for advertising and other marketing expenses and lower operational losses of $11 million.
LOANS AND LEASES - average balances | % Change | % Change | ||||||||
(dollars in millions) | Q1 | Q4 | Q1 | Q1 11 vs. | Q1 11 vs. | |||||
2011 | 2010 | 2010 | Q4 10 | Q1 10 | ||||||
(annualized) | ||||||||||
Commercial and industrial | $ | 33,433 | $ | 32,733 | $ | 31,498 | 8.7 | 6.1 | ||
Commercial real estate—other | 11,368 | 11,661 | 12,296 | (10.2 | ) | (7.5 | ) | |||
Commercial real estate—residential ADC | 3,281 | 3,650 | 5,586 | (41.0 | ) | (41.3 | ) | |||
Direct retail lending | 13,672 | 13,770 | 14,165 | (2.9 | ) | (3.5 | ) | |||
Sales finance loans | 7,080 | 7,015 | 6,406 | 3.8 | 10.5 | |||||
Revolving credit loans | 2,082 | 2,086 | 1,991 | (0.8 | ) | 4.6 | ||||
Residential mortgage loans | 17,926 | 16,974 | 15,459 | 22.7 | 16.0 | |||||
Specialized lending | 7,797 | 7,937 | 7,479 | (7.2 | ) | 4.3 | ||||
Other acquired loans | 57 | 63 | 108 | (38.6 | ) | (47.2 | ) | |||
Total loans and leases held for | ||||||||||
investment | ||||||||||
(excluding covered loans) | 96,696 | 95,889 | 94,988 | 3.4 | 1.8 | |||||
Covered loans | 5,927 | 6,488 | 7,642 | (35.1 | ) | (22.4 | ) | |||
Total loans and leases held for | ||||||||||
investment | $ | 102,623 | $ | 102,377 | $ | 102,630 | 1.0 | -- |
First Quarter 2011 compared to First Quarter 2010
Average loans held for investment for the first quarter of 2011 was $102.6 billion, essentially flat compared to the corresponding period of 2010. Average commercial and industrial loans increased $1.9 billion, or 6.1%, compared to the first quarter of 2010. The growth in average commercial and industrial loans reflects management’s focused efforts at growing this component of the loan portfolio. Average commercial real estate – residential ADC and commercial real estate – other declined 41.3% and 7.5%, respectively, compared to first quarter of 2010 as management has intentionally lowered exposures to higher-risk real estate lending during the economic downturn. Average direct retail lending loans for the first quarter of 2011 declined $493 million, or 3.5%, due to continued runoff of residential lot/land loans and
9
lower demand for housing-related credits during most of 2010. Average mortgage loans increased $2.5 billion, or 16.0%, compared to the first quarter of 2010, due to the decision to retain a portion of the 10 to 15 year fixed-rate and adjustable rate mortgage production beginning in the third quarter of 2010. Average sales finance and revolving credit loans continued to show steady growth; up $674 million, or 10.5%, and $91 million, or 4.6%, respectively compared to the first quarter of 2010. The increase in average sales finance loans reflects improvement in prime automobile lending. In addition, average specialized lending loans increased $318 million, or 4.3%, as the majority of these niche businesses experienced growth. Total average loans held for investment includes a decline of $1.8 billion, or 22.8%, in average covered and other acquired loans compared to the first quarter of 2010.
First Quarter 2011 compared to Fourth Quarter 2010
Average loans held for investment for the first quarter of 2011 was up $246 million, or an annualized 1.0%, compared to the fourth quarter of 2010. Average commercial and industrial loans and leases increased $700 million, or an annualized 8.7%, compared to the fourth quarter of 2010, due to focused efforts to grow this component of the loan portfolio. Average commercial real estate – residential ADC and commercial real estate – other declined an annualized 41.0% and 10.2%, respectively, compared to fourth quarter of 2010 due to management’s objective of diversifying the mix of the commercial lending portfolio and lowering exposure to higher-risk real estate lending. Average direct retail lending loans were down an annualized 2.9%, or $98 million, compared to the fourth quarter of 2010. Average mortgage loans were up $952 million, or an annualized 22.7%, compared to the fourth quarter of 2010, as management continues to retain certain mortgage loans in the held for investment portfolio. Average specialized lending loans were down $140 million, or an annualized 7.2%, compared to the fourth quarter of 2010, largely as a result of a decline in insurance premium financing. Total average loans held for investment includes a decline of $567 million, or an annualized 35.1%, in average covered and other acquired loans compared to the fourth quarter of 2010.
LOANS HELD FOR SALE - end of period | % Change | % Change | |||||||||||
(Dollars in millions) | Q1 | Q4 | Q1 | Q1 11 vs. | Q1 11 vs. | ||||||||
2011 | 2010 | 2010 | Q4 10 | Q1 10 | |||||||||
(annualized) | |||||||||||||
Residential mortgage | $ | 1,943 | $ | 3,068 | $ | 2,013 | $ | (148.7 | ) | $ | (3.5 | ) | |
Commercial mortgage | 166 | 108 | 44 | NM | NM | ||||||||
Commercial | 203 | 521 | -- | NM | NM | ||||||||
Total loans held for sale | $ | 2,312 | $ | 3,697 | $ | 2,057 | (151.9 | ) | 12.4 | ||||
NM - not meaningful. |
First Quarter 2011 compared to First Quarter 2010
As of March 31, 2011, loans held for sale totaled $2.3 billion, an increase of $255 million compared to $2.1 billion at March 31, 2010. The increase in loans held for sale compared to the
10
prior year includes $203 million of commercial loans that were held for sale due primarily to management’s nonperforming asset disposition strategy and an increase of $122 million related to commercial mortgage banking activities.
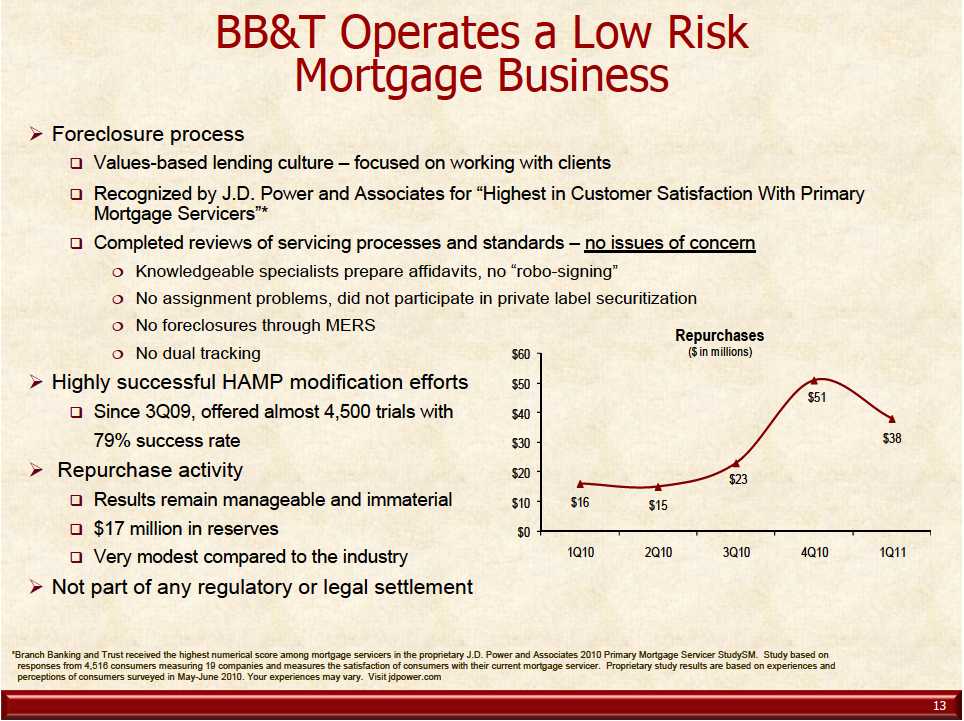
A total of $1.9 billion in unpaid principal balances in commercial loans were transferred into held for sale under the nonperforming asset disposition strategy during 2010. Of this amount, only $377 million remains to be sold at March 31, 2011 with a carrying value of $189 million. The life-to-date loss percentage on commercial loans that were part of this strategy was 51%. In addition, commercial loans held for sale includes a single performing loan of $14 million that was sold in early April.
First Quarter 2011 compared to Fourth Quarter 2010
As of March 31, 2011, loans held for sale totaled $2.3 billion, a decrease of $1.4 billion compared to $3.7 billion at December 31, 2010. The decrease in loans held for sale compared to the prior quarter includes a reduction of $332 million of commercial loans that were held for sale in connection with management’s nonperforming asset disposition strategy, representing approximately two-thirds of the balance of commercial loans held for sale at December 31, 2010. This decrease was partially offset by the $14 million increase related to a single performing loan that was transferred to held for sale in the first quarter of 2011 and sold in early April. Residential mortgages held for sale decreased $1.1 billion compared to the balance at December 31, 2010 due to lower inventory of mortgage loans as rates have increased.
DEPOSITS - average balances | % Change | % Change | ||||||||||
(dollars in millions) | Q1 | Q4 | Q1 | Q1 11 vs. | Q1 11 vs. | |||||||
2011 | 2010 | 2010 | Q4 10 | Q1 10 | ||||||||
(annualized) | ||||||||||||
Noninterest-bearing deposits | $ | 20,990 | $ | 21,027 | $ | 18,464 | $ | (0.7 | ) | $ | 13.7 | |
Interest checking | 3,594 | 3,682 | 3,745 | (9.7 | ) | (4.0 | ) | |||||
Other client deposits | 55,909 | 52,578 | 51,712 | 25.7 | 8.1 | |||||||
Client certificates of deposit | 21,081 | 22,144 | 30,833 | (19.5 | ) | (31.6 | ) | |||||
Total client deposits | 101,574 | 99,431 | 104,754 | 8.7 | (3.0 | ) | ||||||
Other interest-bearing deposits | 4,040 | 6,161 | 6,277 | (139.6 | ) | (35.6 | ) | |||||
Total deposits | $ | 105,614 | $ | 105,592 | $ | 111,031 | 0.1 | (4.9 | ) |
First Quarter 2011 compared to First Quarter 2010
Average deposits for the first quarter of 2011 decreased $5.4 billion, or 4.9%, compared to the same period in 2010. The decline in average deposits reflects the balance sheet deleverage executed in the second quarter of 2010, which was partially offset by strong organic deposit growth. The mix of the portfolio has continued to improve with growth in noninterest-bearing and lower-cost client deposits and declines in client certificates of deposits. The categories of deposits with the highest growth for the first quarter of 2011 compared to the same quarter of 2010 were noninterest-bearing deposits, which increased $2.5 billion, or 13.7%, and other client deposits, which include money market deposit accounts, savings accounts, individual retirement
11
accounts and other time deposits, which increased $4.2 billion, or 8.1%. Other interest-bearing deposits, which are primarily Eurodollar deposits and negotiable certificates of deposits decreased $2.2 billion and client certificates of deposit decreased $9.8 billion compared to the first quarter of 2010.
First Quarter 2011 compared to Fourth Quarter 2010
Average deposits for the first quarter of 2011 increased slightly compared to the fourth quarter of 2010. Average client deposits increased $2.1 billion, or an annualized 8.7%, compared to the fourth quarter of 2010. This included growth of $3.3 billion, or an annualized 25.7%, in other client deposits, which were partially offset by a decrease of $1.1 billion, or an annualized 19.5%, in client certificates of deposit. The change in the mix of the portfolio reflects the growth in lower cost client deposits. Other interest-bearing deposits decreased $2.1 billion compared to the fourth quarter of 2010. These sources of funding are subject to greater volatility as they are used interchangeably with short-term borrowed funds.
CAPITAL RATIOS (1) | 2011 | 2010 | |||
Q1 | Q4 | Q3 | Q2 | Q1 | |
Risk-based | |||||
Tier 1 (%) | 12.1 | 11.8 | 11.7 | 11.7 | 11.6 |
Total (%) | 15.8 | 15.5 | 15.7 | 15.8 | 15.9 |
Leverage (%) | 9.3 | 9.1 | 9.3 | 8.9 | 8.7 |
Tangible common equity (%) (2) | 7.2 | 7.1 | 7.0 | 7.0 | 6.4 |
Tier 1 common equity to risk-weighted assets (%) (2) | 9.3 | 9.1 | 9.0 | 8.9 | 8.6 |
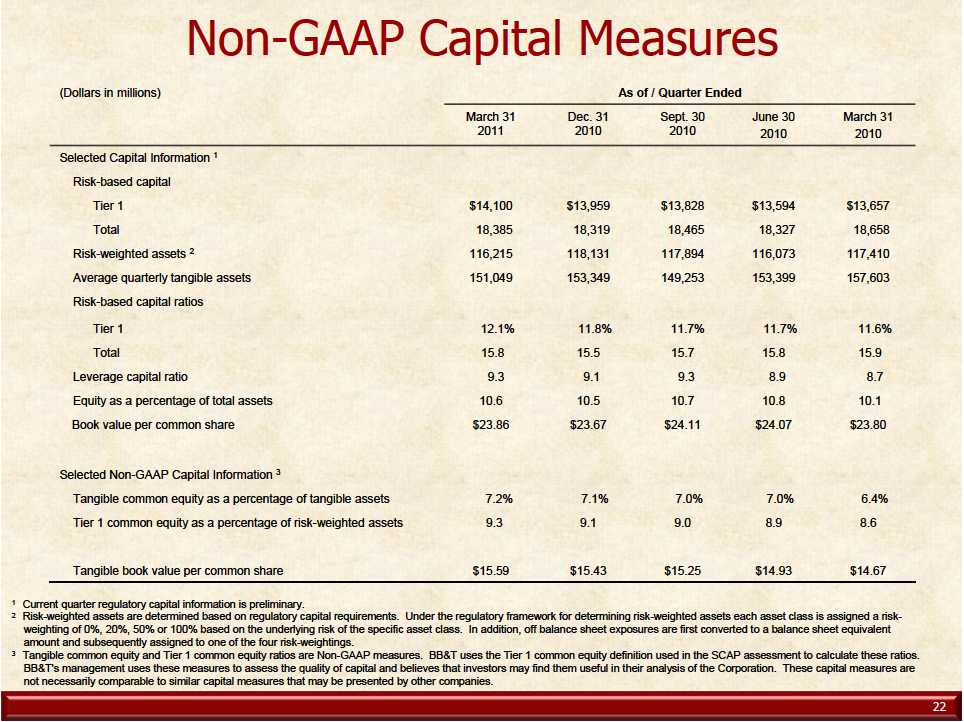
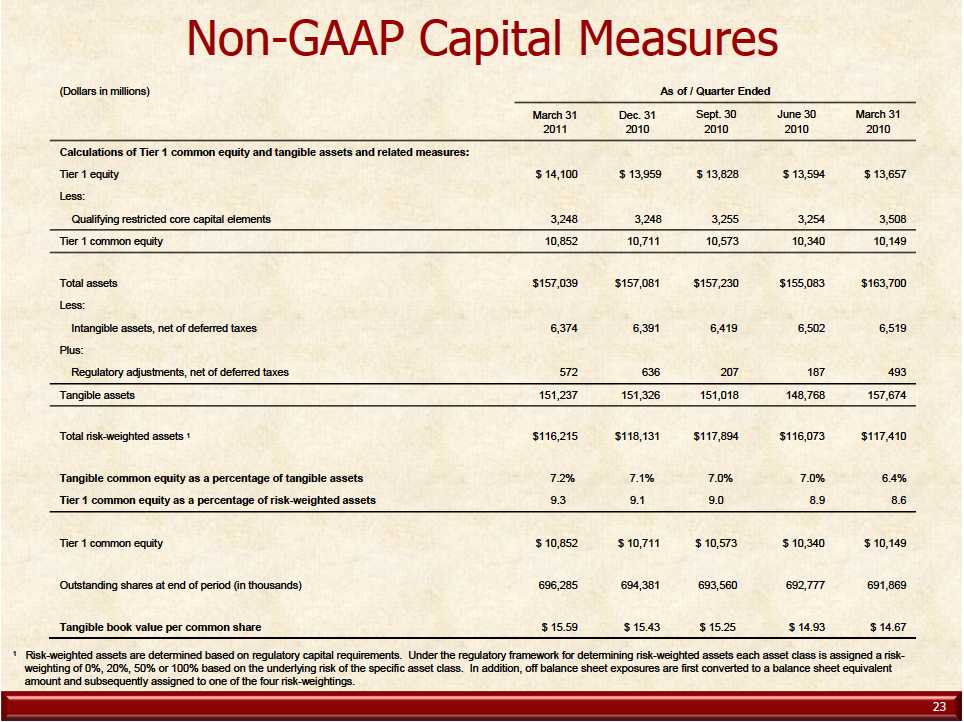
(1) Current quarter regulatory capital ratios are preliminary.
(2) Tangible common equity and Tier 1 common equity ratios are Non-GAAP measures. BB&T uses the Tier 1 common equity definition used in the SCAP assessment to calculate these ratios. See the calculations and management's reasons for using these measures on page 19 of the Quarterly Performance Summary.
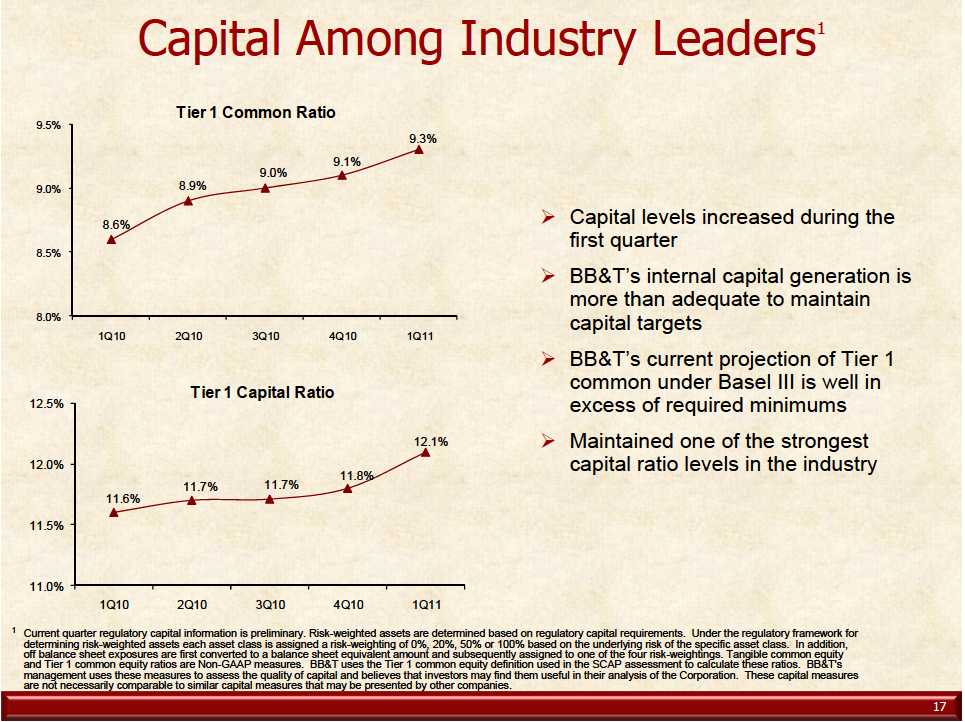
BB&T’s capital levels at March 31, 2011 remained strong. All of BB&T’s capital measurements improved compared to December 31, 2010. The Tier 1 risk-based capital ratio and Tier 1 common equity to risk-weighted assets ratio were 12.1% and 9.3%, respectively, compared to 11.8% and 9.1%, respectively, at December 31, 2010. BB&T declared total dividends of $0.17 during the first quarter of 2011, which reflects a $0.16 quarterly dividend and $0.01 special dividend. The $0.16 quarterly dividend amount is a 7% increase over the prior quarter’s amount. BB&T also announced intentions to retire all of its $3.2 billion in trust preferred securities in 2013. In advance of retiring these instruments, management plans to issue approximately $1.75 billion of Tier 1 qualifying instruments in order to maximize the amount of these types of instruments allowable under the Basel III capital standards.
12
ASSET QUALITY (1) | Change | Change | ||||||||||
(dollars in millions) | Q1 | Q4 | Q1 | Q1 11 vs. | Q1 11 vs. | |||||||
2011 | 2010 | 2010 | Q4 10 | Q1 10 | ||||||||
Total nonperforming assets | $ | 3,863 | $ | 3,971 | $ | 4,394 | $ | (108 | ) | $ | (531 | ) |
Total loans 90 days past due and still accruing | 263 | 295 | 295 | (32 | ) | (32 | ) | |||||
Total loans 30-89 days past due | 1,099 | 1,408 | 1,577 | (309 | ) | (478 | ) | |||||
Allowance for loan and lease losses | 2,497 | 2,564 | 2,695 | (67 | ) | (198 | ) | |||||
Total performing TDRs | 1,309 | 1,476 | 1,715 | (167 | ) | (406 | ) | |||||
Nonperforming loans and leases as a percentage of total | ||||||||||||
loans and leases (%) | 2.64 | 2.64 | 2.91 | (.00 | ) | (.27 | ) | |||||
Nonperforming assets as a percentage of total assets (%) | 2.56 | 2.64 | 2.82 | (.08 | ) | (.26 | ) | |||||
Allowance for loan and lease losses as a percentage of | ||||||||||||
loans and leases held for investment (%) | 2.58 | 2.63 | 2.84 | (.05 | ) | (.26 | ) | |||||
Net charge-offs as a percentage of average loans and | ||||||||||||
leases (%) annualized | 1.65 | 2.15 | 1.99 | (.50 | ) | (.34 | ) | |||||
Ratio of allowance for loan and lease losses to net | ||||||||||||
charge-offs (times) annualized | 1.52 | 1.20 | 1.40 | .32 | .12 | |||||||
Ratio of allowance for loan and lease losses to | ||||||||||||
nonperforming loans and leases held for | ||||||||||||
investment (times) | 1.03 | 1.19 | .96 | (.16 | ) | .07 |
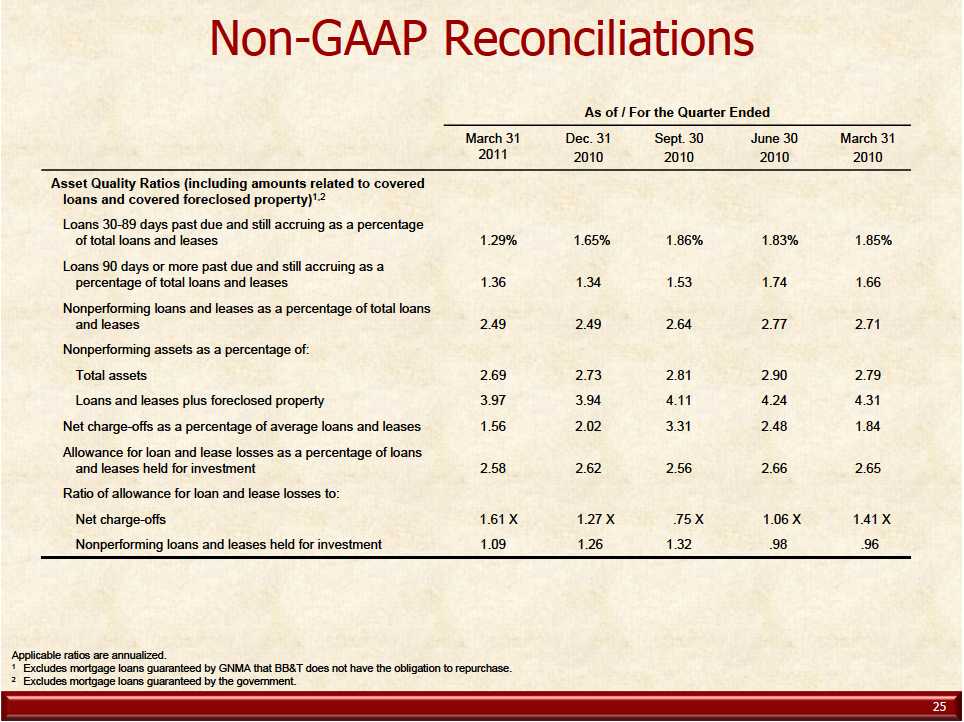
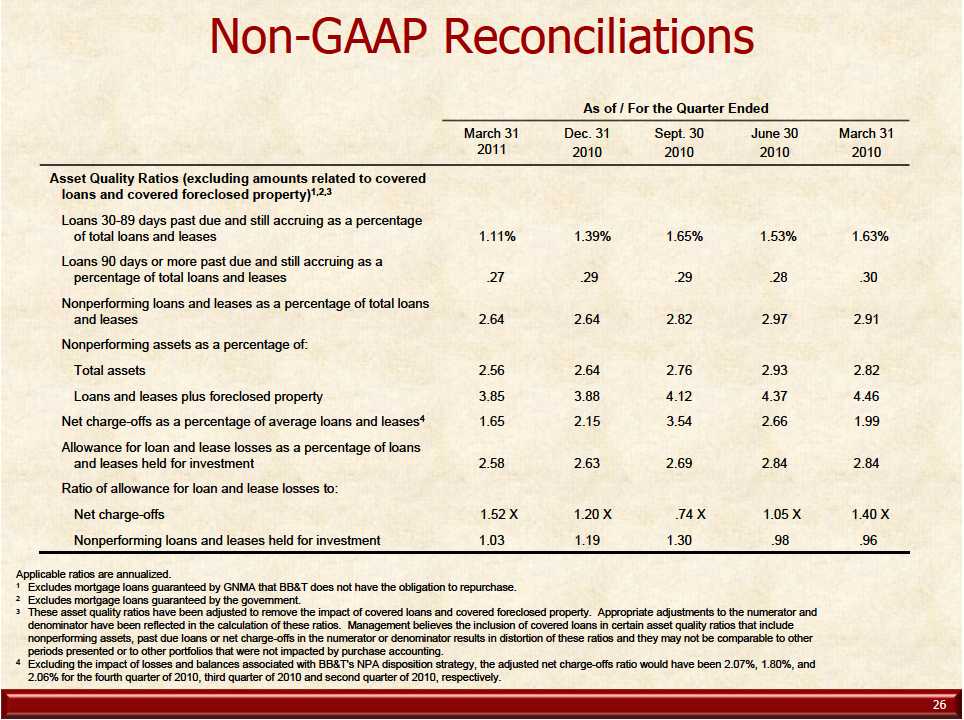
(1) Excludes amounts related to covered assets and government guaranteed loans. See footnotes on page 13 and page 15 of the Quarterly Performance Summary for additional information.
Total nonperforming assets were $3.9 billion at March 31, 2011, a decrease of $108 million, or 2.7%, compared to December 31, 2010. This is the fourth consecutive quarterly decline in nonperforming assets. The decline in nonperforming assets reflects the continuation of the nonperforming asset disposition strategy that was initiated during the second quarter of 2010.
Total performing troubled debt restructurings (“TDRs”) were $1.3 billion at March 31, 2011, a decrease of $167 million, or 11.3%, compared to December 31, 2010. Commercial performing TDRs declined $179 million which was offset by slight increases across several of the other lending portfolios.
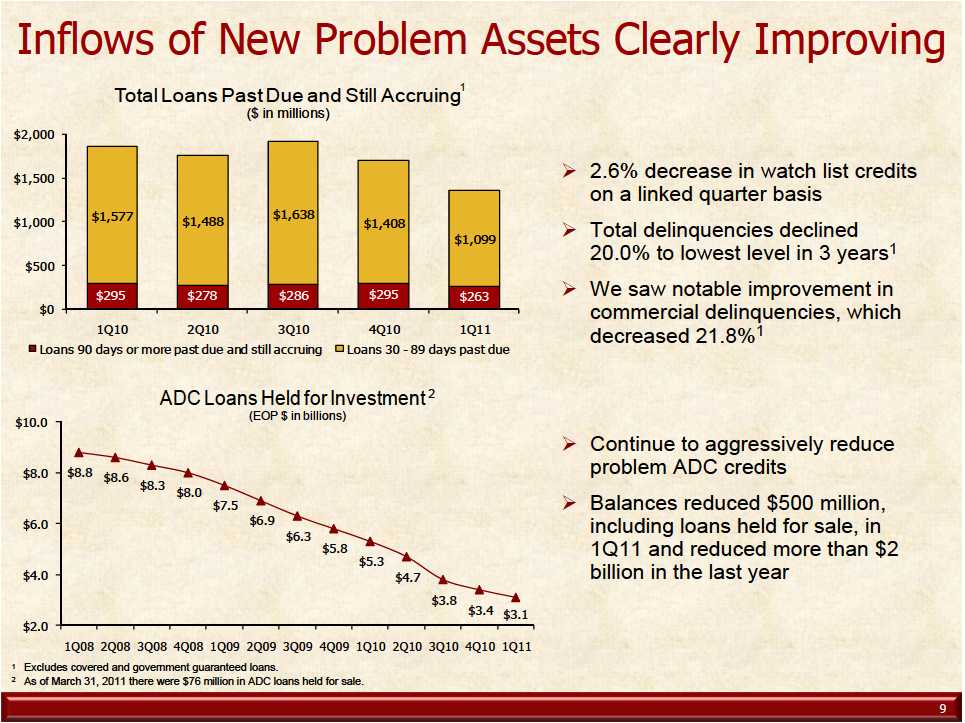
In addition, loan delinquencies improved further during the first quarter of 2011. Loans 30-89 days past due and still accruing, excluding loans guaranteed by the government, totaled $1.1 billion at March 31, 2011, a decrease of $309 million, or 21.9%, compared to December 31, 2010 reflecting the lowest balance since the second quarter of 2007. Loans 90 days past due and still accruing, excluding loans guaranteed by the government, were $263 million at March 31, 2011, a decrease of $32 million, or 10.8%, compared to December 31, 2010 reflecting the lowest balance since the first quarter of 2008.
13
Net charge-offs during the first quarter of 2011 were 1.65% of average loans and leases, excluding covered loans, compared to 2.15% during the fourth quarter of 2010 and 1.99% during the first quarter of 2010. Net charge-offs were $404 million for the first quarter of 2011, down $134 million compared to $538 million for the fourth quarter of 2010. Net charge-offs were lower in essentially all loan portfolios with the majority of the decline occurring in the commercial portfolio, which was down $115 million compared to the fourth quarter of 2010. The reduction in net charge-offs for commercial loans reflects the overall improvement in the quality of the loan portfolio.
As of March 31, 2011, the allowance for loan and lease losses was 2.58% of total loans and leases, excluding covered loans, compared to 2.63% at December 31, 2010 and 2.84% at March 31, 2010. The decline in the allowance as a percentage of total loans reflects the improvement in the overall quality of the loan portfolio.
Earnings webcast, presentation and Quarterly Performance Summary
To hear a live webcast of BB&T’s first quarter 2011 earnings conference call at 8 a.m. (ET) today, please visit our Web site at www.BBT.com. A presentation will be used during the earnings conference call and will be available on our Web site. Replays of the conference call will be available on the BB&T Web site until Thursday, May 5, or by dialing 1-888-203-1112 (access code 4313363) until April 26.
To access the webcast and presentation, including an appendix reconciling non-GAAP disclosures, go to www.BBT.com and click on “About BB&T” and proceed to “Investor Relations.” The webcast link can be found under “Webcasts” and the presentation can be found under “View Recent Presentations.”
BB&T’s First Quarter 2011 Quarterly Performance Summary, which contains detailed financial schedules, is available on BB&T’s Web site at www.BBT.com/financials.html.
About BB&T
As of March 31, 2011, BB&T is one of the largest financial services holding companies in the U.S. with $157 billion in assets and market capitalization of $19.1 billion. Based in Winston-Salem, N.C., the company operates approximately 1,800 financial centers in 12 states and Washington, D.C., and offers a full range of consumer and commercial banking, securities brokerage, asset management, mortgage and insurance products and services. A Fortune 500 company, BB&T is consistently recognized for outstanding client satisfaction by J.D. Power and Associates, the U.S. Small Business Administration, Greenwich Associates and others. More information about BB&T and its full line of products and services is available at www.BBT.com.
14
###
This news release contains financial information and performance measures determined by methods other than in accordance with accounting principles generally accepted in the United States of America (“GAAP”). BB&T’s management uses these “non-GAAP” measures in their analysis of the corporation’s performance. BB&T’s management uses these measures to evaluate the underlying performance and efficiency of its operations. It believes that these non-GAAP measures provide a greater understanding of ongoing operations and enhance comparability of results with prior periods as well as demonstrating the effects of significant gains and charges in the current period. The company believes that a meaningful analysis of its financial performance requires an understanding of the factors underlying that performance. BB&T’s management believes that investors may use these non-GAAP financial measures to analyze financial performance without the impact of unusual items that may obscure trends in the company’s underlying performance. These disclosures should not be viewed as a substitute for financial measures determined in accordance with GAAP, nor are they necessarily comparable to non-GAAP performance measures that may be presented by other companies. Tangible common equity and Tier 1 common equity ratios are non-GAAP measures. BB&T uses the Tier 1 common equity definition used in the SCAP assessment to calculate these ratios. BB&T's management uses these measures to assess the quality of capital and believes that investors may find them useful in their analysis of the corporation. These capital measures are not necessarily comparable to similar capital measures that may be presented by other companies. Asset quality ratios have been adjusted to remove the impact of acquired loans and foreclosed property covered by the FDIC loss sharing agreements as management believes their inclusion results in distortion of those ratios and may not be comparable to other periods presented or to other portfolios that were not impacted by purchase accounting.
This news release contains certain forward-looking statements as defined in the Private Securities Litigation Reform Act of 1995. These statements may address issues that involve significant risks, uncertainties, estimates and assumptions made by management. Actual results may differ materially from current projections. Please refer to BB&T’s filings with the Securities and Exchange Commission for a summary of important factors that may affect BB&T’s forward-looking statements. BB&T undertakes no obligation to revise these statements following the date of this news release.
15
BB&T Corporation
Quarterly Performance Summary
First Quarter 2011
2
BB&T Corporation Financial Highlights (Dollars in millions, except per share data, shares in thousands) |
|
Year-to-Date | |||||||
March 31 | % | ||||||
2011 | 2010 | Change | |||||
Summary Income Statement | |||||||
Interest income | $ | 1,713 | $ | 1,813 | (5.5 | ) % | |
Interest expense | 392 | 466 | (15.9 | ) | |||
Net interest income - taxable equivalent | 1,321 | 1,347 | (1.9 | ) | |||
Less: Taxable-equivalent adjustment | 36 | 33 | 9.1 | ||||
Net interest income | 1,285 | 1,314 | (2.2 | ) | |||
Provision for credit losses | 340 | 575 | (40.9 | ) | |||
Net interest income after provision for credit losses | 945 | 739 | 27.9 | ||||
Noninterest income | 714 | 844 | (15.4 | ) | |||
Noninterest expense | 1,372 | 1,341 | 2.3 | ||||
Income before income taxes | 287 | 242 | 18.6 | ||||
Provision for income taxes | 53 | 48 | 10.4 | ||||
Net income | 234 | 194 | 20.6 | ||||
Noncontrolling interest | 9 | 6 | 50.0 | ||||
Net income available to common shareholders | 225 | 188 | 19.7 | ||||
Per Common Share Data | |||||||
Earnings | |||||||
Basic | $ | .32 | $ | .27 | 18.5 | % | |
Diluted | .32 | .27 | 18.5 | ||||
Cash dividends declared (1) | .17 | .15 | 13.3 | ||||
Book value | 23.86 | 23.80 | 0.3 | ||||
Tangible book value (2) | 15.59 | 14.67 | 6.3 | ||||
End of period shares outstanding (in thousands) | 696,285 | 691,869 | 0.6 | ||||
Weighted average shares (in thousands) | |||||||
Basic | 695,309 | 690,792 | 0.7 | ||||
Diluted | 704,101 | 698,675 | 0.8 | ||||
Performance Ratios | |||||||
Return on average assets | .60 | % | .48 | % | |||
Return on average common shareholders' equity | 5.48 | 4.59 | |||||
Net interest margin - taxable equivalent | 4.01 | 3.88 | |||||
Fee income ratio (3) | 40.1 | 39.0 | |||||
Efficiency ratio (3) | 57.1 | 52.4 | |||||
Credit Quality (including amounts related to covered loans and | |||||||
covered foreclosed property) | |||||||
Nonperforming assets as a percentage of | |||||||
Total assets | 2.69 | % | 2.79 | % | |||
Loans and leases plus foreclosed property | 3.97 | 4.31 | |||||
Net charge-offs as a percentage of average | |||||||
loans and leases | 1.56 | 1.84 | |||||
Allowance for loan and lease losses as a percentage | |||||||
of loans and leases held for investment | 2.58 | 2.65 | |||||
Ratio of allowance for loan and lease losses to | |||||||
nonperforming loans and leases held for investment | 1.09 | X | .96 | X | |||
Average Balances | |||||||
Total assets | $ | 156,931 | $ | 163,807 | (4.2 | ) % | |
Total securities (4) | 25,059 | 32,989 | (24.0 | ) | |||
Loans and leases | 105,294 | 104,468 | 0.8 | ||||
Deposits | 105,614 | 111,031 | (4.9 | ) | |||
Client deposits | 101,574 | 104,754 | (3.0 | ) | |||
Shareholders' equity | 16,673 | 16,627 | 0.3 | ||||
Period-End Balances | |||||||
Total assets | $ | 157,039 | $ | 163,700 | (4.1 | ) % | |
Total securities (4) | 26,220 | 32,654 | (19.7 | ) | |||
Loans and leases | 104,887 | 104,401 | 0.5 | ||||
Deposits | 106,913 | 113,723 | (6.0 | ) | |||
Client deposits | 103,587 | 104,109 | (0.5 | ) | |||
Shareholders' equity | 16,670 | 16,528 | 0.9 | ||||
Capital Ratios (5) | |||||||
Risk-based | |||||||
Tier 1 | 12.1 | % | 11.6 | % | |||
Total | 15.8 | 15.9 | |||||
Leverage | 9.3 | 8.7 | |||||
Tangible common equity (2) | 7.2 | 6.4 | |||||
Tier 1 common equity to risk-weighted assets (2) | 9.3 | 8.6 |
Applicable ratios are annualized. | |
(1) |
BB&T Corporation declared a regular dividend of $0.16 per common share in the first quarter of 2011, as well as a special one-time dividend of $0.01 per common share. |
(2) |
Tangible common equity and Tier 1 common equity ratios are Non-GAAP measures. BB&T uses the Tier 1 common equity definition used in the SCAP assessment to calculate these ratios. See the calculations and management's reasons for using these measures on page 19 of this supplement. |
(3) |
Excludes securities gains (losses), foreclosed property expense, amortization of intangible assets, merger-related and restructuring charges, the impacts of FDIC loss share accounting, and other selected items as detailed on page 21 of this supplement. See Non-GAAP reconciliations. |
(4) |
Total securities includes securities available for sale (AFS) and securities held to maturity (HTM). Average balances reflect both AFS and HTM securities at amortized cost. Period-end balances reflect AFS securities at fair value and HTM securities at amortized cost. |
(5) |
Current quarter regulatory capital information is preliminary. |
3
BB&T Corporation Financial Highlights - Five Quarter Trend (Dollars in millions, except per share data, shares in thousands) |
|
Quarter Ended | |||||||||||||||
March 31 | Dec. 31 | Sept. 30 | June 30 | March 31 | |||||||||||
2011 | 2010 | 2010 | 2010 | 2010 | |||||||||||
Summary Income Statement | |||||||||||||||
Interest income | $ | 1,713 | $ | 1,793 | $ | 1,796 | $ | 1,852 | $ | 1,813 | |||||
Interest expense | 392 | 424 | 449 | 460 | 466 | ||||||||||
Net interest income - taxable equivalent | 1,321 | 1,369 | 1,347 | 1,392 | 1,347 | ||||||||||
Less: Taxable-equivalent adjustment | 36 | 37 | 33 | 32 | 33 | ||||||||||
Net interest income | 1,285 | 1,332 | 1,314 | 1,360 | 1,314 | ||||||||||
Provision for credit losses | 340 | 643 | 770 | 650 | 575 | ||||||||||
Net interest income after provision for credit losses | 945 | 689 | 544 | 710 | 739 | ||||||||||
Noninterest income | 714 | 964 | 1,110 | 1,039 | 844 | ||||||||||
Noninterest expense | 1,372 | 1,421 | 1,408 | 1,500 | 1,341 | ||||||||||
Income before income taxes | 287 | 232 | 246 | 249 | 242 | ||||||||||
Provision for income taxes | 53 | 15 | 27 | 25 | 48 | ||||||||||
Net income | 234 | 217 | 219 | 224 | 194 | ||||||||||
Noncontrolling interest | 9 | 9 | 9 | 14 | 6 | ||||||||||
Net income available to common shareholders | 225 | 208 | 210 | 210 | 188 | ||||||||||
Per Common Share Data | |||||||||||||||
Earnings | |||||||||||||||
Basic | $ | .32 | $ | .30 | $ | .30 | $ | .30 | $ | .27 | |||||
Diluted | .32 | .30 | .30 | .30 | .27 | ||||||||||
Cash dividends declared (1) | .17 | .15 | .15 | .15 | .15 | ||||||||||
Book value | 23.86 | 23.67 | 24.11 | 24.07 | 23.80 | ||||||||||
Tangible book value (2) | 15.59 | 15.43 | 15.25 | 14.93 | 14.67 | ||||||||||
End of period shares outstanding (in thousands) | 696,285 | 694,381 | 693,560 | 692,777 | 691,869 | ||||||||||
Weighted average shares (in thousands) | |||||||||||||||
Basic | 695,309 | 693,993 | 693,017 | 692,113 | 690,792 | ||||||||||
Diluted | 704,101 | 702,781 | 701,535 | 701,322 | 698,675 | ||||||||||
Performance Ratios | |||||||||||||||
Return on average assets | .60 | % | .54 | % | .56 | % | .56 | % | .48 | % | |||||
Return on average common shareholders' equity | 5.48 | 4.88 | 4.91 | 5.01 | 4.59 | ||||||||||
Net interest margin - taxable equivalent | 4.01 | 4.04 | 4.09 | 4.12 | 3.88 | ||||||||||
Fee income ratio (3) | 40.1 | 41.8 | 42.3 | 40.8 | 39.0 | ||||||||||
Efficiency ratio (3) | 57.1 | 55.3 | 54.1 | 53.7 | 52.4 | ||||||||||
Credit Quality (including amounts related to covered | |||||||||||||||
loans and covered foreclosed property) | |||||||||||||||
Nonperforming assets as a percentage of | |||||||||||||||
Total assets | 2.69 | % | 2.73 | % | 2.81 | % | 2.90 | % | 2.79 | % | |||||
Loans and leases plus foreclosed property | 3.97 | 3.94 | 4.11 | 4.24 | 4.31 | ||||||||||
Net charge-offs as a percentage of average | |||||||||||||||
loans and leases | 1.56 | 2.02 | 3.31 | 2.48 | 1.84 | ||||||||||
Allowance for loan and lease losses as a percentage | |||||||||||||||
of loans and leases held for investment | 2.58 | 2.62 | 2.56 | 2.66 | 2.65 | ||||||||||
Ratio of allowance for loan and lease losses to | |||||||||||||||
nonperforming loans and leases held for investment | 1.09 | X | 1.26 | X | 1.32 | X | .98 | X | .96 | X | |||||
Average Balances | |||||||||||||||
Total assets | $ | 156,931 | $ | 159,464 | $ | 155,666 | $ | 159,786 | $ | 163,807 | |||||
Total securities (4) | 25,059 | 25,988 | 23,277 | 28,309 | 32,989 | ||||||||||
Loans and leases | 105,294 | 105,946 | 104,755 | 103,964 | 104,468 | ||||||||||
Deposits | 105,614 | 105,592 | 103,505 | 107,060 | 111,031 | ||||||||||
Client deposits | 101,574 | 99,431 | 99,914 | 102,203 | 104,754 | ||||||||||
Shareholders' equity | 16,673 | 16,951 | 17,035 | 16,925 | 16,627 | ||||||||||
Period-End Balances | |||||||||||||||
Total assets | $ | 157,039 | $ | 157,081 | $ | 157,230 | $ | 155,083 | $ | 163,700 | |||||
Total securities (4) | 26,220 | 23,169 | 24,497 | 23,662 | 32,654 | ||||||||||
Loans and leases | 104,887 | 107,264 | 106,014 | 104,719 | 104,401 | ||||||||||
Deposits | 106,913 | 107,213 | 106,419 | 104,451 | 113,723 | ||||||||||
Client deposits | 103,587 | 100,044 | 99,399 | 101,115 | 104,109 | ||||||||||
Shareholders' equity | 16,670 | 16,498 | 16,787 | 16,740 | 16,528 | ||||||||||
Capital Ratios (5) | |||||||||||||||
Risk-based | |||||||||||||||
Tier 1 | 12.1 | % | 11.8 | % | 11.7 | % | 11.7 | % | 11.6 | % | |||||
Total | 15.8 | 15.5 | 15.7 | 15.8 | 15.9 | ||||||||||
Leverage | 9.3 | 9.1 | 9.3 | 8.9 | 8.7 | ||||||||||
Tangible common equity (2) | 7.2 | 7.1 | 7.0 | 7.0 | 6.4 | ||||||||||
Tier 1 common equity to risk-weighted assets (2) | 9.3 | 9.1 | 9.0 | 8.9 | 8.6 |
Applicable ratios are annualized. | |
(1) |
BB&T Corporation declared a regular dividend of $0.16 per common share in the first quarter of 2011, as well as a special one-time dividend of $0.01 per common share. |
(2) |
Tangible common equity and Tier 1 common equity ratios are Non-GAAP measures. BB&T uses the Tier 1 common equity definition used in the SCAP assessment to calculate these ratios. See the calculations and management's reasons for using these measures on page 19 of this supplement. |
(3) |
Excludes securities gains (losses), foreclosed property expense, amortization of intangible assets, merger-related and restructuring charges, the impacts of FDIC loss share accounting, and other selected items as detailed on page 21 of this supplement. See Non-GAAP reconciliations. |
(4) |
Total securities includes securities available for sale (AFS) and securities held to maturity (HTM). Average balances reflect both AFS and HTM securities at amortized cost. Period-end balances reflect AFS securities at fair value and HTM securities at amortized cost. |
(5) |
Current regulatory capital information is preliminary. |
4
BB&T Corporation Consolidated Statements of Income (Dollars in millions, except per share data, shares in thousands) |
|
Year-to-Date | |||||||||||
March 31 | Change | ||||||||||
2011 | 2010 | $ | % | ||||||||
Interest Income | |||||||||||
Interest and fees on loans and leases | $ | 1,520 | $ | 1,440 | $ | 80 | 5.6 | % | |||
Interest and dividends on securities | 150 | 336 | (186 | ) | (55.4 | ) | |||||
Interest on other earning assets | 6 | 3 | 3 | 100.0 | |||||||
Total interest income | 1,676 | 1,779 | (103 | ) | (5.8 | ) | |||||
Interest Expense | |||||||||||
Interest on deposits | 171 | 259 | (88 | ) | (34.0 | ) | |||||
Interest on federal funds purchased, securities sold under | |||||||||||
repurchase agreements and short-term borrowed funds | 4 | 5 | (1 | ) | (20.0 | ) | |||||
Interest on long-term debt | 216 | 201 | 15 | 7.5 | |||||||
Total interest expense | 391 | 465 | (74 | ) | (15.9 | ) | |||||
Net interest income | 1,285 | 1,314 | (29 | ) | (2.2 | ) | |||||
Provision for credit losses | 340 | 575 | (235 | ) | (40.9 | ) | |||||
Net interest income after provision for credit loss | 945 | 739 | 206 | 27.9 | |||||||
Noninterest income | |||||||||||
Insurance income | 250 | 253 | (3 | ) | (1.2 | ) | |||||
Service charges on deposits | 135 | 164 | (29 | ) | (17.7 | ) | |||||
Mortgage banking income | 95 | 89 | 6 | 6.7 | |||||||
Investment banking and brokerage fees and commissions | 87 | 79 | 8 | 10.1 | |||||||
Checkcard fees | 72 | 61 | 11 | 18.0 | |||||||
Other nondeposit fees and commissions | 67 | 65 | 2 | 3.1 | |||||||
Bankcard fees and merchant discounts | 46 | 40 | 6 | 15.0 | |||||||
Trust and investment advisory revenues | 43 | 38 | 5 | 13.2 | |||||||
Income from bank-owned life insurance | 30 | 31 | (1 | ) | (3.2 | ) | |||||
FDIC loss share income, net | (58 | ) | 5 | (63 | ) | NM | |||||
Securities gains (losses), net | - | (3 | ) | 3 | (100.0 | ) | |||||
Other income, net | (53 | ) | 22 | (75 | ) | NM | |||||
Total noninterest income | 714 | 844 | (130 | ) | (15.4 | ) | |||||
Noninterest Expense | |||||||||||
Personnel expense | 694 | 646 | 48 | 7.4 | |||||||
Foreclosed property expense | 143 | 178 | (35 | ) | (19.7 | ) | |||||
Occupancy and equipment expense | 154 | 138 | 16 | 11.6 | |||||||
Professional services | 71 | 72 | (1 | ) | (1.4 | ) | |||||
Regulatory charges | 61 | 45 | 16 | 35.6 | |||||||
Loan processing expenses | 53 | 35 | 18 | 51.4 | |||||||
Amortization of intangibles | 26 | 32 | (6 | ) | (18.8 | ) | |||||
Software expense | 26 | 29 | (3 | ) | (10.3 | ) | |||||
Merger-related and restructuring charges, net | (2 | ) | 17 | (19 | ) | (111.8 | ) | ||||
Other expenses | 146 | 149 | (3 | ) | (2.0 | ) | |||||
Total noninterest expense | 1,372 | 1,341 | 31 | 2.3 | |||||||
Earnings | |||||||||||
Income before income taxes | 287 | 242 | 45 | 18.6 | |||||||
Provision for income taxes | 53 | 48 | 5 | 10.4 | |||||||
Net Income | 234 | 194 | 40 | 20.6 | |||||||
Noncontrolling interest | 9 | 6 | 3 | 50.0 | |||||||
Net income available to common shareholders | $ | 225 | $ | 188 | $ | 37 | 19.7 | % | |||
Earnings Per Common Share | |||||||||||
Basic | $ | .32 | $ | .27 | $ | .05 | 18.5 | % | |||
Diluted | .32 | .27 | .05 | 18.5 | |||||||
Weighted Average Shares Outstanding | |||||||||||
Basic | 695,309 | 690,792 | 4,517 | 0.7 | |||||||
Diluted | 704,101 | 698,675 | 5,426 | 0.8 | |||||||
NM - not meaningful. |
5
BB&T Corporation Consolidated Statements of Income - Five Quarter Trend (Dollars in millions, except per share data, shares in thousands) |
|
Quarter Ended | |||||||||||||||
March 31 | Dec. 31 | Sept. 30 | June 30 | March 31 | |||||||||||
2011 | 2010 | 2010 | 2010 | 2010 | |||||||||||
Interest Income | |||||||||||||||
Interest and fees on loans and leases | $ | 1,520 | $ | 1,566 | $ | 1,549 | $ | 1,525 | $ | 1,440 | |||||
Interest and dividends on securities | 150 | 185 | 207 | 291 | 336 | ||||||||||
Interest on other earning assets | 6 | 4 | 6 | 3 | 3 | ||||||||||
Total interest income | 1,676 | 1,755 | 1,762 | 1,819 | 1,779 | ||||||||||
Interest Expense | |||||||||||||||
Interest on deposits | 171 | 192 | 225 | 241 | 259 | ||||||||||
Interest on federal funds purchased, securities sold under | |||||||||||||||
repurchase agreements and short-term borrowed funds | 4 | 6 | 5 | 6 | 5 | ||||||||||
Interest on long-term debt | 216 | 225 | 218 | 212 | 201 | ||||||||||
Total interest expense | 391 | 423 | 448 | 459 | 465 | ||||||||||
Net interest income | 1,285 | 1,332 | 1,314 | 1,360 | 1,314 | ||||||||||
Provision for credit losses | 340 | 643 | 770 | 650 | 575 | ||||||||||
Net interest income after provision for credit loss | 945 | 689 | 544 | 710 | 739 | ||||||||||
Noninterest income | |||||||||||||||
Insurance income | 250 | 249 | 252 | 287 | 253 | ||||||||||
Service charges on deposits | 135 | 143 | 147 | 164 | 164 | ||||||||||
Mortgage banking income | 95 | 138 | 184 | 110 | 89 | ||||||||||
Investment banking and brokerage fees and commissions | 87 | 97 | 85 | 91 | 79 | ||||||||||
Checkcard fees | 72 | 73 | 70 | 70 | 61 | ||||||||||
Other nondeposit fees and commissions | 67 | 68 | 74 | 63 | 65 | ||||||||||
Bankcard fees and merchant discounts | 46 | 47 | 45 | 45 | 40 | ||||||||||
Trust and investment advisory revenues | 43 | 42 | 40 | 39 | 38 | ||||||||||
Income from bank-owned life insurance | 30 | 31 | 30 | 31 | 31 | ||||||||||
FDIC loss share income, net | (58 | ) | - | (43 | ) | (78 | ) | 5 | |||||||
Securities gains (losses), net | - | 99 | 239 | 219 | (3 | ) | |||||||||
Other income, net | (53 | ) | (23 | ) | (13 | ) | (2 | ) | 22 | ||||||
Total noninterest income | 714 | 964 | 1,110 | 1,039 | 844 | ||||||||||
Noninterest Expense | |||||||||||||||
Personnel expense | 694 | 679 | 642 | 649 | 646 | ||||||||||
Foreclosed property expense | 143 | 162 | 167 | 240 | 178 | ||||||||||
Occupancy and equipment expense | 154 | 155 | 157 | 158 | 138 | ||||||||||
Professional services | 71 | 92 | 84 | 86 | 72 | ||||||||||
Regulatory charges | 61 | 59 | 61 | 46 | 45 | ||||||||||
Loan processing expenses | 53 | 45 | 53 | 47 | 35 | ||||||||||
Amortization of intangibles | 26 | 28 | 30 | 32 | 32 | ||||||||||
Software expense | 26 | 30 | 28 | 30 | 29 | ||||||||||
Merger-related and restructuring charges, net | (2 | ) | 4 | 10 | 38 | 17 | |||||||||
Other expenses | 146 | 167 | 176 | 174 | 149 | ||||||||||
Total noninterest expense | 1,372 | 1,421 | 1,408 | 1,500 | 1,341 | ||||||||||
Earnings | |||||||||||||||
Income before income taxes | 287 | 232 | 246 | 249 | 242 | ||||||||||
Provision for income taxes | 53 | 15 | 27 | 25 | 48 | ||||||||||
Net Income | 234 | 217 | 219 | 224 | 194 | ||||||||||
Noncontrolling interest | 9 | 9 | 9 | 14 | 6 | ||||||||||
Net income available to common shareholders | $ | 225 | $ | 208 | $ | 210 | $ | 210 | $ | 188 | |||||
Earnings Per Common Share | |||||||||||||||
Basic | $ | .32 | $ | .30 | $ | .30 | $ | .30 | $ | .27 | |||||
Diluted | .32 | .30 | .30 | .30 | .27 | ||||||||||
Weighted Average Shares Outstanding | |||||||||||||||
Basic | 695,309 | 693,993 | 693,017 | 692,113 | 690,792 | ||||||||||
Diluted | 704,101 | 702,781 | 701,535 | 701,322 | 698,675 |
6
As of March 31 | Change | ||||||||||
2011 | 2010 | $ | % | ||||||||
Assets | |||||||||||
Cash and due from banks | $ | 1,030 | $ | 1,265 | $ | (235 | ) | (18.6 | ) % | ||
Interest-bearing deposits with banks | 865 | 574 | 291 | 50.7 | |||||||
Federal funds sold and securities purchased under | |||||||||||
resale agreements or similar arrangements | 305 | 399 | (94 | ) | (23.6 | ) | |||||
Segregated cash due from banks | 153 | 269 | (116 | ) | (43.1 | ) | |||||
Trading securities at fair value | 730 | 651 | 79 | 12.1 | |||||||
Securities available for sale at fair value (1) | 17,887 | 32,654 | (14,767 | ) | (45.2 | ) | |||||
Securities held to maturity | 8,333 | - | 8,333 | NM | |||||||
Loans and leases: | |||||||||||
Commercial loans and leases | |||||||||||
Commercial and industrial | 33,587 | 31,750 | 1,837 | 5.8 | |||||||
Commercial real estate—other | 11,277 | 12,221 | (944 | ) | (7.7 | ) | |||||
Commercial real estate—residential ADC (2) | 3,061 | 5,333 | (2,272 | ) | (42.6 | ) | |||||
Direct retail lending | 13,612 | 14,055 | (443 | ) | (3.2 | ) | |||||
Sales finance loans | 7,121 | 6,555 | 566 | 8.6 | |||||||
Revolving credit loans | 2,063 | 1,981 | 82 | 4.1 | |||||||
Residential mortgage loans | 18,228 | 15,498 | 2,730 | 17.6 | |||||||
Specialized lending | 7,767 | 7,394 | 373 | 5.0 | |||||||
Other acquired loans | 56 | 99 | (43 | ) | (43.4 | ) | |||||
Total loans and leases held for investment (excluding | |||||||||||
covered loans) | 96,772 | 94,886 | 1,886 | 2.0 | |||||||
Covered loans | 5,803 | 7,458 | (1,655 | ) | (22.2 | ) | |||||
Total loans and leases held for investment | 102,575 | 102,344 | 231 | 0.2 | |||||||
Loans held for sale | 2,312 | 2,057 | 255 | 12.4 | |||||||
Total loans and leases | 104,887 | 104,401 | 486 | 0.5 | |||||||
Allowance for loan and lease losses | (2,641 | ) | (2,714 | ) | 73 | (2.7 | ) | ||||
FDIC loss share receivable | 1,580 | 2,611 | (1,031 | ) | (39.5 | ) | |||||
Premises and equipment | 1,830 | 1,798 | 32 | 1.8 | |||||||
Goodwill | 6,014 | 6,055 | (41 | ) | (0.7 | ) | |||||
Core deposit and other intangible assets | 483 | 601 | (118 | ) | (19.6 | ) | |||||
Residential mortgage servicing rights at fair value | 928 | 875 | 53 | 6.1 | |||||||
Other assets (3) | 14,655 | 14,261 | 394 | 2.8 | |||||||
Total assets | $ | 157,039 | $ | 163,700 | $ | (6,661 | ) | (4.1 | ) % | ||
Liabilities and Shareholders' Equity | |||||||||||
Deposits: | |||||||||||
Noninterest-bearing deposits | $ | 21,864 | $ | 19,022 | $ | 2,842 | 14.9 | % | |||
Interest checking | 3,711 | 3,504 | 207 | 5.9 | |||||||
Other client deposits | 57,432 | 51,897 | 5,535 | 10.7 | |||||||
Client certificates of deposit | 20,580 | 29,686 | (9,106 | ) | (30.7 | ) | |||||
Total client deposits | 103,587 | 104,109 | (522 | ) | (0.5 | ) | |||||
Other interest-bearing deposits | 3,326 | 9,614 | (6,288 | ) | (65.4 | ) | |||||
Total deposits | 106,913 | 113,723 | (6,810 | ) | (6.0 | ) | |||||
Fed funds purchased, repos and other borrowings | 5,186 | 7,020 | (1,834 | ) | (26.1 | ) | |||||
Long-term debt | 22,591 | 21,428 | 1,163 | 5.4 | |||||||
Other liabilities | 5,679 | 5,001 | 678 | 13.6 | |||||||
Total liabilities | 140,369 | 147,172 | (6,803 | ) | (4.6 | ) | |||||
Shareholders' equity: | |||||||||||
Common stock | 3,481 | 3,459 | 22 | 0.6 | |||||||
Additional paid-in capital | 5,794 | 5,677 | 117 | 2.1 | |||||||
Retained earnings | 8,042 | 7,624 | 418 | 5.5 | |||||||
Accumulated other comprehensive loss | (706 | ) | (292 | ) | (414 | ) | 141.8 | ||||
Noncontrolling interest | 59 | 60 | (1 | ) | (1.7 | ) | |||||
Total shareholders' equity | 16,670 | 16,528 | 142 | 0.9 | |||||||
Total liabilities and shareholders' equity | $ | 157,039 | $ | 163,700 | $ | (6,661 | ) | (4.1 | ) % |
(1) |
Includes $1.7 billion and $1.3 billion at March 31, 2011 and 2010, respectively, covered by FDIC loss sharing agreements. |
(2) |
Commercial real estate - residential ADC represents residential acquisition, development and construction loans. |
(3) |
Includes $401 million and $229 million of foreclosed property and other assets covered by FDIC loss sharing agreements at March 31, 2011 and 2010, respectively. |
7
As of | |||||||||||||||
March 31 | Dec. 31 | Sept. 30 | June 30 | March 31 | |||||||||||
2011 | 2010 | 2010 | 2010 | 2010 | |||||||||||
Assets | |||||||||||||||
Cash and due from banks | $ | 1,030 | $ | 1,127 | $ | 1,225 | $ | 1,270 | $ | 1,265 | |||||
Interest-bearing deposits with banks | 865 | 931 | 944 | 931 | 574 | ||||||||||
Federal funds sold and securities purchased under | |||||||||||||||
resale agreements or similar arrangements | 305 | 327 | 285 | 308 | 399 | ||||||||||
Segregated cash due from banks | 153 | 309 | 269 | 255 | 269 | ||||||||||
Trading securities at fair value | 730 | 633 | 568 | 587 | 651 | ||||||||||
Securities available for sale at fair value (1) | 17,887 | 23,169 | 24,497 | 23,662 | 32,654 | ||||||||||
Securities held to maturity | 8,333 | - | - | - | - | ||||||||||
Loans and leases: | |||||||||||||||
Commercial loans and leases | |||||||||||||||
Commercial and industrial | 33,587 | 34,050 | 32,591 | 32,147 | 31,750 | ||||||||||
Commercial real estate—other | 11,277 | 11,439 | 11,729 | 12,187 | 12,221 | ||||||||||
Commercial real estate—residential ADC | 3,061 | 3,397 | 3,811 | 4,720 | 5,333 | ||||||||||
Direct retail lending | 13,612 | 13,749 | 13,828 | 13,939 | 14,055 | ||||||||||
Sales finance loans | 7,121 | 7,050 | 6,972 | 6,863 | 6,555 | ||||||||||
Revolving credit loans | 2,063 | 2,127 | 2,065 | 2,024 | 1,981 | ||||||||||
Residential mortgage loans | 18,228 | 17,550 | 16,316 | 15,452 | 15,498 | ||||||||||
Specialized lending | 7,767 | 7,953 | 8,047 | 7,954 | 7,394 | ||||||||||
Other acquired loans | 56 | 58 | 69 | 85 | 99 | ||||||||||
Total loans and leases held for investment (excluding | |||||||||||||||
covered loans) | 96,772 | 97,373 | 95,428 | 95,371 | 94,886 | ||||||||||
Covered loans | 5,803 | 6,194 | 6,753 | 7,177 | 7,458 | ||||||||||
Total loans and leases held for investment | 102,575 | 103,567 | 102,181 | 102,548 | 102,344 | ||||||||||
Loans held for sale | 2,312 | 3,697 | 3,833 | 2,171 | 2,057 | ||||||||||
Total loans and leases | 104,887 | 107,264 | 106,014 | 104,719 | 104,401 | ||||||||||
Allowance for loan and lease losses | (2,641 | ) | (2,708 | ) | (2,611 | ) | (2,723 | ) | (2,714 | ) | |||||
FDIC loss share receivable | 1,580 | 1,922 | 1,924 | 2,230 | 2,611 | ||||||||||
Premises and equipment | 1,830 | 1,840 | 1,831 | 1,835 | 1,798 | ||||||||||
Goodwill | 6,014 | 6,008 | 6,013 | 6,067 | 6,055 | ||||||||||
Core deposit and other intangible assets | 483 | 508 | 535 | 569 | 601 | ||||||||||
Residential mortgage servicing rights at fair value | 928 | 830 | 585 | 665 | 875 | ||||||||||
Other assets (2) | 14,655 | 14,921 | 15,151 | 14,708 | 14,261 | ||||||||||
Total assets | $ | 157,039 | $ | 157,081 | $ | 157,230 | $ | 155,083 | $ | 163,700 | |||||
Liabilities and Shareholders' Equity | |||||||||||||||
Deposits: | |||||||||||||||
Noninterest-bearing deposits | $ | 21,864 | $ | 20,637 | $ | 20,607 | $ | 19,767 | $ | 19,022 | |||||
Interest checking | 3,711 | 4,050 | 2,225 | 3,760 | 3,504 | ||||||||||
Other client deposits | 57,432 | 54,040 | 52,795 | 49,989 | 51,897 | ||||||||||
Client certificates of deposit | 20,580 | 21,317 | 23,772 | 27,599 | 29,686 | ||||||||||
Total client deposits | 103,587 | 100,044 | 99,399 | 101,115 | 104,109 | ||||||||||
Other interest-bearing deposits | 3,326 | 7,169 | 7,020 | 3,336 | 9,614 | ||||||||||
Total deposits | 106,913 | 107,213 | 106,419 | 104,451 | 113,723 | ||||||||||
Fed funds purchased, repos and other borrowings | 5,186 | 5,673 | 5,820 | 6,080 | 7,020 | ||||||||||
Long-term debt | 22,591 | 21,730 | 22,111 | 22,086 | 21,428 | ||||||||||
Other liabilities | 5,679 | 5,967 | 6,093 | 5,726 | 5,001 | ||||||||||
Total liabilities | 140,369 | 140,583 | 140,443 | 138,343 | 147,172 | ||||||||||
Shareholders' equity: | |||||||||||||||
Common stock | 3,481 | 3,472 | 3,468 | 3,464 | 3,459 | ||||||||||
Additional paid-in capital | 5,794 | 5,776 | 5,753 | 5,720 | 5,677 | ||||||||||
Retained earnings | 8,042 | 7,935 | 7,833 | 7,729 | 7,624 | ||||||||||
Accumulated other comprehensive loss | (706 | ) | (747 | ) | (335 | ) | (237 | ) | (292 | ) | |||||
Noncontrolling interest | 59 | 62 | 68 | 64 | 60 | ||||||||||
Total shareholders' equity | 16,670 | 16,498 | 16,787 | 16,740 | 16,528 | ||||||||||
Total liabilities and shareholders' equity | $ | 157,039 | $ | 157,081 | $ | 157,230 | $ | 155,083 | $ | 163,700 |
(1) |
Includes $1.7 billion, $1.5 billion, $1.5 billion, $1.4 billion and $1.3 billion at March 31, 2011, December 31, 2010, September 30, 2010, June 30, 2010 and March 31, 2010, respectively, covered by FDIC loss sharing agreements. |
(2) |
Includes $401 million, $360 million, $314 million, $222 million and $229 million of foreclosed property and other assets covered by FDIC loss sharing agreements at March 31, 2011, December 31, 2010, September 30, 2010, June 30, 2010 and March 31, 2010, respectively. |
8
Year-to-Date | |||||||||
March 31 | Change | ||||||||
2011 | 2010 | $ | % | ||||||
Assets | |||||||||
Total securities, at amortized cost (1) | |||||||||
U.S. government-sponsored entities (GSE) | $ | 93 | $ | 1,636 | $ | (1,543 | ) | (94.3 | ) % |
Mortgage-backed securities issued by GSE | 20,409 | 26,558 | (6,149 | ) | (23.2 | ) | |||
States and political subdivisions | 1,969 | 2,107 | (138 | ) | (6.5 | ) | |||
Non-agency mortgage-backed securities | 595 | 1,311 | (716 | ) | (54.6 | ) | |||
Other securities | 750 | 202 | 548 | NM | |||||
Covered securities | 1,243 | 1,175 | 68 | 5.8 | |||||
Total securities | 25,059 | 32,989 | (7,930 | ) | (24.0 | ) | |||
Other earning assets | 2,978 | 2,681 | 297 | 11.1 | |||||
Loans and leases | |||||||||
Commercial loans and leases | |||||||||
Commercial and industrial | 33,433 | 31,498 | 1,935 | 6.1 | |||||
Commercial real estate—other | 11,368 | 12,296 | (928 | ) | (7.5 | ) | |||
Commercial real estate—residential ADC | 3,281 | 5,586 | (2,305 | ) | (41.3 | ) | |||
Direct retail lending | 13,672 | 14,165 | (493 | ) | (3.5 | ) | |||
Sales finance loans | 7,080 | 6,406 | 674 | 10.5 | |||||
Revolving credit loans | 2,082 | 1,991 | 91 | 4.6 | |||||
Residential mortgage loans | 17,926 | 15,459 | 2,467 | 16.0 | |||||
Specialized lending | 7,797 | 7,479 | 318 | 4.3 | |||||
Other acquired loans | 57 | 108 | (51 | ) | (47.2 | ) | |||
Total loans and leases held for investment (excluding | |||||||||
covered loans) | 96,696 | 94,988 | 1,708 | 1.8 | |||||
Covered loans | 5,927 | 7,642 | (1,715 | ) | (22.4 | ) | |||
Total loans and leases held for investment | 102,623 | 102,630 | (7 | ) | - | ||||
Loans held for sale | 2,671 | 1,838 | 833 | 45.3 | |||||
Total loans and leases | 105,294 | 104,468 | 826 | 0.8 | |||||
Total earning assets | 133,331 | 140,138 | (6,807 | ) | (4.9 | ) | |||
Non-earning assets | 23,600 | 23,669 | (69 | ) | (0.3 | ) | |||
Total assets | $ | 156,931 | $ | 163,807 | $ | (6,876 | ) | (4.2 | ) % |
Liabilities and Shareholders' Equity | |||||||||
Deposits | |||||||||
Noninterest-bearing deposits | $ | 20,990 | $ | 18,464 | $ | 2,526 | 13.7 | % | |
Interest checking | 3,594 | 3,745 | (151 | ) | (4.0 | ) | |||
Other client deposits | 55,909 | 51,712 | 4,197 | 8.1 | |||||
Client certificates of deposit | 21,081 | 30,833 | (9,752 | ) | (31.6 | ) | |||
Total client deposits | 101,574 | 104,754 | (3,180 | ) | (3.0 | ) | |||
Other interest-bearing deposits | 4,040 | 6,277 | (2,237 | ) | (35.6 | ) | |||
Total deposits | 105,614 | 111,031 | (5,417 | ) | (4.9 | ) | |||
Fed funds purchased, repos and other borrowings | 7,286 | 10,207 | (2,921 | ) | (28.6 | ) | |||
Long-term debt | 21,879 | 21,221 | 658 | 3.1 | |||||
Other liabilities | 5,479 | 4,721 | 758 | 16.1 | |||||
Total liabilities | 140,258 | 147,180 | (6,922 | ) | (4.7 | ) | |||
Shareholders' equity | 16,673 | 16,627 | 46 | 0.3 | |||||
Total liabilities and shareholders' equity | $ | 156,931 | $ | 163,807 | $ | (6,876 | ) | (4.2 | ) % |
Average balances exclude basis adjustments for fair value hedges. | |||||||||
(1) Total securities include securities available for sale and securities held to maturity. | |||||||||
NM - not meaningful. |
9
Quarter Ended | ||||||||||
March 31 | Dec. 31 | Sept. 30 | June 30 | March 31 | ||||||
2011 | 2010 | 2010 | 2010 | 2010 | ||||||
Assets | ||||||||||
Total securities, at amortized cost (1) | ||||||||||
U.S. government-sponsored entities (GSE) | $ | 93 | $ | 52 | $ | 54 | $ | 554 | $ | 1,636 |
Mortgage-backed securities issued by GSE | 20,409 | 21,067 | 18,636 | 23,080 | 26,558 | |||||
States and political subdivisions | 1,969 | 1,987 | 2,019 | 2,077 | 2,107 | |||||
Non-agency mortgage-backed securities | 595 | 1,025 | 1,152 | 1,214 | 1,311 | |||||
Other securities | 750 | 641 | 209 | 192 | 202 | |||||
Covered securities | 1,243 | 1,216 | 1,207 | 1,192 | 1,175 | |||||
Total securities | 25,059 | 25,988 | 23,277 | 28,309 | 32,989 | |||||
Other earning assets | 2,978 | 2,995 | 2,951 | 3,101 | 2,681 | |||||
Loans and leases | ||||||||||
Commercial loans and leases | ||||||||||
Commercial and industrial | 33,433 | 32,733 | 32,174 | 31,691 | 31,498 | |||||
Commercial real estate—other | 11,368 | 11,661 | 12,052 | 12,223 | 12,296 | |||||
Commercial real estate—residential ADC | 3,281 | 3,650 | 4,394 | 5,165 | 5,586 | |||||
Direct retail lending | 13,672 | 13,770 | 13,867 | 13,994 | 14,165 | |||||
Sales finance loans | 7,080 | 7,015 | 6,906 | 6,729 | 6,406 | |||||
Revolving credit loans | 2,082 | 2,086 | 2,048 | 2,002 | 1,991 | |||||
Residential mortgage loans | 17,926 | 16,974 | 15,828 | 15,586 | 15,459 | |||||
Specialized lending | 7,797 | 7,937 | 8,046 | 7,645 | 7,479 | |||||
Other acquired loans | 57 | 63 | 73 | 96 | 108 | |||||
Total loans and leases held for investment (excluding | ||||||||||
covered loans) | 96,696 | 95,889 | 95,388 | 95,131 | 94,988 | |||||
Covered loans | 5,927 | 6,488 | 6,957 | 7,162 | 7,642 | |||||
Total loans and leases held for investment | 102,623 | 102,377 | 102,345 | 102,293 | 102,630 | |||||
Loans held for sale | 2,671 | 3,569 | 2,410 | 1,671 | 1,838 | |||||
Total loans and leases | 105,294 | 105,946 | 104,755 | 103,964 | 104,468 | |||||
Total earning assets | 133,331 | 134,929 | 130,983 | 135,374 | 140,138 | |||||
Non-earning assets | 23,600 | 24,535 | 24,683 | 24,412 | 23,669 | |||||
Total assets | $ | 156,931 | $ | 159,464 | $ | 155,666 | $ | 159,786 | $ | 163,807 |
Liabilities and Shareholders' Equity | ||||||||||
Deposits | ||||||||||
Noninterest-bearing deposits | $ | 20,990 | $ | 21,027 | $ | 20,099 | $ | 19,346 | $ | 18,464 |
Interest checking | 3,594 | 3,682 | 3,482 | 3,905 | 3,745 | |||||
Other client deposits | 55,909 | 52,578 | 50,458 | 50,207 | 51,712 | |||||
Client certificates of deposit | 21,081 | 22,144 | 25,875 | 28,745 | 30,833 | |||||
Total client deposits | 101,574 | 99,431 | 99,914 | 102,203 | 104,754 | |||||
Other interest-bearing deposits | 4,040 | 6,161 | 3,591 | 4,857 | 6,277 | |||||
Total deposits | 105,614 | 105,592 | 103,505 | 107,060 | 111,031 | |||||
Fed funds purchased, repos and other borrowings | 7,286 | 9,446 | 7,355 | 9,105 | 10,207 | |||||
Long-term debt | 21,879 | 21,890 | 21,833 | 21,660 | 21,221 | |||||
Other liabilities | 5,479 | 5,585 | 5,938 | 5,036 | 4,721 | |||||
Total liabilities | 140,258 | 142,513 | 138,631 | 142,861 | 147,180 | |||||
Shareholders' equity | 16,673 | 16,951 | 17,035 | 16,925 | 16,627 | |||||
Total liabilities and shareholders' equity | $ | 156,931 | $ | 159,464 | $ | 155,666 | $ | 159,786 | $ | 163,807 |
Average balances exclude basis adjustments for fair value hedges. | |
(1) |
Total securities include securities available for sale and securities held to maturity. |
10
Quarter Ended | ||||||||||||
March 31, 2011 | December 31, 2010 | |||||||||||
Interest | Interest | |||||||||||
Average | Income/ | Yields/ | Average | Income/ | Yields/ | |||||||
Balances (1) | Expense | Rates (2) | Balances (1) | Expense | Rates (2) | |||||||
Assets | ||||||||||||
Total securities, at amortized cost (3) | ||||||||||||
U.S. government-sponsored entities (GSE) | $ | 93 | $ | 1 | 2.41 | % | $ | 52 | $ | 1 | 4.60 | % |
Mortgage-backed securities issued by GSE | 20,409 | 84 | 1.65 | 21,067 | 102 | 1.95 | ||||||
States and political subdivisions | 1,969 | 27 | 5.55 | 1,987 | 27 | 5.58 | ||||||
Non-agency mortgage-backed securities | 595 | 10 | 6.38 | 1,025 | 15 | 5.93 | ||||||
Other securities | 750 | 3 | 1.56 | 641 | 4 | 1.91 | ||||||
Covered securities | 1,243 | 37 | 12.06 | 1,216 | 50 | 16.45 | ||||||
Total securities | 25,059 | 162 | 2.59 | 25,988 | 199 | 3.07 | ||||||
Other earning assets | 2,978 | 6 | .80 | 2,995 | 4 | .56 | ||||||
Loans and leases | ||||||||||||
Commercial loans and leases | ||||||||||||
Commercial and industrial | 33,433 | 359 | 4.35 | 32,733 | 370 | 4.48 | ||||||
Commercial real estate—other | 11,368 | 108 | 3.84 | 11,661 | 111 | 3.78 | ||||||
Commercial real estate—residential ADC | 3,281 | 28 | 3.50 | 3,650 | 33 | 3.60 | ||||||
Direct retail lending | 13,672 | 174 | 5.17 | 13,770 | 181 | 5.23 | ||||||
Sales finance loans | 7,080 | 91 | 5.23 | 7,015 | 97 | 5.48 | ||||||
Revolving credit loans | 2,082 | 46 | 8.90 | 2,086 | 46 | 8.62 | ||||||
Residential mortgage loans | 17,926 | 223 | 4.97 | 16,974 | 218 | 5.14 | ||||||
Specialized lending | 7,797 | 227 | 11.76 | 7,937 | 231 | 11.53 | ||||||
Other acquired loans | 57 | 4 | 31.68 | 63 | 5 | 28.84 | ||||||
Total loans and leases held for investment (excluding | ||||||||||||
covered loans) | 96,696 | 1,260 | 5.27 | 95,889 | 1,292 | 5.35 | ||||||
Covered loans | 5,927 | 262 | 17.96 | 6,488 | 271 | 16.59 | ||||||
Total loans and leases held for investment | 102,623 | 1,522 | 6.00 | 102,377 | 1,563 | 6.06 | ||||||
Loans held for sale | 2,671 | 23 | 3.48 | 3,569 | 27 | 3.09 | ||||||
Total loans and leases | 105,294 | 1,545 | 5.94 | 105,946 | 1,590 | 5.96 | ||||||
Total earning assets | 133,331 | 1,713 | 5.19 | 134,929 | 1,793 | 5.28 | ||||||
Non-earning assets | 23,600 | 24,535 | ||||||||||
Total assets | $ | 156,931 | $ | 159,464 | ||||||||
Liabilities and Shareholders' Equity | ||||||||||||
Interest-bearing deposits | ||||||||||||
Interest checking | $ | 3,594 | 2 | .25 | $ | 3,682 | 2 | .24 | ||||
Other client deposits | 55,909 | 74 | .53 | 52,578 | 76 | .57 | ||||||
Client certificates of deposit | 21,081 | 87 | 1.66 | 22,144 | 103 | 1.84 | ||||||
Other interest-bearing deposits | 4,040 | 8 | .84 | 6,161 | 11 | .66 | ||||||
Total interest-bearing deposits | 84,624 | 171 | .82 | 84,565 | 192 | .90 | ||||||
Fed funds purchased, repos and other borrowings | 7,286 | 5 | .30 | 9,446 | 7 | .29 | ||||||
Long-term debt | 21,879 | 216 | 3.97 | 21,890 | 225 | 4.10 | ||||||
Total interest-bearing liabilities | 113,789 | 392 | 1.39 | 115,901 | 424 | 1.45 | ||||||
Noninterest-bearing deposits | 20,990 | 21,027 | ||||||||||
Other liabilities | 5,479 | 5,585 | ||||||||||
Shareholders' equity | 16,673 | 16,951 | ||||||||||
Total liabilities and shareholders' equity | $ | 156,931 | $ | 159,464 | ||||||||
Average interest-rate spread | 3.80 | 3.83 | ||||||||||
Net interest income/ net interest margin | $ | 1,321 | 4.01 | % | $ | 1,369 | 4.04 | % | ||||
Taxable-equivalent adjustment | $ | 36 | $ | 37 |
Applicable ratios are annualized. | |
(1) |
Excludes basis adjustments for fair value hedges. |
(2) |
Yields are on a fully taxable-equivalent basis. |
(3) |
Total securities include securities available for sale and securities held to maturity. |
11
Quarter Ended | ||||||||||||||||||
September 30, 2010 | June 30, 2010 | March 31, 2010 | ||||||||||||||||
Interest | Interest | Interest | ||||||||||||||||
Average | Income/ | Yields/ | Average | Income/ | Yields/ | Average | Income/ | Yields/ | ||||||||||
Balances (1) | Expense | Rates (2) | Balances (1) | Expense | Rates (2) | Balances (1) | Expense | Rates (2) | ||||||||||
Assets | ||||||||||||||||||
Total securities, at amortized cost (3) | ||||||||||||||||||
U.S. government-sponsored entities (GSE) | $ | 54 | $ | - | 4.65 | % | $ | 554 | $ | 5 | 3.68 | % | $ | 1,636 | $ | 15 | 3.61 | % |
Mortgage-backed securities issued by GSE | 18,636 | 150 | 3.22 | 23,080 | 217 | 3.77 | 26,558 | 254 | 3.82 | |||||||||
States and political subdivisions | 2,019 | 29 | 5.55 | 2,077 | 28 | 5.45 | 2,107 | 28 | 5.38 | |||||||||
Non-agency mortgage-backed securities | 1,152 | 17 | 5.90 | 1,214 | 18 | 5.84 | 1,311 | 19 | 5.80 | |||||||||
Other securities | 209 | 1 | 2.74 | 192 | 1 | 2.43 | 202 | 1 | 2.13 | |||||||||
Covered securities | 1,207 | 23 | 7.61 | 1,192 | 35 | 11.65 | 1,175 | 34 | 11.60 | |||||||||
Total securities | 23,277 | 220 | 3.78 | 28,309 | 304 | 4.30 | 32,989 | 351 | 4.26 | |||||||||
Other earning assets | 2,951 | 6 | .54 | 3,101 | 4 | .57 | 2,681 | 3 | .53 | |||||||||
Loans and leases | ||||||||||||||||||
Commercial loans and leases | ||||||||||||||||||
Commercial and industrial | 32,174 | 364 | 4.49 | 31,691 | 355 | 4.49 | 31,498 | 338 | 4.35 | |||||||||
Commercial real estate—other | 12,052 | 115 | 3.78 | 12,223 | 115 | 3.79 | 12,296 | 124 | 4.11 | |||||||||
Commercial real estate—residential ADC | 4,394 | 38 | 3.40 | 5,165 | 44 | 3.44 | 5,586 | 56 | 4.05 | |||||||||
Direct retail lending | 13,867 | 184 | 5.26 | 13,994 | 185 | 5.31 | 14,165 | 187 | 5.34 | |||||||||
Sales finance loans | 6,906 | 100 | 5.73 | 6,729 | 100 | 6.01 | 6,406 | 100 | 6.31 | |||||||||
Revolving credit loans | 2,048 | 44 | 8.64 | 2,002 | 44 | 8.69 | 1,991 | 44 | 9.04 | |||||||||
Residential mortgage loans | 15,828 | 213 | 5.39 | 15,586 | 215 | 5.51 | 15,459 | 213 | 5.51 | |||||||||
Specialized lending | 8,046 | 229 | 11.33 | 7,645 | 221 | 11.59 | 7,479 | 211 | 11.40 | |||||||||
Other acquired loans | 73 | 3 | 18.97 | 96 | 3 | 10.63 | 108 | 3 | 12.49 | |||||||||
Total loans and leases held for investment (excluding | ||||||||||||||||||
covered loans) | 95,388 | 1,290 | 5.38 | 95,131 | 1,282 | 5.40 | 94,988 | 1,276 | 5.43 | |||||||||
Covered loans | 6,957 | 258 | 14.72 | 7,162 | 242 | 13.52 | 7,642 | 162 | 8.61 | |||||||||
Total loans and leases held for investment | 102,345 | 1,548 | 6.01 | 102,293 | 1,524 | 5.97 | 102,630 | 1,438 | 5.67 | |||||||||
Loans held for sale | 2,410 | 22 | 3.56 | 1,671 | 20 | 4.73 | 1,838 | 21 | 4.68 | |||||||||
Total loans and leases | 104,755 | 1,570 | 5.96 | 103,964 | 1,544 | 5.95 | 104,468 | 1,459 | 5.65 | |||||||||
Total earning assets | 130,983 | 1,796 | 5.45 | 135,374 | 1,852 | 5.48 | 140,138 | 1,813 | 5.22 | |||||||||
Non-earning assets | 24,683 | 24,412 | 23,669 | |||||||||||||||
Total assets | $ | 155,666 | $ | 159,786 | $ | 163,807 | ||||||||||||
Liabilities and Shareholders' Equity | ||||||||||||||||||
Interest-bearing deposits | ||||||||||||||||||
Interest checking | $ | 3,482 | 3 | .29 | $ | 3,905 | 3 | .31 | $ | 3,745 | 3 | .36 | ||||||
Other client deposits | 50,458 | 79 | .62 | 50,207 | 81 | .65 | 51,712 | 90 | .70 | |||||||||
Client certificates of deposit | 25,875 | 132 | 2.02 | 28,745 | 144 | 2.01 | 30,833 | 152 | 2.00 | |||||||||
Other interest-bearing deposits | 3,591 | 11 | 1.18 | 4,857 | 13 | 1.06 | 6,277 | 14 | .93 | |||||||||
Total interest-bearing deposits | 83,406 | 225 | 1.07 | 87,714 | 241 | 1.10 | 92,567 | 259 | 1.14 | |||||||||
Fed funds purchased, repos and other borrowings | 7,355 | 6 | .32 | 9,105 | 7 | .31 | 10,207 | 6 | .23 | |||||||||
Long-term debt | 21,833 | 218 | 3.98 | 21,660 | 212 | 3.92 | 21,221 | 201 | 3.82 | |||||||||
Total interest-bearing liabilities | 112,594 | 449 | 1.58 | 118,479 | 460 | 1.56 | 123,995 | 466 | 1.52 | |||||||||
Noninterest-bearing deposits | 20,099 | 19,346 | 18,464 | |||||||||||||||
Other liabilities | 5,938 | 5,036 | 4,721 | |||||||||||||||
Shareholders' equity | 17,035 | 16,925 | 16,627 | |||||||||||||||
Total liabilities and shareholders' equity | $ | 155,666 | $ | 159,786 | $ | 163,807 | ||||||||||||
Average interest-rate spread | 3.87 | 3.92 | 3.70 | |||||||||||||||
Net interest income/ net interest margin | $ | 1,347 | 4.09 | % | $ | 1,392 | 4.12 | % | $ | 1,347 | 3.88 | % | ||||||
Taxable-equivalent adjustment | $ | 33 | $ | 32 | $ | 33 | ||||||||||||
Applicable ratios are annualized. | |
(1) |
Excludes basis adjustments for fair value hedges. |
(2) |
Yields are on a fully taxable-equivalent basis. |
(3) |
Total securities include securities available for sale and securities held to maturity. |
12
As of/For the Quarter Ended | ||||||||||
March 31 | Dec. 31 | Sept. 30 | June 30 | March 31 | ||||||
2011 | 2010 | 2010 | 2010 | 2010 | ||||||
Nonperforming assets (1) | ||||||||||
Nonaccrual loans and leases | ||||||||||
Commercial loans and leases (7) | ||||||||||
Commercial and industrial | $ | 594 | $ | 508 | $ | 491 | $ | 637 | $ | 500 |
Commercial real estate—other | 508 | 405 | 328 | 631 | 413 | |||||
Commercial real estate—residential ADC | 568 | 513 | 454 | 807 | 875 | |||||
Direct retail lending | 182 | 191 | 216 | 234 | 219 | |||||
Sales finance loans | 9 | 6 | 6 | 6 | 5 | |||||
Residential mortgage loans (8) (9) | 511 | 466 | 416 | 387 | 737 | |||||
Specialized lending | 55 | 60 | 62 | 68 | 69 | |||||
Total nonaccrual loans and leases held for investment | 2,427 | 2,149 | 1,973 | 2,770 | 2,818 | |||||
Loans held for sale | 189 | 521 | 826 | 129 | 6 | |||||
Total nonaccrual loans and leases | 2,616 | 2,670 | 2,799 | 2,899 | 2,824 | |||||
Foreclosed real estate | 1,211 | 1,259 | 1,309 | 1,391 | 1,524 | |||||
Other foreclosed property | 36 | 42 | 39 | 37 | 46 | |||||
Total nonperforming assets (excluding covered assets) (2) | $ | 3,863 | $ | 3,971 | $ | 4,147 | $ | 4,327 | $ | 4,394 |
Performing troubled debt restructurings (TDRs) (3) | ||||||||||
Commercial loans and leases | ||||||||||
Commercial and industrial | $ | 125 | $ | 205 | $ | 260 | $ | 303 | $ | 298 |
Commercial real estate—other | 233 | 280 | 300 | 387 | 334 | |||||
Commercial real estate—residential ADC | 120 | 172 | 316 | 409 | 337 | |||||
Direct retail lending | 146 | 141 | 131 | 133 | 130 | |||||
Sales finance loans | 5 | 5 | - | - | - | |||||
Revolving credit loans | 62 | 62 | 62 | 60 | 58 | |||||
Residential mortgage loans (10) | 587 | 585 | 566 | 595 | 557 | |||||
Specialized lending | 31 | 26 | 4 | 4 | 1 | |||||
Total performing TDRs | $ | 1,309 | $ | 1,476 | $ | 1,639 | $ | 1,891 | $ | 1,715 |
Loans 90 days or more past due and still accruing (4) | ||||||||||
Commercial loans and leases | ||||||||||
Commercial and industrial | $ | 6 | $ | 8 | $ | 7 | $ | 5 | $ | 4 |
Commercial real estate—other | 20 | 4 | 3 | 7 | - | |||||
Commercial real estate—residential ADC | 5 | 8 | 10 | 10 | 10 | |||||
Direct retail lending | 59 | 76 | 69 | 69 | 67 | |||||
Sales finance loans | 23 | 27 | 27 | 28 | 27 | |||||
Revolving credit loans | 18 | 20 | 21 | 20 | 23 | |||||
Residential mortgage loans (9) (11) | 124 | 143 | 137 | 127 | 148 | |||||
Specialized lending | 6 | 6 | 7 | 7 | 10 | |||||
Other acquired loans | 2 | 3 | 5 | 5 | 6 | |||||
Total loans 90 days past due and still accruing (excluding covered | ||||||||||
loans) (5) | $ | 263 | $ | 295 | $ | 286 | $ | 278 | $ | 295 |
Loans 30-89 days past due (4) | ||||||||||
Commercial loans and leases | ||||||||||
Commercial and industrial | $ | 137 | $ | 163 | $ | 213 | $ | 185 | $ | 202 |
Commercial real estate—other | 54 | 68 | 171 | 118 | 182 | |||||
Commercial real estate—residential ADC | 40 | 84 | 151 | 128 | 132 | |||||
Direct retail lending | 166 | 189 | 181 | 188 | 203 | |||||
Sales finance loans | 67 | 95 | 99 | 95 | 94 | |||||
Revolving credit loans | 24 | 28 | 28 | 28 | 30 | |||||
Residential mortgage loans (12) | 444 | 532 | 551 | 519 | 531 | |||||
Specialized lending | 166 | 248 | 242 | 225 | 200 | |||||
Other acquired loans | 1 | 1 | 2 | 2 | 3 | |||||
Total loans 30-89 days past due (excluding covered loans) (6) | $ | 1,099 | $ | 1,408 | $ | 1,638 | $ | 1,488 | $ | 1,577 |
(1) |
Covered and other acquired loans are considered to be performing due to the application of the accretion method. Covered loans that are contractually past due are noted in the footnotes below. |
(2) |
Excludes foreclosed real estate totaling $362 million, $313 million, $276 million, $176 million and $181 million at March 31, 2011, December 31, 2010, September 30, 2010, June 30, 2010 and March 31, 2010, respectively, that are covered by FDIC loss sharing agreements. |
(3) |
Excludes TDRs that are nonperforming totaling $479 million, $479 million, $489 million, $480 million and $333 million at March 31, 2011, December 31, 2010, September 30, 2010, June 30, 2010 and March 31, 2010, respectively. These amounts are included in total nonperforming assets. |
(4) |
Excludes mortgage loans guaranteed by GNMA that BB&T does not have the obligation to repurchase. |
(5) |
Excludes loans past due 90 days or more that are covered by FDIC loss sharing agreements totaling $1.2 billion, $1.1 billion, $1.3 billion, $1.5 billion and $1.4 billion at March 31, 2011, December 31, 2010, September 30, 2010, June 30, 2010 and March 31, 2010, respectively. |
(6) |
Excludes loans totaling $252 million, $363 million, $329 million, $429 million and $356 million past due 30-89 days at March 31, 2011, December 31, 2010, September 30, 2010, June 30,2010 and March 31, 2010, respectively, that are covered by FDIC loss sharing agreements. |
(7) |
Includes a transfer of $1.3 billion book value of nonperforming commercial loans to loans held for sale during the third quarter of 2010 in connection with BB&T's NPA disposition strategy. |
(8) | Includes a reduction of $375 million in mortgage loans during the second quarter of 2010 in connection with BB&T's NPA disposition strategy. |
(9) |
Excludes nonaccrual mortgage loans that are government guaranteed totaling $70 million at March 31, 2010. BB&T revised its nonaccrual policy related to FHA/VA guaranteed mortgage loans during the second quarter of 2010. The change in policy resulted in a decrease in nonaccrual mortgage loans and an increase in mortgage loans 90 days past due and still accruing of approximately $79 million. |
(10) |
Excludes restructured mortgage loans that are government guaranteed totaling $148 million, $129 million, $153 million and $73 million at March 31, 2011, December 31, 2010, September 30, 2010 and June 30,2010, respectively. Includes mortgage loans held for sale. |
(11) |
Excludes mortgage loans past due 90 days or more that are government guaranteed totaling $187 million, $153 million, $119 million, $82 million, and $7 million at March 31, 2011, December 31, 2010, September 30, 2010, June 30,2010 and March 31, 2010, respectively. Includes past due mortgage loans held for sale. |
(12) |
Excludes mortgage loans past due 30-89 days that are government guaranteed totaling $71 million, $83 million, $74 million, $42 million, and $24 million at March 31, 2011, December 31, 2010, September 30, 2010, June 30,2010 and March 31, 2010, respectively. Includes past due mortgage loans held for sale. |
13
As of/For the Quarter Ended | |||||||||||||||
March 31 | Dec. 31 | Sept. 30 | June 30 | March 31 | |||||||||||
2011 | 2010 | 2010 | 2010 | 2010 | |||||||||||
Allowance for credit losses | |||||||||||||||
Beginning balance | $ | 2,755 | $ | 2,650 | $ | 2,753 | $ | 2,759 | $ | 2,672 | |||||
Provision for credit losses (excluding covered loans) | 340 | 543 | 743 | 652 | 556 | ||||||||||
Provision for covered loans | - | 100 | 27 | (2 | ) | 19 | |||||||||
Charge-offs | |||||||||||||||
Commercial loans and leases (1) | |||||||||||||||
Commercial and industrial | (78 | ) | (103 | ) | (143 | ) | (65 | ) | (62 | ) | |||||
Commercial real estate—other | (68 | ) | (125 | ) | (244 | ) | (47 | ) | (54 | ) | |||||
Commercial real estate—residential ADC | (71 | ) | (107 | ) | (285 | ) | (165 | ) | (108 | ) | |||||
Direct retail lending | (78 | ) | (87 | ) | (83 | ) | (82 | ) | (86 | ) | |||||
Sales finance loans | (10 | ) | (12 | ) | (10 | ) | (10 | ) | (16 | ) | |||||
Revolving credit loans | (27 | ) | (28 | ) | (28 | ) | (31 | ) | (31 | ) | |||||
Residential mortgage loans (2) | (54 | ) | (58 | ) | (52 | ) | (207 | ) | (77 | ) | |||||
Specialized lending | (52 | ) | (57 | ) | (56 | ) | (64 | ) | (75 | ) | |||||
Total charge-offs | (438 | ) | (577 | ) | (901 | ) | (671 | ) | (509 | ) | |||||
Recoveries | |||||||||||||||
Commercial loans and leases (1) | |||||||||||||||
Commercial and industrial | 4 | 4 | 4 | 4 | 6 | ||||||||||
Commercial real estate—other | 3 | 4 | - | 1 | - | ||||||||||
Commercial real estate—residential ADC | 4 | 6 | 4 | 3 | 1 | ||||||||||
Direct retail lending | 9 | 8 | 7 | 6 | 12 | ||||||||||
Sales finance loans | 2 | 2 | 2 | 2 | 3 | ||||||||||
Revolving credit loans | 5 | 4 | 4 | 4 | 4 | ||||||||||
Residential mortgage loans (2) | 1 | 1 | 1 | 1 | 1 | ||||||||||
Specialized lending | 6 | 10 | 6 | 8 | 7 | ||||||||||
Total recoveries | 34 | 39 | 28 | 29 | 34 | ||||||||||
Net charge-offs | (404 | ) | (538 | ) | (873 | ) | (642 | ) | (475 | ) | |||||
Other changes | - | - | - | (14 | ) | (13 | ) | ||||||||
Ending balance | $ | 2,691 | $ | 2,755 | $ | 2,650 | $ | 2,753 | $ | 2,759 | |||||
Allowance for credit losses | |||||||||||||||
Allowance for loan and lease losses (excluding covered loans) | $ | 2,497 | $ | 2,564 | $ | 2,567 | $ | 2,706 | $ | 2,695 | |||||
Allowance for covered loans | 144 | 144 | 44 | 17 | 19 | ||||||||||
Reserve for unfunded lending commitments | 50 | 47 | 39 | 30 | 45 | ||||||||||
Total | $ | 2,691 | $ | 2,755 | $ | 2,650 | $ | 2,753 | $ | 2,759 |
(1) |
Includes net charge-offs of $26 million, $431 million and $7 million in commercial loans and leases during the fourth, third and second quarters of 2010, respectively, in connection with BB&T's NPA disposition strategy. |
(2) |
Includes net charge-offs of $141 million in mortgage loans during the second quarter of 2010 in connection with BB&T's NPA disposition strategy. |
14
As of/For the Quarter Ended | ||||||||||
March 31 | Dec. 31 | Sept. 30 | June 30 | March 31 | ||||||
2011 | 2010 | 2010 | 2010 | 2010 | ||||||
Asset Quality Ratios (including amounts related to covered loans | ||||||||||
and covered foreclosed property) (1)(2) | ||||||||||
Loans 30-89 days past due and still accruing as a | ||||||||||
percentage of total loans and leases | 1.29 | % | 1.65 | % | 1.86 | % | 1.83 | % | 1.85 | % |
Loans 90 days or more past due and still accruing | ||||||||||
as a percentage of total loans and leases | 1.36 | 1.34 | 1.53 | 1.74 | 1.66 | |||||
Nonperforming loans and leases as a | ||||||||||
percentage of total loans and leases | 2.49 | 2.49 | 2.64 | 2.77 | 2.71 | |||||
Nonperforming assets as a percentage of: | ||||||||||
Total assets | 2.69 | 2.73 | 2.81 | 2.90 | 2.79 | |||||
Loans and leases plus foreclosed property | 3.97 | 3.94 | 4.11 | 4.24 | 4.31 | |||||
Net charge-offs as a percentage of average loans and leases | 1.56 | 2.02 | 3.31 | 2.48 | 1.84 | |||||
Allowance for loan and lease losses as a percentage of | ||||||||||
loans and leases held for investment | 2.58 | 2.62 | 2.56 | 2.66 | 2.65 | |||||
Ratio of allowance for loan and lease losses to: | ||||||||||
Net charge-offs | 1.61 | X | 1.27 | X | .75 | X | 1.06 | X | 1.41 | X |
Nonperforming loans and leases held for investment | 1.09 | 1.26 | 1.32 | .98 | .96 | |||||
Asset Quality Ratios (excluding amounts related to covered loans | ||||||||||
and covered foreclosed property) (1)(2)(3) | ||||||||||
Loans 30-89 days past due and still accruing as a | ||||||||||
percentage of total loans and leases | 1.11 | % | 1.39 | % | 1.65 | % | 1.53 | % | 1.63 | % |
Loans 90 days or more past due and still accruing | ||||||||||
as a percentage of total loans and leases | .27 | .29 | .29 | .28 | .30 | |||||
Nonperforming loans and leases as a | ||||||||||
percentage of total loans and leases | 2.64 | 2.64 | 2.82 | 2.97 | 2.91 | |||||
Nonperforming assets as a percentage of: | ||||||||||
Total assets | 2.56 | 2.64 | 2.76 | 2.93 | 2.82 | |||||
Loans and leases plus foreclosed property | 3.85 | 3.88 | 4.12 | 4.37 | 4.46 | |||||
Net charge-offs as a percentage of average loans and leases (4) | 1.65 | 2.15 | 3.54 | 2.66 | 1.99 | |||||
Allowance for loan and lease losses as a percentage of | ||||||||||
loans and leases held for investment | 2.58 | 2.63 | 2.69 | 2.84 | 2.84 | |||||
Ratio of allowance for loan and lease losses to: | ||||||||||
Net charge-offs | 1.52 | X | 1.20 | X | .74 | X | 1.05 | X | 1.40 | X |
Nonperforming loans and leases held for investment | 1.03 | 1.19 | 1.30 | .98 | .96 |
Applicable ratios are annualized. | |
(1) |
Excludes mortgage loans guaranteed by GNMA that BB&T does not have the obligation to repurchase. |
(2) |
Excludes mortgage loans guaranteed by the government. |
(3) |
These asset quality ratios have been adjusted to remove the impact of covered loans and covered foreclosed property. Appropriate adjustments to the numerator and denominator have been reflected in the calculation of these ratios. Management believes the inclusion of covered loans in certain asset quality ratios that include nonperforming assets, past due loans or net charge-offs in the numerator or denominator results in distortion of these ratios and they may not be comparable to other periods presented or to other portfolios that were not impacted by purchase accounting. |
(4) |
Excluding the impact of losses and balances associated with BB&T's NPA disposition strategy, the adjusted net charge-offs ratio would have been 2.07%, 1.80% and 2.06% for the fourth quarter of 2010, third quarter of 2010 and second quarter of 2010, respectively. |
15
BB&T Corporation Credit Quality - Supplemental Schedules (Dollars in millions, except average loan and average client size) |
|
SUPPLEMENTAL COMMERCIAL REAL ESTATE LOAN PORTFOLIO INFORMATION (1)(2) | ||||||||||||
RESIDENTIAL ACQUISITION, DEVELOPMENT, AND CONSTRUCTION LOANS (ADC) | ||||||||||||
As of/For the Period Ended March 31, 2011 | ||||||||||||
Builder / | Land / Land | Condos / | ||||||||||
Construction | Development | Townhomes | Total ADC | |||||||||
Total loans outstanding | $ | 829 | $ | 2,079 | $ | 153 | $ | 3,061 | ||||
Average loan size (in thousands) | 220 | 519 | 1,080 | 387 | ||||||||
Average client size (in thousands) | 575 | 855 | 2,268 | 775 | ||||||||
Nonaccrual loans and leases as a percentage of category | 20.12 | % | 18.42 | % | 11.54 | % | 18.54 | % | ||||
Gross charge-offs as a percentage of category: | ||||||||||||
Year-to-Date | 8.23 | 10.07 | .66 | 9.06 | ||||||||
As of/For the Period Ended March 31, 2011 | ||||||||||||
Gross Charge- | ||||||||||||
Offs as a | ||||||||||||
Nonaccrual as a | Percentage of | |||||||||||
RESIDENTIAL ACQUISITION, DEVELOPMENT, AND | Total | Percentage of | Outstandings | |||||||||
CONSTRUCTION LOANS (ADC) BY STATE OF ORIGINATION | Outstandings | Outstandings | Year-to-Date | |||||||||
North Carolina | $ | 1,390 | 21.19 | % | 9.90 | % | ||||||
Virginia | 571 | 6.38 | 1.88 | |||||||||
South Carolina | 283 | 18.57 | 6.51 | |||||||||
Georgia | 234 | 23.37 | 14.66 | |||||||||
Florida | 163 | 27.17 | 11.65 | |||||||||
Washington, D.C. | 103 | 13.13 | 37.50 | |||||||||
Tennessee | 89 | 30.93 | 7.83 | |||||||||
West Virginia | 70 | 14.60 | 9.07 | |||||||||
Kentucky | 67 | 11.67 | 4.98 | |||||||||
Maryland | 54 | 3.29 | .64 | |||||||||
Alabama | 37 | 64.81 | 2.00 | |||||||||
Total | $ | 3,061 | 18.54 | % | 9.06 | % | ||||||
OTHER COMMERCIAL REAL ESTATE LOANS (3) | ||||||||||||
As of/For the Period Ended March 31, 2011 | ||||||||||||
Commercial | Permanent | Total Other | ||||||||||
Commercial | Land/ | Income Producing | Commercial | |||||||||
Construction | Development | Properties | Real Estate | |||||||||
Total loans outstanding | $ | 943 | $ | 1,283 | $ | 9,059 | $ | 11,285 | ||||
Average loan size (in thousands) | 1,029 | 625 | 501 | 536 | ||||||||
Average client size (in thousands) | 1,462 | 745 | 760 | 789 | ||||||||
Nonaccrual loans and leases as a percentage of category | 4.28 | % | 11.82 | % | 3.49 | % | 4.50 | % | ||||
Gross charge-offs as a percentage of category: | ||||||||||||
Year-to-Date | .86 | 11.63 | 1.56 | 2.71 | ||||||||
As of/For the Period Ended March 31, 2011 | ||||||||||||
Gross Charge- | ||||||||||||
Offs as a | ||||||||||||
Nonaccrual as a | Percentage of | |||||||||||
OTHER COMMERCIAL REAL ESTATE LOANS BY STATE OF | Total | Percentage of | Outstandings | |||||||||
ORIGINATION (3) | Outstandings | Outstandings | Year-to-Date | |||||||||
North Carolina | $ | 3,489 | 4.11 | % | 1.67 | % | ||||||
Virginia | 1,872 | 1.59 | .96 | |||||||||
Georgia | 1,649 | 8.37 | 6.92 | |||||||||
South Carolina | 898 | 6.13 | 2.01 | |||||||||
Florida | 761 | 12.77 | 9.25 | |||||||||
Washington, D.C. | 622 | 1.31 | 2.93 | |||||||||
Maryland | 576 | .93 | .04 | |||||||||
Kentucky | 449 | 1.53 | .11 | |||||||||
West Virginia | 412 | .62 | .72 | |||||||||
Tennessee | 346 | 4.95 | 1.08 | |||||||||
Alabama | 98 | 4.86 | - | |||||||||
Other | 113 | - | - | |||||||||
Total | $ | 11,285 | 4.50 | % | 2.71 | % | ||||||
Applicable ratios are annualized. | |
(1) | Commercial real estate loans (CRE) are defined as loans to finance non-owner occupied real property where the primary repayment source is the sale or rental/lease of the real property. Definition is based on internal classification. Excludes covered loans and in process items. |
(2) | Includes net charge-offs and average balances related to loans transferred to held for sale while they were held for investment. Loans transferred to held for sale are excluded from total loans outstanding. As of March 31, 2011, there were $76 million ADC loans and $65 million other CRE loans held for sale. |
All of the held for sale ADC and Other CRE loans are on nonaccrual status. | |
(3) |
C&I loans secured by real property are excluded. |
16
BB&T Corporation Credit Quality - Supplemental Schedules (Dollars in millions, except average loan size) |
|
SUPPLEMENTAL RESIDENTIAL MORTGAGE PORTFOLIO INFORMATION (1) | |||||||||||||||
As of/For the Period Ended March 31, 2011 | |||||||||||||||
Construction/ | |||||||||||||||
RESIDENTIAL MORTGAGE LOANS | Prime | ALT-A | Permanent | Subprime (2) | Total | ||||||||||
Total loans outstanding | $ | 15,430 | $ | 2,031 | $ | 521 | $ | 467 | $ | 18,449 | |||||
Average loan size (in thousands) | 193 | 306 | 310 | 60 | 192 | ||||||||||
Average refreshed credit score (3) | 724 | 694 | 718 | 573 | 717 | ||||||||||
Percentage that are first mortgages | 100 | % | 100 | % | 99 | % | 82 | % | 99 | % | |||||
Average loan to value at origination | 74 | 68 | 73 | 74 | 73 | ||||||||||
Nonaccrual loans and leases as a percentage of category | 1.90 | 7.57 | 7.76 | 9.26 | 2.87 | ||||||||||
Gross charge-offs as a percentage of category: | |||||||||||||||
Year-to-Date | .87 | 2.68 | 3.53 | 4.36 | 1.25 | ||||||||||
As of/For the Period Ended March 31, 2011 | |||||||||||||||
Gross Charge- | |||||||||||||||
Offs as a | |||||||||||||||
Nonaccrual as a | Percentage of | ||||||||||||||
Total | Percentage of | Outstandings | |||||||||||||
RESIDENTIAL MORTGAGE LOANS BY STATE | Outstandings | Outstandings | Year-to-Date | ||||||||||||
North Carolina | $ | 4,470 | 2.17 | % | .66 | % | |||||||||
Virginia | 3,125 | 2.27 | .99 | ||||||||||||
Florida | 2,332 | 5.92 | 3.57 | ||||||||||||
Maryland | 1,782 | 2.65 | .85 | ||||||||||||
South Carolina | 1,703 | 3.29 | 1.08 | ||||||||||||
Georgia | 1,677 | 3.15 | 1.68 | ||||||||||||
Kentucky | 477 | 1.68 | .10 | ||||||||||||
Texas | 431 | .30 | .11 | ||||||||||||
West Virginia | 378 | 1.37 | .38 | ||||||||||||
Tennessee | 370 | 2.74 | .71 | ||||||||||||
Alabama | 251 | 1.20 | .44 | ||||||||||||
Washington, D.C. | 224 | 2.40 | .86 | ||||||||||||
Missouri | 159 | .66 | .36 | ||||||||||||
Indiana | 107 | .44 | .19 | ||||||||||||
Other | 963 | 3.51 | 1.62 | ||||||||||||
Total | $ | 18,449 | 2.87 | % | 1.25 | % | |||||||||
SUPPLEMENTAL DIRECT RETAIL 1-4 FAMILY AND LOT/LAND REAL ESTATE PORTFOLIO INFORMATION (4) | |||||||||||||||
As of/For the Period Ended March 31, 2011 | |||||||||||||||
Residential | Home Equity | Home Equity | |||||||||||||
DIRECT RETAIL 1-4 FAMILY AND LOT/LAND REAL ESTATE LOANS & LINES | Lot/Land Loans | Loans | Lines | Total | |||||||||||
Total loans outstanding | $ | 1,283 | $ | 5,918 | $ | 5,400 | $ | 12,601 | |||||||
Average loan size (in thousands) (5) | 58 | 44 | 36 | 41 | |||||||||||
Average refreshed credit score (6) | 721 | 722 | 761 | 745 | |||||||||||
Percentage that are first mortgages | 100 | % | 77 | % | 28 | % | 59 | % | |||||||
Average loan to value at origination | 78 | 63 | 64 | 64 | |||||||||||
Nonaccrual loans and leases as a percentage of category | 5.23 | 1.41 | .50 | 1.41 | |||||||||||
Gross charge-offs as a percentage of category: | |||||||||||||||
Year-to-Date | 9.03 | 1.57 | 1.34 | 2.25 | |||||||||||
As of/For the Period Ended March 31, 2011 | |||||||||||||||
Gross Charge- | |||||||||||||||
Offs as a | |||||||||||||||
Nonaccrual as a | Percentage of | ||||||||||||||
DIRECT RETAIL 1-4 FAMILY AND LOT/LAND REAL ESTATE | Total | Percentage of | Outstandings | ||||||||||||
LOANS AND LINES BY STATE OF ORIGINATION | Outstandings | Outstandings | Year-to-Date | ||||||||||||
North Carolina | $ | 4,312 | 1.68 | % | 2.35 | % | |||||||||
Virginia | 2,849 | .75 | .92 | ||||||||||||
South Carolina | 1,199 | 1.94 | 3.20 | ||||||||||||
Georgia | 1,007 | 1.58 | 3.37 | ||||||||||||
Maryland | 804 | .85 | 1.81 | ||||||||||||
West Virginia | 764 | 1.19 | 1.07 | ||||||||||||
Florida | 627 | 2.06 | 6.66 | ||||||||||||
Kentucky | 568 | 1.40 | 1.13 | ||||||||||||
Tennessee | 345 | 1.96 | 2.64 | ||||||||||||
Washington, D.C. | 82 | .93 | 4.43 | ||||||||||||
Other | 44 | 1.51 | 1.98 | ||||||||||||
Total | $ | 12,601 | 1.41 | % | 2.25 | % |
Applicable ratios are annualized. | |
(1) | Excludes mortgage loans held for sale, covered loans, mortgage loans guaranteed by GNMA that BB&T does not have the obligation to repurchase and in process items. |
(2) | Includes $327 million in loans originated by Lendmark Financial Services, which are disclosed as a part of the specialized lending category. |
(3) | Weighted based on outstanding balance. |
(4) | Direct retail 1-4 family and lot/land real estate loans are originated through the BB&T branching network. Excludes covered loans and in process items. |
(5) | Home equity lines without an outstanding balance are excluded from this calculation. |
(6) | Based on number of accounts. |
17
SUPPLEMENTAL TROUBLED DEBT RESTRUCTURINGS INFORMATION
As of March 31, 2011 | ||||||||||||||
Past Due 30-89 | Past Due 90+ | |||||||||||||
Current Status | Days | Days | Total | |||||||||||
Performing restructurings: (1) | ||||||||||||||
Commercial loans | ||||||||||||||
Commercial and industrial | $ | 118 | 94.4 | % | $ | 7 | 5.6 | % | $ | - | - | % | $ | 125 |
Commercial real estate—other | 233 | 100.0 | - | - | - | - | 233 | |||||||
Commercial real estate—residential ADC | 117 | 97.5 | 3 | 2.5 | - | - | 120 | |||||||
Direct retail lending | 139 | 95.2 | 6 | 4.1 | 1 | 0.7 | 146 | |||||||
Sales finance loans | 3 | 60.0 | - | - | 2 | 40.0 | 5 | |||||||
Revolving credit loans | 49 | 79.0 | 7 | 11.3 | 6 | 9.7 | 62 | |||||||
Residential mortgage loans (2) | 485 | 82.6 | 82 | 14.0 | 20 | 3.4 | 587 | |||||||
Specialized lending | 29 | 93.5 | 2 | 6.5 | - | - | 31 | |||||||
Total performing restructurings | 1,173 | 89.6 | 107 | 8.2 | 29 | 2.2 | 1,309 | |||||||
Nonperforming restructurings (3) | 142 | 29.7 | 81 | 16.9 | 256 | 53.4 | 479 | |||||||
Total restructurings | $ | 1,315 | 73.6 | $ | 188 | 10.5 | $ | 285 | 15.9 | $ | 1,788 |
(1) | Past due performing restructurings are included in past due disclosures. |
(2) | Excludes restructured mortgage loans that are government guaranteed totaling $148 million. |
(3) | Nonperforming restructurings are included in nonaccrual loan disclosures. |
18
BB&T Corporation Capital Information - Five Quarter Trend (Dollars in millions, except per share data, shares in thousands) |
|
As of / Quarter Ended | |||||||||||||||
March 31 | Dec. 31 | Sept. 30 | June 30 | March 31 | |||||||||||
2011 | 2010 | 2010 | 2010 | 2010 | |||||||||||
Selected Capital Information (1) | |||||||||||||||
Risk-based capital | |||||||||||||||
Tier 1 | $ | 14,100 | $ | 13,959 | $ | 13,828 | $ | 13,594 | $ | 13,657 | |||||
Total | 18,385 | 18,319 | 18,465 | 18,327 | 18,658 | ||||||||||
Risk-weighted assets (2) | 116,215 | 118,131 | 117,894 | 116,073 | 117,410 | ||||||||||
Average quarterly tangible assets | 151,049 | 153,349 | 149,253 | 153,399 | 157,603 | ||||||||||
Risk-based capital ratios | |||||||||||||||
Tier 1 | 12.1 | % | 11.8 | % | 11.7 | % | 11.7 | % | 11.6 | % | |||||
Total | 15.8 | 15.5 | 15.7 | 15.8 | 15.9 | ||||||||||
Leverage capital ratio | 9.3 | 9.1 | 9.3 | 8.9 | 8.7 | ||||||||||
Equity as a percentage of total assets | 10.6 | 10.5 | 10.7 | 10.8 | 10.1 | ||||||||||
Book value per common share | $ | 23.86 | $ | 23.67 | $ | 24.11 | $ | 24.07 | $ | 23.80 | |||||
Selected Non-GAAP Capital Information (3) | |||||||||||||||
Tangible common equity as a percentage of tangible assets | 7.2 | % | 7.1 | % | 7.0 | % | 7.0 | % | 6.4 | % | |||||
Tier 1 common equity as a percentage of risk-weighted assets | 9.3 | 9.1 | 9.0 | 8.9 | 8.6 | ||||||||||
Tangible book value per common share | $ | 15.59 | $ | 15.43 | $ | 15.25 | $ | 14.93 | $ | 14.67 | |||||
Calculations of Tier 1 common equity and tangible assets and related measures: | |||||||||||||||
Tier 1 equity | $ | 14,100 | $ | 13,959 | $ | 13,828 | $ | 13,594 | $ | 13,657 | |||||
Less: | |||||||||||||||
Qualifying restricted core capital elements | 3,248 | 3,248 | 3,255 | 3,254 | 3,508 | ||||||||||
Tier 1 common equity | 10,852 | 10,711 | 10,573 | 10,340 | 10,149 | ||||||||||
Total assets | $ | 157,039 | $ | 157,081 | $ | 157,230 | $ | 155,083 | $ | 163,700 | |||||
Less: | |||||||||||||||
Intangible assets, net of deferred taxes | 6,374 | 6,391 | 6,419 | 6,502 | 6,519 | ||||||||||
Plus: | |||||||||||||||
Regulatory adjustments, net of deferred taxes | 572 | 636 | 207 | 187 | 493 | ||||||||||
Tangible assets | 151,237 | 151,326 | 151,018 | 148,768 | 157,674 | ||||||||||
Total risk-weighted assets (2) | $ | 116,215 | $ | 118,131 | $ | 117,894 | $ | 116,073 | $ | 117,410 | |||||
Tangible common equity as a percentage of tangible assets | 7.2 | % | 7.1 | % | 7.0 | % | 7.0 | % | 6.4 | % | |||||
Tier 1 common equity as a percentage of risk-weighted assets | 9.3 | 9.1 | 9.0 | 8.9 | 8.6 | ||||||||||
Tier 1 common equity | $ | 10,852 | $ | 10,711 | $ | 10,573 | $ | 10,340 | $ | 10,149 | |||||
Outstanding shares at end of period (in thousands) | 696,285 | 694,381 | 693,560 | 692,777 | 691,869 | ||||||||||
Tangible book value per common share | $ | 15.59 | $ | 15.43 | $ | 15.25 | $ | 14.93 | $ | 14.67 |
(1) |
Current quarter regulatory capital information is preliminary. |
(2) |
Risk-weighted assets are determined based on regulatory capital requirements. Under the regulatory framework for determining risk-weighted assets each asset class is assigned a risk-weighting of 0%, 20%, 50% or 100% based on the underlying risk of the specific asset class. In addition, off balance sheet exposures are first converted to a balance sheet equivalent amount and subsequently assigned to one of the four risk-weightings. |
(3) |
Tangible common equity and Tier 1 common equity ratios are Non-GAAP measures. BB&T uses the Tier 1 common equity definition used in the SCAP assessment to calculate these ratios. BB&T's management uses these measures to assess the quality of capital and believes that investors may find them useful in their analysis of the Corporation. These capital measures are not necessarily comparable to similar capital measures that may be presented by other companies. |
19
Percentage Increase (Decrease) | ||||
YTD | Link QTD | |||
PERCENTAGE CHANGES IN SELECTED BALANCE SHEET ITEMS (1) | 1Q11 vs. 1Q10 | 1Q11 vs. 4Q10 | ||
Average Balances | ||||
Commercial loans and leases (2) | ||||
Commercial and industrial | 7.2 | % | 9.1 | % |
Commercial real estate—other | (2.9 | ) | (10.1 | ) |
Commercial real estate—residential ADC | (33.9 | ) | (41.1 | ) |
Direct retail lending | (3.5 | ) | (2.9 | ) |
Sales finance loans | 10.5 | 3.8 | ||
Revolving credit loans | 4.6 | (0.8 | ) | |
Residential mortgage loans (2) | 18.9 | 22.7 | ||
Specialized lending | 4.3 | (7.2 | ) | |
Other acquired loans | (47.2 | ) | (38.6 | ) |
Total loans and leases held for investment (excluding covered loans) | 3.9 | 3.5 | ||
Covered loans | (22.4 | ) | (35.1 | ) |
Total loans and leases held for investment | 1.9 | 1.1 | ||
Noninterest-bearing deposits | 13.8 | (0.7 | ) | |
Interest checking | (3.9 | ) | (9.7 | ) |
Other client deposits | 8.2 | 25.7 | ||
Client certificates of deposit | (31.4 | ) | (19.5 | ) |
Total client deposits | (2.9 | ) | 8.7 | |
Other interest-bearing deposits | (35.6 | ) | (139.6 | ) |
Total deposits | (4.8 | ) | 0.1 | |
Percentage Increase (Decrease) | ||||
YTD | Link QTD | |||
PERCENTAGE CHANGES IN SELECTED INCOME STATEMENT ITEMS (1)(3) | 1Q11 vs. 1Q10 | 1Q11 vs. 4Q10 | ||
Net interest income - taxable equivalent | (5.0 | ) % | (7.9 | ) % |
Noninterest income | ||||
Insurance income | (1.2 | ) | 1.6 | |
Service charges on deposits | (17.7 | ) | (22.7 | ) |
Mortgage banking income | 9.4 | (98.9 | ) | |
Investment banking and brokerage fees and commissions | 10.1 | (41.8 | ) | |
Checkcard fees | 18.0 | (5.6 | ) | |
Other nondeposit fees and commissions | 3.1 | (6.0 | ) | |
Bankcard fees and merchant discounts | 15.0 | (8.6 | ) | |
Trust and investment advisory revenues | 13.2 | 9.7 | ||
Other income, net | (15.0 | ) | (110.1 | ) |
Total noninterest income | (.1 | ) | (30.2 | ) |
Noninterest expense | ||||
Personnel expense | 7.4 | 9.0 | ||
Foreclosed property expense | (19.7 | ) | (47.6 | ) |
Occupancy and equipment expense | .7 | (2.6 | ) | |
Other noninterest expense | 2.1 | (36.6 | ) | |
Total noninterest expense | 1.6 | (12.3 | ) | |
Applicable ratios are annualized. | |
(1) |
Adjusted to exclude estimated growth that resulted from the timing of acquisitions. |
(2) |
Adjusted to exclude the estimated impact of loans disposed of or transferred in connection with BB&T NPA disposition strategy. |
(3) |
Excludes securities gains (losses), merger-related and restructuring charges, the net impact of valuation adjustments for mortgage servicing rights, gains or losses on mortgage servicing rights-related derivatives, the impacts of FDIC loss share accounting, and other selected items as noted on page 21 of this supplement. |
20
Favorable (Unfavorable) | |||||||||||||||||
Selected Items | Pre-Tax | After-Tax | |||||||||||||||
First Quarter 2011 | |||||||||||||||||
Losses/write-downs related to NPA disposition strategy | Other noninterest income | $ | (74 | ) | $ | (46 | ) | ||||||||||
Fourth Quarter 2010 | |||||||||||||||||
Losses/write-downs related to NPA disposition strategy | Other noninterest income | (62 | ) | (39 | ) | ||||||||||||
Third Quarter 2010 | |||||||||||||||||
Losses/write-downs related to NPA disposition strategy | Other noninterest income | (28 | ) | (17 | ) | ||||||||||||
Second Quarter 2010 | |||||||||||||||||
No selected items noted | |||||||||||||||||
First Quarter 2010 | |||||||||||||||||
Colonial premises and equipment adjustment | Occupancy and equipment expense | 16 | 10 | ||||||||||||||
Contingency reserve adjustment | Other noninterest expense | 11 | 7 | ||||||||||||||
As of / Quarter Ended | |||||||||||||||||
March 31 | Dec. 31 | Sept. 30 | June 30 | March 31 | |||||||||||||
2011 | 2010 | 2010 | 2010 | 2010 | |||||||||||||
Selected Mortgage Banking Information | |||||||||||||||||
Income statement impact of mortgage servicing rights valuation | |||||||||||||||||
MSRs fair value increase (decrease) | $ | 41 | $ | 191 | $ | (101 | ) | $ | (234 | ) | $ | 5 | |||||
MSRs hedge gains (losses) | (39 | ) | (176 | ) | 132 | 241 | (1 | ) | |||||||||
Net | $ | 2 | $ | 15 | $ | 31 | $ | 7 | $ | 4 | |||||||
Residential mortgage loan originations | $ | 5,802 | $ | 8,406 | $ | 6,656 | $ | 5,013 | $ | 4,791 | |||||||
Residential mortgage servicing portfolio | |||||||||||||||||
Loans serviced for others | 64,894 | 61,795 | 60,207 | 59,322 | 57,200 | ||||||||||||
Bank-owned loans serviced | 21,271 | 21,396 | 20,331 | 18,621 | 18,719 | ||||||||||||
Total servicing portfolio | 86,165 | 83,191 | 80,538 | 77,943 | 75,919 | ||||||||||||
Weighted-average coupon rate | 5.17 | % | 5.26 | % | 5.37 | % | 5.43 | % | 5.49 | % | |||||||
Weighted-average servicing fee | .346 | .350 | .354 | .357 | .363 | ||||||||||||
Selected Miscellaneous Information | |||||||||||||||||
Derivatives notional amount | $ | 57,160 | $ | 65,386 | $ | 67,201 | $ | 64,187 | $ | 64,558 | |||||||
Fair value of derivatives | (77 | ) | (69 | ) | 277 | 279 | 307 | ||||||||||
Accumulated comprehensive income related to securities, | |||||||||||||||||
net of tax (1) | (307 | ) | (333 | ) | 49 | 74 | (81 | ) | |||||||||
Common stock prices | |||||||||||||||||
High | 29.60 | 27.57 | 28.69 | 35.72 | 32.93 | ||||||||||||
Low | 25.95 | 22.15 | 21.72 | 26.18 | 25.40 | ||||||||||||
End of period | 27.45 | 26.29 | 24.08 | 26.31 | 32.39 | ||||||||||||
Banking offices | 1,781 | 1,782 | 1,790 | 1,791 | 1,838 | ||||||||||||
ATMs | 2,476 | 2,481 | 2,494 | 2,496 | 2,534 | ||||||||||||
FTEs | 31,365 | 31,354 | 31,331 | 31,603 | 31,929 |
(1) |
Includes the impact of the FDIC loss sharing agreements on the covered securities. |
21
Quarter Ended | |||||||||||||||
March 31 | Dec. 31 | Sept. 30 | June 30 | March 31 | |||||||||||
NON-GAAP Reconciliation Table | 2011 | 2010 | 2010 | 2010 | 2010 | ||||||||||
Efficiency ratio - GAAP | 67.4 | % | 60.9 | % | 57.3 | % | 61.7 | % | 61.2 | % | |||||
Effect of securities gains (losses), net | - | 2.4 | 5.6 | 5.1 | (.1 | ) | |||||||||
Effect of merger-related and restructuring charges, net | .1 | (.2 | ) | (.4 | ) | (1.6 | ) | (.7 | ) | ||||||
Effect of contingency reserve | - | - | - | - | .5 | ||||||||||
Effect of losses/write-downs on NPA disposition loans | (2.1 | ) | (1.5 | ) | (.6 | ) | - | - | |||||||
Effect of Colonial premises and equipment adjustments | - | - | - | - | .8 | ||||||||||
Effect of FDIC loss share accounting | - | 2.0 | .6 | - | .3 | ||||||||||
Effect of foreclosed property expense | (7.0 | ) | (7.1 | ) | (7.1 | ) | (10.1 | ) | (8.1 | ) | |||||
Effect of amortization of intangibles | (1.3 | ) | (1.2 | ) | (1.3 | ) | (1.4 | ) | (1.5 | ) | |||||
Efficiency ratio - reported | 57.1 | 55.3 | 54.1 | 53.7 | 52.4 | ||||||||||
Fee income ratio - GAAP | 35.1 | % | 41.3 | % | 45.2 | % | 42.7 | % | 38.5 | % | |||||
Effect of securities gains (losses), net | - | (2.5 | ) | (5.8 | ) | (5.5 | ) | .1 | |||||||
Effect of losses/write-downs on NPA disposition loans | 2.2 | 1.6 | .6 | - | - | ||||||||||
Effect of FDIC loss share accounting | 2.8 | 1.4 | 2.3 | 3.6 | .4 | ||||||||||
Fee income ratio - reported | 40.1 | 41.8 | 42.3 | 40.8 | 39.0 |
22