
© PPL Corporation 2015
4th Quarter Earnings Call
PPL Corporation
February 5, 2015
U.K. Regulated
KY Regulated
PA Regulated
Supply
Exhibit 99.2

© PPL Corporation 2015
2
Cautionary Statements and Factors
That May Affect Future Results
That May Affect Future Results
Any statements made in this presentation about future operating
results or other future events are forward-looking statements
under the Safe Harbor Provisions of the Private Securities
Litigation Reform Act of 1995. Actual results may differ materially
from such forward-looking statements. A discussion of factors
that could cause actual results or events to vary is contained in
the Appendix to this presentation and in the Company’s SEC
filings.

© PPL Corporation 2015
3
2014 Earnings Results, Operational Overview
and 2015 Earnings Forecast
and 2015 Earnings Forecast
Segment Results and Financial Overview
Q&A
W. H. Spence
V. Sorgi
Agenda
© PPL Corporation 2015
4
Earnings Results

© PPL Corporation 2015
5
2015 Ongoing Earnings Forecast
|
Segment
|
2014A
|
2014 Regulated Utility
Earnings (Adjusted) |
2015E
Midpoint(1)
|
|
U.K. Regulated
|
$1.37
|
$1.37
|
$1.38
|
|
Kentucky Regulated
|
0.47
|
0.47
|
0.48
|
|
PA Regulated
|
0.40
|
0.40
|
0.39
|
|
Supply
|
0.29
|
----
|
----
|
|
Corporate and Other(2)
|
(0.08)
|
(0.21)
|
(0.10)
|
|
Total
|
$2.45
|
$2.03
|
$2.15
|
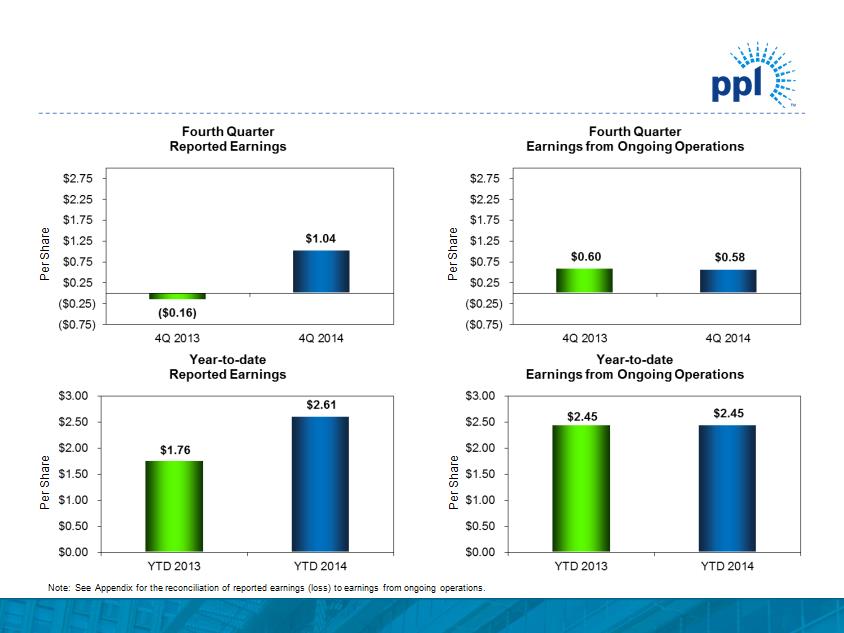
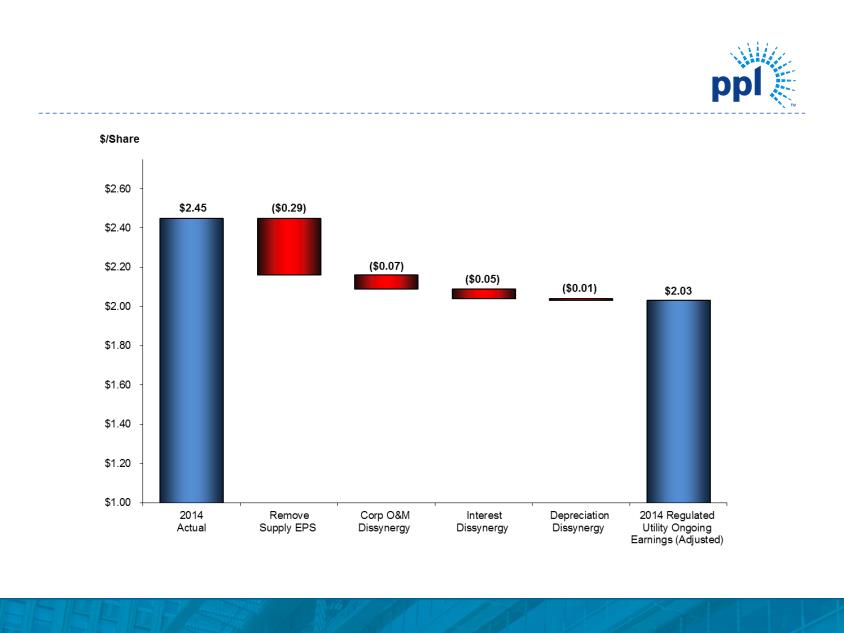
$2.45
$2.25
$2.03
Note: See Appendix for the reconciliation of 2014 reported earnings (loss) to earnings from ongoing operations to regulated utility earnings from ongoing operations (adjusted).
(1) 2015 earnings presented here exclude any earnings from PPL Energy Supply and net costs associated with the Supply spinoff. However, PPL Energy Supply will be part of PPL Corporation’s
consolidated earnings for a portion of 2015 based on an expected closing in Q2 2015.
consolidated earnings for a portion of 2015 based on an expected closing in Q2 2015.
(2) This category primarily includes unallocated corporate-level financing and other costs. For 2014, regulated utility earnings from ongoing operations (adjusted) reflects the full impact of dissynergies
related to the spinoff of PPL Energy Supply: Indirect O&M ($0.07), Interest ($0.05) and Depreciation ($0.01).
related to the spinoff of PPL Energy Supply: Indirect O&M ($0.07), Interest ($0.05) and Depreciation ($0.01).
$2.05

© PPL Corporation 2015
6
• WPD named Utility of the Year
• Update on Kentucky Rate Cases
• Update on Major Capital Projects
2014 Regulated Operational Overview
© PPL Corporation 2015
7
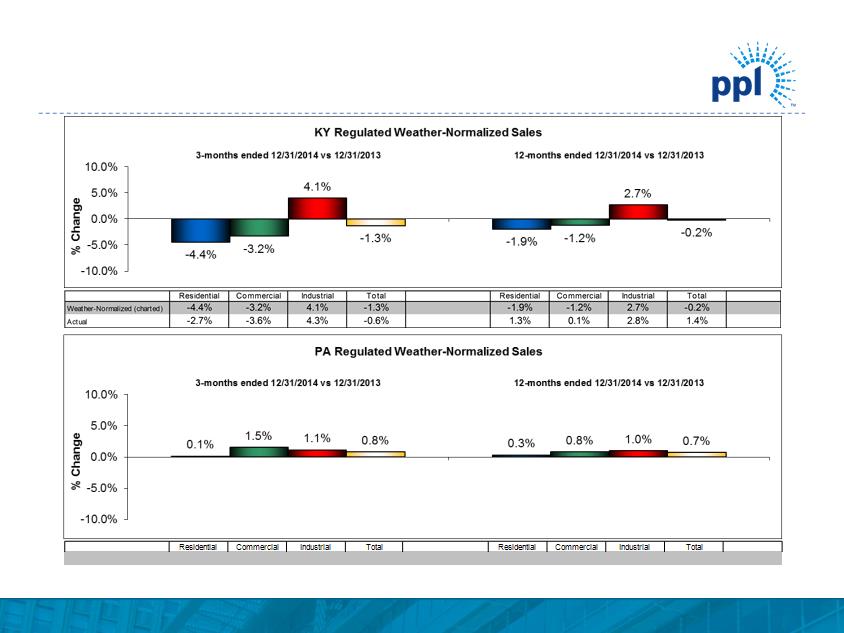
Note: Total includes Residential, Commercial and Industrial customer classes as well as “Other”, which is not depicted on the charts above.
U.S. Regulated Volume Variances
|
Weather-Normalized (charted)
|
0.1%
|
1.5%
|
1.1%
|
0.8%
|
|
0.3%
|
0.8%
|
1.0%
|
0.7%
|
|
|
Actual
|
-4.1%
|
-0.1%
|
1.1%
|
-1.6%
|
|
0.6%
|
0.9%
|
1.0%
|
0.7%
|
|

© PPL Corporation 2015
8
2014 Supply Operational Overview
• Montana hydro sale complete
• Strong 2014 fleet performance
• Energy Supply spin update

© PPL Corporation 2015
9
• Energy Supply spin expected to close in Q2
• WPD focused on executing plan for RIIO-ED1
• LG&E and KU rate cases
• PA rate case
• Execution of $3.6 billion capex program across the
regulated portfolio
regulated portfolio
• Corporate restructuring
2015 Objectives/Highlights

© PPL Corporation 2015
10
|
|
Q4 2014
|
|
Q4 2013
|
|
Change
|
|
U.K. Regulated
|
$0.36
|
|
$0.30
|
|
$0.06
|
|
Kentucky Regulated
|
0.10
|
|
0.12
|
|
(0.02)
|
|
Pennsylvania Regulated
|
0.10
|
|
0.07
|
|
0.03
|
|
Supply
|
0.05
|
|
0.13
|
|
(0.08)
|
|
Corporate and Other
|
(0.03)
|
|
(0.02)
|
|
(0.01)
|
|
Total
|
$0.58
|
|
$0.60
|
|
$(0.02)
|
Ongoing Earnings Overview
Note: See Appendix for the reconciliation of reported earnings (loss) to earnings from ongoing operations.
|
|
2014
|
|
2013
|
|
Change
|
|
U.K. Regulated
|
$1.37
|
|
$1.32
|
|
$0.05
|
|
Kentucky Regulated
|
0.47
|
|
0.48
|
|
(0.01)
|
|
Pennsylvania Regulated
|
0.40
|
|
0.31
|
|
0.09
|
|
Supply
|
0.29
|
|
0.39
|
|
(0.10)
|
|
Corporate and Other
|
(0.08)
|
|
(0.05)
|
|
(0.03)
|
|
Total
|
$2.45
|
|
$2.45
|
|
$0.00
|

© PPL Corporation 2015
11
|
|
Year-to-Date
|
|
|
2013 EPS - Ongoing Earnings
|
|
$1.32
|
|
Utility revenue
|
0.11
|
|
|
O&M
|
0.05
|
|
|
Depreciation
|
(0.02)
|
|
|
Income taxes
|
(0.06)
|
|
|
Other
|
(0.03)
|
|
|
Total
|
|
0.05
|
|
2014 EPS - Ongoing Earnings
|
|
$1.37
|
U.K. Regulated Segment
Earnings Drivers
Earnings Drivers
Note: See Appendix for the reconciliation of reported earnings (loss) to earnings from ongoing operations.

© PPL Corporation 2015
12
|
|
Year-to-Date
|
|
|
2013 EPS - Ongoing Earnings
|
|
$0.48
|
|
Gross margins
|
0.07
|
|
|
O&M
|
(0.03)
|
|
|
Depreciation
|
(0.01)
|
|
|
Financing costs
|
(0.01)
|
|
|
Other
|
(0.03)
|
|
|
Total
|
|
(0.01)
|
|
2014 EPS - Ongoing Earnings
|
|
$0.47
|
Kentucky Regulated Segment
Earnings Drivers
Earnings Drivers
Note: See Appendix for the reconciliation of reported earnings (loss) to earnings from ongoing operations.

© PPL Corporation 2015
13
|
|
Year-to-Date
|
|
|
2013 EPS - Ongoing Earnings
|
|
$0.31
|
|
Gross delivery margins
|
0.10
|
|
|
O&M
|
0.01
|
|
|
Depreciation
|
(0.01)
|
|
|
Financing costs
|
(0.01)
|
|
|
Total
|
|
0.09
|
|
2014 EPS - Ongoing Earnings
|
|
$0.40
|
Pennsylvania Regulated Segment
Earnings Drivers
Earnings Drivers
Note: See Appendix for the reconciliation of reported earnings (loss) to earnings from ongoing operations.

© PPL Corporation 2015
14
|
|
Year-to-Date
|
|
|
2013 EPS - Ongoing Earnings
|
|
$0.39
|
|
East energy margins
|
(0.15)
|
|
|
Financing costs
|
0.03
|
|
|
Income taxes and other
|
0.02
|
|
|
Total
|
|
(0.10)
|
|
2014 EPS - Ongoing Earnings
|
|
$0.29
|
Supply Segment Earnings Drivers
Note: See Appendix for the reconciliation of reported earnings (loss) to earnings from ongoing operations.
© PPL Corporation 2015
15
Note: See Appendix for the reconciliation of reported earnings (loss) to earnings from ongoing operations to regulated utility earnings from ongoing operations (adjusted).
2014 Ongoing Earnings to 2014 Regulated
Utility Ongoing Earnings (Adjusted) Walk
Utility Ongoing Earnings (Adjusted) Walk
© PPL Corporation 2015
16
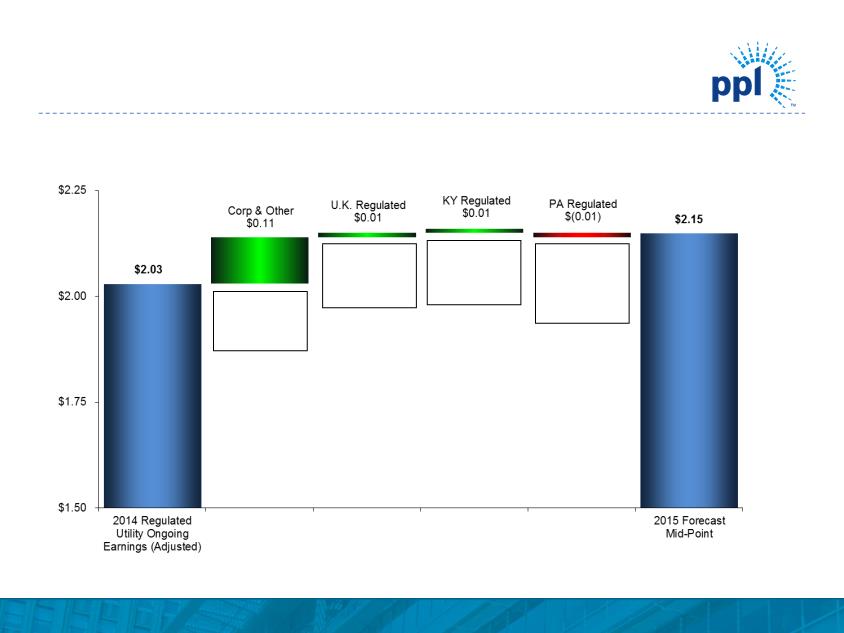
2014 Regulated Utility Ongoing Earnings
(Adjusted) to 2015E Earnings Walk
(Adjusted) to 2015E Earnings Walk
Note: See Appendix for the reconciliation of reported earnings (loss) to earnings from ongoing operations to regulated utility earnings from ongoing operations (adjusted).
($ Per Share)
Revenue: ($.14)
Taxes: $.11
Currency: $.06
Other: ($.02)
Margins: $.09
O&M: ($.05)
Depreciation: ($.01)
Interest: ($.02)
Margins: $.06
O&M: ($.03)
Depreciation: ($.02)
Interest: ($.01)
Taxes: ($.01)
Corporate
Restructuring: $ .07
Restructuring: $ .07
Taxes: $ .02
Other: $ .02
© PPL Corporation 2015
17
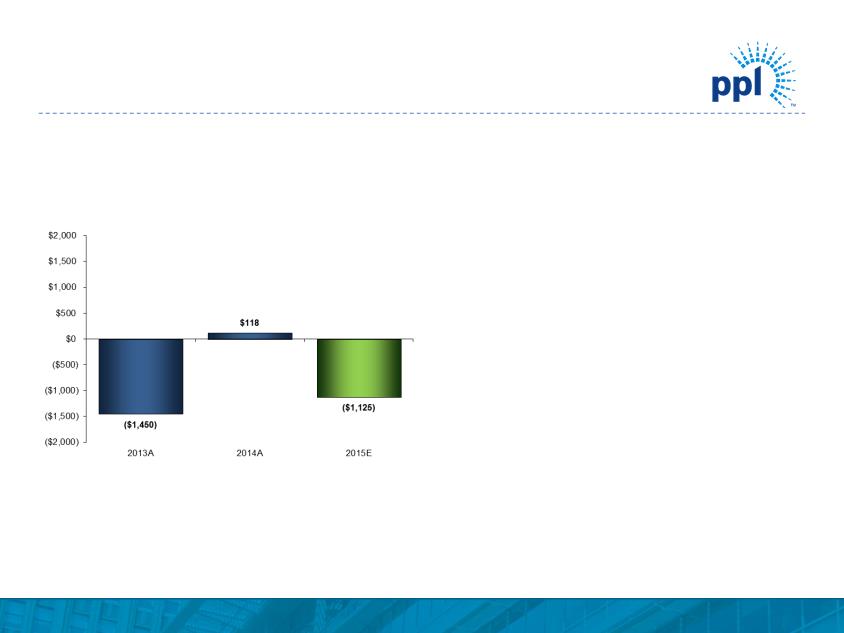
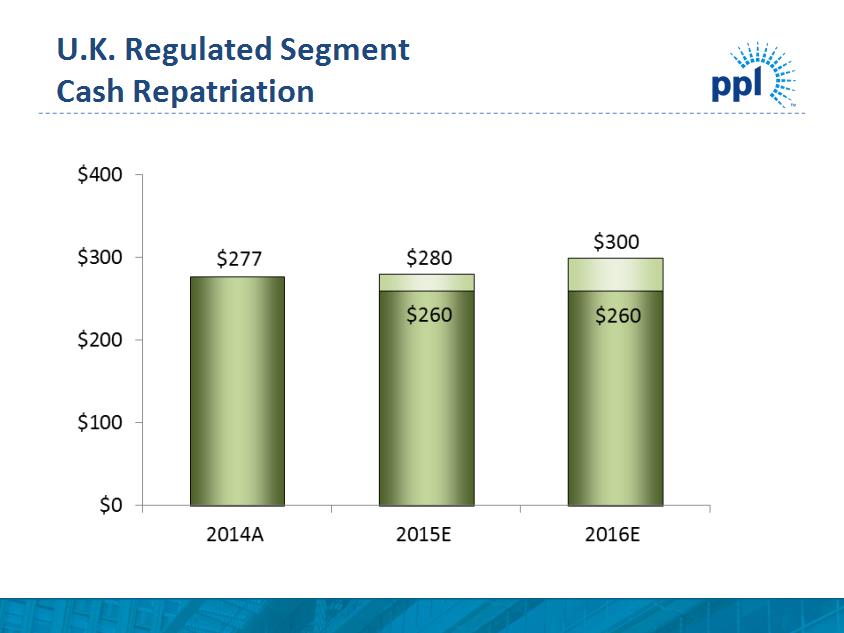
Free Cash Flow before Dividends
Free Cash Flow before
Dividends
Dividends
(Millions of Dollars)
Reconciliation of Cash from
Operations to Free Cash Flow
before Dividends
Operations to Free Cash Flow
before Dividends
(Millions of dollars)
Note: Free Cash Flow forecast updated on an annual basis.
(1) 2015E Cash from Operations includes a distribution of $191M from PPL Energy Supply in Q1 of 2015.
(2) 2014A includes proceeds from the sale of Montana hydro facilities which closed in Q4.
|
|
|
|
2013A
|
2014A
|
2015E
|
|
|
|
|
|
|
|
|
Cash from Operations (1)
|
|
$ 2,857
|
$ 3,403
|
$ 2,486
|
|
|
|
|
|
|
|
|
|
Increase (Decrease) in cash due to:
|
|
|
|
||
|
|
Capital Expenditures
|
(4,307)
|
(4,185)
|
(3,611)
|
|
|
|
Sale of Assets (2)
|
|
900
|
|
|
|
|
|
|
|
|
|
|
Free Cash Flow before Dividends
|
$ (1,450)
|
$ 118
|
$ (1,125)
|
||
© PPL Corporation 2015
18
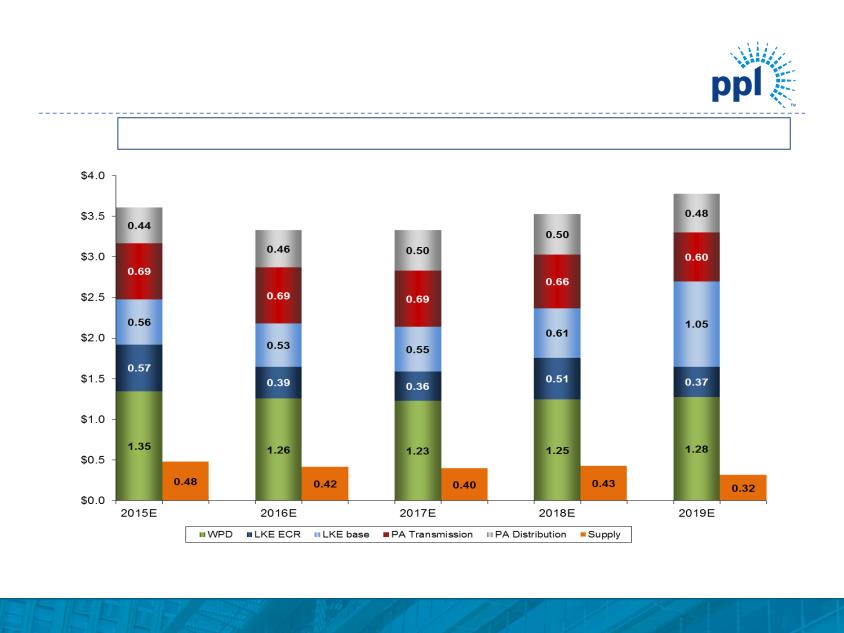
($ in billions)
Note: Corporate and Other capital expenditures average approximately $10 million per year.
(1) WPD figures based on assumed exchange rate of $1.60 / GBP.
(2) Expect between 80% and 90% to receive timely returns via ECR mechanism based on historical experience and future projections.
Operating Segment Capital Expenditures
Significant and stable investment opportunities in regulated utilities
$3.61
$3.33
$3.33
$3.53
$3.78
(1)
(2)

© PPL Corporation 2015
19
($ in billions)
(1) Represents capitalization for LKE, as LG&E and KU rate constructs are based on capitalization. Represents Regulatory Asset Value (RAV) for WPD.
(2) WPD figures based on assumed exchange rate of $1.60 / £ for 2015 - 2019.
5-Year Regulatory Asset Base(1) CAGR: 7.0%
Projected Regulated Rate Base Growth
$22.9
$24.6
$26.2
$28.0
$30.1
$32.1
(2)

© PPL Corporation 2015
20
Targeted 4% to 6% EPS Growth Rate Drivers
Through 2017
Through 2017
PA Regulated
– Successful execution of capex plan
– 2015 Rate Case with rates effective early 2016
– Minimal load growth
KY Regulated
– Environmental capex spending at $1.3B
– 2014 Rate Case with rates effective mid-2015
– Minimal load growth
U.K. Regulated
– Execution of the Ofgem accepted RIIO-ED1 Business plan
– Exchange rate of $1.60 per £
– RPI (inflation rate) - 2.6% for 2015/16; 3.0% for 2016/17
– Incentive revenues
Corp and other
– Eliminate dissynergies of the Supply spin through corporate restructuring
– Equity issuances of $200 million per year
© PPL Corporation 2015
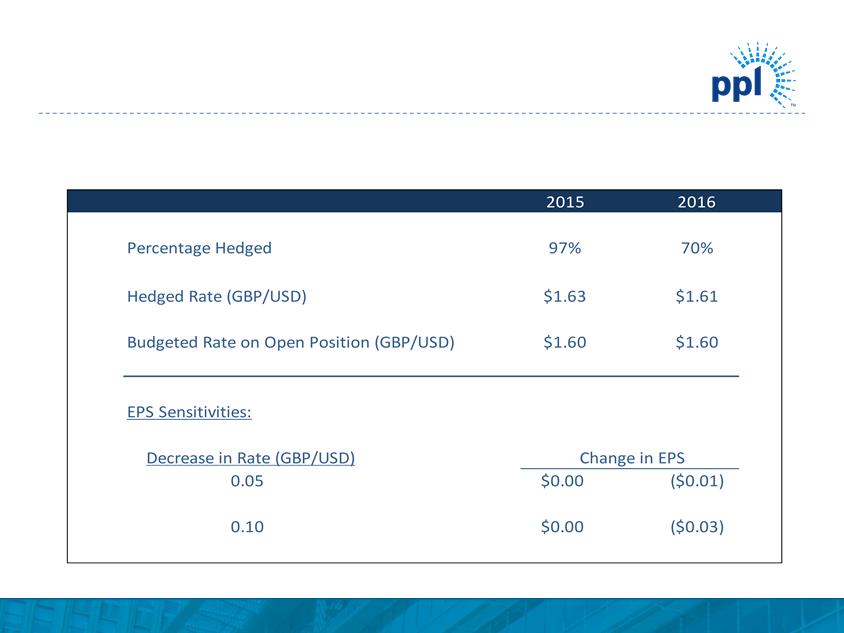
Foreign Currency Hedging Status
21
Foreign Currency Hedging Status 2015 2016 Percentage Hedged Hedged Rate (GBP/USD) Budgeted Rate on Open Position (GBP/USD) EPS Sensitivities: Decrease in Rate (GBP/ USD) 0.05 0.10 97% 70% $1.63 $1.61 $1.60 $1.60 Change in EPS $0.00 ($0.01) $0.00 ($0.03) © PPL Corporation 2015 21

© PPL Corporation 2015
Historical view of GBP Exchange Rate
22
Source: Bloomberg, as of 1/31/2015

© PPL Corporation 2015
23
Appendix

© PPL Corporation 2015
24
Schedule for LG&E and KU Rate Case
|
Timing
|
Milestone
|
|
01/08/2015
|
1st Request for information received
|
|
01/23/2015
|
LG&E and KU responses filed
|
|
02/06/2015
|
Supplemental request for information received
|
|
02/20/2015
|
LG&E and KU responses filed
|
|
03/06/2015
|
Intervenor testimony filed
|
|
03/23/2015
|
Requests to intervenors submitted
|
|
04/06/2015
|
Intervenor responses filed
|
|
04/17/2015
|
LG&E/KU Rebuttal testimony filed
|
|
TBD
|
Settlement conference
|
|
TBD
|
Public meetings across the state
|
|
04/21/2015
|
Public hearing in Frankfort
|
|
TBD
|
Order issued (tentative)
|
|
07/01/2015
|
New rates effective
|
P
Completed
P
P
© PPL Corporation 2015
25
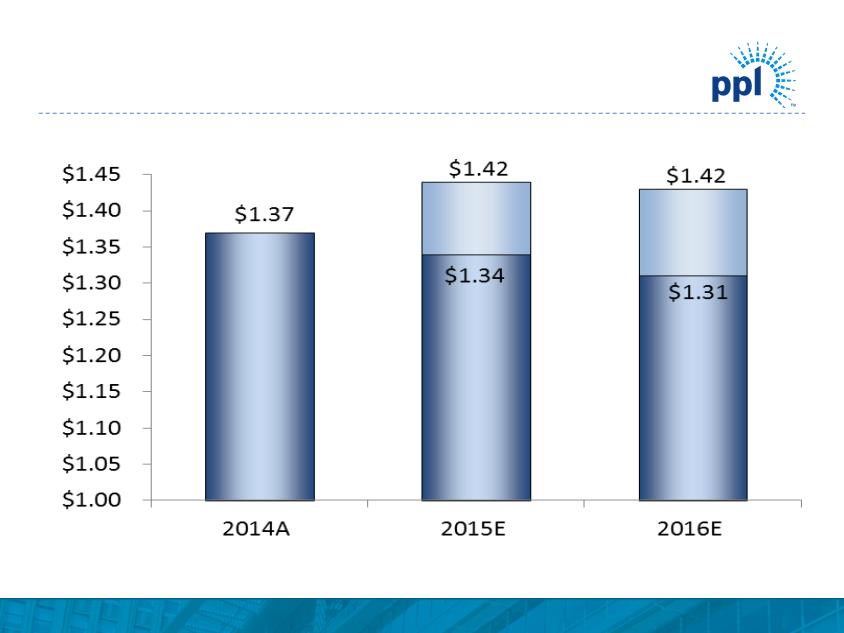
U.K. Regulated Segment
EPS from Ongoing Operations Projection
Note: Assumes foreign currency exchange rate of $1.60/£ for 2015E and 2016E on open positions.
($ Per Share)
Note: See Appendix for the 2014 reconciliation of reported earnings (loss) to earnings from ongoing operations.
© PPL Corporation 2015
26
Note: Assumes foreign currency exchange rate of $1.60/£ for 2015E and 2016E.
($ in millions)

© PPL Corporation 2015
27
Enhancing Value Through Active Hedging
Capacity revenues are expected to be $505 and $455 million for 2015 and 2016 respectively.
(1) Represents expected sales of Supply segment based on current business plan assumptions.
(2) The 2016 ranges of average energy prices for existing hedges were estimated by determining the impact on the existing collars resulting from 2016 power prices at the
5th and 95th percentile confidence levels.
5th and 95th percentile confidence levels.
Enhancing Value Through Active Hedging 2015 2016 Baseload Expected Generation(1) (Million MWhs) 49.7 45.4 East 45.4 41.6 West 4.3 3.9 Current Hedges (%) 97- 99% 24- 26% East 98-100% 21- 23% West 87-89% 48-50% Average Hedged Price (Energy Only) ($/ MWh) (2) East $40- 42 $42- 44 West $39- 41 $39- 41 Current Coal Hedges (%) 95% 69% East 93% 58% West 100% 100% Average Consumed Coal Price (Delivered $/ Ton) East $73- 75 $73- 76 West $26- 31 $27- 33 Intermediate/Peaking Expected Generation(1) (Million MWhs) 11.8 9.7 Current Hedges (%) 52% 9% Capacity revenues are expected to be $505 and $455 million for 2015 and 2016 respectively. (1) Represents expected sales of Supply segment based on current business plan assumptions. (2) The 2016 ranges of average energy prices for existing hedges were estimated by determining the impact on the existing collars resulting from 2016 power prices at the 5th and 95th percentile confidence levels. © PPL Corporation 2015 27
© PPL Corporation 2015
28
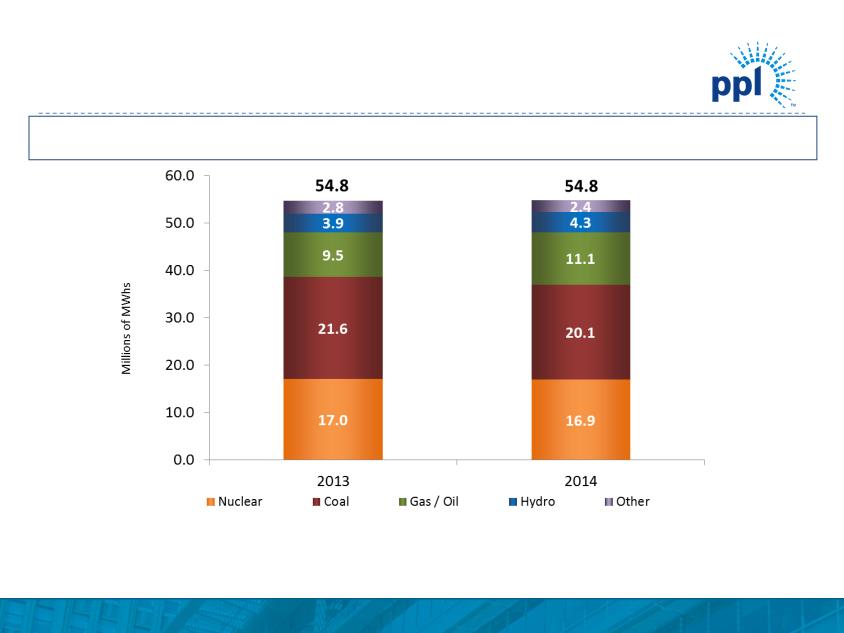
Competitive Generation Overview
Note: As of December 31, 2014
(1) Includes owned and contracted generation.
(2) Other includes PPAs, renewables and NUGS.
(2)
Total 2014 generation output(1) consistent with prior year due to improved gas performance
offset by lower economic operation of coal
offset by lower economic operation of coal

© PPL Corporation 2015
29
|
(1)
|
Hourly average.
|
|
(2)
|
NYMEX and TETCO M3 forward gas prices on 12/31/2014.
|
|
(3)
|
Market Heat Rate = PJM on-peak power price divided by TETCO M3 gas price.
|
Market Prices
Market Prices ELECTRIC AT C(1) NYMEX GAS(2) Mid- Columbia On-Peak Off-Peak AT C(1) PJM On-Peak Off-Peak (Per M W D) HEAT RATE(3) TETCO M3 PJM MARKET CAPACITY PRICES 2015 $45 $32 $38 $27 $21 $25 $3.03 $2.50 17.9 $155 2016 $45 $32 $38 $32 $24 $28 $3.46 $3.05 14.7 $139 (1) Hourly average. (2) NYMEX and TETCO M3 forward gas prices on 12/31/2014. (3) Market Heat Rate = PJM on-peak power price divided by TETCO M3 gas price. © PPL Corporation 2015 29
© PPL Corporation 2015
30
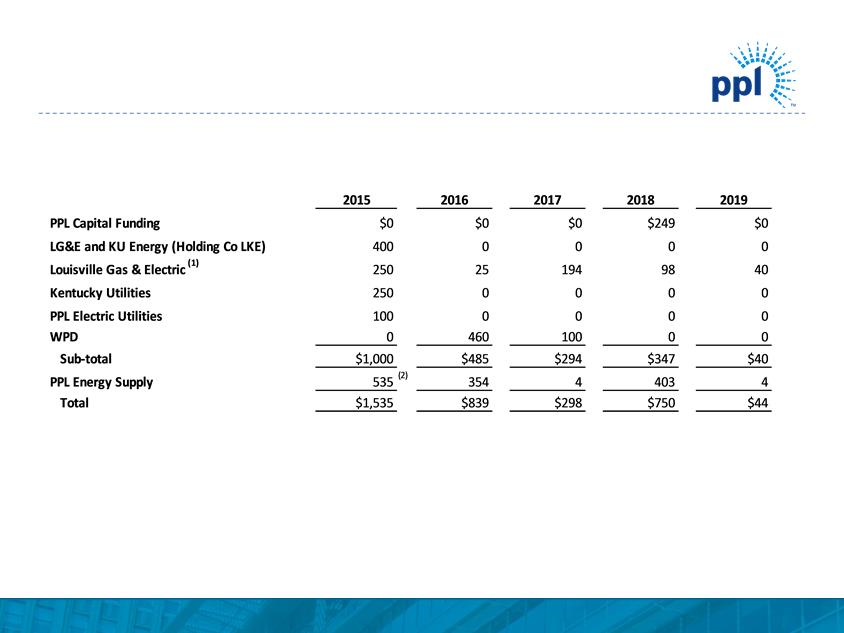
Debt Maturities
Note: As of December 31, 2014
(1) Louisville Gas & Electric has several municipal bonds that may be put by the holders before the bonds’ final maturities. These amounts reflect the timing of any put
option.
option.
(2) This amount includes $81 million of Pennsylvania Economic Development Financing Authority bonds due 2037 and $150 million of Pennsylvania Economic Development
Financing Authority bonds due 2038 that may be put by the holders in September 2015. This amount also includes $300 million of REset Put Securities due 2035 that
are required to be put by the holders in October 2015.
Financing Authority bonds due 2038 that may be put by the holders in September 2015. This amount also includes $300 million of REset Put Securities due 2035 that
are required to be put by the holders in October 2015.
($ in millions)
Debt Maturities ($in millions) 2015 2016 2017 2018 2019 PPL Capital Funding $0 $0 $0 $249 $0 LG& E and KU Energy (Holding Co LKE) 400 0 0 0 0 Louisville Gas & Electric (1) 250 25 194 98 40 Kentucky Utilities 250 0 0 0 0 PPL Electric Utilities 100 0 0 0 0 WPD 0 460 100 0 Sub- total $1,000 $485 $294 $347 $40 PPL Energy Supply 535 (2) 354 4 403 4 Total $1,535 $839 $298 $750 $44 Note: As of December 31, 2014 (1) Louisville Gas & Electric has several municipal bonds that may be put by the holders before the bonds’ final maturities. These amounts reflect the timing of any put option. (2) This amount includes $81 million of Pennsylvania Economic Development Financing Authority bonds due 2037 and $150 million of Pennsylvania Economic Development Financing Authority bonds due 2038 that may be put by the holders in September 2015. This amount also includes $300 million of REset Put Securities due 2035 that are required to be put by the holders in October 2015. © PPL Corporation 2015 30

© PPL Corporation 2015
31
Liquidity Profile
Note: As of December 31, 2014
Credit facilities consist of a diverse bank group, with no bank and its affiliates providing an aggregate commitment of more than 10% of the total committed capacity for the
domestic facilities and 13% of the total committed capacity for WPD’s facilities.
(1) As a result of the proposed spinoff transaction, PPL Energy Supply has syndicated a $1.85 billion credit facility which is currently fully committed. This syndicated credit facility
is replacing the existing $3 billion PPL Energy Supply syndicated credit facility and will be effective upon closing of the spinoff transaction.
is replacing the existing $3 billion PPL Energy Supply syndicated credit facility and will be effective upon closing of the spinoff transaction.
(2) In October 2014, the KU letter of credit facility was terminated and replaced with a new $198 million letter of credit facility expiring October 2017.
(3) In December 2014, the BBVA uncommitted letter of credit facility was terminated.
Liquidity Profile Entity Facility Expiration Date Capacity (Millions) Letters of Credit & Commercial Paper Issued (Millions) Borrowed (Millions) Unused Capacity (Millions) PPL Capital Funding Syndicated Credit Facility Syndicated Credit Facility Bilateral Credit Facility Uncommitted Credit Facility Nov-2018 Jul- 2019 Mar-2015 $300 300 150 65 $815 $0 0 21 1 $22 $0 0 0 0 $0 $300 300 129 64 $793 PPL Electric Utilities Syndicated Credit Facility Jul- 2019 $300 $1 $0 $299 LG& E and KU Energy (LKE) Syndicated Credit Facility Oct-2018 $75 $0 $75 $0 Louisville Gas & Electric Syndicated Credit Facility Jul- 2019 $500 $264 $0 $236 Kentucky Utilities Syndicated Credit Facility Letter of Credit Facility Jul- 2019 Oct-2017 (2) $400 198 $598 $236 198 $434 $0 0 $0 $164 0 $164 WPD WPD Limited Syndicated Credit Facility WPD (South Wes t) Syndicated Credit Facility WPD (East Midlands) Syndicated Credit Facility WPD (Wes t Midlands) Syndicated Credit Facility Uncommitted Credit Facilities Dec-2016 Jul- 2019 Jul- 2019 Jul- 2019 £ 210 245 300 300 105 £1,160 £ 0 0 0 0 5 £5 £ 103 0 64 0 0 £167 £107 245 236 300 100 £ 988 PPL Energy Supply (1) Syndicated Credit Facility Letter of Credit Facility Uncommitted Credit Facilities Nov-2017 Mar-2015 (3) $3,000 150 100 $3,250 $121 138 22 $281 $630 0 0 $630 $2,249 12 78 $2,339 Note: As of December 31, 2014 Credit facilities consist of a diverse bank group, with no bank and its affiliates providing an aggregate commitment of more than 10% of the total committed capacity for the domestic facilities and 13% of the total committed capacity for WPD’s facilities. (1) As a result of the proposed spinoff transaction, PPL Energy Supply has syndicated a $1.85 billion credit facility which is currently fully committed. This syndicated credit facility is replacing the existing $3 billion PPL Energy Supply syndicated credit facility and will be effective upon closing of the spinoff transaction. (2) In October 2014, the KU letter of credit facility was terminated and replaced with a new $198 million letter of credit facility expiring October 2017. (3) In December 2014, the BBVA uncommitted letter of credit facility was terminated. © PPL Corporation 2015 31

© PPL Corporation 2015
32
Reconciliation of Reported Earnings (Loss) to
Earnings from Ongoing Operations
Earnings from Ongoing Operations
|
(After-Tax)
|
|||||||||||||||||||
|
(Unaudited)
|
|||||||||||||||||||
|
|
|
|
|
|
|
|
|
|
|
|
|
|
|
|
|
|
|
|
|
|
4th Quarter 2014
|
|
(millions of dollars)
|
|||||||||||||||||
|
|
|
|
U.K.
|
|
Kentucky
|
|
Pennsylvania
|
|
|
|
Corporate
|
|
|
||||||
|
|
|
|
Regulated
|
|
Regulated
|
|
Regulated
|
|
Supply
|
|
and Other
|
|
Total
|
||||||
|
Reported Earnings (Loss)
|
|
$
|
294
|
|
$
|
65
|
|
$
|
69
|
|
$
|
291
|
|
$
|
(24)
|
|
$
|
695
|
|
|
Special Items (expense) benefit:
|
|
|
|
|
|
|
|
|
|
|
|
|
|
|
|
|
|
|
|
|
Adjusted energy-related economic activity, net
|
|
|
|
|
|
|
|
|
|
|
|
110
|
|
|
|
|
|
110
|
|
|
Foreign currency-related economic hedges
|
|
|
55
|
|
|
|
|
|
|
|
|
|
|
|
|
|
|
55
|
|
|
Spinoff of PPL Energy Supply:
|
|
|
|
|
|
|
|
|
|
|
|
|
|
|
|
|
|
|
|
|
|
Change in tax valuation allowances
|
|
|
|
|
|
|
|
|
|
|
|
|
|
|
3
|
|
|
3
|
|
|
Transition and transaction costs
|
|
|
|
|
|
|
|
|
|
|
|
(1)
|
|
|
(4)
|
|
|
(5)
|
|
|
Separation benefits
|
|
|
|
|
|
|
|
|
|
|
|
(3)
|
|
|
(1)
|
|
|
(4)
|
|
Sale of Montana hydroelectric generating facilities
|
|
|
|
|
|
|
|
|
|
|
|
137
|
|
|
|
|
|
137
|
|
|
Other:
|
|
|
|
|
|
|
|
|
|
|
|
|
|
|
|
|
|
|
|
|
|
Mechanical contracting and engineering revenue adjustment
|
|
|
|
|
|
|
|
|
|
|
|
10
|
|
|
|
|
|
10
|
|
|
Separation benefits - bargaining unit voluntary program
|
|
|
|
|
|
|
|
|
|
|
|
1
|
|
|
|
|
|
1
|
|
Total Special Items
|
|
|
55
|
|
|
|
|
|
|
|
|
254
|
|
|
(2)
|
|
|
307
|
|
|
Earnings from Ongoing Operations
|
|
$
|
239
|
|
$
|
65
|
|
$
|
69
|
|
$
|
37
|
|
$
|
(22)
|
|
$
|
388
|
|
|
|
|
|
|
|
|
|
|
|
|
|
|
|
|
|
|
|
|
|
|
|
|
|
|
|
|
|
|
|
|
|
|
|
|
|
|
|
|
|
|
|
|
|
|
|
|
|
|
|
|
|
|
|
|
|
|
|
|
|
|
|
|
|
|
|
|
(per share - diluted)
|
||||||||||||||||
|
|
|
|
U.K.
|
|
Kentucky
|
|
Pennsylvania
|
|
|
|
Corporate
|
|
|
||||||
|
|
|
|
Regulated
|
|
Regulated
|
|
Regulated
|
|
Supply
|
|
and Other
|
|
Total
|
||||||
|
Reported Earnings (Loss)
|
|
$
|
0.44
|
|
$
|
0.10
|
|
$
|
0.10
|
|
$
|
0.43
|
|
$
|
(0.03)
|
|
$
|
1.04
|
|
|
Special Items (expense) benefit:
|
|
|
|
|
|
|
|
|
|
|
|
|
|
|
|
|
|
|
|
|
Adjusted energy-related economic activity, net
|
|
|
|
|
|
|
|
|
|
|
|
0.16
|
|
|
|
|
|
0.16
|
|
|
Foreign currency-related economic hedges
|
|
|
0.08
|
|
|
|
|
|
|
|
|
|
|
|
|
|
|
0.08
|
|
|
Sale of Montana hydroelectric generating facilities
|
|
|
|
|
|
|
|
|
|
|
|
0.20
|
|
|
|
|
|
0.20
|
|
|
Other:
|
|
|
|
|
|
|
|
|
|
|
|
|
|
|
|
|
|
|
|
|
|
Mechanical contracting and engineering revenue adjustment
|
|
|
|
|
|
|
|
|
|
|
|
0.02
|
|
|
|
|
|
0.02
|
|
Total Special Items
|
|
|
0.08
|
|
|
|
|
|
|
|
|
0.38
|
|
|
|
|
|
0.46
|
|
|
Earnings from Ongoing Operations
|
|
$
|
0.36
|
|
$
|
0.10
|
|
$
|
0.10
|
|
$
|
0.05
|
|
$
|
(0.03)
|
|
$
|
0.58
|
|
|
|
|
|
|
|
|
|
|
|
|
|
|
|
|
|
|
|
|
|
|

© PPL Corporation 2015
33
Reconciliation of Reported Earnings (Loss) to
Earnings from Ongoing Operations
Earnings from Ongoing Operations
|
(After-Tax)
|
|||||||||||||||||||
|
(Unaudited)
|
|||||||||||||||||||
|
|
|
|
|
|
|
|
|
|
|
|
|
|
|
|
|
|
|
|
|
|
Year-to-Date December 31, 2014
|
|
(millions of dollars)
|
|||||||||||||||||
|
|
|
|
U.K.
|
|
Kentucky
|
|
Pennsylvania
|
|
|
|
Corporate
|
|
|
||||||
|
|
|
|
Regulated
|
|
Regulated
|
|
Regulated
|
|
Supply
|
|
and Other
|
|
Total
|
||||||
|
Reported Earnings (Loss)
|
$
|
982
|
|
$
|
312
|
|
$
|
263
|
|
$
|
307
|
|
$
|
(127)
|
|
$
|
1,737
|
||
|
Special Items (expense) benefit:
|
|
|
|
|
|
|
|
|
|
|
|
|
|
|
|
|
|
|
|
|
Adjusted energy-related economic activity, net
|
|
|
|
|
|
|
|
|
|
|
|
(6)
|
|
|
|
|
|
(6)
|
|
|
Foreign currency-related economic hedges
|
|
|
127
|
|
|
|
|
|
|
|
|
|
|
|
|
|
|
127
|
|
|
Kerr Dam Project impairment
|
|
|
|
|
|
|
|
|
|
|
|
(10)
|
|
|
|
|
|
(10)
|
|
|
Spinoff of PPL Energy Supply:
|
|
|
|
|
|
|
|
|
|
|
|
|
|
|
|
|
|
|
|
|
|
Change in tax valuation allowances
|
|
|
|
|
|
|
|
|
|
|
|
|
|
|
(46)
|
|
|
(46)
|
|
|
Transition and transaction costs
|
|
|
|
|
|
|
|
|
|
|
|
(1)
|
|
|
(17)
|
|
|
(18)
|
|
|
Separation benefits
|
|
|
|
|
|
|
|
|
|
|
|
(10)
|
|
|
(12)
|
|
|
(22)
|
|
Sale of Montana hydroelectric generating facilities
|
|
|
|
|
|
|
|
|
|
|
|
137
|
|
|
|
|
|
137
|
|
|
Other:
|
|
|
|
|
|
|
|
|
|
|
|
|
|
|
|
|
|
|
|
|
|
Change in WPD line loss accrual
|
|
|
(52)
|
|
|
|
|
|
|
|
|
|
|
|
|
|
|
(52)
|
|
|
Mechanical contracting and engineering revenue adjustment
|
|
|
|
|
|
|
|
|
|
|
|
10
|
|
|
|
|
|
10
|
|
|
Separation benefits - bargaining unit voluntary program
|
|
|
|
|
|
|
|
|
(2)
|
|
|
(10)
|
|
|
|
|
|
(12)
|
|
Total Special Items
|
|
|
75
|
|
|
|
|
|
(2)
|
|
|
110
|
|
|
(75)
|
|
|
108
|
|
|
Earnings from Ongoing Operations
|
|
$
|
907
|
|
$
|
312
|
|
$
|
265
|
|
$
|
197
|
|
$
|
(52)
|
|
$
|
1,629
|
|
|
|
|
|
|
|
|
|
|
|
|
|
|
|
|
|
|
|
|
|
|

© PPL Corporation 2015
34
Reconciliation of Reported Earnings (Loss) to
Earnings from Ongoing Operations to Regulated
Utility Earnings from Ongoing Operations (Adjusted)
Earnings from Ongoing Operations to Regulated
Utility Earnings from Ongoing Operations (Adjusted)
|
(After-Tax)
|
|||||||||||||||||||
|
(Unaudited)
|
|||||||||||||||||||
|
|
|
|
|
|
|
|
|
|
|
|
|
|
|
|
|
|
|
|
|
|
Year-to-Date December 31, 2014
|
|
(per share - diluted) (a)
|
|||||||||||||||||
|
|
|
|
U.K.
|
|
Kentucky
|
|
Pennsylvania
|
|
|
|
Corporate
|
|
|
||||||
|
|
|
|
Regulated
|
|
Regulated
|
|
Regulated
|
|
Supply
|
|
and Other
|
|
Total
|
||||||
|
Reported Earnings (Loss)
|
|
$
|
1.48
|
|
$
|
0.47
|
|
$
|
0.39
|
|
$
|
0.46
|
|
$
|
(0.19)
|
|
$
|
2.61
|
|
|
Special Items (expense) benefit:
|
|
|
|
|
|
|
|
|
|
|
|
|
|
|
|
|
|
|
|
|
Adjusted energy-related economic activity, net
|
|
|
|
|
|
|
|
|
|
|
|
(0.01)
|
|
|
|
|
|
(0.01)
|
|
|
Foreign currency-related economic hedges
|
|
|
0.19
|
|
|
|
|
|
|
|
|
|
|
|
|
|
|
0.19
|
|
|
Kerr Dam Project impairment
|
|
|
|
|
|
|
|
|
|
|
|
(0.02)
|
|
|
|
|
|
(0.02)
|
|
|
Spinoff of PPL Energy Supply:
|
|
|
|
|
|
|
|
|
|
|
|
|
|
|
|
|
|
|
|
|
|
Change in tax valuation allowances
|
|
|
|
|
|
|
|
|
|
|
|
|
|
|
(0.07)
|
|
|
(0.07)
|
|
|
Transition and transaction costs
|
|
|
|
|
|
|
|
|
|
|
|
|
|
|
(0.02)
|
|
|
(0.02)
|
|
|
Separation benefits
|
|
|
|
|
|
|
|
|
|
|
|
(0.01)
|
|
|
(0.02)
|
|
|
(0.03)
|
|
Sale of Montana hydroelectric generating facilities
|
|
|
|
|
|
|
|
|
|
|
|
0.20
|
|
|
|
|
|
0.20
|
|
|
Other:
|
|
|
|
|
|
|
|
|
|
|
|
|
|
|
|
|
|
|
|
|
|
Change in WPD line loss accrual
|
|
|
(0.08)
|
|
|
|
|
|
|
|
|
|
|
|
|
|
|
(0.08)
|
|
|
Mechanical contracting and engineering revenue adjustment
|
|
|
|
|
|
|
|
|
|
|
|
0.02
|
|
|
|
|
|
0.02
|
|
|
Separation benefits - bargaining unit voluntary program
|
|
|
|
|
|
|
|
|
(0.01)
|
|
|
(0.01)
|
|
|
|
|
|
(0.02)
|
|
Total Special Items
|
|
|
0.11
|
|
|
|
|
|
(0.01)
|
|
|
0.17
|
|
|
(0.11)
|
|
|
0.16
|
|
|
Earnings from Ongoing Operations
|
|
$
|
1.37
|
|
$
|
0.47
|
|
$
|
0.40
|
|
$
|
0.29
|
|
$
|
(0.08)
|
|
$
|
2.45
|
|
|
|
|
|
|
|
|
|
|
|
|
|
|
|
|
|
|
|
|
|
|
|
Regulated Utility Earnings Adjustments (expense) benefit:
|
|
|
|
|
|
|
|
|
|
|
|
|
|
|
|
|
|
|
|
|
Supply segment earnings from ongoing operations (b)
|
|
|
|
|
|
|
|
|
|
|
|
(0.29)
|
|
|
|
|
|
(0.29)
|
|
|
Dissynergies related to the spinoff of PPL Energy Supply: (c)
|
|
|
|
|
|
|
|
|
|
|
|
|
|
|
|
|
|
|
|
|
|
Indirect O&M
|
|
|
|
|
|
|
|
|
|
|
|
|
|
|
(0.07)
|
|
|
(0.07)
|
|
|
Interest expense
|
|
|
|
|
|
|
|
|
|
|
|
|
|
|
(0.05)
|
|
|
(0.05)
|
|
|
Depreciation
|
|
|
|
|
|
|
|
|
|
|
|
|
|
|
(0.01)
|
|
|
(0.01)
|
|
Total Regulated Utility Earnings Adjustments
|
|
|
|
|
|
|
|
|
|
|
|
(0.29)
|
|
|
(0.13)
|
|
|
(0.42)
|
|
|
Regulated Utility Earnings from Ongoing Operations (Adjusted)
|
|
$
|
1.37
|
|
$
|
0.47
|
|
$
|
0.40
|
|
$
|
|
|
$
|
(0.21)
|
|
$
|
2.03
|
|
|
|
|
|
|
|
|
|
|
|
|
|
|
|
|
|
|
|
|
|
|
|
|
|
|
|
|
|
|
|
|
|
|
|
|
|
|
|
|
|
|
|
|
(a) The "If-Converted Method" has been applied to PPL's 2011 Equity Units prior to settlement, resulting in $9 million of interest charges (after-tax) being added back to earnings for the twelve months ended
|
|||||||||||||||||||
|
December 31, 2014, and approximately 11 million shares of PPL Common Stock being treated as outstanding. Both adjustments are only for purposes of calculating diluted earnings per share.
|
|||||||||||||||||||
|
(b) To remove Supply segment earnings from ongoing operations as the segment is expected to be disposed of as a result of the announced spinoff of PPL Energy Supply.
|
|||||||||||||||||||
|
(c) Represents 2014 costs allocated to the Supply segment that will remain with PPL after the expected spinoff of PPL Energy Supply.
|
|||||||||||||||||||

© PPL Corporation 2015
35
Reconciliation of Reported Earnings (Loss) to
Earnings from Ongoing Operations
Earnings from Ongoing Operations
|
(After-Tax)
|
|||||||||||||||||||
|
(Unaudited)
|
|||||||||||||||||||
|
|
|
|
|
|
|
|
|
|
|
|
|
|
|
|
|
|
|
|
|
|
4th Quarter 2013
|
|
(millions of dollars)
|
|||||||||||||||||
|
|
|
|
U.K.
|
|
Kentucky
|
|
Pennsylvania
|
|
|
|
Corporate
|
|
|
||||||
|
|
|
|
Regulated
|
|
Regulated
|
|
Regulated
|
|
Supply
|
|
and Other
|
|
Total
|
||||||
|
Reported Earnings (Loss)
|
|
$
|
181
|
|
$
|
80
|
|
$
|
49
|
|
$
|
(394)
|
|
$
|
(14)
|
|
$
|
(98)
|
|
|
Special Items (expense) benefit:
|
|
|
|
|
|
|
|
|
|
|
|
|
|
|
|
|
|
|
|
|
Adjusted energy-related economic activity, net
|
|
|
|
|
|
|
|
|
|
|
|
(30)
|
|
|
|
|
|
(30)
|
|
|
Foreign currency-related economic hedges
|
|
|
(21)
|
|
|
|
|
|
|
|
|
|
|
|
|
|
|
(21)
|
|
|
Corette asset impairment
|
|
|
|
|
|
|
|
|
|
|
|
(39)
|
|
|
|
|
|
(39)
|
|
|
WPD Midlands acquisition-related adjustments:
|
|
|
|
|
|
|
|
|
|
|
|
|
|
|
|
|
|
|
|
|
|
Other acquisition-related adjustments
|
|
|
10
|
|
|
|
|
|
|
|
|
|
|
|
|
|
|
10
|
|
Other:
|
|
|
|
|
|
|
|
|
|
|
|
|
|
|
|
|
|
|
|
|
|
LKE discontinued operations
|
|
|
|
|
|
1
|
|
|
|
|
|
|
|
|
|
|
|
1
|
|
|
Loss on Colstrip lease termination to facilitate the sale
|
|
|
|
|
|
|
|
|
|
|
|
|
|
|
|
|
|
|
|
|
of Montana hydro assets
|
|
|
|
|
|
|
|
|
|
|
|
(413)
|
|
|
|
|
|
(413)
|
|
Total Special Items
|
|
|
(11)
|
|
|
1
|
|
|
|
|
|
(482)
|
|
|
|
|
|
(492)
|
|
|
Earnings from Ongoing Operations
|
|
$
|
192
|
|
$
|
79
|
|
$
|
49
|
|
$
|
88
|
|
$
|
(14)
|
|
$
|
394
|
|
|
|
|
|
|
|
|
|
|
|
|
|
|
|
|
|
|
|
|
|
|
|
|
|
|
|
|
|
|
|
|
|
|
|
|
|
|
|
|
|
|
|
|
|
|
|
(per share - diluted)
|
||||||||||||||||
|
|
|
|
U.K.
|
|
Kentucky
|
|
Pennsylvania
|
|
|
|
Corporate
|
|
|
||||||
|
|
|
|
Regulated
|
|
Regulated
|
|
Regulated
|
|
Supply
|
|
and Other
|
|
Total
|
||||||
|
Reported Earnings (Loss) (a)
|
|
$
|
0.28
|
|
$
|
0.12
|
|
$
|
0.07
|
|
$
|
(0.61)
|
|
$
|
(0.02)
|
|
$
|
(0.16)
|
|
|
Special Items (expense) benefit:
|
|
|
|
|
|
|
|
|
|
|
|
|
|
|
|
|
|
|
|
|
Adjusted energy-related economic activity, net
|
|
|
|
|
|
|
|
|
|
|
|
(0.04)
|
|
|
|
|
|
(0.04)
|
|
|
Foreign currency-related economic hedges
|
|
|
(0.03)
|
|
|
|
|
|
|
|
|
|
|
|
|
|
|
(0.03)
|
|
|
Corette asset impairment
|
|
|
|
|
|
|
|
|
|
|
|
(0.06)
|
|
|
|
|
|
(0.06)
|
|
|
WPD Midlands acquisition-related adjustments:
|
|
|
|
|
|
|
|
|
|
|
|
|
|
|
|
|
|
|
|
|
|
Other acquisition-related adjustments
|
|
|
0.01
|
|
|
|
|
|
|
|
|
|
|
|
|
|
|
0.01
|
|
Other:
|
|
|
|
|
|
|
|
|
|
|
|
|
|
|
|
|
|
|
|
|
|
Loss on Colstrip lease termination to facilitate the sale
|
|
|
|
|
|
|
|
|
|
|
|
|
|
|
|
|
|
|
|
|
of Montana hydro assets
|
|
|
|
|
|
|
|
|
|
|
|
(0.62)
|
|
|
|
|
|
(0.62)
|
|
Effect of anti-dilutive, incremental shares (a)
|
|
|
|
|
|
|
|
|
|
|
|
(0.02)
|
|
|
|
|
|
(0.02)
|
|
|
Total Special Items
|
|
|
(0.02)
|
|
|
|
|
|
|
|
|
(0.74)
|
|
|
|
|
|
(0.76)
|
|
|
Earnings from Ongoing Operations (b)
|
|
$
|
0.30
|
|
$
|
0.12
|
|
$
|
0.07
|
|
$
|
0.13
|
|
$
|
(0.02)
|
|
$
|
0.60
|
|
|
|
|
|
|
|
|
|
|
|
|
|
|
|
|
|
|
|
|
|
|
|
(a) As a result of reported losses during the period, primarily due to the Colstrip lease termination, diluted earnings per share for the PPL total exclude incremental shares as they were anti-dilutive.
|
|||||||||||||||||||
|
|
The impact from the difference in shares is included in the Supply segment.
|
||||||||||||||||||
|
(b) The "If-Converted Method" has been applied to PPL's 2011 Equity Units prior to settlement, resulting in $7 million of interest charges (after-tax) being added back to earnings for the three months ended
|
|||||||||||||||||||
|
|
December 31, 2013, and approximately 33 million shares of PPL Common Stock being treated as outstanding. Both adjustments are only for purposes of calculating diluted earnings per share.
|
||||||||||||||||||
|
|
|
||||||||||||||||||

© PPL Corporation 2015
36
Reconciliation of Reported Earnings (Loss) to
Earnings from Ongoing Operations
Earnings from Ongoing Operations
|
(After-Tax)
|
|||||||||||||||||||
|
(Unaudited)
|
|||||||||||||||||||
|
|
|
|
|
|
|
|
|
|
|
|
|
|
|
|
|
|
|
|
|
|
Year-to-Date December 31, 2013
|
|
(millions of dollars)
|
|||||||||||||||||
|
|
|
|
U.K.
|
|
Kentucky
|
|
Pennsylvania
|
|
|
|
Corporate
|
|
|
||||||
|
|
|
|
Regulated
|
|
Regulated
|
|
Regulated
|
|
Supply
|
|
and Other
|
|
Total
|
||||||
|
Reported Earnings (Loss)
|
|
$
|
922
|
|
$
|
307
|
|
$
|
209
|
|
$
|
(272)
|
|
$
|
(36)
|
|
$
|
1,130
|
|
|
Special Items (expense) benefit:
|
|
|
|
|
|
|
|
|
|
|
|
|
|
|
|
|
|
|
|
|
Adjusted energy-related economic activity, net
|
|
|
|
|
|
|
|
|
|
|
|
(77)
|
|
|
|
|
|
(77)
|
|
|
Foreign currency-related economic hedges
|
|
|
(29)
|
|
|
|
|
|
|
|
|
|
|
|
|
|
|
(29)
|
|
|
Corette asset impairment
|
|
|
|
|
|
|
|
|
|
|
|
(39)
|
|
|
|
|
|
(39)
|
|
|
WPD Midlands acquisition-related adjustments:
|
|
|
|
|
|
|
|
|
|
|
|
|
|
|
|
|
|
|
|
|
|
Separation benefits
|
|
|
(4)
|
|
|
|
|
|
|
|
|
|
|
|
|
|
|
(4)
|
|
|
Other acquisition-related adjustments
|
|
|
8
|
|
|
|
|
|
|
|
|
|
|
|
|
|
|
8
|
|
Other:
|
|
|
|
|
|
|
|
|
|
|
|
|
|
|
|
|
|
|
|
|
|
LKE discontinued operations
|
|
|
|
|
|
2
|
|
|
|
|
|
|
|
|
|
|
|
2
|
|
|
EEI adjustments
|
|
|
|
|
|
1
|
|
|
|
|
|
|
|
|
|
|
|
1
|
|
|
Change in tax accounting method related to repairs
|
|
|
|
|
|
|
|
|
|
|
|
(3)
|
|
|
|
|
|
(3)
|
|
|
Counterparty bankruptcy
|
|
|
|
|
|
|
|
|
|
|
|
1
|
|
|
|
|
|
1
|
|
|
Windfall tax litigation
|
|
|
43
|
|
|
|
|
|
|
|
|
|
|
|
|
|
|
43
|
|
|
Change in WPD line loss accrual
|
|
|
(35)
|
|
|
|
|
|
|
|
|
|
|
|
|
|
|
(35)
|
|
|
Change in U.K. tax rate
|
|
|
84
|
|
|
|
|
|
|
|
|
|
|
|
|
|
|
84
|
|
|
Loss on Colstrip lease termination to facilitate the sale
|
|
|
|
|
|
|
|
|
|
|
|
|
|
|
|
|
|
|
|
|
of Montana hydro assets
|
|
|
|
|
|
|
|
|
|
|
|
(413)
|
|
|
|
|
|
(413)
|
|
Total Special Items
|
|
|
67
|
|
|
3
|
|
|
|
|
|
(531)
|
|
|
|
|
|
(461)
|
|
|
Earnings from Ongoing Operations
|
|
$
|
855
|
|
$
|
304
|
|
$
|
209
|
|
$
|
259
|
|
$
|
(36)
|
|
$
|
1,591
|
|
|
|
|
|
|
|
|
|
|
|
|
|
|
|
|
|
|
|
|
|
|
|
|
|
|
(per share - diluted) (a)
|
||||||||||||||||
|
|
|
|
U.K.
|
|
Kentucky
|
|
Pennsylvania
|
|
|
|
Corporate
|
|
|
||||||
|
|
|
|
Regulated
|
|
Regulated
|
|
Regulated
|
|
Supply
|
|
and Other
|
|
Total
|
||||||
|
Reported Earnings (Loss)
|
|
$
|
1.43
|
|
$
|
0.48
|
|
$
|
0.31
|
|
$
|
(0.41)
|
|
$
|
(0.05)
|
|
$
|
1.76
|
|
|
Special Items (expense) benefit:
|
|
|
|
|
|
|
|
|
|
|
|
|
|
|
|
|
|
|
|
|
Adjusted energy-related economic activity, net
|
|
|
|
|
|
|
|
|
|
|
|
(0.11)
|
|
|
|
|
|
(0.11)
|
|
|
Foreign currency-related economic hedges
|
|
|
(0.03)
|
|
|
|
|
|
|
|
|
|
|
|
|
|
|
(0.03)
|
|
|
Corette asset impairment
|
|
|
|
|
|
|
|
|
|
|
|
(0.06)
|
|
|
|
|
|
(0.06)
|
|
|
WPD Midlands acquisition-related adjustments:
|
|
|
|
|
|
|
|
|
|
|
|
|
|
|
|
|
|
|
|
|
|
Separation benefits
|
|
|
(0.01)
|
|
|
|
|
|
|
|
|
|
|
|
|
|
|
(0.01)
|
|
|
Other acquisition-related adjustments
|
|
|
0.01
|
|
|
|
|
|
|
|
|
|
|
|
|
|
|
0.01
|
|
Other:
|
|
|
|
|
|
|
|
|
|
|
|
|
|
|
|
|
|
|
|
|
|
Change in tax accounting method related to repairs
|
|
|
|
|
|
|
|
|
|
|
|
(0.01)
|
|
|
|
|
|
(0.01)
|
|
|
Windfall tax litigation
|
|
|
0.06
|
|
|
|
|
|
|
|
|
|
|
|
|
|
|
0.06
|
|
|
Change in WPD line loss accrual
|
|
|
(0.05)
|
|
|
|
|
|
|
|
|
|
|
|
|
|
|
(0.05)
|
|
|
Change in U.K. tax rate
|
|
|
0.13
|
|
|
|
|
|
|
|
|
|
|
|
|
|
|
0.13
|
|
|
Loss on Colstrip lease termination to facilitate the sale
|
|
|
|
|
|
|
|
|
|
|
|
|
|
|
|
|
|
|
|
|
of Montana hydro assets
|
|
|
|
|
|
|
|
|
|
|
|
(0.62)
|
|
|
|
|
|
(0.62)
|
|
Total Special Items
|
|
|
0.11
|
|
|
|
|
|
|
|
|
(0.80)
|
|
|
|
|
|
(0.69)
|
|
|
Earnings from Ongoing Operations
|
$
|
1.32
|
|
$
|
0.48
|
|
$
|
0.31
|
|
$
|
0.39
|
|
$
|
(0.05)
|
|
$
|
2.45
|
||
|
|
|
|
|
|
|
|
|
|
|
|
|
|
|
|
|
|
|
|
|
|
(a) The "If-Converted Method" has been applied to PPL's Equity Units prior to settlement, resulting in $44 million of interest charges (after-tax) being added back to earnings for the twelve months ended December 31, 2013, and approximately
|
|||||||||||||||||||
|
53 million shares of PPL Common Stock being treated as outstanding. Both adjustments are only for purposes of calculating diluted earnings per share.
|
|||||||||||||||||||
© PPL Corporation 2015
37
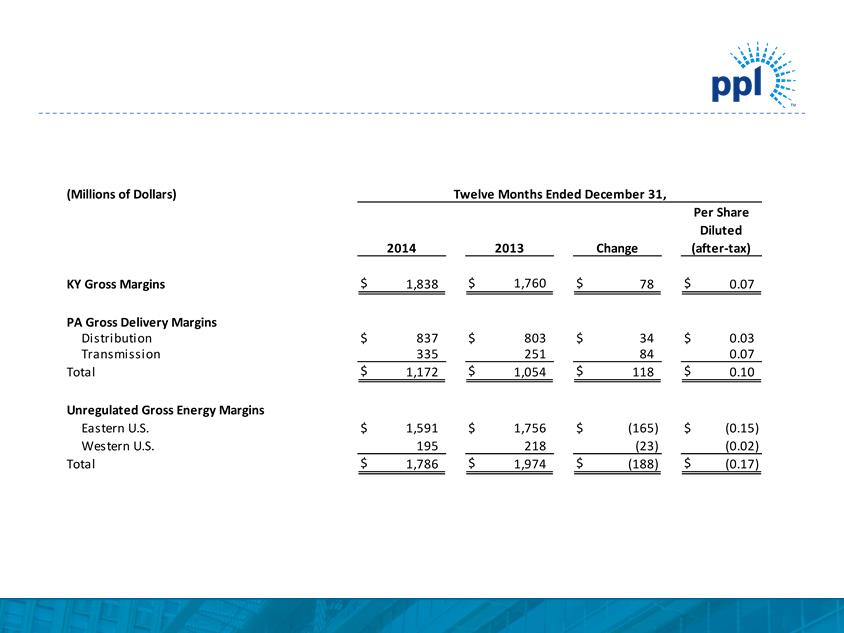
Gross Margins Summary
Gross Margins Summary (Millions of Dollars) 2014 Twelve Months Ended December 31, 2013 Change Per Share Diluted (after- tax) KY Gross Margins $1,838 $1,760 $78 $0.07 Distribution Transmission Total PA Gross Delivery Margins $$837 335 1,172 $803 251 $1,054 $34 84 $118 $0.03 0.07 $0.10 Eastern U.S. Western U.S. Unregulated Gross Energy Margins Total $$1,591 195 1,786 $1,756 218 $1,974 $$(165) (23) (188) $$(0.15) (0.02) (0.17) © PPL Corporation 2015 37
© PPL Corporation 2015
38
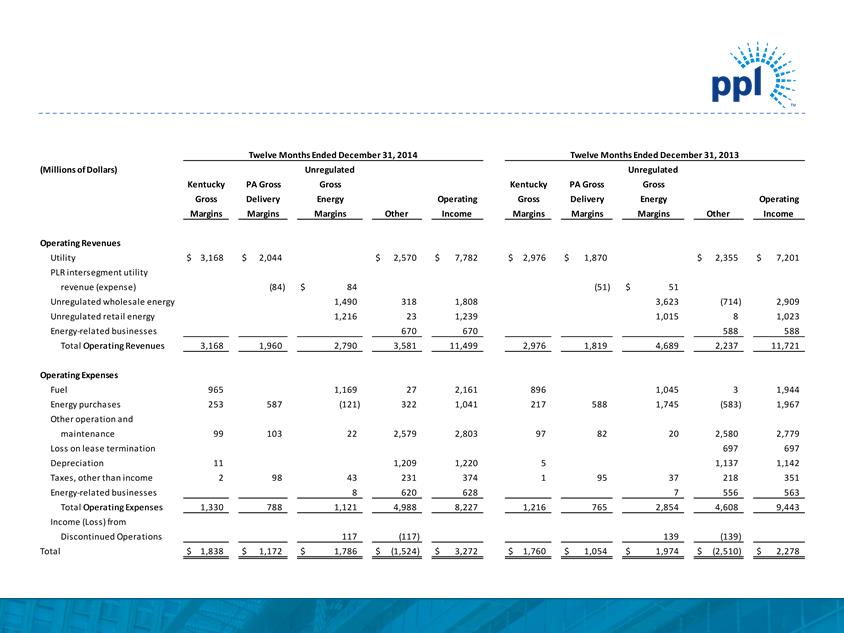
Reconciliation of Year-to-Date
Margins to Operating Income
Margins to Operating Income
Reconciliation of Year- to- Date Margins to Operating Income Twelve Months Ended December 31, 2014 Twelve Months Ended December 31, 2013 (Millions of Dollars) Unregulated Unregulated Kentucky PA Gross Gross Kentucky PA Gross Gross Gross Delivery Energy Operating Gross Delivery Energy Operating Margins Margins Margins Other Income Margins Margins Margins Other Income Operating Revenue s Utility $3,168 $2,044 $2,570 $7,782 $2,976 $1,870 2,355 7,201 PLR intersegment utility revenue (expense) (84) $84 (51) $51 Unregulated wholesale energy 1,490 318 1,808 3,623 (714) 2,909 Unregulated retail energy 1,216 23 1,239 1,015 8 1,023 Energy- related businesses 670 670 588 588 Total Operating Revenues 3,168 1,960 2,790 3,581 11,499 2,976 1,819 4,689 2,237 11,721 Operating Expenses Fuel 965 1,169 27 2,161 896 1,045 3 1,944 Energy purchases 253 587 (121) 322 1,041 217 588 1,745 (583) 1,967 Other operation and maintenance 99 103 22 2,579 2,803 97 82 20 2,580 2,779 Loss on lease termination 697 697 Depreciation 11 1,209 1,220 5 1,137 1,142 Taxes, other than income 2 98 43 231 374 1 95 37 218 351 Energy- related businesses 8 620 628 7 556 563 Total Operating Expenses 1,330 788 1,121 4,988 8,227 1,216 765 2,854 4,608 9,443 Income (Loss) from Discontinued Operations 117 (117) 139 (139) Total $1,838 $1,172 $1,786 $(1,524) $3,272 $1,760 $1,054 $1,974 (2,510) $2,278 © PPL Corporation 2015 38

© PPL Corporation 2015
39
Statements contained in this presentation, including statements with respect to future earnings, cash flows, financing, regulation and
corporate strategy are "forward-looking statements" within the meaning of the federal securities laws. Although PPL Corporation
believes that the expectations and assumptions reflected in these forward-looking statements are reasonable, these statements are
subject to a number of risks and uncertainties, and actual results may differ materially from the results discussed in the statements.
The following are among the important factors that could cause actual results to differ materially from the forward-looking statements:
weather conditions affecting customer energy usage and operating costs; the effect of any business or industry restructuring, including
the ability of PPL Corporation to realize all or a significant portion of the anticipated cost savings from the planned corporate
restructuring efforts following the Supply business spinoff; the profitability and liquidity of PPL Corporation and its subsidiaries; new
accounting requirements or new interpretations or applications of existing requirements; operating performance of generating plants
and other facilities; the length of scheduled and unscheduled outages at our generating plants; environmental conditions and
requirements and the related costs of compliance, including environmental capital expenditures and other expenses; system conditions
and operating costs; development of new projects, markets and technologies; performance of new ventures; asset or business
acquisitions and dispositions; any impact of hurricanes or other severe weather on our business; receipt of necessary government
permits, approvals, rate relief and regulatory cost recovery; capital market conditions and decisions regarding capital structure; the
impact of state, federal or foreign investigations applicable to PPL Corporation and its subsidiaries; the outcome of litigation against
PPL Corporation and its subsidiaries; stock price performance; the market prices of equity securities and the impact on pension income
and resultant cash funding requirements for defined benefit pension plans; the securities and credit ratings of PPL Corporation and its
subsidiaries; political, regulatory or economic conditions in states, regions or countries where PPL Corporation or its subsidiaries
conduct business, including any potential effects of threatened or actual terrorism or war or other hostilities; foreign exchange rates;
new state, federal or foreign legislation, including new tax legislation; and the commitments and liabilities of PPL Corporation and its
subsidiaries. Any such forward-looking statements should be considered in light of such important factors and in conjunction with PPL
Corporation's Form 10-K and other reports on file with the Securities and Exchange Commission.
Forward-Looking Information Statement

© PPL Corporation 2015
40
Definitions of Non-GAAP Financial Measures
"Earnings from ongoing operations," also referred to as "ongoing earnings," should not be considered as an alternative to reported earnings, or net income attributable to PPL
shareowners, which is an indicator of operating performance determined in accordance with U.S. generally accepted accounting principles (GAAP). PPL believes that "earnings from
ongoing operations," although a non-GAAP financial measure, is also useful and meaningful to investors because it provides management's view of PPL's fundamental earnings
performance as another criterion in making investment decisions. PPL's management also uses "earnings from ongoing operations" in measuring certain corporate performance
goals. Other companies may use different measures to present financial performance.
"Earnings from ongoing operations" is adjusted for the impact of special items. Special items include:
• Adjusted energy-related economic activity (as discussed below).
• Unrealized gains or losses on foreign currency-related economic hedges.
• Gains and losses on sales of assets not in the ordinary course of business.
• Impairment charges (including impairments of securities in the company's nuclear decommissioning trust funds).
• Workforce reduction and other restructuring effects.
• Acquisition and disposition-related adjustments.
• Other charges or credits that are, in management's view, not reflective of the company's ongoing operations.
Adjusted energy-related economic activity includes the changes in fair value of positions used to economically hedge a portion of the economic value of the competitive generation
assets, full-requirement sales contracts and retail activities. This economic value is subject to changes in fair value due to market price volatility of the input and output commodities
(e.g., fuel and power) prior to the delivery period that was hedged. Adjusted energy-related economic activity also includes the ineffective portion of qualifying cash flow hedges and
premium amortization associated with options. Unrealized gains and losses related to this activity are deferred and included in earnings from ongoing operations over the delivery
period of the item that was hedged or upon realization. Management believes that adjusting for such amounts provides a better matching of earnings from ongoing operations to the
actual amounts settled for PPL's underlying hedged assets. Please refer to the Notes to the Consolidated Financial Statements and MD&A in PPL Corporation's periodic filings with
the Securities and Exchange Commission for additional information on adjusted energy-related economic activity.
“Regulated utility earnings from ongoing operations” should not be considered as an alternative to reported earnings, or net income attributable to PPL shareowners, which is an
indicator of operating performance determined in accordance with GAAP. PPL believes that “regulated utility earnings from ongoing operations”, although a non-GAAP financial
measure, is also useful and meaningful to investors because it provides management’s view of PPL’s earnings as if the anticipated spinoff of PPL Energy Supply was completed.
Other companies may use different measures to present financial performance. “Regulated utility earnings from ongoing operations” is adjusted for the impact of special items as
described above. It is also adjusted for the Supply segment’s earnings, as the segment is expected to be disposed of upon completion of the announced spinoff of PPL Energy
Supply. “2014 regulated utility earnings from ongoing operations (adjusted)” also reflects, within the Corporate and Other category, the full impact of spinoff dissynergies that would
remain with PPL after the completion of the anticipated transaction, if left unmitigated. Due to the forward-looking nature of any forecasted regulated utility earnings from ongoing
operations for future periods, information to reconcile this non-GAAP financial measure to the most directly comparable GAAP financial measure is not available at this time, as the
company is unable to forecast all special items.
Free cash flow before dividends is derived by deducting capital expenditures, proceeds from the sale of certain assets and other investing activities-net, from cash flow from
operations. Free cash flow before dividends should not be considered as an alternative to cash flow from operations, which is determined in accordance with GAAP. PPL believes that
free cash flow before dividends, although a non-GAAP measure, is an important measure to both management and investors, as it is an indicator of the company's ability to sustain
operations and growth without additional outside financing beyond the requirement to fund maturing debt obligations. Other companies may calculate free cash flow before dividends
in a different manner.

© PPL Corporation 2015
41
Definitions of Non-GAAP Financial Measures
PPL utilizes the following non-GAAP financial measures as indicators of performance for its businesses. These measures are not intended to replace "Operating
Income," which is determined in accordance with GAAP, as an indicator of overall operating performance. Other companies may use different measures to analyze
and report their results of operations. Management believes that these measures provide additional useful criteria to make investment decisions. These
performance measures are used, in conjunction with other information, internally by senior management and PPL's Board of Directors to manage the operations,
analyze actual results compared with budget and, in certain cases, to measure certain corporate financial goals used in determining variable compensation.
"Kentucky Gross Margins“ is a single financial performance measure of the Kentucky Regulated segment's, LKE's, LG&E's and KU's electricity generation,
transmission and distribution operations as well as LKE's and LG&E's distribution and sale of natural gas. In calculating this measure, fuel, energy purchases and
certain variable costs of production (recorded as "Other operation and maintenance" on the Statements of Income) are deducted from revenues. In addition, certain
other expenses, recorded as "Other operation and maintenance", "Depreciation" and "Taxes, other than income" on the Statements of Income, associated with
approved cost recovery mechanisms are offset against the recovery of those expenses, which are included in revenues. These mechanisms allow for direct
recovery of these expenses and, in some cases, returns on capital investments and performance incentives. As a result, this measure represents the net revenues
from the electricity and gas operations.
"Pennsylvania Gross Delivery Margins" is a single financial performance measure of the Pennsylvania Regulated segment's and PPL Electric's electricity delivery
operations, which includes transmission and distribution activities. In calculating this measure, utility revenues and expenses associated with approved recovery
mechanisms, including energy provided as a PLR, are offset with minimal impact on earnings. Costs associated with these mechanisms are recorded in "Energy
purchases," "Other operation and maintenance," which is primarily Act 129 costs, and "Taxes, other than income," which is primarily gross receipts tax. This
performance measure includes PLR energy purchases by PPL Electric from PPL EnergyPlus, which are reflected in "PLR intersegment utility revenue (expense)" .
As a result, this measure represents the net revenues from the Pennsylvania Regulated segment's and PPL Electric's electricity delivery operations.
"Unregulated Gross Energy Margins" is a single financial performance measure of the Supply segment's and PPL Energy Supply's competitive energy activities,
which are managed on a geographic basis. In calculating this measure, energy revenues, including operating revenues associated with certain businesses classified
as discontinued operations, are offset by the cost of fuel, energy purchases, certain other operation and maintenance expenses, primarily ancillary charges, gross
receipts tax, recorded in "Taxes, other than income," and operating expenses associated with certain businesses classified as discontinued operations. This
performance measure is relevant due to the volatility in the individual revenue and expense lines on the Statements of Income that comprise "Unregulated Gross
Energy Margins." This volatility stems from a number of factors, including the required netting of certain transactions with ISOs and significant fluctuations in
unrealized gains and losses. Such factors could result in gains or losses being recorded in either "Unregulated wholesale energy," "Unregulated retail energy" or
"Energy purchases" on the Statements of Income. This performance measure includes PLR revenues from energy sales to PPL Electric by PPL EnergyPlus, which
are reflected in "PLR intersegment utility revenue (expense)" . "Unregulated Gross Energy Margins" excludes adjusted energy-related economic activity, which
includes the changes in fair value of positions used to economically hedge a portion of the economic value of the competitive generation assets, full-requirement
sales contracts and retail activities. This economic value is subject to changes in fair value due to market price volatility of the input and output commodities (e.g.,
fuel and power) prior to the delivery period that was hedged. Adjusted energy-related economic activity includes the ineffective portion of qualifying cash flow
hedges and premium amortization associated with options. Unrealized gains and losses related to this activity are deferred and included in "Unregulated Gross
Energy Margins" over the delivery period of the item that was hedged or upon realization.