
© PPL Corporation 2014
PPL Corporation
2nd Quarter Earnings
July 31, 2014
Exhibit 99.2
PPL Corporation2nd Quarter Earnings July 31, 2014 PPL Corporation2nd Quarter Earnings July 31, 2014

© PPL Corporation 2014
2
Cautionary Statements and Factors
That May Affect Future Results
That May Affect Future Results
Any statements made in this presentation about future operating
results or other future events are forward-looking statements
under the Safe Harbor Provisions of the Private Securities
Litigation Reform Act of 1995. Actual results may differ materially
from such forward-looking statements. A discussion of factors
that could cause actual results or events to vary is contained in
the Appendix to this presentation and in the Company’s SEC
filings.

© PPL Corporation 2014
3
Second Quarter Earnings Results, Operational
Overview and 2014 Earnings Forecast
Overview and 2014 Earnings Forecast
Segment Results and Financial Overview
Talen Update
Q&A
W. H. Spence
V. Sorgi
Agenda
P. Farr

© PPL Corporation 2014
4
Earnings Results
Earnings Results Second Quarter Second Quarter Reported Earnings Earnings from Ongoing Operations $1.50 $1.50 $0.63 $0.34 2Q 2013 2Q 2014 $0.49 $0.53 2Q 2013 2Q 2014 Per SharePer Share $1.00 $0.50 Per Share Per Share $1.00 $0.50 $0.00 $0.00 Year-to-date Year-to-date Reported Earnings Earnings from Ongoing Operations $1.50 $1.00 $0.50 $1.28 $0.83 YTD 2013 YTD 2014 $1.50 $1.00 $0.50 $1.20 $1.33 YTD 2013 YTD 2014 $0.00 $0.00 Note: See Appendix for the reconciliation of earnings from ongoing operations to reported earnings. © PPL Corporation 20144
© PPL Corporation 2014
5
Note: See Appendix for the reconciliation of earnings from ongoing operations to reported earnings.
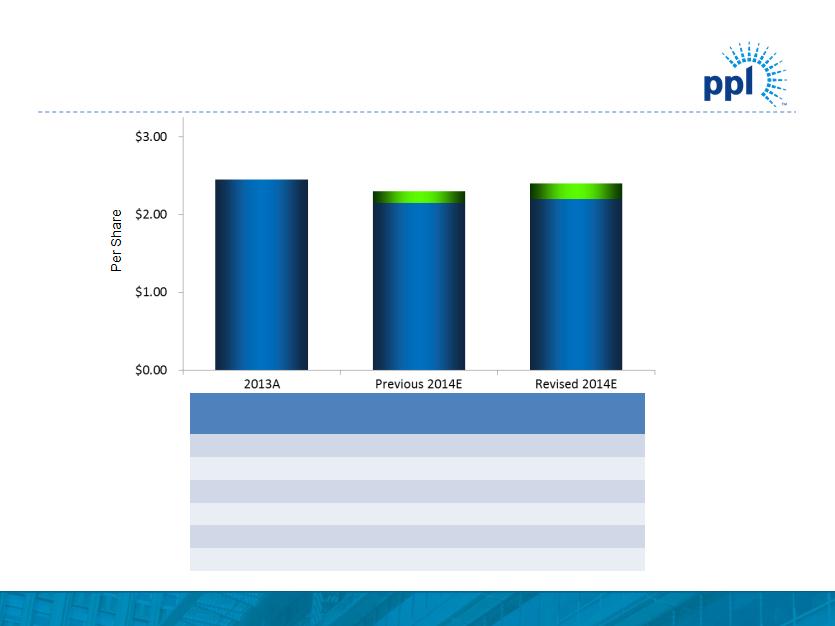
Increasing 2014 Ongoing Earnings Forecast
|
Segment
|
2013A
(Ongoing)
|
Previous
2014E
|
Revised
2014E
|
|
U.K. Regulated
|
$1.32
|
$1.34
|
$1.35
|
|
Kentucky Regulated
|
0.48
|
0.45
|
0.45
|
|
PA Regulated
|
0.31
|
0.39
|
0.39
|
|
Supply
|
0.39
|
0.11
|
0.17
|
|
Corporate and Other
|
(0.05)
|
(0.06)
|
(0.06)
|
|
Total
|
$2.45
|
$2.23
|
$2.30
|
$2.45
$2.30
$2.40
$2.20
$2.15
$0.00 $1.00 $2.00 $3.00Per Share Increasing 2014 Ongoing Earnings Forecast $2.45 $2.30 $2.40 $2.20 $2.15 $0.00 $1.00 $2.00 $3.00Per Share Increasing 2014 Ongoing Earnings Forecast $2.45 $2.30 $2.40 $2.20 $2.15 2013A Previous 2014E Revised 2014E Segment 2013A (Ongoing) Previous 2014E Revised 2014E U.K. Regulated $1.32 $1.34 $1.35 Kentucky Regulated 0.48 0.45 0.45 PA Regulated 0.31 0.39 0.39 Supply 0.39 0.11 0.17 Corporate and Other (0.05) (0.06) (0.06) Total $2.45 $2.23 $2.30 Note: See Appendix for the reconciliation of earnings from ongoing operations to reported earnings. © PPL Corporation 20145

© PPL Corporation 2014
6
• Superior customer satisfaction/service
• Filed Smart Meter plan in Pennsylvania
• Filed Project Compass transmission project with PJM
Regulated Operational Overview
© PPL Corporation 2014
7
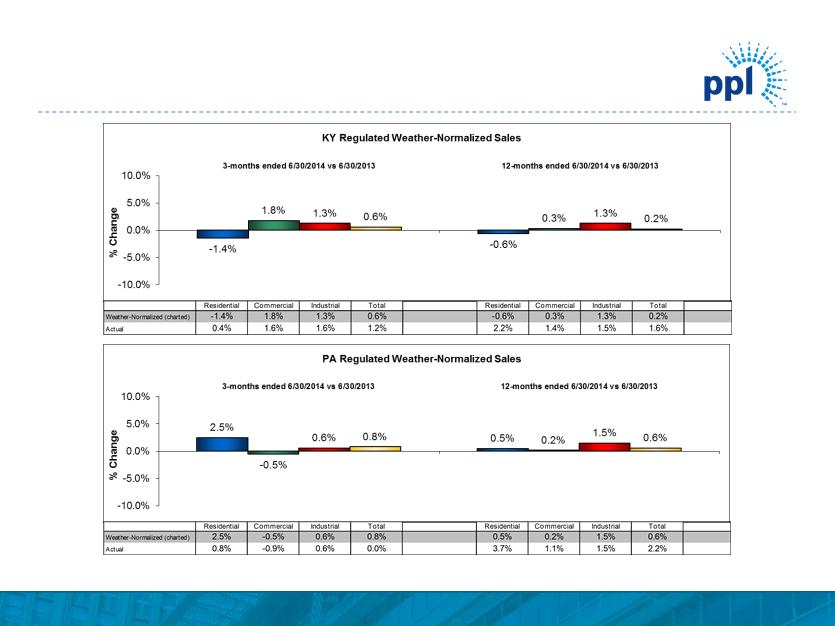
Note: Total includes Residential, Commercial and Industrial customer classes as well as “Other”, which is not depicted on the charts above.
Regulated Volume Variances
Regulated Volume Variances R esidential C o mm erc ial Industrial Total Residential C o m mercial Industrial Total Weather- No r malized (charted) 2.5% -0.5% 0.6% 0.8% 0.5% 0.2% 1.5% 0.6% Actual 0.8% -0.9% 0.6% 0.0% 3.7% 1.1% 1.5% 2.2% Residential C o mm erc ial Industrial Total R esidential C o m m ercial Industrial Total Weather-Normalized (charted) - 1.4% 1.8% 1.3% 0.6% -0.6% 0.3% 1.3% 0.2% Act ual 0.4% 1.6% 1.6% 1.2% 2.2% 1.4% 1.5% 1.6% Note: Total includes Residential, Commercial and Industrial customer classes as well as “Other”, which is not depicted on the charts above. © PPL Corporation 20147

© PPL Corporation 2014
8
• Strong second quarter operational performance from
Eastern fleet
Eastern fleet
• Susquehanna turbine update
• Montana hydro sale update
• Energy Supply Spin/Separation activities underway
Supply Operational Overview

© PPL Corporation 2014
9
Q2 2014
Q2 2013
Change
U.K. Regulated
$0.33
$0.35
$(0.02)
Kentucky Regulated
0.09
0.08
0.01
Pennsylvania Regulated
0.08
0.07
0.01
Supply
0.06
0.01
0.05
Corporate and Other
(0.03)
(0.02)
(0.01)
Total
$0.53
$0.49
$0.04
Ongoing Earnings Overview
Note: See Appendix for the reconciliation of earnings from ongoing operations to reported earnings.

© PPL Corporation 2014
10
|
|
2nd Quarter
|
|
|
2013 EPS - Ongoing Earnings
|
|
$0.35
|
|
Utility revenue
|
0.02
|
|
|
O&M
|
0.01
|
|
|
Depreciation
|
(0.01)
|
|
|
Financing
|
(0.01)
|
|
|
Income taxes and other
|
(0.03)
|
|
|
Total
|
|
(0.02)
|
|
2014 EPS - Ongoing Earnings
|
|
$0.33
|
U.K. Regulated Segment
Earnings Drivers
Earnings Drivers
Note: See Appendix for the reconciliation of earnings from ongoing operations to reported earnings.

© PPL Corporation 2014
11
|
|
2nd Quarter
|
|
|
2013 EPS - Ongoing Earnings
|
|
$0.08
|
|
Gross margins
|
0.02
|
|
|
O&M
|
(0.01)
|
|
|
Total
|
|
0.01
|
|
2014 EPS - Ongoing Earnings
|
|
$0.09
|
Kentucky Regulated Segment
Earnings Drivers
Earnings Drivers
Note: See Appendix for the reconciliation of earnings from ongoing operations to reported earnings.

© PPL Corporation 2014
12
|
|
2nd Quarter
|
|
|
2013 EPS - Ongoing Earnings
|
|
$0.07
|
|
Gross delivery margins
|
0.02
|
|
|
Income taxes and other
|
(0.01)
|
|
|
Total
|
|
0.01
|
|
2014 EPS - Ongoing Earnings
|
|
$0.08
|
Pennsylvania Regulated Segment
Earnings Drivers
Earnings Drivers
Note: See Appendix for the reconciliation of earnings from ongoing operations to reported earnings.

© PPL Corporation 2014
13
|
|
2nd Quarter
|
|
|
2013 EPS - Ongoing Earnings
|
|
$0.01
|
|
East energy margins
|
0.04
|
|
|
Income taxes and other
|
0.01
|
|
|
Total
|
|
0.05
|
|
2014 EPS - Ongoing Earnings
|
|
$0.06
|
Supply Segment Earnings Drivers
Note: See Appendix for the reconciliation of earnings from ongoing operations to reported earnings.

© PPL Corporation 2014
14
U.K. Regulated Segment
EPS from Ongoing Operations Projection
Note: Assumes foreign currency exchange rate of $1.67/£ for any unhedged projection.
See Appendix for the reconciliation of earnings from ongoing operations to reported earnings.
($ Per Share)
U.K. Regulated Segment EPS from Ongoing Operations Projection ($Per Share) Note: Assumes foreign currency exchange rate of $1.67/£ for any unhedged projection. See Appendix for the reconciliation of earnings from ongoing operations to reported earnings. © PPL Corporation 201414
© PPL Corporation 2014
15
U.K. Regulated Segment
Cash Repatriation Projection
Note: Assumes foreign currency exchange rate of $1.67/£ for any unhedged projection.
($ in millions)
U.K. Regulated Segment Cash Repatriation Projection ($in millions) Note: Assumes foreign currency exchange rate of $1.67/£ for any unhedged projection. © PPL Corporation 201415

© PPL Corporation 2014
16
• Talen credit facility syndication process
– $1.85 billion 5-year 1st lien revolving credit facility
– Facility is fully committed and will be available upon transaction close
• RJS Power Holdings bond offering
– Riverstone formed RJS Power Holdings LLC as a holding company to
consolidate the generation portfolios being contributed to Talen
consolidate the generation portfolios being contributed to Talen
– Executed a $1.25 billion bond offering to refinance portfolio-level debt
– RJS bonds will “travel” to Talen upon the merger of RJS Power Holdings
with and into PPL Energy Supply, LLC at or after closing
with and into PPL Energy Supply, LLC at or after closing
– 5-year maturity, 5.125% coupon subject to 50 bps step down if Talen
achieves credit ratings of at least Ba2/BB- or Ba3/BB at time of merger
achieves credit ratings of at least Ba2/BB- or Ba3/BB at time of merger
• Applications filed with FERC, NRC and PA PUC
– DOJ to be filed in 3rd or 4th quarter
Talen Transaction: Activities Since
June 9th Announcement

© PPL Corporation 2014
17
Appendix
© PPL Corporation 2014
18
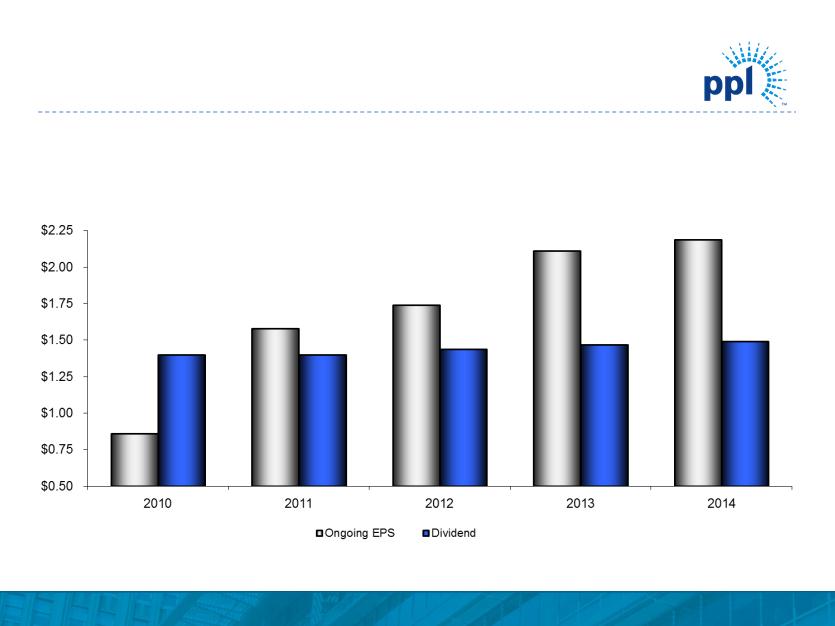
A predominantly rate-regulated business mix provides strong support
for current dividend and a platform for future growth
for current dividend and a platform for future growth
(1) Based on mid-point of forecast. Annualized dividend based on 2/6/2014 announced increase. Actual dividends to be determined by Board of Directors.
(2) From only regulated segments.
(3) See Appendix for the reconciliation of earnings from ongoing operations to reported earnings.
$/Share
Annualized
(2)
(1)
Dividend Profile
(3)
Dividend Profile A predominantly rate-regulated business mix provides strong support for current dividend and a platform for future growth $/ Share Annualized $0.50 $0.75 $1.00 $1.25 $1.50 $1.75 $2.00 $2.25 2010 2011 2012 2013 2014(1) Ongoing EPS (2) (3) Dividend (1) (2) (3) Based on mid-point of forecast. Annualized dividend based on 2/6/2014 announced increase. Actual dividends to be determined by Board of Directors. From only regulated segments. See Appendix for the reconciliation of earnings from ongoing operations to reported earnings. © PPL Corporation 201418

© PPL Corporation 2014
19
($ in billions)
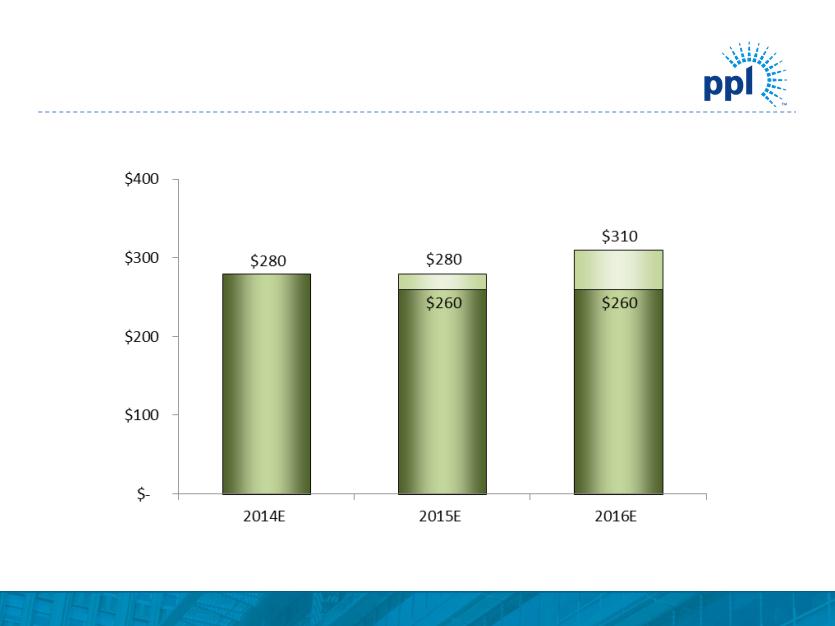
(1) Figures based on assumed exchange rate of $1.67 / £.
(2) Expect between 80% and 90% to receive timely returns via ECR mechanism based on historical experience and future projections.
(1)
(2)
$4.19
$3.88
$3.91
$3.81
Projected Capital Expenditures
Significant and stable investment opportunities in regulated utilities
$3.72
© PPL Corporation 2014
20
($ in billions)
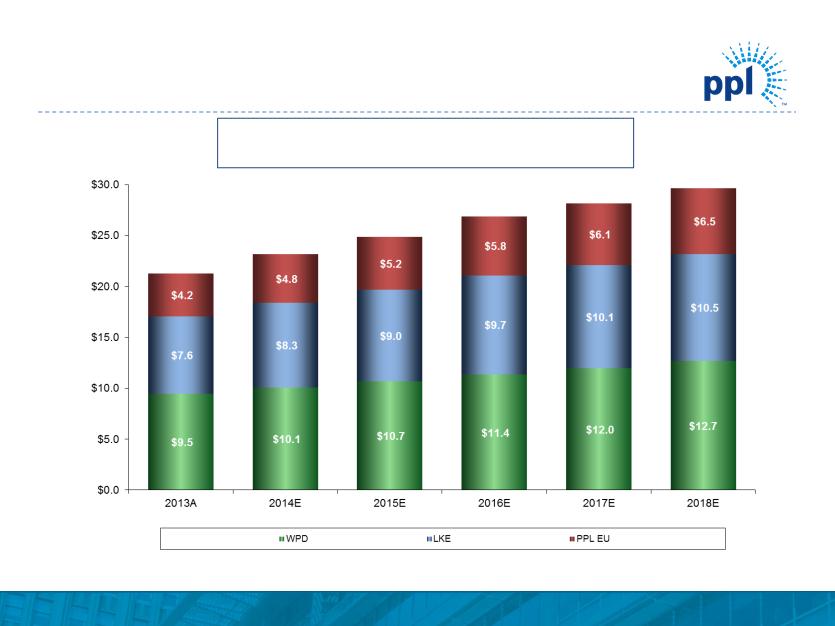
(1) Represents capitalization for LKE, as LG&E and KU rate constructs are based on capitalization. Represents Regulatory Asset Value (RAV) for WPD.
(2) Figures based on assumed exchange rate of $1.67 / £ and the RIIO-ED1 business plan as filed on July 1, 2013.
(2)
5-Year Regulatory Asset Base(1) CAGR: 6.7%
Projected Regulated Rate Base Growth
$21.3
$23.2
$24.9
$26.9
$28.2
$29.7
© PPL Corporation 2014
21
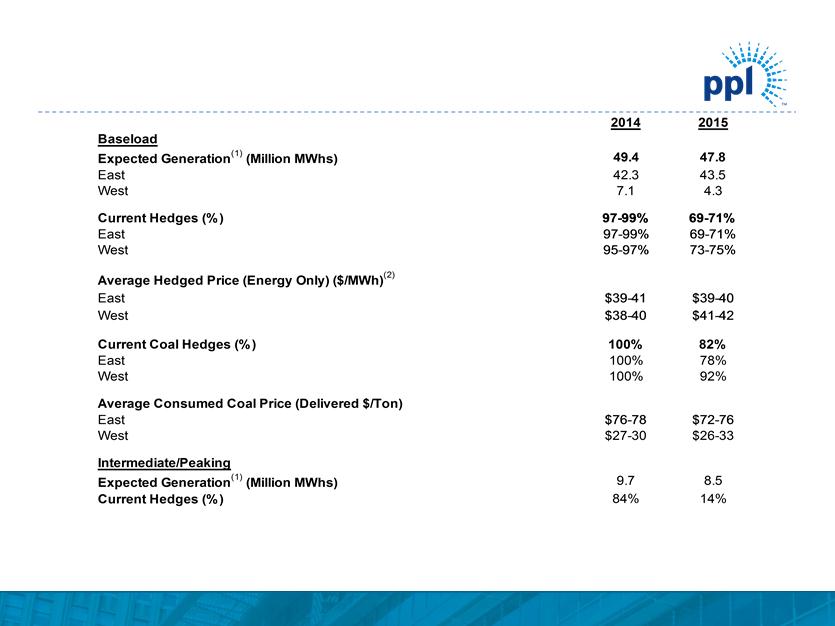
Energy Supply Hedge Update
Capacity revenues are expected to be $560 and $505 million for 2014 and 2015 respectively.
Note: As of June 30, 2014
Includes PPL Montana's hydroelectric facilities through the 3rd quarter of 2014. On September 26, 2013, PPL Montana, LLC reached an agreement to sell all 11 of its hydroelectric power plants. The
sale is subject to regulatory approvals and currently is not expected to close before the fourth quarter of 2014.
(1) Represents expected sales of Supply segment based on current business plan assumptions.
(2) The 2015 ranges of average energy prices for existing hedges were estimated by determining the impact on the existing collars resulting from 2015 power prices at the 5th and 95th percentile
confidence levels.
Energy Supply Hedge Update 2014 2015 Baseload Expected Generation(1) (Million MWhs) 49.4 47.8 East 42.3 43.5 West 7.1 4.3 Current Hedges (%) 97- 99% 69- 71% East 97-99% 69-71% West 95-97% 73-75% Average Hedged Price (Energy Only) ($/MWh) (2) East $39- 41 $39- 40 West $38- 40 $41- 42 Current Coal Hedges (%) 100% 82% East 100% 78% West 100% 92% Average Consumed Coal Price (Delivered $/ Ton) East $76- 78 $72- 76 West $27- 30 $26- 33 Intermediate/Peaking Expected Generation(1) (Million MWhs) 9.7 8.5 Current Hedges (%) 84% 14% Capacity revenues are expected to be $560 and $505 million for 2014 and 2015 respectively. Note: As of June 30, 2014 Includes PPL Montana's hydroelectric facilities through the 3rd quarter of 2014. On September 26, 2013, PPL Montana, LLC reached an agreement to sell all 11 of its hydroelectric power plants. The sale is subject to regulatory approvals and currently is not expected to close before the fourth quarter of 2014. (1) Represents expected sales of Supply segment based on current business plan assumptions. (2) The 2015 ranges of average energy prices for existing hedges were estimated by determining the impact on the existing collars resulting from 2015 power prices at the 5th and 95th percentile confidence levels. © PPL Corporation 201421
© PPL Corporation 2014
22
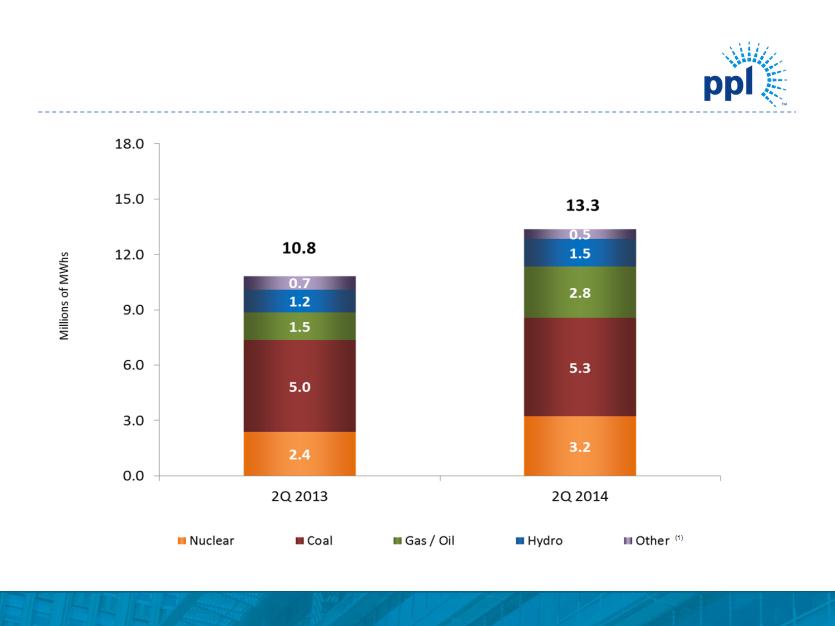
Competitive Generation Overview
Note: Includes owned and contracted generation. As of June 30, 2014
(1) Other includes PPAs, renewables and NUGS.

© PPL Corporation 2014
23
|
(1)
|
24-hour average.
|
|
(2)
|
NYMEX and TETCO M3 forward gas prices on 6/30/2014.
|
|
(3)
|
Market Heat Rate = PJM on-peak power price divided by TETCO M3 gas price.
|
Market Prices
Market Prices On-Peak Off-Peak (Per M W D) EQA HEAT RATE(3) TETCO M3 PJM MARKET CAPACITY PRICES ELECTRIC AT C(1) NYMEX GAS(2) Mid- Columbia On-Peak Off-Peak AT C(1) PJM Balance of 2014 $55 $35 $44 $48 $36 $43 $4.46 $3.66 15.0 $173.85 88% 2015 $52 $34 $42 $40 $29 $36 $4.22 $4.25 12.2 $154.56 89% (1) 24-hour average. (2) NYMEX and TETCO M3 forward gas prices on 6/30/2014. (3) Market Heat Rate = PJM on-peak power price divided by TETCO M3 gas price. © PPL Corporation 201423
© PPL Corporation 2014
24
Free Cash Flow before
Dividends
Dividends
(Millions of Dollars)
Reconciliation of Cash from
Operations to Free Cash Flow
before Dividends
Operations to Free Cash Flow
before Dividends
(Millions of dollars)
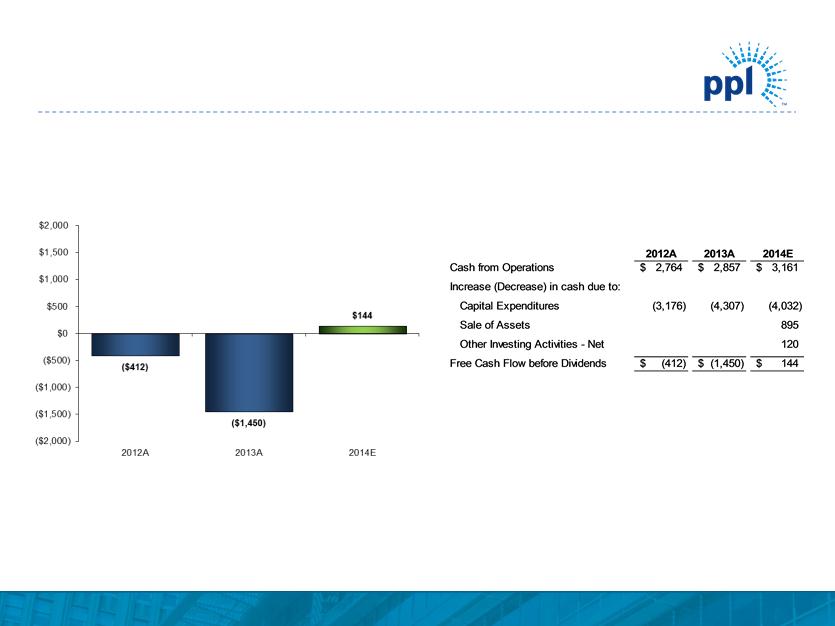
Free Cash Flow before Dividends
Note: Free Cash Flow forecast updated on an annual basis.
(1) 2014E reflects anticipated proceeds from pending sale of Montana hydro facilities, which currently is not expected to close before the fourth quarter of 2014.
(1)
Free Cash Flow before Dividends $2,000 Free Cash Flow before Dividends (Millions of Dollars) Reconciliation of Cash from Operations to Free Cash Flow before Dividends (Millions of dollars) ($1,000) ($500) $0 $500 $1,000 $1,500 ($412) $144 Cash from Operations Increase (Decrease) in cash due to: Capital Expenditures Sale of Assets Other Investing Activities - Net Free Cash Flow before Dividends (1) 2012A 2013A 2,764 $2,857 $(3,176) (4,307) (412) $$(1,450) 2014E 3,161 $(4,032) 895 120 144 $($2,000) ($1,500) 2012A ($1,450) 2013A 2014E Note: Free Cash Flow forecast updated on an annual basis. (1) 2014E reflects anticipated proceeds from pending sale of Montana hydro facilities, which currently is not expected to close before the fourth quarter of 2014. © PPL Corporation 201424
© PPL Corporation 2014
25
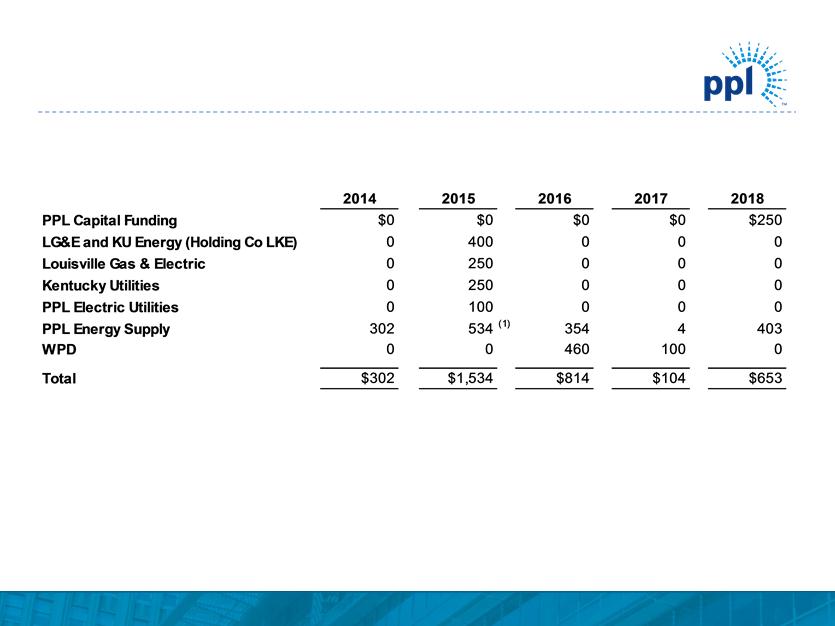
Debt Maturities
Note: As of June 30, 2014
(1) This amount includes $81 million of Pennsylvania Economic Development Financing Authority bonds due 2037 and $150 million of Pennsylvania Economic
Development Financing Authority bonds due 2038 that may be put by the holders in September 2015. This amount also includes $300 million of REset Put
Securities due 2035 that are required to be put by the holders in October 2015.
Development Financing Authority bonds due 2038 that may be put by the holders in September 2015. This amount also includes $300 million of REset Put
Securities due 2035 that are required to be put by the holders in October 2015.
Debt Maturities 2014 2015 2016 2017 2018 PPL Capital Funding $0 $0 $0 $0 $250 LG& E and KU Energy (Holding Co LKE) 0 400 0 0 0 Louisville Gas & Electric 0 250 0 0 0 Kentucky Utilities 0 250 0 0 0 PPL Electric Utilities 0 100 0 0 0 PPL Energy Supply 302 534 (1) 354 4 403 WPD 0 0 460 100 0 Total $302 $1,534 $814 $104 $653 Note: As of June 30, 2014 (1) This amount includes $81 million of Pennsylvania Economic Development Financing Authority bonds due 2037 and $150 million of Pennsylvania Economic Development Financing Authority bonds due 2038 that may be put by the holders in September 2015. This amount also includes $300 million of REset Put Securities due 2035 that are required to be put by the holders in October 2015. © PPL Corporation 201425
© PPL Corporation 2014
26
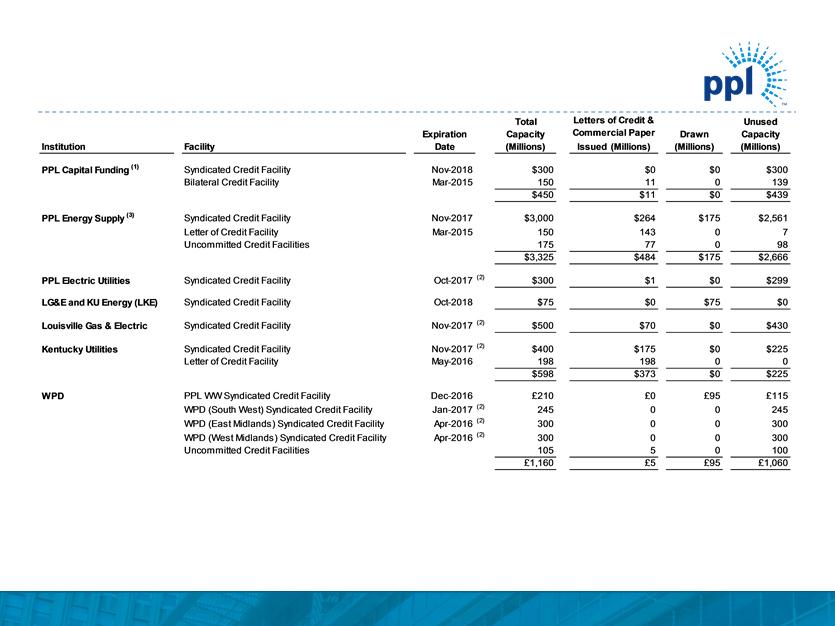
Liquidity Profile
Note: As of June 30, 2014
Credit facilities consist of a diverse bank group, with no bank and its affiliates providing an aggregate commitment of more than 10% of the total committed capacity for the
domestic facilities and 13% of the total committed capacity for WPD’s facilities.
(1) In July 2014, PPL Capital Funding entered into an additional $300 million syndicated credit facility with an expiration date of July 2019.
(2) In July 2014, the existing syndicated credit facilities at Louisville Gas & Electric, Kentucky Utilities, WPD (South West), WPD (East Midlands), and WPD (West Midlands) were
amended and extended to July 2019. The existing syndicated credit facility at PPL Electric Utilities was amended and extended to October 2018, with an automatic extension
to July 2019 upon regulatory approval.
amended and extended to July 2019. The existing syndicated credit facility at PPL Electric Utilities was amended and extended to October 2018, with an automatic extension
to July 2019 upon regulatory approval.
(3) As a result of the proposed spinoff transaction, PPL Energy Supply is in the process of syndicating a $1.85 billion credit facility which is currently fully committed. This
syndicated credit facility will replace the existing $3 billion PPL Energy Supply syndicated credit facility and will be effective upon closing of the spinoff transaction.
syndicated credit facility will replace the existing $3 billion PPL Energy Supply syndicated credit facility and will be effective upon closing of the spinoff transaction.
Liquidity Profile Institution Facility Expiration Date Total Capacity (Millions) Letters of Credit & Commercial Paper Issued (Millions) Drawn (Millions) Unused Capacity (Millions) PPL Capital Funding (1) Syndicated Credit Facility Bilateral Credit Facility Nov- 2018 Mar- 2015 $300 150 $450 $0 11 $11 $0 0 $0 $300 139 $439 PPL Energy Supply (3) Syndicated Credit Facility Letter of Credit Facility Uncom m itted Credit Facilities Nov- 2017 Mar- 2015 $3,000 150 175 $3,325 $264 143 77 $484 $175 0 0 $175 $2,561 7 98 $2,666 PPL Electric Utilities Syndicated Credit Facility Oct-2017 (2) $300 $1 $0 $299 LG& E and KU Energy (LKE) Syndicated Credit Facility Oct-2018 $75 $0 $75 $0 Louisville Gas & Electric Syndicated Credit Facility Nov- 2017 (2) $500 $70 $0 $430 Kentucky Utilities Syndicated Credit Facility Letter of Credit Facility Nov- 2017 (2) May- 2016 $400 198 $598 $175 198 $373 $0 0 $0 $225 0 $225 WPD Note: As of June 30, 2014 PPL WW Syndicated Credit Facility WPD (South Wes t) Syndicated Credit Facility WPD (Eas t Midlands) Syndicated Credit Facility WPD (Wes t Midlands) Syndicated Credit Facility Uncom m itted Credit Facilities Dec- 2016 Jan- 2017 (2) Apr- 2016 (2) Apr- 2016 (2) £210 245 300 300 105 £1,160 £0 0 0 0 5 £5 £ 95 0 0 0 0 £ 95 £115 245 300 300 100 £ 1,060 Credit facilities consist of a diverse bank group, with no bank and its affiliates providing an aggregate commitment of more than 10% of the total committed capacity for the domestic facilities and 13% of the total committed capacity for WPD’s facilities. (1) In July 2014, PPL Capital Funding entered into a new $300 million syndicated credit facility with an expiration date of July 2019. (2) In July 2014, the existing syndicated credit facilities at Louisville Gas & Electric, Kentucky Utilities, WPD (South West), WPD (East Midlands), and WPD (West Midlands) were amended and extended to July 2019. The existing syndicated credit facility at PPL Electric Utilities was amended and extended to October 2018, with an automatic extension to July 2019 upon regulatory approval. (3) As a result of the proposed spinoff transaction, PPL Energy Supply is in the process of syndicating a $1.85 billion credit facility which is currently fully committed. This syndicated credit facility will replace the existing $3 billion PPL Energy Supply syndicated credit facility and will be effective upon closing of the spinoff transaction. © PPL Corporation 201426
© PPL Corporation 2014
27
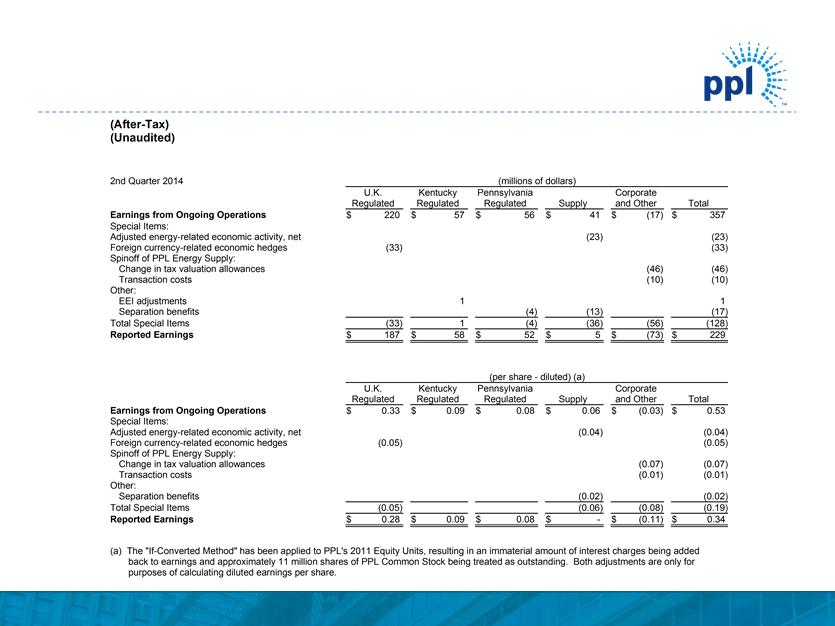
Reconciliation of Second Quarter Earnings from
Ongoing Operations to Reported Earnings
Ongoing Operations to Reported Earnings
© PPL Corporation 2014
28
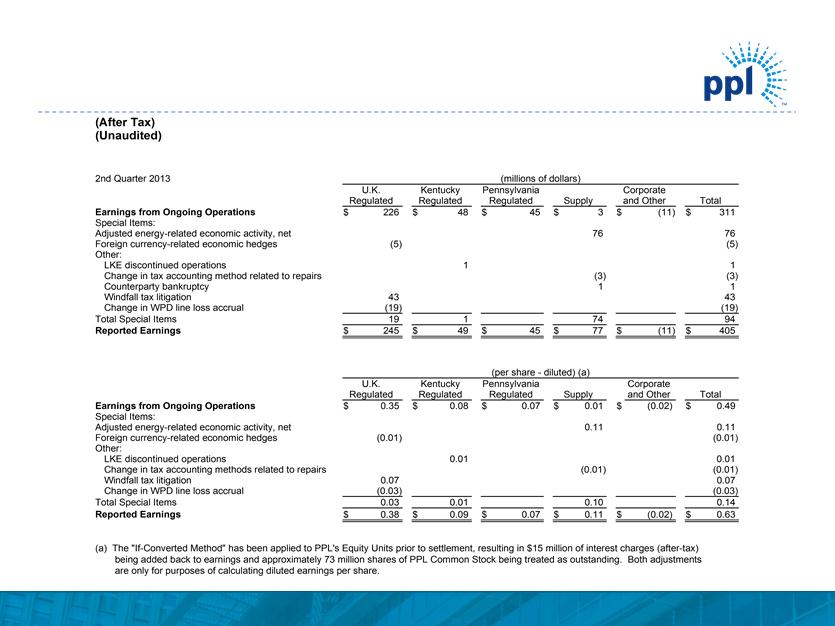
Reconciliation of Second Quarter Earnings from
Ongoing Operations to Reported Earnings
Ongoing Operations to Reported Earnings
Reconciliation of Second Quarter Earnings from Ongoing Operations to Reported Earnings (After Tax) (Unaudited) 2nd Quarter 2013 (millions of dollars) U.K. Kentucky Pennsylvania Corporate Regulated Regulated Regulated Supply and Other Total Earnings from Ongoing Operations $226 $48 $45 $3 $(11) $311 Special Items: Adjusted energy-related economic activity, net 76 76 Foreign currency- related economic hedges (5) (5) Other: LKE discontinued operations 1 1 Change in tax accounting method related to repairs (3) (3) Counterparty bankruptcy 1 1 Windfall tax litigation 43 43 Change in WPD line loss accrual (19) (19) Total Special Items 19 1 74 94 Reported Earnings $245 $49 $45 $77 $(11) $405 (per share - diluted) (a) U.K. Kentucky Pennsylvania Corporate Regulated Regulated Regulated Supply and Other Total Earnings from Ongoing Operations $0.35 $0.08 $0.07 $0.01 $(0.02) $0.49 Special Items: Adjusted energy-related economic activity, net Foreign currency- related economic hedges (0.01) (0.01) Other: LKE discontinued operations 0.01 0.01 Change in tax accounting methods related to repairs (0.01) (0.01) Windfall tax litigation 0.07 0.07 Change in WPD line loss accrual Total Special Items Reported Earnings $0.38 $0.09 $0.07 $0.11 $(0.02) $0.63 (a) The "If-Converted Method" has been applied to PPL's Equity Units prior to settlement, resulting in $15 million of interest charges (after-tax) being added back to earnings and approximately 73 million shares of PPL Common Stock being treated as outstanding. Both adjustments are only for purposes of calculating diluted earnings per share. 0.11 0.11 (0.03) (0.03) 0.03 0.01 0.10 0.14 © PPL Corporation 201428

© PPL Corporation 2014
29
Reconciliation of Year-to-date Earnings from
Ongoing Operations to Reported Earnings
Ongoing Operations to Reported Earnings
Reconciliation of Year- to- date Earnings from Ongoing Operations to Reported Earnings (After Tax) (Unaudited) Y ear- to- Date June 30, 2014 (millions of dollars) U.K. Kentucky Pennsylvania Corporate Regulated Regulated Regulated Supply and Other Total Earnings from Ongoing Operations $484 $164 $141 $115 $(24) $880 Special Items: A djusted energy- related economic activity, net (162) (162) Foreign currency- related economic hedges (39) (39) Kerr Dam Project impairment (10) (10) Spinof f of PPL Energy Supply: Change in tax valuation allow ances (46) (46) Transaction c osts (10) (10) Other: EEI adjustments 1 1 Change in WPD line loss accrual (52) (52) Separation benef its (4) (13) (17) Total Special Items (91) 1 (4) (185) (56) (335) Reported Earnings $393 $165 $137 $(70) $(80) $545 (per share - diluted) (a) U.K. Kentucky Pennsylvania Corporate Regulated Regulated Regulated Supply and Other Total Earnings from Ongoing Operations $0.74 $0.25 $0.21 $0.17 $(0.04) $1.33 Special Items: A djusted energy- related economic activity, net (0.24) (0.24) Foreign currency- related economic hedges (0.06) (0.06) Kerr Dam Project impairment (0.02) (0.02) Spinof f of PPL Energy Supply: Change in tax valuation allow ances (0.07) (0.07) Transaction c osts (0.01) (0.01) Other: Change in WPD line loss accrual (0.08) (0.08) Separation benef its (0.02) (0.02) Total Special Items (0.14) (0.28) (0.08) (0.50) Reported Earnings $0.60 $0.25 $0.21 $(0.11) $(0.12) $0.83 (a) The " If - Converted Method" has been applied to PPL's 2011 Equity Units, resulting in $9 million of interest charges (af ter-tax) being added back to earnings and approximately 21 million shares of PPL Common Stock being treated as outstanding. Both adjustments are only f or purposes of calculating diluted earnings per share. © PPL Corporation 201429
© PPL Corporation 2014
30
Reconciliation of Year-to-date Earnings from
Ongoing Operations to Reported Earnings
Ongoing Operations to Reported Earnings
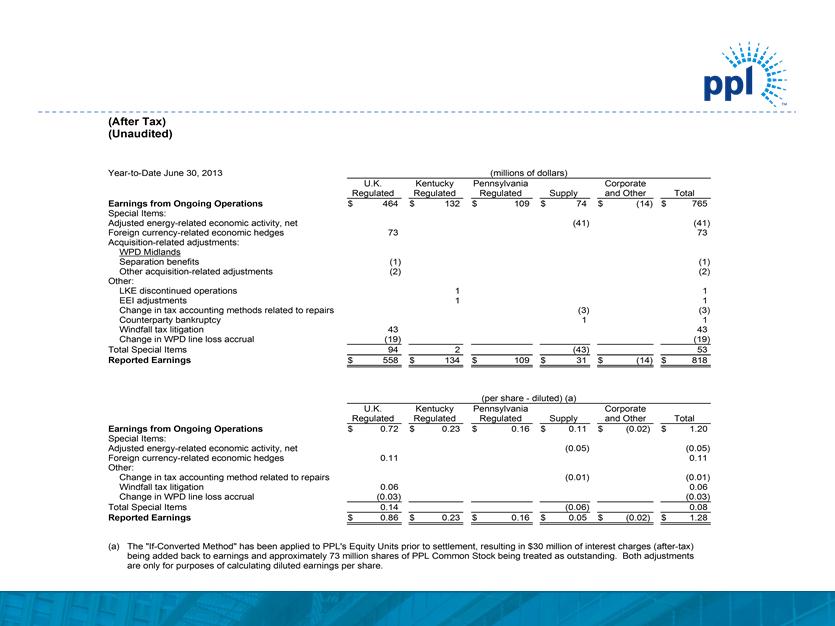
Reconciliation of Year- to- date Earnings from Ongoing Operations to Reported Earnings (After Tax) (Unaudited) Year-to-Date June 30, 2013 U.K. Regulated Kentucky Regulated (millions of dollars) Pennsylvania Regulated Supply Corporate and Other Total Earnings from Ongoing Operations $464 $132 $109 $74 $(14) $765 Special Items: Adjusted energy-related economic activity, net (41) (41) Foreign currency- related economic hedges 73 73 Acquisition-related adjustments: WPD Midlands Separation benefits (1) (1) Other acquisition-related adjustments (2) (2) Other: LKE discontinued operations 1 1 EEI adjustments 1 1 Change in tax accounting methods related to repairs (3) (3) Counterparty bankruptcy 1 1 Windfall tax litigation 43 43 Change in WPD line loss accrual (19) (19) Total Special Items 94 2 (43) 53 Reported Earnings $558 $134 $109 $31 $(14) $818 (per share - diluted) (a) U.K. Regulated Kentucky Regulated Pennsylvania Regulated Supply Corporate and Other Total Earnings from Ongoing Operations Special Items: Adjusted energy-related economic activity, net $0.72 $0.23 $0.16 $0.11 (0.05) $(0.02) $1.20 (0.05) Foreign currency- related economic hedges Other: 0.11 0.11 Change in tax accounting method related to repairs (0.01) (0.01) Windfall tax litigation 0.06 0.06 Change in WPD line loss accrual (0.03) (0.03) Total Special Items 0.14 (0.06) 0.08 Reported Earnings $0.86 $0.23 $0.16 $0.05 $(0.02) $1.28 (a) The "If-Converted Method" has been applied to PPL's Equity Units prior to settlement, resulting in $30 million of interest charges (after-tax) being added back to earnings and approximately 73 million shares of PPL Common Stock being treated as outstanding. Both adjustments are only for purposes of calculating diluted earnings per share. © PPL Corporation 201430
© PPL Corporation 2014
31
Reconciliation of PPL’s Forecast of Earnings from
Ongoing Operations to Reported Earnings
Ongoing Operations to Reported Earnings
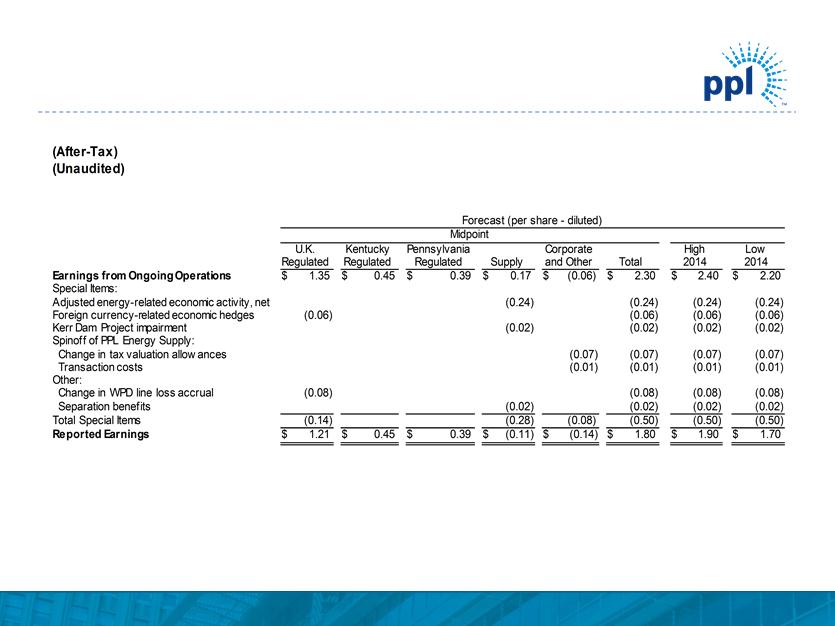
Reconciliation of PPL’s Forecast of Earnings from Ongoing Operations to Reported Earnings (After-Tax) (Unaudited) Forecast (per share - diluted) Midpoint High U.K. Kentucky Pennsylvania Corporate Low Regulated Regulated Regulated Supply and Other Total 2014 2014 Earnings from Ongoing Ope rations $1.35 $0.45 $0.39 $0.17 $(0.06) $2.30 $2.40 $2.20 Special Items: A djusted energy- related economic activity, net (0.24) (0.24) Foreign currency- related economic hedges (0.06) (0.06) (0.06) Kerr Dam Project impairment (0.08) (0.08) (0.02) (0.02) (0.02) (0.02) Spinof f of PPL Energy Supply: Change in tax valuation allow anc es (0.07) (0.07) (0.07) (0.07) Transaction costs (0.01) (0.01) (0.01) (0.01) Other: Change in WPD line loss accrual (0.08) (0.08) Separation benef its(0.02) (0.02) Total Spec ial Items (0.14) (0.28) (0.08) (0.50) (0.50) (0.50) Reported Earnings $1.21 $0.45 $0.39 $(0.11) $(0.14) $1.80 $1.90 $1.70 (0.24) (0.24) (0.02) (0.02) (0.06) © PPL Corporation 201431
© PPL Corporation 2014
32
Reconciliation of U.K. Regulated Segment Earnings
from Ongoing Operations to Reported Earnings
from Ongoing Operations to Reported Earnings
(1) Projected midpoint of Earnings from Ongoing Operations.
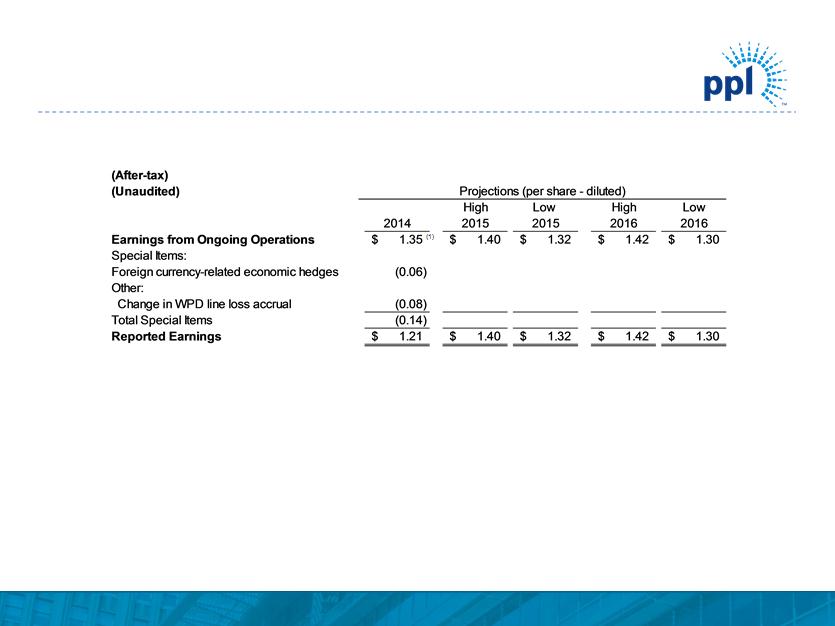
Reconciliation of U.K. Regulated Segment Earnings from Ongoing Operations to Reported Earnings (After- tax) (Unaudited) High Low High Projections (per share - diluted) Low 2014 2015 2015 2016 2016 Earnings from Ongoing Operations Special Items: (1) 1.35 $1.40 $1.32 $1.42 $1.30 $Foreign currency-related economic hedges (0.06) Other: Change in WPD line loss accrual (0.08) Total Special Items (0.14) Reported Earnings 1.21 $1.40 $1.32 $1.42 $1.30 $(1) Projected midpoint of Earnings from Ongoing Operations. © PPL Corporation 201432
© PPL Corporation 2014
33
Reconciliation of PPL’s Earnings from Ongoing
Operations to Reported Earnings
Operations to Reported Earnings
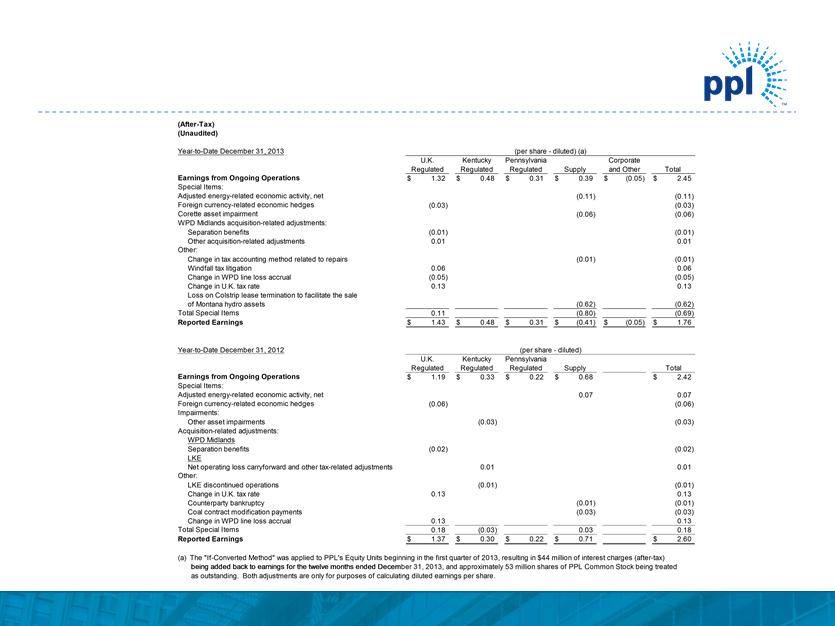
Reconciliation of PPL's Earnings from Ongoing Operations to Reported Earnings Reconciliation of PPL's Earnings from Ongoing Operations to Reported Earnings (After- Tax) (Unaudited) Year-to-Date December 31, 2013 (per share - diluted) (a) U.K. Kentucky Pennsylvania Corporate Regulated Regulated Regulated Supply and Other Total Earnings from Ongoing Operations $1.32 $0.48 $0.31 $0.39 $(0.05) $2.45 Special Items: Adjusted energy-related economic activity, net (0.11) (0.11) Foreign currency-related economic hedges (0.03) (0.03) Corette asset impairment (0.06) (0.06) WPD Midlands acquisition- related adjustments: Separation benefits (0.01) (0.01) Other acquisition-related adjustments 0.01 0.01 Other: Change in tax accounting method related to repairs (0.01) (0.01) Windfall tax litigation 0.06 0.06 Change in WPD line loss accrual (0.05) (0.05) Change in U.K. tax rate 0.13 0.13 Loss on Colstrip lease termination to facilitate the sale of Montana hydro assets (0.62) (0.62) Total Special Items 0.11 (0.80) (0.69) Reported Earnings $1.43 $0.48 $0.31 $(0.41) $(0.05) $1.76 Year-to-Date December 31, 2012 (per share - diluted) U.K. Kentucky Pennsylvania Regulated Regulated Regulated Supply Total Earnings from Ongoing Operations $1.19 $0.33 $0.22 $0.68 $2.42 Special Items: Adjusted energy-related economic activity, net 0.07 0.07 Foreign currency-related economic hedges (0.06) (0.06) Impairments: Other asset impairments (0.03) (0.03) Acquisition-related adjustments: WPD Midlands Separation benefits (0.02) (0.02) LKE Net operating loss carryforward and other tax- related adjustments 0.01 0.01 Other: LKE discontinued operations (0.01) (0.01) Change in U.K. tax rate 0.13 0.13 Counterparty bankruptcy (0.01) (0.01) Coal contract modification payments (0.03) (0.03) Change in WPD line loss accrual 0.13 0.13 Total Special Items 0.18 (0.03) 0.03 0.18 Reported Earnings $1.37 $0.30 $0.22 $0.71 $2.60 (a) The "If-Converted Method" was applied to PPL's Equity Units beginning in the first quarter of 2013, resulting in $44 million of interest charges (after-tax) being added back to earnings for the twelve months ended December 31, 2013, and approximately 53 million shares of PPL Common Stock being treated as outstanding. Both adjustments are only for purposes of calculating diluted earnings per share. © PPL Corporation 201433
© PPL Corporation 2014
34
Reconciliation of PPL’s Earnings from Ongoing
Operations to Reported Earnings
Operations to Reported Earnings
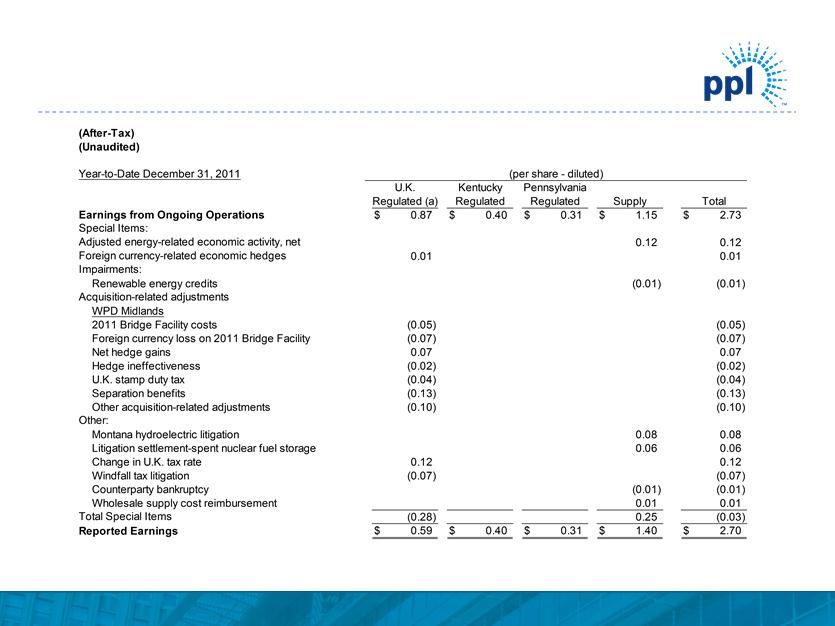
(a) WPD Midlands' results are consolidated on a one-month lag, and include eight months of results in 2011, as the date of acquisition was April 1, 2011.
Reconciliation of PPL’s Earnings from Ongoing Operations to Reported Earnings (After-Tax) (Unaudited) Year-to-date December 31, 2011 Earnings from Ongoing Operations Special Items: Adjusted energy-related economic activity, net Foreign currency-related economic hedges Impairments: Renewable energy credits Acquisition-related adjustments WPD Midlands 2011 Bridge Facility costs Foreign currency loss on 2011 Bridge Facility Net hedge gains Hedge ineffectiveness U.K. stamp duty tax Separation benefits Other acquisition- related adjustments Other: Montana hydroelectric litigation Litigation settlement-spent nuclear f uel storage Change in U.K. tax rate W indfall tax litigation Counterparty bankruptcy Wholesale supply cost reimbursement Total Special Items Reported Earnings (per share - diluted) $0.87 U.K. Regulated (a) $0.40 Regulated Kentucky $0.31 Pennsylvania Regulated $1.15 Supply 0.01 0.12 (0.01) (0.05) (0.07) 0.07 (0.02) (0.04) (0.13) (0.10) 0.12 (0.07) (0.28) $0.59 $0.40 $0.31 $0.08 0.06 (0.01) 0.01 0.25 1.40 Total $2.73 0.12 0.01 (0.01) (0.05) (0.07) 0.07 (0.02) (0.04) (0.13) (0.10) 0.08 0.06 0.12 (0.07) (0.01) 0.01 (0.03) $2.70 (a) WPD Midlands' results are consolidated on a one-month lag, and include eight months of results in 2011, as the date of acquisition was April 1, 2011. © PPL Corporation 201434

© PPL Corporation 2014
35
Reconciliation of PPL’s Earnings from Ongoing
Operations to Reported Earnings
Operations to Reported Earnings
Reconciliation of PPL’s Earnings from Ongoing Operations to Reported Earnings (After- Tax) (Unaudited) Year-to-date December 31, 2010 (per share - diluted) U.K. Kentucky Pennsylvania Regulated Regulated (a) Regulated Supply Other (b) Total Earnings from Ongoing Operations Special Items: $0.53 $0.06 $0.27 $2.27 $3.13 Adjusted energy-related economic activity, net Sales of assets: (0.27) (0.27) Maine hydroelectric generation business 0.03 0.03 Impairments: Emission allowances (0.02) (0.02) Acquisition-related adjustments: LKE Monetization of certain full-requirement sales contracts (0.29) (0.29) Sale of certain non-core generation facilities (0.14) (0.14) Discontinued cash flow hedges and ineffectiveness (0.06) (0.06) Reduction of credit facility (0.01) (0.01) 2010 Bridge Facility costs $(0.12) (0.12) Other acquisition-related adjustments (0.05) (0.05) Other: Montana hydroelectric litigation (0.08) (0.08) Change in U.K. tax rate 0.04 0.04 W indfall tax litigation 0.03 0.03 Health care reform - tax impact Total Special Items 0.07 (0.02) (0.86) (0.17) (0.02) (0.96) Reported Earnings $0.60 $0.06 $0.27 $1.41 $(0.17) $2.17 (a) Includes two months of results in 2010, as the acquisition date of LKE was November 1, 2010. (b) Includes certain costs incurred prior to the November 1, 2010 acquisition of LKE. © PPL Corporation 201435

© PPL Corporation 2014
36
Gross Margins Summary
GrossMarginsSummaryGrossMarginsSummary (Millions of Dollar s) 2014 Thr e e M onths Ended June 30, 2013 Change Per share diluted (after - tax) KY Gross Margins $428 $404 $24 $0.02 Distribution TransmissionPA Gross delivery margins Total $$189 81 270 $18359 $242 $6 22 $28 $-0.02 $0.02 Eastern U. S. Western U. S. Unr e gulated Gross Ener gy Mar gins Total $$400 52452 $349 56 $405 $51 (4) $47 $0.04 - $0.04 © PPL Corporation 201436
© PPL Corporation 2014
37
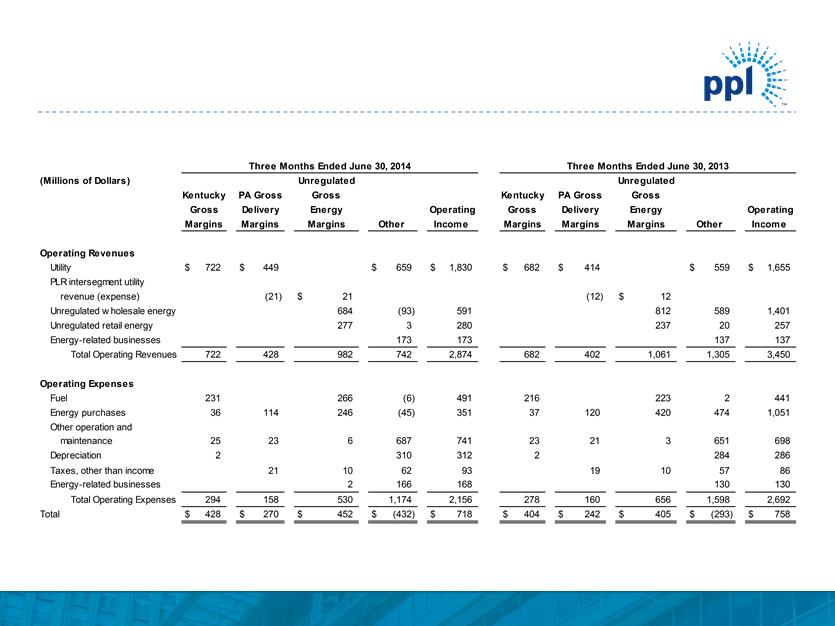
Reconciliation of Second Quarter
Margins to Operating Income
Margins to Operating Income
Reconciliation of Second Quarter Margins to Operating Income Thre e M onths Ended June 30, 2014 Thre e Months Ended June 30, 2013 (Millions of Dollars) Unregulated Unregulated Kentucky PA Gross Gross Kentucky PA Gross Gross Gross Delivery Energy Operating Gross Delivery Energy Operating Margins Margins Margins Other Income Margins Margins Margins Other Income Operating Re ve nues Utility $722 $449 $659 $1,830 $682 $414 $559 $1,655 PLR intersegment utility revenue (expense) (21) $21 (12) $12 Unregulated wholesale energy 684 (93) 591 812 589 1,401 Unregulated retail energy 277 3 280 237 20 257 Energy- related businesses 173 173 137 137 Total Operating Revenues 722 428 982 742 2,874 682 402 1,061 1,305 3,450 Operating Expens e s Fuel 231 266 (6) 491 216 223 2 441 Energy purchases 36 114 246 (45) 351 37 120 420 474 1,051 Other operation and maintenance 25 23 6 687 741 23 21 3 651 698 Depreciation 2 310 312 2 284 286 Taxes , other than income 21 10 62 93 19 10 57 86 Energy- related businesses 2 166 168 130 130 Total Operating Expenses 294 158 530 1,174 2,156 278 160 656 1,598 2,692 Total $428 $270 $452 $(432) $718 $404 $242 $405 $(293) $758 © PPL Corporation 201437

© PPL Corporation 2014
38
Statements contained in this presentation, including statements with respect to future earnings, cash flows, financing, regulation and
corporate strategy are "forward-looking statements" within the meaning of the federal securities laws. Although PPL Corporation
believes that the expectations and assumptions reflected in these forward-looking statements are reasonable, these statements are
subject to a number of risks and uncertainties, and actual results may differ materially from the results discussed in the statements.
The following are among the important factors that could cause actual results to differ materially from the forward-looking statements:
market demand and prices for energy, capacity and fuel; weather conditions affecting customer energy usage and operating costs;
competition in power markets; the effect of any business or industry restructuring; the profitability and liquidity of PPL Corporation and
its subsidiaries; new accounting requirements or new interpretations or applications of existing requirements; operating performance of
generating plants and other facilities; the length of scheduled and unscheduled outages at our generating plants; environmental
conditions and requirements and the related costs of compliance, including environmental capital expenditures and emission
allowance and other expenses; system conditions and operating costs; development of new projects, markets and technologies;
performance of new ventures; asset or business acquisitions and dispositions; any impact of hurricanes or other severe weather on our
business, including any impact on fuel prices; receipt of necessary government permits, approvals, rate relief and regulatory cost
recovery; capital market conditions and decisions regarding capital structure; the impact of state, federal or foreign investigations
applicable to PPL Corporation and its subsidiaries; the outcome of litigation against PPL Corporation and its subsidiaries; stock price
performance; the market prices of equity securities and the impact on pension income and resultant cash funding requirements for
defined benefit pension plans; the securities and credit ratings of PPL Corporation and its subsidiaries; political, regulatory or economic
conditions in states, regions or countries where PPL Corporation or its subsidiaries conduct business, including any potential effects of
threatened or actual terrorism or war or other hostilities; foreign exchange rates; new state, federal or foreign legislation, including new
tax legislation; and the commitments and liabilities of PPL Corporation and its subsidiaries. Any such forward-looking statements
should be considered in light of such important factors and in conjunction with PPL Corporation's Form 10-K and other reports on file
with the Securities and Exchange Commission.
Forward-Looking Information Statement

© PPL Corporation 2014
39
Definitions of Non-GAAP Financial Measures
"Earnings from ongoing operations," also referred to as "ongoing earnings," should not be considered as an alternative to reported earnings, or net
income attributable to PPL shareowners, which is an indicator of operating performance determined in accordance with U.S. generally accepted
accounting principles (GAAP). PPL believes that "earnings from ongoing operations," although a non-GAAP financial measure, is also useful and
meaningful to investors because it provides management's view of PPL's fundamental earnings performance as another criterion in making
investment decisions. PPL's management also uses "earnings from ongoing operations" in measuring certain corporate performance goals. Other
companies may use different measures to present financial performance.
"Earnings from ongoing operations" is adjusted for the impact of special items. Special items include:
• Adjusted energy-related economic activity (as discussed below).
• Unrealized gains or losses on foreign currency-related economic hedges.
• Gains and losses on sales of assets not in the ordinary course of business.
• Impairment charges (including impairments of securities in the company's nuclear decommissioning trust funds).
• Workforce reduction and other restructuring effects.
• Acquisition and disposition-related adjustments.
• Other charges or credits that are, in management's view, not reflective of the company's ongoing operations.
Adjusted energy-related economic activity includes the changes in fair value of positions used to economically hedge a portion of the economic
value of the competitive generation assets, full-requirement sales contracts and retail activities. This economic value is subject to changes in fair
value due to market price volatility of the input and output commodities (e.g., fuel and power) prior to the delivery period that was hedged.
Adjusted energy-related economic activity also includes the ineffective portion of qualifying cash flow hedges, the monetization of certain full-
requirement sales contracts and premium amortization associated with options. Unrealized gains and losses related to this activity are deferred,
with the exception of the full-requirement sales contracts that were monetized, and included in earnings from ongoing operations over the delivery
period of the item that was hedged or upon realization. Management believes that adjusting for such amounts provides a better matching of
earnings from ongoing operations to the actual amounts settled for PPL's underlying hedged assets. Please refer to the Notes to the Consolidated
Financial Statements and MD&A in PPL Corporation's periodic filings with the Securities and Exchange Commission for additional information on
adjusted energy-related economic activity.
Free cash flow before dividends is derived by deducting capital expenditures, proceeds from the sale of certain assets and other investing
activities-net, from cash flow from operations. Free cash flow before dividends should not be considered as an alternative to cash flow from
operations, which is determined in accordance with GAAP. PPL believes that free cash flow before dividends, although a non-GAAP measure, is
an important measure to both management and investors, as it is an indicator of the company's ability to sustain operations and growth without
additional outside financing beyond the requirement to fund maturing debt obligations. Other companies may calculate free cash flow before
dividends in a different manner.

© PPL Corporation 2014
40
Definitions of Non-GAAP Financial Measures
PPL utilizes the following non-GAAP financial measures as indicators of performance for its businesses. These measures are not intended to replace "Operating
Income," which is determined in accordance with GAAP, as an indicator of overall operating performance. Other companies may use different measures to
analyze and report their results of operations. Management believes these measures provide additional useful criteria to make investment decisions. These
performance measures are used, in conjunction with other information, by senior management and PPL's Board of Directors to manage the operations, analyze
actual results compared with budget and, in certain cases, to measure certain corporate financial goals used to determine variable compensation.
"Kentucky Gross Margins" is a single financial performance measure of the Kentucky Regulated segment's, LKE's, LG&E's and KU's electricity generation,
transmission and distribution operations as well as LKE's and LG&E's distribution and sale of natural gas. In calculating this measure, fuel, energy purchases
and certain variable costs of production (recorded as "Other operation and maintenance" on the Statements of Income) are deducted from revenues. In addition,
certain other expenses, recorded as "Other operation and maintenance" and "Depreciation" on the Statements of Income, associated with approved cost
recovery mechanisms are offset against the recovery of those expenses, which are included in revenues. These mechanisms allow for direct recovery of these
expenses and, in some cases, returns on capital investments and performance incentives. As a result, this measure represents the net revenues from the
electricity and gas operations.
"Pennsylvania Gross Delivery Margins" is a single financial performance measure of the Pennsylvania Regulated segment's and PPL Electric's electricity delivery
operations, which includes transmission and distribution activities. In calculating this measure, utility revenues and expenses associated with approved recovery
mechanisms, including energy provided as a PLR, are offset with minimal impact on earnings. Costs associated with these mechanisms are recorded in "Energy
purchases," "Other operation and maintenance," which is primarily Act 129 costs, and "Taxes, other than income," which is primarily gross receipts tax. This
performance measure includes PLR energy purchases by PPL Electric from PPL EnergyPlus, which are reflected in "PLR intersegment utility revenue
(expense)." As a result, this measure represents the net revenues from the Pennsylvania Regulated segment's and PPL Electric's electricity delivery operations.
"Unregulated Gross Energy Margins" is a single financial performance measure of the Supply segment's and PPL Energy Supply's competitive energy activities,
which are managed on a geographic basis. In calculating this measure, energy revenues, including operating revenues associated with certain businesses
classified as discontinued operations, are offset by the cost of fuel, energy purchases, certain other operation and maintenance expenses, primarily ancillary
charges, gross receipts tax, recorded in "Taxes, other than income," and operating expenses associated with certain businesses classified as discontinued
operations. This performance measure is relevant due to the volatility in the individual revenue and expense lines on the Statements of Income that comprise
"Unregulated Gross Energy Margins." This volatility stems from a number of factors, including the required netting of certain transactions with ISOs and
significant fluctuations in unrealized gains and losses. Such factors could result in gains or losses being recorded in either "Unregulated wholesale energy",
"Unregulated retail energy" or "Energy purchases" on the Statements of Income. This performance measure includes PLR revenues from energy sales to PPL
Electric by PPL EnergyPlus, which are reflected in "PLR intersegment utility revenue (expense)." "Unregulated Gross Energy Margins" excludes adjusted energy
-related economic activity, which includes the changes in fair value of positions used to economically hedge a portion of the economic value of the competitive
generation assets, full-requirement sales contracts and retail activities. This economic value is subject to changes in fair value due to market price volatility of
the input and output commodities (e.g., fuel and power) prior to the delivery period that was hedged. Adjusted energy-related economic activity includes the
ineffective portion of qualifying cash flow hedges, the monetization of certain full-requirement sales contracts and premium amortization associated with options.
This economic activity is deferred, with the exception of the full-requirement sales contracts that were monetized, and included in "Unregulated Gross Energy
Margins" over the delivery period that was hedged or upon realization.