
Exhibit 99.2
4th Quarter Earnings Call
PPL Corporation
February 14, 2013
February 14, 2013

© PPL Corporation 2013
2
Cautionary Statements and Factors
That May Affect Future Results
That May Affect Future Results
Any statements made in this presentation about future operating
results or other future events are forward-looking statements
under the Safe Harbor Provisions of the Private Securities
Litigation Reform Act of 1995. Actual results may differ materially
from such forward-looking statements. A discussion of factors
that could cause actual results or events to vary is contained in
the Appendix to this presentation and in the Company’s SEC
filings.

© PPL Corporation 2013
3
2012 Earnings Results, Operational Overview and
2013 Earnings Forecast
2013 Earnings Forecast
Segment Results and Financial Overview
Q&A
W. H. Spence
P. A. Farr
Agenda
© PPL Corporation 2013
4
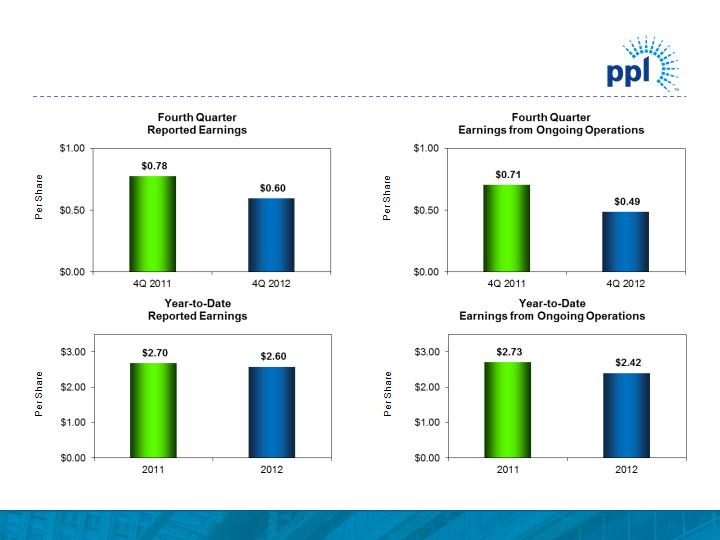
Note: See Appendix for the reconciliation of earnings from ongoing operations to reported earnings.
Strong Earnings Results
© PPL Corporation 2013
5
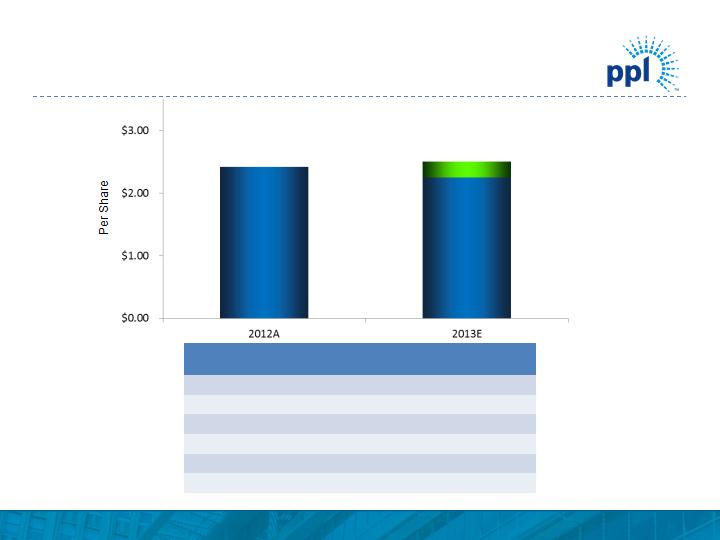
Note: See Appendix for the reconciliation of earnings from ongoing operations to reported earnings.
2013 Earnings Forecast
|
Segment
|
2012A
(Ongoing)
|
2013E Midpoint
|
|
Kentucky Regulated
|
$0.33
|
$0.47
|
|
U.K. Regulated
|
1.19
|
1.25
|
|
PA Regulated
|
0.22
|
0.29
|
|
Supply
|
0.68
|
0.40
|
|
Corporate and Other
|
|
(0.04)
|
|
Total
|
$2.42
|
$2.37
|
$2.42
$2.50
$2.25

© PPL Corporation 2013
6
• LG&E and KU rate case
– Awarded 10.25% ROE for both base rates and ECR mechanism
• Delivered on Midlands integration
– Operational performance exceeded expectations
• PPL Electric Utilities rate case
– Awarded 10.4% ROE for both base rates and DSIC mechanism
• Identified causes of Susquehanna turbine blade cracking
– Plans in place for long-term solution
– Margin impact reduced through effective portfolio management
2012 Operational Overview

© PPL Corporation 2013
7
• Implement planned long-term solution to address
Susquehanna turbine blade cracking
Susquehanna turbine blade cracking
– Restore operational performance to historical levels
• RIIO-ED1 Fast-Track
– Acceleration of price control review for DNOs with well-justified business plans
– Fast-track settlement concludes up to nine months ahead of the standard
timetable
timetable
• Establish DSIC mechanism for PPL Electric Utilities
– Accelerates recovery of ~$700 million in distribution capex related to system
reliability improvements over 5 years
reliability improvements over 5 years
– Expected to take effect May 1, 2013
• Improve earned ROEs at regulated utilities
2013 Objectives

© PPL Corporation 2013
2012
2011
Change
Kentucky Regulated
$0.33
$0.40
($0.07)
U.K. Regulated
1.19
0.87
0.32
Pennsylvania Regulated
0.22
0.31
(0.09)
Supply
0.68
1.15
(0.47)
Total
$2.42
$2.73
($0.31)
8
Q4 2012
Q4 2011
Change
Kentucky Regulated
$0.08
$0.06
$0.02
U.K. Regulated
0.29
0.28
0.01
Pennsylvania Regulated
0.05
0.10
(0.05)
Supply
0.07
0.27
(0.20)
Total
$0.49
$0.71
($0.22)
Ongoing Earnings Overview
Note: See Appendix for the reconciliation of earnings from ongoing operations to reported earnings.

© PPL Corporation 2013
9
|
|
Year-to-Date
|
|
|
2011 EPS - Ongoing Earnings
|
|
$0.40
|
|
Gross margins
|
(0.01)
|
|
|
O&M
|
(0.01)
|
|
|
Depreciation
|
(0.01)
|
|
|
Income taxes and other
|
(0.02)
|
|
|
Dilution
|
(0.02)
|
|
|
Total
|
|
(0.07)
|
|
2012 EPS - Ongoing Earnings
|
|
$0.33
|
Kentucky Regulated Segment
Earnings Drivers
Earnings Drivers
Note: See Appendix for the reconciliation of earnings from ongoing operations to reported earnings.

© PPL Corporation 2013
10
|
|
Year-to-Date
|
|
|
2011 EPS - Ongoing Earnings
|
|
$0.87
|
|
4 additional months of Midlands(1)
|
0.30
|
|
|
Utility revenue
|
0.21
|
|
|
Depreciation
|
(0.03)
|
|
|
Income taxes and other
|
(0.06)
|
|
|
Effect of exchange rates
|
(0.03)
|
|
|
Dilution
|
(0.07)
|
|
|
Total
|
|
0.32
|
|
2012 EPS - Ongoing Earnings
|
|
$1.19
|
U.K. Regulated Segment
Earnings Drivers
Earnings Drivers
Note: See Appendix for the reconciliation of earnings from ongoing operations to reported earnings.
(1) Includes interest expense from the 2011 equity units.

© PPL Corporation 2013
11
|
|
Year-to-Date
|
|
|
2011 EPS - Ongoing Earnings
|
|
$0.31
|
|
Gross delivery margins
|
0.02
|
|
|
O&M
|
(0.05)
|
|
|
Depreciation
|
(0.02)
|
|
|
Income taxes and other
|
(0.03)
|
|
|
Dilution
|
(0.01)
|
|
|
Total
|
|
(0.09)
|
|
2012 EPS - Ongoing Earnings
|
|
$0.22
|
Pennsylvania Regulated Segment
Earnings Drivers
Earnings Drivers
Note: See Appendix for the reconciliation of earnings from ongoing operations to reported earnings.

© PPL Corporation 2013
12
|
|
Year-to-Date
|
|
|
2011 EPS - Ongoing Earnings
|
|
$1.15
|
|
East energy margins
|
(0.16)
|
|
|
West energy margins
|
(0.05)
|
|
|
O&M
|
(0.10)
|
|
|
Depreciation
|
(0.06)
|
|
|
Income taxes and other
|
(0.06)
|
|
|
Dilution
|
(0.04)
|
|
|
Total
|
|
(0.47)
|
|
2012 EPS - Ongoing Earnings
|
|
$0.68
|
Supply Segment Earnings Drivers
Note: See Appendix for the reconciliation of earnings from ongoing operations to reported earnings.
© PPL Corporation 2013
13
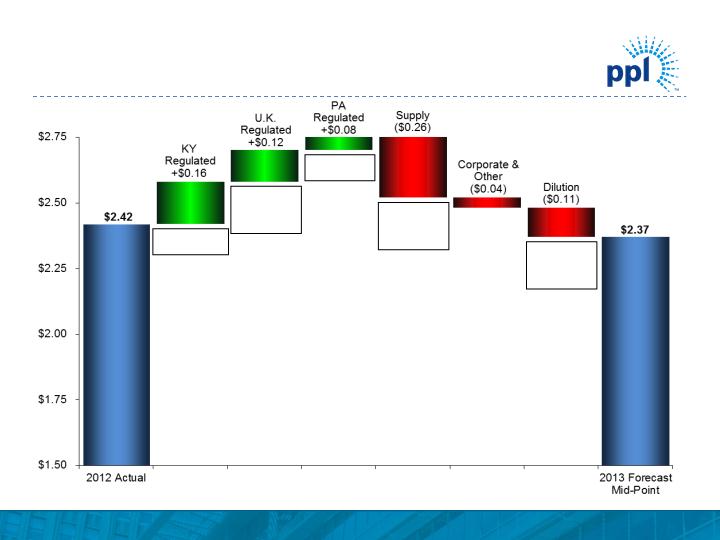
2012A to 2013E Earnings Walk
Note: See Appendix for the reconciliation of earnings from ongoing operations to reported earnings.
(1) Earnings from ongoing operations.
(1)
Margins: $0.20
O&M: ($0.04)
Revenue: $0.22
O&M: ($0.07)
Depr.: ($0.05)
Other: $0.02
Margins: $0.10
Depr.: ($0.02)
Margins: ($0.17)
O&M: ($0.05)
Depr.: ($0.02)
Other: ($0.02)
KY Reg: ($0.02)
U.K. Reg: ($0.06)
PA Reg: ($0.01)
Supply: ($0.02)
© PPL Corporation 2013
14
U.K. Regulated Segment
Modeling Parameters - Ongoing Earnings
Notes: See Appendix for the reconciliation of 2012 earnings from ongoing operations to reported earnings.
(1) Modeling parameters for 2013 and 2014 only. Modeling 2015 and beyond will be dependent on final RIIO-ED1 proposals.
(2) Assumes exchange rate of $1.58/GBP.
(3) Mid-point of 2013 earnings forecast.
($ in millions)
(3)
(1)
(2)
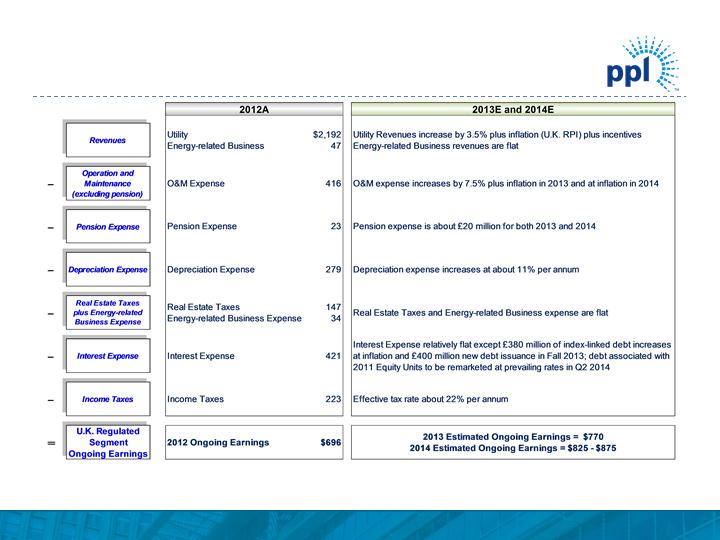
EEI Bkg_inside2 © PPL Corporation 2012 14 2012A 2013E and 2014E Utility Energy-related Business $2,192 47 Utility Revenues increase by 3.5% plus inflation (U.K. RPI) plus incentives Energy-related Business revenues are flat–O&M Expense 416 O&M expense increases by 7.5% plus inflation in 2013 and at inflation in 2014–Pension Expense23Pension expense is about £20 million for both 2013 and 2014–Depreciation Expense 279 Depreciation expense increases at about 11% per annum– Real Estate Taxes Energy-related Business Expense 147 34 Real Estate Taxes and Energy-related Business expense are flat–Interest Expense421Interest Expense relatively flat except £380 million of index-linked debt increases at inflation and £400 million new debt issuance in Fall 2013; debt associated with 2011 Equity Units to be remarketed at prevailing rates in Q2 2014–Income Taxes 223 Effective tax rate about 22% per annum -2012 Ongoing Earnings $696 2013 Estimated Ongoing Earnings = $770 2014 Estimated Ongoing Earnings = $825 - $875 Income Taxes U.K. Regulated Segment Ongoing Earnings Revenues Operation and Maintenance(excluding pension) Pension Expense Depreciation Expense Real Estate Taxes plus Energy-related Business Expense Interest Expense1 U.K. Regulated Segment Modeling Parameters – Ongoing Earnings Notes: See Appendix for the reconciliation of 2012 earnings from ongoing operations to reported earnings. (1) Modeling parameters for 2013 and 2014 only. Modeling 2015 and beyond will be dependent on final RIIO-ED1 proposals. (2) Assumes exchange rate of $1.58/GBP. (3) Mid-point of 2013 earnings forecast. ($ in millions) (3) (1) (2)
© PPL Corporation 2013
15
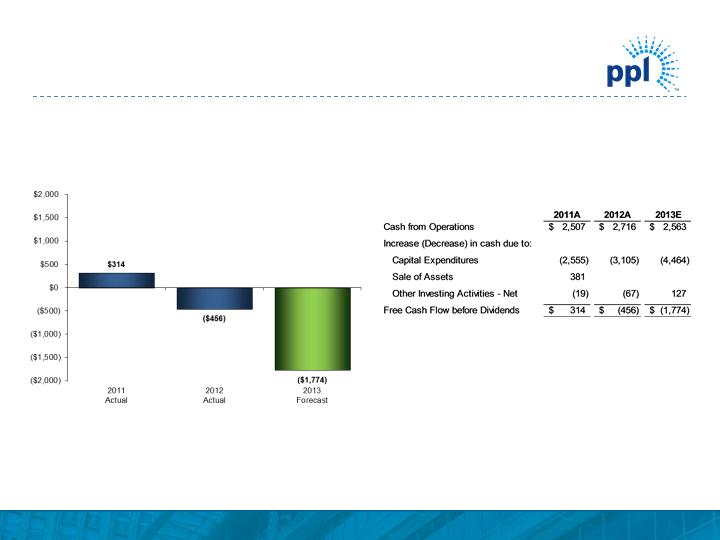
Free Cash Flow before
Dividends
Dividends
(Millions of Dollars)
Note: Free Cash Flow forecast updated on an annual basis.
Reconciliation of Cash from
Operations to Free Cash Flow
before Dividends
Operations to Free Cash Flow
before Dividends
(Millions of dollars)
Free Cash Flow before Dividends
Free Cash Flow before Dividends Reconciliation of Cash from Free Cash Flow before Operations to Free Cash Flow Dividends before Dividends (Millions of Dollars) (Millions of dollars) $314 ($456) ($1,774) ($2,000) ($1,500) ($1,000) ($500) $0 $500 $1,000 $1,500 $2,000 2011A 2012A 2013E Cash from Operations $ 2,507 $ 2,716 $ 2,563 Increase ( Decrease) in cash due to: Capital Expenditures (2,555) (3,105) (4,464) Sale of Assets 381 Other Investing Activities - Net ( 19) (67) 127 Free Cash Flow before Dividends $ 314 $ (456) $ (1,774) 2011 2012 2013 (1) Actual Actual Forecast Note: Free Cash Flow forecast updated on an annual basis. © PPL Corporation 2012 15
© PPL Corporation 2013
16
A significant rate-regulated business mix provides strong support for
current dividend and a platform for future growth
current dividend and a platform for future growth
(1) Based on mid-point of forecast. Annualized dividend based on 2/14/2013 announced increase. Actual dividends to be determined by Board of Directors.
(2) From only regulated segments.
$/Share
Annualized
(2)
(1)
Dividend Profile
2.1%
Dividend
Increase

© PPL Corporation 2013
17
Appendix

© PPL Corporation 2013
18
P
U.K. Electricity Distribution Price Control
Review Schedule
Review Schedule
|
RIIO-ED1 Timetable
|
|
|
Provisional Timing
|
Milestone
|
|
September 2012
|
Publication of Strategy Consultation
|
|
February 2013
|
Publication of Strategy Decision
|
|
July 2013
|
DNOs submit business plans
|
|
October 2013
|
Initial Assessment and publication of Fast-Track Proposals
|
|
February 2014
|
Publication of Fast-Track Decision
|
|
March 2014
|
Business plan resubmitted (non-fast-track)
|
|
July 2014
|
Publication of Initial Proposals Consultation for non-fast-tracked
companies |
|
November 2014
|
Publication of Final Proposals for non-fast-tracked companies
|
|
December 2014
|
Issue statutory consultation on new license conditions
|
|
April 1, 2015
|
New price control period commences
|
Source: Ofgem Strategy Consultation for RIIO-ED1, September 2012
Completed
P
© PPL Corporation 2013
19
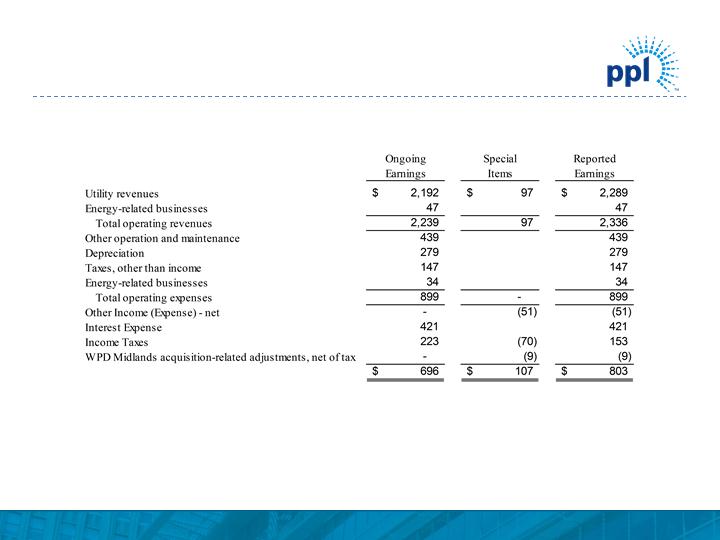
(1) Represents a non-GAAP financial measure.
(2) Represents net income attributable to PPL Shareowners.
U.K. Regulated Segment Modeling:
Reconciliation of 2012 Earnings
($ in millions)
(2)
(1)
(1)
(1)
(1)
(1)
(1)
U. K. Regulated Segment Modeling: Reconciliation of 2012 Earnings ($ in millions) Ongoing Special Reported Earnings Items Earnings Utility revenues $ 2,192 (1) $ 97 $ 2,289 Energy-related businesses 47 47 Total operating revenues 2,239 (1) 97 2,336 Other operation and maintenance 439 439 Depreciation 279 279 Taxes, other than income 147 147 Energy- related businesses 34 34 Total operating expenses 899 - 899 Other Income (Expense) - net - (1) (51) (51) Interest Expense 421 421 Income Taxes 223 (1) (70) 153 WPD Midlands acquisition-related adjustments, net of tax - (1) (9) (9) $ 696 (1) $ 107 $ 803 (2) (1) Represents a non-GAAP financial measure. (2) Represents net income attributable to PPL Shareowners. © PPL Corporation 2012 19
© PPL Corporation 2013
20
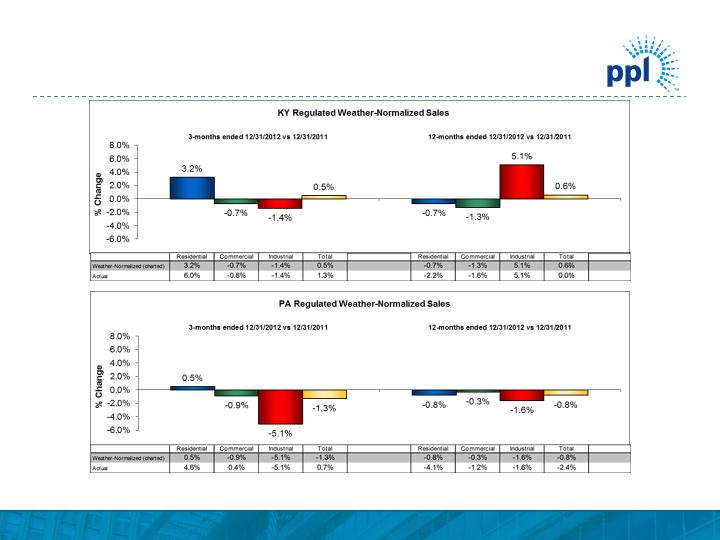
Note: Total includes Residential, Commercial and Industrial customer classes as well as “Other”, which is not depicted on the charts above.
Regulated Volume Variances
© PPL Corporation 2013
21
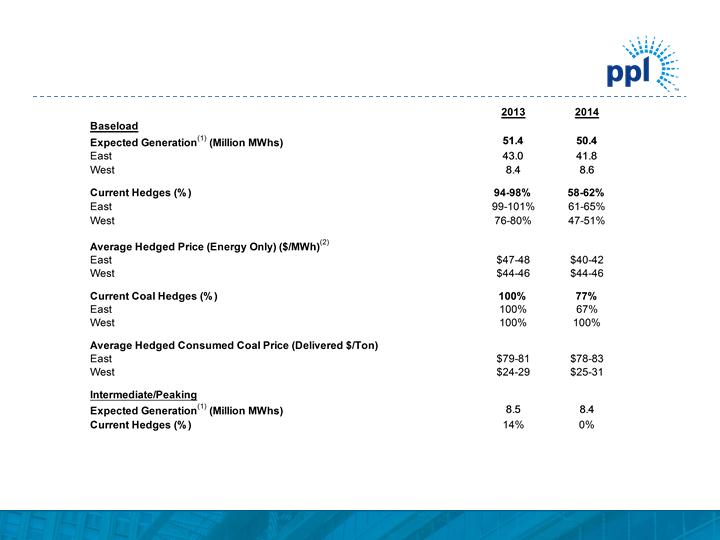
Enhancing Value Through Active Hedging
Capacity revenues are expected to be $590 million and $560 million for 2013 and 2014, respectively.
As of December 31, 2012
(1) Represents expected sales of Supply segment based on current business plan assumptions.
(2) The 2014 ranges of average energy prices for existing hedges were estimated by determining the impact on the existing collars resulting from 2014 power prices at
the 5th and 95th percentile confidence levels.
the 5th and 95th percentile confidence levels.
Enhancing Value Through Active Hedging 2013 2014 Baseload Expected Generation(1) (Million MWhs) 51.4 50.4 East 43.0 41.8 West 8.4 8.6 Current Hedges (%) 94-98% 58-62% East 99-101% 61-65% West 76-80% 47-51% Average Hedged Price (Energy Only) ($/ MWh) (2) East $47-48 $40-42 West $44-46 $44-46 Current Coal Hedges (%) 100% 77% East 100% 67% West 100% 100% Average Hedged Consumed Coal Price (Delivered $/Ton) East $79-81 $78-83 West $24-29 $25-31 Intermediate/Peaking Expected Generation(1) (Million MWhs) 8.5 8.4 Current Hedges (%) 14% 0% Capacity revenues are expected to be $590 million and $560 million for 2013 and 2014, respectively. As of December 31, 2012 (1) Represents expected sales of Supply segment based on current business plan assumptions. (2) The 2014 ranges of average energy prices for existing hedges were estimated by determining the impact on the existing collars resulting from 2014 power prices at the 5th and 95th percentile confidence levels. © PPL Corporation 2012 21
© PPL Corporation 2013
22
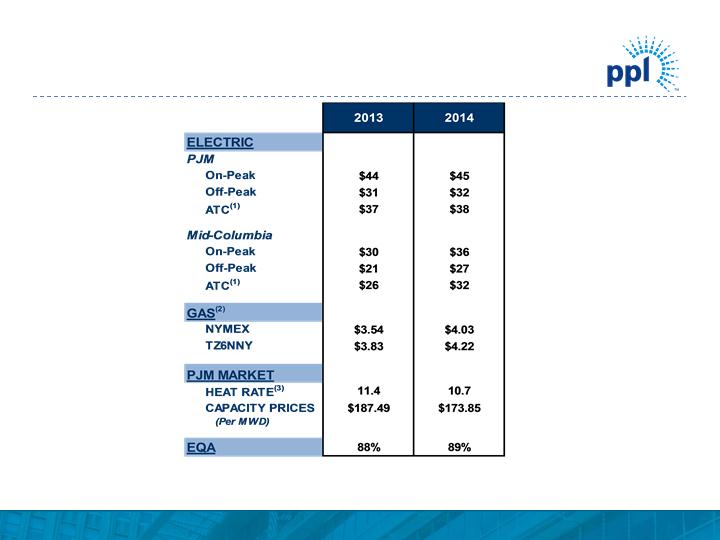
|
(1)
|
24-hour average.
|
|
(2)
|
NYMEX and TZ6NNY forward gas prices on 12/31/2012.
|
|
(3)
|
Market Heat Rate = PJM on-peak power price divided by TZ6NNY gas price.
|
Market Prices
Market Prices © PPL Corporation 2012 22 2013 2014 $44 $45 $31 $32 $37 $38 $30 $36 $21 $27 $26 $32 $3.54 $4.03 $3.83 $4.22 11.4 10.7 $187.49 $173.85 88% 89% PJM On-Peak Off-Peak (Per M W D) EQA HEAT RAT E(3) TZ6NNY PJM MARKET CAPACITY PRICES AT C(1) NYMEX GAS(2) Mid-Columbia On-Peak Off-Peak AT C(1) ELECTRIC (1) 24-hour average. (2) NYMEX and TZ6NNY forward gas prices on 12/31/2012. (3) Market Heat Rate = PJM on-peak power price divided by TZ6NNY gas price.
© PPL Corporation 2013
23
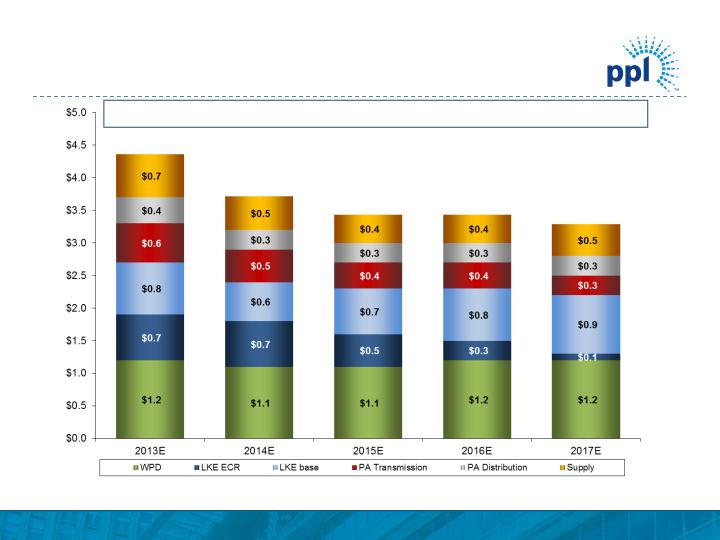
($ in billions)
Note: Corporate and Other capital expenditures average approximately $50 million per year.
(1) Figures based on assumed exchange rate of $1.58 / GBP.
(2) Expect between 80% and 90% to receive timely returns via ECR mechanism based on historical experience and future projections.
(1)
(2)
$4.4
$3.7
$3.4
$3.4
Operating Segment Capital Expenditures
Lower capital expenditures provide additional financial flexibility
$3.3
© PPL Corporation 2013
24
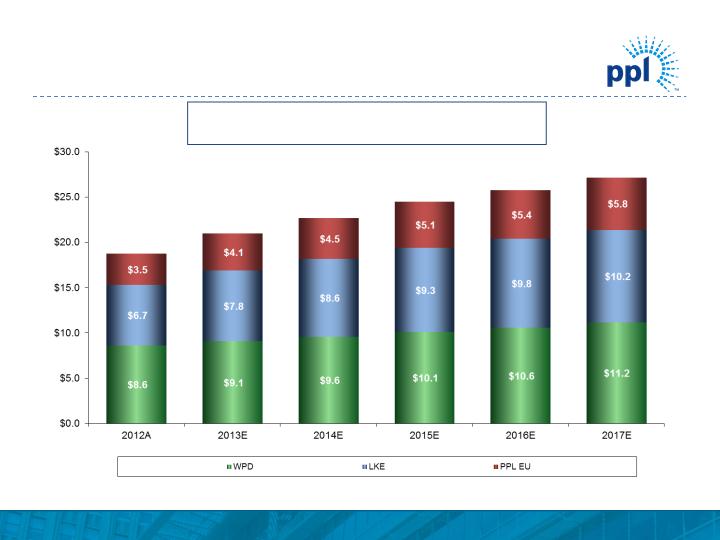
($ in billions)
(1) Represents capitalization for LKE, as LG&E and KU rate constructs are based on capitalization. Represents Regulatory Asset Value (RAV) for WPD.
(2) Figures based on assumed exchange rate of $1.58 / GBP.
$18.8
$21.0
$22.7
$24.5
(2)
2013E - 2017E Regulatory Asset Base(1) CAGR: 7.7%
$25.8
Projected Regulated Rate Base Growth
$27.2
© PPL Corporation 2013
25
Note: As of December 31, 2012
(1) Excludes $1.15 billion of junior subordinated notes due 2018 that are a component of PPL’s 2010 Equity Units and may
be put back to PPL Capital Funding if the remarketing in 2013 is not successful.
(2) Excludes $978 million of junior subordinated notes due 2019 that are a component of PPL’s 2011 Equity Units and may
be put back to PPL Capital Funding if the remarketing in 2014 is not successful.
be put back to PPL Capital Funding if the remarketing in 2014 is not successful.
(3) Bonds defeased in substance in 2008 by depositing sufficient funds with the trustee.
(4) Includes $300 million of REset Put Securities due 2035 that are required to be put by the holders in October 2015 either
for (a) purchase and remarketing by a remarketing dealer or (b) repurchase by PPL Energy Supply.
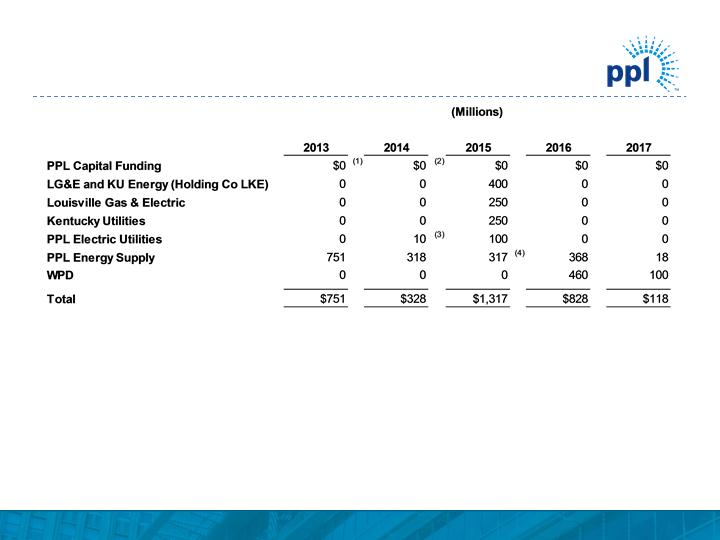
Debt Maturities
Debt Maturities (Millions) 2013 2014 2015 2016 2017 $0 (1) (2) PPL Capital Funding $0 $0 $ 0 $0 LG&E and KU Energy (Holding Co LKE) 0 0 400 0 0 Louisville Gas & Electric 0 0 250 0 0 Kentucky Utilities 0 0 250 0 0 (3) PPL Electric Utilities 0 10 100 0 0 317 (4) PPL Energy Supply 751 318 368 18 WPD 0 0 0 460 100 Total $751 $328 $1,317 $828 $118 © PPL Corporation 2012 25
© PPL Corporation 2013
26
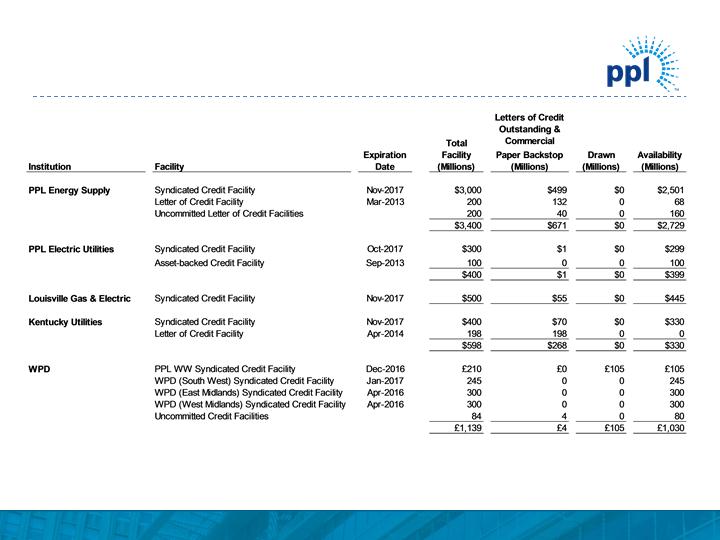
Note: As of December 31, 2012
• Credit facilities consist of a diverse bank group, with no bank and its affiliates providing an aggregate commitment of more than
9% of the total committed capacity for the domestic facilities and 13% of the total committed capacity for WPD’s facilities.
9% of the total committed capacity for the domestic facilities and 13% of the total committed capacity for WPD’s facilities.
Liquidity Profile
Liquidity Profile Institution Facility Expiration Date Total Facility (Millions) Letters of Credit Outstanding & Commercial Paper Backstop (Millions) Drawn (Millions) Availability (Millions) PPL Energy Supply Syndicated Credit Facility Letter of Credit Facility Uncommitted Letter of Credit Facilities Nov-2017 Mar-2013 $ 3,000 200 200 $ 3,400 $499 132 40 $671 $0 0 0 $0 $2,501 68 160 $2,729 PPL Electric Utilities Syndicated Credit Facility Asset-backed Credit Facility Oct-2017 Sep-2013 $ 300 100 $ 400 $1 0 $1 $0 0 $0 $299 100 $399 Louisville Gas & Electric Syndicated Credit Facility Nov-2017 $ 500 $ 55 $ 0 $445 Kentucky Utilities Syndicated Credit Facility Letter of Credit Facility Nov-2017 Apr-2014 $ 400 198 $ 598 $ 70 198 $268 $ 0 0 $0 $330 0 $330 WPD PPL WW Syndicated Credit Facility WPD (South West) Syndicated Credit Facility WPD (East Midlands) Syndicated Credit Facility WPD (West Midlands) Syndicated Credit Facility Uncommitted Credit Facilities Dec-2016 Jan-2017 Apr-2016 Apr-2016 £ 210 245 300 300 84 £ 1,139 £0 0 0 0 4 £4 £105 0 0 0 0 £105 £105 245 300 300 80 £1,030 © PPL Corporation 2012 26

© PPL Corporation 2013
27
Estimated Shares Outstanding
(1) Projected average common shares outstanding include the issuance of common stock to satisfy the 2012 forward equity sale, the DRIP and compensation-related stock
requirements and the conversion of the PPL Capital Funding equity units in 2013 and 2014.
Average Common Shares Outstanding(1)
(in millions)
For the year ended:
|
December 31, 2013
|
615
|
|
December 31, 2014
|
670
|
|
December 31, 2015
|
680
|
© PPL Corporation 2013
28
Reconciliation of Fourth Quarter Earnings from
Ongoing Operations to Reported Earnings
Ongoing Operations to Reported Earnings
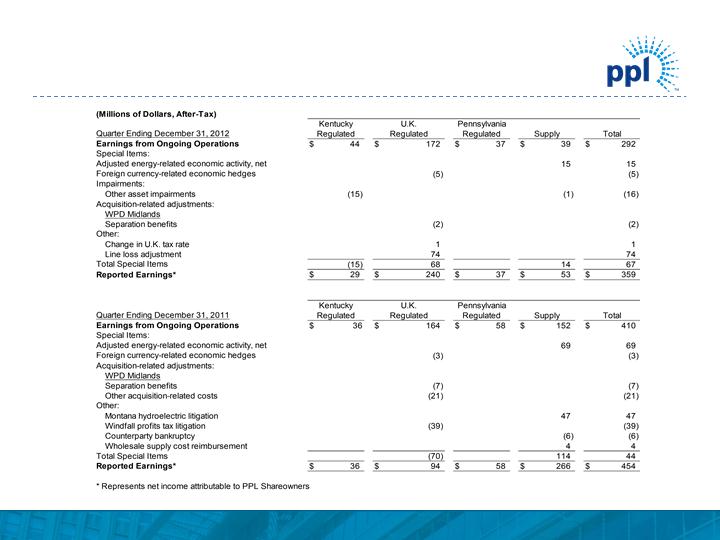
Reconciliation of Fourth Quarter Earnings from Ongoing Operations to Reported Earnings Other asset impairments Acquisition-related adjustments: WPD Midlands Separation benefits Change in U. K. tax rate Line loss adjustment Total Special Items Reported Earnings* Foreign currency-related economic hedges Other: Impairments: Special Items: Adjusted energy-related economic activity, net Earnings from Ongoing Operations Quarter Ending December 31, 2012 (Millions of Dollars, After-Tax) $ 44 (15) (15) $ 29 Regulated Kentucky $ $ 172 (5) (2) 1 74 68 240 Regulated U. K. $ 37 $ 37 Regulated Pennsylvania $ $ 39 15 (1) 14 53 Supply $ $ 292 15 (5) (16) (2) 1 74 67 359 Total Acquisition-related adjustments: WPD Midlands Separation benefits Other acquisition-related costs Montana hydroelectric litigation Windfall profits tax litigation Counterparty bankruptcy Wholesale supply cost reimbursement Total Special Items Other: Reported Earnings* Adjusted energy-related economic activity, net Foreign currency-related economic hedges Earnings from Ongoing Operations Special Items: Quarter Ending December 31, 2011 Kentucky Regulated $ 36 $ 36 $ $ 164 (3) (7) (21) (39) (70) 94 Regulated U. K. $ 58 $ 58 Regulated Pennsylvania $ $ 152 69 47 (6) 4 114 266 Supply $ $ 410 69 (3) (7) (21) 47 (39) (6) 4 44 454 Total * Represents net income attributable to PPL Shareowners © PPL Corporation 2012 28
© PPL Corporation 2013
29
Reconciliation of Fourth Quarter Earnings from
Ongoing Operations to Reported Earnings
Ongoing Operations to Reported Earnings
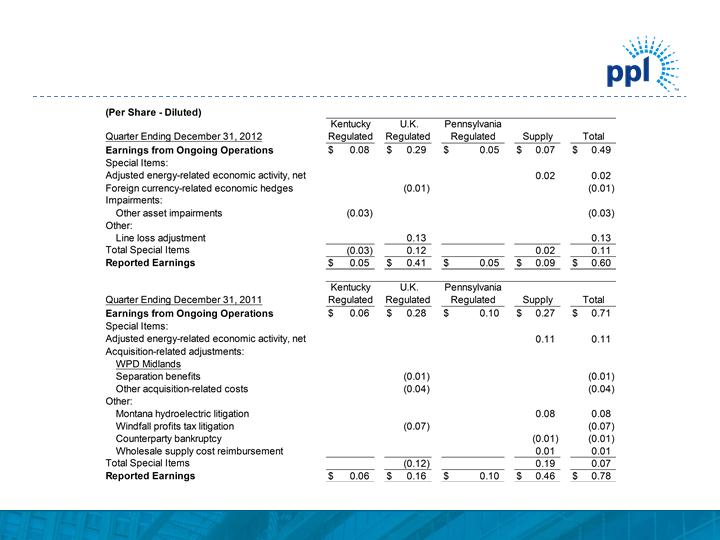
Reconciliation of Fourth Quarter Earnings from Ongoing Operations to Reported Earnings (Per Share - Diluted) Kentucky U. K. Pennsylvania Quarter Ending December 31, 2012 Regulated Regulated Regulated Supply Total Earnings from Ongoing Operations $ 0.08 $ 0.29 $ 0.05 $ 0.07 $ 0.49 Special Items: Adjusted energy-related economic activity, net 0.02 0.02 Foreign currency-related economic hedges (0.01) (0.01) Impairments: Other asset impairments (0.03) (0.03) Other: Line loss adjustment 0.13 0.13 Total Special Items (0.03) 0.12 0.02 0.11 Reported Earnings $ 0.05 $ 0.41 $ 0.05 $ 0.09 $ 0.60 Kentucky U. K. Pennsylvania Quarter Ending December 31, 2011 Regulated Regulated Regulated Supply Total Earnings from Ongoing Operations $ 0.06 $ 0.28 $ 0.10 $ 0.27 $ 0.71 Special Items: Adjusted energy-related economic activity, net 0.11 0.11 Acquisition-related adjustments: WPD Midlands Separation benefits (0.01) (0.01) Other acquisition-related costs (0.04) (0.04) Other: Montana hydroelectric litigation 0.08 0.08 Windfall profits tax litigation (0.07) (0.07) Counterparty bankruptcy (0.01) (0.01) Wholesale supply cost reimbursement 0.01 0.01 Total Special Items (0.12) 0.19 0.07 Reported Earnings $ 0.06 $ 0.16 $ 0.10 $ 0.46 $ 0.78 © PPL Corporation 2012 29
© PPL Corporation 2013
30
Reconciliation of Year-to-Date Earnings from
Ongoing Operations to Reported Earnings
Ongoing Operations to Reported Earnings
© PPL Corporation 2013
31
Reconciliation of Year-to-Date Earnings from
Ongoing Operations to Reported Earnings
Ongoing Operations to Reported Earnings
© PPL Corporation 2013
32
Reconciliation of PPL’s Earnings from
Ongoing Operations to Reported Earnings
Ongoing Operations to Reported Earnings
© PPL Corporation 2013
33
Gross Margins Summary
Gross Margins Summary (Millions of Dollars) Twelve Months Ended December 31, 2012 Per Share Dilute d 2012 2011 Change (after-tax) (a) KY Gross Margins $ 1,540 $ 1,548 $ (8) $ (0.01) PA Gross Delivery Margins by Component Distribution $ 730 $ 741 $ (11) $ (0.01) Transmission 210 180 30 0.03 Total $ 940 $ 921 $ 19 $ 0.02 Unregulated Gross Energy Margins by Region Non-trading Eastern U. S. $ 1,865 $ 2,018 $ (153) $ (0.16) Western U. S. 299 349 (50) (0.05) Net energy trading 4 (2) 6 Total $ 2,168 $ 2,365 $ (197) $ (0.21) (a) Excludes dilution which is primarily associated with the April 2011 issuance of common stock. © PPL Corporation 2012 33
© PPL Corporation 2013
34
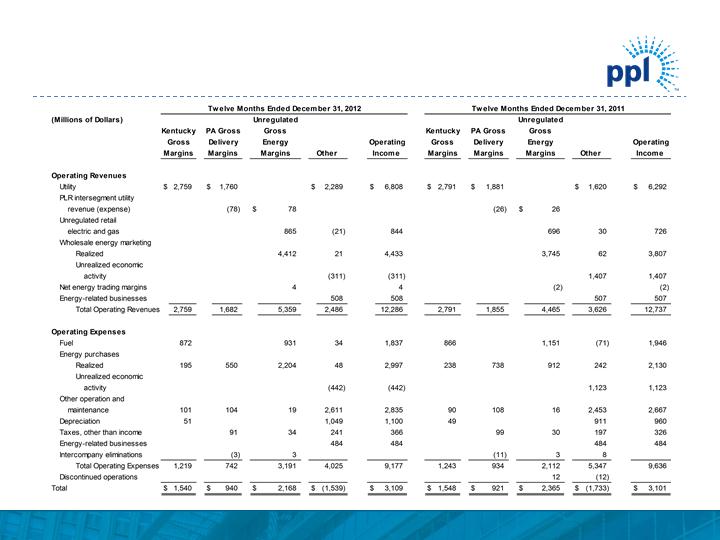
Reconciliation of Fourth Quarter
Operating Income to Margins
Operating Income to Margins
Reconciliation of Fourth Quarter Operating Income to Margins Twelve Months Ended December 31, 2012 Twelve Months Ended December 31, 2011 (Millions of Dollars) Unregulated Unregulated Kentucky PA Gross Gross Kentucky PA Gross Gross Gross Delivery Energy Operating Gross Delivery Energy Operating Margins Margins Margins Other Income Margins Margins Margins Other Income Operating Revenue s Utility $2,759 $1,760 $ 2,289 $ 6,808 $ 2,791 $ 1,881 $ 1,620 $ 6,292 PLR intersegment utility revenue (expense) (78) $ 78 (26) $ 26 Unregulated retail electric and gas 865 (21) 844 696 30 726 Wholesale energy marketing Realized 4,412 21 4,433 3,745 62 3,807 Unrealized economic activity (311) (311) 1,407 1,407 Net energy trading margins 4 4 (2) (2) Energy-related businesses 508 508 507 507 Total Operating Revenues 2,759 1,682 5,359 2,486 12,286 2,791 1,855 4,465 3,626 12,737 Operating Expenses Fuel 872 931 34 1,837 866 1,151 (71) 1,946 Energy purchases Realized 195 550 2,204 48 2,997 238 738 912 242 2,130 Unrealized economic activity (442) (442) 1,123 1,123 Other operation and maintenance 101 104 19 2,611 2,835 90 108 16 2,453 2,667 Depreciation 51 1,049 1,100 49 911 960 Taxes , other than income 91 34 241 366 99 30 197 326 Energy-related businesses 484 484 484 484 Intercompany eliminations (3) 3 (11) 3 8 Total Operating Expenses 1,219 742 3,191 4,025 9,177 1,243 934 2,112 5,347 9,636 Discontinued operations 12 (12) Total $1,540 $ 940 $ 2,168 $ (1,539) $ 3,109 $ 1,548 $ 921 $ 2,365 $ (1,733) $ 3,101 © PPL Corporation 2012 34

© PPL Corporation 2013
35
Statements contained in this presentation, including statements with respect to future earnings, cash flows, financing, regulation and
corporate strategy are "forward-looking statements" within the meaning of the federal securities laws. Although PPL Corporation
believes that the expectations and assumptions reflected in these forward-looking statements are reasonable, these statements are
subject to a number of risks and uncertainties, and actual results may differ materially from the results discussed in the statements.
The following are among the important factors that could cause actual results to differ materially from the forward-looking statements:
market demand and prices for energy, capacity and fuel; weather conditions affecting customer energy usage and operating costs;
competition in power markets; the effect of any business or industry restructuring; the profitability and liquidity of PPL Corporation, its
subsidiaries and customers; new accounting requirements or new interpretations or applications of existing requirements; operating
performance of plants and other facilities; the length of scheduled and unscheduled outages at our generating plants; environmental
conditions and requirements and the related costs of compliance, including environmental capital expenditures and emission
allowance and other expenses; system conditions and operating costs; development of new projects, markets and technologies;
performance of new ventures; asset or business acquisitions and dispositions, and PPL Corporation’s ability to realize the expected
benefits from acquired businesses, including the 2010 acquisition of Louisville Gas and Electric Company and Kentucky Utilities
Company and the 2011 acquisition of the Central Networks electricity distribution businesses in the U.K.; any impact of hurricanes or
other severe weather on our business, including any impact on fuel prices; receipt of necessary government permits, approvals, rate
relief and regulatory cost recovery; capital market conditions and decisions regarding capital structure; the impact of state, federal or
foreign investigations applicable to PPL Corporation and its subsidiaries; the outcome of litigation against PPL Corporation and its
subsidiaries; stock price performance; the market prices of equity securities and the impact on pension income and resultant cash
funding requirements for defined benefit pension plans; the securities and credit ratings of PPL Corporation and its subsidiaries;
political, regulatory or economic conditions in states, regions or countries where PPL Corporation or its subsidiaries conduct business,
including any potential effects of threatened or actual terrorism or war or other hostilities; foreign exchange rates; new state, federal or
foreign legislation, including new tax legislation; and the commitments and liabilities of PPL Corporation and its subsidiaries. Any such
forward-looking statements should be considered in light of such important factors and in conjunction with PPL Corporation's Form 10-
K and other reports on file with the Securities and Exchange Commission.
Forward-Looking Information Statement

© PPL Corporation 2013
36
Definitions of Non-GAAP Financial Measures
“Earnings from ongoing operations,” also referred to as “ongoing earnings,” should not be considered as an alternative to reported earnings, or
net income attributable to PPL shareowners, which is an indicator of operating performance determined in accordance with generally accepted
accounting principles (GAAP). PPL believes that “earnings from ongoing operations,” although a non-GAAP financial measure, is also useful and
meaningful to investors because it provides management’s view of PPL’s fundamental earnings performance as another criterion in making
investment decisions. PPL’s management also uses “earnings from ongoing operations” in measuring certain corporate performance goals.
Other companies may use different measures to present financial performance.
“Earnings from ongoing operations” is adjusted for the impact of special items. Special items include:
• Adjusted energy-related economic activity (as discussed below).
• Foreign currency-related economic hedges.
• Gains and losses on sales of assets not in the ordinary course of business.
• Impairment charges (including impairments of securities in the company’s nuclear decommissioning trust funds).
• Workforce reduction and other restructuring impacts.
• Acquisition-related adjustments.
• Other charges or credits that are, in management’s view, not reflective of the company’s ongoing operations.
Adjusted energy-related economic activity includes the changes in fair value of positions used economically to hedge a portion of the economic
value of PPL’s generation assets, full-requirement sales contracts and retail activities. This economic value is subject to changes in fair value due
to market price volatility of the input and output commodities (e.g., fuel and power) prior to the delivery period that was hedged. Also included in
adjusted energy-related economic activity is the ineffective portion of qualifying cash flow hedges, the monetization of certain full-requirement
sales contracts and premium amortization associated with options. This economic activity is deferred, with the exception of the full-requirement
sales contracts that were monetized, and included in earnings from ongoing operations over the delivery period of the item that was hedged or
upon realization. Management believes that adjusting for such amounts provides a better matching of earnings from ongoing operations to the
actual amounts settled for PPL’s underlying hedged assets. Please refer to the Notes to the Financial Statements and MD&A in PPL
Corporation’s periodic filings with the Securities and Exchange Commission for additional information on energy-related economic activity.
Free cash flow before dividends is derived by deducting capital expenditures and other investing activities-net, from cash flow from operations.
Free cash flow before dividends should not be considered as an alternative to cash flow from operations, which is determined in accordance with
GAAP. PPL believes that free cash flow before dividends, although a non-GAAP measure, is an important measure to both management and
investors, as it is an indicator of the company's ability to sustain operations and growth without additional outside financing beyond the
requirement to fund maturing debt obligations. Other companies may calculate free cash flow before dividends in a different manner.

© PPL Corporation 2013
37
Definitions of Non-GAAP Financial Measures
"Kentucky Gross Margins" is a single financial performance measure of the Kentucky Regulated segment's electricity generation, transmission
and distribution operations as well as its distribution and sale of natural gas. In calculating this measure, utility revenues and expenses
associated with approved cost recovery tracking mechanisms are offset. Certain costs associated with these mechanisms, primarily ECR and
DSM, are recorded as "Other operation and maintenance“ and "Depreciation.” These mechanisms allow for recovery of certain expenses,
returns on capital investments and performance incentives. As a result, this measure represents the net revenues from the Kentucky Regulated
segment's operations.
"Pennsylvania Gross Delivery Margins" is a single financial performance measure of the Pennsylvania Regulated segment's electric delivery
operations, which includes transmission and distribution activities. In calculating this measure, utility revenues and expenses associated with
approved recovery mechanisms, including energy provided as a PLR, are offset with minimal impact on earnings. Costs associated with these
mechanisms are recorded in "Energy purchases," "Other operation and maintenance,“ which is primarily Act 129 costs, and in "Taxes, other
than income," which is primarily gross receipts tax. This performance measure includes PLR energy purchases by PPL Electric from PPL
EnergyPlus, which are reflected in “PLR intersegment utility revenue (expense).” As a result, this measure represents the net revenues from the
Pennsylvania Regulated segment's electric delivery operations.
"Unregulated Gross Energy Margins" is a single financial performance measure of the Supply segment's competitive energy non-trading and
trading activities. In calculating this measure, the Supply segment's energy revenues, which include operating revenues associated with certain
Supply segment businesses that are classified as discontinued operations, are offset by the cost of fuel, energy purchases, certain other
operation and maintenance expenses, primarily ancillary charges, gross receipts tax, which is recorded in "Taxes, other than income," and
operating expenses associated with certain Supply segment businesses that are classified as discontinued operations. This performance
measure is relevant to PPL due to the volatility in the individual revenue and expense lines on the Statements of Income that comprise
"Unregulated Gross Energy Margins." This volatility stems from a number of factors, including the required netting of certain transactions with
ISOs and significant swings in unrealized gains and losses. Such factors could result in gains or losses being recorded in either "Wholesale
energy marketing" or "Energy purchases" on the Statements of Income. This performance measure includes PLR revenues from energy sales
to PPL Electric by PPL EnergyPlus, which are reflected in "PLR intersegment utility revenue (expense)." PPL excludes from "Unregulated
Gross Energy Margins" the Supply segment's adjusted energy-related economic activity, which includes the changes in fair value of positions
used to economically hedge a portion of the economic value of PPL's competitive generation assets, full-requirement sales contracts and retail
activities. This economic value is subject to changes in fair value due to market price volatility of the input and output commodities (e.g., fuel
and power) prior to the delivery period that was hedged. Also included in this energy-related economic activity is the ineffective portion of
qualifying cash flow hedges, the monetization of certain full-requirement sales contracts and premium amortization associated with options. This
economic activity is deferred, with the exception of the full-requirement sales contracts that were monetized, and included in unregulated gross
energy margins over the delivery period that was hedged or upon realization.