
1
© PPL Corporation 2011
PPL Corporation
2nd Quarter Earnings Call
August 5, 2011
August 5, 2011
Exhibit 99.2

2
© PPL Corporation 2011
Any statements made in this presentation about future operating
results or other future events are forward-looking statements under
the Safe Harbor Provisions of the Private Securities Litigation Reform
Act of 1995. Actual results may differ materially from such forward-
looking statements. A discussion of factors that could cause actual
results or events to vary is contained in the Appendix to this
presentation and in the Company’s SEC filings.
Cautionary Statements and Factors
That May Affect Future Results
That May Affect Future Results

3
© PPL Corporation 2011
J. H. Miller
W. H. Spence
P. A. Farr
Agenda
Second Quarter 2011 Earnings and Outlook
Segment Results and Financial Overview
Operational Review
Q&A
4
© PPL Corporation 2011
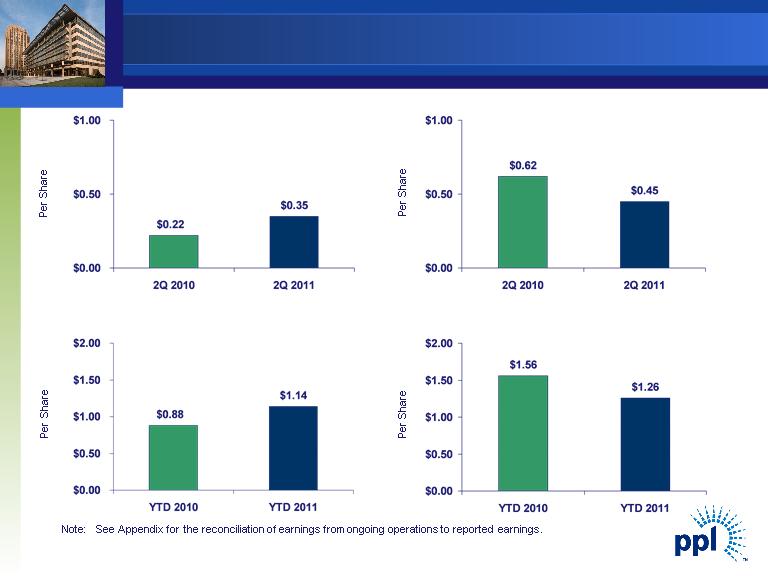
Second Quarter
Reported Earnings
Second Quarter
Earnings from Ongoing Operations
Year-to-Date
Reported Earnings
Year-to-Date
Earnings from Ongoing Operations
Earnings Results
4 © PPL Corporation 2011 Earnings Results $0.35 $0.22 $0.00 $0.50 $1.00 2Q 2010 2Q 2011 $0.62 $0.45 $0.00 $0.50 $1.00 2Q 2010 2Q 2011 Second Quarter Reported Earnings Second Quarter Earnings from Ongoing Operations Per SharePer Share Note: See Appendix for the reconciliation of earnings from ongoing operations to reported earnings. $1.14 $0.88 $0.00 $0.50 $1.00 $1.50 $2.00 YTD 2010 YTD 2011 $1.56 $1.26 $0.00 $0.50 $1.00 $1.50 $2.00 YTD 2010 YTD 2011 Year-to-Date Reported Earnings Year-to-Date Earnings from Ongoing Operations Per SharePer Share 4 © PPL Corporation 2011 Earnings Results $0.35 $0.22 $0.00 $0.50 $1.00 2Q 2010 2Q 2011 $0.62 $0.45 $0.00 $0.50 $1.00 2Q 2010 2Q 2011 Second Quarter Reported Earnings Second Quarter Earnings from Ongoing Operations Per SharePer Share Note: See Appendix for the reconciliation of earnings from ongoing operations to reported earnings. $1.14 $0.88 $0.00 $0.50 $1.00 $1.50 $2.00 YTD 2010 YTD 2011 $1.56 $1.26 $0.00 $0.50 $1.00 $1.50 $2.00 YTD 2010 YTD 2011 Year-to-Date Reported Earnings Year-to-Date Earnings from Ongoing Operations Per SharePer Share
5
© PPL Corporation 2011
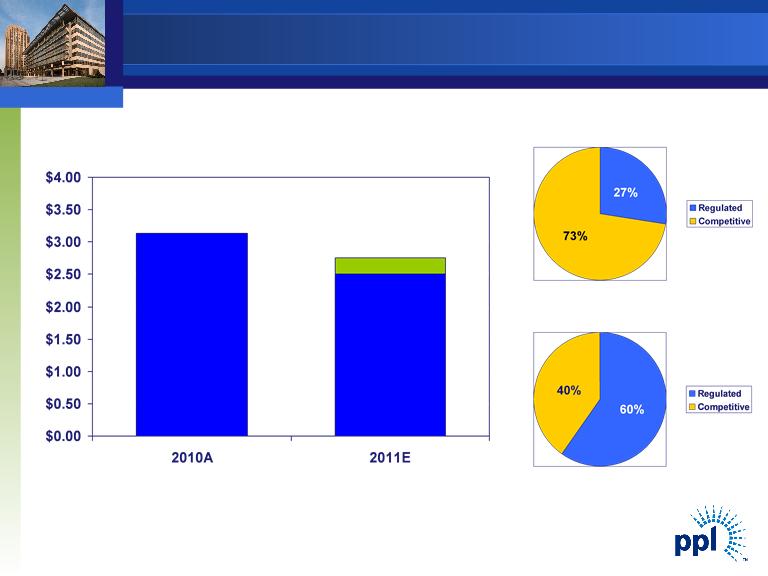
$3.13
$2.75
$/Share
(1) Based on mid-point of forecasted earnings range.
Note: See appendix for reconciliation of earnings from ongoing operations to reported earnings.
(1)
$2.50
2010A
2011E
2011 Earnings from Ongoing Operations Forecast
5 © PPL Corporation 2011 $0.00 $0.50 $1.00 $1.50 $2.00 $2.50 $3.00 $3.50 $4.00 2010A 2011E 2011 Earnings from Ongoing Operations Forecast 27% 73% Regulated Competitive $3.13 $2.75 $/Share (1) Based on mid- point of forecasted earnings range. Note: See appendix for reconciliation of earnings from ongoing operations to reported earnings. (1) $2.50 60% 40% Regulated Competitive 2010A 2011E 5 © PPL Corporation 2011 $0.00 $0.50 $1.00 $1.50 $2.00 $2.50 $3.00 $3.50 $4.00 2010A 2011E 2011 Earnings from Ongoing Operations Forecast 27% 73% Regulated Competitive $3.13 $2.75 $/Share (1) Based on mid- point of forecasted earnings range. Note: See appendix for reconciliation of earnings from ongoing operations to reported earnings. (1) $2.50 60% 40% Regulated Competitive 2010A 2011E

6
© PPL Corporation 2011
($0.17)
$0.62
$0.45
Total
(0.31)
0.43
0.12
Supply
0.02
0.04
0.06
Pennsylvania Regulated
0.06
0.15
0.21
International Regulated
$0.06
$ -
$0.06
Kentucky Regulated
Change
2010
2011
Q2
Q2
|
Note: See Appendix for the reconciliation of earnings from ongoing operations to reported earnings.
|
Ongoing Earnings Overview

7
© PPL Corporation 2011
|
Note: See Appendix for the reconciliation of earnings from ongoing operations to reported earnings.
|
|
|
2nd Quarter
|
|
|
2010 EPS - Ongoing Earnings
|
|
$0.15
|
|
Delivery Revenue
|
0.03
|
|
|
Financing
|
(0.01)
|
|
|
Income Taxes & Other
|
(0.02)
|
|
|
Midlands
|
0.16
|
|
|
Dilution
|
(0.10)
|
|
|
Total
|
|
0.06
|
|
2011 EPS - Ongoing Earnings
|
|
$0.21
|
International Regulated Segment
Earnings Drivers
Earnings Drivers

8
© PPL Corporation 2011
|
Note: See Appendix for the reconciliation of earnings from ongoing operations to reported earnings.
|
|
|
2nd Quarter
|
|
|
2010 EPS - Ongoing Earnings
|
|
$0.04
|
|
Electric Delivery Margins
|
0.03
|
|
|
O&M
|
0.01
|
|
|
Income taxes & other
|
0.01
|
|
|
Dilution
|
(0.03)
|
|
|
Total
|
|
0.02
|
|
2011 EPS - Ongoing Earnings
|
|
$0.06
|
Pennsylvania Regulated Segment
Earnings Drivers
Earnings Drivers

9
© PPL Corporation 2011
|
Note: See Appendix for the reconciliation of earnings from ongoing operations to reported earnings.
|
|
|
2nd Quarter
|
|
|
2010 EPS - Ongoing Earnings
|
|
$0.43
|
|
Margins - East
|
(0.20)
|
|
|
O&M
|
(0.06)
|
|
|
Discontinued Operations
|
0.01
|
|
|
Dilution
|
(0.06)
|
|
|
Total
|
|
(0.31)
|
|
2011 EPS - Ongoing Earnings
|
|
$0.12
|
Supply Segment Earnings Drivers
10
© PPL Corporation 2011
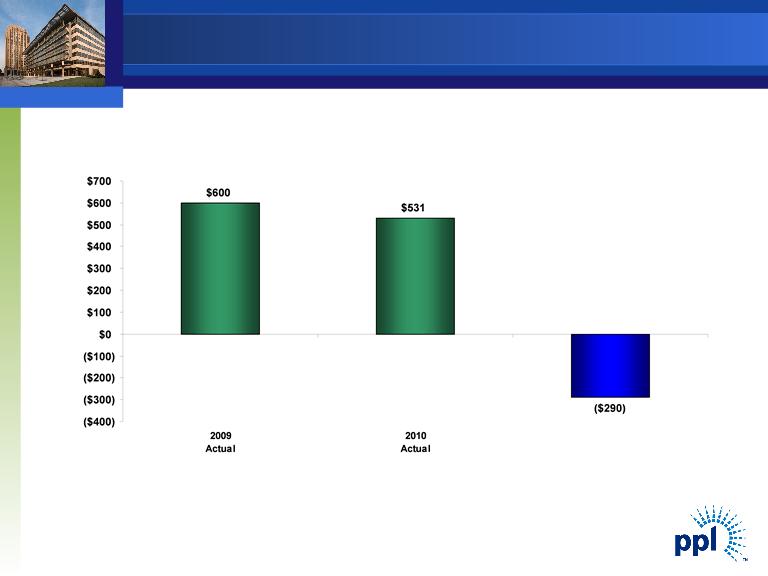
Millions of Dollars
(1) 2010 Free Cash Flow includes two months of the results of the Kentucky Regulated segment.
Note: See Appendix for reconciliation of free cash flow before dividends to cash from operations.
(1)
2011
Forecast
Free Cash Flow before Dividends
10 © PPL Corporation 2011 $600 $531 ( $ 290) ( $ 400) ( $ 300) ( $ 200) ( $ 100) $0 $100 $200 $300 $400 $500 $600 $700 2009 Actual 2010 Actual Free Cash Flow before Dividends Millions of Dollars (1) 2010 Free Cash Flow includes two months of the results of the Kentucky Regulated segment. Note: See Appendix for reconciliation of free cash flow before dividends to cash from operations. (1) 2011 Forecast 10 © PPL Corporation 2011 $600 $531 ( $ 290) ( $ 400) ( $ 300) ( $ 200) ( $ 100) $0 $100 $200 $300 $400 $500 $600 $700 2009 Actual 2010 Actual Free Cash Flow before Dividends Millions of Dollars (1) 2010 Free Cash Flow includes two months of the results of the Kentucky Regulated segment. Note: See Appendix for reconciliation of free cash flow before dividends to cash from operations. (1) 2011 Forecast
11
© PPL Corporation 2011
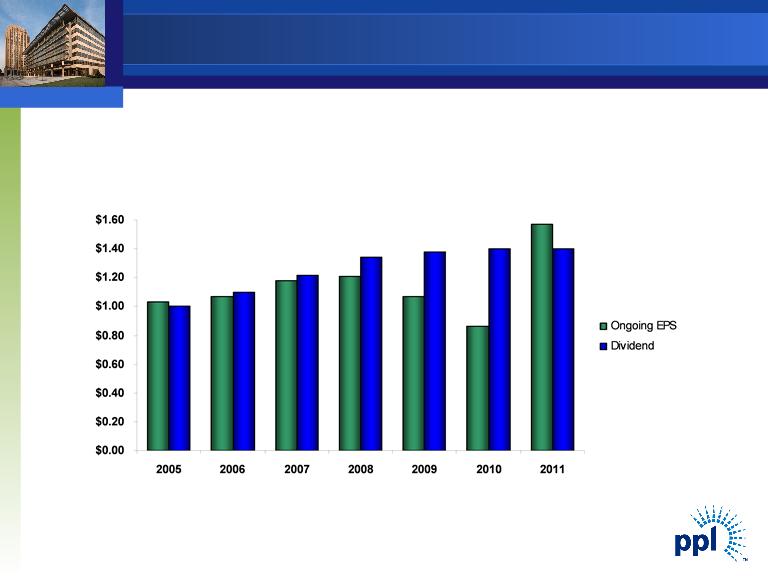
$/Share
Annualized
A significantly more rate-regulated business mix provides strong
support for current dividend and a platform for future growth
(1) Ongoing EPS based on mid-point of forecast. Annualized dividend based on 1st quarter declaration. Actual dividends to
be determined by Board of Directors.
(2) From only regulated segments.
(2)
(1)
Dividend Profile
11 © PPL Corporation 2011 Dividend Profile $/Share Annualized A significantly more rate-regulated business mix provides strong support for current dividend and a platform for future growth (1) Ongoing EPS based on mid- point of forecast. Annualized dividend based on 1st quarter declaration. Actual dividends to be determined by Board of Directors. (2) From only regulated segments. $0.00 $0.20 $0.40 $0.60 $0.80 $1.00 $1.20 $1.40 $1.60 2005 2006 2007 2008 2009 2010 2011 Ongoing EPS Dividend (2) (1) 11 © PPL Corporation 2011 Dividend Profile $/Share Annualized A significantly more rate-regulated business mix provides strong support for current dividend and a platform for future growth (1) Ongoing EPS based on mid- point of forecast. Annualized dividend based on 1st quarter declaration. Actual dividends to be determined by Board of Directors. (2) From only regulated segments. $0.00 $0.20 $0.40 $0.60 $0.80 $1.00 $1.20 $1.40 $1.60 2005 2006 2007 2008 2009 2010 2011 Ongoing EPS Dividend (2) (1)

12
© PPL Corporation 2011
Kentucky Regulated Segment
• Environmental Cost Recovery (ECR) filing with Kentucky PSC
§ Filed in June 2011
§ Discovery phase in process
§ PSC order to be received by year-end 2011
Supply Segment
• Susquehanna Units 1 & 2 return to service after turbine blade replacement
• Generation fleet well-positioned post final EPA regulations
Operational Review

13
© PPL Corporation 2011
International Regulated Segment
• Synergy plan for Midlands integration on track
• Organizational structure and Reorganization plan have been determined
•Transition from a functional structure to a regional structure under way and
will result in:
§ Smaller support structure
§ Elimination of duplicate work
§ Implementation of more efficient procedures
Operational Review (continued)
14
© PPL Corporation 2011
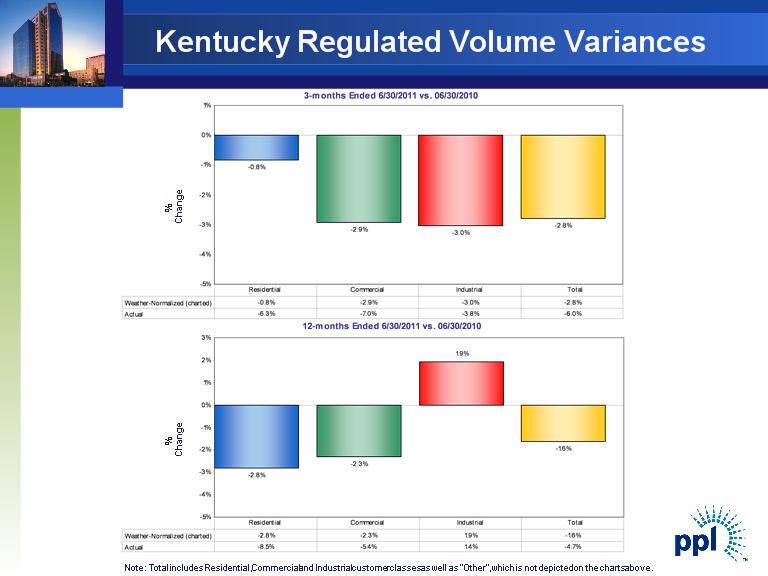
14 © PPL Corporation 2011 Kentucky Regulated Volume Variances % Change% Change Note: Total includes Residential, Commercial and Industrial customer classes as well as “Other” , which is not depicted on the charts above. 3- months Ended 6/ 30/2011 vs. 06/ 30/2010 -0.8% -2.9% -3.0% -2.8% -5% -4% -3% -2% -1% 0% 1% Weather- Normalized ( charted) - 0.8% - 2.9% - 3.0% - 2.8% Actual - 6.3% - 7.0% - 3.8% - 6.0% Residential Commercial Industrial Total 12- months Ended 6/30/ 2011 vs. 06/30/ 2010 -2.8% -2.3% 1.9% -1.6% -5% -4% -3% -2% -1% 0% 1% 2% 3% Weather- Normalized ( charted) -2.8% - 2.3% 1.9% -1.6% Actual -8.5% -5.4% 1.4% -4.7% Residential Commercial Industrial Total 14 © PPL Corporation 2011 Kentucky Regulated Volume Variances % Change% Change Note: Total includes Residential, Commercial and Industrial customer classes as well as “Other” , which is not depicted on the charts above. 3- months Ended 6/ 30/2011 vs. 06/ 30/2010 -0.8% -2.9% -3.0% -2.8% -5% -4% -3% -2% -1% 0% 1% Weather- Normalized ( charted) - 0.8% - 2.9% - 3.0% - 2.8% Actual - 6.3% - 7.0% - 3.8% - 6.0% Residential Commercial Industrial Total 12- months Ended 6/30/ 2011 vs. 06/30/ 2010 -2.8% -2.3% 1.9% -1.6% -5% -4% -3% -2% -1% 0% 1% 2% 3% Weather- Normalized ( charted) -2.8% - 2.3% 1.9% -1.6% Actual -8.5% -5.4% 1.4% -4.7% Residential Commercial Industrial Total
15
© PPL Corporation 2011
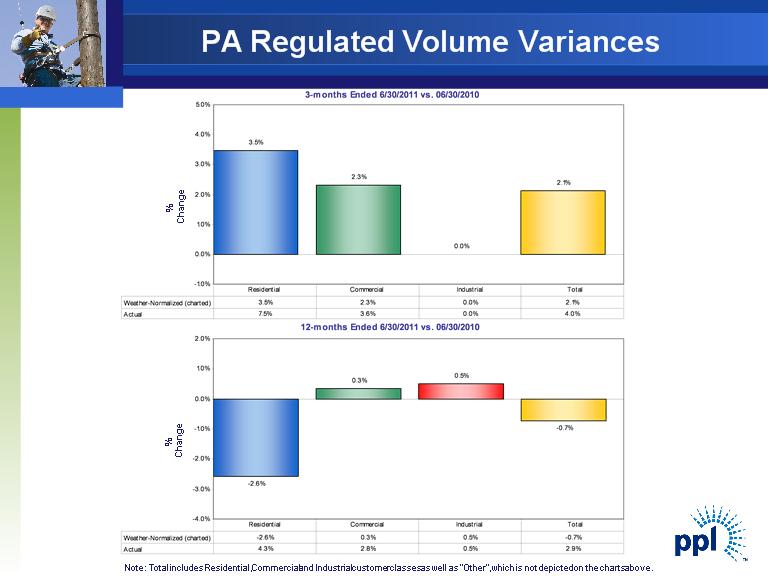
15 © PPL Corporation 2011 PA Regulated Volume Variances % Change% Change Note: Total includes Residential, Commercial and Industrial customer classes as well as “Other” , which is not depicted on the charts above. 3- months Ended 6/30/ 2011 vs. 06/30/ 2010 3.5% 2.3% 0.0% 2.1% -1.0% 0.0% 1.0% 2.0% 3.0% 4.0% 5.0% Weather- Normalized ( charted) 3.5% 2.3% 0.0% 2.1% Actual 7.5% 3.6% 0.0% 4.0% Residential Commercial Industrial Total 12- months Ended 6/ 30/2011 vs. 06/ 30/2010 -2.6% 0.3% 0.5% -0.7% -4.0% -3.0% -2.0% -1.0% 0.0% 1.0% 2.0% Weather- Normalized ( charted) - 2.6% 0.3% 0.5% - 0.7% Actual 4.3% 2.8% 0.5% 2.9% Residential Commercial Industrial Total 15 © PPL Corporation 2011 PA Regulated Volume Variances % Change% Change Note: Total includes Residential, Commercial and Industrial customer classes as well as “Other” , which is not depicted on the charts above. 3- months Ended 6/30/ 2011 vs. 06/30/ 2010 3.5% 2.3% 0.0% 2.1% -1.0% 0.0% 1.0% 2.0% 3.0% 4.0% 5.0% Weather- Normalized ( charted) 3.5% 2.3% 0.0% 2.1% Actual 7.5% 3.6% 0.0% 4.0% Residential Commercial Industrial Total 12- months Ended 6/ 30/2011 vs. 06/ 30/2010 -2.6% 0.3% 0.5% -0.7% -4.0% -3.0% -2.0% -1.0% 0.0% 1.0% 2.0% Weather- Normalized ( charted) - 2.6% 0.3% 0.5% - 0.7% Actual 4.3% 2.8% 0.5% 2.9% Residential Commercial Industrial Total

16
© PPL Corporation 2011
Capacity revenues are expected to be $430 million, $385 million and $590 million for 2011, 2012 and 2013, respectively.
As of June 30, 2011
(1) Represents expected sales based on current business plan assumptions.
(2) The 2011 average hedge energy prices are based on the fixed price swaps as of June 30, 2011; the prior collars have all been converted to fixed swaps.
(3) The 2012 and 2013 ranges of average energy prices for existing hedges were estimated by determining the impact on the existing collars resulting from 2012 and 2013 power prices at the 5th
and 95th percentile confidence levels.
and 95th percentile confidence levels.
(4) Includes six months of actual results.
(5) Transportation contract in negotiation.
|
|
|
|
2011(4)
|
|
2012
|
|
2013
|
|
Baseload
|
|
|
|
|
|
|
|
|
Expected Generation(1) (Million MWhs)
|
|
|
47.9
|
|
54.7
|
|
54.4
|
|
East
|
|
|
40.1
|
|
46.2
|
|
46.0
|
|
West
|
|
|
7.8
|
|
8.5
|
|
8.4
|
|
|
|
|
|
|
|
|
|
|
Current Hedges (%)
|
|
|
98%
|
|
97%
|
|
69%
|
|
East
|
|
|
99%
|
|
98%
|
|
69%
|
|
West
|
|
|
97%
|
|
95%
|
|
72%
|
|
|
|
|
|
|
|
|
|
|
Average Hedged Price (Energy Only) ($/MWh)(2) (3)
|
|
|
|
|
|
|
|
|
East
|
|
|
$57
|
|
$54-55
|
|
$53-56
|
|
West
|
|
|
$54
|
|
$53-54
|
|
$50-51
|
|
|
|
|
|
|
|
|
|
|
Current Coal Hedges (%)
|
|
|
100%
|
|
96%
|
|
88%
|
|
East
|
|
|
100%
|
|
95%
|
|
91%
|
|
West
|
|
|
100%
|
|
100%
|
|
79%
|
|
|
|
|
|
|
|
|
|
|
Average Hedged Consumed Coal Price (Delivered $/Ton)
|
|
|
|
|
|
|
|
|
East
|
|
|
$73-74
|
|
$76-80
|
|
(5)
|
|
West
|
|
|
$23-27
|
|
$23-29
|
|
$23-30
|
|
|
|
|
|
|
|
|
|
|
Intermediate/Peaking
|
|
|
|
|
|
|
|
|
Expected Generation(1) (Million MWhs)
|
|
|
7.6
|
|
6.2
|
|
6.3
|
|
Current Hedges (%)
|
|
|
87%
|
|
32%
|
|
19%
|
Enhancing Value Through Active Hedging

17
© PPL Corporation 2011
Appendix
18
© PPL Corporation 2011
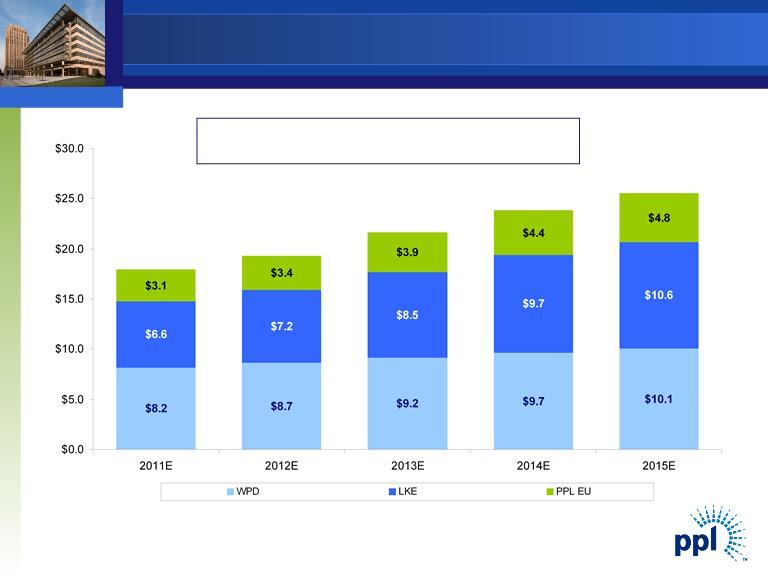
Regulated Rate Base Growth
($ in billions)
(1) Represents capitalization for LKE, as LG&E and KU rate constructs are based on capitalization. Represents Regulatory Asset Value (RAV) for WPD.
(2) Includes RAV for WPD Midlands. Figures based on assumed exchange rate of $1.60 / GBP and are as of year-end December 31.
$17.9
$19.3
$21.6
$23.8
$25.5
2011E - 2015E Regulatory Asset Base(1) CAGR: 9.3%
(2)
18 © PPL Corporation 2011 $8.2 $8.7 $9.2 $9.7 $10.1 $6.6 $7.2 $8.5 $9.7 $10.6 $3.1 $3.4 $3.9 $4.4 $4.8 $0.0 $5.0 $10.0 $15.0 $20.0 $25.0 $30.0 2011E 2012E 2013E 2014E 2015E WPD LKE PPL EU Regulated Rate Base Growth ($ in billions) (1) Represents capitalization for LKE, as LG&E and KU rate constructs are based on capitalization. Represents Regulatory Asset Value (RAV) for WPD. (2) Includes RAV for WPD Midlands. Figures based on assumed exchange rate of $1.60 / GBP and are as of year- end December 31. $17.9 $19.3 $21.6 $23.8 $25.5 2011E – 2015E Regulatory Asset Base(1) CAGR: 9.3% (2) 18 © PPL Corporation 2011 $8.2 $8.7 $9.2 $9.7 $10.1 $6.6 $7.2 $8.5 $9.7 $10.6 $3.1 $3.4 $3.9 $4.4 $4.8 $0.0 $5.0 $10.0 $15.0 $20.0 $25.0 $30.0 2011E 2012E 2013E 2014E 2015E WPD LKE PPL EU Regulated Rate Base Growth ($ in billions) (1) Represents capitalization for LKE, as LG&E and KU rate constructs are based on capitalization. Represents Regulatory Asset Value (RAV) for WPD. (2) Includes RAV for WPD Midlands. Figures based on assumed exchange rate of $1.60 / GBP and are as of year- end December 31. $17.9 $19.3 $21.6 $23.8 $25.5 2011E – 2015E Regulatory Asset Base(1) CAGR: 9.3% (2
19
© PPL Corporation 2011
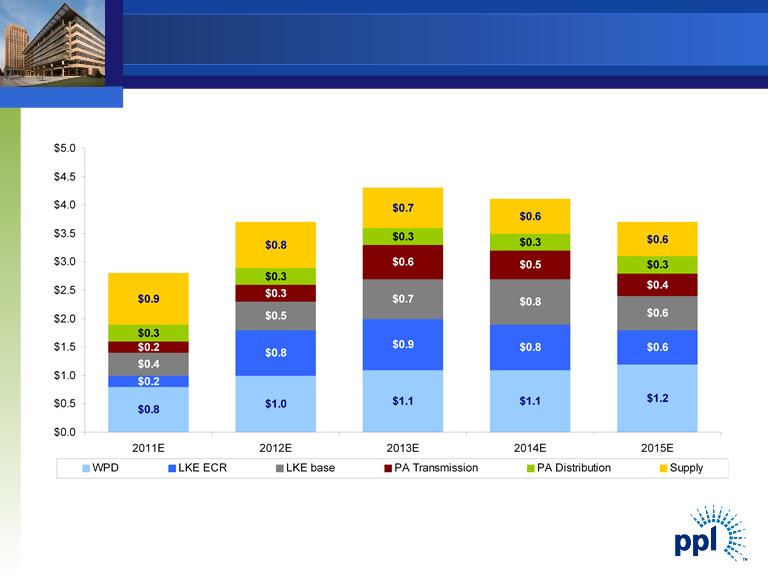
Capital Expenditures
($ in billions)
(1) Includes capex for WPD Midlands. Figures based on assumed exchange rate of $1.60 / GBP.
(2) Expect approximately 85% to receive timely returns via ECR mechanism based on historical experience.
(1)
(2)
$2.8
$3.7
$4.3
$4.1
$3.7
19 © PPL Corporation 2011 $0.8 $1.0 $1.1 $1.1 $1.2 $0.2 $0.8 $0.9 $0.8 $0.6 $0.5 $0.7 $0.8 $0.6 $0.3 $0.6 $0.5 $0.4 $0.3 $0.3 $0.3 $0.3 $0.9 $0.8 $0.7 $0.6 $0.6 $0.4 $0.2 $0.3 $0.0 $0.5 $1.0 $1.5 $2.0 $2.5 $3.0 $3.5 $4.0 $4.5 $5.0 2011E 2012E 2013E 2014E 2015E WPD LKE ECR LKE base PA Transmission PA Distribution Supply Capital Expenditures ($ in billions) (1) Includes capex for WPD Midlands. Figures based on assumed exchange rate of $1.60 / GBP. (2) Expect approximately 85% to receive timely returns via ECR mechanism based on historical experience. (1) (2) $2.8 $3.7 $4.3 $4.1 $3.7 19 © PPL Corporation 2011 $0.8 $1.0 $1.1 $1.1 $1.2 $0.2 $0.8 $0.9 $0.8 $0.6 $0.5 $0.7 $0.8 $0.6 $0.3 $0.6 $0.5 $0.4 $0.3 $0.3 $0.3 $0.3 $0.9 $0.8 $0.7 $0.6 $0.6 $0.4 $0.2 $0.3 $0.0 $0.5 $1.0 $1.5 $2.0 $2.5 $3.0 $3.5 $4.0 $4.5 $5.0 2011E 2012E 2013E 2014E 2015E WPD LKE ECR LKE base PA Transmission PA Distribution Supply Capital Expenditures ($ in billions) (1) Includes capex for WPD Midlands. Figures based on assumed exchange rate of $1.60 / GBP. (2) Expect approximately 85% to receive timely returns via ECR mechanism based on historical experience. (1) (2) $2.8 $3.7 $4.3 $4.1 $3.7
20
© PPL Corporation 2011
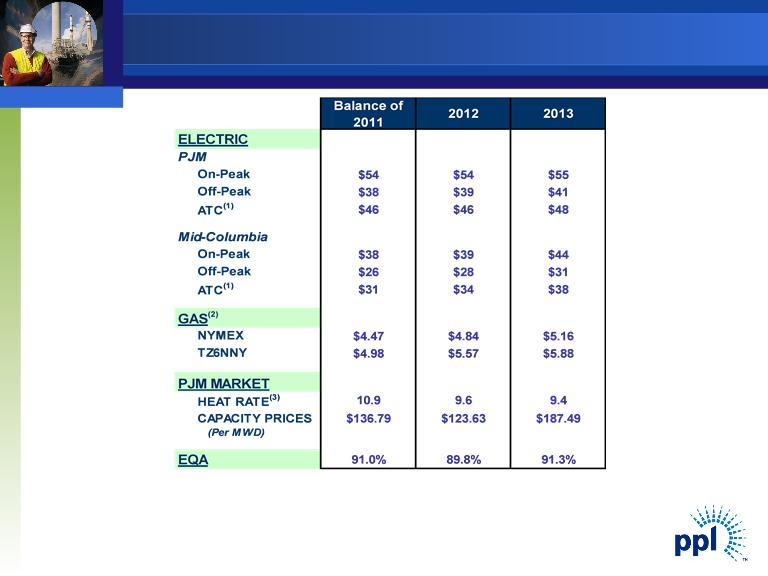
Market Prices
|
(1)
|
24-hour average.
|
|
(2)
|
NYMEX and TZ6NNY forward gas prices on 6/30/2011.
|
|
(3)
|
Market Heat Rate = PJM on-peak power price divided by TZ6NNY gas
price. |
20 © PPL Corporation 2011 Market Prices Balance of 2011 2012 2013 $54 $54 $55 $38 $39 $41 $46 $46 $48 $38 $39 $44 $26 $28 $31 $31 $34 $38 $4.47 $4.84 $5.16 $4.98 $5.57 $5.88 10.9 9.6 9.4 $136.79 $123.63 $187.49 91.0% 89.8% 91.3% Mid- Columbia On-Peak Off-Peak ATC(1) ELECTRIC PJM On-Peak Off-Peak ATC(1) NYMEX GAS(2) CAPACITY PRICES (Per MWD) EQA HEAT RATE(3) TZ6NNY PJM MARKET (1) 24-hour average. (2) NYMEX and TZ6NNY forward gas prices on 6/30/2011. (3) Market Heat Rate = PJM on-peak power price divided by TZ6NNY gas price. 20 © PPL Corporation 2011 Market Prices Balance of 2011 2012 2013 $54 $54 $55 $38 $39 $41 $46 $46 $48 $38 $39 $44 $26 $28 $31 $31 $34 $38 $4.47 $4.84 $5.16 $4.98 $5.57 $5.88 10.9 9.6 9.4 $136.79 $123.63 $187.49 91.0% 89.8% 91.3% Mid- Columbia On-Peak Off-Peak ATC(1) ELECTRIC PJM On-Peak Off-Peak ATC(1) NYMEX GAS(2) CAPACITY PRICES (Per MWD) EQA HEAT RATE(3) TZ6NNY PJM MARKET (1) 24-hour average. (2) NYMEX and TZ6NNY forward gas prices on 6/30/2011. (3) Market Heat Rate = PJM on-peak power price divided by TZ6NNY gas price
21
© PPL Corporation 2011
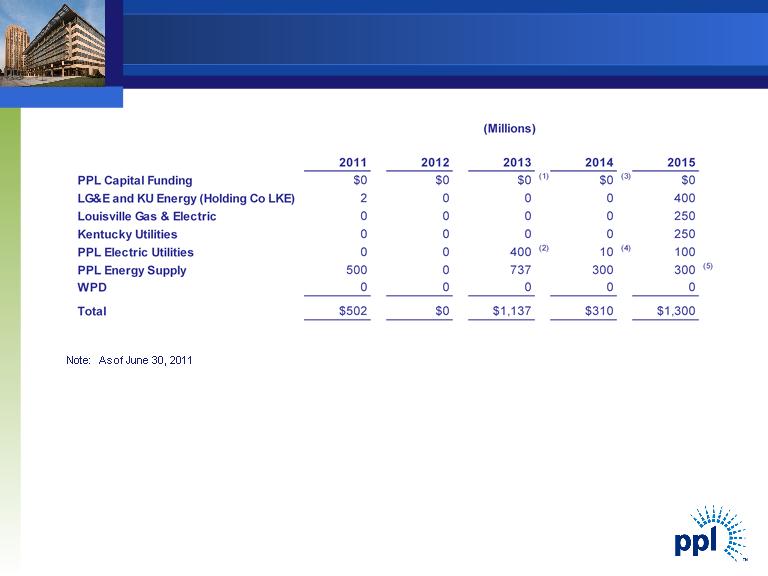
(1) Excludes $1.15 billion of junior subordinated notes due 2018 that are a component of PPL’s 2010 Equity Units and
may be put back to PPL Capital Funding if the remarketing in 2013 is not successful.
may be put back to PPL Capital Funding if the remarketing in 2013 is not successful.
(2) Bonds were redeemed at make-whole redemption price in July 2011.
(3) Excludes $978 million of junior subordinated notes due 2019 that are a component of PPL’s 2011 Equity Units and
may be put back to PPL Capital Funding if the remarketing in 2014 is not successful.
may be put back to PPL Capital Funding if the remarketing in 2014 is not successful.
(4) Bonds defeased in substance in 2008 by depositing sufficient funds with the trustee.
(5) Represents REset Put Securities due 2035 that are required to be put by the holders in October 2015 either for (a)
purchase and remarketing by a remarketing dealer or (b) repurchase by PPL Energy Supply.
purchase and remarketing by a remarketing dealer or (b) repurchase by PPL Energy Supply.
Debt Maturities
21 © PPL Corporation 2011 Debt Maturities Note: As of June 30, 2011 ( 1) Excludes $1.15 billion of junior subordinated notes due 2018 that are a component of PPL’s 2010 Equity Units and may be put back to PPL Capital Funding if the remarketing in 2013 is not successful. ( 2) Bonds were redeemed at make-whole redemption price in July 2011. ( 3) Excludes $978 million of junior subordinated notes due 2019 that are a component of PPL’s 2011 Equity Units and may be put back to PPL Capital Funding if the remarketing in 2014 is not successful. ( 4) Bonds defeased in substance in 2008 by depositing sufficient funds with the trustee. ( 5) Represents REset Put Securities due 2035 that are required to be put by the holders in October 2015 either for (a) purchase and remarketing by a remarketing dealer or (b) repurchase by PPL Energy Supply. 2011 2012 2013 2014 2015 PPL Capital Funding $0 $0 $0 (1) $0 (3) $0 LG& E and KU Energy ( Holding Co LKE) 2 0 0 0 400 Louisville Gas & Electric 0 0 0 0 250 Kentucky Utilities 0 0 0 0 250 PPL Electric Utilities 0 0 400 (2) 10 (4) 100 PPL Energy Supply 500 0 737 300 300 (5) WPD 0 0 0 0 0 Total $502 $ 0 $1,137 $ 310 $1,300 ( Millions) 21 © PPL Corporation 2011 Debt Maturities Note: As of June 30, 2011 ( 1) Excludes $1.15 billion of junior subordinated notes due 2018 that are a component of PPL’s 2010 Equity Units and may be put back to PPL Capital Funding if the remarketing in 2013 is not successful. ( 2) Bonds were redeemed at make-whole redemption price in July 2011. ( 3) Excludes $978 million of junior subordinated notes due 2019 that are a component of PPL’s 2011 Equity Units and may be put back to PPL Capital Funding if the remarketing in 2014 is not successful. ( 4) Bonds defeased in substance in 2008 by depositing sufficient funds with the trustee. ( 5) Represents REset Put Securities due 2035 that are required to be put by the holders in October 2015 either for (a) purchase and remarketing by a remarketing dealer or (b) repurchase by PPL Energy Supply. 2011 2012 2013 2014 2015 PPL Capital Funding $0 $0 $0 (1) $0 (3) $0 LG& E and KU Energy ( Holding Co LKE) 2 0 0 0 400 Louisville Gas & Electric 0 0 0 0 250 Kentucky Utilities 0 0 0 0 250 PPL Electric Utilities 0 0 400 (2) 10 (4) 100 PPL Energy Supply 500 0 737 300 300 (5) WPD 0 0 0 0 0 Total $502 $ 0 $1,137 $ 310 $1,300 ( Millions)
22
© PPL Corporation 2011
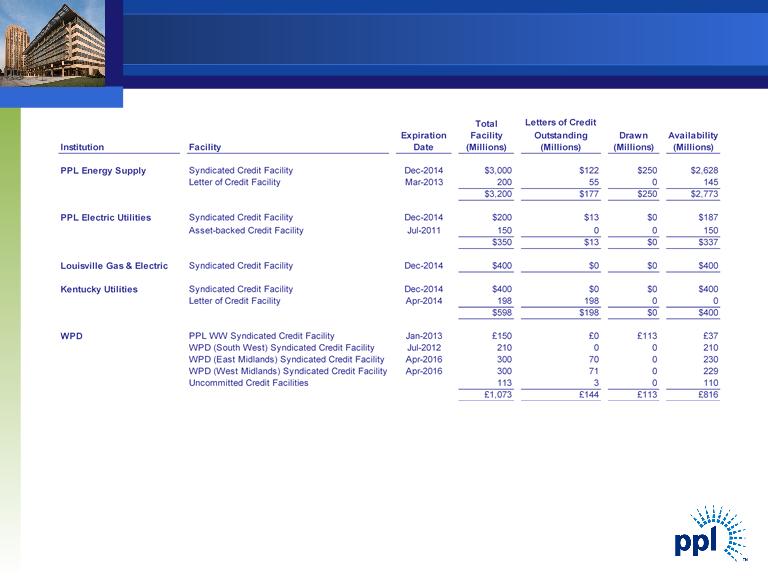
Note: As of June 30, 2011
• Credit facilities consist of a diverse bank group, with no bank and its affiliates providing an aggregate commitment of more than
9% of the total committed capacity for the domestic facilities and 17% of the total committed capacity for WPD’s facilities.
9% of the total committed capacity for the domestic facilities and 17% of the total committed capacity for WPD’s facilities.
• In July 2011, PPL Electric Utilities extended the expiration date of its Asset-backed Credit Facility to July 2012.
Liquidity Profile
22 © PPL Corporation 2011 Liquidity Profile Note: As of June 30, 2011 • Credit facilities consist of a diverse bank group, with no bank and its affiliates providing an aggregate commitment of more than 9% of the total committed capacity for the domestic facilities and 17% of the total committed capacity for WPD’s facilities. • In July 2011, PPL Electric Utilities extended the expiration date of its Asset-backed Credit Facility to July 2012. Institution Facility Expiration Date Total Facility (Millions) Letters of Credit Outstanding (Millions) Drawn (Millions) Availability (Millions) PPL Energy Supply Syndicated Credit Facility Dec-2014 $3,000 $122 $250 $2,628 Letter of Credit Facility Mar-2013 200 55 0 145 $3,200 $177 $250 $ 2,773 PPL Electric Utilities Syndicated Credit Facility Dec-2014 $200 $13 $ 0 $187 Asset-backed Credit Facility Jul-2011 150 0 0 150 $350 $13 $ 0 $337 Louisville Gas & Electric Syndicated Credit Facility Dec-2014 $400 $ 0 $ 0 $400 Kentucky Utilities Syndicated Credit Facility Dec-2014 $400 $ 0 $ 0 $400 Letter of Credit Facility Apr-2014 198 198 0 0 $598 $198 $ 0 $400 WPD PPL WW Syndicated Credit Facility Jan-2013 £150 £ 0 £113 £37 WPD ( South West) Syndicated Credit Facility Jul-2012 210 0 0 210 WPD ( East Midlands) Syndicated Credit Facility Apr-2016 300 70 0 230 WPD ( West Midlands) Syndicated Credit Facility Apr-2016 300 71 0 229 Uncommitted Credit Facilities 113 3 0 110 £1,073 £144 £113 £816 22 © PPL Corporation 2011 Liquidity Profile Note: As of June 30, 2011 • Credit facilities consist of a diverse bank group, with no bank and its affiliates providing an aggregate commitment of more than 9% of the total committed capacity for the domestic facilities and 17% of the total committed capacity for WPD’s facilities. • In July 2011, PPL Electric Utilities extended the expiration date of its Asset-backed Credit Facility to July 2012. Institution Facility Expiration Date Total Facility (Millions) Letters of Credit Outstanding (Millions) Drawn (Millions) Availability (Millions) PPL Energy Supply Syndicated Credit Facility Dec-2014 $3,000 $122 $250 $2,628 Letter of Credit Facility Mar-2013 200 55 0 145 $3,200 $177 $250 $ 2,773 PPL Electric Utilities Syndicated Credit Facility Dec-2014 $200 $13 $ 0 $187 Asset-backed Credit Facility Jul-2011 150 0 0 150 $350 $13 $ 0 $337 Louisville Gas & Electric Syndicated Credit Facility Dec-2014 $400 $ 0 $ 0 $400 Kentucky Utilities Syndicated Credit Facility Dec-2014 $400 $ 0 $ 0 $400 Letter of Credit Facility Apr-2014 198 198 0 0 $598 $198 $ 0 $400 WPD PPL WW Syndicated Credit Facility Jan-2013 £150 £ 0 £113 £37 WPD ( South West) Syndicated Credit Facility Jul-2012 210 0 0 210 WPD ( East Midlands) Syndicated Credit Facility Apr-2016 300 70 0 230 WPD ( West Midlands) Syndicated Credit Facility Apr-2016 300 71 0 229 Uncommitted Credit Facilities 113 3 0 110 £1,073 £144 £113 £816
23
© PPL Corporation 2011
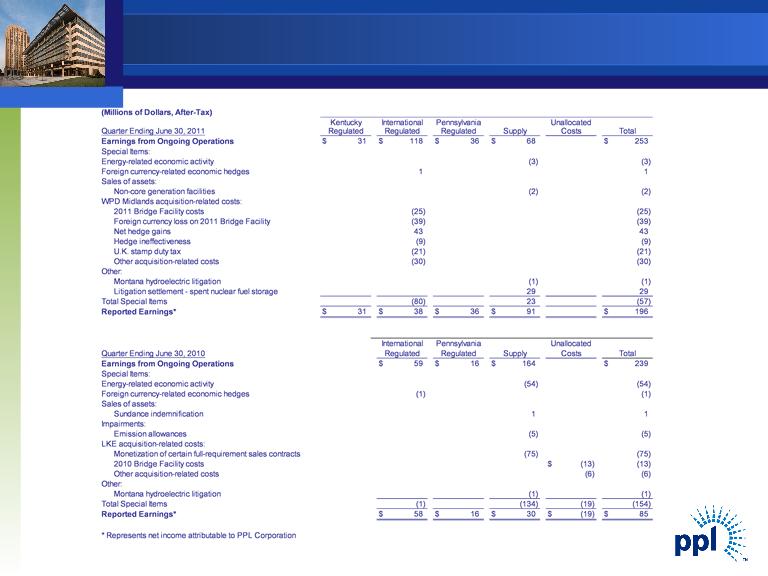
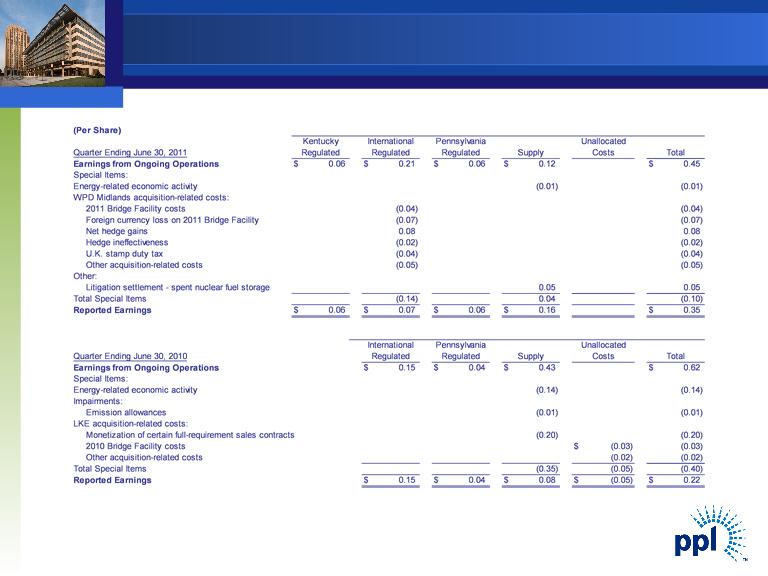
Reconciliation of Second Quarter Earnings from
Ongoing Operations to Reported Earnings
Ongoing Operations to Reported Earnings
23 © PPL Corporation 2011 Reconciliation of Second Quarter Earnings from Ongoing Operations to Reported Earnings $ 31 $ 118 $ 36 $ 68 $ 253 ( 3) ( 3) 1 1 Non-core generation facilities (2) ( 2) 2011 Bridge Facility costs ( 25) ( 25) Foreign currency loss on 2011 Bridge Facility ( 39) ( 39) Net hedge gains 43 43 Hedge ineffectiveness (9) ( 9) U.K. stamp duty tax ( 21) ( 21) Other acquisition-related costs ( 30) ( 30) Other: Montana hydroelectric litigation (1) ( 1) Litigation settlement - spent nuclear fuel storage 29 29 ( 80) 23 ( 57) $ 31 $ 38 $ 36 $ 91 $ 196 $ 59 $ 16 $ 164 $ 239 ( 54) ( 54) ( 1) ( 1) Sundance indemnification 1 1 Impairments: Emission allowances (5) ( 5) Monetization of certain full-requirement sales contracts ( 75) ( 75) 2010 Bridge Facility costs $ ( 13) ( 13) Other acquisition-related costs (6) ( 6) Montana hydroelectric litigation (1) ( 1) (1) ( 134) ( 19) ( 154) $ 58 $ 16 $ 30 $ ( 19) $ 85 * Represents net income attributable to PPL Corporation Total Earnings from Ongoing Operations Energy-related economic activity Supply Special Items: Costs Reported Earnings* Quarter Ending June 30, 2010 Regulated Regulated Total Special Items Foreign currency-related economic hedges LKE acquisition-related costs: Other: Sales of assets: Regulated Special Items: Costs Earnings from Ongoing Operations Energy-related economic activity Quarter Ending June 30, 2011 Regulated ( Millions of Dollars, After- Tax) Unallocated Supply Kentucky International Pennsylvania Total Regulated Unallocated Foreign currency-related economic hedges Sales of assets: WPD Midlands acquisition-related costs: International Pennsylvania Total Special Items Reported Earnings* 23 © PPL Corporation 2011 Reconciliation of Second Quarter Earnings from Ongoing Operations to Reported Earnings $ 31 $ 118 $ 36 $ 68 $ 253 ( 3) ( 3) 1 1 Non-core generation facilities (2) ( 2) 2011 Bridge Facility costs ( 25) ( 25) Foreign currency loss on 2011 Bridge Facility ( 39) ( 39) Net hedge gains 43 43 Hedge ineffectiveness (9) ( 9) U.K. stamp duty tax ( 21) ( 21) Other acquisition-related costs ( 30) ( 30) Other: Montana hydroelectric litigation (1) ( 1) Litigation settlement - spent nuclear fuel storage 29 29 ( 80) 23 ( 57) $ 31 $ 38 $ 36 $ 91 $ 196 $ 59 $ 16 $ 164 $ 239 ( 54) ( 54) ( 1) ( 1) Sundance indemnification 1 1 Impairments: Emission allowances (5) ( 5) Monetization of certain full-requirement sales contracts ( 75) ( 75) 2010 Bridge Facility costs $ ( 13) ( 13) Other acquisition-related costs (6) ( 6) Montana hydroelectric litigation (1) ( 1) (1) ( 134) ( 19) ( 154) $ 58 $ 16 $ 30 $ ( 19) $ 85 * Represents net income attributable to PPL Corporation Total Earnings from Ongoing Operations Energy-related economic activity Supply Special Items: Costs Reported Earnings* Quarter Ending June 30, 2010 Regulated Regulated Total Special Items Foreign currency-related economic hedges LKE acquisition-related costs: Other: Sales of assets: Regulated Special Items: Costs Earnings from Ongoing Operations Energy-related economic activity Quarter Ending June 30, 2011 Regulated ( Millions of Dollars, After- Tax) Unallocated Supply Kentucky International Pennsylvania Total Regulated Unallocated Foreign currency-related economic hedges Sales of assets: WPD Midlands acquisition-related costs: International Pennsylvania Total Special Items Reported Earnings*
24
© PPL Corporation 2011
Reconciliation of Second Quarter Earnings from
Ongoing Operations to Reported Earnings
Ongoing Operations to Reported Earnings
24 © PPL Corporation 2011 Reconciliation of Second Quarter Earnings from Ongoing Operations to Reported Earnings (Per Share) $ 0.06 $ 0.21 $ 0.06 $ 0.12 $ 0.45 (0.01) (0.01) 2011 Bridge Facility costs (0.04) (0.04) Foreign currency loss on 2011 Bridge Facility (0.07) (0.07) Net hedge gains 0.08 0.08 Hedge ineffectiveness (0.02) (0.02) U. K. stamp duty tax ( 0.04) (0.04) Other acquisition-related costs ( 0.05) (0.05) Other: Litigation settlement - spent nuclear fuel storage 0.05 0.05 (0.14) 0.04 (0.10) $ 0.06 $ 0.07 $ 0.06 $ 0.16 $ 0.35 $ 0.15 $ 0.04 $ 0.43 $ 0.62 (0.14) (0.14) Emission allowances (0.01) (0.01) Monetization of certain full-requirement sales contracts ( 0.20) (0.20) 2010 Bridge Facility costs $ (0.03) (0.03) Other acquisition-related costs (0.02) (0.02) (0.35) (0.05) (0.40) $ 0.15 $ 0.04 $ 0.08 $ (0.05) $ 0.22 International Pennsylvania Unallocated Energy-related economic activity WPD Midlands acquisition-related costs: Total Special Items Reported Earnings Supply Total Earnings from Ongoing Operations Special Items: Quarter Ending June 30, 2011 Regulated Regulated Regulated Costs Kentucky International Pennsylvania Unallocated Total Earnings from Ongoing Operations Special Items: Energy-related economic activity Quarter Ending June 30, 2010 Regulated Regulated Supply Costs Impairments: LKE acquisition-related costs: Total Special Items Reported Earnings 24 © PPL Corporation 2011 Reconciliation of Second Quarter Earnings from Ongoing Operations to Reported Earnings (Per Share) $ 0.06 $ 0.21 $ 0.06 $ 0.12 $ 0.45 (0.01) (0.01) 2011 Bridge Facility costs (0.04) (0.04) Foreign currency loss on 2011 Bridge Facility (0.07) (0.07) Net hedge gains 0.08 0.08 Hedge ineffectiveness (0.02) (0.02) U. K. stamp duty tax ( 0.04) (0.04) Other acquisition-related costs ( 0.05) (0.05) Other: Litigation settlement - spent nuclear fuel storage 0.05 0.05 (0.14) 0.04 (0.10) $ 0.06 $ 0.07 $ 0.06 $ 0.16 $ 0.35 $ 0.15 $ 0.04 $ 0.43 $ 0.62 (0.14) (0.14) Emission allowances (0.01) (0.01) Monetization of certain full-requirement sales contracts ( 0.20) (0.20) 2010 Bridge Facility costs $ (0.03) (0.03) Other acquisition-related costs (0.02) (0.02) (0.35) (0.05) (0.40) $ 0.15 $ 0.04 $ 0.08 $ (0.05) $ 0.22 International Pennsylvania Unallocated Energy-related economic activity WPD Midlands acquisition-related costs: Total Special Items Reported Earnings Supply Total Earnings from Ongoing Operations Special Items: Quarter Ending June 30, 2011 Regulated Regulated Regulated Costs Kentucky International Pennsylvania Unallocated Total Earnings from Ongoing Operations Special Items: Energy-related economic activity Quarter Ending June 30, 2010 Regulated Regulated Supply Costs Impairments: LKE acquisition-related costs: Total Special Items Reported Earnings
25
© PPL Corporation 2011
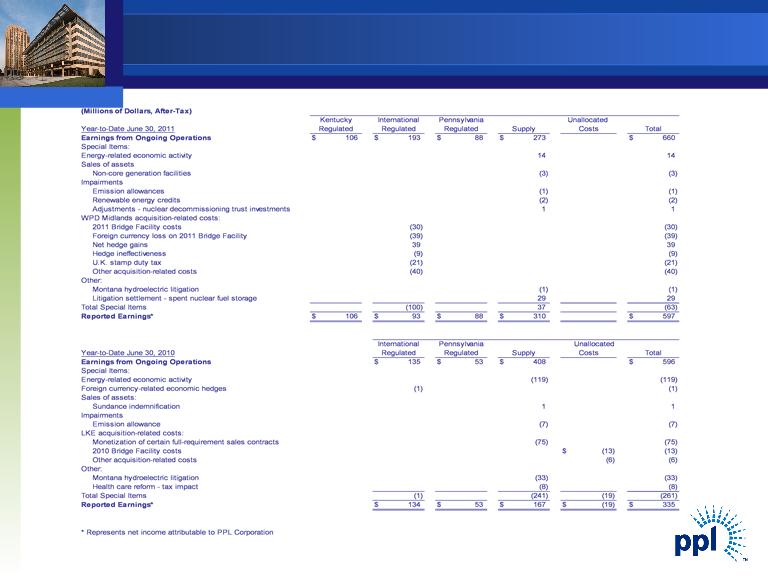
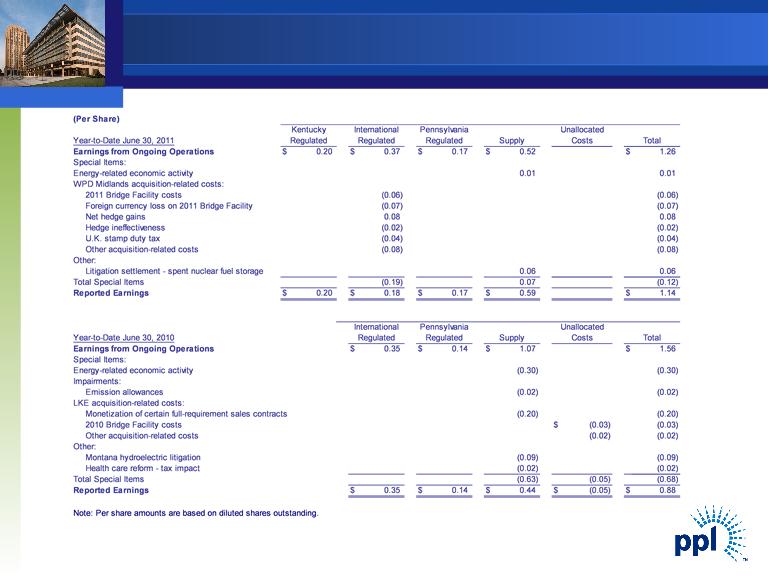
Reconciliation of Year-to-Date Earnings from
Ongoing Operations to Reported Earnings
Ongoing Operations to Reported Earnings
25 © PPL Corporation 2011 Reconciliation of Year-to-Date Earnings from Ongoing Operations to Reported Earnings $ 106 $ 193 $ 88 $ 273 $ 660 14 14 Non-core generation facilities (3) (3) Emission allowances (1) (1) Renewable energy credits (2) (2) Adjustments - nuclear decommissioning trust investments 1 1 2011 Bridge Facility costs (30) (30) Foreign currency loss on 2011 Bridge Facility (39) (39) Net hedge gains 39 39 Hedge ineffectiveness (9) (9) U. K. stamp duty tax (21) (21) Other acquisition-related costs (40) (40) Other: Montana hydroelectric litigation (1) (1) Litigation settlement - spent nuclear fuel storage 29 29 (100) 37 (63) $ 106 $ 93 $ 88 $ 310 $ 597 Unallocated $ 135 $ 53 $ 408 $ 596 (119) (119) Foreign currency-related economic hedges ( 1) (1) Sales of assets: Sundance indemnification 1 1 Emission allowance (7) (7) LKE acquisition-related costs: Monetization of certain full-requirement sales contracts (75) (75) 2010 Bridge Facility costs $ (13) (13) Other acquisition-related costs (6) (6) Montana hydroelectric litigation (33) (33) Health care reform - tax impact (8) (8) (1) (241) (19) (261) $ 134 $ 53 $ 167 $ (19) $ 335 * Represents net income attributable to PPL Corporation Supply Other: Total Special Items Impairments Energy-related economic activity Reported Earnings* Year-to-Date June 30, 2010 Regulated Supply Special Items: Impairments Total Special Items Reported Earnings* Earnings from Ongoing Operations Total Earnings from Ongoing Operations Energy-related economic activity Year-to-Date June 30, 2011 Regulated Regulated Regulated Special Items: Costs (Millions of Dollars, After-Tax) Kentucky International Pennsylvania Unallocated Costs Sales of assets WPD Midlands acquisition-related costs: International Pennsylvania Total Regulated 25 © PPL Corporation 2011 Reconciliation of Year-to-Date Earnings from Ongoing Operations to Reported Earnings $ 106 $ 193 $ 88 $ 273 $ 660 14 14 Non-core generation facilities (3) (3) Emission allowances (1) (1) Renewable energy credits (2) (2) Adjustments - nuclear decommissioning trust investments 1 1 2011 Bridge Facility costs (30) (30) Foreign currency loss on 2011 Bridge Facility (39) (39) Net hedge gains 39 39 Hedge ineffectiveness (9) (9) U. K. stamp duty tax (21) (21) Other acquisition-related costs (40) (40) Other: Montana hydroelectric litigation (1) (1) Litigation settlement - spent nuclear fuel storage 29 29 (100) 37 (63) $ 106 $ 93 $ 88 $ 310 $ 597 Unallocated $ 135 $ 53 $ 408 $ 596 (119) (119) Foreign currency-related economic hedges ( 1) (1) Sales of assets: Sundance indemnification 1 1 Emission allowance (7) (7) LKE acquisition-related costs: Monetization of certain full-requirement sales contracts (75) (75) 2010 Bridge Facility costs $ (13) (13) Other acquisition-related costs (6) (6) Montana hydroelectric litigation (33) (33) Health care reform - tax impact (8) (8) (1) (241) (19) (261) $ 134 $ 53 $ 167 $ (19) $ 335 * Represents net income attributable to PPL Corporation Supply Other: Total Special Items Impairments Energy-related economic activity Reported Earnings* Year-to-Date June 30, 2010 Regulated Supply Special Items: Impairments Total Special Items Reported Earnings* Earnings from Ongoing Operations Total Earnings from Ongoing Operations Energy-related economic activity Year-to-Date June 30, 2011 Regulated Regulated Regulated Special Items: Costs (Millions of Dollars, After-Tax) Kentucky International Pennsylvania Unallocated Costs Sales of assets WPD Midlands acquisition-related costs: International Pennsylvania Total Regulated
26
© PPL Corporation 2011
Reconciliation of Year-to-Date Earnings from
Ongoing Operations to Reported Earnings
Ongoing Operations to Reported Earnings
26 © PPL Corporation 2011 Reconciliation of Year-to-Date Earnings from Ongoing Operations to Reported Earnings (Per Share) $ 0.20 $ 0.37 $ 0.17 $ 0.52 $ 1.26 0.01 0.01 2011 Bridge Facility costs (0.06) (0.06) Foreign currency loss on 2011 Bridge Facility (0.07) (0.07) Net hedge gains 0.08 0.08 Hedge ineffectiveness ( 0.02) (0.02) U. K. stamp duty tax ( 0.04) (0.04) Other acquisition- related costs (0.08) (0.08) Other: Litigation settlement - spent nuclear fuel storage 0.06 0.06 (0.19) 0.07 (0.12) $ 0.20 $ 0.18 $ 0.17 $ 0.59 $ 1.14 $ 0.35 $ 0.14 $ 1.07 $ 1.56 (0.30) (0.30) Emission allowances (0.02) (0.02) Monetization of certain full-requirement sales contracts ( 0.20) (0.20) 2010 Bridge Facility costs $ (0.03) (0.03) Other acquisition- related costs (0.02) (0.02) Montana hydroelectric litigation (0.09) (0.09) Health care reform - tax impact (0.02) (0.02) (0.63) (0.05) (0.68) $ 0.35 $ 0.14 $ 0.44 $ (0.05) $ 0.88 Note: Per share amounts are based on diluted shares outstanding. Impairments: Other: Total Special Items Reported Earnings LKE acquisition-related costs: Total Earnings from Ongoing Operations Special Items: Energy-related economic activity Year-to- Date June 30, 2010 Regulated Regulated Supply Costs Kentucky International Pennsylvania Unallocated Supply Total Earnings from Ongoing Operations Special Items: Year-to- Date June 30, 2011 Regulated Regulated Regulated Costs Energy-related economic activity WPD Midlands acquisition- related costs: Total Special Items Reported Earnings International Pennsylvania Unallocated 26 © PPL Corporation 2011 Reconciliation of Year-to-Date Earnings from Ongoing Operations to Reported Earnings (Per Share) $ 0.20 $ 0.37 $ 0.17 $ 0.52 $ 1.26 0.01 0.01 2011 Bridge Facility costs (0.06) (0.06) Foreign currency loss on 2011 Bridge Facility (0.07) (0.07) Net hedge gains 0.08 0.08 Hedge ineffectiveness ( 0.02) (0.02) U. K. stamp duty tax ( 0.04) (0.04) Other acquisition- related costs (0.08) (0.08) Other: Litigation settlement - spent nuclear fuel storage 0.06 0.06 (0.19) 0.07 (0.12) $ 0.20 $ 0.18 $ 0.17 $ 0.59 $ 1.14 $ 0.35 $ 0.14 $ 1.07 $ 1.56 (0.30) (0.30) Emission allowances (0.02) (0.02) Monetization of certain full-requirement sales contracts ( 0.20) (0.20) 2010 Bridge Facility costs $ (0.03) (0.03) Other acquisition- related costs (0.02) (0.02) Montana hydroelectric litigation (0.09) (0.09) Health care reform - tax impact (0.02) (0.02) (0.63) (0.05) (0.68) $ 0.35 $ 0.14 $ 0.44 $ (0.05) $ 0.88 Note: Per share amounts are based on diluted shares outstanding. Impairments: Other: Total Special Items Reported Earnings LKE acquisition-related costs: Total Earnings from Ongoing Operations Special Items: Energy-related economic activity Year-to- Date June 30, 2010 Regulated Regulated Supply Costs Kentucky International Pennsylvania Unallocated Supply Total Earnings from Ongoing Operations Special Items: Year-to- Date June 30, 2011 Regulated Regulated Regulated Costs Energy-related economic activity WPD Midlands acquisition- related costs: Total Special Items Reported Earnings International Pennsylvania Unallocated
27
© PPL Corporation 2011
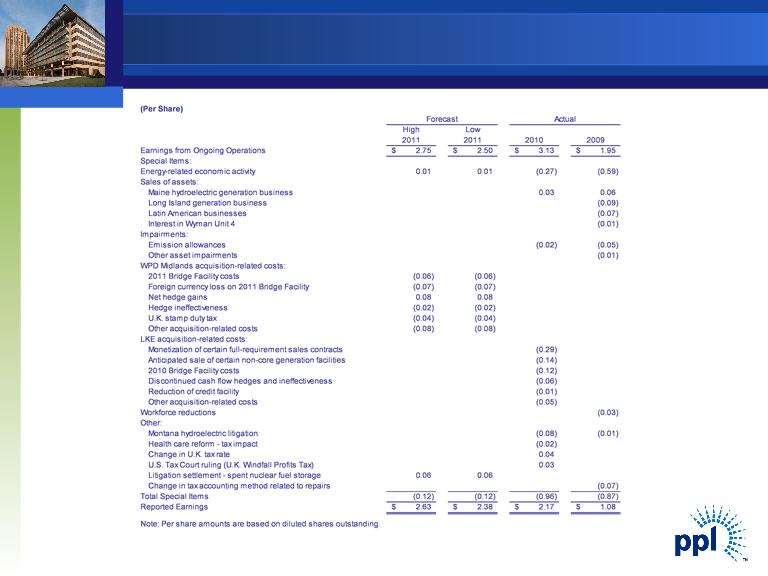
Reconciliation of PPL’s Earnings from Ongoing
Operations to Reported Earnings
Operations to Reported Earnings
27 © PPL Corporation 2011 Reconciliation of PPL’s Earnings from Ongoing Operations to Reported Earnings (Per Share) High Low 2011 2011 2010 2009 Earnings from Ongoing Operations 2.75 $ 2.50 $ 3.13 $ 1.95 $ Special Items: Energy-related economic activity 0.01 0.01 ( 0.27) ( 0.59) Sales of assets: Maine hydroelectric generation business 0.03 0.06 Long Island generation business (0.09) Latin American businesses (0.07) Interest in Wyman Unit 4 (0.01) Impairments: Emission allowances (0.02) ( 0.05) Other asset impairments (0.01) WPD Midlands acquisition- related costs: 2011 Bridge Facility costs (0.06) ( 0.06) Foreign currency loss on 2011 Bridge Facility ( 0.07) ( 0.07) Net hedge gains 0.08 0.08 Hedge ineffectiveness (0.02) ( 0.02) U. K. stamp duty tax ( 0.04) ( 0.04) Other acquisition- related costs ( 0.08) ( 0.08) LKE acquisition-related costs: Monetization of certain full-requirement sales contracts ( 0.29) Anticipated sale of certain non- core generation facilities (0.14) 2010 Bridge Facility costs (0.12) Discontinued cash flow hedges and ineffectiveness (0.06) Reduction of credit facility (0.01) Other acquisition- related costs (0.05) Workforce reductions (0.03) Other: Montana hydroelectric litigation (0.08) ( 0.01) Health care reform - tax impact (0.02) Change in U. K. tax rate 0.04 U.S. Tax Court ruling ( U.K. Windfall Profits Tax) 0.03 Litigation settlement - spent nuclear fuel storage 0.06 0.06 Change in tax accounting method related to repairs (0.07) Total Special Items ( 0.12) ( 0.12) ( 0.96) ( 0.87) Reported Earnings 2.63 $ 2.38 $ 2.17 $ 1.08 $ Note: Per share amounts are based on diluted shares outstanding. Forecast Actual 27 © PPL Corporation 2011 Reconciliation of PPL’s Earnings from Ongoing Operations to Reported Earnings (Per Share) High Low 2011 2011 2010 2009 Earnings from Ongoing Operations 2.75 $ 2.50 $ 3.13 $ 1.95 $ Special Items: Energy-related economic activity 0.01 0.01 ( 0.27) ( 0.59) Sales of assets: Maine hydroelectric generation business 0.03 0.06 Long Island generation business (0.09) Latin American businesses (0.07) Interest in Wyman Unit 4 (0.01) Impairments: Emission allowances (0.02) ( 0.05) Other asset impairments (0.01) WPD Midlands acquisition- related costs: 2011 Bridge Facility costs (0.06) ( 0.06) Foreign currency loss on 2011 Bridge Facility ( 0.07) ( 0.07) Net hedge gains 0.08 0.08 Hedge ineffectiveness (0.02) ( 0.02) U. K. stamp duty tax ( 0.04) ( 0.04) Other acquisition- related costs ( 0.08) ( 0.08) LKE acquisition-related costs: Monetization of certain full-requirement sales contracts ( 0.29) Anticipated sale of certain non- core generation facilities (0.14) 2010 Bridge Facility costs (0.12) Discontinued cash flow hedges and ineffectiveness (0.06) Reduction of credit facility (0.01) Other acquisition- related costs (0.05) Workforce reductions (0.03) Other: Montana hydroelectric litigation (0.08) ( 0.01) Health care reform - tax impact (0.02) Change in U. K. tax rate 0.04 U.S. Tax Court ruling ( U.K. Windfall Profits Tax) 0.03 Litigation settlement - spent nuclear fuel storage 0.06 0.06 Change in tax accounting method related to repairs (0.07) Total Special Items ( 0.12) ( 0.12) ( 0.96) ( 0.87) Reported Earnings 2.63 $ 2.38 $ 2.17 $ 1.08 $ Note: Per share amounts are based on diluted shares outstanding. Forecast Actual
28
© PPL Corporation 2011
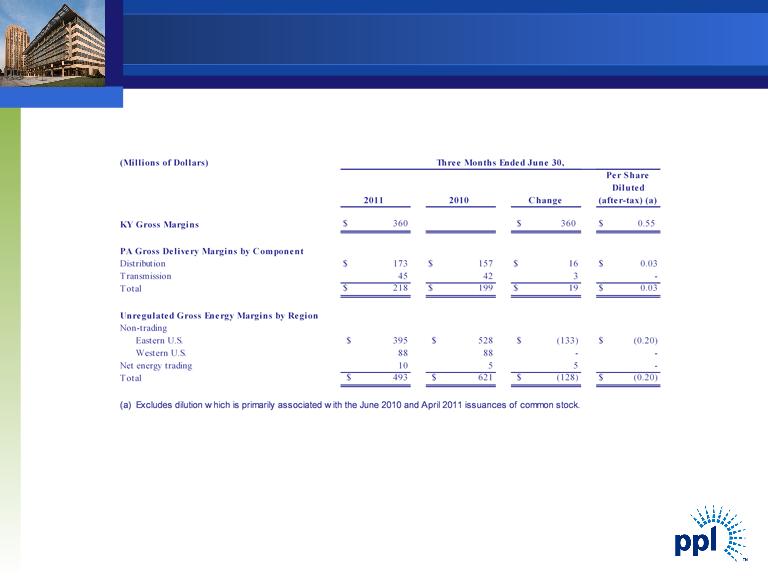
Gross Margins Summary
28 © PPL Corporation 2011 $ 360 $ 360 $ 0.55 $ 173 $ 157 $ 16 $ 0.03 45 42 3 - $ 218 $ 199 $ 19 $ 0.03 Eastern U.S. $ 395 $ 528 $ (133) $ ( 0.20) Western U. S. 88 88 - - 10 5 5 - $ 493 $ 621 $ (128) $ ( 0.20) ( a) Excludes dilution which is primarily associated with the June 2010 and April 2011 issuances of common stock. KY Gross Margins (after-tax) (a) Three Months Ended June 30, Diluted Per Share (Millions of Dollars) 2011 2010 Change PA Gross Delivery Margins by Component Distribution Transmission Total Total Unregulated Gross Energy Margins by Region Non- trading Net energy trading Gross Margins Summary 28 © PPL Corporation 2011 $ 360 $ 360 $ 0.55 $ 173 $ 157 $ 16 $ 0.03 45 42 3 - $ 218 $ 199 $ 19 $ 0.03 Eastern U.S. $ 395 $ 528 $ (133) $ ( 0.20) Western U. S. 88 88 - - 10 5 5 - $ 493 $ 621 $ (128) $ ( 0.20) ( a) Excludes dilution which is primarily associated with the June 2010 and April 2011 issuances of common stock. KY Gross Margins (after-tax) (a) Three Months Ended June 30, Diluted Per Share (Millions of Dollars) 2011 2010 Change PA Gross Delivery Margins by Component Distribution Transmission Total Total Unregulated Gross Energy Margins by Region Non- trading Net energy trading Gross Margins Summary
29
© PPL Corporation 2011
A-10
Reconciliation of Second Quarter
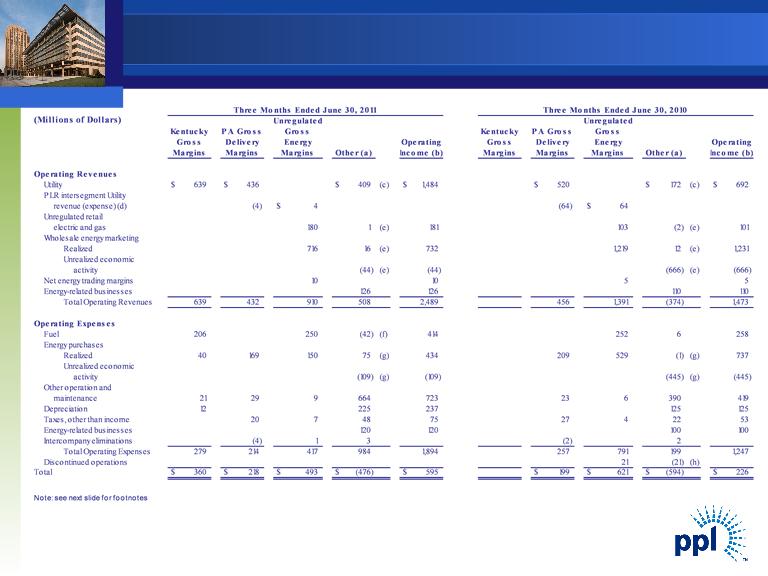
Operating Income to Margins
Operating Income to Margins
29 © PPL Corporation 2011 A-10 Reconciliation of Second Quarter Operating Income to Margins $ 639 $ 436 $ 409 ( c) $ 1,484 $ 520 $ 172 ( c) $ 692 P LR intersegment Utility (4) $ 4 ( 64) $ 64 180 1 ( e) 181 103 ( 2) ( e) 101 716 16 ( e) 732 1,219 12 ( e) 1,231 activity ( 44) ( e) ( 44) ( 666) ( e) ( 666) 10 10 5 5 126 126 110 110 639 432 910 508 2,489 456 1,391 ( 374) 1,473 206 250 ( 42) ( f) 414 252 6 258 40 169 150 75 ( g) 434 209 529 ( 1) ( g) 737 activity ( 109) ( g) ( 109) ( 445) ( g) ( 445) 21 29 9 664 723 23 6 390 419 12 225 237 125 125 20 7 48 75 27 4 22 53 120 120 100 100 (4) 1 3 ( 2) 2 279 214 417 984 1,894 257 791 199 1,247 21 ( 21) ( h) $ 360 $ 218 $ 493 $ ( 476) $ 595 $ 199 $ 621 $ ( 594) $ 226 Note: see next slide for footnotes Operating Revenues Kentucky Other ( a) Delivery Margins Margins Margins Gross Operating Three Months Ended June 30, 2011 PA Gross (Millions of Dollars) Gross Unregulated Energy Inco me ( b) Realized Unrealized economic Unregulated retail Wholesale energy marketing electric and gas Utility Three Months Ended June 30, 2010 Unregulate d Kentucky P A Gross Gross Operating Margins Margins Margins Income ( b) Gross De livery Energy Other ( a) Other operation and Depreciation Energy purchases maintenance Unrealized economic Realized Intercompany eliminations Taxes, other than income Total Total Operating Expenses Energy-related businesses Discontinued operations revenue ( expense) (d) Fuel Operating Expenses Net energy trading margins Total Operating Revenues Energy-related businesses 29 © PPL Corporation 2011 A-10 Reconciliation of Second Quarter Operating Income to Margins $ 639 $ 436 $ 409 ( c) $ 1,484 $ 520 $ 172 ( c) $ 692 P LR intersegment Utility (4) $ 4 ( 64) $ 64 180 1 ( e) 181 103 ( 2) ( e) 101 716 16 ( e) 732 1,219 12 ( e) 1,231 activity ( 44) ( e) ( 44) ( 666) ( e) ( 666) 10 10 5 5 126 126 110 110 639 432 910 508 2,489 456 1,391 ( 374) 1,473 206 250 ( 42) ( f) 414 252 6 258 40 169 150 75 ( g) 434 209 529 ( 1) ( g) 737 activity ( 109) ( g) ( 109) ( 445) ( g) ( 445) 21 29 9 664 723 23 6 390 419 12 225 237 125 125 20 7 48 75 27 4 22 53 120 120 100 100 (4) 1 3 ( 2) 2 279 214 417 984 1,894 257 791 199 1,247 21 ( 21) ( h) $ 360 $ 218 $ 493 $ ( 476) $ 595 $ 199 $ 621 $ ( 594) $ 226 Note: see next slide for footnotes Operating Revenues Kentucky Other ( a) Delivery Margins Margins Margins Gross Operating Three Months Ended June 30, 2011 PA Gross (Millions of Dollars) Gross Unregulated Energy Inco me ( b) Realized Unrealized economic Unregulated retail Wholesale energy marketing electric and gas Utility Three Months Ended June 30, 2010 Unregulated Kentucky PA Gross Gross Operating Margins Margins Margins Inco me ( b) Gross De livery Energy Other ( a) Other operation and Depreciation Energy purchases maintenance Unrealized economic Realized Intercompany eliminations Taxes, other than income Total Total Operating Expenses Energy-related businesses Discontinued operations revenue ( expense) (d) Fuel Operating Expenses Net energy trading margins Total Operating Revenues Energy-related businesses

30
© PPL Corporation 2011
Margins footnotes
a) Represents amounts that are excluded from Margins.
b) As reported on the Statement of Income.
c) Represents WPD's utility revenue.
d) Primarily related to PLR supply sold by PPL EnergyPlus to PPL Electric.
e) Represents revenue associated with energy-related economic activity. This activity is described in the
"Commodity Price Risk (Non-trading) - Economic Activity" section of Note 14 to the Financial Statements
"Commodity Price Risk (Non-trading) - Economic Activity" section of Note 14 to the Financial Statements
in the Form 10-Q for the Quarter Ended June 30, 2011. The three months ended June 30, 2011
includes a pre-tax gain of $6 million related to the amortization of option premiums and a pre-tax
realized gain of $10 million related to the monetization of certain full-requirement sales contracts.
In addition, the three months ended June 30, 2010 includes a pre-tax gain of $12 million related to the
amortization of option premiums.
f) Primarily relates to the $50 million spent nuclear fuel litigation settlement and economic activity related to
fuel.
fuel.
g) Represents expenses associated with energy-related economic activity. This activity is described in the
"Commodity Price Risk (Non-trading) - Economic Activity" section of Note 14 to the Financial Statements
"Commodity Price Risk (Non-trading) - Economic Activity" section of Note 14 to the Financial Statements
in the Form 10-Q for the Quarter Ended June 30, 2011. The three months ended June 30, 2011 includes
a pre-tax loss of $76 million related to the monetization of certain full-requirement sales contracts.
In addition, the three months ended June 30, 2010 includes a pre-tax loss of $1 million related to the
amortization of option premiums.
h) Represents the net of certain revenues and expenses associated with certain businesses that are
classified as discontinued operations. These revenues and expenses are not reflected in "Operating
Income" on the Statements of Income.
classified as discontinued operations. These revenues and expenses are not reflected in "Operating
Income" on the Statements of Income.

31
© PPL Corporation 2011
|
|
2009
|
2010
|
2011
|
||
|
Cash from Operations
|
$1,852
|
|
$2,034
|
|
$2,020
|
|
Increase (Decrease) in cash due to:
|
|
|
|
|
|
|
Capital Expenditures
|
(1,265)
|
|
(1,644)
|
|
(2,805)
|
|
Sale of Assets
|
84
|
|
161
|
|
384
|
|
Other Investing Activities - Net
|
(71)
|
|
(20)
|
|
111
|
|
Free Cash Flow before Dividends
|
$ 600
|
|
$ 531
|
|
$ (290)
|
(Millions of Dollars)
PPL Corporation Reconciliation of Cash from
Operations to Free Cash Flow before Dividends
Operations to Free Cash Flow before Dividends

32
© PPL Corporation 2011
Statements contained in this presentation, including statements with respect to future earnings, cash flows, financing, regulation and
corporate strategy are "forward-looking statements" within the meaning of the federal securities laws. Although PPL Corporation
believes that the expectations and assumptions reflected in these forward-looking statements are reasonable, these statements are
subject to a number of risks and uncertainties, and actual results may differ materially from the results discussed in the statements.
The following are among the important factors that could cause actual results to differ materially from the forward-looking statements:
market demand and prices for energy, capacity and fuel; weather conditions affecting customer energy usage and operating costs;
competition in power markets; the effect of any business or industry restructuring; the profitability and liquidity of PPL Corporation and
its subsidiaries; new accounting requirements or new interpretations or applications of existing requirements; operating performance
of plants and other facilities; the length of scheduled and unscheduled outages at our generating plants; environmental conditions and
requirements and the related costs of compliance, including environmental capital expenditures and emission allowance and other
expenses; system conditions and operating costs; development of new projects, markets and technologies; performance of new
ventures; asset or business acquisitions and dispositions, and PPL Corporation’s ability to realize the expected benefits from acquired
businesses, including the 2010 acquisition of Louisville Gas and Electric Company and Kentucky Utilities Company and the 2011
acquisition of the Central Networks electricity distribution businesses in the U.K.; any impact of hurricanes or other severe weather on
our business, including any impact on fuel prices; receipt of necessary government permits, approvals, rate relief and regulatory cost
recovery; capital market conditions and decisions regarding capital structure; the impact of state, federal or foreign investigations
applicable to PPL Corporation and its subsidiaries; the outcome of litigation against PPL Corporation and its subsidiaries; stock price
performance; the market prices of equity securities and the impact on pension income and resultant cash funding requirements for
defined benefit pension plans; the securities and credit ratings of PPL Corporation and its subsidiaries; political, regulatory or
economic conditions in states, regions or countries where PPL Corporation or its subsidiaries conduct business, including any
potential effects of threatened or actual terrorism or war or other hostilities; foreign exchange rates; new state, federal or foreign
legislation, including new tax legislation; and the commitments and liabilities of PPL Corporation and its subsidiaries. Any such
forward-looking statements should be considered in light of such important factors and in conjunction with PPL Corporation's Form 10
-K and other reports on file with the Securities and Exchange Commission.
Forward-Looking Information Statement

33
© PPL Corporation 2011
“Earnings from ongoing operations” should not be considered as an alternative to reported earnings, or net income attributable to PPL, which is an
indicator of operating performance determined in accordance with generally accepted accounting principles (GAAP). PPL believes that “earnings from
ongoing operations,” although a non-GAAP financial measure, is also useful and meaningful to investors because it provides management’s view of
PPL’s fundamental earnings performance as another criterion in making investment decisions. PPL’s management also uses “earnings from ongoing
operations” in measuring certain corporate performance goals. Other companies may use different measures to present financial performance.
“Earnings from ongoing operations” is adjusted for the impact of special items. Special items include:
• Energy-related economic activity (as discussed below).
• Foreign currency-related economic hedges.
• Gains and losses on sales of assets not in the ordinary course of business.
• Impairment charges (including impairments of securities in the company’s nuclear decommissioning trust funds).
• Workforce reduction and other restructuring impacts.
• Acquisition-related costs and charges.
• Other charges or credits that are, in management’s view, not reflective of the company’s ongoing operations.
Energy-related economic activity includes the changes in fair value of positions used economically to hedge a portion of the economic value of PPL’s
generation assets, full-requirement sales contracts and retail activities. This economic value is subject to changes in fair value due to market price
volatility of the input and output commodities (e.g., fuel and power) prior to the delivery period that was hedged. Also included in energy-related
economic activity is the ineffective portion of qualifying cash flow hedges, the monetization of certain full-requirement sales contracts and premium
amortization associated with options. This economic activity is deferred, with the exception of the full-requirement sales contracts that were
monetized, and included in earnings from ongoing operations over the delivery period of the item that was hedged or upon realization. Management
believes that adjusting for such amounts provides a better matching of earnings from ongoing operations to the actual amounts settled for PPL’s
underlying hedged assets. Please refer to the Notes to the Consolidated Financial Statements and MD&A in PPL Corporation’s periodic filings with
the Securities and Exchange Commission for additional information on energy-related economic activity.
“Free cash flow before dividends” is derived by deducting capital expenditures and other investing activities-net, from cash flow from operations. Free
cash flow before dividends should not be considered as an alternative to cash flow from operations, which is determined in accordance with GAAP.
PPL believes that free cash flow before dividends, although a non-GAAP measure, is an important measure to both management and investors, as it
is an indicator of the company’s ability to sustain operations and growth without additional outside financing beyond the requirement to fund maturing
debt obligations. Other companies may calculate free cash flow before dividends in a different manner.
Definitions of Non-GAAP Financial Measures

34
© PPL Corporation 2011
"Kentucky Gross Margins" is a single financial performance measure of the Kentucky Regulated segment's electricity generation, transmission and
distribution operations as well as its distribution and sale of natural gas. In calculating this measure, utility revenues and expenses associated with
approved cost recovery tracking mechanisms are offset. Certain costs associated with these mechanisms, primarily ECR and DSM, are recorded as
"Other operation and maintenance" expense and the depreciation associated with ECR equipment is recorded as "Depreciation" expense. These
mechanisms allow for recovery of certain expenses, returns on capital investments associated with environmental regulations and performance
incentives. As a result, this measure represents the net revenues from the Kentucky Regulated segment's operations.
"Pennsylvania Gross Delivery Margins" is a single financial performance measure of the Pennsylvania Regulated segment's electric delivery
operations, which includes transmission and distribution activities. In calculating this measure, utility revenues and expenses associated with
approved recovery mechanisms, including energy provided as a PLR, are offset with minimal impact on earnings. Costs associated with these
mechanisms are recorded in "Energy purchases," "Other operation and maintenance," which is primarily Act 129 costs, and in "Taxes, other than
income," which is primarily gross receipts tax. This performance measure includes PLR related energy purchases by PPL Electric from PPL
EnergyPlus, which are reflected in "PLR intersegment utility revenue (expense)." These mechanisms allow for recovery of certain
expenses; therefore, certain expenses and revenues offset with minimal impact on earnings. As a result, this measure represents the net revenues
from the Pennsylvania Regulated segment's electric delivery operations.
"Unregulated Gross Energy Margins" is a single financial performance measure of the Supply segment's competitive energy non-trading and trading
activities. In calculating this measure, the Supply segment's energy revenues, which include operating revenues associated with certain Supply
segment businesses that are classified as discontinued operations, are offset by the cost of fuel, energy purchases, certain other operation and
maintenance expenses, primarily ancillary charges, gross receipts tax, which is recorded in "Taxes, other than income," and operating expenses
associated with certain Supply segment businesses that are classified as discontinued operations. This performance measure is relevant to PPL
due to the volatility in the individual revenue and expense lines on the Statements of Income that comprise "Unregulated Gross Energy Margins."
This volatility stems from a number of factors, including the required netting of certain transactions with ISOs and significant swings in unrealized
gains and losses. Such factors could result in gains or losses being recorded in either "Wholesale energy marketing" or "Energy purchases" on the
Statements of Income. This performance measure includes PLR revenues from energy sales to PPL Electric by PPL EnergyPlus, which are
reflected in "PLR intersegment utility revenue (expense)." in addition, PPL excludes from "Unregulated Gross Energy Margins"
the Supply segment's energy-related economic activity, which includes the changes in fair value of positions used to economically hedge a portion of
the economic value of PPL's competitive generation assets, full-requirement sales contracts and retail activities. This economic value is subject to
changes in fair value due to market price volatility of the input and output commodities (e.g., fuel and power) prior to the delivery period that was
hedged. Also included in this energy-related economic activity is the ineffective portion of qualifying cash flow hedges, the monetization of certain
full-requirement sales contracts and premium amortization associated with options. This economic activity is deferred, with the exception of the full-
requirement sales contracts that were monetized, and included in unregulated gross energy margins over the delivery period that was hedged or
upon realization.
Definitions of Non-GAAP Financial Measures