UNITED STATES
SECURITIES AND EXCHANGE COMMISSION
Washington, D.C. 20549
FORM
CURRENT REPORT
Pursuant to Section 13 or 15(d) of the Securities Exchange Act of 1934
Date of Report (Date of earliest event reported):
Commission |
| Exact Name of Registrant |
| State or Other Jurisdiction of |
| IRS Employer |
Check the appropriate box below if the Form 8-K filing is intended to simultaneously satisfy the filing obligation of the registrant under any of the following provisions:
[
[
[
[
Securities registered pursuant to Section 12(b) of the Act:
Edison International:
Southern California Edison Company: None
Indicate by check mark whether the registrant is an emerging growth company as defined in Rule 405 of the Securities Act of 1933 (§230.405 of this chapter) or Rule 12b-2 of the Securities Exchange Act of 1934 (§240.12b-2 of this chapter).
If an emerging growth company, indicate by check mark if the registrant has elected not to use the extended transition period for complying with any new or revised financial accounting standards provided pursuant to Section 13(a) of the Exchange Act.
This current report and its exhibits include forward-looking statements. Edison International and Southern California Edison Company ("SCE") based these forward-looking statements on their current expectations and projections about future events in light of their knowledge of facts as of the date of this current report and their assumptions about future circumstances. These forward-looking statements are subject to various risks and uncertainties that may be outside the control of Edison International and SCE. Edison International and SCE have no obligation to publicly update or revise any forward-looking statements, whether due to new information, future events, or otherwise. This current report should be read with Edison International's and SCE's combined Annual Report on Form 10-K for the year ended December 31, 2021 and subsequent quarterly Report on Form 10-Q. Additionally, Edison International and SCE provide direct links to EIX and SCE presentations, documents and other information at www.edisoninvestor.com (Presentations and Updates) in order to publicly disseminate such information.
Item 2.02Results of Operations and Financial Condition
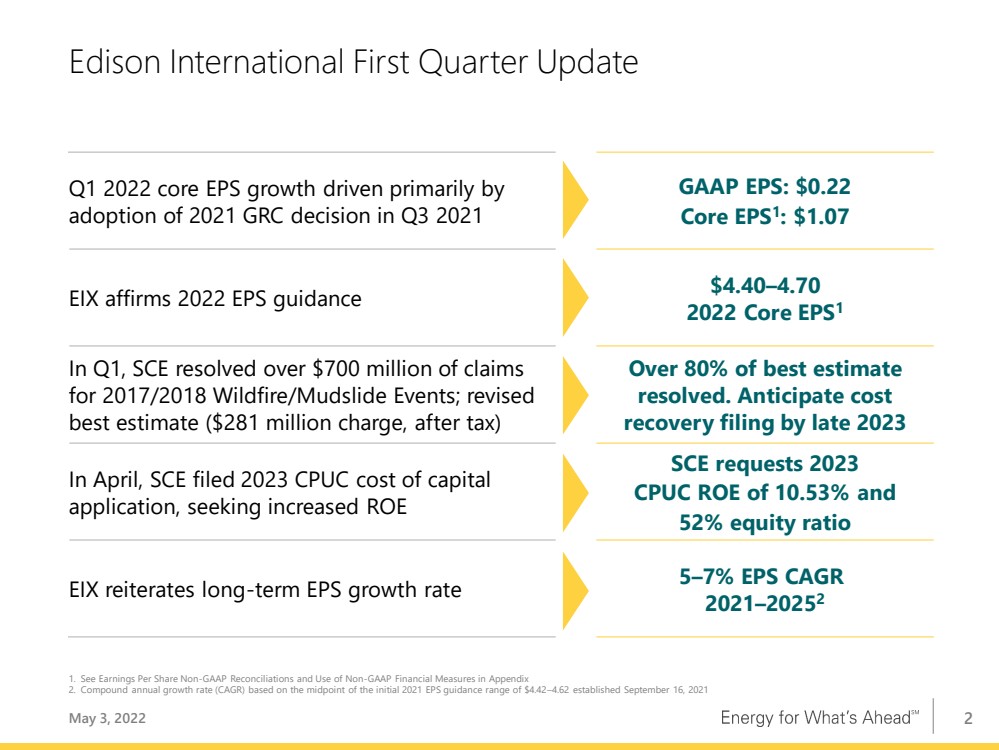
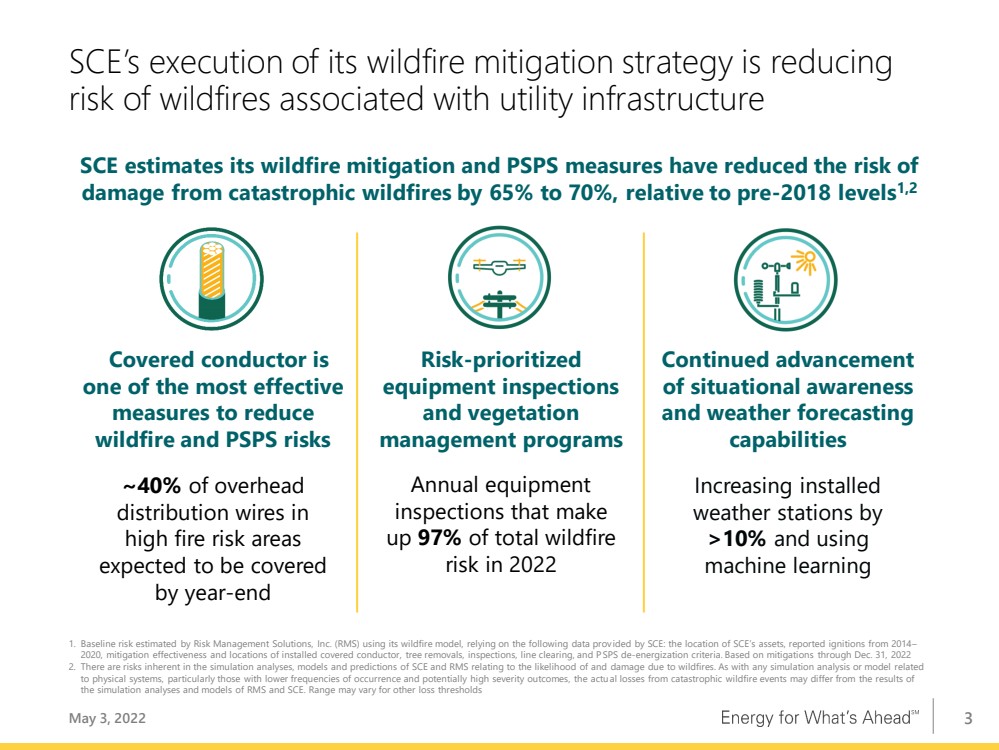
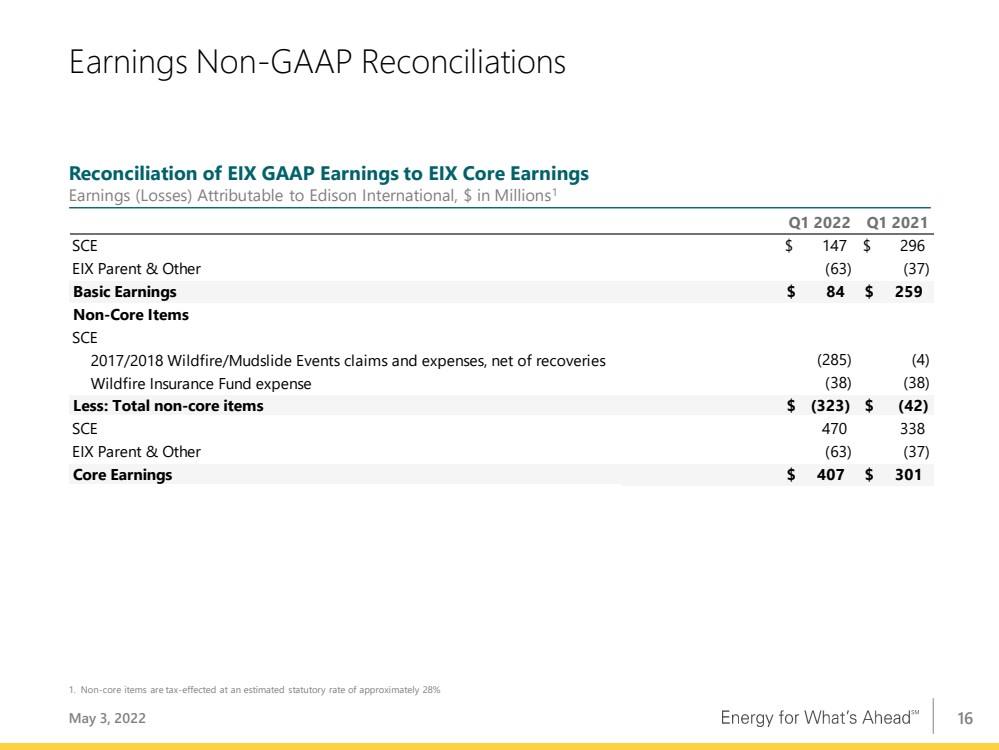
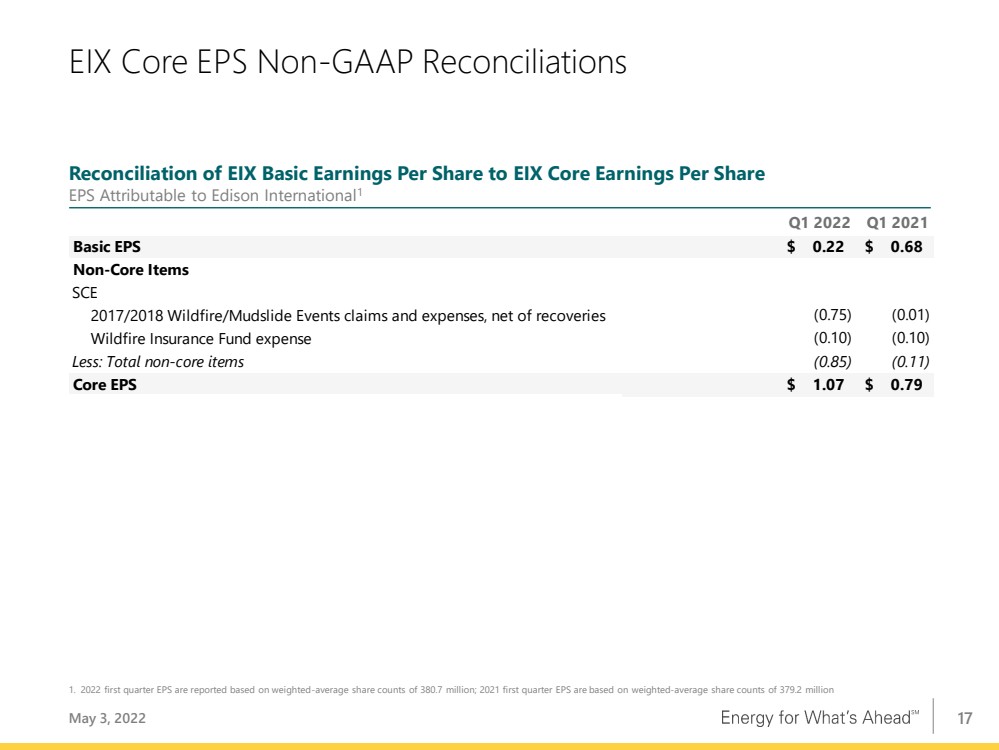
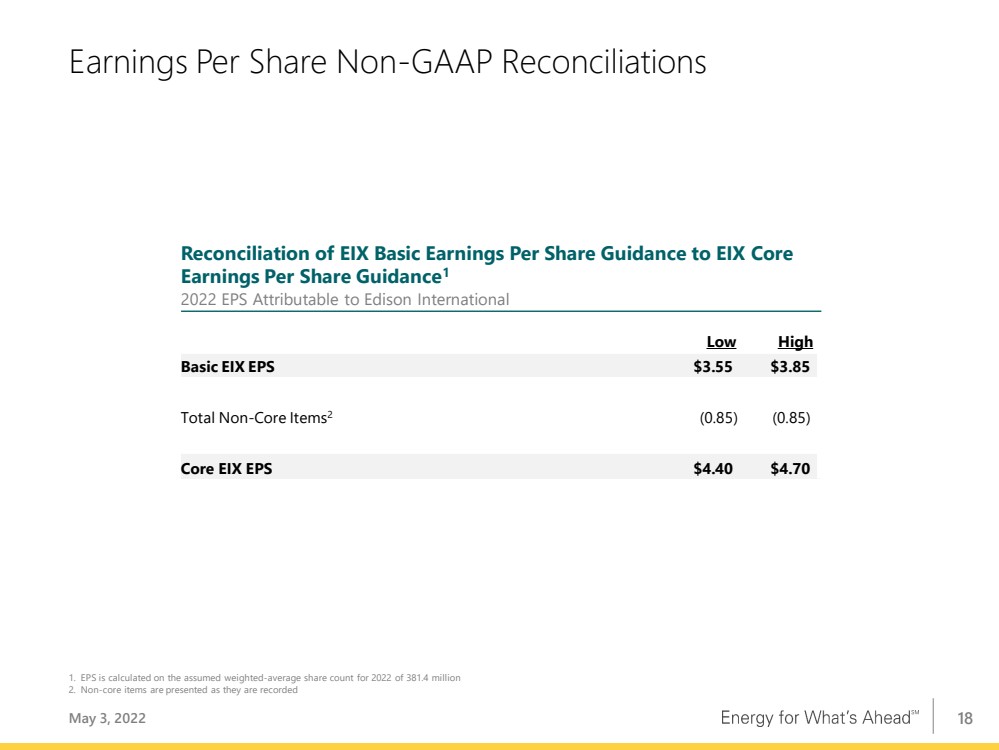
On May 3, 2022, Edison International issued a press release reporting its financial results and the financial results for its subsidiary, Southern California Edison Company, for the quarter ended March 31, 2022. A copy of the press release is attached as Exhibit 99.1. On the same day, members of Edison International's management will speak to investors via a financial teleconference. Senior management's prepared remarks and accompanying presentation are attached as Exhibit 99.2 and Exhibit 99.3 to this report. The information furnished in this Item 2.02 and Exhibits 99.1, 99.2, and 99.3 shall not be deemed to be “filed” for purposes of the Securities Exchange Act of 1934, nor shall it be deemed to be incorporated by reference in any filing under the Securities Act of 1933.
Item 7.01Regulation FD Disclosure
Members of Edison International management will use the information in the presentation furnished as Exhibit 99.3 to this report in meetings with institutional investors and analysts and at investor conferences. The attached presentation will also be posted on www.edisoninvestor.com.
Item 9.01Financial Statements and Exhibits
(d) | Exhibits |
EXHIBIT INDEX
| ||
Exhibit No. |
| Description |
99.1 | ||
99.2 | Edison International Q1 2022 Financial Results Conference Call Prepared Remarks dated May 3, 2022 | |
99.3 | Edison International Q1 2022 Financial Results Conference Call Presentation dated May 3, 2022 | |
104 | Cover Page Interactive Data File (embedded within the Inline XBRL document) |
Exhibit 99.1
FOR IMMEDIATE RELEASE | Investor Relations: Sam Ramraj, (626) 302-2540 | ||
| Media Contact: Jeff Monford, (626) 476-8120 |
Edison International Reports First Quarter 2022 Results
● | First Quarter 2022 GAAP earnings per share of $0.22; Core EPS of $1.07 |
● | Through the end of the first quarter, SCE has deployed over 3,200 miles of covered conductor, nearly double the miles installed at the same time last year |
● | Revises best estimate of expected losses for 2017/2018 Wildfire/Mudslide Events, resulting in net after-tax charge of $281 million; Anticipates cost recovery filing by late 2023 |
● | Affirms 2022 EPS guidance of $4.40–4.70 and long-term EPS growth rate target of 5–7% |
ROSEMEAD, Calif., May 3, 2022 — Edison International (NYSE: EIX) today reported first quarter 2022 net income of $84 million, or $0.22 per share, compared to net income of $259 million, or $0.68 per share, in the first quarter of 2021. As adjusted, first quarter 2022 core earnings were $407 million, or $1.07 per share, compared to core earnings of $301 million, or $0.79 per share, in the first quarter of 2021.
Southern California Edison’s (SCE) first quarter 2022 core earnings per share (EPS) increased year-over-year primarily due to the adoption of the 2021 General Rate Case final decision in the third quarter of 2021, partially offset by interest expense from increased borrowings.
Edison International Parent and Other's first quarter 2022 loss per share increased year-over-year primarily due to higher preferred dividends.
SCE's non-core loss during the quarter was primarily attributable to a charge recorded for 2017/2018 Wildfire/Mudslide Events claims and expenses, net of expected recoveries from FERC customers. This charge is described further below.
“SCE continues to make solid progress in substantially improving its wildfire risk profile.” said Pedro J. Pizarro, president and CEO of Edison International. “The cornerstone of SCE’s grid hardening measures is the wildfire covered conductor program. Over the past year the utility nearly doubled its miles of installed covered conductor. SCE will continue to drive this valuable program forward and by year-end expects 40% of its overhead distribution lines in high fire risk areas will be covered.”
Pizarro added, “We strongly believe Edison International is the best investment vehicle to participate in California’s clean energy transition. SCE’s approach to wildfire mitigation has shown positive results over the last three wildfire seasons and the utility is expeditiously hardening the grid every day, to the benefit of both customers and investors. As an electric-only, wires-focused utility, SCE’s ongoing investment in the grid will enable an electric-led future.”
Edison International uses core earnings, which is a non-GAAP financial measure that adjusts for significant discrete items that management does not consider representative of ongoing earnings. Edison International management believes that core earnings provide more meaningful comparisons of performance from period to period. Please see the attached tables for a reconciliation of core earnings to basic GAAP earnings.
Edison International Reports First Quarter 2022 Financial Results
Page 2 of 10
Revision to Best Estimate of Losses for 2017/2018 Wildfire/Mudslide Events
EIX and SCE revised the estimated losses for the 2017/2018 Wildfire Mudslide Events higher by $416 million as a result of management's first quarter 2022 review, including a review of large damage claims presented by a small number of plaintiffs and new lawsuits filed in the Woolsey Fire litigation. As a result, Edison International and SCE also recorded expected recoveries through FERC electric rates of $26 million against the charge, and the resulting net charge to earnings was $390 million ($281 million after-tax).
Anticipated Timing of Cost Recovery Applications
As previously disclosed, SCE will seek rate recovery at the CPUC of prudently-incurred, actual losses realized in connection with the 2017/2018 Wildfire/Mudslide Events. Based on EIX's and SCE's current best estimate of expected losses, SCE currently expects to seek CPUC-jurisdictional rate recovery of approximately $5.2 billion by filing multiple future applications with the CPUC. SCE currently anticipates filing the first application for cost recovery by late 2023.
2022 Earnings Guidance
The company affirmed its earnings guidance range for 2022 as summarized in the following chart. See the presentation accompanying the company’s conference call for further information and assumptions.
| | 2022 Earnings Guidance | | 2022 Earnings Guidance | ||||||||
| | as of February 24, 2022 | | as of May 3, 2022 | ||||||||
|
| Low |
| High |
| Low |
| High | ||||
EIX Basic EPS | | $ | 4.40 | | $ | 4.70 | | $ | 3.55 | | $ | 3.85 |
Less: Non-core Items* | |
| – | |
| – | |
| (0.85) | |
| (0.85) |
EIX Core EPS | | $ | 4.40 | | $ | 4.70 | | $ | 4.40 | | $ | 4.70 |
* There were ($323) million, or ($0.85) per share of non-core items recorded for the three months ended March 31, 2022, calculated based on an assumed weighted average share count for 2022. Basic EIX EPS guidance only incorporates non-core items to March 31, 2022.
First Quarter 2022 Earnings Conference Call and Webcast Details
When: | | Tuesday, May 3, 2022, 1:30 p.m. (Pacific Time) |
Telephone Numbers: | | 1-888-673-9780 (US) and 1-312-470-0178 (Int'l) - Passcode: Edison |
Telephone Replay: | | 1-866-357-4207 (US) and 1-203-369-0123 (Int’l) - Passcode: 9461 |
| | Telephone replay available through May 18, 2022 at 6:00 p.m. (Pacific Time) |
Webcast: | | www.edisoninvestor.com |
Edison International has posted its earnings conference call prepared remarks by the CEO and CFO, the teleconference presentation, and Form 10-Q to the company's investor relations website. These materials are available at www.edisoninvestor.com.
Edison International Reports First Quarter 2022 Financial Results
Page 3 of 10
About Edison International
Edison International (NYSE: EIX) is one of the nation’s largest electric utility holding companies, providing clean and reliable energy and energy services through its independent companies. Headquartered in Rosemead, California, Edison International is the parent company of Southern California Edison Company, a utility that delivers electricity to 15 million people across Southern, Central and Coastal California. Edison International is also the parent company of Edison Energy, a global energy advisory company delivering comprehensive, data-driven energy solutions to commercial and industrial users to meet their cost, sustainability and risk goals.
Edison International Reports First Quarter 2022 Financial Results
Page 4 of 10
Appendix
Use of Non-GAAP Financial Measures
Edison International’s earnings are prepared in accordance with generally accepted accounting principles used in the United States and represent the company’s earnings as reported to the Securities and Exchange Commission. Our management uses core earnings and core earnings per share (EPS) internally for financial planning and for analysis of performance of Edison International and Southern California Edison. We also use core earnings and core EPS when communicating with analysts and investors regarding our earnings results to facilitate comparisons of the Company’s performance from period to period. Financial measures referred to as net income, basic EPS, core earnings, or core EPS also apply to the description of earnings or earnings per share.
Core earnings and core EPS are non-GAAP financial measures and may not be comparable to those of other companies. Core earnings and core EPS are defined as basic earnings and basic EPS excluding income or loss from discontinued operations and income or loss from significant discrete items that management does not consider representative of ongoing earnings. Basic earnings and losses refer to net income or losses attributable to Edison International shareholders. Core earnings are reconciled to basic earnings in the attached tables. The impact of participating securities (vested awards that earn dividend equivalents that may participate in undistributed earnings with common stock) for the principal operating subsidiary is not material to the principal operating subsidiary’s EPS and is therefore reflected in the results of the Edison International holding company, which is included in Edison International Parent and Other.
Safe Harbor Statement
Statements contained in this presentation about future performance, including, without limitation, operating results, capital expenditures, rate base growth, dividend policy, financial outlook, and other statements that are not purely historical, are forward-looking statements. These forward-looking statements reflect our current expectations; however, such statements involve risks and uncertainties. Actual results could differ materially from current expectations. These forward-looking statements represent our expectations only as of the date of this presentation, and Edison International assumes no duty to update them to reflect new information, events or circumstances. Important factors that could cause different results include, but are not limited to the:
• | ability of SCE to recover its costs through regulated rates, including uninsured wildfire-related and debris flow-related costs, costs incurred to mitigate the risk of utility equipment causing future wildfires, costs incurred to implement SCE's new customer service system, costs incurred as a result of the COVID-19 pandemic, and increased labor and materials costs due to supply chain constraints and inflation; |
• | ability of SCE to implement its Wildfire Mitigation Plan and capital program; |
• | risks of regulatory or legislative restrictions that would limit SCE's ability to implement Public Safety Power Shutoff (“PSPS”) when conditions warrant or would otherwise limit SCE's operational PSPS practices; |
• | risks associated with implementing PSPS, including regulatory fines and penalties, claims for damages and reputational harm; |
• | ability of SCE to maintain a valid safety certification; |
• | ability to obtain sufficient insurance at a reasonable cost, including insurance relating to SCE's nuclear facilities and wildfire-related claims, and to recover the costs of such insurance or, in the event liabilities exceed insured amounts, the ability to recover uninsured losses from customers or other parties; |
• | extreme weather-related incidents (including events caused, or exacerbated, by climate change, such as wildfires, debris flows, droughts, high wind events and extreme heat events) and other natural disasters (such as earthquakes), which could cause, among other things, public safety issues, property damage, operational issues (such as rotating outages and issues due to damaged infrastructure), PSPS activations and unanticipated costs; |
• | risks that California Assembly Bill 1054 (“AB 1054”) does not effectively mitigate the significant exposure faced by California investor-owned utilities related to liability for damages arising from catastrophic wildfires where utility facilities are alleged to be a substantial cause, including the longevity of the Wildfire Insurance Fund and |
Edison International Reports First Quarter 2022 Financial Results
Page 5 of 10
the CPUC's interpretation of and actions under AB 1054, including its interpretation of the prudency standard established under AB 1054; |
• | ability of Edison International and SCE to effectively attract, manage, develop and retain a skilled workforce, including its contract workers; |
• | decisions and other actions by the California Public Utilities Commission, the Federal Energy Regulatory Commission, the Nuclear Regulatory Commission and other governmental authorities, including decisions and actions related to nationwide or statewide crisis, determinations of authorized rates of return or return on equity, the recoverability of wildfire-related and debris flow-related costs, issuance of SCE's wildfire safety certification, wildfire mitigation efforts, approval and implementation of electrification programs, and delays in executive, regulatory and legislative actions; |
• | cost and availability of labor, equipment and materials, including as a result of supply chain constraints; |
• | ability of Edison International or SCE to borrow funds and access bank and capital markets on reasonable terms; |
• | risks associated with the decommissioning of San Onofre, including those related to worker and public safety, public opposition, permitting, governmental approvals, on-site storage of spent nuclear fuel, delays, contractual disputes, and cost overruns; |
• | pandemics, such as COVID-19, and other events that cause regional, statewide, national or global disruption, which could impact, among other things, Edison International's and SCE's business, operations, cash flows, liquidity and/or financial results and cause Edison International and SCE to incur unanticipated costs; |
• | physical security of Edison International's and SCE's critical assets and personnel and the cybersecurity of Edison International's and SCE's critical information technology systems for grid control, and business, employee and customer data; |
• | risks associated with cost allocation resulting in higher rates for utility bundled service customers because of possible customer bypass or departure for other electricity providers such as Community Choice Aggregators (“CCA,” which are cities, counties, and certain other public agencies with the authority to generate and/or purchase electricity for their local residents and businesses) and Electric Service Providers (entities that offer electric power and ancillary services to retail customers, other than electrical corporations (like SCE) and CCAs); |
• | risks inherent in SCE's capital investment program, including those related to project site identification, public opposition, environmental mitigation, construction, permitting, changes in the California Independent System Operator’s transmission plans, and governmental approvals; and |
• | risks associated with the operation of electrical facilities, including worker and public safety issues, the risk of utility assets causing or contributing to wildfires, failure, availability, efficiency, and output of equipment and facilities, and availability and cost of spare parts. |
Additional information about risks and uncertainties, including more detail about the factors described in this report, is contained throughout this report and in the 2021 Form 10-K, including the "Risk Factors" section. Readers are urged to read this entire report, including information incorporated by reference, as well as the 2021 Form 10-K, and carefully consider the risks, uncertainties, and other factors that affect Edison International's and SCE's businesses. Edison International and SCE post or provide direct links (i) to certain SCE and other parties' regulatory filings and documents with the CPUC and the FERC and certain agency rulings and notices in open proceedings in a section titled "SCE Regulatory Highlights," (ii) to certain documents and information related to Southern California wildfires which may be of interest to investors in a section titled "Southern California Wildfires," and (iii) to presentations, documents and other information that may be of interest to investors in a section titled "Presentations and Updates" at www.edisoninvestor.com in order to publicly disseminate such information.
These forward-looking statements represent our expectations only as of the date of this news release, and Edison International assumes no duty to update them to reflect new information, events or circumstances. Readers should review future reports filed by Edison International and SCE with the SEC.
Edison International Reports First Quarter 2022 Financial Results
Page 6 of 10
First Quarter Reconciliation of Basic Earnings Per Share to Core Earnings Per Share
| | Three months ended | | | | ||||
| | March 31, | | | | ||||
|
| 2022 |
| 2021 |
| Change | |||
Earnings (loss) per share attributable to Edison International |
| |
|
| |
|
| |
|
SCE | | $ | 0.38 | | $ | 0.78 | | $ | (0.40) |
Edison International Parent and Other | |
| (0.16) | |
| (0.10) | |
| (0.06) |
Edison International | |
| 0.22 | |
| 0.68 | |
| (0.46) |
Less: Non-core items | |
|
| |
|
| |
|
|
SCE | |
| (0.85) | |
| (0.11) | |
| (0.74) |
Edison International Parent and Other | |
| — | |
| — | |
| — |
Total non-core items | |
| (0.85) | |
| (0.11) | |
| (0.74) |
Core earnings (losses) | |
|
| |
|
| |
|
|
SCE | |
| 1.23 | |
| 0.89 | |
| 0.34 |
Edison International Parent and Other | |
| (0.16) | |
| (0.10) | |
| (0.06) |
Edison International | | $ | 1.07 | | $ | 0.79 | | $ | 0.28 |
Note: Diluted earnings were $0.22 and $0.68 per share for the three months ended March 31, 2022 and 2021.
First Quarter Reconciliation of Basic Earnings Per Share to Core Earnings (in millions)
| | Three months ended | | | | ||||
| | March 31, | | | | ||||
(in millions) |
| 2022 |
| 2021 |
| Change | |||
Net income (loss) attributable to Edison International |
| |
|
| |
|
| |
|
SCE | | $ | 147 | | $ | 296 | | $ | (149) |
Edison International Parent and Other | |
| (63) | |
| (37) | |
| (26) |
Edison International | |
| 84 | |
| 259 | |
| (175) |
Less: Non-core items | |
|
| |
|
| |
|
|
SCE1,2 | |
| (323) | |
| (42) | |
| (281) |
Edison International Parent and Other | |
| — | |
| — | |
| — |
Total non-core items | |
| (323) | |
| (42) | |
| (281) |
Core earnings (losses) | |
|
| |
|
| |
|
|
SCE | |
| 470 | |
| 338 | |
| 132 |
Edison International Parent and Other | |
| (63) | |
| (37) | |
| (26) |
Edison International | | $ | 407 | | $ | 301 | | $ | 106 |
1 | Includes amortization of SCE’s Wildfire Insurance Fund expenses of $53 million ($38 million after-tax) in the first quarter of both 2022 and 2021. |
2 | Includes charges of $396 million ($285 million after-tax) recorded in first quarter of 2022 and $5 million ($4 million after-tax) in the first quarter of 2021 for 2017/2018 Wildfire/Mudslide Events claims and expenses, net of recoveries. |
Edison International Reports First Quarter 2022 Financial Results
Page 7 of 10
Consolidated Statements of Income | | | | | | |
| | | | | | |
| | Three months ended | ||||
| | March 31, | ||||
(in millions, except per-share amounts) |
| 2022 |
| 2021 | ||
Total operating revenue | | $ | 3,968 | | $ | 2,960 |
Purchased power and fuel | |
| 1,037 | |
| 1,013 |
Operation and maintenance | |
| 1,487 | |
| 841 |
Wildfire-related claims, net of insurance recoveries | |
| 425 | |
| 3 |
Wildfire Insurance Fund expense | |
| 53 | |
| 53 |
Depreciation and amortization | |
| 583 | |
| 525 |
Property and other taxes | |
| 126 | |
| 126 |
Other operating income | |
| (2) | |
| — |
Total operating expenses | |
| 3,709 | |
| 2,561 |
Operating income | |
| 259 | |
| 399 |
Interest expense | |
| (246) | |
| (217) |
Other income | |
| 68 | |
| 72 |
Income before income taxes | |
| 81 | |
| 254 |
Income tax benefit | |
| (55) | |
| (36) |
Net income | |
| 136 | |
| 290 |
Preference stock dividend requirements of SCE | |
| 26 | |
| 27 |
Preferred stock dividend requirement of Edison International | | | 26 | | | 4 |
Net income attributable to Edison International common shareholders | | $ | 84 | | $ | 259 |
Basic earnings per share: | |
|
| |
|
|
Weighted average shares of common stock outstanding | |
| 381 | |
| 379 |
Basic earnings per common share attributable to Edison International common shareholders | | $ | 0.22 | | $ | 0.68 |
Diluted earnings per share: | |
|
| |
|
|
Weighted average shares of common stock outstanding, including effect of dilutive securities | |
| 382 | |
| 380 |
Diluted earnings per common share attributable to Edison International common shareholders | | $ | 0.22 | | $ | 0.68 |
Edison International Reports First Quarter 2022 Financial Results
Page 8 of 10
Consolidated Balance Sheets | | Edison International | ||||
| | | | | | |
| | March 31, | | December 31, | ||
(in millions) | | 2022 | | 2021 | ||
ASSETS |
| |
|
| |
|
Cash and cash equivalents | | $ | 231 | | $ | 390 |
Receivables, less allowances of $255 and $193 for uncollectible accounts at respective dates | |
| 1,312 | |
| 1,398 |
Accrued unbilled revenue | |
| 743 | |
| 794 |
Inventory | |
| 434 | |
| 420 |
Prepaid expenses | |
| 258 | |
| 258 |
Regulatory assets | |
| 1,961 | |
| 1,778 |
Wildfire Insurance Fund contributions | |
| 204 | |
| 204 |
Other current assets | |
| 130 | |
| 249 |
Total current assets | |
| 5,273 | |
| 5,491 |
Nuclear decommissioning trusts | |
| 4,527 | |
| 4,870 |
Marketable securities | | | 10 | | | 12 |
Other investments | |
| 44 | |
| 39 |
Total investments | |
| 4,581 | |
| 4,921 |
Utility property, plant and equipment, less accumulated depreciation and amortization of $11,650 and $11,407 at respective dates | |
| 50,793 | |
| 50,497 |
Nonutility property, plant and equipment, less accumulated depreciation of $103 and $98 at respective dates | |
| 207 | |
| 203 |
Total property, plant and equipment | |
| 51,000 | |
| 50,700 |
Receivables, less allowances of $99 and $116 uncollectible accounts at respective dates | | | 66 | | | 122 |
Regulatory assets (includes $849 and $325 related to Variable Interest Entities "VIEs" at respective dates) | |
| 8,008 | |
| 7,660 |
Wildfire Insurance Fund contributions | |
| 2,309 | |
| 2,359 |
Operating lease right-of-use assets | |
| 1,849 | |
| 1,932 |
Long-term insurance receivable | | | 171 | | | 75 |
Other long-term assets | |
| 1,463 | |
| 1,485 |
Total long-term assets | |
| 13,866 | |
| 13,633 |
| | | | | | |
Total assets | | $ | 74,720 | | $ | 74,745 |
Edison International Reports First Quarter 2022 Financial Results
Page 9 of 10
Consolidated Balance Sheets | | Edison International | ||||
| | | | | | |
|
| March 31, |
| December 31, | ||
(in millions, except share amounts) | | 2022 | | 2021 | ||
LIABILITIES AND EQUITY |
| |
|
| |
|
Short-term debt | | $ | 2,049 | | $ | 2,354 |
Current portion of long-term debt | |
| 1,117 | |
| 1,077 |
Accounts payable | |
| 1,973 | |
| 2,002 |
Wildfire-related claims | |
| 137 | |
| 131 |
Customer deposits | |
| 190 | |
| 193 |
Regulatory liabilities | |
| 701 | |
| 603 |
Current portion of operating lease liabilities | |
| 594 | |
| 582 |
Other current liabilities | |
| 1,581 | |
| 1,667 |
Total current liabilities | |
| 8,342 | |
| 8,609 |
Long-term debt (Includes $837 and $314 related to VIEs at respective dates) | |
| 24,967 | |
| 24,170 |
Deferred income taxes and credits | |
| 5,780 | |
| 5,740 |
Pensions and benefits | |
| 488 | |
| 496 |
Asset retirement obligations | |
| 2,839 | |
| 2,772 |
Regulatory liabilities | |
| 8,867 | |
| 8,981 |
Operating lease liabilities | |
| 1,255 | |
| 1,350 |
Wildfire-related claims | |
| 1,531 | |
| 1,733 |
Other deferred credits and other long-term liabilities | |
| 3,019 | |
| 3,105 |
Total deferred credits and other liabilities | |
| 23,779 | |
| 24,177 |
Total liabilities | |
| 57,088 | |
| 56,956 |
Commitments and contingencies | |
|
| |
|
|
Preferred stock (50,000,000 shares authorized; 1,250,000 shares of Series A and 750,000 shares of Series B issued and outstanding at respective dates) | | | 1,977 | | | 1,977 |
Common stock, no par value (800,000,000 shares authorized; 380,901,110 and 380,378,145 shares issued and outstanding at respective dates) | |
| 6,090 | |
| 6,071 |
Accumulated other comprehensive loss | |
| (52) | |
| (54) |
Retained earnings | |
| 7,716 | |
| 7,894 |
Total Edison International's shareholders' equity | |
| 15,731 | |
| 15,888 |
Noncontrolling interests – preference stock of SCE | |
| 1,901 | |
| 1,901 |
Total equity | |
| 17,632 | |
| 17,789 |
| | | | | | |
Total liabilities and equity | | $ | 74,720 | | $ | 74,745 |
Edison International Reports First Quarter 2022 Financial Results
Page 10 of 10
Consolidated Statements of Cash Flows | | Edison International | ||||
| | | | | | |
| | Three months ended March 31, | ||||
(in millions) |
| 2022 |
| 2021 | ||
Cash flows from operating activities: |
| |
|
| |
|
Net income | | $ | 136 | | $ | 290 |
Adjustments to reconcile to net cash provided by operating activities: | |
| | |
| |
Depreciation and amortization | |
| 624 | |
| 542 |
Allowance for equity during construction | |
| (30) | |
| (35) |
Deferred income taxes | |
| (55) | |
| (37) |
Wildfire Insurance Fund amortization expense | |
| 53 | |
| 53 |
Other | |
| 11 | |
| 11 |
Nuclear decommissioning trusts | |
| (34) | |
| (52) |
Changes in operating assets and liabilities: | |
|
| |
|
|
Receivables | |
| 130 | |
| 15 |
Inventory | |
| (14) | |
| (12) |
Accounts payable | |
| (84) | |
| (151) |
Tax receivables and payables | |
| 54 | |
| 178 |
Other current assets and liabilities | |
| 5 | |
| (168) |
Regulatory assets and liabilities, net | |
| 259 | |
| (70) |
Wildfire-related insurance receivable | |
| (96) | |
| 105 |
Wildfire-related claims | |
| (196) | |
| (618) |
Other noncurrent assets and liabilities | |
| 29 | |
| 21 |
Net cash provided by operating activities | |
| 792 | |
| 72 |
Cash flows from financing activities: | |
|
| |
|
|
Long-term debt issued, plus premium and net of discount and issuance costs of $20 and $15 for the respective periods | |
| 1,713 | |
| 1,223 |
Long-term debt repaid | |
| (365) | |
| (490) |
Short-term debt issued | |
| — | |
| 305 |
Short-term debt repaid | |
| (518) | |
| (327) |
Common stock issued | |
| 4 | |
| 15 |
Preferred stock issued, net | |
| — | |
| 1,237 |
Commercial paper repayments, net of borrowing | |
| (306) | |
| (180) |
Dividends and distribution to noncontrolling interests | |
| (32) | |
| (32) |
Common stock dividends paid | |
| (262) | |
| (247) |
Preferred stock dividends paid | | | (46) | | | — |
Other | |
| 17 | |
| 7 |
Net cash provided by financing activities | |
| 205 | |
| 1,511 |
Cash flows from investing activities: | |
|
| |
|
|
Capital expenditures | |
| (1,207) | |
| (1,358) |
Proceeds from sale of nuclear decommissioning trust investments | |
| 867 | |
| 1,270 |
Purchases of nuclear decommissioning trust investments | |
| (833) | |
| (1,218) |
Other | |
| 16 | |
| 24 |
Net cash used in investing activities | |
| (1,157) | |
| (1,282) |
Net (decrease) increase in cash, cash equivalents and restricted cash | |
| (160) | |
| 301 |
Cash, cash equivalents and restricted cash at beginning of period | |
| 394 | |
| 89 |
Cash, cash equivalents and restricted cash at end of period | | $ | 234 | | $ | 390 |
Exhibit 99.2
Prepared Remarks of Edison International CEO and CFO
First Quarter 2022 Earnings Teleconference
May 3, 2022, 1:30 p.m. (PT)
Pedro Pizarro, President and Chief Executive Officer, Edison International
Edison International reported core earnings per share of $1.07 compared to $0.79 a year ago. We are reiterating our 2022 core EPS guidance range of $4.40 to $4.70 and our longer-term EPS growth target of 5 to 7% through 2025, resulting in core EPS of $5.50 to $5.90. Maria will discuss our financial performance in her remarks.
Over the last year, I have been updating you on SCE’s substantial reduction of wildfire risk. Relative to pre-2018 levels, SCE estimates it has reduced the probability of losses from catastrophic wildfire by 65 to 70%, and continued investments will further reduce this risk.
When we look across all 17,000 circuit miles of distribution lines in SCE’s high fire risk area, the utility’s grid hardening measures are focused on the roughly 10,000 miles that are above ground, with the other 7,000 already being underground. The cornerstone of SCE’s grid hardening measures is the wildfire covered conductor program. A key benefit is how quickly it reduces wildfire risk. Through the end of the first quarter, SCE has over 3,200 miles of covered conductor. This is nearly double what was covered at the same time last year. SCE continues to drive this program forward and expects to have covered 40% of its overhead distribution lines, or 4,000 of its 10,000 miles in its high fire risk areas, by year-end.
The utility continues to adapt and update its Wildfire Mitigation Plan to build on successes and learnings from the field. Most importantly, SCE’s WMP is immediately actionable, and the execution results in real risk reduction today and each day that SCE hardens its grid. In addition, SCE is preparing for this wildfire season by prioritizing its inspections and vegetation management programs. SCE focuses its annual inspections on equipment that makes up 97% of total wildfire risk in 2022 and plans to accelerate completion of the vast majority of these inspections before September 1st.
Today, 166 cameras provide visibility to about 90% of high fire risk areas, and planned installations in 2022 and beyond will increase coverage to nearly all of the utility’s HFRA to enhance early fire detection. SCE is increasing installed weather stations by over 10% and using machine learning to further advance forecasting and target PSPS events more precisely. Taken together, all of these efforts give SCE confidence in its ability to mitigate wildfires associated with its equipment.
Turning to wildfire-related settlements, SCE made substantial progress resolving 2017 and 2018 Wildfire and Mudslide Events claims. In the first quarter, SCE resolved over $700 million of claims. Driven by this progress and given SCE’s current assessment of claims, the utility revised the best estimate of total losses higher by $416 million to a total of $7.9 billion. I would like to share the two factors that contributed to this revision. First, during the quarter there were a handful of exceptionally large claims that were settled based on new information that became available during settlement negotiations. Second, as the statute of limitations for the Woolsey fire approaches, SCE saw a higher-than-expected increase in the number of plaintiffs making claims. SCE reviewed its estimate and determined it was appropriate to revise the best estimate, which includes new provisions for future potential exceptionally large claims. In total, the utility has resolved over 80% of its best estimate of expected losses and continues to make steady progress in resolving claims.
I would like to be clear that SCE currently expects to seek full CPUC cost recovery of claims payments, excluding amounts recoverable from insurance or FERC, or foregone under the agreement with the Safety Enforcement Division. A related question we’ve heard from the investment community is, “when does SCE expect to make that filing?” Based on the current pace of settlements, SCE anticipates filing its first application for cost recovery by late 2023. I strongly believe SCE operated its system prudently and will make a solid case in its filing. The considerations SCE will take into account in deciding the timing of its filings are described on page 4.
2
Another action I want to highlight is SCE’s recent legal challenge to inverse condemnation in the Thomas and Koenigstein fire litigation. We have mentioned in past discussions that SCE will always seek opportunities to challenge the doctrine of inverse condemnation. To that end, in April, the utility filed a notice of appeal with the California Court of Appeals challenging inverse condemnation. Cases like this generally take one to two years to reach a conclusion, and we will keep you apprised of any meaningful developments.
On the regulatory front, SCE recently filed its application for the 2023 CPUC cost of capital, requesting a return on equity of 10.53% while maintaining its authorized equity layer at 52%. As we have outlined since publishing the Pathway 2045 vision, economywide electrification is necessary to meet California’s policy goals. SCE will be a key enabler of the clean energy transition and will invest significant amounts of capital in its infrastructure. We believe that SCE’s requested ROE will support attracting this capital necessary to meet its obligations to provide safe, reliable, and resilient service and enable the state’s climate change adaptation and decarbonization goals. Separately, SCE is awaiting resolution of whether the cost of capital mechanism will operate for 2022. We have summarized SCE’s outstanding cost of capital applications on page 5.
Let me conclude by saying that we strongly believe Edison International is the best investment vehicle to participate in California’s clean energy transition. SCE’s approach to wildfire mitigation has shown positive results over the last three wildfire seasons and the utility is expeditiously hardening the grid every day, to the benefit of both customers and investors. As an electric-only, wires-focused utility, SCE’s ongoing investment in the grid will enable an electric-led future by integrating clean resources while enhancing resilience and broader climate adaptation. Economywide electrification is the most affordable path to achieving California’s climate goals.
Maria Rigatti, Executive Vice President and Chief Financial Officer, Edison International
My comments today will cover first quarter 2022 results, our capital expenditure and rate base forecasts, SCE’s cost of capital applications, and 2022 EPS guidance.
3
Edison International reported core earnings of $1.07 per share for the first quarter, an increase of 28 cents per share from the same period last year. Core EPS increased year-over-year primarily due the adoption of the 2021 GRC final decision in the third quarter of 2021, partially offset by interest expense from increased borrowings.
On page 6, you can see SCE’s key first quarter EPS drivers on the right-hand side. I will highlight a few. Authorized revenue from the 2021 GRC was higher by 35 cents for two reasons. First, the escalation mechanism for 2022 contributed 18 cents to the variance. Second, because SCE did not have a GRC final decision in the first quarter of last year, it was recording revenue at 2020 levels. This timing difference contributed 17 cents to year-over-year Q1 revenue growth.
Other CPUC revenue was 51 cents higher, primarily related to the approval of GRC track 2. With this approval, SCE recognized revenue for costs previously deferred to memo accounts. Note that this revenue increase was fully offset, primarily by the recognition of 46 cents of O&M resulting from the track 2 decision.
At EIX Parent and Other, the core loss was 6 cents higher in the first quarter. This was primarily due to dividends on the preferred equity issued last year.
Now let’s move to SCE’s capital expenditure and rate base forecasts. Page 7 shows SCE’s updated capital forecast to reflect its upcoming GRC track 4 application, which will be filed on May 13. Track 4 covers funding for 2024, which is the third attrition year of SCE’s 2021 GRC. In addition to requesting a revenue increase driven by the GRC attrition mechanism and inflation, SCE will propose continued deployment of covered conductor beyond the over 5,000 miles expected to be installed by the end of 2023. I would like to reiterate Pedro’s earlier comment on SCE’s wildfire mitigation plan—it is immediately actionable and the execution of the work results in real risk reduction today and each day that SCE hardens its grid.
As shown on page 8, our capital forecast continues to result in projected rate base growth of 7 to 9% from 2021 to 2025. The forecast reflects SCE’s current view of the requests to be made in GRC track 4, the 2025 GRC, and other applications. We continue to see strong
4
potential for SCE to continue deploying capital and achieving 7 to 9% rate base growth through 2025.
Turning to guidance, pages 9 and 10 show our 2022 guidance and the key assumptions for modeling purposes. We are affirming our 2022 core EPS guidance range of $4.40 to $4.70. SCE is recording revenue based on its currently authorized cost of capital and will reflect the final decision in the 2022 cost of capital proceeding in the quarter it is received. As Pedro mentioned, we are awaiting resolution of whether the cost of capital mechanism will operate for 2022. After receiving a final decision from the CPUC, we will provide an update on guidance to incorporate any changes in the ROE and our outlook for the rest of the year.
Also embedded in our guidance is EIX’s 2022 financing plan, which we disclosed last quarter and remains unchanged. The revision to the best estimate of total expected losses does not change our plan. Also, I’ll remind you that the claims payments themselves are funded with debt issued by SCE.
I’d like to provide some additional insight into two of SCE’s recent applications to the CPUC. First, SCE filed a request to extend its CPUC capital structure waiver with respect to the 2017 and 2018 Wildfire and Mudslide Events. You may recall that the CPUC previously approved a waiver through the earlier of May 2022 or resolution of the 2017 and 2018 events. The waiver allows SCE to exclude certain charges and debt when calculating compliance with its 52% authorized CPUC equity ratio. SCE has requested an extension of the waiver period until the CPUC resolves the last of SCE’s cost recovery applications for the 2017 and 2018 events. The current waiver remains in place until the CPUC rules on the recently filed application. This provides SCE with the flexibility to finance itself in a way that is efficient for customers and shareholders. Second, in SCE’s 2023 cost of capital application, it requested an ROE of 10.53%, consistent with its recently filed off-cycle application. This ROE is at the upper end of the reasonable range estimated by SCE’s expert witness. We believe SCE made strong arguments justifying its request and remind you that in SCE’s last cost of capital decision the CPUC
5
concluded SCE’s ROE should be at the upper end of the range. Under SCE’s proposed schedule, the proceeding would conclude with a final decision by the end of the year.
Turning to page 11, I want to reiterate our growth opportunities that drive strong core earnings growth from 2021 through 2025, and highlight EIX’s potential to achieve double-digit total shareholder return during that period. A key component of our total return proposition is our common dividend, which currently yields approximately 4%. I’m proud of our track record of 18 consecutive years of dividend growth and look forward to building on that history. Our EPS growth of 5 to 7% is driven by SCE’s significant capital expenditure opportunities including investments in the safety and reliability of the grid. Sustainable rate base growth results from the investments necessary to reduce wildfire risk and investments to support infrastructure replacement and load growth. Affordability is also a key consideration, and I would like to emphasize that SCE has the lowest system average rate among California’s large IOUs. This is in large part driven by our strong culture of excellent cost management that has been a cornerstone of the utility for more than a decade.
6
May 3, 2022 First Quarter 2022 Financial Results |
1 Statements contained in this presentation about future performance, including, without limitation, operating results, capital ex penditures, rate base growth, dividend policy, financial outlook, and other statements that are not purely historical, are forward - looking statements. These forward - looking statements r eflect our current expectations; however, such statements involve risks and uncertainties. Actual results could differ materially from current expectations. These forward - looking stateme nts represent our expectations only as of the date of this presentation, and Edison International assumes no duty to update them to reflect new information, events or circumstances. Im por tant factors that could cause different results include, but are not limited to the: • ability of SCE to recover its costs through regulated rates, including uninsured wildfire - related and debris flow - related costs, costs incurred to mitigate the risk of utility equipment causing future wildfires, costs incurred to implement SCE's new customer service system, costs incurred as a result of the CO VID - 19 pandemic, and increased labor and materials costs due to supply chain constraints and inflation; • ability of SCE to implement its Wildfire Mitigation Plan and capital program; • risks of regulatory or legislative restrictions that would limit SCE’s ability to implement Public Safety Power Shutoff (“PSP S”) when conditions warrant or would otherwise limit SCE’s operational PSPS practices; • risks associated with implementing PSPS, including regulatory fines and penalties, claims for damages and reputational harm; • ability of SCE to maintain a valid safety certification; • ability to obtain sufficient insurance at a reasonable cost, including insurance relating to SCE's nuclear facilities and wil dfi re - related claims, and to recover the costs of such insurance or, in the event liabilities exceed insured amounts, the ability to recover uninsured losses from customers or other parties; • extreme weather - related incidents (including events caused, or exacerbated, by climate change, such as wildfires, debris flows, droughts, high wind events and extreme heat events) and other natural disasters (such as earthquakes), which could cause, among other things, public safety issues, property damage, ope rational issues (such as rotating outages and issues due to damaged infrastructure), PSPS activations and unanticipated costs; • risk that California Assembly Bill 1054 (“AB 1054”) does not effectively mitigate the significant exposure faced by Californi a i nvestor - owned utilities related to liability for damages arising from catastrophic wildfires where utility facilities are alleged to be a substantial cause, including the longevity o f t he Wildfire Insurance Fund and the CPUC's interpretation of and actions under AB 1054, including its interpretation of the prudency standard established under AB 1054; • ability of Edison International and SCE to effectively attract, manage, develop and retain a skilled workforce, including its co ntract workers; • decisions and other actions by the California Public Utilities Commission, the Federal Energy Regulatory Commission, the Nucl ear Regulatory Commission and other governmental authorities, including decisions and actions related to nationwide or statewide crisis, determinations of authorized rates of re turn or return on equity, the recoverability of wildfire - related and debris flow - related costs, issuance of SCE's wildfire safety certification, wildfire mitigation efforts, approval an d implementation of electrification programs, and delays in executive, regulatory and legislative actions; • cost and availability of labor, equipment and materials, including as a result of supply chain constraints; • ability of Edison International or SCE to borrow funds and access bank and capital markets on reasonable terms; • risks associated with the decommissioning of San Onofre, including those related to worker and public safety, public oppositi on, permitting, governmental approvals, on - site storage of spent nuclear fuel, delays, contractual disputes, and cost overruns; • pandemics, such as COVID - 19, and other events that cause regional, statewide, national or global disruption, which could impact, among other things, Edison International's and SCE's business, operations, cash flows, liquidity and/or financial results and cause Edison International and SCE to incur unantici pat ed costs; • physical security of Edison International's and SCE's critical assets and personnel and the cybersecurity of Edison Internati ona l's and SCE's critical information technology systems for grid control, and business, employee and customer data; • risks associated with cost allocation resulting in higher rates for utility bundled service customers because of possible cus tom er bypass or departure for other electricity providers such as Community Choice Aggregators (“CCA,” which are cities, counties, and certain other public agencies with the authority to g ene rate and/or purchase electricity for their local residents and businesses) and Electric Service Providers (entities that offer electric power and ancillary services to retail customers , o ther than electrical corporations (like SCE) and CCAs); • risks inherent in SCE’s capital investment program, including those related to project site identification, public opposition , e nvironmental mitigation, construction, permitting, changes in the California Independent System Operator’s transmission plans, and governmental approvals; and • risks associated with the operation of electrical facilities, including worker and public safety issues, the risk of utility ass ets causing or contributing to wildfires, failure, availability, efficiency, and output of equipment and facilities, and availability and cost of spare parts. Other important factors are discussed under the headings “Forward - Looking Statements”, “Risk Factors” and “Management’s Discussi on and Analysis” in Edison International’s Form 10 - K and other reports filed with the Securities and Exchange Commission, which are available on our website: www.edisoninvestor.c om. These filings also provide additional information on historical and other factual data contained in this presentation. Forward - Looking Statements May 3, 2022 |
2 Edison International First Quarter Update Q1 2022 core EPS growth driven primarily by adoption of 2021 GRC decision in Q3 2021 GAAP EPS: $0.22 Core EPS 1 : $1.07 EIX affirms 2022 EPS guidance $4.40 – 4.70 2022 Core EPS 1 In Q1, SCE resolved over $700 million of claims for 2017/2018 Wildfire/Mudslide Events; revised best estimate ($281 million charge, after tax) Over 80% of best estimate resolved. Anticipate cost recovery filing by late 2023 In April, SCE filed 2023 CPUC cost of capital application, seeking increased ROE SCE requests 2023 CPUC ROE of 10.53% and 52% equity ratio EIX reiterates long - term EPS growth rate 5 – 7% EPS CAGR 2021 – 2025 2 1. See Earnings Per Share Non - GAAP Reconciliations and Use of Non - GAAP Financial Measures in Appendix 2. Compound annual growth rate (CAGR) based on the midpoint of the initial 2021 EPS guidance range of $4.42 – 4.62 established Septem ber 16, 2021 May 3, 2022 |
3 SCE’s execution of its wildfire mitigation strategy is reducing risk of wildfires associated with utility infrastructure Annual equipment inspections that make up 97% of total wildfire risk in 2022 Covered conductor is one of the most effective measures to reduce wildfire and PSPS risks Continued advancement of situational awareness and weather forecasting capabilities Risk - prioritized equipment inspections and vegetation management programs SCE estimates its wildfire mitigation and PSPS measures have reduced the risk of damage from catastrophic wildfires by 65% to 70%, relative to pre - 2018 levels 1,2 Increasing installed weather stations by >10% and using machine learning ~40% of overhead distribution wires in high fire risk areas expected to be covered by year - end 1. Baseline risk estimated by Risk Management Solutions, Inc. (RMS) using its wildfire model, relying on the following data prov ide d by SCE: the location of SCE’s assets, reported ignitions from 2014 – 2020, mitigation effectiveness and locations of installed covered conductor, tree removals, inspections, line clearing, and P SPS de - energization criteria. Based on mitigations through Dec. 31, 2022 2. There are risks inherent in the simulation analyses, models and predictions of SCE and RMS relating to the likelihood of and dam age due to wildfires. As with any simulation analysis or model related to physical systems, particularly those with lower frequencies of occurrence and potentially high severity outcomes, the actu al losses from catastrophic wildfire events may differ from the results of the simulation analyses and models of RMS and SCE. Range may vary for other loss thresholds May 3, 2022 |
4 5.2 2.7 2017/2018 Wildfire/Mudslide Events Update: >80% of best estimate resolved. Anticipate cost recovery filing by late 2023 May 3, 2022 6.6 1.3 7.9 Best Estimate of Total Losses Over 80% of best estimate has been resolved 1. After giving effect to approximately $137 million in fixed payments due under settlements executed before March 31, 2022, but no t paid at March 31, 2022 2. CPUC - jurisdictional rate recovery of $375 million of losses is foreclosed from cost recovery under an agreement with the Safety and Enforcement Division of the CPUC (“SED”), which is subject to a pending legal challenge 3. TKM: Collectively, the Thomas Fire, the Koenigstein Fire, and the Montecito Mudslides SCE continues to make substantial progress resolving claims 1 … $ in Billions, as of March 31, 2022 …and SCE will seek recovery at the CPUC for prudently - incurred, actual losses in excess of insurance 2 Remaining Expected Potential Losses 1 $ in Billions, as of March 31, 2022 Amounts recoverable from insurance or FERC, or ineligible 2 Amounts for which SCE currently expects to seek cost recovery SCE currently anticipates filing an application for cost recovery by late 2023 , assuming relevant proceedings progress as expected SCE’s considerations for filing an application include: – Substantial resolution of claims (90%+ of value) in each of TKM 3 and Woolsey – Other litigation activities, including status of SED agreement SCE can file separate applications for TKM and Woolsey |
5 SCE requested a 10.53% ROE for 2023. Also awaiting result for 2022 cost of capital May 3, 2022 10.30% 10.53% 2022 Currently Authorized 2023 Request SCE’s requested ROE balances reasonable returns with affordability for customers CPUC Return on Equity (ROE) In April, SCE filed application to establish 2023 cost of capital and reset cost of capital mechanism for three - year term – Requested ROE of 10.53% and maintaining currently authorized equity ratio of 52% Currently awaiting resolution of whether cost of capital trigger mechanism will operate for 2022 Additionally, in April, SCE filed application to extend waiver period of previously approved regulatory capital structure exclusions related to 2017/2018 Wildfire/Mudslide Events |
6 Higher revenue 0.90 $ CPUC revenue - GRC authorized 0.35 CPUC revenue - Other 3,4 0.51 FERC and other operating revenue 0.04 Higher O&M 4 (0.33) Wildfire-related claims (0.01) Higher depreciation (0.10) Higher net financing costs (0.06) Income taxes 3 (0.08) Other 0.02 Property and other taxes 0.01 Other income and expenses 0.01 Total core drivers 0.34 $ Non-core items 1 (0.74) Total (0.40) $ (0.06) $ Total core drivers (0.06) $ Non-core items — Total (0.06) $ Key SCE EPS Drivers 2 Key EIX EPS Drivers 2 EIX Parent and Other - Higher preferred dividend First Quarter Earnings Summary May 3, 2022 1. See EIX Core EPS Non - GAAP Reconciliation and Use of Non - GAAP Financial Measures in Appendix 2. For comparability, 2022 first quarter core EPS drivers reported based on 2021 weighted - average share count of 379.2 million. 202 2 first quarter weighted - average shares outstanding is 380.7 million 3. Includes $0.06 of lower tax benefits related to balancing accounts, which are offset in revenue 4. Includes $0.46 of previously deferred wildfire - related and drought restoration expenses as a result of 2021 GRC Track 2 approval , which are offset in revenue Note: Diluted earnings were $0.22 and $0.68 per share for the three months ended December 31, 2022 and 2021, respectively Q1 2022 Q1 2021 Variance Basic Earnings Per Share (EPS) SCE 0.38 $ 0.78 $ (0.40) $ EIX Parent & Other (0.16) (0.10) (0.06) Basic EPS 0.22 $ 0.68 $ (0.46) $ Less: Non-core Items 1 SCE (0.85) $ (0.11) $ (0.74) $ EIX Parent & Other — — — Total Non-core Items (0.85) $ (0.11) $ (0.74) $ Core Earnings Per Share (EPS) SCE 1.23 $ 0.89 $ 0.34 $ EIX Parent & Other (0.16) (0.10) (0.06) Core EPS 1.07 $ 0.79 $ 0.28 $ |
7 Range Case 2 n/a 6.0 5. 2 5.2 5.2 5.4 6.2 5.6 5.7 – 5.8 6.7 2021 2022 2023 2024 2025 SCE has significant capital expenditure opportunities driven by investments in the safety and reliability of the grid May 3, 2022 Capital deployment expected to increase in future GRC and other applications 1 Capital Expenditures, $ in Billions Total 2021 – 2025 capital plan of $27 – 30 billion driven by investments in safety and reliability GRC track 1 and other approvals underpin spending through 2023 Primary 2024+ potential: – Deployment of incremental miles of covered conductor 3 – Investment to support infrastructure replacement and load growth – Transmission and energy storage investments to meet long - term state GHG targets 1. Forecast for 2024 includes amounts expected to be requested in track 4 of SCE’s 2021 GRC. Forecast for 2025 includes amounts cur rently expected to be requested in SCE’s 2025 GRC filing. Additionally, reflects non - GRC spending subject to future regulatory requests beyond GRC proceedings and FERC Formula Rate updat es 2. Annual Range Case capital reflects variability associated with future requests based on management judgment, potential for pe rmi tting delays and other operational considerations; GRC forecast is in line with authorized spend over the 2021 GRC track 1 cycle 3. The final decision in track 1 of SCE’s 2021 GRC established a cost recovery mechanism that would allow SCE to install additio nal covered conductor miles above the 4,500 circuit - mile level approved in the decision, including within the track 1 GRC period, subject to after - the - fact reasonableness review Future Requests |
8 Range Case 2 n/a 38.5 41.5 43.4 46.6 2021 GRC track 1 decision provides rate base visibility through 2023; future applications expected to extend growth May 3, 2022 1. Weighted - average year basis. Excludes rate base associated with ~$1.6 billion of wildfire mitigation - related spend that shall no t earn an equity return under AB 1054 2. Range Case rate base reflects capital expenditure Range Case forecast 3. The final decision in track 1 of SCE’s 2021 GRC established a cost recovery mechanism that would allow SCE to install additio nal covered conductor miles above the 4,500 circuit - mile level approved in the decision, including within the track 1 GRC period, subject to after - the - fact reasonableness review From a 2021 base, rate base growth forecast of 7 – 9% through 2025, reflecting future incremental investment Rate Base 1 , $ in Billions Forecast includes recovery of utility - owned storage for summer 2022 reliability and SCE’s building electrification request Substantial longer - term rate base growth potential from: – Deployment of incremental miles of covered conductor 3 – Investment to support infrastructure replacement and load growth – Transmission and energy storage investments to meet long - term state GHG targets 35.3 38.7 42.1 44.5 – 44.8 49.4 2021 2022 2023 2024 2025 ~9 % 2021 – 2025 CAGR Future Requests |
9 EIX affirms 2022 core EPS guidance of $4.40 – 4.70 May 3, 2022 YTD Recorded 1 2022 Guidance 1 SCE 2022 Rate Base EPS 1.26 5.34 SCE Operational Variances 0.05 0.11 – 0.38 EIX Parent and Other (0.16 ) (0.73) – (0.70 ) EIX Operational Results 1.15 4.72 – 5.02 SCE Costs Excluded from Authorized (0.08 ) (0.32 ) EIX Consolidated Core EPS $1.07 $4.40 – 4.70 EIX 2022 Core Earnings Per Share Guidance Range Building from SCE Rate Base EPS Key components of variances from SCE rate base EPS 1 Rate Base EPS Recording at current cost of capital pending 2022 cost of capital decision SCE Operational Variances Includes financing benefits associated with 2022 cost of capital proceeding 0.10 EIX Parent and Other Operating expense, other (0.15) – (0.13 ) Interest expense (0.26 ) EIX preferred dividends (0.32) – (0.31 ) SCE Costs Excluded from Authorized Wildfire Insurance Fund contribution interest expense (0.09 ) Wildfire claims payment debt interest expense 2 (0.07 ) Short - and long - term incentive comp not in rates; SB 901 disallowed exec comp (0.16 ) 1. YTD results as of March 31, 2022, based on 2022 YTD weighted average shares of 380.7 million; 2022 guidance based on weighted av erage shares assumption of 381.4 million 2. SCE is unable to conclude, at this time, that these amounts are probable of recovery; however, recovery may be sought as part of future cost recovery applications Note: See Earnings Per Share Non - GAAP Reconciliations and Use of Non - GAAP Financial Measures in Appendix. All tax - effected infor mation on this slide is based on our current combined statutory tax rate of approximately 28%. Totals may not add due to rounding |
10 2022 EIX Core Earnings Guidance Assumptions May 3, 2022 1. Beginning in 2023, Intervenors have an annual opportunity to terminate the TO2019A Formula Rate. The earliest any new rate co uld become effective is January 1, 2024 2. Does not include securities with equity content that could be issued to enable SCE to issue debt to finance payments for reso lut ion of claims related to the 2017/2018 Wildfire/Mudslide Events while allowing Edison International and SCE to maintain investment grade credit ratings Note: All tax - effected information on this slide is based on our current combined statutory tax rate of approximately 28% 2022 Assumption Additional Notes CPUC Rate Base ($ in Billions) $31.3 • Assumes CSRP track 1 decision in 2022. Decision delay would defer ~$55 million earnings to 2023 Return on Equity (ROE) 10.30% • ROE sensitivity: 4 cents EPS for 10bps change in ROE Equity in Capital Structure 52.0% FERC Rate Base ($ in Billions) $7.4 Return on Equity (ROE) 1 10.30% Equity in Capital Structure 1 47.5% Other Items SCE Operational Variances ($ Millions, after - tax) ~$40 – 145 Representative items: • AFUDC $120 • Financing benefits associated with 2022 cost of capital proceeding $38 • Shareholder - funded expenses not recovered in GRC $45 SCE Wildfire Claims Payment Debt Interest Expense ($ Millions, after - tax) ~$27 • SCE funds resolution of wildfire claims with debt. Additional debt expected to be issued during 2022 • $3 billion outstanding at 12/31/2021 EIX Equity Issuance 2 ($ in Millions) ~$300 – 400 of equity content • Higher than average of up to $250/year in 2022 – ’25 driven by anticipated capex associated with SCE's utility owned storage projects EIX Preferred Dividends ($ in Millions) ~$120 |
11 EIX has double - digit total return potential, supported by leadership role in clean energy transition May 3, 2022 9 – 11% total return o pportunity 4 before potential P/E multiple expansion driven by estimated 65 – 70% wildfire risk reduction 5 , a nd ongoing utility and government wildfire mitigation efforts 1. Compound annual growth rate (CAGR) based on the midpoint of the 2021 Core EPS guidance range of $4.42 – 4.62 established on Septem ber 16, 2021 2. Based on EIX stock price on May 2, 2022 3. Building electrification programs subject to CPUC approval 4. At current P/E multiple. Excludes changes in P/E multiple and potential dividend growth 5. Risk reduction based on mitigations through December 31, 2021 5 – 7% core EPS CAGR 1 2021 to 2025 Underpinned by strong rate base growth of ~7 – 9% $27 – 30 billion 2021 – 2025 capital program ~4% current dividend yield 2 18 consecutive years of dividend growth Target dividend payout of 45 – 55% of SCE core earnings Investments in safety and reliability of the grid Wildfire mitigation execution reduces risk for customers Creates strong foundation for climate adaptation and the clean energy transition One of the strongest electrification profiles in the industry Industry - leading programs for transportation electrification and building electrification 3 Potential for 60% load growth by 2045 |
Appendix |
13 Cash flow from memo account recovery and securitization strengthens our balance sheet and credit metrics May 3, 2022 Approved Applications Application / Account Balance @ Mar. 31 Recovery Through Remaining Rate Recovery by Year 2022 2023 2024 2025 ✓ GRC Track 1 (Jan. – Sept. 2021 Balance) 562 Dec. ’23 241 321 – – ✓ GRC Track 2 390 Feb. ’25 100 134 134 22 ✓ 2020 – 2021 Residential Uncollectibles 1 139 Feb. ’25 75 34 26 4 ✓ WEMA1 126 Dec. ’22 126 – – – ✓ 2019 CEMA 42 Dec. ’22 42 – – – Total 1,259 584 489 160 26 Pending & Future Applications (Subject to CPUC Authorization) Application Request 2 Expected Amort. 2 Expected Rate Recovery by Year 2022 2023 2024 2025 GRC Track 3 497 12 months 124 373 – – 2022 Wildfire Mit. & Veg. Mgmt. (to be filed) 3 330 12 months – – 330 – WEMA2 215 12 months 24 161 – – 2022 CEMA 198 12 months – – 198 – 2021 CEMA 132 12 months – 77 55 – Total 1,372 178 611 583 – Expected Securitizations 4,5 AB 1054 Capital Included In: Amount 2022 2023 2024 2025 ✓ GRC Tracks 1 & 2 (completed) 518 518 – – – GRC Track 3 730 – 730 – – Total 1,248 518 730 – – 1. 2020 – 2021 Residential Uncollectibles are tracked in a balancing account authorized by the CPUC and implemented in rates without a separate application 2. Requested revenue requirement. Amounts and amortization subject to CPUC approval 3. SCE expects to file for recovery of recovery of 2021 above - authorized spending for wildfire mitigation and vegetation management recorded in memo accounts. Final requested amount may change 4. Amounts refer to securitization of AB 1054 capex. Actual timing will depend on the timing of CPUC authorizations and implemen tat ion in customer rates or execution of securitization transactions 5. Amounts reflect capital costs recovered upfront via securitization. Recovery in customer rates of costs to service the bonds tak es place over the tenor of the debt at a fixed recovery charge rate GRC, Uncollectibles, Wildfire - related, and Wildfire Insurance Applications $ in Millions |
14 EIX parent projects total 2022 financing needs of $1.2 billion, including $300 – 400 million equity content May 3, 2022 1. Financing plans are subject to change 2. Edison International expects to issue securities containing up to $250 million of equity content annually, on average from 20 22 through 2025. The higher - than - average equity content expected in 2022 is driven by the anticipated capital expenditures associated with SCE's utility owned storage projects $1,200 $700 parent debt maturities $500 investment in SCE to support rate base growth Use of Proceeds 2022 EIX Financing Plan 1 $ in Millions Expect to issue securities with $300 – 400 million of equity content (consistent with prior disclosure) 2 in combination of: – Potential for cash proceeds of ~$400 – 600 million from preferred equity issuance (50% equity content) – ~$100 million common equity via internal programs (100% equity content) – If needed, use of at - the - market program (100% equity content) Expect to refinance $700 million of parent debt maturities with new debt issuances In April, borrowed $600 million under term loan agreement to provide execution timing flexibility for 2022 financing plan |
15 4.52 4.40 – 4.70 5.50 – 5.90 2021 Guidance Midpoint 2022 Guidance 2023 2024 2025 EIX reaffirms 2021 – 2025 EPS growth rate target, which would result in 2025 EPS of $5.50 – 5.90 May 3, 2022 Earnings progression expected to continue to 2025 Core Earnings per Share 1. Based on the midpoint of initial 2021 Core EPS guidance range of $4.42 – 4.62 established September 16, 2021 2. Components are rounded to the nearest 5 cents and based on EIX 2022 guidance share count of 381.4 million shares. For the pur pos es of this illustration, all costs and dilution associated with any equity content issued beyond 2022 are reflected in the EIX Parent and Other line. Actual financing activity may vary and is s ubj ect to change 3. Based on SCE’s currently - authorized CPUC ROE. SCE has filed an application requesting a CPUC ROE for 2023 of 10.53% 5 – 7% 2021 – ’25 CAGR 1 • Annual core EPS growth during the period expected to be non - linear • Growth in any given year can be outside the range 1 2025 Core EPS Components 2 Core Earnings per Share Key Assumptions • 2025 rate base ($bn) $46.6 – 49.4 – FERC ~16% of rate base • Authorized ROE 3 10.30% • Not assuming financing benefits during 2023 – 2025 period • Up to $250 million per year, on average, equity content 2022 – 2025, as previously disclosed Approximate Ranges 2 2025 Rate Base EPS $6.45 – 6.90 SCE Op. Variances 0.20 – 0.30 EIX Parent and Other (including dilution) (0.80) – (0.95 ) SCE Costs Excluded from Authorized (0.35 ) EIX Cons. Core EPS $5.50 – 5.90 |
16 Earnings Non - GAAP Reconciliations May 3, 2022 Q1 2022 Q1 2021 SCE 147 $ 296 $ EIX Parent & Other (63) (37) Basic Earnings 84 $ 259 $ Non-Core Items SCE 2017/2018 Wildfire/Mudslide Events claims and expenses, net of recoveries (285) (4) Wildfire Insurance Fund expense (38) (38) Less: Total non-core items (323) $ (42) $ SCE 470 338 EIX Parent & Other (63) (37) Core Earnings 407 $ 301 $ 1. Non - core items are tax - effected at an estimated statutory rate of approximately 28% Reconciliation of EIX GAAP Earnings to EIX Core Earnings Earnings (Losses) Attributable to Edison International, $ in Millions 1 |
17 EIX Core EPS Non - GAAP Reconciliations May 3, 2022 1. 2022 first quarter EPS are reported based on weighted - average share counts of 380.7 million; 2021 first quarter EPS are based on weighted - average share counts of 379.2 million Reconciliation of EIX Basic Earnings Per Share to EIX Core Earnings Per Share EPS Attributable to Edison International 1 Q1 2022 Q1 2021 Basic EPS 0.22 $ 0.68 $ Non-Core Items SCE 2017/2018 Wildfire/Mudslide Events claims and expenses, net of recoveries (0.75) (0.01) Wildfire Insurance Fund expense (0.10) (0.10) Less: Total non-core items (0.85) (0.11) Core EPS 1.07 $ 0.79 $ |
18 Low High Basic EIX EPS $3.55 $3.85 Total Non - Core Items 2 (0.85 ) (0.85) Core EIX EPS $4.40 $4.70 1. EPS is calculated on the assumed weighted - average share count for 2022 of 381.4 million 2. Non - core items are presented as they are recorded Earnings Per Share Non - GAAP Reconciliations May 3, 2022 Reconciliation of EIX Basic Earnings Per Share Guidance to EIX Core Earnings Per Share Guidance 1 2022 EPS Attributable to Edison International |
19 Edison International's earnings are prepared in accordance with generally accepted accounting principles used in the United States. Management uses core earnings (losses) internally for financial planning and for analysis of performance. Core earnings (losses) are also used when communicating with investors and analysts regarding Edison International's earnings results to facilitate comparisons of the company's performance from period to period. Core earnings (losses) are a non - GAAP financial measure and may not be comparable to those of other companies. Core earnings (losses) are defined as earnings attributable to Edison International shareholders less non - core items. Non - core items include income or loss from discontinued operations and income or loss from significant discrete items that management does not consider representative of ongoing earnings, such as write downs, asset impairments and other income and expense related to changes in law, outcomes in tax, regulatory or legal proceedings, and exit activities, including sale of certain assets and other activities that are no longer continuing. A reconciliation of Non - GAAP information to GAAP information is included either on the slide where the information appears or on another slide referenced in this presentation. EIX Investor Relations Contact Sam Ramraj, Vice President Derek Matsushima, Senior Manager (626) 302 - 2540 (626) 302 - 3625 Sam.Ramraj@edisonintl.com Derek.Matsushima@edisonintl.com Use of Non - GAAP Financial Measures May 3, 2022 |
FB,W=W!:B1MJ>=($W'T&3R:\)_8UU?55\$^+O"&K:E
M /W/_,W_ /A?7PR_
MZ*+X3_\ !Y:__%T?\+Z^&7_11?"?_@\M?_BZP?$7A;5I-48Z#H_@F#3MJ[4U
M'2'EFW=\LCJ,>G%2>/?#]Y#IHF\(>&?"DMW$DC/;:IIX;SR -BHRL@4DY!+9
M'(Z'?"5JR%K71]1EMGDA5B
M[0-,&\SRV).[# D<9%?)/[2^A?LR?"?X9ZKJG@#7?!'@CXH^'XC?:'=>']2A
M34VNH_F$4@C
WK73"K6C[SU2U_0\G$
M83 U$Z,+*4W:ZUU34FO+8K?##]DKPU\-_'
9C!9N;L#]U&2?*#!0Q5<#.3CDU]._
M%?X,^$_C5HMIIOBK3Y+I;*X6\LKNTN9;6ZLYQP)89HF5XVYZ@\]\UB>!OV9?
MAY\//$$_B#2M(NY?$5S8OIUWK.HZI=7EW=PNP9A+)+*Q!(_#$)\+2SFZ-C+<32E93C+K
M([EU;CJ&'ZFJ'@']E;X;_#6/5UT719T.JV;Z?=/<7\\I>W?[T8R_R@^HP?>J
M>*@TTENW_6_^9E3R?$1G"4Y7LDM]K*UM8MM/R/H>%_L"_!VSU3P?H/Q,U+
M6-5OM:MWN[.SM9)P;:"$LRL-I!)))9LY';TKO_VQ_$'AM[?P9X1U?0-2\5:E
MKFH%;#1K/5/[.AN& "?OYNH7,@P!W^E>V?#[X=>'OA9X9@\/>%]/_LS1X'>2
M.V\Z2;:S'+'=(S-R3ZUC?%CX'>#?C;865IXNTK^T%LI#);2QS/#)$3C=AD(.
M#@9'3@>E<[K*5;VDKV/3C@)T
MN1BN\\$:7
!B@#T^BBB@ HHHH XCXB&>YU3PYI\=Y(/"OAGX=^%#X\\4>(-*&O1VTVH+IUK9Z>=H6>>F*^?-
M$\Z=X(O?&EH_@2Q\)Z_HVDW5L+^PG@VNDL8EE2.5=Q9& ?L
M",BLBX^$GQ7\=6O[3NKZOX+71+SQYH%I9^'],_M*VED