Exhibit 99.1
70 E. Long Lake Rd. Bloomfield Hills, MI 48304 www.agreerealty.com
FOR IMMEDIATE RELEASE |
AGREE REALTY CORPORATION REPORTS FOURTH QUARTER
AND RECORD FULL YEAR 2021 RESULTS
Bloomfield Hills, MI, February 22, 2022 -- Agree Realty Corporation (NYSE: ADC) (the “Company”) today announced results for the quarter and full year ended December 31, 2021. All per share amounts included herein are on a diluted per common share basis unless otherwise stated.
Fourth Quarter 2021 Financial and Operating Highlights:
| § | Invested approximately $315 million in 74 retail net lease properties |
| § | Net Income per share attributable to common stockholders increased 5.2% to $0.44 |
| § | Core Funds from Operations (“Core FFO”) per share increased 10.2% to $0.92 |
| § | Adjusted Funds from Operations (“AFFO”) per share increased 9.2% to $0.91 |
| § | Declared a December monthly dividend of $0.227 per share, a 9.8% year-over-year increase |
| § | Completed a forward equity offering of 5,750,000 shares of common stock, including the underwriters' option to purchase additional shares, raising net proceeds of approximately $375 million |
| § | Settled 1,501,210 shares of the Company’s at-the-market ("ATM") forward equity for net proceeds of approximately $94 million |
| § | Expanded revolving credit facility from $500 million to $1.0 billion while reducing pricing and extending maturity |
| § | Balance sheet positioned for growth at 4.9 times net debt to recurring EBITDA; 3.4 times proforma for the settlement of the Company’s outstanding forward equity offerings |
Full Year 2021 Financial and Operating Highlights:
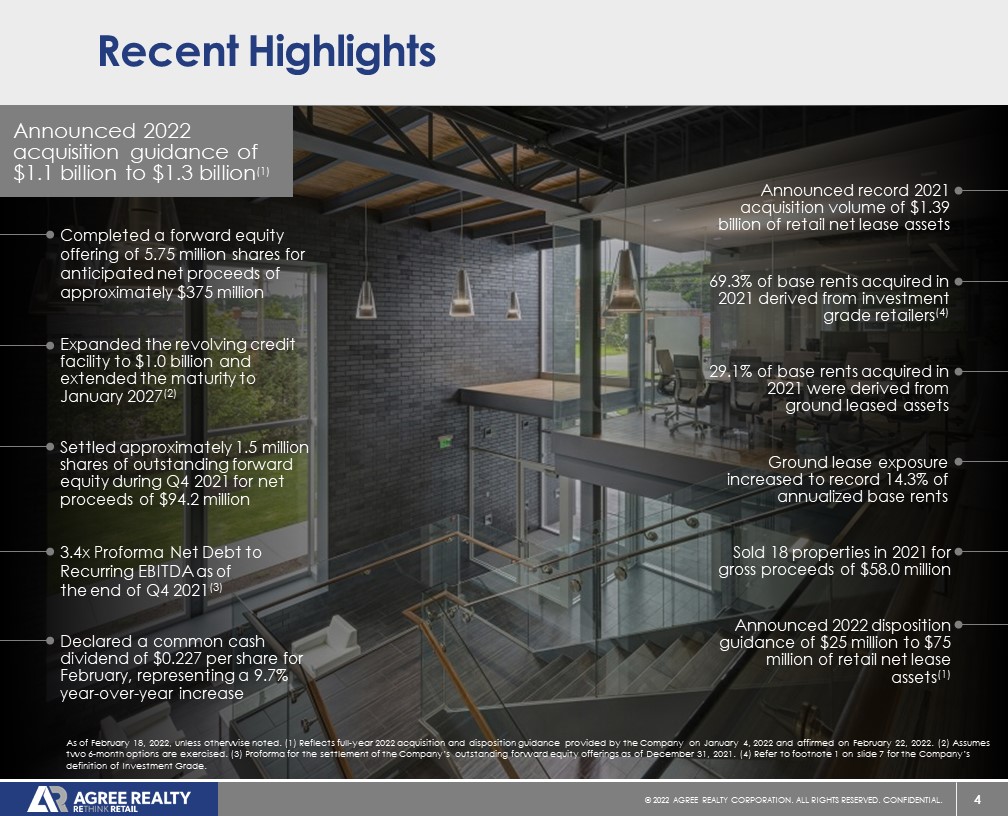
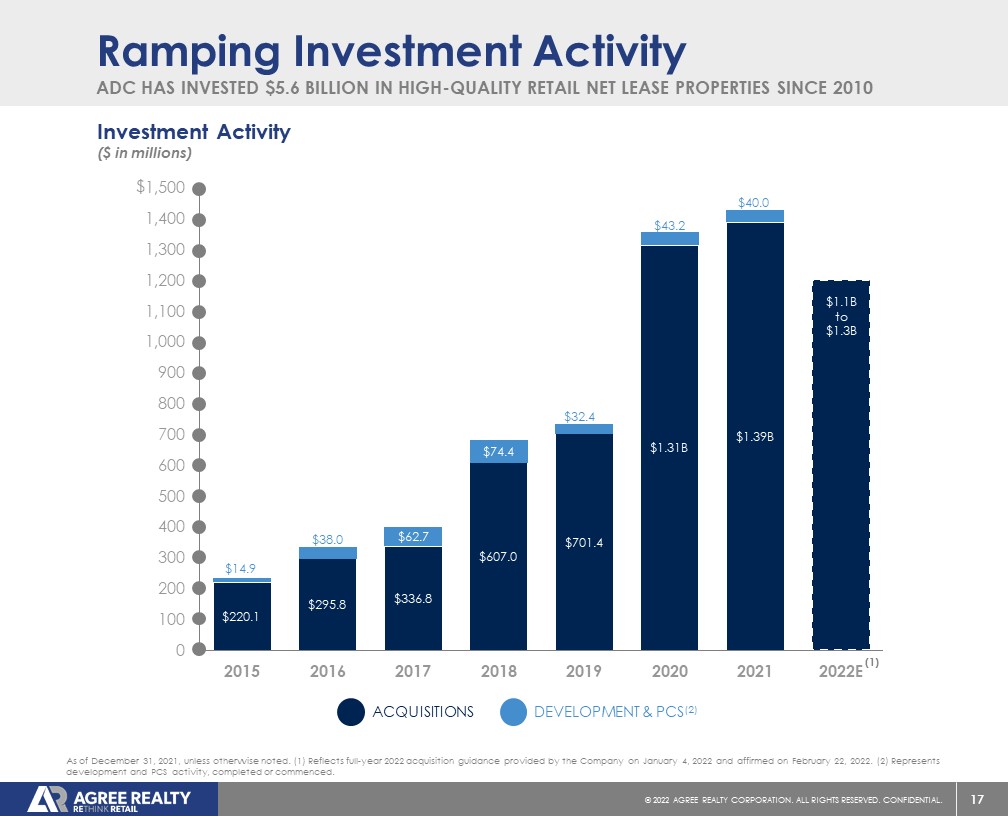
| § | Invested or committed a record $1.43 billion in 297 retail net lease properties |
| § | 29.1% of annualized base rents acquired were derived from ground leased assets |
| § | Net Income per share attributable to common stockholders increased 2.3% to $1.78 |
| § | Core FFO per share increased 10.9% to $3.58 |
| § | AFFO per share increased 9.7% to $3.51 |
| § | Declared dividends of $2.604 per share, an 8.3% year-over-year increase |
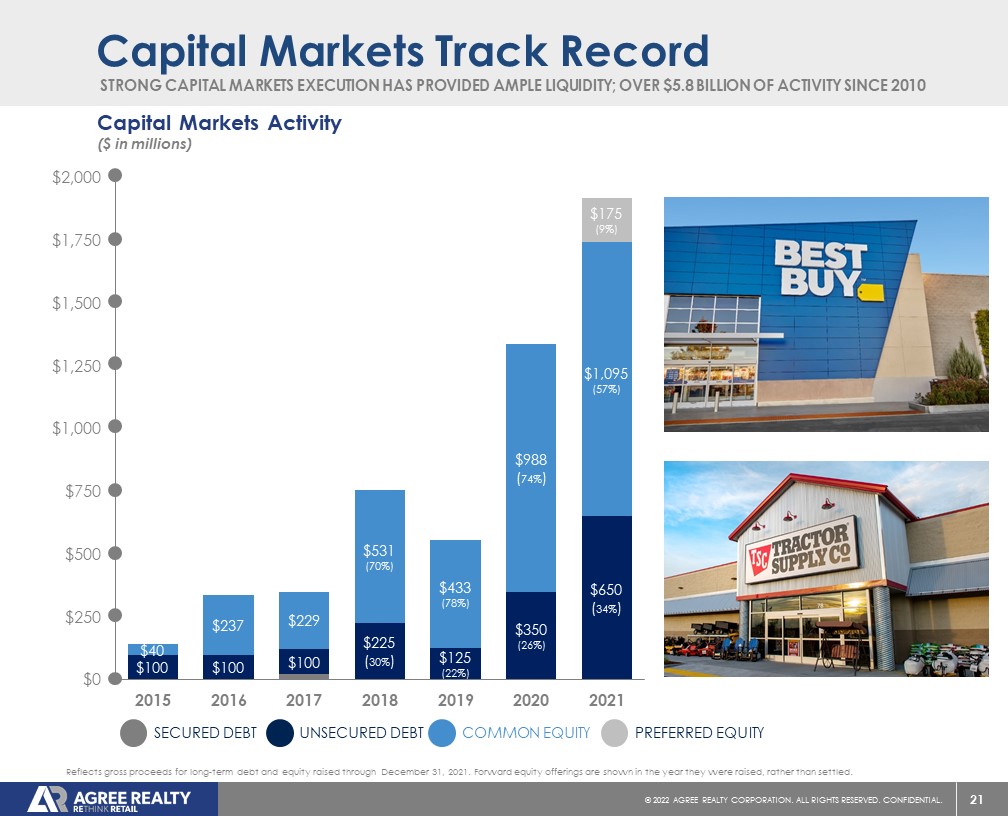
| § | Raised approximately $1.1 billion of gross equity proceeds through three overnight offerings and the Company's ATM program |
| § | Completed dual-tranche public bond offering comprised of $350 million of 2.0% senior unsecured notes due 2028 and $300 million of 2.6% senior unsecured notes due 2033 |
| § | Completed inaugural public offering of 4.250% Series A Cumulative Redeemable Preferred Stock for net proceeds of approximately $170 million |
| § | Ended the year with approximately $1.4 billion in liquidity including cash, capacity on the revolving credit facility, and outstanding forward equity |
1
Financial Results
Net Income Attributable to Common Stockholders
Net Income for the three months ended December 31, 2021 increased 32.5% to $31.3 million, compared to $23.6 million for the comparable period in 2020. Net Income per share for the three months ended December 31, 2021 increased 5.2% to $0.44, compared to $0.42 per share for the comparable period in 2020.
Net Income for the twelve months ended December 31, 2021 increased 31.5% to $120.1 million, compared to $91.4 million for the comparable period in 2020. Net Income per share for the twelve months ended December 31, 2021 increased 2.3% to $1.78, compared to $1.74 per share for the comparable period in 2020.
Core FFO
Core FFO for the three months ended December 31, 2021 increased 38.6% to $65.6 million, compared to Core FFO of $47.3 million for the comparable period in 2020. Core FFO per share for the three months ended December 31, 2021 increased 10.2% to $0.92, compared to Core FFO per share of $0.84 for the comparable period in 2020.
Core FFO for the twelve months ended December 31, 2021 increased 41.9% to $241.5 million, compared to Core FFO of $170.2 million for the comparable period in 2020. Core FFO per share for the twelve months ended December 31, 2021 increased 10.9% to $3.58, compared to Core FFO per share of $3.23 for the comparable period in 2020.
AFFO
AFFO for the three months ended December 31, 2021 increased 37.4% to $64.7 million, compared to AFFO of $47.1 million for the comparable period in 2020. AFFO per share for the three months ended December 31, 2021 increased 9.2% to $0.91, compared to AFFO per share of $0.83 for the comparable period in 2020.
AFFO for the twelve months ended December 31, 2021 increased 40.4% to $237.0 million, compared to AFFO of $168.8 million for the comparable period in 2020. AFFO per share for the twelve months ended December 31, 2021 increased 9.7% to $3.51, compared to AFFO per share of $3.20 for the comparable period in 2020.
Dividend
In the fourth quarter, the Company declared monthly cash dividends of $0.227 per common share for each of October, November and December 2021. The monthly dividends reflected an annualized dividend amount of $2.724 per common share, representing a 9.8% increase over the annualized dividend amount of $2.480 per common share from the fourth quarter of 2020. The dividends represent payout ratios of approximately 74% of Core FFO per share and 75% of AFFO per share, respectively.
For the twelve months ended December 31, 2021, the Company declared monthly dividends totaling $2.604 per common share, an 8.3% increase over the dividends of $2.405 per common share declared for the comparable period in 2020. The dividends represent payout ratios of approximately 73% of Core FFO per share and 74% of AFFO per share, respectively.
Subsequent to quarter end, the Company declared a monthly cash dividend of $0.227 per common share for each of January and February 2022. The monthly dividends reflect an annualized dividend amount of $2.724 per common share, representing a 9.7% increase over the annualized dividend amount of $2.484 per common share from the first quarter of 2021. The January dividend was paid on February 14, 2022 and the February dividend is payable March 14, 2022 to stockholders of record at the close of business on February 28, 2022.
Additionally, subsequent to quarter end, the Company declared a monthly cash dividend for each of January and February on its 4.25% Series A Cumulative Redeemable Preferred Stock of $0.08854 per depositary share, which is equivalent to $1.0625 per annum. The January dividend was paid on February 1, 2022 and the February dividend is payable March 1, 2022 to stockholders of record at the close of business on February 24, 2022.
2
CEO Comments
“We are extremely pleased with our performance during this past year as it marked our tenth consecutive year of achieving record investment volume, resulting in AFFO per share growth of nearly 10%,” said Joey Agree, President and Chief Executive Officer. “Heading into 2022, our balance sheet is well positioned to execute on our growing pipeline of best-in-class opportunities.”
Portfolio Update
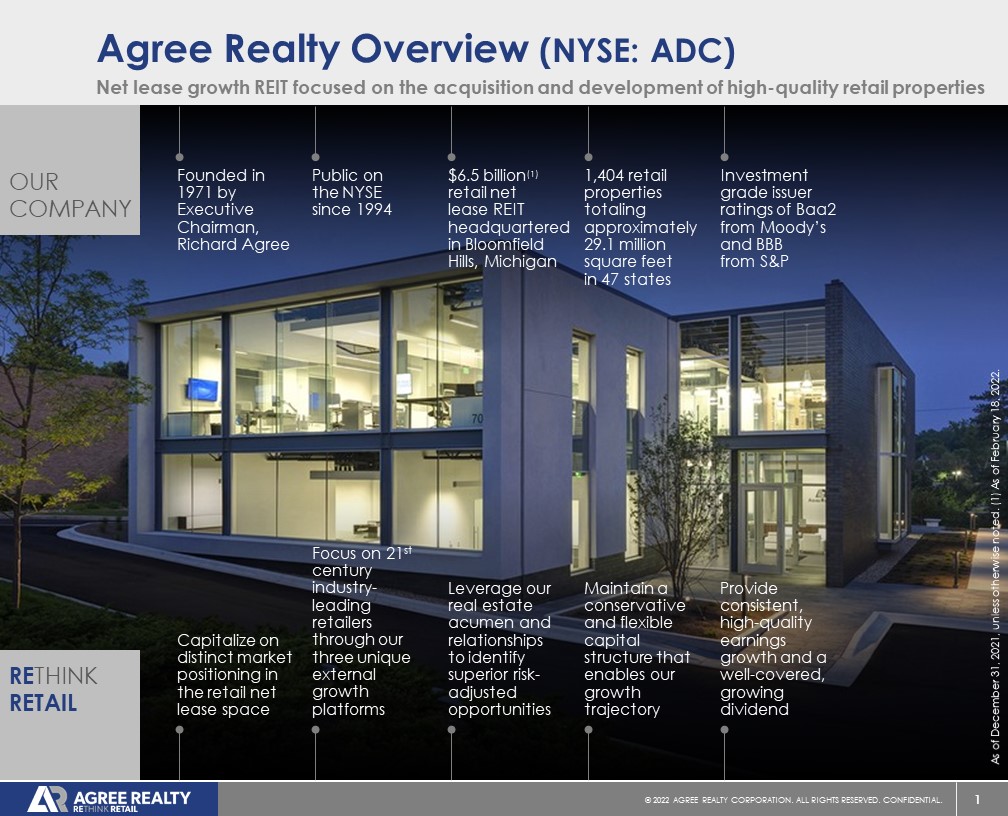
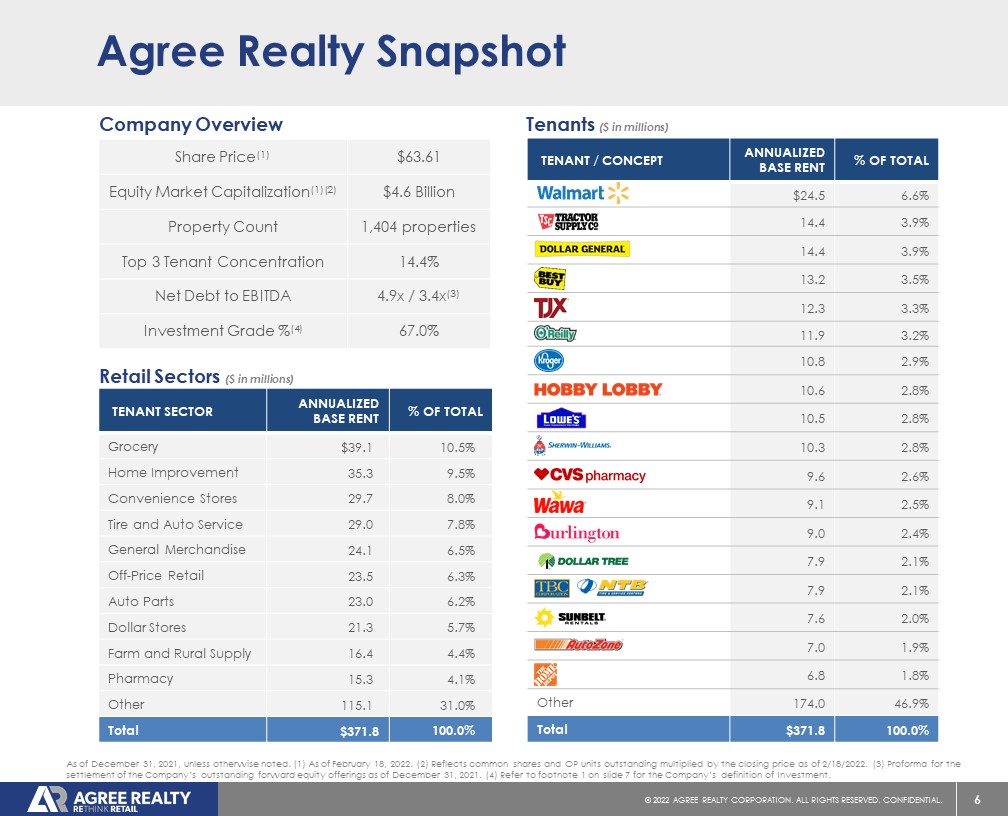
As of December 31, 2021, the Company’s portfolio consisted of 1,404 properties located in 47 states and contained approximately 29.1 million square feet of gross leasable area.
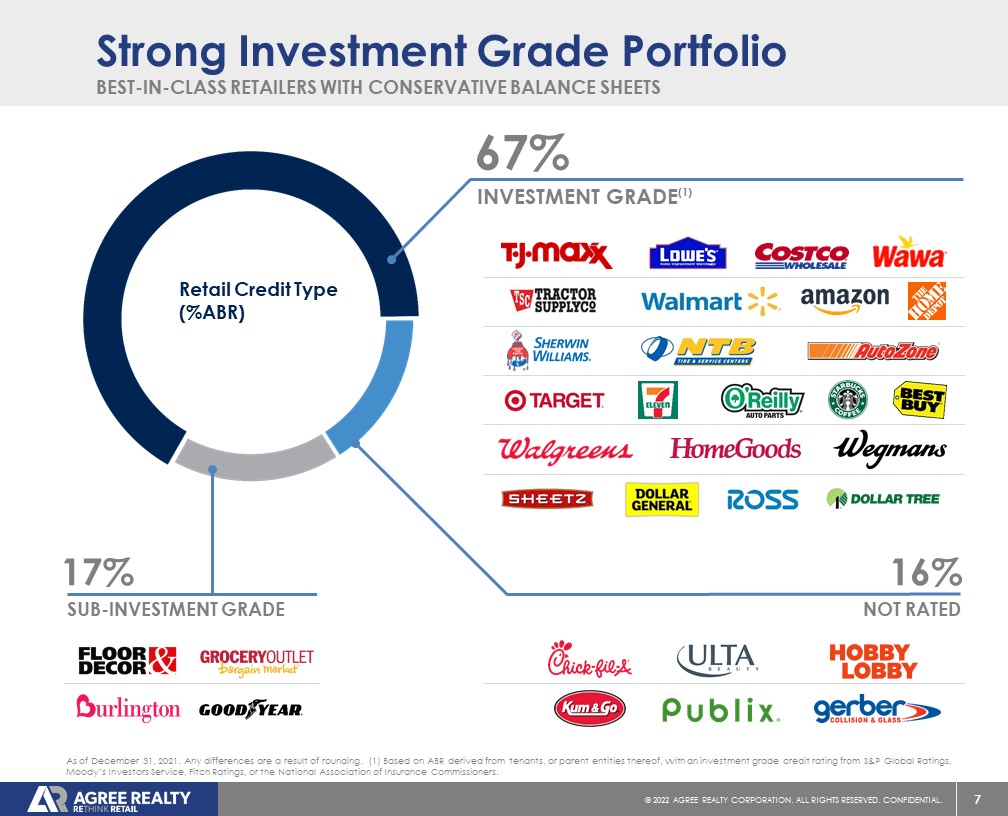
At year-end, the portfolio was 99.5% leased, had a weighted-average remaining lease term of approximately 9.3 years, and generated 67.0% of annualized base rents from investment grade retail tenants.
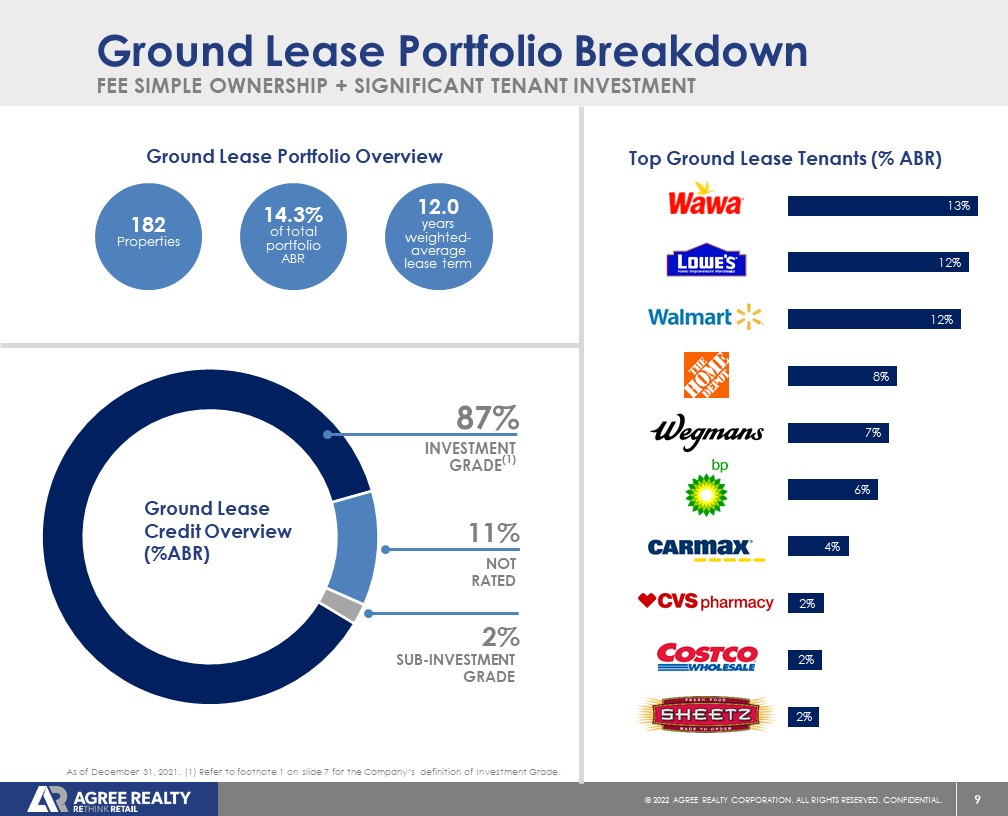
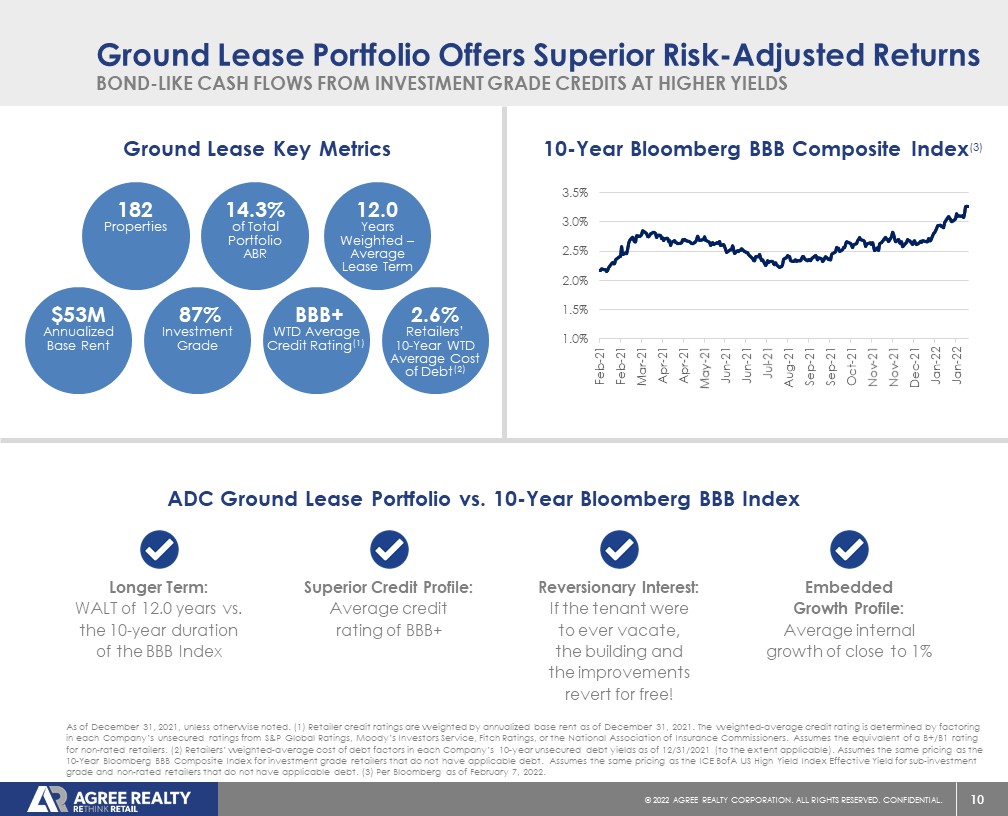
Ground Lease Portfolio
During the quarter, the Company acquired 20 ground leases for an aggregate purchase price of approximately $77.6 million, representing 22.8% of annualized base rents acquired.
As of December 31, 2021, the Company’s ground lease portfolio consisted of 182 leases located in 32 states and totaled approximately 4.9 million square feet of gross leasable area. Properties ground leased to tenants increased to 14.3% of annualized base rents.
At quarter end, the ground lease portfolio was fully occupied, had a weighted-average remaining lease term of approximately 12.0 years, and generated 87.0% of annualized base rents from investment grade retail tenants.
Acquisitions
Total acquisition volume for the fourth quarter was approximately $314.7 million and included 71 properties net leased to leading retailers operating in sectors including general merchandise, home improvement, grocery, off-price retail, convenience stores, tire and auto service, and auto parts. The properties are located in 29 states and leased to tenants operating in 18 sectors.
The properties were acquired at a weighted-average capitalization rate of 6.1% and had a weighted-average remaining lease term of approximately 10.1 years. Approximately 67.6% of annualized base rents acquired were generated from investment grade retail tenants.
For the twelve months ended December 31, 2021, total acquisition volume was approximately $1.39 billion. The 290 acquired properties are located in 43 states and leased to tenants who operate in 27 retail sectors. The properties were acquired at a weighted-average capitalization rate of 6.2% and had a weighted-average remaining lease term of approximately 11.5 years. Approximately 69.3% of annualized base rents were generated from investment grade retail tenants.
The Company's outlook for acquisition volume in 2022, which includes several significant assumptions, remains between $1.1 billion and $1.3 billion of high-quality retail net lease properties.
Dispositions
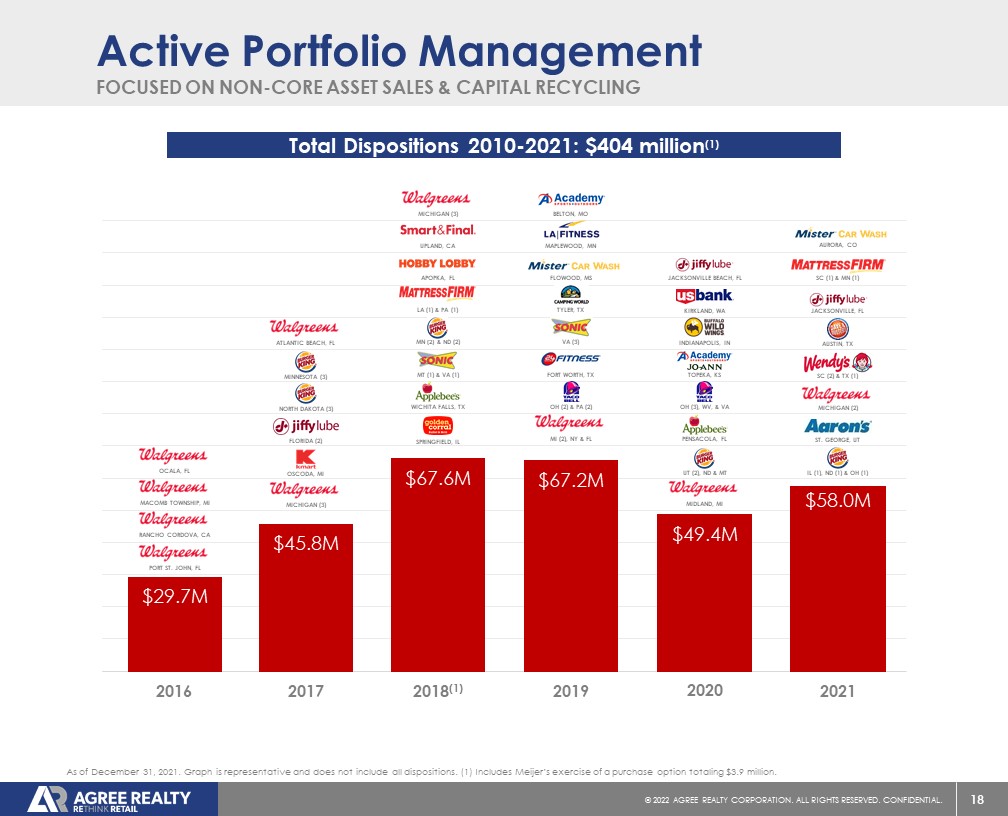
During the three months ended December 31, 2021, the Company sold five properties for gross proceeds of approximately $9.6 million. The weighted-average capitalization rate of the dispositions was 5.7%. During the twelve months ended December 31, 2021, the Company divested 18 properties for total gross proceeds of $58.0 million. The weighted-average capitalization rate of the dispositions was 6.4%.
The Company's disposition guidance for 2022 remains between $25 million and $75 million.
3
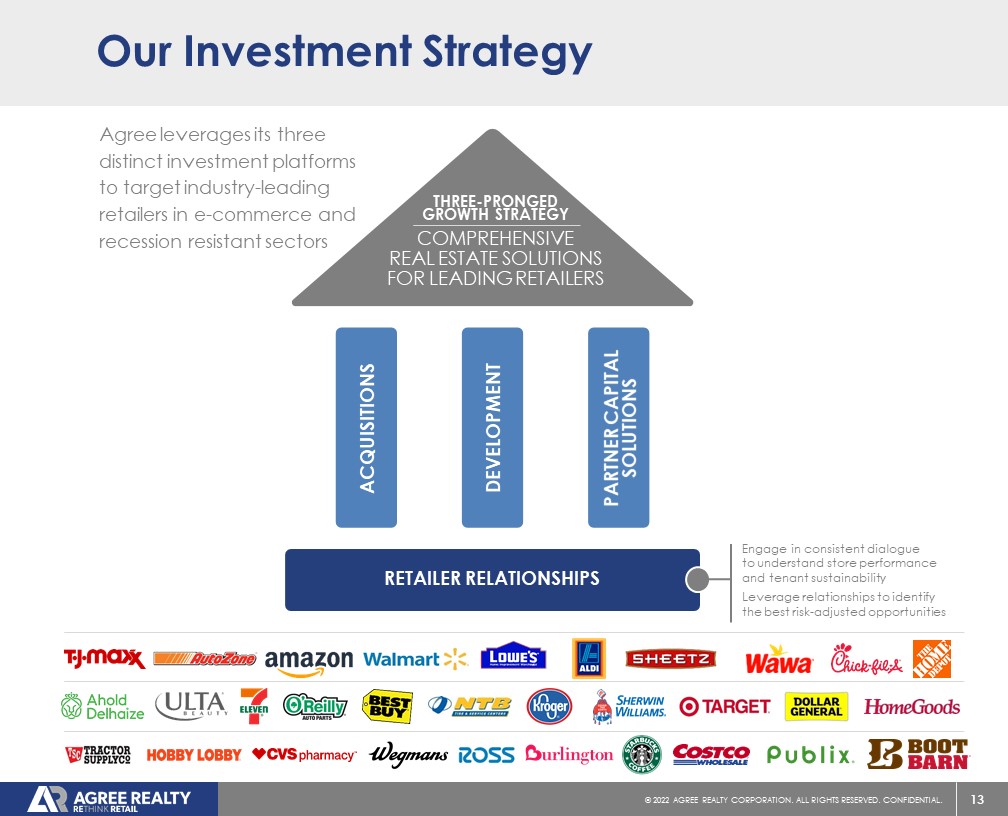
Development and Partner Capital Solutions (“PCS”)
Construction continued during the fourth quarter on the Company’s third project with Gerber Collision in New Port Richey, Florida, which is expected to be completed during the third quarter of 2022, as well as the Company’s first development with 7-Eleven in Saginaw, Michigan and the Company’s second Gerber Collision project in Pooler, Georgia, both of which are expected to be completed during the first quarter of 2022.
For the twelve months ended December 31, 2021, the Company had seven development or PCS projects completed or under construction. Anticipated total costs are approximately $40.0 million and include the following projects:
| Tenant | Location | Lease Structure | Lease Term | Actual or Anticipated Rent Commencement | Status | |||||
| Burlington | Texarkana, TX | Build-to-Suit | 11 years | Q1 2021 | Complete | |||||
| Grocery Outlet | Port Angeles, WA | Build-to-Suit | 15 years | Q2 2021 | Complete | |||||
| Gerber Collision | Buford, GA | Build-to-Suit | 15 years | Q2 2021 | Complete | |||||
| Floor & Décor | Naples, FL | Build-to-Suit | 15 years | Q2 2021 | Complete | |||||
| 7-Eleven | Saginaw, MI | Build-to-Suit | 15 years | Q1 2022 | Under Construction | |||||
| Gerber Collision | Pooler, GA | Build-to-Suit | 15 years | Q1 2022 | Under Construction | |||||
| Gerber Collision | New Port Richey, FL | Build-to-Suit | 15 years | Q3 2022 | Under Construction |
4
Leasing Activity and Expirations
During the fourth quarter, the Company executed new leases, extensions or options on approximately 256,000 square feet of gross leasable area throughout the existing portfolio.
For the twelve months ended December 31, 2021, the Company executed new leases, extensions or options on approximately 603,000 square feet of gross leasable area throughout the existing portfolio. Notable new leases, extensions or options included a new fifteen-year lease for the approximately 70,000-square foot Gardner White Furniture in Canton, Michigan; a new fifteen-year lease for Burlington in Mt. Pleasant, Michigan; and a new seven-year lease for Dollar Tree in Flint, Michigan, replacing an expiring Walgreens lease.
As of December 31, 2021, the Company’s 2022 lease maturities represented 0.5% of annualized base rents. The following table presents contractual lease expirations within the Company’s portfolio as of December 31, 2021, assuming no tenants exercise renewal options:
| Year | Leases | Annualized Base Rent (1) | Percent of Annualized Base Rent | Gross Leasable Area | Percent of Gross Leasable Area | |||||||||||||||
| 2022 | 13 | 1,777 | 0.5 | % | 86 | 0.3 | % | |||||||||||||
| 2023 | 49 | 10,332 | 2.8 | % | 1,309 | 4.5 | % | |||||||||||||
| 2024 | 42 | 13,122 | 3.5 | % | 1,560 | 5.4 | % | |||||||||||||
| 2025 | 68 | 17,064 | 4.6 | % | 1,721 | 5.9 | % | |||||||||||||
| 2026 | 104 | 21,061 | 5.7 | % | 2,169 | 7.5 | % | |||||||||||||
| 2027 | 96 | 23,036 | 6.2 | % | 2,016 | 7.0 | % | |||||||||||||
| 2028 | 104 | 26,678 | 7.2 | % | 2,306 | 8.0 | % | |||||||||||||
| 2029 | 130 | 36,676 | 9.9 | % | 3,419 | 11.8 | % | |||||||||||||
| 2030 | 220 | 44,712 | 12.0 | % | 3,249 | 11.2 | % | |||||||||||||
| 2031 | 133 | 31,976 | 8.6 | % | 2,367 | 8.2 | % | |||||||||||||
| Thereafter | 555 | 145,377 | 39.0 | % | 8,793 | 30.2 | % | |||||||||||||
| Total Portfolio | 1,514 | $ | 371,811 | 100.0 | % | 28,995 | 100.0 | % | ||||||||||||
The contractual lease expirations presented above exclude the effect of replacement tenant leases that had been executed as of December 31, 2021 but that had not yet commenced. Annualized Base Rent and gross leasable area (square feet) are in thousands; any differences are the result of rounding.
| (1) | Annualized Base Rent represents the annualized amount of contractual minimum rent required by tenant lease agreements as of December 31, 2021, computed on a straight-line basis. Annualized Base Rent is not, and is not intended to be, a presentation in accordance with generally accepted accounting principles (“GAAP”). The Company believes annualized contractual minimum rent is useful to management, investors, and other interested parties in analyzing concentrations and leasing activity. |
5
Top Tenants
The following table presents annualized base rents for all tenants that represent 1.5% or greater of the Company’s total annualized base rent as of December 31, 2021:
| Tenant | Annualized Base Rent(1) | Percent of Annualized Base Rent | ||||||
| Walmart | $ | 24,479 | 6.6 | % | ||||
| Tractor Supply | 14,406 | 3.9 | % | |||||
| Dollar General | 14,380 | 3.9 | % | |||||
| Best Buy | 13,166 | 3.5 | % | |||||
| TJX Companies | 12,274 | 3.3 | % | |||||
| O'Reilly Auto Parts | 11,869 | 3.2 | % | |||||
| Kroger | 10,798 | 2.9 | % | |||||
| Hobby Lobby | 10,595 | 2.8 | % | |||||
| Lowe's | 10,543 | 2.8 | % | |||||
| Sherwin-Williams | 10,290 | 2.8 | % | |||||
| CVS | 9,645 | 2.6 | % | |||||
| Wawa | 9,127 | 2.5 | % | |||||
| Burlington | 8,974 | 2.4 | % | |||||
| Dollar Tree | 7,906 | 2.1 | % | |||||
| TBC Corporation | 7,893 | 2.1 | % | |||||
| Sunbelt Rentals | 7,587 | 2.0 | % | |||||
| AutoZone | 7,013 | 1.9 | % | |||||
| Home Depot | 6,841 | 1.8 | % | |||||
| Other(2) | 174,025 | 46.9 | % | |||||
| Total Portfolio | $ | 371,811 | 100.0 | % | ||||
Annualized Base Rent is in thousands; any differences are the result of rounding.
| (1) | Refer to footnote 1 on page 5 for the Company’s definition of Annualized Base Rent. |
| (2) | Includes tenants generating less than 1.5% of Annualized Base Rent. |
6
Retail Sectors
The following table presents annualized base rents for all of the Company’s retail sectors as of December 31, 2021:
| Sector | Annualized Base Rent(1) | Percent of Annualized Base Rent | ||||||
| Grocery Stores | $ | 39,070 | 10.5 | % | ||||
| Home Improvement | 35,291 | 9.5 | % | |||||
| Convenience Stores | 29,732 | 8.0 | % | |||||
| Tire and Auto Service | 29,017 | 7.8 | % | |||||
| General Merchandise | 24,144 | 6.5 | % | |||||
| Off-Price Retail | 23,459 | 6.3 | % | |||||
| Auto Parts | 23,009 | 6.2 | % | |||||
| Dollar Stores | 21,291 | 5.7 | % | |||||
| Farm and Rural Supply | 16,396 | 4.4 | % | |||||
| Pharmacy | 15,326 | 4.1 | % | |||||
| Consumer Electronics | 14,967 | 4.0 | % | |||||
| Crafts and Novelties | 12,825 | 3.4 | % | |||||
| Warehouse Clubs | 8,314 | 2.3 | % | |||||
| Equipment Rental | 7,913 | 2.1 | % | |||||
| Discount Stores | 7,731 | 2.1 | % | |||||
| Restaurants - Quick Service | 7,386 | 2.0 | % | |||||
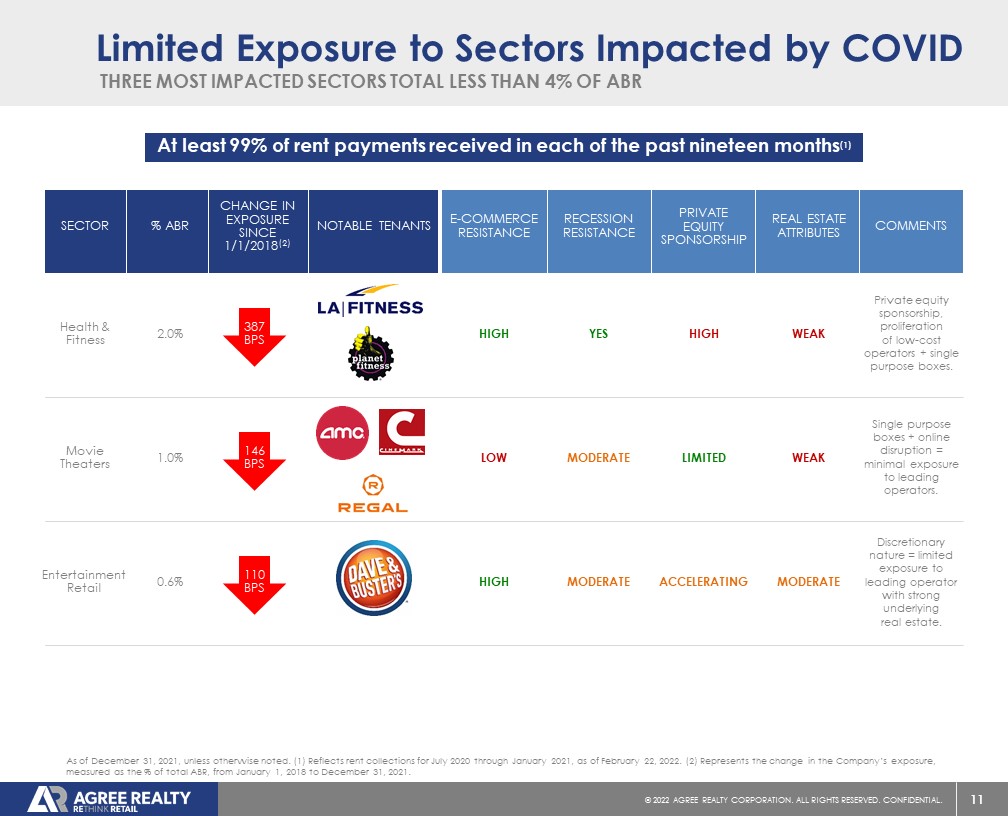
| Health and Fitness | 7,248 | 2.0 | % | |||||
| Health Services | 6,818 | 1.8 | % | |||||
| Dealerships | 6,475 | 1.7 | % | |||||
| Home Furnishings | 5,696 | 1.5 | % | |||||
| Restaurants - Casual Dining | 4,770 | 1.3 | % | |||||
| Specialty Retail | 4,495 | 1.2 | % | |||||
| Financial Services | 4,019 | 1.1 | % | |||||
| Theaters | 3,854 | 1.0 | % | |||||
| Sporting Goods | 3,243 | 0.9 | % | |||||
| Pet Supplies | 2,597 | 0.7 | % | |||||
| Entertainment Retail | 2,333 | 0.6 | % | |||||
| Apparel | 1,201 | 0.3 | % | |||||
| Beauty and Cosmetics | 1,166 | 0.3 | % | |||||
| Shoes | 1,058 | 0.3 | % | |||||
| Office Supplies | 860 | 0.3 | % | |||||
| Miscellaneous | 107 | 0.1 | % | |||||
| Total Portfolio | $ | 371,811 | 100.0 | % | ||||
Annualized Base Rent is in thousands; any differences are the result of rounding.
| (1) | Refer to footnote 1 on page 5 for the Company’s definition of Annualized Base Rent. |
7
Geographic Diversification
The following table presents annualized base rents for all states that represent 2.5% or greater of the Company’s total annualized base rent as of December 31, 2021:
| State | Annualized Base Rent(1) | Percent of Annualized Base Rent | ||||||
| Texas | $ | 26,636 | 7.2 | % | ||||
| Illinois | 21,904 | 5.9 | % | |||||
| Ohio | 21,584 | 5.8 | % | |||||
| Michigan | 20,985 | 5.6 | % | |||||
| Florida | 20,903 | 5.6 | % | |||||
| North Carolina | 19,365 | 5.2 | % | |||||
| New Jersey | 19,200 | 5.2 | % | |||||
| California | 16,095 | 4.3 | % | |||||
| Pennsylvania | 15,324 | 4.1 | % | |||||
| New York | 14,124 | 3.8 | % | |||||
| Georgia | 12,471 | 3.4 | % | |||||
| Virginia | 10,787 | 2.9 | % | |||||
| Wisconsin | 10,370 | 2.8 | % | |||||
| Connecticut | 9,765 | 2.6 | % | |||||
| Other(2) | 132,298 | 35.6 | % | |||||
| Total Portfolio | $ | 371,811 | 100.0 | % | ||||
Annualized Base Rent is in thousands; any differences are the result of rounding.
| (1) | Refer to footnote 1 on page 5 for the Company’s definition of Annualized Base Rent. |
| (2) | Includes states generating less than 2.5% of Annualized Base Rent. |
8
Capital Markets and Balance Sheet
Capital Markets
In December 2021, the Company entered into a Third Amended and Restated Revolving Credit Agreement to increase its senior unsecured credit facility (the “Credit Facility") to $1.0 billion. The Credit Facility includes an accordion option that allows the Company to request additional lender commitments up to a total of $1.75 billion. The Credit Facility matures in January 2026 with Company options to extend the maturity date to January 2027. Based on the Company's credit ratings and leverage ratio at the time of closing, pricing on the Credit Facility was 77.5 basis points over LIBOR, down from 82.5 basis points under the prior revolving credit facility.
In December 2021, the Company completed a follow-on public offering of 5,750,000 shares of common stock, including the full exercise of the underwriters' option to purchase additional shares, in connection with forward sale agreements. Upon settlement, the offering is anticipated to raise net proceeds of approximately $374.8 million after deducting fees and expenses and making certain other adjustments as provided in the equity distribution agreements. To date, the Company has not received any proceeds from the sale of shares of its common stock by the forward purchasers.
During the fourth quarter of 2021, the Company entered into forward sale agreements in connection with its ATM program to sell an aggregate of 207,166 shares of common stock for anticipated net proceeds of approximately $14.2 million. Additionally, the Company settled 1,501,210 shares under forward sale agreements entered into through its ATM program and received net proceeds of approximately $94.2 million.
At year end, the Company had 7,875,296 shares remaining to be settled under existing forward sale agreements, which are anticipated to raise net proceeds of approximately $519.2 million after deducting fees and expenses and making certain other adjustments as provided in the equity distribution agreements.
The following table presents the Company’s outstanding forward equity offerings as of December 31, 2021:
Forward Equity Offerings | Shares Sold | Shares Settled | Shares Remaining | Net Proceeds Received | Anticipated Net Proceeds Remaining | |||||||||||||||
| Q1 2021 ATM Forward Offerings | 372,469 | - | 372,469 | - | $ | 24,358,755 | ||||||||||||||
| Q2 2021 ATM Forward Offerings | 1,178,197 | - | 1,178,197 | - | $ | 79,128,474 | ||||||||||||||
| Q3 2021 ATM Forward Offerings | 367,464 | - | 367,464 | - | $ | 26,693,468 | ||||||||||||||
| Q4 2021 ATM Forward Offerings | 207,166 | - | 207,166 | - | $ | 14,234,169 | ||||||||||||||
| December 2021 Forward Offering | 5,750,000 | - | 5,750,000 | - | $ | 374,768,075 | ||||||||||||||
| Total Forward Equity Offerings | 7,875,296 | - | 7,875,296 | - | $ | 519,182,941 | ||||||||||||||
9
Balance Sheet
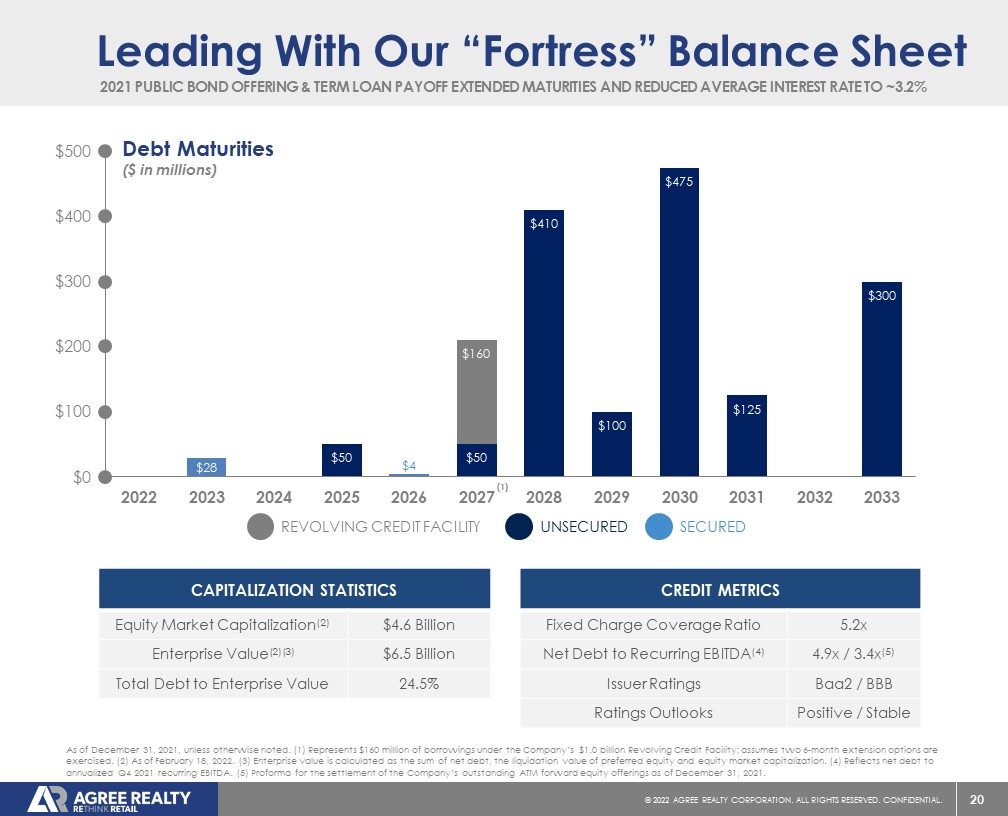
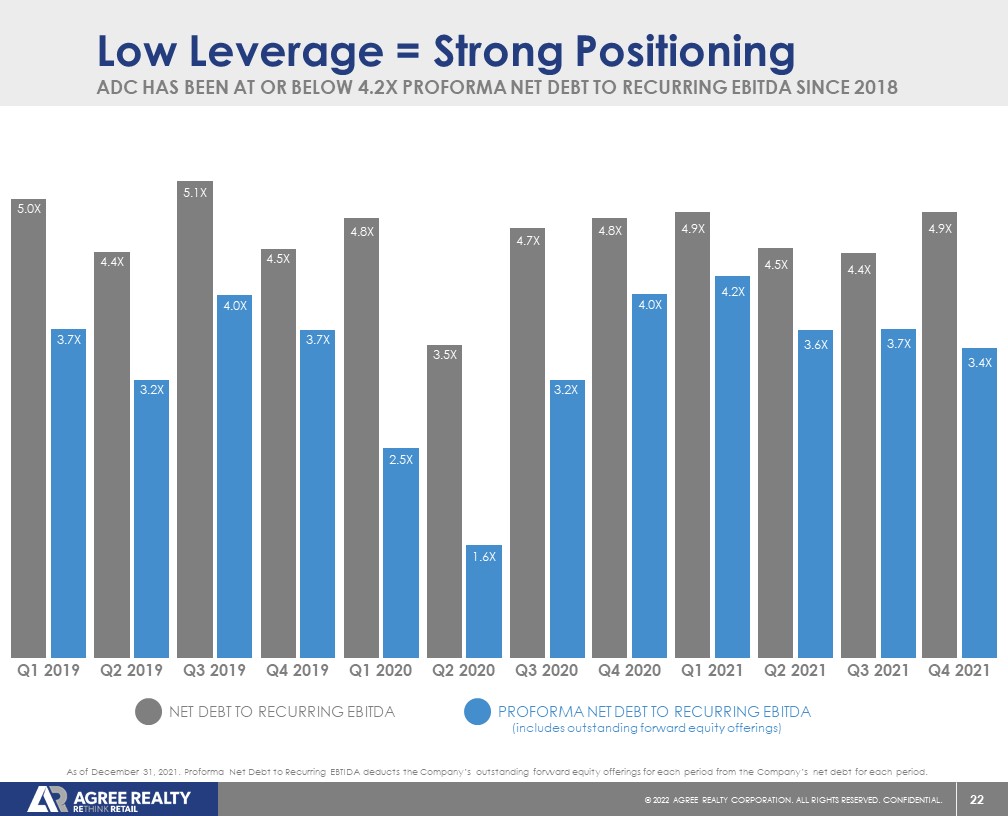
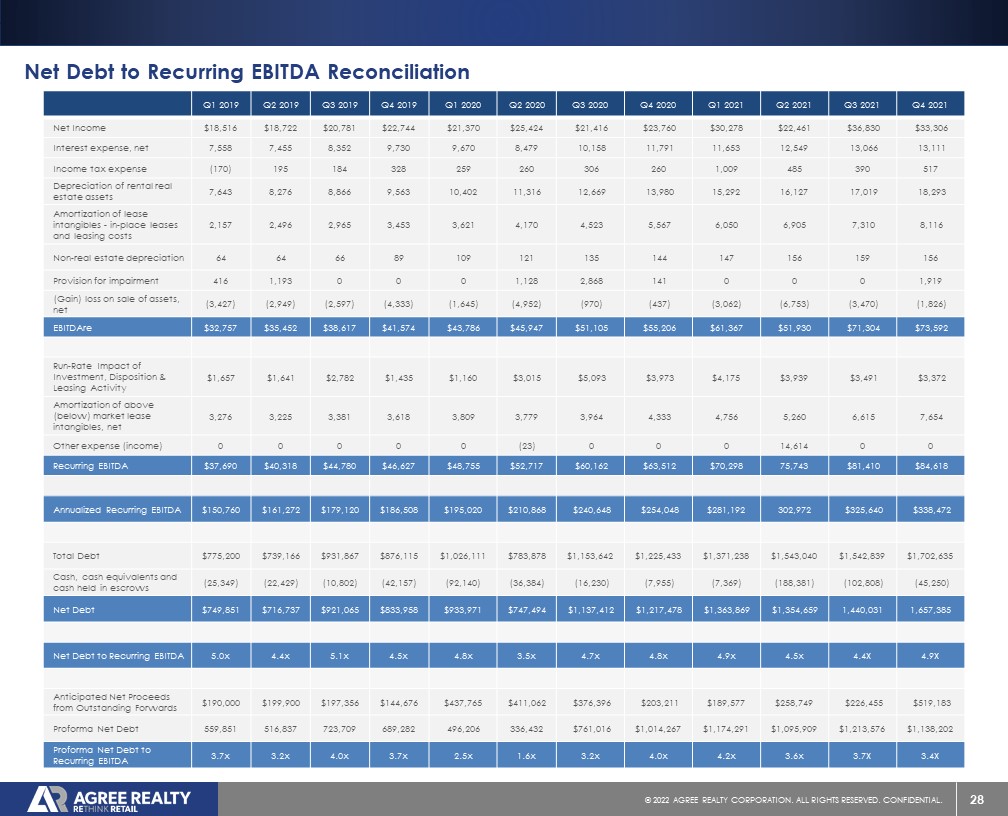
As of December 31, 2021, the Company’s net debt to recurring EBITDA was 4.9 times. The Company’s proforma net debt to recurring EBITDA was 3.4 times when deducting the $519.2 million of anticipated net proceeds from the outstanding forward equity offerings from the Company’s net debt of $1.7 billion as of December 31, 2021. The Company’s fixed charge coverage ratio was 5.2 times as of the end of the fourth quarter.
The Company’s total debt to enterprise value was 24.5% as of December 31, 2021. Enterprise value is calculated as the sum of net debt, the liquidation value of the Company’s preferred stock, and the market value of the Company’s outstanding shares of common stock, assuming conversion of Agree Limited Partnership (the “Operating Partnership” or “OP”) common units into common stock of the Company.
For the three and twelve months ended December 31, 2021, the Company’s fully diluted weighted-average shares outstanding were 70.6 million and 67.1 million, respectively. The basic weighted-average shares outstanding for the
three and twelve months ended December 31, 2021 were 70.3 million and 66.8 million, respectively.
For the three and twelve months ended December 31, 2021, the Company’s fully diluted weighted-average shares and units outstanding were 71.0 million and 67.5 million, respectively. The basic weighted-average shares and units outstanding for the three and twelve months ended December 31, 2021 were 70.6 million and 67.1 million, respectively.
The Company’s assets are held by, and its operations are conducted through, the Operating Partnership, of which the Company is the sole general partner. As of December 31, 2021, there were 347,619 Operating Partnership common units outstanding and the Company held a 99.5% common interest in the Operating Partnership.
Conference Call/Webcast
The Company will host its quarterly analyst and investor conference call on Wednesday, February 23, 2022 at 9:00 AM ET. To participate in the conference call, please dial (866) 363-3979 approximately ten minutes before the call begins.
Additionally, a webcast of the conference call will be available through the Company’s website. To access the webcast, visit www.agreerealty.com ten minutes prior to the start time of the conference call and go to the Investors section of the website. A replay of the conference call webcast will be archived and available online through the Investors section of www.agreerealty.com.
About Agree Realty Corporation
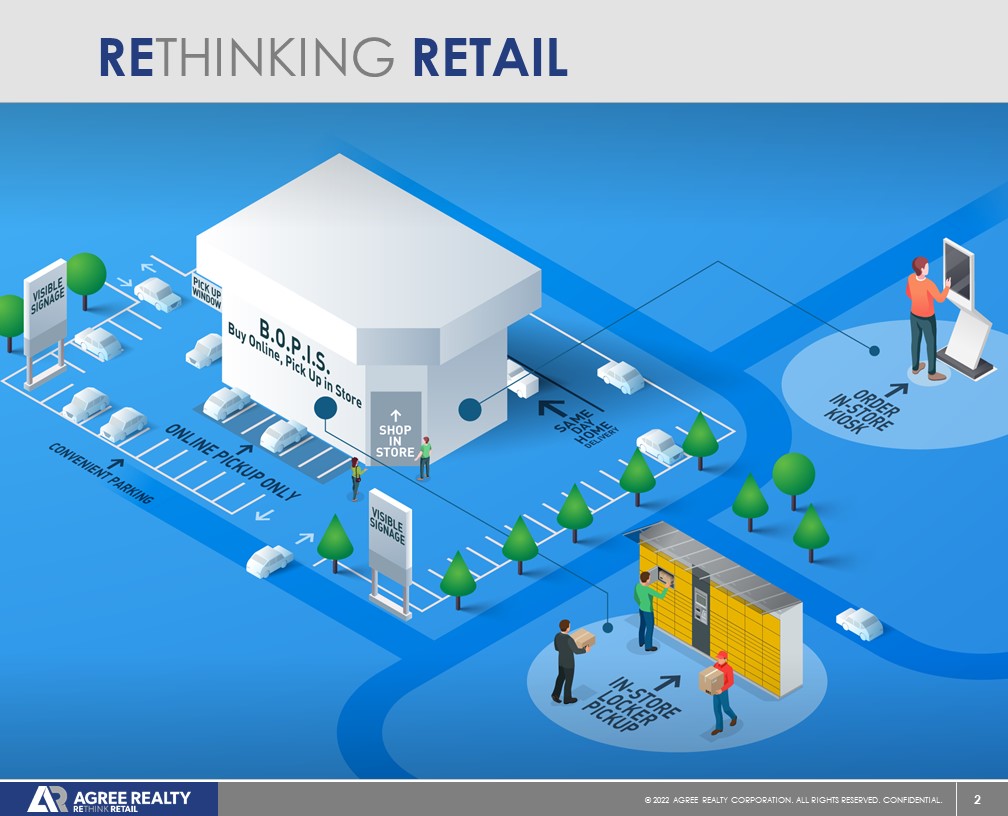
Agree Realty Corporation is a publicly traded real estate investment trust that is RETHINKING RETAIL through the acquisition and development of properties net leased to industry-leading, omni-channel retail tenants. As of December 31, 2021, the Company owned and operated a portfolio of 1,404 properties, located in 47 states and containing approximately 29.1 million square feet of gross leasable area. The Company’s common stock is listed on the New York Stock Exchange under the symbol “ADC”. For additional information on the Company and RETHINKING RETAIL, please visit www.agreerealty.com.
Forward-Looking Statements
This press release contains forward-looking statements, including statements about projected financial and operating results, within the meaning of Section 27A of the Securities Act of 1933, as amended (the “Securities Act”) and Section 21E of the Securities Exchange Act of 1934, as amended (the “Exchange Act”). The Company intends such forward-looking statements to be covered by the safe harbor provisions for forward-looking statements contained in the Private Securities Litigation Reform Act of 1995 and includes this statement for purposes of complying with these safe harbor provisions. Forward-looking statements are generally identifiable by use of forward-looking terminology such as “may,” “will,” “should,” “potential,” “intend,” “expect,” “seek,” “anticipate,” “estimate,” “approximately,” “believe,” “could,” “project,” “predict,” “forecast,” “continue,” “assume,” “plan,” “outlook” or other similar words or expressions. Forward-looking statements are based on certain assumptions and can include future expectations, future plans and strategies, financial and operating projections or other forward-looking information. Although these forward-looking statements are based on good faith beliefs, reasonable assumptions and the Company’s best judgment reflecting current information, you should not rely on forward-looking statements since they involve known and unknown risks, uncertainties and other factors which are, in some cases, beyond the Company’s control and which could materially affect the Company’s results of operations, financial condition, cash flows, performance or future achievements or events. Currently, one of the most significant factors, however, is the potential adverse effect of the current pandemic of the novel coronavirus, or COVID-19, on the financial condition, results of operations, cash flows and performance of the Company and its tenants, the real estate market and the global economy and financial markets. The extent to which COVID-19 impacts the Company and its tenants will depend on future developments, which are highly uncertain and cannot be predicted with confidence, including the scope, severity and duration of the pandemic, the actions taken to contain the pandemic or mitigate its impact and the direct and indirect economic effects of the pandemic and containment measures, among others. Moreover, investors are cautioned to interpret many of the risks identified in the risk factors discussed in the Company’s Annual Report on Form 10-K and subsequent quarterly reports filed with the Securities and Exchange Commission (the “SEC”), as well as the risks set forth below, as being heightened as a result of the ongoing and numerous adverse impacts of COVID-19. Additional important factors, among others, that may cause the Company’s actual results to vary include the general deterioration in national economic conditions, weakening of real estate markets, decreases in the availability of credit, increases in interest rates, adverse changes in the retail industry, the Company’s continuing ability to qualify as a REIT and other factors discussed in the Company’s reports filed with the SEC. The forward-looking statements included in this press release are made as of the date hereof. Unless legally required, the Company disclaims any obligation to update any forward-looking statements, whether as a result of new information, future events, changes in the Company’s expectations or assumptions or otherwise.
10
For further information about the Company’s business and financial results, please refer to the “Management’s Discussion and Analysis of Financial Condition and Results of Operations” and “Risk Factors” sections of the Company’s SEC filings, including, but not limited to, its Annual Report on Form 10-K and Quarterly Reports on Form 10-Q, copies of which may be obtained at the Investor Relations section of the Company’s website at www.agreerealty.com.
The Company defines the “weighted-average capitalization rate” for acquisitions and dispositions as the sum of contractual fixed annual rents computed on a straight-line basis over the primary lease terms and anticipated annual net tenant recoveries, divided by the purchase and sale prices.
References to “Core FFO” and “AFFO” in this press release are representative of Core FFO attributable to OP common unitholders and AFFO attributable to OP common unitholders. Detailed calculations for these measures are shown in the Reconciliation of Net Income to FFO, Core FFO and Adjusted FFO table as “Core Funds From Operations – OP Common Unitholders” and “Adjusted Funds from Operations – OP Common Unitholders”.
###
Contact:
Peter Coughenour
Chief Financial Officer
Agree Realty Corporation
(248) 737-4190
11
Agree Realty Corporation
Consolidated Balance Sheet
($ in thousands, except share and per-share data)
(Unaudited)
| December 31, 2021 | December 31, 2020 | |||||||
| Assets: | ||||||||
| Real Estate Investments: | ||||||||
| Land | $ | 1,559,434 | $ | 1,094,550 | ||||
| Buildings | 3,034,391 | 2,371,553 | ||||||
| Accumulated depreciation | (233,862 | ) | (172,577 | ) | ||||
| Property under development | 7,148 | 10,653 | ||||||
| Net real estate investments | 4,367,111 | 3,304,179 | ||||||
| Real estate held for sale, net | 5,676 | 1,199 | ||||||
| Cash and cash equivalents | 43,252 | 6,137 | ||||||
| Cash held in escrows | 1,998 | 1,818 | ||||||
| Accounts receivable - tenants, net | 53,442 | 37,808 | ||||||
| Lease intangibles, net of accumulated amortization of $180,532 and $125,995 at December 31, 2021 and December 31, 2020, respectively | 672,020 | 473,592 | ||||||
| Other assets, net | 83,407 | 61,450 | ||||||
| Total Assets | $ | 5,226,906 | $ | 3,886,183 | ||||
| Liabilities: | ||||||||
| Mortgage notes payable, net | $ | 32,429 | $ | 33,122 | ||||
| Unsecured term loans, net | - | 237,849 | ||||||
| Senior unsecured notes, net | 1,495,200 | 855,328 | ||||||
| Unsecured revolving credit facility | 160,000 | 92,000 | ||||||
| Dividends and distributions payable | 16,881 | 34,545 | ||||||
| Accounts payable, accrued expenses and other liabilities | 70,005 | 71,390 | ||||||
| Lease intangibles, net of accumulated amortization of $29,726 and $24,651 at December 31, 2021 and December 31, 2020, respectively | 33,075 | 35,700 | ||||||
| Total Liabilities | $ | 1,807,590 | $ | 1,359,934 | ||||
| Equity: | ||||||||
| Preferred Stock, $.0001 par value per share, 4,000,000 shares authorized, 7,000 shares Series A outstanding, at stated liquidation value of $25,000 per share, at December 31, 2021, no shares issued and outstanding at December 31, 2020 | 175,000 | - | ||||||
| Common stock, $.0001 par value per share, 180,000,000 and 90,000,000 shares authorized, 71,285,311 and 60,021,483 shares issued and outstanding at December 31, 2021 and December 31, 2020, respectively | 7 | 6 | ||||||
| Additional paid-in capital | 3,395,549 | 2,652,090 | ||||||
| Dividends in excess of net income | (147,366 | ) | (91,343 | ) | ||||
| Accumulated other comprehensive income (loss) | (5,503 | ) | (36,266 | ) | ||||
| Total Equity - Agree Realty Corporation | $ | 3,417,687 | $ | 2,524,487 | ||||
| Non-controlling interest | 1,629 | 1,762 | ||||||
| Total Equity | $ | 3,419,316 | $ | 2,526,249 | ||||
| Total Liabilities and Equity | $ | 5,226,906 | $ | 3,886,183 | ||||
12
Agree Realty Corporation
Consolidated Statements of Operations and Comprehensive Income
($ in thousands, except share and per share-data)
(Unaudited)
| Three months ended December 31, | Twelve months ended December 31, | |||||||||||||||
| 2021 | 2020 | 2021 | 2020 | |||||||||||||
| Revenues | ||||||||||||||||
| Rental Income | $ | 91,345 | $ | 71,349 | $ | 339,067 | $ | 248,309 | ||||||||
| Other | 67 | 65 | 256 | 259 | ||||||||||||
| Total Revenues | $ | 91,412 | $ | 71,414 | $ | 339,323 | $ | 248,568 | ||||||||
| Operating Expenses | ||||||||||||||||
| Real estate taxes | $ | 6,701 | $ | 6,370 | $ | 25,513 | $ | 21,428 | ||||||||
| Property operating expenses | 4,052 | 2,720 | 13,996 | 9,023 | ||||||||||||
| Land lease expense | 417 | 325 | 1,552 | 1,301 | ||||||||||||
| General and administrative | 6,650 | 6,793 | 25,456 | 20,793 | ||||||||||||
| Depreciation and amortization | 26,565 | 19,691 | 95,729 | 66,758 | ||||||||||||
| Provision for impairment | 1,919 | 141 | 1,919 | 4,137 | ||||||||||||
| Total Operating Expenses | $ | 46,304 | $ | 36,040 | $ | 164,165 | $ | 123,440 | ||||||||
| Gain (loss) on sale of assets, net | 1,759 | 437 | 14,941 | 8,004 | ||||||||||||
| Gain (loss) on involuntary conversion, net | 67 | - | 170 | - | ||||||||||||
| Income from Operations | $ | 46,934 | $ | 35,811 | $ | 190,269 | $ | 133,132 | ||||||||
| Other (Expense) Income | ||||||||||||||||
| Interest expense, net | $ | (13,111 | ) | $ | (11,791 | ) | $ | (50,378 | ) | $ | (40,097 | ) | ||||
| Income tax (expense) benefit | (517 | ) | (260 | ) | (2,401 | ) | (1,086 | ) | ||||||||
| Gain (loss) on early extinguishment of term loans and settlement of related interest rate swaps | - | - | (14,614 | ) | - | |||||||||||
| Other (expense) income | - | - | - | 23 | ||||||||||||
| Net Income | $ | 33,306 | $ | 23,760 | $ | 122,876 | $ | 91,972 | ||||||||
| Less Net Income Attributable to Non-Controlling Interest | 156 | 147 | 603 | 591 | ||||||||||||
| Net Income Attributable to Agree Realty Corporation | $ | 33,150 | $ | 23,613 | $ | 122,273 | $ | 91,381 | ||||||||
| Less Series A Preferred Stock Dividends | 1,859 | - | 2,148 | - | ||||||||||||
| Net Income Attributable to Common Stockholders | $ | 31,291 | $ | 23,613 | $ | 120,125 | $ | 91,381 | ||||||||
| Net Income Per Share Attributable to Common Stockholders | ||||||||||||||||
| Basic | $ | 0.44 | $ | 0.43 | $ | 1.79 | $ | 1.76 | ||||||||
| Diluted | $ | 0.44 | $ | 0.42 | $ | 1.78 | $ | 1.74 | ||||||||
| Other Comprehensive Income | ||||||||||||||||
| Net Income | $ | 33,306 | $ | 23,760 | $ | 122,876 | $ | 91,972 | ||||||||
| Amortization of interest rate swaps | 81 | 501 | 950 | 698 | ||||||||||||
| Change in fair value and settlement of interest rate swaps | (696 | ) | 3,387 | 29,980 | (30,694 | ) | ||||||||||
| Total Comprehensive Income (Loss) | 32,691 | 27,648 | 153,806 | 61,976 | ||||||||||||
| Comprehensive Income Attributable to Non-Controlling Interest | (153 | ) | (182 | ) | (770 | ) | (369 | ) | ||||||||
| Comprehensive Income Attributable to Agree Realty Corporation | $ | 32,538 | $ | 27,466 | $ | 153,036 | $ | 61,607 | ||||||||
| Weighted Average Number of Common Shares Outstanding - Basic | 70,297,659 | 55,397,190 | 66,802,242 | 51,838,219 | ||||||||||||
| Weighted Average Number of Common Shares Outstanding - Diluted | 70,610,082 | 56,063,758 | 67,139,079 | 52,396,734 | ||||||||||||
13
Agree Realty Corporation
Reconciliation of Net Income to FFO, Core FFO and Adjusted FFO
($ in thousands, except share and per-share data)
(Unaudited)
| Three months ended December 31, | Twelve months ended December 31, | |||||||||||||||
| 2021 | 2020 | 2021 | 2020 | |||||||||||||
| Net Income | $ | 33,306 | $ | 23,760 | $ | 122,876 | $ | 91,972 | ||||||||
| Less Series A Preferred Stock Dividends | 1,859 | - | 2,148 | - | ||||||||||||
| Net Income attributable to OP Common Unitholders | 31,447 | 23,760 | 120,728 | 91,972 | ||||||||||||
| Depreciation of rental real estate assets | 18,293 | 13,980 | 66,732 | 48,367 | ||||||||||||
| Amortization of lease intangibles - in-place leases and leasing costs | 8,116 | 5,567 | 28,379 | 17,882 | ||||||||||||
| Provision for impairment | 1,919 | 141 | 1,919 | 4,137 | ||||||||||||
| (Gain) loss on sale or involuntary conversion of assets, net | (1,826 | ) | (437 | ) | (15,111 | ) | (8,004 | ) | ||||||||
| Funds from Operations - OP Common Unitholders | $ | 57,949 | $ | 43,011 | $ | 202,647 | $ | 154,354 | ||||||||
| Loss on extinguishment of debt and settlement of related hedges | - | - | 14,614 | - | ||||||||||||
| Amortization of above (below) market lease intangibles, net | 7,654 | 4,333 | 24,284 | 15,885 | ||||||||||||
| Core Funds from Operations - OP Common Unitholders | $ | 65,603 | $ | 47,344 | $ | 241,545 | $ | 170,239 | ||||||||
| Straight-line accrued rent | (3,078 | ) | (2,204 | ) | (11,857 | ) | (7,818 | ) | ||||||||
| Stock based compensation expense | 1,500 | 1,524 | 5,467 | 4,995 | ||||||||||||
| Amortization of financing costs | 505 | 266 | 1,197 | 826 | ||||||||||||
| Non-real estate depreciation | 156 | 144 | 618 | 509 | ||||||||||||
| Adjusted Funds from Operations - OP Common Unitholders | $ | 64,686 | $ | 47,074 | $ | 236,970 | $ | 168,751 | ||||||||
| Funds from Operations Per Common Share and OP Unit - Basic | $ | 0.82 | $ | 0.77 | $ | 3.02 | $ | 2.96 | ||||||||
| Funds from Operations Per Common Share and OP Unit - Diluted | $ | 0.82 | $ | 0.76 | $ | 3.00 | $ | 2.93 | ||||||||
| Core Funds from Operations Per Common Share and OP Unit - Basic | $ | 0.93 | $ | 0.85 | $ | 3.60 | $ | 3.26 | ||||||||
| Core Funds from Operations Per Common Share and OP Unit - Diluted | $ | 0.92 | $ | 0.84 | $ | 3.58 | $ | 3.23 | ||||||||
| Adjusted Funds from Operations Per Common Share and OP Unit - Basic | $ | 0.92 | $ | 0.84 | $ | 3.53 | $ | 3.23 | ||||||||
| Adjusted Funds from Operations Per Common Share and OP Unit - Diluted | $ | 0.91 | $ | 0.83 | $ | 3.51 | $ | 3.20 | ||||||||
| Weighted Average Number of Common Shares and OP Units Outstanding - Basic | 70,645,278 | 55,744,809 | 67,149,861 | 52,185,838 | ||||||||||||
| Weighted Average Number of Common Shares and OP Units Outstanding - Diluted | 70,957,701 | 56,411,377 | 67,486,698 | 52,744,353 | ||||||||||||
| Additional supplemental disclosure | ||||||||||||||||
| Scheduled principal repayments | $ | 205 | $ | 208 | $ | 799 | $ | 907 | ||||||||
| Capitalized interest | 49 | 63 | 249 | 172 | ||||||||||||
| Capitalized building improvements | 1,445 | 2,333 | 5,821 | 5,581 | ||||||||||||
Non-GAAP Financial Measures
Funds from Operations (“FFO” or “Nareit FFO”)
FFO is defined by the National Association of Real Estate Investment Trusts, Inc. (“Nareit”) to mean net income computed in accordance with GAAP, excluding gains (or losses) from sales of real estate assets and/or changes in control, plus real estate related depreciation and amortization and any impairment charges on depreciable real estate assets, and after adjustments for unconsolidated partnerships and joint ventures. Historical cost accounting for real estate assets in accordance with GAAP implicitly assumes that the value of real estate assets diminishes predictably over time. Since real estate values instead have historically risen or fallen with market conditions, most real estate industry investors consider FFO to be helpful in evaluating a real estate company’s operations. FFO should not be considered an alternative to net income as the primary indicator of the Company’s operating performance, or as an alternative to cash flow as a measure of liquidity. Further, while the Company adheres to the Nareit definition of FFO, its presentation of FFO is not necessarily comparable to similarly titled measures of other REITs due to the fact that all REITs may not use the same definition.
Core Funds from Operations (“Core FFO”)
The Company defines Core FFO as Nareit FFO with the addback of noncash amortization of above- and below- market lease intangibles and certain infrequently recurring items that reduce or increase net income in accordance with GAAP. Under Nareit’s definition of FFO, lease intangibles created upon acquisition of a net lease must be amortized over the remaining term of the lease. The Company believes that by recognizing amortization charges for above- and below-market lease intangibles, the utility of FFO as a financial performance measure can be diminished. Management believes that its measure of Core FFO facilitates useful comparison of performance to its peers who predominantly transact in sale-leaseback transactions and are thereby not required by GAAP to allocate purchase price to lease intangibles. Unlike many of its peers, the Company has acquired the substantial majority of its net leased properties through acquisitions of properties from third parties or in connection with the acquisitions of ground leases from third parties. Core FFO should not be considered an alternative to net income as the primary indicator of the Company’s operating performance, or as an alternative to cash flow as a measure of liquidity. Further, the Company’s presentation of Core FFO is not necessarily comparable to similarly titled measures of other REITs due to the fact that all REITs may not use the same definition.
Adjusted Funds from Operations (“AFFO”)
AFFO is a non-GAAP financial measure of operating performance used by many companies in the REIT industry. AFFO further adjusts FFO and Core FFO for certain non-cash items that reduce or increase net income computed in accordance with GAAP. Management considers AFFO a useful supplemental measure of the Company’s performance, however, AFFO should not be considered an alternative to net income as an indication of its performance, or to cash flow as a measure of liquidity or ability to make distributions. The Company’s computation of AFFO may differ from the methodology for calculating AFFO used by other equity REITs, and therefore may not be comparable to such other REITs.
14
Agree Realty Corporation
Reconciliation of Net Debt to Recurring EBITDA
($ in thousands, except share and per-share data)
(Unaudited)
| Three months ended December 31, | ||||
| 2021 | ||||
| Net Income | $ | 33,306 | ||
| Interest expense, net | 13,111 | |||
| Income tax expense | 517 | |||
| Depreciation of rental real estate assets | 18,293 | |||
| Amortization of lease intangibles - in-place leases and leasing costs | 8,116 | |||
| Non-real estate depreciation | 156 | |||
| Provision for impairment | 1,919 | |||
| (Gain) loss on sale or involuntary conversion of assets, net | (1,826 | ) | ||
| EBITDAre | $ | 73,592 | ||
| Run-Rate Impact of Investment, Disposition and Leasing Activity | $ | 3,372 | ||
| Amortization of above (below) market lease intangibles, net | 7,654 | |||
| Recurring EBITDA | $ | 84,618 | ||
| Annualized Recurring EBITDA | $ | 338,472 | ||
| Total Debt | $ | 1,702,635 | ||
| Cash, cash equivalents and cash held in escrows | (45,250 | ) | ||
| Net Debt | $ | 1,657,385 | ||
| Net Debt to Recurring EBITDA | 4.9 | x | ||
| Net Debt | $ | 1,657,385 | ||
| Anticipated Net Proceeds from ATM Forward Offerings | (144,415 | ) | ||
| Anticipated Net Proceeds from December 2021 Forward Offering | (374,768 | ) | ||
| Proforma Net Debt | $ | 1,138,202 | ||
| Proforma Net Debt to Recurring EBITDA | 3.4 | x | ||
Non-GAAP Financial Measures
EBITDAre
EBITDAre is defined by Nareit to mean net income computed in accordance with GAAP, plus interest expense, income tax expense, depreciation and amortization, any gains (or losses) from sales of real estate assets and/or changes in control, any impairment charges on depreciable real estate assets, and after adjustments for unconsolidated partnerships and joint ventures. The Company considers the non-GAAP measure of EBITDAre to be a key supplemental measure of the Company's performance and should be considered along with, but not as an alternative to, net income or loss as a measure of the Company's operating performance. The Company considers EBITDAre a key supplemental measure of the Company's operating performance because it provides an additional supplemental measure of the Company's performance and operating cash flow that is widely known by industry analysts, lenders and investors. The Company’s calculation of EBITDAre may not be comparable to EBITDAre reported by other REITs that interpret the Nareit definition differently than the Company.
Recurring EBITDA
The Company defines Recurring EBITDA as EBITDAre with the addback of noncash amortization of above- and below- market lease intangibles, and after adjustments for the run-rate impact of the Company's investment and disposition activity for the period presented, as well as adjustments for non-recurring benefits or expenses. The Company considers the non-GAAP measure of Recurring EBITDA to be a key supplemental measure of the Company's performance and should be considered along with, but not as an alternative to, net income or loss as a measure of the Company's operating performance. The Company considers Recurring EBITDA a key supplemental measure of the Company's operating performance because it represents the Company's earnings run rate for the period presented and because it is widely followed by industry analysts, lenders and investors. Our Recurring EBITDA may not be comparable to Recurring EBITDA reported by other companies that have a different interpretation of the definition of Recurring EBITDA. Our ratio of net debt to Recurring EBITDA is used by management as a measure of leverage and may be useful to investors in understanding the Company’s ability to service its debt, as well as assess the borrowing capacity of the Company. Our ratio of net debt to Recurring EBITDA is calculated by taking annualized Recurring EBITDA and dividing it by our net debt per the consolidated balance sheet.
Net Debt
The Company defines Net Debt as total debt less cash, cash equivalents and cash held in escrows. The Company considers the non-GAAP measure of Net Debt to be a key supplemental measure of the Company's overall liquidity, capital structure and leverage. The Company considers Net Debt a key supplemental measure because it provides industry analysts, lenders and investors useful information in understanding our financial condition. The Company’s calculation of Net Debt may not be comparable to Net Debt reported by other REITs that interpret the definition differently than the Company. The Company presents Net Debt on both an actual and proforma basis, assuming the net proceeds of the Forward Offerings (see below) are used to pay down debt. The Company believes the proforma measure may be useful to investors in understanding the potential effect of the Forward Offerings on the Company’s capital structure, its future borrowing capacity, and its ability to service its debt.
Forward Offerings
The Company has 2,125,296 shares remaining to be settled under the ATM Forward Offerings. Upon settlement, the offerings are anticipated to raise net proceeds of approximately $144.4 million based on the applicable forward sale prices as of December 31, 2021. The applicable forward sale price varies depending on the offering. The Company is contractually obligated to settle the ATM Forward Offerings by certain dates between March 2022 and December 2022. In addition, in December 2021, the Company completed an underwritten public offering of 5,750,000 shares of common stock, including the full exercise of the underwriters' option to purchase additional shares, in connection with forward sale agreements. Upon settlement, the December 2021 Forward Offering is anticipated to raise net proceeds of approximately $374.8 million based on the applicable forward sale price as of December 31, 2021. The Company is contractually obligated to settle the offering by December 2022.
15
Agree Realty Corporation
Rental Income
($ in thousands, except share and per share-data)
(Unaudited)
| Three months ended December 31, | Twelve months ended December 31, | |||||||||||||||
| 2021 | 2020 | 2021 | 2020 | |||||||||||||
| Rental Income Source(1) | ||||||||||||||||
| Minimum rents(2) | $ | 86,200 | $ | 65,333 | $ | 314,694 | $ | 228,122 | ||||||||
| Percentage rents(2) | - | - | 593 | 249 | ||||||||||||
| Operating cost reimbursement(2) | 9,721 | 8,145 | 36,206 | 28,005 | ||||||||||||
| Straight-line rental adjustments(3) | 3,078 | 2,204 | 11,857 | 7,818 | ||||||||||||
| Amortization of (above) below market lease intangibles(4) | (7,654 | ) | (4,333 | ) | (24,283 | ) | (15,885 | ) | ||||||||
| Total Rental Income | $ | 91,345 | $ | 71,349 | $ | 339,067 | $ | 248,309 | ||||||||
(1) The Company adopted Financial Accounting Standards Board Accounting Standards Codification (“FASB ASC”) 842 “Leases” using the modified retrospective approach as of January 1, 2019. The Company adopted the practical expedient in FASB ASC 842 that alleviates the requirement to separately present lease and non-lease components of lease contracts. As a result, all income earned pursuant to tenant leases is reflected as one line, “Rental Income,” in the consolidated statement of operations. The purpose of this table is to provide additional supplementary detail of Rental Income.
(2) Represents contractual rentals and/or reimbursements as required by tenant lease agreements, recognized on an accrual basis of accounting. The Company believes that the presentation of contractual lease income is not, and is not intended to be, a presentation in accordance with GAAP. The Company believes this information is frequently used by management, investors, analysts and other interested parties to evaluate the Company’s performance.
(3) Represents adjustments to recognize minimum rents on a straight-line basis, consistent with the requirements of FASB ASC 842.
(4) In allocating the fair value of an acquired property, above- and below-market lease intangibles are recorded based on the present value of the difference between the contractual amounts to be paid pursuant to the leases at the time of acquisition and the Company’s estimate of current market lease rates for the property."
16