485BPOS2020-09-300000916490false2021-01-280.02910.17340.08910.00760.02720.04200.00950.07110.01210.04030.12400.14720.04650.13190.17090.10600.14660.02560.07040.09820.12620.35880.23990.07970.31900.49530.17150.30910.03300.09330.24890.04390.05850.04780.03850.11060.03480.04950.01070.10400.04290.01940.12600.00740.05780.01750.07850.02080.03540.06560.04460.01350.01120.03570.00890.03410.00280.01340.09160.08520.02160.24040.04670.06940.02030.05130.10510.13360.19120.23640.04140.17510.06290.13040.11540.16900.01730.08290.27060.06220.12190.18890.07250.08900.11980.15620.12290.11470.00670.09240.07520.04660.27710.22530.13780.26870.13880.28250.18830.30690.06140.14770.32210.16590.36060.21710.08830.13070.01190.02000.08100.22210.05240.07690.12360.06122020-06-302020-06-302020-06-302020-06-302020-12-312020-12-312020-06-302020-06-302011-09-302020-06-302020-12-312020-06-302018-12-312011-09-302020-03-312020-03-312020-03-312020-03-312020-03-312020-03-312013-06-302020-03-312020-03-312020-03-31<div style="display:none">~ http://www.timothyplan.com/role/ShareholderFeesTimothyAggressiveGrowthFund column period compact * ~</div><div style="display:none">~ http://www.timothyplan.com/role/AnnualFundOperatingExpensesTimothyAggressiveGrowthFund column period compact * ~</div><div style="display:none">~ http://www.timothyplan.com/role/ExpenseExampleTimothyAggressiveGrowthFund column period compact * ~</div><div style="display:none">~ http://www.timothyplan.com/role/ExpenseExampleNoRedemptionTimothyAggressiveGrowthFund column period compact * ~</div><div style="display:none">~ http://www.timothyplan.com/role/AnnualTotalReturnsBarChartTimothyAggressiveGrowthFund column period compact * ~</div><div style="display:none">~ http://www.timothyplan.com/role/AverageAnnualTotalReturnsTransposedTimothyAggressiveGrowthFund column period compact * ~</div><div style="display:none">~ http://www.timothyplan.com/role/ShareholderFeesTimothyPlanInternationalFund column period compact * ~</div><div style="display:none">~ http://www.timothyplan.com/role/AnnualFundOperatingExpensesTimothyPlanInternationalFund column period compact * ~</div><div style="display:none">~ http://www.timothyplan.com/role/ExpenseExampleTimothyPlanInternationalFund column period compact * ~</div><div style="display:none">~ http://www.timothyplan.com/role/ExpenseExampleNoRedemptionTimothyPlanInternationalFund column period compact * ~</div><div style="display:none">~ http://www.timothyplan.com/role/AnnualTotalReturnsBarChartTimothyPlanInternationalFund column period compact * ~</div><div style="display:none">~ http://www.timothyplan.com/role/AverageAnnualTotalReturnsTransposedTimothyPlanInternationalFund column period compact * ~</div><div style="display:none">~ http://www.timothyplan.com/role/ShareholderFeesTimothyPlanDefensiveStrategiesFund column period compact * ~</div><div style="display:none">~ http://www.timothyplan.com/role/AnnualFundOperatingExpensesTimothyPlanDefensiveStrategiesFund column period compact * ~</div><div style="display:none">~ http://www.timothyplan.com/role/ExpenseExampleTimothyPlanDefensiveStrategiesFund column period compact * ~</div><div style="display:none">~ http://www.timothyplan.com/role/ExpenseExampleNoRedemptionTimothyPlanDefensiveStrategiesFund column period compact * ~</div><div style="display:none">~ http://www.timothyplan.com/role/AnnualTotalReturnsBarChartTimothyPlanDefensiveStrategiesFund column period compact * ~</div><div style="display:none">~ http://www.timothyplan.com/role/AverageAnnualTotalReturnsTransposedTimothyPlanDefensiveStrategiesFund column period compact * ~</div><div style="display:none">~ http://www.timothyplan.com/role/ShareholderFeesTimothyLargeMidCapValueFund column period compact * ~</div><div style="display:none">~ http://www.timothyplan.com/role/AnnualFundOperatingExpensesTimothyLargeMidCapValueFund column period compact * ~</div><div style="display:none">~ http://www.timothyplan.com/role/ExpenseExampleTimothyLargeMidCapValueFund column period compact * ~</div><div style="display:none">~ http://www.timothyplan.com/role/ExpenseExampleNoRedemptionTimothyLargeMidCapValueFund column period compact * ~</div><div style="display:none">~ http://www.timothyplan.com/role/AnnualTotalReturnsBarChartTimothyLargeMidCapValueFund column period compact * ~</div><div style="display:none">~ http://www.timothyplan.com/role/AverageAnnualTotalReturnsTransposedTimothyLargeMidCapValueFund column period compact * ~</div><div style="display:none">~ http://www.timothyplan.com/role/ShareholderFeesTimothyPlanGrowthIncomeFund column period compact * ~</div><div style="display:none">~ http://www.timothyplan.com/role/AnnualFundOperatingExpensesTimothyPlanGrowthIncomeFund column period compact * ~</div><div style="display:none">~ http://www.timothyplan.com/role/ExpenseExampleTimothyPlanGrowthIncomeFund column period compact * ~</div><div style="display:none">~ http://www.timothyplan.com/role/ExpenseExampleNoRedemptionTimothyPlanGrowthIncomeFund column period compact * ~</div><div style="display:none">~ http://www.timothyplan.com/role/AnnualTotalReturnsBarChartTimothyPlanGrowthIncomeFund column period compact * ~</div><div style="display:none">~ http://www.timothyplan.com/role/AverageAnnualTotalReturnsTransposedTimothyPlanGrowthIncomeFund column period compact * ~</div><div style="display:none">~ http://www.timothyplan.com/role/ShareholderFeesTimothySmallCapValueFund column period compact * ~</div><div style="display:none">~ http://www.timothyplan.com/role/AnnualFundOperatingExpensesTimothySmallCapValueFund column period compact * ~</div><div style="display:none">~ http://www.timothyplan.com/role/ExpenseExampleTimothySmallCapValueFund column period compact * ~</div><div style="display:none">~ http://www.timothyplan.com/role/ExpenseExampleNoRedemptionTimothySmallCapValueFund column period compact * ~</div><div style="display:none">~ http://www.timothyplan.com/role/AnnualTotalReturnsBarChartTimothySmallCapValueFund column period compact * ~</div><div style="display:none">~ http://www.timothyplan.com/role/AverageAnnualTotalReturnsTransposedTimothySmallCapValueFund column period compact * ~</div><div style="display:none">~ http://www.timothyplan.com/role/ShareholderFeesTimothyStrategicGrowthFund column period compact * ~</div><div style="display:none">~ http://www.timothyplan.com/role/AnnualFundOperatingExpensesTimothyStrategicGrowthFund column period compact * ~</div><div style="display:none">~ http://www.timothyplan.com/role/ExpenseExampleTimothyStrategicGrowthFund column period compact * ~</div><div style="display:none">~ http://www.timothyplan.com/role/ExpenseExampleNoRedemptionTimothyStrategicGrowthFund column period compact * ~</div><div style="display:none">~ http://www.timothyplan.com/role/AnnualTotalReturnsBarChartTimothyStrategicGrowthFund column period compact * ~</div><div style="display:none">~ http://www.timothyplan.com/role/AverageAnnualTotalReturnsTransposedTimothyStrategicGrowthFund column period compact * ~</div><div style="display:none">~ http://www.timothyplan.com/role/ShareholderFeesTimothyLargeMidCapGrowthFund column period compact * ~</div><div style="display:none">~ http://www.timothyplan.com/role/AnnualFundOperatingExpensesTimothyLargeMidCapGrowthFund column period compact * ~</div><div style="display:none">~ http://www.timothyplan.com/role/ExpenseExampleTimothyLargeMidCapGrowthFund column period compact * ~</div><div style="display:none">~ http://www.timothyplan.com/role/ExpenseExampleNoRedemptionTimothyLargeMidCapGrowthFund column period compact * ~</div><div style="display:none">~ http://www.timothyplan.com/role/AnnualTotalReturnsBarChartTimothyLargeMidCapGrowthFund column period compact * ~</div><div style="display:none">~ http://www.timothyplan.com/role/AverageAnnualTotalReturnsTransposedTimothyLargeMidCapGrowthFund column period compact * ~</div><div style="display:none">~ http://www.timothyplan.com/role/ShareholderFeesTimothyFixedIncomeFund column period compact * ~</div><div style="display:none">~ http://www.timothyplan.com/role/AnnualFundOperatingExpensesTimothyFixedIncomeFund column period compact * ~</div><div style="display:none">~ http://www.timothyplan.com/role/ExpenseExampleTimothyFixedIncomeFund column period compact * ~</div><div style="display:none">~ http://www.timothyplan.com/role/ExpenseExampleNoRedemptionTimothyFixedIncomeFund column period compact * ~</div><div style="display:none">~ http://www.timothyplan.com/role/AnnualTotalReturnsBarChartTimothyFixedIncomeFund column period compact * ~</div><div style="display:none">~ http://www.timothyplan.com/role/AverageAnnualTotalReturnsTransposedTimothyFixedIncomeFund column period compact * ~</div><div style="display:none">~ http://www.timothyplan.com/role/ShareholderFeesTimothyConservativeGrowthFund column period compact * ~</div><div style="display:none">~ http://www.timothyplan.com/role/AnnualFundOperatingExpensesTimothyConservativeGrowthFund column period compact * ~</div><div style="display:none">~ http://www.timothyplan.com/role/ExpenseExampleTimothyConservativeGrowthFund column period compact * ~</div><div style="display:none">~ http://www.timothyplan.com/role/ExpenseExampleNoRedemptionTimothyConservativeGrowthFund column period compact * ~</div><div style="display:none">~ http://www.timothyplan.com/role/AnnualTotalReturnsBarChartTimothyConservativeGrowthFund column period compact * ~</div><div style="display:none">~ http://www.timothyplan.com/role/AverageAnnualTotalReturnsTransposedTimothyConservativeGrowthFund column period compact * ~</div><div style="display:none">~ http://www.timothyplan.com/role/ShareholderFeesTimothyIsraelCommonValuesFund column period compact * ~</div><div style="display:none">~ http://www.timothyplan.com/role/AnnualFundOperatingExpensesTimothyIsraelCommonValuesFund column period compact * ~</div><div style="display:none">~ http://www.timothyplan.com/role/ExpenseExampleTimothyIsraelCommonValuesFund column period compact * ~</div><div style="display:none">~ http://www.timothyplan.com/role/ExpenseExampleNoRedemptionTimothyIsraelCommonValuesFund column period compact * ~</div><div style="display:none">~ http://www.timothyplan.com/role/AnnualTotalReturnsBarChartTimothyIsraelCommonValuesFund column period compact * ~</div><div style="display:none">~ http://www.timothyplan.com/role/AverageAnnualTotalReturnsTransposedTimothyIsraelCommonValuesFund column period compact * ~</div><div style="display:none">~ http://www.timothyplan.com/role/ShareholderFeesTimothyPlanHighYieldBondFund column period compact * ~</div><div style="display:none">~ http://www.timothyplan.com/role/AnnualFundOperatingExpensesTimothyPlanHighYieldBondFund column period compact * ~</div><div style="display:none">~ http://www.timothyplan.com/role/ExpenseExampleTimothyPlanHighYieldBondFund column period compact * ~</div><div style="display:none">~ http://www.timothyplan.com/role/ExpenseExampleNoRedemptionTimothyPlanHighYieldBondFund column period compact * ~</div><div style="display:none">~ http://www.timothyplan.com/role/AnnualTotalReturnsBarChartTimothyPlanHighYieldBondFund column period compact * ~</div><div style="display:none">~ http://www.timothyplan.com/role/AverageAnnualTotalReturnsTransposedTimothyPlanHighYieldBondFund column period compact * ~</div>A one percent (1%) contingent deferred sales charge is imposed on any Class C shares sold within the first thirteen months after purchase. The Trust’s Distributor, Timothy Partners, Ltd., will pay a finders’ fee of 1% of the proceeds invested to brokers that purchase shares of the Funds in amounts from $1 million to $2 million, 0.75% on the next $1 million, 0.50% on the next $2 million, and 0.25% on all amounts in excess of $5 million. In such cases, those purchases will be subject to a contingent deferred sales charge of 1% for 18 months after the date of purchase.Acquired Funds Fees and Expenses are the indirect costs of investing in other investment companies. Total Annual Fund Operating Expenses do not correlate to the ratio of average net assets in the Financial Highlights Table, which reflects the operating expenses of the Fund and does not include Acquired Funds Fees and Expenses. Class A share returns reflect the assessment of the maximum front-end sales load on the first business day of the year.After-tax returns are calculated using the historical highest individual federal marginal income tax rates and do not reflect the impact of state and local taxes. After-tax returns depend on an investor’s tax situation and may differ from those shown. After-tax returns shown are not relevant to investors who hold their Fund shares through tax-deferred arrangements, such as 401(k) plans or individual retirement accounts.The Russell Midcap Growth Total Return Index is a widely recognized, unmanaged index of Mid Capitalization growth companies in the United States. The Index assumes reinvestment of all dividends and distributions and does not reflect any asset-based charges for investment management or other expenses. A one percent (1%) contingent deferred sales charge is imposed on any Class C shares sold within the first thirteen months after purchase. The Trust’s Distributor, Timothy Partners, Ltd., will pay a finders’ fee of 1% of the proceeds invested to brokers that purchase shares of the Funds in amounts from $1 million to $2 million, 0.75% on the next $1 million, 0.50% on the next $2 million, and 0.25% on all amounts in excess of $5 million. In such cases, those purchases will be subject to a contingent deferred sales charge of 1% for 18 months after the date of purchase. Acquired Funds Fees and Expenses are the indirect costs of investing in other investment companies. Total Annual Fund Operating Expenses do not correlate to the ratio of average net assets in the Financial Highlights Table, which reflects the operating expenses of the Fund and does not include Acquired Funds Fees and Expenses. The MSCI EAFE Index is a widely recognized unmanaged index of equity prices and is representative of equity market performance of developed countries, excluding the U.S. and Canada. The MSCI ACWI ex USA Index captures large and mid cap representation across 22 of 23 Developed Markets (DM) countries (excluding the US) and 26 Emerging Markets (EM) countries. With 2,377 constituents, the index covers approximately 85% of the global equity opportunity set outside the US. Performance figures include the change in value of the stocks in the index and the reinvestment of dividends.The Timothy Defensive Strategies Fund Blended Index reflects an unmanaged portfolio of 33% of the Bloomberg Barclays U.S. Treasury: 1-3 years Index, 33% of the Bloomberg Commodity Index Total Return and 34% of the MSCI U.S. REIT Gross (USD) Index.The S&P 500 Total Return Index is a widely recognized, unmanaged index of common stock prices. The Index assumes reinvestment of all dividends and distributions and does not reflect any asset-based charges for investment management or other expenses.The Fund commenced investment operations on October 1, 2013.The Timothy Growth & Income Fund Blended Index reflects an unmanaged portfolio of 40% of the Barclays U.S. Aggregate Bond Index and 60% of the Russell 1000 Value Index.The Russell 2000 Total Return Index is a widely recognized, unmanaged index of 2000 Small Capitalization companies in the United States. The Index assumes reinvestment of all dividends and distributions and does not reflect any asset-based charges for investment management or other expenses.The Russell 1000 Growth Total Return Index is a widely recognized, unmanaged index of 1000 large-capitalization companies in the United States. The Index assumes reinvestment of all dividends and distributions and does not reflect any asset-based charges for investment management or other expenses.The Dow Jones Moderately Aggressive Portfolio Index is a widely recognized index that measures global stocks, bonds and cash which are in turn represented by multiple sub-indexes. The Index assumes reinvestment of all dividends and distributions and does not reflect any asset-based charges for investment management or other expenses.The Dow Jones Moderate Portfolio Index is a widely recognized index that measures global stocks, bonds and cash which are in turn represented by multiple sub-indexes. The Index assumes reinvestment of all dividends and distributions and does not reflect any asset-based charges for investment management or other expenses.Bloomberg Barclays U.S. Aggregate Bond Index (formerly Lehman Brothers US Aggregate Bond Index) is a benchmark index composed of US Securities in Treasury, Government-Related, Corporate, and Securitized sectors. It includes securities that are of investment-grade quality or better, have at least one year to maturity, and have an outstanding par value of at least $250 million. The Index assumes reinvestment of all dividends and distributions and does not reflect any asset-based charges for investment management or other expenses.The Fund commenced investment operations on October 12, 2011.The TA — 125 Index is an unmanaged index of equity prices representing the 125 most highly capitalized companies listed on the Tel Aviv Stock Exchange.The Barclays U.S. High Yield Ba/B 3% Index is an issuer-constrained version of the flagship U.S. Corporate High Yield Index, which measures the USD-denominated, high yield, fixed-rate corporate bond market. 0000916490 2021-01-28 2021-01-28 0000916490 tp:S000004482Member 2021-01-28 2021-01-28 0000916490 tp:S000017790Member 2021-01-28 2021-01-28 0000916490 tp:S000026812Member 2021-01-28 2021-01-28 0000916490 tp:S000004480Member 2021-01-28 2021-01-28 0000916490 tp:S000042201Member 2021-01-28 2021-01-28 0000916490 tp:S000004479Member 2021-01-28 2021-01-28 0000916490 tp:S000004484Member 2021-01-28 2021-01-28 0000916490 tp:S000004483Member 2021-01-28 2021-01-28 0000916490 tp:S000004481Member 2021-01-28 2021-01-28 0000916490 tp:S000004485Member 2021-01-28 2021-01-28 0000916490 tp:S000033751Member 2021-01-28 2021-01-28 0000916490 tp:S000017791Member 2021-01-28 2021-01-28 0000916490 tp:S000004482Member tp:C000012339Member 2021-01-28 2021-01-28 0000916490 tp:S000004482Member tp:C000012341Member 2021-01-28 2021-01-28 0000916490 tp:S000017790Member tp:C000049121Member 2021-01-28 2021-01-28 0000916490 tp:S000017790Member tp:C000065170Member 2021-01-28 2021-01-28 0000916490 tp:C000080683Member tp:S000026812Member 2021-01-28 2021-01-28 0000916490 tp:C000080684Member tp:S000026812Member 2021-01-28 2021-01-28 0000916490 tp:C000012333Member tp:S000004480Member 2021-01-28 2021-01-28 0000916490 tp:C000012335Member tp:S000004480Member 2021-01-28 2021-01-28 0000916490 tp:C000130991Member tp:S000042201Member 2021-01-28 2021-01-28 0000916490 tp:C000130992Member tp:S000042201Member 2021-01-28 2021-01-28 0000916490 tp:C000012330Member tp:S000004479Member 2021-01-28 2021-01-28 0000916490 tp:C000012332Member tp:S000004479Member 2021-01-28 2021-01-28 0000916490 tp:C000012345Member tp:S000004484Member 2021-01-28 2021-01-28 0000916490 tp:C000012347Member tp:S000004484Member 2021-01-28 2021-01-28 0000916490 tp:C000012342Member tp:S000004483Member 2021-01-28 2021-01-28 0000916490 tp:C000012344Member tp:S000004483Member 2021-01-28 2021-01-28 0000916490 tp:C000012336Member tp:S000004481Member 2021-01-28 2021-01-28 0000916490 tp:C000012338Member tp:S000004481Member 2021-01-28 2021-01-28 0000916490 tp:C000012348Member tp:S000004485Member 2021-01-28 2021-01-28 0000916490 tp:C000012350Member tp:S000004485Member 2021-01-28 2021-01-28 0000916490 tp:C000104306Member tp:S000033751Member 2021-01-28 2021-01-28 0000916490 tp:C000104307Member tp:S000033751Member 2021-01-28 2021-01-28 0000916490 tp:C000049122Member tp:S000017791Member 2021-01-28 2021-01-28 0000916490 tp:C000065171Member tp:S000017791Member 2021-01-28 2021-01-28 0000916490 tp:S000004482Member tp:C000012339Member rr:AfterTaxesOnDistributionsMember 2021-01-28 2021-01-28 0000916490 tp:S000004482Member tp:C000012341Member rr:AfterTaxesOnDistributionsMember 2021-01-28 2021-01-28 0000916490 tp:S000004482Member tp:C000012339Member rr:AfterTaxesOnDistributionsAndSalesMember 2021-01-28 2021-01-28 0000916490 tp:S000004482Member tp:C000012341Member rr:AfterTaxesOnDistributionsAndSalesMember 2021-01-28 2021-01-28 0000916490 tp:S000004482Member tp:C000012341Member tp:RussellMidcapGrowthTotalReturnIndexMember 2021-01-28 2021-01-28 0000916490 tp:S000004482Member tp:C000012339Member tp:RussellMidcapGrowthTotalReturnIndexMember 2021-01-28 2021-01-28 0000916490 tp:S000017790Member tp:C000049121Member rr:AfterTaxesOnDistributionsMember 2021-01-28 2021-01-28 0000916490 tp:S000017790Member tp:C000065170Member rr:AfterTaxesOnDistributionsMember 2021-01-28 2021-01-28 0000916490 tp:S000017790Member tp:C000049121Member rr:AfterTaxesOnDistributionsAndSalesMember 2021-01-28 2021-01-28 0000916490 tp:S000017790Member tp:C000065170Member rr:AfterTaxesOnDistributionsAndSalesMember 2021-01-28 2021-01-28 0000916490 tp:S000017790Member tp:C000049121Member tp:MsciEafeIndexMember 2021-01-28 2021-01-28 0000916490 tp:S000017790Member tp:C000065170Member tp:MsciEafeIndexMember 2021-01-28 2021-01-28 0000916490 tp:S000017790Member tp:C000049121Member tp:MsciAcWorldIndexExUsaNetUsdMember 2021-01-28 2021-01-28 0000916490 tp:S000017790Member tp:C000065170Member tp:MsciAcWorldIndexExUsaNetUsdMember 2021-01-28 2021-01-28 0000916490 tp:C000080683Member tp:TimothyDefensiveStrategiesFundBlendedIndexMember tp:S000026812Member 2021-01-28 2021-01-28 0000916490 tp:C000080684Member tp:TimothyDefensiveStrategiesFundBlendedIndexMember tp:S000026812Member 2021-01-28 2021-01-28 0000916490 tp:C000080683Member rr:AfterTaxesOnDistributionsMember tp:S000026812Member 2021-01-28 2021-01-28 0000916490 tp:C000080684Member rr:AfterTaxesOnDistributionsMember tp:S000026812Member 2021-01-28 2021-01-28 0000916490 tp:C000080683Member rr:AfterTaxesOnDistributionsAndSalesMember tp:S000026812Member 2021-01-28 2021-01-28 0000916490 tp:C000080684Member rr:AfterTaxesOnDistributionsAndSalesMember tp:S000026812Member 2021-01-28 2021-01-28 0000916490 tp:C000012335Member tp:S000004480Member tp:Sp500TotalReturnIndexReflectsNoDeductionForFeesExpensesOrTaxesMember 2021-01-28 2021-01-28 0000916490 tp:C000012333Member tp:S000004480Member rr:AfterTaxesOnDistributionsMember 2021-01-28 2021-01-28 0000916490 tp:C000012335Member tp:S000004480Member rr:AfterTaxesOnDistributionsMember 2021-01-28 2021-01-28 0000916490 tp:C000012333Member tp:S000004480Member rr:AfterTaxesOnDistributionsAndSalesMember 2021-01-28 2021-01-28 0000916490 tp:C000012335Member tp:S000004480Member rr:AfterTaxesOnDistributionsAndSalesMember 2021-01-28 2021-01-28 0000916490 tp:C000012333Member tp:S000004480Member tp:Sp500TotalReturnIndexReflectsNoDeductionForFeesExpensesOrTaxesMember 2021-01-28 2021-01-28 0000916490 tp:C000130992Member rr:AfterTaxesOnDistributionsAndSalesMember tp:S000042201Member 2021-01-28 2021-01-28 0000916490 tp:C000130991Member tp:TimothyGrowthAndIncomeFundBlendedIndexMember tp:S000042201Member 2021-01-28 2021-01-28 0000916490 tp:C000130991Member rr:AfterTaxesOnDistributionsMember tp:S000042201Member 2021-01-28 2021-01-28 0000916490 tp:C000130992Member rr:AfterTaxesOnDistributionsMember tp:S000042201Member 2021-01-28 2021-01-28 0000916490 tp:C000130991Member rr:AfterTaxesOnDistributionsAndSalesMember tp:S000042201Member 2021-01-28 2021-01-28 0000916490 tp:C000130992Member tp:TimothyGrowthAndIncomeFundBlendedIndexMember tp:S000042201Member 2021-01-28 2021-01-28 0000916490 rr:AfterTaxesOnDistributionsMember tp:C000012330Member tp:S000004479Member 2021-01-28 2021-01-28 0000916490 rr:AfterTaxesOnDistributionsMember tp:C000012332Member tp:S000004479Member 2021-01-28 2021-01-28 0000916490 rr:AfterTaxesOnDistributionsAndSalesMember tp:C000012330Member tp:S000004479Member 2021-01-28 2021-01-28 0000916490 rr:AfterTaxesOnDistributionsAndSalesMember tp:C000012332Member tp:S000004479Member 2021-01-28 2021-01-28 0000916490 tp:Russell2000TotalReturnIndexReflectsNoDeductionForFeesExpensesOrTaxesMember tp:C000012332Member tp:S000004479Member 2021-01-28 2021-01-28 0000916490 tp:Russell2000TotalReturnIndexReflectsNoDeductionForFeesExpensesOrTaxesMember tp:C000012330Member tp:S000004479Member 2021-01-28 2021-01-28 0000916490 tp:C000012345Member rr:AfterTaxesOnDistributionsMember tp:S000004484Member 2021-01-28 2021-01-28 0000916490 tp:C000012347Member rr:AfterTaxesOnDistributionsMember tp:S000004484Member 2021-01-28 2021-01-28 0000916490 tp:C000012345Member rr:AfterTaxesOnDistributionsAndSalesMember tp:S000004484Member 2021-01-28 2021-01-28 0000916490 tp:C000012347Member rr:AfterTaxesOnDistributionsAndSalesMember tp:S000004484Member 2021-01-28 2021-01-28 0000916490 tp:C000012347Member tp:DowJonesModeratelyAggressivePortfolioIndexMember tp:S000004484Member 2021-01-28 2021-01-28 0000916490 tp:C000012345Member tp:DowJonesModeratelyAggressivePortfolioIndexMember tp:S000004484Member 2021-01-28 2021-01-28 0000916490 tp:S000004483Member tp:C000012342Member rr:AfterTaxesOnDistributionsAndSalesMember 2021-01-28 2021-01-28 0000916490 tp:S000004483Member tp:C000012344Member rr:AfterTaxesOnDistributionsAndSalesMember 2021-01-28 2021-01-28 0000916490 tp:S000004483Member tp:C000012342Member tp:Russell1000GrowthTotalReturnIndexReflectsNoDeductionForFeesExpensesOrTaxesMember 2021-01-28 2021-01-28 0000916490 tp:S000004483Member tp:C000012344Member tp:Russell1000GrowthTotalReturnIndexReflectsNoDeductionForFeesExpensesOrTaxesMember 2021-01-28 2021-01-28 0000916490 tp:S000004483Member tp:C000012342Member rr:AfterTaxesOnDistributionsMember 2021-01-28 2021-01-28 0000916490 tp:S000004483Member tp:C000012344Member rr:AfterTaxesOnDistributionsMember 2021-01-28 2021-01-28 0000916490 rr:AfterTaxesOnDistributionsMember tp:C000012336Member tp:S000004481Member 2021-01-28 2021-01-28 0000916490 rr:AfterTaxesOnDistributionsMember tp:C000012338Member tp:S000004481Member 2021-01-28 2021-01-28 0000916490 rr:AfterTaxesOnDistributionsAndSalesMember tp:C000012336Member tp:S000004481Member 2021-01-28 2021-01-28 0000916490 rr:AfterTaxesOnDistributionsAndSalesMember tp:C000012338Member tp:S000004481Member 2021-01-28 2021-01-28 0000916490 tp:BloombergBarclaysUsAggregateBondIndexReflectsNoDeductionForFeesExpensesOrTaxesMember tp:C000012336Member tp:S000004481Member 2021-01-28 2021-01-28 0000916490 tp:BloombergBarclaysUsAggregateBondIndexReflectsNoDeductionForFeesExpensesOrTaxesMember tp:C000012338Member tp:S000004481Member 2021-01-28 2021-01-28 0000916490 tp:C000012348Member tp:S000004485Member rr:AfterTaxesOnDistributionsAndSalesMember 2021-01-28 2021-01-28 0000916490 tp:C000012350Member tp:S000004485Member rr:AfterTaxesOnDistributionsAndSalesMember 2021-01-28 2021-01-28 0000916490 tp:C000012350Member tp:S000004485Member tp:DowJonesModeratePortfolioIndexMember 2021-01-28 2021-01-28 0000916490 tp:C000012348Member tp:S000004485Member tp:DowJonesModeratePortfolioIndexMember 2021-01-28 2021-01-28 0000916490 tp:C000012348Member tp:S000004485Member rr:AfterTaxesOnDistributionsMember 2021-01-28 2021-01-28 0000916490 tp:C000012350Member tp:S000004485Member rr:AfterTaxesOnDistributionsMember 2021-01-28 2021-01-28 0000916490 tp:C000104306Member rr:AfterTaxesOnDistributionsMember tp:S000033751Member 2021-01-28 2021-01-28 0000916490 tp:C000104307Member rr:AfterTaxesOnDistributionsMember tp:S000033751Member 2021-01-28 2021-01-28 0000916490 tp:C000104306Member rr:AfterTaxesOnDistributionsAndSalesMember tp:S000033751Member 2021-01-28 2021-01-28 0000916490 tp:C000104307Member rr:AfterTaxesOnDistributionsAndSalesMember tp:S000033751Member 2021-01-28 2021-01-28 0000916490 tp:C000104306Member tp:IsraelTa125IndexMember tp:S000033751Member 2021-01-28 2021-01-28 0000916490 tp:C000104307Member tp:IsraelTa125IndexMember tp:S000033751Member 2021-01-28 2021-01-28 0000916490 rr:AfterTaxesOnDistributionsMember tp:C000049122Member tp:S000017791Member 2021-01-28 2021-01-28 0000916490 rr:AfterTaxesOnDistributionsMember tp:C000065171Member tp:S000017791Member 2021-01-28 2021-01-28 0000916490 rr:AfterTaxesOnDistributionsAndSalesMember tp:C000049122Member tp:S000017791Member 2021-01-28 2021-01-28 0000916490 tp:BarclaysUsHighyieldBab3IndexReflectsNoDeductionForFeesExpensesOrTaxesMember tp:C000065171Member tp:S000017791Member 2021-01-28 2021-01-28 0000916490 rr:AfterTaxesOnDistributionsAndSalesMember tp:C000065171Member tp:S000017791Member 2021-01-28 2021-01-28 0000916490 tp:BarclaysUsHighyieldBab3IndexReflectsNoDeductionForFeesExpensesOrTaxesMember tp:C000049122Member tp:S000017791Member 2021-01-28 2021-01-28 iso4217:USD xbrli:pure
Securities Act File
No. 033-73248
Investment Company Act File
No. 811-08228
SECURITIES AND EXCHANGE COMMISSION
FORM
N-1A
REGISTRATION STATEMENT
THE SECURITIES ACT OF 1933
Pre-Effective
Amendment No.
Post-Effective Amendment No. 100 x
THE INVESTMENT COMPANY ACT OF 1940
Post-Effective Amendment No. 101 x
(Exact Name of Registrant as Specified in Charter)
1055 MAITLAND CENTER COMMONS
MAITLAND, FL 32751
(Address of Principal Executive Offices) (Zip Code)
Registrant’s Telephone Number, Including Area Code: (407)
644-1986
ARTHUR D. ALLY,
1055 MAITLAND CENTER COMMONS
MAITLAND, FL 32751
(Name and Address of Agent for Service)
Copies to:
DAVID D. JONES, ESQUIRE
20770 Hwy 281 N., Suite
108-619
San Antonio, TX 78258
and
BENJAMIN V. MOLLOZZI, ESQUIRE
225 Pictoria Drive, Suite 450
Cincinnati, Ohio 45246
It is proposed that this filing will become effective:
| ☐ |
immediately upon filing pursuant to paragraph (b) |
| x |
on January 28, 2021 pursuant to paragraph (b) |
| ☐ |
60 days after filing pursuant to paragraph (a)(1) |
| ☐ |
on (date) pursuant to paragraph (a)(1) |
| ☐ |
75 days after filing pursuant to paragraph (a)(2) |
| ☐ |
on (date) pursuant to paragraph (a)(2) of rule 485 |
If appropriate check this box:
| ☐ |
this post-effective amendment designates a new effective date for a previously filed post-effective amendment |
TIMOTHY PLAN FAMILY OF FUNDS
THIS PROSPECTUS OFFERS CLASS A & CLASS C SHARES ONLY OF THE ABOVE FUNDS.
The Timothy Plan believes that it has a responsibility to invest in a moral and ethical manner. Accordingly, none of our Funds invest in any company that is involved in the production or wholesale distribution of alcohol, tobacco, or gambling equipment, gambling enterprises or which is involved, either directly or indirectly, in abortion or pornography, or promoting anti-family entertainment or alternative lifestyles. Securities issued by companies engaged in these prohibited activities are excluded from the Funds’ portfolios and are referred to throughout this Prospectus (the “Prospectus”) as “Excluded Securities”. Under a zero-tolerance policy, Excluded Securities will not be purchased by any of our Funds. Timothy Partners, Ltd. (“TPL”) is Investment Advisor to the Funds and is responsible for determining those securities that are Excluded Securities, and reserves the right to exclude investments, in its best judgment, in other companies whose practices may not fall within the exclusions described above, but nevertheless could be found offensive to basic, traditional Judeo-Christian values. Further, if a company whose securities are being held by one of our Funds is subsequently discovered to be engaged in a prohibited practice, that security will be sold as soon as is reasonably practicable.
THE U. S. SECURITIES AND EXCHANGE COMMISSION HAS NOT APPROVED OR DISAPPROVED THESE SECURITIES OR PASSED UPON THE ADEQUACY OF THIS PROSPECTUS. ANY REPRESENTATION TO THE CONTRARY IS A CRIMINAL OFFENSE.
Beginning on January 1, 2021, as permitted by regulations adopted by the Securities and Exchange Commission, paper copies of the Fund’s shareholder reports like this one will no longer be sent by mail, unless you specifically request paper copies of the reports. Instead, the reports will be made available on the Fund’s website www.timothyplan.com, and you will be notified by mail each time a report is posted and provided with a website link to access the report.
If you already elected to receive shareholder reports electronically, you will not be affected by this change and you need not take any action. You may elect to receive shareholder reports and other communications from the Fund electronically by contacting your financial intermediary (such as a broker-dealer or bank) or, if you are a direct investor, by following the instructions included with paper Fund documents that have been mailed to you. You may also elect to receive all future reports in paper free of charge.
|
|
|
|
|
|
|
Section 1 |
|
|
|
|
|
|
|
|
|
|
|
|
|
|
|
|
|
|
|
|
|
|
|
|
|
|
|
|
|
|
|
|
|
|
|
|
|
|
|
|
|
|
|
|
|
|
|
|
|
|
|
|
|
|
|
|
|
|
|
|
|
|
|
|
|
|
|
|
|
|
|
|
|
|
|
|
|
|
|
|
|
|
|
|
|
|
|
|
|
|
|
|
|
|
|
|
|
|
|
|
|
|
|
|
|
|
|
Section 2 |
|
|
|
|
|
|
|
|
|
|
|
|
|
|
|
|
|
|
|
|
|
|
|
|
|
|
|
|
|
|
|
|
|
|
|
|
|
Section 3 |
|
|
|
|
|
|
|
|
|
|
|
|
|
|
|
|
|
|
|
|
|
|
|
|
|
|
|
|
|
|
|
|
|
|
Section 4 |
|
|
|
|
|
|
|
|
|
|
|
|
|
|
|
|
|
|
|
|
|
|
|
|
|
|
|
|
|
|
|
|
|
|
|
|
|
|
|
|
|
|
|
|
|
|
|
|
|
|
|
Section 5 |
|
|
|
|
|
|
|
|
|
|
|
|
|
|
|
|
|
|
|
|
|
|
|
|
|
|
|
|
|
|
|
|
|
|
|
|
|
|
|
|
|
|
|
|
|
|
|
|
|
|
|
|
|
|
|
|
|
|
|
|
|
|
|
|
|
|
|
|
|
|
|
|
|
|
|
|
|
|
|
Section 6 |
|
|
|
|
|
|
|
|
This section provides the Funds’ financial performance for the past five fiscal periods. |
|
|
|
|
|
|
|
|
|
|
|
|
|
|
|
|
|
|
|
|
|
|
|
|
|
|
|
|
|
|
|
|
|
|
|
|
|
|
|
|
|
|
|
|
|
|
|
|
|
|
|
|
|
|
|
|
|
|
|
|
|
|
|
|
|
|
|
|
|
|
|
|
|
|
|
|
|
|
|
|
|
|
|
|
|
|
|
|
|
|
|
|
|
|
|
|
|
|
Section 7 |
|
|
|
|
|
|
|
|
This section tells you how to obtain additional information relating to the Funds. |
|
|
|
|
|
|
|
|
|
|
|
|
|
|
|
|
|
|
|
|
|
TIMOTHY PLAN FAMILY OF FUNDS
|
|
|
|
|
CLASS A: TAAGX |
|
|
|
CLASS C: TCAGX |
The investment objective of this Fund is to provide you with long-term growth of capital.
This table describes the fees and expenses that you may pay if you buy and hold shares of the Fund. You may pay other fees, such as brokerage commissions and other fees to financial intermediaries, which are not reflected in the tables and examples below. You may qualify for sales charge discounts if you and your family invest, or agree to invest in the future, at least $50,000 in Timothy Plan Funds. More information about these and other discounts is available from your financial professional and in “How to Reduce Your Sales Charge” on page 84 of the Prospectus and “Purchase, Redemption, and Pricing of Shares” on page 38 of the Funds’ Statement of Additional Information.
(Fees paid directly from your investment)
|
|
|
|
|
|
|
|
|
| |
|
Class A |
|
|
Class C |
|
Maximum sales charge (load) imposed on purchases |
|
|
5.50% |
|
|
|
None |
|
Maximum deferred sales charges (load) (as a percentage of the lesser of original purchase price or redemption proceeds) (1) |
|
|
None |
|
|
|
1.00% |
|
|
|
|
None |
|
|
|
None |
|
|
|
|
None |
|
|
|
None |
|
Annual Fund Operating Expenses
(Expenses that you pay each year as a percentage of the value of your investment)
|
|
|
|
|
|
|
|
|
| |
|
Class A |
|
|
Class C |
|
|
|
|
0.85% |
|
|
|
0.85% |
|
Distribution/Service (12b-1 Fees) |
|
|
0.25% |
|
|
|
1.00% |
|
|
|
|
0.61% |
|
|
|
0.61% |
|
Acquired Funds Fees and Expenses (2) |
|
|
0.01% |
|
|
|
0.01% |
|
Total Annual Fund Operating Expenses |
|
|
1.72% |
|
|
|
2.47% |
|
(1) |
A one percent (1%) contingent deferred sales charge is imposed on any Class C shares sold within the first thirteen months after purchase. The Trust’s Distributor, Timothy Partners, Ltd., will pay a finders’ fee of 1% of the proceeds invested to brokers that purchase shares of the Funds in amounts from $1 million to $2 million, 0.75% on the next $1 million, 0.50% on the next $2 million, and 0.25% on all amounts in excess of $5 million. In such cases, those purchases will be subject to a contingent deferred sales charge of 1% for 18 months after the date of purchase. |
(2) |
Acquired Funds Fees and Expenses are the indirect costs of investing in other investment companies. Total Annual Fund Operating Expenses do not correlate to the ratio of average net assets in the Financial Highlights Table, which reflects the operating expenses of the Fund and does not include Acquired Funds Fees and Expenses. |
This Example is intended to help you compare the cost of investing in the Fund with the cost of investing in other mutual funds. For each share class offered, the Example assumes that you invest $10,000 in the Fund for the time periods indicated and then redeem all of your shares at the end of those periods. The Example also assumes that your investment has a 5% return each year and annual Fund operating expenses remain the same for each share class. Although your actual costs may be higher or lower, based on these assumptions your costs would be:
|
|
|
|
|
|
|
| |
|
|
|
|
|
|
|
|
$ 715 |
|
$ 350 |
|
$250 |
|
|
$1,062 |
|
$770 |
|
$770 |
|
|
$1,432 |
|
$1,316 |
|
$1,316 |
|
|
$2,469 |
|
$2,806 |
|
$2,806 |
The Example does not reflect sales charges (loads) on reinvested dividends and other distributions. If these sales charges (loads) were included, your costs would be higher.
The Fund pays transaction costs, such as commissions, when it buys and sells securities (or “turns over” its portfolio). A higher portfolio turnover rate may indicate higher transaction costs and may result in higher taxes when Fund shares are held in a taxable account. These costs, which are not reflected in annual Fund operating expenses or in the Example, affect the Fund’s performance. During the Fund’s most recent fiscal year, the Fund’s portfolio turnover rate was 96% of the average value of its portfolio.
PRINCIPAL INVESTMENT STRATEGIES
|
|
The Fund seeks to achieve its investment strategy by normally investing at least 80% of the Fund’s total assets in U.S. common stocks without regard to market capitalizations. |
|
|
The Fund invests using a growth investing style. Growth funds generally focus on stocks of companies believed to have above-average potential for growth in revenue, earnings, cash flow, or other similar criteria. These stocks typically have low dividend yields and above- average prices in relation to such measures as earnings and book value. Growth and value stocks have historically produced similar long-term returns, though each category has periods when it outperforms the other. |
|
|
The Fund invests its assets in the securities of a limited number of companies, which the Fund’s Investment Manager believes show a high probability for superior growth. Companies that meet or exceed specific criteria established by the Manager in the selection process are purchased. Securities are sold when they reach internally determined pricing targets or no longer qualify under the Manager’s investment criteria. |
|
|
The Fund may, from time to time, take temporary defensive positions that are inconsistent with the Fund’s principal investment strategies in attempting to respond to adverse market, economic, political, or other conditions. When the Fund takes a defensive position, the Fund’s assets will be held in cash and/or cash equivalents. |
|
|
The Fund will not invest in Excluded Securities. Excluded Securities are securities issued by any company that is involved in the production or wholesale distribution of alcohol, tobacco, or gambling equipment, gambling enterprises, or which is involved, either directly or indirectly, in abortion or pornography, or promoting anti-family entertainment or alternative lifestyles. |
1. |
As with most other mutual funds, you can lose money by investing in this Fund. Share prices fluctuate from day to day, and when you sell your shares, they may be worth less than you paid for them. |
2. |
The Fund is an equity fund, so it is subject to the risks inherent in the stock market in general. The stock market is cyclical, with prices generally rising and falling over periods of time. Some of these price cycles can be pronounced and last for a long time. |
3. |
Larger Company Investing Risk Larger, more established companies may be unable to respond quickly to new competitive challenges like changes in consumer tastes or innovative smaller competitors. Also, larger companies are sometimes unable to attain the high growth rates of successful, smaller companies, especially during extended periods of economic expansion. |
4. |
Smaller Company Investing Risk Investing in smaller companies often involves greater risk than investing in larger companies. Smaller companies may not have the management experience, financial resources, product diversification and competitive strengths of larger companies. The securities of smaller companies, therefore, tend to be more volatile than the securities of larger, more established companies. Smaller company stocks tend to be bought and sold less often and in smaller amounts than larger company stocks. Because of this, if a fund wants to sell a large quantity of a small-sized company’s stock, it may have to sell at a lower price than would otherwise be indicated, or it may have to sell in smaller than desired quantities over an increased time period. |
5. |
Because the Fund does not invest in Excluded Securities and will divest itself of securities that are subsequently discovered to be ineligible, the Fund may be riskier than other funds that invest in a broader array of securities. |
6. |
The Fund often invests in companies after assessing their growth potential. Securities of growth companies may be more volatile than other stocks. If the portfolio manager’s perception of a company’s growth potential is not realized, the securities purchased may not perform as expected, reducing the Fund’s return. In addition, because different types of stocks tend to shift in and out of favor depending on market and economic conditions, “growth” stocks may perform differently from the market as a whole and other types of securities. |
7. |
Investing In Other Funds Risk The Fund invests in the securities of other investment companies. To the extent that the Fund invests in other mutual funds, exchange traded funds and other commingled funds, it will indirectly bear the expenses of those funds, which will cause the Fund’s return to be lower. |
8. |
High Portfolio Turnover Risk The Fund has in the past experienced high portfolio turnover (greater than 100%). A higher portfolio turnover rate may indicate higher transaction costs and may result in higher taxes when Fund shares are held in a taxable account. These costs, which are not reflected in annual Fund operating expenses or in the Example, affect the Fund’s performance |
9. |
Despite the various protections utilized by the Fund and its service providers, systems, networks, or devices utilized by the Fund potentially can be breached. The Fund and its shareholders could be negatively impacted as a result of a cybersecurity breach. |
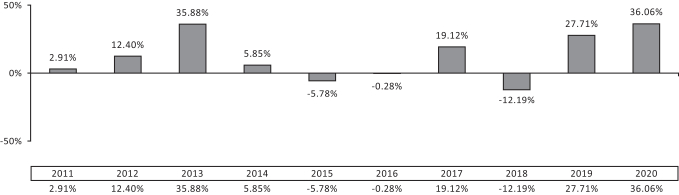
The following bar chart and table provide some indication of the risks of investing in the Fund by showing the variability of the Fund’s performance from year to year and by comparing the Fund’s performance to a broad based index.
The Fund’s past performance (before and after taxes) is not necessarily an indication of how the Fund will perform in the future. More up-to-date returns are available on the Fund’s website at
www.timothyplan.com, or by calling the Fund at
(800) 846-7526.
The bar chart does not reflect sales charges. If these charges were reflected, the returns would be less than those shown.
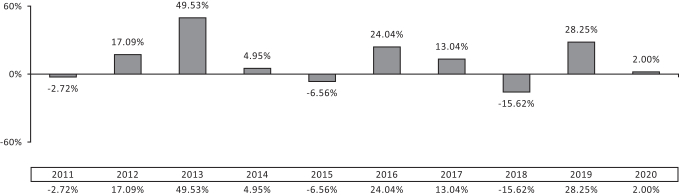
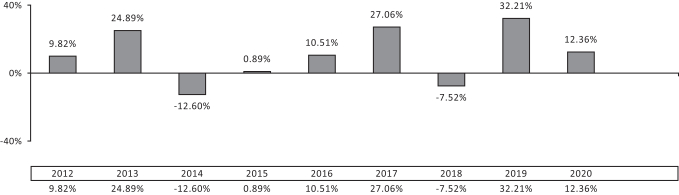
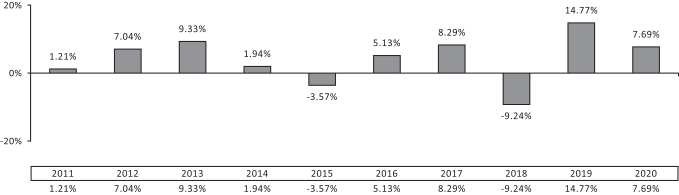
Year-by-year Annual Total Returns for Class A Shares
(for calendar years ending on December 31)
Average Annual Total Returns
(for periods ending on December 31, 2020)
|
|
|
|
|
|
|
|
|
|
|
|
|
Aggressive Growth |
|
Class A (3) |
|
Class C |
|
|
1 Year |
|
5 Year |
|
10 Year |
|
1 Year |
|
5 Year |
|
10 Year |
Return before taxes |
|
28.53% |
|
11.36% |
|
10.38% |
|
34.15% |
|
11.79% |
|
10.18% |
Return after taxes on distributions (1) |
|
26.80% |
|
10.69% |
|
9.23% |
|
31.87% |
|
10.96% |
|
8.84% |
Return after taxes on distributions and sale of shares (1) |
|
18.03% |
|
8.91% |
|
8.22% |
|
21.72% |
|
9.24% |
|
8.00% |
Russell Midcap Growth Total Return Index (2) (reflects no deduction for fees, expenses or taxes) |
|
35.59% |
|
18.66% |
|
15.04% |
|
35.59% |
|
18.66% |
|
15.04% |
(1) |
After-tax returns are calculated using the historical highest individual federal marginal income tax rates and do not reflect the impact of state and local taxes. After-tax returns depend on an investor’s tax situation and may differ from those shown. After-tax returns shown are not relevant to investors who hold their Fund shares through tax-deferred arrangements, such as 401(k) plans or individual retirement accounts. |
(2) |
The Russell Midcap Growth Total Return Index is a widely recognized, unmanaged index of Mid Capitalization growth companies in the United States. The Index assumes reinvestment of all dividends and distributions and does not reflect any asset-based charges for investment management or other expenses. |
(3) |
Class A share returns reflect the assessment of the maximum front-end sales load on the first business day of the year. |
Chartwell Investment Partners serves as Investment Manager to the Fund.
Frank L. Sustersic, CFA, Managing Partner, Senior Portfolio Manager of Chartwell, has been serving the Fund since December 1, 2016. Peter M. Schofield, CFA, Principal and Senior Portfolio Manager, has been serving the Fund since December 18, 2010.
PURCHASE AND SALE OF FUND SHARES
You may purchase, redeem or exchange shares of the Fund on any business day, which is any day the New York Stock Exchange is open for business. You may purchase, redeem or exchange shares of the Fund either through a financial advisor or directly from the Fund. The minimum initial purchase or exchange into the Fund is $1,000, or $50 through monthly systematic investment plan accounts. There is no minimum subsequent investment amount. There are no minimums for purchases or exchanges through employer-sponsored retirement plans, IRAs, or other qualified plans. The Fund shares are redeemable on any business day by contacting your financial advisor, or by written request to the Fund, by telephone, or by wire transfer.
The Fund intends to make distributions that may be taxed as ordinary income or capital gains.
PAYMENTS TO BROKER-DEALERS AND OTHER FINANCIAL INTERMEDIARIES
If you purchase shares of the Fund through a broker-dealer or other financial intermediary (such as a bank), the Fund and its distributor may pay the intermediary for the sale of Fund shares and related services. These payments may create a conflict of interest by influencing the broker-dealer or other financial intermediary and your sales person to recommend the Fund over another investment. Ask your sales person or visit your financial intermediary’s website for more information.
TIMOTHY PLAN FAMILY OF FUNDS
|
|
|
|
|
CLASS A: TPIAX |
|
|
|
CLASS C: TPICX |
The investment objective of this Fund is to provide you with long-term growth of capital.
This table describes the fees and expenses that you may pay if you buy and hold shares of the Fund. You may pay other fees, such as brokerage commissions and other fees to financial intermediaries, which are not reflected in the tables and examples below. You may qualify for sales charge discounts if you and your family invest, or agree to invest in the future, at least $50,000 in Timothy Plan Funds. More information about these and other discounts is available from your financial professional and in “How to Reduce Your Sales Charge” on page 84 of the prospectus and “Purchase, Redemption, and Pricing of Shares” on page 38 of the Funds’ Statement of Additional Information.
(Fees paid directly from your investment)
|
|
|
|
|
| |
|
Class A |
|
Class C |
Maximum sales charge (load) on purchases |
|
5.50% |
|
None |
Maximum deferred sales charges (load) (as a percentage of the lesser of original purchase price or redemption proceeds) (1) |
|
None |
|
1.00% |
Redemption fees |
|
None |
|
None |
Exchange fees |
|
None |
|
None |
Annual Fund Operating Expenses
(Expenses that you pay each year as a percentage of the value of your investment)
|
|
|
|
|
|
|
|
|
| |
|
Class A |
|
|
Class C |
|
|
|
|
1.00% |
|
|
|
1.00% |
|
Distribution/Service (12b-1 Fees) |
|
|
0.25% |
|
|
|
1.00% |
|
|
|
|
0.51% |
|
|
|
0.51% |
|
Fees and Expenses of Acquired Funds (2) |
|
|
0.01% |
|
|
|
0.01% |
|
Total Annual Fund Operating Expenses |
|
|
1.77% |
|
|
|
2.52% |
|
(1) |
A one percent (1%) contingent deferred sales charge is imposed on any Class C shares sold within the first thirteen months after purchase. The Trust’s Distributor, Timothy Partners, Ltd., will pay a finders’ fee of 1% of the proceeds invested to brokers that purchase shares of the Funds in amounts from $1 million to $2 million, 0.75% on the next $1 million, 0.50% on the next $2 million, and 0.25% on all amounts in excess of $5 million. In such cases, those purchases will be subject to a contingent deferred sales charge of 1% for 18 months after the date of purchase. |
(2) |
Acquired Funds Fees and Expenses are the indirect costs of investing in other investment companies. Total Annual Fund Operating Expenses do not correlate to the ratio of average net assets in the Financial Highlights Table, which reflects the operating expenses of the Fund and does not include Acquired Funds Fees and Expenses. |
This Example is intended to help you compare the cost of investing in the Fund with the cost of investing in other mutual funds. For each share class offered, the Example assumes that you invest $10,000 in the Fund for the time periods indicated and then redeem all of your shares at the end of those periods. The Example also assumes that your investment has a 5% return each year and annual Fund operating expenses remain the same for each share class. Although your actual costs may be higher or lower, based on these assumptions your costs would be:
|
|
|
|
|
|
|
| |
|
|
|
|
|
|
|
|
$720 |
|
$355 |
|
$255 |
|
|
$1,077 |
|
$785 |
|
$785 |
|
|
$1,457 |
|
$1,340 |
|
$1,340 |
|
|
$2,519 |
|
$2,856 |
|
$2,856 |
The Example does not reflect sales charges (loads) on reinvested dividends and other distributions. If these sales charges (loads) were included, your costs would be higher.
The Fund pays transaction costs, such as commissions, when it buys and sells securities (or “turns over” its portfolio). A higher portfolio turnover rate may indicate higher transaction costs and may result in higher taxes when Fund shares are held in a taxable account. These costs, which are not reflected in annual Fund operating expenses or in the Example, affect the Fund’s performance. During the Fund’s most recent fiscal year, the Fund’s portfolio turnover rate was 25% of the average value of its portfolio.
PRINCIPAL INVESTMENT STRATEGIES
|
|
The Fund seeks to achieve its investment objectives by normally investing at least 80% of the Fund’s total assets in the securities of foreign companies (companies domiciled in countries other than the United States), without regard to market capitalizations. |
|
|
The Fund invests using a growth investing style. Growth funds generally focus on stocks of companies believed to have above-average potential for growth in revenue, earnings, cash flow, or other similar criteria. These stocks typically have low dividend yields and above- average prices in relation to such measures as earnings and book value. Growth and value stocks have historically produced similar long-term returns, though each category has periods when it outperforms the other. |
|
|
The Fund invests its assets in companies which the Fund’s Investment Manager believes show a high probability for superior growth. Companies that meet or exceed specific criteria established by the Manager in the selection process are purchased. Securities are sold when they reach internally determined pricing targets or no longer qualify under the Manager’s investment criteria. |
|
|
The Fund allocates investments across countries and regions at the Manager’s discretion. |
|
|
The Fund may, from time to time, take temporary defensive positions that are inconsistent with the Fund’s principal investment strategies in attempting to respond to adverse market, economic, political, or other conditions. When the Fund takes a defensive position, the Fund’s assets will be held in cash and/or cash equivalents. |
|
|
The Fund will not invest in Excluded Securities. Excluded Securities are securities issued by any company that is involved in the production or wholesale distribution of alcohol, tobacco, or gambling equipment, gambling enterprises, or which is involved, either directly or indirectly, in abortion or pornography, or promoting anti-family entertainment or alternative lifestyles |
1. |
As with most other mutual funds, you can lose money by investing in this Fund. Share prices fluctuate from day to day, and when you sell your shares, they may be worth less than you paid for them. |
2. |
The Fund is an equity fund, so it is subject to the risks inherent in the stock market in general. The stock market is cyclical, with prices generally rising and falling over periods of time. Some of these price cycles can be pronounced and last for a long time. |
3. |
The Fund’s investments in foreign securities may experience more rapid and extreme changes in value than funds with investments solely in securities of U.S. companies. This is because the securities markets of many foreign countries are relatively small, with a limited number of companies representing a smaller number of industries. Foreign issuers are not subject to the same degree of regulation as U.S. issuers. Also, nationalization, expropriation or confiscatory taxation or political changes could adversely affect the Fund’s investments in a foreign country. The Fund may invest in emerging markets. Emerging markets expose the Fund to additional risks due to the lack of historical or regulatory controls. |
4. |
The value of an individual security or a particular type of security can be more volatile than the market as a whole and can perform differently from the value of the market as a whole. |
5. |
Because the securities represented by ADRs are foreign stocks denominated in non-U.S. currency, there is a risk that fluctuations in the exchange rates between the U.S. dollar and foreign currencies may negatively affect the value of the Fund’s investments in foreign securities. |
6. |
Larger Company Investing Risk Larger, more established companies may be unable to respond quickly to new competitive challenges like changes in consumer tastes or innovative smaller competitors. Also, larger companies are sometimes unable to attain the high growth rates of successful, smaller companies, especially during extended periods of economic expansion. |
7. |
Smaller Company Investing Risk Investing in smaller companies often involves greater risk than investing in larger companies. Smaller companies may not have the management experience, financial resources, product diversification and competitive strengths of larger companies. The securities of smaller companies, therefore, tend to be more volatile than the securities of larger, more established companies. Smaller company stocks tend to be bought and sold less often and in smaller amounts than larger company stocks. Because of this, if a fund wants to sell a large quantity of a small-sized company’s stock, it may have to sell at a lower price than would otherwise be indicated, or it may have to sell in smaller than desired quantities over an increased time period. |
8. |
Because the Fund does not invest in Excluded Securities and will divest itself of securities that are subsequently discovered to be ineligible, the Fund may be riskier than other funds that invest in a broader array of securities. |
9. |
The Fund often invests in companies after assessing their growth potential. Securities of growth companies may be more volatile than other stocks. If the portfolio manager’s perception of a company’s growth potential is not realized, the securities purchased may not perform as expected, reducing the Fund’s return. In addition, because different types of stocks tend to shift in and out of favor depending on market and economic conditions, “growth” stocks may perform differently from the market as a whole and other types of securities. |
10. |
Despite the various protections utilized by the Fund and its service providers, systems, networks, or devices utilized by the Fund potentially can be breached. The Fund and its shareholders could be negatively impacted as a result of a cybersecurity breach. |
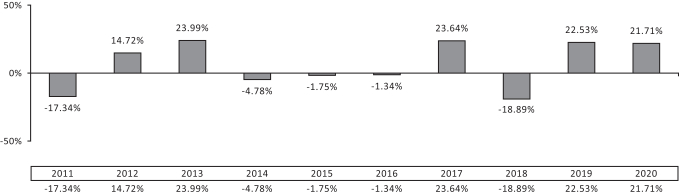
The following bar chart and table provide some indication of the risks of investing in the Fund by showing the variability of the Fund’s performance from year to year and by comparing the Fund’s performance to a broad based index. The Fund’s past performance (before and after taxes) is not necessarily an indication of how the Fund will perform in the future. More up-to-date returns are available on the Fund’s website at www.timothyplan.com, or by calling the Fund at (800) 846-7526.
The bar chart does not reflect sales charges. If these charges were reflected, the returns would be less than those shown.
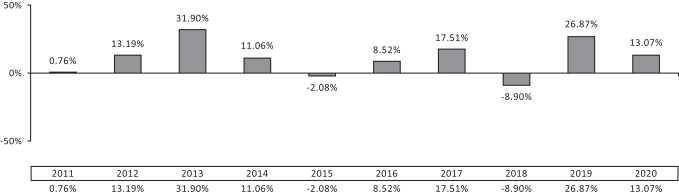
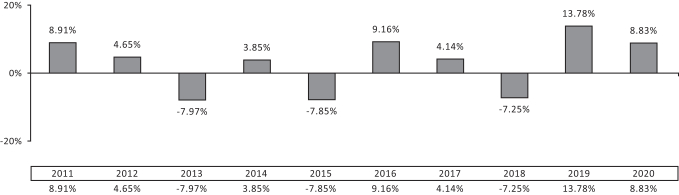
Year-by-year Annual Total Returns for Class A Shares
(for calendar years ending on December 31)
Average Annual Total Returns
(for periods ending on December 31, 2020)
|
|
|
|
|
|
|
|
|
|
|
|
|
International |
|
Class A (3) |
|
Class C |
|
|
1 Year |
|
5 Years |
|
10 Years |
|
1 Year |
|
5 Years |
|
10 Years |
Return before taxes |
|
15.03% |
|
6.86% |
|
4.38% |
|
19.82% |
|
7.29% |
|
4.19% |
Return after taxes on distributions (1) |
|
15.03% |
|
6.61% |
|
4.02% |
|
19.82% |
|
7.18% |
|
3.98% |
Return after taxes on distributions and sale of shares (1) |
|
8.90% |
|
5.34% |
|
3.34% |
|
11.73% |
|
5.70% |
|
3.24% |
(reflects no deduction for fees, expenses or taxes) |
|
5.43% |
|
4.59% |
|
2.62% |
|
5.43% |
|
4.59% |
|
2.62% |
MSCI AC World Index ex USA Net (USD) (2) (reflects no deduction for fees, expenses or taxes) |
|
10.65% |
|
8.93% |
|
4.92% |
|
10.65% |
|
8.93% |
|
4.92% |
(1) |
After-tax returns are calculated using the historical highest individual federal marginal income tax rates and do not reflect the impact of state and local taxes. After-tax returns depend on an investor’s tax situation and may differ from those shown. After-tax returns shown are not relevant to investors who hold their Fund shares through tax-deferred arrangements, such as 401(k) plans or individual retirement accounts. |
(2) |
The MSCI EAFE Index is a widely recognized unmanaged index of equity prices and is representative of equity market performance of developed countries, excluding the U.S. and Canada. The MSCI ACWI ex USA Index captures large and mid cap representation across 22 of 23 Developed Markets (DM) countries (excluding the US) and 26 Emerging Markets (EM) countries. With 2,377 constituents, the index covers approximately 85% of the global equity opportunity set outside the US. Performance figures include the change in value of the stocks in the index and the reinvestment of dividends. |
(3) |
Class A share returns reflect the assessment of the maximum front-end sales load on the first business day of the year. |
Eagle Global Advisors, LLC serves as Investment Manager to the Fund.
Edward R. Allen III, PhD., CFA, Senior Partner; Thomas N. Hunt III, CFA, CPA, Senior Partner; Steven S. Russo, Senior Partner; and John F Gualy, CFA, Partner, of Eagle, have served the Fund since May 1, 2007.
PURCHASE AND SALE OF FUND SHARES
You may purchase, redeem or exchange shares of the Fund on any business day, which is any day the New York Stock Exchange is open for business. You may purchase, redeem or exchange shares of the Fund either through a financial advisor or directly from the Fund. The minimum initial purchase or exchange into the Fund is $1,000, or $50 through monthly systematic investment plan accounts. There is no minimum subsequent investment amount. There are no minimums for purchases or exchanges through employer-sponsored retirement plans, IRAs, or other qualified plans. The Fund shares are redeemable on any business day by contacting your financial advisor, or by written request to the Fund, by telephone, or by wire transfer.
The Fund intends to make distributions that may be taxed as ordinary income or capital gains.
PAYMENTS TO BROKER-DEALERS AND OTHER FINANCIAL INTERMEDIARIES
If you purchase shares of the Fund through a broker-dealer or other financial intermediary (such as a bank), the Fund and its distributor may pay the intermediary for the sale of Fund shares and related services. These payments may create a conflict of interest by influencing the broker-dealer or other financial intermediary and your sales person to recommend the Fund over another investment. Ask your sales person or visit your financial intermediary’s website for more information.
TIMOTHY PLAN FAMILY OF FUNDS
Large/Mid Cap Growth Fund
|
|
|
|
|
CLASS A: TLGAX |
|
|
|
CLASS C: TLGCX |
The investment objective of this Fund is to provide you with long-term growth of capital.
This table describes the fees and expenses that you may pay if you buy and hold shares of the Fund. You may pay other fees, such as brokerage commissions and other fees to financial intermediaries, which are not reflected in the tables and examples below. You may qualify for sales charge discounts if you and your family invest, or agree to invest in the future, at least $50,000 in Timothy Plan Funds. More information about these and other discounts is available from your financial professional and in “How to Reduce Your Sales Charge” on page 84 of the Prospectus and “Purchase, Redemption, and Pricing of Shares” on page 38 of the Funds’ Statement of Additional Information.
(Fees paid directly from your investment)
|
|
|
|
|
|
|
|
|
| |
|
Class A |
|
|
Class C |
|
Maximum sales charge (load) on purchases |
|
|
5.50% |
|
|
|
None |
|
Maximum deferred sales charges (load) (as a percentage of the lesser of original purchase price or redemption proceeds) (1) |
|
|
None |
|
|
|
1.00% |
|
|
|
|
None |
|
|
|
None |
|
|
|
|
None |
|
|
|
None |
|
Annual Fund Operating Expenses
(Expenses that you pay each year as a percentage of the value of your investment)
|
|
|
|
|
|
|
|
|
| |
|
Class A |
|
|
Class C |
|
|
|
|
0.85% |
|
|
|
0.85% |
|
Distribution/Service (12b-1 Fees) |
|
|
0.25% |
|
|
|
1.00% |
|
|
|
|
0.44% |
|
|
|
0.44% |
|
Fees and Expenses of Acquired Funds (2) |
|
|
0.11% |
|
|
|
0.11% |
|
Total Annual Fund Operating Expenses |
|
|
1.65% |
|
|
|
2.40% |
|
(1) |
A one percent (1%) contingent deferred sales charge is imposed on any Class C shares sold within the first thirteen months after purchase. The Trust’s Distributor, Timothy Partners, Ltd., will pay a finders’ fee of 1% of the proceeds invested to brokers that purchase shares of the Funds in amounts from $1 million to $2 million, 0.75% on the next $1 million, 0.50% on the next $2 million, and 0.25% on all amounts in excess of $5 million. In such cases, those purchases will be subject to a contingent deferred sales charge of 1% for 18 months after the date of purchase. |
(2) |
Acquired Funds Fees and Expenses are the indirect costs of investing in other investment companies. Total Annual Fund Operating Expenses do not correlate to the ratio of average net assets in the Financial Highlights Table, which reflects the operating expenses of the Fund and does not include Acquired Funds Fees and Expenses. |
This Example is intended to help you compare the cost of investing in the Fund with the cost of investing in other mutual funds. For each share class offered, the Example assumes that you invest $10,000 in the Fund for the time periods indicated and then redeem all of your shares at the end of those periods. The Example also assumes that your investment has a 5% return each year and annual Fund operating expenses remain the same for each share class. Although your actual costs may be higher or lower, based on these assumptions your costs would be:
|
|
|
|
|
|
|
| |
|
|
|
|
|
|
|
|
$709 |
|
$343 |
|
$243 |
|
|
$1,042 |
|
$748 |
|
$748 |
|
|
$1,398 |
|
$1,280 |
|
$1,280 |
|
|
$2,397 |
|
$2,736 |
|
$2,736 |
The Example does not reflect sales charges (loads) on reinvested dividends and other distributions. If these sales charges (loads) were included, your costs would be higher.
The Fund pays transaction costs, such as commissions, when it buys and sells securities (or “turns over” its portfolio). A higher portfolio turnover rate may indicate higher transaction costs and may result in higher taxes when Fund shares are held in a taxable account. These costs, which are not reflected in annual Fund operating expenses or in the Example, affect the Fund’s performance. During the Fund’s most recent fiscal year, the Fund’s portfolio turnover rate was 23% of the average value of its portfolio.
PRINCIPAL INVESTMENT STRATEGIES
|
|
The Fund seeks to achieve its investment objective by primarily investing at least 80% of the Fund’s total assets in larger U.S. stocks. Larger stocks refer to the common stock of companies whose total market capitalization is generally greater than $2 billion. Current income is not a significant investment consideration and any such income realized will be considered incidental to the Fund’s investment objective. |
|
|
The Fund invests using a growth investing style. Growth funds generally focus on stocks of companies believed to have above-average potential for growth in revenue, earnings, cash flow, or other similar criteria. These stocks typically have low dividend yields and above- average prices in relation to such measures as earnings and book value. Growth and value stocks have historically produced similar long-term returns, though each category has periods when it outperforms the other. |
|
|
The Fund normally invests in a portfolio of securities which includes a broadly diversified number of common stocks that the Fund’s Investment Manager believes show a high probability of superior prospects for above average growth. The Fund’s Investment Manager chooses these securities using a “bottom up” approach of extensively analyzing the financial, management and overall economic conditions of each potential investment. Companies that meet or exceed specific criteria established by the Manager in the selection process are purchased. Securities are sold when they reach internally determined pricing targets or no longer qualify under the Manager’s investment criteria. |
|
|
The Fund may, from time to time, take temporary defensive positions that are inconsistent with the Fund’s principal investment strategies in attempting to respond to adverse market, economic, political, or other conditions. When the Fund takes a defensive position, the Fund’s assets will be held in cash and/or cash equivalents. |
|
|
The Fund will not invest in Excluded Securities. Excluded Securities are securities issued by any company that is involved in the production or wholesale distribution of alcohol, tobacco, or gambling equipment, gambling enterprises, or which is involved, either directly or indirectly, in abortion or pornography, or promoting anti-family entertainment or alternative lifestyles. |
1. |
As with most other mutual funds, you can lose money by investing in this Fund. Share prices fluctuate from day to day, and when you sell your shares, they may be worth less than you paid for them. |
2. |
The Fund is an equity fund, so it is subject to the risks inherent in the stock market in general. The stock market is cyclical, with prices generally rising and falling over periods of time. Some of these price cycles can be pronounced and last for a long time. |
3. |
Because the Fund does not invest in Excluded Securities and will divest itself of securities that are subsequently discovered to be ineligible, the Fund may be riskier than other funds that invest in a broader array of securities. |
4. |
The Fund often invests in companies after assessing their growth potential. Securities of growth companies may be more volatile than other stocks. If the portfolio manager’s perception of a company’s growth potential is not realized, the securities purchased may not perform as expected, reducing the Fund’s return. In addition, because different types of stocks tend to shift in and out of favor depending on market and economic conditions, “growth” stocks may perform differently from the market as a whole and other types of securities. |
5. |
Larger Company Investing Risk Larger, more established companies may be unable to respond quickly to new competitive challenges like changes in consumer tastes or innovative smaller competitors. Also, larger companies are sometimes unable to attain the high growth rates of successful, smaller companies, especially during extended periods of economic expansion. |
6. |
Mid-Sized Company Investing Risk Investing in mid-sized companies often involves greater risk than investing in larger companies. Mid-sized companies may not have the management experience, financial resources, product diversification and competitive strengths of larger companies. The securities of mid-sized companies, therefore, tend to be more volatile than the securities of larger, more established companies. Mid-sized company stocks tend to be bought and sold less often and in smaller amounts than larger company stocks. Because of this, if a fund wants to sell a large quantity of a mid-sized company’s stock, it may have to sell at a lower price than would otherwise be indicated, or it may have to sell in smaller than desired quantities over an increased time period. |
7. |
Despite the various protections utilized by the Fund and its service providers, systems, networks, or devices utilized by the Fund potentially can be breached. The Fund and its shareholders could be negatively impacted as a result of a cybersecurity breach. |
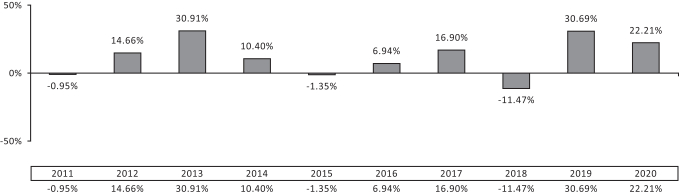
The following bar chart and table provide some indication of the risks of investing in the Fund by showing the variability of the Fund’s performance from year to year and by comparing the Fund’s performance to a broad based index. The Fund’s past performance (before and after taxes) is not necessarily an indication of how the Fund will perform in the future. More up-to-date returns are available on the Fund’s website at www.timothyplan.com, or by calling the Fund at (800) 846-7526.
The bar chart does not reflect sales charges. If these charges were reflected, the returns would be less than those shown.
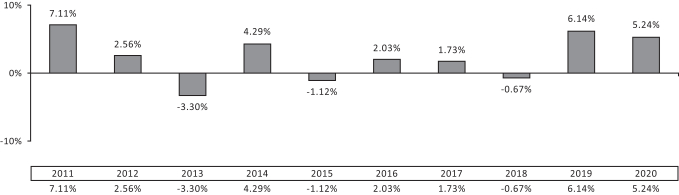
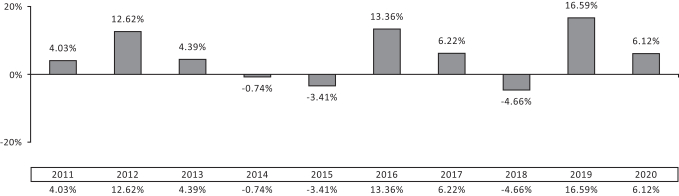
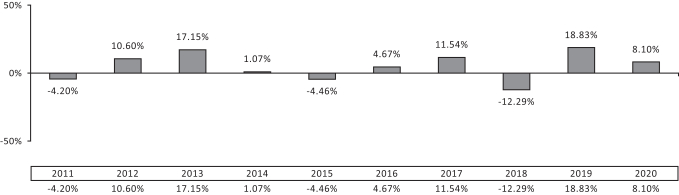
Year-by-year Annual Total Returns for Class A Shares
(for calendar years ending on December 31)
Average Annual Total Returns
(for periods ending on December 31, 2020)
|
|
|
|
|
|
|
|
|
|
|
|
|
Large/Mid Cap Growth |
|
Class A (3) |
|
Class C |
|
|
1 Year |
|
5 Years |
|
10 Years |
|
1 Year |
|
5 Years |
|
10 Years |
Return before taxes |
|
15.52% |
|
10.81% |
|
10.47% |
|
20.33% |
|
11.21% |
|
10.25% |
Return after taxes on distributions (1) |
|
15.05% |
|
10.03% |
|
8.95% |
|
19.69% |
|
10.24% |
|
8.50% |
Return after taxes on distributions and sale of shares (1) |
|
9.50% |
|
8.43% |
|
8.07% |
|
12.46% |
|
8.73% |
|
7.82% |
Russell 1000 Growth Total Return Index (2) (reflects no deduction for fees, expenses or taxes) |
|
38.49% |
|
21.00% |
|
17.21% |
|
38.49% |
|
21.00% |
|
17.21% |
(1) |
After-tax returns are calculated using the historical highest individual federal marginal income tax rates and do not reflect the impact of state and local taxes. After-tax returns depend on an investor’s tax situation and may differ from those shown. After-tax returns shown are not relevant to investors who hold their Fund shares through tax-deferred arrangements, such as 401(k) plans or individual retirement accounts. |
(2) |
The Russell 1000 Growth Total Return Index is a widely recognized, unmanaged index of 1000 large-capitalization companies in the United States. The Index assumes reinvestment of all dividends and distributions and does not reflect any asset-based charges for investment management or other expenses. |
(3) |
Class A share returns reflect the assessment of the maximum front-end sales load on the first business day of the year. |
Chartwell Investment Partners serves as Investment Manager to the Fund.
Frank L. Sustersic, CFA, Managing Partner, Senior Portfolio Manager of Chartwell, has served the Fund since December 1, 2016. Peter M. Schofield, CFA, Principal and Senior Portfolio Manager, has been serving the Fund since December 18, 2010.
PURCHASE AND SALE OF FUND SHARES
You may purchase, redeem or exchange shares of the Fund on any business day, which is any day the New York Stock Exchange is open for business. You may purchase, redeem or exchange shares of the Fund either through a financial advisor or directly from the Fund. The minimum initial purchase or exchange into the Fund is $1,000, or $50 through monthly systematic investment plan accounts. There is no minimum subsequent investment amount. There are no minimums for purchases or exchanges through employer-sponsored retirement plans, IRAs, or other qualified plans. The Fund shares are redeemable on any business day by contacting your financial advisor, or by written request to the Fund, by telephone, or by wire transfer.
The Fund intends to make distributions that may be taxed as ordinary income or capital gains.
PAYMENTS TO BROKER-DEALERS AND OTHER FINANCIAL INTERMEDIARIES
If you purchase shares of the Fund through a broker-dealer or other financial intermediary (such as a bank), the Fund and its distributor may pay the intermediary for the sale of Fund shares and related services. These payments may create a conflict of interest by influencing the broker-dealer or other financial intermediary and your sales person to recommend the Fund over another investment. Ask your sales person or visit your financial intermediary’s website for more information.
TIMOTHY PLAN FAMILY OF FUNDS
|
|
|
|
|
CLASS A: TPLNX |
|
|
|
CLASS C: TSVCX |
The investment objective of this Fund is to provide you with long-term growth of capital, with a secondary objective of current income.
This table describes the fees and expenses that you may pay if you buy and hold shares of the Fund. You may pay other fees, such as brokerage commissions and other fees to financial intermediaries, which are not reflected in the tables and examples below. You may qualify for sales charge discounts if you and your family invest, or agree to invest in the future, at least $50,000 in Timothy Plan Funds. More information about these and other discounts is available from your financial professional and in “How to Reduce Your Sales Charge” on page 84 of the Prospectus and “Purchase, Redemption, and Pricing of Shares” on page 38 of the Funds’ Statement of Additional Information.
(Fees paid directly from your investment)
|
|
|
|
|
|
|
|
|
| |
|
Class A |
|
|
Class C |
|
Maximum sales charge (load) imposed on purchases |
|
|
5.50% |
|
|
|
None |
|
Maximum deferred sales charges (load) (as a percentage of the lesser of original purchase price or redemption proceeds) (1) |
|
|
None |
|
|
|
1.00% |
|
|
|
|
None |
|
|
|
None |
|
|
|
|
None |
|
|
|
None |
|
Annual Fund Operating Expenses
(Expenses that you pay each year as a percentage of the value of your investment)
|
|
|
|
|
|
|
|
|
| |
|
Class A |
|
|
Class C |
|
|
|
|
0.85% |
|
|
|
0.85% |
|
Distribution/Service (12b-1 Fees) |
|
|
0.25% |
|
|
|
1.00% |
|
|
|
|
0.47% |
|
|
|
0.47% |
|
Fees and Expenses of Acquired Funds (2) |
|
|
0.04% |
|
|
|
0.04% |
|
Total Annual Fund Operating Expenses |
|
|
1.61% |
|
|
|
2.36% |
|
(1) |
A one percent (1%) contingent deferred sales charge is imposed on any Class C shares sold within the first thirteen months after purchase. The Trust’s Distributor, Timothy Partners, Ltd., will pay a finders’ fee of 1% of the proceeds invested to brokers that purchase shares of the Funds in amounts from $1 million to $2 million, 0.75% on the next $1 million, 0.50% on the next $2 million, and 0.25% on all amounts in excess of $5 million. In such cases, those purchases will be subject to a contingent deferred sales charge of 1% for 18 months after the date of purchase. |
(2) |
Acquired Funds Fees and Expenses are the indirect costs of investing in other investment companies. Total Annual Fund Operating Expenses do not correlate to the ratio of average net assets in the Financial Highlights Table, which reflects the operating expenses of the Fund and does not include Acquired Funds Fees and Expenses. |
This Example is intended to help you compare the cost of investing in the Fund with the cost of investing in other mutual funds. For each share class offered, the Example assumes that you invest $10,000 in the Fund for the time periods indicated and then redeem all of your shares at the end of those periods. The Example also assumes that your investment has a 5% return each year and annual Fund operating expenses remain the same for each share class. Although your actual costs may be higher or lower, based on these assumptions your costs would be:
|
|
|
|
|
|
|
| |
|
Class A |
|
|
|
|
|
|
$705 |
|
$339 |
|
$239 |
|
|
$1,030 |
|
$736 |
|
$736 |
|
|
$1,378 |
|
$1,260 |
|
$1,260 |
|
|
$2,356 |
|
$2,696 |
|
$2,696 |
The Example does not reflect sales charges (loads) on reinvested dividends and other distributions. If these sales charges (loads) were included, your costs would be higher.
The Fund pays transaction costs, such as commissions, when it buys and sells securities (or “turns over” its portfolio). A higher portfolio turnover rate may indicate higher transaction costs and may result in higher taxes when Fund shares are held in a taxable account. These costs, which are not reflected in annual Fund operating expenses or in the Example, affect the Fund’s performance. During the Fund’s most recent fiscal year, the Fund’s portfolio turnover rate was 73% of the average value of its portfolio.
PRINCIPAL INVESTMENT STRATEGIES
|
|
The Fund seeks to achieve its investment objective by primarily investing at least 80% of the Fund’s total assets in U.S. stocks with market capitalizations that fall within the range of companies included in the Russell 2000 Index (the “Index”). As of June 30, 2020, the capitalization range of companies comprising the Index is approximately $48 million to $6 billion. This Fund invests using a value investing style. Value funds typically emphasize stocks whose prices are below average in relation to such measures as earnings and book value; these stocks often have above-average dividend yields. Growth and value stocks have historically produced similar long-term returns, though each category has periods when it outperforms the other. |
|
|
In determining whether to invest in a particular company, the Fund’s Investment Manager focuses on a number of different attributes of the company, including the company’s market expertise, balance sheet, improving return on equity, price to earnings ratios, industry position and strength, management and a number of other factors. Analyzing companies in this manner is known as a “bottom up” approach to investing. Companies that meet or exceed specific criteria established by the Manager in the selection process are purchased. Securities are sold when they reach internally determined pricing targets or no longer qualify under the Manager’s investment criteria. |
|
|
The Fund may invest in equity securities of foreign issuers in the form of American Depositary Receipts (ADRs). ADRs are certificates held in trust by a U.S. bank or trust company evidencing ownership of shares of foreign-based issuers and are an alternative to purchasing foreign securities in their national market and currency. |
|
|
The Fund may, from time to time, take temporary defensive positions that are inconsistent with the Fund’s principal investment strategies in attempting to respond to adverse market, economic, political, or other conditions. When the Fund takes a defensive position, the Fund’s assets will be held in cash and/or cash equivalents. |
|
|
The Fund will not invest in Excluded Securities. Excluded Securities are securities issued by any company that is involved in the production or wholesale distribution of alcohol, tobacco, or gambling equipment, gambling enterprises, or which is involved, either directly or indirectly, in abortion or pornography, or promoting anti-family entertainment or alternative lifestyles. |
1. |
As with most other mutual funds, you can lose money by investing in this Fund. Share prices fluctuate from day to day, and when you sell your shares, they may be worth less than you paid for them. |
2. |
The Fund is an equity fund, so it is subject to the risks inherent in the stock market in general. The stock market is cyclical, with prices generally rising and falling over periods of time. Some of these price cycles can be pronounced and last for a long time. |
3. |
Smaller Company Investing Risk Investing in smaller companies often involves greater risk than investing in larger companies. Smaller companies may not have the management experience, financial resources, product diversification and competitive strengths of larger companies. The securities of smaller companies, therefore, tend to be more volatile than the securities of larger, more established companies. Smaller company stocks tend to be bought and sold less often and in smaller amounts than larger company stocks. Because of this, if a fund wants to sell a large quantity of a small-sized company’s stock, it may have to sell at a lower price than would otherwise be indicated, or it may have to sell in smaller than desired quantities over an increased time period. |
4. |
Because the Fund does not invest in Excluded Securities and will divest itself of securities that are subsequently discovered to be ineligible, the Fund may be riskier than other funds that invest in a broader array of securities. |
5. |
The Fund’s investments in foreign securities may experience more rapid and extreme changes in value than funds with investments solely in securities of U.S. companies. This is because the securities markets of many foreign countries are relatively small, with a limited number of companies representing a smaller number of industries. Foreign issuers are not subject to the same degree of regulation as U.S. issuers. Also, nationalization, expropriation or confiscatory taxation or political changes could adversely affect the Fund’s investments in a foreign country. There is a risk that fluctuations in the exchange rates between the U.S. dollar and foreign currencies may negatively affect the value of the Fund’s investments in foreign securities. |
6. |
Because different types of stocks tend to shift in and out of favor depending on market and economic conditions, “value” stocks may perform differently from the market as a whole and other types of stocks and can continue to be undervalued by the market for long periods of time. It is also possible that a value stock may never appreciate to the extent expected. |
7. |
Despite the various protections utilized by the Fund and its service providers, systems, networks, or devices utilized by the Fund potentially can be breached. The Fund and its shareholders could be negatively impacted as a result of a cybersecurity breach. |
The following bar chart and table provide some indication of the risks of investing in the Fund by showing the variability of the Fund’s performance from year to year and by comparing the Fund’s performance to a broad based index. The Fund’s past performance (before and after taxes) is not necessarily an indication of how the Fund will perform in the future. More up-to-date returns are available on the Fund’s website at www.timothyplan.com, or by calling the Fund at (800) 846-7526.
The bar chart does not reflect sales charges. If these charges were reflected, the returns would be less than those shown.
Year-by-year Annual Total Returns for Class A Shares
(for calendar years ending on December 31)
Average Annual Total Returns
(for periods ending on December 31, 2020)
|
|
|
|
|
|
|
|
|
|
|
|
|
Small Cap Value |
|
Class A (3) |
|
Class C |
|
|
1 Year |
|
5 Year |
|
10 Year |
|
1 Year |
|
5 Year |
|
10 Year |
Return before taxes |
|
-3.62% |
|
7.90% |
|
9.34% |
|
0.19% |
|
8.32% |
|
9.14% |
Return after taxes on distributions (1) |
|
-3.66% |
|
6.42% |
|
7.52% |
|
0.19% |
|
6.31% |
|
6.85% |
Return after taxes on distributions and sale of shares (1) |
|
-2.12% |
|
5.98% |
|
7.14% |
|
0.11% |
|
6.25% |
|
6.88% |
Russell 2000 Total Return Index (2) (reflects no deduction for fees, expenses or taxes) |
|
19.96% |
|
13.26% |
|
11.20% |
|
19.96% |
|
13.26% |
|
11.20% |
(1) |
After-tax returns are calculated using the historical highest individual federal marginal income tax rates and do not reflect the impact of state and local taxes. After-tax returns depend on an investor’s tax situation and may differ from those shown. After-tax returns shown are not relevant to investors who hold their Fund shares through tax-deferred arrangements, such as 401(k) plans or individual retirement accounts. |
(2) |
The Russell 2000 Total Return Index is a widely recognized, unmanaged index of 2000 Small Capitalization companies in the United States. The Index assumes reinvestment of all dividends and distributions and does not reflect any asset-based charges for investment management or other expenses. |
(3) |
Class A share returns reflect the assessment of the maximum front-end sales load on the first business day of the year. |
Westwood Management Corp. serves as Investment Manager to the Fund.
William E. Costello, CFA, and Matthew R. Lockridge have served the Fund since December 31, 2010 and Frederic G. Rowsey, CFA, has served the Fund since December 1, 2013.
PURCHASE AND SALE OF FUND SHARES
You may purchase, redeem or exchange shares of the Fund on any business day, which is any day the New York Stock Exchange is open for business. You may purchase, redeem or exchange shares of the Fund either through a financial advisor or directly from the Fund. The minimum initial purchase or exchange into the Fund is $1,000, or $50 through monthly systematic investment plan accounts. There is no minimum subsequent investment amount. There are no minimums for purchases or exchanges through employer-sponsored retirement plans, IRAs, or other qualified plans. The Fund shares are redeemable on any business day by contacting your financial advisor, or by written request to the Fund, by telephone, or by wire transfer.
The Fund intends to make distributions that may be taxed as ordinary income or capital gains.
PAYMENTS TO BROKER-DEALERS AND OTHER FINANCIAL INTERMEDIARIES
If you purchase shares of the Fund through a broker-dealer or other financial intermediary (such as a bank), the Fund and its distributor may pay the intermediary for the sale of Fund shares and related services. These payments may create a conflict of interest by influencing the broker-dealer or other financial intermediary and your sales person to recommend the Fund over another investment. Ask your sales person or visit your financial intermediary’s website for more information.
TIMOTHY PLAN FAMILY OF FUNDS
|
|
|
|
|
CLASS A: TLVAX |
|
|
|
CLASS C: TLVCX |
The investment objective of this Fund is to provide you with long-term growth of capital, with a secondary objective of current income.
This table describes the fees and expenses that you may pay if you buy and hold shares of the Fund. You may pay other fees, such as brokerage commissions and other fees to financial intermediaries, which are not reflected in the tables and examples below. You may qualify for sales charge discounts if you and your family invest, or agree to invest in the future, at least $50,000 in Timothy Plan Funds. More information about these and other discounts is available from your financial professional and in “How to Reduce Your Sales Charge” on page 84 of the Prospectus and “Purchase, Redemption, and Pricing of Shares” on page 38 of the Funds’ Statement of Additional Information.
(Fees paid directly from your investment)
|
|
|
|
|
| |
|
Class A |
|
Class C |
Maximum sales charge (load) imposed on purchases
(as % of offering price) |
|
5.50% |
|
None |
Maximum deferred sales charges (load) (as a percentage of the lesser of original purchase price or redemption proceeds) (1) |
|
None |
|
1.00% |
Redemption fees |
|
None |
|
None |
Exchange fees |
|
None |
|
None |
Annual Fund Operating Expenses
(Expenses that you pay each year as a percentage of the value of your investment)
|
|
|
|
|
|
|
|
|
| |
|
Class A |
|
|
Class C |
|
|
|
|
0.85% |
|
|
|
0.85% |
|
Distribution/Service (12b-1 Fees) |
|
|
0.25% |
|
|
|
1.00% |
|
|
|
|
0.41% |
|
|
|
0.41% |
|
Fees and Expenses of Acquired Funds (2) |
|
|
0.12% |
|
|
|
0.12% |
|
Total Annual Fund Operating Expenses |
|
|
1.63% |
|
|
|
2.38% |
|
(1) |
A one percent (1%) contingent deferred sales charge is imposed on any Class C shares sold within the first thirteen months after purchase. The Trust’s Distributor, Timothy Partners, Ltd., will pay a finders’ fee of 1% of the proceeds invested to brokers that purchase shares of the Funds in amounts from $1 million to $2 million, 0.75% on the next $1 million, 0.50% on the next $2 million, and 0.25% on all amounts in excess of $5 million. In such cases, those purchases will be subject to a contingent deferred sales charge of 1% for 18 months after the date of purchase. |
(2) |
Acquired Funds Fees and Expenses are the indirect costs of investing in other investment companies. Total Annual Fund Operating Expenses do not correlate to the ratio of average net assets in the Financial Highlights Table, which reflects the operating expenses of the Fund and does not include Acquired Funds Fees and Expenses. |
This Example is intended to help you compare the cost of investing in the Fund with the cost of investing in other mutual funds. For each share class offered, the Example assumes that you invest $10,000 in the Fund for the time periods indicated and then redeem all of your shares at the end of those periods. The Example also assumes that your investment has a 5% return each year and annual Fund operating expenses remain the same for each share class. Although your actual costs may be higher or lower, based on these assumptions your costs would be:
|
|
|
|
|
|
|
| |
|
|
|
|
|
|
|
|
$ 707 |
|
$ 341 |
|
$ 241 |
|
|
$1,036 |
|
$ 742 |
|
$ 742 |
|
|
$1,388 |
|
$1,270 |
|
$1,270 |
|
|
$2,376 |
|
$2,716 |
|
$2,716 |
The Example does not reflect sales charges (loads) on reinvested dividends and other distributions. If these sales charges (loads) were included, your costs would be higher.
The Fund pays transaction costs, such as commissions, when it buys and sells securities (or “turns over” its portfolio). A higher portfolio turnover rate may indicate higher transaction costs and may result in higher taxes when Fund shares are held in a taxable account. These costs, which are not reflected in annual Fund operating expenses or in the Example, affect the Fund’s performance. During the Fund’s most recent fiscal year, the Fund’s portfolio turnover rate was 26% of the average value of its portfolio.
PRINCIPAL INVESTMENT STRATEGIES
|
|
The Fund seeks to achieve its investment objective by primarily investing in U.S. common stocks. The Fund will normally invest at least 80% of the Fund’s total assets in companies whose total market capitalization exceeds $2 billion. This Fund invests using a value investing style. Value funds typically emphasize stocks whose prices are below average in relation to such measures as earnings and book value; these stocks often have above-average dividend yields. Growth and value stocks have historically produced similar long-term returns, though each category has periods when it outperforms the other. |
|
|
In determining whether to invest in a particular company, the Fund’s Investment Manager focuses on a number of different attributes of the company, including the company’s market expertise, balance sheet, improving return on equity, price to earnings ratios, industry position and strength, management, and a number of other factors. Analyzing companies in this manner is known as a “bottom up” approach to investing. Companies that meet or exceed specific criteria established by the Manager in the selection process are purchased. Securities are sold when they reach internally determined pricing targets or no longer qualify under the Manager’s investment criteria. |
|
|
The Fund may, from time to time, take temporary defensive positions that are inconsistent with the Fund’s principal investment strategies in attempting to respond to adverse market, economic, political, or other conditions. When the Fund takes a defensive position, the Fund’s assets will be held in cash and/or cash equivalents. |
|
|
The Fund will not invest in Excluded Securities. Excluded Securities are securities issued by any company that is involved in the production or wholesale distribution of alcohol, tobacco, or gambling equipment, gambling enterprises, or which is involved, either directly or indirectly, in abortion or pornography, or promoting anti-family entertainment or alternative lifestyles. |
1. |
As with most other mutual funds, you can lose money by investing in this Fund. Share prices fluctuate from day to day, and when you sell your shares, they may be worth less than you paid for them. |
2. |
The Fund is an equity fund, so it is subject to the risks inherent in the stock market in general. The stock market is cyclical, with prices generally rising and falling over periods of time. Some of these price cycles can be pronounced and last for a long time. |
3. |
Larger Company Investing Risk Larger, more established companies may be unable to respond quickly to new competitive challenges like changes in consumer tastes or innovative smaller competitors. Also, larger companies are sometimes unable to attain the high growth rates of successful, smaller companies, especially during extended periods of economic expansion. |
4. |
Mid-Sized Company Investing Risk Investing in mid-sized companies often involves greater risk than investing in larger companies. Mid-sized companies may not have the management experience, financial resources, product diversification and competitive strengths of larger companies. The securities of mid-sized companies, therefore, tend to be more volatile than the securities of larger, more established companies. Mid-sized company stocks tend to be bought and sold less often and in smaller amounts than larger company stocks. Because of this, if a fund wants to sell a large quantity of a mid-sized company’s stock, it may have to sell at a lower price than would otherwise be indicated, or it may have to sell in smaller than desired quantities over an increased time period. |
5. |
Because the Fund does not invest in Excluded Securities and will divest itself of securities that are subsequently discovered to be ineligible, the Fund may be riskier than other funds that invest in a broader array of securities. |
6. |
Because different types of stocks tend to shift in and out of favor depending on market and economic conditions, “value” stocks may perform differently from the market as a whole and other types of stocks and can continue to be undervalued by the market for long periods of time. It is also possible that a value stock may never appreciate to the extent expected. |
7. |
Despite the various protections utilized by the Fund and its service providers, systems, networks, or devices utilized by the Fund potentially can be breached. The Fund and its shareholders could be negatively impacted as a result of a cybersecurity breach. |
The following bar chart and table provide some indication of the risks of investing in the Fund by showing the variability of the Fund’s performance from year to year and by comparing the Fund’s performance to a broad based index. The Fund’s past performance (before and after taxes) is not necessarily an indication of how the Fund will perform in the future. More up-to-date returns are available on the Fund’s website at www.timothyplan.com, or by calling the Fund at (800) 846-7526.
The bar chart does not reflect sales charges. If these charges were reflected, the returns would be less than those shown.
Year-by-year Annual Total Returns for Class A Shares
(for calendar years ending on December 31)
Average Annual Total Returns
(for periods ending on December 31, 2020)
|
|
|
|
|
|
|
|
|
|
|
|
|
Large/Mid Cap Value |
|
Class A (3) |
|
Class C |
|
|
1 Year |
|
5 Years |
|
10 Years |
|
1 Year |
|
5 Years |
|
10 Years |
Return before taxes |
|
6.83% |
|
9.50% |
|
9.93% |
|
11.18% |
|
9.94% |
|
9.72% |
Return after taxes on distributions (1) |
|
5.80% |
|
7.81% |
|
8.33% |
|
9.83% |
|
7.87% |
|
7.87% |
Return after taxes on distributions and sale of shares (1) |
|
4.45% |
|
7.23% |
|
7.77% |
|
7.16% |
|
7.54% |
|
7.57% |
S&P 500 Total Return Index (2)
(reflects no deduction for fees, expenses or taxes) |
|
18.40% |
|
15.22% |
|
13.88% |
|
18.40% |
|
15.22% |
|
13.88% |
(1) |
After-tax returns are calculated using the historical highest individual federal marginal income tax rates and do not reflect the impact of state and local taxes. After-tax returns depend on an investor’s tax situation and may differ from those shown. After-tax returns shown are not relevant to investors who hold their Fund shares through tax-deferred arrangements, such as 401(k) plans or individual retirement accounts. |
(2) |
The S&P 500 Total Return Index is a widely recognized, unmanaged index of common stock prices. The Index assumes reinvestment of all dividends and distributions and does not reflect any asset-based charges for investment management or other expenses. |
(3) |
Class A share returns reflect the assessment of the maximum front-end sales load on the first business day of the year. |
Westwood Management Corp. serves as Investment Manager to the Fund.
Matthew R. Lockridge has served the Fund since December 31, 2012, William D. Sheehan, CFA has served the Fund since September 10, 2019 and Lauren C. Hill has served the Fund since August 2020.
PURCHASE AND SALE OF FUND SHARES
You may purchase, redeem or exchange shares of the Fund on any business day, which is any day the New York Stock Exchange is open for business. You may purchase, redeem or exchange shares of the Fund either through a financial advisor or directly from the Fund. The minimum initial purchase or exchange into the Fund is $1,000, or $50 through monthly systematic investment plan accounts. There is no minimum subsequent investment amount. There are no minimums for purchases or exchanges through employer-sponsored retirement plans, IRAs, or other qualified plans. The Fund shares are redeemable on any business day by contacting your financial advisor, or by written request to the Fund, by telephone, or by wire transfer.
The Fund intends to make distributions that may be taxed as ordinary income or capital gains.
PAYMENTS TO BROKER-DEALERS AND OTHER FINANCIAL INTERMEDIARIES
If you purchase shares of the Fund through a broker-dealer or other financial intermediary (such as a bank), the Fund and its distributor may pay the intermediary for the sale of Fund shares and related services. These payments may create a conflict of interest by influencing the broker-dealer or other financial intermediary and your sales person to recommend the Fund over another investment. Ask your sales person or visit your financial intermediary’s website for more information.
TIMOTHY PLAN FAMILY OF FUNDS
|
|
|
|
|
CLASS A: TFIAX |
|
|
|
CLASS C: TFICX |
The investment objective of this Fund is to generate a high level of current income consistent with prudent investment risk.
This table describes the fees and expenses that you may pay if you buy and hold shares of the Fund. You may pay other fees, such as brokerage commissions and other fees to financial intermediaries, which are not reflected in the tables and examples below. You may qualify for sales charge discounts if you and your family invest, or agree to invest in the future, at least $50,000 in Timothy Plan Funds. More information about these and other discounts is available from your financial professional and in “How to Reduce Your Sales Charge” on page 84 of the Prospectus and “Purchase, Redemption, and Pricing of Shares” on page 38 of the Funds’ Statement of Additional Information.
(Fees paid directly from your investment)
|
|
|
|
|
|
|
|
|
| |
|
Class A |
|
|
Class C |
|
Maximum sales charge (load) imposed on purchases |
|
|
4.50% |
|
|
|
None |
|
Maximum deferred sales charges (load) (as a percentage of the lesser of original purchase price or redemption proceeds) (1) |
|
|
None |
|
|
|
1.00% |
|
|
|
|
None |
|
|
|
None |
|
|
|
|
None |
|
|
|
None |
|
Annual Fund Operating Expenses
(Expenses that you pay each year as a percentage of the value of your investment)
|
|
|
|
|
|
|
|
|
| |
|
Class A |
|
|
Class C |
|
|
|
|
0.60% |
|
|
|
0.60% |
|
Distribution/Service (12b-1 Fees) |
|
|
0.25% |
|
|
|
1.00% |
|
|
|
|
0.45% |
|
|
|
0.45% |
|
Fees and Expenses of Acquired Funds (2) |
|
|
0.00% |
|
|
|
0.00% |
|
Total Annual Fund Operating Expenses |
|
|
1.30% |
|
|
|
2.05% |
|
(1) |
A one percent (1%) contingent deferred sales charge is imposed on any Class C shares sold within the first thirteen months after purchase. The Trust’s Distributor, Timothy Partners, Ltd., will pay a finder’s fee of 0.50% of the proceeds invested to brokers that purchase shares of the Funds in amounts from $1 million to $4 million, and 0.25% on all amounts in excess of $4 million. In such cases, those purchases will be subject to a contingent deferred sales charge of 1% for 18 months after the date of purchase. |
(2) |
Acquired Funds Fees and Expenses are the indirect costs of investing in other investment companies. Total Annual Fund Operating Expenses do not correlate to the ratio of average net assets in the Financial Highlights Table, which reflects the operating expenses of the Fund and does not include Acquired Funds Fees and Expenses. |
This Example is intended to help you compare the cost of investing in the Fund with the cost of investing in other mutual funds. For each share class offered, the Example assumes that you invest $10,000 in the Fund for the time periods indicated and then redeem all of your shares at the end of those periods. The Example also assumes that your investment has a 5% return each year and annual Fund operating expenses remain the same for each share class. Although your actual costs may be higher or lower, based on these assumptions your costs would be:
|
|
|
|
|
|
|
| |
|
Class A |
|
|
|
|
|
|
$576 |
|
$308 |
|
$208 |
|
|
$844 |
|
$643 |
|
$643 |
|
|
$1,131 |
|
$1,103 |
|
$1,103 |
|
|
$1,947 |
|
$2,379 |
|
$2,379 |
The Example does not reflect sales charges (loads) on reinvested dividends and other distributions. If these sales charges (loads) were included, your costs would be higher.
The Fund pays transaction costs, such as commissions, when it buys and sells securities (or “turns over” its portfolio). A higher portfolio turnover rate may indicate higher transaction costs and may result in higher taxes when Fund shares are held in a taxable account. These costs, which are not reflected in annual Fund operating expenses or in the Example, affect the Fund’s performance. During the Fund’s most recent fiscal year, the Fund’s portfolio turnover rate was 32% of the average value of its portfolio.
PRINCIPAL INVESTMENT STRATEGIES
|
|
To achieve its goal, the Fund normally invests at least 80% of its assets in a diversified portfolio of corporate bonds, U.S. government and agency securities, convertible securities and preferred securities. The Investment Manager will only purchase securities for the Fund that are investment grade, with a rating of at least “BBB” as rated by Standard & Poor’s or a comparable rating by another nationally recognized rating agency. The Fund may also invest in debt securities that have not been rated by one of the major rating agencies, so long as the Fund’s Investment Manager has determined that the security is of comparable credit quality to similar rated securities. |
|
|
In managing the portfolio, the Fund’s Investment Manager concentrates on sector analysis, industry allocation and securities selection, deciding which types of bonds and industries to emphasize at a given time, and then which individual bonds to buy. The Fund attempts to anticipate shifts in the business cycle in determining types of bonds and industry sectors to target. In choosing individual securities, the Fund seeks out securities that appear to be undervalued within the emphasized industry sector. Companies that meet or exceed specific criteria established by the Manager in the selection process are purchased. Securities are sold when they reach internally determined pricing targets or no longer qualify under the Manager’s investment criteria. |
|
|
The Fund may, from time to time, take temporary defensive positions that are inconsistent with the Fund’s principal investment strategies in attempting to respond to adverse market, economic, political, or other conditions. When the Fund takes a defensive position, the Fund’s assets will be held in cash and/or cash equivalents. |
|
|
The Fund will not invest in Excluded Securities. Excluded Securities are securities issued by any company that is involved in the production or wholesale distribution of alcohol, tobacco, or gambling equipment, gambling enterprises, or which is involved, either directly or indirectly, in abortion or pornography, or promoting anti-family entertainment or alternative lifestyles. |
1. |
As with most other mutual funds, you can lose money by investing in this Fund. Share prices fluctuate from day to day, and when you sell your shares, they may be worth less than you paid for them. |
2. |
When interest rates rise, bond prices fall; the higher the Fund’s duration (a calculation reflecting time risk, taking into account both the average maturity of the Fund’s portfolio and its average coupon return), the more sensitive the Fund is to interest rate risk. A change in the economic environment that causes interest rates to rise back to more historically “normal” levels could have a pronounced negative effect on the Fund. |
3. |
The Fund could lose money if any bonds it owns are downgraded in credit rating or go into default. For this reason, the Fund will only invest in investment-grade bonds. The degree of risk for a particular security may not be reflected in its credit rating. Bonds rated at the time of purchase BBB by Standard & Poor’s or, unrated, but determined to be of comparable quality by the Investment Manager, are subject to greater market risk and credit risk, or loss of principal and interest, than higher-rated securities. |
4. |
If certain industry sectors or types of securities don’t perform as well as the Fund expects, the Fund’s performance could suffer. |
5. |
Because the Fund does not invest in Excluded Securities and will divest itself of securities that are subsequently discovered to be ineligible, the Fund may be riskier that other Funds that invest in a broader array of securities. |
6. |
Despite the various protections utilized by the Fund and its service providers, systems, networks, or devices utilized by the Fund potentially can be breached. The Fund and its shareholders could be negatively impacted as a result of a cybersecurity breach. |
The following bar chart and table provide some indication of the risks of investing in the Fund by showing the variability of the Fund’s performance from year to year and by comparing the Fund’s performance to a broad based index. The Fund’s past performance (before and after taxes) is not necessarily an indication of how the Fund will perform in the future. More up-to-date returns are available on the Fund’s website at www.timothyplan.com, or by calling the Fund at (800) 846-7526.
The bar chart does not reflect sales charges. If these charges were reflected, the returns would be less than those shown.
Year-by-year Annual Total Returns for Class A Shares
(for calendar years ending on December 31)
Average Annual Total Returns
(for periods ending on December 31, 2020)
|
|
|
|
|
|
|
|
|
|
|
|
|
Fixed Income |
|
Class A (3) |
|
Class C |
|
|
1 Year |
|
5 Year |
|
10 Year |
|
1 Year |
|
5 Year |
|
10 Year |
Return before taxes |
|
0.47% |
|
1.91% |
|
1.77% |
|
3.46% |
|
2.09% |
|
1.60% |
Return after taxes on distributions (1) |
|
-0.03% |
|
1.23% |
|
0.98% |
|
3.33% |
|
1.72% |
|
1.09% |
Return after taxes on distributions and sale of shares (1) |
|
0.28% |
|
1.15% |
|
1.01% |
|
2.05% |
|
1.43% |
|
1.01% |
Bloomberg Barclays U.S. Aggregate Bond Index (2) (reflects no deduction for fees, expenses or taxes) |
|
7.51% |
|
4.44% |
|
3.84% |
|
7.51% |
|
4.44% |
|
3.84% |
(1) |
After-tax returns are calculated using the historical highest individual federal marginal income tax rates and do not reflect the impact of state and local taxes. After-tax returns depend on an investor’s tax situation and may differ from those shown. After-tax returns shown are not relevant to investors who hold their Fund shares through tax-deferred arrangements, such as 401(k) plans or individual retirement accounts. |
(2) |
Bloomberg Barclays U.S. Aggregate Bond Index (formerly Lehman Brothers US Aggregate Bond Index) is a benchmark index composed of US Securities in Treasury, Government-Related, Corporate, and Securitized sectors. It includes securities that are of investment-grade quality or better, have at least one year to maturity, and have an outstanding par value of at least $250 million. The Index assumes reinvestment of all dividends and distributions and does not reflect any asset-based charges for investment management or other expenses. |
(3) |
Class A share returns reflect the assessment of the maximum front-end sales load on the first business day of the year. |
Barrow, Hanley, Mewhinney and Strauss, LLC (“BHMS”) serves as Investment Manager to the Fund.
Mark C. Luchsinger, CFA, J. Scott McDonald, CFA, and Deborah A. Petruzzelli, of BHMS, have served the Fund since July 1, 2004. Erik A. Olson has served the Fund since December 2014, and Rahul Bapna, CFA, has served the Fund since December 2014. Nicholas C. Losey has served the Fund since April 2018 and Chet S. Paipanandiker has served the Fund since December 2017.
PURCHASE AND SALE OF FUND SHARES
You may purchase, redeem or exchange shares of the Fund on any business day, which is any day the New York Stock Exchange is open for business. You may purchase, redeem or exchange shares of the Fund either through a financial advisor or directly from the Fund. The minimum initial purchase or exchange into the Fund is $1,000, or $50 through monthly systematic investment plan accounts. There is no minimum subsequent investment amount. There are no minimums for purchases or exchanges through employer-sponsored retirement plans, IRAs, or other qualified plans. The Fund shares are redeemable on any business day by contacting your financial advisor, or by written request to the Fund, by telephone, or by wire transfer.
The Fund intends to make distributions that may be taxed as ordinary income or capital gains.
PAYMENTS TO BROKER-DEALERS AND OTHER FINANCIAL INTERMEDIARIES
If you purchase shares of the Fund through a broker-dealer or other financial intermediary (such as a bank), the Fund and its distributor may pay the intermediary for the sale of Fund shares and related services. These payments may create a conflict of interest by influencing the broker-dealer or other financial intermediary and your sales person to recommend the Fund over another investment. Ask your sales person or visit your financial intermediary’s website for more information.
TIMOTHY PLAN FAMILY OF FUNDS
|
|
|
|
|
CLASS A: TPHAX |
|
|
|
CLASS C: TPHCX |
The investment objective of this Fund is to generate a high level of current income.
This table describes the fees and expenses that you may pay if you buy and hold shares of the Fund. You may pay other fees, such as brokerage commissions and other fees to financial intermediaries, which are not reflected in the tables and examples below. You may qualify for sales charge discounts if you and your family invest, or agree to invest in the future, at least $50,000 in Timothy Plan Funds. More information about these and other discounts is available from your financial professional and in “How to Reduce Your Sales Charge” on page 84 of the Prospectus and “Purchase, Redemption, and Pricing of Shares” on page 38 of the Funds’ Statement of Additional Information.
(Fees paid directly from your investment)
|
|
|
|
|
|
|
|
|
| |
|
Class A |
|
|
Class C |
|
Maximum sales charge (load) imposed on purchases |
|
|
4.50% |
|
|
|
None |
|
Maximum deferred sales charges (load) (as a percentage of the lesser of original purchase price or redemption proceeds) (1) |
|
|
None |
|
|
|
1.00% |
|
|
|
|
None |
|
|
|
None |
|
|
|
|
None |
|
|
|
None |
|
Annual Fund Operating Expenses
(Expenses that you pay each year as a percentage of the value of your investment)
|
|
|
|
|
|
|
|
|
| |
|
Class A |
|
|
Class C |
|
|
|
|
0.60% |
|
|
|
0.60% |
|
Distribution/Service (12b-1 Fees) |
|
|
0.25% |
|
|
|
1.00% |
|
|
|
|
0.49% |
|
|
|
0.49% |
|
Fees and Expenses of Acquired Funds (2) |
|
|
0.01% |
|
|
|
0.01% |
|
Total Annual Fund Operating Expenses |
|
|
1.35% |
|
|
|
2.10% |
|
(1) |
A one percent (1%) contingent deferred sales charge is imposed on any Class C shares sold within the first thirteen months after purchase. The Trust’s Distributor, Timothy Partners, Ltd., will pay a finder’s fee of 0.50% of the proceeds invested to brokers that purchase shares of the Funds in amounts from $1 million to $4 million, and 0.25% on all amounts in excess of $4 million. In such cases, those purchases will be subject to a contingent deferred sales charge of 1% for 18 months after the date of purchase. |
(2) |
Acquired Funds Fees and Expenses are the indirect costs of investing in other investment companies. Total Annual Fund Operating Expenses do not correlate to the ratio of average net assets in the Financial Highlights Table, which reflects the operating expenses of the Fund and does not include Acquired Funds Fees and Expenses. |
This Example is intended to help you compare the cost of investing in the Fund with the cost of investing in other mutual funds. For each share class offered, the Example assumes that you invest $10,000 in the Fund for the time periods indicated and then redeem all of your shares at the end of those periods. The Example also assumes that your investment has a 5% return each year and annual Fund operating expenses remain the same for each share class. Although your actual costs may be higher or lower, based on these assumptions your costs would be:
|
|
|
|
|
|
|
| |
|
|
|
|
|
|
| |
|
$581 |
|
$313 |
|
$213 |
| |
|
$858 |
|
$658 |
|
$658 |
| |
|
$1,156 |
|
$1,129 |
|
$1,129 |
| |
|
$2,001 |
|
$2,431 |
|
$2,431 |
The Example does not reflect sales charges (loads) on reinvested dividends and other distributions. If these sales charges (loads) were included, your costs would be higher.
The Fund pays transaction costs, such as commissions, when it buys and sells securities (or “turns over” its portfolio). A higher portfolio turnover rate may indicate higher transaction costs and may result in higher taxes when Fund shares are held in a taxable account. These costs, which are not reflected in annual Fund operating expenses or in the Example, affect the Fund’s performance. During the Fund’s most recent fiscal year, the Fund’s portfolio turnover rate was 91% of the average value of its portfolio.
PRINCIPAL INVESTMENT STRATEGIES
|
|
To achieve its goal, the Fund normally invests at least 80% of its total assets in a diversified portfolio of high yield fixed income securities. These include corporate bonds, convertible securities and preferred securities. The Investment Manager will generally purchase securities for the Fund that are not investment grade (“junk” bonds), meaning securities with a rating of “BB” or lower as rated by Standard & Poor’s or a comparable rating by another nationally recognized rating agency. The Fund may also invest in debt securities that have not been rated by one of the major rating agencies, so long as the Fund’s Investment Manager has determined that the security is of comparable credit quality to similar rated securities. |
|
|
In managing its portfolio, the Fund’s Investment Manager concentrates on sector analysis, industry allocation and securities selection, deciding which types of bonds and industries to emphasize at a given time, and then which individual bonds to buy. The Fund attempts to anticipate shifts in the business cycle in determining types of bonds and industry sectors to target. In choosing individual securities, the Fund seeks out securities that appear to be undervalued within the emphasized industry sector. Companies that meet or exceed specific criteria established by the Manager in the selection process are purchased. Securities are sold when they reach internally determined pricing targets or no longer qualify under the Manager’s investment criteria. |
|
|
The Fund may, from time to time, take temporary defensive positions that are inconsistent with the Fund’s principal investment strategies in attempting to respond to adverse market, economic, political, or other conditions. When the Fund takes a defensive position, the Fund’s assets will be held in cash and/or cash equivalents. |
|
|
The Fund will not invest in Excluded Securities. Excluded Securities are securities issued by any company that is involved in the production or wholesale distribution of alcohol, tobacco, or gambling equipment, gambling enterprises, or which is involved, either directly or indirectly, in abortion or pornography, or promoting anti-family entertainment or alternative lifestyles. |
1. |
As with most other mutual funds, you can lose money by investing in this Fund. Share prices fluctuate from day to day, and when you sell your shares, they may be worth less than you paid for them. |
2. |
Investments in fixed-income securities that are rated below investment grade (“high yield securities”) by one or more Nationally Recognized Statistical Rating Organizations (NRSROs) may be subject to greater risk of loss of principal and interest than investments in higher-rated fixed-income securities. High yield securities are also generally considered to be subject to greater market risk than higher-rated securities. The capacity of issuers of high yield securities to pay interest and repay principal is more likely to weaken than is that of issuers of higher-rated securities in times of deteriorating economic conditions or rising interest rates. In addition, high yield securities may be more susceptible to real or perceived adverse economic conditions than higher-rated securities. The market for high yield securities may be less liquid than the market for higher-rated securities. This can adversely affect the Fund’s ability to buy or sell optimal quantities of high yield securities at desired prices. |
3. |
When interest rates rise, bond prices fall; the higher the Fund’s duration (a calculation reflecting time risk, taking into account both the average maturity of the Fund’s portfolio and its average coupon return), the more sensitive the Fund is to interest rate risk. A change in the economic environment that causes interest rates to rise back to more historically “normal” levels could have a pronounced negative effect on the Fund. |
4. |
High Yield securities (“junk” bonds) are subject to greater risk of loss than investment grade securities. The degree of risk for a particular security may not be reflected in its credit rating, and high yield securities may be particularly subject to this risk. Bonds rated, at the time of purchase, BB or lower by Standard & Poor’s (“junk” bonds) or, unrated, but determined to be of comparable quality by the Investment Manager, are subject to greater market risk and credit risk, or loss of principal and interest, than higher-rated securities. |
5. |
If certain industry sectors or types of securities don’t perform as well as the Fund expects, the Fund’s performance could suffer. |
6. |
Because the Fund does not invest in Excluded Securities and will divest itself of securities that are subsequently discovered to be ineligible, the Fund may be riskier that other Funds that invest in a broader array of securities. |
7. |
Despite the various protections utilized by the Fund and its service providers, systems, networks, or devices utilized by the Fund potentially can be breached. The Fund and its shareholders could be negatively impacted as a result of a cybersecurity breach. |
The following bar chart and table provide some indication of the risks of investing in the Fund by showing the variability of the Fund’s performance from year to year and by comparing the Fund’s performance to a broad based index. The Fund’s past performance (before and after taxes) is not necessarily an indication of how the Fund will perform in the future. More up-to-date returns are available on the Fund’s website at www.timothyplan.com, or by calling the Fund at (800) 846-7526.
The bar chart does not reflect sales charges. If these charges were reflected, the returns would be less than those shown.
Year-by-year Annual Total Returns for Class A Shares
(for calendar years ending on December 31)
Average Annual Total Returns
(for periods ending on December 31, 2020)
|
|
|
|
|
|
|
|
|
|
|
|
|
High Yield Bond |
|
Class A (3) |
|
Class C |
|
|
1 Year |
|
5 Years |
|
10 Years |
|
1 Year |
|
5 Years |
|
10 Years |
Return before taxes |
|
1.35% |
|
6.30% |
|
4.63% |
|
4.24% |
|
6.46% |
|
4.44% |
Return after taxes on distributions (1) |
|
-0.52% |
|
4.52% |
|
2.72% |
|
2.69% |
|
5.06% |
|
2.87% |
Return after taxes on distributions and sale of shares (1) |
|
0.70% |
|
4.04% |
|
2.69% |
|
2.44% |
|
4.37% |
|
2.73% |
Barclays U.S. High-Yield Ba/B 3% Index (2) (reflects no deduction for fees, expenses or taxes) |
|
7.73% |
|
8.24% |
|
6.84% |
|
7.73% |
|
8.24% |
|
6.84% |
(1) |
After-tax returns are calculated using the historical highest individual federal marginal income tax rates and do not reflect the impact of state and local taxes. After-tax returns depend on an investor’s tax situation and may differ from those shown. After-tax returns shown are not relevant to investors who hold their Fund shares through tax-deferred arrangements, such as 401(k) plans or individual retirement accounts. |
(2) |
The Barclays U.S. High Yield Ba/B 3% Index is an issuer-constrained version of the flagship U.S. Corporate High Yield Index, which measures the USD-denominated, high yield, fixed-rate corporate bond market. |
(3) |
Class A share returns reflect the assessment of the maximum front-end sales load on the first business day of the year. |
Barrow, Hanley, Mewhinney and Strauss, LLC (“BHMS”) serves as Investment Manager to the Fund.
Mark C. Luchsinger, CFA, J. Scott McDonald, CFA and Deborah A. Petruzzelli, of BHMS, have served the Fund since May 1, 2007. Erik A. Olson has served the Fund since December 2014, Rahul Bapna, CFA, has served the Fund since December 2017. Chet Paipanandiker has served the Fund since December 2017 and Nicholas C. Losey has served the Fund since April 2018.
PURCHASE AND SALE OF FUND SHARES
You may purchase, redeem or exchange shares of the Fund on any business day, which is any day the New York Stock Exchange is open for business. You may purchase, redeem or exchange shares of the Fund either through a financial advisor or directly from the Fund. The minimum initial purchase or exchange into the Fund is $1,000, or $50 through monthly systematic investment plan accounts. There is no minimum subsequent investment amount. There are no minimums for purchases or exchanges through employer-sponsored retirement plans, IRAs, or other qualified plans. The Fund shares are redeemable on any business day by contacting your financial advisor, or by written request to the Fund, by telephone, or by wire transfer.
The Fund intends to make distributions that may be taxed as ordinary income or capital gains.
PAYMENTS TO BROKER-DEALERS AND OTHER FINANCIAL INTERMEDIARIES
If you purchase shares of the Fund through a broker-dealer or other financial intermediary (such as a bank), the Fund and its distributor may pay the intermediary for the sale of Fund shares and related services. These payments may create a conflict of interest by influencing the broker-dealer or other financial intermediary and your sales person to recommend the Fund over another investment. Ask your sales person or visit your financial intermediary’s website for more information.
TIMOTHY PLAN FAMILY OF FUNDS
Israel Common Values Fund
|
|
|
|
|
CLASS A: TPAIX |
|
|
|
CLASS C: TPCIX |
The investment objective of this Fund is to provide you with long-term growth of capital.
This table describes the fees and expenses that you may pay if you buy and hold shares of the Fund. You may pay other fees, such as brokerage commissions and other fees to financial intermediaries, which are not reflected in the tables and examples below. You may qualify for sales charge discounts if you and your family invest, or agree to invest in the future, at least $50,000 in Timothy Plan Funds. More information about these and other discounts is available from your financial professional and in “How to Reduce Your Sales Charge” on page 84 of the Prospectus and “Purchase, Redemption, and Pricing of Shares” on page 38 of the Funds’ Statement of Additional Information.
(Fees paid directly from your investment)
|
|
|
|
|
|
|
|
|
| |
|
Class A |
|
|
Class C |
|
Maximum sales charge (load) imposed on purchases |
|
|
5.50% |
|
|
|
None |
|
Maximum deferred sales charges (load) (as a percentage of the lesser of original purchase price or redemption proceeds) (1) |
|
|
None |
|
|
|
1.00% |
|
| |
|
|
None |
|
|
|
None |
|
| |
|
|
None |
|
|
|
None |
|
Annual Fund Operating Expenses
(Expenses that you pay each year as a percentage of the value of your investment)
|
|
|
|
|
|
|
|
|
| |
|
Class A |
|
|
Class C |
|
| |
|
|
1.00% |
|
|
|
1.00% |
|
Distribution/Service (12b-1 Fees) |
|
|
0.25% |
|
|
|
1.00% |
|
| |
|
|
0.59% |
|
|
|
0.59% |
|
Acquired Funds Fees and Expenses (2) |
|
|
0.00% |
|
|
|
0.00% |
|
Total Annual Fund Operating Expenses |
|
|
1.84% |
|
|
|
2.59% |
|
(1) |
A one percent (1%) contingent deferred sales charge is imposed on any Class C shares sold within the first thirteen months after purchase. The Trust’s Distributor, Timothy Partners, Ltd., will pay a finders’ fee of 1% of the proceeds invested to brokers that purchase shares of the Funds in amounts from $1 million to $2 million, 0.75% on the next $1 million, 0.50% on the next $2 million, and 0.25% on all amounts in excess of $5 million. In such cases, those purchases will be subject to a contingent deferred sales charge of 1% for 18 months after the date of purchase. |
(2) |
Acquired Funds Fees and Expenses are the indirect costs of investing in other investment companies. Total Annual Fund Operating Expenses do not correlate to the ratio of average net assets in the Financial Highlights Table, which reflects the operating expenses of the Fund and does not include Acquired Funds Fees and Expenses. |
This Example is intended to help you compare the cost of investing in the Fund with the cost of investing in other mutual funds. For each share class offered, the Example assumes that you invest $10,000 in the Fund for the time periods indicated and then redeem all of your shares at the end of those periods. The Example also assumes that your investment has a 5% return each year and annual Fund operating expenses remain the same for each share class. Although your actual costs may be higher or lower, based on these assumptions your costs would be:
|
|
|
|
|
|
|
| |
|
Class A |
|
|
|
|
| |
|
$727 |
|
$362 |
|
$262 |
| |
|
$1,097 |
|
$805 |
|
$805 |
| |
|
$1,491 |
|
$1,375 |
|
$1,375 |
| |
|
$2,590 |
|
$2,925 |
|
$2,925 |
The Example does not reflect sales charges (loads) on reinvested dividends and other distributions. If these sales charges (loads) were included, your costs would be higher.
The Fund pays transaction costs, such as commissions, when it buys and sells securities (or “turns over” its portfolio). A higher portfolio turnover rate may indicate higher transaction costs and may result in higher taxes when Fund shares are held in a taxable account. These costs, which are not reflected in annual Fund operating expenses or in the Example, affect the Fund’s performance. During the Fund’s most recent fiscal year, the Fund’s portfolio turnover rate was 16% of the average value of its portfolio.
PRINCIPAL INVESTMENT STRATEGIES
|
|
The Fund seeks to achieve its investment objectives by normally investing at least 80% of the Fund’s total assets in the common stock of companies domiciled and/or headquartered in Israel through the purchase of American Depositary Receipts (ADRs) and direct investments in such companies on foreign stock exchanges, without regard to market capitalizations. |
|
|
The Fund invests using a growth investing style. Growth funds generally focus on stocks of companies believed to have above-average potential for growth in revenue, earnings, cash flow, or other similar criteria. These stocks typically have low dividend yields and above- average prices in relation to such measures as earnings and book value. Growth and value stocks have historically produced similar long-term returns, though each category has periods when it outperforms the other. |
|
|
The Fund invests its assets in companies which the Fund’s Investment Manager believes show a high probability for superior growth. Companies that meet or exceed specific criteria established by the Manager in the selection process are purchased. Securities are sold when they reach internally determined pricing targets or no longer qualify under the Manager’s investment criteria. |
|
|
The Fund may, from time to time, take temporary defensive positions that are inconsistent with the Fund’s principal investment strategies in attempting to respond to adverse market, economic, political, or other conditions. When the Fund takes a defensive position, the Fund’s assets will be held in cash and/or cash equivalents. |
|
|
The Fund will not invest in Excluded Securities. Excluded Securities are securities issued by any company that is involved in the production or wholesale distribution of alcohol, tobacco, or gambling equipment, gambling enterprises, or which is involved, either directly or indirectly, in abortion or pornography, or promoting anti-family entertainment or alternative lifestyles. |
1. |
As with most other mutual funds, you can lose money by investing in this Fund. Share prices fluctuate from day to day, and when you sell your shares, they may be worth less than you paid for them. |
2. |
The Fund is an equity fund, so it is subject to the risks inherent in the stock market in general. The stock market is cyclical, with prices generally rising and falling over periods of time. Some of these price cycles can be pronounced and last for a long time. |
3. |
The value of an individual security or a particular type of security can be more volatile than the market as a whole and can perform differently from the value of the market as a whole. |
4. |
The Fund invests in Israeli securities, and Israel is subject to unique political and economic risks. As a result, Israeli securities can be more volatile than the market as a whole and can perform differently from the value of the market as a whole. The Fund’s investments in the securities of Israel may experience more rapid and extreme changes in value than funds with investments solely in securities of U.S. companies or funds that invest across a larger spectrum of the foreign market. This is because the securities market in Israel is relatively small, with a limited number of companies representing a smaller number of industries. Israeli issuers are not subject to the same degree of regulation as U.S. issuers. Also, nationalization, expropriation or confiscatory taxation or political changes could adversely affect the Fund’s investments in a foreign country. |
5. |
Because the securities represented by ADRs are foreign stocks denominated in non-U.S. currency, there is a risk that fluctuations in the exchange rates between the U.S. dollar and foreign currencies may negatively affect the value of the Fund’s investments in foreign securities. |
6. |
Larger Company Investing Risk Larger, more established companies may be unable to respond quickly to new competitive challenges like changes in consumer tastes or innovative smaller competitors. Also, larger companies are sometimes unable to attain the high growth rates of successful, smaller companies, especially during extended periods of economic expansion. |
7. |
Smaller Company Investing Risk Investing in smaller companies often involves greater risk than investing in larger companies. Smaller companies may not have the management experience, financial resources, product diversification and competitive strengths of larger companies. The securities of smaller companies, therefore, tend to be more volatile than the securities of larger, more established companies. Smaller company stocks tend to be bought and sold less often and in smaller amounts than larger company stocks. Because of this, if a fund wants to sell a large quantity of a small-sized company’s stock, it may have to sell at a lower price than would otherwise be indicated, or it may have to sell in smaller than desired quantities over an increased time period. |
8. |
Because the Fund does not invest in Excluded Securities and will divest itself of securities that are subsequently discovered to be ineligible, the Fund may be riskier than other funds that invest in a broader array of securities. |
9. |
The Fund often invests in companies after assessing their growth potential. Securities of growth companies may be more volatile than other stocks. If the portfolio manager’s perception of a company’s growth potential is not realized, the securities purchased may not perform as expected, reducing the Fund’s return. In addition, because different types of stocks tend to shift in and out of favor depending on market and economic conditions, “growth” stocks may perform differently from the market as a whole and other types of securities. |
10. |
Despite the various protections utilized by the Fund and its service providers, systems, networks, or devices utilized by the Fund potentially can be breached. The Fund and its shareholders could be negatively impacted as a result of a cybersecurity breach. |
The following bar chart and table provide some indication of the risks of investing in the Fund by showing the variability of the Fund’s performance from year to year and by comparing the Fund’s performance to a broad based index.
The Fund’s past performance (before and after taxes) is not necessarily an indication of how the Fund will perform in the future. More up-to-date returns are available on the Fund’s website at
www.timothyplan.com, or by calling the Fund at
(800) 846-7526.
The bar chart does not reflect sales charges. If these charges were reflected, the returns would be less than those shown.
Year-by-year Annual Total Returns for Class A Shares
(for calendar years ending on December 31)
Average Annual Total Returns
(for periods ending on December 31, 2020)
|
|
|
|
|
|
|
|
|
|
|
|
|
Israel Common Values |
|
Class A (3) |
|
Class C |
|
|
1 Year |
|
5 Year |
|
Since
Inception (4) |
|
1 Year |
|
5 Year |
|
Since
Inception (4) |
Return before taxes |
|
6.20% |
|
12.76% |
|
8.81% |
|
10.53% |
|
13.18% |
|
8.65% |
Return after taxes on distributions (1) |
|
6.20% |
|
12.56% |
|
8.47% |
|
10.53% |
|
13.02% |
|
8.34% |
Return after taxes on distributions and sale of shares (1) |
|
3.67% |
|
10.21% |
|
7.04% |
|
6.23% |
|
10.54% |
|
6.90% |
(reflects no deduction for fees, expenses or taxes) |
|
4.23% |
|
7.61% |
|
6.78% |
|
4.23% |
|
7.61% |
|
6.78% |
(1) |
After-tax returns are calculated using the historical highest individual federal marginal income tax rates and do not reflect the impact of state and local taxes. After-tax returns depend on an investor’s tax situation and may differ from those shown. After-tax returns shown are not relevant to investors who hold their Fund shares through tax-deferred arrangements, such as 401(k) plans or individual retirement accounts. |
(2) |
The TA — 125 Index is an unmanaged index of equity prices representing the 125 most highly capitalized companies listed on the Tel Aviv Stock Exchange. |
(3) |
Class A share returns reflect the assessment of the maximum front-end sales load on the first business day of the year. |
(4) |
The Fund commenced investment operations on October 12, 2011. |
Eagle Global Advisors, LLC serves as the Investment Manager to the Fund.
Edward R. Allen, III, PHD, CFA, Senior Partner; Thomas N. Hunt, III, CFA, CPA Senior Partner; Steven S. Russo, Senior Partner; and John F Gualy, CFA, Partner, of Eagle, have served the Fund since its inception on October 12, 2011.
PURCHASE AND SALE OF FUND SHARES
You may purchase, redeem or exchange shares of the Fund on any business day, which is any day the New York Stock Exchange is open for business. You may purchase, redeem or exchange shares of the Fund either through a financial advisor or directly from the Fund. The minimum initial purchase or exchange into the Fund is $1,000, or $50 through monthly systematic investment plan accounts. There is no minimum subsequent investment amount. There are no minimums for purchases or exchanges through employer-sponsored retirement plans, IRAs, or other qualified plans. The Fund shares are redeemable on any business day by contacting your financial advisor, or by written request to the Fund, by telephone, or by wire transfer.
The Fund intends to make distributions that may be taxed as ordinary income or capital gains.
PAYMENTS TO BROKER-DEALERS AND OTHER FINANCIAL INTERMEDIARIES
If you purchase shares of the Fund through a broker-dealer or other financial intermediary (such as a bank), the Fund and its distributor may pay the intermediary for the sale of Fund shares and related services. These payments may create a conflict of interest by influencing the broker-dealer or other financial intermediary and your sales person to recommend the Fund over another investment. Ask your sales person or visit your financial intermediary’s website for more information.
TIMOTHY PLAN FAMILY OF FUNDS
Defensive Strategies Fund
|
|
|
|
|
CLASS A: TPDAX |
|
|
|
CLASS C: TPDCX |
The investment objective of this Fund is the protection of principal through aggressive, proactive reactions to prevailing economic conditions.
This table describes the fees and expenses that you may pay if you buy and hold shares of the Fund. You may pay other fees, such as brokerage commissions and other fees to financial intermediaries, which are not reflected in the tables and examples below. You may qualify for sales charge discounts if you and your family invest, or agree to invest in the future, at least $50,000 in Timothy Plan Funds. More information about these and other discounts is available from your financial professional and in “How to Reduce Your Sales Charge” on page 84 of the Prospectus and “Purchase, Redemption, and Pricing of Shares” on page 38 of the Funds’ Statement of Additional Information.
(Fees paid directly from your investment)
|
|
|
|
|
| |
|
Class A |
|
Class C |
Maximum sales charge (load) imposed on purchases
(as % of offering price) |
|
5.50% |
|
None |
Maximum deferred sales charges (load) (as a percentage of the lesser of original purchase price or redemption proceeds) (1) |
|
None |
|
1.00% |
Redemption fees |
|
None |
|
None |
Exchange fees |
|
None |
|
None |
Annual Fund Operating Expenses
(Expenses that you pay each year as a percentage of the value of your investment)
|
|
|
|
|
|
|
|
|
| |
|
Class A |
|
|
Class C |
|
|
|
|
0.60% |
|
|
|
0.60% |
|
Distribution/Service (12b-1 Fees) |
|
|
0.25% |
|
|
|
1.00% |
|
|
|
|
0.69% |
|
|
|
0.69% |
|
Fees and Expenses of Acquired Funds (2) |
|
|
0.01% |
|
|
|
0.01% |
|
Total Annual Fund Operating Expenses |
|
|
1.55% |
|
|
|
2.30% |
|
(1) |
A one percent (1%) contingent deferred sales charge is imposed on any Class C shares sold within the first thirteen months after purchase. The Trust’s Distributor, Timothy Partners, Ltd., will pay a finders’ fee of 1% of the proceeds invested to brokers that purchase shares of the Funds in amounts from $1 million to $2 million, 0.75% on the next $1 million, 0.50% on the next $2 million, and 0.25% on all amounts in excess of $5 million. In such cases, those purchases will be subject to a contingent deferred sales charge of 1% for 18 months after the date of purchase. |
(2) |
Acquired Funds Fees and Expenses are the indirect costs of investing in other investment companies. Total Annual Fund Operating Expenses do not correlate to the ratio of average net assets in the Financial Highlights Table, which reflects the operating expenses of the Fund and does not include Acquired Funds Fees and Expenses. |
This Example is intended to help you compare the cost of investing in the Fund with the cost of investing in other mutual funds. For each share class offered, the Example assumes that you invest $10,000 in the Fund for the time periods indicated and then redeem all of your shares at the end of those periods. The Example also assumes that your investment has a 5% return each year and annual Fund operating expenses remain the same for each share class. Although your actual costs may be higher or lower, based on these assumptions your costs would be:
|
|
|
|
|
|
|
| |
|
|
|
|
|
|
|
|
$ 699 |
|
$333 |
|
$233 |
|
|
$1,013 |
|
$718 |
|
$718 |
|
|
$1,348 |
|
$1,230 |
|
$1,230 |
|
|
$2,294 |
|
$2,636 |
|
$2,636 |
The Example does not reflect sales charges (loads) on reinvested dividends and other distributions. If these sales charges (loads) were included, your costs would be higher.
The Fund pays transaction costs, such as commissions, when it buys and sells securities (or “turns over” its portfolio). A higher portfolio turnover rate may indicate higher transaction costs and may result in higher taxes when Fund shares are held in a taxable account. These costs, which are not reflected in annual Fund operating expenses or in the Example, affect the Fund’s performance. During the Fund’s most recent fiscal year, the Fund’s portfolio turnover rate was 49% of the average value of its portfolio.
PRINCIPAL INVESTMENT STRATEGIES
To achieve its goal, the Fund will invest varying percentages of the Fund’s total assets in the investment sectors set forth below:
|
|
Real Estate Investment Trusts (REITs), that invest in different kinds of real estate or real estate related assets, including shopping centers, office buildings, hotels, and mortgages secured by real estate, all of which are historically sensitive to both inflation and deflation. |
|
|
Commodities-based securities, including but not limited to, exchange traded funds (ETFs), other pooled investment fund securities, and commodities-related stocks, for the purpose of providing the opportunity to invest in inflation sensitive physical commodities and/or commodities futures markets. ETFs are investment securities that are registered as investment companies and invest in a basket of other securities, mostly common stocks that are included in a specific index. Pooled investment fund securities are securities that invest in a basket of other securities, mainly stocks, but are not registered as investment companies and do not trade on an exchange. |
|
|
Various Fixed Income securities and Treasury-Inflation Protection Securities (TIPS). TIPS have coupon payments and underlying principal that are automatically increased to compensate for inflation as measured by the consumer price index (CPI). The fixed income securities in which the Fund may invest, other than TIPS, include U.S. Treasury bills, notes and bonds, corporate notes and bonds, and federal agency-issued securities. |
|
|
Cash and cash equivalents. |
|
|
During times of significant market upheaval, the Fund may take positions that are inconsistent with the Fund’s principal investment strategies. During such times, the Fund may take large, small, or even no position in any one or more of the Asset Classes, may invest in gold and other eligible precious metals to the maximum extent allowed, and/or may hold some or all of the Fund’s assets in cash and/or cash equivalents. When the Fund takes such positions, it will not be investing in accordance with its principal investment strategies and may not achieve its stated investment objective. |
|
|
The Fund will not invest in Excluded Securities. Excluded Securities are securities issued by any company that is involved in the production or wholesale distribution of alcohol, tobacco, or gambling equipment, gambling enterprises, or which is involved, either directly or indirectly, in abortion or pornography, or promoting anti-family entertainment or alternative lifestyles. |
|
|
Current income is not a significant investment consideration and any such income realized will be considered incidental to the Fund’s investment objective. To allow for optimal flexibility, the Fund is classified as a “non-diversified” fund, and, as such the Fund’s portfolio may include the securities of a smaller total number of issuers than if the Fund were classified as “diversified”. |
1. |
As with most other mutual funds, you can lose money by investing in this Fund. Share prices fluctuate from day to day, and when you sell your shares, they may be worth less than you paid for them. |
2. |
Real Estate Investment Trust Risk The Fund is subject to the risks experienced in real estate ownership, real estate financing, or both. As the economy is subjected to a period of economic deflation or interest rate increases, the demand for real estate may fall, causing a decline in the value of real estate owned. Also, as interest rates increase, the values of existing mortgages fall. The higher the duration (a calculation reflecting time risk, taking into account the average maturity of the mortgages) of the mortgages held in REITs owned by the Fund, the more sensitive the Fund is to interest rate risks. The Fund is also subject to credit risk; the Fund could lose money if mortgagors default on mortgages held in the REITs. |
3. |
Commodities-based Exchange Traded Funds Commodity ETFs invest in Physical Commodities and/or Commodity Futures Contracts which Contracts are highly leveraged investment vehicles, and therefore generally considered to be high risk. By investing in Commodity ETFs the |
|
Fund assumes portions of that risk. ETFs may only purchase commodities futures contracts (the buy side), therefore the Fund’s risk includes missing opportunities to realize gains by shorting futures contracts (the sell side) in deflationary economic periods. It is possible the Fund’s entire ETF investment could be lost. |
4. |
Treasury-Inflation Protection Securities Risk Because the real rate of return offered by TIPS, which represents the growth of your purchasing power, is guaranteed by the Federal Government, TIPS may offer a lower return than other fixed income instruments that do not have such guarantees. Other conventional bond issues may offer higher yields, and the Fund may invest in such bond issues if deemed advantageous by the Advisor and Investment Managers. |
5. |
When interest rates rise, bond prices fall; the higher the Fund’s duration (a calculation reflecting time risk, taking into account both the average maturity of the Fund’s portfolio and its average coupon return), the more sensitive the Fund is to interest rate risk. |
6. |
The Fund could lose money if any bonds it owns are downgraded in credit rating or go into default. For this reason, the Fund will only invest in investment-grade bonds. The degree of risk for a particular security may be reflected in its credit rating. Bonds rated at the time of purchase BBB by Standard & Poor’s, or unrated, but determined to be of comparable quality by the investment manager, are subject to greater market risk and credit risk, or loss of principal and interest, than higher-rated securities. |
7. |
If certain industry sectors or types of securities don’t perform as well as the Fund expects, the Fund’s performance could suffer. |
8. |
Because the Fund does not invest in Excluded Securities (including certain REITs) and will divest itself of securities that are subsequently discovered to be ineligible, the Fund may be riskier than other Funds that invest in a broader array of securities. |
9. |
Because the Fund may invest in a smaller number of securities, adverse changes to a single security will have a more pronounced negative effect on the Fund than if the Fund’s investments were more widely distributed. |
10. |
The Fund’s gold and silver may be subject to loss, damage, theft, or restriction on access, and the Fund’s recovery may be limited, even in the event of fraud, to the market value of the metals at the time the fraud is discovered. International crises may motivate large-scale sales of precious metals which could decrease their prices and adversely affect the value of the Shares. The price of metals may also be adversely affected by the sale of gold or silver by ETFs or other exchange traded vehicles tracking the precious metals markets. In the event of the insolvency of the Custodian, a liquidator may seek to freeze access to the metals held in all of the accounts held by the Custodian, including the Fund’s Allocated Account. Although the Fund would retain legal title to the allocated gold and silver bars, the Fund could incur expenses in connection with obtaining control of the allocated gold or silver, and the assertion of a claim by such liquidator for unpaid fees could delay redemptions. |
11. |
Despite the various protections utilized by the Fund and its service providers, systems, networks, or devices utilized by the Fund potentially can be breached. The Fund and its shareholders could be negatively impacted as a result of a cybersecurity breach. |
The following bar chart and table provide some indication of the risks of investing in the Fund by showing the variability of the Fund’s performance from year to year and by comparing the Fund’s performance to a broad based index. The Fund’s past performance (before and after taxes) is not necessarily an indication of how the Fund will perform in the future. More up-to-date returns are available on the Fund’s website at www.timothyplan.com, or by calling the Fund at (800) 846-7526.
The bar chart does not reflect sales charges. If these charges were reflected, the returns would be less than those shown.
Year-by-year Annual Total Returns for Class A Shares
(for calendar years ending on December 31)
Average Annual Total Returns
(for periods ending on December 31, 2020)
|
|
|
|
|
|
|
|
|
|
|
|
|
Defensive Strategies |
|
Class A (3) |
|
Class C |
|
|
1 Year |
|
5 Year |
|
10 Year |
|
1 Year |
|
5 Year |
|
10 Year |
Return before taxes |
|
2.83% |
|
4.29% |
|
2.13% |
|
7.09% |
|
4.68% |
|
1.98% |
Return after taxes on distributions (1) |
|
2.83% |
|
3.93% |
|
1.73% |
|
7.09% |
|
4.43% |
|
1.70% |
Return after taxes on distributions and sale of shares (1) |
|
1.68% |
|
3.24% |
|
1.57% |
|
4.19% |
|
3.59% |
|
1.51% |
Timothy Defensive Strategies Fund Blended Index (2)
(reflects no deduction for fees, expenses or taxes) |
|
-1.65% |
|
3.02% |
|
1.38% |
|
-1.65% |
|
3.02% |
|
1.38% |
(1) |
After-tax returns are calculated using the historical highest individual federal marginal income tax rates and do not reflect the impact of state and local taxes. After-tax returns depend on an investor’s tax situation and may differ from those shown. After-tax returns shown are not relevant to investors who hold their Fund shares through tax-deferred arrangements, such as 401(k) plans or individual retirement accounts. |
(2) |
The Timothy Defensive Strategies Fund Blended Index reflects an unmanaged portfolio of 33% of the Bloomberg Barclays U.S. Treasury: 1-3 years Index, 33% of the Bloomberg Commodity Index Total Return and 34% of the MSCI U.S. REIT Gross (USD) Index. |
(3) |
Class A share returns reflect the assessment of the maximum front-end sales load on the first business day of the year. |
Timothy Partners, Ltd. manages the cash sleeve and the precious metals sleeve of the Fund.
Barrow, Hanley, Mewhinney and Strauss, LLC (“BHMS”) serves as Investment Manager of the Debt Instrument Sector of the Fund. Delaware Investment Fund Advisers served as Investment Manager of the REITs portion of the Fund until September 2020, and was replaced by Chilton Capital Management, LLC. Core Commodity Management, LLC serves as Investment Manager of the Commodity portion of the Fund.
Arthur D. Ally, President of Timothy Partners, Ltd., has served the Fund since November 1, 2009.
Mark C. Luchsinger, CFA, and J. Scott McDonald, CFA, of BHMS, have served the Fund since November 1, 2009. Erik A. Olson has served the Fund since December 2014, and Rahul Bapna, CFA, has served the Fund since December 2017. They manage the TIPS sleeve of the Fund.
Christopher Gowlland, CFA, of Delaware Investment Fund Advisers, served the Fund from July 2019 to September 2020, and managed the REIT portion of the Fund. Bruce G. Garrison and Matthew R. Werner of Chilton Capital Management, LLC have served the Fund since September 2020.
Adam C. De Chiara, of CoreCommodity Management, has served the Fund since September 27, 2011, and manages the Commodity portion of the Fund.
PURCHASE AND SALE OF FUND SHARES
You may purchase, redeem or exchange shares of the Fund on any business day, which is any day the New York Stock Exchange is open for business. You may purchase, redeem or exchange shares of the Fund either through a financial advisor or directly from the Fund. The minimum initial purchase or exchange into the Fund is $1,000, or $50 through monthly systematic investment plan accounts. There is no minimum subsequent investment amount. There are no minimums for purchases or exchanges through employer-sponsored retirement plans, IRAs, or other qualified plans. The Fund shares are redeemable on any business day by contacting your financial advisor, or by written request to the Fund, by telephone, or by wire transfer.
The Fund intends to make distributions that may be taxed as ordinary income or capital gains.
PAYMENTS TO BROKER-DEALERS AND OTHER FINANCIAL INTERMEDIARIES
If you purchase shares of the Fund through a broker-dealer or other financial intermediary (such as a bank), the Fund and its distributor may pay the intermediary for the sale of Fund shares and related services. These payments may create a conflict of interest by influencing the broker-dealer or other financial intermediary and your sales person to recommend the Fund over another investment. Ask your sales person or visit your financial intermediary’s website for more information.
TIMOTHY PLAN FAMILY OF FUNDS
Growth & Income Fund
|
|
|
|
|
CLASS A: TGIAX |
|
|
|
CLASS C: TGCIX |
INVESTMENT OBJECTIVE
The investment objective of this Fund is to provide total return through a combination of growth and income and preservation of capital in declining markets.
This table describes the fees and expenses that you may pay if you buy and hold shares of the Fund. You may pay other fees, such as brokerage commissions and other fees to financial intermediaries, which are not reflected in the tables and examples below. You may qualify for sales charge discounts if you and your family invest, or agree to invest in the future, at least $50,000 in Timothy Plan Funds. More information about these and other discounts is available from your financial professional and in “How to Reduce Your Sales Charge” on page 84 of the Prospectus and “Purchase, Redemption, and Pricing of Shares” on page 38 of the Funds’ Statement of Additional Information.
(Fees paid directly from your investment)
|
|
|
|
|
|
|
|
|
| |
|
Class A |
|
|
Class C |
|
Maximum sales charge (load) imposed on purchases |
|
|
5.50% |
|
|
|
None |
|
Maximum deferred sales charges (load) (as a percentage of the lesser of original purchase price or redemption proceeds) (1) |
|
|
None |
|
|
|
1.00% |
|
|
|
|
None |
|
|
|
None |
|
|
|
|
None |
|
|
|
None |
|
Annual Fund Operating Expenses
(Expenses that you pay each year as a percentage of the value of your investment)
|
|
|
|
|
|
|
|
|
| |
|
Class A |
|
|
Class C |
|
|
|
|
0.85% |
|
|
|
0.85% |
|
Distribution/Service (12b-1 Fees) |
|
|
0.25% |
|
|
|
1.00% |
|
|
|
|
0.75% |
|
|
|
0.75% |
|
Fees and Expenses of Acquired Funds (2) |
|
|
0.30% |
|
|
|
0.30% |
|
Total Annual Fund Operating Expenses |
|
|
2.15% |
|
|
|
2.90% |
|
(1) |
A one percent (1%) contingent deferred sales charge is imposed on any Class C shares sold within the first thirteen months after purchase. The Trust’s Distributor, Timothy Partners, Ltd., will pay a finders’ fee of 1% of the proceeds invested to brokers that purchase shares of the Funds in amounts from $1 million to $2 million, 0.75% on the next $1 million, 0.50% on the next $2 million, and 0.25% on all amounts in excess of $5 million. In such cases, those purchases will be subject to a contingent deferred sales charge of 1% for 18 months after the date of purchase. |
(2) |
Acquired Funds Fees and Expenses are the indirect costs of investing in other investment companies. Total Annual Operating Expenses do not correlate to the ratio of average net assets in the Financial Highlights Table, which reflects the operating expenses of the Fund and does not include Acquired Funds Fees and Expenses. |
This Example is intended to help you compare the cost of investing in the Fund with the cost of investing in other mutual funds. For each share class offered, the Example assumes that you invest $10,000 in the Fund for the time periods indicated and then redeem all of your shares at the end of those periods. The Example also assumes that your investment has a 5% return each year and annual Fund operating expenses remain the same for each share class. Although your actual costs may be higher or lower, based on these assumptions your costs would be:
|
|
|
|
|
|
|
| |
|
Class A |
|
|
|
|
|
|
$756 |
|
$393 |
|
$293 |
|
|
$1,186 |
|
$898 |
|
$898 |
|
|
$1,641 |
|
$1,528 |
|
$1,528 |
|
|
$2,896 |
|
$3,223 |
|
$3,223 |
The Example does not reflect sales charges (loads) on reinvested dividends and other distributions. If these sales charges (loads) were included, your costs would be higher.
The Fund pays transaction costs, such as commissions, when it buys and sells securities (or “turns over” its portfolio). A higher portfolio turnover rate may indicate higher transaction costs and may result in higher taxes when Fund shares are held in a taxable account. These costs, which are not reflected in annual Fund operating expenses or in the Example, affect the Fund’s performance. During the Fund’s most recent fiscal year, the Fund’s portfolio turnover rate was 39% of the average value of its portfolio.
PRINCIPAL INVESTMENT STRATEGIES
|
|
To achieve its goals, the Fund primarily invests in equity securities, including affiliated Exchange Traded Funds (“ETF’s”), and in fixed income securities. The Fund will normally hold both equity securities and fixed income securities, with at least 25% of its assets in equity securities and at least 25% of its assets in fixed income securities. The Advisor is responsible for determining the allocation of Fund assets to be invested in equity and fixed income securities. The Advisor will adjust those allocations from time to time in response to market changes |
|
|
The Fund’s fixed income holdings are U.S. government securities, corporate bonds, municipal bonds and/or sovereign bonds of any maturity, as well as ETFs that invest primarily in such securities. Any non-US government securities in the Fund’s portfolio consist primarily of issues rated “Baa2” or better by Moody’s Investors Service, Inc. (“Moody’s”) or “BBB” or better by Standard & Poor’s Ratings Group (“S&P”) and unrated securities determined by the Advisor to be of equivalent quality, as well as high quality money market instruments. |
|
|
The Fund’s fixed income Investment Manager reviews the various sectors looking for historical patterns of undervalue or overvalue in an effort to identify appropriate fixed income securities to purchase. The Investment Manager also analyzes interest rate risk in the bond market and makes adjustments in the maturities of bonds to adjust for this risk. Lastly, if a bond is being downgraded, or the company has other issues that may affect the bond, the Investment Manager reviews it to see if the bond should be sold. |
|
|
The Fund’s fixed income portfolio’s duration is adjusted based on a regularly conducted analysis of the interest rate risk. Typically, the duration of the Fund’s bond portfolio runs between 1 and 8 years. The Investment Manager shortens portfolio durations when its research indicates a rising interest rate environment to preserve capital. |
|
|
The Fund’s equity securities are sold when such considerations as valuation, earnings and relative price strength are determined to warrant a sale. The Advisor reviews a stock if there is a major change in its corporate structure or management. |
|
|
The Fund will not invest in Excluded Securities. Excluded Securities are securities issued by any company that is involved in the production or wholesale distribution of alcohol, tobacco, or gambling equipment, gambling enterprises, or which is involved, either directly or indirectly, in abortion or pornography, or promoting anti-family entertainment or alternative lifestyles. |
1. |
As with most other mutual funds, you can lose money by investing in this Fund. Share prices fluctuate from day to day, and when you sell your shares, they may be worth less than you paid for them. |
2. |
Overall stock market risks may affect the value of the Fund. Factors such as domestic economic growth and market conditions, interest rate levels, and political events affect the securities markets. When the value of the Fund’s investments goes down, your investment in the Fund decreases in value and you could lose money. |
3. |
The Fund invests in fixed income securities. These securities will increase or decrease in value based on changes in interest rates. If rates increase, the value of the Fund’s fixed income securities generally will decline, and those securities with longer terms generally will decline more. Your investment will decline in value if the value of the Fund’s investments decreases. There is a risk that issuers and counterparties will not make payments on fixed income securities and repurchase agreements held by the Fund. Such defaults could result in losses to the Fund. Securities with lower credit quality have a greater risk of default. In addition, the credit quality of securities held by the Fund may be lowered if an issuer’s financial condition changes. Lower credit quality may lead to greater volatility in the price of a security and in shares of the Fund. Lower credit quality also may affect liquidity and make it difficult for the Fund to sell the security. |
4. |
The Advisor’s judgments about the attractiveness, value and potential appreciation of a particular asset class or individual security in which the Fund invests may prove to be incorrect. The Fund may experience losses regardless of the overall performance of the market. |
5. |
Smaller capitalization companies may experience higher failure rates than do larger capitalization companies. In addition, smaller companies may be more vulnerable to economic, market and industry changes. As a result, share price changes may be more sudden or erratic than the prices of other equity securities, especially over the short term. Such companies may have limited product lines, markets or financial resources and may lack management depth. The trading volume of securities of smaller capitalization companies is normally less than that of larger capitalization companies, and therefore may disproportionately affect their market price, tending to make them fall more in response to selling pressure than is the case with larger capitalization companies. Some small capitalization stocks may be illiquid. These risks may be enhanced for micro-cap securities. Many micro-cap companies tend to be new and have no proven track record. Some of these companies have no assets or operations, while others have products and services that are still in development or have yet to be tested in the market. Because micro-cap stocks trade in low volumes, any size of trade can have a large percentage impact on the price of the stock. |
6. |
Foreign investing involves risks not typically associated with U.S. investments. These risks include, among others, adverse fluctuations in foreign currency values as well as adverse political, social and economic developments affecting a foreign country. In addition, foreign investing involves less publicly available information, and more volatile or less liquid securities markets. Investments in foreign countries could be affected by factors not present in the U.S., such as restrictions on receiving the investment proceeds from a foreign country, foreign tax laws, and potential difficulties in enforcing contractual obligations. Foreign accounting may be less transparent than U.S. accounting practices and foreign regulation may be inadequate or irregular. Owning foreign securities could cause the Fund’s performance to fluctuate more than if it held only U.S. securities. |
7. |
Municipal Securities Risk The power or ability of an issuer to make principal and interest payments on municipal securities may be materially adversely affected by economic conditions, litigation or other factors. The Fund’s right to receive principal and interest payments may be subject to the provisions of bankruptcy, insolvency, and other laws affecting the rights and remedies of creditors, as well as laws, if any, which may be enacted by Congress or state legislatures extending the time for payment of principal and/or interest or imposing other constraints upon the enforcement of such obligations. In addition, substantial changes in federal income tax laws could cause municipal security prices to decline because the demand for municipal securities is strongly influenced by the value of tax exempt income to investors. |
8. |
The Fund may invest in sovereign debt obligations. Investment in sovereign debt obligations involves special risks not present in corporate debt obligations. The issuer of the sovereign debt or the governmental authorities that control the repayment of the debt may be unable or unwilling to repay principal or interest when due, and the Fund may have limited recourse in the event of a default. During periods of economic uncertainty, the market prices of sovereign debt, and the Fund’s net asset value, may be more volatile than prices of U.S. debt obligations. |
9. |
Exchange Traded Fund Risk An ETF may trade at a discount to its net asset value. Investors in the Fund will indirectly bear fees and expenses charged by the underlying ETFs in which the Fund invests, in addition to the Fund’s direct fees and expenses. The Fund will also incur brokerage costs when it purchases shares of ETFs. In addition, the Fund will be affected by losses of the underlying ETF and the level of risk arising from the investment practices of the underlying ETF. |
10. |
Because the Fund does not invest in Excluded Securities and will divest itself of securities that are subsequently discovered to be ineligible, the Fund may be riskier than other funds that invest in a broader array of securities. |
11. |
Despite the various protections utilized by the Fund and its service providers, systems, networks, or devices utilized by the Fund potentially can be breached. The Fund and its shareholders could be negatively impacted as a result of a cybersecurity breach. |
The following bar chart and table provide some indication of the risks of investing in the Fund by showing the variability of the Fund’s performance from year to year and by comparing the Fund’s performance to a broad based index. The Fund’s past performance (before and after taxes) is not necessarily an indication of how the Fund will perform in the future. More up-to-date returns are available on the Fund’s website at www.timothyplan.com, or by calling the Fund at (800) 846-7526.
The bar chart does not reflect sales charges. If these charges were reflected, the returns would be less than those shown.
Year-by-year Annual Total Returns for Class A Shares
(for calendar years ending on December 31)
Average Annual Total Returns
(for periods ending on December 31, 2020)
|
|
|
|
|
|
|
|
|
|
|
|
|
Growth & Income |
|
Class A (3) |
|
Class C |
|
|
1 Year |
|
5 Years |
|
Since
Inception (5) |
|
1 Year |
|
5 Years |
|
Since
Inception (4) |
Return before taxes |
|
-4.38% |
|
0.80% |
|
1.39% |
|
-0.57% |
|
1.17% |
|
1.42% |
Return after taxes on distributions (1) |
|
-4.65% |
|
0.49% |
|
1.17% |
|
-0.67% |
|
0.93% |
|
1.26% |
Return after taxes on distributions and sale of shares (1) |
|
-2.45% |
|
0.58% |
|
1.05% |
|
-0.29% |
|
0.88% |
|
1.08% |
Timothy Growth and Income Fund Blended Index (2) (reflects no deduction for fees, expenses or taxes) |
|
5.62% |
|
7.96% |
|
7.38% |
|
5.62% |
|
7.96% |
|
7.38% |
(1) |
After-tax returns are calculated using the historical highest individual federal marginal income tax rates and do not reflect the impact of state and local taxes. After-tax returns depend on an investor’s tax situation and may differ from those shown. After-tax returns shown are not relevant to investors who hold their Fund shares through tax-deferred arrangements, such as 401(k) plans or individual retirement accounts. |
(2) |
The Timothy Growth & Income Fund Blended Index reflects an unmanaged portfolio of 40% of the Barclays U.S. Aggregate Bond Index and 60% of the Russell 1000 Value Index. |
(3) |
Class A share returns reflect the assessment of the maximum front-end sales load on the first business day of the year. |
(4) |
The Fund commenced investment operations on October 1, 2013. |
Effective May 1, 2019, Barrow, Hanley, Mewhinney & Strauss, LLC (“BHMS”) serves as Investment Manager to the fixed income allocation of the Fund’s investment portfolio.
Art Ally, President and Chief Investment Officer of Timothy Partners, Ltd., manages the equity sleeve of the Fund’s investment portfolio and determines the allocations between equity and fixed income investments since May 1, 2019.
Mr. Scott McDonald, CFA, Mr. Mark Luchsinger, CFA, Ms. Deborah A Petruzzelli, Mr. Erik Olson, Mr. Rahul Bapna, CFA, Mr. Chet Paipanandiker and Mr. Nick Losey, CFA have served the Fund since May 2019.
PURCHASE AND SALE OF FUND SHARES
You may purchase, redeem or exchange shares of the Fund on any business day, which is any day the New York Stock Exchange is open for business. You may purchase, redeem or exchange shares of the Fund either through a financial advisor or directly from the Fund. The minimum initial purchase or exchange into the Fund is $1,000, or $50 through monthly systematic investment plan accounts. There is no minimum subsequent investment amount. There are no minimums for purchases or exchanges through employer-sponsored retirement plans, IRAs, or other qualified plans. The Fund shares are redeemable on any business day by contacting your financial advisor, or by written request to the Fund, by telephone, or by wire transfer.
The Fund intends to make distributions that may be taxed as ordinary income or capital gains.
PAYMENTS TO BROKER-DEALERS AND OTHER FINANCIAL INTERMEDIARIES
If you purchase shares of the Fund through a broker-dealer or other financial intermediary (such as a bank), the Fund and its distributor may pay the intermediary for the sale of Fund shares and related services. These payments may create a conflict of interest by influencing the broker-dealer or other financial intermediary and your sales person to recommend the Fund over another investment. Ask your sales person or visit your financial intermediary’s website for more information.
TIMOTHY PLAN FAMILY OF FUNDS
|
|
|
|
|
CLASS A: TSGAX |
|
|
|
CLASS C: TSGCX |
The investment objective of the Fund is to generate medium to high levels of long-term capital growth.
This table describes the fees and expenses that you may pay if you buy and hold shares of the Fund. You may pay other fees, such as brokerage commissions and other fees to financial intermediaries, which are not reflected in the tables and examples below. You may qualify for sales charge discounts if you and your family invest, or agree to invest in the future, at least $50,000 in Timothy Plan Funds. More information about these and other discounts is available from your financial professional and in “How to Reduce Your Sales Charge” on page 84 of the Prospectus and “Purchase, Redemption, and Pricing of Shares” on page 38 of the Funds’ Statement of Additional Information.
(Fees paid directly from your investment)
|
|
|
|
|
| |
|
Class A |
|
Class C |
Maximum sales charge (load) imposed on purchases |
|
5.50% |
|
None |
Maximum deferred sales charges (load) (as a percentage of the lesser of original purchase price or redemption proceeds) (1) |
|
None |
|
1.00% |
Redemption fees |
|
None |
|
None |
Exchange fees |
|
None |
|
None |
Annual Fund Operating Expenses
(Expenses that you pay each year as a percentage of the value of your investment)
|
|
|
|
|
|
|
|
|
| |
|
Class A |
|
|
Class C |
|
|
|
|
0.65% |
|
|
|
0.65% |
|
Distribution/Service (12b-1 Fees) |
|
|
0.00% |
|
|
|
0.75% |
|
|
|
|
0.50% |
|
|
|
0.50% |
|
Fees and Expenses of Acquired Funds (2) |
|
|
0.91% |
|
|
|
0.91% |
|
Total Annual Fund Operating Expenses |
|
|
2.06% |
|
|
|
2.81% |
|
(1) |
A one percent (1%) contingent deferred sales charge is imposed on any Class C shares sold within the first thirteen months after purchase. The Trust’s Distributor, Timothy Partners, Ltd., will pay a finders’ fee of 1% of the proceeds invested to brokers that purchase shares of the Funds in amounts from $1 million to $2 million, 0.75% on the next $1 million, 0.50% on the next $2 million, and 0.25% on all amounts in excess of $5 million. In such cases, those purchases will be subject to a contingent deferred sales charge of 1% for 18 months after the date of purchase. |
(2) |
Acquired Funds Fees and Expenses are the indirect costs of investing in other investment companies. Total Annual Fund Operating Expenses do not correlate to the ratio of average net assets in the Financial Highlights Table, which reflects the operating expenses of the Fund and does not include Acquired Funds Fees and Expenses. |
This Example is intended to help you compare the cost of investing in the Fund with the cost of investing in other mutual funds. For each share class offered, the Example assumes that you invest $10,000 in the Fund for the time periods indicated and then redeem all of your shares at the end of those periods. The Example also assumes that your investment has a 5% return each year and annual Fund operating expenses remain the same for each share class. Although your actual costs may be higher or lower, based on these assumptions your costs would be:
|
|
|
|
|
|
|
| |
|
Class A |
|
Class C
(with redemption) |
|
Class C
(without redemption) |
|
|
$748 |
|
$384 |
|
$284 |
|
|
$1,160 |
|
$871 |
|
$871 |
|
|
$1,597 |
|
$1,484 |
|
$1,484 |
|
|
$2,808 |
|
$3,138 |
|
$3,138 |
The Example does not reflect sales charges (loads) on reinvested dividends and other distributions. If these sales charges (loads) were included, your costs would be higher.
The Fund pays transaction costs, such as commissions, when it buys and sells securities (or “turns over” its portfolio). A higher portfolio turnover rate may indicate higher transaction costs and may result in higher taxes when Fund shares are held in a taxable account. These costs, which are not reflected in annual Fund operating expenses or in the Example, affect the Fund’s performance. During the Fund’s most recent fiscal year, the Fund’s portfolio turnover rate was 47% of the average value of its portfolio.
PRINCIPAL INVESTMENT STRATEGIES
The Fund normally will invest at least 75% of its total assets in the following Traditional Funds according to the following approximate range of percentages:
|
|
|
Timothy Plan Traditional Fund |
|
Invested in Traditional Fund |
Large/Mid Cap Growth Fund |
|
0 - 20% |
|
|
0 - 20% |
|
|
0 - 10% |
|
|
0 - 10% |
|
|
0 - 20% |
|
|
5 - 15% |
Defensive Strategies Fund |
|
5 - 30% |
Israel Common Values Fund |
|
0 - 10% |
|
|
0 - 20% |
US Large / Mid Cap Core ETF |
|
0 - 40% |
|
|
0 - 20% |
|
|
0 - 30% |
|
|
0 - 20% |
Timothy Partners, Ltd. (“TPL”) will determine the specific asset allocation program on a continuous basis, based on its forecast of the overall market. On each day that the Fund is open for business, TPL will review the asset allocation program and reallocate, as necessary, and will reallocate for any new underlying funds in which the Fund may elect to invest. The Advisor also will reallocate the Fund’s investments in the Traditional Funds at the end of each fiscal quarter to maintain the asset allocation program.
1. |
As with most other mutual funds, you can lose money by investing in the Fund. Share prices fluctuate from day to day, and when you sell your shares, they may be worth less than you paid for them. |
2. |
The Fund is indirectly subject to the following risks that are inherent in the Traditional Funds in which the Fund invests: |
|
|
|
Commodities-based Exchange Traded Funds Risk: Commodity ETFs invest in Physical Commodities and/or Commodity Futures Contracts which Contracts are highly leveraged investment vehicles, and therefore generally considered to be high risk. By investing in underlying funds holding Commodity ETFs, the Fund assumes portions of that risk. ETFs may only purchase commodities futures contracts (the buy side), therefore the risks include missing opportunities to realize gains by shorting futures contracts (the sell side) in deflationary economic periods. It is possible an underlying Fund’s entire ETF investment could be lost. Also, ETF’s have expenses associated with them, and although indirect, these expenses may cause the Fund’s return to be lower. |
|
|
|
One underlying fund invests in Israeli securities, and Israel is subject to unique political and economic risks. As a result, Israeli securities can be more volatile than the market as a whole and can perform differently from the value of the market as a whole. The investments in the securities of Israel may experience more rapid and extreme changes in value than funds with investments solely in securities of U.S. companies or funds that invest across a larger spectrum of the foreign market. This is because the securities market in Israel is relatively small, with a limited number of companies representing a smaller number of industries. Israeli issuers are not subject to the same degree of regulation as U.S. issuers. Also, nationalization, expropriation or confiscatory taxation or political changes could adversely affect the Fund’s investments in a foreign country. |
|
|
|
If investment grade bonds are downgraded in credit rating or go into default, the result could be a loss of value, and the Fund could lose money. The degree of risk for a particular security may or may not be reflected in its credit rating. Bonds that are unrated, or rated BBB by Standard & Poor’s at the time of purchase, are subject to greater market risk and credit risk, or loss of principal and interest, than higher-rated securities. High yield securities (“junk” bonds) are subject to greater risk of loss than investment grade securities. Unrated bonds or bonds rated BB or lower by Standard & Poor’s at the time of purchase, (“junk” bonds) are subject to greater market risk and credit risk, or loss of principal and interest, than higher-rated securities. |
|
|
|
Securities represented by ADRs are foreign stocks denominated in non-U.S. currency, and there is a risk that fluctuations in the exchange rates between the U.S. dollar and foreign currencies may negatively affect the value of the investments in foreign securities. For securities that are foreign stocks denominated in non-U.S. currency, there is a risk that fluctuations in the exchange rates between the U.S. dollar and foreign currencies may negatively affect the value of the investments in foreign securities. |
|
|
|
Investments in the securities of emerging countries may experience more rapid and extreme changes in value than investments solely in securities of U.S. companies and investments in a larger spectrum of the foreign market. This is because the securities markets in some emerging countries are relatively small, with a limited number of companies representing a smaller number of industries. Issuers in emerging countries are frequently not subject to the same degree of regulation as U.S. issuers. Also, nationalization, expropriation or confiscatory taxation or political changes could adversely affect investments in emerging foreign countries. |
|
|
|
Overall, stock market risks may affect the value of the Fund. Factors such as domestic economic growth and market conditions, interest rate levels, and political events affect the securities markets. When the value of the Fund’s investments goes down, your investment in the Fund decreases in value and you could lose money. |
|
|
|
Exchange Traded Fund Risk: An ETF may trade at a discount to its net asset value. Investors indirectly bear fees and expenses charged by the underlying ETFs in addition to the Fund’s direct fees and expenses. There are also brokerage costs incurred when purchasing ETFs. In addition, losses of the underlying ETF and the level of risk arising from the investment practices of an underlying ETF may impact returns. |
|
|
|
Because the underlying Funds do not invest in Excluded Securities (including certain REITs) and will divest themselves of securities that are subsequently discovered to be ineligible, the Fund may be riskier than similar funds that invest in underlying funds that invest in broader arrays of securities. |
|
|
|
Fixed income securities will increase or decrease in value based on changes in interest rates. If rates increase, fixed income securities generally will decline, and those securities with longer terms generally will decline more. Your investment will decline in value if the value of fixed income securities decrease. There is a risk that issuers and counterparties will not make payments on fixed income securities and repurchase agreements. Such defaults could result in losses to the Fund. |
|
|
|
Foreign investing involves risks not typically associated with U.S. investments and may experience more rapid and extreme changes in value than investments solely in securities of U.S. companies. These risks include, among others, adverse fluctuations in foreign currency values as well as adverse political, social and economic developments affecting a foreign country. In addition, foreign investing involves less publicly available information, and more volatile or less liquid securities markets. Investments in foreign countries could be affected by factors not present in the U.S., such as restrictions on receiving the investment proceeds from a foreign country, foreign tax laws, and potential difficulties in enforcing contractual obligations. Foreign accounting may be less transparent than U.S. accounting practices and foreign regulation may be inadequate or irregular. Underlying Funds owning foreign securities could cause the Fund’s performance to fluctuate more than if it held only U.S. securities. |
|
|
|
As with most other mutual funds, you can lose money by investing in this Fund. Share prices fluctuate from day to day, and when you sell your shares, they may be worth less than you paid for them. |
|
|
|
Some underlying Funds invest in companies after assessing their growth potential. Securities of growth companies may be more volatile than other stocks. If a portfolio manager’s perception of a company’s growth potential is not realized, the securities purchased may not perform as expected, reducing the Fund’s return. In addition, because different types of stocks tend to shift in and out of favor depending on market and economic conditions, “growth” stocks may perform differently from the market as a whole and other types of securities. |
|
|
|
High Yield Security Risk: Investments in fixed-income securities that are rated below investment grade (“high yield securities”) by one or more Nationally Recognized Statistical Rating Organizations (NRSROs) may be subject to greater risk of loss of principal and interest than investments in higher-rated fixed-income securities. High yield securities are also generally considered to be subject to greater market risk than higher-rated securities. The capacity of issuers of high yield securities to pay interest and repay principal is more likely to weaken than is that of issuers of higher-rated securities in times of deteriorating economic conditions or rising interest rates. In addition, high yield securities may be more susceptible to real or perceived adverse economic conditions than higher-rated securities. The market for high yield securities may be less liquid than the market for higher-rated securities. This can adversely affect an underlying Fund’s ability to buy or sell optimal quantities of high yield securities at desired prices. |
|
|
|
When interest rates rise, bond prices fall; the higher an underlying Fund’s duration (a calculation reflecting time risk, taking into account both the average maturity of the Fund’s portfolio and its average coupon return), the more sensitive the underlying Fund is to interest rate risk. |
|
|
|
Investing In Other Funds Risk: The Fund invests in the securities of other investment companies. To the extent that the Fund invests in other mutual funds, exchange traded funds and other commingled funds, it will indirectly bear the expenses of those funds, which will cause the Fund’s return to be lower. |
|
|
|
The value of an individual security or a particular type of security can be more volatile than the market as a whole and can perform differently from the value of the market as a whole. |
|
|
|
Larger Company Investing Risk: Larger, more established companies may be unable to respond quickly to new competitive challenges like changes in consumer tastes or innovative smaller competitors. Also, larger companies are sometimes unable to attain the high growth rates of successful, smaller companies, especially during extended periods of economic expansion. |
|
|
|
An Advisor’s judgments about the attractiveness, value and potential appreciation of a particular asset class or individual security in which an underlying Fund invests may prove to be incorrect. The Fund may experience losses regardless of the overall performance of the market. |
|
|
|
Mid-Sized Company Investing Risk: Investing in mid-sized companies often involves greater risk than investing in larger companies. Mid-sized companies may not have the management experience, financial resources, product diversification and competitive strengths of larger companies. The securities of mid-sized companies, therefore, tend to be more volatile than the securities of larger, more established companies. Mid-sized company stocks tend to be bought and sold less often and in smaller amounts than larger company stocks. Because of this, if a fund wants to sell a large quantity of a mid-sized company’s stock, it may have to sell at a lower price than would otherwise be indicated, or it may have to sell in smaller than desired quantities over an increased time period. |
|
|
|
Municipal Securities Risk: The power or ability of an issuer to make principal and interest payments on municipal securities may be materially adversely affected by economic conditions, litigation or other factors. An underlying Fund’s right to receive principal and interest payments may be subject to the provisions of bankruptcy, insolvency, and other laws affecting the rights and remedies of creditors, as well as laws, if any, which may be enacted by Congress or state legislatures extending the time for payment of principal and/ or interest or imposing other constraints upon the enforcement of such obligations. In addition, substantial changes in federal income tax laws could cause municipal security prices to decline because the demand for municipal securities is strongly influenced by the value of tax exempt income to investors. |
|
|
|
Non-Diversification Risk: |
|
|
|
Real Estate Investment Trust Risk: To the extent underlying Funds invest in real estate investment trusts, the Fund is subject to risks experienced in real estate ownership, real estate financing, or both. As the economy is subjected to a period of economic deflation or interest rate increases, the demand for real estate may fall, causing a decline in the value of real estate owned. Also, as interest rates increase, the values of existing mortgages fall. The higher the duration (a calculation reflecting time risk, taking into account the average maturity of the mortgages) of the mortgages held in REITs owned by underlying Funds, the more sensitive the Fund is to interest rate risks. The underlying Funds are also subject to credit risk; the Fund could lose money if mortgagors default on mortgages held in the REITs. |
|
|
|
If certain industry sectors or types of securities don’t perform as well as the managers of the underlying Funds expect, the Fund’s performance could suffer. |
|
|
|
Smaller capitalization companies may experience higher failure rates than do larger capitalization companies. In addition, smaller companies may be more vulnerable to economic, market and industry changes. As a result, share price changes may be more sudden or erratic than the prices of other equity securities, especially over the short term. Such companies may have limited product lines, markets or financial resources and may lack management depth. The trading volume of securities of smaller capitalization companies is normally less than that of larger capitalization companies, and therefore may disproportionately affect their market price, tending to make them fall more in response to selling pressure than is the case with larger capitalization companies. Some small capitalization stocks may be illiquid. These risks may be enhanced for micro-cap securities. Many micro-cap companies tend to be new and have no proven track record. Some of these companies have no assets or operations, while others have products and services that are still in development or have yet to be tested in the market. Because micro-cap stocks trade in low volumes, any size of trade can have a large percentage impact on the price of the stock. |
|
|
|
The underlying Funds may invest in sovereign debt obligations. Investment in sovereign debt obligations involves special risks not present in corporate debt obligations. The issuer of the sovereign debt or the governmental authorities that control the repayment of the debt may be unable or unwilling to repay principal or interest when due, and the Fund may have limited recourse in the event of a default. During periods of economic uncertainty, the market prices of sovereign debt, and the underlying Funds’ net asset values, may be more volatile than prices of U.S. debt obligations. |
|
|
|
The Fund is an equity fund, so it is subject to the risks inherent in the stock market in general. The stock market is cyclical, with prices generally rising and falling over periods of time. Some of these price cycles can be pronounced and last for a long time. |
|
|
|
Treasury-Inflation Protected Securities Risk: Because the real rate of return offered by TIPS, which represents the growth of purchasing power, is guaranteed by the Federal Government, TIPS may offer a lower return than other fixed income instruments that do not have such guarantees. Other conventional bond issues may offer higher yields. |
|
|
|
Because different types of stocks tend to shift in and out of favor depending on market and economic conditions, “value” stocks may perform differently from the market as a whole and other types of stocks and can continue to be undervalued by the market for long periods of time. It is also possible that a value stock may never appreciate to the extent expected. |
|
|
|
The Fund’s gold and silver may be subject to loss, damage, theft, or restriction on access, and the Fund’s recovery may be limited, even in the event of fraud, to the market value of the metals at the time the fraud is discovered. International crises may motivate large-scale sales of precious metals which could decrease their prices and adversely affect the value of the Shares. The price of metals may also be adversely affected by the sale of gold or silver by ETFs or other exchange traded vehicles tracking the precious metals markets. In the event of the insolvency of the Custodian, a liquidator may seek to freeze access to the metals held in all of the accounts held by the Custodian, including the Fund’s Allocated Account. Although the Fund would retain legal title to the allocated gold and silver bars, the Fund could incur expenses in connection with obtaining control of the allocated gold or silver, and the assertion of a claim by such liquidator for unpaid fees could delay redemptions. |
|
|
|
Despite the various protections utilized by the Fund and its service providers, systems, networks, or devices utilized by the Fund potentially can be breached. The Fund and its shareholders could be negatively impacted as a result of a cybersecurity breach. |
The following bar chart and table provide some indication of the risks of investing in the Fund by showing the variability of the Fund’s performance from year to year and by comparing the Fund’s performance to a broad based index. The Fund’s past performance (before and after taxes) is not necessarily an indication of how the Fund will perform in the future. More up-to-date returns are available on the Fund’s website at www.timothyplan.com, or by calling the Fund at (800) 846-7526.
The bar chart does not reflect sales charges. If these charges were reflected, the returns would be less than those shown.
Year-by-year Annual Total Returns for Class A Shares
(for calendar years ending on December 31)
Average Annual Total Returns
(for periods ending on December 31, 2020)
|
|
|
|
|
|
|
|
|
|
|
|
|
Strategic Growth |
|
Class A (3) |
|
Class C |
|
|
1 Year |
|
5 Years |
|
10 Years |
|
1 Year |
|
5 Years |
|
10 Years |
Return before taxes |
|
2.14% |
|
4.44% |
|
4.06% |
|
6.24% |
|
4.83% |
|
3.84% |
Return after taxes on distributions (1) |
|
1.39% |
|
4.09% |
|
3.81% |
|
5.32% |
|
4.43% |
|
3.61% |
Return after taxes on distributions and sale of shares (1) |
|
1.89% |
|
3.44% |
|
3.18% |
|
4.35% |
|
3.74% |
|
3.02% |
Dow Jones Moderately Aggressive Portfolio Index (2) (reflects no deduction for fees, expenses or taxes) |
|
14.14% |
|
11.08% |
|
8.94% |
|
14.14% |
|
11.08% |
|
8.94% |
(1) |
After-tax returns are calculated using the historical highest individual federal marginal income tax rates and do not reflect the impact of state and local taxes. After-tax returns depend on an investor’s tax situation and may differ from those shown. After-tax returns shown are not relevant to investors who hold their Fund shares through tax-deferred arrangements, such as 401(k) plans or individual retirement accounts. |
(2) |
The Dow Jones Moderately Aggressive Portfolio Index is a widely recognized index that measures global stocks, bonds and cash which are in turn represented by multiple sub-indexes. The Index assumes reinvestment of all dividends and distributions and does not reflect any asset-based charges for investment management or other expenses. |
(3) |
Class A share returns reflect the assessment of the maximum front-end sales load on the first business day of the year. |
Arthur D. Ally, President of Timothy Partners, Ltd., has served the Fund since October 1, 2000.
PURCHASE AND SALE OF FUND SHARES
You may purchase, redeem or exchange shares of the Fund on any business day, which is any day the New York Stock Exchange is open for business. You may purchase, redeem or exchange shares of the Fund either through a financial advisor or directly from the Fund. The minimum initial purchase or exchange into the Fund is $1,000, or $50 through monthly systematic investment plan accounts. There is no minimum subsequent investment amount. There are no minimums for purchases or exchanges through employer-sponsored retirement plans, IRAs, or other qualified plans. The Fund shares are redeemable on any business day by contacting your financial advisor, or by written request to the Fund, by telephone, or by wire transfer.
The Fund intends to make distributions that may be taxed as ordinary income or capital gains.
PAYMENTS TO BROKER-DEALERS AND OTHER FINANCIAL INTERMEDIARIES
If you purchase shares of the Fund through a broker-dealer or other financial intermediary (such as a bank), the Fund and its distributor may pay the intermediary for the sale of Fund shares and related services. These payments may create a conflict of interest by influencing the broker-dealer or other financial intermediary and your sales person to recommend the Fund over another investment. Ask your sales person or visit your financial intermediary’s website for more information.
TIMOTHY PLAN FAMILY OF FUNDS
|
|
|
|
|
CLASS A: TCGAX |
|
|
|
CLASS C: TCVCX |
The investment objective of the Fund is to generate moderate levels of long-term capital growth.
This table describes the fees and expenses that you may pay if you buy and hold shares of the Fund. You may pay other fees, such as brokerage commissions and other fees to financial intermediaries, which are not reflected in the tables and examples below. You may qualify for sales charge discounts if you and your family invest, or agree to invest in the future, at least $50,000 in Timothy Plan Funds. More information about these and other discounts is available from your financial professional and in “How to Reduce Your Sales Charge” on page 84 of the Prospectus and “Purchase, Redemption, and Pricing of Shares” on page 38 of the Funds’ Statement of Additional Information.
(Fees paid directly from your investment)
|
|
|
|
|
|
|
|
|
| |
|
Class A |
|
|
Class C |
|
Maximum sales charge (load) imposed on purchases |
|
|
5.50% |
|
|
|
None |
|
Maximum deferred sales charges (load) (as a percentage of the lesser of original purchase price or redemption proceeds) (1) |
|
|
None |
|
|
|
1.00% |
|
|
|
|
None |
|
|
|
None |
|
|
|
|
None |
|
|
|
None |
|
Annual Fund Operating Expenses
(Expenses that you pay each year as a percentage of the value of your investment)
|
|
|
|
|
|
|
|
|
| |
|
Class A |
|
|
Class C |
|
|
|
|
0.65% |
|
|
|
0.65% |
|
Distribution/Service (12b-1 Fees) |
|
|
0.00% |
|
|
|
0.75% |
|
|
|
|
0.47% |
|
|
|
0.47% |
|
Fees and Expenses of Acquired Funds (2) |
|
|
0.95% |
|
|
|
0.95% |
|
Total Annual Fund Operating Expenses |
|
|
2.07% |
|
|
|
2.82% |
|
(1) |
A one percent (1%) contingent deferred sales charge is imposed on any Class C shares sold within the first thirteen months after purchase. The Trust’s Distributor, Timothy Partners, Ltd., will pay a finders’ fee of 1% of the proceeds invested to brokers that purchase shares of the Funds in amounts from $1 million to $2 million, 0.75% on the next $1 million, 0.50% on the next $2 million, and 0.25% on all amounts in excess of $5 million. In such cases, those purchases will be subject to a contingent deferred sales charge of 1% for 18 months after the date of purchase. |
(2) |
Acquired Funds Fees and Expenses are the indirect costs of investing in other investment companies. Total Annual Fund Operating Expenses do not correlate to the ratio of average net assets in the Financial Highlights Table, which reflects the operating expenses of the Fund and does not include Acquired Funds Fees and Expenses. |
This Example is intended to help you compare the cost of investing in the Fund with the cost of investing in other mutual funds. For each share class offered, the Example assumes that you invest $10,000 in the Fund for the time periods indicated and then redeem all of your shares at the end of those periods. The Example also assumes that your investment has a 5% return each year and annual Fund operating expenses remain the same for each share class. Although your actual costs may be higher or lower, based on these assumptions your costs would be:
|
|
|
|
|
|
|
| |
|
|
|
|
|
|
|
|
$748 |
|
$385 |
|
$285 |
|
|
$1,163 |
|
$874 |
|
$874 |
|
|
$1,602 |
|
$1,489 |
|
$1,489 |
|
|
$2,818 |
|
$3,147 |
|
$3,147 |
The Example does not reflect sales charges (loads) on reinvested dividends and other distributions. If these sales charges (loads) were included, your costs would be higher.
The Fund pays transaction costs, such as commissions, when it buys and sells securities (or “turns over” its portfolio). A higher portfolio turnover rate may indicate higher transaction costs and may result in higher taxes when Fund shares are held in a taxable account. These costs, which are not reflected in annual Fund operating expenses or in the Example, affect the Fund’s performance. During the Fund’s most recent fiscal year, the Fund’s portfolio turnover rate was 37% of the average value of its portfolio.
PRINCIPAL INVESTMENT STRATEGIES
The Fund normally will invest at least 75% of its total assets in the following Traditional Funds according to the following approximate range of percentages:
|
|
|
Timothy Plan Traditional Fund |
|
Invested in Traditional Fund |
Large/Mid Cap Growth Fund |
|
0 - 15% |
|
|
0 - 15% |
|
|
0 - 10% |
|
|
0 - 5% |
|
|
0 - 20% |
|
|
5 - 15% |
Defensive Strategies Fund |
|
5 - 30% |
Israel Common Values Fund |
|
0 - 10% |
|
|
20 - 40% |
US Large / Mid Cap Core ETF |
|
0 - 30% |
US High Dividend Stock ETF |
|
0 - 25% |
|
|
0 - 25% |
|
|
0 - 15% |
Timothy Partners, Ltd. (“TPL”) will determine the specific asset allocation program on a continuous basis, based on its forecast of the overall market. On each day that the Fund is open for business, TPL will review the asset allocation program and reallocate, as necessary, and will reallocate for any new underlying funds in which the Fund may elect to invest. The Advisor also will reallocate the Fund’s investments in the Traditional Funds at the end of each fiscal quarter to maintain the asset allocation program.
1. |
As with most other mutual funds, you can lose money by investing in the Fund. Share prices fluctuate from day to day, and when you sell your shares, they may be worth less than you paid for them. |
2. |
The Fund is indirectly subject to the following risks that are inherent in the Traditional Funds in which the Fund invests: |
|
|
|
Commodities-based Exchange Traded Funds Risk: Commodity ETFs invest in Physical Commodities and/or Commodity Futures Contracts which Contracts are highly leveraged investment vehicles, and therefore generally considered to be high risk. By investing in underlying funds holding Commodity ETFs, the Fund assumes portions of that risk. ETFs may only purchase commodities futures contracts (the buy side), therefore the risks include missing opportunities to realize gains by shorting futures contracts (the sell side) in deflationary economic periods. It is possible an underlying Fund’s entire ETF investment could be lost. Also, ETF’s have expenses associated with them, and although indirect, these expenses may cause the Fund’s return to be lower. |
|
|
|
One underlying fund invests in Israeli securities, and Israel is subject to unique political and economic risks. As a result, Israeli securities can be more volatile than the market as a whole and can perform differently from the value of the market as a whole. The investments in the securities of Israel may experience more rapid and extreme changes in value than funds with investments solely in securities of U.S. companies or funds that invest across a larger spectrum of the foreign market. This is because the securities market in Israel is relatively small, with a limited number of companies representing a smaller number of industries. Israeli issuers are not subject to the same degree of regulation as U.S. issuers. Also, nationalization, expropriation or confiscatory taxation or political changes could adversely affect the Fund’s investments in a foreign country. |
|
|
|
If investment grade bonds are downgraded in credit rating or go into default, the result could be a loss of value, and the Fund could lose money. The degree of risk for a particular security may or may not be reflected in its credit rating. Bonds that are unrated, or rated BBB by Standard & Poor’s at the time of purchase, are subject to greater market risk and credit risk, or loss of principal and interest, than higher-rated securities. High yield securities (“junk” bonds) are subject to greater risk of loss than investment grade securities. Unrated bonds or bonds rated BB or lower by Standard & Poor’s at the time of purchase, (“junk” bonds) are subject to greater market risk and credit risk, or loss of principal and interest, than higher-rated securities. |
|
|
|
Securities represented by ADRs are foreign stocks denominated in non-U.S. currency, and there is a risk that fluctuations in the exchange rates between the U.S. dollar and foreign currencies may negatively affect the value of the investments in foreign securities. For securities that are foreign stocks denominated in non-U.S. currency, there is a risk that fluctuations in the exchange rates between the U.S. dollar and foreign currencies may negatively affect the value of the investments in foreign securities. |
|
|
|
Investments in the securities of emerging countries may experience more rapid and extreme changes in value than investments solely in securities of U.S. companies and investments in a larger spectrum of the foreign market. This is because the securities markets in some emerging countries are relatively small, with a limited number of companies representing a smaller number of industries. Issuers in emerging countries are frequently not subject to the same degree of regulation as U.S. issuers. Also, nationalization, expropriation or confiscatory taxation or political changes could adversely affect investments in emerging foreign countries. |
|
|
|
Overall, stock market risks may affect the value of the Fund. Factors such as domestic economic growth and market conditions, interest rate levels, and political events affect the securities markets. When the value of the Fund’s investments goes down, your investment in the Fund decreases in value and you could lose money. |
|
|
|
Exchange Traded Fund Risk: An ETF may trade at a discount to its net asset value. Investors indirectly bear fees and expenses charged by the underlying ETFs in addition to the Fund’s direct fees and expenses. There are also brokerage costs incurred when purchasing ETFs. In addition, losses of the underlying ETF and the level of risk arising from the investment practices of an underlying ETF may impact returns. |
|
|
|
Because the underlying Funds do not invest in Excluded Securities (including certain REITs) , and will divest themselves of securities that are subsequently discovered to be ineligible, the Fund may be riskier than similar funds that invest in underlying funds that invest in broader arrays of securities. |
|
|
|
Fixed income securities will increase or decrease in value based on changes in interest rates. If rates increase, fixed income securities generally will decline, and those securities with longer terms generally will decline more. Your investment will decline in value if the value of fixed income securities decrease. There is a risk that issuers and counterparties will not make payments on fixed income securities and repurchase agreements. Such defaults could result in losses to the Fund. |
|
|
|
Foreign investing involves risks not typically associated with U.S. investments and may experience more rapid and extreme changes in value than investments solely in securities of U.S. companies. These risks include, among others, adverse fluctuations in foreign currency values as well as adverse political, social and economic developments affecting a foreign country. In addition, foreign investing involves less publicly available information, and more volatile or less liquid securities markets. Investments in foreign countries could be affected by factors not present in the U.S., such as restrictions on receiving the investment proceeds from a foreign country, foreign tax laws, and potential difficulties in enforcing contractual obligations. Foreign accounting may be less transparent than U.S. accounting practices and foreign regulation may be inadequate or irregular. Underlying Funds owning foreign securities could cause the Fund’s performance to fluctuate more than if it held only U.S. securities. |
|
|
|
As with most other mutual funds, you can lose money by investing in this Fund. Share prices fluctuate from day to day, and when you sell your shares, they may be worth less than you paid for them. |
|
|
|
Some underlying Funds invest in companies after assessing their growth potential. Securities of growth companies may be more volatile than other stocks. If a portfolio manager’s perception of a company’s growth potential is not realized, the securities purchased may not perform as expected, reducing the Fund’s return. In addition, because different types of stocks tend to shift in and out of favor depending on market and economic conditions, “growth” stocks may perform differently from the market as a whole and other types of securities. |
|
|
|
High Yield Security Risk: Investments in fixed-income securities that are rated below investment grade (“high yield securities”) by one or more Nationally Recognized Statistical Rating Organizations (NRSROs) may be subject to greater risk of loss of principal and interest than investments in higher-rated fixed-income securities. High yield securities are also generally considered to be subject to greater market risk than higher-rated securities. The capacity of issuers of high yield securities to pay interest and repay principal is more likely to weaken than is that of issuers of higher-rated securities in times of deteriorating economic conditions or rising interest rates. In addition, high yield securities may be more susceptible to real or perceived adverse economic conditions than higher-rated securities. The market for high yield securities may be less liquid than the market for higher-rated securities. This can adversely affect an underlying Fund’s ability to buy or sell optimal quantities of high yield securities at desired prices. |
|
|
|
When interest rates rise, bond prices fall; the higher an underlying Fund’s duration (a calculation reflecting time risk, taking into account both the average maturity of the Fund’s portfolio and its average coupon return), the more sensitive the underlying Fund is to interest rate risk. |
|
|
|
Investing In Other Funds Risk: The Fund invests in the securities of other investment companies. To the extent that the Fund invests in other mutual funds, exchange traded funds and other commingled funds, it will indirectly bear the expenses of those funds, which will cause the Fund’s return to be lower. |
|
|
|
The value of an individual security or a particular type of security can be more volatile than the market as a whole and can perform differently from the value of the market as a whole. |
|
|
|
Larger Company Investing Risk: Larger, more established companies may be unable to respond quickly to new competitive challenges like changes in consumer tastes or innovative smaller competitors. Also, larger companies are sometimes unable to attain the high growth rates of successful, smaller companies, especially during extended periods of economic expansion. |
|
|
|
An Advisor’s judgments about the attractiveness, value and potential appreciation of a particular asset class or individual security in which an underlying Fund invests may prove to be incorrect. The Fund may experience losses regardless of the overall performance of the market. |
|
|
|
Mid-Sized Company Investing Risk: Investing in mid-sized companies often involves greater risk than investing in larger companies. Mid-sized companies may not have the management experience, financial resources, product diversification and competitive strengths of larger companies. The securities of mid-sized companies, therefore, tend to be more volatile than the securities of larger, more established companies. Mid-sized company stocks tend to be bought and sold less often and in smaller amounts than larger company stocks. Because of this, if a fund wants to sell a large quantity of a mid-sized company’s stock, it may have to sell at a lower price than would otherwise be indicated, or it may have to sell in smaller than desired quantities over an increased time period. |
|
|
|
Municipal Securities Risk: The power or ability of an issuer to make principal and interest payments on municipal securities may be materially adversely affected by economic conditions, litigation or other factors. An underlying Fund’s right to receive principal and interest payments may be subject to the provisions of bankruptcy, insolvency, and other laws affecting the rights and remedies of creditors, as well as laws, if any, which may be enacted by Congress or state legislatures extending the time for payment of principal and/ or interest or imposing other constraints upon the enforcement of such obligations. In addition, substantial changes in federal income tax laws could cause municipal security prices to decline because the demand for municipal securities is strongly influenced by the value of tax exempt income to investors. |
|
|
|
Non-Diversification Risk: |
|
|
|
Real Estate Investment Trust Risk: To the extent underlying Funds invest in real estate investment trusts, the Fund is subject to risks experienced in real estate ownership, real estate financing, or both. As the economy is subjected to a period of economic deflation or interest rate increases, the demand for real estate may fall, causing a decline in the value of real estate owned. Also, as interest rates increase, the values of existing mortgages fall. The higher the duration (a calculation reflecting time risk, taking into account the average maturity of the mortgages) of the mortgages held in REITs owned by underlying Funds, the more sensitive the Fund is to interest rate risks. The underlying Funds are also subject to credit risk; the Fund could lose money if mortgagors default on mortgages held in the REITs. |
|
|
|
If certain industry sectors or types of securities don’t perform as well as the managers of the underlying Funds expect, the Fund’s performance could suffer. |
|
|
|
Smaller capitalization companies may experience higher failure rates than do larger capitalization companies. In addition, smaller companies may be more vulnerable to economic, market and industry changes. As a result, share price changes may be more sudden or erratic than the prices of other equity securities, especially over the short term. Such companies may have limited product lines, markets or financial resources and may lack management depth. The trading volume of securities of smaller capitalization companies is normally less than that of larger capitalization companies, and therefore may disproportionately affect their market price, tending to make them fall more in response to selling pressure than is the case with larger capitalization companies. Some small capitalization stocks may be illiquid. These risks may be enhanced for micro-cap securities. Many micro-cap companies tend to be new and have no proven track record. Some of these companies have no assets or operations, while others have products and services that are still in development or have yet to be tested in the market. Because micro-cap stocks trade in low volumes, any size of trade can have a large percentage impact on the price of the stock. |
|
|
|
The underlying Funds may invest in sovereign debt obligations. Investment in sovereign debt obligations involves special risks not present in corporate debt obligations. The issuer of the sovereign debt or the governmental authorities that control the repayment of the debt may be unable or unwilling to repay principal or interest when due, and the Fund may have limited recourse in the event of a default. During periods of economic uncertainty, the market prices of sovereign debt, and the underlying Funds’ net asset values, may be more volatile than prices of U.S. debt obligations. |
|
|
|
The Fund is an equity fund, so it is subject to the risks inherent in the stock market in general. The stock market is cyclical, with prices generally rising and falling over periods of time. Some of these price cycles can be pronounced and last for a long time. |
|
|
|
Treasury-Inflation Protected Securities Risk: Because the real rate of return offered by TIPS, which represents the growth of purchasing power, is guaranteed by the Federal Government, TIPS may offer a lower return than other fixed income instruments that do not have such guarantees. Other conventional bond issues may offer higher yields. |
|
|
|
Because different types of stocks tend to shift in and out of favor depending on market and economic conditions, “value” stocks may perform differently from the market as a whole and other types of stocks and can continue to be undervalued by the market for long periods of time. It is also possible that a value stock may never appreciate to the extent expected. |
|
|
|
The Fund’s gold and silver may be subject to loss, damage, theft, or restriction on access, and the Fund’s recovery may be limited, even in the event of fraud, to the market value of the metals at the time the fraud is discovered. International crises may motivate large-scale sales of precious metals which could decrease their prices and adversely affect the value of the Shares. The price of metals may also be adversely affected by the sale of gold or silver by ETFs or other exchange traded vehicles tracking the precious metals markets. In the event of the insolvency of the Custodian, a liquidator may seek to freeze access to the metals held in all of the accounts held by the Custodian, including the Fund’s Allocated Account. Although the Fund would retain legal title to the allocated gold and silver bars, the Fund could incur expenses in connection with obtaining control of the allocated gold or silver, and the assertion of a claim by such liquidator for unpaid fees could delay redemptions. |
|
|
|
Despite the various protections utilized by the Fund and its service providers, systems, networks, or devices utilized by the Fund potentially can be breached. The Fund and its shareholders could be negatively impacted as a result of a cybersecurity breach. |
The following bar chart and table provide some indication of the risks of investing in the Fund by showing the variability of the Fund’s performance from year to year and by comparing the Fund’s performance to a broad based index. The Fund’s past performance (before and after taxes) is not necessarily an indication of how the Fund will perform in the future. More up-to-date returns are available on the Fund’s website at www.timothyplan.com, or by calling the Fund at (800) 846-7526.
The bar chart does not reflect sales charges. If these charges were reflected, the returns would be less than those shown.
Year-by-year Annual Total Returns for Class A Shares
(for calendar years ending on December 31)
Average Annual Total Returns
(for periods ending on December 31, 2020)
|
|
|
|
|
|
|
|
|
|
|
|
|
Conservative Growth |
|
Class A (3) |
|
Class C |
|
|
1 Year |
|
5 Year |
|
10 Year |
|
1 Year |
|
5 Year |
|
10 Year |
Return before taxes |
|
1.76% |
|
3.82% |
|
3.46% |
|
5.81% |
|
4.21% |
|
3.26% |
Return after taxes on distributions (1) |
|
1.19% |
|
3.39% |
|
2.92% |
|
5.19% |
|
3.74% |
|
2.79% |
Return after taxes on distributions and sale of shares (1) |
|
1.51% |
|
2.94% |
|
2.62% |
|
3.87% |
|
3.23% |
|
2.51% |
Dow Jones Moderate Portfolio Index (2) (reflects no deduction for fees, expenses or taxes) |
|
12.24% |
|
9.36% |
|
7.59% |
|
12.24% |
|
9.36% |
|
7.59% |
(1) |
After-tax returns are calculated using the historical highest individual federal marginal income tax rates and do not reflect the impact of state and local taxes. After-tax returns depend on an investor’s tax situation and may differ from those shown. After-tax returns shown are not relevant to investors who hold their Fund shares through tax-deferred arrangements, such as 401(k) plans or individual retirement accounts. |
(2) |
The Dow Jones Moderate Portfolio Index is a widely recognized index that measures global stocks, bonds and cash which are in turn represented by multiple sub-indexes. The Index assumes reinvestment of all dividends and distributions and does not reflect any asset-based charges for investment management or other expenses. |
(3) |
Class A share returns reflect the assessment of the maximum front-end sales load on the first business day of the year. |
Arthur D. Ally, President of Timothy Partners, Ltd., has served the Fund since October 1, 2000.
PURCHASE AND SALE OF FUND SHARES
You may purchase, redeem or exchange shares of the Fund on any business day, which is any day the New York Stock Exchange is open for business. You may purchase, redeem or exchange shares of the Fund either through a financial advisor or directly from the Fund. The minimum initial purchase or exchange into the Fund is $1,000, or $50 through monthly systematic investment plan accounts. There is no minimum subsequent investment amount. There are no minimums for purchases or exchanges through employer-sponsored retirement plans, IRAs, or other qualified plans. The Fund shares are redeemable on any business day by contacting your financial advisor, or by written request to the Fund, by telephone, or by wire transfer.
The Fund intends to make distributions that may be taxed as ordinary income or capital gains.
PAYMENTS TO BROKER-DEALERS AND OTHER FINANCIAL INTERMEDIARIES
If you purchase shares of the Fund through a broker-dealer or other financial intermediary (such as a bank), the Fund and its distributor may pay the intermediary for the sale of Fund shares and related services. These payments may create a conflict of interest by influencing the broker-dealer or other financial intermediary and your sales person to recommend the Fund over another investment. Ask your sales person or visit your financial intermediary’s website for more information.
The investment objective of this Fund is to provide you with long-term growth of capital. The Fund attempts to achieve its investment objective by:
|
|
The Fund seeks to achieve its investment strategy by normally investing at least 80% of the Fund’s total assets in U.S. common stocks without regard to market capitalizations. |
|
|
The Fund invests using a growth investing style. Growth funds generally focus on stocks of companies believed to have above-average potential for growth in revenue, earnings, cash flow, or other similar criteria. These stocks typically have low dividend yields and above- average prices in relation to such measures as earnings and book value. Growth and value stocks have historically produced similar long-term returns, though each category has periods when it outperforms the other. |
|
|
The Fund invests its assets in the securities of a limited number of companies, which the Fund’s Investment Manager believes show a high probability for superior growth. Companies that meet or exceed specific criteria established by the Manager in the selection process are purchased. Securities are sold when they reach internally determined pricing targets or no longer qualify under the Manager’s investment criteria. |
|
|
The Fund may, from time to time, take temporary defensive positions that are inconsistent with the Fund’s principal investment strategies in attempting to respond to adverse market, economic, political, or other conditions. When the Fund takes a defensive position, the Fund’s assets will be held in cash and/or cash equivalents. |
|
|
The Fund will not invest in Excluded Securities. Excluded Securities are securities issued by any company that is involved in the production or wholesale distribution of alcohol, tobacco, or gambling equipment, gambling enterprises, or which is involved, either directly or indirectly, in abortion or pornography, or promoting anti-family entertainment or alternative lifestyles. |
The Fund is subject to the following Principal Risks:
1. |
As with most other mutual funds, you can lose money by investing in this Fund. Share prices fluctuate from day to day, and when you sell your shares, they may be worth less than you paid for them. |
2. |
The Fund is an equity fund, so it is subject to the risks inherent in the stock market in general. The stock market is cyclical, with prices generally rising and falling over periods of time. Some of these price cycles can be pronounced and last for a long time. |
3. |
Larger Company Investing Risk Larger, more established companies may be unable to respond quickly to new competitive challenges like changes in consumer tastes or innovative smaller competitors. Also, larger companies are sometimes unable to attain the high growth rates of successful, smaller companies, especially during extended periods of economic expansion. |
4. |
Smaller Company Investing Risk Investing in smaller companies often involves greater risk than investing in larger companies. Smaller companies may not have the management experience, financial resources, product diversification and competitive strengths of larger companies. The securities of smaller companies, therefore, tend to be more volatile than the securities of larger, more established companies. Smaller company stocks tend to be bought and sold less often and in smaller amounts than larger company stocks. Because of this, if a fund wants to sell a large quantity of a small-sized company’s stock, it may have to sell at a lower price than would otherwise be indicated, or it may have to sell in smaller than desired quantities over an increased time period. |
5. |
Because the Fund does not invest in Excluded Securities and will divest itself of securities that are subsequently discovered to be ineligible, the Fund may be riskier than other funds that invest in a broader array of securities. |
6. |
The Fund often invests in companies after assessing their growth potential. Securities of growth companies may be more volatile than other stocks. If the portfolio manager’s perception of a company’s growth potential is not realized, the securities purchased may not perform as expected, reducing the Fund’s return. In addition, because different types of stocks tend to shift in and out of favor depending on market and economic conditions, “growth” stocks may perform differently from the market as a whole and other types of securities. |
7. |
Investing In Other Funds Risk The Fund invests in the securities of other investment companies. To the extent that the Fund invests in other mutual funds, exchange traded funds and other commingled funds, it will indirectly bear the expenses of those funds, which will cause the Fund’s return to be lower. |
8. |
High Portfolio Turnover Risk The Fund has in the past experienced high portfolio turnover (greater than 100%). A higher portfolio turnover rate may indicate higher transaction costs and may result in higher taxes when Fund shares are held in a taxable account. These costs, which are not reflected in annual Fund operating expenses or in the Example, affect the Fund’s performance. |
9. |
The computer systems, networks and devices used by the Fund and its service providers to carry out routine business operations employ a variety of protections designed to prevent damage or interruption from computer viruses, network failures, computer and telecommunication failures, infiltration by unauthorized persons and security breaches. Despite the various protections utilized by the Fund and its service providers, systems, networks, or devices potentially can be breached. The Fund and its shareholders could be negatively impacted as a result of a cybersecurity breach. Cybersecurity breaches can include unauthorized access to systems, networks, or devices; |
|
infection from computer viruses or other malicious software code; and attacks that shut down, disable, slow, or otherwise disrupt operations, business processes, or website access or functionality. Cybersecurity breaches may cause disruptions and impact the Fund’s business operations, potentially resulting in financial losses; interference with the Fund’s ability to calculate its NAV; impediments to trading; the inability of the Fund, the Advisor, and other service providers to transact business; violations of applicable privacy and other laws; regulatory fines; penalties, reputational damage, reimbursement or other compensation costs, or additional compliance costs; as well as the inadvertent release of confidential information. |
A description of the Fund’s policies and procedures with respect to the disclosure of the Fund’s portfolio securities is available in the Funds’ SAI for Class A and Class C shares. It is also available on the Fund’s website, www.timothyplan.com.
The investment objective of this Fund is to provide you with long-term growth of capital. The Fund attempts to achieve it investment objective by:
|
|
The Fund seeks to achieve its investment objectives by normally investing at least 80% of the Fund’s total assets in the securities of foreign companies (companies domiciled in countries other than the United States) through the purchase of American Depositary Receipts (ADRs), without regard to market capitalizations. |
|
|
The Fund invests using a growth investing style. Growth funds generally focus on stocks of companies believed to have above-average potential for growth in revenue, earnings, cash flow, or other similar criteria. These stocks typically have low dividend yields and above- average prices in relation to such measures as earnings and book value. Growth and value stocks have historically produced similar long-term returns, though each category has periods when it outperforms the other. |
|
|
The Fund invests its assets in the ADRs of companies which the Fund’s Investment Manager believes show a high probability for superior growth. Companies that meet or exceed specific criteria established by the Manager in the selection process are purchased. Securities are sold when they reach internally determined pricing targets or no longer qualify under the Manager’s investment criteria. |
|
|
The Fund allocates investments across countries and regions at the Manager’s discretion. |
|
|
The Fund may, from time to time, take temporary defensive positions that are inconsistent with the Fund’s principal investment strategies in attempting to respond to adverse market, economic, political, or other conditions. When the Fund takes a defensive position, the Fund’s assets will be held in cash and/or cash equivalents. |
|
|
The Fund will not invest in Excluded Securities. Excluded Securities are securities issued by any company that is involved in the production or wholesale distribution of alcohol, tobacco, or gambling equipment, gambling enterprises, or which is involved, either directly or indirectly, in abortion or pornography, or promoting anti-family entertainment or alternative lifestyles. |
The Fund is subject to the following Principal Risks:
1. |
As with most other mutual funds, you can lose money by investing in this Fund. Share prices fluctuate from day to day, and when you sell your shares, they may be worth less than you paid for them. |
2. |
The Fund is an equity fund, so it is subject to the risks inherent in the stock market in general. The stock market is cyclical, with prices generally rising and falling over periods of time. Some of these price cycles can be pronounced and last for a long time. |
3. |
The Fund’s investments in foreign securities may experience more rapid and extreme changes in value than funds with investments solely in securities of U.S. companies. This is because the securities markets of many foreign countries are relatively small, with a limited number of companies representing a smaller number of industries. Foreign issuers are not subject to the same degree of regulation as U.S. issuers. Also, nationalization, expropriation or confiscatory taxation or political changes could adversely affect the Fund’s investments in a foreign country. The Fund may invest in emerging markets. Emerging markets expose the Fund to additional risks due to the lack of historical or regulatory controls. |
4. |
The value of an individual security or a particular type of security can be more volatile than the market as a whole and can perform differently from the value of the market as a whole. |
5. |
Because the securities represented by ADRs are foreign stocks denominated in non-U.S. currency, there is a risk that fluctuations in the exchange rates between the U.S. dollar and foreign currencies may negatively affect the value of the Fund’s investments in foreign securities. |
6. |
Larger Company Investing Risk Larger, more established companies may be unable to respond quickly to new competitive challenges like changes in consumer tastes or innovative smaller competitors. Also, larger companies are sometimes unable to attain the high growth rates of successful, smaller companies, especially during extended periods of economic expansion. |
7. |
Smaller Company Investing Risk Investing in smaller companies often involves greater risk than investing in larger companies. Smaller companies may not have the management experience, financial resources, product diversification and competitive strengths of larger companies. The securities of smaller companies, therefore, tend to be more volatile than the securities of larger, more established companies. Smaller company stocks tend to be bought and sold less often and in smaller amounts than larger company stocks. Because of this, if a fund wants to sell a large quantity of a small-sized company’s stock, it may have to sell at a lower price than would otherwise be indicated, or it may have to sell in smaller than desired quantities over an increased time period. |
8. |
Because the Fund does not invest in Excluded Securities and will divest itself of securities that are subsequently discovered to be ineligible, the Fund may be riskier than other funds that invest in a broader array of securities. |
9. |
The Fund often invests in companies after assessing their growth potential. Securities of growth companies may be more volatile than other stocks. If the portfolio manager’s perception of a company’s growth potential is not realized, the securities purchased may not perform as expected, reducing the Fund’s return. In addition, because different types of stocks tend to shift in and out of favor depending on market and economic conditions, “growth” stocks may perform differently from the market as a whole and other types of securities. |
10. |
The computer systems, networks and devices used by the Fund and its service providers to carry out routine business operations employ a variety of protections designed to prevent damage or interruption from computer viruses, network failures, computer and telecommunication failures, infiltration by unauthorized persons and security breaches. Despite the various protections utilized by the Fund and its service providers, systems, networks, or devices potentially can be breached. The Fund and its shareholders could be negatively impacted as a result of a cybersecurity breach. Cybersecurity breaches can include unauthorized access to systems, networks, or devices; infection from computer viruses or other malicious software code; and attacks that shut down, disable, slow, or otherwise disrupt operations, |
|
business processes, or website access or functionality. Cybersecurity breaches may cause disruptions and impact the Fund’s business operations, potentially resulting in financial losses; interference with the Fund’s ability to calculate its NAV; impediments to trading; the inability of the Fund, the Advisor, and other service providers to transact business; violations of applicable privacy and other laws; regulatory fines; penalties, reputational damage, reimbursement or other compensation costs, or additional compliance costs; as well as the inadvertent release of confidential information. |
A description of the Fund’s policies and procedures with respect to the disclosure of the Fund’s portfolio securities is available in the Funds’ SAI for Class A and Class C shares. It is also available on the Fund’s website, www.timothyplan.com.
LARGE/MID CAP GROWTH FUND
The investment objective of this Fund is to provide you with long-term growth of capital. The Fund seeks to achieve its investment objective by:
|
|
The Fund seeks to achieve its investment objective by primarily investing at least 80% of the Fund’s total assets in larger U.S. stocks. Larger stocks refer to the common stock of companies whose total market capitalization is generally greater than $2 billion. Current income is not a significant investment consideration and any such income realized will be considered incidental to the Fund’s investment objective. |
|
|
The Fund invests using a growth investing style. Growth funds generally focus on stocks of companies believed to have above-average potential for growth in revenue, earnings, cash flow, or other similar criteria. These stocks typically have low dividend yields and above- average prices in relation to such measures as earnings and book value. Growth and value stocks have historically produced similar long-term returns, though each category has periods when it outperforms the other. |
|
|
The Fund normally invests in a portfolio of securities which includes a broadly diversified number of common stocks that the Fund’s Investment Manager believes show a high probability of superior prospects for above average growth. The Fund’s Investment Manager chooses these securities using a “bottom up” approach of extensively analyzing the financial, management and overall economic conditions of each potential investment. Companies that meet or exceed specific criteria established by the Manager in the selection process are purchased. Securities are sold when they reach internally determined pricing targets or no longer qualify under the Manager’s investment criteria. |
|
|
The Fund may, from time to time, take temporary defensive positions that are inconsistent with the Fund’s principal investment strategies in attempting to respond to adverse market, economic, political, or other conditions. When the Fund takes a defensive position, the Fund’s assets will be held in cash and/or cash equivalents. |
|
|
The Fund will not invest in Excluded Securities. Excluded Securities are securities issued by any company that is involved in the production or wholesale distribution of alcohol, tobacco, or gambling equipment, gambling enterprises, or which is involved, either directly or indirectly, in abortion or pornography, or promoting anti-family entertainment or alternative lifestyles. |
The Fund is subject to the following Principal Risks:
1. |
As with most other mutual funds, you can lose money by investing in this Fund. Share prices fluctuate from day to day, and when you sell your shares, they may be worth less than you paid for them. |
2. |
The Fund is an equity fund, so it is subject to the risks inherent in the stock market in general. The stock market is cyclical, with prices generally rising and falling over periods of time. Some of these price cycles can be pronounced and last for a long time. |
3. |
Because the Fund does not invest in Excluded Securities and will divest itself of securities that are subsequently discovered to be ineligible, the Fund may be riskier than other funds that invest in a broader array of securities. |
4. |
The Fund often invests in companies after assessing their growth potential. Securities of growth companies may be more volatile than other stocks. If the portfolio manager’s perception of a company’s growth potential is not realized, the securities purchased may not perform as expected, reducing the Fund’s return. In addition, because different types of stocks tend to shift in and out of favor depending on market and economic conditions, “growth” stocks may perform differently from the market as a whole and other types of securities. |
5. |
Larger Company Investing Risk Larger, more established companies may be unable to respond quickly to new competitive challenges like changes in consumer tastes or innovative smaller competitors. Also, larger companies are sometimes unable to attain the high growth rates of successful, smaller companies, especially during extended periods of economic expansion. |
6. |
Mid-Sized Company Investing Risk Investing in mid-sized companies often involves greater risk than investing in larger companies. Mid-sized companies may not have the management experience, financial resources, product diversification and competitive strengths of larger companies. The securities of mid-sized companies, therefore, tend to be more volatile than the securities of larger, more established companies. Mid-sized company stocks tend to be bought and sold less often and in smaller amounts than larger company stocks. Because of this, if a fund wants to sell a large quantity of a mid-sized company’s stock, it may have to sell at a lower price than would otherwise be indicated, or it may have to sell in smaller than desired quantities over an increased time period. |
7. |
The computer systems, networks and devices used by the Fund and its service providers to carry out routine business operations employ a variety of protections designed to prevent damage or interruption from computer viruses, network failures, computer and telecommunication failures, infiltration by unauthorized persons and security breaches. Despite the various protections utilized by the Fund and its service providers, systems, networks, or devices potentially can be breached. The Fund and its shareholders could be negatively impacted as a result of a cybersecurity breach. Cybersecurity breaches can include unauthorized access to systems, networks, or devices; infection from computer viruses or other malicious software code; and attacks that shut down, disable, slow, or otherwise disrupt operations, business processes, or website access or functionality. Cybersecurity breaches may cause disruptions and impact the Fund’s business operations, potentially resulting in financial losses; interference with the Fund’s ability to calculate its NAV; impediments to trading; the inability of the Fund, the Advisor, and other service providers to transact business; violations of applicable privacy and other laws; regulatory fines; penalties, reputational damage, reimbursement or other compensation costs, or additional compliance costs; as well as the inadvertent release of confidential information. |
A description of the Fund’s policies and procedures with respect to the disclosure of the Fund’s portfolio securities is available in the Funds’ SAI for Class A and Class C shares. It is also available on the Fund’s website, www.timothyplan.com.
The investment objective of this Fund is to provide you with long-term growth of capital, with a secondary objective of current income. The Fund seeks to achieve its investment objective by:
|
|
The Fund seeks to achieve its investment objective by primarily investing at least 80% of the Fund’s total assets in US Stocks with market capitalizations that fall within the range of companies included in the Russell 2000 Index (the “Index”). As of June 30, 2020, the capitalization range of companies comprising the Index is approximately $48 million to $6 billion. This Fund invests using a value investing style. Value funds typically emphasize stocks whose prices are below average in relation to such measures as earnings and book value; these stocks often have above-average dividend yields. Growth and value stocks have historically produced similar long-term returns, though each category has periods when it outperforms the other. |
|
|
In determining whether to invest in a particular company, the Fund’s Investment Manager focuses on a number of different attributes of the company, including the company’s market expertise, balance sheet, improving return on equity, price to earnings ratios, industry position and strength, management and a number of other factors. Analyzing companies in this manner is known as a “bottom up” approach to investing. Companies that meet or exceed specific criteria established by the Manager in the selection process are purchased. Securities are sold when they reach internally determined pricing targets or no longer qualify under the Manager’s investment criteria. |
|
|
The Fund may invest in equity securities of foreign issuers in the form of American Depositary Receipts (ADRs). ADRs are certificates held in trust by a U.S. bank or trust company evidencing ownership of shares of foreign-based issuers and are an alternative to purchasing foreign securities in their national market and currency. |
|
|
The Fund may, from time to time, take temporary defensive positions that are inconsistent with the Fund’s principal investment strategies in attempting to respond to adverse market, economic, political, or other conditions. When the Fund takes a defensive position, the Fund’s assets will be held in cash and/or cash equivalents. |
|
|
The Fund will not invest in Excluded Securities. Excluded Securities are securities issued by any company that is involved in the production or wholesale distribution of alcohol, tobacco, or gambling equipment, gambling enterprises, or which is involved, either directly or indirectly, in abortion or pornography, or promoting anti-family entertainment or alternative lifestyles. |
The Fund is subject to the following Principal Risks:
1. |
As with most other mutual funds, you can lose money by investing in this Fund. Share prices fluctuate from day to day, and when you sell your shares, they may be worth less than you paid for them. |
2. |
The Fund is an equity fund, so it is subject to the risks inherent in the stock market in general. The stock market is cyclical, with prices generally rising and falling over periods of time. Some of these price cycles can be pronounced and last for a long time. |
3. |
Smaller Company Investing Risk Investing in smaller companies often involves greater risk than investing in larger companies. Smaller companies may not have the management experience, financial resources, product diversification and competitive strengths of larger companies. The securities of smaller companies, therefore, tend to be more volatile than the securities of larger, more established companies. Smaller company stocks tend to be bought and sold less often and in smaller amounts than larger company stocks. Because of this, if a fund wants to sell a large quantity of a small-sized company’s stock, it may have to sell at a lower price than would otherwise be indicated, or it may have to sell in smaller than desired quantities over an increased time period. |
4. |
Because the Fund does not invest in Excluded Securities and will divest itself of securities that are subsequently discovered to be ineligible, the Fund may be riskier than other funds that invest in a broader array of securities. |
5. |
The Fund’s investments in foreign securities may experience more rapid and extreme changes in value than funds with investments solely in securities of U.S. companies. This is because the securities markets of many foreign countries are relatively small, with a limited number of companies representing a smaller number of industries. Foreign issuers are not subject to the same degree of regulation as U.S. issuers. Also, nationalization, expropriation or confiscatory taxation or political changes could adversely affect the Fund’s investments in a foreign country. There is a risk that fluctuations in the exchange rates between the U.S. dollar and foreign currencies may negatively affect the value of the Fund’s investments in foreign securities. |
6. |
Because different types of stocks tend to shift in and out of favor depending on market and economic conditions, “value” stocks may perform differently from the market as a whole and other types of stocks and can continue to be undervalued by the market for long periods of time. It is also possible that a value stock may never appreciate to the extent expected. |
7. |
The computer systems, networks and devices used by the Fund and its service providers to carry out routine business operations employ a variety of protections designed to prevent damage or interruption from computer viruses, network failures, computer and telecommunication failures, infiltration by unauthorized persons and security breaches. Despite the various protections utilized by the Fund and its service providers, systems, networks, or devices potentially can be breached. The Fund and its shareholders could be negatively impacted as a result of a cybersecurity breach. Cybersecurity breaches can include unauthorized access to systems, networks, or devices; infection from computer viruses or other malicious software code; and attacks that shut down, disable, slow, or otherwise disrupt operations, business processes, or website access or functionality. Cybersecurity breaches may cause disruptions and impact the Fund’s business operations, potentially resulting in financial losses; interference with the Fund’s ability to calculate its NAV; impediments to trading; the inability of the Fund, the Advisor, and other service providers to transact business; violations of applicable privacy and other laws; regulatory fines; penalties, reputational damage, reimbursement or other compensation costs, or additional compliance costs; as well as the inadvertent release of confidential information. |
A description of the Fund’s policies and procedures with respect to the disclosure of the Fund’s portfolio securities is available in the Funds’ SAI for Class A and Class C shares. It is also available on the Fund’s website, www.timothyplan.com.
The investment objective of this Fund is to provide you with long-term growth of capital, with a secondary objective of current income. The Fund seeks to achieve its investment objective by:
|
|
The Fund seeks to achieve its investment objective by primarily investing in U.S. common stocks. The Fund will normally invest at least 80% of the Fund’s total assets in companies whose total market capitalization exceeds $2 billion. This Fund invests using a value investing style. Value funds typically emphasize stocks whose prices are below average in relation to such measures as earnings and book value; these stocks often have above-average dividend yields. Growth and value stocks have historically produced similar long-term returns, though each category has periods when it outperforms the other. |
|
|
In determining whether to invest in a particular company, the Fund’s Investment Manager focuses on a number of different attributes of the company, including the company’s market expertise, balance sheet, improving return on equity, price to earnings ratios, industry position and strength, management, and a number of other factors. Analyzing companies in this manner is known as a “bottom up” approach to investing. Companies that meet or exceed specific criteria established by the Manager in the selection process are purchased. Securities are sold when they reach internally determined pricing targets or no longer qualify under the Manager’s investment criteria. |
|
|
The Fund may, from time to time, take temporary defensive positions that are inconsistent with the Fund’s principal investment strategies in attempting to respond to adverse market, economic, political, or other conditions. When the Fund takes a defensive position, the Fund’s assets will be held in cash and/or cash equivalents. |
|
|
The Fund will not invest in Excluded Securities. Excluded Securities are securities issued by any company that is involved in the production or wholesale distribution of alcohol, tobacco, or gambling equipment, gambling enterprises, or which is involved, either directly or indirectly, in abortion or pornography, or promoting anti-family entertainment or alternative lifestyles. |
The Fund is subject to the following Principal Risks:
1. |
As with most other mutual funds, you can lose money by investing in this Fund. Share prices fluctuate from day to day, and when you sell your shares, they may be worth less than you paid for them. |
2. |
The Fund is an equity fund, so it is subject to the risks inherent in the stock market in general. The stock market is cyclical, with prices generally rising and falling over periods of time. Some of these price cycles can be pronounced and last for a long time. |
3. |
Larger Company Investing Risk Larger, more established companies may be unable to respond quickly to new competitive challenges like changes in consumer tastes or innovative smaller competitors. Also, larger companies are sometimes unable to attain the high growth rates of successful, smaller companies, especially during extended periods of economic expansion. |
4. |
Mid-Sized Company Investing Risk Investing in mid-sized companies often involves greater risk than investing in larger companies. Mid-sized companies may not have the management experience, financial resources, product diversification and competitive strengths of larger companies. The securities of mid-sized companies, therefore, tend to be more volatile than the securities of larger, more established companies. Mid-sized company stocks tend to be bought and sold less often and in smaller amounts than larger company stocks. Because of this, if a fund wants to sell a large quantity of a mid-sized company’s stock, it may have to sell at a lower price than would otherwise be indicated, or it may have to sell in smaller than desired quantities over an increased time period. |
5. |
Because the Fund does not invest in Excluded Securities and will divest itself of securities that are subsequently discovered to be ineligible, the Fund may be riskier than other funds that invest in a broader array of securities. |
6. |
Because different types of stocks tend to shift in and out of favor depending on market and economic conditions, “value” stocks may perform differently from the market as a whole and other types of stocks and can continue to be undervalued by the market for long periods of time. It is also possible that a value stock may never appreciate to the extent expected. |
7. |
The computer systems, networks and devices used by the Fund and its service providers to carry out routine business operations employ a variety of protections designed to prevent damage or interruption from computer viruses, network failures, computer and telecommunication failures, infiltration by unauthorized persons and security breaches. Despite the various protections utilized by the Fund and its service providers, systems, networks, or devices potentially can be breached. The Fund and its shareholders could be negatively impacted as a result of a cybersecurity breach. Cybersecurity breaches can include unauthorized access to systems, networks, or devices; infection from computer viruses or other malicious software code; and attacks that shut down, disable, slow, or otherwise disrupt operations, business processes, or website access or functionality. Cybersecurity breaches may cause disruptions and impact the Fund’s business operations, potentially resulting in financial losses; interference with the Fund’s ability to calculate its NAV; impediments to trading; the inability of the Fund, the Advisor, and other service providers to transact business; violations of applicable privacy and other laws; regulatory fines; penalties, reputational damage, reimbursement or other compensation costs, or additional compliance costs; as well as the inadvertent release of confidential information. |
A description of the Fund’s policies and procedures with respect to the disclosure of the Fund’s portfolio securities is available in the Funds’ SAI for Class A and Class C shares. It is also available on the Fund’s website, www.timothyplan.com.
The investment objective of this Fund is to generate a high level of current income consistent with prudent investment risk. The Fund attempts to achieve its investment objective by:
|
|
To achieve its goal, the Fund normally invests at least 80% of its assets in a diversified portfolio of corporate bonds, U.S. government and agency securities, convertible securities and preferred securities. The Investment Manager will only purchase securities for the Fund that are investment grade, with a rating of at least “BBB” as rated by Standard & Poor’s or a comparable rating by another nationally recognized rating agency. The Fund may also invest in debt securities that have not been rated by one of the major rating agencies, so long as the Fund’s Investment Manager has determined that the security is of comparable credit quality to similar rated securities. |
|
|
In managing the portfolio, the Fund’s Investment Manager concentrates on sector analysis, industry allocation and securities selection, deciding which types of bonds and industries to emphasize at a given time, and then which individual bonds to buy. The Fund attempts to anticipate shifts in the business cycle in determining types of bonds and industry sectors to target. In choosing individual securities, the Fund seeks out securities that appear to be undervalued within the emphasized industry sector. Companies that meet or exceed specific criteria established by the Manager in the selection process are purchased. Securities are sold when they reach internally determined pricing targets or no longer qualify under the Manager’s investment criteria. |
|
|
The Fund may, from time to time, take temporary defensive positions that are inconsistent with the Fund’s principal investment strategies in attempting to respond to adverse market, economic, political, or other conditions. When the Fund takes a defensive position, the Fund’s assets will be held in cash and/or cash equivalents. |
|
|
The Fund will not invest in Excluded Securities. Excluded Securities are securities issued by any company that is involved in the production or wholesale distribution of alcohol, tobacco, or gambling equipment, gambling enterprises, or which is involved, either directly or indirectly, in abortion or pornography, or promoting anti-family entertainment or alternative lifestyles. |
The Fund is subject to the following Principal Risks:
1. |
As with most other mutual funds, you can lose money by investing in this Fund. Share prices fluctuate from day to day, and when you sell your shares, they may be worth less than you paid for them. |
2. |
When interest rates rise, bond prices fall; the higher the Fund’s duration (a calculation reflecting time risk, taking into account both the average maturity of the Fund’s portfolio and its average coupon return), the more sensitive the Fund is to interest rate risk. A change in the economic environment that causes interest rates to rise back to more historically “normal” levels could have a pronounced negative effect on the Fund. |
3. |
The Fund could lose money if any bonds it owns are downgraded in credit rating or go into default. For this reason, the Fund will only invest in investment-grade bonds. The degree of risk for a particular security may not be reflected in its credit rating. Bonds rated at the time of purchase BBB by Standard & Poor’s or, unrated, but determined to be of comparable quality by the Investment Manager, are subject to greater market risk and credit risk, or loss of principal and interest, than higher-rated securities. |
4. |
If certain industry sectors or types of securities don’t perform as well as the Fund expects, the Fund’s performance could suffer. |
5. |
Because the Fund does not invest in Excluded Securities and will divest itself of securities that are subsequently discovered to be ineligible, the Fund may be riskier that other Funds that invest in a broader array of securities. |
6. |
The computer systems, networks and devices used by the Fund and its service providers to carry out routine business operations employ a variety of protections designed to prevent damage or interruption from computer viruses, network failures, computer and telecommunication failures, infiltration by unauthorized persons and security breaches. Despite the various protections utilized by the Fund and its service providers, systems, networks, or devices potentially can be breached. The Fund and its shareholders could be negatively impacted as a result of a cybersecurity breach. Cybersecurity breaches can include unauthorized access to systems, networks, or devices; infection from computer viruses or other malicious software code; and attacks that shut down, disable, slow, or otherwise disrupt operations, business processes, or website access or functionality. Cybersecurity breaches may cause disruptions and impact the Fund’s business operations, potentially resulting in financial losses; interference with the Fund’s ability to calculate its NAV; impediments to trading; the inability of the Fund, the Advisor, and other service providers to transact business; violations of applicable privacy and other laws; regulatory fines; penalties, reputational damage, reimbursement or other compensation costs, or additional compliance costs; as well as the inadvertent release of confidential information. |
A description of the Fund’s policies and procedures with respect to the disclosure of the Fund’s portfolio securities is available in the Funds’ SAI for Class A and Class C shares. It is also available on the Fund’s website, www.timothyplan.com.
The investment objective of this Fund is to generate a high level of current income. The Fund attempts to achieve its investment objective by:
|
|
To achieve its goal, the Fund normally invests at least 80% of its total assets in a diversified portfolio of high yield fixed income securities. These include corporate bonds, convertible securities and preferred securities. The Investment Manager will generally purchase securities for the Fund that are not investment grade (“junk” bonds), meaning securities with a rating of “BB” or lower as rated by Standard & Poor’s or a comparable rating by another nationally recognized rating agency. The Fund may also invest in debt securities that have not been rated by one of the major rating agencies, so long as the Fund’s Investment Manager has determined that the security is of comparable credit quality to similar rated securities. |
|
|
In managing its portfolio, the Fund’s Investment Manager concentrates on sector analysis, industry allocation and securities selection, deciding which types of bonds and industries to emphasize at a given time, and then which individual bonds to buy. The Fund attempts to anticipate shifts in the business cycle in determining types of bonds and industry sectors to target. In choosing individual securities, the Fund seeks out securities that appear to be undervalued within the emphasized industry sector. Companies that meet or exceed specific criteria established by the Manager in the selection process are purchased. Securities are sold when they reach internally determined pricing targets or no longer qualify under the Manager’s investment criteria. |
|
|
The Fund may, from time to time, take temporary defensive positions that are inconsistent with the Fund’s principal investment strategies in attempting to respond to adverse market, economic, political, or other conditions. When the Fund takes a defensive position, the Fund’s assets will be held in cash and/or cash equivalents. |
|
|
The Fund will not invest in Excluded Securities. Excluded Securities are securities issued by any company that is involved in the production or wholesale distribution of alcohol, tobacco, or gambling equipment, gambling enterprises, or which is involved, either directly or indirectly, in abortion or pornography, or promoting anti-family entertainment or alternative lifestyles. |
The Fund is subject to the following Principal Risks:
1. |
As with most other mutual funds, you can lose money by investing in this Fund. Share prices fluctuate from day to day, and when you sell your shares, they may be worth less than you paid for them. |
2. |
Investments in fixed-income securities that are rated below investment grade (“high yield securities”) by one or more Nationally Recognized Statistical Rating Organizations (NRSROs) may be subject to greater risk of loss of principal and interest than investments in higher-rated fixed-income securities. High yield securities are also generally considered to be subject to greater market risk than higher-rated securities. The capacity of issuers of high yield securities to pay interest and repay principal is more likely to weaken than is that of issuers of higher-rated securities in times of deteriorating economic conditions or rising interest rates. In addition, high yield securities may be more susceptible to real or perceived adverse economic conditions than higher-rated securities. The market for high yield securities may be less liquid than the market for higher-rated securities. This can adversely affect the Fund’s ability to buy or sell optimal quantities of high yield securities at desired prices. |
3. |
When interest rates rise, bond prices fall; the higher the Fund’s duration (a calculation reflecting time risk, taking into account both the average maturity of the Fund’s portfolio and its average coupon return), the more sensitive the Fund is to interest rate risk. A change in the economic environment that causes interest rates to rise back to more historically “normal” levels could have a pronounced negative effect on the Fund. |
4. |
High Yield securities (“junk” bonds) are subject to greater risk of loss than investment grade securities. The degree of risk for a particular security may not be reflected in its credit rating, and high yield securities may be particularly subject to this risk. Bonds rated, at the time of purchase, BB or lower by Standard & Poor’s (“junk” bonds) or, unrated, but determined to be of comparable quality by the Investment Manager, are subject to greater market risk and credit risk, or loss of principal and interest, than higher-rated securities. |
5. |
If certain industry sectors or types of securities don’t perform as well as the Fund expects, the Fund’s performance could suffer. |
6. |
Because the Fund does not invest in Excluded Securities and will divest itself of securities that are subsequently discovered to be ineligible, the Fund may be riskier that other Funds that invest in a broader array of securities. |
7. |
The computer systems, networks and devices used by the Fund and its service providers to carry out routine business operations employ a variety of protections designed to prevent damage or interruption from computer viruses, network failures, computer and telecommunication failures, infiltration by unauthorized persons and security breaches. Despite the various protections utilized by the Fund and its service providers, systems, networks, or devices potentially can be breached. The Fund and its shareholders could be negatively impacted as a result of a cybersecurity breach. Cybersecurity breaches can include unauthorized access to systems, networks, or devices; infection from computer viruses or other malicious software code; and attacks that shut down, disable, slow, or otherwise disrupt operations, business processes, or website access or functionality. Cybersecurity breaches may cause disruptions and impact the Fund’s business operations, potentially resulting in financial losses; interference with the Fund’s ability to calculate its NAV; impediments to trading; the inability of the Fund, the Advisor, and other service providers to transact business; violations of applicable privacy and other laws; regulatory fines; penalties, reputational damage, reimbursement or other compensation costs, or additional compliance costs; as well as the inadvertent release of confidential information. |
A description of the Fund’s policies and procedures with respect to the disclosure of the Fund’s portfolio securities is available in the Funds’ SAI for Class A and Class C shares. It is also available on the Fund’s website, www.timothyplan.com.
ISRAEL COMMON VALUES FUND
The investment objective of this Fund is to provide you with long-term growth of capital. The Fund seeks to achieve its investment objective by:
|
|
To achieve its goal, the Fund normally invests at least 80% of the Fund’s total assets in the common stock of companies domiciled and/or headquartered in Israel through the purchase of American Depositary Receipts (ADRs) and direct investments in such companies on foreign stock exchanges, without regard to market capitalizations. |
|
|
The Fund invests using a growth investing style. Growth funds generally focus on stocks of companies believed to have above-average potential for growth in revenue, earnings, cash flow, or other similar criteria. These stocks typically have low dividend yields and above- average prices in relation to such measures as earnings and book value. Growth and value stocks have historically produced similar long-term returns, though each category has periods when it outperforms the other. |
|
|
The Fund invests its assets in companies which the Fund’s Investment Manager believes show a high probability for superior growth. Companies that meet or exceed specific criteria established by the Manager in the selection process are purchased. Securities are sold when they reach internally determined pricing targets or no longer qualify under the Manager’s investment criteria. |
|
|
The Fund may, from time to time, take temporary defensive positions that are inconsistent with the Fund’s principal investment strategies in attempting to respond to adverse market, economic, political, or other conditions. When the Fund takes a defensive position, the Fund’s assets will be held in cash and/or cash equivalents. |
|
|
The Fund will not invest in Excluded Securities. Excluded Securities are securities issued by any company that is involved in the production or wholesale distribution of alcohol, tobacco, or gambling equipment, gambling enterprises, or which is involved, either directly or indirectly, in abortion or pornography, or promoting anti-family entertainment or alternative lifestyles. |
The Fund is subject to the following Principal Risks:
1. |
As with most other mutual funds, you can lose money by investing in this Fund. Share prices fluctuate from day to day, and when you sell your shares, they may be worth less than you paid for them. |
2. |
The Fund is an equity fund, so it is subject to the risks inherent in the stock market in general. The stock market is cyclical, with prices generally rising and falling over periods of time. Some of these price cycles can be pronounced and last for a long time. |
3. |
The value of an individual security or a particular type of security can be more volatile than the market as a whole and can perform differently from the value of the market as a whole. |
4. |
The Fund invests in Israeli securities, and Israel is subject to unique political and economic risks. As a result, Israeli securities can be more volatile than the market as a whole and can perform differently from the value of the market as a whole. The Fund’s investments in the securities of Israel may experience more rapid and extreme changes in value than funds with investments solely in securities of U.S. companies or funds that invest across a larger spectrum of the foreign market. This is because the securities market in Israel is relatively small, with a limited number of companies representing a smaller number of industries. Israeli issuers are not subject to the same degree of regulation as U.S. issuers. Also, nationalization, expropriation or confiscatory taxation or political changes could adversely affect the Fund’s investments in a foreign country. |
5. |
Because the securities represented by ADRs are foreign stocks denominated in non-U.S. currency, there is a risk that fluctuations in the exchange rates between the U.S. dollar and foreign currencies may negatively affect the value of the Fund’s investments in foreign securities. |
6. |
Larger Company Investing Risk Larger, more established companies may be unable to respond quickly to new competitive challenges like changes in consumer tastes or innovative smaller competitors. Also, larger companies are sometimes unable to attain the high growth rates of successful, smaller companies, especially during extended periods of economic expansion. |
7. |
Smaller Company Investing Risk Investing in smaller companies often involves greater risk than investing in larger companies. Smaller companies may not have the management experience, financial resources, product diversification and competitive strengths of larger companies. The securities of smaller companies, therefore, tend to be more volatile than the securities of larger, more established companies. Smaller company stocks tend to be bought and sold less often and in smaller amounts than larger company stocks. Because of this, if a fund wants to sell a large quantity of a small-sized company’s stock, it may have to sell at a lower price than would otherwise be indicated, or it may have to sell in smaller than desired quantities over an increased time period. |
8. |
Because the Fund does not invest in Excluded Securities and will divest itself of securities that are subsequently discovered to be ineligible, the Fund may be riskier than other funds that invest in a broader array of securities. |
9. |
The Fund often invests in companies after assessing their growth potential. Securities of growth companies may be more volatile than other stocks. If the portfolio manager’s perception of a company’s growth potential is not realized, the securities purchased may not perform as expected, reducing the Fund’s return. In addition, because different types of stocks tend to shift in and out of favor depending on market and economic conditions, “growth” stocks may perform differently from the market as a whole and other types of securities. |
10. |
The computer systems, networks and devices used by the Fund and its service providers to carry out routine business operations employ a variety of protections designed to prevent damage or interruption from computer viruses, network failures, computer and telecommunication failures, infiltration by unauthorized persons and security breaches. Despite the various protections utilized by the Fund and its service providers, systems, networks, or devices potentially can be breached. The Fund and its shareholders could be negatively impacted as a result of a cybersecurity breach. Cybersecurity breaches can include unauthorized access to systems, networks, or devices; |
|
infection from computer viruses or other malicious software code; and attacks that shut down, disable, slow, or otherwise disrupt operations, business processes, or website access or functionality. Cybersecurity breaches may cause disruptions and impact the Fund’s business operations, potentially resulting in financial losses; interference with the Fund’s ability to calculate its NAV; impediments to trading; the inability of the Fund, the Advisor, and other service providers to transact business; violations of applicable privacy and other laws; regulatory fines; penalties, reputational damage, reimbursement or other compensation costs, or additional compliance costs; as well as the inadvertent release of confidential information. |
A description of the Fund’s policies and procedures with respect to the disclosure of the Fund’s portfolio securities is available in the Funds’ SAI for Class A and Class C shares. It is also available on the Fund’s website, www.timothyplan.com.
DEFENSIVE STRATEGIES FUND
The Fund’s investment objective is the protection of principal through aggressive, proactive reactions to prevailing economic conditions. The Fund attempts to achieve its investment objective by investing varying percentages of the Fund’s total assets in the investment sectors set forth below:
|
|
Real Estate Investment Trusts (REITs), that invest in different kinds of real estate or real estate related assets, including shopping centers, office buildings, hotels, and mortgages secured by real estate, all of which are historically sensitive to both inflation and deflation. |
|
|
Commodities-based securities, including but not limited to, exchange traded funds (ETFs), other pooled investment fund securities, and commodities-related stocks, for the purpose of providing the opportunity to invest in inflation sensitive physical commodities and/or commodities futures markets. ETFs are investment securities that are registered as investment companies and invest in a basket of other securities, mostly common stocks, that are included in a specific index. Pooled investment fund securities are securities that invest in a basket of other securities, mainly stocks, but are not registered as investment companies and do not trade on an exchange. |
|
|
Various Fixed Income securities and Treasury-Inflation Protection Securities (TIPS). TIPS have coupon payments and underlying principal that are automatically increased to compensate for inflation as measured by the consumer price index (CPI). The fixed income securities in which the Fund may invest, other than TIPS, include U.S. Treasury bills, notes and bonds, corporate notes and bonds, and federal agency-issued securities. |
|
|
Cash and cash equivalents. |
|
|
During times of significant market upheaval, the Fund may take positions that are inconsistent with the Fund’s principal investment strategies. During such times, the Fund may take large, small, or even no position in any one or more of the Asset Classes, may invest in gold and other eligible precious metals to the maximum extent allowed, and/or may hold some or all of the Fund’s assets in cash and/or cash equivalents. When the Fund takes such positions, it will not be investing in accordance with its principal investment strategies and may not achieve its stated investment objective. |
|
|
The Fund will not invest in Excluded Securities. Excluded Securities are securities issued by any company that is involved in the production or wholesale distribution of alcohol, tobacco, or gambling equipment, gambling enterprises, or which is involved, either directly or indirectly, in abortion or pornography, or promoting anti-family entertainment or alternative lifestyles. |
|
|
Current income is not a significant investment consideration and any such income realized will be considered incidental to the Fund’s investment objective. To allow for optimal flexibility, the Fund is classified as a “non-diversified” fund, and, as such the Fund’s portfolio may include the securities of a smaller total number of issuers than if the Fund were classified as “diversified”. |
The Fund is subject to the following Principal Risks:
1. |
As with most other mutual funds, you can lose money by investing in this Fund. Share prices fluctuate from day to day, and when you sell your shares, they may be worth less than you paid for them. |
2. |
Real Estate Investment Trust Risk The Fund is subject to the risks experienced in real estate ownership, real estate financing, or both. As the economy is subjected to a period of economic deflation or interest rate increases, the demand for real estate may fall, causing a decline in the value of real estate owned. Also, as interest rates increase, the values of existing mortgages fall. The higher the duration (a calculation reflecting time risk, taking into account the average maturity of the mortgages) of the mortgages held in REITs owned by the Fund, the more sensitive the Fund is to interest rate risks. The Fund is also subject to credit risk; the Fund could lose money if mortgagors default on mortgages held in the REITs. |
3. |
Commodities-based Exchange Traded Funds Commodity ETFs invest in Physical Commodities and/or Commodity Futures Contracts which Contracts are highly leveraged investment vehicles, and therefore generally considered to be high risk. By investing in Commodity ETFs the Fund assumes portions of that risk. ETFs may only purchase commodities futures contracts (the buy side), therefore the Fund’s risk includes missing opportunities to realize gains by shorting futures contracts (the sell side) in deflationary economic periods. It is possible the Fund’s entire ETF investment could be lost. |
4. |
Treasury-Inflation Protection Securities Risk Because the real rate of return offered by TIPS, which represents the growth of your purchasing power, is guaranteed by the Federal Government, TIPS may offer a lower return than other fixed income instruments that do not have such guarantees. Other conventional bond issues may offer higher yields, and the Fund may invest in such bond issues if deemed advantageous by the Advisor and Investment Managers. |
5. |
When interest rates rise, bond prices fall; the higher the Fund’s duration (a calculation reflecting time risk, taking into account both the average maturity of the Fund’s portfolio and its average coupon return), the more sensitive the Fund is to interest rate risk. |
6. |
The Fund could lose money if any bonds it owns are downgraded in credit rating or go into default. For this reason, the Fund will only invest in investment-grade bonds. The degree of risk for a particular security may be reflected in its credit rating. Bonds rated at the time of purchase BBB by Standard & Poor’s, or unrated, but determined to be of comparable quality by the investment manager, are subject to greater market risk and credit risk, or loss of principal and interest, than higher-rated securities. |
7. |
If certain industry sectors or types of securities don’t perform as well as the Fund expects, the Fund’s performance could suffer. |
8. |
Because the Fund does not invest in Excluded Securities (including certain REITs) and will divest itself of securities that are subsequently discovered to be ineligible, the Fund may be riskier than other Funds that invest in a broader array of securities. |
9. |
Because the Fund may invest in a smaller number of securities, adverse changes to a single security will have a more pronounced negative effect on the Fund than if the Fund’s investments were more widely distributed. |
10. |
The Fund’s gold and silver may be subject to loss, damage, theft, or restriction on access, and the Fund’s recovery may be limited, even in the event of fraud, to the market value of the metals at the time the fraud is discovered. International crises may motivate large-scale sales of precious metals which could decrease their prices and adversely affect the value of the Shares. The price of metals may also be adversely affected by the sale of gold or silver by ETFs or other exchange traded vehicles tracking the precious metals markets. In the event of the insolvency of the Custodian, a liquidator may seek to freeze access to the metals held in all of the accounts held by the Custodian, including the Fund’s Allocated Account. Although the Fund would retain legal title to the allocated gold and silver bars, the Fund could incur expenses in connection with obtaining control of the allocated gold or silver, and the assertion of a claim by such liquidator for unpaid fees could delay redemptions. |
11. |
The computer systems, networks and devices used by the Fund and its service providers to carry out routine business operations employ a variety of protections designed to prevent damage or interruption from computer viruses, network failures, computer and telecommunication failures, infiltration by unauthorized persons and security breaches. Despite the various protections utilized by the Fund and its service providers, systems, networks, or devices potentially can be breached. The Fund and its shareholders could be negatively impacted as a result of a cybersecurity breach. Cybersecurity breaches can include unauthorized access to systems, networks, or devices; infection from computer viruses or other malicious software code; and attacks that shut down, disable, slow, or otherwise disrupt operations, business processes, or website access or functionality. Cybersecurity breaches may cause disruptions and impact the Fund’s business operations, potentially resulting in financial losses; interference with the Fund’s ability to calculate its NAV; impediments to trading; the inability of the Fund, the Advisor, and other service providers to transact business; violations of applicable privacy and other laws; regulatory fines; penalties, reputational damage, reimbursement or other compensation costs, or additional compliance costs; as well as the inadvertent release of confidential information. |
A description of the Fund’s policies and procedures with respect to the disclosure of the Fund’s portfolio securities is available in the Funds’ SAI for Class A and Class C shares. It is also available on the Fund’s website, www.timothyplan.com.
The investment objective of this Fund is to provide total return through a combination of growth and income and preservation of capital in declining markets.
|
|
To achieve its goals, the Fund primarily invests in equity securities, including affiliated Exchange Traded Funds (“ETF’s”), and in fixed income securities. The Fund will normally hold both equity securities and fixed income securities, with at least 25% of its assets in equity securities and at least 25% of its assets in fixed income securities. The Advisor is responsible for determining the allocation of Fund assets to be invested in equity and fixed income securities. The Advisor will adjust those allocations from time to time in response to market changes. |
|
|
The Fund’s fixed income holdings are U.S. government securities, corporate bonds, municipal bonds and/or sovereign bonds of any maturity, as well as ETFs that invest primarily in such securities. Any non-US government securities in the Fund’s portfolio consist primarily of issues rated “Baa2” or better by Moody’s Investors Service, Inc. (“Moody’s”) or “BBB” or better by Standard & Poor’s Ratings Group (“S&P”) and unrated securities determined by the Advisor to be of equivalent quality, as well as high quality money market instruments. |
|
|
The Fund’s fixed income Investment Manager reviews the various sectors looking for historical patterns of undervalue or overvalue in an effort to identify appropriate fixed income securities to purchase. The Investment Manager also analyzes interest rate risk in the bond market and makes adjustments in the maturities of bonds to adjust for this risk. Lastly, if a bond is being downgraded, or the company has other issues that may affect the bond, the Investment Manager reviews it to see if the bond should be sold. |
|
|
The Fund’s fixed income portfolio’s duration is adjusted based on a regularly conducted analysis of the interest rate risk. Typically, the duration of the Fund’s bond portfolio runs between 1 and 8 years. The Investment Manager shortens portfolio durations, when its research indicates a rising interest rate environment, to preserve capital. |
|
|
The Fund’s equity securities are sold when such considerations as valuation, earnings and relative price strength are determined to warrant a sale. The Advisor reviews a stock if there is a major change in its corporate structure or management. |
|
|
The Fund will not invest in Excluded Securities. Excluded Securities are securities issued by any company that is involved in the production or wholesale distribution of alcohol, tobacco, or gambling equipment, gambling enterprises, or which is involved, either directly or indirectly, in abortion or pornography, or promoting anti-family entertainment or alternative lifestyles. |
The Fund is subject to the following Principal Risks:
1. |
As with most other mutual funds, you can lose money by investing in this Fund. Share prices fluctuate from day to day, and when you sell your shares, they may be worth less than you paid for them. |
2. |
Overall stock market risks may affect the value of the Fund. Factors such as domestic economic growth and market conditions, interest rate levels, and political events affect the securities markets. When the value of the Fund’s investments goes down, your investment in the Fund decreases in value and you could lose money. |
3. |
The Fund invests in fixed income securities. These securities will increase or decrease in value based on changes in interest rates. If rates increase, the value of the Fund’s fixed income securities generally will decline, and those securities with longer terms generally will decline more. Your investment will decline in value if the value of the Fund’s investments decreases. There is a risk that issuers and counterparties will not make payments on fixed income securities and repurchase agreements held by the Fund. Such defaults could result in losses to the Fund. Securities with lower credit quality have a greater risk of default. In addition, the credit quality of securities held by the Fund may be lowered if an issuer’s financial condition changes. Lower credit quality may lead to greater volatility in the price of a security and in shares of the Fund. Lower credit quality also may affect liquidity and make it difficult for the Fund to sell the security. |
4. |
The Advisor’s judgments about the attractiveness, value and potential appreciation of a particular asset class or individual security in which the Fund invests may prove to be incorrect. The Fund may experience losses regardless of the overall performance of the market. |
5. |
Smaller capitalization companies may experience higher failure rates than do larger capitalization companies. In addition, smaller companies may be more vulnerable to economic, market and industry changes. As a result, share price changes may be more sudden or erratic than the prices of other equity securities, especially over the short term. Such companies may have limited product lines, markets or financial resources and may lack management depth. The trading volume of securities of smaller capitalization companies is normally less than that of larger capitalization companies, and therefore may disproportionately affect their market price, tending to make them fall more in response to selling pressure than is the case with larger capitalization companies. Some small capitalization stocks may be illiquid. These risks may be enhanced for micro-cap securities. Many micro-cap companies tend to be new and have no proven track record. Some of these companies have no assets or operations, while others have products and services that are still in development or have yet to be tested in the market. Because micro-cap stocks trade in low volumes, any size of trade can have a large percentage impact on the price of the stock. |
6. |
Foreign investing involves risks not typically associated with U.S. investments. These risks include, among others, adverse fluctuations in foreign currency values as well as adverse political, social and economic developments affecting a foreign country. In addition, foreign investing involves less publicly available information, and more volatile or less liquid securities markets. Investments in foreign countries could be affected by factors not present in the U.S., such as restrictions on receiving the investment proceeds from a foreign country, foreign tax laws, and potential difficulties in enforcing contractual obligations. Foreign accounting may be less transparent than U.S. accounting practices and foreign regulation may be inadequate or irregular. Owning foreign securities could cause the Fund’s performance to fluctuate more than if it held only U.S. securities. |
7. |
Municipal Securities Risk The power or ability of an issuer to make principal and interest payments on municipal securities may be materially adversely affected by economic conditions, litigation or other factors. The Fund’s right to receive principal and interest payments may be subject to the provisions of bankruptcy, insolvency, and other laws affecting the rights and remedies of creditors, as well as laws, if any, which may be enacted by Congress or state legislatures extending the time for payment of principal and/or interest or imposing other constraints upon the enforcement of such obligations. In addition, substantial changes in federal income tax laws could cause municipal security prices to decline because the demand for municipal securities is strongly influenced by the value of tax exempt income to investors. |
8. |
The Fund may invest in sovereign debt obligations. Investment in sovereign debt obligations involves special risks not present in corporate debt obligations. The issuer of the sovereign debt or the governmental authorities that control the repayment of the debt may be unable or unwilling to repay principal or interest when due, and the Fund may have limited recourse in the event of a default. During periods of economic uncertainty, the market prices of sovereign debt, and the Fund’s net asset value, may be more volatile than prices of U.S. debt obligations. |
9. |
Exchange Traded Fund Risk An ETF may trade at a discount to its net asset value. Investors in the Fund will indirectly bear fees and expenses charged by the underlying ETFs in which the Fund invests, in addition to the Fund’s direct fees and expenses. The Fund will also incur brokerage costs when it purchases shares of ETFs. In addition, the Fund will be affected by losses of the underlying ETF and the level of risk arising from the investment practices of the underlying ETF. |
10. |
Because the Fund does not invest in Excluded Securities and will divest itself of securities that are subsequently discovered to be ineligible, the Fund may be riskier than other funds that invest in a broader array of securities. |
11. |
The computer systems, networks and devices used by the Fund and its service providers to carry out routine business operations employ a variety of protections designed to prevent damage or interruption from computer viruses, network failures, computer and telecommunication failures, infiltration by unauthorized persons and security breaches. Despite the various protections utilized by the Fund and its service providers, systems, networks, or devices potentially can be breached. The Fund and its shareholders could be negatively impacted as a result of a cybersecurity breach. Cybersecurity breaches can include unauthorized access to systems, networks, or devices; infection from computer viruses or other malicious software code; and attacks that shut down, disable, slow, or otherwise disrupt operations, business processes, or website access or functionality. Cybersecurity breaches may cause disruptions and impact the Fund’s business operations, potentially resulting in financial losses; interference with the Fund’s ability to calculate its NAV; impediments to trading; the inability of the Fund, the Advisor, and other service providers to transact business; violations of applicable privacy and other laws; regulatory fines; penalties, reputational damage, reimbursement or other compensation costs, or additional compliance costs; as well as the inadvertent release of confidential information. |
A description of the Fund’s policies and procedures with respect to the disclosure of the Fund’s portfolio securities is available in the Funds’ SAI for Class A and Class C shares. It is also available on the Fund’s website, www.timothyplan.com.
The Fund’s investment objective is to generate medium to high levels of long-term capital growth. The Fund attempts to achieve its investment strategy by normally investing at least 75% of its total assets in the following Traditional Funds according to the following approximate range of percentages:
|
|
|
Timothy Plan Traditional Funds |
|
% of Fund’s Net Assets
Invested in Timothy Plan
Traditional Funds |
Large/Mid Cap Growth Fund |
|
0 - 20% |
| |
|
0 - 20% |
| |
|
0 - 10% |
| |
|
0 - 10% |
| |
|
0 - 20% |
| |
|
5 - 15% |
Defensive Strategies Fund |
|
5 - 30% |
Israel Common Values Fund |
|
0 - 10% |
| |
|
0 - 20% |
US Large /Mid Cap Core ETF |
|
0 - 40% |
| |
|
0 - 20% |
| |
|
0 - 30% |
| |
|
0 - 20% |
Timothy Partners, Ltd. (“TPL”) will determine the specific asset allocation program on a continuous basis, based on its forecast of the overall market. On each day that the Fund is open for business, TPL will review the asset allocation program and reallocate, as necessary, for any new funds invested in the Fund. The Advisor also will reallocate the Fund’s investments in the Traditional Funds at the end of each fiscal quarter to maintain the asset allocation program.
The Fund is subject to the following Principal Risks:
1. |
As with most other mutual funds, you can lose money by investing in the Fund. Share prices fluctuate from day to day, and when you sell your shares, they may be worth less than you paid for them. |
2. |
The Fund is indirectly subject to the following risks that are inherent in the Traditional Funds in which the Fund invests: |
|
|
|
Commodities-based Exchange Traded Funds Risk: Commodity ETFs invest in Physical Commodities and/or Commodity Futures Contracts which Contracts are highly leveraged investment vehicles, and therefore generally considered to be high risk. By investing in underlying funds holding Commodity ETFs, the Fund assumes portions of that risk. ETFs may only purchase commodities futures contracts (the buy side), therefore the risks include missing opportunities to realize gains by shorting futures contracts (the sell side) in deflationary economic periods. It is possible an underlying Fund’s entire ETF investment could be lost. Also, ETF’s have expenses associated with them, and although indirect, these expenses may cause the Fund’s return to be lower. |
|
|
|
One underlying fund invests in Israeli securities, and Israel is subject to unique political and economic risks. As a result, Israeli securities can be more volatile than the market as a whole and can perform differently from the value of the market as a whole. The investments in the securities of Israel may experience more rapid and extreme changes in value than funds with investments solely in securities of U.S. companies or funds that invest across a larger spectrum of the foreign market. This is because the securities market in Israel is relatively small, with a limited number of companies representing a smaller number of industries. Israeli issuers are not subject to the same degree of regulation as U.S. issuers. Also, nationalization, expropriation or confiscatory taxation or political changes could adversely affect the Fund’s investments in a foreign country. |
|
|
|
If investment grade bonds are downgraded in credit rating or go into default, the result could be a loss of value, and the Fund could lose money. The degree of risk for a particular security may or may not be reflected in its credit rating. Bonds that are unrated, or rated BBB by Standard & Poor’s at the time of purchase, are subject to greater market risk and credit risk, or loss of principal and interest, than higher-rated securities. High yield securities (“junk” bonds) are subject to greater risk of loss than investment grade securities. Unrated bonds or bonds rated BB or lower by Standard & Poor’s at the time of purchase, (“junk” bonds) are subject to greater market risk and credit risk, or loss of principal and interest, than higher-rated securities. |
|
|
|
Securities represented by ADRs are foreign stocks denominated in non-U.S. currency, and there is a risk that fluctuations in the exchange rates between the U.S. dollar and foreign currencies may negatively affect the value of the investments in foreign securities. For securities that are foreign stocks denominated in non-U.S. currency, there is a risk that fluctuations in the exchange rates between the U.S. dollar and foreign currencies may negatively affect the value of the investments in foreign securities. |
|
|
|
Investments in the securities of emerging countries may experience more rapid and extreme changes in value than investments solely in securities of U.S. companies and investments in a larger spectrum of the foreign market. This is because the securities markets in some emerging countries are relatively small, with a limited number of companies representing a smaller number of industries. Issuers in emerging countries are frequently not subject to the same degree of regulation as U.S. issuers. Also, nationalization, expropriation or confiscatory taxation or political changes could adversely affect investments in emerging foreign countries. |
|
|
|
Overall, stock market risks may affect the value of the Fund. Factors such as domestic economic growth and market conditions, interest rate levels, and political events affect the securities markets. When the value of the Fund’s investments goes down, your investment in the Fund decreases in value and you could lose money. |
|
|
|
Exchange Traded Fund Risk: An ETF may trade at a discount to its net asset value. Investors indirectly bear fees and expenses charged by the underlying ETFs in addition to the Fund’s direct fees and expenses. There are also brokerage costs incurred when purchasing ETFs. In addition, losses of the underlying ETF and the level of risk arising from the investment practices of an underlying ETF may impact returns. |
|
|
|
Because the underlying Funds do not invest in Excluded Securities (including certain REITs) , and will divest themselves of securities that are subsequently discovered to be ineligible, the Fund may be riskier than similar funds that invest in underlying funds that invest in broader arrays of securities. |
|
|
|
Fixed income securities will increase or decrease in value based on changes in interest rates. If rates increase, fixed income securities generally will decline, and those securities with longer terms generally will decline more. Your investment will decline in value if the value of fixed income securities decrease. There is a risk that issuers and counterparties will not make payments on fixed income securities and repurchase agreements. Such defaults could result in losses to the Fund. |
|
|
|
Foreign investing involves risks not typically associated with U.S. investments and may experience more rapid and extreme changes in value than investments solely in securities of U.S. companies. These risks include, among others, adverse fluctuations in foreign currency values as well as adverse political, social and economic developments affecting a foreign country. In addition, foreign investing involves less publicly available information, and more volatile or less liquid securities markets. Investments in foreign countries could be affected by factors not present in the U.S., such as restrictions on receiving the investment proceeds from a foreign country, foreign tax laws, and potential difficulties in enforcing contractual obligations. Foreign accounting may be less transparent than U.S. accounting practices and foreign regulation may be inadequate or irregular. Underlying Funds owning foreign securities could cause the Fund’s performance to fluctuate more than if it held only U.S. securities. |
|
|
|
As with most other mutual funds, you can lose money by investing in this Fund. Share prices fluctuate from day to day, and when you sell your shares, they may be worth less than you paid for them. |
|
|
|
Some underlying Funds invest in companies after assessing their growth potential. Securities of growth companies may be more volatile than other stocks. If a portfolio manager’s perception of a company’s growth potential is not realized, the securities purchased may not perform as expected, reducing the Fund’s return. In addition, because different types of stocks tend to shift in and out of favor depending on market and economic conditions, “growth” stocks may perform differently from the market as a whole and other types of securities. |
|
|
|
High Portfolio Turnover Risk: Higher portfolio turnover rates may indicate higher transaction costs and may result in higher taxes when Fund shares are held in a taxable account. These costs, which are not reflected in annual Fund operating expenses or in the Example, affect the Fund’s performance. |
|
|
|
High Yield Security Risk: Investments in fixed-income securities that are rated below investment grade (“high yield securities”) by one or more Nationally Recognized Statistical Rating Organizations (NRSROs) may be subject to greater risk of loss of principal and interest than investments in higher-rated fixed-income securities. High yield securities are also generally considered to be subject to greater market risk than higher-rated securities. The capacity of issuers of high yield securities to pay interest and repay principal is more likely to weaken than is that of issuers of higher-rated securities in times of deteriorating economic conditions or rising interest rates. In addition, high yield securities may be more susceptible to real or perceived adverse economic conditions than higher-rated securities. The market for high yield securities may be less liquid than the market for higher-rated securities. This can adversely affect an underlying Fund’s ability to buy or sell optimal quantities of high yield securities at desired prices. |
|
|
|
When interest rates rise, bond prices fall; the higher an underlying Fund’s duration (a calculation reflecting time risk, taking into account both the average maturity of the Fund’s portfolio and its average coupon return), the more sensitive the underlying Fund is to interest rate risk. |
|
|
|
Investing In Other Funds Risk: The Fund invests in the securities of other investment companies. To the extent that the Fund invests in other mutual funds, exchange traded funds and other commingled funds, it will indirectly bear the expenses of those funds, which will cause the Fund’s return to be lower. |
|
|
|
The value of an individual security or a particular type of security can be more volatile than the market as a whole and can perform differently from the value of the market as a whole. |
|
|
|
Larger Company Investing Risk: Larger, more established companies may be unable to respond quickly to new competitive challenges like changes in consumer tastes or innovative smaller competitors. Also, larger companies are sometimes unable to attain the high growth rates of successful, smaller companies, especially during extended periods of economic expansion. |
|
|
|
An Advisor’s judgments about the attractiveness, value and potential appreciation of a particular asset class or individual security in which an underlying Fund invests may prove to be incorrect. The Fund may experience losses regardless of the overall performance of the market. |
|
|
|
Mid-Sized Company Investing Risk: Investing in mid-sized companies often involves greater risk than investing in larger companies. Mid-sized companies may not have the management experience, financial resources, product diversification and competitive strengths of larger companies. The securities of mid-sized companies, therefore, tend to be more volatile than the securities of larger, more established companies. Mid-sized company stocks tend to be bought and sold less often and in smaller amounts than larger company stocks. Because of this, if a fund wants to sell a large quantity of a mid-sized company’s stock, it may have to sell at a lower price than would otherwise be indicated, or it may have to sell in smaller than desired quantities over an increased time period. |
|
|
|
Municipal Securities Risk: The power or ability of an issuer to make principal and interest payments on municipal securities may be materially adversely affected by economic conditions, litigation or other factors. An underlying Fund’s right to receive principal and interest payments may be subject to the provisions of bankruptcy, insolvency, and other laws affecting the rights and remedies of creditors, as wells as laws, if any, which may be enacted by Congress or state legislatures extending the time for payment of principal and/or interest or imposing other constraints upon the enforcement of such obligations. In addition, substantial changes in federal income tax laws could cause municipal security prices to decline because the demand for municipal securities is strongly influenced by the value of tax exempt income to investors. |
|
|
|
Non-Diversification Risk: Because the underlying Funds may invest in a smaller number of securities, adverse changes to a single security might have a more pronounced negative effect on a Fund than if the Fund’s investments were more widely distributed. |
|
|
|
Real Estate Investment Trust Risk: To the extent underlying Funds invest in real estate investment trusts, the Fund is subject to risks experienced in real estate ownership, real estate financing, or both. As the economy is subjected to a period of economic deflation or interest rate increases, the demand for real estate may fall, causing a decline in the value of real estate owned. Also, as interest rates increase, the values of existing mortgages fall. The higher the duration (a calculation reflecting time risk, taking into account the average maturity of the mortgages) of the mortgages held in REITs owned by underlying Funds, the more sensitive the Fund is to interest rate risks. The underlying Funds are also subject to credit risk; the Fund could lose money if mortgagors default on mortgages held in the REITs. |
|
|
|
If certain industry sectors or types of securities don’t perform as well as the managers of the underlying Funds expect, the Fund’s performance could suffer. |
|
|
|
Smaller capitalization companies may experience higher failure rates than do larger capitalization companies. In addition, smaller companies may be more vulnerable to economic, market and industry changes. As a result, share price changes may be more sudden or erratic than the prices of other equity securities, especially over the short term. Such companies may have limited product lines, markets or financial resources and may lack management depth. The trading volume of securities of smaller capitalization companies is normally less than that of larger capitalization companies, and therefore may disproportionately affect their market price, tending to make them fall more in response to selling pressure than is the case with larger capitalization companies. Some small capitalization stocks may be illiquid. These risks may be enhanced for micro-cap securities. Many micro-cap companies tend to be new and have no proven track record. Some of these companies have no assets or operations, while others have products and services that are still in development or have yet to be tested in the market. Because micro-cap stocks trade in low volumes, any size of trade can have a large percentage impact on the price of the stock. |
|
|
|
The underlying Funds may invest in sovereign debt obligations. Investment in sovereign debt obligations involves special risks not present in corporate debt obligations. The issuer of the sovereign debt or the governmental authorities that control the repayment of the debt may be unable or unwilling to repay principal or interest when due, and the Fund may have limited recourse in the event of a default. During periods of economic uncertainty, the market prices of sovereign debt, and the underlying Funds’ net asset values, may be more volatile than prices of U.S. debt obligations. |
|
|
|
The Fund is an equity fund, so it is subject to the risks inherent in the stock market in general. The stock market is cyclical, with prices generally rising and falling over periods of time. Some of these price cycles can be pronounced and last for a long time. |
|
|
|
Treasury-Inflation Protected Securities Risk: Because the real rate of return offered by TIPS, which represents the growth of purchasing power, is guaranteed by the Federal Government, TIPS may offer a lower return than other fixed income instruments that do not have such guarantees. Other conventional bond issues may offer higher yields. |
|
|
|
Because different types of stocks tend to shift in and out of favor depending on market and economic conditions, “value” stocks may perform differently from the market as a whole and other types of stocks and can continue to be undervalued by the market for long periods of time. It is also possible that a value stock may never appreciate to the extent expected. |
|
|
|
The Fund’s gold and silver may be subject to loss, damage, theft, or restriction on access, and the Fund’s recovery may be limited, even in the event of fraud, to the market value of the metals at the time the fraud is discovered. International crises may motivate large-scale sales of precious metals which could decrease their prices and adversely affect the value of the Shares. The price of metals may also be adversely affected by the sale of gold or silver by ETFs or other exchange traded vehicles tracking the precious metals markets. In the event of the insolvency of the Custodian, a liquidator may seek to freeze access to the metals held in all of the accounts held by the Custodian, including the Fund’s Allocated Account. Although the Fund would retain legal title to the allocated gold and silver bars, the Fund could incur expenses in connection with obtaining control of the allocated gold or silver, and the assertion of a claim by such liquidator for unpaid fees could delay redemptions. |
|
|
|
The computer systems, networks and devices used by the Fund and its service providers to carry out routine business operations employ a variety of protections designed to prevent damage or interruption from computer viruses, network failures, computer and telecommunication failures, infiltration by unauthorized persons and security breaches. Despite the various protections utilized by the Fund and its service providers, systems, networks, or devices potentially can be breached. The Fund and its |
|
shareholders could be negatively impacted as a result of a cybersecurity breach. Cybersecurity breaches can include unauthorized access to systems, networks, or devices; infection from computer viruses or other malicious software code; and attacks that shut down, disable, slow, or otherwise disrupt operations, business processes, or website access or functionality. Cybersecurity breaches may cause disruptions and impact the Fund’s business operations, potentially resulting in financial losses; interference with the Fund’s ability to calculate its NAV; impediments to trading; the inability of the Fund, the Advisor, and other service providers to transact business; violations of applicable privacy and other laws; regulatory fines; penalties, reputational damage, reimbursement or other compensation costs, or additional compliance costs; as well as the inadvertent release of confidential information. |
A description of the Fund’s policies and procedures with respect to the disclosure of the Fund’s portfolio securities is available in the Funds’ SAI for Class A and Class C shares. It is also available on the Fund’s website, www.timothyplan.com.
The Fund’s investment objective is to generate moderate levels of long-term capital growth. The Fund attempts to achieve its investment objective by normally investing at least 75% of its total assets in the following Traditional Funds according to the following approximate range of percentages:
|
|
|
Timothy Traditional Plan Funds |
|
% of Fund’s Net Assets
Invested in Timothy Plan
Traditional Funds |
Large/Mid Cap Growth Fund |
|
0 - 15% |
| |
|
0 - 15% |
| |
|
0 - 10% |
| |
|
0 - 5% |
| |
|
0 - 20% |
| |
|
5 - 15% |
Defensive Strategies Fund |
|
5 - 30% |
Israel Common Values Fund |
|
0 - 10% |
| |
|
20 - 40% |
US Large /Mid Cap Core ETF |
|
0 - 30% |
| |
|
0 - 25% |
| |
|
0 - 25% |
| |
|
0 - 15% |
Timothy Partners, Ltd. (“TPL”) will determine the specific asset allocation program on a continuous basis, based on its forecast of the overall market. On each day that the Fund is open for business, TPL will review the asset allocation program and reallocate, as necessary, for any new funds invested in the Fund. The Advisor also will reallocate the Fund’s investments in the Traditional Funds at the end of each fiscal quarter to maintain the asset allocation program.
The Fund is subject to the following Principal Risks:
1. |
As with most other mutual funds, you can lose money by investing in the Fund. Share prices fluctuate from day to day, and when you sell your shares, they may be worth less than you paid for them. |
2. |
The Fund is indirectly subject to the following risks that are inherent in the Traditional Funds in which the Fund invests: |
|
|
|
Commodities-based Exchange Traded Funds Risk: Commodity ETFs invest in Physical Commodities and/or Commodity Futures Contracts which Contracts are highly leveraged investment vehicles, and therefore generally considered to be high risk. By investing in underlying funds holding Commodity ETFs, the Fund assumes portions of that risk. ETFs may only purchase commodities futures contracts (the buy side), therefore the risks include missing opportunities to realize gains by shorting futures contracts (the sell side) in deflationary economic periods. It is possible an underlying Fund’s entire ETF investment could be lost. Also, ETF’s have expenses associated with them, and although indirect, these expenses may cause the Fund’s return to be lower. |
|
|
|
One underlying fund invests in Israeli securities, and Israel is subject to unique political and economic risks. As a result, Israeli securities can be more volatile than the market as a whole and can perform differently from the value of the market as a whole. The investments in the securities of Israel may experience more rapid and extreme changes in value than funds with investments solely in securities of U.S. companies or funds that invest across a larger spectrum of the foreign market. This is because the securities market in Israel is relatively small, with a limited number of companies representing a smaller number of industries. Israeli issuers are not subject to the same degree of regulation as U.S. issuers. Also, nationalization, expropriation or confiscatory taxation or political changes could adversely affect the Fund’s investments in a foreign country. |
|
|
|
If investment grade bonds are downgraded in credit rating or go into default, the result could be a loss of value, and the Fund could lose money. The degree of risk for a particular security may or may not be reflected in its credit rating. Bonds that are unrated, or rated BBB by Standard & Poor’s at the time of purchase, are subject to greater market risk and credit risk, or loss of principal and interest, than higher-rated securities. High yield securities (“junk” bonds) are subject to greater risk of loss than investment grade securities. Unrated bonds or bonds rated BB or lower by Standard & Poor’s at the time of purchase, (“junk” bonds) are subject to greater market risk and credit risk, or loss of principal and interest, than higher-rated securities. |
|
|
|
Securities represented by ADRs are foreign stocks denominated in non-U.S. currency, and there is a risk that fluctuations in the exchange rates between the U.S. dollar and foreign currencies may negatively affect the value of the investments in foreign securities. For securities that are foreign stocks denominated in non-U.S. currency, there is a risk that fluctuations in the exchange rates between the U.S. dollar and foreign currencies may negatively affect the value of the investments in foreign securities. |
|
|
|
Investments in the securities of emerging countries may experience more rapid and extreme changes in value than investments solely in securities of U.S. companies and investments in a larger spectrum of the foreign market. This is because the |
|
securities markets in some emerging countries are relatively small, with a limited number of companies representing a smaller number of industries. Issuers in emerging countries are frequently not subject to the same degree of regulation as U.S. issuers. Also, nationalization, expropriation or confiscatory taxation or political changes could adversely affect investments in emerging foreign countries. |
|
|
|
Overall, stock market risks may affect the value of the Fund. Factors such as domestic economic growth and market conditions, interest rate levels, and political events affect the securities markets. When the value of the Fund’s investments goes down, your investment in the Fund decreases in value and you could lose money. |
|
|
|
Exchange Traded Fund Risk: An ETF may trade at a discount to its net asset value. Investors indirectly bear fees and expenses charged by the underlying ETFs in addition to the Fund’s direct fees and expenses. There are also brokerage costs incurred when purchasing ETFs. In addition, losses of the underlying ETF and the level of risk arising from the investment practices of an underlying ETF may impact returns. |
|
|
|
Because the underlying Funds do not invest in Excluded Securities (including certain REITs) , and will divest themselves of securities that are subsequently discovered to be ineligible, the Fund may be riskier than similar funds that invest in underlying funds that invest in broader arrays of securities. |
|
|
|
Fixed income securities will increase or decrease in value based on changes in interest rates. If rates increase, fixed income securities generally will decline, and those securities with longer terms generally will decline more. Your investment will decline in value if the value of fixed income securities decrease. There is a risk that issuers and counterparties will not make payments on fixed income securities and repurchase agreements. Such defaults could result in losses to the Fund. |
|
|
|
Foreign investing involves risks not typically associated with U.S. investments and may experience more rapid and extreme changes in value than investments solely in securities of U.S. companies. These risks include, among others, adverse fluctuations in foreign currency values as well as adverse political, social and economic developments affecting a foreign country. In addition, foreign investing involves less publicly available information, and more volatile or less liquid securities markets. Investments in foreign countries could be affected by factors not present in the U.S., such as restrictions on receiving the investment proceeds from a foreign country, foreign tax laws, and potential difficulties in enforcing contractual obligations. Foreign accounting may be less transparent than U.S. accounting practices and foreign regulation may be inadequate or irregular. Underlying Funds owning foreign securities could cause the Fund’s performance to fluctuate more than if it held only U.S. securities. |
|
|
|
As with most other mutual funds, you can lose money by investing in this Fund. Share prices fluctuate from day to day, and when you sell your shares, they may be worth less than you paid for them. |
|
|
|
Some underlying Funds invest in companies after assessing their growth potential. Securities of growth companies may be more volatile than other stocks. If a portfolio manager’s perception of a company’s growth potential is not realized, the securities purchased may not perform as expected, reducing the Fund’s return. In addition, because different types of stocks tend to shift in and out of favor depending on market and economic conditions, “growth” stocks may perform differently from the market as a whole and other types of securities. |
|
|
|
High Portfolio Turnover Risk: Higher portfolio turnover rates may indicate higher transaction costs and may result in higher taxes when Fund shares are held in a taxable account. These costs, which are not reflected in annual Fund operating expenses or in the Example, affect the Fund’s performance. |
|
|
|
High Yield Security Risk: Investments in fixed-income securities that are rated below investment grade (“high yield securities”) by one or more Nationally Recognized Statistical Rating Organizations (NRSROs) may be subject to greater risk of loss of principal and interest than investments in higher-rated fixed-income securities. High yield securities are also generally considered to be subject to greater market risk than higher-rated securities. The capacity of issuers of high yield securities to pay interest and repay principal is more likely to weaken than is that of issuers of higher-rated securities in times of deteriorating economic conditions or rising interest rates. In addition, high yield securities may be more susceptible to real or perceived adverse economic conditions than higher-rated securities. The market for high yield securities may be less liquid than the market for higher-rated securities. This can adversely affect an underlying Fund’s ability to buy or sell optimal quantities of high yield securities at desired prices. |
|
|
|
When interest rates rise, bond prices fall; the higher an underlying Fund’s duration (a calculation reflecting time risk, taking into account both the average maturity of the Fund’s portfolio and its average coupon return), the more sensitive the underlying Fund is to interest rate risk. |
|
|
|
Investing In Other Funds Risk: The Fund invests in the securities of other investment companies. To the extent that the Fund invests in other mutual funds, exchange traded funds and other commingled funds, it will indirectly bear the expenses of those funds, which will cause the Fund’s return to be lower. |
|
|
|
The value of an individual security or a particular type of security can be more volatile than the market as a whole and can perform differently from the value of the market as a whole. |
|
|
|
Larger Company Investing Risk: Larger, more established companies may be unable to respond quickly to new competitive challenges like changes in consumer tastes or innovative smaller competitors. Also, larger companies are sometimes unable to attain the high growth rates of successful, smaller companies, especially during extended periods of economic expansion. |
|
|
|
An Advisor’s judgments about the attractiveness, value and potential appreciation of a particular asset class or individual security in which an underlying Fund invests may prove to be incorrect. The Fund may experience losses regardless of the overall performance of the market. |
|
|
|
Mid-Sized Company Investing Risk: Investing in mid-sized companies often involves greater risk than investing in larger companies. Mid-sized companies may not have the management experience, financial resources, product diversification and competitive strengths of |
|
larger companies. The securities of mid-sized companies, therefore, tend to be more volatile than the securities of larger, more established companies. Mid-sized company stocks tend to be bought and sold less often and in smaller amounts than larger company stocks. Because of this, if a fund wants to sell a large quantity of a mid-sized company’s stock, it may have to sell at a lower price than would otherwise be indicated, or it may have to sell in smaller than desired quantities over an increased time period. |
|
|
|
Municipal Securities Risk: The power or ability of an issuer to make principal and interest payments on municipal securities may be materially adversely affected by economic conditions, litigation or other factors. An underlying Fund’s right to receive principal and interest payments may be subject to the provisions of bankruptcy, insolvency, and other laws affecting the rights and remedies of creditors, as wells as laws, if any, which may be enacted by Congress or state legislatures extending the time for payment of principal and/or interest or imposing other constraints upon the enforcement of such obligations. In addition, substantial changes in federal income tax laws could cause municipal security prices to decline because the demand for municipal securities is strongly influenced by the value of tax exempt income to investors. |
|
|
|
Non-Diversification Risk: Because the underlying Funds may invest in a smaller number of securities, adverse changes to a single security might have a more pronounced negative effect on a Fund than if the Fund’s investments were more widely distributed. |
|
|
|
Real Estate Investment Trust Risk: To the extent underlying Funds invest in real estate investment trusts, the Fund is subject to risks experienced in real estate ownership, real estate financing, or both. As the economy is subjected to a period of economic deflation or interest rate increases, the demand for real estate may fall, causing a decline in the value of real estate owned. Also, as interest rates increase, the values of existing mortgages fall. The higher the duration (a calculation reflecting time risk, taking into account the average maturity of the mortgages) of the mortgages held in REITs owned by underlying Funds, the more sensitive the Fund is to interest rate risks. The underlying Funds are also subject to credit risk; the Fund could lose money if mortgagors default on mortgages held in the REITs. |
|
|
|
If certain industry sectors or types of securities don’t perform as well as the managers of the underlying Funds expect, the Fund’s performance could suffer. |
|
|
|
Smaller capitalization companies may experience higher failure rates than do larger capitalization companies. In addition, smaller companies may be more vulnerable to economic, market and industry changes. As a result, share price changes may be more sudden or erratic than the prices of other equity securities, especially over the short term. Such companies may have limited product lines, markets or financial resources and may lack management depth. The trading volume of securities of smaller capitalization companies is normally less than that of larger capitalization companies, and therefore may disproportionately affect their market price, tending to make them fall more in response to selling pressure than is the case with larger capitalization companies. Some small capitalization stocks may be illiquid. These risks may be enhanced for micro-cap securities. Many micro-cap companies tend to be new and have no proven track record. Some of these companies have no assets or operations, while others have products and services that are still in development or have yet to be tested in the market. Because micro-cap stocks trade in low volumes, any size of trade can have a large percentage impact on the price of the stock. |
|
|
|
The underlying Funds may invest in sovereign debt obligations. Investment in sovereign debt obligations involves special risks not present in corporate debt obligations. The issuer of the sovereign debt or the governmental authorities that control the repayment of the debt may be unable or unwilling to repay principal or interest when due, and the Fund may have limited recourse in the event of a default. During periods of economic uncertainty, the market prices of sovereign debt, and the underlying Funds’ net asset values, may be more volatile than prices of U.S. debt obligations. |
|
|
|
The Fund is an equity fund, so it is subject to the risks inherent in the stock market in general. The stock market is cyclical, with prices generally rising and falling over periods of time. Some of these price cycles can be pronounced and last for a long time. |
|
|
|
Treasury-Inflation Protected Securities Risk: Because the real rate of return offered by TIPS, which represents the growth of purchasing power, is guaranteed by the Federal Government, TIPS may offer a lower return than other fixed income instruments that do not have such guarantees. Other conventional bond issues may offer higher yields. |
|
|
|
Because different types of stocks tend to shift in and out of favor depending on market and economic conditions, “value” stocks may perform differently from the market as a whole and other types of stocks and can continue to be undervalued by the market for long periods of time. It is also possible that a value stock may never appreciate to the extent expected. |
|
|
|
The Fund’s gold and silver may be subject to loss, damage, theft, or restriction on access, and the Fund’s recovery may be limited, even in the event of fraud, to the market value of the metals at the time the fraud is discovered. International crises may motivate large-scale sales of precious metals which could decrease their prices and adversely affect the value of the Shares. The price of metals may also be adversely affected by the sale of gold or silver by ETFs or other exchange traded vehicles tracking the precious metals markets. In the event of the insolvency of the Custodian, a liquidator may seek to freeze access to the metals held in all of the accounts held by the Custodian, including the Fund’s Allocated Account. Although the Fund would retain legal title to the allocated gold and silver bars, the Fund could incur expenses in connection with obtaining control of the allocated gold or silver, and the assertion of a claim by such liquidator for unpaid fees could delay redemptions. |
|
|
|
The computer systems, networks and devices used by the Fund and its service providers to carry out routine business operations employ a variety of protections designed to prevent damage or interruption from computer viruses, network failures, computer and telecommunication failures, infiltration by unauthorized persons and security breaches. Despite the various protections utilized by the Fund and its service providers, systems, networks, or devices potentially can be breached. The Fund and its shareholders could be negatively impacted as a result of a cybersecurity breach. Cybersecurity breaches can include unauthorized access |
|
to systems, networks, or devices; infection from computer viruses or other malicious software code; and attacks that shut down, disable, slow, or otherwise disrupt operations, business processes, or website access or functionality. Cybersecurity breaches may cause disruptions and impact the Fund’s business operations, potentially resulting in financial losses; interference with the Fund’s ability to calculate its NAV; impediments to trading; the inability of the Fund, the Advisor, and other service providers to transact business; violations of applicable privacy and other laws; regulatory fines; penalties, reputational damage, reimbursement or other compensation costs, or additional compliance costs; as well as the inadvertent release of confidential information. |
A description of the Fund’s policies and procedures with respect to the disclosure of the Fund’s portfolio securities is available in the Funds’ SAI for Class A and Class C shares. It is also available on the Fund’s website, www.timothyplan.com.
To help you understand how the Funds’ assets are managed, this section includes a detailed discussion of the Funds’ Investment Advisor and each Investment Manager. For a more complete discussion of these matters, please consult the Statement of Additional Information, which is available by calling (800) 846-7526 or by visiting Timothy Plan’s website at www.timothyplan.com.
Timothy Partners, Ltd. (“TPL”), 1055 Maitland Center Commons Boulevard, Maitland, FL 32751, is a Florida limited partnership organized on December 6, 1993, and is registered with the Securities and Exchange Commission as an investment advisor. TPL supervises the investment of the assets of each Fund in accordance with the objectives, policies and restrictions of the Trust. TPL approves the portfolio of securities selected by the Investment Managers. To determine which securities are Excluded Securities, TPL utilizes an affiliated company to conduct its research, and consults a number of Christian ministries on these issues. TPL retains the right to change the sources from whom it acquires its information, at its discretion. TPL has been the advisor to the Funds since their inceptions.
As of September 30, 2020, TPL managed approximately $ 1.3 billion in Timothy Plan Fund Assets.
Covenant Funds, Inc., a Florida corporation (“CFI”), is the managing general partner of TPL. Arthur D. Ally is President, Chairman and Trustee of the Trust, as well as President and 75% shareholder of CFI. Mr. Ally had over eighteen years of experience in the investment industry prior to founding TPL, having worked for Prudential Bache, Shearson Lehman Brothers and Investment Management & Research. Some or all of these firms may be utilized by an Investment Manager to execute portfolio trades for a Fund. Neither Mr. Ally nor any affiliated person of the Trust will receive any benefit from such transactions.
For its advisory services, TPL is paid an annual fee equal to 0.85% on the Small Cap Value Fund, 0.85% on the Large/Mid Cap Value Fund, 0.85% on the Aggressive Growth Fund, 0.85% on the Large/Mid Cap Growth Fund, 1.00% on the International Fund, 0.60% on the Fixed Income Fund, 0.60% on the High Yield Bond Fund, 1.00% on the Israel Common Values Fund, 0.60% on the Defensive Strategies Fund, 0.85% on the Growth & Income Fund and 0.65% on both the Strategic Growth Fund and the Conservative Growth Fund.
During the fiscal year ended September 30, 2020, the Adviser voluntarily waived a portion of its fees for certain Funds in order to lower the expenses of those Funds for shareholders. The table below highlights the Funds that received fee waivers, the Total Expense Ratios before fee waivers, and the Total Expense Ratios after fee waivers.
|
|
|
|
|
|
|
Fund |
|
Share Class |
|
|
|
|
Aggressive Growth |
|
A |
|
1.71% |
|
1.61% |
Aggressive Growth |
|
C |
|
2.46% |
|
2.36% |
International Fund |
|
A |
|
1.76% |
|
1.71% |
International Fund |
|
C |
|
2.51% |
|
2.46% |
Large/Mid Growth Fund |
|
A |
|
1.54% |
|
1.49% |
Large/Mid Growth Fund |
|
C |
|
2.29% |
|
2.24% |
Small Cap Value Fund |
|
A |
|
1.57% |
|
1.47% |
Small Cap Value |
|
C |
|
2.32% |
|
2.22% |
Large/Mid Value Fund |
|
A |
|
1.51% |
|
1.41% |
Large/Mid Value Fund |
|
C |
|
2.26% |
|
2.16% |
Fixed Income Fund |
|
A |
|
1.30% |
|
1.10% |
Fixed income Fund |
|
C |
|
2.05% |
|
1.85% |
High Yield Bond Fund |
|
A |
|
1.34% |
|
1.29% |
High Yield Bond Fund |
|
C |
|
2.09% |
|
2.04% |
Defensive Strategies Fund |
|
A |
|
1.54% |
|
1.49% |
Defensive Strategies Fund |
|
C |
|
2.29% |
|
2.24% |
Growth & Income Fund |
|
A |
|
1.85% |
|
1.50% |
Growth & Income Fund |
|
C |
|
2.60% |
|
2.25% |
* |
Numbers reflect the expense ratios disclosed in the Trust’s Audited Annual Report, dated September 30, 2020, and do not include deemed expenses due to Acquired Funds Fees and Expenses. |
TPL, with the Trust’s consent, has engaged the services of the Investment Managers described below to provide day-to-day investment advisory services to certain of the Funds. TPL pays all fees charged by the Investment Managers for such services.
A discussion of the considerations employed by the Board of Trustees (the “Board”) in their approval of TPL as Advisor to the Trust, and each Investment Manager as manager of the Funds in 2020, is available in the Funds’ semi-annual report dated March 31, 2020.
The Statement of Additional Information (“SAI”) for the Trust’s Class A and Class C Shares, dated January 28, 2021, contains additional information about the compensation paid to the portfolio managers, other accounts and account types managed by the Advisor and Investment Managers, and ownership of Fund shares. The SAI is available upon request at no charge. To receive a copy of the SAI you may request one by calling the Funds at (800) 846-7526.
CHARTWELL INVESTMENT PARTNERS
Chartwell Investment Partners (“Chartwell”), 1205 Westlakes Drive, Suite 100, Berwyn, PA 19312, serves as Investment Manager to the Aggressive Growth Fund and the Large/Mid Cap Growth Fund. Chartwell Investment Partners, LLC, is a Berwyn, Pennsylvania based investment firm, founded in 1997, focusing on institutional, sub-advisory and private client relationships. Chartwell is a wholly-owned subsidiary of TriState Capital Holdings, Inc., a registered bank holding company based in Pittsburgh, Pennsylvania.
The Large/Mid Cap Growth Fund and Aggressive Growth Fund
is team managed by Frank L. Sustersic and Peter M. Schofield each of whom participate in the investment decision process during meetings in which the team determines the allocation of securities held in the portfolio. Each has authority to direct trading activity in the Fund.
Mr. Frank L. Sustersic, CFA
, is a Managing Partner and Senior Portfolio Manager for the Fund and has been in the investments arena since 1989.
Mr. Peter M. Schofield, CFA
, is a Senior Portfolio Manager to the Fund and has been in the investment arena since 1996.
As of September 30, 2020, Chartwell managed approximately $ 9.6 billion in client assets.
EAGLE GLOBAL ADVISORS, LLC
Eagle Global Advisors, LLC (“Eagle”), 1330 Post Oak Blvd., Suite 300, Houston, TX 77056 is the Investment Manager for the International Fund and the Israel Common Values Fund. Eagle was founded in 1996 and is owned by its employees. The senior members discussed below have worked together since 1992. Eagle has provided investment management services and advice in the international sector since its founding.
is team managed, with each member of the team assuming responsibility for a geographic area of the globe, and specific market sectors within that geographic area. The senior and founding partners of the firm are members of the team responsible for the Fund’s management.
Mr. Edward R. Allen, III, PhD., CFA
, Senior Partner. Mr. Allen is a portfolio manager and serves as a member of the International investment committee. Prior to founding Eagle, Mr. Allen was employed by Eagle Management & Trust Company. Before entering the investment advisory business, he served as an assistant professor of economics at the University of Houston. He earned a Bachelor’s degree in engineering from Princeton University and a Ph.D. in economics from the University of Chicago. Mr. Allen holds the Chartered Financial Analyst designation and is also a member of the American Finance Association, the CFA Institute, and the CFA Society of Houston.
Mr. Thomas N. Hunt, III, CFA, CPA
, Senior Partner. Mr. Hunt is a portfolio manager and serves as a member of the International investment committee. Prior to founding Eagle, Mr. Hunt was employed by Eagle Management & Trust Company. Mr. Hunt also worked for the public accounting firm of Ernst & Young. He earned a Bachelor’s degree in accounting from the University of Texas and an MBA from the Harvard Business School. Mr. Hunt holds the Chartered Financial Analyst and Certified Public Accountant designations and is also a member of the CFA Institute, the CFA Society of Houston, and the Texas Society of Certified Public Accountants.
, Senior Partner. Mr. Russo is a portfolio manager and serves as a member of the International investment committee. Prior to founding Eagle, Mr. Russo was employed by Eagle Management & Trust Company and Criterion Investment Management Company. Mr. Russo earned a Bachelor’s degree in finance from the University of Texas and an MBA from Rice University. Mr. Russo also serves as a Board Member of the M.A. Wright Fund at Rice University’s Jones School of Management.
, Partner. Mr. Gualy serves as a portfolio manager and serves as co-Chairman of the International investment committee. Prior to founding Eagle, Mr. Gualy was employed by Eagle Management & Trust Company and as director of research for Continental Intervest. He earned a Bachelor’s degree in economics from the University of Texas and an MBA from Rice University. Mr. Gualy holds the Chartered Financial Analyst designation, is a member of the CFA Institute and is a former President and Director of the CFA Society of Houston. He also served as an Adjunct Professor at Rice University’s Jones Graduate School of Business teaching an MBA class on Stock Analysis.
The Israel Common Values Fund
is team managed, with each member of the team assuming responsibility for a specific market sector. The senior and founding partners of the firm sit on the team responsible for the Fund’s management.
Mr. Edward R. Allen, III, PhD., CFA
, Senior Partner. Mr. Allen is a portfolio manager and serves as a member of the International investment committee. Prior to founding Eagle, Mr. Allen was employed by Eagle Management & Trust Company. Before entering the investment advisory business, he served as an assistant professor of economics at the University of Houston. He earned a Bachelor’s degree in engineering from Princeton University and a Ph.D. in economics from the University of Chicago. Mr. Allen holds the Chartered Financial Analyst designation and is also a member of the American Finance Association, the CFA Institute, and the CFA Society of Houston.
Mr. Thomas N. Hunt, III, CFA, CPA
, Senior Partner. Mr. Hunt is a portfolio manager and serves as a member of the International investment committee. Prior to founding Eagle, Mr. Hunt was employed by Eagle Management & Trust Company. Mr. Hunt also worked for the public accounting firm of Ernst & Young. He earned a Bachelor’s degree in accounting from the University of Texas and an MBA from the Harvard Business School. Mr. Hunt holds the Chartered Financial Analyst and Certified Public Accountant designations and is also a member of the CFA Institute, the CFA Society of Houston, and the Texas Society of Certified Public Accountants.
, Senior Partner. Mr. Russo is a portfolio manager and serves as a member of the International investment committee. Prior to founding Eagle, Mr. Russo was employed by Eagle Management & Trust Company and Criterion Investment Management Company. Mr. Russo earned a Bachelor’s degree in finance from the University of Texas and an MBA from Rice University. Mr. Russo also serves as a Board Member of the M.A. Wright Fund at Rice University’s Jones School of Management.
, Partner. Mr. Gualy serves as a portfolio manager and serves as co-Chairman of the International investment committee. Prior to founding Eagle, Mr. Gualy was employed by Eagle Management & Trust Company and as director of research for Continental Intervest. He earned a Bachelor’s degree in economics from the University of Texas and an MBA from Rice University. Mr. Gualy holds the Chartered Financial Analyst designation, is a member of the CFA Institute and is a former President and Director of the CFA Society of Houston. He also served as an Adjunct Professor at Rice University’s Jones Graduate School of Business teaching an MBA class on Stock Analysis.
Mr. Allen, Mr. Hunt, Mr. Russo and Mr. Gualy all sat on the team responsible for the development of the Eagle security ranking model.
As of September 30, 2020, Eagle managed approximately $1.8 billion in client assets.
WESTWOOD MANAGEMENT CORP.
Westwood Management Corp. (“Westwood”), 200 Crescent Court, Suite 1200, Dallas, TX 75201, is the Investment Manager responsible for the day-to-day activities of the Large/Mid Cap Value and Small Cap Value Funds’ assets. Westwood Holdings Group, Inc., a public company listed on the New York Stock Exchange (“WHG”), is the parent company of Westwood. Ms. Susan M. Byrne founded Westwood and currently serves as the Vice Chairman of the Board of Directors of Westwood Holdings Group, Inc.
The Large/Mid Cap Value Fund
Westwood utilizes a team of portfolio managers who are responsible for the day-to-day recommendations regarding the investment of the Large/Mid Cap Value Fund’s portfolio.
has served as Senior Vice President, Co-Director of Equity Portfolios for Westwood since February 2018. Prior to this appointment, he served Westwood as Senior Vice President and Research Analyst from 2015 to 2018, and as Vice President and Research Analyst from 2010 to 2015. Mr. Lockridge has served on the portfolio team for the Timothy Plan Large/Mid Cap Value Fund since December 2012 and on the Timothy Plan Small Cap Value Fund since December 2010.
Mr. William D. Sheehan, CFA
has served as Vice President, Research Analyst for Westwood since March 2019. Prior to this appointment, he served Westwood as an Associate Vice President and Research Analyst from 2018 to 2019. Mr. Sheehan has served on the portfolio team for the Timothy Plan Large/Mid Cap Value Fund since September 2019.
has served as Vice President, Research Analyst for Westwood since February 2017. Prior to this appointment, she served Westwood as an Associate Vice President and Research Analyst from 2015 to 2017. Ms. Hill has served on the portfolio team for the Timothy Plan Large/Mid Cap Value Fund since August 2020.
Westwood utilizes a team of portfolio managers who are responsible for the day-to-day recommendations regarding the investment of the Small Cap Value Fund’s portfolio. In addition to Mr. Matthew Lockridge listed above, the other team members include Mr. William Costello and Mr. Frederic Rowsey.
Mr. William E. Costello, CFA
has served as Senior Vice President, Co-Director of Equity Portfolios for Westwood since February 2018. Prior to this appointment, he served Westwood as Senior Vice President and Senior Research Analyst from 2010 to 2018. Mr. Costello has served on the portfolio team for the Timothy Plan Small Cap Value Fund since December 2010.
Mr. Frederic G. Rowsey, CFA
has served as Vice President and Research Analyst for Westwood since February 2018. Prior to this appointment, he served Westwood as Associate Vice President and Research Analyst from 2015 to 2018, as a Research Analyst from 2013 to 2015, and as a Research Associate from 2010 to 2013. Mr. Rowsey has served on the portfolio team for the Timothy Plan Small Cap Value Fund since December 2013.
As of September 30, 2020, Westwood Management Corp. managed approximately $8.5 billion in client assets.
DELAWARE INVESTMENTS FUND ADVISERS
Delaware Investments Fund Advisers, a series of Macquarie Investment Management Business Trust (“DIFA”), 610 Market Street, Philadelphia, PA 19106, is the Investment Manager to the REIT sleeve of the Defensive Strategies Fund. The company was founded in 1929 and became a member of the Macquarie Group in 2010. The Macquarie Group is an Australian bank holding company, Macquarie Group Limited. Macquarie Investment Management (“MIM”) is the marketing name for Macquarie Management Holdings, Inc. (MMHI) and its subsidiaries. In August 2020, Delaware announced its intention to resign as Sub-Adviser to the Defensive Strategies Fund and was replaced by Chilton Capital Management, LLC, at a special meeting of the Board held in September 2020.
The Defensive Strategies Fund
REIT sleeve is managed by
.
, of the Macquarie Quantitative Equity team, joined MIM in 2007 as an analyst and currently serves as a portfolio manager for REIT investments. Mr. Gowlland is responsible for the day-to-day recommendations regarding the investment of the Sleeve’s assets.
As of September 30, 2020, MIM managed approximately $242 billion in client assets.
CHILTON CAPITAL MANAGEMENT, LLC
The Fund previously engaged a sub-adviser to manage the REIT allocation of the Fund’s investment portfolio. Delaware Management Business Trust (“Delaware”) had been the Sub-Adviser to the Fund since its inception in October 2013. The Delaware Sub-Advisory Agreement was last approved by shareholders on February 14, 2020. Under the terms of the Delaware sub-advisory agreement, Delaware manages the day-to-day investment and reinvestment of the Fund’s REIT allocation and continuously reviews, supervises and administers the investment program of the Fund, all under the supervision of TPL and the Trust’s Board. Under the agreement, Delaware is not liable for any error of judgment or any loss unless the error or loss results from the gross negligence, bad faith or willful malfeasance in the performance of its duties under the agreement. The agreement may be terminated without penalty by any party upon 60 days written notice.
In August 2020, Delaware announced its intention to resign as Sub-Adviser to the Fund, effective upon the approval of its replacement. Delaware decided to resign because it was in the process of closing its REIT investment operation. At a Special Meeting of the Board held on September 28, 2020, the Board formally considered the engagement of Chilton to replace Delaware, and after full consideration, approved an interim sub-advisory agreement regarding the engagement of Chilton for the REIT allocation of the Fund and directed Trust management to call a shareholders meeting of the Fund to seek shareholder approval of the decision by approving a sub-advisory agreement with Chilton. The proposed sub-advisory agreement with Chilton is identical in all material respects to the current Delaware agreement.
The Board of Trustees (the “Board”) of the Timothy Plan (the “Trust”) has voted to call a special meeting of all shareholders of the Timothy Plan Defensive Strategies Fund (the “Fund”), in order to seek shareholder approval of two proposals relating to the Fund. The Special Meeting was held on Monday, December 21, 2020 at 2:30 p.m., Eastern Time at the offices of the Trust’s Investment Adviser, Timothy Partners, Ltd., located at 1055 Maitland Center Commons Blvd., Maitland, FL 32751, and the Special Meeting was adjourned to January 21, 2021 at 12:30 p.m. Eastern Time.
Chilton Capital Management, LLC
(“Chilton”), 1177 West Loop South, Suite 1750, Houston, TX, was founded in 1996 as a registered investment advisor, and has provided investment advisory services to mutual funds, institutional investors and individual investors since that time. Chilton’s primary owners are Knapp Brothers, LLC (“Knapp Brothers”), a Texas limited liability company, and certain employees of Chilton. Knapp Brothers has a fifty-five percent (55%) direct beneficial ownership and certain employees of Chilton collectively have a forty-five percent (45%) beneficial ownership. The primary owners of Knapp Brothers are Messrs. David M. Underwood, Jr. and A. John Knapp, Jr. Chilton is managed and controlled under the direction of its Board of Managers, which is comprised of Mr. David M. Underwood, Jr., as Chairman, Mr. R. Randall Grace, Jr., Mr. John E. Robertson, Ms. Laura L. Genung, and Mr. Timothy J. Lootens (collectively, the “Board of Managers”).
The REIT allocation of the Timothy Plan Defensive Strategies Fund will utilize a team of investment professionals who are responsible for the day-to-day recommendations regarding the investment of the REIT allocation of the Fund’s portfolio.
Co portfolio managers Bruce G. Garrison with over 48 years of experience as a portfolio manager/analyst and Matthew R. Werner, with 14 years of experience as a portfolio manager/analyst, joined Chilton in 2011 to manage a REIT strategy. They brought $50M in assets from their prior firm. Total strategy assets under advisement are $510M as of 9/30/20.
Fees paid to Chilton under the proposed sub-advisory agreement are almost identical to the fees currently being paid to Delaware under its agreement. It is important to note that fees paid to sub-advisers are paid by TPL, out if its fees, and not by the Fund. Accordingly, even though the sub-advisory fees charged by the two firms are slightly different, there is no effect whatsoever on the Fund and its fee structure.
As of September 30, 2020, Chilton managed approximately $1.6 billion in client assets.
CORECOMMODITY MANAGEMENT, LLC
CoreCommodity Management, LLC, formerly Jefferies Asset Management, LLC (“CORE”), 680 Washington Boulevard, 11th Floor, Stamford, CT 06901 serves as Investment Manager to the Commodities sleeve of the Defensive Strategies Fund. Founded in 2003, CORE commenced trading on behalf of the Fund in September 2011.
The Defensive Strategies Fund
commodities sleeve is managed by:
Co-President of CORE, who is responsible for all investment decisions for the commodities sleeve. As of September 30, 2020, CORE managed approximately $ 3.5 billion in client assets.
BARROW, HANLEY, MEWHINNEY & STRAUSS, LLC
Barrow, Hanley, Mewhinney and Strauss, LLC (“BHMS”), 2200 Ross Avenue, 31st Floor, Dallas, TX 75201, serves as Investment Manager to the Fixed Income Fund and the High Yield Bond Fund. BHMS also serves as Debt Instrument Sector Manager to the Defensive Strategies Fund. BHMS also serves as the Fixed Income Sector Manager to the Growth and Income Fund. BHMS was founded in 1979 as a registered investment advisor and has provided investment advisory services to institutional and individual investors since that time.
Currently BHMS is a subsidiary of BrightSphere Investment Group, a publicly-held company traded on the New York Stock Exchange. At the Timothy Board’s quarterly meeting held on August 28, 2020, the Board was informed that BHMS had entered into an agreement with Perpetual U.S. Holding Company Inc. (“Perpetual”) wherein Perpetual would purchase the entire 75.1% ownership interest in BHMS currently held by BrightSphere. Like BrightSphere, Perpetual is a holding company that invests in a wide variety of financial institutions. BHMS informed the Timothy Board that the BHMS management team would remain in place after the transaction and that the portfolio management teams currently in place for the Funds would remain unchanged after the Transaction. BHMS further informed the Board that the Transaction was due to close on November 30, 2020. The Transaction closed as anticipated and the current sub-advisory agreement terminated. Accordingly, an interim sub-advisory agreement has been approved by the Board and shareholder ratification of a sub-advisory agreement is currently being sought. Shareholders of the Timothy Plan Fixed Income Fund, Timothy Plan High Yield Bond Fund, Timothy Plan Growth and Income Fund and the Defensive Strategies Fund will vote to approve or reject the change in control and new investment sub-advisory agreement with BHMS at a Special Shareholder Meeting to be held on December 21, 2020. The Special Shareholder Meeting has now been adjourned to January 21, 2021.
The Fixed Income Fund, Fixed Income Sleeve of the Growth and Income Fund and High Yield Bond Fund
utilizes a team of investment professionals who are responsible for the day-to-day recommendations regarding the investment of these Funds’ portfolios.
Mr. Mark C. Luchsinger, CFA
, joined BHMS in 1997. He currently serves as a portfolio manager/analyst, specializing in investment grade and high yield corporate bond strategies and is the lead portfolio manager for our Core and Core Plus strategies. He is also a generalist in investment grade and high yield credit research.
, joined BHMS in 1995. He currently serves as the lead portfolio manager for our Long Duration strategies, specializing in corporate and government bonds. He is also a generalist in investment grade fixed income credit research.
Ms. Deborah A. Petruzzelli
joined BHMS in 2003. She serves as our structured securities portfolio manager for mortgage-backed, asset- backed, and commercial mortgage-backed securities.
joined BHMS in 2001. He serves as a portfolio manager/analyst on our high yield strategies and as a senior analyst in credit research.
, joined BHMS in 2012. He serves as a portfolio manager/analyst on our intermediate and short maturity strategies and as a senior analyst in credit research.
Mr. Nicholas C. Losey, CFA
joined BHMS in 2018. He serves as a co-portfolio manager on our high yield and bank loan strategies.
Mr. Chet S. Paipanandiker
joined BHMS in 2017. He serves as a co-portfolio manager on our high yield and bank loan strategies.
The Defensive Strategies Fund
relies on Barrow Hanley to manage the Debt Instrument Sleeve.
Mr. Mark C. Luchsinger, CFA
, joined BHMS in 1997. He currently serves as a portfolio manager/analyst, specializing in investment grade and high yield corporate bond strategies and is the lead portfolio manager for our Core and Core Plus strategies. He is also a generalist in investment grade and high yield credit research.
, joined BHMS in 1995. He currently serves as the lead portfolio manager for our Long Duration strategies, specializing in corporate and government bonds. He is also a generalist in investment grade fixed income credit research.
joined BHMS in 2001. He serves as a portfolio manager/analyst on our high yield strategies and as a senior analyst in credit research.
, joined BHMS in 2012. He serves as a portfolio manager/analyst on our intermediate and short maturity strategies and as a senior analyst in credit research.
As of September 30, 2020, BHMS managed approximately $44.6 billion in client assets.
A MORE COMPREHENSIVE DISCUSSION OF THE ADVISOR’S AND EACH INVESTMENT MANAGER’S ACTIVITIES, COMPENSATION, AND OTHER ACCOUNTS AND ACCOUNT TYPES MANAGED BY THE INVESTMENT MANAGERS MAY BE FOUND IN THE SAI DATED JANUARY 28, 2021. THE SAI IS AVAILABLE UPON REQUEST AT NO CHARGE BY CALLING THE FUND AT (800) 846-7526.
Section 4
|
How You Can Buy and Sell Shares
What Share Classes We Offer
Each Fund offers you a choice of three different classes in which to invest. The main differences between each Class are sales charges and ongoing fees. Each share class in a Fund represents interests in the same portfolio of investments in that Fund. When deciding which Class of shares to purchase, you should consider your investment goals, present and future amounts you may invest in the Funds, and the length of time you intend to hold your shares. This prospectus offers Class A and C shares only. Class I shares are offered via a different Prospectus. For more information regarding the purchase of shares, contact the Trust at (800) 846-7526.
Class A shares are offered at their public offering price, which is net asset value per Class A share plus the applicable sales charge. The sales charge varies, depending on which Fund you choose and how much you invest. There are no sales charges on reinvested distributions. For all Funds except the Fixed Income Fund and High Yield Bond Fund, the following sales charges(1) apply:
|
|
|
|
|
|
|
Amount Invested |
|
|
|
|
|
Dealer Concession as a
Percentage of Offering Price |
| |
|
|
|
|
|
|
| |
|
5.50% |
|
5.82% |
|
5.00% |
| |
|
4.50% |
|
4.71% |
|
4.00% |
| |
|
3.50% |
|
3.63% |
|
3.00% |
| |
|
2.50% |
|
2.56% |
|
2.00% |
| |
|
1.50% |
|
1.52% |
|
1.00% |
| |
|
0.00% |
|
0.00% |
|
0.00% |
The following sales charges(1) apply to the Fixed Income Fund and High Yield Bond Fund:
|
|
|
|
|
|
|
Amount Invested |
|
|
|
As a % of Amount
Invested |
|
Dealer Concession as a
Percentage of Offering Price |
| |
|
|
|
|
|
|
| |
|
4.50% |
|
4.71% |
|
4.00% |
| |
|
3.75% |
|
3.90% |
|
3.25% |
| |
|
2.75% |
|
2.83% |
|
2.25% |
| |
|
2.00% |
|
2.56% |
|
1.50% |
| |
|
1.25% |
|
1.27% |
|
0.75% |
| |
|
1.00% |
|
1.01% |
|
0.50% |
| |
|
0.00% |
|
0.00% |
|
0.00% |
(1) |
There are no sales charges on exchanges of Class A shares of a Timothy Plan Fund for Class A shares of any other Timothy Plan Fund. |
(2) |
The Trust’s Distributor, Timothy Partners, Ltd., will pay a finder’s fee of 1% of the proceeds invested to brokers that purchase shares of the Funds in amounts from $1 million to $2 million, 0.75% on the next $1 million, 0.50% on the next $2 million, and 0.25% on all amounts in excess of $5 million. In such cases, those purchases will be subject to a contingent deferred sales charge of 1% for 18 months after the date of purchase. |
(3) |
The Trust’s Distributor, Timothy Partners, Ltd., will pay a finders’ fee of 0.50% of the proceeds invested to brokers that purchase shares of the Funds in amounts from $1 million to $4 million, and 0.25% on all amounts in excess of $4 million. In such cases, those purchases will be subject to a contingent deferred sales charge of 1% for 18 months after the date of purchase. |
The Trust’s distributor will pay the appropriate dealer concession to those selected dealers who have entered into an agreement with the distributor to sell shares of the Funds. The dealer’s concession may be changed from time to time. The distributor may from time to time offer incentive compensation to dealers who sell shares of the Funds subject to sales charges, allowing such dealers to retain an additional portion of the sales load. A dealer who receives 90% or more of the sales load may be deemed to be an “underwriter” under the Securities Act of 1933, as amended.
Class C shares are sold at net asset value without an initial sales charge. This means that 100% of your initial investment is placed into shares of the Fund of your choice. However, Class C shares of the Traditional Funds pay an annual shareholder servicing fee of 0.25% of average daily net assets and an additional 12b-1 distribution fee of 0.75% per annum of average daily net assets. Class C shares of the Asset Allocation Funds pay an annual 12b-1 distribution fee of 0.75% of average daily net assets. Class C shares of the Asset Allocation Funds also indirectly incur an additional shareholder servicing fee of 0.25% per annum of average daily net assets resulting from the underlying Traditional Funds in which the Asset Allocation Funds invest. In order to recover commissions paid to dealers on investments in Class C shares, you will be charged a contingent deferred sales charge (“CDSC”) of 1.00% of up to the total value of your redemption if you redeem your shares within thirteen months from the date of purchase. No CDSC is charged on reinvested dividends or capital gains, amounts purchased more than thirteen months prior to the redemption, increases in the value of the shares owned, on the first redemption in an amount of ten percent (10%) or less of the initial purchase,
upon the event of the death of the shareholder (unless the account is held in joint name and the survivor liquidates the shares) or shares placed in qualified plans employing a third party administrator, verified disability of the shareholder, and/or required minimum distribution (RMD).
Except as otherwise noted elsewhere in this Prospectus, Class C Shares will automatically convert to Class A Shares in the month following the 7th anniversary of the original purchase date of the Class C Shares.
How To Reduce Your Sales Charge
EXEMPTIONS FROM SALES CHARGES
Accounts that purchased Class A shares on or before September 22, 1997 are not subject to sales charges in those original accounts on any future purchases of Class A shares of any Timothy Fund, including exchanges. The exemption for these accounts applies only so long as the original account is not altered, amended, transferred, conveyed or closed.
The Trust will also waive sales charges on purchases of Class A shares of any Timothy Fund by:
|
1. |
fee-based registered investment advisors for their clients, |
|
2. |
broker/dealers with wrap fee accounts, |
|
3. |
registered investment advisors, and registered representatives and employees of broker/dealers that are members of the Master Selling Group for their own accounts, or family members of their household, |
|
4. |
trustees, directors, officers, agents, employees, and employee-related accounts of the Trust or any entity which provides services to the Timothy Plan pursuant to a written agreement for such services approved by the Board, |
|
5. |
financial intermediaries who have entered into an agreement with the Fund’s distributor to offer shares to self-directed investment brokerage accounts that may or may not charge a transaction fee to its customers. |
The Trust may also, in its sole discretion, waive sales charges on purchases of Class A shares:
|
1. |
by churches purchasing directly from the Fund(s) for their own accounts, |
|
2. |
by religious-based charitable organizations and foundations purchasing directly from the Fund(s) for themselves, for an organization’s retirement plan that places either (i) 200 or more participants or (ii) $300,000 or more of combined participant initial assets into the Funds (the Trust, in its sole discretion, may lower these minimums), |
|
3. |
by shareholders of Timothy Plan Funds who have liquidated shares and are repurchasing shares in any Timothy Plan Fund within 90 days of the liquidation, |
|
4. |
under circumstances in which the waiving of such charges are deemed by the Trust to be in the best interests of the Trust and its shareholders. |
For purchasers that qualify for sales load waivers, Class A shares will be purchased at net asset value.
You may qualify for a reduced sales charge by aggregating the higher of the original purchase or the most recent net asset values of all the load shares you and your related accounts previously purchased and currently hold in any Fund with the dollar amount of shares to be purchased. For example, if you and your related accounts already owned Class A or Class C shares in one or more of the Funds with aggregate purchases or current value of $950,000 at the close of business on the day your order to purchase is received, and you decided to purchase an additional $60,000 of Class A shares of any load Fund, there would be no sales charge on that purchase because with the additional purchase, you will have accumulated more than $1,000,000 in all load Funds of the Trust. Related accounts include and are limited to accounts established by or for you, your parents, in-laws, spouse, children, or grandchildren, including trust, beneficiary and grantor accounts. Related accounts also include participants in their individual employer-sponsored retirement programs. It may be necessary to notify the Fund of related accounts providing the account numbers of the related accounts, or the name of the retirement plan if applicable, to be certain you receive the appropriate break point discount. To ensure the charges assessed against your account are at the appropriate breakpoint level, you should retain any records necessary to substantiate historical costs because the Fund, its transfer agent, and financial intermediaries may not maintain this information.
You may request reinstatement (the repurchase of Fund shares after having liquidated them earlier) at any time after the liquidation of Class A Fund shares, but only if the proceeds of the liquidation have been invested for the entire period in the Timothy Plan money market fund. Reinstatements are at NAV up to the dollar amount liquidated. Reinstatement purchases are available for any Fund repurchased, regardless of which Fund was liquidated. Reinstatement purchases may be affected for the same or any related account.
You can immediately qualify for a reduced or eliminated sales charge by signing a non-binding letter of intent stating your intention to buy an amount of shares in the Fund(s) during the next thirteen (13) months sufficient to qualify for the reduction or elimination. Your letter will not reduce charges assessed on purchases made more than 90 days prior to the letter, however, those purchases will aggregate with future purchases. During the term of your letter of intent, the transfer agent will hold in escrow shares representing the highest applicable sales load for the Fund(s) in which you have purchased shares, each time you make a purchase. Any shares you redeem during that period will count against your commitment. If, by the end of your commitment term, you have purchased all the shares you committed to purchase, the escrowed shares will be released to you. If you have not purchased the full amount of your commitment, your escrowed shares will be redeemed in an amount equal to the sales charge that would apply if you had purchased the actual amount in your account(s) all at once. Any escrowed shares not needed to satisfy that charge would be released to you.
OPENING AND ADDING TO YOUR ACCOUNT
You can invest directly in the Funds by mail, by wire transfer, or through broker-dealers or other financial organizations. Simply choose the one that is most convenient for you. You may also invest in the Funds through an automatic payment plan. Any questions you may have can be answered by calling (800) 662-0201.
Payments for Fund shares must be in U.S. dollars, and in order to avoid fees and delays, should be drawn on a U.S. bank. Please remember that the Trust reserves the right to reject any purchase order for Fund shares. Timothy Plan accepts personal checks made payable to the Timothy Plan.
Unless pre-authorized by the Funds at the Funds’ sole discretion, the Timothy Plan will not accept third party checks. The minimum initial investment amount for the Fund classes offered by this Prospectus is set forth below:
|
|
|
|
|
Type of Investment Account |
|
|
|
|
Regular Accounts |
|
$1,000 |
|
None |
Qualified Retirement Plans and Coverdell |
|
None |
|
None |
Automatic Investment Accounts |
|
$50 |
|
$50/month |
Broker Wrap-Fee Accounts |
|
None |
|
None |
TO OPEN AN ACCOUNT BY MAIL
To make your initial investment in a Fund, simply complete the Account Registration Form included with this Prospectus, make a check payable to the Fund of your choice, and mail the Form and check to:
c/o Gemini Fund Services, LLC
To make subsequent purchases, simply make a check payable to the Fund of your choice and mail the check to the above-mentioned address. Be sure to note your account number on the check.
Your purchase order, if accompanied by payment, will be processed upon receipt by Gemini Fund Services, LLC, each Funds’ transfer agent (the “Transfer Agent”). If the Transfer Agent receives your order and payment by the close of regular trading on the NYSE (currently 4:00 p.m. Eastern time), your shares will be purchased at the applicable Fund’s public offering price calculated at the close of regular trading on that day. Otherwise, your shares will be purchased at the public offering price determined as of the close of regular trading on the next business day. When you make your initial purchase of Fund shares, be sure to indicate which Class of shares you wish to purchase. If you do not select a share class, Class A shares will be purchased for you. For subsequent purchases, additional shares of your currently owned share class will be purchased unless you indicate otherwise on your purchase order.
PURCHASING SHARES BY WIRE TRANSFER
To make an initial purchase of shares by wire transfer, you need to take the following steps:
|
1. |
Fill out and mail or fax (402-963-9094), or complete an electronic Account Registration Form, to the Transfer Agent. |
|
2. |
Call (800) 662-0201 to inform us that a wire is being sent. |
|
3. |
Obtain an account number from the Transfer Agent. |
|
4. |
Ask your bank to wire funds to the account of: |
|
|
|
First National Bank of Omaha |
| |
|
104000016 |
| |
|
The Timothy Plan |
| |
|
110333337 |
| |
|
(Your Name and Account #) |
Include your name(s), address and taxpayer identification number or Social Security number on the wire transfer instructions. The wire should state that you are opening a new Fund account.
As a convenience for investors, the Trust allows investors to fax an Account Registration Form to the Transfer Agent or complete an electronically signed application. If you elect to fax your form to the Transfer Agent, you must also mail the original to the Transfer Agent for the Trust’s permanent files.
To make subsequent purchases by wire, ask your bank to wire funds using the instructions listed above, and be sure to include your account number on the wire transfer instructions.
If you purchase Fund shares by wire, you must complete and file an Account Registration Form with the Transfer Agent before any of the shares purchased can be redeemed. Either fill out and mail the Form included with this Prospectus or call the Transfer Agent and they will send you an application.
You should contact your bank (which will need to be a commercial bank that is a member of the Federal Reserve System) for information on sending funds by wire, including any charges that your bank may make for these services.
PURCHASES THROUGH FINANCIAL SERVICE ORGANIZATIONS
You may purchase shares of the Funds through participating brokers, dealers, and other financial professionals. Simply call your investment professional to make your purchase. If you are a client of a securities broker or other financial organization, such organizations may charge a separate fee for administrative services, ticket fees, redemption fees, and other fees in connection with investments in Fund shares and may impose account minimums and other requirements. These fees and requirements would be in addition to those imposed by the applicable Fund. If you are investing through a securities broker or other financial organization, please refer to its program materials for any additional special provisions or conditions that may be different from those described in this Prospectus (for example, some or all of the services and privileges described may not be available to you). Securities brokers and other financial organizations have the responsibility of transmitting purchase orders and funds and of crediting their customers’ accounts following redemptions, in a timely manner in accordance with their customer agreements and this Prospectus.
PURCHASING SHARES BY AUTOMATIC INVESTMENT PLAN
You may purchase shares of the Funds through an Automatic Investment Plan (the “AIP”). The AIP provides a convenient way for you to have money deducted directly from your checking, savings, or other accounts for investment in shares of the Fund. You can take advantage of the AIP by filling out the AIP application, included with this Prospectus. You may only select this option if you have an account maintained at a domestic financial institution which is an Automated Clearing House member for automatic withdrawals under the AIP. The Trust may alter, modify, amend or terminate the AIP at any time, and will notify you at least 30 days in advance if it does so. For more information, call the Transfer Agent at (800) 662-0201.
Retirement plans may provide you with a method of investing for your retirement by allowing you to exclude from your taxable income, subject to certain limitations, the initial and subsequent investments in your plan and also allowing such investments to grow without the burden of current income tax until moneys are withdrawn from the plan. Contact your investment professional or call the Trust at (800) TIM-PLAN ((800) 846-7526) to receive information concerning your options.
OTHER PURCHASE INFORMATION
Federal regulations require that you provide a certified taxpayer identification number whenever you open or reopen an account. Congress has mandated that if any shareholder fails to provide and certify to the accuracy of the shareholder’s social security number or other taxpayer identification number, a company will be required to withhold a percentage, of all dividends, distributions and payments, including redemption proceeds, to such shareholder as a backup withholding procedure.
For economy and convenience, share certificates will not be issued.
The Timothy Plan wants you to be kept current regarding the status of your account in our Fund(s). To assist you, the following statements and reports will be sent to you, or at your election made available to you on a secure website:
After every transaction that affects your account balance or your account registration.
Semi-annually. To reduce Fund expenses, only one copy of the Fund report will be mailed to each taxpayer identification number even if you have more than one account in the Fund. Unless requested to the contrary, the Annual and Semi-Annual Reports will be householded, which means that only one Report will be sent to an address in which multiple investors reside or declare as their address of record.
The Funds reserve the right to reject applications for shares under circumstances or in amounts considered disadvantageous to shareholders. At the discretion of the Fund, applications may not be accepted unless they are accompanied by payment in U.S. funds. If required, payment must be made by wire transfer, check, or money order drawn on a U.S. bank, savings & loan, or credit union. The custodian will charge a $20.00 fee against your account, in addition to any loss sustained by a Fund, for any payment check returned to the custodian for insufficient funds.
If you place an order for Fund shares through a securities broker, and you place your order in good order before 4:00 p.m. Eastern Time on any business day in accordance with their procedures, your purchase will be processed at the public offering price calculated at 4:00 p.m. on that day, if the securities broker then transmits your order to the Transfer Agent before the end of its business day (which is usually 5:00 p.m. Eastern Time). The securities broker must send to the Transfer Agent immediately available funds in the amount of the purchase price within three business days for the order.
Information about how to purchase shares and possible tax consequences resulting from sales and exchanges of shares are also available online at
www.timothyplan.com
.
You may sell (redeem) your shares at any time, however, proceeds may not be available to you until the check or payment received for investment has cleared, which may take up to seven days. You may request the sale of your shares either by mail, by telephone or by wire.
Redemption requests should be mailed via U.S. mail or overnight delivery to:
c/o Gemini Fund Services, LLC
4221 N. 203rd St, Suite 100
The selling price for No-Load and Class A shares being redeemed will be the applicable Fund’s per share net asset value next calculated after receipt of all required documents in “good order.” The selling price for Class C shares being redeemed will be the Fund’s per share net asset value next calculated after receipt of all required documents in “good order,” less any applicable CDSC. Payment of redemption proceeds will be made no later than the fifth business day after the valuation date unless otherwise expressly agreed by the parties at the time of the transaction.
“Good order” means that the request must include:
|
2. |
The number of shares to be sold (redeemed) or the dollar value of the amount to be redeemed. |
|
3. |
The signatures of all account owners exactly as they are registered on the account. |
|
4. |
Any required signature guarantees. |
|
5. |
Any supporting legal documentation that is required in the case of estates, trusts, corporations or partnerships and certain other types of accounts. |
If you are not certain of the requirements for a redemption, please call customer service at (800) 662-0201. Redemptions specifying a certain date or share price cannot be accepted and will be returned. You will be mailed the proceeds on or before the fifth business day following the redemption. However, payment for redemption made against shares purchased by check will be made only after the check has been collected, which normally may take up to fifteen calendar days. Also, when the New York Stock Exchange is closed (or when trading is restricted) for any reason other than its customary weekend or holiday closing, or under any emergency circumstances, as determined by the Securities and Exchange Commission, the Funds may suspend redemptions or postpone payment dates.
The Fund typically pays redemption proceeds from cash held by the applicable Fund, with payment sent to the redeeming shareholder’s address of record not later than the fifth business day following the day the redemption request is received in good order. If necessary, to meet the requirements of a redemption request, the applicable Fund may sell portfolio assets to the extent necessary. In the event of extreme market stress, pursuant to the Trust’s Agreement and Declaration of Trust, payment for shares redeemed may be made either in cash or in-kind, or partly in cash and partly in-kind. However, the Trust has elected, pursuant to Rule 18f-1 under the 1940 Act, to redeem its shares solely in cash up to the lesser of $250,000 or 1% of the net asset value of the Trust, during any 90-day period for any one shareholder. Payments in excess of this limit will also be made wholly in cash unless the Board believes that economic conditions exist which would make such a practice detrimental to the best interests of the Trust. Any portfolio securities paid or distributed in-kind would be valued as described in the applicable Prospectus. In the event that an in-kind distribution is made, a shareholder may incur additional expenses, such as the payment of brokerage commissions, on the sale or other disposition of the securities received from the Funds.
A signature guarantee of each account owner is generally required to redeem shares under the following circumstances, for redemptions of any size:
|
1. |
if you change the ownership on your account; |
|
2. |
when you want the redemption proceeds sent to a different address than is registered on the account; |
|
3. |
if the proceeds are to be made payable to someone other than the account’s listed owner(s); |
|
4. |
for any redemption transmitted by federal wire transfer to your bank; |
|
5. |
if a change of address request has been received by the Trust or the Transfer Agent within 30 days previous to the request for redemption: and |
|
6. |
for accounts with wire transfer privileges, if you change the designated account for transactions within 30 days previous to the request for redemption. (for joint accounts, all signatures must be guaranteed, if required as above). |
In addition, signature guarantees are generally required for redemptions of $50,000 or more from any Fund shareholder account. At the discretion of the Trust or Gemini Fund Services, LLC, you may be required to furnish additional legal documents, or alternative assurances may be accepted to insure proper authorization. A redemption will not be processed until the signature guarantee, if required, is received in “good order.”
Upon the death of a retirement account owner for accounts below $50,000, named beneficiaries of the retirement account(s), when providing documentation in good order, are not required to provide a medallion signature guarantee. For inherited retirement accounts above $50,000 the Trust may, in its sole discretion, waive a medallion signature guarantee.
Signature guarantees are designed to protect both you and the Trust from fraud. To obtain a signature guarantee, you should visit a bank, trust company, member of a national securities exchange or other broker-dealer, or other eligible guarantor institution. (Notaries public cannot provide signature guarantees.) Guarantees must be signed by an authorized person at one of these institutions and be accompanied by the words “New Technology Medallion Signature Guarantee.” Please call customer service at (800) 662-0201 if you have questions.
You may redeem your shares in the Fund(s) by calling the Transfer Agent at (800) 662-0201 if you elected to use telephone redemption on your account application when you initially purchased shares, or you subsequently completed the telephone authorization request form. Redemption proceeds must be transmitted directly to you or to your pre-designated account at a domestic bank.
Shares purchased by check for which a redemption request has been received will not be redeemed until the check or payment received for investment has cleared.
BY AUTOMATED CLEARING HOUSE (“ACH”)
You may request that the redemption proceeds be transferred to your designated bank if it is a member bank or a correspondent of a member bank of the ACH system. There is no fee charged by the Trust. ACH redemption requests must be received by the Transfer Agent before 4:00 p.m. Eastern Time to receive that day’s closing net assets value. ACH redemptions will be sent on the day following your redemption request. ACH redemption funds are normally available two days after the redemption has been processed.
REDEMPTION AT THE OPTION OF THE TRUST
If the value of the shares in your account falls to less than $1,000 due to redemptions, the Trust may notify you that, unless your account is increased to $1,000 in value, it will redeem all your shares and close the account by paying you the redemption proceeds and any dividends and distributions declared and unpaid at the date of redemption. You will have sixty days after notice to bring the account up to $1,000 before any action is taken. This minimum balance requirement does not apply to Coverdell Savings Accounts, IRAs and other tax-sheltered investment accounts. This right of redemption shall not apply if the value of your account drops below $1,000 as the result of market action. The Trust reserves this right because of the expense to the Fund of maintaining very small accounts.
Dividends, Distributions and Taxes
Dividends paid by each Fund are derived from its net investment income. Net investment income will be distributed at least annually. The Funds’ net investment income is made up of dividends received from the stocks it holds, as well as interest accrued and paid on any other obligations that might be held in the Fund’s portfolio.
Each Fund realizes capital gains when it sells a security for more than it paid for it. A Fund may make distributions of its net realized capital gains (after any reductions for capital loss carry forwards), generally, once a year.
Unless you elect to have your distributions paid in cash, your distributions will be reinvested in additional shares of the applicable Fund. You may change the manner in which your dividends are paid at any time by writing to The Timothy Plan, c/o Gemini Fund Services, LLC, PO Box 541150 Omaha, NE 68154.
The Funds intend to qualify and maintain their qualification as a “regulated investment company” under the Internal Revenue Code (the “Code”), meaning that to the extent a Fund’s earnings are passed on to shareholders as required by the Code, the Fund itself is not required to pay federal income taxes on the earnings. Accordingly, the Fund will pay dividends and make such distributions as are necessary to maintain its qualification as a regulated investment company under the Code.
Before you purchase shares of any Fund, you should consider the effect of both dividends and capital gain distributions that are expected to be declared or that have been declared but not yet paid. When the Fund makes these payments, its share price will be reduced by the amount of the payment, so that you will in effect have paid full price for the shares and then received a portion of your price back as a taxable dividend distribution.
The Funds’ distributions, whether received in cash or reinvested in additional shares of the Fund, may be subject to federal income tax. The Trust will notify you annually as to the tax status of dividend and capital gains distributions paid by the Funds. Such dividends and capital gains may also be subject to state and local taxes.
Exchanges of Fund shares for shares of another Fund will be treated as a sale of the Fund’s shares, and any gain on the transaction may be subject to federal income tax. Because your state and local taxes may be different than the federal taxes described above, you should see your tax advisor regarding these taxes. The tax considerations described in this section do not apply to tax-deferred accounts or other non-taxable entities.
The net asset value (“NAV”) and public offering price, as applicable, of each class of the shares of a Fund is determined at the close of trading (which is normally 4:00 p.m., Eastern Time) on each day the New York Stock Exchange (“NYSE”) is open for business. In the event that the NYSE closes early, the NAV will be determined as of the time of closing. Shares of each Class of the Funds are offered at the NAV and public offering price, as applicable. The public offering price is a Classes’ next calculated NAV, plus the applicable sales charge, if any. The NAV per share of each Class, as applicable, is calculated by adding the value of each Fund’s investments, cash and other assets, subtracting liabilities of the Class, and then dividing the result by the number of shares of the Class outstanding. Each Fund generally determines the total value of each Class of its shares by using market prices for the securities comprising its portfolio. Securities for which quotations are not available and any other assets are valued at fair market value as determined in good faith by the Fund’s Investment Manager, in conformity with guidelines adopted by and subject to the review and supervision of the Board.
The Board has delegated to the Advisor and/or Investment Managers, under the oversight of the Boards’ Pricing Committee, responsibility for determining the value of Fund portfolio securities under certain circumstances. Under such circumstances and under the Pricing Committee’s oversight, the Advisor or Investment Manager will use its best efforts to arrive at the fair value of a security held by the Fund under all reasonably ascertainable facts and circumstances. The Advisor must prepare a report for the Board not less than quarterly containing a complete listing of any securities for which fair value pricing was employed and detailing the specific reasons for such fair value pricing. The Trust has adopted written policies and procedures to guide the Pricing Committee, Advisor and Investment Managers with respect to the circumstances under which, and the methods to be used, in fair valuing securities.
Except for the Israel Common Values and the International Fund which has a higher probability of Fair Value Pricing, the Funds generally invest the vast majority of their assets in frequently traded exchange listed securities of domestic issuers with relatively liquid markets and calculate their NAV as of the time those exchanges close. Except for the Israel Common Values and the International Fund, the Funds typically do not invest in securities on foreign exchanges or in illiquid or restricted securities. Accordingly, except for those Funds, there may be very limited circumstances under which any Fund would hold securities that would need to be fair value priced.
Examples of when it would be likely that a Fund security would require fair value pricing include but are not limited to: if the exchange on which a portfolio security traded were to close early; if trading in a particular security were to be halted on an exchange and did not resume trading prior to
calculation of NAV; if a significant event that materially affected the value of a security were to occur after the securities’ exchange had closed but before the Fund’s NAV had been calculated; and if a security that had a significant exposure to foreign operations was subject to a material event or occurrence in a foreign jurisdiction in which the company had significant operations; or in the event that the Fixed Income or High Yield Bond Funds were to invest in certain types of bonds that had limited marketability, such as “church bonds”.
When a security is fair value priced, it means that the Advisor or Investment Manager is calculating the value of that security on a day and under circumstances where reliable pricing information from normal sources is not available or is otherwise limited. Accordingly, there is always the possibility that the Advisor’s or Investment Manager’s calculations concerning security value could be wrong, and as a result, the Fund’s NAV on that day could be higher or lower, depending on how the security was valued, than would otherwise be the case.
When a security is Evaluated Priced, it means the Advisor and Investment Manager are relying on a nationally recognized company that provides daily pricing of international and domestic securities. Accordingly, there is the possibility that the pricing firm’s calculations or pricing techniques could be wrong, and as a result the Fund’s NAV on that day could be higher or lower, depending on how the security was valued, than would otherwise be the case.
For the protection of its shareholders, the Board has adopted a policy prohibiting frequent purchases and sales of Fund shares. The Board extended the policy to be inclusive of all accounts including accounts transacted by registered investment advisors, broker/dealer representatives, transfer agents, third party administrators and insurance companies, and further includes omnibus accounts. The Funds will reject any transactions the Funds believe in good faith constitute frequent trading, including market timing and late transactions, except that the Fund does not impose restrictions on exchanges from the Fixed Income Fund to any other Fund, nor does it restrict immediate sales of shares upon the event of the death or disability of the shareholder. For the purpose cited here, the Fund has determined that purchase and sale transactions in excess of three times per calendar quarter in a single or related accounts imply frequent trading, and may result in the appropriate actions being taken which may include the restricting of the account and notification to the proper authorities.
Upon the discovery of trades transacted or an attempt to be transacted in violation of Rule 10b (Manipulative and Deceptive Contrivances), or Rule 22c-1 (Pricing), such activity shall be immediately reported to the appropriate regulatory agencies and authorities, and the Fund shall fully comply with such agencies during any ensuing investigation.
Distribution and Service Plans
The Trust has adopted distribution and shareholder servicing plans, pursuant to Rule 12b-1 under the Investment Company Act of 1940, as amended (the “1940 Act”), for Class A and Class C Shares of the Funds (the “Distribution Plans”). The Distribution Plans provide for fees to be deducted from the average net assets of the Funds in order to compensate TPL or others for expenses relating to the promotion and sale of shares of the Funds and the servicing of shareholder accounts.
Under the Class A Distribution Plan, the Class A shares of the Funds compensate TPL for distribution and service fees at an annual rate of 0.25% (all of which may be classified as a service fee), payable on a monthly basis, of the Funds average daily net assets attributable to Class A shares.
Amounts paid under the Class A Distribution Plan are paid to TPL and others to compensate them for services provided and expenses incurred in the distribution of Class A shares, including the paying of commissions for sales of Class A shares.
Under the Class C Distribution Plan, the Class C shares of the Funds compensates TPL for distribution and service fees at an annual rate of 1.00% (0.25% of which is a service fee), payable on a monthly basis, of the Fund’s average daily net assets attributable to Class C shares of the Traditional Funds and 0.75% of the average daily net assets attributable to Class C shares of the Asset Allocation Funds. Amounts paid under the Class C Distribution Plan are paid to TPL and others to compensate them for services provided and expenses incurred in the distribution of Class C shares, including the paying of commissions for sales of Class C shares. The Class C Distribution Plan is designed to allow investors to purchase Class C shares without incurring a front-end sales load and to permit the distributor to compensate authorized dealers for selling such shares. Accordingly, the Class C Distribution Plan combined with the CDSC for Class C shares is to provide for the financing of the distribution of Class C shares.
Because 12b-1 fees are paid out of the Fund’s assets on an on-going basis, over time these fees will increase the cost of your investment and may cost you more than paying other types of sales charges.
Timothy Partners Ltd. acts as principal underwriter for the Trust. The purpose of acting as an underwriter is to facilitate the notice filing of the Funds’ shares under state securities laws and to assist in the sale of shares. TPL also acts as Investment Advisor to the Trust. TPL is not compensated for serving as underwriter of the Trust.
The Board has approved Codes of Ethics for the Funds, the Portfolios, Investment Advisor, Sub-Advisors, and Principal Underwriter. These Codes govern the personal activities of persons who may have knowledge of the investment activities of the Funds and/or Portfolios, require that they file regular reports concerning their personal securities transactions, and prohibit activities that might result in harm to the Funds and/or Portfolios. The Board is responsible for overseeing the implementation of the Codes. The Trust has filed copies of each Code with the Securities and Exchange Commission. Copies of the Codes of Ethics may be reviewed and copied at the SEC’s Public Reference Room in Washington, DC. The Codes are also available on the SEC’s EDGAR database at the SEC’s web site (www.sec.gov). Copies of this information can be obtained after paying a duplication fee, by electronic request (publicinvest@sec.gov) or by writing the SEC’s Public Relations Section, Washington DC 20549-0102. The Board also has approved anti-money laundering procedures which it believes are reasonably designed to detect and prevent attempts to utilize the Portfolios for illegal purposes. Day to day responsibility for the monitoring of such activities has been delegated to the Transfer Agent, subject to Board oversight and periodic independent audit.
Privacy Policy and Customer Identification Program
The Board has approved procedures designed to prevent and detect attempts to launder money as required under the USA PATRIOT Act. The day-to-day responsibility for monitoring and reporting any such activities has been delegated to the transfer agent, subject to the oversight and supervision of the Board.
|
|
|
|
|
|
|
WHAT DOES THE TIMOTHY PLAN FAMILY OF FUNDS (“TIMOTHY PLAN”) DO WITH YOUR PERSONAL INFORMATION? |
|
|
|
|
|
Financial companies choose how they share your personal information. Federal law gives consumers the right to limit some, but not all information sharing. Federal law also requires us to tell you how we collect, share, and protect your personal information. Please read this Notice carefully to understand what we do. |
|
|
|
|
|
The types of information we collect and share depend on the product or service you have with us. This information can include your: ◾ Checking Account History ◾ Wire Transfer Instructions When you are no longer our customer, we continue to share your information as described in this Notice. |
|
|
|
|
|
All financial companies need to share your personal information to run their everyday business. In the section below, we list the reasons financial companies can share their customers’ personal information; the reasons Timothy Plan chooses to share; and whether you can limit this sharing. |
|
|
|
|
|
| |
|
|
Reasons we can share your personal information. |
|
|
|
Can you limit this sharing? |
For our everyday business purposes- Such as to process your transactions, maintain your account(s), respond to court orders and legal investigations, or report to credit bureaus. |
|
Yes |
|
No |
For our marketing purposes- to offer our products and services to you. |
|
Yes |
|
No |
For joint marketing with other financial companies |
|
No |
|
We don’t share |
For our affiliates’ everyday business purposes- information about your transactions and experiences. |
|
Yes |
|
No |
For our affiliates’ everyday business purposes- information about your creditworthiness |
|
No |
|
We don’t share |
For non-affiliates to market to you |
|
No |
|
We don’t share |
|
|
|
|
|
Who is providing this Notice? |
|
The Timothy Plan Family of Funds Timothy Partners, Ltd, investment advisor to Timothy Plan |
|
|
|
|
|
How does Timothy Plan protect your personal information? |
|
To protect your personal information from unauthorized access and use, we use security measures that comply with federal law. These measures include computer safeguards and secured files and buildings. Our service providers are held accountable for adhering to strict policies and procedures to prevent any misuse or your nonpublic personal information. |
How does Timothy Plan collect your personal information? |
|
We collect your personal information, for example, when you: ◾ Provide account information ◾ Give us your contact information ◾ Make deposits or withdrawals from your account ◾ Tell us where to send the money ◾ Tell us who receives the money ◾ Show your government-issued ID ◾ Show your drivers’ license We also collect your personal information from other companies. |
Why can’t I limit all sharing? |
|
Federal law gives you the right to limit only: ◾ Sharing for affiliates’ everyday business purposes – information about your creditworthiness. ◾ Affiliates from using your information to market to you ◾ Sharing for non-affiliates to market to you State laws and individual companies may give you additional rights to limit sharing. |
|
|
|
|
|
|
|
Companies related by common ownership or control. They can be financial and non-financial companies. ◾ Timothy Partners, Ltd, is an affiliate of Timothy Plan. |
|
|
Companies not related by common ownership or control. They can be financial and non-financial companies. ◾ Timothy Plan does not share with non-affiliates so they can market to you. |
|
|
A formal agreement between non-affiliated financial companies that together market financial products to you. ◾ Timothy Plan does not jointly market. |
The table below sets forth data for one share of capital stock outstanding throughout each period represented.
The Financial Highlights Table is intended to help you understand the Fund’s financial performance for the past five years (or, if shorter, the periods since the Fund’s inception). Certain information reflects financial results for a single Fund share. The total returns in the table represent the rate that an investor would have earned (or lost) on an investment in the Fund (assuming reinvestment of all dividends and distributions). The information contained in the tables for the years ended September 30, 2016, 2017, 2018, 2019 and 2020 have been audited by Cohen & Company, Ltd., Independent Registered Public Accounting Firm, whose report, along with the Fund’s financial statements, are included in the annual report, which is available upon request.
|
|
|
|
|
|
|
|
|
|
|
|
|
|
|
|
|
|
|
|
|
| |
|
For the Year
ended
September 30,
2020 |
|
|
For the Year
ended
September 30,
2019 |
|
|
For the Year
ended
September 30,
2018 |
|
|
For the Year
ended
September 30,
2017 |
|
|
For the Year
ended
September 30,
2016 |
|
|
|
|
|
|
|
|
|
|
|
|
|
|
|
|
|
|
|
|
|
|
|
|
|
|
|
|
Net asset value, beginning of year |
|
$ |
7.87 |
|
|
$ |
9.27 |
|
|
$ |
8.10 |
|
|
$ |
6.82 |
|
|
$ |
7.98 |
|
|
|
|
|
|
|
|
|
|
|
|
|
|
|
|
|
|
|
|
|
|
|
|
|
|
|
|
INCOME (LOSS) FROM INVESTMENT OPERATIONS: |
|
|
|
|
|
|
|
|
|
|
|
|
|
|
|
|
|
|
|
|
| |
|
|
(0.09 |
) |
|
|
(0.07 |
) |
|
|
(0.09 |
) |
|
|
(0.08 |
) |
|
|
(0.04 |
) |
Net realized and unrealized gain (loss) on investments |
|
|
2.14 |
|
|
|
(0.81 |
) |
|
|
1.26 |
|
|
|
1.36 |
|
|
|
(0.02 |
) (B) |
|
|
|
|
|
|
|
|
|
|
|
|
|
|
|
|
|
|
|
|
|
Total from investment operations |
|
|
2.05 |
|
|
|
(0.88 |
) |
|
|
1.17 |
|
|
|
1.28 |
|
|
|
(0.06 |
) |
|
|
|
|
|
|
|
|
|
|
|
|
|
|
|
|
|
|
|
|
|
|
|
|
|
|
|
| |
|
|
|
|
|
|
|
|
|
|
|
|
|
|
|
|
|
|
|
|
From net realized gains on investments |
|
|
- |
|
|
|
(0.52 |
) |
|
|
- |
|
|
|
- |
|
|
|
(1.10 |
) |
| |
|
|
- |
|
|
|
(0.00 |
) * |
|
|
- |
|
|
|
- |
|
|
|
- |
|
|
|
|
|
|
|
|
|
|
|
|
|
|
|
|
|
|
|
|
|
|
| |
|
|
- |
|
|
|
(0.52 |
) |
|
|
- |
|
|
|
- |
|
|
|
(1.10 |
) |
|
|
|
|
|
|
|
|
|
|
|
|
|
|
|
|
|
|
|
|
|
|
|
|
|
|
|
Net asset value, end of year |
|
$ |
9.92 |
|
|
$ |
7.87 |
|
|
$ |
9.27 |
|
|
$ |
8.10 |
|
|
$ |
6.82 |
|
|
|
|
|
|
|
|
|
|
|
|
|
|
|
|
|
|
|
|
|
|
|
|
|
|
|
|
| |
|
|
26.05% |
|
|
|
(8.72)% |
|
|
|
14.44% |
|
|
|
18.77% |
|
|
|
(1.03)% |
|
|
|
|
|
|
|
RATIOS/SUPPLEMENTAL DATA: |
|
|
|
|
|
|
|
|
|
|
|
|
|
|
|
|
|
|
|
|
Net assets, end of year (in 000’s) |
|
$ |
30,316 |
|
|
$ |
21,802 |
|
|
$ |
25,926 |
|
|
$ |
22,549 |
|
|
$ |
21,209 |
|
Ratios to average net assets |
|
|
|
|
|
|
|
|
|
|
|
|
|
|
|
|
|
|
|
|
Expenses, before waiver and reimbursement |
|
|
1.71% |
|
|
|
1.64% |
|
|
|
1.73% |
|
|
|
1.69% |
|
|
|
1.69% |
|
Expenses, net waiver and reimbursement (E) |
|
|
1.61% |
|
|
|
1.56% |
|
|
|
1.63% |
|
|
|
1.59% |
|
|
|
1.59% |
|
Net investment loss, before waiver and reimbursement |
|
|
(1.19)% |
|
|
|
(0.91)% |
|
|
|
(1.16)% |
|
|
|
(1.12)% |
|
|
|
(0.73)% |
|
Net investment loss, net waiver and reimbursement (E) |
|
|
(1.09)% |
|
|
|
(0.82)% |
|
|
|
(1.06)% |
|
|
|
(1.02)% |
|
|
|
(0.63)% |
|
| |
|
|
96% |
|
|
|
77% |
|
|
|
85% |
|
|
|
151% |
|
|
|
124% |
|
*Amount is less than $0.005 per share.
|
(A) |
|
Per share amounts calculated using average shares method, which more appropriately presents the per share data for the period. |
|
(B) |
|
Realized and unrealized gains per share in this caption are balancing amounts necessary to reconcile the change in net asset value per share for the period, and may not reconcile with the aggregate gains and losses in the Statements of Operations due to share transactions for the period. |
|
(C) |
|
Total return calculation does not reflect sales load. Total return represents aggregate total return based on Net Asset Value. |
|
(D) |
|
Total return in the above table represents the rate that the investor would have earned or lost on an investment in the Fund assuming reinvestment of dividends. Total return would have been higher or lower if certain expenses had not been reimbursed, waived or recouped. |
|
(E) |
|
This expense decrease from the voluntary waiver is reflected in both the net expense and the net investment income ratios shown. |
The table below sets forth data for one share of capital stock outstanding throughout each period represented.
The Financial Highlights Table is intended to help you understand the Fund’s financial performance for the past five years (or, if shorter, the periods since the Fund’s inception). Certain information reflects financial results for a single Fund share. The total returns in the table represent the rate that an investor would have earned (or lost) on an investment in the Fund (assuming reinvestment of all dividends and distributions). The information contained in the tables for the years ended September 30, 2016, 2017, 2018, 2019 and 2020, have been audited by Cohen & Company, Ltd., Independent Registered Public Accounting Firm, whose report, along with the Fund’s financial statements, are included in the annual report, which is available upon request.
|
|
|
|
|
|
|
|
|
|
|
|
|
|
|
|
|
|
|
|
|
| |
|
For the Year
ended
September 30,
2020 |
|
|
For the Year
ended
September 30,
2019 |
|
|
For the Year
ended
September 30,
2018 |
|
|
For the Year
ended
September 30,
2017 |
|
|
For the Year
ended
September 30,
2016 |
|
|
|
|
|
|
|
|
|
|
|
|
|
|
|
|
|
|
|
|
|
|
|
|
|
|
|
|
Net asset value, beginning of year |
|
$ |
6.34 |
|
|
$ |
7.64 |
|
|
$ |
6.73 |
|
|
$ |
5.71 |
|
|
$ |
6.90 |
|
|
|
|
|
|
|
|
|
|
|
|
|
|
|
|
|
|
|
|
|
|
|
|
|
|
|
|
INCOME (LOSS) FROM INVESTMENT OPERATIONS: |
|
|
|
|
|
|
|
|
|
|
|
|
|
|
|
|
|
|
|
|
| |
|
|
(0.12 |
) |
|
|
(0.11 |
) |
|
|
(0.13 |
) |
|
|
(0.11 |
) |
|
|
(0.08 |
) |
Net realized and unrealized gain (loss) on investments |
|
|
1.71 |
|
|
|
(0.67 |
) |
|
|
1.04 |
|
|
|
1.13 |
|
|
|
(0.01 |
) (B) |
|
|
|
|
|
|
|
|
|
|
|
|
|
|
|
|
|
|
|
|
|
Total from investment operations |
|
|
1.59 |
|
|
|
(0.78 |
) |
|
|
0.91 |
|
|
|
1.02 |
|
|
|
(0.09 |
) |
|
|
|
|
|
|
|
|
|
|
|
|
|
|
|
|
|
|
|
|
|
|
|
|
|
|
|
| |
|
|
|
|
|
|
|
|
|
|
|
|
|
|
|
|
|
|
|
|
From net realized gains on investments |
|
|
- |
|
|
|
(0.52 |
) |
|
|
- |
|
|
|
- |
|
|
|
(1.10 |
) |
| |
|
|
- |
|
|
|
(0.00 |
) * |
|
|
- |
|
|
|
- |
|
|
|
- |
|
|
|
|
|
|
|
|
|
|
|
|
|
|
|
|
|
|
|
|
|
|
| |
|
|
- |
|
|
|
(0.52 |
) |
|
|
- |
|
|
|
- |
|
|
|
(1.10 |
) |
|
|
|
|
|
|
|
|
|
|
|
|
|
|
|
|
|
|
|
|
|
|
|
|
|
|
|
Net asset value, end of year |
|
$ |
7.93 |
|
|
$ |
6.34 |
|
|
$ |
7.64 |
|
|
$ |
6.73 |
|
|
$ |
5.71 |
|
|
|
|
|
|
|
|
|
|
|
|
|
|
|
|
|
|
|
|
|
|
|
|
|
|
|
|
| |
|
|
25.08% |
|
|
|
(9.33)% |
|
|
|
13.52% |
|
|
|
17.86% |
|
|
|
(1.73)% |
|
|
|
|
|
|
|
RATIOS/SUPPLEMENTAL DATA: |
|
|
|
|
|
|
|
|
|
|
|
|
|
|
|
|
|
|
|
|
Net assets, end of year (in 000’s) |
|
$ |
2,230 |
|
|
$ |
2,433 |
|
|
$ |
4,358 |
|
|
$ |
3,584 |
|
|
$ |
3,426 |
|
Ratios to average net assets |
|
|
|
|
|
|
|
|
|
|
|
|
|
|
|
|
|
|
|
|
Expenses, before waiver and reimbursement |
|
|
2.46% |
|
|
|
2.39% |
|
|
|
2.48% |
|
|
|
2.44% |
|
|
|
2.44% |
|
Expenses, net waiver and reimbursement (E) |
|
|
2.36% |
|
|
|
2.31% |
|
|
|
2.38% |
|
|
|
2.34% |
|
|
|
2.34% |
|
Net investment loss, before waiver and reimbursement |
|
|
(1.92)% |
|
|
|
(1.73)% |
|
|
|
(1.91)% |
|
|
|
(1.88)% |
|
|
|
(1.47)% |
|
Net investment loss, net waiver and reimbursement (E) |
|
|
(1.82)% |
|
|
|
(1.64)% |
|
|
|
(1.81)% |
|
|
|
(1.78)% |
|
|
|
(1.37)% |
|
| |
|
|
96% |
|
|
|
77% |
|
|
|
85% |
|
|
|
151% |
|
|
|
124% |
|
*Amount is less than $0.005 per share.
|
(A) |
|
Per share amounts calculated using average shares method, which more appropriately presents the per share data for the period. |
|
(B) |
|
Realized and unrealized gains per share in this caption are balancing amounts necessary to reconcile the change in net asset value per share for the period, and may not reconcile with the aggregate gains and losses in the Statements of Operations due to share transactions for the period. |
|
(C) |
|
Total return calculation does not reflect redemption fee. Total return represents aggregate total return based on Net Asset Value. |
|
(D) |
|
Total return in the above table represents the rate that the investor would have earned or lost on an investment in the Fund assuming reinvestment of dividends. Total return would have been higher or lower if certain expenses had not been reimbursed, waived or recouped. |
|
(E) |
|
This expense decrease from the voluntary waiver is reflected in both the net expense and the net investment income ratios shown. |
The table below sets forth data for one share of capital stock outstanding throughout each period represented.
The Financial Highlights Table is intended to help you understand the Fund’s financial performance for the past five years (or, if shorter, the periods since the Fund’s inception). Certain information reflects financial results for a single Fund share. The total returns in the table represent the rate that an investor would have earned (or lost) on an investment in the Fund (assuming reinvestment of all dividends and distributions). The information contained in the tables for the years ended September 30, 2016, 2017, 2018, 2019 and 2020, have been audited by Cohen & Company, Ltd., Independent Registered Public Accounting Firm, whose report, along with the Fund’s financial statements, are included in the annual report, which is available upon request.
|
|
|
|
|
|
|
|
|
|
|
|
|
|
|
|
|
|
|
|
|
| |
|
For the Year
ended
September 30,
2020 |
|
|
For the Year
ended
September 30,
2019 |
|
|
For the Year
ended
September 30,
2018 |
|
|
For the Year
ended
September 30,
2017 |
|
|
For the Year
ended
September 30,
2016 |
|
|
|
|
|
|
|
|
|
|
|
|
|
|
|
|
|
|
|
|
|
|
|
|
|
|
|
|
Net asset value, beginning of year |
|
$ |
9.09 |
|
|
$ |
9.74 |
|
|
$ |
9.86 |
|
|
$ |
8.53 |
|
|
$ |
8.47 |
|
|
|
|
|
|
|
|
|
|
|
|
|
|
|
|
|
|
|
|
|
|
|
|
|
|
|
|
INCOME (LOSS) FROM INVESTMENT OPERATIONS: |
|
|
|
|
|
|
|
|
|
|
|
|
|
|
|
|
|
|
|
|
Net investment income (loss) (A) |
|
|
(0.03 |
) |
|
|
0.09 |
|
|
|
0.11 |
|
|
|
0.04 |
|
|
|
0.00 |
* |
Net realized and unrealized gain (loss) on investments |
|
|
0.94 |
|
|
|
(0.64 |
) |
|
|
(0.02 |
) |
|
|
1.38 |
|
|
|
0.15 |
|
|
|
|
|
|
|
|
|
|
|
|
|
|
|
|
|
|
|
|
|
|
Total from investment operations |
|
|
0.91 |
|
|
|
(0.55 |
) |
|
|
0.09 |
|
|
|
1.42 |
|
|
|
0.15 |
|
|
|
|
|
|
|
|
|
|
|
|
|
|
|
|
|
|
|
|
|
|
|
|
|
|
|
|
| |
|
|
|
|
|
|
|
|
|
|
|
|
|
|
|
|
|
|
|
|
From net investment income |
|
|
(0.08 |
) |
|
|
(0.10 |
) |
|
|
(0.21 |
) |
|
|
(0.09 |
) |
|
|
(0.09 |
) |
| |
|
|
0.00 |
* |
|
|
- |
|
|
|
- |
|
|
|
- |
|
|
|
- |
|
|
|
|
|
|
|
|
|
|
|
|
|
|
|
|
|
|
|
|
|
|
| |
|
|
(0.08 |
) |
|
|
(0.10 |
) |
|
|
(0.21 |
) |
|
|
(0.09 |
) |
|
|
(0.09 |
) |
|
|
|
|
|
|
|
|
|
|
|
|
|
|
|
|
|
|
|
|
|
|
|
|
|
|
|
Net asset value, end of year |
|
$ |
9.92 |
|
|
$ |
9.09 |
|
|
$ |
9.74 |
|
|
$ |
9.86 |
|
|
$ |
8.53 |
|
|
|
|
|
|
|
|
|
|
|
|
|
|
|
|
|
|
|
|
|
|
|
|
|
|
|
|
| |
|
|
10.00% |
|
|
|
(5.55)% |
|
|
|
0.91% |
|
|
|
16.78% |
|
|
|
1.85% |
|
|
|
|
|
|
|
RATIOS/SUPPLEMENTAL DATA: |
|
|
|
|
|
|
|
|
|
|
|
|
|
|
|
|
|
|
|
|
Net assets, end of year (in 000’s) |
|
$ |
48,608 |
|
|
$ |
58,397 |
|
|
$ |
70,790 |
|
|
$ |
81,153 |
|
|
$ |
70,013 |
|
Ratios to average net assets |
|
|
|
|
|
|
|
|
|
|
|
|
|
|
|
|
|
|
|
|
Expenses, before waiver and reimbursement |
|
|
1.76% |
|
|
|
1.71% |
|
|
|
1.71% |
|
|
|
1.69% |
|
|
|
1.68% |
|
Expenses, net waiver and reimbursement (D) |
|
|
1.71% |
|
|
|
1.67% |
|
|
|
1.66% |
|
|
|
1.64% |
|
|
|
1.63% |
|
Net investment income (loss) before waiver and reimbursement |
|
|
(0.38)% |
|
|
|
0.96% |
|
|
|
1.05% |
|
|
|
0.35% |
|
|
|
(0.03)% |
|
Net investment income (loss), net waiver and reimbursement (D) |
|
|
(0.33)% |
|
|
|
1.01% |
|
|
|
1.10% |
|
|
|
0.40% |
|
|
|
0.02% |
|
| |
|
|
25% |
|
|
|
27% |
|
|
|
19% |
|
|
|
42% |
|
|
|
28% |
|
*Amount is less than $0.005 per share.
|
(A) |
|
Per share amounts calculated using average shares method, which more appropriately presents the per share data for the period. |
|
(B) |
|
Total return calculation does not reflect sales load. Total return represents aggregate total return based on Net Asset Value. |
|
(C) |
|
Total return in the above table represents the rate that the investor would have earned or lost on an investment in the Fund assuming reinvestment of dividends. Total return would have been higher or lower if certain expenses had not been reimbursed, waived or recouped. |
|
(D) |
|
This expense decrease from the voluntary waiver is reflected in both the net expense and the net investment income ratios shown. |
The table below sets forth data for one share of capital stock outstanding throughout each period represented.
The Financial Highlights Table is intended to help you understand the Fund’s financial performance for the past five years (or, if shorter, the periods since the Fund’s inception). Certain information reflects financial results for a single Fund share. The total returns in the table represent the rate that an investor would have earned (or lost) on an investment in the Fund (assuming reinvestment of all dividends and distributions). The information contained in the tables for the years ended September 30, 2016, 2017, 2018, 2019 and 2020, have been audited by Cohen & Company, Ltd., Independent Registered Public Accounting Firm, whose report, along with the Fund’s financial statements, are included in the annual report, which is available upon request.
|
|
|
|
|
|
|
|
|
|
|
|
|
|
|
|
|
|
|
|
|
| |
|
For the Year
ended
September 30,
2020 |
|
|
For the Year
ended
September 30,
2019 |
|
|
For the Year
ended
September 30,
2018 |
|
|
For the Year
ended
September 30,
2017 |
|
|
For the Year
ended
September 30,
2016 |
|
|
|
|
|
|
|
|
|
|
|
|
|
|
|
|
|
|
|
|
|
|
|
|
|
|
|
|
Net asset value, beginning of year |
|
$ |
8.80 |
|
|
$ |
9.41 |
|
|
$ |
9.55 |
|
|
$ |
8.25 |
|
|
$ |
8.21 |
|
|
|
|
|
|
|
|
|
|
|
|
|
|
|
|
|
|
|
|
|
|
|
|
|
|
|
|
INCOME (LOSS) FROM INVESTMENT OPERATIONS: |
|
|
|
|
|
|
|
|
|
|
|
|
|
|
|
|
|
|
|
|
Net investment income (loss) (A) |
|
|
(0.10 |
) |
|
|
0.01 |
|
|
|
0.03 |
|
|
|
(0.03 |
) |
|
|
(0.06 |
) |
Net realized and unrealized gain (loss) on investments |
|
|
0.92 |
|
|
|
(0.61 |
) |
|
|
(0.01 |
) |
|
|
1.34 |
|
|
|
0.15 |
|
|
|
|
|
|
|
|
|
|
|
|
|
|
|
|
|
|
|
|
|
|
Total from investment operations |
|
|
0.82 |
|
|
|
(0.60 |
) |
|
|
0.02 |
|
|
|
1.31 |
|
|
|
0.09 |
|
|
|
|
|
|
|
|
|
|
|
|
|
|
|
|
|
|
|
|
|
|
|
|
|
|
|
|
| |
|
|
|
|
|
|
|
|
|
|
|
|
|
|
|
|
|
|
|
|
From net investment income |
|
|
- |
|
|
|
(0.01 |
) |
|
|
(0.16 |
) |
|
|
(0.01 |
) |
|
|
(0.05 |
) |
|
|
|
|
|
|
|
|
|
|
|
|
|
|
|
|
|
|
|
|
|
| |
|
|
- |
|
|
|
(0.01 |
) |
|
|
(0.16 |
) |
|
|
(0.01 |
) |
|
|
(0.05 |
) |
|
|
|
|
|
|
|
|
|
|
|
|
|
|
|
|
|
|
|
|
|
|
|
|
|
|
|
Net asset value, end of year |
|
$ |
9.62 |
|
|
$ |
8.80 |
|
|
$ |
9.41 |
|
|
$ |
9.55 |
|
|
$ |
8.25 |
|
|
|
|
|
|
|
|
|
|
|
|
|
|
|
|
|
|
|
|
|
|
|
|
|
|
|
|
| |
|
|
9.32% |
|
|
|
(6.31)% |
|
|
|
0.12% |
|
|
|
15.93% |
|
|
|
1.09% |
|
|
|
|
|
|
|
RATIOS/SUPPLEMENTAL DATA: |
|
|
|
|
|
|
|
|
|
|
|
|
|
|
|
|
|
|
|
|
Net assets, end of year (in 000’s) |
|
$ |
2,122 |
|
|
$ |
2,641 |
|
|
$ |
4,779 |
|
|
$ |
4,620 |
|
|
$ |
4,495 |
|
Ratios to average net assets |
|
|
|
|
|
|
|
|
|
|
|
|
|
|
|
|
|
|
|
|
Expenses, before waiver and reimbursement |
|
|
2.51% |
|
|
|
2.46% |
|
|
|
2.46% |
|
|
|
2.44% |
|
|
|
2.43% |
|
Expenses, net waiver and reimbursement (D) |
|
|
2.46% |
|
|
|
2.42% |
|
|
|
2.41% |
|
|
|
2.39% |
|
|
|
2.38% |
|
Net investment income (loss) before waiver and reimbursement |
|
|
(1.17)% |
|
|
|
0.09% |
|
|
|
0.28% |
|
|
|
(0.41)% |
|
|
|
(0.74)% |
|
Net investment income (loss), net waiver and reimbursement (D) |
|
|
(1.12)% |
|
|
|
0.12% |
|
|
|
0.33% |
|
|
|
(0.36)% |
|
|
|
(0.69)% |
|
| |
|
|
25% |
|
|
|
27% |
|
|
|
19% |
|
|
|
42% |
|
|
|
28% |
|
|
(A) |
|
Per share amounts calculated using average shares method, which more appropriately presents the per share data for the period. |
|
(B) |
|
Total return calculation does not reflect redemption fee. |
|
(C) |
|
Total return in the above table represents the rate that the investor would have earned or lost on an investment in the Fund assuming reinvestment of dividends. Total return would have been higher or lower if certain expenses had not been reimbursed, waived or recouped. |
|
(D) |
|
This expense decrease from the voluntary waiver is reflected in both the net expense and the net investment income ratios shown. |
LARGE/MID CAP GROWTH FUND
(CLASS A)
The table below sets forth data for one share of capital stock outstanding throughout each period represented.
The Financial Highlights Table is intended to help you understand the Fund’s financial performance for the past five years (or, if shorter, the periods since the Fund’s inception). Certain information reflects financial results for a single Fund share. The total returns in the table represent the rate that an investor would have earned (or lost) on an investment in the Fund (assuming reinvestment of all dividends and distributions). The information contained in the tables for the years ended September 30, 2016, 2017, 2018, 2019 and 2020, have been audited by Cohen & Company, Ltd., Independent Registered Public Accounting Firm, whose report, along with the Fund’s financial statements, are included in the annual report, which is available upon request.
|
|
|
|
|
|
|
|
|
|
|
|
|
|
|
|
|
|
|
|
|
| |
|
For the Year
ended
September 30,
2020 |
|
|
For the Year
ended
September 30,
2019 |
|
|
For the Year
ended
September 30,
2018 |
|
|
For the Year
ended
September 30,
2017 |
|
|
For the Year
ended
September 30,
2016 |
|
|
|
|
|
|
|
|
|
|
|
|
|
|
|
|
|
|
|
|
|
|
|
|
|
|
|
|
Net asset value, beginning of year |
|
$ |
8.70 |
|
|
$ |
9.34 |
|
|
$ |
8.59 |
|
|
$ |
7.46 |
|
|
$ |
7.75 |
|
|
|
|
|
|
|
|
|
|
|
|
|
|
|
|
|
|
|
|
|
|
|
|
|
|
|
|
INCOME (LOSS) FROM INVESTMENT OPERATIONS: |
|
|
|
|
|
|
|
|
|
|
|
|
|
|
|
|
|
|
|
|
| |
|
|
(0.04 |
) |
|
|
(0.03 |
) |
|
|
(0.02 |
) |
|
|
(0.01 |
) |
|
|
(0.02 |
) |
Net realized and unrealized gain (loss) on investments |
|
|
1.48 |
|
|
|
(0.19 |
) |
|
|
0.99 |
|
|
|
1.23 |
|
|
|
0.51 |
|
|
|
|
|
|
|
|
|
|
|
|
|
|
|
|
|
|
|
|
|
|
Total from investment operations |
|
|
1.44 |
|
|
|
(0.22 |
) |
|
|
0.97 |
|
|
|
1.22 |
|
|
|
0.49 |
|
|
|
|
|
|
|
|
|
|
|
|
|
|
|
|
|
|
|
|
|
|
|
|
|
|
|
|
| |
|
|
|
|
|
|
|
|
|
|
|
|
|
|
|
|
|
|
|
|
From net realized gains on investments |
|
|
(0.37 |
) |
|
|
(0.42 |
) |
|
|
(0.22 |
) |
|
|
(0.09 |
) |
|
|
(0.78 |
) |
|
|
|
|
|
|
|
|
|
|
|
|
|
|
|
|
|
|
|
|
|
| |
|
|
(0.37 |
) |
|
|
(0.42 |
) |
|
|
(0.22 |
) |
|
|
(0.09 |
) |
|
|
(0.78 |
) |
|
|
|
|
|
|
|
|
|
|
|
|
|
|
|
|
|
|
|
|
|
|
|
|
|
|
|
Net asset value, end of year |
|
$ |
9.77 |
|
|
$ |
8.70 |
|
|
$ |
9.34 |
|
|
$ |
8.59 |
|
|
$ |
7.46 |
|
|
|
|
|
|
|
|
|
|
|
|
|
|
|
|
|
|
|
|
|
|
|
|
|
|
|
|
| |
|
|
16.93% |
|
|
|
(1.48)% |
|
|
|
11.49% |
|
|
|
16.53% |
|
|
|
6.65% |
|
|
|
|
|
|
|
RATIOS/SUPPLEMENTAL DATA: |
|
|
|
|
|
|
|
|
|
|
|
|
|
|
|
|
|
|
|
|
Net assets, end of year (in 000’s) |
|
$ |
70,891 |
|
|
$ |
64,150 |
|
|
$ |
79,897 |
|
|
$ |
68,291 |
|
|
$ |
53,827 |
|
Ratios to average net assets |
|
|
|
|
|
|
|
|
|
|
|
|
|
|
|
|
|
|
|
|
Expenses, before waiver and reimbursement |
|
|
1.54% |
|
|
|
1.56% |
|
|
|
1.52% |
|
|
|
1.52% |
|
|
|
1.54% |
|
Expenses, net waiver and reimbursement (D) |
|
|
1.49% |
|
|
|
1.52% |
|
|
|
1.47% |
|
|
|
1.47% |
|
|
|
1.49% |
|
Net investment loss, before waiver and reimbursement |
|
|
(0.48)% |
|
|
|
(0.35)% |
|
|
|
(0.25)% |
|
|
|
(0.19)% |
|
|
|
(0.38)% |
|
Net investment loss, net waiver and reimbursement (D) |
|
|
(0.43)% |
|
|
|
(0.31)% |
|
|
|
(0.20)% |
|
|
|
(0.14)% |
|
|
|
(0.33)% |
|
| |
|
|
23% |
|
|
|
44% |
|
|
|
57% |
|
|
|
76% |
|
|
|
71% |
|
|
(A) |
|
Per share amounts calculated using average shares method, which more appropriately presents the per share data for the period. |
|
(B) |
|
Total return calculation does not reflect sales load. |
|
(C) |
|
Total return in the above table represents the rate that the investor would have earned or lost on an investment in the Fund assuming reinvestment of dividends. Total return would have been higher or lower if certain expenses had not been reimbursed, waived or recouped. |
|
(D) |
|
This expense decrease from the voluntary waiver is reflected in both the net expense and the net investment income ratios shown. |
LARGE/MID CAP GROWTH FUND
(CLASS C)
The table below sets forth data for one share of capital stock outstanding throughout each period represented.
The Financial Highlights Table is intended to help you understand the Fund’s financial performance for the past five years (or, if shorter, the periods since the Fund’s inception). Certain information reflects financial results for a single Fund share. The total returns in the table represent the rate that an investor would have earned (or lost) on an investment in the Fund (assuming reinvestment of all dividends and distributions). The information contained in the tables for the years ended September 30, 2016, 2017, 2018, 2019 and 2020, have been audited by Cohen & Company, Ltd., Independent Registered Public Accounting Firm, whose report, along with the Fund’s financial statements, are included in the annual report, which is available upon request.
|
|
|
|
|
|
|
|
|
|
|
|
|
|
|
|
|
|
|
|
|
| |
|
For the Year
ended
September 30,
2020 |
|
|
For the Year
ended
September 30,
2019 |
|
|
For the Year
ended
September 30,
2018 |
|
|
For the Year
ended
September 30,
2017 |
|
|
For the Year
ended
September 30,
2016 |
|
|
|
|
|
|
|
|
|
|
|
|
|
|
|
|
|
|
|
|
|
|
|
|
|
|
|
|
Net asset value, beginning of year |
|
$ |
6.96 |
|
|
$ |
7.63 |
|
|
$ |
7.11 |
|
|
$ |
6.24 |
|
|
$ |
6.64 |
|
|
|
|
|
|
|
|
|
|
|
|
|
|
|
|
|
|
|
|
|
|
|
|
|
|
|
|
INCOME (LOSS) FROM INVESTMENT OPERATIONS: |
|
|
|
|
|
|
|
|
|
|
|
|
|
|
|
|
|
|
|
|
| |
|
|
(0.08 |
) |
|
|
(0.07 |
) |
|
|
(0.07 |
) |
|
|
(0.06 |
) |
|
|
(0.07 |
) |
Net realized and unrealized gain (loss) on investments |
|
|
1.17 |
|
|
|
(0.18 |
) |
|
|
0.81 |
|
|
|
1.02 |
|
|
|
0.45 |
|
|
|
|
|
|
|
|
|
|
|
|
|
|
|
|
|
|
|
|
|
|
Total from investment operations |
|
|
1.09 |
|
|
|
(0.25 |
) |
|
|
0.74 |
|
|
|
0.96 |
|
|
|
0.38 |
|
|
|
|
|
|
|
|
|
|
|
|
|
|
|
|
|
|
|
|
|
|
|
|
|
|
|
|
| |
|
|
|
|
|
|
|
|
|
|
|
|
|
|
|
|
|
|
|
|
From net realized gains on investments |
|
|
(0.37 |
) |
|
|
(0.42 |
) |
|
|
(0.22 |
) |
|
|
(0.09 |
) |
|
|
(0.78 |
) |
|
|
|
|
|
|
|
|
|
|
|
|
|
|
|
|
|
|
|
|
|
| |
|
|
(0.37 |
) |
|
|
(0.42 |
) |
|
|
(0.22 |
) |
|
|
(0.09 |
) |
|
|
(0.78 |
) |
|
|
|
|
|
|
|
|
|
|
|
|
|
|
|
|
|
|
|
|
|
|
|
|
|
|
|
Net asset value, end of year |
|
$ |
7.68 |
|
|
$ |
6.96 |
|
|
$ |
7.63 |
|
|
$ |
7.11 |
|
|
$ |
6.24 |
|
|
|
|
|
|
|
|
|
|
|
|
|
|
|
|
|
|
|
|
|
|
|
|
|
|
|
|
| |
|
|
16.09% |
|
|
|
(2.24)% |
|
|
|
10.63% |
|
|
|
15.58% |
|
|
|
6.04% |
|
|
|
|
|
|
|
RATIOS/SUPPLEMENTAL DATA: |
|
|
|
|
|
|
|
|
|
|
|
|
|
|
|
|
|
|
|
|
Net assets, end of year (in 000’s) |
|
$ |
8,192 |
|
|
$ |
7,950 |
|
|
$ |
11,355 |
|
|
$ |
9,909 |
|
|
$ |
7,636 |
|
Ratios to average net assets |
|
|
|
|
|
|
|
|
|
|
|
|
|
|
|
|
|
|
|
|
Expenses, before waiver and reimbursement |
|
|
2.29% |
|
|
|
2.31% |
|
|
|
2.27% |
|
|
|
2.27% |
|
|
|
2.30% |
|
Expenses, net waiver and reimbursement (D) |
|
|
2.24% |
|
|
|
2.27% |
|
|
|
2.22% |
|
|
|
2.22% |
|
|
|
2.24% |
|
Net investment loss, before waiver and reimbursement |
|
|
(1.23)% |
|
|
|
(1.10)% |
|
|
|
(1.00)% |
|
|
|
(0.94)% |
|
|
|
(1.14)% |
|
Net investment loss, net waiver and reimbursement (D) |
|
|
(1.18)% |
|
|
|
(1.06)% |
|
|
|
(0.95)% |
|
|
|
(0.89)% |
|
|
|
(1.08)% |
|
| |
|
|
23% |
|
|
|
44% |
|
|
|
57% |
|
|
|
76% |
|
|
|
71% |
|
|
(A) |
|
Per share amounts calculated using average shares method, which more appropriately presents the per share data for the period. |
|
(B) |
|
Total return calculation does not reflect redemption fee. |
|
(C) |
|
Total return in the above table represents the rate that the investor would have earned or lost on an investment in the Fund assuming reinvestment of dividends. Total return would have been higher or lower if certain expenses had not been reimbursed, waived or recouped. |
|
(D) |
|
This expense decrease from the voluntary waiver is reflected in both the net expense and the net investment income ratios shown. |
The table below sets forth data for one share of capital stock outstanding throughout each period represented.
The Financial Highlights Table is intended to help you understand the Fund’s financial performance for the past five years (or, if shorter, the periods since the Fund’s inception). Certain information reflects financial results for a single Fund share. The total returns in the table represent the rate that an investor would have earned (or lost) on an investment in the Fund (assuming reinvestment of all dividends and distributions). The information contained in the tables for the years ended September 30, 2016, 2017, 2018, 2019 and 2020, have been audited by Cohen & Company, Ltd., Independent Registered Public Accounting Firm, whose report, along with the Fund’s financial statements, are included in the annual report, which is available upon request.
|
|
|
|
|
|
|
|
|
|
|
|
|
|
|
|
|
|
|
|
|
| |
|
For the Year
ended
September 30,
2020 |
|
|
For the Year
ended
September 30,
2019 |
|
|
For the Year
ended
September 30,
2018 |
|
|
For the Year
ended
September 30,
2017 |
|
|
For the Year
ended
September 30,
2016 |
|
|
|
|
|
|
|
|
|
|
|
|
|
|
|
|
|
|
|
|
|
|
|
|
|
|
|
|
Net asset value, beginning of year |
|
$ |
17.15 |
|
|
$ |
20.67 |
|
|
$ |
20.50 |
|
|
$ |
17.09 |
|
|
$ |
16.93 |
|
|
|
|
|
|
|
|
|
|
|
|
|
|
|
|
|
|
|
|
|
|
|
|
|
|
|
|
INCOME (LOSS) FROM INVESTMENT OPERATIONS: |
|
|
|
|
|
|
|
|
|
|
|
|
|
|
|
|
|
|
|
|
Net investment income (loss) (A) |
|
|
0.04 |
|
|
|
0.06 |
|
|
|
0.00 |
* |
|
|
0.03 |
|
|
|
(0.01 |
) |
Net realized and unrealized gain (loss) on investments |
|
|
(2.39 |
) |
|
|
(1.28 |
) |
|
|
1.96 |
|
|
|
3.63 |
|
|
|
1.65 |
|
|
|
|
|
|
|
|
|
|
|
|
|
|
|
|
|
|
|
|
|
|
Total from investment operations |
|
|
(2.35 |
) |
|
|
(1.22 |
) |
|
|
1.96 |
|
|
|
3.66 |
|
|
|
1.64 |
|
|
|
|
|
|
|
|
|
|
|
|
|
|
|
|
|
|
|
|
|
|
|
|
|
|
|
|
| |
|
|
|
|
|
|
|
|
|
|
|
|
|
|
|
|
|
|
|
|
From net investment income |
|
|
(0.04 |
) |
|
|
- |
|
|
|
(0.00 |
) * |
|
|
- |
|
|
|
- |
|
From net realized gains on investments |
|
|
(0.60 |
) |
|
|
(2.30 |
) |
|
|
(1.79 |
) |
|
|
(0.25 |
) |
|
|
(1.48 |
) |
|
|
|
|
|
|
|
|
|
|
|
|
|
|
|
|
|
|
|
|
|
| |
|
|
(0.64 |
) |
|
|
(2.30 |
) |
|
|
(1.79 |
) |
|
|
(0.25 |
) |
|
|
(1.48 |
) |
|
|
|
|
|
|
|
|
|
|
|
|
|
|
|
|
|
|
|
|
|
|
|
|
|
|
|
Net asset value, end of year |
|
$ |
14.16 |
|
|
$ |
17.15 |
|
|
$ |
20.67 |
|
|
$ |
20.50 |
|
|
$ |
17.09 |
|
|
|
|
|
|
|
|
|
|
|
|
|
|
|
|
|
|
|
|
|
|
|
|
|
|
|
|
| |
|
|
(14.38)% |
|
|
|
(3.77)% |
|
|
|
10.11% |
|
|
|
21.55% |
|
|
|
10.67% |
|
|
|
|
|
|
|
RATIOS/SUPPLEMENTAL DATA: |
|
|
|
|
|
|
|
|
|
|
|
|
|
|
|
|
|
|
|
|
Net assets, end of year (in 000’s) |
|
$ |
74,130 |
|
|
$ |
99,077 |
|
|
$ |
114,985 |
|
|
$ |
112,953 |
|
|
$ |
94,871 |
|
Ratios to average net assets |
|
|
|
|
|
|
|
|
|
|
|
|
|
|
|
|
|
|
|
|
Expenses, before waiver and reimbursement |
|
|
1.57% |
|
|
|
1.52% |
|
|
|
1.50% |
|
|
|
1.46% |
|
|
|
1.48% |
|
Expenses, net waiver and reimbursement (D) |
|
|
1.47% |
|
|
|
1.43% |
|
|
|
1.44% |
|
|
|
1.41% |
|
|
|
1.44% |
|
Net investment income (loss), before waiver and reimbursement |
|
|
0.19% |
|
|
|
0.29% |
|
|
|
(0.08)% |
|
|
|
0.13% |
|
|
|
(0.09)% |
|
Net investment income (loss), net waiver and reimbursement (D) |
|
|
0.29% |
|
|
|
0.38% |
|
|
|
(0.02)% |
|
|
|
0.18% |
|
|
|
(0.04)% |
|
| |
|
|
73% |
|
|
|
63% |
|
|
|
58% |
|
|
|
57% |
|
|
|
73% |
|
*Amount is less than $0.005 per share.
|
(A) |
|
Per share amounts calculated using average shares method, which more appropriately presents the per share data for the period. |
|
(B) |
|
Total return calculation does not reflect sales load. |
|
(C) |
|
Total return in the above table represents the rate that the investor would have earned or lost on an investment in the Fund assuming reinvestment of dividends. Total return would have been higher or lower if certain expenses had not been reimbursed, waived or recouped. |
|
(D) |
|
This expense decrease from the voluntary waiver is reflected in both the net expense and the net investment income ratios shown. |
The table below sets forth data for one share of capital stock outstanding throughout each period represented.
The Financial Highlights Table is intended to help you understand the Fund’s financial performance for the past five years (or, if shorter, the periods since the Fund’s inception). Certain information reflects financial results for a single Fund share. The total returns in the table represent the rate that an investor would have earned (or lost) on an investment in the Fund (assuming reinvestment of all dividends and distributions). The information contained in the tables for the years ended September 30, 2016, 2017, 2018, 2019 and 2020, have been audited by Cohen & Company, Ltd., Independent Registered Public Accounting Firm, whose report, along with the Fund’s financial statements, are included in the annual report, which is available upon request.
|
|
|
|
|
|
|
|
|
|
|
|
|
|
|
|
|
|
|
|
|
| |
|
For the Year
ended
September 30,
2020 |
|
|
For the Year
ended
September 30,
2019 |
|
|
For the Year
ended
September 30,
2018 |
|
|
For the Year
ended
September 30,
2017 |
|
|
For the Year
ended
September 30,
2016 |
|
|
|
|
|
|
|
|
|
|
|
|
|
|
|
|
|
|
|
|
|
|
|
|
|
|
|
|
Net asset value, beginning of year |
|
$ |
11.69 |
|
|
$ |
15.09 |
|
|
$ |
15.54 |
|
|
$ |
13.10 |
|
|
$ |
13.42 |
|
|
|
|
|
|
|
|
|
|
|
|
|
|
|
|
|
|
|
|
|
|
|
|
|
|
|
|
INCOME (LOSS) FROM INVESTMENT OPERATIONS: |
|
|
|
|
|
|
|
|
|
|
|
|
|
|
|
|
|
|
|
|
| |
|
|
(0.05 |
) |
|
|
(0.05 |
) |
|
|
(0.11 |
) |
|
|
(0.08 |
) |
|
|
(0.10 |
) |
Net realized and unrealized gain (loss) on investments |
|
|
(1.59 |
) |
|
|
(1.05 |
) |
|
|
1.45 |
|
|
|
2.77 |
|
|
|
1.26 |
|
|
|
|
|
|
|
|
|
|
|
|
|
|
|
|
|
|
|
|
|
|
Total from investment operations |
|
|
(1.64 |
) |
|
|
(1.10 |
) |
|
|
1.34 |
|
|
|
2.69 |
|
|
|
1.16 |
|
|
|
|
|
|
|
|
|
|
|
|
|
|
|
|
|
|
|
|
|
|
|
|
|
|
|
|
| |
|
|
|
|
|
|
|
|
|
|
|
|
|
|
|
|
|
|
|
|
From net realized gains on investments |
|
|
(0.60 |
) |
|
|
(2.30 |
) |
|
|
(1.79 |
) |
|
|
(0.25 |
) |
|
|
(1.48 |
) |
|
|
|
|
|
|
|
|
|
|
|
|
|
|
|
|
|
|
|
|
|
| |
|
|
(0.60 |
) |
|
|
(2.30 |
) |
|
|
(1.79 |
) |
|
|
(0.25 |
) |
|
|
(1.48 |
) |
|
|
|
|
|
|
|
|
|
|
|
|
|
|
|
|
|
|
|
|
|
|
|
|
|
|
|
Net asset value, end of year |
|
$ |
9.45 |
|
|
$ |
11.69 |
|
|
$ |
15.09 |
|
|
$ |
15.54 |
|
|
$ |
13.10 |
|
|
|
|
|
|
|
|
|
|
|
|
|
|
|
|
|
|
|
|
|
|
|
|
|
|
|
|
| |
|
|
(15.01)% |
|
|
|
(4.49)% |
|
|
|
9.24% |
|
|
|
20.70% |
|
|
|
9.81% |
|
|
|
|
|
|
|
RATIOS/SUPPLEMENTAL DATA: |
|
|
|
|
|
|
|
|
|
|
|
|
|
|
|
|
|
|
|
|
Net assets, end of year (in 000’s) |
|
$ |
5,663 |
|
|
$ |
8,963 |
|
|
$ |
14,603 |
|
|
$ |
13,210 |
|
|
$ |
10,257 |
|
Ratios to average net assets |
|
|
|
|
|
|
|
|
|
|
|
|
|
|
|
|
|
|
|
|
Expenses, before waiver and reimbursement |
|
|
2.32% |
|
|
|
2.27% |
|
|
|
2.25% |
|
|
|
2.21% |
|
|
|
2.23% |
|
Expenses, net waiver and reimbursement (D) |
|
|
2.22% |
|
|
|
2.18% |
|
|
|
2.19% |
|
|
|
2.16% |
|
|
|
2.18% |
|
Net investment loss, before waiver and reimbursement |
|
|
(0.55)% |
|
|
|
(0.50)% |
|
|
|
(0.82)% |
|
|
|
(0.62)% |
|
|
|
(0.84)% |
|
Net investment loss, net waiver and reimbursement (D) |
|
|
(0.45)% |
|
|
|
(0.42)% |
|
|
|
(0.76)% |
|
|
|
(0.57)% |
|
|
|
(0.78)% |
|
| |
|
|
73% |
|
|
|
63% |
|
|
|
58% |
|
|
|
57% |
|
|
|
73% |
|
|
(A) |
|
Per share amounts calculated using average shares method, which more appropriately presents the per share data for the period. |
|
(B) |
|
Total return calculation does not reflect redemption fee. |
|
(C) |
|
Total return in the above table represents the rate that the investor would have earned or lost on an investment in the Fund assuming reinvestment of dividends. Total return would have been higher or lower if certain expenses had not been reimbursed, waived or recouped. |
|
(D) |
|
This expense decrease from the voluntary waiver is reflected in both the net expense and the net investment income ratios shown. |
The table below sets forth data for one share of capital stock outstanding throughout each period represented.
The Financial Highlights Table is intended to help you understand the Fund’s financial performance for the past five years (or, if shorter, the periods since the Fund’s inception). Certain information reflects financial results for a single Fund share. The total returns in the table represent the rate that an investor would have earned (or lost) on an investment in the Fund (assuming reinvestment of all dividends and distributions). The information contained in the tables for the years ended September 30, 2016, 2017, 2018, 2019 and 2020, have been audited by Cohen & Company, Ltd., Independent Registered Public Accounting Firm, whose report, along with the Fund’s financial statements, are included in the annual report, which is available upon request.
|
|
|
|
|
|
|
|
|
|
|
|
|
|
|
|
|
|
|
|
|
| |
|
For the Year
ended
September 30,
2020 |
|
|
For the Year
ended
September 30,
2019 |
|
|
For the Year
ended
September 30,
2018 |
|
|
For the Year
ended
September 30,
2017 |
|
|
For the Year
ended
September 30,
2016 |
|
|
|
|
|
|
|
|
|
|
|
|
|
|
|
|
|
|
|
|
|
|
|
|
|
|
|
|
Net asset value, beginning of year |
|
$ |
18.86 |
|
|
$ |
20.38 |
|
|
$ |
19.16 |
|
|
$ |
17.15 |
|
|
$ |
18.20 |
|
|
|
|
|
|
|
|
|
|
|
|
|
|
|
|
|
|
|
|
|
|
|
|
|
|
|
|
INCOME FROM INVESTMENT OPERATIONS: |
|
|
|
|
|
|
|
|
|
|
|
|
|
|
|
|
|
|
|
|
Net investment income (A) |
|
|
0.03 |
|
|
|
0.09 |
|
|
|
0.07 |
|
|
|
0.05 |
|
|
|
0.01 |
|
Net realized and unrealized gain on investments (B) |
|
|
0.72 |
|
|
|
0.12 |
|
|
|
2.45 |
|
|
|
2.18 |
|
|
|
1.04 |
|
|
|
|
|
|
|
|
|
|
|
|
|
|
|
|
|
|
|
|
|
|
Total from investment operations |
|
|
0.75 |
|
|
|
0.21 |
|
|
|
2.52 |
|
|
|
2.23 |
|
|
|
1.05 |
|
|
|
|
|
|
|
|
|
|
|
|
|
|
|
|
|
|
|
|
|
|
|
|
|
|
|
|
| |
|
|
|
|
|
|
|
|
|
|
|
|
|
|
|
|
|
|
|
|
From net investment income |
|
|
(0.08 |
) |
|
|
(0.06 |
) |
|
|
(0.03 |
) |
|
|
- |
|
|
|
- |
|
From net realized gains on investments |
|
|
(2.10 |
) |
|
|
(1.67 |
) |
|
|
(1.27 |
) |
|
|
(0.22 |
) |
|
|
(2.10 |
) |
|
|
|
|
|
|
|
|
|
|
|
|
|
|
|
|
|
|
|
|
|
| |
|
|
(2.18 |
) |
|
|
(1.73 |
) |
|
|
(1.30 |
) |
|
|
(0.22 |
) |
|
|
(2.10 |
) |
|
|
|
|
|
|
|
|
|
|
|
|
|
|
|
|
|
|
|
|
|
|
|
|
|
|
|
Net asset value, end of year |
|
$ |
17.43 |
|
|
$ |
18.86 |
|
|
$ |
20.38 |
|
|
$ |
19.16 |
|
|
$ |
17.15 |
|
|
|
|
|
|
|
|
|
|
|
|
|
|
|
|
|
|
|
|
|
|
|
|
|
|
|
|
| |
|
|
3.93% |
|
|
|
2.54% |
|
|
|
13.58% |
|
|
|
13.10% |
|
|
|
6.40% |
|
|
|
|
|
|
|
RATIOS/SUPPLEMENTAL DATA: |
|
|
|
|
|
|
|
|
|
|
|
|
|
|
|
|
|
|
|
|
Net assets, end of year (in 000’s) |
|
$ |
130,296 |
|
|
$ |
142,420 |
|
|
$ |
172,163 |
|
|
$ |
167,056 |
|
|
$ |
154,260 |
|
Ratios to average net assets |
|
|
|
|
|
|
|
|
|
|
|
|
|
|
|
|
|
|
|
|
Expenses, before waiver and reimbursement |
|
|
1.51% |
|
|
|
1.51% |
|
|
|
1.46% |
|
|
|
1.49% |
|
|
|
1.48% |
|
Expenses, net waiver and reimbursement (E) |
|
|
1.41% |
|
|
|
1.41% |
|
|
|
1.35% |
|
|
|
1.41% |
|
|
|
1.43% |
|
Net investment income, before waiver and reimbursement |
|
|
0.06% |
|
|
|
0.42% |
|
|
|
0.27% |
|
|
|
0.18% |
|
|
|
(0.01)% |
|
Net investment income, net waiver and reimbursement (E) |
|
|
0.16% |
|
|
|
0.52% |
|
|
|
0.38% |
|
|
|
0.26% |
|
|
|
0.04% |
|
| |
|
|
26% |
|
|
|
51% |
|
|
|
24% |
|
|
|
39% |
|
|
|
45% |
|
|
(A) |
|
Per share amounts calculated using average shares method, which more appropriately presents the per share data for the period. |
|
(B) |
|
Realized and unrealized gains and losses per share in this caption are balancing amounts necessary to reconcile the change in net asset value per share for the period, and may not agree to the aggregate gains and losses in the Statement of Operations due to the fluctuations in share transactions. |
|
(C) |
|
Total return calculation does not reflect sales load. |
|
(D) |
|
Total return in the above table represents the rate that the investor would have earned or lost on an investment in the Fund assuming reinvestment of dividends. Total return would have been higher or lower if certain expenses had not been reimbursed, waived or recouped. |
|
(E) |
|
This expense decrease from the voluntary waiver is reflected in both the net expense and the net investment income ratios shown. |
The table below sets forth data for one share of capital stock outstanding throughout each period represented.
The Financial Highlights Table is intended to help you understand the Fund’s financial performance for the past five years (or, if shorter, the periods since the Fund’s inception). Certain information reflects financial results for a single Fund share. The total returns in the table represent the rate that an investor would have earned (or lost) on an investment in the Fund (assuming reinvestment of all dividends and distributions). The information contained in the tables for the years ended September 30, 2016, 2017, 2018, 2019 and 2020, have been audited by Cohen & Company, Ltd., Independent Registered Public Accounting Firm, whose report, along with the Fund’s financial statements, are included in the annual report, which is available upon request.
|
|
|
|
|
|
|
|
|
|
|
|
|
|
|
|
|
|
|
|
|
| |
|
For the Year
ended
September 30,
2020 |
|
|
For the Year
ended
September 30,
2019 |
|
|
For the Year
ended
September 30,
2018 |
|
|
For the Year
ended
September 30,
2017 |
|
|
For the Year
ended
September 30,
2016 |
|
|
|
|
|
|
|
|
|
|
|
|
|
|
|
|
|
|
|
|
|
|
|
|
|
|
|
|
Net asset value, beginning of year |
|
$ |
14.82 |
|
|
$ |
16.49 |
|
|
$ |
15.82 |
|
|
$ |
14.30 |
|
|
$ |
15.62 |
|
|
|
|
|
|
|
|
|
|
|
|
|
|
|
|
|
|
|
|
|
|
|
|
|
|
|
|
INCOME (LOSS) FROM INVESTMENT OPERATIONS: |
|
|
|
|
|
|
|
|
|
|
|
|
|
|
|
|
|
|
|
|
| |
|
|
(0.08 |
) |
|
|
(0.03 |
) |
|
|
(0.06 |
) |
|
|
(0.07 |
) |
|
|
(0.10 |
) |
Net realized and unrealized gain on investments (B) |
|
|
0.57 |
|
|
|
0.03 |
|
|
|
2.00 |
|
|
|
1.81 |
|
|
|
0.88 |
|
|
|
|
|
|
|
|
|
|
|
|
|
|
|
|
|
|
|
|
|
|
Total from investment operations |
|
|
0.49 |
|
|
|
0.00 |
|
|
|
1.94 |
|
|
|
1.74 |
|
|
|
0.78 |
|
|
|
|
|
|
|
|
|
|
|
|
|
|
|
|
|
|
|
|
|
|
|
|
|
|
|
|
| |
|
|
|
|
|
|
|
|
|
|
|
|
|
|
|
|
|
|
|
|
From net realized gains on investments |
|
|
(2.10 |
) |
|
|
(1.67 |
) |
|
|
(1.27 |
) |
|
|
(0.22 |
) |
|
|
(2.10 |
) |
|
|
|
|
|
|
|
|
|
|
|
|
|
|
|
|
|
|
|
|
|
| |
|
|
(2.10 |
) |
|
|
(1.67 |
) |
|
|
(1.27 |
) |
|
|
(0.22 |
) |
|
|
(2.10 |
) |
|
|
|
|
|
|
|
|
|
|
|
|
|
|
|
|
|
|
|
|
|
|
|
|
|
|
|
Net asset value, end of year |
|
$ |
13.21 |
|
|
$ |
14.82 |
|
|
$ |
16.49 |
|
|
$ |
15.82 |
|
|
$ |
14.30 |
|
|
|
|
|
|
|
|
|
|
|
|
|
|
|
|
|
|
|
|
|
|
|
|
|
|
|
|
| |
|
|
3.14% |
|
|
|
1.74% |
|
|
|
12.75% |
|
|
|
12.27% |
|
|
|
5.64% |
|
|
|
|
|
|
|
RATIOS/SUPPLEMENTAL DATA: |
|
|
|
|
|
|
|
|
|
|
|
|
|
|
|
|
|
|
|
|
Net assets, end of year (in 000’s) |
|
$ |
14,102 |
|
|
$ |
16,627 |
|
|
$ |
25,852 |
|
|
$ |
23,803 |
|
|
$ |
20,855 |
|
Ratios to average net assets |
|
|
|
|
|
|
|
|
|
|
|
|
|
|
|
|
|
|
|
|
Expenses, before waiver and reimbursement |
|
|
2.26% |
|
|
|
2.26% |
|
|
|
2.21% |
|
|
|
2.24% |
|
|
|
2.23% |
|
Expenses, net waiver and reimbursement (E) |
|
|
2.16% |
|
|
|
2.16% |
|
|
|
2.10% |
|
|
|
2.16% |
|
|
|
2.18% |
|
Net investment loss, before waiver and reimbursement |
|
|
(0.69)% |
|
|
|
(0.32)% |
|
|
|
(0.48)% |
|
|
|
(0.57)% |
|
|
|
(0.76)% |
|
Net investment loss, net waiver and reimbursement (E) |
|
|
(0.59)% |
|
|
|
(0.22)% |
|
|
|
(0.37)% |
|
|
|
(0.49)% |
|
|
|
(0.70)% |
|
| |
|
|
26% |
|
|
|
51% |
|
|
|
24% |
|
|
|
39% |
|
|
|
45% |
|
|
(A) |
|
Per share amounts calculated using average shares method, which more appropriately presents the per share data for the period. |
|
(B) |
|
Realized and unrealized gains per share in this caption are balancing amounts necessary to reconcile the change in net asset value per share for the period, and may not reconcile with aggregate gains and losses in the Statement of Operations due to the timing of share transactions for the period. |
|
(C) |
|
Total return calculation does not reflect redemption fee. |
|
(D) |
|
Total return in the above table represents the rate that the investor would have earned or lost on an investment in the Fund assuming reinvestment of dividends. Total return would have been higher or lower if certain expenses had not been reimbursed, waived or recouped. |
|
(E) |
|
This expense decrease from the voluntary waiver is reflected in both the net expense and the net investment income ratios shown. |
The table below sets forth data for one share of capital stock outstanding throughout each period represented.
The Financial Highlights Table is intended to help you understand the Fund’s financial performance for the past five years (or, if shorter, the periods since the Fund’s inception). Certain information reflects financial results for a single Fund share. The total returns in the table represent the rate that an investor would have earned (or lost) on an investment in the Fund (assuming reinvestment of all dividends and distributions). The information contained in the tables for the years ended September 30, 2016, 2017, 2018, 2019 and 2020, have been audited by Cohen & Company, Ltd., Independent Registered Public Accounting Firm, whose report, along with the Fund’s financial statements, are included in the annual report, which is available upon request.
|
|
|
|
|
|
|
|
|
|
|
|
|
|
|
|
|
|
|
|
|
| |
|
For the Year
ended
September 30,
2020 |
|
|
For the Year
ended
September 30,
2019 |
|
|
For the Year
ended
September 30,
2018 |
|
|
For the Year
ended
September 30,
2017 |
|
|
For the Year
ended
September 30,
2016 |
|
|
|
|
|
|
|
|
|
|
|
|
|
|
|
|
|
|
|
|
|
|
|
|
|
|
|
|
Net asset value, beginning of year |
|
$ |
10.39 |
|
|
$ |
9.81 |
|
|
$ |
10.22 |
|
|
$ |
10.47 |
|
|
$ |
10.27 |
|
|
|
|
|
|
|
|
|
|
|
|
|
|
|
|
|
|
|
|
|
|
|
|
|
|
|
|
INCOME (LOSS) FROM INVESTMENT OPERATIONS: |
|
|
|
|
|
|
|
|
|
|
|
|
|
|
|
|
|
|
|
|
Net investment income (A) |
|
|
0.12 |
|
|
|
0.16 |
|
|
|
0.16 |
|
|
|
0.13 |
|
|
|
0.14 |
|
Net realized and unrealized gain (loss) on investments |
|
|
0.44 |
|
|
|
0.60 |
|
|
|
(0.39 |
) |
|
|
(0.22 |
) |
|
|
0.21 |
|
|
|
|
|
|
|
|
|
|
|
|
|
|
|
|
|
|
|
|
|
|
Total from investment operations |
|
|
0.56 |
|
|
|
0.76 |
|
|
|
(0.23 |
) |
|
|
(0.09 |
) |
|
|
0.35 |
|
|
|
|
|
|
|
|
|
|
|
|
|
|
|
|
|
|
|
|
|
|
|
|
|
|
|
|
| |
|
|
|
|
|
|
|
|
|
|
|
|
|
|
|
|
|
|
|
|
From net investment income |
|
|
(0.15 |
) |
|
|
(0.18 |
) |
|
|
(0.18 |
) |
|
|
(0.16 |
) |
|
|
(0.15 |
) |
From net realized gains on investments |
|
|
- |
|
|
|
- |
|
|
|
- |
|
|
|
- |
|
|
|
- |
|
|
|
|
|
|
|
|
|
|
|
|
|
|
|
|
|
|
|
|
|
|
| |
|
|
(0.15 |
) |
|
|
(0.18 |
) |
|
|
(0.18 |
) |
|
|
(0.16 |
) |
|
|
(0.15 |
) |
|
|
|
|
|
|
|
|
|
|
|
|
|
|
|
|
|
|
|
|
|
|
|
|
|
|
|
Net asset value, end of year |
|
$ |
10.80 |
|
|
$ |
10.39 |
|
|
$ |
9.81 |
|
|
$ |
10.22 |
|
|
$ |
10.47 |
|
|
|
|
|
|
|
|
|
|
|
|
|
|
|
|
|
|
|
|
|
|
|
|
|
|
|
|
| |
|
|
5.39% |
|
|
|
7.76% |
|
|
|
(2.31)% |
|
|
|
(0.81)% |
|
|
|
3.47% |
|
|
|
|
|
|
|
RATIOS/SUPPLEMENTAL DATA: |
|
|
|
|
|
|
|
|
|
|
|
|
|
|
|
|
|
|
|
|
Net assets, end of year (in 000’s) |
|
$ |
91,403 |
|
|
$ |
85,375 |
|
|
$ |
66,119 |
|
|
$ |
75,858 |
|
|
$ |
86,142 |
|
Ratios to average net assets |
|
|
|
|
|
|
|
|
|
|
|
|
|
|
|
|
|
|
|
|
Expenses, before waiver and reimbursement |
|
|
1.30% |
|
|
|
1.30% |
|
|
|
1.30% |
|
|
|
1.30% |
|
|
|
1.24% |
|
Expenses, net waiver and reimbursement (D) |
|
|
1.10% |
|
|
|
1.13% |
|
|
|
1.10% |
|
|
|
1.10% |
|
|
|
1.04% |
|
Net investment income, before waiver and reimbursement |
|
|
0.90% |
|
|
|
1.46% |
|
|
|
1.40% |
|
|
|
1.05% |
|
|
|
1.19% |
|
Net investment income, net waiver and reimbursement (D) |
|
|
1.10% |
|
|
|
1.62% |
|
|
|
1.60% |
|
|
|
1.25% |
|
|
|
1.39% |
|
| |
|
|
32% |
|
|
|
53% |
|
|
|
30% |
|
|
|
43% |
|
|
|
40% |
|
|
(A) |
|
Per share amounts calculated using average shares method, which more appropriately presents the per share data for the period. |
|
(B) |
|
Total return calculation does not reflect sales load. |
|
(C) |
|
Total return in the above table represents the rate that the investor would have earned or lost on an investment in the Fund assuming reinvestment of dividends. Total return would have been higher or lower if certain expenses had not been reimbursed, waived or recouped. |
|
(D) |
|
This expense decrease from the voluntary waiver is reflected in both the net expense and the net investment income ratios shown. |
The table below sets forth data for one share of capital stock outstanding throughout each period represented.
The Financial Highlights Table is intended to help you understand the Fund’s financial performance for the past five years (or, if shorter, the periods since the Fund’s inception). Certain information reflects financial results for a single Fund share. The total returns in the table represent the rate that an investor would have earned (or lost) on an investment in the Fund (assuming reinvestment of all dividends and distributions). The information contained in the tables for the years ended September 30, 2016, 2017, 2018, 2019 and 2020, have been audited by Cohen & Company, Ltd., Independent Registered Public Accounting Firm, whose report, along with the Fund’s financial statements, are included in the annual report, which is available upon request.
|
|
|
|
|
|
|
|
|
|
|
|
|
|
|
|
|
|
|
|
|
| |
|
|
|
|
For the Year
ended
September 30,
2019 |
|
|
For the Year
ended
September 30, |
|
|
For the Year
ended
September 30,
2017 |
|
|
For the Year
ended
September 30,
2016 |
|
|
|
|
|
|
|
|
|
|
|
|
|
|
|
|
|
|
|
|
|
|
|
|
|
|
|
|
Net asset value, beginning of year |
|
$ |
9.99 |
|
|
$ |
9.44 |
|
|
$ |
9.85 |
|
|
$ |
10.09 |
|
|
$ |
9.89 |
|
|
|
|
|
|
|
|
|
|
|
|
|
|
|
|
|
|
|
|
|
|
|
|
|
|
|
|
INCOME (LOSS) FROM INVESTMENT OPERATIONS: |
|
|
|
|
|
|
|
|
|
|
|
|
|
|
|
|
|
|
|
|
Net investment income (A) |
|
|
0.04 |
|
|
|
0.09 |
|
|
|
0.08 |
|
|
|
0.05 |
|
|
|
0.07 |
|
Net realized and unrealized gain (loss) on investments |
|
|
0.42 |
|
|
|
0.57 |
|
|
|
(0.39 |
) |
|
|
(0.20 |
) |
|
|
0.19 |
|
|
|
|
|
|
|
|
|
|
|
|
|
|
|
|
|
|
|
|
|
|
Total from investment operations |
|
|
0.46 |
|
|
|
0.66 |
|
|
|
(0.31 |
) |
|
|
(0.15 |
) |
|
|
0.26 |
|
|
|
|
|
|
|
|
|
|
|
|
|
|
|
|
|
|
|
|
|
|
|
|
|
|
|
|
| |
|
|
|
|
|
|
|
|
|
|
|
|
|
|
|
|
|
|
|
|
From net investment income |
|
|
(0.07 |
) |
|
|
(0.11 |
) |
|
|
(0.10 |
) |
|
|
(0.09 |
) |
|
|
(0.06 |
) |
From net realized gains on investments |
|
|
- |
|
|
|
- |
|
|
|
- |
|
|
|
- |
|
|
|
- |
|
|
|
|
|
|
|
|
|
|
|
|
|
|
|
|
|
|
|
|
|
|
| |
|
|
(0.07 |
) |
|
|
(0.11 |
) |
|
|
(0.10 |
) |
|
|
(0.09 |
) |
|
|
(0.06 |
) |
|
|
|
|
|
|
|
|
|
|
|
|
|
|
|
|
|
|
|
|
|
|
|
|
|
|
|
Net asset value, end of year |
|
$ |
10.38 |
|
|
$ |
9.99 |
|
|
$ |
9.44 |
|
|
$ |
9.85 |
|
|
$ |
10.09 |
|
|
|
|
|
|
|
|
|
|
|
|
|
|
|
|
|
|
|
|
|
|
|
|
|
|
|
|
| |
|
|
4.59% |
|
|
|
7.06% |
|
|
|
(3.15)% |
|
|
|
(1.49)% |
|
|
|
2.66% |
|
|
|
|
|
|
|
RATIOS/SUPPLEMENTAL DATA: |
|
|
|
|
|
|
|
|
|
|
|
|
|
|
|
|
|
|
|
|
Net assets, end of year (in 000’s) |
|
$ |
9,320 |
|
|
$ |
8,502 |
|
|
$ |
9,653 |
|
|
$ |
9,637 |
|
|
$ |
9,660 |
|
Ratios to average net assets |
|
|
|
|
|
|
|
|
|
|
|
|
|
|
|
|
|
|
|
|
Expenses, before waiver and reimbursement |
|
|
2.05% |
|
|
|
2.05% |
|
|
|
2.05% |
|
|
|
2.06% |
|
|
|
1.99% |
|
Expenses, net waiver and reimbursement (D) |
|
|
1.85% |
|
|
|
1.88% |
|
|
|
1.85% |
|
|
|
1.86% |
|
|
|
1.79% |
|
Net investment income, before waiver and reimbursement |
|
|
0.15% |
|
|
|
0.72% |
|
|
|
0.65% |
|
|
|
0.30% |
|
|
|
0.46% |
|
Net investment income, net waiver and reimbursement (D) |
|
|
0.35% |
|
|
|
0.89% |
|
|
|
0.85% |
|
|
|
0.50% |
|
|
|
0.65% |
|
| |
|
|
32% |
|
|
|
53% |
|
|
|
30% |
|
|
|
43% |
|
|
|
40% |
|
|
(A) |
|
Per share amounts calculated using average shares method, which more appropriately presents the per share data for the period. |
|
(B) |
|
Total return calculation does not reflect redemption fee. |
|
(C) |
|
Total return in the above table represents the rate that the investor would have earned or lost on an investment in the Fund assuming reinvestment of dividends. Total return would have been higher or lower if certain expenses had not been reimbursed, waived or recouped. |
|
(D) |
|
This expense decrease from the voluntary waiver is reflected in both the net expense and the net investment income ratios shown. |
The table below sets forth data for one share of capital stock outstanding throughout each period represented.
The Financial Highlights Table is intended to help you understand the Fund’s financial performance for the past five years (or, if shorter, the periods since the Fund’s inception). Certain information reflects financial results for a single Fund share. The total returns in the table represent the rate that an investor would have earned (or lost) on an investment in the Fund (assuming reinvestment of all dividends and distributions). The information contained in the tables for the years ended September 30, 2016, 2017, 2018, 2019 and 2020, have been audited by Cohen & Company, Ltd., Independent Registered Public Accounting Firm, whose report, along with the Fund’s financial statements, are included in the annual report, which is available upon request.
|
|
|
|
|
|
|
|
|
|
|
|
|
|
|
|
|
|
|
|
|
| |
|
For the Year
ended
September 30,
2020 |
|
|
For the Year
ended
September 30,
2019 |
|
|
For the Year
ended
September 30,
2018 |
|
|
For the Year
ended
September 30,
2017 |
|
|
For the Year
ended
September 30,
2016 |
|
|
|
|
|
|
|
|
|
|
|
|
|
|
|
|
|
|
|
|
|
|
|
|
|
|
|
|
Net asset value, beginning of year |
|
$ |
9.39 |
|
|
$ |
9.02 |
|
|
$ |
9.40 |
|
|
$ |
9.11 |
|
|
$ |
8.64 |
|
|
|
|
|
|
|
|
|
|
|
|
|
|
|
|
|
|
|
|
|
|
|
|
|
|
|
|
INCOME (LOSS) FROM INVESTMENT OPERATIONS: |
|
|
|
|
|
|
|
|
|
|
|
|
|
|
|
|
|
|
|
|
Net investment income (A) |
|
|
0.43 |
|
|
|
0.39 |
|
|
|
0.34 |
|
|
|
0.34 |
|
|
|
0.36 |
|
Net realized and unrealized gain (loss) on investments |
|
|
(0.15 |
) |
|
|
0.36 |
|
|
|
(0.36 |
) |
|
|
0.28 |
|
|
|
0.46 |
|
|
|
|
|
|
|
|
|
|
|
|
|
|
|
|
|
|
|
|
|
|
Total from investment operations |
|
|
0.28 |
|
|
|
0.75 |
|
|
|
(0.02 |
) |
|
|
0.62 |
|
|
|
0.82 |
|
|
|
|
|
|
|
|
|
|
|
|
|
|
|
|
|
|
|
|
|
|
|
|
|
|
|
|
| |
|
|
|
|
|
|
|
|
|
|
|
|
|
|
|
|
|
|
|
|
From net investment income |
|
|
(0.41 |
) |
|
|
(0.38 |
) |
|
|
(0.36 |
) |
|
|
(0.33 |
) |
|
|
(0.35 |
) |
|
|
|
|
|
|
|
|
|
|
|
|
|
|
|
|
|
|
|
|
|
| |
|
|
(0.41 |
) |
|
|
(0.38 |
) |
|
|
(0.36 |
) |
|
|
(0.33 |
) |
|
|
(0.35 |
) |
|
|
|
|
|
|
|
|
|
|
|
|
|
|
|
|
|
|
|
|
|
|
|
|
|
|
|
Net asset value, end of year |
|
$ |
9.26 |
|
|
$ |
9.39 |
|
|
$ |
9.02 |
|
|
$ |
9.40 |
|
|
$ |
9.11 |
|
|
|
|
|
|
|
|
|
|
|
|
|
|
|
|
|
|
|
|
|
|
|
|
|
|
|
|
| |
|
|
3.26% |
|
|
|
8.50% |
|
|
|
(0.17)% |
|
|
|
6.94% |
|
|
|
9.80% |
|
|
|
|
|
|
|
RATIOS/SUPPLEMENTAL DATA: |
|
|
|
|
|
|
|
|
|
|
|
|
|
|
|
|
|
|
|
|
Net assets, end of year (in 000’s) |
|
$ |
45,940 |
|
|
$ |
39,777 |
|
|
$ |
41,991 |
|
|
$ |
52,950 |
|
|
$ |
49,187 |
|
Ratios to average net assets |
|
|
|
|
|
|
|
|
|
|
|
|
|
|
|
|
|
|
|
|
Expenses, before waiver and reimbursement |
|
|
1.34% |
|
|
|
1.35% |
|
|
|
1.44% |
|
|
|
1.32% |
|
|
|
1.29% |
|
Expenses, net waiver and reimbursement (D) |
|
|
1.29% |
|
|
|
1.31% |
|
|
|
1.39% |
|
|
|
1.27% |
|
|
|
1.24% |
|
Net investment income, before waiver and reimbursement |
|
|
4.61% |
|
|
|
4.24% |
|
|
|
3.67% |
|
|
|
3.66% |
|
|
|
4.03% |
|
Net investment income, net waiver and reimbursement (D) |
|
|
4.66% |
|
|
|
4.28% |
|
|
|
3.72% |
|
|
|
3.71% |
|
|
|
4.08% |
|
| |
|
|
91% |
|
|
|
75% |
|
|
|
12% |
|
|
|
45% |
|
|
|
27% |
|
|
(A) |
|
Per share amounts calculated using average shares method, which more appropriately presents the per share data for the period. |
|
(B) |
|
Total return calculation does not reflect sales load. |
|
(C) |
|
Total return in the above table represents the rate that the investor would have earned or lost on an investment in the Fund assuming reinvestment of dividends. Total return would have been higher or lower if certain expenses had not been reimbursed, waived or recouped. |
|
(D) |
|
This expense decrease from the voluntary waiver is reflected in both the net expense and the net investment income ratios shown. |
The table below sets forth data for one share of capital stock outstanding throughout each period represented.
The Financial Highlights Table is intended to help you understand the Fund’s financial performance for the past five years (or, if shorter, the periods since the Fund’s inception). Certain information reflects financial results for a single Fund share. The total returns in the table represent the rate that an investor would have earned (or lost) on an investment in the Fund (assuming reinvestment of all dividends and distributions). The information contained in the tables for the years ended September 30, 2016, 2017, 2018, 2019 and 2020, have been audited by Cohen & Company, Ltd., Independent Registered Public Accounting Firm, whose report, along with the Fund’s financial statements, are included in the annual report, which is available upon request.
|
|
|
|
|
|
|
|
|
|
|
|
|
|
|
|
|
|
|
|
|
| |
|
For the Year
ended
September 30,
2020 |
|
|
For the Year
ended
September 30,
2019 |
|
|
For the Year
ended
September 30,
2018 |
|
|
For the Year
ended
September 30,
2017 |
|
|
For the Year
ended
September 30,
2016 |
|
|
|
|
|
|
|
|
|
|
|
|
|
|
|
|
|
|
|
|
|
|
|
|
|
|
|
|
Net asset value, beginning of year |
|
$ |
9.52 |
|
|
$ |
9.14 |
|
|
$ |
9.51 |
|
|
$ |
9.22 |
|
|
$ |
8.72 |
|
|
|
|
|
|
|
|
|
|
|
|
|
|
|
|
|
|
|
|
|
|
|
|
|
|
|
|
INCOME (LOSS) FROM INVESTMENT OPERATIONS: |
|
|
|
|
|
|
|
|
|
|
|
|
|
|
|
|
|
|
|
|
Net investment income (A) |
|
|
0.36 |
|
|
|
0.32 |
|
|
|
0.28 |
|
|
|
0.28 |
|
|
|
0.30 |
|
Net realized and unrealized gain (loss) on investments |
|
|
(0.14 |
) |
|
|
0.36 |
|
|
|
(0.36 |
) |
|
|
0.27 |
|
|
|
0.47 |
|
|
|
|
|
|
|
|
|
|
|
|
|
|
|
|
|
|
|
|
|
|
Total from investment operations |
|
|
0.22 |
|
|
|
0.68 |
|
|
|
(0.08 |
) |
|
|
0.55 |
|
|
|
0.77 |
|
|
|
|
|
|
|
|
|
|
|
|
|
|
|
|
|
|
|
|
|
|
|
|
|
|
|
|
| |
|
|
|
|
|
|
|
|
|
|
|
|
|
|
|
|
|
|
|
|
From net investment income |
|
|
(0.34 |
) |
|
|
(0.30 |
) |
|
|
(0.29 |
) |
|
|
(0.26 |
) |
|
|
(0.27 |
) |
|
|
|
|
|
|
|
|
|
|
|
|
|
|
|
|
|
|
|
|
|
| |
|
|
(0.34 |
) |
|
|
(0.30 |
) |
|
|
(0.29 |
) |
|
|
(0.26 |
) |
|
|
(0.27 |
) |
|
|
|
|
|
|
|
|
|
|
|
|
|
|
|
|
|
|
|
|
|
|
|
|
|
|
|
Net asset value, end of year |
|
$ |
9.40 |
|
|
$ |
9.52 |
|
|
$ |
9.14 |
|
|
$ |
9.51 |
|
|
$ |
9.22 |
|
|
|
|
|
|
|
|
|
|
|
|
|
|
|
|
|
|
|
|
|
|
|
|
|
|
|
|
| |
|
|
2.45% |
|
|
|
7.63% |
|
|
|
(0.85)% |
|
|
|
6.04% |
|
|
|
9.04% |
|
|
|
|
|
|
|
RATIOS/SUPPLEMENTAL DATA: |
|
|
|
|
|
|
|
|
|
|
|
|
|
|
|
|
|
|
|
|
Net assets, end of year (in 000’s) |
|
$ |
2,427 |
|
|
$ |
2,660 |
|
|
$ |
3,219 |
|
|
$ |
3,539 |
|
|
$ |
3,108 |
|
Ratios to average net assets |
|
|
|
|
|
|
|
|
|
|
|
|
|
|
|
|
|
|
|
|
Expenses, before waiver and reimbursement |
|
|
2.09% |
|
|
|
2.10% |
|
|
|
2.19% |
|
|
|
2.07% |
|
|
|
2.03% |
|
Expenses, net waiver and reimbursement (D) |
|
|
2.04% |
|
|
|
2.06% |
|
|
|
2.14% |
|
|
|
2.02% |
|
|
|
1.98% |
|
Net investment income, before waiver and reimbursement |
|
|
3.84% |
|
|
|
3.46% |
|
|
|
2.92% |
|
|
|
2.91% |
|
|
|
3.30% |
|
Net investment income, net waiver and reimbursement (D) |
|
|
3.89% |
|
|
|
3.50% |
|
|
|
2.97% |
|
|
|
2.96% |
|
|
|
3.35% |
|
| |
|
|
91% |
|
|
|
75% |
|
|
|
12% |
|
|
|
45% |
|
|
|
27% |
|
|
(A) |
|
Per share amounts calculated using average shares method, which more appropriately presents the per share data for the period. |
|
(B) |
|
Total return calculation does not reflect redemption fee. |
|
(C) |
|
Total return in the above table represents the rate that the investor would have earned or lost on an investment in the Fund assuming reinvestment of dividends. Total return would have been higher or lower if certain expenses had not been reimbursed, waived or recouped. |
|
(D) |
|
This expense decrease from the voluntary waiver is reflected in both the net expense and the net investment income ratios shown. |
ISRAEL COMMON VALUES FUND
(CLASS A)
The table below sets forth data for one share of capital stock outstanding throughout each period represented.
The Financial Highlights Table is intended to help you understand the Fund’s financial performance for the past five years (or, if shorter, the periods since the Fund’s inception). Certain information reflects financial results for a single Fund share. The total returns in the table represent the rate that an investor would have earned (or lost) on an investment in the Fund (assuming reinvestment of all dividends and distributions). The information contained in the tables for the years ended September 30, 2016, 2017, 2018, 2019 and 2020, have been audited by Cohen & Company, Ltd., Independent Registered Public Accounting Firm, whose report, along with the Fund’s financial statements, are included in the annual report, which is available upon request.
|
|
|
|
|
|
|
|
|
|
|
|
|
|
|
|
|
|
|
|
|
| |
|
For the Year
ended
September 30,
2020 |
|
|
For the Year
ended
September 30,
2019 |
|
|
For the Year
ended
September 30,
2018 |
|
|
For the Year
ended
September 30,
2017 |
|
|
For the Year
ended
September 30,
2016 |
|
|
|
|
|
|
|
|
|
|
|
|
|
|
|
|
|
|
|
|
|
|
|
|
|
|
|
|
Net asset value, beginning of year |
|
$ |
17.84 |
|
|
$ |
15.74 |
|
|
$ |
14.91 |
|
|
$ |
12.45 |
|
|
$ |
11.10 |
|
|
|
|
|
|
|
|
|
|
|
|
|
|
|
|
|
|
|
|
|
|
|
|
|
|
|
|
INCOME (LOSS) FROM INVESTMENT OPERATIONS: |
|
|
|
|
|
|
|
|
|
|
|
|
|
|
|
|
|
|
|
|
Net investment income (loss) (A) |
|
|
(0.10 |
) |
|
|
0.00 |
* |
|
|
(0.04 |
) |
|
|
0.07 |
|
|
|
(0.09 |
) |
Net realized and unrealized gain (loss) on investments |
|
|
(1.01 |
) |
|
|
2.20 |
|
|
|
1.07 |
|
|
|
2.58 |
|
|
|
1.44 |
|
|
|
|
|
|
|
|
|
|
|
|
|
|
|
|
|
|
|
|
|
|
Total from investment operations |
|
|
(1.11 |
) |
|
|
2.20 |
|
|
|
1.03 |
|
|
|
2.65 |
|
|
|
1.35 |
|
|
|
|
|
|
|
|
|
|
|
|
|
|
|
|
|
|
|
|
|
|
|
|
|
|
|
|
| |
|
|
|
|
|
|
|
|
|
|
|
|
|
|
|
|
|
|
|
|
From net investment income |
|
|
(0.18 |
) |
|
|
- |
|
|
|
(0.14 |
) |
|
|
(0.19 |
) |
|
|
- |
|
From net realized gains on investments |
|
|
- |
|
|
|
(0.10 |
) |
|
|
- |
|
|
|
- |
|
|
|
- |
|
| |
|
|
0.00 |
* |
|
|
- |
|
|
|
(0.06 |
) |
|
|
- |
|
|
|
- |
|
|
|
|
|
|
|
|
|
|
|
|
|
|
|
|
|
|
|
|
|
|
| |
|
|
(0.18 |
) |
|
|
(0.10 |
) |
|
|
(0.20 |
) |
|
|
(0.19 |
) |
|
|
- |
|
|
|
|
|
|
|
|
|
|
|
|
|
|
|
|
|
|
|
|
|
|
|
|
|
|
|
|
Net asset value, end of year |
|
$ |
16.55 |
|
|
$ |
17.84 |
|
|
$ |
15.74 |
|
|
$ |
14.91 |
|
|
$ |
12.45 |
|
|
|
|
|
|
|
|
|
|
|
|
|
|
|
|
|
|
|
|
|
|
|
|
|
|
|
|
| |
|
|
(6.35)% |
|
|
|
14.12% |
|
|
|
7.00% |
|
|
|
21.62% |
|
|
|
12.16% |
|
|
|
|
|
|
|
RATIOS/SUPPLEMENTAL DATA: |
|
|
|
|
|
|
|
|
|
|
|
|
|
|
|
|
|
|
|
|
Net assets, end of year (in 000’s) |
|
$ |
36,800 |
|
|
$ |
49,123 |
|
|
$ |
41,137 |
|
|
$ |
34,958 |
|
|
$ |
16,030 |
|
Ratio of expenses to average net assets |
|
|
1.84% |
|
|
|
1.76% |
|
|
|
1.84% |
|
|
|
1.80% |
|
|
|
1.96% |
|
Ratio of net investment income (loss) to average net assets |
|
|
(0.62)% |
|
|
|
0.02% |
|
|
|
(0.27)% |
|
|
|
0.54% |
|
|
|
(0.82)% |
|
| |
|
|
16% |
|
|
|
23% |
|
|
|
9% |
|
|
|
10% |
|
|
|
38% |
|
*Amount is less than $0.005 per share.
|
(A) |
|
Per share amounts calculated using average shares method, which more appropriately presents the per share data for the period. |
|
(B) |
|
Total return calculation does not reflect sales load. |
|
(C) |
|
Total return in the above table represents the rate that the investor would have earned or lost on an investment in the Fund assuming reinvestment of dividends. |
ISRAEL COMMON VALUES FUND
(CLASS C)
The table below sets forth data for one share of capital stock outstanding throughout each period represented.
The Financial Highlights Table is intended to help you understand the Fund’s financial performance for the past five years (or, if shorter, the periods since the Fund’s inception). Certain information reflects financial results for a single Fund share. The total returns in the table represent that rate that an investor would have earned (or lost) on an investment in the Fund (assuming reinvestment of all dividends and distributions). The information contained in the tables for the years ended September 30, 2016, 2017, 2018, 2019 and 2020, have been audited by Cohen & Company, Ltd., Independent Registered Public Accounting Firm, whose report, along with the Fund’s financial statements, are included in the annual report, which is available upon request.
|
|
|
|
|
|
|
|
|
|
|
|
|
|
|
|
|
|
|
|
|
| |
|
For the Year
ended
September 30,
2020 |
|
|
For the Year
ended
September 30,
2019 |
|
|
For the Year
ended
September 30,
2018 |
|
|
For the Year
ended
September 30,
2017 |
|
|
For the Year
ended
September 30,
2016 |
|
|
|
|
|
|
|
|
|
|
|
|
|
|
|
|
|
|
|
|
|
|
|
|
|
|
|
|
Net asset value, beginning of year |
|
$ |
16.97 |
|
|
$ |
15.09 |
|
|
$ |
14.33 |
|
|
$ |
12.01 |
|
|
$ |
10.78 |
|
|
|
|
|
|
|
|
|
|
|
|
|
|
|
|
|
|
|
|
|
|
|
|
|
|
|
|
INCOME (LOSS) FROM INVESTMENT OPERATIONS: |
|
|
|
|
|
|
|
|
|
|
|
|
|
|
|
|
|
|
|
|
| |
|
|
(0.22 |
) |
|
|
(0.12 |
) |
|
|
(0.15 |
) |
|
|
(0.03 |
) |
|
|
(0.18 |
) |
Net realized and unrealized gain (loss) on investments |
|
|
(0.96 |
) |
|
|
2.10 |
|
|
|
1.03 |
|
|
|
2.48 |
|
|
|
1.41 |
|
|
|
|
|
|
|
|
|
|
|
|
|
|
|
|
|
|
|
|
|
|
Total from investment operations |
|
|
(1.18 |
) |
|
|
1.98 |
|
|
|
0.88 |
|
|
|
2.45 |
|
|
|
1.23 |
|
|
|
|
|
|
|
|
|
|
|
|
|
|
|
|
|
|
|
|
|
|
|
|
|
|
|
|
| |
|
|
|
|
|
|
|
|
|
|
|
|
|
|
|
|
|
|
|
|
From net investment income |
|
|
(0.06 |
) |
|
|
- |
|
|
|
(0.07 |
) |
|
|
(0.13 |
) |
|
|
- |
|
From net realized gains on investments |
|
|
- |
|
|
|
(0.10 |
) |
|
|
- |
|
|
|
- |
|
|
|
- |
|
| |
|
|
0.00 |
* |
|
|
- |
|
|
|
(0.05 |
) |
|
|
- |
|
|
|
- |
|
|
|
|
|
|
|
|
|
|
|
|
|
|
|
|
|
|
|
|
|
|
| |
|
|
(0.06 |
) |
|
|
(0.10 |
) |
|
|
(0.12 |
) |
|
|
(0.13 |
) |
|
|
- |
|
|
|
|
|
|
|
|
|
|
|
|
|
|
|
|
|
|
|
|
|
|
|
|
|
|
|
|
Net asset value, end of year |
|
$ |
15.73 |
|
|
$ |
16.97 |
|
|
$ |
15.09 |
|
|
$ |
14.33 |
|
|
$ |
12.01 |
|
|
|
|
|
|
|
|
|
|
|
|
|
|
|
|
|
|
|
|
|
|
|
|
|
|
|
|
| |
|
|
(7.00)% |
|
|
|
13.26% |
|
|
|
6.20% |
|
|
|
20.60% |
|
|
|
11.41% |
|
|
|
|
|
|
|
RATIOS/SUPPLEMENTAL DATA: |
|
|
|
|
|
|
|
|
|
|
|
|
|
|
|
|
|
|
|
|
Net assets, end of year (in 000’s) |
|
$ |
9,076 |
|
|
$ |
9,750 |
|
|
$ |
9,220 |
|
|
$ |
7,905 |
|
|
$ |
4,144 |
|
Ratio of expenses to average net assets |
|
|
2.59% |
|
|
|
2.51% |
|
|
|
2.59% |
|
|
|
2.56% |
|
|
|
2.71% |
|
Ratio of net investment loss to average net assets |
|
|
(1.37)% |
|
|
|
(0.75)% |
|
|
|
(1.01)% |
|
|
|
(0.21)% |
|
|
|
(1.57)% |
|
| |
|
|
16% |
|
|
|
23% |
|
|
|
9% |
|
|
|
10% |
|
|
|
38% |
|
*Amount is less than $0.005 per share.
|
(A) |
|
Per share amounts calculated using average shares method, which more appropriately presents the per share data for the period. |
|
(B) |
|
Total return calculation does not reflect redemption fee. |
|
(C) |
|
Total return in the above table represents the rate that the investor would have earned or lost on an investment in the Fund assuming reinvestment of dividends. |
DEFENSIVE STRATEGIES FUND
(CLASS A)
The table below sets forth data for one share of capital stock outstanding throughout each period represented.
The Financial Highlights Table is intended to help you understand the Fund’s financial performance for the past five years (or, if shorter, the periods since the Fund’s inception). Certain information reflects financial results for a single Fund share. The total returns in the table represent the rate that an investor would have earned (or lost) on an investment in the Fund (assuming reinvestment of all dividends and distributions). The information contained in the tables for the years ended September 30, 2016, 2017, 2018, 2019 and 2020, have been audited by Cohen & Company, Ltd., Independent Registered Public Accounting Firm, whose report, along with the Fund’s financial statements, are included in the annual report, which is available upon request.
|
|
|
|
|
|
|
|
|
|
|
|
|
|
|
|
|
|
|
|
|
| |
|
For the Year
ended
September 30,
2020 |
|
|
For the Year
ended
September 30,
2019 |
|
|
For the Year
ended
September 30,
2018 |
|
|
For the Year
ended
September 30,
2017 |
|
|
For the Year
ended
September 30,
2016 |
|
|
|
|
|
|
|
|
|
|
|
|
|
|
|
|
|
|
|
|
|
|
|
|
|
|
|
|
Net asset value, beginning of year |
|
$ |
11.69 |
|
|
$ |
11.44 |
|
|
$ |
11.37 |
|
|
$ |
11.49 |
|
|
$ |
10.54 |
|
|
|
|
|
|
|
|
|
|
|
|
|
|
|
|
|
|
|
|
|
|
|
|
|
|
|
|
INCOME (LOSS) FROM INVESTMENT OPERATIONS: |
|
|
|
|
|
|
|
|
|
|
|
|
|
|
|
|
|
|
|
|
Net investment income (loss) (A) |
|
|
(0.01 |
) |
|
|
0.06 |
|
|
|
0.10 |
|
|
|
0.00 |
* |
|
|
0.04 |
|
Net realized and unrealized gain (loss) on investments |
|
|
0.44 |
|
|
|
0.48 |
|
|
|
(0.01 |
) |
|
|
(0.08 |
) |
|
|
0.91 |
|
|
|
|
|
|
|
|
|
|
|
|
|
|
|
|
|
|
|
|
|
|
Total from investment operations |
|
|
0.43 |
|
|
|
0.54 |
|
|
|
0.09 |
|
|
|
(0.08 |
) |
|
|
0.95 |
|
|
|
|
|
|
|
|
|
|
|
|
|
|
|
|
|
|
|
|
|
|
|
|
|
|
|
|
| |
|
|
|
|
|
|
|
|
|
|
|
|
|
|
|
|
|
|
|
|
From net investment income |
|
|
(0.06 |
) |
|
|
(0.11 |
) |
|
|
(0.02 |
) |
|
|
(0.04 |
) |
|
|
- |
|
From net realized gains on investments |
|
|
(0.28 |
) |
|
|
(0.18 |
) |
|
|
- |
|
|
|
- |
|
|
|
- |
|
| |
|
|
0.00 |
* |
|
|
- |
|
|
|
- |
|
|
|
- |
|
|
|
- |
|
|
|
|
|
|
|
|
|
|
|
|
|
|
|
|
|
|
|
|
|
|
| |
|
|
(0.34 |
) |
|
|
(0.29 |
) |
|
|
(0.02 |
) |
|
|
(0.04 |
) |
|
|
- |
|
|
|
|
|
|
|
|
|
|
|
|
|
|
|
|
|
|
|
|
|
|
|
|
|
|
|
|
Net asset value, end of year |
|
$ |
11.78 |
|
|
$ |
11.69 |
|
|
$ |
11.44 |
|
|
$ |
11.37 |
|
|
$ |
11.49 |
|
|
|
|
|
|
|
|
|
|
|
|
|
|
|
|
|
|
|
|
|
|
|
|
|
|
|
|
| |
|
|
3.75% |
|
|
|
4.92% |
|
|
|
0.75% |
|
|
|
(0.72)% |
|
|
|
9.01% |
|
|
|
|
|
|
|
RATIOS/SUPPLEMENTAL DATA: |
|
|
|
|
|
|
|
|
|
|
|
|
|
|
|
|
|
|
|
|
Net assets, end of year (in 000’s) |
|
$ |
29,577 |
|
|
$ |
33,926 |
|
|
$ |
40,573 |
|
|
$ |
50,080 |
|
|
$ |
68,706 |
|
Ratios to average net assets |
|
|
|
|
|
|
|
|
|
|
|
|
|
|
|
|
|
|
|
|
Expenses, before waiver and reimbursement |
|
|
1.54% |
|
|
|
1.45% |
|
|
|
1.41% |
|
|
|
1.44% |
|
|
|
1.35% |
|
Expenses, net waiver and reimbursement (D) |
|
|
1.49% |
|
|
|
1.41% |
|
|
|
1.36% |
|
|
|
1.39% |
|
|
|
1.30% |
|
Net investment income, before waiver and reimbursement |
|
|
(0.13)% |
|
|
|
0.52% |
|
|
|
0.86% |
|
|
|
(0.05)% |
|
|
|
0.35% |
|
Net investment income, net waiver and reimbursement (D) |
|
|
(0.08)% |
|
|
|
0.56% |
|
|
|
0.91% |
|
|
|
0.00% |
|
|
|
0.40% |
|
| |
|
|
49% |
|
|
|
34% |
|
|
|
35% |
|
|
|
51% |
|
|
|
58% |
|
*Amount is less than $0.005 per share.
|
(A) |
|
Per share amounts calculated using average shares method, which more appropriately presents the per share data for the period. |
|
(B) |
|
Total return calculation does not reflect sales load. Total return represents aggregate total return based on Net Asset Value. |
|
(C) |
|
Total return in the above table represents the rate that the investor would have earned or lost on an investment in the Fund assuming reinvestment of dividends. Total return would have been higher or lower if certain expenses had not been reimbursed, waived or recouped. |
|
(D) |
|
This expense decrease from the voluntary waiver is reflected in both the net expense and the net investment income ratios shown. |
DEFENSIVE STRATEGIES FUND
(CLASS C)
The table below sets forth data for one share of capital stock outstanding throughout each period represented.
The Financial Highlights Table is intended to help you understand the Fund’s financial performance for the past five years (or, if shorter, the periods since the Fund’s inception). Certain information reflects financial results for a single Fund share. The total returns in the table represent the rate that an investor would have earned (or lost) on an investment in the Fund (assuming reinvestment of all dividends and distributions). The information contained in the tables for the years ended September 30, 2016, 2017, 2018, 2019 and 2020, have been audited by Cohen & Company, Ltd., Independent Registered Public Accounting Firm, whose report, along with the Fund’s financial statements, are included in the annual report, which is available upon request.
|
|
|
|
|
|
|
|
|
|
|
|
|
|
|
|
|
|
|
|
|
| |
|
For the Year
ended
September 30,
2020 |
|
|
For the Year
ended
September 30,
2019 |
|
|
For the Year
ended
September 30,
2018 |
|
|
For the Year
ended
September 30,
2017 |
|
|
For the Year
ended
September 30,
2016 |
|
|
|
|
|
|
|
|
|
|
|
|
|
|
|
|
|
|
|
|
|
|
|
|
|
|
|
|
Net asset value, beginning of year |
|
$ |
11.13 |
|
|
$ |
10.90 |
|
|
$ |
10.90 |
|
|
$ |
11.07 |
|
|
$ |
10.22 |
|
|
|
|
|
|
|
|
|
|
|
|
|
|
|
|
|
|
|
|
|
|
|
|
|
|
|
|
INCOME (LOSS) FROM INVESTMENT OPERATIONS: |
|
|
|
|
|
|
|
|
|
|
|
|
|
|
|
|
|
|
|
|
Net investment income (loss) (A) |
|
|
(0.09 |
) |
|
|
(0.03 |
) |
|
|
0.02 |
|
|
|
(0.08 |
) |
|
|
(0.04 |
) |
Net realized and unrealized gain (loss) on investments |
|
|
0.42 |
|
|
|
0.46 |
|
|
|
(0.02 |
) |
|
|
(0.09 |
) |
|
|
0.89 |
(B) |
|
|
|
|
|
|
|
|
|
|
|
|
|
|
|
|
|
|
|
|
|
Total from investment operations |
|
|
0.33 |
|
|
|
0.43 |
|
|
|
0.00 |
|
|
|
(0.17 |
) |
|
|
0.85 |
|
|
|
|
|
|
|
|
|
|
|
|
|
|
|
|
|
|
|
|
|
|
|
|
|
|
|
|
| |
|
|
|
|
|
|
|
|
|
|
|
|
|
|
|
|
|
|
|
|
From net investment income |
|
|
- |
|
|
|
(0.02 |
) |
|
|
- |
|
|
|
- |
|
|
|
- |
|
From net realized gains on investments |
|
|
(0.28 |
) |
|
|
(0.18 |
) |
|
|
- |
|
|
|
- |
|
|
|
- |
|
| |
|
|
0.00 |
* |
|
|
- |
|
|
|
- |
|
|
|
- |
|
|
|
- |
|
|
|
|
|
|
|
|
|
|
|
|
|
|
|
|
|
|
|
|
|
|
| |
|
|
(0.28 |
) |
|
|
(0.20 |
) |
|
|
- |
|
|
|
- |
|
|
|
- |
|
|
|
|
|
|
|
|
|
|
|
|
|
|
|
|
|
|
|
|
|
|
|
|
|
|
|
|
Net asset value, end of year |
|
$ |
11.18 |
|
|
$ |
11.13 |
|
|
$ |
10.90 |
|
|
$ |
10.90 |
|
|
$ |
11.07 |
|
|
|
|
|
|
|
|
|
|
|
|
|
|
|
|
|
|
|
|
|
|
|
|
|
|
|
|
| |
|
|
3.01% |
|
|
|
4.06% |
|
|
|
0.00% |
|
|
|
(1.54)% |
|
|
|
8.32% |
|
|
|
|
|
|
|
RATIOS/SUPPLEMENTAL DATA: |
|
|
|
|
|
|
|
|
|
|
|
|
|
|
|
|
|
|
|
|
Net assets, end of year (in 000’s) |
|
$ |
2,464 |
|
|
$ |
3,110 |
|
|
$ |
5,432 |
|
|
$ |
6,683 |
|
|
$ |
9,630 |
|
Ratios to average net assets |
|
|
|
|
|
|
|
|
|
|
|
|
|
|
|
|
|
|
|
|
Expenses, before waiver and reimbursement |
|
|
2.29% |
|
|
|
2.20% |
|
|
|
2.16% |
|
|
|
2.21% |
|
|
|
2.07% |
|
Expenses, net waiver and reimbursement (E) |
|
|
2.24% |
|
|
|
2.16% |
|
|
|
2.11% |
|
|
|
2.16% |
|
|
|
2.02% |
|
Net investment income (loss), before waiver and reimbursement |
|
|
(0.89)% |
|
|
|
(0.31)% |
|
|
|
0.09% |
|
|
|
(0.79)% |
|
|
|
(0.46)% |
|
Net investment income (loss), net waiver and reimbursement (E) |
|
|
(0.84)% |
|
|
|
(0.27)% |
|
|
|
0.14% |
|
|
|
(0.74)% |
|
|
|
(0.41)% |
|
| |
|
|
49 % |
|
|
|
34 % |
|
|
|
35 % |
|
|
|
51 % |
|
|
|
58 % |
|
*Amount is less than $0.005 per share.
|
(A) |
|
Per share amounts calculated using average shares method, which more appropriately presents the per share data for the period. |
|
(B) |
|
Realized and unrealized gains per share in this caption are balancing amounts necessary to reconcile the change in net asset value per share for the period, and may not reconcile with the aggregate gains and losses in the Statements of Operations due to share transactions for the period. |
|
(C) |
|
Total return calculation does not reflect redemption fee. Total return represents aggregate total return based on Net Asset Value. |
|
(D) |
|
Total return in the above table represents the rate that the investor would have earned or lost on an investment in the Fund assuming reinvestment of dividends. Total return would have been higher or lower if certain expenses had not been reimbursed, waived or recouped. |
|
(E) |
|
This expense decrease from the voluntary waiver is reflected in both the net expense and the net investment income ratios shown. |
The table below sets forth data for one share of capital stock outstanding throughout each period represented.
The Financial Highlights Table is intended to help you understand the Fund’s financial performance for the past five years (or, if shorter, the periods since the Fund’s inception). Certain information reflects financial results for a single Fund share. The total returns in the table represent the rate that an investor would have earned (or lost) on an investment in the Fund (assuming reinvestment of all dividends and distributions). The information contained in the tables for the years ended September 30, , 2016, 2017, 2018, 2019 and 2020, have been audited by Cohen & Company, Ltd., Independent Registered Public Accounting Firm, whose report, along with the Fund’s financial statements, are included in the annual report, which is available upon request.
|
|
|
|
|
|
|
|
|
|
|
|
|
|
|
|
|
|
|
|
|
| |
|
For the Year
ended
September 30,
2020 |
|
|
For the Year
ended
September 30,
2019 |
|
|
For the Year
ended
September 30,
2018 |
|
|
For the Year
ended
September 30,
2017 |
|
|
For the Year
ended
September 30,
2016 |
|
|
|
|
|
|
|
|
|
|
|
|
|
|
|
|
|
|
|
|
|
|
|
|
|
|
|
|
Net asset value, beginning of year |
|
$ |
10.60 |
|
|
$ |
10.87 |
|
|
$ |
11.28 |
|
|
$ |
10.76 |
|
|
$ |
10.53 |
|
|
|
|
|
|
|
|
|
|
|
|
|
|
|
|
|
|
|
|
|
|
|
|
|
|
|
|
INCOME (LOSS) FROM INVESTMENT OPERATIONS: |
|
|
|
|
|
|
|
|
|
|
|
|
|
|
|
|
|
|
|
|
Net investment income (A) |
|
|
0.09 |
|
|
|
0.04 |
|
|
|
0.01 |
|
|
|
0.01 |
|
|
|
0.03 |
|
Net realized and unrealized gain (loss) on investments |
|
|
(0.47 |
) |
|
|
(0.07 |
) |
|
|
(0.14 |
) |
|
|
0.52 |
|
|
|
0.22 |
|
|
|
|
|
|
|
|
|
|
|
|
|
|
|
|
|
|
|
|
|
|
Total from investment operations |
|
|
(0.38 |
) |
|
|
(0.03 |
) |
|
|
(0.13 |
) |
|
|
0.53 |
|
|
|
0.25 |
|
|
|
|
|
|
|
|
|
|
|
|
|
|
|
|
|
|
|
|
|
|
|
|
|
|
|
|
| |
|
|
|
|
|
|
|
|
|
|
|
|
|
|
|
|
|
|
|
|
From net investment income |
|
|
(0.11 |
) |
|
|
(0.05 |
) |
|
|
(0.01 |
) |
|
|
(0.01 |
) |
|
|
(0.02 |
) |
From net realized gains on investments |
|
|
- |
|
|
|
(0.19 |
) |
|
|
(0.27 |
) |
|
|
- |
|
|
|
- |
|
| |
|
|
0.00 |
* |
|
|
(0.00 |
) * |
|
|
- |
|
|
|
- |
|
|
|
- |
|
|
|
|
|
|
|
|
|
|
|
|
|
|
|
|
|
|
|
|
|
|
| |
|
|
(0.11 |
) |
|
|
(0.24 |
) |
|
|
(0.28 |
) |
|
|
(0.01 |
) |
|
|
(0.02 |
) |
|
|
|
|
|
|
|
|
|
|
|
|
|
|
|
|
|
|
|
|
|
|
|
|
|
|
|
Net asset value, end of year |
|
$ |
10.11 |
|
|
$ |
10.60 |
|
|
$ |
10.87 |
|
|
$ |
11.28 |
|
|
$ |
10.76 |
|
|
|
|
|
|
|
|
|
|
|
|
|
|
|
|
|
|
|
|
|
|
|
|
|
|
|
|
| |
|
|
(3.48)% |
|
|
|
(0.10)% |
|
|
|
(1.22)% |
|
|
|
4.91% |
|
|
|
2.36% |
|
|
|
|
|
|
|
RATIOS/SUPPLEMENTAL DATA: |
|
|
|
|
|
|
|
|
|
|
|
|
|
|
|
|
|
|
|
|
Net assets, end of year (in 000’s) |
|
$ |
13,295 |
|
|
$ |
14,500 |
|
|
$ |
27,716 |
|
|
$ |
30,426 |
|
|
$ |
36,486 |
|
Ratios to average net assets |
|
|
|
|
|
|
|
|
|
|
|
|
|
|
|
|
|
|
|
|
Expenses, before waiver and reimbursement |
|
|
1.85% |
|
|
|
1.69% |
|
|
|
1.70% |
|
|
|
1.59% |
|
|
|
1.59% |
|
Expenses, net waiver and reimbursement (D) |
|
|
1.50% |
|
|
|
1.65% |
|
|
|
1.65% |
|
|
|
1.54% |
|
|
|
1.54% |
|
Net investment income, before waiver and reimbursement |
|
|
0.55% |
|
|
|
0.37% |
|
|
|
0.08% |
|
|
|
0.03% |
|
|
|
0.20% |
|
Net investment income, net waiver and reimbursement (D) |
|
|
0.90% |
|
|
|
0.42% |
|
|
|
0.13% |
|
|
|
0.08% |
|
|
|
0.25% |
|
| |
|
|
39% |
|
|
|
167% |
|
|
|
56% |
|
|
|
118% |
|
|
|
45% |
|
*Amount is less than $0.005 per share
|
(A) |
|
Per share amounts calculated using average shares method, which more appropriately presents the per share data for the period. |
|
(B) |
|
Total return calculation does not reflect sales load. |
|
(C) |
|
Total return in the above table represents the rate that the investor would have earned or lost on an investment in the Fund assuming reinvestment of dividends. Total return would have been higher or lower if certain expenses had not been reimbursed, waived or recouped. |
|
(D) |
|
This expense decrease from the voluntary waiver is reflected in both the net expense and the net investment income ratios shown. |
The table below sets forth data for one share of capital stock outstanding throughout each period represented.
The Financial Highlights Table is intended to help you understand the Fund’s financial performance for the past five years (or, if shorter, the periods since the Fund’s inception). Certain information reflects financial results for a single Fund share. The total returns in the table represent the rate that an investor would have earned (or lost) on an investment in the Fund (assuming reinvestment of all dividends and distributions). The information contained in the tables for the years ended September 30, 2016, 2017, 2018, 2019 and 2020, have been audited by Cohen & Company, Ltd., Independent Registered Public Accounting Firm, whose report, along with the Fund’s financial statements, are included in the annual report, which is available upon request.
|
|
|
|
|
|
|
|
|
|
|
|
|
|
|
|
|
|
|
|
|
| |
|
For the Year
ended
September 30,
2020 |
|
|
For the Year
ended
September 30,
2019 |
|
|
For the Year
ended
September 30,
2018 |
|
|
For the Year
ended
September 30,
2017 |
|
|
For the Year
ended
September 30,
2016 |
|
|
|
|
|
|
|
|
|
|
|
|
|
|
|
|
|
|
|
|
|
|
|
|
|
|
|
|
Net asset value, beginning of year |
|
$ |
10.21 |
|
|
$ |
10.51 |
|
|
$ |
10.99 |
|
|
$ |
10.55 |
|
|
$ |
10.39 |
|
|
|
|
|
|
|
|
|
|
|
|
|
|
|
|
|
|
|
|
|
|
|
|
|
|
|
|
INCOME (LOSS) FROM INVESTMENT OPERATIONS: |
|
|
|
|
|
|
|
|
|
|
|
|
|
|
|
|
|
|
|
|
Net investment income (loss) (A) |
|
|
0.02 |
|
|
|
(0.03 |
) |
|
|
(0.07 |
) |
|
|
(0.07 |
) |
|
|
(0.06 |
) |
Net realized and unrealized gain (loss) on investments |
|
|
(0.45 |
) |
|
|
(0.07 |
) |
|
|
(0.14 |
) |
|
|
0.51 |
|
|
|
0.22 |
(B) |
|
|
|
|
|
|
|
|
|
|
|
|
|
|
|
|
|
|
|
|
|
Total from investment operations |
|
|
(0.43 |
) |
|
|
(0.10 |
) |
|
|
(0.21 |
) |
|
|
0.44 |
|
|
|
0.16 |
|
|
|
|
|
|
|
|
|
|
|
|
|
|
|
|
|
|
|
|
|
|
|
|
|
|
|
|
| |
|
|
|
|
|
|
|
|
|
|
|
|
|
|
|
|
|
|
|
|
From net investment income |
|
|
(0.04 |
) |
|
|
(0.01 |
) |
|
|
- |
|
|
|
- |
|
|
|
- |
|
From net realized gains on investments |
|
|
- |
|
|
|
(0.19 |
) |
|
|
(0.27 |
) |
|
|
- |
|
|
|
- |
|
| |
|
|
0.00 |
* |
|
|
(0.00 |
) * |
|
|
- |
|
|
|
- |
|
|
|
- |
|
|
|
|
|
|
|
|
|
|
|
|
|
|
|
|
|
|
|
|
|
|
| |
|
|
(0.04 |
) |
|
|
(0.20 |
) |
|
|
(0.27 |
) |
|
|
- |
|
|
|
- |
|
|
|
|
|
|
|
|
|
|
|
|
|
|
|
|
|
|
|
|
|
|
|
|
|
|
|
|
Net asset value, end of year |
|
$ |
9.74 |
|
|
$ |
10.21 |
|
|
$ |
10.51 |
|
|
$ |
10.99 |
|
|
$ |
10.55 |
|
|
|
|
|
|
|
|
|
|
|
|
|
|
|
|
|
|
|
|
|
|
|
|
|
|
|
|
| |
|
|
(4.20)% |
|
|
|
(0.82)% |
|
|
|
(1.97)% |
|
|
|
4.17% |
|
|
|
1.54% |
|
|
|
|
|
|
|
RATIOS/SUPPLEMENTAL DATA: |
|
|
|
|
|
|
|
|
|
|
|
|
|
|
|
|
|
|
|
|
Net assets, end of year (in 000’s) |
|
$ |
1,719 |
|
|
$ |
2,388 |
|
|
$ |
3,176 |
|
|
$ |
3,006 |
|
|
$ |
3,028 |
|
Ratios to average net assets |
|
|
|
|
|
|
|
|
|
|
|
|
|
|
|
|
|
|
|
|
Expenses, before waiver and reimbursement |
|
|
2.60% |
|
|
|
2.44% |
|
|
|
2.45% |
|
|
|
2.34% |
|
|
|
2.32% |
|
Expenses, net waiver and reimbursement (E) |
|
|
2.25% |
|
|
|
2.40% |
|
|
|
2.40% |
|
|
|
2.29% |
|
|
|
2.28% |
|
Net investment income (loss), before waiver and reimbursement |
|
|
(0.19%) |
|
|
|
(0.34%) |
|
|
|
(0.67%) |
|
|
|
(0.73%) |
|
|
|
(0.61%) |
|
Net investment income (loss), net waiver and reimbursement (E) |
|
|
0.16% |
|
|
|
(0.29%) |
|
|
|
(0.62%) |
|
|
|
(0.68%) |
|
|
|
(0.56%) |
|
| |
|
|
39% |
|
|
|
167% |
|
|
|
56% |
|
|
|
118% |
|
|
|
45% |
|
*Amount is less than $0.005 per share
|
(A) |
|
Per share amounts calculated using average shares method, which more appropriately presents the per share data for the period. |
|
(B) |
|
Realized and unrealized gains per share in this caption are balancing amounts necessary to reconcile the change in net asset value per share for the period, and may not reconcile with the aggregate gains and losses in the Statements of Operations due to share transactions for the period. |
|
(C) |
|
Total return calculation does not reflect redemption fee. |
|
(D) |
|
Total return in the above table represents the rate that the investor would have earned or lost on an investment in the Fund assuming reinvestment of dividends. Total return would have been higher or lower if certain expenses had not been reimbursed, waived or recouped. |
|
(E) |
|
This expense decrease from the voluntary waiver is reflected in both the net expense and the net investment income ratios shown. |
The table below sets forth data for one share of capital stock outstanding throughout each period represented.
The Financial Highlights Table is intended to help you understand the Fund’s financial performance for the past five years (or, if shorter, the periods since the Fund’s inception). Certain information reflects financial results for a single Fund share. The total returns in the table represent the rate that an investor would have earned (or lost) on an investment in the Fund (assuming reinvestment of all dividends and distributions). The information contained in the tables for the years ended September 30, 2016, 2017, 2018, 2019 and 2020, have been audited by Cohen & Company, Ltd., Independent Registered Public Accounting Firm, whose report, along with the Fund’s financial statements, are included in the annual report, which is available upon request.
|
|
|
|
|
|
|
|
|
|
|
|
|
|
|
|
|
|
|
|
|
| |
|
For the Year
ended
September 30,
2020 |
|
|
For the Year
ended
September 30,
2019 |
|
|
For the Year
ended
September 30,
2018 |
|
|
For the Year
ended
September 30,
2017 |
|
|
For the Year
ended
September 30,
2016 |
|
|
|
|
|
|
|
|
|
|
|
|
|
|
|
|
|
|
|
|
|
|
|
|
|
|
|
|
Net asset value, beginning of year |
|
$ |
9.64 |
|
|
$ |
9.70 |
|
|
$ |
9.48 |
|
|
$ |
8.73 |
|
|
$ |
8.42 |
|
|
|
|
|
|
|
|
|
|
|
|
|
|
|
|
|
|
|
|
|
|
|
|
|
|
|
|
INCOME (LOSS) FROM INVESTMENT OPERATIONS: |
|
|
|
|
|
|
|
|
|
|
|
|
|
|
|
|
|
|
|
|
Net investment income (loss) (A) |
|
|
0.04 |
|
|
|
0.01 |
|
|
|
0.00 |
* |
|
|
(0.04 |
) |
|
|
(0.03 |
) |
Net realized and unrealized gain (loss) on investments |
|
|
0.16 |
|
|
|
(0.04 |
) |
|
|
0.22 |
|
|
|
0.79 |
|
|
|
0.37 |
|
|
|
|
|
|
|
|
|
|
|
|
|
|
|
|
|
|
|
|
|
|
Total from investment operations |
|
|
0.20 |
|
|
|
(0.03 |
) |
|
|
0.22 |
|
|
|
0.75 |
|
|
|
0.34 |
|
|
|
|
|
|
|
|
|
|
|
|
|
|
|
|
|
|
|
|
|
|
|
|
|
|
|
|
| |
|
|
|
|
|
|
|
|
|
|
|
|
|
|
|
|
|
|
|
|
From net investment income |
|
|
- |
|
|
|
- |
|
|
|
- |
|
|
|
- |
|
|
|
(0.03 |
) |
From net realized gains on investments |
|
|
(0.36 |
) |
|
|
(0.03 |
) |
|
|
- |
|
|
|
- |
|
|
|
- |
|
|
|
|
|
|
|
|
|
|
|
|
|
|
|
|
|
|
|
|
|
|
| |
|
|
(0.36 |
) |
|
|
(0.03 |
) |
|
|
- |
|
|
|
- |
|
|
|
(0.03 |
) |
|
|
|
|
|
|
|
|
|
|
|
|
|
|
|
|
|
|
|
|
|
|
|
|
|
|
|
Net asset value, end of year |
|
$ |
9.48 |
|
|
$ |
9.64 |
|
|
$ |
9.70 |
|
|
$ |
9.48 |
|
|
$ |
8.73 |
|
|
|
|
|
|
|
|
|
|
|
|
|
|
|
|
|
|
|
|
|
|
|
|
|
|
|
|
| |
|
|
2.03% |
|
|
|
(0.26)% |
|
|
|
2.32% |
|
|
|
8.59% |
|
|
|
4.03% |
|
|
|
|
|
|
|
RATIOS/SUPPLEMENTAL DATA: |
|
|
|
|
|
|
|
|
|
|
|
|
|
|
|
|
|
|
|
|
Net assets, end of year (in 000’s) |
|
$ |
32,260 |
|
|
$ |
32,318 |
|
|
$ |
32,078 |
|
|
$ |
32,767 |
|
|
$ |
32,800 |
|
Ratio of expenses to average net assets (D) |
|
|
1.15% |
|
|
|
1.12% |
|
|
|
1.10% |
|
|
|
1.07% |
|
|
|
1.05% |
|
Ratio of net investment income (loss), to average net assets (D)(E) |
|
|
0.42% |
|
|
|
0.16% |
|
|
|
0.00% |
|
|
|
(0.45)% |
|
|
|
(0.38)% |
|
| |
|
|
47% |
|
|
|
50% |
|
|
|
8% |
|
|
|
36% |
|
|
|
37% |
|
*Amount is less than $0.005 per share.
|
(A) |
|
Per share amounts calculated using average shares method, which more appropriately presents the per share data for the period. |
|
(B) |
|
Total return calculation does not reflect sales load. |
|
(C) |
|
Total return in the above table represents the rate that the investor would have earned or lost on an investment in the Fund assuming reinvestment of dividends. |
|
(D) |
|
These ratios exclude the impact of expenses of the underlying security holdings as represented in the Schedule of Investments. |
|
(E) |
|
Recognition of net investment income (loss) by the Fund is affected by the timing of the declaration of dividends by the underlying investment companies in which the Fund invests. |
The table below sets forth data for one share of capital stock outstanding throughout each period represented.
The Financial Highlights Table is intended to help you understand the Fund’s financial performance for the past five years (or, if shorter, the periods since the Fund’s inception). Certain information reflects financial results for a single Fund share. The total returns in the table represent the rate that an investor would have earned (or lost) on an investment in the Fund (assuming reinvestment of all dividends and distributions). The information contained in the tables for the years ended September 30, 2016, 2017, 2018, 2019 and 2020, have been audited by Cohen & Company, Ltd., Independent Registered Public Accounting Firm, whose report, along with the Fund’s financial statements, are included in the annual report, which is available upon request.
|
|
|
|
|
|
|
|
|
|
|
|
|
|
|
|
|
|
|
|
|
| |
|
For the Year
ended
September 30,
2020 |
|
|
For the Year
ended
September 30,
2019 |
|
|
For the Year
ended
September 30,
2018 |
|
|
For the Year
ended
September 30,
2017 |
|
|
For the Year
ended
September 30,
2016 |
|
|
|
|
|
|
|
|
|
|
|
|
|
|
|
|
|
|
|
|
|
|
|
|
|
|
|
|
Net asset value, beginning of year |
|
$ |
8.58 |
|
|
$ |
8.70 |
|
|
$ |
8.57 |
|
|
$ |
7.95 |
|
|
$ |
7.70 |
|
|
|
|
|
|
|
|
|
|
|
|
|
|
|
|
|
|
|
|
|
|
|
|
|
|
|
|
INCOME (LOSS) FROM INVESTMENT OPERATIONS: |
|
|
|
|
|
|
|
|
|
|
|
|
|
|
|
|
|
|
|
|
Net investment income (loss) (A) |
|
|
(0.03 |
) |
|
|
0.03 |
|
|
|
(0.06 |
) |
|
|
(0.10 |
) |
|
|
(0.08 |
) |
Net realized and unrealized gain (loss) on investments |
|
|
0.15 |
|
|
|
(0.12 |
) |
|
|
0.19 |
|
|
|
0.72 |
|
|
|
0.33 |
|
|
|
|
|
|
|
|
|
|
|
|
|
|
|
|
|
|
|
|
|
|
Total from investment operations |
|
|
0.12 |
|
|
|
(0.09 |
) |
|
|
0.13 |
|
|
|
0.62 |
|
|
|
0.25 |
|
|
|
|
|
|
|
|
|
|
|
|
|
|
|
|
|
|
|
|
|
|
|
|
|
|
|
|
| |
|
|
|
|
|
|
|
|
|
|
|
|
|
|
|
|
|
|
|
|
From net realized gains on investments |
|
|
(0.36 |
) |
|
|
(0.03 |
) |
|
|
- |
|
|
|
- |
|
|
|
- |
|
|
|
|
|
|
|
|
|
|
|
|
|
|
|
|
|
|
|
|
|
|
| |
|
|
(0.36 |
) |
|
|
(0.03 |
) |
|
|
- |
|
|
|
- |
|
|
|
- |
|
|
|
|
|
|
|
|
|
|
|
|
|
|
|
|
|
|
|
|
|
|
|
|
|
|
|
|
Net asset value, end of year |
|
$ |
8.34 |
|
|
$ |
8.58 |
|
|
$ |
8.70 |
|
|
$ |
8.57 |
|
|
$ |
7.95 |
|
|
|
|
|
|
|
|
|
|
|
|
|
|
|
|
|
|
|
|
|
|
|
|
|
|
|
|
| |
|
|
1.33% |
|
|
|
(0.99)% |
|
|
|
1.52% |
|
|
|
7.80% |
|
|
|
3.25% |
|
|
|
|
|
|
|
RATIOS/SUPPLEMENTAL DATA: |
|
|
|
|
|
|
|
|
|
|
|
|
|
|
|
|
|
|
|
|
Net assets, end of year (in 000’s) |
|
$ |
2,743 |
|
|
$ |
3,247 |
|
|
$ |
6,313 |
|
|
$ |
6,966 |
|
|
$ |
7,380 |
|
Ratio of expenses to average net assets (D) |
|
|
1.90% |
|
|
|
1.87% |
|
|
|
1.85% |
|
|
|
1.82% |
|
|
|
1.80% |
|
Ratio of net investment income (loss), to average net assets (D)(E) |
|
|
(0.32)% |
|
|
|
0.35% |
|
|
|
(0.70)% |
|
|
|
(1.18)% |
|
|
|
(1.09)% |
|
| |
|
|
47% |
|
|
|
50% |
|
|
|
8% |
|
|
|
36% |
|
|
|
37% |
|
|
(A) |
|
Per share amounts calculated using average shares method, which more appropriately presents the per share data for the period. |
|
(B) |
|
Total return calculation does not reflect redemption fee. |
|
(C) |
|
Total return in the above table represents the rate that the investor would have earned or lost on an investment in the Fund assuming reinvestment of dividends. |
|
(D) |
|
These ratios exclude the impact of expenses of the underlying security holdings as represented in the Schedule of Investments. |
|
(E) |
|
Recognition of net investment income (loss) by the Fund is affected by the timing of the declaration of dividends by the underlying investment companies in which the Fund invests. |
The table below sets forth data for one share of capital stock outstanding throughout each period represented.
The Financial Highlights Table is intended to help you understand the Fund’s financial performance for the past five years (or, if shorter, the periods since the Fund’s inception). Certain information reflects financial results for a single Fund share. The total returns in the table represent the rate that an investor would have earned (or lost) on an investment in the Fund (assuming reinvestment of all dividends and distributions). The information contained in the tables for the years ended September 30, 2016, 2017, 2018, 2019 and 2020, have been audited by Cohen & Company, Ltd., Independent Registered Public Accounting Firm, whose report, along with the Fund’s financial statements, are included in the annual report, which is available upon request.
|
|
|
|
|
|
|
|
|
|
|
|
|
|
|
|
|
|
|
|
|
| |
|
For the Year
ended
September 30,
2020 |
|
|
For the Year
ended
September 30,
2019 |
|
|
For the Year
ended
September 30,
2018 |
|
|
For the Year
ended
September 30,
2017 |
|
|
For the Year
ended
September 30,
2016 |
|
|
|
|
|
|
|
|
|
|
|
|
|
|
|
|
|
|
|
|
|
|
|
|
|
|
|
|
Net asset value, beginning of year |
|
$ |
10.66 |
|
|
$ |
10.75 |
|
|
$ |
10.67 |
|
|
$ |
10.06 |
|
|
$ |
10.32 |
|
|
|
|
|
|
|
|
|
|
|
|
|
|
|
|
|
|
|
|
|
|
|
|
|
|
|
|
INCOME (LOSS) FROM INVESTMENT OPERATIONS: |
|
|
|
|
|
|
|
|
|
|
|
|
|
|
|
|
|
|
|
|
Net investment income (loss) (A) |
|
|
0.05 |
|
|
|
0.05 |
|
|
|
0.02 |
|
|
|
(0.02 |
) |
|
|
(0.03 |
) |
Net realized and unrealized gain on investments |
|
|
0.30 |
|
|
|
0.10 |
|
|
|
0.09 |
|
|
|
0.63 |
|
|
|
0.43 |
|
|
|
|
|
|
|
|
|
|
|
|
|
|
|
|
|
|
|
|
|
|
Total from investment operations |
|
|
0.35 |
|
|
|
0.15 |
|
|
|
0.11 |
|
|
|
0.61 |
|
|
|
0.40 |
|
|
|
|
|
|
|
|
|
|
|
|
|
|
|
|
|
|
|
|
|
|
|
|
|
|
|
|
| |
|
|
|
|
|
|
|
|
|
|
|
|
|
|
|
|
|
|
|
|
From net investment income |
|
|
- |
|
|
|
- |
|
|
|
- |
|
|
|
- |
|
|
|
(0.05 |
) |
From net realized gains on investments |
|
|
(0.39 |
) |
|
|
(0.24 |
) |
|
|
(0.03 |
) |
|
|
- |
|
|
|
(0.61 |
) |
|
|
|
|
|
|
|
|
|
|
|
|
|
|
|
|
|
|
|
|
|
| |
|
|
(0.39 |
) |
|
|
(0.24 |
) |
|
|
(0.03 |
) |
|
|
- |
|
|
|
(0.66 |
) |
|
|
|
|
|
|
|
|
|
|
|
|
|
|
|
|
|
|
|
|
|
|
|
|
|
|
|
Net asset value, end of year |
|
$ |
10.62 |
|
|
$ |
10.66 |
|
|
$ |
10.75 |
|
|
$ |
10.67 |
|
|
$ |
10.06 |
|
|
|
|
|
|
|
|
|
|
|
|
|
|
|
|
|
|
|
|
|
|
|
|
|
|
|
|
| |
|
|
3.27% |
|
|
|
1.61% |
|
|
|
1.06% |
|
|
|
6.06% |
|
|
|
4.22% |
|
|
|
|
|
|
|
RATIOS/SUPPLEMENTAL DATA: |
|
|
|
|
|
|
|
|
|
|
|
|
|
|
|
|
|
|
|
|
Net assets, end of year (in 000’s) |
|
$ |
41,546 |
|
|
$ |
40,590 |
|
|
$ |
42,040 |
|
|
$ |
45,110 |
|
|
$ |
44,437 |
|
Ratio of expenses to average net assets (D) |
|
|
1.12% |
|
|
|
1.08% |
|
|
|
1.08% |
|
|
|
1.04% |
|
|
|
1.02% |
|
Ratio of net investment income (loss) to average net assets (D)(E) |
|
|
0.43% |
|
|
|
0.44% |
|
|
|
0.14% |
|
|
|
(0.20)% |
|
|
|
(0.27)% |
|
| |
|
|
37% |
|
|
|
42% |
|
|
|
7% |
|
|
|
27% |
|
|
|
27% |
|
|
(A) |
|
Per share amounts calculated using average shares method, which more appropriately presents the per share data for the period. |
|
(B) |
|
Total return calculation does not reflect sales load. |
|
(C) |
|
Total return in the above table represents the rate that the investor would have earned or lost on an investment in the Fund assuming reinvestment of dividends. |
|
(D) |
|
These ratios exclude the impact of expenses of the underlying security holdings as represented in the Schedule of Investments. |
|
(E) |
|
Recognition of net investment income (loss) by the Fund is affected by the timing of the declaration of dividends by the underlying investment companies in which the Fund invests. |
The table below sets forth data for one share of capital stock outstanding throughout each period represented.
The Financial Highlights Table is intended to help you understand the Fund’s financial performance for the past five years (or, if shorter, the periods since the Fund’s inception). Certain information reflects financial results for a single Fund share. The total returns in the table represent the rate that an investor would have earned (or lost) on an investment in the Fund (assuming reinvestment of all dividends and distributions). The information contained in the tables for the years ended September 30, 2016, 2017, 2018, 2019 and 2020, have been audited by Cohen & Company, Ltd., Independent Registered Public Accounting Firm, whose report, along with the Fund’s financial statements, are included in the annual report, which is available upon request.
|
|
|
|
|
|
|
|
|
|
|
|
|
|
|
|
|
|
|
|
|
| |
|
For the Year
ended
September 30,
2020 |
|
|
For the Year
ended
September 30,
2019 |
|
|
For the Year
ended
September 30,
2018 |
|
|
For the Year
ended
September 30,
2017 |
|
|
For the Year
ended
September 30,
2016 |
|
|
|
|
|
|
|
|
|
|
|
|
|
|
|
|
|
|
|
|
|
|
|
|
|
|
|
|
Net asset value, beginning of year |
|
$ |
9.59 |
|
|
$ |
9.76 |
|
|
$ |
9.76 |
|
|
$ |
9.27 |
|
|
$ |
9.58 |
|
|
|
|
|
|
|
|
|
|
|
|
|
|
|
|
|
|
|
|
|
|
|
|
|
|
|
|
INCOME (LOSS) FROM INVESTMENT OPERATIONS: |
|
|
|
|
|
|
|
|
|
|
|
|
|
|
|
|
|
|
|
|
Net investment income (loss) (A) |
|
|
(0.03 |
) |
|
|
0.01 |
|
|
|
(0.06 |
) |
|
|
(0.09 |
) |
|
|
(0.09 |
) |
Net realized and unrealized gain on investments |
|
|
0.26 |
|
|
|
0.06 |
|
|
|
0.09 |
(B) |
|
|
0.58 |
(B) |
|
|
0.39 |
(B) |
|
|
|
|
|
|
|
|
|
|
|
|
|
|
|
|
|
|
|
|
|
Total from investment operations |
|
|
0.23 |
|
|
|
0.07 |
|
|
|
0.03 |
|
|
|
0.49 |
|
|
|
0.30 |
|
|
|
|
|
|
|
|
|
|
|
|
|
|
|
|
|
|
|
|
|
|
|
|
|
|
|
|
| |
|
|
|
|
|
|
|
|
|
|
|
|
|
|
|
|
|
|
|
|
From net realized gains on investments |
|
|
(0.39 |
) |
|
|
(0.24 |
) |
|
|
(0.03 |
) |
|
|
- |
|
|
|
(0.61 |
) |
|
|
|
|
|
|
|
|
|
|
|
|
|
|
|
|
|
|
|
|
|
| |
|
|
(0.39 |
) |
|
|
(0.24 |
) |
|
|
(0.03 |
) |
|
|
- |
|
|
|
(0.61 |
) |
|
|
|
|
|
|
|
|
|
|
|
|
|
|
|
|
|
|
|
|
|
|
|
|
|
|
|
Net asset value, end of year |
|
$ |
9.43 |
|
|
$ |
9.59 |
|
|
$ |
9.76 |
|
|
$ |
9.76 |
|
|
$ |
9.27 |
|
|
|
|
|
|
|
|
|
|
|
|
|
|
|
|
|
|
|
|
|
|
|
|
|
|
|
|
| |
|
|
2.36% |
|
|
|
0.94% |
|
|
|
0.34% |
|
|
|
5.29% |
|
|
|
3.39% |
|
|
|
|
|
|
|
RATIOS/SUPPLEMENTAL DATA: |
|
|
|
|
|
|
|
|
|
|
|
|
|
|
|
|
|
|
|
|
Net assets, end of year (in 000’s) |
|
$ |
4,712 |
|
|
$ |
5,504 |
|
|
$ |
9,218 |
|
|
$ |
9,981 |
|
|
$ |
10,697 |
|
Ratio of expenses to average net assets (E) |
|
|
1.87% |
|
|
|
1.83% |
|
|
|
1.83% |
|
|
|
1.79% |
|
|
|
1.77% |
|
Ratio of net investment income (loss), to average net assets (E)(F) |
|
|
(0.31)% |
|
|
|
0.14% |
|
|
|
(0.63)% |
|
|
|
(0.96)% |
|
|
|
(1.01)% |
|
| |
|
|
37% |
|
|
|
42% |
|
|
|
7% |
|
|
|
27% |
|
|
|
27% |
|
|
(A) |
|
Per share amounts calculated using average shares method, which more appropriately presents the per share data for the period. |
|
(B) |
|
Realized and unrealized gains per share in this caption are balancing amounts necessary to reconcile the change in net asset value per share for the period, and may not reconcile with aggregate gains and losses in the Statement of Operations due to the timing of share transactions for the period. |
|
(C) |
|
Total return calculation does not reflect redemption fees. Total return represents aggregate total return based on Net Asset Value. |
|
(D) |
|
Total return in the above table represents the rate that the investor would have earned or lost on an investment in the Fund assuming reinvestment of dividends. |
|
(E) |
|
These ratios exclude the impact of expenses of the underlying security holdings as represented in the Schedule of Investments. |
|
(F) |
|
Recognition of net investment income (loss) by the Fund is affected by the timing of the declaration of dividends by the underlying investment companies in which the Fund invests. |
Additional information about the Funds is available in the Funds’ Class A and C SAI. The SAI contains more detailed information on all aspects of the Funds. A current SAI dated January 28, 2021, has been filed with the SEC and is incorporated by reference into (is legally a part of) this Prospectus. Additional information about each Fund’s investments is also available in the Funds’ semi- annual report, dated March 31, 2020, and audited annual report, dated September 30, 2020. In the Funds’ annual report, you will find a discussion of the market conditions and investment strategies that significantly affected each Fund’s performance during its last fiscal year.
The Funds’ SAI, annual report and semi-annual report are available, without charge upon request. To receive a copy of any of these documents or to make other types of inquiries to the Funds, please contact the Funds.
|
|
|
|
|
| |
|
Timothy Plan* |
|
Securities and Exchange Commission |
|
|
|
| |
|
(800) 846-7526 |
|
(202) 942-8090 |
| |
|
c/o Timothy Partners, Ltd. 1055 Maitland Center Commons |
|
Securities and Exchange Commission Washington, D.C. 20549-0102 (a duplicating fee required) |
| |
|
invest@timothyplan.com |
|
(a duplicating fee required) |
| |
|
http://www.timothyplan.com |
|
http://www.sec.gov |
| |
|
|
|
Securities and Exchange Commission, |
*A copy of your requested document(s) will be mailed to you within three business days of receipt of your request, by first class mail or other means designed to ensure equally prompt delivery.
Information about the Funds (including the SAI) can also be reviewed and copied at the SEC’s Public Reference Room in Washington, D.C. Information concerning the operation of the Public Reference Room may be obtained by calling the SEC at (202) 942-8090. Information about the Funds are also available on the SEC’s EDGAR database at the SEC’s web site (www.sec.gov). Copies of this information can be obtained, after paying a duplicating fee, by electronic request (publicinvest@sec.gov), or by writing the SEC’s Public Reference Section, Washington, DC 20549-0102.
Investment Company Act No. 811-08228
Intermediary-Defined Sales Charge Waiver Policies
The availability of certain initial or deferred sales charge waivers and discounts may depend on the particular financial intermediary or type of account through which you purchase or hold Fund shares.
Intermediaries may have different policies and procedures regarding the availability of front-end sales load waivers or contingent deferred (back-end) sales load (“CDSC”) waivers, which are discussed below. In all instances, it is the purchaser’s responsibility to notify the fund or the purchaser’s financial intermediary at the time of purchase of any relationship or other facts qualifying the purchaser for sales charge waivers or discounts. For waivers and discounts not available through a particular intermediary, shareholders will have to purchase fund shares directly from the fund or through another intermediary to receive these waivers or discounts.
Raymond James & Associates, Inc., Raymond James Financial Services, Inc. and each entity’s affiliates (“Raymond James”)
Effective March 1, 2019, shareholders purchasing fund shares through a Raymond James platform or account, or through an introducing broker-dealer or independent registered investment adviser for which Raymond James provides trade execution, clearance, and/or custody services, will be eligible only for the following load waivers (front-end sales charge waivers and contingent deferred, or back-end, sales charge waivers) and discounts, which may differ from those disclosed elsewhere in this fund’s prospectus or SAI.
Front-end sales load waivers on Class A shares available at Raymond James
|
|
Shares purchased in an investment advisory program. |
|
|
Shares purchased within the same fund family through a systematic reinvestment of capital gains and dividend distributions. |
|
|
Employees and registered representatives of Raymond James or its affiliates and their family members as designated by Raymond James. |
|
|
Shares purchased from the proceeds of redemptions within the same fund family, provided (1) the repurchase occurs within 90 days following the redemption, (2) the redemption and purchase occur in the same account, and (3) redeemed shares were subject to a front-end or deferred sales load (known as Rights of Reinstatement). |
|
|
A shareholder in the Fund’s Class C shares will have their shares converted at net asset value to Class A shares (or the appropriate share class) of the Fund if the shares are no longer subject to a CDSC and the conversion is in line with the policies and procedures of Raymond James. |
CDSC Waivers on Classes A, B and C shares available at Raymond James
|
|
Death or disability of the shareholder. |
|
|
Shares sold as part of a systematic withdrawal plan as described in the fund’s prospectus. |
|
|
Return of excess contributions from an IRA Account. |
|
|
Shares sold as part of a required minimum distribution for IRA and retirement accounts due to the shareholder reaching the qualified age based on applicable IRS regulations as described in the fund’s prospectus. |
|
|
Shares sold to pay Raymond James fees but only if the transaction is initiated by Raymond James. |
|
|
Shares acquired through a right of reinstatement. |
Front-end load discounts available at Raymond James: breakpoints, rights of accumulation, and/or letters of intent
|
|
Breakpoints as described in this prospectus. |
|
|
Rights of accumulation which entitle shareholders to breakpoint discounts will be automatically calculated based on the aggregated holding of fund family assets held by accounts within the purchaser’s household at Raymond James. Eligible fund family assets not held at Raymond James may be included in the calculation of rights of accumulation only if the shareholder notifies his or her financial advisor about such assets. |
|
|
Letters of intent which allow for breakpoint discounts based on anticipated purchases within a fund family, over a 13-month time period. Eligible fund family assets not held at Raymond James may be included in the calculation of letters of intent only if the shareholder notifies his or her financial advisor about such assets. |
The availability of certain sales charge waivers and discounts will depend on whether you purchase your shares directly from the Fund or through a financial intermediary. Intermediaries may have different policies and procedures regarding the availability of front-end sales load waivers or contingent deferred (back-end) sales load (“CDSC”) waivers, which are discussed below. In all instances, it is the purchaser’s responsibility to notify the Fund or the purchaser’s financial intermediary at the time of purchase of any relationship or other facts qualifying the purchaser for sales charge waivers or discounts. For waivers and discounts not available through a particular intermediary, shareholders will have to purchase Fund shares directly from the Fund or through another intermediary to receive these waivers or discounts.
Shareholders purchasing Fund shares through a Merrill Lynch platform or account will be eligible only for the following load waivers (front-end sales charge waivers and contingent deferred, or back-end, sales charge waivers) and discounts, which may differ from those disclosed elsewhere in this Fund’s prospectus or SAI.
Front-end sales load waivers on Class A shares available at Merrill Lynch
|
|
Employer-sponsored retirement, deferred compensation and employee benefit plans (including health savings accounts) and trusts used to fund those plans, provided that the shares are not held in a commission-based brokerage account and shares are held for the benefit of the plan |
|
|
Shares purchased by or through a 529 Plan |
|
|
Shares purchased through a Merrill Lynch affiliated investment advisory program |
|
|
Shares exchanged due to the holdings moving from a Merrill Lynch affiliated investment advisory program to a Merrill Lynch brokerage (non-advisory) account pursuant to Merrill Lynch’s policies relating to sales load discounts and waiver |
|
|
Shares purchased by third party investment advisors on behalf of their advisory clients through Merrill Lynch’s platform |
|
|
[Shares of funds purchased through the Merrill Edge Self-Directed platform] (if applicable) |
|
|
Shares purchased through reinvestment of capital gains distributions and dividend reinvestment when purchasing shares of the same fund (but not any other fund within the fund family) |
|
|
Shares exchanged from Class C (i.e. level-load) shares of the same fund pursuant to Merrill Lynch’s policies relating to sales load discounts and waivers |
|
|
Employees and registered representatives of Merrill Lynch or its affiliates and their family members |
|
|
Directors or Trustees of the Fund, and employees of the Fund’s investment adviser or any of its affiliates, as described in this prospectus |
|
|
Eligible shares purchased from the proceeds of redemptions within the same fund family, provided (1) the repurchase occurs within 90 days following the redemption, (2) the redemption and purchase occur in the same account, and (3) redeemed shares were subject to a front-end or deferred sales load (known as Rights of Reinstatement). Automated transactions (i.e. systematic purchases and withdrawals) and purchases made after shares are automatically sold to pay Merrill Lynch’s account maintenance fees are not eligible for reinstatement |
CDSC Waivers on A, B and C shares available at Merrill Lynch
|
|
Death or disability of the shareholder |
|
|
Shares sold as part of a systematic withdrawal plan as described in the Fund’s prospectus |
|
|
Return of excess contributions from an IRA Account |
|
|
Shares sold as part of a required minimum distribution for IRA and retirement accounts due to the shareholder reaching age 70 / |
|
|
Shares sold to pay Merrill Lynch fees but only if the transaction is initiated by Merrill Lynch |
|
|
Shares acquired through a right of reinstatement |
|
|
Shares held in retirement brokerage accounts, that are exchanged for a lower cost share class due to transfer to certain fee based accounts or platforms (applicable to A and C shares only) |
|
|
Shares received through an exchange due to the holdings moving from a Merrill Lynch affiliated investment advisory program to a Merrill Lynch brokerage (non-advisory) account pursuant to Merrill Lynch’s policies relating to sales load discounts and waiver |
Front-end load discounts available at Merrill Lynch: breakpoints, rights of accumulation & letters of intent
|
|
Breakpoints as described in this prospectus. |
|
|
Rights of Accumulation (ROA) which entitle shareholders to breakpoint discounts as described in the Fund’s prospectus will be automatically calculated based on the aggregated holding of fund family assets held by accounts (including 529 program holdings, where applicable) within the purchaser’s household at Merrill Lynch. Eligible fund family assets not held at Merrill Lynch may be included in the ROA calculation only if the shareholder notifies his or her financial advisor about such assets |
|
|
[Letters of Intent (LOI) which allow for breakpoint discounts based on anticipated purchases within a fund family, through Merrill Lynch, over a 13-month period of time] (if applicable) |
Sales Waivers and Reductions in Sales Charges
Effective on or after May 1, 2020, clients of Edward Jones (also referred to as “shareholders”) purchasing fund shares on the Edward Jones commission and fee-based platforms are eligible only for the following sales charge discounts (also referred to as “breakpoints”) and waivers, which can differ from breakpoints and waivers described elsewhere in the mutual fund prospectus or SAI or through another broker-dealer. In all instances, it is the shareholder’s responsibility to inform Edward Jones at the time of purchase of any relationship, holdings of the Timothy Plan Family of Funds or other facts qualifying the purchaser for breakpoints or waivers. Edward Jones can ask for documentation of such circumstance.
Rights of Accumulation (ROA)
|
|
The applicable sales charge on a purchase of Class A shares is determined by taking into account all share classes (except any money market funds and retirement plan share classes) of the Timothy Plan Family of Funds held by the shareholder or in an account grouped by Edward Jones with other accounts for the purpose of providing certain pricing considerations (“pricing groups”). This includes all share classes held on the Edward Jones platform and/or held on another platform. The inclusion of eligible fund family assets in the rights of accumulation calculation is dependent on the shareholder notifying his or her financial advisor of such assets at the time of calculation. |
|
|
ROA is determined by calculating the higher of cost or market value (current shares x NAV). |
|
|
Through a LOI, shareholders can receive the sales charge and breakpoint discounts for purchases shareholders intend to make over a 13-month period from the date Edward Jones receives the LOI. The LOI is determined by calculating the higher of cost or market value of qualifying holdings at LOI initiation in combination with the value that the shareholder intends to buy over a 13-month period to calculate the front-end sales charge and any breakpoint discounts. Each purchase the shareholder makes during that 13-month period will receive the sales charge and breakpoint discount that applies to the total amount. The inclusion of eligible fund family assets in the LOI calculation is dependent on the shareholder notifying his or her financial advisor of such assets at the time of calculation. Purchases made before the LOI is received by Edward Jones are not covered under the LOI and will not reduce the sales charge previously paid. Sales charges will be adjusted if LOI is not met. |
Sales charges are waived for the following shareholders and in the following situations:
|
|
Associates of Edward Jones and its affiliates and their family members who are in the same pricing group (as determined by Edward Jones under its policies and procedures) as the associate. This waiver will continue for the remainder of the associate’s life if the associate retires from Edward Jones in good-standing. |
|
|
Shares purchased in an Edward Jones fee-based program. |
|
|
Shares purchased through reinvestment of capital gains distributions and dividend reinvestment. |
|
|
Shares purchased from the proceeds of redeemed shares of the same fund family so long as the following conditions are met: 1) the proceeds are from the sale of shares within 60 days of the purchase, and 2) the sale and purchase are made in the same share class and the same account or the purchase is made in an individual retirement account with proceeds from liquidations in a non-retirement account. |
|
|
Shares exchanged into class A shares from another share class so long as the exchange is into the same fund and was initiated at the discretion of Edward Jones. Edward Jones is responsible for any remaining CDSC due to the fund company, if applicable. Any future purchases are subject to the applicable sales charge as disclosed in the prospectus. |
|
|
Exchanges from class C shares to class A shares of the same fund, generally, in the 84th month following the anniversary of the purchase date or earlier at the discretion of Edward Jones. |
Contingent Deferred Sales Charge (CDSC) Waivers
If the shareholder purchases shares that are subject to a CDSC and those shares are redeemed before the CDSC is expired, the shareholder is responsible to pay the CDSC except in the following conditions:
|
|
The death or disability of the shareholder |
|
|
Systematic withdrawals with up to 10% per year of the account value |
|
|
Return of excess contributions from an Individual Retirement Account (IRA) |
|
|
Shares sold as part of a required minimum distribution for IRA and retirement accounts if the redemption is taken in or after the year the shareholder reaches qualified age based on applicable IRS regulations |
|
|
Shares sold to pay Edward Jones fees or costs in such cases where the transaction is initiated by Edward Jones |
|
|
Shares exchanged in an Edward Jones fee-based program |
|
|
Shares acquired through NAV reinstatement |
Other Important Information
|
|
$250 initial purchase minimum |
|
|
$50 subsequent purchase minimum |
|
|
Edward Jones has the right to redeem at its discretion fund holdings with a balance of $250 or less. The following are examples of accounts that are not included in this policy: |
|
o |
A fee-based account held on an Edward Jones platform |
|
o |
A 529 account held on an Edward Jones platform |
|
o |
An account with an active systematic investment plan or letter of intent (LOI) |
|
|
At any time it deems necessary, Edward Jones has the authority to exchange at NAV a shareholder’s holdings in a fund to Class A shares. |

SAI
STATEMENT OF ADDITIONAL INFORMATION
January 28, 2021
TIMOTHY PLAN FAMILY OF FUNDS
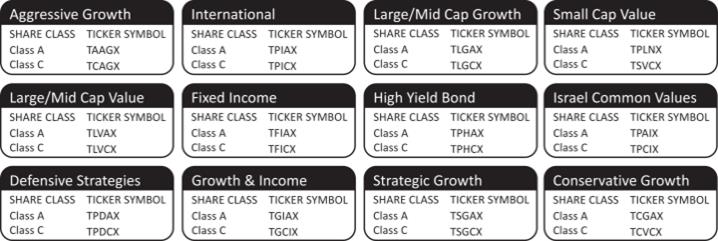
THIS SAI PERTAINS ONLY TO CLASS A AND CLASS C SHARES OF THE ABOVE FUNDS.
This Statement of Additional Information (“SAI”) is not a prospectus. It should be read and retained in conjunction with the Fund’s prospectus dated January 28, 2021 (the “Prospectus”). This SAI incorporates by reference the annual report to shareholders of the Timothy Plan Class A and C Shares of the above listed Funds for the fiscal year ended September 30, 2020.
COPIES OF THIS SAI AND/OR THE PROSPECTUS TO WHICH IT RELATES MAY BE OBTAINED FROM THE TRUST WITHOUT CHARGE BY WRITING THE TIMOTHY PLAN TRUST (1) 1055 MAITLAND CENTER COMMONS, MAITLAND, FL 32751, BY CALLING THE TRUST AT (800) 846-7526 OR ON THE FUND’S WEBSITE AT WWW.TIMOTHYPLAN.COM. RETAIN THIS SAI FOR FUTURE REFERENCE.
| |
(1) |
The Timothy Plan (the “Trust”) is registered with the Securities and Exchange Commission as an open-end management investment company. |
THE FUNDS ARE DISTRIBUTED THROUGH: Timothy Partners, Ltd., 1055 Maitland Center Commons, Maitland, Florida 32751
CLASS A and CLASS C: THIS SAI PERTAINS ONLY TO CLASS A AND CLASS C SHARES OF THE ABOVE FUNDS.
This Statement of Additional Information (“SAI”) is not a prospectus. It is an additional disclosure document supplementing The Timothy Plan Class A and Class C Shares Prospectus, which contains information concerning the: Timothy Plan Aggressive Growth Fund (“Aggressive Growth Fund”), the Timothy Plan Large/Mid Cap Growth Fund (“Large/Mid Cap Growth Fund”), the Timothy Plan Small Cap Value Fund (“Small Cap Value Fund”), the Timothy Plan Large/Mid Cap Value Fund (“Large/Mid Cap Value Fund”), the Timothy Plan International Fund (“International Fund”), the Timothy Plan Fixed Income Fund (“Fixed Income Fund”), the Timothy Plan High Yield Bond Fund (“High Yield Bond Fund”), the Timothy Plan Defensive Strategies Fund (“Defensive Strategies Fund”), the Timothy Plan Israel Common Values Fund (“Israel Common Values Fund”) and the Timothy Plan Growth & Income Fund (“Growth & Income Fund”)
(collectively, the “Traditional Funds”); as well as the Timothy Plan Strategic Growth Fund (“Strategic Growth Fund”) and the Timothy Plan Conservative Growth Fund (“Conservative Growth Fund”) (collectively, the “Asset Allocation Funds”), dated January 28, 2021.
Each of the Traditional Funds currently offers three classes of shares: Class A, Class C and Class I. Each of the Asset Allocation Funds currently offers two classes of shares: Class A and Class C. This SAI relates only to Class A and Class C shares of the above funds. Class I shares are covered in a separate SAI.
Table of Contents
Section 1 | General Information
Fund History
The Timothy Plan (the “Trust”) was organized as a Delaware Statutory Trust (fka as a business trust) on December 16, 1993 and is a mutual fund company of the type known as, and registered with the Securities and Exchange Commission as, an open-end management investment company. It is authorized to create an unlimited number of series of shares (each a “Fund”) and an unlimited number of share classes within each series. A mutual fund permits an investor to pool his or her assets with those of others in order to achieve economies of scale, take advantage of professional money managers and enjoy other advantages traditionally reserved for large investors. This SAI pertains to Class A and Class C Shares of the following 12 series of the Trust:
TRADITIONAL FUNDS
Aggressive Growth Fund,
Large/Mid Cap Growth Fund,
Small Cap Value Fund,
Large/Mid Cap Value Fund,
International Fund,
Fixed Income Fund,
High Yield Bond Fund,
Defensive Strategies Fund,
Israel Common Values Fund
Growth & Income Fund
ASSET ALLOCATION FUNDS
Strategic Growth Fund, and
Conservative Growth Fund
The shares of each series are fully paid and non-assessable. They are entitled to such dividends and distributions as may be paid with respect to the shares and shall be entitled to such sums on liquidation as shall be determined. Other than these rights, they have no preference as to conversion, exchange, dividends, retirement or other features and have no preemption rights. There are three Classes of shares currently offered by the Trust: Class A shares are offered with a front-end sales charge and ongoing service/distribution fees; Class C shares are offered with a contingent deferred sales charge that ends after the first year and ongoing service and distribution fees and Class I shares, which are offered without any sales charges or ongoing service/distribution fees. This SAI relates only to Class A and Class C shares of the Funds. Class I shares of the Funds are offered in a different Prospectus and SAI dated January 28, 2021.
Shareholder meetings will not be held unless required by federal or state law.
Section 2 | Investments and Risks
Investment Strategies and Risks
Each Fund seeks to achieve its objectives by making investments selected in accordance with that Fund’s investment restrictions and policies. Each Fund will vary its investment strategy as described in the applicable Prospectus to achieve its objectives. Each Fund’s particular investment strategies and risks are described in the Prospectus, and those discussions are incorporated herein by reference. This SAI contains further information concerning the techniques and operations of the Funds, the securities in which they may invest, and the policies they will follow.
COMMON STOCK
Common stock is defined as shares of a corporation that entitle the holder to a pro rata share of the profits of the corporation, if any, without a preference over any other shareholder or class of shareholders, including holders of the corporation’s preferred stock and other senior equity. Common stock usually carries with it the right to vote, and frequently, an exclusive right to do so. Holders of common stock also have the right to participate in the remaining assets of the corporation after all other claims, including those of debt securities and preferred stock, are paid.
PREFERRED STOCK
Generally, preferred stock receives dividends prior to distributions on common stock and usually has a priority of claim over common stockholders if the issuer of the stock is liquidated. Unlike common stock, preferred stock does not usually have voting rights; preferred stock, in some instances, is convertible into common stock. In order to be payable, dividends on preferred stock must be declared by the issuer’s Board of Directors. Dividends on the typical preferred stock are cumulative, causing dividends to accrue even if not declared by the Board of Directors. There is, however, no assurance that dividends will be declared by the Board of Directors of issuers of the preferred stocks in which the Funds invest.
3
CONVERTIBLE SECURITIES
Traditional convertible securities include corporate bonds, notes and preferred stocks that may be converted into or exchanged for common stock, and other securities that also provide an opportunity for equity participation. These securities are generally convertible either at a stated price or a stated rate (that is, for a specific number of shares of common stock or other security). As with other fixed income securities, the price of a convertible security to some extent varies inversely with interest rates. While providing a fixed income stream (generally higher in yield than the income derivable from a common stock but lower than that afforded by a non-convertible debt security), a convertible security also affords the investor an opportunity, through its conversion feature, to participate in the capital appreciation of the common stock into which it is convertible. As the market price of the underlying common stock declines, convertible securities tend to trade increasingly on a yield basis and so may not experience market value declines to the same extent as the underlying common stock. When the market price of the underlying common stock increases, the price of a convertible security tends to rise as a reflection of the value of the underlying common stock. To obtain such a higher yield, the Funds may be required to pay for a convertible security an amount in excess of the value of the underlying common stock. Common stock acquired by a Fund upon conversion of a convertible security will generally be held for so long as the Fund’s Advisor or the Fund’s Investment Manager anticipates such stock will provide the Fund with opportunities that are consistent with the Fund’s investment objectives and policies.
INVESTMENT GRADE BONDS
Investment Grade Bonds are public and privately issued debt securities that generally carry a rating of BBB and above by Standard & Poor’s, or similar ratings by other recognized rating agencies. Because they are considered investment grade, they generally carry lower coupon rates than non-investment grade (“high yield” or “junk”) bonds.
WARRANTS
A warrant is an instrument issued by a corporation which gives the holder the right to subscribe to a specified amount of the issuer’s capital stock at a set price for a specified period of time.
AMERICAN DEPOSITARY RECEIPTS
American Depositary Receipts (“ADRs”) are receipts typically issued by a U.S. bank or trust company which evidence ownership of underlying securities issued by a foreign corporation. The Funds may purchase ADRs whether they are “sponsored” or “unsponsored.” “Sponsored” ADRs are issued jointly by the issuer of the underlying security and a depository. “Unsponsored” ADRs are issued without participation of the issuer of the deposited security. Holders of unsponsored ADRs generally bear all the costs of such facilities. The depository of an unsponsored facility frequently is under no obligation to distribute shareholder communications received from the issuer of the deposited security or to pass through voting rights to the holders of such receipts in respect to the deposited securities. Therefore, there may not be a correlation between information concerning the issuer of the security and the market value of an unsponsored ADR. ADRs may result in a withholding tax by the foreign country of source, which will have the effect of reducing the income distributable to shareholders. Because each Fund, except the International Fund and Israel Common Values Fund, some of which are heavily invested in ADRs, will not invest more than 50% of the value of its total assets in stock or securities issued by foreign corporations, it will be unable to pass through the foreign taxes that the Fund pays (or is deemed to pay) to shareholders under the Internal Revenue Code of 1986, as amended (the “Code”).
REAL ESTATE INVESTMENT TRUSTS
Real Estate Investment Trusts (“REITs”) are liquid, dividend-paying means of participating in the real estate market. REITs invest in different kinds of real estate or real estate related assets, including shopping centers, office buildings, and hotels, or mortgages secured by real estate. Some REITs are hybrid, investing in both the actual real estate and real estate-backed mortgages.
COMMODITY EXCHANGE TRADED FUNDS
Commodity Exchange Traded Funds (“ETFs”) are very similar to a mutual fund but have very little management. A commodity ETF has a set plan for investment in a group of commodities that may be readjusted periodically by the Fund manager. Most commodity ETFs were created to mirror the returns of commodities by investing in the commodity futures markets. They are all buy-side futures contracts based on the amount of funds they receive from investors. Some commodity ETFs focus on commodity sectors and only buy futures contracts in that area – oil, agriculture or gold. Some focus on a more diversified basket of commodities. ETFs trade like stocks, can be purchased or sold at any time during market hours, and unlike futures contracts which are highly leveraged, ETFs cannot lose more than the initial investment.
TREASURY INFLATION-PROTECTED SECURITIES
Treasury Inflation-Protected Securities (TIPS) are special types of Treasury notes or bonds that offer protection from inflation. Like other Treasuries, TIPS pay interest every six months and pay the principal when the security matures. Unlike conventional governments, TIPS coupon payments and underlying principal are automatically increased to compensate for inflation as measured by the consumer price index (CPI). When a TIPS matures, you are paid the adjusted principal or original principal, whichever is greater. The rate is applied to the adjusted principal; so, like the principal, interest payments rise with inflation and fall with deflation.
4
Consequently, the real rate of return, which represents the growth of purchasing power, is guaranteed. Because of their safety, TIPS offer a low return.
HIGH YIELD BONDS
High Yield Bonds are public and privately issued debt securities that are rated below investment grade (such as “BB” or lower by Standard & Poor’s Ratings Services and/or Ba or lower by Moody’s Investors Services, Inc.) or deemed to be below investment grade by the Fund’s Investment Manager. These types of securities are commonly referred to as “junk” bonds. Because these securities are below investment grade, they carry higher coupon rates and are subject to greater credit risk.
TEMPORARY DEFENSIVE MEASURES
The Investment Manager(s) of each Traditional and Asset Allocation Fund may take temporary defensive actions when it is determined to be in the best interests of the applicable Fund’s shareholders. Such defensive actions may include, but not be limited to, increasing the percentage of the Fund invested in cash and cash equivalents, investing more heavily in a particular sector, and investing without regard to capitalization rates. When a Fund takes a temporary defensive position, it will not be investing according to its investment objective, and at such times, the performance of the Fund will be different than it would have been if it had invested strictly according to its objectives.
NATURAL DISASTER / EPIDEMIC RISK
Natural or environmental disasters, such as earthquakes, fires, floods, hurricanes, tsunamis and other severe weather-related phenomena generally, and widespread disease, including pandemics and epidemics, have been and can be highly disruptive to economies and markets, adversely impacting individual companies, sectors, industries, markets, currencies, interest and inflation rates, credit ratings, investor sentiment, and other factors affecting the value of the Fund’s investments. Given the increasing interdependence among global economies and markets, conditions in one country, market, or region are increasingly likely to adversely affect markets, issuers, and/or foreign exchange rates in other countries, including the United States. These disruptions could prevent the funds from executing advantageous investment decisions in a timely manner and negatively impact the fund’s ability to achieve their investment objectives. Any such event(s) could have a significant adverse impact on the value and risk profile of the funds.
ADDITIONAL CONSIDERATIONS FOR SHAREHOLDERS OF THE DEFENSIVE STRATEGIES FUND
The Defensive Strategies Fund is not a diversified fund as defined by the Investment Company Act of 1940. The Defensive Strategies Fund is a non-diversified fund. As a non-diversified fund, the Defensive Strategies Fund may invest up to 25% of its total assets under management in any single issue, and up to 50% of its assets under management in just two issues. However, the remaining fifty percent of the Fund’s assets must adhere to the diversification requirements of the other Timothy Plan Traditional Funds, meaning that the remaining 50% of the Fund’s assets will be diversified, meaning not over 5% will be invested in any one company’s shares or issuer’s units of ownership.
ADDITIONAL CONSIDERATIONS FOR SHAREHOLDERS OF THE ASSET ALLOCATION FUNDS
Depending on an Asset Allocation Fund’s percentage ownership in an underlying Traditional Fund both before and after a redemption, an Asset Allocation Fund’s redemption of shares of such Traditional Fund may cause the Asset Allocation Fund to be treated as not receiving capital gain income on the amount by which the distribution exceeds the Asset Allocation Fund’s tax basis in the shares of the underlying Traditional Fund, but instead to be treated as receiving a dividend taxable as ordinary income on the full amounts of the distribution. This could cause shareholders of the Asset Allocation Fund to recognize higher amounts of ordinary income than if the shareholders had held the shares of the underlying Traditional Funds directly.
Fund Policies
In addition to those set forth in the current applicable Prospectus, the Traditional Funds (except for the Defensive Strategies Fund) have adopted the investment restrictions set forth below, which are fundamental policies of each Fund, and which cannot be changed without the approval of a majority of the outstanding voting securities of each Fund. As provided in the Investment Company Act of 1940, as amended (the “1940 Act”), a “vote of a majority of the outstanding voting securities” means the affirmative vote of the lesser of (i) more than 50% of the outstanding shares, or (ii) 67% or more of the shares present at a meeting if more than 50% of the outstanding shares are represented at the meeting in person or by proxy.
These investment restrictions provide that each Traditional Fund (except for the Defensive Strategies Fund) will not:
| |
1. |
issue senior securities; |
5
| |
2. |
engage in the underwriting of securities except insofar as the Fund may be deemed an underwriter under the Securities Act of 1933 (the “1933 Act”) in disposing of a portfolio security; |
| |
3. |
purchase or sell real estate or interests therein, although the Funds may each purchase debt instruments or securities of issuers which engage in real estate operations; |
| |
4. |
invest for the purpose of exercising control or management of another company; |
| |
5. |
purchase oil, gas or other mineral leases, rights or royalty contracts or exploration or development programs, except that the Funds may each invest in the debt instruments or securities of companies which invest in or sponsor such programs; |
| |
6. |
invest more than 25% of the value of the Fund’s total assets in one particular industry, except for temporary defensive purposes; |
| |
7. |
make purchases of securities on “margin”, or make short sales of securities, provided that each Fund may enter into futures contracts and related options and make initial and variation margin deposits in connection therewith; |
| |
8. |
invest in securities of any open-end investment company, except that each Fund may purchase securities of money market mutual funds, but such investments in money market mutual funds may be made only in accordance with the limitations imposed by the 1940 Act and the rules thereunder, as amended. But in no event may a Fund purchase more than 10% of the voting securities, or more than 10% of any class of securities, of another investment company. For purposes of this restriction, all outstanding fixed income securities of an issuer are considered a single class. (The Asset Allocation Funds are not subject to this restriction.); |
| |
9. |
except for the Defensive Strategies Fund, as to 75% of a Fund’s total assets, invest more than 5% of its assets in the securities of any one issuer. (This limitation does not apply to cash and cash items, or obligations issued or guaranteed by the U.S. Government, its agencies or instrumentalities.); |
| |
10. |
purchase or sell commodities or commodity futures contracts, other than those related to stock indexes; |
| |
11. |
make loans of money or securities, except (i) by purchase of fixed income securities in which a Fund may invest consistent with its investment objective and policies; or (ii) by investment in repurchase agreements; |
| |
12. |
invest in securities of any company if any officer or trustee of the Funds or the Funds’ Advisor owns more than 0.5% of the outstanding securities of such company and such officers and trustees, in the aggregate, own more than 5% of the outstanding securities of such company; |
| |
13. |
borrow money, except that each Fund may borrow from banks (i) for temporary or emergency purposes in an amount not exceeding the Fund’s assets or (ii) to meet redemption requests that might otherwise require the untimely disposition of portfolio securities, in an amount not to exceed 33% of the value of the Fund’s total assets (including the amount borrowed) at the time the borrowing is made; and whenever borrowings by a Fund, including reverse repurchase agreements, exceed 5% of the value of a Fund’s total assets, the Fund will not purchase any securities. Interest paid on borrowing will reduce net income; |
| |
14. |
pledge, mortgage, hypothecate, or otherwise encumber its assets, except in an amount up to 33% of the value of its net assets, but only to secure borrowing for temporary or emergency purposes, such as to effect redemptions; or |
| |
15. |
purchase the securities of any issuer, if, as a result, more than 10% of the value of a Fund’s net assets would be invested in securities that are subject to legal or contractual restrictions on resale (“restricted securities”), in securities for which there is no readily available market quotations (“illiquid securities”), or in repurchase agreements maturing in more than 7 days, if all such securities would constitute more than 10% of a Fund’s net assets. |
In addition to those set forth in the current applicable Prospectus, the Defensive Strategies Fund has adopted the investment restrictions set forth below, which are fundamental policies of that Fund, and which cannot be changed without the approval of a majority of the outstanding voting securities of the Fund. As provided in the Investment Company Act of 1940, as amended (the “1940 Act”), a “vote of a majority of the outstanding voting securities” means the affirmative vote of the lesser of (i) more than 50% of the outstanding shares, or (ii) 67% or more of the shares present at a meeting if more than 50% of the outstanding shares are represented at the meeting in person or by proxy.
These investment restrictions provide that the Defensive Strategies Fund will not:
| |
1. |
engage in borrowing except as permitted by the 1940 Act, any rules and regulations promulgated thereunder or interpretations of the SEC or its staff; |
| |
2. |
issue senior securities. This limitation is not applicable to activities that may be deemed to involve the issuance or sale of a senior security by the Fund, provided that the Fund’s engagement in such activities is consistent with or permitted by the 1940 Act, the rules and regulations promulgated thereunder or interpretations of the SEC or its staff; |
| |
3. |
purchase or sell commodities unless acquired as a result of ownership of securities or other investments to the extent permitted under the 1940 Act and the regulations of any other agency with authority over the Fund. This limitation does not preclude the Fund from purchasing or selling options or futures contracts, from investing in securities or other instruments backed by commodities or from investing in companies that are engaged in a commodities business or have a significant portion of their assets in commodities. This limitation does not preclude the Fund from purchasing and selling gold and other precious metals in amounts not to exceed ten percent (10%) of the Fund’s net assets, in the aggregate, as measured at the time of purchase; |
6
| |
4. |
invest more than 25% of its total assets in a particular industry or group of industries. This limitation is not applicable to investments in obligations issued or guaranteed by the U.S. government, its agencies and instrumentalities or repurchase agreements with respect thereto, or investments in other investment companies; |
| |
5. |
purchase or sell real estate directly. This limitation is not applicable to investments in marketable securities which are secured by or represent interests in real estate. This limitation does not preclude the Fund from holding or selling real estate acquired as a result of the Fund’s ownership of securities or other instruments, investing in mortgage-related securities or investing in companies engaged in the real estate business or that have a significant portion of their assets in real estate (including real estate investment trusts); |
| |
6. |
act as underwriter of securities issued by other persons. This limitation is not applicable to the extent that, in connection with the disposition of portfolio securities (including restricted securities), the Fund may be deemed an underwriter under certain federal securities laws or in connection with investments in other investment companies; or |
| |
7. |
make loans to other persons, except (a) by loaning portfolio securities, (b) by engaging in repurchase agreements, (c) by purchasing non-publicly offered debt securities, (d) by purchasing commercial paper, or (e) by entering into any other lending arrangement permitted by the 1940 Act, any rules and regulations promulgated thereunder or interpretation of the SEC or its staff. For purposes of this limitation, the term “loans” shall not include the purchase of a portion of an issue of publicly distributed bonds, debentures or other debt securities. |
Except for the restriction on investing in illiquid securities, which applies under all circumstances to all of the Traditional Funds, so long as percentage restrictions are observed by a Fund at the time it purchases any security, changes in values of particular Fund assets or the assets of the Fund as a whole will not cause a violation of any of the foregoing restrictions.
Each of the Asset Allocation Funds may not:
| |
1. |
purchase or sell physical commodities unless acquired as a result of ownership of securities or other instruments (except this shall not prevent the Fund from purchasing or selling options or futures contracts or from investing in securities or other instruments backed by physical commodities); |
| |
2. |
purchase or sell real estate including limited partnership interests, although it may purchase and sell securities of companies that deal in real estate and may purchase and sell securities that are secured by interests in real estate; |
| |
3. |
make loans to any person, except loans of portfolio securities to the extent that no more than 33 1/3% of its total assets would be lent to other parties, but this limitation does not apply to purchases of debt securities or repurchase agreements; |
| |
4. |
purchase more than 10% of any class of the outstanding voting securities of any issuer (except other investment companies as defined in the 1940 Act), and purchase securities of an issuer (except obligations of the U.S. government and its agencies and instrumentalities and securities of other investment companies as defined in the 1940 Act) if, as a result, with respect to 75% of its total assets, more than 5% of the Fund’s total assets, at market value, would be invested in the securities of issuer; |
| |
5. |
issue senior securities (as defined in the 1940 Act) except as permitted by rule, regulation or order of the Securities and Exchange Commission; |
| |
6. |
borrow, except from banks for temporary or emergency (not leveraging) purposes including the meeting of redemption requests that might otherwise require the untimely disposition of securities in an aggregate amount not exceeding 30% of the value of the Fund’s total assets (including the amount borrowed) at the time the borrowing is made; and whenever borrowings by a Fund, including reverse repurchase agreements, exceed 5% of the value of a Fund’s total assets, the Fund will not purchase any securities; |
| |
7. |
underwrite securities issued by others, except to the extent that the Fund may be considered an underwriter within the meaning of the 1933 Act in the disposition of restricted securities; |
| |
8. |
write or acquire options or interests in oil, gas or other mineral exploration or development programs; and |
| |
9. |
concentrate its investments in any one sector or industry. |
Portfolio Turnover
It is not the policy of any of the Funds to purchase or sell securities for short-term trading purposes, but the Funds may sell securities to recognize gains or avoid potential for loss. A Fund will, however, sell any portfolio security (without regard to the time it has been held) when the Investment Manager believes that market conditions, credit-worthiness factors or general economic conditions warrant such a step. The Asset Allocation Funds invest the majority of their assets in certain of the Traditional Funds and adjust the ratio of such investments regularly. As a result, portfolio turnover for the Asset Allocation Funds could be substantial and could cause the Traditional
7
Funds to also experience higher portfolio turnover. The portfolio turnover rates for each Fund for the fiscal periods ended September 30, 2019 and 2020 are set forth in the table below:
|
|
|
|
|
| |
|
2019 |
|
2020 |
| Aggressive Growth Fund |
|
77% |
|
96% |
| International Fund |
|
27% |
|
25% |
| Large/Mid Cap Growth Fund |
|
44% |
|
23% |
| Small Cap Value Fund |
|
63% |
|
73% |
| Large/Mid Cap Value Fund |
|
51% |
|
26% |
| Fixed Income Fund |
|
53% |
|
32% |
| High Yield Bond Fund |
|
75% |
|
91% |
| Defensive Strategies Fund |
|
34% |
|
49% |
| Israel Common Values Fund |
|
23% |
|
16% |
| Growth & Income Fund |
|
167% |
|
39% |
| Strategic Growth Fund |
|
50% |
|
47% |
| Conservative Growth Fund |
|
42% |
|
37% |
High portfolio turnover rates (annual rates in excess of 100%) involve additional transaction costs (such as brokerage commissions) which are borne by the Funds and may result in adverse tax effects to Fund shareholders. (See “Dividends, Distributions and Taxes” in the Class A and Class C shares Prospectus.)
8
Disclosure of Portfolio Holdings
The following discussion sets forth the Trust’s policies and procedures with respect to the disclosure of Fund portfolio holdings.
FUND SERVICE PROVIDERS
Fund service providers include the following: Fund Transfer and Accounting Agent, Fund Administrator, Independent Registered Public Accounting Firm, Compliance Consulting Firm, Principal Underwriter and Custodian. The Trust has entered into arrangements with certain third party service providers for services that require these groups to have access to each Fund’s portfolio on a real time basis. For example, the Trust’s fund accounting agent is responsible for maintaining the accounting records of each Fund, which includes maintaining a current record of the portfolio holdings of each Fund. The Trust also undergoes an annual audit which requires the Trust’s independent registered public accounting firm to review each Fund’s portfolio. In addition to the fund accounting agent, the Trust’s custodian also maintains an up-to-date list of each Fund’s portfolio holdings. The Trust’s compliance consulting firm must also have access to each Fund’s portfolio information in order to verify compliance with the Federal Securities laws. Each of these parties is contractually and/or ethically prohibited from sharing any Fund’s portfolio holdings information with any third party unless specifically authorized by the Trust’s President, Secretary or Treasurer.
The Board of Trustees (the “Board”) monitors the services provided by each of the service providers to ensure each is complying with the contractual terms or expectation of the arrangement. If the Board is unsatisfied with any of these service providers, the Board may terminate them accordingly. Each of the entities which provide one or more of the services discussed above has adopted a code of ethics which requires that any person associated with such entity (1) maintains the confidentiality of all Trust information obtained by such person, and (2) does not use such person’s knowledge of Trust activities for their own personal benefit. The Trust relies on the compliance departments of each entity to enforce its code.
RATING AND RANKING ORGANIZATIONS
The Trust may from time to time provide the entire portfolio holdings of each Fund to various rating and ranking organizations, such as Morningstar, Inc., Lipper, Inc., Standard & Poor’s Ratings Group, Bloomberg L.P., and Thomson Financial Research. The Trust has obtained assurances from all such parties that any information provided to them will be held in strict confidence and that such information shall not be used for the personal benefit of the recipient.
The Trust’s management has determined that these groups provide investors with a valuable service and, therefore, are willing to provide them with portfolio information. You should be aware that the Trust does not pay them or receive any compensation from them for providing this information.
DISCLOSURE TO OTHER PARTIES
The Trust is also required under law to file a listing of the portfolio holdings of each Fund with the Securities and Exchange Commission on a quarterly basis. The Trust prohibits the disclosure of portfolio information to any third party other than those described above prior to the day after the information is posted to a Fund’s website or until such information has been posted on the SEC’s Edgar System. The Trust further prohibits any person affiliated with the Trust from entering into any ongoing arrangement with any person other than those described above to receive portfolio holdings information relating to a Fund.
REVIEW
The Board reviews these policies not less than annually and receives periodic attestations from affiliated persons that these policies are being adhered to. The Trust’s President, Secretary and Treasurer are authorized, subject to subsequent Board review, to make exceptions to the above-described policies.
Section 3 | Management of the Fund
Investment Advisor
The Board has entered into advisory agreements with Timothy Partners, Ltd. (“TPL”), the Advisor for the provision of investment advisory services on behalf of the Trust to each Fund (collectively referred to as the “Advisory Agreement”), subject to the supervision and direction of the Board. The latest continuance of the Advisory Agreement with TPL was approved by the Trustees, including a majority of the Trustees who are not interested persons of the Trust or any person who is a party to the Agreement, at an in-person meeting held on February 14, 2020. More complete factors considered by the Board in renewing the investment advisory agreement are available in the Trust’s semi-annual report dated March 31, 2020.
9
The Advisory Agreement may be renewed after its initial two year term only so long as such renewal and continuance are specifically approved at least annually by the Board or by vote of a majority of the outstanding voting securities of the applicable Fund, and only if the terms of the renewal thereof have been approved by the vote of a majority of the Trustees who are not parties thereto or interested persons of any such party, cast in person at a meeting called for the purpose of voting on such approval. The Advisory Agreement will terminate automatically in the event of its assignment.
INVESTMENT ADVISORY FEES
The following table sets forth the investment advisory fees paid to TPL for the fiscal years ended September 30, 2018, 2019 and 2020:
|
|
|
|
|
|
|
|
|
|
|
|
|
| |
|
|
2018 |
|
|
|
2019 |
|
|
|
2020 |
|
| Aggressive Growth Fund |
|
|
|
|
|
|
|
|
|
|
|
|
| Fees Payable to TPL |
|
|
$248,801 |
|
|
|
$225,372 |
|
|
|
$235,083 |
|
| Amount (Reimbursed) Recouped by TPL |
|
|
($29,271 |
) |
|
|
($22,439 |
) |
|
|
($27,657 |
) |
| International Fund |
|
|
|
|
|
|
|
|
|
|
|
|
| Fees Payable to TPL |
|
|
$1,049,025 |
|
|
|
$942,035 |
|
|
|
$832,213 |
|
| Amount (Reimbursed) Recouped by TPL |
|
|
($52,451 |
) |
|
|
($39,588 |
) |
|
|
($41,611 |
) |
| Large/Mid Cap Growth Fund |
|
|
|
|
|
|
|
|
|
|
|
|
| Fees Payable to TPL |
|
|
$788,593 |
|
|
|
$742,366 |
|
|
|
$747,763 |
|
| Amount (Reimbursed) Recouped by TPL |
|
|
($46,388 |
) |
|
|
($36,904 |
) |
|
|
($43,986 |
) |
| Small Cap Value Fund |
|
|
|
|
|
|
|
|
|
|
|
|
| Fees Payable to TPL |
|
|
$1,305,824 |
|
|
|
$1,225,222 |
|
|
|
$1,069,324 |
|
| Amount (Reimbursed) Recouped by TPL |
|
|
($90,874 |
) |
|
|
($121,813 |
) |
|
|
($125,818 |
) |
| Large/Mid Cap Value Fund |
|
|
|
|
|
|
|
|
|
|
|
|
| Fees Payable to TPL |
|
|
$1,892,693 |
|
|
|
$1,798,562 |
|
|
|
$1,665,283 |
|
| Amount (Reimbursed) Recouped by TPL |
|
|
($241,198 |
) |
|
|
($205,161 |
) |
|
|
($195,916 |
) |
| Fixed Income Fund |
|
|
|
|
|
|
|
|
|
|
|
|
| Fees Payable to TPL |
|
|
$494,359 |
|
|
|
$520,274 |
|
|
|
$631,624 |
|
| Amount Waived by TPL |
|
|
($164,786 |
) |
|
|
($143,845 |
) |
|
|
($210,541 |
) |
| High Yield Bond Fund |
|
|
|
|
|
|
|
|
|
|
|
|
| Fees Payable to TPL |
|
|
$359,090 |
|
|
|
$323,951 |
|
|
|
$434,001 |
|
| Amount (Reimbursed) Recouped by TPL |
|
|
($29,924 |
) |
|
|
($23,167 |
) |
|
|
($36,167 |
) |
| Defensive Strategies Fund |
|
|
|
|
|
|
|
|
|
|
|
|
| Fees Payable to TPL |
|
|
$325,371 |
|
|
|
$259,191 |
|
|
|
$228,403 |
|
| Amount (Reimbursed) Recouped by TPL |
|
|
($27,114 |
) |
|
|
($18,051 |
) |
|
|
($19,034 |
) |
| Israel Common Values Fund |
|
|
|
|
|
|
|
|
|
|
|
|
| Fees Payable to TPL |
|
|
$497,192 |
|
|
|
$658,596 |
|
|
|
$745,136 |
|
| Growth & Income Fund |
|
|
|
|
|
|
|
|
|
|
|
|
| Fees Payable to TPL |
|
|
$302,346 |
|
|
|
$235,040 |
|
|
|
$156,809 |
|
| Amount (Reimbursed) Recouped by TPL |
|
|
($17,785 |
) |
|
|
($11,640 |
) |
|
|
($64,584 |
) |
| Strategic Growth Fund |
|
|
|
|
|
|
|
|
|
|
|
|
| Fees Payable to TPL |
|
|
$257,651 |
|
|
|
$231,801 |
|
|
|
$225,496 |
|
| Conservative Growth Fund |
|
|
|
|
|
|
|
|
|
|
|
|
| Fees Payable to TPL |
|
|
$348,384 |
|
|
|
$303,242 |
|
|
|
$291,535 |
|
TPL, with the prior approval of the Board and shareholders of the applicable Fund, may engage the services of other investment advisory firms (“Investment Managers”) to provide portfolio management services to a Fund. The following section provides information relating to the Funds’ current Investment Managers.
Investment Managers
CHARTWELL INVESTMENT PARTNERS
Pursuant to an Investment Sub-Advisory Agreement between TPL, the Trust and Chartwell Investment Partners, (“Chartwell”) dated January 1, 2008, Chartwell serves as Investment Manager to the Large/Mid Cap Growth Fund and the Aggressive Growth Fund. As Investment Manager, Chartwell provides advice and assistance to TPL in the selection of appropriate investments for the Large/Mid Cap Growth Fund and the Aggressive Growth Fund respectively, subject to the supervision and direction of the Board. As compensation for its services, Chartwell receives from TPL an annual fee at a rate equal to 0.42% of the first $10 million in assets of each Fund; 0.40% of the next $5 million in assets; 0.35% of the next $10 million in assets; and 0.25% of assets over $25 million. As of September 30, 2020, Chartwell managed approximately $ 9.6 billion in client assets.
On February 14, 2020 the Board met to consider, among other matters, retaining Chartwell as Investment Manager for the Large/Mid Cap Growth Fund and Aggressive Growth Fund and after full consideration, renewed the Agreement for an additional year. A discussion of the Board’s considerations in renewing the agreement is provided in the Trust’s semi-annual report, dated March 31, 2020.
10
Large/Mid Cap Growth Fund & Aggressive Growth Fund
The following members of Chartwell make up the portfolio management team for the Large/Mid Cap Growth Fund and Aggressive Growth Fund:
| |
Mr. |
Frank L. Sustersic, CFA, is a Managing Partner and Senior Portfolio Manager. Mr. Sustersic earned a Bachelor of Science degree in Economics from The University of Pennsylvania and holds a Chartered Financial Analyst designation. From 2014 to February 2016, Mr. Sustersic worked as a Portfolio Manager at Lazard Asset Management. Prior to that, he worked as a Portfolio Manager at Turner Investments from 1994 to March 2014. In addition, Mr. Sustersic worked as a Portfolio Manager at First Fidelity Bank Corporation from 1989 to April 1994. Mr. Sustersic is a member of the CFA Institute and the CFA Society of Philadelphia. Mr. Sustersic participates in the investment decision process during meetings in which the team determines the allocation of securities held in the portfolio. He has authority to direct trading activity on the Funds, and he is also responsible for representing the Funds to investors. |
| |
Mr. |
Peter M. Schofield, CFA, is a Senior Portfolio Manager. Mr. Schofield earned a bachelor’s degree in History from the University of Pennsylvania. He holds the Chartered Financial Analyst designation. From 2005 to 2010, he was Co-Chief Investment Officer at Knott Capital. From 1996 to 2005 he was a Portfolio Manager at Sovereign Asset Management. Prior to Sovereign Asset Management, he was a portfolio manager at Geewax, Terker & Company. Mr. Schofield is a member of the CFA Institute and the CFA Society of Philadelphia. Mr. Schofield serves as a Senior Portfolio Manager on Chartwell’s Large Cap Value Investing Team. |
Each team member has a number of other Chartwell professionals supporting their efforts. The members of the Chartwell investment teams average in excess of 20 years’ experience in the investment field.
Other Information Relating to Chartwell
The following table presents information relating to the persons responsible for managing Fund assets, the number and types of other accounts managed by such persons, and how such persons are compensated for managing such accounts. The information is current as of September 30, 2020.
|
|
|
|
|
|
|
|
|
|
|
|
|
| |
|
Number of Other Accounts Managed
and Assets by Account Type |
|
Number of Accounts and Assets for Which
Advisory Fee is Performance-Based |
| Name of Sub-Advisor and Portfolio Manager |
|
Registered
Investment Companies ($mils) |
|
Other Pooled
Investment Vehicles ($mils) |
|
Other
Accounts ($mils) |
|
Registered
Investment Companies ($mils) |
|
Other Pooled
Investment Vehicles ($mils) |
|
Other
Accounts ($mils) |
| Chartwell Investment Partners: |
|
|
|
|
|
|
|
|
| Peter M. Schofield |
|
1 ($328) |
|
N/A |
|
20 ($537) |
|
N/A |
|
N/A |
|
N/A |
| Frank L. Sustersic |
|
1 ($23) |
|
1 ($2) |
|
2 ($138) |
|
N/A |
|
N/A |
|
N/A |
The compensation paid to a Chartwell portfolio manager and analyst consists of base salary, annual bonus, and an annual profit-sharing contribution to the firm’s retirement plan.
A portfolio manager’s and analyst’s base salary is determined by Chartwell’s Compensation Committee and is reviewed at least annually. A portfolio manager’s and analyst’s experience, historical performance, and role in firm or product team management are the primary considerations in determining the base salary. Industry benchmarking is utilized by the Compensation Committee on an annual basis.
Annual bonuses are determined by the Compensation Committee based on a number of factors. The primary factor is a performance- based compensation schedule that is applied to all accounts managed by a portfolio manager within a particular investment product and is not specific to any one account. The bonus is calibrated based on the gross composite performance of such accounts versus the appropriate benchmark and peer group rankings. Portfolio construction, sector and security weighting, and performance are reviewed by the Compliance Committee and Compensation Committee to prevent a manager from taking undue risks. Additional factors used to determine the annual bonus include the portfolio manager’s contribution as an analyst, product team management, and contribution to the strategic planning and development of the investment group as well as the firm. For employee retention purposes, if an individual employee’s annual bonus exceeds $50,000 for a given year, an amount equal to 25% of the bonus is deferred and paid 3 years after the initial pay date.
Chartwell also provides a profit sharing and 401(k) plan for all employees. The annual profit sharing contribution and/or matching contribution from Chartwell is discretionary and based solely on the profitability of the firm.
11
As of September 30, 2020, the Portfolio Managers listed below held a beneficial interest in the following Timothy Plan Funds:
|
|
|
|
|
| Name of Person |
|
Dollar Range
of Equity Securities in each Fund |
|
Aggregate Dollar Range of Equity Securities in all
Funds Held By Portfolio Manager |
| Peter M. Schofield |
|
None |
|
None |
| Frank L. Sustersic |
|
None |
|
None |
EAGLE GLOBAL ADVISERS, LLC
Pursuant to an Investment Sub-Advisory Agreement between TPL, the Trust and Eagle Global Advisers, LLC (“Eagle”), dated April 18, 2007, Eagle serves as Investment Manager to the International Fund. As such, Eagle provides advice and assistance to TPL in the selection of appropriate investments for the International Fund, subject to the supervision and direction of the Board. As compensation for its services, Eagle receives from TPL an annual fee at a rate equal to 0.60% of the first $100 million in assets of the Fund; and 0.50% of assets over $100 million. As of September 30, 2020, Eagle managed approximately $ 1.8 billion in client assets.
Pursuant to an Investment Sub-Advisory Agreement between TPL, the Trust and Eagle Global Advisers, LLC (“Eagle”), dated October 27, 2011, Eagle serves as Investment Manager to the Israel Common Values Fund. As such, Eagle provides advice and assistance to TPL in the selection of appropriate investments for the Israel Common Values Fund, subject to the supervision and direction of the Funds’ Board. As compensation for its services, Eagle receives from TPL an annual fee at a rate equal to 0.60% of the first $50 million in assets of the Fund; and 0.50% of assets over $50 million.
On February 14, 2020, the Board met to consider, among other matters, retaining Eagle as Investment Manager for the International Fund and Israel Common Values Fund and after full consideration, renewed the agreements for an additional year. A discussion of the Board’s considerations in ratifying the agreements are provided in the Trust’s semi-annual report, dated March 31, 2020.
International Fund & Israel Common Values Fund
Eagle utilizes the team approach to portfolio management for the International Fund and the Israel Common Values Fund. Team members have specific regional and sector responsibilities but have an equal vote in the investment decision-making process. The Eagle Team Members for each Fund are:
| |
Mr. |
Edward R. Allen III, Ph.D., CFA, Senior Partner. Mr. Allen is a portfolio manager and serves as a member of the International investment committee. Prior to founding Eagle, Mr. Allen was employed by Eagle Management & Trust Company. Before entering the investment advisory business, he served as an assistant professor of economics at the University of Houston. He earned a Bachelor’s degree in engineering from Princeton University and a Ph.D. in economics from the University of Chicago. Mr. Allen holds the Chartered Financial Analyst designation and is also a member of the American Finance Association, the CFA Institute, and the FA Society of Houston. |
| |
Mr. |
Thomas N. Hunt III, CFA, CPA, Senior Partner. Mr. Hunt is a portfolio manager and serves as a member of the International investment committee. Prior to founding Eagle, Mr. Hunt was employed by Eagle Management & Trust Company. Mr. Hunt also worked for the public accounting firm of Ernst & Young. He earned a Bachelor’s degree in accounting from the University of Texas and an MBA from the Harvard Business School. Mr. Hunt holds the Chartered Financial Analyst and Certified Public Accountant designations and is also a member of the CFA Institute, the CFA Society of Houston, and the Texas Society of Certified Public Accountants. |
| |
Mr. |
Steven S. Russo, Senior Partner. Mr. Russo is a portfolio manager and serves as a member of the International investment committee. Prior to founding Eagle, Mr. Russo was employed by Eagle Management & Trust Company and Criterion Investment Management Company. Mr. Russo earned a Bachelor’s degree in finance from the University of Texas and an MBA from Rice University. Mr. Russo also serves as a Board Member of the M.A. Wright Fund at Rice University’s Jones School of Management. |
| |
Mr. |
John F. Gualy, CFA, Partner. Mr. Gualy serves as a portfolio manager and oversees Eagle’s trading operations, and is also a member of the firm’s investment committees. Prior to founding Eagle, Mr. Gualy was employed by Eagle Management & Trust Company and as director of research for Continental Intervest. He earned a Bachelor’s degree in economics from the University of Texas and an MBA from Rice University. Mr. Gualy holds the Chartered Financial Analyst designation, is a member of the CFA Institute and is a former President and Director of the CFA Society of Houston. He also serves as an Adjunct Professor at Rice University’s Jones Graduate School of Business teaching an MBA class on Stock Analysis. Mr. Gualy is a native of Colombia and is fluent in Spanish. |
Each of the team members is a founding partner of the company and has been with the firm since its inception in 1996.
12
Other Information Relating to Eagle
The following table presents information relating to the persons responsible for managing Fund assets, the number and types of other accounts managed by such persons, and how such persons are compensated for managing such accounts. The information is current as of September 30, 2020.
|
|
|
|
|
|
|
|
|
|
|
|
|
| |
|
Number of Other Accounts Managed
and Assets by Account Type |
|
Number of Accounts and Assets for Which
Advisory Fee is Performance-Based |
| Name of Sub-Advisor and Portfolio Manager |
|
Registered
Investment Companies ($mils) |
|
Other Pooled
Investment Vehicles ($mils) |
|
Other
Accounts ($mils) |
|
Registered
Investment Companies ($mils) |
|
Other Pooled
Investment Vehicles ($mils) |
|
Other Accounts
($mils) |
| Eagle Global Advisors, LLC: |
| Edward R. Allen, III |
|
3 ($225.0) |
|
N/A |
|
320 ($1094.0) |
|
N/A |
|
N/A |
|
N/A |
| Thomas N. Hunt, III |
|
3 ($225.0) |
|
N/A |
|
320 ($1094.0) |
|
N/A |
|
N/A |
|
N/A |
| Steven S. Russo |
|
3 ($225.0) |
|
N/A |
|
320 ($1094.0) |
|
N/A |
|
N/A |
|
N/A |
| John F. Gualy |
|
2 ($157.5) |
|
N/A |
|
320 ($1094.0) |
|
N/A |
|
N/A |
|
N/A |
Each team member is a partner and an equity owner of the firm. Compensation of Eagle partners has two primary components: (1) a base salary and (2) profit participation based on firm ownership. Compensation of Eagle Partners is reviewed primarily on an annual basis. Profit participations are typically paid near or just after year-end.
Eagle compensates its partners based primarily on the scale and complexity of their portfolio responsibilities. The performance of portfolio managers is evaluated primarily based on success in achieving portfolio objectives for managed funds and accounts. Eagle seeks to compensate partners commensurate with their responsibilities and performance competitively with other firms within the investment management industry. This is reflected in partners’ salaries. Salaries and profit participation are also influenced by the operating performance of Eagle. While the salaries of Eagle’s partners are comparatively fixed, profit participation may fluctuate substantially from year to year, based on changes in financial performance of the firm.
As of September 30, 2020, the Portfolio Managers listed below held a beneficial interest in the following Timothy Plan Funds:
|
|
|
|
|
| Name of Person |
|
Dollar Range
of Equity Securities in each Fund |
|
Aggregate Dollar Range of Equity Securities in all
Funds Held By Portfolio Manager |
| Edward R. Allen, III |
|
None |
|
None |
| Thomas N. Hunt, III |
|
None |
|
None |
| Steven S. Russo |
|
None |
|
None |
| John F. Gualy |
|
None |
|
None |
WESTWOOD MANAGEMENT CORP.
Pursuant to Investment Sub-Advisory Agreements between TPL, the Trust and Westwood Management Corp., (“Westwood”) dated February 28, 2005, and January 1, 2006, Westwood serves as Investment Manager to the Large/Mid Cap Value Fund and the Small Cap Value Fund. As such Westwood provides advice and assistance to TPL in the selection of appropriate investments for the Large/Mid Cap Value Fund and the Small Cap Value Fund respectively, subject to the supervision and direction of the Funds’ Board. As compensation for its services, Westwood receives from TPL an annual fee at a rate equal to 0.42% of the first $10 million in assets of each Fund; 0.40% of the next $5 million in assets; 0.35% of the next $10 million in assets; and 0.25% of assets over $25 million. As of September 30, 2020, Westwood Management Corp. managed approximately $ 8.5 billion in client assets.
On February 14, 2020, the Board met to consider, among other matters, retaining Westwood as sub-investment Advisor for the Large/Mid Cap Value Fund and the Small Cap Value Fund, and after full consideration, renewed the agreements for an additional year. A discussion of the Board’s considerations in renewing the agreements is available in the Trust’s semi-annual report dated March 31, 2020.
Large/Mid Cap Value Fund & Small Cap Value Fund
Westwood utilizes a team of portfolio managers who are responsible for the day-to-day recommendations regarding the investment of the Large/Mid Cap Value Fund’s portfolio.
| |
Mr. |
Matthew R. Lockridge has served as Senior Vice President, Co-Director of Equity Portfolios for Westwood since February 2018. Prior to this appointment, he served Westwood as Senior Vice President and Research Analyst from 2015 to 2018, and as Vice President and Research Analyst from 2010 to 2015. Mr. Lockridge has served on the portfolio team for the Timothy Plan Large/Mid Cap Value Fund since December 2012 and on the Timothy Plan Small Cap Value Fund since December 2010. |
13
| |
Mr. |
William D. Sheehan, CFA has served as Vice President, Research Analyst for Westwood since March 2019. Prior to this appointment, he served Westwood as an Associate Vice President and Research Analyst from 2018 to 2019. Mr. Sheehan has served on the portfolio team for the Timothy Plan Large/Mid Cap Value Fund since September 2019. |
Ms. Lauren C. Hill, CFA has served as Vice President, Research Analyst for Westwood since February 2017. Prior to this appointment, she served Westwood as an Associate Vice President and Research Analyst from 2015 to 2017. Ms. Hill has served on the portfolio team for the Timothy Plan Large/Mid Cap Value Fund since August 2020.
Small Cap Value Fund
Westwood utilizes a team of portfolio managers who are responsible for the day-to-day recommendations regarding the investment of the Small Cap Value Fund’s portfolio. In addition to Mr. Matthew Lockridge listed above, the other team members include Mr. William Costello and Mr. Frederic Rowsey.
| |
Mr. |
William E. Costello, CFA has served as Senior Vice President, Co-Director of Equity Portfolios for Westwood since February 2018. Prior to this appointment, he served Westwood as Senior Vice President and Senior Research Analyst from 2010 to 2018. Mr. Costello has served on the portfolio team for the Timothy Plan Small Cap Value Fund since December 2010. |
| |
Mr. |
Frederic G. Rowsey, CFA has served as Vice President and Research Analyst for Westwood since February 2018. Prior to this appointment, he served Westwood as Associate Vice President and Research Analyst from 2015 to 2018, as a Research Analyst from 2013 to 2015, and as a Research Associate from 2010 to 2013. Mr. Rowsey has served on the portfolio team for the Timothy Plan Small Cap Value Fund since December 2013. |
Other Information Relating to Westwood
The following table presents information relating to the persons responsible for managing Fund assets, the number and types of other accounts managed by such persons, and how such persons are compensated for managing such accounts. The information is current as of September 30, 2020.
|
|
|
|
|
|
|
|
|
|
|
|
|
| |
|
Number of Other Accounts Managed
and Assets by Account Type |
|
Number of Accounts and Assets for Which
Advisory Fee is Performance-Based |
| Name of Sub-Advisor and Portfolio Manager |
|
Registered
Investment Companies ($mils) |
|
Other Pooled
Investment Vehicles ($mils) |
|
Other
Accounts ($mils) |
|
Registered
Investment
Companies ($mils) |
|
Other Pooled
Investment Vehicles ($mils) |
|
Other Accounts
($mils) |
| Westwood Management Corp: |
|
|
|
|
|
|
|
|
|
|
|
|
| Matthew R. Lockridge |
|
6 $1,639.98 |
|
8 $531.94 |
|
41 $1,852.11 |
|
N/A |
|
1 $12.53 |
|
N/A |
| William D. Sheehan, CFA |
|
4 $1,060.20 |
|
6 $472.93 |
|
19 $1,096.31 |
|
N/A |
|
1 $12.53 |
|
N/A |
| Lauren C. Hill, CFA |
|
4 $1,060.20 |
|
6 $472.93 |
|
20 $1,095.56 |
|
N/A |
|
1 $12.53 |
|
N/A |
| William E. Costello, CFA |
|
4 $1,004.87 |
|
4 $138.81 |
|
38 $1,020.26 |
|
N/A |
|
N/A |
|
N/A |
| Frederic G. Rowsey, CFA |
|
2 $579.78 |
|
2 $59.01 |
|
20 $755.64 |
|
N/A |
|
N/A |
|
N/A |
Westwood’s compensation package includes base salary, cash bonus, and equity-based incentive compensation as well as a full benefits package for all employees, including those involved in the product. Westwood annually reviews all forms of compensation for all employees of the company. Base salary levels are maintained at levels that the compensation committee deems to be commensurate with similar companies in the asset management industry. In determining incentive compensation and annual merit-based salary increases, components of this evaluation are based in major part upon the portfolio performance, individual stock recommendations, and individual buy and sell recommendations.
As of September 30, 2020, the Portfolio Managers listed below held a beneficial interest in the following Timothy Plan Funds:
|
|
|
|
|
| Name of Person |
|
Dollar Range
of Equity Securities in each Fund |
|
Aggregate Dollar Range of Equity Securities in all
Funds Held By Portfolio Manager |
| Matthew R. Lockridge |
|
None |
|
None |
| William D. Sheehan, CFA |
|
None |
|
None |
| Lauren C. Hill, CFA |
|
None |
|
None |
| William E. Costello, CFA |
|
None |
|
None |
| Frederic G. Rowsey, CFA |
|
None |
|
None |
14
DELAWARE INVESTMENTS FUND ADVISERS Pursuant to the Investment Sub-Advisory Agreement between TPL, the Trust and Delaware Investments Fund Advisers, a series of Macquarie Investment Management Business Trust (“DIFA”) dated August 6, 2010, DIFA assumed responsibility as the Investment Manager to the REIT sleeve of the Defensive Strategies Fund. As Investment Manager, DIFA provides advice and assistance to TPL in the selection of appropriate investments for the Fund’s REIT sleeve, subject to the supervision and direction of the Board . As compensation for its services, DIFA receives from TPL an annual fee at a rate equal to 0.42% of the first $10 million in assets in the REITs portion of the Fund; 0.40% of the next $5 million in assets; 0.35% of the next $10 million in assets; and 0.25% of assets over $25 million.
As of September 30, 2020, Macquarie Investment Management managed approximately $242 billion in client assets.
On February 14, 2020, the Board met to consider, among other matters, retaining DIFA as Investment Manager for the REIT Sleeve of the Defensive Strategies Fund, and after full consideration, renewed the agreement for an additional year. A discussion of the Board’s considerations in renewing the agreement is available in the Trust’s semi-annual report dated March 31, 2020. In August 2020, Delaware announced its intention to resign as Sub-Adviser to the Fund and was replaced by Chilton Capital Management, LLC, at a special meeting of the Board held on September 28, 2020.
Defensive Strategies | REIT Sleeve
The Team members managing the REIT sleeve are as follows:
Chris Gowlland, CFA - Senior Vice President, Head of Equity Quantitative Research - Chris Gowlland, CFA - Senior Vice President, Head of Equity Quantitative Research - Chris Gowlland is the head of equity quantitative research, a role he assumed in July 2019. As part of his role, he also serves as portfolio manager for certain portfolios managed by the Global Equity team and for several different strategies in the firm’s multi-asset class offerings. Previously, he was a senior quantitative analyst for the firm’s equity department. Prior to joining Macquarie Investment Management in May 2007, he spent seven years working in fundamental equity research and corporate finance for Morgan Stanley and Commerzbank Securities, followed by two years as a quantitative strategist at Morgan Stanley and at State Street Global Markets. Gowlland holds a bachelor’s degree in Chinese and Spanish from the University of Leeds (U.K.), a master’s degree in development studies from Brown University, and another master’s degree in international management from Thunderbird School of Global Management. He also spent several years in a Ph.D. program in political economy at Harvard University. Gowlland is a member of the CFA Institute, the CFA Society New York, the CFA Society of Philadelphia, and the Society of Quantitative Analysts.
15
Other Information Relating to Delaware Investments Fund Advisers
The following table presents information relating to the persons responsible for managing Fund assets, the number and types of other accounts managed by such persons, and how such persons are compensated for managing such accounts. The information is current as of September 30, 2020.
|
|
|
|
|
|
|
|
|
|
|
|
|
| |
|
Number of Other Accounts Managed
and Assets by Account Type |
|
Number of Accounts and Assets for Which
Advisory Fee is Performance-Based |
| Name of Sub-Advisor and Portfolio Manager |
|
Registered
Investment Companies ($mils) |
|
Other Pooled
Investment Vehicles ($mils) |
|
Other
Accounts ($mils) |
|
Registered
Investment Companies ($mils) |
|
Other Pooled
Investment Vehicles ($mils) |
|
Other Accounts
($mils) |
| Delaware Investments Fund Advisers: |
| Christopher Gowlland |
|
9 ($1,493) |
|
1 ($17.8) |
|
0 ($0) |
|
0 ($0) |
|
0 ($0) |
|
0 ($0) |
Investment professionals are compensated with a combination of a base salary, a short-term incentive bonus (which may include various objective and subjective components), and long-term equity. Key operating principles of the total compensation plan are to compensate professionals in direct relation to performance in their respective realms of responsibility and the overall business success of the team and to reflect total cash compensation that is closely aligned to the competitive market.
As of September 30, 2020, the Portfolio Manager listed below held a beneficial interest in the following Timothy Plan Funds:
|
|
|
|
|
| Name of Person |
|
Dollar Range
of Equity Securities in each Fund |
|
Aggregate Dollar Range of Equity Securities in all
Funds Held By Portfolio Manager |
| Christopher Gowlland |
|
None |
|
None |
CHILTON CAPITAL MANAGEMENT, LLC
The Defensive Strategies Fund currently engages a sub-adviser to manage the REIT allocation of the Fund’s investment portfolio. Delaware Management Business Trust (“Delaware”) has been the Sub-Adviser to the Defensive Strategies Fund since its inception in October 2013. The Delaware Sub-Advisory Agreement was last approved by the Board on February 14, 2020. Under the terms of the Delaware sub-advisory agreement, Delaware manages the day-to-day investment and reinvestment of the Fund’s REIT allocation and continuously reviews, supervises and administers the investment program of the Fund, all under the supervision of TPL and the Trust’s Board. Under the agreement, Delaware is not liable for any error of judgment or any loss unless the error or loss results from the gross negligence, bad faith or willful malfeasance in the performance of its duties under the agreement. The agreement may be terminated without penalty by any party upon 60 days written notice.
In August 2020, Delaware announced its intention to resign as Sub-Adviser to the Defensive Strategies Fund, effective upon the approval of its replacement. Delaware decided to resign because it was in the process of closing its REIT investment operation. At a Special Meeting of the Board held on September 28, 2020, the Board formally considered the engagement of Chilton to replace Delaware, and after full consideration, approved the engagement of Chilton for the REIT allocation of the Fund and directed Trust management to call a shareholders meeting of the Fund to seek shareholder approval of the decision. The proposed sub-advisory agreement with Chilton is identical in all material respects to the current Delaware agreement.
The Board of the Timothy Plan (the “Trust”) has voted to call a special meeting of all shareholders of the Timothy Plan Defensive Strategies Fund (the “Fund”), in order to seek shareholder approval of two proposals relating to the Defensive Strategies Fund. The Special Meeting was held on Monday, December 21, 2020 at 2:30 p.m., Eastern Time at the offices of the Trust’s Investment Adviser, Timothy Partners, Ltd., located at 1055 Maitland Center Commons Blvd., Maitland, FL 32751, and the Special Meeting was adjourned until January 21, 2021.
Chilton Capital Management, LLC (“Chilton”), 1177 West Loop South, Suite 1750, Houston, TX, was founded in 1996 as a registered investment advisor, and has provided investment advisory services to mutual funds, institutional investors and individual investors since that time. Chilton’s primary owners are Knapp Brothers, LLC (“Knapp Brothers”), a Texas limited liability company, and certain employees of Chilton. Knapp Brothers has a fifty-five percent (55%) direct beneficial ownership and certain employees of Chilton collectively have a forty-five percent (45%) beneficial ownership. The primary owners of Knapp Brothers are Messrs. David M. Underwood, Jr. and A. John Knapp, Jr. Chilton is managed and
16
controlled under the direction of its Board of Managers, which is comprised of Mr. David M. Underwood, Jr., as Chairman, Mr. R. Randall Grace, Jr., Mr. John E. Robertson, Ms. Laura L. Genung, and Mr. Timothy J. Lootens (collectively, the “Board of Managers”).
The REIT allocation of the Timothy Plan Defensive Strategies Fund will utilize a team of investment professionals who are responsible for the day-to-day recommendations regarding the investment of the REIT allocation of the Fund’s portfolio. Co portfolio managers Bruce G. Garrison with over 48 years of experience as a portfolio manager/analyst and Matthew R. Werner, with 14 years of experience as a portfolio manager/analyst, joined Chilton in 2011 to manage a REIT strategy.
The Defensive Strategies Fund REIT sleeve is managed by
Bruce G. Garrison, CFA is the senior portfolio manager for the firm’s REIT strategy. Prior to joining Chilton Capital Management in 2011 he served as a Director in the Investments Group at Salient Partners. Mr. Garrison began his career in 1972 with Morgan Guaranty Trust Co. His career experience also includes tenure as Managing Director for Kidder Peabody & Co., and Paine Webber (now UBS), where he participated in over $8 billion of financings (primarily equity) involving REITs. In 1993 and 1994, Mr. Garrison was voted Institutional Investor All American for REIT Research, first and second, respectively, and won the Realty Stock Review All-Star Analyst Award in 1992, 1993, and 1994.
Mr. Garrison has a BBA and MBA from the University of Texas at Austin. He is a CFA charter holder, a member of the CFA Institute, and the CFA Society of Houston and a member and former governor of the National Association of Real Estate Investment Trusts (NAREIT). Mr. Garrison serves on the firm’s Investment Policy Committee.
Matt Werner is a Managing Director / Portfolio Manager who leads the Chilton REIT Team along with strategy founder Bruce Garrison. Matt performs analysis, conducts property tours, and meets with REIT management teams in order to assemble a portfolio that seeks to outperform the benchmark, net of all fees and expenses. His team is responsible for managing separately managed accounts for institutions and high net worth individuals, as well as a public 40 Act Fund. Matt also interfaces with clients and prospects in order to communicate how this proven strategy will continue to build wealth so that clients can achieve their financial goals.
Prior to arriving at Chilton, Matt worked on the investment team at Salient Partners, where he gained valuable knowledge of analyzing and assessing real estate fund managers for a fund-of-funds, as well as working on the Salient REIT Team.
Matt holds a CFA charter and is a member of the Houston CFA Society, CFA Institute, and National Association of Real Estate Trusts (NAREIT). He has been quoted in numerous national publications including the Wall Street Journal, Forbes, Barron’s, Financial Times, Investors Business Daily, Grant’s Interest Rate Observer, and Kiplinger’s. Matt holds a BS degree in Finance from Boston College.
Fees paid to Chilton under the proposed sub-advisory agreement are almost identical to the fees currently being paid to Delaware under its agreement. It is important to note that fees paid to sub-advisers are paid by TPL, out if its fees, and not by the Fund. Accordingly, even though the sub-advisory fees charged by the two firms are slightly different, there is no effect whatsoever on the Defensive Strategies Fund and its fee structure.
For its services rendered to the Defensive Strategies Fund, TPL will pay Chilton a fee at an annual rate equal to 0.42% of the Fund’s average daily assets allocated to the REIT sleeve of the Defensive Fund’s investment portfolio (“Allocated Assets”) up to $10 million, 0.40% for the next $10 million in Allocated Assets, 0.35% for the next $30 million in Allocated Assets, and 0.30% of Allocated Assets over $50 million.
As of September 30, 2020, Chilton managed approximately $1.6 billion in client assets.
Other Information Relating to Chilton
The following table presents information relating to the persons responsible for managing Fund assets, the number and types of other accounts managed by such persons, and how such persons are compensated for managing such accounts. The information is current as of September 30, 2020.
17
|
|
|
|
|
|
|
|
|
|
|
|
|
| |
|
Number of Other Accounts Managed
and Assets by Account Type |
|
Number of Accounts and Assets for Which
Advisory Fee is Performance-Based |
| Name of Sub-Advisor and Portfolio Manager |
|
Registered
Investment Companies ($mils) |
|
Other Pooled
Investment Vehicles ($mils) |
|
Other
Accounts ($mils) |
|
Registered
Investment Companies ($mils) |
|
Other Pooled
Investment Vehicles ($mils) |
|
Other Accounts
($mils) |
| CHILTON CAPITAL MANAGEMENT, LLC |
|
|
|
|
|
|
|
|
|
|
|
|
| Bruce Garrison |
|
1($34M) |
|
0 |
|
376 ($370M) |
|
N/A |
|
N/A |
|
N/A |
| Matt Werner |
|
1($34M) |
|
0 |
|
376 ($370M) |
|
N/A |
|
N/A |
|
N/A |
In addition to base salary, all portfolio managers and analysts share in a bonus pool that is distributed semi-annually. The amount of bonus compensation is based on quantitative and qualitative factors. Analysts and portfolio managers are rated on their value added to the team-oriented investment process. Compensation is not tied to a published or private benchmark. It is important to understand that contributions to the overall investment process may include not recommending securities in an analyst’s sector if there are no compelling opportunities among the industries covered by that analyst. Many of our key employees, including all portfolio managers and the majority of our analysts, have economic ownership in Chilton.
The compensation of portfolio managers is not directly tied to growth in assets and portfolio managers are not compensated for bringing in new business. Of course, growth in assets from the appreciation of existing assets and/or growth in new assets will increase revenues and profit. The consistent, long-term growth in assets at any investment firm is to a great extent, dependent upon the success of the portfolio management team. The compensation of the portfolio management team at Chilton will increase over time, if and when assets continue to grow.
As of September 30, 2020, none of the Portfolio Managers listed above held a beneficial interest in any Timothy Plan Funds.
|
|
|
|
|
| Name of Person |
|
Dollar Range
of Equity Securities in each Fund |
|
Aggregate Dollar Range of Equity Securities in all
Funds Held By Portfolio Manager |
| Bruce Garrison |
|
None |
|
None |
| Matt Werner |
|
None |
|
None |
CORECOMMODITY MANAGEMENT, LLC
Pursuant to an Investment Sub-Advisory Agreement between TPL, the Trust and CoreCommodity Management, LLC (“CORE”), (formerly Jefferies Asset Management, LLC), dated September 27, 2011, CORE assumed responsibility as the Investment Manager to the commodities-based sleeve of the Defensive Strategies Fund. As Investment Manager, CORE provides advice and assistance to TPL in the selection of appropriate investments for the Fund’s commodities-based sleeve, subject to the supervision and direction of the Funds’ Board. As compensation for its services to the Fund, CORE receives from TPL an annual fee at a rate equal to 0.40% of the Fund’s average daily assets up to $25 million, and 0.35% of average daily net assets over $25 million.
As of September 30, 2020, CORE managed approximately $3.5 billion in client assets (measured at agreed upon notional amount for managed accounts, net asset value for pooled vehicles and includes anticipated subscriptions or redemptions for the first business day of the following month).
On February 14, 2020, the Board met to consider, among other matters, retaining CORE as Investment Manager for the commodities sleeve for the Defensive Strategies Fund and after full consideration, renewed the agreement for an additional year. A discussion of the Board’s considerations in ratifying the agreements are provided in the Trust’s semi-annual report, dated March 31, 2020.
Defensive Strategies | Commodities Sleeve
Mr. Adam C. De Chiara serves as the Fund’s commodities-based Portfolio Manager and is responsible for all investment decisions for the Fund.
| |
Mr. |
Adam De Chiara is a Co-Founder of CORE and the Portfolio Manager of the CORE Commodity Programs. Mr. De Chiara began his commodity career in 1991 at Goldman Sachs where he was responsible for trading the Goldman Sachs Commodity Index (“GSCI”). In 1994, Mr. De Chiara founded the commodity index group at AIG, where he designed and launched the Dow Jones - AIG Commodity Index. In 2003, Mr. De Chiara co-founded the commodities group at Jefferies. Mr. De Chiara received a BA from Harvard University and a JD from Harvard Law School. |
18
Other Information Relating to CoreCommodity Management, LLC
The following table presents information relating to the persons responsible for managing Fund assets, the number and types of other accounts managed by such persons, and how such persons are compensated for managing such accounts. The information is current as of September 30, 2020.
|
|
|
|
|
|
|
|
|
|
|
|
|
| |
|
Number of Other Accounts Managed
and Assets by Account Type |
|
Number of Accounts and Assets for Which
Advisory Fee is Performance-Based |
| Name of Sub-Advisor and Portfolio Manager |
|
Registered
Investment Companies ($mils) |
|
Other Pooled
Investment Vehicles ($mils) |
|
Other
Accounts ($mils) |
|
Registered
Investment Companies ($mils) |
|
Other Pooled
Investment Vehicles ($mils) |
|
Other
Accounts ($mils) |
| CoreCommodity Management, LLC: |
|
|
|
|
|
|
|
|
|
|
|
|
| Adam De Chiara |
|
1 ($56) |
|
4 ($560) |
|
14 ($2,554) |
|
N/A |
|
3 ($348)* |
|
9 ($1,787) |
| |
* |
Investors in certain private funds have the option of selecting a performance fee. |
The portfolio manager’s total compensation consists of base salary and cash bonus. Base salaries are determined by considering experience and expertise and may be reviewed for adjustment annually. The portfolio manager is eligible to receive bonuses, which may be significantly more than his base salary, upon attaining certain performance objectives based on measures of individual, group or department success. These goals are specific to the portfolio manager. Achievement of these goals is an important, but not exclusive, element of the bonus decision process, and, absent a contractual agreement, bonuses are determined at the discretion of CORE. Likewise, while the portfolio manager may manage accounts that have a performance or outperformance fee component, absent a contractual arrangement, bonuses are determined at the discretion of CORE. Certain portfolio managers may also have employment contracts, which may guarantee severance payments in the event of involuntary termination. However, given that Mr. De Chiara also serves as a co-President of CORE, his compensation is heavily influenced by the overall performance and reputation of CORE rather than being triggered by the performance of any one program or client account. The portfolio manager may also participate in benefit plans and programs available generally to all employees. He also receives, indirectly, compensation from CORE’s affiliate, Core Commodity Indexes, LLC which acts as an index sponsor to certain indexes.
As of September 30, 2020, the Portfolio Managers listed below held a beneficial interest in the following Timothy Plan Funds:
|
|
|
|
|
| Name of Person |
|
Dollar Range
of Equity Securities in each Fund |
|
Aggregate Dollar Range of Equity Securities in all
Funds Held By Portfolio Manager |
| Adam De Chiara |
|
None |
|
None |
BARROW, HANLEY, MEWHINNEY AND STRAUSS, LLC
Pursuant to an Investment Sub-Advisory Agreement between TPL, the Trust and Barrow, Hanley, Mewhinney and Strauss, LLC (“BHMS”), dated July 1, 2004 (the “BHMS Sub-Advisory Agreement”), BHMS provides advice and assistance to TPL in the selection of appropriate investments for the Fixed-Income Fund. Pursuant to amendments to the Agreement dated May 1, 2007, and November 1, 2009, and May 1, 2019 BHMS provides such advice to the High Yield Bond Fund and to the Debt Instrument Sleeve of the Defensive Strategies Fund, and to the fixed income sector of the Growth and Income Fund, respectively, subject to the supervision and direction of the Funds’ Board. As compensation for its services with respect to the Fixed-Income Fund and High Yield Bond Fund, BHMS receives from TPL an annual fee at a rate equal to 0.375% of 1% of the first $20,000 in the average net assets of each Fund. As compensation for its services with respect to the Defensive Strategies Fund, BHMS receives from TPL an annual fee at a rate equal to 0.15% of the average net assets in the Debt Instrument Sleeve of the Fund. As compensation for its services with respect to the Growth and Income Fund , BHMS receives from TPL an annual fee at a rate equal to 0.375 of 1% of the first $20,000,00 of the average net assets in the Fixed Income Sector of the Fund.
As of September 30, 2020, BHMS managed approximately $ 44.6 billion in client assets.
On February 14, 2020, the Board met to consider, among other matters, retaining BHMS as sub-investment Advisor for the Fixed Income Fund, High Yield Bond Fund, Defensive Strategies Fund Debt Instrument Sector and the fixed income sector of the Growth and Income Fund and after full consideration, the Board renewed the agreement for an additional year. A discussion of the Board’s considerations in renewing the agreement is available in the Trust’s semi-annual report dated March 31, 2020.
*Fixed Income Fund
*High Yield Bond Fund
*Fixed Income Allocation of the Growth and Income Fund
*Debt instrument Allocation of the Defensive Strategies Fund
19
* At the Timothy Board’s quarterly meeting held on August 28, 2020, the Board was informed that BHMS had entered into an agreement with Perpetual U.S. Holding Company Inc. (“Perpetual”) wherein Perpetual would purchase the entire 75.1% ownership interest in BHMS currently held by BrightSphere. Like BrightSphere, Perpetual is a holding company that invests in a wide variety of financial institutions. BHMS informed the Timothy Board that the BHMS management team would remain in place after the transaction and that the portfolio management teams currently in place for the Funds would remain unchanged after the Transaction. BHMS further informed the Board that the Transaction was due to close on November 30, 2020. The Transaction did close as anticipated, and the current sub-advisory agreements terminated. Accordingly, a new sub-advisory agreement has been approved by the Board and shareholder ratification is currently being sought. Shareholders of the Timothy Plan Fixed Income Fund, Timothy Plan High Yield Bond Fund, Timothy Plan Growth and Income Fund and the Defensive Strategies Fund will vote to approve or reject the change in control and new investment sub-advisory agreement with BHMS at a Special Shareholder Meeting to be held on December 21, 2020. Subsequently the Special Shareholder Meeting has been adjourned until January 21, 2021.
Fixed Income Fund, Fixed Income Allocation of the Growth and Income Fund and High Yield Bond Fund
BHMS employs a team concept in the management of the Timothy Plan Funds. Team members are assigned specific sector responsibilities, but enjoy equal responsibilities in the investment process. The members have equal say in the actual management. The members of the team are Mark C. Luchsinger, Scott McDonald, Deborah A. Petruzzelli and Erik A. Olson, Rahul Bapna, Nicholas C. Losey and Chet S. Paipanandiker.
| |
Mr. |
Mark C. Luchsinger, CFA, joined BHMS in 1997. He currently serves as a portfolio manager/ analyst, specializing in investment grade and high yield corporate bond strategies and is the lead portfolio manager for our Core and Core Plus strategies. |
| |
Mr. |
J. Scott McDonald, CFA, joined BHMS in 1995. He currently serves as the lead portfolio manager for our Long Duration strategies, specializing in corporate and government bonds. He is also a generalist in investment grade fixed income credit research. |
| |
Ms. |
Deborah A. Petruzzelli joined BHMS in 2003. She serves as our structured securities portfolio manager for mortgage- backed, asset-backed, and commercial mortgage-backed securities. |
| |
Mr. |
Erik A. Olson joined BHMS in 2001. He serves as a co-portfolio manager on our high yield strategies and as a senior analyst in credit research. |
| |
Mr. |
Rahul Bapna, CFA, joined BHMS in 2012. He serves as a portfolio manager/analyst on our intermediate and short maturity strategies and as senior analyst in credit research. |
| |
Mr. |
Nicholas C. Losey, CFA joined BHMS in 2018. He serves as a co-portfolio manager on our high yield and bank loan strategies. |
| |
Mr. |
Chet S. Paipanandiker joined BHMS in 2017. He serves as a co-portfolio manager on our high yield and bank loan strategies. |
Defensive Strategies | Debt Instrument Sector
| |
Mr. |
Mark C. Luchsinger, CFA, joined BHMS in 1997. He currently serves as a portfolio manager/analyst, specializing in investment grade and high yield corporate bond strategies and is the lead portfolio manager for our Core and Core Plus strategies. |
| |
Mr. |
J. Scott McDonald, CFA, joined BHMS in 1995. He currently serves as the lead portfolio manager for our Long Duration strategies, specializing in corporate and government bonds. He is also a generalist in investment grade fixed income credit research. |
| |
Mr. |
Erik A. Olson joined BHMS in 2001. He serves as a co-portfolio manager on our high yield strategies and as a senior analyst in credit research. |
| |
Mr. |
Rahul Bapna, CFA, joined BHMS in 2012. He serves as a portfolio manager/analyst on our intermediate and short maturity strategies and as a senior analyst in credit research. |
Other Information Relating to BHMS
The following table presents information relating to the persons responsible for managing Fund assets, the number and types of other accounts managed by such persons, and how such persons are compensated for managing such accounts. The information is current as of September 30, 2020.
20
|
|
|
|
|
|
|
|
|
|
|
|
|
| |
|
Number of Other Accounts Managed
And Assets by Account Type |
|
Number of Accounts and Assets for Which
Advisory Fee is Performance-Based |
| Name of Sub-Advisor and Portfolio Manager |
|
Registered
Investment Companies ($mils) |
|
Other Pooled
Investment Vehicles ($mils) |
|
Other
Accounts
($mils) |
|
Registered
Investment
Companies
($mils) |
|
Other Pooled
Investment
Vehicles
($mils) |
|
Other
Accounts
($mils) |
| Barrow, Hanley, Mewhinney & Strauss, LLC: |
|
|
|
|
|
|
|
|
| Mr. J. Scott McDonald, CFA |
|
2 (117.1) |
|
1 (62.4) |
|
97(10,331.3) |
|
0 |
|
0 |
|
1 (967.4) |
| Mr. Mark C. Luchsinger, CFA |
|
2 (117.1) |
|
3 (253.6) |
|
97(10,366.1) |
|
0 |
|
0 |
|
1 (967.4) |
| Ms. Deborah A. Petruzzelli |
|
2 (117.1) |
|
1 (62.4) |
|
67(4,707.5) |
|
0 |
|
0 |
|
0 |
| Mr. Erik A. Olson |
|
2 (117.1) |
|
3 (253.6) |
|
97(10,366.1) |
|
0 |
|
0 |
|
1 (967.4) |
| Mr. Rahul Bapna, CFA |
|
2 (117.1) |
|
2 (145.4) |
|
94(10,296.5) |
|
0 |
|
0 |
|
1 (967.4) |
| Mr. Nicholas C. Losey, CFA |
|
0 |
|
2 (191.2) |
|
11(762.7) |
|
0 |
|
0 |
|
0 |
| Mr. Chet S. Paipanandiker |
|
0 |
|
2 (191.2) |
|
11(762.7) |
|
0 |
|
0 |
|
0 |
Compensation of our investment professionals is tied to their overall contribution to the success of Barrow Hanley. In addition to base salary, all portfolio managers and analysts re eligible to participate in a bonus pool. The amount of bonus compensation is based on quantitative and qualitative factors and may be substantially higher than an investment professional’s base compensation. Portfolio managers and analysts are evaluated on the value each adds to the overall investment process and performance, and their contributions in other areas, such as meetings with clients and consultants. Bonus compensation for analysts is directly tied to their investment recommendations, which are evaluated every six months versus the appropriate industry group/sector benchmark based on trailing one-year and three-year relative performance.
The final component of compensation of key employees, including portfolio managers and analysts, is their interest in our equity plan. Each quarter, equity owners receive a share of the firm’s profits in the form of a dividend, which is related to the performance of the entire firm.
As of September 30, 2020, the Portfolio Managers listed below held a beneficial interest in the following Timothy Plan Funds:
|
|
|
|
|
| Name of Person |
|
Dollar Range
of Equity Securities in each Fund |
|
Aggregate Dollar Range of Equity Securities in all
Funds Held By Portfolio Manager |
| J. Scott McDonald |
|
None |
|
None |
| Mark C. Luchsinger |
|
None |
|
None |
| Deborah A. Petruzzelli |
|
None |
|
None |
| Erik A. Olson |
|
None |
|
None |
| Rahul Bapna |
|
None |
|
None |
| Nicholas C. Losey |
|
None |
|
None |
| Chet S. Paipanandiker |
|
None |
|
None |
21
SUB-ADVISOR FEES
The following table sets forth the fees paid to each Sub-Advisor by TPL for the fiscal years ended September 30, 2018, 2019 and 2020:
|
|
|
|
|
|
|
|
|
|
|
| Investment Manager |
|
2018 |
|
2019 |
|
|
2020 |
|
|
|
| Chartwell Investment Partners – Aggressive Growth |
|
$266,439 |
|
$115,262 |
|
|
$107,766 |
|
|
|
| Chartwell Investment Partners – Large/Mid Cap Growth |
|
$107,676 |
|
$224,140 |
|
|
$208,809 |
|
|
|
| Eagle Global Advisers – International |
|
$594,838 |
|
$519,599 |
|
|
$469,252 |
|
|
|
| Eagle Global Advisers – Israel Common Values |
|
$281,983 |
|
$405,442 |
|
|
$420,069 |
|
|
|
| Macquarie Investment Management (formerly Delaware Investment Fund Advisers) – Defensive Strategies REITs Sleeve |
|
$52,623 |
|
$35,504 |
|
|
$31,244*** |
|
|
|
| Barrow, Hanley, Mewhinney and Strauss – Defensive Strategies Debt Instrument Sleeve |
|
$26,355 |
|
$18,290 |
|
|
$16,432 |
|
|
|
| Barrow, Hanley, Mewhinney and Strauss – Fixed Income |
|
$197,441 |
|
$211,229 |
|
|
$229,095 |
|
|
|
| Barrow Hanley, Mewhinney and Strauss – High Yield Bond |
|
$143,563 |
|
$131,432 |
|
|
$157,328 |
|
|
|
| Westwood Management Corp. – Large/Mid Cap Value |
|
$591,454 |
|
$485,685 |
|
|
$411,732 |
|
|
|
| Westwood Management Corp. – Small Cap Value |
|
$418,703 |
|
$396,771 |
|
|
$326,181 |
|
|
|
| Brandes Investment Partners, LP – Emerging Markets |
|
$172,513 |
|
$152,752 |
|
|
$27,511* |
|
|
|
| James Investment Research – Growth & Income |
|
$123,425 |
|
$36,306 |
|
|
0 ** |
|
|
|
| CoreCommodity Management – Defensive Strategies Commodities Sleeve |
|
$49,411 |
|
$33,741 |
|
|
$30,343 |
|
|
|
| Barrow, Hanley, Mewhinney and Strauss – Growth & Income |
|
$0 |
|
$0 |
|
|
$16,832** |
|
|
|
| Chilton Capital Management, LLC – Defensive Strategies REIT Sleeve |
|
$0 |
|
$0 |
|
|
$0*** |
|
|
|
| * Emerging Markets Fund ceased operations on 12/27/2019 ** Barrow Hanley, Mewhinney and Strauss replaced James Investment Research as Sub-Advisor in 2020 *** Chilton replaced Macquarie Investment Management in 2020 on the Defensive Strategies Fund |
|
|
|
|
|
|
|
|
|
|
22
TRUSTEES AND PRINCIPAL EXECUTIVE OFFICERS OF THE TRUST
The Trustees and Principal Executive Officers of the Trust and their principal occupations for the past five years are listed as follows:
INTERESTED TRUSTEES
|
|
|
|
|
|
|
| Name, Age and Address |
|
Position(s) Held With Trust |
|
Term of Office
and Length of Time Served |
|
Number of Portfolios
in Fund Complex Overseen by Trustee |
| Arthur D. Ally* |
|
Trustee, Chairman, President, and Treasurer |
|
Indefinite; Trustee and President since
1994 |
|
18 |
| 1055 Maitland Center Commons |
|
|
|
|
|
|
| Maitland, FL |
|
|
|
|
|
Other Directorships |
|
|
Principal Occupation During Past 5 Years |
|
Held by Trustee |
| Born: 1942 |
|
President and controlling shareholder of Covenant Funds, Inc. (“CFI”), a holding company. President and general partner of Timothy Partners, Ltd. (“TPL”), the investment Advisor and principal underwriter to each Fund. CFI is also the managing general partner of TPL. |
|
None |
|
|
|
|
|
|
|
|
|
|
|
| Name, Age and Address |
|
Position(s) Held With Trust |
|
Term of Office
and Length of Time Served |
|
Number of Portfolios
in Fund Complex Overseen by Trustee |
| Mathew D. Staver** |
|
Trustee |
|
Indefinite; Trustee since 2000 |
|
18 |
| 1055 Maitland Center Commons |
|
|
|
|
|
Other Directorships |
| Maitland, FL |
|
Principal Occupation During Past 5 Years |
|
Held by Trustee |
| Born: 1956 |
|
Attorney specializing in free speech, appellate practice and religious liberty constitutional law. Founder of Liberty Counsel, a religious civil liberties education and legal defense organization. Host of two radio programs devoted to religious freedom issues. Editor of a monthly newsletter devoted to religious liberty topics. Mr. Staver has argued before the United States Supreme Court and has published numerous legal articles. |
|
None |
| * Mr. Ally is an “interested” Trustee, as that term is defined in the 1940 Act, because of his positions with and financial interests in CFI and TPL. ** Mr. Staver is an “interested” Trustee, as that term is defined in the 1940 Act, because he has a limited partnership interest in TPL. INDEPENDENT TRUSTEES |
| Name, Age and Address |
|
Position(s) Held With Trust |
|
Term of Office
and Length of Time Served |
|
Number of Portfolios
in Fund Complex Overseen by Trustee |
| Richard W. Copeland |
|
Trustee |
|
Indefinite; Trustee since 2005 |
|
18 |
| 1055 Maitland Center Commons |
|
|
|
|
|
Other Directorships |
| Maitland, FL |
|
Principal Occupation During Past 5 Years |
|
Held by Trustee |
| Born: 1947 |
|
Retired. Associate Professor Stetson University for the past 40 years. Retired Principal of Copeland & Covert, Attorneys at Law; specializing in tax and estate planning. B.A. from Mississippi College, JD from University of Florida and LLM Taxation from University of Miami. |
|
None |
23
|
|
|
|
|
|
|
| Name, Age and Address |
|
Position(s) Held With Trust |
|
Term of Office and Length of Time Served |
|
Number of Portfolios
in Fund Complex Overseen by Trustee |
| Deborah Honeycutt |
|
Trustee |
|
Indefinite; Trustee since 2010 |
|
18 |
| 1055 Maitland Center Commons |
|
|
|
|
|
Other Directorships |
| Maitland, FL |
|
Principal Occupation During Past 5 Years |
|
Held by Trustee |
| Born: 1947 |
|
Dr. Honeycutt is a licensed physician currently serving as Medical Director of Clayton State University Health Services in Morrow, GA, CEO of Minority Health Services in Atlanta, and as a volunteer at Good Shepherd Clinic. Dr. Honeycutt received her B.A. and M.D. at the University of Illinois. |
|
None |
|
|
|
|
|
|
|
|
|
|
|
| Name, Age and Address |
|
Position(s) Held With Trust |
|
Term of Office and Length of Time Served |
|
Number of Portfolios
in Fund Complex Overseen by Trustee |
| Bill Johnson |
|
Trustee |
|
Indefinite; Trustee since 2005 |
|
18 |
| 1055 Maitland Center Commons |
|
|
|
|
|
Other Directorships |
| Maitland, FL |
|
Principal Occupation During Past 5 Years |
|
Held by Trustee |
| Born: 1946 |
|
President (and Founder) of American Decency Association, Freemont, MI since 1999. Previously served as Michigan State Director for American Family Association (1987-1999). Previously a public school teacher for 18 years. B.S. from Michigan State University and a Masters of Religious Education from Grand Rapids Baptist Seminary. |
|
None |
|
|
|
|
|
|
|
| Name, Age and Address |
|
Position(s) Held With Trust |
|
Term of Office and Length of Time Served |
|
Number of Portfolios
in Fund Complex Overseen by Trustee |
| John C. Mulder |
|
Trustee |
|
Indefinite; Trustee since 2005 |
|
18 |
| 1055 Maitland Center Commons |
|
|
|
|
|
Other Directorships |
| Maitland, FL |
|
Principal Occupation During Past 5 Years |
|
Held by Trustee |
| Born: 1950 |
|
President of WaterStone (formerly the Christian Community Foundation and National Foundation) since 2001. Prior: 22 years of executive experience for a group of banks and a trust company. B.A. in Economics from Wheaton College and MBA from University of Chicago. |
|
None
|
| |
|
|
|
|
|
|
|
|
|
|
|
| Name, Age and Address |
|
Position(s) Held With Trust |
|
Term of Office and Length of Time Served |
|
Number of Portfolios
in Fund Complex Overseen by Trustee |
| Scott Preissler, Ph.D. |
|
Trustee |
|
Indefinite; Trustee since 2004 |
|
18 |
| 1055 Maitland Center Commons |
|
|
|
|
|
Other Directorships |
| Maitland, FL |
|
Principal Occupation During Past 5 Years |
|
Held by Trustee |
| Born: 1960 |
|
Scott Preissler, Ph.D. is the Executive Director of The National Center for Stewardship & Generosity. He is a former professor and past President and CEO of The Christian Stewardship Association (CSA) and Southern Baptist state headquarters in Texas and Georgia |
|
None |
|
|
|
|
|
|
|
|
|
|
|
| Name, Age and Address |
|
Position(s) Held With Trust |
|
Term of Office and Length of Time Served |
|
Number of Portfolios
in Fund Complex Overseen by Trustee |
| Alan M. Ross |
|
Trustee, Vice Chairman |
|
Indefinite; Trustee since 2004 |
|
18 |
| 1055 Maitland Center Commons |
|
|
|
|
|
Other Directorships |
| Maitland, FL |
|
Principal Occupation During Past 5 Years |
|
Held by Trustee |
| Born: 1951 |
|
Founder and CEO of Corporate Development Institute which he founded in 2000. Previously he served as President and CEO of Fellowship of Companies for Christ and has authored three books: Beyond World Class, Unconditional Excellence, Breaking Through to Prosperity. |
|
None |
24
|
|
|
|
|
|
|
| Name, Age and Address |
|
Position(s) Held With Trust |
|
Term of Office and Length of Time Served |
|
Number of Portfolios
in Fund Complex Overseen by Trustee |
| Patrice Tsague |
|
Trustee |
|
Indefinite; Trustee since 2011 |
|
18 |
| 1055 Maitland Center Commons |
|
|
|
|
|
Other Directorships |
| Maitland, FL |
|
Principal Occupation During Past 5 Years |
|
Held by Trustee |
| Born: 1973 |
|
President and Chief Servant Officer of the Nehemiah Project International Ministries Inc. since 1999. |
|
None |
|
|
|
|
|
|
|
|
|
|
|
| Name, Age and Address |
|
Position(s) Held With Trust |
|
Term of Office and Length of Time Served |
|
Number of Portfolios
in Fund Complex Overseen by Trustee |
| Abraham M. Rivera |
|
Trustee |
|
Indefinite; Trustee since 2020 |
|
18 |
| 1055 Maitland Center Commons |
|
|
|
|
|
Other Directorships |
| Maitland, FL |
|
Principal Occupation During Past 5 Years |
|
Held by Trustee |
| Born: 1969 |
|
Pastor / President / Director, for La Puerta Life Center, Inc., a Florida corporation. |
|
1 |
|
|
|
|
|
|
|
| Name, Age and Address |
|
Position(s) Held With Trust |
|
Term of Office and Length of Time Served |
|
Number of Portfolios
in Fund Complex Overseen by Trustee |
| Dale A. Bissonette |
|
Trustee |
|
Indefinite; Trustee since 2020 |
|
18 |
| 1055 Maitland Center Commons |
|
|
|
|
|
Other Directorships |
| Maitland, FL |
|
Principal Occupation During Past 5 Years |
|
Held by Trustee |
| Born: 1958 |
|
President, Good Place Holdings, a Christian Centered Business Holding Company. |
|
None |
PRINCIPAL EXECUTIVE OFFICERS
|
|
|
|
|
|
|
| Name, Age and Address |
|
Position(s) Held With Trust |
|
Term of Office and Length of Time Served |
|
Number of Portfolios
in Fund Complex Overseen by Trustee |
| Terry Covert |
|
Executive Officer, Vice President |
|
Officer since 2019 Indefinite Term |
|
N/A |
| 1055 Maitland Center Commons |
|
|
|
|
|
Other Directorships |
| Maitland, FL |
|
Principal Occupation During Past 5 Years |
|
Held by Trustee |
| Born: 1947 |
|
Chief Compliance Officer and General Counsel for the Advisor, Timothy Partners, Ltd. |
|
N/A |
|
|
|
|
|
|
|
|
|
|
|
| Name, Address & Age |
|
Position(s)
Held with the Trust |
|
Length of Time
Served and Term of Office |
|
Number of Portfolios
in Fund Complex
Overseen by Trustee |
| Cheryl Mumbert |
|
Executive Officer, Vice President |
|
Officer since 2019 Indefinite Term |
|
N/A |
| 1055 Maitland Center Commons |
|
|
|
|
|
Other Directorships |
| Maitland, FL |
|
Principal Occupation During Past 5 Years |
|
Held by Trustee |
| Born: 1970 |
|
Chief Marketing Officer for Advisor, Timothy Partners, Ltd. |
|
N/A |
| Name, Address & Age |
|
Position(s)
Held with the Trust |
|
Length of Time
Served and Term of Office |
|
Number of Portfolios
in Fund Complex
Overseen by Trustee |
| David D. Jones |
|
Chief Compliance Officer |
|
Since 2004, Indefinite Term |
|
N/A |
25
|
|
|
|
|
|
|
| 1055 Maitland Center Commons |
|
|
|
|
|
Other Directorships |
| Maitland, FL |
|
Principal Occupation During Past 5 Years |
|
Held by Trustee |
| Born: 1957 |
|
Co-founder and Managing Member, Drake Compliance, LLC (compliance consulting); founder and controlling shareholder, David Jones & Associates (law firm), 1998 to 2015. |
|
N/A |
| Name, Address & Age |
|
Position(s)
Held with the Trust |
|
Length of Time
Served and Term of Office |
|
Number of Portfolios
in Fund Complex
Overseen by Trustee |
| Joseph E. Boatwright |
|
Trustee Emeritus and Secretary |
|
Indefinite; Trustee and Secretary since 1995, Trustee Emeritus as of 2020 |
|
N/A |
| 1055 Maitland Center Commons |
|
|
|
|
|
Other Directorships |
| Maitland, FL |
|
Principal Occupation During Past 5 Years |
|
Held by Trustee |
| Born: 1930 |
|
Retired Minister. Currently serves as a consultant to the Greater Orlando Baptist Association. Served as Senior Pastor to Aloma Baptist Church from 1970-1996. |
|
None |
ADDITIONAL INFORMATION ABOUT THE TRUSTEES
The Board of Trustees believes that each Trustee’s experience, qualifications, attributes or skills on an individual basis and in combination with those of the other Trustees lead to the conclusion that the Trustees possess the requisite experience, qualifications, attributes and skills to serve on the Board. The Board of Trustees believes that the Trustees’ ability to review critically, evaluate, question and discuss information provided to them; to interact effectively with the Advisor, other service providers, legal counsel and independent public accountants; and to exercise effective business judgment in the performance of their duties as Trustees, support this conclusion. The Board of Trustees has also considered the contributions that each Trustee can make to the Board and the Trust.
As described in the table above, the Independent Trustees have served as such for a considerable period of time which has provided them with knowledge of the business and operation of the Funds and the Trust. In addition, the following specific experience, qualifications, attributes and/or skills apply as to each Trustee:
Arthur Ally served as a financial professional for nearly twenty years prior to establishing TPL, the advisor and distributor of the Timothy Plan Funds. Mr. Ally has a degree in accounting and economics and has earned numerous professional designations.
Mat Staver Served as Dean of Liberty University School of Law and is the founder and chairperson of Liberty Counsel. Mr. Staver has argued before the United States Supreme Court and brings his extensive legal background to the Board.
Richard Copeland Retired Associate Professor Stetson University School of Business Administration. Retired Principal of Copeland & Covert, Attorneys at Law specializing in tax and estate planning. B.A. from Mississippi College, JD from University of Florida and LLM Taxation from University of Miami.
Deborah Honeycutt is a physician practicing in the Atlanta, GA area. Dr. Honeycutt has experience in managing and directing health clinics and as a family medical practitioner. She brings extensive business experience, as well as experience in the health care sector, to the Board.
Bill Johnson has been in the ministry front lines in the fight against pornography. Mr. Johnson brings a keen knowledge of the various forms of pornography, as well as hands-on experience running a non-profit organization.
John Mulder is the executive director of Waterstone, a charitable remainder trust custodian that serves persons across the United States. Mr. Mulder brings proficiency in taxation as well as the skills he has acquired in managing a national organization.
Scott Preissler, Ph.D. is the Executive Director of The National Center for Stewardship & Generosity. He is a former professor and past President and CEO of The Christian Stewardship Association (CSA) and Southern Baptist state headquarters in Texas and Georgia. Dr. Preissler brings extensive organizational and public service experience to the Board.
Alan Ross is an entrepreneur specializing in corporate turn-around ventures. Mr. Ross offers the Board the wealth of knowledge he has gained in his experiences as a manager/owner of numerous companies.
Patrice Tsague brings a unique combined perspective from his career that includes counseling for international entrepreneurship and development of organizational techniques and avenues for businesses.
26
Pastor Abraham M. Rivera is the recipient of various honors and awards for his work in the community, including the United States Congressional Award for Hispanic Leadership and is currently on the teaching staff of St. Thomas University. Mr. Rivera is the Pastor / President / Director, for the La Puerta Life Center, Inc. in Florida.
Dale A. Bissonette is the President of Good Place Holdings, a Christian Centered Business holding Company. Mr. Bissonette adds a wealth of diverse business skills and experience to the Board.
References to the experience, qualifications, attributes or skills of the Trustees are pursuant to requirements of the Securities and Exchange Commission and do not constitute indicating that the Board or any Trustee has special expertise or experience, and shall not impose any greater responsibility or liability on such Trustee or on the Board by reason thereof.
BOARD STRUCTURE
The Board is responsible for overseeing the management and operations of the Trust and the Funds. The Board currently consists of nine Independent Trustees and two Trustees who are interested persons of the Trust. Arthur D. Ally, who is an interested person of the Trust, serves as Chair of the Board, Mr. Alan Ross serves as Vice-Chair of the Board, and the Lead Independent Trustee. Mr. Ross works with Mr. Ally to set the agendas for the Board and Committee meetings, chair meetings of the Independent Trustees, and generally serves as a liaison between the Independent Trustees and the Trust’s management between Board meetings.
The Board has two standing committees: the Audit Committee and the Pricing Committee. Both Committees are chaired by an Independent Trustee, and consist of Messrs. Ross, Mulder and Copeland, with Mr. Ross as chair. The members of the Committees are not “interested” persons of the Trust (as defined in the 1940 Act). The primary responsibilities of the Trust’s Audit Committee are, as set forth in its charter, to make recommendations to the Board as to: the engagement or discharge of the Trust’s independent auditors (including the audit fees charged by auditors); the supervision of investigations into matters relating to audit matters; the review with the independent auditors of the results of audits; and addressing any other matters regarding audits. The Audit Committee met two times during the last fiscal year. The Pricing Committee was established in November 2013. The Committee will be called upon in the event a security requires a fair pricing analysis to establish the applicable Fund’s net asset value (“NAV”).
The Board holds four regular meetings each year to consider and act upon matters involving the Trust and the Funds. The Board also may hold special meetings to address matters arising between regular meetings. Beginning in March 2020, the Trustees may conduct quarterly meetings telephonically in accordance with relief granted by the U.S. Securities and Exchange Commission (the “SEC”) to ease certain governance obligations in light of current travel concerns related to the COVID-19 pandemic. The Trustees acknowledge that all actions that require a vote of the Trustees at an in-person meeting would be ratified, as required by the SEC’s relief, at a later in-person meeting. The Independent Trustees also regularly meet outside the presence of management and are advised by legal counsel. These meetings may take place in person or by telephone. Through the Audit Committee, the Independent Trustees consider and address important matters involving the Funds, including those presenting conflicts or potential conflicts of interest for Trust management. The Board has determined that its committee structure helps ensure that the Funds have effective and independent governance and oversight. Given the Advisor’s sponsorship of the Trust, that investors have selected the Advisor to provide overall management to the Funds, and Mr. Ally’s senior leadership role within the Advisor, the Board elected him Chairman. The Board reviews its structure regularly and believes that its leadership structure, including having at least two thirds Independent Trustees, coupled with the responsibilities undertaken by Mr. Ally as Chair, Mr. Ross as Vice-Chair and Lead Independent Trustee, is appropriate and in the best interests of the Trust, given its specific characteristics. The Board also believes its leadership structure facilitates the orderly and efficient flow of information to the Independent Trustees from Fund management.
BOARD OVERSIGHT OF RISK
An integral part of the Board’s overall responsibility for overseeing the management and operations of the Trust is the Board’s oversight of the risk management of the Trust’s investment programs and business affairs. The Funds are subject to a number of risks, such as investment risk, credit risk, valuation risk, operational risk, and legal, compliance and regulatory risk. The Trust, the Advisor and the other service providers have implemented various processes, procedures and controls to identify risks to the Funds, to lessen the probability of their occurrence and to mitigate any adverse effect should they occur. Different processes, procedures and controls are employed with respect to different types of risks. These systems include those that are embedded in the conduct of the regular operations of the Board and in the regular responsibilities of the officers of the Trust and the other service providers.
The Board exercises oversight of the risk management process through the Board itself and through the Audit Committee. In addition to adopting, and periodically reviewing, policies and procedures designed to address risks to the Funds, the Board requires management of the Advisor and the Trust, including the Trust’s Chief Compliance Officer (“CCO”), to report to the Board and the Audit Committee on a variety of matters, including matters relating to risk management, at regular and special meetings. The Board and the Audit Committee receive regular reports from the Trust’s independent public accountants on internal control and financial reporting matters. On at least an annual basis, the Independent Trustees meet separately with the Funds’ CCO outside the presence of management, to discuss issues related to compliance. Furthermore, the Board receives a quarterly report from the Funds’ CCO regarding the operation of the compliance policies and procedures of the Trust and its primary service providers. The Board also receives quarterly reports from the Advisor on the investments and securities trading of the Funds, including their investment performance, as well as reports regarding the valuation of the Funds’ securities. In addition, in its annual review of the Funds’ advisory agreements, the Board reviews information provided by the Advisor relating to its operational capabilities, financial condition and resources. The Board also conducts an annual self-evaluation that includes a review of its effectiveness in overseeing the number of Funds in the Trust and the effectiveness of its committee structure.
27
The Board recognizes that it is not possible to identify all of the risks that may affect a Fund or to develop processes, procedures and controls to eliminate or mitigate every occurrence or effect. The Board may, at any time and in its discretion, change the manner in which it conducts its risk oversight role.
28
TRUSTEE OWNERSHIP
The following table sets forth information about the Trustees and the dollar range of shares of the Timothy Plan Family of Funds owned by each Trustee. As of December 31, 2020, the Trustees owned the following dollar ranges of Fund shares.
|
|
|
|
|
|
|
|
|
|
|
|
|
|
|
| Name of Director1 |
|
Fund Name |
|
|
Dollar Range of Equity
Securities each Fund |
|
|
|
Aggregate Dollar Range of
Equity Securities in all Funds Overseen by a Director in the Timothy Plan Family of Funds |
|
|
|
|
|
| Interested Trustees |
|
|
|
|
|
|
|
|
|
|
|
|
|
|
| Arthur D. Ally |
|
Small Cap Value |
|
|
$1 - $10,000 |
|
|
|
|
|
|
|
|
|
| |
|
Large/Mid Cap Value |
|
|
$1 - $10,000 |
|
|
|
|
|
|
|
|
|
| |
|
Aggressive Growth |
|
|
$1 - $10,000 |
|
|
|
|
|
|
|
|
|
| |
|
Large/Mid Growth |
|
|
$1 - $10,000 |
|
|
|
|
|
|
|
|
|
| |
|
International |
|
|
$1 - $10,000 |
|
|
|
|
|
|
|
|
|
| |
|
Defensive Strategies |
|
|
$1 - $10,000 |
|
|
|
|
|
|
|
|
|
| |
|
Israel Common Values |
|
|
$1 - $10,000 |
|
|
|
|
|
|
|
|
|
| |
|
Growth and Income |
|
|
$1 - $10,000 |
|
|
|
|
|
|
|
|
|
| |
|
|
|
|
|
|
|
|
$1 - $10,000 |
|
|
|
|
|
| Mathew D. Staver |
|
Small Cap Value |
|
|
$10,001 - $50,000 |
|
|
|
|
|
|
|
|
|
| |
|
Large Mid/Cap Value |
|
|
$50,001 - $100,000 |
|
|
|
|
|
|
|
|
|
| |
|
Aggressive Growth |
|
|
$50,001 - $100,000 |
|
|
|
|
|
|
|
|
|
| |
|
Large Mid/Growth |
|
|
Over $100,000 |
|
|
|
|
|
|
|
|
|
| |
|
Conservative Growth Variable |
|
|
$10,001 - $50,000 |
|
|
|
|
|
|
|
|
|
| |
|
Defensive Strategies |
|
|
$10,001 - $50,000 |
|
|
|
|
|
|
|
|
|
| |
|
Israel Common Values |
|
|
$10,001 - $50,000 |
|
|
|
|
|
|
|
|
|
| |
|
High Dividend Stock ETF |
|
|
$1 - $10,000 |
|
|
|
|
|
|
|
|
|
| |
|
|
|
|
|
|
|
|
Over $100,000 |
|
|
|
|
|
| Independent Trustees |
|
|
|
|
|
|
|
|
|
|
|
|
|
|
| Richard W. Copeland |
|
Small Cap Value |
|
|
Over $100,000 |
|
|
|
|
|
|
|
|
|
| |
|
Large/Mid Cap |
|
|
Over $100,000 |
|
|
|
|
|
|
|
|
|
| |
|
|
|
|
|
|
|
|
Over $100,000 |
|
|
|
|
|
| Deborah T. Honeycutt |
|
None |
|
|
|
|
|
|
|
|
|
|
|
|
| Bill Johnson |
|
None |
|
|
|
|
|
|
|
|
|
|
|
|
| John C. Mulder |
|
Defensive Strategies |
|
|
Over $100,000 |
|
|
|
|
|
|
|
|
|
| |
|
Strategic Growth |
|
|
$50,001 - $100,000 |
|
|
|
|
|
|
|
|
|
| |
|
International |
|
|
$50,001 - $100,000 |
|
|
|
|
|
|
|
|
|
| |
|
Large/Mid Growth |
|
|
$50,001 - $100,000 |
|
|
|
|
|
|
|
|
|
| |
|
High Dividend Stock ETF |
|
|
$50,001 - $100,000 |
|
|
|
|
|
|
|
|
|
| |
|
Large/Mid Cap Value |
|
|
$50,001 - $100,000 |
|
|
|
|
|
|
|
|
|
| |
|
US Large Cap Core ETF |
|
|
$50,001 - $100,000 |
|
|
|
|
|
|
|
|
|
| |
|
Israel Common Values |
|
|
$10,001 - $50,000 |
|
|
|
|
|
|
|
|
|
| |
|
Small Cap Value |
|
|
$50,001 - $100,000 |
|
|
|
|
|
|
|
|
|
| |
|
|
|
|
|
|
|
|
Over $100,000 |
|
|
|
|
|
| Scott Preissler, Ph.D. |
|
None |
|
|
|
|
|
|
|
|
|
|
|
|
| Alan M. Ross |
|
Conservative Growth |
|
|
$10,001 - $50,000 |
|
|
|
|
|
|
|
|
|
| |
|
Growth & Income |
|
|
$10,001 - $50,000 |
|
|
|
|
|
|
|
|
|
| |
|
Defensive Strategies |
|
|
$10,001 - $50,000 |
|
|
|
|
|
|
|
|
|
| |
|
Small Cap |
|
|
$10,001 - $50,000 |
|
|
|
|
|
|
|
|
|
| |
|
Large/Mid Cap Value |
|
|
$10,001 - $50,000 |
|
|
|
|
|
|
|
|
|
| |
|
Large/Mid Growth |
|
|
$10,001 - $50,000 |
|
|
|
|
|
|
|
|
|
| |
|
|
|
|
|
|
|
|
$50,001 - $100,000 |
|
|
|
|
|
| Patrice Tsague |
|
Strategic Growth |
|
|
$10,001 - $50,000 |
|
|
|
|
|
|
|
|
|
| |
|
International |
|
|
$10,001 - $50,000 |
|
|
|
|
|
|
|
|
|
| |
|
Large Mid Cap Value |
|
|
$1 - $10,000 |
|
|
|
|
|
|
|
|
|
| |
|
|
|
|
|
|
|
|
$50,001 - $100,000 |
|
|
|
|
|
| Abraham M. Rivera |
|
None |
|
|
|
|
|
|
|
|
|
|
|
|
| Dale A. Bissonette |
|
None |
|
|
|
|
|
|
|
|
|
|
|
|
1 Trustees, for their services to the Funds, may purchase Class A shares at NAV; commissions normally charged on A share purchases are waived.
29
Compensation
Compensation was paid by the Trust to the Trustees during the past fiscal year ended September 30, 2020, as set forth in the table below.
|
|
|
|
|
|
|
|
|
| Name of Person, Position |
|
Aggregate
Compensation
from Funds |
|
Pension or Retirement
Benefits Accrued As
Part of Funds Expenses |
|
Estimated Annual
Benefits Upon
Retirement |
|
Total Compensation
From Fund and Fund
Complex Paid to
Directors |
| Interested Trustees |
|
|
|
|
|
|
|
|
| Arthur D. Ally, Chairman |
|
$0 |
|
$0 |
|
$0 |
|
$0 |
| Mathew D. Staver |
|
$0 |
|
$0 |
|
$0 |
|
$0 |
| Charles E. Nelson* |
|
$0 |
|
$0 |
|
$0 |
|
$0 |
| Independent Trustees |
|
|
|
|
|
|
|
|
| Kenneth Blackwell* |
|
$3,750 |
|
$0 |
|
$0 |
|
$3,750 |
| Richard W. Copeland |
|
$4,375 |
|
$0 |
|
$0 |
|
$4,375 |
| Deborah Honeycutt |
|
$5,625 |
|
$0 |
|
$0 |
|
$5,625 |
| Bill Johnson |
|
$5,625 |
|
$0 |
|
$0 |
|
$5,625 |
| John C. Mulder |
|
$4,375 |
|
$0 |
|
$0 |
|
$4,375 |
| Scott Preissler, Ph.D. |
|
$5,625 |
|
$0 |
|
$0 |
|
$5,625 |
| Alan M. Ross |
|
$5,625 |
|
$0 |
|
$0 |
|
$5,625 |
| Patrice Tsague |
|
$5,625 |
|
$0 |
|
$0 |
|
$5,625 |
| Dale A. Bissonette |
|
$0 |
|
$0 |
|
$0 |
|
$0 |
| Abraham M. Rivera |
|
$625 |
|
$0 |
|
$0 |
|
$625 |
*No longer a Trustee
Code of Ethics
The Trust, the Advisor, the investment managers and the Funds’ underwriter have each adopted a Code of Ethics under Rule 17j-1 of the Investment Company Act of 1940. The personnel subject to the Code are permitted to invest in securities; however, the Advisor’s, Trust’s and underwriter’s employees are prohibited from purchasing securities that are held by the Funds. You may obtain a copy of the Code of Ethics from the Securities and Exchange Commission. Pursuant to Section 406 of the Sarbanes-Oxley Act of 2002, the Trustees amended the Codes of Ethics to accommodate the requirements of Section 406. The amended Codes of Ethics adopted by the Trust, TPL, and each Sub-Advisor, have each been reviewed and ratified by the Board.
Proxy Voting Policies
The Board of the Trust has approved proxy voting procedures for the Trust. These procedures set forth guidelines and procedures for the voting of proxies relating to securities held by the Funds. Records of the Funds’ proxy voting records are maintained and are available for inspection. The Board is responsible for overseeing the implementation of the procedures. Copies of the proxy voting procedures have been filed with the Securities and Exchange Commission, which may be reviewed and copied at the SEC’s Public Reference Room in Washington, DC. The procedures are also available on the SEC’s EDGAR database at the SEC’s web site (www.sec.gov). Copies of the procedures can be obtained, after paying a duplicating fee, by electronic request (publicinvest@sec.gov) or by writing the SEC’s Public Reference Section, Washington, DC 20549-0102. A copy will also be sent to you, free of charge, at your request by writing to the Trust at Gemini Fund Services, LLC, 4221 N. 203rd St, Suite 100, Elkhorn, NE 68022, or calling toll free at 800-662-0201. A summary of the Trust’s Proxy Voting Procedures is also attached to this SAI as Appendix A.
Section 4 | Control Persons and
Principal Holders of Securities
For the purposes of ownership, “control” means the beneficial ownership, either directly or through one or more controlled companies, of more than 25% of the voting securities of a company. A controlling ownership may be detrimental to the other shareholders of a Fund.
A principal shareholder is any person who owns (either of record or beneficially) 5% or more of the outstanding shares of any class of a Fund.
As of December 31, 2020, the following persons were the record owners (or to the knowledge of the Trust, beneficial owners) of 5% or more of the outstanding shares of a class of the Funds. The Trust, to the best of its knowledge, believes that most of the shares referred to below were held by the persons indicated in accounts for their fiduciary, agency or custodial customers.
30
HOLDERS OF MORE THAN 5% OF EACH CLASS OF THE FUNDS AS OF 12-31-2020
|
|
|
|
|
|
|
|
|
| NAME OF SHAREHOLDER AND ADDRESS |
|
NAME OF FUND |
|
FUND CLASS |
|
|
% OF SHARE CLASS OWNED |
|
| EDWARD JONES & CO FOR THE BENEFIT OF CUSTOMERS 12555 MANCHESTER RD SAINT LOUIS,
MO 63131 |
|
TPL SMALL CAP VALUE |
|
CLASS A |
|
|
5.66 |
% |
| |
|
| EDWARD JONES & CO FOR THE BENEFIT OF CUSTOMERS 12555 MANCHESTER RD SAINT LOUIS,
MO 63131 |
|
TPL LARGE/MID CAP VALUE |
|
CLASS A |
|
|
12.64 |
% |
| |
|
| PERSHING LLC 1 PERSHING PLAZA JERSEY CITY, NJ 07399-0002 |
|
TPL LARGE/MID CAP VALUE |
|
CLASS A |
|
|
5.47 |
% |
| |
|
| EDWARD JONES & CO FOR THE BENEFIT OF CUSTOMERS 12555 MANCHESTER RD SAINT LOUIS,
MO 63131 |
|
TPL FIXED INCOME |
|
CLASS A |
|
|
11.93 |
% |
| |
|
| NATIONAL FINANCIAL SERVICES LLC FEBO 499 WASHINGTON BLVD JERSEY CITY, NJ 07310 |
|
TPL FIXED INCOME |
|
CLASS A |
|
|
37.72 |
% |
| |
|
| EDWARD JONES & CO FOR THE BENEFIT OF CUSTOMERS 12555 MANCHESTER RD SAINT LOUIS,
MO 63131 |
|
TPL AGGRESSIVE GROWTH |
|
CLASS A |
|
|
5.76 |
% |
| |
|
| PERSHING LLC 1 PERSHING PLAZA JERSEY CITY, NJ 07399-0002 |
|
TPL AGGRESSIVE GROWTH |
|
CLASS A |
|
|
5.04 |
% |
| |
|
| EDWARD JONES & CO FOR THE BENEFIT OF CUSTOMERS 12555 MANCHESTER RD SAINT LOUIS,
MO 63131 |
|
TPL LARGE/MID GROWTH |
|
CLASS A |
|
|
15.31 |
% |
| |
|
| EDWARD JONES & CO FOR THE BENEFIT OF CUSTOMERS 12555 MANCHESTER RD SAINT LOUIS,
MO 63131 |
|
TPL STRATEGIC GROWTH |
|
CLASS A |
|
|
7.46 |
% |
| |
|
| EDWARD JONES & CO FOR THE BENEFIT OF CUSTOMERS 12555 MANCHESTER RD SAINT LOUIS,
MO 63131 |
|
TPL CONSERVATIVE GROWTH |
|
CLASS A |
|
|
16.37 |
% |
| |
|
| EDWARD JONES & CO FOR THE BENEFIT OF CUSTOMERS 12555 MANCHESTER RD SAINT LOUIS,
MO 63131 |
|
TPL INTERNATIONAL |
|
CLASS A |
|
|
13.94 |
% |
| |
|
| NATIONAL FINANCIAL SERVICES LLC 499 WASHINGTON BLVD JERSEY CITY, NJ 07310 |
|
TPL INTERNATIONAL |
|
CLASS A |
|
|
13.27 |
% |
| |
|
| EDWARD JONES & CO FOR THE BENEFIT OF CUSTOMERS 12555 MANCHESTER RD SAINT LOUIS,
MO 63131 |
|
TPL HIGH YIELD BOND |
|
CLASS A |
|
|
7.72 |
% |
| |
|
| CHARLES SCHWAB & CO INC/SPECIAL CUSTODY ACCT FBO CUSTOMERS 101 MONTGOMERY STREET SAN FRANCISCO, CA 94104 |
|
TPL HIGH YIELD BOND |
|
CLASS A |
|
|
22.93 |
% |
| |
|
| PERSHING LLC 1 PERSHING PLAZA JERSEY CITY, NJ 07399-0002 |
|
TPL HIGH YIELD BOND |
|
CLASS A |
|
|
5.17 |
% |
| |
|
| NATIONAL FINANCIAL SERVICES LLC 499 WASHINGTON BLVD JERSEY CITY, NJ 07310 |
|
TPL HIGH YIELD BOND |
|
CLASS A |
|
|
13.45 |
% |
| |
|
| EDWARD JONES & CO FOR THE BENEFIT OF CUSTOMERS 12555 MANCHESTER RD SAINT LOUIS,
MO 63131 |
|
TPL DEFENSIVE STRATEGIES |
|
CLASS A |
|
|
5.93 |
% |
| |
|
| NATIONAL FINANCIAL SERVICES LLC 499 WASHINGTON BLVD JERSEY CITY, NJ 07310 |
|
TPL DEFENSIVE STRATEGIES |
|
CLASS A |
|
|
25.90 |
% |
| |
|
| EDWARD JONES & CO FOR THE BENEFIT OF CUSTOMERS 12555 MANCHESTER RD SAINT LOUIS,
MO 63131 |
|
TPL GROWTH AND INOCME |
|
CLASS A |
|
|
25.34 |
% |
| |
|
| CONSTELLATION TRUST CO CUST FBO/TERRY D HALLMARK IRA 60022 PARADISE CIR AMORY,
MS 38821 |
|
TPL AGGRESSIVE GROWTH |
|
CLASS C |
|
|
5.18 |
% |
| |
|
31
|
|
|
|
|
|
|
|
|
| NAME OF SHAREHOLDER AND ADDRESS |
|
NAME OF FUND |
|
FUND CLASS |
|
|
% OF SHARE CLASS OWNED |
|
| PERSHING LLC 1 PERSHING PLAZA JERSEY CITY, NJ 07399-0002 |
|
TPL SMALL CAP VALUE |
|
CLASS C |
|
|
6.00 |
% |
| |
|
| PERSHING LLC 1 PERSHING PLAZA JERSEY CITY, NJ 07399-0002 |
|
TPL LARGE/MID CAP VALUE |
|
CLASS C |
|
|
7.32 |
% |
| |
|
| EDWARD JONES & CO FOR THE BENEFIT OF CUSTOMERS 12555 MANCHESTER RD SAINT LOUIS,
MO 63131 |
|
TPL LARGE/MID CAP GROWTH |
|
CLASS C |
|
|
6.99 |
% |
| |
|
| PERSHING LLC 1 PERSHING PLAZA JERSEY CITY, NJ 07399-0002 |
|
TPL LARGE/MID GROWTH |
|
CLASS C |
|
|
6.63 |
% |
| |
|
| CONSTELLATION TRUST CO CUST FBO/PETER C WYSE IRA 272 KIRKWOOD RD ROCHESTER,
NY 14612 |
|
TPL STRATEGIC GROWTH |
|
CLASS C |
|
|
5.67 |
% |
| |
|
| CHARLES SCHWAB & CO INC/SPECIAL CUSTODY ACCT FBO CUSTOMERS 211 MAIN ST SAN FRANCISCO,
CA 94105 |
|
TPL STRATEGIC GROWTH |
|
CLASS C |
|
|
5.46 |
% |
| |
|
| CONSTELLATION TRUST CO CUST FBO/JAMES HOYT TEETER R/O IRA PO BOX 309 OAKBORO,
NC 28129 |
|
TPL STRATEGIC GROWTH |
|
CLASS C |
|
|
5.12 |
% |
| |
|
| EDWARD JONES & CO FOR THE BENEFIT OF CUSTOMERS 12555 MANCHESTER RD SAINT LOUIS,
MO 63131 |
|
TPL CONSERVATIVE GROWTH |
|
CLASS C |
|
|
6.76 |
% |
| |
|
| LPL FINANCIAL A/C XXXX-XXX05 4707 EXECUTIVE DRIVE SAN DIEGO, CA 92121-3091 |
|
TPL CONSERVATIVE GROWTH |
|
CLASS C |
|
|
10.67 |
% |
| |
|
| EDWARD JONES & CO FOR THE BENEFIT OF CUSTOMERS 12555 MANCHESTER RD SAINT LOUIS,
MO 63131 |
|
TPL INTERNATIONAL |
|
CLASS C |
|
|
8.43 |
% |
| |
|
| EDWARD JONES & CO FOR THE BENEFIT OF CUSTOMERS 12555 MANCHESTER RD SAINT LOUIS,
MO 63131 |
|
TPL HIGH YIELD BOND |
|
CLASS C |
|
|
7.40 |
% |
| |
|
| LPL FINANCIAL A/C XXXX-XXX05 4707 EXECUTIVE DRIVE SAN DIEGO, CA 92121-3091 |
|
TPL HIGH YIELD BOND |
|
CLASS C |
|
|
12.50 |
% |
| |
|
| PERSHING LLC 1 PERSHING PLAZA JERSEY CITY, NJ 07399-0002 |
|
TPL HIGH YIELD BOND |
|
CLASS C |
|
|
8.18 |
% |
| |
|
| CONSTELLATION TRUST CO CUST FBO/WALTER ARMSTRONG 403B FELLOWSHIP FOUNDATION INC 135 LAMORAK LN MAITLAND, FL 32751 |
|
TPL DEFENSIVE STRATEGIES |
|
CLASS C |
|
|
5.62 |
% |
| LPL FINANCIAL A/C XXXX-XXX05 4707 EXECUTIVE DRIVE SAN DIEGO, CA 92121-3091 |
|
TPL ISRAEL COMMON VALUE |
|
CLASS C |
|
|
5.92 |
% |
| |
|
| EDWARD JONES & CO FOR THE BENEFIT OF CUSTOMERS 12555 MANCHESTER RD SAINT LOUIS,
MO 63131 |
|
TPL GROWTH AND INCOME |
|
CLASS C |
|
|
11.04 |
% |
| |
|
| PERSHING LLC 1 PERSHING PLAZA JERSEY CITY, NJ 07399-0002 |
|
TPL GROWTH AND INCOME |
|
CLASS C |
|
|
10.57 |
% |
| |
|
| LPL FINANCIAL A/C XXXX-XXX05 4707 EXECUTIVE DRIVE SAN DIEGO, CA 92121-3091 |
|
TPL AGGRESSIVE GROWTH |
|
CLASS I |
|
|
5.24 |
% |
| |
|
| PERSHING LLC 1 PERSHING PLAZA JERSEY CITY, NJ 07399-0002 |
|
TPL AGGRESSIVE GROWTH |
|
CLASS I |
|
|
49.75 |
% |
| |
|
32
|
|
|
|
|
|
|
|
|
| NAME OF SHAREHOLDER AND ADDRESS |
|
NAME OF FUND |
|
FUND CLASS |
|
|
% OF SHARE CLASS OWNED |
|
| CHARLES SCHWAB & CO INC/SPECIAL CUSTODY ACCT FBO CUSTOMERS 211 MAIN ST SAN FRANCISCO, CA 94105 |
|
TPL AGGRESSIVE GROWTH |
|
CLASS I |
|
|
6.20 |
% |
| |
|
| LPL FINANCIAL A/C XXXX-XXX05 4707 EXECUTIVE DRIVE SAN DIEGO, CA 92121-3091 |
|
TPL SMALL CAP VALUE |
|
CLASS I |
|
|
21.83 |
% |
| |
|
| PERSHING LLC 1 PERSHING PLAZA JERSEY CITY, NJ 07399-0002 |
|
TPL SMALL CAP VALUE |
|
CLASS I |
|
|
7.40 |
% |
| |
|
| LPL FINANCIAL A/C XXXX-XXX05 4707 EXECUTIVE DRIVE SAN DIEGO, CA 92121-3091 |
|
TPL LARGE/MID CAP VALUE |
|
CLASS I |
|
|
11.74 |
% |
| |
|
| PERSHING LLC 1 PERSHING PLAZA JERSEY CITY, NJ 07399-0002 |
|
TPL LARGE/MID CAP VALUE |
|
CLASS I |
|
|
9.55 |
% |
| |
|
| LPL FINANCIAL A/C XXXX-XXX05 4707 EXECUTIVE DRIVE SAN DIEGO, CA 92121-3091 |
|
TPL FIXED INCOME |
|
CLASS I |
|
|
17.28 |
% |
| |
|
| PERSHING LLC 1 PERSHING PLAZA JERSEY CITY, NJ 07399-0002 |
|
TPL FIXED INCOME |
|
CLASS I |
|
|
6.63 |
% |
| |
|
| LPL FINANCIAL A/C XXXX-XXX05 4707 EXECUTIVE DRIVE SAN DIEGO, CA 92121-3091 |
|
TPL LARGE/MID GROWTH |
|
CLASS I |
|
|
7.01 |
% |
| |
|
| PERSHING LLC 1 PERSHING PLAZA JERSEY CITY, NJ 07399-0002 |
|
TPL LARGE/MID GROWTH |
|
CLASS I |
|
|
16.83 |
% |
| |
|
| LPL FINANCIAL A/C XXXX-XXX05 4707 EXECUTIVE DRIVE SAN DIEGO, CA 92121-3091 |
|
TPL INTERNATIONAL |
|
CLASS I |
|
|
14.19 |
% |
| |
|
| PERSHING LLC 1 PERSHING PLAZA JERSEY CITY, NJ 07399-0002 |
|
TPL INTERNATIONAL |
|
CLASS I |
|
|
6.07 |
% |
| |
|
| NATIONAL FINANCIAL SERVICES LLC 499 WASHINGTON BLVD JERSEY CITY, NJ 07310 |
|
TPL INTERNATIONAL |
|
CLASS I |
|
|
13.84 |
% |
| |
|
| SEI PRIVATE TRUST COMPANY/C/O ROCKLAND SWP 1 FREEDOM VALLEY DRIVE OAKS, PA 19456 |
|
TPL INTERNATIONAL |
|
CLASS I |
|
|
10.99 |
% |
| |
|
| LPL FINANCIAL A/C XXXX-XXX05 4707 EXECUTIVE DRIVE SAN DIEGO, CA 92121-3091 |
|
TPL HIGH YIELD BOND |
|
CLASS I |
|
|
31.94 |
% |
| |
|
| NATIONAL FINANCIAL SERVICES LLC 499 WASHINGTON BLVD JERSEY CITY, NJ 07310 |
|
TPL HIGH YIELD BOND |
|
CLASS I |
|
|
11.31 |
% |
| |
|
| E*TRADE SAVINGS BANK/FBO 699 PO BOX 6503 ENGLEWOOD, CO 80155 |
|
TPL HIGH YIELD BOND |
|
CLASS I |
|
|
5.60 |
% |
| |
|
| LPL FINANCIAL A/C XXXX-XXX05 4707 EXECUTIVE DRIVE SAN DIEGO, CA 92121-3091 |
|
TPL DEFENSIVE STRATEGIES |
|
CLASS I |
|
|
22.67 |
% |
| |
|
33
|
|
|
|
|
|
|
|
|
| NAME OF SHAREHOLDER AND ADDRESS |
|
NAME OF FUND |
|
FUND CLASS |
|
|
% OF SHARE CLASS OWNED |
|
| PERSHING LLC 1 PERSHING PLAZA JERSEY CITY, NJ 07399-0002 |
|
TPL DEFENSIVE STRATEGIES |
|
CLASS I |
|
|
14.14 |
% |
| |
|
| CHARLES SCHWAB & CO INC/SPECIAL CUSTODY ACCT FBO CUSTOMERS 211 MAIN ST SAN FRANCISCO, CA 94105 |
|
TPL DEFENSIVE STRATEGIES |
|
CLASS I |
|
|
25.43 |
% |
| |
|
| LPL FINANCIAL A/C XXXX-XXX05 4707 EXECUTIVE DRIVE SAN DIEGO, CA 92121-3091 |
|
TPL ISRAEL COMMON VALUE |
|
CLASS I |
|
|
17.29 |
% |
| |
|
| PERSHING LLC 1 PERSHING PLAZA JERSEY CITY, NJ 07399-0002 |
|
TPL ISRAEL COMMON VALUE |
|
CLASS I |
|
|
6.10 |
% |
| |
|
| TD AMERITRADE FBO/SAMUEL M AND JUDITH M AND JUDITH M CAMP CHAR REM UNITRUST UA FEB 10, 2015 SAMUEL M CAMP OR JUDITH M CAMP TRS 139 BODET RD COVINGTON, LA 70433-6256 |
|
TPL ISRAEL COMMON VALUE |
|
CLASS I |
|
|
6.27 |
% |
| |
|
| TD AMERITRADE FBO/LORI M THOMAS 785 BOCAGE LN MANDEVILLE, LA 70471-11607 |
|
TPL ISRAEL COMMON VALUE |
|
CLASS I |
|
|
12.58 |
% |
| |
|
| CHARLES SCWAB & CO INC/ SPECIAL CUSTODY ACCT FOR THE BENE OF OUR CUSTOMERS 101 MONTGOMERY STREET SAN FRANCISCO, CA 94104 |
|
TPL GROWTH AND INCOME |
|
CLASS I |
|
|
12.65 |
% |
| |
|
| PERSHING LLC 1 PERSHING PLAZA JERSEY CITY, NJ 07399-0002 |
|
TPL GROWTH AND INCOME |
|
CLASS I |
|
|
16.65 |
% |
| |
|
| MATRIX TRUST COMPANY AS TTEE FBO/EPLAN SERVICES GROUP PO BOX 512129 PHOENIX, AZ 85072 |
|
TPL GROWTH AND INCOME |
|
CLASS I |
|
|
10.40 |
% |
| |
|
| CHRISTIAN COMMUNITY FOUNDATION INC DBA/WATERSTONE JOHN C MULDER (PRESIDENT) CHRISTOPHER START (TREASURER) 10807 NEW ALLEGIANCE DR STE 240 COLORADO SPRINGS, CO 80921-3803 |
|
TPL GROWTH AND INCOME |
|
CLASS I |
|
|
23.62 |
% |
| |
|
MANAGEMENT OWNERSHIP
As of December 31, 2020, the Trustees and Officers, as a group, owned less than 1% of each class of each Fund.
Section 5 | Other Service Providers
Principal Underwriter
Timothy Partners, Ltd. (“TPL”), 1055 Maitland Center Commons, Maitland, FL 32751, also acts as the principal underwriter (the “Underwriter”) of the Funds’ shares for the purpose of facilitating the notice filing of shares of the Funds under state securities laws and to assist in sales of shares pursuant to a written underwriting agreement (the “Underwriting Agreement”) approved by the Funds’ Trustees. TPL is not compensated for serving as principal underwriter to the Funds.
In that regard, TPL has agreed at its own expense to qualify as a broker/dealer under all applicable federal or state laws in those states which the Funds shall from time to time identify to TPL as states in which it wishes to offer its shares for sale, in order that state notice filings may be maintained by the Funds.
34
TPL is a broker/dealer registered with the U.S. Securities and Exchange Commission and is a member in good standing of the Financial Industry Regulatory Authority.
The Funds shall continue to bear the expense of all filing or registration fees incurred in connection with the notice filing of shares under state securities laws.
The Underwriting Agreement may be terminated by either party upon 60 days’ prior written notice to the other party.
Arthur D. Ally is President, Chairman and Trustee of the Trust. Mr. Ally is also President of Timothy Partners, Ltd. Mr. Ally had over eighteen years of experience in the investment industry prior to becoming president of Timothy Plan, having worked for Prudential Bache, Shearson Lehman Brothers and Investment Management & Research. Some or all of these firms may be utilized by an investment manager to execute portfolio trades for a Fund. Neither Mr. Ally nor any affiliated person of the Trust will receive any benefit from such transactions.
Transfer/Fund Accounting Agent/Administrator
Gemini Fund Services, LLC, 4221 N. 203rd St, Suite 100, Elkhorn, NE 68022 serves as transfer agent, fund accounting agent and administrator to the Trust pursuant to a written agreement dated April 18, 2011, as amended. For the services rendered to the Fund by the Administrator, the Fund pays the Administrator the greater of an annual minimum fee or an asset based fee, which scales downward based upon net assets for fund administration, fund accounting and transfer agency services. Gemini Fund Services, LLC provides various administrative services to the Funds’ shareholders that invest a portion of their Timothy Plan IRA assets in the BlackRock money market fund (“Shareholder Services”). Gemini Fund Services, LLC receives compensation from BlackRock Advisors, LLC for the provision of said Shareholder Services.
For the fiscal periods ended September 30, 2018, 2019 and 2020, the Funds paid the following fees for transfer agency, fund accounting and administration to Gemini Fund Services LLC.
|
|
|
|
|
|
|
|
|
|
|
|
|
| |
|
|
|
| Service |
|
|
2018 |
|
|
|
2019 |
|
|
|
2020 |
|
| Administration Fees |
|
|
$2,149,975 |
|
|
|
$2,251,208 |
|
|
|
$2,299,845 |
|
Rule 12b-1 Plans
DISTRIBUTION PLANS
The Trust has adopted a plan pursuant to Rule 12b-1 under the 1940 Act (collectively, the “Plans”) for each Class offered by a Fund up to a maximum of 1.00% for Class C shares and 0.25% for Class A shares (of which, up to 0.25% may be service fees to be paid by each respective class of shares to TPL, dealers and others, for providing personal service and/or maintaining shareholder accounts) per annum of its average daily net assets for expenses incurred by the Underwriter in the distribution of the Timothy Plan Funds’ shares.
The fees are paid on a monthly basis, based on a Fund’s average daily net assets attributable to such class of shares.
Pursuant to the Plans, TPL, as underwriter, is paid a fee each month (up to the maximum of 1.00% for Class C shares per annum of average net assets of each Timothy Plan Fund) for expenses incurred in the distribution and promotion of the shares, including but not limited to, printing of prospectuses and reports used for sales purposes, preparation and printing of sales literature and related expenses, advertisements, and other distribution-related expenses as well as any distribution or service fees paid to securities dealers or others who have executed a dealer agreement with the underwriter. Any expense of distribution in excess of 1.00% for Class C shares per annum will be borne by TPL without any additional payments by the Funds. You should be aware that it is possible that Plan accruals will exceed the actual expenditures by TPL for eligible services. Accordingly, such fees are not strictly tied to the provision of such services.
The Plans also provide that to the extent that the Funds, TPL, the investment managers, or other parties on behalf of the Funds, TPL, or the investment managers make payments that are deemed to be payments for the financing of any activity primarily intended to result in the sale of shares issued by the Funds within the context of Rule 12b-1, such payments shall be deemed to be made pursuant to the Plans.
The Board has determined that a consistent cash flow resulting from the sale of new shares is necessary and appropriate to meet redemptions and to take advantage of buying opportunities without having to make unwarranted liquidations of portfolio securities. The Board therefore believes that it will likely benefit the Funds to have moneys available for the direct distribution activities of TPL in promoting the sale of the Funds’ shares, and to avoid any uncertainties as to whether other payments constitute distribution expenses on behalf of the Funds. The Trustees, including the non-interested Trustees, have concluded that in the exercise of their reasonable business judgment and in light of their fiduciary duties, there is a reasonable likelihood that the Plans will benefit the Funds and their shareholders.
35
The Plans have been approved by the Board, including all of the Trustees who are non-interested persons as defined in the 1940 Act. The Plans must be renewed annually by the Board, including a majority of the Trustees who are non-interested persons of the Funds and who have no direct or indirect financial interest in the operation of the Plans. The votes must be cast in person at a meeting called for that purpose. It is also required that the selection and nomination of such Trustees be done by the non-interested Trustees. The Plans and any related agreements may be terminated at any time, without any penalty: 1) by vote of a majority of the non-interested Trustees on not more than 60 days’ written notice, 2) by the Underwriter on not more than 60 days’ written notice, 3) by vote of a majority of a Fund’s outstanding shares, on 60 days’ written notice, and 4) automatically by any act that terminates the Underwriting Agreement with TPL. TPL or any dealer or other firm may also terminate their respective agreements at any time upon written notice.
The Plans and any related agreement may not be amended to increase materially the amounts to be spent for distribution expenses without approval by a majority of a Fund’s outstanding shares, and all material amendments to the Plans or any related agreements shall be approved by a vote of the non-interested Trustees, cast in person at a meeting called for the purpose of voting on any such amendment.
TPL is required to report in writing to the Board of the Funds, at least quarterly, on the amounts and purpose of any payment made under the Plans, as well as to furnish the Board with such other information as may reasonably be requested in order to enable the Board to make an informed determination of whether the Plans should be continued.
The following are the principal types of activities for which payments were made, and the amounts for each, for fiscal year ended September 30, 2020.
|
|
|
| Expense Type |
|
Amount Paid |
| Advertising |
|
$575,732 |
| Printing and Postage |
|
$100,548 |
| Compensation to Broker-Dealers |
|
$1,710,936 |
| Other Expenses |
|
$1,920,921 |
For the fiscal year ended September 30, 2020, TPL was compensated for distribution and service-related expenses by the Funds as follows:
|
|
|
|
|
|
|
| Fund Name |
|
|
Class A |
|
|
Class C |
| Aggressive Growth |
|
|
$56,920 |
|
|
$23,655 |
| International |
|
|
$129,078 |
|
|
$24,671 |
| Large/Mid Cap Growth |
|
|
$161,066 |
|
|
$78,118 |
| Small Cap Value |
|
|
$207,722 |
|
|
$72,062 |
| Large/Mid Cap Value |
|
|
$328,668 |
|
|
$149,949 |
| Fixed Income |
|
|
$216,167 |
|
|
$90,378 |
| High Yield Bond |
|
|
$111,578 |
|
|
$25,697 |
| Israel Common Values |
|
|
$102,604 |
|
|
$94,256 |
| Defensive Strategies |
|
|
$77,092 |
|
|
$27,634 |
| Strategic Growth |
|
|
N/A |
|
|
$22,107 |
| Conservative Growth |
|
|
N/A |
|
|
$38,651 |
| Growth & Income |
|
|
$33,835 |
|
|
$21,196 |
Other Service Providers
INDEPENDENT REGISTERED PUBLIC ACCOUNTING FIRM
The firm of Cohen & Company, Ltd., 1350 Euclid Ave., Suite 800, Cleveland, Ohio 44115, has been selected as the independent registered public accounting firm for the Funds for the fiscal year ending September 30, 2021. Cohen & Company, Ltd. performs an annual audit of the Funds’ financial statements and provides financial, tax, and accounting consulting services as requested.
Service Agreements
CUSTODIAN
US Bank, 425 Walnut Street, Cincinnati, Ohio 45202, is custodian of the Funds’ investments. The custodian acts as the Funds’ depository, safe-keeps its portfolio securities, collects all income and other payments with respect thereto, disburses funds at the Funds’ request and maintains records in connection with its duties. For its custodial services the bank receives, in addition to certain per transaction fees, the greater of $225 per month per fund or (annualized) 1.20 basis points (.00012) for the first $75 million in assets, 1.0 basis point (.00010) on the next $100 million in assets, and 0.75 basis point (.000075) on all amounts over $175 million in assets.
36
Section 6 | Brokerage Allocation
Brokerage Transactions
The Funds’ Advisor and/or investment Sub-Advisors, when effecting the purchases and sales of portfolio securities for the account of a Fund, will seek execution of trades either (i) at the most favorable and competitive rate of commission charged by any broker, dealer or member of an exchange, or (ii) at a higher rate of commission charges if reasonable in relation to brokerage and research services provided to the Fund or the investment manager by such member, broker, or dealer. Such services may include, but are not limited to, any one or more of the following: information on the availability of securities for purchase or sale, statistical or factual information, or opinions pertaining to investments. The Advisor and each Sub-Advisor are prohibited from considering brokerage allocation to dealers in consideration of a dealers’ distribution efforts of Portfolio or Fund shares. The Trust has adopted policies and procedures to detect and prohibit brokerage allocation based on broker/dealer Fund share sales.
TPL, through the investment managers, is responsible for making the Funds’ portfolio decisions subject to instructions described in the applicable Prospectus. The Board may, however, impose limitations on the allocation of portfolio brokerage.
Securities held by one Fund may also be held by another Fund or other accounts for which TPL or the investment manager serves as an Advisor or held by TPL or the investment manager for their own accounts. If purchases or sales of securities for a Fund or other entities for which they act as investment Advisor or for their advisory clients arise for consideration at or about the same time, transactions in such securities will be made, insofar as feasible, for the respective entities and clients in a manner deemed equitable to all. To the extent that transactions on behalf of more than one client of TPL or the investment manager during the same period may increase the demand for securities being purchased or the supply of securities being sold, there may be an adverse effect on price.
On occasions when TPL or an investment manager deems the purchase or sale of a security to be in the best interests of one or more Funds or other accounts, they may to the extent permitted by applicable laws and regulations, but will not be obligated to, aggregate the securities to be sold or purchased for the Fund with those to be sold or purchased for the other Fund or accounts in order to obtain favorable execution and lower brokerage commissions. In that event, allocation of the securities purchased or sold, as well as the expenses incurred in the transaction, will be made by an investment manager in the manner it considers to be most equitable and consistent with its fiduciary obligations to the Funds and to such other accounts. In some cases this procedure may adversely affect the size of the position obtainable for a Fund.
The Board regularly reviews the brokerage placement practices of the investment managers on behalf of the Funds, and reviews the prices and commissions, if any, paid by the Funds to determine if they were reasonable.
37
Commissions
The chart below shows the brokerage fees and commissions paid by the Funds for the fiscal years ending September 30, 2018, 2019 and 2020.
|
|
|
|
|
|
|
|
|
|
|
| |
|
2018 |
|
|
2019 |
|
|
|
2020 |
|
| Aggressive Growth Fund |
|
N/A |
|
|
$22 |
|
|
|
$20 |
|
| International Fund |
|
$16,500 |
|
|
$30,135 |
|
|
|
$39,399 |
|
| Large/Mid Cap Growth Fund |
|
N/A |
|
|
$3,641 |
|
|
|
$525 |
|
| Small Cap Value Fund |
|
$372 |
|
|
$751 |
|
|
|
$4,350 |
|
| Large/Mid Cap Value Fund |
|
N/A |
|
|
$9,200 |
|
|
|
N/A |
|
| Fixed Income Fund |
|
N/A |
|
|
$4,125 |
|
|
|
N/A |
|
| High Yield Bond Fund |
|
N/A |
|
|
N/A |
|
|
|
$525 |
|
| Defensive Strategies Fund |
|
$7,519 |
|
|
$9,016 |
|
|
|
$12,828 |
|
| Israel Common Values Fund |
|
$12,216 |
|
|
$19,441 |
|
|
|
$14,106 |
|
| Growth & Income Fund |
|
$12 |
|
|
$4,723 |
|
|
|
$1,178 |
|
| Strategic Growth Fund |
|
N/A |
|
|
$2,563 |
|
|
|
$3,521 |
|
| Conservative Growth Fund |
|
N/A |
|
|
$2,844 |
|
|
|
$3,707 |
|
Section 7 | Purchase, Redemption, and Pricing of Shares
Purchase of Shares
The shares of the Timothy Plan Funds are continuously offered by the distributor. Orders will not be considered complete until receipt by the distributor of a completed account application form, and receipt by the custodian of payment for the shares purchased. Once both are received, such orders will be confirmed at the next determined NAV per share (based upon valuation procedures described in the Prospectus), plus the applicable sales load for Class A shares, as of the close of business of the business day on which the completed order is received, normally 4 p.m. Eastern time. Completed orders received by the Funds after 4 p.m. will be confirmed at the next business day’s price.
TAX-DEFERRED RETIREMENT PLANS
Shares of the Timothy Plan Funds are available to all types of tax-deferred retirement plans such as individual retirement accounts (“IRAs”), employer-sponsored defined contribution plans (including 401(k) plans) and tax-sheltered custodial accounts described in Section 403(b) of the Internal Revenue Code. Qualified investors benefit from the tax-free compounding of income dividends and capital gains distributions. The Timothy Plan Funds sponsor IRAs. Subject to certain income restrictions, individuals, who are active participants in an employer maintained retirement plan, are eligible to contribute on a deductible basis to an IRA account. All individuals who have earned income may make nondeductible IRA contributions to the extent that they are not eligible for a deductible contribution. Income earned by an IRA account will continue to be tax deferred.
A special IRA program is available for employers under which the employers may establish IRA accounts for their employees in lieu of establishing tax qualified retirement plans. Known as SEP-IRAs (Simplified Employee Pension-IRA), they free the employer of many of the record keeping requirements of establishing and maintaining a tax qualified retirement plan trust.
If you are entitled to receive a distribution from a qualified retirement plan, you may rollover all or part of that distribution into a Timothy Plan Fund IRA. Your rollover contribution is not subject to the limits on annual IRA contributions. You can continue to defer federal income taxes on your contribution and on any income that is earned on that contribution.
The Timothy Plan Funds may be utilized as investment vehicles for employer sponsored and administered 403(b) retirement plans, by schools, hospitals, and certain other tax-exempt organizations or associations. 403(b) contributions, to the extent they satisfy the Plan Document requirements and do not exceed applicable limitations, are excludable from the gross income of the employee for federal income tax purposes.
The Timothy Plan Funds also offer Roth IRAs. While contributions to a Roth IRA are not currently deductible, the amounts within the accounts accumulate tax-free and qualified distributions will not be included in a shareholder’s taxable income. The contribution limit for 2020 is $6,000 in aggregate with contributions to traditional IRAs. Certain catch-up provisions and income phase-outs apply.
In all these plans, distributions of net investment income and capital gains will be automatically reinvested.
38
All the foregoing retirement plan options require special plan documents. Please call the Timothy Plan at (800) TIM-PLAN ((800) 846-7526) to obtain information regarding the establishment of retirement plan accounts. In the case of IRAs and 403(b) Plans, Constellation Trust acts as the plan custodian. The Fund custodian, Constellation Trust, charges $10.00 per social security number and account type in connection with plan establishment and maintenance, of which $5.00 is remitted to the Fund underwriter, Timothy Partners, Ltd. These IRA fees are detailed in the plan documents; you should consult your employer’s plan document for details of the expenses incurred by 403(b) accounts. You should consult with your attorney or other tax advisor for specific advice prior to establishing a plan.
DEALER TRANSACTION FEES
Dealers may charge their customers a processing or service fee in connection with the purchase or redemption of Fund shares. The amount and applicability of such a fee is determined and disclosed to its customers by each individual dealer. Processing or service fees typically are in addition to the sales and other charges described in the Prospectus and this SAI. Your dealer will provide you with specific information about any processing or service fees you will be charged.
Redemption of Shares
The redemption price will be based upon the NAV per share (subject to any applicable CDSC for Class C shares) next determined after receipt of the redemption request, provided it has been submitted in the manner described below. The redemption price may be more or less than your cost, depending upon the NAV per Class at the time of redemption. Shares of the Timothy Plan Funds may be redeemed through certain brokers, financial institutions or service organizations, banks and bank trust departments, who may charge a transaction fee or other fee for their services at the time of redemption. Such fees would not otherwise be charged if the shares were purchased directly from the Timothy Plan Funds.
Payment for shares tendered for redemption is made by check within seven days after tender in proper form, except that the Funds reserve the right to suspend the right of redemption, or to postpone the date of payment upon redemption beyond seven days: (i) for any period during which the New York Stock Exchange is restricted, (ii) for any period during which an emergency exists as determined by the U.S. Securities and Exchange Commission as a result of which disposal of securities owned by the Funds is not reasonably predictable or it is not reasonably practicable for the Funds fairly to determine the value of its net assets, or (iii) for such other periods as the U.S. Securities and Exchange Commission may by order permit for the protection of shareholders of the Funds.
Pursuant to the Trust’s Agreement and Declaration of Trust, payment for shares redeemed may be made either in cash or in-kind, or partly in cash and partly in-kind. However, the Trust has elected, pursuant to Rule 18f-1 under the 1940 Act, to redeem its shares solely in cash up to the lesser of $250,000 or 1% of the NAV of the Fund, during any 90-day period for any one shareholder.
Payments in excess of this limit will also be made wholly in cash unless the Board believes that economic conditions exist which would make such a practice detrimental to the best interests of the Fund. Any portfolio securities paid or distributed in-kind would be valued as described under “Other Purchase Information” in the applicable Prospectus. In the event that an in-kind distribution is made, a shareholder may incur additional expenses, such as the payment of brokerage commissions, on the sale or other disposition of the securities received from the Funds.
In-kind payments need not constitute a cross-section of a Fund’s portfolio. Where a shareholder has requested redemption of all or a part of the shareholder’s investment, and where a Fund completes such redemption in-kind, that Fund will not recognize gain or loss for federal tax purposes, on the securities used to complete the redemption. The shareholder will recognize gain or loss equal to the difference between the fair market value of the securities received and the shareholder’s basis in the Fund shares redeemed.
Net Asset Value
The NAV and public offering price of each class of the shares of a Fund is determined at the close of trading (which is normally 4:00 p.m., Eastern Time) on each day the New York Stock Exchange (“NYSE”) is open for business. If the NYSE closes early, the NAV will be determined as of the time of closing. Shares of each Class of the Funds are offered at the public offering price for each Class. The public offering price is each Class’s next calculated NAV plus the applicable sales charge, if any. The NAV per share of each Class is calculated by adding the value of each Fund’s investments, cash and other assets, subtracting liabilities of the Class, and then dividing the result by the number of shares of the Class outstanding. Each Fund generally determines the total value of each Class of its shares by using market prices for the securities comprising its portfolio. Securities for which quotations are not available and any other assets are valued at fair market value as determined in good faith by the Fund’s Investment Manager, in conformity with guidelines adopted by and subject to the review and supervision of the Board.
39
Fair Value Pricing
The Board has delegated to the Advisor and/or Investment Managers, under the oversight of the Board of Trustees Pricing Committee, responsibility for determining the value of Fund portfolio securities under certain circumstances. Under such circumstances and under the Pricing Committee’s oversight, the Advisor or Investment Manager will use its best efforts to arrive at the fair value of a security held by the Fund under all reasonably ascertainable facts and circumstances. The Advisor must prepare a report for the Board not less than quarterly containing a complete listing of any securities for which fair value pricing was employed and detailing the specific reasons for such fair value pricing. The Trust has adopted written policies and procedures to guide the Pricing Committee, Advisor and Investment Managers with respect to the circumstances under which, and the methods to be used, in fair valuing securities.
Except for the Israel Common Values, and International Fund which have a higher probability of Fair Value Pricing, the Funds generally invest the vast majority of their assets in frequently traded exchange listed securities of domestic issuers with relatively liquid markets and calculate their NAV as of the time those exchanges close. Except for the Israel Common Values and International Funds, the Funds typically do not invest in securities on foreign exchanges or in illiquid or restricted securities. Accordingly, except for those Funds, there may be very limited circumstances under which any Fund would hold securities that would need to be fair value priced. Examples of when it would be likely that a Fund security would require fair value pricing include but are not limited to: if the exchange on which a portfolio security traded were to close early; if trading in a particular security were to be halted on an exchange and did not resume trading prior to calculation of NAV; if a significant event that materially affected the value of a security were to occur after the securities’ exchange had closed but before the Fund’s NAV had been calculated; and if a security that had a significant exposure to foreign operations was subject to a material event or occurrence in a foreign jurisdiction in which the company had significant operations; or in the event that the Fixed Income or High Yield Bond Funds were to invest in certain types of bonds that had limited marketability, such as “church bonds”.
When a security is fair value priced, it means that the Advisor or Investment Manager is calculating the value of that security on a day and under circumstances where reliable pricing information from normal sources is not available or is otherwise limited. Accordingly, there is always the possibility that the Advisor’s or Investment Manager’s calculations concerning security value could be wrong, and as a result, the Fund’s NAV on that day could be higher or lower, depending on how the security was valued, than would otherwise be the case.
When a security is Evaluated Priced, it means the Advisor and Investment Manager are relying on a nationally recognized company that provides daily pricing of international and domestic securities. Accordingly, there is the possibility that the pricing firm’s calculations or pricing techniques could be wrong, and as a result the Fund’s NAV on that day could be higher or lower, depending on how the security was valued, than would otherwise be the case.
Section 8 | Taxation of the Fund
Taxation
The Timothy Plan Funds intend to qualify each year as a regulated investment company under Subchapter M of the Internal Revenue Code of 1986, as amended (the “Code”).
In order to so qualify, a Fund must, among other things, (i) derive at least 90% of its gross income from dividends, interest, payments with respect to certain securities loans, gains from the sale of securities or foreign currencies, or other income (including but not limited to gains from options, futures or forward contracts) derived with respect to its business of investing in such stock, securities or currencies; (ii) distribute at least 98.2% of its dividends, interest and certain other taxable income each year; and (iii) at the end of each fiscal quarter maintain at least 50% of the value of its total assets in cash, government securities, securities of other regulated investment companies, and other securities of issuers which represent, with respect to each issuer, no more than 5% of the value of a Fund’s total assets and 10% of the outstanding voting securities of such issuer, and with no more than 25% of its assets invested in the securities (other than those of the government or other regulated investment companies) of any one issuer or of two or more issuers which a Fund controls and which are engaged in the same, similar or related trades and businesses.
To the extent each Fund qualifies for treatment as a regulated investment company, it will not be subject to federal income tax on income and net capital gains paid to shareholders in the form of dividends or capital gains distributions.
An excise tax at the rate of 4% will be imposed on the excess, if any, of each Fund’s “required distributions” over actual distributions in any calendar year. Generally, the “required distribution” is 98% of a Fund’s ordinary income for the calendar year plus 98.2% of its capital gain net income recognized during the one-year period ending on October 31 plus undistributed amounts from prior years. Each Fund intends to make distributions sufficient to avoid imposition of the excise tax. Distributions declared by a Fund during October, November or December to shareholders of record during such month and paid by January 31 of the following year will be taxable to shareholders in the calendar year in which they are declared, rather than the calendar year in which they are received.
If shares of a Fund are purchased within 30 days before or after redeeming other shares of the Fund at a loss, all or a portion of that loss will not be deductible and will increase the basis of the newly purchased shares.
40
Shareholders will be subject to federal income taxes on distributions made by a Fund whether received in cash or additional shares of the Fund. Distributions of net investment income and net short-term capital gains, if any, will be taxable to shareholders as ordinary income. Distributions of net long-term capital gains, if any, will be taxable to shareholders as long-term capital gains, without regard to how long a shareholder has held shares of the Fund. A loss on the sale of shares held for six months or less will be treated as a long- term capital loss to the extent of any long-term capital gain dividend paid to the shareholder with respect to such shares. A redemption of a Fund’s shares will result in a taxable gain or loss to the redeeming shareholder, depending on whether the redemption proceeds are more or less than the shareholder’s adjusted basis for the redeemed shares (which normally includes any sales charge paid on Class A shares). An exchange of shares of any Fund for shares of another Fund generally will have similar tax consequences. However, special rules apply when a shareholder disposes of Class A shares of a Fund through a redemption or exchange within 90 days after purchase thereof and subsequently reacquires Class A shares of that Fund or of another Timothy Plan Fund without paying a sales charge due to the 90-day reinstatement or exchange privileges. In these cases, any gain on the disposition of the original Class A shares will be increased, or loss decreased, by the amount of the sales charge paid when those shares were acquired, and that amount will increase the basis of the shares subsequently acquired. In addition, if shares of a Fund are purchased (whether pursuant to the reinstatement privilege or otherwise) within 30 days before or after redeeming other shares of that Fund (regardless of class) at a loss, all or a portion of that loss will not be deductible and will increase the basis of the newly purchased shares. Dividends eligible for designation under the dividends received deduction and paid by a Fund may qualify in part for the 70% dividends received deduction for corporations provided, however, that those shares have been held for at least 45 days.
The Trust will notify shareholders each year of the amount of dividends and distributions, including the amount of any distribution of long-term capital gains, and the portion of its dividends which may qualify for the 70% deduction.
By law, each Fund must withhold a percentage of your taxable distributions and proceeds (“back-up withholding”) if you do not provide your correct social security or taxpayer identification number, or if the IRS instructs the Fund to do so. The withholding provision generally does not apply to nonresident aliens. Ordinarily, distributions and redemption proceeds earned by a Fund’s shareholders are not subject to withholding of federal income tax. However, if a shareholder fails to furnish a tax identification number or social security number, or certify under penalties of perjury that such number is correct, the Fund may be required to withhold federal income tax from all dividend, capital gain and/or redemption payments to such shareholder. Dividends and capital gain distributions may also be subject to back-up withholding if a shareholder fails to certify under penalties of perjury that such shareholder is not subject to back-up withholding due to the underreporting of certain income. These certifications are contained in the purchase application enclosed with the Prospectus.
The foregoing is a general and abbreviated summary of the applicable provisions of the Code and Treasury regulations currently in effect. For the complete provisions, reference should be made to the pertinent Code sections and regulations. The Code and regulations are subject to change by legislative or administrative action at any time, and retroactively.
Each class of shares of the Timothy Plan Funds will share proportionately in the investment income and expenses of that Fund, except that each class will incur different distribution expenses.
Dividends and distributions also may be subject to state and local taxes.
Shareholders are urged to consult their tax advisors regarding specific questions as to federal, state and local taxes.
Section 9 | Calculation of Performance Data
Performance
Performance information for the shares of the Timothy Plan Funds will vary due to the effect of expense ratios on the performance calculations.
Current yield and total return may be quoted in advertisements, shareholder reports or other communications to shareholders. Yield is the ratio of income per share derived from a Fund’s investments to a current maximum offering price expressed in terms of percent. The yield is quoted on the basis of earnings after expenses have been deducted. Total return is the total of all income and capital gains paid to shareholders, assuming reinvestment of all distributions, plus (or minus) the change in the value of the original investment, expressed as a percentage of the purchase price. Occasionally, a Fund may include their distribution rates in advertisements. The distribution rate is the amount of distributions per share made by a Fund over a 12-month period divided by the current maximum offering price.
U.S. Securities and Exchange Commission (“Commission”) rules require the use of standardized performance quotations or, alternatively, that every non-standardized performance quotation furnished by a Fund be accompanied by certain standardized performance information computed as required by the Commission. Current yield and total return quotations used by a Fund are based on the standardized methods of computing performance mandated by the Commission. An explanation of those and other methods used by the Funds to compute or express performance follows.
41
AVERAGE ANNUAL TOTAL RETURN QUOTATION
As the following formula indicates, the average annual total return is determined by multiplying a hypothetical initial purchase order of $1,000 by the average annual compound rate of return (including capital appreciation/depreciation and dividends and distributions paid and reinvested) for the stated period less any fees charged to all shareholder accounts and annualizing the result. The calculation assumes the maximum sales load is deducted from the initial $1,000 purchase order and that all dividends and distributions are reinvested at the NAV on the reinvestment dates during the period. The quotation assumes the account was completely redeemed at the end of each one, five and ten-year period and assumes the deduction of all applicable charges and fees. According to the Commission formula:
P(1+T)n = ERV
|
|
|
|
|
|
|
|
|
| W H E R E : |
|
|
P |
|
|
= |
|
a hypothetical initial payment of $1,000. |
|
|
|
|
|
|
|
T |
|
|
= |
|
average annual total return. |
|
|
|
|
|
|
|
n |
|
|
= |
|
number of years. |
|
|
|
|
|
|
|
ERV |
|
|
= |
|
ending redeemable value of a hypothetical $1,000 payment made at the beginning of the one, five or ten-year periods, determined at the end of the one, five or ten-year periods (or fractional portion thereof). |
The advertised after-tax returns for a class of a fund are calculated by equaling an initial amount invested in a class of a fund to the ending value, according to the following formulas:
After Taxes on Distributions
P(1+T)n = ATVD
After Taxes on Distributions and Redemptions
P(1+T)n—ATVDR
|
|
|
|
|
|
|
|
|
| W H E R E : |
|
|
P |
|
|
= |
|
a hypothetical initial payment of $1,000. |
|
|
|
|
|
|
|
T |
|
|
= |
|
average annual return (after taxes on distributions or after taxes on distributions and redemptions as applicable, |
|
|
|
|
|
|
|
n |
|
|
= |
|
number of years. |
|
|
|
|
|
|
|
ATVD |
|
|
= |
|
ending value of a hypothetical $1,000 payment made at the beginning of the one, five or ten-year periods at the end of the one, five or ten-year periods (or fractional portion), after taxes on redemption. |
|
|
|
|
|
|
|
ATVDR |
|
|
= |
|
ending value of a hypothetical $1,000 payment made at the beginning of the one, five or ten-year periods at the end of the one, five or ten-year periods (or financial portion) after taxes on fund distributions and redemption. |
42
Based on these formulas, annualized total returns were as follows for the periods and Funds indicated:
|
|
|
|
|
|
|
|
|
|
|
|
|
|
|
|
|
|
|
| Fund Name |
|
|
1-Year |
|
|
|
5-Year |
|
|
|
10-Year |
|
|
Since Inception |
|
|
Inception Date |
|
| Aggressive Growth - Class A |
|
|
|
|
|
|
|
|
|
|
|
|
|
|
|
|
Oct-05-00 |
|
| Pre-Tax |
|
|
28.53 |
% |
|
|
11.36 |
% |
|
|
10.38 |
% |
|
|
|
|
|
|
| Pre-Liquidation After-Tax |
|
|
26.80 |
% |
|
|
10.69 |
% |
|
|
9.23 |
% |
|
|
|
|
|
|
| Post-Liquidation After-Tax |
|
|
18.03 |
% |
|
|
8.91 |
% |
|
|
8.22 |
% |
|
|
|
|
|
|
| Aggressive Growth - Class C |
|
|
|
|
|
|
|
|
|
|
|
|
|
|
|
|
Feb-03-04 |
|
| Pre-Tax |
|
|
34.15 |
% |
|
|
11.79 |
% |
|
|
10.18 |
% |
|
|
|
|
|
|
| Pre-Liquidation After-Tax |
|
|
31.87 |
% |
|
|
10.96 |
% |
|
|
8,84 |
% |
|
|
|
|
|
|
| Post-Liquidation After-Tax |
|
|
21.72 |
% |
|
|
9.24 |
% |
|
|
8.00 |
% |
|
|
|
|
|
|
| International - Class A |
|
|
|
|
|
|
|
|
|
|
|
|
|
|
|
|
May-03-07 |
|
| Pre-Tax |
|
|
15.03 |
% |
|
|
6.86 |
% |
|
|
4.38 |
% |
|
|
|
|
|
|
| Pre-Liquidation After-Tax |
|
|
15.03 |
% |
|
|
6.61 |
% |
|
|
4.02 |
% |
|
|
|
|
|
|
| Post-Liquidation After-Tax |
|
|
8.90 |
% |
|
|
5.34 |
% |
|
|
3.34 |
% |
|
|
|
|
|
|
| International - Class C |
|
|
|
|
|
|
|
|
|
|
|
|
|
|
|
|
May-03-07 |
|
| Pre-Tax |
|
|
19.82 |
% |
|
|
7.29 |
% |
|
|
4.19 |
% |
|
|
|
|
|
|
| Pre-Liquidation After-Tax |
|
|
19.82 |
% |
|
|
7.18 |
% |
|
|
3.98 |
% |
|
|
|
|
|
|
| Post-Liquidation After-Tax |
|
|
11.73 |
% |
|
|
5.70 |
% |
|
|
3.24 |
% |
|
|
|
|
|
|
| Large/Mid Cap Growth - Class A |
|
|
|
|
|
|
|
|
|
|
|
|
|
|
|
|
Oct-05-00 |
|
| Pre-Tax |
|
|
15.52 |
% |
|
|
10.81 |
% |
|
|
10.47 |
% |
|
|
|
|
|
|
| Pre-Liquidation After-Tax |
|
|
15.05 |
% |
|
|
10.03 |
% |
|
|
8.95 |
% |
|
|
|
|
|
|
| Post-Liquidation After-Tax |
|
|
9.50 |
% |
|
|
8.43 |
% |
|
|
8.07 |
% |
|
|
|
|
|
|
| Large/Mid Cap Growth - Class C |
|
|
|
|
|
|
|
|
|
|
|
|
|
|
|
|
Feb-03-04 |
|
| Pre-Tax |
|
|
20.33 |
% |
|
|
11.21 |
% |
|
|
10.25 |
% |
|
|
|
|
|
|
| Pre-Liquidation After-Tax |
|
|
19.69 |
% |
|
|
10.24 |
% |
|
|
8.50 |
% |
|
|
|
|
|
|
| Post-Liquidation After-Tax |
|
|
12.46 |
% |
|
|
8.73 |
% |
|
|
7.82 |
% |
|
|
|
|
|
|
| Small Cap Value - Class A |
|
|
|
|
|
|
|
|
|
|
|
|
|
|
|
|
Mar-24-94 |
|
| Pre-Tax |
|
|
-3.62 |
% |
|
|
7.90 |
% |
|
|
9.34 |
% |
|
|
|
|
|
|
| Pre-Liquidation After-Tax |
|
|
-3.66 |
% |
|
|
6.42 |
% |
|
|
7.52 |
% |
|
|
|
|
|
|
| Post-Liquidation After-Tax |
|
|
-2.12 |
% |
|
|
5.98 |
% |
|
|
7.14 |
% |
|
|
|
|
|
|
| Small Cap Value - Class C |
|
|
|
|
|
|
|
|
|
|
|
|
|
|
|
|
Feb-03-04 |
|
| Pre-Tax |
|
|
0.19 |
% |
|
|
8.32 |
% |
|
|
9.14 |
% |
|
|
|
|
|
|
| Pre-Liquidation After-Tax |
|
|
0.19 |
% |
|
|
6.31 |
% |
|
|
6.85 |
% |
|
|
|
|
|
|
| Post-Liquidation After-Tax |
|
|
0.11 |
% |
|
|
6.25 |
% |
|
|
6.88 |
% |
|
|
|
|
|
|
| Large/Mid Cap Value - Class A |
|
|
|
|
|
|
|
|
|
|
|
|
|
|
|
|
Jul-14-99 |
|
| Pre-Tax |
|
|
6.83 |
% |
|
|
9.50 |
% |
|
|
9.93 |
% |
|
|
|
|
|
|
| Pre-Liquidation After-Tax |
|
|
5.80 |
% |
|
|
7.81 |
% |
|
|
8.33 |
% |
|
|
|
|
|
|
| Post-Liquidation After-Tax |
|
|
4.45 |
% |
|
|
7.23 |
% |
|
|
7.77 |
% |
|
|
|
|
|
|
| Large/Mid Cap Value - Class C |
|
|
|
|
|
|
|
|
|
Feb-03-04 |
|
| Pre-Tax |
|
|
11.18 |
% |
|
|
9.94 |
% |
|
|
9.72 |
% |
|
|
|
|
|
|
| Pre-Liquidation After-Tax |
|
|
9.83 |
% |
|
|
7.87 |
% |
|
|
7.87 |
% |
|
|
|
|
|
|
| Post-Liquidation After-Tax |
|
|
7.16 |
% |
|
|
7.54 |
% |
|
|
7.57 |
% |
|
|
|
|
|
|
| Fixed Income - Class A |
|
|
|
|
|
|
|
|
|
|
|
|
|
|
|
|
Jul-14-99 |
|
| Pre-Tax |
|
|
0.47 |
% |
|
|
1.91 |
% |
|
|
1.77 |
% |
|
|
|
|
|
|
| Pre-Liquidation After-Tax |
|
|
-0.03 |
% |
|
|
1.23 |
% |
|
|
0.98 |
% |
|
|
|
|
|
|
| Post-Liquidation After-Tax |
|
|
0.28 |
% |
|
|
1.15 |
% |
|
|
1.01 |
% |
|
|
|
|
|
|
| Fixed Income - Class C |
|
|
|
|
|
|
|
|
|
|
|
|
|
|
|
|
Feb-03-04 |
|
| Pre-Tax |
|
|
3.46 |
% |
|
|
2.09 |
% |
|
|
1.60 |
% |
|
|
|
|
|
|
| Pre-Liquidation After-Tax |
|
|
3.33 |
% |
|
|
1.72 |
% |
|
|
1.09 |
% |
|
|
|
|
|
|
| Post-Liquidation After-Tax |
|
|
2.05 |
% |
|
|
1.43 |
% |
|
|
1.01 |
% |
|
|
|
|
|
|
| High Yield Bond - Class A |
|
|
|
|
|
|
|
|
|
|
|
|
|
|
|
|
May-07-07 |
|
| Pre-Tax |
|
|
1.35 |
% |
|
|
6.30 |
% |
|
|
4.63 |
% |
|
|
|
|
|
|
| Pre-Liquidation After-Tax |
|
|
-0.52 |
% |
|
|
4.52 |
% |
|
|
2.72 |
% |
|
|
|
|
|
|
| Post-Liquidation After-Tax |
|
|
0.70 |
% |
|
|
4.04 |
% |
|
|
2.69 |
% |
|
|
|
|
|
|
| High Yield Bond - Class C |
|
|
|
|
|
|
|
|
|
|
|
|
|
|
|
|
May-07-07 |
|
| Pre-Tax |
|
|
4.24 |
% |
|
|
6.46 |
% |
|
|
4.44 |
% |
|
|
|
|
|
|
| Pre-Liquidation After-Tax |
|
|
2.69 |
% |
|
|
5.06 |
% |
|
|
2.87 |
% |
|
|
|
|
|
|
| Post-Liquidation After-Tax |
|
|
2.44 |
% |
|
|
4.37 |
% |
|
|
2.73 |
% |
|
|
|
|
|
|
43
|
|
|
|
|
|
|
|
|
|
|
|
|
|
|
|
|
|
|
|
|
|
|
|
|
| Defensive Strategies - Class A |
|
|
|
|
|
|
|
|
|
|
|
|
|
|
|
|
|
|
|
|
|
|
Nov-04-09 |
|
| Pre-Tax |
|
|
2.83 |
% |
|
|
4.29 |
% |
|
|
2.13 |
% |
|
|
|
|
|
|
|
|
|
|
|
|
| Pre-Liquidation After-Tax |
|
|
2.83 |
% |
|
|
3.93 |
% |
|
|
1.73 |
% |
|
|
|
|
|
|
|
|
|
|
|
|
| Post-Liquidation After-Tax |
|
|
1.68 |
% |
|
|
3.24 |
% |
|
|
1.57 |
% |
|
|
|
|
|
|
|
|
|
|
|
|
| Defensive Strategies - Class C |
|
|
|
|
|
|
|
|
|
|
|
|
|
|
|
|
|
|
|
|
|
|
Nov-04-09 |
|
| Pre-Tax |
|
|
7.09 |
% |
|
|
4.68 |
% |
|
|
1.98 |
% |
|
|
|
|
|
|
|
|
|
|
|
|
| Pre-Liquidation After-Tax |
|
|
7.09 |
% |
|
|
4.43 |
% |
|
|
1.70 |
% |
|
|
|
|
|
|
|
|
|
|
|
|
| Post-Liquidation After-Tax |
|
|
4.19 |
% |
|
|
3.59 |
% |
|
|
1.51 |
% |
|
|
|
|
|
|
|
|
|
|
|
|
| Israel Common Values - Class A |
|
|
|
|
|
|
|
|
|
|
|
|
|
|
|
|
|
|
|
|
|
|
Oct-12-11 |
|
| Pre-Tax |
|
|
6.20 |
% |
|
|
12.76 |
% |
|
|
|
|
|
|
|
|
|
|
8.81 |
% |
|
|
|
|
| Pre-Liquidation After-Tax |
|
|
6.20 |
% |
|
|
12.56 |
% |
|
|
|
|
|
|
|
|
|
|
8.47 |
% |
|
|
|
|
| Post-Liquidation After-Tax |
|
|
3.67 |
% |
|
|
10.21 |
% |
|
|
|
|
|
|
|
|
|
|
7.04 |
% |
|
|
|
|
| Israel Common Values - Class C |
|
|
|
|
|
|
|
|
|
|
|
|
|
|
|
|
|
|
|
|
|
|
Oct-12-11 |
|
| Pre-Tax |
|
|
10.53 |
% |
|
|
13.18 |
% |
|
|
|
|
|
|
|
|
|
|
8.65 |
% |
|
|
|
|
| Pre-Liquidation After-Tax |
|
|
10.53 |
% |
|
|
13.02 |
% |
|
|
|
|
|
|
|
|
|
|
8.34 |
% |
|
|
|
|
| Post-Liquidation After-Tax |
|
|
6.23 |
% |
|
|
10.54 |
% |
|
|
|
|
|
|
|
|
|
|
6.90 |
% |
|
|
|
|
| Growth & Income - Class A |
|
|
|
|
|
|
|
|
|
|
|
|
|
|
|
|
|
|
|
|
|
|
Oct-01-13 |
|
| Pre-Tax |
|
|
-4.38 |
% |
|
|
0.80 |
% |
|
|
|
|
|
|
|
|
|
|
1.39 |
% |
|
|
|
|
| Pre-Liquidation After-Tax |
|
|
-4.65 |
% |
|
|
0.49 |
% |
|
|
|
|
|
|
|
|
|
|
1.17 |
% |
|
|
|
|
| Post-Liquidation After-Tax |
|
|
-2.45 |
% |
|
|
0.58 |
% |
|
|
|
|
|
|
|
|
|
|
1.05 |
% |
|
|
|
|
| Growth & Income - Class C |
|
|
|
|
|
|
|
|
|
|
|
|
|
|
|
|
|
|
|
|
|
|
Oct-01-13 |
|
| Pre-Tax |
|
|
-0.57 |
% |
|
|
1.17 |
% |
|
|
|
|
|
|
|
|
|
|
1.42 |
% |
|
|
|
|
| Pre-Liquidation After-Tax |
|
|
-0.67 |
% |
|
|
0.93 |
% |
|
|
|
|
|
|
|
|
|
|
1.26 |
% |
|
|
|
|
| Post-Liquidation After-Tax |
|
|
-0.29 |
% |
|
|
0.88 |
% |
|
|
|
|
|
|
|
|
|
|
1.08 |
% |
|
|
|
|
| Strategic Growth - Class A |
|
|
|
|
|
|
|
|
|
|
|
|
|
|
|
|
|
|
|
|
|
|
Oct-05-00 |
|
| Pre-Tax |
|
|
2.14 |
% |
|
|
4.44 |
% |
|
|
4.06 |
% |
|
|
|
|
|
|
|
|
|
|
|
|
| Pre-Liquidation After-Tax |
|
|
1.39 |
% |
|
|
4.09 |
% |
|
|
3.81 |
% |
|
|
|
|
|
|
|
|
|
|
|
|
| Post-Liquidation After-Tax |
|
|
1.89 |
% |
|
|
3.44 |
% |
|
|
3.18 |
% |
|
|
|
|
|
|
|
|
|
|
|
|
| Strategic Growth - Class C |
|
|
|
|
|
|
|
|
|
|
|
|
|
|
|
|
|
|
|
|
|
|
Feb-03-04 |
|
| Pre-Tax |
|
|
6.24 |
% |
|
|
4.83 |
% |
|
|
3.84 |
% |
|
|
|
|
|
|
|
|
|
|
|
|
| Pre-Liquidation After-Tax |
|
|
5.32 |
% |
|
|
4.43 |
% |
|
|
3.61 |
% |
|
|
|
|
|
|
|
|
|
|
|
|
| Post-Liquidation After-Tax |
|
|
4.35 |
% |
|
|
3.74 |
% |
|
|
3.02 |
% |
|
|
|
|
|
|
|
|
|
|
|
|
| Conservative Growth - Class A |
|
|
|
|
|
|
|
|
|
|
|
|
|
|
|
|
|
|
|
|
|
|
Oct-05-00 |
|
| Pre-Tax |
|
|
1.76 |
% |
|
|
3.82 |
% |
|
|
3.46 |
% |
|
|
|
|
|
|
|
|
|
|
|
|
| Pre-Liquidation After-Tax |
|
|
1.19 |
% |
|
|
3.39 |
% |
|
|
2.92 |
% |
|
|
|
|
|
|
|
|
|
|
|
|
| Post-Liquidation After-Tax |
|
|
1.51 |
% |
|
|
2.94 |
% |
|
|
2.62 |
% |
|
|
|
|
|
|
|
|
|
|
|
|
| Conservative Growth - Class C |
|
|
|
|
|
|
|
|
|
|
|
|
|
|
|
|
|
|
|
|
|
|
Feb-03-04 |
|
| Pre-Tax |
|
|
5.81 |
% |
|
|
4.21 |
% |
|
|
3.26 |
% |
|
|
|
|
|
|
|
|
|
|
|
|
| Pre-Liquidation After-Tax |
|
|
5.19 |
% |
|
|
3.74 |
% |
|
|
2.79 |
% |
|
|
|
|
|
|
|
|
|
|
|
|
| Post-Liquidation After-Tax |
|
|
3.87 |
% |
|
|
3.23 |
% |
|
|
2.51 |
% |
|
|
|
|
|
|
|
|
|
|
|
|
YIELD QUOTATION
A fund’s “yield” is determined in accordance with the method defined by the Securities and Exchange Commission. A yield quotation is based on a 30 day (or one month) period and is computed by dividing the net investment income per share earned during the period by the maximum offering price per share on the last day of the period, according to the following formula:
Yield = 2[(a-b/cd+1)6 – 1]
|
|
|
|
|
|
|
|
|
| W H E R E : |
|
|
a |
|
|
= |
|
dividends and interest earned during the period |
|
|
|
|
|
|
|
b |
|
|
= |
|
expenses accrued for the period (net of reimbursements) |
|
|
|
|
|
|
|
c |
|
|
= |
|
the average daily number of shares outstanding during the period that were entitled to receive dividends |
|
|
|
|
|
|
|
d |
|
|
= |
|
the maximum offering price per share on the last day of the period |
Solely for the purpose of computing yield, dividend income is recognized by accruing 1/360 of the stated dividend rate of the security each day that a fund owns the security. Generally, interest earned (for the purpose of “a” above) on debt obligations is computed by reference to the yield to maturity of each obligation held based on the market value of the obligation (including actual accrued interest) at the close of business on the last business day prior to the start of the 30-day (or one month) period for which yield is being calculated, or, with respect to obligations purchased during the month, the purchase price (plus actual accrued interest). With respect to the treatment of discount and premium on mortgage or other receivable-backed obligations which are expected to be subject to monthly paydowns of principal and interest, gain or loss attributable to actual monthly paydowns is accounted for as an increase or decrease to interest income during the period and discount or premium on the remaining security is not amortized.
44
Section 10 | Financial Statements
The Trust’s financial statements, including the notes thereto, dated September 30, 2020, which have been audited by Cohen & Company, Ltd., Independent Registered Public Accounting Firm, are incorporated by reference from the Timothy Plan’s September 30, 2020 Annual Report to Shareholders.
Appendix A | Proxy Voting Policy
Preface
Timothy Partners, Ltd. (“Advisor”) is registered with the Securities and Exchange Commission as an investment Advisor under the Investment Advisors Act of 1940, as amended (“Advisors Act”). Pursuant to an advisory agreement between Advisor and The Timothy Plan (the “Trust”), Advisor manages the assets of the Timothy Plan Funds (the “Funds”). As the investment Advisor to the Funds, Advisor is responsible for voting all proxies related to securities held in the Funds’ investment portfolios. Because the Funds’ Sub-Advisors, under the close scrutiny of the Advisor, perform economic and management analyses of the companies in which the Funds are invested, Advisor looks to the Funds’ Sub-Advisors to vote proxies, and each Sub-Advisors’ proxy policies and procedures are incorporated herein by specific reference.
Advisor, consistent with its fiduciary duties and pursuant to Rule 206(4)-6 under the Advisors Act, has designed this proxy voting policy (the “Policy”) to reflect its commitment to vote all proxies, when called upon to vote by a Sub-Advisor who perceives a potential conflict or for any other reason, in a manner consistent with the best interests of the Funds’ shareholders. Sub-Advisors, and Advisor, consistent with their duty of care, will monitor corporate actions for those issuers whose securities are called upon to vote. Consistent with its duty of loyalty, Advisor will, in all cases, vote, or cause Sub-Advisors to vote, to promote the Funds’ shareholders’ best interests. In determining how to vote proxies, Advisor and Sub-Advisors shall initially review each Proxy subject to perform an analysis of the impact each issue may have pursuant to the moral considerations set forth in the Prospectus, and shall vote in a manner not inconsistent with those moral considerations. Further, Advisor and Sub-Advisors will not subordinate the economic interest of the Funds’ shareholders to their own interests or to that of any other entity or interested party.
Key Proxy Voting Issues
All votes shall initially be reviewed subject to an analysis of the impact each issue may have pursuant to the moral considerations set forth in the Prospectus. Subsequent to the moral analysis, all votes shall be on a company-by-company basis, and each issue shall be considered in the context of the company under review, and the various economic impacts such issues may have on the Funds’ stated investment objectives. Advisor will give great weight to the views of management if and only if the issues involved will not have a negative impact on the Funds’ shareholder values. In all other cases, Advisor will engage in an independent analysis of the impact that the proposed action will have on shareholder values.
Electing directors is one of the most important rights of stock ownership that company shareholders can exercise. Advisor believes that company directors should act in the long-term best interests of the company’s shareholders and the company as a whole. Generally, subsequent to the moral considerations addressed above, when called upon by a Sub-Advisor to vote, Advisor will vote in favor of director nominees that have expressed and/or demonstrated a commitment to the interest of the company’s shareholders. Advisor will consider the following factors in deciding how to vote proxies relating to director elections:
| |
i. |
In re-electing incumbent directors, the long-term performance of the company relative to its peers – Advisor will not vote to re-elect a board if the company has had consistent poor performance relative to its peers in the industry, unless the board has taken or is attempting to take steps to improve the company’s performance. |
| |
ii. |
Whether the slate of director nominees promotes a majority of independent directors on the full board – Advisor believes that it is in the best interest of all company shareholders to have, as a majority, directors that are independent of management. |
| |
iii. |
A director nominee’s attendance at less than 75% of required meetings – Frequent non-attendance at board meetings will be grounds for voting against re-election. |
| |
iv. |
Existence of any prior SEC violations and/or other criminal offenses – Advisor will not vote in favor of a director nominee who, to Advisor’s actual knowledge, is the subject of SEC or other criminal enforcement actions. |
Advisor believes that it is in the shareholders’ best interests to have bright and experienced directors serving on a company’s board. To this end, Advisor believes that companies should be allowed to establish director compensation packages that attract and retain desirable directors. Advisor will consider whether proposals relating to director compensation are reasonable in relation to the company’s performance and resources. Advisor will vote in favor of proposals that seek to impose reasonable limits on director compensation.
45
In all other issues that may arise relating to the Board of Directors, Advisor will vote against all proposals that benefit directors at the expense of shareholders, and in favor of all proposals that do not unreasonably abrogate the rights of shareholders. As previously stated, each issue will be analyzed on an issue-by-issue basis.
Corporate governance issues may include, but are not limited to, the following: (i) corporate defenses, (ii) corporate restructuring proposals, (iii) proposals affecting the capital structure of a company, (iv) proposals regarding executive compensation, or (v) proposals regarding the independent auditors of the company. When called upon by a Sub-Advisor to vote:
| |
i. |
Corporate Defenses | Although Advisor will review each proposal on a case-by-case basis, Advisor will generally vote against management proposals that (a) seek to insulate management from all threats of change in control, (b) provide the board with veto power against all takeover bids, (c) allow management or the board of the company to buy shares from particular shareholders at a premium at the expense of the majority of shareholders, or (d) allow management to increase or decrease the size of the board at its own discretion. Advisor will only vote in favor of those proposals that do not unreasonably discriminate against a majority of shareholders, or greatly alter the balance of power between shareholders, on one side, and management and the board, on the other. |
| |
ii. |
Corporate Restructuring | These may include mergers and acquisitions, spin-offs, asset sales, leveraged buy-outs and/or liquidations. In determining the vote on these types of proposals, Advisor will consider the following factors: (a) whether the proposed action represents the best means of enhancing shareholder values, (b) whether the company’s long-term prospects will be positively affected by the proposal, (c) how the proposed action will impact corporate governance and/or shareholder rights, (d) how the proposed deal was negotiated, (e) whether all shareholders receive equal/fair treatment under the terms of the proposed action, and/or (f) whether shareholders could realize greater value through alternative means. |
| |
iii. |
Capital Structure | Proposals affecting the capital structure of a company may have significant impact on shareholder value, particularly when they involve the issuance of additional stock. As such, Advisor will vote in favor of proposals to increase the authorized or outstanding stock of the company only when management provides persuasive business justification for the increase, such as to fund acquisitions, recapitalization or debt restructuring. Advisor will vote against proposals that unreasonably dilute shareholder value or create classes of stock with unequal voting rights if, over time, such action may lead to a concentration of voting power in the hands of few insiders. |
| |
iv. |
Executive Compensation | Advisor believes executives should be compensated at a reasonable rate and that companies should be free to offer attractive compensation packages that encourage high performance in executives because, over time, it will increase shareholder values. Advisor also believes however, that executive compensation should, to some extent, be tied to the performance of the company. Therefore, Advisor will vote in favor of proposals that provide challenging performance objectives to company executives, and which serve to motivate executives to better performance. Advisor will vote against all proposals that offer unreasonable benefits to executives whose past performance has been less than satisfactory. |
Advisor will vote against shareholder proposals that summarily restrict executive compensation without regard to the company’s performance, and in favor of shareholder proposals that seek additional disclosures on executive compensation.
| |
v. |
Independent Registered Public Accountants | The engagement, retention and termination of a Company’s independent auditors must be approved by the Company’s audit committee, which typically includes only those independent directors who are not affiliated with or compensated by the Company, except for directors’ fees. In reliance on the audit committee’s recommendation, Advisor generally will vote to ratify the employment or retention of a Company’s independent auditors unless Advisor is aware that the auditor is not independent or that the auditor has, in the past, rendered an opinion that was neither accurate nor indicative of the Company’s financial position. |
State law provides shareholders of a company with various rights, including, but not limited to, cumulative voting, appraisal rights, the ability to call special meetings, the ability to vote by written consent and the ability to amend the charter or bylaws of the company. When called upon by a Sub-Advisor to vote, Advisor will carefully analyze all proposals relating to shareholder rights and will vote against proposals that seek to eliminate existing shareholder rights or restrict the ability of shareholders to act in a reasonable manner to protect their interest in the company. In all cases, Advisor will vote in favor of proposals that best represent the long-term financial interest of Fund shareholders.
| |
4. |
Social and Environmental Issues |
When called upon by a Sub-Advisor to vote, in determining how to vote proxies in this category, Advisor will consider the following factors:
| |
• |
|
Whether the proposal creates a stated position that could affect the company’s reputation and/or operations, or leave it vulnerable to boycotts and other negative consumer responses; |
| |
• |
|
The percentage of assets of the company that will be devoted to implementing the proposal; |
| |
• |
|
Whether the issue is more properly dealt with through other means, such as through governmental action; |
46
| |
• |
|
Whether the company has already dealt with the issue in some other appropriate way; and |
| |
• |
|
What other companies have done in response to the issue. |
While Advisor generally supports shareholder proposals that seek to create good corporate citizenship, Advisor will vote against proposals that would tie up a large percentage of the assets of the company. Advisor believes that such proposals are inconsistent with its duty to seek long-term value for Fund shareholders. Advisor will also evaluate all proposals seeking to bring to an end certain corporate actions to determine whether the proposals adversely affect the ability of the company to remain profitable. Advisor will vote in favor of proposals that enhance or do not negatively impact long-term shareholder values.
Proxy Voting Procedures
| |
1. |
The Proxy Voting Officer |
Advisor hereby appoints Mr. Terry Covert as the person responsible for voting all proxies relating to securities held in the Funds’ accounts (the “Proxy Voting Officer”) when called upon by a Sub-Advisor to vote. The Proxy Voting Officer shall take all reasonable efforts to monitor corporate actions, obtain all information sufficient to allow an informed vote on the matter, and ensure that all proxy votes are cast in a timely fashion and in a manner consistent with this Policy.
If, in the Proxy Voting Officer’s reasonable belief, it is in the best interest of the Fund shareholders to cast a particular vote in a manner that is contrary to this policy, the Advisor shall submit a request for a waiver to the Board of Trustees of the Trust (the “Board”), stating the facts and reasons for the Proxy Voting Officer’s belief. The Proxy Voting Officer shall proceed to vote the proxy in accordance with the decision of the Board.
In addition, if, in the Proxy Voting Officer’s reasonable belief, it is in the best interest of the Fund shareholders to abstain from voting on a particular proxy solicitation, the Proxy Voting Officer shall make a record summarizing the reasons for the Proxy Voting Officer’s belief and shall present this summary to the Board along with other reports required in Section 3 below.
| |
2. |
Conflict of Interest Transactions |
The Proxy Voting Officer shall submit to the Trust’s Board of Trustees all proxies solicitations that, in the Proxy Voting Officer’s reasonable belief, present a conflict between the interests of the Fund shareholders on one hand, and those of an Advisor or any of its affiliated persons/entities (each, an “Advisory Entity”). Conflict of interest transactions include, but are not limited to, situations where:
| |
1. |
an Advisory Entity has a business or personal relationship with the participant of a proxy contest such as members of the issuer’s management or the soliciting shareholder(s); |
| |
2. |
an Advisory Entity provides advisory, brokerage, underwriting, insurance or banking or other services to the issuer whose management is soliciting proxies; |
| |
3. |
an Advisory Entity has a personal or business relationship with a candidate for directorship; or |
| |
4. |
an Advisory Entity manages a pension plan or administers an employee benefit plan, or intends to pursue an opportunity to do so. |
In all such cases, the materials submitted to the Board shall include the name of the affiliated party whose interests in the transaction are believed to be contrary to the interests of the Funds, a brief description of the conflict, and any other information in the Proxy Voting Officer’s possession that would enable the Board to make an informed decision on the matter. The Proxy Voting Officer shall vote the proxy in accordance with the direction of the Board.
| |
3. |
Report to the Board of Trustees |
The Proxy Voting Officer shall, from reports received from Sub-Advisors and votes cast when called upon by a Sub-Advisor to vote, compile and present to the Board of Trustees an annual report of all proxy solicitations received by the Funds, including for each proxy solicitation, (i) the name of the issuer; (ii) the exchange ticker symbol for the security; (iii) the CUSIP number; (iv) the shareholder meeting date; (iv) a brief identification of the matter voted on; (v) whether the matter was proposed by the management or by a security holder; (vi) whether the Proxy Voting Officer cast its vote on the matter and if not, an explanation of why no vote was cast; (vii) how the vote was cast (i.e., for or against the proposal); (viii) whether the vote was cast for or against management; and (ix) whether the vote was consistent with this Policy, and if inconsistent, an explanation of why the vote was cast in such manner. The report shall also include a summary of all transactions which, in the Proxy Voting Officer’s reasonable opinion, presented a potential conflict of interest, and a brief explanation of how each conflict was resolved.
| |
4. |
Responding to Fund Shareholders’ Request for Proxy Voting Disclosure |
Consistent with this Policy, Sub-Advisors shall submit to Timothy Partners, Ltd. a complete proxy voting record to be filed with the Securities and Exchange Commission on an annual basis for each period ending June 30th on SEC Form N-PX. In addition, the Proxy Voting Officer shall make the Fund’s proxy voting record available to any Fund shareholder who may wish to review such
47
record through The Timothy Plan website. The Timothy Plan website shall notify shareholders of the Fund that the Fund’s proxy voting record and a copy of this Policy is available, without charge, to the shareholders by calling the Trust’s toll-free number as listed in its current prospectus. Timothy Partners shall respond to all shareholder requests for records within three business days of such request by first-class mail or other means designed to ensure prompt delivery.
Record Keeping
In connection with this Policy, the Proxy Voting Officer, when called upon by a Sub-Advisor to vote, shall maintain a record of the following:
| |
1. |
copies of all proxy solicitations received by the Fund, including a brief summary of the name of the issuer of the portfolio security, the exchange ticker symbol for the security, the CUSIP number, and the shareholder meeting date; |
| |
2. |
a reconciliation of the proxy solicitations received and number of shares held by the Fund in the company; |
| |
3. |
the analysis undertaken to ensure that the vote cast is consistent with this Policy; |
| |
4. |
copies, if any, of all waiver requests submitted to the Board and the Board’s final determination relating thereto; |
| |
5. |
copies, if any, of all documents submitted to the Board relating to conflict of interest transactions and the Board’s final determination relating thereto; |
| |
6. |
copies of any other documents created or used by the Proxy Voting Officer in determining how to vote the proxy; |
| |
7. |
copies of all votes cast; |
| |
8. |
copies of all quarterly summaries presented to the Board; and |
| |
9. |
copies of all shareholder requests for the Fund’s proxy voting record and responses thereto. |
All records required to be maintained under this Policy shall be maintained in the manner and for such period as is consistent with other records required to be maintained by Advisor pursuant to Rule 204-2 of the Advisors Act. Copies shall be provided to Timothy Partners, Ltd. promptly upon request.
Summary
Timothy Partners, Ltd. (the “Advisor”) is registered with the Securities and Exchange Commission as an Investment Advisor under the Investment Advisors Act of 1940, as amended (the “Advisors Act”). Pursuant to an advisory agreement between Advisor and The Timothy Plan (the “Trust”), the Advisor manages the assets of The Timothy Plan Family of Funds (the “Funds”). As the Investment Advisor to the Funds, the Advisor is responsible for voting all proxies related to securities held in their investment portfolios. With the approval of the Board of Trustees of the Trust (the “Board”), the Advisor has delegated day-to-day money management responsibilities for certain of the Funds to Sub-Advisors. Because a Fund’s Sub-Advisor, under the close scrutiny of the Advisor, monitors and reviews the companies in which the Fund invests, the Advisor has delegated its authority to vote proxies to the Fund’s Sub-Advisor. Each Sub-Advisor’s proxy voting policies and procedures have been reviewed by the Advisor and the Board.
Advisor, consistent with its fiduciary duties and pursuant to Rule 206(4)-6 under the Advisors Act, will vote, or cause the Funds’ Sub-Advisors to vote, proxies in a manner that promotes the shareholders’ best interests. In determining how to vote proxies, the Advisor and the Sub-Advisors shall review each proxy proposal, analyze the impact each proposal may have on the moral considerations set forth in the Funds’ Prospectus, and shall vote in a manner not inconsistent with those moral considerations. Advisor and the Sub-Advisors will not subordinate the economic interests of the Funds’ shareholders to their own interests or to that of any other entity or interested party. In the event that a conflict of interest arises between Advisor or a Sub-Advisor and a Fund, a complete description of the conflict will be presented to the Board, and the proxy will be voted as directed by the Board.
A copy of Advisor’s Proxy Voting Policies and Procedures may be obtained by calling The Timothy Plan at 1-(800)-846-7526 or may be viewed on line at www.timothyplan.com. A copy also may be obtained from Fund documents filed with the SEC at its website www.sec.gov. A record of the actual proxy votes cast by each Fund also is available upon request made to The Timothy Plan either by phone or by contacting Timothy Plan on its website.
48

PART C. OTHER INFORMATION
|
|
|
|
|
| a. |
|
Articles of Incorporation—Form of Agreement and Declaration of Trust, of The Timothy Plan, a Delaware Business Trust (effective 2002 the Delaware Statutory Trust Act), filed on April 30, 1996, as an Exhibit to Registrant’s Post-Effective Amendment and incorporated herein by reference. |
| b. |
|
By-Laws – Form of Agreement and Declaration of Trust of The Timothy Plan a Delaware Business Trust (effective 2002 the Delaware Statutory Trust Act), filed on April 30, 1996, as an Exhibit to Registrant’s Post-Effective Amendment and incorporated herein by reference. |
| c. |
|
Instruments Defining Rights of Security Holders – Form of Agreement and Declaration of Trust of The Timothy Plan a Delaware Business Trust (effective 2002 the Delaware Statutory Trust Act), filed on April 30, 1996, as an Exhibit to Registrant’s Post-Effective Amendment and incorporated herein by reference. |
| d. |
|
Investment Advisory Contracts |
|
|
(1) |
|
Registrant’s Form of Consolidated and Restated Investment Advisory Agreement with Timothy Partners, Ltd., filed as an Exhibit to Registrant’s Post-Effective Amendment on April 30, 2014, and incorporated herein by reference. |
|
|
(1.a) |
|
Registrant’s Form of Amended Advisory Agreement with Timothy Partners, Ltd., and filed as an Exhibit to Registrant’s Post-Effective Amendment filed on January 28, 2020, and incorporated herein by reference. |
|
|
(2) |
|
Copy of Sub-Investment Advisory Agreement by and between Timothy Partners, Ltd. and Chartwell Investment Partners, on behalf of the Timothy Plan Aggressive Growth Fund, and Timothy Plan Large/Mid Cap Growth Fund, filed as Exhibit B to Registrant’s Definitive Proxy, Form DEF 14A, on November 6, 2007, and incorporated herein by reference. |
|
|
(2.a) |
|
Copy of Sub-Investment Advisory Agreement by and between Timothy Partners, Ltd. and Chartwell Investment Partners, on behalf of the and Timothy Plan Large/Mid Cap Growth Fund, filed as Exhibit B to Registrant’s Post Effective Annual Amendment on April 15, 2020, and incorporated herein by reference. |
|
|
(3) |
|
Copy of Sub-Investment Advisory Agreement by and between Timothy Partners, Ltd. and Eagle Global Advisors , on behalf of the Timothy Plan International Fund, filed as an Exhibit to Registrant’s Post-Effective Amendment on May 2, 2007, and incorporated herein by reference. |
|
|
(3.a) |
|
Copy of Sub-Investment Advisory Agreement by and between Timothy Partners, Ltd. and Eagle Global Advisors, on behalf of the Timothy Plan Israel Common Values Fund, filed as an Exhibit to Registrant’s Post-Effective Amendment on October 11, 2011, and incorporated herein by reference. |
|
|
(4) |
|
Copy of Sub-Investment Advisory Agreement by and between Timothy Partners, Ltd. and Westwood Management Group, on behalf of the and Timothy Plan Small-Cap Value Fund, filed as an Exhibit to Registrant’s Post-Effective Amendment on April 27, 2006, and incorporated herein by reference. |
|
|
(4.a) |
|
Copy of Sub-Investment Advisory Agreement by and between Timothy Partners, Ltd. and Westwood Management Group, on behalf of the Timothy Plan Large/Mid Cap Value Fund, filed as an Exhibit to Registrant’s Post-Effective Amendment on April 27, 2006, and incorporated herein by reference. |
|
|
(5) |
|
Copy of Interim Sub-Investment Advisory Agreement with Timothy Partners, Ltd. and Barrow, Hanley & Mewhinney & Strauss, on behalf of the Timothy Plan Fixed Income Fund , Timothy Plan High Yield Bond Fund, Timothy Growth and Income Fund and Timothy Plan Defensive Strategies Fund Fixed Income Allocation dated November 17, 2020. Filed herewith. |
|
|
(5.a) |
|
Form of Sub-Investment Advisory Agreement with Timothy Partners, Ltd. and Barrow, Hanley & Mewhinney & Strauss, on behalf of the Timothy Plan Fixed Income Fund , Timothy Plan High Yield Bond Fund, Timothy Growth and Income Fund and Timothy Plan Defensive Strategies Fund Fixed Income Allocation. Filed herewith. |
|
|
(6) |
|
Copy of Interim Sub-Investment Advisory Agreement with Timothy Partners, Ltd. and Chilton Capital Management, LLC on behalf of the Timothy Plan Defensive Strategies Fund REIT Allocation, dated November 1, 2020. Filed herewith. |
|
|
(6.a.) |
|
Form of Sub-Investment Advisory Agreement with Timothy Partners, Ltd. and Chilton Capital Management, LLC on behalf of the Timothy Plan Defensive Strategies Fund REIT Allocation. Filed herewith. |
|
|
(7) |
|
Copy of Sub-Investment Advisory Agreement by and between Timothy Partners, Ltd. and CoreCommodity, LLC, on behalf of the Timothy Plan Defensive Strategies Fund, filed as Exhibit B to Registrant’s Definitive Proxy, DEF 14A, on November 5, 2013, and incorporated herein by reference. |
|
|
(8) |
|
Copy of Sub-Investment Advisory Agreement by and between Timothy Partners, Ltd. and Victory Capital Management, Inc, on behalf of the Timothy Plan US Large Cap Core ETF, Timothy Plan US Small- Cap Core ETF, Timothy Plan International ETF, and Timothy Plan US High Dividend Stock ETF, filed as an Exhibit to Registrant’s Post-Effective Amendment filed on April 30, 2019, and incorporated herein by reference. |
|
|
|
|
|
| e. |
|
Underwriting Contracts |
|
|
(1) |
|
Form of Registrant’s Underwriting Agreement with Timothy Partners, Ltd., filed as an Exhibit to Registrant’s Post-Effective Amendment on July 22, 1997, and incorporated herein by reference. |
|
|
(1.a) |
|
Form of Registrant’s Amendment to Underwriting Agreement with Timothy Partners Ltd. on behalf of the Timothy Plan Israel Common Values Fund, filed as an Exhibit to Registrant’s Post-Effective Amendment on October 11, 2011, and incorporated herein by reference. |
|
|
(1.b) |
|
Form of Registrant’s Amendment to Underwriting Agreement with Timothy Partners Ltd. on behalf of the Timothy Plan Emerging Markets Fund , filed as an Exhibit to Registrant’s Post-Effective Amendment on November 30, 2012, and incorporated herein by reference. |
|
|
(1.c) |
|
Form of Registrant’s Amendment to Underwriting Agreement with Timothy Partners Ltd. on behalf of the Timothy Plan Growth and Income Fund , filed as an Exhibit to Registrant’s Post-Effective Amendment on October 1, 2013, and incorporated herein by reference. |
|
|
(2) |
|
Form of Registrant’s Underwriting Agreement with Foreside Distributors, on behalf of the Timothy Plan US Large Cap Core ETF, Timothy Plan US Small-Cap Core ETF, Timothy Plan International ETF, and Timothy Plan US High Dividend Stock ETF, filed as an Exhibit to Registrant’s Post-Effective Amendment filed on April 30, 2019, and incorporated herein by reference. |
| f. |
|
Bonus or Profit-Sharing Contracts—Not Applicable |
| g. |
|
Custodian Agreements |
|
|
(1) |
|
Copy of Registrants Custodian Agreement with Star Bank N.A. (k/n/a U.S. Bank N.A.), filed as an Exhibit to Registrant’s Post-Effective Amendment on April 30, 2002, and incorporated herein by reference. |
|
|
(2) |
|
Copy of Registrants Custodian Agreement with Citibank, N.A. for the Timothy Plan ETF Funds, filed as an Exhibit to Registrant’s Post-Effective Amendment on April 30, 2019, and incorporated herein by reference. |
| h. |
|
Other Material Contracts |
|
|
(1) |
|
Copy of Registrant’s Mutual Fund Services Agreement with Gemini Fund Services, Inc., filed as an Exhibit to Registrant’s Post-Effective Amendment on January 28, 2015 and incorporated herein by reference. |
|
|
(1.a) |
|
Copy of Registrant’s 1st Amendment to Mutual Fund Services Agreement with Gemini Fund Services, Inc., filed as an Exhibit to Registrants Post-Effective Amendment and incorporated herein by reference . |
|
|
(1.b) |
|
Copy of Registrant’s 2nd Amendment to Mutual Fund Services Agreement with Gemini Fund Services, Inc., filed as an Exhibit to Registrants Post-Effective Amendment and incorporated herein by reference. |
|
|
(1.c) |
|
Copy of Registrant’s 3rd Amendment to Mutual Fund Services Agreement with Gemini Fund Services, Inc., filed as an Exhibit to Registrants Post-Effective Amendment and incorporated herein by reference. |
|
|
(2) |
|
Copy of Registrant’s Transfer Agent, Administrative and Fund Accounting Agreement with Citi Fund Services Ohio and Citibank, N.A ., filed as an Exhibit to Registrant’s Post-Effective Amendment on April 29, 2019, and incorporated herein by reference. |
|
|
(3) |
|
Trustee Powers of Attorney executed February 13, 18, 19, 2020, filed as an Exhibit April 15, 2020, and incorporated herein by reference. |
|
|
(3.a) |
|
Trustee Powers of Attorney executed December 6, 2020 and January 15, 2021 filed herewith. |
| i. |
|
Opinion and Consent of Counsel – Opinion and Consent of David Jones, Esq., filed as an Exhibit to Registrant’s Post-Effective Amendment on October 1, 2013, and incorporated herein by reference. |
| j. |
|
Other Opinions-Consent of Independent Registered Public Accounting Firm, Cohen & Company Ltd., filed herewith. |
| k. |
|
Omitted Financial Statements—None |
| l. |
|
Initial Capital Agreements – Investment letters between the Registrant and its initial shareholders, filed as an Exhibit to Registrant’s Post-Effective Amendment on April 30, 1996, are hereby incorporated by reference. |
| m. |
|
Rule 12b-1 Plans |
|
|
(1) |
|
Registrant’s Plan of Distribution for Class A Shares, which was filed as an Exhibit to Registrant’s Post- Effective Amendment on March 18, 1999, and incorporated herein by reference. |
|
|
(2) |
|
Registrant’s Plan of Distribution for Class C shares, which was filed as an Exhibit to Registrant’s Post-effective Amendment on March 18, 1999, and incorporated herein by reference. |
|
|
(3) |
|
Registrant’s Amendment to Plan of Distribution for Class A Shares, adding the Timothy Plan High Yield Fund and Timothy Plan International Fund, which was filed as an Exhibit to Registrant’s Post-Effective Amendment on May 2, 2007, and incorporated herein by reference. |
|
|
(4) |
|
Registrant’s Amendment to Plan of Distribution for Class C Shares, adding the Timothy Plan High Yield Fund and Timothy Plan International Fund, which was filed as an Exhibit to Registrant’s Post-Effective Amendment on May 2, 2007, and incorporated herein by reference. |
|
|
(5) |
|
Registrant’s Amendment to Plan of Distribution for Class A Shares, adding the Timothy Plan Defensive Strategies Fund, which was filed as an Exhibit to Registrant’s Post-Effective Amendment on August 6. 2009, and is incorporated herein by reference. |
|
|
(6) |
|
Registrant’s Amendment to Plan of Distribution for Class C Shares, adding the Timothy Plan Defensive Strategies Fund, which was filed as an Exhibit to Registrant’s Post-Effective on August 6, 2009, is hereby incorporated by reference. |
|
|
(7) |
|
Registrant’s Amendment to Plan of Distribution for Class C shares, adding the Timothy Plan Israel Common Values Fund, filed as an Exhibit to Registrant’s Post-Effective Amendment on October 11, 2011, and incorporated herein by reference. |
|
|
(8) |
|
Registrant’s Amendment to Plan of Distribution for Class A Shares, adding the Timothy Plan Israel Common Values Fund, which was filed as an Exhibit to Registrant’s Post-Effective Amendment on October 11, 2011, and incorporated herein by reference. |
|
|
|
|
|
|
|
(9) |
|
Registrant’s amended Plan of Distribution for Class C shares, adding the Timothy Plan Growth and Income Fund, which was filed as an Exhibit to Registrant’s Post-Effective on October 1, 2013, is hereby incorporated by reference. |
|
|
(10) |
|
Registrant’s amended Plan of Distribution for Class A shares, adding the Timothy Plan Growth and Income Fund, which was filed as an Exhibit to Registrant’s Post-Effective Amendment on October 1, 2013, is hereby incorporated by reference. |
| n. |
|
Rule 18f-3 Plan |
|
|
(1) |
|
Registrant’s Multiple Class Plan filed as an Exhibit to Registrant’s Post-Effective Amendment, on July 22, 1997 and incorporated herein by reference. |
| o. |
|
Reserved |
| p. |
|
Code of Ethics |
|
|
(1) |
|
Form of Code of Ethics for the Timothy Plan and Timothy Partners Ltd., filed as an Exhibit to Registrant’s Post-Effective Amendment dated April 15, 2020, and incorporated herein by reference. |
|
|
(2) |
|
Form of Code of Ethics of Barrow, Hanley, Mewhinney & Strauss, LLC, filed as an Exhibit to Registrant’s Post-Effective Amendment dated April 15, 2020, and incorporated herein by reference. |
|
|
(3) |
|
Form of Code of Ethics of Chartwell Investment Partners, filed as an Exhibit to Registrant’s Post-Effective Amendment dated April 15, 2020, and incorporated herein by reference. |
|
|
(4) |
|
Form of Code of Ethics of Chilton Capital Management, LLC filed as an Exhibit to Registrant’s Post-Effective Amendment dated January 28, 2021, and filed herewith. |
|
|
(5) |
|
Form of Code of Ethics of Eagle Global Advisors, LLC, filed as an Exhibit to Registrant’s Post-Effective Amendment dated April 15, 2020, and incorporated herein by reference. |
|
|
(6) |
|
Form of Code of Ethics of CoreCommodity, LLC, filed as an Exhibit to Registrant’s Post-Effective Amendment dated April 15, 2020, and incorporated herein by reference. |
|
|
(7) |
|
Form of Code of Ethics of Westwood Management Corp., filed as an Exhibit to Registrant’s Post-Effective Amendment dated January 28, 2021, and filed herewith. |
|
|
(8) |
|
Form of Code of Ethics of Victory Capital Management, Inc. filed as an Exhibit to Registrant’s Post-Effective Amendment dated April 15, 2020 and incorporated herein. |
|
|
|
|
|
| 101 |
|
XBRL Exhbits |
|
|
| EX-101.INS |
|
XBRL Instance Document |
|
|
| EX-1-1.SCH |
|
XBRL Taxonomy Extension Schema |
|
|
| EX-101.DEF |
|
XBRL Taxonomy Extension Definition Linkbase |
|
|
| EX-101.LAB |
|
XBRL Taxonomy Extension Label Linkbase |
|
|
| EX-101.PRE |
|
XBRL Taxonomy Extension Presentation Linkbase |
| Item 29. |
Persons Controlled by or Under Common Control with Registrant—None |
Under the terms of the Delaware Business Trust Act (effective 2002 the Delaware Statutory Trust Act) and the Registrant’s Agreement and Declaration of Trust and By-Laws, no officer or Trustee of the Trust shall have any liability to the Trust or its shareholders for damages, except to the extent such limitation of liability is precluded by Delaware law, the Agreement and Declaration of Trust or the By-Laws.
The Delaware Business Trust Act, section 3817, permits a business trust to indemnify any trustee, beneficial owner, or other person from and against any claims and demands whatsoever. Section 3803 protects a trustee, when acting in such capacity, from liability to any person other than the business trust or beneficial owner for any act, omission, or obligation of the business trust or any trustee thereof, except as otherwise provided in the Agreement and Declaration of Trust.
The Agreement and Declaration of Trust provides that the Trustees shall not be responsible or liable in any event for any neglect or wrong-doing of any officer, agent, employee, manager or principal underwriter of the Trust, nor shall any Trustee be responsible for the act or omission of any other Trustee, and, subject to the provisions of the By-Laws, the Trust out of its assets may indemnify and hold harmless each and every officer and Trustee of the Trust from and against any and all claims, demands, costs, losses, expenses, and damages whatsoever arising out of or related to such Trustee’s performance of his or her duties as a officer or Trustee of the Trust; provided that nothing contained in the Agreement and Declaration of Trust shall indemnify, hold harmless or protect any officer or Trustee from or against any liability to the Trust or any shareholder to which he or she would otherwise be subject by reason of willful misfeasance, bad faith, gross negligence or reckless disregard of the duties involved in the conduct of his or her office.
The By-Laws provide indemnification for an officer or Trustee who was or is a party or is threatened to be made a party to any proceeding (other than an action by or in the right of the Trust), by reason of the fact that such person is or was an agent of the Trust, against expenses, judgments, fines, settlements and other amounts actually and reasonably incurred in connection with such proceeding, if it is determined that such person acted in good faith and reasonably believed: (a) in the case of conduct in his official capacity as an agent of the Trust, that his conduct was in the Trust’s best interests and (b) in all other cases, that his conduct was at least not opposed to the Trust’s best interests and (c) in the case of a criminal proceeding, that he had no reasonable cause to believe the conduct of that person was unlawful.
The termination of any proceeding by judgment, order or settlement shall not of itself create a presumption that the person did not meet the requisite standard of conduct set forth above. The termination of any proceeding by conviction, or a plea of nolo contendere or its equivalent, or any entry of an order of probation prior to judgment, shall create a rebuttable presumption that the person did not meet the requisite standard of conduct set forth above.
The By-Laws further provide indemnification for an officer or Trustee who was or is a party or is threatened to be made a party to any proceeding by or in the right of the Trust to procure a judgment in its favor by reason of the fact that the person is or was an agent of the Trust, against expenses actually and reasonably incurred by that person in connection with the defense or settlement of that action if that person acted in good faith, in a manner that person believed to be in the best interests of the Trust and with such care, including reasonable inquiry, as an ordinarily prudent person in a like position would use under similar circumstances.
The By-Laws provide no right to indemnification for any liability arising by reason of willful misfeasance, bad faith, gross negligence, or the reckless disregard of the duties involved in the conduct of an officer’s or Trustee’s office with the Trust. Further no indemnification shall be made:
(a) In respect of any proceeding as to which an officer or Trustee shall have been adjudged to be liable on the basis that personal benefit was improperly received by him, whether or not the benefit resulted from an action taken in the person’s official capacity; or
(b) In respect of any proceeding as to which an officer or Trustee shall have been adjudged to be liable in the performance of that person’s duty to the Trust, unless and only to the extent that the court in which that action was brought shall determine upon application that in view of all the relevant circumstances of the case, that person is fairly and reasonably entitled to indemnity for the expenses which the court shall determine; however, in such case, indemnification with respect to any proceeding by or in the right of the Trust or in which liability shall have been adjudged by reason of the disabling conduct set forth in the preceding paragraph shall be limited to expenses; or
(c) Of amounts paid in settling or otherwise disposing of a proceeding, with or without court approval, or of expenses incurred in defending a proceeding which is settled or otherwise disposed of without court approval, unless the required approval as set forth below is obtained.
The By-Laws provide to the extent that an officer or Trustee has been successful, on the merits or otherwise, in the defense of any proceeding as set forth above before a court or other body before whom a proceeding was brought, the officer or Trustee shall be indemnified against expenses actually and reasonably incurred by the officer or Trustee in connection therewith, provided that the Board of Trustees, including a majority who are disinterested, non-party Trustees, also determines that based upon a review of the facts, the officer or Trustee was not liable by reason of the disabling conduct also as set forth above.
Except as provided for in the preceding paragraph, the By-Laws provide that any indemnification provided therein shall be made by the Trust only if authorized in the specific case on a determination that indemnification of the officer or Trustee is proper in the circumstances because the officer or Trustee has met the applicable standard of conduct as set forth above and is not prohibited from indemnification because of the disabling conduct also as set forth above, by:
(a) A majority vote of a quorum consisting of Trustees who are not parties to the proceeding and are not interested persons of the Trust (as defined in the Investment Company Act of 1940);
(b) A written opinion by an independent legal counsel; or
(c) The shareholders; however, shares held by an officer or Trustee who is a party to the proceeding may not be voted on the subject matter.
The By-Laws permit expenses incurred in defending any proceeding as set forth above to be advanced by the Trust before the final disposition of the proceeding if (a) receipt of a written affirmation by the officer or Trustee of his good faith belief that he has met the standard of conduct necessary for indemnification as set forth therein and a written undertaking by or on behalf of the officer or Trustee, such undertaking being an unlimited general obligation to repay the amount of the advance if it is ultimately determined that he has not me those requirements, and (b) a determination would not preclude indemnification as set forth therein. Determinations and authorizations of payments must be made in the manner specified above for determining that the indemnification is permissible.
No indemnification or advance is permitted under the By-Laws, with limited exceptions as set forth therein, in any circumstances where it appears:
(a) That it would be inconsistent with a provision of the Agreement and Declaration of Trust of the Trust, a resolution of the shareholders, or an agreement in effect at the time of accrual of the alleged cause of action asserted in the proceeding in which the expenses were incurred or other amounts were paid which prohibits or otherwise limits indemnification; or
(b) That it would be inconsistent with any condition expressly imposed by a court in approving a settlement.
The Trustees and officers of the Trust are entitled and empowered under the Agreement and Declaration of Trust and By-Laws, to the fullest extent permitted by law, to purchase errors and omissions liability insurance with assets of the Trust, whether or not a Fund would have the power to indemnify him against such liability under the Agreement and Declaration of Trust or By-Laws.
Insofar as indemnification for liabilities arising under the Securities Act of 1933 may be permitted to the Trustees, the officers, the underwriter or control persons of the Registrant pursuant to the foregoing provisions, the Registrant has been informed that, in the opinion of the Securities and Exchange Commission, such indemnification is against public policy as expressed in that Act and is, therefore, unenforceable.
Item 31. Business and Other Connections of the Investment Manager
| |
(1.) |
Covenant Funds, Inc., a Florida corporation and the managing general partner of the advisor, Timothy Partners, Ltd. Arthur D. Ally, is President and 75% shareholder of this corporation. |
| Item 32. |
Principal Underwriter. |
| |
(1.a) |
Timothy Partners, Ltd. is the principal underwriter for the Trust and currently acts only as an underwriter for the Trust. |
| |
(1.b) |
The table below sets forth certain information as to the Underwriter’s directors, officers and control persons: |
|
|
|
|
|
|
|
|
|
| Name and Principal Business Address |
|
Positions and Offices
with the Underwriter |
|
|
Positions and Offices
with the Trust |
|
| Arthur D. Ally |
|
|
President of Timothy Partners, Ltd. |
|
|
|
Chairman, President and Treasurer |
|
| 1055 Maitland Center Commons |
|
|
|
|
|
|
|
|
| Maitland, FL 32751 |
|
|
|
|
|
|
|
|
Item 33. Location of Accounts and Records.
Each account, book or other document required to be maintained by Section 31(a) of the 1940 Act and Rules 17 CFR 270.31a-1 to 31a-3 promulgated thereunder, is maintained by the Trust at 1055 Maitland Center Commons, Maitland, Florida 32751, except for those maintained by the Trust’s custodians, US Bank, N.A., 425 Vine Street, Cincinnati, Ohio, 45202, CitiBank, N.A. 388 Greenwich Street, New York, NY 10013 and the Registrant’s administrator, transfer, redemption/ dividend disbursing agent and accounting services agent, Gemini Fund Services, Inc., 4221 N. 203rd St, Suite 100, Elkhorn, NE 68022-3474.
Each adviser (or sub-adviser) will maintain physical possession of the accounts, books and other documents required to be maintained by Rule 31a-1(f) at the address of record for each separate series of the Trust that the adviser manages.
Item 34. Management Services None
Item 35. Undertakings.
Registrant hereby undertakes, if requested by the holders of at least 10% of the Registrant’s outstanding shares, to call a meeting of shareholders for the purpose of voting upon the question of removal of a director(s) and to assist in communications with other shareholders in accordance with Section 16(c) of the 1940 Act, as though Section 16(c) applied.
Registrant hereby undertakes to furnish each person to whom a prospectus is delivered with a copy of its latest annual report to shareholders, upon request and without charge.
Registrant hereby undertakes to carry out all indemnification provisions of its Agreement and Declaration of Trust and By-Laws in accordance with Investment Company Act Release No. 11330 (Sept. 4, 1980) and successor releases.
Insofar as indemnifications for liability arising under the Securities Act of 1933, as amended (“1933 Act”), may be permitted to directors, officers and controlling person of the Registrant pursuant to the provision under Item 27 herein, or otherwise, the Registrant has been advised that in the opinion of the SEC such indemnification is against public policy as expressed in the 1933 Act and is, therefore, unenforceable. In the event that a claim for indemnification against such liabilities (other than the payment by the Registrant of expenses incurred or paid by a director, officer or controlling person of the Registrant in the successful defense of any action, suit or proceeding) is asserted by such director, officer or controlling person in connection with the securities being registered, the Registrant will, unless in the opinion of its counsel the matter has been settled by controlling precedent, submit to a court of appropriate jurisdiction the question whether such indemnification by it is against public policy as expressed in the 1933 Act and will be governed by the final adjudication.
EXHIBIT INDEX
|
|
|
| Exhibit Number |
|
Description |
|
|
| EX.28. d (5) |
|
Copy of Interim Sub-Investment Advisory Agreement with Timothy Partners, Ltd. and Barrow, Hanley & Mewhinney & Strauss, on behalf of the Timothy Plan Fixed Income Fund, Timothy Plan High Yield Bond Fund, Timothy Growth and Income Fund and Timothy Plan Defensive Strategies Fund Fixed Income Allocation dated November 17, 2020. |
|
|
| EX.28.d (5.a) |
|
Form of Sub-Investment Advisory Agreement with Timothy Partners, Ltd. and Barrow, Hanley & Mewhinney & Strauss, on behalf of the Timothy Plan Fixed Income Fund , Timothy Plan High Yield Bond Fund, Timothy Growth and Income Fund and Timothy Plan Defensive Strategies Fund Fixed Income Allocation. |
|
|
| EX.28. d (6.) |
|
Copy of Interim Sub-Investment Advisory Agreement with Timothy Partners, Ltd. and Chilton Capital Management, LLC on behalf of the Timothy Plan Defensive Strategies Fund REIT Allocation dated November 1, 2020. |
|
|
| EX.28.d (6.a) |
|
Form of Sub-Investment Advisory Agreement with Timothy Partners, Ltd. and Chilton Capital Management, LLC on behalf of the Timothy Plan Defensive Strategies Fund REIT Allocation. |
|
|
| EX.28 h (3.a) |
|
Trustee Power of Attorney |
|
|
| EX.28.j |
|
Consent of Independent Registered Public Accounting Firm |
|
|
| EX.28. p. 4 |
|
Form of Code of Ethics of Chilton Capital Management LLC. |
|
|
| EX.28. p. 7 |
|
Form of Code of Ethics of Westwood Management Corp. |
|
|
| EX-101.INS |
|
XBRL Instance Document |
|
|
| EX-101.SCH |
|
XBRL Taxonomy Extension Schema |
|
|
| EX-101.DEF |
|
XBRL Taxonomy Extension Definition Linkbase |
|
|
| EX-101.LAB |
|
XBRL Taxonomy Extension Label Linkbase |
|
|
| EX-101.PRE |
|
XBRL Taxonomy Extension Presentation Linkbase |
SIGNATURES
Pursuant to the requirements of the Securities Act of 1933, as amended, and the Investment Company Act of 1940, as amended, The Timothy Plan (the “Trust”) hereby certifies that it meets all of the requirements for effectiveness of this Registration Statement pursuant to Rule 485(b) under the Securities Act of 1933 and has duly caused this Registration Statement to be signed on its behalf by the undersigned, thereto duly authorized, in the city of Maitland and the State of Florida on January 28, 2021.
|
|
|
|
|
|
|
THE TIMOTHY PLAN |
|
|
|
|
|
|
|
By: /s/ Arthur D. Ally |
|
|
|
|
ARTHUR D. ALLY |
|
|
|
|
Chairman, President and Treasurer |
|
|
Pursuant to the requirements of the Securities Act of 1933, as amended, this Registration Statement has been signed below by the following persons in the capacities and on the date indicated.
|
|
|
|
|
| Signature |
|
Title |
|
Date |
|
|
|
| /s/ Arthur D. Ally |
|
Chairman, President & Treasurer-Trustee |
|
January 28, 2021 |
| ARTHUR D. ALLY |
|
|
|
|
|
|
|
| /s/ Mathew D. Staver* |
|
Trustee |
|
January 28, 2021 |
| MATHEW D. STAVER |
|
|
|
|
|
|
|
| /s/ Deborah Honeycutt* |
|
Trustee |
|
January 28, 2021 |
| DEBORAH HONEYCUTT |
|
|
|
|
|
|
|
| /s/ Dale Bissonette* |
|
Trustee |
|
January 28, 2021 |
| DALE BISSONNETTE |
|
|
|
|
|
|
|
| /s/ Scott Preissler, Ph.D.* |
|
Trustee |
|
January 28, 2021 |
| SCOTT PREISSLER, Ph.D. |
|
|
|
|
|
|
|
| /s/ Alan M. Ross* |
|
Trustee |
|
January 28, 2021 |
| ALAN M. ROSS |
|
|
|
|
|
|
|
| /s/ Richard W. Copeland* |
|
Trustee |
|
January 28, 2021 |
| RICHARD W. COPELAND |
|
|
|
|
|
|
|
| /s/ Abraham M. Rivera* |
|
Trustee |
|
January 28, 2021 |
| ABRAHAM M. RIVERA |
|
|
|
|
|
|
|
| /s/ William W. Johnson* |
|
Trustee |
|
January 28, 2021 |
| WILLAM W. JOHNSON |
|
|
|
|
|
|
|
| /s/ John C. Mulder* |
|
Trustee |
|
January 28, 2021 |
| JOHN C. MULDER |
|
|
|
|
|
|
|
| /s/ Patrice Tsague* |
|
Trustee |
|
January 28, 2021 |
| PATRICE TSAGUE |
|
|
|
|
* Signed pursuant to a Power of Attorney by Arthur D. Ally.