UNITED STATES
SECURITIES AND EXCHANGE COMMISSION
Washington, D.C. 20549
FORM N-CSR
CERTIFIED SHAREHOLDER REPORT OF REGISTERED
MANAGEMENT INVESTMENT COMPANIES
| Investment Company Act file number | 811-08274 | ||||
| MassMutual Select Funds | |||||
| (Exact name of registrant as specified in charter) | |||||
| 1295 State Street, Springfield, MA | 01111 | ||||
| (Address of principal executive offices) | (Zip code) | ||||
| Paul LaPiana | |||||
| 1295 State Street, Springfield, MA 01111 | |||||
| (Name and address of agent for service) | |||||
| Registrant's telephone number, including area code: | (413) 744-1000 | ||||
| Date of fiscal year end: | 9/30/2022 | ||||
| Date of reporting period: | 9/30/2022 | ||||
Item 1. Reports to Stockholders.
| (a) | The Reports to Stockholders are attached herewith. |
Table of Contents |
|
This material must be preceded or accompanied by a current prospectus (or summary prospectus, if available) for the applicable MassMutual Funds. Investors should consider a Fund’s investment objective, risks, and charges and expenses carefully before investing. This and other information about the investment company is available in the prospectus (or summary prospectus, if available). Read it carefully before investing.
[THIS PAGE INTENTIONALLY LEFT BLANK]
MassMutual Funds Annual Report – President’s Letter to Shareholders (Unaudited) |
To Our Shareholders

Paul LaPiana
“At MassMutual, our goal is to help you build the future you want for yourself and your family. We want to help you with your retirement plans today, so you can feel more comfortable about tomorrow.”
September 30, 2022
Continued market volatility challenges retirement investors
I am pleased to present you with the MassMutual Funds Annual Report. During the fiscal year ended September 30, 2022, U.S. stocks were down over 15%, with investors concerned that stimulus-fueled recovery from the COVID-19 pandemic was over and that domestic monetary policy had turned toward combating heightened inflation. Stocks in foreign developed markets and emerging markets also experienced significant losses in the fiscal year, hurt by elevated energy prices, a strengthening U.S. dollar, and concerns that consumer spending and corporate earnings growth would slow. U.S. bond investors experienced negative returns in the rising interest rate environment, fueled by aggressive interest rate hikes by the U.S. Federal Reserve Board that were aimed at reducing demand-driven inflationary pressures.
Suggestions for retirement investors under any market conditions
|
● |
You are likely in it for the long term. Retirement planning involves what financial professionals refer to as “long-term investing,” since most people save and invest for retirement throughout their working years. Even in retirement, many individuals will systematically withdraw their retirement savings over a number of years, keeping a portion of their funds invested. Although the financial markets will go up and down, individuals who take a long-term approach to investing don’t focus on current headlines – because they realize that they have time to ride out the downturns. |
|
● |
Keep contributing. While you have no control over the investment markets, you can control how often and how much you contribute to your retirement account. Saving as much as possible and increasing your contributions regularly is one way retirement investors can help boost their retirement savings, regardless of the performance of the stock and bond markets. |
|
● |
Invest continually.1 Financial professionals often advise their clients to stay in the market, regardless of short-term results. Here’s why: Those who can invest in all market conditions have the potential to be rewarded even during market downturns, when more favorable prices may enable them to accumulate larger positions. |
|
● |
Monitor your asset allocation and diversify. Stocks, bonds, and short-term/money market investments are asset classes that tend to behave differently, depending upon the economic and market environment. These broad asset classes contain an even greater array of asset sub-categories (such as small-cap stocks, international stocks, and high-yield bonds). Most financial professionals agree that investors can take advantage of different opportunities in the market and reduce the risk of over-exposure to one or two poorly performing asset types by selecting a number of investments that represent a mix of asset classes and sub-categories. |
1 Systematic investing and asset allocation do not ensure a profit or protect against loss in a declining market. Systematic investing involves continuous investment in securities regardless of fluctuating price levels. Investors should consider their ability to continue investing through periods of low price levels.
(Continued)
1
MassMutual Funds Annual Report – President’s Letter to Shareholders (Unaudited) (Continued) |
Is this a good time to track your progress?
If you work with a financial professional, you may wish to consider checking in with him or her to help you determine if:
|
● |
you are saving enough for retirement – and, if in retirement, you are withdrawing an appropriate amount each year, based on your personal circumstances; |
|
● |
your retirement account is invested appropriately for all market conditions, based on your goals and objectives, as well as your investment time horizon; and |
|
● |
you are taking steps to help reduce your longevity risk, which is the chance that you could “run out” of retirement savings during your lifetime. |
Get to where you want to be
At MassMutual, our goal is to help you build the future you want for yourself and your family. We want to help you with your retirement plans today, so you can feel more comfortable about tomorrow. That’s why we continue to encourage you to maintain perspective when it comes to retirement investing, regardless of any headline-making events. MassMutual’s view is that changing market conditions have the potential to reward patient investors. Thank you for your continued confidence and trust in MassMutual.
Sincerely,

Paul LaPiana
President
MassMutual Funds
MML Investment Advisers, LLC
© 2022 Massachusetts Mutual Life Insurance Company (MassMutual®), Springfield, MA 01111-0001. All rights reserved. www.MassMutual.com.
MML Distributors, LLC (MMLD) serves as the exclusive wholesale marketing agent for all MassMutual Funds, as well as the distributor for all MassMutual Funds, except the MassMutual Global Floating Rate Fund, MassMutual Global Credit Income Opportunities Fund, MassMutual Emerging Markets Debt Blended Total Return Fund, MassMutual Global Emerging Markets Equity Fund, MassMutual High Yield Fund, and MassMutual Short-Duration Bond Fund. MMLD Member FINRA and SIPC (www.FINRA.org and www.SIPC.org), 1295 State Street, Springfield, MA 01111-0001. Investment advisory services are provided to all MassMutual Funds by MML Investment Advisers, LLC (MML Advisers). MMLD and MML Advisers are subsidiaries of MassMutual.
The information provided is the opinion of MML Advisers and is subject to change without notice. It is not to be construed as tax, legal, or investment advice. Of course, past performance does not guarantee future results.
MM202310-303203
2
MassMutual Funds Annual Report – Economic and Market Overview (Unaudited) |
September 30, 2022
Continued market volatility challenges retirement investors
During the fiscal year ended September 30, 2022, U.S. stocks were down over 15%, with investors concerned that stimulus-fueled recovery from the COVID-19 pandemic was over and that domestic monetary policy had turned toward combating heightened inflation. Stocks in foreign developed markets and emerging markets also experienced significant losses in the fiscal year, hurt by elevated energy prices, a strengthening U.S. dollar, and concerns that consumer spending and corporate earnings growth would slow. U.S. bond investors experienced negative returns in the rising interest rate environment, fueled by aggressive interest rate hikes by the U.S. Federal Reserve Board (the “Fed”) that were aimed at reducing demand-driven inflationary pressures.
Market Highlights
|
● |
For the reporting period from October 1, 2021 through September 30, 2022, U.S. stocks were down over 15%, in a market environment where the Fed aggressively raised interest rates in an effort to combat heightened inflation. |
|
● |
In the fourth quarter of 2021, expectations for strong economic and earnings growth in 2022, bolstered by the possibility of a $2 trillion economic stimulus and social spending plan, allowed investors to look past sharp increases in COVID-19 Omicron variant cases and heightened inflationary pressures. |
|
● |
In the first quarter of 2022, investors in both stocks and bonds were challenged by a sharp rise in energy prices after Russia’s invasion of Ukraine, a stalled domestic economic stimulus plan, and the Fed raising interest rates for the first time since 2018. |
|
● |
The second quarter of 2022 was another difficult quarter, as Fed interest rate hikes, investor concerns over high inflation, and concern about the potential of an impending global recession dominated the narrative. |
|
● |
The third quarter of 2022 was an extension of the difficult second quarter, with continued inflationary pressures, weakening economic data, and aggressive Fed interest rate hikes. |
|
● |
Foreign stocks in developed markets and emerging markets also experienced losses in the fiscal year, against the backdrop of Russia’s invasion of Ukraine (and the resulting economic sanctions that kept energy prices elevated), the strengthening U.S. dollar, and threatened consumer spending and corporate earnings growth. |
|
● |
U.S. bond investors experienced negative returns in the rising interest rate environment, fueled by an increase in short-term interest rates, heighted inflationary pressures, and the reversal of monetary and fiscal policy support. |
Market Environment
For the fiscal year beginning on October 1, 2021, global stock investors experienced significant losses. U.S. stocks fell sharply in the period in response, with the S&P 500 Index® (“S&P 500”)1 entering bear market territory after declining more than 20% from its previous highs. Investors sought safety from high inflation, rising interest rates, and the increasing possibility of a recession. Consumer sentiment fell sharply, down 17.2% in the period2, as high inflation – driven by rising energy, food, and housing costs – overwhelmed low unemployment and strong wage growth. As of August 2022, more Americans are borrowing to make ends meet in these inflationary times, resulting in consumer loan levels at record highs, having increased by 12.4% year-over-year3.
1 The S&P 500 Index measures the performance of 500 widely held stocks in the U.S. equity market. Standard and Poor’s chooses member companies for the index based on market size, liquidity, and industry group representation. Included are the stocks of industrial, financial, utility, and transportation companies. Since mid-1989, this composition has been more flexible and the number of issues in each sector has varied. It is market capitalization-weighted. The Index does not reflect any deduction for fees, expenses, or taxes and cannot be purchased directly by investors.
2 June 24, 2022, University of Michigan: Consumer Sentiment (UMCSENT), retrieved from FRED, Federal Reserve Bank of St. Louis; https://fred.stlouisfed.org/series/UMCSENT
3 Board of Governors of the Federal Reserve System (US), Consumer Loans, All Commercial Banks [CONSUMER], retrieved from FRED, Federal Reserve Bank of St. Louis; https://fred.stlouisfed.org/series/CONSUMER, October 11, 2022.
3
MassMutual Funds Annual Report – Economic and Market Overview (Unaudited) (Continued) |
As a result, the broad market S&P 500 fell 15.47% for the period. The technology-heavy NASDAQ Composite Index4 performed even worse, dropping 26.25%. The more economically sensitive Dow Jones Industrial AverageSM5 was down 13.40%. During the reporting period, small-cap stocks underperformed their larger-cap peers, while value stocks outperformed their growth brethren. The communication services, consumer discretionary, and information technology sectors were all down by 20% or more. The energy sector was the strongest performer for the fiscal year, up 45.70%, aided by an 18% increase in the price of West Texas Intermediate (WTI) crude oil. The utilities sector also ended the period positively, gaining 5.58% for the period.
Developed international markets, as measured by the MSCI EAFE® Index6, trailed their domestic peers, ending the fiscal year down 25.13%. Emerging-market stocks, as measured by the MSCI Emerging Markets Index7, also fell sharply, ending down 28.11% for the period. Investors sold off developed international and emerging-market stocks on concerns that higher interest rates and commodity prices would impair consumer spending and corporate earnings growth.
Bond yields rose sharply during the fiscal year, with the 10-year U.S. Treasury bond yield rising from a low of 1.52% on October 1, 2021 to close the period at 3.83%. Rising yields generally produce falling bond prices; consequently, bond index returns suffered. The Bloomberg U.S. Aggregate Bond Index8 ended the period down 14.60%. Investment-grade corporate bonds fared even worse. The Bloomberg U.S. Corporate Bond Index9, which tracks investment-grade corporate bonds, ended the period with an 18.53% loss. The Bloomberg U.S. Corporate High-Yield Bond Index10 also ended in negative territory, declining 14.14% for the period.
4 The NASDAQ Composite Index measures the performance of all domestic and international based common type stocks listed on the NASDAQ Stock Market. It includes common stocks, ordinary shares, ADRs, shares of beneficial interest or limited partnership interests and tracking stocks. The index is market capitalization-weighted. The Index does not reflect any deduction for fees, expenses, or taxes and cannot be purchased directly by investors.
5 The Dow Jones Industrial Average Index measures the performance of stocks of 30 U.S. blue-chip companies covering all industries with the exception of transportation and utilities. It is price-weighted. The Index does not reflect any deduction for fees or expenses and cannot be purchased directly by investors.
6 The MSCI EAFE Index measures the performance of the large- and mid-cap segments of developed markets, excluding the U.S. and Canada equity securities. It is free float-adjusted market-capitalization weighted. The Index does not reflect any deduction for fees or expenses and cannot be purchased directly by investors.
7 The MSCI Emerging Markets Index measures the performance of the large- and mid-cap segments of emerging market equity securities. It is free float-adjusted market-capitalization weighted. The Index does not reflect any deduction for fees or expenses and cannot be purchased directly by investors.
8 The Bloomberg U.S. Aggregate Bond Index measures the performance of investment grade, U.S. dollar-denominated, fixed-rate taxable bond market securities, including Treasuries, government-related and corporate securities, mortgage-backed securities (MBS) (agency fixed-rate and hybrid ARM pass-throughs), asset-backed securities (ABS), and commercial mortgage-backed securities (CMBS). It rolls up into other Bloomberg flagship indexes, such as the multi-currency Global Aggregate Index and the U.S. Universal Index, which includes high yield and emerging markets debt. The Index does not reflect any deduction for fees, expenses, or taxes and cannot be purchased directly by investors.
9 The Bloomberg U.S. Corporate Bond Index measures the performance of the investment grade, U.S. dollar-denominated, fixed-rate, taxable corporate bond market. It includes U.S. dollar-denominated securities publicly issued by U.S. and non-U.S. industrial, utility, and financial issuers that meet specified maturity, liquidity, and quality requirements. The Index does not reflect any deduction for fees, expenses, or taxes and cannot be purchased directly by investors.
10 The Bloomberg U.S. Corporate High-Yield Bond Index measures the performance of U.S. dollar-denominated, non-investment grade, fixed-rate, taxable corporate bonds, including corporate bonds, fixed-rate bullet, putable, and callable bonds, SEC Rule 144A securities, original issue zeros, pay-in-kind bonds, fixed-rate and fixed-to-floating capital securities. The Index does not reflect any deduction for fees, expenses, or taxes and cannot be purchased directly by investors.
4
MassMutual Funds Annual Report – Economic and Market Overview (Unaudited) (Continued) |
Review and maintain your strategy
MassMutual is committed to helping people secure their long-term future and protect the ones they love. While the current market volatility, including the reality of market sell-offs, can test an investor’s mettle, we’d like to remind you that, as a retirement investor, it’s important to maintain perspective and have realistic expectations about the future performance of your investment accounts. As described in this report, financial markets can reverse suddenly with little or no notice. That’s why we continue to believe that retirement investors should create and maintain a plan that focuses on their goals, how long they have to invest, and how comfortable they are with market volatility. Our multi-managed and sub-advised mutual funds tap into the deep expertise of seasoned asset managers who are committed to helping long-term investors prepare for retirement – in all market conditions. As always, we recommend that you work with a personal financial professional, who can help you define an investment strategy that aligns with your comfort level with respect to market volatility, how long you have to save and invest, and your specific financial goals. Thank you for your confidence in MassMutual.
© 2022 Massachusetts Mutual Life Insurance Company (MassMutual®), Springfield, MA 01111-0001. All rights reserved. www.MassMutual.com.
MML Distributors, LLC (MMLD) serves as the exclusive wholesale marketing agent for all MassMutual Funds, as well as the distributor for all MassMutual Funds, except the MassMutual Global Floating Rate Fund, MassMutual Global Credit Income Opportunities Fund, MassMutual Emerging Markets Debt Blended Total Return Fund, MassMutual Global Emerging Markets Equity Fund, MassMutual High Yield Fund, and MassMutual Short-Duration Bond Fund. MMLD Member FINRA and SIPC (www.FINRA.org and www.SIPC.org), 1295 State Street, Springfield, MA 01111-0001. Investment advisory services are provided to all MassMutual Funds by MML Investment Advisers, LLC (MML Advisers). MMLD and MML Advisers are subsidiaries of MassMutual.
The information provided is the opinion of MML Advisers and is subject to change without notice. It is not to be construed as tax, legal, or investment advice. Of course, past performance does not guarantee future results.
5
MassMutual Total Return Bond Fund – Portfolio Manager Report (Unaudited) |
What is the investment approach of MassMutual Total Return Bond Fund, and who is the Fund’s subadviser?
The Fund seeks maximum total return, consistent with preservation of capital and prudent investment management, by investing, under normal circumstances, at least 80% of its net assets (plus the amount of any borrowings for investment purposes) in a diversified portfolio of investment grade fixed income securities (rated Baa3 or higher by Moody’s, BBB- or higher by Standard & Poor’s, BBB- or higher by Fitch, or A-2 by S&P, P-2 by Moody’s, or F-2 by Fitch for short-term debt obligations, or, if unrated, determined by the Fund’s subadviser to be of comparable quality). The Fund’s subadviser is Metropolitan West Asset Management, LLC (MetWest).
How did the Fund perform during the 12 months ended September 30, 2022?
The Fund’s Class I shares returned -15.97%, underperforming the -14.60% return of the Bloomberg U.S. Aggregate Bond Index (the “benchmark”), which measures the performance of investment grade, U.S. dollar-denominated, fixed-rate taxable bond market securities, including Treasuries, government-related and corporate securities, mortgage-backed securities (MBS) (agency fixed-rate and hybrid ARM pass-throughs), asset-backed securities (ABS), and commercial mortgage-backed securities (CMBS).
For a discussion on the economic and market environment during the 12-month period ended September 30, 2022, please see the Economic and Market Overview, beginning on page 3.
Subadviser discussion of factors that contributed to the Fund’s performance
For the fiscal year ended September 30, 2022, although the Fund began the year positioned defensively, Fund management extended the portfolio’s duration position in a disciplined fashion alongside the rise in Treasury yields. Ultimately, the Fund ended the period with a duration that was longer than the benchmark’s. This modestly weighed on returns, while further headwinds resulted from the curve-steepening bias that was maintained throughout the fiscal year. (Duration is a measure of a bond fund’s sensitivity to interest rates. The longer the duration, the greater the price impact on the bond or portfolio when interest rates rise or fall. The yield curve is a graph showing the term structure of interest rates by plotting the yields of all bonds of comparable quality with maturities ranging from the shortest – typically one month – to the longest – typically 30 years – available. The resulting curve shows whether short-term interest rates are higher or lower than long-term rates.)
Elsewhere, the Fund’s residential MBS exposure was a drag on performance, given the struggles faced by both agency- and non-agency-backed collateral during the year, in addition to volatility, increased costs of financing – and, in the agency MBS space, reduced Federal Reserve purchasing activity. (“Agency” refers to debt issued by U.S. federal government agencies or government-sponsored entities for financing purposes). The Fund’s small allocation to CMBS and ABS modestly reduced returns, as yield spreads in both sectors widened in sympathy with the broader market.
Turning to corporate securities, returns were decreased by the Fund’s emphasis on defensive sectors, including consumer non-cyclicals and communications, as they were among the poorer performers during the fiscal year. Nevertheless, the Fund’s relative underweight to overall corporate credit throughout the first half of the period benefited performance and helped to blunt the impact of the downdraft faced by corporates in early 2022. As market dislocations and price declines became more pronounced in the latter part of the fiscal year, the Fund expanded its risk budget, meaningfully increasing its corporate credit allocation in the process and ending the fiscal year overweight relative to the benchmark. These additions, made during times of yield premiums rising and asset prices falling, ultimately weighed on performance.
The Fund’s use of derivatives to manage duration and yield curve positioning had a minimal impact on performance. Derivatives are securities that derive their value from the performance of one or more other investments and take the form of a contract between two or more parties. Most derivatives are used for hedging, speculation, or both.
Subadviser outlook
MetWest notes that any attempt to understand the full economic fallout of a tightening cycle this aggressive against the competing crosswinds of a consumer still fairly flush with cash – and anxious to spend that money on services and experiences post-pandemic – is a nearly impossible task. In Fund management’s view, possibly clouding the outlook further will be the often overlooked, but impactful repercussions of quantitative tightening, which could take many more months to become apparent. Meanwhile, unlike in recessions past, as of the end of the fiscal year, there was no major economy well positioned to pull the
6
MassMutual Total Return Bond Fund – Portfolio Manager Report (Unaudited) (Continued) |
rest of the world along on its coattails of strong growth. In MetWest’s view, synchronized global tightening, combined with the lagged effects of policy, could mean that volatility will come in a generally declining market, with credit of all types weakening as the cumulative impact of these changes takes hold. As long as economic and monetary policy continues to shift, MetWest believes that the current period of volatility could persist for some time. On the positive side, however, Fund management notes that these market conditions create opportunities that can be exploited by disciplined active managers, potentially setting the stage for strong performance as the volatility ultimately subsides.
7
MassMutual Total Return Bond Fund – Portfolio Manager Report (Unaudited) (Continued) |
MassMutual |
|
U.S. Government Agency Obligations and Instrumentalities* |
37.9% |
Corporate Debt |
29.5% |
U.S. Treasury Obligations |
28.7% |
Non-U.S. Government Agency Obligations |
17.2% |
Mutual Funds |
2.3% |
Bank Loans |
2.2% |
Sovereign Debt Obligations |
1.1% |
Municipal Obligations |
0.2% |
Common Stock |
0.1% |
Rights |
0.0% |
Total Long-Term Investments |
119.2% |
Short-Term Investments and Other Assets and Liabilities |
(19.2)% |
Net Assets |
100.0% |
|
* |
May contain securities that are issued by a U.S. Government Agency, but are unsecured and are not guaranteed by a U.S. Government Agency. |
8
MassMutual Total Return Bond Fund – Portfolio Manager Report (Unaudited) (Continued) |
GROWTH OF $10,000 INVESTMENT - Class I
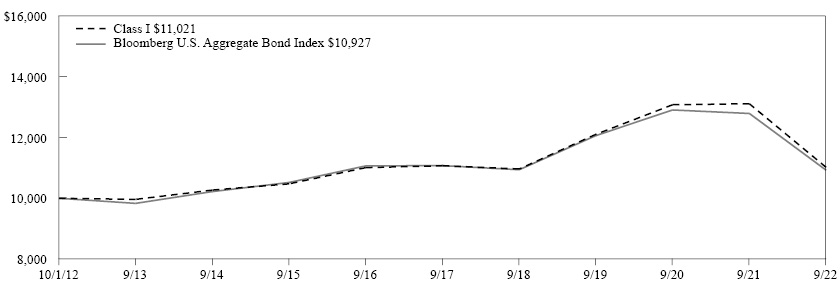
The graph above illustrates a representative class of the Fund’s historical performance for the past 10 fiscal years or since inception (for Funds lacking 10-year records) in comparison to its benchmark index, as well as one or more additional indexes, if applicable. The performance of other share classes will be greater than or less than the class depicted above.
Average Annual Total Returns (for the periods ended 09/30/2022) |
|||||
|
Inception Date |
1 Year |
5 Years |
10 Years |
Since Inception |
Class I |
07/06/2010 |
-15.97% |
-0.09% |
0.98% |
|
Class R5 |
07/06/2010 |
-15.99% |
-0.17% |
0.87% |
|
Service Class |
07/06/2010 |
-16.14% |
-0.30% |
0.76% |
|
Administrative Class |
07/06/2010 |
-16.20% |
-0.37% |
0.67% |
|
Class R4 |
07/06/2010 |
-16.35% |
-0.52% |
0.53% |
|
Class A |
04/01/2014 |
-16.40% |
-0.63% |
0.51% |
|
Class A (sales load deducted)* |
04/01/2014 |
-19.96% |
-1.49% |
0.00% |
|
Class R3 |
07/06/2010 |
-16.54% |
-0.78% |
0.28% |
|
Bloomberg U.S. Aggregate Bond Index |
|
-14.60% |
-0.27% |
0.89% |
1.05% |
* Class A (sales load deducted) returns include the 4.25% maximum sales charge.
Generally accepted accounting principles require adjustments to be made to the net assets of the Fund at period end for financial reporting purposes only, and as such, the total return based on the unadjusted net asset value per share may differ from the total return reported in the financial highlights.
Performance results in the graph and table are shown both with and without the imposition of the maximum applicable sales charge (if applicable) and reflect the percentage change in net asset value, including reinvestment of dividends and capital gains distributions. Investors should note that the Fund is a professionally managed mutual fund, while the index or indexes shown above are unmanaged, cannot be purchased directly, and, with the exception of any peer group index, do not incur expenses.
Performance data quoted in the graph and table represents past performance; past performance is not predictive of future results. The investment return and principal value of shares of the Fund fluctuate, so your shares, when sold, may be worth more or less than their original cost. Current performance of the Fund may be lower or higher than the performance quoted. The performance shown does not reflect the deduction of taxes, if any, that a shareholder would pay on Fund distributions or the redemption of Fund shares. Performance data current to the most recent month end may be obtained by calling 1-888-309-3539.
Investors should read the Fund’s prospectus with regard to the Fund’s investment objectives, risks, and charges and expenses in conjunction with these financial statements. Employee retirement benefit plans that invest plan assets in the Separate Investment Accounts (SIAs) may be subject to certain charges as set forth in their respective Plan Documents. Total return figures would be lower for the periods presented if they reflected these charges.
9
MassMutual Strategic Bond Fund – Portfolio Manager Report (Unaudited) |
What is the investment approach of MassMutual Strategic Bond Fund, and who are the Fund’s subadvisers?
The Fund seeks a superior total rate of return by investing in fixed income instruments. Under normal circumstances, the Fund invests at least 80% of its net assets (plus the amount of any borrowings for investment purposes) in U.S. dollar-denominated fixed income securities and other debt instruments of domestic and foreign entities, including corporate bonds, securities issued or guaranteed as to principal or interest by the U.S. Government or its agencies or instrumentalities, mortgage-backed securities, and money market instruments. The Fund’s subadvisers are Western Asset Management Company, LLC (Western Asset) and its affiliate, Western Asset Management Company Limited (Western Asset Limited), which were responsible for approximately 59% of the Fund’s portfolio (Western Asset Limited manages the non-U.S. dollar denominated investments of the Fund); and Brandywine Global Investment Management, LLC (Brandywine Global), which was responsible for approximately 41% of the Fund’s portfolio, as of September 30, 2022.
How did the Fund perform during the 12 months ended September 30, 2022?
The Fund’s Class R5 shares returned -17.14%, underperforming the -14.60% return of the Bloomberg U.S. Aggregate Bond Index (the “benchmark”), which measures the performance of investment grade, U.S. dollar-denominated, fixed-rate taxable bond market securities, including Treasuries, government-related and corporate securities, mortgage-backed securities (MBS) (agency fixed-rate and hybrid ARM pass-throughs), asset-backed securities (ABS), and commercial mortgage-backed securities (CMBS).
For a discussion on the economic and market environment during the 12-month period ended September 30, 2022, please see the Economic and Market Overview, beginning on page 3.
Subadviser discussion of factors that contributed to the Fund’s performance
With respect to the Western Asset component of the Fund, in aggregate, their top-down macro strategies detracted from performance. For most of the reporting period, the Western Asset Fund component had more interest rate exposure (duration) than the benchmark, which significantly detracted from performance as interest rates rose considerably from the beginning to the end of the period. Duration is a measure of a bond fund’s sensitivity to interest rates. The longer the duration, the greater the price impact on the bond or portfolio when interest rates rise or fall. Over the period, the 10-year U.S. Treasury yield rose from 1.52% to 3.83%. During the fiscal year, the 5s-30s section of the curve, which compares 5-year rates to 30-year rates, ended the period inverted at -0.27%, versus 1.10% at the beginning of the period. Thus, the portfolio’s yield curve positioning, which was focused on an overweight to the back end of the curve, contributed to returns. (The yield curve is a graph showing the term structure of interest rates by plotting the yields of all bonds of comparable quality with maturities ranging from the shortest – typically one month – to the longest – typically 30 years – available. The resulting curve shows whether short-term interest rates are higher or lower than long-term rates.)
For the fiscal year ended September 30, 2022, the Western Asset Fund component’s exposures to non-U.S. developed markets negatively impacted performance, mainly due to currency positioning, as the U.S. dollar (USD) appreciated versus long currency positions. The portfolio’s emerging-markets exposures, which included both local currency and USD-denominated positions, also meaningfully detracted from results over the period, mainly due to the sell-off in Russian assets as a result of sanctions and the Ukraine invasion, but also as USD-denominated emerging-market bond spreads widened, though some local currency positions provided a partial offset. In terms of contributors, an underweight to agency MBS contributed, as spreads gradually widened during the period. (“Agency” refers to debt issued by U.S. federal government agencies or government-sponsored entities for financing purposes.) Finally, exposures to structured products – including non-agency residential mortgage-backed securities (RMBS), CMBS and ABS – positively contributed to performance due to selection, as spreads generally widened during the 12-month period. Finally, Western Asset used derivative instruments to manage its overall duration and yield curve exposure, overall interest rate sensitivity, and exposures to certain international bond markets – as well as to manage against anticipated changes in interest rates. Derivatives are securities that derive their value from the performance of one or more other investments and take the form of a contract between two or more parties. Derivatives are used for hedging, speculation, or both. Overall, the Fund component portfolio’s use of derivatives detracted from performance during the period.
For the Brandywine Global component of the Fund, an overweight allocation to long-dated U.S. Treasuries was the key detractor from performance on both a relative and absolute basis, as U.S. interest rates increased during the Fund’s fiscal year. Fund management materially increased Brandywine Global’s allocation to these securities in the spring of 2022, after yields initially
10
MassMutual Strategic Bond Fund – Portfolio Manager Report (Unaudited) (Continued) |
surged higher and macroeconomic concerns appeared. In Brandywine Global’s view, it is not atypical for the Fund component to underperform in the latter innings of a blow-off top in yields, like the current market environment. Brandywine Global believes that the Fund component’s overweight allocation to U.S. Treasuries remains a high-conviction trade. On a positive note, Brandywine Global’s underweight allocation to both investment-grade corporate credits and mortgage-backed securities proved beneficial during the fiscal year, as yields were rising and spreads were (marginally) widening over the period. Credit spreads represent the difference in yields between nearly identical bonds with comparable maturities but different quality ratings. From September 2021 through August 2022, the Fund component utilized derivatives to add duration to its portfolio. Derivatives are securities that derive their value from the performance of one or more other investments and take the form of a contract between two or more parties. Most derivatives are used for hedging, speculation, or both. Overall, the Fund component portfolio’s use of derivatives detracted from absolute performance during the period.
Subadviser outlook
In Western Asset’s view, the key to an improved tone and more stability in fixed income markets is a moderation in inflation. Western Asset’s base case is that supply chains will slowly begin to normalize. Fund management believes that this trend, combined with the Federal Reserve and other major central banks around the world tightening monetary policy (along with negative real incomes slowing consumption), has the potential to cause inflation to moderate. Western Asset anticipates that inflationary pressures could peak in the third quarter of 2022 and potentially decline into 2023. While global central banks are expected to raise interest rates further in the short term, Fund management believes that more aggressive action is already anticipated by the markets.
Brandywine Global expects market volatility to remain elevated against a backdrop of central bank tightening, sticky inflation, the war in Ukraine, and weakening economic data. At the end of the fiscal year, in Brandywine Global’s view, the U.S. economy was holding up relatively well, despite the recession in housing. Fund management believes that there is still the possibility of a “goldilocks” outcome if inflation retreats enough, with limited weakness in the labor market. But Brandywine Global believes that the odds of recession are growing, given the Fed’s haste to push interest rates higher.
11
MassMutual Strategic Bond Fund – Portfolio Manager Report (Unaudited) (Continued) |
MassMutual |
|
U.S. Treasury Obligations |
34.0% |
Corporate Debt |
27.1% |
U.S. Government Agency Obligations and Instrumentalities* |
20.5% |
Non-U.S. Government Agency Obligations |
9.3% |
Sovereign Debt Obligations |
4.1% |
Bank Loans |
3.5% |
Mutual Funds |
0.6% |
Municipal Obligations |
0.0% |
Purchased Options |
0.0% |
Total Long-Term Investments |
99.1% |
Short-Term Investments and Other Assets and Liabilities |
0.9% |
Net Assets |
100.0% |
|
* |
May contain securities that are issued by a U.S. Government Agency, but are unsecured and are not guaranteed by a U.S. Government Agency. |
12
MassMutual Strategic Bond Fund – Portfolio Manager Report (Unaudited) (Continued) |
GROWTH OF $10,000 INVESTMENT - Class R5
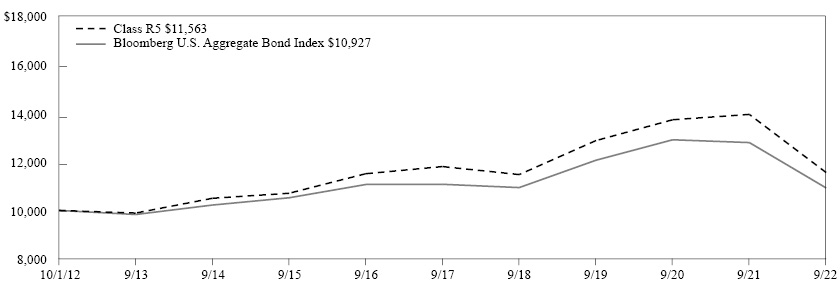
The graph above illustrates a representative class of the Fund’s historical performance for the past 10 fiscal years or since inception (for Funds lacking 10-year records) in comparison to its benchmark index, as well as one or more additional indexes, if applicable. The performance of other share classes will be greater than or less than the class depicted above.
Average Annual Total Returns (for the periods ended 09/30/2022) |
|||||
|
Inception Date |
1 Year |
5 Years |
10 Years |
Since Inception |
Class I |
04/01/2014 |
-17.05% |
-0.31% |
1.58% |
|
Class R5 |
12/31/2004 |
-17.14% |
-0.41% |
1.46% |
|
Service Class |
12/31/2004 |
-17.25% |
-0.50% |
1.36% |
|
Administrative Class |
12/31/2004 |
-17.29% |
-0.61% |
1.26% |
|
Class R4 |
04/01/2014 |
-17.50% |
-0.77% |
1.12% |
|
Class A |
12/31/2004 |
-17.56% |
-0.87% |
0.99% |
|
Class A (sales load deducted)* |
12/31/2004 |
-21.06% |
-1.73% |
0.56% |
|
Class R3 |
12/31/2004 |
-17.61% |
-1.00% |
0.83% |
|
Bloomberg U.S. Aggregate Bond Index |
|
-14.60% |
-0.27% |
0.89% |
1.05% |
* Class A (sales load deducted) returns include the 4.25% maximum sales charge.
Generally accepted accounting principles require adjustments to be made to the net assets of the Fund at period end for financial reporting purposes only, and as such, the total return based on the unadjusted net asset value per share may differ from the total return reported in the financial highlights.
Performance results in the graph and table are shown both with and without the imposition of the maximum applicable sales charge (if applicable) and reflect the percentage change in net asset value, including reinvestment of dividends and capital gains distributions. Investors should note that the Fund is a professionally managed mutual fund, while the index or indexes shown above are unmanaged, cannot be purchased directly, and, with the exception of any peer group index, do not incur expenses.
Performance data quoted in the graph and table represents past performance; past performance is not predictive of future results. The investment return and principal value of shares of the Fund fluctuate, so your shares, when sold, may be worth more or less than their original cost. Current performance of the Fund may be lower or higher than the performance quoted. The performance shown does not reflect the deduction of taxes, if any, that a shareholder would pay on Fund distributions or the redemption of Fund shares. Performance data current to the most recent month end may be obtained by calling 1-888-309-3539.
Investors should read the Fund’s prospectus with regard to the Fund’s investment objectives, risks, and charges and expenses in conjunction with these financial statements. Employee retirement benefit plans that invest plan assets in the Separate Investment Accounts (SIAs) may be subject to certain charges as set forth in their respective Plan Documents. Total return figures would be lower for the periods presented if they reflected these charges.
13
MassMutual Diversified Value Fund – Portfolio Manager Report (Unaudited) |
What is the investment approach of MassMutual Diversified Value Fund, and who are the Fund’s subadvisers?
The Fund seeks to achieve long-term growth of capital and income by investing primarily in a diversified portfolio of equity securities of larger, well-established companies. The Fund invests primarily in stocks of companies that the subadvisers believe are undervalued in the marketplace. While the Fund does not limit its investments to issuers in a particular capitalization range, the subadvisers currently focus on securities of larger size companies. The Fund normally invests at least 80% of its net assets (plus the amount of any borrowings for investment purposes) in stocks, securities convertible into stocks, and other securities, such as warrants and stock rights, whose value is based on stock prices. The Fund’s subadvisers are T. Rowe Price Associates, Inc. (T. Rowe Price), which was responsible for approximately 36% of the Fund’s portfolio; and Brandywine Global Investment Management, LLC (Brandywine Global), which managed approximately 64% of the Fund’s portfolio, as of September 30, 2022.
How did the Fund perform during the 12 months ended September 30, 2022?
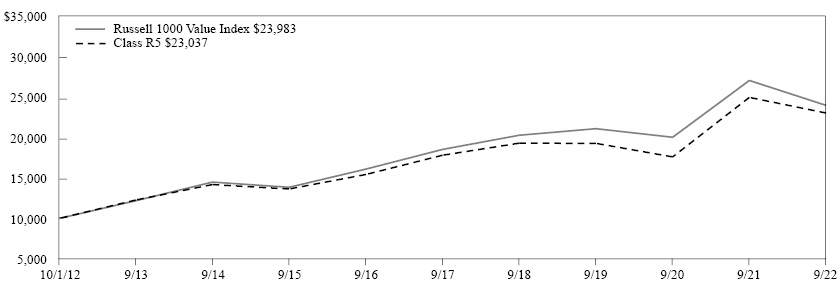
The Fund’s Class R5 shares returned -8.48%, outperforming the -11.36% return of the Russell 1000® Value Index (the “benchmark”), which measures the performance of the large-cap value segment of U.S. equity securities. It includes the Russell 1000 Index companies with lower price-to-book ratios and lower expected growth values. It is market-capitalization weighted.
For a discussion on the economic and market environment during the 12-month period ended September 30, 2022, please see the Economic and Market Overview, beginning on page 3.
Subadviser discussion of factors that contributed to the Fund’s performance
With respect to the Brandywine Global component of the Fund, the largest sector-related contribution to outperformance came from the health care sector. The Fund component benefited from an underweight allocation to the medical devices group, which underperformed, and strong returns from pharmaceuticals distributor McKesson and the biotech firm AbbVie. Within the industrial sector, allocations to defense contractors Lockheed Martin, Northrop Grumman, and General Dynamics contributed to the Fund’s performance during the period, as they performed well after the Russian invasion of Ukraine. Within the communication services sector, not owning entertainment company Disney, due to its unattractive valuation, and telecom giants AT&T and Verizon, due to poor price momentum, was a positive for the Fund component, as all three stocks lagged the market. The largest detractors from relative performance were Brandywine Global’s positions in large U.S. banks, including JP Morgan, Bank of America, and US Bank. In Brandywine Global’s experience, while these banks generally benefit from rising interest rates, the impact of a slowing economy on loan growth and potentially increased loan defaults more than offset any advantage that higher rates generally offer.
For the T. Rowe Price segment of the Fund, both sector allocation and security selection drove the Fund component’s outperformance. The financial sector was the top contributor for the period. There, Fund component holding Chubb continued to benefit from the rising property and casualty (P&C) pricing cycle. Over the one-year period, Chubb delivered earnings that exceeded consensus estimates, driven by a higher underwriting premium amid the longest P&C upcycle in history. Another Fund component holding, Qualcomm, and an underweight allocation to the information technology sector also contributed to relative performance. Shares of Qualcomm outperformed the information technology benchmark over the one-year period. Late in 2021, the company’s shares advanced, as company management raised guidance. Within the utilities sector, Fund component holding Sempra Energy, in tandem with an overweight allocation to the sector, further aided relative results. On the contrary, adverse security selection in the energy sector detracted from relative returns. Shares of TotalEnergies (a French multinational integrated energy and petroleum company) hampered relative performance over the period, as shares lagged the broader energy sector. During the first quarter of 2022, as Russia invaded Ukraine, shares of TotalEnergies were pressured as the company’s Russian assets and investments were quickly written down by the market. In addition, detrimental stock choices in the industrial and business services sector weighed on relative results for the fiscal year. The T. Rowe Price component of the Fund held warrants during the period, which had a negligible impact on performance. Derivatives are securities that derive their value from the performance of one or more other investments and take the form of a contract between two or more parties. Derivatives can be used for hedging, speculation, or both.
14
MassMutual Diversified Value Fund – Portfolio Manager Report (Unaudited) (Continued) |
Subadviser outlook
As of the end of the Fund’s fiscal year, Brandywine Global observed that the investing world remained more volatile than usual, as measured by the VIX benchmark of stock variability. Although this index was down from its highs in 2008 and 2020, as of the end of the fiscal year, it remained above its typical level. Value investing outperformed over the last two years after an extended period of growth dominance. However, growth valuations as of the end of the fiscal year remained elevated compared to value stock valuations – as high as during the 2000 technology bubble – suggesting, in Brandywine Global’s view, the potential for more value performance gains. Regardless of the market environment, Brandywine Global continues to implement its process-oriented investment approach.
T. Rowe Price notes that as the market continues to focus on inflation, they recognize that the range of potential outcomes moving forward is abnormally wide. Their view is that, at current levels as of the end of the fiscal year, markets have generally priced in a considerable amount of bad information, and the domestic economy is potentially entering what could be the most widely anticipated economic slowdown and potential recession, on record. Despite this, Fund management notes that the magnitude of the slowdown is difficult to predict, as the lag in domestic monetary policy implementation and the impact on the U.S. economy leave investors and companies vulnerable to a misstep from the Federal Reserve. Amid this backdrop, Fund management plans to continue to build a portfolio that is balanced for a variety of market environments. Their view is that the market could be choppy moving forward, and they will continue to look for investment opportunities where the risk/reward ratio is particularly attractive. Ultimately, their focus will remain on names where, in Fund management’s view, there is considerable downside already priced in, there are secular winners that are reasonably priced, and there are companies that can help provide defense against an inflationary environment.
15
MassMutual Diversified Value Fund – Portfolio Manager Report (Unaudited) (Continued) |
MassMutual |
|
Exxon Mobil Corp. |
2.7% |
Elevance Health, Inc. |
2.7% |
AbbVie, Inc. |
2.6% |
JP Morgan Chase & Co. |
2.2% |
QUALCOMM, Inc. |
2.2% |
United Parcel Service, Inc. Class B |
2.0% |
Bank of America Corp. |
2.0% |
Pfizer, Inc. |
1.9% |
Wells Fargo & Co. |
1.8% |
Sempra Energy |
1.8% |
21.9% |
|
MassMutual |
|
Consumer, Non-cyclical |
25.7% |
Financial |
23.4% |
Industrial |
9.9% |
Energy |
9.4% |
Technology |
7.6% |
Utilities |
6.2% |
Consumer, Cyclical |
5.9% |
Communications |
5.5% |
Basic Materials |
4.2% |
Mutual Funds |
1.3% |
Total Long-Term Investments |
99.1% |
Short-Term Investments and Other Assets and Liabilities |
0.9% |
Net Assets |
100.0% |
16
MassMutual Diversified Value Fund – Portfolio Manager Report (Unaudited) (Continued) |
GROWTH OF $10,000 INVESTMENT - Class R5

The graph above illustrates a representative class of the Fund’s historical performance for the past 10 fiscal years or since inception (for Funds lacking 10-year records) in comparison to its benchmark index, as well as one or more additional indexes, if applicable. The performance of other share classes will be greater than or less than the class depicted above.
Average Annual Total Returns (for the periods ended 09/30/2022) |
|||||
|
Inception Date |
1 Year |
5 Years |
10 Years |
Since Inception |
Class I |
04/01/2014 |
-8.47% |
6.34% |
7.22% |
|
Class R5 |
10/15/2004 |
-8.48% |
6.23% |
9.58% |
|
Service Class |
10/15/2004 |
-8.57% |
6.13% |
9.48% |
|
Administrative Class |
10/15/2004 |
-8.76% |
6.01% |
9.36% |
|
Class R4 |
04/01/2014 |
-8.83% |
5.87% |
6.75% |
|
Class A |
10/15/2004 |
-8.93% |
5.75% |
9.09% |
|
Class A (sales load deducted)* |
10/15/2004 |
-13.94% |
4.56% |
8.47% |
|
Class R3 |
10/15/2004 |
-9.09% |
5.60% |
8.90% |
|
Russell 1000 Value Index |
|
-11.36% |
5.29% |
9.17% |
6.70% |
* Class A (sales load deducted) returns include the 5.50% maximum sales charge.
Generally accepted accounting principles require adjustments to be made to the net assets of the Fund at period end for financial reporting purposes only, and as such, the total return based on the unadjusted net asset value per share may differ from the total return reported in the financial highlights.
Performance results in the graph and table are shown both with and without the imposition of the maximum applicable sales charge (if applicable) and reflect the percentage change in net asset value, including reinvestment of dividends and capital gains distributions. Investors should note that the Fund is a professionally managed mutual fund, while the index or indexes shown above are unmanaged, cannot be purchased directly, and, with the exception of any peer group index, do not incur expenses.
Performance data quoted in the graph and table represents past performance; past performance is not predictive of future results. The investment return and principal value of shares of the Fund fluctuate, so your shares, when sold, may be worth more or less than their original cost. Current performance of the Fund may be lower or higher than the performance quoted. The performance shown does not reflect the deduction of taxes, if any, that a shareholder would pay on Fund distributions or the redemption of Fund shares. Performance data current to the most recent month end may be obtained by calling 1-888-309-3539.
Investors should read the Fund’s prospectus with regard to the Fund’s investment objectives, risks, and charges and expenses in conjunction with these financial statements. Employee retirement benefit plans that invest plan assets in the Separate Investment Accounts (SIAs) may be subject to certain charges as set forth in their respective Plan Documents. Total return figures would be lower for the periods presented if they reflected these charges.
17
MassMutual Fundamental Value Fund – Portfolio Manager Report (Unaudited) |
What is the investment approach of MassMutual Fundamental Value Fund, and who are the Fund’s subadvisers?
The Fund seeks long-term total return by investing primarily in equity securities of issuers that the Fund’s subadvisers believe are undervalued. Under normal circumstances, the Fund invests at least 80% of its net assets (plus the amount of any borrowings for investment purposes) in equity securities. Although the Fund may invest in companies of any size, the Fund will tend to focus on companies with large market capitalizations (which the Fund’s subadvisers believe are generally above $1 billion). The Fund’s subadvisers are Boston Partners Global Investors, Inc. (Boston Partners), which managed approximately 50% of the Fund’s portfolio; and Barrow, Hanley, Mewhinney & Strauss, LLC (Barrow Hanley), which was responsible for approximately 50% of the Fund’s portfolio, as of September 30, 2022.
How did the Fund perform during the 12 months ended September 30, 2022?
The Fund’s Class R5 shares returned -7.73%, outperforming the -11.36% return of the Russell 1000® Value Index (the “benchmark”), which measures the performance of the large-cap value segment of U.S. equity securities. It includes the Russell 1000 Index companies with lower price-to-book ratios and lower expected growth values. It is market-capitalization weighted.
For a discussion on the economic and market environment during the 12-month period ended September 30, 2022, please see the Economic and Market Overview, beginning on page 3.
Subadviser discussion of factors that contributed to the Fund’s performance
For the fiscal year ended September 30, 2022, within the Boston Partners component of the Fund, the primary driver of performance was stock selection within the health care, consumer discretionary, and industrial sectors. In health care, health insurers Cigna and Centene were two Fund component holdings that outperformed due to strong earnings and guidance, and better-than-expected rate increases for government-sponsored insurance. In consumer discretionary, Fund component holding AutoZone continued to gain share with commercial customers, resulting in better-than-expected sales and earnings. Within the industrial sector, aerospace and defense companies General Dynamics and Howmet were two Fund component holdings that outperformed after Russia’s invasion of Ukraine. Fund component holdings within the materials and consumer staples sectors detracted from returns. In the materials sector, chemical companies Axalta and Dupont both struggled. Construction materials company CRH lagged, despite strong construction trends, as rising interest rates tempered investor sentiment. In consumer staples, US Foods detracted from relative performance, as food cost inflation and labor costs eroded the company’s margins. From a sector perspective, Boston Partners’ overweight allocation to information technology and its underweight allocation to utilities and consumer staples detracted from its relative performance.
Within the Barrow Hanley segment of the Fund, component holdings in the health care sector added to Barrow Hanley’s relative performance. Also contributing to their results was strong stock selection within, and underweight allocations to, the technology and financial sectors. Conversely, stock selection within the consumer staples, materials, and energy sectors detracted from the Fund component’s performance.
Subadviser outlook
Boston Partners plan to continue to maintain a focus on finding investments that not only have attractive valuation characteristics and solid business fundamentals, but also improving business momentum and catalysts to help drive stock prices higher. Boston Partners’ view is that the global economy has the potential to experience a steady cyclical recovery over the next few years. In their opinion, the starting point was exceptional at fiscal year-end 2022, since valuation spreads were at such extreme levels. They remain cautiously optimistic about the coming 12-month period and beyond.
Barrow Hanley notes that, while uncertainty surrounding the markets remains elevated, Barrow Hanley believes that the primary conditions needed for a sustained, impactful value run remain the same: rising interest rates, higher inflation, and reasonable economic growth. In Barrow Hanley’s view, although economic growth remains less certain, higher interest rates and inflation remains persistent as of the end of the fiscal year, when compared to the prior decade. While their opinion is that expectations are high for a recession in the coming year, there remain several areas of strength related to consumer and corporate spending that have the potential to mitigate some of the possible headwinds. Barrow Hanley remains focused on stock selection as the key determinant of its Fund component’s performance.
18
MassMutual Fundamental Value Fund – Portfolio Manager Report (Unaudited) (Continued) |
MassMutual |
|
UnitedHealth Group, Inc. |
2.6% |
Johnson & Johnson |
2.4% |
CVS Health Corp. |
2.4% |
Cigna Corp. |
2.4% |
JP Morgan Chase & Co. |
2.3% |
Wells Fargo & Co. |
2.3% |
Berkshire Hathaway, Inc. Class B |
2.0% |
Merck & Co., Inc. |
1.9% |
ConocoPhillips |
1.9% |
Deere & Co. |
1.9% |
22.1% |
|
MassMutual |
|
Consumer, Non-cyclical |
28.3% |
Financial |
19.1% |
Industrial |
11.9% |
Energy |
10.9% |
Technology |
8.1% |
Basic Materials |
5.2% |
Communications |
5.1% |
Consumer, Cyclical |
4.9% |
Utilities |
4.0% |
Mutual Funds |
0.7% |
Total Long-Term Investments |
98.2% |
Short-Term Investments and Other Assets and Liabilities |
1.8% |
Net Assets |
100.0% |
19
MassMutual Fundamental Value Fund – Portfolio Manager Report (Unaudited) (Continued) |
GROWTH OF $10,000 INVESTMENT - Class R5
The graph above illustrates a representative class of the Fund’s historical performance for the past 10 fiscal years or since inception (for Funds lacking 10-year records) in comparison to its benchmark index, as well as one or more additional indexes, if applicable. The performance of other share classes will be greater than or less than the class depicted above.
Average Annual Total Returns (for the periods ended 09/30/2022) |
|||||
|
Inception Date |
1 Year |
5 Years |
10 Years |
Since Inception |
Class I |
11/15/2010 |
-7.69% |
5.37% |
8.82% |
|
Class R5 |
12/31/2001 |
-7.73% |
5.27% |
8.70% |
|
Service Class |
12/31/2001 |
-7.76% |
5.17% |
8.60% |
|
Administrative Class |
12/31/2001 |
-7.94% |
5.06% |
8.48% |
|
Class R4 |
04/01/2014 |
-8.06% |
4.89% |
6.05% |
|
Class A |
12/31/2001 |
-8.13% |
4.80% |
8.21% |
|
Class A (sales load deducted)* |
12/31/2001 |
-13.18% |
3.62% |
7.60% |
|
Class R3 |
12/31/2002 |
-8.26% |
4.65% |
8.03% |
|
Russell 1000 Value Index |
|
-11.36% |
5.29% |
9.17% |
6.70% |
* Class A (sales load deducted) returns include the 5.50% maximum sales charge.
Generally accepted accounting principles require adjustments to be made to the net assets of the Fund at period end for financial reporting purposes only, and as such, the total return based on the unadjusted net asset value per share may differ from the total return reported in the financial highlights.
Performance results in the graph and table are shown both with and without the imposition of the maximum applicable sales charge (if applicable) and reflect the percentage change in net asset value, including reinvestment of dividends and capital gains distributions. Investors should note that the Fund is a professionally managed mutual fund, while the index or indexes shown above are unmanaged, cannot be purchased directly, and, with the exception of any peer group index, do not incur expenses.
Performance data quoted in the graph and table represents past performance; past performance is not predictive of future results. The investment return and principal value of shares of the Fund fluctuate, so your shares, when sold, may be worth more or less than their original cost. Current performance of the Fund may be lower or higher than the performance quoted. The performance shown does not reflect the deduction of taxes, if any, that a shareholder would pay on Fund distributions or the redemption of Fund shares. Performance data current to the most recent month end may be obtained by calling 1-888-309-3539.
Investors should read the Fund’s prospectus with regard to the Fund’s investment objectives, risks, and charges and expenses in conjunction with these financial statements. Employee retirement benefit plans that invest plan assets in the Separate Investment Accounts (SIAs) may be subject to certain charges as set forth in their respective Plan Documents. Total return figures would be lower for the periods presented if they reflected these charges.
20
MM S&P 500® Index Fund – Portfolio Manager Report (Unaudited) |
What is the investment approach of MM S&P 500® Index Fund, and who is the Fund’s subadviser?
The Fund seeks to approximate as closely as practicable (before fees and expenses) the capitalization-weighted total rate of return of that portion of the U.S. market for publicly-traded common stocks composed of larger-capitalized companies. Under normal circumstances, the Fund invests at least 80% (and, typically, substantially all) of its net assets (plus the amount of any borrowings for investment purposes) in the equity securities of companies included within the S&P 500® Index* (the “Index”), in weightings that approximate the relative composition of the securities contained in the Index, and in Index futures contracts. The Fund’s subadviser is Northern Trust Investments, Inc. (NTI).
* The “S&P 500 Index” is a product of S&P Dow Jones Indices LLC or its affiliates (“SPDJI”), and has been licensed for use by MassMutual. Standard & Poor’s®, S&P®, and S&P 500® are registered trademarks of Standard & Poor’s Financial Services LLC (“S&P”); and Dow Jones® is a registered trademark of Dow Jones Trademark Holdings LLC (“Dow Jones”). The Fund is not sponsored, endorsed, sold or promoted by SPDJI, Dow Jones, S&P, or their respective affiliates, and none of such parties make any representation regarding the advisability of investing in such product(s) nor do they have any liability for any errors, omissions, or interruptions of the S&P 500 Index.
How did the Fund perform during the 12 months ended September 30, 2022?
The Fund’s Service Class shares returned -15.84%, underperforming the -15.47% return of the Index, which measures the performance of 500 widely held stocks in the U.S. equity market.
For a discussion on the economic and market environment during the 12-month period ended September 30, 2022, please see the Economic and Market Overview, beginning on page 3.
Subadviser discussion of factors that contributed to the Fund’s performance
Generally, the Fund’s underperformance versus the Index was mainly attributable to the impact of fees and expenses necessary for the management and operation of the Fund. The Index is not subject to fees or expenses and it is not possible to invest directly in the Index.
For the fiscal year ended September 30, 2022, U.S. large-cap equities underperformed their mid-cap counterparts, but outperformed small-cap equities. Global equities finished 2021 strong, despite higher inflation and rising short-term interest rates. Companies were largely able to pass on cost pressures, profit margins were durable, and earnings marched higher. In the first quarter of 2022, global equities were dominated by headlines surrounding high inflation and geopolitical unrest, which led to declines across developed and emerging markets. Continued high inflation, compounded by Russia’s invasion of Ukraine, led to a pullback in investor risk appetite. Headwinds for global financial markets continued in the second quarter, with negative returns in most major asset classes outside of cash. Elevated inflationary pressures led to increased investor expectations for monetary policy tightening throughout the second quarter, which in turn heightened investor concerns on the economic growth outlook.
The third quarter of 2022 was another challenging one for financial markets. Negative returns in most asset classes outside of cash, the inflation trajectory, and central bank tightening were once again top considerations for investors amid a difficult backdrop – including the continuing Russia-Ukraine war, energy price concerns in Europe, and China growth worries. Despite seeing double-digit gains by mid-August, U.S. equity markets ended with a loss for the third quarter, as investor hopes of a dovish Federal Reserve (the “Fed”) pivot evaporated following hawkish Fed leader rhetoric and more durable core inflation. Interest rates increased sharply in August and September, including a late-September rise stemming from U.K. financial stability concerns. Overall, the central banks’ focus on lowering inflation led to both the Fed and the European Central Bank raising their interest rates in the quarter by 1.50% and 1.25%, respectively – leaving the Bank of Japan as the only developed market central bank with a negative interest rate policy at the end of the Fund’s fiscal year.
The top-performing sectors of the Index during the reporting period were energy and utilities, returning 45.70% and 5.55%, respectively. Communication services and consumer discretionary were the worst-performing sectors for this period, with returns of -39.07% and -20.89%, respectively.
21
MM S&P 500® Index Fund – Portfolio Manager Report (Unaudited) (Continued) |
The Fund generally uses equity futures to equitize/gain market exposure for relatively small amounts of cash in the Fund in an effort to minimize the uninvested cash balances and reduce the impact of any cash drag. Derivatives are securities that derive their value from the performance of one or more other investments and take the form of a contract between two or more parties. Derivatives can be used for hedging, speculation, or both.
Subadviser outlook
NTI notes that economic growth has slowed as of the end of the fiscal year, after a strong rebound from the pandemic’s disruptions. In Fund management’s view, companies may look to shift their supply chains to mitigate exposures to inflation and begin prioritizing stability and sustainability over pure cost-effectiveness and profit maximization. NTI believes that, while these shifts could have the potential to benefit company stakeholders, they could also create uncertainty among shareholders – ultimately contributing to continued volatility within the markets.
22
MM S&P 500® Index Fund – Portfolio Manager Report (Unaudited) (Continued) |
MM S&P 500 Index Fund |
|
Apple, Inc. |
6.9% |
Microsoft Corp. |
5.8% |
Amazon.com, Inc. |
3.3% |
Tesla, Inc. |
2.3% |
Alphabet, Inc. Class A |
1.9% |
Alphabet, Inc. Class C |
1.7% |
Berkshire Hathaway, Inc. Class B |
1.6% |
UnitedHealth Group, Inc. |
1.6% |
Johnson & Johnson |
1.4% |
Exxon Mobil Corp. |
1.2% |
|
27.7% |
MM S&P 500 Index Fund |
|
Technology |
22.6% |
Consumer, Non-cyclical |
22.5% |
Financial |
14.9% |
Communications |
12.5% |
Consumer, Cyclical |
10.0% |
Industrial |
7.7% |
Energy |
4.8% |
Utilities |
3.2% |
Basic Materials |
2.0% |
Total Long-Term Investments |
100.2% |
Short-Term Investments and Other Assets and Liabilities |
(0.2)% |
Net Assets |
100.0% |
23
MM S&P 500® Index Fund – Portfolio Manager Report (Unaudited) (Continued) |
GROWTH OF $10,000 INVESTMENT - Service Class

The graph above illustrates a representative class of the Fund’s historical performance for the past 10 fiscal years or since inception (for Funds lacking 10-year records) in comparison to its benchmark index, as well as one or more additional indexes, if applicable. The performance of other share classes will be greater than or less than the class depicted above.
Average Annual Total Returns (for the periods ended 09/30/2022) |
|||||
|
Inception Date |
1 Year |
5 Years |
10 Years |
Since Inception |
Class I |
12/07/2011 |
-15.56% |
9.14% |
11.59% |
|
Class R5 |
05/01/2001 |
-15.68% |
9.01% |
11.47% |
|
Service Class |
03/01/1998 |
-15.84% |
8.85% |
11.29% |
|
Administrative Class |
03/01/1998 |
-15.88% |
8.74% |
11.20% |
|
Class R4 |
03/01/1998 |
-16.01% |
8.58% |
11.02% |
|
Class A |
04/01/2014 |
-16.06% |
8.47% |
9.25% |
|
Class A (sales load deducted)* |
04/01/2014 |
-20.68% |
7.25% |
8.53% |
|
Class R3 |
12/31/2002 |
-16.25% |
8.31% |
10.74% |
|
S&P 500 Index |
|
-15.47% |
9.24% |
11.70% |
10.02% |
* Class A (sales load deducted) returns include the 5.50% maximum sales charge.
Generally accepted accounting principles require adjustments to be made to the net assets of the Fund at period end for financial reporting purposes only, and as such, the total return based on the unadjusted net asset value per share may differ from the total return reported in the financial highlights.
Performance results in the graph and table are shown both with and without the imposition of the maximum applicable sales charge (if applicable) and reflect the percentage change in net asset value, including reinvestment of dividends and capital gains distributions. Investors should note that the Fund is a professionally managed mutual fund, while the index or indexes shown above are unmanaged, cannot be purchased directly, and, with the exception of any peer group index, do not incur expenses.
Performance data quoted in the graph and table represents past performance; past performance is not predictive of future results. The investment return and principal value of shares of the Fund fluctuate, so your shares, when sold, may be worth more or less than their original cost. Current performance of the Fund may be lower or higher than the performance quoted. The performance shown does not reflect the deduction of taxes, if any, that a shareholder would pay on Fund distributions or the redemption of Fund shares. Performance data current to the most recent month end may be obtained by calling 1-888-309-3539.
Investors should read the Fund’s prospectus with regard to the Fund’s investment objectives, risks, and charges and expenses in conjunction with these financial statements. Employee retirement benefit plans that invest plan assets in the Separate Investment Accounts (SIAs) may be subject to certain charges as set forth in their respective Plan Documents. Total return figures would be lower for the periods presented if they reflected these charges.
24
MassMutual Equity Opportunities Fund – Portfolio Manager Report (Unaudited) |
What is the investment approach of MassMutual Equity Opportunities Fund, and who are the Fund’s subadvisers?
The Fund seeks growth of capital over the long-term by investing primarily in equity securities of U.S. companies that the Fund’s subadvisers believe are financially sound, valued conservatively by the market, and have improving prospects. Under normal circumstances, the Fund invests at least 80% of its net assets (plus the amount of any borrowings for investment purposes) in equity securities. The Fund’s subadvisers are T. Rowe Price Associates, Inc. (T. Rowe Price), which was responsible for approximately 27% of the Fund’s portfolio; and Wellington Management Company LLP (Wellington Management), which managed approximately 73% of the Fund’s portfolio, as of September 30, 2022.
How did the Fund perform during the 12 months ended September 30, 2022?
The Fund’s Class R5 shares returned -7.05%, significantly outperforming the -17.22% return of the Russell 1000® Index (the “benchmark”), which measures the performance of the large-cap segment of U.S. equity securities. It is a subset of the Russell 3000® Index and includes approximately 1000 of the largest securities based on a combination of their market cap and current index membership.
For a discussion on the economic and market environment during the 12-month period ended September 30, 2022, please see the Economic and Market Overview, beginning on page 3.
Subadviser discussion of factors that contributed to the Fund’s performance
Within the Wellington Management component of the Fund, strong stock selection drove outperformance, particularly within the industrial, financial, and information technology sectors. This was partially offset by stock selection within the materials and health care sectors. Sector allocation, a result of Wellington Management’s bottom-up stock selection process, also contributed to its strong relative performance. The Fund component’s lack of exposure to communication services, an overweight allocation to consumer staples, and an underweight to information technology contributed the most. This was partially offset by a lack of exposure to the energy and utilities sectors. From a Fund component holdings standpoint, top relative contributors included aerospace and defense technology company Northrop Grumman (industrials sector) and UnitedHealth Group (health care sector), a health care and insurance company. In the first three quarters of 2022, shares of Northrop Grumman rose on strength in the industry as the conflict in Ukraine has led to increased military spending. Shares of UnitedHealth Group rose throughout the fiscal year following the company’s announcement of third-calendar quarter results, 2021 guidance, and initial commentary around 2022 guidance – all of which came in slightly ahead of consensus. On the downside, Fund component holdings that were among the top relative detractors included athletic apparel company Nike (consumer discretionary sector) and not holding technology giant Apple (information technology sector). Shares of Nike fell during the period, as China lockdowns continued to weigh on sales. Shares of benchmark constituent Apple were down slightly over the period. However, the company reported strong earnings for the second and third fiscal quarters, beating consensus estimates, as iPhone sales set all-time revenue records.
For the T. Rowe Price segment of the Fund, both sector allocation and security selection drove the Fund component’s outperformance. The financial sector was the top contributor for the period. There, Fund component holding Chubb continued to benefit from the rising property and casualty (P&C) pricing cycle. Over the one-year period, Chubb delivered earnings that exceeded consensus estimates, driven by higher underwriting premiums amid the longest P&C upcycle in history. Another Fund component holding, Qualcomm, and an underweight allocation to the information technology sector also contributed to relative performance. Shares of Qualcomm outperformed the information technology benchmark over the one-year period. Late in 2021, the company’s shares advanced, as management raised guidance. Within the utilities sector, Fund component holding Sempra Energy, along with an overweight allocation to the sector, further aided relative results. On the other hand, adverse security selection in the energy sector detracted from relative returns. Shares of TotalEnergies (a French multinational integrated energy and petroleum company) hampered relative performance over the period, as shares lagged the broader energy sector. During the first quarter of 2022, as Russia invaded Ukraine, shares of TotalEnergies were pressured as the company’s Russian assets and investments were quickly written down by the market. Finally, detrimental stock choices in the industrial and business services sector also weighed on T. Rowe Price’s relative results for the fiscal year.
25
MassMutual Equity Opportunities Fund – Portfolio Manager Report (Unaudited) (Continued) |
Subadviser outlook
Wellington Management believes strongly in the power of economics and markets. In their view, their current investment posture is well suited for today’s challenging environment. At the end of the reporting period, the Wellington Management Fund component held its largest overweight allocations to the consumer staples and health care sectors, and its most significantly underweight allocation to the information technology sector.
T. Rowe Price believes that many economic signals that have been accurate recession warnings in the past were, at the close of the fiscal year, indicating a likely recession. Among them: global manufacturing activity fell fast; stock market returns tumbled; and the inverted Treasury yield curve was showing that long-term growth and inflation expectations were waning as the Federal Reserve raised short-term interest rates. (The yield curve is a graph showing the term structure of interest rates by plotting the yields of all bonds of comparable quality with maturities ranging from the shortest – typically one month – to the longest – typically 30 years – available. The resulting curve shows whether short-term interest rates are higher or lower than long-term rates.) In Fund management’s view, however, if a recession is coming, it could be an unusual one. Over the last few months, the economy has created about two to three times the number of jobs as compared with the pre-pandemic average. As of the end of the fiscal year, economists were struggling with historical comparisons because the United States has never had such an extraordinary level of job openings with unemployment this low (3.7% in August 2022) – in T. Rowe Price’s opinion, this is an example of a pandemic-related distortion. Fund management believes, on the other hand, that several other pre-recession signals were, at fiscal year-end, mitigating the likelihood of a recession: U.S. manufacturing activity (as measured by the Purchasing Managers’ Index), earnings surprises, nominal consumption growth, and leverage, while trending negative, were not near historical pre-recession levels.
26
MassMutual Equity Opportunities Fund – Portfolio Manager Report (Unaudited) (Continued) |
MassMutual |
|
The TJX Cos., Inc. |
4.5% |
UnitedHealth Group, Inc. |
4.0% |
Chubb Ltd. |
3.9% |
Danaher Corp. |
3.5% |
PepsiCo, Inc. |
3.4% |
Honeywell International, Inc. |
3.3% |
Marsh & McLennan Cos., Inc. |
3.3% |
Visa, Inc. Class A |
3.2% |
NIKE, Inc. Class B |
3.2% |
Colgate-Palmolive Co. |
3.2% |
|
35.5% |
MassMutual |
|
Consumer, Non-cyclical |
34.2% |
Financial |
19.9% |
Industrial |
12.4% |
Consumer, Cyclical |
11.6% |
Basic Materials |
7.5% |
Technology |
6.6% |
Utilities |
2.5% |
Energy |
2.4% |
Communications |
1.3% |
Total Long-Term Investments |
98.4% |
Short-Term Investments and Other Assets and Liabilities |
1.6% |
Net Assets |
100.0% |
27
MassMutual Equity Opportunities Fund – Portfolio Manager Report (Unaudited) (Continued) |
GROWTH OF $10,000 INVESTMENT - Class R5

The graph above illustrates a representative class of the Fund’s historical performance for the past 10 fiscal years or since inception (for Funds lacking 10-year records) in comparison to its benchmark index, as well as one or more additional indexes, if applicable. The performance of other share classes will be greater than or less than the class depicted above.
Average Annual Total Returns (for the periods ended 09/30/2022) |
|||||
|
Inception Date |
1 Year |
5 Years |
10 Years |
Since Inception |
Class I |
11/15/2010 |
-6.98% |
9.12% |
12.02% |
|
Class R5 |
05/01/2000 |
-7.05% |
9.01% |
11.90% |
|
Service Class |
05/01/2000 |
-7.18% |
8.90% |
11.79% |
|
Administrative Class |
05/01/2000 |
-7.30% |
8.77% |
11.67% |
|
Class R4 |
04/01/2014 |
-7.41% |
8.61% |
8.99% |
|
Class A |
05/01/2000 |
-7.52% |
8.51% |
11.38% |
|
Class A (sales load deducted)* |
05/01/2000 |
-12.61% |
7.29% |
10.76% |
|
Class R3 |
12/31/2002 |
-7.66% |
8.34% |
11.19% |
|
Russell 1000 Index |
-17.22% |
9.00% |
11.60% |
9.74% |
|
* Class A (sales load deducted) returns include the 5.50% maximum sales charge.
Generally accepted accounting principles require adjustments to be made to the net assets of the Fund at period end for financial reporting purposes only, and as such, the total return based on the unadjusted net asset value per share may differ from the total return reported in the financial highlights.
Performance results in the graph and table are shown both with and without the imposition of the maximum applicable sales charge (if applicable) and reflect the percentage change in net asset value, including reinvestment of dividends and capital gains distributions. Investors should note that the Fund is a professionally managed mutual fund, while the index or indexes shown above are unmanaged, cannot be purchased directly, and, with the exception of any peer group index, do not incur expenses.
Performance data quoted in the graph and table represents past performance; past performance is not predictive of future results. The investment return and principal value of shares of the Fund fluctuate, so your shares, when sold, may be worth more or less than their original cost. Current performance of the Fund may be lower or higher than the performance quoted. The performance shown does not reflect the deduction of taxes, if any, that a shareholder would pay on Fund distributions or the redemption of Fund shares. Performance data current to the most recent month end may be obtained by calling 1-888-309-3539.
Investors should read the Fund’s prospectus with regard to the Fund’s investment objectives, risks, and charges and expenses in conjunction with these financial statements. Employee retirement benefit plans that invest plan assets in the Separate Investment Accounts (SIAs) may be subject to certain charges as set forth in their respective Plan Documents. Total return figures would be lower for the periods presented if they reflected these charges.
28
MassMutual Fundamental Growth Fund – Portfolio Manager Report (Unaudited) |
What is the investment approach of MassMutual Fundamental Growth Fund, and who are the Fund’s subadvisers?
The Fund seeks long-term growth of capital by investing primarily in domestic equity securities that the Fund’s subadvisers believe offer the potential for long-term growth. While the Fund may invest in issuers of any size, the Fund currently focuses on securities of mid-capitalization companies. The Fund’s subadvisers are Westfield Capital Management Company, L.P. (Westfield), which was responsible for approximately 48% of the Fund’s portfolio; and Wellington Management Company LLP (Wellington Management), which managed approximately 52% of the Fund’s portfolio, as of September 30, 2022.
How did the Fund perform during the 12 months ended September 30, 2022?
The Fund’s Class R5 shares returned -31.94%, underperforming the -29.50% return of the Russell Midcap® Growth Index (the “benchmark”), which measures the performance of the mid-cap growth segment of the U.S. equity universe. It includes Russell Midcap Index companies with higher price-to-book ratios and higher forecasted growth values. It is market-capitalization weighted.
For a discussion on the economic and market environment during the 12-month period ended September 30, 2022, please see the Economic and Market Overview, beginning on page 3.
Subadviser discussion of factors that contributed to the Fund’s performance
In the Wellington Management component of the Fund, security selection was the most notable driver of relative performance for the fiscal year ended September 30, 2022. Weak security selection within the information technology, consumer staples, and industrial sectors detracted from relative returns, while favorable stock choices within communication services and consumer discretionary partially offset the relative weakness. Sector allocation, a residual of Wellington Management’s bottom-up stock selection process, also weighed on performance, driven by an overweight allocation to communication services and an underweight allocation to energy. With respect to specific Fund component holdings, top detractors from relative returns included Align Technology (health care sector) and Match Group (communication services sector). Align Technology, a medical device company focused on dentistry and orthodontics, experienced a share price decline after management released results citing both revenue and adjusted earnings had missed estimates for the first quarter of 2022. Invisalign case shipments were lower than expected, partially due to the impact of COVID-19 on dental visits worldwide. Shares of Match Group, a provider of online dating services and applications, struggled during this period as its core property, Tinder, saw a slowdown in engagement and user growth. Turning to the positive, Fund component holdings that were top contributors to relative performance during the period included Gartner (information technology sector) and Wingstop, Inc. (consumer discretionary sector). The share price of Gartner, an IT research and advisory services company, increased after the company reported stronger-than-expected second-fiscal quarter earnings. Wingstop is a multinational restaurant chain specializing in chicken wings. Its shares fared better than the benchmark during the period, as the company strongly rebounded in July after management released better-than-expected same-store sales results against a challenging macro backdrop.
Within the Westfield component of the Fund, Fund component holdings in the information technology sector proved to be the top detractors from relative results over the period. While some of Westfield’s best-performing holdings were in this sector, the underperformance was primarily driven by Westfield’s software, payments, and IT services holdings. Lightspeed Commerce, a cloud-based point-of-sale software vendor for retailers and restaurants, was the largest source of relative weakness within the Fund component’s holdings in the information technology sector. Fund component holdings in the health care sector also detracted from relative performance over the period, as Westfield’s biotechnology and health care equipment & services holdings drove the majority of the underperformance. Commercial oncology company Seagen, Inc. was the largest detractor from relative results during the period. Turning to the positive, consumer discretionary was a strong relative performer during the fiscal year. With respect to Fund component holdings, Ulta Beauty, Inc., a beauty products retailer, was the top contributing name over the period, as the company benefited from strong execution and recovering demand for beauty products as consumer behaviors normalized, with people returning to work, dining out, and traveling. Fund component holdings in the financial sector also contributed to relative performance. Specifically, LPL Financial Holdings, a provider of integrated brokerage and investment advisory services, was the top contributing Fund component holding within the group over the period. Communication services also contributed to performance. The outperformance was driven by strong stock selection within entertainment and media: global entertainment producer Live Nation Entertainment, Inc. was the top contributing name within the sector. The company experienced strong demand, as customers demonstrated an increased willingness to see live shows following the pandemic.
29
MassMutual Fundamental Growth Fund – Portfolio Manager Report (Unaudited) (Continued) |
Subadviser outlook
Looking ahead, Wellington Management expects an increasingly challenging macro backdrop over the near term, given the Federal Reserve’s (the “Fed”) resolve to tame inflation at a cost of lower growth. However, in Wellington Management’s observation, the resilience of the labor market and early signs of supply chain bottlenecks easing as of the end of the Fund’s fiscal year give Fund management confidence in the growth outlook beyond the immediate future. Within Wellington Management’s opportunity set, Fund management expects to continue to steer away from expensive benchmark constituents based on its valuation discipline and instead, to lean into secular growers with high returns on invested capital trading at reasonable prices. Fund management also expects to be increasingly focused on identifying higher-quality businesses that could be more resilient during a down cycle, while having the potential to outperform if the environment stabilizes and turns more favorable.
At the end of the period, the Westfield component’s portfolio was most overweight the communication services, health care, and financial sectors, and most underweight the industrials, materials, and energy sectors. Looking ahead, Westfield believes that the likelihood of a U.S. recession seems to be all but inevitable; in Westfield’s view, the pivotal question is whether the Fed will pause or pivot their hawkish stance – in light of slowing economic activity, moderating inflation, and global market instability. At fiscal year-end, in Westfield’s observation, consumer prices for some things (like gasoline) had moderated; however, Westfield believes consumer prices for other things (like shelter) will likely remain high for some time. Westfield expects a more gradual decline in inflation than many other observers in the market are currently forecasting. Turning to the earnings outlook, as of the Fund’s fiscal year end, Westfield believes that the environment remains challenging, with market estimates still likely too high among forecasters. Slowing spending and job growth, combined with growing margin pressures and building inventories, is, in Westfield’s view, a recipe for an economic slowdown. In Westfield’s opinion, when these factors are combined with rising funding costs due to interest rates, it is difficult to envision an outcome that does not propel the economy into a recession.
30
MassMutual Fundamental Growth Fund – Portfolio Manager Report (Unaudited) (Continued) |
MassMutual |
|
ICON PLC |
4.4% |
Gartner, Inc. |
3.7% |
Hilton Worldwide Holdings, Inc. |
3.3% |
Ceridian HCM Holding, Inc. |
3.3% |
ZoomInfo Technologies, Inc. |
2.9% |
Lululemon Athletica, Inc. |
2.8% |
Agilent Technologies, Inc. |
2.8% |
CDW Corp. |
2.6% |
Palo Alto Networks, Inc. |
2.4% |
Wingstop, Inc. |
2.3% |
30.5% |
|
MassMutual |
|
Consumer, Non-cyclical |
25.8% |
Technology |
22.0% |
Consumer, Cyclical |
16.5% |
Industrial |
12.3% |
Communications |
10.2% |
Financial |
9.4% |
Energy |
2.1% |
Basic Materials |
0.6% |
Mutual Funds |
0.4% |
Total Long-Term Investments |
99.3% |
Short-Term Investments and Other Assets and Liabilities |
0.7% |
Net Assets |
100.0% |
31
MassMutual Fundamental Growth Fund – Portfolio Manager Report (Unaudited) (Continued) |
GROWTH OF $10,000 INVESTMENT - Class R5
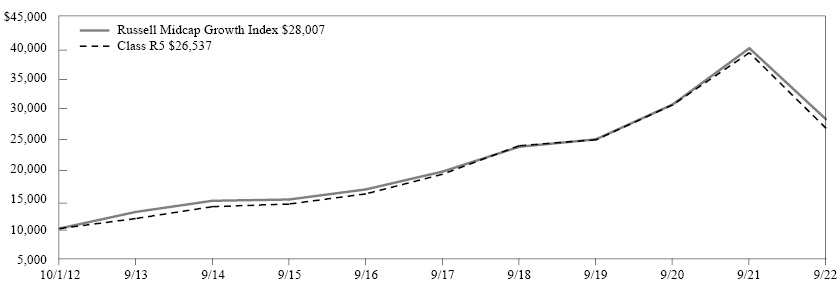
The graph above illustrates a representative class of the Fund’s historical performance for the past 10 fiscal years or since inception (for Funds lacking 10-year records) in comparison to its benchmark index, as well as one or more additional indexes, if applicable. The performance of other share classes will be greater than or less than the class depicted above.
Average Annual Total Returns (for the periods ended 09/30/2022) |
|||||
|
Inception Date |
1 Year |
5 Years |
10 Years |
Since Inception |
Class I |
04/01/2014 |
-31.76% |
7.08% |
8.91% |
|
Class R5 |
05/01/2000 |
-31.94% |
6.95% |
10.25% |
|
Service Class |
05/01/2000 |
-31.97% |
6.86% |
10.15% |
|
Administrative Class |
05/01/2000 |
-32.21% |
6.77% |
10.03% |
|
Class R4 |
04/01/2014 |
-32.23% |
6.60% |
8.42% |
|
Class A |
05/01/2000 |
-32.20% |
6.50% |
9.75% |
|
Class A (sales load deducted)* |
05/01/2000 |
-35.93% |
5.31% |
9.13% |
|
Class R3 |
12/31/2002 |
-32.59% |
6.29% |
9.55% |
|
Russell Midcap Growth Index |
-29.50% |
7.62% |
10.85% |
8.43% |
|
* Class A (sales load deducted) returns include the 5.50% maximum sales charge.
Generally accepted accounting principles require adjustments to be made to the net assets of the Fund at period end for financial reporting purposes only, and as such, the total return based on the unadjusted net asset value per share may differ from the total return reported in the financial highlights.
Performance results in the graph and table are shown both with and without the imposition of the maximum applicable sales charge (if applicable) and reflect the percentage change in net asset value, including reinvestment of dividends and capital gains distributions. Investors should note that the Fund is a professionally managed mutual fund, while the index or indexes shown above are unmanaged, cannot be purchased directly, and, with the exception of any peer group index, do not incur expenses.
Performance data quoted in the graph and table represents past performance; past performance is not predictive of future results. The investment return and principal value of shares of the Fund fluctuate, so your shares, when sold, may be worth more or less than their original cost. Current performance of the Fund may be lower or higher than the performance quoted. The performance shown does not reflect the deduction of taxes, if any, that a shareholder would pay on Fund distributions or the redemption of Fund shares. Performance data current to the most recent month end may be obtained by calling 1-888-309-3539.
Investors should read the Fund’s prospectus with regard to the Fund’s investment objectives, risks, and charges and expenses in conjunction with these financial statements. Employee retirement benefit plans that invest plan assets in the Separate Investment Accounts (SIAs) may be subject to certain charges as set forth in their respective Plan Documents. Total return figures would be lower for the periods presented if they reflected these charges.
32
MassMutual Blue Chip Growth Fund – Portfolio Manager Report (Unaudited) |
What is the investment approach of MassMutual Blue Chip Growth Fund, and who are the Fund’s subadvisers?
The Fund seeks growth of capital over the long term by investing, under normal circumstances, at least 80% of its net assets (plus the amount of any borrowings for investment purposes) in the common stocks of large- and medium-sized blue chip growth companies. The Fund’s subadvisers currently define blue chip growth companies to mean firms that, in their view, are well-established in their industries and have the potential for above-average earnings growth. The Fund’s subadvisers are T. Rowe Price Associates, Inc. (T. Rowe Price), which was responsible for approximately 53% of the Fund’s portfolio; and Loomis, Sayles & Company, L.P. (Loomis Sayles), which managed approximately 47% of the Fund’s portfolio, as of September 30, 2022.
How did the Fund perform during the 12 months ended September 30, 2022?
The Fund’s Class R5 shares returned -32.04%, significantly underperforming the -22.59% return of the Russell 1000® Growth Index (the “benchmark”), which measures the performance of the large-cap growth segment of U.S. equity securities. It includes the Russell 1000 Index companies with higher price-to-book ratios and higher forecasted growth values. It is market-capitalization weighted. The Fund also significantly underperformed the -15.47% return of the S&P 500® Index, which measures the performance of 500 widely held stocks in the U.S. equity market.
For a discussion on the economic and market environment during the 12-month period ended September 30, 2022, please see the Economic and Market Overview, beginning on page 3.
Subadviser discussion of factors that contributed to the Fund’s performance
For the T. Rowe Price component of the Fund, less-than-favorable security selection and sector allocation drove the Fund component’s relative underperformance. Fund component holdings in the communication services, information technology, and consumer discretionary sectors detracted the most, while holdings in the health care and financial sectors contributed the most to relative returns. With respect to specific Fund component holdings, within the information technology sector, shares of technology giant Apple declined slightly, although outperforming the sector. The Fund component’s underweight allocation to the information technology sector also detracted from relative returns. In the consumer discretionary sector, online used car retailer Carvana traded lower amid a challenging backdrop that included supply constraints and affordability concerns for consumers. Turning to the positive, Fund component holding UnitedHealth Group in the health care sector held up relatively well due to better-than-expected cost trends as utilization returned to normal and contributed to Fund performance.
Within the Loomis Sayles component of the Fund, stock selection in the information technology, industrial, consumer discretionary, and consumer staples sectors – along with the Fund component’s allocations to the communication services, consumer staples, and information technology sectors – detracted from relative performance. Fund component holdings, Meta Platforms and Boeing were the greatest detractors from performance. Meta Platforms operates online social networking platforms, including Facebook, Messenger, WhatsApp, and Instagram, which allow people to connect, share, and interact with friends and communities. The company’s shares declined substantially following its fourth-quarter financial report in early February. Operating expenses were greater than expectations and the company issued guidance for the first quarter of 2022 that was well below expectations. Founded in 1916, Boeing is a global leader in the commercial and defense aerospace industries. Along with Airbus, Boeing is part of a global duopoly that generally accounts for almost all commercial planes sold with more than 125 seats – typically the largest market segment. Boeing’s financial results during the period were mixed and largely below expectations. On the positive side, stock selection in the health care, communication services, and financial sectors, along with the Fund component’s allocations to the health care, industrial, consumer discretionary, and energy sectors, contributed positively to relative performance. With respect to Fund component holdings, Vertex Pharmaceuticals and Schlumberger were the top contributors to performance. Vertex Pharmaceuticals is a leader in creating therapies for patients suffering from cystic fibrosis (CF). Vertex reported financial results during the period that reflected the continued penetration of TRIKAFTA®, its latest and most efficacious CF therapy. Although Fund management exited its position in Schlumberger in March 2022, since 2020, the company was among the Fund component’s highest-returning securities. Schlumberger is a leading global supplier of technology, equipment, integrated project management, and information solutions to the global oil and gas exploration and production industry.
33
MassMutual Blue Chip Growth Fund – Portfolio Manager Report (Unaudited) (Continued) |
Subadviser outlook
T. Rowe Price believes that many economic signals that have been accurate recession warnings in the past were, at the close of the fiscal year, indicating a likely recession. Among them: global manufacturing activity fell fast; stock market returns tumbled; and the inverted Treasury yield curve was showing that long-term growth and inflation expectations were waning as the Federal Reserve raised short-term interest rates. (The yield curve is a graph showing the term structure of interest rates by plotting the yields of all bonds of comparable quality with maturities ranging from the shortest – typically one month – to the longest – typically 30 years – available. The resulting curve shows whether short-term interest rates are higher or lower than long-term rates.) In Fund management’s view, however, if a recession is coming, it could be an unusual one. Over the last few months, the economy has created about two to three times the number of jobs as compared with the pre-pandemic average. As of the end of the fiscal year, economists were struggling with historical comparisons because the United States had never had such an extraordinary level of job openings with unemployment this low (3.7% in August 2022) – in T. Rowe Price’s opinion, this is an example of a pandemic-related distortion. Fund management believes, on the other hand, that several other pre-recession signals were, at fiscal year-end, mitigating the likelihood of a recession: U.S. manufacturing activity (as measured by the Purchasing Managers’ Index), earnings surprises, nominal consumption growth, and leverage, while trending negative, were not near historical pre-recession levels.
The Loomis Sayles investment process is generally characterized by bottom-up, fundamental research and a long-term investment time horizon. The nature of the process typically leads to a lower turnover portfolio, where sector positioning is the result of stock selection. At the end of the fiscal year, the Loomis Sayles Fund component held overweight allocations to the communication services, health care, industrial, and financial sectors – and underweight allocations to the information technology, consumer staples, and consumer discretionary sectors. As of September 30, 2022, Loomis Sayles held no positions in the real estate, energy, materials, or utilities sectors.
34
MassMutual Blue Chip Growth Fund – Portfolio Manager Report (Unaudited) (Continued) |
MassMutual |
|
Amazon.com, Inc. |
8.8% |
Microsoft Corp. |
7.5% |
Alphabet, Inc. Class C |
6.6% |
Visa, Inc. Class A |
4.6% |
Tesla, Inc. |
4.6% |
Apple, Inc. |
4.3% |
Meta Platforms, Inc. Class A |
3.5% |
NVIDIA Corp. |
3.2% |
Alphabet, Inc. Class A |
2.7% |
UnitedHealth Group, Inc. |
2.6% |
48.4% |
|
MassMutual |
|
Communications |
29.0% |
Technology |
28.5% |
Consumer, Non-cyclical |
19.9% |
Consumer, Cyclical |
9.5% |
Financial |
8.1% |
Industrial |
4.1% |
Basic Materials |
0.5% |
Mutual Funds |
0.2% |
Total Long-Term Investments |
99.8% |
Short-Term Investments and Other Assets and Liabilities |
0.2% |
Net Assets |
100.0% |
35
MassMutual Blue Chip Growth Fund – Portfolio Manager Report (Unaudited) (Continued) |
GROWTH OF $10,000 INVESTMENT - Class R5
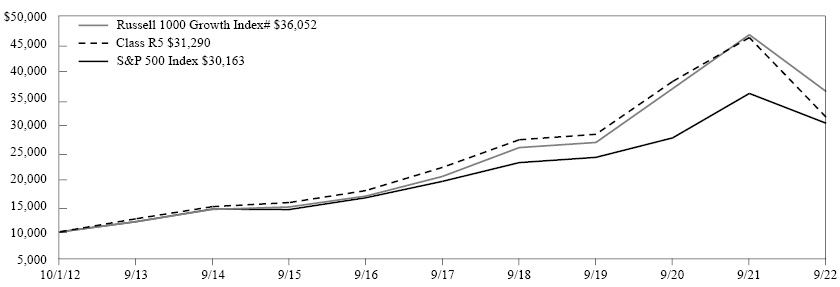
The graph above illustrates a representative class of the Fund’s historical performance for the past 10 fiscal years or since inception (for Funds lacking 10-year records) in comparison to its benchmark index, as well as one or more additional indexes, if applicable. The performance of other share classes will be greater than or less than the class depicted above.
Average Annual Total Returns (for the periods ended 09/30/2022) |
|||||
|
Inception Date |
1 Year |
5 Years |
10 Years |
Since Inception |
Class I |
04/01/2014 |
-31.96% |
7.44% |
10.15% |
|
Class R5 |
06/01/2001 |
-32.04% |
7.32% |
12.08% |
|
Service Class |
06/01/2001 |
-32.12% |
7.21% |
11.98% |
|
Administrative Class |
06/01/2001 |
-32.16% |
7.12% |
11.86% |
|
Class R4 |
04/01/2014 |
-32.26% |
6.96% |
9.66% |
|
Class A |
06/01/2001 |
-32.34% |
6.84% |
11.58% |
|
Class A (sales load deducted)* |
06/01/2001 |
-36.06% |
5.64% |
10.95% |
|
Class R3 |
12/31/2002 |
-32.41% |
6.69% |
11.40% |
|
Russell 1000 Growth Index# |
-22.59% |
12.17% |
13.70% |
12.45% |
|
S&P 500 Index |
-15.47% |
9.24% |
11.70% |
10.02% |
|
* Class A (sales load deducted) returns include the 5.50% maximum sales charge.
# Benchmark
Generally accepted accounting principles require adjustments to be made to the net assets of the Fund at period end for financial reporting purposes only, and as such, the total return based on the unadjusted net asset value per share may differ from the total return reported in the financial highlights.
Performance results in the graph and table are shown both with and without the imposition of the maximum applicable sales charge (if applicable) and reflect the percentage change in net asset value, including reinvestment of dividends and capital gains distributions. Investors should note that the Fund is a professionally managed mutual fund, while the index or indexes shown above are unmanaged, cannot be purchased directly, and, with the exception of any peer group index, do not incur expenses.
Performance data quoted in the graph and table represents past performance; past performance is not predictive of future results. The investment return and principal value of shares of the Fund fluctuate, so your shares, when sold, may be worth more or less than their original cost. Current performance of the Fund may be lower or higher than the performance quoted. The performance shown does not reflect the deduction of taxes, if any, that a shareholder would pay on Fund distributions or the redemption of Fund shares. Performance data current to the most recent month end may be obtained by calling 1-888-309-3539.
Investors should read the Fund’s prospectus with regard to the Fund’s investment objectives, risks, and charges and expenses in conjunction with these financial statements. Employee retirement benefit plans that invest plan assets in the Separate Investment Accounts (SIAs) may be subject to certain charges as set forth in their respective Plan Documents. Total return figures would be lower for the periods presented if they reflected these charges.
36
MassMutual Growth Opportunities Fund – Portfolio Manager Report (Unaudited) |
What is the investment approach of MassMutual Growth Opportunities Fund, and who are the Fund’s subadvisers?
The Fund seeks long-term capital appreciation by investing primarily in equity securities of U.S. companies that the Fund’s subadvisers believe offer the potential for long-term growth. Under normal market conditions, the Fund invests at least 80% of its net assets (plus the amount of any borrowings for investment purposes) in equity securities. The Fund’s subadvisers are Sands Capital Management, LLC (Sands Capital), which managed approximately 50% of the Fund’s portfolio; and Jackson Square Partners, LLC (Jackson Square), which was responsible for approximately 50% of the Fund’s portfolio, as of September 30, 2022.
How did the Fund perform during the 12 months ended September 30, 2022?
The Fund’s Class R5 shares returned -47.21%, significantly underperforming the -22.59% return of the Russell 1000® Growth Index (the “benchmark”), which measures the performance of the large-cap growth segment of U.S. equity securities. It includes the Russell 1000 Index companies with higher price-to-book ratios and higher forecasted growth values. It is market-capitalization weighted.
For a discussion on the economic and market environment during the 12-month period ended September 30, 2022, please see the Economic and Market Overview, beginning on page 3.
Subadviser discussion of factors that contributed to the Fund’s performance
For the fiscal year ended September 30, 2022, the Sands Capital component of the Fund primarily suffered from less-than-favorable security selection. Fund component holdings that were the largest individual detractors from performance, relative to the benchmark, were Sea, a Southeast Asia internet-based provider of ecommerce and digital financial services; Block, a digital financial services pioneer; Match Group, a leader in online dating applications; Shopify, a leading global ecommerce platform enabling the next generation of retail; and Twilio, a leading software-enabled communications platform. On the other hand, the Fund component holdings that drove Sands Capital’s performance during the fiscal year included Sarepta Therapeutics, a developer of therapies for rare neuromuscular diseases; CoStar Group, a provider of data, analytics, and online marketplaces to the U.S. commercial real estate industry; Zillow, a leading digital-services provider for the real estate industry; Datadog, a provider of key monitoring and observability capabilities to support modern cloud infrastructure; and Zoetis, a global leader in the development, manufacturing, and commercialization of animal-health medicines for livestock and companion animals.
Within the Jackson Square component of the Fund, disruptors such as Fund component holding Twilio Inc., a cloud communications platform, were a source of underperformance during the period. These names faced macro headwinds from rising interest rates. Additionally, disruptors experienced a growth rotation during the fiscal year that saw the subset generally trade in a highly correlated fashion, regardless of underlying fundamentals and despite these stocks having different business models, end markets, and growth drivers. Fund component holdings in the health care sector also detracted from performance. Within that market segment, Fund component holdings such as 10X Genomics, a provider of instruments and consumables for genomic sequencing of single cells, and Align Technology, a global leader in clear teeth aligners for treating malocclusion, detracted from performance. More defensive holdings such as Waste Management Inc., a provider of waste management and recycling services, and Canadian Pacific Railway Limited, a Class 1 railway spanning from Canada to Mexico, benefited from the market rotation during the period and contributed to performance.
Subadviser outlook
In Sands Capital’s view, the past 12 months represent the most challenging period of relative performance in its Fund component’s history. Nevertheless, in their view, as of the end of the fiscal year, the poor sentiment in equity markets conflicted with recent earnings results and the favorable long-term outlook of the Fund component’s holdings. Sands Capital believes that this potentially presents an opportunity. They believe that an increasingly challenging macroeconomic environment could enable their Fund component holdings to improve their competitive positions.
Jackson Square expects inflation and interest rates to continue to drive market volatility. Jackson Square expects to pay particular attention to certain market characteristics, including 1) compressing consumer spending, particularly on the lower end of the income spectrum, with a continuation of the trend shifting from goods to services; 2) slowing business investment; and 3) softening labor markets. They believe company fundamentals, quality, and resiliency will become increasingly important moving forward.
37
MassMutual Growth Opportunities Fund – Portfolio Manager Report (Unaudited) (Continued) |
MassMutual |
|
Amazon.com, Inc. |
8.9% |
Visa, Inc. Class A |
7.3% |
Microsoft Corp. |
5.9% |
ServiceNow, Inc. |
5.6% |
Uber Technologies, Inc. |
4.0% |
Edwards Lifesciences Corp. |
3.8% |
Mastercard, Inc. Class A |
3.4% |
Snowflake, Inc. Class A |
3.2% |
DexCom, Inc. |
3.1% |
Atlassian Corp. PLC Class A |
2.7% |
|
47.9% |
MassMutual |
|
Technology |
30.9% |
Communications |
26.0% |
Consumer, Non-cyclical |
19.6% |
Financial |
11.9% |
Industrial |
5.8% |
Consumer, Cyclical |
3.9% |
Mutual Funds |
2.9% |
Total Long-Term Investments |
101.0% |
Short-Term Investments and Other Assets and Liabilities |
(1.0)% |
Net Assets |
100.0% |
38
MassMutual Growth Opportunities Fund – Portfolio Manager Report (Unaudited) (Continued) |
GROWTH OF $10,000 INVESTMENT - Class R5
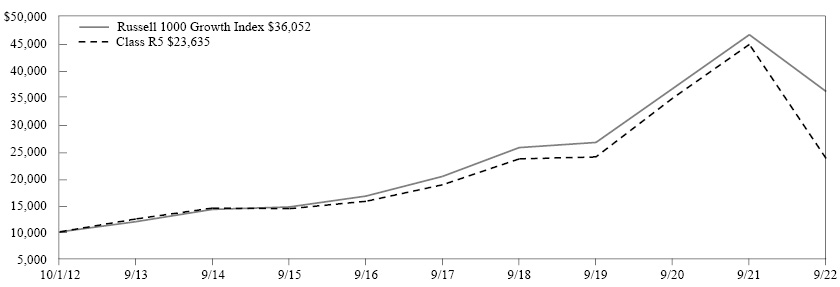
The graph above illustrates a representative class of the Fund’s historical performance for the past 10 fiscal years or since inception (for Funds lacking 10-year records) in comparison to its benchmark index, as well as one or more additional indexes, if applicable. The performance of other share classes will be greater than or less than the class depicted above.
Average Annual Total Returns (for the periods ended 09/30/2022) |
||||||
|
Inception Date |
1 Year |
5 Years |
10 Years |
Since Inception |
Since Inception |
Class I |
12/07/2011 |
-47.25% |
4.80% |
10.24% |
||
Class R5 |
05/01/2000 |
-47.21% |
4.74% |
8.98% |
||
Service Class |
05/01/2000 |
-47.38% |
4.60% |
8.86% |
||
Administrative Class |
05/01/2000 |
-47.40% |
4.50% |
8.74% |
||
Class R4 |
04/01/2014 |
-47.38% |
4.36% |
6.22% |
||
Class A |
05/01/2000 |
-47.50% |
4.25% |
8.48% |
||
Class A (sales load deducted)* |
05/01/2000 |
-50.38% |
3.07% |
7.87% |
||
Class R3 |
12/31/2002 |
-47.66% |
4.10% |
8.29% |
||
Russell 1000 Growth Index |
-22.59% |
12.17% |
13.70% |
14.13% |
12.45% |
|
* Class A (sales load deducted) returns include the 5.50% maximum sales charge.
Generally accepted accounting principles require adjustments to be made to the net assets of the Fund at period end for financial reporting purposes only, and as such, the total return based on the unadjusted net asset value per share may differ from the total return reported in the financial highlights.
Performance results in the graph and table are shown both with and without the imposition of the maximum applicable sales charge (if applicable) and reflect the percentage change in net asset value, including reinvestment of dividends and capital gains distributions. Investors should note that the Fund is a professionally managed mutual fund, while the index or indexes shown above are unmanaged, cannot be purchased directly, and, with the exception of any peer group index, do not incur expenses.
Performance data quoted in the graph and table represents past performance; past performance is not predictive of future results. The investment return and principal value of shares of the Fund fluctuate, so your shares, when sold, may be worth more or less than their original cost. Current performance of the Fund may be lower or higher than the performance quoted. The performance shown does not reflect the deduction of taxes, if any, that a shareholder would pay on Fund distributions or the redemption of Fund shares. Performance data current to the most recent month end may be obtained by calling 1-888-309-3539.
Investors should read the Fund’s prospectus with regard to the Fund’s investment objectives, risks, and charges and expenses in conjunction with these financial statements. Employee retirement benefit plans that invest plan assets in the Separate Investment Accounts (SIAs) may be subject to certain charges as set forth in their respective Plan Documents. Total return figures would be lower for the periods presented if they reflected these charges.
39
MassMutual Mid Cap Value Fund – Portfolio Manager Report (Unaudited) |
What is the investment approach of MassMutual Mid Cap Value Fund, and who are the Fund’s subadvisers?
The Fund seeks growth of capital over the long-term by investing primarily in equity securities of mid-capitalization companies that the Fund’s subadvisers believe are undervalued. Under normal circumstances, the Fund invests at least 80% of its net assets (plus the amount of any borrowings for investment purposes) in the stocks of mid-cap companies. The Fund’s subadvisers are American Century Investment Management, Inc. (American Century), which managed approximately 35% of the Fund’s portfolio; PanAgora Asset Management, Inc. (PanAgora), which oversaw approximately 30% of the Fund’s portfolio; and Thompson, Siegel & Walmsley LLC (TSW), which was responsible for approximately 35% of the Fund’s portfolio, as of September 30, 2022.
How did the Fund perform during the 12 months ended September 30, 2022?
The Fund’s Class R5 shares returned -9.51%, outperforming the -13.56% return of the Russell Midcap® Value Index (the “benchmark”), which measures the performance of the mid-cap value segment of the U.S. equity universe. It includes Russell Midcap Index companies with lower price-to-book ratios and lower forecasted growth values. It is market-capitalization weighted.
For a discussion on the economic and market environment during the 12-month period ended September 30, 2022, please see the Economic and Market Overview, beginning on page 3.
Subadviser discussion of factors that contributed to the Fund’s performance
For the fiscal year ended September 30, 2022, within the American Century component of the Fund, security selection in the consumer discretionary sector (and the multiline retail industry in particular) supported the Fund component’s performance, relative to the benchmark. Within that sector, discount retailer Dollar Tree was a top performer. Security selection in the financial sector also boosted relative results: Reinsurance Group of America and The Allstate Corp. were two Fund component holdings that contributed to returns. Conversely, security selection in the materials sector weighed on performance. In addition, not holding select benchmark names in the chemicals industry detracted from the Fund component’s relative performance. American Century generally buys foreign exchange forward hedge contracts to offset the inherent currency risks of holding foreign securities. Exposure to derivatives did add somewhat to performance during the fiscal year due to currency volatility. Derivatives are securities that derive their value from the performance of one or more other investments and take the form of a contract between two or more parties. Derivatives can be used for hedging, speculation, or both.
Within the TSW segment of the Fund, the primary drivers of performance were Fund component holdings within the consumer discretionary, financial, and energy sectors. Within consumer discretionary, Dollar Tree, Inc., an operator of discount value stores, and LKQ Corp., a leading distributor of automotive aftermarket parts, were top contributors. In the financial sector, an overweight allocation to the insurance sector, relative to the benchmark, along with positive stock selection across the industry contributed to returns. Alleghany Corp., a primary insurer and reinsurer, was the Fund component’s top performing holding for the fiscal year. Arch Capital Group, a provider of property and casualty insurance and reinsurance, also contributed to the Fund’s performance. Within the energy sector, an overweight allocation and favorable stock selection contributed to relative returns. Fund component holdings within the telecommunications and basic materials sectors detracted from relative performance. In telecommunications, Liberty Broadband Corp. and Dish Network Corp. were the primary detractors. Within basic materials, an underweight allocation and Fund component holding Cleveland-Cliffs were the primary detractors.
For the Fund’s PanAgora component, strong stock selection within the health care sector was the primary driver of performance for the period. The top contributor was an overweight position in the strong-performing McKesson Corp., an American company that is a distributor of pharmaceuticals and a provider of health information technology, medical supplies, and care management tools. The company’s share price advanced over 64% during the fiscal year. Materials was the second top sector contributor for the period. There, PanAgora’s overweight position in CF Industries Holdings Inc., a North American manufacturer and distributor of agricultural fertilizers, benefited the Fund component, as that holding advanced 57% for the period. The top detractor for the period was the consumer discretionary sector, where stocks generally suffered due to supply chain issues. The largest hindrance within the sector was PanAgora’s overweight position in Garmin Ltd., which provides navigation, communications, and information devices. Its share price declined over 46% during the reporting period.
40
MassMutual Mid Cap Value Fund – Portfolio Manager Report (Unaudited) (Continued) |
Subadviser outlook
American Century plans to remain disciplined in these uncertain times. They expect market volatility to linger as investors navigate a complex environment of high inflation, rising interest rates, and economic uncertainty. In addition, in American Century’s view, the ongoing Russia-Ukraine conflict has complicated an already-tense geopolitical backdrop. American Century plans to continue monitoring the evolving situation and to take advantage of favorable valuations that may arise in the face of continued volatility.
In TSW’s view, sentiment in the market continues to be bearish, driven primarily by ongoing recessionary concerns. TSW believes that factors contributing to pessimistic market outlook include the ongoing war between Russia and Ukraine, continued growth headwinds in China and other parts of the world, overall inflationary pressures, and more stressed financial markets. Nevertheless, TSW believes that mixed signals potentially point to improvements in specific aspects of the global supply chain – and even signs of inflationary pressures potentially easing for specific goods and services. In TSW’s observation as of the end of the fiscal quarter, the focus continued to be on central banks and their ability to dampen inflation without causing a hard landing. TSW ultimately expects overall uncertainty and volatility to remain elevated.
For PanAgora, their focus on company fundamentals plays a critical role during periods of market turbulence. They believe that their preference for companies that are profitable, well managed, and competitive in their industry will allow their Fund component to have the potential to prevail in periods of extreme market stress. In their ongoing search for investment opportunities, they research new data sources in an effort to find those that are undiscovered by competitors.
41
MassMutual Mid Cap Value Fund – Portfolio Manager Report (Unaudited) (Continued) |
MassMutual |
|
Northern Trust Corp. |
1.4% |
The Allstate Corp. |
1.4% |
AmerisourceBergen Corp. |
1.3% |
Zimmer Biomet Holdings, Inc. |
1.3% |
Quest Diagnostics, Inc. |
1.2% |
Laboratory Corp. of America Holdings |
1.2% |
Huntington Ingalls Industries, Inc. |
1.2% |
Alleghany Corp. |
1.2% |
Dollar Tree, Inc. |
1.2% |
Henry Schein, Inc. |
1.1% |
12.5% |
|
MassMutual |
|
Financial |
27.2% |
Consumer, Non-cyclical |
19.3% |
Industrial |
12.7% |
Utilities |
9.0% |
Consumer, Cyclical |
8.6% |
Communications |
7.2% |
Energy |
6.3% |
Basic Materials |
3.4% |
Technology |
3.2% |
Mutual Funds |
0.7% |
Total Long-Term Investments |
97.6% |
Short-Term Investments and Other Assets and Liabilities |
2.4% |
Net Assets |
100.0% |
42
MassMutual Mid Cap Value Fund – Portfolio Manager Report (Unaudited) (Continued) |
GROWTH OF $10,000 INVESTMENT - Class R5
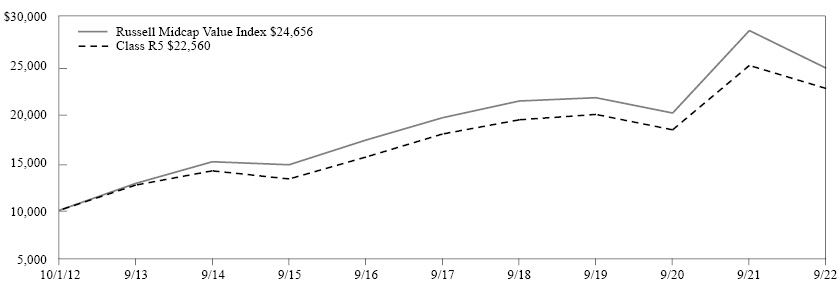
The graph above illustrates a representative class of the Fund’s historical performance for the past 10 fiscal years or since inception (for Funds lacking 10-year records) in comparison to its benchmark index, as well as one or more additional indexes, if applicable. The performance of other share classes will be greater than or less than the class depicted above.
Average Annual Total Returns (for the periods ended 09/30/2022) |
|||||
|
Inception Date |
1 Year |
5 Years |
10 Years |
Since Inception |
Class I |
12/07/2011 |
-9.37% |
4.88% |
||
Class R5 |
08/29/2006 |
-9.51% |
4.77% |
8.48% |
|
Service Class |
08/29/2006 |
-9.60% |
4.65% |
8.37% |
|
Administrative Class |
08/29/2006 |
-9.63% |
4.58% |
8.26% |
|
Class R4 |
04/01/2014 |
-9.79% |
4.42% |
5.42% |
|
Class A |
08/29/2006 |
-9.87% |
4.30% |
7.98% |
|
Class A (sales load deducted)* |
08/29/2006 |
-14.83% |
3.12% |
7.37% |
|
Class R3 |
08/29/2006 |
-9.96% |
4.17% |
7.81% |
|
Russell Midcap Value Index |
-13.56% |
4.76% |
9.44% |
6.36% |
|
* Class A (sales load deducted) returns include the 5.50% maximum sales charge.
Generally accepted accounting principles require adjustments to be made to the net assets of the Fund at period end for financial reporting purposes only, and as such, the total return based on the unadjusted net asset value per share may differ from the total return reported in the financial highlights.
Performance results in the graph and table are shown both with and without the imposition of the maximum applicable sales charge (if applicable) and reflect the percentage change in net asset value, including reinvestment of dividends and capital gains distributions. Investors should note that the Fund is a professionally managed mutual fund, while the index or indexes shown above are unmanaged, cannot be purchased directly, and, with the exception of any peer group index, do not incur expenses.
Performance data quoted in the graph and table represents past performance; past performance is not predictive of future results. The investment return and principal value of shares of the Fund fluctuate, so your shares, when sold, may be worth more or less than their original cost. Current performance of the Fund may be lower or higher than the performance quoted. The performance shown does not reflect the deduction of taxes, if any, that a shareholder would pay on Fund distributions or the redemption of Fund shares. Performance data current to the most recent month end may be obtained by calling 1-888-309-3539.
Investors should read the Fund’s prospectus with regard to the Fund’s investment objectives, risks, and charges and expenses in conjunction with these financial statements. Employee retirement benefit plans that invest plan assets in the Separate Investment Accounts (SIAs) may be subject to certain charges as set forth in their respective Plan Documents. Total return figures would be lower for the periods presented if they reflected these charges.
43
MassMutual Small Cap Value Equity Fund – Portfolio Manager Report (Unaudited) |
What is the investment approach of MassMutual Small Cap Value Equity Fund, and who are the Fund’s subadvisers?
The Fund seeks to maximize total return through investment primarily in small capitalization equity securities that the Fund’s subadvisers believe are undervalued. Under normal circumstances, the Fund invests at least 80% of its net assets (plus the amount of any borrowings for investment purposes) in equity securities of companies whose market capitalizations at the time of purchase are within the market capitalization range of companies included in the Russell 2000® Index or the S&P SmallCap 600 Index. The Fund’s subadvisers are Wellington Management Company LLP (Wellington Management), which managed approximately 56% of the Fund’s portfolio; and Barrow, Hanley, Mewhinney & Strauss, LLC (Barrow Hanley), which was responsible for approximately 44% of the Fund’s portfolio, as of September 30, 2022.
How did the Fund perform during the 12 months ended September 30, 2022?
The Fund’s Class R5 shares returned -13.61%, outperforming the -17.69% return of the Russell 2000 Value Index (the “benchmark”), which measures the performance of the small-cap value segment of the U.S. equity universe. It includes those Russell 2000 Index companies with lower price-to-book ratios and lower forecasted growth values. It is market-capitalization weighted.
For a discussion on the economic and market environment during the 12-month period ended September 30, 2022, please see the Economic and Market Overview, beginning on page 3.
Subadviser discussion of factors that contributed to the Fund’s performance
In the Wellington Management segment of the Fund, strong security selection in the health care, consumer discretionary, and information technology sectors was the primary driver of the Fund component’s outperformance of the benchmark. This was partially offset by weaker stock selection in the consumer staples, materials, and real estate sectors. Sector allocation, a residual of Wellington Management’s bottom-up stock selection process, detracted from relative performance. An underweight allocation to the energy sector detracted but was partially offset by an underweight allocation to the communication services sector and an overweight allocation to the materials sector. With respect to specific Fund component holdings, among the top relative contributors for the period were Huron Consulting (industrials sector) and Haemonetics (health care sector). Shares of Huron Consulting, a consulting company with large practices focused on health care and education, rose during the period due to improving fundamentals and management raising the company’s 2022 guidance. Shares of Haemonetics – a global health care company that engages in the development and distribution of hematology products and services – rose, as management reported strong earnings results over the last several quarters. Among the top relative detractors for the period were Spectrum Brands Holdings (consumer staples sector) and Tyman (industrials sector). Shares of Spectrum Brands Holdings, a consumer products and home essentials company, declined on weaker retail sales and profits – and the risk that the sale of the company’s Home & Hardware division to Assa Abloy will not be allowed to proceed. Shares of Tyman, a manufacturer of door and window components for the residential and commercial construction industry, were weak due to temporary supply chain constraints and concerns about future North American housing construction.
Within the Barrow Hanley component of the Fund, both an overweight allocation to the materials sector, and favorable stock selection within that market segment, were particularly notable. With respect to specific Fund component holdings, specialty materials producer ATI, Inc. (previously Allegheny Technologies Incorporated), a holding since 2016, had the greatest attribution of any single holding, returning more than 59% over the past 12 months. During the reporting period, two other Fund component holdings with significantly positive attributions, Cornerstone Building Brands Inc. and Rogers Corporation (a specialty engineered materials company), were purchased at significant premiums to their share prices. On the downside, Fund component holdings in economically sensitive sectors – such as consumer discretionary, industrial, information technology, and materials (which the Barrow Hanley component of the Fund typically has heavy exposure to due to their higher longer-term return potential) – detracted from the Fund component’s performance during the fiscal year.
Subadviser outlook
Wellington Management’s investment approach emphasizes individual stock selection; sector weights are a residual of their bottom-up investment process. However, Fund management does regularly consider diversification across economic sectors and industries, and continually monitors portfolio risk. Based on their three- to five-year time horizon, Wellington Management believes they will be able to continue to find attractively valued investment opportunities created by the inefficiencies frequently
44
MassMutual Small Cap Value Equity Fund – Portfolio Manager Report (Unaudited) (Continued) |
found among small- and mid-cap companies. At the end of the fiscal year, the Wellington Management Fund component had its largest overweight allocations to the materials, information technology, and consumer discretionary sectors. The Fund component was most significantly underweight in the health care, real estate, and energy sectors at fiscal year-end.
Barrow Hanley notes that, as a matter of policy, they do not forecast absolute returns. Instead, regardless of market conditions, they attempt to provide for maximum possible relative returns. Consistent with this objective, Barrow Hanley believes that the market’s desire for certainty and the “company of the crowd” will tend to provide a high level of individual stock-specific opportunity for longer-term, lower-risk investing. Barrow Hanley believes that, when this occurs, those with the discipline to remain apart from the crowd and seek out unpopular opportunities could benefit disproportionately.
45
MassMutual Small Cap Value Equity Fund – Portfolio Manager Report (Unaudited) (Continued) |
MassMutual |
|
ATI, Inc. |
2.0% |
Super Micro Computer, Inc. |
2.0% |
Darling Ingredients, Inc. |
1.9% |
Texas Capital Bancshares, Inc. |
1.8% |
OFG Bancorp |
1.7% |
Gentherm, Inc. |
1.7% |
WillScot Mobile Mini Holdings Corp. |
1.7% |
Air Transport Services Group, Inc. |
1.6% |
Old National Bancorp |
1.5% |
Cabot Corp. |
1.5% |
17.4% |
|
MassMutual |
|
Financial |
23.8% |
Industrial |
22.5% |
Consumer, Non-cyclical |
14.5% |
Consumer, Cyclical |
11.5% |
Technology |
9.1% |
Basic Materials |
8.4% |
Communications |
3.8% |
Energy |
2.0% |
Utilities |
1.5% |
Mutual Funds |
0.5% |
Total Long-Term Investments |
97.6% |
Short-Term Investments and Other Assets and Liabilities |
2.4% |
Net Assets |
100.0% |
46
MassMutual Small Cap Value Equity Fund – Portfolio Manager Report (Unaudited) (Continued) |
GROWTH OF $10,000 INVESTMENT - Class R5
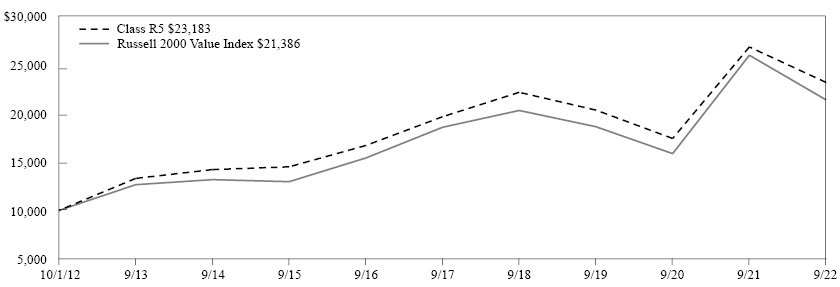
The graph above illustrates a representative class of the Fund’s historical performance for the past 10 fiscal years or since inception (for Funds lacking 10-year records) in comparison to its benchmark index, as well as one or more additional indexes, if applicable. The performance of other share classes will be greater than or less than the class depicted above.
Average Annual Total Returns (for the periods ended 09/30/2022) |
|||||
|
Inception Date |
1 Year |
5 Years |
10 Years |
Since Inception |
Class I |
04/01/2014 |
-13.54% |
3.46% |
5.46% |
|
Class R5 |
03/31/2006 |
-13.61% |
3.36% |
8.77% |
|
Service Class |
03/31/2006 |
-13.72% |
3.26% |
8.66% |
|
Administrative Class |
03/31/2006 |
-13.80% |
3.16% |
8.54% |
|
Class R4 |
04/01/2014 |
-13.99% |
2.98% |
4.99% |
|
Class A |
03/31/2006 |
-14.05% |
2.89% |
8.26% |
|
Class A (sales load deducted)* |
03/31/2006 |
-18.78% |
1.73% |
7.65% |
|
Class R3 |
04/01/2014 |
-14.19% |
2.72% |
4.72% |
|
Russell 2000 Value Index |
-17.69% |
2.87% |
7.94% |
5.05% |
|
* Class A (sales load deducted) returns include the 5.50% maximum sales charge.
Generally accepted accounting principles require adjustments to be made to the net assets of the Fund at period end for financial reporting purposes only, and as such, the total return based on the unadjusted net asset value per share may differ from the total return reported in the financial highlights.
Performance results in the graph and table are shown both with and without the imposition of the maximum applicable sales charge (if applicable) and reflect the percentage change in net asset value, including reinvestment of dividends and capital gains distributions. Investors should note that the Fund is a professionally managed mutual fund, while the index or indexes shown above are unmanaged, cannot be purchased directly, and, with the exception of any peer group index, do not incur expenses.
Performance data quoted in the graph and table represents past performance; past performance is not predictive of future results. The investment return and principal value of shares of the Fund fluctuate, so your shares, when sold, may be worth more or less than their original cost. Current performance of the Fund may be lower or higher than the performance quoted. The performance shown does not reflect the deduction of taxes, if any, that a shareholder would pay on Fund distributions or the redemption of Fund shares. Performance data current to the most recent month end may be obtained by calling 1-888-309-3539.
Investors should read the Fund’s prospectus with regard to the Fund’s investment objectives, risks, and charges and expenses in conjunction with these financial statements. Employee retirement benefit plans that invest plan assets in the Separate Investment Accounts (SIAs) may be subject to certain charges as set forth in their respective Plan Documents. Total return figures would be lower for the periods presented if they reflected these charges.
47
MassMutual Small Company Value Fund – Portfolio Manager Report (Unaudited) |
What is the investment approach of MassMutual Small Company Value Fund, and who are the Fund’s subadvisers?
The Fund seeks to achieve long-term growth of capital by investing primarily in a diversified portfolio of equity securities of smaller companies that the Fund’s subadvisers consider to be undervalued. Under normal circumstances, the Fund invests at least 80% of its net assets (plus the amount of any borrowings for investment purposes) in the securities of companies whose market capitalizations at the time of purchase are within the market capitalization range of companies included in the Russell 2000® Index or the S&P SmallCap 600 Index. The Fund’s subadvisers are AllianceBernstein L.P. (AllianceBernstein), which managed approximately 68% of the Fund’s portfolio; and American Century Investment Management, Inc. (American Century), which was responsible for approximately 32% of the Fund’s portfolio, as of September 30, 2022.
How did the Fund perform during the 12 months ended September 30, 2022?
The Fund’s Class R5 shares returned -19.35%, underperforming the -17.69% return of the Russell 2000 Value Index (the “benchmark”), which measures the performance of the small-cap value segment of the U.S. equity universe. It includes those Russell 2000 Index companies with lower price-to-book ratios and lower forecasted growth values. It is market-capitalization weighted. The Fund outperformed the -23.50% return of the Russell 2000 Index, which measures the performance of the small-cap segment of the U.S. equity universe. It is a subset of the Russell 3000 Index and includes approximately 2000 of the smallest securities based on a combination of their market cap and current index membership.
For a discussion on the economic and market environment during the 12-month period ended September 30, 2022, please see the Economic and Market Overview, beginning on page 3.
Subadviser discussion of factors that contributed to the Fund’s performance
For the fiscal year ended September 30, 2022, with respect to the AllianceBernstein component of the Fund, both sector selection and security selection detracted from relative performance. An underweight to the energy sector detracted, more than offsetting an underweight to health care, which contributed. Security selection in the industrial sector hampered returns, while Fund component holdings in the financial sector contributed. With respect to specific Fund component holdings, Hain Celestial (an American food company whose main focus is natural foods) detracted after it reported a weak first-quarter 2022 and missed expectations with continued cost inflation, supply-chain headwinds, and weakness in European consumer spending. Nomad Foods, a European frozen foods company, also detracted after reporting second-quarter 2022 results. Amusement park operator Six Flags also hindered performance after reporting its first-quarter 2022 results, which included attendance volumes that were down 22% from pre-pandemic levels. With respect to Fund component holdings that contributed to returns, HF Sinclair, an oil refiner and manufacturer of lubricants, benefited from a sharp increase in refining margins, driven by turmoil in the energy markets after the Russian invasion of Ukraine. Health care data analytics company Change Healthcare contributed after it reported stronger-than-expected revenue – and improved terms for its pending acquisition by UnitedHealth Group. Behavioral health care provider Acadia Healthcare contributed after posting positive earnings results throughout the fiscal year.
Within the American Century segment of the Fund, positioning in the energy sector was the primary detractor from performance. The Fund’s underweight allocation to energy hampered returns, as did stock selection within the sector. Most of the drag on performance occurred in the oil, gas, and consumable fuels industry. The information technology sector also detracted from performance. A large overweight to the sector hindered returns, as did stock selection within the market segment. Fund component holdings in the communications equipment industry detracted from performance. An overweight to Avaya Holdings, a cloud communications company, proved especially unfavorable. In the software industry, Fund component holding Teradata, a cloud database firm that was not represented in the benchmark during the fiscal period, also proved detrimental. Turning to the positive, the financial sector was the leading contributor to performance, with stock selection providing the bulk of the return. Avoiding the mortgage real estate investment trust (REIT) industry was also beneficial for the Fund component. Returns in the insurance industry stemmed mostly from American Century’s position in Axis Capital Holdings, a reinsurance company. In the banking industry, a significantly overweight allocation was advantageous. In particular, an overweight allocation to SouthState, a South Carolina-based bank, and a position in FNB, a bank holding company based in Pennsylvania that was not in the benchmark during the fiscal period, were leading contributors. American Century’s positioning in the health care sector also added to relative returns. The primary contributing factor was a decision to avoid exposure to the biotechnology industry. Fund component holdings in the health care providers and services industry also enhanced performance, where a lack of exposure to Invitae, a medical testing firm, proved advantageous. The American Century Fund component’s exposure to derivatives did not have a
48
MassMutual Small Company Value Fund – Portfolio Manager Report (Unaudited) (Continued) |
material effect on performance during the period. Derivatives are securities that derive their value from the performance of one or more other investments and take the form of a contract between two or more parties. Derivatives can be used for hedging, speculation, or both.
Subadviser outlook
AllianceBernstein observes that, as of the end of the fiscal year, markets remained focused on multiple challenges that may impact how much companies will earn and the appropriate multiple to pay for those earnings. In AllianceBernstein’s view, these challenges include supply-chain bottlenecks, cost inflation, and a concern that Federal Reserve interest rate increases may lead to a recession. Stock prices have gyrated as investors have tried to assess which combination of risks will prevail. Overall, in AllianceBernstein’s view, the market seems to have assumed that tougher times are ahead. Fund management sees the potential for challenges in the future, as the global economy undergoes dramatic structural changes in areas like supply-chain onshoring and energy security. As longer-term value investors, AllianceBernstein plans to focus on those companies that combine high quality with strong business models – and can thrive in the new economy that lies ahead.
At the end of the fiscal year, American Century was maintaining a large overweight in the information technology sector – on the view that valuations are attractive due to cyclical reasons, trade war fears, operational miscues, and the conflict in Ukraine. Their Fund component was also overweight in the industrial sector – with Fund component holdings that include quality companies in machinery, distribution, and commercial services, many of which have maintained their pricing power during the inflationary environment. Fund management also views the consumer discretionary sector as attractive, and throughout the fiscal year, the American Century Fund component’s overweight allocation to that sector was dispersed across higher-quality specialty retailers, leisure product manufacturers, attractively valued restaurant and leisure companies, and household durables providers. While many have underperformed recently, Fund management believes that such companies will generate strong results in various economic environments.
49
MassMutual Small Company Value Fund – Portfolio Manager Report (Unaudited) (Continued) |
MassMutual |
|
First BanCorp |
1.9% |
BankUnited, Inc. |
1.5% |
Pacific Premier Bancorp, Inc. |
1.5% |
Change Healthcare, Inc. |
1.2% |
Belden, Inc. |
1.2% |
Texas Capital Bancshares, Inc. |
1.2% |
Selective Insurance Group, Inc. |
1.2% |
ArcBest Corp. |
1.1% |
IDACORP, Inc. |
1.1% |
Independent Bank Group, Inc. |
1.1% |
13.0% |
|
MassMutual |
|
Financial |
36.9% |
Consumer, Cyclical |
17.2% |
Industrial |
16.2% |
Consumer, Non-cyclical |
11.6% |
Technology |
5.9% |
Energy |
3.7% |
Basic Materials |
3.3% |
Utilities |
2.3% |
Communications |
2.2% |
Mutual Funds |
1.6% |
Total Long-Term Investments |
100.9% |
Short-Term Investments and Other Assets and Liabilities |
(0.9)% |
Net Assets |
100.0% |
50
MassMutual Small Company Value Fund – Portfolio Manager Report (Unaudited) (Continued) |
GROWTH OF $10,000 INVESTMENT - Class R5
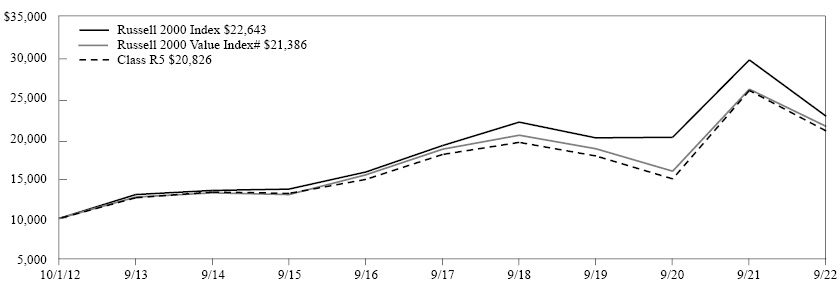
The graph above illustrates a representative class of the Fund’s historical performance for the past 10 fiscal years or since inception (for Funds lacking 10-year records) in comparison to its benchmark index, as well as one or more additional indexes, if applicable. The performance of other share classes will be greater than or less than the class depicted above.
Average Annual Total Returns (for the periods ended 09/30/2022) |
|||||
|
Inception Date |
1 Year |
5 Years |
10 Years |
Since Inception |
Class I |
11/15/2010 |
-19.24% |
3.16% |
7.74% |
|
Class R5 |
12/31/2001 |
-19.35% |
3.06% |
7.61% |
|
Service Class |
12/31/2001 |
-19.41% |
2.96% |
7.51% |
|
Administrative Class |
12/31/2001 |
-19.50% |
2.86% |
7.40% |
|
Class R4 |
04/01/2014 |
-19.62% |
2.70% |
4.38% |
|
Class A |
12/31/2001 |
-19.76% |
2.57% |
7.12% |
|
Class A (sales load deducted)* |
12/31/2001 |
-24.17% |
1.42% |
6.52% |
|
Class R3 |
12/31/2002 |
-19.84% |
2.42% |
6.94% |
|
Russell 2000 Value Index# |
-17.69% |
2.87% |
7.94% |
5.05% |
|
Russell 2000 Index |
-23.50% |
3.55% |
8.55% |
5.60% |
|
* Class A (sales load deducted) returns include the 5.50% maximum sales charge.
# Benchmark
Generally accepted accounting principles require adjustments to be made to the net assets of the Fund at period end for financial reporting purposes only, and as such, the total return based on the unadjusted net asset value per share may differ from the total return reported in the financial highlights.
Performance results in the graph and table are shown both with and without the imposition of the maximum applicable sales charge (if applicable) and reflect the percentage change in net asset value, including reinvestment of dividends and capital gains distributions. Investors should note that the Fund is a professionally managed mutual fund, while the index or indexes shown above are unmanaged, cannot be purchased directly, and, with the exception of any peer group index, do not incur expenses.
Performance data quoted in the graph and table represents past performance; past performance is not predictive of future results. The investment return and principal value of shares of the Fund fluctuate, so your shares, when sold, may be worth more or less than their original cost. Current performance of the Fund may be lower or higher than the performance quoted. The performance shown does not reflect the deduction of taxes, if any, that a shareholder would pay on Fund distributions or the redemption of Fund shares. Performance data current to the most recent month end may be obtained by calling 1-888-309-3539.
Investors should read the Fund’s prospectus with regard to the Fund’s investment objectives, risks, and charges and expenses in conjunction with these financial statements. Employee retirement benefit plans that invest plan assets in the Separate Investment Accounts (SIAs) may be subject to certain charges as set forth in their respective Plan Documents. Total return figures would be lower for the periods presented if they reflected these charges.
51
MassMutual Mid Cap Growth Fund – Portfolio Manager Report (Unaudited) |
What is the investment approach of MassMutual Mid Cap Growth Fund, and who are the Fund’s subadvisers?
The Fund seeks growth of capital over the long-term by investing primarily in equity securities of mid-capitalization companies that the Fund’s subadvisers believe offer the potential for long-term growth. Under normal circumstances, the Fund invests at least 80% of its net assets (plus the amount of any borrowings for investment purposes) in a broadly diversified portfolio of common stocks of mid-cap companies whose earnings the Fund’s subadvisers expect to grow at a faster rate than the average company. The Fund’s subadvisers are T. Rowe Price Associates, Inc. (T. Rowe Price), which managed approximately 76% of the Fund’s portfolio; and Frontier Capital Management Company, LLC (Frontier), which was responsible for approximately 24% of the Fund’s portfolio, as of September 30, 2022. In addition, T. Rowe Price Investment Management, Inc. serves as a sub-subadviser for the portion of the portfolio subadvised by T. Rowe Price.
How did the Fund perform during the 12 months ended September 30, 2022?
The Fund’s Class R5 shares returned -26.76%, outperforming the -29.50% return of the Russell Midcap® Growth Index (the “benchmark”), which measures the performance of the mid-cap growth segment of the U.S. equity universe. It includes Russell Midcap Index companies with higher price-to-book ratios and higher forecasted growth values. It is market-capitalization weighted.
For a discussion on the economic and market environment during the 12-month period ended September 30, 2022, please see the Economic and Market Overview, beginning on page 3.
Subadviser discussion of factors that contributed to the Fund’s performance
For the fiscal year ended September 30, 2022, within the T. Rowe Price component of the Fund, both stock selection and sector allocation drove the Fund component’s outperformance. Favorable stock selection in the health care sector contributed to relative results. With respect to specific Fund component holdings, while Hologic, a medical technology company primarily focused on women’s health, declined in performance during the fiscal year, it performed well relative to its sector peers, and the company exhibited broad-based strength during the period. Within the consumer discretionary sector, Dollar General shares advanced, as the company benefited from consumers’ renewed focus on discounted goods. Security selection and an underweight allocation to the communication services sector further boosted T. Rowe Price’s relative performance for the period. On the downside, an underweight allocation to the energy sector detracted from relative returns, but this was offset by strong stock selection in that market segment. The materials sector also detracted due to unfavorable stock selection, but this was partially offset by an overweight position. Shares of Ball, a leading global manufacturer of aluminum packaging products, declined on weaker results and lowered 2022 guidance due to numerous headwinds, including inflationary pressures, a severe recession in Brazil, and the closure of its Russia-based business. The T. Rowe Price component of the Fund held warrants during the period, which had a negligible impact on performance. Derivatives are securities that derive their value from the performance of one or more other investments and take the form of a contract between two or more parties. Derivatives can be used for hedging, speculation, or both.
Adverse sector allocation that neutralized favorable stock selection challenged the Frontier component of the Fund during the fiscal year. The Fund component’s underweight allocations to the energy and consumer staples sectors, the top two performing market segments, accounted for most of the allocation headwind, as investors reached for an inflation hedge on the one hand – and safety on the other. Stock selection was the strongest in the technology sector, followed by consumer discretionary and health care, with partial offsets coming from Fund component holdings in energy and telecommunications. With respect to specific Fund component holdings, network security software provider Palo Alto Networks Inc. benefited from a strong product cycle, share gains, and heightened customer awareness against security breaches. Semiconductor supplier Wolfspeed Inc. reported improving sales and raised its long-term revenue forecast by a third based on expanding manufacturing capacity and accelerating share gains in the electrical vehicle market. In the consumer discretionary sector, toy maker Mattel Inc. reported significantly better-than-expected results. Discount retailer Dollar General Corporation posted same-store sales above Wall Street’s estimates and raised its annual revenue target. Signify Health Inc. rose sharply, as CVS Health Corporation agreed to buy the value-based care provider for a 78% premium. Together, these contributions overcame the headwinds from economically sensitive Fund component holdings – such as Caesars Entertainment, Inc. (an American hotel and casino entertainment company); Block, Inc. (an American multinational technology conglomerate); and SVB Financial Group (a holding company that provides banking and financial services), all of which underperformed in the rising interest rate environment.
52
MassMutual Mid Cap Growth Fund – Portfolio Manager Report (Unaudited) (Continued) |
Subadviser outlook
In T. Rowe Price’s view, investors in the United States continue to live and invest in an unprecedented macroeconomic environment. T. Rowe Price believes that the bear market in the U.S. that was present at the end of the fiscal year was particularly unusual in that it took place in conjunction with a tight labor market featuring record job openings and historically low unemployment. Looking ahead, T. Rowe Price believes that investors are likely to remain focused on whether the Federal Reserve (the “Fed”) can achieve a soft landing by taming inflation without sending the economy into recession. Outside of the U.S., Fund management believes that the probability of a recession is higher due to the implications of the Russian invasion of Ukraine, soaring energy prices, and persistent inflation. Regardless of the macroeconomic environment, Fund management’s focus remains on long-term outperformance. They expect to continue to seek out reasonably valued equities with strong fundamental underpinnings, while paying careful attention to risk and valuation relative to growth prospects.
In Frontier’s view, the probability of a recession has increased substantially, due to stubborn inflation and a more aggressive Fed, which seems determined to tame prices, even at the expense of economic growth. Fund management believes that the substantial decline in the benchmark partly reflects the impending slump. On the brighter side, Frontier believes that the combination of lower demand and loosening supply has the potential to reduce inflation. Price declines, as of September 30, 2022, were already visible in categories ranging from rents and home values to commodities and autos. At the same time, in Frontier’s opinion, the ongoing market correction places U.S. equities on a firmer footing by driving out excess speculation and potentially setting the stage for the next expansion.
53
MassMutual Mid Cap Growth Fund – Portfolio Manager Report (Unaudited) (Continued) |
MassMutual |
|
Hologic, Inc. |
2.5% |
Microchip Technology, Inc. |
2.4% |
Agilent Technologies, Inc. |
2.1% |
Textron, Inc. |
1.8% |
Teleflex, Inc. |
1.7% |
Ingersoll Rand, Inc. |
1.7% |
Marvell Technology, Inc. |
1.7% |
Dollar General Corp. |
1.5% |
KLA Corp. |
1.5% |
Chipotle Mexican Grill, Inc. |
1.3% |
18.2% |
|
MassMutual |
|
Consumer, Non-cyclical |
30.1% |
Technology |
19.4% |
Industrial |
16.7% |
Consumer, Cyclical |
15.5% |
Financial |
6.3% |
Communications |
4.5% |
Energy |
3.2% |
Basic Materials |
0.8% |
Mutual Funds |
0.5% |
Total Long-Term Investments |
97.0% |
Short-Term Investments and Other Assets and Liabilities |
3.0% |
Net Assets |
100.0% |
54
MassMutual Mid Cap Growth Fund – Portfolio Manager Report (Unaudited) (Continued) |
GROWTH OF $10,000 INVESTMENT - Class R5
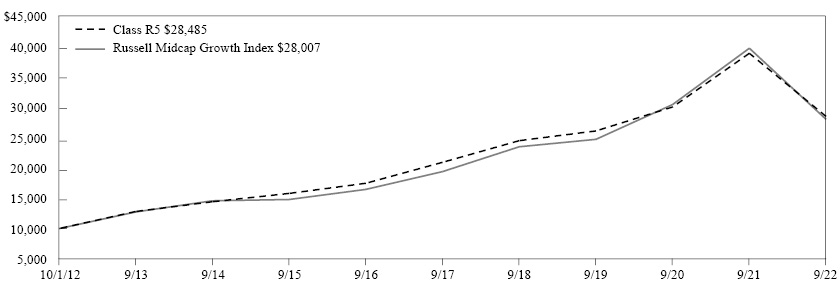
The graph above illustrates a representative class of the Fund’s historical performance for the past 10 fiscal years or since inception (for Funds lacking 10-year records) in comparison to its benchmark index, as well as one or more additional indexes, if applicable. The performance of other share classes will be greater than or less than the class depicted above.
Average Annual Total Returns (for the periods ended 09/30/2022) |
|||||
|
Inception Date |
1 Year |
5 Years |
10 Years |
Since Inception |
Class I |
11/15/2010 |
-26.68% |
6.47% |
11.15% |
|
Class R5 |
06/01/2000 |
-26.76% |
6.36% |
11.04% |
|
Service Class |
06/01/2000 |
-26.85% |
6.25% |
10.93% |
|
Administrative Class |
06/01/2000 |
-26.93% |
6.14% |
10.81% |
|
Class R4 |
04/01/2014 |
-26.98% |
5.99% |
8.08% |
|
Class A |
06/01/2000 |
-27.06% |
5.89% |
10.53% |
|
Class A (sales load deducted)* |
06/01/2000 |
-31.07% |
4.69% |
9.91% |
|
Class R3 |
12/31/2002 |
-27.22% |
5.72% |
10.34% |
|
Russell Midcap Growth Index |
-29.50% |
7.62% |
10.85% |
8.43% |
|
* Class A (sales load deducted) returns include the 5.50% maximum sales charge.
Generally accepted accounting principles require adjustments to be made to the net assets of the Fund at period end for financial reporting purposes only, and as such, the total return based on the unadjusted net asset value per share may differ from the total return reported in the financial highlights.
Performance results in the graph and table are shown both with and without the imposition of the maximum applicable sales charge (if applicable) and reflect the percentage change in net asset value, including reinvestment of dividends and capital gains distributions. Investors should note that the Fund is a professionally managed mutual fund, while the index or indexes shown above are unmanaged, cannot be purchased directly, and, with the exception of any peer group index, do not incur expenses.
Performance data quoted in the graph and table represents past performance; past performance is not predictive of future results. The investment return and principal value of shares of the Fund fluctuate, so your shares, when sold, may be worth more or less than their original cost. Current performance of the Fund may be lower or higher than the performance quoted. The performance shown does not reflect the deduction of taxes, if any, that a shareholder would pay on Fund distributions or the redemption of Fund shares. Performance data current to the most recent month end may be obtained by calling 1-888-309-3539.
Investors should read the Fund’s prospectus with regard to the Fund’s investment objectives, risks, and charges and expenses in conjunction with these financial statements. Employee retirement benefit plans that invest plan assets in the Separate Investment Accounts (SIAs) may be subject to certain charges as set forth in their respective Plan Documents. Total return figures would be lower for the periods presented if they reflected these charges.
55
MassMutual Small Cap Growth Equity Fund – Portfolio Manager Report (Unaudited) |
What is the investment approach of MassMutual Small Cap Growth Equity Fund, and who are the Fund’s subadvisers?
The Fund seeks long-term capital appreciation by investing primarily in equity securities of smaller companies that the Fund’s subadvisers believe offer potential for long-term growth. Under normal circumstances, the Fund invests at least 80% of its net assets (plus the amount of any borrowings for investment purposes) in the equity securities of companies whose market capitalizations at the time of purchase are within the market capitalization range of companies included in the Russell 2000® Index or the S&P SmallCap 600 Index. The Fund’s subadvisers are Wellington Management Company LLP (Wellington Management), which managed approximately 60% of the Fund’s portfolio; and Invesco Advisers, Inc. (Invesco Advisers), which oversaw approximately 40% of the Fund’s portfolio, as of September 30, 2022.
How did the Fund perform during the 12 months ended September 30, 2022?
The Fund’s Class R5 shares returned -26.73%, outperforming the -29.27% return of the Russell 2000 Growth Index (the “benchmark”), which measures the performance of the small-cap growth segment of the U.S. equity universe. It includes Russell 2000 Index companies with higher price-to-book ratios and higher forecasted growth values. It is market-capitalization weighted. The Fund underperformed the -23.50% return of the Russell 2000 Index, which measures the performance of the small-cap segment of the U.S. equity universe. It is a subset of the Russell 3000 Index and includes approximately 2000 of the smallest securities based on a combination of their market cap and current index membership.
For a discussion on the economic and market environment during the 12-month period ended September 30, 2022, please see the Economic and Market Overview, beginning on page 3.
Subadviser discussion of factors that contributed to the Fund’s performance
In the Wellington Management component of the Fund, strong security selection in the health care and industrial sectors was the primary driver of the Fund component’s outperformance of the benchmark for the one-year period ended September 30, 2022. This was partially offset by weaker stock selection within the communication services, health care, and information technology sectors. With regard to specific Fund component holdings, among the top relative contributors were Fluor (industrial sector) and Viper Energy Partners (energy sector). Shares of Fluor ended the period higher after the engineering and construction firm reported fourth-quarter 2021 adjusted earnings per share (EPS) levels above expectations. The company also provided strong 2022 EPS guidance. Shares of Viper Energy Partners ended the period higher after the mineral rights company reported strong fourth-quarter 2021 adjusted earnings, beating consensus estimates. Among the top relative detractors for the period were Bandwidth (communication services sector) and Rapid7 (information technology sector). The share price of Bandwidth, a cloud-based communication services company, fell over the period after management released disappointing 2022 guidance. The company suffered a Distributed Denial of Service (DDoS) attack in third-quarter 2021 and Fund management eliminated the position during the period, given gross margin pressure and a reduced growth outlook for the company. Rapid7 shares fell during the period as the company shared second-quarter 2022 results. Demand in the vulnerability management segment softened during the quarter and the company sold off, along with the software sector more broadly, given the rising interest rate environment and multiple contractions that impacted the broader industry.
With respect to the Invesco Advisers component of the Fund, strong stock selection in the financial sector contributed to the Fund component’s performance for the fiscal year ended September 30, 2022. The major detractor from performance was weaker stock selection in the consumer staples, consumer discretionary, and industrial sectors. Fund component holdings that were among the top-performing stocks included Shockwave Medical, LPL Financial, and WillScot Mobile Mini. Shockwave Medical, a cardiovascular medical device company, reported multiple quarters of substantial upside due to continued fast-paced adoption of their technology used to remove calcified lesions in patients with heart disease. LPL Financial offers technology, brokerage, and investment advisory services through business relationships with many types of financial advisors. They reported another strong quarter for second-quarter 2022. Throughout the fiscal year, LPL Financial benefitted from higher interest rates; they continued to hire new advisors at a fast pace, which helped to grow overall assets under management. WillScot Mobile Mini provides modular and portable storage services. The company reported solid second-quarter 2022 revenue and EBITDA that beat consensus estimates, and it also raised its 2022 guidance. (Earnings before interest, tax, depreciation, and amortization (EBITDA) is a measure of a company’s operating performance.) Fund component holdings that were top detractors from performance included Kornit Digital, Tandem Diabetes Care, and Boot Barn. Kornit Digital develops, manufactures, and markets
56
MassMutual Small Cap Growth Equity Fund – Portfolio Manager Report (Unaudited) (Continued) |
industrial and commercial printing solutions for the garment, apparel, and textiles industries. The stock declined in the second quarter of 2022 as a result of reduced consumer spending, which caused management to lower its guidance. Tandem Diabetes Care is a medical device company for the treatment of diabetes. The company reported mixed financial results during the second quarter of 2022. The stock lagged on growing fear of competition in the diabetes pump sector. Boot Barn detracted from performance in the third quarter of 2022 as its inventories were elevated – and its guidance fell short of Wall Street estimates.
Subadviser outlook
In Wellington Management’s view, this past fiscal year has been categorized by heightened market volatility, spurred on by a steady slate of macro cross-currents, ranging from record inflation to persistent supply chain challenges and Russia’s invasion of Ukraine. In Wellington Management’s observation, markets ended the period lower, as investors braced for a recession; however, as of the end of the fiscal period, the timing and magnitude are still unknown, as market participants weigh the impacts of persistent inflation, recession, and the Federal Reserve’s (the “Fed”) reactionary function. As a result, stocks within the Wellington Management Fund component were prone to trading on narrative rather than fundamentals during the period. Given this uncertainty, Fund management remains disciplined within their upside/downside valuation framework – and expects to position the portfolio to be balanced, yet in a position to potentially recover when markets begin to turn positive. At the end of the fiscal year, the Wellington Management Fund component had its largest overweight allocation to the real estate, industrial, and energy sectors, and its most significant underweight allocation to the information technology, financial, and consumer discretionary sectors.
In Invesco Advisers’ view, as the final quarter of 2022 begins, financial markets remain unusually volatile as a complex global scenario unfolds. In Invesco Advisers’ observation, the market’s primary focus is on aggressive Fed monetary policy tightening to address excessive inflation, and how much harm such tightening may inflict on gross domestic product (GDP) and corporate earnings. GDP fell at a -1.6% annual rate in the second quarter of 2022, so the likelihood of a hard landing increased. Meanwhile, as of the end of the fiscal period, rising interest rates, commodity, labor, and supply chain costs were weighing on corporate margins. Although Fund management has sought to defend against this hostile macroeconomic picture with a defensive portfolio strategy in recent months, they are alert to the eventual return of favorable conditions on the road ahead. There has been a sizable valuation reset in growth stock valuations this year, which has, in Invesco Advisers’ view, improved the risk/reward trade-off.
57
MassMutual Small Cap Growth Equity Fund – Portfolio Manager Report (Unaudited) (Continued) |
MassMutual |
|
Chart Industries, Inc. |
1.7% |
WillScot Mobile Mini Holdings Corp. |
1.4% |
Casella Waste Systems, Inc. Class A |
1.4% |
Manhattan Associates, Inc. |
1.3% |
Inspire Medical Systems, Inc. |
1.2% |
Calix, Inc. |
1.1% |
Acadia Healthcare Co., Inc. |
1.1% |
Globus Medical, Inc. Class A |
1.1% |
SM Energy Co. |
1.0% |
Livent Corp. |
1.0% |
12.3% |
|
MassMutual |
|
Consumer, Non-cyclical |
29.0% |
Industrial |
16.0% |
Technology |
13.7% |
Financial |
13.3% |
Consumer, Cyclical |
9.4% |
Energy |
6.0% |
Communications |
3.6% |
Mutual Funds |
2.5% |
Basic Materials |
2.5% |
Utilities |
1.1% |
Total Long-Term Investments |
97.1% |
Short-Term Investments and Other Assets and Liabilities |
2.9% |
Net Assets |
100.0% |
58
MassMutual Small Cap Growth Equity Fund – Portfolio Manager Report (Unaudited) (Continued) |
GROWTH OF $10,000 INVESTMENT - Class R5
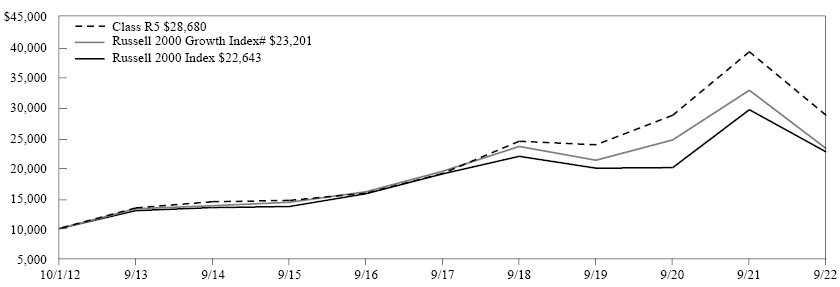
The graph above illustrates a representative class of the Fund’s historical performance for the past 10 fiscal years or since inception (for Funds lacking 10-year records) in comparison to its benchmark index, as well as one or more additional indexes, if applicable. The performance of other share classes will be greater than or less than the class depicted above.
Average Annual Total Returns (for the periods ended 09/30/2022) |
|||||
|
Inception Date |
1 Year |
5 Years |
10 Years |
Since Inception |
Class I |
11/15/2010 |
-26.67% |
8.60% |
11.22% |
|
Class R5 |
05/03/1999 |
-26.73% |
8.49% |
11.11% |
|
Service Class |
05/03/1999 |
-26.82% |
8.38% |
10.99% |
|
Administrative Class |
05/03/1999 |
-26.83% |
8.28% |
10.88% |
|
Class R4 |
04/01/2014 |
-26.96% |
8.13% |
7.69% |
|
Class A |
05/03/1999 |
-27.06% |
8.00% |
10.59% |
|
Class A (sales load deducted)* |
05/03/1999 |
-31.07% |
6.79% |
9.97% |
|
Class R3 |
12/31/2002 |
-27.10% |
7.85% |
10.41% |
|
Russell 2000 Growth Index# |
-29.27% |
3.60% |
8.81% |
5.75% |
|
Russell 2000 Index |
-23.50% |
3.55% |
8.55% |
5.60% |
|
* Class A (sales load deducted) returns include the 5.50% maximum sales charge.
# Benchmark
Generally accepted accounting principles require adjustments to be made to the net assets of the Fund at period end for financial reporting purposes only, and as such, the total return based on the unadjusted net asset value per share may differ from the total return reported in the financial highlights.
Performance results in the graph and table are shown both with and without the imposition of the maximum applicable sales charge (if applicable) and reflect the percentage change in net asset value, including reinvestment of dividends and capital gains distributions. Investors should note that the Fund is a professionally managed mutual fund, while the index or indexes shown above are unmanaged, cannot be purchased directly, and, with the exception of any peer group index, do not incur expenses.
Performance data quoted in the graph and table represents past performance; past performance is not predictive of future results. The investment return and principal value of shares of the Fund fluctuate, so your shares, when sold, may be worth more or less than their original cost. Current performance of the Fund may be lower or higher than the performance quoted. The performance shown does not reflect the deduction of taxes, if any, that a shareholder would pay on Fund distributions or the redemption of Fund shares. Performance data current to the most recent month end may be obtained by calling 1-888-309-3539.
Investors should read the Fund’s prospectus with regard to the Fund’s investment objectives, risks, and charges and expenses in conjunction with these financial statements. Employee retirement benefit plans that invest plan assets in the Separate Investment Accounts (SIAs) may be subject to certain charges as set forth in their respective Plan Documents. Total return figures would be lower for the periods presented if they reflected these charges.
59
MassMutual Overseas Fund – Portfolio Manager Report (Unaudited) |
What is the investment approach of MassMutual Overseas Fund, and who are the Fund’s subadvisers?
The Fund seeks growth of capital over the long-term by investing in foreign equity securities. Under normal circumstances, the Fund invests at least 80% of its net assets (plus the amount of any borrowings for investment purposes) in stocks of foreign companies, including companies located in Europe, Latin America, and Asia. The Fund may invest up to 25% of its total assets in equity securities of issuers in emerging markets. The Fund’s subadvisers are Massachusetts Financial Services Company (MFS), which was responsible for approximately 68% of the Fund’s portfolio; and Harris Associates L.P. (Harris), which oversaw approximately 32% of the Fund’s portfolio, as of September 30, 2022.
How did the Fund perform during the 12 months ended September 30, 2022?
The Fund’s Class R5 shares returned -24.74%, outperforming the -25.13% return of the MSCI EAFE Index (the “benchmark”), which measures the performance of the large- and mid-cap segments of developed markets, excluding the U.S. and Canada equity securities. It is free float-adjusted market-capitalization weighted.
For a discussion on the economic and market environment during the 12-month period ended September 30, 2022, please see the Economic and Market Overview, beginning on page 3.
Subadviser discussion of factors that contributed to the Fund’s performance
For the fiscal year ended September 30, 2022, with respect to the MFS component of the Fund, stock selection in the information technology, financial, and consumer discretionary sectors contributed to performance relative to the benchmark. Within the information technology sector, not holding shares of lithography systems manufacturer for the semiconductor industry ASML (Netherlands) supported the Fund component’s relative results. Within the financial sector, overweight positions in stock exchange operator Deutsche Börse (Germany), banking services provider DBS Group (Singapore), and investment management and banking firm UBS (Switzerland) bolstered relative results. Within the consumer discretionary sector, an overweight position in food catering company Compass Group (United Kingdom) supported the Fund component’s relative performance. During the reporting period, the Fund component’s relative currency exposure, resulting primarily from differences between MFS’s and the benchmark’s exposures to holdings of securities denominated in foreign currencies, was another contributor to relative performance. Detracting from relative performance for the fiscal year was an underweight position and, to a lesser extent, stock selection within, the energy sector – where not owning shares of strong-performing global energy and petrochemicals company Shell (United Kingdom) and integrated energy and petroleum company TotalEnergies (France) hampered performance. Security selection in the materials sector also weakened relative results. Within that market segment, not owning shares of mining giant BHP Group (Australia) and an overweight position in paint and specialty chemicals manufacturer Akzo Nobel (Netherlands) hindered relative performance.
For the Harris Fund component of the Fund, Japan provided the best relative performance, due primarily to allocation effects, while stock selection also contributed. The Netherlands produced the next-best result, owing to stock selection effects in this geography – followed by Indonesia, where the underlying Fund component holding produced a positive absolute return. Holdings in Germany detracted the most from relative performance, predominantly driven by Harris’s higher exposure to the country relative to the benchmark. The next-largest negative relative results came from holdings in the U.K. and France. From a sector perspective, the materials sector furnished the best relative performance, due to positive outcomes from both stock selection as well as a greater-than-benchmark weighting. Fund component holdings in the technology and industrial sectors delivered the next best performance, due to a combination of weighting and stock selection effects. The financial sector supplied the largest negative relative result, due to stock selection effects, as nine of 13 underlying holdings lost value during the period. Fund component holdings in the consumer discretionary and communication services sectors produced the next-largest negative relative results for the period, due to a combination of weighting and stock selection effects. As of September 30, 2022, the Fund component no longer held any hedges or derivatives; however, over the past 12 months, hedges contributed to the Harris Fund component’s performance. Derivatives are securities that derive their value from the performance of one or more other investments and take the form of a contract between two or more parties. Derivatives can be used for hedging, speculation, or both.
60
MassMutual Overseas Fund – Portfolio Manager Report (Unaudited) (Continued) |
Subadviser outlook
MFS believes that, as of the end of the fiscal year, with central banks aggressively raising interest rates to combat stubbornly elevated inflation levels, Russia restricting its natural gas supply to Europe, and China continuing to enforce its Zero-COVID lockdown policy, it seems like a matter of when, not if, many company earnings decline from record levels. Composite leading indicators compiled by the Organization for Economic Co-operation and Development (OECD) during the fiscal year support this potential outcome. After suggesting expansionary economic activity just one year ago, the OECD’s global, developed markets and emerging markets leading indicators have all turned negative as of the end of the fiscal year. Although MFS believes that it is difficult to forecast how far earnings might decline from current levels, in MFS’s opinion, the companies in its Fund component’s portfolio have more pricing power, higher returns, and less volatile earnings than the market overall.
Harris observes that a variety of macroeconomic concerns pressured financial markets throughout the fiscal year. While Harris does not overlook the negative impacts that the war in Ukraine, tightening financial conditions, energy crisis, and volatile currencies will continue to have, Harris remains cognizant that a company’s value is generally derived from its longer-term cash flows, discounted back to the present day. As share prices fall across the board, Harris plans to focus on long-term normalized earning power at normalized discount rates, purchasing them at valuations below Fund management’s estimate of intrinsic value.
61
MassMutual Overseas Fund – Portfolio Manager Report (Unaudited) (Continued) |
MassMutual |
|
Nestle SA Registered |
2.7% |
Roche Holding AG |
2.6% |
Capgemini SE |
2.0% |
Schneider Electric SE |
1.9% |
SAP SE |
1.8% |
Bayer AG Registered |
1.7% |
Intesa Sanpaolo SpA |
1.7% |
Air Liquide SA |
1.7% |
LVMH Moet Hennessy Louis Vuitton SE |
1.6% |
Novo Nordisk A/S Class B |
1.5% |
|
19.2% |
MassMutual |
|
Consumer, Non-cyclical |
29.2% |
Financial |
18.3% |
Consumer, Cyclical |
14.8% |
Industrial |
14.5% |
Technology |
7.6% |
Basic Materials |
5.5% |
Communications |
4.8% |
Energy |
1.6% |
Utilities |
0.8% |
Mutual Funds |
0.7% |
Total Long-Term Investments |
97.8% |
Short-Term Investments and Other Assets and Liabilities |
2.2% |
Net Assets |
100.0% |
62
MassMutual Overseas Fund – Portfolio Manager Report (Unaudited) (Continued) |
GROWTH OF $10,000 INVESTMENT - Class R5
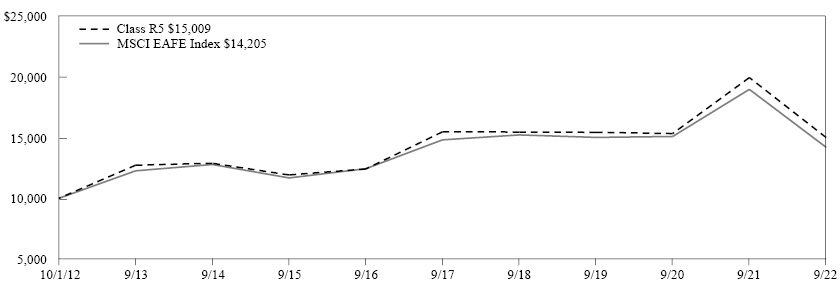
The graph above illustrates a representative class of the Fund’s historical performance for the past 10 fiscal years or since inception (for Funds lacking 10-year records) in comparison to its benchmark index, as well as one or more additional indexes, if applicable. The performance of other share classes will be greater than or less than the class depicted above.
Average Annual Total Returns (for the periods ended 09/30/2022) |
|||||
|
Inception Date |
1 Year |
5 Years |
10 Years |
Since Inception |
Class I |
11/15/2010 |
-24.66% |
-0.51% |
4.29% |
|
Class R5 |
05/01/2001 |
-24.74% |
-0.61% |
4.14% |
|
Service Class |
05/01/2001 |
-24.79% |
-0.70% |
4.06% |
|
Administrative Class |
05/01/2001 |
-24.93% |
-0.81% |
3.95% |
|
Class R4 |
04/01/2014 |
-24.94% |
-0.95% |
1.08% |
|
Class A |
05/01/2001 |
-25.07% |
-1.05% |
3.69% |
|
Class A (sales load deducted)* |
05/01/2001 |
-29.19% |
-2.17% |
3.11% |
|
Class R3 |
12/31/2002 |
-25.23% |
-1.20% |
3.50% |
|
MSCI EAFE Index |
-25.13% |
-0.84% |
3.67% |
1.00% |
|
* Class A (sales load deducted) returns include the 5.50% maximum sales charge.
Generally accepted accounting principles require adjustments to be made to the net assets of the Fund at period end for financial reporting purposes only, and as such, the total return based on the unadjusted net asset value per share may differ from the total return reported in the financial highlights.
Performance results in the graph and table are shown both with and without the imposition of the maximum applicable sales charge (if applicable) and reflect the percentage change in net asset value, including reinvestment of dividends and capital gains distributions. Investors should note that the Fund is a professionally managed mutual fund, while the index or indexes shown above are unmanaged, cannot be purchased directly, and, with the exception of any peer group index, do not incur expenses.
Performance data quoted in the graph and table represents past performance; past performance is not predictive of future results. The investment return and principal value of shares of the Fund fluctuate, so your shares, when sold, may be worth more or less than their original cost. Current performance of the Fund may be lower or higher than the performance quoted. The performance shown does not reflect the deduction of taxes, if any, that a shareholder would pay on Fund distributions or the redemption of Fund shares. Performance data current to the most recent month end may be obtained by calling 1-888-309-3539.
Investors should read the Fund’s prospectus with regard to the Fund’s investment objectives, risks, and charges and expenses in conjunction with these financial statements. Employee retirement benefit plans that invest plan assets in the Separate Investment Accounts (SIAs) may be subject to certain charges as set forth in their respective Plan Documents. Total return figures would be lower for the periods presented if they reflected these charges.
63
MassMutual Select T. Rowe Price International Equity Fund – Portfolio Manager Report (Unaudited) |
What is the investment approach of MassMutual Select T. Rowe Price International Equity Fund, and who are the Fund’s subadvisers?
The Fund seeks long-term capital growth and current income primarily through investments in non-U.S. stocks. Under normal circumstances, the Fund invests at least 80% of its net assets (plus the amount of any borrowings for investment purposes) in equity securities. The Fund normally invests in a number of different countries throughout the world and may purchase the stocks of companies of any size. The Fund’s subadviser is T. Rowe Price Associates, Inc. (T. Rowe Price). In addition, each of T. Rowe Price International Ltd, T. Rowe Price Hong Kong Limited, and T. Rowe Price Singapore Private Ltd. serves as a sub-subadviser for the Fund.
Except as noted below, the MassMutual Select T. Rowe Price International Equity Fund has not been available for purchase by new or existing investors since October 29, 2020. The MassMutual Select T. Rowe Price Retirement Funds will continue to be able to purchase shares of the Fund. No other new or existing customers will be able to make purchases of the Fund, except that existing customers may continue to reinvest any dividends and capital gains distributions. Purchases of Fund shares may be further restricted or reopened in the future.
How did the Fund perform during the 12 months ended September 30, 2022?
The Fund’s Class I shares returned -25.28%, underperforming the -25.17% return of the MSCI All Country World Index (ACWI) ex USA (the “benchmark”), which measures the performance of the large- and mid-cap segments of the particular regions, excluding U.S. equity securities, including developed and emerging markets. It is free float-adjusted market-capitalization weighted.
For a discussion on the economic and market environment during the 12-month period ended September 30, 2022, please see the Economic and Market Overview, beginning on page 3.
Subadviser discussion of factors that contributed to the Fund’s performance
T. Rowe Price takes a core approach to investing, which provides exposure to both growth and value styles of investing. For the fiscal year ended September 30, 2022, stock selection among the emerging markets stock and international developed value equity allocations detracted from relative returns, as the allocations lagged their respective benchmarks. Conversely, selection in the international developed growth and emerging markets value equity allocations lifted relative results. Tactical positioning had a mixed impact on results. An overweight allocation to international large-cap value equities, which outpaced growth equities for the period, was beneficial. However, an overweight allocation to emerging markets equities, which trailed international developed stocks, weighed on relative performance.
Within the emerging markets equity allocation, less-than-favorable stock selection in the financial sector detracted from relative results, driven by holdings in the banking industry. Weak stock selection in the communication services sector also had a negative impact on relative performance. Conversely, favorable stock selection in the real estate sector lifted relative results, led by the real estate management and development industry. From a country perspective, weak stock selection in India weighed on relative returns. However, positive stock selection in Hong Kong aided relative returns, although it was mostly offset by an overweight allocation.
The international equity value allocation underperformed, as unfavorable security selection, coupled with an overweight allocation to the information technology sector, weighed on relative performance, driven by holdings in the semiconductors and semiconductor equipment industry. Detrimental stock choices and an underweight allocation to the energy sector also held back relative results. However, favorable stock selection in the consumer staples sector added value, led by the food products industry. Regionally, stock selection in developed Europe was a notable detractor from relative performance, driven by underperforming shares in the United Kingdom. Conversely, out-of-benchmark exposure to Canada bolstered returns.
Within the international core equity allocation, security selection in the financial sector contributed to relative performance, led by holdings in the insurance industry. However, stock selection within the consumer discretionary sector weighed on relative returns, driven by holdings within the internet and direct marketing retail industry. The health care sector also hurt relative returns due to poor stock selection. Regionally, out-of-benchmark exposure to Canada proved beneficial. On the contrary, security selection within developed Europe detracted from relative results, driven by shares in the United Kingdom.
64
MassMutual Select T. Rowe Price International Equity Fund – Portfolio Manager Report (Unaudited) (Continued) |
The international equity growth allocation posted negative absolute returns. Nevertheless, favorable stock selection in the industrial and business services sector significantly contributed to relative results, driven by holdings in the aerospace and defense industry. Strong stock choices, coupled with an overweight allocation in the financial sector, also bolstered relative performance. Conversely, stock selection in the health care sector held back relative returns, driven by holdings in the pharmaceuticals industry. Regionally, favorable stock selection in and an underweight allocation to Japan was a notable contributor to relative performance. However, unfavorable security selection in Latin America detracted, driven by exposure to Brazilian equities.
The emerging markets value equity allocation posted negative absolute returns, although strong security selection in the industrial and business services sector was a significant contributor to relative performance, led by holdings in the machinery industry. Favorable stock selection, coupled with an underweight allocation to the health care sector, also had a positive impact on relative returns. Conversely, unfavorable stock selection within the financial sector was a notable detractor from relative performance, led by holdings in the capital markets industry. From a regional perspective, security selection in Pacific ex-Japan contributed significantly to relative performance, led by Chinese shares. Conversely, selection in the emerging markets Europe, Middle East, and Africa (EMEA) region detracted from relative results.
During the fiscal year, the Fund held equity options and rights. The use of rights added slightly to performance, whereas the estimated return impact from employing equity options was negligible. Derivatives are securities that derive their value from the performance of one or more other investments and take the form of a contract between two or more parties. Derivatives can be used for hedging, speculation, or both.
Subadviser outlook
T. Rowe Price notes that, as of the end of the fiscal year, valuations improved as risk assets pulled back from recent highs; however, in T. Rowe Price’s view uncertainty around corporate fundamentals suggests limited near-term upside, particularly as earnings estimates have not seen significant downward revision to reflect rising recession risks. Fund management continues to assess when to add to equities and other risk assets as they evaluate long-term valuations and early indications of stabilization or improvement in macroeconomic conditions. Given the range of potential paths for growth and inflation, Fund management expects its positioning to remain cautious, as they anticipate a firm commitment from major central banks to bring down inflation could result in a low ceiling for stocks in the near term – and could exacerbate economic contraction through over-tightening. In T. Rowe Price’s view, other key risks to global markets include the Russia-Ukraine conflict and the associated impact of energy supply shortages, which could weigh on European manufacturing, broader geopolitical instability, and unexpected supply chain disruption. They believe that such conditions contribute to a less compelling risk/reward trade-off between stocks and bonds or cash in the near term, and that a more modest allocation to equities may be prudent.
65
MassMutual Select T. Rowe Price International Equity Fund – Portfolio Manager Report (Unaudited) (Continued) |
MassMutual Select |
|
Taiwan Semiconductor Manufacturing Co. Ltd. |
2.3% |
Samsung Electronics Co. Ltd. |
1.6% |
Roche Holding AG |
1.6% |
AstraZeneca PLC Sponsored ADR |
1.5% |
Nestle SA Registered |
1.5% |
Nippon Telegraph & Telephone Corp. |
1.4% |
ASML Holding NV |
1.1% |
TotalEnergies SE |
0.9% |
Sanofi |
0.9% |
Unilever PLC |
0.9% |
13.7% |
|
MassMutual Select |
|
Financial |
22.7% |
Consumer, Non-cyclical |
22.2% |
Consumer, Cyclical |
10.9% |
Industrial |
10.7% |
Communications |
9.9% |
Technology |
9.4% |
Basic Materials |
5.2% |
Energy |
3.5% |
Utilities |
2.3% |
Mutual Funds |
2.0% |
Total Long-Term Investments |
98.8% |
Short-Term Investments and Other Assets and Liabilities |
1.2% |
Net Assets |
100.0% |
66
MassMutual Select T. Rowe Price International Equity Fund – Portfolio Manager Report (Unaudited) (Continued) |
GROWTH OF $10,000 INVESTMENT - Class I
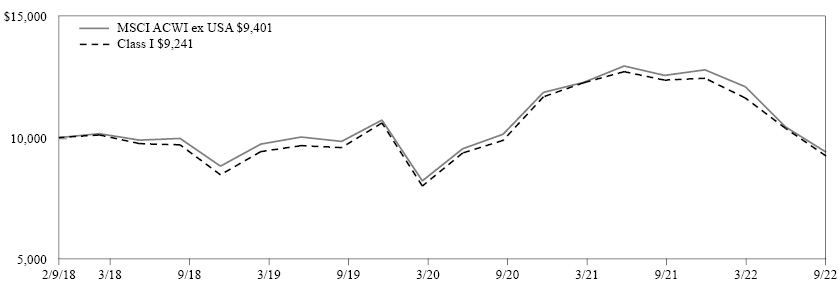
The graph above illustrates the Fund’s historical performance for the past 10 fiscal years or since inception (for Funds lacking 10-year records) in comparison to its benchmark index, as well as one or more additional indexes, if applicable.
Average Annual Total Returns (for the periods ended 09/30/2022) |
|||
|
Inception Date |
1 Year |
Since Inception |
Class I |
02/09/2018 |
-25.28% |
-1.69% |
MSCI ACWI ex USA |
-25.17% |
-1.64% |
|
Generally accepted accounting principles require adjustments to be made to the net assets of the Fund at period end for financial reporting purposes only, and as such, the total return based on the unadjusted net asset value per share may differ from the total return reported in the financial highlights.
Performance results in the graph and table are shown both with and without the imposition of the maximum applicable sales charge (if applicable) and reflect the percentage change in net asset value, including reinvestment of dividends and capital gains distributions. Investors should note that the Fund is a professionally managed mutual fund, while the index or indexes shown above are unmanaged, cannot be purchased directly, and, with the exception of any peer group index, do not incur expenses.
Performance data quoted in the graph and table represents past performance; past performance is not predictive of future results. The investment return and principal value of shares of the Fund fluctuate, so your shares, when sold, may be worth more or less than their original cost. Current performance of the Fund may be lower or higher than the performance quoted. The performance shown does not reflect the deduction of taxes, if any, that a shareholder would pay on Fund distributions or the redemption of Fund shares. Performance data current to the most recent month end may be obtained by calling 1-888-309-3539.
Investors should read the Fund’s prospectus with regard to the Fund’s investment objectives, risks, and charges and expenses in conjunction with these financial statements. Employee retirement benefit plans that invest plan assets in the Separate Investment Accounts (SIAs) may be subject to certain charges as set forth in their respective Plan Documents. Total return figures would be lower for the periods presented if they reflected these charges.
67
MassMutual Total Return Bond Fund – Portfolio of Investments |
September 30, 2022 |
Number of |
Value |
|||||||
EQUITIES — 0.1% |
||||||||
COMMON STOCK — 0.1% |
||||||||
Communications — 0.1% |
||||||||
Telecommunications — 0.1% |
||||||||
Intelsat Emergence SA |
16,754 | $ | 435,604 | |||||
TOTAL COMMON STOCK (Cost $1,575,355) |
435,604 | |||||||
TOTAL EQUITIES (Cost $1,575,355) |
435,604 | |||||||
Principal |
||||||||
BONDS & NOTES — 116.8% |
||||||||
BANK LOANS — 2.2% |
||||||||
Aerospace & Defense — 0.1% |
||||||||
TransDigm, Inc. |
||||||||
2020 Term Loan E, 3 mo. USD LIBOR + 2.250% |
||||||||
5.924% VRN 5/30/25 |
$ | 289,790 | 277,631 | |||||
2020 Term Loan F, 3 mo. USD LIBOR + 2.250% |
||||||||
5.924% VRN 12/09/25 |
17,502 | 16,741 | ||||||
| 294,372 | ||||||||
Airlines — 0.0% |
||||||||
American Airlines, Inc., 2017 1st Lien Term Loan, 1 mo. USD LIBOR + 1.750% |
||||||||
4.871% VRN 1/29/27 |
86,864 | 79,697 | ||||||
United Airlines, Inc., 2021 Term Loan B, 3 mo. USD LIBOR + 3.750% |
||||||||
6.533% VRN 4/21/28 |
53,349 | 50,823 | ||||||
| 130,520 | ||||||||
Auto Parts & Equipment — 0.0% |
||||||||
Clarios Global LP, 2021 USD Term Loan B, 1 mo. USD LIBOR + 3.250% |
||||||||
6.365% VRN 4/30/26 |
211,302 | 199,416 | ||||||
Beverages — 0.0% |
||||||||
Naked Juice LLC, Term Loan, 3 mo. USD SOFR + 3.250% |
||||||||
6.903% VRN 1/24/29 |
90,825 | 83,066 | ||||||
Chemicals — 0.1% |
||||||||
Zep, Inc., 2017 1st Lien Term Loan, 3 mo. USD LIBOR + 4.000% |
||||||||
7.674% VRN 8/12/24 |
257,988 | 222,514 | ||||||
Principal |
Value |
|||||||
AI Aqua Merger Sub, Inc. |
||||||||
2022 Term Loan B, |
||||||||
0.000% 7/31/28 (a) |
$ | 80,329 | $ | 74,556 | ||||
2022 Delayed Draw Term loan, |
||||||||
0.000% 7/31/28 (a) |
18,257 | 16,944 | ||||||
Amentum Government Services Holdings LLC, Term Loan B, 3 mo. USD LIBOR + 4.000%, 6 mo. USD LIBOR + 4.000% |
||||||||
8.170% - 8.170% VRN 1/29/27 |
69,340 | 65,989 | ||||||
Element Materials Technology Group US Holdings, Inc. |
||||||||
2022 USD Delayed Draw Term Loan, |
||||||||
0.000% 7/06/29 (a) (b) |
22,372 | 20,946 | ||||||
2022 USD Term Loan, |
||||||||
0.000% 7/06/29 (a) |
48,472 | 45,382 | ||||||
Pre-Paid Legal Services, Inc., 2021 Term Loan, 3 mo. USD LIBOR + 3.750% |
||||||||
6.820% VRN 12/15/28 |
104,070 | 98,606 | ||||||
Prime Security Services Borrower, LLC, 2021 Term Loan, 1 mo. USD LIBOR + 2.750% |
||||||||
5.303% VRN 9/23/26 |
111,517 | 107,840 | ||||||
Safe Fleet Holdings LLC, 2022 Term Loan, 1 mo. USD SOFR CME + 3.750% |
||||||||
6.826% VRN 2/23/29 |
30,994 | 29,134 | ||||||
Spin Holdco, Inc., 2021 Term Loan, 3 mo. USD LIBOR + 4.000% |
||||||||
7.144% VRN 3/04/28 |
230,968 | 202,048 | ||||||
Trans Union, LLC, 2021 Term Loan B6, 1 mo. USD LIBOR + 2.250% |
||||||||
5.365% VRN 12/01/28 |
123,892 | 119,789 | ||||||
TruGreen Ltd. Partnership, 2020 Term Loan, 1 mo. USD LIBOR + 4.000% |
||||||||
7.115% VRN 11/02/27 |
57,339 | 54,042 | ||||||
| 835,276 | ||||||||
Computers — 0.0% |
||||||||
Peraton Corp., Term Loan B, 1 mo. USD LIBOR + 3.750% |
||||||||
6.865% VRN 2/01/28 |
70,467 | 66,662 | ||||||
Cosmetics & Personal Care — 0.0% |
||||||||
Sunshine Luxembourg VII SARL, 2021 Term Loan B3, 3 mo. USD LIBOR + 3.750% |
||||||||
7.424% VRN 10/01/26 |
115,428 | 107,124 | ||||||
The accompanying notes are an integral part of the financial statements.
68
MassMutual Total Return Bond Fund – Portfolio of Investments (Continued) |
Principal |
Value |
|||||||
Diversified Financial Services — 0.1% |
||||||||
Avolon TLB Borrower 1 (US) LLC, Term Loan B3, 1 mo. USD LIBOR + 1.750% |
||||||||
4.764% VRN 1/15/25 |
$ | 70,325 | $ | 68,552 | ||||
Deerfield Dakota Holding, LLC, 2020 USD Term Loan B, 1 mo. USD SOFR CME + 3.750% |
||||||||
6.784% VRN 4/09/27 |
141,408 | 133,160 | ||||||
Setanta Aircraft Leasing Designated Activity Co., Term Loan B, 3 mo. USD LIBOR + 2.000% |
||||||||
5.674% VRN 11/05/28 |
700,000 | 682,500 | ||||||
| 884,212 | ||||||||
Electronics — 0.0% |
||||||||
II-VI, Inc., 2022 Term Loan B, 1 mo. USD LIBOR + 2.750% |
||||||||
5.314% VRN 7/02/29 |
39,896 | 38,567 | ||||||
Ingram Micro, Inc., 2021 Term Loan B, 3 mo. USD LIBOR + 3.500% |
||||||||
7.174% VRN 6/30/28 |
128,212 | 124,686 | ||||||
| 163,253 | ||||||||
Entertainment — 0.0% |
||||||||
J&J Ventures Gaming, LLC, Term Loan, 3 mo. USD LIBOR + 4.000% |
||||||||
7.674% VRN 4/26/28 |
32,433 | 30,670 | ||||||
Penn National Gaming, Inc., 2022 Term Loan B, 1 mo. USD SOFR CME + 2.750% |
||||||||
5.884% VRN 5/03/29 |
53,067 | 50,929 | ||||||
Scientific Games International, Inc., 2022 USD Term Loan, 1 mo. USD SOFR CME + 3.000% |
||||||||
5.906% VRN 4/14/29 |
107,613 | 104,331 | ||||||
| 185,930 | ||||||||
Food — 0.0% |
||||||||
Hostess Brands LLC, 2019 Term Loan, 1 mo. USD LIBOR + 2.250%, 3 mo. USD LIBOR + 2.250% |
||||||||
5.056% - 5.365% VRN 8/03/25 |
191,681 | 184,999 | ||||||
Health Care – Products — 0.1% |
||||||||
Avantor Funding, Inc., 2021 Term Loan B5, 1 mo. USD LIBOR + 2.250% |
||||||||
5.365% VRN 11/08/27 |
359,280 | 349,008 | ||||||
Bausch & Lomb, Inc., Term Loan, 1 mo. USD SOFR CME + 3.250% |
||||||||
6.098% VRN 5/10/27 |
38,250 | 35,512 | ||||||
Principal |
Value |
|||||||
Medline Borrower LP, USD Term Loan B, 1 mo. USD LIBOR + 3.250% |
||||||||
6.365% VRN 10/23/28 |
$ | 104,738 | $ | 96,129 | ||||
| 480,649 | ||||||||
Insurance — 0.2% |
||||||||
Acrisure, LLC, 2020 Term Loan B, 1 mo. USD LIBOR + 3.500% |
||||||||
6.615% VRN 2/15/27 |
198,473 | 181,023 | ||||||
AmWINS Group, Inc., 2021 Term Loan B, 1 mo. USD LIBOR + 2.250% |
||||||||
5.365% VRN 2/19/28 |
957,945 | 914,617 | ||||||
Asurion, LLC |
||||||||
2020 Term Loan B8, 1 mo. USD LIBOR + 3.250% |
||||||||
6.365% VRN 12/23/26 |
204,286 | 172,751 | ||||||
2022 Term Loan B10, 3 mo. USD SOFR CME + 4.000% |
||||||||
7.703% VRN 8/19/28 |
132,740 | 112,773 | ||||||
Hub International Ltd., 2021 Term Loan B, 3 mo. USD LIBOR + 3.250% |
||||||||
5.982% VRN 4/25/25 |
114,157 | 109,805 | ||||||
| 1,490,969 | ||||||||
Internet — 0.0% |
||||||||
Proofpoint, Inc., 1st Lien Term Loan, 3 mo. USD LIBOR + 3.250% |
||||||||
6.320% VRN 8/31/28 |
10,000 | 9,371 | ||||||
Lodging — 0.1% |
||||||||
Caesars Resort Collection, LLC, 2017 1st Lien Term Loan B, 1 mo. USD LIBOR + 2.750% |
||||||||
5.865% VRN 12/23/24 |
227,350 | 221,689 | ||||||
Fertitta Entertainment, LLC, 2022 Term Loan B, |
||||||||
0.000% 1/27/29 (a) |
299,250 | 277,117 | ||||||
| 498,806 | ||||||||
Media — 0.1% |
||||||||
Charter Communications Operating LLC, 2019 Term Loan B2, 1 mo. USD LIBOR + 1.750% |
||||||||
4.870% VRN 2/01/27 |
97,243 | 93,434 | ||||||
CSC Holdings LLC, 2017 Term Loan B1, 1 mo. USD LIBOR + 2.250% |
||||||||
5.068% VRN 7/17/25 |
146,826 | 139,578 | ||||||
Diamond Sports Group LLC, 2022 2nd Lien Term Loan, 1 mo. USD SOFR CME + 3.250% |
||||||||
5.946% VRN 8/24/26 |
172,799 | 32,954 | ||||||
The accompanying notes are an integral part of the financial statements.
69
MassMutual Total Return Bond Fund – Portfolio of Investments (Continued) |
Principal |
Value |
|||||||
DirecTV Financing, LLC, Term Loan, 1 mo. USD LIBOR + 5.000% |
||||||||
8.115% VRN 8/02/27 |
$ | 409,500 | $ | 380,479 | ||||
Telenet Financing USD LLC, 2020 USD Term Loan AR, 1 mo. USD LIBOR + 2.000% |
||||||||
4.818% VRN 4/30/28 |
300,000 | 283,875 | ||||||
| 930,320 | ||||||||
Metal Fabricate & Hardware — 0.0% |
||||||||
AZZ, Inc., Term Loan B, |
||||||||
0.000% 5/13/29 (a) |
28,189 | 27,390 | ||||||
Packaging & Containers — 0.2% |
||||||||
Berry Global, Inc., 2021 Term Loan Z, 3 mo. USD LIBOR + 1.750% |
||||||||
4.178% VRN 7/01/26 |
985,634 | 953,069 | ||||||
Pharmaceuticals — 0.4% |
||||||||
Change Healthcare Holdings LLC, 2017 Term Loan B, 3 mo. USD PRIME + 1.500% |
||||||||
7.750% VRN 3/01/24 |
187,719 | 186,989 | ||||||
Elanco Animal Health, Inc., Term Loan B, 1 mo. USD LIBOR + 1.750% |
||||||||
4.314% VRN 8/01/27 |
632,677 | 600,651 | ||||||
Gainwell Acquisition Corp., Term Loan B, 3 mo. USD LIBOR + 4.000% |
||||||||
7.674% VRN 10/01/27 |
223,295 | 212,298 | ||||||
Grifols Worldwide Operations USA, Inc., USD 2019 Term Loan B, 1 mo. USD LIBOR + 2.000% |
||||||||
5.115% VRN 11/15/27 |
723,383 | 685,304 | ||||||
Horizon Therapeutics USA, Inc., 2021 Term Loan B2, 1 mo. USD LIBOR + 1.750% |
||||||||
4.875% VRN 3/15/28 |
315,950 | 302,721 | ||||||
Jazz Financing Lux SARL, USD Term Loan, 1 mo. USD LIBOR + 3.500% |
||||||||
6.615% VRN 5/05/28 |
385,931 | 372,424 | ||||||
Organon & Co, USD Term Loan, 3 mo. USD LIBOR + 3.000% |
||||||||
6.188% VRN 6/02/28 |
461,595 | 450,055 | ||||||
| 2,810,442 | ||||||||
Retail — 0.1% |
||||||||
1011778 B.C. Unlimited Liability Co., Term Loan B4, 1 mo. USD LIBOR + 1.750% |
||||||||
4.871% VRN 11/19/26 |
366,939 | 350,100 | ||||||
Principal |
Value |
|||||||
Whatabrands LLC, 2021 Term Loan B, 1 mo. USD LIBOR + 3.250% |
||||||||
6.365% VRN 8/03/28 |
$ | 471,438 | $ | 435,255 | ||||
| 785,355 | ||||||||
Semiconductors — 0.0% |
||||||||
Entegris, Inc., 2022 Term Loan B, 1 mo. USD SOFRTE + 3.000% |
||||||||
5.455% VRN 7/06/29 |
130,000 | 128,844 | ||||||
Software — 0.1% |
||||||||
Athenahealth, Inc. |
||||||||
2022 Delayed Draw Term Loan, 3 mo. USD LIBOR + 3.500% |
||||||||
3.500% VRN 2/15/29 (b) |
6,289 | 5,622 | ||||||
2022 Term Loan B, 1 mo. USD SOFR CME + 3.500% |
||||||||
6.576% VRN 2/15/29 |
37,010 | 33,087 | ||||||
CDK Global, Inc., 2022 USD Term Loan B, 3 mo. USD SOFR CME + 4.500% |
||||||||
6.610% VRN 7/06/29 |
183,478 | 176,411 | ||||||
DTI Holdco, Inc., 2022 Term Loan, 3 mo. USD SOFR CME + 4.750% |
||||||||
7.327% VRN 4/26/29 |
23,080 | 21,823 | ||||||
Mitnick Corporate Purchaser, Inc., Term Loan, |
||||||||
0.000% 5/02/29 (a) |
36,000 | 33,930 | ||||||
NortonLifeLock, Inc., 2022 Term Loan B, 3 mo. USD SOFR + 2.000% |
||||||||
4.848% VRN 9/12/29 |
550,000 | 527,725 | ||||||
RealPage, Inc., 1st Lien Term Loan, 1 mo. USD LIBOR + 3.000% |
||||||||
3.500% VRN 4/24/28 |
36,000 | 33,670 | ||||||
Sophia, L.P., 2021 Term Loan B, 3 mo. USD LIBOR + 3.500% |
||||||||
7.174% VRN 10/07/27 |
98,156 | 94,230 | ||||||
| 926,498 | ||||||||
Telecommunications — 0.5% |
||||||||
CenturyLink, Inc., 2020 Term Loan B, 1 mo. USD LIBOR + 2.250% |
||||||||
5.365% VRN 3/15/27 |
858,350 | 779,090 | ||||||
CommScope, Inc., 2019 Term Loan B, 1 mo. USD LIBOR + 3.250% |
||||||||
6.365% VRN 4/06/26 |
291,000 | 268,084 | ||||||
Intelsat Jackson Holdings S.A., 2021 Exit Term Loan B, 6 mo. USD SOFRTE + 4.500% |
||||||||
7.445% VRN 2/01/29 |
101,028 | 94,587 | ||||||
The accompanying notes are an integral part of the financial statements.
70
MassMutual Total Return Bond Fund – Portfolio of Investments (Continued) |
Principal |
Value |
|||||||
Level 3 Financing, Inc., 2019 Term Loan B, 1 mo. USD LIBOR + 1.750% |
||||||||
4.865% VRN 3/01/27 |
$ | 1,131,435 | $ | 1,072,918 | ||||
SBA Senior Finance II LLC, 2018 Term Loan B, 1 mo. USD LIBOR + 1.750% |
||||||||
4.870% VRN 4/11/25 |
478,750 | 464,986 | ||||||
Zayo Group Holdings, Inc., USD Term Loan, 1 mo. USD LIBOR + 3.000% |
||||||||
6.115% VRN 3/09/27 |
837,204 | 697,081 | ||||||
| 3,376,746 | ||||||||
Transportation — 0.0% |
||||||||
Genesee & Wyoming, Inc., Term Loan, 3 mo. USD LIBOR + 2.000% |
||||||||
5.674% VRN 12/30/26 |
66,813 | 64,854 | ||||||
TOTAL BANK LOANS (Cost $16,651,191) |
15,840,657 | |||||||
CORPORATE DEBT — 29.5% |
||||||||
Aerospace & Defense — 0.3% |
||||||||
The Boeing Co. |
||||||||
1.167% 2/04/23 |
1,855,000 | 1,832,083 | ||||||
Agriculture — 0.5% |
||||||||
BAT Capital Corp. |
||||||||
4.390% 8/15/37 |
340,000 | 242,409 | ||||||
4.540% 8/15/47 |
2,165,000 | 1,434,540 | ||||||
5.650% 3/16/52 |
570,000 | 434,708 | ||||||
Imperial Brands Finance PLC |
||||||||
3.875% 7/26/29 (c) |
50,000 | 42,445 | ||||||
6.125% 7/27/27 (c) |
690,000 | 680,203 | ||||||
Reynolds American, Inc. |
||||||||
5.850% 8/15/45 |
1,160,000 | 910,117 | ||||||
| 3,744,422 | ||||||||
Airlines — 0.1% |
||||||||
U.S. Airways Pass-Through Trust |
||||||||
7.125% 4/22/25 |
624,753 | 620,482 | ||||||
Auto Manufacturers — 0.1% |
||||||||
Allison Transmission, Inc. |
||||||||
3.750% 1/30/31 (c) |
475,000 | 364,130 | ||||||
General Motors Co. |
||||||||
4.875% 10/02/23 |
150,000 | 149,345 | ||||||
| 513,475 | ||||||||
Banks — 10.0% |
||||||||
Bank of America Corp. |
||||||||
SOFR + 1.370% 1.922% VRN 10/24/31 |
925,000 | 682,914 | ||||||
Principal |
Value |
|||||||
SOFR + 1.060% 2.087% VRN 6/14/29 |
$ | 1,835,000 | $ | 1,492,029 | ||||
SOFR + 1.220% 2.299% VRN 7/21/32 |
490,000 | 365,683 | ||||||
SOFR + 1.210% 2.572% VRN 10/20/32 |
1,300,000 | 993,812 | ||||||
SOFR + 2.150% 2.592% VRN 4/29/31 |
290,000 | 229,896 | ||||||
SOFR + 1.320% 2.687% VRN 4/22/32 |
245,000 | 190,839 | ||||||
SOFR + 1.330% 2.972% VRN 2/04/33 |
475,000 | 371,157 | ||||||
3 mo. USD LIBOR + .790% 3.004% VRN 12/20/23 |
355,000 | 353,127 | ||||||
3 mo. USD LIBOR + .810% 3.366% VRN 1/23/26 |
5,365,000 | 5,084,911 | ||||||
3 mo. USD LIBOR + 1.070% 3.970% VRN 3/05/29 |
1,670,000 | 1,511,626 | ||||||
Citigroup, Inc. |
||||||||
SOFR + .770% 1.462% VRN 6/09/27 |
1,225,000 | 1,043,359 | ||||||
SOFR + 1.167% 2.561% VRN 5/01/32 |
1,030,000 | 790,340 | ||||||
SOFR + 2.107% 2.572% VRN 6/03/31 |
1,070,000 | 841,234 | ||||||
SOFR + 1.146% 2.666% VRN 1/29/31 |
430,000 | 342,943 | ||||||
SOFR + 1.422% 2.976% VRN 11/05/30 |
500,000 | 410,777 | ||||||
SOFR + 1.351% 3.057% VRN 1/25/33 |
1,350,000 | 1,062,678 | ||||||
SOFR + 1.280% 3.070% VRN 2/24/28 |
410,000 | 365,129 | ||||||
SOFR + 3.914% 4.412% VRN 3/31/31 |
830,000 | 744,894 | ||||||
Credit Suisse Group AG |
||||||||
SOFR + .980% 1.305% VRN 2/02/27 (c) |
1,315,000 | 1,067,570 | ||||||
SOFR + 1.730% 3.091% VRN 5/14/32 (c) |
1,850,000 | 1,297,138 | ||||||
SOFR + 3.700% 6.442% VRN 8/11/28 (c) |
345,000 | 320,974 | ||||||
SOFR + 3.920% 6.537% VRN 8/12/33 (c) |
2,135,000 | 1,918,360 | ||||||
Discover Bank |
||||||||
4.200% 8/08/23 |
1,120,000 | 1,113,089 | ||||||
DNB Bank ASA 1 year CMT + .680% |
||||||||
1.605% VRN 3/30/28 (c) |
1,400,000 | 1,166,028 | ||||||
Global Bank Corp. 3 mo. USD LIBOR + 3.300% |
||||||||
5.250% VRN 4/16/29 (c) |
200,000 | 183,640 | ||||||
The accompanying notes are an integral part of the financial statements.
71
MassMutual Total Return Bond Fund – Portfolio of Investments (Continued) |
Principal |
Value |
|||||||
The Goldman Sachs Group, Inc. |
||||||||
SOFR + .486% 0.925% VRN 10/21/24 |
$ | 895,000 | $ | 850,194 | ||||
SOFR + .789% 1.093% VRN 12/09/26 |
485,000 | 418,592 | ||||||
1.217% 12/06/23 |
2,245,000 | 2,152,805 | ||||||
SOFR + .798% 1.431% VRN 3/09/27 |
2,295,000 | 1,973,734 | ||||||
SOFR + .913% 1.948% VRN 10/21/27 |
1,755,000 | 1,501,446 | ||||||
SOFR + 1.090% 1.992% VRN 1/27/32 |
315,000 | 232,780 | ||||||
SOFR + 1.248% 2.383% VRN 7/21/32 |
950,000 | 715,957 | ||||||
SOFR + 1.264% 2.650% VRN 10/21/32 |
465,000 | 356,098 | ||||||
HSBC Holdings PLC |
||||||||
SOFR + 1.732% 2.013% VRN 9/22/28 |
1,370,000 | 1,095,535 | ||||||
SOFR + 1.929% 2.099% VRN 6/04/26 |
1,480,000 | 1,325,487 | ||||||
SOFR + 1.285% 2.206% VRN 8/17/29 |
1,135,000 | 878,683 | ||||||
SOFR + 1.187% 2.804% VRN 5/24/32 |
865,000 | 634,752 | ||||||
SOFR + 2.110% 4.755% VRN 6/09/28 |
1,080,000 | 992,835 | ||||||
SOFR + 2.870% 5.402% VRN 8/11/33 |
320,000 | 284,415 | ||||||
JP Morgan Chase & Co. |
||||||||
SOFR + .580% 0.697% VRN 3/16/24 |
440,000 | 430,743 | ||||||
3 mo. TSFR + .580% 0.969% VRN 6/23/25 |
2,650,000 | 2,451,811 | ||||||
SOFR + .605% 1.561% VRN 12/10/25 |
1,890,000 | 1,733,649 | ||||||
SOFR + .885% 1.578% VRN 4/22/27 |
1,360,000 | 1,175,096 | ||||||
SOFR + 1.180% 2.545% VRN 11/08/32 |
850,000 | 644,690 | ||||||
SOFR + 1.250% 2.580% VRN 4/22/32 |
390,000 | 301,919 | ||||||
SOFR + 1.510% 2.739% VRN 10/15/30 |
540,000 | 438,905 | ||||||
SOFR + 1.170% 2.947% VRN 2/24/28 |
535,000 | 473,264 | ||||||
3 mo. USD LIBOR + 1.245% 3.960% VRN 1/29/27 |
630,000 | 594,727 | ||||||
Lloyds Banking Group PLC |
||||||||
1 year CMT + .850% 1.627% VRN 5/11/27 |
1,000,000 | 850,165 | ||||||
3 mo. USD LIBOR + .810% 2.907% VRN 11/07/23 |
1,090,000 | 1,087,471 | ||||||
Principal |
Value |
|||||||
3 mo. USD LIBOR + 1.205% 3.574% VRN 11/07/28 |
$ | 425,000 | $ | 372,906 | ||||
1 year CMT + 3.500% 3.870% VRN 7/09/25 |
415,000 | 400,250 | ||||||
1 year CMT + 2.300% 4.976% VRN 8/11/33 |
995,000 | 869,035 | ||||||
Macquarie Group Ltd. |
||||||||
SOFR + 1.069% 1.340% VRN 1/12/27 (c) |
920,000 | 787,668 | ||||||
SOFR + 1.440% 2.691% VRN 6/23/32 (c) (d) |
5,000 | 3,763 | ||||||
SOFR + 1.532% 2.871% VRN 1/14/33 (c) |
1,335,000 | 1,002,715 | ||||||
SOFR + 2.405% 4.442% VRN 6/21/33 (c) |
525,000 | 447,226 | ||||||
Morgan Stanley |
||||||||
SOFR + .560% 1.164% VRN 10/21/25 |
2,885,000 | 2,628,561 | ||||||
SOFR + .879% 1.593% VRN 5/04/27 |
1,365,000 | 1,176,926 | ||||||
SOFR + 1.020% 1.928% VRN 4/28/32 |
1,005,000 | 733,358 | ||||||
SOFR + 1.178% 2.239% VRN 7/21/32 |
360,000 | 270,427 | ||||||
SOFR + 1.360% 2.484% VRN 9/16/36 |
980,000 | 701,935 | ||||||
SOFR + 1.200% 2.511% VRN 10/20/32 |
585,000 | 446,825 | ||||||
Natwest Group PLC 3 mo. USD LIBOR + 1.762% |
||||||||
4.269% VRN 3/22/25 |
1,710,000 | 1,662,905 | ||||||
Santander UK Group Holdings PLC |
||||||||
SOFR + .787% 1.089% VRN 3/15/25 |
1,825,000 | 1,685,337 | ||||||
1 year CMT + 1.250% 1.532% VRN 8/21/26 |
295,000 | 255,810 | ||||||
SOFR + .989% 1.673% VRN 6/14/27 |
340,000 | 282,711 | ||||||
SOFR + 1.220% 2.469% VRN 1/11/28 |
285,000 | 237,327 | ||||||
3 mo. USD LIBOR + 1.570% 4.796% VRN 11/15/24 |
525,000 | 517,746 | ||||||
Santander UK PLC |
||||||||
5.000% 11/07/23 (c) |
1,390,000 | 1,375,335 | ||||||
UBS Group AG Registered 1 year CMT + 1.550% |
||||||||
4.488% VRN 5/12/26 (c) |
445,000 | 428,948 | ||||||
Wells Fargo & Co. |
||||||||
SOFR + 2.100% 2.393% VRN 6/02/28 |
1,710,000 | 1,467,177 | ||||||
SOFR + 1.500% 3.350% VRN 3/02/33 |
3,750,000 | 3,039,707 | ||||||
The accompanying notes are an integral part of the financial statements.
72
MassMutual Total Return Bond Fund – Portfolio of Investments (Continued) |
Principal |
Value |
|||||||
SOFR + 1.510% 3.526% VRN 3/24/28 |
$ | 1,800,000 | $ | 1,631,043 | ||||
3 mo. USD LIBOR + 1.310% 3.584% VRN 5/22/28 |
1,345,000 | 1,216,696 | ||||||
SOFR + 2.100% 4.897% VRN 7/25/33 |
1,025,000 | 940,491 | ||||||
| 72,122,728 | ||||||||
Beverages — 0.4% |
||||||||
Anheuser-Busch Cos. LLC/Anheuser-Busch InBev Worldwide, Inc. |
||||||||
4.900% 2/01/46 |
2,215,000 | 1,919,641 | ||||||
Bacardi Ltd. |
||||||||
5.300% 5/15/48 (c) |
275,000 | 233,749 | ||||||
Constellation Brands, Inc. |
||||||||
4.750% 5/09/32 |
785,000 | 731,178 | ||||||
| 2,884,568 | ||||||||
Chemicals — 0.2% |
||||||||
International Flavors & Fragrances, Inc. |
||||||||
2.300% 11/01/30 (c) |
1,685,000 | 1,292,873 | ||||||
5.000% 9/26/48 |
430,000 | 358,919 | ||||||
| 1,651,792 | ||||||||
Commercial Services — 0.3% |
||||||||
Global Payments, Inc. |
||||||||
5.400% 8/15/32 |
365,000 | 337,148 | ||||||
5.950% 8/15/52 |
495,000 | 436,169 | ||||||
Rent-A-Center, Inc. |
||||||||
6.375% 2/15/29 (c) (d) |
85,000 | 66,300 | ||||||
S&P Global, Inc. |
||||||||
2.900% 3/01/32 (c) |
415,000 | 346,064 | ||||||
4.750% 8/01/28 (c) |
750,000 | 732,361 | ||||||
WASH Multifamily Acquisition, Inc. |
||||||||
5.750% 4/15/26 (c) |
85,000 | 78,389 | ||||||
| 1,996,431 | ||||||||
Computers — 0.1% |
||||||||
Lenovo Group Ltd. |
||||||||
6.536% 7/27/32 (c) |
370,000 | 340,373 | ||||||
NCR Corp. |
||||||||
5.125% 4/15/29 (c) |
175,000 | 131,254 | ||||||
6.125% 9/01/29 (c) (d) |
225,000 | 193,734 | ||||||
| 665,361 | ||||||||
Cosmetics & Personal Care — 0.2% |
||||||||
GSK Consumer Healthcare Co. |
||||||||
3.625% 3/24/32 (c) |
1,430,000 | 1,208,086 | ||||||
Principal |
Value |
|||||||
Diversified Financial Services — 1.2% |
||||||||
AerCap Ireland Capital DAC / AerCap Global Aviation Trust |
||||||||
3.300% 1/30/32 |
$ | 2,270,000 | $ | 1,704,847 | ||||
AerCap Ireland Capital DAC/AerCap Global Aviation Trust |
||||||||
3.875% 1/23/28 |
265,000 | 228,838 | ||||||
4.125% 7/03/23 |
220,000 | 218,278 | ||||||
Air Lease Corp. |
||||||||
3.250% 3/01/25 |
950,000 | 889,931 | ||||||
Avolon Holdings Funding Ltd. |
||||||||
2.528% 11/18/27 (c) |
1,109,000 | 871,429 | ||||||
2.875% 2/15/25 (c) |
860,000 | 778,056 | ||||||
3.950% 7/01/24 (c) |
380,000 | 359,568 | ||||||
Capital One Financial Corp. SOFR + 1.790% |
||||||||
3.273% VRN 3/01/30 |
1,160,000 | 970,350 | ||||||
Charles Schwab Corp. |
||||||||
2.900% 3/03/32 |
415,000 | 341,666 | ||||||
Discover Financial Services |
||||||||
3.950% 11/06/24 |
150,000 | 146,286 | ||||||
Intercontinental Exchange, Inc. |
||||||||
4.600% 3/15/33 |
990,000 | 921,381 | ||||||
ORIX Corp. |
||||||||
5.200% 9/13/32 |
745,000 | 707,819 | ||||||
Park Aerospace Holdings Ltd. |
||||||||
4.500% 3/15/23 (c) |
700,000 | 695,863 | ||||||
5.500% 2/15/24 (c) |
75,000 | 73,220 | ||||||
| 8,907,532 | ||||||||
Electric — 1.5% |
||||||||
Ameren Illinois Co. |
||||||||
3.700% 12/01/47 |
480,000 | 364,466 | ||||||
Consolidated Edison Co. of New York, Inc. |
||||||||
4.650% 12/01/48 |
1,000,000 | 851,612 | ||||||
Duke Energy Carolinas LLC |
||||||||
3.700% 12/01/47 |
738,000 | 551,056 | ||||||
Duke Energy Corp. |
||||||||
2.550% 6/15/31 |
560,000 | 438,403 | ||||||
3.750% 9/01/46 |
471,000 | 333,585 | ||||||
Entergy Louisiana LLC |
||||||||
3.780% 4/01/25 |
1,250,000 | 1,205,760 | ||||||
Eversource Energy |
||||||||
4.600% 7/01/27 |
735,000 | 709,701 | ||||||
FirstEnergy Transmission LLC |
||||||||
2.866% 9/15/28 (c) |
1,401,000 | 1,191,584 | ||||||
5.450% 7/15/44 (c) |
600,000 | 542,692 | ||||||
Florida Power & Light Co. |
||||||||
3.990% 3/01/49 |
1,000,000 | 808,739 | ||||||
The accompanying notes are an integral part of the financial statements.
73
MassMutual Total Return Bond Fund – Portfolio of Investments (Continued) |
Principal |
Value |
|||||||
Metropolitan Edison Co. |
||||||||
4.000% 4/15/25 (c) |
$ | 985,000 | $ | 934,652 | ||||
MidAmerican Energy Co. |
||||||||
4.400% 10/15/44 |
1,905,000 | 1,618,047 | ||||||
Mong Duong Finance Holdings BV |
||||||||
5.125% 5/07/29 (c) |
250,000 | 195,827 | ||||||
NextEra Energy Capital Holdings, Inc. |
||||||||
4.625% 7/15/27 |
925,000 | 894,417 | ||||||
| 10,640,541 | ||||||||
Engineering & Construction — 0.1% |
||||||||
Artera Services LLC |
||||||||
9.033% 12/04/25 (c) |
257,000 | 206,885 | ||||||
Heathrow Funding Ltd. |
||||||||
1.875% 3/14/36 EUR (c) (e) |
895,000 | 616,657 | ||||||
| 823,542 | ||||||||
Entertainment — 0.5% |
||||||||
Caesars Entertainment, Inc. |
||||||||
8.125% 7/01/27 (c) (d) |
250,000 | 238,771 | ||||||
Warnermedia Holdings, Inc. |
||||||||
5.050% 3/15/42 (c) |
1,760,000 | 1,317,088 | ||||||
5.141% 3/15/52 (c) |
2,551,000 | 1,850,877 | ||||||
| 3,406,736 | ||||||||
Environmental Controls — 0.0% |
||||||||
Waste Pro USA, Inc. |
||||||||
5.500% 2/15/26 (c) |
400,000 | 352,532 | ||||||
Food — 0.6% |
||||||||
JBS USA LUX SA/JBS USA Food Co./JBS USA Finance, Inc. |
||||||||
3.000% 2/02/29 (c) |
730,000 | 597,359 | ||||||
3.000% 5/15/32 (c) |
410,000 | 302,785 | ||||||
6.500% 12/01/52 (c) |
900,000 | 801,945 | ||||||
Kraft Heinz Foods Co. |
||||||||
4.875% 10/01/49 |
815,000 | 671,802 | ||||||
5.200% 7/15/45 |
750,000 | 650,506 | ||||||
Pilgrim’s Pride Corp. |
||||||||
3.500% 3/01/32 (c) |
500,000 | 376,277 | ||||||
5.875% 9/30/27 (c) |
75,000 | 72,938 | ||||||
Post Holdings, Inc. |
||||||||
5.750% 3/01/27 (c) |
525,000 | 500,750 | ||||||
| 3,974,362 | ||||||||
Gas — 0.2% |
||||||||
KeySpan Gas East Corp. |
||||||||
5.819% 4/01/41 (c) |
1,337,000 | 1,262,022 | ||||||
Health Care – Products — 0.0% |
||||||||
Medline Borrower LP |
||||||||
3.875% 4/01/29 (c) |
375,000 | 300,937 | ||||||
Principal |
Value |
|||||||
Health Care – Services — 1.7% |
||||||||
Aetna, Inc. |
||||||||
3.500% 11/15/24 |
$ | 500,000 | $ | 485,990 | ||||
Centene Corp. |
||||||||
2.450% 7/15/28 |
1,951,000 | 1,588,543 | ||||||
4.250% 12/15/27 |
590,000 | 538,567 | ||||||
CommonSpirit Health |
||||||||
2.782% 10/01/30 |
455,000 | 362,979 | ||||||
3.347% 10/01/29 |
1,200,000 | 1,015,500 | ||||||
HCA, Inc. |
||||||||
2.375% 7/15/31 |
230,000 | 170,059 | ||||||
3.500% 9/01/30 |
859,000 | 709,293 | ||||||
4.125% 6/15/29 |
1,262,000 | 1,106,381 | ||||||
5.125% 6/15/39 |
650,000 | 545,533 | ||||||
5.250% 4/15/25 |
644,000 | 630,892 | ||||||
5.250% 6/15/49 |
485,000 | 394,426 | ||||||
5.375% 9/01/26 |
590,000 | 571,809 | ||||||
5.500% 6/15/47 |
775,000 | 654,797 | ||||||
Humana, Inc. |
||||||||
3.700% 3/23/29 |
2,050,000 | 1,838,773 | ||||||
ModivCare Escrow Issuer, Inc. |
||||||||
5.000% 10/01/29 (c) |
425,000 | 345,312 | ||||||
Molina Healthcare, Inc. |
||||||||
3.875% 11/15/30 (c) |
417,000 | 349,976 | ||||||
3.875% 5/15/32 (c) |
850,000 | 696,273 | ||||||
| 12,005,103 | ||||||||
Household Products & Wares — 0.0% |
||||||||
Central Garden & Pet Co. |
||||||||
5.125% 2/01/28 |
22,000 | 19,806 | ||||||
Insurance — 1.5% |
||||||||
Alliant Holdings Intermediate LLC/Alliant Holdings Co-Issuer |
||||||||
6.750% 10/15/27 (c) |
90,000 | 77,561 | ||||||
Aon Corp. / Aon Global Holdings PLC |
||||||||
3.900% 2/28/52 |
845,000 | 626,405 | ||||||
5.000% 9/12/32 |
545,000 | 522,103 | ||||||
Athene Global Funding |
||||||||
1.985% 8/19/28 (c) |
2,200,000 | 1,736,271 | ||||||
3.205% 3/08/27 (c) |
445,000 | 393,504 | ||||||
Berkshire Hathaway Finance Corp. |
||||||||
3.850% 3/15/52 |
600,000 | 458,485 | ||||||
Farmers Exchange Capital |
||||||||
3 mo. USD LIBOR + 3.454% 5.454% VRN 10/15/54 (c) |
3,290,000 | 3,030,465 | ||||||
3 mo. USD LIBOR + 3.744% 6.151% VRN 11/01/53 (c) |
350,000 | 333,897 | ||||||
The accompanying notes are an integral part of the financial statements.
74
MassMutual Total Return Bond Fund – Portfolio of Investments (Continued) |
Principal |
Value |
|||||||
Teachers Insurance & Annuity Association of America 3 mo. USD LIBOR + 2.661% |
||||||||
4.375% VRN 9/15/54 (c) |
$ | 4,000,000 | $ | 3,843,078 | ||||
| 11,021,769 | ||||||||
Internet — 0.2% |
||||||||
NortonLifeLock, Inc. |
||||||||
6.750% 9/30/27 (c) |
400,000 | 385,212 | ||||||
Tencent Holdings Ltd. |
||||||||
3.680% 4/22/41 (c) |
455,000 | 326,371 | ||||||
3.840% 4/22/51 (c) |
455,000 | 297,162 | ||||||
3.975% 4/11/29 (c) |
410,000 | 367,147 | ||||||
| 1,375,892 | ||||||||
Lodging — 0.1% |
||||||||
Hyatt Hotels Corp. |
||||||||
1.800% 10/01/24 |
930,000 | 872,165 | ||||||
Machinery – Diversified — 0.0% |
||||||||
OT Merger Corp. |
||||||||
7.875% 10/15/29 (c) |
125,000 | 84,688 | ||||||
Media — 0.8% |
||||||||
Cable One, Inc. |
||||||||
4.000% 11/15/30 (c) |
1,085,000 | 840,584 | ||||||
CCO Holdings LLC/CCO Holdings Capital Corp. |
||||||||
4.250% 2/01/31 (c) |
975,000 | 746,213 | ||||||
4.250% 1/15/34 (c) |
500,000 | 358,125 | ||||||
Charter Communications Operating LLC/Charter Communications Operating Capital |
||||||||
3.750% 2/15/28 |
500,000 | 441,901 | ||||||
4.800% 3/01/50 |
375,000 | 270,556 | ||||||
4.908% 7/23/25 |
1,105,000 | 1,077,711 | ||||||
5.250% 4/01/53 |
250,000 | 191,069 | ||||||
5.375% 4/01/38 |
5,000 | 4,057 | ||||||
5.375% 5/01/47 |
180,000 | 139,252 | ||||||
5.750% 4/01/48 |
1,088,000 | 878,239 | ||||||
CSC Holdings LLC |
||||||||
5.375% 2/01/28 (c) |
125,000 | 109,161 | ||||||
Diamond Sports Group LLC / Diamond Sports Finance Co. |
||||||||
5.375% 8/15/26 (c) |
1,175,000 | 230,888 | ||||||
Time Warner Cable, Inc. |
||||||||
5.500% 9/01/41 |
370,000 | 290,456 | ||||||
5.875% 11/15/40 |
360,000 | 296,394 | ||||||
| 5,874,606 | ||||||||
Miscellaneous - Manufacturing — 0.2% |
||||||||
GE Capital International Funding Co. Unlimited Co. |
||||||||
4.418% 11/15/35 |
1,067,000 | 957,722 | ||||||
Principal |
Value |
|||||||
General Electric Co. |
||||||||
6.750% 3/15/32 |
$ | 480,000 | $ | 518,407 | ||||
| 1,476,129 | ||||||||
Oil & Gas — 0.5% |
||||||||
Ecopetrol SA |
||||||||
6.875% 4/29/30 |
200,000 | 168,023 | ||||||
KazMunay Gas National Co. |
||||||||
4.750% 4/19/27 (c) |
200,000 | 167,210 | ||||||
Occidental Petroleum Corp. |
||||||||
0.000% 10/10/36 |
115,000 | 58,396 | ||||||
4.500% 7/15/44 |
400,000 | 334,025 | ||||||
Pertamina Persero PT |
||||||||
3.100% 8/27/30 (c) |
875,000 | 713,385 | ||||||
Petroleos Mexicanos |
||||||||
6.625% 6/15/35 |
2,100,000 | 1,341,900 | ||||||
7.690% 1/23/50 |
295,000 | 181,867 | ||||||
Petronas Capital Ltd. |
||||||||
3.500% 4/21/30 (c) |
200,000 | 182,212 | ||||||
Saudi Arabian Oil Co. |
||||||||
1.625% 11/24/25 (c) |
200,000 | 179,933 | ||||||
Transocean Guardian Ltd. |
||||||||
5.875% 1/15/24 (c) |
184,550 | 173,774 | ||||||
Transocean Poseidon Ltd. |
||||||||
6.875% 2/01/27 (c) |
203,875 | 186,545 | ||||||
| 3,687,270 | ||||||||
Oil & Gas Services — 0.1% |
||||||||
Transocean Proteus Ltd. |
||||||||
6.250% 12/01/24 (c) |
391,950 | 368,433 | ||||||
USA Compression Partners LP/USA Compression Finance Corp. |
||||||||
6.875% 4/01/26 |
70,000 | 64,121 | ||||||
| 432,554 | ||||||||
Packaging & Containers — 0.2% |
||||||||
Berry Global, Inc. |
||||||||
1.650% 1/15/27 |
85,000 | 70,513 | ||||||
4.875% 7/15/26 (c) |
585,000 | 549,900 | ||||||
Mauser Packaging Solutions Holding Co. |
||||||||
5.500% 4/15/24 (c) |
70,000 | 66,500 | ||||||
Sealed Air Corp. |
||||||||
1.573% 10/15/26 (c) |
1,200,000 | 1,005,080 | ||||||
Trivium Packaging Finance BV |
||||||||
8.500% 8/15/27 (c) (d) |
75,000 | 66,211 | ||||||
| 1,758,204 | ||||||||
Pharmaceuticals — 1.4% |
||||||||
AbbVie, Inc. |
||||||||
4.450% 5/14/46 |
695,000 | 564,899 | ||||||
4.500% 5/14/35 |
234,000 | 208,289 | ||||||
The accompanying notes are an integral part of the financial statements.
75
MassMutual Total Return Bond Fund – Portfolio of Investments (Continued) |
Principal |
Value |
|||||||
4.550% 3/15/35 |
$ | 576,000 | $ | 516,437 | ||||
Bayer US Finance II LLC |
||||||||
4.375% 12/15/28 (c) |
3,281,000 | 3,003,565 | ||||||
4.625% 6/25/38 (c) |
1,310,000 | 1,084,165 | ||||||
4.875% 6/25/48 (c) |
220,000 | 179,643 | ||||||
Becton Dickinson and Co. |
||||||||
2.823% 5/20/30 |
1,735,000 | 1,451,521 | ||||||
Cigna Corp. |
||||||||
3.400% 3/15/51 |
210,000 | 143,222 | ||||||
4.125% 11/15/25 |
695,000 | 675,107 | ||||||
CVS Health Corp. |
||||||||
3.250% 8/15/29 |
5,000 | 4,374 | ||||||
5.050% 3/25/48 |
2,360,000 | 2,070,474 | ||||||
Embecta Corp. |
||||||||
5.000% 2/15/30 (c) |
425,000 | 364,790 | ||||||
Endo DAC / Endo Finance LLC / Endo Finco, Inc. |
||||||||
6.000% 6/30/28 (c) (f) |
75,000 | 4,125 | ||||||
| 10,270,611 | ||||||||
Pipelines — 1.0% |
||||||||
Energy Transfer LP |
||||||||
4.950% 6/15/28 |
1,291,000 | 1,203,056 | ||||||
5.350% 5/15/45 |
370,000 | 297,631 | ||||||
5.400% 10/01/47 |
1,275,000 | 1,032,239 | ||||||
5.500% 6/01/27 |
264,000 | 256,975 | ||||||
5.950% 10/01/43 |
750,000 | 649,905 | ||||||
6.250% 4/15/49 |
105,000 | 94,029 | ||||||
Galaxy Pipeline Assets Bidco Ltd. |
||||||||
2.160% 3/31/34 (c) |
369,880 | 303,743 | ||||||
Kinder Morgan, Inc. |
||||||||
5.550% 6/01/45 |
565,000 | 492,511 | ||||||
Plains All American Pipeline LP/PAA Finance Corp. |
||||||||
3.550% 12/15/29 |
228,000 | 189,852 | ||||||
Rockies Express Pipeline LLC |
||||||||
4.950% 7/15/29 (c) |
1,000,000 | 857,795 | ||||||
6.875% 4/15/40 (c) |
745,000 | 606,393 | ||||||
Sabine Pass Liquefaction LLC |
||||||||
4.500% 5/15/30 |
765,000 | 696,627 | ||||||
Southern Gas Corridor CJSC |
||||||||
6.875% 3/24/26 (c) |
400,000 | 393,440 | ||||||
| 7,074,196 | ||||||||
Real Estate — 0.0% |
||||||||
Vonovia SE |
||||||||
1.500% 6/14/41 EUR (c) (e) |
200,000 | 106,114 | ||||||
Real Estate Investment Trusts (REITS) — 1.9% |
||||||||
Alexandria Real Estate Equities, Inc. |
||||||||
1.875% 2/01/33 |
630,000 | 442,545 | ||||||
Principal |
Value |
|||||||
2.950% 3/15/34 |
$ | 420,000 | $ | 324,372 | ||||
American Assets Trust LP |
||||||||
3.375% 2/01/31 |
865,000 | 686,722 | ||||||
American Homes Rent |
||||||||
3.625% 4/15/32 |
1,650,000 | 1,360,227 | ||||||
CapLand Ascendas REIT |
||||||||
0.750% 6/23/28 EUR (c) (e) |
445,000 | 333,887 | ||||||
GLP Capital LP/GLP Financing II, Inc. |
||||||||
4.000% 1/15/30 |
60,000 | 50,108 | ||||||
5.250% 6/01/25 |
600,000 | 579,947 | ||||||
5.300% 1/15/29 |
620,000 | 565,378 | ||||||
5.375% 4/15/26 |
1,820,000 | 1,740,848 | ||||||
Healthcare Realty Holdings LP |
||||||||
2.000% 3/15/31 |
340,000 | 249,628 | ||||||
2.400% 3/15/30 |
615,000 | 470,916 | ||||||
3.100% 2/15/30 |
825,000 | 675,391 | ||||||
3.625% 1/15/28 |
33,000 | 29,068 | ||||||
3.750% 7/01/27 |
130,000 | 119,358 | ||||||
Hudson Pacific Properties LP |
||||||||
4.650% 4/01/29 |
1,185,000 | 1,052,308 | ||||||
Invitation Homes Operating Partnership LP |
||||||||
2.000% 8/15/31 |
145,000 | 103,973 | ||||||
4.150% 4/15/32 |
670,000 | 565,934 | ||||||
Life Storage LP |
||||||||
2.400% 10/15/31 |
925,000 | 694,417 | ||||||
Physicians Realty LP |
||||||||
2.625% 11/01/31 |
465,000 | 352,587 | ||||||
SL Green Operating Partnership LP |
||||||||
3.250% 10/15/22 |
1,000,000 | 999,598 | ||||||
VICI Properties LP |
||||||||
3.750% 2/15/27 (c) |
60,000 | 52,552 | ||||||
3.875% 2/15/29 (c) |
485,000 | 406,869 | ||||||
4.500% 9/01/26 (c) |
240,000 | 219,351 | ||||||
4.500% 1/15/28 (c) |
135,000 | 119,770 | ||||||
4.625% 6/15/25 (c) |
65,000 | 61,150 | ||||||
4.950% 2/15/30 |
20,000 | 18,074 | ||||||
5.125% 5/15/32 |
770,000 | 682,528 | ||||||
5.625% 5/15/52 |
403,000 | 333,397 | ||||||
5.750% 2/01/27 (c) |
255,000 | 240,281 | ||||||
| 13,531,184 | ||||||||
Retail — 0.3% |
||||||||
1011778 BC ULC/New Red Finance, Inc. |
||||||||
4.000% 10/15/30 (c) |
450,000 | 354,411 | ||||||
Fertitta Entertainment LLC/Fertitta Entertainment Finance Co., Inc. |
||||||||
6.750% 1/15/30 (c) |
85,000 | 64,616 | ||||||
The accompanying notes are an integral part of the financial statements.
76
MassMutual Total Return Bond Fund – Portfolio of Investments (Continued) |
Principal |
Value |
|||||||
The Michaels Cos., Inc. |
||||||||
5.250% 5/01/28 (c) |
$ | 556,000 | $ | 390,301 | ||||
7.875% 5/01/29 (c) (d) |
339,000 | 195,732 | ||||||
Papa John’s International, Inc. |
||||||||
3.875% 9/15/29 (c) (d) |
233,000 | 186,281 | ||||||
Starbucks Corp. |
||||||||
3.000% 2/14/32 (d) |
835,000 | 690,805 | ||||||
| 1,882,146 | ||||||||
Savings & Loans — 0.3% |
||||||||
Nationwide Building Society |
||||||||
SOFR + 1.290% 2.972% VRN 2/16/28 (c) |
720,000 | 619,209 | ||||||
3 mo. USD LIBOR + 1.064% 3.766% VRN 3/08/24 (c) |
1,215,000 | 1,201,445 | ||||||
3 mo. USD LIBOR + 1.392% 4.363% VRN 8/01/24 (c) |
300,000 | 296,036 | ||||||
| 2,116,690 | ||||||||
Semiconductors — 0.2% |
||||||||
Broadcom, Inc. |
||||||||
3.419% 4/15/33 (c) |
420,000 | 320,389 | ||||||
4.300% 11/15/32 |
385,000 | 323,180 | ||||||
Intel Corp. |
||||||||
3.050% 8/12/51 (d) |
664,000 | 426,056 | ||||||
TSMC Global Ltd. |
||||||||
4.625% 7/22/32 (c) |
250,000 | 236,804 | ||||||
| 1,306,429 | ||||||||
Software — 0.4% |
||||||||
Change Healthcare Holdings LLC/Change Healthcare Finance, Inc. |
||||||||
5.750% 3/01/25 (c) |
288,000 | 286,924 | ||||||
Oracle Corp. |
||||||||
2.875% 3/25/31 |
115,000 | 90,657 | ||||||
3.800% 11/15/37 |
200,000 | 144,503 | ||||||
3.950% 3/25/51 |
2,078,000 | 1,378,335 | ||||||
Take-Two Interactive Software, Inc. |
||||||||
4.000% 4/14/32 |
810,000 | 703,161 | ||||||
| 2,603,580 | ||||||||
Telecommunications — 2.4% |
||||||||
AT&T, Inc. |
||||||||
2.550% 12/01/33 |
210,000 | 155,385 | ||||||
3.800% 12/01/57 |
4,140,000 | 2,797,194 | ||||||
4.500% 5/15/35 |
110,000 | 95,087 | ||||||
4.750% 5/15/46 |
100,000 | 83,825 | ||||||
4.850% 3/01/39 |
366,000 | 316,878 | ||||||
5.250% 3/01/37 |
850,000 | 782,643 | ||||||
Intelsat Jackson Holdings S.A. |
||||||||
6.500% 3/15/30 (c) (d) |
2,240,000 | 1,904,448 | ||||||
Principal |
Value |
|||||||
Intelsat Jackson Holdings S.A., Escrow |
||||||||
8.500% 10/15/24 (c) (g) (h) (i) |
$ | 378,000 | $ | — | ||||
9.750% 7/15/25 (c) (g) (h) (i) |
1,379,000 | — | ||||||
Level 3 Financing, Inc. |
||||||||
3.400% 3/01/27 (c) |
825,000 | 690,937 | ||||||
3.875% 11/15/29 (c) |
230,000 | 181,503 | ||||||
Sprint Spectrum Co. LLC/Sprint Spectrum Co. II LLC/Sprint Spectrum Co. III LLC |
||||||||
4.738% 9/20/29 (c) |
2,153,125 | 2,122,251 | ||||||
5.152% 9/20/29 (c) |
2,015,000 | 1,972,441 | ||||||
T-Mobile USA, Inc. |
||||||||
2.250% 2/15/26 |
1,217,000 | 1,088,947 | ||||||
2.550% 2/15/31 |
955,000 | 756,306 | ||||||
3.750% 4/15/27 |
1,270,000 | 1,172,593 | ||||||
3.875% 4/15/30 |
580,000 | 514,272 | ||||||
4.375% 4/15/40 |
840,000 | 684,119 | ||||||
Verizon Communications, Inc. |
||||||||
2.355% 3/15/32 |
80,000 | 61,316 | ||||||
2.550% 3/21/31 |
410,000 | 327,710 | ||||||
Vodafone Group PLC |
||||||||
4.875% 6/19/49 |
1,260,000 | 990,506 | ||||||
5.250% 5/30/48 |
1,000,000 | 828,137 | ||||||
| 17,526,498 | ||||||||
Transportation — 0.0% |
||||||||
Empresa de Transporte de Pasajeros Metro SA |
||||||||
3.650% 5/07/30 (c) |
200,000 | 172,005 | ||||||
TOTAL CORPORATE DEBT (Cost $247,677,231) |
212,105,271 | |||||||
MUNICIPAL OBLIGATIONS — 0.2% |
||||||||
City of New York NY, General Obligation |
||||||||
3.000% 8/01/34 |
945,000 | 760,811 | ||||||
County of Miami-Dade FL Aviation Revenue, Revenue Bond |
||||||||
2.707% 10/01/33 |
375,000 | 294,377 | ||||||
University of Michigan, Revenue |
||||||||
3.504% 4/01/52 |
335,000 | 256,736 | ||||||
| 1,311,924 | ||||||||
TOTAL MUNICIPAL OBLIGATIONS (Cost $1,734,213) |
1,311,924 | |||||||
The accompanying notes are an integral part of the financial statements.
77
MassMutual Total Return Bond Fund – Portfolio of Investments (Continued) |
Principal |
Value |
|||||||
NON-U.S. GOVERNMENT AGENCY OBLIGATIONS — 17.2% |
||||||||
Commercial Mortgage-Backed Securities — 3.2% |
||||||||
BAMLL Commercial Mortgage Securities Trust |
||||||||
Series 2019-BPR, Class AMP, 3.287% 11/05/32 (c) |
$ | 1,920,000 | $ | 1,740,114 | ||||
Series 2018-PARK, Class A, 4.227% VRN 8/10/38 (c) (j) |
1,280,000 | 1,162,823 | ||||||
BX Commercial Mortgage Trust |
||||||||
Series 2019-XL, Class A, 1 mo. USD LIBOR + .920% 3.738% FRN 10/15/36 (c) |
2,339,554 | 2,304,488 | ||||||
Series 2022-CSMO, Class A, 1 mo. TSFR + 2.115% 4.960% FRN 6/15/27 (c) |
1,641,000 | 1,632,849 | ||||||
BX Trust |
||||||||
Series 2019-OC11, Class A, 3.202% 12/09/41 (c) |
420,000 | 349,609 | ||||||
Series 2022-VAMF, Class C, 1 mo. TSFR + 1.580% 4.425% FRN 1/15/39 (c) |
1,057,000 | 1,012,348 | ||||||
Series 2022-PSB, Class D, 1 mo. TSFR + 4.693% 7.538% FRN 8/15/39 (c) |
1,340,000 | 1,325,755 | ||||||
CALI Mortgage Trust, Series 2019-101C, Class A |
||||||||
3.957% 3/10/39 (c) |
945,000 | 833,423 | ||||||
CPT Mortgage Trust, Series 2019-CPT, Class A |
||||||||
2.865% 11/13/39 (c) |
805,000 | 655,254 | ||||||
DC Office Trust, Series 2019-MTC, Class A |
||||||||
2.965% 9/15/45 (c) |
860,000 | 709,180 | ||||||
GS Mortgage-Backed Securities |
||||||||
3.000% 1/25/53 (c) |
4,300,000 | 3,665,183 | ||||||
Hudson Yards Mortgage Trust |
||||||||
Series 2019-55HY, Class A, 3.041% VRN 12/10/41 (c) (j) |
860,000 | 724,661 | ||||||
Series 2019-30HY, Class A, 3.228% 7/10/39 (c) |
880,000 | 757,655 | ||||||
JP Morgan Chase Commercial Mortgage Securities Trust |
||||||||
Series 2019-OSB, Class A, 3.397% 6/05/39 (c) |
900,000 | 775,389 | ||||||
Series 2021-HTL5, Class A, 1 mo. USD LIBOR + 1.115% 3.933% FRN 11/15/38 (c) |
2,138,000 | 2,052,725 | ||||||
MKT Mortgage Trust, Series 2020-525M, Class A |
||||||||
2.694% 2/12/40 (c) |
570,000 | 455,740 | ||||||
Principal |
Value |
|||||||
One Bryant Park Trust, Series 2019-OBP, Class A |
||||||||
2.516% 9/15/54 (c) |
$ | 1,085,000 | $ | 889,907 | ||||
RBS Commercial Funding, Inc. Trust, Series 2013-GSP, Class A, |
||||||||
3.961% VRN 1/15/32 (c) (j) |
640,000 | 610,917 | ||||||
SFAVE Commercial Mortgage Securities Trust, Series 2015-5AVE, Class A2B, |
||||||||
4.144% VRN 1/05/43 (c) (j) |
50,000 | 36,919 | ||||||
TTAN, Series 2021-MHC, Class E, 1 mo. USD LIBOR + 2.400% |
||||||||
5.218% FRN 3/15/38 (c) |
1,345,716 | 1,261,888 | ||||||
| 22,956,827 | ||||||||
Home Equity Asset-Backed Securities — 0.9% |
||||||||
Argent Securities, Inc., Series 2005-W2, Class M1, 1 mo. USD LIBOR + .735% |
||||||||
3.819% FRN 10/25/35 |
2,129,975 | 2,090,750 | ||||||
Morgan Stanley Capital, Inc. Trust, Series 2006-HE1, Class A4, 1 mo. USD LIBOR + .580% |
||||||||
3.664% FRN 1/25/36 |
2,065,948 | 1,995,737 | ||||||
Option One Mortgage Loan Trust, Series 2006-3, Class 1A1, 1 mo. USD LIBOR + .140% |
||||||||
3.224% FRN 2/25/37 |
3,700,843 | 2,388,712 | ||||||
| 6,475,199 | ||||||||
Other Asset-Backed Securities — 4.7% |
||||||||
AGL CLO Ltd., Series 2021-13A, Class A1, 3 mo. USD LIBOR + 1.160% |
||||||||
3.870% FRN 10/20/34 (c) |
2,400,000 | 2,290,531 | ||||||
AIG CLO Ltd., Series 2019-2A, Class BR, 3 mo. USD LIBOR + 1.600% |
||||||||
4.383% FRN 10/25/33 (c) |
2,400,000 | 2,243,839 | ||||||
Aimco CLO Ltd., Series 2020-11A, Class AR, 3 mo. USD LIBOR + 1.130% |
||||||||
3.870% FRN 10/17/34 (c) |
2,075,000 | 1,978,998 | ||||||
Arbor Realty Commercial Real Estate Notes Ltd., Series 2021-FL3, Class A, 1 mo. USD LIBOR + 1.070% |
||||||||
3.888% FRN 8/15/34 (c) |
2,018,000 | 1,946,780 | ||||||
Barings CLO Ltd., Series 2013-IA, Class AR, 3 mo. USD LIBOR + .800% |
||||||||
3.510% FRN 1/20/28 (c) |
2,648,560 | 2,610,280 | ||||||
The accompanying notes are an integral part of the financial statements.
78
MassMutual Total Return Bond Fund – Portfolio of Investments (Continued) |
Principal |
Value |
|||||||
Countrywide Asset-Backed Certificates Trust |
||||||||
Series 2007-7, Class 1A, 1 mo. USD LIBOR + .200% 3.284% FRN 10/25/47 |
$ | 3,018,116 | $ | 2,873,771 | ||||
Series 2004-5, Class M1, 1 mo. USD LIBOR + .855% 3.939% FRN 8/25/34 |
127,365 | 125,383 | ||||||
First Franklin Mortgage Loan Trust, Series 2005-FF9, Class A4, 1 mo. USD LIBOR + .720% |
||||||||
3.804% FRN 10/25/35 |
83,587 | 83,505 | ||||||
Flatiron CLO Ltd., Series 2021-1A, Class B, 3 mo. USD LIBOR + 1.600% |
||||||||
4.338% FRN 7/19/34 (c) |
2,400,000 | 2,225,782 | ||||||
GoldenTree Loan Opportunities Ltd., Series 2014-9A, Class AR2, 3 mo. USD LIBOR + 1.110% |
||||||||
3.916% FRN 10/29/29 (c) |
2,015,667 | 1,989,159 | ||||||
GSAMP Trust, Series 2006-HE1, Class M1, 1 mo. USD LIBOR + .585% |
||||||||
3.669% FRN 1/25/36 |
978,184 | 969,156 | ||||||
LCM Ltd., Series 19A, Class AR, 3 mo. USD LIBOR + 1.240% |
||||||||
3.752% FRN 7/15/27 (c) |
405,381 | 402,537 | ||||||
Lehman XS Trust, Series 2005-4, Class 1A3, 1 mo. USD LIBOR + .800% |
||||||||
3.884% FRN 10/25/35 |
15,805 | 15,772 | ||||||
Magnetite Ltd., Series 2012-7A, Class A1R2, 3 mo. USD LIBOR + .800% |
||||||||
3.312% FRN 1/15/28 (c) |
1,365,837 | 1,339,973 | ||||||
Morgan Stanley Capital, Inc. Trust, Series 2006-NC2, Class A2D, 1 mo. USD LIBOR + .580% |
||||||||
3.664% FRN 2/25/36 |
1,946,175 | 1,899,064 | ||||||
New Economy Assets Phase 1 Sponsor LLC, Series 2021-1, Class A1 |
||||||||
1.910% 10/20/61 (c) |
1,646,000 | 1,393,279 | ||||||
Progress Residential Trust |
||||||||
Series 2021-SFR8, Class C, 1.931% 10/17/38 (c) |
2,500,000 | 2,114,860 | ||||||
Series 2020-SFR3, Class F, 2.796% 10/17/27 (c) |
860,000 | 761,433 | ||||||
Series 2021-SFR10, Class F, 4.608% 12/17/40 (c) |
1,160,000 | 946,690 | ||||||
Principal |
Value |
|||||||
Rockford Tower Ltd., Series 2019-1A, Class AR, 3 mo. USD LIBOR + 1.120% |
||||||||
3.830% FRN 4/20/34 (c) |
$ | 2,435,000 | $ | 2,309,753 | ||||
TRTX Issuer Ltd., Series 2019-FL3, Class A, 1 mo. TSFR + 1.264% |
||||||||
4.186% FRN 10/15/34 (c) |
458,953 | 458,821 | ||||||
VOLT CIII LLC, Series 2021-CF1, Class A1, |
||||||||
1.992% STEP 8/25/51 (c) |
2,810,099 | 2,619,012 | ||||||
| 33,598,378 | ||||||||
Student Loans Asset-Backed Securities — 2.5% |
||||||||
Access Group, Inc., Series 2015-1, Class A, 1 mo. USD LIBOR + .700% |
||||||||
3.784% FRN 7/25/56 (c) |
1,422,360 | 1,367,961 | ||||||
Education Loan Asset-Backed Trust, Series 2013-1, Class A2, 1 mo. USD LIBOR + .800% |
||||||||
3.884% FRN 4/26/32 (c) |
2,426,285 | 2,395,312 | ||||||
Nelnet Student Loan Trust, Series 2006-1, Class A6, 3 mo. USD LIBOR + .450% |
||||||||
3.408% FRN 8/23/36 (c) |
1,885,480 | 1,825,276 | ||||||
SLM Student Loan Trust |
||||||||
Series 2014-1, Class A3, 1 mo. USD LIBOR + .600% 3.684% FRN 2/26/29 |
1,429,490 | 1,363,906 | ||||||
Series 2012-7, Class A3, 1 mo. USD LIBOR + .650% 3.734% FRN 5/26/26 |
2,431,145 | 2,328,686 | ||||||
Series 2008-5, Class B, 3 mo. USD LIBOR + 1.850% 4.633% FRN 7/25/73 |
3,735,000 | 3,683,981 | ||||||
Series 2008-9, Class B, 3 mo. USD LIBOR + 2.250% 5.033% FRN 10/25/83 |
3,630,000 | 3,498,508 | ||||||
Wachovia Student Loan Trust, Series 2006-1, Class A6, 3 mo. USD LIBOR + .170% |
||||||||
2.953% FRN 4/25/40 (c) |
1,927,633 | 1,853,913 | ||||||
| 18,317,543 | ||||||||
Whole Loan Collateral Collateralized Mortgage Obligations — 5.9% |
||||||||
Ajax Mortgage Loan Trust |
||||||||
Series 2019-,Class A1, 2.860% STEP 7/25/59 (c) |
1,943,076 | 1,857,776 | ||||||
Series 2022-B, Class A1, 3.500% STEP 3/27/62 (c) |
3,172,144 | 2,964,637 | ||||||
The accompanying notes are an integral part of the financial statements.
79
MassMutual Total Return Bond Fund – Portfolio of Investments (Continued) |
Principal |
Value |
|||||||
American Home Mortgage Investment Trust, Series 2006-1, Class 12A1, 1 mo. USD LIBOR + .400% |
||||||||
3.484% FRN 3/25/46 |
$ | 1,514,422 | $ | 1,327,119 | ||||
Bear Stearns Trust, Series 2005-4, Class 25A1, |
||||||||
3.244% VRN 5/25/35 (j) |
664,507 | 596,908 | ||||||
BINOM Securitization Trust, Series 2022-RPL1, Class A1, |
||||||||
3.000% VRN 2/25/61 (c) (j) |
2,983,586 | 2,673,212 | ||||||
CIM Trust, Series 2021-J3, Class A1, |
||||||||
2.500% VRN 6/25/51 (c) (j) |
4,629,932 | 3,671,392 | ||||||
Citigroup Mortgage Loan Trust, Series 2006-AR2, Class 1A2, |
||||||||
2.664% VRN 3/25/36 (j) |
2,722 | 2,523 | ||||||
Credit Suisse Mortgage Trust, Series 2018-RPL9, Class A, |
||||||||
3.850% VRN 9/25/57 (c) (j) |
1,669,518 | 1,590,752 | ||||||
First Horizon Alternative Mortgage Securities Trust, Series 2005-AA9, Class 2A1, |
||||||||
2.869% VRN 11/25/35 (j) |
1,347,348 | 1,147,117 | ||||||
HarborView Mortgage Loan Trust |
||||||||
Series 2006-10, Class 1A1A, 1 mo. USD LIBOR + .200% 3.193% FRN 11/19/36 |
2,691,969 | 2,118,843 | ||||||
Series 2007-6, Class 1A1A, 1 mo. USD LIBOR + .200% 3.193% FRN 8/19/37 |
2,494,388 | 2,055,099 | ||||||
HomeBanc Mortgage Trust, Series 2005-5, Class A1, 1 mo. USD LIBOR + .520% |
||||||||
3.604% FRN 1/25/36 |
2,231,473 | 2,111,532 | ||||||
JP Morgan Mortgage Trust |
||||||||
Series 2021-13, Class A3, 2.500% VRN 4/25/52 (c) (j) |
3,943,374 | 3,134,367 | ||||||
Series 2005-A5, Class 1A2, 3.341% VRN 8/25/35 (j) |
85,186 | 80,825 | ||||||
MASTR Adjustable Rate Mortgages Trust, Series 2004-3, Class 4A1, |
||||||||
2.691% VRN 4/25/34 (j) |
485,235 | 429,794 | ||||||
Preston Ridge Partners Mortgage |
||||||||
Series 2021-5, Class A1, 1.793% STEP 6/25/26 (c) |
3,872,507 | 3,583,228 | ||||||
Series 2021-6, Class A1, 1.793% STEP 7/25/26 (c) |
1,778,191 | 1,648,907 | ||||||
Series 2022-1, Class A1, 3.720% STEP 2/25/27 (c) |
3,826,175 | 3,615,909 | ||||||
Series 2022-4, Class A1, 5.000% VRN 8/25/27 (c) (j) |
909,902 | 875,920 | ||||||
Principal |
Value |
|||||||
RALI Trust, Series 2006-QA7, Class 2A1, 1 mo. USD LIBOR + .370% |
||||||||
3.454% FRN 8/25/36 |
$ | 531,293 | $ | 461,374 | ||||
Residential Asset Securitization Trust, Series 2006-A14C, Class 1A1 |
||||||||
6.250% 12/25/36 |
1,932,339 | 1,474,578 | ||||||
Structured Asset Mortgage Investments Trust, Series 2006-AR1, Class 3A1, 1 mo. USD LIBOR + .460% |
||||||||
3.544% FRN 2/25/36 |
2,354,016 | 2,020,398 | ||||||
Washington Mutual Mortgage Pass-Through Certificates, Series 2005-AR2, Class 2A1A, 1 mo. USD LIBOR + .620% |
||||||||
3.704% FRN 1/25/45 |
511,152 | 493,463 | ||||||
Washington Mutual Mortgage Pass-Through Certificates Trust, Series 2005-7, Class 4CB |
||||||||
7.000% 8/25/35 |
2,676,987 | 2,038,209 | ||||||
Wells Fargo Mortgage-Backed Securities Trust, Series 2007-AR3, Class A4, |
||||||||
2.804% VRN 4/25/37 (j) |
820,286 | 721,662 | ||||||
| 42,695,544 | ||||||||
TOTAL NON-U.S. GOVERNMENT AGENCY OBLIGATIONS (Cost $130,851,675) |
124,043,491 | |||||||
SOVEREIGN DEBT OBLIGATIONS — 1.1% |
||||||||
Abu Dhabi Government International Bond |
||||||||
2.500% 9/30/29 (c) |
647,000 | 562,942 | ||||||
Brazilian Government International Bond |
||||||||
3.875% 6/12/30 |
730,000 | 603,405 | ||||||
Chile Government International Bond |
||||||||
2.550% 1/27/32 (d) |
400,000 | 313,968 | ||||||
Colombia Government International Bond |
||||||||
3.000% 1/30/30 |
200,000 | 143,242 | ||||||
3.125% 4/15/31 |
200,000 | 138,650 | ||||||
4.500% 1/28/26 |
200,000 | 183,050 | ||||||
Dominican Republic International Bond |
||||||||
4.500% 1/30/30 (c) |
440,000 | 345,931 | ||||||
Egypt Government International Bond |
||||||||
7.600% 3/01/29 (c) |
200,000 | 139,656 | ||||||
Hong Kong Airport Authority |
||||||||
3.250% 1/12/52 (c) |
850,000 | 614,091 | ||||||
The accompanying notes are an integral part of the financial statements.
80
MassMutual Total Return Bond Fund – Portfolio of Investments (Continued) |
Principal |
Value |
|||||||
Hungary Government International Bond |
||||||||
2.125% 9/22/31 (c) |
$ | 250,000 | $ | 170,661 | ||||
Indonesia Government International Bond |
||||||||
2.850% 2/14/30 |
300,000 | 256,937 | ||||||
Mexico Government International Bond |
||||||||
2.659% 5/24/31 (d) |
613,000 | 470,410 | ||||||
3.750% 1/11/28 |
420,000 | 385,862 | ||||||
4.750% 4/27/32 (d) |
200,000 | 179,640 | ||||||
Oman Government International Bond |
||||||||
5.625% 1/17/28 (c) |
200,000 | 185,814 | ||||||
Panama Government International Bond |
||||||||
2.252% 9/29/32 |
200,000 | 141,212 | ||||||
3.160% 1/23/30 |
400,000 | 326,629 | ||||||
Peruvian Government International Bond |
||||||||
2.844% 6/20/30 |
200,000 | 163,919 | ||||||
4.125% 8/25/27 |
254,000 | 240,298 | ||||||
Philippine Government International Bond |
||||||||
2.457% 5/05/30 |
200,000 | 165,473 | ||||||
Qatar Government International Bond |
||||||||
4.500% 4/23/28 (c) |
600,000 | 592,098 | ||||||
Republic of South Africa Government International Bond |
||||||||
4.850% 9/30/29 |
200,000 | 165,000 | ||||||
4.875% 4/14/26 |
200,000 | 186,416 | ||||||
5.875% 4/20/32 |
200,000 | 165,022 | ||||||
Republic of Turkey International Bond |
||||||||
3.250% 3/23/23 |
200,000 | 197,600 | ||||||
Romanian Government International Bond |
||||||||
3.000% 2/14/31 (c) |
270,000 | 191,371 | ||||||
Saudi Government International Bond |
||||||||
3.250% 10/26/26 (c) |
400,000 | 380,277 | ||||||
3.625% 3/04/28 (c) |
200,000 | 189,024 | ||||||
| 7,798,598 | ||||||||
TOTAL SOVEREIGN DEBT OBLIGATIONS (Cost $9,663,549) |
7,798,598 | |||||||
Principal |
Value |
|||||||
U.S. GOVERNMENT AGENCY OBLIGATIONS AND INSTRUMENTALITIES (k) — 37.9% |
||||||||
Collateralized Mortgage Obligations — 0.7% |
||||||||
Federal Home Loan Mortgage Corp. Multifamily Structured Pass-Through Certificates Series K155, Class A3 3.750% 4/25/33 |
$ | 2,115,000 | $ | 1,968,014 | ||||
Federal National Mortgage Association REMICS |
||||||||
Series 2018-43, Class CT, 3.000% 6/25/48 |
586,023 | 536,912 | ||||||
Series 2018-55, Class PA, 3.500% 1/25/47 |
485,883 | 487,715 | ||||||
Series 2018-54, Class KA, 3.500% 1/25/47 |
468,226 | 469,990 | ||||||
Series 2018-38, Class PA, 3.500% 6/25/47 |
709,185 | 674,571 | ||||||
Government National Mortgage Association |
||||||||
Series 2018-124, Class NW, 3.500% 9/20/48 |
559,361 | 515,539 | ||||||
Series 2019-15, Class GT, 3.500% 2/20/49 |
590,372 | 545,536 | ||||||
| 5,198,277 | ||||||||
Pass-Through Securities — 35.7% |
||||||||
Federal Home Loan Mortgage Corp. |
||||||||
Pool #SD8193 2.000% 2/01/52 |
4,219,107 | 3,421,536 | ||||||
Pool #SD8199 2.000% 3/01/52 |
2,231,782 | 1,809,891 | ||||||
Pool #QE0312 2.000% 4/01/52 |
2,030,909 | 1,646,356 | ||||||
Pool #SD8189 2.500% 1/01/52 |
2,417,690 | 2,035,652 | ||||||
Pool #SD8194 2.500% 2/01/52 |
3,943,022 | 3,319,955 | ||||||
Pool #SD8200 2.500% 3/01/52 |
2,363,405 | 1,989,207 | ||||||
Pool #SD8205 2.500% 4/01/52 |
4,184,720 | 3,520,191 | ||||||
Pool #SD8212 2.500% 5/01/52 |
4,067,348 | 3,421,458 | ||||||
Pool #G18596 3.000% 4/01/31 |
260,342 | 247,359 | ||||||
Pool #G18691 3.000% 6/01/33 |
97,006 | 91,290 | ||||||
Pool #G08710 3.000% 6/01/46 |
59,039 | 52,389 | ||||||
Pool #G08715 3.000% 8/01/46 |
1,259,741 | 1,117,842 | ||||||
Pool #G08721 3.000% 9/01/46 |
169,871 | 150,737 | ||||||
Pool #G08726 3.000% 10/01/46 |
2,271,650 | 2,015,769 | ||||||
Pool #G08732 3.000% 11/01/46 |
1,612,892 | 1,429,701 | ||||||
Pool #G08741 3.000% 1/01/47 |
1,092,348 | 967,257 | ||||||
Pool #G18713 3.500% 11/01/33 |
698,207 | 663,307 | ||||||
Pool #G16756 3.500% 1/01/34 |
288,417 | 274,812 | ||||||
Pool #G60038 3.500% 1/01/44 |
562,666 | 519,725 | ||||||
Pool #G07848 3.500% 4/01/44 |
4,426,745 | 4,093,060 | ||||||
Pool #G07924 3.500% 1/01/45 |
1,220,155 | 1,128,181 | ||||||
Pool #G60138 3.500% 8/01/45 |
2,539,397 | 2,352,741 | ||||||
Pool #G08711 3.500% 6/01/46 |
970,771 | 892,741 | ||||||
Pool #G08716 3.500% 8/01/46 |
1,404,442 | 1,291,554 | ||||||
The accompanying notes are an integral part of the financial statements.
81
MassMutual Total Return Bond Fund – Portfolio of Investments (Continued) |
Principal |
Value |
|||||||
Pool #G67703 3.500% 4/01/47 |
$ | 1,736,582 | $ | 1,606,765 | ||||
Pool #G67706 3.500% 12/01/47 |
1,394,419 | 1,286,694 | ||||||
Pool #G08792 3.500% 12/01/47 |
1,182,747 | 1,082,874 | ||||||
Pool #G67707 3.500% 1/01/48 |
1,651,102 | 1,527,160 | ||||||
Pool #G67708 3.500% 3/01/48 |
3,019,118 | 2,787,765 | ||||||
Pool #G67709 3.500% 3/01/48 |
3,945,978 | 3,633,736 | ||||||
Pool #G67711 4.000% 3/01/48 |
449,703 | 425,404 | ||||||
Pool #G67713 4.000% 6/01/48 |
1,175,535 | 1,112,017 | ||||||
Pool #G67714 4.000% 7/01/48 |
1,633,748 | 1,544,451 | ||||||
Pool #G67717 4.000% 11/01/48 |
1,449,142 | 1,369,935 | ||||||
Pool #G08843 4.500% 10/01/48 |
531,622 | 514,585 | ||||||
Pool #G08826 5.000% 6/01/48 |
163,777 | 162,380 | ||||||
Pool #G08844 5.000% 10/01/48 |
62,351 | 61,761 | ||||||
Federal National Mortgage Association |
||||||||
Pool #MA4093 2.000% 8/01/40 |
853,532 | 725,790 | ||||||
Pool #MA4152 2.000% 10/01/40 |
3,211,860 | 2,724,138 | ||||||
Pool #MA4176 2.000% 11/01/40 |
2,333,207 | 1,978,908 | ||||||
Pool #MA4333 2.000% 5/01/41 |
695,842 | 587,568 | ||||||
Pool #BQ6913 2.000% 12/01/51 |
4,422,175 | 3,587,599 | ||||||
Pool #CB2767 2.000% 1/01/52 |
4,236,422 | 3,435,577 | ||||||
Pool #CB2766 2.000% 2/01/52 |
2,899,575 | 2,351,445 | ||||||
Pool #FS1598 2.000% 4/01/52 |
4,275,996 | 3,467,671 | ||||||
Pool #BL6060 2.455% 4/01/40 |
1,265,000 | 918,906 | ||||||
Pool #MA4548 2.500% 2/01/52 |
3,975,513 | 3,347,312 | ||||||
Pool #MA4563 2.500% 3/01/52 |
4,075,714 | 3,430,405 | ||||||
Pool #MA3029 3.000% 6/01/32 |
259,476 | 244,862 | ||||||
Pool #MA1607 3.000% 10/01/33 |
1,901,550 | 1,739,815 | ||||||
Pool #BN7755 3.000% 9/01/49 |
1,847,412 | 1,630,962 | ||||||
Pool #MA3811 3.000% 10/01/49 |
478,091 | 413,523 | ||||||
Pool #BO2259 3.000% 10/01/49 |
3,184,391 | 2,805,325 | ||||||
Pool #MA4579 3.000% 4/01/52 |
3,964,559 | 3,455,454 | ||||||
Pool #AB4262 3.500% 1/01/32 |
1,340,412 | 1,257,060 | ||||||
Pool #MA1148 3.500% 8/01/42 |
2,495,582 | 2,347,416 | ||||||
Pool #CA0996 3.500% 1/01/48 |
82,899 | 76,138 | ||||||
Pool #MA3276 3.500% 2/01/48 |
183,234 | 167,545 | ||||||
Pool #MA3305 3.500% 3/01/48 |
621,964 | 568,711 | ||||||
Pool #MA3332 3.500% 4/01/48 |
24,701 | 22,586 | ||||||
Pool #CA3633 3.500% 6/01/49 |
716,295 | 654,797 | ||||||
Pool #MA2995 4.000% 5/01/47 |
521,963 | 491,990 | ||||||
Pool #AS9830 4.000% 6/01/47 |
293,392 | 276,544 | ||||||
Pool #MA3027 4.000% 6/01/47 |
478,989 | 451,484 | ||||||
Pool #AS9972 4.000% 7/01/47 |
280,071 | 263,813 | ||||||
Pool #AL9106 4.500% 2/01/46 |
242,027 | 236,316 | ||||||
Pool #CA1710 4.500% 5/01/48 |
949,100 | 918,993 | ||||||
Pool #CA1711 4.500% 5/01/48 |
17,159 | 16,614 | ||||||
Pool #CA2208 4.500% 8/01/48 |
663,283 | 641,413 | ||||||
Government National Mortgage Association II |
||||||||
Pool #MA4126 3.000% 12/20/46 |
1,500,160 | 1,347,393 | ||||||
Principal |
Value |
|||||||
Pool #MA4836 3.000% 11/20/47 |
$ | 1,062,652 | $ | 953,774 | ||||
Pool #MA6209 3.000% 10/20/49 |
439,073 | 380,913 | ||||||
Pool #MA4127 3.500% 12/20/46 |
1,022,916 | 942,501 | ||||||
Pool #MA4382 3.500% 4/20/47 |
174,433 | 160,720 | ||||||
Pool #MA4719 3.500% 9/20/47 |
1,532,616 | 1,411,174 | ||||||
Pool #MA4837 3.500% 11/20/47 |
208,889 | 192,272 | ||||||
Pool #MA4962 3.500% 1/20/48 |
523,416 | 481,778 | ||||||
Pool #MA5019 3.500% 2/20/48 |
718,016 | 660,898 | ||||||
Pool #MA4838 4.000% 11/20/47 |
437,092 | 413,233 | ||||||
Pool #MA4901 4.000% 12/20/47 |
358,353 | 338,681 | ||||||
Pool #MA5078 4.000% 3/20/48 |
295,996 | 279,469 | ||||||
Pool #MA5466 4.000% 9/20/48 |
203,967 | 191,878 | ||||||
Pool #MA5528 4.000% 10/20/48 |
819,819 | 770,522 | ||||||
Pool #MA4264 4.500% 2/20/47 |
222,371 | 217,918 | ||||||
Pool #MA4512 4.500% 6/20/47 |
1,341,347 | 1,310,295 | ||||||
Pool #MA3666 5.000% 5/20/46 |
29,878 | 30,069 | ||||||
Pool #MA3806 5.000% 7/20/46 |
203,018 | 203,817 | ||||||
Pool #MA4072 5.000% 11/20/46 |
39,411 | 39,540 | ||||||
Pool #MA4454 5.000% 5/20/47 |
727,839 | 731,349 | ||||||
Government National Mortgage Association II TBA 2.500% 10/20/52 (l) |
11,675,000 | 10,032,291 | ||||||
Uniform Mortgage Backed Securities TBA |
||||||||
2.000% 10/13/52 (l) |
12,000,000 | 9,716,250 | ||||||
2.000% 11/14/52 (l) |
22,100,000 | 17,893,230 | ||||||
2.500% 11/10/51 (l) |
22,075,000 | 18,533,514 | ||||||
2.500% 10/13/52 (l) |
9,050,000 | 7,599,879 | ||||||
3.000% 10/13/52 (l) |
22,275,000 | 19,379,250 | ||||||
3.500% 10/13/52 (l) |
5,575,000 | 5,015,758 | ||||||
4.000% 10/13/52 (l) |
8,250,000 | 7,650,586 | ||||||
4.500% 10/13/52 (l) |
33,925,000 | 32,292,359 | ||||||
5.000% 10/13/52 (l) |
17,775,000 | 17,302,852 | ||||||
| 257,279,081 | ||||||||
U.S. Agencies Notes — 1.5% |
||||||||
Federal Home Loan Banks |
||||||||
1.040% 6/14/24 |
8,900,000 | 8,405,864 | ||||||
1.610% 9/04/24 |
2,115,000 | 2,002,664 | ||||||
| 10,408,528 | ||||||||
TOTAL U.S. GOVERNMENT AGENCY OBLIGATIONS AND INSTRUMENTALITIES (Cost $292,502,278) |
272,885,886 | |||||||
U.S. TREASURY OBLIGATIONS — 28.7% |
||||||||
U.S. Treasury Bonds & Notes — 28.7% |
||||||||
U.S. Treasury Bond |
||||||||
2.000% 11/15/41 |
39,402,000 | 28,203,215 | ||||||
The accompanying notes are an integral part of the financial statements.
82
MassMutual Total Return Bond Fund – Portfolio of Investments (Continued) |
Principal |
Value |
|||||||
2.375% 2/15/42 |
$ | 17,185,000 | $ | 13,173,376 | ||||
3.000% 8/15/52 |
14,606,000 | 12,613,651 | ||||||
U.S. Treasury Inflation Index |
||||||||
0.125% 2/15/52 |
1,399,528 | 879,571 | ||||||
U.S. Treasury Note |
||||||||
2.750% 7/31/27 |
20,265,000 | 19,095,012 | ||||||
2.750% 8/15/32 |
2,450,000 | 2,239,453 | ||||||
3.000% 7/31/24 |
23,820,000 | 23,295,217 | ||||||
3.250% 8/31/24 (d) |
28,495,000 | 27,988,547 | ||||||
3.250% 6/30/27 |
2,780,000 | 2,681,180 | ||||||
3.500% 9/15/25 |
750,000 | 734,883 | ||||||
4.125% 9/30/27 |
44,880,000 | 45,074,914 | ||||||
4.250% 9/30/24 |
30,635,000 | 30,662,715 | ||||||
| 206,641,734 | ||||||||
TOTAL U.S. TREASURY OBLIGATIONS (Cost $219,464,137) |
206,641,734 | |||||||
TOTAL BONDS & NOTES (Cost $918,544,274) |
840,627,561 | |||||||
Number of |
||||||||
RIGHTS — 0.0% |
||||||||
Communications — 0.0% |
||||||||
Telecommunications — 0.0% |
||||||||
Intelsat Jackson Holdings S.A. (g) (h) (i) |
1,754 | — | ||||||
Intelsat Jackson Holdings S.A. (g) (h) (i) |
1,754 | — | ||||||
TOTAL RIGHTS (Cost $0) |
— | |||||||
MUTUAL FUNDS — 2.3% |
||||||||
Diversified Financial Services — 2.3% |
||||||||
State Street Navigator Securities Lending Government Money Market Portfolio (m) |
16,726,548 | 16,726,548 | ||||||
TOTAL MUTUAL FUNDS (Cost $16,726,548) |
16,726,548 | |||||||
TOTAL LONG-TERM INVESTMENTS (Cost $936,846,177) |
857,789,713 | |||||||
Principal |
Value |
|||||||
SHORT-TERM INVESTMENTS — 4.3% |
||||||||
Repurchase Agreement — 2.2% |
||||||||
Fixed Income Clearing Corp., Repurchase Agreement, dated 9/30/22, 0.830%, due 10/03/22 (n) |
$ | 15,693,982 | $ | 15,693,982 | ||||
U.S. Treasury Bill — 2.1% |
||||||||
U.S. Treasury Bill |
||||||||
2.448% 12/22/22 (o) |
445,000 | 441,866 | ||||||
3.791% 3/16/23 (o) |
15,375,000 | 15,117,877 | ||||||
| 15,559,743 | ||||||||
TOTAL SHORT-TERM INVESTMENTS (Cost $31,251,376) |
31,253,725 | |||||||
TOTAL INVESTMENTS — 123.5% (Cost $968,097,553) (p) |
889,043,438 | |||||||
Less Unfunded Loan Commitments — 0.00% |
(27,180 | ) | ||||||
NET INVESTMENTS — 123.5% (Cost $968,070,373) |
889,016,258 | |||||||
Other Assets/(Liabilities) — (23.5)% |
(169,122,142 | ) | ||||||
NET ASSETS — 100.0% |
$ | 719,894,116 | ||||||
Abbreviation Legend
|
CLO |
Collateralized Loan Obligation |
|
FRN |
Floating Rate Note |
|
REMICS |
Real Estate Mortgage Investment Conduits |
|
STEP |
Step Up Bond |
|
TBA |
To Be Announced |
|
VRN |
Variable Rate Note |
Notes to Portfolio of Investments
Percentages are stated as a percent of net assets.
|
(a) |
All or a portion of the security represents unsettled loan commitments at September 30, 2022 where the rate will be determined at time of settlement. |
|
(b) |
Unfunded or partially unfunded loan commitments. |
|
(c) |
Security is exempt from registration under Regulation S or Rule 144A of the Securities Act of 1933. These securities are considered restricted and may be resold in transactions exempt from registration. At September 30, 2022, the aggregate market value of these securities amounted to $154,913,458 or 21.52% of net assets. |
The accompanying notes are an integral part of the financial statements.
83
MassMutual Total Return Bond Fund – Portfolio of Investments (Continued) |
Notes to Portfolio of Investments (Continued)
|
(d) |
Denotes all or a portion of security on loan. The total value of securities on loan as of September 30, 2022, was $31,021,740 or 4.31% of net assets. The Fund received $14,947,430 of non-cash collateral (U.S. Treasury and/or Agency obligations) related to securities lending activity. This amount is not reflected on either the Portfolio of Investments or the Statement of Assets and Liabilities. (Note 2). |
|
(e) |
The principal amount of the security is in foreign currency. The market value is in U.S. dollars. |
|
(f) |
Security is currently in default due to bankruptcy or failure to make payment of principal or interest of the issuer. Income is not being accrued. At September 30, 2022, these securities amounted to a value of $4,125 or 0.00% of net assets. |
|
(g) |
This security is fair valued in good faith in accordance with procedures approved by the Board of Trustees. At September 30, 2022, these securities amounted to a value of $0 or 0.00% of net assets. |
|
(h) |
Investment is valued using significant unobservable inputs. |
|
(i) |
Non-income producing security. |
|
(j) |
Certain variable rate securities are not based on a published reference rate and spread but are determined by the issuer or agent and are based on current market conditions. These securities do not indicate a reference rate and spread in their description above. The rates shown are the current interest rates at September 30, 2022. |
|
(k) |
May contain securities that are issued by a U.S. Government Agency, but are unsecured and are not guaranteed by a U.S. Government Agency. |
|
(l) |
A portion of this security is purchased on a when-issued, delayed-delivery or forward commitment basis. (Note 2). |
|
(m) |
Represents investment of security lending cash collateral. (Note 2). |
|
(n) |
Maturity value of $15,695,068. Collateralized by U.S. Government Agency obligations with a rate of 0.000%, maturity date of 3/30/23, and an aggregate market value, including accrued interest, of $16,007,891. |
|
(o) |
The rate shown represents yield-to-maturity. |
|
(p) |
See Note 6 for aggregate cost for federal tax purposes. |
Forward contracts
Counterparty |
Settlement |
Currency Purchased |
Currency Sold |
Unrealized |
||||||||||||||||||||
Citibank N.A.* |
10/07/22 | EUR | 119,000 | USD | 117,316 | $ | (667 | ) | ||||||||||||||||
Citibank N.A.* |
10/07/22 | USD | 1,132,148 | EUR | 1,107,000 | 47,011 | ||||||||||||||||||
Goldman Sachs International* |
10/07/22 | USD | 136,253 | EUR | 133,000 | 5,880 | ||||||||||||||||||
| $ | 52,224 | |||||||||||||||||||||||
Futures contracts
|
Expiration |
Number of |
Notional |
Value/ Net |
||||||||||||
Long |
||||||||||||||||
U.S. Treasury Ultra Bond |
12/20/22 | 27 | $ | 4,032,216 | $ | (333,216 | ) | |||||||||
U.S. Treasury Note 2 Year |
12/30/22 | 615 | 128,208,948 | (1,893,713 | ) | |||||||||||
|
$ | (2,226,929 | ) | |||||||||||||
Short |
||||||||||||||||
U.S. Treasury Ultra 10 Year |
12/20/22 | 70 | $ | (8,647,084 | ) | $ | 353,178 | |||||||||
The accompanying notes are an integral part of the financial statements.
84
MassMutual Total Return Bond Fund – Portfolio of Investments (Continued) |
Centrally Cleared Interest Rate Swaps
Paid by the Fund |
Received by the Fund |
||||||||||||||||||||||||||||||||
Rate/ Reference |
Frequency |
Rate/ Reference |
Frequency |
Termination |
Notional |
Value |
Upfront |
Unrealized |
|||||||||||||||||||||||||
12-Month USD SOFR |
Annually | Fixed 1.950% |
Annually | 6/10/24 | USD | 41,670,000 | $ | (1,538,273 | ) | $ | — | $ | (1,538,273 | ) | |||||||||||||||||||
3-Month USD LIBOR BBA |
Quarterly | Fixed 1.073% |
Semi-Annually | 7/24/25 | USD | 10,155,000 | (588,710 | ) | — | (588,710 | ) | ||||||||||||||||||||||
3-Month USD LIBOR BBA |
Quarterly | Fixed 1.034% |
Semi-Annually | 7/24/25 | USD | 15,025,000 | (881,808 | ) | — | (881,808 | ) | ||||||||||||||||||||||
3-Month USD LIBOR BBA |
Quarterly | Fixed 1.026% |
Semi-Annually | 7/24/25 | USD | 20,310,000 | (1,194,969 | ) | — | (1,194,969 | ) | ||||||||||||||||||||||
3-Month USD LIBOR BBA |
Quarterly | Fixed 1.390% |
Semi-Annually | 9/28/25 | USD | 25,970,000 | (1,302,803 | ) | — | (1,302,803 | ) | ||||||||||||||||||||||
Fixed 1.808% |
Semi-Annually | 3-Month USD LIBOR BBA |
Quarterly | 7/24/53 | USD | 850,000 | 224,274 | — | 224,274 | ||||||||||||||||||||||||
Fixed 1.785% |
Semi-Annually | 3-Month USD LIBOR BBA |
Quarterly | 7/24/53 | USD | 1,250,000 | 335,022 | — | 335,022 | ||||||||||||||||||||||||
Fixed 1.773% |
Semi-Annually | 3-Month USD LIBOR BBA |
Quarterly | 7/24/53 | USD | 1,700,000 | 459,564 | — | 459,564 | ||||||||||||||||||||||||
Fixed 1.870% |
Semi-Annually | 3-Month USD LIBOR BBA |
Quarterly | 9/28/53 | USD | 2,215,000 | 548,043 | — | 548,043 | ||||||||||||||||||||||||
| $ | (3,939,660 | ) | $ | — | $ | (3,939,660 | ) | ||||||||||||||||||||||||||
| * | Contracts are subject to a master netting agreement or similar agreement. |
Currency Legend
|
EUR |
Euro |
|
USD |
U.S. Dollar |
The accompanying notes are an integral part of the financial statements.
85
September 30, 2022 |
Principal |
Value |
|||||||
BONDS & NOTES — 98.5% |
||||||||
BANK LOANS — 3.5% |
||||||||
Advertising — 0.0% |
||||||||
CMG Media Corp., 2021 Term Loan, 1 mo. USD LIBOR + 3.500% |
||||||||
6.615% VRN 12/17/26 |
$ | 188,192 | $ | 175,803 | ||||
Airlines — 0.1% |
||||||||
United Airlines, Inc., 2021 Term Loan B, 3 mo. USD LIBOR + 3.750% |
||||||||
6.533% VRN 4/21/28 |
483,751 | 460,841 | ||||||
Auto Parts & Equipment — 0.1% |
||||||||
Clarios Global LP, 2021 USD Term Loan B, 1 mo. USD LIBOR + 3.250% |
||||||||
6.365% VRN 4/30/26 |
380,344 | 358,949 | ||||||
Beverages — 0.1% |
||||||||
Triton Water Holdings, Inc., Term Loan, 3 mo. USD LIBOR + 3.500% |
||||||||
7.174% VRN 3/31/28 |
485,100 | 434,233 | ||||||
Commercial Services — 0.3% |
||||||||
API Group DE, Inc., Term Loan B, 1 mo. USD LIBOR + 2.500% |
||||||||
3.115% VRN 10/01/26 |
226,314 | 220,261 | ||||||
Prime Security Services Borrower, LLC, 2021 Term Loan, 1 mo. USD LIBOR + 2.750% |
||||||||
5.303% VRN 9/23/26 |
483,847 | 467,894 | ||||||
Verscend Holding Corp., 2021 Term Loan B, 1 mo. USD LIBOR + 4.000% |
||||||||
7.115% VRN 8/27/25 |
514,029 | 497,323 | ||||||
| 1,185,478 | ||||||||
Computers — 0.2% |
||||||||
Magenta Buyer LLC, 2021 USD 1st Lien Term Loan, 1 mo. USD LIBOR + 4.750% |
||||||||
7.870% VRN 7/27/28 |
486,325 | 437,693 | ||||||
Peraton Corp., Term Loan B, 1 mo. USD LIBOR + 3.750% |
||||||||
6.865% VRN 2/01/28 |
274,673 | 259,840 | ||||||
| 697,533 | ||||||||
Diversified Financial Services — 0.3% |
||||||||
Avolon TLB Borrower 1 (US) LLC, 2021 Term Loan B5, 1 mo. USD LIBOR + 2.250% |
||||||||
5.264% VRN 12/01/27 |
87,683 | 85,271 | ||||||
Castlelake Aviation Ltd., Term Loan B, 3 mo. USD LIBOR + 2.750% |
||||||||
6.043% VRN 10/22/26 |
316,452 | 305,310 | ||||||
Principal |
Value |
|||||||
Citadel Securities LP, 2021 Term Loan B, 1 mo. USD SOFR CME + 2.500% |
||||||||
5.649% VRN 2/02/28 |
$ | 52,438 | $ | 50,852 | ||||
Deerfield Dakota Holding, LLC, 2020 USD Term Loan B, 1 mo. USD SOFR CME + 3.750% |
||||||||
6.784% VRN 4/09/27 |
278,967 | 262,695 | ||||||
Jane Street Group, LLC, 2021 Term Loan, 1 mo. USD LIBOR + 2.750% |
||||||||
5.865% VRN 1/26/28 |
347,451 | 332,757 | ||||||
VFH Parent LLC, 2022 Term Loan B, 1 mo. USD SOFR + 3.000% |
||||||||
6.118% VRN 1/13/29 |
110,000 | 105,153 | ||||||
| 1,142,038 | ||||||||
Electronics — 0.0% |
||||||||
II-VI, Inc., 2022 Term Loan B, 1 mo. USD LIBOR + 2.750% |
||||||||
5.314% VRN 7/02/29 |
160,000 | 154,667 | ||||||
Entertainment — 0.1% |
||||||||
PCI Gaming Authority, Term Loan, 1 mo. USD LIBOR + 2.500% |
||||||||
5.615% VRN 5/29/26 |
258,892 | 251,126 | ||||||
Scientific Games International, Inc., 2022 USD Term Loan, 1 mo. USD SOFR CME + 3.000% |
||||||||
5.906% VRN 4/14/29 |
239,400 | 232,098 | ||||||
| 483,224 | ||||||||
Food — 0.1% |
||||||||
Froneri International PLC, 2020 USD Term Loan, 1 mo. USD LIBOR + 2.250% |
||||||||
5.365% VRN 1/29/27 |
303,025 | 285,374 | ||||||
Health Care – Products — 0.1% |
||||||||
Sotera Health Holdings, LLC, 2021 Term Loan, 1 mo. USD LIBOR + 2.750% |
||||||||
5.865% VRN 12/11/26 |
260,000 | 227,500 | ||||||
Health Care – Services — 0.2% |
||||||||
Global Medical Response, Inc., 2020 Term Loan B, 1 mo. USD LIBOR + 4.250% |
||||||||
6.814% VRN 10/02/25 |
382,996 | 331,100 | ||||||
Phoenix Guarantor, Inc., 2020 Term Loan B, 1 mo. USD LIBOR + 3.250% |
||||||||
6.365% VRN 3/05/26 |
488,659 | 461,959 | ||||||
The accompanying notes are an integral part of the financial statements.
86
MassMutual Strategic Bond Fund — Portfolio of Investments (Continued) |
Principal |
Value |
|||||||
RegionalCare Hospital Partners Holdings, Inc., 2018 Term Loan B, 1 mo. USD LIBOR + 3.750% |
||||||||
6.871% VRN 11/16/25 |
$ | 22,800 | $ | 21,151 | ||||
| 814,210 | ||||||||
Housewares — 0.1% |
||||||||
Solis IV BV, USD Term Loan B1, 3 mo. USD SOFR CME + 3.500% |
||||||||
6.340% VRN 2/26/29 |
370,000 | 302,845 | ||||||
Insurance — 0.1% |
||||||||
AmWINS Group, Inc., 2021 Term Loan B, 1 mo. USD LIBOR + 2.250% |
||||||||
5.365% VRN 2/19/28 |
304,577 | 290,801 | ||||||
Leisure Time — 0.1% |
||||||||
Alterra Mountain Co., 2021 Series B-2 Consenting Term Loan, 1 mo. USD LIBOR + 3.500% |
||||||||
6.615% VRN 8/17/28 |
366,700 | 354,782 | ||||||
Lodging — 0.3% |
||||||||
Caesars Resort Collection, LLC, 2017 1st Lien Term Loan B, 1 mo. USD LIBOR + 2.750% |
||||||||
5.865% VRN 12/23/24 |
478,955 | 467,029 | ||||||
Four Seasons Holdings, Inc., New 1st Lien Term Loan, 1 mo. USD LIBOR + 2.000% |
||||||||
5.121% VRN 11/30/23 |
71,596 | 71,175 | ||||||
Hilton Worldwide Finance, LLC, 2019 Term Loan B2, 1 mo. USD LIBOR + 1.750% |
||||||||
4.834% VRN 6/22/26 |
286,204 | 276,424 | ||||||
Station Casinos, LLC, 2020 Term Loan B, 1 mo. USD LIBOR + 2.250% |
||||||||
5.370% VRN 2/08/27 |
462,692 | 441,774 | ||||||
| 1,256,402 | ||||||||
Machinery – Diversified — 0.1% |
||||||||
Ali Group North America Corp., 2021 Term Loan B, 1 mo. USD LIBOR + 2.000% |
||||||||
5.149% VRN 7/30/29 |
263,578 | 253,562 | ||||||
Media — 0.2% |
||||||||
iHeartCommunications, Inc., 2020 Term Loan, 1 mo. USD LIBOR + 3.000% |
||||||||
6.115% VRN 5/01/26 |
495,927 | 464,753 | ||||||
Nexstar Broadcasting, Inc., 2019 Term Loan B4, 1 mo. USD LIBOR + 2.500% |
||||||||
5.615% VRN 9/18/26 |
320,071 | 315,155 | ||||||
Principal |
Value |
|||||||
Virgin Media Bristol LLC, USD Term Loan N, 1 mo. USD LIBOR + 2.500% |
||||||||
5.318% VRN 1/31/28 |
$ | 203,954 | $ | 194,323 | ||||
| 974,231 | ||||||||
Pharmaceuticals — 0.3% |
||||||||
Change Healthcare Holdings LLC, 2017 Term Loan B, 3 mo. USD PRIME + 1.500% |
||||||||
7.750% VRN 3/01/24 |
188,015 | 187,283 | ||||||
Grifols Worldwide Operations USA, Inc., USD 2019 Term Loan B, 1 mo. USD LIBOR + 2.000% |
||||||||
5.115% VRN 11/15/27 |
347,795 | 329,487 | ||||||
Horizon Therapeutics USA, Inc., 2021 Term Loan B2, 1 mo. USD LIBOR + 1.750% |
||||||||
4.875% VRN 3/15/28 |
474,000 | 454,154 | ||||||
Jazz Financing Lux SARL, USD Term Loan, 1 mo. USD LIBOR + 3.500% |
||||||||
6.615% VRN 5/05/28 |
436,456 | 421,180 | ||||||
| 1,392,104 | ||||||||
Retail — 0.2% |
||||||||
1011778 B.C. Unlimited Liability Co., Term Loan B4, 1 mo. USD LIBOR + 1.750% |
||||||||
4.871% VRN 11/19/26 |
331,199 | 316,000 | ||||||
Harbor Freight Tools USA, Inc., 2021 Term Loan B, 1 mo. USD LIBOR + 2.750% |
||||||||
5.865% VRN 10/19/27 |
373,522 | 337,104 | ||||||
| 653,104 | ||||||||
Software — 0.2% |
||||||||
Athenahealth, Inc. |
||||||||
2022 Delayed Draw Term Loan, 3 mo. USD LIBOR + 3.500% |
||||||||
3.500% VRN 2/15/29 (a) |
59,420 | 53,122 | ||||||
2022 Term Loan B, 1 mo. USD SOFR CME + 3.500% |
||||||||
6.576% VRN 2/15/29 |
349,703 | 312,634 | ||||||
Cloudera, Inc., 2021 Term Loan, 1 mo. USD LIBOR + 3.750% |
||||||||
6.865% VRN 10/08/28 |
199,000 | 174,125 | ||||||
DCert Buyer, Inc., 2019 Term Loan B, 3 mo. USD LIBOR + 4.000% |
||||||||
6.903% VRN 10/16/26 |
111,700 | 106,302 | ||||||
The accompanying notes are an integral part of the financial statements.
87
MassMutual Strategic Bond Fund — Portfolio of Investments (Continued) |
Principal |
Value |
|||||||
Rackspace Technology Global, Inc., 2021 Term Loan B, 3 mo. USD LIBOR + 2.750% |
||||||||
5.617% VRN 2/15/28 |
$ | 433,301 | $ | 307,193 | ||||
| 953,376 | ||||||||
Telecommunications — 0.2% |
||||||||
Level 3 Financing, Inc., 2019 Term Loan B, 1 mo. USD LIBOR + 1.750% |
||||||||
4.865% VRN 3/01/27 |
386,209 | 366,234 | ||||||
Zayo Group Holdings, Inc., USD Term Loan, 1 mo. USD LIBOR + 3.000% |
||||||||
6.115% VRN 3/09/27 |
410,000 | 341,378 | ||||||
| 707,612 | ||||||||
Transportation — 0.1% |
||||||||
Genesee & Wyoming, Inc., Term Loan, 3 mo. USD LIBOR + 2.000% |
||||||||
5.674% VRN 12/30/26 |
492,492 | 478,052 | ||||||
TOTAL BANK LOANS (Cost $15,012,956) |
14,036,721 | |||||||
CORPORATE DEBT — 27.1% |
||||||||
Aerospace & Defense — 0.8% |
||||||||
The Boeing Co. |
||||||||
2.196% 2/04/26 |
230,000 | 204,503 | ||||||
2.700% 2/01/27 |
90,000 | 78,410 | ||||||
2.800% 3/01/27 |
150,000 | 131,812 | ||||||
3.100% 5/01/26 |
80,000 | 73,047 | ||||||
3.200% 3/01/29 |
290,000 | 242,125 | ||||||
3.250% 2/01/35 |
360,000 | 254,488 | ||||||
3.550% 3/01/38 |
80,000 | 54,805 | ||||||
3.750% 2/01/50 |
240,000 | 156,317 | ||||||
5.150% 5/01/30 |
160,000 | 147,822 | ||||||
5.705% 5/01/40 |
110,000 | 96,093 | ||||||
5.805% 5/01/50 |
270,000 | 235,177 | ||||||
5.930% 5/01/60 |
40,000 | 34,221 | ||||||
General Dynamics Corp. |
||||||||
3.500% 5/15/25 |
50,000 | 48,585 | ||||||
4.250% 4/01/40 |
20,000 | 17,505 | ||||||
4.250% 4/01/50 |
50,000 | 43,369 | ||||||
L3 Harris Technologies, Inc. |
||||||||
5.054% 4/27/45 |
50,000 | 44,271 | ||||||
Lockheed Martin Corp. |
||||||||
3.550% 1/15/26 |
45,000 | 43,511 | ||||||
3.900% 6/15/32 |
50,000 | 46,241 | ||||||
4.150% 6/15/53 |
320,000 | 267,205 | ||||||
4.500% 5/15/36 |
60,000 | 54,910 | ||||||
Principal |
Value |
|||||||
Northrop Grumman Corp. |
||||||||
2.930% 1/15/25 |
$ | 160,000 | $ | 152,565 | ||||
3.250% 1/15/28 |
290,000 | 264,316 | ||||||
5.250% 5/01/50 |
160,000 | 152,697 | ||||||
Raytheon Technologies Corp. |
||||||||
2.250% 7/01/30 |
110,000 | 88,879 | ||||||
4.125% 11/16/28 |
160,000 | 149,576 | ||||||
4.500% 6/01/42 |
80,000 | 68,969 | ||||||
| 3,151,419 | ||||||||
Agriculture — 0.4% |
||||||||
Altria Group, Inc. |
||||||||
2.450% 2/04/32 |
140,000 | 99,190 | ||||||
4.400% 2/14/26 (b) |
192,000 | 184,824 | ||||||
5.800% 2/14/39 |
240,000 | 209,588 | ||||||
5.950% 2/14/49 |
120,000 | 99,369 | ||||||
6.200% 2/14/59 |
56,000 | 48,708 | ||||||
BAT Capital Corp. |
||||||||
3.557% 8/15/27 |
170,000 | 149,253 | ||||||
4.540% 8/15/47 |
250,000 | 165,651 | ||||||
Cargill, Inc. |
||||||||
1.375% 7/23/23 (c) |
180,000 | 175,322 | ||||||
Philip Morris International, Inc. |
||||||||
1.125% 5/01/23 |
190,000 | 186,151 | ||||||
2.100% 5/01/30 |
40,000 | 30,374 | ||||||
4.500% 3/20/42 |
80,000 | 58,608 | ||||||
Reynolds American, Inc. |
||||||||
5.850% 8/15/45 |
110,000 | 86,304 | ||||||
| 1,493,342 | ||||||||
Airlines — 0.9% |
||||||||
Delta Air Lines, Inc. |
||||||||
3.800% 4/19/23 (b) |
90,000 | 89,105 | ||||||
2.900% 10/28/24 (b) |
180,000 | 167,107 | ||||||
7.000% 5/01/25 (c) |
1,670,000 | 1,681,000 | ||||||
7.375% 1/15/26 (b) |
380,000 | 384,133 | ||||||
Delta Air Lines, Inc./SkyMiles IP Ltd. |
||||||||
4.500% 10/20/25 (c) |
320,000 | 310,638 | ||||||
4.750% 10/20/28 (c) |
300,000 | 279,532 | ||||||
Hawaiian Brand Intellectual Property Ltd. / HawaiianMiles Loyalty Ltd. |
||||||||
5.750% 1/20/26 (c) |
10,000 | 8,820 | ||||||
Mileage Plus Holdings LLC / Mileage Plus Intellectual Property Assets Ltd. |
||||||||
6.500% 6/20/27 (c) |
313,500 | 305,793 | ||||||
Spirit Loyalty Cayman Ltd. / Spirit IP Cayman Ltd. |
||||||||
8.000% 9/20/25 (c) |
240,000 | 241,399 | ||||||
The accompanying notes are an integral part of the financial statements.
88
MassMutual Strategic Bond Fund — Portfolio of Investments (Continued) |
Principal |
Value |
|||||||
United Airlines, Inc. |
||||||||
4.375% 4/15/26 (c) |
$ | 80,000 | $ | 71,400 | ||||
4.625% 4/15/29 (c) |
290,000 | 240,700 | ||||||
| 3,779,627 | ||||||||
Apparel — 0.1% |
||||||||
NIKE, Inc. |
||||||||
2.850% 3/27/30 |
280,000 | 243,147 | ||||||
3.250% 3/27/40 |
130,000 | 100,103 | ||||||
3.375% 3/27/50 |
40,000 | 29,772 | ||||||
| 373,022 | ||||||||
Auto Manufacturers — 0.7% |
||||||||
Ford Motor Co. |
||||||||
4.750% 1/15/43 |
90,000 | 59,615 | ||||||
6.100% 8/19/32 |
90,000 | 79,344 | ||||||
Ford Motor Credit Co. LLC |
||||||||
2.900% 2/16/28 |
390,000 | 307,308 | ||||||
3.625% 6/17/31 |
220,000 | 163,449 | ||||||
4.000% 11/13/30 |
200,000 | 156,000 | ||||||
4.125% 8/17/27 |
200,000 | 172,320 | ||||||
4.950% 5/28/27 |
250,000 | 222,152 | ||||||
5.125% 6/16/25 |
200,000 | 188,709 | ||||||
General Motors Co. |
||||||||
5.150% 4/01/38 |
40,000 | 32,188 | ||||||
5.200% 4/01/45 |
412,000 | 313,751 | ||||||
5.400% 10/02/23 |
130,000 | 130,049 | ||||||
5.950% 4/01/49 |
110,000 | 91,765 | ||||||
6.125% 10/01/25 |
20,000 | 20,012 | ||||||
6.600% 4/01/36 |
10,000 | 9,344 | ||||||
General Motors Financial Co., Inc. |
||||||||
3.100% 1/12/32 (b) |
40,000 | 30,155 | ||||||
4.250% 5/15/23 |
10,000 | 9,960 | ||||||
Nissan Motor Co. Ltd. |
||||||||
3.043% 9/15/23 (c) |
200,000 | 194,432 | ||||||
3.522% 9/17/25 (c) |
410,000 | 377,138 | ||||||
4.345% 9/17/27 (c) |
300,000 | 257,667 | ||||||
| 2,815,358 | ||||||||
Banks — 7.6% |
||||||||
ABN AMRO Bank NV |
||||||||
4.750% 7/28/25 (c) |
260,000 | 250,093 | ||||||
Banco Santander SA |
||||||||
2.746% 5/28/25 |
600,000 | 548,689 | ||||||
3 mo. USD LIBOR + 1.120% 3.543% FRN 4/12/23 |
200,000 | 200,092 | ||||||
Bank of America Corp. |
||||||||
SOFR + 1.210% 2.572% VRN 10/20/32 |
60,000 | 45,868 | ||||||
SOFR + 2.150% 2.592% VRN 4/29/31 |
360,000 | 285,388 | ||||||
Principal |
Value |
|||||||
SOFR + 1.330% 2.972% VRN 2/04/33 |
$ | 130,000 | $ | 101,580 | ||||
3 mo. USD LIBOR + 1.040% 3.419% VRN 12/20/28 |
570,000 | 505,816 | ||||||
3 mo. USD LIBOR + 1.370% 3.593% VRN 7/21/28 |
270,000 | 243,969 | ||||||
3 mo. USD LIBOR + 1.070% 3.970% VRN 3/05/29 |
890,000 | 805,597 | ||||||
3 mo. USD LIBOR + 1.210% 3.974% VRN 2/07/30 |
270,000 | 240,755 | ||||||
4.000% 4/01/24 |
270,000 | 266,946 | ||||||
4.000% 1/22/25 |
270,000 | 261,365 | ||||||
3 mo. USD LIBOR + 3.150% 4.083% VRN 3/20/51 |
4,500,000 | 3,372,039 | ||||||
4.200% 8/26/24 |
380,000 | 373,874 | ||||||
4.250% 10/22/26 |
50,000 | 47,525 | ||||||
3 mo. USD LIBOR + 1.520% 4.330% VRN 3/15/50 |
90,000 | 70,854 | ||||||
SOFR + 1.580% 4.376% VRN 4/27/28 |
300,000 | 281,173 | ||||||
4.450% 3/03/26 |
50,000 | 48,197 | ||||||
5.000% 1/21/44 |
130,000 | 112,310 | ||||||
3 mo. USD LIBOR + 3.705% 6.250% VRN (d) |
170,000 | 164,263 | ||||||
Bank of Montreal |
||||||||
1.850% 5/01/25 |
70,000 | 64,411 | ||||||
5 year USD Swap + 1.432% 3.803% VRN 12/15/32 |
90,000 | 78,080 | ||||||
The Bank of New York Mellon Corp. |
||||||||
1.600% 4/24/25 |
170,000 | 157,040 | ||||||
The Bank of Nova Scotia |
||||||||
1.300% 6/11/25 |
120,000 | 107,932 | ||||||
5 year CMT + 2.050% 4.588% VRN 5/04/37 |
100,000 | 83,807 | ||||||
Barclays PLC 3 mo. USD LIBOR + 3.054% |
||||||||
5.088% VRN 6/20/30 |
510,000 | 443,183 | ||||||
BNP Paribas SA |
||||||||
SOFR + 2.074% 2.219% VRN 6/09/26 (c) |
200,000 | 179,855 | ||||||
5 year USD Swap + 1.483% 4.375% VRN 3/01/33 (c) |
220,000 | 189,726 | ||||||
4.400% 8/14/28 (c) |
400,000 | 360,168 | ||||||
4.625% 3/13/27 (c) |
260,000 | 240,348 | ||||||
Canadian Imperial Bank of Commerce |
||||||||
0.950% 6/23/23 |
120,000 | 116,736 | ||||||
Citigroup, Inc. |
||||||||
SOFR + 2.107% 2.572% VRN 6/03/31 |
170,000 | 133,654 | ||||||
SOFR + 1.939% 3.785% VRN 3/17/33 |
510,000 | 427,314 | ||||||
The accompanying notes are an integral part of the financial statements.
89
MassMutual Strategic Bond Fund — Portfolio of Investments (Continued) |
Principal |
Value |
|||||||
3 mo. USD LIBOR + 1.338% 3.980% VRN 3/20/30 |
$ | 180,000 | $ | 159,629 | ||||
4.125% 7/25/28 |
150,000 | 135,390 | ||||||
4.300% 11/20/26 |
670,000 | 634,287 | ||||||
SOFR + 3.914% 4.412% VRN 3/31/31 |
410,000 | 367,960 | ||||||
4.450% 9/29/27 |
480,000 | 444,179 | ||||||
4.650% 7/30/45 |
181,000 | 145,373 | ||||||
4.650% 7/23/48 |
70,000 | 57,044 | ||||||
SOFR + 1.887% 4.658% VRN 5/24/28 |
50,000 | 47,596 | ||||||
4.750% 5/18/46 |
40,000 | 31,881 | ||||||
SOFR + 2.086% 4.910% VRN 5/24/33 |
130,000 | 119,676 | ||||||
5.300% 5/06/44 |
16,000 | 13,945 | ||||||
3 mo. USD LIBOR + 4.068% 5.950% VRN (b) (d) |
50,000 | 49,406 | ||||||
3 mo. USD LIBOR + 3.905% 5.950% VRN (d) |
150,000 | 135,757 | ||||||
3 mo. USD LIBOR + 3.423% 6.300% VRN (d) |
60,000 | 55,877 | ||||||
6.625% 6/15/32 |
20,000 | 20,214 | ||||||
8.125% 7/15/39 |
50,000 | 59,221 | ||||||
Cooperatieve Rabobank UA |
||||||||
4.375% 8/04/25 |
470,000 | 449,171 | ||||||
Credit Agricole SA SOFR + 1.676% |
||||||||
1.907% VRN 6/16/26 (c) |
270,000 | 241,504 | ||||||
Credit Suisse AG |
||||||||
5.000% 7/09/27 |
250,000 | 230,837 | ||||||
Credit Suisse Group AG |
||||||||
SOFR + 2.044% 2.193% VRN 6/05/26 (c) |
480,000 | 417,415 | ||||||
SOFR + 1.730% 3.091% VRN 5/14/32 (c) |
350,000 | 245,404 | ||||||
SOFR + 3.730% 4.194% VRN 4/01/31 (c) |
250,000 | 196,568 | ||||||
5 year CMT + 6.383% 9.750% VRN (c) (d) |
470,000 | 460,939 | ||||||
Danske Bank A/S |
||||||||
5.375% 1/12/24 (c) |
240,000 | 238,695 | ||||||
Goldman Sachs Capital II 3 mo. USD LIBOR + .768% |
||||||||
4.000% VRN (d) |
8,000 | 5,784 | ||||||
The Goldman Sachs Group, Inc. |
||||||||
SOFR + 1.472% 2.908% VRN 7/21/42 |
80,000 | 51,444 | ||||||
SOFR + 1.513% 3.210% VRN 4/22/42 |
40,000 | 27,106 | ||||||
3.500% 4/01/25 |
370,000 | 353,473 | ||||||
3.500% 11/16/26 |
200,000 | 184,596 | ||||||
Principal |
Value |
|||||||
SOFR + 1.846% 3.615% VRN 3/15/28 |
$ | 50,000 | $ | 45,522 | ||||
3 mo. USD LIBOR + 1.510% 3.691% VRN 6/05/28 |
430,000 | 389,517 | ||||||
3.850% 7/08/24 |
90,000 | 87,978 | ||||||
4.000% 3/03/24 |
100,000 | 98,549 | ||||||
3 mo. USD LIBOR + 1.301% 4.223% VRN 5/01/29 |
490,000 | 445,584 | ||||||
4.250% 10/21/25 |
260,000 | 250,853 | ||||||
4.750% 10/21/45 |
130,000 | 108,418 | ||||||
5.150% 5/22/45 |
290,000 | 240,935 | ||||||
6.250% 2/01/41 |
130,000 | 129,046 | ||||||
6.750% 10/01/37 |
80,000 | 79,699 | ||||||
HSBC Holdings PLC |
||||||||
SOFR + 1.929% 2.099% VRN 6/04/26 |
510,000 | 456,756 | ||||||
4.250% 8/18/25 |
330,000 | 313,315 | ||||||
SOFR + 2.530% 4.762% VRN 3/29/33 |
200,000 | 164,083 | ||||||
Intesa Sanpaolo SpA |
||||||||
3.375% 1/12/23 (c) |
350,000 | 348,047 | ||||||
5.017% 6/26/24 (c) |
900,000 | 838,850 | ||||||
5.710% 1/15/26 (c) |
200,000 | 181,961 | ||||||
JP Morgan Chase & Co. |
||||||||
SOFR + 1.850% 2.083% VRN 4/22/26 |
340,000 | 309,813 | ||||||
SOFR + 2.040% 2.522% VRN 4/22/31 |
300,000 | 237,043 | ||||||
SOFR + 1.180% 2.545% VRN 11/08/32 |
160,000 | 121,353 | ||||||
SOFR + 2.440% 3.109% VRN 4/22/51 |
80,000 | 50,694 | ||||||
SOFR + 1.580% 3.328% VRN 4/22/52 |
1,660,000 | 1,091,083 | ||||||
3 mo. USD LIBOR + .945% 3.509% VRN 1/23/29 |
70,000 | 61,950 | ||||||
3.875% 9/10/24 |
300,000 | 293,465 | ||||||
3 mo. USD LIBOR + 1.260% 4.203% VRN 7/23/29 |
310,000 | 282,233 | ||||||
4.250% 10/01/27 |
70,000 | 65,642 | ||||||
3 mo. USD LIBOR + 1.330% 4.452% VRN 12/05/29 |
830,000 | 760,096 | ||||||
4.950% 6/01/45 |
140,000 | 116,800 | ||||||
Lloyds Banking Group PLC |
||||||||
4.550% 8/16/28 |
370,000 | 337,196 | ||||||
Mitsubishi UFJ Financial Group, Inc. 1 year CMT + 1.125% |
||||||||
3.837% VRN 4/17/26 (b) |
200,000 | 191,474 | ||||||
Morgan Stanley |
||||||||
SOFR + 1.143% 2.699% VRN 1/22/31 |
10,000 | 8,105 | ||||||
The accompanying notes are an integral part of the financial statements.
90
MassMutual Strategic Bond Fund — Portfolio of Investments (Continued) |
Principal |
Value |
|||||||
SOFR + 3.120% 3.622% VRN 4/01/31 |
$ | 750,000 | $ | 645,013 | ||||
3 mo. USD LIBOR + 1.140% 3.772% VRN 1/24/29 |
350,000 | 314,379 | ||||||
3 mo. USD LIBOR + 1.628% 4.431% VRN 1/23/30 |
10,000 | 9,190 | ||||||
National Securities Clearing Corp. |
||||||||
1.500% 4/23/25 (c) |
250,000 | 230,288 | ||||||
Natwest Group PLC 3 mo. USD LIBOR + 1.550% |
||||||||
4.519% VRN 6/25/24 |
200,000 | 197,642 | ||||||
Royal Bank of Canada |
||||||||
1.150% 6/10/25 |
310,000 | 279,780 | ||||||
1.600% 4/17/23 |
30,000 | 29,578 | ||||||
3.875% 5/04/32 |
40,000 | 35,286 | ||||||
Santander Holdings USA, Inc. |
||||||||
4.500% 7/17/25 |
50,000 | 47,836 | ||||||
The Toronto-Dominion Bank |
||||||||
1.150% 6/12/25 |
300,000 | 269,656 | ||||||
UBS Group AG |
||||||||
4.253% 3/23/28 (c) |
340,000 | 314,036 | ||||||
5 year USD Swap + 4.344% 7.000% VRN (c) (d) |
500,000 | 473,100 | ||||||
US Bancorp |
||||||||
1.450% 5/12/25 |
280,000 | 257,065 | ||||||
Wells Fargo & Co. |
||||||||
SOFR + 2.000% 2.188% VRN 4/30/26 |
200,000 | 182,680 | ||||||
SOFR + 2.100% 2.393% VRN 6/02/28 |
230,000 | 197,340 | ||||||
3 mo. TSFR + 1.432% 2.879% VRN 10/30/30 |
150,000 | 123,200 | ||||||
3.000% 10/23/26 |
350,000 | 317,179 | ||||||
SOFR + 1.500% 3.350% VRN 3/02/33 |
360,000 | 291,812 | ||||||
4.300% 7/22/27 |
370,000 | 346,529 | ||||||
4.400% 6/14/46 |
180,000 | 137,245 | ||||||
SOFR + 4.032% 4.478% VRN 4/04/31 |
210,000 | 192,015 | ||||||
4.650% 11/04/44 |
80,000 | 63,575 | ||||||
4.750% 12/07/46 |
10,000 | 7,975 | ||||||
4.900% 11/17/45 |
250,000 | 202,343 | ||||||
SOFR + 4.502% 5.013% VRN 4/04/51 |
1,350,000 | 1,162,147 | ||||||
5.375% 11/02/43 |
110,000 | 95,254 | ||||||
3 mo. USD LIBOR + 3.990% 5.875% VRN (d) |
50,000 | 47,521 | ||||||
| 30,964,742 | ||||||||
Principal |
Value |
|||||||
Beverages — 0.5% |
||||||||
Anheuser-Busch Cos. LLC/Anheuser-Busch InBev Worldwide, Inc. |
||||||||
3.650% 2/01/26 |
$ | 320,000 | $ | 307,486 | ||||
4.900% 2/01/46 |
50,000 | 43,333 | ||||||
Anheuser-Busch InBev Worldwide, Inc. |
||||||||
3.500% 6/01/30 |
130,000 | 116,001 | ||||||
4.000% 4/13/28 |
80,000 | 75,556 | ||||||
4.350% 6/01/40 |
30,000 | 25,412 | ||||||
4.500% 6/01/50 |
360,000 | 295,854 | ||||||
4.600% 4/15/48 |
20,000 | 16,565 | ||||||
4.750% 1/23/29 |
230,000 | 224,176 | ||||||
5.550% 1/23/49 |
110,000 | 103,286 | ||||||
The Coca-Cola Co. |
||||||||
1.450% 6/01/27 (b) |
250,000 | 216,097 | ||||||
2.500% 6/01/40 |
10,000 | 6,981 | ||||||
2.600% 6/01/50 |
80,000 | 51,480 | ||||||
Constellation Brands, Inc. |
||||||||
3.600% 5/09/24 |
60,000 | 58,743 | ||||||
4.350% 5/09/27 |
80,000 | 76,770 | ||||||
Molson Coors Beverage Co. |
||||||||
3.000% 7/15/26 |
50,000 | 45,684 | ||||||
4.200% 7/15/46 |
50,000 | 37,073 | ||||||
PepsiCo, Inc. |
||||||||
1.625% 5/01/30 |
170,000 | 136,202 | ||||||
| 1,836,699 | ||||||||
Biotechnology — 0.1% |
||||||||
Amgen, Inc. |
||||||||
4.663% 6/15/51 |
24,000 | 20,169 | ||||||
Gilead Sciences, Inc. |
||||||||
3.700% 4/01/24 |
130,000 | 127,988 | ||||||
4.500% 2/01/45 |
10,000 | 8,275 | ||||||
4.750% 3/01/46 |
40,000 | 34,817 | ||||||
| 191,249 | ||||||||
Building Materials — 0.0% |
||||||||
Builders FirstSource, Inc. |
||||||||
4.250% 2/01/32 (c) |
20,000 | 15,343 | ||||||
Carrier Global Corp. |
||||||||
3.577% 4/05/50 |
20,000 | 13,851 | ||||||
| 29,194 | ||||||||
Chemicals — 0.2% |
||||||||
Equate Petrochemical BV |
||||||||
4.250% 11/03/26 (c) |
230,000 | 216,600 | ||||||
OCP SA |
||||||||
3.750% 6/23/31 (c) |
260,000 | 196,928 | ||||||
5.125% 6/23/51 (c) |
220,000 | 139,700 | ||||||
The accompanying notes are an integral part of the financial statements.
91
MassMutual Strategic Bond Fund — Portfolio of Investments (Continued) |
Principal |
Value |
|||||||
Orbia Advance Corp. SAB de CV |
||||||||
2.875% 5/11/31 (c) |
$ | 490,000 | $ | 356,819 | ||||
| 910,047 | ||||||||
Commercial Services — 0.2% |
||||||||
The ADT Security Corp. |
||||||||
4.125% 8/01/29 (c) |
10,000 | 8,300 | ||||||
Allied Universal Holdco LLC / Allied Universal Finance Corp. |
||||||||
6.625% 7/15/26 (c) |
10,000 | 8,912 | ||||||
Cintas Corp. No 2 |
||||||||
3.700% 4/01/27 |
160,000 | 151,740 | ||||||
DP World Ltd. |
||||||||
5.625% 9/25/48 (c) |
330,000 | 288,071 | ||||||
PayPal Holdings, Inc. |
||||||||
1.650% 6/01/25 |
270,000 | 248,607 | ||||||
United Rentals North America, Inc. |
||||||||
3.750% 1/15/32 |
80,000 | 62,657 | ||||||
3.875% 11/15/27 |
60,000 | 53,691 | ||||||
3.875% 2/15/31 (b) |
20,000 | 16,265 | ||||||
| 838,243 | ||||||||
Computers — 0.2% |
||||||||
Apple, Inc. |
||||||||
2.450% 8/04/26 |
480,000 | 442,797 | ||||||
International Business Machines Corp. |
||||||||
3.000% 5/15/24 |
320,000 | 311,331 | ||||||
| 754,128 | ||||||||
Cosmetics & Personal Care — 0.1% |
||||||||
GSK Consumer Healthcare Capital US LLC |
||||||||
3.375% 3/24/29 (c) |
260,000 | 226,742 | ||||||
The Procter & Gamble Co. |
||||||||
3.000% 3/25/30 |
100,000 | 89,527 | ||||||
| 316,269 | ||||||||
Distribution & Wholesale — 0.0% |
||||||||
H&E Equipment Services, Inc. |
||||||||
3.875% 12/15/28 (c) |
20,000 | 15,700 | ||||||
Diversified Financial Services — 0.7% |
||||||||
AerCap Ireland Capital DAC / AerCap Global Aviation Trust |
||||||||
2.450% 10/29/26 |
170,000 | 143,470 | ||||||
3.000% 10/29/28 |
160,000 | 128,653 | ||||||
3.150% 2/15/24 |
190,000 | 182,514 | ||||||
3.300% 1/30/32 |
160,000 | 120,165 | ||||||
Air Lease Corp. |
||||||||
3.375% 7/01/25 |
80,000 | 74,559 | ||||||
American Express Co. |
||||||||
3.375% 5/03/24 |
130,000 | 126,790 | ||||||
4.050% 5/03/29 |
210,000 | 192,685 | ||||||
Principal |
Value |
|||||||
Blue Owl Finance LLC |
||||||||
3.125% 6/10/31 (c) |
$ | 1,610,000 | $ | 1,142,833 | ||||
ILFC E-Capital Trust II |
||||||||
5.365% VRN 12/21/65 (c) (e) |
10,000 | 6,800 | ||||||
KKR Group Finance Co. II LLC |
||||||||
5.500% 2/01/43 (c) |
20,000 | 18,094 | ||||||
Mastercard, Inc. |
||||||||
3.850% 3/26/50 |
50,000 | 40,225 | ||||||
Park Aerospace Holdings Ltd. |
||||||||
4.500% 3/15/23 (c) |
10,000 | 9,941 | ||||||
5.500% 2/15/24 (c) |
50,000 | 48,813 | ||||||
Vanguard Group, Inc. |
||||||||
3.050% 8/22/50 |
450,000 | 300,944 | ||||||
Visa, Inc. |
||||||||
3.150% 12/14/25 |
200,000 | 190,973 | ||||||
4.300% 12/14/45 |
160,000 | 139,393 | ||||||
| 2,866,852 | ||||||||
Electric — 0.2% |
||||||||
American Transmission Systems, Inc. |
||||||||
2.650% 1/15/32 (c) |
440,000 | 345,248 | ||||||
Consolidated Edison Co. of New York, Inc. |
||||||||
3.350% 4/01/30 |
70,000 | 61,487 | ||||||
3.950% 4/01/50 |
50,000 | 38,460 | ||||||
Duke Energy Ohio, Inc. |
||||||||
3.650% 2/01/29 |
260,000 | 237,501 | ||||||
Exelon Corp. |
||||||||
5.625% 6/15/35 |
40,000 | 39,011 | ||||||
Pacific Gas and Electric Co. |
||||||||
2.100% 8/01/27 |
140,000 | 113,226 | ||||||
2.500% 2/01/31 |
40,000 | 29,094 | ||||||
3.300% 8/01/40 |
50,000 | 32,007 | ||||||
3.500% 8/01/50 |
80,000 | 48,692 | ||||||
| 944,726 | ||||||||
Electronics — 0.0% |
||||||||
Honeywell International, Inc. |
||||||||
1.350% 6/01/25 |
80,000 | 73,641 | ||||||
Entertainment — 0.2% |
||||||||
Warnermedia Holdings, Inc. |
||||||||
3.755% 3/15/27 (c) |
60,000 | 53,705 | ||||||
4.054% 3/15/29 (c) |
80,000 | 69,271 | ||||||
4.279% 3/15/32 (c) |
430,000 | 353,686 | ||||||
5.050% 3/15/42 (c) |
20,000 | 14,967 | ||||||
5.141% 3/15/52 (c) |
300,000 | 217,665 | ||||||
| 709,294 | ||||||||
Environmental Controls — 0.1% |
||||||||
Republic Services, Inc. |
||||||||
2.500% 8/15/24 |
230,000 | 219,654 | ||||||
The accompanying notes are an integral part of the financial statements.
92
MassMutual Strategic Bond Fund — Portfolio of Investments (Continued) |
Principal |
Value |
|||||||
Food — 0.2% |
||||||||
Danone SA |
||||||||
2.589% 11/02/23 (c) |
$ | 310,000 | $ | 303,066 | ||||
The Hershey Co. |
||||||||
0.900% 6/01/25 |
50,000 | 45,388 | ||||||
Mars, Inc. |
||||||||
2.700% 4/01/25 (c) |
140,000 | 133,161 | ||||||
3.200% 4/01/30 (c) |
80,000 | 70,613 | ||||||
Mondelez International, Inc. |
||||||||
1.500% 5/04/25 |
390,000 | 356,509 | ||||||
| 908,737 | ||||||||
Forest Products & Paper — 0.1% |
||||||||
Suzano Austria GmbH |
||||||||
3.125% 1/15/32 |
80,000 | 57,576 | ||||||
3.750% 1/15/31 |
430,000 | 336,884 | ||||||
| 394,460 | ||||||||
Health Care – Products — 0.1% |
||||||||
Abbott Laboratories |
||||||||
3.750% 11/30/26 |
139,000 | 134,865 | ||||||
4.750% 11/30/36 |
80,000 | 77,982 | ||||||
4.900% 11/30/46 |
100,000 | 95,771 | ||||||
Medtronic, Inc. |
||||||||
4.625% 3/15/45 |
18,000 | 16,249 | ||||||
| 324,867 | ||||||||
Health Care – Services — 0.4% |
||||||||
Aetna, Inc. |
||||||||
2.800% 6/15/23 |
40,000 | 39,485 | ||||||
Centene Corp. |
||||||||
2.625% 8/01/31 |
10,000 | 7,551 | ||||||
3.000% 10/15/30 |
10,000 | 7,919 | ||||||
4.250% 12/15/27 |
70,000 | 63,898 | ||||||
4.625% 12/15/29 |
120,000 | 107,832 | ||||||
CommonSpirit Health |
||||||||
4.350% 11/01/42 |
20,000 | 15,762 | ||||||
Elevance Health, Inc. |
||||||||
3.350% 12/01/24 |
120,000 | 115,453 | ||||||
3.650% 12/01/27 |
140,000 | 130,446 | ||||||
4.100% 5/15/32 |
60,000 | 54,169 | ||||||
4.550% 5/15/52 |
10,000 | 8,437 | ||||||
Fresenius Medical Care US Finance II, Inc. |
||||||||
4.750% 10/15/24 (c) |
70,000 | 68,759 | ||||||
HCA, Inc. |
||||||||
3.500% 9/01/30 |
70,000 | 57,800 | ||||||
4.500% 2/15/27 |
40,000 | 37,339 | ||||||
5.000% 3/15/24 |
50,000 | 49,670 | ||||||
5.250% 6/15/26 |
60,000 | 58,001 | ||||||
5.500% 6/15/47 |
80,000 | 67,592 | ||||||
Principal |
Value |
|||||||
Humana, Inc. |
||||||||
2.150% 2/03/32 |
$ | 40,000 | $ | 30,380 | ||||
4.500% 4/01/25 |
50,000 | 49,292 | ||||||
4.625% 12/01/42 |
70,000 | 59,775 | ||||||
4.800% 3/15/47 |
10,000 | 8,697 | ||||||
Tenet Healthcare Corp. |
||||||||
4.375% 1/15/30 (c) |
10,000 | 8,347 | ||||||
UnitedHealth Group, Inc. |
||||||||
1.250% 1/15/26 |
110,000 | 98,136 | ||||||
2.000% 5/15/30 |
100,000 | 80,410 | ||||||
2.300% 5/15/31 |
20,000 | 16,082 | ||||||
3.125% 5/15/60 |
30,000 | 19,213 | ||||||
3.875% 12/15/28 |
110,000 | 102,767 | ||||||
3.875% 8/15/59 |
90,000 | 66,781 | ||||||
4.000% 5/15/29 |
100,000 | 93,217 | ||||||
4.200% 5/15/32 |
70,000 | 64,982 | ||||||
4.250% 6/15/48 |
110,000 | 91,150 | ||||||
4.450% 12/15/48 |
50,000 | 42,626 | ||||||
5.800% 3/15/36 |
70,000 | 71,325 | ||||||
| 1,793,293 | ||||||||
Home Builders — 0.0% |
||||||||
Lennar Corp. |
||||||||
4.500% 4/30/24 |
100,000 | 98,164 | ||||||
4.750% 11/29/27 |
40,000 | 36,978 | ||||||
MDC Holdings, Inc. |
||||||||
6.000% 1/15/43 |
20,000 | 15,040 | ||||||
| 150,182 | ||||||||
Insurance — 0.2% |
||||||||
Ambac Assurance Corp. |
||||||||
5.100% (c) (d) |
4,362 | 4,427 | ||||||
Berkshire Hathaway Finance Corp. |
||||||||
4.250% 1/15/49 |
160,000 | 132,988 | ||||||
Brighthouse Financial, Inc. |
||||||||
4.700% 6/22/47 |
11,000 | 7,790 | ||||||
Chubb INA Holdings, Inc. |
||||||||
3.350% 5/03/26 |
120,000 | 113,451 | ||||||
Guardian Life Global Funding |
||||||||
1.100% 6/23/25 (c) |
120,000 | 107,801 | ||||||
MetLife Capital Trust IV |
||||||||
7.875% 12/15/37 (c) |
200,000 | 213,500 | ||||||
New York Life Global Funding |
||||||||
0.950% 6/24/25 (c) |
100,000 | 89,606 | ||||||
Principal Life Global Funding II |
||||||||
1.250% 6/23/25 (c) |
110,000 | 98,830 | ||||||
Teachers Insurance & Annuity Association of America |
||||||||
4.900% 9/15/44 (c) |
50,000 | 43,821 | ||||||
The accompanying notes are an integral part of the financial statements.
93
MassMutual Strategic Bond Fund — Portfolio of Investments (Continued) |
Principal |
Value |
|||||||
6.850% 12/16/39 (c) |
$ | 22,000 | $ | 23,959 | ||||
| 836,173 | ||||||||
Internet — 1.3% |
||||||||
Alphabet, Inc. |
||||||||
0.450% 8/15/25 |
50,000 | 44,838 | ||||||
0.800% 8/15/27 |
90,000 | 75,951 | ||||||
1.900% 8/15/40 |
100,000 | 64,200 | ||||||
2.050% 8/15/50 |
60,000 | 35,263 | ||||||
Amazon.com, Inc. |
||||||||
2.100% 5/12/31 |
80,000 | 64,845 | ||||||
2.500% 6/03/50 |
60,000 | 37,467 | ||||||
3.150% 8/22/27 |
470,000 | 438,194 | ||||||
3.300% 4/13/27 |
40,000 | 37,771 | ||||||
3.450% 4/13/29 |
80,000 | 74,008 | ||||||
3.600% 4/13/32 (b) |
320,000 | 290,831 | ||||||
4.050% 8/22/47 |
100,000 | 84,487 | ||||||
4.250% 8/22/57 |
70,000 | 58,245 | ||||||
4.950% 12/05/44 |
180,000 | 171,890 | ||||||
Meta Platforms, Inc. |
||||||||
4.450% 8/15/52 (c) |
3,215,000 | 2,624,093 | ||||||
Prosus NV |
||||||||
3.061% 7/13/31 (c) |
570,000 | 391,262 | ||||||
3.832% 2/08/51 (c) |
210,000 | 116,549 | ||||||
4.027% 8/03/50 (c) |
310,000 | 172,733 | ||||||
Tencent Holdings Ltd. |
||||||||
3.680% 4/22/41 (c) |
210,000 | 150,633 | ||||||
3.840% 4/22/51 (c) |
320,000 | 208,993 | ||||||
| 5,142,253 | ||||||||
Investment Companies — 0.3% |
||||||||
Golub Capital BDC, Inc. |
||||||||
2.500% 8/24/26 |
1,570,000 | 1,316,566 | ||||||
Iron & Steel — 0.1% |
||||||||
ArcelorMittal SA |
||||||||
7.000% STEP 10/15/39 (b) |
60,000 | 56,934 | ||||||
Vale Overseas Ltd. |
||||||||
6.875% 11/21/36 |
174,000 | 165,148 | ||||||
| 222,082 | ||||||||
Leisure Time — 0.0% |
||||||||
VOC Escrow Ltd. |
||||||||
5.000% 2/15/28 (c) |
210,000 | 170,806 | ||||||
Lodging — 0.4% |
||||||||
Las Vegas Sands Corp. |
||||||||
2.900% 6/25/25 |
100,000 | 89,698 | ||||||
3.200% 8/08/24 |
790,000 | 744,899 | ||||||
Sands China Ltd. |
||||||||
4.300% STEP 1/08/26 |
280,000 | 238,302 | ||||||
5.625% STEP 8/08/25 |
750,000 | 679,447 | ||||||
| 1,752,346 | ||||||||
Principal |
Value |
|||||||
Machinery – Construction & Mining — 0.0% |
||||||||
Vertiv Group Corp. |
||||||||
4.125% 11/15/28 (b) (c) |
$ | 30,000 | $ | 24,150 | ||||
Machinery – Diversified — 0.1% |
||||||||
Deere & Co. |
||||||||
3.100% 4/15/30 |
60,000 | 53,369 | ||||||
3.750% 4/15/50 (b) |
260,000 | 212,067 | ||||||
Otis Worldwide Corp. |
||||||||
2.056% 4/05/25 |
140,000 | 129,516 | ||||||
| 394,952 | ||||||||
Media — 1.1% |
||||||||
CCO Holdings LLC/CCO Holdings Capital Corp. |
||||||||
4.500% 8/15/30 (c) |
30,000 | 23,725 | ||||||
4.500% 5/01/32 |
840,000 | 640,643 | ||||||
4.750% 2/01/32 (c) |
70,000 | 54,515 | ||||||
Charter Communications Operating LLC/Charter Communications Operating Capital |
||||||||
3.500% 3/01/42 |
60,000 | 37,870 | ||||||
4.200% 3/15/28 |
190,000 | 170,667 | ||||||
4.400% 4/01/33 |
140,000 | 115,531 | ||||||
4.800% 3/01/50 |
100,000 | 72,148 | ||||||
4.908% 7/23/25 |
270,000 | 263,332 | ||||||
5.050% 3/30/29 |
360,000 | 331,243 | ||||||
5.125% 7/01/49 |
40,000 | 29,702 | ||||||
5.375% 4/01/38 |
100,000 | 81,138 | ||||||
5.375% 5/01/47 |
20,000 | 15,472 | ||||||
5.500% 4/01/63 |
80,000 | 60,434 | ||||||
6.484% 10/23/45 |
160,000 | 140,628 | ||||||
6.834% 10/23/55 |
60,000 | 54,589 | ||||||
Comcast Corp. |
||||||||
2.800% 1/15/51 |
30,000 | 18,265 | ||||||
2.887% 11/01/51 |
320,000 | 200,427 | ||||||
3.150% 3/01/26 |
280,000 | 263,859 | ||||||
3.250% 11/01/39 |
30,000 | 22,035 | ||||||
3.300% 4/01/27 |
120,000 | 111,337 | ||||||
3.400% 4/01/30 |
180,000 | 158,252 | ||||||
3.400% 7/15/46 |
30,000 | 21,125 | ||||||
3.450% 2/01/50 |
40,000 | 27,937 | ||||||
3.750% 4/01/40 |
80,000 | 62,898 | ||||||
3.969% 11/01/47 |
80,000 | 61,177 | ||||||
3.999% 11/01/49 |
20,000 | 15,330 | ||||||
4.000% 8/15/47 |
20,000 | 15,475 | ||||||
4.000% 3/01/48 |
50,000 | 38,231 | ||||||
4.150% 10/15/28 |
180,000 | 170,148 | ||||||
4.250% 10/15/30 |
230,000 | 212,867 | ||||||
4.250% 1/15/33 |
20,000 | 18,105 | ||||||
4.950% 10/15/58 |
10,000 | 8,590 | ||||||
The accompanying notes are an integral part of the financial statements.
94
MassMutual Strategic Bond Fund — Portfolio of Investments (Continued) |
Principal |
Value |
|||||||
6.500% 11/15/35 |
$ | 41,000 | $ | 43,653 | ||||
CSC Holdings LLC |
||||||||
6.500% 2/01/29 (c) |
250,000 | 221,644 | ||||||
DISH DBS Corp. |
||||||||
5.250% 12/01/26 (c) |
120,000 | 98,263 | ||||||
5.750% 12/01/28 (c) |
120,000 | 90,427 | ||||||
Fox Corp. |
||||||||
5.476% 1/25/39 |
90,000 | 78,044 | ||||||
Time Warner Cable, Inc. |
||||||||
6.550% 5/01/37 |
50,000 | 45,115 | ||||||
6.750% 6/15/39 |
120,000 | 107,280 | ||||||
7.300% 7/01/38 |
100,000 | 95,108 | ||||||
Time Warner Entertainment Co. LP |
||||||||
8.375% 7/15/33 |
20,000 | 21,326 | ||||||
Virgin Media Secured Finance PLC |
||||||||
5.500% 5/15/29 (c) |
210,000 | 179,793 | ||||||
The Walt Disney Co. |
||||||||
6.200% 12/15/34 |
20,000 | 20,990 | ||||||
6.650% 11/15/37 |
50,000 | 54,556 | ||||||
| 4,573,894 | ||||||||
Mining — 0.5% |
||||||||
Anglo American Capital PLC |
||||||||
4.750% 4/10/27 (c) |
230,000 | 217,573 | ||||||
Barrick Gold Corp. |
||||||||
5.250% 4/01/42 |
20,000 | 18,250 | ||||||
Barrick North America Finance LLC |
||||||||
5.700% 5/30/41 |
80,000 | 75,994 | ||||||
5.750% 5/01/43 |
80,000 | 75,285 | ||||||
BHP Billiton Finance USA Ltd. |
||||||||
5.000% 9/30/43 |
100,000 | 94,793 | ||||||
First Quantum Minerals Ltd. |
||||||||
6.875% 10/15/27 (c) |
230,000 | 206,549 | ||||||
Freeport-McMoRan, Inc. |
||||||||
4.550% 11/14/24 |
10,000 | 9,847 | ||||||
4.625% 8/01/30 |
120,000 | 105,189 | ||||||
5.450% 3/15/43 |
466,000 | 388,784 | ||||||
Glencore Funding LLC |
||||||||
3.875% 10/27/27 (c) |
90,000 | 81,857 | ||||||
4.000% 3/27/27 (c) |
270,000 | 251,611 | ||||||
4.125% 5/30/23 (c) |
130,000 | 129,176 | ||||||
4.125% 3/12/24 (c) |
130,000 | 127,749 | ||||||
Hudbay Minerals, Inc. |
||||||||
6.125% 4/01/29 (b) (c) |
10,000 | 8,057 | ||||||
Southern Copper Corp. |
||||||||
5.250% 11/08/42 |
450,000 | 394,258 | ||||||
Teck Resources Ltd. |
||||||||
6.000% 8/15/40 |
20,000 | 17,641 | ||||||
| 2,202,613 | ||||||||
Principal |
Value |
|||||||
Miscellaneous - Manufacturing — 0.1% |
||||||||
3M Co. |
||||||||
2.375% 8/26/29 (b) |
$ | 140,000 | $ | 114,741 | ||||
3.050% 4/15/30 (b) |
60,000 | 50,965 | ||||||
3.700% 4/15/50 |
150,000 | 109,060 | ||||||
Eaton Corp. |
||||||||
4.150% 11/02/42 |
40,000 | 32,879 | ||||||
General Electric Co. |
||||||||
6.750% 3/15/32 |
114,000 | 123,122 | ||||||
| 430,767 | ||||||||
Oil & Gas — 2.3% |
||||||||
BP Capital Markets America, Inc. |
||||||||
3.000% 2/24/50 |
340,000 | 220,612 | ||||||
3.119% 5/04/26 |
290,000 | 271,212 | ||||||
3.588% 4/14/27 |
100,000 | 93,695 | ||||||
3.633% 4/06/30 |
120,000 | 107,676 | ||||||
Chevron Corp. |
||||||||
1.995% 5/11/27 |
110,000 | 97,529 | ||||||
3.078% 5/11/50 |
20,000 | 14,153 | ||||||
Chevron USA, Inc. |
||||||||
3.850% 1/15/28 |
300,000 | 285,091 | ||||||
ConocoPhillips Co. |
||||||||
6.950% 4/15/29 |
75,000 | 82,233 | ||||||
Continental Resources, Inc. |
||||||||
2.268% 11/15/26 (c) |
70,000 | 59,735 | ||||||
4.375% 1/15/28 |
130,000 | 116,672 | ||||||
5.750% 1/15/31 (c) |
250,000 | 225,965 | ||||||
Coterra Energy, Inc. |
||||||||
3.900% 5/15/27 (c) |
230,000 | 213,221 | ||||||
4.375% 3/15/29 (c) |
220,000 | 203,309 | ||||||
Devon Energy Corp. |
||||||||
4.750% 5/15/42 |
10,000 | 8,145 | ||||||
5.000% 6/15/45 |
440,000 | 366,194 | ||||||
5.250% 10/15/27 |
32,000 | 32,070 | ||||||
5.600% 7/15/41 |
140,000 | 125,381 | ||||||
5.850% 12/15/25 |
120,000 | 121,061 | ||||||
5.875% 6/15/28 |
26,000 | 25,968 | ||||||
8.250% 8/01/23 |
30,000 | 30,705 | ||||||
Diamondback Energy, Inc. |
||||||||
3.250% 12/01/26 |
10,000 | 9,226 | ||||||
3.500% 12/01/29 |
160,000 | 138,051 | ||||||
Ecopetrol SA |
||||||||
5.875% 5/28/45 |
770,000 | 467,698 | ||||||
EOG Resources, Inc. |
||||||||
3.900% 4/01/35 |
200,000 | 170,313 | ||||||
4.150% 1/15/26 |
70,000 | 68,211 | ||||||
4.375% 4/15/30 |
60,000 | 57,116 | ||||||
4.950% 4/15/50 |
40,000 | 37,216 | ||||||
The accompanying notes are an integral part of the financial statements.
95
MassMutual Strategic Bond Fund — Portfolio of Investments (Continued) |
Principal |
Value |
|||||||
EQT Corp. |
||||||||
3.900% 10/01/27 |
$ | 280,000 | $ | 254,836 | ||||
6.125% STEP 2/01/25 |
20,000 | 20,026 | ||||||
7.000% STEP 2/01/30 |
50,000 | 51,595 | ||||||
Exxon Mobil Corp. |
||||||||
2.992% 3/19/25 |
340,000 | 326,168 | ||||||
3.043% 3/01/26 |
130,000 | 122,876 | ||||||
3.482% 3/19/30 |
190,000 | 172,469 | ||||||
4.114% 3/01/46 |
200,000 | 165,235 | ||||||
4.327% 3/19/50 |
20,000 | 17,035 | ||||||
KazMunayGas National Co. JSC |
||||||||
5.375% 4/24/30 (c) |
200,000 | 158,350 | ||||||
Occidental Petroleum Corp. |
||||||||
4.400% 4/15/46 |
40,000 | 32,917 | ||||||
4.625% 6/15/45 |
80,000 | 66,229 | ||||||
6.600% 3/15/46 |
630,000 | 648,900 | ||||||
Petrobras Global Finance BV |
||||||||
5.500% 6/10/51 (b) |
610,000 | 433,594 | ||||||
5.999% 1/27/28 |
900,000 | 868,730 | ||||||
7.375% 1/17/27 |
260,000 | 267,518 | ||||||
Petroleos Mexicanos |
||||||||
6.375% 1/23/45 |
220,000 | 121,550 | ||||||
6.625% 6/15/35 |
303,000 | 193,617 | ||||||
6.875% 8/04/26 |
160,000 | 144,085 | ||||||
Pioneer Natural Resources Co. |
||||||||
1.125% 1/15/26 |
40,000 | 34,983 | ||||||
2.150% 1/15/31 |
190,000 | 146,326 | ||||||
Reliance Industries Ltd. |
||||||||
3.625% 1/12/52 (c) |
330,000 | 206,884 | ||||||
Shell International Finance BV |
||||||||
2.750% 4/06/30 |
160,000 | 136,548 | ||||||
2.875% 5/10/26 |
130,000 | 121,167 | ||||||
3.250% 4/06/50 |
230,000 | 161,598 | ||||||
4.000% 5/10/46 |
180,000 | 143,203 | ||||||
4.550% 8/12/43 |
100,000 | 86,666 | ||||||
Sinopec Group Overseas Development 2014 Ltd. |
||||||||
4.375% 4/10/24 (c) |
330,000 | 329,013 | ||||||
Southwestern Energy Co. |
||||||||
4.750% 2/01/32 (b) |
60,000 | 50,286 | ||||||
5.375% 3/15/30 |
20,000 | 18,021 | ||||||
| 9,148,883 | ||||||||
Oil & Gas Services — 0.0% |
||||||||
Halliburton Co. |
||||||||
3.800% 11/15/25 |
2,000 | 1,926 | ||||||
4.850% 11/15/35 |
20,000 | 17,348 | ||||||
5.000% 11/15/45 |
110,000 | 91,356 | ||||||
Principal |
Value |
|||||||
Schlumberger Holdings Corp. |
||||||||
3.900% 5/17/28 (c) |
$ | 31,000 | $ | 27,992 | ||||
| 138,622 | ||||||||
Packaging & Containers — 0.0% |
||||||||
Ball Corp. |
||||||||
3.125% 9/15/31 (b) |
100,000 | 75,375 | ||||||
Pharmaceuticals — 1.8% |
||||||||
AbbVie, Inc. |
||||||||
2.600% 11/21/24 |
550,000 | 523,556 | ||||||
2.950% 11/21/26 |
260,000 | 238,300 | ||||||
3.200% 11/21/29 |
600,000 | 526,081 | ||||||
3.600% 5/14/25 |
130,000 | 124,968 | ||||||
3.800% 3/15/25 |
180,000 | 174,354 | ||||||
4.250% 11/21/49 |
20,000 | 16,058 | ||||||
4.550% 3/15/35 |
90,000 | 80,693 | ||||||
4.875% 11/14/48 |
20,000 | 17,588 | ||||||
Becton Dickinson and Co. |
||||||||
3.363% 6/06/24 |
82,000 | 79,705 | ||||||
4.685% 12/15/44 |
18,000 | 15,375 | ||||||
Bristol-Myers Squibb Co. |
||||||||
2.900% 7/26/24 |
206,000 | 199,842 | ||||||
3.200% 6/15/26 |
204,000 | 193,134 | ||||||
3.400% 7/26/29 |
19,000 | 17,269 | ||||||
Cigna Corp. |
||||||||
3.750% 7/15/23 |
161,000 | 159,814 | ||||||
4.125% 11/15/25 |
100,000 | 97,138 | ||||||
4.375% 10/15/28 |
760,000 | 717,503 | ||||||
4.900% 12/15/48 |
20,000 | 17,273 | ||||||
CVS Health Corp. |
||||||||
1.875% 2/28/31 |
30,000 | 22,841 | ||||||
2.125% 9/15/31 |
140,000 | 107,086 | ||||||
3.750% 4/01/30 |
150,000 | 133,336 | ||||||
4.125% 4/01/40 |
120,000 | 95,562 | ||||||
4.250% 4/01/50 |
30,000 | 23,447 | ||||||
4.300% 3/25/28 |
578,000 | 546,418 | ||||||
5.050% 3/25/48 |
120,000 | 105,278 | ||||||
5.125% 7/20/45 |
100,000 | 87,556 | ||||||
CVS Pass-Through Trust |
||||||||
5.298% 1/11/27 (c) |
4,636 | 4,583 | ||||||
5.880% 1/10/28 |
59,251 | 58,986 | ||||||
6.036% 12/10/28 |
54,806 | 54,435 | ||||||
6.943% 1/10/30 |
50,886 | 52,413 | ||||||
Johnson & Johnson |
||||||||
0.550% 9/01/25 |
120,000 | 107,164 | ||||||
0.950% 9/01/27 |
40,000 | 33,870 | ||||||
3.625% 3/03/37 |
320,000 | 276,478 | ||||||
Merck & Co., Inc. |
||||||||
0.750% 2/24/26 |
200,000 | 175,392 | ||||||
The accompanying notes are an integral part of the financial statements.
96
MassMutual Strategic Bond Fund — Portfolio of Investments (Continued) |
Principal |
Value |
|||||||
1.450% 6/24/30 |
$ | 120,000 | $ | 93,799 | ||||
Pfizer, Inc. |
||||||||
0.800% 5/28/25 |
270,000 | 245,207 | ||||||
1.700% 5/28/30 |
280,000 | 223,516 | ||||||
Teva Pharmaceutical Finance Netherlands III BV |
||||||||
3.150% 10/01/26 |
900,000 | 738,450 | ||||||
6.000% 4/15/24 |
350,000 | 339,689 | ||||||
7.125% 1/31/25 |
390,000 | 379,628 | ||||||
| 7,103,785 | ||||||||
Pipelines — 1.5% |
||||||||
Cameron LNG LLC |
||||||||
2.902% 7/15/31 (c) |
40,000 | 32,932 | ||||||
3.302% 1/15/35 (c) |
130,000 | 102,185 | ||||||
Cheniere Energy Partners LP |
||||||||
3.250% 1/31/32 (c) |
170,000 | 132,053 | ||||||
El Paso Natural Gas Co. LLC |
||||||||
8.375% 6/15/32 |
289,000 | 321,179 | ||||||
Energy Transfer LP |
||||||||
2.900% 5/15/25 |
170,000 | 158,148 | ||||||
3.750% 5/15/30 |
430,000 | 363,967 | ||||||
4.950% 6/15/28 |
50,000 | 46,594 | ||||||
5.250% 4/15/29 |
80,000 | 75,218 | ||||||
5.300% 4/01/44 |
20,000 | 16,023 | ||||||
5.400% 10/01/47 |
40,000 | 32,384 | ||||||
6.250% 4/15/49 |
260,000 | 232,835 | ||||||
3 mo. USD LIBOR + 4.028% 6.250% VRN (d) |
20,000 | 16,400 | ||||||
5 year CMT + 5.694% 6.500% VRN (d) |
50,000 | 43,640 | ||||||
5 year CMT + 5.134% 6.750% VRN (d) |
160,000 | 137,707 | ||||||
5 year CMT + 5.306% 7.125% VRN (d) |
150,000 | 123,221 | ||||||
Enterprise Products Operating LLC |
||||||||
3.700% 1/31/51 |
10,000 | 7,032 | ||||||
4.150% 10/16/28 |
980,000 | 911,636 | ||||||
3 mo. USD LIBOR + 2.570% 5.375% VRN 2/15/78 |
40,000 | 30,033 | ||||||
5.700% 2/15/42 |
40,000 | 37,118 | ||||||
EQM Midstream Partners LP |
||||||||
5.500% 7/15/28 |
10,000 | 8,550 | ||||||
Kinder Morgan Energy Partners LP |
||||||||
5.500% 3/01/44 |
30,000 | 24,941 | ||||||
Kinder Morgan, Inc. |
||||||||
4.300% 3/01/28 |
110,000 | 102,996 | ||||||
5.200% 3/01/48 |
20,000 | 16,720 | ||||||
MPLX LP |
||||||||
4.500% 4/15/38 |
70,000 | 56,330 | ||||||
Principal |
Value |
|||||||
4.700% 4/15/48 |
$ | 210,000 | $ | 160,021 | ||||
4.800% 2/15/29 |
190,000 | 176,744 | ||||||
4.875% 12/01/24 |
90,000 | 88,930 | ||||||
5.500% 2/15/49 |
100,000 | 84,884 | ||||||
Southern Natural Gas Co. LLC |
||||||||
8.000% 3/01/32 |
148,000 | 161,423 | ||||||
Tallgrass Energy Partners LP / Tallgrass Energy Finance Corp. |
||||||||
6.000% 12/31/30 (c) |
10,000 | 8,501 | ||||||
Targa Resources Corp. |
||||||||
4.200% 2/01/33 |
100,000 | 83,239 | ||||||
4.950% 4/15/52 |
40,000 | 30,780 | ||||||
Targa Resources Partners LP/Targa Resources Partners Finance Corp. |
||||||||
4.875% 2/01/31 |
130,000 | 111,800 | ||||||
Tennessee Gas Pipeline Co. LLC |
||||||||
2.900% 3/01/30 (c) |
200,000 | 163,647 | ||||||
Transcontinental Gas Pipe Line Co. LLC |
||||||||
7.850% 2/01/26 |
60,000 | 63,704 | ||||||
Venture Global Calcasieu Pass LLC |
||||||||
3.875% 11/01/33 (c) |
80,000 | 62,200 | ||||||
Western Midstream Operating LP |
||||||||
3.350% STEP 2/01/25 |
240,000 | 223,123 | ||||||
3 mo. USD LIBOR + 1.100% 3.555% FRN 1/13/23 |
90,000 | 89,338 | ||||||
4.300% STEP 2/01/30 |
900,000 | 769,734 | ||||||
5.500% 8/15/48 |
20,000 | 16,175 | ||||||
5.500% STEP 2/01/50 |
230,000 | 185,725 | ||||||
The Williams Cos., Inc. |
||||||||
3.750% 6/15/27 |
170,000 | 156,452 | ||||||
7.500% 1/15/31 |
200,000 | 214,452 | ||||||
7.750% 6/15/31 (b) |
350,000 | 379,771 | ||||||
| 6,260,485 | ||||||||
Real Estate Investment Trusts (REITS) — 0.1% |
||||||||
CTR Partnership LP / CareTrust Capital Corp. |
||||||||
3.875% 6/30/28 (c) |
20,000 | 16,454 | ||||||
GLP Capital LP/GLP Financing II, Inc. |
||||||||
5.250% 6/01/25 |
10,000 | 9,666 | ||||||
5.375% 4/15/26 |
40,000 | 38,260 | ||||||
MPT Operating Partnership LP / MPT Finance Corp. |
||||||||
3.500% 3/15/31 |
110,000 | 76,588 | ||||||
4.625% 8/01/29 |
10,000 | 8,046 | ||||||
5.000% 10/15/27 |
30,000 | 25,928 | ||||||
The accompanying notes are an integral part of the financial statements.
97
MassMutual Strategic Bond Fund — Portfolio of Investments (Continued) |
Principal |
Value |
|||||||
WEA Finance LLC/Westfield UK & Europe Finance PLC |
||||||||
3.750% 9/17/24 (c) |
$ | 220,000 | $ | 207,881 | ||||
| 382,823 | ||||||||
Retail — 0.9% |
||||||||
Costco Wholesale Corp. |
||||||||
1.375% 6/20/27 |
190,000 | 164,067 | ||||||
1.600% 4/20/30 |
110,000 | 88,164 | ||||||
The Home Depot, Inc. |
||||||||
2.700% 4/15/30 |
70,000 | 59,766 | ||||||
3.300% 4/15/40 |
120,000 | 91,770 | ||||||
3.350% 4/15/50 |
220,000 | 157,633 | ||||||
3.900% 12/06/28 |
30,000 | 28,512 | ||||||
3.900% 6/15/47 |
40,000 | 31,835 | ||||||
Lowe’s Cos., Inc. |
||||||||
4.500% 4/15/30 |
50,000 | 46,681 | ||||||
5.625% 4/15/53 |
2,341,000 | 2,170,159 | ||||||
McDonald’s Corp. |
||||||||
3.300% 7/01/25 |
60,000 | 57,736 | ||||||
3.500% 7/01/27 |
180,000 | 168,178 | ||||||
3.600% 7/01/30 |
190,000 | 170,744 | ||||||
3.625% 9/01/49 |
40,000 | 29,134 | ||||||
3.800% 4/01/28 |
110,000 | 103,380 | ||||||
4.200% 4/01/50 |
140,000 | 112,200 | ||||||
Target Corp. |
||||||||
2.250% 4/15/25 |
110,000 | 103,783 | ||||||
Walmart, Inc. |
||||||||
1.500% 9/22/28 |
80,000 | 66,935 | ||||||
1.800% 9/22/31 |
40,000 | 31,763 | ||||||
| 3,682,440 | ||||||||
Semiconductors — 0.3% |
||||||||
Broadcom, Inc. |
||||||||
3.137% 11/15/35 (c) |
490,000 | 343,136 | ||||||
Intel Corp. |
||||||||
1.600% 8/12/28 |
190,000 | 156,897 | ||||||
3.050% 8/12/51 (b) |
90,000 | 57,748 | ||||||
3.700% 7/29/25 |
40,000 | 38,980 | ||||||
4.750% 3/25/50 |
20,000 | 17,284 | ||||||
NVIDIA Corp. |
||||||||
2.850% 4/01/30 |
90,000 | 77,105 | ||||||
3.500% 4/01/40 |
240,000 | 186,443 | ||||||
3.500% 4/01/50 |
170,000 | 124,474 | ||||||
3.700% 4/01/60 |
170,000 | 121,690 | ||||||
NXP BV / NXP Funding LLC / NXP USA, Inc. |
||||||||
2.700% 5/01/25 |
120,000 | 111,294 | ||||||
Principal |
Value |
|||||||
Texas Instruments, Inc. |
||||||||
1.750% 5/04/30 |
$ | 110,000 | $ | 88,116 | ||||
| 1,323,167 | ||||||||
Software — 0.5% |
||||||||
Microsoft Corp. |
||||||||
2.400% 8/08/26 |
530,000 | 490,805 | ||||||
2.525% 6/01/50 |
133,000 | 86,910 | ||||||
2.675% 6/01/60 (b) |
17,000 | 10,692 | ||||||
2.921% 3/17/52 |
107,000 | 75,574 | ||||||
3.041% 3/17/62 |
83,000 | 56,642 | ||||||
3.300% 2/06/27 |
290,000 | 275,998 | ||||||
Open Text Holdings, Inc. |
||||||||
4.125% 2/15/30 (c) |
10,000 | 7,986 | ||||||
4.125% 12/01/31 (c) |
10,000 | 7,593 | ||||||
Oracle Corp. |
||||||||
1.650% 3/25/26 |
300,000 | 262,955 | ||||||
2.875% 3/25/31 |
350,000 | 275,913 | ||||||
2.950% 4/01/30 |
20,000 | 16,115 | ||||||
Salesforce, Inc. |
||||||||
3.250% 4/11/23 |
60,000 | 59,718 | ||||||
3.700% 4/11/28 |
50,000 | 47,415 | ||||||
Workday, Inc. |
||||||||
3.500% 4/01/27 |
50,000 | 46,212 | ||||||
3.700% 4/01/29 |
80,000 | 72,004 | ||||||
3.800% 4/01/32 (b) |
100,000 | 86,897 | ||||||
| 1,879,429 | ||||||||
Telecommunications — 1.7% |
||||||||
Altice France SA |
||||||||
5.500% 10/15/29 (c) |
210,000 | 158,003 | ||||||
AT&T, Inc. |
||||||||
1.650% 2/01/28 (b) |
280,000 | 230,229 | ||||||
2.250% 2/01/32 |
20,000 | 15,119 | ||||||
2.300% 6/01/27 |
250,000 | 218,610 | ||||||
2.550% 12/01/33 |
120,000 | 88,792 | ||||||
3.300% 2/01/52 (b) |
40,000 | 25,777 | ||||||
3.500% 9/15/53 |
180,000 | 119,510 | ||||||
3.550% 9/15/55 |
173,000 | 113,470 | ||||||
3.650% 9/15/59 |
60,000 | 38,880 | ||||||
3.800% 12/01/57 |
10,000 | 6,756 | ||||||
4.350% 6/15/45 |
101,000 | 78,021 | ||||||
5.350% 9/01/40 |
40,000 | 36,100 | ||||||
5.550% 8/15/41 |
40,000 | 37,097 | ||||||
CommScope, Inc. |
||||||||
4.750% 9/01/29 (c) |
20,000 | 16,313 | ||||||
6.000% 3/01/26 (c) |
60,000 | 55,243 | ||||||
Sprint Capital Corp. |
||||||||
8.750% 3/15/32 |
20,000 | 23,175 | ||||||
The accompanying notes are an integral part of the financial statements.
98
MassMutual Strategic Bond Fund — Portfolio of Investments (Continued) |
Principal |
Value |
|||||||
Sprint Spectrum Co. LLC/Sprint Spectrum Co. II LLC/Sprint Spectrum Co. III LLC |
||||||||
4.738% 9/20/29 (c) |
$ | 137,500 | $ | 135,529 | ||||
T-Mobile USA, Inc. |
||||||||
2.250% 2/15/26 |
70,000 | 62,635 | ||||||
2.250% 11/15/31 |
70,000 | 52,728 | ||||||
2.550% 2/15/31 |
130,000 | 102,953 | ||||||
2.625% 2/15/29 |
230,000 | 189,897 | ||||||
2.875% 2/15/31 |
170,000 | 136,993 | ||||||
3.000% 2/15/41 |
60,000 | 40,097 | ||||||
3.300% 2/15/51 |
20,000 | 13,031 | ||||||
3.375% 4/15/29 |
70,000 | 60,429 | ||||||
3.500% 4/15/25 |
350,000 | 334,564 | ||||||
3.500% 4/15/31 |
290,000 | 244,734 | ||||||
3.750% 4/15/27 |
50,000 | 46,165 | ||||||
3.875% 4/15/30 |
190,000 | 168,468 | ||||||
5.650% 1/15/53 |
1,232,000 | 1,162,161 | ||||||
Telefonica Emisiones SA |
||||||||
5.213% 3/08/47 |
150,000 | 114,096 | ||||||
Verizon Communications, Inc. |
||||||||
1.750% 1/20/31 |
280,000 | 209,896 | ||||||
2.355% 3/15/32 |
40,000 | 30,658 | ||||||
2.550% 3/21/31 |
570,000 | 455,597 | ||||||
2.650% 11/20/40 |
260,000 | 169,484 | ||||||
2.875% 11/20/50 |
530,000 | 324,146 | ||||||
3.400% 3/22/41 |
40,000 | 29,210 | ||||||
3.850% 11/01/42 |
40,000 | 30,653 | ||||||
3.875% 2/08/29 |
130,000 | 118,635 | ||||||
4.000% 3/22/50 |
120,000 | 91,538 | ||||||
4.125% 8/15/46 |
180,000 | 142,517 | ||||||
4.329% 9/21/28 |
440,000 | 414,382 | ||||||
4.400% 11/01/34 |
270,000 | 237,506 | ||||||
4.500% 8/10/33 |
40,000 | 36,009 | ||||||
5.250% 3/16/37 |
170,000 | 158,819 | ||||||
5.500% 3/16/47 |
30,000 | 28,617 | ||||||
Vmed O2 UK Financing I PLC |
||||||||
4.750% 7/15/31 (c) |
200,000 | 154,302 | ||||||
Vodafone Group PLC |
||||||||
4.375% 5/30/28 (b) |
70,000 | 65,882 | ||||||
| 6,823,426 | ||||||||
Transportation — 0.1% |
||||||||
Union Pacific Corp. |
||||||||
2.150% 2/05/27 |
50,000 | 44,642 | ||||||
2.891% 4/06/36 |
270,000 | 205,222 | ||||||
3.750% 7/15/25 |
70,000 | 68,281 | ||||||
3.750% 2/05/70 |
150,000 | 104,707 | ||||||
3.839% 3/20/60 |
120,000 | 88,811 | ||||||
Principal |
Value |
|||||||
XPO Logistics, Inc. |
||||||||
6.250% 5/01/25 (c) |
$ | 9,000 | $ | 9,025 | ||||
| 520,688 | ||||||||
TOTAL CORPORATE DEBT (Cost $128,025,740) |
110,260,470 | |||||||
MUNICIPAL OBLIGATIONS — 0.0% |
||||||||
Northeast Ohio Regional Sewer District, Revenue Bond |
||||||||
5.000% 11/15/43 |
50,000 | 50,571 | ||||||
State of California, General Obligation |
||||||||
5.000% 11/01/43 |
50,000 | 50,875 | ||||||
| 101,446 | ||||||||
TOTAL MUNICIPAL OBLIGATIONS (Cost $102,278) |
101,446 | |||||||
NON-U.S. GOVERNMENT AGENCY OBLIGATIONS — 9.3% |
||||||||
Automobile Asset-Backed Securities — 0.6% |
||||||||
Avis Budget Rental Car Funding, Series 2021-1A, Class A |
||||||||
1.380% 8/20/27 (c) |
490,000 | 419,717 | ||||||
Hertz Vehicle Financing III LP, Series 2021-2A, Class C |
||||||||
2.520% 12/27/27 (c) |
2,500,000 | 2,111,442 | ||||||
| 2,531,159 | ||||||||
Commercial Mortgage-Backed Securities — 3.9% |
||||||||
Banc of America Merrill Lynch Trust, Series 2016-GG10, Class AJA, |
||||||||
5.809% VRN 8/10/45 (c) (e) |
408,268 | 155,142 | ||||||
BANK, Series 2017-BNK4, Class XA, |
||||||||
1.488% VRN 5/15/50 (e) |
3,274,144 | 149,283 | ||||||
Benchmark Mortgage Trust, Series 2021-B29, Class XA, |
||||||||
1.155% VRN 9/15/54 (e) |
2,511,300 | 143,236 | ||||||
BPR Trust, Series 2021-TY, Class A, 1 mo. USD LIBOR + 1.050% |
||||||||
3.868% FRN 9/15/38 (c) |
140,000 | 133,021 | ||||||
Citigroup Commercial Mortgage Trust, Series 2014-GC23, Class B, |
||||||||
4.175% VRN 7/10/47 (e) |
350,000 | 335,438 | ||||||
Credit Suisse Mortgage Trust |
||||||||
Series 2014-USA, Class A2, 3.953% 9/15/37 (c) |
190,000 | 172,152 | ||||||
Series 2014-USA, Class E, 4.373% 9/15/37 (c) |
140,000 | 99,356 | ||||||
Series 2014-USA, Class F, 4.373% 9/15/37 (c) |
2,440,000 | 1,542,946 | ||||||
The accompanying notes are an integral part of the financial statements.
99
MassMutual Strategic Bond Fund — Portfolio of Investments (Continued) |
Principal |
Value |
|||||||
Series 2022-MARK, Class A, 1 mo. TSFR + 2.695% 5.541% FRN 6/15/39 (c) |
$ | 130,000 | $ | 129,708 | ||||
Series 2019-RIO Class A, 1 mo. USD LIBOR + 3.024% 5.842% FRN 12/15/22 (c) |
2,483,371 | 2,455,516 | ||||||
Series 2017-CHOP, Class G, 1 mo. USD LIBOR + 5.350% 8.168% FRN 7/15/32 (c) |
1,160,000 | 1,038,581 | ||||||
Deutsche Bank Commercial Mortgage Trust, Series 2016-C3, Class A4 |
||||||||
2.632% 8/10/49 |
160,000 | 145,198 | ||||||
GS Mortgage Securities Trust, Series 2018-SRP5, Class A, 1 mo. USD LIBOR + 1.800% |
||||||||
4.618% FRN 9/15/31 (c) |
1,240,611 | 1,181,581 | ||||||
JPMBB Commercial Mortgage Securities Trust |
||||||||
Series 2014-C19, Class XA, 0.785% VRN 4/15/47 (e) |
998,377 | 5,885 | ||||||
Series 2015-C31, Class B, 4.776% VRN 8/15/48 (e) |
160,000 | 152,154 | ||||||
Series 2013-C17, Class B, 5.049% VRN 1/15/47 (e) |
30,000 | 29,159 | ||||||
ML-CFC Commercial Mortgage Trust, Series 2007-9, Class AJ, |
||||||||
6.193% VRN 9/12/49 (e) |
3,242 | 3,203 | ||||||
Morgan Stanley Capital I Trust, Series 2019-L2, Class B, |
||||||||
4.494% VRN 3/15/52 (e) |
850,000 | 769,209 | ||||||
MTN Commercial Mortgage Trust, Series 2022-LPFL, Class A, 1 mo. TSFR + 1.397% |
||||||||
4.242% FRN 3/15/39 (c) |
190,000 | 186,084 | ||||||
PFP Ltd., Series 2021-8, Class A, 1 mo. USD LIBOR + 1.000% |
||||||||
3.939% FRN 8/09/37 (c) |
749,517 | 721,988 | ||||||
Shops at Crystals Trust, Series 2016-CSTL, Class A |
||||||||
3.126% 7/05/36 (c) |
320,000 | 276,709 | ||||||
TTAN, Series 2021-MHC, Class A, 1 mo. USD LIBOR + .850% |
||||||||
3.668% FRN 3/15/38 (c) |
468,509 | 453,922 | ||||||
UBS Commercial Mortgage Trust, Series 2017-C1, Class A4 |
||||||||
3.460% 6/15/50 |
170,000 | 155,337 | ||||||
Waterfall Commercial Mortgage Trust, Series 2015-SBC5, Class A |
||||||||
4.104% 9/14/49 (c) |
54,712 | 53,936 | ||||||
Principal |
Value |
|||||||
Wells Fargo Commercial Mortgage Trust |
||||||||
Series 2019-C52, Class XA, 1.751% VRN 8/15/52 (e) |
$ | 5,558,315 | $ | 409,972 | ||||
Series 2013-LC12, Class B, 4.432% VRN 7/15/46 (e) |
140,000 | 132,869 | ||||||
WFRBS Commercial Mortgage Trust |
||||||||
Series 2014-C24, Class B, 4.204% VRN 11/15/47 (e) |
190,000 | 172,926 | ||||||
Series 2014-C24, Class C, 4.290% VRN 11/15/47 (e) |
190,000 | 161,550 | ||||||
Series 2014-LC14, Class D, 4.586% VRN 3/15/47 (c) (e) |
5,000,000 | 4,618,350 | ||||||
| 15,984,411 | ||||||||
Home Equity Asset-Backed Securities — 0.6% |
||||||||
Accredited Mortgage Loan Trust, Series 2006-2, Class M1, 1 mo. USD LIBOR + .270% |
||||||||
3.354% FRN 9/25/36 |
420,000 | 396,384 | ||||||
Asset Backed Securities Corp. Home Equity Loan Trust, Series 2003-HE6, Class A3B, 1 mo. USD LIBOR + .960% |
||||||||
4.044% FRN 11/25/33 |
1,206,558 | 1,088,715 | ||||||
GSAA Home Equity Trust, Series 2006-5, Class 2A3, 1 mo. USD LIBOR + .540% |
||||||||
3.624% FRN 3/25/36 |
316,015 | 156,744 | ||||||
RBSSP Resecuritization Trust, Series 2010-4, Class 6A2, |
||||||||
5.825% STEP 2/26/36 (c) |
723,005 | 684,633 | ||||||
| 2,326,476 | ||||||||
Manufactured Housing Asset-Backed Securities — 0.1% |
||||||||
Conseco Finance Corp., Series 1996-4, Class M1, |
||||||||
7.750% VRN 6/15/27 (e) |
462,857 | 477,753 | ||||||
Other Asset-Backed Securities — 2.1% |
||||||||
Arbor Realty Commercial Real Estate Notes Ltd., Series 2021-FL3, Class A, 1 mo. USD LIBOR + 1.070% |
||||||||
3.888% FRN 8/15/34 (c) |
790,000 | 762,119 | ||||||
Dividend Solar Loans LLC, Series 2019-1, Class A |
||||||||
3.670% 8/22/39 (c) |
765,903 | 690,488 | ||||||
First Franklin Mortgage Loan Trust, Series 2006-FF15, Class A2, 1 mo. USD LIBOR + .120% |
||||||||
3.204% FRN 11/25/36 |
293,270 | 270,937 | ||||||
InStar Leasing III LLC, Series 2021-1A, Class A |
||||||||
2.300% 2/15/54 (c) |
579,233 | 492,236 | ||||||
The accompanying notes are an integral part of the financial statements.
100
MassMutual Strategic Bond Fund — Portfolio of Investments (Continued) |
Principal |
Value |
|||||||
Magnolia Finance, Series 2019-1OTF, Class A1, 3 mo. USD LIBOR + 2.900% |
||||||||
5.682% FRN 8/09/24 (c) |
$ | 945,000 | $ | 924,323 | ||||
PFCA Home Equity Investment Trust, Series 2003-IFC6, Class A, |
||||||||
4.773% VRN 4/22/35 (c) (e) |
401,766 | 400,665 | ||||||
Saxon Asset Securities Trust, Series 2006-3, Class A4, 1 mo. USD LIBOR + .240% |
||||||||
2.684% FRN 10/25/46 |
440,000 | 352,387 | ||||||
SBA Small Business Investment Cos. |
||||||||
Series 2019-25G, Class 1, 2.690% 7/01/44 |
203,018 | 173,020 | ||||||
Series 2019-20D, Class 1, 2.980% 4/01/39 |
143,497 | 130,578 | ||||||
Structured Asset Investment Loan Trust, Series 2004-8, Class A9, 1 mo. USD LIBOR + 1.000% |
||||||||
4.084% FRN 9/25/34 |
626,087 | 611,943 | ||||||
Taco Bell Funding LLC, Series 2021-1A, Class A23 |
||||||||
2.542% 8/25/51 (c) |
3,970,000 | 3,035,758 | ||||||
USQ Rail LLC, Series 2021-1A, Class A |
||||||||
2.250% 2/28/51 (c) |
721,158 | 617,884 | ||||||
| 8,462,338 | ||||||||
Student Loans Asset-Backed Securities — 0.5% |
||||||||
College Ave Student Loans LLC, Series 2019-A, Class A2 |
||||||||
3.280% 12/28/48 (c) |
263,722 | 241,744 | ||||||
Navient Private Education Loan Trust, Series 2020-IA, Class A1A |
||||||||
1.330% 4/15/69 (c) |
405,683 | 352,537 | ||||||
SLM Student Loan Trust, Series 2003-7A, Class A5A, 3 mo. USD LIBOR + 1.200% |
||||||||
4.493% FRN 12/15/33 (c) |
329,927 | 325,100 | ||||||
SMB Private Education Loan Trust |
||||||||
Series 2020-A, Class A2A, 2.230% 9/15/37 (c) |
460,799 | 433,539 | ||||||
Series 2021-A, Class B, 2.310% 1/15/53 (c) |
600,000 | 535,627 | ||||||
| 1,888,547 | ||||||||
Whole Loan Collateral Collateralized Mortgage Obligations — 1.5% |
||||||||
Bear Stearns Asset -Backed Securities I Trust, Series 2005-AC8, Class A3, 1 mo. USD LIBOR + 7.650% |
||||||||
4.566% FRN 11/25/35 |
638,523 | 105,252 | ||||||
Principal |
Value |
|||||||
BRAVO Residential Funding Trust, Series 2022-NQM3, Class A1, |
||||||||
5.108% VRN 7/25/62 (c) (e) |
$ | 345,278 | $ | 338,663 | ||||
Citigroup Mortgage Loan Trust, Series 2007-6, Class 2A4, 1 mo. USD LIBOR + .350% |
||||||||
3.434% FRN 5/25/37 |
1,429,791 | 763,543 | ||||||
Credit Suisse Mortgage Trust |
||||||||
Series 2015-4R, Class 3A3, 1 mo. USD LIBOR + .310% 3.064% FRN 10/27/36 (c) |
683,894 | 327,241 | ||||||
Series 2021-2R, Class 1A1, 1 mo. USD LIBOR + 1.750% 4.303% FRN 7/25/47 (c) |
15 | 15 | ||||||
Flagstar Mortgage Trust, Series 2018-2, Class A4, |
||||||||
3.500% VRN 4/25/48 (c) (e) |
20,938 | 20,670 | ||||||
GS Mortgage Securities Trust, Series 2014-2R, Class 3B |
||||||||
0.702% 11/26/37 (c) |
1,220,000 | 1,025,010 | ||||||
GSR Mortgage Loan Trust, Series 2005-AR5, Class 2A3, |
||||||||
3.493% VRN 10/25/35 (e) |
45,672 | 26,306 | ||||||
HarborView Mortgage Loan Trust, Series 2006-2, Class 1A, |
||||||||
3.524% VRN 2/25/36 (e) |
27,306 | 10,091 | ||||||
JP Morgan Mortgage Trust |
||||||||
Series 2018-3, Class A1, 3.500% VRN 9/25/48 (c) (e) |
250,086 | 224,781 | ||||||
Series 2018-4, Class A1, 3.500% VRN 10/25/48 (c) (e) |
106,917 | 95,928 | ||||||
Series 2018-5, Class A1, 3.500% VRN 10/25/48 (c) (e) |
134,039 | 120,119 | ||||||
Mortgage Repurchase Agreement Financing Trust II |
||||||||
4.496% 3/30/25 (c) |
290,000 | 290,000 | ||||||
New Residential Mortgage Loan Trust |
||||||||
Series 2018-RPL1, Class M2, 3.500% VRN 12/25/57 (c) (e) |
730,000 | 613,768 | ||||||
Series 2017-4A, Class A1, 4.000% VRN 5/25/57 (c) (e) |
231,576 | 222,820 | ||||||
Prime Mortgage Trust |
||||||||
Series 2006-DR1, Class 1A1, 5.500% 5/25/35 (c) |
6,364 | 6,243 | ||||||
Series 2006-DR1, Class 2A2, 6.000% 5/25/35 (c) |
490,198 | 420,244 | ||||||
Structured Adjustable Rate Mortgage Loan Trust, Series 2006-7, Class 1A1, |
||||||||
2.878% VRN 8/25/36 (e) |
162,263 | 115,470 | ||||||
The accompanying notes are an integral part of the financial statements.
101
MassMutual Strategic Bond Fund — Portfolio of Investments (Continued) |
Principal |
Value |
|||||||
Structured Asset Mortgage Investments, Inc., Series 2005-AR7, Class 4A1, 12 mo. MTA + 2.150% |
||||||||
3.254% FRN 3/25/46 |
$ | 173,143 | $ | 166,803 | ||||
Towd Point Mortgage Trust |
||||||||
Series 2017-4, Class B2, 3.396% VRN 6/25/57 (c) (e) |
740,000 | 562,926 | ||||||
Series 2022-4,Class A1, 3.750% VRN 9/25/62 (c) (e) (j) |
440,000 | 417,092 | ||||||
Washington Mutual Mortgage Pass-Through Certificates, Series 2006-AR3, Class A1B, 12 mo. MTA + 1.000% |
||||||||
2.104% FRN 2/25/46 |
474,652 | 415,520 | ||||||
| 6,288,505 | ||||||||
Whole Loan Collateral Planned Amortization Classes — 0.0% |
||||||||
Countrywide Alternative Loan Trust, Series 2006-18CB, Class A6, 1 mo. USD LIBOR + 28.600% |
||||||||
16.264% FRN 7/25/36 |
41,353 | 34,253 | ||||||
TOTAL NON-U.S. GOVERNMENT AGENCY OBLIGATIONS (Cost $42,450,689) |
37,993,442 | |||||||
SOVEREIGN DEBT OBLIGATIONS — 4.1% |
||||||||
Argentine Republic Government International Bond |
||||||||
1.500% STEP 7/09/35 |
1,927,319 | 350,648 | ||||||
3.500% STEP 7/09/41 (f) |
110,000 | 23,565 | ||||||
Brazilian Government International Bond |
||||||||
5.000% 1/27/45 |
510,000 | 370,370 | ||||||
5.625% 1/07/41 |
730,000 | 588,921 | ||||||
Colombia Government International Bond |
||||||||
3.250% 4/22/32 (b) |
430,000 | 290,608 | ||||||
4.125% 2/22/42 |
440,000 | 250,096 | ||||||
Indonesia Government International Bond |
||||||||
5.125% 1/15/45 (c) |
220,000 | 192,338 | ||||||
6.500% 2/15/31 IDR (g) |
58,983,000,000 | 3,661,149 | ||||||
Israel Government International Bond |
||||||||
2.750% 7/03/30 |
310,000 | 274,350 | ||||||
Mexican Bonos |
||||||||
7.750% 11/23/34 MXN (g) |
17,120,000 | 732,863 | ||||||
7.750% 11/13/42 MXN (g) |
34,785,600 | 1,432,377 | ||||||
8.000% 11/07/47 MXN (g) |
76,980,000 | 3,223,111 | ||||||
8.500% 5/31/29 MXN (g) |
28,500,000 | 1,332,924 | ||||||
Principal |
Value |
|||||||
Mexico Government International Bond |
||||||||
4.750% 3/08/44 |
$ | 830,000 | $ | 635,443 | ||||
Nigeria Government International Bond |
||||||||
7.143% 2/23/30 (c) |
210,000 | 136,899 | ||||||
Panama Government International Bond |
||||||||
4.500% 4/01/56 |
350,000 | 236,351 | ||||||
Peruvian Government International Bond |
||||||||
6.550% 3/14/37 |
210,000 | 215,042 | ||||||
Provincia de Buenos Aires/Government Bonds, |
||||||||
5.250% STEP 9/01/37 (c) |
540,019 | 167,406 | ||||||
Republic of Kenya Government International Bond |
||||||||
6.300% 1/23/34 (c) |
370,000 | 225,700 | ||||||
Russian Federal Bond— OFZ |
||||||||
6.900% 5/23/29 RUB (g) |
269,798,000 | 1,411,734 | ||||||
7.250% 5/10/34 RUB (g) |
60,500,000 | 316,570 | ||||||
7.700% 3/16/39 RUB (g) |
86,260,000 | 451,360 | ||||||
| 16,519,825 | ||||||||
TOTAL SOVEREIGN DEBT OBLIGATIONS (Cost $25,690,132) |
16,519,825 | |||||||
U.S. GOVERNMENT AGENCY OBLIGATIONS AND INSTRUMENTALITIES (h) — 20.5% |
||||||||
Collateralized Mortgage Obligations — 1.9% |
||||||||
Federal Home Loan Mortgage Corp. |
||||||||
Series 3422, Class AI, 0.250% STEP 1/15/38 |
7,753 | 56 | ||||||
Series 5018, Class MI, 2.000% 10/25/50 |
350,459 | 46,976 | ||||||
Series 5085, Class NI, 2.000% 3/25/51 |
631,893 | 85,935 | ||||||
Series 5140, Class NI, 2.500% 5/25/49 |
281,219 | 40,533 | ||||||
Series 5010, Class IK, 2.500% 9/25/50 |
211,710 | 31,543 | ||||||
Series 5010, Class JI, 2.500% 9/25/50 |
500,049 | 80,495 | ||||||
Series 5013, Class IN, 2.500% 9/25/50 |
262,280 | 42,037 | ||||||
Series 5040, Class IB, 2.500% 11/25/50 |
151,732 | 21,447 | ||||||
Series 5059, Class IB, 2.500% 1/25/51 |
710,231 | 115,298 | ||||||
Series 5069, Class MI, 2.500% 2/25/51 |
81,627 | 11,580 | ||||||
The accompanying notes are an integral part of the financial statements.
102
MassMutual Strategic Bond Fund — Portfolio of Investments (Continued) |
Principal |
Value |
|||||||
Series 4793, Class CB, 3.000% 5/15/48 |
$ | 205,026 | $ | 184,523 | ||||
Series 4793, Class CD, 3.000% 6/15/48 |
124,841 | 111,834 | ||||||
Series 4813, Class CJ, 3.000% 8/15/48 |
105,650 | 97,438 | ||||||
Series 353, Class S1, 1 mo. USD LIBOR + 6.000% 3.182% FRN 12/15/46 |
221,238 | 22,332 | ||||||
Series 334, Class S7, 1 mo. USD LIBOR + 6.100% 3.282% FRN 8/15/44 |
89,573 | 9,797 | ||||||
Series 3621, Class SB, 1 mo. USD LIBOR + 6.230% 3.412% FRN 1/15/40 |
20,796 | 2,131 | ||||||
Series 4203, Class PS, 1 mo. USD LIBOR + 6.250% 3.432% FRN 9/15/42 |
86,503 | 7,076 | ||||||
Series 3973, Class SA, 1 mo. USD LIBOR + 6.490% 3.672% FRN 12/15/41 |
135,036 | 15,519 | ||||||
Series 5224, Class HL, 4.000% 4/25/52 |
400,000 | 362,637 | ||||||
Series R007, Class ZA, 6.000% 5/15/36 |
56,687 | 58,111 | ||||||
Federal Home Loan Mortgage Corp. Multifamily Structured Pass-Through Certificates |
||||||||
Series K741, Class X1, 0.656% VRN 12/25/27 (e) |
2,996,571 | 71,831 | ||||||
Series K094, Class X1, 1.015% VRN 6/25/29 (e) |
995,480 | 47,194 | ||||||
Series K743, Class X1, 1.028% VRN 5/25/28 (e) |
3,998,733 | 170,132 | ||||||
Series KC05, Class X1, 1.343% VRN 6/25/27 (e) |
1,564,313 | 52,937 | ||||||
Series K736, Class X1, 1.414% VRN 7/25/26 (e) |
2,047,498 | 84,578 | ||||||
Series K110, Class X1, 1.814% VRN 4/25/30 (e) |
1,295,665 | 125,459 | ||||||
Series 2019-KF58, Class B, 1 mo. USD LIBOR + 2.150% 4.703% FRN 1/25/26 (c) |
506,574 | 501,355 | ||||||
Federal National Mortgage Association |
||||||||
Series 2005-88, Class IP, 0.023% FRN 10/25/35 (e) |
21,418 | 770 | ||||||
Series 2006-88, Class IP, 0.153% VRN 3/25/36 (e) |
26,804 | 1,184 | ||||||
Series 2006-59, Class IP, 0.775% FRN 7/25/36 (e) |
61,825 | 4,030 | ||||||
Series 2020-47, Class GZ, 2.000% 7/25/50 |
313,797 | 198,082 | ||||||
Series 2020-97, Class AI, 2.000% 1/25/51 |
182,305 | 24,238 | ||||||
Principal |
Value |
|||||||
Series 2020-56, Class DI, 2.500% 8/25/50 |
$ | 404,010 | $ | 65,027 | ||||
Series 2020-74, Class EI, 2.500% 10/25/50 |
159,583 | 24,778 | ||||||
Series 2020-89, Class DI, 2.500% 12/25/50 |
1,112,738 | 167,965 | ||||||
Series 2021-3, Class QI, 2.500% 2/25/51 |
755,517 | 117,282 | ||||||
Series 2006-118, Class IP1, 2.587% FRN 12/25/36 (e) |
48,528 | 2,806 | ||||||
Series 2006-118, Class IP2, 2.587% FRN 12/25/36 (e) |
38,834 | 2,124 | ||||||
Series 2013-124, Class SB, 1 mo. USD LIBOR + 5.950% 2.866% FRN 12/25/43 |
216,727 | 21,856 | ||||||
Series 409, Class C2, 3.000% 4/25/27 |
41,865 | 1,764 | ||||||
Series 2016-61, Class BS, 1 mo. USD LIBOR + 6.100% 3.016% FRN 9/25/46 |
78,159 | 5,903 | ||||||
Series 2017-76, Class SB, 1 mo. USD LIBOR + 6.100% 3.016% FRN 10/25/57 |
449,496 | 50,287 | ||||||
Series 2012-133, Class CS, 1 mo. USD LIBOR + 6.150% 3.066% FRN 12/25/42 |
65,883 | 9,216 | ||||||
Series 2012-134, Class SK, 1 mo. USD LIBOR + 6.150% 3.066% FRN 12/25/42 |
122,913 | 15,242 | ||||||
Series 2013-54, Class BS, 1 mo. USD LIBOR + 6.150% 3.066% FRN 6/25/43 |
162,897 | 18,205 | ||||||
Series 2017-85, Class SC, 1 mo. USD LIBOR + 6.200% 3.116% FRN 11/25/47 |
130,510 | 11,644 | ||||||
Series 2012-35, Class SC, 1 mo. USD LIBOR + 6.500% 3.416% FRN 4/25/42 |
60,729 | 7,174 | ||||||
Series 2011-87, Class SG, 1 mo. USD LIBOR + 6.550% 3.466% FRN 4/25/40 |
56,946 | 1,725 | ||||||
Series 2011-96, Class SA, 1 mo. USD LIBOR + 6.550% 3.466% FRN 10/25/41 |
133,454 | 12,600 | ||||||
Series 409, Class C13, 3.500% 11/25/41 |
51,963 | 7,847 | ||||||
Series 2012-74, Class SA, 1 mo. USD LIBOR + 6.650% 3.566% FRN 3/25/42 |
33,571 | 2,707 | ||||||
Series 409, Class C18, 4.000% 4/25/42 |
60,214 | 10,551 | ||||||
Series 409, Class C22, 4.500% 11/25/39 |
39,941 | 7,080 | ||||||
The accompanying notes are an integral part of the financial statements.
103
MassMutual Strategic Bond Fund — Portfolio of Investments (Continued) |
Principal |
Value |
|||||||
Series 2011-59, Class NZ, 5.500% 7/25/41 |
$ | 264,852 | $ | 270,075 | ||||
Series 2013-9, Class CB, 5.500% 4/25/42 |
221,397 | 224,255 | ||||||
Series 2012-46, Class BA, 6.000% 5/25/42 |
53,746 | 55,314 | ||||||
Series 2012-28, Class B, 6.500% 6/25/39 |
4,793 | 4,874 | ||||||
Series 2013-9, Class BC, 6.500% 7/25/42 |
64,423 | 67,572 | ||||||
Series 2012-51, Class B, 7.000% 5/25/42 |
46,796 | 49,226 | ||||||
Federal National Mortgage Association ACES |
||||||||
Series 2020-M36, Class X1, 1.552% VRN 9/25/34 (e) |
1,213,504 | 102,248 | ||||||
Series 2019-M19, Class A2, 2.560% 9/25/29 |
434,284 | 386,165 | ||||||
Federal National Mortgage Association Grantor Trust Series 2017-T1, Class A 2.898% 6/25/27 |
99,422 | 92,915 | ||||||
Government National Mortgage Association |
||||||||
Series 2014-22, Class IA, 0.000%FRN 11/20/42 (e) |
19,859 | 493 | ||||||
Series 2012-144, Class IO, 0.323% VRN 1/16/53 (e) |
2,228,304 | 27,235 | ||||||
Series 2012-135, Class IO, 0.340% VRN 1/16/53 (e) |
2,317,151 | 26,065 | ||||||
Series 2014-186, Class IO, 0.375% VRN 8/16/54 (e) |
351,766 | 3,907 | ||||||
Series 2017-41, Class IO, 0.618% VRN 7/16/58 (e) |
588,440 | 18,828 | ||||||
Series 2021-60, Class IO, 0.826% VRN 5/16/63 (e) |
2,307,170 | 149,716 | ||||||
Series 2012-H27, Class AI, 1.585% VRN 10/20/62 (e) |
333,141 | 11,045 | ||||||
Series 2017-H15, Class KI, 1.698% VRN 7/20/67 (e) |
109,348 | 6,113 | ||||||
Series 2022-3, Class B, 1.850% 2/16/61 |
200,000 | 120,347 | ||||||
Series 2020-181, Class WI, 2.000% 12/20/50 |
1,392,438 | 158,377 | ||||||
Series 2017-H20, Class IB, 2.294% VRN 10/20/67 (e) |
56,366 | 2,587 | ||||||
Series 2020-123, Class NI, 2.500% 8/20/50 |
410,079 | 59,641 | ||||||
Series 2020-123, Class IL, 2.500% 8/20/50 |
163,948 | 23,221 | ||||||
Series 2020-127, Class IN, 2.500% 8/20/50 |
163,551 | 23,555 | ||||||
Principal |
Value |
|||||||
Series 2020-129, Class IE, 2.500% 9/20/50 |
$ | 169,810 | $ | 24,272 | ||||
Series 2020-160, Class IH, 2.500% 10/20/50 |
172,504 | 25,745 | ||||||
Series 2020-160, Class YI, 2.500% 10/20/50 |
689,689 | 98,091 | ||||||
Series 2020-160, Class VI, 2.500% 10/20/50 |
251,146 | 36,632 | ||||||
Series 2022-115, Class MI, 2.500% 5/20/51 |
269,629 | 30,295 | ||||||
Series 2017-H18, Class BI, 2.655% VRN 9/20/67 (e) |
2,784,224 | 107,919 | ||||||
Series 2018-H07, Class FD, 1 mo. USD LIBOR + .300% 2.657% FRN 5/20/68 |
261,444 | 259,498 | ||||||
Series 2010-H28, Class FE, 1 mo. USD LIBOR + .400% 2.757% FRN 12/20/60 |
81,001 | 80,546 | ||||||
Series 2014-H20, Class FA, 1 mo. USD LIBOR + .430% 2.787% FRN 10/20/64 |
872,854 | 863,941 | ||||||
Series 2020-H13, Class FA, 1 mo. USD LIBOR + .450% 2.807% FRN 7/20/70 |
134,291 | 131,519 | ||||||
Series 2020-H13, Class FC, 1 mo. USD LIBOR + .450% 2.807% FRN 7/20/70 |
54,899 | 53,852 | ||||||
Series 2011-H08, Class FG, 1 mo. USD LIBOR + .480% 2.837% FRN 3/20/61 |
68,256 | 67,954 | ||||||
Series 2013-107, Class AD, 2.849% VRN 11/16/47 (e) |
157,285 | 146,842 | ||||||
Series 2011-H09, Class AF, 1 mo. USD LIBOR + .500% 2.857% FRN 3/20/61 |
45,681 | 45,517 | ||||||
Series 2020-H09, Class FL, 1 mo. USD LIBOR + 1.150% 2.883% FRN 5/20/70 |
389,778 | 388,662 | ||||||
Series 2016-21, Class ST, 1 mo. USD LIBOR + 6.150% 3.136% FRN 2/20/46 |
60,229 | 6,980 | ||||||
Series 2016-135, Class SB, 1 mo. USD LIBOR + 6.100% 3.161% FRN 10/16/46 |
104,907 | 15,115 | ||||||
Series 2013-53, Class OI, 3.500% 4/20/43 |
330,005 | 34,132 | ||||||
Series 2020-47, Class MI, 3.500% 4/20/50 |
282,614 | 47,506 | ||||||
Series 2020-47, Class NI, 3.500% 4/20/50 |
76,043 | 13,327 | ||||||
Series 2020-H09, Class NF, 1 mo. USD LIBOR + 1.250% 3.607% FRN 4/20/70 |
126,586 | 127,229 | ||||||
The accompanying notes are an integral part of the financial statements.
104
MassMutual Strategic Bond Fund — Portfolio of Investments (Continued) |
Principal |
Value |
|||||||
Series 2010-85, Class HS, 1 mo. USD LIBOR + 6.650% 3.636% FRN 1/20/40 |
$ | 5,529 | $ | 94 | ||||
Series 2014-176, Class IA, 4.000% 11/20/44 |
38,081 | 6,467 | ||||||
Series 2015-167, Class OI, 4.000% 4/16/45 |
48,508 | 8,562 | ||||||
Series 2016-84, Class IG, 4.500% 11/16/45 |
222,652 | 44,716 | ||||||
| 7,742,058 | ||||||||
Pass-Through Securities — 17.8% |
||||||||
Federal Home Loan Mortgage Corp. |
||||||||
Pool #RB5125 2.000% 9/01/41 |
909,254 | 765,500 | ||||||
Pool #RB5145 2.000% 2/01/42 |
191,486 | 160,733 | ||||||
Pool #RA3882 2.000% 11/01/50 |
337,050 | 274,440 | ||||||
Pool #QB8602 2.000% 2/01/51 |
79,452 | 64,979 | ||||||
Pool #QB9087 2.000% 2/01/51 |
415,317 | 339,143 | ||||||
Pool #SD0552 2.000% 3/01/51 |
433,640 | 352,479 | ||||||
Pool #QB9482 2.000% 3/01/51 |
80,325 | 65,542 | ||||||
Pool #QC0041 2.000% 3/01/51 |
78,607 | 64,141 | ||||||
Pool #QC0160 2.000% 3/01/51 |
76,749 | 62,673 | ||||||
Pool #QC0161 2.000% 3/01/51 |
84,323 | 68,804 | ||||||
Pool #QB9290 2.000% 3/01/51 |
264,253 | 215,786 | ||||||
Pool #SD0573 2.000% 4/01/51 |
156,314 | 127,742 | ||||||
Pool #QC0885 2.000% 4/01/51 |
86,956 | 71,061 | ||||||
Pool #QC1164 2.000% 4/01/51 |
80,803 | 65,932 | ||||||
Pool #SD0745 2.000% 11/01/51 |
92,170 | 75,063 | ||||||
Pool #840698 5 year CMT + 1.284% 2.097% FRN 3/01/47 |
19,819 | 18,456 | ||||||
Pool #QK0701 2.500% 4/01/41 |
82,729 | 71,886 | ||||||
Pool #SD7525 2.500% 10/01/50 |
153,299 | 130,393 | ||||||
Pool #QB5092 2.500% 11/01/50 |
163,040 | 138,576 | ||||||
Pool #QB5093 2.500% 11/01/50 |
79,984 | 67,958 | ||||||
Pool #RA3913 2.500% 11/01/50 |
473,269 | 402,551 | ||||||
Pool #RA4142 2.500% 12/01/50 |
78,970 | 67,121 | ||||||
Pool #QB8934 2.500% 2/01/51 |
166,510 | 140,641 | ||||||
Pool #QC0165 2.500% 3/01/51 |
81,621 | 69,476 | ||||||
Pool #QC5830 2.500% 8/01/51 |
184,037 | 155,833 | ||||||
Pool #QC6551 2.500% 9/01/51 |
88,944 | 75,313 | ||||||
Pool #QC7411 2.500% 9/01/51 |
93,905 | 79,485 | ||||||
Pool #RA5921 2.500% 9/01/51 |
178,050 | 149,873 | ||||||
Pool #SD1345 2.500% 10/01/51 |
495,795 | 417,489 | ||||||
Pool #SD7548 2.500% 11/01/51 |
936,673 | 793,711 | ||||||
Pool #SD0849 2.500% 1/01/52 |
96,892 | 81,975 | ||||||
Pool #RA6562 2.500% 1/01/52 |
185,288 | 157,514 | ||||||
Pool #SD7552 2.500% 1/01/52 |
286,734 | 242,702 | ||||||
Pool #QD6079 2.500% 2/01/52 |
96,014 | 81,172 | ||||||
Pool #QD8675 2.500% 3/01/52 |
97,580 | 82,435 | ||||||
Principal |
Value |
|||||||
Pool #841077 12 mo. USD LIBOR + 1.619% 2.873% FRN 11/01/47 |
$ | 126,912 | $ | 122,196 | ||||
Pool #ZS8669 3.000% 9/01/32 |
68,953 | 65,069 | ||||||
Pool #ZS8673 3.000% 10/01/32 |
47,957 | 45,166 | ||||||
Pool #ZT1257 3.000% 1/01/46 |
153,279 | 137,128 | ||||||
Pool #G67701 3.000% 10/01/46 |
604,274 | 536,472 | ||||||
Pool #G60985 3.000% 5/01/47 |
1,201,583 | 1,067,362 | ||||||
Pool #ZT1493 3.000% 9/01/48 |
128,226 | 113,473 | ||||||
Pool #RA1293 3.000% 9/01/49 |
409,464 | 361,746 | ||||||
Pool #SD7509 3.000% 11/01/49 |
51,081 | 45,096 | ||||||
Pool #RA3175 3.000% 7/01/50 |
96,086 | 84,018 | ||||||
Pool #QC9154 3.000% 10/01/51 |
95,641 | 83,995 | ||||||
Pool #SD0809 3.000% 1/01/52 |
93,756 | 81,782 | ||||||
Pool #841076 12 mo. USD LIBOR + 1.628% 3.008% FRN 11/01/48 |
487,736 | 464,526 | ||||||
Pool #841081 12 mo. USD LIBOR + 1.621% 3.083% FRN 2/01/50 |
206,363 | 197,194 | ||||||
Pool #ZS9316 3.500% 1/01/38 |
282,324 | 265,651 | ||||||
Pool #Q41209 3.500% 6/01/46 |
127,817 | 118,182 | ||||||
Pool #SD0958 3.500% 4/01/52 |
386,992 | 351,015 | ||||||
Pool #QE2057 3.500% 5/01/52 |
97,738 | 88,430 | ||||||
Pool #RA7378 3.500% 5/01/52 |
96,686 | 87,478 | ||||||
Pool #Q19135 4.000% 6/01/43 |
23,838 | 22,677 | ||||||
Pool #Q19236 4.000% 6/01/43 |
15,502 | 14,722 | ||||||
Pool #Q19615 4.000% 7/01/43 |
24,440 | 23,249 | ||||||
Pool #Q19985 4.000% 7/01/43 |
683,873 | 650,768 | ||||||
Pool #C09071 4.000% 2/01/45 |
134,827 | 127,542 | ||||||
Pool #G67713 4.000% 6/01/48 |
500,820 | 473,759 | ||||||
Pool #QE4026 4.000% 6/01/52 |
99,107 | 92,084 | ||||||
Pool #SD1132 4.000% 6/01/52 |
99,174 | 92,270 | ||||||
Pool #QE5203 4.000% 6/01/52 |
99,611 | 92,553 | ||||||
Pool #QE5811 4.000% 7/01/52 |
99,702 | 92,598 | ||||||
Pool #QE6418 4.000% 7/01/52 |
99,718 | 92,657 | ||||||
Pool #U92272 4.500% 12/01/43 |
2,693 | 2,621 | ||||||
Pool #Q49177 4.500% 6/01/47 |
48,331 | 47,022 | ||||||
Pool #SD1143 4.500% 9/01/50 |
658,348 | 636,641 | ||||||
Pool #SD1305 5.000% 7/01/52 |
444,228 | 434,137 | ||||||
Pool #G06875 5.500% 12/01/38 |
4,598 | 4,714 | ||||||
Pool #G06669 6.500% 9/01/39 |
8,989 | 9,558 | ||||||
Pool #G07509 6.500% 9/01/39 |
8,463 | 9,048 | ||||||
Pool #G07335 7.000% 3/01/39 |
19,042 | 20,861 | ||||||
Federal National Mortgage Association |
||||||||
Pool #FS2528 1.500% 1/01/51 |
99,491 | 76,561 | ||||||
Pool #MA4280 1.500% 3/01/51 |
355,339 | 272,888 | ||||||
Pool #MA4501 2.000% 12/01/41 (i) |
94,427 | 79,350 | ||||||
Pool #MA4606 2.000% 5/01/42 |
97,323 | 81,571 | ||||||
Pool #BQ0254 2.000% 8/01/50 |
74,683 | 61,079 | ||||||
The accompanying notes are an integral part of the financial statements.
105
MassMutual Strategic Bond Fund — Portfolio of Investments (Continued) |
Principal |
Value |
|||||||
Pool #BQ1528 2.000% 9/01/50 |
$ | 70,398 | $ | 57,574 | ||||
Pool #MA4208 2.000% 12/01/50 (i) |
241,038 | 196,452 | ||||||
Pool #BQ9224 2.000% 1/01/51 |
175,327 | 142,512 | ||||||
Pool #BQ9687 2.000% 1/01/51 |
172,488 | 140,582 | ||||||
Pool #BR2641 2.000% 2/01/51 |
80,985 | 66,132 | ||||||
Pool #BR2643 2.000% 2/01/51 |
75,386 | 61,559 | ||||||
Pool #BR2644 2.000% 2/01/51 |
77,023 | 62,848 | ||||||
Pool #BR2664 2.000% 2/01/51 |
307,139 | 250,806 | ||||||
Pool #BR3500 2.000% 2/01/51 |
69,060 | 56,285 | ||||||
Pool #BR3256 2.000% 2/01/51 |
79,045 | 64,671 | ||||||
Pool #BR3257 2.000% 2/01/51 |
81,510 | 66,662 | ||||||
Pool #BR3290 2.000% 3/01/51 |
343,718 | 279,387 | ||||||
Pool #BR3286 2.000% 3/01/51 |
81,477 | 66,533 | ||||||
Pool #BR4722 2.000% 3/01/51 |
80,077 | 65,340 | ||||||
Pool #BR4753 2.000% 3/01/51 |
85,170 | 69,549 | ||||||
Pool #BR4756 2.000% 3/01/51 |
78,954 | 64,423 | ||||||
Pool #BR5487 2.000% 3/01/51 |
84,941 | 69,308 | ||||||
Pool #BR5587 2.000% 3/01/51 |
84,946 | 69,366 | ||||||
Pool #BR5577 2.000% 3/01/51 |
86,630 | 70,687 | ||||||
Pool #BR5649 2.000% 3/01/51 |
89,115 | 72,715 | ||||||
Pool #BR5633 2.000% 3/01/51 |
87,739 | 71,591 | ||||||
Pool #BR6462 2.000% 3/01/51 |
86,470 | 70,286 | ||||||
Pool #FM6343 2.000% 3/01/51 |
87,949 | 71,763 | ||||||
Pool #BQ9453 2.000% 3/01/51 |
175,659 | 143,441 | ||||||
Pool #BR4080 2.000% 3/01/51 |
86,388 | 70,219 | ||||||
Pool #BR5589 2.000% 3/01/51 |
82,882 | 67,370 | ||||||
Pool #FM6418 2.000% 3/01/51 |
86,512 | 70,699 | ||||||
Pool #BR7745 2.000% 4/01/51 |
80,096 | 65,356 | ||||||
Pool #BR7744 2.000% 4/01/51 |
84,370 | 68,896 | ||||||
Pool #BR8478 2.000% 4/01/51 |
83,547 | 68,224 | ||||||
Pool #BR8518 2.000% 4/01/51 |
79,454 | 64,832 | ||||||
Pool #MA4305 2.000% 4/01/51 |
522,254 | 425,323 | ||||||
Pool #FM9441 2.000% 4/01/51 |
636,081 | 518,024 | ||||||
Pool #CB1273 2.000% 8/01/51 |
92,573 | 75,392 | ||||||
Pool #FS0349 2.000% 1/01/52 |
191,553 | 155,821 | ||||||
Pool #FS1014 2.000% 2/01/52 |
96,019 | 78,077 | ||||||
Pool #FS1015 2.000% 2/01/52 |
290,293 | 236,051 | ||||||
Pool #FS1112 2.000% 3/01/52 |
194,426 | 158,462 | ||||||
Pool #MA2749 2.500% 9/01/36 |
43,791 | 39,201 | ||||||
Pool #FM3123 2.500% 3/01/38 |
430,772 | 385,620 | ||||||
Pool #CA9358 2.500% 3/01/41 |
86,156 | 74,864 | ||||||
Pool #CB0100 2.500% 4/01/41 |
173,686 | 150,922 | ||||||
Pool #CB0101 2.500% 4/01/41 |
87,746 | 76,246 | ||||||
Pool #CB0114 2.500% 4/01/41 |
350,760 | 304,788 | ||||||
Pool #CB0470 2.500% 5/01/41 |
701,850 | 609,862 | ||||||
Pool #BK2620 2.500% 6/01/50 |
67,563 | 57,467 | ||||||
Pool #BP7887 2.500% 8/01/50 |
132,867 | 112,473 | ||||||
Pool #MA4120 2.500% 9/01/50 |
59,597 | 50,450 | ||||||
Pool #FM4577 2.500% 10/01/50 |
238,763 | 202,862 | ||||||
Principal |
Value |
|||||||
Pool #BM6623 2.500% 10/01/50 |
$ | 93,833 | $ | 78,016 | ||||
Pool #CA7257 2.500% 10/01/50 |
81,387 | 69,200 | ||||||
Pool #FM5313 2.500% 10/01/50 |
87,361 | 73,953 | ||||||
Pool #BQ5876 2.500% 11/01/50 |
83,571 | 71,005 | ||||||
Pool #BR0001 2.500% 12/01/50 |
80,323 | 68,195 | ||||||
Pool #FM5423 2.500% 1/01/51 |
400,313 | 339,871 | ||||||
Pool #FM5713 2.500% 2/01/51 |
153,875 | 129,969 | ||||||
Pool #FM6460 2.500% 3/01/51 |
164,590 | 139,688 | ||||||
Pool #CB0414 2.500% 5/01/51 |
85,770 | 72,391 | ||||||
Pool #CB0458 2.500% 5/01/51 |
1,983,810 | 1,671,263 | ||||||
Pool #CB0517 2.500% 5/01/51 |
436,635 | 368,253 | ||||||
Pool #FM7675 2.500% 6/01/51 |
236,614 | 200,666 | ||||||
Pool #FM7676 2.500% 6/01/51 |
88,625 | 75,071 | ||||||
Pool #FM7900 2.500% 7/01/51 |
174,494 | 147,807 | ||||||
Pool #BT3303 2.500% 8/01/51 |
92,189 | 78,061 | ||||||
Pool # FS0024 2.500% 9/01/51 |
88,509 | 75,360 | ||||||
Pool #BU0051 2.500% 9/01/51 |
564,207 | 474,744 | ||||||
Pool #CB1666 2.500% 9/01/51 |
92,761 | 78,458 | ||||||
Pool #FM8864 2.500% 10/01/51 |
181,306 | 153,520 | ||||||
Pool #FM9335 2.500% 10/01/51 |
91,454 | 77,031 | ||||||
Pool #FM9195 2.500% 10/01/51 |
278,299 | 234,258 | ||||||
Pool #FS1104 2.500% 11/01/51 |
92,003 | 78,026 | ||||||
Pool #FS0434 2.500% 11/01/51 |
93,041 | 79,196 | ||||||
Pool #BT9482 2.500% 12/01/51 |
94,819 | 80,073 | ||||||
Pool #FS1107 2.500% 12/01/51 |
186,056 | 158,022 | ||||||
Pool #FS0366 2.500% 1/01/52 |
94,947 | 80,841 | ||||||
Pool #BU2599 2.500% 1/01/52 |
95,308 | 80,575 | ||||||
Pool #FS0424 2.500% 1/01/52 |
95,491 | 80,730 | ||||||
Pool #FS0439 2.500% 1/01/52 (i) |
94,747 | 80,079 | ||||||
Pool #BV3089 2.500% 2/01/52 |
96,491 | 81,515 | ||||||
Pool #CB2869 2.500% 2/01/52 |
283,000 | 238,281 | ||||||
Pool #FS0523 2.500% 2/01/52 |
95,581 | 80,776 | ||||||
Pool #FS0605 2.500% 2/01/52 |
287,575 | 242,672 | ||||||
Pool #FS0551 2.500% 2/01/52 |
95,306 | 80,574 | ||||||
Pool #CB3044 2.500% 3/01/52 |
98,501 | 83,244 | ||||||
Pool #CB3031 2.500% 3/01/52 |
189,483 | 159,482 | ||||||
Pool #BF0560 2.500% 9/01/61 |
97,292 | 80,041 | ||||||
Pool #AM8674 2.810% 4/01/25 |
50,000 | 47,907 | ||||||
Pool #MA2320 3.000% 7/01/35 |
41,053 | 37,625 | ||||||
Pool #MA2523 3.000% 2/01/36 |
278,680 | 255,412 | ||||||
Pool #MA2579 3.000% 4/01/36 |
203,501 | 186,510 | ||||||
Pool #MA2707 3.000% 8/01/36 |
250,163 | 229,276 | ||||||
Pool #MA2773 3.000% 10/01/36 |
927,752 | 850,292 | ||||||
Pool #MA2832 3.000% 12/01/36 |
469,884 | 429,919 | ||||||
Pool #AQ7306 3.000% 1/01/43 |
25,432 | 22,474 | ||||||
Pool #AR1202 3.000% 1/01/43 |
34,042 | 30,083 | ||||||
Pool #AR7399 3.000% 6/01/43 |
19,669 | 17,596 | ||||||
Pool #AS0038 3.000% 7/01/43 |
43,350 | 38,782 | ||||||
Pool #AU6735 3.000% 10/01/43 |
28,263 | 25,259 | ||||||
The accompanying notes are an integral part of the financial statements.
106
MassMutual Strategic Bond Fund — Portfolio of Investments (Continued) |
Principal |
Value |
|||||||
Pool #AS7738 3.000% 8/01/46 |
$ | 388,217 | $ | 344,158 | ||||
Pool #BC1509 3.000% 8/01/46 |
35,744 | 31,688 | ||||||
Pool #AS7844 3.000% 9/01/46 |
61,915 | 54,888 | ||||||
Pool #BC2817 3.000% 9/01/46 |
47,106 | 41,760 | ||||||
Pool #BD8104 3.000% 10/01/46 |
171,209 | 152,046 | ||||||
Pool #AL9397 3.000% 10/01/46 |
70,988 | 62,931 | ||||||
Pool #BM1565 3.000% 4/01/47 |
667,630 | 592,485 | ||||||
Pool #CA4979 3.000% 1/01/50 |
144,848 | 126,791 | ||||||
Pool #FM8576 3.000% 2/01/50 |
80,836 | 71,586 | ||||||
Pool #CA5220 3.000% 2/01/50 |
134,280 | 117,330 | ||||||
Pool #BP7009 3.000% 8/01/50 |
110,895 | 96,966 | ||||||
Pool #FM4311 3.000% 8/01/50 |
76,893 | 67,427 | ||||||
Pool #FM8577 3.000% 8/01/51 |
172,688 | 152,617 | ||||||
Pool #FS0037 3.000% 8/01/51 |
83,626 | 73,906 | ||||||
Pool #FM8648 3.000% 9/01/51 |
86,961 | 76,181 | ||||||
Pool #CB1878 3.000% 10/01/51 |
183,703 | 160,300 | ||||||
Pool #FM9044 3.000% 10/01/51 |
87,131 | 76,766 | ||||||
Pool #FM9292 3.000% 11/01/51 |
184,337 | 162,408 | ||||||
Pool #FS0034 3.000% 12/01/51 |
94,564 | 83,374 | ||||||
Pool # FS0240 3.000% 1/01/52 |
94,514 | 83,448 | ||||||
Pool #FS0331 3.000% 1/01/52 |
94,582 | 82,680 | ||||||
Pool # FS1074 3.000% 3/01/52 |
481,077 | 423,810 | ||||||
Pool #FS1289 3.000% 3/01/52 |
96,248 | 85,039 | ||||||
Pool #FS1877 3.000% 5/01/52 |
392,623 | 342,328 | ||||||
Pool #CB3833 3.000% 6/01/52 |
99,294 | 86,698 | ||||||
Pool #AN8048 3.080% 1/01/28 |
210,000 | 196,293 | ||||||
Pool #BL2454 3.160% 5/01/29 |
86,028 | 79,986 | ||||||
Pool #MA2110 3.500% 12/01/34 |
61,307 | 57,648 | ||||||
Pool #MA2138 3.500% 1/01/35 |
31,802 | 29,904 | ||||||
Pool #AS8740 3.500% 2/01/37 |
68,125 | 64,102 | ||||||
Pool #FM5754 3.500% 3/01/37 |
54,087 | 50,859 | ||||||
Pool #890827 3.500% 12/01/37 |
43,563 | 40,827 | ||||||
Pool #FM6015 3.500% 8/01/39 |
55,993 | 52,686 | ||||||
Pool #FM0068 3.500% 2/01/40 |
220,185 | 204,429 | ||||||
Pool #FM0071 3.500% 2/01/40 |
44,965 | 41,649 | ||||||
Pool #MA1177 3.500% 9/01/42 |
17,915 | 16,849 | ||||||
Pool #MA1213 3.500% 10/01/42 |
109,391 | 100,196 | ||||||
Pool #AL3026 3.500% 12/01/42 |
33,781 | 31,174 | ||||||
Pool #AY6181 3.500% 4/01/45 |
88,043 | 81,138 | ||||||
Pool #AS6328 3.500% 12/01/45 |
333,835 | 304,709 | ||||||
Pool #AS6541 3.500% 1/01/46 |
93,528 | 86,543 | ||||||
Pool #AL9546 3.500% 11/01/46 |
180,005 | 166,618 | ||||||
Pool #FM3347 3.500% 5/01/47 |
195,167 | 179,433 | ||||||
Pool #CA0907 3.500% 12/01/47 |
3,694 | 3,393 | ||||||
Pool #FM3469 3.500% 8/01/48 |
378,090 | 347,844 | ||||||
Pool #FM3773 3.500% 11/01/48 |
396,686 | 364,704 | ||||||
Pool #FS2740 3.500% 6/01/49 |
197,329 | 180,680 | ||||||
Pool #FM9993 3.500% 7/01/51 |
455,443 | 414,633 | ||||||
Pool #CB2442 3.500% 12/01/51 |
88,744 | 80,362 | ||||||
Principal |
Value |
|||||||
Pool #FS1240 3.500% 12/01/51 |
$ | 93,225 | $ | 84,250 | ||||
Pool #CB2680 3.500% 1/01/52 |
93,318 | 84,242 | ||||||
Pool #FS1462 3.500% 1/01/52 |
94,531 | 85,957 | ||||||
Pool #CB3126 3.500% 3/01/52 |
193,283 | 175,314 | ||||||
Pool #FS1207 3.500% 3/01/52 |
96,346 | 87,238 | ||||||
Pool #BV5395 3.500% 4/01/52 |
96,883 | 87,945 | ||||||
Pool #CB3255 3.500% 4/01/52 |
96,126 | 87,002 | ||||||
Pool #FS1555 3.500% 4/01/52 |
96,872 | 87,526 | ||||||
Pool #FS1092 3.500% 4/01/52 |
289,971 | 261,913 | ||||||
Pool #FS1454 3.500% 4/01/52 |
98,158 | 88,637 | ||||||
Pool #BV8546 3.500% 5/01/52 |
98,009 | 88,829 | ||||||
Pool #FS1556 3.500% 5/01/52 |
390,168 | 354,231 | ||||||
Pool #BS6565 3.740% 9/01/32 |
100,000 | 93,468 | ||||||
Pool #BS6215 3.840% 7/01/32 |
100,000 | 94,920 | ||||||
Pool #BS6149 3.840% 8/01/32 |
100,000 | 96,209 | ||||||
Pool #AK8441 4.000% 4/01/42 |
13,604 | 13,102 | ||||||
Pool #AO2711 4.000% 5/01/42 |
10,203 | 9,822 | ||||||
Pool #AO6086 4.000% 6/01/42 |
21,367 | 20,568 | ||||||
Pool #AP0692 4.000% 7/01/42 |
14,851 | 14,330 | ||||||
Pool #AP5333 4.000% 7/01/42 |
146,784 | 141,270 | ||||||
Pool #AP2530 4.000% 8/01/42 |
15,644 | 15,064 | ||||||
Pool #AP4903 4.000% 9/01/42 |
26,753 | 25,409 | ||||||
Pool #AP7399 4.000% 9/01/42 |
39,268 | 37,295 | ||||||
Pool #AP9229 4.000% 10/01/42 |
8,528 | 8,100 | ||||||
Pool #AP9766 4.000% 10/01/42 |
63,864 | 60,296 | ||||||
Pool #MA1217 4.000% 10/01/42 |
81,641 | 77,080 | ||||||
Pool #AQ3599 4.000% 11/01/42 |
16,458 | 15,631 | ||||||
Pool #MA1253 4.000% 11/01/42 |
49,323 | 46,568 | ||||||
Pool #AQ7003 4.000% 12/01/42 |
30,949 | 29,394 | ||||||
Pool #AQ4555 4.000% 12/01/42 |
28,482 | 27,051 | ||||||
Pool #AQ7082 4.000% 1/01/43 |
37,608 | 35,719 | ||||||
Pool #AL3508 4.000% 4/01/43 |
25,773 | 24,494 | ||||||
Pool #AQ4078 4.000% 6/01/43 |
23,670 | 22,495 | ||||||
Pool #AQ4080 4.000% 6/01/43 |
16,527 | 15,681 | ||||||
Pool #AT8394 4.000% 6/01/43 |
25,796 | 24,516 | ||||||
Pool #AB9683 4.000% 6/01/43 |
35,931 | 34,092 | ||||||
Pool #AT9637 4.000% 7/01/43 |
72,006 | 68,322 | ||||||
Pool #AT9653 4.000% 7/01/43 |
55,469 | 52,717 | ||||||
Pool #AT9657 4.000% 7/01/43 |
44,558 | 42,278 | ||||||
Pool #AS0070 4.000% 8/01/43 |
24,114 | 22,752 | ||||||
Pool #MA1547 4.000% 8/01/43 |
25,038 | 23,623 | ||||||
Pool #AS4347 4.000% 1/01/45 |
41,513 | 39,402 | ||||||
Pool #FS2061 4.000% 6/01/52 |
98,586 | 91,815 | ||||||
Pool #FS2066 4.000% 6/01/52 |
293,544 | 273,936 | ||||||
Pool #FS2185 4.000% 6/01/52 |
197,037 | 183,321 | ||||||
Pool #MA4626 4.000% 6/01/52 |
17,657,613 | 16,395,332 | ||||||
Pool #BW1515 4.000% 7/01/52 |
9,975 | 9,268 | ||||||
Pool #CB4121 4.000% 7/01/52 |
197,447 | 183,456 | ||||||
Pool #BF0104 4.000% 2/01/56 |
81,720 | 76,823 | ||||||
The accompanying notes are an integral part of the financial statements.
107
MassMutual Strategic Bond Fund — Portfolio of Investments (Continued) |
Principal |
Value |
|||||||
Pool #BF0183 4.000% 1/01/57 |
$ | 45,796 | $ | 43,052 | ||||
Pool #BF0191 4.000% 6/01/57 |
80,328 | 75,465 | ||||||
Pool #MA0706 4.500% 4/01/31 |
10,757 | 10,628 | ||||||
Pool #MA0734 4.500% 5/01/31 |
37,591 | 37,139 | ||||||
Pool #MA0776 4.500% 6/01/31 |
12,956 | 12,800 | ||||||
Pool #MA0913 4.500% 11/01/31 |
9,901 | 9,781 | ||||||
Pool #MA0939 4.500% 12/01/31 |
9,709 | 9,592 | ||||||
Pool #993117 4.500% 1/01/39 |
1,034 | 1,018 | ||||||
Pool #AA0856 4.500% 1/01/39 |
7,071 | 6,970 | ||||||
Pool #AA3495 4.500% 2/01/39 |
5,323 | 5,245 | ||||||
Pool #935520 4.500% 8/01/39 |
9,792 | 9,651 | ||||||
Pool #AD5481 4.500% 5/01/40 |
256,027 | 252,398 | ||||||
Pool #AD6914 4.500% 6/01/40 |
29,112 | 28,699 | ||||||
Pool #AD8685 4.500% 8/01/40 |
84,287 | 83,051 | ||||||
Pool #MA1591 4.500% 9/01/43 |
46,733 | 45,440 | ||||||
Pool #MA1629 4.500% 10/01/43 |
42,511 | 41,335 | ||||||
Pool #AL4341 4.500% 10/01/43 |
2,855 | 2,793 | ||||||
Pool #MA1664 4.500% 11/01/43 |
20,225 | 19,665 | ||||||
Pool #MA1711 4.500% 12/01/43 |
44,092 | 42,873 | ||||||
Pool #AL4741 4.500% 1/01/44 |
18,994 | 18,469 | ||||||
Pool #AW0318 4.500% 2/01/44 |
46,474 | 45,436 | ||||||
Pool #AL5562 4.500% 4/01/44 |
8,454 | 8,270 | ||||||
Pool #890604 4.500% 10/01/44 |
198,267 | 193,713 | ||||||
Pool #AS4271 4.500% 1/01/45 |
24,180 | 23,678 | ||||||
Pool #CA2047 4.500% 7/01/48 |
177,625 | 172,434 | ||||||
Pool #CA5379 4.500% 3/01/50 |
187,122 | 180,967 | ||||||
Pool #BW1473 4.500% 6/01/52 |
98,207 | 93,649 | ||||||
Pool #CB3918 4.500% 6/01/52 |
197,005 | 187,986 | ||||||
Pool #FS2172 4.500% 6/01/52 |
95,915 | 91,413 | ||||||
Pool #BW1954 4.500% 7/01/52 |
99,521 | 94,902 | ||||||
Pool #FS2475 4.500% 8/01/52 |
196,186 | 186,973 | ||||||
Pool #BF0148 4.500% 4/01/56 |
364,879 | 356,061 | ||||||
Pool #BF0222 4.500% 9/01/57 |
396,070 | 383,011 | ||||||
Pool #BF0301 4.500% 8/01/58 |
41,329 | 39,837 | ||||||
Pool #BF0338 4.500% 1/01/59 |
98,219 | 94,520 | ||||||
Pool #915154 5.000% 4/01/37 |
29,454 | 29,641 | ||||||
Pool #974965 5.000% 4/01/38 |
77,369 | 77,669 | ||||||
Pool #983077 5.000% 5/01/38 |
22,131 | 22,231 | ||||||
Pool #310088 5.000% 6/01/38 |
20,604 | 20,687 | ||||||
Pool #AE2266 5.000% 3/01/40 |
54,029 | 54,311 | ||||||
Pool #995072 5.500% 8/01/38 |
10,911 | 11,215 | ||||||
Pool #BF0141 5.500% 9/01/56 |
406,927 | 415,817 | ||||||
Pool #481473 6.000% 2/01/29 |
11 | 11 | ||||||
Pool #867557 6.000% 2/01/36 |
1,493 | 1,527 | ||||||
Pool #AE0469 6.000% 12/01/39 |
87,063 | 90,860 | ||||||
Pool #BM1948 6.000% 7/01/41 |
99,131 | 103,271 | ||||||
Pool #AL4324 6.500% 5/01/40 |
55,503 | 59,305 | ||||||
Pool #AE0758 7.000% 2/01/39 |
30,595 | 33,393 | ||||||
Principal |
Value |
|||||||
Government National Mortgage Association |
||||||||
Pool #AB2892 3.000% 9/15/42 |
$ | 79,112 | $ | 72,953 | ||||
Pool #AA5649 3.000% 9/15/42 |
80,719 | 74,398 | ||||||
Pool #783669 3.000% 9/15/42 |
146,784 | 135,391 | ||||||
Pool #AB9108 3.000% 10/15/42 |
557,169 | 513,533 | ||||||
Pool #AB9109 3.000% 10/15/42 |
47,473 | 43,761 | ||||||
Pool #AB9207 3.000% 11/15/42 |
41,162 | 37,155 | ||||||
Pool #784571 3.500% 6/15/48 |
173,573 | 160,440 | ||||||
Pool #BS8439 3.500% 5/15/50 |
140,162 | 128,156 | ||||||
Pool #487588 6.000% 4/15/29 |
640 | 656 | ||||||
Pool #595077 6.000% 10/15/32 |
195 | 201 | ||||||
Pool #596620 6.000% 10/15/32 |
66 | 68 | ||||||
Pool #604706 6.000% 10/15/33 |
26,929 | 27,875 | ||||||
Pool #636251 6.000% 3/15/35 |
3,646 | 3,789 | ||||||
Pool #782034 6.000% 1/15/36 |
28,892 | 29,983 | ||||||
Pool #658029 6.000% 7/15/36 |
7,528 | 7,846 | ||||||
Government National Mortgage Association II |
||||||||
Pool #MA7589 2.500% 9/20/51 |
635,712 | 548,450 | ||||||
Pool #MA7649 2.500% 10/20/51 |
92,278 | 79,582 | ||||||
Pool #MA4068 3.000% 11/20/46 |
20,191 | 18,135 | ||||||
Pool #MA7590 3.000% 9/20/51 |
691,319 | 614,708 | ||||||
Pool #CJ9477 3.000% 1/20/52 |
285,866 | 251,663 | ||||||
Pool #785944 3.000% 2/20/52 |
97,515 | 85,970 | ||||||
Pool #786095 3.000% 4/20/52 |
98,519 | 85,193 | ||||||
Pool #786134 3.000% 4/20/52 |
98,321 | 86,250 | ||||||
Pool #MA1995 3.500% 6/20/44 |
51,196 | 47,235 | ||||||
Pool #MA2678 3.500% 3/20/45 |
22,001 | 20,285 | ||||||
Pool #784106 3.500% 1/20/46 |
57,886 | 53,371 | ||||||
Pool #MA3597 3.500% 4/20/46 |
91,456 | 84,295 | ||||||
Pool #BC4732 3.500% 10/20/47 |
204,304 | 187,668 | ||||||
Pool #BD0384 3.500% 10/20/47 |
150,174 | 137,946 | ||||||
Pool #784825 3.500% 10/20/49 |
45,444 | 40,991 | ||||||
Pool #BM7534 3.500% 2/20/50 |
63,873 | 58,313 | ||||||
Pool #MA7883 3.500% 2/20/52 |
291,469 | 265,413 | ||||||
Pool #786216 3.500% 6/20/52 |
99,525 | 90,052 | ||||||
Pool #MA4511 4.000% 6/20/47 |
569,150 | 538,260 | ||||||
Pool #MA4720 4.000% 9/20/47 |
371,560 | 351,278 | ||||||
Pool #BM9734 4.000% 10/20/49 |
37,172 | 34,910 | ||||||
Pool #BM9743 4.000% 11/20/49 |
43,236 | 40,606 | ||||||
Pool #BS1728 4.000% 1/20/50 |
47,187 | 44,316 | ||||||
Pool #BS1742 4.000% 2/20/50 |
41,659 | 39,125 | ||||||
Pool #BS1757 4.000% 3/20/50 |
30,251 | 28,382 | ||||||
Pool #BS8420 4.000% 4/20/50 |
152,343 | 142,932 | ||||||
Pool #783298 4.500% 4/20/41 |
82,266 | 80,911 | ||||||
Pool #783368 4.500% 7/20/41 |
12,194 | 11,965 | ||||||
Pool #MA4654 4.500% 8/20/47 |
124,632 | 121,397 | ||||||
Pool #MA5138 4.500% 4/20/48 |
191,488 | 185,739 | ||||||
The accompanying notes are an integral part of the financial statements.
108
MassMutual Strategic Bond Fund — Portfolio of Investments (Continued) |
Principal |
Value |
|||||||
Pool #MA5193 4.500% 5/20/48 |
$ | 194,698 | $ | 188,731 | ||||
Pool #MA5265 4.500% 6/20/48 |
170,188 | 164,918 | ||||||
Pool #MA5331 4.500% 7/20/48 |
42,422 | 41,095 | ||||||
Pool #MA5818 4.500% 3/20/49 |
56,324 | 54,496 | ||||||
Pool #G24747 5.000% 7/20/40 |
50,849 | 51,014 | ||||||
Government National Mortgage Association II TBA |
||||||||
2.500% 10/20/52 (i) |
2,400,000 | 2,062,313 | ||||||
3.000% 10/20/52 (i) |
1,700,000 | 1,501,578 | ||||||
3.500% 10/20/52 (i) |
500,000 | 454,453 | ||||||
4.500% 10/20/52 (i) |
100,000 | 95,633 | ||||||
Uniform Mortgage Backed Securities TBA |
||||||||
2.000% 10/13/52 (i) |
1,400,000 | 1,133,563 | ||||||
2.500% 10/13/52 (i) |
500,000 | 419,883 | ||||||
3.000% 10/13/52 (i) |
800,000 | 696,000 | ||||||
| 72,324,550 | ||||||||
Whole Loans — 0.8% |
||||||||
Federal Home Loan Mortgage Corp. Structured Agency Credit Risk Debt Notes |
||||||||
Series 2020-DNA6, Class M2, 30 day SOFR + 2.000% 4.281% FRN 12/25/50 (c) |
721,130 | 715,858 | ||||||
Series 2020-DNA2, Class M2, 1 mo. USD LIBOR + 1.850% 4.934% FRN 2/25/50 (c) |
354,173 | 348,787 | ||||||
Series 2020-DNA1, Class B1, 1 mo. USD LIBOR + 2.300% 5.384% FRN 1/25/50 (c) |
380,000 | 352,709 | ||||||
Series 2017-DNA1, Class B1, 1 mo. USD LIBOR + 4.950% 8.034% FRN 7/25/29 |
1,450,000 | 1,512,118 | ||||||
Federal National Mortgage Association Connecticut Avenue Securities Trust |
||||||||
Series 2019-R07, Class 1M2, 1 mo. USD LIBOR + 2.100% 5.184% FRN 10/25/39 (c) |
61,391 | 60,941 | ||||||
Series 2019-R02, Class 1M2, 1 mo. USD LIBOR + 2.300% 5.384% FRN 8/25/31 (c) |
89,601 | 89,379 | ||||||
Series 2018-C05, Class 1B1, 1 mo. USD LIBOR + 4.250% 7.334% FRN 1/25/31 |
370,000 | 378,023 | ||||||
| 3,457,815 | ||||||||
TOTAL U.S. GOVERNMENT AGENCY OBLIGATIONS AND INSTRUMENTALITIES (Cost $92,729,043) |
83,524,423 | |||||||
Principal |
Value |
|||||||
U.S. TREASURY OBLIGATIONS — 34.0% |
||||||||
U.S. Treasury Bonds & Notes — 34.0% |
||||||||
U.S. Treasury Bond |
||||||||
1.625% 11/15/50 |
$ | 710,000 | $ | 440,644 | ||||
1.750% 8/15/41 |
110,000 | 75,230 | ||||||
1.875% 2/15/51 |
2,480,000 | 1,641,450 | ||||||
1.875% 11/15/51 |
6,892,000 | 4,557,335 | ||||||
2.000% 11/15/41 |
160,000 | 114,525 | ||||||
2.000% 2/15/50 |
1,730,000 | 1,188,834 | ||||||
2.250% 5/15/41 |
300,000 | 226,781 | ||||||
2.250% 2/15/52 |
25,920,000 | 18,828,451 | ||||||
2.375% 5/15/51 |
1,770,000 | 1,324,181 | ||||||
2.875% 5/15/52 |
46,470,000 | 38,983,976 | ||||||
3.000% 2/15/48 |
16,000 | 13,483 | ||||||
3.000% 8/15/52 |
7,090,000 | 6,122,880 | ||||||
3.750% 11/15/43 |
800,000 | 759,875 | ||||||
U.S. Treasury Floating Rate Note |
||||||||
3 mo. Treasury money market yield - .075% 3.222% FRN 4/30/24 |
42,810,000 | 42,742,138 | ||||||
3 mo. Treasury money market yield + .035% 3.332% FRN 10/31/23 |
13,430,000 | 13,440,350 | ||||||
3 mo. Treasury money market yield + .037% 3.334% FRN 7/31/24 |
3,880,000 | 3,875,380 | ||||||
U.S. Treasury Note |
||||||||
0.250% 11/15/23 |
70,000 | 66,910 | ||||||
1.375% 11/15/31 |
1,190,000 | 966,689 | ||||||
2.625% 5/31/27 |
60,000 | 56,358 | ||||||
2.750% 8/15/32 |
1,570,000 | 1,435,078 | ||||||
3.125% 8/31/29 |
780,000 | 740,513 | ||||||
U.S. Treasury Strip |
||||||||
0.000% 5/15/49 |
1,450,000 | 536,574 | ||||||
| 138,137,635 | ||||||||
TOTAL U.S. TREASURY OBLIGATIONS (Cost $150,783,939) |
138,137,635 | |||||||
TOTAL BONDS & NOTES (Cost $454,794,777) |
400,573,962 | |||||||
TOTAL PURCHASED OPTIONS (#) — 0.0% (Cost $296,854) |
85,018 | |||||||
The accompanying notes are an integral part of the financial statements.
109
MassMutual Strategic Bond Fund — Portfolio of Investments (Continued) |
Number of |
Value |
|||||||
MUTUAL FUNDS — 0.6% |
||||||||
Diversified Financial Services — 0.6% |
||||||||
State Street Navigator Securities Lending Government Money Market Portfolio (k) |
2,470,330 | $ | 2,470,330 | |||||
TOTAL MUTUAL FUNDS (Cost $2,470,330) |
2,470,330 | |||||||
TOTAL LONG-TERM INVESTMENTS (Cost $457,561,961) |
403,129,310 | |||||||
Principal |
||||||||
SHORT-TERM INVESTMENTS — 0.5% |
||||||||
Discount Notes — 0.3% |
||||||||
Federal Home Loan Bank, 2.572%, due 10/28/22 |
$ | 990,000 | 987,921 | |||||
Repurchase Agreement — 0.2% |
||||||||
Fixed Income Clearing Corp., Repurchase Agreement, dated 9/30/22, 0.830%, due 10/03/22 (l) |
972,044 | 972,044 | ||||||
TOTAL SHORT-TERM INVESTMENTS (Cost $1,960,173) |
1,959,965 | |||||||
TOTAL INVESTMENTS — 99.6% (Cost $459,522,134) (m) |
405,089,275 | |||||||
Less Unfunded Loan Commitments — 0.0% |
(59,420 | ) | ||||||
NET INVESTMENTS — 99.6% (Cost $459,462,714) |
405,029,855 | |||||||
Other Assets/(Liabilities) — 0.4% |
1,826,765 | |||||||
NET ASSETS — 100.0% |
$ | 406,856,620 | ||||||
Abbreviation Legend
|
FRN |
Floating Rate Note |
|
STEP |
Step Up Bond |
|
TBA |
To Be Announced |
|
VRN |
Variable Rate Note |
Notes to Portfolio of Investments
Percentages are stated as a percent of net assets.
|
(a) |
Unfunded or partially unfunded loan commitments. |
|
(b) |
Denotes all or a portion of security on loan. The total value of securities on loan as of September 30, 2022, was $3,125,444 or 0.77% of net assets. The Fund received $727,177 of non-cash collateral (U.S. Treasury and/or Agency obligations) related to securities lending activity. This amount is not reflected on either the Portfolio of Investments or the Statement of Assets and Liabilities. (Note 2). |
|
(c) |
Security is exempt from registration under Regulation S or Rule 144A of the Securities Act of 1933. These securities are considered restricted and may be resold in transactions exempt from registration. At September 30, 2022, the aggregate market value of these securities amounted to $55,786,755 or 13.71% of net assets. |
|
(d) |
Security is perpetual and has no stated maturity date. |
|
(e) |
Certain variable rate securities are not based on a published reference rate and spread but are determined by the issuer or agent and are based on current market conditions. These securities do not indicate a reference rate and spread in their description above. The rates shown are the current interest rates at September 30, 2022. |
|
(f) |
Security is currently in default due to bankruptcy or failure to make payment of principal or interest of the issuer. Income is not being accrued. At September 30, 2022, these securities amounted to a value of $23,565 or 0.01% of net assets. |
|
(g) |
The principal amount of the security is in foreign currency. The market value is in U.S. dollars. |
|
(h) |
May contain securities that are issued by a U.S. Government Agency, but are unsecured and are not guaranteed by a U.S. Government Agency. |
|
(i) |
A portion of this security is purchased on a when-issued, delayed-delivery or forward commitment basis. (Note 2). |
|
(j) |
This security is fair valued in good faith in accordance with procedures approved by the Board of Trustees. At September 30, 2022, these securities amounted to a value of $417,092 or 0.10% of net assets. |
|
(k) |
Represents investment of security lending cash collateral. (Note 2). |
|
(l) |
Maturity value of $972,111. Collateralized by U.S. Government Agency obligations with a rate of 3.500%, maturity date of 9/15/25, and an aggregate market value, including accrued interest, of $991,491. |
|
(m) |
See Note 6 for aggregate cost for federal tax purposes. |
The accompanying notes are an integral part of the financial statements.
110
MassMutual Strategic Bond Fund — Portfolio of Investments (Continued) |
(#) OTC Options Purchased
Description |
Counterparty |
Expiration |
Exercise |
No. of |
Notional |
Value |
Premiums |
Unrealized |
|||||||||||||||||||||||||
Put |
|||||||||||||||||||||||||||||||||
USD Put JPY Call |
Citigroup Global Markets, Inc.* |
10/06/22 | 131.39 | 459,513 | USD | 459,513 | $ | — | $ | 6,890 | $ | (6,890 | ) | ||||||||||||||||||||
USD Put CAD Call |
Citigroup Global Markets, Inc.* |
10/11/22 | 1.27 | 289,000 | USD | 289,000 | — | 2,185 | (2,185 | ) | |||||||||||||||||||||||
USD Put CAD Call |
Citigroup Global Markets, Inc.* |
10/11/22 | 1.27 | 289,000 | USD | 289,000 | — | 2,195 | (2,195 | ) | |||||||||||||||||||||||
USD Put CAD Call |
Citigroup Global Markets, Inc.* |
10/11/22 | 1.27 | 867,000 | USD | 867,000 | 1 | 6,589 | (6,588 | ) | |||||||||||||||||||||||
USD Put JPY Call |
Goldman Sachs & Co.* |
10/05/22 | 131.55 | 1,544,640 | USD | 1,544,640 | 2 | 24,078 | (24,076 | ) | |||||||||||||||||||||||
USD Put JPY Call |
Goldman Sachs & Co.* |
10/06/22 | 131.50 | 513,468 | USD | 513,468 | 1 | 7,840 | (7,839 | ) | |||||||||||||||||||||||
USD Put CAD Call |
Goldman Sachs & Co.* |
10/14/22 | 1.27 | 871,000 | USD | 871,000 | 1 | 6,582 | (6,581 | ) | |||||||||||||||||||||||
USD Put CAD Call |
Morgan Stanley & Co. LLC* |
10/07/22 | 1.27 | 595,000 | USD | 595,000 | 1 | 4,366 | (4,365 | ) | |||||||||||||||||||||||
| $ | 6 | $ | 60,725 | $ | (60,719 | ) | |||||||||||||||||||||||||||
(#) Exchange-Traded Options Purchased
Description |
Expiration |
Exercise |
No. of |
Notional |
Value |
Premiums |
Unrealized |
|||||||||||||||||||||||||
Call |
||||||||||||||||||||||||||||||||
U.S. Treasury Note 10 Year Future |
10/21/22 | 112.50 | 60 | USD | 6,723,750 | $ | 53,437 | $ | 60,541 | $ | (7,104 | ) | ||||||||||||||||||||
U.S. Treasury Note 10 Year Future |
10/21/22 | 116.50 | 60 | USD | 6,723,750 | 6,563 | 32,167 | (25,604 | ) | |||||||||||||||||||||||
U.S. Treasury Note 5 Year Future |
10/21/22 | 111.50 | 14 | USD | 1,505,109 | 438 | 6,314 | (5,876 | ) | |||||||||||||||||||||||
SOFR 1 Year Mid Curve Future |
12/16/22 | 95.75 | 74 | USD | 17,717,450 | 11,562 | 57,005 | (45,443 | ) | |||||||||||||||||||||||
SOFR 1 Year Mid Curve Future |
12/16/22 | 96.50 | 42 | USD | 10,055,850 | 10,762 | 12,688 | (1,926 | ) | |||||||||||||||||||||||
Eurodollar Future |
12/19/22 | 98.38 | 120 | USD | 28,593,000 | 2,250 | 67,414 | (65,164 | ) | |||||||||||||||||||||||
| $ | 85,012 | $ | 236,129 | $ | (151,117 | ) | ||||||||||||||||||||||||||
OTC Options Written
Description |
Counterparty |
Expiration |
Exercise |
No. of |
Notional |
Value |
Premiums |
Unrealized |
|||||||||||||||||||||||||
Put |
|||||||||||||||||||||||||||||||||
USD Put GBP Call |
Citigroup Global Markets, Inc.* |
10/27/22 | 1.21 | 3,139,862 | USD | 3,139,862 | $ | (3,140 | ) | $ | (31,006 | ) | $ | 27,866 | |||||||||||||||||||
USD Put GBP Call |
Goldman Sachs & Co.* |
12/22/22 | 1.08 | 1,280,000 | USD | 1,280,000 | (71,040 | ) | (45,613 | ) | (25,427 | ) | |||||||||||||||||||||
USD Put GBP Call |
Morgan Stanley & Co. LLC* |
12/22/22 | 1.12 | 1,307,000 | USD | 1,307,000 | (42,608 | ) | (28,184 | ) | (14,424 | ) | |||||||||||||||||||||
| $ | (116,788 | ) | $ | (104,803 | ) | $ | (11,985 | ) | |||||||||||||||||||||||||
The accompanying notes are an integral part of the financial statements.
111
MassMutual Strategic Bond Fund — Portfolio of Investments (Continued) |
Exchange-Traded Options Written
Description |
Expiration |
Exercise |
No. of |
Notional |
Value |
Premiums |
Unrealized |
|||||||||||||||||||||||||
Call |
||||||||||||||||||||||||||||||||
U.S. Treasury Note 10 Year Future |
10/21/22 | 119.00 | 104 | USD | 11,654,500 | $ | (4,875 | ) | $ | (34,633 | ) | $ | 29,758 | |||||||||||||||||||
U.S. Treasury Note 10 Year Future |
11/25/22 | 115.50 | 120 | USD | 13,447,500 | (60,000 | ) | (60,246 | ) | 246 | ||||||||||||||||||||||
U.S. Treasury Note 10 Year Future |
11/25/22 | 119.50 | 120 | USD | 13,447,500 | (15,000 | ) | (33,574 | ) | 18,574 | ||||||||||||||||||||||
Eurodollar Future |
12/19/22 | 96.50 | 50 | USD | 11,913,750 | (3,125 | ) | (33,020 | ) | 29,895 | ||||||||||||||||||||||
Eurodollar Future |
12/19/22 | 97.00 | 202 | USD | 48,131,550 | (8,838 | ) | (158,200 | ) | 149,362 | ||||||||||||||||||||||
Eurodollar Future |
12/19/22 | 98.13 | 120 | USD | 28,593,000 | (2,250 | ) | (104,748 | ) | 102,498 | ||||||||||||||||||||||
Eurodollar Future |
6/19/23 | 97.50 | 33 | USD | 7,865,138 | (4,950 | ) | (9,831 | ) | 4,881 | ||||||||||||||||||||||
3 Month SOFR Future |
9/15/23 | 98.75 | 43 | USD | 10,285,600 | (5,375 | ) | (14,559 | ) | 9,184 | ||||||||||||||||||||||
3 Month SOFR Future |
12/15/23 | 96.50 | 74 | USD | 17,717,450 | (80,013 | ) | (72,020 | ) | (7,993 | ) | |||||||||||||||||||||
3 Month SOFR Future |
12/15/23 | 96.63 | 14 | USD | 3,351,950 | (13,913 | ) | (14,196 | ) | 283 | ||||||||||||||||||||||
| $ | (198,339 | ) | $ | (535,027 | ) | $ | 336,688 | |||||||||||||||||||||||||
Put |
||||||||||||||||||||||||||||||||
U.S. Treasury Note 10 Year Future |
10/21/22 | 113.50 | 60 | USD | 6,723,750 | $ | (118,125 | ) | $ | (15,115 | ) | $ | (103,010 | ) | ||||||||||||||||||
Eurodollar Future |
12/19/22 | 98.13 | 89 | USD | 21,206,475 | (626,337 | ) | (69,900 | ) | (556,437 | ) | |||||||||||||||||||||
Eurodollar Future |
6/19/23 | 97.00 | 27 | USD | 6,435,113 | (116,943 | ) | (5,343 | ) | (111,600 | ) | |||||||||||||||||||||
| $ | (861,405 | ) | $ | (90,358 | ) | $ | (771,047 | ) | ||||||||||||||||||||||||
| $ | (1,059,744 | ) | $ | (625,385 | ) | $ | (434,359 | ) | ||||||||||||||||||||||||
Forward contracts
Counterparty |
Settlement |
Currency Purchased |
Currency Sold |
Unrealized |
||||||||||||||||||||
BNP Paribas SA* |
10/18/22 | JPY | 642,474,779 | USD | 4,748,951 | $ | (304,103 | ) | ||||||||||||||||
BNP Paribas SA* |
10/18/22 | NOK | 12,358,698 | EUR | 1,194,213 | (36,446 | ) | |||||||||||||||||
BNP Paribas SA* |
10/18/22 | USD | 330,307 | EUR | 325,834 | 10,668 | ||||||||||||||||||
Citibank N.A.* |
10/11/22 | USD | 134,790 | JPY | 18,175,418 | 9,128 | ||||||||||||||||||
Citibank N.A.* |
10/12/22 | USD | 618,448 | CAD | 789,230 | 47,109 | ||||||||||||||||||
Citibank N.A.* |
10/18/22 | CAD | 12,506,390 | USD | 9,652,522 | (599,096 | ) | |||||||||||||||||
Citibank N.A.* |
10/18/22 | AUD | 12,148,833 | USD | 8,267,503 | (495,436 | ) | |||||||||||||||||
Citibank N.A.* |
10/18/22 | MXN | 27,971,949 | USD | 1,319,974 | 65,366 | ||||||||||||||||||
Citibank N.A.* |
10/18/22 | USD | 1,499,882 | CNH | 10,055,443 | 91,306 | ||||||||||||||||||
Citibank N.A.* |
10/18/22 | USD | 2,099,351 | IDR | 31,594,508,090 | 25,384 | ||||||||||||||||||
Goldman Sachs International* |
10/07/22 | USD | 473,690 | JPY | 63,910,200 | 31,987 | ||||||||||||||||||
Goldman Sachs International* |
10/11/22 | USD | 154,040 | JPY | 20,772,348 | 10,424 | ||||||||||||||||||
Goldman Sachs International* |
10/17/22 | USD | 373,047 | CAD | 477,500 | 27,382 | ||||||||||||||||||
Goldman Sachs International* |
10/18/22 | GBP | 2,632,114 | USD | 3,172,961 | (233,187 | ) | |||||||||||||||||
Goldman Sachs International* |
10/18/22 | JPY | 141,511,143 | USD | 1,026,346 | (47,326 | ) | |||||||||||||||||
Goldman Sachs International* |
10/18/22 | USD | 2,202,036 | AUD | 3,284,836 | 100,603 | ||||||||||||||||||
Goldman Sachs International* |
10/18/22 | USD | 1,848,825 | CAD | 2,457,405 | 69,900 | ||||||||||||||||||
Goldman Sachs International* |
10/18/22 | USD | 1,340,797 | GBP | 1,217,000 | (18,454 | ) | |||||||||||||||||
Goldman Sachs International* |
12/28/22 | GBP | 700,000 | USD | 757,750 | 24,889 | ||||||||||||||||||
Goldman Sachs International* |
12/28/22 | USD | 580,315 | GBP | 523,000 | (4,428 | ) | |||||||||||||||||
Morgan Stanley & Co. LLC* |
10/11/22 | USD | 255,551 | CAD | 326,160 | 19,437 | ||||||||||||||||||
Morgan Stanley & Co. LLC* |
10/18/22 | MXN | 8,362,000 | USD | 403,239 | 10,898 | ||||||||||||||||||
The accompanying notes are an integral part of the financial statements.
112
MassMutual Strategic Bond Fund — Portfolio of Investments (Continued) |
Counterparty |
Settlement |
Currency Purchased |
Currency Sold |
Unrealized |
||||||||||||||||||||
Morgan Stanley & Co. LLC* |
10/18/22 | CNH | 4,890,000 | USD | 678,978 | $ | 6,018 | |||||||||||||||||
Morgan Stanley & Co. LLC* |
10/18/22 | USD | 446,719 | CAD | 590,000 | 19,616 | ||||||||||||||||||
Morgan Stanley & Co. LLC* |
10/18/22 | USD | 2,098,433 | MXN | 42,923,480 | (27,398 | ) | |||||||||||||||||
Morgan Stanley & Co. LLC* |
10/18/22 | ZAR | 6,889,002 | USD | 411,264 | (31,139 | ) | |||||||||||||||||
Morgan Stanley & Co. LLC* |
12/28/22 | GBP | 569,213 | USD | 630,945 | 5,467 | ||||||||||||||||||
Morgan Stanley & Co. LLC* |
12/28/22 | USD | 49,689 | GBP | 45,000 | (623 | ) | |||||||||||||||||
Morgan Stanley & Co. LLC* |
1/18/23 | USD | 680,774 | CNH | 4,890,000 | (5,702 | ) | |||||||||||||||||
| $ | (1,227,756 | ) | ||||||||||||||||||||||
Futures contracts
|
Expiration |
Number of |
Notional |
Value/ Net |
||||||||||||
Long |
||||||||||||||||
Euro-BOBL |
12/08/22 | 9 | $ | 1,081,221 | $ | (24,972 | ) | |||||||||
Euro-OAT |
12/08/22 | 14 | 1,896,854 | (84,075 | ) | |||||||||||
Australia Treasury Bond 10 Year |
12/15/22 | 36 | 2,771,207 | (74,319 | ) | |||||||||||
3 Month Euribor Interest Rate |
12/19/22 | 51 | 12,406,802 | (191,690 | ) | |||||||||||
90 Day Eurodollar |
12/19/22 | 269 | 65,678,823 | (1,582,848 | ) | |||||||||||
U.S. Treasury Long Bond |
12/20/22 | 168 | 22,929,247 | (1,692,997 | ) | |||||||||||
U.S. Treasury Ultra Bond |
12/20/22 | 209 | 31,091,829 | (2,458,829 | ) | |||||||||||
UK Long Gilt |
12/28/22 | 13 | 1,594,220 | (194,960 | ) | |||||||||||
U.S. Treasury Note 5 Year |
12/30/22 | 1,581 | 175,905,888 | (5,936,036 | ) | |||||||||||
90 Day Eurodollar |
3/13/23 | 36 | 8,556,337 | 20,213 | ||||||||||||
90 Day Eurodollar |
6/19/23 | 46 | 11,413,711 | (450,186 | ) | |||||||||||
3 Month SOFR |
9/19/23 | 1 | 241,415 | (2,377 | ) | |||||||||||
90 Day Eurodollar |
12/18/23 | 27 | 6,592,207 | (145,282 | ) | |||||||||||
3 Month SOFR |
3/18/25 | 103 | 24,960,027 | (158,914 | ) | |||||||||||
|
$ | (12,977,272 | ) | |||||||||||||
Short |
||||||||||||||||
Euro-Bund |
12/08/22 | 10 | $ | (1,415,572 | ) | $ | 58,301 | |||||||||
Euro-Buxl 30 Year Bond |
12/08/22 | 2 | (314,339 | ) | 26,910 | |||||||||||
Japanese 10 Year Bond |
12/13/22 | 4 | (4,098,575 | ) | (91 | ) | ||||||||||
U.S. Treasury Note 10 Year |
12/20/22 | 939 | (110,299,821 | ) | 5,073,133 | |||||||||||
U.S. Treasury Ultra 10 Year |
12/20/22 | 43 | (5,427,282 | ) | 332,454 | |||||||||||
U.S. Treasury Note 2 Year |
12/30/22 | 301 | (62,721,029 | ) | 898,451 | |||||||||||
3 Month SOFR |
3/19/24 | 202 | (48,616,198 | ) | 252,348 | |||||||||||
90 Day Eurodollar |
3/17/25 | 91 | (22,266,417 | ) | 399,117 | |||||||||||
|
$ | 7,040,623 | ||||||||||||||
The accompanying notes are an integral part of the financial statements.
113
MassMutual Strategic Bond Fund — Portfolio of Investments (Continued) |
Centrally Cleared Credit Default Swaps - Buy Protection
Reference |
Rate Paid |
Payment |
Termination |
Notional |
Value |
Upfront |
Unrealized |
|||||||||||||||||||||||||
CDX.NA.HY Series 39† |
5.000% | Quarterly | 12/20/27 | USD | 2,162,100 | $ | 90,624 | $ | 88,518 | $ | 2,106 | |||||||||||||||||||||
Centrally Cleared Credit Default Swaps - Sell Protection††
Reference |
Rate |
Payment |
Termination |
Credit |
Notional |
Value |
Upfront |
Unrealized |
|||||||||||||||||||||||||
CDX.NA.IG Series 39† |
1.000% | Quarterly |
12/20/27 | BBB+** | USD | 60,779,000 | $ | (215,644 | ) | $ | (44,799 | ) | $ | (170,845 | ) | ||||||||||||||||||
Centrally Cleared Interest Rate Swaps
Paid by the Fund |
Received by the Fund |
||||||||||||||||||||||||||||||||
Rate/ Reference |
Frequency |
Rate/ Reference |
Frequency |
Termination |
Notional |
Value |
Upfront |
Unrealized |
|||||||||||||||||||||||||
28 Day-MXN-TIIE-Banxico |
Monthly | Fixed 7.450% |
Monthly | 7/18/29 | MXN | 88,370,000 | $ | (393,572 | ) | $ | 37,242 | $ | (430,814 | ) | |||||||||||||||||||
Fixed 3.970% |
Maturity | U.S. Consumer Price Index |
Maturity | 11/18/23 | USD | 3,530,000 | 98,661 | (19,506 | ) | 118,167 | |||||||||||||||||||||||
U.S. Consumer Price Index |
Maturity | Fixed 3.370% |
Maturity | 11/18/26 | USD | 3,530,000 | (50,421 | ) | 55,349 | (105,770 | ) | ||||||||||||||||||||||
Fixed 1.520% |
Annually | 12-Month USD SOFR |
Annually | 11/20/26 | USD | 4,000,000 | 237,284 | (9,570 | ) | 246,854 | |||||||||||||||||||||||
Fixed 0.710% |
Annually | 12-Month USD SOFR |
Annually | 5/15/27 | USD | 6,565,000 | 862,110 | 21,202 | 840,908 | ||||||||||||||||||||||||
Fixed 1.130% |
Annually | 12-Month USD SOFR |
Annually | 8/15/28 | USD | 980,000 | 133,895 | 6,525 | 127,370 | ||||||||||||||||||||||||
Fixed 1.220% |
Annually | 12-Month USD SOFR |
Annually | 8/15/28 | USD | 2,942,000 | 388,130 | (190 | ) | 388,320 | |||||||||||||||||||||||
Fixed 2.850% |
Annually | 12-Month USD SOFR |
Annually | 2/15/29 | USD | 3,019,000 | 146,617 | (3,872 | ) | 150,489 | |||||||||||||||||||||||
Fixed 3.270% |
Annually | 12-Month USD SOFR |
Annually | 4/30/29 | USD | 6,978,000 | 173,459 | (62,288 | ) | 235,747 | |||||||||||||||||||||||
Fixed 1.733% |
Annually | 12-Month USD SOFR |
Annually | 10/20/31 | USD | 3,125,000 | 195,003 | 13,280 | 181,723 | ||||||||||||||||||||||||
Fixed 2.000% |
Annually | 12-Month USD SOFR |
Annually | 3/18/32 | USD | 1,542,000 | 194,150 | 10,018 | 184,132 | ||||||||||||||||||||||||
Fixed 0.560% |
Annually | 12-Month USD SOFR |
Annually | 7/20/45 | USD | 3,470,000 | 1,486,049 | 78,573 | 1,407,476 | ||||||||||||||||||||||||
Fixed 1.729% |
Annually | Fed Funds |
Annually | 2/15/47 | USD | 1,725,000 | 426,922 | 25,406 | 401,516 | ||||||||||||||||||||||||
Fixed 1.520% |
Annually | 12-Month USD SOFR |
Annually | 2/15/47 | USD | 1,137,000 | 320,479 | (29,927 | ) | 350,406 | |||||||||||||||||||||||
Fixed 1.630% |
Annually | 12-Month USD SOFR |
Annually | 5/15/47 | USD | 580,000 | 153,279 | 25,405 | 127,874 | ||||||||||||||||||||||||
Fixed 1.650% |
Annually | 12-Month USD SOFR |
Annually | 8/15/47 | USD | 226,000 | 59,078 | 22,724 | 36,354 | ||||||||||||||||||||||||
The accompanying notes are an integral part of the financial statements.
114
MassMutual Strategic Bond Fund — Portfolio of Investments (Continued) |
Paid by the Fund |
Received by the Fund |
||||||||||||||||||||||||||||||||
Rate/ Reference |
Frequency |
Rate/ Reference |
Frequency |
Termination |
Notional |
Value |
Upfront |
Unrealized |
|||||||||||||||||||||||||
Fixed 2.620% |
Annually | 12-Month USD SOFR |
Annually | 2/15/48 | USD | 505,000 | $ | 49,436 | $ | 577 | $ | 48,859 | |||||||||||||||||||||
Fixed 2.510% |
Annually | 12-Month USD SOFR |
Annually | 2/15/48 | USD | 1,829,000 | 213,137 | 11,993 | 201,144 | ||||||||||||||||||||||||
Fixed 2.600% |
Annually | 12-Month USD SOFR |
Annually | 2/15/48 | USD | 1,281,000 | 126,759 | 88,054 | 38,705 | ||||||||||||||||||||||||
Fixed 2.500% |
Annually | 12-Month USD SOFR |
Annually | 4/21/52 | USD | 1,900,000 | 207,379 | 3,409 | 203,970 | ||||||||||||||||||||||||
| $ | 5,027,834 | $ | 274,404 | $ | 4,753,430 | ||||||||||||||||||||||||||||
|
* |
Contracts are subject to a master netting agreement or similar agreement. |
|
** |
Rating is determined by Western Asset Management Company and represents a weighted average of the ratings of all securities included in the underlying index for the credit default swap. Ratings used in the weighted average are from Moody’s Investors Service, Inc., S&P Global Ratings, or Fitch Ratings, whichever is the highest for each constituent. All ratings are as of the report date and do not reflect subsequent changes. |
|
† |
Payment is based on a percentage of the index. Reference entities are a number of individual issuers comprising the index. |
|
†† |
For each credit derivative with sold protection, the credit ratings of the entities referenced, as rated by any rating organization, are included in the equivalent S&P Global Ratings or Western Asset Management Company’s rating category, as applicable. The reference entity rating represents the creditworthiness of the underlying issuer. As the credit rating declines, the likelihood of payment by the fund increases. Notional amounts represent the maximum potential amount of future payments (undiscounted) the Fund could be required to make under the credit derivatives with sold protection. |
Currency Legend
|
AUD |
Australian Dollar |
|
CAD |
Canadian Dollar |
|
CNH |
Offshore Chinese Yuan |
|
EUR |
Euro |
|
GBP |
British Pound |
|
IDR |
Indonesian Rupiah |
|
JPY |
Japanese Yen |
|
MXN |
Mexican Peso |
|
NOK |
Norwegian Krone |
|
RUB |
Russian Ruble |
|
USD |
U.S. Dollar |
|
ZAR |
South African Rand |
The accompanying notes are an integral part of the financial statements.
115
MassMutual Diversified Value Fund — Portfolio of Investments |
September 30, 2022 |
Number of |
Value |
|||||||
EQUITIES — 97.8% |
||||||||
COMMON STOCK — 96.9% |
||||||||
Basic Materials — 4.2% |
||||||||
Chemicals — 2.3% |
||||||||
Celanese Corp. |
3,100 | $ | 280,054 | |||||
CF Industries Holdings, Inc. |
34,004 | 3,272,885 | ||||||
Dow, Inc. |
13,000 | 571,090 | ||||||
DuPont de Nemours, Inc. |
10,400 | 524,160 | ||||||
Eastman Chemical Co. |
3,700 | 262,885 | ||||||
FMC Corp. |
2,700 | 285,390 | ||||||
Huntsman Corp. |
2,500 | 61,350 | ||||||
LyondellBasell Industries NV Class A |
5,800 | 436,624 | ||||||
The Mosaic Co. |
10,300 | 497,799 | ||||||
Olin Corp. |
2,700 | 115,776 | ||||||
| 6,308,013 | ||||||||
Forest Products & Paper — 0.8% |
||||||||
International Paper Co. |
69,989 | 2,218,651 | ||||||
Iron & Steel — 0.6% |
||||||||
Nucor Corp. |
8,200 | 877,318 | ||||||
Reliance Steel & Aluminum Co. |
1,700 | 296,497 | ||||||
Steel Dynamics, Inc. |
5,900 | 418,605 | ||||||
| 1,592,420 | ||||||||
Mining — 0.5% |
||||||||
Alcoa Corp. |
3,300 | 111,078 | ||||||
Freeport-McMoRan, Inc. |
25,800 | 705,114 | ||||||
Newmont Corp. |
16,100 | 676,683 | ||||||
| 1,492,875 | ||||||||
| 11,611,959 | ||||||||
Communications — 5.5% |
||||||||
Advertising — 0.2% |
||||||||
The Interpublic Group of Cos., Inc. |
6,800 | 174,080 | ||||||
Omnicom Group, Inc. |
6,000 | 378,540 | ||||||
| 552,620 | ||||||||
Internet — 0.2% |
||||||||
Meta Platforms, Inc. Class A (a) |
4,600 | 624,128 | ||||||
Media — 3.0% |
||||||||
Comcast Corp. Class A |
146,054 | 4,283,764 | ||||||
Fox Corp. Class A |
9,200 | 282,256 | ||||||
News Corp. Class A |
121,031 | 1,828,779 | ||||||
Nexstar Media Group, Inc. Class A |
700 | 116,795 | ||||||
The Walt Disney Co. (a) |
18,513 | 1,746,331 | ||||||
| 8,257,925 | ||||||||
Telecommunications — 2.1% |
||||||||
AT&T, Inc. |
123,500 | 1,894,490 | ||||||
Cisco Systems, Inc. |
90,000 | 3,600,000 | ||||||
Number of |
Value |
|||||||
Corning, Inc. |
14,700 | $ | 426,594 | |||||
| 5,921,084 | ||||||||
| 15,355,757 | ||||||||
Consumer, Cyclical — 5.1% |
||||||||
Apparel — 0.1% |
||||||||
Capri Holdings Ltd. (a) |
2,900 | 111,476 | ||||||
Ralph Lauren Corp. |
800 | 67,944 | ||||||
Skechers U.S.A., Inc. Class A (a) |
2,600 | 82,472 | ||||||
Tapestry, Inc. |
4,500 | 127,935 | ||||||
| 389,827 | ||||||||
Auto Manufacturers — 0.8% |
||||||||
Cummins, Inc. |
2,600 | 529,126 | ||||||
Ford Motor Co. |
106,700 | 1,195,040 | ||||||
PACCAR, Inc. |
6,300 | 527,247 | ||||||
| 2,251,413 | ||||||||
Auto Parts & Equipment — 0.1% |
||||||||
BorgWarner, Inc. |
4,300 | 135,020 | ||||||
Lear Corp. |
1,400 | 167,566 | ||||||
| 302,586 | ||||||||
Distribution & Wholesale — 0.1% |
||||||||
LKQ Corp. |
8,200 | 386,630 | ||||||
Home Builders — 0.7% |
||||||||
D.R. Horton, Inc. |
10,000 | 673,500 | ||||||
Lennar Corp. Class A |
7,600 | 566,580 | ||||||
NVR, Inc. (a) |
80 | 318,966 | ||||||
PulteGroup, Inc. |
7,500 | 281,250 | ||||||
| 1,840,296 | ||||||||
Home Furnishing — 0.1% |
||||||||
Whirlpool Corp. |
1,800 | 242,658 | ||||||
Housewares — 0.0% |
||||||||
Newell Brands, Inc. |
7,400 | 102,786 | ||||||
Leisure Time — 0.1% |
||||||||
Brunswick Corp. |
2,200 | 143,990 | ||||||
Polaris, Inc. |
1,100 | 105,215 | ||||||
| 249,205 | ||||||||
Lodging — 0.6% |
||||||||
Boyd Gaming Corp. |
1,200 | 57,180 | ||||||
Las Vegas Sands Corp. (a) |
40,186 | 1,507,779 | ||||||
| 1,564,959 | ||||||||
Retail — 2.5% |
||||||||
AutoNation, Inc. (a) |
2,500 | 254,675 | ||||||
AutoZone, Inc. (a) |
600 | 1,285,158 | ||||||
Best Buy Co., Inc. |
3,900 | 247,026 | ||||||
Darden Restaurants, Inc. |
1,400 | 176,848 | ||||||
Dick’s Sporting Goods, Inc. (b) |
900 | 94,176 | ||||||
Lithia Motors, Inc. |
500 | 107,275 | ||||||
The accompanying notes are an integral part of the financial statements.
116
MassMutual Diversified Value Fund — Portfolio of Investments (Continued) |
Number of |
Value |
|||||||
Lowe’s Cos., Inc. |
20,000 | $ | 3,756,200 | |||||
Penske Automotive Group, Inc. |
1,700 | 167,331 | ||||||
Walgreens Boots Alliance, Inc. |
18,600 | 584,040 | ||||||
Williams-Sonoma, Inc. |
1,200 | 141,420 | ||||||
| 6,814,149 | ||||||||
| 14,144,509 | ||||||||
Consumer, Non-cyclical — 25.6% |
||||||||
Agriculture — 2.8% |
||||||||
Altria Group, Inc. |
39,500 | 1,595,010 | ||||||
Archer-Daniels-Midland Co. |
15,200 | 1,222,840 | ||||||
Darling Ingredients, Inc. (a) |
2,900 | 191,835 | ||||||
Philip Morris International, Inc. |
56,090 | 4,656,031 | ||||||
| 7,665,716 | ||||||||
Beverages — 0.1% |
||||||||
Molson Coors Beverage Co. Class B |
3,600 | 172,764 | ||||||
Biotechnology — 2.1% |
||||||||
Amgen, Inc. |
9,500 | 2,141,300 | ||||||
Biogen, Inc. (a) |
2,400 | 640,800 | ||||||
Gilead Sciences, Inc. |
25,400 | 1,566,926 | ||||||
Regeneron Pharmaceuticals, Inc. (a) |
2,300 | 1,584,401 | ||||||
| 5,933,427 | ||||||||
Commercial Services — 0.6% |
||||||||
AMERCO |
600 | 305,532 | ||||||
FleetCor Technologies, Inc. (a) |
1,300 | 229,021 | ||||||
Global Payments, Inc. |
1,500 | 162,075 | ||||||
Robert Half International, Inc. |
1,900 | 145,350 | ||||||
Service Corp. International |
4,900 | 282,926 | ||||||
United Rentals, Inc. (a) |
1,600 | 432,192 | ||||||
| 1,557,096 | ||||||||
Food — 2.5% |
||||||||
Campbell Soup Co. |
3,200 | 150,784 | ||||||
Conagra Brands, Inc. |
77,953 | 2,543,606 | ||||||
Ingredion, Inc. |
500 | 40,260 | ||||||
The J.M. Smucker Co. |
2,300 | 316,043 | ||||||
Kellogg Co. |
6,800 | 473,688 | ||||||
The Kraft Heinz Co. |
26,200 | 873,770 | ||||||
The Kroger Co. |
15,900 | 695,625 | ||||||
Tyson Foods, Inc. Class A |
27,935 | 1,841,755 | ||||||
| 6,935,531 | ||||||||
Health Care – Products — 0.7% |
||||||||
Henry Schein, Inc. (a) |
3,000 | 197,310 | ||||||
Hologic, Inc. (a) |
5,100 | 329,052 | ||||||
Medtronic PLC |
18,028 | 1,455,761 | ||||||
| 1,982,123 | ||||||||
Health Care – Services — 4.1% |
||||||||
Centene Corp. (a) |
11,800 | 918,158 | ||||||
DaVita, Inc. (a) |
3,000 | 248,310 | ||||||
Number of |
Value |
|||||||
Elevance Health, Inc. |
16,381 | $ | 7,440,905 | |||||
HCA Healthcare, Inc. |
9,200 | 1,690,868 | ||||||
Laboratory Corp. of America Holdings |
2,700 | 552,987 | ||||||
Quest Diagnostics, Inc. |
3,600 | 441,684 | ||||||
Universal Health Services, Inc. Class B |
2,200 | 193,996 | ||||||
| 11,486,908 | ||||||||
Household Products & Wares — 0.8% |
||||||||
Kimberly-Clark Corp. |
19,630 | 2,209,160 | ||||||
Pharmaceuticals — 11.9% |
||||||||
AbbVie, Inc. |
53,002 | 7,113,398 | ||||||
AmerisourceBergen Corp. |
5,600 | 757,848 | ||||||
Becton Dickinson and Co. |
13,750 | 3,063,913 | ||||||
Bristol-Myers Squibb Co. |
38,000 | 2,701,420 | ||||||
Cardinal Health, Inc. |
4,800 | 320,064 | ||||||
Cigna Corp. |
7,400 | 2,053,278 | ||||||
CVS Health Corp. |
44,851 | 4,277,440 | ||||||
McKesson Corp. |
4,400 | 1,495,428 | ||||||
Merck & Co., Inc. |
48,800 | 4,202,656 | ||||||
Pfizer, Inc. |
120,600 | 5,277,456 | ||||||
Sanofi ADR |
48,196 | 1,832,412 | ||||||
| 33,095,313 | ||||||||
| 71,038,038 | ||||||||
Energy — 9.4% |
||||||||
Energy – Alternate Sources — 0.1% |
||||||||
First Solar, Inc. (a) |
2,400 | 317,448 | ||||||
Oil & Gas — 8.1% |
||||||||
APA Corp. |
7,400 | 253,006 | ||||||
Chevron Corp. |
14,100 | 2,025,747 | ||||||
ConocoPhillips |
6,600 | 675,444 | ||||||
Devon Energy Corp. |
11,400 | 685,482 | ||||||
Diamondback Energy, Inc. |
3,000 | 361,380 | ||||||
EOG Resources, Inc. |
28,139 | 3,143,970 | ||||||
Exxon Mobil Corp. |
85,300 | 7,447,543 | ||||||
Marathon Oil Corp. |
15,700 | 354,506 | ||||||
Ovintiv, Inc. |
5,300 | 243,800 | ||||||
PDC Energy, Inc. |
1,600 | 92,464 | ||||||
Pioneer Natural Resources Co. |
4,100 | 887,773 | ||||||
TotalEnergies SE |
90,274 | 4,249,190 | ||||||
TotalEnergies SE Sponsored ADR |
25,056 | 1,165,605 | ||||||
Valero Energy Corp. |
8,800 | 940,280 | ||||||
| 22,526,190 | ||||||||
Pipelines — 1.2% |
||||||||
Kinder Morgan, Inc. |
48,500 | 807,040 | ||||||
ONEOK, Inc. |
8,900 | 456,036 | ||||||
The accompanying notes are an integral part of the financial statements.
117
MassMutual Diversified Value Fund — Portfolio of Investments (Continued) |
Number of |
Value |
|||||||
TC Energy Corp. |
52,200 | $ | 2,103,138 | |||||
| 3,366,214 | ||||||||
| 26,209,852 | ||||||||
Financial — 23.4% |
||||||||
Banks — 12.9% |
||||||||
Bank of America Corp. |
181,500 | 5,481,300 | ||||||
The Bank of New York Mellon Corp. |
18,900 | 728,028 | ||||||
BOK Financial Corp. |
1,200 | 106,632 | ||||||
Comerica, Inc. |
3,000 | 213,300 | ||||||
Commerce Bancshares, Inc. |
2,600 | 172,016 | ||||||
East West Bancorp, Inc. |
2,900 | 194,706 | ||||||
Fifth Third Bancorp |
63,864 | 2,041,093 | ||||||
First Horizon Corp. |
8,700 | 199,230 | ||||||
The Goldman Sachs Group, Inc. |
14,111 | 4,135,229 | ||||||
Huntington Bancshares, Inc. |
183,535 | 2,418,991 | ||||||
JP Morgan Chase & Co. |
59,000 | 6,165,500 | ||||||
KeyCorp. |
20,900 | 334,818 | ||||||
Morgan Stanley |
29,800 | 2,354,498 | ||||||
Northern Trust Corp. |
4,400 | 376,464 | ||||||
Pinnacle Financial Partners, Inc. |
800 | 64,880 | ||||||
The PNC Financial Services Group, Inc. |
9,000 | 1,344,780 | ||||||
Prosperity Bancshares, Inc. |
1,700 | 113,356 | ||||||
Regions Financial Corp. |
20,500 | 411,435 | ||||||
State Street Corp. |
21,109 | 1,283,638 | ||||||
Synovus Financial Corp. |
1,400 | 52,514 | ||||||
Truist Financial Corp. |
28,800 | 1,253,952 | ||||||
US Bancorp |
32,000 | 1,290,240 | ||||||
Wells Fargo & Co. |
127,389 | 5,123,586 | ||||||
Zions Bancorp NA |
3,500 | 178,010 | ||||||
| 36,038,196 | ||||||||
Diversified Financial Services — 1.4% |
||||||||
American Express Co. |
16,600 | 2,239,506 | ||||||
Ameriprise Financial, Inc. |
2,400 | 604,680 | ||||||
Credit Acceptance Corp. (a) |
400 | 175,200 | ||||||
Discover Financial Services |
6,400 | 581,888 | ||||||
SEI Investments Co. |
3,100 | 152,055 | ||||||
The Western Union Co. |
7,000 | 94,500 | ||||||
| 3,847,829 | ||||||||
Insurance — 7.3% |
||||||||
Aflac, Inc. |
14,900 | 837,380 | ||||||
The Allstate Corp. |
6,400 | 796,992 | ||||||
American Financial Group, Inc. |
1,800 | 221,274 | ||||||
American International Group, Inc. |
65,779 | 3,123,187 | ||||||
Arch Capital Group Ltd. (a) |
8,600 | 391,644 | ||||||
Assurant, Inc. |
1,400 | 203,378 | ||||||
Chubb Ltd. |
25,319 | 4,605,020 | ||||||
Cincinnati Financial Corp. |
3,400 | 304,538 | ||||||
Number of |
Value |
|||||||
Equitable Holdings, Inc. |
81,523 | $ | 2,148,131 | |||||
Everest Re Group Ltd. |
1,000 | 262,440 | ||||||
Fidelity National Financial, Inc. |
6,200 | 224,440 | ||||||
First American Financial Corp. |
2,500 | 115,250 | ||||||
Globe Life, Inc. |
2,100 | 209,370 | ||||||
The Hartford Financial Services Group, Inc. |
7,700 | 476,938 | ||||||
Lincoln National Corp. |
4,100 | 180,031 | ||||||
Loews Corp. |
5,800 | 289,072 | ||||||
Markel Corp. (a) |
320 | 346,950 | ||||||
MetLife, Inc. |
19,100 | 1,160,898 | ||||||
Old Republic International Corp. |
4,400 | 92,092 | ||||||
Principal Financial Group, Inc. |
6,000 | 432,900 | ||||||
Prudential Financial, Inc. |
8,400 | 720,552 | ||||||
Reinsurance Group of America, Inc. |
1,200 | 150,972 | ||||||
RenaissanceRe Holdings Ltd. |
1,000 | 140,390 | ||||||
The Travelers Cos., Inc. |
10,100 | 1,547,320 | ||||||
Unum Group |
3,600 | 139,680 | ||||||
Voya Financial, Inc. |
2,800 | 169,400 | ||||||
W.R. Berkley Corp. |
5,800 | 374,564 | ||||||
Willis Towers Watson PLC |
2,800 | 562,632 | ||||||
| 20,227,435 | ||||||||
Real Estate — 0.2% |
||||||||
CBRE Group, Inc. Class A (a) |
5,200 | 351,052 | ||||||
Jones Lang LaSalle, Inc. (a) |
1,500 | 226,605 | ||||||
| 577,657 | ||||||||
Real Estate Investment Trusts (REITS) — 1.6% |
||||||||
Equity Residential |
37,567 | 2,525,254 | ||||||
Weyerhaeuser Co. |
66,363 | 1,895,327 | ||||||
| 4,420,581 | ||||||||
| 65,111,698 | ||||||||
Industrial — 9.9% |
||||||||
Aerospace & Defense — 2.5% |
||||||||
The Boeing Co. (a) |
7,742 | 937,401 | ||||||
L3 Harris Technologies, Inc. |
18,642 | 3,874,367 | ||||||
Lockheed Martin Corp. |
5,600 | 2,163,224 | ||||||
| 6,974,992 | ||||||||
Building Materials — 0.5% |
||||||||
Builders FirstSource, Inc. (a) |
3,100 | 182,652 | ||||||
Carrier Global Corp. |
14,566 | 517,967 | ||||||
Masco Corp. |
7,200 | 336,168 | ||||||
Owens Corning |
3,000 | 235,830 | ||||||
| 1,272,617 | ||||||||
Electronics — 0.2% |
||||||||
Arrow Electronics, Inc. (a) |
2,200 | 202,818 | ||||||
Jabil, Inc. |
4,100 | 236,611 | ||||||
The accompanying notes are an integral part of the financial statements.
118
MassMutual Diversified Value Fund — Portfolio of Investments (Continued) |
Number of |
Value |
|||||||
Sensata Technologies Holding PLC |
3,000 | $ | 111,840 | |||||
| 551,269 | ||||||||
Engineering & Construction — 0.0% |
||||||||
TopBuild Corp. (a) |
200 | 32,956 | ||||||
Hand & Machine Tools — 0.1% |
||||||||
Snap-on, Inc. |
1,600 | 322,160 | ||||||
Machinery – Construction & Mining — 0.6% |
||||||||
Caterpillar, Inc. |
9,200 | 1,509,536 | ||||||
Oshkosh Corp. |
1,400 | 98,406 | ||||||
| 1,607,942 | ||||||||
Machinery – Diversified — 1.0% |
||||||||
AGCO Corp. |
1,400 | 134,638 | ||||||
Deere & Co. |
6,600 | 2,203,674 | ||||||
Dover Corp. |
2,700 | 314,766 | ||||||
| 2,653,078 | ||||||||
Miscellaneous - Manufacturing — 1.9% |
||||||||
General Electric Co. |
69,378 | 4,295,192 | ||||||
Parker-Hannifin Corp. |
2,800 | 678,468 | ||||||
Textron, Inc. |
6,300 | 367,038 | ||||||
| 5,340,698 | ||||||||
Packaging & Containers — 0.5% |
||||||||
Amcor PLC |
43,100 | 462,463 | ||||||
Berry Global Group, Inc. (a) |
2,400 | 111,672 | ||||||
Crown Holdings, Inc. |
3,600 | 291,708 | ||||||
Packaging Corp. of America |
2,700 | 303,183 | ||||||
Sealed Air Corp. |
4,300 | 191,393 | ||||||
WestRock Co. |
4,600 | 142,094 | ||||||
| 1,502,513 | ||||||||
Shipbuilding — 0.1% |
||||||||
Huntington Ingalls Industries, Inc. |
900 | 199,350 | ||||||
Transportation — 2.5% |
||||||||
C.H. Robinson Worldwide, Inc. |
2,600 | 250,406 | ||||||
Expeditors International of Washington, Inc. |
3,300 | 291,423 | ||||||
FedEx Corp. |
4,700 | 697,809 | ||||||
Knight-Swift Transportation Holdings, Inc. |
3,500 | 171,255 | ||||||
United Parcel Service, Inc. Class B |
34,745 | 5,612,708 | ||||||
| 7,023,601 | ||||||||
| 27,481,176 | ||||||||
Technology — 7.6% |
||||||||
Computers — 1.7% |
||||||||
CACI International, Inc. Class A (a) |
400 | 104,424 | ||||||
Cognizant Technology Solutions Corp. Class A |
9,000 | 516,960 | ||||||
Dell Technologies, Inc. |
4,800 | 164,016 | ||||||
DXC Technology Co. (a) |
4,000 | 97,920 | ||||||
Number of |
Value |
|||||||
Hewlett Packard Enterprise Co. |
35,400 | $ | 424,092 | |||||
HP, Inc. |
35,300 | 879,676 | ||||||
International Business Machines Corp. |
18,200 | 2,162,342 | ||||||
Leidos Holdings, Inc. |
2,500 | 218,675 | ||||||
NetApp, Inc. |
3,700 | 228,845 | ||||||
| 4,796,950 | ||||||||
Semiconductors — 2.5% |
||||||||
KLA Corp. |
2,500 | 756,575 | ||||||
QUALCOMM, Inc. |
53,420 | 6,035,392 | ||||||
| 6,791,967 | ||||||||
Software — 3.4% |
||||||||
Fidelity National Information Services, Inc. |
10,600 | 801,042 | ||||||
Fiserv, Inc. (a) |
11,500 | 1,076,055 | ||||||
Microsoft Corp. |
11,906 | 2,772,907 | ||||||
Oracle Corp. |
80,500 | 4,916,135 | ||||||
| 9,566,139 | ||||||||
| 21,155,056 | ||||||||
Utilities — 6.2% |
||||||||
Electric — 6.1% |
||||||||
Alliant Energy Corp. |
5,400 | 286,146 | ||||||
Dominion Energy, Inc. |
17,300 | 1,195,603 | ||||||
Duke Energy Corp. |
13,600 | 1,265,072 | ||||||
Edison International |
7,700 | 435,666 | ||||||
Entergy Corp. |
4,300 | 432,709 | ||||||
Evergy, Inc. |
4,900 | 291,060 | ||||||
Eversource Energy |
6,900 | 537,924 | ||||||
Exelon Corp. |
26,800 | 1,003,928 | ||||||
OGE Energy Corp. |
3,600 | 131,256 | ||||||
Pinnacle West Capital Corp. |
2,100 | 135,471 | ||||||
PPL Corp. |
15,200 | 385,320 | ||||||
Public Service Enterprise Group, Inc. |
14,400 | 809,712 | ||||||
Sempra Energy |
33,640 | 5,043,982 | ||||||
The Southern Co. |
69,761 | 4,743,748 | ||||||
Vistra Corp. |
9,800 | 205,800 | ||||||
| 16,903,397 | ||||||||
Gas — 0.1% |
||||||||
National Fuel Gas Co. |
1,700 | 104,635 | ||||||
UGI Corp. |
3,600 | 116,388 | ||||||
| 221,023 | ||||||||
| 17,124,420 | ||||||||
TOTAL COMMON STOCK (Cost $258,613,267) |
269,232,465 | |||||||
The accompanying notes are an integral part of the financial statements.
119
MassMutual Diversified Value Fund — Portfolio of Investments (Continued) |
Number of |
Value |
|||||||
PREFERRED STOCK — 0.9% |
||||||||
Consumer, Cyclical — 0.8% |
||||||||
Auto Manufacturers — 0.8% |
||||||||
Dr Ing hc F Porsche AG (a) |
9,293 | $ | 751,377 | |||||
Volkswagen AG 6.014% |
12,535 | 1,548,309 | ||||||
| 2,299,686 | ||||||||
Consumer, Non-cyclical — 0.1% |
||||||||
Pharmaceuticals — 0.1% |
||||||||
Becton Dickinson and Co. Convertible 6.000% |
8,676 | 408,987 | ||||||
TOTAL PREFERRED STOCK (Cost $3,776,400) |
2,708,673 | |||||||
TOTAL EQUITIES (Cost $262,389,667) |
271,941,138 | |||||||
MUTUAL FUNDS — 1.3% |
||||||||
Diversified Financial Services — 1.3% |
||||||||
iShares Russell 1000 Value ETF |
26,200 | 3,562,938 | ||||||
State Street Navigator Securities Lending Government Money Market Portfolio (c) |
95,114 | 95,114 | ||||||
| 3,658,052 | ||||||||
TOTAL MUTUAL FUNDS (Cost $3,724,904) |
3,658,052 | |||||||
TOTAL LONG-TERM INVESTMENTS (Cost $266,114,571) |
275,599,190 | |||||||
SHORT-TERM INVESTMENTS — 1.2% |
||||||||
Mutual Fund — 0.0% |
||||||||
T. Rowe Price Government Reserve Investment Fund |
105 | 105 | ||||||
Principal |
Value |
|||||||
Repurchase Agreement — 1.2% |
||||||||
Fixed Income Clearing Corp., Repurchase Agreement, dated 9/30/22, 0.830%, due 10/03/22 (d) |
$ | 3,266,398 | $ | 3,266,398 | ||||
TOTAL SHORT-TERM INVESTMENTS (Cost $3,266,503) |
3,266,503 | |||||||
TOTAL INVESTMENTS — 100.3% (Cost $269,381,074) (e) |
278,865,693 | |||||||
Other Assets/(Liabilities) — (0.3)% |
(950,195 | ) | ||||||
NET ASSETS — 100.0% |
$ | 277,915,498 | ||||||
Abbreviation Legend
|
ADR |
American Depositary Receipt |
|
ETF |
Exchange-Traded Fund |
Notes to Portfolio of Investments
Percentages are stated as a percent of net assets.
|
(a) |
Non-income producing security. |
|
(b) |
Denotes all or a portion of security on loan. The total value of securities on loan as of September 30, 2022, was $93,234 or 0.03% of net assets. This amount is not reflected on either the Portfolio of Investments or the Statement of Assets and Liabilities. (Note 2). |
|
(c) |
Represents investment of security lending cash collateral. (Note 2). |
|
(d) |
Maturity value of $3,266,624. Collateralized by U.S. Government Agency obligations with a rate of 0.000%, maturity date of 3/30/23, and an aggregate market value, including accrued interest, of $3,331,801. |
|
(e) |
See Note 6 for aggregate cost for federal tax purposes. |
The accompanying notes are an integral part of the financial statements.
120
MassMutual Fundamental Value Fund — Portfolio of Investments |
September 30, 2022 |
Number of |
Value |
|||||||
EQUITIES — 97.5% |
||||||||
COMMON STOCK — 97.5% |
||||||||
Basic Materials — 5.2% |
||||||||
Chemicals — 5.2% |
||||||||
Air Products & Chemicals, Inc. |
24,783 | $ | 5,767,748 | |||||
Axalta Coating Systems Ltd. (a) |
156,878 | 3,303,851 | ||||||
DuPont de Nemours, Inc. |
122,644 | 6,181,258 | ||||||
Element Solutions, Inc. |
88,924 | 1,446,793 | ||||||
International Flavors & Fragrances, Inc. |
48,055 | 4,364,836 | ||||||
Olin Corp. |
27,871 | 1,195,108 | ||||||
| 22,259,594 | ||||||||
| 22,259,594 | ||||||||
Communications — 5.1% |
||||||||
Internet — 2.0% |
||||||||
Alphabet, Inc. Class A (a) |
54,531 | 5,215,890 | ||||||
Meta Platforms, Inc. Class A (a) |
24,022 | 3,259,305 | ||||||
| 8,475,195 | ||||||||
Media — 0.9% |
||||||||
Altice USA, Inc. Class A (a) |
70,566 | 411,400 | ||||||
Comcast Corp. Class A |
113,375 | 3,325,289 | ||||||
| 3,736,689 | ||||||||
Telecommunications — 2.2% |
||||||||
Cisco Systems, Inc. |
96,452 | 3,858,080 | ||||||
T-Mobile US, Inc. (a) |
41,172 | 5,524,047 | ||||||
| 9,382,127 | ||||||||
| 21,594,011 | ||||||||
Consumer, Cyclical — 4.9% |
||||||||
Distribution & Wholesale — 0.4% |
||||||||
LKQ Corp. |
33,054 | 1,558,496 | ||||||
Entertainment — 0.5% |
||||||||
Marriott Vacations Worldwide Corp. |
7,517 | 916,022 | ||||||
SeaWorld Entertainment, Inc. (a) |
29,998 | 1,365,209 | ||||||
| 2,281,231 | ||||||||
Food Services — 0.4% |
||||||||
Aramark |
55,597 | 1,734,626 | ||||||
Home Furnishing — 0.2% |
||||||||
Sony Group Corp. Sponsored ADR |
15,377 | 984,897 | ||||||
Lodging — 0.7% |
||||||||
Las Vegas Sands Corp. (a) |
54,802 | 2,056,171 | ||||||
MGM Resorts International |
33,560 | 997,403 | ||||||
| 3,053,574 | ||||||||
Retail — 2.7% |
||||||||
Advance Auto Parts, Inc. |
19,397 | 3,032,527 | ||||||
AutoZone, Inc. (a) |
2,543 | 5,446,928 | ||||||
Dollar General Corp. |
9,230 | 2,213,908 | ||||||
Number of |
Value |
|||||||
Lithia Motors, Inc. |
3,209 | $ | 688,491 | |||||
| 11,381,854 | ||||||||
| 20,994,678 | ||||||||
Consumer, Non-cyclical — 28.3% |
||||||||
Agriculture — 1.3% |
||||||||
Philip Morris International, Inc. |
64,166 | 5,326,420 | ||||||
Beverages — 2.5% |
||||||||
Coca-Cola Europacific Partners PLC |
109,213 | 4,654,658 | ||||||
Keurig Dr Pepper, Inc. |
116,981 | 4,190,259 | ||||||
Molson Coors Beverage Co. Class B |
37,832 | 1,815,558 | ||||||
| 10,660,475 | ||||||||
Biotechnology — 0.2% |
||||||||
Corteva, Inc. |
16,190 | 925,258 | ||||||
Commercial Services — 1.5% |
||||||||
FleetCor Technologies, Inc. (a) |
10,112 | 1,781,431 | ||||||
Global Payments, Inc. |
17,875 | 1,931,394 | ||||||
PROG Holdings, Inc. (a) |
24,069 | 360,554 | ||||||
United Rentals, Inc. (a) |
8,994 | 2,429,459 | ||||||
| 6,502,838 | ||||||||
Cosmetics & Personal Care — 0.4% |
||||||||
The Procter & Gamble Co. |
14,849 | 1,874,686 | ||||||
Food — 0.3% |
||||||||
US Foods Holding Corp. (a) |
46,986 | 1,242,310 | ||||||
Health Care – Products — 2.3% |
||||||||
Avantor, Inc. (a) |
96,039 | 1,882,364 | ||||||
Envista Holdings Corp. (a) |
35,816 | 1,175,123 | ||||||
Hologic, Inc. (a) |
20,874 | 1,346,791 | ||||||
LivaNova PLC (a) |
19,978 | 1,014,283 | ||||||
Medtronic PLC |
53,308 | 4,304,621 | ||||||
| 9,723,182 | ||||||||
Health Care – Services — 5.4% |
||||||||
Centene Corp. (a) |
53,385 | 4,153,887 | ||||||
Elevance Health, Inc. |
5,604 | 2,545,561 | ||||||
Humana, Inc. |
7,253 | 3,519,083 | ||||||
ICON PLC (a) |
9,124 | 1,676,809 | ||||||
UnitedHealth Group, Inc. |
21,993 | 11,107,344 | ||||||
| 23,002,684 | ||||||||
Pharmaceuticals — 14.4% |
||||||||
AbbVie, Inc. |
27,870 | 3,740,433 | ||||||
AmerisourceBergen Corp. |
17,619 | 2,384,379 | ||||||
Becton Dickinson and Co. |
9,928 | 2,212,256 | ||||||
Bristol-Myers Squibb Co. |
61,443 | 4,367,983 | ||||||
Cigna Corp. |
36,499 | 10,127,377 | ||||||
CVS Health Corp. |
107,183 | 10,222,043 | ||||||
Johnson & Johnson |
62,942 | 10,282,205 | ||||||
McKesson Corp. |
3,265 | 1,109,676 | ||||||
Merck & Co., Inc. |
93,151 | 8,022,164 | ||||||
The accompanying notes are an integral part of the financial statements.
121
MassMutual Fundamental Value Fund — Portfolio of Investments (Continued) |
Number of |
Value |
|||||||
Novartis AG Sponsored ADR |
14,369 | $ | 1,092,188 | |||||
Perrigo Co. PLC |
95,248 | 3,396,544 | ||||||
Sanofi ADR |
116,912 | 4,444,994 | ||||||
| 61,402,242 | ||||||||
| 120,660,095 | ||||||||
Energy — 10.9% |
||||||||
Oil & Gas — 9.3% |
||||||||
Canadian Natural Resources Ltd. (b) |
57,082 | 2,658,309 | ||||||
Cenovus Energy, Inc. (b) |
138,084 | 2,122,351 | ||||||
ConocoPhillips |
77,988 | 7,981,292 | ||||||
Devon Energy Corp. |
41,577 | 2,500,025 | ||||||
EOG Resources, Inc. |
16,181 | 1,807,903 | ||||||
Hess Corp. |
52,316 | 5,701,921 | ||||||
Marathon Petroleum Corp. |
38,024 | 3,776,924 | ||||||
Phillips 66 |
72,418 | 5,845,581 | ||||||
Pioneer Natural Resources Co. |
26,531 | 5,744,757 | ||||||
Valero Energy Corp. |
11,904 | 1,271,942 | ||||||
| 39,411,005 | ||||||||
Oil & Gas Services — 0.9% |
||||||||
Halliburton Co. |
56,625 | 1,394,108 | ||||||
Schlumberger NV |
72,299 | 2,595,534 | ||||||
| 3,989,642 | ||||||||
Pipelines — 0.7% |
||||||||
Enbridge, Inc. |
79,999 | 2,967,963 | ||||||
| 46,368,610 | ||||||||
Financial — 19.1% |
||||||||
Banks — 8.7% |
||||||||
Bank of America Corp. |
102,723 | 3,102,235 | ||||||
The Goldman Sachs Group, Inc. |
9,836 | 2,882,440 | ||||||
JP Morgan Chase & Co. |
95,387 | 9,967,941 | ||||||
M&T Bank Corp. |
14,035 | 2,474,651 | ||||||
Northern Trust Corp. |
40,703 | 3,482,549 | ||||||
Truist Financial Corp. |
45,493 | 1,980,765 | ||||||
US Bancorp |
85,960 | 3,465,907 | ||||||
Wells Fargo & Co. |
239,508 | 9,633,012 | ||||||
| 36,989,500 | ||||||||
Diversified Financial Services — 2.1% |
||||||||
AerCap Holdings NV (a) |
21,648 | 916,360 | ||||||
American Express Co. |
7,467 | 1,007,373 | ||||||
Capital One Financial Corp. |
9,554 | 880,592 | ||||||
The Charles Schwab Corp. |
69,233 | 4,975,776 | ||||||
Intercontinental Exchange, Inc. |
13,880 | 1,254,058 | ||||||
| 9,034,159 | ||||||||
Insurance — 6.8% |
||||||||
The Allstate Corp. |
52,047 | 6,481,413 | ||||||
American International Group, Inc. |
39,165 | 1,859,554 | ||||||
Axis Capital Holdings Ltd. |
24,855 | 1,221,623 | ||||||
Number of |
Value |
|||||||
Berkshire Hathaway, Inc. Class B (a) |
31,553 | $ | 8,425,282 | |||||
Chubb Ltd. |
39,843 | 7,246,645 | ||||||
Everest Re Group Ltd. |
6,527 | 1,712,946 | ||||||
Willis Towers Watson PLC |
9,276 | 1,863,919 | ||||||
| 28,811,382 | ||||||||
Real Estate — 0.2% |
||||||||
The Howard Hughes Corp. (a) |
13,759 | 762,111 | ||||||
Real Estate Investment Trusts (REITS) — 1.3% |
||||||||
Corporate Office Properties Trust |
122,595 | 2,847,882 | ||||||
VICI Properties, Inc. |
92,725 | 2,767,841 | ||||||
| 5,615,723 | ||||||||
| 81,212,875 | ||||||||
Industrial — 11.9% |
||||||||
Aerospace & Defense — 2.9% |
||||||||
General Dynamics Corp. |
21,965 | 4,660,314 | ||||||
Howmet Aerospace, Inc. |
76,913 | 2,378,919 | ||||||
Raytheon Technologies Corp. |
66,763 | 5,465,219 | ||||||
| 12,504,452 | ||||||||
Building Materials — 1.5% |
||||||||
CRH PLC Sponsored ADR (b) |
52,382 | 1,688,272 | ||||||
Masco Corp. |
31,186 | 1,456,074 | ||||||
MDU Resources Group, Inc. |
65,793 | 1,799,439 | ||||||
Mohawk Industries, Inc. (a) |
14,690 | 1,339,581 | ||||||
| 6,283,366 | ||||||||
Electronics — 0.5% |
||||||||
Allegion PLC |
12,305 | 1,103,513 | ||||||
Fortive Corp. |
21,901 | 1,276,828 | ||||||
| 2,380,341 | ||||||||
Engineering & Construction — 0.7% |
||||||||
AECOM |
26,647 | 1,821,855 | ||||||
Jacobs Solutions, Inc. |
10,320 | 1,119,617 | ||||||
| 2,941,472 | ||||||||
Hand & Machine Tools — 0.7% |
||||||||
Stanley Black & Decker, Inc. |
38,002 | 2,858,130 | ||||||
Machinery – Construction & Mining — 1.2% |
||||||||
BWX Technologies, Inc. |
35,818 | 1,804,153 | ||||||
Caterpillar, Inc. |
9,261 | 1,519,545 | ||||||
Vertiv Holdings Co. |
171,156 | 1,663,636 | ||||||
| 4,987,334 | ||||||||
Machinery – Diversified — 2.8% |
||||||||
Deere & Co. |
23,633 | 7,890,822 | ||||||
Dover Corp. |
8,204 | 956,422 | ||||||
Otis Worldwide Corp. |
30,102 | 1,920,508 | ||||||
Westinghouse Air Brake Technologies Corp. |
15,619 | 1,270,606 | ||||||
| 12,038,358 | ||||||||
The accompanying notes are an integral part of the financial statements.
122
MassMutual Fundamental Value Fund — Portfolio of Investments (Continued) |
Number of |
Value |
|||||||
Miscellaneous - Manufacturing — 0.6% |
||||||||
Eaton Corp. PLC |
18,543 | $ | 2,472,895 | |||||
Transportation — 1.0% |
||||||||
J.B. Hunt Transport Services, Inc. |
12,845 | 2,009,215 | ||||||
Union Pacific Corp. |
11,297 | 2,200,881 | ||||||
| 4,210,096 | ||||||||
| 50,676,444 | ||||||||
Technology — 8.1% |
||||||||
Computers — 1.6% |
||||||||
CACI International, Inc. Class A (a) |
6,712 | 1,752,235 | ||||||
Cognizant Technology Solutions Corp. Class A |
56,660 | 3,254,551 | ||||||
Leidos Holdings, Inc. |
19,558 | 1,710,738 | ||||||
| 6,717,524 | ||||||||
Semiconductors — 3.5% |
||||||||
Applied Materials, Inc. |
20,689 | 1,695,050 | ||||||
Broadcom, Inc. |
3,427 | 1,521,622 | ||||||
Lam Research Corp. |
1,838 | 672,708 | ||||||
Microchip Technology, Inc. |
50,917 | 3,107,465 | ||||||
Micron Technology, Inc. |
29,445 | 1,475,194 | ||||||
NXP Semiconductor NV |
5,043 | 743,893 | ||||||
Qorvo, Inc. (a) |
15,776 | 1,252,772 | ||||||
QUALCOMM, Inc. |
39,959 | 4,514,568 | ||||||
| 14,983,272 | ||||||||
Software — 3.0% |
||||||||
Activision Blizzard, Inc. |
10,293 | 765,182 | ||||||
Electronic Arts, Inc. |
16,257 | 1,881,097 | ||||||
Fidelity National Information Services, Inc. |
54,490 | 4,117,809 | ||||||
Oracle Corp. |
73,110 | 4,464,828 | ||||||
SS&C Technologies Holdings, Inc |
33,320 | 1,591,030 | ||||||
| 12,819,946 | ||||||||
| 34,520,742 | ||||||||
Utilities — 4.0% |
||||||||
Electric — 4.0% |
||||||||
CenterPoint Energy, Inc. |
143,333 | 4,039,124 | ||||||
Dominion Energy, Inc. |
28,634 | 1,978,896 | ||||||
Entergy Corp. |
40,206 | 4,045,930 | ||||||
Exelon Corp. |
40,298 | 1,509,563 | ||||||
FirstEnergy Corp. |
37,021 | 1,369,777 | ||||||
Number of |
Value |
|||||||
Pinnacle West Capital Corp. |
64,868 | $ | 4,184,634 | |||||
| 17,127,924 | ||||||||
| 17,127,924 | ||||||||
TOTAL COMMON STOCK (Cost $391,991,924) |
415,414,973 | |||||||
TOTAL EQUITIES (Cost $391,991,924) |
415,414,973 | |||||||
MUTUAL FUNDS — 0.7% |
||||||||
Diversified Financial Services — 0.7% |
||||||||
State Street Navigator Securities Lending Government Money Market Portfolio (c) |
2,886,035 | 2,886,035 | ||||||
TOTAL MUTUAL FUNDS (Cost $2,886,035) |
2,886,035 | |||||||
TOTAL LONG-TERM INVESTMENTS (Cost $394,877,959) |
418,301,008 | |||||||
Principal |
||||||||
SHORT-TERM INVESTMENTS — 2.4% |
||||||||
Repurchase Agreement — 2.4% |
||||||||
Fixed Income Clearing Corp., Repurchase Agreement, dated 9/30/22, 0.830%, due 10/03/22 (d) |
$ | 10,027,512 | 10,027,512 | |||||
TOTAL SHORT-TERM INVESTMENTS (Cost $10,027,512) |
10,027,512 | |||||||
TOTAL INVESTMENTS — 100.6% (Cost $404,905,471) (e) |
428,328,520 | |||||||
Other Assets/(Liabilities) — (0.6)% |
(2,358,214 | ) | ||||||
NET ASSETS — 100.0% |
$ | 425,970,306 | ||||||
Abbreviation Legend
|
ADR |
American Depositary Receipt |
The accompanying notes are an integral part of the financial statements.
123
MassMutual Fundamental Value Fund — Portfolio of Investments (Continued) |
Notes to Portfolio of Investments
Percentages are stated as a percent of net assets.
|
(a) |
Non-income producing security. |
|
(b) |
Denotes all or a portion of security on loan. The total value of securities on loan as of September 30, 2022, was $4,483,728 or 1.05% of net assets. The Fund received $1,717,780 of non-cash collateral (U.S. Treasury and/or Agency obligations) related to securities lending activity. This amount is not reflected on either the Portfolio of Investments or the Statement of Assets and Liabilities. (Note 2). |
|
(c) |
Represents investment of security lending cash collateral. (Note 2). |
|
(d) |
Maturity value of $10,028,205. Collateralized by U.S. Government Agency obligations with rates ranging from 0.000% - 3.500%, maturity dates ranging from 3/30/23 - 9/15/25, and an aggregate market value, including accrued interest, of $10,228,249. |
|
(e) |
See Note 6 for aggregate cost for federal tax purposes. |
The accompanying notes are an integral part of the financial statements.
124
MM S&P 500 Index Fund — Portfolio of Investments |
September 30, 2022 |
Number of |
Value |
|||||||
COMMON STOCK — 100.2% |
||||||||
Basic Materials — 2.0% |
||||||||
Chemicals — 1.6% |
||||||||
Air Products & Chemicals, Inc. |
16,374 | $ | 3,810,721 | |||||
Albemarle Corp. |
8,667 | 2,291,902 | ||||||
Celanese Corp. |
7,292 | 658,759 | ||||||
CF Industries Holdings, Inc. |
14,696 | 1,414,490 | ||||||
Dow, Inc. |
52,892 | 2,323,546 | ||||||
DuPont de Nemours, Inc. |
36,919 | 1,860,718 | ||||||
Eastman Chemical Co. |
8,945 | 635,542 | ||||||
Ecolab, Inc. |
18,389 | 2,655,739 | ||||||
FMC Corp. |
9,352 | 988,506 | ||||||
International Flavors & Fragrances, Inc. |
18,850 | 1,712,146 | ||||||
Linde PLC |
36,780 | 9,915,520 | ||||||
LyondellBasell Industries NV Class A |
18,685 | 1,406,607 | ||||||
The Mosaic Co. |
25,462 | 1,230,578 | ||||||
PPG Industries, Inc. |
17,474 | 1,934,197 | ||||||
The Sherwin-Williams Co. |
17,404 | 3,563,469 | ||||||
| 36,402,440 | ||||||||
Forest Products & Paper — 0.0% |
||||||||
International Paper Co. |
26,629 | 844,139 | ||||||
Iron & Steel — 0.1% |
||||||||
Nucor Corp. |
19,326 | 2,067,689 | ||||||
Mining — 0.3% |
||||||||
Freeport-McMoRan, Inc. |
105,439 | 2,881,648 | ||||||
Newmont Corp. |
58,750 | 2,469,263 | ||||||
| 5,350,911 | ||||||||
| 44,665,179 | ||||||||
Communications — 12.5% |
||||||||
Advertising — 0.1% |
||||||||
The Interpublic Group of Cos., Inc. |
29,243 | 748,621 | ||||||
Omnicom Group, Inc. |
15,098 | 952,533 | ||||||
| 1,701,154 | ||||||||
Internet — 9.0% |
||||||||
Alphabet, Inc. Class A (a) |
442,633 | 42,337,846 | ||||||
Alphabet, Inc. Class C (a) |
395,825 | 38,058,574 | ||||||
Amazon.com, Inc. (a) |
654,284 | 73,934,092 | ||||||
Booking Holdings, Inc. (a) |
2,931 | 4,816,248 | ||||||
CDW Corp. |
9,967 | 1,555,649 | ||||||
eBay, Inc. |
40,444 | 1,488,744 | ||||||
Etsy, Inc. (a) |
9,351 | 936,316 | ||||||
Expedia Group, Inc. (a) |
11,168 | 1,046,330 | ||||||
F5, Inc. (a) |
4,494 | 650,417 | ||||||
Match Group, Inc. (a) |
20,845 | 995,349 | ||||||
Meta Platforms, Inc. Class A (a) |
168,352 | 22,841,999 | ||||||
Number of |
Value |
|||||||
Netflix, Inc. (a) |
32,822 | $ | 7,727,612 | |||||
NortonLifeLock, Inc. |
44,324 | 892,685 | ||||||
Twitter, Inc. (a) |
49,596 | 2,174,289 | ||||||
VeriSign, Inc. (a) |
6,889 | 1,196,619 | ||||||
| 200,652,769 | ||||||||
Media — 1.4% |
||||||||
Charter Communications, Inc. Class A (a) |
8,172 | 2,478,976 | ||||||
Comcast Corp. Class A |
324,608 | 9,520,753 | ||||||
DISH Network Corp. Class A (a) |
19,303 | 266,960 | ||||||
FactSet Research Systems, Inc. |
2,827 | 1,131,111 | ||||||
Fox Corp. Class A |
23,039 | 706,837 | ||||||
Fox Corp. Class B |
10,899 | 310,622 | ||||||
News Corp. Class A |
29,085 | 439,474 | ||||||
News Corp. Class B |
9,628 | 148,464 | ||||||
Paramount Global Class B (b) |
37,104 | 706,460 | ||||||
The Walt Disney Co. (a) |
134,434 | 12,681,159 | ||||||
Warner Bros Discovery, Inc. (a) |
163,220 | 1,877,030 | ||||||
| 30,267,846 | ||||||||
Telecommunications — 2.0% |
||||||||
Arista Networks, Inc. (a) |
18,124 | 2,046,018 | ||||||
AT&T, Inc. |
526,615 | 8,078,274 | ||||||
Cisco Systems, Inc. |
305,777 | 12,231,080 | ||||||
Corning, Inc. |
56,225 | 1,631,650 | ||||||
Juniper Networks, Inc. |
23,953 | 625,652 | ||||||
Lumen Technologies, Inc. |
69,237 | 504,045 | ||||||
Motorola Solutions, Inc. |
12,370 | 2,770,509 | ||||||
T-Mobile US, Inc. (a) |
44,395 | 5,956,477 | ||||||
Verizon Communications, Inc. |
310,305 | 11,782,281 | ||||||
| 45,625,986 | ||||||||
| 278,247,755 | ||||||||
Consumer, Cyclical — 10.0% |
||||||||
Airlines — 0.2% |
||||||||
Alaska Air Group, Inc. (a) |
9,425 | 368,989 | ||||||
American Airlines Group, Inc. (a) |
47,461 | 571,431 | ||||||
Delta Air Lines, Inc. (a) |
47,670 | 1,337,620 | ||||||
Southwest Airlines Co. (a) |
43,598 | 1,344,562 | ||||||
United Airlines Holdings, Inc. (a) |
24,557 | 798,839 | ||||||
| 4,421,441 | ||||||||
Apparel — 0.4% |
||||||||
NIKE, Inc. Class B |
93,345 | 7,758,837 | ||||||
Ralph Lauren Corp. |
3,124 | 265,321 | ||||||
Tapestry, Inc. |
18,890 | 537,043 | ||||||
VF Corp. |
24,487 | 732,406 | ||||||
| 9,293,607 | ||||||||
Auto Manufacturers — 2.9% |
||||||||
Cummins, Inc. |
10,420 | 2,120,574 | ||||||
The accompanying notes are an integral part of the financial statements.
125
MM S&P 500 Index Fund — Portfolio of Investments (Continued) |
Number of |
Value |
|||||||
Ford Motor Co. |
291,569 | $ | 3,265,573 | |||||
General Motors Co. |
107,823 | 3,460,040 | ||||||
PACCAR, Inc. |
25,696 | 2,150,498 | ||||||
Tesla, Inc. (a) |
196,586 | 52,144,437 | ||||||
| 63,141,122 | ||||||||
Auto Parts & Equipment — 0.1% |
||||||||
Aptiv PLC (a) |
20,046 | 1,567,798 | ||||||
BorgWarner, Inc. |
17,846 | 560,364 | ||||||
| 2,128,162 | ||||||||
Distribution & Wholesale — 0.3% |
||||||||
Copart, Inc. (a) |
15,761 | 1,676,970 | ||||||
Fastenal Co. |
42,561 | 1,959,508 | ||||||
LKQ Corp. |
19,163 | 903,536 | ||||||
Pool Corp. |
2,902 | 923,445 | ||||||
W.W. Grainger, Inc. |
3,335 | 1,631,449 | ||||||
| 7,094,908 | ||||||||
Entertainment — 0.1% |
||||||||
Caesars Entertainment, Inc. (a) |
15,736 | 507,643 | ||||||
Live Nation Entertainment, Inc. (a) |
10,370 | 788,535 | ||||||
| 1,296,178 | ||||||||
Home Builders — 0.2% |
||||||||
D.R. Horton, Inc. |
23,579 | 1,588,046 | ||||||
Lennar Corp. Class A |
19,020 | 1,417,941 | ||||||
NVR, Inc. (a) |
228 | 909,054 | ||||||
PulteGroup, Inc. |
17,085 | 640,687 | ||||||
| 4,555,728 | ||||||||
Home Furnishing — 0.0% |
||||||||
Whirlpool Corp. |
3,945 | 531,825 | ||||||
Housewares — 0.0% |
||||||||
Newell Brands, Inc. |
27,141 | 376,988 | ||||||
Leisure Time — 0.1% |
||||||||
Carnival Corp. (a) (b) |
74,389 | 522,955 | ||||||
Norwegian Cruise Line Holdings Ltd. (a) |
30,620 | 347,843 | ||||||
Royal Caribbean Cruises Ltd. (a) |
16,142 | 611,782 | ||||||
| 1,482,580 | ||||||||
Lodging — 0.3% |
||||||||
Hilton Worldwide Holdings, Inc. |
20,241 | 2,441,469 | ||||||
Las Vegas Sands Corp. (a) |
24,251 | 909,898 | ||||||
Marriott International, Inc. Class A |
20,319 | 2,847,505 | ||||||
MGM Resorts International |
23,917 | 710,813 | ||||||
Wynn Resorts Ltd. (a) |
7,757 | 488,924 | ||||||
| 7,398,609 | ||||||||
Retail — 5.4% |
||||||||
Advance Auto Parts, Inc. |
4,573 | 714,943 | ||||||
AutoZone, Inc. (a) |
1,438 | 3,080,095 | ||||||
Bath & Body Works, Inc. |
17,089 | 557,101 | ||||||
Number of |
Value |
|||||||
Best Buy Co., Inc. |
14,690 | $ | 930,465 | |||||
CarMax, Inc. (a) |
11,634 | 768,077 | ||||||
Chipotle Mexican Grill, Inc. (a) |
2,049 | 3,079,155 | ||||||
Costco Wholesale Corp. |
32,704 | 15,445,118 | ||||||
Darden Restaurants, Inc. |
8,998 | 1,136,627 | ||||||
Dollar General Corp. |
16,756 | 4,019,094 | ||||||
Dollar Tree, Inc. (a) |
15,581 | 2,120,574 | ||||||
Domino’s Pizza, Inc. |
2,616 | 811,483 | ||||||
Genuine Parts Co. |
10,437 | 1,558,453 | ||||||
The Home Depot, Inc. |
75,878 | 20,937,775 | ||||||
Lowe’s Cos., Inc. |
47,183 | 8,861,439 | ||||||
McDonald’s Corp. |
54,332 | 12,536,566 | ||||||
O’Reilly Automotive, Inc. (a) |
4,706 | 3,309,965 | ||||||
Ross Stores, Inc. |
25,685 | 2,164,475 | ||||||
Starbucks Corp. |
84,701 | 7,136,906 | ||||||
Target Corp. |
34,225 | 5,078,648 | ||||||
The TJX Cos., Inc. |
86,275 | 5,359,403 | ||||||
Tractor Supply Co. |
8,155 | 1,515,852 | ||||||
Ulta Beauty, Inc. (a) |
3,856 | 1,546,989 | ||||||
Walgreens Boots Alliance, Inc. |
52,991 | 1,663,918 | ||||||
Walmart, Inc. |
105,233 | 13,648,720 | ||||||
Yum! Brands, Inc. |
21,048 | 2,238,244 | ||||||
| 120,220,085 | ||||||||
Toys, Games & Hobbies — 0.0% |
||||||||
Hasbro, Inc. |
9,628 | 649,120 | ||||||
| 222,590,353 | ||||||||
Consumer, Non-cyclical — 22.5% |
||||||||
Agriculture — 0.8% |
||||||||
Altria Group, Inc. |
133,044 | 5,372,317 | ||||||
Archer-Daniels-Midland Co. |
41,343 | 3,326,044 | ||||||
Philip Morris International, Inc. |
114,451 | 9,500,578 | ||||||
| 18,198,939 | ||||||||
Beverages — 1.9% |
||||||||
Brown-Forman Corp. Class B |
13,258 | 882,585 | ||||||
The Coca-Cola Co. |
287,261 | 16,092,361 | ||||||
Constellation Brands, Inc. Class A |
11,749 | 2,698,510 | ||||||
Keurig Dr Pepper, Inc. |
62,644 | 2,243,908 | ||||||
Molson Coors Beverage Co. Class B |
13,851 | 664,710 | ||||||
Monster Beverage Corp. (a) |
28,379 | 2,467,838 | ||||||
PepsiCo, Inc. |
101,813 | 16,621,990 | ||||||
| 41,671,902 | ||||||||
Biotechnology — 1.7% |
||||||||
Amgen, Inc. |
39,476 | 8,897,890 | ||||||
Bio-Rad Laboratories, Inc. Class A (a) |
1,588 | 662,418 | ||||||
Biogen, Inc. (a) |
10,704 | 2,857,968 | ||||||
Corteva, Inc. |
52,998 | 3,028,836 | ||||||
Gilead Sciences, Inc. |
92,585 | 5,711,569 | ||||||
Illumina, Inc. (a) |
11,626 | 2,218,125 | ||||||
The accompanying notes are an integral part of the financial statements.
126
MM S&P 500 Index Fund — Portfolio of Investments (Continued) |
Number of |
Value |
|||||||
Incyte Corp. (a) |
13,585 | $ | 905,304 | |||||
Moderna, Inc. (a) |
24,830 | 2,936,147 | ||||||
Regeneron Pharmaceuticals, Inc. (a) |
7,911 | 5,449,651 | ||||||
Vertex Pharmaceuticals, Inc. (a) |
18,921 | 5,478,386 | ||||||
| 38,146,294 | ||||||||
Commercial Services — 1.9% |
||||||||
Automatic Data Processing, Inc. |
30,722 | 6,949,009 | ||||||
Cintas Corp. |
6,356 | 2,467,336 | ||||||
CoStar Group, Inc. (a) |
29,183 | 2,032,596 | ||||||
Equifax, Inc. |
9,047 | 1,550,927 | ||||||
FleetCor Technologies, Inc. (a) |
5,523 | 972,987 | ||||||
Gartner, Inc. (a) |
5,834 | 1,614,209 | ||||||
Global Payments, Inc. |
20,437 | 2,208,218 | ||||||
MarketAxess Holdings, Inc. |
2,772 | 616,742 | ||||||
Moody’s Corp. |
11,655 | 2,833,447 | ||||||
Nielsen Holdings PLC |
27,026 | 749,161 | ||||||
PayPal Holdings, Inc. (a) |
85,225 | 7,335,316 | ||||||
Quanta Services, Inc. |
10,446 | 1,330,716 | ||||||
Robert Half International, Inc. |
8,143 | 622,939 | ||||||
Rollins, Inc. |
16,887 | 585,641 | ||||||
S&P Global, Inc. |
25,148 | 7,678,942 | ||||||
United Rentals, Inc. (a) |
5,154 | 1,392,198 | ||||||
Verisk Analytics, Inc. |
11,537 | 1,967,405 | ||||||
| 42,907,789 | ||||||||
Cosmetics & Personal Care — 1.4% |
||||||||
Colgate-Palmolive Co. |
61,376 | 4,311,664 | ||||||
The Estee Lauder Cos., Inc. Class A |
17,118 | 3,695,776 | ||||||
The Procter & Gamble Co. |
176,377 | 22,267,596 | ||||||
| 30,275,036 | ||||||||
Food — 1.2% |
||||||||
Campbell Soup Co. |
14,878 | 701,051 | ||||||
Conagra Brands, Inc. |
35,780 | 1,167,501 | ||||||
General Mills, Inc. |
43,824 | 3,357,357 | ||||||
The Hershey Co. |
10,897 | 2,402,462 | ||||||
Hormel Foods Corp. |
21,468 | 975,506 | ||||||
The J.M. Smucker Co. |
7,804 | 1,072,348 | ||||||
Kellogg Co. |
19,070 | 1,328,416 | ||||||
The Kraft Heinz Co. |
58,695 | 1,957,478 | ||||||
The Kroger Co. |
48,009 | 2,100,394 | ||||||
Lamb Weston Holdings, Inc. |
10,608 | 820,847 | ||||||
McCormick & Co., Inc. |
18,554 | 1,322,344 | ||||||
Mondelez International, Inc. Class A |
100,928 | 5,533,882 | ||||||
Sysco Corp. |
37,681 | 2,664,424 | ||||||
Tyson Foods, Inc. Class A |
21,522 | 1,418,945 | ||||||
| 26,822,955 | ||||||||
Health Care – Products — 3.8% |
||||||||
Abbott Laboratories |
129,303 | 12,511,358 | ||||||
ABIOMED, Inc. (a) |
3,356 | 824,435 | ||||||
Number of |
Value |
|||||||
Align Technology, Inc. (a) |
5,415 | $ | 1,121,501 | |||||
Baxter International, Inc. |
37,242 | 2,005,854 | ||||||
Bio-Techne Corp. |
2,903 | 824,452 | ||||||
Boston Scientific Corp. (a) |
105,707 | 4,094,032 | ||||||
The Cooper Cos., Inc. |
3,648 | 962,707 | ||||||
Danaher Corp. |
48,314 | 12,479,023 | ||||||
Edwards Lifesciences Corp. (a) |
45,727 | 3,778,422 | ||||||
Henry Schein, Inc. (a) |
10,144 | 667,171 | ||||||
Hologic, Inc. (a) |
18,398 | 1,187,039 | ||||||
IDEXX Laboratories, Inc. (a) |
6,136 | 1,999,109 | ||||||
Intuitive Surgical, Inc. (a) |
26,373 | 4,943,355 | ||||||
Medtronic PLC |
98,029 | 7,915,842 | ||||||
PerkinElmer, Inc. |
9,328 | 1,122,438 | ||||||
ResMed, Inc. |
10,814 | 2,360,696 | ||||||
Steris PLC |
7,414 | 1,232,800 | ||||||
Stryker Corp. |
24,830 | 5,029,068 | ||||||
Teleflex, Inc. |
3,452 | 695,440 | ||||||
Thermo Fisher Scientific, Inc. |
28,914 | 14,664,892 | ||||||
Waters Corp. (a) |
4,389 | 1,182,967 | ||||||
West Pharmaceutical Services, Inc. |
5,486 | 1,349,995 | ||||||
Zimmer Biomet Holdings, Inc. |
15,465 | 1,616,866 | ||||||
| 84,569,462 | ||||||||
Health Care – Services — 2.8% |
||||||||
Catalent, Inc. (a) |
13,242 | 958,191 | ||||||
Centene Corp. (a) |
42,159 | 3,280,392 | ||||||
Charles River Laboratories International, Inc. (a) |
3,805 | 748,824 | ||||||
DaVita, Inc. (a) |
4,074 | 337,205 | ||||||
Elevance Health, Inc. |
17,731 | 8,054,129 | ||||||
HCA Healthcare, Inc. |
15,876 | 2,917,850 | ||||||
Humana, Inc. |
9,357 | 4,539,923 | ||||||
IQVIA Holdings, Inc. (a) |
13,755 | 2,491,581 | ||||||
Laboratory Corp. of America Holdings |
6,643 | 1,360,553 | ||||||
Molina Healthcare, Inc. (a) |
4,275 | 1,410,066 | ||||||
Quest Diagnostics, Inc. |
8,668 | 1,063,477 | ||||||
UnitedHealth Group, Inc. |
69,060 | 34,878,062 | ||||||
Universal Health Services, Inc. Class B |
4,903 | 432,347 | ||||||
| 62,472,600 | ||||||||
Household Products & Wares — 0.3% |
||||||||
Avery Dennison Corp. |
6,014 | 978,478 | ||||||
Church & Dwight Co., Inc. |
17,934 | 1,281,205 | ||||||
The Clorox Co. |
9,132 | 1,172,457 | ||||||
Kimberly-Clark Corp. |
24,926 | 2,805,172 | ||||||
| 6,237,312 | ||||||||
Pharmaceuticals — 6.7% |
||||||||
AbbVie, Inc. |
130,503 | 17,514,808 | ||||||
AmerisourceBergen Corp. |
11,453 | 1,549,934 | ||||||
The accompanying notes are an integral part of the financial statements.
127
MM S&P 500 Index Fund — Portfolio of Investments (Continued) |
Number of |
Value |
|||||||
Becton Dickinson and Co. |
21,059 | $ | 4,692,577 | |||||
Bristol-Myers Squibb Co. |
157,607 | 11,204,282 | ||||||
Cardinal Health, Inc. |
20,146 | 1,343,335 | ||||||
Cigna Corp. |
22,506 | 6,244,740 | ||||||
CVS Health Corp. |
96,887 | 9,240,113 | ||||||
Dentsply Sirona, Inc. |
15,796 | 447,817 | ||||||
DexCom, Inc. (a) |
29,035 | 2,338,479 | ||||||
Eli Lilly & Co. |
58,217 | 18,824,467 | ||||||
Johnson & Johnson |
194,042 | 31,698,701 | ||||||
McKesson Corp. |
10,592 | 3,599,903 | ||||||
Merck & Co., Inc. |
187,001 | 16,104,526 | ||||||
Organon & Co. |
18,329 | 428,899 | ||||||
Pfizer, Inc. |
414,306 | 18,130,031 | ||||||
Viatris, Inc. |
89,558 | 763,034 | ||||||
Zoetis, Inc. |
34,574 | 5,126,978 | ||||||
| 149,252,624 | ||||||||
| 500,554,913 | ||||||||
Energy — 4.8% |
||||||||
Energy – Alternate Sources — 0.2% |
||||||||
Enphase Energy, Inc. (a) |
9,993 | 2,772,758 | ||||||
SolarEdge Technologies, Inc. (a) |
4,111 | 951,532 | ||||||
| 3,724,290 | ||||||||
Oil & Gas — 4.0% |
||||||||
APA Corp. |
24,104 | 824,116 | ||||||
Chevron Corp. |
132,945 | 19,100,208 | ||||||
ConocoPhillips |
94,017 | 9,621,700 | ||||||
Coterra Energy, Inc. |
58,714 | 1,533,610 | ||||||
Devon Energy Corp. |
48,338 | 2,906,564 | ||||||
Diamondback Energy, Inc. |
13,117 | 1,580,074 | ||||||
EOG Resources, Inc. |
43,289 | 4,836,680 | ||||||
EQT Corp. |
27,279 | 1,111,619 | ||||||
Exxon Mobil Corp. |
307,700 | 26,865,287 | ||||||
Hess Corp. |
20,480 | 2,232,115 | ||||||
Marathon Oil Corp. |
50,009 | 1,129,203 | ||||||
Marathon Petroleum Corp. |
36,776 | 3,652,960 | ||||||
Occidental Petroleum Corp. |
55,023 | 3,381,163 | ||||||
Phillips 66 |
35,589 | 2,872,744 | ||||||
Pioneer Natural Resources Co. |
17,622 | 3,815,692 | ||||||
Valero Energy Corp. |
29,072 | 3,106,343 | ||||||
| 88,570,078 | ||||||||
Oil & Gas Services — 0.3% |
||||||||
Baker Hughes Co. |
74,772 | 1,567,221 | ||||||
Halliburton Co. |
66,669 | 1,641,390 | ||||||
Schlumberger NV |
104,562 | 3,753,776 | ||||||
| 6,962,387 | ||||||||
Pipelines — 0.3% |
||||||||
Kinder Morgan, Inc. |
146,076 | 2,430,705 | ||||||
Number of |
Value |
|||||||
ONEOK, Inc. |
32,977 | $ | 1,689,741 | |||||
The Williams Cos., Inc. |
90,074 | 2,578,819 | ||||||
| 6,699,265 | ||||||||
| 105,956,020 | ||||||||
Financial — 14.9% |
||||||||
Banks — 4.6% |
||||||||
Bank of America Corp. |
516,075 | 15,585,465 | ||||||
The Bank of New York Mellon Corp. |
54,241 | 2,089,363 | ||||||
Citigroup, Inc. |
142,847 | 5,952,435 | ||||||
Citizens Financial Group, Inc. |
36,731 | 1,262,077 | ||||||
Comerica, Inc. |
9,664 | 687,110 | ||||||
Fifth Third Bancorp |
50,774 | 1,622,737 | ||||||
First Republic Bank |
13,453 | 1,756,289 | ||||||
The Goldman Sachs Group, Inc. |
25,183 | 7,379,878 | ||||||
Huntington Bancshares, Inc. |
106,850 | 1,408,283 | ||||||
JP Morgan Chase & Co. |
216,577 | 22,632,297 | ||||||
KeyCorp. |
68,697 | 1,100,526 | ||||||
M&T Bank Corp. |
12,929 | 2,279,641 | ||||||
Morgan Stanley |
98,845 | 7,809,744 | ||||||
Northern Trust Corp. |
15,437 | 1,320,790 | ||||||
The PNC Financial Services Group, Inc. |
30,373 | 4,538,334 | ||||||
Regions Financial Corp. |
68,967 | 1,384,168 | ||||||
Signature Bank |
4,649 | 701,999 | ||||||
State Street Corp. |
27,140 | 1,650,383 | ||||||
SVB Financial Group (a) |
4,354 | 1,461,986 | ||||||
Truist Financial Corp. |
97,758 | 4,256,383 | ||||||
US Bancorp |
99,815 | 4,024,541 | ||||||
Wells Fargo & Co. |
280,024 | 11,262,565 | ||||||
Zions Bancorp NA |
11,051 | 562,054 | ||||||
| 102,729,048 | ||||||||
Diversified Financial Services — 3.7% |
||||||||
American Express Co. |
44,284 | 5,974,354 | ||||||
Ameriprise Financial, Inc. |
7,979 | 2,010,309 | ||||||
BlackRock, Inc. |
11,131 | 6,125,167 | ||||||
Capital One Financial Corp. |
28,316 | 2,609,886 | ||||||
Cboe Global Markets, Inc. |
7,886 | 925,580 | ||||||
The Charles Schwab Corp. |
112,701 | 8,099,821 | ||||||
CME Group, Inc. |
26,458 | 4,686,505 | ||||||
Discover Financial Services |
20,138 | 1,830,947 | ||||||
Franklin Resources, Inc. |
20,802 | 447,659 | ||||||
Intercontinental Exchange, Inc. |
41,296 | 3,731,094 | ||||||
Invesco Ltd. |
33,387 | 457,402 | ||||||
Mastercard, Inc. Class A |
62,993 | 17,911,430 | ||||||
Nasdaq, Inc. |
24,977 | 1,415,696 | ||||||
Raymond James Financial, Inc. |
14,369 | 1,419,945 | ||||||
Synchrony Financial |
35,508 | 1,000,970 | ||||||
T. Rowe Price Group, Inc. |
16,588 | 1,741,906 | ||||||
The accompanying notes are an integral part of the financial statements.
128
MM S&P 500 Index Fund — Portfolio of Investments (Continued) |
Number of |
Value |
|||||||
Visa, Inc. Class A |
120,713 | $ | 21,444,664 | |||||
| 81,833,335 | ||||||||
Insurance — 3.8% |
||||||||
Aflac, Inc. |
42,395 | 2,382,599 | ||||||
The Allstate Corp. |
19,940 | 2,483,128 | ||||||
American International Group, Inc. |
56,038 | 2,660,684 | ||||||
Aon PLC Class A |
15,599 | 4,178,504 | ||||||
Arthur J Gallagher & Co. |
15,555 | 2,663,327 | ||||||
Assurant, Inc. |
3,984 | 578,756 | ||||||
Berkshire Hathaway, Inc. Class B (a) |
133,260 | 35,583,085 | ||||||
Brown & Brown, Inc. |
17,384 | 1,051,384 | ||||||
Chubb Ltd. |
30,830 | 5,607,361 | ||||||
Cincinnati Financial Corp. |
11,725 | 1,050,208 | ||||||
Everest Re Group Ltd. |
2,891 | 758,714 | ||||||
Globe Life, Inc. |
6,790 | 676,963 | ||||||
The Hartford Financial Services Group, Inc. |
23,808 | 1,474,668 | ||||||
Lincoln National Corp. |
11,351 | 498,423 | ||||||
Loews Corp. |
14,730 | 734,143 | ||||||
Marsh & McLennan Cos., Inc. |
36,831 | 5,498,500 | ||||||
MetLife, Inc. |
49,435 | 3,004,659 | ||||||
Principal Financial Group, Inc. |
17,045 | 1,229,797 | ||||||
The Progressive Corp. |
43,174 | 5,017,251 | ||||||
Prudential Financial, Inc. |
27,436 | 2,353,460 | ||||||
The Travelers Cos., Inc. |
17,507 | 2,682,072 | ||||||
W.R. Berkley Corp. |
15,019 | 969,927 | ||||||
Willis Towers Watson PLC |
8,110 | 1,629,623 | ||||||
| 84,767,236 | ||||||||
Real Estate — 0.1% |
||||||||
CBRE Group, Inc. Class A (a) |
23,698 | 1,599,852 | ||||||
Real Estate Investment Trusts (REITS) — 2.7% |
||||||||
Alexandria Real Estate Equities, Inc. |
10,996 | 1,541,529 | ||||||
American Tower Corp. |
34,368 | 7,378,810 | ||||||
AvalonBay Communities, Inc. |
10,340 | 1,904,525 | ||||||
Boston Properties, Inc. |
10,523 | 788,909 | ||||||
Camden Property Trust |
7,841 | 936,607 | ||||||
Crown Castle, Inc. |
31,960 | 4,619,818 | ||||||
Digital Realty Trust, Inc. |
21,282 | 2,110,749 | ||||||
Duke Realty Corp. |
28,439 | 1,370,760 | ||||||
Equinix, Inc. |
6,722 | 3,823,742 | ||||||
Equity Residential |
24,897 | 1,673,576 | ||||||
Essex Property Trust, Inc. |
4,822 | 1,168,033 | ||||||
Extra Space Storage, Inc. |
9,805 | 1,693,422 | ||||||
Federal Realty Investment Trust |
5,346 | 481,782 | ||||||
Healthpeak Properties, Inc. |
39,825 | 912,789 | ||||||
Host Hotels & Resorts, Inc. |
52,813 | 838,670 | ||||||
Invitation Homes, Inc. |
42,647 | 1,440,189 | ||||||
Iron Mountain, Inc. |
21,498 | 945,267 | ||||||
Number of |
Value |
|||||||
Kimco Realty Corp. |
45,915 | $ | 845,295 | |||||
Mid-America Apartment Communities, Inc. |
8,521 | 1,321,351 | ||||||
Prologis, Inc. |
54,642 | 5,551,627 | ||||||
Public Storage |
11,654 | 3,412,408 | ||||||
Realty Income Corp. |
45,442 | 2,644,724 | ||||||
Regency Centers Corp. |
11,440 | 616,044 | ||||||
SBA Communications Corp. |
7,978 | 2,270,938 | ||||||
Simon Property Group, Inc. |
24,040 | 2,157,590 | ||||||
UDR, Inc. |
22,305 | 930,342 | ||||||
Ventas, Inc. |
29,475 | 1,184,011 | ||||||
VICI Properties, Inc. |
71,250 | 2,126,813 | ||||||
Vornado Realty Trust |
11,626 | 269,258 | ||||||
Welltower, Inc. |
34,175 | 2,198,136 | ||||||
Weyerhaeuser Co. |
55,055 | 1,572,371 | ||||||
| 60,730,085 | ||||||||
| 331,659,556 | ||||||||
Industrial — 7.7% |
||||||||
Aerospace & Defense — 1.6% |
||||||||
The Boeing Co. (a) |
41,199 | 4,988,375 | ||||||
General Dynamics Corp. |
16,582 | 3,518,203 | ||||||
Howmet Aerospace, Inc. |
27,244 | 842,657 | ||||||
L3 Harris Technologies, Inc. |
14,108 | 2,932,066 | ||||||
Lockheed Martin Corp. |
17,413 | 6,726,468 | ||||||
Northrop Grumman Corp. |
10,732 | 5,047,474 | ||||||
Raytheon Technologies Corp. |
108,977 | 8,920,857 | ||||||
Teledyne Technologies, Inc. (a) |
3,453 | 1,165,284 | ||||||
TransDigm Group, Inc. |
3,792 | 1,990,117 | ||||||
| 36,131,501 | ||||||||
Building Materials — 0.4% |
||||||||
Carrier Global Corp. |
61,994 | 2,204,507 | ||||||
Fortune Brands Home & Security, Inc. |
9,781 | 525,142 | ||||||
Johnson Controls International PLC |
50,773 | 2,499,047 | ||||||
Martin Marietta Materials, Inc. |
4,637 | 1,493,531 | ||||||
Masco Corp. |
16,540 | 772,252 | ||||||
Mohawk Industries, Inc. (a) |
3,820 | 348,346 | ||||||
Vulcan Materials Co. |
9,842 | 1,552,182 | ||||||
| 9,395,007 | ||||||||
Electrical Components & Equipment — 0.3% |
||||||||
AMETEK, Inc. |
17,025 | 1,930,805 | ||||||
Emerson Electric Co. |
43,582 | 3,191,074 | ||||||
Generac Holdings, Inc. (a) |
4,704 | 837,971 | ||||||
| 5,959,850 | ||||||||
Electronics — 1.1% |
||||||||
Agilent Technologies, Inc. |
22,023 | 2,676,896 | ||||||
Allegion PLC |
6,580 | 590,094 | ||||||
Amphenol Corp. Class A |
44,136 | 2,955,346 | ||||||
Fortive Corp. |
26,152 | 1,524,662 | ||||||
The accompanying notes are an integral part of the financial statements.
129
MM S&P 500 Index Fund — Portfolio of Investments (Continued) |
Number of |
Value |
|||||||
Garmin Ltd. |
11,242 | $ | 902,845 | |||||
Honeywell International, Inc. |
49,713 | 8,300,580 | ||||||
Keysight Technologies, Inc. (a) |
13,204 | 2,077,781 | ||||||
Mettler-Toledo International, Inc. (a) |
1,657 | 1,796,387 | ||||||
TE Connectivity Ltd. |
23,541 | 2,597,985 | ||||||
Trimble, Inc. (a) |
18,124 | 983,589 | ||||||
| 24,406,165 | ||||||||
Engineering & Construction — 0.0% |
||||||||
Jacobs Solutions, Inc. |
9,343 | 1,013,622 | ||||||
Environmental Controls — 0.3% |
||||||||
Pentair PLC |
12,006 | 487,804 | ||||||
Republic Services, Inc. |
15,182 | 2,065,359 | ||||||
Waste Management, Inc. |
27,798 | 4,453,518 | ||||||
| 7,006,681 | ||||||||
Hand & Machine Tools — 0.1% |
||||||||
Snap-on, Inc. |
3,974 | 800,165 | ||||||
Stanley Black & Decker, Inc. |
10,867 | 817,307 | ||||||
| 1,617,472 | ||||||||
Machinery – Construction & Mining — 0.3% |
||||||||
Caterpillar, Inc. |
38,962 | 6,392,885 | ||||||
Machinery – Diversified — 0.8% |
||||||||
Deere & Co. |
20,528 | 6,854,094 | ||||||
Dover Corp. |
10,686 | 1,245,774 | ||||||
IDEX Corp. |
5,494 | 1,097,976 | ||||||
Ingersoll Rand, Inc. |
29,919 | 1,294,296 | ||||||
Nordson Corp. |
4,006 | 850,354 | ||||||
Otis Worldwide Corp. |
31,218 | 1,991,708 | ||||||
Rockwell Automation, Inc. |
8,500 | 1,828,435 | ||||||
Westinghouse Air Brake Technologies Corp. |
13,430 | 1,092,530 | ||||||
Xylem, Inc. |
13,431 | 1,173,332 | ||||||
| 17,428,499 | ||||||||
Miscellaneous - Manufacturing — 1.1% |
||||||||
3M Co. |
40,786 | 4,506,853 | ||||||
A.O. Smith Corp. |
9,584 | 465,591 | ||||||
Eaton Corp. PLC |
29,457 | 3,928,385 | ||||||
General Electric Co. |
80,884 | 5,007,528 | ||||||
Illinois Tool Works, Inc. |
20,769 | 3,751,920 | ||||||
Parker-Hannifin Corp. |
9,475 | 2,295,887 | ||||||
Textron, Inc. |
15,823 | 921,848 | ||||||
Trane Technologies PLC |
17,070 | 2,471,907 | ||||||
| 23,349,919 | ||||||||
Packaging & Containers — 0.2% |
||||||||
Amcor PLC |
110,715 | 1,187,972 | ||||||
Ball Corp. |
23,180 | 1,120,057 | ||||||
Packaging Corp. of America |
6,872 | 771,657 | ||||||
Sealed Air Corp. |
10,964 | 488,008 | ||||||
Number of |
Value |
|||||||
WestRock Co. |
18,379 | $ | 567,727 | |||||
| 4,135,421 | ||||||||
Shipbuilding — 0.0% |
||||||||
Huntington Ingalls Industries, Inc. |
2,945 | 652,318 | ||||||
Transportation — 1.5% |
||||||||
C.H. Robinson Worldwide, Inc. |
9,140 | 880,273 | ||||||
CSX Corp. |
158,095 | 4,211,651 | ||||||
Expeditors International of Washington, Inc. |
12,071 | 1,065,990 | ||||||
FedEx Corp. |
17,644 | 2,619,605 | ||||||
J.B. Hunt Transport Services, Inc. |
6,211 | 971,525 | ||||||
Norfolk Southern Corp. |
17,338 | 3,634,912 | ||||||
Old Dominion Freight Line, Inc. |
6,705 | 1,668,003 | ||||||
Union Pacific Corp. |
46,111 | 8,983,345 | ||||||
United Parcel Service, Inc. Class B |
54,038 | 8,729,298 | ||||||
| 32,764,602 | ||||||||
| 170,253,942 | ||||||||
Technology — 22.6% |
||||||||
Computers — 8.4% |
||||||||
Accenture PLC Class A |
46,673 | 12,008,963 | ||||||
Apple, Inc. |
1,115,110 | 154,108,202 | ||||||
Cognizant Technology Solutions Corp. Class A |
38,110 | 2,189,038 | ||||||
DXC Technology Co. (a) |
16,950 | 414,936 | ||||||
EPAM Systems, Inc. (a) |
4,230 | 1,532,064 | ||||||
Fortinet, Inc. (a) |
48,299 | 2,372,930 | ||||||
Hewlett Packard Enterprise Co. |
96,463 | 1,155,627 | ||||||
HP, Inc. |
67,022 | 1,670,188 | ||||||
International Business Machines Corp. |
66,674 | 7,921,538 | ||||||
Leidos Holdings, Inc. |
10,084 | 882,047 | ||||||
NetApp, Inc. |
16,076 | 994,300 | ||||||
Seagate Technology Holdings PLC |
14,594 | 776,839 | ||||||
Western Digital Corp. (a) |
23,127 | 752,784 | ||||||
| 186,779,456 | ||||||||
Office & Business Equipment — 0.0% |
||||||||
Zebra Technologies Corp. Class A (a) |
3,876 | 1,015,551 | ||||||
Semiconductors — 4.7% |
||||||||
Advanced Micro Devices, Inc. (a) |
119,236 | 7,554,793 | ||||||
Analog Devices, Inc. |
38,458 | 5,358,738 | ||||||
Applied Materials, Inc. |
64,180 | 5,258,268 | ||||||
Broadcom, Inc. |
29,806 | 13,234,162 | ||||||
Intel Corp. |
303,035 | 7,809,212 | ||||||
KLA Corp. |
10,461 | 3,165,813 | ||||||
Lam Research Corp. |
10,105 | 3,698,430 | ||||||
Microchip Technology, Inc. |
40,677 | 2,482,517 | ||||||
Micron Technology, Inc. |
81,403 | 4,078,290 | ||||||
Monolithic Power Systems, Inc. |
3,243 | 1,178,506 | ||||||
NVIDIA Corp. |
184,842 | 22,437,970 | ||||||
The accompanying notes are an integral part of the financial statements.
130
MM S&P 500 Index Fund — Portfolio of Investments (Continued) |
Number of |
Value |
|||||||
NXP Semiconductor NV |
19,426 | $ | 2,865,529 | |||||
ON Semiconductor Corp. (a) |
32,139 | 2,003,224 | ||||||
Qorvo, Inc. (a) |
7,556 | 600,022 | ||||||
QUALCOMM, Inc. |
82,895 | 9,365,477 | ||||||
Skyworks Solutions, Inc. |
11,875 | 1,012,581 | ||||||
Teradyne, Inc. |
11,534 | 866,780 | ||||||
Texas Instruments, Inc. |
67,446 | 10,439,292 | ||||||
| 103,409,604 | ||||||||
Software — 9.5% |
||||||||
Activision Blizzard, Inc. |
52,536 | 3,905,526 | ||||||
Adobe, Inc. (a) |
34,544 | 9,506,509 | ||||||
Akamai Technologies, Inc. (a) |
11,622 | 933,479 | ||||||
ANSYS, Inc. (a) |
6,470 | 1,434,399 | ||||||
Autodesk, Inc. (a) |
15,973 | 2,983,756 | ||||||
Broadridge Financial Solutions, Inc. |
8,664 | 1,250,389 | ||||||
Cadence Design Systems, Inc. (a) |
20,198 | 3,300,959 | ||||||
Ceridian HCM Holding, Inc. (a) |
11,217 | 626,806 | ||||||
Citrix Systems, Inc. (c) |
9,075 | 942,893 | ||||||
Electronic Arts, Inc. |
19,481 | 2,254,147 | ||||||
Fidelity National Information Services, Inc. |
44,857 | 3,389,844 | ||||||
Fiserv, Inc. (a) |
47,192 | 4,415,755 | ||||||
Intuit, Inc. |
20,804 | 8,057,805 | ||||||
Jack Henry & Associates, Inc. |
5,408 | 985,716 | ||||||
Microsoft Corp. |
550,564 | 128,226,356 | ||||||
MSCI, Inc. |
5,941 | 2,505,854 | ||||||
Oracle Corp. |
112,121 | 6,847,229 | ||||||
Paychex, Inc. |
23,762 | 2,666,334 | ||||||
Paycom Software, Inc. (a) |
3,581 | 1,181,694 | ||||||
PTC, Inc. (a) |
7,816 | 817,554 | ||||||
Roper Technologies, Inc. |
7,825 | 2,814,183 | ||||||
Salesforce, Inc. (a) |
73,439 | 10,563,466 | ||||||
ServiceNow, Inc. (a) |
14,902 | 5,627,144 | ||||||
Synopsys, Inc. (a) |
11,326 | 3,460,206 | ||||||
Take-Two Interactive Software, Inc. (a) |
11,689 | 1,274,101 | ||||||
Tyler Technologies, Inc. (a) |
3,099 | 1,076,903 | ||||||
| 211,049,007 | ||||||||
| 502,253,618 | ||||||||
Utilities — 3.2% |
||||||||
Electric — 3.0% |
||||||||
The AES Corp. |
49,449 | 1,117,547 | ||||||
Alliant Energy Corp. |
18,565 | 983,759 | ||||||
Ameren Corp. |
19,044 | 1,533,994 | ||||||
American Electric Power Co., Inc. |
37,918 | 3,278,011 | ||||||
CenterPoint Energy, Inc. |
46,745 | 1,317,274 | ||||||
CMS Energy Corp. |
21,361 | 1,244,065 | ||||||
Consolidated Edison, Inc. |
26,195 | 2,246,483 | ||||||
Number of |
Value |
|||||||
Constellation Energy Corp. |
24,183 | $ | 2,011,784 | |||||
Dominion Energy, Inc. |
61,389 | 4,242,594 | ||||||
DTE Energy Co. |
14,332 | 1,648,897 | ||||||
Duke Energy Corp. |
56,888 | 5,291,722 | ||||||
Edison International |
28,183 | 1,594,594 | ||||||
Entergy Corp. |
15,015 | 1,510,959 | ||||||
Evergy, Inc. |
16,853 | 1,001,068 | ||||||
Eversource Energy |
25,506 | 1,988,448 | ||||||
Exelon Corp. |
73,213 | 2,742,559 | ||||||
FirstEnergy Corp. |
39,857 | 1,474,709 | ||||||
NextEra Energy, Inc. |
145,105 | 11,377,683 | ||||||
NRG Energy, Inc. |
17,236 | 659,622 | ||||||
PG&E Corp. (a) |
118,773 | 1,484,663 | ||||||
Pinnacle West Capital Corp. |
8,424 | 543,432 | ||||||
PPL Corp. |
54,422 | 1,379,598 | ||||||
Public Service Enterprise Group, Inc. |
36,945 | 2,077,417 | ||||||
Sempra Energy |
23,266 | 3,488,504 | ||||||
The Southern Co. |
78,433 | 5,333,444 | ||||||
WEC Energy Group, Inc. |
23,338 | 2,087,117 | ||||||
Xcel Energy, Inc. |
40,309 | 2,579,776 | ||||||
| 66,239,723 | ||||||||
Gas — 0.1% |
||||||||
Atmos Energy Corp. |
10,292 | 1,048,240 | ||||||
NiSource, Inc. |
29,702 | 748,194 | ||||||
| 1,796,434 | ||||||||
Water — 0.1% |
||||||||
American Water Works Co., Inc. |
13,431 | 1,748,179 | ||||||
| 69,784,336 | ||||||||
TOTAL COMMON STOCK (Cost $1,441,265,714) |
2,225,965,672 | |||||||
TOTAL EQUITIES (Cost $1,441,265,714) |
2,225,965,672 | |||||||
TOTAL LONG-TERM INVESTMENTS (Cost $1,441,265,714) |
2,225,965,672 | |||||||
The accompanying notes are an integral part of the financial statements.
131
MM S&P 500 Index Fund — Portfolio of Investments (Continued) |
Principal |
Value |
|||||||
SHORT-TERM INVESTMENTS — 0.8% |
||||||||
Repurchase Agreement — 0.5% |
||||||||
Fixed Income Clearing Corp., Repurchase Agreement, dated 9/30/22, 0.830%, due 10/03/22 (d) |
$ | 11,486,546 | $ | 11,486,546 | ||||
U.S. Treasury Bill — 0.3% |
||||||||
U.S. Treasury Bill |
||||||||
1.859% 11/25/22 (e) (f) |
7,365,000 | 7,334,468 | ||||||
TOTAL SHORT-TERM INVESTMENTS (Cost $18,831,067) |
18,821,014 | |||||||
TOTAL INVESTMENTS — 101.0% (Cost $1,460,096,781) (g) |
2,244,786,686 | |||||||
Other Assets/(Liabilities) — (1.0)% |
(22,553,589 | ) | ||||||
NET ASSETS — 100.0% |
$ | 2,222,233,097 | ||||||
Notes to Portfolio of Investments
Percentages are stated as a percent of net assets.
|
(a) |
Non-income producing security. |
|
(b) |
Denotes all or a portion of security on loan. The total value of securities on loan as of September 30, 2022, was $875,955 or 0.04% of net assets. The Fund received $897,606 of non-cash collateral (U.S. Treasury and/or Agency obligations) related to securities lending activity. This amount is not reflected on either the Portfolio of Investments or the Statement of Assets and Liabilities. (Note 2). |
|
(c) |
This security is fair valued in good faith in accordance with procedures approved by the Board of Trustees. At September 30, 2022, these securities amounted to a value of $942,893 or 0.04% of net assets. |
|
(d) |
Maturity value of $11,487,340. Collateralized by U.S. Government Agency obligations with a rate of 0.000%, maturity date of 3/30/23, and an aggregate market value, including accrued interest, of $11,716,341. |
|
(e) |
All or a portion of this security is pledged/held as collateral for open derivatives. (Note 2). |
|
(f) |
The rate shown represents yield-to-maturity. |
|
(g) |
See Note 6 for aggregate cost for federal tax purposes. |
Futures contracts
|
Expiration |
Number of |
Notional |
Value/ Net |
||||||||||||
Long |
||||||||||||||||
S&P 500 E Mini Index |
12/16/22 | 101 | $ | 20,346,467 | $ | (2,158,892 | ) | |||||||||
The accompanying notes are an integral part of the financial statements.
132
MassMutual Equity Opportunities Fund — Portfolio of Investments |
September 30, 2022 |
Number of |
Value |
|||||||
EQUITIES — 98.4% |
||||||||
COMMON STOCK — 97.6% |
||||||||
Basic Materials — 7.5% |
||||||||
Chemicals — 7.0% |
||||||||
CF Industries Holdings, Inc. |
52,300 | $ | 5,033,875 | |||||
Ecolab, Inc. |
118,307 | 17,085,897 | ||||||
Linde PLC |
61,867 | 16,678,724 | ||||||
| 38,798,496 | ||||||||
Forest Products & Paper — 0.5% |
||||||||
International Paper Co. |
97,600 | 3,093,920 | ||||||
| 41,892,416 | ||||||||
Communications — 1.3% |
||||||||
Media — 1.3% |
||||||||
Comcast Corp. Class A |
74,200 | 2,176,286 | ||||||
News Corp. Class A |
177,400 | 2,680,514 | ||||||
The Walt Disney Co. (a) |
28,300 | 2,669,539 | ||||||
| 7,526,339 | ||||||||
Consumer, Cyclical — 10.9% |
||||||||
Apparel — 3.3% |
||||||||
NIKE, Inc. Class B |
216,548 | 17,999,470 | ||||||
Lodging — 0.4% |
||||||||
Las Vegas Sands Corp. (a) |
62,400 | 2,341,248 | ||||||
Retail — 7.2% |
||||||||
McDonald’s Corp. |
65,917 | 15,209,688 | ||||||
The TJX Cos., Inc. |
400,732 | 24,893,472 | ||||||
| 40,103,160 | ||||||||
| 60,443,878 | ||||||||
Consumer, Non-cyclical — 34.1% |
||||||||
Agriculture — 0.5% |
||||||||
Philip Morris International, Inc. |
34,900 | 2,897,049 | ||||||
Beverages — 4.9% |
||||||||
The Coca-Cola Co. |
144,025 | 8,068,280 | ||||||
PepsiCo, Inc. |
117,029 | 19,106,155 | ||||||
| 27,174,435 | ||||||||
Cosmetics & Personal Care — 6.0% |
||||||||
Colgate-Palmolive Co. |
254,343 | 17,867,596 | ||||||
The Procter & Gamble Co. |
125,375 | 15,828,594 | ||||||
| 33,696,190 | ||||||||
Food — 1.0% |
||||||||
Conagra Brands, Inc. |
106,800 | 3,484,884 | ||||||
Tyson Foods, Inc. Class A |
33,900 | 2,235,027 | ||||||
| 5,719,911 | ||||||||
Health Care – Products — 10.6% |
||||||||
Baxter International, Inc. |
172,687 | 9,300,922 | ||||||
Danaher Corp. |
75,534 | 19,509,677 | ||||||
Medtronic PLC |
174,467 | 14,088,210 | ||||||
Number of |
Value |
|||||||
Stryker Corp. |
78,413 | $ | 15,881,769 | |||||
| 58,780,578 | ||||||||
Health Care – Services — 5.2% |
||||||||
Elevance Health, Inc. |
14,650 | 6,654,616 | ||||||
UnitedHealth Group, Inc. |
43,932 | 22,187,417 | ||||||
| 28,842,033 | ||||||||
Household Products & Wares — 0.6% |
||||||||
Kimberly-Clark Corp. |
30,200 | 3,398,708 | ||||||
Pharmaceuticals — 5.3% |
||||||||
AbbVie, Inc. |
26,600 | 3,569,986 | ||||||
Becton Dickinson and Co. |
21,100 | 4,701,713 | ||||||
CVS Health Corp. |
27,600 | 2,632,212 | ||||||
Johnson & Johnson |
86,806 | 14,180,628 | ||||||
Pfizer, Inc. |
31,800 | 1,391,568 | ||||||
Sanofi ADR |
74,100 | 2,817,282 | ||||||
| 29,293,389 | ||||||||
| 189,802,293 | ||||||||
Energy — 2.4% |
||||||||
Oil & Gas — 1.8% |
||||||||
EOG Resources, Inc. |
18,600 | 2,078,178 | ||||||
TotalEnergies SE |
138,800 | 6,533,305 | ||||||
TotalEnergies SE Sponsored ADR |
37,900 | 1,763,108 | ||||||
| 10,374,591 | ||||||||
Pipelines — 0.6% |
||||||||
TC Energy Corp. |
80,400 | 3,239,316 | ||||||
| 13,613,907 | ||||||||
Financial — 19.9% |
||||||||
Banks — 3.3% |
||||||||
Fifth Third Bancorp |
75,100 | 2,400,196 | ||||||
The Goldman Sachs Group, Inc. |
10,400 | 3,047,720 | ||||||
Huntington Bancshares, Inc. |
247,600 | 3,263,368 | ||||||
State Street Corp. |
33,000 | 2,006,730 | ||||||
Wells Fargo & Co. |
190,000 | 7,641,800 | ||||||
| 18,359,814 | ||||||||
Diversified Financial Services — 5.5% |
||||||||
American Express Co. |
93,372 | 12,596,817 | ||||||
Visa, Inc. Class A |
101,856 | 18,094,718 | ||||||
| 30,691,535 | ||||||||
Insurance — 8.6% |
||||||||
American International Group, Inc. |
101,000 | 4,795,480 | ||||||
Chubb Ltd. |
120,000 | 21,825,600 | ||||||
Equitable Holdings, Inc. |
109,800 | 2,893,230 | ||||||
Marsh & McLennan Cos., Inc. |
121,758 | 18,177,252 | ||||||
| 47,691,562 | ||||||||
Real Estate Investment Trusts (REITS) — 2.5% |
||||||||
American Tower Corp. |
33,223 | 7,132,978 | ||||||
The accompanying notes are an integral part of the financial statements.
133
MassMutual Equity Opportunities Fund — Portfolio of Investments (Continued) |
Number of |
Value |
|||||||
Equity Residential |
57,900 | $ | 3,892,038 | |||||
Weyerhaeuser Co. |
102,400 | 2,924,544 | ||||||
| 13,949,560 | ||||||||
| 110,692,471 | ||||||||
Industrial — 12.4% |
||||||||
Aerospace & Defense — 4.9% |
||||||||
The Boeing Co. (a) |
11,700 | 1,416,636 | ||||||
L3 Harris Technologies, Inc. |
21,900 | 4,551,477 | ||||||
Lockheed Martin Corp. |
10,551 | 4,075,746 | ||||||
Northrop Grumman Corp. |
36,337 | 17,090,018 | ||||||
| 27,133,877 | ||||||||
Electronics — 3.3% |
||||||||
Honeywell International, Inc. |
111,039 | 18,540,181 | ||||||
Miscellaneous - Manufacturing — 1.2% |
||||||||
General Electric Co. |
107,200 | 6,636,752 | ||||||
Transportation — 3.0% |
||||||||
Union Pacific Corp. |
59,482 | 11,588,283 | ||||||
United Parcel Service, Inc. Class B |
30,700 | 4,959,278 | ||||||
| 16,547,561 | ||||||||
| 68,858,371 | ||||||||
Technology — 6.6% |
||||||||
Computers — 2.5% |
||||||||
Accenture PLC Class A |
54,967 | 14,143,009 | ||||||
Semiconductors — 1.1% |
||||||||
QUALCOMM, Inc. |
51,700 | 5,841,066 | ||||||
Software — 3.0% |
||||||||
Microsoft Corp. |
71,129 | 16,565,944 | ||||||
| 36,550,019 | ||||||||
Utilities — 2.5% |
||||||||
Electric — 2.5% |
||||||||
Sempra Energy |
43,800 | 6,567,372 | ||||||
The Southern Co. |
107,200 | 7,289,600 | ||||||
| 13,856,972 | ||||||||
TOTAL COMMON STOCK (Cost $521,725,154) |
543,236,666 | |||||||
PREFERRED STOCK — 0.8% |
||||||||
Consumer, Cyclical — 0.7% |
||||||||
Auto Manufacturers — 0.7% |
||||||||
Dr Ing hc F Porsche AG (a) |
14,292 | 1,155,567 | ||||||
Volkswagen AG 6.014% |
19,400 | 2,396,266 | ||||||
| 3,551,833 | ||||||||
Number of |
Value |
|||||||
Consumer, Non-cyclical — 0.1% |
||||||||
Pharmaceuticals — 0.1% |
||||||||
Becton Dickinson and Co. Convertible 6.000% |
14,700 | $ | 692,958 | |||||
TOTAL PREFERRED STOCK (Cost $5,980,277) |
4,244,791 | |||||||
TOTAL EQUITIES (Cost $527,705,431) |
547,481,457 | |||||||
TOTAL LONG-TERM INVESTMENTS (Cost $527,705,431) |
547,481,457 | |||||||
|
||||||||
SHORT-TERM INVESTMENTS — 1.6% |
||||||||
Mutual Fund — 0.0% |
||||||||
T. Rowe Price Government Reserve Investment Fund |
158 | 158 | ||||||
Principal |
||||||||
Repurchase Agreement — 1.6% |
||||||||
Fixed Income Clearing Corp., Repurchase Agreement, dated 9/30/22, 0.830%, due 10/03/22 (b) |
$ | 9,104,118 | 9,104,118 | |||||
TOTAL SHORT-TERM INVESTMENTS (Cost $9,104,276) |
9,104,276 | |||||||
TOTAL INVESTMENTS — 100.0% (Cost $536,809,707) (c) |
556,585,733 | |||||||
Other Assets/(Liabilities) — 0.0% |
253,025 | |||||||
NET ASSETS — 100.0% |
$ | 556,838,758 | ||||||
Abbreviation Legend
|
ADR |
American Depositary Receipt |
Notes to Portfolio of Investments
Percentages are stated as a percent of net assets.
|
(a) |
Non-income producing security. |
|
(b) |
Maturity value of $9,104,748. Collateralized by U.S. Government Agency obligations with a rate of 0.000%, maturity date of 3/30/23, and an aggregate market value, including accrued interest, of $9,286,310. |
|
(c) |
See Note 6 for aggregate cost for federal tax purposes. |
The accompanying notes are an integral part of the financial statements.
134
MassMutual Equity Opportunities Fund — Portfolio of Investments (Continued) |
Country weightings, as a percentage of net assets, is as follows:
United States |
83.2 | % | ||
Ireland |
8.1 | % | ||
Switzerland |
3.9 | % | ||
France |
2.0 | % | ||
Germany |
0.6 | % | ||
Canada |
0.6 | % | ||
Total Long-Term Investments |
98.4 | % | ||
Short-Term Investments and Other Assets and Liabilities |
1.6 | % | ||
Net Assets |
100.0 | % |
The accompanying notes are an integral part of the financial statements.
135
MassMutual Fundamental Growth Fund — Portfolio of Investments |
September 30, 2022 |
Number of |
Value |
|||||||
EQUITIES — 98.9% |
||||||||
COMMON STOCK — 98.9% |
||||||||
Basic Materials — 0.6% |
||||||||
Chemicals — 0.6% |
||||||||
Celanese Corp. |
1,790 | $ | 161,709 | |||||
Communications — 10.2% |
||||||||
Internet — 8.7% |
||||||||
CDW Corp. |
4,314 | 673,329 | ||||||
Etsy, Inc. (a) |
5,620 | 562,731 | ||||||
Match Group, Inc. (a) |
8,378 | 400,049 | ||||||
Palo Alto Networks, Inc. (a) |
3,753 | 614,704 | ||||||
| 2,250,813 | ||||||||
Telecommunications — 1.5% |
||||||||
Ciena Corp. (a) |
3,990 | 161,315 | ||||||
Nice Ltd. Sponsored ADR (a) (b) |
1,270 | 239,065 | ||||||
| 400,380 | ||||||||
| 2,651,193 | ||||||||
Consumer, Cyclical — 16.5% |
||||||||
Apparel — 0.8% |
||||||||
Tapestry, Inc. |
7,110 | 202,137 | ||||||
Auto Parts & Equipment — 0.5% |
||||||||
Aptiv PLC (a) |
1,740 | 136,085 | ||||||
Distribution & Wholesale — 2.5% |
||||||||
Copart, Inc. (a) |
2,530 | 269,192 | ||||||
WESCO International, Inc. (a) |
3,250 | 387,985 | ||||||
| 657,177 | ||||||||
Entertainment — 1.5% |
||||||||
Live Nation Entertainment, Inc. (a) |
2,910 | 221,276 | ||||||
Vail Resorts, Inc. |
810 | 174,669 | ||||||
| 395,945 | ||||||||
Lodging — 3.3% |
||||||||
Hilton Worldwide Holdings, Inc. |
7,150 | 862,433 | ||||||
Retail — 7.9% |
||||||||
Chipotle Mexican Grill, Inc. (a) |
220 | 330,608 | ||||||
Freshpet, Inc. (a) (b) |
7,591 | 380,233 | ||||||
Lululemon Athletica, Inc. (a) |
2,643 | 738,877 | ||||||
Wingstop, Inc. |
4,688 | 587,969 | ||||||
| 2,037,687 | ||||||||
| 4,291,464 | ||||||||
Consumer, Non-cyclical — 25.8% |
||||||||
Biotechnology — 2.4% |
||||||||
Sarepta Therapeutics, Inc. (a) |
1,180 | 130,437 | ||||||
Seagen, Inc. (a) |
3,535 | 483,694 | ||||||
| 614,131 | ||||||||
Commercial Services — 9.7% |
||||||||
CoStar Group, Inc. (a) |
2,910 | 202,681 | ||||||
Number of |
Value |
|||||||
FTI Consulting, Inc. (a) |
850 | $ | 140,854 | |||||
Gartner, Inc. (a) |
3,439 | 951,537 | ||||||
Global Payments, Inc. |
2,290 | 247,434 | ||||||
Shift4 Payments, Inc. Class A (a) |
11,507 | 513,327 | ||||||
TransUnion |
7,838 | 466,283 | ||||||
| 2,522,116 | ||||||||
Health Care – Products — 6.1% |
||||||||
Align Technology, Inc. (a) |
1,575 | 326,198 | ||||||
Avantor, Inc. (a) |
8,590 | 168,364 | ||||||
The Cooper Cos., Inc. |
755 | 199,245 | ||||||
IDEXX Laboratories, Inc. (a) |
773 | 251,843 | ||||||
Insulet Corp. (a) |
750 | 172,050 | ||||||
Omnicell, Inc. (a) |
5,214 | 453,775 | ||||||
| 1,571,475 | ||||||||
Health Care – Services — 5.1% |
||||||||
ICON PLC (a) |
6,235 | 1,145,868 | ||||||
Quest Diagnostics, Inc. |
1,550 | 190,170 | ||||||
| 1,336,038 | ||||||||
Pharmaceuticals — 2.5% |
||||||||
Ascendis Pharma A/S ADR (a) |
2,780 | 287,063 | ||||||
DexCom, Inc. (a) |
4,580 | 368,873 | ||||||
| 655,936 | ||||||||
| 6,699,696 | ||||||||
Energy — 2.1% |
||||||||
Oil & Gas — 1.5% |
||||||||
Devon Energy Corp. |
6,560 | 394,453 | ||||||
Pipelines — 0.6% |
||||||||
Cheniere Energy, Inc. |
828 | 137,373 | ||||||
| 531,826 | ||||||||
Financial — 9.4% |
||||||||
Banks — 0.8% |
||||||||
First Republic Bank |
1,570 | 204,964 | ||||||
Diversified Financial Services — 3.8% |
||||||||
Hamilton Lane, Inc. Class A |
9,076 | 541,020 | ||||||
LPL Financial Holdings, Inc. |
1,280 | 279,655 | ||||||
Tradeweb Markets, Inc. Class A |
3,050 | 172,081 | ||||||
| 992,756 | ||||||||
Insurance — 1.0% |
||||||||
Arthur J Gallagher & Co. |
1,460 | 249,981 | ||||||
Private Equity — 2.1% |
||||||||
Ares Management Corp. Class A |
8,800 | 545,160 | ||||||
Real Estate Investment Trusts (REITS) — 1.7% |
||||||||
Essex Property Trust, Inc. |
1,190 | 288,254 | ||||||
Lamar Advertising Co. Class A |
2,040 | 168,279 | ||||||
| 456,533 | ||||||||
| 2,449,394 | ||||||||
The accompanying notes are an integral part of the financial statements.
136
MassMutual Fundamental Growth Fund — Portfolio of Investments (Continued) |
Number of |
Value |
|||||||
Industrial — 12.3% |
||||||||
Aerospace & Defense — 3.8% |
||||||||
Hexcel Corp. |
9,324 | $ | 482,237 | |||||
Teledyne Technologies, Inc. (a) |
615 | 207,544 | ||||||
TransDigm Group, Inc. |
564 | 295,999 | ||||||
| 985,780 | ||||||||
Electrical Components & Equipment — 0.9% |
||||||||
AMETEK, Inc. |
2,050 | 232,490 | ||||||
Electronics — 2.8% |
||||||||
Agilent Technologies, Inc. |
6,020 | 731,731 | ||||||
Environmental Controls — 0.8% |
||||||||
Waste Connections, Inc. |
1,660 | 224,316 | ||||||
Machinery – Construction & Mining — 2.0% |
||||||||
BWX Technologies, Inc. |
10,206 | 514,076 | ||||||
Machinery – Diversified — 2.0% |
||||||||
IDEX Corp. |
1,150 | 229,828 | ||||||
Rockwell Automation, Inc. |
1,355 | 291,474 | ||||||
| 521,302 | ||||||||
| 3,209,695 | ||||||||
Technology — 22.0% |
||||||||
Computers — 5.8% |
||||||||
Fortinet, Inc. (a) |
8,700 | 427,431 | ||||||
Genpact Ltd. |
3,630 | 158,885 | ||||||
NetApp, Inc. |
3,450 | 213,383 | ||||||
Varonis Systems, Inc. (a) |
16,737 | 443,865 | ||||||
Zscaler, Inc. (a) |
1,640 | 269,567 | ||||||
| 1,513,131 | ||||||||
Semiconductors — 3.8% |
||||||||
Marvell Technology, Inc. |
4,640 | 199,102 | ||||||
Microchip Technology, Inc. |
4,320 | 263,650 | ||||||
ON Semiconductor Corp. (a) |
4,474 | 278,864 | ||||||
Synaptics, Inc. (a) |
2,575 | 254,951 | ||||||
| 996,567 | ||||||||
Software — 12.4% |
||||||||
Ceridian HCM Holding, Inc. (a) |
15,292 | 854,517 | ||||||
Electronic Arts, Inc. |
4,968 | 574,847 | ||||||
HubSpot, Inc. (a) |
539 | 145,595 | ||||||
Lightspeed Commerce, Inc. (a) (b) |
7,100 | 124,818 | ||||||
MongoDB, Inc. (a) |
2,467 | 489,847 | ||||||
MSCI, Inc. |
625 | 263,619 | ||||||
Splunk, Inc. (a) |
130 | 9,776 | ||||||
Number of |
Value |
|||||||
ZoomInfo Technologies, Inc. (a) |
17,980 | $ | 749,047 | |||||
| 3,212,066 | ||||||||
| 5,721,764 | ||||||||
TOTAL COMMON STOCK (Cost $31,181,141) |
25,716,741 | |||||||
TOTAL EQUITIES (Cost $31,181,141) |
25,716,741 | |||||||
MUTUAL FUNDS — 0.4% |
||||||||
Diversified Financial Services — 0.4% |
||||||||
State Street Navigator Securities Lending Government Money Market Portfolio (c) |
94,068 | 94,068 | ||||||
TOTAL MUTUAL FUNDS (Cost $94,068) |
94,068 | |||||||
TOTAL LONG-TERM INVESTMENTS (Cost $31,275,209) |
25,810,809 | |||||||
Principal |
||||||||
SHORT-TERM INVESTMENTS — 1.0% |
||||||||
Repurchase Agreement — 1.0% |
||||||||
Fixed Income Clearing Corp., Repurchase Agreement, dated 9/30/22, 0.830%, due 10/03/22 (d) |
$ | 256,360 | 256,360 | |||||
TOTAL SHORT-TERM INVESTMENTS (Cost $256,360) |
256,360 | |||||||
TOTAL INVESTMENTS — 100.3% (Cost $31,531,569) (e) |
26,067,169 | |||||||
Other Assets/(Liabilities) — (0.3)% |
(65,528 | ) | ||||||
NET ASSETS — 100.0% |
$ | 26,001,641 | ||||||
Abbreviation Legend
|
ADR |
American Depositary Receipt |
The accompanying notes are an integral part of the financial statements.
137
MassMutual Fundamental Growth Fund — Portfolio of Investments (Continued) |
Notes to Portfolio of Investments
Percentages are stated as a percent of net assets.
|
(a) |
Non-income producing security. |
|
(b) |
Denotes all or a portion of security on loan. The total value of securities on loan as of September 30, 2022, was $637,254 or 2.45% of net assets. The Fund received $559,462 of non-cash collateral (U.S. Treasury and/or Agency obligations) related to securities lending activity. This amount is not reflected on either the Portfolio of Investments or the Statement of Assets and Liabilities. (Note 2). |
|
(c) |
Represents investment of security lending cash collateral. (Note 2). |
|
(d) |
Maturity value of $256,377. Collateralized by U.S. Government Agency obligations with rates ranging from 0.000% - 3.500%, maturity dates ranging from 3/30/23 - 9/15/25, and an aggregate market value, including accrued interest, of $261,602. |
|
(e) |
See Note 6 for aggregate cost for federal tax purposes. |
The accompanying notes are an integral part of the financial statements.
138
September 30, 2022 |
Number of |
Value |
|||||||
EQUITIES — 99.5% |
||||||||
COMMON STOCK — 99.4% |
||||||||
Basic Materials — 0.5% |
||||||||
Chemicals — 0.5% |
||||||||
Linde PLC |
24,403 | $ | 6,578,806 | |||||
The Sherwin-Williams Co. |
27,032 | 5,534,801 | ||||||
| 12,113,607 | ||||||||
Communications — 29.0% |
||||||||
Internet — 26.1% |
||||||||
Alibaba Group Holding Ltd. Sponsored ADR (a) |
177,882 | 14,228,781 | ||||||
Alphabet, Inc. Class A (a) |
716,367 | 68,520,503 | ||||||
Alphabet, Inc. Class C (a) |
1,731,058 | 166,441,227 | ||||||
Amazon.com, Inc. (a) |
1,983,827 | 224,172,452 | ||||||
Booking Holdings, Inc. (a) |
4,633 | 7,612,992 | ||||||
DoorDash, Inc., Class A (a) |
60,019 | 2,967,940 | ||||||
Meta Platforms, Inc. Class A (a) |
659,173 | 89,436,593 | ||||||
Netflix, Inc. (a) |
225,441 | 53,077,829 | ||||||
Opendoor Technologies, Inc. (a) |
335,690 | 1,043,996 | ||||||
Sea Ltd. ADR (a) (b) |
170,153 | 9,537,076 | ||||||
Shopify, Inc. Class A (a) |
713,379 | 19,218,430 | ||||||
Spotify Technology SA (a) |
21,355 | 1,842,936 | ||||||
Tencent Holdings Ltd. |
142,100 | 4,799,001 | ||||||
| 662,899,756 | ||||||||
Media — 2.6% |
||||||||
FactSet Research Systems, Inc. |
62,290 | 24,922,852 | ||||||
The Walt Disney Co. (a) |
430,076 | 40,569,069 | ||||||
| 65,491,921 | ||||||||
Telecommunications — 0.3% |
||||||||
T-Mobile US, Inc. (a) |
51,897 | 6,963,020 | ||||||
| 735,354,697 | ||||||||
Consumer, Cyclical — 9.4% |
||||||||
Apparel — 0.4% |
||||||||
NIKE, Inc. Class B |
109,534 | 9,104,466 | ||||||
Auto Manufacturers — 4.6% |
||||||||
Tesla, Inc. (a) |
436,616 | 115,812,394 | ||||||
Retail — 4.4% |
||||||||
Carvana Co. (a) (b) |
125,871 | 2,555,181 | ||||||
Chipotle Mexican Grill, Inc. (a) |
9,673 | 14,536,197 | ||||||
Dollar General Corp. |
63,524 | 15,236,867 | ||||||
Lululemon Athletica, Inc. (a) |
32,029 | 8,954,027 | ||||||
Ross Stores, Inc. |
146,672 | 12,360,049 | ||||||
Starbucks Corp. |
350,838 | 29,561,610 | ||||||
The TJX Cos., Inc. |
52,257 | 3,246,205 | ||||||
Yum China Holdings, Inc. |
179,829 | 8,511,307 | ||||||
Number of |
Value |
|||||||
Yum! Brands, Inc. |
164,896 | $ | 17,535,041 | |||||
| 112,496,484 | ||||||||
| 237,413,344 | ||||||||
Consumer, Non-cyclical — 19.9% |
||||||||
Beverages — 1.9% |
||||||||
Monster Beverage Corp. (a) |
548,311 | 47,681,125 | ||||||
Biotechnology — 4.2% |
||||||||
Illumina, Inc. (a) |
125,001 | 23,848,941 | ||||||
Regeneron Pharmaceuticals, Inc. (a) |
55,645 | 38,332,171 | ||||||
Vertex Pharmaceuticals, Inc. (a) |
150,181 | 43,483,407 | ||||||
| 105,664,519 | ||||||||
Commercial Services — 2.4% |
||||||||
Adyen NV Sponsored ADR (a) |
169,585 | 2,123,204 | ||||||
Affirm Holdings, Inc. (a) (b) |
71,534 | 1,341,978 | ||||||
Ant International Co. Ltd., Class C (Acquired 6/07/18, Cost $3,358,253) (a) (c) (d) (e) |
881,113 | 1,735,793 | ||||||
Block, Inc. (a) |
311,892 | 17,150,941 | ||||||
Cintas Corp. |
6,206 | 2,409,107 | ||||||
PayPal Holdings, Inc. (a) |
284,139 | 24,455,844 | ||||||
S&P Global, Inc. |
28,305 | 8,642,932 | ||||||
TransUnion |
32,791 | 1,950,736 | ||||||
| 59,810,535 | ||||||||
Health Care – Products — 3.2% |
||||||||
Align Technology, Inc. (a) |
8,665 | 1,794,608 | ||||||
Danaher Corp. |
79,933 | 20,645,895 | ||||||
Intuitive Surgical, Inc. (a) |
181,067 | 33,939,198 | ||||||
Stryker Corp. |
60,068 | 12,166,173 | ||||||
Teleflex, Inc. |
12,711 | 2,560,758 | ||||||
Thermo Fisher Scientific, Inc. |
21,968 | 11,141,950 | ||||||
| 82,248,582 | ||||||||
Health Care – Services — 3.1% |
||||||||
Humana, Inc. |
28,044 | 13,606,668 | ||||||
UnitedHealth Group, Inc. |
128,093 | 64,692,089 | ||||||
| 78,298,757 | ||||||||
Pharmaceuticals — 5.1% |
||||||||
AstraZeneca PLC Sponsored ADR |
80,602 | 4,420,214 | ||||||
Eli Lilly & Co. |
96,547 | 31,218,472 | ||||||
Novartis AG Sponsored ADR |
511,996 | 38,916,816 | ||||||
Novo Nordisk A/S Sponsored ADR |
167,150 | 16,653,154 | ||||||
Roche Holding AG Sponsored ADR |
745,332 | 30,275,386 | ||||||
Zoetis, Inc. |
59,341 | 8,799,677 | ||||||
| 130,283,719 | ||||||||
| 503,987,237 | ||||||||
Financial — 8.1% |
||||||||
Banks — 0.6% |
||||||||
The Goldman Sachs Group, Inc. |
55,917 | 16,386,477 | ||||||
The accompanying notes are an integral part of the financial statements.
139
MassMutual Blue Chip Growth Fund — Portfolio of Investments (Continued) |
Number of |
Value |
|||||||
Diversified Financial Services — 7.0% |
||||||||
The Charles Schwab Corp. |
141,292 | $ | 10,154,656 | |||||
Mastercard, Inc. Class A |
115,065 | 32,717,582 | ||||||
SEI Investments Co. |
357,726 | 17,546,460 | ||||||
Visa, Inc. Class A (b) |
654,135 | 116,207,083 | ||||||
| 176,625,781 | ||||||||
Insurance — 0.5% |
||||||||
Chubb Ltd. |
32,613 | 5,931,653 | ||||||
Marsh & McLennan Cos., Inc. |
45,611 | 6,809,266 | ||||||
| 12,740,919 | ||||||||
| 205,753,177 | ||||||||
Industrial — 4.1% |
||||||||
Aerospace & Defense — 2.1% |
||||||||
The Boeing Co. (a) |
428,302 | 51,858,806 | ||||||
Electronics — 0.1% |
||||||||
TE Connectivity Ltd. |
24,863 | 2,743,881 | ||||||
Machinery – Diversified — 0.9% |
||||||||
Deere & Co. |
69,108 | 23,074,470 | ||||||
Miscellaneous - Manufacturing — 0.2% |
||||||||
General Electric Co. |
68,443 | 4,237,306 | ||||||
Transportation — 0.8% |
||||||||
Expeditors International of Washington, Inc. |
236,352 | 20,872,245 | ||||||
| 102,786,708 | ||||||||
Technology — 28.4% |
||||||||
Computers — 4.6% |
||||||||
Apple, Inc. |
785,605 | 108,570,611 | ||||||
Crowdstrike Holdings, Inc. Class A (a) |
18,935 | 3,120,677 | ||||||
Fortinet, Inc. (a) |
68,516 | 3,366,191 | ||||||
| 115,057,479 | ||||||||
Semiconductors — 6.0% |
||||||||
Advanced Micro Devices, Inc. (a) |
183,746 | 11,642,146 | ||||||
ASML Holding NV |
29,294 | 12,167,263 | ||||||
Marvell Technology, Inc. |
127,670 | 5,478,320 | ||||||
Monolithic Power Systems, Inc. |
17,991 | 6,537,929 | ||||||
NVIDIA Corp. |
659,620 | 80,071,272 | ||||||
QUALCOMM, Inc. |
220,901 | 24,957,395 | ||||||
Taiwan Semiconductor Manufacturing Co. Ltd. Sponsored ADR |
60,969 | 4,180,035 | ||||||
Texas Instruments, Inc. |
51,657 | 7,995,470 | ||||||
| 153,029,830 | ||||||||
Software — 17.8% |
||||||||
Atlassian Corp. PLC Class A (a) |
43,402 | 9,140,027 | ||||||
Autodesk, Inc. (a) |
240,723 | 44,967,057 | ||||||
Bill.com Holdings, Inc. (a) |
58,028 | 7,681,166 | ||||||
Number of |
Value |
|||||||
Canva, Inc. (Acquired 8/16/21, Cost $2,302,739) (a) (c) (d) (e) |
1,351 | $ | 1,290,137 | |||||
Confluent, Inc. Class A (a) |
80,739 | 1,919,166 | ||||||
Datadog, Inc. Class A (a) |
35,989 | 3,195,104 | ||||||
Gusto, Inc. (Acquired 4/10/21, Cost $765,943) (a) (c) (d) (e) |
26,606 | 500,991 | ||||||
HashiCorp, Inc. Class A (a) |
18,050 | 581,030 | ||||||
Intuit, Inc. |
61,910 | 23,978,981 | ||||||
Microsoft Corp. |
813,256 | 189,407,324 | ||||||
MongoDB, Inc. (a) |
31,130 | 6,181,173 | ||||||
MSCI, Inc. |
5,732 | 2,417,700 | ||||||
Oracle Corp. |
722,555 | 44,126,434 | ||||||
Paycom Software, Inc. (a) |
5,292 | 1,746,307 | ||||||
Roper Technologies, Inc. |
21,681 | 7,797,355 | ||||||
Salesforce, Inc. (a) |
251,373 | 36,157,492 | ||||||
ServiceNow, Inc. (a) |
80,757 | 30,494,651 | ||||||
Snowflake, Inc. Class A (a) |
21,165 | 3,597,203 | ||||||
Synopsys, Inc. (a) |
63,437 | 19,380,638 | ||||||
Veeva Systems, Inc. Class A (a) |
23,522 | 3,878,307 | ||||||
Workday, Inc. Class A (a) |
87,829 | 13,369,329 | ||||||
| 451,807,572 | ||||||||
| 719,894,881 | ||||||||
TOTAL COMMON STOCK (Cost $2,098,105,348) |
2,517,303,651 | |||||||
PREFERRED STOCK — 0.1% |
||||||||
Technology — 0.1% |
||||||||
Software — 0.1% |
||||||||
Canva, Inc., Series A (Acquired 11/04/21-12/17/21, Cost $144,893) (a) (c) (d) (e) |
85 | 81,171 | ||||||
Canva, Inc., Series A-3 (Acquired 11/04/21-12/17/21, Cost $17,043) (a) (c) (d) (e) |
10 | 9,550 | ||||||
Databricks, Inc., Series G (Acquired 2/01/21, Cost $815,183) (a) (c) (d) (e) |
13,788 | 762,384 | ||||||
Databricks, Inc., Series H (Acquired 8/31/21, Cost $2,202,319) (a) (c) (d) (e) |
29,970 | 1,657,140 | ||||||
Gusto, Inc., Series E (Acquired 7/13/21, Cost $1,117,484) (a) (c) (d) (e) |
36,765 | 692,285 | ||||||
| 3,202,530 | ||||||||
TOTAL PREFERRED STOCK (Cost $4,296,923) |
3,202,530 | |||||||
TOTAL EQUITIES (Cost $2,102,402,271) |
2,520,506,181 | |||||||
The accompanying notes are an integral part of the financial statements.
140
MassMutual Blue Chip Growth Fund — Portfolio of Investments (Continued) |
Principal |
Value |
|||||||
BONDS & NOTES — 0.1% |
||||||||
CORPORATE DEBT — 0.1% |
||||||||
Retail — 0.1% |
||||||||
Carvana Co. |
||||||||
10.250% 5/01/30 (b) (f) |
$ | 3,685,000 | $ | 2,459,737 | ||||
TOTAL CORPORATE DEBT (Cost $3,685,000) |
2,459,737 | |||||||
TOTAL BONDS & NOTES (Cost $3,685,000) |
2,459,737 | |||||||
MUTUAL FUNDS — 0.2% |
||||||||
Diversified Financial Services — 0.2% |
||||||||
State Street Navigator Securities Lending Government Money Market Portfolio (g) |
5,185,964 | 5,185,964 | ||||||
TOTAL MUTUAL FUNDS (Cost $5,185,964) |
5,185,964 | |||||||
TOTAL LONG-TERM INVESTMENTS (Cost $2,111,273,235) |
2,528,151,882 | |||||||
Number of |
||||||||
SHORT-TERM INVESTMENTS — 0.2% |
||||||||
Mutual Fund — 0.0% |
||||||||
T. Rowe Price Government Reserve Investment Fund |
101 | 101 | ||||||
Principal |
||||||||
Repurchase Agreement — 0.2% |
||||||||
Fixed Income Clearing Corp., Repurchase Agreement, dated 9/30/22, 0.830%, due 10/03/22 (h) |
5,924,441 | 5,924,441 | ||||||
TOTAL SHORT-TERM INVESTMENTS (Cost $5,924,542) |
5,924,542 | |||||||
TOTAL INVESTMENTS — 100.0% (Cost $2,117,197,777) (i) |
2,534,076,424 | |||||||
Other Assets/(Liabilities) — (0.0)% |
(926,406 | ) | ||||||
NET ASSETS — 100.0% |
$ | 2,533,150,018 | ||||||
Abbreviation Legend
|
ADR |
American Depositary Receipt |
Notes to Portfolio of Investments
Percentages are stated as a percent of net assets.
|
(a) |
Non-income producing security. |
|
(b) |
Denotes all or a portion of security on loan. The total value of securities on loan as of September 30, 2022, was $14,048,803 or 0.55% of net assets. The Fund received $9,181,968 of non-cash collateral (U.S. Treasury and/or Agency obligations) related to securities lending activity. This amount is not reflected on either the Portfolio of Investments or the Statement of Assets and Liabilities. (Note 2). |
|
(c) |
Investment is valued using significant unobservable inputs. |
|
(d) |
This security is fair valued in good faith in accordance with procedures approved by the Board of Trustees. At September 30, 2022, these securities amounted to a value of $6,729,451 or 0.27% of net assets. |
|
(e) |
Restricted security. Certain securities are restricted as to resale. At September 30, 2022, these securities amounted to a value of $6,729,451 or 0.27% of net assets. The Fund generally bears the costs, if any, associated with the disposition of restricted securities. |
|
(f) |
Security is exempt from registration under Regulation S or Rule 144A of the Securities Act of 1933. These securities are considered restricted and may be resold in transactions exempt from registration. At September 30, 2022, the aggregate market value of these securities amounted to $2,459,737 or 0.10% of net assets. |
|
(g) |
Represents investment of security lending cash collateral. (Note 2). |
|
(h) |
Maturity value of $5,924,851. Collateralized by U.S. Government Agency obligations with a rate of 0.000%, maturity date of 3/30/23, and an aggregate market value, including accrued interest, of $6,043,096. |
|
(i) |
See Note 6 for aggregate cost for federal tax purposes. |
The accompanying notes are an integral part of the financial statements.
141
MassMutual Growth Opportunities Fund — Portfolio of Investments |
September 30, 2022 |
Number of |
Value |
|||||||
EQUITIES — 98.1% |
||||||||
COMMON STOCK — 98.1% |
||||||||
Communications — 26.0% |
||||||||
Internet — 23.8% |
||||||||
Airbnb, Inc. Class A (a) |
44,318 | $ | 4,655,162 | |||||
Amazon.com, Inc. (a) |
184,739 | 20,875,507 | ||||||
DoorDash, Inc., Class A (a) |
35,849 | 1,772,733 | ||||||
Match Group, Inc. (a) |
115,167 | 5,499,224 | ||||||
Meta Platforms, Inc. Class A (a) |
15,189 | 2,060,844 | ||||||
Netflix, Inc. (a) |
18,889 | 4,447,226 | ||||||
Sea Ltd. ADR (a) (b) |
80,321 | 4,501,992 | ||||||
Shopify, Inc. Class A (a) |
98,848 | 2,662,965 | ||||||
Uber Technologies, Inc. (a) |
349,047 | 9,249,745 | ||||||
| 55,725,398 | ||||||||
Media — 2.2% |
||||||||
Charter Communications, Inc. Class A (a) |
17,042 | 5,169,691 | ||||||
| 60,895,089 | ||||||||
Consumer, Cyclical — 3.9% |
||||||||
Apparel — 1.6% |
||||||||
NIKE, Inc. Class B |
43,547 | 3,619,627 | ||||||
Entertainment — 1.1% |
||||||||
Warner Music Group Corp. Class A |
112,425 | 2,609,384 | ||||||
Retail — 1.2% |
||||||||
Floor & Decor Holdings, Inc. Class A (a) |
40,035 | 2,812,859 | ||||||
| 9,041,870 | ||||||||
Consumer, Non-cyclical — 19.6% |
||||||||
Biotechnology — 1.2% |
||||||||
Sarepta Therapeutics, Inc. (a) |
24,763 | 2,737,302 | ||||||
Commercial Services — 6.1% |
||||||||
Block, Inc. (a) |
93,384 | 5,135,186 | ||||||
CoStar Group, Inc. (a) |
81,120 | 5,650,008 | ||||||
S&P Global, Inc. |
11,300 | 3,450,455 | ||||||
| 14,235,649 | ||||||||
Health Care – Products — 7.4% |
||||||||
10X Genomics, Inc. Class A (a) |
34,900 | 993,952 | ||||||
Align Technology, Inc. (a) |
19,278 | 3,992,667 | ||||||
Edwards Lifesciences Corp. (a) |
108,310 | 8,949,655 | ||||||
Intuitive Surgical, Inc. (a) |
18,043 | 3,381,980 | ||||||
| 17,318,254 | ||||||||
Health Care – Services — 1.8% |
||||||||
Catalent, Inc. (a) |
59,195 | 4,283,350 | ||||||
Pharmaceuticals — 3.1% |
||||||||
DexCom, Inc. (a) |
90,171 | 7,262,373 | ||||||
| 45,836,928 | ||||||||
Number of |
Value |
|||||||
Financial — 11.9% |
||||||||
Diversified Financial Services — 10.7% |
||||||||
Mastercard, Inc. Class A |
28,350 | $ | 8,061,039 | |||||
Visa, Inc. Class A (b) |
95,534 | 16,971,615 | ||||||
| 25,032,654 | ||||||||
Private Equity — 1.2% |
||||||||
KKR & Co., Inc. |
66,621 | 2,864,703 | ||||||
| 27,897,357 | ||||||||
Industrial — 5.8% |
||||||||
Aerospace & Defense — 1.6% |
||||||||
The Boeing Co. (a) |
31,770 | 3,846,712 | ||||||
Environmental Controls — 2.0% |
||||||||
Waste Management, Inc. |
28,883 | 4,627,345 | ||||||
Transportation — 2.2% |
||||||||
Canadian Pacific Railway Ltd. (b) |
75,604 | 5,044,299 | ||||||
| 13,518,356 | ||||||||
Technology — 30.9% |
||||||||
Semiconductors — 3.2% |
||||||||
Lam Research Corp. |
8,522 | 3,119,052 | ||||||
NVIDIA Corp. |
35,386 | 4,295,507 | ||||||
| 7,414,559 | ||||||||
Software — 27.7% |
||||||||
Atlassian Corp. PLC Class A (a) |
30,371 | 6,395,829 | ||||||
Cloudflare, Inc. Class A (a) |
69,290 | 3,832,430 | ||||||
Coupa Software, Inc. (a) |
31,948 | 1,878,542 | ||||||
Datadog, Inc. Class A (a) |
54,190 | 4,810,988 | ||||||
Gitlab, Inc. Class A (a) (b) |
44,841 | 2,296,756 | ||||||
Intuit, Inc. |
12,612 | 4,884,880 | ||||||
Microsoft Corp. |
59,395 | 13,833,096 | ||||||
ServiceNow, Inc. (a) |
34,527 | 13,037,740 | ||||||
Snowflake, Inc. Class A (a) |
44,452 | 7,555,062 | ||||||
Twilio, Inc. Class A (a) |
25,774 | 1,782,014 | ||||||
Veeva Systems, Inc. Class A (a) |
26,944 | 4,442,527 | ||||||
| 64,749,864 | ||||||||
| 72,164,423 | ||||||||
TOTAL COMMON STOCK (Cost $274,336,749) |
229,354,023 | |||||||
TOTAL EQUITIES (Cost $274,336,749) |
229,354,023 | |||||||
The accompanying notes are an integral part of the financial statements.
142
MassMutual Growth Opportunities Fund — Portfolio of Investments (Continued) |
Number of |
Value |
|||||||
MUTUAL FUNDS — 2.9% |
||||||||
Diversified Financial Services — 2.9% |
||||||||
State Street Navigator Securities Lending Government Money Market Portfolio (c) |
6,702,873 | $ | 6,702,873 | |||||
TOTAL MUTUAL FUNDS (Cost $6,702,873) |
6,702,873 | |||||||
TOTAL LONG-TERM INVESTMENTS (Cost $281,039,622) |
236,056,896 | |||||||
Principal |
||||||||
SHORT-TERM INVESTMENTS — 2.5% |
||||||||
Repurchase Agreement — 2.5% |
||||||||
Fixed Income Clearing Corp., Repurchase Agreement, dated 9/30/22, 0.830%, due 10/03/22 (d) |
$ | 5,911,529 | 5,911,529 | |||||
TOTAL SHORT-TERM INVESTMENTS (Cost $5,911,529) |
5,911,529 | |||||||
TOTAL INVESTMENTS — 103.5% (Cost $286,951,151) (e) |
241,968,425 | |||||||
Other Assets/(Liabilities) — (3.5)% |
(8,145,877 | ) | ||||||
NET ASSETS — 100.0% |
$ | 233,822,548 | ||||||
Abbreviation Legend
|
ADR |
American Depositary Receipt |
Notes to Portfolio of Investments
Percentages are stated as a percent of net assets.
|
(a) |
Non-income producing security. |
|
(b) |
Denotes all or a portion of security on loan. The total value of securities on loan as of September 30, 2022, was $12,422,337 or 5.31% of net assets. The Fund received $5,999,994 of non-cash collateral (U.S. Treasury and/or Agency obligations) related to securities lending activity. This amount is not reflected on either the Portfolio of Investments or the Statement of Assets and Liabilities. (Note 2). |
|
(c) |
Represents investment of security lending cash collateral. (Note 2). |
|
(d) |
Maturity value of $5,911,938. Collateralized by U.S. Government Agency obligations with rates ranging from 0.000% - 3.500%, maturity dates ranging from 3/30/23 - 9/15/25, and an aggregate market value, including accrued interest, of $6,029,807. |
|
(e) |
See Note 6 for aggregate cost for federal tax purposes. |
The accompanying notes are an integral part of the financial statements.
143
September 30, 2022 |
Number of |
Value |
|||||||
EQUITIES — 96.9% |
||||||||
COMMON STOCK — 96.6% |
||||||||
Basic Materials — 3.4% |
||||||||
Chemicals — 2.5% |
||||||||
Akzo Nobel NV |
5,854 | $ | 330,143 | |||||
Axalta Coating Systems Ltd. (a) |
14,673 | 309,013 | ||||||
Celanese Corp. |
572 | 51,675 | ||||||
CF Industries Holdings, Inc. |
151 | 14,534 | ||||||
Huntsman Corp. |
1,047 | 25,693 | ||||||
LyondellBasell Industries NV Class A |
7,600 | 572,128 | ||||||
The Mosaic Co. |
8,300 | 401,139 | ||||||
Olin Corp. |
19,163 | 821,709 | ||||||
| 2,526,034 | ||||||||
Forest Products & Paper — 0.2% |
||||||||
Mondi PLC |
10,745 | 165,974 | ||||||
Iron & Steel — 0.7% |
||||||||
Cleveland-Cliffs, Inc. (a) |
20,900 | 281,523 | ||||||
United States Steel Corp. |
24,204 | 438,576 | ||||||
| 720,099 | ||||||||
| 3,412,107 | ||||||||
Communications — 7.2% |
||||||||
Advertising — 0.5% |
||||||||
The Interpublic Group of Cos., Inc. |
18,167 | 465,075 | ||||||
Internet — 1.1% |
||||||||
F5, Inc. (a) |
2,828 | 409,297 | ||||||
GoDaddy, Inc. Class A (a) |
2,875 | 203,780 | ||||||
IAC, Inc. (a) |
9,700 | 537,186 | ||||||
| 1,150,263 | ||||||||
Media — 4.9% |
||||||||
Altice USA, Inc. Class A (a) |
39,300 | 229,119 | ||||||
DISH Network Corp. Class A (a) |
38,400 | 531,072 | ||||||
Fox Corp. Class A |
16,300 | 500,084 | ||||||
Fox Corp. Class B |
18,609 | 530,356 | ||||||
Liberty Broadband Corp. Class C (a) |
11,900 | 878,220 | ||||||
Liberty Global PLC Class A (a) |
34,900 | 544,091 | ||||||
Liberty Media Corp-Liberty SiriusXM Class C (a) |
19,800 | 746,658 | ||||||
News Corp. Class A |
37,317 | 563,860 | ||||||
Warner Bros Discovery, Inc. (a) |
34,927 | 401,661 | ||||||
| 4,925,121 | ||||||||
Telecommunications — 0.7% |
||||||||
Corning, Inc. |
18,805 | 545,721 | ||||||
Juniper Networks, Inc. |
5,391 | 140,813 | ||||||
| 686,534 | ||||||||
| 7,226,993 | ||||||||
Number of |
Value |
|||||||
Consumer, Cyclical — 8.6% |
||||||||
Airlines — 1.1% |
||||||||
Alaska Air Group, Inc. (a) |
672 | $ | 26,309 | |||||
Southwest Airlines Co. (a) |
18,305 | 564,526 | ||||||
United Airlines Holdings, Inc. (a) |
15,520 | 504,865 | ||||||
| 1,095,700 | ||||||||
Apparel — 0.5% |
||||||||
PVH Corp. |
2,653 | 118,854 | ||||||
Ralph Lauren Corp. |
248 | 21,063 | ||||||
Tapestry, Inc. |
13,342 | 379,313 | ||||||
| 519,230 | ||||||||
Auto Manufacturers — 1.1% |
||||||||
Cummins, Inc. |
4,779 | 972,574 | ||||||
PACCAR, Inc. |
1,936 | 162,024 | ||||||
| 1,134,598 | ||||||||
Auto Parts & Equipment — 0.8% |
||||||||
Aptiv PLC (a) |
1,431 | 111,918 | ||||||
BorgWarner, Inc. |
16,954 | 532,356 | ||||||
Cie Generale des Etablissements Michelin SCA |
8,113 | 180,749 | ||||||
| 825,023 | ||||||||
Distribution & Wholesale — 0.7% |
||||||||
LKQ Corp. |
15,400 | 726,110 | ||||||
Food Services — 0.3% |
||||||||
Sodexo SA |
4,237 | 318,662 | ||||||
Home Builders — 0.0% |
||||||||
Toll Brothers, Inc. |
345 | 14,490 | ||||||
Home Furnishing — 0.2% |
||||||||
Dolby Laboratories, Inc. Class A |
2,380 | 155,057 | ||||||
Leisure Time — 0.1% |
||||||||
Polaris, Inc. |
386 | 36,921 | ||||||
Lodging — 0.0% |
||||||||
Boyd Gaming Corp. |
660 | 31,449 | ||||||
Retail — 3.8% |
||||||||
Advance Auto Parts, Inc. |
3,695 | 577,676 | ||||||
Bath & Body Works, Inc. |
12,076 | 393,678 | ||||||
Beacon Roofing Supply, Inc. (a) |
2,091 | 114,420 | ||||||
Dick’s Sporting Goods, Inc. (b) |
753 | 78,794 | ||||||
Dollar Tree, Inc. (a) |
8,563 | 1,165,424 | ||||||
Macy’s, Inc. |
14,624 | 229,158 | ||||||
MSC Industrial Direct Co., Inc. Class A |
7,301 | 531,586 | ||||||
Ross Stores, Inc. |
7,600 | 640,452 | ||||||
Williams-Sonoma, Inc. |
1,226 | 144,484 | ||||||
| 3,875,672 | ||||||||
| 8,732,912 | ||||||||
The accompanying notes are an integral part of the financial statements.
144
MassMutual Mid Cap Value Fund — Portfolio of Investments (Continued) |
Number of |
Value |
|||||||
Consumer, Non-cyclical — 19.0% |
||||||||
Agriculture — 0.0% |
||||||||
Archer-Daniels-Midland Co. |
205 | $ | 16,492 | |||||
Beverages — 0.7% |
||||||||
Brown-Forman Corp. Class B |
1,380 | 91,867 | ||||||
Molson Coors Beverage Co. Class B |
13,500 | 647,865 | ||||||
| 739,732 | ||||||||
Biotechnology — 0.9% |
||||||||
Corteva, Inc. |
11,697 | 668,483 | ||||||
Incyte Corp. (a) |
1,815 | 120,952 | ||||||
United Therapeutics Corp. (a) |
600 | 125,628 | ||||||
| 915,063 | ||||||||
Commercial Services — 1.3% |
||||||||
Euronet Worldwide, Inc. (a) |
601 | 45,532 | ||||||
FleetCor Technologies, Inc. (a) |
3,300 | 581,361 | ||||||
Gartner, Inc. (a) |
77 | 21,305 | ||||||
Global Payments, Inc. |
6,000 | 648,300 | ||||||
| 1,296,498 | ||||||||
Cosmetics & Personal Care — 0.0% |
||||||||
Coty, Inc. Class A (a) |
1,719 | 10,864 | ||||||
Food — 3.9% |
||||||||
Campbell Soup Co. |
3,008 | 141,737 | ||||||
Conagra Brands, Inc. |
19,948 | 650,903 | ||||||
The J.M. Smucker Co. |
3,822 | 525,181 | ||||||
Kellogg Co. |
602 | 41,935 | ||||||
Koninklijke Ahold Delhaize NV |
25,115 | 639,527 | ||||||
The Kraft Heinz Co. |
12,000 | 400,200 | ||||||
The Kroger Co. |
14,180 | 620,375 | ||||||
Orkla ASA |
14,211 | 103,185 | ||||||
Post Holdings, Inc. (a) |
10,100 | 827,291 | ||||||
| 3,950,334 | ||||||||
Health Care – Products — 3.9% |
||||||||
Baxter International, Inc. |
3,825 | 206,015 | ||||||
Henry Schein, Inc. (a) |
16,964 | 1,115,722 | ||||||
Hologic, Inc. (a) |
12,247 | 790,176 | ||||||
Koninklijke Philips NV |
33,100 | 509,409 | ||||||
Zimmer Biomet Holdings, Inc. |
12,303 | 1,286,279 | ||||||
| 3,907,601 | ||||||||
Health Care – Services — 3.9% |
||||||||
Centene Corp. (a) |
6,700 | 521,327 | ||||||
Encompass Health Corp. |
532 | 24,062 | ||||||
HCA Healthcare, Inc. |
193 | 35,472 | ||||||
IQVIA Holdings, Inc. (a) |
78 | 14,129 | ||||||
Laboratory Corp. of America Holdings |
5,864 | 1,201,006 | ||||||
Molina Healthcare, Inc. (a) |
911 | 300,484 | ||||||
Quest Diagnostics, Inc. |
10,135 | 1,243,463 | ||||||
Number of |
Value |
|||||||
Universal Health Services, Inc. Class B |
6,156 | $ | 542,836 | |||||
| 3,882,779 | ||||||||
Household Products & Wares — 0.6% |
||||||||
Avery Dennison Corp. |
204 | 33,191 | ||||||
Kimberly-Clark Corp. |
4,822 | 542,668 | ||||||
| 575,859 | ||||||||
Pharmaceuticals — 3.8% |
||||||||
AmerisourceBergen Corp. |
9,556 | 1,293,213 | ||||||
Becton Dickinson and Co. |
865 | 192,748 | ||||||
Cardinal Health, Inc. |
10,566 | 704,541 | ||||||
Dentsply Sirona, Inc. |
8,092 | 229,408 | ||||||
Embecta Corp. |
10,187 | 293,284 | ||||||
Jazz Pharmaceuticals PLC (a) |
678 | 90,371 | ||||||
McKesson Corp. |
51 | 17,333 | ||||||
Organon & Co. |
14,500 | 339,300 | ||||||
Perrigo Co. PLC |
19,100 | 681,106 | ||||||
Premier, Inc. Class A |
625 | 21,213 | ||||||
| 3,862,517 | ||||||||
| 19,157,739 | ||||||||
Energy — 6.3% |
||||||||
Oil & Gas — 4.4% |
||||||||
APA Corp. |
15,727 | 537,706 | ||||||
Chesapeake Energy Corp. (b) |
4,600 | 433,366 | ||||||
Devon Energy Corp. |
18,197 | 1,094,186 | ||||||
Diamondback Energy, Inc. |
4,770 | 574,594 | ||||||
EQT Corp. |
10,146 | 413,449 | ||||||
HF Sinclair Corp. |
8,373 | 450,802 | ||||||
Marathon Oil Corp. |
26,736 | 603,699 | ||||||
Phillips 66 |
2,183 | 176,212 | ||||||
Pioneer Natural Resources Co. |
592 | 128,186 | ||||||
Range Resources Corp. |
2,320 | 58,603 | ||||||
| 4,470,803 | ||||||||
Oil & Gas Services — 0.2% |
||||||||
Baker Hughes Co. |
11,440 | 239,782 | ||||||
Pipelines — 1.7% |
||||||||
Enterprise Products Partners LP (c) |
16,793 | 399,338 | ||||||
Kinder Morgan, Inc. |
36,500 | 607,360 | ||||||
The Williams Cos., Inc. |
24,400 | 698,572 | ||||||
| 1,705,270 | ||||||||
| 6,415,855 | ||||||||
Financial — 27.3% |
||||||||
Banks — 7.9% |
||||||||
The Bank of New York Mellon Corp. |
23,313 | 898,017 | ||||||
Comerica, Inc. |
6,723 | 478,005 | ||||||
Cullen/Frost Bankers, Inc. |
309 | 40,856 | ||||||
East West Bancorp, Inc. |
4,866 | 326,703 | ||||||
The accompanying notes are an integral part of the financial statements.
145
MassMutual Mid Cap Value Fund — Portfolio of Investments (Continued) |
Number of |
Value |
|||||||
First Citizens BancShares, Inc. Class A |
994 | $ | 792,645 | |||||
First Hawaiian, Inc. |
22,176 | 546,195 | ||||||
First Republic Bank |
6,310 | 823,771 | ||||||
KeyCorp. |
33,807 | 541,588 | ||||||
Northern Trust Corp. |
17,022 | 1,456,402 | ||||||
Prosperity Bancshares, Inc. |
6,991 | 466,160 | ||||||
Regions Financial Corp. |
28,243 | 566,837 | ||||||
Truist Financial Corp. |
13,429 | 584,699 | ||||||
Umpqua Holdings Corp. |
1,148 | 19,619 | ||||||
US Bancorp |
6,094 | 245,710 | ||||||
Westamerica Bancorp. |
4,195 | 219,357 | ||||||
| 8,006,564 | ||||||||
Diversified Financial Services — 2.3% |
||||||||
Affiliated Managers Group, Inc. |
1,872 | 209,383 | ||||||
Ally Financial, Inc. |
15,800 | 439,714 | ||||||
Ameriprise Financial, Inc. |
3,435 | 865,449 | ||||||
Evercore, Inc. Class A |
201 | 16,532 | ||||||
Stifel Financial Corp. |
3,858 | 200,269 | ||||||
T. Rowe Price Group, Inc. |
5,506 | 578,185 | ||||||
| 2,309,532 | ||||||||
Insurance — 8.6% |
||||||||
Aflac, Inc. |
6,315 | 354,903 | ||||||
Alleghany Corp. (a) |
1,400 | 1,175,118 | ||||||
The Allstate Corp. |
11,619 | 1,446,914 | ||||||
Arch Capital Group Ltd. (a) |
15,800 | 719,532 | ||||||
Axis Capital Holdings Ltd. |
409 | 20,102 | ||||||
Chubb Ltd. |
962 | 174,969 | ||||||
Equitable Holdings, Inc. |
20,472 | 539,437 | ||||||
Fidelity National Financial, Inc. |
18,400 | 666,080 | ||||||
The Hanover Insurance Group, Inc. |
2,496 | 319,838 | ||||||
The Hartford Financial Services Group, Inc. |
9,847 | 609,923 | ||||||
Loews Corp. |
7,400 | 368,816 | ||||||
Markel Corp. (a) |
500 | 542,110 | ||||||
Old Republic International Corp. |
18,000 | 376,740 | ||||||
Reinsurance Group of America, Inc. |
7,446 | 936,781 | ||||||
Voya Financial, Inc. |
516 | 31,218 | ||||||
Willis Towers Watson PLC |
2,000 | 401,880 | ||||||
| 8,684,361 | ||||||||
Private Equity — 0.3% |
||||||||
The Carlyle Group, Inc. |
11,190 | 289,150 | ||||||
Real Estate — 0.9% |
||||||||
CBRE Group, Inc. Class A (a) |
7,972 | 538,190 | ||||||
Jones Lang LaSalle, Inc. (a) |
2,671 | 403,508 | ||||||
| 941,698 | ||||||||
Real Estate Investment Trusts (REITS) — 7.1% |
||||||||
Annaly Capital Management, Inc. |
26,250 | 450,450 | ||||||
Apartment Income REIT Corp. |
7,784 | 300,618 | ||||||
Number of |
Value |
|||||||
Camden Property Trust |
3,994 | $ | 477,083 | |||||
Duke Realty Corp. |
5,546 | 267,317 | ||||||
Equinix, Inc. |
809 | 460,192 | ||||||
Essex Property Trust, Inc. |
1,724 | 417,605 | ||||||
First Industrial Realty Trust, Inc. |
694 | 31,098 | ||||||
Gaming and Leisure Properties, Inc. |
15,237 | 674,085 | ||||||
Healthcare Realty Trust, Inc. |
6,337 | 132,126 | ||||||
Healthpeak Properties, Inc. |
22,975 | 526,587 | ||||||
Host Hotels & Resorts, Inc. |
30,657 | 486,833 | ||||||
JBG SMITH Properties |
33,143 | 615,797 | ||||||
Mid-America Apartment Communities, Inc. |
3,299 | 511,576 | ||||||
Public Storage |
754 | 220,779 | ||||||
Realty Income Corp. |
7,901 | 459,838 | ||||||
Regency Centers Corp. |
8,218 | 442,539 | ||||||
SBA Communications Corp. |
319 | 90,803 | ||||||
UDR, Inc. |
6,018 | 251,011 | ||||||
VICI Properties, Inc. |
3,792 | 113,191 | ||||||
Weyerhaeuser Co. |
3,507 | 100,160 | ||||||
WP Carey, Inc. |
2,681 | 187,134 | ||||||
| 7,216,822 | ||||||||
Savings & Loans — 0.2% |
||||||||
Capitol Federal Financial, Inc. |
17,778 | 147,557 | ||||||
| 27,595,684 | ||||||||
Industrial — 12.7% |
||||||||
Building Materials — 1.7% |
||||||||
Builders FirstSource, Inc. (a) |
5,500 | 324,060 | ||||||
Cie de Saint-Gobain |
7,934 | 282,957 | ||||||
Louisiana-Pacific Corp. |
7,263 | 371,793 | ||||||
Masco Corp. |
9,409 | 439,306 | ||||||
Owens Corning |
3,507 | 275,685 | ||||||
| 1,693,801 | ||||||||
Electrical Components & Equipment — 0.8% |
||||||||
Emerson Electric Co. |
10,324 | 755,923 | ||||||
Electronics — 2.1% |
||||||||
Agilent Technologies, Inc. |
165 | 20,056 | ||||||
Atkore, Inc. (a) |
2,096 | 163,090 | ||||||
Flex Ltd. (a) |
21,200 | 353,192 | ||||||
Hubbell, Inc. |
365 | 81,395 | ||||||
nVent Electric PLC |
24,017 | 759,177 | ||||||
TE Connectivity Ltd. |
3,040 | 335,494 | ||||||
Vontier Corp. |
27,302 | 456,217 | ||||||
| 2,168,621 | ||||||||
Engineering & Construction — 0.3% |
||||||||
Vinci SA |
3,471 | 278,810 | ||||||
Environmental Controls — 0.2% |
||||||||
Republic Services, Inc. |
1,346 | 183,110 | ||||||
The accompanying notes are an integral part of the financial statements.
146
MassMutual Mid Cap Value Fund — Portfolio of Investments (Continued) |
Number of |
Value |
|||||||
Tetra Tech, Inc. |
166 | $ | 21,336 | |||||
| 204,446 | ||||||||
Hand & Machine Tools — 0.1% |
||||||||
Stanley Black & Decker, Inc. |
1,579 | 118,757 | ||||||
Machinery – Construction & Mining — 0.7% |
||||||||
Oshkosh Corp. |
10,363 | 728,415 | ||||||
Machinery – Diversified — 0.4% |
||||||||
CNH Industrial NV |
25,400 | 283,718 | ||||||
IMI PLC |
13,525 | 167,801 | ||||||
| 451,519 | ||||||||
Miscellaneous - Manufacturing — 1.4% |
||||||||
A.O. Smith Corp. |
6,160 | 299,253 | ||||||
Parker-Hannifin Corp. |
2,332 | 565,067 | ||||||
Textron, Inc. |
9,509 | 553,994 | ||||||
| 1,418,314 | ||||||||
Packaging & Containers — 2.5% |
||||||||
Amcor PLC |
20,429 | 219,203 | ||||||
Berry Global Group, Inc. (a) |
3,000 | 139,590 | ||||||
Graphic Packaging Holding Co. |
27,500 | 542,850 | ||||||
Packaging Corp. of America |
4,887 | 548,761 | ||||||
Sealed Air Corp. |
10,464 | 465,753 | ||||||
Sonoco Products Co. |
3,578 | 202,980 | ||||||
WestRock Co. |
13,281 | 410,250 | ||||||
| 2,529,387 | ||||||||
Shipbuilding — 1.2% |
||||||||
Huntington Ingalls Industries, Inc. |
5,317 | 1,177,715 | ||||||
Transportation — 1.3% |
||||||||
Expeditors International of Washington, Inc. |
5,800 | 512,198 | ||||||
FedEx Corp. |
2,200 | 326,634 | ||||||
Heartland Express, Inc. |
16,793 | 240,308 | ||||||
Kirby Corp. (a) |
318 | 19,325 | ||||||
Knight-Swift Transportation Holdings, Inc. |
819 | 40,073 | ||||||
Ryder System, Inc. |
1,979 | 149,395 | ||||||
| 1,287,933 | ||||||||
| 12,813,641 | ||||||||
Technology — 3.2% |
||||||||
Computers — 2.1% |
||||||||
Amdocs Ltd. |
3,686 | 292,853 | ||||||
Dell Technologies, Inc. |
2,542 | 86,860 | ||||||
DXC Technology Co. (a) |
9,251 | 226,465 | ||||||
Fortinet, Inc. (a) |
380 | 18,669 | ||||||
HP, Inc. |
30,672 | 764,346 | ||||||
Lumentum Holdings, Inc. (a) |
2,661 | 182,465 | ||||||
Western Digital Corp. (a) |
17,100 | 556,605 | ||||||
| 2,128,263 | ||||||||
Number of |
Value |
|||||||
Semiconductors — 0.2% |
||||||||
Applied Materials, Inc. |
1,708 | $ | 139,937 | |||||
Teradyne, Inc. |
1,100 | 82,665 | ||||||
| 222,602 | ||||||||
Software — 0.9% |
||||||||
Cadence Design Systems, Inc. (a) |
106 | 17,324 | ||||||
DocuSign, Inc. (a) |
61 | 3,262 | ||||||
Dropbox, Inc. Class A (a) |
736 | 15,250 | ||||||
Electronic Arts, Inc. |
2,825 | 326,881 | ||||||
Manhattan Associates, Inc. (a) |
229 | 30,464 | ||||||
Open Text Corp. |
6,233 | 164,800 | ||||||
SS&C Technologies Holdings, Inc |
3,500 | 167,125 | ||||||
Synopsys, Inc. (a) |
448 | 136,868 | ||||||
Teradata Corp. (a) |
409 | 12,703 | ||||||
| 874,677 | ||||||||
| 3,225,542 | ||||||||
Utilities — 8.9% |
||||||||
Electric — 7.1% |
||||||||
CenterPoint Energy, Inc. |
16,900 | 476,242 | ||||||
Constellation Energy Corp. |
2,519 | 209,556 | ||||||
DTE Energy Co. |
4,649 | 534,867 | ||||||
Duke Energy Corp. |
382 | 35,534 | ||||||
Edison International |
19,279 | 1,090,806 | ||||||
Entergy Corp. |
5,433 | 546,723 | ||||||
Evergy, Inc. |
12,186 | 723,848 | ||||||
Eversource Energy |
9,303 | 725,262 | ||||||
NorthWestern Corp. |
10,222 | 503,740 | ||||||
OGE Energy Corp. |
17,100 | 623,466 | ||||||
PG&E Corp. (a) |
6,681 | 83,512 | ||||||
Pinnacle West Capital Corp. |
6,400 | 412,864 | ||||||
Vistra Corp. |
29,400 | 617,400 | ||||||
Xcel Energy, Inc. |
9,680 | 619,520 | ||||||
| 7,203,340 | ||||||||
Gas — 1.8% |
||||||||
Atmos Energy Corp. |
839 | 85,452 | ||||||
NiSource, Inc. |
25,100 | 632,269 | ||||||
Spire, Inc. |
9,894 | 616,693 | ||||||
UGI Corp. |
15,700 | 507,581 | ||||||
| 1,841,995 | ||||||||
| 9,045,335 | ||||||||
TOTAL COMMON STOCK (Cost $112,052,258) |
97,625,808 | |||||||
The accompanying notes are an integral part of the financial statements.
147
MassMutual Mid Cap Value Fund — Portfolio of Investments (Continued) |
Number of |
Value |
|||||||
PREFERRED STOCK — 0.3% |
||||||||
Consumer, Non-cyclical — 0.3% |
||||||||
Household Products & Wares — 0.3% |
||||||||
Henkel AG & Co. KGaA |
5,365 | $ | 320,678 | |||||
TOTAL PREFERRED STOCK (Cost $347,763) |
320,678 | |||||||
TOTAL EQUITIES (Cost $112,400,021) |
97,946,486 | |||||||
MUTUAL FUNDS — 0.7% |
||||||||
Diversified Financial Services — 0.7% |
||||||||
iShares Russell Mid-Cap Value ETF |
6,717 | 645,168 | ||||||
State Street Navigator Securities Lending Government Money Market Portfolio (d) |
68,961 | 68,961 | ||||||
| 714,129 | ||||||||
TOTAL MUTUAL FUNDS (Cost $776,228) |
714,129 | |||||||
TOTAL LONG-TERM INVESTMENTS (Cost $113,176,249) |
98,660,615 | |||||||
Currency Legend
|
EUR |
Euro |
|
GBP |
British Pound |
|
NOK |
Norwegian Krone |
|
USD |
U.S. Dollar |
Principal |
Value |
|||||||
SHORT-TERM INVESTMENTS — 2.7% |
||||||||
Repurchase Agreement — 2.7% |
||||||||
Fixed Income Clearing Corp., Repurchase Agreement, dated 9/30/22, 0.830%, due 10/03/22 (e) |
$ | 2,750,893 | $ | 2,750,893 | ||||
TOTAL SHORT-TERM INVESTMENTS (Cost $2,750,893) |
2,750,893 | |||||||
TOTAL INVESTMENTS — 100.3% (Cost $115,927,142) (f) |
101,411,508 | |||||||
Other Assets/(Liabilities) — (0.3)% |
(350,453 | ) | ||||||
NET ASSETS — 100.0% |
$ | 101,061,055 | ||||||
Abbreviation Legend
|
ETF |
Exchange-Traded Fund |
Notes to Portfolio of Investments
Percentages are stated as a percent of net assets.
|
(a) |
Non-income producing security. |
|
(b) |
Denotes all or a portion of security on loan. The total value of securities on loan as of September 30, 2022, was $494,945 or 0.49% of net assets. The Fund received $436,212 of non-cash collateral (U.S. Treasury and/or Agency obligations) related to securities lending activity. This amount is not reflected on either the Portfolio of Investments or the Statement of Assets and Liabilities. (Note 2). |
|
(c) |
Security is a Master Limited Partnership |
|
(d) |
Represents investment of security lending cash collateral. (Note 2). |
|
(e) |
Maturity value of $2,751,083. Collateralized by U.S. Government Agency obligations with rates ranging from 0.000% - 3.500%, maturity dates ranging from 3/30/23 - 9/15/25, and an aggregate market value, including accrued interest, of $2,806,097. |
|
(f) |
See Note 6 for aggregate cost for federal tax purposes. |
Forward contracts
Counterparty |
Settlement |
Currency Purchased |
Currency Sold |
Unrealized |
||||||||||||||||||||
Bank of America N.A. |
12/30/22 | GBP | 8,137 | USD | 8,703 | $ | 395 | |||||||||||||||||
Bank of America N.A. |
12/30/22 | USD | 294,098 | GBP | 260,269 | 3,088 | ||||||||||||||||||
JP Morgan Chase Bank N.A. |
12/30/22 | EUR | 71,062 | USD | 68,765 | 1,376 | ||||||||||||||||||
JP Morgan Chase Bank N.A. |
12/30/22 | USD | 2,104,580 | EUR | 2,142,077 | (9,726 | ) | |||||||||||||||||
UBS AG |
12/30/22 | NOK | 118,298 | USD | 11,066 | (178 | ) | |||||||||||||||||
UBS AG |
12/30/22 | USD | 101,932 | NOK | 1,058,072 | 4,542 | ||||||||||||||||||
| $ | (503 | ) | ||||||||||||||||||||||
The accompanying notes are an integral part of the financial statements.
148
MassMutual Small Cap Value Equity Fund — Portfolio of Investments |
September 30, 2022 |
Number of |
Value |
|||||||
EQUITIES — 97.1% |
||||||||
COMMON STOCK — 97.1% |
||||||||
Basic Materials — 8.4% |
||||||||
Chemicals — 4.6% |
||||||||
Axalta Coating Systems Ltd. (a) |
13,147 | $ | 276,876 | |||||
Cabot Corp. |
11,161 | 713,076 | ||||||
Element Solutions, Inc. |
26,791 | 435,889 | ||||||
H.B. Fuller Co. |
4,507 | 270,871 | ||||||
Mativ Holdings, Inc. |
17,950 | 396,336 | ||||||
Orion Engineered Carbons SA |
14,166 | 189,116 | ||||||
| 2,282,164 | ||||||||
Iron & Steel — 2.0% |
||||||||
ATI, Inc. (a) |
36,949 | 983,213 | ||||||
Mining — 1.8% |
||||||||
Ferroglobe PLC (a) |
49,318 | 260,399 | ||||||
Kaiser Aluminum Corp. |
10,123 | 621,046 | ||||||
| 881,445 | ||||||||
| 4,146,822 | ||||||||
Communications — 3.8% |
||||||||
Internet — 1.8% |
||||||||
ePlus, Inc. (a) |
6,397 | 265,731 | ||||||
Perficient, Inc. (a) |
20 | 1,300 | ||||||
Shutterstock, Inc. |
6,244 | 313,262 | ||||||
Ziff Davis, Inc. (a) |
4,441 | 304,120 | ||||||
| 884,413 | ||||||||
Media — 0.5% |
||||||||
WideOpenWest, Inc. (a) |
16,979 | 208,332 | ||||||
Telecommunications — 1.5% |
||||||||
Ciena Corp. (a) |
9,344 | 377,778 | ||||||
Infinera Corp. (a) (b) |
76,313 | 369,355 | ||||||
| 747,133 | ||||||||
| 1,839,878 | ||||||||
Consumer, Cyclical — 11.5% |
||||||||
Apparel — 1.6% |
||||||||
Deckers Outdoor Corp. (a) |
1,228 | 383,885 | ||||||
Kontoor Brands, Inc. |
11,260 | 378,449 | ||||||
| 762,334 | ||||||||
Auto Parts & Equipment — 5.2% |
||||||||
Adient PLC (a) |
23,361 | 648,268 | ||||||
American Axle & Manufacturing Holdings, Inc. (a) |
84,879 | 579,724 | ||||||
Gentherm, Inc. (a) |
16,770 | 833,972 | ||||||
Visteon Corp. (a) |
4,503 | 477,588 | ||||||
| 2,539,552 | ||||||||
Food Services — 0.9% |
||||||||
Aramark |
14,871 | 463,975 | ||||||
Number of |
Value |
|||||||
Home Builders — 1.2% |
||||||||
Century Communities, Inc. |
6,502 | $ | 278,155 | |||||
TRI Pointe Homes, Inc. (a) |
19,888 | 300,508 | ||||||
| 578,663 | ||||||||
Lodging — 0.4% |
||||||||
Wyndham Hotels & Resorts, Inc. |
3,146 | 193,007 | ||||||
Office Furnishings — 0.8% |
||||||||
Interface, Inc. |
43,348 | 389,698 | ||||||
Retail — 0.6% |
||||||||
Five Below, Inc. (a) |
2,160 | 297,367 | ||||||
Textiles — 0.8% |
||||||||
UniFirst Corp. |
2,411 | 405,603 | ||||||
| 5,630,199 | ||||||||
Consumer, Non-cyclical — 14.5% |
||||||||
Agriculture — 1.9% |
||||||||
Darling Ingredients, Inc. (a) |
14,016 | 927,159 | ||||||
Beverages — 0.4% |
||||||||
C&C Group PLC (a) |
130,594 | 217,736 | ||||||
Commercial Services — 5.2% |
||||||||
BrightView Holdings, Inc. (a) |
24,156 | 191,799 | ||||||
Huron Consulting Group, Inc. (a) |
8,075 | 534,969 | ||||||
ICF International, Inc. |
2,927 | 319,101 | ||||||
Monro, Inc. |
9,074 | 394,356 | ||||||
Sterling Check Corp. (a) (b) |
15,239 | 268,816 | ||||||
WillScot Mobile Mini Holdings Corp. (a) |
20,246 | 816,521 | ||||||
| 2,525,562 | ||||||||
Food — 2.6% |
||||||||
Cranswick PLC |
8,523 | 254,598 | ||||||
Post Holdings, Inc. (a) |
2,862 | 234,427 | ||||||
SunOpta, Inc. (a) |
53,471 | 486,586 | ||||||
United Natural Foods, Inc. (a) |
8,590 | 295,238 | ||||||
| 1,270,849 | ||||||||
Health Care – Products — 2.4% |
||||||||
Azenta, Inc. |
8,046 | 344,851 | ||||||
Haemonetics Corp. (a) |
6,925 | 512,658 | ||||||
ICU Medical, Inc. (a) |
2,271 | 342,013 | ||||||
| 1,199,522 | ||||||||
Health Care – Services — 0.6% |
||||||||
Syneos Health, Inc. (a) |
6,395 | 301,524 | ||||||
Household Products & Wares — 0.8% |
||||||||
ACCO Brands Corp. |
39,851 | 195,270 | ||||||
Spectrum Brands Holdings, Inc. |
5,201 | 202,995 | ||||||
| 398,265 | ||||||||
The accompanying notes are an integral part of the financial statements.
149
MassMutual Small Cap Value Equity Fund — Portfolio of Investments (Continued) |
Number of |
Value |
|||||||
Pharmaceuticals — 0.6% |
||||||||
Owens & Minor, Inc. |
11,810 | $ | 284,621 | |||||
| 7,125,238 | ||||||||
Energy — 2.0% |
||||||||
Oil & Gas — 1.2% |
||||||||
Brigham Minerals, Inc. Class A |
11,626 | 286,814 | ||||||
Chord Energy Corp. |
2,342 | 320,315 | ||||||
| 607,129 | ||||||||
Oil & Gas Services — 0.8% |
||||||||
NOW, Inc. (a) |
37,377 | 375,639 | ||||||
| 982,768 | ||||||||
Financial — 23.8% |
||||||||
Banks — 12.8% |
||||||||
Atlantic Union Bankshares Corp. |
7,986 | 242,615 | ||||||
Cadence Bank |
11,766 | 298,974 | ||||||
Eastern Bankshares, Inc. |
17,866 | 350,888 | ||||||
First Citizens BancShares, Inc. Class A |
622 | 496,001 | ||||||
First Interstate BancSystem, Inc. Class A |
8,045 | 324,616 | ||||||
Hancock Whitney Corp. |
8,641 | 395,844 | ||||||
International Bancshares Corp. |
9,200 | 391,000 | ||||||
OFG Bancorp |
34,003 | 854,495 | ||||||
Old National Bancorp |
45,684 | 752,416 | ||||||
Synovus Financial Corp. |
8,803 | 330,201 | ||||||
Texas Capital Bancshares, Inc. (a) |
15,314 | 903,985 | ||||||
Umpqua Holdings Corp. |
39,454 | 674,269 | ||||||
Webster Financial Corp. |
6,384 | 288,557 | ||||||
| 6,303,861 | ||||||||
Diversified Financial Services — 0.7% |
||||||||
Air Lease Corp. |
10,652 | 330,319 | ||||||
Insurance — 4.7% |
||||||||
Assured Guaranty Ltd. |
5,579 | 270,302 | ||||||
Kemper Corp. |
9,589 | 395,642 | ||||||
NMI Holdings, Inc. Class A (a) |
19,767 | 402,654 | ||||||
ProAssurance Corp. |
14,210 | 277,237 | ||||||
Reinsurance Group of America, Inc. |
3,526 | 443,606 | ||||||
SiriusPoint Ltd. (a) |
34,165 | 169,117 | ||||||
White Mountains Insurance Group Ltd. |
286 | 372,664 | ||||||
| 2,331,222 | ||||||||
Real Estate — 0.5% |
||||||||
Alexander & Baldwin, Inc. |
15,048 | 249,496 | ||||||
Real Estate Investment Trusts (REITS) — 4.3% |
||||||||
Brandywine Realty Trust |
12,427 | 83,882 | ||||||
Centerspace |
4,268 | 287,322 | ||||||
Global Medical REIT, Inc. |
14,907 | 127,008 | ||||||
LXP Industrial Trust |
22,179 | 203,159 | ||||||
Number of |
Value |
|||||||
Pebblebrook Hotel Trust |
19,323 | $ | 280,377 | |||||
Phillips Edison & Co., Inc. |
10,986 | 308,157 | ||||||
Piedmont Office Realty Trust, Inc. Class A |
27,594 | 291,392 | ||||||
PotlatchDeltic Corp. |
5,769 | 236,760 | ||||||
RPT Realty |
36,728 | 277,664 | ||||||
| 2,095,721 | ||||||||
Savings & Loans — 0.8% |
||||||||
Banc of California, Inc. |
24,609 | 393,006 | ||||||
| 11,703,625 | ||||||||
Industrial — 22.5% |
||||||||
Aerospace & Defense — 0.5% |
||||||||
Hexcel Corp. |
5,285 | 273,340 | ||||||
Building Materials — 3.9% |
||||||||
American Woodmark Corp. (a) |
5,513 | 241,800 | ||||||
Apogee Enterprises, Inc. |
16,872 | 644,848 | ||||||
The AZEK Co., Inc (a) |
7,436 | 123,586 | ||||||
Gibraltar Industries, Inc. (a) |
16,352 | 669,287 | ||||||
Tyman PLC |
98,564 | 215,976 | ||||||
| 1,895,497 | ||||||||
Electrical Components & Equipment — 1.0% |
||||||||
Belden, Inc. |
7,979 | 478,900 | ||||||
Electronics — 3.5% |
||||||||
Coherent Corp. (a) |
19,467 | 678,425 | ||||||
CTS Corp. |
8,746 | 364,271 | ||||||
FARO Technologies, Inc. (a) |
7,787 | 213,675 | ||||||
National Instruments Corp. |
7,154 | 269,992 | ||||||
Vishay Precision Group, Inc. (a) |
6,748 | 199,673 | ||||||
| 1,726,036 | ||||||||
Engineering & Construction — 0.1% |
||||||||
Primoris Services Corp. |
1,934 | 31,428 | ||||||
Environmental Controls — 1.3% |
||||||||
Clean Harbors, Inc. (a) |
3,174 | 349,077 | ||||||
Harsco Corp. (a) |
72,160 | 269,878 | ||||||
| 618,955 | ||||||||
Hand & Machine Tools — 2.9% |
||||||||
Enerpac Tool Group Corp. |
37,637 | 671,068 | ||||||
Kennametal, Inc. |
24,659 | 507,482 | ||||||
Luxfer Holdings PLC |
17,139 | 248,515 | ||||||
| 1,427,065 | ||||||||
Machinery – Diversified — 0.4% |
||||||||
Thermon Group Holdings, Inc. (a) |
13,483 | 207,773 | ||||||
Metal Fabricate & Hardware — 0.6% |
||||||||
Standex International Corp. |
3,893 | 317,863 | ||||||
Miscellaneous - Manufacturing — 1.3% |
||||||||
John Bean Technologies Corp. |
2,881 | 247,766 | ||||||
The accompanying notes are an integral part of the financial statements.
150
MassMutual Small Cap Value Equity Fund — Portfolio of Investments (Continued) |
Number of |
Value |
|||||||
Materion Corp. |
4,931 | $ | 394,480 | |||||
| 642,246 | ||||||||
Packaging & Containers — 1.9% |
||||||||
Sealed Air Corp. |
10,003 | 445,234 | ||||||
TriMas Corp. |
19,587 | 491,046 | ||||||
| 936,280 | ||||||||
Transportation — 3.2% |
||||||||
Air Transport Services Group, Inc. (a) |
32,446 | 781,624 | ||||||
Dorian LPG Ltd. |
10,019 | 135,958 | ||||||
Kirby Corp. (a) |
11,161 | 678,254 | ||||||
| 1,595,836 | ||||||||
Trucking & Leasing — 1.9% |
||||||||
GATX Corp. |
3,571 | 304,071 | ||||||
The Greenbrier Cos., Inc. |
25,178 | 611,070 | ||||||
| 915,141 | ||||||||
| 11,066,360 | ||||||||
Technology — 9.1% |
||||||||
Computers — 3.7% |
||||||||
Science Applications International Corp. |
4,798 | 424,287 | ||||||
Super Micro Computer, Inc. (a) |
17,391 | 957,722 | ||||||
WNS Holdings Ltd. ADR (a) |
5,158 | 422,131 | ||||||
| 1,804,140 | ||||||||
Semiconductors — 3.0% |
||||||||
Cohu, Inc. (a) |
19,986 | 515,239 | ||||||
Diodes, Inc. (a) |
8,046 | 522,266 | ||||||
Photronics, Inc. (a) |
28,812 | 421,231 | ||||||
| 1,458,736 | ||||||||
Software — 2.4% |
||||||||
ACI Worldwide, Inc. (a) |
16,612 | 347,191 | ||||||
Concentrix Corp. |
2,934 | 327,522 | ||||||
Digital Turbine, Inc. (a) |
6,861 | 98,867 | ||||||
Progress Software Corp. |
9,859 | 419,501 | ||||||
| 1,193,081 | ||||||||
| 4,455,957 | ||||||||
Utilities — 1.5% |
||||||||
Gas — 1.5% |
||||||||
New Jersey Resources Corp. |
5,977 | 231,310 | ||||||
Spire, Inc. |
2,796 | 174,275 | ||||||
UGI Corp. |
9,747 | 315,120 | ||||||
| 720,705 | ||||||||
TOTAL COMMON STOCK (Cost $47,608,592) |
47,671,552 | |||||||
TOTAL EQUITIES (Cost $47,608,592) |
47,671,552 | |||||||
Number of |
Value |
|||||||
MUTUAL FUNDS — 0.5% |
||||||||
Diversified Financial Services — 0.5% |
||||||||
State Street Navigator Securities Lending Government Money Market Portfolio (c) |
246,505 | $ | 246,505 | |||||
TOTAL MUTUAL FUNDS (Cost $246,505) |
246,505 | |||||||
TOTAL LONG-TERM INVESTMENTS (Cost $47,855,097) |
47,918,057 | |||||||
Principal |
||||||||
SHORT-TERM INVESTMENTS — 4.7% |
||||||||
Repurchase Agreement — 4.7% |
||||||||
Fixed Income Clearing Corp., Repurchase Agreement, dated 9/30/22, 0.830%, due 10/03/22 (d) |
$ | 2,276,333 | 2,276,333 | |||||
TOTAL SHORT-TERM INVESTMENTS (Cost $2,276,333) |
2,276,333 | |||||||
TOTAL INVESTMENTS — 102.3% (Cost $50,131,430) (e) |
50,194,390 | |||||||
Other Assets/(Liabilities) — (2.3)% |
(1,105,874 | ) | ||||||
NET ASSETS — 100.0% |
$ | 49,088,516 | ||||||
Abbreviation Legend
|
ADR |
American Depositary Receipt |
Notes to Portfolio of Investments
Percentages are stated as a percent of net assets.
|
(a) |
Non-income producing security. |
|
(b) |
Denotes all or a portion of security on loan. The total value of securities on loan as of September 30, 2022, was $504,280 or 1.03% of net assets. The Fund received $272,858 of non-cash collateral (U.S. Treasury and/or Agency obligations) related to securities lending activity. This amount is not reflected on either the Portfolio of Investments or the Statement of Assets and Liabilities. (Note 2). |
|
(c) |
Represents investment of security lending cash collateral. (Note 2). |
|
(d) |
Maturity value of $2,276,491. Collateralized by U.S. Government Agency obligations with a rate of 0.000%, maturity date of 3/30/23, and an aggregate market value, including accrued interest, of $2,322,019. |
|
(e) |
See Note 6 for aggregate cost for federal tax purposes. |
The accompanying notes are an integral part of the financial statements.
151
MassMutual Small Company Value Fund — Portfolio of Investments |
September 30, 2022 |
Number of |
Value |
|||||||
EQUITIES — 99.3% |
||||||||
COMMON STOCK — 99.3% |
||||||||
Basic Materials — 3.3% |
||||||||
Chemicals — 2.4% |
||||||||
AdvanSix, Inc. |
41,060 | $ | 1,318,026 | |||||
Element Solutions, Inc. |
21,814 | 354,914 | ||||||
H.B. Fuller Co. |
23,950 | 1,439,395 | ||||||
Innospec, Inc. |
10,460 | 896,108 | ||||||
Minerals Technologies, Inc. |
12,451 | 615,204 | ||||||
| 4,623,647 | ||||||||
Iron & Steel — 0.9% |
||||||||
ATI, Inc. (a) |
66,736 | 1,775,845 | ||||||
| 6,399,492 | ||||||||
Communications — 2.2% |
||||||||
Advertising — 0.2% |
||||||||
Entravision Communications Corp. Class A |
100,543 | 399,156 | ||||||
Internet — 0.9% |
||||||||
Criteo SA Sponsored ADR (a) |
63,861 | 1,726,163 | ||||||
Solo Brands, Inc. Class A (a) |
28,928 | 109,926 | ||||||
| 1,836,089 | ||||||||
Media — 0.1% |
||||||||
Townsquare Media, Inc. Class A (a) |
11,915 | 86,503 | ||||||
Telecommunications — 1.0% |
||||||||
A10 Networks, Inc. |
99,309 | 1,317,831 | ||||||
Casa Systems, Inc. (a) |
203,780 | 637,831 | ||||||
| 1,955,662 | ||||||||
| 4,277,410 | ||||||||
Consumer, Cyclical — 17.2% |
||||||||
Airlines — 0.6% |
||||||||
Alaska Air Group, Inc. (a) |
30,160 | 1,180,764 | ||||||
Apparel — 0.6% |
||||||||
Tapestry, Inc. |
42,015 | 1,194,486 | ||||||
Auto Manufacturers — 1.2% |
||||||||
Blue Bird Corp. (a) (b) |
81,556 | 680,993 | ||||||
REV Group, Inc. |
149,770 | 1,651,963 | ||||||
| 2,332,956 | ||||||||
Auto Parts & Equipment — 2.3% |
||||||||
Dana, Inc. |
102,086 | 1,166,843 | ||||||
The Goodyear Tire & Rubber Co. (a) |
174,550 | 1,761,210 | ||||||
The Shyft Group, Inc. |
77,098 | 1,575,112 | ||||||
| 4,503,165 | ||||||||
Distribution & Wholesale — 1.1% |
||||||||
A-Mark Precious Metals, Inc. |
16,449 | 466,987 | ||||||
H&E Equipment Services, Inc. |
44,448 | 1,259,656 | ||||||
Number of |
Value |
|||||||
KAR Auction Services, Inc. (a) |
37,063 | $ | 413,994 | |||||
| 2,140,637 | ||||||||
Entertainment — 1.6% |
||||||||
Accel Entertainment, Inc. (a) |
51,853 | 404,972 | ||||||
IMAX Corp. (a) |
89,000 | 1,256,680 | ||||||
Penn Entertainment ,Inc. (a) |
9,281 | 255,320 | ||||||
Six Flags Entertainment Corp. (a) (b) |
66,710 | 1,180,767 | ||||||
| 3,097,739 | ||||||||
Home Builders — 2.3% |
||||||||
KB Home |
56,280 | 1,458,778 | ||||||
Skyline Champion Corp. (a) |
21,045 | 1,112,649 | ||||||
Taylor Morrison Home Corp. (a) |
81,539 | 1,901,489 | ||||||
| 4,472,916 | ||||||||
Home Furnishing — 0.1% |
||||||||
MillerKnoll, Inc. |
12,905 | 201,318 | ||||||
Vizio Holding Corp. Class A (a) (b) |
13,267 | 115,954 | ||||||
| 317,272 | ||||||||
Leisure Time — 1.2% |
||||||||
Brunswick Corp. |
17,118 | 1,120,373 | ||||||
Malibu Boats, Inc. Class A (a) |
12,851 | 616,720 | ||||||
OneWater Marine, Inc. Class A (a) |
17,981 | 541,408 | ||||||
| 2,278,501 | ||||||||
Lodging — 0.7% |
||||||||
Boyd Gaming Corp. |
5,690 | 271,128 | ||||||
Hilton Grand Vacations, Inc. (a) |
33,310 | 1,095,566 | ||||||
| 1,366,694 | ||||||||
Retail — 5.4% |
||||||||
Beacon Roofing Supply, Inc. (a) |
18,090 | 989,885 | ||||||
Citi Trends, Inc. (a) |
43,009 | 667,070 | ||||||
Dave & Buster’s Entertainment, Inc. (a) |
15,340 | 476,000 | ||||||
Dine Brands Global, Inc. |
24,190 | 1,537,516 | ||||||
Genesco, Inc. (a) |
26,980 | 1,060,854 | ||||||
GMS, Inc. (a) |
18,009 | 720,540 | ||||||
MarineMax, Inc. (a) |
19,564 | 582,812 | ||||||
Papa John’s International, Inc. |
19,220 | 1,345,592 | ||||||
Penske Automotive Group, Inc. |
10,966 | 1,079,383 | ||||||
Red Robin Gourmet Burgers, Inc. (a) |
23,754 | 159,864 | ||||||
RH (a) |
1,401 | 344,744 | ||||||
Sally Beauty Holdings, Inc. (a) |
134,460 | 1,694,196 | ||||||
| 10,658,456 | ||||||||
Textiles — 0.1% |
||||||||
UniFirst Corp. |
685 | 115,238 | ||||||
| 33,658,824 | ||||||||
The accompanying notes are an integral part of the financial statements.
152
MassMutual Small Company Value Fund — Portfolio of Investments (Continued) |
Number of |
Value |
|||||||
Consumer, Non-cyclical — 11.6% |
||||||||
Commercial Services — 5.2% |
||||||||
Adtalem Global Education, Inc. (a) |
48,619 | $ | 1,772,163 | |||||
AMN Healthcare Services, Inc. (a) |
2,627 | 278,357 | ||||||
Barrett Business Services, Inc. |
4,781 | 372,918 | ||||||
The Brink’s Co. |
23,923 | 1,158,830 | ||||||
Deluxe Corp. |
29,106 | 484,615 | ||||||
Euronet Worldwide, Inc. (a) |
4,079 | 309,025 | ||||||
EVERTEC, Inc. |
42,525 | 1,333,159 | ||||||
Herc Holdings, Inc. |
18,054 | 1,875,449 | ||||||
Korn Ferry |
43,753 | 2,054,203 | ||||||
Loomis AB |
19,207 | 471,324 | ||||||
| 10,110,043 | ||||||||
Cosmetics & Personal Care — 0.6% |
||||||||
Edgewell Personal Care Co. |
31,718 | 1,186,253 | ||||||
Food — 1.4% |
||||||||
The Hain Celestial Group, Inc. (a) |
80,584 | 1,360,258 | ||||||
Nomad Foods Ltd. (a) |
104,388 | 1,482,310 | ||||||
| 2,842,568 | ||||||||
Health Care – Products — 1.2% |
||||||||
Integra LifeSciences Holdings Corp. (a) |
35,660 | 1,510,558 | ||||||
Patterson Cos., Inc. |
28,072 | 674,289 | ||||||
Zimvie, Inc. (a) |
9,842 | 97,141 | ||||||
| 2,281,988 | ||||||||
Health Care – Services — 2.5% |
||||||||
Acadia Healthcare Co., Inc. (a) |
27,220 | 2,128,059 | ||||||
National HealthCare Corp. |
576 | 36,484 | ||||||
Pediatrix Medical Group, Inc. (a) |
94,880 | 1,566,469 | ||||||
Syneos Health, Inc. (a) |
25,460 | 1,200,439 | ||||||
| 4,931,451 | ||||||||
Household Products & Wares — 0.5% |
||||||||
Spectrum Brands Holdings, Inc. |
24,977 | 974,852 | ||||||
Pharmaceuticals — 0.2% |
||||||||
Embecta Corp. |
15,817 | 455,371 | ||||||
| 22,782,526 | ||||||||
Energy — 3.7% |
||||||||
Energy – Alternate Sources — 0.2% |
||||||||
Enviva, Inc. |
7,804 | 468,708 | ||||||
Oil & Gas — 3.0% |
||||||||
Earthstone Energy, Inc. Class A (a) (b) |
12,162 | 149,836 | ||||||
Helmerich & Payne, Inc. |
48,800 | 1,804,136 | ||||||
HF Sinclair Corp. |
35,240 | 1,897,322 | ||||||
Magnolia Oil & Gas Corp. Class A |
97,320 | 1,927,909 | ||||||
| 5,779,203 | ||||||||
Oil & Gas Services — 0.5% |
||||||||
ChampionX Corp. |
50,659 | 991,396 | ||||||
Number of |
Value |
|||||||
NCS Multistage Holdings, Inc. (a) |
897 | $ | 19,510 | |||||
| 1,010,906 | ||||||||
| 7,258,817 | ||||||||
Financial — 36.9% |
||||||||
Banks — 21.3% |
||||||||
1st Source Corp. |
31,748 | 1,469,932 | ||||||
Ameris Bancorp |
21,164 | 946,242 | ||||||
Associated Banc-Corp. |
103,929 | 2,086,894 | ||||||
Bank of Marin Bancorp |
28,346 | 848,963 | ||||||
BankUnited, Inc. |
86,767 | 2,964,828 | ||||||
Carter Bankshares, Inc. (a) |
66,675 | 1,073,468 | ||||||
ConnectOne Bancorp, Inc. |
14,238 | 328,328 | ||||||
F.N.B. Corp. |
113,316 | 1,314,466 | ||||||
First BanCorp |
272,540 | 3,728,347 | ||||||
First Hawaiian, Inc. |
3,844 | 94,678 | ||||||
First Interstate BancSystem, Inc. Class A |
10,886 | 439,250 | ||||||
First Merchants Corp. |
6,492 | 251,111 | ||||||
First Mid Bancshares, Inc. |
4,018 | 128,455 | ||||||
HarborOne Bancorp, Inc. |
125,437 | 1,683,365 | ||||||
Heritage Financial Corp. |
78,132 | 2,068,154 | ||||||
Home BancShares, Inc. |
46,070 | 1,037,036 | ||||||
Independent Bank Corp. |
1,680 | 125,210 | ||||||
Independent Bank Group, Inc. |
35,592 | 2,184,993 | ||||||
Old National Bancorp |
86,890 | 1,431,078 | ||||||
Origin Bancorp, Inc. |
8,957 | 344,576 | ||||||
PacWest Bancorp |
9,714 | 219,536 | ||||||
Premier Financial Corp. |
65,598 | 1,685,869 | ||||||
QCR Holdings, Inc. |
5,227 | 266,263 | ||||||
Sandy Spring Bancorp, Inc. |
36,129 | 1,273,909 | ||||||
SouthState Corp. |
17,300 | 1,368,776 | ||||||
Synovus Financial Corp. |
45,377 | 1,702,091 | ||||||
Texas Capital Bancshares, Inc. (a) |
38,700 | 2,284,461 | ||||||
Towne Bank |
12,529 | 336,153 | ||||||
TriCo Bancshares |
42,678 | 1,905,573 | ||||||
UMB Financial Corp. |
15,201 | 1,281,292 | ||||||
Umpqua Holdings Corp. |
76,284 | 1,303,694 | ||||||
Valley National Bancorp |
95,849 | 1,035,169 | ||||||
Veritex Holdings, Inc. |
24,711 | 657,066 | ||||||
Webster Financial Corp. |
40,202 | 1,817,130 | ||||||
| 41,686,356 | ||||||||
Diversified Financial Services — 1.4% |
||||||||
Enact Holdings, Inc. |
4,304 | 95,420 | ||||||
Moelis & Co. Class A |
45,851 | 1,550,222 | ||||||
Stifel Financial Corp. |
19,945 | 1,035,345 | ||||||
| 2,680,987 | ||||||||
Insurance — 2.8% |
||||||||
Axis Capital Holdings Ltd. |
21,104 | 1,037,261 | ||||||
The accompanying notes are an integral part of the financial statements.
153
MassMutual Small Company Value Fund — Portfolio of Investments (Continued) |
Number of |
Value |
|||||||
The Hanover Insurance Group, Inc. |
14,370 | $ | 1,841,372 | |||||
ProAssurance Corp. |
14,631 | 285,451 | ||||||
Selective Insurance Group, Inc. |
27,762 | 2,259,827 | ||||||
| 5,423,911 | ||||||||
Investment Companies — 0.5% |
||||||||
Compass Diversified Holdings (b) |
60,272 | 1,088,512 | ||||||
Private Equity — 0.1% |
||||||||
Patria Investments Ltd. Class A |
14,892 | 194,341 | ||||||
Real Estate Investment Trusts (REITS) — 7.1% |
||||||||
Broadstone Net Lease, Inc. (b) |
99,420 | 1,543,993 | ||||||
CareTrust REIT, Inc. |
24,056 | 435,654 | ||||||
Cousins Properties, Inc. |
49,979 | 1,167,010 | ||||||
Easterly Government Properties, Inc. |
14,287 | 225,306 | ||||||
Four Corners Property Trust, Inc. |
22,365 | 541,009 | ||||||
Getty Realty Corp. |
10,417 | 280,113 | ||||||
Highwoods Properties, Inc. |
8,706 | 234,714 | ||||||
Independence Realty Trust, Inc. |
111,740 | 1,869,410 | ||||||
Kite Realty Group Trust |
27,803 | 478,768 | ||||||
National Health Investors, Inc. |
7,631 | 431,380 | ||||||
National Storage Affiliates Trust |
30,354 | 1,262,119 | ||||||
NETSTREIT Corp. (b) |
86,362 | 1,538,107 | ||||||
Physicians Realty Trust |
136,124 | 2,047,305 | ||||||
Sabra Health Care REIT, Inc. |
15,326 | 201,077 | ||||||
STAG Industrial, Inc. |
49,348 | 1,402,964 | ||||||
Summit Hotel Properties, Inc. |
34,808 | 233,910 | ||||||
| 13,892,839 | ||||||||
Savings & Loans — 3.7% |
||||||||
Berkshire Hills Bancorp, Inc. |
75,280 | 2,055,144 | ||||||
Pacific Premier Bancorp, Inc. |
92,162 | 2,853,336 | ||||||
Provident Financial Services, Inc. |
15,803 | 308,158 | ||||||
WSFS Financial Corp. |
43,836 | 2,036,621 | ||||||
| 7,253,259 | ||||||||
| 72,220,205 | ||||||||
Industrial — 16.2% |
||||||||
Aerospace & Defense — 0.4% |
||||||||
Spirit AeroSystems Holdings, Inc. Class A |
35,840 | 785,613 | ||||||
Building Materials — 1.4% |
||||||||
Hayward Holdings, Inc. (a) |
38,530 | 341,761 | ||||||
Masonite International Corp. (a) |
19,907 | 1,419,170 | ||||||
Mohawk Industries, Inc. (a) |
3,939 | 359,198 | ||||||
Tecnoglass, Inc. |
28,276 | 593,513 | ||||||
| 2,713,642 | ||||||||
Electrical Components & Equipment — 1.2% |
||||||||
Belden, Inc. |
38,409 | 2,305,308 | ||||||
Graham Corp. |
10,385 | 91,284 | ||||||
| 2,396,592 | ||||||||
Number of |
Value |
|||||||
Electronics — 2.7% |
||||||||
Advanced Energy Industries, Inc. |
3,235 | $ | 250,421 | |||||
Avnet, Inc. |
32,453 | 1,172,202 | ||||||
Coherent Corp. (a) |
39,641 | 1,381,489 | ||||||
RADA Electronic Industries Ltd. (a) |
7,692 | 74,074 | ||||||
TTM Technologies, Inc. (a) |
149,540 | 1,970,937 | ||||||
Vontier Corp. |
28,198 | 471,189 | ||||||
| 5,320,312 | ||||||||
Engineering & Construction — 2.8% |
||||||||
Arcosa, Inc. |
34,760 | 1,987,577 | ||||||
Dycom Industries, Inc. (a) |
20,143 | 1,924,261 | ||||||
Fluor Corp. (a) |
23,880 | 594,373 | ||||||
Great Lakes Dredge & Dock Corp. (a) |
139,940 | 1,060,745 | ||||||
| 5,566,956 | ||||||||
Environmental Controls — 0.1% |
||||||||
CECO Environmental Corp. (a) |
17,463 | 154,547 | ||||||
Charah Solutions, Inc. (a) (b) |
29,837 | 54,602 | ||||||
| 209,149 | ||||||||
Hand & Machine Tools — 0.1% |
||||||||
Luxfer Holdings PLC |
10,396 | 150,742 | ||||||
Machinery – Construction & Mining — 0.7% |
||||||||
Terex Corp. |
45,649 | 1,357,601 | ||||||
Machinery – Diversified — 2.4% |
||||||||
Cactus, Inc. Class A |
32,650 | 1,254,740 | ||||||
DXP Enterprises, Inc. (a) |
11,209 | 265,429 | ||||||
Enovis Corp. (a) |
14,528 | 669,305 | ||||||
Esab Corp. |
10,923 | 364,391 | ||||||
Gates Industrial Corp. PLC (a) |
72,474 | 707,346 | ||||||
Ichor Holdings Ltd. (a) |
58,200 | 1,409,022 | ||||||
| 4,670,233 | ||||||||
Metal Fabricate & Hardware — 0.9% |
||||||||
Hillman Solutions Corp. (a) |
26,839 | 202,366 | ||||||
The Timken Co. |
25,178 | 1,486,509 | ||||||
| 1,688,875 | ||||||||
Miscellaneous - Manufacturing — 0.0% |
||||||||
DIRTT Environmental Solutions (a) |
61,401 | 26,403 | ||||||
Packaging & Containers — 1.1% |
||||||||
Graphic Packaging Holding Co. |
55,539 | 1,096,340 | ||||||
Karat Packaging, Inc. (a) |
5,242 | 83,820 | ||||||
O-I Glass, Inc. (a) |
40,691 | 526,948 | ||||||
Pactiv Evergreen, Inc. |
60,333 | 526,707 | ||||||
| 2,233,815 | ||||||||
Transportation — 2.4% |
||||||||
ArcBest Corp. |
30,780 | 2,238,630 | ||||||
Kirby Corp. (a) |
18,820 | 1,143,691 | ||||||
The accompanying notes are an integral part of the financial statements.
154
MassMutual Small Company Value Fund — Portfolio of Investments (Continued) |
Number of |
Value |
|||||||
Star Bulk Carriers Corp. |
76,510 | $ | 1,337,395 | |||||
| 4,719,716 | ||||||||
| 31,839,649 | ||||||||
Technology — 5.9% |
||||||||
Computers — 0.3% |
||||||||
Unisys Corp. (a) |
80,062 | 604,468 | ||||||
Semiconductors — 1.8% |
||||||||
Cohu, Inc. (a) |
21,603 | 556,926 | ||||||
Kulicke & Soffa Industries, Inc. |
48,172 | 1,856,067 | ||||||
Magnachip Semiconductor Corp. (a) |
107,980 | 1,105,715 | ||||||
| 3,518,708 | ||||||||
Software — 3.8% |
||||||||
ACI Worldwide, Inc. (a) |
59,970 | 1,253,373 | ||||||
Change Healthcare, Inc. (a) |
85,640 | 2,354,244 | ||||||
CommVault Systems, Inc. (a) |
23,197 | 1,230,369 | ||||||
Digital Turbine, Inc. (a) |
16,064 | 231,482 | ||||||
Donnelley Financial Solutions, Inc. (a) |
19,314 | 714,038 | ||||||
IBEX Holdings Ltd. (a) |
10,326 | 191,754 | ||||||
Teradata Corp. (a) |
44,637 | 1,386,425 | ||||||
| 7,361,685 | ||||||||
| 11,484,861 | ||||||||
Utilities — 2.3% |
||||||||
Electric — 1.4% |
||||||||
ALLETE, Inc. |
4,748 | 237,637 | ||||||
IDACORP, Inc. |
22,120 | 2,190,101 | ||||||
PNM Resources, Inc. |
5,924 | 270,905 | ||||||
| 2,698,643 | ||||||||
Gas — 0.9% |
||||||||
Northwest Natural Holding Co. |
3,063 | 132,873 | ||||||
Southwest Gas Holdings, Inc. |
23,961 | 1,671,280 | ||||||
| 1,804,153 | ||||||||
| 4,502,796 | ||||||||
TOTAL COMMON STOCK (Cost $219,991,062) |
194,424,580 | |||||||
TOTAL EQUITIES (Cost $219,991,062) |
194,424,580 | |||||||
Number of |
Value |
|||||||
MUTUAL FUNDS — 1.6% |
||||||||
Diversified Financial Services — 1.6% |
||||||||
State Street Navigator Securities Lending Government Money Market Portfolio (c) |
3,166,453 | $ | 3,166,453 | |||||
TOTAL MUTUAL FUNDS (Cost $3,166,453) |
3,166,453 | |||||||
TOTAL LONG-TERM INVESTMENTS (Cost $223,157,515) |
197,591,033 | |||||||
Principal |
||||||||
SHORT-TERM INVESTMENTS — 0.8% |
||||||||
Repurchase Agreement — 0.8% |
||||||||
Fixed Income Clearing Corp., Repurchase Agreement, dated 9/30/22, 0.830%, due 10/03/22 (d) |
$ | 1,594,316 | 1,594,316 | |||||
TOTAL SHORT-TERM INVESTMENTS (Cost $1,594,316) |
1,594,316 | |||||||
TOTAL INVESTMENTS — 101.7% (Cost $224,751,831) (e) |
199,185,349 | |||||||
Other Assets/(Liabilities) — (1.7)% |
(3,300,238 | ) | ||||||
NET ASSETS — 100.0% |
$ | 195,885,111 | ||||||
Abbreviation Legend
|
ADR |
American Depositary Receipt |
Notes to Portfolio of Investments
Percentages are stated as a percent of net assets.
|
(a) |
Non-income producing security. |
|
(b) |
Denotes all or a portion of security on loan. The total value of securities on loan as of September 30, 2022, was $5,492,315 or 2.80% of net assets. The Fund received $2,469,247 of non-cash collateral (U.S. Treasury and/or Agency obligations) related to securities lending activity. This amount is not reflected on either the Portfolio of Investments or the Statement of Assets and Liabilities. (Note 2). |
|
(c) |
Represents investment of security lending cash collateral. (Note 2). |
|
(d) |
Maturity value of $1,594,427. Collateralized by U.S. Government Agency obligations with a rate of 3.500%, maturity date of 9/15/25, and an aggregate market value, including accrued interest, of $1,626,300. |
|
(e) |
See Note 6 for aggregate cost for federal tax purposes. |
The accompanying notes are an integral part of the financial statements.
155
MassMutual Small Company Value Fund — Portfolio of Investments (Continued) |
Forward contracts
Counterparty |
Settlement |
Currency Purchased |
Currency Sold |
Unrealized |
||||||||||||||||||||
UBS AG |
12/30/22 | SEK | 124,077 | USD | 11,106 | $ | 141 | |||||||||||||||||
UBS AG |
12/30/22 | USD | 404,183 | SEK | 4,554,940 | (8,696 | ) | |||||||||||||||||
| $ | (8,555 | ) | ||||||||||||||||||||||
Currency Legend
|
SEK |
Swedish Krona |
|
USD |
U.S. Dollar |
The accompanying notes are an integral part of the financial statements.
156
September 30, 2022 |
Number of |
Value |
|||||||
EQUITIES — 96.5% |
||||||||
COMMON STOCK — 95.9% |
||||||||
Basic Materials — 0.8% |
||||||||
Chemicals — 0.8% |
||||||||
RPM International, Inc. |
371,000 | $ | 30,908,010 | |||||
The Sherwin-Williams Co. |
54,305 | 11,118,949 | ||||||
| 42,026,959 | ||||||||
| 42,026,959 | ||||||||
Communications — 4.5% |
||||||||
Advertising — 1.2% |
||||||||
The Trade Desk, Inc. Class A (a) |
1,018,069 | 60,829,623 | ||||||
Internet — 1.8% |
||||||||
Chewy, Inc. Class A (a) (b) |
183,563 | 5,639,055 | ||||||
Lyft, Inc. Class A (a) |
342,525 | 4,511,054 | ||||||
Match Group, Inc. (a) |
225,000 | 10,743,750 | ||||||
Okta, Inc. (a) |
132,869 | 7,556,260 | ||||||
Palo Alto Networks, Inc. (a) |
245,967 | 40,286,935 | ||||||
Roku, Inc. (a) (b) |
99,692 | 5,622,629 | ||||||
Spotify Technology SA (a) |
200,000 | 17,260,000 | ||||||
| 91,619,683 | ||||||||
Media — 0.8% |
||||||||
Liberty Media Corp-Liberty Formula One Class C (a) |
644,000 | 37,674,000 | ||||||
Telecommunications — 0.7% |
||||||||
Arista Networks, Inc. (a) |
154,342 | 17,423,669 | ||||||
Corning, Inc. |
665,000 | 19,298,300 | ||||||
| 36,721,969 | ||||||||
| 226,845,275 | ||||||||
Consumer, Cyclical — 15.4% |
||||||||
Airlines — 0.8% |
||||||||
Azul SA ADR (a) (b) |
250,624 | 2,040,079 | ||||||
Southwest Airlines Co. (a) |
1,258,000 | 38,796,720 | ||||||
| 40,836,799 | ||||||||
Apparel — 0.2% |
||||||||
Deckers Outdoor Corp. (a) |
37,000 | 11,566,570 | ||||||
On Holding AG, Class A (a) |
105,000 | 1,685,250 | ||||||
| 13,251,820 | ||||||||
Auto Manufacturers — 0.3% |
||||||||
Rivian Automotive, Inc. Class A (a) (b) |
453,462 | 14,923,434 | ||||||
Auto Parts & Equipment — 0.0% |
||||||||
BorgWarner, Inc. |
6,769 | 212,547 | ||||||
Entertainment — 1.5% |
||||||||
Caesars Entertainment, Inc. (a) |
600,481 | 19,371,517 | ||||||
DraftKings, Inc. Class A (a) |
602,000 | 9,114,280 | ||||||
Live Nation Entertainment, Inc. (a) |
303,063 | 23,044,911 | ||||||
Number of |
Value |
|||||||
Vail Resorts, Inc. |
112,000 | $ | 24,151,680 | |||||
| 75,682,388 | ||||||||
Leisure Time — 0.4% |
||||||||
Planet Fitness, Inc. Class A (a) |
332,039 | 19,145,369 | ||||||
Lodging — 2.0% |
||||||||
Hilton Worldwide Holdings, Inc. |
502,000 | 60,551,240 | ||||||
MGM Resorts International |
1,360,000 | 40,419,200 | ||||||
| 100,970,440 | ||||||||
Retail — 9.3% |
||||||||
Advance Auto Parts, Inc. |
84,183 | 13,161,170 | ||||||
Bath & Body Works, Inc. |
599,000 | 19,527,400 | ||||||
Burlington Stores, Inc. (a) |
448,204 | 50,149,546 | ||||||
Carvana Co. (a) (b) |
40,237 | 816,811 | ||||||
Casey’s General Stores, Inc. |
225,000 | 45,567,000 | ||||||
Chipotle Mexican Grill, Inc. (a) |
44,780 | 67,293,593 | ||||||
Darden Restaurants, Inc. |
83,510 | 10,548,983 | ||||||
Dollar General Corp. |
312,816 | 75,032,046 | ||||||
Dollar Tree, Inc. (a) |
299,000 | 40,693,900 | ||||||
Domino’s Pizza, Inc. |
90,000 | 27,918,000 | ||||||
Five Below, Inc. (a) |
150,000 | 20,650,500 | ||||||
Floor & Decor Holdings, Inc. Class A (a) |
78,600 | 5,522,436 | ||||||
Leslie’s, Inc. (a) (b) |
808,675 | 11,895,609 | ||||||
Lululemon Athletica, Inc. (a) |
29,000 | 8,107,240 | ||||||
O’Reilly Automotive, Inc. (a) |
72,212 | 50,790,310 | ||||||
Ross Stores, Inc. |
329,397 | 27,758,285 | ||||||
Warby Parker, Inc. Class A (a) |
150,000 | 2,001,000 | ||||||
Yum! Brands, Inc. |
19,000 | 2,020,460 | ||||||
| 479,454,289 | ||||||||
Toys, Games & Hobbies — 0.9% |
||||||||
Mattel, Inc. (a) |
2,362,376 | 44,743,401 | ||||||
| 789,220,487 | ||||||||
Consumer, Non-cyclical — 29.9% |
||||||||
Beverages — 0.4% |
||||||||
The Boston Beer Co., Inc. Class A (a) |
60,000 | 19,419,000 | ||||||
Biotechnology — 3.7% |
||||||||
Alnylam Pharmaceuticals, Inc. (a) |
237,000 | 47,437,920 | ||||||
Apellis Pharmaceuticals, Inc. (a) |
127,000 | 8,674,100 | ||||||
Argenx SE ADR (a) |
97,000 | 34,245,850 | ||||||
BioMarin Pharmaceutical, Inc. (a) |
88,633 | 7,513,419 | ||||||
CRISPR Therapeutics AG (a) (b) |
90,152 | 5,891,433 | ||||||
Exelixis, Inc. (a) |
352,000 | 5,519,360 | ||||||
Horizon Therapeutics PLC (a) |
148,950 | 9,218,516 | ||||||
Illumina, Inc. (a) |
17,020 | 3,247,246 | ||||||
Ionis Pharmaceuticals, Inc. (a) |
629,000 | 27,820,670 | ||||||
Karuna Therapeutics, Inc. (a) |
20,809 | 4,680,568 | ||||||
Moderna, Inc. (a) |
43,077 | 5,093,855 | ||||||
Sarepta Therapeutics, Inc. (a) |
76,842 | 8,494,115 | ||||||
The accompanying notes are an integral part of the financial statements.
157
MassMutual Mid Cap Growth Fund — Portfolio of Investments (Continued) |
Number of |
Value |
|||||||
Seagen, Inc. (a) |
120,000 | $ | 16,419,600 | |||||
Ultragenyx Pharmaceutical, Inc. (a) |
101,000 | 4,182,410 | ||||||
| 188,439,062 | ||||||||
Commercial Services — 8.4% |
||||||||
Block, Inc. (a) |
191,326 | 10,521,017 | ||||||
Bright Horizons Family Solutions, Inc. (a) |
428,464 | 24,700,950 | ||||||
Cintas Corp. |
77,038 | 29,905,381 | ||||||
Clarivate PLC (a) |
1,499,000 | 14,075,610 | ||||||
CoStar Group, Inc. (a) |
607,000 | 42,277,550 | ||||||
Dlocal Ltd. (a) (b) |
466,908 | 9,580,952 | ||||||
Equifax, Inc. |
288,263 | 49,416,926 | ||||||
FleetCor Technologies, Inc. (a) |
262,000 | 46,156,540 | ||||||
Global Payments, Inc. |
163,619 | 17,679,033 | ||||||
MarketAxess Holdings, Inc. |
150,000 | 33,373,500 | ||||||
Moody’s Corp. |
26,854 | 6,528,476 | ||||||
Multiplan Corp. (a) (b) |
2,475,000 | 7,078,500 | ||||||
Paylocity Holding Corp. (a) |
117,000 | 28,264,860 | ||||||
Quanta Services, Inc. |
146,648 | 18,681,489 | ||||||
TransUnion |
683,609 | 40,667,899 | ||||||
United Rentals, Inc. (a) |
60,000 | 16,207,200 | ||||||
Verisk Analytics, Inc. |
210,000 | 35,811,300 | ||||||
| 430,927,183 | ||||||||
Cosmetics & Personal Care — 0.0% |
||||||||
Olaplex Holdings, Inc. (a) (b) |
122,982 | 1,174,478 | ||||||
Food — 0.4% |
||||||||
TreeHouse Foods, Inc. (a) |
424,000 | 17,986,080 | ||||||
Health Care – Products — 10.6% |
||||||||
Alcon, Inc. |
660,367 | 38,420,152 | ||||||
Align Technology, Inc. (a) |
32,357 | 6,701,458 | ||||||
Avantor, Inc. (a) |
2,472,000 | 48,451,200 | ||||||
Bruker Corp. |
1,030,000 | 54,651,800 | ||||||
The Cooper Cos., Inc. |
178,000 | 46,974,200 | ||||||
Edwards Lifesciences Corp. (a) |
66,387 | 5,485,558 | ||||||
Exact Sciences Corp. (a) |
325,377 | 10,571,499 | ||||||
Hologic, Inc. (a) |
1,952,600 | 125,981,752 | ||||||
ICU Medical, Inc. (a) |
132,000 | 19,879,200 | ||||||
IDEXX Laboratories, Inc. (a) |
35,938 | 11,708,600 | ||||||
Inspire Medical Systems, Inc. (a) |
37,329 | 6,621,045 | ||||||
Insulet Corp. (a) |
61,826 | 14,182,885 | ||||||
Novocure Ltd. (a) (b) |
72,685 | 5,522,606 | ||||||
Quidelortho Corp. (a) |
334,000 | 23,874,320 | ||||||
ResMed, Inc. |
20,610 | 4,499,163 | ||||||
Teleflex, Inc. |
442,220 | 89,089,641 | ||||||
West Pharmaceutical Services, Inc. |
120,000 | 29,529,600 | ||||||
| 542,144,679 | ||||||||
Health Care – Services — 4.3% |
||||||||
Acadia Healthcare Co., Inc. (a) |
724,000 | 56,602,320 | ||||||
Number of |
Value |
|||||||
agilon health, Inc. (a) |
195,000 | $ | 4,566,900 | |||||
Amedisys, Inc. (a) |
114,612 | 11,093,295 | ||||||
Catalent, Inc. (a) |
794,000 | 57,453,840 | ||||||
Humana, Inc. |
47,919 | 23,249,820 | ||||||
Molina Healthcare, Inc. (a) |
131,432 | 43,351,531 | ||||||
Signify Health, Inc. Class A (a) |
885,357 | 25,808,157 | ||||||
| 222,125,863 | ||||||||
Household Products & Wares — 1.2% |
||||||||
Avery Dennison Corp. |
281,000 | 45,718,700 | ||||||
Reynolds Consumer Products, Inc. (b) |
615,000 | 15,996,150 | ||||||
| 61,714,850 | ||||||||
Pharmaceuticals — 0.9% |
||||||||
Alkermes PLC (a) |
336,000 | 7,502,880 | ||||||
Ascendis Pharma A/S ADR (a) (b) |
35,000 | 3,614,100 | ||||||
Dentsply Sirona, Inc. |
300,000 | 8,505,000 | ||||||
DexCom, Inc. (a) |
182,960 | 14,735,598 | ||||||
Neurocrine Biosciences, Inc. (a) |
75,000 | 7,965,750 | ||||||
Perrigo Co. PLC |
131,000 | 4,671,460 | ||||||
| 46,994,788 | ||||||||
| 1,530,925,983 | ||||||||
Energy — 3.2% |
||||||||
Energy – Alternate Sources — 0.2% |
||||||||
Shoals Technologies Group, Inc. Class A (a) |
376,000 | 8,102,800 | ||||||
Oil & Gas — 2.3% |
||||||||
Coterra Energy, Inc. |
2,346,452 | 61,289,325 | ||||||
Pioneer Natural Resources Co. |
112,000 | 24,251,360 | ||||||
SM Energy Co. |
288,939 | 10,866,996 | ||||||
Venture Global LNG, Inc., Series B (Acquired 3/08/18, Cost $652,320) (a) (c) (d) (e) |
216 | 3,195,772 | ||||||
Venture Global LNG, Inc., Series C (Acquired 10/16/17-3/08/18, Cost $4,872,708) (a) (c) (d) (e) |
1,328 | 19,648,079 | ||||||
| 119,251,532 | ||||||||
Pipelines — 0.7% |
||||||||
Cheniere Energy, Inc. |
222,000 | 36,832,020 | ||||||
| 164,186,352 | ||||||||
Financial — 6.2% |
||||||||
Banks — 0.4% |
||||||||
SVB Financial Group (a) |
57,825 | 19,416,478 | ||||||
Diversified Financial Services — 2.1% |
||||||||
Apollo Global Management, Inc. |
205,570 | 9,559,005 | ||||||
Cboe Global Markets, Inc. |
180,000 | 21,126,600 | ||||||
Intercontinental Exchange, Inc. |
19,000 | 1,716,650 | ||||||
LPL Financial Holdings, Inc. |
140,196 | 30,630,022 | ||||||
Raymond James Financial, Inc. |
151,000 | 14,921,820 | ||||||
The accompanying notes are an integral part of the financial statements.
158
MassMutual Mid Cap Growth Fund — Portfolio of Investments (Continued) |
Number of |
Value |
|||||||
Tradeweb Markets, Inc. Class A |
548,000 | $ | 30,918,160 | |||||
| 108,872,257 | ||||||||
Insurance — 2.4% |
||||||||
Aon PLC Class A |
163,564 | 43,813,889 | ||||||
Assurant, Inc. |
315,000 | 45,760,050 | ||||||
Axis Capital Holdings Ltd. |
531,000 | 26,098,650 | ||||||
Kemper Corp. |
190,000 | 7,839,400 | ||||||
| 123,511,989 | ||||||||
Private Equity — 1.3% |
||||||||
KKR & Co., Inc. |
1,537,733 | 66,122,519 | ||||||
| 317,923,243 | ||||||||
Industrial — 16.6% |
||||||||
Building Materials — 1.1% |
||||||||
Builders FirstSource, Inc. (a) |
240,134 | 14,148,695 | ||||||
Martin Marietta Materials, Inc. |
131,000 | 42,193,790 | ||||||
| 56,342,485 | ||||||||
Electrical Components & Equipment — 0.1% |
||||||||
Littelfuse, Inc. |
32,000 | 6,358,080 | ||||||
Electronics — 5.6% |
||||||||
Agilent Technologies, Inc. |
886,444 | 107,747,268 | ||||||
Amphenol Corp. Class A |
536,028 | 35,892,435 | ||||||
Coherent Corp. (a) |
107,435 | 3,744,110 | ||||||
Fortive Corp. |
908,000 | 52,936,400 | ||||||
Keysight Technologies, Inc. (a) |
385,000 | 60,583,600 | ||||||
National Instruments Corp. |
667,000 | 25,172,580 | ||||||
| 286,076,393 | ||||||||
Engineering & Construction — 0.3% |
||||||||
MasTec, Inc. (a) |
199,857 | 12,690,919 | ||||||
Environmental Controls — 0.8% |
||||||||
Waste Connections, Inc. |
319,082 | 43,117,551 | ||||||
Machinery – Construction & Mining — 0.3% |
||||||||
BWX Technologies, Inc. |
299,000 | 15,060,630 | ||||||
Machinery – Diversified — 3.3% |
||||||||
Cognex Corp. |
375,000 | 15,543,750 | ||||||
Enovis Corp. (a) |
438,000 | 20,178,660 | ||||||
Esab Corp. |
449,000 | 14,978,640 | ||||||
IDEX Corp. |
148,000 | 29,577,800 | ||||||
Ingersoll Rand, Inc. |
2,039,000 | 88,207,140 | ||||||
| 168,485,990 | ||||||||
Miscellaneous - Manufacturing — 1.8% |
||||||||
Textron, Inc. |
1,612,000 | 93,915,120 | ||||||
Packaging & Containers — 1.8% |
||||||||
Ball Corp. |
1,123,000 | 54,263,360 | ||||||
Sealed Air Corp. |
804,000 | 35,786,040 | ||||||
| 90,049,400 | ||||||||
Number of |
Value |
|||||||
Transportation — 1.5% |
||||||||
J.B. Hunt Transport Services, Inc. |
401,000 | $ | 62,724,420 | |||||
Knight-Swift Transportation Holdings, Inc. |
226,248 | 11,070,315 | ||||||
XPO Logistics, Inc. (a) |
118,054 | 5,255,764 | ||||||
| 79,050,499 | ||||||||
| 851,147,067 | ||||||||
Technology — 19.3% |
||||||||
Computers — 3.3% |
||||||||
Crowdstrike Holdings, Inc. Class A (a) |
170,000 | 28,017,700 | ||||||
EPAM Systems, Inc. (a) |
80,742 | 29,243,945 | ||||||
Fortinet, Inc. (a) |
1,188,000 | 58,366,440 | ||||||
Genpact Ltd. |
428,885 | 18,772,296 | ||||||
KBR, Inc. |
486,868 | 21,042,435 | ||||||
Leidos Holdings, Inc. |
163,000 | 14,257,610 | ||||||
Thoughtworks Holding, Inc. (a) |
77,269 | 810,552 | ||||||
| 170,510,978 | ||||||||
Semiconductors — 7.0% |
||||||||
KLA Corp. |
247,219 | 74,815,886 | ||||||
Lam Research Corp. |
10,574 | 3,870,084 | ||||||
Lattice Semiconductor Corp. (a) |
390,000 | 19,191,900 | ||||||
Marvell Technology, Inc. |
2,045,064 | 87,753,696 | ||||||
Microchip Technology, Inc. |
2,000,184 | 122,071,229 | ||||||
Monolithic Power Systems, Inc. |
24,184 | 8,788,466 | ||||||
SiTime Corp. (a) |
47,342 | 3,727,236 | ||||||
Wolfspeed, Inc. (a) |
341,827 | 35,331,239 | ||||||
| 355,549,736 | ||||||||
Software — 9.0% |
||||||||
Atlassian Corp. PLC Class A (a) |
200,442 | 42,211,081 | ||||||
Autodesk, Inc. (a) |
37,023 | 6,915,896 | ||||||
Bill.com Holdings, Inc. (a) |
175,992 | 23,296,061 | ||||||
Black Knight, Inc. (a) |
599,000 | 38,773,270 | ||||||
Broadridge Financial Solutions, Inc. |
88,000 | 12,700,160 | ||||||
CCC Intelligent Solutions Holdings, Inc. (a) |
2,211,000 | 20,120,100 | ||||||
Clear Secure Inc. Class A (a) (b) |
255,000 | 5,829,300 | ||||||
DocuSign, Inc. (a) |
187,000 | 9,998,890 | ||||||
Doximity, Inc. Class A (a) (b) |
300,000 | 9,066,000 | ||||||
Fair Isaac Corp. (a) |
120,137 | 49,497,645 | ||||||
HubSpot, Inc. (a) |
34,079 | 9,205,420 | ||||||
MongoDB, Inc. (a) |
19,000 | 3,772,640 | ||||||
MSCI, Inc. |
44,124 | 18,611,062 | ||||||
Paycom Software, Inc. (a) |
81,944 | 27,040,701 | ||||||
PTC, Inc. (a) |
259,000 | 27,091,400 | ||||||
Roper Technologies, Inc. |
96,000 | 34,525,440 | ||||||
SentinelOne Inc. Class A (a) |
337,000 | 8,613,720 | ||||||
Synopsys, Inc. (a) |
150,000 | 45,826,500 | ||||||
Veeva Systems, Inc. Class A (a) |
390,056 | 64,312,433 | ||||||
The accompanying notes are an integral part of the financial statements.
159
MassMutual Mid Cap Growth Fund — Portfolio of Investments (Continued) |
Number of |
Value |
|||||||
Vimeo, Inc. (a) |
536,000 | $ | 2,144,000 | |||||
Workday, Inc. Class A (a) |
22,845 | 3,477,466 | ||||||
| 463,029,185 | ||||||||
| 989,089,899 | ||||||||
TOTAL COMMON STOCK (Cost $4,751,897,997) |
4,911,365,265 | |||||||
PREFERRED STOCK — 0.6% |
||||||||
Consumer, Cyclical — 0.1% |
||||||||
Auto Manufacturers — 0.1% |
||||||||
Nuro, Inc., Series D (Acquired 10/29/21, Cost $3,125,294) (a) (c) (d) (e) |
149,925 | 3,125,295 | ||||||
Consumer, Non-cyclical — 0.2% |
||||||||
Commercial Services — 0.1% |
||||||||
Redwood Materials, Inc., Series C (Acquired 5/28/21, Cost $3,678,889) (a) (c) (d) (e) |
77,608 | 6,053,424 | ||||||
Health Care – Services — 0.1% |
||||||||
Caris Life Sciences, Inc., Series D (Acquired 5/11/21, Cost $5,006,003) (a) (c) (d) (e) |
618,025 | 4,066,605 | ||||||
| 10,120,029 | ||||||||
Financial — 0.1% |
||||||||
Investment Companies — 0.1% |
||||||||
Maplebear, Inc., Series E (Acquired 11/19/21-12/01/21, Cost $10,196,716) (a) (c) (d) (e) |
84,807 | 4,111,443 | ||||||
Maplebear, Inc. Series I (Acquired 2/26/21, Cost $1,765,375) (a) (c) (d) (e) |
14,123 | 684,683 | ||||||
| 4,796,126 | ||||||||
Industrial — 0.1% |
||||||||
Electrical Components & Equipment — 0.1% |
||||||||
Sila Nanotechnologies, Inc., Series F (Acquired 1/07/21, Cost $7,310,568) (a) (c) (d) (e) |
177,128 | 5,521,080 | ||||||
Technology — 0.1% |
||||||||
Software — 0.1% |
||||||||
Databricks, Inc., Series G (Acquired 2/01/21, Cost $2,400,675) (a) (c) (d) (e) |
40,605 | 2,245,184 | ||||||
Number of |
Value |
|||||||
Databricks, Inc., Series H (Acquired 8/31/21, Cost $3,616,301) (a) (c) (d) (e) |
49,212 | $ | 2,721,094 | |||||
| 4,966,278 | ||||||||
TOTAL PREFERRED STOCK (Cost $37,099,821) |
28,528,808 | |||||||
TOTAL EQUITIES (Cost $4,788,997,818) |
4,939,894,073 | |||||||
MUTUAL FUNDS — 0.5% |
||||||||
Diversified Financial Services — 0.5% |
||||||||
State Street Navigator Securities Lending Government Money Market Portfolio (f) |
25,184,258 | 25,184,258 | ||||||
TOTAL MUTUAL FUNDS (Cost $25,184,258) |
25,184,258 | |||||||
TOTAL LONG-TERM INVESTMENTS (Cost $4,814,182,076) |
4,965,078,331 | |||||||
SHORT-TERM INVESTMENTS — 3.6% |
||||||||
Mutual Fund — 2.0% |
||||||||
T. Rowe Price Government Reserve Investment Fund |
104,697,257 | 104,697,257 | ||||||
Principal |
||||||||
Repurchase Agreement — 1.6% |
||||||||
Fixed Income Clearing Corp., Repurchase Agreement, dated 9/30/22, 0.830%, due 10/03/22 (g) |
$ | 84,415,685 | 84,415,685 | |||||
TOTAL SHORT-TERM INVESTMENTS (Cost $189,112,942) |
189,112,942 | |||||||
TOTAL INVESTMENTS — 100.6% (Cost $5,003,295,018) (h) |
5,154,191,273 | |||||||
Other Assets/(Liabilities) — (0.6)% |
(32,773,315 | ) | ||||||
NET ASSETS — 100.0% |
$ | 5,121,417,958 | ||||||
Abbreviation Legend
|
ADR |
American Depositary Receipt |
The accompanying notes are an integral part of the financial statements.
160
MassMutual Mid Cap Growth Fund — Portfolio of Investments (Continued) |
Notes to Portfolio of Investments
Percentages are stated as a percent of net assets.
|
(a) |
Non-income producing security. |
|
(b) |
Denotes all or a portion of security on loan. The total value of securities on loan as of September 30, 2022, was $78,799,801 or 1.54% of net assets. The Fund received $55,792,459 of non-cash collateral (U.S. Treasury and/or Agency obligations) related to securities lending activity. This amount is not reflected on either the Portfolio of Investments or the Statement of Assets and Liabilities. (Note 2). |
|
(c) |
Investment is valued using significant unobservable inputs. |
|
(d) |
Restricted security. Certain securities are restricted as to resale. At September 30, 2022, these securities amounted to a value of $51,372,659 or 1.00% of net assets. The Fund generally bears the costs, if any, associated with the disposition of restricted securities. |
|
(e) |
This security is fair valued in good faith in accordance with procedures approved by the Board of Trustees. At September 30, 2022, these securities amounted to a value of $51,372,659 or 1.00% of net assets. |
|
(f) |
Represents investment of security lending cash collateral. (Note 2). |
|
(g) |
Maturity value of $84,421,524. Collateralized by U.S. Government Agency obligations with a rate of 3.500%, maturity date of 9/15/25, and an aggregate market value, including accrued interest, of $86,104,154. |
|
(h) |
See Note 6 for aggregate cost for federal tax purposes. |
The accompanying notes are an integral part of the financial statements.
161
MassMutual Small Cap Growth Equity Fund — Portfolio of Investments |
September 30, 2022 |
Number of |
Value |
|||||||
EQUITIES — 94.6% |
||||||||
COMMON STOCK — 94.6% |
||||||||
Basic Materials — 2.5% |
||||||||
Chemicals — 1.5% |
||||||||
Cabot Corp. |
73,212 | $ | 4,677,514 | |||||
Methanex Corp. (a) |
44,471 | 1,417,291 | ||||||
Olin Corp. |
35,627 | 1,527,686 | ||||||
| 7,622,491 | ||||||||
Mining — 1.0% |
||||||||
Livent Corp. (a) (b) |
172,099 | 5,274,834 | ||||||
| 12,897,325 | ||||||||
Communications — 3.6% |
||||||||
Internet — 1.6% |
||||||||
Bumble, Inc. Class A (a) (b) |
22,129 | 475,552 | ||||||
Cargurus, Inc. (b) |
145,744 | 2,065,193 | ||||||
Criteo SA Sponsored ADR (b) |
48,482 | 1,310,468 | ||||||
Perficient, Inc. (b) |
41,869 | 2,722,322 | ||||||
Ziff Davis, Inc. (b) |
24,006 | 1,643,931 | ||||||
| 8,217,466 | ||||||||
Media — 0.6% |
||||||||
The New York Times Co. Class A |
48,786 | 1,402,598 | ||||||
World Wrestling Entertainment, Inc. Class A |
25,876 | 1,815,719 | ||||||
| 3,218,317 | ||||||||
Telecommunications — 1.4% |
||||||||
Calix, Inc. (b) |
94,607 | 5,784,272 | ||||||
Viavi Solutions, Inc. (b) |
130,558 | 1,703,782 | ||||||
| 7,488,054 | ||||||||
| 18,923,837 | ||||||||
Consumer, Cyclical — 9.4% |
||||||||
Apparel — 1.8% |
||||||||
Carter’s, Inc. |
15,496 | 1,015,453 | ||||||
Crocs, Inc. (b) |
16,715 | 1,147,652 | ||||||
Deckers Outdoor Corp. (b) |
4,013 | 1,254,504 | ||||||
On Holding AG, Class A (a) (b) |
61,592 | 988,551 | ||||||
Oxford Industries, Inc. |
33,186 | 2,979,439 | ||||||
Steven Madden Ltd. |
83,298 | 2,221,558 | ||||||
| 9,607,157 | ||||||||
Auto Parts & Equipment — 0.2% |
||||||||
Visteon Corp. (b) |
10,008 | 1,061,449 | ||||||
Distribution & Wholesale — 0.4% |
||||||||
WESCO International, Inc. (b) |
17,761 | 2,120,308 | ||||||
Entertainment — 0.8% |
||||||||
Cinemark Holdings, Inc. (b) |
100,661 | 1,219,005 | ||||||
DraftKings, Inc. Class A (b) |
66,117 | 1,001,011 | ||||||
Red Rock Resorts, Inc. Class A |
67,686 | 2,318,922 | ||||||
| 4,538,938 | ||||||||
Number of |
Value |
|||||||
Food Services — 0.4% |
||||||||
Sovos Brands, Inc. (b) |
134,880 | $ | 1,920,691 | |||||
Home Builders — 1.0% |
||||||||
Century Communities, Inc. |
38,320 | 1,639,330 | ||||||
Skyline Champion Corp. (b) |
67,750 | 3,581,942 | ||||||
| 5,221,272 | ||||||||
Leisure Time — 0.6% |
||||||||
Acushnet Holdings Corp. |
32,690 | 1,421,688 | ||||||
Planet Fitness, Inc. Class A (b) |
27,672 | 1,595,568 | ||||||
| 3,017,256 | ||||||||
Lodging — 0.3% |
||||||||
Boyd Gaming Corp. |
32,524 | 1,549,769 | ||||||
Retail — 3.9% |
||||||||
BJ’s Wholesale Club Holdings, Inc. (b) |
35,102 | 2,555,777 | ||||||
Boot Barn Holdings, Inc. (b) |
41,707 | 2,438,191 | ||||||
Denny’s Corp. (b) |
99,693 | 938,111 | ||||||
Nu Skin Enterprises, Inc. Class A |
42,767 | 1,427,135 | ||||||
Ollie’s Bargain Outlet Holdings, Inc. (b) |
24,646 | 1,271,734 | ||||||
Patrick Industries, Inc. |
31,569 | 1,383,985 | ||||||
Rush Enterprises, Inc. Class A |
40,888 | 1,793,348 | ||||||
Sweetgreen, Inc. Class A (a) (b) |
39,051 | 722,443 | ||||||
Texas Roadhouse, Inc. |
29,419 | 2,567,102 | ||||||
Victoria’s Secret & Co. (b) |
47,575 | 1,385,384 | ||||||
Wingstop, Inc. |
32,606 | 4,089,444 | ||||||
| 20,572,654 | ||||||||
| 49,609,494 | ||||||||
Consumer, Non-cyclical — 29.0% |
||||||||
Beverages — 1.1% |
||||||||
Celsius Holdings, Inc. (a) (b) |
37,812 | 3,428,792 | ||||||
MGP Ingredients, Inc. (a) |
21,833 | 2,317,792 | ||||||
| 5,746,584 | ||||||||
Biotechnology — 6.2% |
||||||||
Akero Therapeutics, Inc. (a) (b) |
28,598 | 973,762 | ||||||
Amicus Therapeutics, Inc. (b) |
143,662 | 1,499,831 | ||||||
Apellis Pharmaceuticals, Inc. (b) |
31,484 | 2,150,357 | ||||||
Blueprint Medicines Corp. (b) |
17,525 | 1,154,722 | ||||||
Celldex Therapeutics, Inc. (b) |
15,803 | 444,222 | ||||||
Crinetics Pharmaceuticals, Inc. (b) |
81,307 | 1,596,869 | ||||||
Cytokinetics, Inc. (b) |
63,615 | 3,082,147 | ||||||
Fate Therapeutics, Inc. (a) (b) |
16,573 | 371,401 | ||||||
Halozyme Therapeutics, Inc. (b) |
105,261 | 4,162,020 | ||||||
Immatics NV (b) |
82,413 | 824,130 | ||||||
Intellia Therapeutics, Inc. (b) |
14,725 | 824,011 | ||||||
Intra-Cellular Therapies, Inc. (b) |
48,298 | 2,247,306 | ||||||
Karuna Therapeutics, Inc. (b) |
10,441 | 2,348,494 | ||||||
The accompanying notes are an integral part of the financial statements.
162
MassMutual Small Cap Growth Equity Fund — Portfolio of Investments (Continued) |
Number of |
Value |
|||||||
Kymera Therapeutics, Inc. (b) |
43,930 | $ | 956,356 | |||||
Mirati Therapeutics, Inc. (b) |
6,023 | 420,646 | ||||||
Myriad Genetics, Inc. (b) |
72,557 | 1,384,388 | ||||||
PTC Therapeutics, Inc. (b) |
23,619 | 1,185,674 | ||||||
Relay Therapeutics, Inc. (b) |
31,100 | 695,707 | ||||||
Revolution Medicines, Inc. (b) |
79,679 | 1,571,270 | ||||||
Rocket Pharmaceuticals, Inc. (b) |
82,515 | 1,316,939 | ||||||
Sage Therapeutics, Inc. (b) |
12,972 | 507,984 | ||||||
Syndax Pharmaceuticals, Inc. (b) |
65,193 | 1,566,588 | ||||||
Veracyte, Inc. (b) |
55,446 | 920,404 | ||||||
Zentalis Pharmaceuticals, Inc. (b) |
29,986 | 649,497 | ||||||
| 32,854,725 | ||||||||
Commercial Services — 5.8% |
||||||||
AMN Healthcare Services, Inc. (b) |
18,643 | 1,975,412 | ||||||
Cross Country Healthcare, Inc. (b) |
59,714 | 1,694,086 | ||||||
Driven Brands Holdings, Inc. (b) |
35,559 | 994,941 | ||||||
H&R Block, Inc. |
41,647 | 1,771,663 | ||||||
HealthEquity, Inc. (b) |
46,966 | 3,154,706 | ||||||
Herc Holdings, Inc. |
27,293 | 2,835,197 | ||||||
Paylocity Holding Corp. (b) |
18,289 | 4,418,257 | ||||||
R1 RCM, Inc. (b) |
147,622 | 2,735,436 | ||||||
TriNet Group, Inc. (b) |
51,068 | 3,637,063 | ||||||
WillScot Mobile Mini Holdings Corp. (b) |
182,470 | 7,359,015 | ||||||
| 30,575,776 | ||||||||
Cosmetics & Personal Care — 1.0% |
||||||||
elf Beauty, Inc. (b) |
136,819 | 5,147,131 | ||||||
Food — 1.1% |
||||||||
Grocery Outlet Holding Corp. (b) |
37,281 | 1,241,084 | ||||||
Performance Food Group Co. (b) |
105,049 | 4,511,855 | ||||||
| 5,752,939 | ||||||||
Health Care – Products — 8.5% |
||||||||
AtriCure, Inc. (b) |
42,930 | 1,678,563 | ||||||
Axonics Inc. (b) |
65,677 | 4,626,288 | ||||||
CONMED Corp. |
12,728 | 1,020,404 | ||||||
Glaukos Corp. (b) |
24,478 | 1,303,209 | ||||||
Globus Medical, Inc. Class A (b) |
93,821 | 5,588,917 | ||||||
Haemonetics Corp. (b) |
62,196 | 4,604,370 | ||||||
ICU Medical, Inc. (b) |
10,640 | 1,602,384 | ||||||
Inari Medical, Inc. (b) |
51,684 | 3,754,326 | ||||||
Inspire Medical Systems, Inc. (b) |
35,847 | 6,358,182 | ||||||
Integra LifeSciences Holdings Corp. (b) |
31,866 | 1,349,844 | ||||||
iRhythm Technologies, Inc. (b) |
9,766 | 1,223,484 | ||||||
Lantheus Holdings, Inc. (b) |
7,087 | 498,429 | ||||||
Omnicell, Inc. (b) |
14,749 | 1,283,605 | ||||||
Repligen Corp. (b) |
23,703 | 4,435,068 | ||||||
Shockwave Medical, Inc. (b) |
18,228 | 5,068,660 | ||||||
Number of |
Value |
|||||||
Tandem Diabetes Care, Inc. (b) |
9,211 | $ | 440,746 | |||||
| 44,836,479 | ||||||||
Health Care – Services — 2.6% |
||||||||
Acadia Healthcare Co., Inc. (b) |
73,857 | 5,774,140 | ||||||
Amedisys, Inc. (b) |
16,435 | 1,590,744 | ||||||
Medpace Holdings, Inc. (b) |
20,974 | 3,296,483 | ||||||
Surgery Partners, Inc. (a) (b) |
68,725 | 1,608,165 | ||||||
Tenet Healthcare Corp. (b) |
26,874 | 1,386,161 | ||||||
| 13,655,693 | ||||||||
Pharmaceuticals — 2.7% |
||||||||
Aclaris Therapeutics, Inc. (b) |
56,675 | 892,065 | ||||||
Alkermes PLC (b) |
20,210 | 451,289 | ||||||
Ascendis Pharma A/S ADR (b) |
5,936 | 612,951 | ||||||
BellRing Brands, Inc. (b) |
73,063 | 1,505,828 | ||||||
Covetrus, Inc. (b) |
127,465 | 2,661,469 | ||||||
Harmony Biosciences Holdings, Inc. (b) |
24,989 | 1,106,763 | ||||||
Myovant Sciences Ltd. (a) (b) |
52,064 | 935,069 | ||||||
Option Care Health, Inc. (b) |
59,931 | 1,886,029 | ||||||
Owens & Minor, Inc. |
127,095 | 3,062,990 | ||||||
Pacira BioSciences, Inc. (b) |
14,861 | 790,457 | ||||||
Y-mAbs Therapeutics, Inc. (b) |
30,864 | 445,059 | ||||||
| 14,349,969 | ||||||||
| 152,919,296 | ||||||||
Energy — 6.0% |
||||||||
Energy – Alternate Sources — 0.6% |
||||||||
First Solar, Inc. (b) |
18,242 | 2,412,869 | ||||||
Maxeon Solar Technologies Ltd. (a) (b) |
33,208 | 789,354 | ||||||
| 3,202,223 | ||||||||
Oil & Gas — 5.0% |
||||||||
Brigham Minerals, Inc. Class A |
130,131 | 3,210,332 | ||||||
Chord Energy Corp. (a) |
37,782 | 5,167,444 | ||||||
Magnolia Oil & Gas Corp. Class A |
51,617 | 1,022,533 | ||||||
Matador Resources Co. |
77,851 | 3,808,471 | ||||||
PBF Energy, Inc. Class A (b) |
31,112 | 1,093,898 | ||||||
PDC Energy, Inc. |
36,779 | 2,125,459 | ||||||
SM Energy Co. |
141,489 | 5,321,401 | ||||||
Viper Energy Partners LP (c) |
163,693 | 4,691,441 | ||||||
| 26,440,979 | ||||||||
Oil & Gas Services — 0.1% |
||||||||
Aris Water Solution, Inc. Class A |
53,506 | 682,736 | ||||||
Pipelines — 0.3% |
||||||||
New Fortress Energy, Inc. |
31,184 | 1,363,053 | ||||||
| 31,688,991 | ||||||||
The accompanying notes are an integral part of the financial statements.
163
MassMutual Small Cap Growth Equity Fund — Portfolio of Investments (Continued) |
Number of |
Value |
|||||||
Financial — 13.3% |
||||||||
Banks — 3.8% |
||||||||
Ameris Bancorp |
101,601 | $ | 4,542,581 | |||||
Atlantic Union Bankshares Corp. |
59,662 | 1,812,532 | ||||||
Cadence Bank |
71,844 | 1,825,556 | ||||||
First Interstate BancSystem, Inc. Class A |
55,941 | 2,257,219 | ||||||
National Bank Holdings Corp. Class A |
51,412 | 1,901,730 | ||||||
Pinnacle Financial Partners, Inc. |
24,255 | 1,967,080 | ||||||
Seacoast Banking Corp. of Florida |
63,288 | 1,913,196 | ||||||
Synovus Financial Corp. |
54,023 | 2,026,403 | ||||||
Wintrust Financial Corp. |
24,208 | 1,974,162 | ||||||
| 20,220,459 | ||||||||
Diversified Financial Services — 3.2% |
||||||||
Air Lease Corp. |
60,430 | 1,873,934 | ||||||
Cohen & Steers, Inc. |
9,279 | 581,144 | ||||||
Hamilton Lane, Inc. Class A |
49,196 | 2,932,574 | ||||||
Hannon Armstrong Sustainable Infrastructure Capital, Inc. (a) |
106,544 | 3,188,862 | ||||||
LPL Financial Holdings, Inc. |
17,318 | 3,783,637 | ||||||
PJT Partners, Inc. Class A |
14,200 | 948,844 | ||||||
PRA Group, Inc. (b) |
58,513 | 1,922,737 | ||||||
StepStone Group, Inc. Class A |
69,726 | 1,708,984 | ||||||
| 16,940,716 | ||||||||
Insurance — 2.1% |
||||||||
Assured Guaranty Ltd. |
48,710 | 2,360,000 | ||||||
The Hanover Insurance Group, Inc. |
6,158 | 789,086 | ||||||
Kemper Corp. |
36,597 | 1,509,992 | ||||||
Kinsale Capital Group, Inc. |
11,850 | 3,026,727 | ||||||
MGIC Investment Corp. |
125,527 | 1,609,256 | ||||||
Selective Insurance Group, Inc. |
19,808 | 1,612,371 | ||||||
| 10,907,432 | ||||||||
Real Estate — 0.4% |
||||||||
McGrath RentCorp |
22,400 | 1,878,464 | ||||||
Real Estate Investment Trusts (REITS) — 3.8% |
||||||||
Centerspace |
21,849 | 1,470,875 | ||||||
Douglas Emmett, Inc. |
67,789 | 1,215,457 | ||||||
Essential Properties Realty Trust, Inc. |
165,160 | 3,212,362 | ||||||
Independence Realty Trust, Inc. |
74,407 | 1,244,829 | ||||||
National Storage Affiliates Trust |
86,793 | 3,608,853 | ||||||
Outfront Media, Inc. |
57,523 | 873,774 | ||||||
Phillips Edison & Co., Inc. (a) |
123,759 | 3,471,440 | ||||||
PotlatchDeltic Corp. |
40,774 | 1,673,365 | ||||||
Ryman Hospitality Properties, Inc. |
25,887 | 1,905,024 | ||||||
Xenia Hotels & Resorts, Inc. |
100,153 | 1,381,110 | ||||||
| 20,057,089 | ||||||||
| 70,004,160 | ||||||||
Number of |
Value |
|||||||
Industrial — 16.0% |
||||||||
Aerospace & Defense — 1.5% |
||||||||
Curtiss-Wright Corp. |
36,887 | $ | 5,133,195 | |||||
Mercury Systems, Inc. (b) |
34,081 | 1,383,688 | ||||||
Spirit AeroSystems Holdings, Inc. Class A |
56,640 | 1,241,549 | ||||||
| 7,758,432 | ||||||||
Building Materials — 0.5% |
||||||||
The AZEK Co., Inc (b) |
73,032 | 1,213,792 | ||||||
Louisiana-Pacific Corp. |
24,613 | 1,259,939 | ||||||
| 2,473,731 | ||||||||
Electrical Components & Equipment — 1.2% |
||||||||
Acuity Brands, Inc. |
13,910 | 2,190,408 | ||||||
Novanta, Inc. (b) |
34,585 | 3,999,755 | ||||||
| 6,190,163 | ||||||||
Electronics — 0.2% |
||||||||
Coherent Corp. (b) |
23,265 | 810,785 | ||||||
Engineering & Construction — 1.5% |
||||||||
Comfort Systems USA, Inc. |
29,701 | 2,890,798 | ||||||
Fluor Corp. (b) |
204,778 | 5,096,925 | ||||||
| 7,987,723 | ||||||||
Environmental Controls — 2.7% |
||||||||
Casella Waste Systems, Inc. Class A (b) |
93,346 | 7,130,701 | ||||||
Clean Harbors, Inc. (b) |
41,528 | 4,567,250 | ||||||
Evoqua Water Technologies Corp. (b) |
75,688 | 2,503,002 | ||||||
| 14,200,953 | ||||||||
Hand & Machine Tools — 0.7% |
||||||||
Enerpac Tool Group Corp. |
29,251 | 521,545 | ||||||
Kennametal, Inc. |
64,947 | 1,336,609 | ||||||
Regal Rexnord Corp. |
10,960 | 1,538,346 | ||||||
| 3,396,500 | ||||||||
Machinery – Diversified — 4.5% |
||||||||
Albany International Corp. Class A |
20,759 | 1,636,432 | ||||||
Applied Industrial Technologies, Inc. |
39,496 | 4,059,399 | ||||||
Cactus, Inc. Class A |
48,294 | 1,855,938 | ||||||
Chart Industries, Inc. (a) (b) |
49,497 | 9,124,772 | ||||||
Enovis Corp. (b) |
28,136 | 1,296,225 | ||||||
Flowserve Corp. |
59,759 | 1,452,144 | ||||||
The Middleby Corp. (b) |
10,193 | 1,306,437 | ||||||
Zurn Elkay Water Solutions Corp. |
128,088 | 3,138,156 | ||||||
| 23,869,503 | ||||||||
Metal Fabricate & Hardware — 1.5% |
||||||||
Advanced Drainage Systems, Inc. |
29,183 | 3,629,490 | ||||||
Helios Technologies, Inc. |
28,802 | 1,457,381 | ||||||
Valmont Industries, Inc. |
11,166 | 2,999,411 | ||||||
| 8,086,282 | ||||||||
The accompanying notes are an integral part of the financial statements.
164
MassMutual Small Cap Growth Equity Fund — Portfolio of Investments (Continued) |
Number of |
Value |
|||||||
Packaging & Containers — 0.7% |
||||||||
Graphic Packaging Holding Co. |
194,425 | $ | 3,837,950 | |||||
Transportation — 0.7% |
||||||||
CryoPort, Inc. (b) |
25,285 | 615,943 | ||||||
Kirby Corp. (b) |
31,247 | 1,898,880 | ||||||
Saia, Inc. (b) |
7,032 | 1,336,080 | ||||||
| 3,850,903 | ||||||||
Trucking & Leasing — 0.3% |
||||||||
GATX Corp. |
19,014 | 1,619,042 | ||||||
| 84,081,967 | ||||||||
Technology — 13.7% |
||||||||
Computers — 3.9% |
||||||||
CyberArk Software Ltd. (b) |
30,554 | 4,581,267 | ||||||
Exlservice Holdings, Inc. (b) |
34,410 | 5,070,658 | ||||||
Globant SA (b) |
13,479 | 2,521,651 | ||||||
KBR, Inc. |
60,883 | 2,631,363 | ||||||
Rapid7, Inc. (b) |
60,369 | 2,589,830 | ||||||
Tenable Holdings, Inc. (b) |
21,503 | 748,304 | ||||||
Varonis Systems, Inc. (b) |
27,199 | 721,318 | ||||||
WNS Holdings Ltd. ADR (b) |
21,632 | 1,770,363 | ||||||
| 20,634,754 | ||||||||
Semiconductors — 3.5% |
||||||||
Cirrus Logic, Inc. (b) |
21,876 | 1,505,069 | ||||||
FormFactor, Inc. (b) |
51,099 | 1,280,030 | ||||||
Impinj, Inc. (b) |
38,769 | 3,102,683 | ||||||
Lattice Semiconductor Corp. (b) |
75,544 | 3,717,520 | ||||||
MACOM Technology Solutions Holdings, Inc. (b) |
25,286 | 1,309,562 | ||||||
MKS Instruments, Inc. |
10,763 | 889,455 | ||||||
Nova Ltd. (b) |
12,779 | 1,090,049 | ||||||
Power Integrations, Inc. |
26,204 | 1,685,441 | ||||||
Synaptics, Inc. (b) |
17,810 | 1,763,368 | ||||||
Tower Semiconductor Ltd. (b) |
47,614 | 2,092,159 | ||||||
| 18,435,336 | ||||||||
Software — 6.3% |
||||||||
Box, Inc. Class A (b) |
42,204 | 1,029,356 | ||||||
Confluent, Inc. Class A (a) (b) |
28,878 | 686,430 | ||||||
DoubleVerify Holdings, Inc. (b) |
64,205 | 1,756,007 | ||||||
Doximity, Inc. Class A (a) (b) |
21,800 | 658,796 | ||||||
Duolingo, Inc. (b) |
12,949 | 1,233,133 | ||||||
Evolent Health, Inc. Class A (b) |
51,667 | 1,856,395 | ||||||
Five9, Inc. (b) |
23,238 | 1,742,385 | ||||||
Gitlab, Inc. Class A (a) (b) |
13,641 | 698,692 | ||||||
HashiCorp, Inc. Class A (a) (b) |
18,056 | 581,223 | ||||||
Jamf Holding Corp. (a) (b) |
177,788 | 3,939,782 | ||||||
Manhattan Associates, Inc. (b) |
50,114 | 6,666,665 | ||||||
New Relic, Inc. (b) |
22,393 | 1,284,910 | ||||||
Number of |
Value |
|||||||
PowerSchool Holdings, Inc. Class A (b) |
61,036 | $ | 1,018,691 | |||||
Privia Health Group, Inc. (b) |
42,934 | 1,462,332 | ||||||
RingCentral, Inc. Class A (b) |
51,257 | 2,048,230 | ||||||
Samsara, Inc. Class A (b) |
51,990 | 627,519 | ||||||
Sprout Social, Inc. Class A (b) |
44,246 | 2,684,847 | ||||||
Verra Mobility Corp. (b) |
212,499 | 3,266,110 | ||||||
| 33,241,503 | ||||||||
| 72,311,593 | ||||||||
Utilities — 1.1% |
||||||||
Electric — 0.8% |
||||||||
Ameresco, Inc. Class A (b) |
9,730 | 646,850 | ||||||
Atlantica Sustainable Infrastructure PLC |
62,055 | 1,632,047 | ||||||
Portland General Electric Co. |
47,732 | 2,074,433 | ||||||
| 4,353,330 | ||||||||
Gas — 0.3% |
||||||||
ONE Gas, Inc. |
22,060 | 1,552,803 | ||||||
| 5,906,133 | ||||||||
TOTAL COMMON STOCK (Cost $525,086,485) |
498,342,796 | |||||||
TOTAL EQUITIES (Cost $525,086,485) |
498,342,796 | |||||||
MUTUAL FUNDS — 2.5% |
||||||||
Diversified Financial Services — 2.5% |
||||||||
iShares Russell 2000 ETF (a) |
15,178 | 2,503,156 | ||||||
iShares Russell 2000 Growth ETF |
10,241 | 2,115,688 | ||||||
State Street Navigator Securities Lending Government Money Market Portfolio (d) |
8,359,079 | 8,359,079 | ||||||
| 12,977,923 | ||||||||
TOTAL MUTUAL FUNDS (Cost $13,545,744) |
12,977,923 | |||||||
TOTAL LONG-TERM INVESTMENTS (Cost $538,632,229) |
511,320,719 | |||||||
The accompanying notes are an integral part of the financial statements.
165
MassMutual Small Cap Growth Equity Fund — Portfolio of Investments (Continued) |
Principal |
Value |
|||||||
SHORT-TERM INVESTMENTS — 3.9% |
||||||||
Repurchase Agreement — 3.9% |
||||||||
Fixed Income Clearing Corp., Repurchase Agreement, dated 9/30/22, 0.830%, due 10/03/22 (e) |
$ | 20,746,302 | $ | 20,746,302 | ||||
TOTAL SHORT-TERM INVESTMENTS (Cost $20,746,302) |
20,746,302 | |||||||
TOTAL INVESTMENTS — 101.0% (Cost $559,378,531) (f) |
532,067,021 | |||||||
Other Assets/(Liabilities) — (1.0)% |
(5,485,059 | ) | ||||||
NET ASSETS — 100.0% |
$ | 526,581,962 | ||||||
Abbreviation Legend
|
ADR |
American Depositary Receipt |
Notes to Portfolio of Investments
Percentages are stated as a percent of net assets.
|
(a) |
Denotes all or a portion of security on loan. The total value of securities on loan as of September 30, 2022, was $26,470,437 or 5.03% of net assets. The Fund received $18,820,026 of non-cash collateral (U.S. Treasury and/or Agency obligations) related to securities lending activity. This amount is not reflected on either the Portfolio of Investments or the Statement of Assets and Liabilities. (Note 2). |
|
(b) |
Non-income producing security. |
|
(c) |
Security is a Master Limited Partnership |
|
(d) |
Represents investment of security lending cash collateral. (Note 2). |
|
(e) |
Maturity value of $20,747,737. Collateralized by U.S. Government Agency obligations with a rate of 3.500%, maturity date of 9/15/25, and an aggregate market value, including accrued interest, of $21,161,413. |
|
(f) |
See Note 6 for aggregate cost for federal tax purposes. |
The accompanying notes are an integral part of the financial statements.
166
September 30, 2022 |
Number of |
Value |
|||||||
EQUITIES — 97.1% |
||||||||
COMMON STOCK — 96.7% |
||||||||
Australia — 0.4% |
||||||||
Brambles Ltd. |
71,200 | $ | 516,601 | |||||
Orica Ltd. |
126,529 | 1,062,315 | ||||||
| 1,578,916 | ||||||||
Belgium — 0.9% |
||||||||
Anheuser-Busch InBev SA |
47,500 | 2,148,805 | ||||||
KBC Group NV |
32,414 | 1,520,497 | ||||||
| 3,669,302 | ||||||||
Canada — 3.6% |
||||||||
Canadian National Railway Co. |
42,192 | 4,556,314 | ||||||
Intact Financial Corp. |
16,363 | 2,315,708 | ||||||
Open Text Corp. |
66,300 | 1,752,353 | ||||||
Restaurant Brands International, Inc. |
14,400 | 765,792 | ||||||
Suncor Energy, Inc. |
62,604 | 1,762,982 | ||||||
The Toronto-Dominion Bank |
47,683 | 2,924,461 | ||||||
| 14,077,610 | ||||||||
Cayman Islands — 2.0% |
||||||||
Alibaba Group Holding Ltd. (a) |
253,240 | 2,540,224 | ||||||
NetEase, Inc. |
91,800 | 1,394,043 | ||||||
Tencent Holdings Ltd. |
71,500 | 2,414,698 | ||||||
Trip.com Group Ltd. (a) |
13,599 | 371,485 | ||||||
Vipshop Holdings Ltd. ADR (a) |
151,204 | 1,271,625 | ||||||
| 7,992,075 | ||||||||
Denmark — 2.5% |
||||||||
Carlsberg A/S Class B |
20,100 | 2,345,258 | ||||||
DSV A/S |
11,555 | 1,339,296 | ||||||
Novo Nordisk A/S Class B |
61,346 | 6,114,601 | ||||||
| 9,799,155 | ||||||||
Finland — 0.2% |
||||||||
UPM-Kymmene OYJ |
30,500 | 969,210 | ||||||
France — 17.1% |
||||||||
Accor SA (a) |
116,355 | 2,429,340 | ||||||
Air Liquide SA |
57,859 | 6,588,219 | ||||||
BNP Paribas SA |
94,631 | 3,995,070 | ||||||
Capgemini SE |
48,388 | 7,732,914 | ||||||
Cie de Saint-Gobain |
49,484 | 1,764,789 | ||||||
Cie Generale des Etablissements Michelin SCA |
73,876 | 1,645,877 | ||||||
Danone SA |
30,700 | 1,446,488 | ||||||
Dassault Systemes SE |
46,444 | 1,596,452 | ||||||
Edenred |
26,000 | 1,195,043 | ||||||
Engie SA |
291,966 | 3,349,972 | ||||||
EssilorLuxottica SA |
29,143 | 3,948,748 | ||||||
Kering SA |
3,770 | 1,667,165 | ||||||
L’Oreal SA |
6,990 | 2,225,741 | ||||||
Number of |
Value |
|||||||
Legrand SA |
32,980 | $ | 2,130,801 | |||||
LVMH Moet Hennessy Louis Vuitton SE |
11,018 | 6,476,766 | ||||||
Pernod Ricard SA |
27,276 | 4,985,589 | ||||||
Publicis Groupe SA |
49,669 | 2,350,229 | ||||||
Schneider Electric SE |
66,115 | 7,417,502 | ||||||
Valeo |
112,730 | 1,694,373 | ||||||
Worldline SA (a) (b) |
78,600 | 3,073,665 | ||||||
| 67,714,743 | ||||||||
Germany — 14.5% |
||||||||
adidas AG |
19,945 | 2,314,629 | ||||||
Allianz SE Registered |
20,440 | 3,234,644 | ||||||
Bayer AG Registered |
149,468 | 6,897,638 | ||||||
Bayerische Motoren Werke AG |
49,385 | 3,376,409 | ||||||
Beiersdorf AG |
46,606 | 4,611,931 | ||||||
Continental AG |
61,080 | 2,744,233 | ||||||
Daimler Truck Holding AG (a) |
103,061 | 2,358,645 | ||||||
Deutsche Boerse AG |
33,802 | 5,565,061 | ||||||
Fresenius Medical Care AG & Co. KGaA |
41,800 | 1,188,080 | ||||||
Fresenius SE & Co. KGaA |
118,300 | 2,533,898 | ||||||
Henkel AG & Co. KGaA |
33,400 | 1,906,423 | ||||||
Mercedes-Benz Group AG |
69,173 | 3,537,345 | ||||||
Merck KGaA |
31,804 | 5,190,522 | ||||||
MTU Aero Engines AG |
9,028 | 1,362,357 | ||||||
SAP SE |
85,681 | 7,063,097 | ||||||
Siemens AG Registered |
24,600 | 2,434,748 | ||||||
thyssenkrupp AG (a) |
290,817 | 1,242,586 | ||||||
| 57,562,246 | ||||||||
Hong Kong — 1.4% |
||||||||
AIA Group Ltd. |
666,000 | 5,529,503 | ||||||
India — 1.7% |
||||||||
Axis Bank Ltd. |
92,205 | 825,501 | ||||||
HDFC Bank Ltd. |
101,812 | 1,765,059 | ||||||
Housing Development Finance Corp. Ltd. |
77,779 | 2,166,696 | ||||||
Tata Consultancy Services Ltd. |
56,278 | 2,059,807 | ||||||
| 6,817,063 | ||||||||
Ireland — 2.1% |
||||||||
Linde PLC (a) |
13,222 | 3,615,780 | ||||||
Ryanair Holdings PLC Sponsored ADR (a) |
81,060 | 4,735,525 | ||||||
| 8,351,305 | ||||||||
Israel — 0.9% |
||||||||
Check Point Software Technologies Ltd. (a) |
33,636 | 3,767,905 | ||||||
Italy — 2.4% |
||||||||
Eni SpA |
253,547 | 2,693,607 | ||||||
The accompanying notes are an integral part of the financial statements.
167
MassMutual Overseas Fund — Portfolio of Investments (Continued) |
Number of |
Value |
|||||||
Intesa Sanpaolo SpA |
4,189,027 | $ | 6,894,794 | |||||
| 9,588,401 | ||||||||
Japan — 10.3% |
||||||||
Daikin Industries Ltd. |
28,700 | 4,434,726 | ||||||
Denso Corp. |
45,300 | 2,067,671 | ||||||
Fujitsu Ltd. |
1,000 | 107,842 | ||||||
Hitachi Ltd. |
127,200 | 5,385,937 | ||||||
Hoya Corp. |
33,600 | 3,230,468 | ||||||
Koito Manufacturing Co. Ltd. |
119,600 | 1,639,039 | ||||||
Komatsu Ltd. |
62,200 | 1,124,819 | ||||||
Kose Corp. |
27,500 | 2,799,383 | ||||||
Kubota Corp. |
232,500 | 3,224,114 | ||||||
Kyocera Corp. |
70,000 | 3,538,406 | ||||||
Olympus Corp. |
185,000 | 3,560,479 | ||||||
Shin-Etsu Chemical Co. Ltd. |
12,600 | 1,251,226 | ||||||
SMC Corp. |
5,500 | 2,218,825 | ||||||
Sony Group Corp. |
48,700 | 3,134,445 | ||||||
Terumo Corp. |
111,100 | 3,135,084 | ||||||
| 40,852,464 | ||||||||
Mexico — 0.2% |
||||||||
Grupo Televisa SAB Sponsored ADR |
154,900 | 833,362 | ||||||
Netherlands — 5.2% |
||||||||
Akzo Nobel NV |
54,711 | 3,085,488 | ||||||
CNH Industrial NV |
231,697 | 2,586,685 | ||||||
EXOR NV (a) (c) |
47,100 | 3,022,580 | ||||||
ING Groep NV |
271,634 | 2,329,075 | ||||||
Koninklijke Philips NV |
108,370 | 1,673,942 | ||||||
Prosus NV (a) |
62,523 | 3,258,319 | ||||||
QIAGEN NV (a) |
57,697 | 2,427,990 | ||||||
Randstad NV (d) |
47,932 | 2,072,720 | ||||||
| 20,456,799 | ||||||||
Portugal — 0.4% |
||||||||
Galp Energia SGPS SA |
183,193 | 1,755,713 | ||||||
Republic of Korea — 0.4% |
||||||||
NAVER Corp. |
11,965 | 1,594,651 | ||||||
Singapore — 1.0% |
||||||||
DBS Group Holdings, Ltd. |
166,500 | 3,849,475 | ||||||
Spain — 0.9% |
||||||||
Amadeus IT Group SA (a) |
76,189 | 3,526,709 | ||||||
Sweden — 1.4% |
||||||||
Hennes & Mauritz AB Class B (d) |
185,694 | 1,716,188 | ||||||
SKF AB Class B |
147,700 | 1,975,038 | ||||||
Volvo AB Class B |
119,200 | 1,681,941 | ||||||
| 5,373,167 | ||||||||
Number of |
Value |
|||||||
Switzerland — 13.2% |
||||||||
Cie Financiere Richemont SA Registered |
53,641 | $ | 5,033,312 | |||||
Credit Suisse Group AG Registered (a) |
706,794 | 2,785,551 | ||||||
Holcim AG (a) |
59,184 | 2,414,574 | ||||||
Julius Baer Group Ltd. (a) |
42,123 | 1,832,913 | ||||||
Nestle SA Registered |
97,122 | 10,516,333 | ||||||
Novartis AG Registered |
73,059 | 5,569,525 | ||||||
Roche Holding AG |
31,372 | 10,229,124 | ||||||
Schindler Holding AG |
5,120 | 794,207 | ||||||
Sika AG Registered |
10,981 | 2,198,926 | ||||||
The Swatch Group AG |
5,445 | 1,222,836 | ||||||
UBS Group AG Registered |
368,817 | 5,327,918 | ||||||
Zurich Insurance Group AG |
10,549 | 4,193,486 | ||||||
| 52,118,705 | ||||||||
Taiwan — 0.8% |
||||||||
Taiwan Semiconductor Manufacturing Co. Ltd. Sponsored ADR |
44,851 | 3,074,984 | ||||||
United Kingdom — 12.6% |
||||||||
Ashtead Group PLC |
29,900 | 1,334,912 | ||||||
Compass Group PLC |
300,387 | 6,004,499 | ||||||
Diageo PLC |
110,636 | 4,637,391 | ||||||
Experian PLC |
143,285 | 4,200,717 | ||||||
Glencore PLC |
484,100 | 2,556,308 | ||||||
Informa PLC |
207,700 | 1,196,576 | ||||||
Liberty Global PLC Class A (a) |
91,600 | 1,428,044 | ||||||
Lloyds Banking Group PLC |
8,184,497 | 3,739,205 | ||||||
London Stock Exchange Group PLC |
30,203 | 2,546,823 | ||||||
Prudential PLC |
405,505 | 3,984,118 | ||||||
Reckitt Benckiser Group PLC |
49,510 | 3,272,185 | ||||||
RELX PLC |
176,591 | 4,311,050 | ||||||
Rio Tinto PLC |
44,984 | 2,436,492 | ||||||
Rolls-Royce Holdings PLC (a) |
1,886,927 | 1,450,095 | ||||||
Schroders PLC |
451,964 | 1,956,767 | ||||||
Smiths Group PLC |
45,558 | 763,531 | ||||||
Tesco PLC |
935,867 | 2,142,872 | ||||||
WPP PLC |
217,044 | 1,796,137 | ||||||
| 49,757,722 | ||||||||
United States — 0.6% |
||||||||
Yum China Holdings, Inc. |
46,695 | 2,210,074 | ||||||
TOTAL COMMON STOCK (Cost $433,518,282) |
382,821,259 | |||||||
The accompanying notes are an integral part of the financial statements.
168
MassMutual Overseas Fund — Portfolio of Investments (Continued) |
Number of |
Value |
|||||||
PREFERRED STOCK — 0.4% |
||||||||
Republic of Korea — 0.4% |
||||||||
Samsung Electronics Co. Ltd. 1.760% |
52,500 | $ | 1,708,272 | |||||
TOTAL PREFERRED STOCK (Cost $2,997,578) |
1,708,272 | |||||||
TOTAL EQUITIES (Cost $436,515,860) |
384,529,531 | |||||||
MUTUAL FUNDS — 0.7% |
||||||||
United States — 0.7% |
||||||||
State Street Navigator Securities Lending Government Money Market Portfolio (e) |
2,564,482 | 2,564,482 | ||||||
TOTAL MUTUAL FUNDS (Cost $2,564,482) |
2,564,482 | |||||||
TOTAL LONG-TERM INVESTMENTS (Cost $439,080,342) |
387,094,013 | |||||||
Principal |
||||||||
SHORT-TERM INVESTMENTS — 2.4% |
||||||||
Repurchase Agreement — 2.4% |
||||||||
Fixed Income Clearing Corp., Repurchase Agreement, dated 9/30/22, 0.830%, due 10/03/22 (f) |
$ | 9,671,698 | 9,671,698 | |||||
TOTAL SHORT-TERM INVESTMENTS (Cost $9,671,698) |
9,671,698 | |||||||
TOTAL INVESTMENTS — 100.2% (Cost $448,752,040) (g) |
396,765,711 | |||||||
Other Assets/(Liabilities) — (0.2)% |
(782,917 | ) | ||||||
NET ASSETS — 100.0% |
$ | 395,982,794 | ||||||
Abbreviation Legend
|
ADR |
American Depositary Receipt |
Notes to Portfolio of Investments
Percentages are stated as a percent of net assets.
|
(a) |
Non-income producing security. |
|
(b) |
Security is exempt from registration under Regulation S or Rule 144A of the Securities Act of 1933. These securities are considered restricted and may be resold in transactions exempt from registration. At September 30, 2022, the aggregate market value of these securities amounted to $3,073,665 or 0.78% of net assets. |
|
(c) |
This security is fair valued in good faith in accordance with procedures approved by the Board of Trustees. At September 30, 2022, these securities amounted to a value of $3,022,580 or 0.76% of net assets. |
|
(d) |
Denotes all or a portion of security on loan. The total value of securities on loan as of September 30, 2022, was $2,441,007 or 0.62% of net assets. This amount is not reflected on either the Portfolio of Investments or the Statement of Assets and Liabilities. (Note 2). |
|
(e) |
Represents investment of security lending cash collateral. (Note 2). |
|
(f) |
Maturity value of $9,672,367. Collateralized by U.S. Government Agency obligations with a rate of 3.500%, maturity date of 9/15/25, and an aggregate market value, including accrued interest, of $9,865,186. |
|
(g) |
See Note 6 for aggregate cost for federal tax purposes. |
Sector weightings, as a percentage of net assets, is as follows:
Consumer, Non-cyclical |
29.2 | % | ||
Financial |
18.3 | % | ||
Consumer, Cyclical |
14.8 | % | ||
Industrial |
14.5 | % | ||
Technology |
7.6 | % | ||
Basic Materials |
5.5 | % | ||
Communications |
4.8 | % | ||
Energy |
1.6 | % | ||
Utilities |
0.8 | % | ||
Mutual Funds |
0.7 | % | ||
Total Long-Term Investments |
97.8 | % | ||
Short-Term Investments and Other Assets and Liabilities |
2.2 | % | ||
Net Assets |
100.0 | % |
The accompanying notes are an integral part of the financial statements.
169
MassMutual Select T. Rowe Price International Equity Fund — Portfolio of Investments |
September 30, 2022 |
Number of |
Value |
|||||||
EQUITIES — 96.8% |
||||||||
COMMON STOCK — 96.2% |
||||||||
Australia — 2.7% |
||||||||
Australia & New Zealand Banking Group Ltd. |
124,850 | $ | 1,812,792 | |||||
BHP Group Ltd. |
127,425 | 3,173,508 | ||||||
BHP Group Ltd. (a) |
231,810 | 5,821,930 | ||||||
Challenger Ltd. |
203,981 | 765,048 | ||||||
Downer EDI Ltd. |
601,763 | 1,745,342 | ||||||
IGO Ltd. |
598,148 | 5,213,933 | ||||||
Incitec Pivot Ltd. |
337,901 | 760,909 | ||||||
Macquarie Group Ltd. |
17,949 | 1,741,860 | ||||||
Rio Tinto Ltd. |
13,665 | 813,243 | ||||||
Scentre Group |
884,324 | 1,423,458 | ||||||
South32 Ltd. |
1,884,742 | 4,356,369 | ||||||
Treasury Wine Estates Ltd. |
191,187 | 1,539,360 | ||||||
Woodside Energy Group Ltd. |
19,231 | 394,766 | ||||||
Worley Ltd. |
544,386 | 4,425,956 | ||||||
| 33,988,474 | ||||||||
Austria — 0.4% |
||||||||
BAWAG Group AG (b) |
63,163 | 2,710,405 | ||||||
Erste Group Bank AG |
105,757 | 2,315,987 | ||||||
| 5,026,392 | ||||||||
Belgium — 0.2% |
||||||||
KBC Group NV |
32,966 | 1,546,391 | ||||||
Umicore SA |
44,802 | 1,298,978 | ||||||
| 2,845,369 | ||||||||
Bermuda — 0.3% |
||||||||
China Resources Gas Group Ltd. |
685,900 | 2,164,952 | ||||||
Credicorp Ltd. |
3,470 | 426,116 | ||||||
Hongkong Land Holdings Ltd. |
309,100 | 1,355,957 | ||||||
| 3,947,025 | ||||||||
Brazil — 1.4% |
||||||||
Ambev SA |
879,200 | 2,532,792 | ||||||
B3 SA - Brasil Bolsa Balcao |
1,023,000 | 2,474,840 | ||||||
Banco BTG Pactual SA |
518,300 | 2,383,795 | ||||||
EDP - Energias do Brasil SA |
314,707 | 1,273,565 | ||||||
Klabin SA |
363,900 | 1,224,389 | ||||||
Localiza Rent a Car SA |
127,600 | 1,445,046 | ||||||
Multiplan Empreendimentos Imobiliarios SA |
384,600 | 1,723,244 | ||||||
Raia Drogasil SA |
489,558 | 2,062,835 | ||||||
Rede D’Or Sao Luiz SA (b) |
76,319 | 420,477 | ||||||
Suzano SA |
222,127 | 1,832,408 | ||||||
WEG SA |
42,300 | 252,027 | ||||||
| 17,625,418 | ||||||||
Canada — 4.1% |
||||||||
BRP, Inc. |
15,174 | 934,706 | ||||||
Number of |
Value |
|||||||
Canadian Pacific Railway Ltd. |
80,794 | $ | 5,390,576 | |||||
Constellation Software, Inc. |
2,271 | 3,160,000 | ||||||
Definity Financial Corp. |
93,903 | 2,638,951 | ||||||
The Descartes Systems Group, Inc. (c) |
16,908 | 1,074,165 | ||||||
Element Fleet Management Corp. |
278,000 | 3,280,414 | ||||||
Magna International, Inc. |
79,328 | 3,761,734 | ||||||
Manulife Financial Corp. (a) |
293,473 | 4,605,998 | ||||||
National Bank of Canada |
120,184 | 7,532,871 | ||||||
Shopify, Inc. Class A (c) |
40,160 | 1,081,910 | ||||||
Sun Life Financial, Inc. |
151,358 | 6,018,819 | ||||||
TC Energy Corp. (a) |
44,072 | 1,775,195 | ||||||
TELUS International CDA, Inc. (c) |
67,461 | 1,765,946 | ||||||
TMX Group Ltd. |
58,708 | 5,400,107 | ||||||
Waste Connections, Inc. |
26,034 | 3,517,974 | ||||||
| 51,939,366 | ||||||||
Cayman Islands — 6.2% |
||||||||
Alibaba Group Holding Ltd. (c) |
531,280 | 5,329,213 | ||||||
Alibaba Group Holding Ltd. Sponsored ADR (c) |
101,001 | 8,079,070 | ||||||
Baidu, Inc. Class A (c) |
236,050 | 3,483,263 | ||||||
Baidu, Inc. Sponsored ADR (c) |
35,744 | 4,199,563 | ||||||
Bizlink Holding, Inc. |
202,000 | 1,787,137 | ||||||
Budweiser Brewing Co. APAC Ltd. (b) |
960,200 | 2,502,736 | ||||||
Chailease Holding Co. Ltd. |
137,000 | 779,443 | ||||||
China Resources Mixc Lifestyle Services Ltd. (b) |
238,000 | 911,834 | ||||||
CK Hutchison Holdings Ltd. |
279,000 | 1,532,141 | ||||||
ENN Energy Holdings Ltd. |
88,300 | 1,174,956 | ||||||
JD Health International, Inc. (b) (c) |
266,850 | 1,521,130 | ||||||
JD.com, Inc. Class A |
49,050 | 1,238,577 | ||||||
JOYY, Inc. ADR |
91,826 | 2,387,476 | ||||||
Kanzhun Ltd. ADR (c) |
23,981 | 404,799 | ||||||
KE Holdings, Inc. ADR (c) |
201,587 | 3,531,804 | ||||||
Kingdee International Software Group Co. Ltd. (c) |
559,000 | 722,756 | ||||||
Li Auto, Inc. ADR (c) |
24,600 | 566,046 | ||||||
Li Auto, Inc. Class A (c) |
5,200 | 60,148 | ||||||
Li Ning Co. Ltd. |
54,000 | 410,358 | ||||||
Longfor Group Holdings Ltd. (b) |
635,759 | 1,801,663 | ||||||
Meituan Class B (b) (c) |
137,500 | 2,881,874 | ||||||
Pinduoduo, Inc. ADR (c) |
13,600 | 851,088 | ||||||
Sea Ltd. ADR (c) |
39,839 | 2,232,976 | ||||||
Silergy Corp. |
108,000 | 1,415,703 | ||||||
Sunny Optical Technology Group Co. Ltd. |
61,800 | 580,867 | ||||||
Tencent Holdings Ltd. |
306,700 | 10,357,872 | ||||||
Tingyi Cayman Islands Holding Corp. |
1,008,000 | 1,725,327 | ||||||
Tongcheng Travel Holdings Ltd. (c) |
1,510,800 | 2,950,947 | ||||||
The accompanying notes are an integral part of the financial statements.
170
MassMutual Select T. Rowe Price International Equity Fund — Portfolio of Investments (Continued) |
Number of |
Value |
|||||||
Trip.com Group Ltd. (c) |
78,750 | $ | 2,151,218 | |||||
Trip.com Group Ltd. ADR (c) |
100,741 | 2,751,237 | ||||||
Weibo Corp. Sponsored ADR (c) |
54,531 | 932,480 | ||||||
Wuxi Biologics Cayman, Inc. (b) (c) |
325,500 | 1,950,216 | ||||||
XP, Inc. Class A (a) (c) |
133,868 | 2,544,831 | ||||||
Zhongsheng Group Holdings Ltd. |
686,500 | 2,699,239 | ||||||
| 78,449,988 | ||||||||
Chile — 0.2% |
||||||||
Banco de Chile |
26,165,703 | 2,302,180 | ||||||
China — 3.6% |
||||||||
Beijing Capital International Airport Co. Ltd. Class H (c) |
2,302,000 | 1,237,065 | ||||||
China Construction Bank Corp. Class H |
4,234,000 | 2,436,514 | ||||||
China Oilfield Services Ltd. Class A |
936,500 | 1,889,140 | ||||||
Foshan Haitian Flavouring & Food Co. Ltd. Class A |
30,700 | 356,892 | ||||||
Fuyao Glass Industry Group Co. Ltd. Class A |
699,800 | 3,531,938 | ||||||
Glodon Co. Ltd. Class A |
88,000 | 566,092 | ||||||
Gree Electric Appliances, Inc. of Zhuhai Class A |
374,600 | 1,712,000 | ||||||
Hisense Home Appliances Group Co. Ltd. Class A |
610,455 | 963,408 | ||||||
Hongfa Technology Co. Ltd. Class A |
140,420 | 686,344 | ||||||
Huayu Automotive Systems Co. Ltd. Class |
536,900 | 1,249,839 | ||||||
Hundsun Technologies, Inc. Class A |
311,100 | 1,485,110 | ||||||
Inner Mongolia Yili Industrial Group Co. Ltd. Class A |
392,500 | 1,822,492 | ||||||
Kweichow Moutai Co. Ltd. Class A |
8,698 | 2,287,896 | ||||||
Midea Group Co. Ltd. Class A |
204,400 | 1,420,258 | ||||||
NARI Technology Co. Ltd. Class A |
1,351,038 | 4,716,548 | ||||||
PICC Property & Casualty Co. Ltd. Class H |
2,008,000 | 2,076,964 | ||||||
Ping An Bank Co. Ltd. Class A |
743,500 | 1,236,112 | ||||||
Ping An Insurance Group Co. of China Ltd. Class H |
417,500 | 2,075,939 | ||||||
Pony Testing International Group Co. Ltd. Class A |
89,980 | 444,073 | ||||||
Sangfor Technologies, Inc. Class A |
18,700 | 263,004 | ||||||
Shandong Pharmaceutical Glass Co. Ltd. Class A |
314,700 | 1,281,769 | ||||||
Shenzhen Inovance Technology Co. Ltd. Class A |
361,500 | 2,920,098 | ||||||
Sinopharm Group Co. Ltd. Class H |
278,800 | 556,589 | ||||||
Songcheng Performance Development Co. Ltd. Class A |
774,400 | 1,309,367 | ||||||
Tsingtao Brewery Co. Ltd. Class H |
312,000 | 2,950,760 | ||||||
Weichai Power Co. Ltd. Class A |
942,000 | 1,276,789 | ||||||
WuXi AppTec Co. Ltd. Class A |
55,500 | 555,545 | ||||||
Number of |
Value |
|||||||
Yifeng Pharmacy Chain Co. Ltd. Class A |
155,916 | $ | 1,088,835 | |||||
Zhejiang Sanhua Intelligent Controls Co. Ltd. Class A |
267,500 | 927,021 | ||||||
| 45,324,401 | ||||||||
Cyprus — 0.0% |
||||||||
Ozon Holdings PLC ADR (c) (d) (e) |
18,310 | — | ||||||
TCS Group Holding, PLC (c) (d) (e) |
10,848 | — | ||||||
| — | ||||||||
Denmark — 0.4% |
||||||||
Carlsberg A/S Class B |
17,873 | 2,085,413 | ||||||
Genmab A/S (c) |
9,725 | 3,134,746 | ||||||
| 5,220,159 | ||||||||
Finland — 0.9% |
||||||||
Kojamo OYJ |
48,463 | 615,905 | ||||||
Metso Outotec OYJ |
126,296 | 836,923 | ||||||
Sampo OYJ Class A |
188,398 | 8,040,353 | ||||||
Stora Enso OYJ Class R |
164,709 | 2,100,667 | ||||||
| 11,593,848 | ||||||||
France — 7.2% |
||||||||
Air Liquide SA |
22,644 | 2,578,400 | ||||||
Alstom SA |
84,796 | 1,363,537 | ||||||
AXA SA |
486,349 | 10,648,491 | ||||||
BNP Paribas SA |
127,280 | 5,373,424 | ||||||
Capgemini SE |
11,522 | 1,841,337 | ||||||
Dassault Aviation SA |
53,834 | 6,114,125 | ||||||
Engie SA |
608,697 | 6,984,093 | ||||||
EssilorLuxottica SA |
53,658 | 7,270,422 | ||||||
Faurecia SE (c) |
67,740 | 723,743 | ||||||
Ipsen SA |
7,577 | 699,778 | ||||||
Kering SA |
11,074 | 4,897,130 | ||||||
L’Oreal SA |
11,040 | 3,515,334 | ||||||
Legrand SA |
36,870 | 2,382,130 | ||||||
LVMH Moet Hennessy Louis Vuitton SE |
2,253 | 1,324,392 | ||||||
Safran SA |
44,185 | 4,017,503 | ||||||
Sanofi |
150,086 | 11,454,606 | ||||||
Teleperformance |
14,620 | 3,693,631 | ||||||
Thales SA |
44,099 | 4,864,116 | ||||||
TotalEnergies SE (a) |
252,291 | 11,875,317 | ||||||
| 91,621,509 | ||||||||
Germany — 5.3% |
||||||||
BASF SE |
41,407 | 1,604,678 | ||||||
Bayer AG Registered |
185,836 | 8,575,946 | ||||||
Beiersdorf AG |
11,212 | 1,109,492 | ||||||
Covestro AG (b) |
112,709 | 3,258,626 | ||||||
Daimler Truck Holding AG (c) |
120,267 | 2,752,420 | ||||||
The accompanying notes are an integral part of the financial statements.
171
MassMutual Select T. Rowe Price International Equity Fund — Portfolio of Investments (Continued) |
Number of |
Value |
|||||||
Deutsche Boerse AG |
12,099 | $ | 1,991,943 | |||||
Deutsche Post AG Registered |
66,069 | 2,010,373 | ||||||
Deutsche Telekom AG Registered |
465,270 | 7,975,694 | ||||||
Evotec SE (c) |
139,643 | 2,456,626 | ||||||
Fresenius SE & Co. KGaA |
145,833 | 3,123,634 | ||||||
GEA Group AG |
44,667 | 1,460,628 | ||||||
HeidelbergCement AG |
25,120 | 1,006,227 | ||||||
Infineon Technologies AG |
73,375 | 1,626,030 | ||||||
KION Group AG |
43,577 | 844,410 | ||||||
Knorr-Bremse AG |
15,515 | 672,668 | ||||||
Mercedes-Benz Group AG |
40,176 | 2,054,506 | ||||||
Muenchener Rueckversicherungs-Gesellschaft AG in Muenchen Registered |
24,404 | 5,903,013 | ||||||
SAP SE |
40,141 | 3,309,016 | ||||||
Siemens AG Registered |
105,022 | 10,394,393 | ||||||
Siemens Healthineers AG (b) |
65,775 | 2,849,158 | ||||||
Stroeer SE & Co KGaA |
17,577 | 662,038 | ||||||
Vonovia SE |
29,809 | 648,755 | ||||||
Zalando SE (b) (c) |
47,146 | 934,795 | ||||||
| 67,225,069 | ||||||||
Hong Kong — 1.5% |
||||||||
AIA Group Ltd. |
1,073,400 | 8,911,964 | ||||||
Beijing Enterprises Holdings Ltd. |
261,500 | 731,599 | ||||||
China Overseas Land & Investment Ltd. |
821,000 | 2,117,432 | ||||||
Fosun International Ltd. |
1,282,000 | 793,111 | ||||||
Galaxy Entertainment Group Ltd. |
851,000 | 4,968,843 | ||||||
Guangdong Investment Ltd. |
1,626,000 | 1,301,003 | ||||||
Hong Kong Exchanges & Clearing Ltd. |
17,300 | 587,389 | ||||||
| 19,411,341 | ||||||||
Hungary — 0.3% |
||||||||
OTP Bank Nyrt |
176,604 | 3,223,358 | ||||||
India — 4.9% |
||||||||
Ashok Leyland Ltd. |
473,907 | 884,548 | ||||||
Asian Paints Ltd. |
15,770 | 653,135 | ||||||
Axis Bank Ltd. |
434,853 | 3,893,190 | ||||||
HDFC Asset Management Co. Ltd. (b) |
27,091 | 626,963 | ||||||
HDFC Bank Ltd. |
134,097 | 2,324,767 | ||||||
HDFC Life Insurance Co. Ltd. (b) |
466,313 | 3,027,071 | ||||||
Hindalco Industries Ltd. |
299,070 | 1,420,476 | ||||||
Hindustan Unilever Ltd. |
24,504 | 808,113 | ||||||
Housing Development Finance Corp. Ltd. |
335,833 | 9,355,327 | ||||||
ICICI Bank Ltd. |
371,651 | 3,914,781 | ||||||
ICICI Bank Ltd. Sponsored ADR |
108,482 | 2,274,868 | ||||||
Indus Towers Ltd. |
538,693 | 1,305,615 | ||||||
Infosys Ltd. |
123,614 | 2,118,724 | ||||||
Number of |
Value |
|||||||
Kotak Mahindra Bank Ltd. |
217,230 | $ | 4,804,976 | |||||
Maruti Suzuki India Ltd. |
29,058 | 3,150,239 | ||||||
NTPC Ltd. |
2,750,137 | 5,370,853 | ||||||
Petronet LNG Ltd. |
1,244,771 | 3,042,210 | ||||||
Reliance Industries Ltd. |
167,603 | 4,844,367 | ||||||
Shree Cement Ltd. |
3,524 | 913,037 | ||||||
Shriram Transport Finance Co. Ltd. |
229,312 | 3,353,011 | ||||||
Tata Consultancy Services Ltd. |
11,420 | 417,979 | ||||||
Tech Mahindra Ltd. |
110,890 | 1,359,305 | ||||||
Voltas Ltd. |
184,348 | 2,042,530 | ||||||
| 61,906,085 | ||||||||
Indonesia — 0.9% |
||||||||
Bank Central Asia Tbk PT |
10,082,500 | 5,628,437 | ||||||
Bank Rakyat Indonesia Persero Tbk PT |
11,581,564 | 3,406,953 | ||||||
Sarana Menara Nusantara Tbk PT |
24,941,000 | 2,017,207 | ||||||
Sumber Alfaria Trijaya Tbk PT |
723,400 | 113,218 | ||||||
| 11,165,815 | ||||||||
Ireland — 0.4% |
||||||||
DCC PLC |
26,790 | 1,393,736 | ||||||
Linde PLC (c) |
15,602 | 4,266,631 | ||||||
| 5,660,367 | ||||||||
Italy — 1.5% |
||||||||
Amplifon SpA |
35,622 | 932,859 | ||||||
Banca Mediolanum SpA |
372,244 | 2,331,416 | ||||||
DiaSorin SpA |
15,651 | 1,748,876 | ||||||
Enel SpA |
718,046 | 2,942,569 | ||||||
Ermenegildo Zegna NV (a) |
104,719 | 1,125,729 | ||||||
Intesa Sanpaolo SpA |
640,689 | 1,054,521 | ||||||
Leonardo SpA |
209,300 | 1,481,155 | ||||||
Moncler SpA |
44,712 | 1,835,864 | ||||||
Prysmian SpA |
143,264 | 4,103,602 | ||||||
UniCredit SpA |
179,830 | 1,818,467 | ||||||
| 19,375,058 | ||||||||
Japan — 14.3% |
||||||||
Asahi Group Holdings Ltd. |
88,800 | 2,754,694 | ||||||
Asahi Kasei Corp. |
251,200 | 1,661,346 | ||||||
Asics Corp. |
74,500 | 1,187,119 | ||||||
Astellas Pharma, Inc. |
567,800 | 7,505,384 | ||||||
Central Japan Railway Co. |
13,900 | 1,628,387 | ||||||
Chugai Pharmaceutical Co. Ltd. |
117,800 | 2,941,356 | ||||||
CyberAgent, Inc. |
199,400 | 1,660,846 | ||||||
Dai-ichi Life Holdings, Inc. |
40,800 | 648,538 | ||||||
Daiichi Sankyo Co. Ltd. |
125,300 | 3,485,455 | ||||||
Daikin Industries Ltd. |
11,900 | 1,838,789 | ||||||
Denso Corp. |
31,600 | 1,442,349 | ||||||
DIC Corp. |
58,200 | 969,658 | ||||||
Disco Corp. |
6,800 | 1,481,830 | ||||||
The accompanying notes are an integral part of the financial statements.
172
MassMutual Select T. Rowe Price International Equity Fund — Portfolio of Investments (Continued) |
Number of |
Value |
|||||||
Electric Power Development Co. Ltd. |
97,900 | $ | 1,382,279 | |||||
Fujitsu General Ltd. (a) |
124,100 | 2,583,819 | ||||||
Fujitsu Ltd. |
31,200 | 3,364,684 | ||||||
Hamamatsu Photonics KK |
41,000 | 1,760,364 | ||||||
Hikari Tsushin, Inc. |
10,400 | 1,216,984 | ||||||
Hitachi Ltd. |
94,500 | 4,001,344 | ||||||
Honda Motor Co. Ltd. |
37,800 | 823,438 | ||||||
Keyence Corp. |
6,900 | 2,290,820 | ||||||
Kirin Holdings Co. Ltd. |
95,500 | 1,470,813 | ||||||
MatsukiyoCocokara & Co. |
61,900 | 2,647,445 | ||||||
Mitsubishi Corp. |
69,300 | 1,903,238 | ||||||
Mitsubishi Electric Corp. |
522,500 | 4,720,003 | ||||||
Mitsubishi Estate Co. Ltd. |
135,700 | 1,780,510 | ||||||
Mitsubishi HC Capital, Inc. |
242,200 | 1,041,921 | ||||||
Mitsubishi UFJ Financial Group, Inc. |
972,400 | 4,384,966 | ||||||
Mitsui Fudosan Co. Ltd. |
286,900 | 5,468,933 | ||||||
Murata Manufacturing Co. Ltd. |
96,200 | 4,418,940 | ||||||
Nippon Sanso Holdings Corp. |
51,200 | 808,683 | ||||||
Nippon Shokubai Co. Ltd. |
25,000 | 934,476 | ||||||
Nippon Steel Corp. |
96,100 | 1,337,613 | ||||||
Nippon Telegraph & Telephone Corp. |
675,700 | 18,229,042 | ||||||
NSK Ltd. (a) |
142,400 | 697,768 | ||||||
NTT Data Corp. |
413,900 | 5,349,145 | ||||||
Omron Corp. |
20,300 | 925,227 | ||||||
ORIX Corp. |
167,700 | 2,358,530 | ||||||
Otsuka Holdings Co. Ltd. |
253,400 | 8,037,381 | ||||||
Outsourcing, Inc. |
171,200 | 1,280,583 | ||||||
Pan Pacific International Holding Corp. |
88,100 | 1,548,092 | ||||||
Panasonic Holdings Corp. |
250,000 | 1,755,629 | ||||||
Persol Holdings Co. Ltd. |
190,300 | 3,468,205 | ||||||
Pola Orbis Holdings, Inc. |
25,600 | 286,879 | ||||||
Recruit Holdings Co. Ltd. |
77,200 | 2,228,240 | ||||||
Renesas Electronics Corp. (c) |
122,000 | 1,016,763 | ||||||
Seven & i Holdings Co. Ltd. |
190,900 | 7,668,253 | ||||||
Shimadzu Corp. |
60,100 | 1,564,397 | ||||||
SMC Corp. |
2,300 | 927,872 | ||||||
SoftBank Group Corp. |
29,000 | 985,134 | ||||||
Sompo Holdings, Inc. |
58,400 | 2,327,543 | ||||||
Sony Group Corp. |
75,200 | 4,840,046 | ||||||
Stanley Electric Co. Ltd. |
214,600 | 3,366,679 | ||||||
Sumitomo Corp. |
299,700 | 3,739,940 | ||||||
Sumitomo Mitsui Trust Holdings, Inc. |
46,200 | 1,305,927 | ||||||
Sumitomo Rubber Industries Ltd. |
66,600 | 530,821 | ||||||
Suzuki Motor Corp. |
111,000 | 3,443,243 | ||||||
Taiheiyo Cement Corp. (a) |
76,900 | 1,086,843 | ||||||
Takeda Pharmaceutical Co. Ltd. |
71,700 | 1,862,203 | ||||||
TechnoPro Holdings, Inc. |
91,400 | 1,921,410 | ||||||
THK Co. Ltd. |
43,300 | 749,172 | ||||||
Number of |
Value |
|||||||
Tokio Marine Holdings, Inc. |
198,300 | $ | 3,524,507 | |||||
Tokyo Electron Ltd. |
15,600 | 3,862,419 | ||||||
Tosoh Corp. |
21,300 | 237,845 | ||||||
Toyota Motor Corp. |
726,900 | 9,461,935 | ||||||
Welcia Holdings Co. Ltd. |
36,300 | 762,716 | ||||||
Z Holdings Corp. (a) |
1,316,200 | 3,420,125 | ||||||
| 182,317,538 | ||||||||
Luxembourg — 0.3% |
||||||||
Millicom International Cellular SA (a) (c) |
91,856 | 1,052,086 | ||||||
Samsonite International SA (b) (c) |
496,500 | 1,191,712 | ||||||
Tenaris SA |
150,076 | 1,945,710 | ||||||
| 4,189,508 | ||||||||
Malaysia — 0.2% |
||||||||
CIMB Group Holdings Bhd |
2,906,624 | 3,203,580 | ||||||
Mexico — 0.8% |
||||||||
Gruma SAB de CV Class B |
217,575 | 2,071,875 | ||||||
Grupo Aeroportuario del Pacifico SAB de CV ADR |
16,900 | 2,142,582 | ||||||
Grupo Aeroportuario del Sureste SAB de CV ADR |
2,138 | 419,411 | ||||||
Grupo Financiero Banorte SAB de CV Class O |
228,000 | 1,460,527 | ||||||
Grupo Mexico SAB de CV Series B |
757,282 | 2,557,676 | ||||||
Orbia Advance Corp. SAB de CV |
445,479 | 749,857 | ||||||
Wal-Mart de Mexico SAB de CV |
338,700 | 1,189,516 | ||||||
| 10,591,444 | ||||||||
Netherlands — 5.3% |
||||||||
Adyen NV (b) (c) |
1,644 | 2,045,215 | ||||||
AerCap Holdings NV (c) |
52,597 | 2,226,431 | ||||||
Airbus SE |
39,699 | 3,429,687 | ||||||
Akzo Nobel NV |
154,224 | 8,697,634 | ||||||
ASML Holding NV |
34,496 | 14,308,641 | ||||||
Heineken NV |
5,821 | 510,307 | ||||||
ING Groep NV |
1,103,115 | 9,458,452 | ||||||
Koninklijke DSM NV |
9,957 | 1,129,322 | ||||||
Koninklijke Philips NV |
431,785 | 6,669,587 | ||||||
NXP Semiconductor NV |
31,803 | 4,691,260 | ||||||
Prosus NV (c) |
26,528 | 1,369,545 | ||||||
Prosus NV (c) |
170,474 | 8,884,069 | ||||||
Shop Apotheke Europe NV (b) (c) |
3,995 | 162,193 | ||||||
Signify NV (b) |
59,799 | 1,547,661 | ||||||
Stellantis NV |
160,491 | 1,896,404 | ||||||
X5 Retail Group NV GDR (d) (e) |
53,349 | — | ||||||
Yandex N.V. (c) (d) (e) |
66,647 | — | ||||||
| 67,026,408 | ||||||||
Norway — 0.9% |
||||||||
DNB Bank ASA |
232,842 | 3,686,344 | ||||||
The accompanying notes are an integral part of the financial statements.
173
MassMutual Select T. Rowe Price International Equity Fund — Portfolio of Investments (Continued) |
Number of |
Value |
|||||||
Equinor ASA |
179,775 | $ | 5,929,623 | |||||
Storebrand ASA |
313,171 | 2,154,175 | ||||||
| 11,770,142 | ||||||||
Philippines — 0.3% |
||||||||
Bank of the Philippine Islands |
367,000 | 560,737 | ||||||
SM Investments Corp. |
175,930 | 2,169,234 | ||||||
Universal Robina Corp. |
331,770 | 645,084 | ||||||
| 3,375,055 | ||||||||
Poland — 0.2% |
||||||||
Powszechna Kasa Oszczednosci Bank Polski SA |
110,844 | 483,909 | ||||||
Powszechny Zaklad Ubezpieczen SA |
342,217 | 1,584,746 | ||||||
| 2,068,655 | ||||||||
Portugal — 0.6% |
||||||||
Banco Comercial Portugues SA |
4,512,532 | 534,234 | ||||||
Galp Energia SGPS SA |
582,580 | 5,583,420 | ||||||
Jeronimo Martins SGPS SA |
82,866 | 1,543,896 | ||||||
| 7,661,550 | ||||||||
Republic of Korea — 3.2% |
||||||||
Amorepacific Corp. |
10,324 | 729,425 | ||||||
CJ CheilJedang Corp. |
5,413 | 1,553,713 | ||||||
Hyundai Motor Co. |
19,767 | 2,421,187 | ||||||
Kangwon Land, Inc. (c) |
125,254 | 2,047,442 | ||||||
KT Corp. |
112,382 | 2,831,762 | ||||||
KT Corp. Sponsored ADR |
149,163 | 1,822,772 | ||||||
LG Chem Ltd. |
4,726 | 1,751,338 | ||||||
LG H&H Co. Ltd. |
2,464 | 1,080,670 | ||||||
NAVER Corp. |
38,067 | 5,073,428 | ||||||
POSCO Holdings, Inc. |
1,931 | 284,327 | ||||||
Samsung Electronics Co. Ltd. |
568,956 | 20,905,338 | ||||||
| 40,501,402 | ||||||||
Russia — 0.0% |
||||||||
Gazprom PJSC (c) (d) (e) |
496,602 | — | ||||||
Novatek PJSC (d) (e) |
73,140 | — | ||||||
| — | ||||||||
Saudi Arabia — 0.8% |
||||||||
Nahdi Medical Co. |
32,793 | 1,645,571 | ||||||
The Saudi British Bank |
276,186 | 2,862,155 | ||||||
The Saudi National Bank |
363,663 | 6,071,218 | ||||||
| 10,578,944 | ||||||||
Singapore — 1.3% |
||||||||
DBS Group Holdings, Ltd. |
77,400 | 1,789,486 | ||||||
Jardine Cycle & Carriage Ltd. |
106,100 | 2,482,091 | ||||||
United Overseas Bank Ltd. |
329,600 | 5,984,378 | ||||||
Wilmar International Ltd. |
1,101,700 | 2,933,074 | ||||||
Number of |
Value |
|||||||
Yangzijiang Shipbuilding Holdings Ltd. |
3,846,100 | $ | 2,750,128 | |||||
| 15,939,157 | ||||||||
South Africa — 0.5% |
||||||||
Capitec Bank Holdings Ltd. |
21,010 | 1,800,979 | ||||||
Clicks Group Ltd. |
80,140 | 1,257,583 | ||||||
FirstRand Ltd. |
954,991 | 3,177,638 | ||||||
| 6,236,200 | ||||||||
Spain — 0.7% |
||||||||
Amadeus IT Group SA (c) |
67,137 | 3,107,702 | ||||||
Fluidra SA (a) |
137,086 | 2,043,723 | ||||||
Iberdrola SA |
363,169 | 3,376,156 | ||||||
Indra Sistemas SA |
101,848 | 773,964 | ||||||
| 9,301,545 | ||||||||
Sweden — 1.4% |
||||||||
Assa Abloy AB Class B |
93,110 | 1,739,983 | ||||||
Elekta AB |
235,915 | 1,193,757 | ||||||
Essity AB Class B |
109,377 | 2,159,015 | ||||||
Olink Holding AB ADR (a) (c) |
29,221 | 354,743 | ||||||
Svenska Handelsbanken AB Class A |
312,311 | 2,552,065 | ||||||
Swedbank AB Class A |
331,663 | 4,336,397 | ||||||
Telefonaktiebolaget LM Ericsson Class B (a) |
945,075 | 5,503,862 | ||||||
| 17,839,822 | ||||||||
Switzerland — 7.0% |
||||||||
ABB Ltd. Registered |
135,698 | 3,494,356 | ||||||
Alcon, Inc. |
85,852 | 4,971,691 | ||||||
Barry Callebaut AG Registered |
2,252 | 4,234,378 | ||||||
Holcim AG (c) |
44,979 | 1,835,042 | ||||||
Julius Baer Group Ltd. (c) |
161,101 | 7,010,045 | ||||||
Lonza Group AG Registered |
7,300 | 3,550,055 | ||||||
Nestle SA Registered |
178,492 | 19,327,045 | ||||||
Novartis AG Registered |
133,944 | 10,210,986 | ||||||
Partners Group Holding AG |
4,743 | 3,810,374 | ||||||
PolyPeptide Group AG (b) (c) |
18,229 | 528,624 | ||||||
Roche Holding AG |
62,713 | 20,448,140 | ||||||
UBS Group AG Registered |
185,143 | 2,674,570 | ||||||
Zurich Insurance Group AG |
18,519 | 7,361,755 | ||||||
| 89,457,061 | ||||||||
Taiwan — 2.9% |
||||||||
Hon Hai Precision Industry Co. Ltd. |
1,217,000 | 3,885,235 | ||||||
Largan Precision Co. Ltd. |
11,000 | 573,629 | ||||||
MediaTek, Inc. |
181,000 | 3,150,151 | ||||||
Taiwan Semiconductor Manufacturing Co. Ltd. |
2,229,000 | 29,298,612 | ||||||
Vanguard International Semiconductor Corp. |
251,000 | 507,414 | ||||||
| 37,415,041 | ||||||||
The accompanying notes are an integral part of the financial statements.
174
MassMutual Select T. Rowe Price International Equity Fund — Portfolio of Investments (Continued) |
Number of |
Value |
|||||||
Thailand — 0.7% |
||||||||
Airports of Thailand PCL (c) |
150,100 | $ | 288,501 | |||||
Bangkok Dusit Medical Services PCL |
3,213,700 | 2,492,066 | ||||||
Bumrungrad Hospital PCL |
12,100 | 72,468 | ||||||
CP ALL PCL |
2,539,300 | 3,786,734 | ||||||
Land & Houses PCL |
8,595,000 | 2,020,124 | ||||||
| 8,659,893 | ||||||||
United Arab Emirates — 0.2% |
||||||||
First Abu Dhabi Bank PJSC |
516,473 | 2,510,021 | ||||||
United Kingdom — 11.1% |
||||||||
Amcor PLC |
280,026 | 2,973,673 | ||||||
Antofagasta PLC |
145,756 | 1,797,936 | ||||||
Ashtead Group PLC |
108,511 | 4,844,568 | ||||||
ASOS PLC (a) (c) |
138,436 | 866,162 | ||||||
AstraZeneca PLC Sponsored ADR |
354,400 | 19,435,296 | ||||||
Atlassian Corp. PLC Class A (c) |
5,700 | 1,200,363 | ||||||
boohoo Group PLC (a) (c) |
564,651 | 224,636 | ||||||
Bridgepoint Group PLC (b) |
657,881 | 1,370,987 | ||||||
British American Tobacco PLC |
62,661 | 2,240,720 | ||||||
Bunzl PLC |
48,767 | 1,484,083 | ||||||
Burberry Group PLC |
193,959 | 3,867,760 | ||||||
Close Brothers Group PLC |
42,247 | 435,682 | ||||||
Compass Group PLC |
175,361 | 3,505,328 | ||||||
Diageo PLC |
87,510 | 3,668,047 | ||||||
Direct Line Insurance Group PLC |
1,022,195 | 2,102,685 | ||||||
Dr. Martens Plc |
280,761 | 687,962 | ||||||
Fresnillo PLC |
187,815 | 1,604,839 | ||||||
Great Portland Estates PLC |
388,313 | 1,900,312 | ||||||
GSK PLC ADR |
163,418 | 4,809,392 | ||||||
Haleon PLC ADR (a) (c) |
203,999 | 1,242,354 | ||||||
HSBC Holdings PLC |
515,632 | 2,671,957 | ||||||
Imperial Brands PLC |
157,581 | 3,251,807 | ||||||
Informa PLC |
252,887 | 1,456,902 | ||||||
InterContinental Hotels Group PLC |
35,826 | 1,718,774 | ||||||
Investec PLC |
213,326 | 858,841 | ||||||
Johnson Matthey PLC |
82,519 | 1,677,801 | ||||||
Kingfisher PLC |
946,979 | 2,300,396 | ||||||
Lloyds Banking Group PLC |
9,018,811 | 4,120,373 | ||||||
London Stock Exchange Group PLC |
38,643 | 3,258,513 | ||||||
Melrose Industries PLC |
1,500,024 | 1,674,816 | ||||||
Mondi PLC |
56,319 | 869,937 | ||||||
National Grid PLC |
246,034 | 2,539,032 | ||||||
Network International Holdings PLC (b) (c) |
560,012 | 1,896,214 | ||||||
Next PLC |
57,747 | 3,068,140 | ||||||
Persimmon PLC |
95,989 | 1,321,475 | ||||||
Prudential PLC |
366,261 | 3,598,542 | ||||||
Rightmove PLC |
118,746 | 629,849 | ||||||
Number of |
Value |
|||||||
Rolls-Royce Holdings PLC (c) |
2,401,817 | $ | 1,845,786 | |||||
Shell PLC |
196,579 | 4,890,943 | ||||||
Shell PLC ADR |
52,880 | 2,631,309 | ||||||
Smith & Nephew PLC |
275,760 | 3,181,400 | ||||||
Smiths Group PLC |
118,834 | 1,991,603 | ||||||
Standard Chartered PLC |
325,846 | 2,049,518 | ||||||
Taylor Wimpey PLC |
1,143,706 | 1,115,294 | ||||||
Unilever PLC |
251,047 | 11,046,030 | ||||||
Unilever PLC |
117,536 | 5,183,764 | ||||||
Vodafone Group PLC |
1,860,830 | 2,095,811 | ||||||
Vodafone Group PLC Sponsored ADR |
228,204 | 2,585,551 | ||||||
Wizz Air Holdings Plc (b) (c) |
17,580 | 309,188 | ||||||
WPP PLC |
622,205 | 5,149,027 | ||||||
| 141,251,378 | ||||||||
United States — 1.1% |
||||||||
Autoliv, Inc. |
21,746 | 1,468,540 | ||||||
Broadcom, Inc. |
10,005 | 4,442,320 | ||||||
Canva, Inc. (Acquired 8/16/21, Cost $652,842) (c) (d) (e) (f) |
383 | 365,746 | ||||||
Mastercard, Inc. Class A |
7,933 | 2,255,669 | ||||||
MercadoLibre, Inc. (c) |
600 | 496,668 | ||||||
Southern Copper Corp. |
11,900 | 533,596 | ||||||
Yum China Holdings, Inc. |
101,000 | 4,780,330 | ||||||
Yum China Holdings, Inc. |
6,150 | 290,205 | ||||||
| 14,633,074 | ||||||||
TOTAL COMMON STOCK (Cost $1,449,344,888) |
1,224,378,640 | |||||||
PREFERRED STOCK — 0.6% |
||||||||
Germany — 0.6% |
||||||||
Dr Ing hc F Porsche AG (a) (c) |
59,265 | 4,791,820 | ||||||
Sartorius AG 0.130% 0.357% |
4,258 | 1,487,186 | ||||||
Volkswagen AG 6.014% 6.014% |
15,707 | 1,940,110 | ||||||
| 8,219,116 | ||||||||
United States — 0.0% |
||||||||
Canva, Inc., Series A , (Acquired 11/04/21, Cost $39,209) (d) (e) (f) |
23 | 21,964 | ||||||
TOTAL PREFERRED STOCK (Cost $8,763,724) |
8,241,080 | |||||||
TOTAL EQUITIES (Cost $1,458,108,612) |
1,232,619,720 | |||||||
The accompanying notes are an integral part of the financial statements.
175
MassMutual Select T. Rowe Price International Equity Fund — Portfolio of Investments (Continued) |
Number of |
Value |
|||||||
MUTUAL FUNDS — 2.0% |
||||||||
United States — 2.0% |
||||||||
State Street Navigator Securities Lending Government Money Market Portfolio (g) |
25,119,089 | $ | 25,119,089 | |||||
TOTAL MUTUAL FUNDS (Cost $25,119,089) |
25,119,089 | |||||||
RIGHTS — 0.0% |
||||||||
Brazil — 0.0% |
||||||||
Localiza Rent a Car SA (c) |
391 | 797 | ||||||
Russia — 0.0% |
||||||||
Moscow Exchange (c) (d) (e) |
1,181,630 | — | ||||||
Moscow Exchange (c) (d) (e) |
83,990 | — | ||||||
| — | ||||||||
TOTAL RIGHTS (Cost $2,619,126) |
797 | |||||||
TOTAL LONG-TERM INVESTMENTS (Cost $1,485,846,827) |
1,257,739,606 | |||||||
SHORT-TERM INVESTMENTS — 3.3% |
||||||||
Mutual Fund — 3.2% |
||||||||
T. Rowe Price Government Reserve Investment Fund |
40,804,373 | 40,804,373 | ||||||
Principal |
||||||||
Repurchase Agreement — 0.1% |
||||||||
Fixed Income Clearing Corp., Repurchase Agreement, dated 9/30/22, 0.830%, due 10/03/22 (h) |
$ | 796,077 | 796,077 | |||||
TOTAL SHORT-TERM INVESTMENTS (Cost $41,600,450) |
41,600,450 | |||||||
TOTAL INVESTMENTS — 102.1% (Cost $1,527,447,277) (i) |
1,299,340,056 | |||||||
Other Assets/(Liabilities) — (2.1)% |
(26,344,138 | ) | ||||||
NET ASSETS — 100.0% |
$ | 1,272,995,918 | ||||||
Abbreviation Legend
|
ADR |
American Depositary Receipt |
|
GDR |
Global Depositary Receipt |
Notes to Portfolio of Investments
Percentages are stated as a percent of net assets.
|
(a) |
Denotes all or a portion of security on loan. The total value of securities on loan as of September 30, 2022, was $35,499,222 or 2.79% of net assets. The Fund received $12,253,302 of non-cash collateral (U.S. Treasury and/or Agency obligations) related to securities lending activity. This amount is not reflected on either the Portfolio of Investments or the Statement of Assets and Liabilities. (Note 2). |
|
(b) |
Security is exempt from registration under Regulation S or Rule 144A of the Securities Act of 1933. These securities are considered restricted and may be resold in transactions exempt from registration. At September 30, 2022, the aggregate market value of these securities amounted to $34,448,742 or 2.71% of net assets. |
|
(c) |
Non-income producing security. |
|
(d) |
Investment is valued using significant unobservable inputs. |
|
(e) |
This security is fair valued in good faith in accordance with procedures approved by the Board of Trustees. At September 30, 2022, these securities amounted to a value of $387,710 or 0.03% of net assets. |
|
(f) |
Restricted security. Certain securities are restricted as to resale. At September 30, 2022, these securities amounted to a value of $387,710 or 0.03% of net assets. The Fund generally bears the costs, if any, associated with the disposition of restricted securities. |
|
(g) |
Represents investment of security lending cash collateral. (Note 2). |
|
(h) |
Maturity value of $796,132. Collateralized by U.S. Government Agency obligations with a rate of 0.000%, maturity date of 3/30/23, and an aggregate market value, including accrued interest, of $812,005. |
|
(i) |
See Note 6 for aggregate cost for federal tax purposes. |
Sector weightings, as a percentage of net assets, is as follows:
Financial |
22.7 | % | ||
Consumer, Non-cyclical |
22.2 | % | ||
Consumer, Cyclical |
10.9 | % | ||
Industrial |
10.7 | % | ||
Communications |
9.9 | % | ||
Technology |
9.4 | % | ||
Basic Materials |
5.2 | % | ||
Energy |
3.5 | % | ||
Utilities |
2.3 | % | ||
Mutual Funds |
2.0 | % | ||
Total Long-Term Investments |
98.8 | % | ||
Short-Term Investments and Other Assets and Liabilities |
1.2 | % | ||
Net Assets |
100.0 | % |
The accompanying notes are an integral part of the financial statements.
176
[THIS PAGE INTENTIONALLY LEFT BLANK]
MassMutual Funds – Financial Statements |
MassMutual |
MassMutual |
|||||||
Assets: |
||||||||
Investments, at value (Note 2) (a) |
$ | 873,322,276 | $ | 404,057,811 | ||||
Repurchase agreements, at value (Note 2) (b) |
15,693,982 | 972,044 | ||||||
Total investments (c) |
889,016,258 | 405,029,855 | ||||||
Cash |
23,641 | 3,556,764 | ||||||
Foreign currency, at value (d) |
— | 1,465,668 | ||||||
Receivables from: |
||||||||
Investments sold |
||||||||
Regular delivery |
3,045,922 | 69,357 | ||||||
Delayed delivery |
49,071,402 | 3,119,710 | ||||||
Open forward contracts (Note 2) |
52,891 | 575,582 | ||||||
Fund shares sold |
387,111 | 151,838 | ||||||
Premiums for closed swap agreements, at value |
— | 135,613 | ||||||
Cash collateral pledged for open derivatives (Note 2) |
6,144,894 | 4,698,304 | ||||||
Variation margin on open derivative instruments (Note 2) |
— | 115,765 | ||||||
Interest and dividends |
3,979,100 | 3,291,365 | ||||||
Foreign tax reclaims |
14,304 | 2,326 | ||||||
Prepaid expenses |
41,068 | 36,530 | ||||||
Total assets |
951,776,591 | 422,248,677 | ||||||
Liabilities: |
||||||||
Payables for: |
||||||||
Investments purchased |
||||||||
Regular delivery |
10,936,246 | — | ||||||
Delayed delivery |
202,984,650 | 9,147,916 | ||||||
Written options outstanding, at value (Note 2) (e) |
— | 1,176,532 | ||||||
Open forward contracts (Note 2) |
667 | 1,803,338 | ||||||
Foreign currency overdraft |
59 | — | ||||||
Interest and dividends |
— | 21,413 | ||||||
Fund shares repurchased |
485,282 | 192,275 | ||||||
Cash collateral held for securities on loan (Note 2) |
16,726,548 | 2,470,330 | ||||||
Cash collateral held for open derivatives (Note 2) |
— | 30,000 | ||||||
Trustees’ fees and expenses (Note 3) |
130,800 | 44,840 | ||||||
Variation margin on open derivative instruments (Note 2) |
105,026 | — | ||||||
Affiliates (Note 3): |
||||||||
Administration fees |
84,965 | 120,847 | ||||||
Investment advisory fees |
182,908 | 137,607 | ||||||
Service fees |
54,960 | 26,410 | ||||||
Distribution fees |
11,748 | 3,553 | ||||||
Accrued expense and other liabilities |
178,616 | 216,996 | ||||||
Total liabilities |
231,882,475 | 15,392,057 | ||||||
Net assets |
$ | 719,894,116 | $ | 406,856,620 | ||||
Net assets consist of: |
||||||||
Paid-in capital |
$ | 851,225,751 | $ | 491,982,477 | ||||
Accumulated earnings (loss) |
(131,331,635 | ) | (85,125,857 | ) | ||||
Net assets |
$ | 719,894,116 | $ | 406,856,620 | ||||
(a) |
Cost of investments: |
$ | 952,376,391 | $ | 458,490,670 | ||||
(b) |
Cost of repurchase agreements: |
$ | 15,693,982 | $ | 972,044 | ||||
(c) |
Securities on loan with market value of: |
$ | 31,021,740 | $ | 3,125,444 | ||||
(d) |
Cost of foreign currency: |
$ | — | $ | 1,514,626 | ||||
(e) |
Premiums on written options: |
$ | — | $ | 730,188 |
The accompanying notes are an integral part of the financial statements.
178
MassMutual |
MassMutual |
MM S&P 500 |
MassMutual |
MassMutual |
MassMutual |
||||||||||||||||||
| $ | 275,599,295 | $ | 418,301,008 | $ | 2,233,300,140 | $ | 547,481,615 | $ | 25,810,809 | $ | 2,528,151,983 | ||||||||||||
| 3,266,398 | 10,027,512 | 11,486,546 | 9,104,118 | 256,360 | 5,924,441 | ||||||||||||||||||
| 278,865,693 | 428,328,520 | 2,244,786,686 | 556,585,733 | 26,067,169 | 2,534,076,424 | ||||||||||||||||||
| 434 | 62,842 | 11,582 | — | 3 | — | ||||||||||||||||||
| — | 268,087 | — | 957 | — | 1 | ||||||||||||||||||
| 9,424,467 | 428,730 | — | 950,672 | 306,153 | 6,544,621 | ||||||||||||||||||
| — | — | — | — | — | — | ||||||||||||||||||
| — | — | — | — | — | — | ||||||||||||||||||
| 51,187 | 136,307 | 1,053,344 | 159,729 | 47,919 | 768,907 | ||||||||||||||||||
| — | — | — | — | — | — | ||||||||||||||||||
| — | — | — | — | — | — | ||||||||||||||||||
| — | — | — | — | — | — | ||||||||||||||||||
| 561,139 | 759,044 | 1,793,080 | 959,603 | 6,325 | 435,013 | ||||||||||||||||||
| 17,106 | 82,264 | — | 81,695 | — | 2,195,482 | ||||||||||||||||||
| 43,066 | 39,143 | 39,300 | 34,735 | 37,649 | 38,249 | ||||||||||||||||||
| 288,963,092 | 430,104,937 | 2,247,683,992 | 558,773,124 | 26,465,218 | 2,544,058,697 | ||||||||||||||||||
| 10,469,533 | 427,592 | 2,596,095 | 1,222,853 | 229,741 | — | ||||||||||||||||||
| — | — | — | — | — | — | ||||||||||||||||||
| — | — | — | — | — | — | ||||||||||||||||||
| — | — | — | — | — | — | ||||||||||||||||||
| — | — | — | — | — | — | ||||||||||||||||||
| — | — | — | — | — | — | ||||||||||||||||||
| 103,826 | 284,472 | 20,816,005 | 76,162 | 210 | 3,372,710 | ||||||||||||||||||
| 95,114 | 2,886,035 | — | — | 94,068 | 5,185,964 | ||||||||||||||||||
| — | — | — | — | — | — | ||||||||||||||||||
| 114,123 | 152,210 | 383,762 | 100,105 | 12,791 | 229,057 | ||||||||||||||||||
| — | — | 291,885 | — | — | — | ||||||||||||||||||
| 39,918 | 47,418 | 343,088 | 59,974 | 23,608 | 208,437 | ||||||||||||||||||
| 123,820 | 225,650 | 199,219 | 340,295 | 14,968 | 1,393,179 | ||||||||||||||||||
| 22,340 | 19,960 | 397,714 | 33,537 | 6,694 | 119,696 | ||||||||||||||||||
| 968 | 898 | 148,631 | 2,647 | 766 | 21,865 | ||||||||||||||||||
| 77,952 | 90,396 | 274,496 | 98,793 | 80,731 | 377,771 | ||||||||||||||||||
| 11,047,594 | 4,134,631 | 25,450,895 | 1,934,366 | 463,577 | 10,908,679 | ||||||||||||||||||
| $ | 277,915,498 | $ | 425,970,306 | $ | 2,222,233,097 | $ | 556,838,758 | $ | 26,001,641 | $ | 2,533,150,018 | ||||||||||||
| $ | 237,681,802 | $ | 338,053,136 | $ | 908,110,704 | $ | 450,202,185 | $ | 33,823,786 | $ | 1,867,468,321 | ||||||||||||
| 40,233,696 | 87,917,170 | 1,314,122,393 | 106,636,573 | (7,822,145 | ) | 665,681,697 | |||||||||||||||||
| $ | 277,915,498 | $ | 425,970,306 | $ | 2,222,233,097 | $ | 556,838,758 | $ | 26,001,641 | $ | 2,533,150,018 | ||||||||||||
| $ | 266,114,676 | $ | 394,877,959 | $ | 1,448,610,235 | $ | 527,705,589 | $ | 31,275,209 | $ | 2,111,273,336 | ||||||||||||
| $ | 3,266,398 | $ | 10,027,512 | $ | 11,486,546 | $ | 9,104,118 | $ | 256,360 | $ | 5,924,441 | ||||||||||||
| $ | 93,234 | $ | 4,483,728 | $ | 875,955 | $ | — | $ | 637,254 | $ | 14,048,803 | ||||||||||||
| $ | — | $ | 283,981 | $ | — | $ | 955 | $ | — | $ | 1 | ||||||||||||
| $ | — | $ | — | $ | — | $ | — | $ | — | $ | — |
The accompanying notes are an integral part of the financial statements.
179
MassMutual Funds – Financial Statements (Continued) |
Statements of Assets and Liabilities |
MassMutual |
MassMutual |
|||||||
Class I shares: |
||||||||
Net assets |
$ | 553,148,930 | $ | 261,784,392 | ||||
Shares outstanding (a) |
65,669,583 | 30,771,884 | ||||||
Net asset value, offering price and redemption price per share |
$ | 8.42 | $ | 8.51 | ||||
Class R5 shares: |
||||||||
Net assets |
$ | 25,777,109 | $ | 53,494,357 | ||||
Shares outstanding (a) |
3,065,943 | 6,285,462 | ||||||
Net asset value, offering price and redemption price per share |
$ | 8.41 | $ | 8.51 | ||||
Service Class shares: |
||||||||
Net assets |
$ | 49,613,742 | $ | 33,007,097 | ||||
Shares outstanding (a) |
5,875,445 | 3,880,262 | ||||||
Net asset value, offering price and redemption price per share |
$ | 8.44 | $ | 8.51 | ||||
Administrative Class shares: |
||||||||
Net assets |
$ | 9,164,509 | $ | 20,187,952 | ||||
Shares outstanding (a) |
1,091,500 | 2,378,492 | ||||||
Net asset value, offering price and redemption price per share |
$ | 8.40 | $ | 8.49 | ||||
Class R4 shares: |
||||||||
Net assets |
$ | 53,395,321 | $ | 18,820,890 | ||||
Shares outstanding (a) |
6,312,414 | 2,233,927 | ||||||
Net asset value, offering price and redemption price per share |
$ | 8.46 | $ | 8.43 | ||||
Class A shares: |
||||||||
Net assets |
$ | 11,148,694 | $ | 14,285,204 | ||||
Shares outstanding (a) |
1,335,036 | 1,685,544 | ||||||
Net asset value, and redemption price per share |
$ | 8.35 | $ | 8.48 | ||||
Offering price per share (100/[100-maximum sales charge] of net asset value) |
$ | 8.72 | $ | 8.86 | ||||
Class R3 shares: |
||||||||
Net assets |
$ | 17,645,811 | $ | 5,276,728 | ||||
Shares outstanding (a) |
2,107,348 | 631,319 | ||||||
Net asset value, offering price and redemption price per share |
$ | 8.37 | $ | 8.36 | ||||
|
(a) |
Authorized unlimited number of shares with no par value. |
The accompanying notes are an integral part of the financial statements.
180
MassMutual |
MassMutual |
MM S&P 500 |
MassMutual |
MassMutual |
MassMutual |
||||||||||||||||||
| $ | 168,929,107 | $ | 277,620,740 | $ | 900,470,762 | $ | 355,034,578 | $ | 2,653,933 | $ | 1,748,402,304 | ||||||||||||
| 15,542,653 | 32,495,314 | 56,540,779 | 21,315,984 | 890,798 | 93,295,049 | ||||||||||||||||||
| $ | 10.87 | $ | 8.54 | $ | 15.93 | $ | 16.66 | $ | 2.98 | $ | 18.74 | ||||||||||||
| $ | 48,258,955 | $ | 69,771,116 | $ | 300,070,119 | $ | 84,470,832 | $ | 4,939,175 | $ | 333,396,486 | ||||||||||||
| 4,428,236 | 8,097,561 | 18,749,092 | 5,044,467 | 1,648,044 | 17,873,503 | ||||||||||||||||||
| $ | 10.90 | $ | 8.62 | $ | 16.00 | $ | 16.75 | $ | 3.00 | $ | 18.65 | ||||||||||||
| $ | 11,979,334 | $ | 26,310,541 | $ | 244,212,074 | $ | 34,750,254 | $ | 4,211,009 | $ | 121,094,390 | ||||||||||||
| 1,099,494 | 3,075,110 | 15,220,793 | 2,136,382 | 1,527,179 | 6,590,348 | ||||||||||||||||||
| $ | 10.90 | $ | 8.56 | $ | 16.04 | $ | 16.27 | $ | 2.76 | $ | 18.37 | ||||||||||||
| $ | 16,694,929 | $ | 24,363,553 | $ | 213,738,638 | $ | 34,103,898 | $ | 4,609,568 | $ | 171,168,299 | ||||||||||||
| 1,518,812 | 2,816,248 | 13,708,006 | 2,141,537 | 1,850,682 | 9,536,595 | ||||||||||||||||||
| $ | 10.99 | $ | 8.65 | $ | 15.59 | $ | 15.92 | $ | 2.49 | $ | 17.95 | ||||||||||||
| $ | 8,853,003 | $ | 3,936,960 | $ | 333,262,904 | $ | 6,353,720 | $ | 1,220,162 | $ | 48,674,177 | ||||||||||||
| 830,739 | 475,352 | 21,795,322 | 439,377 | 642,179 | 2,909,856 | ||||||||||||||||||
| $ | 10.66 | $ | 8.28 | $ | 15.29 | $ | 14.46 | $ | 1.90 | $ | 16.73 | ||||||||||||
| $ | 21,804,938 | $ | 22,657,304 | $ | 18,171,856 | $ | 38,061,716 | $ | 7,266,709 | $ | 80,083,855 | ||||||||||||
| 2,008,048 | 2,669,890 | 1,199,740 | 2,567,367 | 3,654,701 | 4,792,051 | ||||||||||||||||||
| $ | 10.86 | $ | 8.49 | $ | 15.15 | $ | 14.83 | $ | 1.99 | $ | 16.71 | ||||||||||||
| $ | 11.49 | $ | 8.98 | $ | 16.03 | $ | 15.69 | $ | 2.11 | $ | 17.68 | ||||||||||||
| $ | 1,395,232 | $ | 1,310,092 | $ | 212,306,744 | $ | 4,063,760 | $ | 1,101,085 | $ | 30,330,507 | ||||||||||||
| 129,470 | 159,203 | 14,518,936 | 308,690 | 851,558 | 2,022,654 | ||||||||||||||||||
| $ | 10.78 | $ | 8.23 | $ | 14.62 | $ | 13.16 | $ | 1.29 | $ | 15.00 | ||||||||||||
The accompanying notes are an integral part of the financial statements.
181
MassMutual Funds – Financial Statements (Continued) |
Statements of Assets and Liabilities |
MassMutual |
MassMutual |
|||||||
Assets: |
||||||||
Investments, at value (Note 2) (a) |
$ | 236,056,896 | $ | 98,660,615 | ||||
Repurchase agreements, at value (Note 2) (b) |
5,911,529 | 2,750,893 | ||||||
Total investments (c) |
241,968,425 | 101,411,508 | ||||||
Cash |
— | 363 | ||||||
Foreign currency, at value (d) |
— | — | ||||||
Receivables from: |
||||||||
Investments sold |
||||||||
Regular delivery |
2,123,186 | 569,694 | ||||||
Open forward contracts (Note 2) |
— | 9,401 | ||||||
Fund shares sold |
87,793 | 10,829 | ||||||
Investment adviser (Note 3) |
— | 32,198 | ||||||
Interest and dividends |
32,972 | 169,849 | ||||||
Foreign tax reclaims |
10,968 | 1,721 | ||||||
Prepaid expenses |
38,523 | 44,962 | ||||||
Total assets |
244,261,867 | 102,250,525 | ||||||
Liabilities: |
||||||||
Payables for: |
||||||||
Investments purchased |
||||||||
Regular delivery |
2,597,419 | 916,579 | ||||||
Open forward contracts (Note 2) |
— | 9,904 | ||||||
Foreign currency overdraft |
— | 25 | ||||||
Fund shares repurchased |
744,350 | 895 | ||||||
Cash collateral held for securities on loan (Note 2) |
6,702,873 | 68,961 | ||||||
Trustees’ fees and expenses (Note 3) |
82,885 | 16,877 | ||||||
Affiliates (Note 3): |
||||||||
Administration fees |
37,278 | 27,513 | ||||||
Investment advisory fees |
150,427 | 62,975 | ||||||
Service fees |
12,374 | 1,190 | ||||||
Distribution fees |
1,052 | 82 | ||||||
Due to custodian |
29,341 | — | ||||||
Accrued expense and other liabilities |
81,320 | 84,469 | ||||||
Total liabilities |
10,439,319 | 1,189,470 | ||||||
Net assets |
$ | 233,822,548 | $ | 101,061,055 | ||||
Net assets consist of: |
||||||||
Paid-in capital |
$ | 255,410,891 | $ | 108,175,707 | ||||
Accumulated earnings (loss) |
(21,588,343 | ) | (7,114,652 | ) | ||||
Net assets |
$ | 233,822,548 | $ | 101,061,055 | ||||
(a) |
Cost of investments: |
$ | 281,039,622 | $ | 113,176,249 | ||||
(b) |
Cost of repurchase agreements: |
$ | 5,911,529 | $ | 2,750,893 | ||||
(c) |
Securities on loan with market value of: |
$ | 12,422,337 | $ | 494,945 | ||||
(d) |
Cost of foreign currency: |
$ | — | $ | — |
The accompanying notes are an integral part of the financial statements.
182
MassMutual |
MassMutual |
MassMutual |
MassMutual |
MassMutual |
MassMutual Select |
||||||||||||||||||
| $ | 47,918,057 | $ | 197,591,033 | $ | 5,069,775,588 | $ | 511,320,719 | $ | 387,094,013 | $ | 1,298,543,979 | ||||||||||||
| 2,276,333 | 1,594,316 | 84,415,685 | 20,746,302 | 9,671,698 | 796,077 | ||||||||||||||||||
| 50,194,390 | 199,185,349 | 5,154,191,273 | 532,067,021 | 396,765,711 | 1,299,340,056 | ||||||||||||||||||
| — | — | 5 | 17,675 | 23,197 | 203,820 | ||||||||||||||||||
| 60 | — | — | 11 | 29,448 | 3,812,285 | ||||||||||||||||||
| 276,954 | 207,259 | 30,677,811 | 1,911,637 | 303,873 | 4,146,220 | ||||||||||||||||||
| — | 141 | — | — | — | — | ||||||||||||||||||
| 8,395 | 36,650 | 3,374,428 | 1,659,497 | 262,081 | 617,764 | ||||||||||||||||||
| — | 23,906 | — | — | 72,510 | 126,870 | ||||||||||||||||||
| 42,684 | 169,599 | 705,666 | 303,411 | 452,421 | 3,736,012 | ||||||||||||||||||
| — | — | 32,171 | — | 3,208,219 | 3,218,995 | ||||||||||||||||||
| 37,829 | 38,851 | 59,378 | 50,185 | 39,201 | 8,577 | ||||||||||||||||||
| 50,560,312 | 199,661,755 | 5,189,040,732 | 536,009,437 | 401,156,661 | 1,315,210,599 | ||||||||||||||||||
| 1,063,986 | 263,589 | 32,951,496 | 131,252 | 967,272 | 15,535,739 | ||||||||||||||||||
| — | 8,696 | — | — | — | — | ||||||||||||||||||
| — | — | — | — | — | — | ||||||||||||||||||
| 8,088 | 10,486 | 5,217,436 | 219,458 | 829,829 | 437,224 | ||||||||||||||||||
| 246,505 | 3,166,453 | 25,184,258 | 8,359,079 | 2,564,482 | 25,119,089 | ||||||||||||||||||
| 16,871 | 54,923 | 468,462 | 91,363 | 88,137 | 47,362 | ||||||||||||||||||
| 22,179 | 30,610 | 315,309 | 49,089 | 53,801 | 32,936 | ||||||||||||||||||
| 32,280 | 147,741 | 3,123,102 | 365,381 | 277,302 | — | ||||||||||||||||||
| 4,425 | 8,072 | 117,820 | 23,280 | 22,996 | — | ||||||||||||||||||
| 433 | 232 | 13,625 | 2,320 | 2,848 | — | ||||||||||||||||||
| — | — | — | — | — | — | ||||||||||||||||||
| 77,029 | 85,842 | 231,266 | 186,253 | 367,200 | 1,042,331 | ||||||||||||||||||
| 1,471,796 | 3,776,644 | 67,622,774 | 9,427,475 | 5,173,867 | 42,214,681 | ||||||||||||||||||
| $ | 49,088,516 | $ | 195,885,111 | $ | 5,121,417,958 | $ | 526,581,962 | $ | 395,982,794 | $ | 1,272,995,918 | ||||||||||||
| $ | 43,568,226 | $ | 197,633,188 | $ | 4,320,179,799 | $ | 585,628,115 | $ | 429,828,715 | $ | 1,513,587,468 | ||||||||||||
| 5,520,290 | (1,748,077 | ) | 801,238,159 | (59,046,153 | ) | (33,845,921 | ) | (240,591,550 | ) | ||||||||||||||
| $ | 49,088,516 | $ | 195,885,111 | $ | 5,121,417,958 | $ | 526,581,962 | $ | 395,982,794 | $ | 1,272,995,918 | ||||||||||||
| $ | 47,855,097 | $ | 223,157,515 | $ | 4,918,879,333 | $ | 538,632,229 | $ | 439,080,342 | $ | 1,526,651,200 | ||||||||||||
| $ | 2,276,333 | $ | 1,594,316 | $ | 84,415,685 | $ | 20,746,302 | $ | 9,671,698 | $ | 796,077 | ||||||||||||
| $ | 504,280 | $ | 5,492,315 | $ | 78,799,801 | $ | 26,470,437 | $ | 2,441,007 | $ | 35,499,222 | ||||||||||||
| $ | 62 | $ | — | $ | — | $ | 12 | $ | 29,704 | $ | 3,824,637 |
The accompanying notes are an integral part of the financial statements.
183
MassMutual Funds – Financial Statements (Continued) |
Statements of Assets and Liabilities |
MassMutual |
MassMutual |
|||||||
Class I shares: |
||||||||
Net assets |
$ | 146,814,187 | $ | 97,583,652 | ||||
Shares outstanding (a) |
32,164,168 | 9,240,256 | ||||||
Net asset value, offering price and redemption price per share |
$ | 4.56 | $ | 10.56 | ||||
Class R5 shares: |
||||||||
Net assets |
$ | 33,626,104 | $ | 782,397 | ||||
Shares outstanding (a) |
7,647,326 | 73,028 | ||||||
Net asset value, offering price and redemption price per share |
$ | 4.40 | $ | 10.71 | ||||
Service Class shares: |
||||||||
Net assets |
$ | 14,637,206 | $ | 88,418 | ||||
Shares outstanding (a) |
3,655,045 | 8,343 | ||||||
Net asset value, offering price and redemption price per share |
$ | 4.00 | $ | 10.60 | ||||
Administrative Class shares: |
||||||||
Net assets |
$ | 22,601,669 | $ | 841,233 | ||||
Shares outstanding (a) |
6,432,032 | 77,242 | ||||||
Net asset value, offering price and redemption price per share |
$ | 3.51 | $ | 10.89 | ||||
Class R4 shares: |
||||||||
Net assets |
$ | 637,840 | $ | 255,326 | ||||
Shares outstanding (a) |
238,146 | 24,365 | ||||||
Net asset value, offering price and redemption price per share |
$ | 2.68 | $ | 10.48 | ||||
Class A shares: |
||||||||
Net assets |
$ | 14,094,579 | $ | 1,390,331 | ||||
Shares outstanding (a) |
5,439,605 | 130,519 | ||||||
Net asset value, and redemption price per share |
$ | 2.59 | $ | 10.65 | ||||
Offering price per share (100/[100-maximum sales charge] of net asset value) |
$ | 2.74 | $ | 11.27 | ||||
Class R3 shares: |
||||||||
Net assets |
$ | 1,410,963 | $ | 119,698 | ||||
Shares outstanding (a) |
833,623 | 11,460 | ||||||
Net asset value, offering price and redemption price per share |
$ | 1.69 | $ | 10.44 | ||||
|
(a) |
Authorized unlimited number of shares with no par value. |
The accompanying notes are an integral part of the financial statements.
184
MassMutual |
MassMutual |
MassMutual |
MassMutual |
MassMutual |
MassMutual Select |
||||||||||||||||||
| $ | 31,862,720 | $ | 132,528,131 | $ | 3,824,988,373 | $ | 368,199,152 | $ | 232,440,544 | $ | 1,272,995,918 | ||||||||||||
| 3,667,279 | 14,965,996 | 206,209,245 | 30,786,558 | 33,498,924 | 151,767,928 | ||||||||||||||||||
| $ | 8.69 | $ | 8.86 | $ | 18.55 | $ | 11.96 | $ | 6.94 | $ | 8.39 | ||||||||||||
| $ | 6,512,723 | $ | 35,441,827 | $ | 834,944,781 | $ | 88,121,261 | $ | 86,220,183 | $ | — | ||||||||||||
| 748,784 | 3,968,827 | 45,835,794 | 7,570,805 | 12,370,892 | — | ||||||||||||||||||
| $ | 8.70 | $ | 8.93 | $ | 18.22 | $ | 11.64 | $ | 6.97 | $ | — | ||||||||||||
| $ | 2,189,326 | $ | 7,189,010 | $ | 158,487,439 | $ | 17,932,145 | $ | 30,650,933 | $ | — | ||||||||||||
| 250,569 | 811,550 | 9,067,443 | 1,712,130 | 4,431,201 | — | ||||||||||||||||||
| $ | 8.74 | $ | 8.86 | $ | 17.48 | $ | 10.47 | $ | 6.92 | $ | — | ||||||||||||
| $ | 2,188,714 | $ | 9,380,321 | $ | 136,292,494 | $ | 18,392,624 | $ | 13,633,077 | $ | — | ||||||||||||
| 254,273 | 1,089,753 | 8,390,865 | 1,991,195 | 1,949,717 | — | ||||||||||||||||||
| $ | 8.61 | $ | 8.61 | $ | 16.24 | $ | 9.24 | $ | 6.99 | $ | — | ||||||||||||
| $ | 1,193,383 | $ | 627,521 | $ | 59,610,584 | $ | 11,840,257 | $ | 16,143,896 | $ | — | ||||||||||||
| 143,692 | 78,385 | 4,146,859 | 1,629,678 | 2,436,772 | — | ||||||||||||||||||
| $ | 8.31 | $ | 8.01 | $ | 14.37 | $ | 7.27 | $ | 6.63 | $ | — | ||||||||||||
| $ | 4,520,796 | $ | 10,386,659 | $ | 87,758,068 | $ | 18,688,278 | $ | 12,858,190 | $ | — | ||||||||||||
| 540,607 | 1,275,287 | 6,199,943 | 2,620,458 | 1,888,026 | — | ||||||||||||||||||
| $ | 8.36 | $ | 8.14 | $ | 14.15 | $ | 7.13 | $ | 6.81 | $ | — | ||||||||||||
| $ | 8.85 | $ | 8.61 | $ | 14.97 | $ | 7.54 | $ | 7.21 | $ | — | ||||||||||||
| $ | 620,854 | $ | 331,642 | $ | 19,336,219 | $ | 3,408,245 | $ | 4,035,971 | $ | — | ||||||||||||
| 76,245 | 45,728 | 1,571,686 | 655,832 | 602,186 | — | ||||||||||||||||||
| $ | 8.14 | $ | 7.25 | $ | 12.30 | $ | 5.20 | $ | 6.70 | $ | — | ||||||||||||
The accompanying notes are an integral part of the financial statements.
185
MassMutual Funds – Financial Statements (Continued) |
Statements of Operations |
MassMutual |
MassMutual |
|||||||
Investment income (Note 2): |
||||||||
Dividends (a) |
$ | 844 | $ | — | ||||
Interest (b) |
18,043,590 | 14,174,426 | ||||||
Securities lending net income |
154,511 | 6,694 | ||||||
Non cash income |
— | — | ||||||
Total investment income |
18,198,945 | 14,181,120 | ||||||
Expenses (Note 3): |
||||||||
Investment advisory fees |
2,433,628 | 1,966,150 | ||||||
Custody fees |
178,740 | 193,916 | ||||||
Audit fees |
56,475 | 65,807 | ||||||
Legal fees |
38,864 | 85,576 | ||||||
Proxy fees |
1,332 | 1,337 | ||||||
Accounting & Administration fees |
78,419 | 125,780 | ||||||
Shareholder reporting fees |
27,294 | 28,641 | ||||||
Trustees’ fees |
42,202 | 26,287 | ||||||
Registration and filing fees |
101,275 | 98,032 | ||||||
Transfer agent fees |
2,959 | 2,718 | ||||||
| 2,961,188 | 2,594,244 | |||||||
Administration fees: |
||||||||
Class R5 |
31,100 | 65,910 | ||||||
Service Class |
118,268 | 73,682 | ||||||
Administrative Class |
42,987 | 88,834 | ||||||
Class R4 |
133,098 | 55,282 | ||||||
Class A |
34,394 | 57,770 | ||||||
Class R3 |
39,497 | 14,016 | ||||||
Distribution and Service fees: |
||||||||
Class R4 |
166,372 | 69,103 | ||||||
Class A |
28,662 | 48,142 | ||||||
Class R3 |
98,744 | 35,040 | ||||||
Total expenses |
3,654,310 | 3,102,023 | ||||||
Expenses waived (Note 3): |
||||||||
Advisory fees waived |
(243,363 | ) | (252,307 | ) | ||||
Net expenses: |
3,410,947 | 2,849,716 | ||||||
Net investment income (loss) |
14,787,998 | 11,331,404 | ||||||
The accompanying notes are an integral part of the financial statements.
186
MassMutual |
MassMutual |
MM S&P 500 |
MassMutual |
MassMutual |
MassMutual |
||||||||||||||||||
| $ | 9,156,185 | $ | 11,524,566 | $ | 45,698,730 | $ | 13,568,727 | $ | 250,523 | $ | 16,689,086 | ||||||||||||
| 2,745 | 6,507 | 61,400 | — | 796 | 179,807 | ||||||||||||||||||
| 5,519 | 9,753 | 3,473 | 7,644 | 1,576 | 68,974 | ||||||||||||||||||
| — | — | 113,275 | — | — | 350,651 | ||||||||||||||||||
| 9,164,449 | 11,540,826 | 45,876,878 | 13,576,371 | 252,895 | 17,288,518 | ||||||||||||||||||
| 1,802,361 | 3,333,973 | 2,966,050 | 4,925,333 | 271,192 | 21,544,826 | ||||||||||||||||||
| 52,804 | 51,759 | 230,358 | 58,652 | 35,479 | 353,299 | ||||||||||||||||||
| 49,845 | 49,748 | 53,941 | 52,102 | 52,704 | 52,620 | ||||||||||||||||||
| 9,766 | 13,879 | 84,144 | 19,233 | 1,028 | 92,612 | ||||||||||||||||||
| 1,337 | 1,337 | 1,337 | 1,337 | 1,337 | 1,337 | ||||||||||||||||||
| 30,803 | 31,646 | 75,954 | 35,745 | 26,288 | 78,347 | ||||||||||||||||||
| 14,496 | 27,474 | 70,875 | 18,694 | 14,331 | 68,467 | ||||||||||||||||||
| 20,272 | 30,600 | 161,460 | 37,098 | 2,378 | 182,221 | ||||||||||||||||||
| 100,513 | 102,819 | 108,236 | 102,394 | 99,417 | 111,792 | ||||||||||||||||||
| 2,968 | 2,968 | 2,968 | 2,967 | 2,968 | 2,968 | ||||||||||||||||||
| 2,085,165 | 3,646,203 | 3,755,323 | 5,253,555 | 507,122 | 22,488,489 | ||||||||||||||||||
| 61,766 | 101,114 | 438,115 | 137,287 | 8,316 | 481,161 | ||||||||||||||||||
| 29,862 | 61,802 | 846,442 | 88,542 | 10,836 | 348,116 | ||||||||||||||||||
| 60,889 | 119,822 | 1,071,065 | 137,643 | 18,715 | 770,026 | ||||||||||||||||||
| 23,154 | 14,939 | 1,080,554 | 16,712 | 2,785 | 196,458 | ||||||||||||||||||
| 78,859 | 88,179 | 72,363 | 144,387 | 30,225 | 344,629 | ||||||||||||||||||
| 2,371 | 3,131 | 651,201 | 7,610 | 2,702 | 87,287 | ||||||||||||||||||
| 28,942 | 18,673 | 1,080,554 | 20,890 | 3,481 | 245,572 | ||||||||||||||||||
| 65,716 | 73,482 | 51,688 | 120,322 | 25,186 | 287,193 | ||||||||||||||||||
| 5,928 | 7,828 | 1,302,402 | 19,026 | 6,756 | 218,216 | ||||||||||||||||||
| 2,442,652 | 4,135,173 | 10,349,707 | 5,945,974 | 616,124 | 25,467,147 | ||||||||||||||||||
| — | — | — | — | (3,775 | ) | — | |||||||||||||||||
| 2,442,652 | 4,135,173 | 10,349,707 | 5,945,974 | 612,349 | 25,467,147 | ||||||||||||||||||
| 6,721,797 | 7,405,653 | 35,527,171 | 7,630,397 | (359,454 | ) | (8,178,629 | ) | ||||||||||||||||
The accompanying notes are an integral part of the financial statements.
187
MassMutual Funds – Financial Statements (Continued) |
Statements of Operations |
MassMutual |
MassMutual |
|||||||
Realized and unrealized gain (loss): |
||||||||
Net realized gain (loss) on: |
||||||||
Investment transactions |
$ | (55,524,266 | ) | $ | (15,217,884 | ) | ||
Futures contracts |
(753,509 | ) | (22,401,574 | ) | ||||
Written options |
(2,358,289 | ) | 2,251,186 | |||||
Swap agreements |
15,526 | 3,552,280 | ||||||
Foreign currency transactions |
43,207 | (228,452 | ) | |||||
Forward contracts |
138,550 | (2,541,719 | ) | |||||
Net realized gain (loss) |
(58,438,781 | ) | (34,586,163 | ) | ||||
Net change in unrealized appreciation (depreciation) on: |
||||||||
Investment transactions |
(89,522,651 | ) | (62,284,751 | )* | ||||
Futures contracts |
(1,702,501 | ) | (3,851,488 | ) | ||||
Written options |
53,377 | (480,143 | ) | |||||
Swap agreements |
(3,846,884 | ) | 1,639,219 | |||||
Translation of assets and liabilities in foreign currencies |
(2,067 | ) | 9,780 | |||||
Forward contracts |
52,224 | (1,180,378 | ) | |||||
Net change in unrealized appreciation (depreciation) |
(94,968,502 | ) | (66,147,761 | ) | ||||
Net realized gain (loss) and change in unrealized appreciation (depreciation) |
(153,407,283 | ) | (100,733,924 | ) | ||||
Net increase (decrease) in net assets resulting from operations |
$ | (138,619,285 | ) | $ | (89,402,520 | ) | ||
(a) |
Net of foreign withholding tax of: |
$ | — | $ | — | ||||
(b) |
Net of foreign withholding tax of: |
$ | — | $ | 26,418 | ||||
* |
Net of net increase (decrease) in accrued foreign capital gains tax of: |
$ | — | $ | 4,077 |
The accompanying notes are an integral part of the financial statements.
188
MassMutual |
MassMutual |
MM S&P 500 |
MassMutual |
MassMutual |
MassMutual |
||||||||||||||||||
| $ | 31,438,954 | $ | 69,872,024 | $ | 563,413,164 | $ | 91,683,265 | $ | (1,530,616 | ) | $ | 321,056,019 | |||||||||||
| — | — | (2,024,579 | ) | — | — | — | |||||||||||||||||
| — | — | — | — | — | — | ||||||||||||||||||
| — | — | — | — | — | — | ||||||||||||||||||
| (2,109 | ) | 82 | — | (16,588 | ) | 1 | (1,240 | ) | |||||||||||||||
| — | — | — | — | — | — | ||||||||||||||||||
| 31,436,845 | 69,872,106 | 561,388,585 | 91,666,677 | (1,530,615 | ) | 321,054,779 | |||||||||||||||||
| (63,531,195 | ) | (109,676,818 | ) | (996,755,380 | ) | (134,604,817 | ) | (13,385,532 | ) | (1,559,109,735 | ) | ||||||||||||
| — | — | (1,426,502 | ) | — | — | — | |||||||||||||||||
| — | — | — | — | — | — | ||||||||||||||||||
| — | — | — | — | — | — | ||||||||||||||||||
| 4,623 | (20,851 | ) | — | 2,795 | — | — | |||||||||||||||||
| — | — | — | — | — | — | ||||||||||||||||||
| (63,526,572 | ) | (109,697,669 | ) | (998,181,882 | ) | (134,602,022 | ) | (13,385,532 | ) | (1,559,109,735 | ) | ||||||||||||
| (32,089,727 | ) | (39,825,563 | ) | (436,793,297 | ) | (42,935,345 | ) | (14,916,147 | ) | (1,238,054,956 | ) | ||||||||||||
| $ | (25,367,930 | ) | $ | (32,419,910 | ) | $ | (401,266,126 | ) | $ | (35,304,948 | ) | $ | (15,275,601 | ) | $ | (1,246,233,585 | ) | ||||||
| $ | 88,576 | $ | 118,965 | $ | 10,004 | $ | 136,703 | $ | 335 | $ | 552,042 | ||||||||||||
| $ | — | $ | — | $ | — | $ | — | $ | — | $ | — | ||||||||||||
| $ | — | $ | — | $ | — | $ | — | $ | — | $ | — |
The accompanying notes are an integral part of the financial statements.
189
MassMutual Funds – Financial Statements (Continued) |
Statements of Operations |
MassMutual |
MassMutual |
|||||||
Investment income (Note 2): |
||||||||
Dividends (a) |
$ | 812,468 | $ | 2,479,207 | ||||
Interest |
7,884 | 3,164 | ||||||
Securities lending net income |
29,265 | 2,882 | ||||||
Non cash income |
— | — | ||||||
Total investment income |
849,617 | 2,485,253 | ||||||
Expenses (Note 3): |
||||||||
Investment advisory fees |
2,594,889 | 835,677 | ||||||
Custody fees |
42,729 | 48,274 | ||||||
Audit fees |
49,413 | 51,680 | ||||||
Legal fees |
9,602 | 3,182 | ||||||
Proxy fees |
1,337 | 1,337 | ||||||
Accounting & Administration fees |
29,148 | 41,098 | ||||||
Shareholder reporting fees |
15,559 | 16,938 | ||||||
Trustees’ fees |
20,791 | 6,063 | ||||||
Registration and filing fees |
100,942 | 99,941 | ||||||
Transfer agent fees |
2,968 | 2,968 | ||||||
| 2,867,378 | 1,107,158 | |||||||
Administration fees: |
||||||||
Class R5 |
55,515 | 990 | ||||||
Service Class |
44,470 | 651 | ||||||
Administrative Class |
105,244 | 2,950 | ||||||
Class R4 |
3,392 | 565 | ||||||
Class A |
77,374 | 4,548 | ||||||
Class R3 |
4,173 | 270 | ||||||
Distribution and Service fees: |
||||||||
Class R4 |
4,241 | 706 | ||||||
Class A |
64,479 | 3,790 | ||||||
Class R3 |
10,432 | 676 | ||||||
Total expenses |
3,236,698 | 1,122,304 | ||||||
Expenses waived (Note 3): |
||||||||
Class I fees reimbursed by adviser |
— | (365,521 | ) | |||||
Class R5 fees reimbursed by adviser |
— | (3,141 | ) | |||||
Service Class fees reimbursed by adviser |
— | (1,010 | ) | |||||
Administrative Class fees reimbursed by adviser |
— | (3,121 | ) | |||||
Class R4 fees reimbursed by adviser |
— | (900 | ) | |||||
Class A fees reimbursed by adviser |
— | (4,805 | ) | |||||
Class R3 fees reimbursed by adviser |
— | (429 | ) | |||||
Advisory fees waived |
(73,133 | ) | — | |||||
Net expenses: |
3,163,565 | 743,377 | ||||||
Net investment income (loss) |
(2,313,948 | ) | 1,741,876 | |||||
The accompanying notes are an integral part of the financial statements.
190
MassMutual |
MassMutual |
MassMutual |
MassMutual |
MassMutual |
MassMutual Select |
||||||||||||||||||
| $ | 741,303 | $ | 4,198,012 | $ | 34,180,136 | $ | 4,712,893 | $ | 12,779,588 | $ | 42,316,521 | ||||||||||||
| 1,547 | 1,921 | 946,424 | 21,256 | 11,923 | 207,088 | ||||||||||||||||||
| 1,000 | 27,875 | 263,892 | 114,533 | 80,156 | 271,262 | ||||||||||||||||||
| 5,743 | — | — | — | 1,328,018 | 5,910,137 | ||||||||||||||||||
| 749,593 | 4,227,808 | 35,390,452 | 4,848,682 | 14,199,685 | 48,705,008 | ||||||||||||||||||
| 449,998 | 2,207,447 | 48,463,244 | 5,226,397 | 4,456,361 | — | ||||||||||||||||||
| 43,677 | 43,932 | 481,702 | 84,164 | 272,958 | 957,947 | ||||||||||||||||||
| 51,648 | 49,537 | 57,594 | 54,850 | 74,919 | 84,414 | ||||||||||||||||||
| 1,452 | 7,153 | 185,178 | 17,139 | 14,691 | 42,540 | ||||||||||||||||||
| 1,337 | 1,337 | 1,337 | 1,337 | 1,337 | 1,337 | ||||||||||||||||||
| 26,617 | 30,001 | 146,129 | 35,687 | 39,868 | 44,283 | ||||||||||||||||||
| 13,805 | 15,823 | 592,035 | 107,703 | 46,079 | 40,347 | ||||||||||||||||||
| 3,292 | 13,885 | 369,012 | 34,075 | 29,968 | 79,107 | ||||||||||||||||||
| 100,155 | 101,491 | 134,211 | 106,675 | 102,246 | 25,663 | ||||||||||||||||||
| 2,968 | 2,968 | 2,968 | 2,968 | 2,968 | 2,968 | ||||||||||||||||||
| 694,949 | 2,473,574 | 50,433,410 | 5,670,995 | 5,041,395 | 1,278,606 | ||||||||||||||||||
| 9,033 | 55,566 | 1,229,423 | 117,094 | 123,268 | — | ||||||||||||||||||
| 5,572 | 17,460 | 472,964 | 52,337 | 82,943 | — | ||||||||||||||||||
| 7,698 | 38,729 | 572,958 | 73,250 | 52,377 | — | ||||||||||||||||||
| 2,840 | 1,519 | 186,589 | 29,201 | 39,542 | — | ||||||||||||||||||
| 16,722 | 39,453 | 375,884 | 75,274 | 57,340 | — | ||||||||||||||||||
| 1,431 | 758 | 51,208 | 8,474 | 12,135 | — | ||||||||||||||||||
| 3,549 | 1,899 | 233,236 | 36,501 | 49,428 | — | ||||||||||||||||||
| 13,935 | 32,878 | 313,239 | 62,729 | 47,784 | — | ||||||||||||||||||
| 3,578 | 1,894 | 128,018 | 21,184 | 30,336 | — | ||||||||||||||||||
| 759,307 | 2,663,730 | 53,996,929 | 6,147,039 | 5,536,548 | 1,278,606 | ||||||||||||||||||
| — | (156,822 | ) | — | — | (378,113 | ) | (1,278,606 | ) | |||||||||||||||
| — | (50,029 | ) | — | — | (143,755 | ) | — | ||||||||||||||||
| — | (8,195 | ) | — | — | (47,434 | ) | — | ||||||||||||||||
| — | (11,805 | ) | — | — | (20,459 | ) | — | ||||||||||||||||
| — | (711 | ) | — | — | (22,329 | ) | — | ||||||||||||||||
| — | (12,237 | ) | — | — | (22,089 | ) | — | ||||||||||||||||
| — | (359 | ) | — | — | (7,389 | ) | — | ||||||||||||||||
| — | — | (1,497,063 | ) | — | — | — | |||||||||||||||||
| 759,307 | 2,423,572 | 52,499,866 | 6,147,039 | 4,894,980 | — | ||||||||||||||||||
| (9,714 | ) | 1,804,236 | (17,109,414 | ) | (1,298,357 | ) | 9,304,705 | 48,705,008 | |||||||||||||||
The accompanying notes are an integral part of the financial statements.
191
MassMutual Funds – Financial Statements (Continued) |
Statements of Operations |
MassMutual |
MassMutual |
|||||||
Realized and unrealized gain (loss): |
||||||||
Net realized gain (loss) on: |
||||||||
Investment transactions |
$ | 35,962,382 | $ | 7,925,042 | ||||
Written options |
— | — | ||||||
Foreign currency transactions |
(60 | ) | (3,436 | ) | ||||
Forward contracts |
— | 522,470 | ||||||
Net realized gain (loss) |
35,962,322 | 8,444,076 | ||||||
Net change in unrealized appreciation (depreciation) on: |
||||||||
Investment transactions |
(256,082,499 | ) | (20,260,633 | ) | ||||
Translation of assets and liabilities in foreign currencies |
(74 | ) | (330 | ) | ||||
Forward contracts |
— | (38,924 | ) | |||||
Net change in unrealized appreciation (depreciation) |
(256,082,573 | ) | (20,299,887 | ) | ||||
Net realized gain (loss) and change in unrealized appreciation (depreciation) |
(220,120,251 | ) | (11,855,811 | ) | ||||
Net increase (decrease) in net assets resulting from operations |
$ | (222,434,199 | ) | $ | (10,113,935 | ) | ||
(a) |
Net of foreign withholding tax of: |
$ | 7,067 | $ | 17,523 | ||||
* |
Net of net increase (decrease) in accrued foreign capital gains tax of: |
$ | — | $ | — |
The accompanying notes are an integral part of the financial statements.
192
MassMutual |
MassMutual |
MassMutual |
MassMutual |
MassMutual |
MassMutual Select |
||||||||||||||||||
| $ | 9,238,514 | $ | 25,649,138 | $ | 769,437,185 | $ | (21,760,546 | ) | $ | 35,721,888 | $ | (11,663,786 | ) | ||||||||||
| — | — | — | — | — | 16,350 | ||||||||||||||||||
| (108 | ) | (75 | ) | (1,304 | ) | — | (161,784 | ) | (353,858 | ) | |||||||||||||
| — | 145,723 | — | — | 307,193 | — | ||||||||||||||||||
| 9,238,406 | 25,794,786 | 769,435,881 | (21,760,546 | ) | 35,867,297 | (12,001,294 | ) | ||||||||||||||||
| (16,694,657 | ) | (76,349,772 | ) | (2,767,704,752 | ) | (172,539,430 | ) | (181,819,734 | )* | (476,086,442 | )* | ||||||||||||
| 26 | — | — | (1 | ) | (330,699 | ) | (987,557 | ) | |||||||||||||||
| — | (14,881 | ) | — | — | (130,292 | ) | — | ||||||||||||||||
| (16,694,631 | ) | (76,364,653 | ) | (2,767,704,752 | ) | (172,539,431 | ) | (182,280,725 | ) | (477,073,999 | ) | ||||||||||||
| (7,456,225 | ) | (50,569,867 | ) | (1,998,268,871 | ) | (194,299,977 | ) | (146,413,428 | ) | (489,075,293 | ) | ||||||||||||
| $ | (7,465,939 | ) | $ | (48,765,631 | ) | $ | (2,015,378,285 | ) | $ | (195,598,334 | ) | $ | (137,108,723 | ) | $ | (440,370,285 | ) | ||||||
| $ | 2,380 | $ | 11,121 | $ | 88,004 | $ | 4,271 | $ | 1,673,786 | $ | 4,990,499 | ||||||||||||
| $ | — | $ | — | $ | — | $ | — | $ | 575,834 | $ | 1,197,831 |
The accompanying notes are an integral part of the financial statements.
193
MassMutual Funds – Financial Statements (Continued) |
MassMutual |
||||||||
Year |
Year |
|||||||
Increase (Decrease) in Net Assets: |
||||||||
Operations: |
||||||||
Net investment income (loss) |
$ | 14,787,998 | $ | 13,180,083 | ||||
Net realized gain (loss) |
(58,438,781 | ) | 4,466,855 | |||||
Net change in unrealized appreciation (depreciation) |
(94,968,502 | ) | (16,898,443 | ) | ||||
Net increase (decrease) in net assets resulting from operations |
(138,619,285 | ) | 748,495 | |||||
Distributions to shareholders (Note 2): |
||||||||
Class I |
(12,175,679 | ) | (36,195,787 | ) | ||||
Class R5 |
(629,319 | ) | (2,183,127 | ) | ||||
Service Class |
(1,020,606 | ) | (4,814,337 | ) | ||||
Administrative Class |
(271,077 | ) | (1,077,493 | ) | ||||
Class R4 |
(1,037,468 | ) | (5,283,413 | ) | ||||
Class A |
(151,047 | ) | (595,039 | ) | ||||
Class R3 |
(234,819 | ) | (1,444,165 | ) | ||||
Total distributions |
(15,520,015 | ) | (51,593,361 | ) | ||||
Net fund share transactions (Note 5): |
||||||||
Class I |
(7,978,138 | ) | 96,163,136 | |||||
Class R5 |
(8,311,019 | ) | 3,833,656 | |||||
Service Class |
(10,451,111 | ) | (17,605,651 | ) | ||||
Administrative Class |
(7,623,068 | ) | (175,722 | ) | ||||
Class R4 |
(14,311,651 | ) | (16,602,248 | ) | ||||
Class A |
1,690,277 | 968,248 | ||||||
Class R3 |
(999,369 | ) | (3,848,267 | ) | ||||
Increase (decrease) in net assets from fund share transactions |
(47,984,079 | ) | 62,733,152 | |||||
Total increase (decrease) in net assets |
(202,123,379 | ) | 11,888,286 | |||||
Net assets |
||||||||
Beginning of year |
922,017,495 | 910,129,209 | ||||||
End of year |
$ | 719,894,116 | $ | 922,017,495 | ||||
The accompanying notes are an integral part of the financial statements.
194
MassMutual |
MassMutual |
||||||||||||||
Year |
Year |
Year |
Year |
||||||||||||
| $ | 11,331,404 | $ | 15,753,495 | $ | 6,721,797 | $ | 6,805,227 | ||||||||
| (34,586,163 | ) | 20,775,833 | 31,436,845 | 43,114,317 | |||||||||||
| (66,147,761 | ) | (24,654,966 | ) | (63,526,572 | ) | 76,405,646 | |||||||||
| (89,402,520 | ) | 11,874,362 | (25,367,930 | ) | 126,325,190 | ||||||||||
| (20,295,777 | ) | (23,040,523 | ) | (28,645,872 | ) | (4,826,890 | ) | ||||||||
| (4,546,406 | ) | (4,697,559 | ) | (8,493,887 | ) | (1,427,247 | ) | ||||||||
| (2,619,511 | ) | (1,923,985 | ) | (1,877,787 | ) | (310,576 | ) | ||||||||
| (1,912,369 | ) | (3,735,392 | ) | (2,424,318 | ) | (339,296 | ) | ||||||||
| (1,635,600 | ) | (2,384,840 | ) | (1,549,573 | ) | (199,786 | ) | ||||||||
| (1,094,081 | ) | (3,173,070 | ) | (3,138,699 | ) | (504,355 | ) | ||||||||
| (396,988 | ) | (702,974 | ) | (130,528 | ) | (24,615 | ) | ||||||||
| (32,500,732 | ) | (39,658,343 | ) | (46,260,664 | ) | (7,632,765 | ) | ||||||||
| (62,180,026 | ) | (7,328,067 | ) | (15,793,942 | ) | (41,004,875 | ) | ||||||||
| (13,402,075 | ) | (3,524,026 | ) | (10,349,015 | ) | (13,881,575 | ) | ||||||||
| 13,880,105 | (7,247,620 | ) | (312,742 | ) | (3,425,423 | ) | |||||||||
| (23,921,417 | ) | (16,752,042 | ) | (717,783 | ) | (637,603 | ) | ||||||||
| (16,414,746 | ) | (6,478,544 | ) | (1,474,661 | ) | (871,873 | ) | ||||||||
| (11,353,295 | ) | (27,857,171 | ) | 102,357 | (10,390,898 | ) | |||||||||
| (4,675,194 | ) | (3,711,171 | ) | 559,826 | (900,942 | ) | |||||||||
| (118,066,648 | ) | (72,898,641 | ) | (27,985,960 | ) | (71,113,189 | ) | ||||||||
| (239,969,900 | ) | (100,682,622 | ) | (99,614,554 | ) | 47,579,236 | |||||||||
| 646,826,520 | 747,509,142 | 377,530,052 | 329,950,816 | ||||||||||||
| $ | 406,856,620 | $ | 646,826,520 | $ | 277,915,498 | $ | 377,530,052 | ||||||||
The accompanying notes are an integral part of the financial statements.
195
MassMutual Funds – Financial Statements (Continued) |
Statements of Changes in Net Assets |
MassMutual |
||||||||
Year |
Year |
|||||||
Increase (Decrease) in Net Assets: |
||||||||
Operations: |
||||||||
Net investment income (loss) |
$ | 7,405,653 | $ | 6,635,888 | ||||
Net realized gain (loss) |
69,872,106 | 74,837,269 | ||||||
Net change in unrealized appreciation (depreciation) |
(109,697,669 | ) | 123,978,956 | |||||
Net increase (decrease) in net assets resulting from operations |
(32,419,910 | ) | 205,452,113 | |||||
Distributions to shareholders (Note 2): |
||||||||
Class I |
(42,679,244 | ) | (5,157,291 | ) | ||||
Class R5 |
(13,424,402 | ) | (2,353,725 | ) | ||||
Service Class |
(3,658,666 | ) | (360,826 | ) | ||||
Administrative Class |
(5,544,501 | ) | (834,960 | ) | ||||
Class R4 |
(1,143,867 | ) | (115,118 | ) | ||||
Class A |
(3,738,569 | ) | (375,447 | ) | ||||
Class R3 |
(189,182 | ) | (10,379 | ) | ||||
Total distributions |
(70,378,431 | ) | (9,207,746 | ) | ||||
Net fund share transactions (Note 5): |
||||||||
Class I |
(10,069,823 | ) | (19,247,814 | ) | ||||
Class R5 |
(24,357,743 | ) | (69,565,446 | ) | ||||
Service Class |
2,258,758 | 279,092 | ||||||
Administrative Class |
(16,813,679 | ) | (28,849,743 | ) | ||||
Class R4 |
(4,217,325 | ) | (1,209,026 | ) | ||||
Class A |
(5,570,490 | ) | (12,884,956 | ) | ||||
Class R3 |
(75,885 | ) | 332,463 | |||||
Increase (decrease) in net assets from fund share transactions |
(58,846,187 | ) | (131,145,430 | ) | ||||
Total increase (decrease) in net assets |
(161,644,528 | ) | 65,098,937 | |||||
Net assets |
||||||||
Beginning of year |
587,614,834 | 522,515,897 | ||||||
End of year |
$ | 425,970,306 | $ | 587,614,834 | ||||
The accompanying notes are an integral part of the financial statements.
196
MM S&P 500 |
MassMutual |
||||||||||||||
Year |
Year |
Year |
Year |
||||||||||||
| $ | 35,527,171 | $ | 39,543,942 | $ | 7,630,397 | $ | 8,893,421 | ||||||||
| 561,388,585 | 428,951,911 | 91,666,677 | 82,440,199 | ||||||||||||
| (998,181,882 | ) | 412,353,799 | (134,602,022 | ) | 82,435,725 | ||||||||||
| (401,266,126 | ) | 880,849,652 | (35,304,948 | ) | 173,769,345 | ||||||||||
| (184,016,801 | ) | (184,594,221 | ) | (51,816,002 | ) | (29,303,320 | ) | ||||||||
| (60,703,846 | ) | (62,427,564 | ) | (19,138,493 | ) | (11,320,812 | ) | ||||||||
| (45,847,810 | ) | (56,637,356 | ) | (5,530,550 | ) | (3,060,907 | ) | ||||||||
| (43,469,722 | ) | (56,802,753 | ) | (6,343,270 | ) | (3,107,276 | ) | ||||||||
| (59,838,315 | ) | (81,258,599 | ) | (1,104,425 | ) | (641,099 | ) | ||||||||
| (2,886,746 | ) | (3,735,318 | ) | (6,388,911 | ) | (4,112,745 | ) | ||||||||
| (36,541,127 | ) | (33,665,725 | ) | (456,521 | ) | (280,015 | ) | ||||||||
| (433,304,367 | ) | (479,121,536 | ) | (90,778,172 | ) | (51,826,174 | ) | ||||||||
| (255,288,917 | ) | 119,039,680 | (1,791,654 | ) | (38,652,063 | ) | |||||||||
| (52,512,755 | ) | 292,712 | (58,102,852 | ) | (18,198,761 | ) | |||||||||
| (33,680,700 | ) | (55,563,343 | ) | (4,247,306 | ) | (8,411,791 | ) | ||||||||
| (74,032,960 | ) | (46,621,732 | ) | (9,342,480 | ) | (1,296,344 | ) | ||||||||
| (41,857,468 | ) | (128,706,061 | ) | (849,806 | ) | (1,300,240 | ) | ||||||||
| (1,953,696 | ) | (1,424,408 | ) | (6,175,857 | ) | (11,829,692 | ) | ||||||||
| 17,760,894 | 29,862,549 | 1,650,535 | (689,241 | ) | |||||||||||
| (441,565,602 | ) | (83,120,603 | ) | (78,859,420 | ) | (80,378,132 | ) | ||||||||
| (1,276,136,095 | ) | 318,607,513 | (204,942,540 | ) | 41,565,039 | ||||||||||
| 3,498,369,192 | 3,179,761,679 | 761,781,298 | 720,216,259 | ||||||||||||
| $ | 2,222,233,097 | $ | 3,498,369,192 | $ | 556,838,758 | $ | 761,781,298 | ||||||||
The accompanying notes are an integral part of the financial statements.
197
MassMutual Funds – Financial Statements (Continued) |
Statements of Changes in Net Assets |
MassMutual |
||||||||
Year |
Year |
|||||||
Increase (Decrease) in Net Assets: |
||||||||
Operations: |
||||||||
Net investment income (loss) |
$ | (359,454 | ) | $ | (564,496 | ) | ||
Net realized gain (loss) |
(1,530,615 | ) | 17,886,297 | |||||
Net change in unrealized appreciation (depreciation) |
(13,385,532 | ) | (376,347 | ) | ||||
Net increase (decrease) in net assets resulting from operations |
(15,275,601 | ) | 16,945,454 | |||||
Distributions to shareholders (Note 2): |
||||||||
Class I |
(3,135,065 | ) | (6,380,932 | ) | ||||
Class R5 |
(2,856,640 | ) | (6,053,760 | ) | ||||
Service Class |
(1,845,774 | ) | (3,030,485 | ) | ||||
Administrative Class |
(2,350,670 | ) | (6,751,917 | ) | ||||
Class R4 |
(569,215 | ) | (841,305 | ) | ||||
Class A |
(4,304,968 | ) | (7,726,774 | ) | ||||
Class R3 |
(735,465 | ) | (1,759,650 | ) | ||||
Total distributions |
(15,797,797 | ) | (32,544,823 | ) | ||||
Net fund share transactions (Note 5): |
||||||||
Class I |
(4,177,932 | ) | 3,998,568 | |||||
Class R5 |
(134,116 | ) | 1,326,428 | |||||
Service Class |
1,394,111 | 1,716,809 | ||||||
Administrative Class |
1,212,754 | (2,357,880 | ) | |||||
Class R4 |
591,480 | 473,520 | ||||||
Class A |
2,080,096 | 1,341,065 | ||||||
Class R3 |
777,393 | (274,762 | ) | |||||
Increase (decrease) in net assets from fund share transactions |
1,743,786 | 6,223,748 | ||||||
Total increase (decrease) in net assets |
(29,329,612 | ) | (9,375,621 | ) | ||||
Net assets |
||||||||
Beginning of year |
55,331,253 | 64,706,874 | ||||||
End of year |
$ | 26,001,641 | $ | 55,331,253 | ||||
The accompanying notes are an integral part of the financial statements.
198
MassMutual |
MassMutual |
||||||||||||||
Year |
Year |
Year |
Year |
||||||||||||
| $ | (8,178,629 | ) | $ | (10,923,488 | ) | $ | (2,313,948 | ) | $ | (3,465,501 | ) | ||||
| 321,054,779 | 798,397,828 | 35,962,322 | 118,471,910 | ||||||||||||
| (1,559,109,735 | ) | 89,559,232 | (256,082,573 | ) | 15,322,375 | ||||||||||
| (1,246,233,585 | ) | 877,033,572 | (222,434,199 | ) | 130,328,784 | ||||||||||
| (505,752,573 | ) | (127,404,610 | ) | (63,212,251 | ) | (47,724,289 | ) | ||||||||
| (109,320,598 | ) | (28,785,200 | ) | (16,825,851 | ) | (21,391,483 | ) | ||||||||
| (38,828,325 | ) | (9,281,346 | ) | (7,030,586 | ) | (6,439,381 | ) | ||||||||
| (63,222,321 | ) | (18,063,967 | ) | (13,489,206 | ) | (11,015,116 | ) | ||||||||
| (25,050,959 | ) | (6,486,894 | ) | (871,903 | ) | (691,469 | ) | ||||||||
| (28,345,519 | ) | (10,446,481 | ) | (12,095,384 | ) | (9,735,160 | ) | ||||||||
| (11,466,411 | ) | (3,093,658 | ) | (1,142,314 | ) | (479,063 | ) | ||||||||
| (781,986,706 | ) | (203,562,156 | ) | (114,667,495 | ) | (97,475,961 | ) | ||||||||
| 310,223,790 | (374,006,009 | ) | 41,322,162 | 33,930,008 | |||||||||||
| (10,020,589 | ) | (85,488,562 | ) | 1,550,921 | (34,648,348 | ) | |||||||||
| 13,091,552 | (6,808,938 | ) | 4,561,394 | (3,278,486 | ) | ||||||||||
| (27,500,331 | ) | (96,534,878 | ) | 4,741,775 | (8,087,089 | ) | |||||||||
| (19,969,685 | ) | (11,561,211 | ) | (236,423 | ) | (119,268 | ) | ||||||||
| 6,353,988 | (90,410,401 | ) | 3,069,711 | (3,377,993 | ) | ||||||||||
| 1,097,524 | (13,043,278 | ) | 1,166,309 | 1,659,825 | |||||||||||
| 273,276,249 | (677,853,277 | ) | 56,175,849 | (13,921,351 | ) | ||||||||||
| (1,754,944,042 | ) | (4,381,861 | ) | (280,925,845 | ) | 18,931,472 | |||||||||
| 4,288,094,060 | 4,292,475,921 | 514,748,393 | 495,816,921 | ||||||||||||
| $ | 2,533,150,018 | $ | 4,288,094,060 | $ | 233,822,548 | $ | 514,748,393 | ||||||||
The accompanying notes are an integral part of the financial statements.
199
MassMutual Funds – Financial Statements (Continued) |
Statements of Changes in Net Assets |
MassMutual |
||||||||
Year |
Year |
|||||||
Increase (Decrease) in Net Assets: |
||||||||
Operations: |
||||||||
Net investment income (loss) |
$ | 1,741,876 | $ | 1,514,512 | ||||
Net realized gain (loss) |
8,444,076 | 29,432,448 | ||||||
Net change in unrealized appreciation (depreciation) |
(20,299,887 | ) | 5,223,076 | |||||
Net increase (decrease) in net assets resulting from operations |
(10,113,935 | ) | 36,170,036 | |||||
Distributions to shareholders (Note 2): |
||||||||
Class I |
(26,888,446 | ) | (1,535,817 | ) | ||||
Class R5 |
(232,404 | ) | (9,182 | ) | ||||
Service Class |
(134,310 | ) | (2,890 | ) | ||||
Administrative Class |
(217,970 | ) | (10,657 | ) | ||||
Class R4 |
(64,772 | ) | (9,681 | ) | ||||
Class A |
(345,700 | ) | (33,097 | ) | ||||
Class R3 |
(33,429 | ) | (3,107 | ) | ||||
Total distributions |
(27,917,031 | ) | (1,604,431 | ) | ||||
Net fund share transactions (Note 5): |
||||||||
Class I |
19,458,604 | (15,118,386 | ) | |||||
Class R5 |
102,804 | (78,209 | ) | |||||
Service Class |
(358,287 | ) | 284,050 | |||||
Administrative Class |
17,849 | (37,094 | ) | |||||
Class R4 |
72,072 | (951,165 | ) | |||||
Class A |
333,445 | (2,624,903 | ) | |||||
Class R3 |
20,617 | (356,301 | ) | |||||
Increase (decrease) in net assets from fund share transactions |
19,647,104 | (18,882,008 | ) | |||||
Total increase (decrease) in net assets |
(18,383,862 | ) | 15,683,597 | |||||
Net assets |
||||||||
Beginning of year |
119,444,917 | 103,761,320 | ||||||
End of year |
$ | 101,061,055 | $ | 119,444,917 | ||||
The accompanying notes are an integral part of the financial statements.
200
MassMutual |
MassMutual |
||||||||||||||
Year |
Year |
Year |
Year |
||||||||||||
| $ | (9,714 | ) | $ | (47,141 | ) | $ | 1,804,236 | $ | 1,012,014 | ||||||
| 9,238,406 | 15,364,222 | 25,794,786 | 44,645,407 | ||||||||||||
| (16,694,631 | ) | 23,244,043 | (76,364,653 | ) | 69,536,582 | ||||||||||
| (7,465,939 | ) | 38,561,124 | (48,765,631 | ) | 115,194,003 | ||||||||||
| (9,194,395 | ) | (1,714,290 | ) | (24,481,352 | ) | (812,256 | ) | ||||||||
| (2,283,497 | ) | (392,010 | ) | (8,756,926 | ) | (380,666 | ) | ||||||||
| (701,615 | ) | (102,703 | ) | (1,250,165 | ) | (31,805 | ) | ||||||||
| (618,052 | ) | (119,788 | ) | (2,095,447 | ) | (88,859 | ) | ||||||||
| (353,982 | ) | (87,302 | ) | (113,169 | ) | (6,237 | ) | ||||||||
| (1,433,744 | ) | (190,647 | ) | (1,983,118 | ) | (31,978 | ) | ||||||||
| (177,490 | ) | (26,075 | ) | (57,144 | ) | — | |||||||||
| (14,762,775 | ) | (2,632,815 | ) | (38,737,321 | ) | (1,351,801 | ) | ||||||||
| 8,892,953 | (38,627,240 | ) | 9,672,869 | 29,888,794 | |||||||||||
| (1,280,738 | ) | (4,505,136 | ) | (12,319,821 | ) | (12,033,263 | ) | ||||||||
| 97,714 | (720,319 | ) | 1,464,061 | 1,296,461 | |||||||||||
| 601,427 | (2,046,395 | ) | (1,110,615 | ) | (6,925,230 | ) | |||||||||
| 241,957 | (1,861,118 | ) | 117,088 | (811,423 | ) | ||||||||||
| 249,890 | (665,065 | ) | 1,183,657 | (4,188,434 | ) | ||||||||||
| 210,790 | (379,380 | ) | 114,824 | 90,947 | |||||||||||
| 9,013,993 | (48,804,653 | ) | (877,937 | ) | 7,317,852 | ||||||||||
| (13,214,721 | ) | (12,876,344 | ) | (88,380,889 | ) | 121,160,054 | |||||||||
| 62,303,237 | 75,179,581 | 284,266,000 | 163,105,946 | ||||||||||||
| $ | 49,088,516 | $ | 62,303,237 | $ | 195,885,111 | $ | 284,266,000 | ||||||||
The accompanying notes are an integral part of the financial statements.
201
MassMutual Funds – Financial Statements (Continued) |
Statements of Changes in Net Assets |
MassMutual Mid |
||||||||
Year |
Year |
|||||||
Increase (Decrease) in Net Assets: |
||||||||
Operations: |
||||||||
Net investment income (loss) |
$ | (17,109,414 | ) | $ | (30,632,373 | ) | ||
Net realized gain (loss) |
769,435,881 | 1,647,676,829 | ||||||
Net change in unrealized appreciation (depreciation) |
(2,767,704,752 | ) | 828,830,012 | |||||
Net increase (decrease) in net assets resulting from operations |
(2,015,378,285 | ) | 2,445,874,468 | |||||
Distributions to shareholders (Note 2): |
||||||||
Class I |
(1,191,184,730 | ) | (375,441,053 | ) | ||||
Class R5 |
(296,057,142 | ) | (93,364,700 | ) | ||||
Service Class |
(60,589,689 | ) | (21,000,941 | ) | ||||
Administrative Class |
(48,166,646 | ) | (16,747,973 | ) | ||||
Class R4 |
(26,566,357 | ) | (12,555,638 | ) | ||||
Class A |
(35,773,353 | ) | (14,060,398 | ) | ||||
Class R3 |
(7,898,792 | ) | (2,425,094 | ) | ||||
Total distributions |
(1,666,236,709 | ) | (535,595,797 | ) | ||||
Net fund share transactions (Note 5): |
||||||||
Class I |
(5,330,556 | ) | (1,050,859,042 | ) | ||||
Class R5 |
(202,318,073 | ) | (133,644,713 | ) | ||||
Service Class |
(41,632,499 | ) | (79,897,288 | ) | ||||
Administrative Class |
(7,318,752 | ) | (67,420,563 | ) | ||||
Class R4 |
(45,705,671 | ) | (56,872,643 | ) | ||||
Class A |
(7,838,409 | ) | (67,523,371 | ) | ||||
Class R3 |
3,117,602 | (5,336,176 | ) | |||||
Increase (decrease) in net assets from fund share transactions |
(307,026,358 | ) | (1,461,553,796 | ) | ||||
Total increase (decrease) in net assets |
(3,988,641,352 | ) | 448,724,875 | |||||
Net assets |
||||||||
Beginning of year |
9,110,059,310 | 8,661,334,435 | ||||||
End of year |
$ | 5,121,417,958 | $ | 9,110,059,310 | ||||
The accompanying notes are an integral part of the financial statements.
202
MassMutual |
MassMutual |
||||||||||||||
Year |
Year |
Year |
Year |
||||||||||||
| $ | (1,298,357 | ) | $ | (3,403,677 | ) | $ | 9,304,705 | $ | 7,891,034 | ||||||
| (21,760,546 | ) | 182,434,815 | 35,867,297 | 57,353,956 | |||||||||||
| (172,539,431 | ) | 33,560,588 | (182,280,725 | ) | 118,601,925 | ||||||||||
| (195,598,334 | ) | 212,591,726 | (137,108,723 | ) | 183,846,915 | ||||||||||
| (106,892,194 | ) | (29,012,613 | ) | (36,687,508 | ) | (9,459,279 | ) | ||||||||
| (33,194,542 | ) | (11,622,191 | ) | (14,531,662 | ) | (3,249,074 | ) | ||||||||
| (7,598,507 | ) | (2,891,135 | ) | (4,314,842 | ) | (923,098 | ) | ||||||||
| (7,499,285 | ) | (2,733,082 | ) | (1,831,463 | ) | (421,047 | ) | ||||||||
| (5,183,552 | ) | (1,628,809 | ) | (2,008,900 | ) | (395,010 | ) | ||||||||
| (9,396,325 | ) | (4,198,556 | ) | (2,031,119 | ) | (637,174 | ) | ||||||||
| (1,924,436 | ) | (582,672 | ) | (623,942 | ) | (131,963 | ) | ||||||||
| (171,688,841 | ) | (52,669,058 | ) | (62,029,436 | ) | (15,216,645 | ) | ||||||||
| 123,189,907 | 48,500,540 | (32,486,555 | ) | (89,876,994 | ) | ||||||||||
| (1,391,715 | ) | (14,434,041 | ) | (28,533,311 | ) | (11,110,200 | ) | ||||||||
| (3,835,779 | ) | (4,142,715 | ) | 305,435 | (2,927,620 | ) | |||||||||
| 3,495,946 | (6,527,416 | ) | 159,356 | (4,219,010 | ) | ||||||||||
| 4,261,260 | (1,752,684 | ) | 2,592,594 | (1,874,361 | ) | ||||||||||
| 3,820,832 | (11,314,222 | ) | (4,725,515 | ) | (14,609,910 | ) | |||||||||
| 1,815,321 | 46,831 | (726,116 | ) | (734,871 | ) | ||||||||||
| 131,355,772 | 10,376,293 | (63,414,112 | ) | (125,352,966 | ) | ||||||||||
| (235,931,403 | ) | 170,298,961 | (262,552,271 | ) | 43,277,304 | ||||||||||
| 762,513,365 | 592,214,404 | 658,535,065 | 615,257,761 | ||||||||||||
| $ | 526,581,962 | $ | 762,513,365 | $ | 395,982,794 | $ | 658,535,065 | ||||||||
The accompanying notes are an integral part of the financial statements.
203
MassMutual Funds – Financial Statements (Continued) |
Statements of Changes in Net Assets |
MassMutual Select T. Rowe Price |
||||||||
Year |
Year |
|||||||
Increase (Decrease) in Net Assets: |
||||||||
Operations: |
||||||||
Net investment income (loss) |
$ | 48,705,008 | $ | 39,053,643 | ||||
Net realized gain (loss) |
(12,001,294 | ) | 61,703,034 | |||||
Net change in unrealized appreciation (depreciation) |
(477,073,999 | ) | 231,627,276 | |||||
Net increase (decrease) in net assets resulting from operations |
(440,370,285 | ) | 332,383,953 | |||||
Distributions to shareholders (Note 2): |
||||||||
Class I |
(71,743,166 | ) | (23,974,243 | ) | ||||
Total distributions |
(71,743,166 | ) | (23,974,243 | ) | ||||
Net fund share transactions (Note 5): |
||||||||
Class I |
85,010,969 | 77,255,606 | ||||||
Increase (decrease) in net assets from fund share transactions |
85,010,969 | 77,255,606 | ||||||
Total increase (decrease) in net assets |
(427,102,482 | ) | 385,665,316 | |||||
Net assets |
||||||||
Beginning of year |
1,700,098,400 | 1,314,433,084 | ||||||
End of year |
$ | 1,272,995,918 | $ | 1,700,098,400 | ||||
The accompanying notes are an integral part of the financial statements.
204
[THIS PAGE INTENTIONALLY LEFT BLANK]
MassMutual Total Return Bond Fund – Financial Statements (Continued) |
Financial Highlights (For a share outstanding throughout each period) |
Income (loss) from investment |
Less distributions to shareholders |
Ratios / Supplemental Data |
|||||||||||
Net |
Net |
Net |
Total income |
From net |
From net |
Total |
Net |
Total |
Net |
Ratio of |
Ratio of |
Net |
|
Class I |
|||||||||||||
9/30/22 |
$ 10.21 |
$ 0.18 |
$ (1.78) |
$ (1.60) |
$ (0.17) |
$ (0.02) |
$ (0.19) |
$ 8.42 |
(15.97%) |
$ 553,149 |
0.37% |
0.34% |
1.92% |
9/30/21 |
10.80 |
0.16 |
(0.13) |
0.03 |
(0.24) |
(0.38) |
(0.62) |
10.21 |
0.24% |
677,869 |
0.36% |
0.33% |
1.55% |
9/30/20 |
10.30 |
0.22 |
0.59 |
0.81 |
(0.31) |
— |
(0.31) |
10.80 |
8.06% |
616,932 |
0.36% |
N/A |
2.08% |
9/30/19 |
9.62 |
0.30 |
0.67 |
0.97 |
(0.29) |
— |
(0.29) |
10.30 |
10.42% |
479,295 |
0.36% |
N/A |
3.03% |
9/30/18 |
9.99 |
0.25 |
(0.34) |
(0.09) |
(0.28) |
— |
(0.28) |
9.62 |
(0.98%) |
426,828 |
0.34% |
N/A |
2.62% |
Class R5 |
|||||||||||||
9/30/22 |
$ 10.19 |
$ 0.16 |
$ (1.76) |
$ (1.60) |
$ (0.16) |
$ (0.02) |
$ (0.18) |
$ 8.41 |
(15.99%) |
$ 25,777 |
0.47% |
0.44% |
1.74% |
9/30/21 |
10.79 |
0.15 |
(0.14) |
0.01 |
(0.23) |
(0.38) |
(0.61) |
10.19 |
0.06% |
39,879 |
0.46% |
0.43% |
1.45% |
9/30/20 |
10.28 |
0.21 |
0.59 |
0.80 |
(0.29) |
— |
(0.29) |
10.79 |
8.04% |
38,177 |
0.46% |
N/A |
2.04% |
9/30/19 |
9.60 |
0.29 |
0.67 |
0.96 |
(0.28) |
— |
(0.28) |
10.28 |
10.32% |
44,973 |
0.46% |
N/A |
2.93% |
9/30/18 |
9.96 |
0.24 |
(0.34) |
(0.10) |
(0.26) |
— |
(0.26) |
9.60 |
(1.01%) |
51,708 |
0.44% |
N/A |
2.49% |
Service Class |
|||||||||||||
9/30/22 |
$ 10.24 |
$ 0.16 |
$ (1.79) |
$ (1.63) |
$ (0.15) |
$ (0.02) |
$ (0.17) |
$ 8.44 |
(16.22%) |
$ 49,614 |
0.57% |
0.54% |
1.67% |
9/30/21 |
10.82 |
0.14 |
(0.12) |
0.02 |
(0.22) |
(0.38) |
(0.60) |
10.24 |
0.11% |
70,920 |
0.55% |
0.53% |
1.33% |
9/30/20 |
10.32 |
0.20 |
0.59 |
0.79 |
(0.29) |
— |
(0.29) |
10.82 |
7.82% |
93,185 |
0.56% |
N/A |
1.93% |
9/30/19 |
9.63 |
0.28 |
0.68 |
0.96 |
(0.27) |
— |
(0.27) |
10.32 |
10.24% |
116,389 |
0.56% |
N/A |
2.83% |
9/30/18 |
10.00 |
0.23 |
(0.34) |
(0.11) |
(0.26) |
— |
(0.26) |
9.63 |
(1.17%) |
131,813 |
0.54% |
N/A |
2.41% |
Year ended September 30 |
|||||
2022 |
2021 |
2020 |
2019 |
2018 |
|
Portfolio turnover rate |
442% |
435% |
316% |
217% |
243% |
|
c |
Per share amount calculated on the average shares method. |
|
d |
Amount is less than $0.005 per share. |
|
j |
Computed after giving effect to an agreement by MML Advisers to waive certain fees and expenses of the Fund. |
|
l |
Employee retirement benefit plans that invest plan assets in the Separate Investment Accounts (SIAs) may be subject to certain charges as set forth in their respective Plan Documents. Total return figures would be lower for the periods presented if they reflected these charges. |
|
m |
Total return excludes sales charges, if any, and would be lower for the period presented if it reflected these charges. |
The accompanying notes are an integral part of the financial statements.
206
Income (loss) from investment |
Less distributions to shareholders |
Ratios / Supplemental Data |
|||||||||||
Net |
Net |
Net |
Total income |
From net |
From net |
Total |
Net |
Total |
Net |
Ratio of |
Ratio of |
Net |
|
Administrative Class |
|||||||||||||
9/30/22 |
$ 10.18 |
$ 0.14 |
$ (1.76) |
$ (1.62) |
$ (0.14) |
$ (0.02) |
$ (0.16) |
$ 8.40 |
(16.20%) |
$ 9,165 |
0.67% |
0.64% |
1.44% |
9/30/21 |
10.77 |
0.13 |
(0.13) |
0.00d |
(0.21) |
(0.38) |
(0.59) |
10.18 |
(0.07%) |
19,333 |
0.66% |
0.63% |
1.24% |
9/30/20 |
10.25 |
0.19 |
0.59 |
0.78 |
(0.26) |
— |
(0.26) |
10.77 |
7.79% |
20,596 |
0.66% |
N/A |
1.84% |
9/30/19 |
9.57 |
0.27 |
0.67 |
0.94 |
(0.26) |
— |
(0.26) |
10.25 |
10.10% |
21,183 |
0.66% |
N/A |
2.77% |
9/30/18 |
9.93 |
0.22 |
(0.34) |
(0.12) |
(0.24) |
— |
(0.24) |
9.57 |
(1.21%) |
53,849 |
0.64% |
N/A |
2.30% |
Class R4 |
|||||||||||||
9/30/22 |
$ 10.25 |
$ 0.13 |
$ (1.78) |
$ (1.65) |
$ (0.12) |
$ (0.02) |
$ (0.14) |
$ 8.46 |
(16.35%) |
$ 53,395 |
0.82% |
0.79% |
1.41% |
9/30/21 |
10.83 |
0.11 |
(0.13) |
(0.02) |
(0.18) |
(0.38) |
(0.56) |
10.25 |
(0.20%) |
79,970 |
0.80% |
0.78% |
1.07% |
9/30/20 |
10.32 |
0.18 |
0.59 |
0.77 |
(0.26) |
— |
(0.26) |
10.83 |
7.64% |
102,120 |
0.81% |
N/A |
1.72% |
9/30/19 |
9.63 |
0.25 |
0.69 |
0.94 |
(0.25) |
— |
(0.25) |
10.32 |
9.96% |
160,788 |
0.81% |
N/A |
2.58% |
9/30/18 |
9.99 |
0.21 |
(0.35) |
(0.14) |
(0.22) |
— |
(0.22) |
9.63 |
(1.42%) |
172,390 |
0.79% |
N/A |
2.15% |
Class A |
|||||||||||||
9/30/22 |
$ 10.12 |
$ 0.13 |
$ (1.77) |
$ (1.64) |
$ (0.11) |
$ (0.02) |
$ (0.13) |
$ 8.35 |
(16.40%) |
$ 11,149 |
0.92% |
0.89% |
1.42% |
9/30/21 |
10.72 |
0.10 |
(0.13) |
(0.03) |
(0.19) |
(0.38) |
(0.57) |
10.12 |
(0.33%) |
11,662 |
0.91% |
0.88% |
0.98% |
9/30/20 |
10.23 |
0.16 |
0.58 |
0.74 |
(0.25) |
— |
(0.25) |
10.72 |
7.45% |
11,334 |
0.91% |
N/A |
1.56% |
9/30/19 |
9.56 |
0.24 |
0.68 |
0.92 |
(0.25) |
— |
(0.25) |
10.23 |
9.89% |
8,464 |
0.91% |
N/A |
2.48% |
9/30/18 |
9.93 |
0.20 |
(0.35) |
(0.15) |
(0.22) |
— |
(0.22) |
9.56 |
(1.51%) |
4,327 |
0.89% |
N/A |
2.07% |
Class R3 |
|||||||||||||
9/30/22 |
$ 10.15 |
$ 0.11 |
$ (1.78) |
$ (1.67) |
$ (0.09) |
$ (0.02) |
$ (0.11) |
$ 8.37 |
(16.62%) |
$ 17,646 |
1.07% |
1.04% |
1.20% |
9/30/21 |
10.73 |
0.09 |
(0.12) |
(0.03) |
(0.17) |
(0.38) |
(0.55) |
10.15 |
(0.37%) |
22,384 |
1.05% |
1.03% |
0.83% |
9/30/20 |
10.23 |
0.15 |
0.58 |
0.73 |
(0.23) |
— |
(0.23) |
10.73 |
7.33% |
27,785 |
1.06% |
N/A |
1.43% |
9/30/19 |
9.55 |
0.23 |
0.67 |
0.90 |
(0.22) |
— |
(0.22) |
10.23 |
9.63% |
30,478 |
1.06% |
N/A |
2.33% |
9/30/18 |
9.90 |
0.18 |
(0.34) |
(0.16) |
(0.19) |
— |
(0.19) |
9.55 |
(1.61%) |
33,583 |
1.04% |
N/A |
1.91% |
The accompanying notes are an integral part of the financial statements.
207
MassMutual Strategic Bond Fund – Financial Statements (Continued) |
Financial Highlights (For a share outstanding throughout each period) |
Income (loss) from investment |
Less distributions to shareholders |
Ratios / Supplemental Data |
|||||||||||
Net |
Net |
Net |
Total |
From net |
From net |
Total |
Net |
Total |
Net |
Ratio of |
Ratio of |
Net |
|
Class I |
|||||||||||||
9/30/22 |
$ 10.90 |
$ 0.23 |
$ (1.97) |
$ (1.74) |
$ (0.44) |
$ (0.21) |
$ (0.65) |
$ 8.51 |
(17.05%) |
$ 261,784 |
0.51% |
0.46% |
2.35% |
9/30/21 |
11.30 |
0.25 |
(0.05) |
0.20 |
(0.33) |
(0.27) |
(0.60) |
10.90 |
1.79% |
400,718 |
0.46% |
0.46%k |
2.28% |
9/30/20 |
11.05 |
0.30 |
0.41 |
0.71 |
(0.31) |
(0.15) |
(0.46) |
11.30 |
6.70% |
423,904 |
0.47% |
0.47%n |
2.76% |
9/30/19 |
10.12 |
0.35 |
0.86 |
1.21 |
(0.28) |
— |
(0.28) |
11.05 |
12.31% |
377,879 |
0.49% |
0.48% |
3.37% |
9/30/18 |
10.65 |
0.32 |
(0.60) |
(0.28) |
(0.25) |
— |
(0.25) |
10.12 |
(2.69%) |
287,070 |
0.47% |
0.47%n |
3.13% |
Class R5 |
|||||||||||||
9/30/22 |
$ 10.90 |
$ 0.22 |
$ (1.98) |
$ (1.76) |
$ (0.42) |
$ (0.21) |
$ (0.63) |
$ 8.51 |
(17.14%) |
$ 53,494 |
0.61% |
0.56% |
2.25% |
9/30/21 |
11.31 |
0.24 |
(0.06) |
0.18 |
(0.32) |
(0.27) |
(0.59) |
10.90 |
1.61% |
83,071 |
0.56% |
0.56%k |
2.19% |
9/30/20 |
11.05 |
0.29 |
0.42 |
0.71 |
(0.30) |
(0.15) |
(0.45) |
11.31 |
6.66% |
89,644 |
0.57% |
0.57%n |
2.65% |
9/30/19 |
10.12 |
0.34 |
0.86 |
1.20 |
(0.27) |
— |
(0.27) |
11.05 |
12.20% |
79,978 |
0.59% |
0.58% |
3.27% |
9/30/18 |
10.65 |
0.31 |
(0.60) |
(0.29) |
(0.24) |
— |
(0.24) |
10.12 |
(2.79%) |
78,583 |
0.57% |
0.57%n |
3.02% |
Service Class |
|||||||||||||
9/30/22 |
$ 10.91 |
$ 0.21 |
$ (1.98) |
$ (1.77) |
$ (0.42) |
$ (0.21) |
$ (0.63) |
$ 8.51 |
(17.25%) |
$ 33,007 |
0.72% |
0.67% |
2.20% |
9/30/21 |
11.31 |
0.23 |
(0.05) |
0.18 |
(0.31) |
(0.27) |
(0.58) |
10.91 |
1.59% |
29,022 |
0.66% |
0.66%k |
2.08% |
9/30/20 |
11.05 |
0.28 |
0.42 |
0.70 |
(0.29) |
(0.15) |
(0.44) |
11.31 |
6.53% |
37,611 |
0.67% |
0.67%n |
2.57% |
9/30/19 |
10.12 |
0.33 |
0.86 |
1.19 |
(0.26) |
— |
(0.26) |
11.05 |
12.02% |
36,123 |
0.69% |
0.68% |
3.17% |
9/30/18 |
10.64 |
0.30 |
(0.59) |
(0.29) |
(0.23) |
— |
(0.23) |
10.12 |
(2.78%) |
52,794 |
0.67% |
0.67%n |
2.89% |
Year ended September 30 |
|||||
2022 |
2021 |
2020 |
2019 |
2018 |
|
Portfolio turnover rate |
118% |
120% |
193% |
262% |
294% |
|
c |
Per share amount calculated on the average shares method. |
|
j |
Computed after giving effect to an agreement by MML Advisers to waive certain fees and expenses of the Fund. |
|
k |
Amount waived had no impact on the ratio of expenses to average daily net assets. |
|
l |
Employee retirement benefit plans that invest plan assets in the Separate Investment Accounts (SIAs) may be subject to certain charges as set forth in their respective Plan Documents. Total return figures would be lower for the periods presented if they reflected these charges. |
|
m |
Total return excludes sales charges, if any, and would be lower for the period presented if it reflected these charges. |
|
n |
Expenses incurred during the period fell under the expense cap. |
The accompanying notes are an integral part of the financial statements.
208
Income (loss) from investment |
Less distributions to shareholders |
Ratios / Supplemental Data |
|||||||||||
Net |
Net |
Net |
Total |
From net |
From net |
Total |
Net |
Total |
Net |
Ratio of |
Ratio of |
Net |
|
Administrative Class |
|||||||||||||
9/30/22 |
$ 10.85 |
$ 0.20 |
$ (1.97) |
$ (1.77) |
$ (0.38) |
$ (0.21) |
$ (0.59) |
$ 8.49 |
(17.29%) |
$ 20,188 |
0.81% |
0.76% |
1.98% |
9/30/21 |
11.25 |
0.22 |
(0.05) |
0.17 |
(0.30) |
(0.27) |
(0.57) |
10.85 |
1.49% |
50,859 |
0.76% |
0.76%k |
1.98% |
9/30/20 |
11.00 |
0.27 |
0.41 |
0.68 |
(0.28) |
(0.15) |
(0.43) |
11.25 |
6.40% |
70,366 |
0.77% |
0.77%n |
2.47% |
9/30/19 |
10.08 |
0.32 |
0.85 |
1.17 |
(0.25) |
— |
(0.25) |
11.00 |
11.91% |
76,297 |
0.79% |
0.78% |
3.07% |
9/30/18 |
10.61 |
0.29 |
(0.60) |
(0.31) |
(0.22) |
— |
(0.22) |
10.08 |
(2.96%) |
70,368 |
0.77% |
0.77%n |
2.81% |
Class R4 |
|||||||||||||
9/30/22 |
$ 10.78 |
$ 0.18 |
$ (1.95) |
$ (1.77) |
$ (0.37) |
$ (0.21) |
$ (0.58) |
$ 8.43 |
(17.40%) |
$ 18,821 |
0.96% |
0.91% |
1.86% |
9/30/21 |
11.18 |
0.20 |
(0.05) |
0.15 |
(0.28) |
(0.27) |
(0.55) |
10.78 |
1.31% |
41,556 |
0.91% |
0.91%k |
1.83% |
9/30/20 |
10.93 |
0.25 |
0.41 |
0.66 |
(0.26) |
(0.15) |
(0.41) |
11.18 |
6.29% |
49,770 |
0.92% |
0.92%n |
2.33% |
9/30/19 |
10.01 |
0.30 |
0.86 |
1.16 |
(0.24) |
— |
(0.24) |
10.93 |
11.82% |
66,656 |
0.94% |
0.93% |
2.91% |
9/30/18 |
10.55 |
0.27 |
(0.60) |
(0.33) |
(0.21) |
— |
(0.21) |
10.01 |
(3.17%) |
67,672 |
0.92% |
0.92%n |
2.67% |
Class A |
|||||||||||||
9/30/22 |
$ 10.80 |
$ 0.17 |
$ (1.96) |
$ (1.79) |
$ (0.32) |
$ (0.21) |
$ (0.53) |
$ 8.48 |
(17.46%) |
$ 14,285 |
1.06% |
1.01% |
1.76% |
9/30/21 |
11.21 |
0.19 |
(0.05) |
0.14 |
(0.28) |
(0.27) |
(0.55) |
10.80 |
1.21% |
30,068 |
1.01% |
1.01%k |
1.72% |
9/30/20 |
10.97 |
0.24 |
0.41 |
0.65 |
(0.26) |
(0.15) |
(0.41) |
11.21 |
6.09% |
60,452 |
1.02% |
1.02%n |
2.20% |
9/30/19 |
10.04 |
0.29 |
0.86 |
1.15 |
(0.22) |
— |
(0.22) |
10.97 |
11.72% |
49,917 |
1.04% |
1.03% |
2.82% |
9/30/18 |
10.57 |
0.26 |
(0.59) |
(0.33) |
(0.20) |
— |
(0.20) |
10.04 |
(3.23%) |
45,189 |
1.02% |
1.02%n |
2.54% |
Class R3 |
|||||||||||||
9/30/22 |
$ 10.67 |
$ 0.16 |
$ (1.94) |
$ (1.78) |
$ (0.32) |
$ (0.21) |
$ (0.53) |
$ 8.36 |
(17.61%) |
$ 5,277 |
1.21% |
1.16% |
1.60% |
9/30/21 |
11.07 |
0.17 |
(0.05) |
0.12 |
(0.25) |
(0.27) |
(0.52) |
10.67 |
1.03% |
11,534 |
1.16% |
1.16%k |
1.59% |
9/30/20 |
10.82 |
0.22 |
0.41 |
0.63 |
(0.23) |
(0.15) |
(0.38) |
11.07 |
6.02% |
15,761 |
1.17% |
1.17%n |
2.09% |
9/30/19 |
9.92 |
0.27 |
0.84 |
1.11 |
(0.21) |
— |
(0.21) |
10.82 |
11.48% |
18,689 |
1.19% |
1.18% |
2.67% |
9/30/18 |
10.45 |
0.24 |
(0.58) |
(0.34) |
(0.19) |
— |
(0.19) |
9.92 |
(3.32%) |
19,519 |
1.17% |
1.17%n |
2.42% |
The accompanying notes are an integral part of the financial statements.
209
MassMutual Diversified Value Fund – Financial Statements (Continued) |
Financial Highlights (For a share outstanding throughout each period) |
Income (loss) from investment |
Less distributions to shareholders |
Ratios / Supplemental Data |
||||||||||
Net |
Net |
Net |
Total |
From net |
From net |
Total |
Net |
Total |
Net |
Ratio of |
Net |
|
Class I |
||||||||||||
9/30/22 |
$ 13.48 |
$ 0.25 |
$ (1.15) |
$ (0.90) |
$ (0.26) |
$ (1.45) |
$ (1.71) |
$ 10.87 |
(8.47%) |
$ 168,929 |
0.58% |
1.97% |
9/30/21 |
9.87 |
0.23 |
3.62 |
3.85 |
(0.24) |
— |
(0.24) |
13.48 |
39.59% |
230,230 |
0.57% |
1.84% |
9/30/20 |
11.48 |
0.25 |
(1.01) |
(0.76) |
(0.28) |
(0.57) |
(0.85) |
9.87 |
(7.64%) |
197,915 |
0.58% |
2.42% |
9/30/19 |
13.48 |
0.26 |
(0.33) |
(0.07) |
(0.26) |
(1.67) |
(1.93) |
11.48 |
1.59% |
210,652 |
0.58% |
2.31% |
9/30/18 |
16.69 |
0.25 |
1.70 |
1.95 |
(0.42) |
(4.74) |
(5.16) |
13.48 |
13.43% |
202,121 |
0.57% |
1.85% |
Class R5 |
||||||||||||
9/30/22 |
$ 13.50 |
$ 0.24 |
$ (1.15) |
$ (0.91) |
$ (0.24) |
$ (1.45) |
$ (1.69) |
$ 10.90 |
(8.48%) |
$ 48,259 |
0.68% |
1.86% |
9/30/21 |
9.89 |
0.22 |
3.62 |
3.84 |
(0.23) |
— |
(0.23) |
13.50 |
39.38% |
70,251 |
0.67% |
1.74% |
9/30/20 |
11.50 |
0.24 |
(1.02) |
(0.78) |
(0.26) |
(0.57) |
(0.83) |
9.89 |
(7.75%) |
62,821 |
0.68% |
2.33% |
9/30/19 |
13.50 |
0.25 |
(0.33) |
(0.08) |
(0.25) |
(1.67) |
(1.92) |
11.50 |
1.48% |
74,403 |
0.68% |
2.19% |
9/30/18 |
16.71 |
0.24 |
1.69 |
1.93 |
(0.40) |
(4.74) |
(5.14) |
13.50 |
13.28% |
143,091 |
0.67% |
1.80% |
Service Class |
||||||||||||
9/30/22 |
$ 13.50 |
$ 0.23 |
$ (1.15) |
$ (0.92) |
$ (0.23) |
$ (1.45) |
$ (1.68) |
$ 10.90 |
(8.57%) |
$ 11,979 |
0.78% |
1.77% |
9/30/21 |
9.89 |
0.20 |
3.63 |
3.83 |
(0.22) |
— |
(0.22) |
13.50 |
39.28% |
15,170 |
0.77% |
1.65% |
9/30/20 |
11.51 |
0.23 |
(1.02) |
(0.79) |
(0.26) |
(0.57) |
(0.83) |
9.89 |
(7.88%) |
13,967 |
0.78% |
2.25% |
9/30/19 |
13.49 |
0.24 |
(0.32) |
(0.08) |
(0.23) |
(1.67) |
(1.90) |
11.51 |
1.40% |
10,046 |
0.78% |
2.08% |
9/30/18 |
16.69 |
0.22 |
1.70 |
1.92 |
(0.38) |
(4.74) |
(5.12) |
13.49 |
13.21% |
13,564 |
0.77% |
1.64% |
Year ended September 30 |
|||||
2022 |
2021 |
2020 |
2019 |
2018 |
|
Portfolio turnover rate |
43% |
60% |
52% |
42% |
75% |
|
c |
Per share amount calculated on the average shares method. |
|
l |
Employee retirement benefit plans that invest plan assets in the Separate Investment Accounts (SIAs) may be subject to certain charges as set forth in their respective Plan Documents. Total return figures would be lower for the periods presented if they reflected these charges. |
|
m |
Total return excludes sales charges, if any, and would be lower for the period presented if it reflected these charges. |
The accompanying notes are an integral part of the financial statements.
210
Income (loss) from investment |
Less distributions to shareholders |
Ratios / Supplemental Data |
||||||||||
Net |
Net |
Net |
Total |
From net |
From net |
Total |
Net |
Total |
Net |
Ratio of |
Net |
|
Administrative Class |
||||||||||||
9/30/22 |
$ 13.61 |
$ 0.21 |
$ (1.17) |
$ (0.96) |
$ (0.21) |
$ (1.45) |
$ (1.66) |
$ 10.99 |
(8.76%) |
$ 16,695 |
0.88% |
1.66% |
9/30/21 |
9.96 |
0.19 |
3.67 |
3.86 |
(0.21) |
— |
(0.21) |
13.61 |
39.24% |
21,354 |
0.87% |
1.54% |
9/30/20 |
11.59 |
0.22 |
(1.03) |
(0.81) |
(0.25) |
(0.57) |
(0.82) |
9.96 |
(7.99%) |
16,359 |
0.88% |
2.12% |
9/30/19 |
13.58 |
0.23 |
(0.33) |
(0.10) |
(0.22) |
(1.67) |
(1.89) |
11.59 |
1.29% |
20,346 |
0.88% |
2.01% |
9/30/18 |
16.76 |
0.21 |
1.70 |
1.91 |
(0.35) |
(4.74) |
(5.09) |
13.58 |
13.07% |
15,165 |
0.87% |
1.61% |
Class R4 |
||||||||||||
9/30/22 |
$ 13.24 |
$ 0.19 |
$ (1.12) |
$ (0.93) |
$ (0.20) |
$ (1.45) |
$ (1.65) |
$ 10.66 |
(8.83%) |
$ 8,853 |
1.03% |
1.51% |
9/30/21 |
9.70 |
0.17 |
3.57 |
3.74 |
(0.20) |
— |
(0.20) |
13.24 |
39.00% |
12,608 |
1.02% |
1.39% |
9/30/20 |
11.31 |
0.20 |
(1.01) |
(0.81) |
(0.23) |
(0.57) |
(0.80) |
9.70 |
(8.14%) |
9,823 |
1.03% |
2.00% |
9/30/19 |
13.32 |
0.21 |
(0.32) |
(0.11) |
(0.23) |
(1.67) |
(1.90) |
11.31 |
1.18% |
6,570 |
1.03% |
1.88% |
9/30/18 |
16.56 |
0.19 |
1.68 |
1.87 |
(0.37) |
(4.74) |
(5.11) |
13.32 |
12.93% |
4,523 |
1.02% |
1.44% |
Class A |
||||||||||||
9/30/22 |
$ 13.45 |
$ 0.18 |
$ (1.15) |
$ (0.97) |
$ (0.17) |
$ (1.45) |
$ (1.62) |
$ 10.86 |
(8.93%) |
$ 21,805 |
1.13% |
1.42% |
9/30/21 |
9.85 |
0.16 |
3.63 |
3.79 |
(0.19) |
— |
(0.19) |
13.45 |
38.84% |
26,835 |
1.12% |
1.29% |
9/30/20 |
11.46 |
0.19 |
(1.02) |
(0.83) |
(0.21) |
(0.57) |
(0.78) |
9.85 |
(8.22%) |
27,575 |
1.13% |
1.87% |
9/30/19 |
13.45 |
0.20 |
(0.32) |
(0.12) |
(0.20) |
(1.67) |
(1.87) |
11.46 |
1.03% |
37,170 |
1.13% |
1.75% |
9/30/18 |
16.64 |
0.18 |
1.69 |
1.87 |
(0.32) |
(4.74) |
(5.06) |
13.45 |
12.82% |
45,319 |
1.12% |
1.36% |
Class R3 |
||||||||||||
9/30/22 |
$ 13.35 |
$ 0.16 |
$ (1.14) |
$ (0.98) |
$ (0.14) |
$ (1.45) |
$ (1.59) |
$ 10.78 |
(9.09%) |
$ 1,395 |
1.28% |
1.31% |
9/30/21 |
9.77 |
0.14 |
3.61 |
3.75 |
(0.17) |
— |
(0.17) |
13.35 |
38.73% |
1,082 |
1.27% |
1.14% |
9/30/20 |
11.39 |
0.18 |
(1.02) |
(0.84) |
(0.21) |
(0.57) |
(0.78) |
9.77 |
(8.38%) |
1,492 |
1.28% |
1.76% |
9/30/19 |
13.37 |
0.18 |
(0.31) |
(0.13) |
(0.18) |
(1.67) |
(1.85) |
11.39 |
0.91% |
1,387 |
1.28% |
1.59% |
9/30/18 |
16.59 |
0.15 |
1.68 |
1.83 |
(0.31) |
(4.74) |
(5.05) |
13.37 |
12.56% |
2,177 |
1.27% |
1.13% |
The accompanying notes are an integral part of the financial statements.
211
MassMutual Fundamental Value Fund – Financial Statements (Continued) |
Financial Highlights (For a share outstanding throughout each period) |
Income (loss) from investment |
Less distributions to shareholders |
Ratios / Supplemental Data |
||||||||||
Net |
Net |
Net |
Total |
From net |
From net |
Total |
Net |
Total |
Net |
Ratio of |
Net |
|
Class I |
||||||||||||
9/30/22 |
$ 10.48 |
$ 0.14 |
$ (0.77) |
$ (0.63) |
$ (0.08) |
$ (1.23) |
$ (1.31) |
$ 8.54 |
(7.69%) |
$ 277,621 |
0.66% |
1.43% |
9/30/21 |
7.52 |
0.12 |
2.99 |
3.11 |
(0.15) |
— |
(0.15) |
10.48 |
41.76% |
353,238 |
0.65% |
1.19% |
9/30/20 |
10.33 |
0.15 |
(0.72) |
(0.57) |
(0.23) |
(2.01) |
(2.24) |
7.52 |
(8.51%) |
268,368 |
0.66% |
1.85% |
9/30/19 |
11.93 |
0.20 |
(0.39) |
(0.19) |
(0.23) |
(1.18) |
(1.41) |
10.33 |
(0.07%) |
353,302 |
0.64% |
1.96% |
9/30/18 |
13.01 |
0.23 |
0.81 |
1.04 |
(0.24) |
(1.88) |
(2.12) |
11.93 |
8.56% |
632,974 |
0.63% |
1.91% |
Class R5 |
||||||||||||
9/30/22 |
$ 10.56 |
$ 0.13 |
$ (0.78) |
$ (0.65) |
$ (0.06) |
$ (1.23) |
$ (1.29) |
$ 8.62 |
(7.73%) |
$ 69,771 |
0.76% |
1.31% |
9/30/21 |
7.57 |
0.11 |
3.02 |
3.13 |
(0.14) |
— |
(0.14) |
10.56 |
41.74% |
112,193 |
0.75% |
1.11% |
9/30/20 |
10.39 |
0.14 |
(0.73) |
(0.59) |
(0.22) |
(2.01) |
(2.23) |
7.57 |
(8.68%) |
132,370 |
0.76% |
1.75% |
9/30/19 |
11.98 |
0.19 |
(0.38) |
(0.19) |
(0.22) |
(1.18) |
(1.40) |
10.39 |
(0.13%) |
196,887 |
0.74% |
1.85% |
9/30/18 |
13.06 |
0.22 |
0.80 |
1.02 |
(0.22) |
(1.88) |
(2.10) |
11.98 |
8.39% |
309,004 |
0.73% |
1.80% |
Service Class |
||||||||||||
9/30/22 |
$ 10.49 |
$ 0.12 |
$ (0.76) |
$ (0.64) |
$ (0.06) |
$ (1.23) |
$ (1.29) |
$ 8.56 |
(7.76%) |
$ 26,311 |
0.86% |
1.23% |
9/30/21 |
7.53 |
0.10 |
2.99 |
3.09 |
(0.13) |
— |
(0.13) |
10.49 |
41.43% |
29,948 |
0.85% |
0.99% |
9/30/20 |
10.34 |
0.13 |
(0.72) |
(0.59) |
(0.21) |
(2.01) |
(2.22) |
7.53 |
(8.76%) |
21,654 |
0.86% |
1.64% |
9/30/19 |
11.93 |
0.18 |
(0.38) |
(0.20) |
(0.21) |
(1.18) |
(1.39) |
10.34 |
(0.25%) |
30,115 |
0.84% |
1.75% |
9/30/18 |
13.00 |
0.20 |
0.81 |
1.01 |
(0.20) |
(1.88) |
(2.08) |
11.93 |
8.36% |
49,551 |
0.83% |
1.69% |
Year ended September 30 |
|||||
2022 |
2021 |
2020 |
2019 |
2018 |
|
Portfolio turnover rate |
30% |
38% |
54% |
103% |
46% |
|
c |
Per share amount calculated on the average shares method. |
|
l |
Employee retirement benefit plans that invest plan assets in the Separate Investment Accounts (SIAs) may be subject to certain charges as set forth in their respective Plan Documents. Total return figures would be lower for the periods presented if they reflected these charges. |
|
m |
Total return excludes sales charges, if any, and would be lower for the period presented if it reflected these charges. |
The accompanying notes are an integral part of the financial statements.
212
Income (loss) from investment |
Less distributions to shareholders |
Ratios / Supplemental Data |
||||||||||
Net |
Net |
Net |
Total |
From net |
From net |
Total |
Net |
Total |
Net |
Ratio of |
Net |
|
Administrative Class |
||||||||||||
9/30/22 |
$ 10.59 |
$ 0.11 |
$ (0.78) |
$ (0.67) |
$ (0.04) |
$ (1.23) |
$ (1.27) |
$ 8.65 |
(7.94%) |
$ 24,364 |
0.96% |
1.09% |
9/30/21 |
7.60 |
0.09 |
3.02 |
3.11 |
(0.12) |
— |
(0.12) |
10.59 |
41.33% |
47,797 |
0.95% |
0.92% |
9/30/20 |
10.41 |
0.13 |
(0.73) |
(0.60) |
(0.20) |
(2.01) |
(2.21) |
7.60 |
(8.78%) |
56,880 |
0.96% |
1.53% |
9/30/19 |
12.00 |
0.17 |
(0.38) |
(0.21) |
(0.20) |
(1.18) |
(1.38) |
10.41 |
(0.36%) |
58,983 |
0.94% |
1.65% |
9/30/18 |
13.07 |
0.19 |
0.81 |
1.00 |
(0.19) |
(1.88) |
(2.07) |
12.00 |
8.21% |
85,905 |
0.93% |
1.60% |
Class R4 |
||||||||||||
9/30/22 |
$ 10.19 |
$ 0.09 |
$ (0.74) |
$ (0.65) |
$ (0.03) |
$ (1.23) |
$ (1.26) |
$ 8.28 |
(8.06%) |
$ 3,937 |
1.11% |
0.95% |
9/30/21 |
7.32 |
0.07 |
2.91 |
2.98 |
(0.11) |
— |
(0.11) |
10.19 |
41.10% |
9,329 |
1.10% |
0.74% |
9/30/20 |
10.11 |
0.11 |
(0.70) |
(0.59) |
(0.19) |
(2.01) |
(2.20) |
7.32 |
(8.98%) |
7,609 |
1.11% |
1.41% |
9/30/19 |
11.67 |
0.15 |
(0.37) |
(0.22) |
(0.16) |
(1.18) |
(1.34) |
10.11 |
(0.47%) |
9,055 |
1.09% |
1.48% |
9/30/18 |
12.77 |
0.17 |
0.79 |
0.96 |
(0.18) |
(1.88) |
(2.06) |
11.67 |
8.06% |
9,172 |
1.08% |
1.45% |
Class A |
||||||||||||
9/30/22 |
$ 10.41 |
$ 0.09 |
$ (0.77) |
$ (0.68) |
$ (0.01) |
$ (1.23) |
$ (1.24) |
$ 8.49 |
(8.13%) |
$ 22,657 |
1.21% |
0.87% |
9/30/21 |
7.46 |
0.06 |
2.98 |
3.04 |
(0.09) |
— |
(0.09) |
10.41 |
40.98% |
33,431 |
1.20% |
0.65% |
9/30/20 |
10.26 |
0.11 |
(0.73) |
(0.62) |
(0.17) |
(2.01) |
(2.18) |
7.46 |
(9.06%) |
34,647 |
1.21% |
1.33% |
9/30/19 |
11.83 |
0.14 |
(0.37) |
(0.23) |
(0.16) |
(1.18) |
(1.34) |
10.26 |
(0.58%) |
66,407 |
1.19% |
1.38% |
9/30/18 |
12.90 |
0.16 |
0.80 |
0.96 |
(0.15) |
(1.88) |
(2.03) |
11.83 |
7.94% |
84,733 |
1.18% |
1.34% |
Class R3 |
||||||||||||
9/30/22 |
$ 10.14 |
$ 0.07 |
$ (0.74) |
$ (0.67) |
$ (0.01) |
$ (1.23) |
$ (1.24) |
$ 8.23 |
(8.26%) |
$ 1,310 |
1.36% |
0.73% |
9/30/21 |
7.27 |
0.05 |
2.90 |
2.95 |
(0.08) |
— |
(0.08) |
10.14 |
40.82% |
1,678 |
1.35% |
0.49% |
9/30/20 |
10.05 |
0.09 |
(0.71) |
(0.62) |
(0.15) |
(2.01) |
(2.16) |
7.27 |
(9.23%) |
989 |
1.36% |
1.15% |
9/30/19 |
11.63 |
0.12 |
(0.37) |
(0.25) |
(0.15) |
(1.18) |
(1.33) |
10.05 |
(0.77%) |
2,362 |
1.34% |
1.23% |
9/30/18 |
12.72 |
0.14 |
0.79 |
0.93 |
(0.14) |
(1.88) |
(2.02) |
11.63 |
7.84% |
2,831 |
1.33% |
1.21% |
The accompanying notes are an integral part of the financial statements.
213
MM S&P 500 Index Fund – Financial Statements (Continued) |
Financial Highlights (For a share outstanding throughout each period) |
Income (loss) from investment |
Less distributions to shareholders |
Ratios / Supplemental Data |
||||||||||
Net |
Net |
Net |
Total |
From net |
From net |
Total |
Net |
Total |
Net |
Ratio of |
Net |
|
Class I |
||||||||||||
9/30/22 |
$ 21.46 |
$ 0.27 |
$ (2.98) |
$ (2.71) |
$ (0.29) |
$ (2.53) |
$ (2.82) |
$ 15.93 |
(15.56%) |
$ 900,471 |
0.12% |
1.36% |
9/30/21 |
19.31 |
0.28 |
4.91 |
5.19 |
(0.39) |
(2.65) |
(3.04) |
21.46 |
29.93% |
1,495,161 |
0.12% |
1.36% |
9/30/20 |
17.92 |
0.32 |
2.30 |
2.62 |
(0.40) |
(0.83) |
(1.23) |
19.31 |
15.04% |
1,210,251 |
0.12% |
1.79% |
9/30/19 |
20.48 |
0.32 |
(0.00)d,aa |
0.32 |
(0.37) |
(2.51) |
(2.88) |
17.92 |
4.17% |
1,083,523 |
0.12% |
1.86% |
9/30/18 |
21.59 |
0.37 |
3.00 |
3.37 |
(0.48) |
(4.00) |
(4.48) |
20.48 |
17.77% |
819,557 |
0.12% |
1.86% |
Class R5 |
||||||||||||
9/30/22 |
$ 21.55 |
$ 0.25 |
$ (3.01) |
$ (2.76) |
$ (0.26) |
$ (2.53) |
$ (2.79) |
$ 16.00 |
(15.68%) |
$ 300,070 |
0.22% |
1.27% |
9/30/21 |
19.38 |
0.26 |
4.93 |
5.19 |
(0.37) |
(2.65) |
(3.02) |
21.55 |
29.78% |
471,641 |
0.22% |
1.26% |
9/30/20 |
17.98 |
0.30 |
2.31 |
2.61 |
(0.38) |
(0.83) |
(1.21) |
19.38 |
14.93% |
416,360 |
0.22% |
1.70% |
9/30/19 |
20.53 |
0.31 |
(0.01)aa |
0.30 |
(0.34) |
(2.51) |
(2.85) |
17.98 |
4.05% |
487,312 |
0.22% |
1.76% |
9/30/18 |
21.63 |
0.35 |
3.01 |
3.36 |
(0.46) |
(4.00) |
(4.46) |
20.53 |
17.65% |
532,163 |
0.22% |
1.75% |
Service Class |
||||||||||||
9/30/22 |
$ 21.60 |
$ 0.22 |
$ (3.02) |
$ (2.80) |
$ (0.23) |
$ (2.53) |
$ (2.76) |
$ 16.04 |
(15.84%) |
$ 244,212 |
0.37% |
1.12% |
9/30/21 |
19.41 |
0.23 |
4.95 |
5.18 |
(0.34) |
(2.65) |
(2.99) |
21.60 |
29.63% |
371,149 |
0.37% |
1.11% |
9/30/20 |
18.00 |
0.28 |
2.31 |
2.59 |
(0.35) |
(0.83) |
(1.18) |
19.41 |
14.80% |
381,745 |
0.37% |
1.54% |
9/30/19 |
20.55 |
0.28 |
(0.01)aa |
0.27 |
(0.31) |
(2.51) |
(2.82) |
18.00 |
3.84% |
395,249 |
0.37% |
1.61% |
9/30/18 |
21.64 |
0.32 |
3.02 |
3.34 |
(0.43) |
(4.00) |
(4.43) |
20.55 |
17.48% |
481,405 |
0.37% |
1.59% |
Year ended September 30 |
|||||
2022 |
2021 |
2020 |
2019 |
2018 |
|
Portfolio turnover rate |
2% |
4% |
6% |
4% |
3%q |
|
c |
Per share amount calculated on the average shares method. |
|
d |
Amount is less than $0.005 per share. |
|
l |
Employee retirement benefit plans that invest plan assets in the Separate Investment Accounts (SIAs) may be subject to certain charges as set forth in their respective Plan Documents. Total return figures would be lower for the periods presented if they reflected these charges. |
|
m |
Total return excludes sales charges, if any, and would be lower for the period presented if it reflected these charges. |
|
q |
Portfolio turnover excludes securities received from subscriptions in-kind. Amount would be 12% including securities received from subscriptions in-kind. |
|
aa |
The amount shown for a share outstanding does not correspond with the aggregate net realized and unrealized gain (loss) for the period due to the timing of purchases and redemptions of Fund shares in relation to the fluctuating market values of the Fund. |
The accompanying notes are an integral part of the financial statements.
214
Income (loss) from investment |
Less distributions to shareholders |
Ratios / Supplemental Data |
||||||||||
Net |
Net |
Net |
Total |
From net |
From net |
Total |
Net |
Total |
Net |
Ratio of |
Net |
|
Administrative Class |
||||||||||||
9/30/22 |
$ 21.05 |
$ 0.19 |
$ (2.92) |
$ (2.73) |
$ (0.20) |
$ (2.53) |
$ (2.73) |
$ 15.59 |
(15.88%) |
$ 213,739 |
0.47% |
1.01% |
9/30/21 |
18.99 |
0.20 |
4.83 |
5.03 |
(0.32) |
(2.65) |
(2.97) |
21.05 |
29.45% |
368,149 |
0.47% |
1.01% |
9/30/20 |
17.63 |
0.25 |
2.27 |
2.52 |
(0.33) |
(0.83) |
(1.16) |
18.99 |
14.68% |
370,740 |
0.47% |
1.45% |
9/30/19 |
20.19 |
0.26 |
(0.01)aa |
0.25 |
(0.30) |
(2.51) |
(2.81) |
17.63 |
3.77% |
476,225 |
0.47% |
1.51% |
9/30/18 |
21.34 |
0.29 |
2.97 |
3.26 |
(0.41) |
(4.00) |
(4.41) |
20.19 |
17.34% |
606,359 |
0.47% |
1.50% |
Class R4 |
||||||||||||
9/30/22 |
$ 20.69 |
$ 0.16 |
$ (2.87) |
$ (2.71) |
$ (0.16) |
$ (2.53) |
$ (2.69) |
$ 15.29 |
(16.01%) |
$ 333,263 |
0.62% |
0.87% |
9/30/21 |
18.71 |
0.17 |
4.75 |
4.92 |
(0.29) |
(2.65) |
(2.94) |
20.69 |
29.26% |
494,937 |
0.62% |
0.87% |
9/30/20 |
17.39 |
0.22 |
2.24 |
2.46 |
(0.31) |
(0.83) |
(1.14) |
18.71 |
14.51% |
561,315 |
0.62% |
1.29% |
9/30/19 |
19.95 |
0.23 |
(0.02)aa |
0.21 |
(0.26) |
(2.51) |
(2.77) |
17.39 |
3.61% |
594,415 |
0.62% |
1.36% |
9/30/18 |
21.13 |
0.26 |
2.93 |
3.19 |
(0.37) |
(4.00) |
(4.37) |
19.95 |
17.15% |
681,097 |
0.62% |
1.35% |
Class A |
||||||||||||
9/30/22 |
$ 20.51 |
$ 0.14 |
$ (2.83) |
$ (2.69) |
$ (0.14) |
$ (2.53) |
$ (2.67) |
$ 15.15 |
(16.06%) |
$ 18,172 |
0.72% |
0.77% |
9/30/21 |
18.57 |
0.15 |
4.72 |
4.87 |
(0.28) |
(2.65) |
(2.93) |
20.51 |
29.14% |
25,655 |
0.72% |
0.76% |
9/30/20 |
17.26 |
0.21 |
2.21 |
2.42 |
(0.28) |
(0.83) |
(1.11) |
18.57 |
14.40% |
23,908 |
0.72% |
1.20% |
9/30/19 |
19.82 |
0.21 |
(0.02)aa |
0.19 |
(0.24) |
(2.51) |
(2.75) |
17.26 |
3.46% |
28,147 |
0.72% |
1.26% |
9/30/18 |
21.03 |
0.24 |
2.92 |
3.16 |
(0.37) |
(4.00) |
(4.37) |
19.82 |
17.06% |
34,494 |
0.72% |
1.25% |
Class R3 |
||||||||||||
9/30/22 |
$ 19.92 |
$ 0.11 |
$ (2.74) |
$ (2.63) |
$ (0.14) |
$ (2.53) |
$ (2.67) |
$ 14.62 |
(16.25%) |
$ 212,307 |
0.87% |
0.63% |
9/30/21 |
18.12 |
0.11 |
4.60 |
4.71 |
(0.26) |
(2.65) |
(2.91) |
19.92 |
28.96% |
271,678 |
0.87% |
0.60% |
9/30/20 |
16.87 |
0.17 |
2.17 |
2.34 |
(0.26) |
(0.83) |
(1.09) |
18.12 |
14.25% |
215,443 |
0.87% |
1.04% |
9/30/19 |
19.45 |
0.18 |
(0.02)aa |
0.16 |
(0.23) |
(2.51) |
(2.74) |
16.87 |
3.34% |
222,503 |
0.87% |
1.11% |
9/30/18 |
20.72 |
0.21 |
2.87 |
3.08 |
(0.35) |
(4.00) |
(4.35) |
19.45 |
16.90% |
251,216 |
0.87% |
1.10% |
The accompanying notes are an integral part of the financial statements.
215
MassMutual Equity Opportunities Fund – Financial Statements (Continued) |
Financial Highlights (For a share outstanding throughout each period) |
Income (loss) from investment |
Less distributions to shareholders |
Ratios / Supplemental Data |
||||||||||
Net |
Net |
Net |
Total |
From net |
From net |
Total |
Net |
Total |
Net |
Ratio of |
Net |
|
Class I |
||||||||||||
9/30/22 |
$ 20.17 |
$ 0.23 |
$ (1.29) |
$ (1.06) |
$ (0.25) |
$ (2.20) |
$ (2.45) |
$ 16.66 |
(6.98%) |
$ 355,035 |
0.74% |
1.17% |
9/30/21 |
17.22 |
0.24 |
3.99 |
4.23 |
(0.24) |
(1.04) |
(1.28) |
20.17 |
25.67% |
432,817 |
0.73% |
1.25% |
9/30/20 |
18.33 |
0.27 |
0.26 |
0.53 |
(0.29) |
(1.35) |
(1.64) |
17.22 |
2.73% |
402,371 |
0.74% |
1.64% |
9/30/19 |
18.41 |
0.27 |
1.36 |
1.63 |
(0.28) |
(1.43) |
(1.71) |
18.33 |
10.82% |
274,970 |
0.74% |
1.60% |
9/30/18 |
22.45 |
0.27 |
2.75 |
3.02 |
(0.51) |
(6.55) |
(7.06) |
18.41 |
16.23% |
268,240 |
0.74% |
1.50% |
Class R5 |
||||||||||||
9/30/22 |
$ 20.26 |
$ 0.21 |
$ (1.29) |
$ (1.08) |
$ (0.23) |
$ (2.20) |
$ (2.43) |
$ 16.75 |
(7.05%) |
$ 84,471 |
0.83% |
1.06% |
9/30/21 |
17.30 |
0.22 |
4.00 |
4.22 |
(0.22) |
(1.04) |
(1.26) |
20.26 |
25.48% |
165,143 |
0.83% |
1.15% |
9/30/20 |
18.41 |
0.26 |
0.25 |
0.51 |
(0.27) |
(1.35) |
(1.62) |
17.30 |
2.61% |
156,171 |
0.84% |
1.50% |
9/30/19 |
18.47 |
0.26 |
1.37 |
1.63 |
(0.26) |
(1.43) |
(1.69) |
18.41 |
10.76% |
180,002 |
0.84% |
1.50% |
9/30/18 |
22.50 |
0.25 |
2.75 |
3.00 |
(0.48) |
(6.55) |
(7.03) |
18.47 |
16.09% |
188,418 |
0.84% |
1.38% |
Service Class |
||||||||||||
9/30/22 |
$ 19.75 |
$ 0.18 |
$ (1.25) |
$ (1.07) |
$ (0.21) |
$ (2.20) |
$ (2.41) |
$ 16.27 |
(7.18%) |
$ 34,750 |
0.94% |
0.96% |
9/30/21 |
16.88 |
0.20 |
3.91 |
4.11 |
(0.20) |
(1.04) |
(1.24) |
19.75 |
25.44% |
46,987 |
0.93% |
1.04% |
9/30/20 |
18.00 |
0.23 |
0.25 |
0.48 |
(0.25) |
(1.35) |
(1.60) |
16.88 |
2.52% |
48,504 |
0.94% |
1.41% |
9/30/19 |
18.10 |
0.24 |
1.33 |
1.57 |
(0.24) |
(1.43) |
(1.67) |
18.00 |
10.61% |
53,931 |
0.94% |
1.41% |
9/30/18 |
22.17 |
0.23 |
2.71 |
2.94 |
(0.46) |
(6.55) |
(7.01) |
18.10 |
16.00% |
50,746 |
0.94% |
1.28% |
Year ended September 30 |
|||||
2022 |
2021 |
2020 |
2019 |
2018 |
|
Portfolio turnover rate |
25% |
25% |
41% |
33% |
35% |
|
c |
Per share amount calculated on the average shares method. |
|
l |
Employee retirement benefit plans that invest plan assets in the Separate Investment Accounts (SIAs) may be subject to certain charges as set forth in their respective Plan Documents. Total return figures would be lower for the periods presented if they reflected these charges. |
|
m |
Total return excludes sales charges, if any, and would be lower for the period presented if it reflected these charges. |
The accompanying notes are an integral part of the financial statements.
216
Income (loss) from investment |
Less distributions to shareholders |
Ratios / Supplemental Data |
||||||||||
Net |
Net |
Net |
Total |
From net |
From net |
Total |
Net |
Total |
Net |
Ratio of |
Net |
|
Administrative Class |
||||||||||||
9/30/22 |
$ 19.38 |
$ 0.16 |
$ (1.23) |
$ (1.07) |
$ (0.19) |
$ (2.20) |
$ (2.39) |
$ 15.92 |
(7.30%) |
$ 34,104 |
1.04% |
0.86% |
9/30/21 |
16.59 |
0.18 |
3.83 |
4.01 |
(0.18) |
(1.04) |
(1.22) |
19.38 |
25.26% |
51,726 |
1.03% |
0.95% |
9/30/20 |
17.71 |
0.21 |
0.25 |
0.46 |
(0.23) |
(1.35) |
(1.58) |
16.59 |
2.42% |
45,175 |
1.04% |
1.30% |
9/30/19 |
17.84 |
0.21 |
1.31 |
1.52 |
(0.22) |
(1.43) |
(1.65) |
17.71 |
10.46% |
55,316 |
1.04% |
1.29% |
9/30/18 |
21.94 |
0.21 |
2.68 |
2.89 |
(0.44) |
(6.55) |
(6.99) |
17.84 |
15.92% |
75,215 |
1.04% |
1.19% |
Class R4 |
||||||||||||
9/30/22 |
$ 17.80 |
$ 0.12 |
$ (1.09) |
$ (0.97) |
$ (0.17) |
$ (2.20) |
$ (2.37) |
$ 14.46 |
(7.41%) |
$ 6,354 |
1.19% |
0.71% |
9/30/21 |
15.34 |
0.13 |
3.54 |
3.67 |
(0.17) |
(1.04) |
(1.21) |
17.80 |
25.07% |
8,727 |
1.18% |
0.79% |
9/30/20 |
16.48 |
0.18 |
0.23 |
0.41 |
(0.20) |
(1.35) |
(1.55) |
15.34 |
2.28% |
8,716 |
1.19% |
1.18% |
9/30/19 |
16.74 |
0.17 |
1.21 |
1.38 |
(0.21) |
(1.43) |
(1.64) |
16.48 |
10.30% |
6,921 |
1.19% |
1.13% |
9/30/18 |
21.00 |
0.17 |
2.54 |
2.71 |
(0.42) |
(6.55) |
(6.97) |
16.74 |
15.70% |
9,409 |
1.19% |
1.04% |
Class A |
||||||||||||
9/30/22 |
$ 18.18 |
$ 0.11 |
$ (1.12) |
$ (1.01) |
$ (0.14) |
$ (2.20) |
$ (2.34) |
$ 14.83 |
(7.46%) |
$ 38,062 |
1.29% |
0.61% |
9/30/21 |
15.64 |
0.12 |
3.61 |
3.73 |
(0.15) |
(1.04) |
(1.19) |
18.18 |
24.94% |
53,123 |
1.28% |
0.70% |
9/30/20 |
16.78 |
0.16 |
0.24 |
0.40 |
(0.19) |
(1.35) |
(1.54) |
15.64 |
2.19% |
55,832 |
1.29% |
1.05% |
9/30/19 |
16.98 |
0.16 |
1.24 |
1.40 |
(0.17) |
(1.43) |
(1.60) |
16.78 |
10.19% |
63,914 |
1.29% |
1.04% |
9/30/18 |
21.17 |
0.16 |
2.56 |
2.72 |
(0.36) |
(6.55) |
(6.91) |
16.98 |
15.62% |
78,457 |
1.29% |
0.92% |
Class R3 |
||||||||||||
9/30/22 |
$ 16.40 |
$ 0.07 |
$ (0.98) |
$ (0.91) |
$ (0.13) |
$ (2.20) |
$ (2.33) |
$ 13.16 |
(7.66%) |
$ 4,064 |
1.44% |
0.49% |
9/30/21 |
14.22 |
0.09 |
3.27 |
3.36 |
(0.14) |
(1.04) |
(1.18) |
16.40 |
24.79% |
3,259 |
1.43% |
0.55% |
9/30/20 |
15.42 |
0.13 |
0.22 |
0.35 |
(0.20) |
(1.35) |
(1.55) |
14.22 |
2.00% |
3,447 |
1.44% |
0.92% |
9/30/19 |
15.77 |
0.13 |
1.12 |
1.25 |
(0.17) |
(1.43) |
(1.60) |
15.42 |
10.01% |
3,297 |
1.44% |
0.92% |
9/30/18 |
20.10 |
0.12 |
2.41 |
2.53 |
(0.31) |
(6.55) |
(6.86) |
15.77 |
15.43% |
2,679 |
1.44% |
0.78% |
The accompanying notes are an integral part of the financial statements.
217
MassMutual Fundamental Growth Fund – Financial Statements (Continued) |
Financial Highlights (For a share outstanding throughout each period) |
Income (loss) from investment |
Less distributions to shareholders |
Ratios / Supplemental Data |
|||||||||||
Net |
Net |
Net |
Total |
From net |
From net |
Total |
Net |
Total |
Net |
Ratio of |
Ratio of |
Net |
|
Class I |
|||||||||||||
9/30/22 |
$ 6.15 |
$ (0.02) |
$ (1.42) |
$ (1.44) |
$ — |
$ (1.73) |
$ (1.73) |
$ 2.98 |
(31.76%) |
$ 2,654 |
1.18% |
1.18%k |
(0.59%) |
9/30/21 |
8.33 |
(0.04) |
1.93 |
1.89 |
— |
(4.07) |
(4.07) |
6.15 |
28.46% |
13,386 |
1.04% |
N/A |
(0.61%) |
9/30/20 |
8.03 |
0.00d |
1.67 |
1.67 |
(0.02) |
(1.35) |
(1.37) |
8.33 |
23.25% |
12,278 |
0.89% |
N/A |
(0.01%) |
9/30/19 |
9.81 |
0.02 |
(0.00)d,aa |
0.02 |
(0.05) |
(1.75) |
(1.80) |
8.03 |
4.27% |
67,992 |
0.82% |
0.78% |
0.31% |
9/30/18 |
8.44 |
0.05 |
1.95 |
2.00 |
(0.07) |
(0.56) |
(0.63) |
9.81 |
24.98% |
64,876 |
0.78% |
0.70% |
0.56% |
Class R5 |
|||||||||||||
9/30/22 |
$ 6.19 |
$ (0.03) |
$ (1.43) |
$ (1.46) |
$ — |
$ (1.73) |
$ (1.73) |
$ 3.00 |
(31.94%) |
$ 4,939 |
1.32% |
1.31% |
(0.71%) |
9/30/21 |
8.37 |
(0.05) |
1.94 |
1.89 |
(0.00)d |
(4.07) |
(4.07) |
6.19 |
28.29% |
10,813 |
1.14% |
N/A |
(0.71%) |
9/30/20 |
8.05 |
(0.01) |
1.69 |
1.68 |
(0.01) |
(1.35) |
(1.36) |
8.37 |
23.34% |
12,351 |
0.99% |
N/A |
(0.17%) |
9/30/19 |
9.83 |
0.02 |
(0.01)aa |
0.01 |
(0.04) |
(1.75) |
(1.79) |
8.05 |
4.13% |
31,014 |
0.92% |
0.88% |
0.21% |
9/30/18 |
8.46 |
0.04 |
1.95 |
1.99 |
(0.06) |
(0.56) |
(0.62) |
9.83 |
24.80% |
32,604 |
0.88% |
0.80% |
0.45% |
Service Class |
|||||||||||||
9/30/22 |
$ 5.84 |
$ (0.03) |
$ (1.32) |
$ (1.35) |
$ — |
$ (1.73) |
$ (1.73) |
$ 2.76 |
(31.97%) |
$ 4,211 |
1.43% |
1.42% |
(0.80%) |
9/30/21 |
8.11 |
(0.05) |
1.85 |
1.80 |
(0.00)d |
(4.07) |
(4.07) |
5.84 |
28.05% |
6,641 |
1.24% |
N/A |
(0.81%) |
9/30/20 |
7.83 |
(0.02) |
1.66 |
1.64 |
(0.01) |
(1.35) |
(1.36) |
8.11 |
23.35% |
6,285 |
1.09% |
N/A |
(0.30%) |
9/30/19 |
9.62 |
0.01 |
(0.02)aa |
(0.01) |
(0.03) |
(1.75) |
(1.78) |
7.83 |
3.97% |
9,805 |
1.02% |
0.98% |
0.11% |
9/30/18 |
8.29 |
0.03 |
1.92 |
1.95 |
(0.06) |
(0.56) |
(0.62) |
9.62 |
24.72% |
9,630 |
0.98% |
0.90% |
0.35% |
Year ended September 30 |
|||||
2022 |
2021 |
2020 |
2019 |
2018 |
|
Portfolio turnover rate |
67% |
78% |
164% |
123% |
47% |
|
c |
Per share amount calculated on the average shares method. |
|
d |
Amount is less than $0.005 per share. |
|
e |
Amount is less than 0.005%. |
|
j |
Computed after giving effect to an agreement by MML Advisers to waive certain fees and expenses of the Fund. |
|
k |
Amount waived had no impact on the ratio of expenses to average daily net assets. |
|
l |
Employee retirement benefit plans that invest plan assets in the Separate Investment Accounts (SIAs) may be subject to certain charges as set forth in their respective Plan Documents. Total return figures would be lower for the periods presented if they reflected these charges. |
|
m |
Total return excludes sales charges, if any, and would be lower for the period presented if it reflected these charges. |
|
aa |
The amount shown for a share outstanding does not correspond with the aggregate net realized and unrealized gain (loss) for the period due to the timing of purchases and redemptions of Fund shares in relation to the fluctuating market values of the Fund. |
The accompanying notes are an integral part of the financial statements.
218
Income (loss) from investment |
Less distributions to shareholders |
Ratios / Supplemental Data |
|||||||||||
Net |
Net |
Net |
Total |
From net |
From net |
Total |
Net |
Total |
Net |
Ratio of |
Ratio of |
Net |
|
Administrative Class |
|||||||||||||
9/30/22 |
$ 5.46 |
$ (0.03) |
$ (1.21) |
$ (1.24) |
$ — |
$ (1.73) |
$ (1.73) |
$ 2.49 |
(32.21%) |
$ 4,610 |
1.52% |
1.51% |
(0.90%) |
9/30/21 |
7.80 |
(0.05) |
1.78 |
1.73 |
(0.00)d |
(4.07) |
(4.07) |
5.46 |
28.26% |
8,032 |
1.34% |
N/A |
(0.91%) |
9/30/20 |
7.59 |
(0.03) |
1.59 |
1.56 |
— |
(1.35) |
(1.35) |
7.80 |
23.08% |
13,485 |
1.19% |
N/A |
(0.41%) |
9/30/19 |
9.38 |
0.00d |
(0.02)aa |
(0.02) |
(0.02) |
(1.75) |
(1.77) |
7.59 |
3.97% |
14,315 |
1.12% |
1.09% |
0.01% |
9/30/18 |
8.10 |
0.02 |
1.87 |
1.89 |
(0.05) |
(0.56) |
(0.61) |
9.38 |
24.56% |
12,307 |
1.08% |
1.00% |
0.25% |
Class R4 |
|||||||||||||
9/30/22 |
$ 4.59 |
$ (0.03) |
$ (0.93) |
$ (0.96) |
$ — |
$ (1.73) |
$ (1.73) |
$ 1.90 |
(32.23%) |
$ 1,220 |
1.69% |
1.68% |
(1.05%) |
9/30/21 |
7.14 |
(0.05) |
1.57 |
1.52 |
(0.00)d |
(4.07) |
(4.07) |
4.59 |
27.79% |
1,699 |
1.49% |
N/A |
(1.06%) |
9/30/20 |
7.06 |
(0.04) |
1.47 |
1.43 |
— |
(1.35) |
(1.35) |
7.14 |
22.94% |
1,662 |
1.34% |
N/A |
(0.59%) |
9/30/19 |
8.86 |
(0.01) |
(0.03)aa |
(0.04) |
(0.01) |
(1.75) |
(1.76) |
7.06 |
3.87% |
1,217 |
1.27% |
1.22% |
(0.08%) |
9/30/18 |
7.68 |
0.01 |
1.77 |
1.78 |
(0.04) |
(0.56) |
(0.60) |
8.86 |
24.48% |
2,757 |
1.23% |
1.15% |
0.10% |
Class A |
|||||||||||||
9/30/22 |
$ 4.72 |
$ (0.03) |
$ (0.97) |
$ (1.00) |
$ — |
$ (1.73) |
$ (1.73) |
$ 1.99 |
(32.20%) |
$ 7,267 |
1.77% |
1.76% |
(1.15%) |
9/30/21 |
7.25 |
(0.06) |
1.60 |
1.54 |
(0.00)d |
(4.07) |
(4.07) |
4.72 |
27.60% |
13,199 |
1.59% |
N/A |
(1.16%) |
9/30/20 |
7.15 |
(0.04) |
1.49 |
1.45 |
— |
(1.35) |
(1.35) |
7.25 |
22.92% |
15,843 |
1.44% |
N/A |
(0.67%) |
9/30/19 |
8.95 |
(0.02) |
(0.03)aa |
(0.05) |
— |
(1.75) |
(1.75) |
7.15 |
3.67% |
14,997 |
1.37% |
1.33% |
(0.23%) |
9/30/18 |
7.75 |
0.00d |
1.79 |
1.79 |
(0.03) |
(0.56) |
(0.59) |
8.95 |
24.31% |
18,868 |
1.33% |
1.25% |
0.00%e |
Class R3 |
|||||||||||||
9/30/22 |
$ 3.70 |
$ (0.02) |
$ (0.66) |
$ (0.68) |
$ — |
$ (1.73) |
$ (1.73) |
$ 1.29 |
(32.59%) |
$ 1,101 |
1.94% |
1.93% |
(1.30%) |
9/30/21 |
6.45 |
(0.05) |
1.37 |
1.32 |
(0.00)d |
(4.07) |
(4.07) |
3.70 |
27.69% |
1,562 |
1.74% |
N/A |
(1.32%) |
9/30/20 |
6.51 |
(0.05) |
1.34 |
1.29 |
— |
(1.35) |
(1.35) |
6.45 |
22.70% |
2,803 |
1.59% |
N/A |
(0.82%) |
9/30/19 |
8.34 |
(0.03) |
(0.05)aa |
(0.08) |
— |
(1.75) |
(1.75) |
6.51 |
3.54% |
2,794 |
1.52% |
1.48% |
(0.40%) |
9/30/18 |
7.27 |
(0.01) |
1.67 |
1.66 |
(0.03) |
(0.56) |
(0.59) |
8.34 |
24.08% |
3,307 |
1.48% |
1.40% |
(0.15%) |
The accompanying notes are an integral part of the financial statements.
219
MassMutual Blue Chip Growth Fund – Financial Statements (Continued) |
Financial Highlights (For a share outstanding throughout each period) |
Income (loss) from investment |
Less distributions to shareholders |
Ratios / Supplemental Data |
||||||||||
Net |
Net |
Net |
Total |
From net |
From net |
Total |
Net |
Total |
Net |
Ratio of |
Net |
|
Class I |
||||||||||||
9/30/22 |
$ 33.66 |
$ (0.04) |
$ (8.56) |
$ (8.60) |
$ — |
$ (6.32) |
$ (6.32) |
$ 18.74 |
(31.96%) |
$ 1,748,402 |
0.64% |
(0.15%) |
9/30/21 |
28.98 |
(0.05) |
6.11 |
6.06 |
— |
(1.38) |
(1.38) |
33.66 |
21.60% |
2,790,281 |
0.63% |
(0.15%) |
9/30/20 |
22.73 |
0.01 |
7.59 |
7.60 |
(0.09) |
(1.26) |
(1.35) |
28.98 |
34.96% |
2,729,246 |
0.64% |
0.06% |
9/30/19 |
23.37 |
0.07 |
0.59 |
0.66 |
(0.11) |
(1.19) |
(1.30) |
22.73 |
3.82% |
1,947,695 |
0.64% |
0.34% |
9/30/18 |
19.78 |
0.06 |
4.45 |
4.51 |
(0.11) |
(0.81) |
(0.92) |
23.37 |
23.49% |
1,799,107 |
0.64% |
0.30% |
Class R5 |
||||||||||||
9/30/22 |
$ 33.56 |
$ (0.06) |
$ (8.53) |
$ (8.59) |
$ — |
$ (6.32) |
$ (6.32) |
$ 18.65 |
(32.04%) |
$ 333,396 |
0.74% |
(0.25%) |
9/30/21 |
28.93 |
(0.08) |
6.09 |
6.01 |
— |
(1.38) |
(1.38) |
33.56 |
21.46% |
616,307 |
0.73% |
(0.25%) |
9/30/20 |
22.69 |
(0.01) |
7.58 |
7.57 |
(0.07) |
(1.26) |
(1.33) |
28.93 |
34.84% |
604,630 |
0.74% |
(0.04%) |
9/30/19 |
23.32 |
0.05 |
0.59 |
0.64 |
(0.08) |
(1.19) |
(1.27) |
22.69 |
3.75% |
456,222 |
0.74% |
0.24% |
9/30/18 |
19.75 |
0.04 |
4.43 |
4.47 |
(0.09) |
(0.81) |
(0.90) |
23.32 |
23.31% |
503,294 |
0.74% |
0.19% |
Service Class |
||||||||||||
9/30/22 |
$ 33.18 |
$ (0.09) |
$ (8.40) |
$ (8.49) |
$ — |
$ (6.32) |
$ (6.32) |
$ 18.37 |
(32.12%) |
$ 121,094 |
0.84% |
(0.35%) |
9/30/21 |
28.64 |
(0.11) |
6.03 |
5.92 |
— |
(1.38) |
(1.38) |
33.18 |
21.36% |
207,565 |
0.83% |
(0.35%) |
9/30/20 |
22.47 |
(0.04) |
7.51 |
7.47 |
(0.04) |
(1.26) |
(1.30) |
28.64 |
34.72% |
184,567 |
0.84% |
(0.17%) |
9/30/19 |
23.10 |
0.03 |
0.58 |
0.61 |
(0.05) |
(1.19) |
(1.24) |
22.47 |
3.61% |
114,021 |
0.84% |
0.14% |
9/30/18 |
19.57 |
0.02 |
4.39 |
4.41 |
(0.07) |
(0.81) |
(0.88) |
23.10 |
23.21% |
122,916 |
0.84% |
0.09% |
Year ended September 30 |
|||||
2022 |
2021 |
2020 |
2019 |
2018 |
|
Portfolio turnover rate |
16% |
20% |
28% |
25% |
17% |
|
c |
Per share amount calculated on the average shares method. |
|
d |
Amount is less than $0.005 per share. |
|
l |
Employee retirement benefit plans that invest plan assets in the Separate Investment Accounts (SIAs) may be subject to certain charges as set forth in their respective Plan Documents. Total return figures would be lower for the periods presented if they reflected these charges. |
|
m |
Total return excludes sales charges, if any, and would be lower for the period presented if it reflected these charges. |
The accompanying notes are an integral part of the financial statements.
220
Income (loss) from investment |
Less distributions to shareholders |
Ratios / Supplemental Data |
||||||||||
Net |
Net |
Net |
Total |
From net |
From net |
Total |
Net |
Total |
Net |
Ratio of |
Net |
|
Administrative Class |
||||||||||||
9/30/22 |
$ 32.58 |
$ (0.11) |
$ (8.20) |
$ (8.31) |
$ — |
$ (6.32) |
$ (6.32) |
$ 17.95 |
(32.16%) |
$ 171,168 |
0.94% |
(0.46%) |
9/30/21 |
28.18 |
(0.14) |
5.92 |
5.78 |
— |
(1.38) |
(1.38) |
32.58 |
21.21% |
347,256 |
0.93% |
(0.45%) |
9/30/20 |
22.13 |
(0.06) |
7.40 |
7.34 |
(0.03) |
(1.26) |
(1.29) |
28.18 |
34.60% |
388,847 |
0.94% |
(0.24%) |
9/30/19 |
22.78 |
0.01 |
0.57 |
0.58 |
(0.04) |
(1.19) |
(1.23) |
22.13 |
3.51% |
312,815 |
0.94% |
0.04% |
9/30/18 |
19.31 |
(0.00)d |
4.33 |
4.33 |
(0.05) |
(0.81) |
(0.86) |
22.78 |
23.08% |
315,952 |
0.94% |
(0.01%) |
Class R4 |
||||||||||||
9/30/22 |
$ 30.82 |
$ (0.14) |
$ (7.63) |
$ (7.77) |
$ — |
$ (6.32) |
$ (6.32) |
$ 16.73 |
(32.26%) |
$ 48,674 |
1.08% |
(0.59%) |
9/30/21 |
26.76 |
(0.17) |
5.61 |
5.44 |
— |
(1.38) |
(1.38) |
30.82 |
21.05% |
128,730 |
1.08% |
(0.60%) |
9/30/20 |
21.09 |
(0.09) |
7.02 |
6.93 |
— |
(1.26) |
(1.26) |
26.76 |
34.34% |
121,843 |
1.09% |
(0.38%) |
9/30/19 |
21.78 |
(0.02) |
0.54 |
0.52 |
(0.02) |
(1.19) |
(1.21) |
21.09 |
3.38% |
106,445 |
1.09% |
(0.11%) |
9/30/18 |
18.51 |
(0.03) |
4.15 |
4.12 |
(0.04) |
(0.81) |
(0.85) |
21.78 |
22.92% |
107,811 |
1.09% |
(0.16%) |
Class A |
||||||||||||
9/30/22 |
$ 30.82 |
$ (0.16) |
$ (7.63) |
$ (7.79) |
$ — |
$ (6.32) |
$ (6.32) |
$ 16.71 |
(32.34%) |
$ 80,084 |
1.19% |
(0.70%) |
9/30/21 |
26.79 |
(0.20) |
5.61 |
5.41 |
— |
(1.38) |
(1.38) |
30.82 |
20.91% |
142,265 |
1.18% |
(0.69%) |
9/30/20 |
21.13 |
(0.11) |
7.03 |
6.92 |
— |
(1.26) |
(1.26) |
26.79 |
34.23% |
202,794 |
1.18% |
(0.48%) |
9/30/19 |
21.82 |
(0.04) |
0.54 |
0.50 |
— |
(1.19) |
(1.19) |
21.13 |
3.27% |
181,457 |
1.19% |
(0.21%) |
9/30/18 |
18.53 |
(0.05) |
4.15 |
4.10 |
— |
(0.81) |
(0.81) |
21.82 |
22.76% |
198,284 |
1.19% |
(0.26%) |
Class R3 |
||||||||||||
9/30/22 |
$ 28.32 |
$ (0.18) |
$ (6.82) |
$ (7.00) |
$ — |
$ (6.32) |
$ (6.32) |
$ 15.00 |
(32.41%) |
$ 30,331 |
1.34% |
(0.85%) |
9/30/21 |
24.76 |
(0.23) |
5.17 |
4.94 |
— |
(1.38) |
(1.38) |
28.32 |
20.72% |
55,690 |
1.33% |
(0.85%) |
9/30/20 |
19.64 |
(0.13) |
6.51 |
6.38 |
— |
(1.26) |
(1.26) |
24.76 |
34.06% |
60,548 |
1.33% |
(0.62%) |
9/30/19 |
20.41 |
(0.07) |
0.49 |
0.42 |
— |
(1.19) |
(1.19) |
19.64 |
3.10% |
61,141 |
1.34% |
(0.36%) |
9/30/18 |
17.41 |
(0.08) |
3.90 |
3.82 |
(0.01) |
(0.81) |
(0.82) |
20.41 |
22.57% |
60,560 |
1.34% |
(0.41%) |
The accompanying notes are an integral part of the financial statements.
221
MassMutual Growth Opportunities Fund – Financial Statements (Continued) |
Financial Highlights (For a share outstanding throughout each period) |
Income (loss) from investment |
Less distributions to shareholders |
Ratios / Supplemental Data |
|||||||||||
Net |
Net |
Net |
Total |
From net |
From net |
Total |
Net |
Total |
Net |
Ratio of |
Ratio of |
Net |
|
Class I |
|||||||||||||
9/30/22 |
$ 11.31 |
$ (0.04) |
$ (4.23) |
$ (4.27) |
$ — |
$ (2.48) |
$ (2.48) |
$ 4.56 |
(47.25%) |
$ 146,814 |
0.78% |
0.76% |
(0.53%) |
9/30/21 |
10.57 |
(0.06) |
2.82 |
2.76 |
— |
(2.02) |
(2.02) |
11.31 |
28.69% |
304,938 |
0.76% |
0.74% |
(0.54%) |
9/30/20 |
10.21 |
(0.02) |
3.53 |
3.51 |
(0.06) |
(3.09) |
(3.15) |
10.57 |
45.81% |
248,333 |
0.77% |
0.76% |
(0.23%) |
9/30/19 |
13.19 |
(0.03) |
(0.29)aa |
(0.32) |
— |
(2.66) |
(2.66) |
10.21 |
1.63% |
168,427 |
0.76% |
N/A |
(0.24%) |
9/30/18 |
11.97 |
(0.04) |
2.81 |
2.77 |
— |
(1.55) |
(1.55) |
13.19 |
25.79% |
390,266 |
0.74% |
N/A |
(0.30%) |
Class R5 |
|||||||||||||
9/30/22 |
$ 11.00 |
$ (0.04) |
$ (4.08) |
$ (4.12) |
$ — |
$ (2.48) |
$ (2.48) |
$ 4.40 |
(47.21%) |
$ 33,626 |
0.88% |
0.86% |
(0.63%) |
9/30/21 |
10.33 |
(0.07) |
2.76 |
2.69 |
— |
(2.02) |
(2.02) |
11.00 |
28.64% |
82,696 |
0.86% |
0.84% |
(0.64%) |
9/30/20 |
10.05 |
(0.03) |
3.45 |
3.42 |
(0.05) |
(3.09) |
(3.14) |
10.33 |
45.51% |
112,882 |
0.87% |
0.86% |
(0.31%) |
9/30/19 |
13.04 |
(0.04) |
(0.29)aa |
(0.33) |
— |
(2.66) |
(2.66) |
10.05 |
1.56% |
127,577 |
0.86% |
N/A |
(0.36%) |
9/30/18 |
11.87 |
(0.05) |
2.77 |
2.72 |
— |
(1.55) |
(1.55) |
13.04 |
25.58% |
153,460 |
0.84% |
N/A |
(0.40%) |
Service Class |
|||||||||||||
9/30/22 |
$ 10.27 |
$ (0.05) |
$ (3.74) |
$ (3.79) |
$ — |
$ (2.48) |
$ (2.48) |
$ 4.00 |
(47.38%) |
$ 14,637 |
0.98% |
0.96% |
(0.73%) |
9/30/21 |
9.77 |
(0.07) |
2.59 |
2.52 |
— |
(2.02) |
(2.02) |
10.27 |
28.53% |
30,819 |
0.96% |
0.94% |
(0.74%) |
9/30/20 |
9.66 |
(0.03) |
3.27 |
3.24 |
(0.04) |
(3.09) |
(3.13) |
9.77 |
45.46% |
31,955 |
0.97% |
0.96% |
(0.37%) |
9/30/19 |
12.67 |
(0.05) |
(0.30)aa |
(0.35) |
— |
(2.66) |
(2.66) |
9.66 |
1.40% |
73,129 |
0.96% |
N/A |
(0.47%) |
9/30/18 |
11.58 |
(0.06) |
2.70 |
2.64 |
— |
(1.55) |
(1.55) |
12.67 |
25.52% |
68,041 |
0.94% |
N/A |
(0.50%) |
Year ended September 30 |
|||||
2022 |
2021 |
2020 |
2019 |
2018 |
|
Portfolio turnover rate |
29% |
26% |
47% |
33% |
28% |
|
c |
Per share amount calculated on the average shares method. |
|
d |
Amount is less than $0.005 per share. |
|
j |
Computed after giving effect to an agreement by MML Advisers to waive certain fees and expenses of the Fund. |
|
l |
Employee retirement benefit plans that invest plan assets in the Separate Investment Accounts (SIAs) may be subject to certain charges as set forth in their respective Plan Documents. Total return figures would be lower for the periods presented if they reflected these charges. |
|
m |
Total return excludes sales charges, if any, and would be lower for the period presented if it reflected these charges. |
|
aa |
The amount shown for a share outstanding does not correspond with the aggregate net realized and unrealized gain (loss) for the period due to the timing of purchases and redemptions of Fund shares in relation to the fluctuating market values of the Fund. |
The accompanying notes are an integral part of the financial statements.
222
Income (loss) from investment |
Less distributions to shareholders |
Ratios / Supplemental Data |
|||||||||||
Net |
Net |
Net |
Total |
From net |
From net |
Total |
Net |
Total |
Net |
Ratio of |
Ratio of |
Net |
|
Administrative Class |
|||||||||||||
9/30/22 |
$ 9.34 |
$ (0.05) |
$ (3.30) |
$ (3.35) |
$ — |
$ (2.48) |
$ (2.48) |
$ 3.51 |
(47.40%) |
$ 22,602 |
1.08% |
1.06% |
(0.83%) |
9/30/21 |
9.06 |
(0.08) |
2.38 |
2.30 |
— |
(2.02) |
(2.02) |
9.34 |
28.30% |
51,978 |
1.06% |
1.04% |
(0.84%) |
9/30/20 |
9.17 |
(0.04) |
3.05 |
3.01 |
(0.03) |
(3.09) |
(3.12) |
9.06 |
45.29% |
57,076 |
1.07% |
1.06% |
(0.52%) |
9/30/19 |
12.19 |
(0.05) |
(0.31)aa |
(0.36) |
— |
(2.66) |
(2.66) |
9.17 |
1.38% |
48,666 |
1.06% |
N/A |
(0.56%) |
9/30/18 |
11.21 |
(0.07) |
2.60 |
2.53 |
— |
(1.55) |
(1.55) |
12.19 |
25.36% |
56,625 |
1.04% |
N/A |
(0.60%) |
Class R4 |
|||||||||||||
9/30/22 |
$ 7.76 |
$ (0.05) |
$ (2.55) |
$ (2.60) |
$ — |
$ (2.48) |
$ (2.48) |
$ 2.68 |
(47.38%) |
$ 638 |
1.23% |
1.21% |
(0.99%) |
9/30/21 |
7.84 |
(0.08) |
2.02 |
1.94 |
— |
(2.02) |
(2.02) |
7.76 |
28.08% |
2,721 |
1.21% |
1.19% |
(0.99%) |
9/30/20 |
8.32 |
(0.04) |
2.66 |
2.62 |
(0.01) |
(3.09) |
(3.10) |
7.84 |
45.05% |
2,777 |
1.22% |
1.21% |
(0.60%) |
9/30/19 |
11.37 |
(0.06) |
(0.33)aa |
(0.39) |
— |
(2.66) |
(2.66) |
8.32 |
1.17% |
9,775 |
1.21% |
N/A |
(0.71%) |
9/30/18 |
10.57 |
(0.08) |
2.43 |
2.35 |
— |
(1.55) |
(1.55) |
11.37 |
25.17% |
16,920 |
1.19% |
N/A |
(0.75%) |
Class A |
|||||||||||||
9/30/22 |
$ 7.60 |
$ (0.05) |
$ (2.48) |
$ (2.53) |
$ — |
$ (2.48) |
$ (2.48) |
$ 2.59 |
(47.50%) |
$ 14,095 |
1.33% |
1.31% |
(1.08%) |
9/30/21 |
7.72 |
(0.08) |
1.98 |
1.90 |
— |
(2.02) |
(2.02) |
7.60 |
27.99% |
38,900 |
1.31% |
1.29% |
(1.09%) |
9/30/20 |
8.24 |
(0.05) |
2.63 |
2.58 |
(0.01) |
(3.09) |
(3.10) |
7.72 |
44.93% |
41,810 |
1.32% |
1.31% |
(0.77%) |
9/30/19 |
11.30 |
(0.07) |
(0.33)aa |
(0.40) |
— |
(2.66) |
(2.66) |
8.24 |
1.06% |
36,629 |
1.31% |
N/A |
(0.81%) |
9/30/18 |
10.52 |
(0.09) |
2.42 |
2.33 |
— |
(1.55) |
(1.55) |
11.30 |
25.08% |
49,746 |
1.29% |
N/A |
(0.85%) |
Class R3 |
|||||||||||||
9/30/22 |
$ 5.90 |
$ (0.03) |
$ (1.70) |
$ (1.73) |
$ — |
$ (2.48) |
$ (2.48) |
$ 1.69 |
(47.66%) |
$ 1,411 |
1.48% |
1.46% |
(1.23%) |
9/30/21 |
6.40 |
(0.07) |
1.59 |
1.52 |
— |
(2.02) |
(2.02) |
5.90 |
27.84% |
2,696 |
1.46% |
1.44% |
(1.24%) |
9/30/20 |
7.33 |
(0.05) |
2.21 |
2.16 |
(0.00)d |
(3.09) |
(3.09) |
6.40 |
44.85% |
984 |
1.47% |
1.46% |
(0.92%) |
9/30/19 |
10.41 |
(0.07) |
(0.35)aa |
(0.42) |
— |
(2.66) |
(2.66) |
7.33 |
0.95% |
925 |
1.46% |
N/A |
(0.97%) |
9/30/18 |
9.82 |
(0.10) |
2.24 |
2.14 |
— |
(1.55) |
(1.55) |
10.41 |
24.93% |
976 |
1.44% |
N/A |
(1.00%) |
The accompanying notes are an integral part of the financial statements.
223
MassMutual Mid Cap Value Fund – Financial Statements (Continued) |
Financial Highlights (For a share outstanding throughout each period) |
Income (loss) from investment |
Less distributions to shareholders |
Ratios / Supplemental Data |
|||||||||||
Net |
Net |
Net |
Total |
From net |
From net |
Total |
Net |
Total |
Net |
Ratio of |
Ratio of |
Net |
|
Class I |
|||||||||||||
9/30/22 |
$ 15.11 |
$ 0.19 |
$ (1.12) |
$ (0.93) |
$ (0.16) |
$ (3.46) |
$ (3.62) |
$ 10.56 |
(9.37%) |
$ 97,584 |
0.93% |
0.61% |
1.47% |
9/30/21 |
11.24 |
0.18 |
3.87 |
4.05 |
(0.18) |
— |
(0.18) |
15.11 |
36.36% |
114,786 |
0.93% |
0.70% |
1.28% |
9/30/20 |
12.42 |
0.20 |
(1.15) |
(0.95) |
(0.23) |
— |
(0.23) |
11.24 |
(7.88%) |
97,457 |
1.00% |
0.80% |
1.75% |
9/30/19 |
14.05 |
0.21 |
(0.11)aa |
0.10 |
(0.16) |
(1.57) |
(1.73) |
12.42 |
2.92% |
93,413 |
1.00% |
0.80% |
1.73% |
9/30/18 |
15.20 |
0.18 |
0.99 |
1.17 |
(0.21) |
(2.11) |
(2.32) |
14.05 |
8.30% |
91,004 |
0.98% |
0.80% |
1.28% |
Class R5 |
|||||||||||||
9/30/22 |
$ 15.28 |
$ 0.18 |
$ (1.15) |
$ (0.97) |
$ (0.14) |
$ (3.46) |
$ (3.60) |
$ 10.71 |
(9.51%) |
$ 782 |
1.03% |
0.71% |
1.36% |
9/30/21 |
11.36 |
0.17 |
3.91 |
4.08 |
(0.16) |
— |
(0.16) |
15.28 |
36.22% |
1,001 |
1.03% |
0.79% |
1.18% |
9/30/20 |
12.55 |
0.20 |
(1.17) |
(0.97) |
(0.22) |
— |
(0.22) |
11.36 |
(7.96%) |
843 |
1.10% |
0.90% |
1.67% |
9/30/19 |
14.15 |
0.20 |
(0.10)aa |
0.10 |
(0.13) |
(1.57) |
(1.70) |
12.55 |
2.78% |
1,332 |
1.10% |
0.90% |
1.68% |
9/30/18 |
15.28 |
0.16 |
1.02 |
1.18 |
(0.20) |
(2.11) |
(2.31) |
14.15 |
8.26% |
949 |
1.08% |
0.90% |
1.10% |
Service Class |
|||||||||||||
9/30/22 |
$ 15.16 |
$ 0.15 |
$ (1.12) |
$ (0.97) |
$ (0.13) |
$ (3.46) |
$ (3.59) |
$ 10.60 |
(9.60%) |
$ 88 |
1.12% |
0.81% |
1.15% |
9/30/21 |
11.28 |
0.16 |
3.88 |
4.04 |
(0.16) |
— |
(0.16) |
15.16 |
36.08% |
569 |
1.13% |
0.87% |
1.07% |
9/30/20 |
12.46 |
0.18 |
(1.16) |
(0.98) |
(0.20) |
— |
(0.20) |
11.28 |
(8.05%) |
203 |
1.20% |
1.00% |
1.55% |
9/30/19 |
14.09 |
0.18 |
(0.10)aa |
0.08 |
(0.14) |
(1.57) |
(1.71) |
12.46 |
2.73% |
215 |
1.20% |
1.00% |
1.53% |
9/30/18 |
15.24 |
0.17 |
0.97 |
1.14 |
(0.18) |
(2.11) |
(2.29) |
14.09 |
8.03% |
255 |
1.18% |
1.00% |
1.14% |
Year ended September 30 |
|||||
2022 |
2021 |
2020 |
2019 |
2018 |
|
Portfolio turnover rate |
82% |
134% |
74% |
54% |
98% |
|
c |
Per share amount calculated on the average shares method. |
|
j |
Computed after giving effect to an agreement by MML Advisers to waive certain fees and expenses of the Fund. |
|
l |
Employee retirement benefit plans that invest plan assets in the Separate Investment Accounts (SIAs) may be subject to certain charges as set forth in their respective Plan Documents. Total return figures would be lower for the periods presented if they reflected these charges. |
|
m |
Total return excludes sales charges, if any, and would be lower for the period presented if it reflected these charges. |
|
aa |
The amount shown for a share outstanding does not correspond with the aggregate net realized and unrealized gain (loss) for the period due to the timing of purchases and redemptions of Fund shares in relation to the fluctuating market values of the Fund. |
The accompanying notes are an integral part of the financial statements.
224
Income (loss) from investment |
Less distributions to shareholders |
Ratios / Supplemental Data |
|||||||||||
Net |
Net |
Net |
Total |
From net |
From net |
Total |
Net |
Total |
Net |
Ratio of |
Ratio of |
Net |
|
Administrative Class |
|||||||||||||
9/30/22 |
$ 15.46 |
$ 0.15 |
$ (1.16) |
$ (1.01) |
$ (0.10) |
$ (3.46) |
$ (3.56) |
$ 10.89 |
(9.63%) |
$ 841 |
1.23% |
0.91% |
1.17% |
9/30/21 |
11.50 |
0.14 |
3.97 |
4.11 |
(0.15) |
— |
(0.15) |
15.46 |
35.93% |
1,124 |
1.23% |
1.00% |
0.98% |
9/30/20 |
12.71 |
0.17 |
(1.19) |
(1.02) |
(0.19) |
— |
(0.19) |
11.50 |
(8.19%) |
873 |
1.30% |
1.10% |
1.46% |
9/30/19 |
14.32 |
0.18 |
(0.10)aa |
0.08 |
(0.12) |
(1.57) |
(1.69) |
12.71 |
2.62% |
889 |
1.30% |
1.10% |
1.44% |
9/30/18 |
15.43 |
0.14 |
1.03 |
1.17 |
(0.17) |
(2.11) |
(2.28) |
14.32 |
8.08% |
888 |
1.28% |
1.10% |
0.97% |
Class R4 |
|||||||||||||
9/30/22 |
$ 14.96 |
$ 0.13 |
$ (1.12) |
$ (0.99) |
$ (0.03) |
$ (3.46) |
$ (3.49) |
$ 10.48 |
(9.79%) |
$ 255 |
1.38% |
1.06% |
1.04% |
9/30/21 |
11.14 |
0.11 |
3.84 |
3.95 |
(0.13) |
— |
(0.13) |
14.96 |
35.64% |
276 |
1.38% |
1.20% |
0.81% |
9/30/20 |
12.31 |
0.15 |
(1.14) |
(0.99) |
(0.18) |
— |
(0.18) |
11.14 |
(8.27%) |
934 |
1.45% |
1.25% |
1.29% |
9/30/19 |
13.97 |
0.16 |
(0.11)aa |
0.05 |
(0.14) |
(1.57) |
(1.71) |
12.31 |
2.48% |
1,050 |
1.45% |
1.25% |
1.36% |
9/30/18 |
15.11 |
0.13 |
0.99 |
1.12 |
(0.15) |
(2.11) |
(2.26) |
13.97 |
7.89% |
307 |
1.43% |
1.25% |
0.90% |
Class A |
|||||||||||||
9/30/22 |
$ 15.13 |
$ 0.12 |
$ (1.14) |
$ (1.02) |
$ — |
$ (3.46) |
$ (3.46) |
$ 10.65 |
(9.87%) |
$ 1,390 |
1.48% |
1.16% |
0.93% |
9/30/21 |
11.27 |
0.10 |
3.88 |
3.98 |
(0.12) |
— |
(0.12) |
15.13 |
35.51% |
1,544 |
1.48% |
1.26% |
0.73% |
9/30/20 |
12.47 |
0.14 |
(1.17) |
(1.03) |
(0.17) |
— |
(0.17) |
11.27 |
(8.41%) |
3,071 |
1.55% |
1.35% |
1.23% |
9/30/19 |
14.07 |
0.14 |
(0.09)aa |
0.05 |
(0.08) |
(1.57) |
(1.65) |
12.47 |
2.41% |
2,788 |
1.55% |
1.35% |
1.18% |
9/30/18 |
15.21 |
0.10 |
1.00 |
1.10 |
(0.13) |
(2.11) |
(2.24) |
14.07 |
7.73% |
2,464 |
1.53% |
1.35% |
0.73% |
Class R3 |
|||||||||||||
9/30/22 |
$ 14.92 |
$ 0.10 |
$ (1.12) |
$ (1.02) |
$ — |
$ (3.46) |
$ (3.46) |
$ 10.44 |
(10.05%) |
$ 120 |
1.63% |
1.31% |
0.77% |
9/30/21 |
11.10 |
0.07 |
3.84 |
3.91 |
(0.09) |
— |
(0.09) |
14.92 |
35.39% |
144 |
1.63% |
1.42% |
0.52% |
9/30/20 |
12.28 |
0.12 |
(1.15) |
(1.03) |
(0.15) |
— |
(0.15) |
11.10 |
(8.53%) |
381 |
1.70% |
1.50% |
1.05% |
9/30/19 |
13.90 |
0.13 |
(0.11)aa |
0.02 |
(0.07) |
(1.57) |
(1.64) |
12.28 |
2.19% |
503 |
1.70% |
1.50% |
1.06% |
9/30/18 |
15.06 |
0.08 |
1.00 |
1.08 |
(0.13) |
(2.11) |
(2.24) |
13.90 |
7.66% |
383 |
1.68% |
1.50% |
0.57% |
The accompanying notes are an integral part of the financial statements.
225
MassMutual Small Cap Value Equity Fund – Financial Statements (Continued) |
Financial Highlights (For a share outstanding throughout each period) |
Income (loss) from investment |
Less distributions to shareholders |
Ratios / Supplemental Data |
|||||||||||
Net |
Net |
Net |
Total |
From net |
From net |
Total |
Net |
Total |
Net |
Ratio of |
Ratio of |
Net |
|
Class I |
|||||||||||||
9/30/22 |
$ 13.05 |
$ 0.01bb |
$ (1.25) |
$ (1.24) |
$ — |
$ (3.12) |
$ (3.12) |
$ 8.69 |
(13.54%) |
$ 31,863 |
1.16% |
N/A |
0.10% |
9/30/21 |
8.72 |
0.00d |
4.68 |
4.68 |
— |
(0.35) |
(0.35) |
13.05 |
54.27% |
37,021 |
1.03% |
N/A |
0.04% |
9/30/20 |
11.17 |
0.02 |
(1.39) |
(1.37) |
(0.03) |
(1.05) |
(1.08) |
8.72 |
(14.27%) |
51,492 |
1.05% |
N/A |
0.22% |
9/30/19 |
18.11 |
0.05 |
(2.20) |
(2.15) |
(0.06) |
(4.73) |
(4.79) |
11.17 |
(8.20%) |
47,894 |
0.97% |
0.93% |
0.44% |
9/30/18 |
18.07 |
0.06 |
2.07 |
2.13 |
(0.09) |
(2.00) |
(2.09) |
18.11 |
12.92% |
51,328 |
0.89% |
0.80% |
0.32% |
Class R5 |
|||||||||||||
9/30/22 |
$ 13.07 |
$ (0.00)d |
$ (1.25) |
$ (1.25) |
$ — |
$ (3.12) |
$ (3.12) |
$ 8.70 |
(13.61%) |
$ 6,513 |
1.25% |
N/A |
(0.02%) |
9/30/21 |
8.74 |
(0.01) |
4.69 |
4.68 |
— |
(0.35) |
(0.35) |
13.07 |
54.14% |
11,028 |
1.13% |
N/A |
(0.07%) |
9/30/20 |
11.19 |
0.01 |
(1.40) |
(1.39) |
(0.01) |
(1.05) |
(1.06) |
8.74 |
(14.38%) |
10,194 |
1.15% |
N/A |
0.11% |
9/30/19 |
18.12 |
0.04 |
(2.20) |
(2.16) |
(0.04) |
(4.73) |
(4.77) |
11.19 |
(8.26%) |
16,680 |
1.07% |
1.01% |
0.31% |
9/30/18 |
18.08 |
0.04 |
2.08 |
2.12 |
(0.08) |
(2.00) |
(2.08) |
18.12 |
12.80% |
42,389 |
0.99% |
0.90% |
0.24% |
Service Class |
|||||||||||||
9/30/22 |
$ 13.13 |
$ (0.01) |
$ (1.26) |
$ (1.27) |
$ — |
$ (3.12) |
$ (3.12) |
$ 8.74 |
(13.72%) |
$ 2,189 |
1.36% |
N/A |
(0.12%) |
9/30/21 |
8.79 |
(0.02) |
4.71 |
4.69 |
— |
(0.35) |
(0.35) |
13.13 |
53.95% |
3,143 |
1.23% |
N/A |
(0.15%) |
9/30/20 |
11.24 |
0.00d |
(1.40) |
(1.40) |
(0.00)d |
(1.05) |
(1.05) |
8.79 |
(14.38%) |
2,572 |
1.25% |
N/A |
0.02% |
9/30/19 |
18.15 |
0.03 |
(2.20) |
(2.17) |
(0.01) |
(4.73) |
(4.74) |
11.24 |
(8.39%) |
4,730 |
1.17% |
1.12% |
0.23% |
9/30/18 |
18.11 |
0.02 |
2.08 |
2.10 |
(0.06) |
(2.00) |
(2.06) |
18.15 |
12.66% |
5,773 |
1.09% |
1.00% |
0.14% |
Year ended September 30 |
|||||
2022 |
2021 |
2020 |
2019 |
2018 |
|
Portfolio turnover rate |
47% |
23% |
77% |
30% |
24% |
|
c |
Per share amount calculated on the average shares method. |
|
d |
Amount is less than $0.005 per share. |
|
e |
Amount is less than 0.005%. |
|
j |
Computed after giving effect to an agreement by MML Advisers to waive certain fees and expenses of the Fund. |
|
l |
Employee retirement benefit plans that invest plan assets in the Separate Investment Accounts (SIAs) may be subject to certain charges as set forth in their respective Plan Documents. Total return figures would be lower for the periods presented if they reflected these charges. |
|
m |
Total return excludes sales charges, if any, and would be lower for the period presented if it reflected these charges. |
|
bb |
The amount shown for a share outstanding does not correspond with the aggregate net investment income (loss) as shown on the Statement of Operations for the period due to the timing of class-specific expenses. See Note 3 for each fund’s expense structure. |
The accompanying notes are an integral part of the financial statements.
226
Income (loss) from investment |
Less distributions to shareholders |
Ratios / Supplemental Data |
|||||||||||
Net |
Net |
Net |
Total |
From net |
From net |
Total |
Net |
Total |
Net |
Ratio of |
Ratio of |
Net |
|
Administrative Class |
|||||||||||||
9/30/22 |
$ 12.99 |
$ (0.02) |
$ (1.24) |
$ (1.26) |
$ — |
$ (3.12) |
$ (3.12) |
$ 8.61 |
(13.80%) |
$ 2,189 |
1.46% |
N/A |
(0.21%) |
9/30/21 |
8.70 |
(0.03) |
4.67 |
4.64 |
— |
(0.35) |
(0.35) |
12.99 |
53.93% |
2,550 |
1.33% |
N/A |
(0.25%) |
9/30/20 |
11.16 |
(0.01) |
(1.40) |
(1.41) |
— |
(1.05) |
(1.05) |
8.70 |
(14.58%) |
3,126 |
1.35% |
N/A |
(0.08%) |
9/30/19 |
18.07 |
0.02 |
(2.19) |
(2.17) |
(0.01) |
(4.73) |
(4.74) |
11.16 |
(8.45%) |
3,240 |
1.27% |
1.22% |
0.13% |
9/30/18 |
18.00 |
(0.00)d |
2.07 |
2.07 |
(0.00)d |
(2.00) |
(2.00) |
18.07 |
12.57% |
5,162 |
1.19% |
1.10% |
(0.01%) |
Class R4 |
|||||||||||||
9/30/22 |
$ 12.65 |
$ (0.04) |
$ (1.18) |
$ (1.22) |
$ — |
$ (3.12) |
$ (3.12) |
$ 8.31 |
(13.88%) |
$ 1,193 |
1.61% |
N/A |
(0.36%) |
9/30/21 |
8.50 |
(0.05) |
4.55 |
4.50 |
— |
(0.35) |
(0.35) |
12.65 |
53.54% |
1,492 |
1.48% |
N/A |
(0.41%) |
9/30/20 |
10.93 |
(0.02) |
(1.36) |
(1.38) |
— |
(1.05) |
(1.05) |
8.50 |
(14.62%) |
2,332 |
1.50% |
N/A |
(0.24%) |
9/30/19 |
17.83 |
(0.00)d |
(2.17) |
(2.17) |
— |
(4.73) |
(4.73) |
10.93 |
(8.59%) |
4,301 |
1.42% |
1.38% |
(0.00%)e |
9/30/18 |
17.85 |
(0.01) |
2.03 |
2.02 |
(0.04) |
(2.00) |
(2.04) |
17.83 |
12.37% |
3,350 |
1.34% |
1.25% |
(0.08%) |
Class A |
|||||||||||||
9/30/22 |
$ 12.73 |
$ (0.05) |
$ (1.20) |
$ (1.25) |
$ — |
$ (3.12) |
$ (3.12) |
$ 8.36 |
(14.05%) |
$ 4,521 |
1.71% |
N/A |
(0.47%) |
9/30/21 |
8.56 |
(0.06) |
4.58 |
4.52 |
— |
(0.35) |
(0.35) |
12.73 |
53.40% |
6,375 |
1.58% |
N/A |
(0.50%) |
9/30/20 |
11.01 |
(0.03) |
(1.37) |
(1.40) |
— |
(1.05) |
(1.05) |
8.56 |
(14.70%) |
4,715 |
1.60% |
N/A |
(0.34%) |
9/30/19 |
17.93 |
(0.01) |
(2.18) |
(2.19) |
— |
(4.73) |
(4.73) |
11.01 |
(8.68%) |
7,990 |
1.52% |
1.47% |
(0.11%) |
9/30/18 |
17.92 |
(0.03) |
2.04 |
2.01 |
(0.00)d |
(2.00) |
(2.00) |
17.93 |
12.26% |
11,623 |
1.44% |
1.35% |
(0.20%) |
Class R3 |
|||||||||||||
9/30/22 |
$ 12.49 |
$ (0.06) |
$ (1.17) |
$ (1.23) |
$ — |
$ (3.12) |
$ (3.12) |
$ 8.14 |
(14.19%) |
$ 621 |
1.86% |
N/A |
(0.61%) |
9/30/21 |
8.41 |
(0.08) |
4.51 |
4.43 |
— |
(0.35) |
(0.35) |
12.49 |
53.27% |
695 |
1.73% |
N/A |
(0.66%) |
9/30/20 |
10.86 |
(0.04) |
(1.36) |
(1.40) |
— |
(1.05) |
(1.05) |
8.41 |
(14.92%) |
748 |
1.75% |
N/A |
(0.47%) |
9/30/19 |
17.79 |
(0.03) |
(2.17) |
(2.20) |
— |
(4.73) |
(4.73) |
10.86 |
(8.84%) |
856 |
1.67% |
1.61% |
(0.27%) |
9/30/18 |
17.81 |
(0.06) |
2.04 |
1.98 |
— |
(2.00) |
(2.00) |
17.79 |
12.14% |
1,544 |
1.59% |
1.50% |
(0.34%) |
The accompanying notes are an integral part of the financial statements.
227
MassMutual Small Company Value Fund – Financial Statements (Continued) |
Financial Highlights (For a share outstanding throughout each period) |
Income (loss) from investment |
Less distributions to shareholders |
Ratios / Supplemental Data |
|||||||||||
Net |
Net |
Net |
Total |
From net |
From net |
Total |
Net |
Total |
Net |
Ratio of |
Ratio of |
Net |
|
Class I |
|||||||||||||
9/30/22 |
$ 12.69 |
$ 0.09 |
$ (2.16) |
$ (2.07) |
$ (0.04) |
$ (1.72) |
$ (1.76) |
$ 8.86 |
(19.24%) |
$ 132,528 |
0.95% |
0.86% |
0.77% |
9/30/21 |
7.36 |
0.05 |
5.35 |
5.40 |
(0.07) |
— |
(0.07) |
12.69 |
73.67% |
179,847 |
0.96% |
0.94% |
0.48% |
9/30/20 |
9.22 |
0.05 |
(1.41) |
(1.36) |
(0.07) |
(0.43) |
(0.50) |
7.36 |
(15.96%) |
86,121 |
1.00% |
N/A |
0.67% |
9/30/19 |
12.04 |
0.07 |
(1.28) |
(1.21) |
(0.04) |
(1.57) |
(1.61) |
9.22 |
(8.59%) |
95,423 |
0.98% |
0.98%k |
0.73% |
9/30/18 |
13.45 |
0.06 |
0.93 |
0.99 |
(0.09) |
(2.31) |
(2.40) |
12.04 |
8.45% |
103,334 |
0.95% |
0.93% |
0.47% |
Class R5 |
|||||||||||||
9/30/22 |
$ 12.78 |
$ 0.07 |
$ (2.18) |
$ (2.11) |
$ (0.02) |
$ (1.72) |
$ (1.74) |
$ 8.93 |
(19.35%) |
$ 35,442 |
1.05% |
0.96% |
0.66% |
9/30/21 |
7.42 |
0.05 |
5.37 |
5.42 |
(0.06) |
— |
(0.06) |
12.78 |
73.32% |
65,854 |
1.06% |
1.04% |
0.40% |
9/30/20 |
9.28 |
0.04 |
(1.41) |
(1.37) |
(0.06) |
(0.43) |
(0.49) |
7.42 |
(15.95%) |
48,006 |
1.10% |
N/A |
0.55% |
9/30/19 |
12.10 |
0.06 |
(1.28) |
(1.22) |
(0.03) |
(1.57) |
(1.60) |
9.28 |
(8.67%) |
78,145 |
1.08% |
1.08%k |
0.64% |
9/30/18 |
13.50 |
0.04 |
0.95 |
0.99 |
(0.08) |
(2.31) |
(2.39) |
12.10 |
8.35% |
74,247 |
1.05% |
1.03% |
0.37% |
Service Class |
|||||||||||||
9/30/22 |
$ 12.69 |
$ 0.06 |
$ (2.16) |
$ (2.10) |
$ (0.01) |
$ (1.72) |
$ (1.73) |
$ 8.86 |
(19.41%) |
$ 7,189 |
1.15% |
1.06% |
0.58% |
9/30/21 |
7.37 |
0.03 |
5.34 |
5.37 |
(0.05) |
— |
(0.05) |
12.69 |
73.14% |
8,737 |
1.16% |
1.14% |
0.28% |
9/30/20 |
9.23 |
0.04 |
(1.42) |
(1.38) |
(0.05) |
(0.43) |
(0.48) |
7.37 |
(16.11%) |
4,281 |
1.20% |
N/A |
0.44% |
9/30/19 |
12.03 |
0.05 |
(1.27) |
(1.22) |
(0.01) |
(1.57) |
(1.58) |
9.23 |
(8.70%) |
6,847 |
1.18% |
1.18%k |
0.52% |
9/30/18 |
13.43 |
0.03 |
0.94 |
0.97 |
(0.06) |
(2.31) |
(2.37) |
12.03 |
8.25% |
8,664 |
1.15% |
1.13% |
0.27% |
Year ended September 30 |
|||||
2022 |
2021 |
2020 |
2019 |
2018 |
|
Portfolio turnover rate |
42% |
66% |
57% |
146% |
65% |
|
c |
Per share amount calculated on the average shares method. |
|
d |
Amount is less than $0.005 per share. |
|
j |
Computed after giving effect to an agreement by MML Advisers to waive certain fees and expenses of the Fund. |
|
k |
Amount waived had no impact on the ratio of expenses to average daily net assets. |
|
l |
Employee retirement benefit plans that invest plan assets in the Separate Investment Accounts (SIAs) may be subject to certain charges as set forth in their respective Plan Documents. Total return figures would be lower for the periods presented if they reflected these charges. |
|
m |
Total return excludes sales charges, if any, and would be lower for the period presented if it reflected these charges. |
The accompanying notes are an integral part of the financial statements.
228
Income (loss) from investment |
Less distributions to shareholders |
Ratios / Supplemental Data |
|||||||||||
Net |
Net |
Net |
Total |
From net |
From net |
Total |
Net |
Total |
Net |
Ratio of |
Ratio of |
Net |
|
Administrative Class |
|||||||||||||
9/30/22 |
$ 12.38 |
$ 0.05 |
$ (2.10) |
$ (2.05) |
$ — |
$ (1.72) |
$ (1.72) |
$ 8.61 |
(19.50%) |
$ 9,380 |
1.25% |
1.16% |
0.47% |
9/30/21 |
7.19 |
0.02 |
5.22 |
5.24 |
(0.05) |
— |
(0.05) |
12.38 |
73.10% |
14,862 |
1.26% |
1.24% |
0.20% |
9/30/20 |
9.01 |
0.03 |
(1.38) |
(1.35) |
(0.04) |
(0.43) |
(0.47) |
7.19 |
(16.15%) |
12,971 |
1.30% |
N/A |
0.36% |
9/30/19 |
11.80 |
0.04 |
(1.26) |
(1.22) |
(0.00)d |
(1.57) |
(1.57) |
9.01 |
(8.88%) |
11,363 |
1.28% |
1.28%k |
0.42% |
9/30/18 |
13.22 |
0.02 |
0.92 |
0.94 |
(0.05) |
(2.31) |
(2.36) |
11.80 |
8.14% |
14,411 |
1.25% |
1.23% |
0.17% |
Class R4 |
|||||||||||||
9/30/22 |
$ 11.65 |
$ 0.03 |
$ (1.95) |
$ (1.92) |
$ — |
$ (1.72) |
$ (1.72) |
$ 8.01 |
(19.62%) |
$ 628 |
1.40% |
1.31% |
0.33% |
9/30/21 |
6.78 |
0.00d |
4.91 |
4.91 |
(0.04) |
— |
(0.04) |
11.65 |
72.68% |
780 |
1.41% |
1.40% |
0.02% |
9/30/20 |
8.52 |
0.02 |
(1.30) |
(1.28) |
(0.03) |
(0.43) |
(0.46) |
6.78 |
(16.25%) |
882 |
1.45% |
N/A |
0.28% |
9/30/19 |
11.26 |
0.02 |
(1.19) |
(1.17) |
(0.00)d |
(1.57) |
(1.57) |
8.52 |
(8.96%) |
541 |
1.43% |
1.43%k |
0.27% |
9/30/18 |
12.73 |
0.00d |
0.88 |
0.88 |
(0.04) |
(2.31) |
(2.35) |
11.26 |
7.95% |
663 |
1.40% |
1.38% |
0.02% |
Class A |
|||||||||||||
9/30/22 |
$ 11.83 |
$ 0.02 |
$ (1.99) |
$ (1.97) |
$ — |
$ (1.72) |
$ (1.72) |
$ 8.14 |
(19.76%) |
$ 10,387 |
1.50% |
1.41% |
0.22% |
9/30/21 |
6.87 |
(0.01) |
4.99 |
4.98 |
(0.02) |
— |
(0.02) |
11.83 |
72.61% |
13,826 |
1.51% |
1.49% |
(0.06%) |
9/30/20 |
8.64 |
0.01 |
(1.33) |
(1.32) |
(0.02) |
(0.43) |
(0.45) |
6.87 |
(16.45%) |
10,694 |
1.55% |
N/A |
0.11% |
9/30/19 |
11.40 |
0.01 |
(1.20) |
(1.19) |
— |
(1.57) |
(1.57) |
8.64 |
(9.03%) |
16,723 |
1.53% |
1.53%k |
0.17% |
9/30/18 |
12.85 |
(0.01) |
0.89 |
0.88 |
(0.02) |
(2.31) |
(2.33) |
11.40 |
7.84% |
21,061 |
1.50% |
1.48% |
(0.08%) |
Class R3 |
|||||||||||||
9/30/22 |
$ 10.73 |
$ 0.01 |
$ (1.77) |
$ (1.76) |
$ — |
$ (1.72) |
$ (1.72) |
$ 7.25 |
(19.84%) |
$ 332 |
1.65% |
1.56% |
0.08% |
9/30/21 |
6.23 |
(0.02) |
4.52 |
4.50 |
— |
— |
— |
10.73 |
72.23% |
359 |
1.66% |
1.64% |
(0.23%) |
9/30/20 |
7.86 |
(0.00)d |
(1.20) |
(1.20) |
(0.00)d |
(0.43) |
(0.43) |
6.23 |
(16.47%) |
151 |
1.70% |
N/A |
(0.04%) |
9/30/19 |
10.57 |
0.00d |
(1.14) |
(1.14) |
— |
(1.57) |
(1.57) |
7.86 |
(9.30%) |
422 |
1.68% |
1.68%k |
0.04% |
9/30/18 |
12.09 |
(0.02) |
0.83 |
0.81 |
(0.02) |
(2.31) |
(2.33) |
10.57 |
7.76% |
418 |
1.65% |
1.63% |
(0.19%) |
The accompanying notes are an integral part of the financial statements.
229
MassMutual Mid Cap Growth Fund – Financial Statements (Continued) |
Financial Highlights (For a share outstanding throughout each period) |
Income (loss) from investment |
Less distributions to shareholders |
Ratios / Supplemental Data |
|||||||||||
Net |
Net |
Net |
Total |
From net |
From net |
Total |
Net |
Total |
Net |
Ratio of |
Ratio of |
Net |
|
Class I |
|||||||||||||
9/30/22 |
$ 31.23 |
$ (0.05) |
$ (6.68) |
$ (6.73) |
$ — |
$ (5.95) |
$ (5.95) |
$ 18.55 |
(26.70%) |
$ 3,824,988 |
0.71% |
0.69% |
(0.19%) |
9/30/21 |
25.51 |
(0.08) |
7.39 |
7.31 |
— |
(1.59) |
(1.59) |
31.23 |
29.56% |
6,514,823 |
0.70% |
N/A |
(0.26%) |
9/30/20 |
23.34 |
0.01 |
3.43 |
3.44 |
(0.01) |
(1.26) |
(1.27) |
25.51 |
15.23% |
6,188,463 |
0.71% |
N/A |
0.03% |
9/30/19 |
24.10 |
0.03 |
1.14 |
1.17 |
(0.01) |
(1.92) |
(1.93) |
23.34 |
6.66% |
5,925,776 |
0.71% |
N/A |
0.15% |
9/30/18 |
21.92 |
0.01 |
3.59 |
3.60 |
— |
(1.42) |
(1.42) |
24.10 |
17.21% |
5,436,930 |
0.71% |
N/A |
0.06% |
Class R5 |
|||||||||||||
9/30/22 |
$ 30.80 |
$ (0.07) |
$ (6.56) |
$ (6.63) |
$ — |
$ (5.95) |
$ (5.95) |
$ 18.22 |
(26.76%) |
$ 834,945 |
0.81% |
0.79% |
(0.30%) |
9/30/21 |
25.20 |
(0.11) |
7.30 |
7.19 |
— |
(1.59) |
(1.59) |
30.80 |
29.44% |
1,668,653 |
0.80% |
N/A |
(0.36%) |
9/30/20 |
23.08 |
(0.02) |
3.40 |
3.38 |
— |
(1.26) |
(1.26) |
25.20 |
15.13% |
1,471,580 |
0.81% |
N/A |
(0.07%) |
9/30/19 |
23.87 |
0.01 |
1.12 |
1.13 |
— |
(1.92) |
(1.92) |
23.08 |
6.54% |
1,533,487 |
0.81% |
N/A |
0.05% |
9/30/18 |
21.75 |
(0.01) |
3.55 |
3.54 |
— |
(1.42) |
(1.42) |
23.87 |
17.06% |
1,517,553 |
0.81% |
N/A |
(0.04%) |
Service Class |
|||||||||||||
9/30/22 |
$ 29.82 |
$ (0.09) |
$ (6.30) |
$ (6.39) |
$ — |
$ (5.95) |
$ (5.95) |
$ 17.48 |
(26.85%) |
$ 158,487 |
0.91% |
0.89% |
(0.39%) |
9/30/21 |
24.47 |
(0.13) |
7.07 |
6.94 |
— |
(1.59) |
(1.59) |
29.82 |
29.29% |
325,714 |
0.90% |
N/A |
(0.46%) |
9/30/20 |
22.47 |
(0.04) |
3.30 |
3.26 |
— |
(1.26) |
(1.26) |
24.47 |
15.00% |
335,782 |
0.91% |
N/A |
(0.17%) |
9/30/19 |
23.31 |
(0.01) |
1.09 |
1.08 |
— |
(1.92) |
(1.92) |
22.47 |
6.48% |
373,475 |
0.91% |
N/A |
(0.05%) |
9/30/18 |
21.30 |
(0.03) |
3.46 |
3.43 |
— |
(1.42) |
(1.42) |
23.31 |
16.90% |
405,725 |
0.91% |
N/A |
(0.14%) |
Year ended September 30 |
|||||
2022 |
2021 |
2020 |
2019 |
2018 |
|
Portfolio turnover rate |
22% |
29% |
37% |
37% |
34% |
|
c |
Per share amount calculated on the average shares method. |
|
j |
Computed after giving effect to an agreement by MML Advisers to waive certain fees and expenses of the Fund. |
|
l |
Employee retirement benefit plans that invest plan assets in the Separate Investment Accounts (SIAs) may be subject to certain charges as set forth in their respective Plan Documents. Total return figures would be lower for the periods presented if they reflected these charges. |
|
m |
Total return excludes sales charges, if any, and would be lower for the period presented if it reflected these charges. |
The accompanying notes are an integral part of the financial statements.
230
Income (loss) from investment |
Less distributions to shareholders |
Ratios / Supplemental Data |
|||||||||||
Net |
Net |
Net |
Total |
From net |
From net |
Total |
Net |
Total |
Net |
Ratio of |
Ratio of |
Net |
|
Administrative Class |
|||||||||||||
9/30/22 |
$ 28.15 |
$ (0.10) |
$ (5.86) |
$ (5.96) |
$ — |
$ (5.95) |
$ (5.95) |
$ 16.24 |
(26.93%) |
$ 136,292 |
1.01% |
0.99% |
(0.49%) |
9/30/21 |
23.20 |
(0.15) |
6.69 |
6.54 |
— |
(1.59) |
(1.59) |
28.15 |
29.16% |
246,666 |
1.00% |
N/A |
(0.56%) |
9/30/20 |
21.38 |
(0.06) |
3.14 |
3.08 |
— |
(1.26) |
(1.26) |
23.20 |
14.92% |
261,188 |
1.01% |
N/A |
(0.27%) |
9/30/19 |
22.32 |
(0.03) |
1.01 |
0.98 |
— |
(1.92) |
(1.92) |
21.38 |
6.31% |
290,024 |
1.01% |
N/A |
(0.15%) |
9/30/18 |
20.46 |
(0.05) |
3.33 |
3.28 |
— |
(1.42) |
(1.42) |
22.32 |
16.85% |
337,284 |
1.01% |
N/A |
(0.25%) |
Class R4 |
|||||||||||||
9/30/22 |
$ 25.63 |
$ (0.13) |
$ (5.18) |
$ (5.31) |
$ — |
$ (5.95) |
$ (5.95) |
$ 14.37 |
(27.06%) |
$ 59,611 |
1.16% |
1.14% |
(0.66%) |
9/30/21 |
21.28 |
(0.17) |
6.11 |
5.94 |
— |
(1.59) |
(1.59) |
25.63 |
28.97% |
155,374 |
1.15% |
N/A |
(0.72%) |
9/30/20 |
19.74 |
(0.08) |
2.88 |
2.80 |
— |
(1.26) |
(1.26) |
21.28 |
14.73% |
176,500 |
1.16% |
N/A |
(0.42%) |
9/30/19 |
20.80 |
(0.06) |
0.92 |
0.86 |
— |
(1.92) |
(1.92) |
19.74 |
6.18% |
222,247 |
1.16% |
N/A |
(0.29%) |
9/30/18 |
19.19 |
(0.08) |
3.11 |
3.03 |
— |
(1.42) |
(1.42) |
20.80 |
16.65% |
229,517 |
1.16% |
N/A |
(0.39%) |
Class A |
|||||||||||||
9/30/22 |
$ 25.35 |
$ (0.14) |
$ (5.11) |
$ (5.25) |
$ — |
$ (5.95) |
$ (5.95) |
$ 14.15 |
(27.14%) |
$ 87,758 |
1.26% |
1.24% |
(0.74%) |
9/30/21 |
21.08 |
(0.20) |
6.06 |
5.86 |
— |
(1.59) |
(1.59) |
25.35 |
28.86% |
167,114 |
1.25% |
N/A |
(0.81%) |
9/30/20 |
19.58 |
(0.10) |
2.86 |
2.76 |
— |
(1.26) |
(1.26) |
21.08 |
14.64% |
196,756 |
1.26% |
N/A |
(0.52%) |
9/30/19 |
20.67 |
(0.07) |
0.90 |
0.83 |
— |
(1.92) |
(1.92) |
19.58 |
6.06% |
226,723 |
1.26% |
N/A |
(0.40%) |
9/30/18 |
19.10 |
(0.10) |
3.09 |
2.99 |
— |
(1.42) |
(1.42) |
20.67 |
16.52% |
272,769 |
1.26% |
N/A |
(0.50%) |
Class R3 |
|||||||||||||
9/30/22 |
$ 22.84 |
$ (0.14) |
$ (4.45) |
$ (4.59) |
$ — |
$ (5.95) |
$ (5.95) |
$ 12.30 |
(27.25%) |
$ 19,336 |
1.41% |
1.39% |
(0.89%) |
9/30/21 |
19.16 |
(0.21) |
5.48 |
5.27 |
— |
(1.59) |
(1.59) |
22.84 |
28.65% |
31,715 |
1.40% |
N/A |
(0.96%) |
9/30/20 |
17.93 |
(0.12) |
2.61 |
2.49 |
— |
(1.26) |
(1.26) |
19.16 |
14.48% |
31,065 |
1.41% |
N/A |
(0.67%) |
9/30/19 |
19.14 |
(0.09) |
0.80 |
0.71 |
— |
(1.92) |
(1.92) |
17.93 |
5.91% |
32,770 |
1.41% |
N/A |
(0.54%) |
9/30/18 |
17.81 |
(0.12) |
2.87 |
2.75 |
— |
(1.42) |
(1.42) |
19.14 |
16.36% |
35,471 |
1.41% |
N/A |
(0.64%) |
The accompanying notes are an integral part of the financial statements.
231
MassMutual Small Cap Growth Equity Fund – Financial Statements (Continued) |
Financial Highlights (For a share outstanding throughout each period) |
Income (loss) from investment |
Less distributions to shareholders |
Ratios / Supplemental Data |
||||||||||
Net |
Net |
Net |
Total |
From net |
From net |
Total |
Net |
Total |
Net |
Ratio of |
Net |
|
Class I |
||||||||||||
9/30/22 |
$ 20.88 |
$ (0.02) |
$ (4.41) |
$ (4.43) |
$ — |
$ (4.49) |
$ (4.49) |
$ 11.96 |
(26.63%) |
$ 368,199 |
0.87% |
(0.12%) |
9/30/21 |
16.42 |
(0.07) |
5.93 |
5.86 |
— |
(1.40) |
(1.40) |
20.88 |
36.62% |
487,031 |
0.86% |
(0.37%) |
9/30/20 |
15.30 |
(0.03) |
2.97 |
2.94 |
(0.14) |
(1.68) |
(1.82) |
16.42 |
20.54% |
342,888 |
0.87% |
(0.19%) |
9/30/19 |
19.08 |
(0.01) |
(1.04) |
(1.05) |
— |
(2.73) |
(2.73) |
15.30 |
(2.31%) |
269,356 |
0.86% |
(0.05%) |
9/30/18 |
15.74 |
(0.03) |
4.24 |
4.21 |
— |
(0.87) |
(0.87) |
19.08 |
27.96% |
385,194 |
0.85% |
(0.15%) |
Class R5 |
||||||||||||
9/30/22 |
$ 20.47 |
$ (0.04) |
$ (4.30) |
$ (4.34) |
$ — |
$ (4.49) |
$ (4.49) |
$ 11.64 |
(26.73%) |
$ 88,121 |
0.97% |
(0.24%) |
9/30/21 |
16.13 |
(0.09) |
5.83 |
5.74 |
— |
(1.40) |
(1.40) |
20.47 |
36.53% |
155,912 |
0.96% |
(0.47%) |
9/30/20 |
15.06 |
(0.04) |
2.91 |
2.87 |
(0.12) |
(1.68) |
(1.80) |
16.13 |
20.40% |
134,136 |
0.97% |
(0.29%) |
9/30/19 |
18.85 |
(0.02) |
(1.04) |
(1.06) |
— |
(2.73) |
(2.73) |
15.06 |
(2.40%) |
128,280 |
0.96% |
(0.14%) |
9/30/18 |
15.57 |
(0.04) |
4.19 |
4.15 |
— |
(0.87) |
(0.87) |
18.85 |
27.87% |
142,284 |
0.95% |
(0.25%) |
Service Class |
||||||||||||
9/30/22 |
$ 18.89 |
$ (0.05) |
$ (3.88) |
$ (3.93) |
$ — |
$ (4.49) |
$ (4.49) |
$ 10.47 |
(26.82%) |
$ 17,932 |
1.06% |
(0.34%) |
9/30/21 |
14.99 |
(0.10) |
5.40 |
5.30 |
— |
(1.40) |
(1.40) |
18.89 |
36.36% |
36,258 |
1.06% |
(0.57%) |
9/30/20 |
14.12 |
(0.05) |
2.71 |
2.66 |
(0.11) |
(1.68) |
(1.79) |
14.99 |
20.26% |
31,977 |
1.07% |
(0.39%) |
9/30/19 |
17.89 |
(0.03) |
(1.01) |
(1.04) |
— |
(2.73) |
(2.73) |
14.12 |
(2.43%) |
34,404 |
1.06% |
(0.23%) |
9/30/18 |
14.84 |
(0.06) |
3.98 |
3.92 |
— |
(0.87) |
(0.87) |
17.89 |
27.69% |
33,978 |
1.05% |
(0.34%) |
Year ended September 30 |
|||||
2022 |
2021 |
2020 |
2019 |
2018 |
|
Portfolio turnover rate |
75% |
81% |
79% |
71% |
85% |
|
c |
Per share amount calculated on the average shares method. |
|
l |
Employee retirement benefit plans that invest plan assets in the Separate Investment Accounts (SIAs) may be subject to certain charges as set forth in their respective Plan Documents. Total return figures would be lower for the periods presented if they reflected these charges. |
|
m |
Total return excludes sales charges, if any, and would be lower for the period presented if it reflected these charges. |
The accompanying notes are an integral part of the financial statements.
232
Income (loss) from investment |
Less distributions to shareholders |
Ratios / Supplemental Data |
||||||||||
Net |
Net |
Net |
Total |
From net |
From net |
Total |
Net |
Total |
Net |
Ratio of |
Net |
|
Administrative Class |
||||||||||||
9/30/22 |
$ 17.21 |
$ (0.05) |
$ (3.43) |
$ (3.48) |
$ — |
$ (4.49) |
$ (4.49) |
$ 9.24 |
(26.83%) |
$ 18,393 |
1.17% |
(0.43%) |
9/30/21 |
13.77 |
(0.11) |
4.95 |
4.84 |
— |
(1.40) |
(1.40) |
17.21 |
36.23% |
29,715 |
1.16% |
(0.67%) |
9/30/20 |
13.10 |
(0.06) |
2.51 |
2.45 |
(0.10) |
(1.68) |
(1.78) |
13.77 |
20.16% |
29,067 |
1.17% |
(0.49%) |
9/30/19 |
16.87 |
(0.04) |
(1.00) |
(1.04) |
— |
(2.73) |
(2.73) |
13.10 |
(2.60%) |
28,372 |
1.16% |
(0.34%) |
9/30/18 |
14.05 |
(0.07) |
3.76 |
3.69 |
— |
(0.87) |
(0.87) |
16.87 |
27.60% |
35,642 |
1.15% |
(0.45%) |
Class R4 |
||||||||||||
9/30/22 |
$ 14.53 |
$ (0.05) |
$ (2.72) |
$ (2.77) |
$ — |
$ (4.49) |
$ (4.49) |
$ 7.27 |
(26.91%) |
$ 11,840 |
1.32% |
(0.58%) |
9/30/21 |
11.82 |
(0.12) |
4.23 |
4.11 |
— |
(1.40) |
(1.40) |
14.53 |
36.02% |
17,129 |
1.31% |
(0.82%) |
9/30/20 |
11.48 |
(0.07) |
2.18 |
2.11 |
(0.09) |
(1.68) |
(1.77) |
11.82 |
20.01% |
15,517 |
1.32% |
(0.65%) |
9/30/19 |
15.23 |
(0.06) |
(0.96) |
(1.02) |
— |
(2.73) |
(2.73) |
11.48 |
(2.76%) |
12,843 |
1.31% |
(0.49%) |
9/30/18 |
12.78 |
(0.08) |
3.40 |
3.32 |
— |
(0.87) |
(0.87) |
15.23 |
27.44% |
13,972 |
1.30% |
(0.60%) |
Class A |
||||||||||||
9/30/22 |
$ 14.36 |
$ (0.06) |
$ (2.68) |
$ (2.74) |
$ — |
$ (4.49) |
$ (4.49) |
$ 7.13 |
(27.06%) |
$ 18,688 |
1.42% |
(0.69%) |
9/30/21 |
11.71 |
(0.13) |
4.18 |
4.05 |
— |
(1.40) |
(1.40) |
14.36 |
35.83% |
31,656 |
1.41% |
(0.91%) |
9/30/20 |
11.38 |
(0.08) |
2.16 |
2.08 |
(0.07) |
(1.68) |
(1.75) |
11.71 |
19.94% |
34,699 |
1.42% |
(0.74%) |
9/30/19 |
15.14 |
(0.07) |
(0.96) |
(1.03) |
— |
(2.73) |
(2.73) |
11.38 |
(2.87%) |
33,997 |
1.41% |
(0.59%) |
9/30/18 |
12.72 |
(0.09) |
3.38 |
3.29 |
— |
(0.87) |
(0.87) |
15.14 |
27.33% |
43,682 |
1.40% |
(0.70%) |
Class R3 |
||||||||||||
9/30/22 |
$ 11.72 |
$ (0.06) |
$ (1.97) |
$ (2.03) |
$ — |
$ (4.49) |
$ (4.49) |
$ 5.20 |
(27.10%) |
$ 3,408 |
1.57% |
(0.83%) |
9/30/21 |
9.78 |
(0.12) |
3.46 |
3.34 |
— |
(1.40) |
(1.40) |
11.72 |
35.63% |
4,813 |
1.56% |
(1.07%) |
9/30/20 |
9.79 |
(0.08) |
1.82 |
1.74 |
(0.07) |
(1.68) |
(1.75) |
9.78 |
19.66% |
3,930 |
1.57% |
(0.90%) |
9/30/19 |
13.51 |
(0.07) |
(0.92) |
(0.99) |
— |
(2.73) |
(2.73) |
9.79 |
(2.94%) |
2,728 |
1.56% |
(0.73%) |
9/30/18 |
11.46 |
(0.10) |
3.02 |
2.92 |
— |
(0.87) |
(0.87) |
13.51 |
27.10% |
2,622 |
1.55% |
(0.85%) |
The accompanying notes are an integral part of the financial statements.
233
MassMutual Overseas Fund – Financial Statements (Continued) |
Financial Highlights (For a share outstanding throughout each period) |
Income (loss) from investment |
Less distributions to shareholders |
Ratios / Supplemental Data |
|||||||||||
Net |
Net |
Net |
Total |
From net |
From net |
Total |
Net |
Total |
Net |
Ratio of |
Ratio of |
Net |
|
Class I |
|||||||||||||
9/30/22 |
$ 10.17 |
$ 0.16 |
$ (2.40) |
$ (2.24) |
$ (0.15) |
$ (0.84) |
$ (0.99) |
$ 6.94 |
(24.66%) |
$ 232,441 |
0.91% |
0.79% |
1.75% |
9/30/21 |
7.99 |
0.12 |
2.27 |
2.39 |
(0.05) |
(0.16) |
(0.21) |
10.17 |
30.17% |
383,223 |
0.88% |
0.79% |
1.23% |
9/30/20 |
8.35 |
0.05 |
(0.07) |
(0.02) |
(0.19) |
(0.15) |
(0.34) |
7.99 |
(0.59%) |
370,549 |
0.89% |
0.83% |
0.68% |
9/30/19 |
9.42 |
0.20 |
(0.34) |
(0.14) |
(0.15) |
(0.78) |
(0.93) |
8.35 |
0.01% |
348,467 |
0.87% |
N/A |
2.42% |
9/30/18 |
9.61 |
0.16 |
(0.16) |
0.00d |
(0.19) |
— |
(0.19) |
9.42 |
(0.02%) |
362,074 |
0.92% |
N/A |
1.68% |
Class R5 |
|||||||||||||
9/30/22 |
$ 10.21 |
$ 0.15 |
$ (2.42) |
$ (2.27) |
$ (0.13) |
$ (0.84) |
$ (0.97) |
$ 6.97 |
(24.74%) |
$ 86,220 |
1.00% |
0.89% |
1.64% |
9/30/21 |
8.02 |
0.11 |
2.28 |
2.39 |
(0.04) |
(0.16) |
(0.20) |
10.21 |
30.07% |
158,046 |
0.98% |
0.89% |
1.11% |
9/30/20 |
8.38 |
0.05 |
(0.08) |
(0.03) |
(0.18) |
(0.15) |
(0.33) |
8.02 |
(0.67%) |
132,845 |
0.99% |
0.94% |
0.58% |
9/30/19 |
9.45 |
0.19 |
(0.34) |
(0.15) |
(0.14) |
(0.78) |
(0.92) |
8.38 |
(0.14%) |
122,168 |
0.97% |
N/A |
2.34% |
9/30/18 |
9.64 |
0.15 |
(0.16) |
(0.01) |
(0.18) |
— |
(0.18) |
9.45 |
(0.11%) |
134,803 |
1.02% |
N/A |
1.54% |
Service Class |
|||||||||||||
9/30/22 |
$ 10.14 |
$ 0.14 |
$ (2.40) |
$ (2.26) |
$ (0.12) |
$ (0.84) |
$ (0.96) |
$ 6.92 |
(24.79%) |
$ 30,651 |
1.10% |
0.99% |
1.61% |
9/30/21 |
7.97 |
0.10 |
2.26 |
2.36 |
(0.03) |
(0.16) |
(0.19) |
10.14 |
29.91% |
45,454 |
1.08% |
0.99% |
1.02% |
9/30/20 |
8.33 |
0.04 |
(0.08) |
(0.04) |
(0.17) |
(0.15) |
(0.32) |
7.97 |
(0.79%) |
37,997 |
1.09% |
1.03% |
0.49% |
9/30/19 |
9.39 |
0.18 |
(0.33) |
(0.15) |
(0.13) |
(0.78) |
(0.91) |
8.33 |
(0.15%) |
36,489 |
1.07% |
N/A |
2.27% |
9/30/18 |
9.58 |
0.14 |
(0.16) |
(0.02) |
(0.17) |
— |
(0.17) |
9.39 |
(0.22%) |
39,149 |
1.12% |
N/A |
1.45% |
Year ended September 30 |
|||||
2022 |
2021 |
2020 |
2019 |
2018 |
|
Portfolio turnover rate |
17% |
27% |
34% |
27% |
46% |
|
c |
Per share amount calculated on the average shares method. |
|
d |
Amount is less than $0.005 per share. |
|
j |
Computed after giving effect to an agreement by MML Advisers to waive certain fees and expenses of the Fund. |
|
l |
Employee retirement benefit plans that invest plan assets in the Separate Investment Accounts (SIAs) may be subject to certain charges as set forth in their respective Plan Documents. Total return figures would be lower for the periods presented if they reflected these charges. |
|
m |
Total return excludes sales charges, if any, and would be lower for the period presented if it reflected these charges. |
The accompanying notes are an integral part of the financial statements.
234
Income (loss) from investment |
Less distributions to shareholders |
Ratios / Supplemental Data |
|||||||||||
Net |
Net |
Net |
Total |
From net |
From net |
Total |
Net |
Total |
Net |
Ratio of |
Ratio of |
Net |
|
Administrative Class |
|||||||||||||
9/30/22 |
$ 10.24 |
$ 0.13 |
$ (2.43) |
$ (2.30) |
$ (0.11) |
$ (0.84) |
$ (0.95) |
$ 6.99 |
(24.93%) |
$ 13,633 |
1.20% |
1.09% |
1.47% |
9/30/21 |
8.05 |
0.08 |
2.30 |
2.38 |
(0.03) |
(0.16) |
(0.19) |
10.24 |
29.72% |
19,735 |
1.18% |
1.09% |
0.81% |
9/30/20 |
8.40 |
0.03 |
(0.07) |
(0.04) |
(0.16) |
(0.15) |
(0.31) |
8.05 |
(0.77%) |
19,034 |
1.19% |
1.14% |
0.38% |
9/30/19 |
9.46 |
0.17 |
(0.33) |
(0.16) |
(0.12) |
(0.78) |
(0.90) |
8.40 |
(0.32%) |
21,563 |
1.17% |
N/A |
2.03% |
9/30/18 |
9.65 |
0.13 |
(0.16) |
(0.03) |
(0.16) |
— |
(0.16) |
9.46 |
(0.33%) |
31,199 |
1.22% |
N/A |
1.31% |
Class R4 |
|||||||||||||
9/30/22 |
$ 9.75 |
$ 0.11 |
$ (2.29) |
$ (2.18) |
$ (0.10) |
$ (0.84) |
$ (0.94) |
$ 6.63 |
(24.94%) |
$ 16,144 |
1.35% |
1.24% |
1.34% |
9/30/21 |
7.68 |
0.07 |
2.18 |
2.25 |
(0.02) |
(0.16) |
(0.18) |
9.75 |
29.46% |
20,875 |
1.33% |
1.24% |
0.70% |
9/30/20 |
8.03 |
0.02 |
(0.06) |
(0.04) |
(0.16) |
(0.15) |
(0.31) |
7.68 |
(0.90%) |
18,019 |
1.34% |
1.28% |
0.28% |
9/30/19 |
9.10 |
0.17 |
(0.34) |
(0.17) |
(0.12) |
(0.78) |
(0.90) |
8.03 |
(0.51%) |
14,876 |
1.32% |
N/A |
2.14% |
9/30/18 |
9.30 |
0.12 |
(0.16) |
(0.04) |
(0.16) |
— |
(0.16) |
9.10 |
(0.48%) |
12,903 |
1.37% |
N/A |
1.23% |
Class A |
|||||||||||||
9/30/22 |
$ 9.98 |
$ 0.11 |
$ (2.36) |
$ (2.25) |
$ (0.08) |
$ (0.84) |
$ (0.92) |
$ 6.81 |
(25.07%) |
$ 12,858 |
1.45% |
1.34% |
1.22% |
9/30/21 |
7.85 |
0.06 |
2.24 |
2.30 |
(0.01) |
(0.16) |
(0.17) |
9.98 |
29.45% |
24,231 |
1.43% |
1.34% |
0.59% |
9/30/20 |
8.21 |
0.01 |
(0.08) |
(0.07) |
(0.14) |
(0.15) |
(0.29) |
7.85 |
(1.17%) |
30,721 |
1.44% |
1.38% |
0.17% |
9/30/19 |
9.25 |
0.15 |
(0.32) |
(0.17) |
(0.09) |
(0.78) |
(0.87) |
8.21 |
(0.48%) |
29,537 |
1.42% |
N/A |
1.86% |
9/30/18 |
9.44 |
0.11 |
(0.16) |
(0.05) |
(0.14) |
— |
(0.14) |
9.25 |
(0.60%) |
41,179 |
1.47% |
N/A |
1.11% |
Class R3 |
|||||||||||||
9/30/22 |
$ 9.85 |
$ 0.10 |
$ (2.34) |
$ (2.24) |
$ (0.07) |
$ (0.84) |
$ (0.91) |
$ 6.70 |
(25.23%) |
$ 4,036 |
1.61% |
1.49% |
1.16% |
9/30/21 |
7.76 |
0.05 |
2.21 |
2.26 |
(0.01) |
(0.16) |
(0.17) |
9.85 |
29.29% |
6,971 |
1.58% |
1.49% |
0.51% |
9/30/20 |
8.11 |
(0.00)d |
(0.07) |
(0.07) |
(0.13) |
(0.15) |
(0.28) |
7.76 |
(1.19%) |
6,093 |
1.59% |
1.53% |
(0.03%) |
9/30/19 |
9.17 |
0.15 |
(0.34) |
(0.19) |
(0.09) |
(0.78) |
(0.87) |
8.11 |
(0.72%) |
3,382 |
1.57% |
N/A |
1.86% |
9/30/18 |
9.37 |
0.10 |
(0.17) |
(0.07) |
(0.13) |
— |
(0.13) |
9.17 |
(0.75%) |
3,947 |
1.62% |
N/A |
1.08% |
The accompanying notes are an integral part of the financial statements.
235
MassMutual Select T. Rowe Price International Equity Fund – Financial Statements (Continued) |
Financial Highlights (For a share outstanding throughout each period) |
Income (loss) from investment |
Less distributions to shareholders |
Ratios / Supplemental Data |
|||||||||||
Net |
Net |
Net |
Total |
From net |
From net |
Total |
Net |
Total |
Net |
Ratio of |
Ratio of |
Net |
|
Class I |
|||||||||||||
9/30/22 |
$ 11.71 |
$ 0.32 |
$ (3.16) |
$ (2.84) |
$ (0.32) |
$ (0.16) |
$ (0.48) |
$ 8.39 |
(25.28%) |
$ 1,272,996 |
0.08% |
0.00% |
3.03% |
9/30/21 |
9.51 |
0.27 |
2.10 |
2.37 |
(0.17) |
— |
(0.17) |
11.71 |
25.11% |
1,700,098 |
0.07% |
0.00% |
2.39% |
9/30/20 |
9.43 |
0.15 |
0.16 |
0.31 |
(0.23) |
— |
(0.23) |
9.51 |
3.11% |
1,314,433 |
0.65% |
0.55% |
1.63% |
9/30/19 |
9.70 |
0.26 |
(0.39) |
(0.13) |
(0.14) |
— |
(0.14) |
9.43 |
(1.17%) |
1,135,941 |
0.79% |
0.67% |
2.80% |
9/30/18g |
10.00 |
0.19 |
(0.49) |
(0.30) |
— |
— |
— |
9.70 |
(3.00%)b |
809,616 |
0.89%a |
0.67%a |
3.03%a |
Year ended September 30 |
Period ended |
||||
2022 |
2021 |
2020 |
2019 |
2018b |
|
Portfolio turnover rate |
32% |
28% |
30% |
26% |
24%q |
|
a |
Annualized. |
|
b |
Percentage represents the results for the period and is not annualized. |
|
c |
Per share amount calculated on the average shares method. |
|
g |
For the period February 9, 2018 (commencement of operations) through September 30, 2018. |
|
j |
Computed after giving effect to an agreement by MML Advisers to waive certain fees and expenses of the Fund. |
|
l |
Employee retirement benefit plans that invest plan assets in the Separate Investment Accounts (SIAs) may be subject to certain charges as set forth in their respective Plan Documents. Total return figures would be lower for the periods presented if they reflected these charges. |
|
m |
Total return excludes sales charges, if any, and would be lower for the period presented if it reflected these charges. |
|
q |
Portfolio turnover excludes securities received from subscriptions in-kind. Securities received from subscriptions in-kind had no impact on portfolio turnover. |
The accompanying notes are an integral part of the financial statements.
236
1. The Funds
MassMutual Select Funds (the “Trust”) is registered under the Investment Company Act of 1940, as amended (the “1940 Act”), as an open-end management investment company. The Trust is organized under the laws of the Commonwealth of Massachusetts as a Massachusetts business trust pursuant to an Agreement and Declaration of Trust dated May 28, 1993, as amended and restated as of November 21, 2011, as it may be further amended from time to time. The Trust consists of 51 series, including the following 16 series listed below (each individually referred to as a “Fund” or collectively as the “Funds”):
MassMutual Total Return Bond Fund (“Total Return Bond Fund”)
MassMutual Strategic Bond Fund (“Strategic Bond Fund”)
MassMutual Diversified Value Fund (“Diversified Value Fund”)
MassMutual Fundamental Value Fund (“Fundamental Value Fund”)
MM S&P 500® Index Fund (“S&P 500 Index Fund”)
MassMutual Equity Opportunities Fund (“Equity Opportunities Fund”)
MassMutual Fundamental Growth Fund (“Fundamental Growth Fund”)
MassMutual Blue Chip Growth Fund (“Blue Chip Growth Fund”)
MassMutual Growth Opportunities Fund (“Growth Opportunities Fund”)
MassMutual Mid Cap Value Fund (“Mid Cap Value Fund”)
MassMutual Small Cap Value Equity Fund (“Small Cap Value Equity Fund”)
MassMutual Small Company Value Fund (“Small Company Value Fund”)
MassMutual Mid Cap Growth Fund (“Mid Cap Growth Fund”)
MassMutual Small Cap Growth Equity Fund (“Small Cap Growth Equity Fund”)
MassMutual Overseas Fund (“Overseas Fund”)
MassMutual Select T. Rowe Price International Equity Fund (“MM Select T. Rowe Price International Equity Fund”)
Each share class of a Fund represents an interest in the same portfolio of assets. The principal difference among the classes is the level of service and administration fees, and shareholder and distribution service expenses borne by the classes. Because each class will have different fees and expenses, performance and share prices will vary between the classes. The classes of shares are offered to different types of investors, as outlined in the Funds’ Prospectus.
2. Significant Accounting Policies
The following is a summary of significant accounting policies followed consistently by each Fund in the preparation of the financial statements in conformity with accounting principles generally accepted in the United States of America (“generally accepted accounting principles”). The preparation of the financial statements in accordance with generally accepted accounting principles requires management to make estimates and assumptions that affect the reported amounts and disclosures in the financial statements. Actual results could differ from those estimates.
Each Fund is an investment company and accordingly follows the investment company accounting and reporting guidance of the Financial Accounting Standards Board (“FASB”) Accounting Standards Codification Topic 946, Financial Services – Investment Companies.
Investment Valuation
The net asset value of each Fund’s shares is determined once daily as of the close of regular trading on the New York Stock Exchange (“NYSE”), on each day the NYSE is open for trading (a “business day”). The NYSE normally closes at 4:00 p.m. Eastern Time, but may close earlier on some days. If the NYSE is scheduled to close early, the business day will be considered to end as of the time of the NYSE’s scheduled close. A Fund will not treat an intraday disruption in NYSE trading or other event that causes an unscheduled closing of the NYSE as a close of business of the NYSE for these purposes; instead, MML Investment Advisers, LLC (“MML Advisers”) will determine the fair value of a Fund’s securities in accordance with MML Advisers’ fair valuation policy and procedures. On holidays and other days when the NYSE is closed, each Fund’s net asset value generally is not calculated and the Funds do not anticipate accepting buy or sell orders. However, the value of each Fund’s assets may still be affected on such days to the extent that a Fund holds foreign securities that trade on days that foreign securities markets are open.
237
Notes to Financial Statements (Continued) |
Equity securities and derivative contracts that are actively traded on a national securities exchange or contract market are valued on the basis of information furnished by a pricing service, which provides the last reported sale price, or, in the case of futures contracts, the settlement price, for securities or derivatives listed on the exchange or contract market or the official closing price on the NASDAQ National Market System (“NASDAQ System”), or in the case of over-the-counter (“OTC”) securities for which an official closing price is unavailable or not reported on the NASDAQ System, the last reported bid price. Portfolio securities traded on more than one national securities exchange are valued at the last price at the close of the exchange representing the principal market for such securities. Debt securities are valued on the basis of valuations furnished by a pricing service, which generally determines valuations taking into account factors such as institutional-size trading in similar securities, yield, quality, coupon rate, maturity, type of issue, trading characteristics, and other market data. Shares of other open-end mutual funds are valued at their closing net asset values as reported on each business day.
Investments for which market quotations are readily available are marked to market daily based on those quotations. Market quotations may be provided by third-party vendors or market makers, and may be determined on the basis of a variety of factors, such as broker quotations, financial modeling, and other market data, such as market indexes and yield curves, counterparty information, and foreign exchange rates. U.S. Government and agency securities may be valued on the basis of market quotations or using a model that may incorporate market observable data such as reported sales of similar securities, broker quotes, yields, bids, offers, quoted market prices, and reference data. The fair values of OTC derivative contracts, including forward, swap, and option contracts related to interest rates, foreign currencies, credit standing of reference entities, equity prices, or commodity prices, may be based on market quotations or may be modeled using a series of techniques, including simulation models, depending on the contract and the terms of the transaction. The fair values of asset-backed securities and mortgage-backed securities are estimated based on models that consider the estimated cash flows of each debt tranche of the issuer, established benchmark yield, and estimated tranche-specific spread to the benchmark yield based on the unique attributes of the tranche, including, but not limited to, prepayment speed assumptions and attributes of the collateral.
The Board of Trustees (“Trustees”) have designated MML Advisers as the Funds’ “valuation designee,” responsible for determining the fair value, in good faith, of securities and other instruments held by the Funds for which market quotations are not readily available or for which such market quotations or values are considered by MML Advisers or a subadviser to be unreliable (including, for example, certain foreign securities, thinly-traded securities, certain restricted securities, certain initial public offerings, or securities whose values may have been affected by a significant event). It is possible that a significant amount of a Fund’s assets will be subject to fair valuation in accordance with MML Advisers’ fair valuation policy and procedures. The fair value determined for an investment by MML Advisers may differ from recent market prices for the investment and may be significantly different from the value realized upon the sale of such investment.
The Funds may invest in securities that are traded principally in foreign markets and that trade on weekends and other days when the Funds do not price their shares. As a result, the values of the Funds’ portfolio securities may change on days when the prices of the Funds’ shares are not calculated. The prices of the Funds’ shares will reflect any such changes when the prices of the Funds’ shares are next calculated, which is the next business day. The Funds may use fair value pricing more frequently for securities primarily traded in foreign markets because, among other things, most foreign markets close well before the Funds value their securities. The earlier close of these foreign markets gives rise to the possibility that significant events, including broad market moves, may have occurred in the interim. The Funds’ investments may be priced based on fair values provided by a third-party vendor, based on certain factors and methodologies applied by such vendor, in the event that there is movement in the U.S. market, between the close of the foreign market and the time the Funds calculate their net asset values. All assets and liabilities expressed in foreign currencies are converted into U.S. dollars at the mean between the buying and selling rates of such currencies against the U.S. dollar at the end of each business day.
Investments in equity or debt issued by privately held companies or funds (“Private Company” or collectively, the “Private Companies”) and any other investments fair valued using significant unobservable inputs may be fair valued using one or a combination of, but not limited to, the following inputs:
Market approach: (i) recent market transactions, including subsequent rounds of financing, in the underlying investment or comparable issuers; (ii) recapitalizations and other transactions across the capital structure; and (iii) market multiples of comparable issuers.
238
Notes to Financial Statements (Continued) |
Income approach: (i) future cash flows discounted to present value and adjusted as appropriate for liquidity, credit, and/or market risks; (ii) quoted prices for similar investments or assets in active markets; and (iii) other risk factors, such as interest rates, yield curves, volatilities, prepayment speeds, loss severities, credit risks, recovery rates, liquidation amounts, and/or default rates.
Cost approach: (i) audited or unaudited financial statements, investor communications, and financial or operational metrics issued by the Private Company; (ii) changes in the valuation of relevant indexes or publicly traded companies comparable to the Private Company; (iii) relevant news and other public sources; and (iv) known secondary market transactions in the Private Company’s interests and merger or acquisition activity in companies comparable to the Private Company.
Investments in series of preferred stock issued by Private Companies are typically valued utilizing the Market approach in determining the enterprise value of the company. Such investments often contain rights and preferences that differ from other series of preferred and common stock of the same issuer. Valuation techniques such as the current value method (“CVM”), an option pricing model (“OPM”), a probability weighted expected return model (“PWERM”), or a hybrid of those techniques are used in allocating enterprise value of the company, as deemed appropriate under the circumstances. The CVM allocates value among the various parts of a company’s capital structure assuming that the value of convertible preferred stock is represented by the most favorable claim the preferred stockholders have on the enterprise value as of the valuation date. The use of OPM and PWERM techniques involve a determination of the exit scenarios of the investment in order to appropriately allocate the enterprise value of the company among the various parts of its capital structure.
The Private Companies are not subject to the public company disclosure, timing, and reporting standards as other investments held by a Fund. Typically, the most recently available information for a Private Company is as of a date that is earlier than the date a Fund is calculating its net asset value. This factor may result in a difference between the value of the investment and the price a Fund could receive upon the sale of the investment.
Fair value is defined as the price that would be received to sell an asset or paid to transfer a liability in an orderly transaction between market participants at the measurement date. A three-tier hierarchy is utilized to maximize the use of observable market data inputs and minimize the use of unobservable inputs and to establish classification of fair value measurements for disclosure purposes. Inputs refer broadly to the assumptions that market participants would use in pricing the asset or liability, including assumptions about risk, for example, the risk inherent in a particular valuation technique used to measure fair value (such as a pricing model) and/or the risk inherent in the inputs to the valuation technique. Inputs may be observable or unobservable. Observable inputs are inputs that reflect the assumptions market participants would use in pricing the asset or liability and are developed based on market data obtained from sources independent of the reporting entity. Unobservable inputs are inputs that reflect the reporting entity’s own assumptions about the assumptions market participants would use in pricing the asset or liability and are developed based on the best information available in the circumstances. The three-tier hierarchy of inputs is summarized in the three broad Levels listed below. The inputs or methodology used for valuing investments are not necessarily an indication of the risk associated with investing in those investments and the determination of the significance of a particular input to the fair value measurement in its entirety requires judgment and consideration of factors specific to each security.
Level 1 – quoted prices (unadjusted) in active markets for identical investments that the Funds can access at the measurement date
Level 2 – other significant observable inputs (including quoted prices for similar investments, interest rates, prepayment speeds, credit risk, etc.)
Level 3 – significant unobservable inputs, to the extent observable inputs are not available (including the Funds’ own assumptions in determining the fair value of investments)
239
Notes to Financial Statements (Continued) |
The availability of observable inputs can vary from security to security and is affected by a wide variety of factors, including, for example, the type of security, whether the security is new and not yet established in the marketplace, the liquidity of markets, and other characteristics particular to the security. To the extent that valuation is based on models or inputs that are less observable or unobservable in the market, the determination of fair value requires more judgment. Accordingly, the degree of judgment exercised in determining fair value is greatest for instruments categorized in Level 3.
Changes in valuation techniques may result in transfers in or out of an investment’s assigned Level within the hierarchy. In addition, in periods of market dislocation, the observability of prices and inputs may be reduced for many instruments. This condition, as well as changes related to liquidity of investments, could cause a security to be reclassified between Levels.
In certain cases, the inputs used to measure fair value may fall into different Levels of the fair value hierarchy. In such cases, for disclosure purposes, the Level in the fair value hierarchy within which the fair value measurement falls is determined based on the lowest Level input that is significant to the overall fair value measurement.
The Fundamental Value Fund, Fundamental Growth Fund, Growth Opportunities Fund, and Small Cap Growth Equity Fund characterized all long-term investments at Level 1, and all short-term investments at Level 2, as of September 30, 2022. For each Fund noted in the preceding sentence, the level classification by major category of investments is the same as the category presentation in the Portfolio of Investments.
The following is the aggregate value by input level, as of September 30, 2022, for the remaining Funds’ investments:
Level 1 |
Level 2 |
Level 3 |
Total |
|||||||||||||
Total Return Bond Fund |
||||||||||||||||
Asset Investments |
||||||||||||||||
Common Stock |
$ | 435,604 | $ | — | $ | — | $ | 435,604 | ||||||||
Bank Loans (Less Unfunded Loan Commitments) |
— | 15,814,089 | — | 15,814,089 | ||||||||||||
Corporate Debt |
— | 212,105,271 | — | +,** | 212,105,271 | |||||||||||
Municipal Obligations |
— | 1,311,924 | — | 1,311,924 | ||||||||||||
Non-U.S. Government Agency Obligations |
— | 124,043,491 | — | 124,043,491 | ||||||||||||
Sovereign Debt Obligations |
— | 7,798,598 | — | 7,798,598 | ||||||||||||
U.S. Government Agency Obligations and Instrumentalities |
— | 272,885,886 | — | 272,885,886 | ||||||||||||
U.S. Treasury Obligations |
— | 206,641,734 | — | 206,641,734 | ||||||||||||
Rights |
— | — | — | +,** | — | |||||||||||
Mutual Funds |
16,726,548 | — | — | 16,726,548 | ||||||||||||
Short-Term Investments |
— | 31,253,725 | — | 31,253,725 | ||||||||||||
Unfunded Loan Commitments*** |
— | (612 | ) | — | (612 | ) | ||||||||||
Total Investments |
$ | 17,162,152 | $ | 871,854,106 | $ | — | $ | 889,016,258 | ||||||||
Asset Derivatives |
||||||||||||||||
Forward Contracts |
— | 52,891 | — | 52,891 | ||||||||||||
Futures Contracts |
353,178 | — | — | 353,178 | ||||||||||||
Swap Agreements |
— | 1,566,903 | — | 1,566,903 | ||||||||||||
Total |
$ | 353,178 | $ | 1,619,794 | $ | — | $ | 1,972,972 | ||||||||
Liability Derivatives |
||||||||||||||||
Forward Contracts |
— | (667 | ) | — | (667 | ) | ||||||||||
Futures Contracts |
(2,226,929 | ) | — | — | (2,226,929 | ) | ||||||||||
Swap Agreements |
— | (5,506,563 | ) | — | (5,506,563 | ) | ||||||||||
Total |
$ | (2,226,929 | ) | $ | (5,507,230 | ) | $ | — | $ | (7,734,159 | ) | |||||
240
Notes to Financial Statements (Continued) |
Level 1 |
Level 2 |
Level 3 |
Total |
|||||||||||||
Strategic Bond Fund |
||||||||||||||||
Asset Investments |
||||||||||||||||
Bank Loans (Less Unfunded Loan Commitments) |
$ | — | $ | 13,983,599 | $ | — | $ | 13,983,599 | ||||||||
Corporate Debt |
— | 110,260,470 | — | 110,260,470 | ||||||||||||
Municipal Obligations |
— | 101,446 | — | 101,446 | ||||||||||||
Non-U.S. Government Agency Obligations |
— | 37,993,442 | — | 37,993,442 | ||||||||||||
Sovereign Debt Obligations |
— | 16,519,825 | — | 16,519,825 | ||||||||||||
U.S. Government Agency Obligations and Instrumentalities |
— | 83,524,423 | — | 83,524,423 | ||||||||||||
U.S. Treasury Obligations |
— | 138,137,635 | — | 138,137,635 | ||||||||||||
Purchased Options |
85,012 | 6 | — | 85,018 | ||||||||||||
Mutual Funds |
2,470,330 | — | — | 2,470,330 | ||||||||||||
Short-Term Investments |
— | 1,959,965 | — | 1,959,965 | ||||||||||||
Unfunded Loan Commitments*** |
— | (6,298 | ) | — | (6,298 | ) | ||||||||||
Total Investments |
$ | 2,555,342 | $ | 402,474,513 | $ | — | $ | 405,029,855 | ||||||||
Asset Derivatives |
||||||||||||||||
Forward Contracts |
$ | — | $ | 575,582 | $ | — | $ | 575,582 | ||||||||
Futures Contracts |
7,060,927 | — | — | 7,060,927 | ||||||||||||
Swap Agreements |
— | 5,562,451 | — | 5,562,451 | ||||||||||||
Total |
$ | 7,060,927 | $ | 6,138,033 | $ | — | $ | 13,198,960 | ||||||||
Liability Derivatives |
||||||||||||||||
Forward Contracts |
$ | — | $ | (1,803,338 | ) | $ | — | $ | (1,803,338 | ) | ||||||
Futures Contracts |
(12,997,576 | ) | — | — | (12,997,576 | ) | ||||||||||
Swap Agreements |
— | (659,637 | ) | — | (659,637 | ) | ||||||||||
Written Options |
(1,059,744 | ) | (116,788 | ) | — | (1,176,532 | ) | |||||||||
Total |
$ | (14,057,320 | ) | $ | (2,579,763 | ) | $ | — | $ | (16,637,083 | ) | |||||
Diversified Value Fund |
||||||||||||||||
Asset Investments |
||||||||||||||||
Common Stock |
$ | 264,983,275 | $ | 4,249,190 | * | $ | — | $ | 269,232,465 | |||||||
Preferred Stock |
1,160,364 | 1,548,309 | * | — | 2,708,673 | |||||||||||
Mutual Funds |
3,658,052 | — | — | 3,658,052 | ||||||||||||
Short-Term Investments |
105 | 3,266,398 | — | 3,266,503 | ||||||||||||
Total Investments |
$ | 269,801,796 | $ | 9,063,897 | $ | — | $ | 278,865,693 | ||||||||
S&P 500 Index Fund |
||||||||||||||||
Asset Investments |
||||||||||||||||
Common Stock |
$ | 2,225,022,779 | $ | 942,893 | $ | — | $ | 2,225,965,672 | ||||||||
Short-Term Investments |
— | 18,821,014 | — | 18,821,014 | ||||||||||||
Total Investments |
$ | 2,225,022,779 | $ | 19,763,907 | $ | — | $ | 2,244,786,686 | ||||||||
Liability Derivatives |
||||||||||||||||
Futures Contracts |
$ | (2,158,892 | ) | $ | — | $ | — | $ | (2,158,892 | ) | ||||||
Equity Opportunities Fund |
||||||||||||||||
Asset Investments |
||||||||||||||||
Common Stock |
$ | 536,703,361 | $ | 6,533,305 | * | $ | — | $ | 543,236,666 | |||||||
Preferred Stock |
1,848,525 | 2,396,266 | * | — | 4,244,791 | |||||||||||
Short-Term Investments |
158 | 9,104,118 | — | 9,104,276 | ||||||||||||
Total Investments |
$ | 538,552,044 | $ | 18,033,689 | $ | — | $ | 556,585,733 | ||||||||
241
Notes to Financial Statements (Continued) |
Level 1 |
Level 2 |
Level 3 |
Total |
|||||||||||||
Blue Chip Growth Fund |
||||||||||||||||
Asset Investments |
||||||||||||||||
Common Stock |
$ | 2,508,977,729 | $ | 4,799,001 | * | $ | 3,526,921 | ** | $ | 2,517,303,651 | ||||||
Preferred Stock |
— | — | 3,202,530 | ** | 3,202,530 | |||||||||||
Corporate Debt |
— | 2,459,737 | — | 2,459,737 | ||||||||||||
Mutual Funds |
5,185,964 | — | — | 5,185,964 | ||||||||||||
Short-Term Investments |
101 | 5,924,441 | — | 5,924,542 | ||||||||||||
Total Investments |
$ | 2,514,163,794 | $ | 13,183,179 | $ | 6,729,451 | $ | 2,534,076,424 | ||||||||
Mid Cap Value Fund |
||||||||||||||||
Asset Investments |
||||||||||||||||
Common Stock |
$ | 95,158,000 | $ | 2,467,808 | * | $ | — | $ | 97,625,808 | |||||||
Preferred Stock |
— | 320,678 | * | — | 320,678 | |||||||||||
Mutual Funds |
714,129 | — | — | 714,129 | ||||||||||||
Short-Term Investments |
— | 2,750,893 | — | 2,750,893 | ||||||||||||
Total Investments |
$ | 95,872,129 | $ | 5,539,379 | $ | — | $ | 101,411,508 | ||||||||
Asset Derivatives |
||||||||||||||||
Forward Contracts |
$ | — | $ | 9,401 | $ | — | $ | 9,401 | ||||||||
Liability Derivatives |
||||||||||||||||
Forward Contracts |
$ | — | $ | (9,904 | ) | $ | — | $ | (9,904 | ) | ||||||
Small Cap Value Equity Fund |
||||||||||||||||
Asset Investments |
||||||||||||||||
Common Stock |
$ | 46,983,242 | $ | 688,310 | * | $ | — | $ | 47,671,552 | |||||||
Mutual Funds |
246,505 | — | — | 246,505 | ||||||||||||
Short-Term Investments |
— | 2,276,333 | — | 2,276,333 | ||||||||||||
Total Investments |
$ | 47,229,747 | $ | 2,964,643 | $ | — | $ | 50,194,390 | ||||||||
Small Company Value Fund |
||||||||||||||||
Asset Investments |
||||||||||||||||
Common Stock |
$ | 193,953,256 | $ | 471,324 | * | $ | — | $ | 194,424,580 | |||||||
Mutual Funds |
3,166,453 | — | — | 3,166,453 | ||||||||||||
Short-Term Investments |
— | 1,594,316 | — | 1,594,316 | ||||||||||||
Total Investments |
$ | 197,119,709 | $ | 2,065,640 | $ | — | $ | 199,185,349 | ||||||||
Asset Derivatives |
||||||||||||||||
Forward Contracts |
$ | $ | 141 | $ | $ | 141 | ||||||||||
Liability Derivatives |
||||||||||||||||
Forward Contracts |
$ | $ | (8,696 | ) | $ | $ | (8,696 | ) | ||||||||
Mid Cap Growth Fund |
||||||||||||||||
Asset Investments |
||||||||||||||||
Common Stock |
$ | 4,888,521,414 | $ | — | $ | 22,843,851 | $ | 4,911,365,265 | ||||||||
Preferred Stock |
— | — | 28,528,808 | 28,528,808 | ||||||||||||
Mutual Funds |
25,184,258 | — | — | 25,184,258 | ||||||||||||
Short-Term Investments |
104,697,257 | 84,415,685 | — | 189,112,942 | ||||||||||||
Total Investments |
$ | 5,018,402,929 | $ | 84,415,685 | $ | 51,372,659 | $ | 5,154,191,273 | ||||||||
242
Notes to Financial Statements (Continued) |
Level 1 |
Level 2 |
Level 3 |
Total |
|||||||||||||
Overseas Fund |
||||||||||||||||
Asset Investments |
||||||||||||||||
Common Stock* |
||||||||||||||||
Australia |
$ | — | $ | 1,578,916 | $ | — | $ | 1,578,916 | ||||||||
Belgium |
— | 3,669,302 | — | 3,669,302 | ||||||||||||
Canada |
14,077,610 | — | — | 14,077,610 | ||||||||||||
Cayman Islands |
1,271,625 | 6,720,450 | — | 7,992,075 | ||||||||||||
Denmark |
— | 9,799,155 | — | 9,799,155 | ||||||||||||
Finland |
— | 969,210 | — | 969,210 | ||||||||||||
France |
— | 67,714,743 | — | 67,714,743 | ||||||||||||
Germany |
— | 57,562,246 | — | 57,562,246 | ||||||||||||
Hong Kong |
— | 5,529,503 | — | 5,529,503 | ||||||||||||
India |
— | 6,817,063 | — | 6,817,063 | ||||||||||||
Ireland |
4,735,525 | 3,615,780 | — | 8,351,305 | ||||||||||||
Israel |
3,767,905 | — | — | 3,767,905 | ||||||||||||
Italy |
— | 9,588,401 | — | 9,588,401 | ||||||||||||
Japan |
— | 40,852,464 | — | 40,852,464 | ||||||||||||
Mexico |
833,362 | — | — | 833,362 | ||||||||||||
Netherlands |
— | 20,456,799 | — | 20,456,799 | ||||||||||||
Portugal |
— | 1,755,713 | — | 1,755,713 | ||||||||||||
Republic of Korea |
— | 1,594,651 | — | 1,594,651 | ||||||||||||
Singapore |
— | 3,849,475 | — | 3,849,475 | ||||||||||||
Spain |
— | 3,526,709 | — | 3,526,709 | ||||||||||||
Sweden |
— | 5,373,167 | — | 5,373,167 | ||||||||||||
Switzerland |
— | 52,118,705 | — | 52,118,705 | ||||||||||||
Taiwan |
3,074,984 | — | — | 3,074,984 | ||||||||||||
United Kingdom |
1,428,044 | 48,329,678 | — | 49,757,722 | ||||||||||||
United States |
2,210,074 | — | — | 2,210,074 | ||||||||||||
Preferred Stock* |
||||||||||||||||
Republic of Korea |
— | 1,708,272 | — | 1,708,272 | ||||||||||||
Mutual Funds |
2,564,482 | — | — | 2,564,482 | ||||||||||||
Short-Term Investments |
— | 9,671,698 | — | 9,671,698 | ||||||||||||
Total Investments |
$ | 33,963,611 | $ | 362,802,100 | $ | — | $ | 396,765,711 | ||||||||
MM Select T. Rowe Price International Equity Fund |
||||||||||||||||
Asset Investments |
||||||||||||||||
Common Stock* |
||||||||||||||||
Australia |
$ | — | $ | 33,988,474 | $ | — | $ | 33,988,474 | ||||||||
Austria |
— | 5,026,392 | — | 5,026,392 | ||||||||||||
Belgium |
— | 2,845,369 | — | 2,845,369 | ||||||||||||
Bermuda |
426,116 | 3,520,909 | — | 3,947,025 | ||||||||||||
Brazil |
17,625,418 | — | — | 17,625,418 | ||||||||||||
Canada |
51,939,366 | — | — | 51,939,366 | ||||||||||||
Cayman Islands |
28,481,370 | 49,968,618 | — | 78,449,988 | ||||||||||||
Chile |
2,302,180 | — | — | 2,302,180 | ||||||||||||
China |
— | 45,324,401 | — | 45,324,401 | ||||||||||||
Cyprus |
— | — | — | +,** | — | |||||||||||
Denmark |
— | 5,220,159 | — | 5,220,159 | ||||||||||||
Finland |
— | 11,593,848 | — | 11,593,848 | ||||||||||||
France |
— | 91,621,509 | — | 91,621,509 | ||||||||||||
Germany |
— | 67,225,069 | — | 67,225,069 | ||||||||||||
Hong Kong |
— | 19,411,341 | — | 19,411,341 | ||||||||||||
Hungary |
— | 3,223,358 | — | 3,223,358 | ||||||||||||
243
Notes to Financial Statements (Continued) |
Level 1 |
Level 2 |
Level 3 |
Total |
|||||||||||||
MM Select T. Rowe Price International Equity Fund (Continued) |
||||||||||||||||
Asset Investments (Continued) |
||||||||||||||||
Common Stock* (Continued) |
||||||||||||||||
India |
$ | 2,274,868 | $ | 59,631,217 | $ | — | $ | 61,906,085 | ||||||||
Indonesia |
— | 11,165,815 | — | 11,165,815 | ||||||||||||
Ireland |
— | 5,660,367 | — | 5,660,367 | ||||||||||||
Italy |
1,125,729 | 18,249,329 | — | 19,375,058 | ||||||||||||
Japan |
— | 182,317,538 | — | 182,317,538 | ||||||||||||
Luxembourg |
— | 4,189,508 | — | 4,189,508 | ||||||||||||
Malaysia |
— | 3,203,580 | — | 3,203,580 | ||||||||||||
Mexico |
10,591,444 | — | — | 10,591,444 | ||||||||||||
Netherlands |
6,917,691 | 60,108,717 | — | +,** | 67,026,408 | |||||||||||
Norway |
— | 11,770,142 | — | 11,770,142 | ||||||||||||
Philippines |
— | 3,375,055 | — | 3,375,055 | ||||||||||||
Poland |
— | 2,068,655 | — | 2,068,655 | ||||||||||||
Portugal |
— | 7,661,550 | — | 7,661,550 | ||||||||||||
Republic of Korea |
1,822,772 | 38,678,630 | — | 40,501,402 | ||||||||||||
Russia |
— | — | — | +,** | — | |||||||||||
Saudi Arabia |
— | 10,578,944 | — | 10,578,944 | ||||||||||||
Singapore |
— | 15,939,157 | — | 15,939,157 | ||||||||||||
South Africa |
— | 6,236,200 | — | 6,236,200 | ||||||||||||
Spain |
— | 9,301,545 | — | 9,301,545 | ||||||||||||
Sweden |
354,743 | 17,485,079 | — | 17,839,822 | ||||||||||||
Switzerland |
— | 89,457,061 | — | 89,457,061 | ||||||||||||
Taiwan |
— | 37,415,041 | — | 37,415,041 | ||||||||||||
Thailand |
6,567,301 | 2,092,592 | — | 8,659,893 | ||||||||||||
United Arab Emirates |
— | 2,510,021 | — | 2,510,021 | ||||||||||||
United Kingdom |
31,904,265 | 109,347,113 | — | 141,251,378 | ||||||||||||
United States |
12,508,583 | 1,758,745 | 365,746 | ** | 14,633,074 | |||||||||||
Preferred Stock* |
||||||||||||||||
Germany |
4,791,820 | 3,427,296 | — | 8,219,116 | ||||||||||||
United States |
— | — | 21,964 | ** | 21,964 | |||||||||||
Mutual Funds |
25,119,089 | — | — | 25,119,089 | ||||||||||||
Rights |
797 | — | — | +,** | 797 | |||||||||||
Short-Term Investments |
40,804,373 | 796,077 | — | 41,600,450 | ||||||||||||
Total Investments |
$ | 245,557,925 | $ | 1,053,394,421 | $ | 387,710 | $ | 1,299,340,056 | ||||||||
|
* |
Includes foreign equity securities whose values were adjusted to reflect market trading of comparable securities or other correlated instruments after the close of trading in their respective foreign markets, as applicable. |
|
** |
Level 3 investments at September 30, 2022 in relation to net assets were not significant. |
|
*** |
Unfunded loan commitments are valued at the unrealized appreciation (depreciation) on the commitment. |
|
+ |
Represents a security at $0 value as of September 30, 2022. |
For certain Fund(s) the Statement of Assets and Liabilities shows receivables from investments sold on a delayed delivery basis, cash collateral pledged for open derivatives, and cash collateral pledged for when-issued securities, as well as, any applicable liabilities for investments purchased on a delayed delivery basis, amounts due to custodian, cash collateral held for open derivatives, and cash collateral held for securities on loan. These amounts approximate fair value and would be categorized at Level 2 for each applicable Fund as of September 30, 2022.
The Funds, with the exception of the MM Select T. Rowe Price International Equity Fund, had no Level 3 transfers during the year ended September 30, 2022. The MM Select T. Rowe Price International Equity Fund had Level 3 transfers during the year ended September 30, 2022; however, none of the transfers individually or collectively had a material impact on the MM Select T. Rowe Price International Equity Fund.
244
Notes to Financial Statements (Continued) |
Following is a reconciliation of investments for which significant unobservable inputs (Level 3) were used in determining value:
Asset Valuation Inputs
Investments in Securities |
||||||||||||||||||||||||||||||||||||||||
Balance |
Accrued |
Realized |
Change in |
Purchases |
(Sales) |
Transfers |
Transfers |
Balance |
Net Change |
|||||||||||||||||||||||||||||||
Mid Cap Growth Fund |
||||||||||||||||||||||||||||||||||||||||
Common Stock |
$ | 7,087,099 | $ | — | $ | — | $ | 15,756,752 | $ | — | $ | — | $ | — | $ | — | $ | 22,843,851 | $ | 15,756,752 | ||||||||||||||||||||
Preferred Stock |
129,638,365 | — | — | (94,773,577 | ) | 13,322,011 | (19,657,991 | ) | — | — | 28,528,808 | (9,154,163 | ) | |||||||||||||||||||||||||||
| $ | 136,725,464 | $ | — | $ | — | $ | (79,016,825 | ) | $ | 13,322,011 | $ | (19,657,991 | ) | $ | — | $ | — | $ | 51,372,659 | $ | 6,602,589 | |||||||||||||||||||
The Mid Cap Growth Fund may fair value certain of its Level 3 investments using acquisition cost, although the transaction may not have occurred during the current reporting period. These investments are generally privately held investments, but may include defaulted securities and new debt issuances. There may not be a secondary market for such investments, and/or there are a limited number of investors. The determination to fair value such investments at cost is based upon factors consistent with the principles of fair value measurement that are reasonably available to the valuation designee. Valuations are reviewed by the valuation designee utilizing available market information to determine if the carrying value of these investments should be adjusted. Such market data may include, but is not limited to, observations of the trading multiples of public companies considered comparable to the private companies being valued, financial or operational information released by the company, and/or news or corporate events that affect the investment, also referred to as enterprise value (EV) to earnings before interest, taxes, depreciation, and amortization (EBITDA) ratios. Valuations may be adjusted to account for company-specific issues, the lack of liquidity inherent in a nonpublic investment, and the fact that comparable public companies are not identical to the investments being fair valued by the Mid Cap Growth Fund. All market variables are assessed on a regular frequency and calibrated as necessary.
The table excludes securities which were classified as level 3 based upon a broker quote.
Security Description |
Fair Value |
Valuation Technique(s) |
Unobservable Input |
Range of |
Weighted |
||||||
MassMutual Mid Cap Growth Fund |
|||||||||||
Common Stock |
$ | 22,843,851 | Market |
EV/ EBITDA |
10.1x - 14x | 12.05x |
|||||
Preferred Stock |
$ | 28,528,808 | Market |
Recent Transactions |
$ | 8.10 - $125.00 | $53.93 |
||||
EV / Sales |
5.3x - 16.8x | 7.92x |
|||||||||
EV/ GMV |
0.29x - 0.41x | 0.33x |
|||||||||
EV/ GP |
14.1x - 23.2x | 18.7x |
|||||||||
EV/ EBITDA |
4.3x | — |
|||||||||
Total |
$ | 51,372,659 | |||||||||
|
(a) |
A significant change in unobservable input would have resulted in a correlated (inverse) significant change to value. |
245
Notes to Financial Statements (Continued) |
Abbreviation Legend
EV/ GP - financial ratio of comparable public companies’ enterprise value to gross profit; measures the value of a comparable company in terms of its gross profit for a given year
EV/ GMV - financial ratio of comparable public companies’ enterprise value to gross market value; measures the value of a comparable company in terms of its gross profit for a given year
EV/ Sales - financial ratio of comparable public companies’ enterprise value to sales; measures the value of a comparable company in terms of its sales for a given year
EV/ EBITDA - financial ratio of comparable public companies’ enterprise value to earnings; measures the value of a comparable company in terms of its expected earnings for a given year
Derivative Instruments
Derivatives are financial instruments whose values are based on the values of one or more underlying indicators, such as a security, asset, currency, interest rate, or index. Derivative transactions can create investment leverage and may be highly volatile. Losses from derivatives can be substantially greater than the derivatives’ original cost and can sometimes be unlimited. A Fund may not be able to close out a derivative transaction at a favorable time or price.
At September 30, 2022, and during the year then ended, the Fund(s) had the following derivatives and transactions in derivatives, grouped into the indicated risk categories:
Credit |
Equity |
Foreign |
Interest/ |
Total |
||||||||||||||||
Total Return Bond Fund |
||||||||||||||||||||
Asset Derivatives |
||||||||||||||||||||
Forward Contracts* |
$ | — | $ | — | $ | 52,891 | $ | — | $ | 52,891 | ||||||||||
Futures Contracts^^ |
— | — | — | 353,178 | 353,178 | |||||||||||||||
Swap Agreements^^,^^^ |
— | — | — | 1,566,903 | 1,566,903 | |||||||||||||||
Total Value |
$ | — | $ | — | $ | 52,891 | $ | 1,920,081 | $ | 1,972,972 | ||||||||||
Liability Derivatives |
||||||||||||||||||||
Forward Contracts^ |
$ | — | $ | — | $ | (667 | ) | $ | — | $ | (667 | ) | ||||||||
Futures Contracts^^ |
— | — | — | (2,226,929 | ) | (2,226,929 | ) | |||||||||||||
Swap Agreements^^,^^^ |
— | — | — | (5,506,563 | ) | (5,506,563 | ) | |||||||||||||
Total Value |
$ | — | $ | — | $ | (667 | ) | $ | (7,733,492 | ) | $ | (7,734,159 | ) | |||||||
Realized Gain (Loss)# |
||||||||||||||||||||
Purchased Options |
$ | — | $ | — | $ | $ | 216,912 | $ | 216,912 | |||||||||||
Forward Contracts |
— | — | 138,550 | — | 138,550 | |||||||||||||||
Futures Contracts |
— | — | — | (753,509 | ) | (753,509 | ) | |||||||||||||
Swap Agreements |
— | — | — | 15,526 | 15,526 | |||||||||||||||
Written Options |
— | — | — | (2,358,289 | ) | (2,358,289 | ) | |||||||||||||
Total Realized Gain (Loss) |
$ | — | $ | — | $ | 138,550 | $ | (2,879,360 | ) | $ | (2,740,810 | ) | ||||||||
Change in Appreciation (Depreciation)## |
||||||||||||||||||||
Purchased Options |
$ | — | $ | — | $ | — | $ | (143,612 | ) | $ | (143,612 | ) | ||||||||
Forward Contracts |
— | — | 52,224 | — | 52,224 | |||||||||||||||
Futures Contracts |
— | — | — | (1,702,501 | ) | (1,702,501 | ) | |||||||||||||
Swap Agreements |
— | — | — | (3,846,884 | ) | (3,846,884 | ) | |||||||||||||
Written Options |
— | — | — | 53,377 | 53,377 | |||||||||||||||
Total Change in Appreciation (Depreciation) |
$ | — | $ | — | $ | 52,224 | $ | (5,639,620 | ) | $ | (5,587,396 | ) | ||||||||
246
Notes to Financial Statements (Continued) |
Credit |
Equity |
Foreign |
Interest/ |
Total |
||||||||||||||||
Strategic Bond Fund |
||||||||||||||||||||
Asset Derivatives |
||||||||||||||||||||
Purchased Options* |
$ | — | $ | — | $ | 6 | $ | — | $ | 6 | ||||||||||
Purchased Options*,^^^ |
— | — | — | 85,012 | 85,012 | |||||||||||||||
Forward Contracts* |
— | — | 575,582 | — | 575,582 | |||||||||||||||
Futures Contracts^^ |
— | — | — | 7,060,927 | 7,060,927 | |||||||||||||||
Swap Agreements^^,^^^ |
90,624 | — | — | 5,471,827 | 5,562,451 | |||||||||||||||
Total Value |
$ | 90,624 | $ | — | $ | 575,588 | $ | 12,617,766 | $ | 13,283,978 | ||||||||||
Liability Derivatives |
||||||||||||||||||||
Forward Contracts^ |
$ | — | $ | — | $ | (1,803,338 | ) | $ | — | $ | (1,803,338 | ) | ||||||||
Futures Contracts^^ |
— | — | — | (12,997,576 | ) | (12,997,576 | ) | |||||||||||||
Swap Agreements^^,^^^ |
(215,644 | ) | — | — | (443,993 | ) | (659,637 | ) | ||||||||||||
Written Options^ |
— | — | (116,788 | ) | — | (116,788 | ) | |||||||||||||
Written Options^,^^^ |
— | — | — | (1,059,744 | ) | (1,059,744 | ) | |||||||||||||
Total Value |
$ | (215,644 | ) | $ | — | $ | (1,920,126 | ) | $ | (14,501,313 | ) | $ | (16,637,083 | ) | ||||||
Realized Gain (Loss)# |
||||||||||||||||||||
Purchased Options |
$ | — | $ | — | $ | (54,298 | ) | $ | (1,714,836 | ) | $ | (1,769,134 | ) | |||||||
Forward Contracts |
— | — | (2,541,719 | ) | — | (2,541,719 | ) | |||||||||||||
Futures Contracts |
— | — | — | (22,401,574 | ) | (22,401,574 | ) | |||||||||||||
Swap Agreements |
(601,431 | ) | — | — | 4,153,711 | 3,552,280 | ||||||||||||||
Written Options |
— | — | 21,334 | 2,229,852 | 2,251,186 | |||||||||||||||
Total Realized Gain (Loss) |
$ | (601,431 | ) | $ | — | $ | (2,574,683 | ) | $ | (17,732,847 | ) | $ | (20,908,961 | ) | ||||||
Change in Appreciation (Depreciation)## |
||||||||||||||||||||
Purchased Options |
$ | — | $ | — | $ | (21,359 | ) | $ | (78,525 | ) | $ | (99,884 | ) | |||||||
Forward Contracts |
— | — | (1,180,378 | ) | — | (1,180,378 | ) | |||||||||||||
Futures Contracts |
— | — | — | (3,851,488 | ) | (3,851,488 | ) | |||||||||||||
Swap Agreements |
(124,957 | ) | — | — | 1,764,176 | 1,639,219 | ||||||||||||||
Written Options |
— | — | (18,763 | ) | (461,380 | ) | (480,143 | ) | ||||||||||||
Total Change in Appreciation (Depreciation) |
$ | (124,957 | ) | $ | — | $ | (1,220,500 | ) | $ | (2,627,217 | ) | $ | (3,972,674 | ) | ||||||
S&P 500 Index Fund |
||||||||||||||||||||
Liability Derivatives |
||||||||||||||||||||
Futures Contracts^^ |
$ | — | $ | (2,158,892 | ) | $ | — | $ | — | $ | (2,158,892 | ) | ||||||||
Realized Gain (Loss)# |
||||||||||||||||||||
Futures Contracts |
$ | — | $ | (2,024,579 | ) | $ | — | $ | — | $ | (2,024,579 | ) | ||||||||
Change in Appreciation (Depreciation)## |
||||||||||||||||||||
Futures Contracts |
$ | — | $ | (1,426,502 | ) | $ | — | $ | — | $ | (1,426,502 | ) | ||||||||
Mid Cap Value Fund |
||||||||||||||||||||
Asset Derivatives |
||||||||||||||||||||
Forward Contracts *,^^^ |
$ | — | $ | — | $ | 9,401 | $ | — | $ | 9,401 | ||||||||||
Liability Derivatives |
||||||||||||||||||||
Forward Contracts ^,^^^ |
$ | — | $ | — | $ | (9,904 | ) | $ | — | $ | (9,904 | ) | ||||||||
Realized Gain (Loss)# |
||||||||||||||||||||
Forward Contracts |
$ | — | $ | — | $ | 522,470 | $ | — | $ | 522,470 | ||||||||||
Change in Appreciation (Depreciation)## |
||||||||||||||||||||
Forward Contracts |
$ | — | $ | — | $ | (38,924 | ) | $ | — | $ | (38,924 | ) | ||||||||
247
Notes to Financial Statements (Continued) |
Credit |
Equity |
Foreign |
Interest/ |
Total |
||||||||||||||||
Small Company Value Fund |
||||||||||||||||||||
Asset Derivatives |
||||||||||||||||||||
Forward Contracts*,^^^ |
$ | — | $ | — | $ | 141 | $ | — | $ | 141 | ||||||||||
Liability Derivatives |
||||||||||||||||||||
Forward Contracts^,^^^ |
$ | — | $ | — | $ | (8,696 | ) | $ | — | $ | (8,696 | ) | ||||||||
Realized Gain (Loss)# |
||||||||||||||||||||
Forward Contracts |
$ | — | $ | — | $ | 145,723 | $ | — | $ | 145,723 | ||||||||||
Change in Appreciation (Depreciation)## |
||||||||||||||||||||
Forward Contracts |
$ | — | $ | — | $ | (14,881 | ) | $ | — | $ | (14,881 | ) | ||||||||
Overseas Fund |
||||||||||||||||||||
Realized Gain (Loss)# |
||||||||||||||||||||
Forward Contracts |
$ | — | — | $ | 307,193 | $ | — | $ | 307,193 | |||||||||||
Change in Appreciation (Depreciation)## |
||||||||||||||||||||
Forward Contracts |
$ | — | $ | — | $ | (130,292 | ) | $ | — | $ | (130,292 | ) | ||||||||
MM Select T. Rowe Price International Equity Fund |
||||||||||||||||||||
Realized Gain (Loss)# |
||||||||||||||||||||
Written Options |
$ | — | $ | 16,350 | $ | — | $ | — | $ | 16,350 | ||||||||||
|
* |
Statements of Assets and Liabilities location: Investments, at value, or Receivables from: open forward contracts, as applicable. |
|
^ |
Statements of Assets and Liabilities location: Payables for: open forward contracts, or written options outstanding, at value, as applicable. |
|
^^ |
Cumulative appreciation (depreciation) on futures contracts and centrally cleared swaps is reported in “Futures Contracts” and “Swap Agreements” in each applicable Fund’s Portfolio of Investments. Only current day’s variation margin, if any, is reported within the Statements of Assets and Liabilities. |
|
^^^ |
Represents centrally cleared swaps, exchange-traded purchased and written options, or forward contracts, which are not subject to a master netting agreement or similar agreement. |
|
# |
Statements of Operations location: Amounts are included in net realized gain (loss) on: investment transactions, forward contracts, futures contracts, swap agreements, or written options, as applicable. |
|
## |
Statements of Operations location: Amounts are included in net change in unrealized appreciation (depreciation) on: investment transactions, forward contracts, futures contracts, swap agreements, or written options, as applicable. |
For the year ended September 30, 2022, the average number of contracts, notional amounts, or shares/units for each derivative type was as follows:
Average Number of Contracts, Notional Amounts, or Shares/Units† |
||||||||||||||||||||||||||||
Fund Name |
Futures |
Forward |
Swap |
Purchased |
Purchased |
Written |
Written |
|||||||||||||||||||||
Total Return Bond Fund |
213 | $ | 7,762,453 | $ | 105,540,000 | 510 | $ | 3,710,000 | 1,353 | $ | 41,670,000 | |||||||||||||||||
Strategic Bond Fund |
4,433 | 39,462,205 | 238,432,642 | 2,151,192 | 9,706,667 | 1,207,604 | 9,706,667 | |||||||||||||||||||||
S&P 500 Index Fund |
115 | — | — | — | — | — | — | |||||||||||||||||||||
Mid Cap Value Fund |
— | 3,196,596 | — | — | — | — | — | |||||||||||||||||||||
Small Company Value Fund |
— | 658,987 | — | — | — | — | — | |||||||||||||||||||||
Overseas Fund |
— | 3,533,841 | — | — | — | — | — | |||||||||||||||||||||
MM Select T. Rowe Price International Equity Fund |
— | — | — | — | — | 88 | — | |||||||||||||||||||||
|
† |
Amount(s) disclosed represent average number of contracts for futures contracts, notional amounts for forward contracts, swap agreements, purchased swaptions and written swaptions, or shares/units outstanding for purchased options and written options, based on |
248
Notes to Financial Statements (Continued) |
absolute values, which is indicative of volume of this derivative type, for the months that the Fund held such derivatives during the year ended September 30, 2022.
The Portfolio of Investments included in a Fund’s financial statements shows the assets or liabilities of the Fund associated with individual derivatives transactions. The terms of many of those transactions contemplate that derivatives receivables and payables between the same two parties may be netted and that the parties will collateralize certain obligations. The following tables provide an illustration of the possible effect of netting provisions and of collateral (delivered or received) on a Fund’s derivatives exposure as of September 30, 2022. Netting arrangements vary among different counterparties, and the actual disposition of derivatives receivables and payables, and of collateral, in a bankruptcy or insolvency can be complicated and difficult to predict.
The following table presents derivative assets by counterparty net of amounts available for offset under a master netting agreement (“MNA”) or similar agreement and net of the related collateral received by the Fund(s) as of September 30, 2022.
Counterparty |
Derivative |
Financial |
Collateral |
Net Amount* |
||||||||||||
Total Return Bond Fund |
||||||||||||||||
Citibank N.A. |
$ | 47,011 | $ | (667 | ) | $ | — | $ | 46,344 | |||||||
Goldman Sachs International |
5,880 | — | — | 5,880 | ||||||||||||
| $ | 52,891 | $ | (667 | ) | $ | — | $ | 52,224 | ||||||||
Strategic Bond Fund |
||||||||||||||||
BNP Paribas SA |
$ | 10,668 | $ | (10,668 | ) | $ | — | $ | — | |||||||
Citibank N.A. |
238,293 | (238,293 | ) | — | — | |||||||||||
Citigroup Global Markets, Inc. |
1 | (1 | ) | — | — | |||||||||||
Goldman Sachs & Co. |
4 | (4 | ) | — | — | |||||||||||
Goldman Sachs International |
265,185 | (265,185 | ) | — | — | |||||||||||
Morgan Stanley & Co. LLC |
61,437 | (61,437 | ) | — | — | |||||||||||
| $ | 575,588 | $ | (575,588 | ) | $ | — | $ | — | ||||||||
The following table presents derivative liabilities by counterparty net of amounts available for offset under an MNA or similar agreement and net of the related collateral pledged by the Fund(s) as of September 30, 2022.
Counterparty |
Derivative |
Financial |
Collateral |
Net Amount** |
||||||||||||
Total Return Bond Fund |
||||||||||||||||
Citibank N.A. |
$ | (667 | ) | $ | 667 | $ | — | $ | — | |||||||
Strategic Bond Fund |
||||||||||||||||
BNP Paribas SA |
$ | (340,549 | ) | $ | 10,668 | $ | — | $ | (329,881 | ) | ||||||
Citibank N.A. |
(1,094,532 | ) | 238,293 | — | (856,239 | ) | ||||||||||
Citigroup Global Markets, Inc. |
(3,140 | ) | 1 | 3,139 | — | |||||||||||
Goldman Sachs & Co. |
(71,040 | ) | 4 | — | (71,036 | ) | ||||||||||
Goldman Sachs International |
(303,395 | ) | 265,185 | — | (38,210 | ) | ||||||||||
Morgan Stanley & Co. LLC |
(107,470 | ) | 61,437 | — | (46,033 | ) | ||||||||||
| $ | (1,920,126 | ) | $ | 575,588 | $ | 3,139 | $ | (1,341,399 | ) | |||||||
|
* |
Represents the net amount receivable from the counterparty in the event of default. |
249
Notes to Financial Statements (Continued) |
|
** |
Represents the net amount payable to the counterparty in the event of default. |
|
*** |
The amount presented here may be less than the total amount of collateral received/pledged as the net amount of derivative assets and liabilities for a counterparty cannot be less than $0. |
|
† |
The amount presented here may be less than the total amount shown in the Statements of Assets and Liabilities as some derivatives held by the counterparty are not covered within an MNA or similar agreement. |
Such agreements typically permit a single net payment in the event of default, including the bankruptcy or insolvency of the counterparty. The Fund(s) and counterparties may not be permitted to sell, re-pledge, or use the collateral they receive. In the event that cash collateral is restricted for use, the balance will be reflected as restricted cash within the Statement of Assets and Liabilities.
Further details regarding the derivatives and other investments held by the Fund(s) during the year ended September 30, 2022, are discussed below.
Foreign Currency Exchange Transactions
A Fund may enter into foreign currency exchange transactions for hedging purposes in order to protect against uncertainty in the level of future foreign currency exchange rates, or for other, non-hedging purposes.
A Fund may enter into foreign currency exchange transactions, including foreign currency forward contracts. These contracts call for the Fund to deliver in the future an amount of one currency in return for an amount of another currency, at an exchange rate determined at the time the contract is entered into. Forward contracts are private contractual arrangements and a Fund is subject to the risk that its counterparty will not, or will not be able to, perform its obligations. This type of arrangement may require the Fund to post margin. A Fund may also buy and sell options on currencies. When the Fund buys an option, its loss should generally be limited to the amount of the premium paid and any transaction costs. If a Fund sells an option on a currency, it is subject generally to the same risks as if it had entered into a futures contract or forward contract with respect to that currency. A Fund may enter into foreign currency exchange transactions in order to hedge against changes in the values of the assets or liabilities denominated in one or more foreign currencies, or otherwise to increase or reduce a Fund’s exposure to various foreign currencies. The use of foreign currency exchange transactions may create investment leverage.
Whenever a Fund enters into a foreign currency exchange transaction, it is subject to the risk that the value of the transaction will move in a direction unfavorable to it. When the Fund uses the transactions for hedging purposes, it is likely that the Fund will have an asset or liability that will offset any loss (or gain) on the transactions, at least in part. If a Fund enters into foreign currency exchange transactions other than for hedging purposes (for example, seeking to profit from an anticipated change in the values of currencies by creating directional exposures in the portfolio with respect to one or more currencies), it will generally be subject to the same risks, but is less likely to have assets or liabilities that will offset any losses on the transactions. There can be no assurance that a Fund will be able to terminate any foreign currency exchange transaction prior to its maturity in order to limit its loss on the transaction.
Forward foreign currency contracts are marked to market daily and the change in their value is recorded by the Funds as an unrealized gain or loss. Forward foreign currency contracts are valued at the settlement price established through dealers or other market sources on the day which they are traded. When a forward foreign currency contract is extinguished, through delivery or offset by entering into another forward foreign currency contract, the Funds record a realized gain or loss equal to the difference between the value of the contract at the time it was opened and the value of the contract at the time it was extinguished or offset. The notional or contractual amounts of these instruments do not necessarily represent the amounts potentially subject to risk. The measurement of the risk associated with these instruments is meaningful only when all related and offsetting transactions and counterparty risks are considered. For information regarding the accounting treatment of options, see “Options, Rights, and Warrants” below.
A Fund’s current exposure to a counterparty is the unrealized appreciation/(depreciation) on the contract.
250
Notes to Financial Statements (Continued) |
Futures Contracts
A Fund may seek to manage a variety of different risks, such as interest rate risk, equity price risk, and currency risk, through the use of futures contracts and related options.
Futures Contracts. A Fund may use interest rate futures contracts to adjust the interest rate sensitivity (duration) of its portfolio or the credit exposure of the portfolio. Interest rate futures contracts obligate the long or short holder to take or make delivery of a specified quantity of a financial instrument, such as a specific fixed income security, during a specified future period at a specified price. A Fund may use index futures contracts to hedge against broad market risks to its portfolio or to gain broad market exposure when it holds uninvested cash or as an inexpensive substitute for cash investments directly in securities or other assets, including commodities and precious metals. Securities index futures contracts are contracts to buy or sell units of a securities index at a specified future date at a price agreed upon when the contract is made and are settled in cash. Positions in futures contracts may be closed out only on an exchange or board of trade which provides a market for such futures. Because futures contracts are exchange-traded, they typically have minimal exposure to counterparty risk.
Parties to a futures contract are not required to post the entire notional amount of the contract, but rather a small percentage of that amount (by way of margin), both at the time they enter into futures transactions, and then on a daily basis if their positions decline in value; as a result, futures contracts are highly leveraged. Such payments are known as variation margin and are recorded by the Funds as unrealized gains or losses. Because futures markets are highly leveraged, they can be extremely volatile, and there can be no assurance that the pricing of a futures contract will correlate precisely with the pricing of the asset or index underlying it or the asset or liability of the Fund that is the subject of the hedge. It may not always be possible for a Fund to enter into a closing transaction with respect to a futures contract it has entered into, at a favorable time or price. When a Fund enters into a futures transaction, it is subject to the risk that the value of the futures contract will move in a direction unfavorable to it. When a Fund uses futures contracts for hedging purposes, it is likely that the Fund will have an asset or liability that will offset any loss (or gain) on the transactions, at least in part.
Options on Futures Contracts. If a Fund buys an option on a futures contract, it will have the right to assume a futures contract at a particular price during the course of the option. Its potential loss should generally be limited to the amount of the premium paid and any transaction costs. If a Fund sells an option on a futures contract, it is subject generally to the same risks as if it had entered into a futures contract underlying the option itself.
When a futures contract is closed, the Fund records a realized gain or loss equal to the difference between the value of the contract at the time it was opened and the value at the time it was closed. Futures contracts are valued at the settlement price established each day by the board of trade or exchange on which they are traded. For information regarding the accounting treatment of options, see “Options, Rights, and Warrants” below.
Swap Agreements
Swap agreements are typically two-party contracts entered into primarily by institutional investors. In a standard “swap” transaction, two parties agree to exchange the returns (or differentials in rates of return) earned or realized on particular predetermined investments or instruments or rates, which may be adjusted for an interest factor. The gross returns to be exchanged or “swapped” between the parties are generally calculated with respect to a “notional amount,” (i.e., the return on or increase in value of a particular dollar amount invested at a particular interest rate or in a “basket” of securities representing a particular index).
Interest Rate Swaps. When a Fund enters into an interest rate swap, it typically agrees to make payments to its counterparty based on a specified long- or short-term interest rate, and will receive payments from its counterparty based on another interest rate. Other forms of interest rate swap agreements include, among others, interest rate caps, under which, in return for a specified payment stream, one party agrees to make payments to the other to the extent that interest rates exceed a specified rate, or “cap”; interest rate floors, under which, in return for a specified payment stream, one party agrees to make payments to the other to the extent that interest rates fall below a specified rate, or “floor”; and interest rate collars, under which a party sells a cap and purchases a floor or vice versa in an attempt to protect itself against interest rate movements exceeding given minimum or
251
Notes to Financial Statements (Continued) |
maximum levels. A Fund may enter into an interest rate swap in order, for example, to hedge against the effect of interest rate changes on the value of specific securities in its portfolio, or to adjust the interest rate sensitivity (duration) or the credit exposure of its portfolio overall, or otherwise as a substitute for a direct investment in debt securities.
Credit Default Swaps. A Fund also may enter into credit default swap transactions, as a “buyer” or “seller” of credit protection. In a credit default swap, one party provides what is in effect insurance against a default or other adverse credit event affecting an issuer of debt securities (typically referred to as a “reference entity”). In general, the buyer of credit protection is obligated to pay the protection seller an upfront amount or a periodic stream of payments over the term of the swap. If a “credit event” occurs, the buyer has the right to deliver to the seller bonds or other obligations of the reference entity (with a value up to the full notional value of the swap), and to receive a payment equal to the par value of the bonds or other obligations. Credit events that would trigger a request that the seller make payment are specific to each credit default swap agreement, but generally include bankruptcy, failure to pay, restructuring, acceleration, default, or repudiation/moratorium. When a Fund buys protection, it may or may not own securities of the reference entity. If it does own securities of the reference entity, the swap serves as a hedge against a decline in the value of the securities due to the occurrence of a credit event involving the issuer of the securities. If the Fund does not own securities of the reference entity, the credit default swap may be seen to create a short position in the reference entity. If a Fund is a buyer and no credit event occurs, the Fund will typically recover nothing under the swap, but will have had to pay the required upfront payment and stream of continuing payments under the swap. When a Fund sells protection under a credit default swap, the position may have the effect of creating leverage in the Fund’s portfolio through the Fund’s indirect long exposure to the issuer or securities on which the swap is written. When a Fund sells protection, it may do so either to earn additional income or to create a “synthetic” long position.
Whenever a Fund enters into a swap agreement, it takes on counterparty risk — the risk that its counterparty will be unable or unwilling to meet its obligations under the swap agreement. The Fund also takes the risk that the market will move against its position in the swap agreement. In the case of an interest rate swap, the value of the swap may increase or decrease depending on changes in interest rates. In the case of a credit default swap, the swap will become more or less valuable depending on the credit of the issuer of the underlying security, and, if a credit event occurs under a swap where the Fund is the seller of credit protection, the Fund could be required to purchase the security at par value, resulting in a significant loss to the Fund. When the Fund enters into any type of swap for hedging purposes, it is likely that the Fund will have an asset or liability that will offset any loss (or gain) on the swap, at least in part. Swap agreements may be non-transferable or otherwise highly illiquid, and a Fund may not be able to terminate or transfer a swap agreement at any particular time or at an acceptable price.
Swaptions. A Fund may also enter into options on swap agreements (“swaptions”). A swaption is a contract that gives a counterparty the right (but not the obligation) to enter into a new swap agreement or to shorten, extend, cancel, or otherwise modify an existing swap agreement, at some designated future time on specified terms. A Fund may write (sell) and purchase put and call swaptions. Depending on the terms of the particular option agreement, a Fund will generally incur a greater degree of risk when it writes a swaption than it will incur when it purchases a swaption. When a Fund purchases a swaption, it risks losing only the amount of the premium it has paid should it decide to let the option expire unexercised. However, when a Fund writes a swaption, upon exercise of the option the Fund will become obligated according to the terms of the underlying agreement. A Fund may enter into swaptions for the same purposes as swaps. For information regarding the accounting treatment of options, see “Options, Rights, and Warrants” below.
Centrally Cleared Swaps. Certain clearinghouses currently offer clearing for limited types of derivatives transactions, principally certain interest rate swaps, certain index swaps, and credit derivatives. In a cleared derivative transaction, a Fund typically enters into the transaction with a financial institution counterparty, and performance of the transaction is effectively guaranteed by a central clearinghouse, thereby reducing or eliminating the Fund’s exposure to the credit risk of its original counterparty. The Fund will be required to post amounts (“initial margin”) with the clearinghouse or at the instruction of the clearinghouse. The initial margin required by a clearinghouse may be greater than the initial margin the Fund would be required to post in an uncleared transaction. If cash is deposited as the initial margin, it is shown as collateral on a Fund’s Statement of Assets and Liabilities. Swap agreements are marked-to-market daily and subsequent payments (“variation margin”) are made or received by a Fund depending on whether unrealized gains or losses are incurred. These amounts are reflected as receivables or payables
252
Notes to Financial Statements (Continued) |
on a Fund’s Statement of Assets and Liabilities (“Variation margin on open derivative instruments”) and as a component of net change in unrealized appreciation (depreciation) on a Fund’s Statement of Operations. Only a limited number of transaction types are currently eligible for clearing.
During the term of a swap transaction, changes in the value of the swap are recognized as unrealized gains or losses by marking to market to reflect the market value of the swap. When the swap is terminated, a Fund will record a realized gain or loss equal to the difference, if any, between the proceeds from (or cost of) the closing transaction and a Fund’s basis in the agreement. Upfront swap premium payments paid or received by a Fund, if any, are recorded within the value of the open swap agreement on the Fund’s Statement of Assets and Liabilities and represent payments paid or received upon entering into the swap agreement to compensate for differences between stated terms of the swap agreement and prevailing market conditions (credit spreads, currency exchange rates, and other relevant factors). These upfront payments are recorded as realized gain or loss on the Fund’s Statement of Operations upon termination or maturity of the swap agreement.
During the term of a swap transaction, the periodic net payments can be made for a set period of time or may be triggered by a predetermined credit event. The net periodic payments may be based on a fixed or variable interest rate, the change in market value of a specified security, basket of securities or index, or the return generated by a security. These periodic payments received or made by the Funds are recorded in the accompanying Statements of Operations as realized gains and losses, respectively.
A Fund’s current exposure to a counterparty is the fair value of the transaction.
Options, Rights, and Warrants
A Fund may purchase and sell put and call options on portfolio securities or an index of securities to enhance investment performance or to protect against changes in market prices. A Fund that invests in debt securities may also purchase and sell put and call options to adjust the interest rate sensitivity of its portfolio or the credit exposure of the portfolio.
Call Options. A call option gives the holder the right to purchase, and obligates the writer to sell, a security at the strike price at any time before the expiration date in the case of an American-style option or only on the expiration date in the case of a European-style option.
Put Options. A put option gives the holder the right to sell, and obligates the writer to buy, a security at the exercise price.
Writing put and call options. A Fund may write call options on a security it owns, in a “directional” strategy hoping to realize a greater current return through the receipt of premiums. In return for the option premium, the Fund takes the risk that it will have to forego any increase in the value of the security over the strike price. When a Fund has written a call option on a security it does not own, its exposure on such an option is theoretically unlimited. A Fund may enter into closing purchase transactions in order to realize a profit or limit a loss on a previously written call option or, in the case of a call option on a security it owns, to free itself to sell the underlying security or to write another call on the security, or protect a security from being called in an unexpected market rise. Any profits from a closing purchase transaction in the case of a call option on a security a Fund owns may be offset by a decline in the value of the underlying security. Conversely, because increases in the market price of a call option will generally reflect increases in the market price of the underlying security, any loss resulting from a closing purchase transaction relating to a call option on a security a Fund owns is likely to be offset in whole or in part by unrealized appreciation of the underlying security owned by the Fund. A Fund may not be able to close out a call option that it has previously written. A Fund may write put options in order to enhance its current return by taking a long directional position as to a security or index of securities. By writing a put option, the Fund assumes the risk that it may be required to purchase the underlying security for an exercise price higher than its then current market value, resulting in a potential capital loss unless the security later appreciates in value. A Fund may terminate a put option that it has written before it expires by entering into a closing purchase transaction. Any loss from this transaction may be partially or entirely offset by the premium received on the terminated option. A Fund may not be able to close out a put option that it has previously written.
253
Notes to Financial Statements (Continued) |
When a Fund writes a call or put option, an amount equal to the premium received is recorded as a liability. Premiums received from writing options which expire are treated as realized gains. Premiums received from writing options which are exercised or closed are added to the proceeds or offset against the amount paid on the underlying investment to determine the realized gain or loss.
Purchasing put and call options. A Fund may purchase put options to protect portfolio holdings against a decline in market value of a security or securities held by it. A Fund may also purchase a put option hoping to profit from an anticipated decline in the value of the underlying security. If the Fund holds the security underlying the option, the option premium and any transaction costs will reduce any profit the Fund might have realized had it sold the underlying security instead of buying the put option. A Fund may purchase call options to hedge against an increase in the price of securities that the Fund wants ultimately to buy. A Fund may also purchase a call option as a long directional investment hoping to profit from an anticipated increase in the value of the underlying security. In order for a call option to be profitable, the market price of the underlying security must rise sufficiently above the exercise price to cover the premium and transaction costs. These costs will reduce any profit the Fund might have realized had it bought the underlying security at the time it purchased the call option.
When a Fund purchases an option, it runs the risk that it will lose its entire investment in the option in a relatively short period of time, unless the Fund exercises the option or enters into a closing sale transaction before the option’s expiration. If the price of the underlying security does not rise (in the case of a call) or fall (in the case of a put) to an extent sufficient to cover the option premium and transaction costs, the Fund will lose part or all of its investment in the option. This contrasts with an investment by a Fund in the underlying security, since the Fund will not realize a loss if the security’s price does not change. Premiums paid for purchasing options that expire are treated as realized losses.
Exchange Traded Options. Exchange traded options purchased or sold by a Fund may be traded on a securities or options exchange or market. Such options typically have minimal exposure to counterparty risk. However, an exchange or market may at times find it necessary to impose restrictions on particular types of options transactions, such as opening transactions. If an underlying security ceases to meet qualifications imposed by the market or the Options Clearing Corporation, new series of options on that security will no longer be opened to replace expiring series, and opening transactions in existing series may be prohibited. Exchange traded options are valued at the last sale price, or if no sales are reported, the last bid price.
OTC Options. OTC options purchased or sold by a Fund are not traded on securities or options exchanges or backed by clearinghouses. Rather, they are entered into directly between a Fund and the counterparty to the option. In the case of an OTC option purchased by the Fund, the value of the option to the Fund will depend on the willingness and ability of the option writer to perform its obligations to the Fund. In addition, OTC options may not be transferable and there may be little or no secondary market for them, so they may be considered illiquid. It may not be possible to enter into closing transactions with respect to OTC options or otherwise to terminate such options, and as a result a Fund may be required to remain obligated on an unfavorable OTC option until its expiration. OTC options are valued using prices supplied by a primary pricing source, selected pursuant to procedures approved by the Trustees.
Rights and Warrants. A Fund may purchase or hold warrants or rights in order to gain exposure to the underlying security without owning the security, including, for example, cases where the Fund hopes to lock in the price today of a security it may wish to purchase in the future. Warrants generally give the holder the right, but not the obligation, to buy a security at a stated price. In order for a warrant to be profitable, the market price of the underlying security must rise sufficiently above the exercise price to cover any premium and transaction costs. Rights may similarly confer on the holder the right to purchase or acquire securities, including through participation in a so-called rights offering. Bonds may be issued with warrants or other rights attached to purchase or acquire equity or other debt securities, typically of the bond issuer. The market prices of bonds with warrants or rights attached to purchase equity securities or bonds may, to some degree, reflect changes in the values of the underlying securities.
When a Fund purchases or otherwise acquires warrants or other rights, it runs the risk that it will lose its entire investment in the warrants or rights, unless the Fund exercises the warrant or right, acquires the underlying securities, or enters into a closing transaction before expiration. If the price of the underlying security does not rise to an extent sufficient to cover any premium and transaction costs, the Fund will lose part or all of its investment. Any premiums or purchase price paid for warrants or other
254
Notes to Financial Statements (Continued) |
rights that expire are treated as realized losses. Warrants and similar rights differ from options in that they are typically written by the issuer of the security underlying the warrant or right. Although some warrants and rights may be non-transferable, others may be traded over-the-counter or on an exchange.
Hybrid Instruments
A hybrid instrument may be a debt security, preferred stock, warrant, convertible security, certificate of deposit, or other evidence of indebtedness on which a portion of or all interest payments, and/or the principal or stated amount payable at maturity, redemption, or retirement, is determined by reference to one or more underlying assets, indexes, economic factors, or other benchmarks. Because hybrid instruments may be designed to provide indirect exposures to virtually any type of derivative instrument, a Fund may invest in a hybrid instrument for any purpose it might engage in derivatives transactions. Hybrid instruments may take a number of forms, including, for example, debt instruments with interest or principal payments or redemption terms determined by reference to the value of an index, security, or other measure at a future time, preferred stock with dividend rates determined by reference to the value of a currency, or convertible securities where the conversion terms relate to a particular commodity. The risks of investing in a hybrid instrument may, depending on the nature of the instrument, reflect a combination of the risks of investing in securities, options, futures, currencies or other types of investments, and will depend upon the terms of the instrument. Such risks generally depend upon factors unrelated to the operations or credit quality of the issuer of the hybrid instrument, and may not be foreseen by the purchaser, such as financial or market developments, economic and political events, the supply and demand of the underlying assets, and interest rate movements. Hybrid instruments may be highly volatile and their use by a Fund may not be successful. The terms of a hybrid instrument may create investment leverage. Hybrid instruments are typically privately issued, presenting credit risk of the issuer, and may be highly illiquid and difficult to value.
Inflation-Linked Securities
Inflation-linked securities are typically fixed income securities whose principal values are periodically adjusted according to a measure of inflation. If the index measuring inflation falls, the principal value of an inflation-linked security will be adjusted downward, and consequently the interest payable on the security (calculated with respect to a smaller principal amount) will be reduced. Repayment of the original principal of the security upon maturity (as adjusted for inflation) is guaranteed in the case of U.S. Treasury inflation-linked securities. For securities that do not provide a similar guarantee, the adjusted principal value of the security repaid at maturity may be less than the original principal.
Alternatively, the interest rates payable on certain inflation-linked securities may be adjusted according to a measure of inflation. As a result, the principal values of such securities do not adjust according to the rate of inflation, although the interest payable on such securities may decline during times of falling inflation.
The values of inflation-linked securities are expected to change in response to changes in real interest rates. Real interest rates are tied to the relationship between nominal interest rates and the rate of inflation. If nominal interest rates increase at a faster rate than inflation, real interest rates may rise, leading to a decrease in value of inflation-linked securities. Inflation-linked securities may cause a potential cash flow mismatch to investors, because an increase in the principal amount of an inflation-linked security will be treated as interest income currently subject to tax at ordinary income rates even though investors will not receive repayment of principal until maturity. If a Fund invests in such securities, it will be required to distribute such interest income in order to qualify for treatment as a regulated investment company and eliminate the Fund-level tax, without a corresponding receipt of cash, and therefore may be required to dispose of portfolio securities at a time when it may not be advantageous to do so in order to make such distributions.
Bank Loans
A Fund may invest in bank loans including, for example, corporate loans, loan participations, direct debt, bank debt, and bridge debt. A Fund may invest in a loan by lending money to a borrower directly as part of a syndicate of lenders. In a syndicated loan, the agent that originated and structured the loan typically administers and enforces the loan on behalf of the syndicate. Failure by the agent to fulfill its obligations may delay or adversely affect receipt of payment by a Fund. A Fund may also invest in loans through novations, assignments, and participation interests. In a novation, a Fund typically assumes all of the rights of a
255
Notes to Financial Statements (Continued) |
lending institution in a loan, including the right to receive payments of principal and interest and other amounts directly from the borrower and to enforce its rights as a lender directly against the borrower. When a Fund takes an assignment of a loan, the Fund acquires some or all of the interest of another lender (or assignee) in the loan. In such cases, the Fund may be required generally to rely upon the assignor to demand payment and enforce rights under the loan. If a Fund acquires a participation in the loan, the Fund purchases an indirect interest in a loan held by a third party and the Fund typically will have a contractual relationship only with the third party loan investor, not with the borrower. As a result, a Fund may have the right to receive payments of principal, interest, and any fees to which it is entitled only from the loan investor selling the participation and only upon receipt by such loan investor of such payments from the borrower. In such cases, a Fund assumes the credit risk of both the borrower and the loan investor selling the participation, and the Fund may be unable to realize some or all of the value of its interest in the loan in the event of the insolvency of the third party.
Changes in the financial condition of the borrower or economic conditions or other circumstances may reduce the capacity of the borrower to make principal and interest payments on such instruments and may lead to defaults. The value of any collateral securing a bank loan may decline after the Fund invests, and there is a risk that the value of the collateral may not be sufficient to cover the amount owed to the Fund.
The Total Return Bond Fund and Strategic Bond Fund entered into certain loan agreements which are unfunded. The Total Return Bond Fund and Strategic Bond Fund are obligated to fund these commitments at the borrower’s discretion. These commitments are disclosed in the Total Return Bond Fund’s and Strategic Bond Fund’s Portfolio of Investments. At September 30, 2022, the Total Return Bond Fund and Strategic Bond Fund had sufficient cash and/or securities to cover these commitments.
Repurchase Agreements
Each Fund may enter into repurchase agreements with certain banks and broker-dealers whereby a Fund acquires a security for cash and obtains a simultaneous commitment from the seller to repurchase the security at an agreed upon price and date. A Fund, through its custodian, takes possession of the securities collateralizing the repurchase agreement in a segregated account. Repurchase agreements must be fully collateralized at all times, but involve some risk to a Fund if the other party should default on its obligation and the Fund is delayed or prevented from recovering the collateral, or if the Fund is required to return collateral to a borrower at a time when it may realize a loss on the investment of that collateral.
When-Issued, Delayed-Delivery, Forward Commitment, and To-Be-Announced Transactions
A Fund may enter into when-issued, delayed-delivery, forward commitment, or to-be-announced (“TBA”) transactions (collectively, the “Forward Transactions”) in order to lock in the purchase price of the underlying security, or in order to adjust the interest rate exposure of the Fund’s existing portfolio. In Forward Transactions, a Fund commits to purchase or sell particular securities, with payment and delivery to take place at a future date. In the case of TBA purchase commitments, the unit price and the estimated principal amount are established when the Fund enters into a commitment, with the actual principal amount being within a specified range of the estimate. Although a Fund does not typically pay for the securities in these types of transactions until they are delivered, it immediately assumes the risks of ownership, including the risk of price fluctuation. As a result, each of these types of transactions may create investment leverage in a Fund’s portfolio and increase the volatility of the Fund. If a Fund’s counterparty fails to deliver a security purchased in a Forward Transaction, there may be a loss, and the Fund may have missed an opportunity to make an alternative investment.
These securities are valued on the basis of valuations furnished by a pricing service, selected pursuant to procedures approved by the Trustees, which determines valuations taking into account appropriate factors such as institutional-size trading in similar groups of securities, yield, quality, coupon rate, maturity, type of issue, trading characteristics, and other market data. Securities for which no market quotation is available are valued at fair value in accordance with procedures approved by the Trustees. The Funds record on a daily basis the unrealized appreciation (depreciation) based upon changes in the values of these securities. When a Forward Transaction is closed, the Funds record a realized gain or loss equal to the difference between the value of the transaction at the time it was opened and the value of the transaction at the time it was closed.
256
Notes to Financial Statements (Continued) |
Dollar Roll Transactions
A Fund may enter into dollar roll transactions, in which the Fund sells mortgage-backed securities for delivery in the current month and simultaneously contracts to purchase substantially similar securities on a specified future date from the same party. A Fund may invest in dollar rolls in order to benefit from anticipated changes in pricing for the mortgage-backed securities during the term of the transaction, or for the purpose of creating investment leverage. In a dollar roll, the securities that are to be purchased will be of the same type as the securities sold, but will be supported by different pools of mortgages.
Dollar rolls involve the risk that the Fund’s counterparty will be unable to deliver the mortgage-backed securities underlying the dollar roll at the fixed time. If the counterparty files for bankruptcy or becomes insolvent, a Fund’s use of the transaction proceeds may be restricted pending a determination by the counterparty or its representative, whether to enforce the Fund’s obligation to repurchase the securities. A Fund can incur a loss on a dollar roll transaction (either because its counterparty fails to perform or because the value of the mortgages subject to the transaction declines) and on the investments made by the Fund with the proceeds of the dollar roll transaction.
A Fund accounts for a dollar roll transaction as a purchase and sale whereby the difference in the sales price and purchase price of the security sold is recorded as a realized gain (loss). If certain criteria are met, these dollar roll transactions may be considered financing transactions, whereby the difference in the sales price and the future purchase price is recorded as an adjustment to interest income. Dollar roll transactions generally have the effect of creating leverage in a Fund’s portfolio.
Securities Lending
Each Fund may lend its securities; however, lending cannot exceed 33% of the total assets of the Fund taken at current value. The Funds’ securities lending activities are governed by a Securities Lending Agency Agreement (“Lending Agreement”) between each Fund and the lending agent (“Agent”). The Lending Agreement authorizes the Agent to lend portfolio securities held by a Fund to approved borrowers (each, a “Borrower”).
Each Fund expects that in connection with any securities on loan, the loan will be secured continuously by collateral consisting of cash (U.S. currency) and/or securities (U.S. Treasury and Agency obligations) adjusted daily to have value at least equal to the current market value of the securities loaned. The market value of the loaned securities is determined at the close of business of a Fund and any additional collateral is delivered to the Fund the next business day. The Funds bear the risk of loss with respect to the investment of cash collateral. As with other extensions of credit, the Funds may bear the risk of delay in recovery of the loaned securities or even loss of rights in the collateral should the Borrower of the securities fail financially. Pursuant to the Lending Agreement, the Agent has provided indemnification to the Funds in the event of default by a Borrower with respect to a loan. The Funds receive compensation for lending their securities in the form of a securities loan fee paid by the Borrower, as well as a share of the income earned on investment of the cash collateral received for the loaned securities. At September 30, 2022, the Funds’ collateral was equal to or greater than 100% of the market value of securities on loan and all of the Funds’ cash collateral was invested in the State Street Navigator Securities Lending Government Money Market Portfolio.
Subject to the terms of the Lending Agreement and the agreement between the Agent and the applicable Borrower (“Borrowing Agreement”), security loans can be terminated by the Agent, the Fund, or the Borrower and the related securities must be returned within the earlier of the customary settlement period for such securities or the period of time specified in the Borrowing Agreement.
The Funds employ the Agent to implement their securities lending program and the Agent receives a fee from the Funds for its services. In addition, the Funds may be required to pay a rebate to the Borrower. Accordingly, a Fund’s compensation for lending its securities is reduced by any such fees or rebate paid to the Agent or Borrower, respectively. Income received by the Funds in securities lending transactions during the year ended September 30, 2022, is reflected as securities lending income on the Statement of Operations.
257
Notes to Financial Statements (Continued) |
Accounting for Investment Transactions
Investment transactions are accounted for on the trade date. Realized gains and losses on sales of investments and unrealized appreciation and depreciation of investments are computed by the specific identification cost method. Proceeds received from litigation, if any, are included in realized gains on investment transactions for any investments that are no longer held in the portfolio and as a reduction in cost for investments that continue to be held in the portfolio. Interest income, adjusted for amortization of discounts and premiums on debt securities, is earned from the settlement date and is recorded on the accrual basis. Dividend income and realized capital gain distributions are recorded on the ex-dividend date. Withholding taxes on foreign interest, dividends, and capital gains have been provided for in accordance with the applicable country’s tax rules and rates. Foreign dividend income is recorded on the ex-dividend date or as soon as practicable after the Fund determines the existence of a dividend declaration after exercising reasonable due diligence. Distributions received on securities that represent a return of capital or capital gains are recorded as a reduction of cost of investments and/or as a realized gain.
Foreign Currency Translation
The books and records of the Funds are maintained in U.S. dollars. The market values of foreign currencies, foreign securities, and other assets and liabilities denominated in foreign currencies are translated into U.S. dollars at the mean of the buying and selling rates of such currencies against the U.S. dollar at the end of each business day. Purchases and sales of foreign securities and income and expense items are translated at the rates of exchange prevailing on the respective dates of such transactions. The Funds do not isolate that portion of the results of operations arising from changes in the exchange rates from that portion arising from changes in the market prices of securities. Net realized foreign currency gains and losses resulting from changes in exchange rates include foreign currency gains and losses between trade date and settlement date on investment securities transactions, foreign currency transactions, and the difference between the amounts of dividends or interest recorded on the books of the Funds and the amount actually received.
Allocation of Operating Activity
In maintaining the records for the Funds, the income and expense accounts are allocated daily to each class of shares. Investment income and loss, and unrealized and realized gains or losses are prorated among the classes of shares based on the relative net assets of each. Expenses are allocated to each class of shares depending on the nature of the expenditures. Administration and service fees, if any, which are directly attributable to a class of shares, are charged to that class’s operations. Expenses of a Fund not directly attributable to the operations of any specific class of shares of the Fund are prorated among the classes to which the expense relates based on relative net assets or another alternative method.
Foreign Securities
Each of the Overseas Fund and MM Select T. Rowe Price International Equity Fund invests substantially all of its assets in foreign securities. The other Funds may also invest in foreign securities. Foreign securities, including American Depositary Receipts, are subject to additional risks compared to securities of U.S. issuers, including international trade, currency, political, regulatory, public health, and diplomatic risks. In addition, fluctuations in currency exchange rates may favorably or unfavorably affect the values of foreign securities and the price of a Fund’s shares. Emerging markets securities are subject to greater risks than securities issued in developed foreign markets, including less liquidity, less stringent investor protection and disclosure standards, less reliable settlement practices, greater price volatility, higher relative rates of inflation, greater political, economic, and social instability, greater custody and operational risks, greater risk of new or inconsistent government treatment of or restrictions on issuers and instruments, and greater volatility in currency exchange rates, and are more susceptible to environmental problems.
Federal Income Tax
It is each Fund’s intent to continue to comply with the provisions of Subchapter M of the Internal Revenue Code of 1986, as amended (the “Code”), applicable to a regulated investment company. Under such provisions, the Funds would not be subject to federal income taxes on their ordinary income and net realized capital gains to the extent they are distributed or deemed to have been distributed to their shareholders. Therefore, the Funds have not made any provision for federal income tax.
258
Notes to Financial Statements (Continued) |
Dividends and Distributions to Shareholders
Dividends from net investment income and distributions of any net realized capital gains of each Fund are declared and paid annually and at other times as may be required to satisfy tax or regulatory requirements.
Distributions to shareholders are recorded on the ex-dividend date. Income and capital gain distributions are determined in accordance with income tax regulations, which may differ from generally accepted accounting principles. As a result, net investment income and net realized capital gains on investment transactions for a reporting period may differ significantly from distributions during such period.
3. Advisory Fees and Other Transactions
Investment Advisory Fees and Investment Subadvisers
MML Investment Advisers, LLC (“MML Advisers”), a wholly-owned subsidiary of Massachusetts Mutual Life Insurance Company (“MassMutual”), serves as investment adviser to each Fund. Under the investment advisory agreements between MML Advisers and the Trust on behalf of each Fund, MML Advisers is responsible for providing investment management services for each Fund. In return for these services, MML Advisers receives advisory fees, based upon each Fund’s average daily net assets, computed and accrued daily and payable monthly, at the annual rates shown in the following table.
MML Advisers has also entered into investment subadvisory agreements for each Fund with the unaffiliated investment subadviser(s) shown in the following table. MML Advisers pays a subadvisory fee to each of these subadvisers based upon the aggregate net assets under management which include (1) the average daily net assets of the specified Fund which it manages, and, if applicable, (2) the average daily net assets of other Funds or accounts of MML Advisers or its affiliates for which the subadviser provides subadvisory services.
The Funds’ subadvisory fees, if applicable, are paid monthly by MML Advisers out of the advisory fees.
Fund |
Investment Advisory Fee |
Investment Subadviser(s) |
Total Return Bond Fund |
0.30% on the first $2 billion; and |
Metropolitan West Asset Management, LLC |
0.27% on any excess over $2 billion |
||
Strategic Bond Fund |
0.45% on the first $200 million; and 0.35% on any excess over $200 million |
Brandywine Global Investment Management, LLC; Western Asset Management Company, LLC; and Western Asset Management Company Limited |
Diversified Value Fund |
0.50% on the first $400 million; and |
Brandywine Global Investment Management, LLC; |
0.475% on any excess over $400 million |
and T. Rowe Price Associates, Inc. |
|
Fundamental Value Fund |
0.60% on the first $1.25 billion; |
Barrow, Hanley, Mewhinney & Strauss, LLC; and |
0.575% on the next $250 million; and |
Boston Partners Global Investors, Inc. |
|
0.55% on any excess over $1.5 billion |
||
S&P 500 Index Fund |
0.10% on the first $2.5 billion; |
Northern Trust Investments, Inc. |
0.08% on the next $2.5 billion; and |
||
0.05% on any excess over $5 billion |
||
Equity Opportunities Fund |
0.69% on the first $1 billion; and |
T. Rowe Price Associates, Inc.; and |
0.64% on any excess over $1 billion |
Wellington Management Company LLP |
|
Fundamental Growth Fund |
0.65% on the first $300 million; and |
Wellington Management Company LLP; and |
0.60% on any excess over $300 million |
Westfield Capital Management Company, L.P. |
|
Blue Chip Growth Fund |
0.65% on the first $750 million; and |
Loomis, Sayles & Company, L.P.; and |
0.60% on any excess over $750 million |
T. Rowe Price Associates, Inc. |
|
Growth Opportunities Fund |
0.71% on the first $500 million; and |
Jackson Square Partners, LLC; and |
0.68% on any excess over $500 million |
Sands Capital Management, LLC |
|
Mid Cap Value Fund |
0.70% on the first $300 million; and |
American Century Investment Management, Inc.; |
259
Notes to Financial Statements (Continued) |
Fund |
Investment Advisory Fee |
Investment Subadviser(s) |
0.65% on any excess over $300 million |
PanAgora Asset Management, Inc.; and Thompson, Siegel & Walmsley LLC |
|
Small Cap Value Equity Fund |
0.75% on the first $300 million; and 0.70% on any excess over $300 million |
Barrow, Hanley, Mewhinney & Strauss, LLC; and Wellington Management Company LLP |
Small Company Value Fund |
0.85% on the first $750 million; and |
AllianceBernstein L.P.; and |
0.80% on any excess over $750 million |
American Century Investment Management, Inc. |
|
Mid Cap Growth Fund* |
0.72% on the first $2 billion; and |
Frontier Capital Management Company, LLC; |
0.67% on any excess over $2 billion |
and T. Rowe Price Associates, Inc. |
|
Small Cap Growth Equity Fund |
0.80% on the first $1 billion; and |
Invesco Advisers, Inc.; and Wellington |
0.78% on any excess over $1 billion |
Management Company LLP |
|
Overseas Fund |
0.80% on the first $750 million; |
Harris Associates L.P.; and |
0.775% on the next $500 million; and |
Massachusetts Financial Services Company |
|
0.75% on any excess over $1.25 billion |
||
MM Select T. Rowe Price International Equity Fund** |
0.00% |
T. Rowe Price Associates, Inc. |
|
* |
Effective March 7, 2022, T. Rowe Price Investment Management, Inc. was added as as a sub-subadviser of the Fund. |
|
** |
T. Rowe Price International Ltd, T. Rowe Price Hong Kong Limited, and T. Rowe Price Singapore Private Ltd. each serves as a sub-subadviser of the Fund. |
Administration Fees
Under an Administrative and Shareholder Services Agreement between the Trust and MML Advisers, on behalf of each Fund, MML Advisers is obligated to provide certain administrative and shareholder services. In return for these services, MML Advisers receives an administrative services fee, based upon the average daily net assets of the applicable class of shares of the Funds, at the following annual rates:
Class I |
Class R5 |
Service |
Administrative |
Class R4 |
Class A |
Class R3 |
||||||||||||||||||||||
Total Return Bond Fund |
None | 0.10 | % | 0.20 | % | 0.30 | % | 0.20 | % | 0.30 | % | 0.20 | % | |||||||||||||||
Strategic Bond Fund |
None | 0.10 | % | 0.20 | % | 0.30 | % | 0.20 | % | 0.30 | % | 0.20 | % | |||||||||||||||
Diversified Value Fund |
None | 0.10 | % | 0.20 | % | 0.30 | % | 0.20 | % | 0.30 | % | 0.20 | % | |||||||||||||||
Fundamental Value Fund |
None | 0.10 | % | 0.20 | % | 0.30 | % | 0.20 | % | 0.30 | % | 0.20 | % | |||||||||||||||
S&P 500 Index Fund |
None | 0.10 | % | 0.25 | % | 0.35 | % | 0.25 | % | 0.35 | % | 0.25 | % | |||||||||||||||
Equity Opportunities Fund |
None | 0.10 | % | 0.20 | % | 0.30 | % | 0.20 | % | 0.30 | % | 0.20 | % | |||||||||||||||
Fundamental Growth Fund |
None | 0.10 | % | 0.20 | % | 0.30 | % | 0.20 | % | 0.30 | % | 0.20 | % | |||||||||||||||
Blue Chip Growth Fund |
None | 0.10 | % | 0.20 | % | 0.30 | % | 0.20 | % | 0.30 | % | 0.20 | % | |||||||||||||||
Growth Opportunities Fund |
None | 0.10 | % | 0.20 | % | 0.30 | % | 0.20 | % | 0.30 | % | 0.20 | % | |||||||||||||||
Mid Cap Value Fund |
None | 0.10 | % | 0.20 | % | 0.30 | % | 0.20 | % | 0.30 | % | 0.20 | % | |||||||||||||||
Small Cap Value Equity Fund |
None | 0.10 | % | 0.20 | % | 0.30 | % | 0.20 | % | 0.30 | % | 0.20 | % | |||||||||||||||
Small Company Value Fund |
None | 0.10 | % | 0.20 | % | 0.30 | % | 0.20 | % | 0.30 | % | 0.20 | % | |||||||||||||||
Mid Cap Growth Fund |
None | 0.10 | % | 0.20 | % | 0.30 | % | 0.20 | % | 0.30 | % | 0.20 | % | |||||||||||||||
Small Cap Growth Equity Fund |
None | 0.10 | % | 0.20 | % | 0.30 | % | 0.20 | % | 0.30 | % | 0.20 | % | |||||||||||||||
Overseas Fund |
None | 0.10 | % | 0.20 | % | 0.30 | % | 0.20 | % | 0.30 | % | 0.20 | % | |||||||||||||||
MM Select T. Rowe Price International Equity Fund |
None | N/A | N/A | N/A | N/A | N/A | N/A | |||||||||||||||||||||
Distribution and Service Fees
MML Distributors, LLC (the “Distributor”) acts as distributor to each Fund. Pursuant to a 12b-1 Plan adopted by the Trust, Class R4 shares and Class A shares of each Fund pay an annual fee of 0.25% of the average daily net assets of the class; and Class R3 shares of each Fund pay an annual fee of 0.50% of the average daily net assets of the class, to the Distributor. Such payments
260
Notes to Financial Statements (Continued) |
compensate the Distributor for services provided and expenses incurred by it for purposes of promoting the sale of the relevant class of shares, reducing redemptions of shares, or maintaining or improving services provided to each Fund’s shareholders. The Distributor is a wholly-owned subsidiary of MassMutual.
Expense Caps and Waivers
MML Advisers has agreed to cap the fees and expenses of the Funds noted below (other than extraordinary legal and other expenses, Acquired Fund Fees and Expenses#, interest expense, expenses related to borrowings, securities lending, leverage, taxes, and brokerage, short sale dividend and loan expense, or other non-recurring or unusual expenses such as organizational expenses and shareholder meeting expenses, as applicable), based upon the average daily net assets of the applicable class of shares of the Funds, as follows:
Class I |
Class R5 |
Service |
Administrative |
Class R4 |
Class A |
Class R3 |
||||||||||||||||||||||
Mid Cap Value Fund* |
0.61 | % | 0.71 | % | 0.81 | % | 0.91 | % | 1.06 | % | 1.16 | % | 1.31 | % | ||||||||||||||
Small Company Value Fund* |
0.86 | % | 0.96 | % | 1.06 | % | 1.16 | % | 1.31 | % | 1.41 | % | 1.56 | % | ||||||||||||||
MM Select T. Rowe Price International Equity Fund* |
0.00 | % | N/A | N/A | N/A | N/A | N/A | N/A | ||||||||||||||||||||
|
# |
Acquired Fund Fees and Expenses are borne indirectly by a Fund through investments in other pooled investment vehicles. |
|
* |
Expense caps in effect through January 31, 2023. |
Effective February 1, 2022, MML Advisers has agreed to cap the fees and expenses of the Fund noted below (other than extraordinary legal and other expenses, Acquired Fund Fees and Expenses#, interest expense, expenses related to borrowings, securities lending, leverage, taxes, and brokerage, short sale dividend and loan expense, or other non-recurring or unusual expenses such as organizational expenses and shareholder meeting expenses, as applicable), based upon the average daily net assets of the applicable class of shares of the Fund, as follows:
Class I |
Class R5 |
Service |
Administrative |
Class R4 |
Class A |
Class R3 |
||||||||||||||||||||||
Overseas Fund* |
0.79 | % | 0.89 | % | 0.99 | % | 1.09 | % | 1.24 | % | 1.34 | % | 1.49 | % | ||||||||||||||
|
# |
Acquired Fund Fees and Expenses are borne indirectly by a Fund through investments in other pooled investment vehicles. |
|
* |
Expense caps in effect through January 31, 2023. |
Prior to February 1, 2022, MML Advisers agreed to cap the fees and expenses of the Fund noted below (other than extraordinary litigation and legal expenses, Acquired Fund Fees and Expenses#, interest expense, short sale dividend and loan expense, or other non-recurring or unusual expenses such as organizational expenses and shareholder meeting expenses, as applicable), based upon the average daily net assets of the applicable class of shares of the Fund, as follows:
Class I |
Class R5 |
Service |
Administrative |
Class R4 |
Class A |
Class R3 |
||||||||||||||||||||||
Overseas Fund* |
0.79 | % | 0.89 | % | 0.99 | % | 1.09 | % | 1.24 | % | 1.34 | % | 1.49 | % | ||||||||||||||
|
# |
Acquired Fund Fees and Expenses are borne indirectly by a Fund through investments in other pooled investment vehicles. |
|
* |
Expense caps in effect through January 31, 2022. |
MML Advisers has agreed to waive 0.03% of the investment advisory fees of the Total Return Bond Fund through January 31, 2023.
MML Advisers has agreed to waive 0.05% of the investment advisory fees of the Strategic Bond Fund through January 31, 2023.
261
Notes to Financial Statements (Continued) |
MML Advisers has agreed to waive 0.02% of the investment advisory fees of the Growth Opportunities Fund through January 31, 2023.
Effective March 31, 2022, MML Advisers has agreed to waive 0.05% of the investment advisory fees of the Mid Cap Growth Fund through January 31, 2024.
Effective July 1, 2022, MML Advisers has agreed to waive 0.05% of the investment advisory fees of the Fundamental Growth Fund through January 31, 2024.
Expense caps and waiver amounts are reflected as a reduction of expenses on the Statements of Operations.
Rebated Brokerage Commissions
The Funds listed below have entered into agreements with certain brokers whereby the brokers will rebate to the Funds, in cash, a portion of brokerage commissions. Rebated brokerage commissions are amounts earned by the Funds and are included with realized gain or loss on investment transactions presented in the Statements of Operations. For the year ended September 30, 2022, brokerage commissions rebated under these agreements were as follows:
Rebated |
||||
Diversified Value Fund |
$ | 5,421 | ||
Fundamental Value Fund |
773 | |||
Equity Opportunities Fund |
337 | |||
Fundamental Growth Fund |
2,378 | |||
Blue Chip Growth Fund |
22,861 | |||
Growth Opportunities Fund |
5,269 | |||
Mid Cap Value Fund |
1,792 | |||
Small Cap Value Equity Fund |
480 | |||
Mid Cap Growth Fund |
83,365 | |||
Small Cap Growth Equity Fund |
14,031 | |||
Deferred Compensation
Trustees of the Funds who are not officers or employees of MassMutual may elect to defer receipt of their annual fees in accordance with terms of a Non-Qualified Deferred Compensation Plan. Amounts deferred shall accrue interest or earnings and shall be recorded on the Funds’ books as other liabilities. Deferred compensation is included within Trustees’ fees and expenses in the Statements of Assets and Liabilities.
Other
Certain officers and trustees of the Funds may also be employees of MassMutual. The compensation of a trustee who is not an employee of MassMutual is borne by the Funds.
The following table shows beneficial ownership of Funds’ shares by related parties at September 30, 2022:
Total % Ownership |
||||
Total Return Bond Fund |
80.8 | % | ||
Strategic Bond Fund |
95.4 | % | ||
Diversified Value Fund |
93.8 | % | ||
262
Notes to Financial Statements (Continued) |
Total % Ownership |
||||
Fundamental Value Fund |
96.6 | % | ||
S&P 500 Index Fund |
92.6 | % | ||
Equity Opportunities Fund |
88.4 | % | ||
Fundamental Growth Fund |
90.5 | % | ||
Blue Chip Growth Fund |
87.6 | % | ||
Growth Opportunities Fund |
91.5 | % | ||
Mid Cap Value Fund |
96.5 | % | ||
Small Cap Value Equity Fund |
89.3 | % | ||
Small Company Value Fund |
91.5 | % | ||
Mid Cap Growth Fund |
71.1 | % | ||
Small Cap Growth Equity Fund |
82.9 | % | ||
Overseas Fund |
83.2 | % | ||
MM Select T. Rowe Price International Equity Fund |
100.0 | % | ||
4. Purchases and Sales of Investments
Cost of purchases and proceeds from sales of investment securities (excluding short-term investments) for the year ended September 30, 2022, were as follows:
Purchases |
Sales |
|||||||||||||||
Long- |
Other |
Long- |
Other |
|||||||||||||
Total Return Bond Fund |
$ | 3,776,593,685 | $ | 224,974,737 | $ | 3,856,277,715 | $ | 140,629,620 | ||||||||
Strategic Bond Fund |
531,045,186 | 45,161,011 | 478,007,852 | 147,084,807 | ||||||||||||
Diversified Value Fund |
— | 152,074,989 | — | 220,412,742 | ||||||||||||
Fundamental Value Fund |
— | 160,122,944 | — | 287,547,521 | ||||||||||||
S&P 500 Index Fund |
— | 56,010,393 | — | 877,807,804 | ||||||||||||
Equity Opportunities Fund |
— | 172,727,295 | — | 329,533,858 | ||||||||||||
Fundamental Growth Fund |
— | 27,621,698 | — | 41,393,771 | ||||||||||||
Blue Chip Growth Fund |
— | 556,933,914 | — | 1,038,939,179 | ||||||||||||
Growth Opportunities Fund |
— | 102,823,456 | — | 160,068,314 | ||||||||||||
Mid Cap Value Fund |
— | 94,247,762 | — | 99,856,925 | ||||||||||||
Small Cap Value Equity Fund |
— | 27,034,942 | — | 32,745,534 | ||||||||||||
Small Company Value Fund |
— | 108,192,287 | — | 143,159,735 | ||||||||||||
Mid Cap Growth Fund |
— | 1,545,107,070 | — | 3,537,058,886 | ||||||||||||
Small Cap Growth Equity Fund |
— | 475,674,049 | — | 523,709,298 | ||||||||||||
Overseas Fund |
— | 94,719,179 | — | 207,558,573 | ||||||||||||
MM Select T. Rowe Price International Equity Fund |
— | 556,982,177 | — | 494,572,891 | ||||||||||||
263
Notes to Financial Statements (Continued) |
The Funds may purchase from, or sell securities to, other affiliated Funds under procedures adopted by the Trustees. These procedures have been designed to ensure that cross trades conducted by the Funds comply with Rule 17a-7 under the 1940 Act. The cross trades disclosed in the table below are included within the respective purchases and sales amounts shown in the table above, as applicable.
Purchases |
Sales |
Realized |
||||||||||
Equity Opportunities Fund |
$ | — | $ | 5,055,917 | $ | 2,020,515 | ||||||
Blue Chip Growth Fund |
— | 2,525,761 | 609,593 | |||||||||
Mid Cap Value Fund |
50,474 | — | — | |||||||||
Mid Cap Growth Fund |
1,642,438 | 3,281,933 | 1,365,506 | |||||||||
Small Cap Growth Equity Fund |
81,579 | 56,485 | 19,180 | |||||||||
Overseas Fund |
— | 294,018 | 3,566 | |||||||||
International Equity Fund |
— | 3,585 | (55,128 | ) | ||||||||
5. Capital Share Transactions
Changes in shares outstanding for each Fund were as follows:
Year Ended September 30, 2022 |
Year Ended September 30, 2021 |
|||||||||||||||
Shares |
Amount |
Shares |
Amount |
|||||||||||||
Total Return Bond Fund Class I |
||||||||||||||||
Sold |
19,268,431 | $ | 180,631,888 | 19,146,497 | $ | 197,586,295 | ||||||||||
Issued as reinvestment of dividends |
1,213,926 | 12,175,679 | 3,517,569 | 36,195,787 | ||||||||||||
Redeemed |
(21,180,830 | ) | (200,785,705 | ) | (13,402,414 | ) | (137,618,946 | ) | ||||||||
Net increase (decrease) |
(698,473 | ) | $ | (7,978,138 | ) | 9,261,652 | $ | 96,163,136 | ||||||||
Total Return Bond Fund Class R5 |
||||||||||||||||
Sold |
378,114 | $ | 3,440,340 | 966,646 | $ | 9,943,955 | ||||||||||
Issued as reinvestment of dividends |
62,806 | 629,319 | 212,366 | 2,183,127 | ||||||||||||
Redeemed |
(1,286,666 | ) | (12,380,678 | ) | (807,001 | ) | (8,293,426 | ) | ||||||||
Net increase (decrease) |
(845,746 | ) | $ | (8,311,019 | ) | 372,011 | $ | 3,833,656 | ||||||||
Total Return Bond Fund Service Class |
||||||||||||||||
Sold |
609,708 | $ | 5,754,384 | 2,109,996 | $ | 22,504,731 | ||||||||||
Issued as reinvestment of dividends |
101,251 | 1,020,606 | 466,054 | 4,814,337 | ||||||||||||
Redeemed |
(1,764,330 | ) | (17,226,101 | ) | (4,257,688 | ) | (44,924,719 | ) | ||||||||
Net increase (decrease) |
(1,053,371 | ) | $ | (10,451,111 | ) | (1,681,638 | ) | $ | (17,605,651 | ) | ||||||
Total Return Bond Fund Administrative Class |
||||||||||||||||
Sold |
486,547 | $ | 4,764,503 | 473,476 | $ | 4,887,313 | ||||||||||
Issued as reinvestment of dividends |
27,027 | 271,077 | 104,814 | 1,077,493 | ||||||||||||
Redeemed |
(1,321,362 | ) | (12,658,648 | ) | (591,870 | ) | (6,140,528 | ) | ||||||||
Net increase (decrease) |
(807,788 | ) | $ | (7,623,068 | ) | (13,580 | ) | $ | (175,722 | ) | ||||||
Total Return Bond Fund Class R4 |
||||||||||||||||
Sold |
687,484 | $ | 6,518,995 | 1,619,080 | $ | 16,849,147 | ||||||||||
Issued as reinvestment of dividends |
102,618 | 1,037,468 | 509,982 | 5,283,413 | ||||||||||||
Redeemed |
(2,280,633 | ) | (21,868,114 | ) | (3,756,435 | ) | (38,734,808 | ) | ||||||||
Net increase (decrease) |
(1,490,531 | ) | $ | (14,311,651 | ) | (1,627,373 | ) | $ | (16,602,248 | ) | ||||||
Total Return Bond Fund Class A |
||||||||||||||||
Sold |
371,616 | $ | 3,438,059 | 485,232 | $ | 4,955,544 | ||||||||||
Issued as reinvestment of dividends |
15,120 | 151,047 | 58,109 | 595,039 | ||||||||||||
Redeemed |
(203,610 | ) | (1,898,829 | ) | (448,655 | ) | (4,582,335 | ) | ||||||||
Net increase (decrease) |
183,126 | $ | 1,690,277 | 94,686 | $ | 968,248 | ||||||||||
264
Notes to Financial Statements (Continued) |
Year Ended September 30, 2022 |
Year Ended September 30, 2021 |
|||||||||||||||
Shares |
Amount |
Shares |
Amount |
|||||||||||||
Total Return Bond Fund Class R3 |
||||||||||||||||
Sold |
521,332 | $ | 4,807,515 | 457,819 | $ | 4,729,647 | ||||||||||
Issued as reinvestment of dividends |
23,412 | 234,819 | 140,483 | 1,444,165 | ||||||||||||
Redeemed |
(643,656 | ) | (6,041,703 | ) | (980,562 | ) | (10,022,079 | ) | ||||||||
Net increase (decrease) |
(98,912 | ) | $ | (999,369 | ) | (382,260 | ) | $ | (3,848,267 | ) | ||||||
Strategic Bond Fund Class I |
||||||||||||||||
Sold |
8,671,159 | $ | 83,748,590 | 9,792,877 | $ | 107,787,429 | ||||||||||
Issued as reinvestment of dividends |
1,975,931 | 20,292,814 | 2,100,242 | 23,039,656 | ||||||||||||
Redeemed |
(16,636,543 | ) | (166,221,430 | ) | (12,641,185 | ) | (138,155,152 | ) | ||||||||
Net increase (decrease) |
(5,989,453 | ) | $ | (62,180,026 | ) | (748,066 | ) | $ | (7,328,067 | ) | ||||||
Strategic Bond Fund Class R5 |
||||||||||||||||
Sold |
750,285 | $ | 7,330,910 | 1,720,310 | $ | 18,754,867 | ||||||||||
Issued as reinvestment of dividends |
442,257 | 4,546,406 | 427,829 | 4,697,559 | ||||||||||||
Redeemed |
(2,525,557 | ) | (25,279,391 | ) | (2,458,439 | ) | (26,976,452 | ) | ||||||||
Net increase (decrease) |
(1,333,015 | ) | $ | (13,402,075 | ) | (310,300 | ) | $ | (3,524,026 | ) | ||||||
Strategic Bond Fund Service Class |
||||||||||||||||
Sold |
1,963,475 | $ | 21,120,432 | 703,441 | $ | 7,620,821 | ||||||||||
Issued as reinvestment of dividends |
254,816 | 2,619,511 | 175,067 | 1,923,985 | ||||||||||||
Redeemed |
(999,065 | ) | (9,859,838 | ) | (1,543,663 | ) | (16,792,426 | ) | ||||||||
Net increase (decrease) |
1,219,226 | $ | 13,880,105 | (665,155 | ) | $ | (7,247,620 | ) | ||||||||
Strategic Bond Fund Administrative Class |
||||||||||||||||
Sold |
300,891 | $ | 2,938,333 | 2,372,820 | $ | 25,699,371 | ||||||||||
Issued as reinvestment of dividends |
186,209 | 1,912,369 | 341,132 | 3,735,392 | ||||||||||||
Redeemed |
(2,794,950 | ) | (28,772,119 | ) | (4,280,361 | ) | (46,186,805 | ) | ||||||||
Net increase (decrease) |
(2,307,850 | ) | $ | (23,921,417 | ) | (1,566,409 | ) | $ | (16,752,042 | ) | ||||||
Strategic Bond Fund Class R4 |
||||||||||||||||
Sold |
296,853 | $ | 2,867,133 | 653,572 | $ | 7,092,970 | ||||||||||
Issued as reinvestment of dividends |
160,353 | 1,635,600 | 218,994 | 2,384,840 | ||||||||||||
Redeemed |
(2,078,364 | ) | (20,917,479 | ) | (1,470,051 | ) | (15,956,354 | ) | ||||||||
Net increase (decrease) |
(1,621,158 | ) | $ | (16,414,746 | ) | (597,485 | ) | $ | (6,478,544 | ) | ||||||
Strategic Bond Fund Class A |
||||||||||||||||
Sold |
140,027 | $ | 1,346,776 | 1,496,947 | $ | 16,640,515 | ||||||||||
Issued as reinvestment of dividends |
106,519 | 1,093,950 | 290,574 | 3,173,070 | ||||||||||||
Redeemed |
(1,344,105 | ) | (13,794,021 | ) | (4,394,795 | ) | (47,670,756 | ) | ||||||||
Net increase (decrease) |
(1,097,559 | ) | $ | (11,353,295 | ) | (2,607,274 | ) | $ | (27,857,171 | ) | ||||||
Strategic Bond Fund Class R3 |
||||||||||||||||
Sold |
168,015 | $ | 1,599,808 | 319,656 | $ | 3,425,685 | ||||||||||
Issued as reinvestment of dividends |
39,151 | 396,988 | 65,090 | 702,974 | ||||||||||||
Redeemed |
(656,488 | ) | (6,671,990 | ) | (727,933 | ) | (7,839,830 | ) | ||||||||
Net increase (decrease) |
(449,322 | ) | $ | (4,675,194 | ) | (343,187 | ) | $ | (3,711,171 | ) | ||||||
Diversified Value Fund Class I |
||||||||||||||||
Sold |
3,280,888 | $ | 42,214,632 | 4,766,409 | $ | 58,517,759 | ||||||||||
Issued as reinvestment of dividends |
2,269,879 | 28,645,872 | 438,410 | 4,826,890 | ||||||||||||
Redeemed |
(7,093,566 | ) | (86,654,446 | ) | (8,179,237 | ) | (104,349,524 | ) | ||||||||
Net increase (decrease) |
(1,542,799 | ) | $ | (15,793,942 | ) | (2,974,418 | ) | $ | (41,004,875 | ) | ||||||
Diversified Value Fund Class R5 |
||||||||||||||||
Sold |
529,104 | $ | 6,772,798 | 645,349 | $ | 8,129,226 | ||||||||||
Issued as reinvestment of dividends |
670,394 | 8,493,887 | 129,280 | 1,427,247 | ||||||||||||
Redeemed |
(1,973,294 | ) | (25,615,700 | ) | (1,925,876 | ) | (23,438,048 | ) | ||||||||
Net increase (decrease) |
(773,796 | ) | $ | (10,349,015 | ) | (1,151,247 | ) | $ | (13,881,575 | ) | ||||||
265
Notes to Financial Statements (Continued) |
Year Ended September 30, 2022 |
Year Ended September 30, 2021 |
|||||||||||||||
Shares |
Amount |
Shares |
Amount |
|||||||||||||
Diversified Value Fund Service Class |
||||||||||||||||
Sold |
119,767 | $ | 1,525,851 | 164,512 | $ | 2,075,082 | ||||||||||
Issued as reinvestment of dividends |
148,207 | 1,877,787 | 28,106 | 310,576 | ||||||||||||
Redeemed |
(291,952 | ) | (3,716,380 | ) | (481,322 | ) | (5,811,081 | ) | ||||||||
Net increase (decrease) |
(23,978 | ) | $ | (312,742 | ) | (288,704 | ) | $ | (3,425,423 | ) | ||||||
Diversified Value Fund Administrative Class |
||||||||||||||||
Sold |
197,859 | $ | 2,566,448 | 347,161 | $ | 4,457,155 | ||||||||||
Issued as reinvestment of dividends |
189,400 | 2,424,318 | 30,457 | 339,296 | ||||||||||||
Redeemed |
(437,980 | ) | (5,708,549 | ) | (450,291 | ) | (5,434,054 | ) | ||||||||
Net increase (decrease) |
(50,721 | ) | $ | (717,783 | ) | (72,673 | ) | $ | (637,603 | ) | ||||||
Diversified Value Fund Class R4 |
||||||||||||||||
Sold |
102,763 | $ | 1,297,321 | 271,872 | $ | 3,106,319 | ||||||||||
Issued as reinvestment of dividends |
123,743 | 1,536,882 | 18,255 | 198,248 | ||||||||||||
Redeemed |
(348,040 | ) | (4,308,864 | ) | (350,322 | ) | (4,176,440 | ) | ||||||||
Net increase (decrease) |
(121,534 | ) | $ | (1,474,661 | ) | (60,195 | ) | $ | (871,873 | ) | ||||||
Diversified Value Fund Class A |
||||||||||||||||
Sold |
157,190 | $ | 2,007,522 | 421,139 | $ | 5,205,137 | ||||||||||
Issued as reinvestment of dividends |
247,566 | 3,136,659 | 45,661 | 504,096 | ||||||||||||
Redeemed |
(391,831 | ) | (5,041,824 | ) | (1,271,123 | ) | (16,100,131 | ) | ||||||||
Net increase (decrease) |
12,925 | $ | 102,357 | (804,323 | ) | $ | (10,390,898 | ) | ||||||||
Diversified Value Fund Class R3 |
||||||||||||||||
Sold |
61,871 | $ | 732,416 | 30,422 | $ | 403,152 | ||||||||||
Issued as reinvestment of dividends |
10,368 | 130,528 | 2,246 | 24,615 | ||||||||||||
Redeemed |
(23,859 | ) | (303,118 | ) | (104,228 | ) | (1,328,709 | ) | ||||||||
Net increase (decrease) |
48,380 | $ | 559,826 | (71,560 | ) | $ | (900,942 | ) | ||||||||
Fundamental Value Fund Class I |
||||||||||||||||
Sold |
4,154,703 | $ | 41,232,959 | 6,014,795 | $ | 58,173,128 | ||||||||||
Issued as reinvestment of dividends |
4,341,734 | 42,679,244 | 600,383 | 5,157,291 | ||||||||||||
Redeemed |
(9,716,082 | ) | (93,982,026 | ) | (8,589,850 | ) | (82,578,233 | ) | ||||||||
Net increase (decrease) |
(1,219,645 | ) | $ | (10,069,823 | ) | (1,974,672 | ) | $ | (19,247,814 | ) | ||||||
Fundamental Value Fund Class R5 |
||||||||||||||||
Sold |
598,274 | $ | 6,029,023 | 1,298,021 | $ | 13,009,525 | ||||||||||
Issued as reinvestment of dividends |
1,353,266 | 13,424,402 | 271,793 | 2,353,725 | ||||||||||||
Redeemed |
(4,483,140 | ) | (43,811,168 | ) | (8,416,442 | ) | (84,928,696 | ) | ||||||||
Net increase (decrease) |
(2,531,600 | ) | $ | (24,357,743 | ) | (6,846,628 | ) | $ | (69,565,446 | ) | ||||||
Fundamental Value Fund Service Class |
||||||||||||||||
Sold |
660,330 | $ | 6,723,705 | 715,166 | $ | 7,256,979 | ||||||||||
Issued as reinvestment of dividends |
371,015 | 3,658,211 | 41,902 | 360,779 | ||||||||||||
Redeemed |
(810,851 | ) | (8,123,158 | ) | (778,059 | ) | (7,338,666 | ) | ||||||||
Net increase (decrease) |
220,494 | $ | 2,258,758 | (20,991 | ) | $ | 279,092 | |||||||||
Fundamental Value Fund Administrative Class |
||||||||||||||||
Sold |
197,766 | $ | 2,026,958 | 594,754 | $ | 5,712,661 | ||||||||||
Issued as reinvestment of dividends |
555,561 | 5,544,501 | 95,972 | 834,960 | ||||||||||||
Redeemed |
(2,451,430 | ) | (24,385,138 | ) | (3,661,979 | ) | (35,397,364 | ) | ||||||||
Net increase (decrease) |
(1,698,103 | ) | $ | (16,813,679 | ) | (2,971,253 | ) | $ | (28,849,743 | ) | ||||||
Fundamental Value Fund Class R4 |
||||||||||||||||
Sold |
227,033 | $ | 2,098,750 | 50,328 | $ | 473,808 | ||||||||||
Issued as reinvestment of dividends |
119,651 | 1,143,866 | 13,737 | 115,118 | ||||||||||||
Redeemed |
(787,028 | ) | (7,459,941 | ) | (187,920 | ) | (1,797,952 | ) | ||||||||
Net increase (decrease) |
(440,344 | ) | $ | (4,217,325 | ) | (123,855 | ) | $ | (1,209,026 | ) | ||||||
266
Notes to Financial Statements (Continued) |
Year Ended September 30, 2022 |
Year Ended September 30, 2021 |
|||||||||||||||
Shares |
Amount |
Shares |
Amount |
|||||||||||||
Fundamental Value Fund Class A |
||||||||||||||||
Sold |
276,458 | $ | 2,756,626 | 393,724 | $ | 3,933,994 | ||||||||||
Issued as reinvestment of dividends |
380,538 | 3,733,076 | 43,766 | 375,073 | ||||||||||||
Redeemed |
(1,199,674 | ) | (12,060,192 | ) | (1,869,795 | ) | (17,194,023 | ) | ||||||||
Net increase (decrease) |
(542,678 | ) | $ | (5,570,490 | ) | (1,432,305 | ) | $ | (12,884,956 | ) | ||||||
Fundamental Value Fund Class R3 |
||||||||||||||||
Sold |
36,870 | $ | 351,938 | 78,733 | $ | 805,088 | ||||||||||
Issued as reinvestment of dividends |
19,872 | 189,182 | 1,242 | 10,379 | ||||||||||||
Redeemed |
(62,987 | ) | (617,005 | ) | (50,502 | ) | (483,004 | ) | ||||||||
Net increase (decrease) |
(6,245 | ) | $ | (75,885 | ) | 29,473 | $ | 332,463 | ||||||||
S&P 500 Index Fund Class I |
||||||||||||||||
Sold |
12,415,578 | $ | 241,988,303 | 17,260,205 | $ | 347,463,609 | ||||||||||
Issued as reinvestment of dividends |
8,976,077 | 184,009,587 | 10,266,209 | 184,586,442 | ||||||||||||
Redeemed |
(34,517,227 | ) | (681,286,807 | ) | (20,521,046 | ) | (413,010,371 | ) | ||||||||
Net increase (decrease) |
(13,125,572 | ) | $ | (255,288,917 | ) | 7,005,368 | $ | 119,039,680 | ||||||||
S&P 500 Index Fund Class R5 |
||||||||||||||||
Sold |
2,177,188 | $ | 43,135,931 | 1,891,528 | $ | 38,627,265 | ||||||||||
Issued as reinvestment of dividends |
2,943,930 | 60,703,846 | 3,454,763 | 62,427,564 | ||||||||||||
Redeemed |
(8,254,438 | ) | (156,352,532 | ) | (4,944,523 | ) | (100,762,117 | ) | ||||||||
Net increase (decrease) |
(3,133,320 | ) | $ | (52,512,755 | ) | 401,768 | $ | 292,712 | ||||||||
S&P 500 Index Fund Service Class |
||||||||||||||||
Sold |
1,764,830 | $ | 35,213,022 | 2,704,969 | $ | 55,210,299 | ||||||||||
Issued as reinvestment of dividends |
2,214,870 | 45,847,810 | 3,123,958 | 56,637,356 | ||||||||||||
Redeemed |
(5,944,281 | ) | (114,741,532 | ) | (8,306,556 | ) | (167,410,998 | ) | ||||||||
Net increase (decrease) |
(1,964,581 | ) | $ | (33,680,700 | ) | (2,477,629 | ) | $ | (55,563,343 | ) | ||||||
S&P 500 Index Fund Administrative Class |
||||||||||||||||
Sold |
1,481,165 | $ | 28,550,360 | 1,845,338 | $ | 37,527,075 | ||||||||||
Issued as reinvestment of dividends |
2,159,450 | 43,469,722 | 3,211,009 | 56,802,753 | ||||||||||||
Redeemed |
(7,419,879 | ) | (146,053,042 | ) | (7,090,273 | ) | (140,951,560 | ) | ||||||||
Net increase (decrease) |
(3,779,264 | ) | $ | (74,032,960 | ) | (2,033,926 | ) | $ | (46,621,732 | ) | ||||||
S&P 500 Index Fund Class R4 |
||||||||||||||||
Sold |
2,805,251 | $ | 52,122,826 | 2,912,407 | $ | 56,820,281 | ||||||||||
Issued as reinvestment of dividends |
3,028,215 | 59,837,538 | 4,668,157 | 81,225,926 | ||||||||||||
Redeemed |
(7,958,794 | ) | (153,817,832 | ) | (13,658,676 | ) | (266,752,268 | ) | ||||||||
Net increase (decrease) |
(2,125,328 | ) | $ | (41,857,468 | ) | (6,078,112 | ) | $ | (128,706,061 | ) | ||||||
S&P 500 Index Fund Class A |
||||||||||||||||
Sold |
420,533 | $ | 7,396,269 | 272,433 | $ | 5,131,189 | ||||||||||
Issued as reinvestment of dividends |
147,358 | 2,886,746 | 216,289 | 3,735,318 | ||||||||||||
Redeemed |
(618,869 | ) | (12,236,711 | ) | (525,326 | ) | (10,290,915 | ) | ||||||||
Net increase (decrease) |
(50,978 | ) | $ | (1,953,696 | ) | (36,604 | ) | $ | (1,424,408 | ) | ||||||
S&P 500 Index Fund Class R3 |
||||||||||||||||
Sold |
2,786,022 | $ | 50,256,371 | 3,895,891 | $ | 74,728,360 | ||||||||||
Issued as reinvestment of dividends |
1,929,310 | 36,541,127 | 2,006,301 | 33,665,725 | ||||||||||||
Redeemed |
(3,837,904 | ) | (69,036,604 | ) | (4,151,692 | ) | (78,531,536 | ) | ||||||||
Net increase (decrease) |
877,428 | $ | 17,760,894 | 1,750,500 | $ | 29,862,549 | ||||||||||
Equity Opportunities Fund Class I |
||||||||||||||||
Sold |
2,195,204 | $ | 42,163,425 | 2,342,051 | $ | 44,627,814 | ||||||||||
Issued as reinvestment of dividends |
2,666,804 | 51,816,002 | 1,667,804 | 29,303,320 | ||||||||||||
Redeemed |
(5,006,569 | ) | (95,771,081 | ) | (5,915,556 | ) | (112,583,197 | ) | ||||||||
Net increase (decrease) |
(144,561 | ) | $ | (1,791,654 | ) | (1,905,701 | ) | $ | (38,652,063 | ) | ||||||
267
Notes to Financial Statements (Continued) |
Year Ended September 30, 2022 |
Year Ended September 30, 2021 |
|||||||||||||||
Shares |
Amount |
Shares |
Amount |
|||||||||||||
Equity Opportunities Fund Class R5 |
||||||||||||||||
Sold |
1,027,695 | $ | 19,913,069 | 842,306 | $ | 15,151,904 | ||||||||||
Issued as reinvestment of dividends |
978,951 | 19,138,493 | 641,043 | 11,320,812 | ||||||||||||
Redeemed |
(5,111,865 | ) | (97,154,414 | ) | (2,362,507 | ) | (44,671,477 | ) | ||||||||
Net increase (decrease) |
(3,105,219 | ) | $ | (58,102,852 | ) | (879,158 | ) | $ | (18,198,761 | ) | ||||||
Equity Opportunities Fund Service Class |
||||||||||||||||
Sold |
147,025 | $ | 2,787,131 | 376,730 | $ | 6,983,511 | ||||||||||
Issued as reinvestment of dividends |
290,928 | 5,530,550 | 177,650 | 3,060,907 | ||||||||||||
Redeemed |
(681,168 | ) | (12,564,987 | ) | (1,048,051 | ) | (18,456,209 | ) | ||||||||
Net increase (decrease) |
(243,215 | ) | $ | (4,247,306 | ) | (493,671 | ) | $ | (8,411,791 | ) | ||||||
Equity Opportunities Fund Administrative Class |
||||||||||||||||
Sold |
130,689 | $ | 2,377,512 | 620,927 | $ | 11,214,685 | ||||||||||
Issued as reinvestment of dividends |
340,670 | 6,343,270 | 183,645 | 3,107,276 | ||||||||||||
Redeemed |
(998,655 | ) | (18,063,262 | ) | (858,899 | ) | (15,618,305 | ) | ||||||||
Net increase (decrease) |
(527,296 | ) | $ | (9,342,480 | ) | (54,327 | ) | $ | (1,296,344 | ) | ||||||
Equity Opportunities Fund Class R4 |
||||||||||||||||
Sold |
69,873 | $ | 1,187,174 | 58,146 | $ | 972,979 | ||||||||||
Issued as reinvestment of dividends |
65,235 | 1,104,425 | 41,202 | 641,099 | ||||||||||||
Redeemed |
(185,953 | ) | (3,141,405 | ) | (177,306 | ) | (2,914,318 | ) | ||||||||
Net increase (decrease) |
(50,845 | ) | $ | (849,806 | ) | (77,958 | ) | $ | (1,300,240 | ) | ||||||
Equity Opportunities Fund Class A |
||||||||||||||||
Sold |
111,063 | $ | 1,913,973 | 286,817 | $ | 4,880,640 | ||||||||||
Issued as reinvestment of dividends |
367,584 | 6,384,936 | 258,475 | 4,112,340 | ||||||||||||
Redeemed |
(832,793 | ) | (14,474,766 | ) | (1,193,610 | ) | (20,822,672 | ) | ||||||||
Net increase (decrease) |
(354,146 | ) | $ | (6,175,857 | ) | (648,318 | ) | $ | (11,829,692 | ) | ||||||
Equity Opportunities Fund Class R3 |
||||||||||||||||
Sold |
162,725 | $ | 2,434,201 | 88,794 | $ | 1,445,005 | ||||||||||
Issued as reinvestment of dividends |
29,567 | 456,521 | 19,486 | 280,015 | ||||||||||||
Redeemed |
(82,307 | ) | (1,240,187 | ) | (151,917 | ) | (2,414,261 | ) | ||||||||
Net increase (decrease) |
109,985 | $ | 1,650,535 | (43,637 | ) | $ | (689,241 | ) | ||||||||
Fundamental Growth Fund Class I |
||||||||||||||||
Sold |
759,136 | $ | 3,067,412 | 1,285,417 | $ | 8,075,228 | ||||||||||
Issued as reinvestment of dividends |
741,150 | 3,135,065 | 1,160,169 | 6,380,932 | ||||||||||||
Redeemed |
(2,786,328 | ) | (10,380,409 | ) | (1,742,122 | ) | (10,457,592 | ) | ||||||||
Net increase (decrease) |
(1,286,042 | ) | $ | (4,177,932 | ) | 703,464 | $ | 3,998,568 | ||||||||
Fundamental Growth Fund Class R5 |
||||||||||||||||
Sold |
114,385 | $ | 480,384 | 237,897 | $ | 1,631,222 | ||||||||||
Issued as reinvestment of dividends |
669,002 | 2,856,640 | 1,092,737 | 6,053,760 | ||||||||||||
Redeemed |
(881,784 | ) | (3,471,140 | ) | (1,059,599 | ) | (6,358,554 | ) | ||||||||
Net increase (decrease) |
(98,397 | ) | $ | (134,116 | ) | 271,035 | $ | 1,326,428 | ||||||||
Fundamental Growth Fund Service Class |
||||||||||||||||
Sold |
142,141 | $ | 531,470 | 96,110 | $ | 571,166 | ||||||||||
Issued as reinvestment of dividends |
457,949 | 1,799,739 | 579,443 | 3,030,485 | ||||||||||||
Redeemed |
(209,547 | ) | (937,098 | ) | (314,225 | ) | (1,884,842 | ) | ||||||||
Net increase (decrease) |
390,543 | $ | 1,394,111 | 361,328 | $ | 1,716,809 | ||||||||||
Fundamental Growth Fund Administrative Class |
||||||||||||||||
Sold |
103,196 | $ | 343,927 | 228,849 | $ | 1,235,015 | ||||||||||
Issued as reinvestment of dividends |
662,161 | 2,350,670 | 1,380,760 | 6,751,917 | ||||||||||||
Redeemed |
(386,854 | ) | (1,481,843 | ) | (1,865,226 | ) | (10,344,812 | ) | ||||||||
Net increase (decrease) |
378,503 | $ | 1,212,754 | (255,617 | ) | $ | (2,357,880 | ) | ||||||||
268
Notes to Financial Statements (Continued) |
Year Ended September 30, 2022 |
Year Ended September 30, 2021 |
|||||||||||||||
Shares |
Amount |
Shares |
Amount |
|||||||||||||
Fundamental Growth Fund Class R4 |
||||||||||||||||
Sold |
151,138 | $ | 336,164 | 43,223 | $ | 201,697 | ||||||||||
Issued as reinvestment of dividends |
199,206 | 539,848 | 187,400 | 772,086 | ||||||||||||
Redeemed |
(78,108 | ) | (284,532 | ) | (93,402 | ) | (500,263 | ) | ||||||||
Net increase (decrease) |
272,236 | $ | 591,480 | 137,221 | $ | 473,520 | ||||||||||
Fundamental Growth Fund Class A |
||||||||||||||||
Sold |
212,935 | $ | 564,827 | 189,500 | $ | 906,932 | ||||||||||
Issued as reinvestment of dividends |
1,515,834 | 4,304,968 | 1,822,352 | 7,726,774 | ||||||||||||
Redeemed |
(868,878 | ) | (2,789,699 | ) | (1,402,788 | ) | (7,292,641 | ) | ||||||||
Net increase (decrease) |
859,891 | $ | 2,080,096 | 609,064 | $ | 1,341,065 | ||||||||||
Fundamental Growth Fund Class R3 |
||||||||||||||||
Sold |
298,513 | $ | 505,343 | 204,225 | $ | 737,635 | ||||||||||
Issued as reinvestment of dividends |
397,548 | 735,465 | 530,015 | 1,759,650 | ||||||||||||
Redeemed |
(267,063 | ) | (463,415 | ) | (746,314 | ) | (2,772,047 | ) | ||||||||
Net increase (decrease) |
428,998 | $ | 777,393 | (12,074 | ) | $ | (274,762 | ) | ||||||||
Blue Chip Growth Fund Class I |
||||||||||||||||
Sold |
9,673,480 | $ | 241,938,987 | 9,208,665 | $ | 288,635,407 | ||||||||||
Issued as reinvestment of dividends |
17,779,562 | 505,650,751 | 4,344,635 | 127,384,702 | ||||||||||||
Redeemed |
(17,057,755 | ) | (437,365,948 | ) | (24,822,276 | ) | (790,026,118 | ) | ||||||||
Net increase (decrease) |
10,395,287 | $ | 310,223,790 | (11,268,976 | ) | $ | (374,006,009 | ) | ||||||||
Blue Chip Growth Fund Class R5 |
||||||||||||||||
Sold |
1,236,217 | $ | 30,016,798 | 2,679,809 | $ | 82,658,186 | ||||||||||
Issued as reinvestment of dividends |
3,858,828 | 109,320,598 | 983,773 | 28,785,200 | ||||||||||||
Redeemed |
(5,586,636 | ) | (149,357,985 | ) | (6,199,890 | ) | (196,931,948 | ) | ||||||||
Net increase (decrease) |
(491,591 | ) | $ | (10,020,589 | ) | (2,536,308 | ) | $ | (85,488,562 | ) | ||||||
Blue Chip Growth Fund Service Class |
||||||||||||||||
Sold |
772,920 | $ | 17,294,659 | 1,223,525 | $ | 37,332,066 | ||||||||||
Issued as reinvestment of dividends |
1,390,201 | 38,828,325 | 320,599 | 9,281,346 | ||||||||||||
Redeemed |
(1,829,132 | ) | (43,031,432 | ) | (1,731,897 | ) | (53,422,350 | ) | ||||||||
Net increase (decrease) |
333,989 | $ | 13,091,552 | (187,773 | ) | $ | (6,808,938 | ) | ||||||||
Blue Chip Growth Fund Administrative Class |
||||||||||||||||
Sold |
569,232 | $ | 12,944,622 | 1,382,931 | $ | 43,389,745 | ||||||||||
Issued as reinvestment of dividends |
2,315,836 | 63,222,321 | 634,937 | 18,063,967 | ||||||||||||
Redeemed |
(4,007,587 | ) | (103,667,274 | ) | (5,159,799 | ) | (157,988,590 | ) | ||||||||
Net increase (decrease) |
(1,122,519 | ) | $ | (27,500,331 | ) | (3,141,931 | ) | $ | (96,534,878 | ) | ||||||
Blue Chip Growth Fund Class R4 |
||||||||||||||||
Sold |
410,114 | $ | 9,072,831 | 1,076,100 | $ | 30,583,742 | ||||||||||
Issued as reinvestment of dividends |
983,162 | 25,050,959 | 240,790 | 6,486,894 | ||||||||||||
Redeemed |
(2,660,512 | ) | (54,093,475 | ) | (1,692,637 | ) | (48,631,847 | ) | ||||||||
Net increase (decrease) |
(1,267,236 | ) | $ | (19,969,685 | ) | (375,747 | ) | $ | (11,561,211 | ) | ||||||
Blue Chip Growth Fund Class A |
||||||||||||||||
Sold |
423,196 | $ | 8,776,808 | 1,018,552 | $ | 28,655,216 | ||||||||||
Issued as reinvestment of dividends |
1,109,963 | 28,270,753 | 387,337 | 10,446,481 | ||||||||||||
Redeemed |
(1,357,136 | ) | (30,693,573 | ) | (4,359,478 | ) | (129,512,098 | ) | ||||||||
Net increase (decrease) |
176,023 | $ | 6,353,988 | (2,953,589 | ) | $ | (90,410,401 | ) | ||||||||
Blue Chip Growth Fund Class R3 |
||||||||||||||||
Sold |
286,428 | $ | 5,575,165 | 357,619 | $ | 9,388,348 | ||||||||||
Issued as reinvestment of dividends |
501,154 | 11,466,411 | 124,694 | 3,093,658 | ||||||||||||
Redeemed |
(731,417 | ) | (15,944,052 | ) | (961,576 | ) | (25,525,284 | ) | ||||||||
Net increase (decrease) |
56,165 | $ | 1,097,524 | (479,263 | ) | $ | (13,043,278 | ) | ||||||||
269
Notes to Financial Statements (Continued) |
Year Ended September 30, 2022 |
Year Ended September 30, 2021 |
|||||||||||||||
Shares |
Amount |
Shares |
Amount |
|||||||||||||
Growth Opportunities Fund Class I |
||||||||||||||||
Sold |
6,817,009 | $ | 44,270,684 | 5,964,565 | $ | 64,460,451 | ||||||||||
Issued as reinvestment of dividends |
7,852,454 | 63,212,251 | 4,781,993 | 47,724,289 | ||||||||||||
Redeemed |
(9,466,676 | ) | (66,160,773 | ) | (7,289,756 | ) | (78,254,732 | ) | ||||||||
Net increase (decrease) |
5,202,787 | $ | 41,322,162 | 3,456,802 | $ | 33,930,008 | ||||||||||
Growth Opportunities Fund Class R5 |
||||||||||||||||
Sold |
931,257 | $ | 5,867,268 | 1,827,378 | $ | 19,490,118 | ||||||||||
Issued as reinvestment of dividends |
2,168,280 | 16,825,851 | 2,200,770 | 21,391,483 | ||||||||||||
Redeemed |
(2,968,007 | ) | (21,142,198 | ) | (7,435,247 | ) | (75,529,949 | ) | ||||||||
Net increase (decrease) |
131,530 | $ | 1,550,921 | (3,407,099 | ) | $ | (34,648,348 | ) | ||||||||
Growth Opportunities Fund Service Class |
||||||||||||||||
Sold |
618,173 | $ | 4,088,158 | 347,551 | $ | 3,384,510 | ||||||||||
Issued as reinvestment of dividends |
994,425 | 7,030,586 | 709,183 | 6,439,381 | ||||||||||||
Redeemed |
(959,196 | ) | (6,557,350 | ) | (1,325,612 | ) | (13,102,377 | ) | ||||||||
Net increase (decrease) |
653,402 | $ | 4,561,394 | (268,878 | ) | $ | (3,278,486 | ) | ||||||||
Growth Opportunities Fund Administrative Class |
||||||||||||||||
Sold |
1,065,357 | $ | 5,048,692 | 539,808 | $ | 4,962,892 | ||||||||||
Issued as reinvestment of dividends |
2,172,175 | 13,489,206 | 1,331,937 | 11,015,116 | ||||||||||||
Redeemed |
(2,368,525 | ) | (13,796,123 | ) | (2,609,272 | ) | (24,065,097 | ) | ||||||||
Net increase (decrease) |
869,007 | $ | 4,741,775 | (737,527 | ) | $ | (8,087,089 | ) | ||||||||
Growth Opportunities Fund Class R4 |
||||||||||||||||
Sold |
29,591 | $ | 127,103 | 34,506 | $ | 256,709 | ||||||||||
Issued as reinvestment of dividends |
183,946 | 871,903 | 100,504 | 691,469 | ||||||||||||
Redeemed |
(325,831 | ) | (1,235,429 | ) | (138,783 | ) | (1,067,446 | ) | ||||||||
Net increase (decrease) |
(112,294 | ) | $ | (236,423 | ) | (3,773 | ) | $ | (119,268 | ) | ||||||
Growth Opportunities Fund Class A |
||||||||||||||||
Sold |
396,938 | $ | 1,438,351 | 683,345 | $ | 4,932,367 | ||||||||||
Issued as reinvestment of dividends |
2,635,032 | 12,094,799 | 1,444,315 | 9,734,684 | ||||||||||||
Redeemed |
(2,707,665 | ) | (10,463,439 | ) | (2,427,204 | ) | (18,045,044 | ) | ||||||||
Net increase (decrease) |
324,305 | $ | 3,069,711 | (299,544 | ) | $ | (3,377,993 | ) | ||||||||
Growth Opportunities Fund Class R3 |
||||||||||||||||
Sold |
128,656 | $ | 301,790 | 402,025 | $ | 2,286,504 | ||||||||||
Issued as reinvestment of dividends |
380,771 | 1,142,314 | 91,599 | 479,063 | ||||||||||||
Redeemed |
(133,099 | ) | (277,795 | ) | (190,176 | ) | (1,105,742 | ) | ||||||||
Net increase (decrease) |
376,328 | $ | 1,166,309 | 303,448 | $ | 1,659,825 | ||||||||||
Mid Cap Value Fund Class I |
||||||||||||||||
Sold |
1,257,943 | $ | 15,822,348 | 1,378,441 | $ | 19,471,679 | ||||||||||
Issued as reinvestment of dividends |
2,209,404 | 26,888,446 | 120,645 | 1,535,817 | ||||||||||||
Redeemed |
(1,823,408 | ) | (23,252,190 | ) | (2,569,512 | ) | (36,125,882 | ) | ||||||||
Net increase (decrease) |
1,643,939 | $ | 19,458,604 | (1,070,426 | ) | $ | (15,118,386 | ) | ||||||||
Mid Cap Value Fund Class R5 |
||||||||||||||||
Sold |
31,538 | $ | 403,759 | 26,384 | $ | 378,441 | ||||||||||
Issued as reinvestment of dividends |
18,803 | 232,404 | 713 | 9,182 | ||||||||||||
Redeemed |
(42,869 | ) | (533,359 | ) | (35,750 | ) | (465,832 | ) | ||||||||
Net increase (decrease) |
7,472 | $ | 102,804 | (8,653 | ) | $ | (78,209 | ) | ||||||||
Mid Cap Value Fund Service Class |
||||||||||||||||
Sold |
504 | $ | 6,628 | 21,295 | $ | 311,554 | ||||||||||
Issued as reinvestment of dividends |
8,620 | 105,510 | 125 | 1,602 | ||||||||||||
Redeemed |
(38,303 | ) | (470,425 | ) | (1,891 | ) | (29,106 | ) | ||||||||
Net increase (decrease) |
(29,179 | ) | $ | (358,287 | ) | 19,529 | $ | 284,050 | ||||||||
270
Notes to Financial Statements (Continued) |
Year Ended September 30, 2022 |
Year Ended September 30, 2021 |
|||||||||||||||
Shares |
Amount |
Shares |
Amount |
|||||||||||||
Mid Cap Value Fund Administrative Class |
||||||||||||||||
Sold |
11,380 | $ | 145,965 | 12,029 | $ | 184,500 | ||||||||||
Issued as reinvestment of dividends |
14,968 | 188,296 | 723 | 9,443 | ||||||||||||
Redeemed |
(21,782 | ) | (316,412 | ) | (15,951 | ) | (231,037 | ) | ||||||||
Net increase (decrease) |
4,566 | $ | 17,849 | (3,199 | ) | $ | (37,094 | ) | ||||||||
Mid Cap Value Fund Class R4 |
||||||||||||||||
Sold |
7,390 | $ | 90,949 | 7,013 | $ | 97,079 | ||||||||||
Issued as reinvestment of dividends |
1,257 | 15,233 | 622 | 7,872 | ||||||||||||
Redeemed |
(2,759 | ) | (34,110 | ) | (72,997 | ) | (1,056,116 | ) | ||||||||
Net increase (decrease) |
5,888 | $ | 72,072 | (65,362 | ) | $ | (951,165 | ) | ||||||||
Mid Cap Value Fund Class A |
||||||||||||||||
Sold |
25,694 | $ | 318,289 | 142,864 | $ | 1,953,163 | ||||||||||
Issued as reinvestment of dividends |
28,037 | 345,700 | 2,584 | 33,097 | ||||||||||||
Redeemed |
(25,277 | ) | (330,544 | ) | (315,794 | ) | (4,611,163 | ) | ||||||||
Net increase (decrease) |
28,454 | $ | 333,445 | (170,346 | ) | $ | (2,624,903 | ) | ||||||||
Mid Cap Value Fund Class R3 |
||||||||||||||||
Sold |
1,287 | $ | 15,692 | 5,118 | $ | 70,621 | ||||||||||
Issued as reinvestment of dividends |
2,760 | 33,429 | 246 | 3,107 | ||||||||||||
Redeemed |
(2,251 | ) | (28,504 | ) | (30,021 | ) | (430,029 | ) | ||||||||
Net increase (decrease) |
1,796 | $ | 20,617 | (24,657 | ) | $ | (356,301 | ) | ||||||||
Small Cap Value Equity Fund Class I |
||||||||||||||||
Sold |
1,167,883 | $ | 12,820,652 | 907,032 | $ | 11,357,203 | ||||||||||
Issued as reinvestment of dividends |
879,846 | 9,194,395 | 152,789 | 1,714,290 | ||||||||||||
Redeemed |
(1,217,492 | ) | (13,122,094 | ) | (4,127,369 | ) | (51,698,733 | ) | ||||||||
Net increase (decrease) |
830,237 | $ | 8,892,953 | (3,067,548 | ) | $ | (38,627,240 | ) | ||||||||
Small Cap Value Equity Fund Class R5 |
||||||||||||||||
Sold |
120,937 | $ | 1,244,751 | 809,584 | $ | 10,404,197 | ||||||||||
Issued as reinvestment of dividends |
218,099 | 2,283,497 | 34,845 | 392,010 | ||||||||||||
Redeemed |
(433,913 | ) | (4,808,986 | ) | (1,166,710 | ) | (15,301,343 | ) | ||||||||
Net increase (decrease) |
(94,877 | ) | $ | (1,280,738 | ) | (322,281 | ) | $ | (4,505,136 | ) | ||||||
Small Cap Value Equity Fund Service Class |
||||||||||||||||
Sold |
28,655 | $ | 318,523 | 29,025 | $ | 363,192 | ||||||||||
Issued as reinvestment of dividends |
66,630 | 701,615 | 9,089 | 102,703 | ||||||||||||
Redeemed |
(84,191 | ) | (922,424 | ) | (91,348 | ) | (1,186,214 | ) | ||||||||
Net increase (decrease) |
11,094 | $ | 97,714 | (53,234 | ) | $ | (720,319 | ) | ||||||||
Small Cap Value Equity Fund Administrative Class |
||||||||||||||||
Sold |
21,006 | $ | 225,176 | 40,323 | $ | 521,611 | ||||||||||
Issued as reinvestment of dividends |
59,543 | 618,051 | 10,705 | 119,788 | ||||||||||||
Redeemed |
(22,610 | ) | (241,800 | ) | (213,856 | ) | (2,687,794 | ) | ||||||||
Net increase (decrease) |
57,939 | $ | 601,427 | (162,828 | ) | $ | (2,046,395 | ) | ||||||||
Small Cap Value Equity Fund Class R4 |
||||||||||||||||
Sold |
23,940 | $ | 233,301 | 36,336 | $ | 451,536 | ||||||||||
Issued as reinvestment of dividends |
35,292 | 353,982 | 7,995 | 87,302 | ||||||||||||
Redeemed |
(33,450 | ) | (345,326 | ) | (200,794 | ) | (2,399,956 | ) | ||||||||
Net increase (decrease) |
25,782 | $ | 241,957 | (156,463 | ) | $ | (1,861,118 | ) | ||||||||
Small Cap Value Equity Fund Class A |
||||||||||||||||
Sold |
46,544 | $ | 461,230 | 152,503 | $ | 1,865,323 | ||||||||||
Issued as reinvestment of dividends |
141,955 | 1,433,744 | 17,347 | 190,647 | ||||||||||||
Redeemed |
(148,716 | ) | (1,645,084 | ) | (219,908 | ) | (2,721,035 | ) | ||||||||
Net increase (decrease) |
39,783 | $ | 249,890 | (50,058 | ) | $ | (665,065 | ) | ||||||||
271
Notes to Financial Statements (Continued) |
Year Ended September 30, 2022 |
Year Ended September 30, 2021 |
|||||||||||||||
Shares |
Amount |
Shares |
Amount |
|||||||||||||
Small Cap Value Equity Fund Class R3 |
||||||||||||||||
Sold |
22,511 | $ | 225,025 | 21,846 | $ | 274,446 | ||||||||||
Issued as reinvestment of dividends |
18,019 | 177,490 | 2,414 | 26,075 | ||||||||||||
Redeemed |
(19,924 | ) | (191,725 | ) | (57,525 | ) | (679,901 | ) | ||||||||
Net increase (decrease) |
20,606 | $ | 210,790 | (33,265 | ) | $ | (379,380 | ) | ||||||||
Small Company Value Fund Class I |
||||||||||||||||
Sold |
2,118,392 | $ | 24,273,570 | 4,737,139 | $ | 55,347,151 | ||||||||||
Issued as reinvestment of dividends |
2,185,835 | 24,481,352 | 85,053 | 812,256 | ||||||||||||
Redeemed |
(3,510,738 | ) | (39,082,053 | ) | (2,348,073 | ) | (26,270,613 | ) | ||||||||
Net increase (decrease) |
793,489 | $ | 9,672,869 | 2,474,119 | $ | 29,888,794 | ||||||||||
Small Company Value Fund Class R5 |
||||||||||||||||
Sold |
588,489 | $ | 6,674,727 | 2,238,221 | $ | 24,968,017 | ||||||||||
Issued as reinvestment of dividends |
774,949 | 8,756,926 | 39,529 | 380,666 | ||||||||||||
Redeemed |
(2,546,690 | ) | (27,751,474 | ) | (3,598,862 | ) | (37,381,946 | ) | ||||||||
Net increase (decrease) |
(1,183,252 | ) | $ | (12,319,821 | ) | (1,321,112 | ) | $ | (12,033,263 | ) | ||||||
Small Company Value Fund Service Class |
||||||||||||||||
Sold |
146,974 | $ | 1,680,344 | 317,513 | $ | 3,700,087 | ||||||||||
Issued as reinvestment of dividends |
111,423 | 1,250,165 | 3,323 | 31,805 | ||||||||||||
Redeemed |
(135,183 | ) | (1,466,448 | ) | (213,621 | ) | (2,435,431 | ) | ||||||||
Net increase (decrease) |
123,214 | $ | 1,464,061 | 107,215 | $ | 1,296,461 | ||||||||||
Small Company Value Fund Administrative Class |
||||||||||||||||
Sold |
98,759 | $ | 1,121,612 | 319,890 | $ | 3,595,272 | ||||||||||
Issued as reinvestment of dividends |
192,067 | 2,095,447 | 9,514 | 88,859 | ||||||||||||
Redeemed |
(401,496 | ) | (4,327,674 | ) | (933,127 | ) | (10,609,361 | ) | ||||||||
Net increase (decrease) |
(110,670 | ) | $ | (1,110,615 | ) | (603,723 | ) | $ | (6,925,230 | ) | ||||||
Small Company Value Fund Class R4 |
||||||||||||||||
Sold |
7,196 | $ | 73,173 | 73,265 | $ | 751,995 | ||||||||||
Issued as reinvestment of dividends |
9,904 | 100,625 | 673 | 5,920 | ||||||||||||
Redeemed |
(5,716 | ) | (56,710 | ) | (137,064 | ) | (1,569,338 | ) | ||||||||
Net increase (decrease) |
11,384 | $ | 117,088 | (63,126 | ) | $ | (811,423 | ) | ||||||||
Small Company Value Fund Class A |
||||||||||||||||
Sold |
198,112 | $ | 2,088,446 | 299,765 | $ | 3,244,014 | ||||||||||
Issued as reinvestment of dividends |
191,789 | 1,983,094 | 3,577 | 31,978 | ||||||||||||
Redeemed |
(283,124 | ) | (2,887,883 | ) | (691,731 | ) | (7,464,426 | ) | ||||||||
Net increase (decrease) |
106,777 | $ | 1,183,657 | (388,389 | ) | $ | (4,188,434 | ) | ||||||||
Small Company Value Fund Class R3 |
||||||||||||||||
Sold |
16,157 | $ | 149,603 | 16,202 | $ | 161,460 | ||||||||||
Issued as reinvestment of dividends |
6,198 | 57,144 | — | — | ||||||||||||
Redeemed |
(10,084 | ) | (91,923 | ) | (7,013 | ) | (70,513 | ) | ||||||||
Net increase (decrease) |
12,271 | $ | 114,824 | 9,189 | $ | 90,947 | ||||||||||
Mid Cap Growth Fund Class I |
||||||||||||||||
Sold |
20,610,345 | $ | 476,359,783 | 21,183,859 | $ | 619,721,055 | ||||||||||
Issued as reinvestment of dividends |
46,250,992 | 1,175,700,217 | 13,500,310 | 369,233,487 | ||||||||||||
Redeemed |
(69,265,310 | ) | (1,657,390,556 | ) | (68,670,135 | ) | (2,039,813,584 | ) | ||||||||
Net increase (decrease) |
(2,403,973 | ) | $ | (5,330,556 | ) | (33,985,966 | ) | $ | (1,050,859,042 | ) | ||||||
Mid Cap Growth Fund Class R5 |
||||||||||||||||
Sold |
8,992,426 | $ | 210,964,292 | 8,395,381 | $ | 240,160,574 | ||||||||||
Issued as reinvestment of dividends |
11,851,698 | 296,055,421 | 3,401,006 | 91,793,143 | ||||||||||||
Redeemed |
(29,181,230 | ) | (709,337,786 | ) | (16,010,155 | ) | (465,598,430 | ) | ||||||||
Net increase (decrease) |
(8,337,106 | ) | $ | (202,318,073 | ) | (4,213,768 | ) | $ | (133,644,713 | ) | ||||||
272
Notes to Financial Statements (Continued) |
Year Ended September 30, 2022 |
Year Ended September 30, 2021 |
|||||||||||||||
Shares |
Amount |
Shares |
Amount |
|||||||||||||
Mid Cap Growth Fund Service Class |
||||||||||||||||
Sold |
714,735 | $ | 16,317,851 | 1,066,469 | $ | 29,688,014 | ||||||||||
Issued as reinvestment of dividends |
2,525,623 | 60,589,689 | 803,095 | 21,000,941 | ||||||||||||
Redeemed |
(5,095,676 | ) | (118,540,039 | ) | (4,669,869 | ) | (130,586,243 | ) | ||||||||
Net increase (decrease) |
(1,855,318 | ) | $ | (41,632,499 | ) | (2,800,305 | ) | $ | (79,897,288 | ) | ||||||
Mid Cap Growth Fund Administrative Class |
||||||||||||||||
Sold |
441,681 | $ | 8,788,650 | 869,031 | $ | 23,069,316 | ||||||||||
Issued as reinvestment of dividends |
2,158,971 | 48,166,646 | 677,781 | 16,747,973 | ||||||||||||
Redeemed |
(2,971,122 | ) | (64,274,048 | ) | (4,042,762 | ) | (107,237,852 | ) | ||||||||
Net increase (decrease) |
(370,470 | ) | $ | (7,318,752 | ) | (2,495,950 | ) | $ | (67,420,563 | ) | ||||||
Mid Cap Growth Fund Class R4 |
||||||||||||||||
Sold |
615,731 | $ | 11,433,813 | 1,821,605 | $ | 43,245,580 | ||||||||||
Issued as reinvestment of dividends |
1,343,771 | 26,566,357 | 557,533 | 12,555,638 | ||||||||||||
Redeemed |
(3,875,215 | ) | (83,705,841 | ) | (4,612,065 | ) | (112,673,861 | ) | ||||||||
Net increase (decrease) |
(1,915,713 | ) | $ | (45,705,671 | ) | (2,232,927 | ) | $ | (56,872,643 | ) | ||||||
Mid Cap Growth Fund Class A |
||||||||||||||||
Sold |
229,031 | $ | 4,280,448 | 588,035 | $ | 13,908,258 | ||||||||||
Issued as reinvestment of dividends |
1,836,269 | 35,770,513 | 630,794 | 14,060,392 | ||||||||||||
Redeemed |
(2,458,058 | ) | (47,889,370 | ) | (3,959,939 | ) | (95,492,021 | ) | ||||||||
Net increase (decrease) |
(392,758 | ) | $ | (7,838,409 | ) | (2,741,110 | ) | $ | (67,523,371 | ) | ||||||
Mid Cap Growth Fund Class R3 |
||||||||||||||||
Sold |
268,929 | $ | 4,468,724 | 393,431 | $ | 8,615,707 | ||||||||||
Issued as reinvestment of dividends |
466,005 | 7,898,792 | 120,591 | 2,425,094 | ||||||||||||
Redeemed |
(552,097 | ) | (9,249,914 | ) | (746,836 | ) | (16,376,977 | ) | ||||||||
Net increase (decrease) |
182,837 | $ | 3,117,602 | (232,814 | ) | $ | (5,336,176 | ) | ||||||||
Small Cap Growth Equity Fund Class I |
||||||||||||||||
Sold |
8,410,974 | $ | 128,433,942 | 7,016,670 | $ | 144,369,320 | ||||||||||
Issued as reinvestment of dividends |
6,689,062 | 106,891,206 | 1,541,584 | 29,012,613 | ||||||||||||
Redeemed |
(7,633,386 | ) | (112,135,241 | ) | (6,121,222 | ) | (124,881,393 | ) | ||||||||
Net increase (decrease) |
7,466,650 | $ | 123,189,907 | 2,437,032 | $ | 48,500,540 | ||||||||||
Small Cap Growth Equity Fund Class R5 |
||||||||||||||||
Sold |
1,375,497 | $ | 18,571,896 | 1,671,272 | $ | 32,751,480 | ||||||||||
Issued as reinvestment of dividends |
2,133,325 | 33,194,542 | 629,588 | 11,622,191 | ||||||||||||
Redeemed |
(3,555,151 | ) | (53,158,153 | ) | (2,999,349 | ) | (58,807,712 | ) | ||||||||
Net increase (decrease) |
(46,329 | ) | $ | (1,391,715 | ) | (698,489 | ) | $ | (14,434,041 | ) | ||||||
Small Cap Growth Equity Fund Service Class |
||||||||||||||||
Sold |
157,740 | $ | 2,016,421 | 293,630 | $ | 5,450,566 | ||||||||||
Issued as reinvestment of dividends |
542,363 | 7,598,507 | 169,568 | 2,891,135 | ||||||||||||
Redeemed |
(907,393 | ) | (13,450,707 | ) | (677,279 | ) | (12,484,416 | ) | ||||||||
Net increase (decrease) |
(207,290 | ) | $ | (3,835,779 | ) | (214,081 | ) | $ | (4,142,715 | ) | ||||||
Small Cap Growth Equity Fund Administrative Class |
||||||||||||||||
Sold |
146,697 | $ | 1,698,408 | 203,401 | $ | 3,468,903 | ||||||||||
Issued as reinvestment of dividends |
606,248 | 7,499,285 | 175,761 | 2,733,082 | ||||||||||||
Redeemed |
(487,977 | ) | (5,701,747 | ) | (763,539 | ) | (12,729,401 | ) | ||||||||
Net increase (decrease) |
264,968 | $ | 3,495,946 | (384,377 | ) | $ | (6,527,416 | ) | ||||||||
Small Cap Growth Equity Fund Class R4 |
||||||||||||||||
Sold |
269,555 | $ | 2,345,814 | 241,546 | $ | 3,516,902 | ||||||||||
Issued as reinvestment of dividends |
532,192 | 5,183,552 | 123,958 | 1,628,809 | ||||||||||||
Redeemed |
(350,548 | ) | (3,268,106 | ) | (499,572 | ) | (6,898,395 | ) | ||||||||
Net increase (decrease) |
451,199 | $ | 4,261,260 | (134,068 | ) | $ | (1,752,684 | ) | ||||||||
273
Notes to Financial Statements (Continued) |
Year Ended September 30, 2022 |
Year Ended September 30, 2021 |
|||||||||||||||
Shares |
Amount |
Shares |
Amount |
|||||||||||||
Small Cap Growth Equity Fund Class A |
||||||||||||||||
Sold |
135,438 | $ | 1,176,763 | 504,453 | $ | 6,982,978 | ||||||||||
Issued as reinvestment of dividends |
976,336 | 9,343,532 | 322,918 | 4,197,930 | ||||||||||||
Redeemed |
(695,452 | ) | (6,699,463 | ) | (1,587,189 | ) | (22,495,130 | ) | ||||||||
Net increase (decrease) |
416,322 | $ | 3,820,832 | (759,818 | ) | $ | (11,314,222 | ) | ||||||||
Small Cap Growth Equity Fund Class R3 |
||||||||||||||||
Sold |
103,693 | $ | 748,306 | 134,796 | $ | 1,555,386 | ||||||||||
Issued as reinvestment of dividends |
275,707 | 1,924,436 | 54,866 | 582,672 | ||||||||||||
Redeemed |
(134,122 | ) | (857,421 | ) | (180,997 | ) | (2,091,227 | ) | ||||||||
Net increase (decrease) |
245,278 | $ | 1,815,321 | 8,665 | $ | 46,831 | ||||||||||
Overseas Fund Class I |
||||||||||||||||
Sold |
9,543,684 | $ | 84,880,892 | 9,326,183 | $ | 89,997,203 | ||||||||||
Issued as reinvestment of dividends |
3,877,276 | 36,679,034 | 1,033,783 | 9,459,111 | ||||||||||||
Redeemed |
(17,598,167 | ) | (154,046,481 | ) | (19,054,553 | ) | (189,333,308 | ) | ||||||||
Net increase (decrease) |
(4,177,207 | ) | $ | (32,486,555 | ) | (8,694,587 | ) | $ | (89,876,994 | ) | ||||||
Overseas Fund Class R5 |
||||||||||||||||
Sold |
2,624,329 | $ | 22,012,321 | 2,048,201 | $ | 19,758,875 | ||||||||||
Issued as reinvestment of dividends |
1,528,040 | 14,531,662 | 353,544 | 3,249,074 | ||||||||||||
Redeemed |
(7,259,037 | ) | (65,077,294 | ) | (3,483,345 | ) | (34,118,149 | ) | ||||||||
Net increase (decrease) |
(3,106,668 | ) | $ | (28,533,311 | ) | (1,081,600 | ) | $ | (11,110,200 | ) | ||||||
Overseas Fund Service Class |
||||||||||||||||
Sold |
661,295 | $ | 6,299,812 | 412,087 | $ | 3,976,372 | ||||||||||
Issued as reinvestment of dividends |
456,597 | 4,314,842 | 101,106 | 923,098 | ||||||||||||
Redeemed |
(1,168,642 | ) | (10,309,219 | ) | (798,474 | ) | (7,827,090 | ) | ||||||||
Net increase (decrease) |
(50,750 | ) | $ | 305,435 | (285,281 | ) | $ | (2,927,620 | ) | |||||||
Overseas Fund Administrative Class |
||||||||||||||||
Sold |
155,540 | $ | 1,373,856 | 382,828 | $ | 3,680,866 | ||||||||||
Issued as reinvestment of dividends |
191,576 | 1,831,463 | 45,617 | 421,047 | ||||||||||||
Redeemed |
(324,641 | ) | (3,045,963 | ) | (866,637 | ) | (8,320,923 | ) | ||||||||
Net increase (decrease) |
22,475 | $ | 159,356 | (438,192 | ) | $ | (4,219,010 | ) | ||||||||
Overseas Fund Class R4 |
||||||||||||||||
Sold |
494,669 | $ | 4,073,590 | 721,382 | $ | 6,841,308 | ||||||||||
Issued as reinvestment of dividends |
221,488 | 2,008,900 | 44,888 | 395,010 | ||||||||||||
Redeemed |
(419,701 | ) | (3,489,896 | ) | (973,710 | ) | (9,110,679 | ) | ||||||||
Net increase (decrease) |
296,456 | $ | 2,592,594 | (207,440 | ) | $ | (1,874,361 | ) | ||||||||
Overseas Fund Class A |
||||||||||||||||
Sold |
223,843 | $ | 1,944,155 | 264,898 | $ | 2,542,503 | ||||||||||
Issued as reinvestment of dividends |
217,687 | 2,031,016 | 70,638 | 637,155 | ||||||||||||
Redeemed |
(980,502 | ) | (8,700,686 | ) | (1,819,906 | ) | (17,789,568 | ) | ||||||||
Net increase (decrease) |
(538,972 | ) | $ | (4,725,515 | ) | (1,484,370 | ) | $ | (14,609,910 | ) | ||||||
Overseas Fund Class R3 |
||||||||||||||||
Sold |
104,735 | $ | 893,761 | 205,906 | $ | 2,014,268 | ||||||||||
Issued as reinvestment of dividends |
67,894 | 623,942 | 14,811 | 131,963 | ||||||||||||
Redeemed |
(278,087 | ) | (2,243,819 | ) | (297,944 | ) | (2,881,102 | ) | ||||||||
Net increase (decrease) |
(105,458 | ) | $ | (726,116 | ) | (77,227 | ) | $ | (734,871 | ) | ||||||
274
Notes to Financial Statements (Continued) |
Year Ended September 30, 2022 |
Year Ended September 30, 2021 |
|||||||||||||||
Shares |
Amount |
Shares |
Amount |
|||||||||||||
MM Select T. Rowe Price International Equity Fund Class I |
||||||||||||||||
Sold |
28,306,280 | $ | 303,954,011 | 26,565,354 | $ | 299,651,877 | ||||||||||
Issued as reinvestment of dividends |
6,457,531 | 71,743,166 | 2,226,021 | 23,974,243 | ||||||||||||
Redeemed |
(28,231,952 | ) | (290,686,208 | ) | (21,745,375 | ) | (246,370,514 | ) | ||||||||
Net increase (decrease) |
6,531,859 | $ | 85,010,969 | 7,046,000 | $ | 77,255,606 | ||||||||||
Unless waived, purchases of Class A shares are subject to a front-end sales charge of up to 5.50% of the amount purchased. A portion of the front-end sales charge may be retained by the Distributor. The Distributor retained the following amounts during the year ended September 30, 2022:
Front-End |
||||
Diversified Value Fund |
$ | 730 | ||
Fundamental Value Fund |
730 | |||
S&P 500 Index Fund |
72 | |||
Equity Opportunities Fund |
948 | |||
Blue Chip Growth Fund |
2,541 | |||
Mid Cap Growth Fund |
353 | |||
Small Cap Growth Equity Fund |
204 | |||
Unless waived, redemptions of Class A shares made within 18 months of purchase from initial investments of $1 million or more are subject to a contingent deferred sales charge of 1.00% of the amount redeemed. The Distributor receives all contingent deferred sales charges. For the year ended September 30, 2022, no amounts have been retained by the Distributor.
With respect to Class A shares, the Distributor may pay an up-front concession to financial intermediaries through which sales are made as described in the Funds’ Prospectus.
6. Federal Income Tax Information
At September 30, 2022, the aggregate cost of investments and the unrealized appreciation (depreciation) in the value of all investments owned by the Fund(s), as computed on a federal income tax basis, were as follows:
Federal |
Tax Basis |
Tax Basis |
Net Unrealized |
|||||||||||||
Total Return Bond Fund |
$ | 970,946,424 | $ | 1,863,766 | $ | (89,555,119 | ) | $ | (87,691,353 | ) | ||||||
Strategic Bond Fund |
451,301,290 | 679,020 | (50,706,701 | ) | (50,027,681 | ) | ||||||||||
Diversified Value Fund |
271,912,452 | 27,635,543 | (20,682,302 | ) | 6,953,241 | |||||||||||
Fundamental Value Fund |
409,875,190 | 54,996,296 | (36,542,966 | ) | 18,453,330 | |||||||||||
S&P 500 Index Fund |
1,488,200,396 | 852,981,927 | (98,554,529 | ) | 754,427,398 | |||||||||||
Equity Opportunities Fund |
538,148,395 | 65,007,630 | (46,570,292 | ) | 18,437,338 | |||||||||||
Fundamental Growth Fund |
33,079,588 | 948,526 | (7,960,945 | ) | (7,012,419 | ) | ||||||||||
Blue Chip Growth Fund |
2,133,505,318 | 748,563,713 | (347,992,607 | ) | 400,571,106 | |||||||||||
Growth Opportunities Fund |
290,036,620 | 22,499,516 | (70,567,711 | ) | (48,068,195 | ) | ||||||||||
Mid Cap Value Fund |
116,860,661 | 3,304,863 | (18,754,519 | ) | (15,449,656 | ) | ||||||||||
275
Notes to Financial Statements (Continued) |
Federal |
Tax Basis |
Tax Basis |
Net Unrealized |
|||||||||||||
Small Cap Value Equity Fund |
$ | 52,261,678 | $ | 4,900,208 | $ | (6,967,496 | ) | $ | (2,067,288 | ) | ||||||
Small Company Value Fund |
227,350,773 | 10,928,876 | (39,102,855 | ) | (28,173,979 | ) | ||||||||||
Mid Cap Growth Fund |
5,055,056,521 | 727,201,932 | (628,067,180 | ) | 99,134,752 | |||||||||||
Small Cap Growth Equity Fund |
565,112,495 | 41,590,494 | (74,635,968 | ) | (33,045,474 | ) | ||||||||||
Overseas Fund |
470,913,216 | 25,386,377 | (99,533,882 | ) | (74,147,505 | ) | ||||||||||
MM Select T. Rowe Price International Equity Fund |
1,565,674,800 | 56,714,241 | (323,048,985 | ) | (266,334,744 | ) | ||||||||||
Net capital loss carryforwards may be applied against any net realized taxable gains in succeeding years, subject to the carryforward period limitations, where applicable. Capital losses may be carried forward indefinitely, and retain the character of the original loss.
At September 30, 2022, the following Fund had accumulated capital loss carryforwards:
Short Term |
Long Term |
|||||||
Total Return Bond Fund |
$ | 36,914,682 | $ | 21,099,505 | ||||
The following Fund(s) elected to defer to the fiscal year beginning October 1, 2022, post-October capital losses:
Post-October |
||||
Strategic Bond Fund |
$ | 36,444,508 | ||
Fundamental Growth Fund |
558,057 | |||
Small Cap Growth Equity Fund |
25,213,098 | |||
MM Select T. Rowe Price International Equity Fund |
9,477,776 | |||
The following Fund(s) elected to defer to the fiscal year beginning October 1, 2022, late year ordinary losses:
Amount |
||||
Fundamental Growth Fund |
$ | 239,500 | ||
Blue Chip Growth Fund |
4,335,079 | |||
Growth Opportunities Fund |
1,463,203 | |||
Mid Cap Growth Fund |
9,137,771 | |||
Small Cap Growth Equity Fund |
705,925 | |||
Generally accepted accounting principles in the United States of America require that only distributions in excess of tax basis earnings and profits be reported in the financial statements as a return of capital.
276
Notes to Financial Statements (Continued) |
The tax character of distributions (including capital gain dividends, if any, designated pursuant to Section 852 of the Code) paid during the year ended September 30, 2022, was as follows:
Ordinary |
Long Term |
|||||||
Total Return Bond Fund |
$ | 15,520,015 | $ | — | ||||
Strategic Bond Fund |
24,543,559 | 7,957,173 | ||||||
Diversified Value Fund |
19,350,206 | 26,910,458 | ||||||
Fundamental Value Fund |
9,848,859 | 60,529,572 | ||||||
S&P 500 Index Fund |
42,035,877 | 391,268,490 | ||||||
Equity Opportunities Fund |
13,075,519 | 77,702,653 | ||||||
Fundamental Growth Fund |
9,232,807 | 6,564,990 | ||||||
Blue Chip Growth Fund |
37,765,672 | 744,221,034 | ||||||
Growth Opportunities Fund |
9,742,882 | 104,924,613 | ||||||
Mid Cap Value Fund |
17,733,220 | 10,183,811 | ||||||
Small Cap Value Equity Fund |
3,627,991 | 11,134,784 | ||||||
Small Company Value Fund |
16,833,062 | 21,904,259 | ||||||
Mid Cap Growth Fund |
203,027,887 | 1,463,208,822 | ||||||
Small Cap Growth Equity Fund |
42,925,417 | 128,763,424 | ||||||
Overseas Fund |
14,112,279 | 47,917,157 | ||||||
MM Select T. Rowe Price International Equity Fund |
54,455,017 | 17,288,149 | ||||||
The tax character of distributions (including capital gain dividends, if any, designated pursuant to Section 852 of the Code) paid during the year ended September 30, 2021, was as follows:
Ordinary |
Long Term |
|||||||
Total Return Bond Fund |
$ | 51,593,361 | $ | — | ||||
Strategic Bond Fund |
21,393,604 | 18,264,739 | ||||||
Diversified Value Fund |
7,632,765 | — | ||||||
Fundamental Value Fund |
9,207,746 | — | ||||||
S&P 500 Index Fund |
59,183,283 | 419,938,253 | ||||||
Equity Opportunities Fund |
13,151,452 | 38,674,722 | ||||||
Fundamental Growth Fund |
14,953,658 | 17,591,165 | ||||||
Blue Chip Growth Fund |
— | 203,562,156 | ||||||
Growth Opportunities Fund |
4,069,271 | 93,406,690 | ||||||
Mid Cap Value Fund |
1,604,431 | — | ||||||
Small Cap Value Equity Fund |
26,515 | 2,606,300 | ||||||
Small Company Value Fund |
1,351,801 | — | ||||||
Mid Cap Growth Fund |
14,252,104 | 521,343,693 | ||||||
Small Cap Growth Equity Fund |
6,970,464 | 45,698,594 | ||||||
Overseas Fund |
5,244,641 | 9,972,004 | ||||||
MM Select T. Rowe Price International Equity Fund |
23,974,243 | — | ||||||
277
Notes to Financial Statements (Continued) |
The following Fund(s) have elected to pass through the foreign tax credit for the year ended September 30, 2022:
Amount |
||||
Overseas Fund |
$ | 1,601,994 | ||
MM Select T. Rowe Price International Equity Fund |
4,040,098 | |||
Capital accounts within the financial statements are periodically adjusted for permanent differences between book and tax accounting. These adjustments have no impact on net assets or the results of operations. Temporary book and tax accounting differences will reverse in subsequent periods. At September 30, 2022, temporary book and tax accounting differences were primarily attributable to the deferral of wash sale losses, deferred Trustee compensation, and other temporary basis adjustments.
At September 30, 2022, the components of distributable earnings on a tax basis were as follows:
Undistributed |
Undistributed |
Other |
Unrealized |
Total |
||||||||||||||||
Total Return Bond Fund |
$ | 14,501,233 | $ | (58,014,187 | ) | $ | (125,130 | ) | $ | (87,693,551 | ) | $ | (131,331,635 | ) | ||||||
Strategic Bond Fund |
1,435,360 | — | (36,481,768 | ) | (50,079,449 | ) | (85,125,857 | ) | ||||||||||||
Diversified Value Fund |
4,179,651 | 29,205,957 | (108,809 | ) | 6,956,897 | 40,233,696 | ||||||||||||||
Fundamental Value Fund |
6,504,986 | 63,123,610 | (143,977 | ) | 18,432,551 | 87,917,170 | ||||||||||||||
S&P 500 Index Fund |
22,700,764 | 537,331,780 | (337,549 | ) | 754,427,398 | 1,314,122,393 | ||||||||||||||
Equity Opportunities Fund |
5,584,722 | 82,705,656 | (89,494 | ) | 18,435,689 | 106,636,573 | ||||||||||||||
Fundamental Growth Fund |
— | — | (809,726 | ) | (7,012,419 | ) | (7,822,145 | ) | ||||||||||||
Blue Chip Growth Fund |
— | 269,621,836 | (4,511,245 | ) | 400,571,106 | 665,681,697 | ||||||||||||||
Growth Opportunities Fund |
— | 28,020,548 | (1,540,622 | ) | (48,068,269 | ) | (21,588,343 | ) | ||||||||||||
Mid Cap Value Fund |
3,121,076 | 5,229,263 | (15,104 | ) | (15,449,887 | ) | (7,114,652 | ) | ||||||||||||
Small Cap Value Equity Fund |
704,792 | 6,898,738 | (15,977 | ) | (2,067,263 | ) | 5,520,290 | |||||||||||||
Small Company Value Fund |
3,967,197 | 22,509,754 | (51,049 | ) | (28,173,979 | ) | (1,748,077 | ) | ||||||||||||
Mid Cap Growth Fund |
— | 711,603,693 | (9,500,286 | ) | 99,134,752 | 801,238,159 | ||||||||||||||
Small Cap Growth Equity Fund |
— | — | (26,000,678 | ) | (33,045,475 | ) | (59,046,153 | ) | ||||||||||||
Overseas Fund |
8,986,988 | 31,806,250 | (79,818 | ) | (74,559,341 | ) | (33,845,921 | ) | ||||||||||||
MM Select T. Rowe Price International Equity Fund |
35,803,184 | — | (9,501,032 | ) | (266,893,702 | ) | (240,591,550 | ) | ||||||||||||
During the year ended September 30, 2022, the following amounts were reclassified due to permanent differences between book and tax accounting:
Paid-in |
Accumulated |
Undistributed |
||||||||||
Total Return Bond Fund |
$ | — | $ | (1,455,179 | ) | $ | 1,455,179 | |||||
Strategic Bond Fund |
— | 3,775,714 | (3,775,714 | ) | ||||||||
Diversified Value Fund |
— | 900,902 | (900,902 | ) | ||||||||
Fundamental Value Fund |
— | 118,323 | (118,323 | ) | ||||||||
S&P 500 Index Fund |
— | 1,401,288 | (1,401,288 | ) | ||||||||
Equity Opportunities Fund |
— | 84,317 | (84,317 | ) | ||||||||
278
Notes to Financial Statements (Continued) |
Paid-in |
Accumulated |
Undistributed |
||||||||||
Fundamental Growth Fund |
$ | (170,180 | ) | $ | 47,706 | $ | 122,474 | |||||
Blue Chip Growth Fund |
(3,881,397 | ) | 1,240 | 3,880,157 | ||||||||
Growth Opportunities Fund |
(866,828 | ) | 60 | 866,768 | ||||||||
Mid Cap Value Fund |
(39,130 | ) | (422,186 | ) | 461,316 | |||||||
Small Cap Value Equity Fund |
— | (13,020 | ) | 13,020 | ||||||||
Small Company Value Fund |
(18 | ) | 542,600 | (542,582 | ) | |||||||
Mid Cap Growth Fund |
(7,732,929 | ) | 33,690 | 7,699,239 | ||||||||
Small Cap Growth Equity Fund |
(4,185,933 | ) | 3,576,594 | 609,339 | ||||||||
Overseas Fund |
— | (279,790 | ) | 279,790 | ||||||||
MM Select T. Rowe Price International Equity Fund |
— | 1,157,052 | (1,157,052 | ) | ||||||||
The Funds did not have any unrecognized tax benefits at September 30, 2022, nor were there any increases or decreases in unrecognized tax benefits for the year then ended. The Funds recognize interest and penalties, if any, related to unrecognized tax benefits as an income tax expense in the Statements of Operations. During the year ended September 30, 2022, the Funds did not incur any such interest or penalties. The Funds are subject to examination by U.S. federal and state tax authorities for returns filed for the prior three fiscal years. Foreign taxes are provided for based on the Funds’ understanding of the tax rules and rates that exist in the foreign markets in which they invest.
7. Indemnifications
Under the Funds’ organizational documents, current and former Trustees and Officers are provided with specified rights to indemnification against liabilities arising in connection with the performance of their duties to the Funds, and shareholders are indemnified against personal liability for obligations of the Funds. In the normal course of business, the Funds may also enter into contracts that provide general indemnifications. The Funds’ maximum exposure under these arrangements is unknown as this would be dependent on future claims that may be made against the Funds. The risk of material loss from such claims is considered remote.
8. New Accounting Pronouncements
In January 2021, FASB issued Accounting Standards Update 2021-01 — Reference Rate Reform (Topic 848) — Scope (“ASU 2021-01”) as an update to Accounting Standards Update 2020-04 — Reference Rate Reform (Topic 848) — Facilitation of the Effects of Reference Rate Reform on Financial Reporting (“ASU 2020-04”) in order to make certain clarifications. ASU 2020-04 and ASU 2021-01 provide optional temporary financial reporting relief from the effect of certain types of contract modifications due to the planned discontinuation of the London Interbank Offered Rate (“LIBOR”) and other interbank-offered based reference rates. The temporary relief provided by ASU 2020-04 and ASU 2021-01 is effective for certain reference rate-related contract modifications that occur during the period March 12, 2020 through December 31, 2022. Management does not believe the impact of adopting ASU 2020-04 and ASU 2021-01 will have a material impact on the financial statements.
In June 2022, FASB issued Accounting Standards Update 2022-03 — Fair Value Measurement (Topic 820) — Fair Value Measurement of Equity Securities Subject to Contractual Sale Restrictions (“ASU 2022-03”). ASU 2022-03 clarifies the guidance in Topic 820 to indicate that a contractual sale restriction should not be considered in the fair value of an equity security subject to such a restriction, and requires entities with investments in equity securities subject to contractual sale restrictions to disclose certain qualitative and quantitative information about such securities. ASU 2022-03 is effective for fiscal years, and interim periods within those fiscal years, beginning after December 15, 2023, and allows for early adoption. ASU 2022-03 will only be applicable to an equity security in which the contractual arrangement that restricts its sale is executed or modified on or after the adoption date. Management is currently evaluating the impact of applying this update.
279
Notes to Financial Statements (Continued) |
9. Coronavirus (COVID-19) Pandemic
The global pandemic outbreak of the novel coronavirus known as COVID-19 and efforts to contain its spread have produced, and will likely continue to produce, substantial market volatility, severe market dislocations and liquidity constraints in many markets, exchange trading suspensions and closures, higher default rates, and global business disruption, and they may result in future significant adverse effects, such as declines in global financial markets and a substantial economic downturn or recession throughout the world. Such factors may have a significant adverse effect on a Fund’s performance and have the potential to impair the ability of a Fund’s investment adviser, subadviser, or other service providers to serve the Fund and could lead to disruptions that negatively impact the Fund.
10. Russia-Ukraine War
In February 2022, Russia commenced a large-scale military attack on Ukraine. The outbreak of hostilities between the two countries could result in more widespread conflict and could have a severe adverse effect on the regional and the global financial markets and economies. One or more of the Funds hold positions in securities or other instruments that are economically tied to Russia. Investments in Russia are subject to political, economic, legal, market, and currency risks, as well as the risks related to the economic sanctions on Russia, Russian individuals, and Russian corporate and banking entities imposed by the United States and/or other countries. Such sanctions — which affect companies in many sectors, including energy, financial services, and defense, among others — could adversely affect the global energy and financial markets and, thus, could affect the value of a Fund’s investments, even beyond any direct exposure the Fund may have to Russian issuers or the adjoining geographic regions. Such sanctions may also result in a decline in the value and liquidity of Russian securities and a weakening of the ruble, and will impair a Fund’s ability to buy, sell, receive, or deliver Russian securities. In addition, certain transactions have been or may be prohibited and/or existing investments have or may become illiquid (e.g., because transacting in certain existing investments is prohibited), which could cause a Fund to sell other portfolio holdings at a disadvantageous time or price in order to meet shareholder redemptions.
280
To the Board of Trustees of MassMutual Select Funds and Shareholders of MassMutual Total Return Bond Fund, MassMutual Strategic Bond Fund, MassMutual Diversified Value Fund, MassMutual Fundamental Value Fund, MM S&P 500® Index Fund, MassMutual Equity Opportunities Fund, MassMutual Fundamental Growth Fund, MassMutual Blue Chip Growth Fund, MassMutual Growth Opportunities Fund, MassMutual Mid Cap Value Fund, MassMutual Small Cap Value Equity Fund, MassMutual Small Company Value Fund, MassMutual Mid Cap Growth Fund, MassMutual Small Cap Growth Equity Fund, MassMutual Overseas Fund, and MassMutual Select T. Rowe Price International Equity Fund (collectively, the “Funds”):
Opinion on the Financial Statements and Financial Highlights
We have audited the accompanying statements of assets and liabilities of the Funds, including the portfolios of investments as of September 30, 2022, the related statements of operations for the year then ended, the statements of changes in net assets for each of the two years in the period then ended, and the financial highlights for each of the five years in the period then ended (except for the MassMutual Select T. Rowe Price International Equity Fund’s financial highlights which are for each of the four years in the period then ended and the period February 9, 2018 (commencement of operations) to September 30, 2018), and the related notes.
In our opinion, the financial statements and financial highlights present fairly, in all material respects, the financial position of the Funds, as of September 30, 2022, and the results of their operations for the year then ended, the changes in their net assets for each of the two years in the period then ended, and the financial highlights for each of the five years in the period then ended (except for the MassMutual Select T. Rowe Price International Equity Fund’s financial highlights which are for each of the four years in the period then ended and the period February 9, 2018 (commencement of operations) to September 30, 2018), in conformity with accounting principles generally accepted in the United States of America.
Basis for Opinion
These financial statements and financial highlights are the responsibility of the Funds’ management. Our responsibility is to express an opinion on the Funds’ financial statements and financial highlights based on our audits. We are a public accounting firm registered with the Public Company Accounting Oversight Board (United States) (PCAOB) and are required to be independent with respect to the Funds in accordance with the U.S. federal securities laws and the applicable rules and regulations of the Securities and Exchange Commission and the PCAOB.
We conducted our audits in accordance with the standards of the PCAOB. Those standards require that we plan and perform the audit to obtain reasonable assurance about whether the financial statements and financial highlights are free of material misstatement, whether due to error or fraud. The Funds are not required to have, nor were we engaged to perform, an audit of their internal control over financial reporting. As part of our audits we are required to obtain an understanding of internal control over financial reporting but not for the purpose of expressing an opinion on the effectiveness of the Funds’ internal control over financial reporting. Accordingly, we express no such opinion.
Our audits included performing procedures to assess the risks of material misstatement of the financial statements and financial highlights, whether due to error or fraud, and performing procedures that respond to those risks. Such procedures included examining, on a test basis, evidence regarding the amounts and disclosures in the financial statements and financial highlights. Our audits also included evaluating the accounting principles used and significant estimates made by management, as well as evaluating
281
Report of Independent Registered Public Accounting Firm (Continued) |
the overall presentation of the financial statements and financial highlights. Our procedures included confirmation of securities owned as of September 30, 2022, by correspondence with the custodian, brokers and agent banks; when replies were not received from brokers or agent banks, we performed other auditing procedures. We believe that our audits provide a reasonable basis for our opinion.
/s/ Deloitte & Touche LLP
Boston, Massachusetts
November 28, 2022
We have served as the auditor of one or more MassMutual investment companies since 1995.
282
The following table lists the Trust’s Trustees and Principal Officers; their address and year of birth; their position with the Trust; the length of time holding that position with the Trust; their principal occupation(s) during at least the past five years; the number of portfolios in the fund complex they oversee; and other directorships they hold in companies subject to registration or reporting requirements of the Securities Exchange Act of 1934 (generally called “public companies”) or in registered investment companies. The Trust’s Statement of Additional Information includes additional information about the Trust’s Trustees and is available, without charge, upon request by calling 1-888-309-3539 or by writing MassMutual Funds, c/o Massachusetts Mutual Life Insurance Company, 1295 State Street, Springfield, Massachusetts 01111-0001, Attention: Investment Management Solutions.
Independent Trustees
Name, Address*, |
Position(s) |
Term of |
Principal Occupation(s) |
Number of |
Other Directorships |
Allan W. Blair Year of birth: 1948 |
Trustee |
Since 2003 |
Retired. |
108 |
Trustee (since 2012), MassMutual Premier Funds (open-end investment company); Trustee (since 2021), MassMutual Advantage Funds (open-end investment company); Trustee (since 2003), MML Series Investment Fund (open-end investment company); Trustee (since 2012), MML Series Investment Fund II (open-end investment company). |
Nabil N. El-Hage Year of birth: 1958 |
Trustee |
Since 2012 |
Founder and CEO (since 2018), AEE International LLC (a Puerto Rico LLC); Founder and sole member (2016-2018), PR Academy of Executive Education LLC (a Puerto Rico LLC). |
108 |
Trustee (since 2003), Chairman (2006-2012), MassMutual Premier Funds (open-end investment company); Trustee (since 2021), MassMutual Advantage Funds (open-end investment company); Trustee (since 2012), MML Series Investment Fund (open-end investment company); Trustee (since 2005), Chairman (2006-2012), MML Series Investment Fund II (open-end investment company). |
Maria D. Furman Year of birth: 1954 |
Trustee |
Since 2012 |
Retired. |
108 |
Trustee (since 2004), MassMutual Premier Funds (open-end investment company); Trustee (since 2021), MassMutual Advantage Funds (open-end investment company); Trustee (since 2012), MML Series Investment Fund (open-end investment company); Trustee (since 2005), MML Series Investment Fund II (open-end investment company). |
R. Bradford Malt Year of birth: 1954 |
Trustee |
Since 2022 |
Chairman (2004-2019), Management Committee (1993-2019), Partner (1987-2019), Associate (1979-1987), Ropes & Gray LLP (counsel to the Trust and MassMutual). |
108 |
Trustee (since 2022), MassMutual Premier Funds (open-end investment company); Trustee (since 2022), MassMutual Advantage Funds (open-end investment company); Trustee (since 2022), MML Series Investment Fund (open-end investment company); Trustee (since 2022), MML Series Investment Fund II (open-end investment company). |
283
Trustees and Principal Officers (Unaudited) (Continued) |
Name, Address*, |
Position(s) |
Term of |
Principal Occupation(s) |
Number of |
Other Directorships |
C. Ann Merrifield Year of birth: 1951 |
Trustee |
Since 2012 |
Retired. |
108 |
Director (since 2020), Lead Director (2020-2022), Chairperson (since 2020) of the Nominating and Governance Committee, Member (since 2020) and Chairperson (2020-2022) of the Compensation Committee, and Member (2020-2022) of the Audit Committee, Lyra Therapeutics (a clinical-stage specialty pharmaceutical company); Chairperson (since 2017), Director (since 2014), InVivo Therapeutics (research and clinical-stage biomaterials and biotechnology company); Trustee (since 2004), MassMutual Premier Funds (open-end investment company); Trustee (since 2021), MassMutual Advantage Funds (open-end investment company); Trustee (since 2012), MML Series Investment Fund (open-end investment company); Trustee (since 2005), MML Series Investment Fund II (open-end investment company). |
Cynthia R. Plouché Year of birth: 1957 |
Trustee |
Since 2022 |
Retired; Assessor (2014-2018), Moraine Township (property assessment). |
108 |
Trustee (since 2014), Northern Trust Funds (open-end investment companies); Trustee (since 2022), MassMutual Premier Funds (open-end investment company); Trustee (since 2022), MassMutual Advantage Funds (open-end investment company); Trustee (since 2022), MML Series Investment Fund (open-end investment company); Trustee (since 2022), MML Series Investment Fund II (open-end investment company). |
Jason J. Price Year of birth: 1973 |
Trustee |
Since 2022 |
Co-Founder and Chairman of the Board (2017-2021), NXTHVN (arts organization); Principal (2012-2017), Exaltare Capital Partners, LLC (private equity firm). |
108 |
Trustee (since 2022), MassMutual Premier Funds (open-end investment company); Trustee (since 2022), MassMutual Advantage Funds (open-end investment company); Trustee (since 2022), MML Series Investment Fund (open-end investment company); Trustee (since 2022), MML Series Investment Fund II (open-end investment company). |
Susan B. Sweeney Year of birth: 1952 |
Chairperson
Trustee |
Since 2022
Since 2009 |
Retired. |
110^ |
Trustee (since 2012), Barings Corporate Investors (closed-end investment company); Trustee (since 2012), Barings Participation Investors (closed-end investment company); Chairperson (since 2022), Trustee (since 2012), MassMutual Premier Funds (open-end investment company); Chairperson (since 2022), Trustee (since 2021), MassMutual Advantage Funds (open-end investment company); Chairperson (since 2022), Trustee (since 2009), MML Series Investment Fund (open-end investment company); Chairperson (since 2022), Trustee (since 2012), MML Series Investment Fund II (open-end investment company). |
284
Trustees and Principal Officers (Unaudited) (Continued) |
Interested Trustees
Name, Address*, and Year of Birth |
Position(s) |
Term of |
Principal Occupation(s) |
Number of |
Other Directorships |
Michael R. Fanning^^ Year of birth: 1963 |
Trustee |
Since 2021 |
Head of MassMutual U.S. (since 2016), Executive Vice President (2016-2018), Member of MassMutual’s Executive Leadership Team (since 2008), MassMutual. |
108 |
Director (since 2016), MML Advisers; Trustee (since 2021), MassMutual Premier Funds (open-end investment company); Trustee (since 2021), MassMutual Advantage Funds (open-end investment company); Trustee (since 2021), MML Series Investment Fund (open-end investment company); Trustee (since 2021), MML Series Investment Fund II (open-end investment company). |
Clifford M, Noreen^^^ |
Trustee |
Since 2021 |
Head of Global Investment Strategy (since 2019), Deputy Chief Investment Officer and Managing Director (2016-2018), MassMutual; President (2008-2016), Vice Chairman (2007-2008), Member of the Board of Managers (2006-2016), Managing Director (2000-2016), Barings LLC. |
110^ |
Chairman (since 2009), Trustee (since 2005), President (2005-2009), CI Subsidiary Trust and PI Subsidiary Trust; Chairman and Trustee (since 2009), President (2005-2009), Vice President (1993-2005), Barings Corporate Investors (closed-end investment company); Chairman and Trustee (since 2009), President (2005-2009), Vice President (1993-2005), Barings Participation Investors (closed-end investment company); Trustee (since 2021), MassMutual Premier Funds (open-end investment company); Trustee (since 2021), MassMutual Advantage Funds (open-end investment company); Trustee (since 2021), MML Series Investment Fund (open-end investment company); Trustee (since 2021), MML Series Investment Fund II (open-end investment company). |
Principal Officers
Name, Address*, and Year of Birth |
Position(s) |
Term of |
Principal Occupation(s) |
Number of |
Andrea Anastasio Year of birth: 1974 |
Vice President
|
Since 2021 |
Vice President (since 2021), MML Advisers; Head of Investment Management Solutions (since 2021), MassMutual; Head of Investment Strategy and Research, North America (2019-2021), Head of Investment Product Management (2016- 2019), State Street Global Advisors; Vice President (since 2021), MassMutual Premier Funds (open-end investment company); Vice President (since 2021), MassMutual Advantage Funds (open-end investment company); Vice President (since 2021), MML Series Investment Fund (open-end investment company); Vice President (since 2021), MML Series Investment Fund II (open-end investment company). |
108 |
285
Trustees and Principal Officers (Unaudited) (Continued) |
Name, Address*, and Year of Birth |
Position(s) |
Term of |
Principal Occupation(s) |
Number of |
Andrew M. Goldberg Year of birth: 1966 |
Vice President, Secretary, and Chief Legal Officer
Assistant Secretary |
Since 2008
2001- 2008 |
Lead Counsel, Investment Adviser & Mutual Funds (since 2018), Assistant Vice President and Counsel (2004-2018), MassMutual; Secretary (since 2015), Assistant Secretary (2013-2015), MML Advisers; Vice President, Secretary (formerly known as “Clerk”), and Chief Legal Officer (since 2008), Assistant Clerk (2004-2008), MassMutual Premier Funds (open-end investment company); Vice President, Secretary, and Chief Legal Officer (since 2021), MassMutual Advantage Funds (open-end investment company); Vice President, Secretary, and Chief Legal Officer (since 2008), Assistant Secretary (2001-2008), MML Series Investment Fund (open-end investment company); Vice President, Secretary (formerly known as “Clerk”), and Chief Legal Officer (since 2008), Assistant Clerk (2005-2008), MML Series Investment Fund II (open-end investment company). |
108 |
Renee Hitchcock Year of birth: 1970 |
Chief Financial Officer and Treasurer
Assistant Treasurer |
Since 2016
2007- 2016 |
Head of Mutual Fund Administration (since 2018), Assistant Vice President (2015-2018), MassMutual; Chief Financial Officer and Treasurer (since 2016), Assistant Treasurer (2007-2016), MassMutual Premier Funds (open-end investment company); Chief Financial Officer and Treasurer (since 2021), MassMutual Advantage Funds (open-end investment company); Chief Financial Officer and Treasurer (since 2016), Assistant Treasurer (2007-2016), MML Series Investment Fund (open-end investment company); Chief Financial Officer and Treasurer (since 2016), Assistant Treasurer (2007-2016), MML Series Investment Fund II (open-end investment company). |
108 |
Paul LaPiana |
President |
Since 2021 |
President (since 2021), MML Advisers; Head of MassMutual U.S. Product (since 2019), Head of Field Management (2016-2019), MassMutual; President (since 2021), MassMutual Premier Funds (open-end investment company); President (since 2021), MassMutual Advantage Funds (open-end investment company); President (since 2021), MML Series Investment Fund (open-end investment company); President (since 2021), MML Series Investment Fund II (open-end investment company). |
108 |
Jill Nareau Robert Year of birth: 1972 |
Vice President and Assistant Secretary
Assistant Secretary |
Since 2017
2008- 2017 |
Lead Counsel, Investment Adviser & Mutual Funds (since 2018), Assistant Vice President and Counsel (2009-2018), MassMutual; Assistant Secretary (since 2015), MML Advisers; Vice President and Assistant Secretary (since 2017), Assistant Secretary (formerly known as “Assistant Clerk”) (2008-2017), MassMutual Premier Funds (open-end investment company); Vice President and Assistant Secretary (since 2021), MassMutual Advantage Funds (open-end investment company); Vice President and Assistant Secretary (since 2017), Assistant Secretary (2008-2017), MML Series Investment Fund (open-end investment company); Vice President and Assistant Secretary (since 2017), Assistant Secretary (formerly known as “Assistant Clerk”) (2008-2017), MML Series Investment Fund II (open-end investment company). |
108 |
Douglas Steele Year of birth: 1975 |
Vice President |
Since 2016 |
Head of Product Management (since 2021), Vice President (since 2017), Head of Investment Management (2017-2021), Head of Investment Due Diligence (2016-2017), MML Advisers; Head of Product Management (since 2021), Head of Manager Research (2021), Head of Investment Management (2017-2021), Assistant Vice President (2013-2017), MassMutual; Vice President (since 2016), MassMutual Premier Funds (open-end investment company); Vice President (since 2021), MassMutual Advantage Funds (open-end investment company); Vice President (since 2016), MML Series Investment Fund (open-end investment company); Vice President (since 2016), MML Series Investment Fund II (open-end investment company). |
108 |
286
Trustees and Principal Officers (Unaudited) (Continued) |
Name, Address*, |
Position(s) |
Term of |
Principal Occupation(s) |
Number of |
Philip S. Wellman Year of birth: 1964 |
Vice President and Chief Compliance Officer |
Since 2007 |
Vice President and Chief Compliance Officer (since 2013), MML Advisers; Head of Mutual Funds & RIA Compliance (since 2018), Vice President, Associate General Counsel, and Chief Compliance Officer (Mutual Funds) (2014-2018), MassMutual; Vice President and Chief Compliance Officer (since 2007), MassMutual Premier Funds (open-end investment company); Vice President and Chief Compliance Officer (since 2021), MassMutual Advantage Funds (open-end investment company); Vice President and Chief Compliance Officer (since 2007), MML Series Investment Fund (open-end investment company); Vice President and Chief Compliance Officer (since 2007), MML Series Investment Fund II (open-end investment company). |
108 |
|
* |
The address of each Trustee and Principal Officer is the same as that for the Trust; 1295 State Street, Springfield, Massachusetts 01111-0001. |
|
** |
Each Trustee of the Trust serves until the next meeting of shareholders called for the purpose of electing Trustees and until the election and qualification of his or her successor or until he or she dies, resigns, or is removed. Notwithstanding the foregoing, unless the Trustees determine that it is desirable and in the best interest of the Trust that an exception to the retirement policy of the Trust be made, a Trustee shall retire and cease to serve as a Trustee upon the conclusion of the calendar year in which such Trustee attains the age of seventy-five years, however, an interested Trustee of the Trust shall no longer serve as a Trustee if or when they are no longer an employee of MassMutual or an affiliate. |
|
|
The Chairperson is elected to hold such office for a term of three years or until their successor is elected and qualified to carry out the duties and responsibilities of their office, or until he or she retires, dies, resigns, is removed, or becomes disqualified, and any such Chairperson may not serve more than two consecutive terms. The Chairperson shall hold office at the pleasure of the Trustees. |
|
^ |
Barings Participation Investors and Barings Corporate Investors are deemed to be a part of the Fund Complex, because they are managed by Barings LLC, an affiliate of MML Advisers. |
|
^^ |
Mr. Fanning is an “Interested Person,” as that term is defined in the 1940 Act, as an employee of MassMutual. |
|
^^^ |
Mr. Noreen is an “Interested Person,” as that term is defined in the 1940 Act, as an employee of MassMutual. |
|
# |
The President, Treasurer, and Secretary and such other officers as the Trustees may in their discretion from time to time elect are elected to hold such office until their successor is elected and qualified to carry out the duties and responsibilities of their office, or until he or she dies, resigns, is removed, or becomes disqualified. Each officer shall hold office at the pleasure of the Trustees. |
287
For corporate shareholders, a portion of the ordinary dividends paid during the Fund(s)’ year ended September 30, 2022, qualified for the dividends received deduction, as follows:
Dividends |
||||
Diversified Value Fund |
52.49 | % | ||
Fundamental Value Fund |
77.36 | % | ||
S&P 500 Index Fund |
100.00 | % | ||
Equity Opportunities Fund |
72.39 | % | ||
Fundamental Growth Fund |
2.38 | % | ||
Blue Chip Growth Fund |
45.22 | % | ||
Growth Opportunities Fund |
6.26 | % | ||
Mid Cap Value Fund |
14.04 | % | ||
Small Cap Value Equity Fund |
18.74 | % | ||
Small Company Value Fund |
18.40 | % | ||
Mid Cap Growth Fund |
17.09 | % | ||
Small Cap Growth Equity Fund |
5.52 | % | ||
Overseas Fund |
0.17 | % | ||
MM Select T. Rowe Price International Equity Fund |
0.76 | % | ||
For the year ended September 30, 2022, the following Fund(s) earned the following foreign sources of income:
Amount |
||||
Overseas Fund |
$ | 10,455,344 | ||
MM Select T. Rowe Price International Equity Fund |
51,373,867 | |||
Under Section 854(b)(2) of the Code, the Fund(s) hereby designate the maximum amounts as qualified dividends for purposes of the maximum rate under Section 1(h)(11) of the Code for the year ended September 30, 2022.
The Fund(s) intend to pass through the maximum amount allowable as Section 163(j) Interest Dividends as defined in the Treasury Regulations §1.163(j)-1(b).
288
A description of the policies and procedures that each Fund’s investment adviser and subadvisers use to vote proxies relating to the Fund’s portfolio securities is available, without charge, upon request, by calling 1-888-309-3539, and on the Securities and Exchange Commission’s (“SEC”) EDGAR database on its website at http://www.sec.gov.
Information regarding how the Funds voted proxies relating to portfolio securities during the most recent 12-month period ended June 30 is available, without charge, upon request, on the MassMutual website at http://www.massmutual.com/funds and on the SEC’s EDGAR database on its website at http://www.sec.gov.
The Funds file their complete schedule of portfolio holdings with the SEC for the first and third quarters of each fiscal year as an exhibit to their reports on Form N-PORT. The Funds’ Forms N-PORT are available on the SEC’s EDGAR database on its website at http://www.sec.gov. In addition, the Funds make the complete schedule of portfolio holdings from their filings on Form N-PORT available to shareholders at http://www.massmutual.com/funds.
Trustees’ Approval of Investment Advisory Contracts
At their meetings in May and June 2022, the Contract Committee (the “Committee”) and the Trustees, including the Trustees who are not “interested persons” (as such term is defined in the 1940 Act) of the Trust, MML Advisers, or the subadvisers (the “Independent Trustees”), re-approved the existing advisory and subadvisory agreements (collectively, the “Contracts”) for each of the Total Return Bond Fund, Strategic Bond Fund, Diversified Value Fund, Fundamental Value Fund, S&P 500 Index Fund, Equity Opportunities Fund, Fundamental Growth Fund, Blue Chip Growth Fund, Growth Opportunities Fund, Mid Cap Value Fund, Small Cap Value Equity Fund, Small Company Value Fund, Mid Cap Growth Fund, Small Cap Growth Equity Fund, Overseas Fund, and MM Select T. Rowe Price International Equity Fund. In preparation for the meetings, the Trustees requested, and MML Advisers and the subadvisers provided in advance, certain materials relevant to the consideration of the Contracts (the “Meeting Materials”). In all of their deliberations, the Trustees were advised by independent counsel.
The Committee received in advance of the meetings (i) a memorandum from MML Advisers discussing the nature and quality of the services it provides as investment adviser to the Funds; (ii) a profitability analysis prepared by MML Advisers; and (iii) a fee and performance study report (the “Third-Party Report”) with respect to each Fund prepared by an independent third-party vendor (the “Third-Party”). The Third-Party Report provided detailed comparative advisory fee, total expense, and performance information for each Fund to assist the Committee in its evaluation of the Contracts. The Committee also considered information presented to it throughout the year regarding MML Advisers and each of the subadvisers.
The Committee considered the nature, scope, and quality of services MML Advisers provides to the Funds, including: (i) the financial condition, stability, and business strategy of MML Advisers; (ii) the capabilities of MML Advisers with respect to regulatory compliance and its ability to monitor compliance with the investment policies of the Funds; (iii) MML Advisers’ ability to provide investment oversight and provide for administrative and shareholder services to the Funds; and (iv) the experience and qualifications of the personnel of MML Advisers that perform, or oversee the performance of, the services provided to the Funds, and the needs of the Funds for administrative and shareholder services. The Committee noted that it had received in the Meeting Materials or during the course of the past year: (i) detailed information regarding MML Advisers’ ability to provide investment oversight and provide for administrative and shareholder services to the Funds; and (ii) a wide range of information about the subadvisers and their personnel with responsibility for providing services to the Funds and the fees payable to each subadviser by MML Advisers. MML Advisers reviewed with the Committee in detail the work MML Advisers does in its oversight roles, the expertise it brings to these roles, the size of its teams, and the financial commitment it has made to provide those services.
The Committee then reviewed and considered, for each Fund separately, the detailed information presented in the Third-Party Report regarding: (i) Fund expenses, including, among other things, both the Fund’s net advisory fee and total net expense ratio against peer funds; and (ii) the Fund’s relative performance (over various time periods against funds in its “category” and a benchmark index). In connection with the Committee’s review, MML Advisers provided commentary and analysis regarding each Fund’s expenses and performance and a recommendation as to the action to be taken by the Committee. Throughout the discussion, MML Advisers responded to Committee members’ questions and provided additional information concerning each Fund.
289
Other Information (Unaudited) (Continued) |
The Committee reviewed the expense and performance information for each Fund. (References to any one- or three-year period below are to periods ended December 31, 2021. In all cases, the comparative expense information is that of a Fund’s “peer group” and the comparative performance information is that of a Fund’s “performance category.”)
The Committee considered that the total net expense ratios for all but one of the Funds were at or within the top fifty percent of their peer groups, and in most cases in the top forty percent. All of the Funds with total net expense ratios at or below the 50th comparative percentile of their peer groups had net advisory fees below the medians of their peer groups, or within the top three comparative quintiles of their peer groups, except the Small Company Value Fund, Overseas Fund, Fundamental Value Fund, Equity Opportunities Fund, and Growth Opportunities Fund, the levels of whose net advisory fees the Committee did not consider to be inconsistent with the advisory agreements’ continuation, in light of the Funds’ generally acceptable total net expense ratios and/or general favorable investment performance over time. In their consideration of these Funds, the Committee took into account MML Advisers’ proposal to implement a five basis point contractual advisory fee waiver for the Fundamental Growth Fund, which MML Advisers believes will improve the Fund’s total net expense profile, as well as the advisory fee waivers and expense caps currently in place for certain Funds.
The Small Cap Value Equity Fund has a total net expense ratio higher than the 60th comparative percentile of its peer group. The Committee considered MML Advisers’ statement that although the Fund’s total net expense ratio and net advisory fee were each at the 67th comparative percentile of its peer group, the Fund’s total net expense ratio was only four basis points above the peer group median.
The Committee determined on the basis of these factors that the levels of the Funds’ net advisory fees, and the total net expenses of the Funds generally, were consistent with the continuation of their advisory agreements.
The Committee considered that the large majority of the Funds achieved three-year investment performance above the medians of their performance categories, or at or within the top sixty percent of their performance categories, except those Funds referred to below.
The Committee considered that each of the Fundamental Growth Fund, Small Cap Value Equity Fund, Diversified Value Fund, and Fundamental Value Fund had experienced three-year investment performance outside the top sixty percent of its performance category. The Committee considered MML Advisers’ statement that a contributor to the underperformance of the first three of those Funds was a relatively low exposure to high-growth stocks during recent high-growth equity markets, particularly in 2020, due to a general value-investing orientation of their subadvisers, and MML Advisers’ confidence in each Fund’s investment strategy and subadviser(s) over time. The Committee also noted that the Diversified Value Fund had experienced favorable performance for the one-year period, at the 27th comparative percentile of its performance category. As to the Fundamental Value Fund, the Committee considered MML Advisers’ statements that the Fund’s performance for the three-year period had been less than one percentage point below the median of its performance category, and that the Fund’s performance had improved for the one-year period to the 29th comparative percentile of its performance category.
As to the Equity Opportunities Fund, Mid Cap Value Fund, and Mid Cap Growth Fund, the Committee noted that each Fund had experienced three-year investment performance outside the top sixty percent of its performance category. The Committee considered MML Advisers’ statement that each Fund’s underperformance was due in part to the Fund’s lower risk profile during a period in which investors preferred higher momentum, more speculative stocks. The Committee also noted that each of the Equity Opportunities Fund and Mid Cap Growth Fund ranked in the top half of its respective performance category for six of the last 10 years, and that the Mid Cap Growth Fund experienced improved performance for the one-year period to the 42nd percentile of its performance category. As to the Mid Cap Value Fund, the Committee noted that the Fund had experienced a subadviser change in the past year, which MML Advisers believes should lead to improving performance. As to the Blue Chip Growth Fund, the Committee noted that the Fund had experienced performance for the one- and three-year periods in the 71st and 80th comparative percentiles of its performance category, respectively. The Committee considered MML Advisers’ statements that the Fund’s longer-term performance is competitive, with the Fund ranking in the 56th and 22nd comparative percentiles of its performance category for the five- and ten-year periods, respectively, and that a relatively narrow set of stocks was an outsized contributor to the Fund’s more recent underperformance. The Committee also noted MML Advisers’ positive opinion on the Fund’s new lead portfolio manager.
290
Other Information (Unaudited) (Continued) |
The Committee also reviewed and considered information included in the Meeting Materials, or discussed at the meeting and during the course of the year, concerning economies of scale and the profitability of MML Advisers’ advisory relationship with the various Funds, including: (i) a description of MML Advisers’ revenues from the Funds (including advisory fees and administrative and shareholder services fees, as applicable) and the expense allocation methodology employed by MML Advisers; and (ii) profitability information for each individual Fund. The discussions included consideration of the intangible benefits derived by MML Advisers and its affiliates resulting from their relationships with the Funds and any so-called “fallout benefits” to MML Advisers (which were not considered to be substantial in any event), such as any reputational value derived from serving as investment adviser to the Funds, and benefits accruing to subadvisers due to so-called “soft-dollar arrangements.”
Prior to the votes being taken to approve the Contracts, the Committee met separately in executive session to discuss the appropriateness of such contracts. The Committee weighed the foregoing matters in light of the advice given to them by their independent legal counsel as to the law applicable to the review of investment advisory contracts. In arriving at a decision, the Committee did not identify any single matter as all-important or controlling. The foregoing summary does not detail all of the matters considered.
As to each of the Funds, the Committee concluded that: (i) overall, it was satisfied with the nature, extent, and quality of services provided, and expected to be provided in the future, under the Contracts, including the level of MML Advisers’ oversight of each Fund and the subadvisory process; (ii) MML Advisers’ levels of profitability from its relationship with the various Funds are not excessive and the advisory fees payable under the advisory agreements and each Fund’s total net expenses are fair and reasonable; (iii) the investment processes, research capabilities, and philosophies of the subadvisers generally appear well suited to the Funds, given their investment objectives and policies; (iv) either the relative or absolute performance of a Fund (in each case, taking into account the applicable investment strategy and risk profile of the Fund), or the steps MML Advisers has proposed in respect of the underperformance of a Fund, are sufficient to warrant continuation of the Contracts for each of the Funds; and (v) the terms of the Contracts are fair and reasonable with respect to each Fund and are in the best interests of each Fund’s shareholders.
291
Other Information (Unaudited) (Continued) |
Submission of Matters to a Vote of Security Holders
A Special Meeting of Shareholders of the Trust was held on May 25, 2022 and on the adjournment dates of June 9, 2022, July 28, 2022, and September 14, 2022. The Notice of Meeting of Shareholders, and a Proxy Statement and voting instruction card, were first mailed, or otherwise made available, on or about April 8, 2022 to shareholders of record as of February 25, 2022. The results of the vote on the matters submitted to shareholders at the Special Meeting are as follows:
|
Proposal 1: |
To elect Allan W. Blair, Nabil N. El-Hage, Michael R. Fanning, Maria D. Furman, R. Bradford Malt, C. Ann Merrifield, Clifford M. Noreen, Cynthia R. Plouché, Jason J. Price, and Susan B. Sweeney as Trustees of each Trust of which the Funds are series for an indefinite term of office.* |
This matter was approved by the Trust’s shareholders on June 9, 2022. The results of the votes were as follows:
Shares Voted |
Shares For |
% of Shares Outstanding |
Withhold |
% of Shares Outstanding |
||||||||||||||||
Allan W. Blair |
1,062,272,572.058 | 1,055,134,595.262 | 42.213 | % | 7,137,976.796 | 0.285 | % | |||||||||||||
Nabil N. El-Hage |
1,062,272,572.058 | 1,055,187,057.064 | 42.215 | % | 7,085,514.994 | 0.283 | % | |||||||||||||
Michael R. Fanning |
1,062,272,572.058 | 1,054,435,784.031 | 42.185 | % | 7,836,788.027 | 0.313 | % | |||||||||||||
Maria D. Furman |
1,062,272,572.058 | 1,055,334,004.749 | 42.221 | % | 6,938,567.309 | 0.277 | % | |||||||||||||
R. Bradford Malt |
1,062,272,572.058 | 1,054,410,988.847 | 42.184 | % | 7,861,583.211 | 0.314 | % | |||||||||||||
C. Ann Merrifield |
1,062,272,572.058 | 1,054,614,232.611 | 42.192 | % | 7,658,339.447 | 0.306 | % | |||||||||||||
Clifford M. Noreen |
1,062,272,572.058 | 1,054,519,598.373 | 42.188 | % | 7,752,973.685 | 0.310 | % | |||||||||||||
Cynthia R. Plouché |
1,062,272,572.058 | 1,055,673,410.167 | 42.234 | % | 6,599,161.891 | 0.264 | % | |||||||||||||
Jason J. Price |
1,062,272,572.058 | 1,055,486,383.752 | 42.227 | % | 6,786,188.306 | 0.271 | % | |||||||||||||
Susan B. Sweeney |
1,062,272,572.058 | 1,055,272,106.456 | 42.218 | % | 7,000,465.602 | 0.280 | % | |||||||||||||
|
* |
Denotes Trust-wide proposal and voting results. |
|
Proposal 2: |
To change the status of certain Funds from diversified funds to non-diversified funds. |
This matter was approved by the following Fund’s shareholders on September 14, 2022. The results of the votes were as follows:
Shares Voted |
Shares For |
% of Shares Outstanding |
Against |
% of Shares Outstanding |
Abstain |
% of Shares Outstanding |
Broker |
% of Shares Outstanding |
||||||||||||||||||||||||||||
Blue Chip Growth Fund |
76,580,926.865 | 71,611,265.587 | 48.765 | % | 1,065,213.725 | 0.725 | % | 2,799,778.734 | 1.906 | % | 1,104,668.819 | 0.752 | % | |||||||||||||||||||||||
292
Other Information (Unaudited) (Continued) |
Fund Expenses September 30, 2022
Expense Examples:
The following information is in regards to expenses for the six months ended September 30, 2022:
As a shareholder of the Funds, you may incur two types of costs: (1) transaction costs, including sales charges (loads) on purchase payments or redemptions; and (2) ongoing costs, including advisory fees, distribution and/or service (12b-1) fees, and other Fund expenses. These examples are intended to help you understand your ongoing costs (in dollars) of investing in the Funds and to compare these costs with the ongoing costs of investing in other mutual funds. These examples are based on an investment of $1,000 invested for the six months ended September 30, 2022.
Actual Expenses:
The first four columns of the table below provide information about actual account values and actual expenses. You may use this information, together with the amount you invested, to estimate the expenses that you paid over the period. Simply divide your account value by $1,000 (for example, an $8,600 account value divided by $1,000 = 8.6), then multiply the result by the number under the heading entitled “Operating Expenses Incurred” to estimate the expenses you paid on your account during this period.
Hypothetical Example for Comparison Purposes:
The last two columns of the table below provide information about hypothetical account values and hypothetical expenses based on the Fund’s actual expense ratio and an assumed rate of return of 5% per year before expenses, which is not the Fund’s actual return. The hypothetical account values and expenses may not be used to estimate the actual ending account balance or expenses you paid for the period. You may use this information to compare the ongoing costs of investing in the Fund and other funds. To do so, compare this 5% hypothetical example with the 5% hypothetical examples that appear in the shareholder reports of the other funds.
Please note that the expenses shown in the table are meant to highlight your ongoing costs only and do not reflect any transactional costs. Therefore, the last two columns of the table are useful in comparing ongoing costs only, and will not help you determine the relative total costs of owning different funds. In addition, if these transactional costs were included, your costs would have been higher.
Beginning Value |
Annualized Expense |
Ending Value (Based on Actual Returns and Expenses) |
Operating Expenses Incurred* |
Ending Value (Based on Hypothetical Returns and Expenses) |
Operating Expenses Incurred* |
|
Total Return Bond Fund |
||||||
Class I |
$1,000 |
0.34% |
$895.70 |
$1.62 |
$1,023.40 |
$1.72 |
Class R5 |
1,000 |
0.45% |
895.60 |
2.14 |
1,022.80 |
2.28 |
Service Class |
1,000 |
0.54% |
894.10 |
2.56 |
1,022.40 |
2.74 |
Administrative Class |
1,000 |
0.65% |
894.60 |
3.09 |
1,021.80 |
3.29 |
Class R4 |
1,000 |
0.79% |
893.30 |
3.75 |
1,021.10 |
4.00 |
Class A |
1,000 |
0.89% |
893.00 |
4.22 |
1,020.60 |
4.51 |
Class R3 |
1,000 |
1.04% |
892.30 |
4.93 |
1,019.90 |
5.27 |
293
Other Information (Unaudited) (Continued) |
Beginning Value |
Annualized Expense |
Ending Value (Based on Actual Returns and Expenses) |
Operating Expenses Incurred* |
Ending Value (Based on Hypothetical Returns and Expenses) |
Operating Expenses Incurred* |
|
Strategic Bond Fund |
||||||
Class I |
1,000 |
0.48% |
886.50 |
2.27 |
1,022.70 |
2.43 |
Class R5 |
1,000 |
0.58% |
885.50 |
2.74 |
1,022.20 |
2.94 |
Service Class |
1,000 |
0.68% |
885.50 |
3.21 |
1,021.70 |
3.45 |
Administrative Class |
1,000 |
0.78% |
885.30 |
3.69 |
1,021.20 |
3.95 |
Class R4 |
1,000 |
0.93% |
884.50 |
4.39 |
1,020.40 |
4.71 |
Class A |
1,000 |
1.03% |
883.20 |
4.86 |
1,019.90 |
5.22 |
Class R3 |
1,000 |
1.18% |
883.70 |
5.57 |
1,019.20 |
5.97 |
Diversified Value Fund |
||||||
Class I |
$1,000 |
0.59% |
$839.40 |
$2.72 |
$1,022.10 |
$2.99 |
Class R5 |
1,000 |
0.69% |
839.10 |
3.18 |
1,021.60 |
3.50 |
Service Class |
1,000 |
0.79% |
838.50 |
3.64 |
1,021.10 |
4.00 |
Administrative Class |
1,000 |
0.89% |
837.70 |
4.10 |
1,020.60 |
4.51 |
Class R4 |
1,000 |
1.04% |
837.40 |
4.79 |
1,019.90 |
5.27 |
Class A |
1,000 |
1.14% |
837.30 |
5.25 |
1,019.40 |
5.77 |
Class R3 |
1,000 |
1.29% |
836.30 |
5.94 |
1,018.60 |
6.53 |
Fundamental Value Fund |
||||||
Class I |
1,000 |
0.66% |
844.70 |
3.05 |
1,021.80 |
3.35 |
Class R5 |
1,000 |
0.76% |
845.10 |
3.52 |
1,021.30 |
3.85 |
Service Class |
1,000 |
0.86% |
845.00 |
3.98 |
1,020.80 |
4.36 |
Administrative Class |
1,000 |
0.96% |
843.90 |
4.44 |
1,020.30 |
4.86 |
Class R4 |
1,000 |
1.11% |
843.20 |
5.13 |
1,019.50 |
5.62 |
Class A |
1,000 |
1.21% |
843.10 |
5.59 |
1,019.00 |
6.12 |
Class R3 |
1,000 |
1.37% |
842.40 |
6.33 |
1,018.20 |
6.93 |
S&P 500 Index Fund |
||||||
Class I |
1,000 |
0.13% |
797.30 |
0.59 |
1,024.40 |
0.66 |
Class R5 |
1,000 |
0.23% |
796.40 |
1.04 |
1,023.90 |
1.17 |
Service Class |
1,000 |
0.38% |
796.00 |
1.71 |
1,023.20 |
1.93 |
Administrative Class |
1,000 |
0.48% |
795.80 |
2.16 |
1,022.70 |
2.43 |
Class R4 |
1,000 |
0.63% |
795.10 |
2.84 |
1,021.90 |
3.19 |
Class A |
1,000 |
0.73% |
794.90 |
3.28 |
1,021.40 |
3.70 |
Class R3 |
1,000 |
0.88% |
794.10 |
3.96 |
1,020.70 |
4.46 |
Equity Opportunities Fund |
||||||
Class I |
1,000 |
0.74% |
851.70 |
3.44 |
1,021.40 |
3.75 |
Class R5 |
1,000 |
0.84% |
851.10 |
3.90 |
1,020.90 |
4.26 |
Service Class |
1,000 |
0.94% |
850.50 |
4.36 |
1,020.40 |
4.76 |
Administrative Class |
1,000 |
1.04% |
850.00 |
4.82 |
1,019.90 |
5.27 |
Class R4 |
1,000 |
1.19% |
849.60 |
5.52 |
1,019.10 |
6.02 |
Class A |
1,000 |
1.29% |
848.80 |
5.98 |
1,018.60 |
6.53 |
Class R3 |
1,000 |
1.44% |
847.90 |
6.67 |
1,017.80 |
7.28 |
Fundamental Growth Fund |
||||||
Class I |
1,000 |
1.25% |
750.60 |
5.49 |
1,018.80 |
6.33 |
Class R5 |
1,000 |
1.41% |
750.00 |
6.19 |
1,018.00 |
7.13 |
Service Class |
1,000 |
1.52% |
748.00 |
6.66 |
1,017.40 |
7.69 |
Administrative Class |
1,000 |
1.61% |
747.70 |
7.05 |
1,017.00 |
8.14 |
Class R4 |
1,000 |
1.77% |
748.00 |
7.76 |
1,016.20 |
8.95 |
Class A |
1,000 |
1.86% |
748.10 |
8.15 |
1,015.70 |
9.40 |
Class R3 |
1,000 |
2.02% |
745.70 |
8.84 |
1,014.90 |
10.20 |
294
Other Information (Unaudited) (Continued) |
Beginning Value |
Annualized Expense |
Ending Value (Based on Actual Returns and Expenses) |
Operating Expenses Incurred* |
Ending Value (Based on Hypothetical Returns and Expenses) |
Operating Expenses Incurred* |
|
Blue Chip Growth Fund |
||||||
Class I |
1,000 |
0.65% |
724.10 |
2.81 |
1,021.80 |
3.29 |
Class R5 |
1,000 |
0.75% |
723.70 |
3.24 |
1,021.30 |
3.80 |
Service Class |
1,000 |
0.85% |
723.20 |
3.67 |
1,020.80 |
4.31 |
Administrative Class |
1,000 |
0.95% |
723.20 |
4.10 |
1,020.30 |
4.81 |
Class R4 |
1,000 |
1.09% |
722.70 |
4.71 |
1,019.60 |
5.52 |
Class A |
1,000 |
1.20% |
722.10 |
5.18 |
1,019.10 |
6.07 |
Class R3 |
1,000 |
1.35% |
721.80 |
5.83 |
1,018.30 |
6.83 |
Growth Opportunities Fund |
||||||
Class I |
$1,000 |
0.78% |
$662.80 |
$3.25 |
$1,021.20 |
$3.95 |
Class R5 |
1,000 |
0.88% |
663.70 |
3.67 |
1,020.70 |
4.46 |
Service Class |
1,000 |
0.98% |
662.30 |
4.08 |
1,020.20 |
4.96 |
Administrative Class |
1,000 |
1.09% |
662.30 |
4.54 |
1,019.60 |
5.52 |
Class R4 |
1,000 |
1.23% |
663.40 |
5.13 |
1,018.90 |
6.23 |
Class A |
1,000 |
1.33% |
662.40 |
5.54 |
1,018.40 |
6.73 |
Class R3 |
1,000 |
1.47% |
660.20 |
6.12 |
1,017.70 |
7.44 |
Mid Cap Value Fund |
||||||
Class I |
1,000 |
0.61% |
835.40 |
2.81 |
1,022.00 |
3.09 |
Class R5 |
1,000 |
0.71% |
835.40 |
3.27 |
1,021.50 |
3.60 |
Service Class |
1,000 |
0.81% |
834.60 |
3.73 |
1,021.00 |
4.10 |
Administrative Class |
1,000 |
0.91% |
834.50 |
4.18 |
1,020.50 |
4.61 |
Class R4 |
1,000 |
1.06% |
833.70 |
4.87 |
1,019.80 |
5.37 |
Class A |
1,000 |
1.16% |
833.30 |
5.33 |
1,019.30 |
5.87 |
Class R3 |
1,000 |
1.31% |
833.30 |
6.02 |
1,018.50 |
6.63 |
Small Cap Value Equity Fund |
||||||
Class I |
1,000 |
1.20% |
821.40 |
5.48 |
1,019.10 |
6.07 |
Class R5 |
1,000 |
1.29% |
821.50 |
5.89 |
1,018.60 |
6.53 |
Service Class |
1,000 |
1.40% |
820.70 |
6.39 |
1,018.00 |
7.08 |
Administrative Class |
1,000 |
1.50% |
820.80 |
6.85 |
1,017.50 |
7.59 |
Class R4 |
1,000 |
1.65% |
819.30 |
7.53 |
1,016.80 |
8.34 |
Class A |
1,000 |
1.75% |
818.80 |
7.98 |
1,016.30 |
8.85 |
Class R3 |
1,000 |
1.90% |
818.10 |
8.66 |
1,015.50 |
9.60 |
Small Company Value Fund |
||||||
Class I |
1,000 |
0.86% |
805.50 |
3.89 |
1,020.80 |
4.36 |
Class R5 |
1,000 |
0.96% |
804.50 |
4.34 |
1,020.30 |
4.86 |
Service Class |
1,000 |
1.06% |
804.00 |
4.79 |
1,019.80 |
5.37 |
Administrative Class |
1,000 |
1.16% |
803.90 |
5.25 |
1,019.30 |
5.87 |
Class R4 |
1,000 |
1.31% |
803.40 |
5.92 |
1,018.50 |
6.63 |
Class A |
1,000 |
1.41% |
802.00 |
6.37 |
1,018.00 |
7.13 |
Class R3 |
1,000 |
1.56% |
802.00 |
7.05 |
1,017.20 |
7.89 |
Mid Cap Growth Fund |
||||||
Class I |
1,000 |
0.67% |
795.10 |
3.02 |
1,021.70 |
3.40 |
Class R5 |
1,000 |
0.77% |
794.90 |
3.46 |
1,021.20 |
3.90 |
Service Class |
1,000 |
0.87% |
794.20 |
3.91 |
1,020.70 |
4.41 |
Administrative Class |
1,000 |
0.97% |
793.70 |
4.36 |
1,020.20 |
4.91 |
Class R4 |
1,000 |
1.12% |
793.60 |
5.04 |
1,019.50 |
5.67 |
Class A |
1,000 |
1.22% |
793.30 |
5.48 |
1,019.00 |
6.17 |
Class R3 |
1,000 |
1.37% |
792.00 |
6.15 |
1,018.20 |
6.93 |
295
Other Information (Unaudited) (Continued) |
Beginning Value |
Annualized Expense |
Ending Value (Based on Actual Returns and Expenses) |
Operating Expenses Incurred* |
Ending Value (Based on Hypothetical Returns and Expenses) |
Operating Expenses Incurred* |
|
Small Cap Growth Equity Fund |
||||||
Class I |
1,000 |
0.88% |
799.50 |
3.97 |
1,020.70 |
4.46 |
Class R5 |
1,000 |
0.98% |
798.90 |
4.42 |
1,020.20 |
4.96 |
Service Class |
1,000 |
1.07% |
798.00 |
4.82 |
1,019.70 |
5.42 |
Administrative Class |
1,000 |
1.18% |
798.60 |
5.32 |
1,019.20 |
5.97 |
Class R4 |
1,000 |
1.33% |
798.00 |
5.99 |
1,018.40 |
6.73 |
Class A |
1,000 |
1.43% |
796.60 |
6.44 |
1,017.90 |
7.23 |
Class R3 |
1,000 |
1.58% |
797.50 |
7.12 |
1,017.10 |
7.99 |
Overseas Fund |
||||||
Class I |
$1,000 |
0.79% |
$782.40 |
$3.53 |
$1,021.10 |
$4.00 |
Class R5 |
1,000 |
0.89% |
782.30 |
3.98 |
1,020.60 |
4.51 |
Service Class |
1,000 |
0.99% |
781.90 |
4.42 |
1,020.10 |
5.01 |
Administrative Class |
1,000 |
1.08% |
781.00 |
4.82 |
1,019.70 |
5.47 |
Class R4 |
1,000 |
1.24% |
780.90 |
5.54 |
1,018.90 |
6.28 |
Class A |
1,000 |
1.34% |
780.10 |
5.98 |
1,018.40 |
6.78 |
Class R3 |
1,000 |
1.48% |
779.10 |
6.60 |
1,017.60 |
7.49 |
MM Select T. Rowe Price International Equity Fund |
||||||
Class I |
1,000 |
0.00% |
794.50 |
0.00 |
1,025.10 |
0.00 |
|
* |
Expenses are calculated using the annualized expense ratio for the six months ended September 30, 2022, multiplied by the average account value over the period, multiplied by 183 days in the period, divided by 365 days in the year, unless stated otherwise. |
296
[THIS PAGE INTENTIONALLY LEFT BLANK]
[THIS PAGE INTENTIONALLY LEFT BLANK]
[THIS PAGE INTENTIONALLY LEFT BLANK]
Underwriter:
MML Distributors, LLC
1295 State Street
Springfield, Massachusetts 01111-0001

© 2022 Massachusetts Mutual Life Insurance Company (MassMutual®), Springfield, MA 01111-0001. All rights reserved. www.MassMutual.com. Investment Adviser: MML Investment Advisers, LLC |
MM202311-303387 |
Table of Contents |
|
This material must be preceded or accompanied by a current prospectus (or summary prospectus, if available) for the applicable MassMutual Funds. Investors should consider a Fund’s investment objective, risks, and charges and expenses carefully before investing. This and other information about the investment company is available in the prospectus (or summary prospectus, if available). Read it carefully before investing.
[THIS PAGE INTENTIONALLY LEFT BLANK]
MassMutual Funds Annual Report – President’s Letter to Shareholders (Unaudited) |
To Our
Shareholders

Paul LaPiana
“At MassMutual, our goal is to help you build the future you want for yourself and your family. We want to help you with your retirement plans today, so you can feel more comfortable about tomorrow.”
September 30, 2022
Continued market volatility challenges retirement investors
I am pleased to present you with the MassMutual Funds Annual Report. During the fiscal year ended September 30, 2022, U.S. stocks were down over 15%, with investors concerned that stimulus-fueled recovery from the COVID-19 pandemic was over and that domestic monetary policy had turned toward combating heightened inflation. Stocks in foreign developed markets and emerging markets also experienced significant losses in the fiscal year, hurt by elevated energy prices, a strengthening U.S. dollar, and concerns that consumer spending and corporate earnings growth would slow. U.S. bond investors experienced negative returns in the rising interest rate environment, fueled by aggressive interest rate hikes by the U.S. Federal Reserve Board that were aimed at reducing demand-driven inflationary pressures.
Suggestions for retirement investors under any market conditions
|
● |
You are likely in it for the long term. Retirement planning involves what financial professionals refer to as “long-term investing,” since most people save and invest for retirement throughout their working years. Even in retirement, many individuals will systematically withdraw their retirement savings over a number of years, keeping a portion of their funds invested. Although the financial markets will go up and down, individuals who take a long-term approach to investing don’t focus on current headlines – because they realize that they have time to ride out the downturns. |
|
● |
Keep contributing. While you have no control over the investment markets, you can control how often and how much you contribute to your retirement account. Saving as much as possible and increasing your contributions regularly is one way retirement investors can help boost their retirement savings, regardless of the performance of the stock and bond markets. |
|
● |
Invest continually.1 Financial professionals often advise their clients to stay in the market, regardless of short-term results. Here’s why: Those who can invest in all market conditions have the potential to be rewarded even during market downturns, when more favorable prices may enable them to accumulate larger positions. |
|
● |
Monitor your asset allocation and diversify. Stocks, bonds, and short-term/money market investments are asset classes that tend to behave differently, depending upon the economic and market environment. These broad asset classes contain an even greater array of asset sub-categories (such as small-cap stocks, international stocks, and high-yield bonds). Most financial professionals agree that investors can take advantage of different opportunities in the market and reduce the risk of over-exposure to one or two poorly performing asset types by selecting a number of investments that represent a mix of asset classes and sub-categories. |
Is this a good time to track your progress?
If you work with a financial professional, you may wish to consider checking in with him or her to help you determine if:
|
● |
you are saving enough for retirement – and, if in retirement, you are withdrawing an appropriate amount each year, based on your personal circumstances; |
1 Systematic investing and asset allocation do not ensure a profit or protect against loss in a declining market. Systematic investing involves continuous investment in securities regardless of fluctuating price levels. Investors should consider their ability to continue investing through periods of low price levels.
(Continued)
1
MassMutual Funds Annual Report – President’s Letter to Shareholders (Unaudited) (Continued) |
|
● |
your retirement account is invested appropriately for all market conditions, based on your goals and objectives, as well as your investment time horizon; and |
|
● |
you are taking steps to help reduce your longevity risk, which is the chance that you could “run out” of retirement savings during your lifetime. |
Get to where you want to be
At MassMutual, our goal is to help you build the future you want for yourself and your family. We want to help you with your retirement plans today, so you can feel more comfortable about tomorrow. That’s why we continue to encourage you to maintain perspective when it comes to retirement investing, regardless of any headline-making events. MassMutual’s view is that changing market conditions have the potential to reward patient investors. Thank you for your continued confidence and trust in MassMutual.
Sincerely,

Paul LaPiana
President
MassMutual Funds
MML Investment Advisers, LLC
© 2022 Massachusetts Mutual Life Insurance Company (MassMutual®), Springfield, MA 01111-0001. All rights reserved. www.MassMutual.com.
MML Distributors, LLC (MMLD) serves as the exclusive wholesale marketing agent for all MassMutual Funds, as well as the distributor for all MassMutual Funds, except the MassMutual Global Floating Rate Fund, MassMutual Global Credit Income Opportunities Fund, MassMutual Emerging Markets Debt Blended Total Return Fund, MassMutual Global Emerging Markets Equity Fund, MassMutual High Yield Fund, and MassMutual Short-Duration Bond Fund. MMLD Member FINRA and SIPC (www.FINRA.org and www.SIPC.org), 1295 State Street, Springfield, MA 01111-0001. Investment advisory services are provided to all MassMutual Funds by MML Investment Advisers, LLC (MML Advisers). MMLD and MML Advisers are subsidiaries of MassMutual.
The information provided is the opinion of MML Advisers and is subject to change without notice. It is not to be construed as tax, legal, or investment advice. Of course, past performance does not guarantee future results.
MM202310-303203
2
MassMutual Funds Annual Report – Economic and Market Overview (Unaudited) |
September 30, 2022
Continued market volatility challenges retirement investors
During the fiscal year ended September 30, 2022, U.S. stocks were down over 15%, with investors concerned that stimulus-fueled recovery from the COVID-19 pandemic was over and that domestic monetary policy had turned toward combating heightened inflation. Stocks in foreign developed markets and emerging markets also experienced significant losses in the fiscal year, hurt by elevated energy prices, a strengthening U.S. dollar, and concerns that consumer spending and corporate earnings growth would slow. U.S. bond investors experienced negative returns in the rising interest rate environment, fueled by aggressive interest rate hikes by the U.S. Federal Reserve Board (the “Fed”) that were aimed at reducing demand-driven inflationary pressures.
Market Highlights
|
● |
For the reporting period from October 1, 2021 through September 30, 2022, U.S. stocks were down over 15%, in a market environment where the Fed aggressively raised interest rates in an effort to combat heightened inflation. |
|
● |
In the fourth quarter of 2021, expectations for strong economic and earnings growth in 2022, bolstered by the possibility of a $2 trillion economic stimulus and social spending plan, allowed investors to look past sharp increases in COVID-19 Omicron variant cases and heightened inflationary pressures. |
|
● |
In the first quarter of 2022, investors in both stocks and bonds were challenged by a sharp rise in energy prices after Russia’s invasion of Ukraine, a stalled domestic economic stimulus plan, and the Fed raising interest rates for the first time since 2018. |
|
● |
The second quarter of 2022 was another difficult quarter, as Fed interest rate hikes, investor concerns over high inflation, and concern about the potential of an impending global recession dominated the narrative. |
|
● |
The third quarter of 2022 was an extension of the difficult second quarter, with continued inflationary pressures, weakening economic data, and aggressive Fed interest rate hikes. |
|
● |
Foreign stocks in developed markets and emerging markets also experienced losses in the fiscal year, against the backdrop of Russia’s invasion of Ukraine (and the resulting economic sanctions that kept energy prices elevated), the strengthening U.S. dollar, and threatened consumer spending and corporate earnings growth. |
|
● |
U.S. bond investors experienced negative returns in the rising interest rate environment, fueled by an increase in short-term interest rates, heighted inflationary pressures, and the reversal of monetary and fiscal policy support. |
Market Environment
For the fiscal year beginning on October 1, 2021, global stock investors experienced significant losses. U.S. stocks fell sharply in the period in response, with the S&P 500 Index® (“S&P 500”)1 entering bear market territory after declining more than 20% from its previous highs. Investors sought safety from high inflation, rising interest rates, and the increasing possibility of a recession. Consumer sentiment fell sharply, down 17.2% in the period2, as high inflation – driven by rising energy, food, and housing costs – overwhelmed low unemployment and strong wage growth. As of August 2022, more Americans are borrowing to make ends meet in these inflationary times, resulting in consumer loan levels at record highs, having increased by 12.4% year-over-year3.
1 The S&P 500 Index measures the performance of 500 widely held stocks in the U.S. equity market. Standard and Poor’s chooses member companies for the index based on market size, liquidity, and industry group representation. Included are the stocks of industrial, financial, utility, and transportation companies. Since mid-1989, this composition has been more flexible and the number of issues in each sector has varied. It is market capitalization-weighted. The Index does not reflect any deduction for fees, expenses, or taxes and cannot be purchased directly by investors.
2 June 24, 2022, University of Michigan: Consumer Sentiment (UMCSENT), retrieved from FRED, Federal Reserve Bank of St. Louis; https://fred.stlouisfed.org/series/UMCSENT
3 Board of Governors of the Federal Reserve System (US), Consumer Loans, All Commercial Banks [CONSUMER], retrieved from FRED, Federal Reserve Bank of St. Louis; https://fred.stlouisfed.org/series/CONSUMER, October 11, 2022.
3
MassMutual Funds Annual Report – Economic and Market Overview (Unaudited) (Continued) |
As a result, the broad market S&P 500 fell 15.47% for the period. The technology-heavy NASDAQ Composite Index4 performed even worse, dropping 26.25%. The more economically sensitive Dow Jones Industrial AverageSM5 was down 13.40%. During the reporting period, small-cap stocks underperformed their larger-cap peers, while value stocks outperformed their growth brethren. The communication services, consumer discretionary, and information technology sectors were all down by 20% or more. The energy sector was the strongest performer for the fiscal year, up 45.70%, aided by an 18% increase in the price of West Texas Intermediate (WTI) crude oil. The utilities sector also ended the period positively, gaining 5.58% for the period.
Developed international markets, as measured by the MSCI EAFE® Index6, trailed their domestic peers, ending the fiscal year down 25.13%. Emerging-market stocks, as measured by the MSCI Emerging Markets Index7, also fell sharply, ending down 28.11% for the period. Investors sold off developed international and emerging-market stocks on concerns that higher interest rates and commodity prices would impair consumer spending and corporate earnings growth.
Bond yields rose sharply during the fiscal year, with the 10-year U.S. Treasury bond yield rising from a low of 1.52% on October 1, 2021 to close the period at 3.83%. Rising yields generally produce falling bond prices; consequently, bond index returns suffered. The Bloomberg U.S. Aggregate Bond Index8 ended the period down 14.60%. Investment-grade corporate bonds fared even worse. The Bloomberg U.S. Corporate Bond Index9, which tracks investment-grade corporate bonds, ended the period with an 18.53% loss. The Bloomberg U.S. Corporate High-Yield Bond Index10 also ended in negative territory, declining 14.14% for the period.
4 The NASDAQ Composite Index measures the performance of all domestic and international based common type stocks listed on the NASDAQ Stock Market. It includes common stocks, ordinary shares, ADRs, shares of beneficial interest or limited partnership interests and tracking stocks. The index is market capitalization-weighted. The Index does not reflect any deduction for fees, expenses, or taxes and cannot be purchased directly by investors.
5 The Dow Jones Industrial Average Index measures the performance of stocks of 30 U.S. blue-chip companies covering all industries with the exception of transportation and utilities. It is price-weighted. The Index does not reflect any deduction for fees or expenses and cannot be purchased directly by investors.
6 The MSCI EAFE Index measures the performance of the large- and mid-cap segments of developed markets, excluding the U.S. and Canada equity securities. It is free float-adjusted market-capitalization weighted. The Index does not reflect any deduction for fees or expenses and cannot be purchased directly by investors.
7 The MSCI Emerging Markets Index measures the performance of the large- and mid-cap segments of emerging market equity securities. It is free float-adjusted market-capitalization weighted. The Index does not reflect any deduction for fees or expenses and cannot be purchased directly by investors.
8 The Bloomberg U.S. Aggregate Bond Index measures the performance of investment grade, U.S. dollar-denominated, fixed-rate taxable bond market securities, including Treasuries, government-related and corporate securities, mortgage-backed securities (MBS) (agency fixed-rate and hybrid ARM pass-throughs), asset-backed securities (ABS), and commercial mortgage-backed securities (CMBS). It rolls up into other Bloomberg flagship indexes, such as the multi-currency Global Aggregate Index and the U.S. Universal Index, which includes high yield and emerging markets debt. The Index does not reflect any deduction for fees, expenses, or taxes and cannot be purchased directly by investors.
9 The Bloomberg U.S. Corporate Bond Index measures the performance of the investment grade, U.S. dollar-denominated, fixed-rate, taxable corporate bond market. It includes U.S. dollar-denominated securities publicly issued by U.S. and non-U.S. industrial, utility, and financial issuers that meet specified maturity, liquidity, and quality requirements. The Index does not reflect any deduction for fees, expenses, or taxes and cannot be purchased directly by investors.
10 The Bloomberg U.S. Corporate High-Yield Bond Index measures the performance of U.S. dollar-denominated, non-investment grade, fixed-rate, taxable corporate bonds, including corporate bonds, fixed-rate bullet, putable, and callable bonds, SEC Rule 144A securities, original issue zeros, pay-in-kind bonds, fixed-rate and fixed-to-floating capital securities. The Index does not reflect any deduction for fees, expenses, or taxes and cannot be purchased directly by investors.
4
MassMutual Funds Annual Report – Economic and Market Overview (Unaudited) (Continued) |
Review and maintain your strategy
MassMutual is committed to helping people secure their long-term future and protect the ones they love. While the current market volatility, including the reality of market sell-offs, can test an investor’s mettle, we’d like to remind you that, as a retirement investor, it’s important to maintain perspective and have realistic expectations about the future performance of your investment accounts. As described in this report, financial markets can reverse suddenly with little or no notice. That’s why we continue to believe that retirement investors should create and maintain a plan that focuses on their goals, how long they have to invest, and how comfortable they are with market volatility. Our multi-managed and sub-advised mutual funds tap into the deep expertise of seasoned asset managers who are committed to helping long-term investors prepare for retirement – in all market conditions. As always, we recommend that you work with a personal financial professional, who can help you define an investment strategy that aligns with your comfort level with respect to market volatility, how long you have to save and invest, and your specific financial goals. Thank you for your confidence in MassMutual.
© 2022 Massachusetts Mutual Life Insurance Company (MassMutual®), Springfield, MA 01111-0001. All rights reserved. www.MassMutual.com.
MML Distributors, LLC (MMLD) serves as the exclusive wholesale marketing agent for all MassMutual Funds, as well as the distributor for all MassMutual Funds, except the MassMutual Global Floating Rate Fund, MassMutual Global Credit Income Opportunities Fund, MassMutual Emerging Markets Debt Blended Total Return Fund, MassMutual Global Emerging Markets Equity Fund, MassMutual High Yield Fund, and MassMutual Short-Duration Bond Fund. MMLD Member FINRA and SIPC (www.FINRA.org and www.SIPC.org), 1295 State Street, Springfield, MA 01111-0001. Investment advisory services are provided to all MassMutual Funds by MML Investment Advisers, LLC (MML Advisers). MMLD and MML Advisers are subsidiaries of MassMutual.
The information provided is the opinion of MML Advisers and is subject to change without notice. It is not to be construed as tax, legal, or investment advice. Of course, past performance does not guarantee future results.
5
MassMutual Target Allocation Funds – Portfolio Manager Report (Unaudited) |
What are the investment approaches of the Funds that constitute the MassMutual Target Allocation Series, and who is the Series’ investment adviser?
The MassMutual (“MM”) Target Allocation Series (the “Series”) comprises four Funds – each of which has a “fund of funds” structure. The four Funds are MM 20/80 Allocation Fund, MM 40/60 Allocation Fund, MM 60/40 Allocation Fund, and MM 80/20 Allocation Fund. All Funds in the Series seek to achieve as high a total return over time as is considered consistent with prudent investment risk, preservation of capital, and recognition of the Funds’ stated asset allocation.
Each Fund seeks to achieve its investment objective by investing in a combination of U.S. domestic and international mutual funds (“Underlying Funds”) using an asset allocation strategy. Underlying Funds will include a combination of MassMutual Funds (advised by MML Investment Advisers, LLC (MML Advisers), a wholly-owned subsidiary of Massachusetts Mutual Life Insurance Company (MassMutual)), and may also include other, non-affiliated mutual funds. The Underlying Funds may invest in various asset classes, including equity securities, fixed income securities, and money market instruments. Underlying Funds may also invest some or all of their assets in commodities or commodities-related investments. The Series’ investment adviser is MML Advisers.
Each Fund’s assets are allocated among its Underlying Funds according to an asset allocation strategy, as follows:
|
● |
MM 20/80 Allocation Fund: The Fund typically invests approximately 20% of its assets in equity and similar funds and approximately 80% in fixed income funds, including money market funds. |
|
● |
MM 40/60 Allocation Fund: The Fund typically invests approximately 40% of its assets in equity and similar funds and approximately 60% in fixed income funds, including money market funds. |
|
● |
MM 60/40 Allocation Fund: The Fund typically invests approximately 60% of its assets in equity and similar funds and approximately 40% in fixed income funds, including money market funds. |
|
● |
MM 80/20 Allocation Fund: The Fund typically invests approximately 80% of its assets in equity and similar funds and approximately 20% in fixed income funds, including money market funds. |
How did each Fund perform during the 12 months ended September 30, 2022?
The return of each Fund’s Class R5 shares is shown below in comparison to the Lipper Balanced Fund Index, an unmanaged, equally weighted index of the 30 largest mutual funds within the Lipper Balanced Category; the Bloomberg U.S. Aggregate Bond Index, which measures the performance of investment grade, U.S. dollar-denominated, fixed-rate taxable bond market securities, including Treasuries, government-related and corporate securities, mortgage-backed securities (MBS) (agency fixed-rate and hybrid ARM pass-throughs), asset-backed securities (ABS), and commercial mortgage-backed securities (CMBS); and the S&P 500® Index, which measures the performance of 500 widely held stocks in the U.S. equity market.
Fund’s Class R5 |
Lipper Balanced |
Bloomberg U.S. |
S&P 500 |
|
MM 20/80 Allocation Fund |
-15.64% |
-15.90 % |
-14.60%* |
-15.47% |
MM 40/60 Allocation Fund |
-16.37% |
-15.90 % |
-14.60% |
-15.47%* |
MM 60/40 Allocation Fund |
-16.53% |
-15.90 % |
-14.60% |
-15.47%* |
MM 80/20 Allocation Fund |
-17.91% |
-15.90 % |
-14.60% |
-15.47%* |
|
* |
Benchmark return |
For the year ended September 30, 2022, all of the MM Target Allocation Series Funds underperformed the Bloomberg U.S. Aggregate Bond Index. The MM 20/80 Allocation Fund outperformed the Lipper Balanced Fund Index, whereas the other three Funds underperformed. Finally, all of the Funds underperformed the S&P 500 Index.
For a discussion on the economic and market environment during the 12-month period ended September 30, 2022, please see the Economic and Market Overview, beginning on page 3.
6
MassMutual Target Allocation Funds – Portfolio Manager Report (Unaudited) (Continued) |
Investment adviser discussion of factors that contributed to the Funds’ performance
For the fiscal year ending September 30, 2022, global stock investors experienced significant losses. U.S. equities fell sharply in response, with the S&P 500 Index entering bear market territory after declining more than 20% from its previous highs. U.S. fixed income was also down sharply, as monetary tightening by the U.S. Federal Reserve to fight inflation drove interest rates significantly higher, increasing the possibility of a recession. As a result, the Series’ allocation to equities versus fixed income was only a small performance driver. Allocations within markets made more of a difference to the Series’ performance, as U.S. equities outperformed international developed- and emerging-market equities by a wide margin, and U.S. large-cap equities outperformed U.S. small-cap stocks. U.S. value equities outperformed their U.S. growth counterparts, and shorter-duration bonds outperformed their longer-duration counterparts. Duration is a measure of a fixed income investment’s sensitivity to interest rates. The longer the duration, the greater the price impact on the bond or portfolio when interest rates rise or fall.
Throughout the fiscal year, the Funds maintained a neutral position relative to overall risk, which had little impact on performance. The Funds’ positions in international bonds and U.S. small- and mid-cap equities detracted from performance, while their positions in commodities and shorter-duration bonds contributed. An underweight position in international developed- and emerging-market equities contributed to performance. Those Series Funds with higher equity allocations – the MM 80/20 Allocation, MM 60/40 Allocation, and MM 40/60 Allocation Funds – underperformed their counterpart with a higher fixed income allocation, the MM 20/80 Allocation Fund.
Manager selection of Underlying Funds contributed to overall performance in the 12-month period ending September 30, 2022. Strong performance by the MassMutual Equity Opportunities, MassMutual Fundamental Value, MassMutual Diversified Value, and MassMutual International Equity Funds was a significant driver of outperformance. Weak performance by the MassMutual Blue Chip Growth, MassMutual Strategic Emerging Markets, MassMutual Strategic Bond, and MassMutual Core Bonds Funds detracted from performance. There were no changes to the Underlying Funds during the year.
Investment adviser outlook
Despite the stock market sell-off in 2022, MML Advisers views the stock markets as extended and valuations high relative to market history. While, in MML Advisers’ observation, the prospect of positive economic and corporate earnings growth supports a bull case, MML Advisers believes that more clarity on the persistency of inflation, labor costs, China’s COVID-19 policy, and the impact of monetary policy tightening is needed for the allocation to stocks to increase. Against this backdrop, MML Advisers believes that diversification across global assets could be a sensible approach for what Fund management believes could be a bumpy ride. Looking ahead to 2023, Fund management expects to closely monitor how trends unfold as they manage the positioning of each Fund within the Series.
7
MassMutual Target Allocation Funds – Portfolio Manager Report (Unaudited) (Continued) |
MassMutual 20/80 |
|
Fixed Income Funds |
79.9% |
Equity Funds |
20.1% |
Total Long-Term Investments |
100.0% |
Other Assets & Liabilities |
(0.0)% |
Net Assets |
100.0% |
MassMutual 40/60 |
|
Fixed Income Funds |
60.8% |
Equity Funds |
39.3% |
Total Long-Term Investments |
100.1% |
Other Assets & Liabilities |
(0.1)% |
Net Assets |
100.0% |
MassMutual 60/40 |
|
Equity Funds |
60.4% |
Fixed Income Funds |
39.7% |
Total Long-Term Investments |
100.1% |
Other Assets & Liabilities |
(0.1)% |
Net Assets |
100.0% |
MassMutual 80/20 |
|
Equity Funds |
75.8% |
Fixed Income Funds |
24.3% |
Total Long-Term Investments |
100.1% |
Other Assets & Liabilities |
(0.1)% |
Net Assets |
100.0% |
8
MassMutual RetireSMARTSM by JPMorgan (target-date) Funds – Portfolio Manager Report (Unaudited) |
What are the investment approaches of the Funds that constitute the MassMutual RetireSMARTSM by JPMorgan (target date) Series, and who are the Series’ investment adviser and subadviser?
The MassMutual (“MM”) RetireSMART by JPMorgan (target date) Series (the “Series”) comprises 10 Funds – each of which has a “fund of funds” structure.
The 10 Funds are MM RetireSMART by JPMorgan In Retirement Fund, MM RetireSMART by JPMorgan 2020 Fund, MM RetireSMART by JPMorgan 2025 Fund, MM RetireSMART by JPMorgan 2030 Fund, MM RetireSMART by JPMorgan 2035 Fund, MM RetireSMART by JPMorgan 2040 Fund, MM RetireSMART by JPMorgan 2045 Fund, MM RetireSMART by JPMorgan 2050 Fund, MM RetireSMART by JPMorgan 2055 Fund, and MM RetireSMART by JPMorgan 2060 Fund.
|
● |
MM RetireSMART by JPMorgan In Retirement Fund seeks current income and some capital appreciation. |
|
● |
MM RetireSMART by JPMorgan 2020/2025/2030/2035/2040/2045/2050/2055/2060 Funds each seeks total return through the Fund’s asset allocation, which is designed to become more conservative over time. As each Fund approaches and passes the target retirement date, the Fund’s objective will shift to seeking current income and some capital appreciation. |
Each Fund seeks to achieve its investment objective by investing in a combination of U.S. domestic and international mutual funds (“Underlying Funds”) using an asset allocation strategy designed for investors who plan to retire around the year specified in the Fund’s name (the target retirement year) and then withdraw their investment in the Fund over time throughout retirement (or designed for investors who are retired or expect to retire soon for the MM RetireSMART by JPMorgan In Retirement Fund). Each Fund is advised by MML Investment Advisers, LLC (MML Advisers) and subadvised by J.P. Morgan Investment Management Inc. (J.P. Morgan). J.P. Morgan has responsibility for determining each Fund’s strategic asset allocation (its “glide path” for each Fund with a target retirement year in its name) and tactical asset allocation (adjusting the Fund’s specific exposures in response to changes in market conditions). MML Advisers has overall responsibility for each Fund and for implementing those allocations through the selection of, and allocations to, Underlying Funds.
Each Fund with a specified target retirement year in its name seeks to help investors save for retirement and then, after reaching the target retirement year, withdraw a portion of their investment in the Fund each year until 35 years after the target retirement year, the target maturity year. Each Fund assumes a person will be at or around age 65 at the target retirement year.
Underlying Funds will include a combination of MassMutual Funds advised by MML Advisers and J.P. Morgan Funds advised by J.P. Morgan or its affiliates, and may also include other, non-affiliated mutual funds. Underlying Funds may invest in various asset classes, including equity securities, fixed income securities, and money market instruments. Underlying Funds may also invest some or all of their assets in commodities or commodities-related investments.
The Funds will typically invest 80% or more of their assets in mutual funds advised by MML Advisers, J.P. Morgan, or affiliates of J.P. Morgan, including typically a 15% to 35% allocation to mutual funds advised or subadvised by J.P. Morgan or its affiliates. Non-affiliated Underlying Funds in which the Funds may invest are typically passively managed funds that seek to track the performance of a particular market index, which may be broad-based or relate to a particular sector, market, region, or industry.
Each Fund’s assets are allocated to the Underlying Funds according to an asset allocation strategy, as follows:
|
● |
MM RetireSMART by JPMorgan In Retirement Fund: The Fund’s assets are allocated among Underlying Funds according to an asset allocation strategy that emphasizes fixed income and money market funds, but also includes smaller allocations to equity and certain other funds. |
|
● |
MM RetireSMART by JPMorgan 2020/2025/2030/2035/2040/2045/2050/2055/2060 Funds: Each Fund’s asset allocation strategy is designed with two main goals in mind: promoting asset accumulation prior to retirement, during the Fund’s “Savings Phase,” and supporting investors withdrawing their investments in the Fund throughout retirement, during the Fund’s “Spending Phase.” As a result, the Fund’s asset allocation strategy will change over time, generally becoming more conservative as it approaches the target retirement year and then remaining relatively stable afterwards. The asset allocation strategy during the Savings Phase will generally start with a greater emphasis on equity investments and gradually shift to more emphasis on fixed income investments. During the Spending Phase, a Fund will generally have a greater emphasis on fixed income investments. |
9
MassMutual RetireSMARTSM by JPMorgan (target-date) Funds – Portfolio Manager Report (Unaudited) (Continued) |
How did each Fund perform during the 12 months ended September 30, 2022?
The return of a representative class of each Fund is shown below in comparison to the return of each Fund’s respective S&P Target Date Index. For the year ended September 30, 2022, each of the Funds underperformed its respective S&P Target Date Index.
Fund’s Service Class |
S&P Target Date |
|
MM RetireSMART by JPMorgan In Retirement Fund |
-16.26% |
-13.31% |
MM RetireSMART by JPMorgan 2020 Fund |
-16.29% |
-14.75% |
MM RetireSMART by JPMorgan 2025 Fund |
-17.48% |
-15.16% |
MM RetireSMART by JPMorgan 2030 Fund |
-18.23% |
-16.23% |
MM RetireSMART by JPMorgan 2035 Fund |
-19.06% |
-17.42% |
MM RetireSMART by JPMorgan 2040 Fund |
-19.49% |
-18.21% |
MM RetireSMART by JPMorgan 2045 Fund |
-19.74% |
-18.70% |
MM RetireSMART by JPMorgan 2050 Fund |
-19.78% |
-18.88% |
MM RetireSMART by JPMorgan 2055 Fund |
-19.85% |
-18.94% |
Fund’s Class I |
S&P Target Date |
|
MM RetireSMART by JPMorgan 2060 Fund |
-19.60% |
-18.99% |
|
* |
The S&P Target Date Index for each Fund in the Series is as follows: MM RetireSMART by JPMorgan In Retirement Fund: S&P Target Date Retirement Income Index; MM RetireSMART by JPMorgan 2020 Fund: S&P Target Date 2020 Index; MM RetireSMART by JPMorgan 2025 Fund: S&P Target Date 2025 Index; MM RetireSMART by JPMorgan 2030 Fund: S&P Target Date 2030 Index; MM RetireSMART by JPMorgan 2035 Fund: S&P Target Date 2035 Index; MM RetireSMART by JPMorgan 2040 Fund: S&P Target Date 2040 Index; MM RetireSMART by JPMorgan 2045 Fund: S&P Target Date 2045 Index; MM RetireSMART by JPMorgan 2050 Fund: S&P Target Date 2050 Index; MM RetireSMART by JPMorgan 2055 Fund: S&P Target Date 2055 Index; and MM RetireSMART by JPMorgan 2060 Fund: S&P Target Date 2060 Index. |
S&P Target Date® Index Series:
The S&P Target Date Index Series consists of 13 multi-asset class indexes: the S&P Target Date Retirement Income Index and 12 date-specific indexes, corresponding to a specific target retirement date. Each index provides varying levels of exposure to equities and fixed income. Each target date allocation is created and retired according to a pre-determined schedule related to the respective target date.
For a discussion on the economic and market environment during the 12-month period ended September 30, 2022, please see the Economic and Market Overview, beginning on page 3.
Discussion of factors that contributed to the Funds’ performance
At the end of 2021, the Funds held a pro-risk tilt, with an overweight allocation to stocks. Within equities, Fund management preferred U.S. large-cap and developed international stocks. In MML Advisers’ view, this position was supported at the time by a broad market anticipation for strong growth across regions, driven by earnings expectations and reasonable valuations, concurrent with the pandemic’s fading impact on the global economy. Inflation levels were elevated at that time, but considered to be transitory by the U.S. Federal Reserve Board (the “Fed”) and the market.
Entering 2022, Fund management’s positive macro-outlook shifted, as concerns over the Russian invasion of Ukraine increased and the Fed signaled interest rate hikes to combat inflation, which was no longer viewed as temporary. Tensions in Europe pushed energy and commodity prices to historically high levels, exacerbating inflation and dampening global growth. Throughout the first quarter, the Funds eliminated their overweight allocation to international equity, initiated an underweight allocation to emerging-markets equity, and maintained their slight overweight allocation to U.S. large-cap equities. As expected, the Fed raised the federal funds rate – the Fed’s overnight bank lending rate – by 0.25%. At quarter-end, the S&P 500® Index (the “S&P 500”) was down 4.6% and the Bloomberg U.S. Aggregate Bond Index had fallen 5.9%.
10
MassMutual RetireSMARTSM by JPMorgan (target-date) Funds – Portfolio Manager Report (Unaudited) (Continued) |
The second quarter of 2022 remained challenging for markets. Inflation continued to dominate headlines as the escalation of war in Europe contributed to a further squeeze in food and energy prices. China’s zero-tolerance policy toward COVID-19 resulted in rolling lockdowns, which disrupted their domestic economic activity, with spill-over effects on the global economy. In the U.S., the Fed increased the federal funds rate in June by 0.75% – the largest single move since 1994 – in an effort to control inflation. During the second quarter, the S&P 500 fell 15.4% and the Bloomberg U.S. Aggregate Bond Index was down 5.4%. By quarter-end, the Funds had added underweight positions to all risk assets, including U.S. large-cap, real estate investment trusts (REITs), U.S. high-yield, and emerging-markets debt.
Through the third quarter of 2022, Fed policy, slowing global growth, and elevated geopolitical risk led markets to post broad negative returns. A strong U.S. dollar, coupled with slowing global growth, weighed on emerging markets over the quarter. Inflation and a tight labor market continued to dominate headlines, as both remained resilient, despite global central bank efforts to tighten financial conditions. On the international front, Europe’s reliance on outside energy production came into acute focus, given Russia’s indefinite halt of natural gas supply, which continued to raise the odds of a recession in Europe. The Funds continued to hold a diversified underweight allocation across risk assets throughout the third quarter.
The strategic asset allocation (glide path) detracted over the past year. Relative to the S&P Target Date Indexes, having more total stocks versus bonds, particularly in the vintages further from retirement, detracted from performance. Within stocks, holding a lower allocation to U.S. mid-cap equities detracted from performance. Diversification in fixed income, relative to the S&P Target Date Indexes, contributed to performance, as U.S. core fixed income underperformed U.S. high-yield.
Active asset allocation over the one-year period added value, primarily driven by the Funds’ diversified underweight allocations across risk assets. As market volatility continued, the Funds were positioned to protect participant capital. Specifically, underweight allocations to emerging-markets equity and U.S. REITs were particularly additive, as both asset classes declined by more than 10%.
Outlook
As we head into 2023, Fund management expects sub-trend global growth to continue, with recession in Europe and the U.K. seeming highly probable. In Fund management’s view, the U.S. may narrowly avoid recession; however, Fund management expects continued volatility across capital markets as goods, inventories, and earnings decrease. Fund management also expects continued tightening in monetary policy, in spite of slower global growth, as inflation endures across regions. Fund management’s opinion is that geopolitical risk continues to be elevated, with no signs of abatement in the near term, and they expect meaningful downgrades to earnings globally.
11
MassMutual RetireSMARTSM by JPMorgan (target-date) Funds – Portfolio Manager Report (Unaudited) (Continued) |
MassMutual RetireSMART |
|
Fixed Income Funds |
65.6% |
Equity Funds |
34.6% |
Total Long-Term Investments |
100.2% |
Other Assets & Liabilities |
(0.2)% |
Net Assets |
100.0% |
MassMutual RetireSMART |
|
Fixed Income Funds |
65.5% |
Equity Funds |
34.6% |
Total Long-Term Investments |
100.1% |
Other Assets & Liabilities |
(0.1)% |
Net Assets |
100.0% |
MassMutual RetireSMART |
|
Fixed Income Funds |
54.1% |
Equity Funds |
46.0% |
Total Long-Term Investments |
100.1% |
Other Assets & Liabilities |
(0.1)% |
Net Assets |
100.0% |
MassMutual RetireSMART |
|
Equity Funds |
59.0% |
Fixed Income Funds |
41.1% |
Total Long-Term Investments |
100.1% |
Other Assets & Liabilities |
(0.1)% |
Net Assets |
100.0% |
MassMutual RetireSMART |
|
Equity Funds |
71.2% |
Fixed Income Funds |
28.9% |
Total Long-Term Investments |
100.1% |
Other Assets & Liabilities |
(0.1)% |
Net Assets |
100.0% |
MassMutual RetireSMART |
|
Equity Funds |
81.1% |
Fixed Income Funds |
19.0% |
Total Long-Term Investments |
100.1% |
Other Assets & Liabilities |
(0.1)% |
Net Assets |
100.0% |
MassMutual RetireSMART |
|
Equity Funds |
88.6% |
Fixed Income Funds |
11.5% |
Total Long-Term Investments |
100.1% |
Other Assets & Liabilities |
(0.1)% |
Net Assets |
100.0% |
MassMutual RetireSMART |
|
Equity Funds |
90.0% |
Fixed Income Funds |
10.1% |
Total Long-Term Investments |
100.1% |
Other Assets & Liabilities |
(0.1)% |
Net Assets |
100.0% |
12
MassMutual RetireSMARTSM by JPMorgan (target-date) Funds – Portfolio Manager Report (Unaudited) (Continued) |
MassMutual RetireSMART |
|
Equity Funds |
90.0% |
Fixed Income Funds |
10.1% |
Total Long-Term Investments |
100.1% |
Other Assets & Liabilities |
(0.1)% |
Net Assets |
100.0% |
MassMutual RetireSMART |
|
Equity Funds |
90.2% |
Fixed Income Funds |
10.1% |
Total Long-Term Investments |
100.3% |
Other Assets & Liabilities |
(0.3)% |
Net Assets |
100.0% |
13
MassMutual Select T. Rowe Price Retirement Balanced Fund – Portfolio Manager Report (Unaudited) |
What is the investment approach of the MassMutual Select T. Rowe Price Retirement Balanced Fund, and who is the Fund’s subadviser?
The Fund seeks the highest total return over time consistent with an emphasis on both capital growth and income. The Fund is a “fund of funds” and pursues its objective by investing in a diversified portfolio of other stock and bond series of both the MassMutual Funds and T. Rowe Price Funds that represent various asset classes and sectors (“Underlying Funds”). The Fund is subadvised by T. Rowe Price Associates, Inc. (T. Rowe Price). The Underlying Funds in which the Fund invests are predominantly either advised or subadvised by T. Rowe Price. The Fund is intended for retired investors who seek income and relative stability from bonds along with some capital appreciation potential from stocks. The Fund’s “neutral allocations,” which are what T. Rowe Price considers broadly appropriate for investors during their retirement years, are 40% stock funds and 60% bond funds. The allocations are referred to as “neutral allocations” because they do not reflect any tactical decisions made by T. Rowe Price to overweight or underweight a particular asset class or sector based on its market outlook.
How did the Fund perform during the 12 months ended September 30, 2022?
The Fund’s Class I shares returned -14.93%, underperforming the -13.31% return of the S&P Target Date Retirement Income Index (the “benchmark”), which provides varying levels of exposure to equities and fixed income.
For a discussion on the economic and market environment during the 12-month period ended September 30, 2022, please see the Economic and Market Overview, beginning on page 3.
Subadviser discussion of factors that contributed to the Fund’s performance
For the fiscal year ended September 30, 2022, the Fund’s total allocation to equities, bonds, and cash detracted from performance. The Fund held less fixed income exposure relative to the benchmark and underperformed in a market environment where equities underperformed bonds and both asset classes lagged cash.
Conversely, the Fund’s structural composition contributed to performance, due in part to a larger allocation to domestic equities relative to the benchmark. The Fund’s dedicated allocation to real assets equities and diversified international developed equities also was beneficial.
Security selection within the underlying allocation to U.S. large-cap growth stocks weighed on the Fund’s relative performance. Conversely, the allocation to U.S. mid-cap growth and value stocks added value.
Subadviser outlook
T. Rowe Price observes that, as of the end of the fiscal year, valuations have improved as risk assets have pulled back from their recent highs, but uncertainty around corporate fundamentals suggests limited near-term upside, particularly as earnings estimates have not seen significant downward revision to reflect rising recession risks. Fund management continues to assess when to add to equities and other risk assets as they evaluate long-term valuations and possible early indications of stabilization or improvement in macroeconomic conditions. Given the range of potential paths for growth and inflation, Fund management expects their positioning to remain cautious, as they expect that a firm commitment from major central banks to bring down inflation could result in a low ceiling for stocks in the near term, and possibly exacerbate economic contraction through overtightening. In T. Rowe Price’s opinion, other key risks to global markets include the Russia-Ukraine conflict and the associated impact of energy supply shortages, which could weigh on European manufacturing, broader geopolitical instability, and unexpected supply chain disruptions. In T. Rowe Price’s view, these conditions could contribute to a less compelling risk/reward trade-off between stocks and bonds or cash in the near term, and they believe that a more modest allocation to equities may be prudent.
14
MassMutual Select T. Rowe Price Retirement Balanced Fund – Portfolio Manager Report (Unaudited) (Continued) |
MassMutual Select |
|
Fixed Income Funds |
62.8% |
Equity Funds |
37.2% |
Total Long-Term Investments |
100.0% |
Other Assets & Liabilities |
(0.0)% |
Net Assets |
100.0% |
15
MassMutual Select T. Rowe Price Retirement (target-date) Funds – Portfolio Manager Report (Unaudited) |
What are the investment approaches of the Funds that constitute the MassMutual Select T. Rowe Price Retirement (target date) Series, and who is the Series’ subadviser?
The MassMutual (“MM”) Select T. Rowe Price (target date) Series (the “Series”) comprises 12 Funds – each of which has a “fund of funds” structure. The 12 Funds are MM Select T. Rowe Price Retirement 2005 Fund, MM Select T. Rowe Price Retirement 2010 Fund, MM Select T. Rowe Price Retirement 2015 Fund, MM Select T. Rowe Price Retirement 2020 Fund, MM Select T. Rowe Price Retirement 2025 Fund, MM Select T. Rowe Price Retirement 2030 Fund, MM Select T. Rowe Price Retirement 2035 Fund, MM Select T. Rowe Price Retirement 2040 Fund, MM Select T. Rowe Price Retirement 2045 Fund, MM Select T. Rowe Price Retirement 2050 Fund, MM Select T. Rowe Price Retirement 2055 Fund, and MM Select T. Rowe Price Retirement 2060 Fund. All Funds in the Series seek the highest total return over time consistent with an emphasis on both capital growth and income. Each Fund pursues its investment objective by investing in a diversified portfolio of other stock and bond series of both the MassMutual Funds and T. Rowe Price Funds that represent various asset classes and sectors (“Underlying Funds”). Each Fund’s allocation among Underlying Funds will change over time in relation to its target retirement date. Each Fund is subadvised by T. Rowe Price Associates, Inc. (T. Rowe Price). The Underlying Funds in which each Fund invests are predominantly either advised or subadvised by T. Rowe Price.
Each Fund is managed based on the specific retirement year (e.g., target date 2005) included in its name and assumes a retirement age of 65. The target date refers to the approximate year an investor in the Fund would have retired or would plan to retire and likely stopped or would stop making new investments in the Fund. Each Fund is primarily designed for an investor who retired or anticipates retiring at or about the target date and who plans to withdraw the value of the account in the Fund gradually after retirement.
Each Fund’s assets are allocated to the Underlying Funds according to an asset allocation strategy that becomes increasingly conservative over time, reaching approximately 55% allocation to stocks at the target date and continuing to decline until approximately 30 years after its target date, when its allocation to stocks and bonds will remain unchanged.
During the second quarter of 2020, each Fund began to shift its asset allocation strategy so that the overall allocation to stocks at 30 years past retirement will increase from 20% to 30%. The transition may take up to two years from the start of the transition to fully implement.
How did each Fund perform during the 12 months ended September 30, 2022?
The return of each Fund’s Class I shares is shown below in comparison to the return of each Fund’s respective S&P Target Date Index.
Fund’s Class I |
S&P Target Date |
|
MM Select T. Rowe Price Retirement 2005 Fund |
-15.62% |
-13.31% |
MM Select T. Rowe Price Retirement 2010 Fund |
-16.02% |
-13.60% |
MM Select T. Rowe Price Retirement 2015 Fund |
-16.38% |
-13.95% |
MM Select T. Rowe Price Retirement 2020 Fund |
-16.84% |
-14.75% |
MM Select T. Rowe Price Retirement 2025 Fund |
-17.83% |
-15.16% |
MM Select T. Rowe Price Retirement 2030 Fund |
-19.32% |
-16.23% |
MM Select T. Rowe Price Retirement 2035 Fund |
-20.63% |
-17.42% |
MM Select T. Rowe Price Retirement 2040 Fund |
-21.66% |
-18.21% |
MM Select T. Rowe Price Retirement 2045 Fund |
-21.99% |
-18.70% |
MM Select T. Rowe Price Retirement 2050 Fund |
-22.18% |
-18.88% |
MM Select T. Rowe Price Retirement 2055 Fund |
-22.22% |
-18.94% |
MM Select T. Rowe Price Retirement 2060 Fund |
-22.19% |
-18.99% |
|
* |
The S&P Target Date Index for each Fund in the Series is as follows: MM Select T. Rowe Price Retirement 2005 Fund: S&P Target Date Retirement Income Index; MM Select T. Rowe Price Retirement 2010 Fund: S&P Target Date 2010 Index; MM Select T. Rowe Price Retirement 2015 Fund: S&P Target Date 2015 Index; MM Select T. Rowe Price Retirement 2020 Fund: S&P Target Date 2020 Index; MM Select T. Rowe Price Retirement 2025 Fund: S&P Target Date 2025 Index; MM Select T. Rowe Price Retirement 2030 Fund: S&P Target Date 2030 Index; MM Select T. Rowe Price Retirement 2035 Fund: S&P Target Date 2035 Index; MM Select T. |
16
MassMutual Select T. Rowe Price Retirement (target-date) Funds – Portfolio Manager Report (Unaudited) (Continued) |
Rowe Price Retirement 2040 Fund: S&P Target Date 2040 Index; MM Select T. Rowe Price Retirement 2045 Fund: S&P Target Date 2045 Index; MM Select T. Rowe Price Retirement 2050 Fund: S&P Target Date 2050 Index; MM Select T. Rowe Price Retirement 2055 Fund: S&P Target Date 2055 Index; and MM Select T. Rowe Price Retirement 2060 Fund: S&P Target Date 2060 Index.
For the year ended September 30, 2022, each of the MM Select T. Rowe Price Retirement (target-date) Funds underperformed its respective S&P Target Date Index. (S&P Target Date Indexes are defined in the following section.)
S&P Target Date® Index Series:
The S&P Target Date Index Series consists of 13 multi-asset class indexes: the S&P Target Date Retirement Income Index and 12 date-specific indexes, corresponding to a specific target retirement date. Each index provides varying levels of exposure to equities and fixed income. Each target date allocation is created and retired according to a pre-determined schedule related to the respective target date. The Index does not reflect any deduction for fees, expenses, or taxes and cannot be purchased directly by investors.
For a discussion on the economic and market environment during the 12-month period ended September 30, 2022, please see the Economic and Market Overview, beginning on page 3.
Subadviser discussion of factors that contributed to the Funds’ performance
For the fiscal year ended September 30, 2022, the Funds’ total allocation to equities, bonds, and cash detracted from performance across the Series. The Funds held less fixed income exposure relative to the S&P Target Date Indexes – and underperformed in a market environment where equities underperformed bonds and both asset classes lagged cash. This impact was most pronounced in vintages in or near retirement, where the S&P Target Date Indexes typically had more than double the cash allocation exposure.
Conversely, the Funds’ structural composition contributed to performance, due in part to a larger allocation to domestic equities relative to the benchmarks. The Funds’ dedicated allocation to real assets equities and diversified international developed equities also was beneficial.
Security selection within the underlying allocation to U.S. large-cap growth stocks weighed on the Funds’ relative performance. Conversely, the allocations to U.S. mid-cap growth and value stocks added value.
Subadviser outlook
T. Rowe Price observes that, as of the end of the fiscal year, valuations have improved as risk assets have pulled back from their recent highs, but uncertainty around corporate fundamentals suggests limited near-term upside, particularly as earnings estimates have not seen significant downward revision to reflect rising recession risks. Fund management continues to assess when to add to equities and other risk assets as they evaluate long-term valuations and possible early indications of stabilization or improvement in macroeconomic conditions. Given the range of potential paths for growth and inflation, Fund management expects their positioning to remain cautious, as they expect that a firm commitment from major central banks to bring down inflation could result in a low ceiling for stocks in the near term, and possibly exacerbate economic contraction through overtightening. In T. Rowe Price’s opinion, other key risks to global markets include the Russia-Ukraine conflict and the associated impact of energy supply shortages, which could weigh on European manufacturing, broader geopolitical instability, and unexpected supply chain disruptions. In T. Rowe Price’s view, these conditions could contribute to a less compelling risk/reward trade-off between stocks and bonds or cash in the near term, and they believe that a more modest allocation to equities may be prudent.
17
MassMutual Select T. Rowe Price Retirement (target-date) Funds – Portfolio Manager Report (Unaudited) (Continued) |
MassMutual Select |
|
Fixed Income Funds |
59.6% |
Equity Funds |
40.4% |
Total Long-Term Investments |
100.0% |
Other Assets & Liabilities |
(0.0)% |
Net Assets |
100.0% |
MassMutual Select |
|
Fixed Income Funds |
56.1% |
Equity Funds |
43.9% |
Total Long-Term Investments |
100.0% |
Other Assets & Liabilities |
(0.0)% |
Net Assets |
100.0% |
MassMutual Select |
|
Fixed Income Funds |
53.1% |
Equity Funds |
46.9% |
Total Long-Term Investments |
100.0% |
Other Assets & Liabilities |
(0.0)% |
Net Assets |
100.0% |
MassMutual Select |
|
Equity Funds |
50.5% |
Fixed Income Funds |
49.5% |
Total Long-Term Investments |
100.0% |
Other Assets & Liabilities |
(0.0)% |
Net Assets |
100.0% |
MassMutual Select |
|
Equity Funds |
57.8% |
Fixed Income Funds |
42.2% |
Total Long-Term Investments |
100.0% |
Other Assets & Liabilities |
(0.0)% |
Net Assets |
100.0% |
MassMutual Select |
|
Equity Funds |
69.1% |
Fixed Income Funds |
31.0% |
Total Long-Term Investments |
100.1% |
Other Assets & Liabilities |
(0.1)% |
Net Assets |
100.0% |
MassMutual Select |
|
Equity Funds |
80.2% |
Fixed Income Funds |
19.9% |
Total Long-Term Investments |
100.1% |
Other Assets & Liabilities |
(0.1)% |
Net Assets |
100.0% |
MassMutual Select |
|
Equity Funds |
89.4% |
Fixed Income Funds |
10.7% |
Total Long-Term Investments |
100.1% |
Other Assets & Liabilities |
(0.1)% |
Net Assets |
100.0% |
18
MassMutual Select T. Rowe Price Retirement (target-date) Funds – Portfolio Manager Report (Unaudited) (Continued) |
MassMutual Select |
|
Equity Funds |
94.2% |
Fixed Income Funds |
5.9% |
Total Long-Term Investments |
100.1% |
Other Assets & Liabilities |
(0.1)% |
Net Assets |
100.0% |
MassMutual Select |
|
Equity Funds |
95.7% |
Fixed Income Funds |
4.4% |
Total Long-Term Investments |
100.1% |
Other Assets & Liabilities |
(0.1)% |
Net Assets |
100.0% |
MassMutual Select |
|
Equity Funds |
96.2% |
Fixed Income Funds |
3.9% |
Total Long-Term Investments |
100.1% |
Other Assets & Liabilities |
(0.1)% |
Net Assets |
100.0% |
MassMutual Select |
|
Equity Funds |
96.2% |
Fixed Income Funds |
3.9% |
Total Long-Term Investments |
100.1% |
Other Assets & Liabilities |
(0.1)% |
Net Assets |
100.0% |
19
MassMutual 20/80 Allocation Fund – Portfolio Manager Report (Unaudited) |
GROWTH OF $10,000 INVESTMENT - CLASS R5
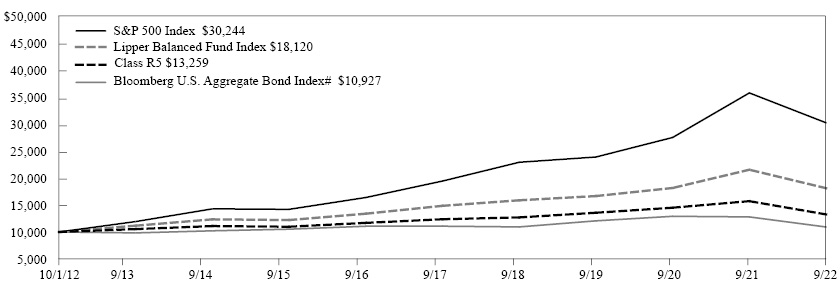
The graph above illustrates a representative class of the Fund’s historical performance for the past 10 fiscal years or since inception (for Funds lacking 10-year records) in comparison to its benchmark index, as well as one or more additional indexes, if applicable. The performance of other share classes will be greater than or less than the class depicted above.
Average Annual Total Returns (for the periods ended 09/30/2022) |
|||||
|
Inception Date |
1 Year |
5 Years |
10 Years |
Since Inception |
Class I |
04/01/2014 |
-15.46% |
1.50% |
2.40% |
|
Class R5 |
06/20/2011 |
-15.64% |
1.41% |
2.86% |
|
Service Class |
06/20/2011 |
-15.66% |
1.31% |
2.77% |
|
Administrative Class |
06/20/2011 |
-15.72% |
1.21% |
2.67% |
|
Class R4 |
04/01/2014 |
-15.92% |
1.04% |
1.94% |
|
Class A |
06/20/2011 |
-15.90% |
0.97% |
2.41% |
|
Class A (sales load deducted)* |
06/20/2011 |
-20.53% |
-0.17% |
1.83% |
|
Class R3 |
04/01/2014 |
-16.05% |
0.81% |
1.69% |
|
Bloomberg U.S. Aggregate Bond Index# |
|
-14.60% |
-0.27% |
0.89% |
1.05% |
S&P 500 Index |
|
-15.47% |
9.24% |
11.70% |
10.12% |
Lipper Balanced Fund Index |
|
-15.90% |
4.06% |
6.12% |
5.00% |
* Class A (sales load deducted) returns include the 5.50% maximum sales charge.
# Benchmark
Generally accepted accounting principles require adjustments to be made to the net assets of the Fund at period end for financial reporting purposes only, and as such, the total return based on the unadjusted net asset value per share may differ from the total return reported in the financial highlights.
Performance results in the graph and table are shown both with and without the imposition of the maximum applicable sales charge (if applicable) and reflect the percentage change in net asset value, including reinvestment of dividends and capital gains distributions. Investors should note that the Fund is a professionally managed mutual fund, while the index or indexes shown above are unmanaged, cannot be purchased directly, and, with the exception of any peer group index, do not incur expenses.
Performance data quoted in the graph and table represents past performance; past performance is not predictive of future results. The investment return and principal value of shares of the Fund fluctuate, so your shares, when sold, may be worth more or less than their original cost. Current performance of the Fund may be lower or higher than the performance quoted. The performance shown does not reflect the deduction of taxes, if any, that a shareholder would pay on Fund distributions or the redemption of Fund shares. Performance data current to the most recent month end may be obtained by calling 1-888-309-3539.
Investors should read the Fund’s prospectus with regard to the Fund’s investment objectives, risks, and charges and expenses in conjunction with these financial statements. Employee retirement benefit plans that invest plan assets in the Separate Investment Accounts (SIAs) may be subject to certain charges as set forth in their respective Plan Documents. Total return figures would be lower for the periods presented if they reflected these charges.
20
MassMutual 40/60 Allocation Fund – Portfolio Manager Report (Unaudited) |
GROWTH OF $10,000 INVESTMENT - CLASS R5
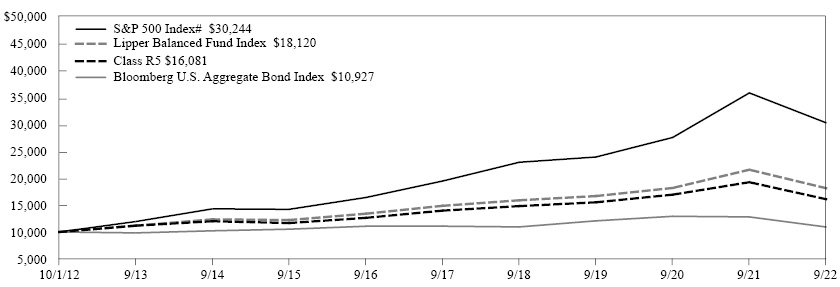
The graph above illustrates a representative class of the Fund’s historical performance for the past 10 fiscal years or since inception (for Funds lacking 10-year records) in comparison to its benchmark index, as well as one or more additional indexes, if applicable. The performance of other share classes will be greater than or less than the class depicted above.
Average Annual Total Returns (for the periods ended 09/30/2022) |
|||||
|
Inception Date |
1 Year |
5 Years |
10 Years |
Since Inception |
Class I |
04/01/2014 |
-16.39% |
2.96% |
3.75% |
|
Class R5 |
06/20/2011 |
-16.37% |
2.87% |
4.87% |
|
Service Class |
06/20/2011 |
-16.40% |
2.77% |
4.78% |
|
Administrative Class |
06/20/2011 |
-16.55% |
2.67% |
4.66% |
|
Class R4 |
04/01/2014 |
-16.65% |
2.53% |
3.30% |
|
Class A |
06/20/2011 |
-16.82% |
2.39% |
4.40% |
|
Class A (sales load deducted)* |
06/20/2011 |
-21.39% |
1.24% |
3.81% |
|
Class R3 |
04/01/2014 |
-17.01% |
2.23% |
3.04% |
|
S&P 500 Index# |
|
-15.47% |
9.24% |
11.70% |
10.12% |
Bloomberg U.S. Aggregate Bond Index |
|
-14.60% |
-0.27% |
0.89% |
1.05% |
Lipper Balanced Fund Index |
|
-15.90% |
4.06% |
6.12% |
5.00% |
* Class A (sales load deducted) returns include the 5.50% maximum sales charge.
# Benchmark
Generally accepted accounting principles require adjustments to be made to the net assets of the Fund at period end for financial reporting purposes only, and as such, the total return based on the unadjusted net asset value per share may differ from the total return reported in the financial highlights.
Performance results in the graph and table are shown both with and without the imposition of the maximum applicable sales charge (if applicable) and reflect the percentage change in net asset value, including reinvestment of dividends and capital gains distributions. Investors should note that the Fund is a professionally managed mutual fund, while the index or indexes shown above are unmanaged, cannot be purchased directly, and, with the exception of any peer group index, do not incur expenses.
Performance data quoted in the graph and table represents past performance; past performance is not predictive of future results. The investment return and principal value of shares of the Fund fluctuate, so your shares, when sold, may be worth more or less than their original cost. Current performance of the Fund may be lower or higher than the performance quoted. The performance shown does not reflect the deduction of taxes, if any, that a shareholder would pay on Fund distributions or the redemption of Fund shares. Performance data current to the most recent month end may be obtained by calling 1-888-309-3539.
Investors should read the Fund’s prospectus with regard to the Fund’s investment objectives, risks, and charges and expenses in conjunction with these financial statements. Employee retirement benefit plans that invest plan assets in the Separate Investment Accounts (SIAs) may be subject to certain charges as set forth in their respective Plan Documents. Total return figures would be lower for the periods presented if they reflected these charges.
21
MassMutual 60/40 Allocation Fund – Portfolio Manager Report (Unaudited) |
GROWTH OF $10,000 INVESTMENT - CLASS R5
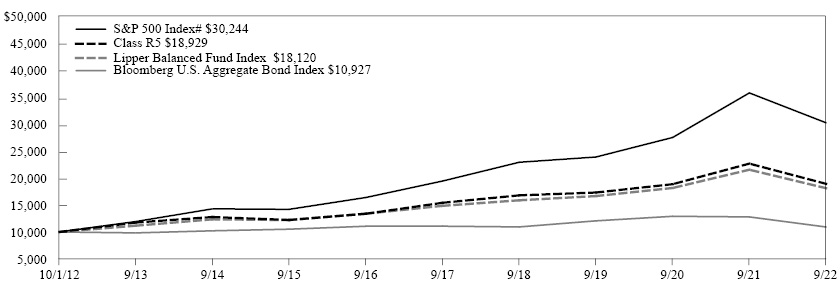
The graph above illustrates a representative class of the Fund’s historical performance for the past 10 fiscal years or since inception (for Funds lacking 10-year records) in comparison to its benchmark index, as well as one or more additional indexes, if applicable. The performance of other share classes will be greater than or less than the class depicted above.
Average Annual Total Returns (for the periods ended 09/30/2022) |
|||||
|
Inception Date |
1 Year |
5 Years |
10 Years |
Since Inception |
Class I |
04/01/2014 |
-16.45% |
4.30% |
4.94% |
|
Class R5 |
06/20/2011 |
-16.53% |
4.19% |
6.59% |
|
Service Class |
06/20/2011 |
-16.66% |
4.08% |
6.49% |
|
Administrative Class |
06/20/2011 |
-16.62% |
3.99% |
6.40% |
|
Class R4 |
04/01/2014 |
-16.78% |
3.84% |
4.49% |
|
Class A |
06/20/2011 |
-16.84% |
3.74% |
6.13% |
|
Class A (sales load deducted)* |
06/20/2011 |
-21.41% |
2.57% |
5.53% |
|
Class R3 |
04/01/2014 |
-17.00% |
3.56% |
4.22% |
|
S&P 500 Index# |
|
-15.47% |
9.24% |
11.70% |
10.12% |
Bloomberg U.S. Aggregate Bond Index |
|
-14.60% |
-0.27% |
0.89% |
1.05% |
Lipper Balanced Fund Index |
|
-15.90% |
4.06% |
6.12% |
5.00% |
* Class A (sales load deducted) returns include the 5.50% maximum sales charge.
# Benchmark
Generally accepted accounting principles require adjustments to be made to the net assets of the Fund at period end for financial reporting purposes only, and as such, the total return based on the unadjusted net asset value per share may differ from the total return reported in the financial highlights.
Performance results in the graph and table are shown both with and without the imposition of the maximum applicable sales charge (if applicable) and reflect the percentage change in net asset value, including reinvestment of dividends and capital gains distributions. Investors should note that the Fund is a professionally managed mutual fund, while the index or indexes shown above are unmanaged, cannot be purchased directly, and, with the exception of any peer group index, do not incur expenses.
Performance data quoted in the graph and table represents past performance; past performance is not predictive of future results. The investment return and principal value of shares of the Fund fluctuate, so your shares, when sold, may be worth more or less than their original cost. Current performance of the Fund may be lower or higher than the performance quoted. The performance shown does not reflect the deduction of taxes, if any, that a shareholder would pay on Fund distributions or the redemption of Fund shares. Performance data current to the most recent month end may be obtained by calling 1-888-309-3539.
Investors should read the Fund’s prospectus with regard to the Fund’s investment objectives, risks, and charges and expenses in conjunction with these financial statements. Employee retirement benefit plans that invest plan assets in the Separate Investment Accounts (SIAs) may be subject to certain charges as set forth in their respective Plan Documents. Total return figures would be lower for the periods presented if they reflected these charges.
22
MassMutual 80/20 Allocation Fund – Portfolio Manager Report (Unaudited) |
GROWTH OF $10,000 INVESTMENT - CLASS R5
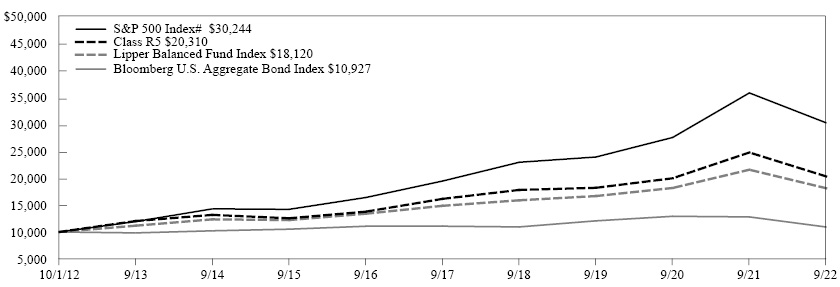
The graph above illustrates a representative class of the Fund’s historical performance for the past 10 fiscal years or since inception (for Funds lacking 10-year records) in comparison to its benchmark index, as well as one or more additional indexes, if applicable. The performance of other share classes will be greater than or less than the class depicted above.
Average Annual Total Returns (for the periods ended 09/30/2022) |
|||||
|
Inception Date |
1 Year |
5 Years |
10 Years |
Since Inception |
Class I |
04/01/2014 |
-17.85% |
4.79% |
5.42% |
|
Class R5 |
06/20/2011 |
-17.91% |
4.70% |
7.34% |
|
Service Class |
06/20/2011 |
-18.04% |
4.58% |
7.24% |
|
Administrative Class |
06/20/2011 |
-18.10% |
4.47% |
7.13% |
|
Class R4 |
04/01/2014 |
-18.17% |
4.31% |
4.94% |
|
Class A |
06/20/2011 |
-18.30% |
4.22% |
6.87% |
|
Class A (sales load deducted)* |
06/20/2011 |
-22.79% |
3.04% |
6.27% |
|
Class R3 |
04/01/2014 |
-18.47% |
4.06% |
4.68% |
|
S&P 500 Index# |
|
-15.47% |
9.24% |
11.70% |
10.12% |
Bloomberg U.S. Aggregate Bond Index |
|
-14.60% |
-0.27% |
0.89% |
1.05% |
Lipper Balanced Fund Index |
|
-15.90% |
4.06% |
6.12% |
5.00% |
* Class A (sales load deducted) returns include the 5.50% maximum sales charge.
# Benchmark
Generally accepted accounting principles require adjustments to be made to the net assets of the Fund at period end for financial reporting purposes only, and as such, the total return based on the unadjusted net asset value per share may differ from the total return reported in the financial highlights.
Performance results in the graph and table are shown both with and without the imposition of the maximum applicable sales charge (if applicable) and reflect the percentage change in net asset value, including reinvestment of dividends and capital gains distributions. Investors should note that the Fund is a professionally managed mutual fund, while the index or indexes shown above are unmanaged, cannot be purchased directly, and, with the exception of any peer group index, do not incur expenses.
Performance data quoted in the graph and table represents past performance; past performance is not predictive of future results. The investment return and principal value of shares of the Fund fluctuate, so your shares, when sold, may be worth more or less than their original cost. Current performance of the Fund may be lower or higher than the performance quoted. The performance shown does not reflect the deduction of taxes, if any, that a shareholder would pay on Fund distributions or the redemption of Fund shares. Performance data current to the most recent month end may be obtained by calling 1-888-309-3539.
Investors should read the Fund’s prospectus with regard to the Fund’s investment objectives, risks, and charges and expenses in conjunction with these financial statements. Employee retirement benefit plans that invest plan assets in the Separate Investment Accounts (SIAs) may be subject to certain charges as set forth in their respective Plan Documents. Total return figures would be lower for the periods presented if they reflected these charges.
23
MassMutual RetireSMARTSM by JPMorgan In Retirement Fund – Portfolio Manager Report (Unaudited) |
GROWTH OF $10,000 INVESTMENT - SERVICE CLASS
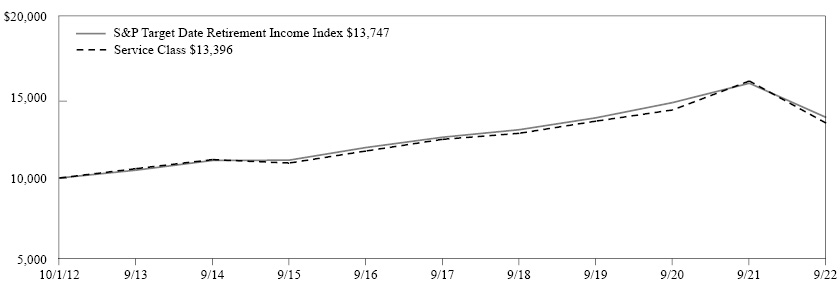
The graph above illustrates a representative class of the Fund’s historical performance for the past 10 fiscal years or since inception (for Funds lacking 10-year records) in comparison to its benchmark index, as well as one or more additional indexes, if applicable. The performance of other share classes will be greater than or less than the class depicted above.
Average Annual Total Returns (for the periods ended 09/30/2022) |
|||||
|
Inception Date |
1 Year |
5 Years |
10 Years |
Since Inception |
Class I |
04/01/2014 |
-16.12% |
1.75% |
2.55% |
|
Class R5 |
04/01/2014 |
-16.20% |
1.66% |
2.45% |
|
Service Class |
12/31/2003 |
-16.26% |
1.57% |
2.97% |
|
Administrative Class |
12/31/2003 |
-16.45% |
1.46% |
2.87% |
|
Class R4 |
04/01/2014 |
-16.47% |
1.31% |
2.10% |
|
Class A |
12/31/2003 |
-16.64% |
1.19% |
2.59% |
|
Class A (sales load deducted)* |
12/31/2003 |
-21.22% |
0.05% |
2.01% |
|
Class R3 |
12/31/2003 |
-16.67% |
1.05% |
2.43% |
|
S&P Target Date Retirement Income Index |
|
-13.31% |
1.88% |
3.23% |
2.82% |
* Class A (sales load deducted) returns include the 5.50% maximum sales charge.
Generally accepted accounting principles require adjustments to be made to the net assets of the Fund at period end for financial reporting purposes only, and as such, the total return based on the unadjusted net asset value per share may differ from the total return reported in the financial highlights.
Performance results in the graph and table are shown both with and without the imposition of the maximum applicable sales charge (if applicable) and reflect the percentage change in net asset value, including reinvestment of dividends and capital gains distributions. Investors should note that the Fund is a professionally managed mutual fund, while the index or indexes shown above are unmanaged, cannot be purchased directly, and, with the exception of any peer group index, do not incur expenses.
Performance data quoted in the graph and table represents past performance; past performance is not predictive of future results. The investment return and principal value of shares of the Fund fluctuate, so your shares, when sold, may be worth more or less than their original cost. Current performance of the Fund may be lower or higher than the performance quoted. The performance shown does not reflect the deduction of taxes, if any, that a shareholder would pay on Fund distributions or the redemption of Fund shares. Performance data current to the most recent month end may be obtained by calling 1-888-309-3539.
Investors should read the Fund’s prospectus with regard to the Fund’s investment objectives, risks, and charges and expenses in conjunction with these financial statements. Employee retirement benefit plans that invest plan assets in the Separate Investment Accounts (SIAs) may be subject to certain charges as set forth in their respective Plan Documents. Total return figures would be lower for the periods presented if they reflected these charges.
24
MassMutual RetireSMARTSM by JPMorgan 2020 Fund – Portfolio Manager Report (Unaudited) |
GROWTH OF $10,000 INVESTMENT - Service Class
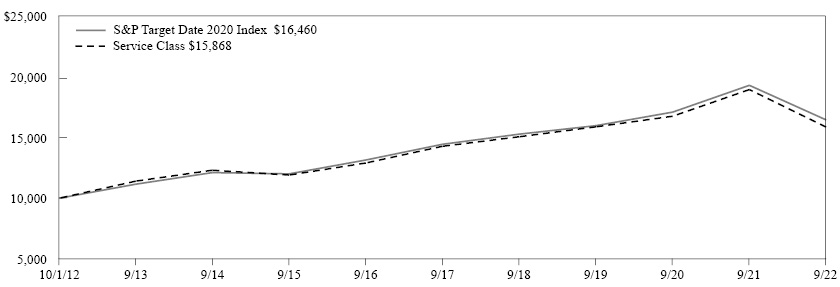
The graph above illustrates a representative class of the Fund’s historical performance for the past 10 fiscal years or since inception (for Funds lacking 10-year records) in comparison to its benchmark index, as well as one or more additional indexes, if applicable. The performance of other share classes will be greater than or less than the class depicted above.
Average Annual Total Returns (for the periods ended 09/30/2022) |
|||||
|
Inception Date |
1 Year |
5 Years |
10 Years |
Since Inception |
Class I |
04/01/2014 |
-16.09% |
2.35% |
3.38% |
|
Class R5 |
04/01/2014 |
-16.24% |
2.24% |
3.27% |
|
Service Class |
12/31/2003 |
-16.29% |
2.13% |
4.73% |
|
Administrative Class |
12/31/2003 |
-16.43% |
2.02% |
4.63% |
|
Class R4 |
04/01/2014 |
-16.51% |
1.88% |
2.91% |
|
Class A |
12/31/2003 |
-16.60% |
1.76% |
4.34% |
|
Class A (sales load deducted)* |
12/31/2003 |
-21.19% |
0.61% |
3.75% |
|
Class R3 |
12/31/2003 |
-16.70% |
1.63% |
4.17% |
|
S&P Target Date 2020 Index |
|
-14.75% |
2.64% |
5.11% |
3.98% |
* Class A (sales load deducted) returns include the 5.50% maximum sales charge.
Generally accepted accounting principles require adjustments to be made to the net assets of the Fund at period end for financial reporting purposes only, and as such, the total return based on the unadjusted net asset value per share may differ from the total return reported in the financial highlights.
Performance results in the graph and table are shown both with and without the imposition of the maximum applicable sales charge (if applicable) and reflect the percentage change in net asset value, including reinvestment of dividends and capital gains distributions. Investors should note that the Fund is a professionally managed mutual fund, while the index or indexes shown above are unmanaged, cannot be purchased directly, and, with the exception of any peer group index, do not incur expenses.
Performance data quoted in the graph and table represents past performance; past performance is not predictive of future results. The investment return and principal value of shares of the Fund fluctuate, so your shares, when sold, may be worth more or less than their original cost. Current performance of the Fund may be lower or higher than the performance quoted. The performance shown does not reflect the deduction of taxes, if any, that a shareholder would pay on Fund distributions or the redemption of Fund shares. Performance data current to the most recent month end may be obtained by calling 1-888-309-3539.
Investors should read the Fund’s prospectus with regard to the Fund’s investment objectives, risks, and charges and expenses in conjunction with these financial statements. Employee retirement benefit plans that invest plan assets in the Separate Investment Accounts (SIAs) may be subject to certain charges as set forth in their respective Plan Documents. Total return figures would be lower for the periods presented if they reflected these charges.
25
MassMutual RetireSMARTSM by JPMorgan 2025 Fund – Portfolio Manager Report (Unaudited) |
GROWTH OF $10,000 INVESTMENT - Service Class
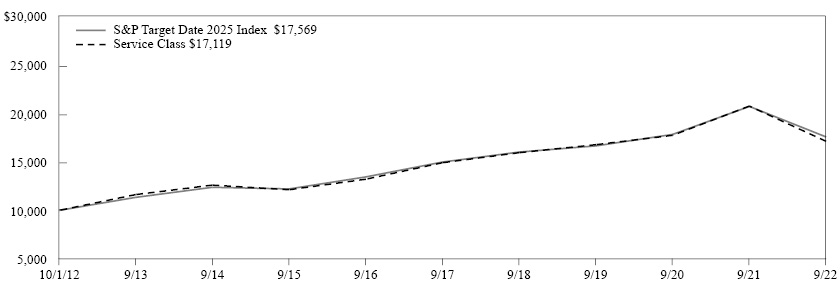
The graph above illustrates a representative class of the Fund’s historical performance for the past 10 fiscal years or since inception (for Funds lacking 10-year records) in comparison to its benchmark index, as well as one or more additional indexes, if applicable. The performance of other share classes will be greater than or less than the class depicted above.
Average Annual Total Returns (for the periods ended 09/30/2022) |
|||||
|
Inception Date |
1 Year |
5 Years |
10 Years |
Since Inception |
Class I |
04/01/2014 |
-17.29% |
3.01% |
3.99% |
|
Class R5 |
04/01/2014 |
-17.42% |
2.93% |
3.90% |
|
Service Class |
04/01/2010 |
-17.48% |
2.80% |
5.52% |
|
Administrative Class |
04/01/2010 |
-17.50% |
2.71% |
5.44% |
|
Class R4 |
04/01/2014 |
-17.65% |
2.54% |
3.52% |
|
Class A |
04/01/2010 |
-17.74% |
2.44% |
5.15% |
|
Class A (sales load deducted)* |
04/01/2010 |
-22.27% |
1.29% |
4.56% |
|
Class R3 |
04/01/2014 |
-17.85% |
2.30% |
3.27% |
|
S&P Target Date 2025 Index |
|
-15.16% |
3.24% |
5.80% |
4.51% |
* Class A (sales load deducted) returns include the 5.50% maximum sales charge.
Generally accepted accounting principles require adjustments to be made to the net assets of the Fund at period end for financial reporting purposes only, and as such, the total return based on the unadjusted net asset value per share may differ from the total return reported in the financial highlights.
Performance results in the graph and table are shown both with and without the imposition of the maximum applicable sales charge (if applicable) and reflect the percentage change in net asset value, including reinvestment of dividends and capital gains distributions. Investors should note that the Fund is a professionally managed mutual fund, while the index or indexes shown above are unmanaged, cannot be purchased directly, and, with the exception of any peer group index, do not incur expenses.
Performance data quoted in the graph and table represents past performance; past performance is not predictive of future results. The investment return and principal value of shares of the Fund fluctuate, so your shares, when sold, may be worth more or less than their original cost. Current performance of the Fund may be lower or higher than the performance quoted. The performance shown does not reflect the deduction of taxes, if any, that a shareholder would pay on Fund distributions or the redemption of Fund shares. Performance data current to the most recent month end may be obtained by calling 1-888-309-3539.
Investors should read the Fund’s prospectus with regard to the Fund’s investment objectives, risks, and charges and expenses in conjunction with these financial statements. Employee retirement benefit plans that invest plan assets in the Separate Investment Accounts (SIAs) may be subject to certain charges as set forth in their respective Plan Documents. Total return figures would be lower for the periods presented if they reflected these charges.
26
MassMutual RetireSMARTSM by JPMorgan 2030 Fund – Portfolio Manager Report (Unaudited) |
GROWTH OF $10,000 INVESTMENT - Service Class
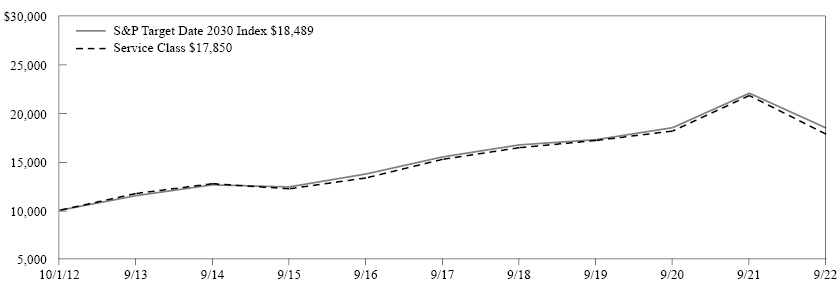
The graph above illustrates a representative class of the Fund’s historical performance for the past 10 fiscal years or since inception (for Funds lacking 10-year records) in comparison to its benchmark index, as well as one or more additional indexes, if applicable. The performance of other share classes will be greater than or less than the class depicted above.
Average Annual Total Returns (for the periods ended 09/30/2022) |
|||||
|
Inception Date |
1 Year |
5 Years |
10 Years |
Since Inception |
Class I |
04/01/2014 |
-18.08% |
3.40% |
4.35% |
|
Class R5 |
04/01/2014 |
-18.18% |
3.27% |
4.23% |
|
Service Class |
12/31/2003 |
-18.23% |
3.19% |
5.97% |
|
Administrative Class |
12/31/2003 |
-18.33% |
3.08% |
5.86% |
|
Class R4 |
04/01/2014 |
-18.47% |
2.91% |
3.86% |
|
Class A |
12/31/2003 |
-18.55% |
2.83% |
5.58% |
|
Class A (sales load deducted)* |
12/31/2003 |
-23.03% |
1.67% |
4.99% |
|
Class R3 |
12/31/2003 |
-18.67% |
2.66% |
5.40% |
|
S&P Target Date 2030 Index |
|
-16.23% |
3.58% |
6.34% |
4.90% |
* Class A (sales load deducted) returns include the 5.50% maximum sales charge.
Generally accepted accounting principles require adjustments to be made to the net assets of the Fund at period end for financial reporting purposes only, and as such, the total return based on the unadjusted net asset value per share may differ from the total return reported in the financial highlights.
Performance results in the graph and table are shown both with and without the imposition of the maximum applicable sales charge (if applicable) and reflect the percentage change in net asset value, including reinvestment of dividends and capital gains distributions. Investors should note that the Fund is a professionally managed mutual fund, while the index or indexes shown above are unmanaged, cannot be purchased directly, and, with the exception of any peer group index, do not incur expenses.
Performance data quoted in the graph and table represents past performance; past performance is not predictive of future results. The investment return and principal value of shares of the Fund fluctuate, so your shares, when sold, may be worth more or less than their original cost. Current performance of the Fund may be lower or higher than the performance quoted. The performance shown does not reflect the deduction of taxes, if any, that a shareholder would pay on Fund distributions or the redemption of Fund shares. Performance data current to the most recent month end may be obtained by calling 1-888-309-3539.
Investors should read the Fund’s prospectus with regard to the Fund’s investment objectives, risks, and charges and expenses in conjunction with these financial statements. Employee retirement benefit plans that invest plan assets in the Separate Investment Accounts (SIAs) may be subject to certain charges as set forth in their respective Plan Documents. Total return figures would be lower for the periods presented if they reflected these charges.
27
MassMutual RetireSMARTSM by JPMorgan 2035 Fund – Portfolio Manager Report (Unaudited) |
GROWTH OF $10,000 INVESTMENT - Service Class
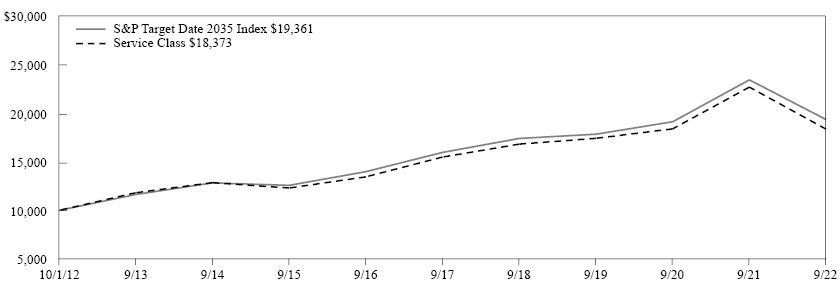
The graph above illustrates a representative class of the Fund’s historical performance for the past 10 fiscal years or since inception (for Funds lacking 10-year records) in comparison to its benchmark index, as well as one or more additional indexes, if applicable. The performance of other share classes will be greater than or less than the class depicted above.
Average Annual Total Returns (for the periods ended 09/30/2022) |
|||||
|
Inception Date |
1 Year |
5 Years |
10 Years |
Since Inception |
Class I |
04/01/2014 |
-18.91% |
3.67% |
4.59% |
|
Class R5 |
04/01/2014 |
-19.03% |
3.56% |
4.48% |
|
Service Class |
04/01/2010 |
-19.06% |
3.46% |
6.27% |
|
Administrative Class |
04/01/2010 |
-19.17% |
3.36% |
6.16% |
|
Class R4 |
04/01/2014 |
-19.29% |
3.20% |
4.13% |
|
Class A |
04/01/2010 |
-19.34% |
3.11% |
5.89% |
|
Class A (sales load deducted)* |
04/01/2010 |
-23.78% |
1.95% |
5.29% |
|
Class R3 |
04/01/2014 |
-19.50% |
2.95% |
3.86% |
|
S&P Target Date 2035 Index |
|
-17.42% |
3.92% |
6.83% |
5.28% |
* Class A (sales load deducted) returns include the 5.50% maximum sales charge.
Generally accepted accounting principles require adjustments to be made to the net assets of the Fund at period end for financial reporting purposes only, and as such, the total return based on the unadjusted net asset value per share may differ from the total return reported in the financial highlights.
Performance results in the graph and table are shown both with and without the imposition of the maximum applicable sales charge (if applicable) and reflect the percentage change in net asset value, including reinvestment of dividends and capital gains distributions. Investors should note that the Fund is a professionally managed mutual fund, while the index or indexes shown above are unmanaged, cannot be purchased directly, and, with the exception of any peer group index, do not incur expenses.
Performance data quoted in the graph and table represents past performance; past performance is not predictive of future results. The investment return and principal value of shares of the Fund fluctuate, so your shares, when sold, may be worth more or less than their original cost. Current performance of the Fund may be lower or higher than the performance quoted. The performance shown does not reflect the deduction of taxes, if any, that a shareholder would pay on Fund distributions or the redemption of Fund shares. Performance data current to the most recent month end may be obtained by calling 1-888-309-3539.
Investors should read the Fund’s prospectus with regard to the Fund’s investment objectives, risks, and charges and expenses in conjunction with these financial statements. Employee retirement benefit plans that invest plan assets in the Separate Investment Accounts (SIAs) may be subject to certain charges as set forth in their respective Plan Documents. Total return figures would be lower for the periods presented if they reflected these charges.
28
MassMutual RetireSMARTSM by JPMorgan 2040 Fund – Portfolio Manager Report (Unaudited) |
GROWTH OF $10,000 INVESTMENT - Service Class
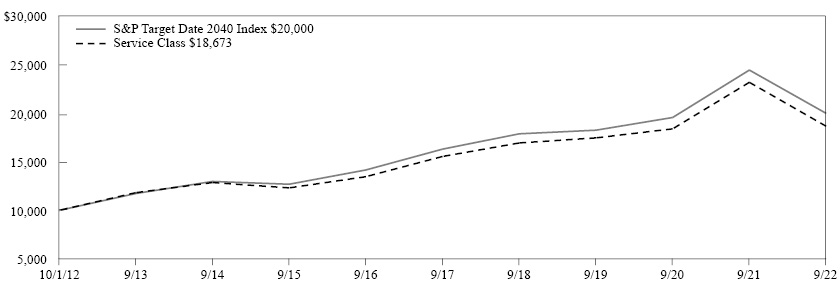
The graph above illustrates a representative class of the Fund’s historical performance for the past 10 fiscal years or since inception (for Funds lacking 10-year records) in comparison to its benchmark index, as well as one or more additional indexes, if applicable. The performance of other share classes will be greater than or less than the class depicted above.
Average Annual Total Returns (for the periods ended 09/30/2022) |
|||||
|
Inception Date |
1 Year |
5 Years |
10 Years |
Since Inception |
Class I |
04/01/2014 |
-19.31% |
3.93% |
4.77% |
|
Class R5 |
04/01/2014 |
-19.36% |
3.83% |
4.68% |
|
Service Class |
12/31/2003 |
-19.49% |
3.72% |
6.44% |
|
Administrative Class |
12/31/2003 |
-19.56% |
3.61% |
6.34% |
|
Class R4 |
04/01/2014 |
-19.70% |
3.44% |
4.29% |
|
Class A |
12/31/2003 |
-19.73% |
3.36% |
6.06% |
|
Class A (sales load deducted)* |
12/31/2003 |
-24.15% |
2.20% |
5.46% |
|
Class R3 |
12/31/2003 |
-19.88% |
3.21% |
5.87% |
|
S&P Target Date 2040 Index |
|
-18.21% |
4.16% |
7.18% |
5.54% |
* Class A (sales load deducted) returns include the 5.50% maximum sales charge.
Generally accepted accounting principles require adjustments to be made to the net assets of the Fund at period end for financial reporting purposes only, and as such, the total return based on the unadjusted net asset value per share may differ from the total return reported in the financial highlights.
Performance results in the graph and table are shown both with and without the imposition of the maximum applicable sales charge (if applicable) and reflect the percentage change in net asset value, including reinvestment of dividends and capital gains distributions. Investors should note that the Fund is a professionally managed mutual fund, while the index or indexes shown above are unmanaged, cannot be purchased directly, and, with the exception of any peer group index, do not incur expenses.
Performance data quoted in the graph and table represents past performance; past performance is not predictive of future results. The investment return and principal value of shares of the Fund fluctuate, so your shares, when sold, may be worth more or less than their original cost. Current performance of the Fund may be lower or higher than the performance quoted. The performance shown does not reflect the deduction of taxes, if any, that a shareholder would pay on Fund distributions or the redemption of Fund shares. Performance data current to the most recent month end may be obtained by calling 1-888-309-3539.
Investors should read the Fund’s prospectus with regard to the Fund’s investment objectives, risks, and charges and expenses in conjunction with these financial statements. Employee retirement benefit plans that invest plan assets in the Separate Investment Accounts (SIAs) may be subject to certain charges as set forth in their respective Plan Documents. Total return figures would be lower for the periods presented if they reflected these charges.
29
MassMutual RetireSMARTSM by JPMorgan 2045 Fund – Portfolio Manager Report (Unaudited) |
GROWTH OF $10,000 INVESTMENT - Service Class
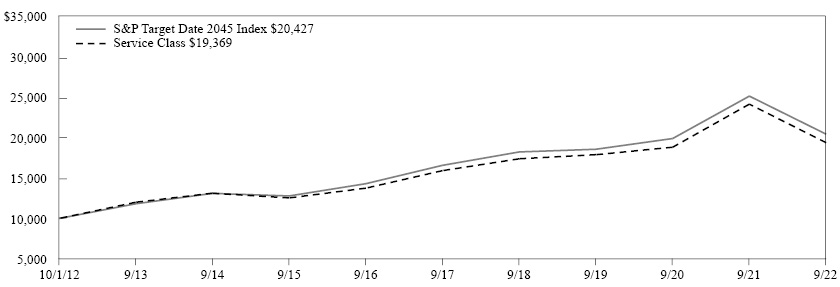
The graph above illustrates a representative class of the Fund’s historical performance for the past 10 fiscal years or since inception (for Funds lacking 10-year records) in comparison to its benchmark index, as well as one or more additional indexes, if applicable. The performance of other share classes will be greater than or less than the class depicted above.
Average Annual Total Returns (for the periods ended 09/30/2022) |
|||||
|
Inception Date |
1 Year |
5 Years |
10 Years |
Since Inception |
Class I |
04/01/2014 |
-19.49% |
4.23% |
5.00% |
|
Class R5 |
04/01/2014 |
-19.57% |
4.12% |
4.90% |
|
Service Class |
04/01/2010 |
-19.74% |
4.00% |
6.83% |
|
Administrative Class |
04/01/2010 |
-19.76% |
3.91% |
6.73% |
|
Class R4 |
04/01/2014 |
-19.92% |
3.74% |
4.51% |
|
Class A |
04/01/2010 |
-19.94% |
3.65% |
6.46% |
|
Class A (sales load deducted)* |
04/01/2010 |
-24.34% |
2.49% |
5.86% |
|
Class R3 |
04/01/2014 |
-20.09% |
3.48% |
4.26% |
|
S&P Target Date 2045 Index |
|
-18.70% |
4.27% |
7.40% |
5.69% |
* Class A (sales load deducted) returns include the 5.50% maximum sales charge.
Generally accepted accounting principles require adjustments to be made to the net assets of the Fund at period end for financial reporting purposes only, and as such, the total return based on the unadjusted net asset value per share may differ from the total return reported in the financial highlights.
Performance results in the graph and table are shown both with and without the imposition of the maximum applicable sales charge (if applicable) and reflect the percentage change in net asset value, including reinvestment of dividends and capital gains distributions. Investors should note that the Fund is a professionally managed mutual fund, while the index or indexes shown above are unmanaged, cannot be purchased directly, and, with the exception of any peer group index, do not incur expenses.
Performance data quoted in the graph and table represents past performance; past performance is not predictive of future results. The investment return and principal value of shares of the Fund fluctuate, so your shares, when sold, may be worth more or less than their original cost. Current performance of the Fund may be lower or higher than the performance quoted. The performance shown does not reflect the deduction of taxes, if any, that a shareholder would pay on Fund distributions or the redemption of Fund shares. Performance data current to the most recent month end may be obtained by calling 1-888-309-3539.
Investors should read the Fund’s prospectus with regard to the Fund’s investment objectives, risks, and charges and expenses in conjunction with these financial statements. Employee retirement benefit plans that invest plan assets in the Separate Investment Accounts (SIAs) may be subject to certain charges as set forth in their respective Plan Documents. Total return figures would be lower for the periods presented if they reflected these charges.
30
MassMutual RetireSMARTSM by JPMorgan 2050 Fund – Portfolio Manager Report (Unaudited) |
GROWTH OF $10,000 INVESTMENT - Service Class
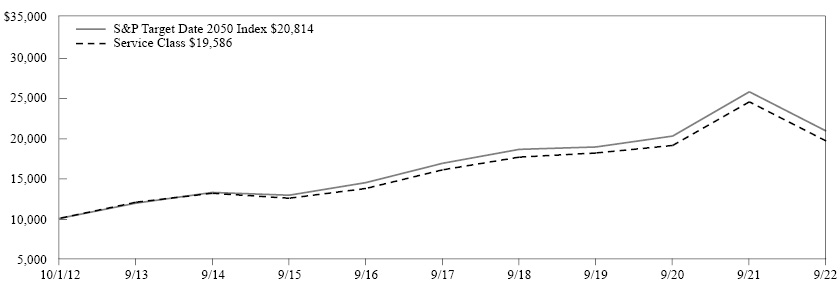
The graph above illustrates a representative class of the Fund’s historical performance for the past 10 fiscal years or since inception (for Funds lacking 10-year records) in comparison to its benchmark index, as well as one or more additional indexes, if applicable. The performance of other share classes will be greater than or less than the class depicted above.
Average Annual Total Returns (for the periods ended 09/30/2022) |
|||||
|
Inception Date |
1 Year |
5 Years |
10 Years |
Since Inception |
Class I |
04/01/2014 |
-19.60% |
4.30% |
5.11% |
|
Class R5 |
04/01/2014 |
-19.73% |
4.19% |
5.02% |
|
Service Class |
12/17/2007 |
-19.78% |
4.11% |
6.95% |
|
Administrative Class |
12/17/2007 |
-19.88% |
4.00% |
6.84% |
|
Class R4 |
04/01/2014 |
-19.97% |
3.83% |
4.65% |
|
Class A |
12/17/2007 |
-20.08% |
3.73% |
6.57% |
|
Class A (sales load deducted)* |
12/17/2007 |
-24.47% |
2.56% |
5.97% |
|
Class R3 |
12/17/2007 |
-20.23% |
3.59% |
6.38% |
|
S&P Target Date 2050 Index |
|
-18.88% |
4.35% |
7.61% |
5.82% |
* Class A (sales load deducted) returns include the 5.50% maximum sales charge.
Generally accepted accounting principles require adjustments to be made to the net assets of the Fund at period end for financial reporting purposes only, and as such, the total return based on the unadjusted net asset value per share may differ from the total return reported in the financial highlights.
Performance results in the graph and table are shown both with and without the imposition of the maximum applicable sales charge (if applicable) and reflect the percentage change in net asset value, including reinvestment of dividends and capital gains distributions. Investors should note that the Fund is a professionally managed mutual fund, while the index or indexes shown above are unmanaged, cannot be purchased directly, and, with the exception of any peer group index, do not incur expenses.
Performance data quoted in the graph and table represents past performance; past performance is not predictive of future results. The investment return and principal value of shares of the Fund fluctuate, so your shares, when sold, may be worth more or less than their original cost. Current performance of the Fund may be lower or higher than the performance quoted. The performance shown does not reflect the deduction of taxes, if any, that a shareholder would pay on Fund distributions or the redemption of Fund shares. Performance data current to the most recent month end may be obtained by calling 1-888-309-3539.
Investors should read the Fund’s prospectus with regard to the Fund’s investment objectives, risks, and charges and expenses in conjunction with these financial statements. Employee retirement benefit plans that invest plan assets in the Separate Investment Accounts (SIAs) may be subject to certain charges as set forth in their respective Plan Documents. Total return figures would be lower for the periods presented if they reflected these charges.
31
MassMutual RetireSMARTSM by JPMorgan 2055 Fund – Portfolio Manager Report (Unaudited) |
GROWTH OF $10,000 INVESTMENT - Service Class
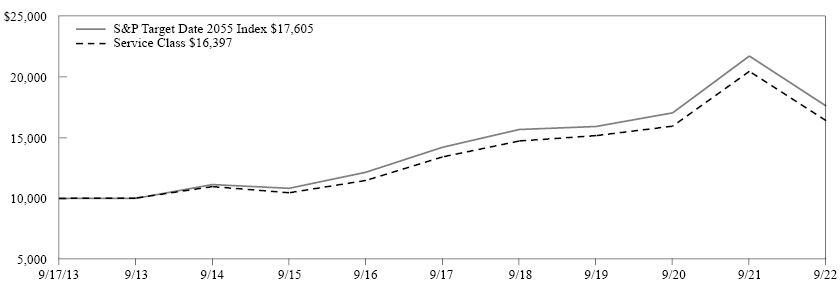
The graph above illustrates a representative class of the Fund’s historical performance for the past 10 fiscal years or since inception (for Funds lacking 10-year records) in comparison to its benchmark index, as well as one or more additional indexes, if applicable. The performance of other share classes will be greater than or less than the class depicted above.
Average Annual Total Returns (for the periods ended 09/30/2022) |
|||||
|
Inception Date |
1 Year |
5 Years |
Since Inception |
Since Inception |
Class I |
04/01/2014 |
-19.58% |
4.32% |
5.16% |
|
Class R5 |
04/01/2014 |
-19.69% |
4.21% |
5.04% |
|
Service Class |
09/17/2013 |
-19.85% |
4.11% |
5.62% |
|
Administrative Class |
09/17/2013 |
-19.92% |
4.00% |
5.52% |
|
Class R4 |
04/01/2014 |
-19.98% |
3.86% |
4.69% |
|
Class A |
09/17/2013 |
-19.98% |
3.76% |
5.27% |
|
Class A (sales load deducted)* |
09/17/2013 |
-24.38% |
2.59% |
4.61% |
|
Class R3 |
04/01/2014 |
-20.23% |
3.58% |
4.42% |
|
S&P Target Date 2055 Index |
|
-18.94% |
4.39% |
6.46% |
5.88% |
* Class A (sales load deducted) returns include the 5.50% maximum sales charge.
Generally accepted accounting principles require adjustments to be made to the net assets of the Fund at period end for financial reporting purposes only, and as such, the total return based on the unadjusted net asset value per share may differ from the total return reported in the financial highlights.
Performance results in the graph and table are shown both with and without the imposition of the maximum applicable sales charge (if applicable) and reflect the percentage change in net asset value, including reinvestment of dividends and capital gains distributions. Investors should note that the Fund is a professionally managed mutual fund, while the index or indexes shown above are unmanaged, cannot be purchased directly, and, with the exception of any peer group index, do not incur expenses.
Performance data quoted in the graph and table represents past performance; past performance is not predictive of future results. The investment return and principal value of shares of the Fund fluctuate, so your shares, when sold, may be worth more or less than their original cost. Current performance of the Fund may be lower or higher than the performance quoted. The performance shown does not reflect the deduction of taxes, if any, that a shareholder would pay on Fund distributions or the redemption of Fund shares. Performance data current to the most recent month end may be obtained by calling 1-888-309-3539.
Investors should read the Fund’s prospectus with regard to the Fund’s investment objectives, risks, and charges and expenses in conjunction with these financial statements. Employee retirement benefit plans that invest plan assets in the Separate Investment Accounts (SIAs) may be subject to certain charges as set forth in their respective Plan Documents. Total return figures would be lower for the periods presented if they reflected these charges.
32
MassMutual RetireSMARTSM by JPMorgan 2060 Fund – Portfolio Manager Report (Unaudited) |
GROWTH OF $10,000 INVESTMENT - Class I
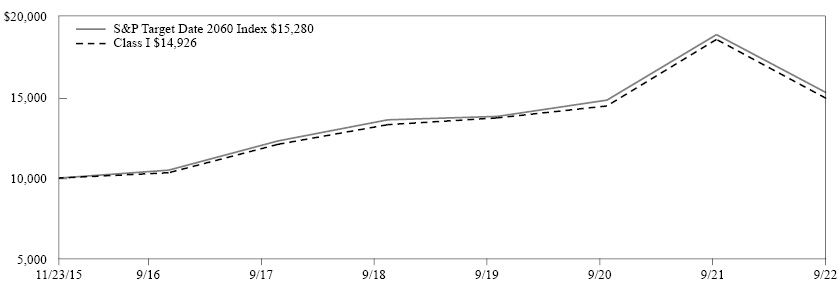
The graph above illustrates a representative class of the Fund’s historical performance for the past 10 fiscal years or since inception (for Funds lacking 10-year records) in comparison to its benchmark index, as well as one or more additional indexes, if applicable. The performance of other share classes will be greater than or less than the class depicted above.
Average Annual Total Returns (for the periods ended 09/30/2022) |
||||
|
Inception Date |
1 Year |
5 Year |
Since Inception |
Class I |
11/23/2015 |
-19.60% |
4.31% |
6.02% |
Class R5 |
11/23/2015 |
-19.72% |
4.19% |
5.90% |
Service Class |
11/23/2015 |
-19.75% |
4.10% |
5.80% |
Administrative Class |
11/23/2015 |
-19.96% |
3.97% |
5.68% |
Class R4 |
11/23/2015 |
-20.02% |
3.84% |
5.54% |
Class A |
11/23/2015 |
-20.10% |
3.71% |
5.42% |
Class A (sales load deducted)* |
11/23/2015 |
-24.50% |
2.54% |
4.55% |
Class R3 |
11/23/2015 |
-20.18% |
3.58% |
5.29% |
S&P Target Date 2060 Index |
|
-18.99% |
4.44% |
6.38% |
* Class A (sales load deducted) returns include the 5.50% maximum sales charge.
Generally accepted accounting principles require adjustments to be made to the net assets of the Fund at period end for financial reporting purposes only, and as such, the total return based on the unadjusted net asset value per share may differ from the total return reported in the financial highlights.
Performance results in the graph and table are shown both with and without the imposition of the maximum applicable sales charge (if applicable) and reflect the percentage change in net asset value, including reinvestment of dividends and capital gains distributions. Investors should note that the Fund is a professionally managed mutual fund, while the index or indexes shown above are unmanaged, cannot be purchased directly, and, with the exception of any peer group index, do not incur expenses.
Performance data quoted in the graph and table represents past performance; past performance is not predictive of future results. The investment return and principal value of shares of the Fund fluctuate, so your shares, when sold, may be worth more or less than their original cost. Current performance of the Fund may be lower or higher than the performance quoted. The performance shown does not reflect the deduction of taxes, if any, that a shareholder would pay on Fund distributions or the redemption of Fund shares. Performance data current to the most recent month end may be obtained by calling 1-888-309-3539.
Investors should read the Fund’s prospectus with regard to the Fund’s investment objectives, risks, and charges and expenses in conjunction with these financial statements. Employee retirement benefit plans that invest plan assets in the Separate Investment Accounts (SIAs) may be subject to certain charges as set forth in their respective Plan Documents. Total return figures would be lower for the periods presented if they reflected these charges.
33
MassMutual Select T. Rowe Price Retirement Balanced Fund – Portfolio Manager Report (Unaudited) |
GROWTH OF $10,000 INVESTMENT - Class I

The graph above illustrates a representative class of the Fund’s historical performance for the past 10 fiscal years or since inception (for Funds lacking 10-year records) in comparison to its benchmark index, as well as one or more additional indexes, if applicable. The performance of other share classes will be greater than or less than the class depicted above.
Average Annual Total Returns (for the periods ended 09/30/2022) |
|||
|
Inception Date |
1 Year |
Since Inception |
Class I |
02/16/2018 |
-14.93% |
2.49% |
Class M5 |
02/16/2018 |
-15.09% |
2.34% |
Class M4 |
02/16/2018 |
-15.28% |
2.08% |
Class M3 |
02/16/2018 |
-15.55% |
1.82% |
S&P Target Date Retirement Income Index |
|
-13.31% |
1.66% |
Generally accepted accounting principles require adjustments to be made to the net assets of the Fund at period end for financial reporting purposes only, and as such, the total return based on the unadjusted net asset value per share may differ from the total return reported in the financial highlights.
Performance results in the graph and table are shown both with and without the imposition of the maximum applicable sales charge (if applicable) and reflect the percentage change in net asset value, including reinvestment of dividends and capital gains distributions. Investors should note that the Fund is a professionally managed mutual fund, while the index or indexes shown above are unmanaged, cannot be purchased directly, and, with the exception of any peer group index, do not incur expenses.
Performance data quoted in the graph and table represents past performance; past performance is not predictive of future results. The investment return and principal value of shares of the Fund fluctuate, so your shares, when sold, may be worth more or less than their original cost. Current performance of the Fund may be lower or higher than the performance quoted. The performance shown does not reflect the deduction of taxes, if any, that a shareholder would pay on Fund distributions or the redemption of Fund shares. Performance data current to the most recent month end may be obtained by calling 1-888-309-3539.
Investors should read the Fund’s prospectus with regard to the Fund’s investment objectives, risks, and charges and expenses in conjunction with these financial statements. Employee retirement benefit plans that invest plan assets in the Separate Investment Accounts (SIAs) may be subject to certain charges as set forth in their respective Plan Documents. Total return figures would be lower for the periods presented if they reflected these charges.
34
MassMutual Select T. Rowe Price Retirement 2005 Fund – Portfolio Manager Report (Unaudited) |
GROWTH OF $10,000 INVESTMENT - Class I
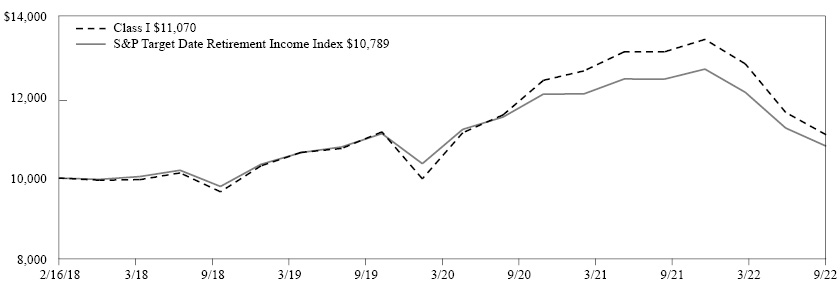
The graph above illustrates a representative class of the Fund’s historical performance for the past 10 fiscal years or since inception (for Funds lacking 10-year records) in comparison to its benchmark index, as well as one or more additional indexes, if applicable. The performance of other share classes will be greater than or less than the class depicted above.
Average Annual Total Returns (for the periods ended 09/30/2022) |
|||
|
Inception Date |
1 Year |
Since Inception |
Class I |
02/16/2018 |
-15.62% |
2.22% |
Class M5 |
02/16/2018 |
-15.73% |
2.06% |
Class M4 |
02/16/2018 |
-15.93% |
1.82% |
Class M3 |
02/16/2018 |
-16.17% |
1.55% |
S&P Target Date Retirement Income Index |
|
-13.31% |
1.66% |
Generally accepted accounting principles require adjustments to be made to the net assets of the Fund at period end for financial reporting purposes only, and as such, the total return based on the unadjusted net asset value per share may differ from the total return reported in the financial highlights.
Performance results in the graph and table are shown both with and without the imposition of the maximum applicable sales charge (if applicable) and reflect the percentage change in net asset value, including reinvestment of dividends and capital gains distributions. Investors should note that the Fund is a professionally managed mutual fund, while the index or indexes shown above are unmanaged, cannot be purchased directly, and, with the exception of any peer group index, do not incur expenses.
Performance data quoted in the graph and table represents past performance; past performance is not predictive of future results. The investment return and principal value of shares of the Fund fluctuate, so your shares, when sold, may be worth more or less than their original cost. Current performance of the Fund may be lower or higher than the performance quoted. The performance shown does not reflect the deduction of taxes, if any, that a shareholder would pay on Fund distributions or the redemption of Fund shares. Performance data current to the most recent month end may be obtained by calling 1-888-309-3539.
Investors should read the Fund’s prospectus with regard to the Fund’s investment objectives, risks, and charges and expenses in conjunction with these financial statements. Employee retirement benefit plans that invest plan assets in the Separate Investment Accounts (SIAs) may be subject to certain charges as set forth in their respective Plan Documents. Total return figures would be lower for the periods presented if they reflected these charges.
35
MassMutual Select T. Rowe Price Retirement 2010 Fund – Portfolio Manager Report (Unaudited) |
GROWTH OF $10,000 INVESTMENT - Class I
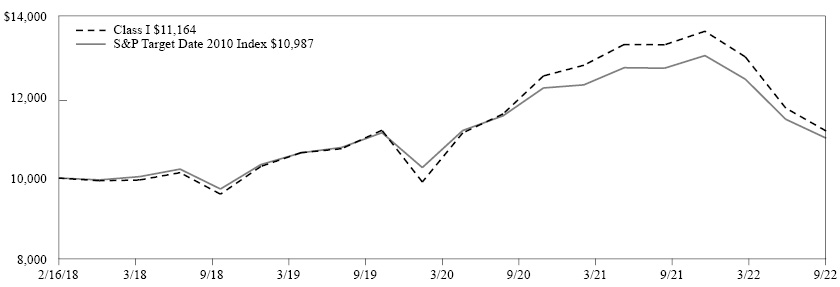
The graph above illustrates a representative class of the Fund’s historical performance for the past 10 fiscal years or since inception (for Funds lacking 10-year records) in comparison to its benchmark index, as well as one or more additional indexes, if applicable. The performance of other share classes will be greater than or less than the class depicted above.
Average Annual Total Returns (for the periods ended 09/30/2022) |
|||
|
Inception Date |
1 Year |
Since Inception |
Class I |
02/16/2018 |
-16.02% |
2.41% |
Class M5 |
02/16/2018 |
-16.10% |
2.27% |
Class M4 |
02/16/2018 |
-16.40% |
2.00% |
Class M3 |
02/16/2018 |
-16.57% |
1.74% |
S&P Target Date 2010 Index |
|
-13.60% |
2.06% |
Generally accepted accounting principles require adjustments to be made to the net assets of the Fund at period end for financial reporting purposes only, and as such, the total return based on the unadjusted net asset value per share may differ from the total return reported in the financial highlights.
Performance results in the graph and table are shown both with and without the imposition of the maximum applicable sales charge (if applicable) and reflect the percentage change in net asset value, including reinvestment of dividends and capital gains distributions. Investors should note that the Fund is a professionally managed mutual fund, while the index or indexes shown above are unmanaged, cannot be purchased directly, and, with the exception of any peer group index, do not incur expenses.
Performance data quoted in the graph and table represents past performance; past performance is not predictive of future results. The investment return and principal value of shares of the Fund fluctuate, so your shares, when sold, may be worth more or less than their original cost. Current performance of the Fund may be lower or higher than the performance quoted. The performance shown does not reflect the deduction of taxes, if any, that a shareholder would pay on Fund distributions or the redemption of Fund shares. Performance data current to the most recent month end may be obtained by calling 1-888-309-3539.
Investors should read the Fund’s prospectus with regard to the Fund’s investment objectives, risks, and charges and expenses in conjunction with these financial statements. Employee retirement benefit plans that invest plan assets in the Separate Investment Accounts (SIAs) may be subject to certain charges as set forth in their respective Plan Documents. Total return figures would be lower for the periods presented if they reflected these charges.
36
MassMutual Select T. Rowe Price Retirement 2015 Fund – Portfolio Manager Report (Unaudited) |
GROWTH OF $10,000 INVESTMENT - Class I
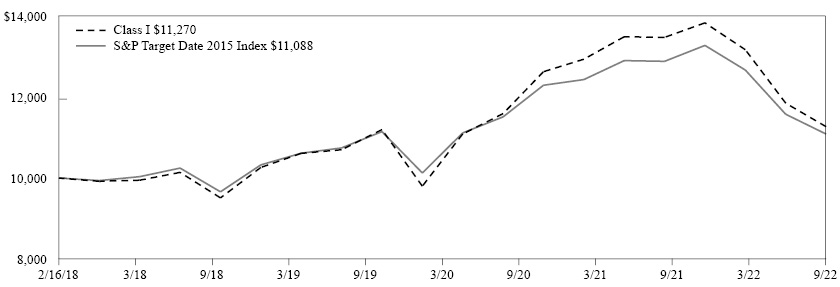
The graph above illustrates a representative class of the Fund’s historical performance for the past 10 fiscal years or since inception (for Funds lacking 10-year records) in comparison to its benchmark index, as well as one or more additional indexes, if applicable. The performance of other share classes will be greater than or less than the class depicted above.
Average Annual Total Returns (for the periods ended 09/30/2022) |
|||
|
Inception Date |
1 Year |
Since Inception |
Class I |
02/16/2018 |
-16.38% |
2.62% |
Class M5 |
02/16/2018 |
-16.50% |
2.47% |
Class M4 |
02/16/2018 |
-16.68% |
2.21% |
Class M3 |
02/16/2018 |
-16.89% |
1.96% |
S&P Target Date 2015 Index |
|
-13.95% |
2.26% |
Generally accepted accounting principles require adjustments to be made to the net assets of the Fund at period end for financial reporting purposes only, and as such, the total return based on the unadjusted net asset value per share may differ from the total return reported in the financial highlights.
Performance results in the graph and table are shown both with and without the imposition of the maximum applicable sales charge (if applicable) and reflect the percentage change in net asset value, including reinvestment of dividends and capital gains distributions. Investors should note that the Fund is a professionally managed mutual fund, while the index or indexes shown above are unmanaged, cannot be purchased directly, and, with the exception of any peer group index, do not incur expenses.
Performance data quoted in the graph and table represents past performance; past performance is not predictive of future results. The investment return and principal value of shares of the Fund fluctuate, so your shares, when sold, may be worth more or less than their original cost. Current performance of the Fund may be lower or higher than the performance quoted. The performance shown does not reflect the deduction of taxes, if any, that a shareholder would pay on Fund distributions or the redemption of Fund shares. Performance data current to the most recent month end may be obtained by calling 1-888-309-3539.
Investors should read the Fund’s prospectus with regard to the Fund’s investment objectives, risks, and charges and expenses in conjunction with these financial statements. Employee retirement benefit plans that invest plan assets in the Separate Investment Accounts (SIAs) may be subject to certain charges as set forth in their respective Plan Documents. Total return figures would be lower for the periods presented if they reflected these charges.
37
MassMutual Select T. Rowe Price Retirement 2020 Fund – Portfolio Manager Report (Unaudited) |
GROWTH OF $10,000 INVESTMENT - Class I
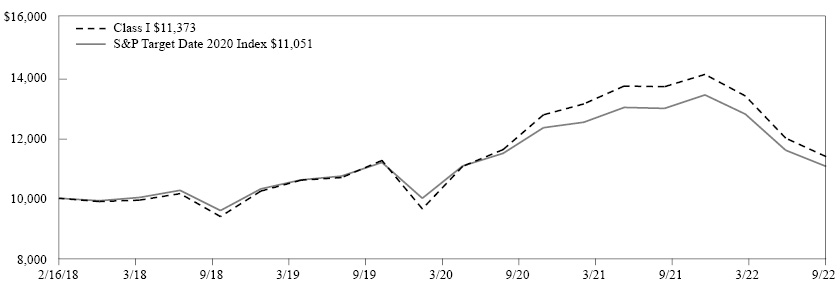
The graph above illustrates a representative class of the Fund’s historical performance for the past 10 fiscal years or since inception (for Funds lacking 10-year records) in comparison to its benchmark index, as well as one or more additional indexes, if applicable. The performance of other share classes will be greater than or less than the class depicted above.
Average Annual Total Returns (for the periods ended 09/30/2022) |
|||
|
Inception Date |
1 Year |
Since Inception |
Class I |
02/16/2018 |
-16.84% |
2.82% |
Class M5 |
02/16/2018 |
-16.98% |
2.67% |
Class M4 |
02/16/2018 |
-17.15% |
2.42% |
Class M3 |
02/16/2018 |
-17.37% |
2.16% |
S&P Target Date 2020 Index |
|
-14.75% |
2.19% |
Generally accepted accounting principles require adjustments to be made to the net assets of the Fund at period end for financial reporting purposes only, and as such, the total return based on the unadjusted net asset value per share may differ from the total return reported in the financial highlights.
Performance results in the graph and table are shown both with and without the imposition of the maximum applicable sales charge (if applicable) and reflect the percentage change in net asset value, including reinvestment of dividends and capital gains distributions. Investors should note that the Fund is a professionally managed mutual fund, while the index or indexes shown above are unmanaged, cannot be purchased directly, and, with the exception of any peer group index, do not incur expenses.
Performance data quoted in the graph and table represents past performance; past performance is not predictive of future results. The investment return and principal value of shares of the Fund fluctuate, so your shares, when sold, may be worth more or less than their original cost. Current performance of the Fund may be lower or higher than the performance quoted. The performance shown does not reflect the deduction of taxes, if any, that a shareholder would pay on Fund distributions or the redemption of Fund shares. Performance data current to the most recent month end may be obtained by calling 1-888-309-3539.
Investors should read the Fund’s prospectus with regard to the Fund’s investment objectives, risks, and charges and expenses in conjunction with these financial statements. Employee retirement benefit plans that invest plan assets in the Separate Investment Accounts (SIAs) may be subject to certain charges as set forth in their respective Plan Documents. Total return figures would be lower for the periods presented if they reflected these charges.
38
MassMutual Select T. Rowe Price Retirement 2025 Fund – Portfolio Manager Report (Unaudited) |
GROWTH OF $10,000 INVESTMENT - Class I
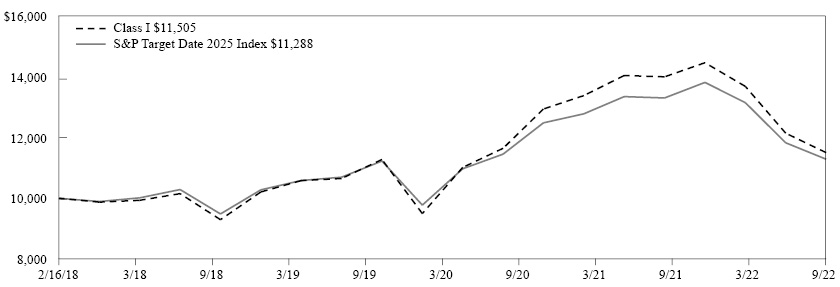
The graph above illustrates a representative class of the Fund’s historical performance for the past 10 fiscal years or since inception (for Funds lacking 10-year records) in comparison to its benchmark index, as well as one or more additional indexes, if applicable. The performance of other share classes will be greater than or less than the class depicted above.
Average Annual Total Returns (for the periods ended 09/30/2022) |
|||
|
Inception Date |
1 Year |
Since Inception |
Class I |
02/16/2018 |
-17.83% |
3.08% |
Class M5 |
02/16/2018 |
-17.99% |
2.92% |
Class M4 |
02/16/2018 |
-18.16% |
2.66% |
Class M3 |
02/16/2018 |
-18.37% |
2.40% |
S&P Target Date 2025 Index |
-15.16% |
2.66% |
|
Generally accepted accounting principles require adjustments to be made to the net assets of the Fund at period end for financial reporting purposes only, and as such, the total return based on the unadjusted net asset value per share may differ from the total return reported in the financial highlights.
Performance results in the graph and table are shown both with and without the imposition of the maximum applicable sales charge (if applicable) and reflect the percentage change in net asset value, including reinvestment of dividends and capital gains distributions. Investors should note that the Fund is a professionally managed mutual fund, while the index or indexes shown above are unmanaged, cannot be purchased directly, and, with the exception of any peer group index, do not incur expenses.
Performance data quoted in the graph and table represents past performance; past performance is not predictive of future results. The investment return and principal value of shares of the Fund fluctuate, so your shares, when sold, may be worth more or less than their original cost. Current performance of the Fund may be lower or higher than the performance quoted. The performance shown does not reflect the deduction of taxes, if any, that a shareholder would pay on Fund distributions or the redemption of Fund shares. Performance data current to the most recent month end may be obtained by calling 1-888-309-3539.
Investors should read the Fund’s prospectus with regard to the Fund’s investment objectives, risks, and charges and expenses in conjunction with these financial statements. Employee retirement benefit plans that invest plan assets in the Separate Investment Accounts (SIAs) may be subject to certain charges as set forth in their respective Plan Documents. Total return figures would be lower for the periods presented if they reflected these charges.
39
MassMutual Select T. Rowe Price Retirement 2030 Fund – Portfolio Manager Report (Unaudited) |
GROWTH OF $10,000 INVESTMENT - Class I
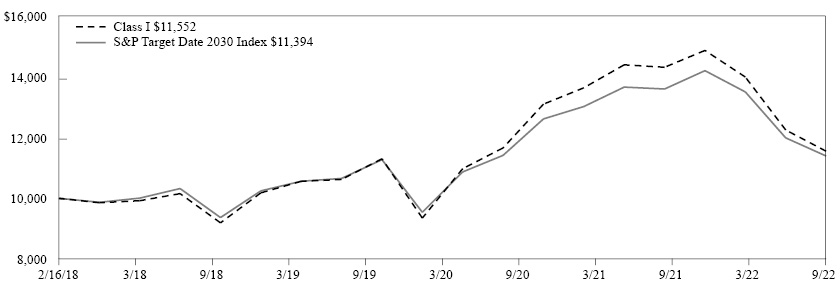
The graph above illustrates a representative class of the Fund’s historical performance for the past 10 fiscal years or since inception (for Funds lacking 10-year records) in comparison to its benchmark index, as well as one or more additional indexes, if applicable. The performance of other share classes will be greater than or less than the class depicted above.
Average Annual Total Returns (for the periods ended 09/30/2022) |
|||
|
Inception Date |
1 Year |
Since Inception |
Class I |
02/16/2018 |
-19.32% |
3.17% |
Class M5 |
02/16/2018 |
-19.51% |
3.01% |
Class M4 |
02/16/2018 |
-19.66% |
2.76% |
Class M3 |
02/16/2018 |
-19.91% |
2.49% |
S&P Target Date 2030 Index |
|
-16.23% |
2.86% |
Generally accepted accounting principles require adjustments to be made to the net assets of the Fund at period end for financial reporting purposes only, and as such, the total return based on the unadjusted net asset value per share may differ from the total return reported in the financial highlights.
Performance results in the graph and table are shown both with and without the imposition of the maximum applicable sales charge (if applicable) and reflect the percentage change in net asset value, including reinvestment of dividends and capital gains distributions. Investors should note that the Fund is a professionally managed mutual fund, while the index or indexes shown above are unmanaged, cannot be purchased directly, and, with the exception of any peer group index, do not incur expenses.
Performance data quoted in the graph and table represents past performance; past performance is not predictive of future results. The investment return and principal value of shares of the Fund fluctuate, so your shares, when sold, may be worth more or less than their original cost. Current performance of the Fund may be lower or higher than the performance quoted. The performance shown does not reflect the deduction of taxes, if any, that a shareholder would pay on Fund distributions or the redemption of Fund shares. Performance data current to the most recent month end may be obtained by calling 1-888-309-3539.
Investors should read the Fund’s prospectus with regard to the Fund’s investment objectives, risks, and charges and expenses in conjunction with these financial statements. Employee retirement benefit plans that invest plan assets in the Separate Investment Accounts (SIAs) may be subject to certain charges as set forth in their respective Plan Documents. Total return figures would be lower for the periods presented if they reflected these charges.
40
MassMutual Select T. Rowe Price Retirement 2035 Fund – Portfolio Manager Report (Unaudited) |
GROWTH OF $10,000 INVESTMENT - Class I
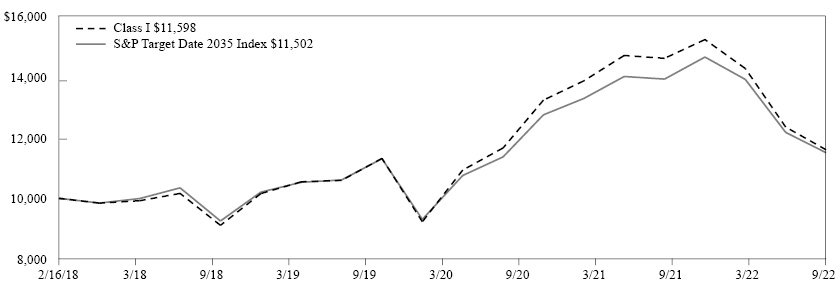
The graph above illustrates a representative class of the Fund’s historical performance for the past 10 fiscal years or since inception (for Funds lacking 10-year records) in comparison to its benchmark index, as well as one or more additional indexes, if applicable. The performance of other share classes will be greater than or less than the class depicted above.
Average Annual Total Returns (for the periods ended 09/30/2022) |
|||
|
Inception Date |
1 Year |
Since Inception |
Class I |
02/16/2018 |
-20.63% |
3.26% |
Class M5 |
02/16/2018 |
-20.78% |
3.09% |
Class M4 |
02/16/2018 |
-20.92% |
2.85% |
Class M3 |
02/16/2018 |
-21.16% |
2.58% |
S&P Target Date 2035 Index |
|
-17.42% |
3.07% |
Generally accepted accounting principles require adjustments to be made to the net assets of the Fund at period end for financial reporting purposes only, and as such, the total return based on the unadjusted net asset value per share may differ from the total return reported in the financial highlights.
Performance results in the graph and table are shown both with and without the imposition of the maximum applicable sales charge (if applicable) and reflect the percentage change in net asset value, including reinvestment of dividends and capital gains distributions. Investors should note that the Fund is a professionally managed mutual fund, while the index or indexes shown above are unmanaged, cannot be purchased directly, and, with the exception of any peer group index, do not incur expenses.
Performance data quoted in the graph and table represents past performance; past performance is not predictive of future results. The investment return and principal value of shares of the Fund fluctuate, so your shares, when sold, may be worth more or less than their original cost. Current performance of the Fund may be lower or higher than the performance quoted. The performance shown does not reflect the deduction of taxes, if any, that a shareholder would pay on Fund distributions or the redemption of Fund shares. Performance data current to the most recent month end may be obtained by calling 1-888-309-3539.
Investors should read the Fund’s prospectus with regard to the Fund’s investment objectives, risks, and charges and expenses in conjunction with these financial statements. Employee retirement benefit plans that invest plan assets in the Separate Investment Accounts (SIAs) may be subject to certain charges as set forth in their respective Plan Documents. Total return figures would be lower for the periods presented if they reflected these charges.
41
MassMutual Select T. Rowe Price Retirement 2040 Fund – Portfolio Manager Report (Unaudited) |
GROWTH OF $10,000 INVESTMENT - Class I
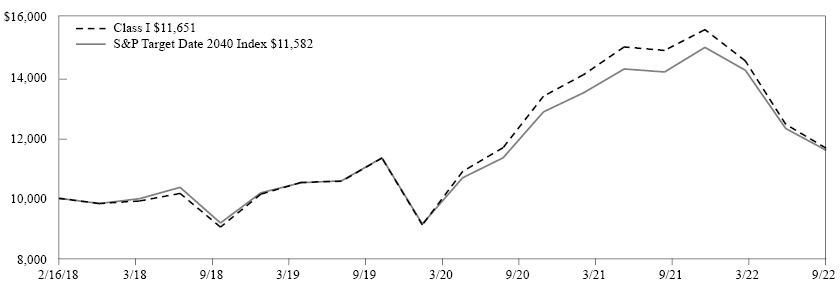
The graph above illustrates a representative class of the Fund’s historical performance for the past 10 fiscal years or since inception (for Funds lacking 10-year records) in comparison to its benchmark index, as well as one or more additional indexes, if applicable. The performance of other share classes will be greater than or less than the class depicted above.
Average Annual Total Returns (for the periods ended 09/30/2022) |
|||
|
Inception Date |
1 Year |
Since Inception |
Class I |
02/16/2018 |
-21.66% |
3.36% |
Class M5 |
02/16/2018 |
-21.80% |
3.20% |
Class M4 |
02/16/2018 |
-22.03% |
2.94% |
Class M3 |
02/16/2018 |
-22.18% |
2.69% |
S&P Target Date 2040 Index |
|
-18.21% |
3.23% |
Generally accepted accounting principles require adjustments to be made to the net assets of the Fund at period end for financial reporting purposes only, and as such, the total return based on the unadjusted net asset value per share may differ from the total return reported in the financial highlights.
Performance results in the graph and table are shown both with and without the imposition of the maximum applicable sales charge (if applicable) and reflect the percentage change in net asset value, including reinvestment of dividends and capital gains distributions. Investors should note that the Fund is a professionally managed mutual fund, while the index or indexes shown above are unmanaged, cannot be purchased directly, and, with the exception of any peer group index, do not incur expenses.
Performance data quoted in the graph and table represents past performance; past performance is not predictive of future results. The investment return and principal value of shares of the Fund fluctuate, so your shares, when sold, may be worth more or less than their original cost. Current performance of the Fund may be lower or higher than the performance quoted. The performance shown does not reflect the deduction of taxes, if any, that a shareholder would pay on Fund distributions or the redemption of Fund shares. Performance data current to the most recent month end may be obtained by calling 1-888-309-3539.
Investors should read the Fund’s prospectus with regard to the Fund’s investment objectives, risks, and charges and expenses in conjunction with these financial statements. Employee retirement benefit plans that invest plan assets in the Separate Investment Accounts (SIAs) may be subject to certain charges as set forth in their respective Plan Documents. Total return figures would be lower for the periods presented if they reflected these charges.
42
MassMutual Select T. Rowe Price Retirement 2045 Fund – Portfolio Manager Report (Unaudited) |
GROWTH OF $10,000 INVESTMENT - Class I

The graph above illustrates a representative class of the Fund’s historical performance for the past 10 fiscal years or since inception (for Funds lacking 10-year records) in comparison to its benchmark index, as well as one or more additional indexes, if applicable. The performance of other share classes will be greater than or less than the class depicted above.
Average Annual Total Returns (for the periods ended 09/30/2022) |
|||
|
Inception Date |
1 Year |
Since Inception |
Class I |
02/16/2018 |
-21.99% |
3.52% |
Class M5 |
02/16/2018 |
-22.11% |
3.34% |
Class M4 |
02/16/2018 |
-22.35% |
3.08% |
Class M3 |
02/16/2018 |
-22.50% |
2.83% |
S&P Target Date 2045 Index |
|
-18.70% |
3.29% |
Generally accepted accounting principles require adjustments to be made to the net assets of the Fund at period end for financial reporting purposes only, and as such, the total return based on the unadjusted net asset value per share may differ from the total return reported in the financial highlights.
Performance results in the graph and table are shown both with and without the imposition of the maximum applicable sales charge (if applicable) and reflect the percentage change in net asset value, including reinvestment of dividends and capital gains distributions. Investors should note that the Fund is a professionally managed mutual fund, while the index or indexes shown above are unmanaged, cannot be purchased directly, and, with the exception of any peer group index, do not incur expenses.
Performance data quoted in the graph and table represents past performance; past performance is not predictive of future results. The investment return and principal value of shares of the Fund fluctuate, so your shares, when sold, may be worth more or less than their original cost. Current performance of the Fund may be lower or higher than the performance quoted. The performance shown does not reflect the deduction of taxes, if any, that a shareholder would pay on Fund distributions or the redemption of Fund shares. Performance data current to the most recent month end may be obtained by calling 1-888-309-3539.
Investors should read the Fund’s prospectus with regard to the Fund’s investment objectives, risks, and charges and expenses in conjunction with these financial statements. Employee retirement benefit plans that invest plan assets in the Separate Investment Accounts (SIAs) may be subject to certain charges as set forth in their respective Plan Documents. Total return figures would be lower for the periods presented if they reflected these charges.
43
MassMutual Select T. Rowe Price Retirement 2050 Fund – Portfolio Manager Report (Unaudited) |
GROWTH OF $10,000 INVESTMENT - Class I

The graph above illustrates a representative class of the Fund’s historical performance for the past 10 fiscal years or since inception (for Funds lacking 10-year records) in comparison to its benchmark index, as well as one or more additional indexes, if applicable. The performance of other share classes will be greater than or less than the class depicted above.
Average Annual Total Returns (for the periods ended 09/30/2022) |
|||
|
Inception Date |
1 Year |
Since Inception |
Class I |
02/16/2018 |
-22.18% |
3.48% |
Class M5 |
02/16/2018 |
-22.30% |
3.31% |
Class M4 |
02/16/2018 |
-22.51% |
3.05% |
Class M3 |
02/16/2018 |
-22.64% |
2.80% |
S&P Target Date 2050 Index |
|
-18.88% |
3.33% |
Generally accepted accounting principles require adjustments to be made to the net assets of the Fund at period end for financial reporting purposes only, and as such, the total return based on the unadjusted net asset value per share may differ from the total return reported in the financial highlights.
Performance results in the graph and table are shown both with and without the imposition of the maximum applicable sales charge (if applicable) and reflect the percentage change in net asset value, including reinvestment of dividends and capital gains distributions. Investors should note that the Fund is a professionally managed mutual fund, while the index or indexes shown above are unmanaged, cannot be purchased directly, and, with the exception of any peer group index, do not incur expenses.
Performance data quoted in the graph and table represents past performance; past performance is not predictive of future results. The investment return and principal value of shares of the Fund fluctuate, so your shares, when sold, may be worth more or less than their original cost. Current performance of the Fund may be lower or higher than the performance quoted. The performance shown does not reflect the deduction of taxes, if any, that a shareholder would pay on Fund distributions or the redemption of Fund shares. Performance data current to the most recent month end may be obtained by calling 1-888-309-3539.
Investors should read the Fund’s prospectus with regard to the Fund’s investment objectives, risks, and charges and expenses in conjunction with these financial statements. Employee retirement benefit plans that invest plan assets in the Separate Investment Accounts (SIAs) may be subject to certain charges as set forth in their respective Plan Documents. Total return figures would be lower for the periods presented if they reflected these charges.
44
MassMutual Select T. Rowe Price Retirement 2055 Fund – Portfolio Manager Report (Unaudited) |
GROWTH OF $10,000 INVESTMENT - Class I

The graph above illustrates a representative class of the Fund’s historical performance for the past 10 fiscal years or since inception (for Funds lacking 10-year records) in comparison to its benchmark index, as well as one or more additional indexes, if applicable. The performance of other share classes will be greater than or less than the class depicted above.
Average Annual Total Returns (for the periods ended 09/30/2022) |
|||
|
Inception Date |
1 Year |
Since Inception |
Class I |
02/16/2018 |
-22.22% |
3.46% |
Class M5 |
02/16/2018 |
-22.33% |
3.29% |
Class M4 |
02/16/2018 |
-22.52% |
3.03% |
Class M3 |
02/16/2018 |
-22.72% |
2.77% |
S&P Target Date 2055 Index |
|
-18.94% |
3.35% |
Generally accepted accounting principles require adjustments to be made to the net assets of the Fund at period end for financial reporting purposes only, and as such, the total return based on the unadjusted net asset value per share may differ from the total return reported in the financial highlights.
Performance results in the graph and table are shown both with and without the imposition of the maximum applicable sales charge (if applicable) and reflect the percentage change in net asset value, including reinvestment of dividends and capital gains distributions. Investors should note that the Fund is a professionally managed mutual fund, while the index or indexes shown above are unmanaged, cannot be purchased directly, and, with the exception of any peer group index, do not incur expenses.
Performance data quoted in the graph and table represents past performance; past performance is not predictive of future results. The investment return and principal value of shares of the Fund fluctuate, so your shares, when sold, may be worth more or less than their original cost. Current performance of the Fund may be lower or higher than the performance quoted. The performance shown does not reflect the deduction of taxes, if any, that a shareholder would pay on Fund distributions or the redemption of Fund shares. Performance data current to the most recent month end may be obtained by calling 1-888-309-3539.
Investors should read the Fund’s prospectus with regard to the Fund’s investment objectives, risks, and charges and expenses in conjunction with these financial statements. Employee retirement benefit plans that invest plan assets in the Separate Investment Accounts (SIAs) may be subject to certain charges as set forth in their respective Plan Documents. Total return figures would be lower for the periods presented if they reflected these charges.
45
MassMutual Select T. Rowe Price Retirement 2060 Fund – Portfolio Manager Report (Unaudited) |
GROWTH OF $10,000 INVESTMENT - Class I

The graph above illustrates a representative class of the Fund’s historical performance for the past 10 fiscal years or since inception (for Funds lacking 10-year records) in comparison to its benchmark index, as well as one or more additional indexes, if applicable. The performance of other share classes will be greater than or less than the class depicted above.
Average Annual Total Returns (for the periods ended 09/30/2022) |
|||
|
Inception Date |
1 Year |
Since Inception |
Class I |
02/16/2018 |
-22.19% |
3.46% |
Class M5 |
02/16/2018 |
-22.34% |
3.29% |
Class M4 |
02/16/2018 |
-22.54% |
3.03% |
Class M3 |
02/16/2018 |
-22.76% |
2.77% |
S&P Target Date 2060 Index |
|
-18.99% |
3.38% |
Generally accepted accounting principles require adjustments to be made to the net assets of the Fund at period end for financial reporting purposes only, and as such, the total return based on the unadjusted net asset value per share may differ from the total return reported in the financial highlights.
Performance results in the graph and table are shown both with and without the imposition of the maximum applicable sales charge (if applicable) and reflect the percentage change in net asset value, including reinvestment of dividends and capital gains distributions. Investors should note that the Fund is a professionally managed mutual fund, while the index or indexes shown above are unmanaged, cannot be purchased directly, and, with the exception of any peer group index, do not incur expenses.
Performance data quoted in the graph and table represents past performance; past performance is not predictive of future results. The investment return and principal value of shares of the Fund fluctuate, so your shares, when sold, may be worth more or less than their original cost. Current performance of the Fund may be lower or higher than the performance quoted. The performance shown does not reflect the deduction of taxes, if any, that a shareholder would pay on Fund distributions or the redemption of Fund shares. Performance data current to the most recent month end may be obtained by calling 1-888-309-3539.
Investors should read the Fund’s prospectus with regard to the Fund’s investment objectives, risks, and charges and expenses in conjunction with these financial statements. Employee retirement benefit plans that invest plan assets in the Separate Investment Accounts (SIAs) may be subject to certain charges as set forth in their respective Plan Documents. Total return figures would be lower for the periods presented if they reflected these charges.
46
September 30, 2022 |
Number of |
Value |
|||||||
Equity Funds — 20.1% |
||||||||
DFA Commodity Strategy Portfolio |
143,356 | $ | 739,715 | |||||
Invesco Real Estate Fund, Class R6 |
21,983 | 382,731 | ||||||
MassMutual Blue Chip Growth Fund, Class I (a) |
165,770 | 3,106,536 | ||||||
MassMutual Diversified Value Fund, Class I (a) |
216,232 | 2,350,436 | ||||||
MassMutual Equity Opportunities Fund, Class I (a) |
263,528 | 4,390,370 | ||||||
MassMutual Fundamental Value Fund, Class I (a) |
321,660 | 2,746,981 | ||||||
MassMutual Growth Opportunities Fund, Class I (a) |
157,290 | 717,241 | ||||||
MassMutual International Equity Fund, Class I (a) |
70,427 | 502,848 | ||||||
MassMutual Mid Cap Growth Fund, Class I (a) |
55,205 | 1,024,044 | ||||||
MassMutual Mid Cap Value Fund, Class I (a) |
103,164 | 1,089,407 | ||||||
MassMutual Overseas Fund, Class I (a) |
413,574 | 2,870,205 | ||||||
MassMutual Small Cap Growth Equity Fund, Class I (a) |
14,732 | 176,193 | ||||||
MassMutual Small Cap Value Equity Fund, Class I (a) |
82,566 | 717,500 | ||||||
MassMutual Strategic Emerging Markets Fund, Class I (a) |
89,468 | 734,534 | ||||||
MM Equity Asset Fund, Class I (a) |
900,264 | 6,301,846 | ||||||
Vanguard Developed Markets Index Fund, Admiral Shares |
156,596 | 1,829,042 | ||||||
Vanguard Emerging Markets Stock Index Fund, Admiral Shares |
11,966 | 364,259 | ||||||
Vanguard Mid-Cap Index Fund, Admiral Shares |
4,764 | 1,109,193 | ||||||
Vanguard Small-Cap Index Fund, Admiral Shares |
7,901 | 647,046 | ||||||
| 31,800,127 | ||||||||
Fixed Income Funds — 79.9% |
||||||||
Invesco International Bond Fund, Class R6 |
1,561,526 | 6,121,181 | ||||||
MassMutual Core Bond Fund, Class I (a) |
2,842,951 | 25,870,850 | ||||||
MassMutual Global Floating Rate Fund, Class I (a) |
59,408 | 502,000 | ||||||
MassMutual High Yield Fund, Class I (a) |
197,181 | 1,433,505 | ||||||
MassMutual Inflation-Protected and Income Fund, Class I (a) |
175,750 | 1,643,259 | ||||||
MassMutual Short-Duration Bond Fund, Class I (a) |
3,236,147 | 28,057,391 | ||||||
Number of |
Value |
|||||||
MassMutual Strategic Bond Fund, Class I (a) |
2,502,209 | $ | 21,293,795 | |||||
MassMutual Total Return Bond Fund, Class I (a) |
4,132,178 | 34,792,943 | ||||||
Vanguard Long-Term Treasury Index Fund, Admiral Shares |
10,989 | 231,978 | ||||||
Vanguard Total Bond Market Index Fund, Institutional Shares |
702,834 | 6,599,613 | ||||||
| 126,546,515 | ||||||||
TOTAL MUTUAL FUNDS (Cost $187,882,833) |
158,346,642 | |||||||
TOTAL LONG-TERM INVESTMENTS (Cost $187,882,833) |
158,346,642 | |||||||
TOTAL INVESTMENTS — 100.0% (Cost $187,882,833) (b) |
158,346,642 | |||||||
Other Assets/(Liabilities) — (0.0)% |
(70,401 | ) | ||||||
NET ASSETS — 100.0% |
$ | 158,276,241 | ||||||
Notes to Portfolio of Investments
Percentages are stated as a percent of net assets.
|
(a) |
Affiliated issuer. See Note 7 for a summary of transactions in the investments of affiliated issuers. |
|
(b) |
See Note 6 for aggregate cost for federal tax purposes. |
The accompanying notes are an integral part of the financial statements.
47
September 30, 2022 |
Number of |
Value |
|||||||
MUTUAL FUNDS — 100.1% |
||||||||
Equity Funds — 39.3% |
||||||||
DFA Commodity Strategy Portfolio |
135,261 | $ | 697,949 | |||||
Invesco Real Estate Fund, Class R6 |
33,270 | 579,232 | ||||||
MassMutual Blue Chip Growth Fund, Class I (a) |
319,654 | 5,990,319 | ||||||
MassMutual Diversified Value Fund, Class I (a) |
425,847 | 4,628,956 | ||||||
MassMutual Equity Opportunities Fund, Class I (a) |
446,900 | 7,445,347 | ||||||
MassMutual Fundamental Value Fund, Class I (a) |
685,645 | 5,855,407 | ||||||
MassMutual Growth Opportunities Fund, Class I (a) |
305,827 | 1,394,572 | ||||||
MassMutual International Equity Fund, Class I (a) |
273,129 | 1,950,143 | ||||||
MassMutual Mid Cap Growth Fund, Class I (a) |
87,503 | 1,623,178 | ||||||
MassMutual Mid Cap Value Fund, Class I (a) |
245,377 | 2,591,176 | ||||||
MassMutual Overseas Fund, Class I (a) |
634,679 | 4,404,672 | ||||||
MassMutual Small Cap Growth Equity Fund, Class I (a) |
32,298 | 386,287 | ||||||
MassMutual Small Cap Value Equity Fund, Class I (a) |
212,284 | 1,844,744 | ||||||
MassMutual Strategic Emerging Markets Fund, Class I (a) |
133,679 | 1,097,501 | ||||||
MM Equity Asset Fund, Class I (a) |
2,412,323 | 16,886,259 | ||||||
Vanguard Developed Markets Index Fund, Institutional Shares |
393,235 | 4,596,917 | ||||||
Vanguard Emerging Markets Stock Index Fund, Admiral Shares |
24,804 | 755,045 | ||||||
Vanguard Mid-Cap Index Fund, Admiral Shares |
10,578 | 2,463,100 | ||||||
Vanguard Small-Cap Index Fund, Admiral Shares |
18,228 | 1,492,707 | ||||||
| 66,683,511 | ||||||||
Fixed Income Funds — 60.8% |
||||||||
Invesco International Bond Fund, Class R6 |
1,246,162 | 4,884,954 | ||||||
MassMutual Core Bond Fund, Class I (a) |
2,195,950 | 19,983,148 | ||||||
MassMutual Global Floating Rate Fund, Class I (a) |
99,844 | 843,680 | ||||||
MassMutual High Yield Fund, Class I (a) |
281,654 | 2,047,623 | ||||||
MassMutual Inflation-Protected and Income Fund, Class I (a) |
96,866 | 905,701 | ||||||
MassMutual Short-Duration Bond Fund, Class I (a) |
2,231,419 | 19,346,403 | ||||||
Number of |
Value |
|||||||
MassMutual Strategic Bond Fund, Class I (a) |
2,039,373 | $ | 17,355,061 | |||||
MassMutual Total Return Bond Fund, Class I (a) |
3,633,416 | 30,593,366 | ||||||
Vanguard Long-Term Treasury Index Fund, Admiral Shares |
11,768 | 248,419 | ||||||
Vanguard Total Bond Market Index Fund, Institutional Shares |
740,078 | 6,949,337 | ||||||
| 103,157,692 | ||||||||
TOTAL MUTUAL FUNDS (Cost $202,662,688) |
169,841,203 | |||||||
TOTAL LONG-TERM INVESTMENTS (Cost $202,662,688) |
169,841,203 | |||||||
TOTAL INVESTMENTS — 100.1% (Cost $202,662,688) (b) |
169,841,203 | |||||||
Other Assets/(Liabilities) — (0.1)% |
(183,923 | ) | ||||||
NET ASSETS — 100.0% |
$ | 169,657,280 | ||||||
Notes to Portfolio of Investments
Percentages are stated as a percent of net assets.
|
(a) |
Affiliated issuer. See Note 7 for a summary of transactions in the investments of affiliated issuers. |
|
(b) |
See Note 6 for aggregate cost for federal tax purposes. |
The accompanying notes are an integral part of the financial statements.
48
September 30, 2022 |
Number of |
Value |
|||||||
MUTUAL FUNDS — 100.1% |
||||||||
Equity Funds — 60.4% |
||||||||
DFA Commodity Strategy Portfolio |
102,979 | $ | 531,373 | |||||
Invesco Real Estate Fund, Class R6 |
39,379 | 685,597 | ||||||
MassMutual Blue Chip Growth Fund, Class I (a) |
438,117 | 8,210,320 | ||||||
MassMutual Diversified Value Fund, Class I (a) |
611,779 | 6,650,039 | ||||||
MassMutual Equity Opportunities Fund, Class I (a) |
643,458 | 10,720,004 | ||||||
MassMutual Fundamental Value Fund, Class I (a) |
934,241 | 7,978,415 | ||||||
MassMutual Growth Opportunities Fund, Class I (a) |
390,709 | 1,781,631 | ||||||
MassMutual International Equity Fund, Class I (a) |
272,993 | 1,949,169 | ||||||
MassMutual Mid Cap Growth Fund, Class I (a) |
138,039 | 2,560,631 | ||||||
MassMutual Mid Cap Value Fund, Class I (a) |
379,585 | 4,008,413 | ||||||
MassMutual Overseas Fund, Class I (a) |
637,553 | 4,424,617 | ||||||
MassMutual Small Cap Growth Equity Fund, Class I (a) |
69,786 | 834,643 | ||||||
MassMutual Small Cap Value Equity Fund, Class I (a) |
259,782 | 2,257,501 | ||||||
MassMutual Strategic Emerging Markets Fund, Class I (a) |
32,846 | 269,666 | ||||||
MM Equity Asset Fund, Class I (a) |
4,308,684 | 30,160,787 | ||||||
Vanguard Developed Markets Index Fund, Institutional Shares |
491,818 | 5,749,357 | ||||||
Vanguard Emerging Markets Stock Index Fund, Admiral Shares |
42,222 | 1,285,235 | ||||||
Vanguard Mid-Cap Index Fund, Admiral Shares |
15,992 | 3,723,833 | ||||||
Vanguard Small-Cap Index Fund, Admiral Shares |
12,868 | 1,053,720 | ||||||
| 94,834,951 | ||||||||
Fixed Income Funds — 39.7% |
||||||||
Invesco International Bond Fund, Class R6 |
922,500 | 3,616,199 | ||||||
MassMutual Core Bond Fund, Class I (a) |
1,340,171 | 12,195,555 | ||||||
MassMutual Global Floating Rate Fund, Class I (a) |
266,507 | 2,251,981 | ||||||
MassMutual High Yield Fund, Class I (a) |
543,376 | 3,950,346 | ||||||
MassMutual Inflation-Protected and Income Fund, Class I (a) |
45,311 | 423,661 | ||||||
MassMutual Short-Duration Bond Fund, Class I (a) |
1,235,402 | 10,710,938 | ||||||
Number of |
Value |
|||||||
MassMutual Strategic Bond Fund, Class I (a) |
960,683 | $ | 8,175,411 | |||||
MassMutual Total Return Bond Fund, Class I (a) |
1,933,960 | 16,283,943 | ||||||
Vanguard Long-Term Treasury Index Fund, Admiral Shares |
12,912 | 272,565 | ||||||
Vanguard Total Bond Market Index Fund, Institutional Shares |
478,114 | 4,489,487 | ||||||
| 62,370,086 | ||||||||
TOTAL MUTUAL FUNDS (Cost $187,041,018) |
157,205,037 | |||||||
TOTAL LONG-TERM INVESTMENTS (Cost $187,041,018) |
157,205,037 | |||||||
TOTAL INVESTMENTS — 100.1% (Cost $187,041,018) (b) |
157,205,037 | |||||||
Other Assets/(Liabilities) — (0.1)% |
(150,011 | ) | ||||||
NET ASSETS — 100.0% |
$ | 157,055,026 | ||||||
Notes to Portfolio of Investments
Percentages are stated as a percent of net assets.
|
(a) |
Affiliated issuer. See Note 7 for a summary of transactions in the investments of affiliated issuers. |
|
(b) |
See Note 6 for aggregate cost for federal tax purposes. |
The accompanying notes are an integral part of the financial statements.
49
September 30, 2022 |
Number of |
Value |
|||||||
MUTUAL FUNDS — 100.1% |
||||||||
Equity Funds — 75.8% |
||||||||
DFA Commodity Strategy Portfolio |
57,861 | $ | 298,565 | |||||
Invesco Real Estate Fund, Class R6 |
50,093 | 872,127 | ||||||
MassMutual Blue Chip Growth Fund, Class I (a) |
394,000 | 7,383,551 | ||||||
MassMutual Diversified Value Fund, Class I (a) |
456,696 | 4,964,284 | ||||||
MassMutual Equity Opportunities Fund, Class I (a) |
471,375 | 7,853,104 | ||||||
MassMutual Fundamental Value Fund, Class I (a) |
748,295 | 6,390,439 | ||||||
MassMutual Growth Opportunities Fund, Class I (a) |
339,469 | 1,547,978 | ||||||
MassMutual International Equity Fund, Class I (a) |
192,310 | 1,373,095 | ||||||
MassMutual Mid Cap Growth Fund, Class I (a) |
157,222 | 2,916,472 | ||||||
MassMutual Mid Cap Value Fund, Class I (a) |
337,024 | 3,558,971 | ||||||
MassMutual Overseas Fund, Class I (a) |
874,726 | 6,070,597 | ||||||
MassMutual Small Cap Growth Equity Fund, Class I (a) |
77,447 | 926,270 | ||||||
MassMutual Small Cap Value Equity Fund, Class I (a) |
299,738 | 2,604,724 | ||||||
MassMutual Strategic Emerging Markets Fund, Class I (a) |
244,147 | 2,004,445 | ||||||
MM Equity Asset Fund, Class I (a) |
3,446,162 | 24,123,131 | ||||||
Vanguard Developed Markets Index Fund, Institutional Shares |
495,498 | 5,792,367 | ||||||
Vanguard Emerging Markets Stock Index Fund, Admiral Shares |
46,876 | 1,426,904 | ||||||
Vanguard Mid-Cap Index Fund, Admiral Shares |
17,460 | 4,065,460 | ||||||
Vanguard Small-Cap Index Fund, Admiral Shares |
25,421 | 2,081,736 | ||||||
| 86,254,220 | ||||||||
Fixed Income Funds — 24.3% |
||||||||
Invesco International Bond Fund, Class R6 |
655,653 | 2,570,158 | ||||||
MassMutual Core Bond Fund, Class I (a) |
431,890 | 3,930,195 | ||||||
MassMutual Global Floating Rate Fund, Class I (a) |
209,815 | 1,772,935 | ||||||
MassMutual High Yield Fund, Class I (a) |
538,176 | 3,912,539 | ||||||
MassMutual Inflation-Protected and Income Fund, Class I (a) |
14,650 | 136,977 | ||||||
MassMutual Short-Duration Bond Fund, Class I (a) |
621,984 | 5,392,597 | ||||||
Number of |
Value |
|||||||
MassMutual Strategic Bond Fund, Class I (a) |
327,873 | $ | 2,790,199 | |||||
MassMutual Total Return Bond Fund, Class I (a) |
717,003 | 6,037,165 | ||||||
Vanguard Long-Term Treasury Index Fund, Admiral Shares |
6,180 | 130,452 | ||||||
Vanguard Total Bond Market Index Fund, Admiral Shares |
99,127 | 930,800 | ||||||
| 27,604,017 | ||||||||
TOTAL MUTUAL FUNDS (Cost $135,839,192) |
113,858,237 | |||||||
TOTAL LONG-TERM INVESTMENTS (Cost $135,839,192) |
113,858,237 | |||||||
TOTAL INVESTMENTS — 100.1% (Cost $135,839,192) (b) |
113,858,237 | |||||||
Other Assets/(Liabilities) — (0.1)% |
(103,383 | ) | ||||||
NET ASSETS — 100.0% |
$ | 113,754,854 | ||||||
Notes to Portfolio of Investments
Percentages are stated as a percent of net assets.
|
(a) |
Affiliated issuer. See Note 7 for a summary of transactions in the investments of affiliated issuers. |
|
(b) |
See Note 6 for aggregate cost for federal tax purposes. |
The accompanying notes are an integral part of the financial statements.
50
MassMutual RetireSMARTSM by JPMorgan In Retirement Fund – Portfolio of Investments |
September 30, 2022 |
Number of |
Value |
|||||||
Equity Funds — 34.6% |
||||||||
JPMorgan Emerging Markets Research Enhanced Equity Fund, Class R6 |
59,784 | $ | 814,857 | |||||
JPMorgan Large Cap Value Fund, Class R6 |
62,804 | 1,048,819 | ||||||
MassMutual Blue Chip Growth Fund, Class I (a) |
79,243 | 1,485,007 | ||||||
MassMutual Diversified Value Fund, Class I (a) |
82,457 | 896,307 | ||||||
MassMutual Equity Opportunities Fund, Class I (a) |
142,862 | 2,380,089 | ||||||
MassMutual Fundamental Value Fund, Class I (a) |
140,653 | 1,201,178 | ||||||
MassMutual Growth Opportunities Fund, Class I (a) |
97,947 | 446,639 | ||||||
MassMutual International Equity Fund, Class I (a) |
208,259 | 1,486,972 | ||||||
MassMutual Mid Cap Growth Fund, Class I (a) |
37,683 | 699,012 | ||||||
MassMutual Mid Cap Value Fund, Class I (a) |
66,028 | 697,253 | ||||||
MassMutual Overseas Fund, Class I (a) |
372,909 | 2,587,988 | ||||||
MassMutual Small Cap Growth Equity Fund, Class I (a) |
42,197 | 504,671 | ||||||
MassMutual Small Cap Value Equity Fund, Class I (a) |
76,416 | 664,053 | ||||||
MassMutual Strategic Emerging Markets Fund, Class I (a) |
184,405 | 1,513,967 | ||||||
MM Equity Asset Fund, Class I (a) |
1,060,367 | 7,422,572 | ||||||
Vanguard Developed Markets Index Fund, Admiral Shares |
283,515 | 3,311,452 | ||||||
Vanguard Mid-Cap Index Fund, Admiral Shares |
2,563 | 596,735 | ||||||
Vanguard Real Estate Index Fund, Admiral Shares |
4,400 | 499,949 | ||||||
Vanguard Small-Cap Index Fund, Admiral Shares |
6,101 | 499,571 | ||||||
| 28,757,091 | ||||||||
Fixed Income Funds — 65.6% |
||||||||
JPMorgan Emerging Markets Debt Fund, Class R6 |
120,160 | 656,076 | ||||||
JPMorgan U.S. Government Money Market Fund, Class IM |
11,674,820 | 11,674,820 | ||||||
MassMutual Core Bond Fund, Class I (a) |
1,786,003 | 16,252,626 | ||||||
MassMutual Global Floating Rate Fund, Class I (a) |
21,078 | 178,107 | ||||||
MassMutual High Yield Fund, Class I (a) |
599,909 | 4,361,340 | ||||||
Number of |
Value |
|||||||
MassMutual Inflation-Protected and Income Fund, Class I (a) |
665,043 | $ | 6,218,155 | |||||
MassMutual Strategic Bond Fund, Class I (a) |
645,508 | 5,493,275 | ||||||
MassMutual Total Return Bond Fund, Class I (a) |
651,675 | 5,487,106 | ||||||
Vanguard Total Bond Market Index Fund, Institutional Shares |
436,121 | 4,095,179 | ||||||
| 54,416,684 | ||||||||
TOTAL MUTUAL FUNDS (Cost $97,846,315) |
83,173,775 | |||||||
TOTAL LONG-TERM INVESTMENTS (Cost $97,846,315) |
83,173,775 | |||||||
TOTAL INVESTMENTS — 100.2% (Cost $97,846,315) (b) |
83,173,775 | |||||||
Other Assets/(Liabilities) — (0.2)% |
(137,969 | ) | ||||||
NET ASSETS — 100.0% |
$ | 83,035,806 | ||||||
Notes to Portfolio of Investments
Percentages are stated as a percent of net assets.
|
(a) |
Affiliated issuer. See Note 7 for a summary of transactions in the investments of affiliated issuers. |
|
(b) |
See Note 6 for aggregate cost for federal tax purposes. |
The accompanying notes are an integral part of the financial statements.
51
MassMutual RetireSMARTSM by JPMorgan 2020 Fund – Portfolio of Investments |
September 30, 2022 |
Number of |
Value |
|||||||
Equity Funds — 34.6% |
||||||||
JPMorgan Emerging Markets Research Enhanced Equity Fund, Class R6 |
117,180 | $ | 1,597,162 | |||||
JPMorgan Large Cap Value Fund, Class R6 |
122,418 | 2,044,386 | ||||||
MassMutual Blue Chip Growth Fund, Class I (a) |
154,052 | 2,886,943 | ||||||
MassMutual Diversified Value Fund, Class I (a) |
160,730 | 1,747,134 | ||||||
MassMutual Equity Opportunities Fund, Class I (a) |
278,489 | 4,639,628 | ||||||
MassMutual Fundamental Value Fund, Class I (a) |
273,458 | 2,335,332 | ||||||
MassMutual Growth Opportunities Fund, Class I (a) |
190,931 | 870,646 | ||||||
MassMutual International Equity Fund, Class I (a) |
407,159 | 2,907,114 | ||||||
MassMutual Mid Cap Growth Fund, Class I (a) |
73,454 | 1,362,569 | ||||||
MassMutual Mid Cap Value Fund, Class I (a) |
128,708 | 1,359,160 | ||||||
MassMutual Overseas Fund, Class I (a) |
724,643 | 5,029,025 | ||||||
MassMutual Small Cap Growth Equity Fund, Class I (a) |
82,254 | 983,753 | ||||||
MassMutual Small Cap Value Equity Fund, Class I (a) |
148,957 | 1,294,436 | ||||||
MassMutual Strategic Emerging Markets Fund, Class I (a) |
360,607 | 2,960,581 | ||||||
MM Equity Asset Fund, Class I (a) |
2,061,511 | 14,430,574 | ||||||
Vanguard Developed Markets Index Fund, Institutional Shares |
547,535 | 6,400,687 | ||||||
Vanguard Mid-Cap Index Fund, Admiral Shares |
4,958 | 1,154,451 | ||||||
Vanguard Real Estate Index Fund, Admiral Shares |
8,512 | 967,178 | ||||||
Vanguard Small-Cap Index Fund, Admiral Shares |
11,802 | 966,503 | ||||||
| 55,937,262 | ||||||||
Fixed Income Funds — 65.5% |
||||||||
JPMorgan Emerging Markets Debt Fund, Class R6 |
233,920 | 1,277,201 | ||||||
JPMorgan U.S. Government Money Market Fund, Class IM |
22,726,427 | 22,726,427 | ||||||
MassMutual Core Bond Fund, Class I (a) |
3,476,364 | 31,634,913 | ||||||
MassMutual Global Floating Rate Fund, Class I (a) |
40,771 | 344,517 | ||||||
MassMutual High Yield Fund, Class I (a) |
1,167,790 | 8,489,836 | ||||||
Number of |
Value |
|||||||
MassMutual Inflation-Protected and Income Fund, Class I (a) |
1,294,400 | $ | 12,102,642 | |||||
MassMutual Strategic Bond Fund, Class I (a) |
1,256,423 | 10,692,160 | ||||||
MassMutual Total Return Bond Fund, Class I (a) |
1,268,424 | 10,680,131 | ||||||
Vanguard Total Bond Market Index Fund, Institutional Shares |
843,690 | 7,922,245 | ||||||
| 105,870,072 | ||||||||
TOTAL MUTUAL FUNDS (Cost $190,821,773) |
161,807,334 | |||||||
TOTAL LONG-TERM INVESTMENTS (Cost $190,821,773) |
161,807,334 | |||||||
TOTAL INVESTMENTS — 100.1% (Cost $190,821,773) (b) |
161,807,334 | |||||||
Other Assets/(Liabilities) — (0.1)% |
(215,857 | ) | ||||||
NET ASSETS — 100.0% |
$ | 161,591,477 | ||||||
Notes to Portfolio of Investments
Percentages are stated as a percent of net assets.
|
(a) |
Affiliated issuer. See Note 7 for a summary of transactions in the investments of affiliated issuers. |
|
(b) |
See Note 6 for aggregate cost for federal tax purposes. |
The accompanying notes are an integral part of the financial statements.
52
MassMutual RetireSMARTSM by JPMorgan 2025 Fund – Portfolio of Investments |
September 30, 2022 |
Number of |
Value |
|||||||
Equity Funds — 46.0% |
||||||||
JPMorgan Emerging Markets Research Enhanced Equity Fund, Class R6 |
171,915 | $ | 2,343,205 | |||||
JPMorgan Large Cap Value Fund, Class R6 |
139,706 | 2,333,093 | ||||||
MassMutual Blue Chip Growth Fund, Class I (a) |
174,905 | 3,277,716 | ||||||
MassMutual Diversified Value Fund, Class I (a) |
183,370 | 1,993,229 | ||||||
MassMutual Equity Opportunities Fund, Class I (a) |
317,389 | 5,287,700 | ||||||
MassMutual Fundamental Value Fund, Class I (a) |
310,639 | 2,652,861 | ||||||
MassMutual Growth Opportunities Fund, Class I (a) |
217,436 | 991,507 | ||||||
MassMutual International Equity Fund, Class I (a) |
459,422 | 3,280,272 | ||||||
MassMutual Mid Cap Growth Fund, Class I (a) |
81,922 | 1,519,645 | ||||||
MassMutual Mid Cap Value Fund, Class I (a) |
143,541 | 1,515,798 | ||||||
MassMutual Overseas Fund, Class I (a) |
819,827 | 5,689,596 | ||||||
MassMutual Small Cap Growth Equity Fund, Class I (a) |
91,153 | 1,090,195 | ||||||
MassMutual Small Cap Value Equity Fund, Class I (a) |
165,412 | 1,437,432 | ||||||
MassMutual Strategic Emerging Markets Fund, Class I (a) |
533,290 | 4,378,314 | ||||||
MM Equity Asset Fund, Class I (a) |
2,343,868 | 16,407,076 | ||||||
Vanguard Developed Markets Index Fund, Institutional Shares |
627,229 | 7,332,311 | ||||||
Vanguard Mid-Cap Index Fund, Admiral Shares |
5,568 | 1,296,456 | ||||||
Vanguard Real Estate Index Fund, Admiral Shares |
12,566 | 1,427,693 | ||||||
Vanguard Small-Cap Index Fund, Admiral Shares |
13,184 | 1,079,671 | ||||||
| 65,333,770 | ||||||||
Fixed Income Funds — 54.1% |
||||||||
JPMorgan Emerging Markets Debt Fund, Class R6 |
422,877 | 2,308,909 | ||||||
JPMorgan U.S. Government Money Market Fund, Class IM |
9,984,624 | 9,984,624 | ||||||
MassMutual Core Bond Fund, Class I (a) |
2,933,751 | 26,697,133 | ||||||
MassMutual Global Floating Rate Fund, Class I (a) |
34,386 | 290,558 | ||||||
MassMutual High Yield Fund, Class I (a) |
1,002,136 | 7,285,532 | ||||||
Number of |
Value |
|||||||
MassMutual Inflation-Protected and Income Fund, Class I (a) |
591,707 | $ | 5,532,456 | |||||
MassMutual Strategic Bond Fund, Class I (a) |
1,059,146 | 9,013,330 | ||||||
MassMutual Total Return Bond Fund, Class I (a) |
1,069,262 | 9,003,189 | ||||||
Vanguard Total Bond Market Index Fund, Institutional Shares |
718,965 | 6,751,079 | ||||||
| 76,866,810 | ||||||||
TOTAL MUTUAL FUNDS (Cost $171,438,920) |
142,200,580 | |||||||
TOTAL LONG-TERM INVESTMENTS (Cost $171,438,920) |
142,200,580 | |||||||
TOTAL INVESTMENTS — 100.1% (Cost $171,438,920) (b) |
142,200,580 | |||||||
Other Assets/(Liabilities) — (0.1)% |
(144,847 | ) | ||||||
NET ASSETS — 100.0% |
$ | 142,055,733 | ||||||
Notes to Portfolio of Investments
Percentages are stated as a percent of net assets.
|
(a) |
Affiliated issuer. See Note 7 for a summary of transactions in the investments of affiliated issuers. |
|
(b) |
See Note 6 for aggregate cost for federal tax purposes. |
The accompanying notes are an integral part of the financial statements.
53
MassMutual RetireSMARTSM by JPMorgan 2030 Fund – Portfolio of Investments |
September 30, 2022 |
Number of |
Value |
|||||||
Equity Funds — 59.0% |
||||||||
JPMorgan Emerging Markets Research Enhanced Equity Fund, Class R6 |
493,153 | $ | 6,721,680 | |||||
JPMorgan Large Cap Value Fund, Class R6 |
385,711 | 6,441,379 | ||||||
MassMutual Blue Chip Growth Fund, Class I (a) |
487,014 | 9,126,647 | ||||||
MassMutual Diversified Value Fund, Class I (a) |
505,973 | 5,499,928 | ||||||
MassMutual Equity Opportunities Fund, Class I (a) |
875,961 | 14,593,512 | ||||||
MassMutual Fundamental Value Fund, Class I (a) |
864,079 | 7,379,233 | ||||||
MassMutual Growth Opportunities Fund, Class I (a) |
599,986 | 2,735,934 | ||||||
MassMutual International Equity Fund, Class I (a) |
1,278,625 | 9,129,380 | ||||||
MassMutual Mid Cap Growth Fund, Class I (a) |
221,940 | 4,116,982 | ||||||
MassMutual Mid Cap Value Fund, Class I (a) |
388,877 | 4,106,542 | ||||||
MassMutual Overseas Fund, Class I (a) |
2,301,178 | 15,970,176 | ||||||
MassMutual Small Cap Growth Equity Fund, Class I (a) |
248,659 | 2,973,963 | ||||||
MassMutual Small Cap Value Equity Fund, Class I (a) |
451,552 | 3,923,985 | ||||||
MassMutual Strategic Emerging Markets Fund, Class I (a) |
1,517,550 | 12,459,089 | ||||||
MM Equity Asset Fund, Class I (a) |
6,522,952 | 45,660,666 | ||||||
Vanguard Developed Markets Index Fund, Institutional Shares |
1,737,668 | 20,313,341 | ||||||
Vanguard Mid-Cap Index Fund, Admiral Shares |
15,072 | 3,509,582 | ||||||
Vanguard Real Estate Index Fund, Institutional Shares |
271,594 | 4,774,623 | ||||||
Vanguard Small-Cap Index Fund, Admiral Shares |
35,952 | 2,944,088 | ||||||
| 182,380,730 | ||||||||
Fixed Income Funds — 41.1% |
||||||||
JPMorgan Emerging Markets Debt Fund, Class R6 |
531,505 | 2,902,018 | ||||||
JPMorgan U.S. Government Money Market Fund, Class IM |
16,314,743 | 16,314,743 | ||||||
MassMutual Core Bond Fund, Class I (a) |
5,272,277 | 47,977,718 | ||||||
MassMutual High Yield Fund, Class I (a) |
1,865,812 | 13,564,456 | ||||||
MassMutual Inflation-Protected and Income Fund, Class I (a) |
198,617 | 1,857,071 | ||||||
Number of |
Value |
|||||||
MassMutual Strategic Bond Fund, Class I (a) |
1,903,460 | $ | 16,198,443 | |||||
MassMutual Total Return Bond Fund, Class I (a) |
1,921,645 | 16,180,252 | ||||||
Vanguard Total Bond Market Index Fund, Institutional Shares |
1,285,683 | 12,072,561 | ||||||
| 127,067,262 | ||||||||
TOTAL MUTUAL FUNDS (Cost $374,525,840) |
309,447,992 | |||||||
TOTAL LONG-TERM INVESTMENTS (Cost $374,525,840) |
309,447,992 | |||||||
TOTAL INVESTMENTS — 100.1% (Cost $374,525,840) (b) |
309,447,992 | |||||||
Other Assets/(Liabilities) — (0.1)% |
(305,860 | ) | ||||||
NET ASSETS — 100.0% |
$ | 309,142,132 | ||||||
Notes to Portfolio of Investments
Percentages are stated as a percent of net assets.
|
(a) |
Affiliated issuer. See Note 7 for a summary of transactions in the investments of affiliated issuers. |
|
(b) |
See Note 6 for aggregate cost for federal tax purposes. |
The accompanying notes are an integral part of the financial statements.
54
MassMutual RetireSMARTSM by JPMorgan 2035 Fund – Portfolio of Investments |
September 30, 2022 |
Number of |
Value |
|||||||
Equity Funds — 71.2% |
||||||||
JPMorgan Emerging Markets Research Enhanced Equity Fund, Class R6 |
500,571 | $ | 6,822,777 | |||||
JPMorgan Large Cap Value Fund, Class R6 |
207,442 | 3,464,280 | ||||||
MassMutual Blue Chip Growth Fund, Class I (a) |
392,444 | 7,354,394 | ||||||
MassMutual Diversified Value Fund, Class I (a) |
272,534 | 2,962,450 | ||||||
MassMutual Equity Opportunities Fund, Class I (a) |
294,705 | 4,909,785 | ||||||
MassMutual Fundamental Value Fund, Class I (a) |
406,281 | 3,469,640 | ||||||
MassMutual Growth Opportunities Fund, Class I (a) |
539,287 | 2,459,150 | ||||||
MassMutual International Equity Fund, Class I (a) |
863,972 | 6,168,761 | ||||||
MassMutual Mid Cap Growth Fund, Class I (a) |
119,106 | 2,209,417 | ||||||
MassMutual Mid Cap Value Fund, Class I (a) |
208,695 | 2,203,818 | ||||||
MassMutual Overseas Fund, Class I (a) |
1,414,156 | 9,814,244 | ||||||
MassMutual Small Cap Growth Equity Fund, Class I (a) |
133,162 | 1,592,613 | ||||||
MassMutual Small Cap Value Equity Fund, Class I (a) |
241,534 | 2,098,930 | ||||||
MassMutual Strategic Emerging Markets Fund, Class I (a) |
446,463 | 3,665,464 | ||||||
MM Equity Asset Fund, Class I (a) |
3,503,296 | 24,523,070 | ||||||
Vanguard Developed Markets Index Fund, Admiral Shares |
731,797 | 8,547,391 | ||||||
Vanguard Mid-Cap Index Fund, Admiral Shares |
8,108 | 1,887,889 | ||||||
Vanguard Real Estate Index Fund, Admiral Shares |
24,550 | 2,789,353 | ||||||
Vanguard Small-Cap Index Fund, Admiral Shares |
19,247 | 1,576,165 | ||||||
| 98,519,591 | ||||||||
Fixed Income Funds — 28.9% |
||||||||
JPMorgan Emerging Markets Debt Fund, Class R6 |
49,481 | 270,168 | ||||||
JPMorgan U.S. Government Money Market Fund, Class IM |
7,302,162 | 7,302,162 | ||||||
MassMutual Core Bond Fund, Class I (a) |
675,853 | 6,150,261 | ||||||
MassMutual High Yield Fund, Class I (a) |
511,843 | 3,721,095 | ||||||
MassMutual Strategic Bond Fund, Class I (a) |
1,230,679 | 10,473,078 | ||||||
Number of |
Value |
|||||||
MassMutual Total Return Bond Fund, Class I (a) |
1,241,958 | $ | 10,457,290 | |||||
Vanguard Total Bond Market Index Fund, Admiral Shares |
164,698 | 1,546,515 | ||||||
| 39,920,569 | ||||||||
TOTAL MUTUAL FUNDS (Cost $168,853,818) |
138,440,160 | |||||||
TOTAL LONG-TERM INVESTMENTS (Cost $168,853,818) |
138,440,160 | |||||||
TOTAL INVESTMENTS — 100.1% (Cost $168,853,818) (b) |
138,440,160 | |||||||
Other Assets/(Liabilities) — (0.1)% |
(147,323 | ) | ||||||
|
||||||||
NET ASSETS — 100.0% |
$ | 138,292,837 | ||||||
Notes to Portfolio of Investments
Percentages are stated as a percent of net assets.
|
(a) |
Affiliated issuer. See Note 7 for a summary of transactions in the investments of affiliated issuers. |
|
(b) |
See Note 6 for aggregate cost for federal tax purposes. |
The accompanying notes are an integral part of the financial statements.
55
MassMutual RetireSMARTSM by JPMorgan 2040 Fund – Portfolio of Investments |
September 30, 2022 |
Number of |
Value |
|||||||
Equity Funds — 81.1% |
||||||||
JPMorgan Emerging Markets Research Enhanced Equity Fund, Class R6 |
901,798 | $ | 12,291,508 | |||||
JPMorgan Large Cap Value Fund, Class R6 |
379,760 | 6,341,987 | ||||||
MassMutual Blue Chip Growth Fund, Class I (a) |
720,090 | 13,494,495 | ||||||
MassMutual Diversified Value Fund, Class I (a) |
498,791 | 5,421,859 | ||||||
MassMutual Equity Opportunities Fund, Class I (a) |
539,889 | 8,994,559 | ||||||
MassMutual Fundamental Value Fund, Class I (a) |
745,430 | 6,365,970 | ||||||
MassMutual Growth Opportunities Fund, Class I (a) |
986,500 | 4,498,440 | ||||||
MassMutual International Equity Fund, Class I (a) |
1,626,120 | 11,610,500 | ||||||
MassMutual Mid Cap Growth Fund, Class I (a) |
215,987 | 4,006,555 | ||||||
MassMutual Mid Cap Value Fund, Class I (a) |
378,444 | 3,996,370 | ||||||
MassMutual Overseas Fund, Class I (a) |
2,671,514 | 18,540,308 | ||||||
MassMutual Small Cap Growth Equity Fund, Class I (a) |
242,314 | 2,898,074 | ||||||
MassMutual Small Cap Value Equity Fund, Class I (a) |
440,458 | 3,827,579 | ||||||
MassMutual Strategic Emerging Markets Fund, Class I (a) |
807,023 | 6,625,655 | ||||||
MM Equity Asset Fund, Class I (a) |
6,433,007 | 45,031,049 | ||||||
Vanguard Developed Markets Index Fund, Institutional Shares |
1,370,561 | 16,021,854 | ||||||
Vanguard Mid-Cap Index Fund, Admiral Shares |
14,680 | 3,418,195 | ||||||
Vanguard Real Estate Index Fund, Admiral Shares |
47,790 | 5,429,910 | ||||||
Vanguard Small-Cap Index Fund, Admiral Shares |
34,922 | 2,859,800 | ||||||
| 181,674,667 | ||||||||
Fixed Income Funds — 19.0% |
||||||||
JPMorgan Emerging Markets Debt Fund, Class R6 |
366,122 | 1,999,027 | ||||||
JPMorgan U.S. Government Money Market Fund, Class IM |
9,023,525 | 9,023,525 | ||||||
MassMutual Core Bond Fund, Class I (a) |
587,412 | 5,345,450 | ||||||
MassMutual High Yield Fund, Class I (a) |
638,198 | 4,639,696 | ||||||
MassMutual Strategic Bond Fund, Class I (a) |
1,181,868 | 10,057,701 | ||||||
Number of |
Value |
|||||||
MassMutual Total Return Bond Fund, Class I (a) |
1,192,159 | $ | 10,037,981 | |||||
Vanguard Total Bond Market Index Fund, Admiral Shares |
142,636 | 1,339,354 | ||||||
| 42,442,734 | ||||||||
TOTAL MUTUAL FUNDS (Cost $274,997,968) |
224,117,401 | |||||||
TOTAL LONG-TERM INVESTMENTS (Cost $274,997,968) |
224,117,401 | |||||||
TOTAL INVESTMENTS — 100.1% (Cost $274,997,968) (b) |
224,117,401 | |||||||
Other Assets/(Liabilities) — (0.1)% |
(205,553 | ) | ||||||
NET ASSETS — 100.0% |
$ | 223,911,848 | ||||||
Notes to Portfolio of Investments
Percentages are stated as a percent of net assets.
|
(a) |
Affiliated issuer. See Note 7 for a summary of transactions in the investments of affiliated issuers. |
|
(b) |
See Note 6 for aggregate cost for federal tax purposes. |
The accompanying notes are an integral part of the financial statements.
56
MassMutual RetireSMARTSM by JPMorgan 2045 Fund – Portfolio of Investments |
September 30, 2022 |
Number of |
Value |
|||||||
Equity Funds — 88.6% |
||||||||
JPMorgan Emerging Markets Research Enhanced Equity Fund, Class R6 |
448,065 | $ | 6,107,130 | |||||
JPMorgan Large Cap Value Fund, Class R6 |
187,227 | 3,126,690 | ||||||
MassMutual Blue Chip Growth Fund, Class I (a) |
353,854 | 6,631,222 | ||||||
MassMutual Diversified Value Fund, Class I (a) |
245,385 | 2,667,336 | ||||||
MassMutual Equity Opportunities Fund, Class I (a) |
265,825 | 4,428,636 | ||||||
MassMutual Fundamental Value Fund, Class I (a) |
366,614 | 3,130,881 | ||||||
MassMutual Growth Opportunities Fund, Class I (a) |
486,392 | 2,217,950 | ||||||
MassMutual International Equity Fund, Class I (a) |
801,624 | 5,723,596 | ||||||
MassMutual Mid Cap Growth Fund, Class I (a) |
106,489 | 1,975,366 | ||||||
MassMutual Mid Cap Value Fund, Class I (a) |
186,583 | 1,970,321 | ||||||
MassMutual Overseas Fund, Class I (a) |
1,312,110 | 9,106,041 | ||||||
MassMutual Small Cap Growth Equity Fund, Class I (a) |
119,472 | 1,428,886 | ||||||
MassMutual Small Cap Value Equity Fund, Class I (a) |
216,488 | 1,881,282 | ||||||
MassMutual Strategic Emerging Markets Fund, Class I (a) |
399,600 | 3,280,714 | ||||||
MM Equity Asset Fund, Class I (a) |
3,158,146 | 22,107,022 | ||||||
Vanguard Developed Markets Index Fund, Admiral Shares |
679,205 | 7,933,120 | ||||||
Vanguard Mid-Cap Index Fund, Admiral Shares |
7,260 | 1,690,518 | ||||||
Vanguard Real Estate Index Fund, Admiral Shares |
24,197 | 2,749,220 | ||||||
Vanguard Small-Cap Index Fund, Admiral Shares |
17,271 | 1,414,357 | ||||||
| 89,570,288 | ||||||||
Fixed Income Funds — 11.5% |
||||||||
JPMorgan Emerging Markets Debt Fund, Class R6 |
80,803 | 441,186 | ||||||
JPMorgan U.S. Government Money Market Fund, Class IM |
4,075,772 | 4,075,772 | ||||||
MassMutual Core Bond Fund, Class I (a) |
132,690 | 1,207,475 | ||||||
MassMutual High Yield Fund, Class I (a) |
145,466 | 1,057,534 | ||||||
MassMutual Strategic Bond Fund, Class I (a) |
266,871 | 2,271,070 | ||||||
Number of |
Value |
|||||||
MassMutual Total Return Bond Fund, Class I (a) |
269,422 | $ | 2,268,531 | |||||
Vanguard Total Bond Market Index Fund, Admiral Shares |
32,389 | 304,137 | ||||||
| 11,625,705 | ||||||||
TOTAL MUTUAL FUNDS (Cost $124,884,882) |
101,195,993 | |||||||
TOTAL LONG-TERM INVESTMENTS (Cost $124,884,882) |
101,195,993 | |||||||
TOTAL INVESTMENTS — 100.1% (Cost $124,884,882) (b) |
101,195,993 | |||||||
Other Assets/(Liabilities) — (0.1)% |
(121,650 | ) | ||||||
NET ASSETS — 100.0% |
$ | 101,074,343 | ||||||
Notes to Portfolio of Investments
Percentages are stated as a percent of net assets.
|
(a) |
Affiliated issuer. See Note 7 for a summary of transactions in the investments of affiliated issuers. |
|
(b) |
See Note 6 for aggregate cost for federal tax purposes. |
The accompanying notes are an integral part of the financial statements.
57
MassMutual RetireSMARTSM by JPMorgan 2050 Fund – Portfolio of Investments |
September 30, 2022 |
Number of |
Value |
|||||||
Equity Funds — 90.0% |
||||||||
JPMorgan Emerging Markets Research Enhanced Equity Fund, Class R6 |
706,929 | $ | 9,635,446 | |||||
JPMorgan Large Cap Value Fund, Class R6 |
294,670 | 4,920,996 | ||||||
MassMutual Blue Chip Growth Fund, Class I (a) |
558,365 | 10,463,758 | ||||||
MassMutual Diversified Value Fund, Class I (a) |
386,251 | 4,198,553 | ||||||
MassMutual Equity Opportunities Fund, Class I (a) |
418,434 | 6,971,114 | ||||||
MassMutual Fundamental Value Fund, Class I (a) |
578,488 | 4,940,290 | ||||||
MassMutual Growth Opportunities Fund, Class I (a) |
765,583 | 3,491,057 | ||||||
MassMutual International Equity Fund, Class I (a) |
1,262,496 | 9,014,221 | ||||||
MassMutual Mid Cap Growth Fund, Class I (a) |
168,112 | 3,118,475 | ||||||
MassMutual Mid Cap Value Fund, Class I (a) |
294,562 | 3,110,575 | ||||||
MassMutual Overseas Fund, Class I (a) |
2,074,487 | 14,396,937 | ||||||
MassMutual Small Cap Growth Equity Fund, Class I (a) |
188,055 | 2,249,143 | ||||||
MassMutual Small Cap Value Equity Fund, Class I (a) |
340,776 | 2,961,344 | ||||||
MassMutual Strategic Emerging Markets Fund, Class I (a) |
632,391 | 5,191,926 | ||||||
MM Equity Asset Fund, Class I (a) |
4,979,512 | 34,856,582 | ||||||
Vanguard Developed Markets Index Fund, Admiral Shares |
1,065,684 | 12,447,193 | ||||||
Vanguard Mid-Cap Index Fund, Admiral Shares |
11,390 | 2,652,135 | ||||||
Vanguard Real Estate Index Fund, Admiral Shares |
38,041 | 4,322,192 | ||||||
Vanguard Small-Cap Index Fund, Admiral Shares |
27,097 | 2,218,957 | ||||||
| 141,160,894 | ||||||||
Fixed Income Funds — 10.1% |
||||||||
JPMorgan Emerging Markets Debt Fund, Class R6 |
99,737 | 544,566 | ||||||
JPMorgan U.S. Government Money Market Fund, Class IM |
6,323,586 | 6,323,586 | ||||||
MassMutual Core Bond Fund, Class I (a) |
166,861 | 1,518,434 | ||||||
MassMutual High Yield Fund, Class I (a) |
184,527 | 1,341,512 | ||||||
MassMutual Strategic Bond Fund, Class I (a) |
335,796 | 2,857,625 | ||||||
Number of |
Value |
|||||||
MassMutual Total Return Bond Fund, Class I (a) |
339,006 | $ | 2,854,432 | |||||
Vanguard Total Bond Market Index Fund, Admiral Shares |
40,513 | 380,413 | ||||||
| 15,820,568 | ||||||||
TOTAL MUTUAL FUNDS (Cost $193,502,717) |
156,981,462 | |||||||
TOTAL LONG-TERM INVESTMENTS (Cost $193,502,717) |
156,981,462 | |||||||
TOTAL INVESTMENTS — 100.1% (Cost $193,502,717) (b) |
156,981,462 | |||||||
Other Assets/(Liabilities) — (0.1)% |
(139,888 | ) | ||||||
NET ASSETS — 100.0% |
$ | 156,841,574 | ||||||
Notes to Portfolio of Investments
Percentages are stated as a percent of net assets.
|
(a) |
Affiliated issuer. See Note 7 for a summary of transactions in the investments of affiliated issuers. |
|
(b) |
See Note 6 for aggregate cost for federal tax purposes. |
The accompanying notes are an integral part of the financial statements.
58
MassMutual RetireSMARTSM by JPMorgan 2055 Fund – Portfolio of Investments |
September 30, 2022 |
Number of |
Value |
|||||||
Equity Funds — 90.0% |
||||||||
JPMorgan Emerging Markets Research Enhanced Equity Fund, Class R6 |
236,915 | $ | 3,229,149 | |||||
JPMorgan Large Cap Value Fund, Class R6 |
98,825 | 1,650,376 | ||||||
MassMutual Blue Chip Growth Fund, Class I (a) |
187,390 | 3,511,680 | ||||||
MassMutual Diversified Value Fund, Class I (a) |
129,537 | 1,408,068 | ||||||
MassMutual Equity Opportunities Fund, Class I (a) |
140,330 | 2,337,900 | ||||||
MassMutual Fundamental Value Fund, Class I (a) |
194,145 | 1,657,994 | ||||||
MassMutual Growth Opportunities Fund, Class I (a) |
256,766 | 1,170,851 | ||||||
MassMutual International Equity Fund, Class I (a) |
423,196 | 3,021,617 | ||||||
MassMutual Mid Cap Growth Fund, Class I (a) |
56,383 | 1,045,907 | ||||||
MassMutual Mid-Cap Value Fund, Class I (a) |
98,792 | 1,043,240 | ||||||
MassMutual Overseas Fund, Class I (a) |
695,876 | 4,829,382 | ||||||
MassMutual Small Cap Growth Equity Fund, Class I (a) |
63,077 | 754,402 | ||||||
MassMutual Small Cap Value Equity Fund, Class I (a) |
114,296 | 993,233 | ||||||
MassMutual Strategic Emerging Markets Fund, Class I (a) |
212,249 | 1,742,565 | ||||||
MM Equity Asset Fund, Class I (a) |
1,671,138 | 11,697,963 | ||||||
Vanguard Developed Markets Index Fund, Admiral Shares |
358,575 | 4,188,154 | ||||||
Vanguard Mid-Cap Index Fund, Admiral Shares |
3,832 | 892,369 | ||||||
Vanguard Real Estate Index Fund, Admiral Shares |
12,800 | 1,454,319 | ||||||
Vanguard Small-Cap Index Fund, Admiral Shares |
9,117 | 746,607 | ||||||
| 47,375,776 | ||||||||
Fixed Income Funds — 10.1% |
||||||||
JPMorgan Emerging Markets Debt Fund, Class R6 |
33,470 | 182,744 | ||||||
JPMorgan U.S. Government Money Market Fund, Class IM |
2,122,120 | 2,122,120 | ||||||
MassMutual Core Bond Fund, Class I (a) |
55,998 | 509,578 | ||||||
MassMutual High Yield Fund, Class I (a) |
61,924 | 450,188 | ||||||
MassMutual Strategic Bond Fund, Class I (a) |
112,692 | 959,010 | ||||||
Number of |
Value |
|||||||
MassMutual Total Return Bond Fund, Class I (a) |
113,769 | $ | 957,939 | |||||
Vanguard Total Bond Market Index Fund, Admiral Shares |
13,632 | 128,001 | ||||||
| 5,309,580 | ||||||||
TOTAL MUTUAL FUNDS (Cost $65,220,986) |
52,685,356 | |||||||
TOTAL LONG-TERM INVESTMENTS (Cost $65,220,986) |
52,685,356 | |||||||
TOTAL INVESTMENTS — 100.1% (Cost $65,220,986) (b) |
52,685,356 | |||||||
Other Assets/(Liabilities) — (0.1)% |
(64,784 | ) | ||||||
NET ASSETS — 100.0% |
$ | 52,620,572 | ||||||
Notes to Portfolio of Investments
Percentages are stated as a percent of net assets.
|
(a) |
Affiliated issuer. See Note 7 for a summary of transactions in the investments of affiliated issuers. |
|
(b) |
See Note 6 for aggregate cost for federal tax purposes. |
The accompanying notes are an integral part of the financial statements.
59
MassMutual RetireSMARTSM by JPMorgan 2060 Fund – Portfolio of Investments |
September 30, 2022 |
Number of |
Value |
|||||||
Equity Funds — 90.2% |
||||||||
JPMorgan Emerging Markets Research Enhanced Equity Fund, Class R6 |
78,042 | $ | 1,063,709 | |||||
JPMorgan Large Cap Value Fund, Class R6 |
32,555 | 543,663 | ||||||
MassMutual Blue Chip Growth Fund, Class I (a) |
61,685 | 1,155,979 | ||||||
MassMutual Diversified Value Fund, Class I (a) |
42,672 | 463,844 | ||||||
MassMutual Equity Opportunities Fund, Class I (a) |
46,227 | 770,138 | ||||||
MassMutual Fundamental Value Fund, Class I (a) |
63,908 | 545,772 | ||||||
MassMutual Growth Opportunities Fund, Class I (a) |
84,580 | 385,683 | ||||||
MassMutual International Equity Fund, Class I (a) |
139,407 | 995,368 | ||||||
MassMutual Mid Cap Growth Fund, Class I (a) |
18,573 | 344,527 | ||||||
MassMutual Mid Cap Value Fund, Class I (a) |
32,542 | 343,647 | ||||||
MassMutual Overseas Fund, Class I (a) |
229,073 | 1,589,770 | ||||||
MassMutual Small Cap Growth Equity Fund, Class I (a) |
20,779 | 248,512 | ||||||
MassMutual Small Cap Value Equity Fund, Class I (a) |
37,649 | 327,174 | ||||||
MassMutual Strategic Emerging Markets Fund, Class I (a) |
69,767 | 572,787 | ||||||
MM Equity Asset Fund, Class I (a) |
550,104 | 3,850,731 | ||||||
Vanguard Developed Markets Index Fund, Admiral Shares |
118,107 | 1,379,492 | ||||||
Vanguard Mid-Cap Index Fund, Admiral Shares |
1,262 | 293,925 | ||||||
Vanguard Real Estate Index Fund, Admiral Shares |
4,216 | 479,027 | ||||||
Vanguard Small-Cap Index Fund, Admiral Shares |
3,003 | 245,911 | ||||||
| 15,599,659 | ||||||||
Fixed Income Funds — 10.1% |
||||||||
JPMorgan Emerging Markets Debt Fund, Class R6 |
11,021 | 60,175 | ||||||
JPMorgan U.S. Government Money Market Fund, Class IM |
698,687 | 698,687 | ||||||
MassMutual Core Bond Fund, Class I (a) |
18,439 | 167,798 | ||||||
MassMutual High Yield Fund, Class I (a) |
20,391 | 148,240 | ||||||
MassMutual Strategic Bond Fund, Class I (a) |
37,108 | 315,792 | ||||||
Number of |
Value |
|||||||
MassMutual Total Return Bond Fund, Class I (a) |
37,463 | $ | 315,439 | |||||
Vanguard Total Bond Market Index Fund, Admiral Shares |
4,490 | 42,162 | ||||||
| 1,748,293 | ||||||||
TOTAL MUTUAL FUNDS (Cost $21,405,228) |
17,347,952 | |||||||
TOTAL LONG-TERM INVESTMENTS (Cost $21,405,228) |
17,347,952 | |||||||
TOTAL INVESTMENTS — 100.3% (Cost $21,405,228) (b) |
17,347,952 | |||||||
Other Assets/(Liabilities) — (0.3)% |
(49,260 | ) | ||||||
NET ASSETS — 100.0% |
$ | 17,298,692 | ||||||
Notes to Portfolio of Investments
Percentages are stated as a percent of net assets.
|
(a) |
Affiliated issuer. See Note 7 for a summary of transactions in the investments of affiliated issuers. |
|
(b) |
See Note 6 for aggregate cost for federal tax purposes. |
The accompanying notes are an integral part of the financial statements.
60
MassMutual Select T. Rowe Price Retirement Balanced Fund – Portfolio of Investments |
September 30, 2022 |
Number of |
Value |
|||||||
MUTUAL FUNDS — 100.0% |
||||||||
Equity Funds — 37.2% |
||||||||
MassMutual Select T. Rowe Price International Equity Fund, Class I (a) |
2,004,251 | $ | 16,815,662 | |||||
MassMutual Select T. Rowe Price Large Cap Blend Fund, Class I (a) |
2,168,614 | 24,353,536 | ||||||
MassMutual Select T. Rowe Price Real Assets Fund, Class I (a) |
262,556 | 2,714,833 | ||||||
MassMutual Select T. Rowe Price Small and Mid Cap Blend Fund, Class I (a) |
773,426 | 8,515,421 | ||||||
MM S&P 500 Index Fund, Class I (a) |
409,753 | 6,527,362 | ||||||
| 58,926,814 | ||||||||
Fixed Income Funds — 62.8% |
||||||||
MassMutual Select T. Rowe Price Bond Asset Fund, Class I (a) |
3,925,924 | 33,880,728 | ||||||
MassMutual Select T. Rowe Price Emerging Markets Bond Fund, Class I (a) |
926,416 | 6,308,894 | ||||||
MassMutual Select T. Rowe Price Limited Duration Inflation Focused Bond Fund, Class I (a) |
3,299,041 | 32,495,550 | ||||||
MassMutual Select T. Rowe Price U.S. Treasury Long-Term Index Fund, Class I (a) |
879,580 | 4,811,303 | ||||||
State Street Institutional U.S. Government Money Market Fund |
4,893,152 | 4,893,152 | ||||||
T. Rowe Price Dynamic Global Bond Fund, Class I |
759,099 | 7,583,401 | ||||||
Number of |
Value |
|||||||
T. Rowe Price Institutional Floating Rate Fund |
386,673 | $ | 3,510,992 | |||||
T. Rowe Price Institutional High Yield Fund |
805,426 | 5,774,901 | ||||||
| 99,258,921 | ||||||||
TOTAL MUTUAL FUNDS (Cost $185,289,644) |
158,185,735 | |||||||
TOTAL LONG-TERM INVESTMENTS (Cost $185,289,644) |
158,185,735 | |||||||
TOTAL INVESTMENTS — 100.0% (Cost $185,289,644) (b) |
158,185,735 | |||||||
Other Assets/(Liabilities) — (0.0)% |
(54,665 | ) | ||||||
NET ASSETS — 100.0% |
$ | 158,131,070 | ||||||
Notes to Portfolio of Investments
Percentages are stated as a percent of net assets.
|
(a) |
Affiliated issuer. See Note 7 for a summary of transactions in the investments of affiliated issuers. |
|
(b) |
See Note 6 for aggregate cost for federal tax purposes. |
The accompanying notes are an integral part of the financial statements.
61
MassMutual Select T. Rowe Price Retirement 2005 Fund – Portfolio of Investments |
September 30, 2022 |
Number of |
Value |
|||||||
MUTUAL FUNDS — 100.0% |
||||||||
Equity Funds — 40.4% |
||||||||
MassMutual Select T. Rowe Price International Equity Fund, Class I (a) |
331,747 | $ | 2,783,353 | |||||
MassMutual Select T. Rowe Price Large Cap Blend Fund, Class I (a) |
363,376 | 4,080,715 | ||||||
MassMutual Select T. Rowe Price Real Assets Fund, Class I (a) |
44,245 | 457,498 | ||||||
MassMutual Select T. Rowe Price Small and Mid Cap Blend Fund, Class I (a) |
131,895 | 1,452,168 | ||||||
MM S&P 500 Index Fund, Class I (a) |
68,297 | 1,087,971 | ||||||
| 9,861,705 | ||||||||
Fixed Income Funds — 59.6% |
||||||||
MassMutual Select T. Rowe Price Bond Asset Fund, Class I (a) |
602,760 | 5,201,816 | ||||||
MassMutual Select T. Rowe Price Emerging Markets Bond Fund, Class I (a) |
139,057 | 946,977 | ||||||
MassMutual Select T. Rowe Price Limited Duration Inflation Focused Bond Fund, Class I (a) |
429,844 | 4,233,959 | ||||||
MassMutual Select T. Rowe Price U.S. Treasury Long-Term Index Fund, Class I (a) |
141,284 | 772,825 | ||||||
State Street Institutional U.S. Government Money Market Fund |
800,107 | 800,107 | ||||||
T. Rowe Price Dynamic Global Bond Fund, Class I |
115,947 | 1,158,315 | ||||||
Number of |
Value |
|||||||
T. Rowe Price Institutional Floating Rate Fund |
58,570 | $ | 531,814 | |||||
T. Rowe Price Institutional High Yield Fund |
121,838 | 873,582 | ||||||
| 14,519,395 | ||||||||
TOTAL MUTUAL FUNDS (Cost $29,043,176) |
24,381,100 | |||||||
TOTAL LONG-TERM INVESTMENTS (Cost $29,043,176) |
24,381,100 | |||||||
TOTAL INVESTMENTS — 100.0% (Cost $29,043,176) (b) |
24,381,100 | |||||||
Other Assets/(Liabilities) — (0.0)% |
(1,860 | ) | ||||||
NET ASSETS — 100.0% |
$ | 24,379,240 | ||||||
Notes to Portfolio of Investments
Percentages are stated as a percent of net assets.
|
(a) |
Affiliated issuer. See Note 7 for a summary of transactions in the investments of affiliated issuers. |
|
(b) |
See Note 6 for aggregate cost for federal tax purposes. |
The accompanying notes are an integral part of the financial statements.
62
MassMutual Select T. Rowe Price Retirement 2010 Fund – Portfolio of Investments |
September 30, 2022 |
Number of |
Value |
|||||||
MUTUAL FUNDS — 100.0% |
||||||||
Equity Funds — 43.9% |
||||||||
MassMutual Select T. Rowe Price International Equity Fund, Class I (a) |
1,523,963 | $ | 12,786,049 | |||||
MassMutual Select T. Rowe Price Large Cap Blend Fund, Class I (a) |
1,676,648 | 18,828,760 | ||||||
MassMutual Select T. Rowe Price Real Assets Fund, Class I (a) |
202,832 | 2,097,283 | ||||||
MassMutual Select T. Rowe Price Small and Mid Cap Blend Fund, Class I (a) |
601,372 | 6,621,101 | ||||||
MM S&P 500 Index Fund, Class I (a) |
312,847 | 4,983,657 | ||||||
| 45,316,850 | ||||||||
Fixed Income Funds — 56.1% |
||||||||
MassMutual Select T. Rowe Price Bond Asset Fund, Class I (a) |
2,470,066 | 21,316,665 | ||||||
MassMutual Select T. Rowe Price Emerging Markets Bond Fund, Class I (a) |
561,875 | 3,826,371 | ||||||
MassMutual Select T. Rowe Price Limited Duration Inflation Focused Bond Fund, Class I (a) |
1,598,390 | 15,744,144 | ||||||
MassMutual Select T. Rowe Price U.S. Treasury Long-Term Index Fund, Class I (a) |
605,537 | 3,312,288 | ||||||
State Street Institutional U.S. Government Money Market Fund |
3,294,316 | 3,294,317 | ||||||
T. Rowe Price Dynamic Global Bond Fund, Class I |
476,984 | 4,765,075 | ||||||
T. Rowe Price Institutional Floating Rate Fund |
240,056 | 2,179,710 | ||||||
Number of |
Value |
|||||||
T. Rowe Price Institutional High Yield Fund |
494,652 | $ | 3,546,651 | |||||
| 57,985,221 | ||||||||
TOTAL MUTUAL FUNDS (Cost $122,372,166) |
103,302,071 | |||||||
TOTAL LONG-TERM INVESTMENTS (Cost $122,372,166) |
103,302,071 | |||||||
TOTAL INVESTMENTS — 100.0% (Cost $122,372,166) (b) |
103,302,071 | |||||||
Other Assets/(Liabilities) — (0.0)% |
(39,129 | ) | ||||||
NET ASSETS — 100.0% |
$ | 103,262,942 | ||||||
Notes to Portfolio of Investments
Percentages are stated as a percent of net assets.
|
(a) |
Affiliated issuer. See Note 7 for a summary of transactions in the investments of affiliated issuers. |
|
(b) |
See Note 6 for aggregate cost for federal tax purposes. |
The accompanying notes are an integral part of the financial statements.
63
MassMutual Select T. Rowe Price Retirement 2015 Fund – Portfolio of Investments |
September 30, 2022 |
Number of |
Value |
|||||||
MUTUAL FUNDS — 100.0% |
||||||||
Equity Funds — 46.9% |
||||||||
MassMutual Select T. Rowe Price International Equity Fund, Class I (a) |
1,810,764 | $ | 15,192,313 | |||||
MassMutual Select T. Rowe Price Large Cap Blend Fund, Class I (a) |
1,980,010 | 22,235,508 | ||||||
MassMutual Select T. Rowe Price Real Assets Fund, Class I (a) |
239,712 | 2,478,619 | ||||||
MassMutual Select T. Rowe Price Small and Mid Cap Blend Fund, Class I (a) |
722,564 | 7,955,434 | ||||||
MM S&P 500 Index Fund, Class I (a) |
358,409 | 5,709,460 | ||||||
| 53,571,334 | ||||||||
Fixed Income Funds — 53.1% |
||||||||
MassMutual Select T. Rowe Price Bond Asset Fund, Class I (a) |
2,638,510 | 22,770,341 | ||||||
MassMutual Select T. Rowe Price Emerging Markets Bond Fund, Class I (a) |
591,427 | 4,027,616 | ||||||
MassMutual Select T. Rowe Price Limited Duration Inflation Focused Bond Fund, Class I (a) |
1,533,748 | 15,107,415 | ||||||
MassMutual Select T. Rowe Price U.S. Treasury Long-Term Index Fund, Class I (a) |
671,445 | 3,672,806 | ||||||
State Street Institutional U.S. Government Money Market Fund |
3,860,173 | 3,860,173 | ||||||
T. Rowe Price Dynamic Global Bond Fund, Class I |
514,446 | 5,139,320 | ||||||
T. Rowe Price Institutional Floating Rate Fund |
258,927 | 2,351,056 | ||||||
Number of |
Value |
|||||||
T. Rowe Price Institutional High Yield Fund |
525,469 | $ | 3,767,609 | |||||
| 60,696,336 | ||||||||
TOTAL MUTUAL FUNDS (Cost $134,502,281) |
114,267,670 | |||||||
TOTAL LONG-TERM INVESTMENTS (Cost $134,502,281) |
114,267,670 | |||||||
TOTAL INVESTMENTS — 100.0% (Cost $134,502,281) (b) |
114,267,670 | |||||||
Other Assets/(Liabilities) — (0.0)% |
(36,236 | ) | ||||||
NET ASSETS — 100.0% |
$ | 114,231,434 | ||||||
Notes to Portfolio of Investments
Percentages are stated as a percent of net assets.
|
(a) |
Affiliated issuer. See Note 7 for a summary of transactions in the investments of affiliated issuers. |
|
(b) |
See Note 6 for aggregate cost for federal tax purposes. |
The accompanying notes are an integral part of the financial statements.
64
MassMutual Select T. Rowe Price Retirement 2020 Fund – Portfolio of Investments |
September 30, 2022 |
Number of |
Value |
|||||||
MUTUAL FUNDS — 100.0% |
||||||||
Equity Funds — 50.5% |
||||||||
MassMutual Select T. Rowe Price International Equity Fund, Class I (a) |
8,858,855 | $ | 74,325,793 | |||||
MassMutual Select T. Rowe Price Large Cap Blend Fund, Class I (a) |
9,440,751 | 106,019,636 | ||||||
MassMutual Select T. Rowe Price Real Assets Fund, Class I (a) |
1,161,833 | 12,013,357 | ||||||
MassMutual Select T. Rowe Price Small and Mid Cap Blend Fund, Class I (a) |
3,472,421 | 38,231,353 | ||||||
MM S&P 500 Index Fund, Class I (a) |
1,762,055 | 28,069,532 | ||||||
| 258,659,671 | ||||||||
Fixed Income Funds — 49.5% |
||||||||
MassMutual Select T. Rowe Price Bond Asset Fund, Class I (a) |
11,548,304 | 99,661,860 | ||||||
MassMutual Select T. Rowe Price Emerging Markets Bond Fund, Class I (a) |
2,504,178 | 17,053,450 | ||||||
MassMutual Select T. Rowe Price Limited Duration Inflation Focused Bond Fund, Class I (a) |
5,820,223 | 57,329,199 | ||||||
MassMutual Select T. Rowe Price U.S. Treasury Long-Term Index Fund, Class I (a) |
3,025,247 | 16,548,103 | ||||||
State Street Institutional U.S. Government Money Market Fund |
15,064,448 | 15,064,448 | ||||||
T. Rowe Price Dynamic Global Bond Fund, Class I |
2,206,497 | 22,042,910 | ||||||
T. Rowe Price Institutional Floating Rate Fund |
1,090,120 | 9,898,286 | ||||||
Number of |
Value |
|||||||
T. Rowe Price Institutional High Yield Fund |
2,211,119 | $ | 15,853,722 | |||||
| 253,451,978 | ||||||||
TOTAL MUTUAL FUNDS (Cost $598,638,492) |
512,111,649 | |||||||
TOTAL LONG-TERM INVESTMENTS (Cost $598,638,492) |
512,111,649 | |||||||
TOTAL INVESTMENTS — 100.0% (Cost $598,638,492) (b) |
512,111,649 | |||||||
Other Assets/(Liabilities) — (0.0)% |
(253,598 | ) | ||||||
NET ASSETS — 100.0% |
$ | 511,858,051 | ||||||
Notes to Portfolio of Investments
Percentages are stated as a percent of net assets.
|
(a) |
Affiliated issuer. See Note 7 for a summary of transactions in the investments of affiliated issuers. |
|
(b) |
See Note 6 for aggregate cost for federal tax purposes. |
The accompanying notes are an integral part of the financial statements.
65
MassMutual Select T. Rowe Price Retirement 2025 Fund – Portfolio of Investments |
September 30, 2022 |
Number of |
Value |
|||||||
MUTUAL FUNDS — 100.0% |
||||||||
Equity Funds — 57.8% |
||||||||
MassMutual Select T. Rowe Price International Equity Fund, Class I (a) |
10,258,571 | $ | 86,069,408 | |||||
MassMutual Select T. Rowe Price Large Cap Blend Fund, Class I (a) |
11,215,659 | 125,951,849 | ||||||
MassMutual Select T. Rowe Price Real Assets Fund, Class I (a) |
1,377,795 | 14,246,400 | ||||||
MassMutual Select T. Rowe Price Small and Mid Cap Blend Fund, Class I (a) |
4,129,756 | 45,468,612 | ||||||
MM S&P 500 Index Fund, Class I (a) |
2,086,592 | 33,239,405 | ||||||
| 304,975,674 | ||||||||
Fixed Income Funds — 42.2% |
||||||||
MassMutual Select T. Rowe Price Bond Asset Fund, Class I (a) |
10,585,261 | 91,350,803 | ||||||
MassMutual Select T. Rowe Price Emerging Markets Bond Fund, Class I (a) |
2,107,509 | 14,352,134 | ||||||
MassMutual Select T. Rowe Price Limited Duration Inflation Focused Bond Fund, Class I (a) |
3,920,675 | 38,618,648 | ||||||
MassMutual Select T. Rowe Price U.S. Treasury Long-Term Index Fund, Class I (a) |
3,304,491 | 18,075,564 | ||||||
State Street Institutional U.S. Government Money Market Fund |
18,039,995 | 18,039,995 | ||||||
T. Rowe Price Dynamic Global Bond Fund, Class I |
2,026,835 | 20,248,082 | ||||||
T. Rowe Price Institutional Floating Rate Fund |
978,652 | 8,886,162 | ||||||
Number of |
Value |
|||||||
T. Rowe Price Institutional High Yield Fund |
1,851,126 | $ | 13,272,570 | |||||
| 222,843,958 | ||||||||
TOTAL MUTUAL FUNDS (Cost $623,607,680) |
527,819,632 | |||||||
TOTAL LONG-TERM INVESTMENTS (Cost $623,607,680) |
527,819,632 | |||||||
TOTAL INVESTMENTS — 100.0% (Cost $623,607,680) (b) |
527,819,632 | |||||||
Other Assets/(Liabilities) — (0.0)% |
(247,854 | ) | ||||||
NET ASSETS — 100.0% |
$ | 527,571,778 | ||||||
Notes to Portfolio of Investments
Percentages are stated as a percent of net assets.
|
(a) |
Affiliated issuer. See Note 7 for a summary of transactions in the investments of affiliated issuers. |
|
(b) |
See Note 6 for aggregate cost for federal tax purposes. |
The accompanying notes are an integral part of the financial statements.
66
MassMutual Select T. Rowe Price Retirement 2030 Fund – Portfolio of Investments |
September 30, 2022 |
Number of |
Value |
|||||||
MUTUAL FUNDS — 100.1% |
||||||||
Equity Funds — 69.1% |
||||||||
MassMutual Select T. Rowe Price International Equity Fund, Class I (a) |
27,285,577 | $ | 228,925,991 | |||||
MassMutual Select T. Rowe Price Large Cap Blend Fund, Class I (a) |
29,922,920 | 336,034,396 | ||||||
MassMutual Select T. Rowe Price Real Assets Fund, Class I (a) |
3,683,865 | 38,091,163 | ||||||
MassMutual Select T. Rowe Price Small and Mid Cap Blend Fund, Class I (a) |
10,821,690 | 119,146,811 | ||||||
MM S&P 500 Index Fund, Class I (a) |
5,523,928 | 87,996,174 | ||||||
| 810,194,535 | ||||||||
Fixed Income Funds — 31.0% |
||||||||
MassMutual Select T. Rowe Price Bond Asset Fund, Class I (a) |
19,343,894 | 166,937,807 | ||||||
MassMutual Select T. Rowe Price Emerging Markets Bond Fund, Class I (a) |
3,118,868 | 21,239,488 | ||||||
MassMutual Select T. Rowe Price Limited Duration Inflation Focused Bond Fund, Class I (a) |
2,504,069 | 24,665,077 | ||||||
MassMutual Select T. Rowe Price U.S. Treasury Long-Term Index Fund, Class I (a) |
7,567,574 | 41,394,630 | ||||||
State Street Institutional U.S. Government Money Market Fund |
38,935,707 | 38,935,707 | ||||||
T. Rowe Price Dynamic Global Bond Fund, Class I |
3,599,810 | 35,962,097 | ||||||
T. Rowe Price Institutional Floating Rate Fund |
1,637,847 | 14,871,647 | ||||||
Number of |
Value |
|||||||
T. Rowe Price Institutional High Yield Fund |
2,728,339 | $ | 19,562,191 | |||||
| 363,568,644 | ||||||||
TOTAL MUTUAL FUNDS (Cost $1,355,298,450) |
1,173,763,179 | |||||||
TOTAL LONG-TERM INVESTMENTS (Cost $1,355,298,450) |
1,173,763,179 | |||||||
TOTAL INVESTMENTS — 100.1% (Cost $1,355,298,450) (b) |
1,173,763,179 | |||||||
Other Assets/(Liabilities) — (0.1)% |
(636,439 | ) | ||||||
NET ASSETS — 100.0% |
$ | 1,173,126,740 | ||||||
Notes to Portfolio of Investments
Percentages are stated as a percent of net assets.
|
(a) |
Affiliated issuer. See Note 7 for a summary of transactions in the investments of affiliated issuers. |
|
(b) |
See Note 6 for aggregate cost for federal tax purposes. |
The accompanying notes are an integral part of the financial statements.
67
MassMutual Select T. Rowe Price Retirement 2035 Fund – Portfolio of Investments |
September 30, 2022 |
Number of |
Value |
|||||||
MUTUAL FUNDS — 100.1% |
||||||||
Equity Funds — 80.2% |
||||||||
MassMutual Select T. Rowe Price International Equity Fund, Class I (a) |
16,806,438 | $ | 141,006,016 | |||||
MassMutual Select T. Rowe Price Large Cap Blend Fund, Class I (a) |
18,183,534 | 204,201,090 | ||||||
MassMutual Select T. Rowe Price Real Assets Fund, Class I (a) |
2,235,119 | 23,111,135 | ||||||
MassMutual Select T. Rowe Price Small and Mid Cap Blend Fund, Class I (a) |
6,596,448 | 72,626,897 | ||||||
MM S&P 500 Index Fund, Class I (a) |
3,196,031 | 50,912,772 | ||||||
| 491,857,910 | ||||||||
Fixed Income Funds — 19.9% |
||||||||
MassMutual Select T. Rowe Price Bond Asset Fund, Class I (a) |
6,572,102 | 56,717,237 | ||||||
MassMutual Select T. Rowe Price Emerging Markets Bond Fund, Class I (a) |
851,100 | 5,795,993 | ||||||
MassMutual Select T. Rowe Price Limited Duration Inflation Focused Bond Fund, Class I (a) |
33,130 | 326,326 | ||||||
MassMutual Select T. Rowe Price U.S. Treasury Long-Term Index Fund, Class I (a) |
3,044,208 | 16,651,820 | ||||||
State Street Institutional U.S. Government Money Market Fund |
20,611,783 | 20,611,783 | ||||||
T. Rowe Price Dynamic Global Bond Fund, Class I |
1,196,095 | 11,948,987 | ||||||
T. Rowe Price Institutional Floating Rate Fund |
521,696 | 4,737,001 | ||||||
Number of |
Value |
|||||||
T. Rowe Price Institutional High Yield Fund |
760,861 | $ | 5,455,371 | |||||
| 122,244,518 | ||||||||
TOTAL MUTUAL FUNDS (Cost $720,002,967) |
614,102,428 | |||||||
TOTAL LONG-TERM INVESTMENTS (Cost $720,002,967) |
614,102,428 | |||||||
TOTAL INVESTMENTS — 100.1% (Cost $720,002,967) (b) |
614,102,428 | |||||||
Other Assets/(Liabilities) — (0.1)% |
(317,059 | ) | ||||||
NET ASSETS — 100.0% |
$ | 613,785,369 | ||||||
Notes to Portfolio of Investments
Percentages are stated as a percent of net assets.
|
(a) |
Affiliated issuer. See Note 7 for a summary of transactions in the investments of affiliated issuers. |
|
(b) |
See Note 6 for aggregate cost for federal tax purposes. |
The accompanying notes are an integral part of the financial statements.
68
MassMutual Select T. Rowe Price Retirement 2040 Fund – Portfolio of Investments |
September 30, 2022 |
Number of |
Value |
|||||||
MUTUAL FUNDS — 100.1% |
||||||||
Equity Funds — 89.4% |
||||||||
MassMutual Select T. Rowe Price International Equity Fund, Class I (a) |
31,104,501 | $ | 260,966,760 | |||||
MassMutual Select T. Rowe Price Large Cap Blend Fund, Class I (a) |
34,012,438 | 381,959,678 | ||||||
MassMutual Select T. Rowe Price Real Assets Fund, Class I (a) |
4,183,309 | 43,255,420 | ||||||
MassMutual Select T. Rowe Price Small and Mid Cap Blend Fund, Class I (a) |
12,380,163 | 136,305,591 | ||||||
MM S&P 500 Index Fund, Class I (a) |
6,036,269 | 96,157,761 | ||||||
| 918,645,210 | ||||||||
Fixed Income Funds — 10.7% |
||||||||
MassMutual Select T. Rowe Price Bond Asset Fund, Class I (a) |
5,155,975 | 44,496,064 | ||||||
MassMutual Select T. Rowe Price Emerging Markets Bond Fund, Class I (a) |
346,102 | 2,356,952 | ||||||
MassMutual Select T. Rowe Price Limited Duration Inflation Focused Bond Fund, Class I (a) |
54,388 | 535,724 | ||||||
MassMutual Select T. Rowe Price U.S. Treasury Long-Term Index Fund, Class I (a) |
2,814,978 | 15,397,932 | ||||||
State Street Institutional U.S. Government Money Market Fund |
31,349,451 | 31,349,451 | ||||||
Number of |
Value |
|||||||
T. Rowe Price Dynamic Global Bond Fund, Class I |
903,384 | $ | 9,024,805 | |||||
T. Rowe Price Institutional High Yield Fund |
842,681 | 6,042,021 | ||||||
| 109,202,949 | ||||||||
TOTAL MUTUAL FUNDS (Cost $1,191,433,428) |
1,027,848,159 | |||||||
TOTAL LONG-TERM INVESTMENTS (Cost $1,191,433,428) |
1,027,848,159 | |||||||
TOTAL INVESTMENTS — 100.1% (Cost $1,191,433,428) (b) |
1,027,848,159 | |||||||
Other Assets/(Liabilities) — (0.1)% |
(593,438 | ) | ||||||
NET ASSETS — 100.0% |
$ | 1,027,254,721 | ||||||
Notes to Portfolio of Investments
Percentages are stated as a percent of net assets.
|
(a) |
Affiliated issuer. See Note 7 for a summary of transactions in the investments of affiliated issuers. |
|
(b) |
See Note 6 for aggregate cost for federal tax purposes. |
The accompanying notes are an integral part of the financial statements.
69
MassMutual Select T. Rowe Price Retirement 2045 Fund – Portfolio of Investments |
September 30, 2022 |
Number of |
Value |
|||||||
MUTUAL FUNDS — 100.1% |
||||||||
Equity Funds — 94.2% |
||||||||
MassMutual Select T. Rowe Price International Equity Fund, Class I (a) |
15,164,567 | $ | 127,230,715 | |||||
MassMutual Select T. Rowe Price Large Cap Blend Fund, Class I (a) |
16,430,222 | 184,511,397 | ||||||
MassMutual Select T. Rowe Price Real Assets Fund, Class I (a) |
2,036,053 | 21,052,785 | ||||||
MassMutual Select T. Rowe Price Small and Mid Cap Blend Fund, Class I (a) |
6,127,429 | 67,462,988 | ||||||
MM S&P 500 Index Fund, Class I (a) |
2,979,229 | 47,459,123 | ||||||
| 447,717,008 | ||||||||
Fixed Income Funds — 5.9% |
||||||||
MassMutual Select T. Rowe Price Bond Asset Fund, Class I (a) |
931,788 | 8,041,326 | ||||||
MassMutual Select T. Rowe Price Limited Duration Inflation Focused Bond Fund, Class I (a) |
24,427 | 240,606 | ||||||
MassMutual Select T. Rowe Price U.S. Treasury Long-Term Index Fund, Class I (a) |
567,878 | 3,106,295 | ||||||
State Street Institutional U.S. Government Money Market Fund |
15,124,853 | 15,124,853 | ||||||
Number of |
Value |
|||||||
T. Rowe Price Dynamic Global Bond Fund, Class I |
146,515 | $ | 1,463,685 | |||||
| 27,976,765 | ||||||||
TOTAL MUTUAL FUNDS (Cost $560,331,673) |
475,693,773 | |||||||
TOTAL LONG-TERM INVESTMENTS (Cost $560,331,673) |
475,693,773 | |||||||
TOTAL INVESTMENTS — 100.1% (Cost $560,331,673) (b) |
475,693,773 | |||||||
Other Assets/(Liabilities) — (0.1)% |
(258,820 | ) | ||||||
NET ASSETS — 100.0% |
$ | 475,434,953 | ||||||
Notes to Portfolio of Investments
Percentages are stated as a percent of net assets.
|
(a) |
Affiliated issuer. See Note 7 for a summary of transactions in the investments of affiliated issuers. |
|
(b) |
See Note 6 for aggregate cost for federal tax purposes. |
The accompanying notes are an integral part of the financial statements.
70
MassMutual Select T. Rowe Price Retirement 2050 Fund – Portfolio of Investments |
September 30, 2022 |
Number of |
Value |
|||||||
MUTUAL FUNDS — 100.1% |
||||||||
Equity Funds — 95.7% |
||||||||
MassMutual Select T. Rowe Price International Equity Fund, Class I (a) |
22,788,378 | $ | 191,194,494 | |||||
MassMutual Select T. Rowe Price Large Cap Blend Fund, Class I (a) |
24,600,211 | 276,260,366 | ||||||
MassMutual Select T. Rowe Price Real Assets Fund, Class I (a) |
3,045,122 | 31,486,565 | ||||||
MassMutual Select T. Rowe Price Small and Mid Cap Blend Fund, Class I (a) |
9,123,299 | 100,447,523 | ||||||
MM S&P 500 Index Fund, Class I (a) |
4,504,562 | 71,757,681 | ||||||
| 671,146,629 | ||||||||
Fixed Income Funds — 4.4% |
||||||||
MassMutual Select T. Rowe Price Bond Asset Fund, Class I (a) |
597,665 | 5,157,848 | ||||||
MassMutual Select T. Rowe Price Limited Duration Inflation Focused Bond Fund, Class I (a) |
38,322 | 377,475 | ||||||
MassMutual Select T. Rowe Price U.S. Treasury Long-Term Index Fund, Class I (a) |
343,016 | 1,876,296 | ||||||
State Street Institutional U.S. Government Money Market Fund |
22,016,715 | 22,016,715 | ||||||
Number of |
Value |
|||||||
T. Rowe Price Dynamic Global Bond Fund, Class I |
93,869 | $ | 937,754 | |||||
| 30,366,088 | ||||||||
TOTAL MUTUAL FUNDS (Cost $818,940,116) |
701,512,717 | |||||||
TOTAL LONG-TERM INVESTMENTS (Cost $818,940,116) |
701,512,717 | |||||||
TOTAL INVESTMENTS — 100.1% (Cost $818,940,116) (b) |
701,512,717 | |||||||
Other Assets/(Liabilities) — (0.1)% |
(413,435 | ) | ||||||
NET ASSETS — 100.0% |
$ | 701,099,282 | ||||||
Notes to Portfolio of Investments
Percentages are stated as a percent of net assets.
|
(a) |
Affiliated issuer. See Note 7 for a summary of transactions in the investments of affiliated issuers. |
|
(b) |
See Note 6 for aggregate cost for federal tax purposes. |
The accompanying notes are an integral part of the financial statements.
71
MassMutual Select T. Rowe Price Retirement 2055 Fund – Portfolio of Investments |
September 30, 2022 |
Number of |
Value |
|||||||
MUTUAL FUNDS — 100.1% |
||||||||
Equity Funds — 96.2% |
||||||||
MassMutual Select T. Rowe Price International Equity Fund, Class I (a) |
9,579,697 | $ | 80,373,659 | |||||
MassMutual Select T. Rowe Price Large Cap Blend Fund, Class I (a) |
10,405,983 | 116,859,191 | ||||||
MassMutual Select T. Rowe Price Real Assets Fund, Class I (a) |
1,288,939 | 13,327,629 | ||||||
MassMutual Select T. Rowe Price Small and Mid Cap Blend Fund, Class I (a) |
3,872,211 | 42,633,047 | ||||||
MM S&P 500 Index Fund, Class I (a) |
1,903,690 | 30,325,790 | ||||||
| 283,519,316 | ||||||||
Fixed Income Funds — 3.9% |
||||||||
MassMutual Select T. Rowe Price Bond Asset Fund, Class I (a) |
246,694 | 2,128,967 | ||||||
MassMutual Select T. Rowe Price Limited Duration Inflation Focused Bond Fund, Class I (a) |
14,886 | 146,626 | ||||||
MassMutual Select T. Rowe Price U.S. Treasury Long-Term Index Fund, Class I (a) |
145,834 | 797,710 | ||||||
State Street Institutional U.S. Government Money Market Fund |
7,958,488 | 7,958,488 | ||||||
Number of |
Value |
|||||||
T. Rowe Price Dynamic Global Bond Fund, Class I |
40,963 | $ | 409,222 | |||||
| 11,441,013 | ||||||||
TOTAL MUTUAL FUNDS (Cost $350,485,595) |
294,960,329 | |||||||
TOTAL LONG-TERM INVESTMENTS (Cost $350,485,595) |
294,960,329 | |||||||
TOTAL INVESTMENTS — 100.1% (Cost $350,485,595) (b) |
294,960,329 | |||||||
Other Assets/(Liabilities) — (0.1)% |
(160,959 | ) | ||||||
NET ASSETS — 100.0% |
$ | 294,799,370 | ||||||
Notes to Portfolio of Investments
Percentages are stated as a percent of net assets.
|
(a) |
Affiliated issuer. See Note 7 for a summary of transactions in the investments of affiliated issuers. |
|
(b) |
See Note 6 for aggregate cost for federal tax purposes. |
The accompanying notes are an integral part of the financial statements.
72
MassMutual Select T. Rowe Price Retirement 2060 Fund – Portfolio of Investments |
September 30, 2022 |
Number of |
Value |
|||||||
MUTUAL FUNDS — 100.1% |
||||||||
Equity Funds — 96.2% |
||||||||
MassMutual Select T. Rowe Price International Equity Fund, Class I (a) |
4,223,121 | $ | 35,431,987 | |||||
MassMutual Select T. Rowe Price Large Cap Blend Fund, Class I (a) |
4,615,511 | 51,832,191 | ||||||
MassMutual Select T. Rowe Price Real Assets Fund, Class I (a) |
571,278 | 5,907,018 | ||||||
MassMutual Select T. Rowe Price Small and Mid Cap Blend Fund, Class I (a) |
1,709,998 | 18,827,080 | ||||||
MM S&P 500 Index Fund, Class I (a) |
842,405 | 13,419,519 | ||||||
| 125,417,795 | ||||||||
Fixed Income Funds — 3.9% |
||||||||
MassMutual Select T. Rowe Price Bond Asset Fund, Class I (a) |
106,354 | 917,837 | ||||||
MassMutual Select T. Rowe Price Limited Duration Inflation Focused Bond Fund, Class I (a) |
6,139 | 60,468 | ||||||
MassMutual Select T. Rowe Price U.S. Treasury Long-Term Index Fund, Class I (a) |
65,366 | 357,552 | ||||||
State Street Institutional U.S. Government Money Market Fund |
3,536,896 | 3,536,896 | ||||||
Number of |
Value |
|||||||
T. Rowe Price Dynamic Global Bond Fund, Class I |
20,173 | $ | 201,531 | |||||
| 5,074,284 | ||||||||
TOTAL MUTUAL FUNDS (Cost $160,209,946) |
130,492,079 | |||||||
TOTAL LONG-TERM INVESTMENTS (Cost $160,209,946) |
130,492,079 | |||||||
TOTAL INVESTMENTS — 100.1% (Cost $160,209,946) (b) |
130,492,079 | |||||||
Other Assets/(Liabilities) — (0.1)% |
(69,342 | ) | ||||||
NET ASSETS — 100.0% |
$ | 130,422,737 | ||||||
Notes to Portfolio of Investments
Percentages are stated as a percent of net assets.
|
(a) |
Affiliated issuer. See Note 7 for a summary of transactions in the investments of affiliated issuers. |
|
(b) |
See Note 6 for aggregate cost for federal tax purposes. |
The accompanying notes are an integral part of the financial statements.
73
MassMutual Funds – Financial Statements |
MassMutual |
MassMutual |
|||||||
Assets: |
||||||||
Investments, at value - unaffiliated issuers (Note 2) (a) |
$ | 18,024,758 | $ | 22,667,660 | ||||
Investments, at value - affiliated issuers (Note 2 & 7) (b) |
140,321,884 | 147,173,543 | ||||||
Total investments |
158,346,642 | 169,841,203 | ||||||
Receivables from: |
||||||||
Investments sold |
||||||||
Regular delivery |
— | — | ||||||
Fund shares sold |
78,384 | 123,273 | ||||||
Investment adviser (Note 3) |
13,676 | 10,830 | ||||||
Dividends |
139,369 | 113,757 | ||||||
Prepaid expenses |
34,954 | 35,618 | ||||||
Total assets |
158,613,025 | 170,124,681 | ||||||
Liabilities: |
||||||||
Payables for: |
||||||||
Investments purchased |
||||||||
Regular delivery |
179,536 | 227,655 | ||||||
Fund shares repurchased |
91 | 7,252 | ||||||
Trustees’ fees and expenses (Note 3) |
21,897 | 36,115 | ||||||
Affiliates (Note 3): |
||||||||
Administration fees |
54,626 | 57,205 | ||||||
Service fees |
14,711 | 62,281 | ||||||
Distribution fees |
2,936 | 10,286 | ||||||
Accrued expense and other liabilities |
62,987 | 66,607 | ||||||
Total liabilities |
336,784 | 467,401 | ||||||
Net assets |
$ | 158,276,241 | $ | 169,657,280 | ||||
Net assets consist of: |
||||||||
Paid-in capital |
$ | 188,088,915 | $ | 201,312,422 | ||||
Accumulated earnings (loss) |
(29,812,674 | ) | (31,655,142 | ) | ||||
Net assets |
$ | 158,276,241 | $ | 169,657,280 | ||||
(a) |
Cost of investments - unaffiliated issuers: |
$ | 21,164,226 | $ | 26,058,079 | ||||
(b) |
Cost of investments - affiliated issuers: |
$ | 166,718,607 | $ | 176,604,609 |
The accompanying notes are an integral part of the financial statements.
74
MassMutual |
MassMutual |
MassMutual |
MassMutual |
MassMutual |
|||||||||||||||
| $ | 21,407,366 | $ | 18,168,569 | $ | 23,197,458 | $ | 45,056,240 | $ | 34,857,041 | ||||||||||
| 135,797,671 | 95,689,668 | 59,976,317 | 116,751,094 | 107,343,539 | |||||||||||||||
| 157,205,037 | 113,858,237 | 83,173,775 | 161,807,334 | 142,200,580 | |||||||||||||||
| — | — | — | — | 203,812 | |||||||||||||||
| 75,249 | 56,680 | 46,650 | 60,076 | 52,946 | |||||||||||||||
| 10,794 | 10,625 | 15,251 | 14,209 | 15,483 | |||||||||||||||
| 94,676 | 62,002 | 57,639 | 112,216 | 78,752 | |||||||||||||||
| 34,953 | 34,953 | 32,011 | 32,385 | 33,750 | |||||||||||||||
| 157,420,709 | 114,022,497 | 83,325,326 | 162,026,220 | 142,585,323 | |||||||||||||||
| 167,874 | 95,849 | 83,839 | 112,278 | 78,752 | |||||||||||||||
| 86 | 21,408 | 19,419 | 57,948 | 238,782 | |||||||||||||||
| 29,447 | 11,006 | 33,731 | 58,518 | 15,718 | |||||||||||||||
| 55,982 | 44,252 | 41,628 | 49,908 | 47,032 | |||||||||||||||
| 42,172 | 31,811 | 24,365 | 47,383 | 46,793 | |||||||||||||||
| 6,474 | 9,727 | 11,005 | 23,069 | 26,366 | |||||||||||||||
| 63,648 | 53,590 | 75,533 | 85,639 | 76,147 | |||||||||||||||
| 365,683 | 267,643 | 289,520 | 434,743 | 529,590 | |||||||||||||||
| $ | 157,055,026 | $ | 113,754,854 | $ | 83,035,806 | $ | 161,591,477 | $ | 142,055,733 | ||||||||||
| $ | 182,545,212 | $ | 132,821,763 | $ | 95,393,977 | $ | 190,575,159 | $ | 168,101,145 | ||||||||||
| (25,490,186 | ) | (19,066,909 | ) | (12,358,171 | ) | (28,983,682 | ) | (26,045,412 | ) | ||||||||||
| $ | 157,055,026 | $ | 113,754,854 | $ | 83,035,806 | $ | 161,591,477 | $ | 142,055,733 | ||||||||||
| $ | 24,740,808 | $ | 19,873,598 | $ | 24,983,847 | $ | 48,561,560 | $ | 38,694,850 | ||||||||||
| $ | 162,300,210 | $ | 115,965,594 | $ | 72,862,468 | $ | 142,260,213 | $ | 132,744,070 |
The accompanying notes are an integral part of the financial statements.
75
MassMutual Funds – Financial Statements (Continued) |
Statements of Assets and Liabilities |
MassMutual |
MassMutual |
|||||||
Class I shares: |
||||||||
Net assets |
$ | 13,143,070 | $ | 30,477,364 | ||||
Shares outstanding (a) |
1,570,580 | 3,755,892 | ||||||
Net asset value, offering price and redemption price per share |
$ | 8.37 | $ | 8.11 | ||||
Class R5 shares: |
||||||||
Net assets |
$ | 2,488,417 | $ | 5,503,150 | ||||
Shares outstanding (a) |
297,957 | 677,574 | ||||||
Net asset value, offering price and redemption price per share |
$ | 8.35 | $ | 8.12 | ||||
Service Class shares: |
||||||||
Net assets |
$ | 103,035,241 | $ | 12,833,857 | ||||
Shares outstanding (a) |
12,340,819 | 1,571,690 | ||||||
Net asset value, offering price and redemption price per share |
$ | 8.35 | $ | 8.17 | ||||
Administrative Class shares: |
||||||||
Net assets |
$ | 18,214,540 | $ | 28,220,282 | ||||
Shares outstanding (a) |
2,174,558 | 3,458,200 | ||||||
Net asset value, offering price and redemption price per share |
$ | 8.38 | $ | 8.16 | ||||
Class R4 shares: |
||||||||
Net assets |
$ | 3,066,307 | $ | 32,057,569 | ||||
Shares outstanding (a) |
360,292 | 3,973,970 | ||||||
Net asset value, offering price and redemption price per share |
$ | 8.51 | $ | 8.07 | ||||
Class A shares: |
||||||||
Net assets |
$ | 14,202,381 | $ | 45,255,831 | ||||
Shares outstanding (a) |
1,687,472 | 5,529,162 | ||||||
Net asset value, and redemption price per share |
8.42 | 8.18 | ||||||
Offering price per share (100/[100-maximum sales charge] of net asset value) |
$ | 8.91 | $ | 8.66 | ||||
Class R3 shares: |
||||||||
Net assets |
$ | 4,126,285 | $ | 15,309,227 | ||||
Shares outstanding (a) |
500,418 | 1,907,610 | ||||||
Net asset value, offering price and redemption price per share |
$ | 8.25 | $ | 8.03 | ||||
|
(a) |
Authorized unlimited number of shares with no par value. |
The accompanying notes are an integral part of the financial statements.
76
MassMutual |
MassMutual |
MassMutual |
MassMutual |
MassMutual |
|||||||||||||||
| $ | 28,472,785 | $ | 33,246,165 | $ | 14,100,038 | $ | 37,477,934 | $ | 44,023,145 | ||||||||||
| 3,548,238 | 3,751,466 | 1,498,635 | 3,741,005 | 4,492,789 | |||||||||||||||
| $ | 8.02 | $ | 8.86 | $ | 9.41 | $ | 10.02 | $ | 9.80 | ||||||||||
| $ | 8,300,085 | $ | 3,300,521 | $ | 3,825,825 | $ | 23,949,940 | $ | 1,186,260 | ||||||||||
| 1,034,248 | 371,926 | 405,404 | 2,396,591 | 119,688 | |||||||||||||||
| $ | 8.03 | $ | 8.87 | $ | 9.44 | $ | 9.99 | $ | 9.91 | ||||||||||
| $ | 20,361,358 | $ | 12,945,343 | $ | 5,973,488 | $ | 9,053,151 | $ | 3,810,763 | ||||||||||
| 2,524,529 | 1,457,182 | 632,312 | 899,081 | 388,055 | |||||||||||||||
| $ | 8.07 | $ | 8.88 | $ | 9.45 | $ | 10.07 | $ | 9.82 | ||||||||||
| $ | 37,870,533 | $ | 17,295,981 | $ | 22,751,126 | $ | 19,965,507 | $ | 24,363,396 | ||||||||||
| 4,693,759 | 1,947,172 | 2,409,216 | 1,990,184 | 2,494,771 | |||||||||||||||
| $ | 8.07 | $ | 8.88 | $ | 9.44 | $ | 10.03 | $ | 9.77 | ||||||||||
| $ | 8,037,485 | $ | 12,041,197 | $ | 9,503,731 | $ | 15,666,183 | $ | 21,217,878 | ||||||||||
| 1,005,936 | 1,379,318 | 1,025,388 | 1,603,593 | 2,212,420 | |||||||||||||||
| $ | 7.99 | $ | 8.73 | $ | 9.27 | $ | 9.77 | $ | 9.59 | ||||||||||
| $ | 44,420,495 | $ | 20,773,090 | $ | 10,306,987 | $ | 20,469,755 | $ | 8,654,945 | ||||||||||
| 5,483,613 | 2,341,656 | 1,093,962 | 2,052,505 | 886,263 | |||||||||||||||
| 8.10 | 8.87 | 9.42 | 9.97 | 9.77 | |||||||||||||||
| $ | 8.57 | $ | 9.39 | $ | 9.97 | $ | 10.55 | $ | 10.34 | ||||||||||
| $ | 9,592,285 | $ | 14,152,557 | $ | 16,574,611 | $ | 35,009,007 | $ | 38,799,346 | ||||||||||
| 1,207,488 | 1,633,253 | 1,806,214 | 3,662,788 | 4,060,046 | |||||||||||||||
| $ | 7.94 | $ | 8.67 | $ | 9.18 | $ | 9.56 | $ | 9.56 | ||||||||||
The accompanying notes are an integral part of the financial statements.
77
MassMutual Funds – Financial Statements (Continued) |
Statements of Assets and Liabilities |
MassMutual |
MassMutual |
|||||||
Assets: |
||||||||
Investments, at value - unaffiliated issuers (Note 2) (a) |
$ | 75,994,015 | $ | 34,206,700 | ||||
Investments, at value - affiliated issuers (Note 2 & 7) (b) |
233,453,977 | 104,233,460 | ||||||
Total investments |
309,447,992 | 138,440,160 | ||||||
Receivables from: |
||||||||
Investments sold |
||||||||
Regular delivery |
— | 48,994 | ||||||
Fund shares sold |
152,331 | 86,952 | ||||||
Investment adviser (Note 3) |
11,516 | 11,100 | ||||||
Dividends |
133,938 | 37,773 | ||||||
Prepaid expenses |
31,921 | 33,751 | ||||||
Total assets |
309,777,698 | 138,658,730 | ||||||
Liabilities: |
||||||||
Payables for: |
||||||||
Investments purchased |
||||||||
Regular delivery |
204,280 | 37,773 | ||||||
Fund shares repurchased |
78,062 | 121,643 | ||||||
Trustees’ fees and expenses (Note 3) |
57,863 | 16,845 | ||||||
Affiliates (Note 3): |
||||||||
Administration fees |
71,630 | 46,357 | ||||||
Service fees |
81,177 | 45,648 | ||||||
Distribution fees |
47,616 | 27,947 | ||||||
Accrued expense and other liabilities |
94,938 | 69,680 | ||||||
Total liabilities |
635,566 | 365,893 | ||||||
Net assets |
$ | 309,142,132 | $ | 138,292,837 | ||||
Net assets consist of: |
||||||||
Paid-in capital |
$ | 366,756,607 | $ | 163,189,382 | ||||
Accumulated earnings (loss) |
(57,614,475 | ) | (24,896,545 | ) | ||||
Net assets |
$ | 309,142,132 | $ | 138,292,837 | ||||
(a) |
Cost of investments - unaffiliated issuers: |
$ | 84,911,465 | $ | 37,673,836 | ||||
(b) |
Cost of investments - affiliated issuers: |
$ | 289,614,375 | $ | 131,179,982 |
The accompanying notes are an integral part of the financial statements.
78
MassMutual |
MassMutual |
MassMutual |
MassMutual |
MassMutual |
|||||||||||||||
| $ | 58,725,160 | $ | 27,842,130 | $ | 43,445,484 | $ | 14,593,839 | $ | 4,806,751 | ||||||||||
| 165,392,241 | 73,353,863 | 113,535,978 | 38,091,517 | 12,541,201 | |||||||||||||||
| 224,117,401 | 101,195,993 | 156,981,462 | 52,685,356 | 17,347,952 | |||||||||||||||
| 5,022 | 50,962 | — | 4,451 | — | |||||||||||||||
| 149,951 | 56,401 | 138,796 | 58,410 | 18,753 | |||||||||||||||
| 13,375 | 15,034 | 14,946 | 17,662 | 16,278 | |||||||||||||||
| 47,906 | 15,040 | 21,283 | 7,140 | 2,349 | |||||||||||||||
| 32,212 | 33,750 | 30,384 | 39,045 | 17,126 | |||||||||||||||
| 224,365,867 | 101,367,180 | 157,186,871 | 52,812,064 | 17,402,458 | |||||||||||||||
| 47,906 | 15,040 | 36,780 | 7,140 | 18,462 | |||||||||||||||
| 152,105 | 106,086 | 121,295 | 62,203 | 2,161 | |||||||||||||||
| 35,942 | 10,277 | 18,515 | 2,841 | 874 | |||||||||||||||
| 59,285 | 42,376 | 50,219 | 35,046 | 28,464 | |||||||||||||||
| 50,975 | 36,223 | 33,701 | 18,644 | 1,732 | |||||||||||||||
| 29,613 | 20,978 | 19,409 | 13,716 | 898 | |||||||||||||||
| 78,193 | 61,857 | 65,378 | 51,902 | 51,175 | |||||||||||||||
| 454,019 | 292,837 | 345,297 | 191,492 | 103,766 | |||||||||||||||
| $ | 223,911,848 | $ | 101,074,343 | $ | 156,841,574 | $ | 52,620,572 | $ | 17,298,692 | ||||||||||
| $ | 262,332,325 | $ | 118,015,772 | $ | 184,824,449 | $ | 62,142,309 | $ | 20,480,977 | ||||||||||
| (38,420,477 | ) | (16,941,429 | ) | (27,982,875 | ) | (9,521,737 | ) | (3,182,285 | ) | ||||||||||
| $ | 223,911,848 | $ | 101,074,343 | $ | 156,841,574 | $ | 52,620,572 | $ | 17,298,692 | ||||||||||
| $ | 65,563,244 | $ | 30,806,194 | $ | 48,160,739 | $ | 16,206,145 | $ | 5,352,992 | ||||||||||
| $ | 209,434,724 | $ | 94,078,688 | $ | 145,341,978 | $ | 49,014,841 | $ | 16,052,236 |
The accompanying notes are an integral part of the financial statements.
79
MassMutual Funds – Financial Statements (Continued) |
Statements of Assets and Liabilities |
MassMutual |
MassMutual |
|||||||
Class I shares: |
||||||||
Net assets |
$ | 56,716,674 | $ | 41,191,145 | ||||
Shares outstanding (a) |
5,661,462 | 4,122,991 | ||||||
Net asset value, offering price and redemption price per share |
$ | 10.02 | $ | 9.99 | ||||
Class R5 shares: |
||||||||
Net assets |
$ | 68,660,859 | $ | 2,624,094 | ||||
Shares outstanding (a) |
6,893,888 | 262,322 | ||||||
Net asset value, offering price and redemption price per share |
$ | 9.96 | $ | 10.00 | ||||
Service Class shares: |
||||||||
Net assets |
$ | 15,661,402 | $ | 6,293,191 | ||||
Shares outstanding (a) |
1,560,289 | 620,056 | ||||||
Net asset value, offering price and redemption price per share |
$ | 10.04 | $ | 10.15 | ||||
Administrative Class shares: |
||||||||
Net assets |
$ | 48,874,028 | $ | 20,431,896 | ||||
Shares outstanding (a) |
4,887,246 | 2,026,251 | ||||||
Net asset value, offering price and redemption price per share |
$ | 10.00 | $ | 10.08 | ||||
Class R4 shares: |
||||||||
Net assets |
$ | 22,702,059 | $ | 18,897,162 | ||||
Shares outstanding (a) |
2,313,892 | 1,908,697 | ||||||
Net asset value, offering price and redemption price per share |
$ | 9.81 | $ | 9.90 | ||||
Class A shares: |
||||||||
Net assets |
$ | 26,416,674 | $ | 7,392,000 | ||||
Shares outstanding (a) |
2,658,275 | 737,018 | ||||||
Net asset value, and redemption price per share |
9.94 | 10.03 | ||||||
Offering price per share (100/[100-maximum sales charge] of net asset value) |
$ | 10.52 | $ | 10.61 | ||||
Class R3 shares: |
||||||||
Net assets |
$ | 70,110,436 | $ | 41,463,349 | ||||
Shares outstanding (a) |
7,300,921 | 4,208,396 | ||||||
Net asset value, offering price and redemption price per share |
$ | 9.60 | $ | 9.85 | ||||
|
(a) |
Authorized unlimited number of shares with no par value. |
The accompanying notes are an integral part of the financial statements.
80
MassMutual |
MassMutual |
MassMutual |
MassMutual |
MassMutual |
|||||||||||||||
| $ | 46,252,489 | $ | 26,481,230 | $ | 26,438,601 | $ | 12,870,592 | $ | 11,504,559 | ||||||||||
| 4,636,380 | 2,657,414 | 3,633,807 | 1,498,910 | 1,347,342 | |||||||||||||||
| $ | 9.98 | $ | 9.97 | $ | 7.28 | $ | 8.59 | $ | 8.54 | ||||||||||
| $ | 47,871,339 | $ | 1,198,683 | $ | 41,661,861 | $ | 876,892 | $ | 194,306 | ||||||||||
| 4,802,893 | 120,283 | 5,739,283 | 102,100 | 22,759 | |||||||||||||||
| $ | 9.97 | $ | 9.97 | $ | 7.26 | $ | 8.59 | $ | 8.54 | ||||||||||
| $ | 11,683,022 | $ | 3,250,613 | $ | 4,477,649 | $ | 2,665,679 | $ | 1,215,462 | ||||||||||
| 1,166,002 | 325,914 | 612,406 | 309,105 | 143,166 | |||||||||||||||
| $ | 10.02 | $ | 9.97 | $ | 7.31 | $ | 8.62 | $ | 8.49 | ||||||||||
| $ | 43,753,637 | $ | 17,419,020 | $ | 34,706,078 | $ | 8,852,150 | $ | 1,788,337 | ||||||||||
| 4,397,047 | 1,758,857 | 4,775,914 | 1,036,007 | 211,268 | |||||||||||||||
| $ | 9.95 | $ | 9.90 | $ | 7.27 | $ | 8.54 | $ | 8.46 | ||||||||||
| $ | 15,650,361 | $ | 15,863,671 | $ | 12,419,078 | $ | 5,975,899 | $ | 923,375 | ||||||||||
| 1,606,123 | 1,634,831 | 1,736,818 | 704,132 | 109,168 | |||||||||||||||
| $ | 9.74 | $ | 9.70 | $ | 7.15 | $ | 8.49 | $ | 8.46 | ||||||||||
| $ | 15,261,594 | $ | 6,266,837 | $ | 8,581,787 | $ | 1,265,166 | $ | 329,228 | ||||||||||
| 1,543,655 | 635,753 | 1,187,030 | 145,933 | 38,821 | |||||||||||||||
| 9.89 | 9.86 | 7.23 | 8.67 | 8.48 | |||||||||||||||
| $ | 10.47 | $ | 10.43 | $ | 7.65 | $ | 9.17 | $ | 8.97 | ||||||||||
| $ | 43,439,406 | $ | 30,594,289 | $ | 28,556,520 | $ | 20,114,194 | $ | 1,343,425 | ||||||||||
| 4,564,648 | 3,166,128 | 4,039,428 | 2,387,908 | 159,589 | |||||||||||||||
| $ | 9.52 | $ | 9.66 | $ | 7.07 | $ | 8.42 | $ | 8.42 | ||||||||||
The accompanying notes are an integral part of the financial statements.
81
MassMutual Funds – Financial Statements (Continued) |
Statements of Assets and Liabilities |
MassMutual |
MassMutual |
|||||||
Assets: |
||||||||
Investments, at value - unaffiliated issuers (Note 2) (a) |
$ | 21,762,446 | $ | 3,363,818 | ||||
Investments, at value - affiliated issuers (Note 2 & 7) (b) |
136,423,289 | 21,017,282 | ||||||
Total investments |
158,185,735 | 24,381,100 | ||||||
Receivables from: |
||||||||
Investments sold |
||||||||
Regular delivery |
44,809 | — | ||||||
Fund shares sold |
19,337 | 61,082 | ||||||
Investment adviser (Note 3) |
16,304 | 3,015 | ||||||
Dividends |
72,450 | 10,994 | ||||||
Total assets |
158,338,635 | 24,456,191 | ||||||
Liabilities: |
||||||||
Payables for: |
||||||||
Investments purchased |
||||||||
Regular delivery |
72,450 | 71,967 | ||||||
Fund shares repurchased |
62,531 | — | ||||||
Affiliates (Note 3): |
||||||||
Investment advisory fees |
61,772 | 1,611 | ||||||
Service fees |
7,899 | 2,402 | ||||||
Distribution fees |
2,913 | 971 | ||||||
Total liabilities |
207,565 | 76,951 | ||||||
Net assets |
$ | 158,131,070 | $ | 24,379,240 | ||||
Net assets consist of: |
||||||||
Paid-in capital |
$ | 179,243,282 | $ | 28,379,614 | ||||
Accumulated earnings (loss) |
(21,112,212 | ) | (4,000,374 | ) | ||||
Net assets |
$ | 158,131,070 | $ | 24,379,240 | ||||
(a) |
Cost of investments - unaffiliated issuers: |
$ | 23,003,306 | $ | 3,558,168 | ||||
(b) |
Cost of investments - affiliated issuers: |
$ | 162,286,338 | $ | 25,485,008 |
The accompanying notes are an integral part of the financial statements.
82
MassMutual |
MassMutual |
MassMutual |
MassMutual |
MassMutual |
|||||||||||||||
| $ | 13,785,753 | $ | 15,118,158 | $ | 62,859,366 | $ | 60,446,809 | $ | 109,331,642 | ||||||||||
| 89,516,318 | 99,149,512 | 449,252,283 | 467,372,823 | 1,064,431,537 | |||||||||||||||
| 103,302,071 | 114,267,670 | 512,111,649 | 527,819,632 | 1,173,763,179 | |||||||||||||||
| 152,129 | — | 655,193 | 39,330 | 636,065 | |||||||||||||||
| 17,244 | 38,705 | 259,952 | 192,107 | 724,737 | |||||||||||||||
| 12,783 | 13,277 | 64,942 | 70,608 | 158,114 | |||||||||||||||
| 45,472 | 49,665 | 207,598 | 187,139 | 314,064 | |||||||||||||||
| 103,529,699 | 114,369,317 | 513,299,334 | 528,308,816 | 1,175,596,159 | |||||||||||||||
| 45,472 | 77,501 | 207,598 | 187,139 | 314,064 | |||||||||||||||
| 168,270 | 9,619 | 909,647 | 225,774 | 1,348,237 | |||||||||||||||
| 33,511 | 39,986 | 223,374 | 235,110 | 592,676 | |||||||||||||||
| 13,465 | 7,450 | 75,621 | 64,183 | 159,346 | |||||||||||||||
| 6,039 | 3,327 | 25,043 | 24,832 | 55,096 | |||||||||||||||
| 266,757 | 137,883 | 1,441,283 | 737,038 | 2,469,419 | |||||||||||||||
| $ | 103,262,942 | $ | 114,231,434 | $ | 511,858,051 | $ | 527,571,778 | $ | 1,173,126,740 | ||||||||||
| $ | 117,354,729 | $ | 127,964,862 | $ | 561,727,839 | $ | 579,822,679 | $ | 1,244,866,205 | ||||||||||
| (14,091,787 | ) | (13,733,428 | ) | (49,869,788 | ) | (52,250,901 | ) | (71,739,465 | ) | ||||||||||
| $ | 103,262,942 | $ | 114,231,434 | $ | 511,858,051 | $ | 527,571,778 | $ | 1,173,126,740 | ||||||||||
| $ | 14,457,111 | $ | 15,850,975 | $ | 66,120,260 | $ | 63,261,810 | $ | 113,183,767 | ||||||||||
| $ | 107,915,055 | $ | 118,651,306 | $ | 532,518,232 | $ | 560,345,870 | $ | 1,242,114,683 |
The accompanying notes are an integral part of the financial statements.
83
MassMutual Funds – Financial Statements (Continued) |
Statements of Assets and Liabilities |
MassMutual |
MassMutual |
|||||||
Class I shares: |
||||||||
Net assets |
$ | 20,187,224 | $ | 15,172,768 | ||||
Shares outstanding (a) |
1,482,489 | 1,218,370 | ||||||
Net asset value, offering price and redemption price per share |
$ | 13.62 | $ | 12.45 | ||||
Class M5 shares: |
||||||||
Net assets |
$ | 126,516,586 | $ | 5,680,762 | ||||
Shares outstanding (a) |
9,279,899 | 457,289 | ||||||
Net asset value, offering price and redemption price per share |
$ | 13.63 | $ | 12.42 | ||||
Class M4 shares: |
||||||||
Net assets |
$ | 7,314,092 | $ | 2,072,962 | ||||
Shares outstanding (a) |
535,904 | 166,957 | ||||||
Net asset value, offering price and redemption price per share |
$ | 13.65 | $ | 12.42 | ||||
Class M3 shares: |
||||||||
Net assets |
$ | 4,113,168 | $ | 1,452,748 | ||||
Shares outstanding (a) |
303,072 | 117,694 | ||||||
Net asset value, offering price and redemption price per share |
$ | 13.57 | $ | 12.34 | ||||
|
(a) |
Authorized unlimited number of shares with no par value. |
The accompanying notes are an integral part of the financial statements.
84
MassMutual |
MassMutual |
MassMutual |
MassMutual |
MassMutual |
|||||||||||||||
| $ | 63,307,726 | $ | 65,437,964 | $ | 267,728,472 | $ | 356,557,480 | $ | 627,370,203 | ||||||||||
| 4,785,746 | 4,823,394 | 19,854,259 | 25,435,211 | 43,670,085 | |||||||||||||||
| $ | 13.23 | $ | 13.57 | $ | 13.48 | $ | 14.02 | $ | 14.37 | ||||||||||
| $ | 20,741,428 | $ | 39,275,015 | $ | 137,210,611 | $ | 83,947,015 | $ | 322,959,100 | ||||||||||
| 1,570,672 | 2,901,405 | 10,191,480 | 6,000,800 | 22,522,655 | |||||||||||||||
| $ | 13.21 | $ | 13.54 | $ | 13.46 | $ | 13.99 | $ | 14.34 | ||||||||||
| $ | 10,566,728 | $ | 5,065,964 | $ | 70,875,716 | $ | 51,635,280 | $ | 143,393,004 | ||||||||||
| 800,253 | 373,672 | 5,266,879 | 3,696,028 | 10,014,914 | |||||||||||||||
| $ | 13.20 | $ | 13.56 | $ | 13.46 | $ | 13.97 | $ | 14.32 | ||||||||||
| $ | 8,647,060 | $ | 4,452,491 | $ | 36,043,252 | $ | 35,432,003 | $ | 79,404,433 | ||||||||||
| 655,974 | 330,170 | 2,679,216 | 2,545,201 | 5,548,207 | |||||||||||||||
| $ | 13.18 | $ | 13.49 | $ | 13.45 | $ | 13.92 | $ | 14.31 | ||||||||||
The accompanying notes are an integral part of the financial statements.
85
MassMutual Funds – Financial Statements (Continued) |
Statements of Assets and Liabilities |
MassMutual |
MassMutual |
|||||||
Assets: |
||||||||
Investments, at value - unaffiliated issuers (Note 2) (a) |
$ | 42,753,142 | $ | 46,416,277 | ||||
Investments, at value - affiliated issuers (Note 2 & 7) (b) |
571,349,286 | 981,431,882 | ||||||
Total investments |
614,102,428 | 1,027,848,159 | ||||||
Receivables from: |
||||||||
Investments sold |
||||||||
Regular delivery |
— | 690,317 | ||||||
Fund shares sold |
480,632 | 560,287 | ||||||
Investment adviser (Note 3) |
89,377 | 151,699 | ||||||
Dividends |
111,676 | 106,849 | ||||||
Total assets |
614,784,113 | 1,029,357,311 | ||||||
Liabilities: |
||||||||
Payables for: |
||||||||
Investments purchased |
||||||||
Regular delivery |
574,753 | 106,849 | ||||||
Fund shares repurchased |
11,001 | 1,239,525 | ||||||
Affiliates (Note 3): |
||||||||
Investment advisory fees |
311,521 | 572,241 | ||||||
Service fees |
76,997 | 138,332 | ||||||
Distribution fees |
24,472 | 45,643 | ||||||
Total liabilities |
998,744 | 2,102,590 | ||||||
Net assets |
$ | 613,785,369 | $ | 1,027,254,721 | ||||
Net assets consist of: |
||||||||
Paid-in capital |
$ | 661,984,177 | $ | 1,069,497,407 | ||||
Accumulated earnings (loss) |
(48,198,808 | ) | (42,242,686 | ) | ||||
Net assets |
$ | 613,785,369 | $ | 1,027,254,721 | ||||
(a) |
Cost of investments - unaffiliated issuers: |
$ | 43,745,622 | $ | 47,192,980 | ||||
(b) |
Cost of investments - affiliated issuers: |
$ | 676,257,345 | $ | 1,144,240,448 |
The accompanying notes are an integral part of the financial statements.
86
MassMutual |
MassMutual |
MassMutual |
MassMutual |
||||||||||||
| $ | 16,588,538 | $ | 22,954,469 | $ | 8,367,710 | $ | 3,738,427 | ||||||||
| 459,105,235 | 678,558,248 | 286,592,619 | 126,753,652 | ||||||||||||
| 475,693,773 | 701,512,717 | 294,960,329 | 130,492,079 | ||||||||||||
| — | — | — | — | ||||||||||||
| 583,100 | 722,900 | 697,320 | 440,173 | ||||||||||||
| 72,160 | 101,632 | 41,750 | 17,497 | ||||||||||||
| 33,092 | 47,260 | 17,442 | 7,570 | ||||||||||||
| 476,382,125 | 702,384,509 | 295,716,841 | 130,957,319 | ||||||||||||
| 584,912 | 169,582 | 709,081 | 439,567 | ||||||||||||
| 26,174 | 593,053 | 2,552 | 6,885 | ||||||||||||
| 256,847 | 404,626 | 156,606 | 66,850 | ||||||||||||
| 60,277 | 86,875 | 36,229 | 16,908 | ||||||||||||
| 18,962 | 31,091 | 13,003 | 4,372 | ||||||||||||
| 947,172 | 1,285,227 | 917,471 | 534,582 | ||||||||||||
| $ | 475,434,953 | $ | 701,099,282 | $ | 294,799,370 | $ | 130,422,737 | ||||||||
| $ | 509,955,379 | $ | 736,924,881 | $ | 321,920,665 | $ | 149,822,527 | ||||||||
| (34,520,426 | ) | (35,825,599 | ) | (27,121,295 | ) | (19,399,790 | ) | ||||||||
| $ | 475,434,953 | $ | 701,099,282 | $ | 294,799,370 | $ | 130,422,737 | ||||||||
| $ | 16,565,415 | $ | 22,940,059 | $ | 8,362,648 | $ | 3,735,596 | ||||||||
| $ | 543,766,258 | $ | 796,000,057 | $ | 342,122,947 | $ | 156,474,350 |
The accompanying notes are an integral part of the financial statements.
87
MassMutual Funds – Financial Statements (Continued) |
Statements of Assets and Liabilities |
MassMutual |
MassMutual |
|||||||
Class I shares: |
||||||||
Net assets |
$ | 412,007,542 | $ | 542,665,826 | ||||
Shares outstanding (a) |
27,990,604 | 36,316,256 | ||||||
Net asset value, offering price and redemption price per share |
$ | 14.72 | $ | 14.94 | ||||
Class M5 shares: |
||||||||
Net assets |
$ | 98,488,110 | $ | 295,086,838 | ||||
Shares outstanding (a) |
6,708,285 | 19,789,368 | ||||||
Net asset value, offering price and redemption price per share |
$ | 14.68 | $ | 14.91 | ||||
Class M4 shares: |
||||||||
Net assets |
$ | 67,260,110 | $ | 123,660,536 | ||||
Shares outstanding (a) |
4,592,168 | 8,313,391 | ||||||
Net asset value, offering price and redemption price per share |
$ | 14.65 | $ | 14.87 | ||||
Class M3 shares: |
||||||||
Net assets |
$ | 36,029,607 | $ | 65,841,521 | ||||
Shares outstanding (a) |
2,458,979 | 4,424,794 | ||||||
Net asset value, offering price and redemption price per share |
$ | 14.65 | $ | 14.88 | ||||
|
(a) |
Authorized unlimited number of shares with no par value. |
The accompanying notes are an integral part of the financial statements.
88
MassMutual |
MassMutual |
MassMutual |
MassMutual |
||||||||||||
| $ | 333,390,181 | $ | 364,456,826 | $ | 215,507,286 | $ | 70,208,313 | ||||||||
| 22,065,169 | 23,970,644 | 14,241,875 | 4,653,653 | ||||||||||||
| $ | 15.11 | $ | 15.20 | $ | 15.13 | $ | 15.09 | ||||||||
| $ | 65,767,959 | $ | 221,154,582 | $ | 32,886,588 | $ | 36,563,564 | ||||||||
| 4,363,488 | 14,576,073 | 2,178,683 | 2,431,675 | ||||||||||||
| $ | 15.07 | $ | 15.17 | $ | 15.09 | $ | 15.04 | ||||||||
| $ | 48,714,663 | $ | 70,887,402 | $ | 27,141,570 | $ | 17,032,085 | ||||||||
| 3,244,769 | 4,686,878 | 1,804,862 | 1,137,823 | ||||||||||||
| $ | 15.01 | $ | 15.12 | $ | 15.04 | $ | 14.97 | ||||||||
| $ | 27,562,150 | $ | 44,600,472 | $ | 19,263,926 | $ | 6,618,775 | ||||||||
| 1,831,842 | 2,950,192 | 1,281,874 | 442,594 | ||||||||||||
| $ | 15.05 | $ | 15.12 | $ | 15.03 | $ | 14.95 | ||||||||
The accompanying notes are an integral part of the financial statements.
89
MassMutual Funds – Financial Statements (Continued) |
Statements of Operations |
MassMutual |
MassMutual |
|||||||
Investment income (Note 2): |
||||||||
Dividends - unaffiliated issuers |
$ | 1,240,569 | $ | 1,292,374 | ||||
Dividends - affiliated issuers (Note 7) |
4,836,638 | 4,535,254 | ||||||
Total investment income |
6,077,207 | 5,827,628 | ||||||
Expenses (Note 3): |
||||||||
Custody fees |
7,906 | 8,003 | ||||||
Audit fees |
43,224 | 43,234 | ||||||
Legal fees |
6,553 | 7,388 | ||||||
Proxy fees |
1,337 | 1,337 | ||||||
Accounting & Administration fees |
33,942 | 33,948 | ||||||
Shareholder reporting fees |
17,036 | 18,111 | ||||||
Trustees’ fees |
9,556 | 10,988 | ||||||
Registration and filing fees |
99,181 | 99,373 | ||||||
Transfer agent fees |
2,968 | 2,968 | ||||||
| 221,703 | 225,350 | |||||||
Administration fees: |
||||||||
Class R5 |
5,458 | 8,155 | ||||||
Service Class |
232,980 | 30,905 | ||||||
Administrative Class |
64,685 | 108,814 | ||||||
Class R4 |
7,354 | 70,188 | ||||||
Class A |
51,699 | 162,342 | ||||||
Class R3 |
10,842 | 33,652 | ||||||
Distribution and Service fees: |
||||||||
Class R4 |
9,192 | 87,735 | ||||||
Class A |
43,083 | 135,284 | ||||||
Class R3 |
27,106 | 84,130 | ||||||
Total expenses |
674,102 | 946,555 | ||||||
Expenses waived (Note 3): |
||||||||
Class I fees reimbursed by adviser |
(12,781 | ) | (20,147 | ) | ||||
Class R5 fees reimbursed by adviser |
(4,153 | ) | (3,844 | ) | ||||
Service Class fees reimbursed by adviser |
(92,468 | ) | (7,443 | ) | ||||
Administrative Class fees reimbursed by adviser |
(17,059 | ) | (17,389 | ) | ||||
Class R4 fees reimbursed by adviser |
(2,911 | ) | (17,031 | ) | ||||
Class A fees reimbursed by adviser |
(13,627 | ) | (26,078 | ) | ||||
Class R3 fees reimbursed by adviser |
(4,285 | ) | (8,211 | ) | ||||
Net expenses: |
526,818 | 846,412 | ||||||
Net investment income (loss) |
5,550,389 | 4,981,216 | ||||||
Realized and unrealized gain (loss): |
||||||||
Net realized gain (loss) on: |
||||||||
Investment transactions - unaffiliated issuers |
136,761 | 46,095 | ||||||
Investment transactions - affiliated issuers (Note 7) |
(1,792,190 | ) | (2,876,477 | ) | ||||
Realized gain distributions - affiliated issuers (Note 7) |
7,082,985 | 14,010,369 | ||||||
Net realized gain (loss) |
5,427,556 | 11,179,987 | ||||||
Net change in unrealized appreciation (depreciation) on: |
||||||||
Investment transactions - unaffiliated issuers |
(5,068,736 | ) | (6,546,835 | ) | ||||
Investment transactions - affiliated issuers (Note 7) |
(36,166,443 | ) | (45,072,500 | ) | ||||
Net change in unrealized appreciation (depreciation) |
(41,235,179 | ) | (51,619,335 | ) | ||||
Net realized gain (loss) and change in unrealized appreciation (depreciation) |
(35,807,623 | ) | (40,439,348 | ) | ||||
Net increase (decrease) in net assets resulting from operations |
$ | (30,257,234 | ) | $ | (35,458,132 | ) | ||
The accompanying notes are an integral part of the financial statements.
90
MassMutual |
MassMutual |
MassMutual |
MassMutual |
MassMutual |
|||||||||||||||
| $ | 1,166,623 | $ | 872,002 | $ | 790,580 | $ | 1,674,402 | $ | 1,629,664 | ||||||||||
| 3,405,998 | 2,072,223 | 2,383,039 | 5,163,906 | 3,821,964 | |||||||||||||||
| 4,572,621 | 2,944,225 | 3,173,619 | 6,838,308 | 5,451,628 | |||||||||||||||
| 7,877 | 8,194 | 10,027 | 9,645 | 9,878 | |||||||||||||||
| 41,803 | 41,758 | 43,177 | 43,949 | 41,806 | |||||||||||||||
| 7,329 | 5,240 | 1,884 | 5,019 | 4,666 | |||||||||||||||
| 1,337 | 1,337 | 1,337 | 1,337 | 1,337 | |||||||||||||||
| 33,951 | 33,945 | 31,227 | 34,195 | 34,182 | |||||||||||||||
| 17,330 | 14,038 | 21,729 | 23,547 | 19,721 | |||||||||||||||
| 10,171 | 6,968 | 5,504 | 11,875 | 9,043 | |||||||||||||||
| 99,182 | 99,172 | 100,454 | 102,285 | 100,490 | |||||||||||||||
| 2,968 | 2,968 | 2,968 | 2,968 | 2,968 | |||||||||||||||
| 221,948 | 213,620 | 218,307 | 234,820 | 224,091 | |||||||||||||||
| 15,971 | 5,801 | 4,492 | 30,698 | 1,351 | |||||||||||||||
| 48,593 | 30,023 | 17,213 | 36,973 | 13,067 | |||||||||||||||
| 144,765 | 63,820 | 83,333 | 86,796 | 92,895 | |||||||||||||||
| 19,233 | 26,746 | 22,930 | 38,042 | 50,298 | |||||||||||||||
| 158,336 | 79,503 | 37,874 | 78,567 | 34,294 | |||||||||||||||
| 23,531 | 34,393 | 39,654 | 85,423 | 100,578 | |||||||||||||||
| 24,041 | 33,434 | 28,663 | 47,553 | 62,874 | |||||||||||||||
| 131,947 | 66,252 | 31,562 | 65,473 | 28,578 | |||||||||||||||
| 58,826 | 85,982 | 99,134 | 213,558 | 251,442 | |||||||||||||||
| 847,191 | 639,574 | 583,162 | 917,903 | 859,468 | |||||||||||||||
| (17,251 | ) | (25,355 | ) | (25,628 | ) | (33,020 | ) | (61,059 | ) | ||||||||||
| (8,242 | ) | (3,719 | ) | (6,986 | ) | (21,684 | ) | (1,568 | ) | ||||||||||
| (13,370 | ) | (9,742 | ) | (13,369 | ) | (12,698 | ) | (7,505 | ) | ||||||||||
| (26,202 | ) | (13,754 | ) | (43,323 | ) | (20,198 | ) | (35,790 | ) | ||||||||||
| (5,273 | ) | (8,661 | ) | (17,785 | ) | (13,461 | ) | (29,113 | ) | ||||||||||
| (28,992 | ) | (16,918 | ) | (19,604 | ) | (18,511 | ) | (13,188 | ) | ||||||||||
| (6,414 | ) | (11,127 | ) | (30,897 | ) | (30,248 | ) | (58,031 | ) | ||||||||||
| 741,447 | 550,298 | 425,570 | 768,083 | 653,214 | |||||||||||||||
| 3,831,174 | 2,393,927 | 2,748,049 | 6,070,225 | 4,798,414 | |||||||||||||||
| 731,408 | 87,180 | (699,559 | ) | (242,711 | ) | 181,045 | |||||||||||||
| 197,863 | 324,973 | (1,100,530 | ) | (1,120,306 | ) | (43,249 | ) | ||||||||||||
| 19,085,809 | 15,710,895 | 5,162,041 | 11,267,199 | 12,035,174 | |||||||||||||||
| 20,015,080 | 16,123,048 | 3,361,952 | 9,904,182 | 12,172,970 | |||||||||||||||
| (7,110,272 | ) | (5,786,542 | ) | (3,510,282 | ) | (8,304,626 | ) | (8,782,803 | ) | ||||||||||
| (48,184,805 | ) | (37,640,045 | ) | (19,418,121 | ) | (41,246,354 | ) | (39,821,736 | ) | ||||||||||
| (55,295,077 | ) | (43,426,587 | ) | (22,928,403 | ) | (49,550,980 | ) | (48,604,539 | ) | ||||||||||
| (35,279,997 | ) | (27,303,539 | ) | (19,566,451 | ) | (39,646,798 | ) | (36,431,569 | ) | ||||||||||
| $ | (31,448,823 | ) | $ | (24,909,612 | ) | $ | (16,818,402 | ) | $ | (33,576,573 | ) | $ | (31,633,155 | ) | |||||
The accompanying notes are an integral part of the financial statements.
91
MassMutual Funds – Financial Statements (Continued) |
Statements of Operations |
MassMutual |
MassMutual |
|||||||
Investment income (Note 2): |
||||||||
Dividends - unaffiliated issuers |
$ | 3,763,583 | $ | 1,614,471 | ||||
Dividends - affiliated issuers (Note 7) |
7,278,361 | 2,806,906 | ||||||
Total investment income |
11,041,944 | 4,421,377 | ||||||
Expenses (Note 3): |
||||||||
Custody fees |
9,478 | 9,502 | ||||||
Audit fees |
43,375 | 43,215 | ||||||
Legal fees |
10,706 | 4,964 | ||||||
Proxy fees |
1,337 | 1,337 | ||||||
Accounting & Administration fees |
34,460 | 34,294 | ||||||
Shareholder reporting fees |
27,612 | 17,465 | ||||||
Trustees’ fees |
20,000 | 8,323 | ||||||
Registration and filing fees |
100,058 | 100,157 | ||||||
Transfer agent fees |
2,968 | 2,968 | ||||||
| 249,994 | 222,225 | |||||||
Administration fees: |
||||||||
Class R5 |
79,593 | 3,322 | ||||||
Service Class |
60,482 | 14,746 | ||||||
Administrative Class |
194,101 | 83,424 | ||||||
Class R4 |
55,354 | 43,495 | ||||||
Class A |
100,144 | 32,029 | ||||||
Class R3 |
165,153 | 97,786 | ||||||
Distribution and Service fees: |
||||||||
Class R4 |
69,192 | 54,369 | ||||||
Class A |
83,453 | 26,691 | ||||||
Class R3 |
412,884 | 244,464 | ||||||
Total expenses |
1,470,350 | 822,551 | ||||||
Expenses waived (Note 3): |
||||||||
Class I fees reimbursed by adviser |
(16,307 | ) | (40,066 | ) | ||||
Class R5 fees reimbursed by adviser |
(20,320 | ) | (2,720 | ) | ||||
Service Class fees reimbursed by adviser |
(7,584 | ) | (6,051 | ) | ||||
Administrative Class fees reimbursed by adviser |
(16,436 | ) | (22,570 | ) | ||||
Class R4 fees reimbursed by adviser |
(7,053 | ) | (17,840 | ) | ||||
Class A fees reimbursed by adviser |
(8,417 | ) | (8,608 | ) | ||||
Class R3 fees reimbursed by adviser |
(21,097 | ) | (40,022 | ) | ||||
Net expenses: |
1,373,136 | 684,674 | ||||||
Net investment income (loss) |
9,668,808 | 3,736,703 | ||||||
Realized and unrealized gain (loss): |
||||||||
Net realized gain (loss) on: |
||||||||
Investment transactions - unaffiliated issuers |
993,846 | 772,104 | ||||||
Investment transactions - affiliated issuers (Note 7) |
3,911,269 | 2,408,395 | ||||||
Realized gain distributions - affiliated issuers (Note 7) |
30,983,017 | 16,236,548 | ||||||
Net realized gain (loss) |
35,888,132 | 19,417,047 | ||||||
Net change in unrealized appreciation (depreciation) on: |
||||||||
Investment transactions - unaffiliated issuers |
(21,016,356 | ) | (9,616,013 | ) | ||||
Investment transactions - affiliated issuers (Note 7) |
(94,958,959 | ) | (45,897,568 | ) | ||||
Net change in unrealized appreciation (depreciation) |
(115,975,315 | ) | (55,513,581 | ) | ||||
Net realized gain (loss) and change in unrealized appreciation (depreciation) |
(80,087,183 | ) | (36,096,534 | ) | ||||
Net increase (decrease) in net assets resulting from operations |
$ | (70,418,375 | ) | $ | (32,359,831 | ) | ||
The accompanying notes are an integral part of the financial statements.
92
MassMutual |
MassMutual |
MassMutual |
MassMutual |
MassMutual |
|||||||||||||||
| $ | 2,817,426 | $ | 1,267,116 | $ | 1,985,401 | $ | 638,785 | $ | 223,448 | ||||||||||
| 3,974,980 | 1,433,805 | 2,218,870 | 701,479 | 253,669 | |||||||||||||||
| 6,792,406 | 2,700,921 | 4,204,271 | 1,340,264 | 477,117 | |||||||||||||||
| 9,283 | 9,517 | 10,532 | 10,784 | 11,521 | |||||||||||||||
| 43,289 | 43,176 | 43,217 | 41,704 | 41,675 | |||||||||||||||
| 8,319 | 3,613 | 5,749 | 1,879 | 660 | |||||||||||||||
| 1,337 | 1,337 | 1,337 | 1,337 | 1,337 | |||||||||||||||
| 34,482 | 34,294 | 34,406 | 34,289 | 34,289 | |||||||||||||||
| 21,406 | 14,776 | 16,682 | 12,667 | 13,101 | |||||||||||||||
| 14,378 | 5,972 | 9,233 | 3,068 | 1,045 | |||||||||||||||
| 101,227 | 100,127 | 99,426 | 100,794 | 94,651 | |||||||||||||||
| 2,968 | 2,968 | 2,968 | 2,968 | 2,968 | |||||||||||||||
| 236,689 | 215,780 | 223,550 | 209,490 | 201,247 | |||||||||||||||
| 55,384 | 1,344 | 48,123 | 1,051 | 240 | |||||||||||||||
| 43,742 | 7,806 | 21,071 | 6,058 | 4,691 | |||||||||||||||
| 173,502 | 68,334 | 129,191 | 31,960 | 6,576 | |||||||||||||||
| 38,309 | 36,634 | 29,453 | 13,858 | 2,046 | |||||||||||||||
| 61,966 | 25,978 | 34,879 | 8,230 | 1,396 | |||||||||||||||
| 101,811 | 72,454 | 65,448 | 46,743 | 2,922 | |||||||||||||||
| 47,886 | 45,794 | 36,815 | 17,322 | 2,558 | |||||||||||||||
| 51,639 | 21,648 | 29,066 | 6,859 | 1,163 | |||||||||||||||
| 254,529 | 181,134 | 163,622 | 116,858 | 7,304 | |||||||||||||||
| 1,065,457 | 676,906 | 781,218 | 458,429 | 230,143 | |||||||||||||||
| (23,424 | ) | (48,216 | ) | (28,644 | ) | (48,503 | ) | (128,034 | ) | ||||||||||
| (25,160 | ) | (2,121 | ) | (47,071 | ) | (3,523 | ) | (2,285 | ) | ||||||||||
| (9,896 | ) | (6,120 | ) | (10,175 | ) | (10,158 | ) | (22,193 | ) | ||||||||||
| (26,094 | ) | (35,681 | ) | (42,002 | ) | (35,726 | ) | (20,724 | ) | ||||||||||
| (8,680 | ) | (28,850 | ) | (14,388 | ) | (23,385 | ) | (9,684 | ) | ||||||||||
| (9,327 | ) | (13,493 | ) | (11,285 | ) | (9,240 | ) | (4,407 | ) | ||||||||||
| (23,020 | ) | (56,937 | ) | (31,989 | ) | (78,955 | ) | (13,908 | ) | ||||||||||
| 939,856 | 485,488 | 595,664 | 248,939 | 28,908 | |||||||||||||||
| 5,852,550 | 2,215,433 | 3,608,607 | 1,091,325 | 448,209 | |||||||||||||||
| 1,582,550 | 953,671 | 1,003,846 | 357,727 | 105,904 | |||||||||||||||
| 4,131,357 | 3,264,292 | 2,755,179 | 1,512,334 | 224,382 | |||||||||||||||
| 29,337,864 | 13,832,891 | 21,529,485 | 6,789,416 | 2,468,796 | |||||||||||||||
| 35,051,771 | 18,050,854 | 25,288,510 | 8,659,477 | 2,799,082 | |||||||||||||||
| (17,061,338 | ) | (8,027,345 | ) | (12,185,454 | ) | (4,024,002 | ) | (1,327,976 | ) | ||||||||||
| (77,959,787 | ) | (36,464,981 | ) | (55,139,907 | ) | (18,526,791 | ) | (6,032,053 | ) | ||||||||||
| (95,021,125 | ) | (44,492,326 | ) | (67,325,361 | ) | (22,550,793 | ) | (7,360,029 | ) | ||||||||||
| (59,969,354 | ) | (26,441,472 | ) | (42,036,851 | ) | (13,891,316 | ) | (4,560,947 | ) | ||||||||||
| $ | (54,116,804 | ) | $ | (24,226,039 | ) | $ | (38,428,244 | ) | $ | (12,799,991 | ) | $ | (4,112,738 | ) | |||||
The accompanying notes are an integral part of the financial statements.
93
MassMutual Funds – Financial Statements (Continued) |
Statements of Operations |
MassMutual |
MassMutual |
|||||||
Investment income (Note 2): |
||||||||
Dividends - unaffiliated issuers |
$ | 807,985 | $ | 123,064 | ||||
Dividends - affiliated issuers (Note 7) |
4,944,424 | 724,361 | ||||||
Total investment income |
5,752,409 | 847,425 | ||||||
Expenses (Note 3): |
||||||||
Investment advisory fees: |
||||||||
Class I |
96,835 | 71,530 | ||||||
Class M5 |
793,676 | 39,711 | ||||||
Class M4 |
55,573 | 14,478 | ||||||
Class M3 |
30,959 | 9,005 | ||||||
Distribution and Service fees: |
||||||||
Class M4 |
25,446 | 6,339 | ||||||
Class M3 |
28,350 | 7,886 | ||||||
Total expenses |
1,030,839 | 148,949 | ||||||
Expenses waived (Note 3): |
||||||||
Class I fees reimbursed by adviser |
(30,184 | ) | (24,648 | ) | ||||
Class M5 fees reimbursed by adviser |
(179,317 | ) | (10,091 | ) | ||||
Class M4 fees reimbursed by adviser |
(12,602 | ) | (3,679 | ) | ||||
Class M3 fees reimbursed by adviser |
(6,974 | ) | (2,289 | ) | ||||
Net expenses: |
801,762 | 108,242 | ||||||
Net investment income (loss) |
4,950,647 | 739,183 | ||||||
Realized and unrealized gain (loss): |
||||||||
Net realized gain (loss) on: |
||||||||
Investment transactions - unaffiliated issuers |
(51,142 | ) | 5,175 | |||||
Investment transactions - affiliated issuers (Note 7) |
886,336 | 60,874 | ||||||
Realized gain distributions - unaffiliated issuers |
99,750 | 15,419 | ||||||
Realized gain distributions - affiliated issuers (Note 7) |
8,243,405 | 1,309,628 | ||||||
Net realized gain (loss) |
9,178,349 | 1,391,096 | ||||||
Net change in unrealized appreciation (depreciation) on: |
||||||||
Investment transactions - unaffiliated issuers |
(1,539,707 | ) | (244,603 | ) | ||||
Investment transactions - affiliated issuers (Note 7) |
(41,526,722 | ) | (6,460,013 | ) | ||||
Net change in unrealized appreciation (depreciation) |
(43,066,429 | ) | (6,704,616 | ) | ||||
Net realized gain (loss) and change in unrealized appreciation (depreciation) |
(33,888,080 | ) | (5,313,520 | ) | ||||
Net increase (decrease) in net assets resulting from operations |
$ | (28,937,433 | ) | $ | (4,574,337 | ) | ||
The accompanying notes are an integral part of the financial statements.
94
MassMutual |
MassMutual |
MassMutual |
MassMutual |
MassMutual |
|||||||||||||||
| $ | 543,886 | $ | 580,740 | $ | 2,488,911 | $ | 2,087,199 | $ | 3,349,889 | ||||||||||
| 3,430,272 | 3,512,147 | 16,564,117 | 14,335,873 | 28,971,191 | |||||||||||||||
| 3,974,158 | 4,092,887 | 19,053,028 | 16,423,072 | 32,321,080 | |||||||||||||||
| 307,537 | 331,798 | 1,421,931 | 1,953,942 | 3,493,681 | |||||||||||||||
| 173,791 | 319,333 | 1,352,227 | 934,446 | 3,487,189 | |||||||||||||||
| 96,671 | 53,189 | 630,827 | 530,723 | 1,535,833 | |||||||||||||||
| 66,351 | 37,434 | 291,824 | 302,450 | 680,778 | |||||||||||||||
| 42,326 | 22,609 | 255,451 | 204,092 | 560,167 | |||||||||||||||
| 58,100 | 31,830 | 236,368 | 232,653 | 496,748 | |||||||||||||||
| 744,776 | 796,193 | 4,188,628 | 4,158,306 | 10,254,396 | |||||||||||||||
| (104,625 | ) | (105,470 | ) | (476,406 | ) | (639,013 | ) | (1,105,400 | ) | ||||||||||
| (43,593 | ) | (75,748 | ) | (321,762 | ) | (221,546 | ) | (762,870 | ) | ||||||||||
| (24,241 | ) | (12,622 | ) | (149,959 | ) | (125,635 | ) | (335,751 | ) | ||||||||||
| (16,642 | ) | (8,877 | ) | (69,347 | ) | (71,534 | ) | (148,607 | ) | ||||||||||
| 555,675 | 593,476 | 3,171,154 | 3,100,578 | 7,901,768 | |||||||||||||||
| 3,418,483 | 3,499,411 | 15,881,874 | 13,322,494 | 24,419,312 | |||||||||||||||
| (57,190 | ) | (48,558 | ) | (256,951 | ) | (140,591 | ) | (430,732 | ) | ||||||||||
| 1,412,720 | 2,825,792 | 19,006,786 | 17,986,615 | 36,874,127 | |||||||||||||||
| 70,467 | 73,795 | 338,540 | 278,036 | 491,796 | |||||||||||||||
| 7,072,923 | 7,923,395 | 41,651,434 | 44,829,260 | 121,946,435 | |||||||||||||||
| 8,498,920 | 10,774,424 | 60,739,809 | 62,953,320 | 158,881,626 | |||||||||||||||
| (997,949 | ) | (1,081,264 | ) | (4,530,411 | ) | (3,742,081 | ) | (5,210,292 | ) | ||||||||||
| (32,383,778 | ) | (37,508,805 | ) | (184,274,756 | ) | (195,358,520 | ) | (474,931,008 | ) | ||||||||||
| (33,381,727 | ) | (38,590,069 | ) | (188,805,167 | ) | (199,100,601 | ) | (480,141,300 | ) | ||||||||||
| (24,882,807 | ) | (27,815,645 | ) | (128,065,358 | ) | (136,147,281 | ) | (321,259,674 | ) | ||||||||||
| $ | (21,464,324 | ) | $ | (24,316,234 | ) | $ | (112,183,484 | ) | $ | (122,824,787 | ) | $ | (296,840,362 | ) | |||||
The accompanying notes are an integral part of the financial statements.
95
MassMutual Funds – Financial Statements (Continued) |
Statements of Operations |
MassMutual |
MassMutual |
|||||||
Investment income (Note 2): |
||||||||
Dividends - unaffiliated issuers |
$ | 1,048,785 | $ | 844,756 | ||||
Dividends - affiliated issuers (Note 7) |
12,852,218 | 21,959,484 | ||||||
Total investment income |
13,901,003 | 22,804,240 | ||||||
Expenses (Note 3): |
||||||||
Investment advisory fees: |
||||||||
Class I |
2,358,795 | 3,099,569 | ||||||
Class M5 |
1,217,349 | 3,485,556 | ||||||
Class M4 |
752,318 | 1,434,750 | ||||||
Class M3 |
304,329 | 597,868 | ||||||
Distribution and Service fees: |
||||||||
Class M4 |
262,829 | 484,936 | ||||||
Class M3 |
212,676 | 404,234 | ||||||
Total expenses |
5,108,296 | 9,506,913 | ||||||
Expenses waived (Note 3): |
||||||||
Class I fees reimbursed by adviser |
(742,403 | ) | (948,552 | ) | ||||
Class M5 fees reimbursed by adviser |
(269,732 | ) | (757,435 | ) | ||||
Class M4 fees reimbursed by adviser |
(166,414 | ) | (311,625 | ) | ||||
Class M3 fees reimbursed by adviser |
(67,266 | ) | (129,800 | ) | ||||
Net expenses: |
3,862,481 | 7,359,501 | ||||||
Net investment income (loss) |
10,038,522 | 15,444,739 | ||||||
Realized and unrealized gain (loss): |
||||||||
Net realized gain (loss) on: |
||||||||
Investment transactions - unaffiliated issuers |
(16,504 | ) | 52,580 | |||||
Investment transactions - affiliated issuers (Note 7) |
16,597,736 | 38,735,322 | ||||||
Realized gain distributions - unaffiliated issuers |
153,313 | 150,491 | ||||||
Realized gain distributions - affiliated issuers (Note 7) |
66,499,665 | 130,697,880 | ||||||
Net realized gain (loss) |
83,234,210 | 169,636,273 | ||||||
Net change in unrealized appreciation (depreciation) on: |
||||||||
Investment transactions - unaffiliated issuers |
(1,521,025 | ) | (1,339,287 | ) | ||||
Investment transactions - affiliated issuers (Note 7) |
(254,377,000 | ) | (475,470,481 | ) | ||||
Net change in unrealized appreciation (depreciation) |
(255,898,025 | ) | (476,809,768 | ) | ||||
Net realized gain (loss) and change in unrealized appreciation (depreciation) |
(172,663,815 | ) | (307,173,495 | ) | ||||
Net increase (decrease) in net assets resulting from operations |
$ | (162,625,293 | ) | $ | (291,728,756 | ) | ||
The accompanying notes are an integral part of the financial statements.
96
MassMutual |
MassMutual |
MassMutual |
MassMutual |
||||||||||||
| $ | 147,379 | $ | 195,835 | $ | 70,367 | $ | 29,476 | ||||||||
| 9,196,666 | 14,343,717 | 5,297,035 | 1,940,475 | ||||||||||||
| 9,344,045 | 14,539,552 | 5,367,402 | 1,969,951 | ||||||||||||
| 1,894,741 | 2,078,037 | 1,098,718 | 391,369 | ||||||||||||
| 990,650 | 2,518,757 | 635,226 | 286,114 | ||||||||||||
| 667,651 | 1,019,569 | 374,810 | 160,831 | ||||||||||||
| 248,264 | 423,107 | 162,903 | 51,988 | ||||||||||||
| 220,438 | 334,065 | 122,647 | 52,627 | ||||||||||||
| 163,962 | 277,266 | 106,612 | 34,024 | ||||||||||||
| 4,185,706 | 6,650,801 | 2,500,916 | 976,953 | ||||||||||||
| (572,431 | ) | (605,925 | ) | (303,293 | ) | (108,032 | ) | ||||||||
| (200,822 | ) | (489,975 | ) | (115,572 | ) | (52,219 | ) | ||||||||
| (135,321 | ) | (198,405 | ) | (68,307 | ) | (29,347 | ) | ||||||||
| (50,309 | ) | (82,385 | ) | (29,706 | ) | (9,488 | ) | ||||||||
| 3,226,823 | 5,274,111 | 1,984,038 | 777,867 | ||||||||||||
| 6,117,222 | 9,265,441 | 3,383,364 | 1,192,084 | ||||||||||||
| 99,012 | 122,663 | 37,315 | 6,440 | ||||||||||||
| 12,894,570 | 21,699,959 | 6,556,373 | 2,293,087 | ||||||||||||
| 25,808 | 36,644 | 13,185 | 5,003 | ||||||||||||
| 58,970,118 | 92,611,083 | 34,125,956 | 12,509,152 | ||||||||||||
| 71,989,508 | 114,470,349 | 40,732,829 | 14,813,682 | ||||||||||||
| (88,200 | ) | (157,317 | ) | (47,548 | ) | (9,538 | ) | ||||||||
| (213,851,849 | ) | (328,740,267 | ) | (126,668,426 | ) | (49,823,733 | ) | ||||||||
| (213,940,049 | ) | (328,897,584 | ) | (126,715,974 | ) | (49,833,271 | ) | ||||||||
| (141,950,541 | ) | (214,427,235 | ) | (85,983,145 | ) | (35,019,589 | ) | ||||||||
| $ | (135,833,319 | ) | $ | (205,161,794 | ) | $ | (82,599,781 | ) | $ | (33,827,505 | ) | ||||
The accompanying notes are an integral part of the financial statements.
97
MassMutual Funds – Financial Statements (Continued) |
MassMutual |
||||||||
Year |
Year |
|||||||
Increase (Decrease) in Net Assets: |
||||||||
Operations: |
||||||||
Net investment income (loss) |
$ | 5,550,389 | $ | 4,853,510 | ||||
Net realized gain (loss) |
5,427,556 | 12,231,136 | ||||||
Net change in unrealized appreciation (depreciation) |
(41,235,179 | ) | (568,220 | ) | ||||
Net increase (decrease) in net assets resulting from operations |
(30,257,234 | ) | 16,516,426 | |||||
Distributions to shareholders (Note 2): |
||||||||
Class I |
(1,238,827 | ) | (1,021,241 | ) | ||||
Class R5 |
(600,769 | ) | (374,459 | ) | ||||
Service Class |
(8,033,664 | ) | (6,084,666 | ) | ||||
Administrative Class |
(1,380,292 | ) | (1,730,543 | ) | ||||
Class R4 |
(245,146 | ) | (166,392 | ) | ||||
Class A |
(1,138,922 | ) | (1,019,820 | ) | ||||
Class R3 |
(352,697 | ) | (350,793 | ) | ||||
Total distributions |
(12,990,317 | ) | (10,747,914 | ) | ||||
Net fund share transactions (Note 5): |
||||||||
Class I |
(2,103,974 | ) | 640,552 | |||||
Class R5 |
(2,305,651 | ) | 10,857 | |||||
Service Class |
6,779,177 | 5,939,309 | ||||||
Administrative Class |
(3,903,293 | ) | (8,031,556 | ) | ||||
Class R4 |
(345,473 | ) | (2,723,094 | ) | ||||
Class A |
(1,622,237 | ) | (2,836,256 | ) | ||||
Class R3 |
(318,660 | ) | (1,397,985 | ) | ||||
Increase (decrease) in net assets from fund share transactions |
(3,820,111 | ) | (8,398,173 | ) | ||||
Total increase (decrease) in net assets |
(47,067,662 | ) | (2,629,661 | ) | ||||
Net assets |
||||||||
Beginning of year |
205,343,903 | 207,973,564 | ||||||
End of year |
$ | 158,276,241 | $ | 205,343,903 | ||||
The accompanying notes are an integral part of the financial statements.
98
MassMutual |
MassMutual |
||||||||||||||
Year |
Year |
Year |
Year |
||||||||||||
| $ | 4,981,216 | $ | 4,354,969 | $ | 3,831,174 | $ | 3,278,539 | ||||||||
| 11,179,987 | 17,886,148 | 20,015,080 | 22,260,237 | ||||||||||||
| (51,619,335 | ) | 6,944,147 | (55,295,077 | ) | 14,518,027 | ||||||||||
| (35,458,132 | ) | 29,185,264 | (31,448,823 | ) | 40,056,803 | ||||||||||
| (4,148,911 | ) | (2,350,248 | ) | (3,794,867 | ) | (1,097,223 | ) | ||||||||
| (1,032,740 | ) | (542,748 | ) | (3,219,903 | ) | (691,355 | ) | ||||||||
| (1,343,448 | ) | (932,924 | ) | (3,146,970 | ) | (1,000,979 | ) | ||||||||
| (3,071,255 | ) | (2,544,613 | ) | (6,382,082 | ) | (2,459,971 | ) | ||||||||
| (2,964,646 | ) | (1,469,659 | ) | (1,207,371 | ) | (353,565 | ) | ||||||||
| (4,443,631 | ) | (3,312,929 | ) | (6,723,767 | ) | (2,120,316 | ) | ||||||||
| (1,638,358 | ) | (432,892 | ) | (1,497,170 | ) | (540,657 | ) | ||||||||
| (18,642,989 | ) | (11,586,013 | ) | (25,972,130 | ) | (8,264,066 | ) | ||||||||
| (6,098,250 | ) | 7,292,276 | 8,957,790 | 3,482,192 | |||||||||||
| (936,236 | ) | (1,499,097 | ) | (7,481,634 | ) | 2,615,974 | |||||||||
| (155,878 | ) | (2,067,919 | ) | 3,069,423 | (4,198,629 | ) | |||||||||
| (7,212,434 | ) | (12,663,811 | ) | (9,391,568 | ) | (8,045,715 | ) | ||||||||
| 8,541,664 | 798,555 | 128,550 | (1,056,129 | ) | |||||||||||
| (2,901,611 | ) | (12,990,498 | ) | 2,953,733 | (10,730,727 | ) | |||||||||
| 13,071,702 | (1,984,417 | ) | (1,229,515 | ) | (3,691,482 | ) | |||||||||
| 4,308,957 | (23,114,911 | ) | (2,993,221 | ) | (21,624,516 | ) | |||||||||
| (49,792,164 | ) | (5,515,660 | ) | (60,414,174 | ) | 10,168,221 | |||||||||
| 219,449,444 | 224,965,104 | 217,469,200 | 207,300,979 | ||||||||||||
| $ | 169,657,280 | $ | 219,449,444 | $ | 157,055,026 | $ | 217,469,200 | ||||||||
The accompanying notes are an integral part of the financial statements.
99
MassMutual Funds – Financial Statements (Continued) |
Statements of Changes in Net Assets |
MassMutual |
||||||||
Year |
Year |
|||||||
Increase (Decrease) in Net Assets: |
||||||||
Operations: |
||||||||
Net investment income (loss) |
$ | 2,393,927 | $ | 1,722,728 | ||||
Net realized gain (loss) |
16,123,048 | 13,817,211 | ||||||
Net change in unrealized appreciation (depreciation) |
(43,426,587 | ) | 15,323,675 | |||||
Net increase (decrease) in net assets resulting from operations |
(24,909,612 | ) | 30,863,614 | |||||
Distributions to shareholders (Note 2): |
||||||||
Class I |
(4,471,193 | ) | (1,893,092 | ) | ||||
Class R5 |
(1,041,225 | ) | (336,870 | ) | ||||
Service Class |
(1,807,424 | ) | (567,307 | ) | ||||
Administrative Class |
(2,483,791 | ) | (1,097,631 | ) | ||||
Class R4 |
(1,513,090 | ) | (587,085 | ) | ||||
Class A |
(3,033,006 | ) | (1,301,110 | ) | ||||
Class R3 |
(1,933,462 | ) | (913,691 | ) | ||||
Total distributions |
(16,283,191 | ) | (6,696,786 | ) | ||||
Net fund share transactions (Note 5): |
||||||||
Class I |
6,133,707 | 1,992,320 | ||||||
Class R5 |
(2,472,773 | ) | 249,411 | |||||
Service Class |
1,534,430 | 2,812,159 | ||||||
Administrative Class |
75,659 | (3,618,048 | ) | |||||
Class R4 |
1,838,245 | (1,578,998 | ) | |||||
Class A |
(4,488,481 | ) | (3,601,539 | ) | ||||
Class R3 |
169,252 | (2,021,783 | ) | |||||
Increase (decrease) in net assets from fund share transactions |
2,790,039 | (5,766,478 | ) | |||||
Total increase (decrease) in net assets |
(38,402,764 | ) | 18,400,350 | |||||
Net assets |
||||||||
Beginning of year |
152,157,618 | 133,757,268 | ||||||
End of year |
$ | 113,754,854 | $ | 152,157,618 | ||||
The accompanying notes are an integral part of the financial statements.
100
MassMutual |
MassMutual |
||||||||||||||
Year |
Year |
Year |
Year |
||||||||||||
| $ | 2,748,049 | $ | 3,910,486 | $ | 6,070,225 | $ | 7,231,280 | ||||||||
| 3,361,952 | 19,360,760 | 9,904,182 | 32,904,933 | ||||||||||||
| (22,928,403 | ) | (985,861 | ) | (49,550,980 | ) | 2,530,103 | |||||||||
| (16,818,402 | ) | 22,285,385 | (33,576,573 | ) | 42,666,316 | ||||||||||
| (2,168,614 | ) | (1,281,353 | ) | (5,427,736 | ) | (2,564,369 | ) | ||||||||
| (583,890 | ) | (337,121 | ) | (3,589,231 | ) | (2,435,234 | ) | ||||||||
| (1,226,005 | ) | (998,395 | ) | (2,853,464 | ) | (1,803,008 | ) | ||||||||
| (3,703,959 | ) | (1,758,950 | ) | (3,361,305 | ) | (2,359,066 | ) | ||||||||
| (1,429,001 | ) | (776,122 | ) | (2,185,392 | ) | (1,462,041 | ) | ||||||||
| (1,511,593 | ) | (4,185,695 | ) | (2,911,317 | ) | (4,612,594 | ) | ||||||||
| (2,558,247 | ) | (1,581,636 | ) | (5,025,570 | ) | (2,920,677 | ) | ||||||||
| (13,181,309 | ) | (10,919,272 | ) | (25,354,015 | ) | (18,156,989 | ) | ||||||||
| 1,483,711 | (3,324,278 | ) | (594,904 | ) | 3,910,094 | ||||||||||
| (1,426,083 | ) | 435,730 | (6,616,765 | ) | (7,984,930 | ) | |||||||||
| (1,786,063 | ) | (7,121,702 | ) | (15,164,374 | ) | (8,369,506 | ) | ||||||||
| (1,422,162 | ) | (595,186 | ) | (15,337,082 | ) | (7,158,402 | ) | ||||||||
| 965,450 | (3,246,708 | ) | (2,784,252 | ) | (7,645,267 | ) | |||||||||
| (783,912 | ) | (64,029,196 | ) | (4,218,129 | ) | (62,556,049 | ) | ||||||||
| (743,759 | ) | (7,370,747 | ) | (2,272,463 | ) | (11,559,220 | ) | ||||||||
| (3,712,818 | ) | (85,252,087 | ) | (46,987,969 | ) | (101,363,280 | ) | ||||||||
| (33,712,529 | ) | (73,885,974 | ) | (105,918,557 | ) | (76,853,953 | ) | ||||||||
| 116,748,335 | 190,634,309 | 267,510,034 | 344,363,987 | ||||||||||||
| $ | 83,035,806 | $ | 116,748,335 | $ | 161,591,477 | $ | 267,510,034 | ||||||||
The accompanying notes are an integral part of the financial statements.
101
MassMutual Funds – Financial Statements (Continued) |
Statements of Changes in Net Assets |
MassMutual |
||||||||
Year |
Year |
|||||||
Increase (Decrease) in Net Assets: |
||||||||
Operations: |
||||||||
Net investment income (loss) |
$ | 4,798,414 | $ | 5,264,263 | ||||
Net realized gain (loss) |
12,172,970 | 32,017,363 | ||||||
Net change in unrealized appreciation (depreciation) |
(48,604,539 | ) | 6,087,986 | |||||
Net increase (decrease) in net assets resulting from operations |
(31,633,155 | ) | 43,369,612 | |||||
Distributions to shareholders (Note 2): |
||||||||
Class I |
(6,727,045 | ) | (3,213,506 | ) | ||||
Class R5 |
(170,263 | ) | (33,951 | ) | ||||
Service Class |
(1,005,276 | ) | (561,635 | ) | ||||
Administrative Class |
(4,048,008 | ) | (2,465,327 | ) | ||||
Class R4 |
(3,159,331 | ) | (1,910,226 | ) | ||||
Class A |
(1,319,721 | ) | (4,502,094 | ) | ||||
Class R3 |
(6,859,146 | ) | (3,819,675 | ) | ||||
Total distributions |
(23,288,790 | ) | (16,506,414 | ) | ||||
Net fund share transactions (Note 5): |
||||||||
Class I |
3,796,983 | 1,684,826 | ||||||
Class R5 |
229,396 | 819,887 | ||||||
Service Class |
(3,127,399 | ) | (2,100,359 | ) | ||||
Administrative Class |
(872,659 | ) | (8,795,084 | ) | ||||
Class R4 |
(452,825 | ) | (3,749,374 | ) | ||||
Class A |
(1,813,979 | ) | (62,530,974 | ) | ||||
Class R3 |
(5,089,454 | ) | (12,799,337 | ) | ||||
Increase (decrease) in net assets from fund share transactions |
(7,329,937 | ) | (87,470,415 | ) | ||||
Total increase (decrease) in net assets |
(62,251,882 | ) | (60,607,217 | ) | ||||
Net assets |
||||||||
Beginning of year |
204,307,615 | 264,914,832 | ||||||
End of year |
$ | 142,055,733 | $ | 204,307,615 | ||||
The accompanying notes are an integral part of the financial statements.
102
MassMutual |
MassMutual |
||||||||||||||
Year |
Year |
Year |
Year |
||||||||||||
| $ | 9,668,808 | $ | 8,231,055 | $ | 3,736,703 | $ | 2,788,974 | ||||||||
| 35,888,132 | 50,277,386 | 19,417,047 | 26,891,204 | ||||||||||||
| (115,975,315 | ) | 29,694,014 | (55,513,581 | ) | 16,592,101 | ||||||||||
| (70,418,375 | ) | 88,202,455 | (32,359,831 | ) | 46,272,279 | ||||||||||
| (7,590,627 | ) | (2,771,252 | ) | (7,493,815 | ) | (2,098,478 | ) | ||||||||
| (9,879,698 | ) | (3,683,540 | ) | (507,462 | ) | (115,358 | ) | ||||||||
| (4,887,084 | ) | (2,484,660 | ) | (1,116,572 | ) | (375,163 | ) | ||||||||
| (8,294,775 | ) | (3,495,256 | ) | (4,300,099 | ) | (1,243,039 | ) | ||||||||
| (3,261,072 | ) | (1,617,889 | ) | (3,138,533 | ) | (1,043,751 | ) | ||||||||
| (3,907,101 | ) | (4,508,898 | ) | (1,587,976 | ) | (1,894,666 | ) | ||||||||
| (9,912,512 | ) | (4,084,867 | ) | (7,197,154 | ) | (2,182,956 | ) | ||||||||
| (47,732,869 | ) | (22,646,362 | ) | (25,341,611 | ) | (8,953,411 | ) | ||||||||
| 11,540,005 | 6,664,481 | 4,176,558 | 3,346,152 | ||||||||||||
| 14,286,906 | (2,990,481 | ) | 251,733 | 787,383 | |||||||||||
| (21,407,161 | ) | (11,081,271 | ) | 689,935 | (1,656,107 | ) | |||||||||
| (8,251,960 | ) | (3,876,626 | ) | (3,135,451 | ) | (1,214,423 | ) | ||||||||
| (2,558,212 | ) | (6,053,147 | ) | 2,298,212 | (4,455,903 | ) | |||||||||
| (962,124 | ) | (68,752,181 | ) | (3,140,448 | ) | (36,356,681 | ) | ||||||||
| 8,851,699 | (13,903,673 | ) | 4,710,453 | (10,743,198 | ) | ||||||||||
| 1,499,153 | (99,992,898 | ) | 5,850,992 | (50,292,777 | ) | ||||||||||
| (116,652,091 | ) | (34,436,805 | ) | (51,850,450 | ) | (12,973,909 | ) | ||||||||
| 425,794,223 | 460,231,028 | 190,143,287 | 203,117,196 | ||||||||||||
| $ | 309,142,132 | $ | 425,794,223 | $ | 138,292,837 | $ | 190,143,287 | ||||||||
The accompanying notes are an integral part of the financial statements.
103
MassMutual Funds – Financial Statements (Continued) |
Statements of Changes in Net Assets |
MassMutual |
||||||||
Year |
Year |
|||||||
Increase (Decrease) in Net Assets: |
||||||||
Operations: |
||||||||
Net investment income (loss) |
$ | 5,852,550 | $ | 3,764,293 | ||||
Net realized gain (loss) |
35,051,771 | 37,862,229 | ||||||
Net change in unrealized appreciation (depreciation) |
(95,021,125 | ) | 32,747,288 | |||||
Net increase (decrease) in net assets resulting from operations |
(54,116,804 | ) | 74,373,810 | |||||
Distributions to shareholders (Note 2): |
||||||||
Class I |
(7,184,429 | ) | (883,182 | ) | ||||
Class R5 |
(7,743,505 | ) | (1,113,580 | ) | ||||
Service Class |
(3,883,802 | ) | (525,453 | ) | ||||
Administrative Class |
(8,831,913 | ) | (1,007,829 | ) | ||||
Class R4 |
(2,703,434 | ) | (398,076 | ) | ||||
Class A |
(3,004,403 | ) | (900,085 | ) | ||||
Class R3 |
(7,294,397 | ) | (875,634 | ) | ||||
Total distributions |
(40,645,883 | ) | (5,703,839 | ) | ||||
Net fund share transactions (Note 5): |
||||||||
Class I |
12,439,829 | 3,870,335 | ||||||
Class R5 |
4,018,713 | 86,549 | ||||||
Service Class |
(9,323,196 | ) | (3,077,408 | ) | ||||
Administrative Class |
(1,620,308 | ) | 295,247 | |||||
Class R4 |
710,885 | (8,693,510 | ) | |||||
Class A |
(3,716,959 | ) | (36,179,265 | ) | ||||
Class R3 |
8,645,354 | (13,335,325 | ) | |||||
Increase (decrease) in net assets from fund share transactions |
11,154,318 | (57,033,377 | ) | |||||
Total increase (decrease) in net assets |
(83,608,369 | ) | 11,636,594 | |||||
Net assets |
||||||||
Beginning of year |
307,520,217 | 295,883,623 | ||||||
End of year |
$ | 223,911,848 | $ | 307,520,217 | ||||
The accompanying notes are an integral part of the financial statements.
104
MassMutual |
MassMutual |
||||||||||||||
Year |
Year |
Year |
Year |
||||||||||||
| $ | 2,215,433 | $ | 1,421,719 | $ | 3,608,607 | $ | 2,105,122 | ||||||||
| 18,050,854 | 20,969,325 | 25,288,510 | 23,782,150 | ||||||||||||
| (44,492,326 | ) | 15,567,728 | (67,325,361 | ) | 23,878,457 | ||||||||||
| (24,226,039 | ) | 37,958,772 | (38,428,244 | ) | 49,765,729 | ||||||||||
| (5,197,007 | ) | (1,026,207 | ) | (4,001,187 | ) | (439,469 | ) | ||||||||
| (233,390 | ) | (43,936 | ) | (6,771,126 | ) | (1,003,491 | ) | ||||||||
| (750,930 | ) | (167,829 | ) | (1,792,181 | ) | (233,370 | ) | ||||||||
| (4,119,090 | ) | (832,689 | ) | (6,326,202 | ) | (693,031 | ) | ||||||||
| (3,070,820 | ) | (795,600 | ) | (2,086,826 | ) | (279,871 | ) | ||||||||
| (1,394,259 | ) | (1,232,845 | ) | (1,613,009 | ) | (519,288 | ) | ||||||||
| (6,234,573 | ) | (1,619,261 | ) | (4,577,472 | ) | (546,001 | ) | ||||||||
| (21,000,069 | ) | (5,718,367 | ) | (27,168,003 | ) | (3,714,521 | ) | ||||||||
| 7,715,151 | 3,379,864 | 10,073,048 | 3,190,555 | ||||||||||||
| 387,622 | 168,831 | 7,904,319 | (2,908,732 | ) | |||||||||||
| 35,405 | (723,264 | ) | (5,029,138 | ) | (137,559 | ) | |||||||||
| (1,062,181 | ) | 2,121,410 | 3,181,675 | 3,017,064 | |||||||||||
| 3,364,801 | (3,160,347 | ) | 1,281,405 | (2,853,407 | ) | ||||||||||
| (2,516,569 | ) | (23,562,563 | ) | (2,365,207 | ) | (19,246,407 | ) | ||||||||
| 4,216,865 | (11,948,690 | ) | 5,682,779 | (6,081,271 | ) | ||||||||||
| 12,141,094 | (33,724,759 | ) | 20,728,881 | (25,019,757 | ) | ||||||||||
| (33,085,014 | ) | (1,484,354 | ) | (44,867,366 | ) | 21,031,451 | |||||||||
| 134,159,357 | 135,643,711 | 201,708,940 | 180,677,489 | ||||||||||||
| $ | 101,074,343 | $ | 134,159,357 | $ | 156,841,574 | $ | 201,708,940 | ||||||||
The accompanying notes are an integral part of the financial statements.
105
MassMutual Funds – Financial Statements (Continued) |
Statements of Changes in Net Assets |
MassMutual |
||||||||
Year |
Year |
|||||||
Increase (Decrease) in Net Assets: |
||||||||
Operations: |
||||||||
Net investment income (loss) |
$ | 1,091,325 | $ | 643,885 | ||||
Net realized gain (loss) |
8,659,477 | 8,513,792 | ||||||
Net change in unrealized appreciation (depreciation) |
(22,550,793 | ) | 7,891,642 | |||||
Net increase (decrease) in net assets resulting from operations |
(12,799,991 | ) | 17,049,319 | |||||
Distributions to shareholders (Note 2): |
||||||||
Class I |
(2,006,510 | ) | (578,530 | ) | ||||
Class R5 |
(140,902 | ) | (41,165 | ) | ||||
Service Class |
(427,079 | ) | (143,426 | ) | ||||
Administrative Class |
(1,486,503 | ) | (443,948 | ) | ||||
Class R4 |
(978,197 | ) | (417,683 | ) | ||||
Class A |
(278,324 | ) | (613,895 | ) | ||||
Class R3 |
(3,173,283 | ) | (1,317,852 | ) | ||||
Class M5 |
— | — | ||||||
Class M4 |
— | — | ||||||
Class M3 |
— | — | ||||||
Total distributions |
(8,490,798 | ) | (3,556,499 | ) | ||||
Net fund share transactions (Note 5): |
||||||||
Class I |
3,926,497 | 2,423,753 | ||||||
Class R5 |
(330,743 | ) | 682,992 | |||||
Service Class |
439,012 | 209,875 | ||||||
Administrative Class |
1,567,180 | 1,697,156 | ||||||
Class R4 |
588,767 | (608,359 | ) | |||||
Class A |
(4,415,857 | ) | (6,251,387 | ) | ||||
Class R3 |
4,398,521 | (5,132,943 | ) | |||||
Class M5 |
— | — | ||||||
Class M4 |
— | — | ||||||
Class M3 |
— | — | ||||||
Increase (decrease) in net assets from fund share transactions |
6,173,377 | (6,978,913 | ) | |||||
Total increase (decrease) in net assets |
(15,117,412 | ) | 6,513,907 | |||||
Net assets |
||||||||
Beginning of year |
67,737,984 | 61,224,077 | ||||||
End of year |
$ | 52,620,572 | $ | 67,737,984 | ||||
The accompanying notes are an integral part of the financial statements.
106
MassMutual |
MassMutual Select |
||||||||||||||
Year |
Year |
Year |
Year |
||||||||||||
| $ | 448,209 | $ | 253,947 | $ | 4,950,647 | $ | 2,493,205 | ||||||||
| 2,799,082 | 2,246,314 | 9,178,349 | 13,616,655 | ||||||||||||
| (7,360,029 | ) | 2,564,704 | (43,066,429 | ) | 8,169,359 | ||||||||||
| (4,112,738 | ) | 5,064,965 | (28,937,433 | ) | 24,279,219 | ||||||||||
| (1,805,036 | ) | (679,980 | ) | (2,585,460 | ) | (825,060 | ) | ||||||||
| (29,013 | ) | (55,034 | ) | — | — | ||||||||||
| (294,339 | ) | (79,066 | ) | — | — | ||||||||||
| (264,001 | ) | (70,351 | ) | — | — | ||||||||||
| (126,810 | ) | (49,037 | ) | — | — | ||||||||||
| (59,676 | ) | (85,769 | ) | — | — | ||||||||||
| (163,129 | ) | (109,042 | ) | — | — | ||||||||||
| — | — | (14,662,986 | ) | (5,404,774 | ) | ||||||||||
| — | — | (981,001 | ) | (780,868 | ) | ||||||||||
| — | — | (532,352 | ) | (202,562 | ) | ||||||||||
| (2,742,004 | ) | (1,128,279 | ) | (18,761,799 | ) | (7,213,264 | ) | ||||||||
| 1,165,849 | 1,688,197 | 1,445,857 | 4,724,907 | ||||||||||||
| (1,094,424 | ) | 397,580 | — | — | |||||||||||
| (175,190 | ) | 312,652 | — | — | |||||||||||
| 300,268 | 643,251 | — | — | ||||||||||||
| 243,735 | 84,937 | — | — | ||||||||||||
| (150,516 | ) | (885,058 | ) | — | — | ||||||||||
| 304,892 | (741,244 | ) | — | — | |||||||||||
| — | — | 11,700,499 | 13,444,076 | ||||||||||||
| — | — | (4,323,266 | ) | (7,425,851 | ) | ||||||||||
| — | — | (776,293 | ) | (354,901 | ) | ||||||||||
| 594,614 | 1,500,315 | 8,046,797 | 10,388,231 | ||||||||||||
| (6,260,128 | ) | 5,437,001 | (39,652,435 | ) | 27,454,186 | ||||||||||
| 23,558,820 | 18,121,819 | 197,783,505 | 170,329,319 | ||||||||||||
| $ | 17,298,692 | $ | 23,558,820 | $ | 158,131,070 | $ | 197,783,505 | ||||||||
The accompanying notes are an integral part of the financial statements.
107
MassMutual Funds – Financial Statements (Continued) |
Statements of Changes in Net Assets |
MassMutual Select |
||||||||
Year |
Year |
|||||||
Increase (Decrease) in Net Assets: |
||||||||
Operations: |
||||||||
Net investment income (loss) |
$ | 739,183 | $ | 523,707 | ||||
Net realized gain (loss) |
1,391,096 | 3,810,753 | ||||||
Net change in unrealized appreciation (depreciation) |
(6,704,616 | ) | 19,058 | |||||
Net increase (decrease) in net assets resulting from operations |
(4,574,337 | ) | 4,353,518 | |||||
Distributions to shareholders (Note 2): |
||||||||
Class I |
(2,750,646 | ) | (1,057,591 | ) | ||||
Class M5 |
(1,254,316 | ) | (390,897 | ) | ||||
Class M4 |
(435,381 | ) | (141,796 | ) | ||||
Class M3 |
(252,072 | ) | (55,596 | ) | ||||
Total distributions |
(4,692,415 | ) | (1,645,880 | ) | ||||
Net fund share transactions (Note 5): |
||||||||
Class I |
3,300,787 | (3,940,725 | ) | |||||
Class M5 |
249,065 | (1,350,703 | ) | |||||
Class M4 |
(176,218 | ) | (643,232 | ) | ||||
Class M3 |
372,464 | 268,454 | ||||||
Increase (decrease) in net assets from fund share transactions |
3,746,098 | (5,666,206 | ) | |||||
Total increase (decrease) in net assets |
(5,520,654 | ) | (2,958,568 | ) | ||||
Net assets |
||||||||
Beginning of year |
29,899,894 | 32,858,462 | ||||||
End of year |
$ | 24,379,240 | $ | 29,899,894 | ||||
The accompanying notes are an integral part of the financial statements.
108
MassMutual Select |
MassMutual Select |
||||||||||||||
Year |
Year |
Year |
Year |
||||||||||||
| $ | 3,418,483 | $ | 2,149,729 | $ | 3,499,411 | $ | 1,994,474 | ||||||||
| 8,498,920 | 12,144,895 | 10,774,424 | 11,252,183 | ||||||||||||
| (33,381,727 | ) | 6,664,737 | (38,590,069 | ) | 9,859,173 | ||||||||||
| (21,464,324 | ) | 20,959,361 | (24,316,234 | ) | 23,105,830 | ||||||||||
| (8,034,238 | ) | (3,326,410 | ) | (7,318,355 | ) | (3,224,766 | ) | ||||||||
| (4,122,512 | ) | (1,167,166 | ) | (6,292,593 | ) | (2,462,179 | ) | ||||||||
| (2,002,161 | ) | (1,260,759 | ) | (911,386 | ) | (510,957 | ) | ||||||||
| (1,406,657 | ) | (526,947 | ) | (672,724 | ) | (285,443 | ) | ||||||||
| (15,565,568 | ) | (6,281,282 | ) | (15,195,058 | ) | (6,483,345 | ) | ||||||||
| 7,923,247 | (3,974,695 | ) | 7,283,459 | 5,060,245 | |||||||||||
| (3,276,299 | ) | 687,672 | (9,817,010 | ) | 3,921,071 | ||||||||||
| (11,183,029 | ) | (6,556,405 | ) | (4,509,670 | ) | (2,387,102 | ) | ||||||||
| (1,981,825 | ) | (2,013,476 | ) | (784,711 | ) | (985,897 | ) | ||||||||
| (8,517,906 | ) | (11,856,904 | ) | (7,827,932 | ) | 5,608,317 | |||||||||
| (45,547,798 | ) | 2,821,175 | (47,339,224 | ) | 22,230,802 | ||||||||||
| 148,810,740 | 145,989,565 | 161,570,658 | 139,339,856 | ||||||||||||
| $ | 103,262,942 | $ | 148,810,740 | $ | 114,231,434 | $ | 161,570,658 | ||||||||
The accompanying notes are an integral part of the financial statements.
109
MassMutual Funds – Financial Statements (Continued) |
Statements of Changes in Net Assets |
MassMutual Select |
||||||||
Year |
Year |
|||||||
Increase (Decrease) in Net Assets: |
||||||||
Operations: |
||||||||
Net investment income (loss) |
$ | 15,881,874 | $ | 8,885,449 | ||||
Net realized gain (loss) |
60,739,809 | 68,350,257 | ||||||
Net change in unrealized appreciation (depreciation) |
(188,805,167 | ) | 51,903,112 | |||||
Net increase (decrease) in net assets resulting from operations |
(112,183,484 | ) | 129,138,818 | |||||
Distributions to shareholders (Note 2): |
||||||||
Class I |
(34,844,854 | ) | (12,360,165 | ) | ||||
Class M5 |
(34,353,981 | ) | (10,865,930 | ) | ||||
Class M4 |
(12,573,464 | ) | (6,678,707 | ) | ||||
Class M3 |
(5,847,991 | ) | (2,294,268 | ) | ||||
Total distributions |
(87,620,290 | ) | (32,199,070 | ) | ||||
Net fund share transactions (Note 5): |
||||||||
Class I |
53,228,140 | 2,723,752 | ||||||
Class M5 |
(78,657,276 | ) | (8,789,345 | ) | ||||
Class M4 |
(39,379,155 | ) | (37,955,502 | ) | ||||
Class M3 |
(5,415,025 | ) | (18,352,574 | ) | ||||
Increase (decrease) in net assets from fund share transactions |
(70,223,316 | ) | (62,373,669 | ) | ||||
Total increase (decrease) in net assets |
(270,027,090 | ) | 34,566,079 | |||||
Net assets |
||||||||
Beginning of year |
781,885,141 | 747,319,062 | ||||||
End of year |
$ | 511,858,051 | $ | 781,885,141 | ||||
The accompanying notes are an integral part of the financial statements.
110
MassMutual Select |
MassMutual Select |
||||||||||||||
Year |
Year |
Year |
Year |
||||||||||||
| $ | 13,322,494 | $ | 6,612,046 | $ | 24,419,312 | $ | 11,531,579 | ||||||||
| 62,953,320 | 56,088,076 | 158,881,626 | 112,428,148 | ||||||||||||
| (199,100,601 | ) | 59,024,566 | (480,141,300 | ) | 181,743,340 | ||||||||||
| (122,824,787 | ) | 121,724,688 | (296,840,362 | ) | 305,703,067 | ||||||||||
| (39,896,413 | ) | (12,461,008 | ) | (57,773,560 | ) | (15,761,035 | ) | ||||||||
| (20,726,297 | ) | (6,426,451 | ) | (64,993,323 | ) | (16,203,011 | ) | ||||||||
| (9,222,674 | ) | (3,433,898 | ) | (22,804,375 | ) | (9,523,116 | ) | ||||||||
| (5,178,774 | ) | (1,990,274 | ) | (10,071,168 | ) | (3,085,222 | ) | ||||||||
| (75,024,158 | ) | (24,311,631 | ) | (155,642,426 | ) | (44,572,384 | ) | ||||||||
| 95,751,574 | 43,287,653 | 245,256,169 | 62,113,425 | ||||||||||||
| (67,154,610 | ) | 11,256,355 | (169,919,501 | ) | 57,784,752 | ||||||||||
| (23,823,246 | ) | (5,003,142 | ) | (79,993,542 | ) | (58,359,309 | ) | ||||||||
| (1,689,685 | ) | (12,633,520 | ) | (3,403,119 | ) | (33,002,711 | ) | ||||||||
| 3,084,033 | 36,907,346 | (8,059,993 | ) | 28,536,157 | |||||||||||
| (194,764,912 | ) | 134,320,403 | (460,542,781 | ) | 289,666,840 | ||||||||||
| 722,336,690 | 588,016,287 | 1,633,669,521 | 1,344,002,681 | ||||||||||||
| $ | 527,571,778 | $ | 722,336,690 | $ | 1,173,126,740 | $ | 1,633,669,521 | ||||||||
The accompanying notes are an integral part of the financial statements.
111
MassMutual Funds – Financial Statements (Continued) |
Statements of Changes in Net Assets |
MassMutual Select |
||||||||
Year |
Year |
|||||||
Increase (Decrease) in Net Assets: |
||||||||
Operations: |
||||||||
Net investment income (loss) |
$ | 10,038,522 | $ | 4,148,036 | ||||
Net realized gain (loss) |
83,234,210 | 42,634,045 | ||||||
Net change in unrealized appreciation (depreciation) |
(255,898,025 | ) | 99,978,517 | |||||
Net increase (decrease) in net assets resulting from operations |
(162,625,293 | ) | 146,760,598 | |||||
Distributions to shareholders (Note 2): |
||||||||
Class I |
(32,763,576 | ) | (8,473,120 | ) | ||||
Class M5 |
(20,742,335 | ) | (5,490,596 | ) | ||||
Class M4 |
(9,244,410 | ) | (2,391,669 | ) | ||||
Class M3 |
(3,608,202 | ) | (1,372,936 | ) | ||||
Total distributions |
(66,358,523 | ) | (17,728,321 | ) | ||||
Net fund share transactions (Note 5): |
||||||||
Class I |
171,342,119 | 61,811,417 | ||||||
Class M5 |
(81,585,427 | ) | 17,600,348 | |||||
Class M4 |
(21,868,048 | ) | 27,195,717 | |||||
Class M3 |
4,198,299 | (26,034,441 | ) | |||||
Increase (decrease) in net assets from fund share transactions |
72,086,943 | 80,573,041 | ||||||
Total increase (decrease) in net assets |
(156,896,873 | ) | 209,605,318 | |||||
Net assets |
||||||||
Beginning of year |
770,682,242 | 561,076,924 | ||||||
End of year |
$ | 613,785,369 | $ | 770,682,242 | ||||
The accompanying notes are an integral part of the financial statements.
112
MassMutual Select |
MassMutual Select |
||||||||||||||
Year |
Year |
Year |
Year |
||||||||||||
| $ | 15,444,739 | $ | 5,637,091 | $ | 6,117,222 | $ | 1,893,224 | ||||||||
| 169,636,273 | 69,096,997 | 71,989,508 | 28,073,508 | ||||||||||||
| (476,809,768 | ) | 213,921,745 | (213,940,049 | ) | 89,318,652 | ||||||||||
| (291,728,756 | ) | 288,655,833 | (135,833,319 | ) | 119,285,384 | ||||||||||
| (36,056,081 | ) | (9,279,529 | ) | (21,166,192 | ) | (4,711,717 | ) | ||||||||
| (53,396,718 | ) | (11,348,863 | ) | (16,777,545 | ) | (3,915,508 | ) | ||||||||
| (16,502,684 | ) | (6,713,026 | ) | (7,420,678 | ) | (1,690,198 | ) | ||||||||
| (6,931,706 | ) | (1,914,156 | ) | (2,571,996 | ) | (814,412 | ) | ||||||||
| (112,887,189 | ) | (29,255,574 | ) | (47,936,411 | ) | (11,131,835 | ) | ||||||||
| 296,917,672 | 38,354,894 | 190,273,471 | 48,406,423 | ||||||||||||
| (159,456,975 | ) | 89,308,820 | (90,582,508 | ) | 19,957,383 | ||||||||||
| (64,617,604 | ) | (53,092,819 | ) | (14,537,787 | ) | 14,363,561 | |||||||||
| 117,669 | (29,142,186 | ) | 2,860,943 | (22,159,855 | ) | ||||||||||
| 72,960,762 | 45,428,709 | 88,014,119 | 60,567,512 | ||||||||||||
| (331,655,183 | ) | 304,828,968 | (95,755,611 | ) | 168,721,061 | ||||||||||
| 1,358,909,904 | 1,054,080,936 | 571,190,564 | 402,469,503 | ||||||||||||
| $ | 1,027,254,721 | $ | 1,358,909,904 | $ | 475,434,953 | $ | 571,190,564 | ||||||||
The accompanying notes are an integral part of the financial statements.
113
MassMutual Funds – Financial Statements (Continued) |
Statements of Changes in Net Assets |
MassMutual Select |
||||||||
Year |
Year |
|||||||
Increase (Decrease) in Net Assets: |
||||||||
Operations: |
||||||||
Net investment income (loss) |
$ | 9,265,441 | $ | 2,600,288 | ||||
Net realized gain (loss) |
114,470,349 | 37,523,451 | ||||||
Net change in unrealized appreciation (depreciation) |
(328,897,584 | ) | 149,233,866 | |||||
Net increase (decrease) in net assets resulting from operations |
(205,161,794 | ) | 189,357,605 | |||||
Distributions to shareholders (Note 2): |
||||||||
Class I |
(20,743,294 | ) | (5,153,642 | ) | ||||
Class M5 |
(31,856,014 | ) | (7,799,608 | ) | ||||
Class M4 |
(10,328,244 | ) | (4,085,747 | ) | ||||
Class M3 |
(4,275,899 | ) | (1,220,747 | ) | ||||
Total distributions |
(67,203,451 | ) | (18,259,744 | ) | ||||
Net fund share transactions (Note 5): |
||||||||
Class I |
217,391,343 | 50,555,390 | ||||||
Class M5 |
(93,244,315 | ) | 59,353,995 | |||||
Class M4 |
(47,277,199 | ) | (21,630,882 | ) | ||||
Class M3 |
885,289 | (11,460,628 | ) | |||||
Increase (decrease) in net assets from fund share transactions |
77,755,118 | 76,817,875 | ||||||
Total increase (decrease) in net assets |
(194,610,127 | ) | 247,915,736 | |||||
Net assets |
||||||||
Beginning of year |
895,709,409 | 647,793,673 | ||||||
End of year |
$ | 701,099,282 | $ | 895,709,409 | ||||
The accompanying notes are an integral part of the financial statements.
114
MassMutual Select |
MassMutual Select |
||||||||||||||
Year |
Year |
Year |
Year |
||||||||||||
| $ | 3,383,364 | $ | 930,049 | $ | 1,192,084 | $ | 240,505 | ||||||||
| 40,732,829 | 14,304,856 | 14,813,682 | 5,236,544 | ||||||||||||
| (126,715,974 | ) | 50,214,000 | (49,833,271 | ) | 14,212,964 | ||||||||||
| (82,599,781 | ) | 65,448,905 | (33,827,505 | ) | 19,690,013 | ||||||||||
| (9,025,508 | ) | (2,253,961 | ) | (4,688,197 | ) | (924,535 | ) | ||||||||
| (11,205,031 | ) | (2,902,228 | ) | (2,856,276 | ) | (471,099 | ) | ||||||||
| (3,746,457 | ) | (931,634 | ) | (1,576,504 | ) | (386,399 | ) | ||||||||
| (1,509,059 | ) | (521,858 | ) | (472,782 | ) | (168,503 | ) | ||||||||
| (25,486,055 | ) | (6,609,681 | ) | (9,593,759 | ) | (1,950,536 | ) | ||||||||
| 163,059,428 | 25,438,797 | 36,639,255 | 19,809,591 | ||||||||||||
| (81,677,025 | ) | 20,833,986 | 15,997,233 | 13,312,034 | |||||||||||
| (7,108,746 | ) | 8,304,445 | 4,230,614 | 1,889,455 | |||||||||||
| 4,716,926 | (6,861,974 | ) | 2,524,638 | (1,095,127 | ) | ||||||||||
| 78,990,583 | 47,715,254 | 59,391,740 | 33,915,953 | ||||||||||||
| (29,095,253 | ) | 106,554,478 | 15,970,476 | 51,655,430 | |||||||||||
| 323,894,623 | 217,340,145 | 114,452,261 | 62,796,831 | ||||||||||||
| $ | 294,799,370 | $ | 323,894,623 | $ | 130,422,737 | $ | 114,452,261 | ||||||||
The accompanying notes are an integral part of the financial statements.
115
MassMutual 20/80 Allocation Fund – Financial Statements (Continued) |
Financial Highlights (For a share outstanding throughout each period) |
Income (loss) from investment |
Less distributions to shareholders |
Ratios / Supplemental Data |
|||||||||||
Net |
Net |
Net |
Total |
From net |
From net |
Total |
Net |
Total |
Net |
Ratio of |
Ratio of |
Net |
|
Class I |
|||||||||||||
9/30/22 |
$ 10.60 |
$ 0.32 |
$ (1.84) |
$ (1.52) |
$ (0.33) |
$ (0.38) |
$ (0.71) |
$ 8.37 |
(15.46%) |
$ 13,143 |
0.12% |
0.04% |
3.35% |
9/30/21 |
10.34 |
0.28 |
0.56 |
0.84 |
(0.38) |
(0.20) |
(0.58) |
10.60 |
8.35% |
18,990 |
0.12% |
0.03% |
2.67% |
9/30/20 |
10.15 |
0.25 |
0.45 |
0.70 |
(0.31) |
(0.20) |
(0.51) |
10.34 |
7.09% |
17,848 |
0.11% |
0.02% |
2.49% |
9/30/19 |
10.02 |
0.27 |
0.37 |
0.64 |
(0.32) |
(0.19) |
(0.51) |
10.15 |
6.95% |
12,197 |
0.12% |
0.02% |
2.78% |
9/30/18 |
10.04 |
0.23 |
0.04 |
0.27 |
(0.29) |
— |
(0.29) |
10.02 |
2.71% |
8,431 |
0.12% |
0.02% |
2.27% |
Class R5 |
|||||||||||||
9/30/22 |
$ 10.59 |
$ 0.45 |
$ (1.99) |
$ (1.54) |
$ (0.32) |
$ (0.38) |
$ (0.70) |
$ 8.35 |
(15.64%) |
$ 2,488 |
0.22% |
0.14% |
4.59% |
9/30/21 |
10.32 |
0.27 |
0.57 |
0.84 |
(0.37) |
(0.20) |
(0.57) |
10.59 |
8.37% |
6,108 |
0.22% |
0.13% |
2.62% |
9/30/20 |
10.14 |
0.28 |
0.40 |
0.68 |
(0.30) |
(0.20) |
(0.50) |
10.32 |
6.89% |
5,946 |
0.21% |
0.12% |
2.85% |
9/30/19 |
10.01 |
0.29 |
0.34 |
0.63 |
(0.31) |
(0.19) |
(0.50) |
10.14 |
6.83% |
6,919 |
0.22% |
0.12% |
2.96% |
9/30/18 |
10.02 |
0.34 |
(0.07) |
0.27 |
(0.28) |
— |
(0.28) |
10.01 |
2.72% |
7,023 |
0.22% |
0.13% |
3.45% |
Service Class |
|||||||||||||
9/30/22 |
$ 10.58 |
$ 0.28 |
$ (1.82) |
$ (1.54) |
$ (0.31) |
$ (0.38) |
$ (0.69) |
$ 8.35 |
(15.66%) |
$ 103,035 |
0.32% |
0.24% |
2.95% |
9/30/21 |
10.32 |
0.24 |
0.59 |
0.83 |
(0.37) |
(0.20) |
(0.57) |
10.58 |
8.21% |
123,549 |
0.32% |
0.23% |
2.27% |
9/30/20 |
10.13 |
0.05 |
0.63 |
0.68 |
(0.29) |
(0.20) |
(0.49) |
10.32 |
6.90% |
114,464 |
0.31% |
0.22% |
0.51% |
9/30/19 |
10.01 |
0.27 |
0.34 |
0.61 |
(0.30) |
(0.19) |
(0.49) |
10.13 |
6.62% |
9,225 |
0.32% |
0.22% |
2.74% |
9/30/18 |
10.02 |
0.23 |
0.03 |
0.26 |
(0.27) |
— |
(0.27) |
10.01 |
2.61% |
7,882 |
0.32% |
0.22% |
2.27% |
Year ended September 30 |
|||||
2022 |
2021 |
2020 |
2019 |
2018 |
|
Portfolio turnover rate |
27% |
26% |
33% |
39% |
62% |
|
c |
Per share amount calculated on the average shares method. |
|
d |
Amount is less than $0.005 per share. |
|
j |
Computed after giving effect to an agreement by MML Advisers to waive certain fees and expenses of the Fund. |
|
l |
Employee retirement benefit plans that invest plan assets in the Separate Investment Accounts (SIAs) may be subject to certain charges as set forth in their respective Plan Documents. Total return figures would be lower for the periods presented if they reflected these charges. |
|
m |
Total return excludes sales charges, if any, and would be lower for the period presented if it reflected these charges. |
|
w |
Expenses of the underlying funds are not included in the Fund’s expense ratio. The Fund indirectly bears its proportionate share of the expenses of any underlying fund. |
The accompanying notes are an integral part of the financial statements.
116
Income (loss) from investment |
Less distributions to shareholders |
Ratios / Supplemental Data |
|||||||||||
Net |
Net |
Net |
Total |
From net |
From net |
Total |
Net |
Total |
Net |
Ratio of |
Ratio of |
Net |
|
Administrative Class |
|||||||||||||
9/30/22 |
$ 10.60 |
$ 0.28 |
$ (1.84) |
$ (1.56) |
$ (0.28) |
$ (0.38) |
$ (0.66) |
$ 8.38 |
(15.72%) |
$ 18,215 |
0.42% |
0.34% |
2.88% |
9/30/21 |
10.33 |
0.25 |
0.57 |
0.82 |
(0.35) |
(0.20) |
(0.55) |
10.60 |
8.11% |
26,944 |
0.42% |
0.33% |
2.40% |
9/30/20 |
10.14 |
0.22 |
0.44 |
0.66 |
(0.27) |
(0.20) |
(0.47) |
10.33 |
6.72% |
34,036 |
0.41% |
0.32% |
2.17% |
9/30/19 |
10.01 |
0.28 |
0.33 |
0.61 |
(0.29) |
(0.19) |
(0.48) |
10.14 |
6.57% |
32,206 |
0.42% |
0.32% |
2.87% |
9/30/18 |
10.02 |
0.27 |
(0.02) |
0.25 |
(0.26) |
— |
(0.26) |
10.01 |
2.50% |
39,271 |
0.42% |
0.33% |
2.72% |
Class R4 |
|||||||||||||
9/30/22 |
$ 10.76 |
$ 0.27 |
$ (1.87) |
$ (1.60) |
$ (0.27) |
$ (0.38) |
$ (0.65) |
$ 8.51 |
(15.92%) |
$ 3,066 |
0.57% |
0.49% |
2.80% |
9/30/21 |
10.21 |
0.26 |
0.55 |
0.81 |
(0.06) |
(0.20) |
(0.26) |
10.76 |
8.00% |
4,254 |
0.57% |
0.48% |
2.46% |
9/30/20 |
10.04 |
0.39 |
0.25 |
0.64 |
(0.27) |
(0.20) |
(0.47) |
10.21 |
6.51% |
6,643 |
0.56% |
0.47% |
3.94% |
9/30/19 |
9.92 |
0.24 |
0.35 |
0.59 |
(0.28) |
(0.19) |
(0.47) |
10.04 |
6.42% |
124,050 |
0.57% |
0.47% |
2.47% |
9/30/18 |
9.94 |
0.22 |
0.01 |
0.23 |
(0.25) |
— |
(0.25) |
9.92 |
2.31% |
106,763 |
0.57% |
0.48% |
2.24% |
Class A |
|||||||||||||
9/30/22 |
$ 10.65 |
$ 0.26 |
$ (1.84) |
$ (1.58) |
$ (0.27) |
$ (0.38) |
$ (0.65) |
$ 8.42 |
(15.90%) |
$ 14,202 |
0.67% |
0.59% |
2.69% |
9/30/21 |
10.38 |
0.22 |
0.57 |
0.79 |
(0.32) |
(0.20) |
(0.52) |
10.65 |
7.76% |
19,773 |
0.67% |
0.58% |
2.08% |
9/30/20 |
10.19 |
0.23 |
0.41 |
0.64 |
(0.25) |
(0.20) |
(0.45) |
10.38 |
6.45% |
22,073 |
0.66% |
0.57% |
2.30% |
9/30/19 |
10.05 |
0.25 |
0.34 |
0.59 |
(0.26) |
(0.19) |
(0.45) |
10.19 |
6.34% |
25,898 |
0.67% |
0.57% |
2.59% |
9/30/18 |
10.05 |
0.23 |
0.00d |
0.23 |
(0.23) |
— |
(0.23) |
10.05 |
2.30% |
27,681 |
0.67% |
0.58% |
2.25% |
Class R3 |
|||||||||||||
9/30/22 |
$ 10.45 |
$ 0.24 |
$ (1.81) |
$ (1.57) |
$ (0.25) |
$ (0.38) |
$ (0.63) |
$ 8.25 |
(16.05%) |
$ 4,126 |
0.82% |
0.74% |
2.49% |
9/30/21 |
10.20 |
0.21 |
0.56 |
0.77 |
(0.32) |
(0.20) |
(0.52) |
10.45 |
7.64% |
5,725 |
0.82% |
0.73% |
2.06% |
9/30/20 |
10.01 |
0.21 |
0.41 |
0.62 |
(0.23) |
(0.20) |
(0.43) |
10.20 |
6.32% |
6,964 |
0.81% |
0.72% |
2.11% |
9/30/19 |
9.89 |
0.22 |
0.34 |
0.56 |
(0.25) |
(0.19) |
(0.44) |
10.01 |
6.15% |
7,102 |
0.82% |
0.72% |
2.30% |
9/30/18 |
9.91 |
0.20 |
0.01 |
0.21 |
(0.23) |
— |
(0.23) |
9.89 |
2.10% |
7,635 |
0.82% |
0.73% |
2.03% |
The accompanying notes are an integral part of the financial statements.
117
MassMutual 40/60 Allocation Fund – Financial Statements (Continued) |
Financial Highlights (For a share outstanding throughout each period) |
Income (loss) from investment |
Less distributions to shareholders |
Ratios / Supplemental Data |
|||||||||||
Net |
Net |
Net |
Total |
From net |
From net |
Total |
Net |
Total |
Net |
Ratio of |
Ratio of |
Net |
|
Class I |
|||||||||||||
9/30/22 |
$ 10.57 |
$ 0.27 |
$ (1.85) |
$ (1.58) |
$ (0.33) |
$ (0.55) |
$ (0.88) |
$ 8.11 |
(16.39%) |
$ 30,477 |
0.11% |
0.06% |
2.83% |
9/30/21 |
9.80 |
0.22 |
1.11 |
1.33 |
(0.33) |
(0.23) |
(0.56) |
10.57 |
13.89% |
47,449 |
0.11% |
0.05% |
2.09% |
9/30/20 |
9.93 |
0.18 |
0.71 |
0.89 |
(0.24) |
(0.78) |
(1.02) |
9.80 |
9.29% |
36,725 |
0.10% |
0.04% |
1.94% |
9/30/19 |
10.58 |
0.21 |
0.13 |
0.34 |
(0.31) |
(0.68) |
(0.99) |
9.93 |
4.69% |
28,843 |
0.10% |
0.04% |
2.13% |
9/30/18 |
10.31 |
0.16 |
0.47 |
0.63 |
(0.34) |
(0.02) |
(0.36) |
10.58 |
6.21% |
12,666 |
0.09% |
0.05% |
1.50% |
Class R5 |
|||||||||||||
9/30/22 |
$ 10.57 |
$ 0.34 |
$ (1.92) |
$ (1.58) |
$ (0.32) |
$ (0.55) |
$ (0.87) |
$ 8.12 |
(16.37%) |
$ 5,503 |
0.21% |
0.16% |
3.59% |
9/30/21 |
9.81 |
0.23 |
1.08 |
1.31 |
(0.32) |
(0.23) |
(0.55) |
10.57 |
13.66% |
8,580 |
0.21% |
0.15% |
2.23% |
9/30/20 |
9.94 |
0.22 |
0.65 |
0.87 |
(0.22) |
(0.78) |
(1.00) |
9.81 |
9.12% |
9,331 |
0.20% |
0.14% |
2.34% |
9/30/19 |
10.57 |
0.28 |
0.06 |
0.34 |
(0.29) |
(0.68) |
(0.97) |
9.94 |
4.76% |
9,972 |
0.20% |
0.14% |
2.88% |
9/30/18 |
10.31 |
0.29 |
0.32 |
0.61 |
(0.33) |
(0.02) |
(0.35) |
10.57 |
6.01% |
25,611 |
0.19% |
0.15% |
2.78% |
Service Class |
|||||||||||||
9/30/22 |
$ 10.62 |
$ 0.23 |
$ (1.82) |
$ (1.59) |
$ (0.31) |
$ (0.55) |
$ (0.86) |
$ 8.17 |
(16.40%) |
$ 12,834 |
0.31% |
0.26% |
2.43% |
9/30/21 |
9.85 |
0.21 |
1.10 |
1.31 |
(0.31) |
(0.23) |
(0.54) |
10.62 |
13.62% |
16,971 |
0.31% |
0.25% |
2.06% |
9/30/20 |
9.98 |
0.13 |
0.73 |
0.86 |
(0.21) |
(0.78) |
(0.99) |
9.85 |
8.98% |
17,683 |
0.30% |
0.24% |
1.37% |
9/30/19 |
10.62 |
0.23 |
0.10 |
0.33 |
(0.29) |
(0.68) |
(0.97) |
9.98 |
4.53% |
11,427 |
0.30% |
0.24% |
2.35% |
9/30/18 |
10.35 |
0.10 |
0.51 |
0.61 |
(0.32) |
(0.02) |
(0.34) |
10.62 |
5.97% |
11,330 |
0.29% |
0.25% |
0.96% |
Year ended September 30 |
|||||
2022 |
2021 |
2020 |
2019 |
2018 |
|
Portfolio turnover rate |
32% |
24% |
52% |
43% |
52% |
|
c |
Per share amount calculated on the average shares method. |
|
j |
Computed after giving effect to an agreement by MML Advisers to waive certain fees and expenses of the Fund. |
|
l |
Employee retirement benefit plans that invest plan assets in the Separate Investment Accounts (SIAs) may be subject to certain charges as set forth in their respective Plan Documents. Total return figures would be lower for the periods presented if they reflected these charges. |
|
m |
Total return excludes sales charges, if any, and would be lower for the period presented if it reflected these charges. |
|
w |
Expenses of the underlying funds are not included in the Fund’s expense ratio. The Fund indirectly bears its proportionate share of the expenses of any underlying fund. |
The accompanying notes are an integral part of the financial statements.
118
Income (loss) from investment |
Less distributions to shareholders |
Ratios / Supplemental Data |
|||||||||||
Net |
Net |
Net |
Total |
From net |
From net |
Total |
Net |
Total |
Net |
Ratio of |
Ratio of |
Net |
|
Administrative Class |
|||||||||||||
9/30/22 |
$ 10.61 |
$ 0.22 |
$ (1.83) |
$ (1.61) |
$ (0.29) |
$ (0.55) |
$ (0.84) |
$ 8.16 |
(16.55%) |
$ 28,220 |
0.41% |
0.36% |
2.30% |
9/30/21 |
9.84 |
0.21 |
1.09 |
1.30 |
(0.30) |
(0.23) |
(0.53) |
10.61 |
13.46% |
44,399 |
0.41% |
0.35% |
2.02% |
9/30/20 |
9.96 |
0.19 |
0.67 |
0.86 |
(0.20) |
(0.78) |
(0.98) |
9.84 |
8.94% |
53,133 |
0.40% |
0.34% |
1.98% |
9/30/19 |
10.59 |
0.23 |
0.09 |
0.32 |
(0.27) |
(0.68) |
(0.95) |
9.96 |
4.50% |
70,893 |
0.40% |
0.34% |
2.40% |
9/30/18 |
10.32 |
0.23 |
0.37 |
0.60 |
(0.31) |
(0.02) |
(0.33) |
10.59 |
5.86% |
87,160 |
0.39% |
0.35% |
2.18% |
Class R4 |
|||||||||||||
9/30/22 |
$ 10.51 |
$ 0.20 |
$ (1.80) |
$ (1.60) |
$ (0.29) |
$ (0.55) |
$ (0.84) |
$ 8.07 |
(16.65%) |
$ 32,058 |
0.56% |
0.51% |
2.14% |
9/30/21 |
9.75 |
0.17 |
1.10 |
1.27 |
(0.28) |
(0.23) |
(0.51) |
10.51 |
13.27% |
32,786 |
0.56% |
0.50% |
1.65% |
9/30/20 |
9.88 |
0.18 |
0.67 |
0.85 |
(0.20) |
(0.78) |
(0.98) |
9.75 |
8.87% |
29,626 |
0.55% |
0.49% |
1.96% |
9/30/19 |
10.53 |
0.19 |
0.10 |
0.29 |
(0.26) |
(0.68) |
(0.94) |
9.88 |
4.19% |
40,232 |
0.55% |
0.49% |
2.02% |
9/30/18 |
10.26 |
0.18 |
0.41 |
0.59 |
(0.30) |
(0.02) |
(0.32) |
10.53 |
5.80% |
34,455 |
0.54% |
0.50% |
1.69% |
Class A |
|||||||||||||
9/30/22 |
$ 10.64 |
$ 0.20 |
$ (1.84) |
$ (1.64) |
$ (0.27) |
$ (0.55) |
$ (0.82) |
8.18 |
(16.82%) |
$ 45,256 |
0.66% |
0.61% |
2.10% |
9/30/21 |
9.86 |
0.18 |
1.10 |
1.28 |
(0.27) |
(0.23) |
(0.50) |
10.64 |
13.26% |
61,814 |
0.66% |
0.60% |
1.73% |
9/30/20 |
9.99 |
0.16 |
0.67 |
0.83 |
(0.18) |
(0.78) |
(0.96) |
9.86 |
8.56% |
69,682 |
0.65% |
0.59% |
1.67% |
9/30/19 |
10.61 |
0.21 |
0.09 |
0.30 |
(0.24) |
(0.68) |
(0.92) |
9.99 |
4.24% |
81,959 |
0.65% |
0.59% |
2.13% |
9/30/18 |
10.34 |
0.20 |
0.37 |
0.57 |
(0.28) |
(0.02) |
(0.30) |
10.61 |
5.56% |
91,459 |
0.64% |
0.60% |
1.90% |
Class R3 |
|||||||||||||
9/30/22 |
$ 10.50 |
$ 0.21 |
$ (1.83) |
$ (1.62) |
$ (0.30) |
$ (0.55) |
$ (0.85) |
$ 8.03 |
(16.91%) |
$ 15,309 |
0.81% |
0.76% |
2.25% |
9/30/21 |
9.74 |
0.17 |
1.08 |
1.25 |
(0.26) |
(0.23) |
(0.49) |
10.50 |
13.07% |
7,450 |
0.81% |
0.75% |
1.69% |
9/30/20 |
9.86 |
0.14 |
0.68 |
0.82 |
(0.16) |
(0.78) |
(0.94) |
9.74 |
8.56% |
8,785 |
0.80% |
0.74% |
1.46% |
9/30/19 |
10.50 |
0.18 |
0.09 |
0.27 |
(0.23) |
(0.68) |
(0.91) |
9.86 |
3.95% |
9,050 |
0.80% |
0.74% |
1.90% |
9/30/18 |
10.24 |
0.18 |
0.37 |
0.55 |
(0.27) |
(0.02) |
(0.29) |
10.50 |
5.46% |
11,230 |
0.79% |
0.75% |
1.73% |
The accompanying notes are an integral part of the financial statements.
119
MassMutual 60/40 Allocation Fund – Financial Statements (Continued) |
Financial Highlights (For a share outstanding throughout each period) |
Income (loss) from investment |
Less distributions to shareholders |
Ratios / Supplemental Data |
|||||||||||
Net |
Net |
Net |
Total |
From net |
From net |
Total |
Net |
Total |
Net |
Ratio of |
Ratio of |
Net |
|
Class I |
|||||||||||||
9/30/22 |
$ 10.96 |
$ 0.19 |
$ (1.73) |
$ (1.54) |
$ (0.38) |
$ (1.02) |
$ (1.40) |
$ 8.02 |
(16.45%) |
$ 28,473 |
0.12% |
0.06% |
2.05% |
9/30/21 |
9.50 |
0.19 |
1.70 |
1.89 |
(0.28) |
(0.15) |
(0.43) |
10.96 |
20.32% |
28,917 |
0.11% |
0.05% |
1.81% |
9/30/20 |
9.90 |
0.16 |
0.71 |
0.87 |
(0.21) |
(1.06) |
(1.27) |
9.50 |
9.14% |
21,696 |
0.11% |
0.04% |
1.73% |
9/30/19 |
11.21 |
0.21 |
(0.12)aa |
0.09 |
(0.32) |
(1.08) |
(1.40) |
9.90 |
3.17% |
15,679 |
0.11% |
0.04% |
2.19% |
9/30/18 |
10.77 |
0.20 |
0.75 |
0.95 |
(0.40) |
(0.11) |
(0.51) |
11.21 |
9.07% |
8,011 |
0.10% |
0.06% |
1.84% |
Class R5 |
|||||||||||||
9/30/22 |
$ 10.96 |
$ 0.32 |
$ (1.86) |
$ (1.54) |
$ (0.37) |
$ (1.02) |
$ (1.39) |
$ 8.03 |
(16.42%) |
$ 8,300 |
0.21% |
0.16% |
3.24% |
9/30/21 |
9.50 |
0.16 |
1.72 |
1.88 |
(0.27) |
(0.15) |
(0.42) |
10.96 |
20.21% |
20,602 |
0.21% |
0.15% |
1.56% |
9/30/20 |
9.91 |
0.18 |
0.67 |
0.85 |
(0.20) |
(1.06) |
(1.26) |
9.50 |
8.93% |
15,435 |
0.21% |
0.14% |
1.92% |
9/30/19 |
11.21 |
0.22 |
(0.14)aa |
0.08 |
(0.30) |
(1.08) |
(1.38) |
9.91 |
3.12% |
12,028 |
0.21% |
0.14% |
2.21% |
9/30/18 |
10.77 |
0.29 |
0.65 |
0.94 |
(0.39) |
(0.11) |
(0.50) |
11.21 |
8.96% |
13,583 |
0.20% |
0.16% |
2.60% |
Service Class |
|||||||||||||
9/30/22 |
$ 11.01 |
$ 0.19 |
$ (1.75) |
$ (1.56) |
$ (0.36) |
$ (1.02) |
$ (1.38) |
$ 8.07 |
(16.55%) |
$ 20,361 |
0.32% |
0.26% |
2.00% |
9/30/21 |
9.54 |
0.17 |
1.71 |
1.88 |
(0.26) |
(0.15) |
(0.41) |
11.01 |
20.15% |
24,617 |
0.31% |
0.25% |
1.60% |
9/30/20 |
9.93 |
0.07 |
0.79 |
0.86 |
(0.19) |
(1.06) |
(1.25) |
9.54 |
8.94% |
25,087 |
0.31% |
0.24% |
0.76% |
9/30/19 |
11.24 |
0.20 |
(0.14)aa |
0.06 |
(0.29) |
(1.08) |
(1.37) |
9.93 |
2.90% |
9,014 |
0.31% |
0.24% |
2.03% |
9/30/18 |
10.80 |
0.11 |
0.82 |
0.93 |
(0.38) |
(0.11) |
(0.49) |
11.24 |
8.81% |
8,522 |
0.30% |
0.25% |
1.01% |
Year ended September 30 |
|||||
2022 |
2021 |
2020 |
2019 |
2018 |
|
Portfolio turnover rate |
26% |
28% |
58% |
44% |
55% |
|
c |
Per share amount calculated on the average shares method. |
|
j |
Computed after giving effect to an agreement by MML Advisers to waive certain fees and expenses of the Fund. |
|
l |
Employee retirement benefit plans that invest plan assets in the Separate Investment Accounts (SIAs) may be subject to certain charges as set forth in their respective Plan Documents. Total return figures would be lower for the periods presented if they reflected these charges. |
|
m |
Total return does not reflect expenses that apply at the separate account level or to related insurance products. Inclusion of these charges would reduce the total return figures for all periods shown. |
|
w |
Expenses of the underlying funds are not included in the Fund’s expense ratio. The Fund indirectly bears its proportionate share of the expenses of any underlying fund. |
|
aa |
The amount shown for a share outstanding does not correspond with the aggregate net realized and unrealized gain (loss) for the period due to the timing of purchases and redemptions of Fund shares in relation to the fluctuating market values of the Fund. |
The accompanying notes are an integral part of the financial statements.
120
Income (loss) from investment |
Less distributions to shareholders |
Ratios / Supplemental Data |
|||||||||||
Net |
Net |
Net |
Total |
From net |
From net |
Total |
Net |
Total |
Net |
Ratio of |
Ratio of |
Net |
|
Administrative Class |
|||||||||||||
9/30/22 |
$ 11.00 |
$ 0.19 |
$ (1.76) |
$ (1.57) |
$ (0.34) |
$ (1.02) |
$ (1.36) |
$ 8.07 |
(16.62%) |
$ 37,871 |
0.41% |
0.36% |
1.98% |
9/30/21 |
9.53 |
0.16 |
1.71 |
1.87 |
(0.25) |
(0.15) |
(0.40) |
11.00 |
20.00% |
61,143 |
0.41% |
0.35% |
1.53% |
9/30/20 |
9.92 |
0.16 |
0.68 |
0.84 |
(0.17) |
(1.06) |
(1.23) |
9.53 |
8.78% |
59,725 |
0.41% |
0.34% |
1.71% |
9/30/19 |
11.22 |
0.21 |
(0.15)aa |
0.06 |
(0.28) |
(1.08) |
(1.36) |
9.92 |
2.88% |
81,829 |
0.41% |
0.34% |
2.11% |
9/30/18 |
10.79 |
0.19 |
0.72 |
0.91 |
(0.37) |
(0.11) |
(0.48) |
11.22 |
8.62% |
93,858 |
0.40% |
0.36% |
1.75% |
Class R4 |
|||||||||||||
9/30/22 |
$ 10.91 |
$ 0.16 |
$ (1.74) |
$ (1.58) |
$ (0.32) |
$ (1.02) |
$ (1.34) |
$ 7.99 |
(16.78%) |
$ 8,037 |
0.56% |
0.51% |
1.72% |
9/30/21 |
9.43 |
0.13 |
1.71 |
1.84 |
(0.21) |
(0.15) |
(0.36) |
10.91 |
19.83% |
10,735 |
0.56% |
0.50% |
1.26% |
9/30/20 |
9.84 |
0.20 |
0.62 |
0.82 |
(0.17) |
(1.06) |
(1.23) |
9.43 |
8.59% |
10,218 |
0.56% |
0.49% |
2.13% |
9/30/19 |
11.14 |
0.18 |
(0.13)aa |
0.05 |
(0.27) |
(1.08) |
(1.35) |
9.84 |
2.75% |
27,212 |
0.56% |
0.49% |
1.87% |
9/30/18 |
10.72 |
0.16 |
0.73 |
0.89 |
(0.36) |
(0.11) |
(0.47) |
11.14 |
8.47% |
24,118 |
0.55% |
0.51% |
1.46% |
Class A |
|||||||||||||
9/30/22 |
$ 11.04 |
$ 0.16 |
$ (1.76) |
$ (1.60) |
$ (0.32) |
$ (1.02) |
$ (1.34) |
$ 8.10 |
(16.84%) |
$ 44,420 |
0.66% |
0.61% |
1.69% |
9/30/21 |
9.57 |
0.14 |
1.70 |
1.84 |
(0.22) |
(0.15) |
(0.37) |
11.04 |
19.60% |
57,203 |
0.66% |
0.60% |
1.31% |
9/30/20 |
9.96 |
0.13 |
0.69 |
0.82 |
(0.15) |
(1.06) |
(1.21) |
9.57 |
8.51% |
59,454 |
0.66% |
0.59% |
1.43% |
9/30/19 |
11.24 |
0.19 |
(0.14)aa |
0.05 |
(0.25) |
(1.08) |
(1.33) |
9.96 |
2.67% |
65,910 |
0.66% |
0.59% |
1.90% |
9/30/18 |
10.80 |
0.17 |
0.72 |
0.89 |
(0.34) |
(0.11) |
(0.45) |
11.24 |
8.42% |
77,780 |
0.65% |
0.61% |
1.54% |
Class R3 |
|||||||||||||
9/30/22 |
$ 10.84 |
$ 0.15 |
$ (1.74) |
$ (1.59) |
$ (0.29) |
$ (1.02) |
$ (1.31) |
$ 7.94 |
(17.00%) |
$ 9,592 |
0.81% |
0.76% |
1.53% |
9/30/21 |
9.40 |
0.12 |
1.68 |
1.80 |
(0.21) |
(0.15) |
(0.36) |
10.84 |
19.50% |
14,252 |
0.81% |
0.75% |
1.13% |
9/30/20 |
9.80 |
0.11 |
0.68 |
0.79 |
(0.13) |
(1.06) |
(1.19) |
9.40 |
8.33% |
15,686 |
0.81% |
0.74% |
1.16% |
9/30/19 |
11.10 |
0.16 |
(0.13)aa |
0.03 |
(0.25) |
(1.08) |
(1.33) |
9.80 |
2.45% |
16,144 |
0.81% |
0.74% |
1.66% |
9/30/18 |
10.69 |
0.13 |
0.73 |
0.86 |
(0.34) |
(0.11) |
(0.45) |
11.10 |
8.21% |
16,492 |
0.80% |
0.76% |
1.16% |
The accompanying notes are an integral part of the financial statements.
121
MassMutual 80/20 Allocation Fund – Financial Statements (Continued) |
Financial Highlights (For a share outstanding throughout each period) |
Income (loss) from investment |
Less distributions to shareholders |
Ratios / Supplemental Data |
|||||||||||
Net |
Net |
Net |
Total |
From net |
From net |
Total |
Net |
Total |
Net |
Ratio of |
Ratio of |
Net |
|
Class I |
|||||||||||||
9/30/22 |
$ 12.13 |
$ 0.20 |
$ (2.08) |
$ (1.88) |
$ (0.41) |
$ (0.98) |
$ (1.39) |
$ 8.86 |
(17.85%) |
$ 33,246 |
0.16% |
0.09% |
1.91% |
9/30/21 |
10.28 |
0.18 |
2.24 |
2.42 |
(0.23) |
(0.34) |
(0.57) |
12.13 |
24.09% |
38,991 |
0.16% |
0.08% |
1.51% |
9/30/20 |
10.59 |
0.16 |
0.86 |
1.02 |
(0.19) |
(1.14) |
(1.33) |
10.28 |
9.81% |
30,942 |
0.18% |
0.07% |
1.58% |
9/30/19 |
12.25 |
0.21 |
(0.27) |
(0.06) |
(0.34) |
(1.26) |
(1.60) |
10.59 |
2.28% |
23,314 |
0.20% |
0.07% |
2.06% |
9/30/18 |
11.62 |
0.16 |
1.01 |
1.17 |
(0.43) |
(0.11) |
(0.54) |
12.25 |
10.36% |
17,151 |
0.21% |
0.08% |
1.34% |
Class R5 |
|||||||||||||
9/30/22 |
$ 12.14 |
$ 0.32 |
$ (2.21) |
$ (1.89) |
$ (0.40) |
$ (0.98) |
$ (1.38) |
$ 8.87 |
(17.91%) |
$ 3,301 |
0.25% |
0.19% |
2.90% |
9/30/21 |
10.29 |
0.15 |
2.26 |
2.41 |
(0.22) |
(0.34) |
(0.56) |
12.14 |
23.96% |
7,435 |
0.26% |
0.18% |
1.32% |
9/30/20 |
10.60 |
0.15 |
0.86 |
1.01 |
(0.18) |
(1.14) |
(1.32) |
10.29 |
9.71% |
6,025 |
0.28% |
0.17% |
1.54% |
9/30/19 |
12.25 |
0.19 |
(0.25) |
(0.06) |
(0.33) |
(1.26) |
(1.59) |
10.60 |
2.21% |
5,024 |
0.30% |
0.17% |
1.83% |
9/30/18 |
11.62 |
0.23 |
0.93 |
1.16 |
(0.42) |
(0.11) |
(0.53) |
12.25 |
10.26% |
5,780 |
0.31% |
0.19% |
1.96% |
Service Class |
|||||||||||||
9/30/22 |
$ 12.16 |
$ 0.20 |
$ (2.11) |
$ (1.91) |
$ (0.39) |
$ (0.98) |
$ (1.37) |
$ 8.88 |
(18.04%) |
$ 12,945 |
0.35% |
0.29% |
1.85% |
9/30/21 |
10.31 |
0.13 |
2.27 |
2.40 |
(0.21) |
(0.34) |
(0.55) |
12.16 |
23.83% |
15,973 |
0.36% |
0.28% |
1.13% |
9/30/20 |
10.61 |
0.05 |
0.95 |
1.00 |
(0.16) |
(1.14) |
(1.30) |
10.31 |
9.64% |
11,041 |
0.38% |
0.27% |
0.51% |
9/30/19 |
12.27 |
0.19 |
(0.27) |
(0.08) |
(0.32) |
(1.26) |
(1.58) |
10.61 |
2.01% |
3,115 |
0.40% |
0.27% |
1.84% |
9/30/18 |
11.63 |
0.11 |
1.05 |
1.16 |
(0.41) |
(0.11) |
(0.52) |
12.27 |
10.22% |
2,834 |
0.41% |
0.28% |
0.94% |
Year ended September 30 |
|||||
2022 |
2021 |
2020 |
2019 |
2018 |
|
Portfolio turnover rate |
28% |
29% |
62% |
38% |
64% |
|
c |
Per share amount calculated on the average shares method. |
|
j |
Computed after giving effect to an agreement by MML Advisers to waive certain fees and expenses of the Fund. |
|
l |
Employee retirement benefit plans that invest plan assets in the Separate Investment Accounts (SIAs) may be subject to certain charges as set forth in their respective Plan Documents. Total return figures would be lower for the periods presented if they reflected these charges. |
|
m |
Total return excludes sales charges, if any, and would be lower for the period presented if it reflected these charges. |
|
w |
Expenses of the underlying funds are not included in the Fund’s expense ratio. The Fund indirectly bears its proportionate share of the expenses of any underlying fund. |
The accompanying notes are an integral part of the financial statements.
122
Income (loss) from investment |
Less distributions to shareholders |
Ratios / Supplemental Data |
|||||||||||
Net |
Net |
Net |
Total |
From net |
From net |
Total |
Net |
Total |
Net |
Ratio of |
Ratio of |
Net |
|
Administrative Class |
|||||||||||||
9/30/22 |
$ 12.15 |
$ 0.18 |
$ (2.10) |
$ (1.92) |
$ (0.37) |
$ (0.98) |
$ (1.35) |
$ 8.88 |
(18.10%) |
$ 17,296 |
0.45% |
0.39% |
1.69% |
9/30/21 |
10.29 |
0.14 |
2.25 |
2.39 |
(0.19) |
(0.34) |
(0.53) |
12.15 |
23.77% |
23,648 |
0.46% |
0.38% |
1.23% |
9/30/20 |
10.59 |
0.14 |
0.84 |
0.98 |
(0.14) |
(1.14) |
(1.28) |
10.29 |
9.49% |
23,105 |
0.48% |
0.37% |
1.38% |
9/30/19 |
12.25 |
0.20 |
(0.30) |
(0.10) |
(0.30) |
(1.26) |
(1.56) |
10.59 |
1.88% |
31,091 |
0.50% |
0.37% |
1.91% |
9/30/18 |
11.62 |
0.18 |
0.96 |
1.14 |
(0.40) |
(0.11) |
(0.51) |
12.25 |
10.05% |
36,154 |
0.51% |
0.39% |
1.50% |
Class R4 |
|||||||||||||
9/30/22 |
$ 11.96 |
$ 0.16 |
$ (2.05) |
$ (1.89) |
$ (0.36) |
$ (0.98) |
$ (1.34) |
$ 8.73 |
(18.17%) |
$ 12,041 |
0.60% |
0.54% |
1.48% |
9/30/21 |
10.14 |
0.11 |
2.22 |
2.33 |
(0.17) |
(0.34) |
(0.51) |
11.96 |
23.47% |
14,161 |
0.61% |
0.53% |
0.98% |
9/30/20 |
10.46 |
0.15 |
0.81 |
0.96 |
(0.14) |
(1.14) |
(1.28) |
10.14 |
9.37% |
13,465 |
0.63% |
0.52% |
1.51% |
9/30/19 |
12.12 |
0.18 |
(0.29) |
(0.11) |
(0.29) |
(1.26) |
(1.55) |
10.46 |
1.73% |
17,701 |
0.65% |
0.52% |
1.71% |
9/30/18 |
11.51 |
0.15 |
0.96 |
1.11 |
(0.39) |
(0.11) |
(0.50) |
12.12 |
9.86% |
16,469 |
0.66% |
0.54% |
1.26% |
Class A |
|||||||||||||
9/30/22 |
$ 12.13 |
$ 0.17 |
$ (2.11) |
$ (1.94) |
$ (0.34) |
$ (0.98) |
$ (1.32) |
$ 8.87 |
(18.30%) |
$ 20,773 |
0.70% |
0.64% |
1.61% |
9/30/21 |
10.27 |
0.10 |
2.26 |
2.36 |
(0.16) |
(0.34) |
(0.50) |
12.13 |
23.49% |
32,829 |
0.71% |
0.63% |
0.88% |
9/30/20 |
10.58 |
0.11 |
0.85 |
0.96 |
(0.13) |
(1.14) |
(1.27) |
10.27 |
9.19% |
31,252 |
0.73% |
0.62% |
1.11% |
9/30/19 |
12.22 |
0.18 |
(0.29) |
(0.11) |
(0.27) |
(1.26) |
(1.53) |
10.58 |
1.66% |
30,795 |
0.75% |
0.62% |
1.69% |
9/30/18 |
11.59 |
0.17 |
0.94 |
1.11 |
(0.37) |
(0.11) |
(0.48) |
12.22 |
9.77% |
34,466 |
0.75% |
0.64% |
1.46% |
Class R3 |
|||||||||||||
9/30/22 |
$ 11.88 |
$ 0.13 |
$ (2.04) |
$ (1.91) |
$ (0.32) |
$ (0.98) |
$ (1.30) |
$ 8.67 |
(18.38%) |
$ 14,153 |
0.85% |
0.79% |
1.27% |
9/30/21 |
10.08 |
0.10 |
2.20 |
2.30 |
(0.16) |
(0.34) |
(0.50) |
11.88 |
23.30% |
19,120 |
0.86% |
0.78% |
0.86% |
9/30/20 |
10.44 |
0.10 |
0.82 |
0.92 |
(0.14) |
(1.14) |
(1.28) |
10.08 |
8.98% |
17,928 |
0.88% |
0.77% |
1.08% |
9/30/19 |
12.08 |
0.14 |
(0.26) |
(0.12) |
(0.26) |
(1.26) |
(1.52) |
10.44 |
1.58% |
9,013 |
0.90% |
0.77% |
1.36% |
9/30/18 |
11.47 |
0.12 |
0.96 |
1.08 |
(0.36) |
(0.11) |
(0.47) |
12.08 |
9.63% |
8,381 |
0.91% |
0.79% |
1.04% |
The accompanying notes are an integral part of the financial statements.
123
MassMutual RetireSMARTSM by JPMorgan In Retirement Fund – Financial Statements (Continued) |
Financial Highlights (For a share outstanding throughout each period) |
Income (loss) from investment |
Less distributions to shareholders |
Ratios / Supplemental Data |
|||||||||||
Net |
Net |
Net |
Total |
From net |
From net |
Total |
Net |
Total |
Net |
Ratio of |
Ratio of |
Net |
|
Class I |
|||||||||||||
9/30/22 |
$ 12.78 |
$ 0.33 |
$ (2.12) |
$ (1.79) |
$ (0.42) |
$ (1.16) |
$ (1.58) |
$ 9.41 |
(16.12%) |
$ 14,100 |
0.22% |
0.06% |
2.97% |
9/30/21 |
12.02 |
0.34 |
1.16 |
1.50 |
(0.44) |
(0.30) |
(0.74) |
12.78 |
12.84% |
17,522 |
0.14% |
0.06% |
2.69% |
9/30/20 |
11.78 |
0.29 |
0.33 |
0.62 |
(0.28) |
(0.10) |
(0.38) |
12.02 |
5.27% |
19,693 |
0.12% |
0.06% |
2.52% |
9/30/19 |
11.69 |
0.12 |
0.52 |
0.64 |
(0.40) |
(0.15) |
(0.55) |
11.78 |
6.08% |
16,125 |
0.22% |
0.06% |
1.08% |
9/30/18 |
11.55 |
0.32 |
0.05 |
0.37 |
(0.23) |
— |
(0.23) |
11.69 |
3.22% |
2,436 |
0.30% |
0.07% |
2.77% |
Class R5 |
|||||||||||||
9/30/22 |
$ 12.81 |
$ 0.32 |
$ (2.12) |
$ (1.80) |
$ (0.41) |
$ (1.16) |
$ (1.57) |
$ 9.44 |
(16.20%) |
$ 3,826 |
0.32% |
0.16% |
2.91% |
9/30/21 |
12.05 |
0.27 |
1.22 |
1.49 |
(0.43) |
(0.30) |
(0.73) |
12.81 |
12.68% |
6,568 |
0.24% |
0.16% |
2.14% |
9/30/20 |
11.80 |
0.37 |
0.25 |
0.62 |
(0.27) |
(0.10) |
(0.37) |
12.05 |
5.26% |
5,758 |
0.22% |
0.16% |
3.16% |
9/30/19 |
11.69 |
0.12 |
0.51 |
0.63 |
(0.37) |
(0.15) |
(0.52) |
11.80 |
6.02% |
8,776 |
0.32% |
0.16% |
1.01% |
9/30/18 |
11.56 |
0.31 |
0.04 |
0.35 |
(0.22) |
— |
(0.22) |
11.69 |
3.02% |
1,270 |
0.39% |
0.17% |
2.66% |
Service Class |
|||||||||||||
9/30/22 |
$ 12.82 |
$ 0.35 |
$ (2.16) |
$ (1.81) |
$ (0.40) |
$ (1.16) |
$ (1.56) |
$ 9.45 |
(16.26%) |
$ 5,973 |
0.42% |
0.26% |
3.10% |
9/30/21 |
12.06 |
0.40 |
1.08 |
1.48 |
(0.42) |
(0.30) |
(0.72) |
12.82 |
12.58% |
10,332 |
0.34% |
0.26% |
3.18% |
9/30/20 |
11.81 |
0.28 |
0.32 |
0.60 |
(0.25) |
(0.10) |
(0.35) |
12.06 |
5.13% |
16,755 |
0.32% |
0.26% |
2.39% |
9/30/19 |
11.71 |
0.28 |
0.34 |
0.62 |
(0.37) |
(0.15) |
(0.52) |
11.81 |
5.89% |
15,324 |
0.42% |
0.26% |
2.44% |
9/30/18 |
11.57 |
0.28 |
0.06 |
0.34 |
(0.20) |
— |
(0.20) |
11.71 |
3.00% |
12,630 |
0.50% |
0.27% |
2.40% |
Year ended September 30 |
|||||
2022 |
2021 |
2020 |
2019 |
2018 |
|
Portfolio turnover rate |
58% |
28% |
74% |
39% |
80% |
|
c |
Per share amount calculated on the average shares method. |
|
j |
Computed after giving effect to an agreement by MML Advisers to waive certain fees and expenses of the Fund. |
|
l |
Employee retirement benefit plans that invest plan assets in the Separate Investment Accounts (SIAs) may be subject to certain charges as set forth in their respective Plan Documents. Total return figures would be lower for the periods presented if they reflected these charges. |
|
m |
Total return excludes sales charges, if any, and would be lower for the period presented if it reflected these charges. |
|
w |
Expenses of the underlying funds are not included in the Fund’s expense ratio. The Fund indirectly bears its proportionate share of the expenses of any underlying fund. |
The accompanying notes are an integral part of the financial statements.
124
Income (loss) from investment |
Less distributions to shareholders |
Ratios / Supplemental Data |
|||||||||||
Net |
Net |
Net |
Total |
From net |
From net |
Total |
Net |
Total |
Net |
Ratio of |
Ratio of |
Net |
|
Administrative Class |
|||||||||||||
9/30/22 |
$ 12.82 |
$ 0.31 |
$ (2.15) |
$ (1.84) |
$ (0.38) |
$ (1.16) |
$ (1.54) |
$ 9.44 |
(16.45%) |
$ 22,751 |
0.52% |
0.36% |
2.82% |
9/30/21 |
12.05 |
0.25 |
1.22 |
1.47 |
(0.40) |
(0.30) |
(0.70) |
12.82 |
12.54% |
32,436 |
0.44% |
0.36% |
1.99% |
9/30/20 |
11.81 |
0.31 |
0.27 |
0.58 |
(0.24) |
(0.10) |
(0.34) |
12.05 |
4.95% |
30,972 |
0.42% |
0.36% |
2.69% |
9/30/19 |
11.71 |
0.23 |
0.38 |
0.61 |
(0.36) |
(0.15) |
(0.51) |
11.81 |
5.79% |
39,483 |
0.52% |
0.36% |
1.97% |
9/30/18 |
11.56 |
0.27 |
0.07 |
0.34 |
(0.19) |
— |
(0.19) |
11.71 |
2.97% |
22,101 |
0.60% |
0.37% |
2.35% |
Class R4 |
|||||||||||||
9/30/22 |
$ 12.60 |
$ 0.27 |
$ (2.08) |
$ (1.81) |
$ (0.36) |
$ (1.16) |
$ (1.52) |
$ 9.27 |
(16.47%) |
$ 9,504 |
0.67% |
0.51% |
2.48% |
9/30/21 |
11.86 |
0.26 |
1.16 |
1.42 |
(0.38) |
(0.30) |
(0.68) |
12.60 |
12.27% |
11,952 |
0.59% |
0.51% |
2.08% |
9/30/20 |
11.62 |
0.34 |
0.23 |
0.57 |
(0.23) |
(0.10) |
(0.33) |
11.86 |
4.90% |
14,384 |
0.57% |
0.51% |
2.93% |
9/30/19 |
11.53 |
0.06 |
0.52 |
0.58 |
(0.34) |
(0.15) |
(0.49) |
11.62 |
5.55% |
24,032 |
0.67% |
0.51% |
0.52% |
9/30/18 |
11.39 |
0.25 |
0.06 |
0.31 |
(0.17) |
— |
(0.17) |
11.53 |
2.75% |
4,368 |
0.75% |
0.52% |
2.22% |
Class A |
|||||||||||||
9/30/22 |
$ 12.65 |
$ 0.29 |
$ (2.15) |
$ (1.86) |
$ (0.21) |
$ (1.16) |
$ (1.37) |
$ 9.42 |
(16.64%) |
$ 10,307 |
0.77% |
0.61% |
2.59% |
9/30/21 |
11.91 |
0.30 |
1.12 |
1.42 |
(0.38) |
(0.30) |
(0.68) |
12.65 |
12.20% |
14,697 |
0.69% |
0.61% |
2.45% |
9/30/20 |
11.68 |
0.23 |
0.32 |
0.55 |
(0.22) |
(0.10) |
(0.32) |
11.91 |
4.74% |
74,154 |
0.67% |
0.61% |
2.02% |
9/30/19 |
11.61 |
0.17 |
0.40 |
0.57 |
(0.35) |
(0.15) |
(0.50) |
11.68 |
5.47% |
63,336 |
0.77% |
0.61% |
1.53% |
9/30/18 |
11.47 |
0.26 |
0.04 |
0.30 |
(0.16) |
— |
(0.16) |
11.61 |
2.67% |
20,199 |
0.84% |
0.62% |
2.29% |
Class R3 |
|||||||||||||
9/30/22 |
$ 12.48 |
$ 0.26 |
$ (2.08) |
$ (1.82) |
$ (0.32) |
$ (1.16) |
$ (1.48) |
$ 9.18 |
(16.67%) |
$ 16,575 |
0.92% |
0.76% |
2.36% |
9/30/21 |
11.76 |
0.24 |
1.13 |
1.37 |
(0.35) |
(0.30) |
(0.65) |
12.48 |
11.95% |
23,241 |
0.84% |
0.76% |
1.94% |
9/30/20 |
11.52 |
0.25 |
0.28 |
0.53 |
(0.19) |
(0.10) |
(0.29) |
11.76 |
4.62% |
28,918 |
0.82% |
0.76% |
2.23% |
9/30/19 |
11.43 |
0.10 |
0.45 |
0.55 |
(0.31) |
(0.15) |
(0.46) |
11.52 |
5.35% |
37,510 |
0.92% |
0.76% |
0.88% |
9/30/18 |
11.30 |
0.22 |
0.06 |
0.28 |
(0.15) |
— |
(0.15) |
11.43 |
2.45% |
13,161 |
1.00% |
0.77% |
1.92% |
The accompanying notes are an integral part of the financial statements.
125
MassMutual RetireSMARTSM by JPMorgan 2020 Fund – Financial Statements (Continued) |
Financial Highlights (For a share outstanding throughout each period) |
Income (loss) from investment |
Less distributions to shareholders |
Ratios / Supplemental Data |
|||||||||||
Net |
Net |
Net |
Total |
From net |
From net |
Total |
Net |
Total |
Net |
Ratio of |
Ratio of |
Net |
|
Class I |
|||||||||||||
9/30/22 |
$ 13.37 |
$ 0.35 |
$ (2.25) |
$ (1.90) |
$ (0.44) |
$ (1.01) |
$ (1.45) |
$ 10.02 |
(16.09%) |
$ 37,478 |
0.11% |
0.04% |
3.03% |
9/30/21 |
12.46 |
0.30 |
1.31 |
1.61 |
(0.45) |
(0.25) |
(0.70) |
13.37 |
13.31% |
51,145 |
0.09% |
0.04% |
2.25% |
9/30/20 |
12.53 |
0.31 |
0.39 |
0.70 |
(0.36) |
(0.41) |
(0.77) |
12.46 |
5.74% |
43,646 |
0.07% |
0.04% |
2.58% |
9/30/19 |
13.32 |
0.36 |
0.20 |
0.56 |
(0.39) |
(0.96) |
(1.35) |
12.53 |
5.63% |
35,602 |
0.08% |
0.04% |
2.95% |
9/30/18 |
13.01 |
0.32 |
0.42 |
0.74 |
(0.42) |
(0.01) |
(0.43) |
13.32 |
5.77% |
19,424 |
0.06% |
0.05% |
2.41% |
Class R5 |
|||||||||||||
9/30/22 |
$ 13.34 |
$ 0.35 |
$ (2.26) |
$ (1.91) |
$ (0.43) |
$ (1.01) |
$ (1.44) |
$ 9.99 |
(16.24%) |
$ 23,950 |
0.21% |
0.14% |
2.98% |
9/30/21 |
12.43 |
0.32 |
1.28 |
1.60 |
(0.44) |
(0.25) |
(0.69) |
13.34 |
13.22% |
39,112 |
0.19% |
0.14% |
2.47% |
9/30/20 |
12.51 |
0.35 |
0.33 |
0.68 |
(0.35) |
(0.41) |
(0.76) |
12.43 |
5.57% |
44,058 |
0.17% |
0.14% |
2.91% |
9/30/19 |
13.30 |
0.30 |
0.25 |
0.55 |
(0.38) |
(0.96) |
(1.34) |
12.51 |
5.56% |
60,303 |
0.18% |
0.14% |
2.45% |
9/30/18 |
12.99 |
0.32 |
0.41 |
0.73 |
(0.41) |
(0.01) |
(0.42) |
13.30 |
5.69% |
13,848 |
0.16% |
0.15% |
2.48% |
Service Class |
|||||||||||||
9/30/22 |
$ 13.43 |
$ 0.46 |
$ (2.40) |
$ (1.94) |
$ (0.41) |
$ (1.01) |
$ (1.42) |
$ 10.07 |
(16.29%) |
$ 9,053 |
0.31% |
0.24% |
3.81% |
9/30/21 |
12.51 |
0.32 |
1.28 |
1.60 |
(0.43) |
(0.25) |
(0.68) |
13.43 |
13.11% |
29,244 |
0.29% |
0.24% |
2.40% |
9/30/20 |
12.58 |
0.28 |
0.40 |
0.68 |
(0.34) |
(0.41) |
(0.75) |
12.51 |
5.49% |
35,285 |
0.27% |
0.24% |
2.33% |
9/30/19 |
13.34 |
0.40 |
0.14 |
0.54 |
(0.34) |
(0.96) |
(1.30) |
12.58 |
5.42% |
31,848 |
0.28% |
0.24% |
3.22% |
9/30/18 |
13.03 |
0.28 |
0.43 |
0.71 |
(0.39) |
(0.01) |
(0.40) |
13.34 |
5.50% |
83,925 |
0.26% |
0.25% |
2.14% |
Year ended September 30 |
|||||
2022 |
2021 |
2020 |
2019 |
2018 |
|
Portfolio turnover rate |
52% |
30% |
69% |
46% |
62% |
|
c |
Per share amount calculated on the average shares method. |
|
j |
Computed after giving effect to an agreement by MML Advisers to waive certain fees and expenses of the Fund. |
|
l |
Employee retirement benefit plans that invest plan assets in the Separate Investment Accounts (SIAs) may be subject to certain charges as set forth in their respective Plan Documents. Total return figures would be lower for the periods presented if they reflected these charges. |
|
m |
Total return excludes sales charges, if any, and would be lower for the period presented if it reflected these charges. |
|
w |
Expenses of the underlying funds are not included in the Fund’s expense ratio. The Fund indirectly bears its proportionate share of the expenses of any underlying fund. |
The accompanying notes are an integral part of the financial statements.
126
Income (loss) from investment |
Less distributions to shareholders |
Ratios / Supplemental Data |
|||||||||||
Net |
Net |
Net |
Total |
From net |
From net |
Total |
Net |
Total |
Net |
Ratio of |
Ratio of |
Net |
|
Administrative Class |
|||||||||||||
9/30/22 |
$ 13.38 |
$ 0.33 |
$ (2.28) |
$ (1.95) |
$ (0.39) |
$ (1.01) |
$ (1.40) |
$ 10.03 |
(16.43%) |
$ 19,966 |
0.41% |
0.34% |
2.82% |
9/30/21 |
12.46 |
0.28 |
1.30 |
1.58 |
(0.41) |
(0.25) |
(0.66) |
13.38 |
13.02% |
42,876 |
0.39% |
0.34% |
2.17% |
9/30/20 |
12.53 |
0.35 |
0.31 |
0.66 |
(0.32) |
(0.41) |
(0.73) |
12.46 |
5.40% |
46,758 |
0.37% |
0.34% |
2.84% |
9/30/19 |
13.30 |
0.34 |
0.19 |
0.53 |
(0.34) |
(0.96) |
(1.30) |
12.53 |
5.38% |
74,837 |
0.38% |
0.34% |
2.79% |
9/30/18 |
12.99 |
0.29 |
0.40 |
0.69 |
(0.37) |
(0.01) |
(0.38) |
13.30 |
5.43% |
86,230 |
0.36% |
0.35% |
2.24% |
Class R4 |
|||||||||||||
9/30/22 |
$ 13.06 |
$ 0.30 |
$ (2.21) |
$ (1.91) |
$ (0.37) |
$ (1.01) |
$ (1.38) |
$ 9.77 |
(16.51%) |
$ 15,666 |
0.56% |
0.49% |
2.63% |
9/30/21 |
12.17 |
0.26 |
1.27 |
1.53 |
(0.39) |
(0.25) |
(0.64) |
13.06 |
12.89% |
23,718 |
0.54% |
0.49% |
2.05% |
9/30/20 |
12.26 |
0.36 |
0.27 |
0.63 |
(0.31) |
(0.41) |
(0.72) |
12.17 |
5.23% |
29,367 |
0.52% |
0.49% |
2.98% |
9/30/19 |
13.04 |
0.31 |
0.19 |
0.50 |
(0.32) |
(0.96) |
(1.28) |
12.26 |
5.21% |
50,600 |
0.53% |
0.49% |
2.60% |
9/30/18 |
12.76 |
0.24 |
0.41 |
0.65 |
(0.36) |
(0.01) |
(0.37) |
13.04 |
5.18% |
57,866 |
0.51% |
0.50% |
1.90% |
Class A |
|||||||||||||
9/30/22 |
$ 13.24 |
$ 0.31 |
$ (2.27) |
$ (1.96) |
$ (0.30) |
$ (1.01) |
$ (1.31) |
$ 9.97 |
(16.60%) |
$ 20,470 |
0.66% |
0.59% |
2.62% |
9/30/21 |
12.35 |
0.30 |
1.23 |
1.53 |
(0.39) |
(0.25) |
(0.64) |
13.24 |
12.69% |
31,861 |
0.64% |
0.59% |
2.35% |
9/30/20 |
12.44 |
0.24 |
0.38 |
0.62 |
(0.30) |
(0.41) |
(0.71) |
12.35 |
5.10% |
88,011 |
0.62% |
0.59% |
2.04% |
9/30/19 |
13.22 |
0.27 |
0.22 |
0.49 |
(0.31) |
(0.96) |
(1.27) |
12.44 |
5.05% |
73,800 |
0.63% |
0.59% |
2.19% |
9/30/18 |
12.91 |
0.23 |
0.43 |
0.66 |
(0.34) |
(0.01) |
(0.35) |
13.22 |
5.15% |
76,268 |
0.61% |
0.60% |
1.72% |
Class R3 |
|||||||||||||
9/30/22 |
$ 12.81 |
$ 0.27 |
$ (2.16) |
$ (1.89) |
$ (0.35) |
$ (1.01) |
$ (1.36) |
$ 9.56 |
(16.70%) |
$ 35,009 |
0.81% |
0.74% |
2.43% |
9/30/21 |
11.96 |
0.23 |
1.24 |
1.47 |
(0.37) |
(0.25) |
(0.62) |
12.81 |
12.57% |
49,554 |
0.79% |
0.74% |
1.85% |
9/30/20 |
12.05 |
0.25 |
0.34 |
0.59 |
(0.27) |
(0.41) |
(0.68) |
11.96 |
4.97% |
57,238 |
0.77% |
0.74% |
2.14% |
9/30/19 |
12.84 |
0.28 |
0.18 |
0.46 |
(0.29) |
(0.96) |
(1.25) |
12.05 |
4.93% |
66,638 |
0.78% |
0.74% |
2.37% |
9/30/18 |
12.56 |
0.22 |
0.40 |
0.62 |
(0.33) |
(0.01) |
(0.34) |
12.84 |
4.98% |
77,690 |
0.76% |
0.75% |
1.71% |
The accompanying notes are an integral part of the financial statements.
127
MassMutual RetireSMARTSM by JPMorgan 2025 Fund – Financial Statements (Continued) |
Financial Highlights (For a share outstanding throughout each period) |
Income (loss) from investment |
Less distributions to shareholders |
Ratios / Supplemental Data |
|||||||||||
Net |
Net |
Net |
Total |
From net |
From net |
Total |
Net |
Total |
Net |
Ratio of |
Ratio of |
Net |
|
Class I |
|||||||||||||
9/30/22 |
$ 13.47 |
$ 0.34 |
$ (2.35) |
$ (2.01) |
$ (0.46) |
$ (1.20) |
$ (1.66) |
$ 9.80 |
(17.29%) |
$ 44,023 |
0.13% |
0.01% |
2.91% |
9/30/21 |
12.23 |
0.28 |
1.77 |
2.05 |
(0.43) |
(0.38) |
(0.81) |
13.47 |
17.23% |
56,362 |
0.10% |
0.01% |
2.16% |
9/30/20 |
12.50 |
0.31 |
0.42 |
0.73 |
(0.32) |
(0.68) |
(1.00) |
12.23 |
6.02% |
49,478 |
0.09% |
0.01% |
2.59% |
9/30/19 |
13.49 |
0.33 |
0.15 |
0.48 |
(0.40) |
(1.07) |
(1.47) |
12.50 |
5.30% |
40,806 |
0.10% |
0.01% |
2.74% |
9/30/18 |
13.29 |
0.30 |
0.63 |
0.93 |
(0.49) |
(0.24) |
(0.73) |
13.49 |
7.15% |
21,942 |
0.09% |
0.03% |
2.28% |
Class R5 |
|||||||||||||
9/30/22 |
$ 13.61 |
$ 0.33 |
$ (2.39) |
$ (2.06) |
$ (0.44) |
$ (1.20) |
$ (1.64) |
$ 9.91 |
(17.42%) |
$ 1,186 |
0.23% |
0.11% |
2.81% |
9/30/21 |
12.35 |
0.16 |
1.90 |
2.06 |
(0.42) |
(0.38) |
(0.80) |
13.61 |
17.13% |
1,376 |
0.20% |
0.11% |
1.21% |
9/30/20 |
12.62 |
0.28 |
0.44 |
0.72 |
(0.31) |
(0.68) |
(0.99) |
12.35 |
5.87% |
468 |
0.19% |
0.11% |
2.32% |
9/30/19 |
13.51 |
0.07 |
0.42 |
0.49 |
(0.31) |
(1.07) |
(1.38) |
12.62 |
5.26% |
527 |
0.20% |
0.11% |
0.61% |
9/30/18 |
13.29 |
0.23 |
0.70 |
0.93 |
(0.47) |
(0.24) |
(0.71) |
13.51 |
7.16% |
44 |
0.19% |
0.12% |
1.72% |
Service Class |
|||||||||||||
9/30/22 |
$ 13.49 |
$ 0.42 |
$ (2.46) |
$ (2.04) |
$ (0.43) |
$ (1.20) |
$ (1.63) |
$ 9.82 |
(17.48%) |
$ 3,811 |
0.32% |
0.21% |
3.50% |
9/30/21 |
12.25 |
0.27 |
1.76 |
2.03 |
(0.41) |
(0.38) |
(0.79) |
13.49 |
16.97% |
8,867 |
0.30% |
0.21% |
2.04% |
9/30/20 |
12.52 |
0.28 |
0.42 |
0.70 |
(0.29) |
(0.68) |
(0.97) |
12.25 |
5.76% |
9,970 |
0.29% |
0.21% |
2.37% |
9/30/19 |
13.49 |
0.39 |
0.08 |
0.47 |
(0.37) |
(1.07) |
(1.44) |
12.52 |
5.14% |
9,278 |
0.30% |
0.21% |
3.23% |
9/30/18 |
13.29 |
0.27 |
0.63 |
0.90 |
(0.46) |
(0.24) |
(0.70) |
13.49 |
6.94% |
19,582 |
0.29% |
0.23% |
2.00% |
Year ended September 30 |
|||||
2022 |
2021 |
2020 |
2019 |
2018 |
|
Portfolio turnover rate |
54% |
35% |
73% |
47% |
67% |
|
c |
Per share amount calculated on the average shares method. |
|
j |
Computed after giving effect to an agreement by MML Advisers to waive certain fees and expenses of the Fund. |
|
l |
Employee retirement benefit plans that invest plan assets in the Separate Investment Accounts (SIAs) may be subject to certain charges as set forth in their respective Plan Documents. Total return figures would be lower for the periods presented if they reflected these charges. |
|
m |
Total return excludes sales charges, if any, and would be lower for the period presented if it reflected these charges. |
|
w |
Expenses of the underlying funds are not included in the Fund’s expense ratio. The Fund indirectly bears its proportionate share of the expenses of any underlying fund. |
The accompanying notes are an integral part of the financial statements.
128
Income (loss) from investment |
Less distributions to shareholders |
Ratios / Supplemental Data |
|||||||||||
Net |
Net |
Net |
Total |
From net |
From net |
Total |
Net |
Total |
Net |
Ratio of |
Ratio of |
Net |
|
Administrative Class |
|||||||||||||
9/30/22 |
$ 13.42 |
$ 0.32 |
$ (2.36) |
$ (2.04) |
$ (0.41) |
$ (1.20) |
$ (1.61) |
$ 9.77 |
(17.50%) |
$ 24,363 |
0.43% |
0.31% |
2.73% |
9/30/21 |
12.19 |
0.28 |
1.72 |
2.00 |
(0.39) |
(0.38) |
(0.77) |
13.42 |
16.86% |
34,778 |
0.40% |
0.31% |
2.12% |
9/30/20 |
12.47 |
0.27 |
0.42 |
0.69 |
(0.29) |
(0.68) |
(0.97) |
12.19 |
5.64% |
39,673 |
0.39% |
0.31% |
2.30% |
9/30/19 |
13.44 |
0.32 |
0.14 |
0.46 |
(0.36) |
(1.07) |
(1.43) |
12.47 |
5.07% |
43,407 |
0.40% |
0.31% |
2.61% |
9/30/18 |
13.25 |
0.26 |
0.62 |
0.88 |
(0.45) |
(0.24) |
(0.69) |
13.44 |
6.79% |
47,433 |
0.39% |
0.33% |
1.94% |
Class R4 |
|||||||||||||
9/30/22 |
$ 13.20 |
$ 0.28 |
$ (2.30) |
$ (2.02) |
$ (0.39) |
$ (1.20) |
$ (1.59) |
$ 9.59 |
(17.65%) |
$ 21,218 |
0.58% |
0.46% |
2.47% |
9/30/21 |
12.00 |
0.25 |
1.70 |
1.95 |
(0.37) |
(0.38) |
(0.75) |
13.20 |
16.65% |
29,432 |
0.55% |
0.46% |
1.90% |
9/30/20 |
12.29 |
0.36 |
0.30 |
0.66 |
(0.27) |
(0.68) |
(0.95) |
12.00 |
5.49% |
30,218 |
0.54% |
0.46% |
3.02% |
9/30/19 |
13.27 |
0.30 |
0.13 |
0.43 |
(0.34) |
(1.07) |
(1.41) |
12.29 |
4.88% |
58,761 |
0.55% |
0.46% |
2.50% |
9/30/18 |
13.09 |
0.22 |
0.63 |
0.85 |
(0.43) |
(0.24) |
(0.67) |
13.27 |
6.66% |
66,329 |
0.54% |
0.48% |
1.70% |
Class A |
|||||||||||||
9/30/22 |
$ 13.25 |
$ 0.29 |
$ (2.37) |
$ (2.08) |
$ (0.20) |
$ (1.20) |
$ (1.40) |
$ 9.77 |
(17.74%) |
$ 8,655 |
0.68% |
0.56% |
2.48% |
9/30/21 |
12.05 |
0.30 |
1.65 |
1.95 |
(0.37) |
(0.38) |
(0.75) |
13.25 |
16.60% |
13,796 |
0.65% |
0.56% |
2.33% |
9/30/20 |
12.34 |
0.22 |
0.44 |
0.66 |
(0.27) |
(0.68) |
(0.95) |
12.05 |
5.46% |
69,042 |
0.64% |
0.56% |
1.89% |
9/30/19 |
13.32 |
0.21 |
0.21 |
0.42 |
(0.33) |
(1.07) |
(1.40) |
12.34 |
4.74% |
53,785 |
0.65% |
0.56% |
1.71% |
9/30/18 |
13.13 |
0.20 |
0.63 |
0.83 |
(0.40) |
(0.24) |
(0.64) |
13.32 |
6.50% |
40,219 |
0.64% |
0.58% |
1.54% |
Class R3 |
|||||||||||||
9/30/22 |
$ 13.16 |
$ 0.29 |
$ (2.33) |
$ (2.04) |
$ (0.36) |
$ (1.20) |
$ (1.56) |
$ 9.56 |
(17.85%) |
$ 38,799 |
0.83% |
0.71% |
2.49% |
9/30/21 |
11.97 |
0.21 |
1.70 |
1.91 |
(0.34) |
(0.38) |
(0.72) |
13.16 |
16.35% |
59,696 |
0.80% |
0.71% |
1.63% |
9/30/20 |
12.25 |
0.24 |
0.39 |
0.63 |
(0.23) |
(0.68) |
(0.91) |
11.97 |
5.27% |
66,066 |
0.79% |
0.71% |
2.02% |
9/30/19 |
13.23 |
0.26 |
0.14 |
0.40 |
(0.31) |
(1.07) |
(1.38) |
12.25 |
4.59% |
78,974 |
0.80% |
0.71% |
2.18% |
9/30/18 |
13.04 |
0.20 |
0.63 |
0.83 |
(0.40) |
(0.24) |
(0.64) |
13.23 |
6.47% |
87,865 |
0.79% |
0.73% |
1.52% |
The accompanying notes are an integral part of the financial statements.
129
MassMutual RetireSMARTSM by JPMorgan 2030 Fund – Financial Statements (Continued) |
Financial Highlights (For a share outstanding throughout each period) |
Income (loss) from investment |
Less distributions to shareholders |
Ratios / Supplemental Data |
|||||||||||
Net |
Net |
Net |
Total |
From net |
From net |
Total |
Net |
Total |
Net |
Ratio of |
Ratio of |
Net |
|
Class I |
|||||||||||||
9/30/22 |
$ 13.80 |
$ 0.32 |
$ (2.49) |
$ (2.17) |
$ (0.45) |
$ (1.16) |
$ (1.61) |
$ 10.02 |
(18.08%) |
$ 56,717 |
0.07% |
0.04% |
2.68% |
9/30/21 |
12.05 |
0.25 |
2.14 |
2.39 |
(0.36) |
(0.28) |
(0.64) |
13.80 |
20.27% |
65,036 |
0.06% |
0.04% |
1.88% |
9/30/20 |
12.51 |
0.28 |
0.45 |
0.73 |
(0.30) |
(0.89) |
(1.19) |
12.05 |
5.91% |
50,325 |
0.06% |
0.04% |
2.41% |
9/30/19 |
13.91 |
0.32 |
0.03 |
0.35 |
(0.40) |
(1.35) |
(1.75) |
12.51 |
4.77% |
42,529 |
0.06% |
0.04% |
2.64% |
9/30/18 |
13.38 |
0.29 |
0.78 |
1.07 |
(0.49) |
(0.05) |
(0.54) |
13.91 |
8.11% |
20,448 |
0.05% |
0.04% |
2.09% |
Class R5 |
|||||||||||||
9/30/22 |
$ 13.73 |
$ 0.32 |
$ (2.50) |
$ (2.18) |
$ (0.43) |
$ (1.16) |
$ (1.59) |
$ 9.96 |
(18.18%) |
$ 68,661 |
0.17% |
0.14% |
2.69% |
9/30/21 |
11.99 |
0.25 |
2.11 |
2.36 |
(0.34) |
(0.28) |
(0.62) |
13.73 |
20.17% |
79,905 |
0.16% |
0.14% |
1.90% |
9/30/20 |
12.45 |
0.29 |
0.43 |
0.72 |
(0.29) |
(0.89) |
(1.18) |
11.99 |
5.84% |
72,808 |
0.16% |
0.14% |
2.50% |
9/30/19 |
13.87 |
0.25 |
0.08 |
0.33 |
(0.40) |
(1.35) |
(1.75) |
12.45 |
4.56% |
88,078 |
0.16% |
0.14% |
2.03% |
9/30/18 |
13.35 |
0.31 |
0.74 |
1.05 |
(0.48) |
(0.05) |
(0.53) |
13.87 |
7.96% |
11,359 |
0.15% |
0.14% |
2.26% |
Service Class |
|||||||||||||
9/30/22 |
$ 13.82 |
$ 0.43 |
$ (2.63) |
$ (2.20) |
$ (0.42) |
$ (1.16) |
$ (1.58) |
$ 10.04 |
(18.23%) |
$ 15,661 |
0.27% |
0.24% |
3.46% |
9/30/21 |
12.06 |
0.27 |
2.10 |
2.37 |
(0.33) |
(0.28) |
(0.61) |
13.82 |
20.11% |
45,510 |
0.26% |
0.24% |
2.03% |
9/30/20 |
12.52 |
0.24 |
0.47 |
0.71 |
(0.28) |
(0.89) |
(1.17) |
12.06 |
5.67% |
50,072 |
0.26% |
0.24% |
2.00% |
9/30/19 |
13.90 |
0.36 |
(0.03)aa |
0.33 |
(0.36) |
(1.35) |
(1.71) |
12.52 |
4.48% |
44,334 |
0.26% |
0.24% |
2.88% |
9/30/18 |
13.37 |
0.25 |
0.79 |
1.04 |
(0.46) |
(0.05) |
(0.51) |
13.90 |
7.88% |
115,828 |
0.25% |
0.24% |
1.87% |
Year ended September 30 |
|||||
2022 |
2021 |
2020 |
2019 |
2018 |
|
Portfolio turnover rate |
58% |
32% |
70% |
39% |
63% |
|
c |
Per share amount calculated on the average shares method. |
|
d |
Amount is less than $0.005 per share. |
|
j |
Computed after giving effect to an agreement by MML Advisers to waive certain fees and expenses of the Fund. |
|
l |
Employee retirement benefit plans that invest plan assets in the Separate Investment Accounts (SIAs) may be subject to certain charges as set forth in their respective Plan Documents. Total return figures would be lower for the periods presented if they reflected these charges. |
|
m |
Total return excludes sales charges, if any, and would be lower for the period presented if it reflected these charges. |
|
w |
Expenses of the underlying funds are not included in the Fund’s expense ratio. The Fund indirectly bears its proportionate share of the expenses of any underlying fund. |
|
aa |
The amount shown for a share outstanding does not correspond with the aggregate net realized and unrealized gain (loss) for the period due to the timing of purchases and redemptions of Fund shares in relation to the fluctuating market values of the Fund. |
The accompanying notes are an integral part of the financial statements.
130
Income (loss) from investment |
Less distributions to shareholders |
Ratios / Supplemental Data |
|||||||||||
Net |
Net |
Net |
Total |
From net |
From net |
Total |
Net |
Total |
Net |
Ratio of |
Ratio of |
Net |
|
Administrative Class |
|||||||||||||
9/30/22 |
$ 13.77 |
$ 0.32 |
$ (2.53) |
$ (2.21) |
$ (0.40) |
$ (1.16) |
$ (1.56) |
$ 10.00 |
(18.33%) |
$ 48,874 |
0.37% |
0.34% |
2.63% |
9/30/21 |
12.03 |
0.22 |
2.12 |
2.34 |
(0.32) |
(0.28) |
(0.60) |
13.77 |
19.86% |
76,955 |
0.36% |
0.34% |
1.68% |
9/30/20 |
12.48 |
0.28 |
0.42 |
0.70 |
(0.26) |
(0.89) |
(1.15) |
12.03 |
5.66% |
70,563 |
0.36% |
0.34% |
2.33% |
9/30/19 |
13.88 |
0.28 |
0.03 |
0.31 |
(0.36) |
(1.35) |
(1.71) |
12.48 |
4.38% |
106,439 |
0.36% |
0.34% |
2.33% |
9/30/18 |
13.35 |
0.24 |
0.78 |
1.02 |
(0.44) |
(0.05) |
(0.49) |
13.88 |
7.78% |
104,308 |
0.35% |
0.34% |
1.79% |
Class R4 |
|||||||||||||
9/30/22 |
$ 13.53 |
$ 0.27 |
$ (2.46) |
$ (2.19) |
$ (0.37) |
$ (1.16) |
$ (1.53) |
$ 9.81 |
(18.47%) |
$ 22,702 |
0.52% |
0.49% |
2.27% |
9/30/21 |
11.82 |
0.20 |
2.08 |
2.28 |
(0.29) |
(0.28) |
(0.57) |
13.53 |
19.74% |
33,601 |
0.51% |
0.49% |
1.55% |
9/30/20 |
12.29 |
0.29 |
0.38 |
0.67 |
(0.25) |
(0.89) |
(1.14) |
11.82 |
5.42% |
34,745 |
0.51% |
0.49% |
2.50% |
9/30/19 |
13.69 |
0.27 |
0.02 |
0.29 |
(0.34) |
(1.35) |
(1.69) |
12.29 |
4.23% |
57,900 |
0.51% |
0.49% |
2.22% |
9/30/18 |
13.18 |
0.21 |
0.78 |
0.99 |
(0.43) |
(0.05) |
(0.48) |
13.69 |
7.62% |
68,964 |
0.50% |
0.49% |
1.57% |
Class A |
|||||||||||||
9/30/22 |
$ 13.64 |
$ 0.27 |
$ (2.50) |
$ (2.23) |
$ (0.31) |
$ (1.16) |
$ (1.47) |
$ 9.94 |
(18.55%) |
$ 26,417 |
0.62% |
0.59% |
2.27% |
9/30/21 |
11.92 |
0.25 |
2.05 |
2.30 |
(0.30) |
(0.28) |
(0.58) |
13.64 |
19.67% |
37,483 |
0.61% |
0.59% |
1.88% |
9/30/20 |
12.39 |
0.19 |
0.47 |
0.66 |
(0.24) |
(0.89) |
(1.13) |
11.92 |
5.34% |
92,603 |
0.61% |
0.59% |
1.66% |
9/30/19 |
13.78 |
0.23 |
0.05 |
0.28 |
(0.32) |
(1.35) |
(1.67) |
12.39 |
4.13% |
73,893 |
0.61% |
0.59% |
1.92% |
9/30/18 |
13.25 |
0.20 |
0.78 |
0.98 |
(0.40) |
(0.05) |
(0.45) |
13.78 |
7.52% |
75,440 |
0.60% |
0.59% |
1.44% |
Class R3 |
|||||||||||||
9/30/22 |
$ 13.28 |
$ 0.24 |
$ (2.41) |
$ (2.17) |
$ (0.35) |
$ (1.16) |
$ (1.51) |
$ 9.60 |
(18.67%) |
$ 70,110 |
0.77% |
0.74% |
2.05% |
9/30/21 |
11.62 |
0.18 |
2.03 |
2.21 |
(0.27) |
(0.28) |
(0.55) |
13.28 |
19.41% |
87,304 |
0.76% |
0.74% |
1.38% |
9/30/20 |
12.09 |
0.20 |
0.43 |
0.63 |
(0.21) |
(0.89) |
(1.10) |
11.62 |
5.21% |
89,115 |
0.76% |
0.74% |
1.78% |
9/30/19 |
13.50 |
0.25 |
0.00d |
0.25 |
(0.31) |
(1.35) |
(1.66) |
12.09 |
3.92% |
103,094 |
0.76% |
0.74% |
2.08% |
9/30/18 |
13.00 |
0.18 |
0.77 |
0.95 |
(0.40) |
(0.05) |
(0.45) |
13.50 |
7.38% |
118,905 |
0.75% |
0.74% |
1.35% |
The accompanying notes are an integral part of the financial statements.
131
MassMutual RetireSMARTSM by JPMorgan 2035 Fund – Financial Statements (Continued) |
Financial Highlights (For a share outstanding throughout each period) |
Income (loss) from investment |
Less distributions to shareholders |
Ratios / Supplemental Data |
|||||||||||
Net |
Net |
Net |
Total |
From net |
From net |
Total |
Net |
Total |
Net |
Ratio of |
Ratio of |
Net |
|
Class I |
|||||||||||||
9/30/22 |
$ 14.28 |
$ 0.31 |
$ (2.58) |
$ (2.27) |
$ (0.50) |
$ (1.52) |
$ (2.02) |
$ 9.99 |
(18.91%) |
$ 41,191 |
0.13% |
0.05% |
2.56% |
9/30/21 |
12.07 |
0.21 |
2.59 |
2.80 |
(0.31) |
(0.28) |
(0.59) |
14.28 |
23.66% |
53,885 |
0.12% |
0.05% |
1.54% |
9/30/20 |
12.73 |
0.26 |
0.48 |
0.74 |
(0.30) |
(1.10) |
(1.40) |
12.07 |
5.75% |
42,470 |
0.12% |
0.05% |
2.23% |
9/30/19 |
14.18 |
0.32 |
(0.09)aa |
0.23 |
(0.41) |
(1.27) |
(1.68) |
12.73 |
3.77% |
33,309 |
0.12% |
0.05% |
2.56% |
9/30/18 |
13.77 |
0.25 |
0.93 |
1.18 |
(0.51) |
(0.26) |
(0.77) |
14.18 |
8.81% |
21,586 |
0.11% |
0.07% |
1.83% |
Class R5 |
|||||||||||||
9/30/22 |
$ 14.30 |
$ 0.30 |
$ (2.59) |
$ (2.29) |
$ (0.49) |
$ (1.52) |
$ (2.01) |
$ 10.00 |
(19.03%) |
$ 2,624 |
0.23% |
0.15% |
2.46% |
9/30/21 |
12.09 |
0.18 |
2.61 |
2.79 |
(0.30) |
(0.28) |
(0.58) |
14.30 |
23.52% |
3,537 |
0.22% |
0.15% |
1.30% |
9/30/20 |
12.75 |
0.23 |
0.50 |
0.73 |
(0.29) |
(1.10) |
(1.39) |
12.09 |
5.67% |
2,270 |
0.22% |
0.15% |
1.91% |
9/30/19 |
14.16 |
0.05 |
0.17 |
0.22 |
(0.36) |
(1.27) |
(1.63) |
12.75 |
3.68% |
1,801 |
0.22% |
0.15% |
0.41% |
9/30/18 |
13.75 |
0.43 |
0.73 |
1.16 |
(0.49) |
(0.26) |
(0.75) |
14.16 |
8.68% |
132 |
0.21% |
0.18% |
3.09% |
Service Class |
|||||||||||||
9/30/22 |
$ 14.47 |
$ 0.30 |
$ (2.63) |
$ (2.33) |
$ (0.47) |
$ (1.52) |
$ (1.99) |
$ 10.15 |
(19.06%) |
$ 6,293 |
0.33% |
0.25% |
2.42% |
9/30/21 |
12.23 |
0.20 |
2.60 |
2.80 |
(0.28) |
(0.28) |
(0.56) |
14.47 |
23.36% |
8,127 |
0.32% |
0.25% |
1.43% |
9/30/20 |
12.87 |
0.23 |
0.50 |
0.73 |
(0.27) |
(1.10) |
(1.37) |
12.23 |
5.60% |
8,234 |
0.32% |
0.25% |
1.89% |
9/30/19 |
14.30 |
0.33 |
(0.12)aa |
0.21 |
(0.37) |
(1.27) |
(1.64) |
12.87 |
3.55% |
8,093 |
0.32% |
0.25% |
2.62% |
9/30/18 |
13.88 |
0.25 |
0.91 |
1.16 |
(0.48) |
(0.26) |
(0.74) |
14.30 |
8.59% |
12,908 |
0.31% |
0.27% |
1.78% |
Year ended September 30 |
|||||
2022 |
2021 |
2020 |
2019 |
2018 |
|
Portfolio turnover rate |
63% |
34% |
92% |
50% |
62% |
|
c |
Per share amount calculated on the average shares method. |
|
j |
Computed after giving effect to an agreement by MML Advisers to waive certain fees and expenses of the Fund. |
|
l |
Employee retirement benefit plans that invest plan assets in the Separate Investment Accounts (SIAs) may be subject to certain charges as set forth in their respective Plan Documents. Total return figures would be lower for the periods presented if they reflected these charges. |
|
m |
Total return excludes sales charges, if any, and would be lower for the period presented if it reflected these charges. |
|
w |
Expenses of the underlying funds are not included in the Fund’s expense ratio. The Fund indirectly bears its proportionate share of the expenses of any underlying fund. |
|
aa |
The amount shown for a share outstanding does not correspond with the aggregate net realized (loss) and net change in unrealized appreciation (depreciation) on investments due to the timing of the commencement of operations of the share class in relation to fluctuating market values of the investments of the Fund. |
The accompanying notes are an integral part of the financial statements.
132
Income (loss) from investment |
Less distributions to shareholders |
Ratios / Supplemental Data |
|||||||||||
Net |
Net |
Net |
Total |
From net |
From net |
Total |
Net |
Total |
Net |
Ratio of |
Ratio of |
Net |
|
Administrative Class |
|||||||||||||
9/30/22 |
$ 14.39 |
$ 0.29 |
$ (2.62) |
$ (2.33) |
$ (0.46) |
$ (1.52) |
$ (1.98) |
$ 10.08 |
(19.17%) |
$ 20,432 |
0.43% |
0.35% |
2.35% |
9/30/21 |
12.16 |
0.17 |
2.61 |
2.78 |
(0.27) |
(0.28) |
(0.55) |
14.39 |
23.29% |
32,891 |
0.42% |
0.35% |
1.24% |
9/30/20 |
12.81 |
0.22 |
0.49 |
0.71 |
(0.26) |
(1.10) |
(1.36) |
12.16 |
5.46% |
28,848 |
0.42% |
0.35% |
1.83% |
9/30/19 |
14.25 |
0.29 |
(0.09)aa |
0.20 |
(0.37) |
(1.27) |
(1.64) |
12.81 |
3.44% |
32,361 |
0.42% |
0.35% |
2.31% |
9/30/18 |
13.83 |
0.23 |
0.92 |
1.15 |
(0.47) |
(0.26) |
(0.73) |
14.25 |
8.53% |
33,416 |
0.41% |
0.37% |
1.63% |
Class R4 |
|||||||||||||
9/30/22 |
$ 14.16 |
$ 0.25 |
$ (2.56) |
$ (2.31) |
$ (0.43) |
$ (1.52) |
$ (1.95) |
$ 9.90 |
(19.29%) |
$ 18,897 |
0.58% |
0.50% |
2.02% |
9/30/21 |
11.97 |
0.17 |
2.54 |
2.71 |
(0.24) |
(0.28) |
(0.52) |
14.16 |
23.08% |
24,087 |
0.57% |
0.50% |
1.22% |
9/30/20 |
12.63 |
0.30 |
0.38 |
0.68 |
(0.24) |
(1.10) |
(1.34) |
11.97 |
5.30% |
24,244 |
0.57% |
0.50% |
2.47% |
9/30/19 |
14.06 |
0.27 |
(0.09)aa |
0.18 |
(0.34) |
(1.27) |
(1.61) |
12.63 |
3.37% |
49,044 |
0.57% |
0.50% |
2.17% |
9/30/18 |
13.67 |
0.19 |
0.91 |
1.10 |
(0.45) |
(0.26) |
(0.71) |
14.06 |
8.28% |
56,342 |
0.56% |
0.52% |
1.40% |
Class A |
|||||||||||||
9/30/22 |
$ 14.21 |
$ 0.27 |
$ (2.62) |
$ (2.35) |
$ (0.31) |
$ (1.52) |
$ (1.83) |
$ 10.03 |
(19.34%) |
$ 7,392 |
0.68% |
0.60% |
2.16% |
9/30/21 |
12.03 |
0.19 |
2.52 |
2.71 |
(0.25) |
(0.28) |
(0.53) |
14.21 |
22.92% |
13,939 |
0.67% |
0.60% |
1.42% |
9/30/20 |
12.69 |
0.17 |
0.51 |
0.68 |
(0.24) |
(1.10) |
(1.34) |
12.03 |
5.26% |
42,080 |
0.67% |
0.60% |
1.48% |
9/30/19 |
14.12 |
0.22 |
(0.05)aa |
0.17 |
(0.33) |
(1.27) |
(1.60) |
12.69 |
3.21% |
34,479 |
0.67% |
0.60% |
1.74% |
9/30/18 |
13.70 |
0.17 |
0.93 |
1.10 |
(0.42) |
(0.26) |
(0.68) |
14.12 |
8.23% |
33,548 |
0.66% |
0.62% |
1.25% |
Class R3 |
|||||||||||||
9/30/22 |
$ 14.10 |
$ 0.22 |
$ (2.55) |
$ (2.33) |
$ (0.40) |
$ (1.52) |
$ (1.92) |
$ 9.85 |
(19.50%) |
$ 41,463 |
0.83% |
0.75% |
1.85% |
9/30/21 |
11.93 |
0.14 |
2.53 |
2.67 |
(0.22) |
(0.28) |
(0.50) |
14.10 |
22.76% |
53,677 |
0.82% |
0.75% |
1.02% |
9/30/20 |
12.58 |
0.18 |
0.48 |
0.66 |
(0.21) |
(1.10) |
(1.31) |
11.93 |
5.12% |
54,970 |
0.82% |
0.75% |
1.51% |
9/30/19 |
14.02 |
0.24 |
(0.10)aa |
0.14 |
(0.31) |
(1.27) |
(1.58) |
12.58 |
2.99% |
61,925 |
0.82% |
0.75% |
1.95% |
9/30/18 |
13.62 |
0.17 |
0.90 |
1.07 |
(0.41) |
(0.26) |
(0.67) |
14.02 |
8.08% |
69,914 |
0.81% |
0.77% |
1.26% |
The accompanying notes are an integral part of the financial statements.
133
MassMutual RetireSMARTSM by JPMorgan 2040 Fund – Financial Statements (Continued) |
Financial Highlights (For a share outstanding throughout each period) |
Income (loss) from investment |
Less distributions to shareholders |
Ratios / Supplemental Data |
|||||||||||
Net |
Net |
Net |
Total |
From net |
From net |
Total |
Net |
Total |
Net |
Ratio of |
Ratio of |
Net |
|
Class I |
|||||||||||||
9/30/22 |
$ 14.28 |
$ 0.27 |
$ (2.60) |
$ (2.33) |
$ (0.49) |
$ (1.48) |
$ (1.97) |
$ 9.98 |
(19.31%) |
$ 46,252 |
0.09% |
0.04% |
2.25% |
9/30/21 |
11.54 |
0.19 |
2.81 |
3.00 |
(0.26) |
— |
(0.26) |
14.28 |
26.26% |
51,708 |
0.08% |
0.04% |
1.36% |
9/30/20 |
12.19 |
0.23 |
0.47 |
0.70 |
(0.27) |
(1.08) |
(1.35) |
11.54 |
5.59% |
38,583 |
0.09% |
0.04% |
2.06% |
9/30/19 |
13.81 |
0.28 |
(0.16)aa |
0.12 |
(0.39) |
(1.35) |
(1.74) |
12.19 |
3.22% |
28,872 |
0.09% |
0.04% |
2.32% |
9/30/18 |
13.23 |
0.27 |
0.92 |
1.19 |
(0.49) |
(0.12) |
(0.61) |
13.81 |
9.19% |
12,676 |
0.08% |
0.05% |
2.00% |
Class R5 |
|||||||||||||
9/30/22 |
$ 14.26 |
$ 0.27 |
$ (2.60) |
$ (2.33) |
$ (0.48) |
$ (1.48) |
$ (1.96) |
$ 9.97 |
(19.36%) |
$ 47,871 |
0.19% |
0.14% |
2.19% |
9/30/21 |
11.53 |
0.18 |
2.80 |
2.98 |
(0.25) |
— |
(0.25) |
14.26 |
26.08% |
62,894 |
0.18% |
0.14% |
1.35% |
9/30/20 |
12.18 |
0.24 |
0.45 |
0.69 |
(0.26) |
(1.08) |
(1.34) |
11.53 |
5.51% |
51,048 |
0.19% |
0.14% |
2.15% |
9/30/19 |
13.80 |
0.22 |
(0.11)aa |
0.11 |
(0.38) |
(1.35) |
(1.73) |
12.18 |
3.14% |
63,062 |
0.19% |
0.14% |
1.84% |
9/30/18 |
13.22 |
0.26 |
0.92 |
1.18 |
(0.48) |
(0.12) |
(0.60) |
13.80 |
9.10% |
10,301 |
0.18% |
0.15% |
1.94% |
Service Class |
|||||||||||||
9/30/22 |
$ 14.33 |
$ 0.34 |
$ (2.71) |
$ (2.37) |
$ (0.46) |
$ (1.48) |
$ (1.94) |
$ 10.02 |
(19.49%) |
$ 11,683 |
0.29% |
0.24% |
2.72% |
9/30/21 |
11.58 |
0.18 |
2.81 |
2.99 |
(0.24) |
— |
(0.24) |
14.33 |
26.04% |
27,788 |
0.28% |
0.24% |
1.31% |
9/30/20 |
12.23 |
0.19 |
0.48 |
0.67 |
(0.24) |
(1.08) |
(1.32) |
11.58 |
5.32% |
25,091 |
0.29% |
0.24% |
1.67% |
9/30/19 |
13.81 |
0.34 |
(0.23)aa |
0.11 |
(0.34) |
(1.35) |
(1.69) |
12.23 |
3.08% |
22,042 |
0.29% |
0.24% |
2.77% |
9/30/18 |
13.23 |
0.23 |
0.93 |
1.16 |
(0.46) |
(0.12) |
(0.58) |
13.81 |
8.95% |
68,297 |
0.28% |
0.25% |
1.71% |
Year ended September 30 |
|||||
2022 |
2021 |
2020 |
2019 |
2018 |
|
Portfolio turnover rate |
61% |
33% |
89% |
40% |
59% |
|
c |
Per share amount calculated on the average shares method. |
|
j |
Computed after giving effect to an agreement by MML Advisers to waive certain fees and expenses of the Fund. |
|
l |
Employee retirement benefit plans that invest plan assets in the Separate Investment Accounts (SIAs) may be subject to certain charges as set forth in their respective Plan Documents. Total return figures would be lower for the periods presented if they reflected these charges. |
|
m |
Total return excludes sales charges, if any, and would be lower for the period presented if it reflected these charges. |
|
w |
Expenses of the underlying funds are not included in the Fund’s expense ratio. The Fund indirectly bears its proportionate share of the expenses of any underlying fund. |
|
aa |
The amount shown for a share outstanding does not correspond with the aggregate net realized and unrealized gain (loss) for the period due to the timing of purchases and redemptions of Fund shares in relation to the fluctuating market values of the Fund. |
The accompanying notes are an integral part of the financial statements.
134
Income (loss) from investment |
Less distributions to shareholders |
Ratios / Supplemental Data |
|||||||||||
Net |
Net |
Net |
Total |
From net |
From net |
Total |
Net |
Total |
Net |
Ratio of |
Ratio of |
Net |
|
Administrative Class |
|||||||||||||
9/30/22 |
$ 14.24 |
$ 0.27 |
$ (2.63) |
$ (2.36) |
$ (0.45) |
$ (1.48) |
$ (1.93) |
$ 9.95 |
(19.56%) |
$ 43,754 |
0.39% |
0.34% |
2.22% |
9/30/21 |
11.51 |
0.15 |
2.81 |
2.96 |
(0.23) |
— |
(0.23) |
14.24 |
25.89% |
65,351 |
0.38% |
0.34% |
1.08% |
9/30/20 |
12.17 |
0.23 |
0.42 |
0.65 |
(0.23) |
(1.08) |
(1.31) |
11.51 |
5.18% |
52,611 |
0.39% |
0.34% |
1.99% |
9/30/19 |
13.77 |
0.26 |
(0.16)aa |
0.10 |
(0.35) |
(1.35) |
(1.70) |
12.17 |
2.99% |
75,729 |
0.39% |
0.34% |
2.20% |
9/30/18 |
13.19 |
0.22 |
0.92 |
1.14 |
(0.44) |
(0.12) |
(0.56) |
13.77 |
8.86% |
73,290 |
0.38% |
0.35% |
1.66% |
Class R4 |
|||||||||||||
9/30/22 |
$ 13.97 |
$ 0.23 |
$ (2.56) |
$ (2.33) |
$ (0.42) |
$ (1.48) |
$ (1.90) |
$ 9.74 |
(19.70%) |
$ 15,650 |
0.54% |
0.49% |
1.87% |
9/30/21 |
11.29 |
0.14 |
2.74 |
2.88 |
(0.20) |
— |
(0.20) |
13.97 |
25.69% |
21,449 |
0.53% |
0.49% |
1.07% |
9/30/20 |
11.96 |
0.24 |
0.38 |
0.62 |
(0.21) |
(1.08) |
(1.29) |
11.29 |
5.04% |
24,740 |
0.54% |
0.49% |
2.15% |
9/30/19 |
13.56 |
0.24 |
(0.16)aa |
0.08 |
(0.33) |
(1.35) |
(1.68) |
11.96 |
2.84% |
43,641 |
0.54% |
0.49% |
2.05% |
9/30/18 |
13.01 |
0.19 |
0.91 |
1.10 |
(0.43) |
(0.12) |
(0.55) |
13.56 |
8.63% |
46,980 |
0.53% |
0.50% |
1.40% |
Class A |
|||||||||||||
9/30/22 |
$ 14.10 |
$ 0.24 |
$ (2.62) |
$ (2.38) |
$ (0.35) |
$ (1.48) |
$ (1.83) |
$ 9.89 |
(19.73%) |
$ 15,262 |
0.64% |
0.59% |
1.93% |
9/30/21 |
11.41 |
0.15 |
2.74 |
2.89 |
(0.20) |
— |
(0.20) |
14.10 |
25.54% |
25,723 |
0.63% |
0.59% |
1.13% |
9/30/20 |
12.07 |
0.15 |
0.48 |
0.63 |
(0.21) |
(1.08) |
(1.29) |
11.41 |
5.03% |
49,795 |
0.64% |
0.59% |
1.34% |
9/30/19 |
13.66 |
0.20 |
(0.14)aa |
0.06 |
(0.30) |
(1.35) |
(1.65) |
12.07 |
2.68% |
42,006 |
0.64% |
0.59% |
1.71% |
9/30/18 |
13.09 |
0.18 |
0.92 |
1.10 |
(0.41) |
(0.12) |
(0.53) |
13.66 |
8.54% |
44,233 |
0.63% |
0.60% |
1.34% |
Class R3 |
|||||||||||||
9/30/22 |
$ 13.70 |
$ 0.19 |
$ (2.50) |
$ (2.31) |
$ (0.39) |
$ (1.48) |
$ (1.87) |
$ 9.52 |
(19.88%) |
$ 43,439 |
0.79% |
0.74% |
1.64% |
9/30/21 |
11.09 |
0.11 |
2.68 |
2.79 |
(0.18) |
— |
(0.18) |
13.70 |
25.36% |
52,607 |
0.78% |
0.74% |
0.85% |
9/30/20 |
11.75 |
0.15 |
0.45 |
0.60 |
(0.18) |
(1.08) |
(1.26) |
11.09 |
4.92% |
54,015 |
0.79% |
0.74% |
1.34% |
9/30/19 |
13.36 |
0.21 |
(0.18)aa |
0.03 |
(0.29) |
(1.35) |
(1.64) |
11.75 |
2.48% |
59,312 |
0.79% |
0.74% |
1.85% |
9/30/18 |
12.82 |
0.16 |
0.90 |
1.06 |
(0.40) |
(0.12) |
(0.52) |
13.36 |
8.44% |
64,385 |
0.78% |
0.75% |
1.19% |
The accompanying notes are an integral part of the financial statements.
135
MassMutual RetireSMARTSM by JPMorgan 2045 Fund – Financial Statements (Continued) |
Financial Highlights (For a share outstanding throughout each period) |
Income (loss) from investment |
Less distributions to shareholders |
Ratios / Supplemental Data |
|||||||||||
Net |
Net |
Net |
Total |
From net |
From net |
Total |
Net |
Total |
Net |
Ratio of |
Ratio of |
Net |
|
Class I |
|||||||||||||
9/30/22 |
$ 14.76 |
$ 0.27 |
$ (2.59) |
$ (2.32) |
$ (0.53) |
$ (1.94) |
$ (2.47) |
$ 9.97 |
(19.49%) |
$ 26,481 |
0.18% |
0.02% |
2.15% |
9/30/21 |
11.96 |
0.17 |
3.18 |
3.35 |
(0.24) |
(0.31) |
(0.55) |
14.76 |
28.57% |
30,290 |
0.16% |
0.02% |
1.24% |
9/30/20 |
12.75 |
0.24 |
0.48 |
0.72 |
(0.29) |
(1.22) |
(1.51) |
11.96 |
5.41% |
21,522 |
0.18% |
0.02% |
2.04% |
9/30/19 |
14.41 |
0.29 |
(0.18)aa |
0.11 |
(0.39) |
(1.38) |
(1.77) |
12.75 |
3.08% |
19,099 |
0.18% |
0.02% |
2.32% |
9/30/18 |
13.88 |
0.21 |
1.06 |
1.27 |
(0.51) |
(0.23) |
(0.74) |
14.41 |
9.38% |
9,650 |
0.18% |
0.03% |
1.51% |
Class R5 |
|||||||||||||
9/30/22 |
$ 14.76 |
$ 0.25 |
$ (2.59) |
$ (2.34) |
$ (0.51) |
$ (1.94) |
$ (2.45) |
$ 9.97 |
(19.57%) |
$ 1,199 |
0.28% |
0.12% |
2.01% |
9/30/21 |
11.96 |
0.17 |
3.17 |
3.34 |
(0.23) |
(0.31) |
(0.54) |
14.76 |
28.46% |
1,327 |
0.26% |
0.12% |
1.17% |
9/30/20 |
12.76 |
0.20 |
0.50 |
0.70 |
(0.28) |
(1.22) |
(1.50) |
11.96 |
5.25% |
935 |
0.28% |
0.12% |
1.70% |
9/30/19 |
14.41 |
0.12 |
(0.02)aa |
0.10 |
(0.37) |
(1.38) |
(1.75) |
12.76 |
3.02% |
750 |
0.28% |
0.12% |
0.92% |
9/30/18 |
13.88 |
0.33 |
0.92 |
1.25 |
(0.49) |
(0.23) |
(0.72) |
14.41 |
9.24% |
147 |
0.28% |
0.14% |
2.33% |
Service Class |
|||||||||||||
9/30/22 |
$ 14.77 |
$ 0.29 |
$ (2.66) |
$ (2.37) |
$ (0.49) |
$ (1.94) |
$ (2.43) |
$ 9.97 |
(19.74%) |
$ 3,251 |
0.38% |
0.22% |
2.32% |
9/30/21 |
11.97 |
0.16 |
3.17 |
3.33 |
(0.22) |
(0.31) |
(0.53) |
14.77 |
28.30% |
4,642 |
0.36% |
0.22% |
1.14% |
9/30/20 |
12.75 |
0.20 |
0.48 |
0.68 |
(0.24) |
(1.22) |
(1.46) |
11.97 |
5.15% |
4,391 |
0.38% |
0.22% |
1.69% |
9/30/19 |
14.39 |
0.32 |
(0.23)aa |
0.09 |
(0.35) |
(1.38) |
(1.73) |
12.75 |
2.92% |
3,874 |
0.38% |
0.22% |
2.58% |
9/30/18 |
13.86 |
0.23 |
1.01 |
1.24 |
(0.48) |
(0.23) |
(0.71) |
14.39 |
9.19% |
9,964 |
0.38% |
0.24% |
1.66% |
Year ended September 30 |
|||||
2022 |
2021 |
2020 |
2019 |
2018 |
|
Portfolio turnover rate |
63% |
34% |
95% |
46% |
58% |
|
c |
Per share amount calculated on the average shares method. |
|
j |
Computed after giving effect to an agreement by MML Advisers to waive certain fees and expenses of the Fund. |
|
l |
Employee retirement benefit plans that invest plan assets in the Separate Investment Accounts (SIAs) may be subject to certain charges as set forth in their respective Plan Documents. Total return figures would be lower for the periods presented if they reflected these charges. |
|
m |
Total return excludes sales charges, if any, and would be lower for the period presented if it reflected these charges. |
|
w |
Expenses of the underlying funds are not included in the Fund’s expense ratio. The Fund indirectly bears its proportionate share of the expenses of any underlying fund. |
|
aa |
The amount shown for a share outstanding does not correspond with the aggregate net realized and unrealized gain (loss) for the period due to the timing of purchases and redemptions of Fund shares in relation to the fluctuating market values of the Fund. |
The accompanying notes are an integral part of the financial statements.
136
Income (loss) from investment |
Less distributions to shareholders |
Ratios / Supplemental Data |
|||||||||||
Net |
Net |
Net |
Total |
From net |
From net |
Total |
Net |
Total |
Net |
Ratio of |
Ratio of |
Net |
|
Administrative Class |
|||||||||||||
9/30/22 |
$ 14.67 |
$ 0.25 |
$ (2.60) |
$ (2.35) |
$ (0.48) |
$ (1.94) |
$ (2.42) |
$ 9.90 |
(19.76%) |
$ 17,419 |
0.48% |
0.32% |
1.99% |
9/30/21 |
11.90 |
0.12 |
3.17 |
3.29 |
(0.21) |
(0.31) |
(0.52) |
14.67 |
28.11% |
26,780 |
0.46% |
0.32% |
0.87% |
9/30/20 |
12.69 |
0.19 |
0.49 |
0.68 |
(0.25) |
(1.22) |
(1.47) |
11.90 |
5.12% |
19,671 |
0.48% |
0.32% |
1.59% |
9/30/19 |
14.35 |
0.26 |
(0.19)aa |
0.07 |
(0.35) |
(1.38) |
(1.73) |
12.69 |
2.72% |
21,597 |
0.48% |
0.32% |
2.12% |
9/30/18 |
13.82 |
0.22 |
1.01 |
1.23 |
(0.47) |
(0.23) |
(0.70) |
14.35 |
9.12% |
18,549 |
0.48% |
0.34% |
1.54% |
Class R4 |
|||||||||||||
9/30/22 |
$ 14.42 |
$ 0.20 |
$ (2.53) |
$ (2.33) |
$ (0.45) |
$ (1.94) |
$ (2.39) |
$ 9.70 |
(19.92%) |
$ 15,864 |
0.63% |
0.47% |
1.67% |
9/30/21 |
11.70 |
0.12 |
3.10 |
3.22 |
(0.19) |
(0.31) |
(0.50) |
14.42 |
27.98% |
19,388 |
0.61% |
0.47% |
0.90% |
9/30/20 |
12.51 |
0.24 |
0.40 |
0.64 |
(0.23) |
(1.22) |
(1.45) |
11.70 |
4.89% |
18,225 |
0.63% |
0.47% |
2.04% |
9/30/19 |
14.15 |
0.24 |
(0.18)aa |
0.06 |
(0.32) |
(1.38) |
(1.70) |
12.51 |
2.68% |
29,963 |
0.63% |
0.47% |
1.93% |
9/30/18 |
13.65 |
0.20 |
0.98 |
1.18 |
(0.45) |
(0.23) |
(0.68) |
14.15 |
8.86% |
30,899 |
0.63% |
0.49% |
1.42% |
Class A |
|||||||||||||
9/30/22 |
$ 14.50 |
$ 0.20 |
$ (2.58) |
$ (2.38) |
$ (0.32) |
$ (1.94) |
$ (2.26) |
$ 9.86 |
(19.94%) |
$ 6,267 |
0.73% |
0.57% |
1.60% |
9/30/21 |
11.77 |
0.14 |
3.09 |
3.23 |
(0.19) |
(0.31) |
(0.50) |
14.50 |
27.88% |
11,723 |
0.71% |
0.57% |
1.04% |
9/30/20 |
12.58 |
0.14 |
0.49 |
0.63 |
(0.22) |
(1.22) |
(1.44) |
11.77 |
4.79% |
28,190 |
0.73% |
0.57% |
1.18% |
9/30/19 |
14.22 |
0.20 |
(0.15)aa |
0.05 |
(0.31) |
(1.38) |
(1.69) |
12.58 |
2.54% |
19,901 |
0.73% |
0.57% |
1.61% |
9/30/18 |
13.70 |
0.18 |
0.99 |
1.17 |
(0.42) |
(0.23) |
(0.65) |
14.22 |
8.77% |
19,675 |
0.74% |
0.59% |
1.25% |
Class R3 |
|||||||||||||
9/30/22 |
$ 14.36 |
0.18 |
$ (2.53) |
$ (2.35) |
$ (0.41) |
$ (1.94) |
$ (2.35) |
$ 9.66 |
(20.09%) |
$ 30,594 |
0.88% |
0.72% |
1.50% |
9/30/21 |
11.66 |
0.10 |
3.06 |
3.16 |
(0.15) |
(0.31) |
(0.46) |
14.36 |
27.59% |
40,009 |
0.86% |
0.72% |
0.72% |
9/30/20 |
12.47 |
0.14 |
0.47 |
0.61 |
(0.20) |
(1.22) |
(1.42) |
11.66 |
4.62% |
42,710 |
0.88% |
0.72% |
1.25% |
9/30/19 |
14.11 |
0.22 |
(0.19)aa |
0.03 |
(0.29) |
(1.38) |
(1.67) |
12.47 |
2.41% |
46,767 |
0.88% |
0.72% |
1.82% |
9/30/18 |
13.61 |
0.16 |
0.99 |
1.15 |
(0.42) |
(0.23) |
(0.65) |
14.11 |
8.62% |
49,481 |
0.88% |
0.74% |
1.19% |
The accompanying notes are an integral part of the financial statements.
137
MassMutual RetireSMARTSM by JPMorgan 2050 Fund – Financial Statements (Continued) |
Financial Highlights (For a share outstanding throughout each period) |
Income (loss) from investment |
Less distributions to shareholders |
Ratios / Supplemental Data |
|||||||||||
Net |
Net |
Net |
Total |
From net |
From net |
Total |
Net |
Total |
Net |
Ratio of |
Ratio of |
Net |
|
Class I |
|||||||||||||
9/30/22 |
$ 10.46 |
$ 0.19 |
$ (1.91) |
$ (1.72) |
$ (0.36) |
$ (1.10) |
$ (1.46) |
$ 7.28 |
(19.60%) |
$ 26,439 |
0.12% |
0.02% |
2.08% |
9/30/21 |
8.31 |
0.12 |
2.23 |
2.35 |
(0.17) |
(0.03) |
(0.20) |
10.46 |
28.53% |
26,674 |
0.12% |
0.02% |
1.21% |
9/30/20 |
8.80 |
0.16 |
0.33 |
0.49 |
(0.19) |
(0.79) |
(0.98) |
8.31 |
5.29% |
18,528 |
0.13% |
0.02% |
2.02% |
9/30/19 |
10.18 |
0.20 |
(0.15)aa |
0.05 |
(0.28) |
(1.15) |
(1.43) |
8.80 |
3.10% |
15,050 |
0.14% |
0.02% |
2.27% |
9/30/18 |
9.77 |
0.18 |
0.77 |
0.95 |
(0.36) |
(0.18) |
(0.54) |
10.18 |
10.02% |
5,973 |
0.14% |
0.04% |
1.82% |
Class R5 |
|||||||||||||
9/30/22 |
$ 10.44 |
$ 0.18 |
$ (1.91) |
$ (1.73) |
$ (0.35) |
$ (1.10) |
$ (1.45) |
$ 7.26 |
(19.73%) |
$ 41,662 |
0.22% |
0.12% |
2.04% |
9/30/21 |
8.29 |
0.13 |
2.21 |
2.34 |
(0.16) |
(0.03) |
(0.19) |
10.44 |
28.49% |
50,534 |
0.22% |
0.12% |
1.31% |
9/30/20 |
8.78 |
0.16 |
0.32 |
0.48 |
(0.18) |
(0.79) |
(0.97) |
8.29 |
5.20% |
42,985 |
0.23% |
0.12% |
1.93% |
9/30/19 |
10.16 |
0.17 |
(0.13)aa |
0.04 |
(0.27) |
(1.15) |
(1.42) |
8.78 |
3.03% |
45,022 |
0.24% |
0.12% |
1.94% |
9/30/18 |
9.76 |
0.18 |
0.75 |
0.93 |
(0.35) |
(0.18) |
(0.53) |
10.16 |
9.83% |
5,701 |
0.24% |
0.14% |
1.78% |
Service Class |
|||||||||||||
9/30/22 |
$ 10.50 |
$ 0.22 |
$ (1.97) |
$ (1.75) |
$ (0.34) |
$ (1.10) |
$ (1.44) |
$ 7.31 |
(19.78%) |
$ 4,478 |
0.32% |
0.22% |
2.39% |
9/30/21 |
8.34 |
0.12 |
2.23 |
2.35 |
(0.16) |
(0.03) |
(0.19) |
10.50 |
28.34% |
12,565 |
0.32% |
0.22% |
1.19% |
9/30/20 |
8.82 |
0.13 |
0.34 |
0.47 |
(0.16) |
(0.79) |
(0.95) |
8.34 |
5.13% |
10,119 |
0.33% |
0.22% |
1.59% |
9/30/19 |
10.17 |
0.24 |
(0.20)aa |
0.04 |
(0.24) |
(1.15) |
(1.39) |
8.82 |
2.92% |
8,399 |
0.34% |
0.22% |
2.73% |
9/30/18 |
9.76 |
0.15 |
0.78 |
0.93 |
(0.34) |
(0.18) |
(0.52) |
10.17 |
9.81% |
41,405 |
0.34% |
0.24% |
1.55% |
Year ended September 30 |
|||||
2022 |
2021 |
2020 |
2019 |
2018 |
|
Portfolio turnover rate |
60% |
36% |
92% |
40% |
65% |
|
c |
Per share amount calculated on the average shares method. |
|
d |
Amount is less than $0.005 per share. |
|
j |
Computed after giving effect to an agreement by MML Advisers to waive certain fees and expenses of the Fund. |
|
l |
Employee retirement benefit plans that invest plan assets in the Separate Investment Accounts (SIAs) may be subject to certain charges as set forth in their respective Plan Documents. Total return figures would be lower for the periods presented if they reflected these charges. |
|
m |
Total return excludes sales charges, if any, and would be lower for the period presented if it reflected these charges. |
|
w |
Expenses of the underlying funds are not included in the Fund’s expense ratio. The Fund indirectly bears its proportionate share of the expenses of any underlying fund. |
|
aa |
The amount shown for a share outstanding does not correspond with the aggregate net realized and unrealized gain (loss) for the period due to the timing of purchases and redemptions of Fund shares in relation to the fluctuating market values of the Fund. |
The accompanying notes are an integral part of the financial statements.
138
Income (loss) from investment |
Less distributions to shareholders |
Ratios / Supplemental Data |
|||||||||||
Net |
Net |
Net |
Total |
From net |
From net |
Total |
Net |
Total |
Net |
Ratio of |
Ratio of |
Net |
|
Administrative Class |
|||||||||||||
9/30/22 |
$ 10.45 |
$ 0.18 |
$ (1.93) |
$ (1.75) |
$ (0.33) |
$ (1.10) |
$ (1.43) |
$ 7.27 |
(19.88%) |
$ 34,706 |
0.42% |
0.32% |
1.95% |
9/30/21 |
8.30 |
0.09 |
2.23 |
2.32 |
(0.14) |
(0.03) |
(0.17) |
10.45 |
28.20% |
46,558 |
0.42% |
0.32% |
0.91% |
9/30/20 |
8.79 |
0.16 |
0.30 |
0.46 |
(0.16) |
(0.79) |
(0.95) |
8.30 |
4.98% |
34,367 |
0.43% |
0.32% |
1.97% |
9/30/19 |
10.16 |
0.18 |
(0.15)aa |
0.03 |
(0.25) |
(1.15) |
(1.40) |
8.79 |
2.84% |
52,850 |
0.44% |
0.32% |
2.06% |
9/30/18 |
9.75 |
0.15 |
0.77 |
0.92 |
(0.33) |
(0.18) |
(0.51) |
10.16 |
9.72% |
44,569 |
0.44% |
0.34% |
1.47% |
Class R4 |
|||||||||||||
9/30/22 |
$ 10.29 |
$ 0.15 |
$ (1.88) |
$ (1.73) |
$ (0.31) |
$ (1.10) |
$ (1.41) |
$ 7.15 |
(19.97%) |
$ 12,419 |
0.57% |
0.47% |
1.72% |
9/30/21 |
8.18 |
0.08 |
2.19 |
2.27 |
(0.13) |
(0.03) |
(0.16) |
10.29 |
27.93% |
16,268 |
0.57% |
0.47% |
0.86% |
9/30/20 |
8.68 |
0.16 |
0.28 |
0.44 |
(0.15) |
(0.79) |
(0.94) |
8.18 |
4.78% |
15,258 |
0.58% |
0.47% |
1.93% |
9/30/19 |
10.05 |
0.16 |
(0.15)aa |
0.01 |
(0.23) |
(1.15) |
(1.38) |
8.68 |
2.66% |
23,206 |
0.59% |
0.47% |
1.91% |
9/30/18 |
9.65 |
0.13 |
0.77 |
0.90 |
(0.32) |
(0.18) |
(0.50) |
10.05 |
9.56% |
22,706 |
0.59% |
0.49% |
1.37% |
Class A |
|||||||||||||
9/30/22 |
$ 10.35 |
$ 0.15 |
$ (1.91) |
$ (1.76) |
$ (0.26) |
$ (1.10) |
$ (1.36) |
$ 7.23 |
(20.08%) |
$ 8,582 |
0.67% |
0.57% |
1.67% |
9/30/21 |
8.23 |
0.10 |
2.18 |
2.28 |
(0.13) |
(0.03) |
(0.16) |
10.35 |
27.87% |
14,761 |
0.67% |
0.57% |
1.00% |
9/30/20 |
8.72 |
0.10 |
0.34 |
0.44 |
(0.14) |
(0.79) |
(0.93) |
8.23 |
4.81% |
26,813 |
0.68% |
0.57% |
1.22% |
9/30/19 |
10.08 |
0.15 |
(0.14)aa |
0.01 |
(0.22) |
(1.15) |
(1.37) |
8.72 |
2.54% |
21,195 |
0.69% |
0.57% |
1.70% |
9/30/18 |
9.68 |
0.12 |
0.76 |
0.88 |
(0.30) |
(0.18) |
(0.48) |
10.08 |
9.34% |
20,721 |
0.69% |
0.59% |
1.25% |
Class R3 |
|||||||||||||
9/30/22 |
$ 10.20 |
$ 0.13 |
$ (1.87) |
$ (1.74) |
$ (0.29) |
$ (1.10) |
$ (1.39) |
$ 7.07 |
(20.23%) |
$ 28,557 |
0.82% |
0.72% |
1.47% |
9/30/21 |
8.11 |
0.07 |
2.16 |
2.23 |
(0.11) |
(0.03) |
(0.14) |
10.20 |
27.70% |
34,349 |
0.82% |
0.72% |
0.71% |
9/30/20 |
8.60 |
0.10 |
0.32 |
0.42 |
(0.12) |
(0.79) |
(0.91) |
8.11 |
4.59% |
32,608 |
0.83% |
0.72% |
1.23% |
9/30/19 |
9.96 |
0.16 |
(0.16)aa |
0.00d |
(0.21) |
(1.15) |
(1.36) |
8.60 |
2.44% |
34,061 |
0.84% |
0.72% |
1.86% |
9/30/18 |
9.57 |
0.11 |
0.76 |
0.87 |
(0.30) |
(0.18) |
(0.48) |
9.96 |
9.28% |
39,324 |
0.84% |
0.74% |
1.13% |
The accompanying notes are an integral part of the financial statements.
139
MassMutual RetireSMARTSM by JPMorgan 2055 Fund – Financial Statements (Continued) |
Financial Highlights (For a share outstanding throughout each period) |
Income (loss) from investment |
Less distributions to shareholders |
Ratios / Supplemental Data |
|||||||||||
Net |
Net |
Net |
Total |
From net |
From net |
Total |
Net |
Total |
Net |
Ratio of |
Ratio of |
Net |
|
Class I |
|||||||||||||
9/30/22 |
$ 12.33 |
$ 0.23 |
$ (2.26) |
$ (2.03) |
$ (0.44) |
$ (1.27) |
$ (1.71) |
$ 8.59 |
(19.58%) |
$ 12,871 |
0.34% |
0.00% |
2.15% |
9/30/21 |
10.15 |
0.14 |
2.67 |
2.81 |
(0.21) |
(0.42) |
(0.63) |
12.33 |
28.46% |
13,996 |
0.33% |
0.00% |
1.20% |
9/30/20 |
10.73 |
0.21 |
0.40 |
0.61 |
(0.23) |
(0.96) |
(1.19) |
10.15 |
5.43% |
9,429 |
0.39% |
0.00% |
2.09% |
9/30/19 |
12.04 |
0.24 |
(0.13)aa |
0.11 |
(0.33) |
(1.09) |
(1.42) |
10.73 |
3.15% |
7,761 |
0.41% |
0.00% |
2.31% |
9/30/18 |
11.71 |
0.19 |
0.94 |
1.13 |
(0.44) |
(0.36) |
(0.80) |
12.04 |
9.97% |
3,804 |
0.49% |
0.02% |
1.61% |
Class R5 |
|||||||||||||
9/30/22 |
$ 12.33 |
$ 0.21 |
$ (2.26) |
$ (2.05) |
$ (0.42) |
$ (1.27) |
$ (1.69) |
$ 8.59 |
(19.69%) |
$ 877 |
0.44% |
0.10% |
1.97% |
9/30/21 |
10.15 |
0.10 |
2.70 |
2.80 |
(0.20) |
(0.42) |
(0.62) |
12.33 |
28.35% |
1,523 |
0.43% |
0.10% |
0.79% |
9/30/20 |
10.73 |
0.17 |
0.43 |
0.60 |
(0.22) |
(0.96) |
(1.18) |
10.15 |
5.34% |
643 |
0.49% |
0.10% |
1.72% |
9/30/19 |
12.04 |
0.17 |
(0.08)aa |
0.09 |
(0.31) |
(1.09) |
(1.40) |
10.73 |
3.02% |
534 |
0.51% |
0.10% |
1.61% |
9/30/18 |
11.71 |
0.15 |
0.96 |
1.11 |
(0.42) |
(0.36) |
(0.78) |
12.04 |
9.84% |
231 |
0.59% |
0.11% |
1.24% |
Service Class |
|||||||||||||
9/30/22 |
$ 12.38 |
$ 0.23 |
$ (2.31) |
$ (2.08) |
$ (0.41) |
$ (1.27) |
$ (1.68) |
$ 8.62 |
(19.85%) |
$ 2,666 |
0.54% |
0.20% |
2.12% |
9/30/21 |
10.18 |
0.13 |
2.68 |
2.81 |
(0.19) |
(0.42) |
(0.61) |
12.38 |
28.34% |
3,260 |
0.53% |
0.20% |
1.11% |
9/30/20 |
10.75 |
0.18 |
0.40 |
0.58 |
(0.19) |
(0.96) |
(1.15) |
10.18 |
5.15% |
2,498 |
0.59% |
0.20% |
1.77% |
9/30/19 |
12.05 |
0.28 |
(0.19)aa |
0.09 |
(0.30) |
(1.09) |
(1.39) |
10.75 |
2.99% |
2,291 |
0.61% |
0.20% |
2.63% |
9/30/18 |
11.72 |
0.18 |
0.93 |
1.11 |
(0.42) |
(0.36) |
(0.78) |
12.05 |
9.78% |
5,512 |
0.69% |
0.22% |
1.55% |
Year ended September 30 |
|||||
2022 |
2021 |
2020 |
2019 |
2018 |
|
Portfolio turnover rate |
64% |
38% |
89% |
50% |
62% |
|
c |
Per share amount calculated on the average shares method. |
|
j |
Computed after giving effect to an agreement by MML Advisers to waive certain fees and expenses of the Fund. |
|
l |
Employee retirement benefit plans that invest plan assets in the Separate Investment Accounts (SIAs) may be subject to certain charges as set forth in their respective Plan Documents. Total return figures would be lower for the periods presented if they reflected these charges. |
|
m |
Total return excludes sales charges, if any, and would be lower for the period presented if it reflected these charges. |
|
w |
Expenses of the underlying funds are not included in the Fund’s expense ratio. The Fund indirectly bears its proportionate share of the expenses of any underlying fund. |
|
aa |
The amount shown for a share outstanding does not correspond with the aggregate net realized and unrealized gain (loss) for the period due to the timing of purchases and redemptions of Fund shares in relation to the fluctuating market values of the Fund. |
The accompanying notes are an integral part of the financial statements.
140
Income (loss) from investment |
Less distributions to shareholders |
Ratios / Supplemental Data |
|||||||||||
Net |
Net |
Net |
Total |
From net |
From net |
Total |
Net |
Total |
Net |
Ratio of |
Ratio of |
Net |
|
Administrative Class |
|||||||||||||
9/30/22 |
$ 12.28 |
$ 0.20 |
$ (2.27) |
$ (2.07) |
$ (0.40) |
$ (1.27) |
$ (1.67) |
$ 8.54 |
(19.92%) |
$ 8,852 |
0.64% |
0.30% |
1.87% |
9/30/21 |
10.11 |
0.10 |
2.67 |
2.77 |
(0.18) |
(0.42) |
(0.60) |
12.28 |
28.13% |
10,954 |
0.63% |
0.30% |
0.85% |
9/30/20 |
10.69 |
0.16 |
0.42 |
0.58 |
(0.20) |
(0.96) |
(1.16) |
10.11 |
5.13% |
7,482 |
0.69% |
0.30% |
1.61% |
9/30/19 |
12.00 |
0.21 |
(0.14)aa |
0.07 |
(0.29) |
(1.09) |
(1.38) |
10.69 |
2.79% |
8,364 |
0.71% |
0.30% |
1.98% |
9/30/18 |
11.67 |
0.18 |
0.92 |
1.10 |
(0.41) |
(0.36) |
(0.77) |
12.00 |
9.73% |
6,286 |
0.79% |
0.32% |
1.52% |
Class R4 |
|||||||||||||
9/30/22 |
$ 12.20 |
$ 0.19 |
$ (2.25) |
$ (2.06) |
$ (0.38) |
$ (1.27) |
$ (1.65) |
$ 8.49 |
(19.98%) |
$ 5,976 |
0.79% |
0.45% |
1.76% |
9/30/21 |
10.04 |
0.11 |
2.63 |
2.74 |
(0.16) |
(0.42) |
(0.58) |
12.20 |
28.02% |
7,822 |
0.78% |
0.45% |
0.92% |
9/30/20 |
10.64 |
0.22 |
0.33 |
0.55 |
(0.19) |
(0.96) |
(1.15) |
10.04 |
4.85% |
6,887 |
0.84% |
0.45% |
2.20% |
9/30/19 |
11.94 |
0.21 |
(0.14)aa |
0.07 |
(0.28) |
(1.09) |
(1.37) |
10.64 |
2.75% |
12,251 |
0.86% |
0.45% |
2.02% |
9/30/18 |
11.62 |
0.14 |
0.93 |
1.07 |
(0.39) |
(0.36) |
(0.75) |
11.94 |
9.50% |
11,111 |
0.94% |
0.47% |
1.19% |
Class A |
|||||||||||||
9/30/22 |
$ 12.23 |
$ 0.14 |
$ (2.26) |
$ (2.12) |
$ (0.17) |
$ (1.27) |
$ (1.44) |
$ 8.67 |
(19.98%) |
$ 1,265 |
0.89% |
0.55% |
1.27% |
9/30/21 |
10.08 |
0.11 |
2.62 |
2.73 |
(0.16) |
(0.42) |
(0.58) |
12.23 |
27.80% |
6,298 |
0.88% |
0.55% |
0.96% |
9/30/20 |
10.67 |
0.13 |
0.42 |
0.55 |
(0.18) |
(0.96) |
(1.14) |
10.08 |
4.83% |
10,137 |
0.94% |
0.55% |
1.29% |
9/30/19 |
11.97 |
0.16 |
(0.11)aa |
0.05 |
(0.26) |
(1.09) |
(1.35) |
10.67 |
2.55% |
7,587 |
0.96% |
0.55% |
1.57% |
9/30/18 |
11.64 |
0.12 |
0.94 |
1.06 |
(0.37) |
(0.36) |
(0.73) |
11.97 |
9.41% |
7,070 |
1.04% |
0.57% |
1.02% |
Class R3 |
|||||||||||||
9/30/22 |
$ 12.12 |
$ 0.15 |
$ (2.23) |
$ (2.08) |
$ (0.35) |
$ (1.27) |
$ (1.62) |
$ 8.42 |
(20.23%) |
$ 20,114 |
1.04% |
0.70% |
1.46% |
9/30/21 |
9.99 |
0.09 |
2.60 |
2.69 |
(0.14) |
(0.42) |
(0.56) |
12.12 |
27.60% |
23,885 |
1.03% |
0.70% |
0.76% |
9/30/20 |
10.58 |
0.11 |
0.42 |
0.53 |
(0.16) |
(0.96) |
(1.12) |
9.99 |
4.69% |
24,149 |
1.09% |
0.70% |
1.17% |
9/30/19 |
11.88 |
0.19 |
(0.15)aa |
0.04 |
(0.25) |
(1.09) |
(1.34) |
10.58 |
2.44% |
22,185 |
1.11% |
0.70% |
1.79% |
9/30/18 |
11.57 |
0.13 |
0.90 |
1.03 |
(0.36) |
(0.36) |
(0.72) |
11.88 |
9.22% |
21,236 |
1.19% |
0.72% |
1.10% |
The accompanying notes are an integral part of the financial statements.
141
MassMutual RetireSMARTSM by JPMorgan 2060 Fund – Financial Statements (Continued) |
Financial Highlights (For a share outstanding throughout each period) |
Income (loss) from investment |
Less distributions to shareholders |
Ratios / Supplemental Data |
|||||||||||
Net |
Net |
Net |
Total |
From net |
From net |
Total |
Net |
Total |
Net |
Ratio of |
Ratio of |
Net |
|
Class I |
|||||||||||||
9/30/22 |
$ 12.03 |
$ 0.24 |
$ (2.27) |
$ (2.03) |
$ (0.41) |
$ (1.05) |
$ (1.46) |
$ 8.54 |
(19.60%) |
$ 11,505 |
0.95% |
0.00% |
2.31% |
9/30/21 |
9.91 |
0.15 |
2.59 |
2.74 |
(0.20) |
(0.42) |
(0.62) |
12.03 |
28.43% |
14,808 |
1.07% |
0.00% |
1.29% |
9/30/20 |
10.53 |
0.20 |
0.39 |
0.59 |
(0.23) |
(0.98) |
(1.21) |
9.91 |
5.39% |
10,758 |
1.32% |
0.00% |
2.06% |
9/30/19 |
11.92 |
0.28 |
(0.19) |
0.09 |
(0.32) |
(1.16) |
(1.48) |
10.53 |
3.15% |
10,904 |
1.57% |
0.00% |
2.70% |
9/30/18 |
11.40 |
0.22 |
0.89 |
1.11 |
(0.39) |
(0.20) |
(0.59) |
11.92 |
10.03% |
11,994 |
1.68% |
0.02% |
1.90% |
Class R5 |
|||||||||||||
9/30/22 |
$ 12.00 |
$ 0.22 |
$ (2.26) |
$ (2.04) |
$ (0.37) |
$ (1.05) |
$ (1.42) |
$ 8.54 |
(19.72%) |
$ 194 |
1.05% |
0.10% |
2.05% |
9/30/21 |
9.89 |
0.13 |
2.59 |
2.72 |
(0.19) |
(0.42) |
(0.61) |
12.00 |
28.27% |
1,352 |
1.17% |
0.10% |
1.12% |
9/30/20 |
10.51 |
0.25 |
0.33 |
0.58 |
(0.22) |
(0.98) |
(1.20) |
9.89 |
5.33% |
764 |
1.42% |
0.10% |
2.51% |
9/30/19 |
11.91 |
0.10 |
(0.03) |
0.07 |
(0.31) |
(1.16) |
(1.47) |
10.51 |
2.96% |
1,257 |
1.67% |
0.10% |
1.01% |
9/30/18 |
11.39 |
0.13 |
0.97 |
1.10 |
(0.38) |
(0.20) |
(0.58) |
11.91 |
9.94% |
319 |
1.78% |
0.11% |
1.09% |
Service Class |
|||||||||||||
9/30/22 |
$ 11.97 |
$ 0.21 |
$ (2.24) |
$ (2.03) |
$ (0.40) |
$ (1.05) |
$ (1.45) |
$ 8.49 |
(19.75%) |
$ 1,215 |
1.15% |
0.20% |
1.97% |
9/30/21 |
9.87 |
0.12 |
2.58 |
2.70 |
(0.18) |
(0.42) |
(0.60) |
11.97 |
28.15% |
2,047 |
1.27% |
0.21% |
1.03% |
9/30/20 |
10.49 |
0.12 |
0.45 |
0.57 |
(0.21) |
(0.98) |
(1.19) |
9.87 |
5.23% |
1,453 |
1.52% |
0.20% |
1.20% |
9/30/19 |
11.90 |
0.32 |
(0.27) |
0.05 |
(0.30) |
(1.16) |
(1.46) |
10.49 |
2.79% |
529 |
1.77% |
0.20% |
3.10% |
9/30/18 |
11.38 |
0.12 |
0.98 |
1.10 |
(0.38) |
(0.20) |
(0.58) |
11.90 |
9.88% |
668 |
1.88% |
0.21% |
1.01% |
Year ended September 30 |
|||||
2022 |
2021 |
2020 |
2019 |
2018 |
|
Portfolio turnover rate |
78% |
38% |
77% |
51% |
58% |
|
c |
Per share amount calculated on the average shares method. |
|
j |
Computed after giving effect to an agreement by MML Advisers to waive certain fees and expenses of the Fund. |
|
l |
Employee retirement benefit plans that invest plan assets in the Separate Investment Accounts (SIAs) may be subject to certain charges as set forth in their respective Plan Documents. Total return figures would be lower for the periods presented if they reflected these charges. |
|
m |
Total return excludes sales charges, if any, and would be lower for the period presented if it reflected these charges. |
|
w |
Expenses of the underlying funds are not included in the Fund’s expense ratio. The Fund indirectly bears its proportionate share of the expenses of any underlying fund. |
The accompanying notes are an integral part of the financial statements.
142
Income (loss) from investment |
Less distributions to shareholders |
Ratios / Supplemental Data |
|||||||||||
Net |
Net |
Net |
Total |
From net |
From net |
Total |
Net |
Total |
Net |
Ratio of |
Ratio of |
Net |
|
Administrative Class |
|||||||||||||
9/30/22 |
$ 11.95 |
$ 0.19 |
$ (2.25) |
$ (2.06) |
$ (0.38) |
$ (1.05) |
$ (1.43) |
$ 8.46 |
(19.96%) |
$ 1,788 |
1.25% |
0.30% |
1.81% |
9/30/21 |
9.85 |
0.09 |
2.60 |
2.69 |
(0.17) |
(0.42) |
(0.59) |
11.95 |
28.08% |
2,210 |
1.37% |
0.33% |
0.79% |
9/30/20 |
10.48 |
0.12 |
0.43 |
0.55 |
(0.20) |
(0.98) |
(1.18) |
9.85 |
5.07% |
1,304 |
1.62% |
0.30% |
1.29% |
9/30/19 |
11.87 |
0.20 |
(0.15) |
0.05 |
(0.28) |
(1.16) |
(1.44) |
10.48 |
2.81% |
665 |
1.87% |
0.30% |
1.97% |
9/30/18 |
11.36 |
0.17 |
0.91 |
1.08 |
(0.37) |
(0.20) |
(0.57) |
11.87 |
9.71% |
448 |
1.98% |
0.32% |
1.47% |
Class R4 |
|||||||||||||
9/30/22 |
$ 11.94 |
$ 0.18 |
$ (2.25) |
$ (2.07) |
$ (0.36) |
$ (1.05) |
$ (1.41) |
$ 8.46 |
(20.02%) |
$ 923 |
1.40% |
0.45% |
1.74% |
9/30/21 |
9.85 |
0.11 |
2.57 |
2.68 |
(0.17) |
(0.42) |
(0.59) |
11.94 |
27.90% |
1,019 |
1.52% |
0.45% |
0.92% |
9/30/20 |
10.47 |
0.12 |
0.42 |
0.54 |
(0.18) |
(0.98) |
(1.16) |
9.85 |
4.97% |
769 |
1.77% |
0.45% |
1.26% |
9/30/19 |
11.87 |
0.14 |
(0.11) |
0.03 |
(0.27) |
(1.16) |
(1.43) |
10.47 |
2.60% |
374 |
2.02% |
0.45% |
1.36% |
9/30/18 |
11.36 |
0.14 |
0.92 |
1.06 |
(0.35) |
(0.20) |
(0.55) |
11.87 |
9.58% |
255 |
2.13% |
0.47% |
1.24% |
Class A |
|||||||||||||
9/30/22 |
$ 11.89 |
$ 0.20 |
$ (2.28) |
$ (2.08) |
$ (0.28) |
$ (1.05) |
$ (1.33) |
$ 8.48 |
(20.10%) |
$ 329 |
1.50% |
0.55% |
1.86% |
9/30/21 |
9.83 |
0.12 |
2.52 |
2.64 |
(0.16) |
(0.42) |
(0.58) |
11.89 |
27.59% |
613 |
1.62% |
0.59% |
1.04% |
9/30/20 |
10.46 |
0.07 |
0.46 |
0.53 |
(0.18) |
(0.98) |
(1.16) |
9.83 |
4.89% |
1,190 |
1.87% |
0.55% |
0.74% |
9/30/19 |
11.86 |
0.19 |
(0.17) |
0.02 |
(0.26) |
(1.16) |
(1.42) |
10.46 |
2.50% |
437 |
2.12% |
0.55% |
1.84% |
9/30/18 |
11.35 |
0.10 |
0.95 |
1.05 |
(0.34) |
(0.20) |
(0.54) |
11.86 |
9.47% |
304 |
2.23% |
0.56% |
0.89% |
Class R3 |
|||||||||||||
9/30/22 |
$ 11.87 |
$ 0.14 |
$ (2.22) |
$ (2.08) |
$ (0.32) |
$ (1.05) |
$ (1.37) |
$ 8.42 |
(20.18%) |
$ 1,343 |
1.65% |
0.70% |
1.34% |
9/30/21 |
9.80 |
0.12 |
2.51 |
2.63 |
(0.14) |
(0.42) |
(0.56) |
11.87 |
27.53% |
1,510 |
1.77% |
0.70% |
1.03% |
9/30/20 |
10.41 |
0.08 |
0.43 |
0.51 |
(0.14) |
(0.98) |
(1.12) |
9.80 |
4.66% |
1,885 |
2.02% |
0.70% |
0.89% |
9/30/19 |
11.80 |
0.14 |
(0.12) |
0.02 |
(0.25) |
(1.16) |
(1.41) |
10.41 |
2.49% |
1,096 |
2.27% |
0.70% |
1.38% |
9/30/18 |
11.32 |
0.08 |
0.94 |
1.02 |
(0.34) |
(0.20) |
(0.54) |
11.80 |
9.20% |
800 |
2.38% |
0.72% |
0.73% |
The accompanying notes are an integral part of the financial statements.
143
MassMutual Select T. Rowe Price Retirement Balanced Fund – Financial Statements (Continued) |
Financial Highlights (For a share outstanding throughout each period) |
Income (loss) from investment |
Less distributions to shareholders |
Ratios / Supplemental Data |
|||||||||||
Net |
Net |
Net |
Total |
From net |
From net |
Total |
Net |
Total |
Net |
Ratio of |
Ratio of |
Net |
|
Class I |
|||||||||||||
9/30/22 |
$ 17.72 |
$ 0.46 |
$ (2.83) |
$ (2.37) |
$ (0.65) |
$ (1.08) |
$ (1.73) |
$ 13.62 |
(14.93%) |
$ 20,187 |
0.40% |
0.27% |
2.90% |
9/30/21 |
16.19 |
0.25 |
2.00 |
2.25 |
(0.36) |
(0.36) |
(0.72) |
17.72 |
14.19% |
25,173 |
0.40% |
0.27% |
1.42% |
9/30/20 |
15.46 |
0.31 |
0.91 |
1.22 |
(0.38) |
(0.11) |
(0.49) |
16.19 |
8.01% |
18,598 |
0.19% |
0.06% |
2.03% |
9/30/19 |
15.22 |
0.29 |
0.44 |
0.73 |
(0.36) |
(0.13) |
(0.49) |
15.46 |
5.24% |
14,363 |
0.27% |
0.01% |
1.94% |
9/30/18g |
15.00 |
0.02 |
0.20 |
0.22 |
— |
— |
— |
15.22 |
1.47%b |
5,429 |
0.41%a |
0.00%a |
0.25%a |
Class M5 |
|||||||||||||
9/30/22 |
$ 17.73 |
$ 0.42 |
$ (2.83) |
$ (2.41) |
$ (0.61) |
$ (1.08) |
$ (1.69) |
$ 13.63 |
(15.09%) |
$ 126,517 |
0.55% |
0.42% |
2.66% |
9/30/21 |
16.20 |
0.23 |
2.00 |
2.23 |
(0.34) |
(0.36) |
(0.70) |
17.73 |
14.02% |
152,253 |
0.55% |
0.42% |
1.30% |
9/30/20 |
15.48 |
0.34 |
0.85 |
1.19 |
(0.36) |
(0.11) |
(0.47) |
16.20 |
7.85% |
126,059 |
0.33% |
0.20% |
2.17% |
9/30/19 |
15.21 |
0.08 |
0.64 |
0.72 |
(0.32) |
(0.13) |
(0.45) |
15.48 |
5.11% |
118,872 |
0.42% |
0.16% |
0.53% |
9/30/18g |
15.00 |
0.01 |
0.20 |
0.21 |
— |
— |
— |
15.21 |
1.40%b |
9,189 |
0.56%a |
0.15%a |
0.09%a |
Class M4 |
|||||||||||||
9/30/22 |
$ 17.66 |
$ 0.40 |
$ (2.85) |
$ (2.45) |
$ (0.48) |
$ (1.08) |
$ (1.56) |
$ 13.65 |
(15.28%) |
$ 7,314 |
0.80% |
0.67% |
2.50% |
9/30/21 |
16.13 |
0.22 |
1.97 |
2.19 |
(0.30) |
(0.36) |
(0.66) |
17.66 |
13.80% |
14,092 |
0.80% |
0.67% |
1.27% |
9/30/20 |
15.42 |
0.30 |
0.84 |
1.14 |
(0.32) |
(0.11) |
(0.43) |
16.13 |
7.52% |
19,598 |
0.58% |
0.45% |
1.94% |
9/30/19 |
15.18 |
0.27 |
0.41 |
0.68 |
(0.31) |
(0.13) |
(0.44) |
15.42 |
4.85% |
17,961 |
0.67% |
0.40% |
1.79% |
9/30/18g |
15.00 |
(0.02) |
0.20 |
0.18 |
— |
— |
— |
15.18 |
1.20%b |
14,251 |
0.81%a |
0.40%a |
(0.16%)a |
Class M3 |
|||||||||||||
9/30/22 |
$ 17.65 |
$ 0.33 |
$ (2.81) |
$ (2.48) |
$ (0.52) |
$ (1.08) |
$ (1.60) |
$ 13.57 |
(15.55%) |
$ 4,113 |
1.05% |
0.92% |
2.11% |
9/30/21 |
16.11 |
0.13 |
2.01 |
2.14 |
(0.24) |
(0.36) |
(0.60) |
17.65 |
13.47% |
6,265 |
1.05% |
0.92% |
0.74% |
9/30/20 |
15.39 |
0.28 |
0.82 |
1.10 |
(0.27) |
(0.11) |
(0.38) |
16.11 |
7.27% |
6,073 |
0.83% |
0.70% |
1.79% |
9/30/19 |
15.16 |
0.25 |
0.39 |
0.64 |
(0.28) |
(0.13) |
(0.41) |
15.39 |
4.61% |
7,417 |
0.92% |
0.66% |
1.68% |
9/30/18g |
15.00 |
(0.04) |
0.20 |
0.16 |
— |
— |
— |
15.16 |
1.07%b |
6,340 |
1.06%a |
0.65%a |
(0.41%)a |
Year ended September 30 |
|||||
2022 |
2021 |
2020 |
2019 |
Period ended |
|
Portfolio turnover rate |
34% |
38% |
50% |
19% |
60% |
|
a |
Annualized. |
|
b |
Percentage represents the results for the period and is not annualized. |
|
c |
Per share amount calculated on the average shares method. |
|
g |
For the period February 16, 2018 (commencement of operations) through September 30, 2018. |
|
j |
Computed after giving effect to an agreement by MML Advisers to waive certain fees and expenses of the Fund. |
|
l |
Employee retirement benefit plans that invest plan assets in the Separate Investment Accounts (SIAs) may be subject to certain charges as set forth in their respective Plan Documents. Total return figures would be lower for the periods presented if they reflected these charges. |
|
m |
Total return excludes sales charges, if any, and would be lower for the period presented if it reflected these charges. |
|
w |
Expenses of the underlying funds are not included in the Fund’s expense ratio. The Fund indirectly bears its proportionate share of the expenses of any underlying fund. |
The accompanying notes are an integral part of the financial statements.
144
MassMutual Select T. Rowe Price Retirement 2005 Fund – Financial Statements (Continued) |
Financial Highlights (For a share outstanding throughout each period) |
Income (loss) from investment |
Less distributions to shareholders |
Ratios / Supplemental Data |
|||||||||||
Net |
Net |
Net |
Total |
From net |
From net |
Total |
Net |
Total |
Net |
Ratio of |
Ratio of |
Net |
|
Class I |
|||||||||||||
9/30/22 |
$ 17.52 |
$ 0.39 |
$ (2.66) |
$ (2.27) |
$ (0.62) |
$ (2.18) |
$ (2.80) |
$ 12.45 |
(15.62%) |
$ 15,173 |
0.42% |
0.28% |
2.65% |
9/30/21 |
16.24 |
0.30 |
1.84 |
2.14 |
(0.38) |
(0.48) |
(0.86) |
17.52 |
13.48% |
17,418 |
0.42% |
0.28% |
1.74% |
9/30/20 |
15.74 |
0.34 |
0.85 |
1.19 |
(0.43) |
(0.26) |
(0.69) |
16.24 |
7.74% |
19,736 |
0.62% |
0.06% |
2.21% |
9/30/19 |
15.19 |
0.21 |
0.66 |
0.87 |
(0.29) |
(0.03) |
(0.32) |
15.74 |
5.96% |
13,386 |
0.87% |
0.02% |
1.40% |
9/30/18g |
15.00 |
0.04 |
0.15 |
0.19 |
— |
— |
— |
15.19 |
1.27%b |
4,932 |
2.26%a |
0.00%a |
0.38%a |
Class M5 |
|||||||||||||
9/30/22 |
$ 17.48 |
$ 0.41 |
$ (2.69) |
$ (2.28) |
$ (0.60) |
$ (2.18) |
$ (2.78) |
$ 12.42 |
(15.73%) |
$ 5,681 |
0.57% |
0.43% |
2.79% |
9/30/21 |
16.20 |
0.24 |
1.87 |
2.11 |
(0.35) |
(0.48) |
(0.83) |
17.48 |
13.33% |
7,783 |
0.57% |
0.43% |
1.39% |
9/30/20 |
15.71 |
0.41 |
0.75 |
1.16 |
(0.41) |
(0.26) |
(0.67) |
16.20 |
7.55% |
8,440 |
0.77% |
0.20% |
2.63% |
9/30/19 |
15.17 |
0.34 |
0.50 |
0.84 |
(0.27) |
(0.03) |
(0.30) |
15.71 |
5.80% |
8,422 |
1.03% |
0.16% |
2.26% |
9/30/18g |
15.00 |
0.02 |
0.15 |
0.17 |
— |
— |
— |
15.17 |
1.13%b |
7,754 |
2.41%a |
0.15%a |
0.21%a |
Class M4 |
|||||||||||||
9/30/22 |
$ 17.46 |
$ 0.36 |
$ (2.68) |
$ (2.32) |
$ (0.54) |
$ (2.18) |
$ (2.72) |
$ 12.42 |
(15.93%) |
$ 2,073 |
0.82% |
0.68% |
2.46% |
9/30/21 |
16.17 |
0.21 |
1.86 |
2.07 |
(0.30) |
(0.48) |
(0.78) |
17.46 |
13.07% |
3,096 |
0.82% |
0.68% |
1.22% |
9/30/20 |
15.69 |
0.36 |
0.76 |
1.12 |
(0.38) |
(0.26) |
(0.64) |
16.17 |
7.29% |
3,455 |
1.02% |
0.45% |
2.30% |
9/30/19 |
15.15 |
0.25 |
0.56 |
0.81 |
(0.24) |
(0.03) |
(0.27) |
15.69 |
5.53% |
3,138 |
1.28% |
0.41% |
1.64% |
9/30/18g |
15.00 |
(0.00)d |
0.15 |
0.15 |
— |
— |
— |
15.15 |
1.00%b |
2,059 |
2.66%a |
0.40%a |
(0.05%)a |
Class M3 |
|||||||||||||
9/30/22 |
$ 17.39 |
$ 0.29 |
$ (2.64) |
$ (2.35) |
$ (0.52) |
$ (2.18) |
$ (2.70) |
$ 12.34 |
(16.17%) |
$ 1,453 |
1.07% |
0.93% |
2.01% |
9/30/21 |
16.11 |
0.12 |
1.90 |
2.02 |
(0.26) |
(0.48) |
(0.74) |
17.39 |
12.77% |
1,603 |
1.07% |
0.93% |
0.72% |
9/30/20 |
15.64 |
0.32 |
0.76 |
1.08 |
(0.35) |
(0.26) |
(0.61) |
16.11 |
7.01% |
1,227 |
1.27% |
0.69% |
2.07% |
9/30/19 |
15.12 |
0.22 |
0.55 |
0.77 |
(0.22) |
(0.03) |
(0.25) |
15.64 |
5.28% |
1,539 |
1.53% |
0.66% |
1.45% |
9/30/18g |
15.00 |
(0.03) |
0.15 |
0.12 |
— |
— |
— |
15.12 |
0.80%b |
895 |
2.91%a |
0.65%a |
(0.30%)a |
Year ended September 30 |
|||||
2022 |
2021 |
2020 |
2019 |
Period ended |
|
Portfolio turnover rate |
37% |
54% |
59% |
41% |
39% |
|
a |
Annualized. |
|
b |
Percentage represents the results for the period and is not annualized. |
|
c |
Per share amount calculated on the average shares method. |
|
d |
Amount is less than $0.005 per share. |
|
g |
For the period February 16, 2018 (commencement of operations) through September 30, 2018. |
|
j |
Computed after giving effect to an agreement by MML Advisers to waive certain fees and expenses of the Fund. |
|
l |
Employee retirement benefit plans that invest plan assets in the Separate Investment Accounts (SIAs) may be subject to certain charges as set forth in their respective Plan Documents. Total return figures would be lower for the periods presented if they reflected these charges. |
|
m |
Total return excludes sales charges, if any, and would be lower for the period presented if it reflected these charges. |
|
w |
Expenses of the underlying funds are not included in the Fund’s expense ratio. The Fund indirectly bears its proportionate share of the expenses of any underlying fund. |
The accompanying notes are an integral part of the financial statements.
145
MassMutual Select T. Rowe Price Retirement 2010 Fund – Financial Statements (Continued) |
Financial Highlights (For a share outstanding throughout each period) |
Income (loss) from investment |
Less distributions to shareholders |
Ratios / Supplemental Data |
|||||||||||
Net |
Net |
Net |
Total |
From net |
From net |
Total |
Net |
Total |
Net |
Ratio of |
Ratio of |
Net |
|
Class I |
|||||||||||||
9/30/22 |
$ 17.63 |
$ 0.39 |
$ (2.90) |
$ (2.51) |
$ (0.62) |
$ (1.27) |
$ (1.89) |
$ 13.23 |
(16.02%) |
$ 63,308 |
0.42% |
0.28% |
2.51% |
9/30/21 |
16.05 |
0.27 |
2.05 |
2.32 |
(0.37) |
(0.37) |
(0.74) |
17.63 |
14.74% |
75,734 |
0.42% |
0.28% |
1.55% |
9/30/20 |
15.66 |
0.37 |
0.85 |
1.22 |
(0.43) |
(0.40) |
(0.83) |
16.05 |
8.02% |
72,187 |
0.20% |
0.05% |
2.40% |
9/30/19 |
15.20 |
0.34 |
0.50 |
0.84 |
(0.37) |
(0.01) |
(0.38) |
15.66 |
5.84% |
65,842 |
0.16% |
0.01% |
2.26% |
9/30/18g |
15.00 |
0.02 |
0.18 |
0.20 |
— |
— |
— |
15.20 |
1.33%b |
19,842 |
0.26%a |
0.00%a |
0.33%a |
Class M5 |
|||||||||||||
9/30/22 |
$ 17.61 |
$ 0.47 |
$ (2.99) |
$ (2.52) |
$ (0.61) |
$ (1.27) |
$ (1.88) |
$ 13.21 |
(16.10%) |
$ 20,741 |
0.57% |
0.43% |
2.98% |
9/30/21 |
16.03 |
0.21 |
2.08 |
2.29 |
(0.34) |
(0.37) |
(0.71) |
17.61 |
14.57% |
32,649 |
0.57% |
0.43% |
1.20% |
9/30/20 |
15.65 |
0.39 |
0.80 |
1.19 |
(0.41) |
(0.40) |
(0.81) |
16.03 |
7.81% |
28,892 |
0.34% |
0.20% |
2.53% |
9/30/19 |
15.19 |
0.36 |
0.46 |
0.82 |
(0.35) |
(0.01) |
(0.36) |
15.65 |
5.70% |
30,690 |
0.31% |
0.16% |
2.43% |
9/30/18g |
15.00 |
0.01 |
0.18 |
0.19 |
— |
— |
— |
15.19 |
1.27%b |
32,952 |
0.41%a |
0.15%a |
0.16%a |
Class M4 |
|||||||||||||
9/30/22 |
$ 17.56 |
$ 0.38 |
$ (2.96) |
$ (2.58) |
$ (0.51) |
$ (1.27) |
$ (1.78) |
$ 13.20 |
(16.40%) |
$ 10,567 |
0.82% |
0.68% |
2.45% |
9/30/21 |
15.99 |
0.23 |
2.02 |
2.25 |
(0.31) |
(0.37) |
(0.68) |
17.56 |
14.35% |
26,545 |
0.82% |
0.68% |
1.37% |
9/30/20 |
15.61 |
0.33 |
0.82 |
1.15 |
(0.37) |
(0.40) |
(0.77) |
15.99 |
7.56% |
30,398 |
0.60% |
0.45% |
2.16% |
9/30/19 |
15.17 |
0.31 |
0.46 |
0.77 |
(0.32) |
(0.01) |
(0.33) |
15.61 |
5.37% |
23,473 |
0.56% |
0.41% |
2.06% |
9/30/18g |
15.00 |
(0.01) |
0.18 |
0.17 |
— |
— |
— |
15.17 |
1.13%b |
20,459 |
0.66%a |
0.40%a |
(0.08%)a |
Class M3 |
|||||||||||||
9/30/22 |
$ 17.56 |
$ 0.35 |
$ (2.95) |
$ (2.60) |
$ (0.51) |
$ (1.27) |
$ (1.78) |
$ 13.18 |
(16.57%) |
$ 8,647 |
1.07% |
0.93% |
2.28% |
9/30/21 |
15.99 |
0.15 |
2.04 |
2.19 |
(0.25) |
(0.37) |
(0.62) |
17.56 |
13.97% |
13,883 |
1.07% |
0.93% |
0.90% |
9/30/20 |
15.59 |
0.25 |
0.87 |
1.12 |
(0.32) |
(0.40) |
(0.72) |
15.99 |
7.34% |
14,512 |
0.85% |
0.70% |
1.62% |
9/30/19 |
15.14 |
0.26 |
0.48 |
0.74 |
(0.28) |
(0.01) |
(0.29) |
15.59 |
5.15% |
13,737 |
0.81% |
0.66% |
1.74% |
9/30/18g |
15.00 |
(0.04) |
0.18 |
0.14 |
— |
— |
— |
15.14 |
0.93%b |
15,085 |
0.91%a |
0.65%a |
(0.33%)a |
Year ended September 30 |
|||||
2022 |
2021 |
2020 |
2019 |
Period ended |
|
Portfolio turnover rate |
34% |
33% |
53% |
27% |
14% |
|
a |
Annualized. |
|
b |
Percentage represents the results for the period and is not annualized. |
|
c |
Per share amount calculated on the average shares method. |
|
g |
For the period February 16, 2018 (commencement of operations) through September 30, 2018. |
|
j |
Computed after giving effect to an agreement by MML Advisers to waive certain fees and expenses of the Fund. |
|
l |
Employee retirement benefit plans that invest plan assets in the Separate Investment Accounts (SIAs) may be subject to certain charges as set forth in their respective Plan Documents. Total return figures would be lower for the periods presented if they reflected these charges. |
|
m |
Total return excludes sales charges, if any, and would be lower for the period presented if it reflected these charges. |
|
w |
Expenses of the underlying funds are not included in the Fund’s expense ratio. The Fund indirectly bears its proportionate share of the expenses of any underlying fund. |
The accompanying notes are an integral part of the financial statements.
146
MassMutual Select T. Rowe Price Retirement 2015 Fund – Financial Statements (Continued) |
Financial Highlights (For a share outstanding throughout each period) |
Income (loss) from investment |
Less distributions to shareholders |
Ratios / Supplemental Data |
|||||||||||
Net |
Net |
Net |
Total |
From net |
From net |
Total |
Net |
Total |
Net |
Ratio of |
Ratio of |
Net |
|
Class I |
|||||||||||||
9/30/22 |
$ 17.97 |
$ 0.36 |
$ (2.99) |
$ (2.63) |
$ (0.62) |
$ (1.15) |
$ (1.77) |
$ 13.57 |
(16.38%) |
$ 65,438 |
0.44% |
0.30% |
2.29% |
9/30/21 |
16.17 |
0.24 |
2.32 |
2.56 |
(0.35) |
(0.41) |
(0.76) |
17.97 |
16.19% |
78,555 |
0.44% |
0.32% |
1.35% |
9/30/20 |
15.64 |
0.35 |
0.93 |
1.28 |
(0.41) |
(0.34) |
(0.75) |
16.17 |
8.40% |
65,346 |
0.20% |
0.06% |
2.29% |
9/30/19 |
15.21 |
0.30 |
0.49 |
0.79 |
(0.34) |
(0.02) |
(0.36) |
15.64 |
5.52% |
56,389 |
0.17% |
0.01% |
1.99% |
9/30/18g |
15.00 |
0.02 |
0.19 |
0.21 |
— |
— |
— |
15.21 |
1.40%b |
27,304 |
0.34%a |
0.00%a |
0.29%a |
Class M5 |
|||||||||||||
9/30/22 |
$ 17.94 |
$ 0.42 |
$ (3.07) |
$ (2.65) |
$ (0.60) |
$ (1.15) |
$ (1.75) |
$ 13.54 |
(16.50%) |
$ 39,275 |
0.59% |
0.45% |
2.64% |
9/30/21 |
16.14 |
0.21 |
2.32 |
2.53 |
(0.32) |
(0.41) |
(0.73) |
17.94 |
16.05% |
64,169 |
0.59% |
0.47% |
1.21% |
9/30/20 |
15.62 |
0.36 |
0.89 |
1.25 |
(0.39) |
(0.34) |
(0.73) |
16.14 |
8.19% |
53,926 |
0.35% |
0.21% |
2.30% |
9/30/19 |
15.19 |
0.32 |
0.46 |
0.78 |
(0.33) |
(0.02) |
(0.35) |
15.62 |
5.44% |
52,284 |
0.32% |
0.16% |
2.14% |
9/30/18g |
15.00 |
0.01 |
0.18 |
0.19 |
— |
— |
— |
15.19 |
1.27%b |
53,386 |
0.49%a |
0.15%a |
0.14%a |
Class M4 |
|||||||||||||
9/30/22 |
$ 17.92 |
$ 0.35 |
$ (3.04) |
$ (2.69) |
$ (0.52) |
$ (1.15) |
$ (1.67) |
$ 13.56 |
(16.68%) |
$ 5,066 |
0.84% |
0.70% |
2.21% |
9/30/21 |
16.12 |
0.19 |
2.30 |
2.49 |
(0.28) |
(0.41) |
(0.69) |
17.92 |
15.74% |
11,856 |
0.84% |
0.72% |
1.07% |
9/30/20 |
15.60 |
0.31 |
0.89 |
1.20 |
(0.34) |
(0.34) |
(0.68) |
16.12 |
7.89% |
12,857 |
0.60% |
0.46% |
2.03% |
9/30/19 |
15.17 |
0.23 |
0.51 |
0.74 |
(0.29) |
(0.02) |
(0.31) |
15.60 |
5.15% |
13,738 |
0.57% |
0.41% |
1.52% |
9/30/18g |
15.00 |
(0.01) |
0.18 |
0.17 |
— |
— |
— |
15.17 |
1.13%b |
11,781 |
0.74%a |
0.40%a |
(0.12%)a |
Class M3 |
|||||||||||||
9/30/22 |
$ 17.87 |
$ 0.32 |
$ (3.04) |
$ (2.72) |
$ (0.51) |
$ (1.15) |
$ (1.66) |
$ 13.49 |
(16.89%) |
$ 4,452 |
1.09% |
0.95% |
2.01% |
9/30/21 |
16.08 |
0.13 |
2.31 |
2.44 |
(0.24) |
(0.41) |
(0.65) |
17.87 |
15.46% |
6,990 |
1.09% |
0.97% |
0.76% |
9/30/20 |
15.56 |
0.30 |
0.87 |
1.17 |
(0.31) |
(0.34) |
(0.65) |
16.08 |
7.65% |
7,211 |
0.85% |
0.70% |
1.96% |
9/30/19 |
15.15 |
0.28 |
0.41 |
0.69 |
(0.26) |
(0.02) |
(0.28) |
15.56 |
4.84% |
8,621 |
0.82% |
0.66% |
1.89% |
9/30/18g |
15.00 |
(0.04) |
0.19 |
0.15 |
— |
— |
— |
15.15 |
1.00%b |
7,694 |
0.99%a |
0.65%a |
(0.37%)a |
Year ended September 30 |
|||||
2022 |
2021 |
2020 |
2019 |
Period ended |
|
Portfolio turnover rate |
35% |
35% |
57% |
32% |
19% |
|
a |
Annualized. |
|
b |
Percentage represents the results for the period and is not annualized. |
|
c |
Per share amount calculated on the average shares method. |
|
g |
For the period February 16, 2018 (commencement of operations) through September 30, 2018. |
|
j |
Computed after giving effect to an agreement by MML Advisers to waive certain fees and expenses of the Fund. |
|
l |
Employee retirement benefit plans that invest plan assets in the Separate Investment Accounts (SIAs) may be subject to certain charges as set forth in their respective Plan Documents. Total return figures would be lower for the periods presented if they reflected these charges. |
|
m |
Total return excludes sales charges, if any, and would be lower for the period presented if it reflected these charges. |
|
w |
Expenses of the underlying funds are not included in the Fund’s expense ratio. The Fund indirectly bears its proportionate share of the expenses of any underlying fund. |
The accompanying notes are an integral part of the financial statements.
147
MassMutual Select T. Rowe Price Retirement 2020 Fund – Financial Statements (Continued) |
Financial Highlights (For a share outstanding throughout each period) |
Income (loss) from investment |
Less distributions to shareholders |
Ratios / Supplemental Data |
|||||||||||
Net |
Net |
Net |
Total |
From net |
From net |
Total |
Net |
Total |
Net |
Ratio of |
Ratio of |
Net |
|
Class I |
|||||||||||||
9/30/22 |
$ 18.31 |
$ 0.34 |
$ (3.04) |
$ (2.70) |
$ (0.64) |
$ (1.49) |
$ (2.13) |
$ 13.48 |
(16.84%) |
$ 267,728 |
0.47% |
0.31% |
2.16% |
9/30/21 |
16.22 |
0.22 |
2.62 |
2.84 |
(0.34) |
(0.41) |
(0.75) |
18.31 |
17.87% |
303,954 |
0.47% |
0.35% |
1.25% |
9/30/20 |
15.63 |
0.33 |
0.99 |
1.32 |
(0.39) |
(0.34) |
(0.73) |
16.22 |
8.63% |
265,328 |
0.12% |
0.07% |
2.11% |
9/30/19 |
15.23 |
0.27 |
0.47 |
0.74 |
(0.33) |
(0.01) |
(0.34) |
15.63 |
5.20% |
219,375 |
0.05% |
0.02% |
1.81% |
9/30/18g |
15.00 |
0.02 |
0.21 |
0.23 |
— |
— |
— |
15.23 |
1.53%b |
110,027 |
0.05%a |
0.00%a |
0.25%a |
Class M5 |
|||||||||||||
9/30/22 |
$ 18.29 |
$ 0.47 |
$ (3.19) |
$ (2.72) |
$ (0.62) |
$ (1.49) |
$ (2.11) |
$ 13.46 |
(16.98%) |
$ 137,211 |
0.62% |
0.47% |
2.89% |
9/30/21 |
16.20 |
0.19 |
2.62 |
2.81 |
(0.31) |
(0.41) |
(0.72) |
18.29 |
17.71% |
282,667 |
0.62% |
0.50% |
1.05% |
9/30/20 |
15.61 |
0.34 |
0.96 |
1.30 |
(0.37) |
(0.34) |
(0.71) |
16.20 |
8.49% |
257,134 |
0.26% |
0.21% |
2.17% |
9/30/19 |
15.21 |
0.29 |
0.43 |
0.72 |
(0.31) |
(0.01) |
(0.32) |
15.61 |
5.07% |
251,317 |
0.20% |
0.17% |
1.93% |
9/30/18g |
15.00 |
0.01 |
0.20 |
0.21 |
— |
— |
— |
15.21 |
1.40%b |
243,194 |
0.20%a |
0.15%a |
0.09%a |
Class M4 |
|||||||||||||
9/30/22 |
$ 18.24 |
$ 0.33 |
$ (3.09) |
$ (2.76) |
$ (0.53) |
$ (1.49) |
$ (2.02) |
$ 13.46 |
(17.15%) |
$ 70,876 |
0.87% |
0.72% |
2.07% |
9/30/21 |
16.17 |
0.19 |
2.57 |
2.76 |
(0.28) |
(0.41) |
(0.69) |
18.24 |
17.38% |
139,862 |
0.87% |
0.75% |
1.08% |
9/30/20 |
15.58 |
0.30 |
0.96 |
1.26 |
(0.33) |
(0.34) |
(0.67) |
16.17 |
8.24% |
159,246 |
0.51% |
0.46% |
1.92% |
9/30/19 |
15.19 |
0.26 |
0.42 |
0.68 |
(0.28) |
(0.01) |
(0.29) |
15.58 |
4.79% |
147,162 |
0.45% |
0.42% |
1.77% |
9/30/18g |
15.00 |
(0.01) |
0.20 |
0.19 |
— |
— |
— |
15.19 |
1.27%b |
136,540 |
0.45%a |
0.40%a |
(0.16%)a |
Class M3 |
|||||||||||||
9/30/22 |
$ 18.24 |
$ 0.30 |
$ (3.10) |
$ (2.80) |
$ (0.50) |
$ (1.49) |
$ (1.99) |
$ 13.45 |
(17.37%) |
$ 36,043 |
1.12% |
0.97% |
1.86% |
9/30/21 |
16.16 |
0.12 |
2.58 |
2.70 |
(0.21) |
(0.41) |
(0.62) |
18.24 |
17.02% |
55,402 |
1.12% |
1.00% |
0.66% |
9/30/20 |
15.56 |
0.25 |
0.97 |
1.22 |
(0.28) |
(0.34) |
(0.62) |
16.16 |
8.01% |
65,611 |
0.76% |
0.71% |
1.65% |
9/30/19 |
15.17 |
0.21 |
0.43 |
0.64 |
(0.24) |
(0.01) |
(0.25) |
15.56 |
4.49% |
74,882 |
0.70% |
0.67% |
1.39% |
9/30/18g |
15.00 |
(0.04) |
0.21 |
0.17 |
— |
— |
— |
15.17 |
1.13%b |
76,167 |
0.70%a |
0.65%a |
(0.41%)a |
Year ended September 30 |
|||||
2022 |
2021 |
2020 |
2019 |
Period ended |
|
Portfolio turnover rate |
35% |
35% |
53% |
19% |
11% |
|
a |
Annualized. |
|
b |
Percentage represents the results for the period and is not annualized. |
|
c |
Per share amount calculated on the average shares method. |
|
g |
For the period February 16, 2018 (commencement of operations) through September 30, 2018. |
|
j |
Computed after giving effect to an agreement by MML Advisers to waive certain fees and expenses of the Fund. |
|
l |
Employee retirement benefit plans that invest plan assets in the Separate Investment Accounts (SIAs) may be subject to certain charges as set forth in their respective Plan Documents. Total return figures would be lower for the periods presented if they reflected these charges. |
|
m |
Total return excludes sales charges, if any, and would be lower for the period presented if it reflected these charges. |
|
w |
Expenses of the underlying funds are not included in the Fund’s expense ratio. The Fund indirectly bears its proportionate share of the expenses of any underlying fund. |
The accompanying notes are an integral part of the financial statements.
148
MassMutual Select T. Rowe Price Retirement 2025 Fund – Financial Statements (Continued) |
Financial Highlights (For a share outstanding throughout each period) |
Income (loss) from investment |
Less distributions to shareholders |
Ratios / Supplemental Data |
|||||||||||
Net |
Net |
Net |
Total |
From net |
From net |
Total |
Net |
Total |
Net |
Ratio of |
Ratio of |
Net |
|
Class I |
|||||||||||||
9/30/22 |
$ 19.04 |
$ 0.31 |
$ (3.31) |
$ (3.00) |
$ (0.66) |
$ (1.36) |
$ (2.02) |
$ 14.02 |
(17.83%) |
$ 356,557 |
0.50% |
0.34% |
1.88% |
9/30/21 |
16.46 |
0.20 |
3.07 |
3.27 |
(0.33) |
(0.36) |
(0.69) |
19.04 |
20.22% |
377,165 |
0.51% |
0.39% |
1.06% |
9/30/20 |
15.62 |
0.29 |
1.15 |
1.44 |
(0.36) |
(0.24) |
(0.60) |
16.46 |
9.35% |
284,762 |
0.14% |
0.08% |
1.89% |
9/30/19 |
15.23 |
0.22 |
0.47 |
0.69 |
(0.29) |
(0.01) |
(0.30) |
15.62 |
4.91% |
202,728 |
0.06% |
0.02% |
1.43% |
9/30/18g |
15.00 |
0.02 |
0.21 |
0.23 |
— |
— |
— |
15.23 |
1.53%b |
81,689 |
0.09%a |
0.00%a |
0.20%a |
Class M5 |
|||||||||||||
9/30/22 |
$ 19.01 |
$ 0.45 |
$ (3.48) |
$ (3.03) |
$ (0.63) |
$ (1.36) |
$ (1.99) |
$ 13.99 |
(17.99%) |
$ 83,947 |
0.65% |
0.50% |
2.63% |
9/30/21 |
16.43 |
0.17 |
3.07 |
3.24 |
(0.30) |
(0.36) |
(0.66) |
19.01 |
20.08% |
195,342 |
0.66% |
0.54% |
0.93% |
9/30/20 |
15.60 |
0.32 |
1.09 |
1.41 |
(0.34) |
(0.24) |
(0.58) |
16.43 |
9.15% |
158,255 |
0.27% |
0.22% |
2.07% |
9/30/19 |
15.22 |
0.26 |
0.41 |
0.67 |
(0.28) |
(0.01) |
(0.29) |
15.60 |
4.72% |
154,071 |
0.21% |
0.16% |
1.73% |
9/30/18g |
15.00 |
0.00d |
0.22 |
0.22 |
— |
— |
— |
15.22 |
1.47%b |
147,045 |
0.24%a |
0.15%a |
0.05%a |
Class M4 |
|||||||||||||
9/30/22 |
$ 18.96 |
$ 0.30 |
$ (3.36) |
$ (3.06) |
$ (0.57) |
$ (1.36) |
$ (1.93) |
$ 13.97 |
(18.16%) |
$ 51,635 |
0.90% |
0.75% |
1.81% |
9/30/21 |
16.40 |
0.14 |
3.04 |
3.18 |
(0.26) |
(0.36) |
(0.62) |
18.96 |
19.73% |
98,755 |
0.91% |
0.79% |
0.76% |
9/30/20 |
15.58 |
0.26 |
1.11 |
1.37 |
(0.31) |
(0.24) |
(0.55) |
16.40 |
8.85% |
89,755 |
0.53% |
0.48% |
1.69% |
9/30/19 |
15.20 |
0.20 |
0.44 |
0.64 |
(0.25) |
(0.01) |
(0.26) |
15.58 |
4.48% |
81,705 |
0.46% |
0.41% |
1.33% |
9/30/18g |
15.00 |
(0.02) |
0.22 |
0.20 |
— |
— |
— |
15.20 |
1.33%b |
61,589 |
0.49%a |
0.40%a |
(0.20%)a |
Class M3 |
|||||||||||||
9/30/22 |
$ 18.90 |
$ 0.26 |
$ (3.36) |
$ (3.10) |
$ (0.52) |
$ (1.36) |
$ (1.88) |
$ 13.92 |
(18.37%) |
$ 35,432 |
1.15% |
1.00% |
1.57% |
9/30/21 |
16.35 |
0.10 |
3.02 |
3.12 |
(0.21) |
(0.36) |
(0.57) |
18.90 |
19.41% |
51,074 |
1.16% |
1.04% |
0.57% |
9/30/20 |
15.53 |
0.25 |
1.08 |
1.33 |
(0.27) |
(0.24) |
(0.51) |
16.35 |
8.62% |
55,244 |
0.77% |
0.72% |
1.59% |
9/30/19 |
15.17 |
0.16 |
0.44 |
0.60 |
(0.23) |
(0.01) |
(0.24) |
15.53 |
4.23% |
64,120 |
0.71% |
0.66% |
1.10% |
9/30/18g |
15.00 |
(0.04) |
0.21 |
0.17 |
— |
— |
— |
15.17 |
1.13%b |
44,333 |
0.74%a |
0.65%a |
(0.45%)a |
Year ended September 30 |
|||||
2022 |
2021 |
2020 |
2019 |
Period ended |
|
Portfolio turnover rate |
38% |
40% |
42% |
14% |
10% |
|
a |
Annualized. |
|
b |
Percentage represents the results for the period and is not annualized. |
|
c |
Per share amount calculated on the average shares method. |
|
d |
Amount is less than $0.005 per share. |
|
g |
For the period February 16, 2018 (commencement of operations) through September 30, 2018. |
|
j |
Computed after giving effect to an agreement by MML Advisers to waive certain fees and expenses of the Fund. |
|
l |
Employee retirement benefit plans that invest plan assets in the Separate Investment Accounts (SIAs) may be subject to certain charges as set forth in their respective Plan Documents. Total return figures would be lower for the periods presented if they reflected these charges. |
|
m |
Total return excludes sales charges, if any, and would be lower for the period presented if it reflected these charges. |
|
w |
Expenses of the underlying funds are not included in the Fund’s expense ratio. The Fund indirectly bears its proportionate share of the expenses of any underlying fund. |
The accompanying notes are an integral part of the financial statements.
149
MassMutual Select T. Rowe Price Retirement 2030 Fund – Financial Statements (Continued) |
Financial Highlights (For a share outstanding throughout each period) |
Income (loss) from investment |
Less distributions to shareholders |
Ratios / Supplemental Data |
|||||||||||
Net |
Net |
Net |
Total |
From net |
From net |
Total |
Net |
Total |
Net |
Ratio of |
Ratio of |
Net |
|
Class I |
|||||||||||||
9/30/22 |
$ 19.67 |
$ 0.25 |
$ (3.65) |
$ (3.40) |
$ (0.69) |
$ (1.21) |
$ (1.90) |
$ 14.37 |
(19.32%) |
$ 627,370 |
0.53% |
0.37% |
1.44% |
9/30/21 |
16.54 |
0.17 |
3.54 |
3.71 |
(0.31) |
(0.27) |
(0.58) |
19.67 |
22.79% |
582,489 |
0.54% |
0.43% |
0.88% |
9/30/20 |
15.60 |
0.27 |
1.23 |
1.50 |
(0.34) |
(0.22) |
(0.56) |
16.54 |
9.78% |
432,292 |
0.13% |
0.09% |
1.74% |
9/30/19 |
15.23 |
0.20 |
0.45 |
0.65 |
(0.28) |
(0.00)d |
(0.28) |
15.60 |
4.61% |
329,602 |
0.04% |
0.01% |
1.37% |
9/30/18g |
15.00 |
0.01 |
0.22 |
0.23 |
— |
— |
— |
15.23 |
1.53%b |
148,473 |
0.04%a |
0.00%a |
0.16%a |
Class M5 |
|||||||||||||
9/30/22 |
$ 19.65 |
$ 0.37 |
$ (3.81) |
$ (3.44) |
$ (0.66) |
$ (1.21) |
$ (1.87) |
$ 14.34 |
(19.51%) |
$ 322,959 |
0.69% |
0.54% |
2.09% |
9/30/21 |
16.52 |
0.13 |
3.55 |
3.68 |
(0.28) |
(0.27) |
(0.55) |
19.65 |
22.65% |
646,934 |
0.69% |
0.58% |
0.67% |
9/30/20 |
15.58 |
0.28 |
1.20 |
1.48 |
(0.32) |
(0.22) |
(0.54) |
16.52 |
9.65% |
489,123 |
0.27% |
0.23% |
1.77% |
9/30/19 |
15.22 |
0.23 |
0.39 |
0.62 |
(0.26) |
(0.00)d |
(0.26) |
15.58 |
4.41% |
434,061 |
0.19% |
0.16% |
1.53% |
9/30/18g |
15.00 |
0.00d |
0.22 |
0.22 |
— |
— |
— |
15.22 |
1.47%b |
409,120 |
0.19%a |
0.15%a |
0.00%a |
Class M4 |
|||||||||||||
9/30/22 |
$ 19.58 |
$ 0.24 |
$ (3.71) |
$ (3.47) |
$ (0.58) |
$ (1.21) |
$ (1.79) |
$ 14.32 |
(19.66%) |
$ 143,393 |
0.94% |
0.79% |
1.41% |
9/30/21 |
16.48 |
0.14 |
3.48 |
3.62 |
(0.25) |
(0.27) |
(0.52) |
19.58 |
22.29% |
291,355 |
0.94% |
0.83% |
0.73% |
9/30/20 |
15.55 |
0.23 |
1.20 |
1.43 |
(0.28) |
(0.22) |
(0.50) |
16.48 |
9.34% |
298,652 |
0.52% |
0.48% |
1.51% |
9/30/19 |
15.20 |
0.20 |
0.39 |
0.59 |
(0.24) |
(0.00)d |
(0.24) |
15.55 |
4.16% |
247,113 |
0.44% |
0.41% |
1.34% |
9/30/18g |
15.00 |
(0.02) |
0.22 |
0.20 |
— |
— |
— |
15.20 |
1.33%b |
193,313 |
0.44%a |
0.40%a |
(0.25%)a |
Class M3 |
|||||||||||||
9/30/22 |
$ 19.59 |
$ 0.21 |
$ (3.73) |
$ (3.52) |
$ (0.55) |
$ (1.21) |
$ (1.76) |
$ 14.31 |
(19.91%) |
$ 79,404 |
1.19% |
1.04% |
1.19% |
9/30/21 |
16.46 |
0.06 |
3.52 |
3.58 |
(0.18) |
(0.27) |
(0.45) |
19.59 |
22.06% |
112,891 |
1.19% |
1.08% |
0.34% |
9/30/20 |
15.53 |
0.20 |
1.19 |
1.39 |
(0.24) |
(0.22) |
(0.46) |
16.46 |
9.06% |
123,936 |
0.77% |
0.73% |
1.30% |
9/30/19 |
15.17 |
0.15 |
0.41 |
0.56 |
(0.20) |
(0.00)d |
(0.20) |
15.53 |
3.93% |
131,017 |
0.69% |
0.66% |
1.01% |
9/30/18g |
15.00 |
(0.05) |
0.22 |
0.17 |
— |
— |
— |
15.17 |
1.13%b |
123,963 |
0.69%a |
0.65%a |
(0.50%)a |
Year ended September 30 |
|||||
2022 |
2021 |
2020 |
2019 |
Period ended |
|
Portfolio turnover rate |
34% |
27% |
34% |
12% |
7% |
|
a |
Annualized. |
|
b |
Percentage represents the results for the period and is not annualized. |
|
c |
Per share amount calculated on the average shares method. |
|
d |
Amount is less than $0.005 per share. |
|
g |
For the period February 16, 2018 (commencement of operations) through September 30, 2018. |
|
j |
Computed after giving effect to an agreement by MML Advisers to waive certain fees and expenses of the Fund. |
|
l |
Employee retirement benefit plans that invest plan assets in the Separate Investment Accounts (SIAs) may be subject to certain charges as set forth in their respective Plan Documents. Total return figures would be lower for the periods presented if they reflected these charges. |
|
m |
Total return excludes sales charges, if any, and would be lower for the period presented if it reflected these charges. |
|
w |
Expenses of the underlying funds are not included in the Fund’s expense ratio. The Fund indirectly bears its proportionate share of the expenses of any underlying fund. |
The accompanying notes are an integral part of the financial statements.
150
MassMutual Select T. Rowe Price Retirement 2035 Fund – Financial Statements (Continued) |
Financial Highlights (For a share outstanding throughout each period) |
Income (loss) from investment |
Less distributions to shareholders |
Ratios / Supplemental Data |
|||||||||||
Net |
Net |
Net |
Total |
From net |
From net |
Total |
Net |
Total |
Net |
Ratio of |
Ratio of |
Net |
|
Class I |
|||||||||||||
9/30/22 |
$ 20.26 |
$ 0.22 |
$ (4.01) |
$ (3.79) |
$ (0.75) |
$ (1.00) |
$ (1.75) |
$ 14.72 |
(20.63%) |
$ 412,008 |
0.57% |
0.39% |
1.24% |
9/30/21 |
16.64 |
0.14 |
4.02 |
4.16 |
(0.28) |
(0.26) |
(0.54) |
20.26 |
25.35% |
372,474 |
0.57% |
0.44% |
0.71% |
9/30/20 |
15.58 |
0.25 |
1.30 |
1.55 |
(0.32) |
(0.17) |
(0.49) |
16.64 |
10.08% |
250,301 |
0.15% |
0.09% |
1.59% |
9/30/19 |
15.24 |
0.17 |
0.42 |
0.59 |
(0.25) |
(0.00)d |
(0.25) |
15.58 |
4.23% |
172,985 |
0.07% |
0.02% |
1.15% |
9/30/18g |
15.00 |
0.01 |
0.23 |
0.24 |
— |
— |
— |
15.24 |
1.60%b |
70,756 |
0.10%a |
0.00%a |
0.12%a |
Class M5 |
|||||||||||||
9/30/22 |
$ 20.22 |
$ 0.36 |
$ (4.17) |
$ (3.81) |
$ (0.73) |
$ (1.00) |
$ (1.73) |
$ 14.68 |
(20.78%) |
$ 98,488 |
0.72% |
0.56% |
1.98% |
9/30/21 |
16.62 |
0.12 |
3.99 |
4.11 |
(0.25) |
(0.26) |
(0.51) |
20.22 |
25.09% |
233,159 |
0.72% |
0.61% |
0.62% |
9/30/20 |
15.56 |
0.26 |
1.27 |
1.53 |
(0.30) |
(0.17) |
(0.47) |
16.62 |
9.95% |
176,646 |
0.29% |
0.23% |
1.68% |
9/30/19 |
15.23 |
0.20 |
0.37 |
0.57 |
(0.24) |
(0.00)d |
(0.24) |
15.56 |
4.05% |
155,562 |
0.22% |
0.16% |
1.31% |
9/30/18g |
15.00 |
(0.00)d |
0.23 |
0.23 |
— |
— |
— |
15.23 |
1.53%b |
136,793 |
0.25%a |
0.15%a |
(0.03%)a |
Class M4 |
|||||||||||||
9/30/22 |
$ 20.16 |
$ 0.20 |
$ (4.04) |
$ (3.84) |
$ (0.67) |
$ (1.00) |
$ (1.67) |
$ 14.65 |
(20.92%) |
$ 67,260 |
0.97% |
0.81% |
1.10% |
9/30/21 |
16.58 |
0.06 |
4.00 |
4.06 |
(0.22) |
(0.26) |
(0.48) |
20.16 |
24.81% |
120,031 |
0.97% |
0.86% |
0.30% |
9/30/20 |
15.53 |
0.22 |
1.27 |
1.49 |
(0.27) |
(0.17) |
(0.44) |
16.58 |
9.66% |
75,337 |
0.55% |
0.49% |
1.38% |
9/30/19 |
15.20 |
0.16 |
0.38 |
0.54 |
(0.21) |
(0.00)d |
(0.21) |
15.53 |
3.81% |
65,583 |
0.47% |
0.41% |
1.05% |
9/30/18g |
15.00 |
(0.03) |
0.23 |
0.20 |
— |
— |
— |
15.20 |
1.33%b |
54,036 |
0.50%a |
0.40%a |
(0.28%)a |
Class M3 |
|||||||||||||
9/30/22 |
$ 20.13 |
$ 0.15 |
$ (4.05) |
$ (3.90) |
$ (0.58) |
$ (1.00) |
$ (1.58) |
$ 14.65 |
(21.16%) |
$ 36,030 |
1.22% |
1.06% |
0.86% |
9/30/21 |
16.55 |
0.05 |
3.95 |
4.00 |
(0.16) |
(0.26) |
(0.42) |
20.13 |
24.44% |
45,019 |
1.22% |
1.12% |
0.25% |
9/30/20 |
15.50 |
0.19 |
1.25 |
1.44 |
(0.22) |
(0.17) |
(0.39) |
16.55 |
9.39% |
58,793 |
0.79% |
0.73% |
1.19% |
9/30/19 |
15.18 |
0.12 |
0.39 |
0.51 |
(0.19) |
(0.00)d |
(0.19) |
15.50 |
3.57% |
57,490 |
0.72% |
0.66% |
0.80% |
9/30/18g |
15.00 |
(0.05) |
0.23 |
0.18 |
— |
— |
— |
15.18 |
1.20%b |
50,119 |
0.75%a |
0.65%a |
(0.53%)a |
Year ended September 30 |
|||||
2022 |
2021 |
2020 |
2019 |
Period ended |
|
Portfolio turnover rate |
27% |
21% |
27% |
12% |
9% |
|
a |
Annualized. |
|
b |
Percentage represents the results for the period and is not annualized. |
|
c |
Per share amount calculated on the average shares method. |
|
d |
Amount is less than $0.005 per share. |
|
g |
For the period February 16, 2018 (commencement of operations) through September 30, 2018. |
|
j |
Computed after giving effect to an agreement by MML Advisers to waive certain fees and expenses of the Fund. |
|
l |
Employee retirement benefit plans that invest plan assets in the Separate Investment Accounts (SIAs) may be subject to certain charges as set forth in their respective Plan Documents. Total return figures would be lower for the periods presented if they reflected these charges. |
|
m |
Total return excludes sales charges, if any, and would be lower for the period presented if it reflected these charges. |
|
w |
Expenses of the underlying funds are not included in the Fund’s expense ratio. The Fund indirectly bears its proportionate share of the expenses of any underlying fund. |
The accompanying notes are an integral part of the financial statements.
151
MassMutual Select T. Rowe Price Retirement 2040 Fund – Financial Statements (Continued) |
Financial Highlights (For a share outstanding throughout each period) |
Income (loss) from investment |
Less distributions to shareholders |
Ratios / Supplemental Data |
|||||||||||
Net |
Net |
Net |
Total |
From net |
From net |
Total |
Net |
Total |
Net |
Ratio of |
Ratio of |
Net |
|
Class I |
|||||||||||||
9/30/22 |
$ 20.77 |
$ 0.17 |
$ (4.26) |
$ (4.09) |
$ (0.83) |
$ (0.91) |
$ (1.74) |
$ 14.94 |
(21.66%) |
$ 542,666 |
0.59% |
0.41% |
0.95% |
9/30/21 |
16.73 |
0.12 |
4.41 |
4.53 |
(0.25) |
(0.24) |
(0.49) |
20.77 |
27.48% |
416,707 |
0.59% |
0.47% |
0.63% |
9/30/20 |
15.56 |
0.23 |
1.38 |
1.61 |
(0.31) |
(0.13) |
(0.44) |
16.73 |
10.45% |
300,976 |
0.14% |
0.09% |
1.49% |
9/30/19 |
15.24 |
0.16 |
0.40 |
0.56 |
(0.24) |
(0.00)d |
(0.24) |
15.56 |
3.97% |
223,242 |
0.04% |
0.02% |
1.05% |
9/30/18g |
15.00 |
0.01 |
0.23 |
0.24 |
— |
— |
— |
15.24 |
1.60%b |
99,534 |
0.05%a |
0.00%a |
0.08%a |
Class M5 |
|||||||||||||
9/30/22 |
$ 20.74 |
$ 0.32 |
$ (4.44) |
$ (4.12) |
$ (0.80) |
$ (0.91) |
$ (1.71) |
$ 14.91 |
(21.80%) |
$ 295,087 |
0.74% |
0.58% |
1.69% |
9/30/21 |
16.71 |
0.07 |
4.43 |
4.50 |
(0.23) |
(0.24) |
(0.47) |
20.74 |
27.28% |
602,095 |
0.74% |
0.64% |
0.36% |
9/30/20 |
15.54 |
0.23 |
1.36 |
1.59 |
(0.29) |
(0.13) |
(0.42) |
16.71 |
10.32% |
405,437 |
0.29% |
0.25% |
1.47% |
9/30/19 |
15.23 |
0.18 |
0.35 |
0.53 |
(0.22) |
(0.00)d |
(0.22) |
15.54 |
3.77% |
337,741 |
0.19% |
0.16% |
1.20% |
9/30/18g |
15.00 |
(0.01) |
0.24 |
0.23 |
— |
— |
— |
15.23 |
1.53%b |
316,521 |
0.20%a |
0.15%a |
(0.07%)a |
Class M4 |
|||||||||||||
9/30/22 |
$ 20.66 |
$ 0.18 |
$ (4.35) |
$ (4.17) |
$ (0.71) |
$ (0.91) |
$ (1.62) |
$ 14.87 |
(22.03%) |
$ 123,661 |
0.99% |
0.83% |
0.96% |
9/30/21 |
16.66 |
0.09 |
4.35 |
4.44 |
(0.20) |
(0.24) |
(0.44) |
20.66 |
26.97% |
249,137 |
0.99% |
0.89% |
0.48% |
9/30/20 |
15.50 |
0.19 |
1.35 |
1.54 |
(0.25) |
(0.13) |
(0.38) |
16.66 |
10.03% |
249,598 |
0.54% |
0.50% |
1.22% |
9/30/19 |
15.21 |
0.15 |
0.34 |
0.49 |
(0.20) |
(0.00)d |
(0.20) |
15.50 |
3.48% |
189,684 |
0.44% |
0.42% |
1.00% |
9/30/18g |
15.00 |
(0.03) |
0.24 |
0.21 |
— |
— |
— |
15.21 |
1.40%b |
132,361 |
0.45%a |
0.40%a |
(0.32%)a |
Class M3 |
|||||||||||||
9/30/22 |
$ 20.67 |
$ 0.14 |
$ (4.35) |
$ (4.21) |
$ (0.67) |
$ (0.91) |
$ (1.58) |
$ 14.88 |
(22.18%) |
$ 65,842 |
1.24% |
1.08% |
0.78% |
9/30/21 |
16.65 |
0.01 |
4.38 |
4.39 |
(0.13) |
(0.24) |
(0.37) |
20.67 |
26.62% |
90,972 |
1.24% |
1.15% |
0.04% |
9/30/20 |
15.49 |
0.15 |
1.35 |
1.50 |
(0.21) |
(0.13) |
(0.34) |
16.65 |
9.76% |
98,070 |
0.78% |
0.74% |
0.96% |
9/30/19 |
15.18 |
0.09 |
0.38 |
0.47 |
(0.16) |
(0.00)d |
(0.16) |
15.49 |
3.30% |
94,948 |
0.69% |
0.66% |
0.64% |
9/30/18g |
15.00 |
(0.05) |
0.23 |
0.18 |
— |
— |
— |
15.18 |
1.20%b |
86,806 |
0.70%a |
0.65%a |
(0.57%)a |
Year ended September 30 |
|||||
2022 |
2021 |
2020 |
2019 |
Period ended |
|
Portfolio turnover rate |
29% |
18% |
22% |
10% |
6% |
|
a |
Annualized. |
|
b |
Percentage represents the results for the period and is not annualized. |
|
c |
Per share amount calculated on the average shares method. |
|
d |
Amount is less than $0.005 per share. |
|
g |
For the period February 16, 2018 (commencement of operations) through September 30, 2018. |
|
j |
Computed after giving effect to an agreement by MML Advisers to waive certain fees and expenses of the Fund. |
|
l |
Employee retirement benefit plans that invest plan assets in the Separate Investment Accounts (SIAs) may be subject to certain charges as set forth in their respective Plan Documents. Total return figures would be lower for the periods presented if they reflected these charges. |
|
m |
Total return excludes sales charges, if any, and would be lower for the period presented if it reflected these charges. |
|
w |
Expenses of the underlying funds are not included in the Fund’s expense ratio. The Fund indirectly bears its proportionate share of the expenses of any underlying fund. |
The accompanying notes are an integral part of the financial statements.
152
MassMutual Select T. Rowe Price Retirement 2045 Fund – Financial Statements (Continued) |
Financial Highlights (For a share outstanding throughout each period) |
Income (loss) from investment |
Less distributions to shareholders |
Ratios / Supplemental Data |
|||||||||||
Net |
Net |
Net |
Total |
From net |
From net |
Total |
Net |
Total |
Net |
Ratio of |
Ratio of |
Net |
|
Class I |
|||||||||||||
9/30/22 |
$ 21.07 |
$ 0.16 |
$ (4.37) |
$ (4.21) |
$ (0.85) |
$ (0.90) |
$ (1.75) |
$ 15.11 |
(21.99%) |
$ 333,390 |
0.61% |
0.42% |
0.88% |
9/30/21 |
16.76 |
0.10 |
4.69 |
4.79 |
(0.24) |
(0.24) |
(0.48) |
21.07 |
28.97% |
247,138 |
0.61% |
0.47% |
0.50% |
9/30/20 |
15.54 |
0.22 |
1.41 |
1.63 |
(0.29) |
(0.12) |
(0.41) |
16.76 |
10.60% |
154,476 |
0.18% |
0.10% |
1.39% |
9/30/19 |
15.25 |
0.14 |
0.38 |
0.52 |
(0.23) |
(0.00)d |
(0.23) |
15.54 |
3.71% |
111,981 |
0.08% |
0.01% |
0.91% |
9/30/18g |
15.00 |
0.01 |
0.24 |
0.25 |
— |
— |
— |
15.25 |
1.67%b |
41,249 |
0.12%a |
0.00%a |
0.06%a |
Class M5 |
|||||||||||||
9/30/22 |
$ 21.02 |
$ 0.36 |
$ (4.59) |
$ (4.23) |
$ (0.82) |
$ (0.90) |
$ (1.72) |
$ 15.07 |
(22.11%) |
$ 65,768 |
0.76% |
0.60% |
1.88% |
9/30/21 |
16.74 |
0.07 |
4.66 |
4.73 |
(0.21) |
(0.24) |
(0.45) |
21.02 |
28.65% |
198,343 |
0.76% |
0.67% |
0.37% |
9/30/20 |
15.53 |
0.22 |
1.38 |
1.60 |
(0.27) |
(0.12) |
(0.39) |
16.74 |
10.40% |
141,319 |
0.31% |
0.25% |
1.40% |
9/30/19 |
15.23 |
0.16 |
0.35 |
0.51 |
(0.21) |
(0.00)d |
(0.21) |
15.53 |
3.64% |
119,760 |
0.23% |
0.15% |
1.08% |
9/30/18g |
15.00 |
(0.01) |
0.24 |
0.23 |
— |
— |
— |
15.23 |
1.53%b |
106,428 |
0.27%a |
0.15%a |
(0.09%)a |
Class M4 |
|||||||||||||
9/30/22 |
$ 20.96 |
$ 0.15 |
$ (4.42) |
$ (4.27) |
$ (0.78) |
$ (0.90) |
$ (1.68) |
$ 15.01 |
(22.35%) |
$ 48,715 |
1.01% |
0.85% |
0.82% |
9/30/21 |
16.70 |
0.03 |
4.65 |
4.68 |
(0.18) |
(0.24) |
(0.42) |
20.96 |
28.38% |
90,570 |
1.01% |
0.92% |
0.16% |
9/30/20 |
15.50 |
0.18 |
1.38 |
1.56 |
(0.24) |
(0.12) |
(0.36) |
16.70 |
10.12% |
60,056 |
0.56% |
0.50% |
1.15% |
9/30/19 |
15.21 |
0.12 |
0.35 |
0.47 |
(0.18) |
(0.00)d |
(0.18) |
15.50 |
3.35% |
53,040 |
0.48% |
0.40% |
0.78% |
9/30/18g |
15.00 |
(0.03) |
0.24 |
0.21 |
— |
— |
— |
15.21 |
1.40%b |
39,913 |
0.52%a |
0.40%a |
(0.34%)a |
Class M3 |
|||||||||||||
9/30/22 |
$ 20.95 |
$ 0.11 |
$ (4.44) |
$ (4.33) |
$ (0.67) |
$ (0.90) |
$ (1.57) |
$ 15.05 |
(22.50%) |
$ 27,562 |
1.26% |
1.10% |
0.57% |
9/30/21 |
16.67 |
0.01 |
4.61 |
4.62 |
(0.10) |
(0.24) |
(0.34) |
20.95 |
28.02% |
35,140 |
1.26% |
1.17% |
0.03% |
9/30/20 |
15.47 |
0.14 |
1.38 |
1.52 |
(0.20) |
(0.12) |
(0.32) |
16.67 |
9.86% |
46,619 |
0.81% |
0.74% |
0.92% |
9/30/19 |
15.19 |
0.08 |
0.36 |
0.44 |
(0.16) |
(0.00)d |
(0.16) |
15.47 |
3.08% |
44,515 |
0.73% |
0.65% |
0.55% |
9/30/18g |
15.00 |
(0.05) |
0.24 |
0.19 |
— |
— |
— |
15.19 |
1.27%b |
35,501 |
0.77%a |
0.65%a |
(0.59%)a |
Year ended September 30 |
|||||
2022 |
2021 |
2020 |
2019 |
Period ended |
|
Portfolio turnover rate |
23% |
18% |
22% |
10% |
8% |
|
a |
Annualized. |
|
b |
Percentage represents the results for the period and is not annualized. |
|
c |
Per share amount calculated on the average shares method. |
|
d |
Amount is less than $0.005 per share. |
|
g |
For the period February 16, 2018 (commencement of operations) through September 30, 2018. |
|
j |
Computed after giving effect to an agreement by MML Advisers to waive certain fees and expenses of the Fund. |
|
l |
Employee retirement benefit plans that invest plan assets in the Separate Investment Accounts (SIAs) may be subject to certain charges as set forth in their respective Plan Documents. Total return figures would be lower for the periods presented if they reflected these charges. |
|
m |
Total return excludes sales charges, if any, and would be lower for the period presented if it reflected these charges. |
|
w |
Expenses of the underlying funds are not included in the Fund’s expense ratio. The Fund indirectly bears its proportionate share of the expenses of any underlying fund. |
The accompanying notes are an integral part of the financial statements.
153
MassMutual Select T. Rowe Price Retirement 2050 Fund – Financial Statements (Continued) |
Financial Highlights (For a share outstanding throughout each period) |
Income (loss) from investment |
Less distributions to shareholders |
Ratios / Supplemental Data |
|||||||||||
Net |
Net |
Net |
Total |
From net |
From net |
Total |
Net |
Total |
Net |
Ratio of |
Ratio of |
Net |
|
Class I |
|||||||||||||
9/30/22 |
$ 21.08 |
$ 0.16 |
$ (4.46) |
$ (4.30) |
$ (0.86) |
$ (0.72) |
$ (1.58) |
$ 15.20 |
(22.18%) |
$ 364,457 |
0.61% |
0.43% |
0.86% |
9/30/21 |
16.78 |
0.10 |
4.70 |
4.80 |
(0.24) |
(0.26) |
(0.50) |
21.08 |
29.03% |
258,313 |
0.61% |
0.48% |
0.49% |
9/30/20 |
15.55 |
0.22 |
1.41 |
1.63 |
(0.29) |
(0.11) |
(0.40) |
16.78 |
10.57% |
161,863 |
0.16% |
0.10% |
1.39% |
9/30/19 |
15.25 |
0.13 |
0.40 |
0.53 |
(0.23) |
(0.00)d |
(0.23) |
15.55 |
3.75% |
121,897 |
0.06% |
0.01% |
0.90% |
9/30/18g |
15.00 |
0.00d |
0.25 |
0.25 |
— |
— |
— |
15.25 |
1.67%b |
46,555 |
0.08%a |
0.00%a |
0.06%a |
Class M5 |
|||||||||||||
9/30/22 |
$ 21.04 |
$ 0.28 |
$ (4.60) |
$ (4.32) |
$ (0.83) |
$ (0.72) |
$ (1.55) |
$ 15.17 |
(22.30%) |
$ 221,155 |
0.76% |
0.61% |
1.46% |
9/30/21 |
16.76 |
0.05 |
4.71 |
4.76 |
(0.22) |
(0.26) |
(0.48) |
21.04 |
28.76% |
415,859 |
0.76% |
0.67% |
0.27% |
9/30/20 |
15.53 |
0.21 |
1.40 |
1.61 |
(0.27) |
(0.11) |
(0.38) |
16.76 |
10.44% |
280,003 |
0.30% |
0.25% |
1.34% |
9/30/19 |
15.23 |
0.16 |
0.35 |
0.51 |
(0.21) |
(0.00)d |
(0.21) |
15.53 |
3.62% |
223,250 |
0.21% |
0.15% |
1.11% |
9/30/18g |
15.00 |
(0.01) |
0.24 |
0.23 |
— |
— |
— |
15.23 |
1.53%b |
199,760 |
0.23%a |
0.15%a |
(0.09%)a |
Class M4 |
|||||||||||||
9/30/22 |
$ 20.96 |
$ 0.16 |
$ (4.52) |
$ (4.36) |
$ (0.76) |
$ (0.72) |
$ (1.48) |
$ 15.12 |
(22.51%) |
$ 70,887 |
1.01% |
0.86% |
0.87% |
9/30/21 |
16.71 |
0.06 |
4.64 |
4.70 |
(0.19) |
(0.26) |
(0.45) |
20.96 |
28.47% |
160,626 |
1.01% |
0.92% |
0.32% |
9/30/20 |
15.49 |
0.17 |
1.39 |
1.56 |
(0.23) |
(0.11) |
(0.34) |
16.71 |
10.16% |
147,994 |
0.55% |
0.50% |
1.09% |
9/30/19 |
15.21 |
0.14 |
0.33 |
0.47 |
(0.19) |
(0.00)d |
(0.19) |
15.49 |
3.33% |
106,909 |
0.46% |
0.41% |
0.93% |
9/30/18g |
15.00 |
(0.03) |
0.24 |
0.21 |
— |
— |
— |
15.21 |
1.40%b |
76,013 |
0.48%a |
0.40%a |
(0.34%)a |
Class M3 |
|||||||||||||
9/30/22 |
$ 20.95 |
$ 0.13 |
$ (4.52) |
$ (4.39) |
$ (0.72) |
$ (0.72) |
$ (1.44) |
$ 15.12 |
(22.64%) |
$ 44,600 |
1.26% |
1.11% |
0.67% |
9/30/21 |
16.69 |
(0.01) |
4.65 |
4.64 |
(0.12) |
(0.26) |
(0.38) |
20.95 |
28.09% |
60,911 |
1.26% |
1.17% |
(0.07%) |
9/30/20 |
15.47 |
0.13 |
1.39 |
1.52 |
(0.19) |
(0.11) |
(0.30) |
16.69 |
9.91% |
57,934 |
0.80% |
0.74% |
0.84% |
9/30/19 |
15.19 |
0.08 |
0.35 |
0.43 |
(0.15) |
(0.00)d |
(0.15) |
15.47 |
3.03% |
53,218 |
0.71% |
0.65% |
0.54% |
9/30/18g |
15.00 |
(0.05) |
0.24 |
0.19 |
— |
— |
— |
15.19 |
1.27%b |
44,079 |
0.73%a |
0.65%a |
(0.59%)a |
Year ended September 30 |
|||||
2022 |
2021 |
2020 |
2019 |
Period ended |
|
Portfolio turnover rate |
27% |
15% |
22% |
10% |
5% |
|
a |
Annualized. |
|
b |
Percentage represents the results for the period and is not annualized. |
|
c |
Per share amount calculated on the average shares method. |
|
d |
Amount is less than $0.005 per share. |
|
g |
For the period February 16, 2018 (commencement of operations) through September 30, 2018. |
|
j |
Computed after giving effect to an agreement by MML Advisers to waive certain fees and expenses of the Fund. |
|
l |
Employee retirement benefit plans that invest plan assets in the Separate Investment Accounts (SIAs) may be subject to certain charges as set forth in their respective Plan Documents. Total return figures would be lower for the periods presented if they reflected these charges. |
|
m |
Total return excludes sales charges, if any, and would be lower for the period presented if it reflected these charges. |
|
w |
Expenses of the underlying funds are not included in the Fund’s expense ratio. The Fund indirectly bears its proportionate share of the expenses of any underlying fund. |
The accompanying notes are an integral part of the financial statements.
154
MassMutual Select T. Rowe Price Retirement 2055 Fund – Financial Statements (Continued) |
Financial Highlights (For a share outstanding throughout each period) |
Income (loss) from investment |
Less distributions to shareholders |
Ratios / Supplemental Data |
|||||||||||
Net |
Net |
Net |
Total |
From net |
From net |
Total |
Net |
Total |
Net |
Ratio of |
Ratio of |
Net |
|
Class I |
|||||||||||||
9/30/22 |
$ 21.03 |
$ 0.11 |
$ (4.39) |
$ (4.28) |
$ (0.85) |
$ (0.77) |
$ (1.62) |
$ 15.13 |
(22.22%) |
$ 215,507 |
0.61% |
0.44% |
0.60% |
9/30/21 |
16.75 |
0.10 |
4.70 |
4.80 |
(0.24) |
(0.28) |
(0.52) |
21.03 |
29.06% |
112,730 |
0.61% |
0.48% |
0.48% |
9/30/20 |
15.54 |
0.21 |
1.41 |
1.62 |
(0.29) |
(0.12) |
(0.41) |
16.75 |
10.55% |
67,777 |
0.22% |
0.10% |
1.32% |
9/30/19 |
15.25 |
0.13 |
0.39 |
0.52 |
(0.23) |
(0.00)d |
(0.23) |
15.54 |
3.70% |
46,245 |
0.15% |
0.01% |
0.85% |
9/30/18g |
15.00 |
0.00d |
0.25 |
0.25 |
— |
— |
— |
15.25 |
1.67%b |
16,170 |
0.24%a |
0.00%a |
0.06%a |
Class M5 |
|||||||||||||
9/30/22 |
$ 20.98 |
$ 0.43 |
$ (4.72) |
$ (4.29) |
$ (0.83) |
$ (0.77) |
$ (1.60) |
$ 15.09 |
(22.33%) |
$ 32,887 |
0.76% |
0.62% |
2.19% |
9/30/21 |
16.73 |
0.07 |
4.67 |
4.74 |
(0.21) |
(0.28) |
(0.49) |
20.98 |
28.76% |
140,685 |
0.76% |
0.67% |
0.34% |
9/30/20 |
15.52 |
0.21 |
1.39 |
1.60 |
(0.27) |
(0.12) |
(0.39) |
16.73 |
10.43% |
94,767 |
0.36% |
0.24% |
1.34% |
9/30/19 |
15.23 |
0.16 |
0.34 |
0.50 |
(0.21) |
(0.00)d |
(0.21) |
15.52 |
3.57% |
75,163 |
0.30% |
0.15% |
1.06% |
9/30/18g |
15.00 |
(0.01) |
0.24 |
0.23 |
— |
— |
— |
15.23 |
1.53%b |
59,887 |
0.39%a |
0.15%a |
(0.09%)a |
Class M4 |
|||||||||||||
9/30/22 |
$ 20.92 |
$ 0.14 |
$ (4.47) |
$ (4.33) |
$ (0.78) |
$ (0.77) |
$ (1.55) |
$ 15.04 |
(22.52%) |
$ 27,142 |
1.01% |
0.87% |
0.77% |
9/30/21 |
16.69 |
0.02 |
4.67 |
4.69 |
(0.18) |
(0.28) |
(0.46) |
20.92 |
28.46% |
49,056 |
1.01% |
0.92% |
0.11% |
9/30/20 |
15.50 |
0.17 |
1.38 |
1.55 |
(0.24) |
(0.12) |
(0.36) |
16.69 |
10.07% |
32,270 |
0.61% |
0.50% |
1.07% |
9/30/19 |
15.21 |
0.11 |
0.36 |
0.47 |
(0.18) |
(0.00)d |
(0.18) |
15.50 |
3.34% |
25,459 |
0.55% |
0.40% |
0.71% |
9/30/18g |
15.00 |
(0.03) |
0.24 |
0.21 |
— |
— |
— |
15.21 |
1.40%b |
18,047 |
0.64%a |
0.40%a |
(0.34%)a |
Class M3 |
|||||||||||||
9/30/22 |
$ 20.87 |
$ 0.09 |
$ (4.47) |
$ (4.38) |
$ (0.69) |
$ (0.77) |
$ (1.46) |
$ 15.03 |
(22.72%) |
$ 19,264 |
1.26% |
1.12% |
0.49% |
9/30/21 |
16.64 |
(0.01) |
4.64 |
4.63 |
(0.12) |
(0.28) |
(0.40) |
20.87 |
28.16% |
21,424 |
1.26% |
1.18% |
(0.03%) |
9/30/20 |
15.46 |
0.13 |
1.37 |
1.50 |
(0.20) |
(0.12) |
(0.32) |
16.64 |
9.79% |
22,526 |
0.86% |
0.74% |
0.86% |
9/30/19 |
15.19 |
0.08 |
0.35 |
0.43 |
(0.16) |
(0.00)d |
(0.16) |
15.46 |
3.05% |
19,819 |
0.80% |
0.65% |
0.51% |
9/30/18g |
15.00 |
(0.05) |
0.24 |
0.19 |
— |
— |
— |
15.19 |
1.27%b |
13,616 |
0.89%a |
0.65%a |
(0.59%)a |
Year ended September 30 |
|||||
2022 |
2021 |
2020 |
2019 |
Period ended |
|
Portfolio turnover rate |
22% |
17% |
24% |
9% |
9% |
|
a |
Annualized. |
|
b |
Percentage represents the results for the period and is not annualized. |
|
c |
Per share amount calculated on the average shares method. |
|
d |
Amount is less than $0.005 per share. |
|
g |
For the period February 16, 2018 (commencement of operations) through September 30, 2018. |
|
j |
Computed after giving effect to an agreement by MML Advisers to waive certain fees and expenses of the Fund. |
|
l |
Employee retirement benefit plans that invest plan assets in the Separate Investment Accounts (SIAs) may be subject to certain charges as set forth in their respective Plan Documents. Total return figures would be lower for the periods presented if they reflected these charges. |
|
m |
Total return excludes sales charges, if any, and would be lower for the period presented if it reflected these charges. |
|
w |
Expenses of the underlying funds are not included in the Fund’s expense ratio. The Fund indirectly bears its proportionate share of the expenses of any underlying fund. |
The accompanying notes are an integral part of the financial statements.
155
MassMutual Select T. Rowe Price Retirement 2060 Fund – Financial Statements (Continued) |
Financial Highlights (For a share outstanding throughout each period) |
Income (loss) from investment |
Less distributions to shareholders |
Ratios / Supplemental Data |
|||||||||||
Net |
Net |
Net |
Total |
From net |
From net |
Total |
Net |
Total |
Net |
Ratio of |
Ratio of |
Net |
|
Class I |
|||||||||||||
9/30/22 |
$ 21.00 |
$ 0.19 |
$ (4.45) |
$ (4.26) |
$ (0.85) |
$ (0.80) |
$ (1.65) |
$ 15.09 |
(22.19%) |
$ 70,208 |
0.61% |
0.44% |
1.05% |
9/30/21 |
16.73 |
0.08 |
4.71 |
4.79 |
(0.24) |
(0.28) |
(0.52) |
21.00 |
29.03% |
55,382 |
0.61% |
0.48% |
0.41% |
9/30/20 |
15.51 |
0.17 |
1.46 |
1.63 |
(0.29) |
(0.12) |
(0.41) |
16.73 |
10.58% |
27,484 |
0.49% |
0.12% |
1.10% |
9/30/19 |
15.25 |
0.12 |
0.39 |
0.51 |
(0.23) |
(0.02) |
(0.25) |
15.51 |
3.67% |
14,159 |
0.85% |
0.01% |
0.79% |
9/30/18g |
15.00 |
0.00d |
0.25 |
0.25 |
— |
— |
— |
15.25 |
1.67%b |
3,616 |
2.35%a |
0.00%a |
0.06%a |
Class M5 |
|||||||||||||
9/30/22 |
$ 20.95 |
$ 0.17 |
$ (4.46) |
$ (4.29) |
$ (0.82) |
$ (0.80) |
$ (1.62) |
$ 15.04 |
(22.34%) |
$ 36,564 |
0.76% |
0.62% |
0.94% |
9/30/21 |
16.70 |
0.03 |
4.72 |
4.75 |
(0.22) |
(0.28) |
(0.50) |
20.95 |
28.82% |
33,062 |
0.76% |
0.67% |
0.13% |
9/30/20 |
15.49 |
0.17 |
1.43 |
1.60 |
(0.27) |
(0.12) |
(0.39) |
16.70 |
10.41% |
15,067 |
0.64% |
0.27% |
1.07% |
9/30/19 |
15.24 |
0.12 |
0.36 |
0.48 |
(0.21) |
(0.02) |
(0.23) |
15.49 |
3.50% |
7,791 |
1.00% |
0.15% |
0.78% |
9/30/18g |
15.00 |
(0.01) |
0.25 |
0.24 |
— |
— |
— |
15.24 |
1.60%b |
3,032 |
2.50%a |
0.15%a |
(0.09%)a |
Class M4 |
|||||||||||||
9/30/22 |
$ 20.87 |
$ 0.13 |
$ (4.45) |
$ (4.32) |
$ (0.78) |
$ (0.80) |
$ (1.58) |
$ 14.97 |
(22.54%) |
$ 17,032 |
1.01% |
0.87% |
0.69% |
9/30/21 |
16.65 |
0.04 |
4.64 |
4.68 |
(0.18) |
(0.28) |
(0.46) |
20.87 |
28.44% |
19,688 |
1.01% |
0.92% |
0.19% |
9/30/20 |
15.46 |
0.15 |
1.40 |
1.55 |
(0.24) |
(0.12) |
(0.36) |
16.65 |
10.10% |
14,447 |
0.88% |
0.52% |
0.96% |
9/30/19 |
15.21 |
0.10 |
0.36 |
0.46 |
(0.19) |
(0.02) |
(0.21) |
15.46 |
3.34% |
8,489 |
1.25% |
0.40% |
0.68% |
9/30/18g |
15.00 |
(0.02) |
0.23 |
0.21 |
— |
— |
— |
15.21 |
1.40%b |
3,919 |
2.75%a |
0.40%a |
(0.34%)a |
Class M3 |
|||||||||||||
9/30/22 |
$ 20.80 |
$ 0.08 |
$ (4.45) |
$ (4.37) |
$ (0.68) |
$ (0.80) |
$ (1.48) |
$ 14.95 |
(22.76%) |
$ 6,619 |
1.26% |
1.12% |
0.44% |
9/30/21 |
16.61 |
0.00d |
4.62 |
4.62 |
(0.15) |
(0.28) |
(0.43) |
20.80 |
28.14% |
6,320 |
1.26% |
1.18% |
0.03% |
9/30/20 |
15.42 |
0.09 |
1.42 |
1.51 |
(0.20) |
(0.12) |
(0.32) |
16.61 |
9.87% |
5,798 |
1.13% |
0.77% |
0.61% |
9/30/19 |
15.19 |
0.07 |
0.35 |
0.42 |
(0.17) |
(0.02) |
(0.19) |
15.42 |
3.03% |
3,420 |
1.50% |
0.65% |
0.49% |
9/30/18g |
15.00 |
(0.04) |
0.23 |
0.19 |
— |
— |
— |
15.19 |
1.27%b |
2,126 |
3.00%a |
0.65%a |
(0.59%)a |
Year ended September 30 |
|||||
2022 |
2021 |
2020 |
2019 |
Period ended |
|
Portfolio turnover rate |
23% |
19% |
31% |
16% |
36% |
|
a |
Annualized. |
|
b |
Percentage represents the results for the period and is not annualized. |
|
c |
Per share amount calculated on the average shares method. |
|
d |
Amount is less than $0.005 per share. |
|
g |
For the period February 16, 2018 (commencement of operations) through September 30, 2018. |
|
j |
Computed after giving effect to an agreement by MML Advisers to waive certain fees and expenses of the Fund. |
|
l |
Employee retirement benefit plans that invest plan assets in the Separate Investment Accounts (SIAs) may be subject to certain charges as set forth in their respective Plan Documents. Total return figures would be lower for the periods presented if they reflected these charges. |
|
m |
Total return excludes sales charges, if any, and would be lower for the period presented if it reflected these charges. |
|
w |
Expenses of the underlying funds are not included in the Fund’s expense ratio. The Fund indirectly bears its proportionate share of the expenses of any underlying fund. |
The accompanying notes are an integral part of the financial statements.
156
1. The Funds
MassMutual Select Funds (the “Trust”) is registered under the Investment Company Act of 1940, as amended (the “1940 Act”), as an open-end management investment company. The Trust is organized under the laws of the Commonwealth of Massachusetts as a Massachusetts business trust pursuant to an Agreement and Declaration of Trust dated May 28, 1993, as amended and restated as of November 21, 2011, as it may be further amended from time to time. The Trust consists of 51 series, including the following 27 series listed below (each individually referred to as a “Fund” or collectively as the “Funds”):
MassMutual 20/80 Allocation Fund (“20/80 Allocation Fund”)
MassMutual 40/60 Allocation Fund (“40/60 Allocation Fund”)
MassMutual 60/40 Allocation Fund (“60/40 Allocation Fund”)
MassMutual 80/20 Allocation Fund (“80/20 Allocation Fund”)
MassMutual RetireSMARTSM by JPMorgan In Retirement Fund (“MM RetireSMART by JPMorgan In Retirement Fund”)
MassMutual RetireSMARTSM by JPMorgan 2020 Fund (“MM RetireSMART by JPMorgan 2020 Fund”)
MassMutual RetireSMARTSM by JPMorgan 2025 Fund (“MM RetireSMART by JPMorgan 2025 Fund”)
MassMutual RetireSMARTSM by JPMorgan 2030 Fund (“MM RetireSMART by JPMorgan 2030 Fund”)
MassMutual RetireSMARTSM by JPMorgan 2035 Fund (“MM RetireSMART by JPMorgan 2035 Fund”)
MassMutual RetireSMARTSM by JPMorgan 2040 Fund (“MM RetireSMART by JPMorgan 2040 Fund”)
MassMutual RetireSMARTSM by JPMorgan 2045 Fund (“MM RetireSMART by JPMorgan 2045 Fund”)
MassMutual RetireSMARTSM by JPMorgan 2050 Fund (“MM RetireSMART by JPMorgan 2050 Fund”)
MassMutual RetireSMARTSM by JPMorgan 2055 Fund (“MM RetireSMART by JPMorgan 2055 Fund”)
MassMutual RetireSMARTSM by JPMorgan 2060 Fund (“MM RetireSMART by JPMorgan 2060 Fund”)
MassMutual Select T. Rowe Price Retirement Balanced Fund (“MM Select T. Rowe Price Retirement Balanced Fund”)
MassMutual Select T. Rowe Price Retirement 2005 Fund (“MM Select T. Rowe Price Retirement 2005 Fund”)
MassMutual Select T. Rowe Price Retirement 2010 Fund (“MM Select T. Rowe Price Retirement 2010 Fund”)
MassMutual Select T. Rowe Price Retirement 2015 Fund (“MM Select T. Rowe Price Retirement 2015 Fund”)
MassMutual Select T. Rowe Price Retirement 2020 Fund (“MM Select T. Rowe Price Retirement 2020 Fund”)
MassMutual Select T. Rowe Price Retirement 2025 Fund (“MM Select T. Rowe Price Retirement 2025 Fund”)
MassMutual Select T. Rowe Price Retirement 2030 Fund (“MM Select T. Rowe Price Retirement 2030 Fund”)
MassMutual Select T. Rowe Price Retirement 2035 Fund (“MM Select T. Rowe Price Retirement 2035 Fund”)
MassMutual Select T. Rowe Price Retirement 2040 Fund (“MM Select T. Rowe Price Retirement 2040 Fund”)
MassMutual Select T. Rowe Price Retirement 2045 Fund (“MM Select T. Rowe Price Retirement 2045 Fund”)
MassMutual Select T. Rowe Price Retirement 2050 Fund (“MM Select T. Rowe Price Retirement 2050 Fund”)
MassMutual Select T. Rowe Price Retirement 2055 Fund (“MM Select T. Rowe Price Retirement 2055 Fund”)
MassMutual Select T. Rowe Price Retirement 2060 Fund (“MM Select T. Rowe Price Retirement 2060 Fund”)
Each share class of a Fund represents an interest in the same portfolio of assets. The principal difference among the classes is the level of service and administration fees, and shareholder and distribution service expenses borne by the classes. Because each class will have different fees and expenses, performance and share prices will vary between the classes. The classes of shares are offered to different types of investors, as outlined in the Funds’ Prospectuses.
The 20/80 Allocation Fund, 40/60 Allocation Fund, 60/40 Allocation Fund, and 80/20 Allocation Fund (the “MM Target Allocation Funds”) invest their investable assets in shares of MassMutual Funds advised by MML Investment Advisers, LLC (“MML Advisers”) and non-affiliated mutual funds (together, the “MM Target Allocation Underlying Funds”).
The MM RetireSMART by JPMorgan In Retirement Fund, MM RetireSMART by JPMorgan 2020 Fund, MM RetireSMART by JPMorgan 2025 Fund, MM RetireSMART by JPMorgan 2030 Fund, MM RetireSMART by JPMorgan 2035 Fund, MM RetireSMART by JPMorgan 2040 Fund, MM RetireSMART by JPMorgan 2045 Fund, MM RetireSMART by JPMorgan 2050 Fund, MM RetireSMART by JPMorgan 2055 Fund, and MM RetireSMART by JPMorgan 2060 Fund (the “MM RetireSMART by JPMorgan Funds”) invest their investable assets in shares of MassMutual Funds, J.P. Morgan Funds advised by J.P. Morgan Investment Management Inc. (“J.P. Morgan”) or its affiliates, and non-affiliated mutual funds (together, the “MM RetireSMART by JPMorgan Underlying Funds”).
157
Notes to Financial Statements (Continued) |
The MM Select T. Rowe Price Retirement Balanced Fund, MM Select T. Rowe Price Retirement 2005 Fund, MM Select T. Rowe Price Retirement 2010 Fund, MM Select T. Rowe Price Retirement 2015 Fund, MM Select T. Rowe Price Retirement 2020 Fund, MM Select T. Rowe Price Retirement 2025 Fund, MM Select T. Rowe Price Retirement 2030 Fund, MM Select T. Rowe Price Retirement 2035 Fund, MM Select T. Rowe Price Retirement 2040 Fund, MM Select T. Rowe Price Retirement 2045 Fund, MM Select T. Rowe Price Retirement 2050 Fund, MM Select T. Rowe Price Retirement 2055 Fund, and MM Select T. Rowe Price Retirement 2060 Fund (the “MM Select T. Rowe Price Retirement Funds”) invest their investable assets primarily in shares of MassMutual Funds and T. Rowe Price Funds (together, the “MM Select T. Rowe Price Underlying Funds”). The MM Target Allocation Underlying Funds, MM RetireSMART by JPMorgan Underlying Funds, and MM Select T. Rowe Price Underlying Funds are hereinafter collectively referred to as the “Underlying Funds.”
The financial statements included herein are those of the MM Target Allocation Funds, MM RetireSMART by JPMorgan Funds, and MM Select T. Rowe Price Retirement Funds. The financial statements of the applicable Underlying Funds are presented separately and can be obtained from the Securities and Exchange Commission’s (“SEC”) EDGAR database on its website at http://www.sec.gov or by calling MML Advisers at 1-888-309-3539.
2. Significant Accounting Policies
The following is a summary of significant accounting policies followed consistently by each Fund in the preparation of the financial statements in conformity with accounting principles generally accepted in the United States of America (“generally accepted accounting principles”). The preparation of the financial statements in accordance with generally accepted accounting principles requires management to make estimates and assumptions that affect the reported amounts and disclosures in the financial statements. Actual results could differ from those estimates.
Each Fund is an investment company and accordingly follows the investment company accounting and reporting guidance of the Financial Accounting Standards Board Accounting Standards Codification Topic 946, Financial Services – Investment Companies.
Investment Valuation
The net asset value of each Fund’s shares is determined once daily as of the close of regular trading on the New York Stock Exchange (“NYSE”), on each day the NYSE is open for trading (a “business day”). The NYSE normally closes at 4:00 p.m. Eastern Time, but may close earlier on some days. If the NYSE is scheduled to close early, the business day will be considered to end as of the time of the NYSE’s scheduled close. A Fund will not treat an intraday disruption in NYSE trading or other event that causes an unscheduled closing of the NYSE as a close of business of the NYSE for these purposes; instead, MML Advisers will determine the fair value of a Fund’s securities in accordance with MML Advisers’ fair valuation policy and procedures. On holidays and other days when the NYSE is closed, each Fund’s net asset value generally is not calculated and the Funds do not anticipate accepting buy or sell orders. However, the value of each Fund’s assets may still be affected on such days to the extent that an Underlying Fund holds foreign securities that trade on days that foreign securities markets are open.
The net asset value of each Fund is based upon the net asset value(s) of its corresponding Underlying Funds. Shares of the Underlying Funds are valued at their closing net asset values as reported on each business day.
Certain Underlying Funds may invest in securities that are traded principally in foreign markets and that trade on weekends and other days when the Funds do not price their shares. As a result, the values of the Funds’ portfolio securities may change on days when the prices of the Funds’ shares are not calculated. The prices of the Funds’ shares will reflect any such changes when the prices of the Funds’ shares are next calculated, which is the next business day.
The Prospectuses and Statements of Additional Information (“SAIs”) for the Underlying Funds explain the valuation methods for the Underlying Funds, including the circumstances under which the Underlying Funds may use fair value pricing and the effects of doing so. Such Prospectuses and SAIs are available on the SEC’s EDGAR database on its website at http://www.sec.gov.
158
Notes to Financial Statements (Continued) |
Various inputs may be used to determine the value of the Funds’ investments. The Funds categorize the inputs to valuation techniques used to value their investments into a disclosure hierarchy consisting of three levels as summarized below. The inputs or methodology used for valuing investments are not necessarily an indication of the risk associated with investing in those investments.
Level 1 – quoted prices (unadjusted) in active markets for identical investments that the Funds can access at the measurement date
Level 2 – other significant observable inputs (including quoted prices for similar investments, interest rates, prepayment speeds, credit risk, etc.)
Level 3 – significant unobservable inputs, to the extent observable inputs are not available (including the Funds’ own assumptions in determining the fair value of investments)
Each Fund characterized all investments at Level 1, as of September 30, 2022. For each Fund, the level classification by major category of investments is the same as the category presentation in the Portfolio of Investments.
The Funds had no Level 3 transfers during the year ended September 30, 2022.
Accounting for Investment Transactions
Investment transactions are accounted for on the trade date. Realized gains and losses on sales of investments and unrealized appreciation and depreciation of investments are computed by the specific identification cost method. Proceeds received from litigation, if any, are included in realized gains on investment transactions for any investments that are no longer held in the portfolio and as a reduction in cost for investments that continue to be held in the portfolio. Interest income, adjusted for amortization of discounts and premiums on debt securities, is earned from the settlement date and is recorded on the accrual basis. Dividend income and distributions including realized gain distributions are recorded on the ex-dividend date. Withholding taxes on foreign interest, dividends, and capital gains have been provided for in accordance with the applicable country’s tax rules and rates. Foreign dividend income is recorded on the ex-dividend date or as soon as practicable after the Fund determines the existence of a dividend declaration after exercising reasonable due diligence. Distributions received on securities that represent a return of capital or capital gains are recorded as a reduction of cost of investments and/or as a realized gain.
Allocation of Operating Activity
In maintaining the records for the Funds, the income and expense accounts are allocated daily to each class of shares. Investment income and loss, and unrealized and realized gains or losses are prorated among the classes of shares based on the relative net assets of each. Expenses are allocated to each class of shares depending on the nature of the expenditures. Administration and service fees, if any, which are directly attributable to a class of shares, are charged to that class’s operations. Expenses of a Fund not directly attributable to the operations of any specific class of shares of the Fund are prorated among the classes to which the expense relates based on relative net assets or another alternative method.
In addition, each Fund will also incur certain fees and expenses indirectly as a shareholder in the Underlying Funds. Because the Underlying Funds have varied expense and fee levels and each Fund may own different proportions of Underlying Funds at different times, the amount of fees and expenses indirectly incurred by each Fund will vary.
Foreign Securities
Certain Underlying Funds may invest in foreign securities. Foreign securities, including American Depositary Receipts, are subject to additional risks compared to securities of U.S. issuers, including international trade, currency, political, regulatory, public health, and diplomatic risks. In addition, fluctuations in currency exchange rates may favorably or unfavorably affect the values of foreign securities and the price of a Fund’s shares. Emerging markets securities are subject to greater risks than securities issued in developed foreign markets, including less liquidity, less stringent investor protection and disclosure standards,
159
Notes to Financial Statements (Continued) |
less reliable settlement practices, greater price volatility, higher relative rates of inflation, greater political, economic, and social instability, greater custody and operational risks, greater risk of new or inconsistent government treatment of or restrictions on issuers and instruments, and greater volatility in currency exchange rates, and are more susceptible to environmental problems.
Federal Income Tax
It is each Fund’s intent to continue to comply with the provisions of Subchapter M of the Internal Revenue Code of 1986, as amended (the “Code”), applicable to a regulated investment company. Under such provisions, the Funds would not be subject to federal income taxes on their ordinary income and net realized capital gains to the extent they are distributed or deemed to have been distributed to their shareholders. Therefore, the Funds have not made any provision for federal income tax.
Dividends and Distributions to Shareholders
Dividends from net investment income and distributions of any net realized capital gains of each Fund are declared and paid annually and at other times as may be required to satisfy tax or regulatory requirements.
Distributions to shareholders are recorded on the ex-dividend date. Income and capital gain distributions are determined in accordance with income tax regulations, which may differ from generally accepted accounting principles. As a result, net investment income and net realized capital gains on investment transactions for a reporting period may differ significantly from distributions during such period.
|
3. |
Advisory Fees and Other Transactions |
Investment Advisory Fees and Investment Subadviser
MML Advisers, a wholly-owned subsidiary of Massachusetts Mutual Life Insurance Company (“MassMutual”), serves as investment adviser to each Fund. Under the investment advisory agreements between MML Advisers and the Trust on behalf of each Fund, MML Advisers is responsible for providing investment management services for each Fund.
With respect to the MM Target Allocation Funds and MM RetireSMART by JPMorgan Funds, MML Advisers does not receive advisory fees in return for these services.
With respect to the MM Select T. Rowe Price Retirement Funds, in return for these services, MML Advisers receives all-inclusive advisory fees based on each share class of each Fund’s average daily net assets. The all-inclusive advisory fees are computed and accrued daily and payable monthly, and include investment management services and ordinary, recurring operating expenses, but do not cover interest; expenses related to borrowings, securities lending, leverage, taxes, and brokerage; short sale dividend and loan expense; acquired fund fees and expenses; payments pursuant to a Rule 12b-1 plan or similar plan; non-recurring or unusual expenses; and extraordinary legal and other expenses.
The applicable all-inclusive fee rate for each class of an MM Select T. Rowe Price Retirement Fund with a specified target retirement year in its name (“Annual Fee Rate”) shall be determined on each June 1 by calculating the “Years to Target Date” by subtracting the calendar year in which such June 1 falls (e.g., 2030) from the target year in the name of the Fund (e.g., 2060); and (ii) identifying the Annual Fee Rate shown in the table below next to the Years to Target Date so determined. The applicable Annual Fee Rate determined as of any June 1 shall be in effect from, and including, that June 1 through, and including, the following May 31.
Annual Fee Rate (%) |
||||
Years to Target Date |
Class I |
Class M5 |
Class M4 |
Class M3 |
All Prior Years |
0.614% |
0.764% |
0.764% |
0.764% |
31 |
0.613% |
0.763% |
0.763% |
0.763% |
30 |
0.613% |
0.763% |
0.763% |
0.763% |
29 |
0.613% |
0.763% |
0.763% |
0.763% |
28 |
0.613% |
0.763% |
0.763% |
0.763% |
160
Notes to Financial Statements (Continued) |
Annual Fee Rate (%) |
||||
Years to Target Date |
Class I |
Class M5 |
Class M4 |
Class M3 |
27 |
0.613% |
0.763% |
0.763% |
0.763% |
26 |
0.613% |
0.763% |
0.763% |
0.763% |
25 |
0.610% |
0.760% |
0.760% |
0.760% |
24 |
0.608% |
0.758% |
0.758% |
0.758% |
23 |
0.605% |
0.755% |
0.755% |
0.755% |
22 |
0.603% |
0.753% |
0.753% |
0.753% |
21 |
0.599% |
0.749% |
0.749% |
0.749% |
20 |
0.595% |
0.745% |
0.745% |
0.745% |
19 |
0.591% |
0.741% |
0.741% |
0.741% |
18 |
0.586% |
0.736% |
0.736% |
0.736% |
17 |
0.582% |
0.732% |
0.732% |
0.732% |
16 |
0.578% |
0.728% |
0.728% |
0.728% |
15 |
0.573% |
0.723% |
0.723% |
0.723% |
14 |
0.567% |
0.717% |
0.717% |
0.717% |
13 |
0.562% |
0.712% |
0.712% |
0.712% |
12 |
0.556% |
0.706% |
0.706% |
0.706% |
11 |
0.551% |
0.701% |
0.701% |
0.701% |
10 |
0.544% |
0.694% |
0.694% |
0.694% |
9 |
0.537% |
0.687% |
0.687% |
0.687% |
8 |
0.531% |
0.681% |
0.681% |
0.681% |
7 |
0.524% |
0.674% |
0.674% |
0.674% |
6 |
0.517% |
0.667% |
0.667% |
0.667% |
5 |
0.510% |
0.660% |
0.660% |
0.660% |
4 |
0.502% |
0.652% |
0.652% |
0.652% |
3 |
0.495% |
0.645% |
0.645% |
0.645% |
2 |
0.487% |
0.637% |
0.637% |
0.637% |
1 |
0.480% |
0.630% |
0.630% |
0.630% |
0 |
0.474% |
0.624% |
0.624% |
0.624% |
(1) |
0.469% |
0.619% |
0.619% |
0.619% |
(2) |
0.463% |
0.613% |
0.613% |
0.613% |
(3) |
0.458% |
0.608% |
0.608% |
0.608% |
(4) |
0.452% |
0.602% |
0.602% |
0.602% |
(5) |
0.446% |
0.596% |
0.596% |
0.596% |
(6) |
0.440% |
0.590% |
0.590% |
0.590% |
(7) |
0.433% |
0.583% |
0.583% |
0.583% |
(8) |
0.427% |
0.577% |
0.577% |
0.577% |
Thereafter |
0.421% |
0.571% |
0.571% |
0.571% |
The all-inclusive fee rate for each class of the MM Select T. Rowe Price Retirement Balanced Fund is as shown below.
Annual Fee Rate (%) |
||||||||||||||||
Class I |
Class M5 |
Class M4 |
Class M3 |
|||||||||||||
MM Select T. Rowe Price Retirement Balanced Fund |
0.396 | % | 0.546 | % | 0.546 | % | 0.546 | % | ||||||||
MML Advisers has also entered into an investment subadvisory agreement with the unaffiliated investment subadviser, J.P. Morgan, for each of the MM RetireSMART by JPMorgan Funds, and with the unaffiliated investment subadviser, T. Rowe Price Associates, Inc. (“T. Rowe Price”), for each of the MM Select T. Rowe Price Retirement Funds.
161
Notes to Financial Statements (Continued) |
MML Advisers pays a subadvisory fee to T. Rowe Price based upon the aggregate net assets under management which includes the average daily net assets of the specified Fund which it manages. The Funds’ subadvisory fees are paid monthly by MML Advisers out of the advisory fees.
Administration Fees
Under an Administrative and Shareholder Services Agreement between the Trust and MML Advisers, on behalf of each Fund, MML Advisers is obligated to provide certain administrative and shareholder services. In return for these services, MML Advisers receives an administrative services fee, based upon the average daily net assets of the applicable class of shares of the Funds, at the following annual rates:
Class |
Class |
Service |
Administrative |
Class |
Class |
Class |
Class |
Class |
Class |
|
20/80 Allocation Fund |
None |
0.10% |
0.20% |
0.30% |
0.20% |
0.30% |
0.20% |
N/A |
N/A |
N/A |
40/60 Allocation Fund |
None |
0.10% |
0.20% |
0.30% |
0.20% |
0.30% |
0.20% |
N/A |
N/A |
N/A |
60/40 Allocation Fund |
None |
0.10% |
0.20% |
0.30% |
0.20% |
0.30% |
0.20% |
N/A |
N/A |
N/A |
80/20 Allocation Fund |
None |
0.10% |
0.20% |
0.30% |
0.20% |
0.30% |
0.20% |
N/A |
N/A |
N/A |
MM RetireSMART by JPMorgan In Retirement Fund |
None |
0.10% |
0.20% |
0.30% |
0.20% |
0.30% |
0.20% |
N/A |
N/A |
N/A |
MM RetireSMART by JPMorgan 2020 Fund |
None |
0.10% |
0.20% |
0.30% |
0.20% |
0.30% |
0.20% |
N/A |
N/A |
N/A |
MM RetireSMART by JPMorgan 2025 Fund |
None |
0.10% |
0.20% |
0.30% |
0.20% |
0.30% |
0.20% |
N/A |
N/A |
N/A |
MM RetireSMART by JPMorgan 2030 Fund |
None |
0.10% |
0.20% |
0.30% |
0.20% |
0.30% |
0.20% |
N/A |
N/A |
N/A |
MM RetireSMART by JPMorgan 2035 Fund |
None |
0.10% |
0.20% |
0.30% |
0.20% |
0.30% |
0.20% |
N/A |
N/A |
N/A |
MM RetireSMART by JPMorgan 2040 Fund |
None |
0.10% |
0.20% |
0.30% |
0.20% |
0.30% |
0.20% |
N/A |
N/A |
N/A |
MM RetireSMART by JPMorgan 2045 Fund |
None |
0.10% |
0.20% |
0.30% |
0.20% |
0.30% |
0.20% |
N/A |
N/A |
N/A |
MM RetireSMART by JPMorgan 2050 Fund |
None |
0.10% |
0.20% |
0.30% |
0.20% |
0.30% |
0.20% |
N/A |
N/A |
N/A |
MM RetireSMART by JPMorgan 2055 Fund |
None |
0.10% |
0.20% |
0.30% |
0.20% |
0.30% |
0.20% |
N/A |
N/A |
N/A |
MM RetireSMART by JPMorgan 2060 Fund |
None |
0.10% |
0.20% |
0.30% |
0.20% |
0.30% |
0.20% |
N/A |
N/A |
N/A |
MM Select T. Rowe Price Retirement Balanced Fund* |
None |
N/A |
N/A |
N/A |
N/A |
N/A |
N/A |
0.15% |
0.15% |
0.15% |
MM Select T. Rowe Price Retirement 2005 Fund* |
None |
N/A |
N/A |
N/A |
N/A |
N/A |
N/A |
0.15% |
0.15% |
0.15% |
MM Select T. Rowe Price Retirement 2010 Fund* |
None |
N/A |
N/A |
N/A |
N/A |
N/A |
N/A |
0.15% |
0.15% |
0.15% |
MM Select T. Rowe Price Retirement 2015 Fund* |
None |
N/A |
N/A |
N/A |
N/A |
N/A |
N/A |
0.15% |
0.15% |
0.15% |
MM Select T. Rowe Price Retirement 2020 Fund* |
None |
N/A |
N/A |
N/A |
N/A |
N/A |
N/A |
0.15% |
0.15% |
0.15% |
MM Select T. Rowe Price Retirement 2025 Fund* |
None |
N/A |
N/A |
N/A |
N/A |
N/A |
N/A |
0.15% |
0.15% |
0.15% |
MM Select T. Rowe Price Retirement 2030 Fund* |
None |
N/A |
N/A |
N/A |
N/A |
N/A |
N/A |
0.15% |
0.15% |
0.15% |
MM Select T. Rowe Price Retirement 2035 Fund* |
None |
N/A |
N/A |
N/A |
N/A |
N/A |
N/A |
0.15% |
0.15% |
0.15% |
MM Select T. Rowe Price Retirement 2040 Fund* |
None |
N/A |
N/A |
N/A |
N/A |
N/A |
N/A |
0.15% |
0.15% |
0.15% |
162
Notes to Financial Statements (Continued) |
Class |
Class |
Service |
Administrative |
Class |
Class |
Class |
Class |
Class |
Class |
|
MM Select T. Rowe Price Retirement 2045 Fund* |
None |
N/A |
N/A |
N/A |
N/A |
N/A |
N/A |
0.15% |
0.15% |
0.15% |
MM Select T. Rowe Price Retirement 2050 Fund* |
None |
N/A |
N/A |
N/A |
N/A |
N/A |
N/A |
0.15% |
0.15% |
0.15% |
MM Select T. Rowe Price Retirement 2055 Fund* |
None |
N/A |
N/A |
N/A |
N/A |
N/A |
N/A |
0.15% |
0.15% |
0.15% |
MM Select T. Rowe Price Retirement 2060 Fund* |
None |
N/A |
N/A |
N/A |
N/A |
N/A |
N/A |
0.15% |
0.15% |
0.15% |
|
* |
Pursuant to the Fund’s investment advisory agreement, MML Advisers has agreed to pay all of the fees payable by the Fund under the Administrative and Shareholder Services Agreement. As a component of the all-inclusive advisory fees that it receives, MML Advisers receives administrative services fees from the Fund, which are equal to the fees payable under the Administrative and Shareholder Services Agreement. |
Distribution and Service Fees
MML Distributors, LLC (the “Distributor”) acts as a distributor to each Fund. Pursuant to a 12b-1 Plan adopted by the Trust, Class R4 shares, Class A shares, and Class M4 shares of each applicable Fund pay an annual fee of 0.25% of the average daily net assets of the class; and Class R3 shares and Class M3 shares of each applicable Fund pay an annual fee of 0.50% of the average daily net assets of the class, to the Distributor. Such payments compensate the Distributor for services provided and expenses incurred by it for purposes of promoting the sale of the relevant class of shares, reducing redemptions of shares, or maintaining or improving services provided to each Fund’s shareholders. The Distributor is a wholly-owned subsidiary of MassMutual.
Expense Caps and Waivers
MML Advisers has agreed to cap the fees and expenses of the Funds noted below (other than extraordinary legal and other expenses, Acquired Fund Fees and Expenses#, interest expense, expenses related to borrowings, securities lending, leverage, taxes, and brokerage, short sale dividend and loan expense, or other non-recurring or unusual expenses such as organizational expenses and shareholder meeting expenses, as applicable), based upon the average daily net assets of the applicable class of shares of the Funds, as follows:
Class |
Class |
Service |
Administrative |
Class |
Class |
Class |
|
20/80 Allocation Fund* |
0.04% |
0.14% |
0.24% |
0.34% |
0.49% |
0.59% |
0.74% |
40/60 Allocation Fund* |
0.06% |
0.16% |
0.26% |
0.36% |
0.51% |
0.61% |
0.76% |
60/40 Allocation Fund* |
0.06% |
0.16% |
0.26% |
0.36% |
0.51% |
0.61% |
0.76% |
80/20 Allocation Fund* |
0.09% |
0.19% |
0.29% |
0.39% |
0.54% |
0.64% |
0.79% |
MM RetireSMART by JPMorgan In Retirement Fund* |
0.06% |
0.16% |
0.26% |
0.36% |
0.51% |
0.61% |
0.76% |
MM RetireSMART by JPMorgan 2020 Fund* |
0.04% |
0.14% |
0.24% |
0.34% |
0.49% |
0.59% |
0.74% |
MM RetireSMART by JPMorgan 2025 Fund* |
0.01% |
0.11% |
0.21% |
0.31% |
0.46% |
0.56% |
0.71% |
MM RetireSMART by JPMorgan 2030 Fund* |
0.04% |
0.14% |
0.24% |
0.34% |
0.49% |
0.59% |
0.74% |
MM RetireSMART by JPMorgan 2035 Fund* |
0.05% |
0.15% |
0.25% |
0.35% |
0.50% |
0.60% |
0.75% |
MM RetireSMART by JPMorgan 2040 Fund* |
0.04% |
0.14% |
0.24% |
0.34% |
0.49% |
0.59% |
0.74% |
MM RetireSMART by JPMorgan 2045 Fund* |
0.02% |
0.12% |
0.22% |
0.32% |
0.47% |
0.57% |
0.72% |
MM RetireSMART by JPMorgan 2050 Fund* |
0.02% |
0.12% |
0.22% |
0.32% |
0.47% |
0.57% |
0.72% |
MM RetireSMART by JPMorgan 2055 Fund* |
0.00% |
0.10% |
0.20% |
0.30% |
0.45% |
0.55% |
0.70% |
MM RetireSMART by JPMorgan 2060 Fund* |
0.00% |
0.10% |
0.20% |
0.30% |
0.45% |
0.55% |
0.70% |
|
# |
Acquired Fund Fees and Expenses are borne indirectly by a Fund through investments in other pooled investment vehicles. |
|
* |
Expense caps in effect through January 31, 2023. |
163
Notes to Financial Statements (Continued) |
Effective February 1, 2022, MML Advisers has agreed to cap the fees and expenses of the Fund noted below (other than extraordinary legal and other expenses, interest expense, expenses related to borrowings, securities lending, leverage, taxes, and brokerage, short sale dividend and loan expense, or other non-recurring or unusual expenses such as organizational expenses and shareholder meeting expenses, as applicable), based upon the average daily net assets of the applicable class of shares of the Fund, as follows:
Class I |
Class M5 |
Class M4 |
Class M3 |
|
MM Select T. Rowe Price Retirement Balanced Fund* |
0.34% |
0.49% |
0.74% |
0.99% |
|
* |
Expense caps in effect through January 31, 2023. |
Prior to February 1, 2022, MML Advisers had agreed to cap the fees and expenses of the Fund noted below (other than extraordinary legal and other expenses, interest expense, expenses related to borrowings, securities lending, leverage, taxes, and brokerage, short sale dividend and loan expense, or other non-recurring or unusual expenses such as organizational expenses and shareholder meeting expenses, as applicable), based upon the average daily net assets of the applicable class of shares of the Fund, as follows:
Class I |
Class M5 |
Class M4 |
Class M3 |
|
MM Select T. Rowe Price Retirement Balanced Fund |
0.33% |
0.48% |
0.73% |
0.98% |
MML Advisers has agreed to cap the fees and expenses of the Funds noted below (other than extraordinary legal and other expenses, interest expense, expenses related to borrowings, securities lending, leverage, taxes, and brokerage, short sale dividend and loan expense, or other non-recurring or unusual expenses such as organizational expenses and shareholder meeting expenses, as applicable), based upon the average daily net assets of the applicable class of shares of the Funds, as follows:
Class I |
Class M5 |
Class M4 |
Class M3 |
|
MM Select T. Rowe Price Retirement 2005 Fund* |
0.34% |
0.49% |
0.74% |
0.99% |
MM Select T. Rowe Price Retirement 2010 Fund* |
0.34% |
0.49% |
0.74% |
0.99% |
MM Select T. Rowe Price Retirement 2015 Fund* |
0.36% |
0.51% |
0.76% |
1.01% |
MM Select T. Rowe Price Retirement 2020 Fund* |
0.37% |
0.53% |
0.78% |
1.03% |
MM Select T. Rowe Price Retirement 2025 Fund* |
0.39% |
0.55% |
0.80% |
1.05% |
MM Select T. Rowe Price Retirement 2030 Fund* |
0.41% |
0.58% |
0.83% |
1.08% |
MM Select T. Rowe Price Retirement 2035 Fund* |
0.42% |
0.59% |
0.84% |
1.09% |
MM Select T. Rowe Price Retirement 2040 Fund* |
0.43% |
0.60% |
0.85% |
1.10% |
MM Select T. Rowe Price Retirement 2045 Fund* |
0.44% |
0.62% |
0.87% |
1.12% |
MM Select T. Rowe Price Retirement 2050 Fund* |
0.45% |
0.63% |
0.88% |
1.13% |
MM Select T. Rowe Price Retirement 2055 Fund* |
0.46% |
0.64% |
0.89% |
1.14% |
MM Select T. Rowe Price Retirement 2060 Fund* |
0.46% |
0.64% |
0.89% |
1.14% |
|
* |
Expense caps in effect through January 31, 2023. |
Expense caps and waiver amounts are reflected as a reduction of expenses on the Statements of Operations.
Deferred Compensation
Trustees of the Funds who are not officers or employees of MassMutual may elect to defer receipt of their annual fees in accordance with terms of a Non-Qualified Deferred Compensation Plan. Amounts deferred shall accrue interest or earnings and shall be recorded on the Funds’ books as other liabilities. Deferred compensation is included within Trustees’ fees and expenses in the Statements of Assets and Liabilities.
164
Notes to Financial Statements (Continued) |
Other
Certain officers and trustees of the Funds may also be employees of MassMutual. The compensation of a trustee who is not an employee of MassMutual is borne by the Funds.
The following table shows beneficial ownership of Funds’ shares by related parties at September 30, 2022:
Total % Ownership |
|
20/80 Allocation Fund |
92.9% |
40/60 Allocation Fund |
93.4% |
60/40 Allocation Fund |
94.3% |
80/20 Allocation Fund |
91.0% |
MM RetireSMART by JPMorgan In Retirement Fund |
90.6% |
MM RetireSMART by JPMorgan 2020 Fund |
98.3% |
MM RetireSMART by JPMorgan 2025 Fund |
99.3% |
MM RetireSMART by JPMorgan 2030 Fund |
95.1% |
MM RetireSMART by JPMorgan 2035 Fund |
99.9% |
MM RetireSMART by JPMorgan 2040 Fund |
98.7% |
MM RetireSMART by JPMorgan 2045 Fund |
100.0% |
MM RetireSMART by JPMorgan 2050 Fund |
99.9% |
MM RetireSMART by JPMorgan 2055 Fund |
100.0% |
MM RetireSMART by JPMorgan 2060 Fund |
95.0% |
MM Select T. Rowe Price Retirement Balanced Fund |
95.8% |
MM Select T. Rowe Price Retirement 2005 Fund |
94.6% |
MM Select T. Rowe Price Retirement 2010 Fund |
96.8% |
MM Select T. Rowe Price Retirement 2015 Fund |
89.9% |
MM Select T. Rowe Price Retirement 2020 Fund |
94.5% |
MM Select T. Rowe Price Retirement 2025 Fund |
95.3% |
MM Select T. Rowe Price Retirement 2030 Fund |
92.5% |
MM Select T. Rowe Price Retirement 2035 Fund |
90.6% |
MM Select T. Rowe Price Retirement 2040 Fund |
92.1% |
MM Select T. Rowe Price Retirement 2045 Fund |
90.1% |
MM Select T. Rowe Price Retirement 2050 Fund |
92.8% |
MM Select T. Rowe Price Retirement 2055 Fund |
93.1% |
MM Select T. Rowe Price Retirement 2060 Fund |
92.1% |
165
Notes to Financial Statements (Continued) |
4. Purchases and Sales of Investments
Cost of purchases and proceeds from sales of investments in Underlying Funds for the year ended September 30, 2022, were as follows:
Purchases |
Sales |
|||||||||||||||
Long-Term U.S. |
Other Long- |
Long-Term U.S. |
Other Long- |
|||||||||||||
20/80 Allocation Fund |
$ | — | $ | 49,531,260 | $ | — | $ | 53,706,250 | ||||||||
40/60 Allocation Fund |
— | 71,259,751 | — | 66,595,271 | ||||||||||||
60/40 Allocation Fund |
— | 50,860,240 | — | 56,920,805 | ||||||||||||
80/20 Allocation Fund |
— | 43,437,500 | — | 38,831,035 | ||||||||||||
MM RetireSMART by JPMorgan In Retirement Fund |
— | 59,261,219 | — | 68,274,182 | ||||||||||||
MM RetireSMART by JPMorgan 2020 Fund |
— | 110,872,198 | — | 165,915,139 | ||||||||||||
MM RetireSMART by JPMorgan 2025 Fund |
— | 96,885,348 | — | 110,692,699 | ||||||||||||
MM RetireSMART by JPMorgan 2030 Fund |
— | 221,146,058 | — | 226,771,559 | ||||||||||||
MM RetireSMART by JPMorgan 2035 Fund |
— | 106,599,975 | — | 106,125,098 | ||||||||||||
MM RetireSMART by JPMorgan 2040 Fund |
— | 175,548,042 | — | 169,870,939 | ||||||||||||
MM RetireSMART by JPMorgan 2045 Fund |
— | 83,181,272 | — | 75,992,167 | ||||||||||||
MM RetireSMART by JPMorgan 2050 Fund |
— | 131,651,824 | — | 112,949,591 | ||||||||||||
MM RetireSMART by JPMorgan 2055 Fund |
— | 45,537,236 | — | 39,966,716 | ||||||||||||
MM RetireSMART by JPMorgan 2060 Fund |
— | 17,248,728 | — | 16,457,238 | ||||||||||||
MM Select T. Rowe Price Retirement Balanced Fund |
— | 66,161,313 | — | 63,605,499 | ||||||||||||
MM Select T. Rowe Price Retirement 2005 Fund |
— | 11,442,375 | — | 10,329,539 | ||||||||||||
MM Select T. Rowe Price Retirement 2010 Fund |
— | 44,436,811 | — | 57,991,708 | ||||||||||||
MM Select T. Rowe Price Retirement 2015 Fund |
— | 50,946,852 | — | 62,497,121 | ||||||||||||
MM Select T. Rowe Price Retirement 2020 Fund |
— | 236,918,895 | — | 337,063,850 | ||||||||||||
MM Select T. Rowe Price Retirement 2025 Fund |
— | 250,129,267 | — | 263,762,588 | ||||||||||||
MM Select T. Rowe Price Retirement 2030 Fund |
— | 500,593,838 | — | 517,779,292 | ||||||||||||
MM Select T. Rowe Price Retirement 2035 Fund |
— | 279,453,300 | — | 197,148,778 | ||||||||||||
MM Select T. Rowe Price Retirement 2040 Fund |
— | 470,084,838 | — | 363,995,885 | ||||||||||||
MM Select T. Rowe Price Retirement 2045 Fund |
— | 233,723,359 | — | 128,618,639 | ||||||||||||
MM Select T. Rowe Price Retirement 2050 Fund |
— | 345,944,034 | — | 233,663,623 | ||||||||||||
MM Select T. Rowe Price Retirement 2055 Fund |
— | 163,181,776 | — | 72,197,116 | ||||||||||||
MM Select T. Rowe Price Retirement 2060 Fund |
— | 93,072,794 | — | 29,564,292 | ||||||||||||
5. Capital Share Transactions
Changes in shares outstanding for each Fund were as follows:
Year Ended September 30, 2022 |
Year Ended September 30, 2021 |
|||||||||||||||
Shares |
Amount |
Shares |
Amount |
|||||||||||||
20/80 Allocation Fund Class I |
||||||||||||||||
Sold |
423,951 | $ | 4,033,587 | 615,986 | $ | 6,449,363 | ||||||||||
Issued as reinvestment of dividends |
124,256 | 1,238,827 | 99,828 | 1,021,241 | ||||||||||||
Redeemed |
(768,339 | ) | (7,376,388 | ) | (651,575 | ) | (6,830,052 | ) | ||||||||
Net increase (decrease) |
(220,132 | ) | $ | (2,103,974 | ) | 64,239 | $ | 640,552 | ||||||||
20/80 Allocation Fund Class R5 |
||||||||||||||||
Sold |
322,000 | $ | 3,418,809 | 126,991 | $ | 1,317,054 | ||||||||||
Issued as reinvestment of dividends |
60,379 | 600,769 | 36,640 | 374,459 | ||||||||||||
Redeemed |
(661,324 | ) | (6,325,229 | ) | (162,700 | ) | (1,680,656 | ) | ||||||||
Net increase (decrease) |
(278,945 | ) | $ | (2,305,651 | ) | 931 | $ | 10,857 | ||||||||
166
Notes to Financial Statements (Continued) |
Year Ended September 30, 2022 |
Year Ended September 30, 2021 |
|||||||||||||||
Shares |
Amount |
Shares |
Amount |
|||||||||||||
20/80 Allocation Fund Service Class |
||||||||||||||||
Sold |
1,337,448 | $ | 12,737,043 | 1,559,590 | $ | 16,274,460 | ||||||||||
Issued as reinvestment of dividends |
806,593 | 8,033,664 | 595,369 | 6,084,666 | ||||||||||||
Redeemed |
(1,480,152 | ) | (13,991,530 | ) | (1,568,488 | ) | (16,419,817 | ) | ||||||||
Net increase (decrease) |
663,889 | $ | 6,779,177 | 586,471 | $ | 5,939,309 | ||||||||||
20/80 Allocation Fund Administrative Class |
||||||||||||||||
Sold |
256,571 | $ | 2,459,877 | 439,757 | $ | 4,609,186 | ||||||||||
Issued as reinvestment of dividends |
138,029 | 1,380,292 | 168,833 | 1,730,543 | ||||||||||||
Redeemed |
(761,541 | ) | (7,743,462 | ) | (1,360,972 | ) | (14,371,285 | ) | ||||||||
Net increase (decrease) |
(366,941 | ) | $ | (3,903,293 | ) | (752,382 | ) | $ | (8,031,556 | ) | ||||||
20/80 Allocation Fund Class R4 |
||||||||||||||||
Sold |
66,574 | $ | 642,276 | 57,700 | $ | 611,704 | ||||||||||
Issued as reinvestment of dividends |
24,105 | 245,146 | 15,984 | 166,392 | ||||||||||||
Redeemed |
(125,883 | ) | (1,232,895 | ) | (328,611 | ) | (3,501,190 | ) | ||||||||
Net increase (decrease) |
(35,204 | ) | $ | (345,473 | ) | (254,927 | ) | $ | (2,723,094 | ) | ||||||
20/80 Allocation Fund Class A |
||||||||||||||||
Sold |
177,692 | $ | 1,720,692 | 417,925 | $ | 4,408,912 | ||||||||||
Issued as reinvestment of dividends |
113,100 | 1,138,922 | 98,820 | 1,019,820 | ||||||||||||
Redeemed |
(459,164 | ) | (4,481,851 | ) | (787,909 | ) | (8,264,988 | ) | ||||||||
Net increase (decrease) |
(168,372 | ) | $ | (1,622,237 | ) | (271,164 | ) | $ | (2,836,256 | ) | ||||||
20/80 Allocation Fund Class R3 |
||||||||||||||||
Sold |
344,254 | $ | 3,277,658 | 78,669 | $ | 817,184 | ||||||||||
Issued as reinvestment of dividends |
35,734 | 352,697 | 34,595 | 350,793 | ||||||||||||
Redeemed |
(427,407 | ) | (3,949,015 | ) | (248,227 | ) | (2,565,962 | ) | ||||||||
Net increase (decrease) |
(47,419 | ) | $ | (318,660 | ) | (134,963 | ) | $ | (1,397,985 | ) | ||||||
40/60 Allocation Fund Class I |
||||||||||||||||
Sold |
1,388,047 | $ | 13,549,712 | 1,774,313 | $ | 17,979,487 | ||||||||||
Issued as reinvestment of dividends |
420,782 | 4,148,911 | 236,206 | 2,350,248 | ||||||||||||
Redeemed |
(2,543,747 | ) | (23,796,873 | ) | (1,267,232 | ) | (13,037,459 | ) | ||||||||
Net increase (decrease) |
(734,918 | ) | $ | (6,098,250 | ) | 743,287 | $ | 7,292,276 | ||||||||
40/60 Allocation Fund Class R5 |
||||||||||||||||
Sold |
538,833 | $ | 5,647,066 | 151,980 | $ | 1,552,334 | ||||||||||
Issued as reinvestment of dividends |
104,528 | 1,032,740 | 54,493 | 542,748 | ||||||||||||
Redeemed |
(777,160 | ) | (7,616,042 | ) | (346,473 | ) | (3,594,179 | ) | ||||||||
Net increase (decrease) |
(133,799 | ) | $ | (936,236 | ) | (140,000 | ) | $ | (1,499,097 | ) | ||||||
40/60 Allocation Fund Service Class |
||||||||||||||||
Sold |
193,014 | $ | 1,845,937 | 220,392 | $ | 2,281,990 | ||||||||||
Issued as reinvestment of dividends |
135,156 | 1,343,448 | 93,106 | 932,924 | ||||||||||||
Redeemed |
(353,931 | ) | (3,345,263 | ) | (510,566 | ) | (5,282,833 | ) | ||||||||
Net increase (decrease) |
(25,761 | ) | $ | (155,878 | ) | (197,068 | ) | $ | (2,067,919 | ) | ||||||
40/60 Allocation Fund Administrative Class |
||||||||||||||||
Sold |
193,470 | $ | 1,843,868 | 346,012 | $ | 3,577,044 | ||||||||||
Issued as reinvestment of dividends |
308,979 | 3,071,255 | 254,207 | 2,544,613 | ||||||||||||
Redeemed |
(1,227,855 | ) | (12,127,557 | ) | (1,817,227 | ) | (18,785,468 | ) | ||||||||
Net increase (decrease) |
(725,406 | ) | $ | (7,212,434 | ) | (1,217,008 | ) | $ | (12,663,811 | ) | ||||||
40/60 Allocation Fund Class R4 |
||||||||||||||||
Sold |
1,655,895 | $ | 15,864,204 | 564,138 | $ | 5,824,766 | ||||||||||
Issued as reinvestment of dividends |
301,285 | 2,964,646 | 148,002 | 1,469,659 | ||||||||||||
Redeemed |
(1,102,485 | ) | (10,287,186 | ) | (632,927 | ) | (6,495,870 | ) | ||||||||
Net increase (decrease) |
854,695 | $ | 8,541,664 | 79,213 | $ | 798,555 | ||||||||||
167
Notes to Financial Statements (Continued) |
Year Ended September 30, 2022 |
Year Ended September 30, 2021 |
|||||||||||||||
Shares |
Amount |
Shares |
Amount |
|||||||||||||
40/60 Allocation Fund Class A |
||||||||||||||||
Sold |
380,461 | $ | 3,580,805 | 489,022 | $ | 5,085,574 | ||||||||||
Issued as reinvestment of dividends |
444,808 | 4,443,631 | 329,317 | 3,312,929 | ||||||||||||
Redeemed |
(1,105,489 | ) | (10,926,047 | ) | (2,073,497 | ) | (21,389,001 | ) | ||||||||
Net increase (decrease) |
(280,220 | ) | $ | (2,901,611 | ) | (1,255,158 | ) | $ | (12,990,498 | ) | ||||||
40/60 Allocation Fund Class R3 |
||||||||||||||||
Sold |
1,872,290 | $ | 19,355,867 | 112,053 | $ | 1,145,520 | ||||||||||
Issued as reinvestment of dividends |
167,009 | 1,638,358 | 43,594 | 432,892 | ||||||||||||
Redeemed |
(841,536 | ) | (7,922,523 | ) | (347,982 | ) | (3,562,829 | ) | ||||||||
Net increase (decrease) |
1,197,763 | $ | 13,071,702 | (192,335 | ) | $ | (1,984,417 | ) | ||||||||
60/40 Allocation Fund Class I |
||||||||||||||||
Sold |
1,234,145 | $ | 12,093,525 | 1,324,400 | $ | 13,802,997 | ||||||||||
Issued as reinvestment of dividends |
383,320 | 3,794,867 | 109,832 | 1,097,223 | ||||||||||||
Redeemed |
(707,895 | ) | (6,930,602 | ) | (1,079,496 | ) | (11,418,028 | ) | ||||||||
Net increase (decrease) |
909,570 | $ | 8,957,790 | 354,736 | $ | 3,482,192 | ||||||||||
60/40 Allocation Fund Class R5 |
||||||||||||||||
Sold |
644,350 | $ | 7,118,216 | 375,184 | $ | 3,957,691 | ||||||||||
Issued as reinvestment of dividends |
324,915 | 3,219,903 | 69,135 | 691,355 | ||||||||||||
Redeemed |
(1,814,154 | ) | (17,819,753 | ) | (189,198 | ) | (2,033,072 | ) | ||||||||
Net increase (decrease) |
(844,889 | ) | $ | (7,481,634 | ) | 255,121 | $ | 2,615,974 | ||||||||
60/40 Allocation Fund Service Class |
||||||||||||||||
Sold |
305,096 | $ | 2,990,863 | 304,693 | $ | 3,166,826 | ||||||||||
Issued as reinvestment of dividends |
315,644 | 3,146,970 | 99,600 | 1,000,979 | ||||||||||||
Redeemed |
(333,038 | ) | (3,068,410 | ) | (796,540 | ) | (8,366,434 | ) | ||||||||
Net increase (decrease) |
287,702 | $ | 3,069,423 | (392,247 | ) | $ | (4,198,629 | ) | ||||||||
60/40 Allocation Fund Administrative Class |
||||||||||||||||
Sold |
404,343 | $ | 3,819,249 | 800,325 | $ | 8,316,287 | ||||||||||
Issued as reinvestment of dividends |
639,487 | 6,382,082 | 244,773 | 2,459,971 | ||||||||||||
Redeemed |
(1,907,803 | ) | (19,592,899 | ) | (1,751,607 | ) | (18,821,973 | ) | ||||||||
Net increase (decrease) |
(863,973 | ) | $ | (9,391,568 | ) | (706,509 | ) | $ | (8,045,715 | ) | ||||||
60/40 Allocation Fund Class R4 |
||||||||||||||||
Sold |
205,498 | $ | 1,953,469 | 200,230 | $ | 2,104,590 | ||||||||||
Issued as reinvestment of dividends |
122,080 | 1,207,371 | 35,427 | 353,565 | ||||||||||||
Redeemed |
(305,696 | ) | (3,032,290 | ) | (334,841 | ) | (3,514,284 | ) | ||||||||
Net increase (decrease) |
21,882 | $ | 128,550 | (99,184 | ) | $ | (1,056,129 | ) | ||||||||
60/40 Allocation Fund Class A |
||||||||||||||||
Sold |
332,144 | $ | 3,196,807 | 389,012 | $ | 4,151,546 | ||||||||||
Issued as reinvestment of dividends |
669,698 | 6,723,767 | 209,725 | 2,120,316 | ||||||||||||
Redeemed |
(698,211 | ) | (6,966,841 | ) | (1,632,730 | ) | (17,002,589 | ) | ||||||||
Net increase (decrease) |
303,631 | $ | 2,953,733 | (1,033,993 | ) | $ | (10,730,727 | ) | ||||||||
60/40 Allocation Fund Class R3 |
||||||||||||||||
Sold |
148,165 | $ | 1,379,297 | 204,509 | $ | 2,113,598 | ||||||||||
Issued as reinvestment of dividends |
151,843 | 1,497,170 | 54,392 | 540,657 | ||||||||||||
Redeemed |
(406,930 | ) | (4,105,982 | ) | (612,561 | ) | (6,345,737 | ) | ||||||||
Net increase (decrease) |
(106,922 | ) | $ | (1,229,515 | ) | (353,660 | ) | $ | (3,691,482 | ) | ||||||
168
Notes to Financial Statements (Continued) |
Year Ended September 30, 2022 |
Year Ended September 30, 2021 |
|||||||||||||||
Shares |
Amount |
Shares |
Amount |
|||||||||||||
80/20 Allocation Fund Class I |
||||||||||||||||
Sold |
876,254 | $ | 9,538,289 | 1,133,608 | $ | 12,697,745 | ||||||||||
Issued as reinvestment of dividends |
400,286 | 4,471,193 | 173,201 | 1,893,092 | ||||||||||||
Redeemed |
(739,056 | ) | (7,875,775 | ) | (1,102,794 | ) | (12,598,517 | ) | ||||||||
Net increase (decrease) |
537,484 | $ | 6,133,707 | 204,015 | $ | 1,992,320 | ||||||||||
80/20 Allocation Fund Class R5 |
||||||||||||||||
Sold |
308,793 | $ | 3,597,966 | 187,092 | $ | 2,161,751 | ||||||||||
Issued as reinvestment of dividends |
93,050 | 1,041,225 | 30,792 | 336,870 | ||||||||||||
Redeemed |
(642,285 | ) | (7,111,964 | ) | (191,092 | ) | (2,249,210 | ) | ||||||||
Net increase (decrease) |
(240,442 | ) | $ | (2,472,773 | ) | 26,792 | $ | 249,411 | ||||||||
80/20 Allocation Fund Service Class |
||||||||||||||||
Sold |
443,848 | $ | 4,823,322 | 543,749 | $ | 6,294,363 | ||||||||||
Issued as reinvestment of dividends |
161,233 | 1,807,424 | 51,714 | 567,307 | ||||||||||||
Redeemed |
(461,582 | ) | (5,096,316 | ) | (353,074 | ) | (4,049,511 | ) | ||||||||
Net increase (decrease) |
143,499 | $ | 1,534,430 | 242,389 | $ | 2,812,159 | ||||||||||
80/20 Allocation Fund Administrative Class |
||||||||||||||||
Sold |
368,149 | $ | 4,124,673 | 381,941 | $ | 4,543,880 | ||||||||||
Issued as reinvestment of dividends |
221,372 | 2,483,791 | 100,058 | 1,097,631 | ||||||||||||
Redeemed |
(588,613 | ) | (6,532,805 | ) | (780,438 | ) | (9,259,559 | ) | ||||||||
Net increase (decrease) |
908 | $ | 75,659 | (298,439 | ) | $ | (3,618,048 | ) | ||||||||
80/20 Allocation Fund Class R4 |
||||||||||||||||
Sold |
424,491 | $ | 4,200,012 | 175,865 | $ | 2,032,505 | ||||||||||
Issued as reinvestment of dividends |
137,055 | 1,513,090 | 54,309 | 587,085 | ||||||||||||
Redeemed |
(365,828 | ) | (3,874,857 | ) | (374,989 | ) | (4,198,588 | ) | ||||||||
Net increase (decrease) |
195,718 | $ | 1,838,245 | (144,815 | ) | $ | (1,578,998 | ) | ||||||||
80/20 Allocation Fund Class A |
||||||||||||||||
Sold |
276,585 | $ | 2,783,968 | 307,327 | $ | 3,623,235 | ||||||||||
Issued as reinvestment of dividends |
270,081 | 3,033,006 | 118,606 | 1,301,110 | ||||||||||||
Redeemed |
(911,845 | ) | (10,305,455 | ) | (761,299 | ) | (8,525,884 | ) | ||||||||
Net increase (decrease) |
(365,179 | ) | $ | (4,488,481 | ) | (335,366 | ) | $ | (3,601,539 | ) | ||||||
80/20 Allocation Fund Class R3 |
||||||||||||||||
Sold |
145,996 | $ | 1,522,676 | 199,256 | $ | 2,264,624 | ||||||||||
Issued as reinvestment of dividends |
176,089 | 1,933,462 | 84,916 | 913,691 | ||||||||||||
Redeemed |
(298,674 | ) | (3,286,886 | ) | (452,535 | ) | (5,200,098 | ) | ||||||||
Net increase (decrease) |
23,411 | $ | 169,252 | (168,363 | ) | $ | (2,021,783 | ) | ||||||||
MM RetireSMART by JPMorgan In Retirement Fund Class I |
||||||||||||||||
Sold |
326,376 | $ | 3,627,768 | 285,890 | $ | 3,556,472 | ||||||||||
Issued as reinvestment of dividends |
190,731 | 2,168,614 | 105,722 | 1,281,353 | ||||||||||||
Redeemed |
(389,315 | ) | (4,312,671 | ) | (658,698 | ) | (8,162,103 | ) | ||||||||
Net increase (decrease) |
127,792 | $ | 1,483,711 | (267,086 | ) | $ | (3,324,278 | ) | ||||||||
MM RetireSMART by JPMorgan In Retirement Fund Class R5 |
||||||||||||||||
Sold |
25,753 | $ | 275,531 | 99,622 | $ | 1,242,945 | ||||||||||
Issued as reinvestment of dividends |
49,925 | 570,147 | 27,747 | 337,121 | ||||||||||||
Redeemed |
(183,020 | ) | (2,271,761 | ) | (92,620 | ) | (1,144,336 | ) | ||||||||
Net increase (decrease) |
(107,342 | ) | $ | (1,426,083 | ) | 34,749 | $ | 435,730 | ||||||||
169
Notes to Financial Statements (Continued) |
Year Ended September 30, 2022 |
Year Ended September 30, 2021 |
|||||||||||||||
Shares |
Amount |
Shares |
Amount |
|||||||||||||
MM RetireSMART by JPMorgan In Retirement Fund Service Class |
||||||||||||||||
Sold |
104,816 | $ | 1,133,320 | 89,204 | $ | 1,120,546 | ||||||||||
Issued as reinvestment of dividends |
107,168 | 1,226,005 | 82,037 | 998,395 | ||||||||||||
Redeemed |
(385,402 | ) | (4,145,388 | ) | (755,069 | ) | (9,240,643 | ) | ||||||||
Net increase (decrease) |
(173,418 | ) | $ | (1,786,063 | ) | (583,828 | ) | $ | (7,121,702 | ) | ||||||
MM RetireSMART by JPMorgan In Retirement Fund Administrative Class |
||||||||||||||||
Sold |
183,237 | $ | 1,970,479 | 297,386 | $ | 3,672,887 | ||||||||||
Issued as reinvestment of dividends |
323,773 | 3,703,959 | 144,413 | 1,758,950 | ||||||||||||
Redeemed |
(628,407 | ) | (7,096,600 | ) | (480,666 | ) | (6,027,023 | ) | ||||||||
Net increase (decrease) |
(121,397 | ) | $ | (1,422,162 | ) | (38,867 | ) | $ | (595,186 | ) | ||||||
MM RetireSMART by JPMorgan In Retirement Fund Class R4 |
||||||||||||||||
Sold |
751,231 | $ | 8,053,513 | 71,878 | $ | 888,601 | ||||||||||
Issued as reinvestment of dividends |
127,135 | 1,429,001 | 64,731 | 776,122 | ||||||||||||
Redeemed |
(801,273 | ) | (8,517,064 | ) | (401,228 | ) | (4,911,431 | ) | ||||||||
Net increase (decrease) |
77,093 | $ | 965,450 | (264,619 | ) | $ | (3,246,708 | ) | ||||||||
MM RetireSMART by JPMorgan In Retirement Fund Class A |
||||||||||||||||
Sold |
52,812 | $ | 569,104 | 509,268 | $ | 6,265,641 | ||||||||||
Issued as reinvestment of dividends |
131,835 | 1,508,190 | 346,594 | 4,176,453 | ||||||||||||
Redeemed |
(252,796 | ) | (2,861,206 | ) | (5,917,774 | ) | (74,471,290 | ) | ||||||||
Net increase (decrease) |
(68,149 | ) | $ | (783,912 | ) | (5,061,912 | ) | $ | (64,029,196 | ) | ||||||
MM RetireSMART by JPMorgan In Retirement Fund Class R3 |
||||||||||||||||
Sold |
364,136 | $ | 3,762,568 | 261,713 | $ | 3,207,151 | ||||||||||
Issued as reinvestment of dividends |
229,439 | 2,558,247 | 132,911 | 1,581,636 | ||||||||||||
Redeemed |
(649,003 | ) | (7,064,574 | ) | (992,850 | ) | (12,159,534 | ) | ||||||||
Net increase (decrease) |
(55,428 | ) | $ | (743,759 | ) | (598,226 | ) | $ | (7,370,747 | ) | ||||||
MM RetireSMART by JPMorgan 2020 Fund Class I |
||||||||||||||||
Sold |
666,104 | $ | 7,748,692 | 1,144,273 | $ | 14,769,325 | ||||||||||
Issued as reinvestment of dividends |
448,203 | 5,427,736 | 202,557 | 2,564,369 | ||||||||||||
Redeemed |
(1,197,840 | ) | (13,771,332 | ) | (1,026,214 | ) | (13,423,600 | ) | ||||||||
Net increase (decrease) |
(83,533 | ) | $ | (594,904 | ) | 320,616 | $ | 3,910,094 | ||||||||
MM RetireSMART by JPMorgan 2020 Fund Class R5 |
||||||||||||||||
Sold |
276,373 | $ | 3,239,613 | 494,973 | $ | 6,414,846 | ||||||||||
Issued as reinvestment of dividends |
296,876 | 3,589,231 | 192,661 | 2,435,234 | ||||||||||||
Redeemed |
(1,108,675 | ) | (13,445,609 | ) | (1,301,102 | ) | (16,835,010 | ) | ||||||||
Net increase (decrease) |
(535,426 | ) | $ | (6,616,765 | ) | (613,468 | ) | $ | (7,984,930 | ) | ||||||
MM RetireSMART by JPMorgan 2020 Fund Service Class |
||||||||||||||||
Sold |
135,551 | $ | 1,604,963 | 242,063 | $ | 3,190,490 | ||||||||||
Issued as reinvestment of dividends |
234,082 | 2,853,464 | 141,523 | 1,803,008 | ||||||||||||
Redeemed |
(1,647,808 | ) | (19,622,801 | ) | (1,027,042 | ) | (13,363,004 | ) | ||||||||
Net increase (decrease) |
(1,278,175 | ) | $ | (15,164,374 | ) | (643,456 | ) | $ | (8,369,506 | ) | ||||||
MM RetireSMART by JPMorgan 2020 Fund Administrative Class |
||||||||||||||||
Sold |
230,012 | $ | 2,678,038 | 415,118 | $ | 5,407,164 | ||||||||||
Issued as reinvestment of dividends |
276,651 | 3,361,305 | 185,753 | 2,359,066 | ||||||||||||
Redeemed |
(1,722,111 | ) | (21,376,425 | ) | (1,149,396 | ) | (14,924,632 | ) | ||||||||
Net increase (decrease) |
(1,215,448 | ) | $ | (15,337,082 | ) | (548,525 | ) | $ | (7,158,402 | ) | ||||||
170
Notes to Financial Statements (Continued) |
Year Ended September 30, 2022 |
Year Ended September 30, 2021 |
|||||||||||||||
Shares |
Amount |
Shares |
Amount |
|||||||||||||
MM RetireSMART by JPMorgan 2020 Fund Class R4 |
||||||||||||||||
Sold |
223,131 | $ | 2,570,365 | 229,725 | $ | 2,904,104 | ||||||||||
Issued as reinvestment of dividends |
184,421 | 2,185,392 | 117,812 | 1,462,041 | ||||||||||||
Redeemed |
(620,282 | ) | (7,540,009 | ) | (943,885 | ) | (12,011,412 | ) | ||||||||
Net increase (decrease) |
(212,730 | ) | $ | (2,784,252 | ) | (596,348 | ) | $ | (7,645,267 | ) | ||||||
MM RetireSMART by JPMorgan 2020 Fund Class A |
||||||||||||||||
Sold |
85,568 | $ | 989,774 | 537,618 | $ | 6,869,712 | ||||||||||
Issued as reinvestment of dividends |
240,406 | 2,911,317 | 366,079 | 4,612,594 | ||||||||||||
Redeemed |
(679,637 | ) | (8,119,220 | ) | (5,621,623 | ) | (74,038,355 | ) | ||||||||
Net increase (decrease) |
(353,663 | ) | $ | (4,218,129 | ) | (4,717,926 | ) | $ | (62,556,049 | ) | ||||||
MM RetireSMART by JPMorgan 2020 Fund Class R3 |
||||||||||||||||
Sold |
644,883 | $ | 7,055,806 | 343,043 | $ | 4,321,845 | ||||||||||
Issued as reinvestment of dividends |
432,493 | 5,025,570 | 239,400 | 2,920,677 | ||||||||||||
Redeemed |
(1,282,920 | ) | (14,353,839 | ) | (1,499,699 | ) | (18,801,742 | ) | ||||||||
Net increase (decrease) |
(205,544 | ) | $ | (2,272,463 | ) | (917,256 | ) | $ | (11,559,220 | ) | ||||||
MM RetireSMART by JPMorgan 2025 Fund Class I |
||||||||||||||||
Sold |
680,009 | $ | 7,840,753 | 863,739 | $ | 11,356,222 | ||||||||||
Issued as reinvestment of dividends |
556,875 | 6,727,045 | 255,852 | 3,213,506 | ||||||||||||
Redeemed |
(928,540 | ) | (10,770,815 | ) | (979,583 | ) | (12,884,902 | ) | ||||||||
Net increase (decrease) |
308,344 | $ | 3,796,983 | 140,008 | $ | 1,684,826 | ||||||||||
MM RetireSMART by JPMorgan 2025 Fund Class R5 |
||||||||||||||||
Sold |
22,491 | $ | 256,692 | 63,844 | $ | 829,287 | ||||||||||
Issued as reinvestment of dividends |
13,922 | 170,263 | 2,673 | 33,951 | ||||||||||||
Redeemed |
(17,844 | ) | (197,559 | ) | (3,263 | ) | (43,351 | ) | ||||||||
Net increase (decrease) |
18,569 | $ | 229,396 | 63,254 | $ | 819,887 | ||||||||||
MM RetireSMART by JPMorgan 2025 Fund Service Class |
||||||||||||||||
Sold |
121,698 | $ | 1,423,126 | 61,564 | $ | 807,346 | ||||||||||
Issued as reinvestment of dividends |
82,875 | 1,005,276 | 44,574 | 561,635 | ||||||||||||
Redeemed |
(473,798 | ) | (5,555,801 | ) | (262,634 | ) | (3,469,340 | ) | ||||||||
Net increase (decrease) |
(269,225 | ) | $ | (3,127,399 | ) | (156,496 | ) | $ | (2,100,359 | ) | ||||||
MM RetireSMART by JPMorgan 2025 Fund Administrative Class |
||||||||||||||||
Sold |
385,967 | $ | 4,532,380 | 430,375 | $ | 5,542,338 | ||||||||||
Issued as reinvestment of dividends |
335,378 | 4,048,008 | 196,440 | 2,465,327 | ||||||||||||
Redeemed |
(817,664 | ) | (9,453,047 | ) | (1,289,318 | ) | (16,802,749 | ) | ||||||||
Net increase (decrease) |
(96,319 | ) | $ | (872,659 | ) | (662,503 | ) | $ | (8,795,084 | ) | ||||||
MM RetireSMART by JPMorgan 2025 Fund Class R4 |
||||||||||||||||
Sold |
286,564 | $ | 3,239,691 | 446,282 | $ | 5,747,965 | ||||||||||
Issued as reinvestment of dividends |
266,161 | 3,159,331 | 154,549 | 1,910,226 | ||||||||||||
Redeemed |
(569,428 | ) | (6,851,847 | ) | (889,691 | ) | (11,407,565 | ) | ||||||||
Net increase (decrease) |
(16,703 | ) | $ | (452,825 | ) | (288,860 | ) | $ | (3,749,374 | ) | ||||||
MM RetireSMART by JPMorgan 2025 Fund Class A |
||||||||||||||||
Sold |
193,654 | $ | 2,221,071 | 766,755 | $ | 9,748,190 | ||||||||||
Issued as reinvestment of dividends |
109,158 | 1,319,721 | 362,780 | 4,502,094 | ||||||||||||
Redeemed |
(458,106 | ) | (5,354,771 | ) | (5,816,794 | ) | (76,781,258 | ) | ||||||||
Net increase (decrease) |
(155,294 | ) | $ | (1,813,979 | ) | (4,687,259 | ) | $ | (62,530,974 | ) | ||||||
171
Notes to Financial Statements (Continued) |
Year Ended September 30, 2022 |
Year Ended September 30, 2021 |
|||||||||||||||
Shares |
Amount |
Shares |
Amount |
|||||||||||||
MM RetireSMART by JPMorgan 2025 Fund Class R3 |
||||||||||||||||
Sold |
500,081 | $ | 5,772,128 | 560,258 | $ | 7,201,658 | ||||||||||
Issued as reinvestment of dividends |
578,831 | 6,859,146 | 309,536 | 3,819,675 | ||||||||||||
Redeemed |
(1,554,963 | ) | (17,720,728 | ) | (1,854,093 | ) | (23,820,670 | ) | ||||||||
Net increase (decrease) |
(476,051 | ) | $ | (5,089,454 | ) | (984,299 | ) | $ | (12,799,337 | ) | ||||||
MM RetireSMART by JPMorgan 2030 Fund Class I |
||||||||||||||||
Sold |
1,203,134 | $ | 14,332,736 | 1,549,695 | $ | 20,256,456 | ||||||||||
Issued as reinvestment of dividends |
605,796 | 7,590,627 | 217,866 | 2,771,252 | ||||||||||||
Redeemed |
(859,968 | ) | (10,383,358 | ) | (1,231,880 | ) | (16,363,227 | ) | ||||||||
Net increase (decrease) |
948,962 | $ | 11,540,005 | 535,681 | $ | 6,664,481 | ||||||||||
MM RetireSMART by JPMorgan 2030 Fund Class R5 |
||||||||||||||||
Sold |
1,281,379 | $ | 16,763,225 | 809,595 | $ | 10,828,705 | ||||||||||
Issued as reinvestment of dividends |
792,277 | 9,879,698 | 290,959 | 3,683,540 | ||||||||||||
Redeemed |
(1,000,087 | ) | (12,356,017 | ) | (1,353,355 | ) | (17,502,726 | ) | ||||||||
Net increase (decrease) |
1,073,569 | $ | 14,286,906 | (252,801 | ) | $ | (2,990,481 | ) | ||||||||
MM RetireSMART by JPMorgan 2030 Fund Service Class |
||||||||||||||||
Sold |
416,104 | $ | 4,909,520 | 529,922 | $ | 7,049,742 | ||||||||||
Issued as reinvestment of dividends |
388,790 | 4,887,084 | 194,875 | 2,484,660 | ||||||||||||
Redeemed |
(2,538,103 | ) | (31,203,765 | ) | (1,581,653 | ) | (20,615,673 | ) | ||||||||
Net increase (decrease) |
(1,733,209 | ) | $ | (21,407,161 | ) | (856,856 | ) | $ | (11,081,271 | ) | ||||||
MM RetireSMART by JPMorgan 2030 Fund Administrative Class |
||||||||||||||||
Sold |
593,909 | $ | 7,077,979 | 837,105 | $ | 11,009,820 | ||||||||||
Issued as reinvestment of dividends |
661,465 | 8,294,775 | 274,784 | 3,495,256 | ||||||||||||
Redeemed |
(1,955,644 | ) | (23,624,714 | ) | (1,391,908 | ) | (18,381,702 | ) | ||||||||
Net increase (decrease) |
(700,270 | ) | $ | (8,251,960 | ) | (280,019 | ) | $ | (3,876,626 | ) | ||||||
MM RetireSMART by JPMorgan 2030 Fund Class R4 |
||||||||||||||||
Sold |
364,708 | $ | 4,261,776 | 352,659 | $ | 4,601,570 | ||||||||||
Issued as reinvestment of dividends |
264,697 | 3,261,072 | 129,328 | 1,617,889 | ||||||||||||
Redeemed |
(799,032 | ) | (10,081,060 | ) | (938,033 | ) | (12,272,606 | ) | ||||||||
Net increase (decrease) |
(169,627 | ) | $ | (2,558,212 | ) | (456,046 | ) | $ | (6,053,147 | ) | ||||||
MM RetireSMART by JPMorgan 2030 Fund Class A |
||||||||||||||||
Sold |
372,786 | $ | 4,382,292 | 738,006 | $ | 9,420,283 | ||||||||||
Issued as reinvestment of dividends |
313,069 | 3,907,101 | 357,282 | 4,508,898 | ||||||||||||
Redeemed |
(776,370 | ) | (9,251,517 | ) | (6,114,598 | ) | (82,681,362 | ) | ||||||||
Net increase (decrease) |
(90,515 | ) | $ | (962,124 | ) | (5,019,310 | ) | $ | (68,752,181 | ) | ||||||
MM RetireSMART by JPMorgan 2030 Fund Class R3 |
||||||||||||||||
Sold |
1,065,678 | $ | 12,199,652 | 653,877 | $ | 8,513,868 | ||||||||||
Issued as reinvestment of dividends |
820,572 | 9,912,512 | 331,833 | 4,084,867 | ||||||||||||
Redeemed |
(1,157,250 | ) | (13,260,465 | ) | (2,082,719 | ) | (26,502,408 | ) | ||||||||
Net increase (decrease) |
729,000 | $ | 8,851,699 | (1,097,009 | ) | $ | (13,903,673 | ) | ||||||||
MM RetireSMART by JPMorgan 2035 Fund Class I |
||||||||||||||||
Sold |
706,972 | $ | 8,595,786 | 703,560 | $ | 9,562,168 | ||||||||||
Issued as reinvestment of dividends |
590,064 | 7,493,815 | 161,546 | 2,098,478 | ||||||||||||
Redeemed |
(946,853 | ) | (11,913,043 | ) | (610,058 | ) | (8,314,494 | ) | ||||||||
Net increase (decrease) |
350,183 | $ | 4,176,558 | 255,048 | $ | 3,346,152 | ||||||||||
172
Notes to Financial Statements (Continued) |
Year Ended September 30, 2022 |
Year Ended September 30, 2021 |
|||||||||||||||
Shares |
Amount |
Shares |
Amount |
|||||||||||||
MM RetireSMART by JPMorgan 2035 Fund Class R5 |
||||||||||||||||
Sold |
31,149 | $ | 376,615 | 56,642 | $ | 750,936 | ||||||||||
Issued as reinvestment of dividends |
38,740 | 492,774 | 8,543 | 111,139 | ||||||||||||
Redeemed |
(54,922 | ) | (617,656 | ) | (5,612 | ) | (74,692 | ) | ||||||||
Net increase (decrease) |
14,967 | $ | 251,733 | 59,573 | $ | 787,383 | ||||||||||
MM RetireSMART by JPMorgan 2035 Fund Service Class |
||||||||||||||||
Sold |
96,635 | $ | 1,182,111 | 70,952 | $ | 976,059 | ||||||||||
Issued as reinvestment of dividends |
86,422 | 1,116,572 | 28,465 | 375,163 | ||||||||||||
Redeemed |
(124,554 | ) | (1,608,748 | ) | (211,228 | ) | (3,007,329 | ) | ||||||||
Net increase (decrease) |
58,503 | $ | 689,935 | (111,811 | ) | $ | (1,656,107 | ) | ||||||||
MM RetireSMART by JPMorgan 2035 Fund Administrative Class |
||||||||||||||||
Sold |
511,058 | $ | 6,316,851 | 615,738 | $ | 8,406,883 | ||||||||||
Issued as reinvestment of dividends |
334,899 | 4,300,099 | 94,744 | 1,243,039 | ||||||||||||
Redeemed |
(1,105,064 | ) | (13,752,401 | ) | (796,934 | ) | (10,864,345 | ) | ||||||||
Net increase (decrease) |
(259,107 | ) | $ | (3,135,451 | ) | (86,452 | ) | $ | (1,214,423 | ) | ||||||
MM RetireSMART by JPMorgan 2035 Fund Class R4 |
||||||||||||||||
Sold |
295,268 | $ | 3,449,835 | 293,320 | $ | 3,998,036 | ||||||||||
Issued as reinvestment of dividends |
248,498 | 3,138,533 | 80,786 | 1,043,751 | ||||||||||||
Redeemed |
(336,147 | ) | (4,290,156 | ) | (698,757 | ) | (9,497,690 | ) | ||||||||
Net increase (decrease) |
207,619 | $ | 2,298,212 | (324,651 | ) | $ | (4,455,903 | ) | ||||||||
MM RetireSMART by JPMorgan 2035 Fund Class A |
||||||||||||||||
Sold |
98,528 | $ | 1,191,771 | 576,840 | $ | 7,489,927 | ||||||||||
Issued as reinvestment of dividends |
124,061 | 1,587,976 | 145,968 | 1,894,666 | ||||||||||||
Redeemed |
(466,347 | ) | (5,920,195 | ) | (3,241,003 | ) | (45,741,274 | ) | ||||||||
Net increase (decrease) |
(243,758 | ) | $ | (3,140,448 | ) | (2,518,195 | ) | $ | (36,356,681 | ) | ||||||
MM RetireSMART by JPMorgan 2035 Fund Class R3 |
||||||||||||||||
Sold |
630,921 | $ | 7,485,737 | 472,713 | $ | 6,381,523 | ||||||||||
Issued as reinvestment of dividends |
571,656 | 7,197,154 | 169,353 | 2,182,956 | ||||||||||||
Redeemed |
(800,783 | ) | (9,972,438 | ) | (1,444,042 | ) | (19,307,677 | ) | ||||||||
Net increase (decrease) |
401,794 | $ | 4,710,453 | (801,976 | ) | $ | (10,743,198 | ) | ||||||||
MM RetireSMART by JPMorgan 2040 Fund Class I |
||||||||||||||||
Sold |
1,075,427 | $ | 12,911,956 | 880,821 | $ | 12,009,397 | ||||||||||
Issued as reinvestment of dividends |
561,722 | 7,184,429 | 68,783 | 883,182 | ||||||||||||
Redeemed |
(622,851 | ) | (7,656,556 | ) | (671,888 | ) | (9,022,244 | ) | ||||||||
Net increase (decrease) |
1,014,298 | $ | 12,439,829 | 277,716 | $ | 3,870,335 | ||||||||||
MM RetireSMART by JPMorgan 2040 Fund Class R5 |
||||||||||||||||
Sold |
558,573 | $ | 6,714,498 | 744,446 | $ | 10,190,324 | ||||||||||
Issued as reinvestment of dividends |
605,434 | 7,743,505 | 86,727 | 1,113,580 | ||||||||||||
Redeemed |
(770,478 | ) | (10,439,290 | ) | (850,104 | ) | (11,217,355 | ) | ||||||||
Net increase (decrease) |
393,529 | $ | 4,018,713 | (18,931 | ) | $ | 86,549 | |||||||||
MM RetireSMART by JPMorgan 2040 Fund Service Class |
||||||||||||||||
Sold |
521,544 | $ | 6,514,305 | 390,578 | $ | 5,328,872 | ||||||||||
Issued as reinvestment of dividends |
302,006 | 3,883,802 | 40,701 | 525,453 | ||||||||||||
Redeemed |
(1,597,050 | ) | (19,721,303 | ) | (658,350 | ) | (8,931,733 | ) | ||||||||
Net increase (decrease) |
(773,500 | ) | $ | (9,323,196 | ) | (227,071 | ) | $ | (3,077,408 | ) | ||||||
173
Notes to Financial Statements (Continued) |
Year Ended September 30, 2022 |
Year Ended September 30, 2021 |
|||||||||||||||
Shares |
Amount |
Shares |
Amount |
|||||||||||||
MM RetireSMART by JPMorgan 2040 Fund Administrative Class |
||||||||||||||||
Sold |
805,936 | $ | 9,988,039 | 835,431 | $ | 11,198,935 | ||||||||||
Issued as reinvestment of dividends |
690,533 | 8,831,913 | 78,492 | 1,007,829 | ||||||||||||
Redeemed |
(1,687,925 | ) | (20,440,260 | ) | (895,395 | ) | (11,911,517 | ) | ||||||||
Net increase (decrease) |
(191,456 | ) | $ | (1,620,308 | ) | 18,528 | $ | 295,247 | ||||||||
MM RetireSMART by JPMorgan 2040 Fund Class R4 |
||||||||||||||||
Sold |
227,577 | $ | 2,706,756 | 215,837 | $ | 2,861,206 | ||||||||||
Issued as reinvestment of dividends |
215,585 | 2,703,434 | 31,543 | 398,076 | ||||||||||||
Redeemed |
(371,938 | ) | (4,699,305 | ) | (903,189 | ) | (11,952,792 | ) | ||||||||
Net increase (decrease) |
71,224 | $ | 710,885 | (655,809 | ) | $ | (8,693,510 | ) | ||||||||
MM RetireSMART by JPMorgan 2040 Fund Class A |
||||||||||||||||
Sold |
225,774 | $ | 2,727,256 | 597,044 | $ | 7,565,347 | ||||||||||
Issued as reinvestment of dividends |
236,010 | 3,004,403 | 70,650 | 900,085 | ||||||||||||
Redeemed |
(742,122 | ) | (9,448,618 | ) | (3,209,113 | ) | (44,644,697 | ) | ||||||||
Net increase (decrease) |
(280,338 | ) | $ | (3,716,959 | ) | (2,541,419 | ) | $ | (36,179,265 | ) | ||||||
MM RetireSMART by JPMorgan 2040 Fund Class R3 |
||||||||||||||||
Sold |
912,147 | $ | 10,629,034 | 493,967 | $ | 6,414,595 | ||||||||||
Issued as reinvestment of dividends |
594,490 | 7,294,397 | 70,673 | 875,634 | ||||||||||||
Redeemed |
(783,064 | ) | (9,278,077 | ) | (1,596,340 | ) | (20,625,554 | ) | ||||||||
Net increase (decrease) |
723,573 | $ | 8,645,354 | (1,031,700 | ) | $ | (13,335,325 | ) | ||||||||
MM RetireSMART by JPMorgan 2045 Fund Class I |
||||||||||||||||
Sold |
592,449 | $ | 7,567,213 | 525,252 | $ | 7,283,265 | ||||||||||
Issued as reinvestment of dividends |
404,436 | 5,197,007 | 78,039 | 1,026,207 | ||||||||||||
Redeemed |
(392,045 | ) | (5,049,069 | ) | (350,179 | ) | (4,929,608 | ) | ||||||||
Net increase (decrease) |
604,840 | $ | 7,715,151 | 253,112 | $ | 3,379,864 | ||||||||||
MM RetireSMART by JPMorgan 2045 Fund Class R5 |
||||||||||||||||
Sold |
21,658 | $ | 276,808 | 28,352 | $ | 390,936 | ||||||||||
Issued as reinvestment of dividends |
16,774 | 215,718 | 3,044 | 40,056 | ||||||||||||
Redeemed |
(8,061 | ) | (104,904 | ) | (19,682 | ) | (262,161 | ) | ||||||||
Net increase (decrease) |
30,371 | $ | 387,622 | 11,714 | $ | 168,831 | ||||||||||
MM RetireSMART by JPMorgan 2045 Fund Service Class |
||||||||||||||||
Sold |
78,611 | $ | 937,620 | 46,531 | $ | 663,690 | ||||||||||
Issued as reinvestment of dividends |
58,302 | 750,930 | 12,734 | 167,829 | ||||||||||||
Redeemed |
(125,387 | ) | (1,653,145 | ) | (111,768 | ) | (1,554,783 | ) | ||||||||
Net increase (decrease) |
11,526 | $ | 35,405 | (52,503 | ) | $ | (723,264 | ) | ||||||||
MM RetireSMART by JPMorgan 2045 Fund Administrative Class |
||||||||||||||||
Sold |
436,888 | $ | 5,335,791 | 651,275 | $ | 8,846,530 | ||||||||||
Issued as reinvestment of dividends |
321,804 | 4,119,090 | 63,564 | 832,689 | ||||||||||||
Redeemed |
(824,739 | ) | (10,517,062 | ) | (543,064 | ) | (7,557,809 | ) | ||||||||
Net increase (decrease) |
(66,047 | ) | $ | (1,062,181 | ) | 171,775 | $ | 2,121,410 | ||||||||
MM RetireSMART by JPMorgan 2045 Fund Class R4 |
||||||||||||||||
Sold |
255,261 | $ | 3,074,716 | 333,371 | $ | 4,599,616 | ||||||||||
Issued as reinvestment of dividends |
244,492 | 3,070,820 | 61,722 | 795,600 | ||||||||||||
Redeemed |
(209,554 | ) | (2,780,735 | ) | (607,999 | ) | (8,555,563 | ) | ||||||||
Net increase (decrease) |
290,199 | $ | 3,364,801 | (212,906 | ) | $ | (3,160,347 | ) | ||||||||
174
Notes to Financial Statements (Continued) |
Year Ended September 30, 2022 |
Year Ended September 30, 2021 |
|||||||||||||||
Shares |
Amount |
Shares |
Amount |
|||||||||||||
MM RetireSMART by JPMorgan 2045 Fund Class A |
||||||||||||||||
Sold |
124,962 | $ | 1,514,932 | 453,468 | $ | 5,894,716 | ||||||||||
Issued as reinvestment of dividends |
109,182 | 1,394,259 | 95,054 | 1,232,845 | ||||||||||||
Redeemed |
(406,878 | ) | (5,425,760 | ) | (2,135,096 | ) | (30,690,124 | ) | ||||||||
Net increase (decrease) |
(172,734 | ) | $ | (2,516,569 | ) | (1,586,574 | ) | $ | (23,562,563 | ) | ||||||
MM RetireSMART by JPMorgan 2045 Fund Class R3 |
||||||||||||||||
Sold |
533,627 | $ | 6,223,059 | 357,666 | $ | 4,891,336 | ||||||||||
Issued as reinvestment of dividends |
497,572 | 6,234,573 | 125,817 | 1,619,261 | ||||||||||||
Redeemed |
(650,613 | ) | (8,240,767 | ) | (1,361,566 | ) | (18,459,287 | ) | ||||||||
Net increase (decrease) |
380,586 | $ | 4,216,865 | (878,083 | ) | $ | (11,948,690 | ) | ||||||||
MM RetireSMART by JPMorgan 2050 Fund Class I |
||||||||||||||||
Sold |
1,231,698 | $ | 11,292,625 | 727,345 | $ | 7,255,731 | ||||||||||
Issued as reinvestment of dividends |
425,658 | 4,001,187 | 47,153 | 439,469 | ||||||||||||
Redeemed |
(574,106 | ) | (5,220,764 | ) | (454,192 | ) | (4,504,645 | ) | ||||||||
Net increase (decrease) |
1,083,250 | $ | 10,073,048 | 320,306 | $ | 3,190,555 | ||||||||||
MM RetireSMART by JPMorgan 2050 Fund Class R5 |
||||||||||||||||
Sold |
858,393 | $ | 7,586,241 | 1,076,622 | $ | 10,688,801 | ||||||||||
Issued as reinvestment of dividends |
721,868 | 6,771,126 | 107,786 | 1,003,491 | ||||||||||||
Redeemed |
(682,322 | ) | (6,453,048 | ) | (1,525,906 | ) | (14,601,024 | ) | ||||||||
Net increase (decrease) |
897,939 | $ | 7,904,319 | (341,498 | ) | $ | (2,908,732 | ) | ||||||||
MM RetireSMART by JPMorgan 2050 Fund Service Class |
||||||||||||||||
Sold |
455,042 | $ | 4,161,020 | 404,635 | $ | 3,962,019 | ||||||||||
Issued as reinvestment of dividends |
189,649 | 1,792,181 | 24,906 | 233,370 | ||||||||||||
Redeemed |
(1,229,167 | ) | (10,982,339 | ) | (445,648 | ) | (4,332,948 | ) | ||||||||
Net increase (decrease) |
(584,476 | ) | $ | (5,029,138 | ) | (16,107 | ) | $ | (137,559 | ) | ||||||
MM RetireSMART by JPMorgan 2050 Fund Administrative Class |
||||||||||||||||
Sold |
946,201 | $ | 8,542,156 | 1,083,935 | $ | 10,593,161 | ||||||||||
Issued as reinvestment of dividends |
672,285 | 6,326,202 | 74,280 | 693,031 | ||||||||||||
Redeemed |
(1,299,460 | ) | (11,686,683 | ) | (842,002 | ) | (8,269,128 | ) | ||||||||
Net increase (decrease) |
319,026 | $ | 3,181,675 | 316,213 | $ | 3,017,064 | ||||||||||
MM RetireSMART by JPMorgan 2050 Fund Class R4 |
||||||||||||||||
Sold |
303,105 | $ | 2,667,840 | 344,634 | $ | 3,369,310 | ||||||||||
Issued as reinvestment of dividends |
225,116 | 2,086,826 | 30,421 | 279,871 | ||||||||||||
Redeemed |
(371,598 | ) | (3,473,261 | ) | (659,614 | ) | (6,502,588 | ) | ||||||||
Net increase (decrease) |
156,623 | $ | 1,281,405 | (284,559 | ) | $ | (2,853,407 | ) | ||||||||
MM RetireSMART by JPMorgan 2050 Fund Class A |
||||||||||||||||
Sold |
225,995 | $ | 2,031,725 | 502,567 | $ | 4,703,972 | ||||||||||
Issued as reinvestment of dividends |
171,963 | 1,613,009 | 56,079 | 519,288 | ||||||||||||
Redeemed |
(637,062 | ) | (6,009,941 | ) | (2,391,017 | ) | (24,469,667 | ) | ||||||||
Net increase (decrease) |
(239,104 | ) | $ | (2,365,207 | ) | (1,832,371 | ) | $ | (19,246,407 | ) | ||||||
MM RetireSMART by JPMorgan 2050 Fund Class R3 |
||||||||||||||||
Sold |
1,009,350 | $ | 8,760,808 | 551,292 | $ | 5,375,087 | ||||||||||
Issued as reinvestment of dividends |
498,635 | 4,577,472 | 59,803 | 546,001 | ||||||||||||
Redeemed |
(837,554 | ) | (7,655,501 | ) | (1,262,865 | ) | (12,002,359 | ) | ||||||||
Net increase (decrease) |
670,431 | $ | 5,682,779 | (651,770 | ) | $ | (6,081,271 | ) | ||||||||
175
Notes to Financial Statements (Continued) |
Year Ended September 30, 2022 |
Year Ended September 30, 2021 |
|||||||||||||||
Shares |
Amount |
Shares |
Amount |
|||||||||||||
MM RetireSMART by JPMorgan 2055 Fund Class I |
||||||||||||||||
Sold |
403,186 | $ | 4,250,814 | 404,976 | $ | 4,843,286 | ||||||||||
Issued as reinvestment of dividends |
180,930 | 2,006,510 | 52,641 | 578,530 | ||||||||||||
Redeemed |
(220,175 | ) | (2,330,827 | ) | (251,863 | ) | (2,998,063 | ) | ||||||||
Net increase (decrease) |
363,941 | $ | 3,926,497 | 205,754 | $ | 2,423,753 | ||||||||||
MM RetireSMART by JPMorgan 2055 Fund Class R5 |
||||||||||||||||
Sold |
20,162 | $ | 215,789 | 64,369 | $ | 736,277 | ||||||||||
Issued as reinvestment of dividends |
9,869 | 109,550 | 2,696 | 29,652 | ||||||||||||
Redeemed |
(51,453 | ) | (656,082 | ) | (6,858 | ) | (82,937 | ) | ||||||||
Net increase (decrease) |
(21,422 | ) | $ | (330,743 | ) | 60,207 | $ | 682,992 | ||||||||
MM RetireSMART by JPMorgan 2055 Fund Service Class |
||||||||||||||||
Sold |
88,583 | $ | 939,606 | 49,235 | $ | 589,535 | ||||||||||
Issued as reinvestment of dividends |
26,957 | 300,838 | 8,839 | 97,676 | ||||||||||||
Redeemed |
(69,870 | ) | (801,432 | ) | (39,916 | ) | (477,336 | ) | ||||||||
Net increase (decrease) |
45,670 | $ | 439,012 | 18,158 | $ | 209,875 | ||||||||||
MM RetireSMART by JPMorgan 2055 Fund Administrative Class |
||||||||||||||||
Sold |
322,959 | $ | 3,346,192 | 449,762 | $ | 5,104,756 | ||||||||||
Issued as reinvestment of dividends |
134,404 | 1,486,503 | 40,469 | 443,948 | ||||||||||||
Redeemed |
(313,419 | ) | (3,265,515 | ) | (338,394 | ) | (3,851,548 | ) | ||||||||
Net increase (decrease) |
143,944 | $ | 1,567,180 | 151,837 | $ | 1,697,156 | ||||||||||
MM RetireSMART by JPMorgan 2055 Fund Class R4 |
||||||||||||||||
Sold |
170,486 | $ | 1,769,505 | 212,365 | $ | 2,471,970 | ||||||||||
Issued as reinvestment of dividends |
88,927 | 978,197 | 38,284 | 417,683 | ||||||||||||
Redeemed |
(196,555 | ) | (2,158,935 | ) | (295,071 | ) | (3,498,012 | ) | ||||||||
Net increase (decrease) |
62,858 | $ | 588,767 | (44,422 | ) | $ | (608,359 | ) | ||||||||
MM RetireSMART by JPMorgan 2055 Fund Class A |
||||||||||||||||
Sold |
83,704 | $ | 922,581 | 255,117 | $ | 2,896,529 | ||||||||||
Issued as reinvestment of dividends |
24,762 | 278,324 | 56,063 | 613,895 | ||||||||||||
Redeemed |
(477,313 | ) | (5,616,762 | ) | (801,732 | ) | (9,761,811 | ) | ||||||||
Net increase (decrease) |
(368,847 | ) | $ | (4,415,857 | ) | (490,552 | ) | $ | (6,251,387 | ) | ||||||
MM RetireSMART by JPMorgan 2055 Fund Class R3 |
||||||||||||||||
Sold |
548,413 | $ | 5,661,983 | 323,607 | $ | 3,767,844 | ||||||||||
Issued as reinvestment of dividends |
290,062 | 3,173,283 | 121,349 | 1,317,852 | ||||||||||||
Redeemed |
(421,357 | ) | (4,436,745 | ) | (891,831 | ) | (10,218,639 | ) | ||||||||
Net increase (decrease) |
417,118 | $ | 4,398,521 | (446,875 | ) | $ | (5,132,943 | ) | ||||||||
MM RetireSMART by JPMorgan 2060 Fund Class I |
||||||||||||||||
Sold |
180,852 | $ | 1,860,657 | 179,662 | $ | 2,088,609 | ||||||||||
Issued as reinvestment of dividends |
37,118 | 409,416 | 8,069 | 86,576 | ||||||||||||
Redeemed |
(101,256 | ) | (1,104,224 | ) | (42,237 | ) | (486,988 | ) | ||||||||
Net increase (decrease) |
116,714 | $ | 1,165,849 | 145,494 | $ | 1,688,197 | ||||||||||
MM RetireSMART by JPMorgan 2060 Fund Class R5 |
||||||||||||||||
Sold |
3,642 | $ | 37,494 | 59,539 | $ | 684,498 | ||||||||||
Issued as reinvestment of dividends |
207 | 2,290 | 4,064 | 43,480 | ||||||||||||
Redeemed |
(93,773 | ) | (1,134,208 | ) | (28,218 | ) | (330,398 | ) | ||||||||
Net increase (decrease) |
(89,924 | ) | $ | (1,094,424 | ) | 35,385 | $ | 397,580 | ||||||||
176
Notes to Financial Statements (Continued) |
Year Ended September 30, 2022 |
Year Ended September 30, 2021 |
|||||||||||||||
Shares |
Amount |
Shares |
Amount |
|||||||||||||
MM RetireSMART by JPMorgan 2060 Fund Service Class |
||||||||||||||||
Sold |
181,904 | $ | 1,899,588 | 66,564 | $ | 768,465 | ||||||||||
Issued as reinvestment of dividends |
24,323 | 267,065 | 6,326 | 67,620 | ||||||||||||
Redeemed |
(234,100 | ) | (2,341,843 | ) | (48,979 | ) | (523,433 | ) | ||||||||
Net increase (decrease) |
(27,873 | ) | $ | (175,190 | ) | 23,911 | $ | 312,652 | ||||||||
MM RetireSMART by JPMorgan 2060 Fund Administrative Class |
||||||||||||||||
Sold |
123,649 | $ | 1,284,482 | 103,851 | $ | 1,212,381 | ||||||||||
Issued as reinvestment of dividends |
22,762 | 249,474 | 6,022 | 64,312 | ||||||||||||
Redeemed |
(120,113 | ) | (1,233,688 | ) | (57,188 | ) | (633,442 | ) | ||||||||
Net increase (decrease) |
26,298 | $ | 300,268 | 52,685 | $ | 643,251 | ||||||||||
MM RetireSMART by JPMorgan 2060 Fund Class R4 |
||||||||||||||||
Sold |
39,226 | $ | 398,864 | 33,390 | $ | 379,265 | ||||||||||
Issued as reinvestment of dividends |
10,262 | 112,476 | 4,032 | 43,062 | ||||||||||||
Redeemed |
(25,718 | ) | (267,605 | ) | (30,080 | ) | (337,390 | ) | ||||||||
Net increase (decrease) |
23,770 | $ | 243,735 | 7,342 | $ | 84,937 | ||||||||||
MM RetireSMART by JPMorgan 2060 Fund Class A |
||||||||||||||||
Sold |
13,231 | $ | 138,834 | 51,334 | $ | 555,115 | ||||||||||
Issued as reinvestment of dividends |
3,152 | 34,668 | 7,016 | 74,723 | ||||||||||||
Redeemed |
(29,102 | ) | (324,018 | ) | (127,851 | ) | (1,514,896 | ) | ||||||||
Net increase (decrease) |
(12,719 | ) | $ | (150,516 | ) | (69,501 | ) | $ | (885,058 | ) | ||||||
MM RetireSMART by JPMorgan 2060 Fund Class R3 |
||||||||||||||||
Sold |
53,991 | $ | 551,892 | 30,374 | $ | 348,769 | ||||||||||
Issued as reinvestment of dividends |
13,655 | 149,244 | 9,711 | 103,328 | ||||||||||||
Redeemed |
(35,288 | ) | (396,244 | ) | (105,113 | ) | (1,193,341 | ) | ||||||||
Net increase (decrease) |
32,358 | $ | 304,892 | (65,028 | ) | $ | (741,244 | ) | ||||||||
MM Select T. Rowe Price Retirement Balanced Fund Class I |
||||||||||||||||
Sold |
305,970 | $ | 5,129,030 | 464,519 | $ | 8,092,154 | ||||||||||
Issued as reinvestment of dividends |
159,695 | 2,585,460 | 49,672 | 825,060 | ||||||||||||
Redeemed |
(403,719 | ) | (6,268,633 | ) | (242,666 | ) | (4,192,307 | ) | ||||||||
Net increase (decrease) |
61,946 | $ | 1,445,857 | 271,525 | $ | 4,724,907 | ||||||||||
MM Select T. Rowe Price Retirement Balanced Fund Class M5 |
||||||||||||||||
Sold |
939,621 | $ | 15,021,860 | 1,365,518 | $ | 23,265,930 | ||||||||||
Issued as reinvestment of dividends |
903,450 | 14,662,986 | 324,806 | 5,404,774 | ||||||||||||
Redeemed |
(1,149,916 | ) | (17,984,347 | ) | (887,330 | ) | (15,226,628 | ) | ||||||||
Net increase (decrease) |
693,155 | $ | 11,700,499 | 802,994 | $ | 13,444,076 | ||||||||||
MM Select T. Rowe Price Retirement Balanced Fund Class M4 |
||||||||||||||||
Sold |
65,162 | $ | 1,048,778 | 119,741 | $ | 2,040,070 | ||||||||||
Issued as reinvestment of dividends |
60,258 | 981,001 | 47,012 | 780,868 | ||||||||||||
Redeemed |
(387,506 | ) | (6,353,045 | ) | (583,425 | ) | (10,246,789 | ) | ||||||||
Net increase (decrease) |
(262,086 | ) | $ | (4,323,266 | ) | (416,672 | ) | $ | (7,425,851 | ) | ||||||
MM Select T. Rowe Price Retirement Balanced Fund Class M3 |
||||||||||||||||
Sold |
441,659 | $ | 6,880,981 | 90,024 | $ | 1,551,047 | ||||||||||
Issued as reinvestment of dividends |
32,800 | 532,352 | 12,181 | 202,562 | ||||||||||||
Redeemed |
(526,393 | ) | (8,189,626 | ) | (124,296 | ) | (2,108,510 | ) | ||||||||
Net increase (decrease) |
(51,934 | ) | $ | (776,293 | ) | (22,091 | ) | $ | (354,901 | ) | ||||||
177
Notes to Financial Statements (Continued) |
Year Ended September 30, 2022 |
Year Ended September 30, 2021 |
|||||||||||||||
Shares |
Amount |
Shares |
Amount |
|||||||||||||
MM Select T. Rowe Price Retirement 2005 Fund Class I |
||||||||||||||||
Sold |
233,822 | $ | 3,354,818 | 338,862 | $ | 5,732,743 | ||||||||||
Issued as reinvestment of dividends |
184,236 | 2,750,646 | 64,096 | 1,057,591 | ||||||||||||
Redeemed |
(193,687 | ) | (2,804,677 | ) | (624,550 | ) | (10,731,059 | ) | ||||||||
Net increase (decrease) |
224,371 | $ | 3,300,787 | (221,592 | ) | $ | (3,940,725 | ) | ||||||||
MM Select T. Rowe Price Retirement 2005 Fund Class M5 |
||||||||||||||||
Sold |
86,908 | $ | 1,386,710 | 264,139 | $ | 4,508,274 | ||||||||||
Issued as reinvestment of dividends |
84,126 | 1,254,316 | 23,719 | 390,897 | ||||||||||||
Redeemed |
(158,881 | ) | (2,391,961 | ) | (363,714 | ) | (6,249,874 | ) | ||||||||
Net increase (decrease) |
12,153 | $ | 249,065 | (75,856 | ) | $ | (1,350,703 | ) | ||||||||
MM Select T. Rowe Price Retirement 2005 Fund Class M4 |
||||||||||||||||
Sold |
31,602 | $ | 497,323 | 69,605 | $ | 1,191,175 | ||||||||||
Issued as reinvestment of dividends |
29,162 | 435,381 | 8,599 | 141,796 | ||||||||||||
Redeemed |
(71,163 | ) | (1,108,922 | ) | (114,533 | ) | (1,976,203 | ) | ||||||||
Net increase (decrease) |
(10,399 | ) | $ | (176,218 | ) | (36,329 | ) | $ | (643,232 | ) | ||||||
MM Select T. Rowe Price Retirement 2005 Fund Class M3 |
||||||||||||||||
Sold |
14,692 | $ | 214,246 | 52,916 | $ | 909,683 | ||||||||||
Issued as reinvestment of dividends |
15,742 | 234,087 | 3,079 | 50,687 | ||||||||||||
Redeemed |
(4,908 | ) | (75,869 | ) | (40,002 | ) | (691,916 | ) | ||||||||
Net increase (decrease) |
25,526 | $ | 372,464 | 15,993 | $ | 268,454 | ||||||||||
MM Select T. Rowe Price Retirement 2010 Fund Class I |
||||||||||||||||
Sold |
1,143,144 | $ | 17,306,645 | 790,104 | $ | 13,509,877 | ||||||||||
Issued as reinvestment of dividends |
503,398 | 8,034,238 | 201,357 | 3,326,410 | ||||||||||||
Redeemed |
(1,156,618 | ) | (17,417,636 | ) | (1,194,114 | ) | (20,810,982 | ) | ||||||||
Net increase (decrease) |
489,924 | $ | 7,923,247 | (202,653 | ) | $ | (3,974,695 | ) | ||||||||
MM Select T. Rowe Price Retirement 2010 Fund Class M5 |
||||||||||||||||
Sold |
534,947 | $ | 9,126,725 | 605,052 | $ | 10,129,993 | ||||||||||
Issued as reinvestment of dividends |
258,465 | 4,122,512 | 70,652 | 1,167,166 | ||||||||||||
Redeemed |
(1,076,399 | ) | (16,525,536 | ) | (624,441 | ) | (10,609,487 | ) | ||||||||
Net increase (decrease) |
(282,987 | ) | $ | (3,276,299 | ) | 51,263 | $ | 687,672 | ||||||||
MM Select T. Rowe Price Retirement 2010 Fund Class M4 |
||||||||||||||||
Sold |
116,771 | $ | 1,933,606 | 139,338 | $ | 2,385,404 | ||||||||||
Issued as reinvestment of dividends |
125,292 | 2,002,161 | 76,410 | 1,260,759 | ||||||||||||
Redeemed |
(953,754 | ) | (15,118,796 | ) | (604,431 | ) | (10,202,568 | ) | ||||||||
Net increase (decrease) |
(711,691 | ) | $ | (11,183,029 | ) | (388,683 | ) | $ | (6,556,405 | ) | ||||||
MM Select T. Rowe Price Retirement 2010 Fund Class M3 |
||||||||||||||||
Sold |
46,966 | $ | 730,513 | 86,201 | $ | 1,468,587 | ||||||||||
Issued as reinvestment of dividends |
87,971 | 1,406,657 | 31,859 | 526,947 | ||||||||||||
Redeemed |
(269,373 | ) | (4,118,995 | ) | (235,465 | ) | (4,009,010 | ) | ||||||||
Net increase (decrease) |
(134,436 | ) | $ | (1,981,825 | ) | (117,405 | ) | $ | (2,013,476 | ) | ||||||
MM Select T. Rowe Price Retirement 2015 Fund Class I |
||||||||||||||||
Sold |
1,408,416 | $ | 21,902,134 | 1,439,929 | $ | 24,674,475 | ||||||||||
Issued as reinvestment of dividends |
444,615 | 7,318,355 | 192,638 | 3,224,766 | ||||||||||||
Redeemed |
(1,401,511 | ) | (21,937,030 | ) | (1,303,125 | ) | (22,838,996 | ) | ||||||||
Net increase (decrease) |
451,520 | $ | 7,283,459 | 329,442 | $ | 5,060,245 | ||||||||||
178
Notes to Financial Statements (Continued) |
Year Ended September 30, 2022 |
Year Ended September 30, 2021 |
|||||||||||||||
Shares |
Amount |
Shares |
Amount |
|||||||||||||
MM Select T. Rowe Price Retirement 2015 Fund Class M5 |
||||||||||||||||
Sold |
240,413 | $ | 3,934,063 | 432,279 | $ | 7,469,217 | ||||||||||
Issued as reinvestment of dividends |
382,761 | 6,292,593 | 147,172 | 2,462,179 | ||||||||||||
Redeemed |
(1,298,852 | ) | (20,043,666 | ) | (343,439 | ) | (6,010,325 | ) | ||||||||
Net increase (decrease) |
(675,678 | ) | $ | (9,817,010 | ) | 236,012 | $ | 3,921,071 | ||||||||
MM Select T. Rowe Price Retirement 2015 Fund Class M4 |
||||||||||||||||
Sold |
198,709 | $ | 3,285,817 | 102,467 | $ | 1,789,487 | ||||||||||
Issued as reinvestment of dividends |
55,236 | 911,386 | 30,505 | 510,957 | ||||||||||||
Redeemed |
(541,783 | ) | (8,706,873 | ) | (268,944 | ) | (4,687,546 | ) | ||||||||
Net increase (decrease) |
(287,838 | ) | $ | (4,509,670 | ) | (135,972 | ) | $ | (2,387,102 | ) | ||||||
MM Select T. Rowe Price Retirement 2015 Fund Class M3 |
||||||||||||||||
Sold |
63,261 | $ | 1,058,577 | 122,810 | $ | 2,105,488 | ||||||||||
Issued as reinvestment of dividends |
40,920 | 672,724 | 17,052 | 285,443 | ||||||||||||
Redeemed |
(165,128 | ) | (2,516,012 | ) | (197,141 | ) | (3,376,828 | ) | ||||||||
Net increase (decrease) |
(60,947 | ) | $ | (784,711 | ) | (57,279 | ) | $ | (985,897 | ) | ||||||
MM Select T. Rowe Price Retirement 2020 Fund Class I |
||||||||||||||||
Sold |
7,537,641 | $ | 118,800,632 | 4,104,039 | $ | 71,590,126 | ||||||||||
Issued as reinvestment of dividends |
2,115,656 | 34,844,854 | 728,783 | 12,360,165 | ||||||||||||
Redeemed |
(6,399,516 | ) | (100,417,346 | ) | (4,585,926 | ) | (81,226,539 | ) | ||||||||
Net increase (decrease) |
3,253,781 | $ | 53,228,140 | 246,896 | $ | 2,723,752 | ||||||||||
MM Select T. Rowe Price Retirement 2020 Fund Class M5 |
||||||||||||||||
Sold |
2,073,917 | $ | 36,474,873 | 3,066,608 | $ | 52,991,805 | ||||||||||
Issued as reinvestment of dividends |
2,087,119 | 34,353,981 | 640,680 | 10,865,930 | ||||||||||||
Redeemed |
(9,427,089 | ) | (149,486,130 | ) | (4,118,856 | ) | (72,647,080 | ) | ||||||||
Net increase (decrease) |
(5,266,053 | ) | $ | (78,657,276 | ) | (411,568 | ) | $ | (8,789,345 | ) | ||||||
MM Select T. Rowe Price Retirement 2020 Fund Class M4 |
||||||||||||||||
Sold |
1,015,694 | $ | 16,572,201 | 1,201,362 | $ | 21,180,014 | ||||||||||
Issued as reinvestment of dividends |
762,490 | 12,573,464 | 394,024 | 6,678,707 | ||||||||||||
Redeemed |
(4,180,320 | ) | (68,524,820 | ) | (3,774,885 | ) | (65,814,223 | ) | ||||||||
Net increase (decrease) |
(2,402,136 | ) | $ | (39,379,155 | ) | (2,179,499 | ) | $ | (37,955,502 | ) | ||||||
MM Select T. Rowe Price Retirement 2020 Fund Class M3 |
||||||||||||||||
Sold |
385,892 | $ | 6,387,993 | 802,491 | $ | 13,839,761 | ||||||||||
Issued as reinvestment of dividends |
354,209 | 5,847,991 | 135,036 | 2,294,268 | ||||||||||||
Redeemed |
(1,097,789 | ) | (17,651,009 | ) | (1,961,788 | ) | (34,486,603 | ) | ||||||||
Net increase (decrease) |
(357,688 | ) | $ | (5,415,025 | ) | (1,024,261 | ) | $ | (18,352,574 | ) | ||||||
MM Select T. Rowe Price Retirement 2025 Fund Class I |
||||||||||||||||
Sold |
8,539,331 | $ | 140,810,463 | 7,073,901 | $ | 127,891,009 | ||||||||||
Issued as reinvestment of dividends |
2,295,536 | 39,896,413 | 712,872 | 12,461,008 | ||||||||||||
Redeemed |
(5,208,866 | ) | (84,955,302 | ) | (5,281,785 | ) | (97,064,364 | ) | ||||||||
Net increase (decrease) |
5,626,001 | $ | 95,751,574 | 2,504,988 | $ | 43,287,653 | ||||||||||
MM Select T. Rowe Price Retirement 2025 Fund Class M5 |
||||||||||||||||
Sold |
1,563,591 | $ | 27,503,087 | 2,163,008 | $ | 39,540,510 | ||||||||||
Issued as reinvestment of dividends |
1,193,224 | 20,726,297 | 367,856 | 6,426,451 | ||||||||||||
Redeemed |
(7,032,570 | ) | (115,383,994 | ) | (1,885,963 | ) | (34,710,606 | ) | ||||||||
Net increase (decrease) |
(4,275,755 | ) | $ | (67,154,610 | ) | 644,901 | $ | 11,256,355 | ||||||||
MM Select T. Rowe Price Retirement 2025 Fund Class M4 |
||||||||||||||||
Sold |
1,489,503 | $ | 26,528,455 | 1,395,092 | $ | 25,464,651 | ||||||||||
Issued as reinvestment of dividends |
530,954 | 9,222,674 | 196,560 | 3,433,898 | ||||||||||||
Redeemed |
(3,531,937 | ) | (59,574,375 | ) | (1,857,569 | ) | (33,901,691 | ) | ||||||||
Net increase (decrease) |
(1,511,480 | ) | $ | (23,823,246 | ) | (265,917 | ) | $ | (5,003,142 | ) | ||||||
179
Notes to Financial Statements (Continued) |
Year Ended September 30, 2022 |
Year Ended September 30, 2021 |
|||||||||||||||
Shares |
Amount |
Shares |
Amount |
|||||||||||||
MM Select T. Rowe Price Retirement 2025 Fund Class M3 |
||||||||||||||||
Sold |
556,793 | $ | 9,492,429 | 1,110,932 | $ | 19,886,024 | ||||||||||
Issued as reinvestment of dividends |
298,488 | 5,178,774 | 114,056 | 1,990,274 | ||||||||||||
Redeemed |
(1,011,720 | ) | (16,360,888 | ) | (1,902,958 | ) | (34,509,818 | ) | ||||||||
Net increase (decrease) |
(156,439 | ) | $ | (1,689,685 | ) | (677,970 | ) | $ | (12,633,520 | ) | ||||||
MM Select T. Rowe Price Retirement 2030 Fund Class I |
||||||||||||||||
Sold |
17,006,579 | $ | 292,539,511 | 7,281,570 | $ | 135,233,928 | ||||||||||
Issued as reinvestment of dividends |
3,174,371 | 57,773,560 | 881,983 | 15,761,035 | ||||||||||||
Redeemed |
(6,119,019 | ) | (105,056,902 | ) | (4,693,823 | ) | (88,881,538 | ) | ||||||||
Net increase (decrease) |
14,061,931 | $ | 245,256,169 | 3,469,730 | $ | 62,113,425 | ||||||||||
MM Select T. Rowe Price Retirement 2030 Fund Class M5 |
||||||||||||||||
Sold |
4,535,657 | $ | 84,779,466 | 6,781,304 | $ | 123,964,061 | ||||||||||
Issued as reinvestment of dividends |
3,573,025 | 64,993,323 | 906,716 | 16,203,011 | ||||||||||||
Redeemed |
(18,516,774 | ) | (319,692,290 | ) | (4,370,000 | ) | (82,382,320 | ) | ||||||||
Net increase (decrease) |
(10,408,092 | ) | $ | (169,919,501 | ) | 3,318,020 | $ | 57,784,752 | ||||||||
MM Select T. Rowe Price Retirement 2030 Fund Class M4 |
||||||||||||||||
Sold |
2,073,734 | $ | 37,649,230 | 2,608,926 | $ | 49,133,927 | ||||||||||
Issued as reinvestment of dividends |
1,252,988 | 22,804,376 | 533,508 | 9,523,116 | ||||||||||||
Redeemed |
(8,189,081 | ) | (140,447,148 | ) | (6,390,327 | ) | (117,016,352 | ) | ||||||||
Net increase (decrease) |
(4,862,359 | ) | $ | (79,993,542 | ) | (3,247,893 | ) | $ | (58,359,309 | ) | ||||||
MM Select T. Rowe Price Retirement 2030 Fund Class M3 |
||||||||||||||||
Sold |
966,388 | $ | 17,088,642 | 1,077,433 | $ | 19,661,188 | ||||||||||
Issued as reinvestment of dividends |
552,753 | 10,071,168 | 172,455 | 3,085,222 | ||||||||||||
Redeemed |
(1,734,460 | ) | (30,562,929 | ) | (3,015,357 | ) | (55,749,121 | ) | ||||||||
Net increase (decrease) |
(215,319 | ) | $ | (3,403,119 | ) | (1,765,469 | ) | $ | (33,002,711 | ) | ||||||
MM Select T. Rowe Price Retirement 2035 Fund Class I |
||||||||||||||||
Sold |
11,256,790 | $ | 198,143,268 | 5,514,941 | $ | 104,574,394 | ||||||||||
Issued as reinvestment of dividends |
1,726,216 | 32,763,576 | 465,300 | 8,473,120 | ||||||||||||
Redeemed |
(3,378,692 | ) | (59,564,725 | ) | (2,634,738 | ) | (51,236,097 | ) | ||||||||
Net increase (decrease) |
9,604,314 | $ | 171,342,119 | 3,345,503 | $ | 61,811,417 | ||||||||||
MM Select T. Rowe Price Retirement 2035 Fund Class M5 |
||||||||||||||||
Sold |
1,713,564 | $ | 32,461,820 | 1,902,709 | $ | 37,039,466 | ||||||||||
Issued as reinvestment of dividends |
1,094,005 | 20,742,335 | 301,681 | 5,490,596 | ||||||||||||
Redeemed |
(7,630,090 | ) | (134,789,582 | ) | (1,303,922 | ) | (24,929,714 | ) | ||||||||
Net increase (decrease) |
(4,822,521 | ) | $ | (81,585,427 | ) | 900,468 | $ | 17,600,348 | ||||||||
MM Select T. Rowe Price Retirement 2035 Fund Class M4 |
||||||||||||||||
Sold |
1,974,053 | $ | 36,677,551 | 2,258,492 | $ | 43,817,075 | ||||||||||
Issued as reinvestment of dividends |
487,832 | 9,244,410 | 131,483 | 2,391,669 | ||||||||||||
Redeemed |
(3,822,459 | ) | (67,790,009 | ) | (980,018 | ) | (19,013,027 | ) | ||||||||
Net increase (decrease) |
(1,360,574 | ) | $ | (21,868,048 | ) | 1,409,957 | $ | 27,195,717 | ||||||||
MM Select T. Rowe Price Retirement 2035 Fund Class M3 |
||||||||||||||||
Sold |
576,007 | $ | 10,520,197 | 638,967 | $ | 11,825,316 | ||||||||||
Issued as reinvestment of dividends |
190,005 | 3,608,202 | 75,478 | 1,372,936 | ||||||||||||
Redeemed |
(543,110 | ) | (9,930,100 | ) | (2,031,739 | ) | (39,232,693 | ) | ||||||||
Net increase (decrease) |
222,902 | $ | 4,198,299 | (1,317,294 | ) | $ | (26,034,441 | ) | ||||||||
MM Select T. Rowe Price Retirement 2040 Fund Class I |
||||||||||||||||
Sold |
17,842,756 | $ | 323,377,353 | 4,927,804 | $ | 95,246,646 | ||||||||||
Issued as reinvestment of dividends |
1,844,301 | 36,056,081 | 501,325 | 9,279,529 | ||||||||||||
Redeemed |
(3,433,976 | ) | (62,515,762 | ) | (3,359,159 | ) | (66,171,281 | ) | ||||||||
Net increase (decrease) |
16,253,081 | $ | 296,917,672 | 2,069,970 | $ | 38,354,894 | ||||||||||
180
Notes to Financial Statements (Continued) |
Year Ended September 30, 2022 |
Year Ended September 30, 2021 |
|||||||||||||||
Shares |
Amount |
Shares |
Amount |
|||||||||||||
MM Select T. Rowe Price Retirement 2040 Fund Class M5 |
||||||||||||||||
Sold |
4,171,443 | $ | 82,602,986 | 6,572,217 | $ | 124,438,168 | ||||||||||
Issued as reinvestment of dividends |
2,732,688 | 53,396,718 | 613,121 | 11,348,863 | ||||||||||||
Redeemed |
(16,150,828 | ) | (295,456,679 | ) | (2,416,172 | ) | (46,478,211 | ) | ||||||||
Net increase (decrease) |
(9,246,697 | ) | $ | (159,456,975 | ) | 4,769,166 | $ | 89,308,820 | ||||||||
MM Select T. Rowe Price Retirement 2040 Fund Class M4 |
||||||||||||||||
Sold |
2,395,284 | $ | 45,742,603 | 2,075,384 | $ | 40,928,370 | ||||||||||
Issued as reinvestment of dividends |
844,992 | 16,502,684 | 363,456 | 6,713,026 | ||||||||||||
Redeemed |
(6,988,390 | ) | (126,862,891 | ) | (5,360,898 | ) | (100,734,215 | ) | ||||||||
Net increase (decrease) |
(3,748,114 | ) | $ | (64,617,604 | ) | (2,922,058 | ) | $ | (53,092,819 | ) | ||||||
MM Select T. Rowe Price Retirement 2040 Fund Class M3 |
||||||||||||||||
Sold |
855,996 | $ | 15,886,397 | 908,834 | $ | 17,290,393 | ||||||||||
Issued as reinvestment of dividends |
354,201 | 6,931,706 | 103,356 | 1,914,156 | ||||||||||||
Redeemed |
(1,186,981 | ) | (22,700,434 | ) | (2,502,386 | ) | (48,346,735 | ) | ||||||||
Net increase (decrease) |
23,216 | $ | 117,669 | (1,490,196 | ) | $ | (29,142,186 | ) | ||||||||
MM Select T. Rowe Price Retirement 2045 Fund Class I |
||||||||||||||||
Sold |
11,288,128 | $ | 205,849,243 | 3,867,260 | $ | 76,044,553 | ||||||||||
Issued as reinvestment of dividends |
1,064,698 | 21,166,192 | 252,233 | 4,711,717 | ||||||||||||
Redeemed |
(2,017,855 | ) | (36,741,964 | ) | (1,604,391 | ) | (32,349,847 | ) | ||||||||
Net increase (decrease) |
10,334,971 | $ | 190,273,471 | 2,515,102 | $ | 48,406,423 | ||||||||||
MM Select T. Rowe Price Retirement 2045 Fund Class M5 |
||||||||||||||||
Sold |
1,343,450 | $ | 25,847,325 | 1,461,159 | $ | 29,441,322 | ||||||||||
Issued as reinvestment of dividends |
844,791 | 16,777,545 | 209,722 | 3,915,508 | ||||||||||||
Redeemed |
(7,258,926 | ) | (133,207,378 | ) | (679,177 | ) | (13,399,447 | ) | ||||||||
Net increase (decrease) |
(5,070,685 | ) | $ | (90,582,508 | ) | 991,704 | $ | 19,957,383 | ||||||||
MM Select T. Rowe Price Retirement 2045 Fund Class M4 |
||||||||||||||||
Sold |
1,940,581 | $ | 38,287,849 | 1,528,719 | $ | 30,317,779 | ||||||||||
Issued as reinvestment of dividends |
374,404 | 7,420,678 | 90,627 | 1,690,198 | ||||||||||||
Redeemed |
(3,391,168 | ) | (60,246,314 | ) | (893,982 | ) | (17,644,416 | ) | ||||||||
Net increase (decrease) |
(1,076,183 | ) | $ | (14,537,787 | ) | 725,364 | $ | 14,363,561 | ||||||||
MM Select T. Rowe Price Retirement 2045 Fund Class M3 |
||||||||||||||||
Sold |
422,286 | $ | 7,951,088 | 524,290 | $ | 10,038,412 | ||||||||||
Issued as reinvestment of dividends |
129,246 | 2,571,996 | 43,621 | 814,412 | ||||||||||||
Redeemed |
(397,067 | ) | (7,662,141 | ) | (1,687,466 | ) | (33,012,679 | ) | ||||||||
Net increase (decrease) |
154,465 | $ | 2,860,943 | (1,119,555 | ) | $ | (22,159,855 | ) | ||||||||
MM Select T. Rowe Price Retirement 2050 Fund Class I |
||||||||||||||||
Sold |
12,533,874 | $ | 231,236,518 | 3,708,242 | $ | 72,939,736 | ||||||||||
Issued as reinvestment of dividends |
1,034,578 | 20,743,294 | 276,039 | 5,153,642 | ||||||||||||
Redeemed |
(1,853,714 | ) | (34,588,469 | ) | (1,375,033 | ) | (27,537,988 | ) | ||||||||
Net increase (decrease) |
11,714,738 | $ | 217,391,343 | 2,609,248 | $ | 50,555,390 | ||||||||||
MM Select T. Rowe Price Retirement 2050 Fund Class M5 |
||||||||||||||||
Sold |
3,013,172 | $ | 59,185,787 | 4,626,361 | $ | 89,309,701 | ||||||||||
Issued as reinvestment of dividends |
1,590,415 | 31,856,014 | 417,762 | 7,799,608 | ||||||||||||
Redeemed |
(9,794,915 | ) | (184,286,116 | ) | (1,986,442 | ) | (37,755,314 | ) | ||||||||
Net increase (decrease) |
(5,191,328 | ) | $ | (93,244,315 | ) | 3,057,681 | $ | 59,353,995 | ||||||||
181
Notes to Financial Statements (Continued) |
Year Ended September 30, 2022 |
Year Ended September 30, 2021 |
|||||||||||||||
Shares |
Amount |
Shares |
Amount |
|||||||||||||
MM Select T. Rowe Price Retirement 2050 Fund Class M4 |
||||||||||||||||
Sold |
2,415,289 | $ | 47,389,056 | 1,783,070 | $ | 35,187,896 | ||||||||||
Issued as reinvestment of dividends |
516,154 | 10,328,244 | 219,310 | 4,085,747 | ||||||||||||
Redeemed |
(5,909,371 | ) | (104,994,499 | ) | (3,195,050 | ) | (60,904,525 | ) | ||||||||
Net increase (decrease) |
(2,977,928 | ) | $ | (47,277,199 | ) | (1,192,670 | ) | $ | (21,630,882 | ) | ||||||
MM Select T. Rowe Price Retirement 2050 Fund Class M3 |
||||||||||||||||
Sold |
579,263 | $ | 11,001,966 | 820,918 | $ | 15,631,320 | ||||||||||
Issued as reinvestment of dividends |
213,368 | 4,275,899 | 65,421 | 1,220,747 | ||||||||||||
Redeemed |
(749,277 | ) | (14,392,576 | ) | (1,450,967 | ) | (28,312,695 | ) | ||||||||
Net increase (decrease) |
43,354 | $ | 885,289 | (564,628 | ) | $ | (11,460,628 | ) | ||||||||
MM Select T. Rowe Price Retirement 2055 Fund Class I |
||||||||||||||||
Sold |
9,407,027 | $ | 172,120,699 | 1,970,847 | $ | 38,801,235 | ||||||||||
Issued as reinvestment of dividends |
451,953 | 9,025,508 | 120,986 | 2,253,961 | ||||||||||||
Redeemed |
(978,561 | ) | (18,086,779 | ) | (776,180 | ) | (15,616,399 | ) | ||||||||
Net increase (decrease) |
8,880,419 | $ | 163,059,428 | 1,315,653 | $ | 25,438,797 | ||||||||||
MM Select T. Rowe Price Retirement 2055 Fund Class M5 |
||||||||||||||||
Sold |
1,111,691 | $ | 21,879,145 | 1,494,776 | $ | 29,803,216 | ||||||||||
Issued as reinvestment of dividends |
561,937 | 11,205,031 | 155,950 | 2,902,228 | ||||||||||||
Redeemed |
(6,200,220 | ) | (114,761,201 | ) | (610,625 | ) | (11,871,458 | ) | ||||||||
Net increase (decrease) |
(4,526,592 | ) | $ | (81,677,025 | ) | 1,040,101 | $ | 20,833,986 | ||||||||
MM Select T. Rowe Price Retirement 2055 Fund Class M4 |
||||||||||||||||
Sold |
1,404,133 | $ | 27,210,498 | 845,856 | $ | 16,904,947 | ||||||||||
Issued as reinvestment of dividends |
188,075 | 3,746,457 | 50,088 | 931,634 | ||||||||||||
Redeemed |
(2,131,753 | ) | (38,065,701 | ) | (484,615 | ) | (9,532,136 | ) | ||||||||
Net increase (decrease) |
(539,545 | ) | $ | (7,108,746 | ) | 411,329 | $ | 8,304,445 | ||||||||
MM Select T. Rowe Price Retirement 2055 Fund Class M3 |
||||||||||||||||
Sold |
364,367 | $ | 6,750,865 | 442,031 | $ | 8,218,717 | ||||||||||
Issued as reinvestment of dividends |
75,680 | 1,509,059 | 28,072 | 521,858 | ||||||||||||
Redeemed |
(184,672 | ) | (3,542,998 | ) | (797,050 | ) | (15,602,549 | ) | ||||||||
Net increase (decrease) |
255,375 | $ | 4,716,926 | (326,947 | ) | $ | (6,861,974 | ) | ||||||||
MM Select T. Rowe Price Retirement 2060 Fund Class I |
||||||||||||||||
Sold |
2,425,971 | $ | 43,805,340 | 1,493,589 | $ | 29,764,354 | ||||||||||
Issued as reinvestment of dividends |
235,469 | 4,688,197 | 49,706 | 924,535 | ||||||||||||
Redeemed |
(645,198 | ) | (11,854,282 | ) | (548,443 | ) | (10,879,298 | ) | ||||||||
Net increase (decrease) |
2,016,242 | $ | 36,639,255 | 994,852 | $ | 19,809,591 | ||||||||||
MM Select T. Rowe Price Retirement 2060 Fund Class M5 |
||||||||||||||||
Sold |
1,076,260 | $ | 20,001,196 | 898,238 | $ | 17,720,639 | ||||||||||
Issued as reinvestment of dividends |
143,748 | 2,856,276 | 25,355 | 471,099 | ||||||||||||
Redeemed |
(366,788 | ) | (6,860,239 | ) | (247,150 | ) | (4,879,704 | ) | ||||||||
Net increase (decrease) |
853,220 | $ | 15,997,233 | 676,443 | $ | 13,312,034 | ||||||||||
MM Select T. Rowe Price Retirement 2060 Fund Class M4 |
||||||||||||||||
Sold |
1,055,966 | $ | 19,445,369 | 575,616 | $ | 11,433,668 | ||||||||||
Issued as reinvestment of dividends |
79,541 | 1,576,504 | 20,830 | 386,399 | ||||||||||||
Redeemed |
(941,124 | ) | (16,791,259 | ) | (520,718 | ) | (9,930,612 | ) | ||||||||
Net increase (decrease) |
194,383 | $ | 4,230,614 | 75,728 | $ | 1,889,455 | ||||||||||
MM Select T. Rowe Price Retirement 2060 Fund Class M3 |
||||||||||||||||
Sold |
209,526 | $ | 3,852,887 | 198,040 | $ | 3,731,566 | ||||||||||
Issued as reinvestment of dividends |
23,830 | 472,782 | 9,098 | 168,503 | ||||||||||||
Redeemed |
(94,635 | ) | (1,801,031 | ) | (252,373 | ) | (4,995,196 | ) | ||||||||
Net increase (decrease) |
138,721 | $ | 2,524,638 | (45,235 | ) | $ | (1,095,127 | ) | ||||||||
182
Notes to Financial Statements (Continued) |
Unless waived, purchases of Class A shares are subject to a front-end sales charge of up to 5.50% of the amount purchased. A portion of the front-end sales charge may be retained by the Distributor. The Distributor retained $26 for the MM RetireSMART by JPMorgan 2040 Fund during the year ended September 30, 2022.
Unless waived, redemptions of Class A shares made within 18 months of purchase from initial investments of $1 million or more are subject to a contingent deferred sales charge of 1.00% of the amount redeemed. The Distributor receives all contingent deferred sales charges. For the year ended September 30, 2022, no amounts have been retained by the Distributor.
With respect to Class A shares, the Distributor may pay an up-front concession to financial intermediaries through which sales are made as described in the Funds’ Prospectus.
6. Federal Income Tax Information
At September 30, 2022, the aggregate cost of investments and the unrealized appreciation (depreciation) in the value of all investments owned by the Fund(s), as computed on a federal income tax basis, were as follows:
Federal Income |
Tax Basis |
Tax Basis |
Net Unrealized |
|||||||||||||
20/80 Allocation Fund |
$ | 192,745,226 | $ | 399,813 | $ | (34,798,397 | ) | $ | (34,398,584 | ) | ||||||
40/60 Allocation Fund |
210,048,867 | 599,792 | (40,807,456 | ) | (40,207,664 | ) | ||||||||||
60/40 Allocation Fund |
197,081,767 | 221,421 | (40,098,151 | ) | (39,876,730 | ) | ||||||||||
80/20 Allocation Fund |
146,320,698 | 808,484 | (33,270,945 | ) | (32,462,461 | ) | ||||||||||
MM RetireSMART by JPMorgan In Retirement Fund |
101,499,310 | 37,930 | (18,363,465 | ) | (18,325,535 | ) | ||||||||||
MM RetireSMART by JPMorgan 2020 Fund |
197,296,301 | 61,397 | (35,550,364 | ) | (35,488,967 | ) | ||||||||||
MM RetireSMART by JPMorgan 2025 Fund |
178,022,353 | 139,341 | (35,961,114 | ) | (35,821,773 | ) | ||||||||||
MM RetireSMART by JPMorgan 2030 Fund |
393,495,500 | 265,925 | (84,313,433 | ) | (84,047,508 | ) | ||||||||||
MM RetireSMART by JPMorgan 2035 Fund |
177,501,424 | 183,000 | (39,244,264 | ) | (39,061,264 | ) | ||||||||||
MM RetireSMART by JPMorgan 2040 Fund |
287,009,697 | 309,489 | (63,201,785 | ) | (62,892,296 | ) | ||||||||||
MM RetireSMART by JPMorgan 2045 Fund |
131,444,523 | 170,134 | (30,418,664 | ) | (30,248,530 | ) | ||||||||||
MM RetireSMART by JPMorgan 2050 Fund |
202,895,828 | 196,309 | (46,110,675 | ) | (45,914,366 | ) | ||||||||||
MM RetireSMART by JPMorgan 2055 Fund |
68,978,829 | 75,050 | (16,368,523 | ) | (16,293,473 | ) | ||||||||||
MM RetireSMART by JPMorgan 2060 Fund |
22,866,809 | 15,096 | (5,533,953 | ) | (5,518,857 | ) | ||||||||||
MM Select T. Rowe Price Retirement Balanced Fund |
187,913,980 | 193,667 | (29,921,912 | ) | (29,728,245 | ) | ||||||||||
MM Select T. Rowe Price Retirement 2005 Fund |
29,488,915 | 21,691 | (5,129,506 | ) | (5,107,815 | ) | ||||||||||
MM Select T. Rowe Price Retirement 2010 Fund |
125,010,091 | 192,794 | (21,900,814 | ) | (21,708,020 | ) | ||||||||||
MM Select T. Rowe Price Retirement 2015 Fund |
137,036,161 | 196,003 | (22,964,494 | ) | (22,768,491 | ) | ||||||||||
MM Select T. Rowe Price Retirement 2020 Fund |
611,812,731 | 702,434 | (100,403,516 | ) | (99,701,082 | ) | ||||||||||
MM Select T. Rowe Price Retirement 2025 Fund |
634,344,927 | 575,254 | (107,100,549 | ) | (106,525,295 | ) | ||||||||||
MM Select T. Rowe Price Retirement 2030 Fund |
1,375,546,418 | 1,156,133 | (202,939,372 | ) | (201,783,239 | ) | ||||||||||
MM Select T. Rowe Price Retirement 2035 Fund |
727,276,044 | 434,885 | (113,608,501 | ) | (113,173,616 | ) | ||||||||||
MM Select T. Rowe Price Retirement 2040 Fund |
1,202,393,845 | 433,240 | (174,978,926 | ) | (174,545,686 | ) | ||||||||||
MM Select T. Rowe Price Retirement 2045 Fund |
564,885,002 | 23,123 | (89,214,352 | ) | (89,191,229 | ) | ||||||||||
MM Select T. Rowe Price Retirement 2050 Fund |
824,924,897 | 14,410 | (123,426,590 | ) | (123,412,180 | ) | ||||||||||
MM Select T. Rowe Price Retirement 2055 Fund |
352,630,937 | 5,062 | (57,675,670 | ) | (57,670,608 | ) | ||||||||||
MM Select T. Rowe Price Retirement 2060 Fund |
160,877,654 | 2,831 | (30,388,406 | ) | (30,385,575 | ) | ||||||||||
Net capital loss carryforwards may be applied against any net realized taxable gains in succeeding years, subject to the carryforward period limitations, where applicable. Capital losses may be carried forward indefinitely, and retain the character of the original loss.
At September 30, 2022, for federal income tax purposes, there were no unused capital losses.
183
Notes to Financial Statements (Continued) |
The following Fund(s) elected to defer to the fiscal year beginning October 1, 2022, late year ordinary losses:
Amount |
||||
MM Select T. Rowe Price Retirement 2030 Fund |
$ | 2,603,189 | ||
MM Select T. Rowe Price Retirement 2035 Fund |
1,830,737 | |||
MM Select T. Rowe Price Retirement 2040 Fund |
4,734,635 | |||
MM Select T. Rowe Price Retirement 2045 Fund |
2,178,724 | |||
MM Select T. Rowe Price Retirement 2050 Fund |
3,574,783 | |||
MM Select T. Rowe Price Retirement 2060 Fund |
560,467 | |||
Generally accepted accounting principles in the United States of America require that only distributions in excess of tax basis earnings and profits be reported in the financial statements as a return of capital.
The tax character of distributions (including capital gain dividends, if any, designated pursuant to Section 852 of the Code) paid during the year ended September 30, 2022, was as follows:
Ordinary |
Long Term |
|||||||
20/80 Allocation Fund |
$ | 5,773,608 | $ | 7,216,709 | ||||
40/60 Allocation Fund |
6,696,300 | 11,946,689 | ||||||
60/40 Allocation Fund |
8,155,101 | 17,817,029 | ||||||
80/20 Allocation Fund |
4,486,636 | 11,796,555 | ||||||
MM RetireSMART by JPMorgan In Retirement Fund |
3,851,393 | 9,329,916 | ||||||
MM RetireSMART by JPMorgan 2020 Fund |
9,288,244 | 16,065,771 | ||||||
MM RetireSMART by JPMorgan 2025 Fund |
7,124,617 | 16,164,173 | ||||||
MM RetireSMART by JPMorgan 2030 Fund |
13,540,089 | 34,192,780 | ||||||
MM RetireSMART by JPMorgan 2035 Fund |
6,080,813 | 19,260,798 | ||||||
MM RetireSMART by JPMorgan 2040 Fund |
9,354,902 | 31,290,981 | ||||||
MM RetireSMART by JPMorgan 2045 Fund |
4,166,318 | 16,833,751 | ||||||
MM RetireSMART by JPMorgan 2050 Fund |
6,883,238 | 20,284,765 | ||||||
MM RetireSMART by JPMorgan 2055 Fund |
2,039,207 | 6,451,591 | ||||||
MM RetireSMART by JPMorgan 2060 Fund |
783,889 | 1,958,115 | ||||||
MM Select T. Rowe Price Retirement Balanced Fund |
7,115,125 | 11,646,674 | ||||||
MM Select T. Rowe Price Retirement 2005 Fund |
1,357,592 | 3,334,823 | ||||||
MM Select T. Rowe Price Retirement 2010 Fund |
5,310,387 | 10,255,181 | ||||||
MM Select T. Rowe Price Retirement 2015 Fund |
5,206,666 | 9,988,392 | ||||||
MM Select T. Rowe Price Retirement 2020 Fund |
25,271,795 | 62,348,495 | ||||||
MM Select T. Rowe Price Retirement 2025 Fund |
23,345,921 | 51,678,237 | ||||||
MM Select T. Rowe Price Retirement 2030 Fund |
54,756,932 | 100,885,494 | ||||||
MM Select T. Rowe Price Retirement 2035 Fund |
27,736,963 | 38,621,560 | ||||||
MM Select T. Rowe Price Retirement 2040 Fund |
52,502,131 | 60,385,058 | ||||||
MM Select T. Rowe Price Retirement 2045 Fund |
22,858,059 | 25,078,352 | ||||||
MM Select T. Rowe Price Retirement 2050 Fund |
35,715,171 | 31,488,280 | ||||||
MM Select T. Rowe Price Retirement 2055 Fund |
11,815,181 | 13,670,874 | ||||||
MM Select T. Rowe Price Retirement 2060 Fund |
4,846,160 | 4,747,599 | ||||||
184
Notes to Financial Statements (Continued) |
The tax character of distributions (including capital gain dividends, if any, designated pursuant to Section 852 of the Code) paid during the year ended September 30, 2021, was as follows:
Ordinary |
Long Term |
|||||||
20/80 Allocation Fund |
$ | 6,912,673 | $ | 3,835,241 | ||||
40/60 Allocation Fund |
6,528,736 | 5,057,277 | ||||||
60/40 Allocation Fund |
5,152,629 | 3,111,437 | ||||||
80/20 Allocation Fund |
2,329,878 | 4,366,908 | ||||||
MM RetireSMART by JPMorgan In Retirement Fund |
6,142,449 | 4,776,823 | ||||||
MM RetireSMART by JPMorgan 2020 Fund |
11,260,302 | 6,896,687 | ||||||
MM RetireSMART by JPMorgan 2025 Fund |
8,314,627 | 8,191,787 | ||||||
MM RetireSMART by JPMorgan 2030 Fund |
11,888,107 | 10,758,255 | ||||||
MM RetireSMART by JPMorgan 2035 Fund |
4,345,039 | 4,608,372 | ||||||
MM RetireSMART by JPMorgan 2040 Fund |
5,383,008 | 320,831 | ||||||
MM RetireSMART by JPMorgan 2045 Fund |
2,178,218 | 3,540,149 | ||||||
MM RetireSMART by JPMorgan 2050 Fund |
3,156,541 | 557,980 | ||||||
MM RetireSMART by JPMorgan 2055 Fund |
985,575 | 2,570,924 | ||||||
MM RetireSMART by JPMorgan 2060 Fund |
348,416 | 779,863 | ||||||
MM Select T. Rowe Price Retirement Balanced Fund |
3,760,652 | 3,452,612 | ||||||
MM Select T. Rowe Price Retirement 2005 Fund |
804,782 | 841,098 | ||||||
MM Select T. Rowe Price Retirement 2010 Fund |
3,131,794 | 3,149,488 | ||||||
MM Select T. Rowe Price Retirement 2015 Fund |
2,982,450 | 3,500,895 | ||||||
MM Select T. Rowe Price Retirement 2020 Fund |
13,720,482 | 18,478,588 | ||||||
MM Select T. Rowe Price Retirement 2025 Fund |
9,784,845 | 14,526,786 | ||||||
MM Select T. Rowe Price Retirement 2030 Fund |
17,254,192 | 27,318,192 | ||||||
MM Select T. Rowe Price Retirement 2035 Fund |
6,229,193 | 11,499,128 | ||||||
MM Select T. Rowe Price Retirement 2040 Fund |
8,110,897 | 21,144,677 | ||||||
MM Select T. Rowe Price Retirement 2045 Fund |
2,687,176 | 8,444,659 | ||||||
MM Select T. Rowe Price Retirement 2050 Fund |
3,928,942 | 14,330,802 | ||||||
MM Select T. Rowe Price Retirement 2055 Fund |
1,378,034 | 5,231,647 | ||||||
MM Select T. Rowe Price Retirement 2060 Fund |
422,073 | 1,528,463 | ||||||
The following Fund(s) have elected to pass through the foreign tax credit for the year ended September 30, 2022:
Amount |
||||
20/80 Allocation Fund |
$ | 16,804 | ||
40/60 Allocation Fund |
35,053 | |||
60/40 Allocation Fund |
32,402 | |||
80/20 Allocation Fund |
46,848 | |||
MM RetireSMART by JPMorgan In Retirement Fund |
29,290 | |||
MM RetireSMART by JPMorgan 2020 Fund |
64,002 | |||
MM RetireSMART by JPMorgan 2025 Fund |
76,456 | |||
MM RetireSMART by JPMorgan 2030 Fund |
313,670 | |||
MM RetireSMART by JPMorgan 2035 Fund |
107,484 | |||
MM RetireSMART by JPMorgan 2045 Fund |
96,217 | |||
MM RetireSMART by JPMorgan 2050 Fund |
149,584 | |||
MM RetireSMART by JPMorgan 2055 Fund |
47,108 | |||
MM RetireSMART by JPMorgan 2060 Fund |
17,131 | |||
MM Select T. Rowe Price Retirement Balanced Fund |
51,445 | |||
MM Select T. Rowe Price Retirement 2005 Fund |
8,143 | |||
MM Select T. Rowe Price Retirement 2010 Fund |
43,596 | |||
185
Notes to Financial Statements (Continued) |
Amount |
||||
MM Select T. Rowe Price Retirement 2015 Fund |
$ | 49,759 | ||
MM Select T. Rowe Price Retirement 2020 Fund |
264,456 | |||
MM Select T. Rowe Price Retirement 2025 Fund |
285,652 | |||
MM Select T. Rowe Price Retirement 2030 Fund |
759,038 | |||
MM Select T. Rowe Price Retirement 2035 Fund |
401,922 | |||
MM Select T. Rowe Price Retirement 2040 Fund |
768,558 | |||
MM Select T. Rowe Price Retirement 2045 Fund |
342,200 | |||
MM Select T. Rowe Price Retirement 2050 Fund |
536,247 | |||
MM Select T. Rowe Price Retirement 2055 Fund |
198,600 | |||
MM Select T. Rowe Price Retirement 2060 Fund |
72,764 | |||
Capital accounts within the financial statements are periodically adjusted for permanent differences between book and tax accounting. These adjustments have no impact on net assets or the results of operations. Temporary book and tax accounting differences will reverse in subsequent periods. At September 30, 2022, temporary book and tax accounting differences were primarily attributable to the deferral of wash sale losses, deferred Trustee compensation, and other temporary basis adjustments
At September 30, 2022, the components of distributable earnings on a tax basis were as follows:
Undistributed |
Undistributed |
Other |
Unrealized |
Total |
||||||||||||||||
20/80 Allocation Fund |
$ | 1,332,743 | $ | 3,272,268 | $ | (19,101 | ) | $ | (34,398,584 | ) | $ | (29,812,674 | ) | |||||||
40/60 Allocation Fund |
932,404 | 7,653,087 | (32,969 | ) | (40,207,664 | ) | (31,655,142 | ) | ||||||||||||
60/40 Allocation Fund |
568,379 | 13,844,710 | (26,545 | ) | (39,876,730 | ) | (25,490,186 | ) | ||||||||||||
80/20 Allocation Fund |
492,395 | 12,912,102 | (8,945 | ) | (32,462,461 | ) | (19,066,909 | ) | ||||||||||||
MM RetireSMART by JPMorgan In Retirement Fund |
3,877,541 | 2,122,032 | (32,209 | ) | (18,325,535 | ) | (12,358,171 | ) | ||||||||||||
MM RetireSMART by JPMorgan 2020 Fund |
2,043,946 | 4,516,664 | (55,325 | ) | (35,488,967 | ) | (28,983,682 | ) | ||||||||||||
MM RetireSMART by JPMorgan 2025 Fund |
1,263,528 | 8,525,878 | (13,045 | ) | (35,821,773 | ) | (26,045,412 | ) | ||||||||||||
MM RetireSMART by JPMorgan 2030 Fund |
2,631,893 | 23,853,271 | (52,131 | ) | (84,047,508 | ) | (57,614,475 | ) | ||||||||||||
MM RetireSMART by JPMorgan 2035 Fund |
916,469 | 13,262,571 | (14,321 | ) | (39,061,264 | ) | (24,896,545 | ) | ||||||||||||
MM RetireSMART by JPMorgan 2040 Fund |
1,656,575 | 22,847,024 | (31,780 | ) | (62,892,296 | ) | (38,420,477 | ) | ||||||||||||
MM RetireSMART by JPMorgan 2045 Fund |
645,703 | 12,669,855 | (8,457 | ) | (30,248,530 | ) | (16,941,429 | ) | ||||||||||||
MM RetireSMART by JPMorgan 2050 Fund |
1,112,798 | 16,834,365 | (15,672 | ) | (45,914,366 | ) | (27,982,875 | ) | ||||||||||||
MM RetireSMART by JPMorgan 2055 Fund |
324,589 | 6,449,064 | (1,917 | ) | (16,293,473 | ) | (9,521,737 | ) | ||||||||||||
MM RetireSMART by JPMorgan 2060 Fund |
152,120 | 2,185,008 | (556 | ) | (5,518,857 | ) | (3,182,285 | ) | ||||||||||||
MM Select T. Rowe Price Retirement Balanced Fund |
115,374 | 8,500,659 | — | (29,728,245 | ) | (21,112,212 | ) | |||||||||||||
MM Select T. Rowe Price Retirement 2005 Fund |
26,986 | 1,080,455 | — | (5,107,815 | ) | (4,000,374 | ) | |||||||||||||
MM Select T. Rowe Price Retirement 2010 Fund |
73,182 | 7,543,051 | — | (21,708,020 | ) | (14,091,787 | ) | |||||||||||||
MM Select T. Rowe Price Retirement 2015 Fund |
78,570 | 8,956,493 | — | (22,768,491 | ) | (13,733,428 | ) | |||||||||||||
MM Select T. Rowe Price Retirement 2020 Fund |
— | 49,831,294 | — | (99,701,082 | ) | (49,869,788 | ) | |||||||||||||
MM Select T. Rowe Price Retirement 2025 Fund |
— | 54,274,394 | — | (106,525,295 | ) | (52,250,901 | ) | |||||||||||||
MM Select T. Rowe Price Retirement 2030 Fund |
17,739 | 132,629,224 | (2,603,189 | ) | (201,783,239 | ) | (71,739,465 | ) | ||||||||||||
MM Select T. Rowe Price Retirement 2035 Fund |
— | 66,805,545 | (1,830,737 | ) | (113,173,616 | ) | (48,198,808 | ) | ||||||||||||
MM Select T. Rowe Price Retirement 2040 Fund |
— | 137,037,635 | (4,734,635 | ) | (174,545,686 | ) | (42,242,686 | ) | ||||||||||||
MM Select T. Rowe Price Retirement 2045 Fund |
— | 56,849,527 | (2,178,724 | ) | (89,191,229 | ) | (34,520,426 | ) | ||||||||||||
MM Select T. Rowe Price Retirement 2050 Fund |
— | 91,161,364 | (3,574,783 | ) | (123,412,180 | ) | (35,825,599 | ) | ||||||||||||
MM Select T. Rowe Price Retirement 2055 Fund |
— | 30,549,313 | — | (57,670,608 | ) | (27,121,295 | ) | |||||||||||||
MM Select T. Rowe Price Retirement 2060 Fund |
— | 11,546,252 | (560,467 | ) | (30,385,575 | ) | (19,399,790 | ) | ||||||||||||
186
Notes to Financial Statements (Continued) |
During the year ended September 30, 2022, the following amounts were reclassified due to permanent differences between book and tax accounting:
Paid-in |
Accumulated |
Undistributed |
||||||||||
20/80 Allocation Fund |
$ | — | $ | (1,403,778 | ) | $ | 1,403,778 | |||||
40/60 Allocation Fund |
— | (2,478,735 | ) | 2,478,735 | ||||||||
60/40 Allocation Fund |
(1 | ) | (3,215,104 | ) | 3,215,105 | |||||||
80/20 Allocation Fund |
— | (2,586,959 | ) | 2,586,959 | ||||||||
MM RetireSMART by JPMorgan In Retirement Fund |
— | (1,158,471 | ) | 1,158,471 | ||||||||
MM RetireSMART by JPMorgan 2020 Fund |
— | (2,521,357 | ) | 2,521,357 | ||||||||
MM RetireSMART by JPMorgan 2025 Fund |
— | (2,216,935 | ) | 2,216,935 | ||||||||
MM RetireSMART by JPMorgan 2030 Fund |
— | (5,132,587 | ) | 5,132,587 | ||||||||
MM RetireSMART by JPMorgan 2035 Fund |
— | (2,871,508 | ) | 2,871,508 | ||||||||
MM RetireSMART by JPMorgan 2040 Fund |
— | (5,165,510 | ) | 5,165,510 | ||||||||
MM RetireSMART by JPMorgan 2045 Fund |
— | (2,424,649 | ) | 2,424,649 | ||||||||
MM RetireSMART by JPMorgan 2050 Fund |
— | (3,774,418 | ) | 3,774,418 | ||||||||
MM RetireSMART by JPMorgan 2055 Fund |
— | (1,189,249 | ) | 1,189,249 | ||||||||
MM RetireSMART by JPMorgan 2060 Fund |
— | (431,487 | ) | 431,487 | ||||||||
MM Select T. Rowe Price Retirement Balanced Fund |
— | (1,911,067 | ) | 1,911,067 | ||||||||
MM Select T. Rowe Price Retirement 2005 Fund |
— | (299,149 | ) | 299,149 | ||||||||
MM Select T. Rowe Price Retirement 2010 Fund |
— | (1,600,296 | ) | 1,600,296 | ||||||||
MM Select T. Rowe Price Retirement 2015 Fund |
— | (1,785,825 | ) | 1,785,825 | ||||||||
MM Select T. Rowe Price Retirement 2020 Fund |
— | (9,457,020 | ) | 9,457,020 | ||||||||
MM Select T. Rowe Price Retirement 2025 Fund |
— | (10,395,365 | ) | 10,395,365 | ||||||||
MM Select T. Rowe Price Retirement 2030 Fund |
— | (27,724,225 | ) | 27,724,225 | ||||||||
MM Select T. Rowe Price Retirement 2035 Fund |
— | (15,867,704 | ) | 15,867,704 | ||||||||
MM Select T. Rowe Price Retirement 2040 Fund |
— | (32,018,199 | ) | 32,018,199 | ||||||||
MM Select T. Rowe Price Retirement 2045 Fund |
— | (14,562,113 | ) | 14,562,113 | ||||||||
MM Select T. Rowe Price Retirement 2050 Fund |
— | (22,874,947 | ) | 22,874,947 | ||||||||
MM Select T. Rowe Price Retirement 2055 Fund |
— | (9,801,875 | ) | 9,801,875 | ||||||||
MM Select T. Rowe Price Retirement 2060 Fund |
— | (3,093,308 | ) | 3,093,308 | ||||||||
The Funds did not have any unrecognized tax benefits at September 30, 2022, nor were there any increases or decreases in unrecognized tax benefits for the year then ended. The Funds recognize interest and penalties, if any, related to unrecognized tax benefits as an income tax expense in the Statements of Operations. During the year ended September 30, 2022, the Funds did not incur any such interest or penalties. The Funds are subject to examination by U.S. federal and state tax authorities for returns filed for the prior three fiscal years. Foreign taxes are provided for based on the Funds’ understanding of the tax rules and rates that exist in the foreign markets in which they invest.
7. Investment in Affiliated Issuers
A summary of the Funds’ transactions in the securities of affiliated issuers during the year ended September 30, 2022, was as follows:
Beginning |
Purchases |
Sales |
Change in |
Net Realized |
Value as of |
Number of |
Dividend |
Realized |
||||||||||||||||||||||||||||
20/80 Allocation Fund |
||||||||||||||||||||||||||||||||||||
Barings Global Floating Rate Fund, Class Y* |
$ | 1,559,442 | $ | 11,859 | $ | (1,545,740 | ) | $ | (25,561 | ) | $ | — | $ | — | $ | — | $ | 10,473 | $ | — | ||||||||||||||||
187
Notes to Financial Statements (Continued) |
Beginning |
Purchases |
Sales |
Change in |
Net Realized |
Value as of |
Number of |
Dividend |
Realized |
||||||||||||||||||||||||||||
20/80 Allocation Fund (Continued) |
||||||||||||||||||||||||||||||||||||
MassMutual Blue Chip Growth Fund, Class I |
$ | 3,483,144 | $ | 2,568,355 | $ | (884,127 | ) | $ | (2,054,245 | ) | $ | (6,591 | ) | $ | 3,106,536 | 165,770 | $ | — | $ | 647,438 | ||||||||||||||||
MassMutual Core Bond Fund, Class I |
34,993,204 | 4,834,827 | (7,291,606 | ) | (6,522,148 | ) | (143,427 | ) | 25,870,850 | 2,842,951 | 809,728 | 526,742 | ||||||||||||||||||||||||
MassMutual Diversified Value Fund, Class I |
2,709,426 | 502,095 | (310,703 | ) | (617,933 | ) | 67,551 | 2,350,436 | 216,232 | 51,803 | 292,242 | |||||||||||||||||||||||||
MassMutual Equity Opportunities Fund, Class I |
3,997,912 | 1,773,282 | (582,538 | ) | (832,078 | ) | 33,792 | 4,390,370 | 263,528 | 50,516 | 439,769 | |||||||||||||||||||||||||
MassMutual Fundamental Value Fund, Class I |
3,237,834 | 653,317 | (530,186 | ) | (631,697 | ) | 17,713 | 2,746,981 | 321,660 | 23,736 | 377,169 | |||||||||||||||||||||||||
MassMutual Global Floating Rate Fund, Class I |
— | 1,583,012 | (999,999 | ) | (48,126 | ) | (32,887 | ) | 502,000 | 59,408 | 27,666 | — | ||||||||||||||||||||||||
MassMutual Global Floating Rate Fund, Class Y |
— | 12,700 | (13,191 | ) | — | 491 | — | — | 12,702 | — | ||||||||||||||||||||||||||
MassMutual Growth Opportunities Fund, Class I |
1,450,735 | 386,028 | (139,760 | ) | (932,202 | ) | (47,560 | ) | 717,241 | 157,290 | — | 318,405 | ||||||||||||||||||||||||
MassMutual High Yield Fund, Class I |
1,290,445 | 2,686,780 | (2,158,592 | ) | (186,392 | ) | (198,736 | ) | 1,433,505 | 197,181 | 159,547 | — | ||||||||||||||||||||||||
MassMutual Inflation-Protected and Income Fund, Class I |
6,106,746 | 741,516 | (4,404,405 | ) | (825,081 | ) | 24,483 | 1,643,259 | 175,750 | 106,528 | 326,055 | |||||||||||||||||||||||||
MassMutual International Equity Fund, Class I |
767,125 | 231,275 | (278,250 | ) | (98,422 | ) | (118,880 | ) | 502,848 | 70,427 | 15,837 | 78,549 | ||||||||||||||||||||||||
MassMutual Mid Cap Growth Fund, Class I |
1,472,740 | 350,956 | (140,866 | ) | (662,188 | ) | 3,402 | 1,024,044 | 55,205 | — | 280,626 | |||||||||||||||||||||||||
MassMutual Mid-Cap Value Fund, Class I |
2,267,697 | 610,219 | (1,140,865 | ) | (717,148 | ) | 69,504 | 1,089,407 | 103,164 | 23,255 | 518,879 | |||||||||||||||||||||||||
MassMutual Overseas Fund, Class I |
2,736,115 | 2,175,382 | (864,865 | ) | (1,220,125 | ) | 43,698 | 2,870,205 | 413,574 | 38,658 | 224,021 | |||||||||||||||||||||||||
MassMutual Short-Duration Bond Fund, Class I |
40,778,792 | 3,341,740 | (10,385,507 | ) | (4,273,188 | ) | (1,404,446 | ) | 28,057,391 | 3,236,147 | 1,729,010 | — | ||||||||||||||||||||||||
MassMutual Small Cap Growth Equity Fund, Class I |
265,439 | 77,127 | (42,935 | ) | (122,212 | ) | (1,226 | ) | 176,193 | 14,732 | — | 56,937 | ||||||||||||||||||||||||
MassMutual Small Cap Value Equity Fund, Class I |
873,974 | 248,986 | (85,870 | ) | (313,424 | ) | (6,166 | ) | 717,500 | 82,566 | — | 208,607 | ||||||||||||||||||||||||
MassMutual Strategic Bond Fund, Class I |
25,626,277 | 7,416,217 | (6,084,742 | ) | (5,418,451 | ) | (245,506 | ) | 21,293,795 | 2,502,209 | 1,017,428 | 479,459 | ||||||||||||||||||||||||
MassMutual Strategic Emerging Markets Fund, Class I |
1,263,154 | 262,659 | (190,779 | ) | (560,701 | ) | (39,799 | ) | 734,534 | 89,468 | 16,964 | 154,657 | ||||||||||||||||||||||||
MassMutual Total Return Bond Fund, Class I |
37,143,911 | 13,073,019 | (8,818,640 | ) | (6,406,961 | ) | (198,386 | ) | 34,792,943 | 4,132,178 | 613,046 | 72,910 | ||||||||||||||||||||||||
MM Equity Asset Fund, Class I |
10,432,793 | 3,331,439 | (4,155,012 | ) | (3,698,160 | ) | 390,786 | 6,301,846 | 900,264 | 129,741 | 2,080,520 | |||||||||||||||||||||||||
| $ | 182,456,905 | $ | 46,872,790 | $ | (51,049,178 | ) | $ | (36,166,443 | ) | $ | (1,792,190 | ) | $ | 140,321,884 | $ | 4,836,638 | $ | 7,082,985 | ||||||||||||||||||
40/60 Allocation Fund |
||||||||||||||||||||||||||||||||||||
Barings Global Floating Rate Fund, Class Y* |
$ | 2,129,513 | $ | 16,194 | $ | (2,109,642 | ) | $ | (36,065 | ) | $ | — | $ | — | — | $ | 14,303 | $ | — | |||||||||||||||||
MassMutual Blue Chip Growth Fund, Class I |
8,376,584 | 4,753,977 | (2,527,610 | ) | (4,607,999 | ) | (4,633 | ) | 5,990,319 | 319,654 | — | 1,668,598 | ||||||||||||||||||||||||
MassMutual Core Bond Fund, Class I |
26,555,894 | 6,844,985 | (8,041,550 | ) | (4,651,117 | ) | (725,064 | ) | 19,983,148 | 2,195,950 | 662,371 | 430,884 | ||||||||||||||||||||||||
MassMutual Diversified Value Fund, Class I |
5,397,509 | 1,516,617 | (1,158,716 | ) | (1,384,718 | ) | 258,264 | 4,628,956 | 425,847 | 109,498 | 617,731 | |||||||||||||||||||||||||
MassMutual Equity Opportunities Fund, Class I |
8,630,146 | 2,801,982 | (2,348,578 | ) | (2,008,620 | ) | 370,417 | 7,445,347 | 446,900 | 118,122 | 1,028,315 | |||||||||||||||||||||||||
188
Notes to Financial Statements (Continued) |
Beginning |
Purchases |
Sales |
Change in |
Net Realized |
Value as of |
Number of |
Dividend |
Realized |
||||||||||||||||||||||||||||
40/60 Allocation Fund (Continued) |
||||||||||||||||||||||||||||||||||||
MassMutual Fundamental Value Fund, Class I |
$ | 6,732,322 | $ | 1,978,295 | $ | (1,515,736 | ) | $ | (1,426,979 | ) | $ | 87,505 | $ | 5,855,407 | 685,645 | $ | 51,964 | $ | 825,706 | |||||||||||||||||
MassMutual Global Floating Rate Fund, Class I |
— | 2,162,806 | (1,200,001 | ) | (81,156 | ) | (37,969 | ) | 843,680 | 99,844 | 38,887 | — | ||||||||||||||||||||||||
MassMutual Global Floating Rate Fund, Class Y |
— | 12,447 | (14,277 | ) | — | 1,830 | — | — | 17,329 | — | ||||||||||||||||||||||||||
MassMutual Growth Opportunities Fund, Class I |
2,944,392 | 1,007,350 | (508,193 | ) | (1,859,759 | ) | (189,218 | ) | 1,394,572 | 305,827 | — | 676,784 | ||||||||||||||||||||||||
MassMutual High Yield Fund, Class I |
1,466,621 | 2,217,822 | (1,217,292 | ) | (289,409 | ) | (130,119 | ) | 2,047,623 | 281,654 | 184,377 | — | ||||||||||||||||||||||||
MassMutual Inflation-Protected and Income Fund, Class I |
3,832,941 | 862,604 | (3,269,169 | ) | (426,493 | ) | (94,182 | ) | 905,701 | 96,866 | 71,125 | 217,695 | ||||||||||||||||||||||||
MassMutual International Equity Fund, Class I |
1,683,708 | 1,931,383 | (1,033,162 | ) | (327,439 | ) | (304,347 | ) | 1,950,143 | 273,129 | 40,664 | 201,679 | ||||||||||||||||||||||||
MassMutual Mid Cap Growth Fund, Class I |
2,439,138 | 831,080 | (513,583 | ) | (1,140,707 | ) | 7,250 | 1,623,178 | 87,503 | — | 492,432 | |||||||||||||||||||||||||
MassMutual Mid Cap Value Fund, Class I |
4,019,697 | 1,334,654 | (1,513,583 | ) | (1,336,625 | ) | 87,033 | 2,591,176 | 245,377 | 42,723 | 953,282 | |||||||||||||||||||||||||
MassMutual Overseas Fund, Class I |
5,388,214 | 3,696,306 | (2,579,532 | ) | (2,176,428 | ) | 76,112 | 4,404,672 | 634,679 | 85,215 | 493,814 | |||||||||||||||||||||||||
MassMutual Short-Duration Bond Fund, Class I |
26,476,282 | 4,718,774 | (8,015,169 | ) | (2,964,727 | ) | (868,757 | ) | 19,346,403 | 2,231,419 | 1,183,510 | — | ||||||||||||||||||||||||
MassMutual Small Cap Growth Equity Fund, Class I |
597,449 | 237,753 | (153,964 | ) | (290,924 | ) | (4,027 | ) | 386,287 | 32,298 | — | 136,481 | ||||||||||||||||||||||||
MassMutual Small Cap Value Equity Fund, Class I |
2,242,617 | 753,702 | (302,317 | ) | (823,959 | ) | (25,299 | ) | 1,844,744 | 212,284 | — | 553,977 | ||||||||||||||||||||||||
MassMutual Strategic Bond Fund, Class I |
23,119,765 | 6,245,422 | (6,700,039 | ) | (4,445,864 | ) | (864,223 | ) | 17,355,061 | 2,039,373 | 987,740 | 465,469 | ||||||||||||||||||||||||
MassMutual Strategic Emerging Markets Fund, Class I |
1,944,067 | 694,984 | (569,014 | ) | (849,439 | ) | (123,097 | ) | 1,097,501 | 133,679 | 27,981 | 255,103 | ||||||||||||||||||||||||
MassMutual Total Return Bond Fund, Class I |
33,433,186 | 13,374,232 | (9,983,061 | ) | (5,348,393 | ) | (882,598 | ) | 30,593,366 | 3,633,416 | 592,515 | 70,468 | ||||||||||||||||||||||||
MM Equity Asset Fund, Class I |
23,108,280 | 10,117,702 | (8,232,688 | ) | (8,595,680 | ) | 488,645 | 16,886,259 | 2,412,323 | 306,930 | 4,921,951 | |||||||||||||||||||||||||
| $ | 190,518,325 | $ | 68,111,071 | $ | (63,506,876 | ) | $ | (45,072,500 | ) | $ | (2,876,477 | ) | $ | 147,173,543 | $ | 4,535,254 | $ | 14,010,369 | ||||||||||||||||||
60/40 Allocation Fund |
||||||||||||||||||||||||||||||||||||
Barings Global Floating Rate Fund, Class Y* |
$ | 3,636,669 | $ | 27,655 | $ | (3,607,223 | ) | $ | (57,101 | ) | $ | — | $ | — | — | $ | 24,425 | $ | — | |||||||||||||||||
MassMutual Blue Chip Growth Fund, Class I |
11,813,796 | 5,401,984 | (3,269,130 | ) | (5,954,898 | ) | 218,568 | 8,210,320 | 438,117 | — | 2,110,494 | |||||||||||||||||||||||||
MassMutual Core Bond Fund, Class I |
17,508,095 | 1,994,226 | (4,116,705 | ) | (2,868,206 | ) | (321,855 | ) | 12,195,555 | 1,340,171 | 388,855 | 252,957 | ||||||||||||||||||||||||
MassMutual Diversified Value Fund, Class I |
8,517,510 | 1,160,544 | (1,470,756 | ) | (1,808,448 | ) | 251,189 | 6,650,039 | 611,779 | 154,829 | 873,467 | |||||||||||||||||||||||||
MassMutual Equity Opportunities Fund , Class I |
14,092,888 | 1,912,011 | (3,046,061 | ) | (2,725,321 | ) | 486,487 | 10,720,004 | 643,458 | 167,054 | 1,454,297 | |||||||||||||||||||||||||
MassMutual Fundamental Value Fund, Class I |
9,805,210 | 1,893,415 | (1,959,891 | ) | (1,852,022 | ) | 91,703 | 7,978,415 | 934,241 | 69,812 | 1,109,288 | |||||||||||||||||||||||||
MassMutual Global Floating Rate Fund, Class I |
— | 3,700,188 | (1,200,000 | ) | (217,710 | ) | (30,497 | ) | 2,251,981 | 266,507 | 73,072 | — | ||||||||||||||||||||||||
MassMutual Global Floating Rate Fund, Class Y |
— | 21,257 | (19,894 | ) | — | (1,363 | ) | — | — | 29,593 | — | |||||||||||||||||||||||||
189
Notes to Financial Statements (Continued) |
Beginning |
Purchases |
Sales |
Change in |
Net Realized |
Value as of |
Number of |
Dividend |
Realized |
||||||||||||||||||||||||||||
60/40 Allocation Fund (Continued) |
||||||||||||||||||||||||||||||||||||
MassMutual Growth Opportunities Fund, Class I |
$ | 3,995,702 | $ | 911,498 | $ | (589,016 | ) | $ | (2,386,733 | ) | $ | (149,820 | ) | $ | 1,781,631 | 390,709 | $ | — | $ | 842,115 | ||||||||||||||||
MassMutual High Yield Fund, Class I |
3,883,987 | 2,170,232 | (1,105,997 | ) | (824,498 | ) | (173,378 | ) | 3,950,346 | 543,376 | 406,716 | — | ||||||||||||||||||||||||
MassMutual Inflation-Protected and Income Fund, Class I |
1,990,383 | 180,519 | (1,512,996 | ) | (198,427 | ) | (35,818 | ) | 423,661 | 45,311 | 32,646 | 99,924 | ||||||||||||||||||||||||
MassMutual International Equity Fund, Class I |
3,231,405 | 477,780 | (920,704 | ) | (461,303 | ) | (378,009 | ) | 1,949,169 | 272,993 | 61,387 | 304,457 | ||||||||||||||||||||||||
MassMutual Mid Cap Growth Fund, Class I |
4,047,813 | 815,797 | (598,147 | ) | (1,753,325 | ) | 48,493 | 2,560,631 | 138,039 | — | 741,268 | |||||||||||||||||||||||||
MassMutual Mid-Cap Value Fund, Class I |
4,894,347 | 1,206,861 | (575,287 | ) | (1,639,823 | ) | 122,315 | 4,008,413 | 379,585 | 48,571 | 1,083,761 | |||||||||||||||||||||||||
MassMutual Overseas Fund, Class I |
6,369,737 | 2,449,442 | (2,377,570 | ) | (2,141,436 | ) | 124,444 | 4,424,617 | 637,553 | 84,369 | 488,905 | |||||||||||||||||||||||||
MassMutual Short-Duration Bond Fund, Class I |
14,351,051 | 822,730 | (2,589,755 | ) | (1,659,753 | ) | (213,335 | ) | 10,710,938 | 1,235,402 | 575,613 | — | ||||||||||||||||||||||||
MassMutual Small Cap Growth Equity Fund, Class I |
1,299,312 | 299,640 | (180,335 | ) | (599,154 | ) | 15,180 | 834,643 | 69,786 | — | 270,294 | |||||||||||||||||||||||||
MassMutual Small Cap Value Equity Fund, Class I |
3,948,706 | 982,244 | (1,358,644 | ) | (1,141,737 | ) | (173,068 | ) | 2,257,501 | 259,782 | — | 923,880 | ||||||||||||||||||||||||
MassMutual Strategic Bond Fund, Class I |
11,149,866 | 2,744,475 | (3,432,836 | ) | (1,897,642 | ) | (388,452 | ) | 8,175,411 | 960,683 | 419,185 | 197,539 | ||||||||||||||||||||||||
MassMutual Strategic Emerging Markets Fund, Class I |
775,023 | 242,967 | (457,806 | ) | (232,593 | ) | (57,925 | ) | 269,666 | 32,846 | 9,244 | 84,271 | ||||||||||||||||||||||||
MassMutual Total Return Bond Fund, Class I |
21,917,982 | 3,767,381 | (5,900,576 | ) | (3,053,176 | ) | (447,668 | ) | 16,283,943 | 1,933,960 | 348,817 | 41,485 | ||||||||||||||||||||||||
MM Equity Asset Fund, Class I |
42,281,088 | 11,895,559 | (10,515,033 | ) | (14,711,499 | ) | 1,210,672 | 30,160,787 | 4,308,684 | 511,810 | 8,207,407 | |||||||||||||||||||||||||
| $ | 189,510,570 | $ | 45,078,405 | $ | (50,804,362 | ) | $ | (48,184,805 | ) | $ | 197,863 | $ | 135,797,671 | $ | 3,405,998 | $ | 19,085,809 | |||||||||||||||||||
80/20 Allocation Fund |
||||||||||||||||||||||||||||||||||||
Barings Global Floating Rate Fund, Class Y* |
$ | 2,919,474 | $ | 22,201 | $ | (2,895,513 | ) | $ | (46,162 | ) | $ | — | $ | — | — | $ | 19,608 | $ | — | |||||||||||||||||
MassMutual Blue Chip Growth Fund, Class I |
10,463,108 | 5,028,755 | (2,809,018 | ) | (5,475,514 | ) | 176,220 | 7,383,551 | 394,000 | — | 1,888,811 | |||||||||||||||||||||||||
MassMutual Core Bond Fund, Class I |
5,553,330 | 1,232,980 | (1,852,377 | ) | (867,891 | ) | (135,847 | ) | 3,930,195 | 431,890 | 122,946 | 79,978 | ||||||||||||||||||||||||
MassMutual Diversified Value Fund, Class I |
6,101,531 | 1,204,430 | (1,184,740 | ) | (1,426,171 | ) | 269,234 | 4,964,284 | 456,696 | 111,719 | 630,262 | |||||||||||||||||||||||||
MassMutual Equity Opportunities Fund, Class I |
9,751,065 | 2,029,867 | (2,312,298 | ) | (1,924,839 | ) | 309,309 | 7,853,104 | 471,375 | 116,455 | 1,013,808 | |||||||||||||||||||||||||
MassMutual Fundamental Value Fund, Class I |
7,582,006 | 1,899,626 | (1,686,793 | ) | (1,523,068 | ) | 118,668 | 6,390,439 | 748,295 | 54,166 | 860,687 | |||||||||||||||||||||||||
MassMutual Global Floating Rate Fund, Class I |
— | 2,969,744 | (1,000,000 | ) | (171,395 | ) | (25,414 | ) | 1,772,935 | 209,815 | 57,939 | — | ||||||||||||||||||||||||
MassMutual Global Floating Rate Fund, Class Y |
— | 17,064 | (16,291 | ) | — | (773 | ) | — | — | 23,757 | — | |||||||||||||||||||||||||
MassMutual Growth Opportunities Fund, Class I |
3,282,271 | 916,450 | (512,522 | ) | (1,956,938 | ) | (181,283 | ) | 1,547,978 | 339,469 | — | 699,260 | ||||||||||||||||||||||||
MassMutual High Yield Fund, Class I |
3,302,143 | 1,525,355 | (46,471 | ) | (866,452 | ) | (2,036 | ) | 3,912,539 | 538,176 | 350,989 | — | ||||||||||||||||||||||||
MassMutual Inflation-Protected and Income Fund, Class I |
625,407 | 114,891 | (531,403 | ) | (52,353 | ) | (19,565 | ) | 136,977 | 14,650 | 10,315 | 31,573 | ||||||||||||||||||||||||
190
Notes to Financial Statements (Continued) |
Beginning |
Purchases |
Sales |
Change in |
Net Realized |
Value as of |
Number of |
Dividend |
Realized |
||||||||||||||||||||||||||||
80/20 Allocation Fund (Continued) |
||||||||||||||||||||||||||||||||||||
MassMutual International Equity Fund, Class I |
$ | 2,297,789 | $ | 681,954 | $ | (1,022,180 | ) | $ | (216,272 | ) | $ | (368,196 | ) | $ | 1,373,095 | 192,310 | $ | 43,353 | $ | 215,015 | ||||||||||||||||
MassMutual Mid Cap Growth Fund, Class I |
4,294,852 | 1,017,689 | (523,228 | ) | (1,948,969 | ) | 76,128 | 2,916,472 | 157,222 | — | 799,735 | |||||||||||||||||||||||||
MassMutual Mid-Cap Value Fund, Class I |
4,208,767 | 1,189,437 | (504,064 | ) | (1,439,491 | ) | 104,322 | 3,558,971 | 337,024 | 42,220 | 942,062 | |||||||||||||||||||||||||
MassMutual Overseas Fund, Class I |
7,760,610 | 3,784,146 | (2,832,659 | ) | (2,753,812 | ) | 112,312 | 6,070,597 | 874,726 | 104,469 | 605,382 | |||||||||||||||||||||||||
MassMutual Short-Duration Bond Fund, Class I |
6,637,743 | 695,581 | (1,042,238 | ) | (831,945 | ) | (66,544 | ) | 5,392,597 | 621,984 | 275,135 | — | ||||||||||||||||||||||||
MassMutual Small Cap Growth Equity Fund, Class I |
1,356,496 | 351,196 | (154,922 | ) | (636,029 | ) | 9,529 | 926,270 | 77,447 | — | 284,996 | |||||||||||||||||||||||||
MassMutual Small Cap Value Equity Fund, Class I |
3,175,407 | 877,625 | (302,685 | ) | (1,134,928 | ) | (10,695 | ) | 2,604,724 | 299,738 | — | 745,223 | ||||||||||||||||||||||||
MassMutual Strategic Bond Fund, Class I |
4,073,596 | 1,086,449 | (1,548,579 | ) | (648,082 | ) | (173,185 | ) | 2,790,199 | 327,873 | 153,152 | 72,173 | ||||||||||||||||||||||||
MassMutual Strategic Emerging Markets Fund, Class I |
3,424,859 | 801,813 | (624,485 | ) | (1,469,899 | ) | (127,843 | ) | 2,004,445 | 244,147 | 44,949 | 409,797 | ||||||||||||||||||||||||
MassMutual Total Return Bond Fund, Class I |
8,822,195 | 3,162,073 | (4,665,748 | ) | (869,011 | ) | (412,344 | ) | 6,037,165 | 717,003 | 140,992 | 16,768 | ||||||||||||||||||||||||
MM Equity Asset Fund, Class I |
32,928,612 | 11,182,327 | (9,279,960 | ) | (11,380,824 | ) | 672,976 | 24,123,131 | 3,446,162 | 400,059 | 6,415,365 | |||||||||||||||||||||||||
|
$ | 128,561,261 | $ | 41,791,653 | $ | (37,348,174 | ) | $ | (37,640,045 | ) | $ | 324,973 | $ | 95,689,668 | $ | 2,072,223 | $ | 15,710,895 | ||||||||||||||||||
MM RetireSMART by JPMorgan In Retirement Fund |
||||||||||||||||||||||||||||||||||||
Barings Global Floating Rate Fund, Class Y* |
$ | 1,464,503 | $ | 11,087 | $ | (1,420,762 | ) | $ | (55,143 | ) | $ | 315 | $ | — | — | $ | 11,087 | $ | — | |||||||||||||||||
MassMutual Blue Chip Growth Fund, Class I |
1,778,027 | 1,592,850 | (939,725 | ) | (953,719 | ) | 7,574 | 1,485,007 | 79,243 | — | 312,217 | |||||||||||||||||||||||||
MassMutual Core Bond Fund, Class I |
22,877,013 | 7,263,241 | (9,683,302 | ) | (3,433,792 | ) | (770,534 | ) | 16,252,626 | 1,786,003 | 492,849 | 320,607 | ||||||||||||||||||||||||
MassMutual Diversified Value Fund, Class I |
1,931,872 | 1,014,463 | (1,677,309 | ) | (622,796 | ) | 250,077 | 896,307 | 82,457 | 36,134 | 203,854 | |||||||||||||||||||||||||
MassMutual Equity Opportunities Fund, Class I |
2,816,597 | 1,538,884 | (1,448,828 | ) | (840,704 | ) | 314,140 | 2,380,089 | 142,862 | 34,532 | 300,622 | |||||||||||||||||||||||||
MassMutual Fundamental Value Fund, Class I |
1,761,881 | 1,185,471 | (1,410,838 | ) | (610,006 | ) | 274,670 | 1,201,178 | 140,653 | 12,550 | 199,424 | |||||||||||||||||||||||||
MassMutual Global Floating Rate Fund, Class I |
— | 1,371,900 | (1,134,850 | ) | (14,832 | ) | (44,111 | ) | 178,107 | 21,078 | 22,265 | — | ||||||||||||||||||||||||
MassMutual Global Floating Rate Fund, Class Y |
— | 8,331 | (41,340 | ) | — | 33,009 | — | — | 11,390 | — | ||||||||||||||||||||||||||
MassMutual Growth Opportunities Fund, Class I |
538,449 | 614,017 | (283,711 | ) | (272,349 | ) | (149,767 | ) | 446,639 | 97,947 | — | 112,760 | ||||||||||||||||||||||||
MassMutual High Yield Fund, Class I |
12,606,632 | 2,058,381 | (8,262,949 | ) | (1,897,395 | ) | (143,329 | ) | 4,361,340 | 599,909 | 967,968 | — | ||||||||||||||||||||||||
MassMutual Inflation-Protected and Income Fund, Class I |
8,797,706 | 2,160,551 | (3,262,098 | ) | (1,472,296 | ) | (5,708 | ) | 6,218,155 | 665,043 | 144,241 | 441,485 | ||||||||||||||||||||||||
MassMutual International Equity Fund, Class I |
1,838,547 | 1,346,623 | (1,146,617 | ) | (408,987 | ) | (142,594 | ) | 1,486,972 | 208,259 | 37,633 | 186,650 | ||||||||||||||||||||||||
MassMutual Mid Cap Growth Fund, Class I |
806,815 | 587,720 | (342,084 | ) | (422,527 | ) | 69,088 | 699,012 | 37,683 | — | 137,299 | |||||||||||||||||||||||||
MassMutual Mid-Cap Value Fund, Class I |
798,961 | 440,380 | (300,139 | ) | (304,950 | ) | 63,001 | 697,253 | 66,028 | 7,544 | 168,335 | |||||||||||||||||||||||||
191
Notes to Financial Statements (Continued) |
Beginning |
Purchases |
Sales |
Change in |
Net Realized |
Value as of |
Number of |
Dividend |
Realized |
||||||||||||||||||||||||||||
MM RetireSMART by JPMorgan In Retirement Fund (Continued) |
||||||||||||||||||||||||||||||||||||
MassMutual Overseas Fund, Class I |
$ | 4,911,840 | $ | 2,447,280 | $ | (3,367,486 | ) | $ | (1,606,054 | ) | $ | 202,408 | $ | 2,587,988 | 372,909 | $ | 67,656 | $ | 392,058 | |||||||||||||||||
MassMutual Small Cap Growth Equity Fund, Class I |
459,540 | 650,055 | (317,494 | ) | (177,931 | ) | (109,499 | ) | 504,671 | 42,197 | — | 119,781 | ||||||||||||||||||||||||
MassMutual Small Cap Value Equity Fund, Class I |
611,330 | 772,235 | (436,397 | ) | (290,249 | ) | 7,134 | 664,053 | 76,416 | — | 178,892 | |||||||||||||||||||||||||
MassMutual Strategic Bond Fund, Class I |
7,695,134 | 2,674,565 | (3,278,454 | ) | (1,233,795 | ) | (364,175 | ) | 5,493,275 | 645,508 | 284,660 | 134,145 | ||||||||||||||||||||||||
MassMutual Strategic Emerging Markets Fund, Class I |
2,478,194 | 1,783,331 | (1,635,359 | ) | (536,060 | ) | (576,139 | ) | 1,513,967 | 184,405 | 30,363 | 276,810 | ||||||||||||||||||||||||
MassMutual Total Return Bond Fund, Class I |
7,695,134 | 2,310,390 | (3,278,841 | ) | (889,481 | ) | (350,096 | ) | 5,487,106 | 651,675 | 118,460 | 14,089 | ||||||||||||||||||||||||
MM Equity Asset Fund, Class I |
8,830,242 | 6,413,068 | (4,779,689 | ) | (3,375,055 | ) | 334,006 | 7,422,572 | 1,060,367 | 103,707 | 1,663,013 | |||||||||||||||||||||||||
| $ | 90,698,417 | $ | 38,244,823 | $ | (48,448,272 | ) | $ | (19,418,121 | ) | $ | (1,100,530 | ) | $ | 59,976,317 | $ | 2,383,039 | $ | 5,162,041 | ||||||||||||||||||
MM RetireSMART by JPMorgan 2020 Fund |
||||||||||||||||||||||||||||||||||||
Barings Global Floating Rate Fund, Class Y* |
$ | 3,366,161 | $ | 24,979 | $ | (3,311,648 | ) | $ | (83,170 | ) | $ | 3,678 | $ | — | — | $ | 24,980 | $ | — | |||||||||||||||||
MassMutual Blue Chip Growth Fund, Class I |
4,067,993 | 3,254,075 | (2,469,415 | ) | (1,985,180 | ) | 19,470 | 2,886,943 | 154,052 | — | 680,539 | |||||||||||||||||||||||||
MassMutual Core Bond Fund, Class I |
52,339,321 | 13,596,564 | (25,627,624 | ) | (6,787,662 | ) | (1,885,686 | ) | 31,634,913 | 3,476,364 | 1,072,994 | 698,001 | ||||||||||||||||||||||||
MassMutual Diversified Value Fund, Class I |
4,426,230 | 1,715,035 | (3,632,022 | ) | (1,595,358 | ) | 833,249 | 1,747,134 | 160,730 | 79,015 | 445,764 | |||||||||||||||||||||||||
MassMutual Equity Opportunities Fund, Class I |
6,453,314 | 2,581,969 | (3,335,802 | ) | (1,643,088 | ) | 583,235 | 4,639,628 | 278,489 | 75,675 | 658,791 | |||||||||||||||||||||||||
MassMutual Fundamental Value Fund, Class I |
4,030,871 | 2,150,815 | (3,169,383 | ) | (1,431,988 | ) | 755,017 | 2,335,332 | 273,458 | 27,347 | 434,533 | |||||||||||||||||||||||||
MassMutual Global Floating Rate Fund, Class I |
— | 2,892,118 | (2,427,588 | ) | (27,629 | ) | (92,384 | ) | 344,517 | 40,771 | 45,594 | — | ||||||||||||||||||||||||
MassMutual Global Floating Rate Fund, Class Y |
— | 17,991 | (50,893 | ) | — | 32,902 | — | — | 24,434 | — | ||||||||||||||||||||||||||
MassMutual Growth Opportunities Fund, Class I |
1,233,777 | 1,171,217 | (649,034 | ) | (662,362 | ) | (222,952 | ) | 870,646 | 190,931 | — | 246,815 | ||||||||||||||||||||||||
MassMutual High Yield Fund, Class I |
28,885,751 | 3,007,363 | (19,130,416 | ) | (3,690,298 | ) | (582,564 | ) | 8,489,836 | 1,167,790 | 2,081,779 | — | ||||||||||||||||||||||||
MassMutual Inflation-Protected and Income Fund, Class I |
20,158,305 | 3,300,010 | (8,336,591 | ) | (3,204,799 | ) | 185,717 | 12,102,642 | 1,294,400 | 315,306 | 965,072 | |||||||||||||||||||||||||
MassMutual International Equity Fund, Class I |
4,210,086 | 2,588,182 | (2,761,230 | ) | (688,062 | ) | (441,862 | ) | 2,907,114 | 407,159 | 82,358 | 408,466 | ||||||||||||||||||||||||
MassMutual Mid Cap Growth Fund, Class I |
1,848,585 | 1,067,796 | (820,404 | ) | (909,381 | ) | 175,973 | 1,362,569 | 73,454 | — | 300,348 | |||||||||||||||||||||||||
MassMutual Mid-Cap Value Fund, Class I |
1,830,512 | 745,961 | (717,759 | ) | (703,031 | ) | 203,477 | 1,359,160 | 128,708 | 16,498 | 368,104 | |||||||||||||||||||||||||
MassMutual Overseas Fund, Class I |
11,230,700 | 5,319,795 | (8,649,354 | ) | (3,382,154 | ) | 510,038 | 5,029,025 | 724,643 | 147,507 | 854,787 | |||||||||||||||||||||||||
MassMutual Small Cap Growth Equity Fund, Class I |
1,052,879 | 1,267,244 | (735,299 | ) | (418,615 | ) | (182,456 | ) | 983,753 | 82,254 | — | 262,120 | ||||||||||||||||||||||||
MassMutual Small Cap Value Equity Fund, Class I |
1,400,643 | 1,472,173 | (999,340 | ) | (688,141 | ) | 109,101 | 1,294,436 | 148,957 | — | 391,289 | |||||||||||||||||||||||||
MassMutual Strategic Bond Fund, Class I |
17,605,362 | 4,974,962 | (8,575,341 | ) | (2,426,059 | ) | (886,764 | ) | 10,692,160 | 1,256,423 | 619,976 | 292,162 | ||||||||||||||||||||||||
192
Notes to Financial Statements (Continued) |
Beginning |
Purchases |
Sales |
Change in |
Net Realized |
Value as of |
Number of |
Dividend |
Realized |
||||||||||||||||||||||||||||
MM RetireSMART by JPMorgan 2020 Fund (Continued) |
||||||||||||||||||||||||||||||||||||
MassMutual Strategic Emerging Markets Fund, Class I |
$ | 5,674,990 | $ | 3,149,388 | $ | (3,503,244 | ) | $ | (1,625,618 | ) | $ | (734,935 | ) | $ | 2,960,581 | 360,607 | $ | 66,479 | $ | 606,086 | ||||||||||||||||
MassMutual Total Return Bond Fund, Class I |
17,605,362 | 4,338,077 | (8,726,701 | ) | (1,738,915 | ) | (797,692 | ) | 10,680,131 | 1,268,424 | 257,996 | 30,684 | ||||||||||||||||||||||||
MM Equity Asset Fund, Class I |
20,202,269 | 12,773,315 | (12,285,298 | ) | (7,554,844 | ) | 1,295,132 | 14,430,574 | 2,061,511 | 225,968 | 3,623,638 | |||||||||||||||||||||||||
| $ | 207,623,111 | $ | 71,409,029 | $ | (119,914,386 | ) | $ | (41,246,354 | ) | $ | (1,120,306 | ) | $ | 116,751,094 | $ | 5,163,906 | $ | 11,267,199 | ||||||||||||||||||
MM RetireSMART by JPMorgan 2025 Fund |
||||||||||||||||||||||||||||||||||||
Barings Global Floating Rate Fund, Class Y |
$ | 2,057,828 | $ | 28,022 | $ | (2,026,349 | ) | $ | (59,501 | ) | $ | — | $ | — | — | $ | 15,687 | $ | — | |||||||||||||||||
MassMutual Blue Chip Growth Fund, Class I |
4,554,999 | 3,191,152 | (2,187,160 | ) | (2,306,197 | ) | 24,922 | 3,277,716 | 174,905 | — | 801,532 | |||||||||||||||||||||||||
MassMutual Core Bond Fund, Class I |
36,738,296 | 12,051,643 | (15,173,717 | ) | (5,510,674 | ) | (1,408,415 | ) | 26,697,133 | 2,933,751 | 808,233 | 525,770 | ||||||||||||||||||||||||
MassMutual Diversified Value Fund, Class I |
4,944,685 | 1,398,914 | (3,478,418 | ) | (1,696,242 | ) | 824,290 | 1,993,229 | 183,370 | 93,050 | 524,944 | |||||||||||||||||||||||||
MassMutual Equity Opportunities Fund, Class I |
7,204,736 | 1,916,591 | (2,599,624 | ) | (1,464,157 | ) | 230,154 | 5,287,700 | 317,389 | 89,131 | 775,933 | |||||||||||||||||||||||||
MassMutual Fundamental Value Fund, Class I |
4,513,424 | 1,902,945 | (2,984,607 | ) | (1,510,018 | ) | 731,117 | 2,652,861 | 310,639 | 32,220 | 511,978 | |||||||||||||||||||||||||
MassMutual Global Floating Rate Fund, Class I |
— | 1,981,455 | (1,591,615 | ) | (23,391 | ) | (75,891 | ) | 290,558 | 34,386 | 36,840 | — | ||||||||||||||||||||||||
MassMutual Global Floating Rate Fund, Class Y |
— | 16,151 | (44,990 | ) | — | 28,839 | — | — | 16,153 | — | ||||||||||||||||||||||||||
MassMutual Growth Opportunities Fund, Class I |
1,377,094 | 1,238,861 | (591,474 | ) | (795,532 | ) | (237,442 | ) | 991,507 | 217,436 | — | 290,017 | ||||||||||||||||||||||||
MassMutual High Yield Fund, Class I |
16,722,405 | 2,260,142 | (8,830,041 | ) | (2,746,345 | ) | (120,629 | ) | 7,285,532 | 1,002,136 | 1,327,115 | — | ||||||||||||||||||||||||
MassMutual Inflation-Protected and Income Fund, Class I |
6,155,961 | 2,545,851 | (1,991,316 | ) | (1,131,918 | ) | (46,122 | ) | 5,532,456 | 591,707 | 103,733 | 317,499 | ||||||||||||||||||||||||
MassMutual International Equity Fund, Class I |
4,686,905 | 2,511,864 | (2,586,657 | ) | (898,766 | ) | (433,074 | ) | 3,280,272 | 459,422 | 96,616 | 479,179 | ||||||||||||||||||||||||
MassMutual Mid Cap Growth Fund, Class I |
2,097,235 | 1,048,770 | (734,439 | ) | (997,650 | ) | 105,729 | 1,519,645 | 81,922 | — | 366,906 | |||||||||||||||||||||||||
MassMutual Mid-Cap Value Fund, Class I |
2,077,797 | 686,580 | (648,999 | ) | (766,469 | ) | 166,889 | 1,515,798 | 143,541 | 20,097 | 448,413 | |||||||||||||||||||||||||
MassMutual Overseas Fund, Class I |
12,525,152 | 4,427,759 | (7,840,317 | ) | (3,988,913 | ) | 565,915 | 5,689,596 | 819,827 | 173,614 | 1,006,069 | |||||||||||||||||||||||||
MassMutual Small Cap Growth Equity Fund, Class I |
1,192,746 | 1,198,489 | (621,706 | ) | (536,243 | ) | (143,091 | ) | 1,090,195 | 91,153 | — | 291,542 | ||||||||||||||||||||||||
MassMutual Small Cap Value Equity Fund, Class I |
1,582,634 | 1,370,522 | (861,562 | ) | (797,993 | ) | 143,831 | 1,437,432 | 165,412 | — | 433,635 | |||||||||||||||||||||||||
MassMutual Strategic Bond Fund, Class I |
12,365,444 | 4,340,513 | (5,058,981 | ) | (1,991,732 | ) | (641,914 | ) | 9,013,330 | 1,059,146 | 466,984 | 220,064 | ||||||||||||||||||||||||
MassMutual Strategic Emerging Markets Fund, Class I |
6,471,157 | 3,478,808 | (2,497,016 | ) | (2,733,434 | ) | (341,201 | ) | 4,378,314 | 533,290 | 81,586 | 743,818 | ||||||||||||||||||||||||
MassMutual Total Return Bond Fund, Class I |
12,365,444 | 3,846,601 | (5,173,025 | ) | (1,417,367 | ) | (618,464 | ) | 9,003,189 | 1,069,262 | 194,332 | 23,112 | ||||||||||||||||||||||||
MM Equity Asset Fund, Class I |
22,626,948 | 11,520,395 | (10,492,381 | ) | (8,449,194 | ) | 1,201,308 | 16,407,076 | 2,343,868 | 266,573 | 4,274,763 | |||||||||||||||||||||||||
| $ | 162,260,890 | $ | 62,962,028 | $ | (78,014,394 | ) | $ | (39,821,736 | ) | $ | (43,249 | ) | $ | 107,343,539 | $ | 3,821,964 | $ | 12,035,174 | ||||||||||||||||||
193
Notes to Financial Statements (Continued) |
Beginning |
Purchases |
Sales |
Change in |
Net Realized |
Value as of |
Number of |
Dividend |
Realized |
||||||||||||||||||||||||||||
MM RetireSMART by JPMorgan 2030 Fund |
||||||||||||||||||||||||||||||||||||
MassMutual Blue Chip Growth Fund, Class I |
$ | 11,833,758 | $ | 8,705,870 | $ | (5,302,170 | ) | $ | (6,297,383 | ) | $ | 186,572 | $ | 9,126,647 | 487,014 | $ | — | $ | 2,152,778 | |||||||||||||||||
MassMutual Core Bond Fund, Class I |
61,141,813 | 25,008,462 | (26,170,167 | ) | (9,546,784 | ) | (2,455,606 | ) | 47,977,718 | 5,272,277 | 1,380,773 | 898,217 | ||||||||||||||||||||||||
MassMutual Diversified Value Fund, Class I |
12,861,927 | 3,867,274 | (8,894,332 | ) | (3,950,357 | ) | 1,615,416 | 5,499,928 | 505,973 | 248,812 | 1,403,668 | |||||||||||||||||||||||||
MassMutual Equity Opportunities Fund, Class I |
18,756,945 | 5,481,002 | (6,329,980 | ) | (3,532,738 | ) | 218,283 | 14,593,512 | 875,961 | 237,642 | 2,068,800 | |||||||||||||||||||||||||
MassMutual Fundamental Value Fund, Class I |
11,724,657 | 5,149,762 | (7,400,819 | ) | (4,188,946 | ) | 2,094,579 | 7,379,233 | 864,079 | 86,509 | 1,374,612 | |||||||||||||||||||||||||
MassMutual Growth Opportunities Fund, Class I |
3,591,139 | 3,378,738 | (1,484,693 | ) | (2,197,172 | ) | (552,078 | ) | 2,735,934 | 599,986 | — | 775,048 | ||||||||||||||||||||||||
MassMutual High Yield Fund, Class I |
29,983,563 | 5,013,483 | (16,196,190 | ) | (4,874,115 | ) | (362,285 | ) | 13,564,456 | 1,865,812 | 2,420,575 | — | ||||||||||||||||||||||||
MassMutual International Equity Fund, Class I |
12,179,451 | 6,447,732 | (5,905,927 | ) | (2,615,257 | ) | (976,619 | ) | 9,129,380 | 1,278,625 | 258,435 | 1,281,748 | ||||||||||||||||||||||||
MassMutual Mid Cap Growth Fund, Class I |
5,485,186 | 2,895,154 | (1,871,263 | ) | (2,540,842 | ) | 148,747 | 4,116,982 | 221,940 | — | 992,270 | |||||||||||||||||||||||||
MassMutual Mid-Cap Value Fund, Class I |
5,434,357 | 1,982,370 | (1,687,180 | ) | (1,812,794 | ) | 189,789 | 4,106,542 | 388,877 | 54,487 | 1,215,772 | |||||||||||||||||||||||||
MassMutual Overseas Fund, Class I |
35,777,659 | 12,434,421 | (22,455,002 | ) | (13,119,848 | ) | 3,332,946 | 15,970,176 | 2,301,178 | 521,867 | 3,024,157 | |||||||||||||||||||||||||
MassMutual Premier Inflation-Protected and Income Fund, Class I |
— | 2,482,744 | (418,497 | ) | (182,766 | ) | (24,410 | ) | 1,857,071 | 198,617 | — | — | ||||||||||||||||||||||||
MassMutual Small Cap Growth Equity Fund, Class I |
3,126,114 | 3,124,749 | (1,523,237 | ) | (1,585,695 | ) | (167,968 | ) | 2,973,963 | 248,659 | — | 755,469 | ||||||||||||||||||||||||
MassMutual Small Cap Value Equity Fund, Class I |
4,158,561 | 3,570,101 | (2,096,200 | ) | (2,060,200 | ) | 351,723 | 3,923,985 | 451,552 | — | 1,128,220 | |||||||||||||||||||||||||
MassMutual Strategic Bond Fund, Class I |
20,588,259 | 9,180,301 | (8,990,752 | ) | (3,381,516 | ) | (1,197,849 | ) | 16,198,443 | 1,903,460 | 798,882 | 376,470 | ||||||||||||||||||||||||
MassMutual Strategic Emerging Markets Fund, Class I |
16,990,386 | 9,216,754 | (5,273,435 | ) | (8,087,385 | ) | (387,231 | ) | 12,459,089 | 1,517,550 | 223,253 | 2,035,382 | ||||||||||||||||||||||||
MassMutual Total Return Bond Fund, Class I |
20,588,259 | 8,335,918 | (9,192,676 | ) | (2,494,297 | ) | (1,056,952 | ) | 16,180,252 | 1,921,645 | 332,431 | 39,536 | ||||||||||||||||||||||||
MM Equity Asset Fund, Class I |
58,860,073 | 30,980,828 | (24,643,583 | ) | (22,490,864 | ) | 2,954,212 | 45,660,666 | 6,522,952 | 714,695 | 11,460,870 | |||||||||||||||||||||||||
| $ | 333,082,107 | $ | 147,255,663 | $ | (155,836,103 | ) | $ | (94,958,959 | ) | $ | 3,911,269 | $ | 233,453,977 | $ | 7,278,361 | $ | 30,983,017 | |||||||||||||||||||
MM RetireSMART by JPMorgan 2035 Fund |
||||||||||||||||||||||||||||||||||||
MassMutual Blue Chip Growth Fund, Class I |
$ | 9,659,995 | $ | 6,496,484 | $ | (3,998,139 | ) | $ | (4,941,074 | ) | $ | 137,128 | $ | 7,354,394 | 392,444 | $ | — | $ | 1,691,458 | |||||||||||||||||
MassMutual Core Bond Fund, Class I |
6,254,943 | 4,093,444 | (2,856,127 | ) | (1,047,472 | ) | (294,527 | ) | 6,150,261 | 675,853 | 148,560 | 96,640 | ||||||||||||||||||||||||
MassMutual Diversified Value Fund, Class I |
6,369,167 | 1,786,358 | (4,088,476 | ) | (1,783,018 | ) | 678,419 | 2,962,450 | 272,534 | 118,198 | 666,814 | |||||||||||||||||||||||||
MassMutual Equity Opportunities Fund, Class I |
6,383,644 | 1,836,252 | (2,232,835 | ) | (1,174,758 | ) | 97,482 | 4,909,785 | 294,705 | 77,586 | 675,425 | |||||||||||||||||||||||||
MassMutual Fundamental Value Fund, Class I |
6,377,513 | 2,308,791 | (4,147,801 | ) | (2,080,045 | ) | 1,011,182 | 3,469,640 | 406,281 | 45,349 | 720,588 | |||||||||||||||||||||||||
MassMutual Growth Opportunities Fund, Class I |
3,261,242 | 2,815,061 | (1,219,096 | ) | (2,012,943 | ) | (385,114 | ) | 2,459,150 | 539,287 | — | 675,169 | ||||||||||||||||||||||||
MassMutual High Yield Fund, Class I |
10,349,549 | 1,561,576 | (6,553,440 | ) | (1,490,955 | ) | (145,635 | ) | 3,721,095 | 511,843 | 774,668 | — | ||||||||||||||||||||||||
194
Notes to Financial Statements (Continued) |
Beginning |
Purchases |
Sales |
Change in |
Net Realized |
Value as of |
Number of |
Dividend |
Realized |
||||||||||||||||||||||||||||
MM RetireSMART by JPMorgan 2035 Fund (Continued) |
||||||||||||||||||||||||||||||||||||
MassMutual International Equity Fund, Class I |
$ | 8,922,230 | $ | 3,728,599 | $ | (4,041,007 | ) | $ | (1,708,183 | ) | $ | (732,878 | ) | $ | 6,168,761 | 863,972 | $ | 179,010 | $ | 887,828 | ||||||||||||||||
MassMutual Mid Cap Growth Fund, Class I |
2,937,680 | 1,412,090 | (872,572 | ) | (1,354,355 | ) | 86,574 | 2,209,417 | 119,106 | — | 524,093 | |||||||||||||||||||||||||
MassMutual Mid-Cap Value Fund, Class I |
2,910,387 | 1,008,257 | (854,799 | ) | (933,704 | ) | 73,677 | 2,203,818 | 208,695 | 28,785 | 642,292 | |||||||||||||||||||||||||
MassMutual Overseas Fund, Class I |
23,599,269 | 6,622,258 | (14,414,685 | ) | (8,294,313 | ) | 2,301,715 | 9,814,244 | 1,414,156 | 320,844 | 1,859,252 | |||||||||||||||||||||||||
MassMutual Small Cap Growth Equity Fund, Class I |
1,676,740 | 1,543,368 | (716,159 | ) | (838,807 | ) | (72,529 | ) | 1,592,613 | 133,162 | — | 387,240 | ||||||||||||||||||||||||
MassMutual Small Cap Value Equity Fund, Class I |
2,219,180 | 1,759,234 | (991,500 | ) | (1,053,971 | ) | 165,987 | 2,098,930 | 241,534 | — | 578,777 | |||||||||||||||||||||||||
MassMutual Strategic Bond Fund, Class I |
11,737,204 | 7,417,732 | (5,837,037 | ) | (1,982,408 | ) | (862,413 | ) | 10,473,078 | 1,230,679 | 477,482 | 225,011 | ||||||||||||||||||||||||
MassMutual Strategic Emerging Markets Fund, Class I |
4,894,612 | 2,792,374 | (1,606,102 | ) | (2,286,720 | ) | (128,700 | ) | 3,665,464 | 446,463 | 63,028 | 574,623 | ||||||||||||||||||||||||
MassMutual Total Return Bond Fund, Class I |
11,737,204 | 6,942,498 | (5,995,927 | ) | (1,406,405 | ) | (820,080 | ) | 10,457,290 | 1,241,958 | 198,759 | 23,639 | ||||||||||||||||||||||||
MM Equity Asset Fund, Class I |
31,981,431 | 16,100,245 | (13,348,276 | ) | (11,508,437 | ) | 1,298,107 | 24,523,070 | 3,503,296 | 374,637 | 6,007,699 | |||||||||||||||||||||||||
| $ | 151,271,990 | $ | 70,224,621 | $ | (73,773,978 | ) | $ | (45,897,568 | ) | $ | 2,408,395 | $ | 104,233,460 | $ | 2,806,906 | $ | 16,236,548 | |||||||||||||||||||
MM RetireSMART by JPMorgan 2040 Fund |
||||||||||||||||||||||||||||||||||||
MassMutual Blue Chip Growth Fund, Class I |
$ | 17,425,443 | $ | 11,521,217 | $ | (6,623,551 | ) | $ | (9,020,970 | ) | $ | 192,356 | $ | 13,494,495 | 720,090 | $ | — | $ | 3,076,706 | |||||||||||||||||
MassMutual Core Bond Fund, Class I |
5,249,146 | 4,465,701 | (3,112,608 | ) | (855,756 | ) | (401,033 | ) | 5,345,450 | 587,412 | 125,474 | 81,623 | ||||||||||||||||||||||||
MassMutual Diversified Value Fund, Class I |
11,469,626 | 3,316,097 | (7,315,356 | ) | (3,096,166 | ) | 1,047,658 | 5,421,859 | 498,791 | 214,149 | 1,208,120 | |||||||||||||||||||||||||
MassMutual Equity Opportunities Fund, Class I |
11,495,330 | 3,470,759 | (3,980,851 | ) | (2,176,883 | ) | 186,204 | 8,994,559 | 539,889 | 140,565 | 1,223,687 | |||||||||||||||||||||||||
MassMutual Fundamental Value Fund, Class I |
11,509,078 | 4,241,960 | (7,420,524 | ) | (3,564,806 | ) | 1,600,262 | 6,365,970 | 745,430 | 82,437 | 1,309,921 | |||||||||||||||||||||||||
MassMutual Growth Opportunities Fund, Class I |
5,865,429 | 5,063,855 | (2,020,050 | ) | (3,711,415 | ) | (699,379 | ) | 4,498,440 | 986,500 | — | 1,224,927 | ||||||||||||||||||||||||
MassMutual High Yield Fund, Class I |
14,868,449 | 1,738,724 | (9,894,577 | ) | (2,014,519 | ) | (58,381 | ) | 4,639,696 | 638,198 | 1,060,481 | — | ||||||||||||||||||||||||
MassMutual International Equity Fund, Class I |
16,092,842 | 6,843,146 | (6,812,921 | ) | (2,760,219 | ) | (1,752,348 | ) | 11,610,500 | 1,626,120 | 326,239 | 1,618,029 | ||||||||||||||||||||||||
MassMutual Mid Cap Growth Fund , Class I |
5,358,896 | 2,414,363 | (1,420,849 | ) | (2,569,083 | ) | 223,228 | 4,006,555 | 215,987 | — | 964,810 | |||||||||||||||||||||||||
MassMutual Mid-Cap Value Fund, Class I |
5,308,874 | 1,789,303 | (1,518,075 | ) | (1,701,479 | ) | 117,747 | 3,996,370 | 378,444 | 52,992 | 1,182,414 | |||||||||||||||||||||||||
MassMutual Overseas Fund, Class I |
44,061,217 | 12,036,261 | (26,050,741 | ) | (15,198,105 | ) | 3,691,676 | 18,540,308 | 2,671,514 | 604,264 | 3,501,646 | |||||||||||||||||||||||||
MassMutual Small Cap Growth Equity Fund, Class I |
3,046,551 | 2,695,222 | (1,178,508 | ) | (1,608,368 | ) | (56,823 | ) | 2,898,074 | 242,314 | — | 701,472 | ||||||||||||||||||||||||
MassMutual Small Cap Value Equity Fund, Class I |
4,059,060 | 3,030,031 | (1,642,038 | ) | (1,918,238 | ) | 298,764 | 3,827,579 | 440,458 | — | 1,049,147 | |||||||||||||||||||||||||
MassMutual Strategic Bond Fund, Class I |
9,821,574 | 9,360,370 | (6,463,357 | ) | (1,526,959 | ) | (1,133,927 | ) | 10,057,701 | 1,181,868 | 403,250 | 190,030 | ||||||||||||||||||||||||
MassMutual Strategic Emerging Markets Fund, Class I |
8,893,437 | 4,723,455 | (2,496,990 | ) | (4,251,114 | ) | (243,133 | ) | 6,625,655 | 807,023 | 115,724 | 1,055,038 | ||||||||||||||||||||||||
195
Notes to Financial Statements (Continued) |
Beginning |
Purchases |
Sales |
Change in |
Net Realized |
Value as of |
Number of |
Dividend |
Realized |
||||||||||||||||||||||||||||
MM RetireSMART by JPMorgan 2040 Fund (Continued) |
||||||||||||||||||||||||||||||||||||
MassMutual Total Return Bond Fund, Class I |
$ | 9,821,574 | $ | 8,977,504 | $ | (6,639,375 | ) | $ | (1,149,492 | ) | $ | (972,230 | ) | $ | 10,037,981 | 1,192,159 | $ | 167,795 | $ | 19,956 | ||||||||||||||||
MM Equity Asset Fund, Class I |
57,699,866 | 28,585,898 | (22,509,216 | ) | (20,836,215 | ) | 2,090,716 | 45,031,049 | 6,433,007 | 681,610 | 10,930,338 | |||||||||||||||||||||||||
| $ | 242,046,392 | $ | 114,273,866 | $ | (117,099,587 | ) | $ | (77,959,787 | ) | $ | 4,131,357 | $ | 165,392,241 | $ | 3,974,980 | $ | 29,337,864 | |||||||||||||||||||
MM RetireSMART by JPMorgan 2045 Fund |
||||||||||||||||||||||||||||||||||||
MassMutual Blue Chip Growth Fund, Class I |
$ | 8,413,227 | $ | 5,454,023 | $ | (3,001,376 | ) | $ | (4,377,360 | ) | $ | 142,708 | $ | 6,631,222 | 353,854 | $ | — | $ | 1,460,038 | |||||||||||||||||
MassMutual Core Bond Fund, Class I |
230,403 | 1,788,669 | (627,381 | ) | (132,134 | ) | (52,082 | ) | 1,207,475 | 132,690 | 5,462 | 3,553 | ||||||||||||||||||||||||
MassMutual Diversified Value Fund, Class I |
5,541,471 | 1,679,917 | (3,575,920 | ) | (1,497,613 | ) | 519,481 | 2,667,336 | 245,385 | 101,724 | 573,874 | |||||||||||||||||||||||||
MassMutual Equity Opportunities Fund, Class I |
5,553,847 | 1,738,850 | (1,902,485 | ) | (1,053,960 | ) | 92,384 | 4,428,636 | 265,825 | 66,789 | 581,430 | |||||||||||||||||||||||||
MassMutual Fundamental Value Fund, Class I |
5,556,346 | 2,238,902 | (3,718,639 | ) | (1,747,875 | ) | 802,147 | 3,130,881 | 366,614 | 39,155 | 622,166 | |||||||||||||||||||||||||
MassMutual Growth Opportunities Fund, Class I |
2,833,639 | 2,457,141 | (958,494 | ) | (1,787,767 | ) | (326,569 | ) | 2,217,950 | 486,392 | — | 579,955 | ||||||||||||||||||||||||
MassMutual High Yield Fund, Class I |
5,345,441 | 545,532 | (4,205,839 | ) | (570,662 | ) | (56,938 | ) | 1,057,534 | 145,466 | 344,153 | — | ||||||||||||||||||||||||
MassMutual International Equity Fund, Class I |
7,757,333 | 3,507,486 | (3,362,287 | ) | (1,554,858 | ) | (624,078 | ) | 5,723,596 | 801,624 | 154,678 | 767,149 | ||||||||||||||||||||||||
MassMutual Mid Cap Growth Fund, Class I |
2,596,536 | 1,169,159 | (660,847 | ) | (1,223,205 | ) | 93,723 | 1,975,366 | 106,489 | — | 458,684 | |||||||||||||||||||||||||
MassMutual Mid-Cap Value Fund, Class I |
2,572,320 | 931,805 | (769,304 | ) | (814,626 | ) | 50,126 | 1,970,321 | 186,583 | 25,208 | 562,461 | |||||||||||||||||||||||||
MassMutual Overseas Fund, Class I |
21,784,728 | 6,588,503 | (13,618,336 | ) | (7,312,878 | ) | 1,664,024 | 9,106,041 | 1,312,110 | 292,927 | 1,697,478 | |||||||||||||||||||||||||
MassMutual Small Cap Growth Equity Fund, Class I |
1,479,761 | 1,279,962 | (536,804 | ) | (766,024 | ) | (28,009 | ) | 1,428,886 | 119,472 | — | 329,987 | ||||||||||||||||||||||||
MassMutual Small Cap Value Equity Fund, Class I |
1,960,909 | 1,454,882 | (759,184 | ) | (919,463 | ) | 144,138 | 1,881,282 | 216,488 | — | 492,231 | |||||||||||||||||||||||||
MassMutual Strategic Bond Fund, Class I |
431,294 | 3,586,914 | (1,371,605 | ) | (254,911 | ) | (120,622 | ) | 2,271,070 | 266,871 | 17,521 | 8,257 | ||||||||||||||||||||||||
MassMutual Strategic Emerging Markets Fund, Class I |
4,307,963 | 2,370,571 | (1,227,515 | ) | (2,086,339 | ) | (83,966 | ) | 3,280,714 | 399,600 | 55,102 | 502,373 | ||||||||||||||||||||||||
MassMutual Total Return Bond Fund, Class I |
431,294 | 3,583,015 | (1,409,100 | ) | (231,140 | ) | (105,538 | ) | 2,268,531 | 269,422 | 7,291 | 867 | ||||||||||||||||||||||||
MM Equity Asset Fund, Class I |
27,849,409 | 13,766,606 | (10,528,190 | ) | (10,134,166 | ) | 1,153,363 | 22,107,022 | 3,158,146 | 323,795 | 5,192,388 | |||||||||||||||||||||||||
| $ | 104,645,921 | $ | 54,141,937 | $ | (52,233,306 | ) | $ | (36,464,981 | ) | $ | 3,264,292 | $ | 73,353,863 | $ | 1,433,805 | $ | 13,832,891 | |||||||||||||||||||
MM RetireSMART by JPMorgan 2050 Fund |
||||||||||||||||||||||||||||||||||||
MassMutual Blue Chip Growth Fund, Class I |
$ | 12,650,523 | $ | 8,722,678 | $ | (4,209,069 | ) | $ | (6,830,736 | ) | $ | 130,362 | $ | 10,463,758 | 558,365 | $ | — | $ | 2,270,086 | |||||||||||||||||
MassMutual Core Bond Fund, Class I |
346,744 | 2,416,002 | (989,921 | ) | (168,004 | ) | (86,387 | ) | 1,518,434 | 166,861 | 8,385 | 5,454 | ||||||||||||||||||||||||
MassMutual Diversified Value Fund, Class I |
8,325,684 | 2,807,058 | (5,366,837 | ) | (2,256,811 | ) | 689,459 | 4,198,553 | 386,251 | 158,353 | 893,344 | |||||||||||||||||||||||||
MassMutual Equity Opportunities Fund, Class I |
8,344,378 | 2,971,306 | (2,810,430 | ) | (1,650,644 | ) | 116,504 | 6,971,114 | 418,434 | 104,125 | 906,463 | |||||||||||||||||||||||||
MassMutual Fundamental Value Fund, Class I |
8,355,026 | 3,390,584 | (5,289,033 | ) | (2,558,106 | ) | 1,041,819 | 4,940,290 | 578,488 | 60,849 | 966,878 | |||||||||||||||||||||||||
MassMutual Growth Opportunities Fund, Class I |
4,257,864 | 3,947,894 | (1,380,327 | ) | (2,824,407 | ) | (509,967 | ) | 3,491,057 | 765,583 | — | 906,332 | ||||||||||||||||||||||||
196
Notes to Financial Statements (Continued) |
Beginning |
Purchases |
Sales |
Change in |
Net Realized |
Value as of |
Number of |
Dividend |
Realized |
||||||||||||||||||||||||||||
MM RetireSMART by JPMorgan 2050 Fund (Continued) |
||||||||||||||||||||||||||||||||||||
MassMutual High Yield Fund, Class I |
$ | 8,031,944 | $ | 853,642 | $ | (6,609,582 | ) | $ | (831,596 | ) | $ | (102,896 | ) | $ | 1,341,512 | 184,527 | $ | 523,255 | $ | — | ||||||||||||||||
MassMutual International Equity Fund, Class I |
11,655,581 | 5,728,960 | (4,941,255 | ) | (2,124,961 | ) | (1,304,104 | ) | 9,014,221 | 1,262,496 | 240,575 | 1,193,166 | ||||||||||||||||||||||||
MassMutual Mid Cap Growth Fund, Class I |
3,901,346 | 1,912,473 | (911,437 | ) | (1,911,988 | ) | 128,081 | 3,118,475 | 168,112 | — | 716,008 | |||||||||||||||||||||||||
MassMutual Mid-Cap Value Fund, Class I |
3,864,766 | 1,542,189 | (1,088,320 | ) | (1,264,727 | ) | 56,667 | 3,110,575 | 294,562 | 39,318 | 877,320 | |||||||||||||||||||||||||
MassMutual Overseas Fund, Class I |
32,756,086 | 10,392,390 | (19,763,271 | ) | (10,889,371 | ) | 1,901,103 | 14,396,937 | 2,074,487 | 457,033 | 2,648,458 | |||||||||||||||||||||||||
MassMutual Small Cap Growth Equity Fund, Class I |
2,223,382 | 2,055,306 | (779,709 | ) | (1,212,244 | ) | (37,592 | ) | 2,249,143 | 188,055 | — | 515,403 | ||||||||||||||||||||||||
MassMutual Small Cap Value Equity Fund, Class I |
2,946,276 | 2,355,216 | (1,121,799 | ) | (1,439,528 | ) | 221,179 | 2,961,344 | 340,776 | — | 768,199 | |||||||||||||||||||||||||
MassMutual Strategic Bond Fund, Class I |
649,075 | 4,905,404 | (2,177,111 | ) | (319,724 | ) | (200,019 | ) | 2,857,625 | 335,796 | 26,975 | 12,711 | ||||||||||||||||||||||||
MassMutual Strategic Emerging Markets Fund, Class I |
6,473,052 | 3,855,078 | (1,717,971 | ) | (3,202,200 | ) | (216,033 | ) | 5,191,926 | 632,391 | 85,756 | 781,835 | ||||||||||||||||||||||||
MassMutual Total Return Bond Fund, Class I |
649,075 | 4,895,597 | (2,225,352 | ) | (289,547 | ) | (175,341 | ) | 2,854,432 | 339,006 | 11,224 | 1,335 | ||||||||||||||||||||||||
MM Equity Asset Fund, Class I |
41,876,518 | 21,931,026 | (14,687,993 | ) | (15,365,313 | ) | 1,102,344 | 34,856,582 | 4,979,512 | 503,022 | 8,066,493 | |||||||||||||||||||||||||
| $ | 157,307,320 | $ | 84,682,803 | $ | (76,069,417 | ) | $ | (55,139,907 | ) | $ | 2,755,179 | $ | 113,535,978 | $ | 2,218,870 | $ | 21,529,485 | |||||||||||||||||||
MM RetireSMART by JPMorgan 2055 Fund |
||||||||||||||||||||||||||||||||||||
MassMutual Blue Chip Growth Fund, Class I |
$ | 4,249,517 | $ | 3,027,688 | $ | (1,588,022 | ) | $ | (2,252,561 | ) | $ | 75,058 | $ | 3,511,680 | 187,390 | $ | — | $ | 718,705 | |||||||||||||||||
MassMutual Core Bond Fund, Class I |
116,441 | 810,185 | (333,395 | ) | (55,638 | ) | (28,015 | ) | 509,578 | 55,998 | 2,696 | 1,754 | ||||||||||||||||||||||||
MassMutual Diversified Value Fund, Class I |
2,796,332 | 999,830 | (1,878,784 | ) | (775,332 | ) | 266,022 | 1,408,068 | 129,537 | 49,842 | 281,180 | |||||||||||||||||||||||||
MassMutual Equity Opportunities Fund, Class I |
2,802,504 | 1,053,814 | (1,018,113 | ) | (550,768 | ) | 50,463 | 2,337,900 | 140,330 | 32,735 | 284,980 | |||||||||||||||||||||||||
MassMutual Fundamental Value Fund, Class I |
2,806,542 | 1,226,468 | (1,879,897 | ) | (888,315 | ) | 393,196 | 1,657,994 | 194,145 | 19,276 | 306,299 | |||||||||||||||||||||||||
MassMutual Growth Opportunities Fund, Class I |
1,429,901 | 1,348,173 | (527,377 | ) | (894,087 | ) | (185,759 | ) | 1,170,851 | 256,766 | — | 283,571 | ||||||||||||||||||||||||
MassMutual High Yield Fund, Class I |
2,697,370 | 309,239 | (2,252,932 | ) | (267,595 | ) | (35,894 | ) | 450,188 | 61,924 | 167,647 | — | ||||||||||||||||||||||||
MassMutual International Equity Fund, Class I |
3,914,425 | 2,078,549 | (1,848,653 | ) | (778,668 | ) | (344,036 | ) | 3,021,617 | 423,196 | 74,870 | 371,329 | ||||||||||||||||||||||||
MassMutual Mid Cap Growth Fund, Class I |
1,310,220 | 683,209 | (371,597 | ) | (606,424 | ) | 30,499 | 1,045,907 | 56,383 | — | 224,949 | |||||||||||||||||||||||||
MassMutual Mid-Cap Value Fund, Class I |
1,297,971 | 550,581 | (416,472 | ) | (427,066 | ) | 38,226 | 1,043,240 | 98,792 | 12,349 | 275,534 | |||||||||||||||||||||||||
MassMutual Overseas Fund, Class I |
11,003,866 | 3,880,352 | (7,121,329 | ) | (3,676,718 | ) | 743,211 | 4,829,382 | 695,876 | 143,491 | 831,513 | |||||||||||||||||||||||||
MassMutual Small Cap Growth Equity Fund, Class I |
746,702 | 714,663 | (303,525 | ) | (381,072 | ) | (22,366 | ) | 754,402 | 63,077 | — | 161,723 | ||||||||||||||||||||||||
MassMutual Small Cap Value Equity Fund, Class I |
989,492 | 822,768 | (424,804 | ) | (475,244 | ) | 81,021 | 993,233 | 114,296 | — | 241,379 | |||||||||||||||||||||||||
MassMutual Strategic Bond Fund, Class I |
217,968 | 1,640,190 | (728,308 | ) | (106,317 | ) | (64,523 | ) | 959,010 | 112,692 | 8,704 | 4,102 | ||||||||||||||||||||||||
197
Notes to Financial Statements (Continued) |
Beginning |
Purchases |
Sales |
Change in |
Net Realized |
Value as of |
Number of |
Dividend |
Realized |
||||||||||||||||||||||||||||
MM RetireSMART by JPMorgan 2055 Fund (Continued) |
||||||||||||||||||||||||||||||||||||
MassMutual Strategic Emerging Markets Fund, Class I |
$ | 2,173,847 | $ | 1,394,800 | $ | (719,794 | ) | $ | (1,055,788 | ) | $ | (50,500 | ) | $ | 1,742,565 | 212,249 | $ | 26,691 | $ | 243,335 | ||||||||||||||||
MassMutual Total Return Bond Fund, Class I |
217,968 | 1,637,238 | (744,165 | ) | (96,381 | ) | (56,721 | ) | 957,939 | 113,769 | 3,623 | 431 | ||||||||||||||||||||||||
MM Select Equity Asset Fund, Class I |
14,066,851 | 7,830,410 | (5,582,933 | ) | (5,238,817 | ) | 622,452 | 11,697,963 | 1,671,138 | 159,555 | 2,558,632 | |||||||||||||||||||||||||
| $ | 52,837,917 | $ | 30,008,157 | $ | (27,740,100 | ) | $ | (18,526,791 | ) | $ | 1,512,334 | $ | 38,091,517 | $ | 701,479 | $ | 6,789,416 | |||||||||||||||||||
MM RetireSMART by JPMorgan 2060 Fund |
||||||||||||||||||||||||||||||||||||
MassMutual Blue Chip Growth Fund, Class I |
$ | 1,477,247 | $ | 1,126,671 | $ | (709,819 | ) | $ | (728,487 | ) | $ | (9,633 | ) | $ | 1,155,979 | 61,685 | $ | — | $ | 261,113 | ||||||||||||||||
MassMutual Core Bond Fund, Class I |
40,456 | 283,725 | (128,225 | ) | (17,776 | ) | (10,382 | ) | 167,798 | 18,439 | 970 | 630 | ||||||||||||||||||||||||
MassMutual Diversified Value Fund, Class I |
973,075 | 410,538 | (744,226 | ) | (271,618 | ) | 96,075 | 463,844 | 42,672 | 18,084 | 102,025 | |||||||||||||||||||||||||
MassMutual Equity Opportunities Fund, Class I |
975,255 | 437,095 | (474,833 | ) | (212,286 | ) | 44,907 | 770,138 | 46,227 | 11,868 | 103,322 | |||||||||||||||||||||||||
MassMutual Fundamental Value Fund, Class I |
975,582 | 506,644 | (768,071 | ) | (283,255 | ) | 114,872 | 545,772 | 63,908 | 6,995 | 111,159 | |||||||||||||||||||||||||
MassMutual High Yield Fund, Class I |
938,982 | 128,899 | (815,486 | ) | (88,383 | ) | (15,772 | ) | 148,240 | 20,391 | 59,135 | — | ||||||||||||||||||||||||
MassMutual Mid Cap Growth Fund , Class I |
455,955 | 270,103 | (185,301 | ) | (214,439 | ) | 18,209 | 344,527 | 18,573 | — | 81,661 | |||||||||||||||||||||||||
MassMutual Overseas Fund, Class I |
3,822,904 | 1,572,245 | (2,801,281 | ) | (1,172,441 | ) | 168,343 | 1,589,770 | 229,073 | 52,640 | 305,042 | |||||||||||||||||||||||||
MassMutual Small Cap Growth Equity Fund, Class I |
259,843 | 271,529 | (144,996 | ) | (110,257 | ) | (27,607 | ) | 248,512 | 20,779 | — | 58,794 | ||||||||||||||||||||||||
MassMutual Small Cap Value Equity Fund, Class I |
344,327 | 313,491 | (195,368 | ) | (160,339 | ) | 25,063 | 327,174 | 37,649 | — | 87,598 | |||||||||||||||||||||||||
MassMutual Strategic Bond Fund, Class I |
75,731 | 573,752 | (275,949 | ) | (33,943 | ) | (23,799 | ) | 315,792 | 37,108 | 3,126 | 1,473 | ||||||||||||||||||||||||
MassMutual Strategic Emerging Markets Fund, Class I |
756,085 | 560,046 | (362,724 | ) | (323,200 | ) | (57,420 | ) | 572,787 | 69,767 | 9,794 | 89,288 | ||||||||||||||||||||||||
MassMutual Growth Opportunities Fund, Class I |
497,623 | 500,528 | (244,541 | ) | (264,979 | ) | (102,948 | ) | 385,683 | 84,580 | — | 103,301 | ||||||||||||||||||||||||
MassMutual International Equity Fund, Class I |
1,361,435 | 891,935 | (871,499 | ) | (194,448 | ) | (192,055 | ) | 995,368 | 139,407 | 27,467 | 136,227 | ||||||||||||||||||||||||
MassMutual Mid-Cap Value Fund, Class I |
451,678 | 224,677 | (198,255 | ) | (159,663 | ) | 25,210 | 343,647 | 32,542 | 4,483 | 100,019 | |||||||||||||||||||||||||
MassMutual Total Return Bond Fund, Class I |
75,731 | 572,641 | (281,311 | ) | (30,647 | ) | (20,975 | ) | 315,439 | 37,463 | 1,300 | 155 | ||||||||||||||||||||||||
MM Equity Asset Fund, Class I |
4,889,843 | 2,942,485 | (2,407,999 | ) | (1,765,892 | ) | 192,294 | 3,850,731 | 550,104 | 57,807 | 926,989 | |||||||||||||||||||||||||
| $ | 18,371,752 | $ | 11,587,004 | $ | (11,609,884 | ) | $ | (6,032,053 | ) | $ | 224,382 | $ | 12,541,201 | $ | 253,669 | $ | 2,468,796 | |||||||||||||||||||
MM Select T. Rowe Price Retirement Balanced Fund |
||||||||||||||||||||||||||||||||||||
MassMutual Select T. Rowe Price Bond Asset Fund, Class I |
$ | 44,120,683 | $ | 6,699,911 | $ | (9,285,816 | ) | $ | (6,756,753 | ) | $ | (897,297 | ) | $ | 33,880,728 | 3,925,924 | $ | 1,330,497 | $ | 113,380 | ||||||||||||||||
MassMutual Select T. Rowe Price Emerging Markets Bond Fund, Class I |
8,105,476 | 2,158,804 | (1,373,453 | ) | (2,252,536 | ) | (329,397 | ) | 6,308,894 | 926,416 | 449,071 | — | ||||||||||||||||||||||||
MassMutual Select T. Rowe Price International Equity Fund, Class I |
22,137,853 | 5,109,394 | (3,979,637 | ) | (6,761,541 | ) | 309,593 | 16,815,662 | 2,004,251 | 602,712 | 306,554 | |||||||||||||||||||||||||
198
Notes to Financial Statements (Continued) |
Beginning |
Purchases |
Sales |
Change in |
Net Realized |
Value as of |
Number of |
Dividend |
Realized |
||||||||||||||||||||||||||||
MM Select T. Rowe Price Retirement Balanced Fund (Continued) |
||||||||||||||||||||||||||||||||||||
MassMutual Select T. Rowe Price Large Cap Blend Fund, Class I |
$ | 24,107,539 | $ | 16,277,618 | $ | (5,045,868 | ) | $ | (11,482,493 | ) | $ | 496,740 | $ | 24,353,536 | 2,168,614 | $ | 217,769 | $ | 4,100,029 | |||||||||||||||||
MassMutual Select T. Rowe Price Limited Duration Inflation Focused Bond Fund, Class I |
40,496,798 | 7,416,678 | (11,249,390 | ) | (4,358,239 | ) | 189,703 | 32,495,550 | 3,299,041 | 1,935,255 | 529,404 | |||||||||||||||||||||||||
MassMutual Select T. Rowe Price Real Assets Fund, Class I |
2,159,709 | 1,654,074 | (456,675 | ) | (710,193 | ) | 67,918 | 2,714,833 | 262,556 | 60,238 | 131,103 | |||||||||||||||||||||||||
MassMutual Select T. Rowe Price Small and Mid Cap Blend Fund, Class I |
12,063,959 | 2,853,267 | (2,392,778 | ) | (4,359,630 | ) | 350,603 | 8,515,421 | 773,426 | 119,250 | 1,454,413 | |||||||||||||||||||||||||
MassMutual Select T. Rowe Price U.S. Treasury Long-Term Index Fund, Class I |
2,571,128 | 4,522,297 | (798,521 | ) | (713,214 | ) | (770,387 | ) | 4,811,303 | 879,580 | 48,324 | — | ||||||||||||||||||||||||
MM S&P 500 Index Fund, Class I |
14,579,963 | 4,270,709 | (9,660,047 | ) | (4,132,123 | ) | 1,468,860 | 6,527,362 | 409,753 | 181,308 | 1,608,522 | |||||||||||||||||||||||||
| $ | 170,343,108 | $ | 50,962,752 | $ | (44,242,185 | ) | $ | (41,526,722 | ) | $ | 886,336 | $ | 136,423,289 | $ | 4,944,424 | $ | 8,243,405 | |||||||||||||||||||
MM Select T. Rowe Price Retirement 2005 Fund |
||||||||||||||||||||||||||||||||||||
MassMutual Select T. Rowe Price Bond Asset Fund, Class I |
$ | 7,051,411 | $ | 1,198,218 | $ | (1,883,221 | ) | $ | (1,015,969 | ) | $ | (148,623 | ) | $ | 5,201,816 | 602,760 | $ | 206,192 | $ | 17,571 | ||||||||||||||||
MassMutual Select T. Rowe Price Emerging Markets Bond Fund, Class I |
1,329,741 | 259,538 | (234,695 | ) | (365,276 | ) | (42,331 | ) | 946,977 | 139,057 | 73,293 | — | ||||||||||||||||||||||||
MassMutual Select T. Rowe Price International Equity Fund, Class I |
3,441,794 | 1,092,591 | (696,959 | ) | (1,114,171 | ) | 60,098 | 2,783,353 | 331,747 | 95,613 | 48,631 | |||||||||||||||||||||||||
MassMutual Select T. Rowe Price Large Cap Blend Fund, Class I |
3,846,427 | 2,893,804 | (866,941 | ) | (1,878,489 | ) | 85,914 | 4,080,715 | 363,376 | 34,853 | 656,199 | |||||||||||||||||||||||||
MassMutual Select T. Rowe Price Limited Duration Inflation Focused Bond Fund, Class I |
5,174,412 | 1,103,846 | (1,509,678 | ) | (569,250 | ) | 34,629 | 4,233,959 | 429,844 | 248,809 | 68,063 | |||||||||||||||||||||||||
MassMutual Select T. Rowe Price Real Assets Fund, Class I |
327,019 | 312,518 | (74,273 | ) | (128,942 | ) | 21,176 | 457,498 | 44,245 | 9,124 | 19,858 | |||||||||||||||||||||||||
MassMutual Select T. Rowe Price Small and Mid Cap Blend Fund, Class I |
1,903,008 | 533,640 | (330,580 | ) | (693,325 | ) | 39,425 | 1,452,168 | 131,895 | 19,113 | 233,108 | |||||||||||||||||||||||||
MassMutual Select T. Rowe Price U.S. Treasury Long-Term Index Fund, Class I |
418,385 | 715,439 | (128,551 | ) | (184,340 | ) | (48,108 | ) | 772,825 | 141,284 | 7,359 | — | ||||||||||||||||||||||||
MM S&P 500 Index Fund, Class I |
2,317,988 | 778,142 | (1,556,602 | ) | (510,251 | ) | 58,694 | 1,087,971 | 68,297 | 30,005 | 266,198 | |||||||||||||||||||||||||
| $ | 25,810,185 | $ | 8,887,736 | $ | (7,281,500 | ) | $ | (6,460,013 | ) | $ | 60,874 | $ | 21,017,282 | $ | 724,361 | $ | 1,309,628 | |||||||||||||||||||
MM Select T. Rowe Price Retirement 2010 Fund |
||||||||||||||||||||||||||||||||||||
MassMutual Select T. Rowe Price Bond Asset Fund, Class I |
$ | 32,524,950 | $ | 3,350,581 | $ | (9,315,106 | ) | $ | (4,781,915 | ) | $ | (461,845 | ) | $ | 21,316,665 | 2,470,066 | $ | 958,384 | $ | 81,670 | ||||||||||||||||
MassMutual Select T. Rowe Price Emerging Markets Bond Fund, Class I |
5,982,738 | 977,678 | (1,376,341 | ) | (1,491,363 | ) | (266,341 | ) | 3,826,371 | 561,875 | 326,421 | — | ||||||||||||||||||||||||
MassMutual Select T. Rowe Price International Equity Fund, Class I |
19,239,674 | 3,739,685 | (4,909,245 | ) | (5,901,667 | ) | 617,602 | 12,786,049 | 1,523,963 | 518,906 | 263,929 | |||||||||||||||||||||||||
199
Notes to Financial Statements (Continued) |
Beginning |
Purchases |
Sales |
Change in |
Net Realized |
Value as of |
Number of |
Dividend |
Realized |
||||||||||||||||||||||||||||
MM Select T. Rowe Price Retirement 2010 Fund (Continued) |
||||||||||||||||||||||||||||||||||||
MassMutual Select T. Rowe Price Large Cap Blend Fund Class I |
$ | 21,441,836 | $ | 12,936,313 | $ | (6,341,569 | ) | $ | (9,661,237 | ) | $ | 453,417 | $ | 18,828,760 | 1,676,648 | $ | 191,270 | $ | 3,601,103 | |||||||||||||||||
MassMutual Select T. Rowe Price Limited Duration Inflation Focused Bond Fund, Class I |
22,796,923 | 3,204,804 | (8,064,883 | ) | (2,411,580 | ) | 218,880 | 15,744,144 | 1,598,390 | 1,080,309 | 295,526 | |||||||||||||||||||||||||
MassMutual Select T. Rowe Price Real Assets Fund, Class I |
1,802,988 | 1,395,190 | (590,785 | ) | (606,090 | ) | 95,980 | 2,097,283 | 202,832 | 49,815 | 108,420 | |||||||||||||||||||||||||
MassMutual Select T. Rowe Price Small and Mid Cap Blend Fund, Class I |
10,666,083 | 2,134,317 | (2,751,676 | ) | (3,868,548 | ) | 440,925 | 6,621,101 | 601,372 | 105,775 | 1,290,062 | |||||||||||||||||||||||||
MassMutual Select T. Rowe Price U.S. Treasury Long-Term Index Fund, Class I |
2,183,646 | 3,148,523 | (932,779 | ) | (256,817 | ) | (830,285 | ) | 3,312,288 | 605,537 | 37,958 | — | ||||||||||||||||||||||||
MM S&P 500 Index Fund, Class I |
12,858,398 | 3,294,472 | (8,909,039 | ) | (3,404,561 | ) | 1,144,387 | 4,983,657 | 312,847 | 161,434 | 1,432,213 | |||||||||||||||||||||||||
| $ | 129,497,236 | $ | 34,181,563 | $ | (43,191,423 | ) | $ | (32,383,778 | ) | $ | 1,412,720 | $ | 89,516,318 | $ | 3,430,272 | $ | 7,072,923 | |||||||||||||||||||
MM Select T. Rowe Price Retirement 2015 Fund |
||||||||||||||||||||||||||||||||||||
MassMutual Select T. Rowe Price Bond Asset Fund, Class I |
$ | 33,500,301 | $ | 4,333,795 | $ | (9,551,091 | ) | $ | (4,888,370 | ) | $ | (624,294 | ) | $ | 22,770,341 | 2,638,510 | $ | 978,503 | $ | 83,384 | ||||||||||||||||
MassMutual Select T. Rowe Price Emerging Markets Bond Fund, Class I |
5,975,617 | 1,187,421 | (1,339,330 | ) | (1,561,287 | ) | (234,805 | ) | 4,027,616 | 591,427 | 319,136 | — | ||||||||||||||||||||||||
MassMutual Select T. Rowe Price International Equity Fund, Class I |
22,585,742 | 4,327,092 | (5,475,957 | ) | (7,013,208 | ) | 768,644 | 15,192,313 | 1,810,764 | 596,111 | 303,197 | |||||||||||||||||||||||||
MassMutual Select T. Rowe Price Large Cap Blend Fund, Class I |
24,972,217 | 14,768,613 | (6,804,303 | ) | (11,762,916 | ) | 1,061,897 | 22,235,508 | 1,980,010 | 216,931 | 4,084,242 | |||||||||||||||||||||||||
MassMutual Select T. Rowe Price Limited Duration Inflation Focused Bond Fund, Class I |
21,096,655 | 3,583,100 | (7,508,963 | ) | (2,246,788 | ) | 183,411 | 15,107,415 | 1,533,748 | 999,043 | 273,295 | |||||||||||||||||||||||||
MassMutual Select T. Rowe Price Real Assets Fund, Class I |
2,141,866 | 1,615,701 | (672,145 | ) | (718,626 | ) | 111,823 | 2,478,619 | 239,712 | 58,039 | 126,319 | |||||||||||||||||||||||||
MassMutual Select T. Rowe Price Small and Mid Cap Blend Fund, Class I |
12,457,609 | 2,646,385 | (3,220,717 | ) | (4,678,295 | ) | 750,452 | 7,955,434 | 722,564 | 118,980 | 1,451,117 | |||||||||||||||||||||||||
MassMutual Select T. Rowe Price U.S. Treasury Long-Term Index Fund, Class I |
2,637,531 | 3,209,220 | (971,268 | ) | (381,482 | ) | (821,195 | ) | 3,672,806 | 671,445 | 44,848 | — | ||||||||||||||||||||||||
MM S&P 500 Index Fund, Class I |
14,947,394 | 3,662,489 | (10,272,449 | ) | (4,257,833 | ) | 1,629,859 | 5,709,460 | 358,409 | 180,556 | 1,601,841 | |||||||||||||||||||||||||
| $ | 140,314,932 | $ | 39,333,816 | $ | (45,816,223 | ) | $ | (37,508,805 | ) | $ | 2,825,792 | $ | 99,149,512 | $ | 3,512,147 | $ | 7,923,395 | |||||||||||||||||||
MM Select T. Rowe Price Retirement 2020 Fund |
||||||||||||||||||||||||||||||||||||
MassMutual Select T. Rowe Price Bond Asset Fund, Class I |
$ | 157,176,305 | $ | 15,258,813 | $ | (48,459,690 | ) | $ | (21,873,997 | ) | $ | (2,439,571 | ) | $ | 99,661,860 | 11,548,304 | $ | 4,589,280 | $ | 391,081 | ||||||||||||||||
MassMutual Select T. Rowe Price Emerging Markets Bond Fund, Class I |
26,347,495 | 5,283,381 | (6,868,591 | ) | (6,585,436 | ) | (1,123,399 | ) | 17,053,450 | 2,504,178 | 1,441,672 | — | ||||||||||||||||||||||||
MassMutual Select T. Rowe Price International Equity Fund, Class I |
118,204,237 | 19,927,500 | (32,611,056 | ) | (35,676,131 | ) | 4,481,243 | 74,325,793 | 8,858,855 | 3,199,238 | 1,627,211 | |||||||||||||||||||||||||
200
Notes to Financial Statements (Continued) |
Beginning |
Purchases |
Sales |
Change in |
Net Realized |
Value as of |
Number of |
Dividend |
Realized |
||||||||||||||||||||||||||||
MM Select T. Rowe Price Retirement 2020 Fund (Continued) |
||||||||||||||||||||||||||||||||||||
MassMutual Select T. Rowe Price Large Cap Blend Fund, Class I |
$ | 135,946,305 | $ | 64,472,310 | $ | (40,845,597 | ) | $ | (63,141,662 | ) | $ | 9,588,280 | $ | 106,019,636 | 9,440,751 | $ | 1,177,139 | $ | 22,162,427 | |||||||||||||||||
MassMutual Select T. Rowe Price Limited Duration Inflation Focused Bond Fund, Class I |
83,562,636 | 14,826,104 | (32,894,921 | ) | (8,891,379 | ) | 726,759 | 57,329,199 | 5,820,223 | 4,085,396 | 1,117,590 | |||||||||||||||||||||||||
MassMutual Select T. Rowe Price Real Assets Fund, Class I |
11,830,221 | 6,524,925 | (3,511,046 | ) | (3,446,145 | ) | 615,402 | 12,013,357 | 1,161,833 | 324,495 | 706,244 | |||||||||||||||||||||||||
MassMutual Select T. Rowe Price Small and Mid Cap Blend Fund, Class I |
61,545,915 | 16,013,143 | (20,757,963 | ) | (22,843,637 | ) | 4,273,895 | 38,231,353 | 3,472,421 | 588,465 | 7,177,089 | |||||||||||||||||||||||||
MassMutual Select T. Rowe Price U.S. Treasury Long-Term Index Fund, Class I |
11,874,604 | 15,273,356 | (5,059,676 | ) | (1,371,001 | ) | (4,169,180 | ) | 16,548,103 | 3,025,247 | 203,739 | — | ||||||||||||||||||||||||
MM S&P 500 Index Fund, Class I |
78,334,271 | 21,205,118 | (58,077,846 | ) | (20,445,368 | ) | 7,053,357 | 28,069,532 | 1,762,055 | 954,693 | 8,469,792 | |||||||||||||||||||||||||
| $ | 684,821,989 | $ | 178,784,650 | $ | (249,086,386 | ) | $ | (184,274,756 | ) | $ | 19,006,786 | $ | 449,252,283 | $ | 16,564,117 | $ | 41,651,434 | |||||||||||||||||||
MM Select T. Rowe Price Retirement 2025 Fund |
||||||||||||||||||||||||||||||||||||
MassMutual Select T. Rowe Price Bond Asset Fund, Class I |
$ | 127,144,924 | $ | 15,208,924 | $ | (29,676,663 | ) | $ | (19,122,893 | ) | $ | (2,203,489 | ) | $ | 91,350,803 | 10,585,261 | $ | 3,776,030 | $ | 321,779 | ||||||||||||||||
MassMutual Select T. Rowe Price Emerging Markets Bond Fund, Class I |
19,290,365 | 4,852,653 | (3,675,838 | ) | (5,468,016 | ) | (647,030 | ) | 14,352,134 | 2,107,509 | 1,074,128 | — | ||||||||||||||||||||||||
MassMutual Select T. Rowe Price International Equity Fund, Class I |
127,109,159 | 22,362,783 | (27,062,437 | ) | (40,014,813 | ) | 3,674,716 | 86,069,408 | 10,258,571 | 3,506,421 | 1,783,452 | |||||||||||||||||||||||||
MassMutual Select T. Rowe Price Large Cap Blend Fund, Class I |
146,926,049 | 72,447,159 | (31,658,514 | ) | (69,529,840 | ) | 7,766,995 | 125,951,849 | 11,215,659 | 1,289,150 | 24,271,290 | |||||||||||||||||||||||||
MassMutual Select T. Rowe Price Limited Duration Inflation Focused Bond Fund, Class I |
46,133,605 | 15,623,185 | (17,983,164 | ) | (5,193,212 | ) | 38,234 | 38,618,648 | 3,920,675 | 2,444,375 | 668,677 | |||||||||||||||||||||||||
MassMutual Select T. Rowe Price Real Assets Fund, Class I |
12,596,497 | 8,052,356 | (2,960,338 | ) | (3,899,844 | ) | 457,729 | 14,246,400 | 1,377,795 | 350,826 | 763,553 | |||||||||||||||||||||||||
MassMutual Select T. Rowe Price Small and Mid Cap Blend Fund, Class I |
67,883,784 | 18,177,410 | (18,697,990 | ) | (25,871,607 | ) | 3,977,015 | 45,468,612 | 4,129,756 | 661,862 | 8,072,265 | |||||||||||||||||||||||||
MassMutual Select T. Rowe Price U.S. Treasury Long-Term Index Fund, Class I |
12,790,157 | 15,184,748 | (3,834,183 | ) | (2,441,551 | ) | (3,623,607 | ) | 18,075,564 | 3,304,491 | 224,460 | — | ||||||||||||||||||||||||
MM S&P 500 Index Fund, Class I |
82,226,480 | 22,604,481 | (56,320,864 | ) | (23,816,744 | ) | 8,546,052 | 33,239,405 | 2,086,592 | 1,008,621 | 8,948,244 | |||||||||||||||||||||||||
| $ | 642,101,020 | $ | 194,513,699 | $ | (191,869,991 | ) | $ | (195,358,520 | ) | $ | 17,986,615 | $ | 467,372,823 | $ | 14,335,873 | $ | 44,829,260 | |||||||||||||||||||
MM Select T. Rowe Price Retirement 2030 Fund |
||||||||||||||||||||||||||||||||||||
MassMutual Select T. Rowe Price Bond Asset Fund, Class I |
$ | 220,015,462 | $ | 23,852,817 | $ | (39,294,601 | ) | $ | (35,753,963 | ) | $ | (1,881,908 | ) | $ | 166,937,807 | 19,343,894 | $ | 6,587,420 | $ | 561,355 | ||||||||||||||||
MassMutual Select T. Rowe Price Emerging Markets Bond Fund, Class I |
27,678,942 | 7,079,456 | (4,778,885 | ) | (7,740,665 | ) | (999,360 | ) | 21,239,488 | 3,118,868 | 1,552,176 | — | ||||||||||||||||||||||||
MassMutual Select T. Rowe Price International Equity Fund, Class I |
342,929,604 | 51,119,237 | (68,798,454 | ) | (97,431,487 | ) | 1,107,091 | 228,925,991 | 27,285,577 | 9,460,392 | 4,811,787 | |||||||||||||||||||||||||
201
Notes to Financial Statements (Continued) |
Beginning |
Purchases |
Sales |
Change in |
Net Realized |
Value as of |
Number of |
Dividend |
Realized |
||||||||||||||||||||||||||||
MM Select T. Rowe Price Retirement 2030 Fund (Continued) |
||||||||||||||||||||||||||||||||||||
MassMutual Select T. Rowe Price Large Cap Blend Fund, Class I |
$ | 422,668,355 | $ | 169,945,028 | $ | (86,279,029 | ) | $ | (192,057,581 | ) | $ | 21,757,623 | $ | 336,034,396 | 29,922,920 | $ | 3,727,318 | $ | 70,175,578 | |||||||||||||||||
MassMutual Select T. Rowe Price Limited Duration Inflation Focused Bond Fund, Class I |
36,127,574 | 15,261,233 | (23,038,314 | ) | (3,032,148 | ) | (653,268 | ) | 24,665,077 | 2,504,069 | 1,858,850 | 508,502 | ||||||||||||||||||||||||
MassMutual Select T. Rowe Price Real Assets Fund, Class I |
32,691,410 | 20,813,783 | (6,427,700 | ) | (10,102,737 | ) | 1,116,407 | 38,091,163 | 3,683,865 | 917,084 | 1,995,983 | |||||||||||||||||||||||||
MassMutual Select T. Rowe Price Small and Mid Cap Blend Fund, Class I |
177,144,249 | 40,750,105 | (40,669,458 | ) | (64,693,429 | ) | 6,615,344 | 119,146,811 | 10,821,690 | 1,777,034 | 21,673,211 | |||||||||||||||||||||||||
MassMutual Select T. Rowe Price U.S. Treasury Long-Term Index Fund, Class I |
33,075,470 | 30,462,845 | (7,974,529 | ) | (7,301,416 | ) | (6,867,740 | ) | 41,394,630 | 7,567,574 | 586,336 | — | ||||||||||||||||||||||||
MM S&P 500 Index Fund, Class I |
193,813,107 | 43,137,971 | (108,817,260 | ) | (56,817,582 | ) | 16,679,938 | 87,996,174 | 5,523,928 | 2,504,581 | 22,220,019 | |||||||||||||||||||||||||
| $ | 1,486,144,173 | $ | 402,422,475 | $ | (386,078,230 | ) | $ | (474,931,008 | ) | $ | 36,874,127 | $ | 1,064,431,537 | $ | 28,971,191 | $ | 121,946,435 | |||||||||||||||||||
MM Select T. Rowe Price Retirement 2035 Fund |
||||||||||||||||||||||||||||||||||||
MassMutual Select T. Rowe Price Bond Asset Fund, Class I |
$ | 68,896,960 | $ | 9,388,303 | $ | (9,318,515 | ) | $ | (11,741,748 | ) | $ | (507,763 | ) | $ | 56,717,237 | 6,572,102 | $ | 2,078,288 | $ | 177,104 | ||||||||||||||||
MassMutual Select T. Rowe Price Emerging Markets Bond Fund, Class I |
7,138,412 | 1,731,985 | (746,460 | ) | (2,194,850 | ) | (133,094 | ) | 5,795,993 | 851,100 | 398,569 | — | ||||||||||||||||||||||||
MassMutual Select T. Rowe Price International Equity Fund, Class I |
181,999,418 | 39,297,522 | (24,626,546 | ) | (56,663,257 | ) | 998,879 | 141,006,016 | 16,806,438 | 5,071,453 | 2,579,465 | |||||||||||||||||||||||||
MassMutual Select T. Rowe Price Large Cap Blend Fund, Class I |
248,230,801 | 96,867,293 | (38,110,791 | ) | (112,403,831 | ) | 9,617,618 | 204,201,090 | 18,183,534 | 2,199,719 | 41,414,921 | |||||||||||||||||||||||||
MassMutual Select T. Rowe Price Limited Duration Inflation Focused Bond Fund Class I |
6,367,710 | 9,040,663 | (14,557,991 | ) | (165,266 | ) | (358,790 | ) | 326,326 | 33,130 | 352,751 | 96,498 | ||||||||||||||||||||||||
MassMutual Select T. Rowe Price Real Assets Fund, Class I |
17,268,800 | 13,728,062 | (2,395,464 | ) | (5,849,386 | ) | 359,123 | 23,111,135 | 2,235,119 | 487,809 | 1,061,688 | |||||||||||||||||||||||||
MassMutual Select T. Rowe Price Small and Mid Cap Blend Fund, Class I |
95,573,546 | 26,937,528 | (16,665,758 | ) | (35,461,766 | ) | 2,243,347 | 72,626,897 | 6,596,448 | 966,633 | 11,789,327 | |||||||||||||||||||||||||
MassMutual Select T. Rowe Price U.S. Treasury Long-Term Index Fund, Class I |
13,274,357 | 11,098,217 | (1,962,080 | ) | (4,140,413 | ) | (1,618,261 | ) | 16,651,820 | 3,044,208 | 239,633 | — | ||||||||||||||||||||||||
MM S&P 500 Index Fund, Class I |
82,560,915 | 26,071,399 | (37,959,736 | ) | (25,756,483 | ) | 5,996,677 | 50,912,772 | 3,196,031 | 1,057,363 | 9,380,662 | |||||||||||||||||||||||||
| $ | 721,310,919 | $ | 234,160,972 | $ | (146,343,341 | ) | $ | (254,377,000 | ) | $ | 16,597,736 | $ | 571,349,286 | $ | 12,852,218 | $ | 66,499,665 | |||||||||||||||||||
MM Select T. Rowe Price Retirement 2040 Fund |
||||||||||||||||||||||||||||||||||||
MassMutual Select T. Rowe Price Bond Asset Fund, Class I |
$ | 70,468,132 | $ | 6,362,914 | $ | (21,888,506 | ) | $ | (10,162,390 | ) | $ | (284,086 | ) | $ | 44,496,064 | 5,155,975 | $ | 2,024,048 | $ | 172,482 | ||||||||||||||||
MassMutual Select T. Rowe Price Emerging Markets Bond Fund, Class I |
4,379,347 | 792,450 | (1,608,248 | ) | (912,701 | ) | (293,896 | ) | 2,356,952 | 346,102 | 243,837 | — | ||||||||||||||||||||||||
MassMutual Select T. Rowe Price International Equity Fund, Class I |
347,320,194 | 75,273,265 | (55,873,544 | ) | (105,779,868 | ) | 26,713 | 260,966,760 | 31,104,501 | 9,780,335 | 4,974,518 | |||||||||||||||||||||||||
202
Notes to Financial Statements (Continued) |
Beginning |
Purchases |
Sales |
Change in |
Net Realized |
Value as of |
Number of |
Dividend |
Realized |
||||||||||||||||||||||||||||
MM Select T. Rowe Price Retirement 2040 Fund (Continued) |
||||||||||||||||||||||||||||||||||||
MassMutual Select T. Rowe Price Large Cap Blend Fund, Class I |
$ | 515,989,799 | $ | 170,048,810 | $ | (98,919,330 | ) | $ | (230,939,187 | ) | $ | 25,779,586 | $ | 381,959,678 | 34,012,438 | $ | 4,566,617 | $ | 85,977,355 | |||||||||||||||||
MassMutual Select T. Rowe Price Limited Duration Inflation Focused Bond Fund, Class I |
11,111,660 | 14,913,230 | (24,552,148 | ) | (298,672 | ) | (638,346 | ) | 535,724 | 54,388 | 624,538 | 170,847 | ||||||||||||||||||||||||
MassMutual Select T. Rowe Price Real Assets Fund, Class I |
32,833,279 | 25,517,525 | (4,829,342 | ) | (11,110,745 | ) | 844,703 | 43,255,420 | 4,183,309 | 927,528 | 2,018,714 | |||||||||||||||||||||||||
MassMutual Select T. Rowe Price Small and Mid Cap Blend Fund, Class I |
185,600,886 | 45,706,110 | (31,315,928 | ) | (70,254,327 | ) | 6,568,850 | 136,305,591 | 12,380,163 | 1,871,076 | 22,820,173 | |||||||||||||||||||||||||
MassMutual Select T. Rowe Price U.S. Treasury Long-Term Index Fund, Class I |
14,751,557 | 8,372,471 | (2,200,654 | ) | (3,925,515 | ) | (1,599,927 | ) | 15,397,932 | 2,814,978 | 279,914 | — | ||||||||||||||||||||||||
MM S&P 500 Index Fund, Class I |
126,333,730 | 52,044,572 | (48,465,190 | ) | (42,087,076 | ) | 8,331,725 | 96,157,761 | 6,036,269 | 1,641,591 | 14,563,791 | |||||||||||||||||||||||||
| $ | 1,308,788,584 | $ | 399,031,347 | $ | (289,652,890 | ) | $ | (475,470,481 | ) | $ | 38,735,322 | $ | 981,431,882 | $ | 21,959,484 | $ | 130,697,880 | |||||||||||||||||||
MM Select T. Rowe Price Retirement 2045 Fund |
||||||||||||||||||||||||||||||||||||
MassMutual Select T. Rowe Price Bond Asset Fund, Class I |
$ | 17,805,199 | $ | 1,688,791 | $ | (9,532,734 | ) | $ | (1,870,838 | ) | $ | (49,092 | ) | $ | 8,041,326 | 931,788 | $ | 400,489 | $ | 34,128 | ||||||||||||||||
MassMutual Select T. Rowe Price Emerging Markets Bond Fund, Class I |
399,663 | 146 | (398,477 | ) | (3,353 | ) | 2,021 | — | — | — | — | |||||||||||||||||||||||||
MassMutual Select T. Rowe Price International Equity Fund, Class I |
153,325,766 | 41,213,885 | (17,640,477 | ) | (49,500,722 | ) | (167,737 | ) | 127,230,715 | 15,164,567 | 4,378,552 | 2,227,039 | ||||||||||||||||||||||||
MassMutual Select T. Rowe Price Large Cap Blend Fund, Class I |
227,377,125 | 90,318,431 | (37,153,316 | ) | (105,178,798 | ) | 9,147,955 | 184,511,397 | 16,430,222 | 2,055,859 | 38,706,422 | |||||||||||||||||||||||||
MassMutual Select T. Rowe Price Limited Duration Inflation Focused Bond Fund, Class I |
— | 6,392,873 | (5,737,187 | ) | (13,072 | ) | (402,008 | ) | 240,606 | 24,427 | 267,317 | 73,126 | ||||||||||||||||||||||||
MassMutual Select T. Rowe Price Real Assets Fund, Class I |
14,542,969 | 13,187,421 | (1,678,848 | ) | (5,256,565 | ) | 257,808 | 21,052,785 | 2,036,053 | 419,120 | 912,192 | |||||||||||||||||||||||||
MassMutual Select T. Rowe Price Small And Mid Cap Blend Fund, Class I |
85,010,543 | 23,772,007 | (10,848,620 | ) | (32,675,560 | ) | 2,204,618 | 67,462,988 | 6,127,429 | 873,319 | 10,651,252 | |||||||||||||||||||||||||
MassMutual Select T. Rowe Price U.S. Treasury Long-Term Index Fund, Class I |
4,926,821 | 1,061,947 | (1,737,832 | ) | 148,193 | (1,292,834 | ) | 3,106,295 | 567,878 | 84,456 | — | |||||||||||||||||||||||||
MM S&P 500 Index Fund, Class I |
54,852,004 | 26,996,041 | (18,081,627 | ) | (19,501,134 | ) | 3,193,839 | 47,459,123 | 2,979,229 | 717,554 | 6,365,959 | |||||||||||||||||||||||||
| $ | 558,240,090 | $ | 204,631,542 | $ | (102,809,118 | ) | $ | (213,851,849 | ) | $ | 12,894,570 | $ | 459,105,235 | $ | 9,196,666 | $ | 58,970,118 | |||||||||||||||||||
MM Select T. Rowe Price Retirement 2050 Fund |
||||||||||||||||||||||||||||||||||||
MassMutual Select T. Rowe Price Bond Asset Fund, Class I |
$ | 23,875,712 | $ | 1,618,013 | $ | (18,407,501 | ) | $ | (1,353,926 | ) | $ | (574,450 | ) | $ | 5,157,848 | 597,665 | $ | 565,276 | $ | 48,171 | ||||||||||||||||
MassMutual Select T. Rowe Price Emerging Markets Bond Fund, Class I |
411,281 | 56 | (409,923 | ) | (2,797 | ) | 1,383 | — | — | — | — | |||||||||||||||||||||||||
MassMutual Select T. Rowe Price International Equity Fund, Class I |
243,090,454 | 60,133,686 | (35,996,424 | ) | (75,375,859 | ) | (657,363 | ) | 191,194,494 | 22,788,378 | 6,863,647 | 3,491,019 | ||||||||||||||||||||||||
203
Notes to Financial Statements (Continued) |
Beginning |
Purchases |
Sales |
Change in |
Net Realized |
Value as of |
Number of |
Dividend |
Realized |
||||||||||||||||||||||||||||
MM Select T. Rowe Price Retirement 2050 Fund (Continued) |
||||||||||||||||||||||||||||||||||||
MassMutual Select T. Rowe Price Large Cap Blend Fund, Class I |
$ | 360,982,294 | $ | 132,721,107 | $ | (69,548,077 | ) | $ | (164,501,432 | ) | $ | 16,606,474 | $ | 276,260,366 | 24,600,211 | $ | 3,230,363 | $ | 60,819,238 | |||||||||||||||||
MassMutual Select T. Rowe Price Limited Duration Inflation Focused Bond Fund, Class I |
— | 9,877,239 | (8,856,500 | ) | (20,632 | ) | (622,632 | ) | 377,475 | 38,322 | 415,402 | 113,636 | ||||||||||||||||||||||||
MassMutual Select T. Rowe Price Real Assets Fund, Class I |
22,963,725 | 19,696,283 | (3,672,132 | ) | (8,083,979 | ) | 582,668 | 31,486,565 | 3,045,122 | 654,589 | 1,424,675 | |||||||||||||||||||||||||
MassMutual Select T. Rowe Price Small and Mid Cap Blend Fund, Class I |
134,660,513 | 34,088,079 | (21,181,285 | ) | (51,067,038 | ) | 3,947,254 | 100,447,523 | 9,123,299 | 1,373,344 | 16,749,702 | |||||||||||||||||||||||||
MassMutual Select T. Rowe Price U.S. Treasury Long-Term Index Fund, Class I |
7,157,283 | 558,611 | (4,994,633 | ) | 1,827,392 | (2,672,357 | ) | 1,876,296 | 343,016 | 117,908 | — | |||||||||||||||||||||||||
MM S&P 500 Index Fund, Class I |
86,697,540 | 41,573,410 | (31,440,255 | ) | (30,161,996 | ) | 5,088,982 | 71,757,681 | 4,504,562 | 1,123,188 | 9,964,642 | |||||||||||||||||||||||||
| $ | 879,838,802 | $ | 300,266,484 | $ | (194,506,730 | ) | $ | (328,740,267 | ) | $ | 21,699,959 | $ | 678,558,248 | $ | 14,343,717 | $ | 92,611,083 | |||||||||||||||||||
MM Select T. Rowe Price Retirement 2055 Fund |
||||||||||||||||||||||||||||||||||||
MassMutual Select T. Rowe Price Bond Asset Fund, Class I |
$ | 8,683,916 | $ | 895,616 | $ | (6,720,161 | ) | $ | (439,843 | ) | $ | (290,561 | ) | $ | 2,128,967 | 246,694 | $ | 206,980 | $ | 17,638 | ||||||||||||||||
MassMutual Select T. Rowe Price Emerging Markets Bond Fund, Class I |
109,482 | 83 | (109,164 | ) | (1,026 | ) | 625 | — | — | — | — | |||||||||||||||||||||||||
MassMutual Select T. Rowe Price International Equity Fund, Class I |
87,891,211 | 31,696,462 | (9,038,985 | ) | (30,220,158 | ) | 45,129 | 80,373,659 | 9,579,697 | 2,542,187 | 1,293,019 | |||||||||||||||||||||||||
MassMutual Select T. Rowe Price Large Cap Blend Fund, Class I |
130,622,596 | 63,512,193 | (19,896,251 | ) | (62,384,418 | ) | 5,005,071 | 116,859,191 | 10,405,983 | 1,190,610 | 22,416,063 | |||||||||||||||||||||||||
MassMutual Select T. Rowe Price Limited Duration Inflation Focused Bond Fund, Class I |
— | 3,825,261 | (3,438,601 | ) | (7,471 | ) | (232,563 | ) | 146,626 | 14,886 | 153,642 | 42,030 | ||||||||||||||||||||||||
MassMutual Select T. Rowe Price Real Assets Fund, Class I |
8,312,395 | 8,877,453 | (745,746 | ) | (3,239,559 | ) | 123,086 | 13,327,629 | 1,288,939 | 241,817 | 526,299 | |||||||||||||||||||||||||
MassMutual Select T. Rowe Price Small and Mid Cap Blend Fund, Class I |
48,999,792 | 17,363,524 | (5,523,030 | ) | (19,365,681 | ) | 1,158,442 | 42,633,047 | 3,872,211 | 505,727 | 6,167,993 | |||||||||||||||||||||||||
MassMutual Select T. Rowe Price U.S. Treasury Long-Term Index Fund, Class I |
2,690,482 | 337,220 | (1,885,919 | ) | 595,710 | (939,783 | ) | 797,710 | 145,834 | 43,197 | — | |||||||||||||||||||||||||
MM S&P 500 Index Fund, Class I |
31,297,328 | 19,015,708 | (10,068,193 | ) | (11,605,980 | ) | 1,686,927 | 30,325,790 | 1,903,690 | 412,875 | 3,662,914 | |||||||||||||||||||||||||
| $ | 318,607,202 | $ | 145,523,520 | $ | (57,426,050 | ) | $ | (126,668,426 | ) | $ | 6,556,373 | $ | 286,592,619 | $ | 5,297,035 | $ | 34,125,956 | |||||||||||||||||||
204
Notes to Financial Statements (Continued) |
Beginning |
Purchases |
Sales |
Change in |
Net Realized |
Value as of |
Number of |
Dividend |
Realized |
||||||||||||||||||||||||||||
MM Select T. Rowe Price Retirement 2060 Fund |
||||||||||||||||||||||||||||||||||||
MassMutual Select T. Rowe Price Bond Asset Fund, Class I |
$ | 2,822,848 | $ | 584,129 | $ | (2,214,906 | ) | $ | (155,350 | ) | $ | (118,884 | ) | $ | 917,837 | 106,354 | $ | 75,857 | $ | 6,464 | ||||||||||||||||
MassMutual Select T. Rowe Price Emerging Markets Bond Fund, Class I |
68,372 | 63 | (68,201 | ) | (509 | ) | 275 | — | — | — | — | |||||||||||||||||||||||||
MassMutual Select T. Rowe Price International Equity Fund, Class I |
31,125,517 | 20,391,312 | (3,972,310 | ) | (12,420,871 | ) | 308,339 | 35,431,987 | 4,223,121 | 931,321 | 473,692 | |||||||||||||||||||||||||
MassMutual Select T. Rowe Price Large Cap Blend Fund, Class I |
46,239,600 | 36,620,821 | (8,530,000 | ) | (24,103,900 | ) | 1,605,670 | 51,832,191 | 4,615,511 | 437,439 | 8,235,818 | |||||||||||||||||||||||||
MassMutual Select T. Rowe Price Limited Duration Inflation Focused Bond Fund, Class I |
— | 1,549,677 | (1,400,194 | ) | (2,939 | ) | (86,076 | ) | 60,468 | 6,139 | 55,789 | 15,261 | ||||||||||||||||||||||||
MassMutual Select T. Rowe Price Real Assets Fund, Class I |
2,929,894 | 4,663,268 | (372,180 | ) | (1,368,103 | ) | 54,139 | 5,907,018 | 571,278 | 88,310 | 192,203 | |||||||||||||||||||||||||
MassMutual Select T. Rowe Price Small and Mid Cap Blend Fund, Class I |
17,150,646 | 10,758,408 | (1,990,616 | ) | (7,387,261 | ) | 295,903 | 18,827,080 | 1,709,998 | 183,747 | 2,241,029 | |||||||||||||||||||||||||
MassMutual Select T. Rowe Price U.S. Treasury Long-Term Index Fund, Class I |
898,120 | 241,092 | (640,046 | ) | 142,633 | (284,247 | ) | 357,552 | 65,366 | 16,443 | — | |||||||||||||||||||||||||
MM S&P 500 Index Fund, Class I |
11,077,476 | 10,527,952 | (4,176,442 | ) | (4,527,435 | ) | 517,968 | 13,419,519 | 842,405 | 151,569 | 1,344,685 | |||||||||||||||||||||||||
| $ | 112,312,473 | $ | 85,336,722 | $ | (23,364,897 | ) | $ | (49,823,733 | ) | $ | 2,293,087 | $ | 126,753,652 | $ | 1,940,475 | $ | 12,509,152 | |||||||||||||||||||
|
* |
Fund advised by Barings LLC. |
8. Indemnifications
Under the Funds’ organizational documents, current and former Trustees and Officers are provided with specified rights to indemnification against liabilities arising in connection with the performance of their duties to the Funds, and shareholders are indemnified against personal liability for obligations of the Funds. In the normal course of business, the Funds may also enter into contracts that provide general indemnifications. The Funds’ maximum exposure under these arrangements is unknown as this would be dependent on future claims that may be made against the Funds. The risk of material loss from such claims is considered remote.
9. Coronavirus (COVID-19) Pandemic
The global pandemic outbreak of the novel coronavirus known as COVID-19 and efforts to contain its spread have produced, and will likely continue to produce, substantial market volatility, severe market dislocations and liquidity constraints in many markets, exchange trading suspensions and closures, higher default rates, and global business disruption, and they may result in future significant adverse effects, such as declines in global financial markets and a substantial economic downturn or recession throughout the world. Such factors may have a significant adverse effect on a Fund’s performance and have the potential to impair the ability of a Fund’s investment adviser, subadviser, or other service providers to serve the Fund and could lead to disruptions that negatively impact the Fund.
205
Notes to Financial Statements (Continued) |
10. Russia-Ukraine War
In February 2022, Russia commenced a large-scale military attack on Ukraine. The outbreak of hostilities between the two countries could result in more widespread conflict and could have a severe adverse effect on the regional and the global financial markets and economies. One or more of the Underlying Funds hold positions in securities or other instruments that are economically tied to Russia. Investments in Russia are subject to political, economic, legal, market, and currency risks, as well as the risks related to the economic sanctions on Russia, Russian individuals, and Russian corporate and banking entities imposed by the United States and/or other countries. Such sanctions — which affect companies in many sectors, including energy, financial services, and defense, among others — could adversely affect the global energy and financial markets and, thus, could affect the value of an Underlying Fund’s investments, even beyond any direct exposure the Underlying Fund may have to Russian issuers or the adjoining geographic regions. Such sanctions may also result in a decline in the value and liquidity of Russian securities and a weakening of the ruble, and will impair an Underlying Fund’s ability to buy, sell, receive, or deliver Russian securities. In addition, certain transactions have been or may be prohibited and/or existing investments have or may become illiquid (e.g., because transacting in certain existing investments is prohibited), which could cause an Underlying Fund to sell other portfolio holdings at a disadvantageous time or price in order to meet shareholder redemptions.
206
To the Board of Trustees of MassMutual Select Funds and Shareholders of MassMutual 20/80 Allocation Fund, MassMutual 40/60 Allocation Fund, MassMutual 60/40 Allocation Fund, MassMutual 80/20 Allocation Fund, MassMutual RetireSMARTSM by JPMorgan In Retirement Fund, MassMutual RetireSMARTSM by JPMorgan 2020 Fund, MassMutual RetireSMARTSM by JPMorgan 2025 Fund, MassMutual RetireSMARTSM by JPMorgan 2030 Fund, MassMutual RetireSMARTSM by JPMorgan 2035 Fund, MassMutual RetireSMARTSM by JPMorgan 2040 Fund, MassMutual RetireSMARTSM by JPMorgan 2045 Fund, MassMutual RetireSMARTSM by JPMorgan 2050 Fund, MassMutual RetireSMARTSM by JPMorgan 2055 Fund, MassMutual RetireSMARTSM by JPMorgan 2060 Fund, MassMutual Select T. Rowe Price Retirement Balanced Fund, MassMutual Select T. Rowe Price Retirement 2005 Fund, MassMutual Select T. Rowe Price Retirement 2010 Fund, MassMutual Select T. Rowe Price Retirement 2015 Fund, MassMutual Select T. Rowe Price Retirement 2020 Fund, MassMutual Select T. Rowe Price Retirement 2025 Fund, MassMutual Select T. Rowe Price Retirement 2030 Fund, MassMutual Select T. Rowe Price Retirement 2035 Fund, MassMutual Select T. Rowe Price Retirement 2040 Fund, MassMutual Select T. Rowe Price Retirement 2045 Fund, MassMutual Select T. Rowe Price Retirement 2050 Fund, MassMutual Select T. Rowe Price Retirement 2055 Fund, and MassMutual Select T. Rowe Price Retirement 2060 Fund (collectively, the “Funds”):
Opinion on the Financial Statements and Financial Highlights
We have audited the accompanying statements of assets and liabilities of the Funds, including the portfolios of investments, as of September 30, 2022, the related statements of operations for the year then ended, the statements of changes in net assets for each of the two years in the period then ended, the financial highlights for the periods indicated in the table below, and the related notes. In our opinion, the financial statements and financial highlights present fairly, in all material respects, the financial position of each of the Funds as of September 30, 2022, and the results of their operations for the year then ended, the changes in their net assets for each of the two years in the period then ended, and the financial highlights for the periods listed in the table below, in conformity with accounting principles generally accepted in the United States of America.
Individual Fund Comprising the MassMutual Select Funds |
Financial Highlights |
MassMutual 20/80 Allocation Fund, MassMutual 40/60 Allocation Fund, MassMutual 60/40 Allocation Fund, MassMutual 80/20 Allocation Fund, MassMutual RetireSMARTSM by JPMorgan In Retirement Fund, MassMutual RetireSMARTSM by JPMorgan 2020 Fund, MassMutual RetireSMARTSM by JPMorgan 2025 Fund, MassMutual RetireSMARTSM by JPMorgan 2030 Fund, MassMutual RetireSMARTSM by JPMorgan 2035 Fund, MassMutual RetireSMARTSM by JPMorgan 2040 Fund, MassMutual RetireSMARTSM by JPMorgan 2045 Fund, MassMutual RetireSMARTSM by JPMorgan 2050 Fund, MassMutual RetireSMARTSM by JPMorgan 2055 Fund, and MassMutual RetireSMARTSM by JPMorgan 2060 Fund. |
For each of the five years in the period ended September 30, 2022 |
MassMutual Select T. Rowe Price Retirement Balanced Fund, MassMutual Select T. Rowe Price Retirement 2005 Fund, MassMutual Select T. Rowe Price Retirement 2010 Fund, MassMutual Select T. Rowe Price Retirement 2015 Fund, MassMutual Select T. Rowe Price Retirement 2020 Fund, MassMutual Select T. Rowe Price Retirement 2025 Fund, MassMutual Select T. Rowe Price Retirement 2030 Fund, MassMutual Select T. Rowe Price Retirement 2035 Fund, MassMutual Select T. Rowe Price Retirement 2040 Fund, MassMutual Select T. Rowe Price Retirement 2045 Fund, MassMutual Select T. Rowe Price Retirement 2050 Fund, MassMutual Select T. Rowe Price Retirement 2055 Fund, and MassMutual Select T. Rowe Price Retirement 2060 Fund |
For each of the four years in the period ended September 30, 2022, and for the period from February 16, 2018 (commencement of operations) through September 30, 2018 |
207
Report of Independent Registered Public Accounting Firm (Continued) |
Basis for Opinion
These financial statements and financial highlights are the responsibility of the Funds’ management. Our responsibility is to express an opinion on the Funds’ financial statements and financial highlights based on our audits. We are a public accounting firm registered with the Public Company Accounting Oversight Board (United States) (PCAOB) and are required to be independent with respect to the Funds in accordance with the U.S. federal securities laws and the applicable rules and regulations of the Securities and Exchange Commission and the PCAOB.
We conducted our audits in accordance with the standards of the PCAOB. Those standards require that we plan and perform the audit to obtain reasonable assurance about whether the financial statements and financial highlights are free of material misstatement, whether due to error or fraud. The Funds are not required to have, nor were we engaged to perform, an audit of their internal control over financial reporting. As part of our audits we are required to obtain an understanding of internal control over financial reporting but not for the purpose of expressing an opinion on the effectiveness of the Funds’ internal control over financial reporting. Accordingly, we express no such opinion.
Our audits included performing procedures to assess the risks of material misstatement of the financial statements and financial highlights, whether due to error or fraud, and performing procedures that respond to those risks. Such procedures included examining, on a test basis, evidence regarding the amounts and disclosures in the financial statements and financial highlights. Our audits also included evaluating the accounting principles used and significant estimates made by management, as well as evaluating the overall presentation of the financial statements and financial highlights. Our procedures included confirmation of securities owned as of September 30, 2022, by correspondence with transfer agents; when replies were not received from transfer agents, we performed other auditing procedures. We believe that our audits provide a reasonable basis for our opinion.
/s/ Deloitte & Touche LLP
Boston, Massachusetts
December 2, 2022
We have served as the auditor of one or more MassMutual investment companies since 1995.
208
The following table lists the Trust’s Trustees and Principal Officers; their address and year of birth; their position with the Trust; the length of time holding that position with the Trust; their principal occupation(s) during at least the past five years; the number of portfolios in the fund complex they oversee; and other directorships they hold in companies subject to registration or reporting requirements of the Securities Exchange Act of 1934 (generally called “public companies”) or in registered investment companies. The Trust’s Statement of Additional Information includes additional information about the Trust’s Trustees and is available, without charge, upon request by calling 1-888-309-3539 or by writing MassMutual Select Funds, c/o Massachusetts Mutual Life Insurance Company, 1295 State Street, Springfield, Massachusetts 01111-0001, Attention: Investment Management Solutions.
Independent Trustees
Name, Address*, |
Position(s) |
Term of |
Principal Occupation(s) |
Number of |
Other Directorships |
Allan W. Blair Year of birth: 1948 |
Trustee |
Since 2003 |
Retired. |
108 |
Trustee (since 2012), MassMutual Premier Funds (open-end investment company); Trustee (since 2021), MassMutual Advantage Funds (open-end investment company); Trustee (since 2003), MML Series Investment Fund (open-end investment company); Trustee (since 2012), MML Series Investment Fund II (open-end investment company). |
Nabil N. El-Hage Year of birth: 1958 |
Trustee |
Since 2012 |
Founder and CEO (since 2018), AEE International LLC (a Puerto Rico LLC); Founder and sole member (2016-2018), PR Academy of Executive Education LLC (a Puerto Rico LLC). |
108 |
Trustee (since 2003), Chairman (2006-2012), MassMutual Premier Funds (open-end investment company); Trustee (since 2021), MassMutual Advantage Funds (open-end investment company); Trustee (since 2012), MML Series Investment Fund (open-end investment company); Trustee (since 2005), Chairman (2006-2012), MML Series Investment Fund II (open-end investment company). |
Maria D. Furman Year of birth: 1954 |
Trustee |
Since 2012 |
Retired. |
108 |
Trustee (since 2004), MassMutual Premier Funds (open-end investment company); Trustee (since 2021), MassMutual Advantage Funds (open-end investment company); Trustee (since 2012), MML Series Investment Fund (open-end investment company); Trustee (since 2005), MML Series Investment Fund II (open-end investment company). |
R. Bradford Malt |
Trustee |
Since 2022 |
Chairman (2004-2019), Management Committee (1993-2019), Partner (1987-2019), Associate (1979-1987), Ropes & Gray LLP (counsel to the Trust and MassMutual). |
108 |
Trustee (since 2022), MassMutual Premier Funds (open-end investment company); Trustee (since 2022), MassMutual Advantage Funds (open-end investment company); Trustee (since 2022), MML Series Investment Fund (open-end investment company); Trustee (since 2022), MML Series Investment Fund II (open-end investment company). |
209
Trustees and Principal Officers (Unaudited) (Continued) |
Name, Address*, |
Position(s) |
Term of |
Principal Occupation(s) |
Number of |
Other Directorships |
C. Ann Merrifield Year of birth: 1951 |
Trustee |
Since 2012 |
Retired. |
108 |
Director (since 2020). Lead Director (2020 -2022), Chairperson (since 2020) of the Nominating and Governance Committee, Member (since 2020) and Chairperson (2020-2022) of the Compensation Committee, and Member (2020-2022) of the Audit Committee, Lyra Therapeutics (a clinical-stage specialty pharmaceutical company); Chairperson (since 2017), Director (since 2014), InVivo Therapeutics (research and clinical-stage biomaterials and biotechnology company); Trustee (since 2004), MassMutual Premier Funds (open-end investment company); Trustee (since 2021), MassMutual Advantage Funds (open-end investment company); Trustee (since 2012), MML Series Investment Fund (open-end investment company); Trustee (since 2005), MML Series Investment Fund II (open-end investment company). |
Cynthia R. Plouché Year of birth: 1957 |
Trustee |
Since 2022 |
Retired; Assessor (2014-2018), Moraine Township (property assessment). |
108 |
Trustee (since 2014), Northern Trust Funds (open- end investment companies); Trustee (since 2022), MassMutual Premier Funds (open-end investment company); Trustee (since 2022), MassMutual Advantage Funds (open-end investment company); Trustee (since 2022), MML Series Investment Fund (open-end investment company); Trustee (since 2022), MML Series Investment Fund II (open-end investment company). |
Jason J. Price Year of birth: 1973 |
Trustee |
Since 2022 |
Co-Founder and Chairman of the Board (2017-2021), NXTHVN (arts organization); Principal (2012-2017), Exaltare Capital Partners, LLC (private equity firm). |
108 |
Trustee (since 2022), MassMutual Premier Funds (open-end investment company); Trustee (since 2022), MassMutual Advantage Funds (open-end investment company); Trustee (since 2022), MML Series Investment Fund (open-end investment company); Trustee (since 2022), MML Series Investment Fund II (open-end investment company). |
Susan B. Sweeney Year of birth: 1952 |
Chairperson
Trustee |
Since 2022
Since 2009 |
Retired. |
110^ |
Trustee (since 2012), Barings Corporate Investors (closed-end investment company); Trustee (since 2012), Barings Participation Investors (closed-end investment company); Chairperson (since 2022), Trustee (since 2012), MassMutual Premier Funds (open-end investment company); Chairperson (since 2022), Trustee (since 2021), MassMutual Advantage Funds (open-end investment company); Chairperson (since 2022), Trustee (since 2009), MML Series Investment Fund (open-end investment company); Chairperson (since 2022), Trustee (since 2012), MML Series Investment Fund II (open-end investment company). |
210
Trustees and Principal Officers (Unaudited) (Continued) |
Interested Trustees
Name, Address*, |
Position(s) |
Term of |
Principal Occupation(s) |
Number of |
Other Directorships |
Michael R. Fanning^^ Year of birth: 1963 |
Trustee |
Since 2021 |
Head of MassMutual U.S. (since 2016), Executive Vice President (2016-2018), Member of MassMutual’s Executive Leadership Team (since 2008), MassMutual. |
108 |
Director (since 2016), MML Advisers; Trustee (since 2021), MassMutual Premier Funds (open-end investment company); Trustee (since 2021), MassMutual Advantage Funds (open-end investment company); Trustee (since 2021), MML Series Investment Fund (open-end investment company); Trustee (since 2021), MML Series Investment Fund II (open-end investment company). |
Clifford M, Noreen^^^ |
Trustee |
Since 2021 |
Head of Global Investment Strategy (since 2019), Deputy Chief Investment Officer and Managing Director (2016-2018), MassMutual; President (2008-2016), Vice Chairman (2007-2008), Member of the Board of Managers (2006-2016), Managing Director (2000-2016), Barings LLC. |
110^ |
Chairman (since 2009), Trustee (since 2005), President (2005-2009), CI Subsidiary Trust and PI Subsidiary Trust; Chairman and Trustee (since 2009), President (2005-2009), Vice President (1993-2005), Barings Corporate Investors (closed-end investment company); Chairman and Trustee (since 2009), President (2005-2009), Vice President (1993-2005), Barings Participation Investors (closed-end investment company); Trustee (since 2021), MassMutual Premier Funds (open-end investment company); Trustee (since 2021), MassMutual Advantage Funds (open-end investment company); Trustee (since 2021), MML Series Investment Fund (open-end investment company); Trustee (since 2021), MML Series Investment Fund II (open-end investment company). |
Principal Officers
Name, Address*, |
Position(s) |
Term of |
Principal Occupation(s) |
Number of |
Andrea Anastasio Year of birth: 1974 |
Vice President
|
Since 2021 |
Vice President (since 2021), MML Advisers; Head of Investment Management Solutions (since 2021), MassMutual; Head of Investment Strategy and Research, North America (2019-2021), Head of Investment Product Management (2016- 2019), State Street Global Advisors; Vice President (since 2021), MassMutual Premier Funds (open-end investment company); Vice President (since 2021), MassMutual Advantage Funds (open-end investment company); Vice President (since 2021), MML Series Investment Fund (open-end investment company); Vice President (since 2021), MML Series Investment Fund II (open-end investment company). |
108 |
211
Trustees and Principal Officers (Unaudited) (Continued) |
Name, Address*, |
Position(s) |
Term of |
Principal Occupation(s) |
Number of |
Andrew M. Goldberg Year of birth: 1966 |
Vice President, Secretary, and Chief Legal Officer
Assistant Secretary |
Since 2008
2001- 2008 |
Lead Counsel, Investment Adviser & Mutual Funds (since 2018), Assistant Vice President and Counsel (2004-2018), MassMutual; Secretary (since 2015), Assistant Secretary (2013-2015), MML Advisers; Vice President, Secretary (formerly known as “Clerk”), and Chief Legal Officer (since 2008), Assistant Clerk (2004-2008), MassMutual Premier Funds (open-end investment company); Vice President, Secretary, and Chief Legal Officer (since 2021), MassMutual Advantage Funds (open-end investment company); Vice President, Secretary, and Chief Legal Officer (since 2008), Assistant Secretary (2001-2008), MML Series Investment Fund (open-end investment company); Vice President, Secretary (formerly known as “Clerk”), and Chief Legal Officer (since 2008), Assistant Clerk (2005-2008), MML Series Investment Fund II (open-end investment company). |
108 |
Renee Hitchcock Year of birth: 1970 |
Chief Financial Officer and Treasurer
Assistant Treasurer |
Since 2016
2007- 2016 |
Head of Mutual Fund Administration (since 2018), Assistant Vice President (2015-2018), MassMutual; Chief Financial Officer and Treasurer (since 2016), Assistant Treasurer (2007-2016), MassMutual Premier Funds (open-end investment company); Chief Financial Officer and Treasurer (since 2021), MassMutual Advantage Funds (open-end investment company); Chief Financial Officer and Treasurer (since 2016), Assistant Treasurer (2007-2016), MML Series Investment Fund (open-end investment company); Chief Financial Officer and Treasurer (since 2016), Assistant Treasurer (2007-2016), MML Series Investment Fund II (open-end investment company). |
108 |
Paul LaPiana |
President |
Since 2021 |
President (since 2021), MML Advisers; Head of MassMutual U.S. Product (since 2019), Head of Field Management (2016-2019), MassMutual; President (since 2021), MassMutual Premier Funds (open-end investment company); President (since 2021), MassMutual Advantage Funds (open-end investment company); President (since 2021), MML Series Investment Fund (open-end investment company); President (since 2021), MML Series Investment Fund II (open-end investment company). |
108 |
Jill Nareau Robert Year of birth: 1972 |
Vice President and Assistant Secretary
Assistant Secretary |
Since 2017
2008- 2017 |
Lead Counsel, Investment Adviser & Mutual Funds (since 2018), Assistant Vice President and Counsel (2009-2018), MassMutual; Assistant Secretary (since 2015), MML Advisers; Vice President and Assistant Secretary (since 2017), Assistant Secretary (formerly known as “Assistant Clerk”) (2008-2017), MassMutual Premier Funds (open-end investment company); Vice President and Assistant Secretary (since 2021), MassMutual Advantage Funds (open-end investment company); Vice President and Assistant Secretary (since 2017), Assistant Secretary (2008-2017), MML Series Investment Fund (open-end investment company); Vice President and Assistant Secretary (since 2017), Assistant Secretary (formerly known as “Assistant Clerk”) (2008-2017), MML Series Investment Fund II (open-end investment company). |
108 |
Douglas Steele Year of birth: 1975 |
Vice President |
Since 2016 |
Head of Product Management (since 2021), Vice President (since 2017), Head of Investment Management (2017-2021), Head of Investment Due Diligence (2016-2017), MML Advisers; Head of Product Management (since 2021), Head of Manager Research (2021), Head of Investment Management (2017-2021), Assistant Vice President (2013-2017), MassMutual; Vice President (since 2016), MassMutual Premier Funds (open-end investment company); Vice President (since 2021), MassMutual Advantage Funds (open-end investment company); Vice President (since 2016), MML Series Investment Fund (open-end investment company); Vice President (since 2016), MML Series Investment Fund II (open-end investment company). |
108 |
212
Trustees and Principal Officers (Unaudited) (Continued) |
Name, Address*, |
Position(s) |
Term of |
Principal Occupation(s) |
Number of |
Philip S. Wellman Year of birth: 1964 |
Vice President and Chief Compliance Officer |
Since 2007 |
Vice President and Chief Compliance Officer (since 2013), MML Advisers; Head of Mutual Funds & RIA Compliance (since 2018), Vice President, Associate General Counsel, and Chief Compliance Officer (Mutual Funds) (2014-2018), MassMutual; Vice President and Chief Compliance Officer (since 2007), MassMutual Premier Funds (open-end investment company); Vice President and Chief Compliance Officer (since 2021), MassMutual Advantage Funds (open-end investment company); Vice President and Chief Compliance Officer (since 2007), MML Series Investment Fund (open-end investment company); Vice President and Chief Compliance Officer (since 2007), MML Series Investment Fund II (open-end investment company). |
108 |
|
* |
The address of each Trustee and Principal Officer is the same as that for the Trust; 1295 State Street, Springfield, Massachusetts 01111-0001. |
|
** |
Each Trustee of the Trust serves until the next meeting of shareholders called for the purpose of electing Trustees and until the election and qualification of his or her successor or until he or she dies, resigns, or is removed. Notwithstanding the foregoing, unless the Trustees determine that it is desirable and in the best interest of the Trust that an exception to the retirement policy of the Trust be made, a Trustee shall retire and cease to serve as a Trustee upon the conclusion of the calendar year in which such Trustee attains the age of seventy-five years, however, an interested Trustee of the Trust shall no longer serve as a Trustee if or when they are no longer an employee of MassMutual or an affiliate. |
|
|
The Chairperson is elected to hold such office for a term of three years or until their successor is elected and qualified to carry out the duties and responsibilities of their office, or until he or she retires, dies, resigns, is removed, or becomes disqualified, and any such Chairperson may not serve more than two consecutive terms. The Chairperson shall hold office at the pleasure of the Trustees. |
|
^ |
Barings Participation Investors and Barings Corporate Investors are deemed to be a part of the Fund Complex, because they are managed by Barings LLC, an affiliate of MML Advisers. |
|
^^ |
Mr. Fanning is an “Interested Person,” as that term is defined in the 1940 Act, as an employee of MassMutual. |
|
^^^ |
Mr. Noreen is an “Interested Person,” as that term is defined in the 1940 Act, as an employee of MassMutual. |
|
# |
The President, Treasurer, and Secretary and such other officers as the Trustees may in their discretion from time to time elect are elected to hold such office until their successor is elected and qualified to carry out the duties and responsibilities of their office, or until he or she dies, resigns, is removed, or becomes disqualified. Each officer shall hold office at the pleasure of the Trustees. |
213
For corporate shareholders, a portion of the ordinary dividends paid during the Fund(s)’ year ended September 30, 2022, qualified for the dividends received deduction, as follows:
Dividends |
||||
20/80 Allocation Fund |
6.08 | % | ||
40/60 Allocation Fund |
12.71 | % | ||
60/40 Allocation Fund |
19.11 | % | ||
80/20 Allocation Fund |
22.15 | % | ||
MM RetireSMART by JPMorgan In Retirement Fund |
5.37 | % | ||
MM RetireSMART by JPMorgan 2020 Fund |
6.73 | % | ||
MM RetireSMART by JPMorgan 2025 Fund |
10.14 | % | ||
MM RetireSMART by JPMorgan 2030 Fund |
13.18 | % | ||
MM RetireSMART by JPMorgan 2035 Fund |
14.87 | % | ||
MM RetireSMART by JPMorgan 2040 Fund |
16.31 | % | ||
MM RetireSMART by JPMorgan 2045 Fund |
18.42 | % | ||
MM RetireSMART by JPMorgan 2050 Fund |
18.28 | % | ||
MM RetireSMART by JPMorgan 2055 Fund |
18.45 | % | ||
MM RetireSMART by JPMorgan 2060 Fund |
17.49 | % | ||
MM Select T. Rowe Price Retirement Balanced Fund |
8.74 | % | ||
MM Select T. Rowe Price Retirement 2005 Fund |
9.47 | % | ||
MM Select T. Rowe Price Retirement 2010 Fund |
10.54 | % | ||
MM Select T. Rowe Price Retirement 2015 Fund |
10.78 | % | ||
MM Select T. Rowe Price Retirement 2020 Fund |
11.94 | % | ||
MM Select T. Rowe Price Retirement 2025 Fund |
14.01 | % | ||
MM Select T. Rowe Price Retirement 2030 Fund |
16.17 | % | ||
MM Select T. Rowe Price Retirement 2035 Fund |
16.88 | % | ||
MM Select T. Rowe Price Retirement 2040 Fund |
17.10 | % | ||
MM Select T. Rowe Price Retirement 2045 Fund |
17.68 | % | ||
MM Select T. Rowe Price Retirement 2050 Fund |
17.77 | % | ||
MM Select T. Rowe Price Retirement 2055 Fund |
19.75 | % | ||
MM Select T. Rowe Price Retirement 2060 Fund |
17.69 | % | ||
For the year ended September 30, 2022, the following Fund(s) earned the following foreign sources of income:
Amount |
||||
20/80 Allocation Fund |
$ | 114,906 | ||
40/60 Allocation Fund |
253,728 | |||
60/40 Allocation Fund |
274,961 | |||
80/20 Allocation Fund |
320,594 | |||
MM RetireSMART by JPMorgan In Retirement Fund |
262,554 | |||
MM RetireSMART by JPMorgan 2020 Fund |
583,121 | |||
MM RetireSMART by JPMorgan 2025 Fund |
685,433 | |||
MM RetireSMART by JPMorgan 2030 Fund |
1,873,926 | |||
MM RetireSMART by JPMorgan 2035 Fund |
959,353 | |||
MM RetireSMART by JPMorgan 2040 Fund |
1,767,666 | |||
MM RetireSMART by JPMorgan 2045 Fund |
820,601 | |||
MM RetireSMART by JPMorgan 2050 Fund |
1,300,752 | |||
MM RetireSMART by JPMorgan 2055 Fund |
400,645 | |||
MM RetireSMART by JPMorgan 2060 Fund |
156,191 | |||
214
Federal Tax Information (Unaudited) (Continued) |
Amount |
||||
MM Select T. Rowe Price Retirement Balanced Fund |
$ | 518,419 | ||
MM Select T. Rowe Price Retirement 2005 Fund |
82,956 | |||
MM Select T. Rowe Price Retirement 2010 Fund |
440,378 | |||
MM Select T. Rowe Price Retirement 2015 Fund |
501,281 | |||
MM Select T. Rowe Price Retirement 2020 Fund |
2,627,767 | |||
MM Select T. Rowe Price Retirement 2025 Fund |
2,811,634 | |||
MM Select T. Rowe Price Retirement 2030 Fund |
7,326,871 | |||
MM Select T. Rowe Price Retirement 2035 Fund |
3,911,053 | |||
MM Select T. Rowe Price Retirement 2040 Fund |
7,459,153 | |||
MM Select T. Rowe Price Retirement 2045 Fund |
3,314,381 | |||
MM Select T. Rowe Price Retirement 2050 Fund |
5,164,037 | |||
MM Select T. Rowe Price Retirement 2055 Fund |
1,879,313 | |||
MM Select T. Rowe Price Retirement 2060 Fund |
692,966 | |||
Under Section 854(b)(2) of the Code, the Fund(s) hereby designate the maximum amounts as qualified dividends for purposes of the maximum rate under Section 1(h)(11) of the Code for the year ended September 30, 2022.
The Fund(s) intend to pass through the maximum amount allowable as Section 163(j) Interest Dividends as defined in the Treasury Regulations §1.163(j)-1(b).
215
A description of the policies and procedures that each Fund’s investment adviser uses to vote proxies relating to the Fund’s portfolio securities is available, without charge, upon request, by calling 1-888-309-3539, and on the SEC’s EDGAR database on its website at http://www.sec.gov.
Information regarding how the Funds voted proxies relating to portfolio securities during the most recent 12-month period ended June 30 is available, without charge, upon request, on the MassMutual website at http://www.massmutual.com/funds and on the SEC’s EDGAR database on its website at http://www.sec.gov.
The Funds file their complete schedule of portfolio holdings with the SEC for the first and third quarters of each fiscal year as an exhibit to their reports on Form N-PORT. The Funds’ Forms N-PORT are available on the SEC’s EDGAR database on its website at http://www.sec.gov. In addition, the Funds make the complete schedule of portfolio holdings from their filings on Form N-PORT available to shareholders at http://www.massmutual.com/funds.
Trustees’ Approval of Investment Advisory Contracts
At their meetings in May and June 2022, the Contract Committee (the “Committee”) and the Trustees, including the Trustees who are not “interested persons” (as such term is defined in the 1940 Act) of the Trust, MML Advisers, J.P. Morgan, or T. Rowe Price (the “Independent Trustees”), re-approved the existing advisory and subadvisory agreements (collectively, the “Contracts”) for each of the 20/80 Allocation Fund, 40/60 Allocation Fund, 60/40 Allocation Fund, 80/20 Allocation Fund, MM RetireSMART by JPMorgan In Retirement Fund, MM RetireSMART by JPMorgan 2020 Fund, MM RetireSMART by JPMorgan 2025 Fund, MM RetireSMART by JPMorgan 2030 Fund, MM RetireSMART by JPMorgan 2035 Fund, MM RetireSMART by JPMorgan 2040 Fund, MM RetireSMART by JPMorgan 2045 Fund, MM RetireSMART by JPMorgan 2050 Fund, MM RetireSMART by JPMorgan 2055 Fund, MM RetireSMART by JPMorgan 2060 Fund, MM Select T. Rowe Price Retirement Balanced Fund, MM Select T. Rowe Price Retirement 2005 Fund, MM Select T. Rowe Price Retirement 2010 Fund, MM Select T. Rowe Price Retirement 2015 Fund, MM Select T. Rowe Price Retirement 2020 Fund, MM Select T. Rowe Price Retirement 2025 Fund, MM Select T. Rowe Price Retirement 2030 Fund, MM Select T. Rowe Price Retirement 2035 Fund, MM Select T. Rowe Price Retirement 2040 Fund, MM Select T. Rowe Price Retirement 2045 Fund, MM Select T. Rowe Price Retirement 2050 Fund, MM Select T. Rowe Price Retirement 2055 Fund, and MM Select T. Rowe Price Retirement 2060 Fund, as applicable. In preparation for the meetings, the Trustees requested, and MML Advisers, J.P. Morgan, and T. Rowe Price provided in advance, certain materials relevant to the consideration of the Contracts (the “Meeting Materials”). In all of their deliberations, the Trustees were advised by independent counsel.
The Committee received in advance of the meetings (i) a memorandum from MML Advisers discussing the nature and quality of the services it provides as investment adviser to the Funds; (ii) a profitability analysis prepared by MML Advisers; and (iii) a fee and performance study report (the “Third-Party Report”) with respect to each Fund prepared by an independent third-party vendor (the “Third-Party”). The Third-Party Report provided detailed comparative advisory fee, total expense, and performance information for each Fund to assist the Committee in its evaluation of the Contracts. The Committee also considered information presented to it throughout the year regarding MML Advisers, J.P. Morgan, and T. Rowe Price.
The Committee considered the nature, scope, and quality of services MML Advisers provides to the Funds, including: (i) the financial condition, stability, and business strategy of MML Advisers; (ii) the capabilities of MML Advisers with respect to regulatory compliance and its ability to monitor compliance with the investment policies of the Funds; (iii) MML Advisers’ ability to provide investment oversight and provide for administrative and shareholder services to the Funds; and (iv) the experience and qualifications of the personnel of MML Advisers that perform, or oversee the performance of, the services provided to the Funds, and the needs of the Funds for administrative and shareholder services. The Committee noted that it had received in the Meeting Materials or during the course of the past year: (i) detailed information regarding MML Advisers’ ability to provide investment oversight and provide for administrative and shareholder services to the Funds; and (ii) a wide range of information about each of J.P. Morgan and T. Rowe Price and its personnel with responsibility for providing services to the Funds, as applicable, and
216
Other Information (Unaudited) (Continued) |
the fees payable to J.P. Morgan and T. Rowe Price by MML Advisers. MML Advisers reviewed with the Committee in detail the work MML Advisers does in its oversight roles, the expertise it brings to these roles, the size of its teams, and the financial commitment it has made to provide those services.
The Committee then reviewed and considered, for each Fund separately, the detailed information presented in the Third-Party Report regarding (i) Fund expenses, including, among other things, both the Fund’s net advisory fee and total net expense ratio against peer funds; and (ii) the Fund’s relative performance (over various time periods against funds in its “category” and a benchmark index). In connection with the Committee’s review, MML Advisers provided commentary and analysis regarding each Fund’s expenses and performance and a recommendation as to the action to be taken by the Committee. Throughout the discussion, MML Advisers responded to Committee members’ questions and provided additional information concerning each Fund.
The Committee reviewed the expense and performance information for each Fund. (References to any one- or three-year period below are to periods ended December 31, 2021. In all cases, the comparative expense information is that of a Fund’s “peer group” and the comparative performance information is that of a Fund’s “performance category.”)
The Committee considered that the total net expense ratios for all of the Funds, except the MM RetireSMART by JPMorgan In Retirement Fund, were within the top sixty percent of their peer groups, and in the majority of cases in the top forty percent. All of the Funds had net advisory fees at or below the medians of their peer groups, or within the top three comparative quintiles of their peer groups, except the MM Select T. Rowe Price Retirement 2015 Fund, MM Select T. Rowe Price Retirement 2020 Fund, MM Select T. Rowe Price Retirement 2045 Fund, MM Select T. Rowe Price Retirement 2050 Fund, MM Select T. Rowe Price Retirement 2055 Fund, and MM Select T. Rowe Price Retirement 2060 Fund, the levels of whose net advisory fees the Committee did not consider to be inconsistent with the advisory agreements’ continuation, in light of the Funds’ generally acceptable total net expense ratios and/or general favorable investment performance over time. In their consideration of these Funds, the Committee took into account the expense caps currently in place for the Funds.
The MM RetireSMART by JPMorgan In Retirement Fund had a total net expense ratio higher than the 60th comparative percentile of its peer group. The Committee considered MML Advisers’ statement that the Fund’s total net expense ratio, at the 75th percentile of its peer group, was only three basis points above the peer group median. The Committee also considered that the Fund’s net advisory fee was in the 1st comparative percentile of its peer group.
The Committee determined on the basis of these factors that the levels of the Funds’ net advisory fees, and the total net expenses of the Funds generally, were consistent with the continuation of their advisory agreements.
The Committee considered that each of the MM Target Allocation Funds, MM RetireSMART by JPMorgan In Retirement Fund, and MM Select T. Rowe Price Retirement Funds achieved three-year investment performance above the medians of their performance categories.
As to the MM RetireSMART by JPMorgan 2020 Fund, MM RetireSMART by JPMorgan 2025 Fund, MM RetireSMART by JPMorgan 2030 Fund, MM RetireSMART by JPMorgan 2035 Fund, MM RetireSMART by JPMorgan 2040 Fund, MM RetireSMART by JPMorgan 2045 Fund, MM RetireSMART by JPMorgan 2050 Fund, MM RetireSMART by JPMorgan 2055 Fund, and MM RetireSMART by JPMorgan 2060 Fund, the Committee noted that although each Fund had experienced relatively unfavorable three-year performance compared to its performance category, all but one Fund, the MM RetireSMART by JPMorgan 2020 Fund, experienced improved performance above the median of the relevant performance category for the one-year period. The Committee considered MML Advisers’ statement that the Funds’ underperformance for the three-year period (and for the one-year period for the MM RetireSMART by JPMorgan 2020 Fund) was due in substantial part to a strategic asset allocation underweight to large capitalization U.S. equities (and overweight to non-U.S. equities) in 2020. The Committee also considered MML Advisers’ statements that J.P. Morgan had been serving as the Funds’ subadviser to determine the Funds’ strategic asset allocations and tactical asset allocations, and that MML Advisers considers J.P. Morgan to be a premier subadviser that brings significant resources in this regard.
217
Other Information (Unaudited) (Continued) |
The Committee also reviewed and considered information included in the Meeting Materials, or discussed at the meeting and during the course of the year, concerning economies of scale and the profitability of MML Advisers’ advisory relationship with the various Funds, including: (i) a description of MML Advisers’ revenues from the Funds (including advisory fees and administrative and shareholder services fees, as applicable) and the expense allocation methodology employed by MML Advisers; and (ii) profitability information for each individual Fund. The discussions included consideration of the intangible benefits derived by MML Advisers and its affiliates resulting from their relationships with the Funds and any so-called “fallout benefits” to MML Advisers (which were not considered to be substantial in any event), such as any reputational value derived from serving as investment adviser to the Funds.
Prior to the votes being taken to approve the Contracts, the Committee met separately in executive session to discuss the appropriateness of such contracts. The Committee weighed the foregoing matters in light of the advice given to them by their independent legal counsel as to the law applicable to the review of investment advisory contracts. In arriving at a decision, the Committee did not identify any single matter as all-important or controlling. The foregoing summary does not detail all of the matters considered.
As to each of the Funds, the Committee concluded that: (i) overall, it was satisfied with the nature, extent, and quality of services provided, and expected to be provided in the future, under the Contracts, including the level of MML Advisers’ oversight of each Fund and the subadvisory process; (ii) MML Advisers’ levels of profitability from its relationship with the various Funds are not excessive and the advisory fees payable under the advisory agreements and each Fund’s total net expenses are fair and reasonable; (iii) the investment processes, research capabilities, and philosophies of J.P. Morgan and T. Rowe Price generally appear well suited to the Funds, as applicable, given their investment objectives and policies; (iv) either the relative or absolute performance of a Fund (in each case, taking into account the applicable investment strategy and risk profile of the Fund), or the steps MML Advisers has proposed in respect of the underperformance of a Fund, are sufficient to warrant continuation of the Contracts for each of the Funds; and (v) the terms of the Contracts are fair and reasonable with respect to each Fund and are in the best interests of each Fund’s shareholders.
Also at their meeting in June 2022, the Trustees, including the Independent Trustees, reviewed and approved a proposal to make changes to the existing subadvisory agreement between MML Advisers and J.P. Morgan for each of the MM RetireSMART by JPMorgan Funds, in order to require J.P. Morgan to furnish to MML Advisers a “sample withdrawal amount” each year, which would be made available to investors. In their deliberations, the Trustees were advised by independent counsel.
Prior to the vote being taken to approve the amendment to the subadvisory agreement discussed above, the Independent Trustees met separately in executive session to discuss the appropriateness of such contract. The Independent Trustees weighed the foregoing matters in light of the advice given to them by their independent legal counsel as to the law applicable to the review of investment advisory contracts. In arriving at a decision, the Trustees, including the Independent Trustees, did not identify any single matter as all-important or controlling. The foregoing summary does not detail all of the matters considered.
The amended subadvisory agreement became effective on June 22, 2022.
218
Other Information (Unaudited) (Continued) |
Submission of Matters to a Vote of Security Holders
A Special Meeting of Shareholders of the Trust was held on May 25, 2022 and on the adjournment dates of June 9, 2022, July 28, 2022, and September 14, 2022. The Notice of Meeting of Shareholders, and a Proxy Statement and voting instruction card, were first mailed, or otherwise made available, on or about April 8, 2022 to shareholders of record as of February 25, 2022. The results of the vote on the matters submitted to shareholders at the Special Meeting are as follows:
|
Proposal 1: |
To elect Allan W. Blair, Nabil N. El-Hage, Michael R. Fanning, Maria D. Furman, R. Bradford Malt, C. Ann Merrifield, Clifford M. Noreen, Cynthia R. Plouché, Jason J. Price, and Susan B. Sweeney as Trustees of each Trust of which the Funds are series for an indefinite term of office.* |
This matter was approved by the Trust’s shareholders on June 9, 2022. The results of the votes were as follows:
Shares Voted |
Shares For |
% of Shares |
Withhold |
% of Shares |
||||||||||||||||
Allan W. Blair |
1,062,272,572.058 | 1,055,134,595.262 | 42.213 | % | 7,137,976.796 | 0.285 | % | |||||||||||||
Nabil N. El-Hage |
1,062,272,572.058 | 1,055,187,057.064 | 42.215 | % | 7,085,514.994 | 0.283 | % | |||||||||||||
Michael R. Fanning |
1,062,272,572.058 | 1,054,435,784.031 | 42.185 | % | 7,836,788.027 | 0.313 | % | |||||||||||||
Maria D. Furman |
1,062,272,572.058 | 1,055,334,004.749 | 42.221 | % | 6,938,567.309 | 0.277 | % | |||||||||||||
R. Bradford Malt |
1,062,272,572.058 | 1,054,410,988.847 | 42.184 | % | 7,861,583.211 | 0.314 | % | |||||||||||||
C. Ann Merrifield |
1,062,272,572.058 | 1,054,614,232.611 | 42.192 | % | 7,658,339.447 | 0.306 | % | |||||||||||||
Clifford M. Noreen |
1,062,272,572.058 | 1,054,519,598.373 | 42.188 | % | 7,752,973.685 | 0.310 | % | |||||||||||||
Cynthia R. Plouché |
1,062,272,572.058 | 1,055,673,410.167 | 42.234 | % | 6,599,161.891 | 0.264 | % | |||||||||||||
Jason J. Price |
1,062,272,572.058 | 1,055,486,383.752 | 42.227 | % | 6,786,188.306 | 0.271 | % | |||||||||||||
Susan B. Sweeney |
1,062,272,572.058 | 1,055,272,106.456 | 42.218 | % | 7,000,465.602 | 0.280 | % | |||||||||||||
|
* |
Denotes Trust-wide proposal and voting results. |
219
Other Information (Unaudited) (Continued) |
Fund Expenses September 30, 2022
Expense Examples:
The following information is in regards to expenses for the six months ended September 30, 2022:
As a shareholder of the Funds, you may incur two types of costs: (1) transaction costs, including sales charges (loads) on purchase payments or redemptions; and (2) ongoing costs, including advisory fees, distribution and/or service (12b-1) fees, and other Fund expenses. These examples are intended to help you understand your ongoing costs (in dollars) of investing in the Funds and to compare these costs with the ongoing costs of investing in other mutual funds. These examples are based on an investment of $1,000 invested for the six months ended September 30, 2022.
Actual Expenses:
The first four columns of the table below provide information about actual account values and actual expenses. You may use this information, together with the amount you invested, to estimate the expenses that you paid over the period. Simply divide your account value by $1,000 (for example, an $8,600 account value divided by $1,000 = 8.6), then multiply the result by the number under the heading entitled “Operating Expenses Incurred” to estimate the expenses you paid on your account during this period.
Hypothetical Example for Comparison Purposes:
The last two columns of the table below provide information about hypothetical account values and hypothetical expenses based on the Fund’s actual expense ratio and an assumed rate of return of 5% per year before expenses, which is not the Fund’s actual return. The hypothetical account values and expenses may not be used to estimate the actual ending account balance or expenses you paid for the period. You may use this information to compare the ongoing costs of investing in the Fund and other funds. To do so, compare this 5% hypothetical example with the 5% hypothetical examples that appear in the shareholder reports of the other funds.
Please note that the expenses shown in the table are meant to highlight your ongoing costs only and do not reflect any transactional costs. Therefore, the last two columns of the table are useful in comparing ongoing costs only, and will not help you determine the relative total costs of owning different funds. In addition, if these transactional costs were included, your costs would have been higher.
Beginning |
Annualized |
Ending |
Operating |
Ending Value |
Operating |
|
20/80 Allocation Fund |
||||||
Class I |
$1,000 |
0.04% |
$881.10 |
$0.19 |
$1,024.90 |
$0.20 |
Class R5 |
1,000 |
0.14% |
879.90 |
0.66 |
1,024.40 |
0.71 |
Service Class |
1,000 |
0.24% |
879.90 |
1.13 |
1,023.90 |
1.22 |
Administrative Class |
1,000 |
0.34% |
880.30 |
1.60 |
1,023.40 |
1.72 |
Class R4 |
1,000 |
0.49% |
879.10 |
2.31 |
1,022.60 |
2.48 |
Class A |
1,000 |
0.59% |
878.90 |
2.78 |
1,022.10 |
2.99 |
Class R3 |
1,000 |
0.74% |
878.60 |
3.48 |
1,021.40 |
3.75 |
40/60 Allocation Fund |
||||||
Class I |
1,000 |
0.06% |
858.20 |
0.28 |
1,024.80 |
0.30 |
Class R5 |
1,000 |
0.16% |
858.40 |
0.75 |
1,024.30 |
0.81 |
Service Class |
1,000 |
0.26% |
858.20 |
1.21 |
1,023.80 |
1.32 |
Administrative Class |
1,000 |
0.36% |
857.10 |
1.68 |
1,023.30 |
1.83 |
Class R4 |
1,000 |
0.51% |
857.60 |
2.37 |
1,022.50 |
2.59 |
Class A |
1,000 |
0.61% |
855.60 |
2.84 |
1,022.00 |
3.09 |
Class R3 |
1,000 |
0.76% |
855.00 |
3.53 |
1,021.30 |
3.85 |
220
Other Information (Unaudited) (Continued) |
Beginning |
Annualized |
Ending |
Operating |
Ending Value |
Operating |
|
60/40 Allocation Fund |
||||||
Class I |
$1,000 |
0.06% |
$837.20 |
$0.28 |
$1,024.80 |
$0.30 |
Class R5 |
1,000 |
0.16% |
837.20 |
0.74 |
1,024.30 |
0.81 |
Service Class |
1,000 |
0.26% |
837.00 |
1.20 |
1,023.80 |
1.32 |
Administrative Class |
1,000 |
0.36% |
837.10 |
1.66 |
1,023.30 |
1.83 |
Class R4 |
1,000 |
0.51% |
835.80 |
2.35 |
1,022.50 |
2.59 |
Class A |
1,000 |
0.61% |
835.90 |
2.81 |
1,022.00 |
3.09 |
Class R3 |
1,000 |
0.76% |
834.90 |
3.50 |
1,021.30 |
3.85 |
80/20 Allocation Fund |
||||||
Class I |
1,000 |
0.09% |
820.40 |
0.41 |
1,024.60 |
0.46 |
Class R5 |
1,000 |
0.19% |
819.80 |
0.87 |
1,024.10 |
0.96 |
Service Class |
1,000 |
0.29% |
819.20 |
1.32 |
1,023.60 |
1.47 |
Administrative Class |
1,000 |
0.39% |
819.20 |
1.78 |
1,023.10 |
1.98 |
Class R4 |
1,000 |
0.54% |
818.90 |
2.46 |
1,022.40 |
2.74 |
Class A |
1,000 |
0.64% |
818.30 |
2.92 |
1,021.90 |
3.24 |
Class R3 |
1,000 |
0.79% |
817.00 |
3.60 |
1,021.10 |
4.00 |
MM RetireSMART by JPMorgan In Retirement Fund |
||||||
Class I |
1,000 |
0.06% |
864.10 |
0.28 |
1,024.80 |
0.30 |
Class R5 |
1,000 |
0.16% |
863.70 |
0.75 |
1,024.30 |
0.81 |
Service Class |
1,000 |
0.26% |
863.80 |
1.21 |
1,023.80 |
1.32 |
Administrative Class |
1,000 |
0.36% |
862.10 |
1.68 |
1,023.30 |
1.83 |
Class R4 |
1,000 |
0.51% |
862.30 |
2.38 |
1,022.50 |
2.59 |
Class A |
1,000 |
0.61% |
861.80 |
2.85 |
1,022.00 |
3.09 |
Class R3 |
1,000 |
0.76% |
861.20 |
3.55 |
1,021.30 |
3.85 |
MM RetireSMART by JPMorgan 2020 Fund |
||||||
Class I |
1,000 |
0.04% |
864.50 |
0.19 |
1,024.90 |
0.20 |
Class R5 |
1,000 |
0.14% |
863.40 |
0.65 |
1,024.40 |
0.71 |
Service Class |
1,000 |
0.24% |
863.60 |
1.12 |
1,023.90 |
1.22 |
Administrative Class |
1,000 |
0.34% |
862.40 |
1.59 |
1,023.40 |
1.72 |
Class R4 |
1,000 |
0.49% |
862.30 |
2.29 |
1,022.60 |
2.48 |
Class A |
1,000 |
0.59% |
861.70 |
2.75 |
1,022.10 |
2.99 |
Class R3 |
1,000 |
0.74% |
861.30 |
3.45 |
1,021.40 |
3.75 |
MM RetireSMART by JPMorgan 2025 Fund |
||||||
Class I |
1,000 |
0.01% |
848.50 |
0.05 |
1,025.00 |
0.05 |
Class R5 |
1,000 |
0.11% |
847.70 |
0.51 |
1,024.50 |
0.56 |
Service Class |
1,000 |
0.21% |
847.30 |
0.97 |
1,024.00 |
1.07 |
Administrative Class |
1,000 |
0.31% |
847.40 |
1.44 |
1,023.50 |
1.57 |
Class R4 |
1,000 |
0.46% |
846.40 |
2.13 |
1,022.80 |
2.33 |
Class A |
1,000 |
0.56% |
846.60 |
2.59 |
1,022.30 |
2.84 |
Class R3 |
1,000 |
0.71% |
845.30 |
3.28 |
1,021.50 |
3.60 |
MM RetireSMART by JPMorgan 2030 Fund |
||||||
Class I |
1,000 |
0.04% |
835.00 |
0.18 |
1,024.90 |
0.20 |
Class R5 |
1,000 |
0.14% |
834.20 |
0.64 |
1,024.40 |
0.71 |
Service Class |
1,000 |
0.24% |
833.90 |
1.10 |
1,023.90 |
1.22 |
Administrative Class |
1,000 |
0.34% |
833.30 |
1.56 |
1,023.40 |
1.72 |
Class R4 |
1,000 |
0.49% |
832.80 |
2.25 |
1,022.60 |
2.48 |
Class A |
1,000 |
0.59% |
832.50 |
2.71 |
1,022.10 |
2.99 |
Class R3 |
1,000 |
0.74% |
831.90 |
3.40 |
1,021.40 |
3.75 |
221
Other Information (Unaudited) (Continued) |
Beginning |
Annualized |
Ending |
Operating |
Ending Value |
Operating |
|
MM RetireSMART by JPMorgan 2035 Fund |
||||||
Class I |
$1,000 |
0.05% |
$820.20 |
$0.23 |
$1,024.80 |
$0.25 |
Class R5 |
1,000 |
0.15% |
819.70 |
0.68 |
1,024.30 |
0.76 |
Service Class |
1,000 |
0.25% |
819.20 |
1.14 |
1,023.80 |
1.27 |
Administrative Class |
1,000 |
0.35% |
818.80 |
1.60 |
1,023.30 |
1.78 |
Class R4 |
1,000 |
0.50% |
818.20 |
2.28 |
1,022.60 |
2.54 |
Class A |
1,000 |
0.60% |
818.10 |
2.73 |
1,022.10 |
3.04 |
Class R3 |
1,000 |
0.75% |
816.70 |
3.42 |
1,021.30 |
3.80 |
MM RetireSMART by JPMorgan 2040 Fund |
||||||
Class I |
1,000 |
0.04% |
811.40 |
0.18 |
1,024.90 |
0.20 |
Class R5 |
1,000 |
0.14% |
810.60 |
0.64 |
1,024.40 |
0.71 |
Service Class |
1,000 |
0.24% |
810.00 |
1.09 |
1,023.90 |
1.22 |
Administrative Class |
1,000 |
0.34% |
809.60 |
1.54 |
1,023.40 |
1.72 |
Class R4 |
1,000 |
0.49% |
809.00 |
2.22 |
1,022.60 |
2.48 |
Class A |
1,000 |
0.59% |
808.70 |
2.68 |
1,022.10 |
2.99 |
Class R3 |
1,000 |
0.74% |
808.10 |
3.35 |
1,021.40 |
3.75 |
MM RetireSMART by JPMorgan 2045 Fund |
||||||
Class I |
1,000 |
0.02% |
804.70 |
0.09 |
1,025.00 |
0.10 |
Class R5 |
1,000 |
0.12% |
804.00 |
0.54 |
1,024.50 |
0.61 |
Service Class |
1,000 |
0.22% |
802.70 |
0.99 |
1,024.00 |
1.12 |
Administrative Class |
1,000 |
0.32% |
802.90 |
1.45 |
1,023.50 |
1.62 |
Class R4 |
1,000 |
0.47% |
802.30 |
2.12 |
1,022.70 |
2.38 |
Class A |
1,000 |
0.57% |
802.30 |
2.58 |
1,022.20 |
2.89 |
Class R3 |
1,000 |
0.72% |
801.00 |
3.25 |
1,021.50 |
3.65 |
MM RetireSMART by JPMorgan 2050 Fund |
||||||
Class I |
1,000 |
0.02% |
803.50 |
0.09 |
1,025.00 |
0.10 |
Class R5 |
1,000 |
0.12% |
802.20 |
0.54 |
1,024.50 |
0.61 |
Service Class |
1,000 |
0.22% |
802.40 |
0.99 |
1,024.00 |
1.12 |
Administrative Class |
1,000 |
0.32% |
802.40 |
1.45 |
1,023.50 |
1.62 |
Class R4 |
1,000 |
0.47% |
800.70 |
2.12 |
1,022.70 |
2.38 |
Class A |
1,000 |
0.57% |
800.70 |
2.57 |
1,022.20 |
2.89 |
Class R3 |
1,000 |
0.72% |
799.80 |
3.25 |
1,021.50 |
3.65 |
MM RetireSMART by JPMorgan 2055 Fund |
||||||
Class I |
1,000 |
0.00% |
803.60 |
0.00 |
1,025.10 |
|
Class R5 |
1,000 |
0.10% |
802.80 |
0.45 |
1,024.60 |
0.51 |
Service Class |
1,000 |
0.20% |
801.90 |
0.90 |
1,024.10 |
1.01 |
Administrative Class |
1,000 |
0.30% |
801.10 |
1.35 |
1,023.60 |
1.52 |
Class R4 |
1,000 |
0.45% |
801.70 |
2.03 |
1,022.80 |
2.28 |
Class A |
1,000 |
0.55% |
801.30 |
2.48 |
1,022.30 |
2.79 |
Class R3 |
1,000 |
0.70% |
799.60 |
3.16 |
1,021.60 |
3.55 |
MM RetireSMART by JPMorgan 2060 Fund |
||||||
Class I |
1,000 |
0.00% |
803.40 |
0.00 |
1,025.10 |
|
Class R5 |
1,000 |
0.10% |
802.60 |
0.45 |
1,024.60 |
0.51 |
Service Class |
1,000 |
0.20% |
802.50 |
0.90 |
1,024.10 |
1.01 |
Administrative Class |
1,000 |
0.30% |
801.10 |
1.35 |
1,023.60 |
1.52 |
Class R4 |
1,000 |
0.45% |
801.10 |
2.03 |
1,022.80 |
2.28 |
Class A |
1,000 |
0.55% |
800.80 |
2.48 |
1,022.30 |
2.79 |
Class R3 |
1,000 |
0.70% |
800.40 |
3.16 |
1,021.60 |
3.55 |
222
Other Information (Unaudited) (Continued) |
Beginning |
Annualized |
Ending |
Operating |
Ending Value |
Operating |
|
MM Select T. Rowe Price Retirement Balanced Fund |
||||||
Class I |
$1,000 |
0.28% |
$869.20 |
$1.31 |
$1,023.70 |
$1.42 |
Class M5 |
1,000 |
0.43% |
868.20 |
2.01 |
1,022.90 |
2.18 |
Class M4 |
1,000 |
0.68% |
867.80 |
3.18 |
1,021.70 |
3.45 |
Class M3 |
1,000 |
0.93% |
866.00 |
4.35 |
1,020.40 |
4.71 |
MM Select T. Rowe Price Retirement 2005 Fund |
||||||
Class I |
1,000 |
0.28% |
863.40 |
1.31 |
1,023.70 |
1.42 |
Class M5 |
1,000 |
0.43% |
863.10 |
2.01 |
1,022.90 |
2.18 |
Class M4 |
1,000 |
0.68% |
862.50 |
3.17 |
1,021.70 |
3.45 |
Class M3 |
1,000 |
0.93% |
860.50 |
4.34 |
1,020.40 |
4.71 |
MM Select T. Rowe Price Retirement 2010 Fund |
||||||
Class I |
1,000 |
0.28% |
859.10 |
1.30 |
1,023.70 |
1.42 |
Class M5 |
1,000 |
0.43% |
858.90 |
2.00 |
1,022.90 |
2.18 |
Class M4 |
1,000 |
0.68% |
857.10 |
3.17 |
1,021.70 |
3.45 |
Class M3 |
1,000 |
0.93% |
856.40 |
4.33 |
1,020.40 |
4.71 |
MM Select T. Rowe Price Retirement 2015 Fund |
||||||
Class I |
1,000 |
0.30% |
855.60 |
1.40 |
1,023.60 |
1.52 |
Class M5 |
1,000 |
0.45% |
854.80 |
2.09 |
1,022.80 |
2.28 |
Class M4 |
1,000 |
0.70% |
853.90 |
3.25 |
1,021.60 |
3.55 |
Class M3 |
1,000 |
0.95% |
852.70 |
4.41 |
1,020.30 |
4.81 |
MM Select T. Rowe Price Retirement 2020 Fund |
||||||
Class I |
1,000 |
0.31% |
850.50 |
1.44 |
1,023.50 |
1.57 |
Class M5 |
1,000 |
0.47% |
849.70 |
2.18 |
1,022.70 |
2.38 |
Class M4 |
1,000 |
0.72% |
849.20 |
3.34 |
1,021.50 |
3.65 |
Class M3 |
1,000 |
0.97% |
847.50 |
4.49 |
1,020.20 |
4.91 |
MM Select T. Rowe Price Retirement 2025 Fund |
||||||
Class I |
1,000 |
0.34% |
840.50 |
1.57 |
1,023.40 |
1.72 |
Class M5 |
1,000 |
0.50% |
839.70 |
2.31 |
1,022.60 |
2.54 |
Class M4 |
1,000 |
0.75% |
838.50 |
3.46 |
1,021.30 |
3.80 |
Class M3 |
1,000 |
1.00% |
837.50 |
4.61 |
1,020.10 |
5.06 |
MM Select T. Rowe Price Retirement 2030 Fund |
||||||
Class I |
1,000 |
0.37% |
825.40 |
1.69 |
1,023.20 |
1.88 |
Class M5 |
1,000 |
0.54% |
824.60 |
2.47 |
1,022.40 |
2.74 |
Class M4 |
1,000 |
0.79% |
823.50 |
3.61 |
1,021.10 |
4.00 |
Class M3 |
1,000 |
1.04% |
822.40 |
4.75 |
1,019.90 |
5.27 |
MM Select T. Rowe Price Retirement 2035 Fund |
||||||
Class I |
1,000 |
0.39% |
812.40 |
1.77 |
1,023.10 |
1.98 |
Class M5 |
1,000 |
0.56% |
811.50 |
2.54 |
1,022.30 |
2.84 |
Class M4 |
1,000 |
0.81% |
810.70 |
3.68 |
1,021.00 |
4.10 |
Class M3 |
1,000 |
1.06% |
809.40 |
4.81 |
1,019.80 |
5.37 |
MM Select T. Rowe Price Retirement 2040 Fund |
||||||
Class I |
1,000 |
0.41% |
801.90 |
1.85 |
1,023.00 |
2.08 |
Class M5 |
1,000 |
0.58% |
801.60 |
2.62 |
1,022.20 |
2.94 |
Class M4 |
1,000 |
0.83% |
800.30 |
3.75 |
1,020.90 |
4.20 |
Class M3 |
1,000 |
1.08% |
799.60 |
4.87 |
1,019.70 |
5.47 |
MM Select T. Rowe Price Retirement 2045 Fund |
||||||
Class I |
1,000 |
0.42% |
798.20 |
1.89 |
1,023.00 |
2.13 |
Class M5 |
1,000 |
0.60% |
797.40 |
2.70 |
1,022.10 |
3.04 |
Class M4 |
1,000 |
0.85% |
795.90 |
3.83 |
1,020.80 |
4.31 |
Class M3 |
1,000 |
1.10% |
795.50 |
4.95 |
1,019.60 |
5.57 |
223
Other Information (Unaudited) (Continued) |
Beginning |
Annualized |
Ending |
Operating |
Ending Value |
Operating |
|
MM Select T. Rowe Price Retirement 2050 Fund |
||||||
Class I |
$1,000 |
0.43% |
$796.20 |
$1.94 |
$1,022.90 |
$2.18 |
Class M5 |
1,000 |
0.61% |
795.50 |
2.75 |
1,022.00 |
3.09 |
Class M4 |
1,000 |
0.86% |
794.50 |
3.87 |
1,020.80 |
4.36 |
Class M3 |
1,000 |
1.11% |
793.70 |
4.99 |
1,019.50 |
5.62 |
MM Select T. Rowe Price Retirement 2055 Fund |
||||||
Class I |
1,000 |
0.44% |
795.50 |
1.98 |
1,022.90 |
2.23 |
Class M5 |
1,000 |
0.62% |
794.60 |
2.79 |
1,022.00 |
3.14 |
Class M4 |
1,000 |
0.87% |
794.10 |
3.91 |
1,020.70 |
4.41 |
Class M3 |
1,000 |
1.12% |
793.10 |
5.03 |
1,019.50 |
5.67 |
MM Select T. Rowe Price Retirement 2060 Fund |
||||||
Class I |
1,000 |
0.44% |
795.90 |
1.98 |
1,022.90 |
2.23 |
Class M5 |
1,000 |
0.62% |
794.90 |
2.79 |
1,022.00 |
3.14 |
Class M4 |
1,000 |
0.87% |
793.70 |
3.91 |
1,020.70 |
4.41 |
Class M3 |
1,000 |
1.12% |
792.70 |
5.03 |
1,019.50 |
5.67 |
|
* |
Expenses are calculated using the annualized expense ratio for the six months ended September 30, 2022, multiplied by the average account value over the period, multiplied by 183 days in the period, divided by 365 days in the year, unless stated otherwise. |
224
[THIS PAGE INTENTIONALLY LEFT BLANK]
[THIS PAGE INTENTIONALLY LEFT BLANK]
Underwriter:
MML Distributors, LLC
1295 State Street
Springfield, Massachusetts 01111-0001

© 2022 Massachusetts Mutual Life Insurance Company (MassMutual®), Springfield, MA 01111-0001. All rights reserved. www.MassMutual.com. Investment Adviser: MML Investment Advisers, LLC |
MM202311- |
This material must be preceded or accompanied by a current prospectus (or summary prospectus, if available) for the applicable MassMutual Funds. Investors should consider a Fund’s investment objective, risks, and charges and expenses carefully before investing. This and other information about the investment company is available in the prospectus (or summary prospectus, if available). Read it carefully before investing.
[THIS PAGE INTENTIONALLY LEFT BLANK]
MassMutual Funds Annual Report – President’s Letter to Shareholders (Unaudited) |
To Our Shareholders

Paul LaPiana
“At MassMutual, our goal is to help you build the future you want for yourself and your family. We want to help you with your retirement plans today, so you can feel more comfortable about tomorrow.”
September 30, 2022
Continued market volatility challenges retirement investors
I am pleased to present you with the MassMutual Funds Annual Report. During the fiscal year ended September 30, 2022, U.S. stocks were down over 15%, with investors concerned that stimulus-fueled recovery from the COVID-19 pandemic was over and that domestic monetary policy had turned toward combating heightened inflation. Stocks in foreign developed markets and emerging markets also experienced significant losses in the fiscal year, hurt by elevated energy prices, a strengthening U.S. dollar, and concerns that consumer spending and corporate earnings growth would slow. U.S. bond investors experienced negative returns in the rising interest rate environment, fueled by aggressive interest rate hikes by the U.S. Federal Reserve Board that were aimed at reducing demand-driven inflationary pressures.
Suggestions for retirement investors under any market conditions
|
● |
You are likely in it for the long term. Retirement planning involves what financial professionals refer to as “long-term investing,” since most people save and invest for retirement throughout their working years. Even in retirement, many individuals will systematically withdraw their retirement savings over a number of years, keeping a portion of their funds invested. Although the financial markets will go up and down, individuals who take a long-term approach to investing don’t focus on current headlines – because they realize that they have time to ride out the downturns. |
|
● |
Keep contributing. While you have no control over the investment markets, you can control how often and how much you contribute to your retirement account. Saving as much as possible and increasing your contributions regularly is one way retirement investors can help boost their retirement savings, regardless of the performance of the stock and bond markets. |
|
● |
Invest continually.1 Financial professionals often advise their clients to stay in the market, regardless of short-term results. Here’s why: Those who can invest in all market conditions have the potential to be rewarded even during market downturns, when more favorable prices may enable them to accumulate larger positions. |
|
● |
Monitor your asset allocation and diversify. Stocks, bonds, and short-term/money market investments are asset classes that tend to behave differently, depending upon the economic and market environment. These broad asset classes contain an even greater array of asset sub-categories (such as small-cap stocks, international stocks, and high-yield bonds). Most financial professionals agree that investors can take advantage of different opportunities in the market and reduce the risk of over-exposure to one or two poorly performing asset types by selecting a number of investments that represent a mix of asset classes and sub-categories. |
Is this a good time to track your progress?
If you work with a financial professional, you may wish to consider checking in with him or her to help you determine if:
|
● |
you are saving enough for retirement – and, if in retirement, you are withdrawing an appropriate amount each year, based on your personal circumstances; |
|
● |
your retirement account is invested appropriately for all market conditions, based on your goals and objectives, as well as your investment time horizon; and |
|
● |
you are taking steps to help reduce your longevity risk, which is the chance that you could “run out” of retirement savings during your lifetime. |
1 Systematic investing and asset allocation do not ensure a profit or protect against loss in a declining market. Systematic investing involves continuous investment in securities regardless of fluctuating price levels. Investors should consider their ability to continue investing through periods of low price levels.
(Continued)
1
MassMutual Funds Annual Report – President’s Letter to Shareholders (Unaudited) (Continued) |
Get to where you want to be
At MassMutual, our goal is to help you build the future you want for yourself and your family. We want to help you with your retirement plans today, so you can feel more comfortable about tomorrow. That’s why we continue to encourage you to maintain perspective when it comes to retirement investing, regardless of any headline-making events. MassMutual’s view is that changing market conditions have the potential to reward patient investors. Thank you for your continued confidence and trust in MassMutual.
Sincerely,

Paul LaPiana
President
MassMutual Funds
MML Investment Advisers, LLC
© 2022 Massachusetts Mutual Life Insurance Company (MassMutual®), Springfield, MA 01111-0001. All rights reserved. www.MassMutual.com.
MML Distributors, LLC (MMLD) serves as the exclusive wholesale marketing agent for all MassMutual Funds, as well as the distributor for all MassMutual Funds, except the MassMutual Global Floating Rate Fund, MassMutual Global Credit Income Opportunities Fund, MassMutual Emerging Markets Debt Blended Total Return Fund, MassMutual Global Emerging Markets Equity Fund, MassMutual High Yield Fund, and MassMutual Short-Duration Bond Fund. MMLD Member FINRA and SIPC (www.FINRA.org and www.SIPC.org), 1295 State Street, Springfield, MA 01111-0001. Investment advisory services are provided to all MassMutual Funds by MML Investment Advisers, LLC (MML Advisers). MMLD and MML Advisers are subsidiaries of MassMutual.
The information provided is the opinion of MML Advisers and is subject to change without notice. It is not to be construed as tax, legal, or investment advice. Of course, past performance does not guarantee future results.
MM202310-303203
2
MassMutual Funds Annual Report – Economic and Market Overview (Unaudited) |
September 30, 2022
Continued market volatility challenges retirement investors
During the fiscal year ended September 30, 2022, U.S. stocks were down over 15%, with investors concerned that stimulus-fueled recovery from the COVID-19 pandemic was over and that domestic monetary policy had turned toward combating heightened inflation. Stocks in foreign developed markets and emerging markets also experienced significant losses in the fiscal year, hurt by elevated energy prices, a strengthening U.S. dollar, and concerns that consumer spending and corporate earnings growth would slow. U.S. bond investors experienced negative returns in the rising interest rate environment, fueled by aggressive interest rate hikes by the U.S. Federal Reserve Board (the “Fed”) that were aimed at reducing demand-driven inflationary pressures.
Market Highlights
|
● |
For the reporting period from October 1, 2021 through September 30, 2022, U.S. stocks were down over 15%, in a market environment where the Fed aggressively raised interest rates in an effort to combat heightened inflation. |
|
● |
In the fourth quarter of 2021, expectations for strong economic and earnings growth in 2022, bolstered by the possibility of a $2 trillion economic stimulus and social spending plan, allowed investors to look past sharp increases in COVID-19 Omicron variant cases and heightened inflationary pressures. |
|
● |
In the first quarter of 2022, investors in both stocks and bonds were challenged by a sharp rise in energy prices after Russia’s invasion of Ukraine, a stalled domestic economic stimulus plan, and the Fed raising interest rates for the first time since 2018. |
|
● |
The second quarter of 2022 was another difficult quarter, as Fed interest rate hikes, investor concerns over high inflation, and concern about the potential of an impending global recession dominated the narrative. |
|
● |
The third quarter of 2022 was an extension of the difficult second quarter, with continued inflationary pressures, weakening economic data, and aggressive Fed interest rate hikes. |
|
● |
Foreign stocks in developed markets and emerging markets also experienced losses in the fiscal year, against the backdrop of Russia’s invasion of Ukraine (and the resulting economic sanctions that kept energy prices elevated), the strengthening U.S. dollar, and threatened consumer spending and corporate earnings growth. |
|
● |
U.S. bond investors experienced negative returns in the rising interest rate environment, fueled by an increase in short-term interest rates, heighted inflationary pressures, and the reversal of monetary and fiscal policy support. |
Market Environment
For the fiscal year beginning on October 1, 2021, global stock investors experienced significant losses. U.S. stocks fell sharply in the period in response, with the S&P 500 Index® (“S&P 500”)1 entering bear market territory after declining more than 20% from its previous highs. Investors sought safety from high inflation, rising interest rates, and the increasing possibility of a recession. Consumer sentiment fell sharply, down 17.2% in the period2 , as high inflation – driven by rising energy, food, and housing costs – overwhelmed low unemployment and strong wage growth. As of August 2022, more Americans are borrowing to make ends meet in these inflationary times, resulting in consumer loan levels at record highs, having increased by 12.4% year-over-year3.
1 The S&P 500 Index measures the performance of 500 widely held stocks in the U.S. equity market. Standard and Poor’s chooses member companies for the index based on market size, liquidity, and industry group representation. Included are the stocks of industrial, financial, utility, and transportation companies. Since mid-1989, this composition has been more flexible and the number of issues in each sector has varied. It is market capitalization-weighted. The Index does not reflect any deduction for fees, expenses, or taxes and cannot be purchased directly by investors.
2 June 24, 2022, University of Michigan: Consumer Sentiment (UMCSENT), retrieved from FRED, Federal Reserve Bank of St. Louis; https://fred.stlouisfed.org/series/UMCSENT
3 Board of Governors of the Federal Reserve System (US), Consumer Loans, All Commercial Banks [CONSUMER], retrieved from FRED, Federal Reserve Bank of St. Louis; https://fred.stlouisfed.org/series/CONSUMER, October 11, 2022.
3
MassMutual Funds Annual Report – Economic and Market Overview (Unaudited) (Continued) |
As a result, the broad market S&P 500 fell 15.47% for the period. The technology-heavy NASDAQ Composite Index4 performed even worse, dropping 26.25%. The more economically sensitive Dow Jones Industrial AverageSM5 was down 13.40%. During the reporting period, small-cap stocks underperformed their larger-cap peers, while value stocks outperformed their growth brethren. The communication services, consumer discretionary, and information technology sectors were all down by 20% or more. The energy sector was the strongest performer for the fiscal year, up 45.70%, aided by an 18% increase in the price of West Texas Intermediate (WTI) crude oil. The utilities sector also ended the period positively, gaining 5.58% for the period.
Developed international markets, as measured by the MSCI EAFE® Index6 , trailed their domestic peers, ending the fiscal year down 25.13%. Emerging-market stocks, as measured by the MSCI Emerging Markets Index7 , also fell sharply, ending down 28.11% for the period. Investors sold off developed international and emerging-market stocks on concerns that higher interest rates and commodity prices would impair consumer spending and corporate earnings growth.
Bond yields rose sharply during the fiscal year, with the 10-year U.S. Treasury bond yield rising from a low of 1.52% on October 1, 2021 to close the period at 3.83%. Rising yields generally produce falling bond prices; consequently, bond index returns suffered. The Bloomberg U.S. Aggregate Bond Index8 ended the period down 14.60%. Investment-grade corporate bonds fared even worse. The Bloomberg U.S. Corporate Bond Index9 , which tracks investment-grade corporate bonds, ended the period with an 18.53% loss. The Bloomberg U.S. Corporate High-Yield Bond Index10 also ended in negative territory, declining 14.14% for the period.
4 The NASDAQ Composite Index measures the performance of all domestic and international based common type stocks listed on the NASDAQ Stock Market. It includes common stocks, ordinary shares, ADRs, shares of beneficial interest or limited partnership interests and tracking stocks. The index is market capitalization-weighted. The Index does not reflect any deduction for fees, expenses, or taxes and cannot be purchased directly by investors.
5 The Dow Jones Industrial Average Index measures the performance of stocks of 30 U.S. blue-chip companies covering all industries with the exception of transportation and utilities. It is price-weighted. The Index does not reflect any deduction for fees or expenses and cannot be purchased directly by investors.
6 The MSCI EAFE Index measures the performance of the large- and mid-cap segments of developed markets, excluding the U.S. and Canada equity securities. It is free float-adjusted market-capitalization weighted. The Index does not reflect any deduction for fees or expenses and cannot be purchased directly by investors.
7 The MSCI Emerging Markets Index measures the performance of the large- and mid-cap segments of emerging market equity securities. It is free float-adjusted market-capitalization weighted. The Index does not reflect any deduction for fees or expenses and cannot be purchased directly by investors.
8 The Bloomberg U.S. Aggregate Bond Index measures the performance of investment grade, U.S. dollar-denominated, fixed-rate taxable bond market securities, including Treasuries, government-related and corporate securities, mortgage-backed securities (MBS) (agency fixed-rate and hybrid ARM pass-throughs), asset-backed securities (ABS), and commercial mortgage-backed securities (CMBS). It rolls up into other Bloomberg flagship indexes, such as the multi-currency Global Aggregate Index and the U.S. Universal Index, which includes high yield and emerging markets debt. The Index does not reflect any deduction for fees, expenses, or taxes and cannot be purchased directly by investors.
9 The Bloomberg U.S. Corporate Bond Index measures the performance of the investment grade, U.S. dollar-denominated, fixed-rate, taxable corporate bond market. It includes U.S. dollar-denominated securities publicly issued by U.S. and non-U.S. industrial, utility, and financial issuers that meet specified maturity, liquidity, and quality requirements. The Index does not reflect any deduction for fees, expenses, or taxes and cannot be purchased directly by investors.
10 The Bloomberg U.S. Corporate High-Yield Bond Index measures the performance of U.S. dollar-denominated, non-investment grade, fixed-rate, taxable corporate bonds, including corporate bonds, fixed-rate bullet, putable, and callable bonds, SEC Rule 144A securities, original issue zeros, pay-in-kind bonds, fixed-rate and fixed-to-floating capital securities. The Index does not reflect any deduction for fees, expenses, or taxes and cannot be purchased directly by investors.
4
MassMutual Funds Annual Report – Economic and Market Overview (Unaudited) (Continued) |
Review and maintain your strategy
MassMutual is committed to helping people secure their long-term future and protect the ones they love. While the current market volatility, including the reality of market sell-offs, can test an investor’s mettle, we’d like to remind you that, as a retirement investor, it’s important to maintain perspective and have realistic expectations about the future performance of your investment accounts. As described in this report, financial markets can reverse suddenly with little or no notice. That’s why we continue to believe that retirement investors should create and maintain a plan that focuses on their goals, how long they have to invest, and how comfortable they are with market volatility. Our multi-managed and sub-advised mutual funds tap into the deep expertise of seasoned asset managers who are committed to helping long-term investors prepare for retirement – in all market conditions. As always, we recommend that you work with a personal financial professional, who can help you define an investment strategy that aligns with your comfort level with respect to market volatility, how long you have to save and invest, and your specific financial goals. Thank you for your confidence in MassMutual.
© 2022 Massachusetts Mutual Life Insurance Company (MassMutual®), Springfield, MA 01111-0001. All rights reserved. www.MassMutual.com.
MML Distributors, LLC (MMLD) serves as the exclusive wholesale marketing agent for all MassMutual Funds, as well as the distributor for all MassMutual Funds, except the MassMutual Global Floating Rate Fund, MassMutual Global Credit Income Opportunities Fund, MassMutual Emerging Markets Debt Blended Total Return Fund, MassMutual Global Emerging Markets Equity Fund, MassMutual High Yield Fund, and MassMutual Short-Duration Bond Fund. MMLD Member FINRA and SIPC (www.FINRA.org and www.SIPC.org), 1295 State Street, Springfield, MA 01111-0001. Investment advisory services are provided to all MassMutual Funds by MML Investment Advisers, LLC (MML Advisers). MMLD and MML Advisers are subsidiaries of MassMutual.
The information provided is the opinion of MML Advisers and is subject to change without notice. It is not to be construed as tax, legal, or investment advice. Of course, past performance does not guarantee future results.
5
MM Equity Asset Fund – Portfolio Manager Report (Unaudited) |
What is the investment approach of MM Equity Asset Fund, and who is the Fund’s subadviser?
The Fund seeks to provide a consistently high total return from a broadly diversified portfolio of equity securities with risk characteristics similar to the Standard and Poor’s 500 Composite Stock Price Index (S&P 500® Index*). Under normal circumstances, the Fund invests at least 80% of its net assets (plus the amount of any borrowings for investment purposes) in equity securities. The Fund’s subadviser is J.P. Morgan Investment Management Inc. (J.P. Morgan).
* The “S&P 500 Index” is a product of S&P Dow Jones Indices LLC or its affiliates (“SPDJI”), and has been licensed for use by MassMutual. Standard & Poor’s®, S&P®, and S&P 500® are registered trademarks of Standard & Poor’s Financial Services LLC (“S&P”); and Dow Jones® is a registered trademark of Dow Jones Trademark Holdings LLC (“Dow Jones”); and these trademarks have been licensed for use by SPDJI and sublicensed for certain purposes by MassMutual. The Fund is not sponsored, endorsed, sold or promoted by SPDJI, Dow Jones, S&P, or their respective affiliates, and none of such parties make any representation regarding the advisability of investing in such product(s) nor do they have any liability for any errors, omissions, or interruptions of the S&P 500 Index.
How did the Fund perform during the 12 months ended September 30, 2022?
The Fund’s Class I shares returned -14.16%, outperforming the -15.47% return of the S&P 500 Index (the “benchmark”), which measures the performance of 500 widely held stocks in the U.S. equity market.
For a discussion on the economic and market environment during the 12-month period ended September 30, 2022, please see the Economic and Market Overview, beginning on page 3.
Subadviser discussion of factors that contributed to the Fund’s performance
For the one-year period ended September 30, 2022, stock selection in the pharma/medical technology, industrial cyclical, and health services & systems sectors contributed the most to the Fund’s performance – while stock choices in the basic materials, telecommunications, and real estate investment trust (REIT) sectors detracted the most from the Fund’s performance.
On the positive side, the Fund’s underweight allocations to PayPal (PYPL), a company that engages in the development of technology platforms for digital payments; Intel (INTC), a company that designs, manufactures, and sells computer products and technologies; and Adobe (ADBE), a company that develops, markets and supports computer software products and technologies were the top individual contributors to the Fund’s performance. In particular, the Fund’s underweight allocation to PayPal was additive, as the company underperformed during the fiscal year, given the competitive pressures it faced from its more innovative competitors.
On the negative side, the Fund’s overweight allocations to Stanley Black & Decker (SWK), a manufacturer of industrial tools and household hardware; Charter Communications (CHTR), a cable telecommunications company; and Shopify (SHOP), a provider of a cloud-based commerce platform were the top individual detractors. The Fund’s overweight position in Stanley Black & Decker was the largest detractor over the period. As multiples for earlier-cycle names have compressed, the company underperformed; additionally, Stanley Black & Decker did not execute as well as peers with regard to supply chain issues, leading to a lack of volume growth.
Derivatives may generally be used as substitutes for securities in which the Fund can invest. Derivatives are securities that derive their value from the performance of one or more other investments and take the form of a contract between two or more parties. Derivatives can be used for hedging, speculation, or both. During the reporting period, the Fund used futures to hedge cash positions, which were less than 5% of the Fund’s market value. The positions had a negligible impact on performance over the period.
6
MM Equity Asset Fund – Portfolio Manager Report (Unaudited) (Continued) |
Subadviser outlook
Looking ahead, Fund management expects to continue to focus on fundamentals of the economy and company earnings. As of the end of the fiscal year, J.P. Morgan analysts’ estimates for benchmark earnings projected the potential for +10% for 2022 and +6% for 2023. While subject to revision, this forecast reflects J.P. Morgan’s expectations for a recovery in the underlying economy – and includes its best analysis of earnings expectations. J.P. Morgan believes that inflation and other uncertainties – such as the tightening liquidity, lingering supply chain constraints, and economic impacts of the war in Ukraine – will be integral to investor sentiment moving forward.
MM Equity Asset Fund |
|
Apple, Inc. |
6.8% |
Microsoft Corp. |
6.5% |
Amazon.com, Inc. |
3.6% |
Alphabet, Inc. Class A |
2.4% |
Tesla, Inc. |
2.3% |
UnitedHealth Group, Inc. |
1.9% |
Alphabet, Inc. Class C |
1.7% |
Visa, Inc. Class A |
1.4% |
Berkshire Hathaway, Inc. Class B |
1.4% |
Exxon Mobil Corp. |
1.4% |
29.4% |
|
MM Equity Asset Fund |
|
Technology |
22.5% |
Consumer, Non-cyclical |
21.1% |
Financial |
15.5% |
Communications |
12.2% |
Consumer, Cyclical |
9.6% |
Industrial |
7.8% |
Energy |
4.5% |
Utilities |
3.0% |
Basic Materials |
2.1% |
Mutual Funds |
0.1% |
Total Long-Term Investments |
98.4% |
Short-Term Investments and Other Assets and Liabilities |
1.6% |
Net Assets |
100.0% |
7
MM Equity Asset Fund – Portfolio Manager Report (Unaudited) (Continued) |
GROWTH OF $10,000 INVESTMENT - Class I
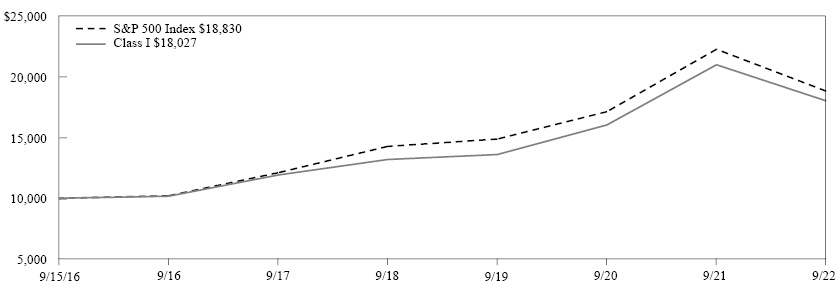
The graph above illustrates the Fund’s historical performance for the past 10 fiscal years or since inception (for Funds lacking 10-year records) in comparison to its benchmark index, as well as one or more additional indexes, if applicable.
Average Annual Total Returns (for the periods ended 09/30/2022) |
||||
|
Inception Date |
1 Year |
5 Years |
Since Inception |
Class I |
09/15/2016 |
-14.16% |
8.63% |
10.24% |
S&P 500 Index |
-15.47% |
9.24% |
11.03% |
|
Generally accepted accounting principles require adjustments to be made to the net assets of the Fund at period end for financial reporting purposes only, and as such, the total return based on the unadjusted net asset value per share may differ from the total return reported in the financial highlights.
Performance results in the graph and table are shown both with and without the imposition of the maximum applicable sales charge (if applicable) and reflect the percentage change in net asset value, including reinvestment of dividends and capital gains distributions. Investors should note that the Fund is a professionally managed mutual fund, while the index or indexes shown above are unmanaged, cannot be purchased directly, and, with the exception of any peer group index, do not incur expenses.
Performance data quoted in the graph and table represents past performance; past performance is not predictive of future results. The investment return and principal value of shares of the Fund fluctuate, so your shares, when sold, may be worth more or less than their original cost. Current performance of the Fund may be lower or higher than the performance quoted. The performance shown does not reflect the deduction of taxes, if any, that a shareholder would pay on Fund distributions or the redemption of Fund shares. Performance data current to the most recent month end may be obtained by calling 1-888-309-3539.
Investors should read the Fund’s prospectus with regard to the Fund’s investment objectives, risks, and charges and expenses in conjunction with these financial statements. Employee retirement benefit plans that invest plan assets in the Separate Investment Accounts (SIAs) may be subject to certain charges as set forth in their respective Plan Documents. Total return figures would be lower for the periods presented if they reflected these charges.
8
MassMutual Select T. Rowe Price Bond Asset Fund – Portfolio Manager Report (Unaudited) |
What is the investment approach of MassMutual Select T. Rowe Price Bond Asset Fund, and who is the Fund’s subadviser?
The Fund seeks a regular level of income consistent with the preservation of capital over time. Under normal circumstances, the Fund invests at least 80% of its net assets (plus the amount of any borrowings for investment purposes) in bonds. The Fund’s investments may include, but are not limited to, obligations issued by U.S. and foreign governments and their agencies, bonds issued by U.S. and foreign corporations, U.S. and non-U.S. dollar denominated foreign securities (including securities of emerging market issuers), mortgage- and asset-backed securities, Treasury inflation protected securities, and bank loans (which represent interests in amounts loaned to companies by banks and other lenders). The Fund is subadvised by T. Rowe Price Associates, Inc. (T. Rowe Price). In addition, T. Rowe Price International Ltd serves as a sub-subadviser for the Fund.
How did the Fund perform during the 12 months ended September 30, 2022?
The Fund’s Class I shares returned -14.50%, outperforming the -14.60% return of the Bloomberg U.S. Aggregate Bond Index (the “benchmark”), which measures the performance of investment grade, U.S. dollar-denominated, fixed-rate taxable bond market securities, including Treasuries, government-related and corporate securities, mortgage-backed securities (MBS) (agency fixed-rate and hybrid ARM pass-throughs), asset-backed securities (ABS), and commercial mortgage-backed securities (CMBS). (“Agency” refers to debt issued by U.S. federal government agencies or government-sponsored entities for financing purposes.)
For a discussion on the economic and market environment during the 12-month period ended September 30, 2022, please see the Economic and Market Overview, beginning on page 3.
Subadviser discussion of factors that contributed to the Fund’s performance
For the one-year period ended September 30, 2022, the U.S. dollar-hedged international bond allocation fell to a lesser extent than the U.S. core bond allocation.
The core bond allocation underperformed the benchmark. Sector allocation detracted in aggregate from relative results due to the Fund’s underweight position in Treasuries and government-related agency bonds, which outperformed the benchmark amid increasing risk-off sentiment. The Fund’s allocations to MBS and investment-grade (IG) and high-yield corporate bonds also hurt performance, as credit spreads widened amid increasing recession concerns. Interest rate management was an overall negative, as Fund management made tactical adjustments during a period of elevated rate volatility. Conversely, security selection was a modest contributor, led by the Fund’s agency MBS and IG corporate holdings.
The U.S. dollar-hedged international bond allocation underperformed the Bloomberg Aggregate ex-USD Hedged Index. In country and duration positioning, a long duration exposure in Hungary, where the central bank raised rates to fight inflation, was a significant detractor for the period. (Duration is a measure of a bond fund’s sensitivity to interest rates. The longer the duration, the greater the price impact on the bond or portfolio when interest rates rise or fall.) Conversely, a short position in Poland was beneficial, as the central bank was also raising rates. Overall, inflation-linked exposures in Europe and Japan contributed.
Within sector allocation and security selection, exposure to U.S. corporate credit held back relative performance as the sector underperformed due to volatility and waning risk appetite. In currencies, overweights in the euro and the yen had a negative impact on relative results. However, the Fund’s overweight allocation to the Mexican peso was beneficial.
Derivatives are securities that derive their value from the performance of one or more other investments and take the form of a contract between two or more parties. Derivatives can be used for hedging, speculation, or both. As of September 30, 2022, the Fund held interest rate futures, interest rate swaps, credit default swaps, currency forwards, and inflation swaps generating gross exposure of approximately 76.6%. The use of futures, swaps, and options detracted from the Fund’s performance. The use of currency forwards added to returns.
Subadviser outlook
T. Rowe Price observes that valuations have improved as risk assets have pulled back from their recent highs, but uncertainty around corporate fundamentals suggests limited near-term upside, particularly as earnings estimates did not see significant downward revision to reflect rising recession risks. Fund management expects to continue to assess when to add to equities and other risk assets as they evaluate long-term valuations and possible early indications of stabilization or improvement
9
MassMutual Select T. Rowe Price Bond Asset Fund – Portfolio Manager Report (Unaudited) (Continued) |
in macroeconomic conditions. Given the range of potential paths for growth and inflation, Fund management expects their positioning to remain cautious, as they expect that a firm commitment from major central banks to bring down inflation could result in a low ceiling for stocks in the near term, and possibly exacerbate economic contraction through overtightening. In T. Rowe Price’s opinion, other key risks to global markets include the Russia-Ukraine conflict and the associated impact of energy supply shortages, which could weigh on European manufacturing, broader geopolitical instability, and unexpected supply chain disruptions. In T. Rowe Price’s view, these conditions could contribute to a less compelling risk/reward trade-off between stocks and bonds or cash in the near term, and they believe that a more modest allocation to equities may be prudent.
MassMutual Select |
|
Corporate Debt |
27.8% |
U.S. Government Agency Obligations and Instrumentalities* |
20.8% |
Sovereign Debt Obligations |
18.1% |
U.S. Treasury Obligations |
17.2% |
Non-U.S. Government Agency Obligations |
9.5% |
Mutual Funds |
2.6% |
Bank Loans |
1.7% |
Municipal Obligations |
0.1% |
Total Long-Term Investments |
97.8% |
Short-Term Investments and Other Assets and Liabilities |
2.2% |
Net Assets |
100.0% |
* May contain securities that are issued by a U.S. Government Agency, but are unsecured and are not guaranteed by a U.S. Government Agency.
10
MassMutual Select T. Rowe Price Bond Asset Fund – Portfolio Manager Report (Unaudited) (Continued) |
GROWTH OF $10,000 INVESTMENT - Class I
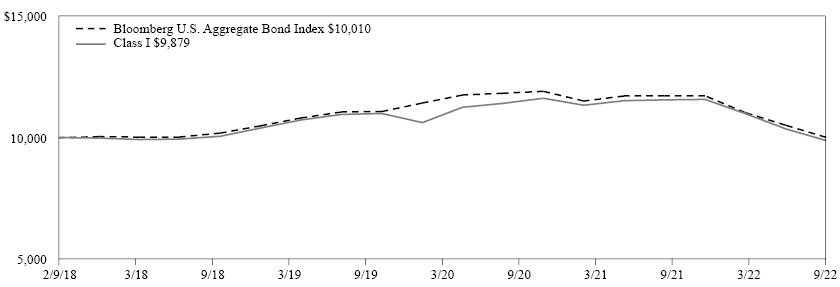
The graph above illustrates the Fund’s historical performance for the past 10 fiscal years or since inception (for Funds lacking 10-year records) in comparison to its benchmark index, as well as one or more additional indexes, if applicable.
Average Annual Total Returns (for the periods ended 09/30/2022) |
|||
|
Inception Date |
1 Year |
Since Inception |
Class I |
02/09/2018 |
-14.50% |
-0.26% |
Bloomberg U.S. Aggregate Bond Index |
-14.60% |
0.02% |
|
Generally accepted accounting principles require adjustments to be made to the net assets of the Fund at period end for financial reporting purposes only, and as such, the total return based on the unadjusted net asset value per share may differ from the total return reported in the financial highlights.
Performance results in the graph and table are shown both with and without the imposition of the maximum applicable sales charge (if applicable) and reflect the percentage change in net asset value, including reinvestment of dividends and capital gains distributions. Investors should note that the Fund is a professionally managed mutual fund, while the index or indexes shown above are unmanaged, cannot be purchased directly, and, with the exception of any peer group index, do not incur expenses.
Performance data quoted in the graph and table represents past performance; past performance is not predictive of future results. The investment return and principal value of shares of the Fund fluctuate, so your shares, when sold, may be worth more or less than their original cost. Current performance of the Fund may be lower or higher than the performance quoted. The performance shown does not reflect the deduction of taxes, if any, that a shareholder would pay on Fund distributions or the redemption of Fund shares. Performance data current to the most recent month end may be obtained by calling 1-888-309-3539.
Investors should read the Fund’s prospectus with regard to the Fund’s investment objectives, risks, and charges and expenses in conjunction with these financial statements. Employee retirement benefit plans that invest plan assets in the Separate Investment Accounts (SIAs) may be subject to certain charges as set forth in their respective Plan Documents. Total return figures would be lower for the periods presented if they reflected these charges.
11
MassMutual Select T. Rowe Price Emerging Markets Bond Fund – Portfolio Manager Report (Unaudited) |
What is the investment approach of MassMutual Select T. Rowe Price Emerging Markets Bond Fund, and who is the Fund’s subadviser?
The Fund seeks to provide high income and capital appreciation. Under normal circumstances, the Fund invests at least 80% of its net assets (plus the amount of any borrowings for investment purposes) in debt securities of emerging market governments or companies located in emerging market countries (including so-called “frontier markets”). The Fund relies on a classification by either J.P. Morgan or the International Monetary Fund to determine which countries are considered emerging markets. The Fund normally will invest in at least three countries. The Fund is subadvised by T. Rowe Price Associates, Inc. (T. Rowe Price).
How did the Fund perform during the 12 months ended September 30, 2022?
The Fund’s Class I shares returned -25.84%, underperforming the -24.28% return of the J.P. Morgan Emerging Markets Bond Index Global Diversified (the “benchmark”), which measures the performance of fixed rate, U.S. dollar-denominated debt instruments issued by emerging market sovereign and quasi-sovereign entities, including Brady bonds, loans, and Eurobonds. The Index limits the weights of those index countries with larger debt stocks by only including a specified portion of a country’s eligible amounts of debt outstanding.
For a discussion on the economic and market environment during the 12-month period ended September 30, 2022, please see the Economic and Market Overview, beginning on page 3.
Subadviser discussion of factors that contributed to the Fund’s performance
For the one-year period ended September 30, 2022, security selection within China was a source of weakness for the Fund, as its holdings of higher-yielding property developers, such as Times China and Shimao, hindered results – as they were dragged lower by tightening domestic financial conditions, liquidity concerns, and recent defaults in the most heavily indebted areas of the Chinese property sector. Consequently, during the period, the Fund eliminated its positions in the Chinese property sector. An underweight allocation to high-quality Chinese sovereign bonds also detracted from the Fund’s relative results amid weaker investor risk appetite and resilient growth in China.
The Fund’s selection of longer-maturity and euro-denominated issues in Romania detracted from relative performance, as did its overweight allocation. High inflation and concerns about a European energy crisis weighed on the country. Euro-denominated issues underperformed amid U.S. dollar strength.
Turning to the positive, the Fund’s significant underweight allocation to Russia and lack of exposure to Belarus aided the Fund’s relative performance, as Russia’s invasion of Ukraine (and Belarus’s support of the former) was met with heavy economic sanctions. The two countries’ assets were removed from major indexes at a price of zero. Fund management eliminated the Fund’s small Russian holdings early in the reporting period. Additionally, the Fund’s underweight allocations to lower-rated Nigeria, Ghana, and Kenya proved beneficial, as investor sentiment was weak and concerns increased about rising food and fuel prices adding pressure to countries with stretched fundamentals. Finally, the Fund’s overweight allocation to higher-yielding Oman was positive, supported by increased oil prices and fiscal reform efforts. These efforts were recognized by a one-notch credit rating upgrade from S&P and Fitch.
Derivatives are securities that derive their value from the performance of one or more other investments and take the form of a contract between two or more parties. Derivatives can be used for hedging, speculation, or both. As of September 30, 2022, the Fund held interest rate futures, currency forwards, and credit default swaps generating gross exposure of approximately 12.0%. The estimated return impact from employing currency forwards and interest rate futures was positive; credit default swaps had a somewhat negative effect on the Fund’s performance during the reporting period.
Subadviser outlook
T. Rowe Price believes that exogenous risks remain a cause for caution. Nevertheless, in Fund management’s observation, recent volatility has moved absolute valuations to below historical averages and increased value dispersion across major markets in the asset class, which created some potential opportunities. In terms of fundamentals, T. Rowe Price observes that, as of the end of the fiscal year, stressed fiscal conditions persisted in some markets due to the lingering effects of the coronavirus pandemic, though strong export demand supported fiscal consolidation in 2022 in many markets. In T. Rowe Price’s view, growth recoveries
12
MassMutual Select T. Rowe Price Emerging Markets Bond Fund – Portfolio Manager Report (Unaudited) (Continued) |
were slowing in some markets as inflation pressures built and the monetary policy trajectory became less accommodative for growth. T. Rowe Price believes that emerging-market debt continues to offer a substantial yield premium and broadly sound fundamentals, making the asset class potentially compelling on a risk-adjusted basis relative to other credit sectors.
MassMutual Select |
|
Sovereign Debt Obligations |
62.5% |
Corporate Debt |
31.9% |
Mutual Funds |
0.9% |
Total Long-Term Investments |
95.3% |
Short-Term Investments and Other Assets and Liabilities |
4.7% |
Net Assets |
100.0% |
13
MassMutual Select T. Rowe Price Emerging Markets Bond Fund – Portfolio Manager Report (Unaudited) (Continued) |
GROWTH OF $10,000 INVESTMENT - Class I
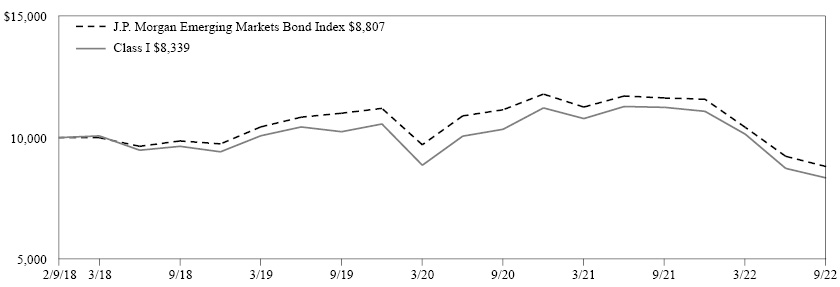
The graph above illustrates the Fund’s historical performance for the past 10 fiscal years or since inception (for Funds lacking 10-year records) in comparison to its benchmark index, as well as one or more additional indexes, if applicable.
Average Annual Total Returns (for the periods ended 09/30/2022) |
|||
|
Inception Date |
1 Year |
Since Inception |
Class I |
02/09/2018 |
-25.84% |
-3.84% |
J.P. Morgan Emerging Markets Bond Index Global Diversified |
-24.28% |
-2.70% |
|
Generally accepted accounting principles require adjustments to be made to the net assets of the Fund at period end for financial reporting purposes only, and as such, the total return based on the unadjusted net asset value per share may differ from the total return reported in the financial highlights.
Performance results in the graph and table are shown both with and without the imposition of the maximum applicable sales charge (if applicable) and reflect the percentage change in net asset value, including reinvestment of dividends and capital gains distributions. Investors should note that the Fund is a professionally managed mutual fund, while the index or indexes shown above are unmanaged, cannot be purchased directly, and, with the exception of any peer group index, do not incur expenses.
Performance data quoted in the graph and table represents past performance; past performance is not predictive of future results. The investment return and principal value of shares of the Fund fluctuate, so your shares, when sold, may be worth more or less than their original cost. Current performance of the Fund may be lower or higher than the performance quoted. The performance shown does not reflect the deduction of taxes, if any, that a shareholder would pay on Fund distributions or the redemption of Fund shares. Performance data current to the most recent month end may be obtained by calling 1-888-309-3539.
Investors should read the Fund’s prospectus with regard to the Fund’s investment objectives, risks, and charges and expenses in conjunction with these financial statements. Employee retirement benefit plans that invest plan assets in the Separate Investment Accounts (SIAs) may be subject to certain charges as set forth in their respective Plan Documents. Total return figures would be lower for the periods presented if they reflected these charges.
14
MassMutual Select T. Rowe Price Large Cap Blend Fund – Portfolio Manager Report (Unaudited) |
What is the investment approach of MassMutual Select T. Rowe Price Large Cap Blend Fund, and who is the Fund’s subadviser?
The Fund seeks long-term capital appreciation through investments in common stock. Under normal circumstances, the Fund invests at least 80% of its net assets (plus the amount of any borrowings for investment purposes) in equity securities of large cap companies. The Fund is subadvised by T. Rowe Price Associates, Inc. (T. Rowe Price).
How did the Fund perform during the 12 months ended September 30, 2022?
The Fund’s Class I shares returned -22.96%, significantly underperforming the -17.22% return of the Russell 1000® Index (the “benchmark”), which measures the performance of the large-cap segment of U.S. equity securities. It is a subset of the Russell 3000® Index and includes approximately 1000 of the largest securities based on a combination of their market cap and current index membership.
For a discussion on the economic and market environment during the 12-month period ended September 30, 2022, please see the Economic and Market Overview, beginning on page 3.
Subadviser discussion of factors that contributed to the Fund’s performance
For the one-year period ended September 30, 2022, within the Fund’s large-cap growth allocation, unfavorable stock selection and an overweight allocation to the communications services sector were notable detractors from the Fund’s relative returns, driven by Fund holdings in the interactive media and services industry. Security selection in the consumer discretionary and information technology sectors also weighed on the Fund’s relative performance. Conversely, favorable stock selection in the health care sector, led by Fund holdings in the health care providers and services industry, contributed to relative returns.
Within the Fund’s large-cap value allocation, an underweight allocation to the energy sector was a notable detractor from relative performance. Stock selection within the health care sector also weighed on the Fund’s relative returns, driven by the pharmaceuticals industry; however, an overweight allocation to the sector moderated the negative impact. Unfavorable stock selection within the materials sector further hurt the Fund’s relative returns, although this was partially offset by an overweight allocation. Additionally, a lack of exposure to the energy sector was a notable detractor from relative results. Security selection in the information technology sector also had a negative impact on the Fund’s relative performance, driven by Fund holdings in the technology hardware, storage, and peripherals industry.
Conversely, the financial sector contributed to relative performance due to strong stock selection, led by Fund holdings in the banking industry. The consumer discretionary sector also had a positive impact on relative returns due to favorable security selection. Within the large-cap core allocation, security selection in the industrials and business services sector contributed to relative performance, led by holdings within the machinery industry. Relative returns were also lifted by an underweight allocation to and favorable stock selection within the communication services sector. Stock selection within the financial sector further aided the Fund’s relative performance.
Subadviser outlook
T. Rowe Price notes that the volatility that gripped global equity and bond markets in the first two quarters of 2022 persisted throughout the third quarter, with most major indexes trending lower over the period. Over the course of the Fund’s fiscal year, central banks raised policy rates, tightening financial conditions, in an effort to combat persistently high inflation. These hawkish moves contributed to elevated equity market volatility and were a catalyst for a sell-off late in the third quarter of 2022. On the other hand, in Fund management’s view, signs suggesting easing inflationary pressures have emerged in recent months, as key input costs – such as oil, lumber, and copper – have declined sharply, while labor participation and employment data suggest a resilient labor in the U.S. in the face of an uncertain growth outlook. Despite conflicting signals, Fund management believes that markets have begun to price in higher recession probabilities, as hopes for a soft landing have diminished. In Fund management’s opinion, it now appears more likely that inflation will take longer to fade and that it will probably settle at high levels, likely above the Fed’s 2% long-term inflation target.
15
MassMutual Select T. Rowe Price Large Cap Blend Fund – Portfolio Manager Report (Unaudited) (Continued) |
MassMutual Select |
|
Microsoft Corp. |
6.3% |
Amazon.com, Inc. |
4.7% |
Apple, Inc. |
4.5% |
Alphabet, Inc. Class C |
3.5% |
UnitedHealth Group, Inc. |
2.4% |
Elevance Health, Inc. |
2.0% |
Becton Dickinson and Co. |
1.9% |
Alphabet, Inc. Class A |
1.8% |
The Southern Co. |
1.7% |
Tesla, Inc. |
1.6% |
|
30.4% |
MassMutual Select |
|
Consumer, Non-cyclical |
24.2% |
Technology |
21.0% |
Communications |
13.2% |
Financial |
11.1% |
Consumer, Cyclical |
10.1% |
Industrial |
7.2% |
Utilities |
5.8% |
Energy |
2.5% |
Basic Materials |
0.8% |
Corporate Debt |
0.0% |
Total Long-Term Investments |
95.9% |
Short-Term Investments and Other Assets and Liabilities |
4.1% |
Net Assets |
100.0% |
16
MassMutual Select T. Rowe Price Large Cap Blend Fund – Portfolio Manager Report (Unaudited) (Continued) |
GROWTH OF $10,000 INVESTMENT - Class I
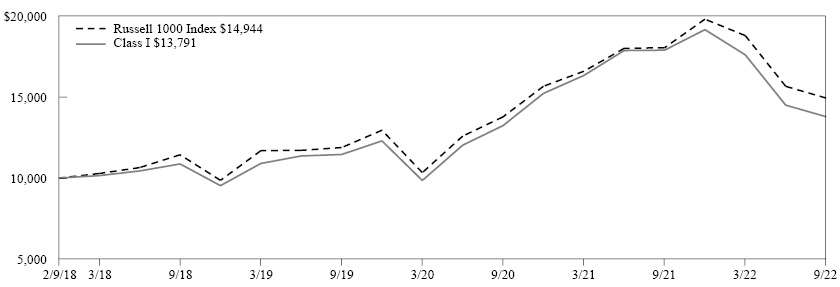
The graph above illustrates the Fund’s historical performance for the past 10 fiscal years or since inception (for Funds lacking 10-year records) in comparison to its benchmark index, as well as one or more additional indexes, if applicable.
Average Annual Total Returns (for the periods ended 09/30/2022) |
|||
|
Inception Date |
1 Year |
Since Inception |
Class I |
02/09/2018 |
-22.96% |
7.17% |
Russell 1000 Index |
-17.22% |
9.04% |
|
Generally accepted accounting principles require adjustments to be made to the net assets of the Fund at period end for financial reporting purposes only, and as such, the total return based on the unadjusted net asset value per share may differ from the total return reported in the financial highlights.
Performance results in the graph and table are shown both with and without the imposition of the maximum applicable sales charge (if applicable) and reflect the percentage change in net asset value, including reinvestment of dividends and capital gains distributions. Investors should note that the Fund is a professionally managed mutual fund, while the index or indexes shown above are unmanaged, cannot be purchased directly, and, with the exception of any peer group index, do not incur expenses.
Performance data quoted in the graph and table represents past performance; past performance is not predictive of future results. The investment return and principal value of shares of the Fund fluctuate, so your shares, when sold, may be worth more or less than their original cost. Current performance of the Fund may be lower or higher than the performance quoted. The performance shown does not reflect the deduction of taxes, if any, that a shareholder would pay on Fund distributions or the redemption of Fund shares. Performance data current to the most recent month end may be obtained by calling 1-888-309-3539.
Investors should read the Fund’s prospectus with regard to the Fund’s investment objectives, risks, and charges and expenses in conjunction with these financial statements. Employee retirement benefit plans that invest plan assets in the Separate Investment Accounts (SIAs) may be subject to certain charges as set forth in their respective Plan Documents. Total return figures would be lower for the periods presented if they reflected these charges.
17
MassMutual Select T. Rowe Price Limited Duration Inflation Focused Bond Fund – Portfolio Manager Report (Unaudited) |
What is the investment approach of MassMutual Select T. Rowe Price Limited Duration Inflation Focused Bond Fund, and who is the Fund’s subadviser?
The Fund seeks a level of income that is consistent with the current rate of inflation. Under normal circumstances, the Fund invests at least 80% of its net assets (plus the amount of any borrowings for investment purposes) in bonds. The Fund invests in a diversified portfolio of short- and intermediate-term investment-grade bonds. The Fund’s investments may include inflation-linked securities, including Treasury Inflation Protected Securities, as well as corporate, government, mortgage-backed, and asset-backed securities. The Fund may also invest in money market securities, bank obligations, collateralized mortgage obligations, and foreign securities. The Fund is subadvised by T. Rowe Price Associates, Inc. (T. Rowe Price).
How did the Fund perform during the 12 months ended September 30, 2022?
The Fund’s Class I shares returned -4.82%, underperforming the -4.09% return of the Bloomberg U.S. 1-5 Year Treasury TIPS Index (the “benchmark”), which measures the performance of inflation-protected securities with maturities of 1-5 years issued by the U.S. Treasury.
For a discussion on the economic and market environment during the 12-month period ended September 30, 2022, please see the Economic and Market Overview, beginning on page 3.
Subadviser discussion of factors that contributed to the Fund’s performance
For the one-year period ended September 30, 2022, interest rate management was the largest detractor from the Fund’s relative results. The Fund’s tactical duration moves were ill-timed, as inflation continued to surprise to the upside, and the significant repricing of Federal Reserve (the “Fed”) rate expectations drove daily interest rate volatility to its highest level since March 2020. (Duration is a measure of a bond fund’s sensitivity to interest rates. The longer the duration, the greater the price impact on the bond or portfolio when interest rates rise or fall.) The Fund’s positioning on the yield curve was beneficial, however, which partially offset the negative impact of duration positioning. (The yield curve is a graph showing the term structure of interest rates by plotting the yields of all bonds of comparable quality with maturities ranging from the shortest – typically one month – to the longest – typically 30 years – available. The resulting curve shows whether short-term interest rates are higher or lower than long-term rates.) The Fund’s out-of-benchmark positions in mortgage-backed securities (MBS), investment-grade corporates, and asset-backed securities (ABS) also weighed on relative performance, as short-dated Treasury inflation-protected securities (TIPS) outperformed most short-duration credit sectors, and the Fund’s position in nominal Treasuries also lagged.
On the positive side, the Fund’s exposure to breakeven spreads via inflation swaps – which are generally used to ensure that the Fund remains inflation hedged when investing outside of the benchmark – contributed to relative results, as inflation expectations increased during the first half of the reporting period. (Breakeven spreads represent the yield differential between nominal Treasuries and TIPS.) Five-year breakeven spreads started the 12-month period at 2.51%, but rose to 3.73% by late March – the highest level since the data series began in 2003. However, breakeven spreads pulled back as the Fed became increasingly hawkish, and finished the period at 2.14%.
Derivatives are securities that derive their value from the performance of one or more other investments and take the form of a contract between two or more parties. Derivatives can be used for hedging, speculation, or both. As of September 30, 2022, the Fund held currency forwards, inflation swaps, interest rate future options, and credit default swaps generating gross exposure of approximately 82.4%. The estimated return impact from employing swaps benefited the Fund’s performance; the use of currency forwards, futures, and options detracted.
Subadviser outlook
In T. Rowe Price’s view, inflation has potentially peaked, and Fund management expects it to slowly move lower before decelerating more quickly in the first half of 2023, assuming that U.S. markets see the lagged effect of declining shelter prices in tandem with goods price deflation due to the strong dollar. Improving data on inventories and supply chain backlogs as of the end of the fiscal year also potentially point to an eventual easing of inflationary pressures, in Fund management’s opinion.
18
MassMutual Select T. Rowe Price Limited Duration Inflation Focused Bond Fund – Portfolio Manager Report (Unaudited) (Continued) |
Assuming that inflation has peaked, Fund management believes that TIPS appear fairly valued across the breakeven curve. As a result, they expect to trim the Fund’s TIPS allocation and add exposure to out-of-benchmark sectors where they see opportunities such as agency MBS. (“Agency” refers to debt issued by U.S. federal government agencies or government-sponsored entities for financing purposes.) This is consistent with Fund management’s general investment process of using short-term, high-quality spread sectors to add yield to the Fund’s portfolio in periods when they expect inflation to moderate.
MassMutual Select |
|
U.S. Treasury Obligations |
79.4% |
Mutual Funds |
6.2% |
Non-U.S. Government Agency Obligations |
5.9% |
Corporate Debt |
5.3% |
U.S. Government Agency Obligations and Instrumentalities* |
2.9% |
Municipal Obligations |
0.4% |
Purchased Options |
0.0% |
Total Long-Term Investments |
100.1% |
Short-Term Investments and Other Assets and Liabilities |
(0.1)% |
Net Assets |
100.0% |
* May contain securities that are issued by a U.S. Government Agency, but are unsecured and are not guaranteed by a U.S. Government Agency.
19
MassMutual Select T. Rowe Price Limited Duration Inflation Focused Bond Fund – Portfolio Manager Report (Unaudited) (Continued) |
GROWTH OF $10,000 INVESTMENT - Class I
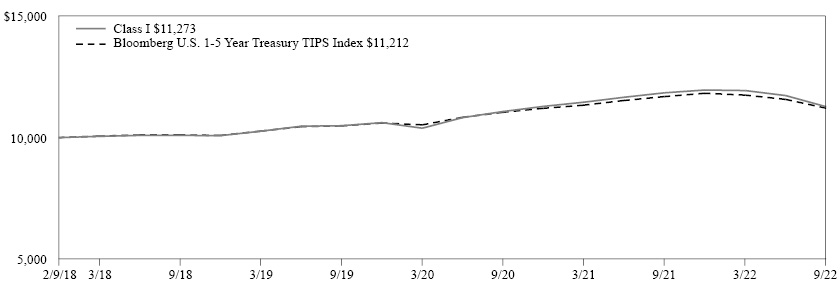
The graph above illustrates the Fund’s historical performance for the past 10 fiscal years or since inception (for Funds lacking 10-year records) in comparison to its benchmark index, as well as one or more additional indexes, if applicable.
Average Annual Total Returns (for the periods ended 09/30/2022) |
|||
|
Inception Date |
1 Year |
Since Inception |
Class I |
02/09/2018 |
-4.82% |
2.62% |
Bloomberg U.S. 1-5 Year Treasury TIPS Index |
-4.09% |
2.49% |
|
Generally accepted accounting principles require adjustments to be made to the net assets of the Fund at period end for financial reporting purposes only, and as such, the total return based on the unadjusted net asset value per share may differ from the total return reported in the financial highlights.
Performance results in the graph and table are shown both with and without the imposition of the maximum applicable sales charge (if applicable) and reflect the percentage change in net asset value, including reinvestment of dividends and capital gains distributions. Investors should note that the Fund is a professionally managed mutual fund, while the index or indexes shown above are unmanaged, cannot be purchased directly, and, with the exception of any peer group index, do not incur expenses.
Performance data quoted in the graph and table represents past performance; past performance is not predictive of future results. The investment return and principal value of shares of the Fund fluctuate, so your shares, when sold, may be worth more or less than their original cost. Current performance of the Fund may be lower or higher than the performance quoted. The performance shown does not reflect the deduction of taxes, if any, that a shareholder would pay on Fund distributions or the redemption of Fund shares. Performance data current to the most recent month end may be obtained by calling 1-888-309-3539.
Investors should read the Fund’s prospectus with regard to the Fund’s investment objectives, risks, and charges and expenses in conjunction with these financial statements. Employee retirement benefit plans that invest plan assets in the Separate Investment Accounts (SIAs) may be subject to certain charges as set forth in their respective Plan Documents. Total return figures would be lower for the periods presented if they reflected these charges.
20
MassMutual Select T. Rowe Price Real Assets Fund – Portfolio Manager Report (Unaudited) |
What is the investment approach of MassMutual Select T. Rowe Price Real Assets Fund, and who is the Fund’s subadviser?
The Fund seeks to provide long-term growth of capital. Under normal circumstances, the Fund invests at least 80% of its net assets (plus the amount of any borrowings for investment purposes) in “real assets” and securities of companies that derive at least 50% of their profits or revenues from, or commit at least 50% of assets to, real assets and activities related to real assets. The Fund’s subadviser currently defines real assets broadly and considers them to include any assets that have physical properties, such as energy and natural resources, real estate, basic materials, equipment, utilities and infrastructure, and commodities. The Fund is subadvised by T. Rowe Price Associates, Inc. (T. Rowe Price). In addition, T. Rowe Price Japan, Inc. serves as a sub-subadviser for the Fund.
How did the Fund perform during the 12 months ended September 30, 2022?
The Fund’s Class I shares returned -12.24%, significantly outperforming the -20.66% return of the MSCI All Country World Index (ACWI) (the “benchmark”), which measures the performance of the large- and mid-cap segments of all country markets. It is free float-adjusted market-capitalization weighted.
For a discussion on the economic and market environment during the 12-month period ended September 30, 2022, please see the Economic and Market Overview, beginning on page 3.
Subadviser discussion of factors that contributed to the Fund’s performance
For the one-year period ended September 30, 2022, multi-asset overlays, which the Fund typically employs in an effort to efficiently implement desired positions, had a positive impact on the Fund’s performance, relative to the benchmark.
Despite the Fund’s significant outperformance, its return for the fiscal year was negative on an absolute basis. Security selection within the Fund’s allocation to commodities – which includes exposure to natural resources, precious metals, and global metals and mining – negatively contributed to the Fund’s performance. The Fund’s underlying natural resources portfolio was the largest driver of underperformance, as the portfolio trailed its style-specific benchmark. The Fund’s performance was also held back by selection within its allocation to real estate, which includes exposure to global and U.S. real estate investment trusts (REITs).
Derivatives are securities that derive their value from the performance of one or more other investments and take the form of a contract between two or more parties. Derivatives can be used for hedging, speculation, or both. As of September 30, 2022, the Fund held currency forwards, equity total return swaps, index futures, and interest rate futures generating gross exposure of approximately 16.8%. Employing currency forwards, options, and swaps was a drag on the Fund’s performance; the use of futures enhanced the Fund’s performance during the reporting period.
Subadviser outlook
T. Rowe Price notes that the volatility that gripped global equity and bond markets in the first two quarters of 2022 persisted throughout the third quarter, with most major indexes trending lower over the period. Over the course of the Fund’s fiscal year, central banks raised policy rates, tightening financial conditions, in an effort to combat persistently high inflation. These hawkish moves contributed to elevated equity market volatility and were a catalyst for a sell-off late in the third quarter of 2022. On the other hand, in Fund management’s view, signs suggesting easing inflationary pressures have emerged in recent months, as key input costs – such as oil, lumber, and copper – have declined sharply, while labor participation and employment data suggest a resilient labor market in the U.S. in the face of an uncertain growth outlook. Despite conflicting signals, Fund management believes that markets have begun to price in higher recession probabilities, as hopes for a soft landing have diminished. In Fund management’s opinion, it now appears more likely that inflation will take longer to fade and that it will probably settle at high levels, likely above the Fed’s 2% long-term inflation target.
21
MassMutual Select T. Rowe Price Real Assets Fund – Portfolio Manager Report (Unaudited) (Continued) |
MassMutual Select |
|
BHP Group Ltd. |
3.9% |
Prologis, Inc. |
2.3% |
Equinix, Inc. |
2.0% |
Public Storage |
2.0% |
ConocoPhillips |
1.7% |
Rio Tinto PLC |
1.6% |
Reliance Steel & Aluminum Co. |
1.5% |
Nutrien Ltd. |
1.5% |
Boliden AB |
1.4% |
Equity LifeStyle Properties, Inc. |
1.4% |
19.3% |
|
MassMutual Select |
|
Financial |
33.3% |
Basic Materials |
28.0% |
Energy |
11.6% |
Industrial |
11.0% |
Mutual Funds |
5.2% |
Consumer, Cyclical |
4.0% |
Utilities |
1.8% |
Consumer, Non-cyclical |
1.1% |
Technology |
0.4% |
Total Long-Term Investments |
96.4% |
Short-Term Investments and Other Assets and Liabilities |
3.6% |
Net Assets |
100.0% |
22
MassMutual Select T. Rowe Price Real Assets Fund – Portfolio Manager Report (Unaudited) (Continued) |
GROWTH OF $10,000 INVESTMENT - Class I
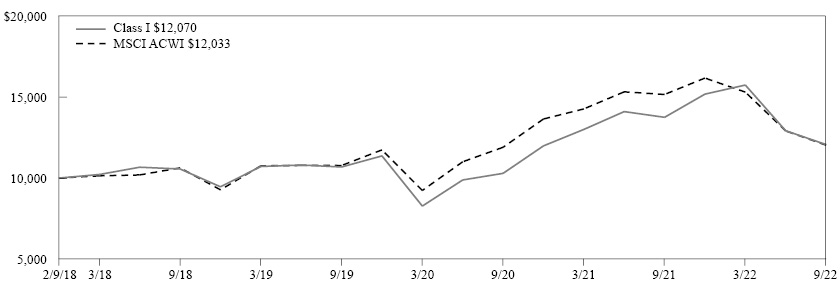
The graph above illustrates the Fund’s historical performance for the past 10 fiscal years or since inception (for Funds lacking 10-year records) in comparison to its benchmark index, as well as one or more additional indexes, if applicable.
Average Annual Total Returns (for the periods ended 09/30/2022) |
|||
|
Inception Date |
1 Year |
Since Inception |
Class I |
02/09/2018 |
-12.24% |
4.14% |
MSCI ACWI |
-20.66% |
4.07% |
|
Generally accepted accounting principles require adjustments to be made to the net assets of the Fund at period end for financial reporting purposes only, and as such, the total return based on the unadjusted net asset value per share may differ from the total return reported in the financial highlights.
Performance results in the graph and table are shown both with and without the imposition of the maximum applicable sales charge (if applicable) and reflect the percentage change in net asset value, including reinvestment of dividends and capital gains distributions. Investors should note that the Fund is a professionally managed mutual fund, while the index or indexes shown above are unmanaged, cannot be purchased directly, and, with the exception of any peer group index, do not incur expenses.
Performance data quoted in the graph and table represents past performance; past performance is not predictive of future results. The investment return and principal value of shares of the Fund fluctuate, so your shares, when sold, may be worth more or less than their original cost. Current performance of the Fund may be lower or higher than the performance quoted. The performance shown does not reflect the deduction of taxes, if any, that a shareholder would pay on Fund distributions or the redemption of Fund shares. Performance data current to the most recent month end may be obtained by calling 1-888-309-3539.
Investors should read the Fund’s prospectus with regard to the Fund’s investment objectives, risks, and charges and expenses in conjunction with these financial statements. Employee retirement benefit plans that invest plan assets in the Separate Investment Accounts (SIAs) may be subject to certain charges as set forth in their respective Plan Documents. Total return figures would be lower for the periods presented if they reflected these charges.
23
MassMutual Select T. Rowe Price Small and Mid Cap Blend Fund – Portfolio Manager Report (Unaudited) |
What is the investment approach of MassMutual Select T. Rowe Price Small and Mid Cap Blend Fund, and who is the Fund’s subadviser?
The Fund seeks long-term capital appreciation by investing primarily in common stocks of small and mid cap companies. Under normal circumstances, the Fund invests at least 80% of its net assets (plus the amount of any borrowings for investment purposes) in equity securities of small and mid cap companies. The Fund’s subadviser and sub-subadviser currently consider small and mid cap companies to include companies with market capitalizations at the time of purchase that are within the market capitalization range of companies included in either the Russell 2000® Index or the Russell Midcap® Index. The Fund is subadvised by T. Rowe Price Associates, Inc. (T. Rowe Price). In addition, T. Rowe Price Investment Management, Inc. serves as a sub-subadviser for the Fund.
How did the Fund perform during the 12 months ended September 30, 2022?
The Fund’s Class I shares returned -21.64%, underperforming the -21.11% return of the Russell 2500 Index (the “benchmark”), which measures the performance of the small- to mid-cap segment of the U.S. equity universe. It is a subset of the Russell 3000 Index and includes approximately 2500 of the smallest securities based on the combination of their market cap and current index membership.
For a discussion on the economic and market environment during the 12-month period ended September 30, 2022, please see the Economic and Market Overview, beginning on page 3.
Subadviser discussion of factors that contributed to the Fund’s performance
For the one-year period ended September 30, 2022, the Fund’s allocations to small-cap growth and value stocks underperformed their benchmarks, while mid-cap stocks outperformed their benchmarks.
Within the small-cap growth allocation, security selection in the information technology (IT) sector was a significant detractor from relative performance, driven by holdings in the IT services industry. An underweight allocation to the energy sector also weighed on the Fund’s relative returns. Stock selection in the health care sector had a further negative impact on relative performance, but the impact was moderated by a favorable overweight allocation to the sector. Conversely, an underweight exposure to the communication services sector contributed to the Fund’s relative results. The real estate sector also aided relative returns due to the Fund’s underweight allocation to the sector, although the impact was partially offset by weak stock selection within the sector.
In the small-cap value allocation, security selection in the financial sector was a notable detractor from relative performance, driven by holdings in the banking industry. Stock selection, coupled with an underweight allocation to the top-performing energy sector, also had a negative impact on the Fund’s relative performance. The utilities sector further weighed on relative results, due to weak security selection. Conversely, an underweight allocation to the communication services sector contributed to relative performance. An underweight allocation to the health care sector, coupled with positive stock selection in that market segment (led by holdings within the biotechnology industry), also aided the Fund’s relative performance.
Within the small-cap core stock allocation, favorable stock selection, coupled with an underweight to the health care sector, contributed to relative returns, driven by holdings in biotechnology. The real estate sector also lifted relative returns due to security selection and an underweight allocation. The communication services sector further bolstered relative performance, owing to an underweight allocation. Conversely, unfavorable stock selection in the industrial and business services sector detracted from relative performance, driven by holdings in the professional services industry. The consumer discretionary sector also weighed on relative results due to less-than-favorable stock picks.
In the mid-cap value allocation, a favorable overweight to the energy sector contributed to relative returns, although the impact was partially offset by weak stock choices. An underweight allocation to the consumer discretionary sector also aided relative results. Positive security selection in the utilities sector further contributed, led by holdings within the electric utilities industry. Conversely, an unfavorable stock selection and an overweight allocation to the health care sector was a notable detractor from relative returns, driven by holdings within the health care equipment and supplies industry. An overweight allocation to the communication services sector also had a negative impact.
24
MassMutual Select T. Rowe Price Small and Mid Cap Blend Fund – Portfolio Manager Report (Unaudited) (Continued) |
Within the mid-cap growth allocation, favorable stock selection in the consumer discretionary sector contributed to relative returns, led by holdings within the multiline retail industry. Strong stock selection in the health care sector was also beneficial; however, an unfavorable overweight to the sector moderated the impact. Security selection, coupled with an underweight allocation in the communication services sector, lifted relative performance. Conversely, an underweight allocation to the energy sector was a notable detractor from relative returns. Stock choices in the materials sector further weighed on relative results, driven by holdings within the chemicals industry; however, an overweight allocation mostly offset the negative impact.
Derivatives are securities that derive their value from the performance of one or more other investments and take the form of a contract between two or more parties. Derivatives can be used for hedging, speculation, or both. The use of warrants had a negligible impact on the Fund’s performance during the reporting period.
Subadviser outlook
T. Rowe Price notes that the volatility that gripped global equity and bond markets in the first two quarters of 2022 persisted throughout the third quarter, with most major indexes trending lower over the period. Over the course of the Fund’s fiscal year, central banks raised policy rates, tightening financial conditions, in an effort to combat persistently high inflation. These hawkish moves contributed to elevated equity market volatility and were a catalyst for a sell-off late in the third quarter of 2022. On the other hand, in Fund management’s view, signs suggesting easing inflationary pressures have emerged in recent months, as key input costs – such as oil, lumber, and copper – have declined sharply, while labor participation and employment data suggest a resilient labor in the U.S. in the face of an uncertain growth outlook. Despite conflicting signals, Fund management believes that markets have begun to price in higher recession probabilities, as hopes for a soft landing have diminished. In Fund management’s opinion, it now appears more likely that inflation will take longer to fade and that it will probably settle at high levels, likely above the Fed’s 2% long-term inflation target.
MassMutual Select |
|
Textron, Inc. |
1.1% |
Ingersoll Rand, Inc. |
1.0% |
Hologic, Inc. |
0.9% |
Paylocity Holding Corp. |
0.9% |
Veeva Systems, Inc. Class A |
0.9% |
J.B. Hunt Transport Services, Inc. |
0.8% |
Atlassian Corp. PLC Class A |
0.7% |
Select Medical Holdings Corp. |
0.7% |
Marvell Technology, Inc. |
0.7% |
PG&E Corp. |
0.7% |
|
8.4% |
MassMutual Select |
|
Consumer, Non-cyclical |
26.2% |
Financial |
17.3% |
Industrial |
15.6% |
Technology |
12.7% |
Consumer, Cyclical |
9.8% |
Energy |
4.1% |
Communications |
3.5% |
Basic Materials |
2.8% |
Utilities |
2.7% |
Mutual Funds |
0.9% |
Diversified |
0.2% |
Total Long-Term Investments |
95.8% |
Short-Term Investments and Other Assets and Liabilities |
4.2% |
Net Assets |
100.0% |
25
MassMutual Select T. Rowe Price Small and Mid Cap Blend Fund – Portfolio Manager Report (Unaudited) (Continued) |
GROWTH OF $10,000 INVESTMENT - Class I
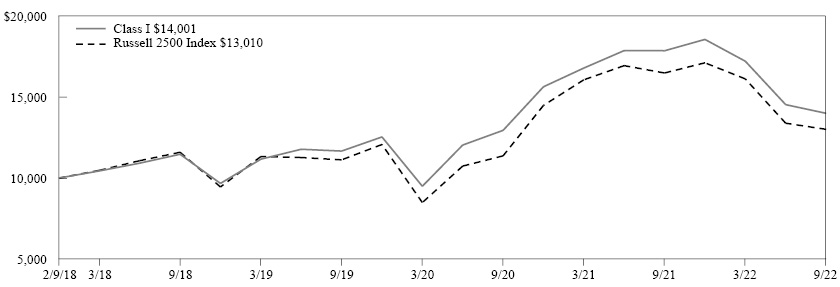
The graph above illustrates the Fund’s historical performance for the past 10 fiscal years or since inception (for Funds lacking 10-year records) in comparison to its benchmark index, as well as one or more additional indexes, if applicable.
Average Annual Total Returns (for the periods ended 09/30/2022) |
|||
|
Inception Date |
1 Year |
Since Inception |
Class I |
02/09/2018 |
-21.64% |
7.52% |
Russell 2500 Index |
-21.11% |
5.83% |
|
Generally accepted accounting principles require adjustments to be made to the net assets of the Fund at period end for financial reporting purposes only, and as such, the total return based on the unadjusted net asset value per share may differ from the total return reported in the financial highlights.
Performance results in the graph and table are shown both with and without the imposition of the maximum applicable sales charge (if applicable) and reflect the percentage change in net asset value, including reinvestment of dividends and capital gains distributions. Investors should note that the Fund is a professionally managed mutual fund, while the index or indexes shown above are unmanaged, cannot be purchased directly, and, with the exception of any peer group index, do not incur expenses.
Performance data quoted in the graph and table represents past performance; past performance is not predictive of future results. The investment return and principal value of shares of the Fund fluctuate, so your shares, when sold, may be worth more or less than their original cost. Current performance of the Fund may be lower or higher than the performance quoted. The performance shown does not reflect the deduction of taxes, if any, that a shareholder would pay on Fund distributions or the redemption of Fund shares. Performance data current to the most recent month end may be obtained by calling 1-888-309-3539.
Investors should read the Fund’s prospectus with regard to the Fund’s investment objectives, risks, and charges and expenses in conjunction with these financial statements. Employee retirement benefit plans that invest plan assets in the Separate Investment Accounts (SIAs) may be subject to certain charges as set forth in their respective Plan Documents. Total return figures would be lower for the periods presented if they reflected these charges.
26
MassMutual Select T. Rowe Price U.S. Treasury Long-Term Index Fund – Portfolio Manager Report (Unaudited) |
What is the investment approach of MassMutual Select T. Rowe Price U.S. Treasury Long-Term Index Fund, and who is the Fund’s subadviser?
The Fund seeks a high level of income consistent with capital preservation. Under normal circumstances, the Fund invests at least 80% of its net assets (plus the amount of any borrowings for investment purposes) in securities that are held in its benchmark index, the Bloomberg U.S. Long Treasury Bond Index*, and at least 80% of its net assets (plus the amount of any borrowings for investment purposes) in U.S. Treasury securities, which are backed by the full faith and credit of the U.S. Government. The Fund is subadvised by T. Rowe Price Associates, Inc. (T. Rowe Price).
* Bloomberg® and Bloomberg U.S. Long Treasury Bond Index are service marks of Bloomberg Finance L.P. and its affiliates, including Bloomberg Index Services Limited (“BISL”), the administrator of the index (collectively, “Bloomberg”) and have been licensed for use for certain purposes by MassMutual. Bloomberg is not affiliated with MassMutual, and Bloomberg does not approve, endorse, review, or recommend the Fund. Bloomberg does not guarantee the timeliness, accurateness, or completeness of any data or information relating to the Fund.
How did the Fund perform during the 12 months ended September 30, 2022?
The Fund’s Class I shares returned -26.97%, underperforming the -26.65% return of the Bloomberg U.S. Long Treasury Bond Index (the “benchmark”), which measures the performance of public obligations of the U.S. Treasury with maturities of 10 years and greater, including securities that roll up to the U.S. Aggregate, U.S. Universal, and Global Aggregate Indexes.
For a discussion on the economic and market environment during the 12-month period ended September 30, 2022, please see the Economic and Market Overview, beginning on page 3.
Subadviser discussion of factors that contributed to the Fund’s performance
For the one-year period ended September 30, 2022, the Fund generated deep losses on an absolute basis, as yields across the Treasury curve increased in response to 40-year highs in inflation, strong job growth, and, consequently, rapid monetary tightening by the Federal Reserve (the “Fed”).
In this environment, Fund management’s tactical adjustments to the Fund’s duration during the fiscal year dampened relative performance. (Duration is a measure of a bond fund’s sensitivity to interest rates. The longer the duration, the greater the price impact on the bond or portfolio when interest rates rise or fall.) In March and April of 2022, Fund management generally favored a neutral to modestly long duration posture versus the benchmark, reflecting Fund management’s expectation that heightened macroeconomic and geopolitical uncertainty would exert downward pressure on yields. This positioning detracted from results, however, as long-term U.S. interest rates actually climbed amid thin liquidity and elevated volatility in the Treasury market. The Fund’s neutral to slightly long duration bias through part of September 2022 also impeded performance, as long-term yields increased due in part to strong inflation, and turmoil in the U.K. gilt market rippled across sovereign bonds.
The Fund’s allocation to Ginnie Mae mortgage-backed securities (MBS) detracted slightly, as the Fed’s quantitative tightening pressured MBS performance. This was largely offset, however, by the Fund’s use of higher-coupon Ginnie Mae MBS and collateralized mortgage obligations that outperformed in the rising rate environment. Tactical use of Treasury inflation-protected securities (TIPS) had a net neutral impact on relative performance.
Derivatives are securities that derive their value from the performance of one or more other investments and take the form of a contract between two or more parties. Derivatives can be used for hedging, speculation, or both. As of September 30, 2022, the Fund held interest rate futures and interest rate future options generating gross exposure of approximately 26.5%. Employing futures had a negative impact on the Fund’s performance; the use of options had a negligible return impact on the Fund’s returns during the reporting period.
Subadviser outlook
T. Rowe Price notes that, as of the end of the fiscal year, the Fed signaled rapid increases to its policy interest rate through 2022, consequently hampering risk assets and lessening the odds of a soft landing for the U.S. economy. In T. Rowe Price’s view, as the Fed pursues its longer-run inflation goal of 2%, considerable headwinds to the global economy could test the central bank’s tightening bias beyond 2022. Still, Fund management believes that the bar for a dovish pivot is high, as Fund management observed Fed officials’ pledge to keep the policy rate in restrictive territory until inflation and the labor market cool meaningfully.
27
MassMutual Select T. Rowe Price U.S. Treasury Long-Term Index Fund – Portfolio Manager Report (Unaudited) (Continued) |
Against this backdrop, Fund management believes that there are increased recession risks in the U.S. over the next 12 months, particularly in light of slowed consumer spending and the rate-sensitive housing sector already in contraction as of the end of the fiscal year. In the near term, however, they expect positive economic growth – albeit below potential – thanks to a strong labor market, easing supply bottlenecks, and leftover household savings from previous years’ stimulus.
MassMutual Select |
|
U.S. Treasury Obligations |
96.3% |
U.S. Government Agency Obligations and Instrumentalities* |
3.0% |
Mutual Funds |
0.3% |
Purchased Options |
0.0% |
Total Long-Term Investments |
99.6% |
Short-Term Investments and Other Assets and Liabilities |
0.4% |
Net Assets |
100.0% |
* May contain securities that are issued by a U.S. Government Agency, but are unsecured and are not guaranteed by a U.S. Government Agency.
28
MassMutual Select T. Rowe Price U.S. Treasury Long-Term Index Fund – Portfolio Manager Report (Unaudited) (Continued) |
GROWTH OF $10,000 INVESTMENT - Class I
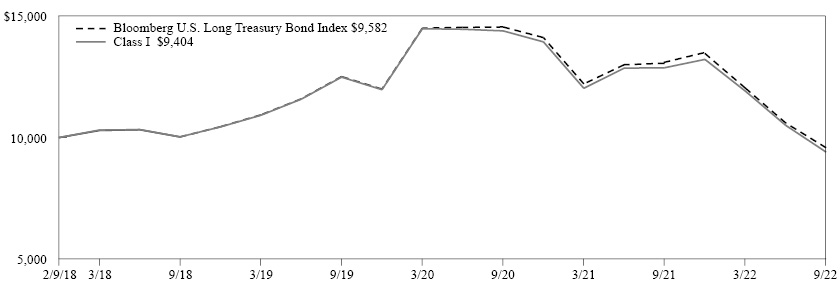
The graph above illustrates the Fund’s historical performance for the past 10 fiscal years or since inception (for Funds lacking 10-year records) in comparison to its benchmark index, as well as one or more additional indexes, if applicable.
Average Annual Total Returns (for the periods ended 09/30/2022) |
|||
|
Inception Date |
1 Year |
Since Inception |
Class I |
02/09/2018 |
-26.97% |
-1.31% |
Bloomberg U.S. Long Treasury Bond Index |
-26.65% |
-0.92% |
|
Generally accepted accounting principles require adjustments to be made to the net assets of the Fund at period end for financial reporting purposes only, and as such, the total return based on the unadjusted net asset value per share may differ from the total return reported in the financial highlights.
Performance results in the graph and table are shown both with and without the imposition of the maximum applicable sales charge (if applicable) and reflect the percentage change in net asset value, including reinvestment of dividends and capital gains distributions. Investors should note that the Fund is a professionally managed mutual fund, while the index or indexes shown above are unmanaged, cannot be purchased directly, and, with the exception of any peer group index, do not incur expenses.
Performance data quoted in the graph and table represents past performance; past performance is not predictive of future results. The investment return and principal value of shares of the Fund fluctuate, so your shares, when sold, may be worth more or less than their original cost. Current performance of the Fund may be lower or higher than the performance quoted. The performance shown does not reflect the deduction of taxes, if any, that a shareholder would pay on Fund distributions or the redemption of Fund shares. Performance data current to the most recent month end may be obtained by calling 1-888-309-3539.
Investors should read the Fund’s prospectus with regard to the Fund’s investment objectives, risks, and charges and expenses in conjunction with these financial statements. Employee retirement benefit plans that invest plan assets in the Separate Investment Accounts (SIAs) may be subject to certain charges as set forth in their respective Plan Documents. Total return figures would be lower for the periods presented if they reflected these charges.
29
MM Equity Asset Fund – Portfolio of Investments |
September 30, 2022 |
Number of |
Value |
|||||||
COMMON STOCK — 98.3% |
||||||||
Basic Materials — 2.1% |
||||||||
Chemicals — 1.8% |
||||||||
Air Products & Chemicals, Inc. |
2,230 | $ | 518,988 | |||||
Celanese Corp. |
2,206 | 199,290 | ||||||
DuPont de Nemours, Inc. |
11,115 | 560,196 | ||||||
Eastman Chemical Co. |
11,868 | 843,221 | ||||||
Linde PLC |
8,283 | 2,233,014 | ||||||
PPG Industries, Inc. |
10,605 | 1,173,868 | ||||||
| 5,528,577 | ||||||||
Iron & Steel — 0.2% |
||||||||
Nucor Corp. |
3,694 | 395,221 | ||||||
Mining — 0.1% |
||||||||
Freeport-McMoRan, Inc. |
11,921 | 325,801 | ||||||
| 6,249,599 | ||||||||
Communications — 12.2% |
||||||||
Advertising — 0.0% |
||||||||
The Interpublic Group of Cos., Inc. |
3,916 | 100,250 | ||||||
Internet — 10.0% |
||||||||
Alphabet, Inc. Class A (a) |
74,566 | 7,132,238 | ||||||
Alphabet, Inc. Class C (a) |
54,600 | 5,249,790 | ||||||
Amazon.com, Inc. (a) |
95,738 | 10,818,394 | ||||||
Booking Holdings, Inc. (a) |
838 | 1,377,010 | ||||||
Expedia Group, Inc. (a) |
5,719 | 535,813 | ||||||
Meta Platforms, Inc. Class A (a) |
26,335 | 3,573,133 | ||||||
Netflix, Inc. (a) |
5,991 | 1,410,521 | ||||||
Uber Technologies, Inc. (a) |
10,713 | 283,894 | ||||||
| 30,380,793 | ||||||||
Media — 1.3% |
||||||||
Charter Communications, Inc. Class A (a) |
4,393 | 1,332,617 | ||||||
Comcast Corp. Class A |
66,566 | 1,952,381 | ||||||
Fox Corp. Class A |
3,233 | 99,188 | ||||||
The Walt Disney Co. (a) |
5,774 | 544,661 | ||||||
| 3,928,847 | ||||||||
Telecommunications — 0.9% |
||||||||
Corning, Inc. |
8,919 | 258,829 | ||||||
Motorola Solutions, Inc. |
2,451 | 548,951 | ||||||
T-Mobile US, Inc. (a) |
11,705 | 1,570,460 | ||||||
Verizon Communications, Inc. |
9,035 | 343,059 | ||||||
| 2,721,299 | ||||||||
| 37,131,189 | ||||||||
Consumer, Cyclical — 9.6% |
||||||||
Airlines — 0.1% |
||||||||
Southwest Airlines Co. (a) |
7,318 | 225,687 | ||||||
Number of |
Value |
|||||||
Apparel — 0.4% |
||||||||
NIKE, Inc. Class B |
16,042 | $ | 1,333,411 | |||||
Auto Manufacturers — 2.5% |
||||||||
General Motors Co. |
10,860 | 348,497 | ||||||
Rivian Automotive, Inc. Class A (a) |
3,089 | 101,659 | ||||||
Tesla, Inc. (a) |
26,318 | 6,980,850 | ||||||
| 7,431,006 | ||||||||
Auto Parts & Equipment — 0.1% |
||||||||
Magna International, Inc. |
8,689 | 412,032 | ||||||
Home Builders — 0.5% |
||||||||
Lennar Corp. Class A |
15,826 | 1,179,828 | ||||||
PulteGroup, Inc. |
2,409 | 90,338 | ||||||
Toll Brothers, Inc. |
7,725 | 324,450 | ||||||
| 1,594,616 | ||||||||
Leisure Time — 0.0% |
||||||||
Royal Caribbean Cruises Ltd. (a) |
2,103 | 79,704 | ||||||
Lodging — 0.3% |
||||||||
Marriott International, Inc. Class A |
6,589 | 923,382 | ||||||
Retail — 5.7% |
||||||||
AutoNation, Inc. (a) |
4,423 | 450,571 | ||||||
AutoZone, Inc. (a) |
354 | 758,243 | ||||||
Best Buy Co., Inc. |
14,613 | 925,587 | ||||||
Burlington Stores, Inc. (a) |
1,712 | 191,556 | ||||||
Chipotle Mexican Grill, Inc. (a) |
1,028 | 1,544,837 | ||||||
Costco Wholesale Corp. |
5,624 | 2,656,047 | ||||||
The Home Depot, Inc. |
5,448 | 1,503,321 | ||||||
Lowe’s Cos., Inc. |
16,916 | 3,176,994 | ||||||
McDonald’s Corp. |
9,985 | 2,303,939 | ||||||
O’Reilly Automotive, Inc. (a) |
2,103 | 1,479,145 | ||||||
Target Corp. |
5,686 | 843,746 | ||||||
The TJX Cos., Inc. |
13,173 | 818,307 | ||||||
Yum! Brands, Inc. |
4,468 | 475,127 | ||||||
| 17,127,420 | ||||||||
| 29,127,258 | ||||||||
Consumer, Non-cyclical — 21.1% |
||||||||
Agriculture — 0.8% |
||||||||
Altria Group, Inc. |
27,037 | 1,091,754 | ||||||
Philip Morris International, Inc. |
15,151 | 1,257,685 | ||||||
| 2,349,439 | ||||||||
Beverages — 2.0% |
||||||||
The Coca-Cola Co. |
65,719 | 3,681,578 | ||||||
Constellation Brands, Inc. Class A |
5,224 | 1,199,848 | ||||||
PepsiCo, Inc. |
8,060 | 1,315,876 | ||||||
| 6,197,302 | ||||||||
Biotechnology — 1.6% |
||||||||
Biogen, Inc. (a) |
3,400 | 907,800 | ||||||
BioMarin Pharmaceutical, Inc. (a) |
2,295 | 194,547 | ||||||
The accompanying notes are an integral part of the financial statements.
30
MM Equity Asset Fund – Portfolio of Investments (Continued) |
Number of |
Value |
|||||||
Regeneron Pharmaceuticals, Inc. (a) |
2,802 | $ | 1,930,214 | |||||
Vertex Pharmaceuticals, Inc. (a) |
5,932 | 1,717,551 | ||||||
| 4,750,112 | ||||||||
Commercial Services — 1.1% |
||||||||
Affirm Holdings, Inc. (a) (b) |
8,018 | 150,418 | ||||||
Booz Allen Hamilton Holding Corp. |
3,576 | 330,243 | ||||||
Cintas Corp. |
1,021 | 396,342 | ||||||
FleetCor Technologies, Inc. (a) |
6,025 | 1,061,424 | ||||||
S&P Global, Inc. |
4,771 | 1,456,825 | ||||||
| 3,395,252 | ||||||||
Cosmetics & Personal Care — 1.4% |
||||||||
Colgate-Palmolive Co. |
16,834 | 1,182,588 | ||||||
The Procter & Gamble Co. |
23,532 | 2,970,915 | ||||||
| 4,153,503 | ||||||||
Food — 0.5% |
||||||||
The Hershey Co. |
1,928 | 425,066 | ||||||
Mondelez International, Inc. Class A |
17,768 | 974,220 | ||||||
| 1,399,286 | ||||||||
Health Care – Products — 4.2% |
||||||||
Abbott Laboratories |
15,760 | 1,524,937 | ||||||
Baxter International, Inc. |
21,559 | 1,161,168 | ||||||
Boston Scientific Corp. (a) |
33,794 | 1,308,842 | ||||||
Danaher Corp. |
7,358 | 1,900,498 | ||||||
Intuitive Surgical, Inc. (a) |
7,139 | 1,338,134 | ||||||
Medtronic PLC |
14,361 | 1,159,651 | ||||||
Thermo Fisher Scientific, Inc. |
7,045 | 3,573,153 | ||||||
Zimmer Biomet Holdings, Inc. |
6,825 | 713,554 | ||||||
| 12,679,937 | ||||||||
Health Care – Services — 3.3% |
||||||||
Centene Corp. (a) |
23,963 | 1,864,561 | ||||||
Elevance Health, Inc. |
4,052 | 1,840,580 | ||||||
Humana, Inc. |
1,257 | 609,884 | ||||||
Town Health International Medical Group Ltd. |
62,000 | 3,351 | ||||||
UnitedHealth Group, Inc. |
11,596 | 5,856,444 | ||||||
| 10,174,820 | ||||||||
Household Products & Wares — 0.4% |
||||||||
Avery Dennison Corp. |
2,369 | 385,436 | ||||||
Kimberly-Clark Corp. |
8,646 | 973,021 | ||||||
| 1,358,457 | ||||||||
Pharmaceuticals — 5.8% |
||||||||
AbbVie, Inc. |
29,802 | 3,999,726 | ||||||
Bristol-Myers Squibb Co. |
46,141 | 3,280,164 | ||||||
DexCom, Inc. (a) |
1,630 | 131,280 | ||||||
Eli Lilly & Co. |
10,411 | 3,366,397 | ||||||
Johnson & Johnson |
18,065 | 2,951,098 | ||||||
McKesson Corp. |
2,486 | 844,917 | ||||||
Number of |
Value |
|||||||
Merck & Co., Inc. |
22,149 | $ | 1,907,472 | |||||
Neurocrine Biosciences, Inc. (a) |
2,355 | 250,125 | ||||||
Pfizer, Inc. |
22,325 | 976,942 | ||||||
| 17,708,121 | ||||||||
| 64,166,229 | ||||||||
Energy — 4.5% |
||||||||
Oil & Gas — 4.4% |
||||||||
Chevron Corp. |
3,529 | 507,012 | ||||||
ConocoPhillips |
33,463 | 3,424,603 | ||||||
Coterra Energy, Inc. |
23,564 | 615,492 | ||||||
Diamondback Energy, Inc. |
14,468 | 1,742,815 | ||||||
EOG Resources, Inc. |
15,886 | 1,774,943 | ||||||
Exxon Mobil Corp. |
47,201 | 4,121,119 | ||||||
Phillips 66 |
9,776 | 789,119 | ||||||
Pioneer Natural Resources Co. |
2,563 | 554,966 | ||||||
Untrade Brightoil (a) (d) |
52,000 | 9,937 | ||||||
| 13,540,006 | ||||||||
Oil & Gas Services — 0.1% |
||||||||
Baker Hughes Co. |
11,350 | 237,896 | ||||||
| 13,777,902 | ||||||||
Financial — 15.5% |
||||||||
Banks — 4.5% |
||||||||
Bank of America Corp. |
92,499 | 2,793,470 | ||||||
Citigroup, Inc. |
15,012 | 625,550 | ||||||
Fifth Third Bancorp |
37,368 | 1,194,281 | ||||||
Morgan Stanley |
17,602 | 1,390,734 | ||||||
State Street Corp. |
8,520 | 518,101 | ||||||
SVB Financial Group (a) |
969 | 325,371 | ||||||
Truist Financial Corp. |
23,028 | 1,002,639 | ||||||
US Bancorp |
58,134 | 2,343,963 | ||||||
Wells Fargo & Co. |
81,998 | 3,297,960 | ||||||
| 13,492,069 | ||||||||
Diversified Financial Services — 5.0% |
||||||||
American Express Co. |
19,160 | 2,584,876 | ||||||
Ameriprise Financial, Inc. |
2,117 | 533,378 | ||||||
Capital One Financial Corp. |
2,805 | 258,537 | ||||||
CME Group, Inc. |
2,396 | 424,403 | ||||||
Intercontinental Exchange, Inc. |
14,943 | 1,350,100 | ||||||
Mastercard, Inc. Class A |
13,923 | 3,958,866 | ||||||
Raymond James Financial, Inc. |
6,144 | 607,150 | ||||||
T. Rowe Price Group, Inc. |
10,267 | 1,078,138 | ||||||
Visa, Inc. Class A |
24,644 | 4,378,006 | ||||||
| 15,173,454 | ||||||||
Insurance — 3.4% |
||||||||
Aon PLC Class A |
3,604 | 965,403 | ||||||
Berkshire Hathaway, Inc. Class B (a) |
16,247 | 4,338,274 | ||||||
Globe Life, Inc. |
1,484 | 147,955 | ||||||
The Progressive Corp. |
19,374 | 2,251,453 | ||||||
The accompanying notes are an integral part of the financial statements.
31
MM Equity Asset Fund – Portfolio of Investments (Continued) |
Number of |
Value |
|||||||
Prudential Financial, Inc. |
3,749 | $ | 321,589 | |||||
The Travelers Cos., Inc. |
14,905 | 2,283,446 | ||||||
| 10,308,120 | ||||||||
Real Estate Investment Trusts (REITS) — 2.6% |
||||||||
Camden Property Trust |
8,652 | 1,033,481 | ||||||
Duke Realty Corp. |
5,307 | 255,797 | ||||||
Equinix, Inc. |
1,478 | 840,745 | ||||||
Equity LifeStyle Properties, Inc. |
9,123 | 573,289 | ||||||
Host Hotels & Resorts, Inc. |
27,601 | 438,304 | ||||||
Kimco Realty Corp. |
17,697 | 325,802 | ||||||
Prologis, Inc. |
17,771 | 1,805,534 | ||||||
SBA Communications Corp. |
2,764 | 786,773 | ||||||
Sun Communities, Inc. |
5,287 | 715,490 | ||||||
UDR, Inc. |
4,193 | 174,890 | ||||||
Ventas, Inc. |
25,041 | 1,005,897 | ||||||
| 7,956,002 | ||||||||
| 46,929,645 | ||||||||
Industrial — 7.8% |
||||||||
Aerospace & Defense — 1.0% |
||||||||
Northrop Grumman Corp. |
1,686 | 792,959 | ||||||
Raytheon Technologies Corp. |
26,358 | 2,157,666 | ||||||
| 2,950,625 | ||||||||
Building Materials — 0.4% |
||||||||
Martin Marietta Materials, Inc. |
1,767 | 569,133 | ||||||
Masco Corp. |
15,628 | 729,671 | ||||||
| 1,298,804 | ||||||||
Electronics — 0.9% |
||||||||
Honeywell International, Inc. |
15,689 | 2,619,592 | ||||||
Machinery – Diversified — 1.4% |
||||||||
Deere & Co. |
7,624 | 2,545,578 | ||||||
Dover Corp. |
5,336 | 622,071 | ||||||
Ingersoll Rand, Inc. |
3,932 | 170,098 | ||||||
Otis Worldwide Corp. |
16,760 | 1,069,288 | ||||||
| 4,407,035 | ||||||||
Miscellaneous - Manufacturing — 2.0% |
||||||||
Eaton Corp. PLC |
13,956 | 1,861,172 | ||||||
Parker-Hannifin Corp. |
5,643 | 1,367,356 | ||||||
Textron, Inc. |
16,076 | 936,588 | ||||||
Trane Technologies PLC |
12,746 | 1,845,748 | ||||||
| 6,010,864 | ||||||||
Transportation — 2.1% |
||||||||
FedEx Corp. |
4,757 | 706,272 | ||||||
Norfolk Southern Corp. |
7,855 | 1,646,801 | ||||||
Union Pacific Corp. |
5,241 | 1,021,052 | ||||||
United Parcel Service, Inc. Class B |
17,810 | 2,877,027 | ||||||
| 6,251,152 | ||||||||
| 23,538,072 | ||||||||
Number of |
Value |
|||||||
Technology — 22.5% |
||||||||
Computers — 8.5% |
||||||||
Accenture PLC Class A |
11,131 | $ | 2,864,006 | |||||
Apple, Inc. |
150,073 | 20,740,089 | ||||||
Fortinet, Inc. (a) |
6,849 | 336,491 | ||||||
Leidos Holdings, Inc. |
10,391 | 908,901 | ||||||
Seagate Technology Holdings PLC |
19,133 | 1,018,450 | ||||||
| 25,867,937 | ||||||||
Semiconductors — 5.5% |
||||||||
Advanced Micro Devices, Inc. (a) |
26,099 | 1,653,633 | ||||||
Analog Devices, Inc. |
16,823 | 2,344,117 | ||||||
Applied Materials, Inc. |
3,639 | 298,143 | ||||||
Lam Research Corp. |
5,944 | 2,175,504 | ||||||
Microchip Technology, Inc. |
12,681 | 773,921 | ||||||
Micron Technology, Inc. |
8,121 | 406,862 | ||||||
NVIDIA Corp. |
22,098 | 2,682,476 | ||||||
NXP Semiconductor NV |
14,274 | 2,105,558 | ||||||
QUALCOMM, Inc. |
6,348 | 717,197 | ||||||
Teradyne, Inc. |
5,139 | 386,196 | ||||||
Texas Instruments, Inc. |
20,437 | 3,163,239 | ||||||
| 16,706,846 | ||||||||
Software — 8.5% |
||||||||
Adobe, Inc. (a) |
5,003 | 1,376,826 | ||||||
Intuit, Inc. |
5,426 | 2,101,598 | ||||||
Microsoft Corp. |
85,265 | 19,858,218 | ||||||
Oracle Corp. |
10,985 | 670,854 | ||||||
Salesforce, Inc. (a) |
4,939 | 710,426 | ||||||
Workday, Inc. Class A (a) |
3,905 | 594,419 | ||||||
ZoomInfo Technologies, Inc. (a) |
8,043 | 335,071 | ||||||
| 25,647,412 | ||||||||
| 68,222,195 | ||||||||
Utilities — 3.0% |
||||||||
Electric — 3.0% |
||||||||
Ameren Corp. |
11,955 | 962,975 | ||||||
CenterPoint Energy, Inc. |
33,000 | 929,940 | ||||||
Evergy, Inc. |
6,376 | 378,734 | ||||||
Exelon Corp. |
52,517 | 1,967,287 | ||||||
FirstEnergy Corp. |
23,273 | 861,101 | ||||||
NextEra Energy, Inc. |
30,803 | 2,415,263 | ||||||
Sempra Energy |
10,692 | 1,603,159 | ||||||
| 9,118,459 | ||||||||
| 9,118,459 | ||||||||
TOTAL COMMON STOCK (Cost $281,848,922) |
298,260,548 | |||||||
TOTAL EQUITIES (Cost $281,848,922) |
298,260,548 | |||||||
The accompanying notes are an integral part of the financial statements.
32
MM Equity Asset Fund – Portfolio of Investments (Continued) |
Number of |
Value |
|||||||
RIGHTS — 0.0% |
||||||||
Consumer, Non-cyclical — 0.0% |
||||||||
Biotechnology — 0.0% |
||||||||
Tobira Therapeutics Inc.,CVR (a) (c) (d) |
505 | $ | — | |||||
TOTAL RIGHTS (Cost $30) |
— | |||||||
MUTUAL FUNDS — 0.1% |
||||||||
Diversified Financial Services — 0.1% |
||||||||
State Street Navigator Securities Lending Government Money Market Portfolio (e) |
146,204 | 146,204 | ||||||
TOTAL MUTUAL FUNDS (Cost $146,204) |
146,204 | |||||||
TOTAL LONG-TERM INVESTMENTS (Cost $281,995,156) |
298,406,752 | |||||||
Principal |
||||||||
SHORT-TERM INVESTMENTS — 1.4% |
||||||||
Repurchase Agreement — 1.4% |
||||||||
Fixed Income Clearing Corp., Repurchase Agreement, dated 9/30/22, 0.830%, due 10/03/22 (f) |
$ | 4,174,155 | 4,174,155 | |||||
TOTAL SHORT-TERM INVESTMENTS (Cost $4,174,155) |
4,174,155 | |||||||
TOTAL INVESTMENTS — 99.8% (Cost $286,169,311) (g) |
302,580,907 | |||||||
Other Assets/(Liabilities) — 0.2% |
693,402 | |||||||
NET ASSETS — 100.0% |
$ | 303,274,309 | ||||||
Abbreviation Legend
|
CVR |
Contingent Value Rights |
Notes to Portfolio of Investments
Percentages are stated as a percent of net assets.
|
(a) |
Non-income producing security. |
|
(b) |
Denotes all or a portion of security on loan. The total value of securities on loan as of September 30, 2022, was $149,001 or 0.05% of net assets. The Fund received $6,654 of non-cash collateral (U.S. Treasury and/or Agency obligations) related to securities lending activity. This amount is not reflected on either the Portfolio of Investments or the Statement of Assets and Liabilities. (Note 2). |
|
(c) |
Investment is valued using significant unobservable inputs. |
|
(d) |
This security is fair valued in good faith in accordance with procedures approved by the Board of Trustees. At September 30, 2022, these securities amounted to a value of $9,937 or 0.00% of net assets. |
|
(e) |
Represents investment of security lending cash collateral. (Note 2). |
|
(f) |
Maturity value of $4,174,444. Collateralized by U.S. Government Agency obligations with a rate of 0.000%, maturity date of 3/30/23, and an aggregate market value, including accrued interest, of $4,257,705. |
|
(g) |
See Note 6 for aggregate cost for federal tax purposes. |
The accompanying notes are an integral part of the financial statements.
33
MM Equity Asset Fund – Portfolio of Investments (Continued) |
Futures contracts
|
Expiration |
Number of |
Notional |
Value/ Net |
||||||||||||
Long |
||||||||||||||||
S&P 500 E Mini Index |
12/16/22 | 24 | $ | 4,745,766 | $ | (423,966 | ) | |||||||||
The accompanying notes are an integral part of the financial statements.
34
MassMutual Select T. Rowe Price Bond Asset Fund – Portfolio of Investments |
September 30, 2022 |
Principal |
Value |
|||||||
BONDS & NOTES — 95.2% |
||||||||
BANK LOANS — 1.7% |
||||||||
Advertising — 0.1% |
||||||||
Clear Channel Outdoor Holdings, Inc., Term Loan B, 3 mo. USD LIBOR + 3.500% |
||||||||
6.306% VRN 8/21/26 |
$ | 145,370 | $ | 129,425 | ||||
Lamar Media Corp., 2020 Term Loan B, 3 mo. USD LIBOR + 1.500% |
||||||||
5.102% VRN 2/05/27 |
305,000 | 294,801 | ||||||
| 424,226 | ||||||||
Aerospace & Defense — 0.0% |
||||||||
TransDigm, Inc., 2020 Term Loan G, 3 mo. USD LIBOR + 2.250% |
||||||||
5.924% VRN 8/22/24 |
134,191 | 130,604 | ||||||
Airlines — 0.1% |
||||||||
American Airlines, Inc., 2021 Term Loan, 3 mo. USD LIBOR + 4.750% |
||||||||
7.460% VRN 4/20/28 |
200,000 | 193,400 | ||||||
Mileage Plus Holdings LLC, 2020 Term Loan B, 3 mo. USD LIBOR + 5.250% |
||||||||
8.777% VRN 6/21/27 |
228,000 | 228,529 | ||||||
| 421,929 | ||||||||
Auto Parts & Equipment — 0.0% |
||||||||
Clarios Global LP, 2021 USD Term Loan B, 1 mo. USD LIBOR + 3.250% |
||||||||
6.365% VRN 4/30/26 |
128,229 | 121,016 | ||||||
Computers — 0.0% |
||||||||
Peraton Corp., Term Loan B, 1 mo. USD LIBOR + 3.750% |
||||||||
6.865% VRN 2/01/28 |
140,905 | 133,296 | ||||||
Cosmetics & Personal Care — 0.0% |
||||||||
Sunshine Luxembourg VII SARL, 2021 Term Loan B3, 3 mo. USD LIBOR + 3.750% |
||||||||
7.424% VRN 10/01/26 |
234,410 | 217,547 | ||||||
Entertainment — 0.2% |
||||||||
Churchill Downs, Inc., 2021 Incremental Term Loan B1, 1 mo. USD LIBOR + 2.000% |
||||||||
5.120% VRN 3/17/28 |
296,809 | 286,917 | ||||||
Delta 2 (LUX) S.A.R.L., 2018 USD Term Loan, 1 mo. USD LIBOR + 2.500% |
||||||||
5.615% VRN 2/01/24 |
315,000 | 310,669 | ||||||
Principal |
Value |
|||||||
SeaWorld Parks & Entertainment, Inc., 2021 Term Loan B, 1 mo. USD LIBOR + 3.000% |
||||||||
6.125% VRN 8/25/28 |
$ | 128,451 | $ | 123,046 | ||||
UFC Holdings, LLC, 2021 Term Loan B, 3 mo. USD LIBOR + 2.750% |
||||||||
5.520% VRN 4/29/26 |
354,895 | 340,404 | ||||||
| 1,061,036 | ||||||||
Environmental Controls — 0.1% |
||||||||
Filtration Group Corp., 2018 1st Lien Term Loan, 1 mo. USD LIBOR + 3.000% |
||||||||
6.115% VRN 3/29/25 |
468,730 | 449,249 | ||||||
GFL Environmental, Inc., 2020 Term Loan, 3 mo. USD LIBOR + 3.000% |
||||||||
5.806% VRN 5/30/25 |
130,906 | 129,319 | ||||||
Madison IAQ LLC, Term Loan, 3 mo. USD LIBOR + 3.250% |
||||||||
6.815% VRN 6/21/28 |
128,363 | 118,346 | ||||||
| 696,914 | ||||||||
Health Care – Products — 0.1% |
||||||||
Avantor Funding, Inc., 2021 Term Loan B5, 1 mo. USD LIBOR + 2.250% |
||||||||
5.365% VRN 11/08/27 |
113,518 | 110,272 | ||||||
Maravai Intermediate Holdings, LLC, 2022 Term Loan B, 3 mo. USD SOFR + 3.000% |
||||||||
5.553% VRN 10/19/27 |
240,448 | 232,485 | ||||||
Medline Borrower LP, USD Term Loan B, 1 mo. USD LIBOR + 3.250% |
||||||||
6.365% VRN 10/23/28 |
229,425 | 210,568 | ||||||
| 553,325 | ||||||||
Health Care – Services — 0.1% |
||||||||
ICON Luxembourg SARL, LUX Term Loan, 3 mo. USD LIBOR + 2.250% |
||||||||
5.938% VRN 7/03/28 |
91,713 | 89,512 | ||||||
PRA Health Sciences, Inc., US Term Loan, 3 mo. USD LIBOR + 2.250% |
||||||||
5.938% VRN 7/03/28 |
23,889 | 23,315 | ||||||
RegionalCare Hospital Partners Holdings, Inc., 2018 Term Loan B, 1 mo. USD LIBOR + 3.750% |
||||||||
6.871% VRN 11/16/25 |
84,589 | 78,471 | ||||||
The accompanying notes are an integral part of the financial statements.
35
MassMutual Select T. Rowe Price Bond Asset Fund – Portfolio of Investments (Continued) |
Principal |
Value |
|||||||
Surgery Center Holdings, Inc., 2021 Term Loan, 1 mo. USD LIBOR + 3.750% |
||||||||
6.510% VRN 8/31/26 |
$ | 145,494 | $ | 137,856 | ||||
| 329,154 | ||||||||
Insurance — 0.2% |
||||||||
Alliant Holdings Intermediate LLC |
||||||||
2018 Term Loan B, 1 mo. USD LIBOR + 3.250% |
||||||||
6.365% VRN 5/09/25 |
75,359 | 72,098 | ||||||
2021 Term Loan B4, 1 mo. USD LIBOR + 3.500% |
||||||||
6.493% VRN 11/06/27 |
68,752 | 65,056 | ||||||
Asurion LLC |
||||||||
2018 Term Loan B7, 1 mo. USD LIBOR + 3.000% |
||||||||
6.115% VRN 11/03/24 |
171,504 | 160,099 | ||||||
2021 Second Lien Term Loan B4, 1 mo. USD LIBOR + 5.250% |
||||||||
8.365% VRN 1/20/29 |
335,000 | 254,600 | ||||||
Hub International Ltd., 2021 Term Loan B, 3 mo. USD LIBOR + 3.250% |
||||||||
5.982% VRN 4/25/25 |
484,398 | 465,933 | ||||||
| 1,017,786 | ||||||||
Lodging — 0.0% |
||||||||
Caesars Resort Collection, LLC |
||||||||
2017 1st Lien Term Loan B, 1 mo. USD LIBOR + 2.750% |
||||||||
5.865% VRN 12/23/24 |
138,219 | 134,778 | ||||||
2020 Term Loan B1, 1 mo. USD LIBOR + 3.500% |
||||||||
6.615% VRN 7/21/25 |
15,508 | 15,257 | ||||||
| 150,035 | ||||||||
Machinery – Construction & Mining — 0.0% |
||||||||
Brookfield WEC Holdings, Inc., 2021 Term Loan, 1 mo. USD LIBOR + 2.750% |
||||||||
5.865% VRN 8/01/25 |
136,306 | 130,063 | ||||||
Machinery – Diversified — 0.1% |
||||||||
Vertical U.S. Newco, Inc., Term Loan B, 6 mo. USD LIBOR + 3.500% |
||||||||
6.871% VRN 7/30/27 |
286,617 | 274,198 | ||||||
Packaging & Containers — 0.1% |
||||||||
Charter NEX US, Inc., 2021 Term Loan, 3 mo. USD LIBOR + 3.750% |
||||||||
6.556% VRN 12/01/27 |
312,149 | 295,567 | ||||||
Principal |
Value |
|||||||
Pharmaceuticals — 0.1% |
||||||||
Gainwell Acquisition Corp., Term Loan B, 3 mo. USD LIBOR + 4.000% |
||||||||
7.674% VRN 10/01/27 |
$ | 285,639 | $ | 271,571 | ||||
PetVet Care Centers, LLC, 2021 Term Loan B3, 1 mo. USD LIBOR + 3.500% |
||||||||
6.615% VRN 2/14/25 |
289,810 | 266,987 | ||||||
| 538,558 | ||||||||
Retail — 0.1% |
||||||||
IRB Holding Corp, 2022 Term Loan B, 1 mo. USD SOFR + 3.000% |
||||||||
5.695% VRN 12/15/27 |
170,116 | 159,058 | ||||||
KFC Holding Co., 2021 Term Loan B, 1 mo. USD LIBOR + 1.750% |
||||||||
4.743% VRN 3/15/28 |
402,284 | 397,424 | ||||||
WOOF Holdings, Inc., 1st Lien Term Loan, 3 mo. USD LIBOR + 3.750% |
||||||||
7.315% VRN 12/21/27 |
126,558 | 119,281 | ||||||
| 675,763 | ||||||||
Software — 0.4% |
||||||||
Applied Systems, Inc., 2017 1st Lien Term Loan, 3 mo. USD LIBOR + 3.000% |
||||||||
6.674% VRN 9/19/24 |
482,227 | 469,631 | ||||||
Ascend Learning LLC, 2021 Term Loan, 1 mo. USD LIBOR + 3.500% |
||||||||
6.615% VRN 12/11/28 |
218,114 | 200,883 | ||||||
Athenahealth, Inc. |
||||||||
2022 Delayed Draw Term Loan, 3 mo. SOFR + 3.500% |
||||||||
3.500% VRN 2/15/29 (a) |
34,058 | 30,448 | ||||||
2022 Term Loan B, 1 mo. SOFR CME + 3.500%, |
||||||||
6.576% VRN 2/15/29 |
200,440 | 179,193 | ||||||
CDK Global, Inc., 2022 USD Term Loan B, 3 mo. SOFR CME + 4.500%, |
||||||||
6.610% VRN 7/06/29 |
130,000 | 124,992 | ||||||
Epicor Software Corp., 2020 Term Loan, 1 mo. USD LIBOR + 3.250% |
||||||||
6.365% VRN 7/30/27 |
295,157 | 275,880 | ||||||
RealPage, Inc., 1st Lien Term Loan, 1 mo. USD LIBOR |
||||||||
6.115% VRN 4/24/28 |
207,203 | 193,793 | ||||||
The accompanying notes are an integral part of the financial statements.
36
MassMutual Select T. Rowe Price Bond Asset Fund – Portfolio of Investments (Continued) |
Principal |
Value |
|||||||
The Ultimate Software Group, Inc. |
||||||||
2021 Term Loan, 3 mo. USD LIBOR + 3.250% |
||||||||
5.535% VRN 5/04/26 |
$ | 864,703 | $ | 820,750 | ||||
2021 2nd Lien Term Loan, 3 mo. USD LIBOR + 5.250% |
||||||||
7.535% VRN 5/03/27 |
95,000 | 89,300 | ||||||
| 2,384,870 | ||||||||
Telecommunications — 0.0% |
||||||||
Intelsat Jackson Holdings S.A., 2021 Exit Term Loan B, 6 mo. SOFR + 4.500% |
||||||||
7.445% VRN 2/01/29 |
542 | 508 | ||||||
Iridium Satellite LLC, 2021 Term Loan B2, 1 mo. USD LIBOR + 2.500% |
||||||||
5.615% VRN 11/04/26 |
150,707 | 146,249 | ||||||
| 146,757 | ||||||||
TOTAL BANK LOANS (Cost $10,234,224) |
9,702,644 | |||||||
CORPORATE DEBT — 27.8% |
||||||||
Agriculture — 0.5% |
||||||||
BAT Capital Corp. |
||||||||
3.557% 8/15/27 |
770,000 | 676,026 | ||||||
4.742% 3/16/32 |
145,000 | 121,244 | ||||||
4.906% 4/02/30 |
470,000 | 414,831 | ||||||
BAT International Finance PLC |
||||||||
1.668% 3/25/26 |
205,000 | 177,269 | ||||||
3.950% 6/15/25 (b) |
786,000 | 749,436 | ||||||
Bunge Finance Europe BV |
||||||||
1.850% 6/16/23 EUR (c) |
220,000 | 212,956 | ||||||
Darling Ingredients, Inc. |
||||||||
6.000% 6/15/30 (b) |
90,000 | 85,652 | ||||||
Reynolds American, Inc. |
||||||||
4.450% 6/12/25 |
395,000 | 381,671 | ||||||
| 2,819,085 | ||||||||
Airlines — 0.2% |
||||||||
American Airlines, Inc. /AAdvantage Loyalty IP Ltd. |
||||||||
5.500% 4/20/26 (b) |
115,000 | 108,005 | ||||||
5.750% 4/20/29 (b) |
105,000 | 91,612 | ||||||
Mileage Plus Holdings LLC / Mileage Plus Intellectual Property Assets Ltd. |
||||||||
6.500% 6/20/27 (b) |
498,750 | 486,488 | ||||||
United Airlines Pass Through Trust |
||||||||
2.900% 11/01/29 |
144,717 | 116,500 | ||||||
2.700% 11/01/33 |
91,005 | 72,664 | ||||||
| 875,269 | ||||||||
Principal |
Value |
|||||||
Apparel — 0.0% |
||||||||
Wolverine World Wide, Inc. |
||||||||
4.000% 8/15/29 (b) (d) |
$ | 160,000 | $ | 122,058 | ||||
Auto Manufacturers — 1.4% |
||||||||
American Honda Finance Corp. |
||||||||
0.750% 11/25/26 GBP (c) |
130,000 | 115,740 | ||||||
1.950% 10/18/24 EUR (c) |
200,000 | 191,492 | ||||||
BMW Finance NV |
||||||||
0.000% 3/24/23 EUR (b) (c) |
117,000 | 113,370 | ||||||
0.000% 4/14/23 EUR (b) (c) |
84,000 | 81,381 | ||||||
0.500% 11/22/22 EUR (b) (c) |
105,000 | 102,688 | ||||||
Ford Motor Co. |
||||||||
6.100% 8/19/32 |
195,000 | 171,912 | ||||||
9.625% 4/22/30 |
145,000 | 161,085 | ||||||
Ford Motor Credit Co. LLC |
||||||||
4.950% 5/28/27 |
265,000 | 235,482 | ||||||
General Motors Co. |
||||||||
4.200% 10/01/27 (d) |
400,000 | 366,403 | ||||||
5.600% 10/15/32 |
135,000 | 120,468 | ||||||
General Motors Financial Co., Inc. |
||||||||
0.850% 2/26/26 EUR (b) (c) |
150,000 | 129,716 | ||||||
0.955% 9/07/23 EUR (b) (c) |
110,000 | 104,937 | ||||||
4.000% 10/06/26 |
620,000 | 573,650 | ||||||
4.350% 4/09/25 |
750,000 | 724,434 | ||||||
5.100% 1/17/24 |
435,000 | 433,494 | ||||||
Hyundai Capital America |
||||||||
1.800% 10/15/25 (b) |
300,000 | 266,852 | ||||||
2.100% 9/15/28 (b) |
470,000 | 369,331 | ||||||
Mercedes-Benz International Finance BV |
||||||||
0.625% 2/27/23 EUR (b) (c) |
112,000 | 109,106 | ||||||
0.750% 5/11/23 EUR (b) (c) |
80,000 | 77,700 | ||||||
RCI Banque SA |
||||||||
0.250% 3/08/23 EUR (b) (c) |
55,000 | 53,384 | ||||||
0.750% 4/10/23 EUR (b) (c) |
68,000 | 65,756 | ||||||
Stellantis NV |
||||||||
2.375% 4/14/23 EUR (b) (c) |
53,000 | 51,802 | ||||||
Toyota Motor Credit Corp. |
||||||||
2.375% 2/01/23 EUR (b) (c) |
81,000 | 79,447 | ||||||
Volkswagen Bank GmbH |
||||||||
0.750% 6/15/23 EUR (b) (c) |
80,000 | 76,956 | ||||||
2.500% 7/31/26 EUR (b) (c) |
700,000 | 644,077 | ||||||
Volkswagen Financial Services AG |
||||||||
0.875% 4/12/23 EUR (b) (c) |
72,000 | 69,755 | ||||||
2.500% 4/06/23 EUR (b) (c) |
67,000 | 65,550 | ||||||
The accompanying notes are an integral part of the financial statements.
37
MassMutual Select T. Rowe Price Bond Asset Fund – Portfolio of Investments (Continued) |
Principal |
Value |
|||||||
Volkswagen Group of America Finance LLC |
||||||||
3.200% 9/26/26 (b) |
$ | 1,320,000 | $ | 1,210,401 | ||||
3.350% 5/13/25 (b) |
500,000 | 474,349 | ||||||
4.600% 6/08/29 (b) |
215,000 | 197,490 | ||||||
Volkswagen International Finance NV |
||||||||
0.875% 1/16/23 EUR (b) (c) |
120,000 | 116,695 | ||||||
Volkswagen Leasing GmbH |
||||||||
1.500% 6/19/26 EUR (b) (c) |
145,000 | 130,423 | ||||||
1.625% 8/15/25 EUR (b) (c) |
150,000 | 138,598 | ||||||
| 7,823,924 | ||||||||
Auto Parts & Equipment — 0.1% |
||||||||
Aptiv PLC |
||||||||
3.100% 12/01/51 |
105,000 | 58,808 | ||||||
Clarios Global LP / Clarios US Finance Co. |
||||||||
6.250% 5/15/26 (b) |
125,000 | 119,375 | ||||||
Continental AG |
||||||||
0.000% 9/12/23 EUR (b) (c) |
45,000 | 42,704 | ||||||
The Goodyear Tire & Rubber Co. |
||||||||
5.000% 7/15/29 (d) |
260,000 | 213,200 | ||||||
Tenneco, Inc. |
||||||||
7.875% 1/15/29 (b) |
170,000 | 165,481 | ||||||
5.125% 4/15/29 (b) |
79,000 | 78,014 | ||||||
| 677,582 | ||||||||
Banks — 8.8% |
||||||||
ABN AMRO Bank NV |
||||||||
2.500% 11/29/23 EUR (b) (c) |
114,000 | 111,446 | ||||||
Arion Banki HF |
||||||||
1.000% 3/20/23 EUR (b) (c) |
150,000 | 145,712 | ||||||
Banco Bilbao Vizcaya Argentaria SA 1 year CMT + 2.300% |
||||||||
5.862% VRN 9/14/26 |
400,000 | 390,260 | ||||||
Banco de Bogota SA |
||||||||
6.250% 5/12/26 (b) |
250,000 | 233,750 | ||||||
Banco de Credito del Peru SA 5 year CMT + 3.000% |
||||||||
3.125% VRN 7/01/30 (b) |
200,000 | 174,851 | ||||||
Banco de Sabadell SA |
||||||||
0.875% 3/05/23 EUR (b) (c) |
300,000 | 292,301 | ||||||
1 mo. EURIBOR ICE Swap + 1.150% 0.875% VRN 6/16/28 EUR (b) (c) |
200,000 | 153,368 | ||||||
Banco Santander SA |
||||||||
1.125% 1/17/25 EUR (b) (c) |
200,000 | 184,983 | ||||||
1.375% 12/14/22 EUR (b) (c) |
100,000 | 98,001 | ||||||
2.746% 5/28/25 |
1,200,000 | 1,097,378 | ||||||
3.490% 5/28/30 |
200,000 | 160,370 | ||||||
1 year CMT + 2.000% 4.175% VRN 3/24/28 |
200,000 | 180,302 | ||||||
Principal |
Value |
|||||||
Bangkok Bank PCL 5 year CMT + 1.900% |
||||||||
3.733% VRN 9/25/34 (b) |
$ | 250,000 | $ | 204,902 | ||||
Bank Hapoalim BM 5 year CMT + 2.155% |
||||||||
3.255% VRN 1/21/32 (b) |
200,000 | 165,992 | ||||||
Bank of America Corp. |
||||||||
0.750% 7/26/23 EUR (b) (c) |
110,000 | 106,100 | ||||||
SOFR + .960% 1.734% VRN 7/22/27 |
585,000 | 501,619 | ||||||
SOFR + 1.530% 1.898% VRN 7/23/31 |
1,240,000 | 922,827 | ||||||
SOFR + 1.220% 2.299% VRN 7/21/32 |
935,000 | 697,784 | ||||||
2.375% 6/19/24 EUR (b) (c) |
150,000 | 144,884 | ||||||
2.375% 6/19/24 EUR (b) (c) |
150,000 | 144,884 | ||||||
3 mo. USD LIBOR + .990% 2.496% VRN 2/13/31 |
1,735,000 | 1,368,488 | ||||||
SOFR + 2.150% 2.592% VRN 4/29/31 |
585,000 | 463,755 | ||||||
3 mo. USD LIBOR + 1.040% 3.419% VRN 12/20/28 |
55,000 | 48,807 | ||||||
3 mo. USD LIBOR + 1.060% 3.559% VRN 4/23/27 |
495,000 | 457,134 | ||||||
3.950% 4/21/25 |
1,365,000 | 1,316,275 | ||||||
4.250% 10/22/26 |
700,000 | 665,356 | ||||||
Bank of Ireland Group PLC 1 year CMT + 2.650% |
||||||||
6.253% VRN 9/16/26 (b) |
355,000 | 347,394 | ||||||
Banque Federative du Credit Mutuel SA |
||||||||
0.750% 6/15/23 EUR (b) (c) |
100,000 | 96,692 | ||||||
Barclays PLC |
||||||||
1 year CMT + 1.050% 2.279% VRN 11/24/27 |
295,000 | 247,171 | ||||||
SOFR + 2.714% 2.852% VRN 5/07/26 |
670,000 | 608,284 | ||||||
3 mo. USD LIBOR + 1.610% 3.932% VRN 5/07/25 |
475,000 | 456,929 | ||||||
1 year CMT + 2.650% 5.501% VRN 8/09/28 |
225,000 | 211,019 | ||||||
BBVA Bancomer SA 5 year CMT + 2.650% |
||||||||
5.125% VRN 1/18/33 (b) |
300,000 | 248,150 | ||||||
BNP Paribas SA |
||||||||
SOFR + 1.004% 1.323% VRN 1/13/27 (b) |
890,000 | 758,781 | ||||||
3 mo. EURIBOR + 1.800% 2.125% VRN 1/23/27 EUR (b) (c) |
200,000 | 182,186 | ||||||
SOFR + 1.228% 2.591% VRN 1/20/28 (b) |
680,000 | 580,953 | ||||||
2.875% 10/24/22 EUR (b) (c) |
96,000 | 94,164 | ||||||
2.875% 9/26/23 EUR (b) (c) |
153,000 | 150,164 | ||||||
4.500% 3/21/23 EUR (b) (c) |
157,000 | 155,620 | ||||||
The accompanying notes are an integral part of the financial statements.
38
MassMutual Select T. Rowe Price Bond Asset Fund – Portfolio of Investments (Continued) |
Principal |
Value |
|||||||
BPCE SA |
||||||||
0.375% 10/05/23 EUR (b) (c) |
$ | 100,000 | $ | 95,600 | ||||
4.625% 7/18/23 EUR (b) (c) |
100,000 | 98,722 | ||||||
CaixaBank SA |
||||||||
1.125% 1/12/23 EUR (b) (c) |
100,000 | 97,743 | ||||||
1.125% 5/17/24 EUR (b) (c) |
100,000 | 94,555 | ||||||
1.750% 10/24/23 EUR (b) (c) |
100,000 | 96,304 | ||||||
5 year EUR Swap + 2.350% 2.750% VRN 7/14/28 EUR (b) (c) |
200,000 | 190,941 | ||||||
Citigroup, Inc. |
||||||||
0.750% 10/26/23 EUR (b) (c) |
110,000 | 105,252 | ||||||
SOFR + 1.167% 2.561% VRN 5/01/32 |
300,000 | 230,196 | ||||||
SOFR + 1.280% 3.070% VRN 2/24/28 |
570,000 | 507,618 | ||||||
SOFR + 2.842% 3.106% VRN 4/08/26 |
475,000 | 445,263 | ||||||
5.610% 9/29/26 |
630,000 | 626,664 | ||||||
Commerzbank AG |
||||||||
0.500% 8/28/23 EUR (b) (c) |
142,000 | 136,241 | ||||||
Cooperatieve Rabobank UA |
||||||||
0.750% 8/29/23 EUR (b) (c) |
100,000 | 96,143 | ||||||
2.375% 5/22/23 EUR (b) (c) |
130,000 | 127,558 | ||||||
3.875% 7/25/23 EUR (b) (c) |
118,000 | 116,245 | ||||||
4.625% 5/23/29 GBP (b) (c) |
150,000 | 139,752 | ||||||
Credit Agricole SA |
||||||||
1.000% 9/16/24 EUR (b) (c) |
200,000 | 189,655 | ||||||
Credit Suisse AG |
||||||||
1.000% 6/07/23 EUR (b) (c) |
111,000 | 107,446 | ||||||
Credit Suisse Group AG 1 mo. BPSW + 1.230% |
||||||||
2.125% VRN 9/12/25 GBP (b) (c) |
250,000 | 249,393 | ||||||
Danske Bank A/S |
||||||||
0.250% 11/28/22 EUR (b) (c) |
109,000 | 106,609 | ||||||
0.875% 5/22/23 EUR (b) (c) |
110,000 | 106,306 | ||||||
5 year EUR Swap + 1.700% 1.375% VRN 2/12/30 EUR (b) (c) |
200,000 | 175,801 | ||||||
3 mo. USD LIBOR + 1.591% 3.244% VRN 12/20/25 (b) |
1,040,000 | 967,128 | ||||||
1 year CMT + 1.450% 3.773% VRN 3/28/25 (b) |
355,000 | 341,422 | ||||||
3.875% 9/12/23 (b) |
5,000 | 4,920 | ||||||
5.375% 1/12/24 (b) |
200,000 | 198,913 | ||||||
Deutsche Bank AG |
||||||||
1.125% 8/30/23 EUR (b) (c) |
114,000 | 109,971 | ||||||
2.375% 1/11/23 EUR (b) (c) |
100,000 | 98,133 | ||||||
Discover Bank |
||||||||
4.650% 9/13/28 |
405,000 | 367,534 | ||||||
DNB Bank ASA |
||||||||
0.050% 11/14/23 EUR (b) (c) |
109,000 | 103,345 | ||||||
Principal |
Value |
|||||||
DNB Boligkreditt AS |
||||||||
1.875% 11/21/22 EUR (b) (c) |
$ | 100,000 | $ | 98,119 | ||||
Fifth Third Bancorp SOFR + 2.127% |
||||||||
4.772% VRN 7/28/30 |
140,000 | 130,810 | ||||||
The Goldman Sachs Group, Inc. |
||||||||
1.375% 5/15/24 EUR (b) (c) |
40,000 | 38,149 | ||||||
SOFR + .818% 1.542% VRN 9/10/27 |
605,000 | 511,336 | ||||||
1.625% 7/27/26 EUR (b) (c) |
140,000 | 125,598 | ||||||
2.000% 7/27/23 EUR (b) (c) |
130,000 | 126,375 | ||||||
SOFR + 1.248% 2.383% VRN 7/21/32 |
510,000 | 384,356 | ||||||
SOFR + 1.281% 2.615% VRN 4/22/32 |
250,000 | 194,026 | ||||||
SOFR + 1.264% 2.650% VRN 10/21/32 |
520,000 | 398,217 | ||||||
3.250% 2/01/23 EUR (b) (c) |
134,000 | 131,896 | ||||||
3.500% 11/16/26 |
745,000 | 687,621 | ||||||
SOFR + 1.846% 3.615% VRN 3/15/28 |
550,000 | 500,746 | ||||||
SOFR + 1.725% 4.482% VRN 8/23/28 |
335,000 | 314,689 | ||||||
Heta Asset Resolution AG |
||||||||
2.375% 12/13/22 EUR (b) (c) |
1,100,000 | 1,080,323 | ||||||
HSBC Continental Europe SA |
||||||||
0.600% 3/20/23 EUR (b) (c) |
100,000 | 97,394 | ||||||
HSBC Holdings PLC |
||||||||
SOFR + 1.538% 1.645% VRN 4/18/26 |
940,000 | 836,059 | ||||||
SOFR + 1.929% 2.099% VRN 6/04/26 |
610,000 | 546,316 | ||||||
SOFR + 1.430% 2.999% VRN 3/10/26 |
560,000 | 517,849 | ||||||
SOFR + 2.110% 4.755% VRN 6/09/28 |
970,000 | 891,713 | ||||||
SOFR + 2.610% 5.210% VRN 8/11/28 |
440,000 | 411,531 | ||||||
ING Groep NV |
||||||||
1.000% 9/20/23 EUR (b) (c) |
100,000 | 96,088 | ||||||
SOFR + 1.005% 1.726% VRN 4/01/27 |
260,000 | 222,979 | ||||||
Intesa Sanpaolo SpA |
||||||||
1.000% 7/04/24 EUR (b) (c) |
300,000 | 280,347 | ||||||
2.125% 8/30/23 EUR (b) (c) |
114,000 | 110,642 | ||||||
JP Morgan Chase & Co. |
||||||||
1.500% 10/26/22 EUR (b) (c) |
111,000 | 108,785 | ||||||
SOFR + .885% 1.578% VRN 4/22/27 |
630,000 | 544,346 | ||||||
3 mo. TSFR + 1.105% 1.764% VRN 11/19/31 |
955,000 | 697,725 | ||||||
SOFR + 1.890% 2.182% VRN 6/01/28 |
675,000 | 574,204 | ||||||
The accompanying notes are an integral part of the financial statements.
39
MassMutual Select T. Rowe Price Bond Asset Fund – Portfolio of Investments (Continued) |
Principal |
Value |
|||||||
SOFR + 1.510% 2.739% VRN 10/15/30 |
$ | 445,000 | $ | 361,690 | ||||
2.750% 2/01/23 EUR (b) (c) |
114,000 | 112,054 | ||||||
SOFR + 1.170% 2.947% VRN 2/24/28 |
570,000 | 504,225 | ||||||
SOFR + 2.515% 2.956% VRN 5/13/31 |
2,320,000 | 1,836,751 | ||||||
SOFR + 2.580% 5.717% VRN 9/14/33 |
340,000 | 321,298 | ||||||
KBC Group NV |
||||||||
0.750% 10/18/23 EUR (b) (c) |
100,000 | 95,601 | ||||||
Kreditanstalt fuer Wiederaufbau |
||||||||
4.700% 6/02/37 CAD (c) |
65,000 | 49,342 | ||||||
4.700% 6/02/37 CAD (c) |
75,000 | 56,933 | ||||||
Landsbankinn HF |
||||||||
0.375% 5/23/25 EUR (b) (c) |
265,000 | 228,268 | ||||||
1.000% 5/30/23 EUR (b) (c) |
100,000 | 96,272 | ||||||
Lloyds Bank Corporate Markets PLC |
||||||||
0.250% 10/04/22 EUR (b) (c) |
100,000 | 98,005 | ||||||
Mitsubishi UFJ Financial Group, Inc. 1 year CMT + 1.900% |
||||||||
5.354% VRN 9/13/28 |
430,000 | 419,213 | ||||||
Morgan Stanley |
||||||||
3 mo. EURIBOR + .698% 0.406% VRN 10/29/27 EUR (c) |
100,000 | 84,226 | ||||||
3 mo. EURIBOR + .753% 0.637% VRN 7/26/24 EUR (c) |
100,000 | 95,767 | ||||||
1.000% 12/02/22 EUR (c) |
110,000 | 107,733 | ||||||
SOFR + .858% 1.512% VRN 7/20/27 |
730,000 | 621,974 | ||||||
SOFR + .879% 1.593% VRN 5/04/27 |
670,000 | 577,685 | ||||||
1.875% 3/30/23 EUR (c) |
113,000 | 110,587 | ||||||
SOFR + 1.178% 2.239% VRN 7/21/32 |
460,000 | 345,546 | ||||||
SOFR + 1.485% 3.217% VRN 4/22/42 |
165,000 | 115,011 | ||||||
SOFR + 1.669% 4.679% VRN 7/17/26 |
215,000 | 209,441 | ||||||
National Australia Bank Ltd. |
||||||||
0.625% 11/10/23 EUR (b) (c) |
56,000 | 53,533 | ||||||
The Nationale-Nederlanden Bank NV |
||||||||
0.375% 2/26/25 EUR (b) (c) |
100,000 | 90,884 | ||||||
Natwest Group PLC |
||||||||
2.500% 3/22/23 EUR (b) (c) |
114,000 | 111,792 | ||||||
Nordea Bank Abp |
||||||||
1.000% 2/22/23 EUR (b) (c) |
111,000 | 108,385 | ||||||
5.375% 9/22/27 (b) |
320,000 | 312,028 | ||||||
The PNC Financial Services Group, Inc. |
||||||||
2.550% 1/22/30 |
145,000 | 119,342 | ||||||
SOFR + 1.850% 4.626% VRN 6/06/33 |
320,000 | 285,333 | ||||||
Principal |
Value |
|||||||
QNB Finance Ltd. |
||||||||
2.750% 2/12/27 (b) |
$ | 200,000 | $ | 180,750 | ||||
Santander Holdings SOFR + 1.249% |
||||||||
2.490% VRN 1/06/28 |
365,000 | 304,510 | ||||||
Santander UK Group Holdings PLC |
||||||||
1.125% 9/08/23 EUR (b) (c) |
111,000 | 106,815 | ||||||
1 year CMT + 1.250% 1.532% VRN 8/21/26 |
1,465,000 | 1,270,377 | ||||||
Shinhan Bank Co. Ltd. |
||||||||
3.875% 3/24/26 (b) |
200,000 | 187,192 | ||||||
4.000% 4/23/29 (b) |
500,000 | 451,542 | ||||||
Standard Chartered PLC |
||||||||
1 year CMT + 1.000% 1.456% VRN 1/14/27 (b) |
295,000 | 249,684 | ||||||
5 year EUR Swap + 2.800% 2.500% VRN 9/09/30 EUR (b) (c) |
300,000 | 267,612 | ||||||
3 mo. USD LIBOR + 1.209% 2.819% VRN 1/30/26 (b) |
200,000 | 183,896 | ||||||
1 year CMT + 1.650% 3.971% VRN 3/30/26 (b) |
285,000 | 268,003 | ||||||
1 year CMT + 3.850% 4.644% VRN 4/01/31 (b) |
1,030,000 | 899,798 | ||||||
The Toronto-Dominion Bank |
||||||||
0.625% 7/20/23 EUR (b) (c) |
110,000 | 106,012 | ||||||
4.456% 6/08/32 |
120,000 | 109,396 | ||||||
Truist Financial Corp. SOFR + 1.368% |
||||||||
4.123% VRN 6/06/28 |
525,000 | 493,728 | ||||||
UBS Group AG |
||||||||
1 year CMT + 1.080% 1.364% VRN 1/30/27 (b) |
235,000 | 200,972 | ||||||
1 year CMT + 1.750% 4.751% VRN 5/12/28 (b) |
200,000 | 187,826 | ||||||
UniCredit SpA |
||||||||
2.000% 3/04/23 EUR (b) (c) |
313,000 | 306,500 | ||||||
5 mo. EURIBOR ICE Swap5 + 4.739% 4.875% VRN 2/20/29 EUR (b) (c) |
200,000 | 190,375 | ||||||
Wells Fargo & Co. |
||||||||
2.250% 5/02/23 EUR (b) (c) |
114,000 | 111,640 | ||||||
SOFR + 2.100% 2.393% VRN 6/02/28 |
1,105,000 | 948,088 | ||||||
SOFR + 1.262% 2.572% VRN 2/11/31 |
1,225,000 | 980,162 | ||||||
3 mo. TSFR + 1.432% 2.879% VRN 10/30/30 |
2,145,000 | 1,761,754 | ||||||
SOFR + 2.530% 3.068% VRN 4/30/41 |
335,000 | 229,683 | ||||||
4.300% 7/22/27 |
290,000 | 271,604 | ||||||
| 49,355,486 | ||||||||
The accompanying notes are an integral part of the financial statements.
40
MassMutual Select T. Rowe Price Bond Asset Fund – Portfolio of Investments (Continued) |
Principal |
Value |
|||||||
Beverages — 0.1% |
||||||||
Anheuser-Busch InBev Worldwide, Inc. |
||||||||
4.500% 6/01/50 |
$ | 380,000 | $ | 312,291 | ||||
Biotechnology — 0.1% |
||||||||
CSL Finance PLC |
||||||||
4.050% 4/27/29 (b) |
260,000 | 239,588 | ||||||
4.250% 4/27/32 (b) |
230,000 | 209,875 | ||||||
|
449,463 | |||||||
Building Materials — 0.2% |
||||||||
Boral Finance Pty Ltd. |
||||||||
3.000% 11/01/22 (b) |
170,000 | 170,000 | ||||||
3.750% 5/01/28 (b) |
135,000 | 119,711 | ||||||
Cie de Saint-Gobain |
||||||||
1.750% 4/03/23 EUR (b) (c) |
100,000 | 97,681 | ||||||
CRH Finance UK PLC |
||||||||
4.125% 12/02/29 GBP (b) (c) |
150,000 | 142,095 | ||||||
Holcim Finance Luxembourg SA |
||||||||
1.375% 5/26/23 EUR (b) (c) |
111,000 | 107,944 | ||||||
Johnson Controls International PLC |
||||||||
1.000% 9/15/23 EUR (c) |
111,000 | 106,602 | ||||||
Martin Marietta Materials, Inc. |
||||||||
2.400% 7/15/31 |
155,000 | 119,600 | ||||||
| 863,633 | ||||||||
Chemicals — 0.4% |
||||||||
Avient Corp. |
||||||||
7.125% 8/01/30 (b) (d) |
65,000 | 59,991 | ||||||
BASF SE |
||||||||
0.101% 6/05/23 EUR (b) (c) |
100,000 | 96,274 | ||||||
Braskem Netherlands Finance BV |
||||||||
4.500% 1/31/30 (b) |
300,000 | 242,460 | ||||||
Celanese US Holdings LLC |
||||||||
6.050% 3/15/25 |
265,000 | 258,974 | ||||||
6.165% 7/15/27 |
285,000 | 268,885 | ||||||
Eastman Chemical Co. |
||||||||
1.500% 5/26/23 EUR (c) |
111,000 | 107,317 | ||||||
Equate Petrochemical BV |
||||||||
2.625% 4/28/28 (b) |
200,000 | 169,250 | ||||||
Evonik Industries AG |
||||||||
1.000% 1/23/23 EUR (b) (c) |
84,000 | 82,222 | ||||||
LANXESS AG |
||||||||
2.625% 11/21/22 EUR (b) (c) |
60,000 | 58,801 | ||||||
Methanex Corp. |
||||||||
5.125% 10/15/27 (d) |
100,000 | 84,000 | ||||||
The Sherwin-Williams Co. |
||||||||
2.950% 8/15/29 |
145,000 | 123,988 | ||||||
Westlake Corp. |
||||||||
1.625% 7/17/29 EUR (c) |
575,000 | 422,731 | ||||||
| 1,974,893 | ||||||||
Principal |
Value |
|||||||
Commercial Services — 0.4% |
||||||||
Abertis Infraestructuras SA |
||||||||
3.000% 3/27/31 EUR (b) (c) |
$ | 100,000 | $ | 84,843 | ||||
Adani Ports & Special Economic Zone Ltd. |
||||||||
4.200% 8/04/27 (b) |
250,000 | 218,850 | ||||||
Equifax, Inc. |
||||||||
5.100% 12/15/27 |
305,000 | 295,230 | ||||||
Holding d’Infrastructures de Transport SASU |
||||||||
0.625% 3/27/23 EUR (b) (c) |
100,000 | 96,783 | ||||||
Transurban Finance Co. |
||||||||
2.450% 3/16/31 (b) (d) |
920,000 | 711,298 | ||||||
3.375% 3/22/27 (b) |
560,000 | 508,079 | ||||||
Verisure Holding AB |
||||||||
3.875% 7/15/26 EUR (b) (c) |
100,000 | 84,118 | ||||||
| 1,999,201 | ||||||||
Computers — 0.0% |
||||||||
Capgemini SE |
||||||||
2.500% 7/01/23 EUR (b) (c) |
100,000 | 97,808 | ||||||
International Business Machines Corp. |
||||||||
0.375% 1/31/23 EUR (c) |
109,000 | 106,354 | ||||||
| 204,162 | ||||||||
Diversified Financial Services — 1.5% |
||||||||
AerCap Ireland Capital DAC / AerCap Global Aviation Trust |
||||||||
2.450% 10/29/26 |
525,000 | 443,069 | ||||||
3.000% 10/29/28 |
265,000 | 213,082 | ||||||
3.300% 1/30/32 |
180,000 | 135,186 | ||||||
3.500% 1/15/25 |
150,000 | 140,979 | ||||||
4.450% 4/03/26 |
270,000 | 251,969 | ||||||
4.875% 1/16/24 |
540,000 | 531,336 | ||||||
6.500% 7/15/25 |
150,000 | 149,751 | ||||||
Ally Financial, Inc. |
||||||||
4.750% 6/09/27 |
1,065,000 | 982,983 | ||||||
Capital One Financial Corp. |
||||||||
1.650% 6/12/29 EUR (c) |
300,000 | 231,188 | ||||||
SOFR + 1.790% 3.273% VRN 3/01/30 |
265,000 | 221,675 | ||||||
3.650% 5/11/27 |
510,000 | 468,201 | ||||||
3.750% 3/09/27 |
115,000 | 105,915 | ||||||
SOFR + 2.160% 4.985% VRN 7/24/26 |
525,000 | 513,342 | ||||||
SOFR + 2.600% 5.247% VRN 7/26/30 |
140,000 | 130,427 | ||||||
Discover Financial Services |
||||||||
4.100% 2/09/27 |
510,000 | 469,104 | ||||||
Encore Capital Group, Inc. |
||||||||
5.375% 2/15/26 GBP (b) (c) |
140,000 | 138,067 | ||||||
The accompanying notes are an integral part of the financial statements.
41
MassMutual Select T. Rowe Price Bond Asset Fund – Portfolio of Investments (Continued) |
Principal |
Value |
|||||||
FCA Bank SpA |
||||||||
0.500% 9/18/23 EUR (b) (c) |
$ | 109,000 | $ | 103,997 | ||||
0.500% 9/13/24 EUR (b) (c) |
160,000 | 147,809 | ||||||
0.625% 11/24/22 EUR (b) (c) |
109,000 | 106,614 | ||||||
Intercontinental Exchange, Inc. |
||||||||
2.650% 9/15/40 |
130,000 | 87,502 | ||||||
4.350% 6/15/29 |
175,000 | 165,513 | ||||||
Iqera Group SAS |
||||||||
4.250% 9/30/24 EUR (b) (c) |
100,000 | 88,628 | ||||||
LeasePlan Corp. NV |
||||||||
0.125% 9/13/23 EUR (c) |
108,000 | 102,639 | ||||||
0.750% 10/03/22 EUR (b) (c) |
109,000 | 106,825 | ||||||
5 mo. EURIBOR ICE Swap + 7.556% 7.375% VRN EUR (b) (c) (e) |
200,000 | 175,429 | ||||||
LSEGA Financing PLC |
||||||||
2.000% 4/06/28 (b) |
1,520,000 | 1,277,825 | ||||||
2.500% 4/06/31 (b) (d) |
435,000 | 353,139 | ||||||
3.200% 4/06/41 (b) |
200,000 | 142,331 | ||||||
Navient Corp. |
||||||||
6.750% 6/15/26 |
155,000 | 140,693 | ||||||
| 8,125,218 | ||||||||
Electric — 1.5% |
||||||||
Ausgrid Finance Pty Ltd. |
||||||||
3.850% 5/01/23 (b) |
585,000 | 580,525 | ||||||
4.350% 8/01/28 (b) |
260,000 | 238,877 | ||||||
Duke Energy Corp. |
||||||||
4.500% 8/15/32 |
940,000 | 849,664 | ||||||
E.ON International Finance BV |
||||||||
0.750% 11/30/22 EUR (b) (c) |
79,000 | 77,302 | ||||||
E.ON SE |
||||||||
0.000% 10/24/22 EUR (b) (c) |
85,000 | 83,238 | ||||||
0.375% 4/20/23 EUR (b) (c) |
104,000 | 100,726 | ||||||
Edison International |
||||||||
4.950% 4/15/25 |
30,000 | 29,395 | ||||||
EDP - Energias de Portugal SA |
||||||||
2.875% 6/01/26 EUR (b) (c) |
200,000 | 189,687 | ||||||
Enel Finance International NV |
||||||||
4.875% 4/17/23 EUR (b) (c) |
120,000 | 119,254 | ||||||
5.250% 9/29/23 EUR (c) |
26,000 | 26,108 | ||||||
5.625% 8/14/24 GBP (b) (c) |
150,000 | 164,317 | ||||||
Engie SA |
||||||||
0.375% 2/28/23 EUR (b) (c) |
100,000 | 97,251 | ||||||
3.000% 2/01/23 EUR (b) (c) |
84,000 | 82,586 | ||||||
Interchile SA |
||||||||
4.500% 6/30/56 (b) |
280,000 | 205,450 | ||||||
Minejesa Capital BV |
||||||||
5.625% 8/10/37 (b) |
300,000 | 214,500 | ||||||
Principal |
Value |
|||||||
NextEra Energy Capital Holdings, Inc. |
||||||||
2.440% 1/15/32 |
$ | 595,000 | $ | 462,435 | ||||
3.000% 1/15/52 |
425,000 | 271,213 | ||||||
5.000% 7/15/32 |
125,000 | 119,292 | ||||||
NRG Energy, Inc. |
||||||||
4.450% 6/15/29 (b) |
230,000 | 199,482 | ||||||
Pacific Gas and Electric Co. |
||||||||
2.100% 8/01/27 |
540,000 | 436,730 | ||||||
2.500% 2/01/31 |
465,000 | 338,212 | ||||||
4.550% 7/01/30 |
510,000 | 436,872 | ||||||
Sempra Energy |
||||||||
3.700% 4/01/29 |
145,000 | 129,512 | ||||||
Southern California Edison Co. |
||||||||
4.700% 6/01/27 |
340,000 | 330,145 | ||||||
State Grid Overseas Investment BVI Ltd. |
||||||||
1.375% 5/02/25 EUR (b) (c) |
100,000 | 92,422 | ||||||
Vistra Corp. 5 year CMT + 6.930% |
||||||||
8.000% VRN (b) (e) |
265,000 | 243,421 | ||||||
Vistra Operations Co. LLC |
||||||||
3.550% 7/15/24 (b) |
1,285,000 | 1,224,702 | ||||||
4.375% 5/01/29 (b) |
195,000 | 162,337 | ||||||
5.125% 5/13/25 (b) |
485,000 | 469,553 | ||||||
Xcel Energy, Inc. |
||||||||
4.600% 6/01/32 |
205,000 | 190,207 | ||||||
| 8,165,415 | ||||||||
Electrical Components & Equipment — 0.0% |
||||||||
Schneider Electric SE |
||||||||
1.500% 9/08/23 EUR (b) (c) |
100,000 | 97,099 | ||||||
Electronics — 0.1% |
||||||||
Arrow Electronics, Inc. |
||||||||
4.000% 4/01/25 |
375,000 | 360,749 | ||||||
Sensata Technologies BV |
||||||||
5.875% 9/01/30 (b) (d) |
345,000 | 322,803 | ||||||
| 683,552 | ||||||||
Engineering & Construction — 0.0% |
||||||||
Cellnex Telecom SA |
||||||||
1.750% 10/23/30 EUR (b) (c) |
200,000 | 137,892 | ||||||
Infrastrutture Wireless Italiane SpA |
||||||||
1.625% 10/21/28 EUR (b) (c) |
155,000 | 121,976 | ||||||
| 259,868 | ||||||||
Entertainment — 0.2% |
||||||||
Cirsa Finance International Sarl |
||||||||
6.250% 12/20/23 EUR (b) (c) |
84,917 | 80,934 | ||||||
International Game Technology PLC |
||||||||
3.500% 6/15/26 EUR (b) (c) |
100,000 | 86,980 | ||||||
3.500% 6/15/26 EUR (b) (c) |
100,000 | 86,980 | ||||||
The accompanying notes are an integral part of the financial statements.
42
MassMutual Select T. Rowe Price Bond Asset Fund – Portfolio of Investments (Continued) |
Principal |
Value |
|||||||
Warnermedia Holdings, Inc. |
||||||||
3.755% 3/15/27 (b) |
$ | 705,000 | $ | 631,040 | ||||
4.279% 3/15/32 (b) |
145,000 | 119,266 | ||||||
| 1,005,200 | ||||||||
Environmental Controls — 0.0% |
||||||||
Madison IAQ LLC |
||||||||
4.125% 6/30/28 (b) (d) |
155,000 | 124,495 | ||||||
Food — 0.1% |
||||||||
Bellis Acquisition Co. PLC |
||||||||
3.250% 2/16/26 GBP (b) (c) |
100,000 | 84,023 | ||||||
Chobani LLC / Chobani Finance Corp., Inc. |
||||||||
4.625% 11/15/28 (b) |
185,000 | 157,350 | ||||||
Mondelez International Holdings Netherlands BV |
||||||||
0.250% 9/09/29 EUR (b) (c) |
198,000 | 151,410 | ||||||
Nestle Finance International Ltd. |
||||||||
0.750% 5/16/23 EUR (b) (c) |
39,000 | 37,871 | ||||||
Tesco Corporate Treasury Services PLC |
||||||||
0.875% 5/29/26 EUR (b) (c) |
150,000 | 129,923 | ||||||
1.875% 11/02/28 GBP (b) (c) |
150,000 | 124,308 | ||||||
| 684,885 | ||||||||
Forest Products & Paper — 0.1% |
||||||||
Celulosa Arauco y Constitucion SA |
||||||||
4.200% 1/29/30 (b) |
200,000 | 164,000 | ||||||
Suzano Austria GmbH |
||||||||
5.000% 1/15/30 |
200,000 | 173,342 | ||||||
| 337,342 | ||||||||
Gas — 0.1% |
||||||||
APA Infrastructure Ltd. |
||||||||
4.250% 7/15/27 (b) |
885,000 | 820,002 | ||||||
Health Care – Products — 0.3% |
||||||||
Abbott Ireland Financing DAC |
||||||||
0.875% 9/27/23 EUR (b) (c) |
111,000 | 106,956 | ||||||
Avantor Funding, Inc. |
||||||||
4.625% 7/15/28 (b) (d) |
90,000 | 79,681 | ||||||
Becton Dickinson Euro Finance SARL |
||||||||
0.632% 6/04/23 EUR (c) |
109,000 | 105,342 | ||||||
1.213% 2/12/36 EUR (c) |
100,000 | 66,127 | ||||||
Medline Borrower LP |
||||||||
3.875% 4/01/29 (b) |
230,000 | 184,575 | ||||||
Medtronic Global Holdings SCA |
||||||||
0.375% 3/07/23 EUR (c) |
160,000 | 155,763 | ||||||
0.375% 10/15/28 EUR (c) |
100,000 | 81,450 | ||||||
PerkinElmer, Inc. |
||||||||
1.900% 9/15/28 |
410,000 | 329,575 | ||||||
2.250% 9/15/31 |
220,000 | 165,352 | ||||||
3.300% 9/15/29 |
195,000 | 164,037 | ||||||
Principal |
Value |
|||||||
Thermo Fisher Scientific, Inc. |
||||||||
0.875% 10/01/31 EUR (c) |
$ | 140,000 | $ | 107,848 | ||||
2.375% 4/15/32 EUR (c) |
100,000 | 87,331 | ||||||
| 1,634,037 | ||||||||
Health Care – Services — 0.8% |
||||||||
Centene Corp. |
||||||||
2.450% 7/15/28 |
230,000 | 187,271 | ||||||
2.625% 8/01/31 |
315,000 | 237,860 | ||||||
3.375% 2/15/30 |
515,000 | 421,012 | ||||||
4.625% 12/15/29 |
875,000 | 786,275 | ||||||
Charles River Laboratories International, Inc. |
||||||||
4.000% 3/15/31 (b) (d) |
110,000 | 88,704 | ||||||
Fresenius Medical Care AG & Co. KGaA |
||||||||
0.250% 11/29/23 EUR (b) (c) |
72,000 | 68,265 | ||||||
Hca, Inc. |
||||||||
3.125% 3/15/27 (b) |
235,000 | 208,134 | ||||||
3.375% 3/15/29 (b) |
90,000 | 76,305 | ||||||
HCA, Inc. |
||||||||
3.500% 9/01/30 |
499,000 | 412,034 | ||||||
5.375% 9/01/26 |
170,000 | 164,759 | ||||||
5.875% 2/15/26 |
625,000 | 618,569 | ||||||
Humana, Inc. |
||||||||
3.700% 3/23/29 |
170,000 | 152,484 | ||||||
4.875% 4/01/30 |
645,000 | 618,433 | ||||||
Tenet Healthcare Corp. |
||||||||
6.125% 6/15/30 (b) |
100,000 | 91,845 | ||||||
UnitedHealth Group, Inc. |
||||||||
2.000% 5/15/30 |
190,000 | 152,778 | ||||||
| 4,284,728 | ||||||||
Holding Company – Diversified — 0.0% |
||||||||
CK Hutchison Finance 16 Ltd. |
||||||||
1.250% 4/06/23 EUR (b) (c) |
111,000 | 108,192 | ||||||
Insurance — 0.8% |
||||||||
AIA Group Ltd. |
||||||||
3.900% 4/06/28 (b) |
640,000 | 604,333 | ||||||
Allianz SE 10 mo. EURIBOR ICE Swap + 3.200% |
||||||||
3.375% VRN EUR (b) (c) (e) |
400,000 | 371,179 | ||||||
Aon Corp. |
||||||||
2.800% 5/15/30 |
145,000 | 119,919 | ||||||
Berkshire Hathaway Finance Corp. |
||||||||
1.500% 3/18/30 EUR (c) |
167,000 | 137,020 | ||||||
2.500% 1/15/51 |
375,000 | 222,538 | ||||||
Berkshire Hathaway, Inc. |
||||||||
0.750% 3/16/23 EUR (c) |
160,000 | 156,072 | ||||||
CNO Financial Group, Inc. |
||||||||
5.250% 5/30/25 |
217,000 | 214,221 | ||||||
The accompanying notes are an integral part of the financial statements.
43
MassMutual Select T. Rowe Price Bond Asset Fund – Portfolio of Investments (Continued) |
Principal |
Value |
|||||||
CNP Assurances |
||||||||
1.875% 10/20/22 EUR (b) (c) |
$ | 100,000 | $ | 97,965 | ||||
Corebridge Financial, Inc. |
||||||||
3.900% 4/05/32 (b) |
145,000 | 121,985 | ||||||
Equitable Holdings, Inc. |
||||||||
4.350% 4/20/28 |
1,150,000 | 1,077,810 | ||||||
Hannover Rueck SE 3 mo. EURIBOR + 3.000% |
||||||||
1.750% VRN 10/08/40 EUR (b) (c) |
300,000 | 223,228 | ||||||
Jackson Financial, Inc. |
||||||||
5.170% 6/08/27 |
430,000 | 412,581 | ||||||
Legal & General Group PLC 5 Year UK Gilt + 4.580% |
||||||||
5.375% VRN 10/27/45 GBP (b) (c) |
185,000 | 190,223 | ||||||
Marsh & McLennan Cos., Inc. |
||||||||
2.250% 11/15/30 |
185,000 | 147,210 | ||||||
Trinity Acquisition PLC |
||||||||
4.400% 3/15/26 |
545,000 | 523,347 | ||||||
| 4,619,631 | ||||||||
Internet — 0.2% |
||||||||
Booking Holdings, Inc. |
||||||||
2.150% 11/25/22 EUR (c) |
100,000 | 97,961 | ||||||
Go Daddy Operating Co. LLC/GD Finance Co., Inc. |
||||||||
5.250% 12/01/27 (b) |
50,000 | 46,055 | ||||||
Match Group Holdings II LLC |
||||||||
5.000% 12/15/27 (b) (d) |
148,000 | 132,090 | ||||||
MercadoLibre, Inc. |
||||||||
3.125% 1/14/31 (d) |
200,000 | 145,000 | ||||||
Netflix, Inc. |
||||||||
4.625% 5/15/29 EUR (c) |
100,000 | 91,416 | ||||||
NortonLifeLock, Inc. |
||||||||
6.750% 9/30/27 (b) |
30,000 | 28,891 | ||||||
7.125% 9/30/30 (b) |
22,000 | 21,279 | ||||||
Tencent Holdings Ltd. |
||||||||
3.240% 6/03/50 (b) |
350,000 | 212,588 | ||||||
3.840% 4/22/51 (b) |
200,000 | 130,620 | ||||||
United Group BV |
||||||||
4.625% 8/15/28 EUR (b) (c) |
100,000 | 69,069 | ||||||
| 974,969 | ||||||||
Investment Companies — 0.1% |
||||||||
Criteria Caixa SA |
||||||||
1.500% 5/10/23 EUR (b) (c) |
100,000 | 97,226 | ||||||
JAB Holdings BV |
||||||||
2.000% 5/18/28 EUR (b) (c) |
300,000 | 250,744 | ||||||
| 347,970 | ||||||||
Iron & Steel — 0.1% |
||||||||
ABJA Investment Co. Pte Ltd. |
||||||||
5.450% 1/24/28 (b) |
200,000 | 185,752 | ||||||
Principal |
Value |
|||||||
Nucor Corp. |
||||||||
3.125% 4/01/32 |
$ | 150,000 | $ | 122,387 | ||||
| 308,139 | ||||||||
Leisure Time — 0.1% |
||||||||
Deuce Finco Plc |
||||||||
5.500% 6/15/27 GBP (b) (c) |
100,000 | 83,183 | ||||||
Royal Caribbean Cruises Ltd. |
||||||||
8.250% 1/15/29 (b) (f) |
205,000 | 199,619 | ||||||
| 282,802 | ||||||||
Lodging — 0.1% |
||||||||
Las Vegas Sands Corp. |
||||||||
3.500% 8/18/26 |
210,000 | 183,658 | ||||||
Marriott International, Inc. |
||||||||
2.850% 4/15/31 |
155,000 | 121,647 | ||||||
5.000% 10/15/27 |
335,000 | 323,675 | ||||||
| 628,980 | ||||||||
Machinery – Diversified — 0.1% |
||||||||
Highland Holdings Sarl |
||||||||
0.318% 12/15/26 EUR (c) |
122,000 | 102,979 | ||||||
TK Elevator Midco GmbH |
||||||||
4.375% 7/15/27 EUR (b) (c) |
100,000 | 82,079 | ||||||
TK Elevator US Newco, Inc. |
||||||||
5.250% 7/15/27 (b) |
285,000 | 242,310 | ||||||
| 427,368 | ||||||||
Media — 0.3% |
||||||||
Altice Financing SA |
||||||||
4.250% 8/15/29 EUR (b) (c) |
100,000 | 75,717 | ||||||
CCO Holdings LLC/CCO Holdings Capital Corp. |
||||||||
4.250% 2/01/31 (b) |
235,000 | 179,856 | ||||||
5.375% 6/01/29 (b) |
80,000 | 70,026 | ||||||
6.375% 9/01/29 (b) |
130,000 | 119,353 | ||||||
Charter Communications Operating LLC/Charter Communications Operating Capital |
||||||||
2.250% 1/15/29 |
355,000 | 277,028 | ||||||
2.800% 4/01/31 |
89,000 | 67,250 | ||||||
4.200% 3/15/28 |
485,000 | 435,650 | ||||||
6.484% 10/23/45 |
105,000 | 92,287 | ||||||
Comcast Corp. |
||||||||
3.250% 11/01/39 |
295,000 | 216,680 | ||||||
DISH DBS Corp. |
||||||||
5.750% 12/01/28 (b) |
105,000 | 79,124 | ||||||
Sirius XM Radio, Inc. |
||||||||
4.000% 7/15/28 (b) |
155,000 | 131,840 | ||||||
Univision Communications, Inc. |
||||||||
7.375% 6/30/30 (b) |
65,000 | 62,029 | ||||||
The accompanying notes are an integral part of the financial statements.
44
MassMutual Select T. Rowe Price Bond Asset Fund – Portfolio of Investments (Continued) |
Principal |
Value |
|||||||
Ziggo BV |
||||||||
2.875% 1/15/30 EUR (b) (c) |
$ | 100,000 | $ | 71,789 | ||||
| 1,878,629 | ||||||||
Mining — 0.0% |
||||||||
Arconic Corp. |
||||||||
6.125% 2/15/28 (b) (d) |
165,000 | 145,749 | ||||||
Hudbay Minerals, Inc. |
||||||||
6.125% 4/01/29 (b) (d) |
100,000 | 80,573 | ||||||
| 226,322 | ||||||||
Miscellaneous - Manufacturing — 0.1% |
||||||||
Parker Hannifin Corp. |
||||||||
4.250% 9/15/27 |
260,000 | 247,756 | ||||||
Parker-Hannifin Corp. |
||||||||
4.500% 9/15/29 |
175,000 | 164,892 | ||||||
Siemens Financieringsmaatschappij NV |
||||||||
0.000% 2/20/23 EUR (b) (c) |
100,000 | 97,218 | ||||||
0.375% 9/06/23 EUR (b) (c) |
107,000 | 102,652 | ||||||
| 612,518 | ||||||||
Oil & Gas — 1.0% |
||||||||
Aker BP ASA |
||||||||
2.875% 1/15/26 (b) |
180,000 | 163,523 | ||||||
BP Capital Markets PLC |
||||||||
1.109% 2/16/23 EUR (b) (c) |
150,000 | 146,666 | ||||||
2.213% 9/25/26 EUR (b) (c) |
160,000 | 149,283 | ||||||
Chesapeake Energy Corp. |
||||||||
6.750% 4/15/29 (b) |
60,000 | 57,315 | ||||||
Continental Resources, Inc. |
||||||||
5.750% 1/15/31 (b) |
160,000 | 144,617 | ||||||
Ecopetrol SA |
||||||||
4.625% 11/02/31 |
225,000 | 157,050 | ||||||
Eni SpA |
||||||||
3.250% 7/10/23 EUR (b) (c) |
117,000 | 115,013 | ||||||
4.750% 9/12/28 (b) |
875,000 | 824,540 | ||||||
Leviathan Bond Ltd. |
||||||||
6.500% 6/30/27 (b) |
300,000 | 275,250 | ||||||
Occidental Petroleum Corp. |
||||||||
6.200% 3/15/40 |
55,000 | 53,213 | ||||||
8.500% 7/15/27 |
225,000 | 240,795 | ||||||
8.875% 7/15/30 |
160,000 | 178,128 | ||||||
OMV AG |
||||||||
0.000% 6/16/23 EUR (b) (c) |
71,000 | 68,307 | ||||||
Petroleos Mexicanos |
||||||||
5.125% 3/15/23 EUR (b) (c) |
850,000 | 830,534 | ||||||
Saudi Arabian Oil Co. |
||||||||
4.250% 4/16/39 (b) |
200,000 | 171,250 | ||||||
TotalEnergies Capital International SA |
||||||||
2.125% 3/15/23 EUR (b) (c) |
100,000 | 98,003 | ||||||
Principal |
Value |
|||||||
Wintershall Dea Finance BV |
||||||||
0.452% 9/25/23 EUR (b) (c) |
$ | 100,000 | $ | 94,722 | ||||
Woodside Finance Ltd. |
||||||||
3.700% 9/15/26 (b) |
2,000,000 | 1,851,828 | ||||||
| 5,620,037 | ||||||||
Packaging & Containers — 0.1% |
||||||||
Ardagh Metal Packaging Finance USA LLC / Ardagh Metal Packaging Finance PLC |
||||||||
3.000% 9/01/29 EUR (b) (c) |
180,000 | 125,641 | ||||||
6.000% 6/15/27 (b) |
240,000 | 226,009 | ||||||
Graphic Packaging International LLC |
||||||||
2.625% 2/01/29 EUR (b) (c) |
100,000 | 74,801 | ||||||
Sealed Air Corp. |
||||||||
5.000% 4/15/29 (b) (d) |
85,000 | 75,862 | ||||||
Trivium Packaging Finance BV |
||||||||
3.750% 8/15/26 EUR (b) (c) |
100,000 | 88,082 | ||||||
| 590,395 | ||||||||
Pharmaceuticals — 1.2% |
||||||||
AbbVie, Inc. |
||||||||
2.950% 11/21/26 |
410,000 | 375,781 | ||||||
3.200% 11/21/29 |
475,000 | 416,481 | ||||||
4.050% 11/21/39 |
270,000 | 217,794 | ||||||
4.250% 11/21/49 |
325,000 | 260,937 | ||||||
4.700% 5/14/45 |
530,000 | 448,355 | ||||||
4.875% 11/14/48 |
980,000 | 861,800 | ||||||
Astrazeneca Finance LLC |
||||||||
1.750% 5/28/28 |
445,000 | 374,211 | ||||||
Bayer Capital Corp. BV |
||||||||
0.625% 12/15/22 EUR (b) (c) |
100,000 | 97,766 | ||||||
1.250% 11/13/23 EUR (b) (c) |
56,000 | 53,768 | ||||||
Becton Dickinson and Co. |
||||||||
1.957% 2/11/31 |
800,000 | 617,342 | ||||||
2.823% 5/20/30 |
510,000 | 426,672 | ||||||
3.020% 5/24/25 GBP (c) |
150,000 | 151,789 | ||||||
4.669% 6/06/47 |
246,000 | 211,231 | ||||||
Cardinal Health, Inc. |
||||||||
4.500% 11/15/44 |
95,000 | 73,464 | ||||||
4.900% 9/15/45 |
105,000 | 86,024 | ||||||
Cigna Corp. |
||||||||
3.400% 3/01/27 |
135,000 | 124,143 | ||||||
CVS Health Corp. |
||||||||
3.250% 8/15/29 |
135,000 | 118,094 | ||||||
5.050% 3/25/48 |
728,000 | 638,689 | ||||||
GlaxoSmithKline Capital PLC |
||||||||
0.125% 5/12/23 EUR (b) (c) |
100,000 | 96,658 | ||||||
Roche Finance Europe BV |
||||||||
0.500% 2/27/23 EUR (b) (c) |
92,000 | 89,753 | ||||||
The accompanying notes are an integral part of the financial statements.
45
MassMutual Select T. Rowe Price Bond Asset Fund – Portfolio of Investments (Continued) |
Principal |
Value |
|||||||
Sanofi |
||||||||
0.500% 3/21/23 EUR (b) (c) |
$ | 100,000 | $ | 97,505 | ||||
2.500% 11/14/23 EUR (b) (c) |
100,000 | 97,892 | ||||||
Teva Pharmaceutical Finance Netherlands BV |
||||||||
6.000% 1/31/25 EUR (c) |
100,000 | 95,563 | ||||||
7.125% 1/31/25 |
200,000 | 194,681 | ||||||
Utah Acquisition Sub, Inc. |
||||||||
3.950% 6/15/26 |
685,000 | 624,731 | ||||||
| 6,851,124 | ||||||||
Pipelines — 2.1% |
||||||||
Boardwalk Pipelines LP |
||||||||
3.400% 2/15/31 |
990,000 | 796,051 | ||||||
4.950% 12/15/24 |
1,415,000 | 1,400,597 | ||||||
Cheniere Corpus Christi Holdings LLC |
||||||||
3.700% 11/15/29 |
465,000 | 403,107 | ||||||
5.125% 6/30/27 |
140,000 | 135,611 | ||||||
5.875% 3/31/25 |
760,000 | 763,412 | ||||||
7.000% 6/30/24 |
290,000 | 294,699 | ||||||
Cheniere Energy Partners LP |
||||||||
3.250% 1/31/32 |
95,000 | 73,794 | ||||||
Cheniere Energy, Inc. |
||||||||
4.625% 10/15/28 |
255,000 | 233,159 | ||||||
Energy Transfer LP |
||||||||
2.900% 5/15/25 |
185,000 | 172,103 | ||||||
4.500% 4/15/24 |
105,000 | 103,369 | ||||||
5.875% 1/15/24 |
600,000 | 601,315 | ||||||
6.000% 6/15/48 |
568,000 | 490,806 | ||||||
6.250% 4/15/49 |
105,000 | 94,030 | ||||||
Enterprise Products Operating LLC |
||||||||
2.800% 1/31/30 |
145,000 | 121,041 | ||||||
Gray Oak Pipeline LLC |
||||||||
2.000% 9/15/23 (b) |
55,000 | 53,158 | ||||||
2.600% 10/15/25 (b) |
170,000 | 152,481 | ||||||
3.450% 10/15/27 (b) |
70,000 | 61,970 | ||||||
Kinetik Holdings LP |
||||||||
5.875% 6/15/30 (b) |
145,000 | 132,771 | ||||||
MPLX LP |
||||||||
4.950% 9/01/32 |
520,000 | 472,193 | ||||||
NuStar Logistics LP |
||||||||
5.750% 10/01/25 |
150,000 | 139,016 | ||||||
Sabine Pass Liquefaction LLC |
||||||||
4.500% 5/15/30 |
95,000 | 86,509 | ||||||
5.000% 3/15/27 |
290,000 | 278,137 | ||||||
5.875% 6/30/26 |
1,715,000 | 1,716,876 | ||||||
Tallgrass Energy Partners LP / Tallgrass Energy Finance Corp |
||||||||
7.500% 10/01/25 (b) |
195,000 | 191,588 | ||||||
Principal |
Value |
|||||||
Targa Resources Partners LP/Targa Resources Partners Finance Corp. |
||||||||
4.000% 1/15/32 |
$ | 125,000 | $ | 103,088 | ||||
4.875% 2/01/31 |
25,000 | 21,500 | ||||||
5.500% 3/01/30 |
150,000 | 135,360 | ||||||
6.875% 1/15/29 |
345,000 | 340,518 | ||||||
Transcanada Trust 3 mo. CDOR + 3.080% |
||||||||
4.650% VRN 5/18/77 CAD (c) |
650,000 | 423,354 | ||||||
Transcontinental Gas Pipe Line Co. LLC |
||||||||
4.000% 3/15/28 |
125,000 | 114,742 | ||||||
4.600% 3/15/48 |
110,000 | 90,264 | ||||||
Venture Global Calcasieu Pass LLC |
||||||||
3.875% 8/15/29 (b) |
55,000 | 47,183 | ||||||
3.875% 11/01/33 (b) |
180,000 | 139,950 | ||||||
4.125% 8/15/31 (b) |
65,000 | 53,916 | ||||||
The Williams Cos., Inc. |
||||||||
3.750% 6/15/27 |
1,170,000 | 1,076,758 | ||||||
| 11,514,426 | ||||||||
Real Estate — 0.2% |
||||||||
Akelius Residential Property AB |
||||||||
1.750% 2/07/25 EUR (b) (c) |
170,000 | 157,067 | ||||||
Blackstone Property Partners Europe Holdings SARL |
||||||||
0.500% 9/12/23 EUR (b) (c) |
100,000 | 94,328 | ||||||
1.750% 3/12/29 EUR (b) (c) |
280,000 | 209,925 | ||||||
Country Garden Holdings Co. Ltd. |
||||||||
5.125% 1/17/25 (b) |
250,000 | 81,847 | ||||||
Cushman & Wakefield US Borrower LLC |
||||||||
6.750% 5/15/28 (b) |
85,000 | 78,842 | ||||||
Dar Al-Arkan Sukuk Co. Ltd. |
||||||||
6.750% 2/15/25 (b) |
300,000 | 289,610 | ||||||
EMG SUKUK Ltd. |
||||||||
4.564% 6/18/24 (b) |
200,000 | 194,974 | ||||||
Howard Hughes Corp. |
||||||||
4.125% 2/01/29 (b) |
195,000 | 150,638 | ||||||
5.375% 8/01/28 (b) |
10,000 | 8,300 | ||||||
Vonovia Finance BV |
||||||||
2.250% 12/15/23 EUR (b) (c) |
100,000 | 96,360 | ||||||
| 1,361,891 | ||||||||
Real Estate Investment Trusts (REITS) — 1.9% |
||||||||
Brixmor Operating Partnership LP |
||||||||
4.050% 7/01/30 |
585,000 | 492,661 | ||||||
4.125% 6/15/26 |
2,000,000 | 1,871,722 | ||||||
4.125% 5/15/29 |
160,000 | 139,021 | ||||||
Crown Castle, Inc. |
||||||||
2.100% 4/01/31 |
155,000 | 116,112 | ||||||
2.250% 1/15/31 |
715,000 | 545,565 | ||||||
The accompanying notes are an integral part of the financial statements.
46
MassMutual Select T. Rowe Price Bond Asset Fund – Portfolio of Investments (Continued) |
Principal |
Value |
|||||||
2.900% 3/15/27 |
$ | 135,000 | $ | 119,883 | ||||
3.800% 2/15/28 |
665,000 | 602,014 | ||||||
Digital Dutch Finco BV |
||||||||
0.125% 10/15/22 EUR (b) (c) |
108,000 | 105,768 | ||||||
Essex Portfolio LP |
||||||||
4.000% 3/01/29 |
760,000 | 688,536 | ||||||
Extra Space Storage LP |
||||||||
2.350% 3/15/32 |
775,000 | 570,731 | ||||||
GLP Capital LP/GLP Financing II, Inc. |
||||||||
3.350% 9/01/24 |
125,000 | 118,388 | ||||||
Healthcare Realty Holdings LP |
||||||||
2.050% 3/15/31 |
230,000 | 167,363 | ||||||
3.625% 1/15/28 |
850,000 | 748,721 | ||||||
Highwoods Realty LP |
||||||||
3.050% 2/15/30 |
675,000 | 546,845 | ||||||
4.125% 3/15/28 |
405,000 | 365,416 | ||||||
Inmobiliaria Colonial Socimi SA |
||||||||
1.625% 11/28/25 EUR (b) (c) |
200,000 | 181,664 | ||||||
Klepierre SA |
||||||||
1.000% 4/17/23 EUR (b) (c) |
100,000 | 97,129 | ||||||
MGM Growth Properties Operating Partnership LP / MGP Finance Co-Issuer, Inc. |
||||||||
5.750% 2/01/27 |
55,000 | 51,425 | ||||||
Prologis LP |
||||||||
2.250% 6/30/29 GBP (c) |
150,000 | 131,090 | ||||||
Realty Income Corp. |
||||||||
3.950% 8/15/27 |
650,000 | 610,701 | ||||||
Regency Centers LP |
||||||||
3.600% 2/01/27 |
305,000 | 283,440 | ||||||
4.125% 3/15/28 |
815,000 | 748,465 | ||||||
SBA Tower Trust |
||||||||
1.840% 4/15/27 (b) |
635,000 | 536,073 | ||||||
2.593% 10/15/56 (b) |
515,000 | 401,835 | ||||||
Scentre Group Trust 1 / Scentre Group Trust 2 |
||||||||
1.375% 3/22/23 EUR (b) (c) |
111,000 | 108,083 | ||||||
| 10,348,651 | ||||||||
Retail — 0.3% |
||||||||
AutoZone, Inc. |
||||||||
4.750% 8/01/32 |
135,000 | 126,555 | ||||||
Bath & Body Works, Inc. |
||||||||
6.625% 10/01/30 (b) |
145,000 | 126,150 | ||||||
Lowe S Cos., Inc. |
||||||||
3.350% 4/01/27 |
45,000 | 41,695 | ||||||
3.750% 4/01/32 |
340,000 | 293,939 | ||||||
Next Group PLC |
||||||||
3.625% 5/18/28 GBP (b) (c) |
250,000 | 223,642 | ||||||
Principal |
Value |
|||||||
O’Reilly Automotive, Inc. |
||||||||
4.700% 6/15/32 |
$ | 135,000 | $ | 126,347 | ||||
PetSmart, Inc. / PetSmart Finance Corp. |
||||||||
4.750% 2/15/28 (b) |
255,000 | 218,342 | ||||||
Ross Stores, Inc. |
||||||||
1.875% 4/15/31 |
535,000 | 398,622 | ||||||
Yum! Brands, Inc. |
||||||||
5.375% 4/01/32 |
250,000 | 221,660 | ||||||
| 1,776,952 | ||||||||
Savings & Loans — 0.0% |
||||||||
Nationwide Building Society |
||||||||
3 mo. EURIBOR + .930% 1.500% VRN 3/08/26 EUR (b) (c) |
140,000 | 127,814 | ||||||
5 year EUR Swap + 1.500% 2.000% VRN 7/25/29 EUR (b) (c) |
150,000 | 137,574 | ||||||
| 265,388 | ||||||||
Semiconductors — 0.4% |
||||||||
Broadcom, Inc. |
||||||||
4.110% 9/15/28 |
135,000 | 121,684 | ||||||
Entegris Escrow Corp. |
||||||||
5.950% 6/15/30 (b) |
185,000 | 168,851 | ||||||
Micron Technology, Inc. |
||||||||
4.185% 2/15/27 |
262,000 | 244,699 | ||||||
4.975% 2/06/26 |
435,000 | 425,130 | ||||||
NXP BV / NXP Funding LLC |
||||||||
5.350% 3/01/26 |
1,115,000 | 1,101,486 | ||||||
NXP BV / NXP Funding LLC / NXP USA, Inc. |
||||||||
2.700% 5/01/25 |
45,000 | 41,735 | ||||||
3.150% 5/01/27 |
95,000 | 84,658 | ||||||
| 2,188,243 | ||||||||
Software — 0.2% |
||||||||
Central Parent, Inc. / CDK Global, Inc. |
||||||||
7.250% 6/15/29 (b) (d) |
129,000 | 122,640 | ||||||
Fidelity National Information Services, Inc. |
||||||||
0.125% 12/03/22 EUR (c) |
109,000 | 106,602 | ||||||
0.750% 5/21/23 EUR (c) |
110,000 | 106,409 | ||||||
Fiserv, Inc. |
||||||||
3.000% 7/01/31 GBP (c) |
250,000 | 212,029 | ||||||
3.500% 7/01/29 |
150,000 | 130,465 | ||||||
Oracle Corp. |
||||||||
2.300% 3/25/28 |
355,000 | 296,645 | ||||||
SAP SE |
||||||||
1.125% 2/20/23 EUR (b) (c) |
106,000 | 103,674 | ||||||
Workday, Inc. |
||||||||
3.500% 4/01/27 |
140,000 | 129,394 | ||||||
3.700% 4/01/29 |
110,000 | 99,005 | ||||||
| 1,306,863 | ||||||||
The accompanying notes are an integral part of the financial statements.
47
MassMutual Select T. Rowe Price Bond Asset Fund – Portfolio of Investments (Continued) |
Principal |
Value |
|||||||
Telecommunications — 1.6% |
||||||||
Altice France SA |
||||||||
3.375% 1/15/28 EUR (b) (c) |
$ | 135,000 | $ | 100,230 | ||||
5.500% 1/15/28 (b) |
290,000 | 229,648 | ||||||
America Movil SAB de CV |
||||||||
5.750% 6/28/30 GBP (c) |
140,000 | 148,954 | ||||||
AT&T, Inc. |
||||||||
1.650% 2/01/28 (d) |
415,000 | 341,232 | ||||||
2.300% 6/01/27 |
450,000 | 393,498 | ||||||
2.500% 3/15/23 EUR (c) |
113,000 | 110,820 | ||||||
Axiata SPV2 Bhd |
||||||||
2.163% 8/19/30 (b) |
250,000 | 202,851 | ||||||
CK Hutchison Group Telecom Finance SA |
||||||||
0.375% 10/17/23 EUR (b) (c) |
109,000 | 103,589 | ||||||
Deutsche Telekom International Finance BV |
||||||||
0.625% 4/03/23 EUR (b) (c) |
112,000 | 108,877 | ||||||
NBN Co., Ltd. |
||||||||
2.625% 5/05/31 (b) |
480,000 | 381,789 | ||||||
NTT Finance Corp. |
||||||||
1.591% 4/03/28 (b) |
765,000 | 631,608 | ||||||
Orange SA |
||||||||
0.750% 9/11/23 EUR (b) (c) |
100,000 | 96,114 | ||||||
PLT VII Finance Sarl |
||||||||
4.625% 1/05/26 EUR (b) (c) |
100,000 | 87,592 | ||||||
Rogers Communications, Inc. |
||||||||
3.200% 3/15/27 (b) |
185,000 | 169,047 | ||||||
3.800% 3/15/32 (b) |
295,000 | 253,927 | ||||||
4.550% 3/15/52 (b) |
145,000 | 115,605 | ||||||
Sprint Capital Corp. |
||||||||
6.875% 11/15/28 |
110,000 | 113,025 | ||||||
T-Mobile USA, Inc. |
||||||||
2.050% 2/15/28 |
270,000 | 223,842 | ||||||
3.750% 4/15/27 |
2,765,000 | 2,552,930 | ||||||
Tele2 AB |
||||||||
0.750% 3/23/31 EUR (b) (c) |
130,000 | 97,717 | ||||||
Telefonica Emisiones SA |
||||||||
3.987% 1/23/23 EUR (b) (c) |
100,000 | 98,525 | ||||||
Verizon Communications, Inc. |
||||||||
2.100% 3/22/28 |
365,000 | 308,115 | ||||||
2.355% 3/15/32 |
718,000 | 550,310 | ||||||
2.550% 3/21/31 |
370,000 | 295,738 | ||||||
2.650% 11/20/40 |
530,000 | 345,486 | ||||||
Vmed O2 UK Financing I PLC |
||||||||
4.500% 7/15/31 GBP (b) (c) |
155,000 | 122,444 | ||||||
4.500% 7/15/31 GBP (b) (c) |
150,000 | 118,494 | ||||||
Principal |
Value |
|||||||
Vodafone Group PLC |
||||||||
1.750% 8/25/23 EUR (b) (c) |
$ | 113,000 | $ | 109,648 | ||||
4.875% 6/19/49 |
38,000 | 29,872 | ||||||
5.250% 5/30/48 |
408,000 | 337,880 | ||||||
| 8,779,407 | ||||||||
Toys, Games & Hobbies — 0.0% |
||||||||
Hasbro, Inc. |
||||||||
3.550% 11/19/26 |
245,000 | 227,430 | ||||||
Transportation — 0.0% |
||||||||
Deutsche Post AG |
||||||||
2.750% 10/09/23 EUR (b) (c) |
62,000 | 60,777 | ||||||
InPost SA |
||||||||
2.250% 7/15/27 EUR (b) (c) |
100,000 | 73,406 | ||||||
| 134,183 | ||||||||
Water — 0.0% |
||||||||
Veolia Environnement SA |
||||||||
0.314% 10/04/23 EUR (b) (c) |
100,000 | 95,598 | ||||||
TOTAL CORPORATE DEBT (Cost $182,208,672) |
155,174,996 | |||||||
MUNICIPAL OBLIGATIONS — 0.1% |
||||||||
Commonwealth of Puerto Rico, General Obligation, |
||||||||
0.000% 11/01/43 |
736,326 | 368,163 | ||||||
TOTAL MUNICIPAL OBLIGATIONS (Cost $392,294) |
368,163 | |||||||
NON-U.S. GOVERNMENT AGENCY OBLIGATIONS — 9.5% |
||||||||
Automobile Asset-Backed Securities — 0.9% |
||||||||
AmeriCredit Automobile Receivables Trust, Series 2020-3, Class D |
||||||||
1.490% 9/18/26 |
275,000 | 257,374 | ||||||
CarMax Auto Owner Trust, Series 2022-1, Class D |
||||||||
2.470% 7/17/28 |
280,000 | 262,232 | ||||||
Exeter Automobile Receivables Trust |
||||||||
Series 2021-2A, Class D, 1.400% 4/15/27 |
235,000 | 216,694 | ||||||
Series 2022-1A, Class D, 3.020% 6/15/28 |
995,000 | 918,375 | ||||||
Series 2022-2A, Class C, 3.850% 7/17/28 |
820,000 | 787,968 | ||||||
Series 2022-3A, Class C, 5.300% 9/15/27 |
520,000 | 509,253 | ||||||
The accompanying notes are an integral part of the financial statements.
48
MassMutual Select T. Rowe Price Bond Asset Fund – Portfolio of Investments (Continued) |
Principal |
Value |
|||||||
GMF Floorplan Owner Revolving Trust, Series 2020-2, Class C |
||||||||
1.310% 10/15/25 (b) |
$ | 290,000 | $ | 278,012 | ||||
Santander Bank NA - SBCLN, Series 2021-1A, Class B |
||||||||
1.833% 12/15/31 (b) |
155,022 | 150,242 | ||||||
Santander Consumer Auto Receivables Trust, Series 2021-AA, Class D |
||||||||
1.570% 1/15/27 (b) |
735,000 | 667,341 | ||||||
Santander Drive Auto Receivables Trust, Series 2021-4, Class D |
||||||||
1.670% 10/15/27 |
310,000 | 287,772 | ||||||
Santander Retail Auto Lease Trust, Series 2021-A, Class D |
||||||||
1.380% 3/22/27 (b) |
715,000 | 671,081 | ||||||
| 5,006,344 | ||||||||
Commercial Mortgage-Backed Securities — 2.8% |
||||||||
Austin Fairmont Hotel Trust, Series 2019-FAIR, Class B, 1 mo. USD LIBOR + 1.250% |
||||||||
4.068% FRN 9/15/32 (b) |
235,000 | 226,239 | ||||||
Aventura Mall Trust, Series 2018-AVM, Class A, |
||||||||
4.249% VRN 7/05/40 (b) (g) |
380,000 | 343,652 | ||||||
Barclays Commercial Mortgage Trust, Series 2019-BWAY, Class D, 1 mo. USD LIBOR + 2.160% |
||||||||
4.978% FRN 11/15/34 (b) |
245,000 | 237,295 | ||||||
Benchmark Mortgage Trust, Series 2018-B1, Class AM, |
||||||||
3.878% VRN 1/15/51 (g) |
290,000 | 264,407 | ||||||
BX Commercial Mortgage Trust |
||||||||
Series 2021-LGCY, Class C, 1 mo. USD LIBOR + 1.004% 3.822% FRN 10/15/23 (b) |
385,000 | 355,296 | ||||||
Series 2021-21M, Class C, 1 mo. USD LIBOR + 1.177% 3.995% FRN 10/15/36 (b) |
340,000 | 315,892 | ||||||
Series 2021-ARIA, Class B, 1 mo. USD LIBOR + 1.297% 4.115% FRN 10/15/36 (b) |
475,000 | 444,203 | ||||||
Series 2022-CSMO, Class B, 1 mo. TSFR + 3.141% 5.986% FRN 6/15/27 (b) |
675,000 | 668,265 | ||||||
Bxsc Commercial Mortgage Trust |
||||||||
Series 2018, Class B, 1 mo. TSFR + 2.092% 4.938% FRN 3/15/35 (b) |
920,000 | 878,621 | ||||||
Series 2022, Class C, 1 mo. TSFR + 2.391% 5.237% FRN 3/15/35 (b) |
170,000 | 164,085 | ||||||
Principal |
Value |
|||||||
Cantor Commercial Real Estate Lending, Series 2019-CF2, Class B |
||||||||
3.267% 11/15/52 |
$ | 295,000 | $ | 242,761 | ||||
Citigroup Commercial Mortgage Trust |
||||||||
Series 2013-375P, Class D, 3.635% VRN 5/10/35 (b) (g) |
315,000 | 303,645 | ||||||
Series 2013-375P, Class C, 3.635% VRN 5/10/35 (b) (g) |
390,000 | 375,929 | ||||||
Cold Storage Trust, Series 2020-ICE5, Class C, 1 mo. USD LIBOR + 1.650% |
||||||||
4.468% FRN 11/15/37 (b) |
285,067 | 276,575 | ||||||
Commercial Mortgage Trust |
||||||||
Series 2015-LC23, Class AM, 4.158% VRN 10/10/48 (g) |
1,650,000 | 1,546,259 | ||||||
Series 2015-CR26, Class B, 4.619% VRN 10/10/48 (g) |
627,000 | 588,893 | ||||||
Credit Suisse Mortgage Trust |
||||||||
Series 2020-NET, Class A, 2.257% 8/15/37 (b) |
298,544 | 269,698 | ||||||
Series 2020-NET, Class C, 3.526% 8/15/37 (b) |
480,000 | 436,594 | ||||||
DC Office Trust, Series 2019-MTC, Class D, |
||||||||
3.174% VRN 9/15/45 (b) (g) |
520,000 | 405,540 | ||||||
Great Wolf Trust |
||||||||
Series 2019-WOLF, Class A, 1 mo. USD LIBOR + 1.034% 3.852% FRN 12/15/36 (b) |
710,000 | 692,376 | ||||||
Series 2019-WOLF, Class C, 1 mo. USD LIBOR + 1.633% 4.451% FRN 12/15/36 (b) |
435,000 | 416,637 | ||||||
Series 2019-WOLF, Class D, 1 mo. USD LIBOR + 1.933% 4.751% FRN 12/15/36 (b) |
820,000 | 783,348 | ||||||
GS Mortgage Securities Trust, Series 2019-GSA1, Class B |
||||||||
3.511% 11/10/52 |
870,000 | 727,516 | ||||||
JP Morgan Chase Commercial Mortgage Securities Trust, Series 2018-WPT, Class AFX |
||||||||
4.248% 7/05/33 (b) |
115,000 | 112,125 | ||||||
Manhattan West Mortgage Trust, Series 2020-1MW, Class D, |
||||||||
2.413% VRN 9/10/39 (b) (g) |
290,000 | 227,538 | ||||||
SMRT, Series 2022-MINI, Class C, 1 mo. TSFR + 1.550% |
||||||||
4.396% FRN 1/15/39 (b) |
580,000 | 546,674 | ||||||
VNDO Trust, Series 2016,Class D, |
||||||||
4.033% VRN 1/10/35 (b) (g) |
750,000 | 636,770 | ||||||
The accompanying notes are an integral part of the financial statements.
49
MassMutual Select T. Rowe Price Bond Asset Fund – Portfolio of Investments (Continued) |
Principal |
Value |
|||||||
Wells Fargo Commercial Mortgage Trust |
||||||||
Series 2014-LC18, Class AS, 3.808% 12/15/47 |
$ | 1,695,000 | $ | 1,593,477 | ||||
Series 2017-C39, Class B, 4.025% 9/15/50 |
1,010,000 | 913,098 | ||||||
Series 2021-SAVE, Class C, 1 mo. USD LIBOR + 1.800% 4.618% FRN 2/15/40 (b) |
368,154 | 353,216 | ||||||
| 15,346,624 | ||||||||
Other Asset-Backed Securities — 3.2% |
||||||||
522 Funding CLO Ltd. |
||||||||
Series 2019-5A, Class AR, 3 mo. TSFR + 1.330% 3.658% FRN 4/15/35 (b) |
825,000 | 789,926 | ||||||
Series 2019-5A, Class BR, 3 mo. TSFR + 1.850% 4.178% FRN 4/15/35 (b) |
465,000 | 430,559 | ||||||
AGL CLO 17 Ltd., Series 2022-17A, Class A, 3 mo. TSFR + 1.330% |
||||||||
3.804% FRN 1/21/35 (b) |
630,000 | 602,608 | ||||||
Amur Equipment Finance Receivables X LLC, Series 2022-1A, Class C |
||||||||
2.370% 4/20/28 (b) |
175,000 | 160,106 | ||||||
Applebee’s Funding LLC/IHOP Funding LLC, Series 2019-1A, Class A2I |
||||||||
4.194% 6/05/49 (b) |
1,386,000 | 1,336,756 | ||||||
Benefit Street Partners CLO Ltd., Series 2020-20A, Class AR, 3 mo. USD LIBOR + 1.170% |
||||||||
3.682% FRN 7/15/34 (b) |
470,000 | 449,503 | ||||||
Carlyle U.S. CLO Ltd., Series 2019-4A, Class A11R, 3 mo. TSFR + 1.320% |
||||||||
3.648% FRN 4/15/35 (b) |
865,000 | 827,796 | ||||||
CBAM Ltd., Series 2019-9A, Class A, 3 mo. USD LIBOR + 1.280% |
||||||||
3.792% FRN 2/12/30 (b) |
1,159,279 | 1,140,780 | ||||||
Cedar Funding VIII Clo Ltd., Series 2017-8A, Class A1R, 3 mo. USD LIBOR + 1.150% |
||||||||
3.890% FRN 10/17/34 (b) |
490,000 | 467,869 | ||||||
CIFC Funding Ltd. |
||||||||
Series 2021-3A, Class A, 3 mo. USD LIBOR + 1.140% 3.652% FRN 7/15/36 (b) |
585,000 | 560,279 | ||||||
Series 2020-1A, Class A1R, 3 mo. USD LIBOR + 1.150% 3.662% FRN 7/15/36 (b) |
925,000 | 886,439 | ||||||
Series 2020-3A, Class A1R, 3 mo. USD LIBOR + 1.130% 3.840% FRN 10/20/34 (b) |
610,000 | 584,340 | ||||||
Principal |
Value |
|||||||
Cologix Canadian Issuer LP, Series 2022-1CAN, Class A2 |
||||||||
4.940% 1/25/52 CAD (b) (c) |
$ | 275,000 | $ | 184,122 | ||||
Driven Brands Funding LLC |
||||||||
Series 2020-2A, Class A2, 3.237% 1/20/51 (b) |
556,525 | 477,102 | ||||||
Series 2020-1A, Class A2, 3.786% 7/20/50 (b) |
269,500 | 236,597 | ||||||
Dryden 86 CLO Ltd., Series 2020-86A, Class A1R, 3 mo. USD LIBOR + 1.100% |
||||||||
3.840% FRN 7/17/34 (b) |
600,000 | 573,495 | ||||||
Hardee’s Funding LLC |
||||||||
Series 2021-1A, Class A2, 2.865% 6/20/51 (b) |
296,250 | 240,747 | ||||||
Series 2018-1A, Class AII, 4.959% 6/20/48 (b) |
312,000 | 292,948 | ||||||
HPEFS Equipment Trust |
||||||||
Series 2022-1A, Class C, 1.960% 5/21/29 (b) |
330,000 | 306,585 | ||||||
Series 2022-1A, Class D, 2.400% 11/20/29 (b) |
350,000 | 324,200 | ||||||
HPS Loan Management Ltd. |
||||||||
Series 2021-16A, Class A1, 3 mo. USD LIBOR + 1.140% 3.923% FRN 1/23/35 (b) |
290,000 | 276,039 | ||||||
Series 11A-17, Class BR, 3 mo. USD LIBOR + 1.550% 4.413% FRN 5/06/30 (b) |
265,000 | 251,404 | ||||||
Jack in the Box Funding LLC, Series 2022-1A, Class A2I |
||||||||
3.445% 2/26/52 (b) |
964,260 | 839,580 | ||||||
Madison Park Funding XXXIII Ltd., Series 2019-33A, Class AR, 3 mo. TSFR + 1.290% |
||||||||
3.618% FRN 10/15/32 (b) |
465,000 | 452,125 | ||||||
Morgan Stanley Eaton Vance CLO, Series 2021-1A, Class B, 3 mo. USD LIBOR + 1.650% |
||||||||
4.433% FRN 10/20/34 (b) |
440,000 | 408,006 | ||||||
Neuberger Berman Loan Advisers CLO Ltd. |
||||||||
Series 2019-32A, Class AR, 3 mo. USD LIBOR + .990% 3.728% FRN 1/20/32 (b) |
1,445,000 | 1,405,382 | ||||||
Series 2021-43A, Class A, 3 mo. USD LIBOR + 1.130% 3.870% FRN 7/17/35 (b) |
685,000 | 656,360 | ||||||
OZLM Ltd., Series 2014-7RA, Class A1R, 3 mo. USD LIBOR + 1.010% |
||||||||
3.750% FRN 7/17/29 (b) |
279,936 | 274,090 | ||||||
The accompanying notes are an integral part of the financial statements.
50
MassMutual Select T. Rowe Price Bond Asset Fund – Portfolio of Investments (Continued) |
Principal |
Value |
|||||||
Palmer Square CLO Ltd., Series 2022-1A, Class A, 3 mo. TSFR + 1.320% |
||||||||
1.786% FRN 4/20/35 (b) |
$ | 480,000 | $ | 462,865 | ||||
Planet Fitness Master Issuer LLC, Series 2022-1A, Class A2I |
||||||||
3.251% 12/05/51 (b) |
631,825 | 547,657 | ||||||
Regatta XIX Funding Ltd., Series 2022-1A, Class B, 3 mo. TSFR + 1.850% |
||||||||
2.929% FRN 4/20/35 (b) |
420,000 | 385,730 | ||||||
Symphony CLO Ltd. |
||||||||
Series 2022-31A, Class B, 3 mo. TSFR + 1.850% 2.155% FRN 4/22/35 (b) |
410,000 | 386,938 | ||||||
Series 2021-26A, Class AR, 3 mo. USD LIBOR + 1.080% 3.790% FRN 4/20/33 (b) |
425,000 | 405,674 | ||||||
Wellfleet CLO Ltd., Series 2017-2A, Class A1R, 3 mo. USD LIBOR + 1.060% |
||||||||
3.770% FRN 10/20/29 (b) |
517,190 | 508,527 | ||||||
| 18,133,134 | ||||||||
Student Loans Asset-Backed Securities — 0.8% |
||||||||
Navient Private Education Refi Loan Trust |
||||||||
Series 2020-HA, Class A, 1.310% 1/15/69 (b) |
175,015 | 157,170 | ||||||
Series 2020-DA, Class A, 1.690% 5/15/69 (b) |
162,287 | 147,070 | ||||||
Series 2022-A, Class A, 2.230% 7/15/70 (b) |
978,347 | 868,176 | ||||||
Series 2019-FA, Class A2, 2.600% 8/15/68 (b) |
337,462 | 311,524 | ||||||
Series 2020-CA, Class B, 2.830% 11/15/68 (b) |
470,000 | 379,278 | ||||||
SMB Private Education Loan Trust |
||||||||
Series 2021-A, Class APT1, 1.070% 1/15/53 (b) |
463,764 | 396,021 | ||||||
Series 2020-BA, Class A1A, 1.290% 7/15/53 (b) |
202,880 | 182,050 | ||||||
Series 2021-A, Class B, 2.310% 1/15/53 (b) |
570,000 | 508,846 | ||||||
Series 2016-B, Class A2A, 2.430% 2/17/32 (b) |
344,401 | 333,037 | ||||||
Series 2018-A, Class A2A, 3.500% 2/15/36 (b) |
716,405 | 692,387 | ||||||
Series 2018-C, Class A2A, 3.630% 11/15/35 (b) |
520,999 | 494,467 | ||||||
| 4,470,026 | ||||||||
Principal |
Value |
|||||||
Whole Loan Collateral Collateralized Mortgage Obligations — 1.8% |
||||||||
Angel Oak Mortgage Trust |
||||||||
Series 2021-4, Class A3, 1.446% VRN 1/20/65 (b) (g) |
$ | 299,152 | $ | 242,660 | ||||
Series 2020-5, Class A3, 2.041% VRN 5/25/65 (b) (g) |
73,768 | 66,258 | ||||||
Series 2022-1, Class A1, 2.881% STEP 12/25/66 (b) |
315,334 | 274,494 | ||||||
Series 2020-5, Class M1, 2.970% VRN 5/25/65 (b) (g) |
275,000 | 223,030 | ||||||
Series 2019-1, Class A2, 4.022% VRN 11/25/48 (b) (g) |
6,458 | 6,431 | ||||||
Bayview MSR Opportunity Master Fund Trust |
||||||||
Series 2021-2, Class A20, 2.500% VRN 6/25/51 (b) (g) |
963,527 | 744,776 | ||||||
Series 2021-4, Class A20, 2.500% VRN 10/25/51 (b) (g) |
437,385 | 338,085 | ||||||
BINOM Securitization Trust, Series 2021-INV1, Class A1, |
||||||||
2.034% VRN 6/25/56 (b) (g) |
304,486 | 269,876 | ||||||
CIM Trust, Series 2021-INV1, Class A29, |
||||||||
2.500% VRN 7/01/51 (b) (g) |
611,255 | 475,537 | ||||||
Citigroup Mortgage Loan Trust, Series 2022-INV1, Class A4B, |
||||||||
3.000% VRN 11/27/51 (b) (g) |
227,180 | 188,630 | ||||||
COLT Mortgage Loan Trust, Series 2020-3, Class A1, |
||||||||
1.506% VRN 4/27/65 (b) (g) |
50,802 | 48,650 | ||||||
Ellington Financial Mortgage Trust |
||||||||
Series 2021-3, Class A1, 1.241% VRN 9/25/66 (b) (g) |
343,595 | 279,727 | ||||||
Series 2020-1, Class A3, 3.999% VRN 5/25/65 (b) (g) |
430,000 | 394,732 | ||||||
Flagstar Mortgage Trust |
||||||||
Series 2020-1INV, Class A11, 1 mo. USD LIBOR + .850% 3.934% FRN 3/25/50 (b) |
93,072 | 86,631 | ||||||
Series 2018-6RR, Class 2A4, 4.000% VRN 9/25/48 (b) (g) |
16,251 | 15,817 | ||||||
Galton Funding Mortgage Trust |
||||||||
Series 2019-H1, Class A3, 2.964% VRN 10/25/59 (b) (g) |
353,866 | 343,633 | ||||||
Series 2018-1, Class A23, 3.500% VRN 11/25/57 (b) (g) |
25,106 | 23,760 | ||||||
Series 2019-1, Class A22, 4.000% VRN 2/25/59 (b) (g) |
11,818 | 11,483 | ||||||
GCAT Trust, Series 2021-NQM4, Class A3, |
||||||||
1.556% VRN 8/25/66 (b) (g) |
197,102 | 159,563 | ||||||
The accompanying notes are an integral part of the financial statements.
51
MassMutual Select T. Rowe Price Bond Asset Fund – Portfolio of Investments (Continued) |
Principal |
Value |
|||||||
GS Mortgage-Backed Securities Trust |
||||||||
Series 2021-GR1, Class A4, 2.500% VRN 11/25/51 (b) (g) |
$ | 462,573 | $ | 357,555 | ||||
Series 2021-GR2, Class A4, 2.500% VRN 2/25/52 (b) (g) |
474,455 | 369,407 | ||||||
Series 2020-INV1, Class A14, 2.940% VRN 10/25/50 (b) (g) |
254,458 | 217,857 | ||||||
Hundred Acre Wood Trust |
||||||||
Series 2021,Class A, 2.500% VRN 7/25/51 (b) (g) |
867,740 | 674,532 | ||||||
Series 2021-INV2, Class A27, 2.500% VRN 10/25/51 (b) (g) |
277,524 | 216,079 | ||||||
Imperial Fund Mortgage Trust, Series 2021-NQM2, Class A1, |
||||||||
1.073% VRN 9/25/56 (b) (g) |
218,475 | 180,843 | ||||||
JP Morgan Mortgage Trust |
||||||||
Series 2020-LTV1, Class B1, 3.253% VRN 6/25/50 (b) (g) |
358,493 | 314,858 | ||||||
Series 2020-INV1, Class A11, 1 mo. USD LIBOR + .830% 3.274% FRN 8/25/50 (b) |
65,161 | 62,378 | ||||||
Series 2019-INV3, Class A15, 3.500% VRN 5/25/50 (b) (g) |
104,577 | 95,718 | ||||||
Series 2019-INV3, Class A3, 3.500% VRN 5/25/50 (b) (g) |
121,478 | 111,923 | ||||||
Series 2020-LTV1, Class A15, 3.500% VRN 6/25/50 (b) (g) |
13,118 | 12,656 | ||||||
Series 2020-LTV1, Class A3, 3.500% VRN 6/25/50 (b) (g) |
30,688 | 29,606 | ||||||
Series 2020-INV1, Class A3, 3.500% VRN 8/25/50 (b) (g) |
102,886 | 91,564 | ||||||
Series 2020-5, Class B2, 3.598% VRN 12/25/50 (b) (g) |
338,381 | 275,034 | ||||||
New Residential Mortgage Loan Trust, Series 2019-NQM5, Class A1, |
||||||||
2.710% VRN 11/25/59 (b) (g) |
241,272 | 223,807 | ||||||
Onslow Bay Financial LLC |
||||||||
Series 2021-NQM3, Class A1, 1.054% VRN 7/25/61 (b) (g) |
329,432 | 252,181 | ||||||
Series 2019-EXP3, Class 1A8, 3.500% VRN 10/25/59 (b) (g) |
58,084 | 55,229 | ||||||
Series 2020-EXP1, Class 1A8, 3.500% VRN 2/25/60 (b) (g) |
277,550 | 247,342 | ||||||
Series 2019-INV2, Class A25, 4.000% VRN 5/27/49 (b) (g) |
114,904 | 108,457 | ||||||
Series 2019-EXP2, Class 1A3, 4.000% VRN 6/25/59 (b) (g) |
89,414 | 85,501 | ||||||
Sequoia Mortgage Trust |
||||||||
Series 2017-CH1, Class A2, 3.500% VRN 8/25/47 (b) (g) |
60,776 | 58,627 | ||||||
Series 2017-CH1, Class A13, 4.000% VRN 8/25/47 (b) (g) |
75,551 | 73,401 | ||||||
Principal |
Value |
|||||||
Series 2018-CH1, Class A19, 4.000% VRN 3/25/48 (b) (g) |
$ | 88,597 | $ | 84,315 | ||||
Series 2018-CH2, Class A21, 4.000% VRN 6/25/48 (b) (g) |
23,732 | 22,674 | ||||||
Series 2018-CH3, Class A2, 4.000% VRN 8/25/48 (b) (g) |
12,557 | 12,431 | ||||||
Series 2018-CH4, Class A2, 4.000% VRN 10/25/48 (b) (g) |
10,631 | 10,523 | ||||||
SG Residential Mortgage Trust, Series 2019-3, Class A1, |
||||||||
2.703% VRN 9/25/59 (b) (g) |
19,517 | 19,146 | ||||||
TRK Trust, Series 2021-INV1, Class A1, |
||||||||
1.153% VRN 7/25/56 (b) (g) |
314,421 | 271,981 | ||||||
Verus Securitization Trust |
||||||||
Series 2021-5, Class A2, 1.218% VRN 9/25/66 (b) (g) |
303,441 | 235,514 | ||||||
Series 2019-4, Class A1, 2.642% STEP 11/25/59 (b) |
131,590 | 128,035 | ||||||
Series 2022-1, Class A1, 2.724% STEP 1/25/67 (b) |
770,331 | 664,922 | ||||||
Series 2019-INV2, Class A2, 3.117% VRN 7/25/59 (b) (g) |
225,291 | 219,780 | ||||||
Series 2020-INV1, Class A3, 3.889% VRN 3/25/60 (b) (g) |
100,000 | 95,662 | ||||||
| 10,073,311 | ||||||||
TOTAL NON-U.S. GOVERNMENT AGENCY OBLIGATIONS (Cost $58,250,898) |
53,029,439 | |||||||
SOVEREIGN DEBT OBLIGATIONS — 18.1% |
||||||||
1Malaysia Development Berhad Global Investments Ltd. |
||||||||
4.400% 3/09/23 (b) |
1,000,000 | 957,817 | ||||||
Albania Government International Bond |
||||||||
3.500% 10/09/25 EUR (b) (c) |
160,000 | 141,612 | ||||||
3.500% 6/16/27 EUR (b) (c) |
105,000 | 89,039 | ||||||
3.500% 11/23/31 EUR (b) (c) |
490,000 | 350,410 | ||||||
Australia Government International Bond |
||||||||
1.250% 5/21/32 AUD (c) |
1,464,000 | 739,195 | ||||||
3.000% 3/21/47 AUD (b) (c) |
808,000 | 427,224 | ||||||
Bonos de la Tesoreria de la Republica en pesos |
||||||||
4.500% 3/01/26 CLP (c) |
445,000,000 | 420,596 | ||||||
4.700% 9/01/30 CLP (b) (c) |
535,000,000 | 483,631 | ||||||
5.000% 10/01/28 CLP (b) (c) |
385,000,000 | 365,834 | ||||||
Brazil Notas do Tesouro Nacional Serie B |
||||||||
6.000% 5/15/25 BRL (c) |
950,000 | 713,299 | ||||||
The accompanying notes are an integral part of the financial statements.
52
MassMutual Select T. Rowe Price Bond Asset Fund – Portfolio of Investments (Continued) |
Principal |
Value |
|||||||
Bundesobligation Bonds |
||||||||
0.000% 4/16/27 EUR (b) (c) |
$ | 3,888,000 | $ | 3,493,513 | ||||
Bundesrepublik Deutschland Bundesanleihe |
||||||||
0.000% 2/15/32 EUR (b) (c) |
8,730,000 | 7,052,166 | ||||||
Canadian Government International Bond |
||||||||
1.250% 3/01/27 CAD (c) |
8,569,000 | 5,666,210 | ||||||
Canadian Government Real Return Bond |
||||||||
4.000% 12/01/31 CAD (c) |
4,122,913 | 3,676,244 | ||||||
Croatia Government International Bond |
||||||||
1.125% 3/04/33 EUR (b) (c) |
184,000 | 129,454 | ||||||
Cyprus Government International Bond |
||||||||
0.000% 2/09/26 EUR (b) (c) |
245,000 | 218,610 | ||||||
0.950% 1/20/32 EUR (b) (c) |
610,000 | 452,895 | ||||||
2.375% 9/25/28 EUR (b) (c) |
1,177,000 | 1,071,236 | ||||||
2.750% 2/26/34 EUR (b) (c) |
93,000 | 80,772 | ||||||
2.750% 5/03/49 EUR (b) (c) |
99,000 | 76,640 | ||||||
3.750% 7/26/23 EUR (b) (c) |
120,000 | 118,998 | ||||||
3.750% 7/26/23 EUR (b) (c) |
100,000 | 99,165 | ||||||
4.250% 11/04/25 EUR (b) (c) |
460,000 | 467,734 | ||||||
4.250% 11/04/25 EUR (b) (c) |
10,000 | 10,168 | ||||||
Czech Republic Government International Bond |
||||||||
2.400% 9/17/25 CZK (b) (c) |
22,450,000 | 814,165 | ||||||
2.750% 7/23/29 CZK (c) |
51,630,000 | 1,748,154 | ||||||
French Republic Government Bond OAT |
||||||||
0.000% 5/25/32 EUR (b) (c) |
2,943,000 | 2,237,198 | ||||||
0.750% 5/25/52 EUR (b) (c) |
3,224,000 | 1,790,863 | ||||||
1.250% 5/25/36 EUR (b) (c) |
1,802,000 | 1,432,200 | ||||||
Hellenic Republic Government Bond |
||||||||
0.750% 6/18/31 EUR (b) (c) |
585,000 | 410,505 | ||||||
Hungary Government International Bond |
||||||||
2.250% 4/20/33 HUF (c) |
1,351,620,000 | 1,640,124 | ||||||
4.750% 11/24/32 HUF (c) |
53,110,000 | 83,997 | ||||||
Iceland Government International Bond |
||||||||
0.000% 4/15/28 EUR (b) (c) |
346,000 | 279,976 | ||||||
Indonesia Government International Bond |
||||||||
3.750% 6/14/28 EUR (b) (c) |
1,280,000 | 1,193,334 | ||||||
Ireland Government International Bond |
||||||||
0.200% 10/18/30 EUR (b) (c) |
897,000 | 733,268 | ||||||
1.350% 3/18/31 EUR (b) (c) |
1,176,000 | 1,056,728 | ||||||
1.500% 5/15/50 EUR (b) (c) |
73,000 | 51,220 | ||||||
2.000% 2/18/45 EUR (b) (c) |
191,000 | 156,395 | ||||||
Israel Government International Bond |
||||||||
1.500% 1/18/27 EUR (b) (c) |
530,000 | 476,038 | ||||||
1.750% 8/31/25 ILS (c) |
4,274,000 | 1,150,833 | ||||||
5.500% 1/31/42 ILS (c) |
3,274,000 | 1,159,117 | ||||||
Principal |
Value |
|||||||
Italy Buoni Poliennali Del Tesoro |
||||||||
2.800% 3/01/67 EUR (b) (c) |
$ | 1,064,000 | $ | 737,504 | ||||
Ivory Coast Government International Bond |
||||||||
4.875% 1/30/32 EUR (b) (c) |
105,000 | 68,716 | ||||||
4.875% 1/30/32 EUR (b) (c) |
270,000 | 176,698 | ||||||
Japan Government CPI Linked Bond |
||||||||
0.005% 3/10/31 JPY (c) |
337,210,426 | 2,472,053 | ||||||
0.100% 3/10/24 JPY (c) |
109,247,000 | 775,969 | ||||||
0.100% 9/10/24 JPY (c) |
287,524,200 | 2,049,203 | ||||||
0.100% 3/10/25 JPY (c) |
304,451,700 | 2,177,209 | ||||||
0.200% 3/10/30 JPY (c) |
85,104,696 | 642,416 | ||||||
Japan Government Ten Year Bond |
||||||||
0.400% 3/20/25 JPY (c) |
364,500,000 | 2,545,985 | ||||||
Japan Government Thirty Year Bond |
||||||||
0.700% 12/20/51 JPY (c) |
20,300,000 | 118,222 | ||||||
1.000% 3/20/52 JPY (c) |
329,400,000 | 2,073,242 | ||||||
1.300% 6/20/52 JPY (c) |
30,400,000 | 205,696 | ||||||
1.700% 9/20/44 JPY (c) |
280,250,000 | 2,161,099 | ||||||
2.200% 9/20/39 JPY (c) |
240,750,000 | 2,013,148 | ||||||
2.500% 9/20/37 JPY (c) |
273,300,000 | 2,361,261 | ||||||
Japan Government Twenty Year Bond |
||||||||
0.600% 6/20/37 JPY (c) |
252,900,000 | 1,722,544 | ||||||
Latvia Government International Bond |
||||||||
0.375% 10/07/26 EUR (b) (c) |
2,114,000 | 1,857,351 | ||||||
Malaysia Government International Bond |
||||||||
3.844% 4/15/33 MYR (c) |
590,000 | 119,177 | ||||||
4.065% 6/15/50 MYR (c) |
2,885,000 | 532,502 | ||||||
4.642% 11/07/33 MYR (c) |
3,255,000 | 699,169 | ||||||
4.736% 3/15/46 MYR (c) |
5,640,000 | 1,173,784 | ||||||
4.921% 7/06/48 MYR (c) |
6,150,000 | 1,298,252 | ||||||
4.935% 9/30/43 MYR (c) |
325,000 | 69,320 | ||||||
Mexican Bonos |
||||||||
8.500% 5/31/29 MXN (c) |
4,567,000 | 213,595 | ||||||
Morocco Government International Bond |
||||||||
1.375% 3/30/26 EUR (b) (c) |
160,000 | 138,055 | ||||||
New South Wales Treasury Corp. |
||||||||
4.000% 5/20/26 AUD (b) (c) |
860,000 | 549,563 | ||||||
4.000% 5/20/26 AUD (b) (c) |
680,000 | 434,538 | ||||||
North Macedonia Government International Bond |
||||||||
1.625% 3/10/28 EUR (b) (c) |
400,000 | 290,997 | ||||||
Norway Government International Bond |
||||||||
3.000% 3/14/24 NOK (b) (c) |
2,700,000 | 247,850 | ||||||
Philippine Government International Bond |
||||||||
0.250% 4/28/25 EUR (c) |
125,000 | 111,885 | ||||||
The accompanying notes are an integral part of the financial statements.
53
MassMutual Select T. Rowe Price Bond Asset Fund – Portfolio of Investments (Continued) |
Principal |
Value |
|||||||
Portugal Obrigacoes do Tesouro OT |
||||||||
4.100% 2/15/45 EUR (b) (c) |
$ | 217,000 | $ | 232,169 | ||||
Province of Ontario Canada |
||||||||
3.500% 6/02/43 CAD (c) |
140,000 | 91,265 | ||||||
3.500% 6/02/43 CAD (c) |
62,000 | 40,418 | ||||||
Republic of Poland Government Bond |
||||||||
3.750% 5/25/27 PLN (c) |
7,848,000 | 1,351,903 | ||||||
Romanian Government International Bond |
||||||||
1.375% 12/02/29 EUR (b) (c) |
110,000 | 71,073 | ||||||
2.000% 1/28/32 EUR (b) (c) |
110,000 | 66,128 | ||||||
2.000% 1/28/32 EUR (b) (c) |
380,000 | 228,442 | ||||||
2.124% 7/16/31 EUR (b) (c) |
642,000 | 399,006 | ||||||
2.125% 3/07/28 EUR (b) (c) |
430,000 | 326,728 | ||||||
2.875% 10/28/24 EUR (b) (c) |
100,000 | 94,758 | ||||||
2.875% 5/26/28 EUR (b) (c) |
560,000 | 432,166 | ||||||
3.624% 5/26/30 EUR (b) (c) |
622,000 | 457,664 | ||||||
Serbia Government International Bond |
||||||||
1.000% 9/23/28 EUR (b) (c) |
850,000 | 554,390 | ||||||
1.500% 6/26/29 EUR (b) (c) |
450,000 | 290,694 | ||||||
1.650% 3/03/33 EUR (b) (c) |
435,000 | 235,244 | ||||||
2.050% 9/23/36 EUR (b) (c) |
280,000 | 143,381 | ||||||
2.050% 9/23/36 EUR (b) (c) |
375,000 | 192,029 | ||||||
Serbia Treasury Bonds |
||||||||
4.500% 8/20/32 RSD (c) |
75,180,000 | 486,601 | ||||||
Singapore Government International Bond |
||||||||
0.500% 11/01/25 SGD (c) |
955,000 | 607,210 | ||||||
1.625% 7/01/31 SGD (c) |
2,512,000 | 1,501,516 | ||||||
2.375% 6/01/25 SGD (c) |
480,000 | 325,013 | ||||||
2.875% 7/01/29 SGD (c) |
990,000 | 662,068 | ||||||
Slovenia Government International Bond |
||||||||
0.000% 2/12/31 EUR (b) (c) |
155,000 | 116,030 | ||||||
1.500% 3/25/35 EUR (b) (c) |
342,000 | 265,538 | ||||||
1.750% 11/03/40 EUR (b) (c) |
450,000 | 326,148 | ||||||
3.125% 8/07/45 EUR (b) (c) |
1,035,000 | 934,705 | ||||||
Spain Government International Bond |
||||||||
0.800% 7/30/29 EUR (c) |
1,954,000 | 1,662,890 | ||||||
Sweden Government International Bond |
||||||||
2.250% 6/01/32 SEK (b) (c) |
32,145,000 | 2,926,712 | ||||||
Thailand Government International Bond |
||||||||
2.000% 12/17/31 THB (c) |
91,434,000 | 2,216,268 | ||||||
3.650% 6/20/31 THB (c) |
19,528,000 | 536,837 | ||||||
United Kingdom Gilt |
||||||||
0.625% 6/07/25 GBP (b) (c) |
1,393,000 | 1,409,462 | ||||||
0.625% 10/22/50 GBP (b) (c) |
732,000 | 375,973 | ||||||
4.250% 6/07/32 GBP (b) (c) |
4,456,000 | 5,040,325 | ||||||
4.250% 12/07/46 GBP (b) (c) |
976,000 | 1,144,333 | ||||||
Principal |
Value |
|||||||
4.750% 12/07/30 GBP (b) (c) |
$ | 1,326,000 | $ | 1,546,474 | ||||
| 101,045,141 | ||||||||
TOTAL SOVEREIGN DEBT OBLIGATIONS (Cost $134,883,553) |
101,045,141 | |||||||
U.S. GOVERNMENT AGENCY OBLIGATIONS AND INSTRUMENTALITIES (h) — 20.8% |
||||||||
Collateralized Mortgage Obligations — 0.1% |
||||||||
Federal Home Loan Mortgage Corp. REMICS Series 4977, Class IO 4.500% 5/25/50 |
265,602 | 52,453 | ||||||
Government National Mortgage Association Series 2022-63, Class LM 3.500% 10/20/50 |
260,000 | 223,050 | ||||||
| 275,503 | ||||||||
Pass-Through Securities — 19.7% |
||||||||
Federal Home Loan Mortgage Corp. |
||||||||
Pool #SB8147 1.500% 4/01/37 |
342,362 | 293,668 | ||||||
Pool #RB5148 2.000% 3/01/42 |
889,149 | 746,351 | ||||||
Pool #RA5258 2.000% 5/01/51 |
868,522 | 705,424 | ||||||
Pool #SD8146 2.000% 5/01/51 |
536,617 | 436,685 | ||||||
Pool #RA6505 2.000% 12/01/51 |
1,500,393 | 1,217,231 | ||||||
Pool #SD8199 2.000% 3/01/52 |
4,691,519 | 3,804,644 | ||||||
Pool #SD8204 2.000% 4/01/52 |
225,493 | 182,866 | ||||||
Pool #RA7324 2.000% 5/01/52 |
149,480 | 121,550 | ||||||
Pool #RB5149 2.500% 3/01/42 |
692,376 | 597,736 | ||||||
Pool #QC1292 2.500% 5/01/51 |
19,807 | 16,705 | ||||||
Pool #QC2902 2.500% 6/01/51 |
40,104 | 34,096 | ||||||
Pool #QC3425 2.500% 6/01/51 |
251,904 | 212,276 | ||||||
Pool #QC3551 2.500% 7/01/51 |
22,523 | 18,980 | ||||||
Pool #QC5137 2.500% 8/01/51 |
63,675 | 53,658 | ||||||
Pool #QC5575 2.500% 8/01/51 |
79,256 | 66,738 | ||||||
Pool #RA6623 2.500% 1/01/52 |
1,124,011 | 949,207 | ||||||
Pool #SD0854 2.500% 1/01/52 |
92,945 | 78,171 | ||||||
Pool #SD8200 2.500% 3/01/52 |
697,298 | 586,895 | ||||||
Pool #SD7554 2.500% 4/01/52 |
364,783 | 308,395 | ||||||
Pool #SD8212 2.500% 5/01/52 |
2,824,436 | 2,375,919 | ||||||
Pool #ZS4693 3.000% 12/01/46 |
73,493 | 65,083 | ||||||
Pool #G08756 3.000% 4/01/47 |
31,359 | 27,768 | ||||||
Pool #SD0080 3.000% 9/01/49 |
142,425 | 126,094 | ||||||
Pool #SD7531 3.000% 12/01/50 |
166,901 | 147,190 | ||||||
Pool #SB0015 3.500% 6/01/33 |
155,050 | 147,113 | ||||||
Pool #U90690 3.500% 6/01/42 |
50,695 | 47,734 | ||||||
Pool #U99051 3.500% 6/01/43 |
51,495 | 47,211 | ||||||
Pool #ZT0179 3.500% 11/01/47 |
310,760 | 286,095 | ||||||
Pool #RA1202 3.500% 8/01/49 |
117,827 | 107,343 | ||||||
The accompanying notes are an integral part of the financial statements.
54
MassMutual Select T. Rowe Price Bond Asset Fund – Portfolio of Investments (Continued) |
Principal |
Value |
|||||||
Pool #SD0212 3.500% 12/01/49 |
$ | 163,872 | $ | 149,189 | ||||
Pool #SD0617 3.500% 11/01/50 |
112,550 | 102,394 | ||||||
Pool #SB8171 4.000% 6/01/37 |
71,879 | 69,378 | ||||||
Pool #RA1906 4.000% 12/01/49 |
202,537 | 190,416 | ||||||
Pool #SD8039 4.000% 1/01/50 |
252,590 | 236,447 | ||||||
Pool #SD1035 4.000% 5/01/52 |
229,592 | 213,466 | ||||||
Pool #SD8244 4.000% 9/01/52 |
349,966 | 324,921 | ||||||
Pool #SD0422 4.500% 7/01/45 |
125,501 | 123,697 | ||||||
Pool #RA2607 4.500% 5/01/50 |
53,978 | 51,848 | ||||||
Pool #ZS3941 5.000% 12/01/41 |
37,844 | 38,033 | ||||||
Pool #SD8246 5.000% 9/01/52 |
2,060,002 | 2,007,415 | ||||||
Federal National Mortgage Association |
||||||||
Pool #MA4581 1.500% 4/01/37 |
705,512 | 605,167 | ||||||
Pool #MA4601 1.500% 5/01/37 |
586,448 | 503,037 | ||||||
Pool #MA4519 1.500% 1/01/42 |
608,905 | 490,261 | ||||||
Pool #MA4586 2.000% 4/01/42 |
1,037,372 | 870,769 | ||||||
Pool #MA4158 2.000% 10/01/50 |
281,016 | 229,211 | ||||||
Pool #MA4325 2.000% 5/01/51 |
2,419,234 | 1,968,711 | ||||||
Pool #CB2357 2.000% 12/01/51 |
1,219,945 | 989,710 | ||||||
Pool #CB2766 2.000% 2/01/52 |
374,037 | 303,330 | ||||||
Pool #CB2848 2.000% 2/01/52 |
605,458 | 491,004 | ||||||
Pool #FS0733 2.000% 2/01/52 |
543,673 | 442,088 | ||||||
Pool #MA4547 2.000% 2/01/52 |
602,051 | 488,240 | ||||||
Pool #FS1618 2.000% 3/01/52 |
282,012 | 229,318 | ||||||
Pool #MA4562 2.000% 3/01/52 |
4,466,466 | 3,622,135 | ||||||
Pool #MA4577 2.000% 4/01/52 |
2,102,966 | 1,704,768 | ||||||
Pool #BM3859 2.500% 8/01/31 |
97,921 | 89,849 | ||||||
Pool #BC9043 2.500% 11/01/31 |
306,869 | 281,188 | ||||||
Pool #BM1890 2.500% 1/01/32 |
72,443 | 66,539 | ||||||
Pool #CB3210 2.500% 3/01/37 |
1,676,119 | 1,519,091 | ||||||
Pool #MA4628 2.500% 6/01/37 |
216,327 | 195,993 | ||||||
Pool #BT0163 2.500% 6/01/51 |
55,195 | 46,926 | ||||||
Pool #BT1265 2.500% 6/01/51 |
343,250 | 289,252 | ||||||
Pool #CB1331 2.500% 8/01/51 |
757,333 | 638,667 | ||||||
Pool #FM8320 2.500% 8/01/51 |
83,471 | 70,339 | ||||||
Pool #CB1783 2.500% 10/01/51 |
1,546,493 | 1,301,758 | ||||||
Pool #CB1866 2.500% 10/01/51 |
1,169,165 | 984,142 | ||||||
Pool #CB2635 2.500% 1/01/52 |
1,248,211 | 1,050,972 | ||||||
Pool #CB2538 2.500% 1/01/52 |
1,121,818 | 947,355 | ||||||
Pool #CB2804 2.500% 2/01/52 |
765,079 | 646,096 | ||||||
Pool #FS2573 2.500% 3/01/52 |
89,221 | 75,694 | ||||||
Pool #MA4578 2.500% 4/01/52 |
386,015 | 324,716 | ||||||
Pool #FS1629 2.500% 4/01/52 |
82,992 | 69,800 | ||||||
Pool #CB3665 2.500% 5/01/52 |
999,900 | 840,805 | ||||||
Pool #BV7868 2.500% 7/01/52 |
906,956 | 762,294 | ||||||
Pool #AS7056 3.000% 4/01/31 |
233,698 | 221,851 | ||||||
Pool #BM5111 3.000% 11/01/33 |
109,134 | 102,783 | ||||||
Pool #CA4885 3.000% 12/01/34 |
401,379 | 375,638 | ||||||
Pool #BO7256 3.000% 1/01/35 |
199,827 | 187,011 | ||||||
Principal |
Value |
|||||||
Pool #FM2547 3.000% 2/01/35 |
$ | 124,509 | $ | 116,524 | ||||
Pool #FM8540 3.000% 11/01/35 |
228,379 | 215,945 | ||||||
Pool #AL9412 3.000% 11/01/36 |
226,711 | 207,782 | ||||||
Pool #CA5597 3.000% 4/01/40 |
865,915 | 781,171 | ||||||
Pool #BM4221 3.000% 1/01/43 |
125,814 | 112,558 | ||||||
Pool #BM5468 3.000% 2/01/43 |
197,229 | 176,448 | ||||||
Pool #AB9248 3.000% 5/01/43 |
50,280 | 44,982 | ||||||
Pool #AU1629 3.000% 7/01/43 |
14,089 | 12,604 | ||||||
Pool #AS0406 3.000% 9/01/43 |
79,208 | 70,837 | ||||||
Pool #BM5469 3.000% 3/01/44 |
359,564 | 321,678 | ||||||
Pool #BM3380 3.000% 6/01/46 |
320,973 | 286,551 | ||||||
Pool #MA2670 3.000% 7/01/46 |
114,251 | 101,284 | ||||||
Pool #BD8462 3.000% 11/01/46 |
1,259,264 | 1,117,135 | ||||||
Pool #MA2806 3.000% 11/01/46 |
214,572 | 190,018 | ||||||
Pool #AS8295 3.000% 11/01/46 |
284,967 | 253,427 | ||||||
Pool #BM1418 3.000% 4/01/47 |
1,425,334 | 1,264,461 | ||||||
Pool #FM1000 3.000% 4/01/47 |
178,907 | 158,435 | ||||||
Pool #MA2956 3.000% 4/01/47 |
140,614 | 124,392 | ||||||
Pool #BM4744 3.000% 6/01/47 |
124,795 | 110,983 | ||||||
Pool #FM1572 3.000% 9/01/48 |
255,628 | 226,377 | ||||||
Pool #FM5499 3.000% 2/01/49 |
166,763 | 147,681 | ||||||
Pool #FM1445 3.000% 8/01/49 |
123,941 | 109,729 | ||||||
Pool #CA4108 3.000% 9/01/49 |
791,500 | 699,259 | ||||||
Pool #FM2870 3.000% 3/01/50 |
219,427 | 193,650 | ||||||
Pool #CA5540 3.000% 4/01/50 |
14,335 | 12,620 | ||||||
Pool #CA6314 3.000% 7/01/50 |
199,692 | 174,860 | ||||||
Pool #BQ1348 3.000% 8/01/50 |
132,831 | 116,397 | ||||||
Pool #CA6738 3.000% 8/01/50 |
248,168 | 217,463 | ||||||
Pool #BQ5052 3.000% 9/01/50 |
6,914 | 6,069 | ||||||
Pool #FM7072 3.000% 4/01/51 |
696,842 | 613,455 | ||||||
Pool #FM3462 3.500% 12/01/33 |
336,435 | 319,550 | ||||||
Pool #AS4449 3.500% 2/01/35 |
111,516 | 104,861 | ||||||
Pool #FM3340 3.500% 5/01/35 |
10,667 | 10,098 | ||||||
Pool #FM8137 3.500% 9/01/35 |
113,634 | 108,037 | ||||||
Pool #MA1283 3.500% 12/01/42 |
42,150 | 38,607 | ||||||
Pool #MA1373 3.500% 3/01/43 |
64,956 | 59,496 | ||||||
Pool #MA1437 3.500% 5/01/43 |
61,363 | 56,205 | ||||||
Pool #MA1546 3.500% 8/01/43 |
147,562 | 135,020 | ||||||
Pool #AL6167 3.500% 1/01/44 |
585,084 | 535,902 | ||||||
Pool #AS5182 3.500% 6/01/45 |
366,136 | 337,419 | ||||||
Pool #BC1747 3.500% 1/01/46 |
959,254 | 883,117 | ||||||
Pool #BM5785 3.500% 9/01/46 |
97,315 | 89,683 | ||||||
Pool #BM4582 3.500% 8/01/47 |
110,302 | 101,892 | ||||||
Pool #BM3122 3.500% 10/01/47 |
1,103,733 | 1,016,819 | ||||||
Pool #CA0858 3.500% 12/01/47 |
50,715 | 46,388 | ||||||
Pool #MA3210 3.500% 12/01/47 |
35,179 | 32,189 | ||||||
Pool #MA3238 3.500% 1/01/48 |
214,370 | 196,083 | ||||||
Pool #BH9277 3.500% 2/01/48 |
385,220 | 352,237 | ||||||
Pool #FM1001 3.500% 11/01/48 |
45,663 | 41,782 | ||||||
The accompanying notes are an integral part of the financial statements.
55
MassMutual Select T. Rowe Price Bond Asset Fund – Portfolio of Investments (Continued) |
Principal |
Value |
|||||||
Pool #FM8196 3.500% 12/01/48 |
$ | 760,995 | $ | 697,264 | ||||
Pool #FM3972 3.500% 7/01/50 |
256,489 | 233,346 | ||||||
Pool #FM8086 3.500% 7/01/51 |
121,146 | 109,562 | ||||||
Pool #MA4514 3.500% 1/01/52 |
533,041 | 480,574 | ||||||
Pool #FS1883 4.000% 6/01/37 |
144,664 | 139,631 | ||||||
Pool #BF0198 4.000% 11/01/40 |
105,512 | 102,013 | ||||||
Pool #MA0639 4.000% 2/01/41 |
337,085 | 325,347 | ||||||
Pool #BM3385 4.000% 6/01/45 |
560,773 | 529,973 | ||||||
Pool #FM2673 4.000% 10/01/45 |
831,864 | 802,618 | ||||||
Pool #AL8387 4.000% 3/01/46 |
599,143 | 566,236 | ||||||
Pool #MA3088 4.000% 8/01/47 |
31,884 | 30,033 | ||||||
Pool #MA3121 4.000% 9/01/47 |
291,928 | 274,982 | ||||||
Pool #MA3467 4.000% 9/01/48 |
4,106 | 3,821 | ||||||
Pool #BM5527 4.000% 10/01/48 |
109,826 | 103,622 | ||||||
Pool #BM5147 4.000% 10/01/48 |
25,176 | 23,809 | ||||||
Pool #FM3664 4.000% 3/01/49 |
390,240 | 366,368 | ||||||
Pool #CA3503 4.000% 5/01/49 |
54,923 | 51,478 | ||||||
Pool #CA4571 4.000% 11/01/49 |
87,971 | 82,397 | ||||||
Pool #CA4823 4.000% 12/01/49 |
113,851 | 106,610 | ||||||
Pool #FS1792 4.000% 5/01/52 |
228,618 | 212,489 | ||||||
Pool #AL0065 4.500% 4/01/41 |
192,571 | 189,845 | ||||||
Pool #AI1888 4.500% 5/01/41 |
213,028 | 210,017 | ||||||
Pool #AL0160 4.500% 5/01/41 |
280,410 | 276,436 | ||||||
Pool #AL6536 4.500% 3/01/45 |
288,031 | 281,594 | ||||||
Pool #BM4185 4.500% 9/01/46 |
161,883 | 158,165 | ||||||
Pool #FM2899 4.500% 11/01/46 |
360,159 | 355,037 | ||||||
Pool #FM5708 4.500% 5/01/47 |
179,493 | 176,956 | ||||||
Pool #BM3148 4.500% 11/01/47 |
143,359 | 139,394 | ||||||
Pool #BM4343 4.500% 5/01/48 |
151,073 | 146,847 | ||||||
Pool #CA2207 4.500% 8/01/48 |
32,771 | 31,691 | ||||||
Pool #CA5186 4.500% 1/01/50 |
28,833 | 27,720 | ||||||
Pool #CA5696 4.500% 5/01/50 |
95,275 | 90,926 | ||||||
Pool #MA4656 4.500% 7/01/52 |
895,000 | 852,905 | ||||||
Pool #MA4701 4.500% 8/01/52 |
221,130 | 210,730 | ||||||
Pool #AD6438 5.000% 6/01/40 |
49,911 | 50,159 | ||||||
Pool #AL9893 5.000% 2/01/45 |
270,209 | 272,093 | ||||||
Pool #FM4212 5.000% 12/01/47 |
439,908 | 441,639 | ||||||
Pool #FS2620 5.000% 8/01/52 |
47,943 | 46,779 | ||||||
Pool #MA4761 5.000% 9/01/52 |
425,001 | 414,151 | ||||||
Pool #BM3279 5.500% 5/01/44 |
666,166 | 682,159 | ||||||
Pool #BM4971 6.000% 7/01/41 |
191,759 | 199,936 | ||||||
Government National Mortgage Association Pool #AA5821 3.000% 11/15/42 |
42,254 | 38,140 | ||||||
Government National Mortgage Association II |
||||||||
Pool #MA7254 2.000% 3/20/51 |
543,958 | 455,929 | ||||||
Pool #MA7471 2.000% 7/20/51 (f) |
530,004 | 443,902 | ||||||
Pool #MA7533 2.000% 8/20/51 |
2,625,279 | 2,198,380 | ||||||
Principal |
Value |
|||||||
Pool #MA7826 2.000% 1/20/52 |
$ | 821,498 | $ | 686,694 | ||||
Pool #MA7935 2.000% 3/20/52 |
481,195 | 401,594 | ||||||
Pool #MA8041 2.000% 5/20/52 |
811,340 | 676,745 | ||||||
Pool #MA6819 2.500% 8/20/50 |
335,401 | 290,908 | ||||||
Pool #MA7649 2.500% 10/20/51 |
2,550,551 | 2,199,647 | ||||||
Pool #MA7705 2.500% 11/20/51 |
643,379 | 554,662 | ||||||
Pool #MA7767 2.500% 12/20/51 |
1,362,732 | 1,174,396 | ||||||
Pool #MA7936 2.500% 3/20/52 |
454,859 | 391,391 | ||||||
Pool #MA2600 3.000% 2/20/45 |
82,285 | 74,137 | ||||||
Pool #MA2891 3.000% 6/20/45 |
668,898 | 602,245 | ||||||
Pool #MA3662 3.000% 5/20/46 |
106,859 | 96,077 | ||||||
Pool #MA3802 3.000% 7/20/46 |
50,884 | 45,734 | ||||||
Pool #MA3873 3.000% 8/20/46 |
294,259 | 264,477 | ||||||
Pool #MA4195 3.000% 1/20/47 |
358,327 | 321,837 | ||||||
Pool #MA6144 3.000% 9/20/49 |
14,016 | 12,160 | ||||||
Pool #MA6209 3.000% 10/20/49 |
84,826 | 73,590 | ||||||
Pool #MA6399 3.000% 1/20/50 |
42,634 | 36,987 | ||||||
Pool #MA6531 3.000% 3/20/50 |
136,743 | 118,246 | ||||||
Pool #MA6589 3.000% 4/20/50 |
65,049 | 56,250 | ||||||
Pool #MA6757 3.000% 7/20/50 |
110,289 | 95,370 | ||||||
Pool #MA7473 3.000% 7/20/51 |
877,800 | 780,798 | ||||||
Pool #MA7650 3.000% 10/20/51 |
308,239 | 273,984 | ||||||
Pool #MA8098 3.000% 6/20/52 |
1,052,372 | 930,817 | ||||||
Pool #MA0318 3.500% 8/20/42 |
165,668 | 156,066 | ||||||
Pool #MA1012 3.500% 5/20/43 |
352,067 | 324,940 | ||||||
Pool #MA1090 3.500% 6/20/43 |
139,721 | 128,955 | ||||||
Pool #AL1773 3.500% 1/20/45 |
173,080 | 159,581 | ||||||
Pool #MA3310 3.500% 12/20/45 |
75,587 | 69,692 | ||||||
Pool #MA3597 3.500% 4/20/46 |
111,608 | 102,869 | ||||||
Pool #MA3663 3.500% 5/20/46 |
86,955 | 80,146 | ||||||
Pool #MA3736 3.500% 6/20/46 |
234,181 | 215,844 | ||||||
Pool #MA3803 3.500% 7/20/46 |
16,782 | 15,462 | ||||||
Pool #MA3937 3.500% 9/20/46 |
111,883 | 103,087 | ||||||
Pool #786092 3.500% 1/20/47 |
156,732 | 144,509 | ||||||
Pool #MA4382 3.500% 4/20/47 |
20,279 | 18,685 | ||||||
Pool #MA4586 3.500% 7/20/47 |
38,470 | 35,421 | ||||||
Pool #MA4719 3.500% 9/20/47 |
13,495 | 12,426 | ||||||
Pool #BC1919 3.500% 9/20/47 |
52,202 | 47,951 | ||||||
Pool #MA4900 3.500% 12/20/47 |
185,171 | 170,441 | ||||||
Pool #785087 3.500% 2/20/48 |
612,176 | 564,050 | ||||||
Pool #MA784472 3.500% 2/20/48 |
301,405 | 276,863 | ||||||
Pool #784504 3.500% 2/20/48 |
126,332 | 116,045 | ||||||
Pool #784474 3.500% 2/20/48 |
165,051 | 151,612 | ||||||
Pool #784891 3.500% 4/20/48 |
475,508 | 437,829 | ||||||
Pool #MA3245 4.000% 11/20/45 |
162,871 | 154,337 | ||||||
Pool #MA4511 4.000% 6/20/47 |
101,699 | 96,180 | ||||||
Pool #MA4720 4.000% 9/20/47 |
357,556 | 338,038 | ||||||
Pool #MA4838 4.000% 11/20/47 |
88,787 | 83,940 | ||||||
Pool #MA6934 4.000% 10/20/50 |
851,749 | 797,870 | ||||||
The accompanying notes are an integral part of the financial statements.
56
MassMutual Select T. Rowe Price Bond Asset Fund – Portfolio of Investments (Continued) |
Principal |
Value |
|||||||
Pool #MA2894 4.500% 6/20/45 |
$ | 153,102 | $ | 150,228 | ||||
Pool #MA2963 4.500% 7/20/45 |
57,500 | 56,420 | ||||||
Pool #MA3312 4.500% 12/20/45 |
2,744 | 2,692 | ||||||
Pool #MA4588 4.500% 7/20/47 |
271,746 | 264,691 | ||||||
Pool #MA4654 4.500% 8/20/47 |
41,752 | 40,668 | ||||||
Pool #MA5079 4.500% 3/20/48 |
64,238 | 62,430 | ||||||
Pool #MA5265 4.500% 6/20/48 |
223 | 216 | ||||||
Pool #MA5399 4.500% 8/20/48 |
54,043 | 52,353 | ||||||
Pool #MA5711 4.500% 1/20/49 |
87,199 | 84,424 | ||||||
Pool #MA4781 5.000% 10/20/47 |
292,128 | 293,354 | ||||||
Pool #MA5194 5.000% 5/20/48 |
60,832 | 60,555 | ||||||
Pool #BF2644 5.000% 5/20/48 |
4,670 | 4,618 | ||||||
Pool #MA5266 5.000% 6/20/48 |
424,699 | 422,500 | ||||||
Pool #BF2878 5.000% 6/20/48 |
15,798 | 15,622 | ||||||
Pool #MA5988 5.000% 6/20/49 |
147,127 | 146,112 | ||||||
Pool #MA5081 5.500% 3/20/48 |
47,034 | 48,639 | ||||||
Pool #MA5140 5.500% 4/20/48 |
36,630 | 37,880 | ||||||
Pool #MA5195 5.500% 5/20/48 |
109,663 | 112,207 | ||||||
Pool #MA5469 5.500% 9/20/48 |
403 | 410 | ||||||
Pool #MA5531 5.500% 10/20/48 |
10,190 | 10,395 | ||||||
Pool #MA5598 5.500% 11/20/48 |
49,208 | 50,180 | ||||||
Pool #MA5654 5.500% 12/20/48 |
137,783 | 140,462 | ||||||
Pool #MA5713 5.500% 1/20/49 |
33,725 | 34,370 | ||||||
Pool #MA5820 5.500% 3/20/49 |
35,814 | 36,477 | ||||||
Government National Mortgage Association II TBA |
||||||||
2.000% 10/20/52 (f) |
1,370,000 | 1,141,167 | ||||||
2.500% 10/20/52 (f) |
950,000 | 816,332 | ||||||
3.000% 10/20/52 (f) |
1,150,000 | 1,015,773 | ||||||
3.500% 10/20/52 (f) |
895,000 | 813,471 | ||||||
4.000% 10/20/52 (f) |
270,000 | 251,986 | ||||||
4.500% 10/20/52 (f) |
1,825,000 | 1,745,299 | ||||||
5.000% 10/20/52 (f) |
1,225,000 | 1,197,437 | ||||||
5.500% 10/20/52 (f) |
3,975,000 | 3,968,789 | ||||||
Uniform Mortgage Backed Securities TBA |
||||||||
1.500% 10/18/37 (f) |
475,000 | 407,090 | ||||||
2.000% 10/13/52 (f) |
4,225,000 | 3,420,930 | ||||||
2.500% 10/18/37 (f) |
580,000 | 524,900 | ||||||
2.500% 10/13/52 (f) |
3,730,000 | 3,132,326 | ||||||
3.000% 10/18/37 (f) |
435,000 | 403,802 | ||||||
3.000% 10/13/52 (f) |
3,115,000 | 2,710,050 | ||||||
3.500% 10/13/52 (f) |
1,125,000 | 1,012,148 | ||||||
4.000% 10/18/37 (f) |
380,000 | 366,403 | ||||||
4.000% 10/13/52 (f) |
875,000 | 811,426 | ||||||
4.500% 10/13/52 (f) |
215,000 | 204,653 | ||||||
5.000% 10/13/52 (f) |
1,665,000 | 1,620,773 | ||||||
| 110,280,644 | ||||||||
Principal |
Value |
|||||||
Whole Loans — 1.0% |
||||||||
Federal Home Loan Mortgage Corp. Structured Agency Credit Risk Debt Notes |
||||||||
Series 2021-HQA1, Class M1, 30 day SOFR + .700% 2.981% FRN 8/25/33 (b) |
$ | 36,798 | $ | 36,701 | ||||
Series 2022-DNA1, Class M1B, 30 day SOFR + 1.850% 4.131% FRN 1/25/42 (b) |
535,000 | 486,227 | ||||||
Series 2021-DNA2, Class M2, 30 day SOFR + 2.300% 4.581% FRN 8/25/33 (b) |
260,000 | 250,537 | ||||||
Series 2022-DNA2, Class M1B, 30 day SOFR + 2.400% 4.681% FRN 2/25/42 (b) |
1,325,000 | 1,243,360 | ||||||
Series 2022-DNA5, Class M1A, 30 day SOFR + 2.950% 5.231% FRN 6/25/42 (b) |
785,789 | 785,585 | ||||||
Federal National Mortgage Association Connecticut Avenue Securities Trust |
||||||||
Series 2022-R01, Class 1M1, 30 day SOFR + 1.000% 3.281% FRN 12/25/41 (b) |
88,783 | 86,785 | ||||||
Series 2022-R02, Class 2M1, 30 day SOFR + 1.200% 3.481% FRN 1/25/42 (b) |
1,038,171 | 1,022,072 | ||||||
Series 2021-R03, Class 1M2, 30 day SOFR + 1.650% 3.931% FRN 12/25/41 (b) |
345,000 | 313,486 | ||||||
Series 2017-C04, Class 2ED2, 1 mo. USD LIBOR + 1.100% 4.184% FRN 11/25/29 |
500,582 | 496,250 | ||||||
Series 2022-R03, Class 1M1, 30 day SOFR + 2.100% 4.381% FRN 3/25/42 (b) |
264,682 | 261,873 | ||||||
Series 2017-C02, Class 2ED3, 1 mo. USD LIBOR + 1.350% 4.434% FRN 9/25/29 |
29,081 | 29,065 | ||||||
Series 2017-C06, Class 1M2B, 1 mo. USD LIBOR + 2.650% 5.734% FRN 2/25/30 |
401,496 | 403,744 | ||||||
| 5,415,685 | ||||||||
TOTAL U.S. GOVERNMENT AGENCY OBLIGATIONS AND INSTRUMENTALITIES (Cost $126,633,023) |
115,971,832 | |||||||
The accompanying notes are an integral part of the financial statements.
57
MassMutual Select T. Rowe Price Bond Asset Fund – Portfolio of Investments (Continued) |
Principal |
Value |
|||||||
U.S. TREASURY OBLIGATIONS — 17.2% |
||||||||
U.S. Treasury Bonds & Notes — 17.2% |
||||||||
U.S. Treasury Bond |
||||||||
2.250% 2/15/52 |
$ | 10,545,000 | $ | 7,659,955 | ||||
2.875% 5/15/52 (i) |
9,080,000 | 7,617,269 | ||||||
3.000% 8/15/52 |
8,900,000 | 7,685,985 | ||||||
3.250% 5/15/42 |
6,685,000 | 5,933,982 | ||||||
3.375% 8/15/42 (d) |
6,545,000 | 5,931,406 | ||||||
U.S. Treasury Note |
||||||||
0.625% 10/15/24 |
1,205,000 | 1,120,085 | ||||||
1.000% 12/15/24 |
8,465,000 | 7,888,983 | ||||||
1.125% 1/15/25 |
11,130,000 | 10,368,291 | ||||||
1.750% 3/15/25 |
2,110,000 | 1,986,697 | ||||||
2.750% 7/31/27 |
6,325,000 | 5,959,830 | ||||||
3.000% 7/15/25 (i) |
12,600,000 | 12,180,657 | ||||||
3.125% 8/31/27 (d) |
10,465,000 | 10,043,947 | ||||||
3.250% 6/30/27 |
12,240,000 | 11,804,906 | ||||||
| 96,181,993 | ||||||||
TOTAL U.S. TREASURY OBLIGATIONS (Cost $103,470,196) |
96,181,993 | |||||||
TOTAL BONDS & NOTES (Cost $616,072,860) |
531,474,208 | |||||||
Number of |
||||||||
MUTUAL FUNDS — 2.6% |
||||||||
Diversified Financial Services— 2.6% |
||||||||
State Street Navigator Securities Lending Government Money Market Portfolio (j) |
14,276,024 | 14,276,024 | ||||||
TOTAL MUTUAL FUNDS (Cost $14,276,024) |
14,276,024 | |||||||
TOTAL LONG-TERM INVESTMENTS (Cost $630,348,884) |
545,750,232 | |||||||
Principal |
||||||||
SHORT-TERM INVESTMENTS — 7.5% |
||||||||
Commercial Paper — 0.2% |
||||||||
Rogers Communications, Inc. (b) |
$ | 1,200,000 | 1,195,330 | |||||
Number of |
Value |
|||||||
Mutual Fund — 6.6% |
||||||||
T. Rowe Price Government Reserve Investment Fund |
37,014,156 | $ | 37,014,156 | |||||
Principal |
||||||||
Repurchase Agreement — 0.5% |
||||||||
Fixed Income Clearing Corp., Repurchase Agreement, dated 9/30/22, 0.830%, due 10/03/22 (k) |
$ | 3,082,003 | 3,082,003 | |||||
U.S. Treasury Bill — 0.2% |
||||||||
U.S. Treasury Bill |
||||||||
1.465% 1/26/23 (l) |
900,000 | 890,296 | ||||||
TOTAL SHORT-TERM INVESTMENTS (Cost $42,186,871) |
42,181,785 | |||||||
TOTAL INVESTMENTS — 105.3% (Cost $672,535,755) (m) |
587,932,017 | |||||||
Less Unfunded Loan Commitments — (0.0)% |
(34,001 | ) | ||||||
NET INVESTMENTS — 105.3% (Cost $672,501,754) |
587,898,016 | |||||||
Other Assets/(Liabilities) — (5.3)% |
(29,407,268 | ) | ||||||
NET ASSETS — 100.0% |
$ | 558,490,748 | ||||||
Abbreviation Legend
|
CLO |
Collateralized Loan Obligation |
|
FRN |
Floating Rate Note |
|
REMICS |
Real Estate Mortgage Investment Conduits |
|
STEP |
Step Up Bond |
|
TBA |
To Be Announced |
|
VRN |
Variable Rate Note |
Notes to Portfolio of Investments
Percentages are stated as a percent of net assets.
|
(a) |
Unfunded or partially unfunded loan commitments. |
|
(b) |
Security is exempt from registration under Regulation S or Rule 144A of the Securities Act of 1933. These securities are considered restricted and may be resold in transactions exempt from registration. At September 30, 2022, the aggregate market value of these securities amounted to $155,939,627 or 27.92% of net assets. |
|
(c) |
The principal amount of the security is in foreign currency. The market value is in U.S. dollars. |
|
(d) |
Denotes all or a portion of security on loan. The total value of securities on loan as of September 30, 2022, was $14,463,396 or 2.59% of net assets. The Fund received $496,881 of non-cash collateral (U.S. Treasury and/or Agency |
The accompanying notes are an integral part of the financial statements.
58
MassMutual Select T. Rowe Price Bond Asset Fund – Portfolio of Investments (Continued) |
Notes to Portfolio of Investments (continued)
obligations) related to securities lending activity. This amount is not reflected on either the Portfolio of Investments or the Statement of Assets and Liabilities. (Note 2).
|
(e) |
Security is perpetual and has no stated maturity date. |
|
(f) |
A portion of this security is purchased on a when-issued, delayed-delivery or forward commitment basis. (Note 2). |
|
(g) |
Certain variable rate securities are not based on a published reference rate and spread but are determined by the issuer or agent and are based on current market conditions. These securities do not indicate a reference rate and spread in their description above. The rates shown are the current interest rates at September 30, 2022. |
|
(h) |
May contain securities that are issued by a U.S. Government Agency, but are unsecured and are not guaranteed by a U.S. Government Agency. |
|
(i) |
All or a portion of this security is pledged/held as collateral for open derivatives. (Note 2). |
|
(j) |
Represents investment of security lending cash collateral. (Note 2). |
|
(k) |
Maturity value of $3,082,216. Collateralized by U.S. Government Agency obligations with a rate of 0.000%, maturity date of 3/30/23, and an aggregate market value, including accrued interest, of $3,143,736. |
|
(l) |
The rate shown represents yield-to-maturity. |
|
(m) |
See Note 6 for aggregate cost for federal tax purposes. |
Forward contracts
Counterparty |
Settlement |
Currency Purchased |
Currency Sold |
Unrealized |
||||||||||||||||||||
Bank of America N.A.* |
10/21/22 | JPY | 11,305,037 | USD | 80,165 | $ | (1,931 | ) | ||||||||||||||||
Barclays Bank PLC* |
10/07/22 | USD | 617,271 | CLP | 573,012,760 | 25,477 | ||||||||||||||||||
Barclays Bank PLC* |
10/07/22 | USD | 446,039 | TWD | 13,041,742 | 35,204 | ||||||||||||||||||
Barclays Bank PLC* |
11/25/22 | USD | 1,176,515 | SEK | 11,723,503 | 117,384 | ||||||||||||||||||
Barclays Bank PLC* |
12/02/22 | USD | 243,935 | BRL | 1,275,880 | 10,510 | ||||||||||||||||||
Barclays Bank PLC* |
12/16/22 | USD | 213,319 | SGD | 305,473 | 432 | ||||||||||||||||||
BNP Paribas SA* |
10/07/22 | USD | 1,220,072 | CLP | 1,146,025,520 | 36,484 | ||||||||||||||||||
BNP Paribas SA* |
10/07/22 | CLP | 970,734,082 | USD | 1,023,722 | (21,170 | ) | |||||||||||||||||
BNP Paribas SA* |
10/21/22 | JPY | 204,697,459 | USD | 1,475,373 | (58,814 | ) | |||||||||||||||||
BNP Paribas SA* |
10/21/22 | USD | 5,691,074 | JPY | 784,081,474 | 265,029 | ||||||||||||||||||
BNP Paribas SA* |
10/21/22 | USD | 4,464,584 | AUD | 6,508,598 | 300,640 | ||||||||||||||||||
BNP Paribas SA* |
10/21/22 | USD | 3,251,818 | CAD | 4,196,226 | 214,184 | ||||||||||||||||||
BNP Paribas SA* |
11/18/22 | USD | 1,747,257 | PLN | 8,142,918 | 116,181 | ||||||||||||||||||
BNP Paribas SA* |
11/25/22 | USD | 7,836,546 | GBP | 6,456,436 | 622,246 | ||||||||||||||||||
BNP Paribas SA* |
12/09/22 | MYR | 890,000 | USD | 192,378 | 25 | ||||||||||||||||||
BNP Paribas SA* |
12/09/22 | USD | 2,482,532 | MYR | 11,075,026 | 88,294 | ||||||||||||||||||
BNP Paribas SA* |
12/16/22 | SGD | 200,000 | USD | 139,667 | (285 | ) | |||||||||||||||||
BNP Paribas SA* |
1/19/23 | USD | 643,812 | CLP | 640,463,728 | (4,484 | ) | |||||||||||||||||
Citibank N.A.* |
10/07/22 | USD | 870,467 | INR | 68,719,850 | 26,004 | ||||||||||||||||||
Citibank N.A.* |
10/07/22 | INR | 4,687,005 | USD | 57,180 | 416 | ||||||||||||||||||
Citibank N.A.* |
10/07/22 | CLP | 166,243,623 | USD | 181,323 | (9,631 | ) | |||||||||||||||||
Citibank N.A.* |
10/14/22 | ZAR | 5,874,836 | USD | 338,371 | (14,089 | ) | |||||||||||||||||
Citibank N.A.* |
10/14/22 | USD | 1,656,970 | CNH | 11,107,000 | 101,203 | ||||||||||||||||||
Citibank N.A.* |
10/14/22 | CNH | 12,651,203 | USD | 1,749,673 | 22,392 | ||||||||||||||||||
Citibank N.A.* |
10/14/22 | USD | 1,870,879 | HUF | 796,017,425 | 32,062 | ||||||||||||||||||
Citibank N.A.* |
10/20/22 | USD | 4,063,105 | ILS | 14,266,780 | 57,420 | ||||||||||||||||||
Citibank N.A.* |
10/20/22 | ILS | 14,019,167 | USD | 4,052,952 | (116,788 | ) | |||||||||||||||||
Citibank N.A.* |
10/21/22 | CAD | 238,000 | USD | 173,231 | (944 | ) | |||||||||||||||||
Citibank N.A.* |
10/21/22 | USD | 383,605 | AUD | 557,534 | 26,916 | ||||||||||||||||||
Citibank N.A.* |
10/21/22 | USD | 101,733 | CHF | 100,000 | 234 | ||||||||||||||||||
Citibank N.A.* |
11/18/22 | USD | 397,524 | RSD | 46,140,575 | 11,637 | ||||||||||||||||||
Citibank N.A.* |
11/25/22 | EUR | 1,583,000 | USD | 1,556,627 | 380 | ||||||||||||||||||
Citibank N.A.* |
11/25/22 | USD | 3,519,552 | GBP | 3,109,000 | 45,615 | ||||||||||||||||||
Citibank N.A.* |
12/09/22 | USD | 1,418,491 | THB | 53,896,000 | (16,209 | ) | |||||||||||||||||
The accompanying notes are an integral part of the financial statements.
59
MassMutual Select T. Rowe Price Bond Asset Fund – Portfolio of Investments (Continued) |
Counterparty |
Settlement |
Currency Purchased |
Currency Sold |
Unrealized |
||||||||||||||||||||
Citibank N.A.* |
12/16/22 | USD | 187,778 | RSD | 22,154,963 | $ | 2,600 | |||||||||||||||||
Citibank N.A.* |
12/16/22 | USD | 594,493 | SGD | 854,394 | (944 | ) | |||||||||||||||||
Citibank N.A.* |
1/13/23 | CNH | 1,564,000 | USD | 219,898 | (378 | ) | |||||||||||||||||
Citibank N.A.* |
1/13/23 | USD | 1,754,243 | CNH | 12,651,203 | (21,454 | ) | |||||||||||||||||
Citibank N.A.* |
1/19/23 | USD | 4,075,339 | ILS | 14,019,167 | 107,933 | ||||||||||||||||||
Citibank N.A.* |
1/19/23 | USD | 807,718 | INR | 66,322,450 | 208 | ||||||||||||||||||
Deutsche Bank AG* |
10/07/22 | INR | 106,125,875 | USD | 1,328,215 | (24,088 | ) | |||||||||||||||||
Deutsche Bank AG* |
11/25/22 | USD | 1,640,539 | EUR | 1,642,000 | 25,501 | ||||||||||||||||||
Deutsche Bank AG* |
11/25/22 | EUR | 642,000 | USD | 656,246 | (24,788 | ) | |||||||||||||||||
Deutsche Bank AG* |
1/19/23 | CLP | 144,073,997 | USD | 146,399 | (563 | ) | |||||||||||||||||
Deutsche Bank AG* |
1/19/23 | USD | 47,474 | INR | 3,905,835 | (82 | ) | |||||||||||||||||
Goldman Sachs International* |
10/07/22 | TWD | 25,522,000 | USD | 801,052 | 2,933 | ||||||||||||||||||
Goldman Sachs International* |
10/07/22 | INR | 98,379,966 | USD | 1,230,965 | (22,023 | ) | |||||||||||||||||
Goldman Sachs International* |
10/07/22 | USD | 426,967 | TWD | 12,480,258 | 33,818 | ||||||||||||||||||
Goldman Sachs International* |
10/07/22 | USD | 961,210 | INR | 76,276,837 | 23,883 | ||||||||||||||||||
Goldman Sachs International* |
10/07/22 | CLP | 427,750,646 | USD | 475,959 | (34,188 | ) | |||||||||||||||||
Goldman Sachs International* |
10/14/22 | USD | 24,893 | CNH | 166,903 | 1,515 | ||||||||||||||||||
Goldman Sachs International* |
10/14/22 | USD | 715,889 | MXN | 14,476,000 | (1,582 | ) | |||||||||||||||||
Goldman Sachs International* |
11/25/22 | GBP | 2,844,000 | USD | 3,296,614 | (118,782 | ) | |||||||||||||||||
Goldman Sachs International* |
12/09/22 | USD | 885,410 | THB | 32,120,852 | 30,359 | ||||||||||||||||||
Goldman Sachs International* |
12/16/22 | USD | 2,519,050 | SGD | 3,516,947 | 68,047 | ||||||||||||||||||
Goldman Sachs International* |
1/19/23 | CLP | 135,065,414 | USD | 135,447 | 1,270 | ||||||||||||||||||
Goldman Sachs International* |
1/19/23 | USD | 805,217 | TWD | 25,522,000 | (6,011 | ) | |||||||||||||||||
Goldman Sachs International* |
1/19/23 | USD | 48,608 | INR | 4,023,006 | (374 | ) | |||||||||||||||||
HSBC Bank USA* |
10/14/22 | HUF | 22,790,730 | USD | 56,694 | (4,047 | ) | |||||||||||||||||
HSBC Bank USA* |
10/14/22 | USD | 52,871 | CNH | 354,097 | 3,273 | ||||||||||||||||||
HSBC Bank USA* |
10/14/22 | CNH | 8,694,538 | USD | 1,208,330 | 9,522 | ||||||||||||||||||
HSBC Bank USA* |
11/25/22 | EUR | 494,000 | USD | 505,812 | (19,924 | ) | |||||||||||||||||
HSBC Bank USA* |
11/25/22 | USD | 17,922,269 | EUR | 17,343,180 | 863,870 | ||||||||||||||||||
HSBC Bank USA* |
11/25/22 | USD | 7,837,048 | GBP | 6,456,436 | 622,748 | ||||||||||||||||||
HSBC Bank USA* |
12/09/22 | USD | 430,286 | THB | 15,640,883 | 13,929 | ||||||||||||||||||
HSBC Bank USA* |
12/09/22 | USD | 3,456,827 | MYR | 15,500,944 | 105,779 | ||||||||||||||||||
HSBC Bank USA* |
1/13/23 | USD | 1,211,538 | CNH | 8,694,538 | (8,810 | ) | |||||||||||||||||
JP Morgan Chase Bank N.A.* |
10/14/22 | CNH | 3,928,258 | USD | 543,463 | 6,772 | ||||||||||||||||||
JP Morgan Chase Bank N.A.* |
10/21/22 | JPY | 23,756,000 | USD | 164,400 | (2 | ) | |||||||||||||||||
JP Morgan Chase Bank N.A.* |
10/21/22 | USD | 296,327 | NOK | 2,939,186 | 26,374 | ||||||||||||||||||
JP Morgan Chase Bank N.A.* |
12/09/22 | MYR | 133,555 | USD | 29,388 | (516 | ) | |||||||||||||||||
JP Morgan Chase Bank N.A.* |
1/13/23 | USD | 544,850 | CNH | 3,928,258 | (6,512 | ) | |||||||||||||||||
Morgan Stanley & Co. LLC* |
10/21/22 | USD | 7,155,674 | JPY | 986,662,772 | 327,714 | ||||||||||||||||||
Morgan Stanley & Co. LLC* |
11/25/22 | USD | 268,195 | EUR | 259,631 | 12,828 | ||||||||||||||||||
Morgan Stanley & Co. LLC* |
11/25/22 | GBP | 71,000 | USD | 81,314 | (1,980 | ) | |||||||||||||||||
Morgan Stanley & Co. LLC* |
12/02/22 | USD | 238,815 | BRL | 1,256,837 | 8,873 | ||||||||||||||||||
Royal Bank of Canada* |
11/25/22 | USD | 31,335 | EUR | 31,127 | 719 | ||||||||||||||||||
State Street Bank and Trust* |
10/14/22 | ZAR | 21,608,618 | USD | 1,256,737 | (63,972 | ) | |||||||||||||||||
State Street Bank and Trust* |
10/14/22 | CNY | 11,838,000 | USD | 1,714,365 | (44,844 | ) | |||||||||||||||||
State Street Bank and Trust* |
10/14/22 | CZK | 3,305,000 | USD | 134,986 | (3,434 | ) | |||||||||||||||||
State Street Bank and Trust* |
10/14/22 | USD | 122,044 | MXN | 2,589,874 | (6,317 | ) | |||||||||||||||||
State Street Bank and Trust* |
10/14/22 | USD | 2,874,249 | CZK | 71,276,340 | 37,163 | ||||||||||||||||||
State Street Bank and Trust* |
10/14/22 | USD | 2,072,537 | CNY | 14,074,000 | 87,671 | ||||||||||||||||||
The accompanying notes are an integral part of the financial statements.
60
MassMutual Select T. Rowe Price Bond Asset Fund – Portfolio of Investments (Continued) |
Counterparty |
Settlement |
Currency Purchased |
Currency Sold |
Unrealized |
||||||||||||||||||||
State Street Bank and Trust* |
10/20/22 | ILS | 517,000 | USD | 155,840 | $ | (10,682 | ) | ||||||||||||||||
State Street Bank and Trust* |
10/20/22 | USD | 101,370 | ILS | 344,000 | 4,785 | ||||||||||||||||||
State Street Bank and Trust* |
10/21/22 | CAD | 1,456,000 | USD | 1,077,779 | (23,786 | ) | |||||||||||||||||
State Street Bank and Trust* |
10/21/22 | JPY | 269,431,909 | USD | 1,982,952 | (118,414 | ) | |||||||||||||||||
State Street Bank and Trust* |
10/21/22 | AUD | 154,000 | USD | 105,674 | (7,151 | ) | |||||||||||||||||
State Street Bank and Trust* |
10/21/22 | USD | 120,820 | AUD | 173,000 | 10,141 | ||||||||||||||||||
State Street Bank and Trust* |
10/21/22 | USD | 4,003,263 | CAD | 5,245,697 | 205,920 | ||||||||||||||||||
State Street Bank and Trust* |
10/21/22 | USD | 7,696,677 | JPY | 1,055,300,013 | 393,731 | ||||||||||||||||||
State Street Bank and Trust* |
11/25/22 | EUR | 3,471,477 | USD | 3,466,033 | (51,558 | ) | |||||||||||||||||
State Street Bank and Trust* |
11/25/22 | SEK | 1,987,000 | USD | 187,694 | (8,183 | ) | |||||||||||||||||
State Street Bank and Trust* |
11/25/22 | GBP | 893,000 | USD | 1,040,907 | (43,086 | ) | |||||||||||||||||
State Street Bank and Trust* |
11/25/22 | USD | 17,380,079 | EUR | 16,824,696 | 831,651 | ||||||||||||||||||
UBS AG* |
10/07/22 | CLP | 650,167,724 | USD | 682,770 | (11,291 | ) | |||||||||||||||||
UBS AG* |
10/07/22 | USD | 1,250,123 | CLP | 1,146,025,520 | 66,534 | ||||||||||||||||||
UBS AG* |
10/07/22 | USD | 806,732 | INR | 64,196,159 | 17,858 | ||||||||||||||||||
UBS AG* |
10/14/22 | ZAR | 5,491,971 | USD | 317,646 | (14,497 | ) | |||||||||||||||||
UBS AG* |
10/14/22 | USD | 1,098,665 | ZAR | 18,758,493 | 63,223 | ||||||||||||||||||
UBS AG* |
10/14/22 | USD | 1,691,998 | CNH | 11,410,000 | 93,789 | ||||||||||||||||||
UBS AG* |
10/14/22 | USD | 823,765 | MXN | 17,213,000 | (29,359 | ) | |||||||||||||||||
UBS AG* |
10/20/22 | ILS | 74,613 | USD | 22,135 | (1,186 | ) | |||||||||||||||||
UBS AG* |
10/21/22 | JPY | 30,161,652 | USD | 218,720 | (9,994 | ) | |||||||||||||||||
UBS AG* |
10/21/22 | CHF | 4,488,000 | USD | 4,630,302 | (75,022 | ) | |||||||||||||||||
UBS AG* |
10/21/22 | USD | 6,586,766 | CAD | 8,598,612 | 362,259 | ||||||||||||||||||
UBS AG* |
10/21/22 | USD | 856,809 | JPY | 115,411,725 | 58,130 | ||||||||||||||||||
UBS AG* |
10/21/22 | CAD | 55,820 | USD | 42,956 | (2,548 | ) | |||||||||||||||||
UBS AG* |
11/25/22 | USD | 2,331,176 | SEK | 23,272,029 | 228,720 | ||||||||||||||||||
UBS AG* |
11/25/22 | USD | 35,770,143 | EUR | 34,600,076 | 1,738,213 | ||||||||||||||||||
UBS AG* |
11/25/22 | EUR | 2,658,000 | USD | 2,633,871 | (19,517 | ) | |||||||||||||||||
UBS AG* |
12/02/22 | USD | 245,409 | BRL | 1,275,880 | 11,983 | ||||||||||||||||||
UBS AG* |
12/09/22 | USD | 1,716,050 | THB | 61,084,517 | 89,993 | ||||||||||||||||||
UBS AG* |
12/09/22 | THB | 58,756,000 | USD | 1,628,718 | (64,646 | ) | |||||||||||||||||
UBS AG* |
1/19/23 | USD | 840,148 | INR | 68,837,555 | 2,016 | ||||||||||||||||||
UBS AG* |
1/19/23 | USD | 668,670 | CLP | 650,167,724 | 10,552 | ||||||||||||||||||
| $ | 7,620,289 | |||||||||||||||||||||||
Futures contracts
|
Expiration |
Number of |
Notional |
Value/ Net |
||||||||||||
Long |
||||||||||||||||
Euro-BOBL |
12/08/22 | 71 | $ | 8,547,583 | $ | (214,952 | ) | |||||||||
Euro-BTP |
12/08/22 | 40 | 4,587,354 | (197,514 | ) | |||||||||||
Euro-Bund |
12/08/22 | 28 | 3,977,915 | (177,555 | ) | |||||||||||
Australia 3 Year Bond |
12/15/22 | 106 | 7,275,748 | (50,525 | ) | |||||||||||
Canada 10 Year Bond |
12/19/22 | 43 | 3,894,854 | (47,625 | ) | |||||||||||
Korea 3 Year Bond |
12/20/22 | 161 | 11,603,826 | (139,033 | ) | |||||||||||
U.S. Treasury Long Bond |
12/20/22 | 237 | 30,997,505 | (1,039,224 | ) | |||||||||||
The accompanying notes are an integral part of the financial statements.
61
MassMutual Select T. Rowe Price Bond Asset Fund – Portfolio of Investments (Continued) |
|
Expiration |
Number of |
Notional |
Value/ Net |
||||||||||||
U.S. Treasury Ultra 10 Year |
12/20/22 | 93 | $ | 11,665,523 | $ | (646,476 | ) | |||||||||
UK Long Gilt |
12/28/22 | 4 | 477,783 | (47,241 | ) | |||||||||||
|
$ | (2,560,145 | ) | |||||||||||||
Short |
||||||||||||||||
Euro-Schatz |
12/08/22 | 78 | $ | (8,268,730 | ) | $ | 76,619 | |||||||||
U.S. Treasury Note 10 Year |
12/20/22 | 20 | (2,276,143 | ) | 34,893 | |||||||||||
U.S. Treasury Note 2 Year |
12/30/22 | 229 | (47,055,872 | ) | 21,419 | |||||||||||
|
$ | 132,931 | ||||||||||||||
Centrally Cleared Credit Default Swaps - Buy Protection
Reference |
Rate Paid |
Payment |
Termination |
Notional |
Value |
Upfront |
Unrealized |
|||||||||||||||||||||||||
BASF Chemicals Co. |
1.000% | Quarterly | 6/20/2027 | EUR | 139,000 | $ | 2,439 | $ | 2,621 | $ | (182 | ) | ||||||||||||||||||||
iTraxx Europe Crossover Series 38† |
1.000% | Quarterly | 12/20/2027 | EUR | 8,025,000 | 176,432 | 123,033 | 53,399 | ||||||||||||||||||||||||
iTraxx Europe Crossover Series 38† |
5.000% | Quarterly | 12/20/2027 | EUR | 3,735,000 | 197,425 | 142,275 | 55,150 | ||||||||||||||||||||||||
Lanxess Chemicals Co. |
1.000% | Quarterly | 12/20/2027 | EUR | 400,000 | 32,724 | 33,676 | (952 | ) | |||||||||||||||||||||||
| $ | 409,020 | $ | 301,605 | $ | 107,415 | |||||||||||||||||||||||||||
Centrally Cleared Credit Default Swaps - Sell Protection††
Reference |
Rate |
Payment |
Termination |
Credit |
Notional |
Value |
Upfront |
Unrealized |
||||||||||||||||||||||||||||
Republic of Indonesia |
1.000% | Quarterly | 12/20/27 | NR** | USD | 2,070,000 | $ | (87,970 | ) | $ | (28,281 | ) | $ | (59,689 | ) | |||||||||||||||||||||
Republic of Mexico |
1.000% | Quarterly | 12/20/27 | NR** | USD | 5,176,000 | (219,968 | ) | (181,872 | ) | (38,096 | ) | ||||||||||||||||||||||||
CDX.NA.IG Series 39† |
1.000% | Quarterly | 12/20/27 | BBB+** | USD | 5,015,000 | (17,485 | ) | (13,233 | ) | (4,252 | ) | ||||||||||||||||||||||||
| $ | (325,423 | ) | $ | (223,386 | ) | $ | (102,037 | ) | ||||||||||||||||||||||||||||
The accompanying notes are an integral part of the financial statements.
62
MassMutual Select T. Rowe Price Bond Asset Fund – Portfolio of Investments (Continued) |
OTC Credit Default Swaps-Sell Protection††
Reference |
Rate |
Payment |
Counterparty |
Credit |
Termination |
Notional |
Value |
Upfront |
Unrealized |
||||||||||||||||||||||||||||
Republic of Greece |
1.000% | Quarterly | Bank of America N.A.* |
BB** | 12/20/24 | USD | 151,000 | $ | (473 | ) | $ | (4,578 | ) | $ | 4,105 | ||||||||||||||||||||||
Republic of Greece |
1.000% | Quarterly | Bank of America N.A.* |
BB** | 12/20/24 | USD | 303,000 | (950 | ) | (9,187 | ) | 8,237 | |||||||||||||||||||||||||
Republic of Greece |
1.000% | Quarterly | Bank of America N.A.* |
BB** | 12/20/24 | USD | 152,000 | (476 | ) | (10,490 | ) | 10,014 | |||||||||||||||||||||||||
Republic of Greece |
1.000% | Quarterly | Bank of America N.A.* |
BB** | 12/20/29 | USD | 225,000 | (17,305 | ) | (11,045 | ) | (6,260 | ) | ||||||||||||||||||||||||
Republic of Greece |
1.000% | Quarterly | Bank of America N.A.* |
BB** | 12/20/29 | USD | 225,000 | (17,305 | ) | (11,239 | ) | (6,066 | ) | ||||||||||||||||||||||||
Republic of Greece |
1.000% | Quarterly | Barclays Bank PLC* |
BB** | 6/20/24 | USD | 135,000 | (91 | ) | (8,192 | ) | 8,101 | |||||||||||||||||||||||||
Republic of Greece |
1.000% | Quarterly | Barclays Bank PLC* |
BB** | 6/20/24 | USD | 67,500 | (46 | ) | (3,879 | ) | 3,833 | |||||||||||||||||||||||||
Republic of Greece |
1.000% | Quarterly | Barclays Bank PLC* |
BB** | 6/20/24 | USD | 67,500 | (46 | ) | (3,879 | ) | 3,833 | |||||||||||||||||||||||||
Republic of Greece |
1.000% | Quarterly | Barclays Bank PLC* |
BB** | 12/20/24 | USD | 450,000 | (1,410 | ) | (2,504 | ) | 1,094 | |||||||||||||||||||||||||
Republic of Greece |
1.000% | Quarterly | Citibank N.A.* |
BB** | 6/20/25 | USD | 150,000 | (1,187 | ) | (9,034 | ) | 7,847 | |||||||||||||||||||||||||
Republic of Greece |
1.000% | Quarterly | Citibank N.A.* |
BB** | 6/20/25 | USD | 75,000 | (594 | ) | (4,350 | ) | 3,756 | |||||||||||||||||||||||||
Republic of Greece |
1.000% | Quarterly | Citibank N.A.* |
BB** | 12/20/25 | USD | 300,000 | (3,768 | ) | (281 | ) | (3,487 | ) | ||||||||||||||||||||||||
Barclays Bank PLC |
1.000% | Quarterly | JP Morgan Chase Bank N.A.* |
A+** | 6/20/24 | EUR | 100,000 | 80 | 1,278 | (1,198 | ) | ||||||||||||||||||||||||||
Republic of Greece |
1.000% | Quarterly | Morgan Stanley & Co. LLC* |
BB** | 12/20/24 | USD | 134,000 | (420 | ) | (993 | ) | 573 | |||||||||||||||||||||||||
Republic of Greece |
1.000% | Quarterly | Morgan Stanley & Co. LLC* |
BB** | 6/20/25 | USD | 94,000 | (744 | ) | (4,498 | ) | 3,754 | |||||||||||||||||||||||||
| $ | (44,735 | ) | $ | (82,871 | ) | $ | 38,136 | ||||||||||||||||||||||||||||||
Centrally Cleared Interest Rate Swaps
Paid by the Fund |
Received by the Fund |
||||||||||||||||||||||||||||||||
Rate/ Reference |
Frequency |
Rate/ |
Frequency |
Termination |
Notional |
Value |
Upfront |
Unrealized |
|||||||||||||||||||||||||
3-Month CNREPOFIX=CFXS-Reuters |
Quarterly | Fixed 2.558% |
Quarterly | 7/17/25 | CNY | 30,000,000 | $ | 30,245 | $ | — | $ | 30,245 | |||||||||||||||||||||
3-Month CNREPOFIX=CFXS-Reuters |
Quarterly | Fixed 2.600% |
Quarterly | 8/06/25 | CNY | 7,500,000 | 8,775 | — | 8,775 | ||||||||||||||||||||||||
3-Month CNREPOFIX=CFXS-Reuters |
Quarterly | Fixed 2.855% |
Quarterly | 11/24/25 | CNY | 26,575,000 | 57,122 | — | 57,122 | ||||||||||||||||||||||||
The accompanying notes are an integral part of the financial statements.
63
MassMutual Select T. Rowe Price Bond Asset Fund – Portfolio of Investments (Continued) |
Paid by the Fund |
Received by the Fund |
||||||||||||||||||||||||||||||||
Rate/ Reference |
Frequency |
Rate/ |
Frequency |
Termination |
Notional |
Value |
Upfront |
Unrealized |
|||||||||||||||||||||||||
3-Month CNREPOFIX=CFXS-Reuters |
Quarterly | Fixed 2.605% |
Quarterly | 1/15/26 | CNY | 58,525,000 | $ | 61,853 | $ | — | $ | 61,853 | |||||||||||||||||||||
3-Month CNREPOFIX=CFXS-Reuters |
Quarterly | Fixed 2.780% |
Quarterly | 6/28/26 | CNY | 9,775,000 | 17,509 | — | 17,509 | ||||||||||||||||||||||||
3-Month CNREPOFIX=CFXS-Reuters |
Quarterly | Fixed 2.560% |
Quarterly | 7/28/26 | CNY | 2,800,000 | 1,899 | — | 1,899 | ||||||||||||||||||||||||
3-Month CNREPOFIX=CFXS-Reuters |
Quarterly | Fixed 2.255% |
Quarterly | 1/26/27 | CNY | 24,350,000 | (25,407 | ) | — | (25,407 | ) | ||||||||||||||||||||||
3-Month CNREPOFIX=CFXS-Reuters |
Quarterly | Fixed 2.355% |
Quarterly | 4/15/27 | CNY | 37,000,000 | (19,687 | ) | — | (19,687 | ) | ||||||||||||||||||||||
3-Month CNREPOFIX=CFXS-Reuters |
Quarterly | Fixed 2.440% |
Quarterly | 7/27/27 | CNY | 5,400,000 | (1,452 | ) | — | (1,452 | ) | ||||||||||||||||||||||
6-Month PRIBOR |
Semi-Annually | Fixed 6.180% |
Annually | 6/21/27 | CZK | 6,266,000 | 6,420 | — | 6,420 | ||||||||||||||||||||||||
6-Month PRIBOR |
Semi-Annually | Fixed 6.180% |
Annually | 6/21/27 | CZK | 6,266,000 | 6,420 | — | 6,420 | ||||||||||||||||||||||||
6-Month PRIBOR |
Semi-Annually | Fixed 6.333% |
Annually | 6/22/27 | CZK | 12,494,000 | 15,869 | — | 15,869 | ||||||||||||||||||||||||
6-Month PRIBOR |
Semi-Annually | Fixed 6.285% |
Annually | 6/22/27 | CZK | 6,304,000 | 7,523 | — | 7,523 | ||||||||||||||||||||||||
6-Month EURIBOR |
Semi-Annually | Fixed -0.001% |
Annually | 10/20/25 | EUR | 690,000 | (59,537 | ) | — | (59,537 | ) | ||||||||||||||||||||||
6-Month EURIBOR |
Semi-Annually | Fixed -0.001% |
Annually | 11/04/25 | EUR | 1,030,000 | (88,106 | ) | — | (88,106 | ) | ||||||||||||||||||||||
6-Month EURIBOR |
Semi-Annually | Fixed -0.057% |
Annually | 5/19/28 | EUR | 1,060,000 | (163,846 | ) | — | (163,846 | ) | ||||||||||||||||||||||
6-Month EURIBOR |
Semi-Annually | Fixed -0.101% |
Annually | 6/01/28 | EUR | 500,000 | (78,796 | ) | — | (78,796 | ) | ||||||||||||||||||||||
6-Month EURIBOR |
Semi-Annually | Fixed -0.100% |
Annually | 6/03/28 | EUR | 365,000 | (57,524 | ) | — | (57,524 | ) | ||||||||||||||||||||||
6-Month EURIBOR |
Semi-Annually | Fixed 0.830% |
Annually | 3/02/32 | EUR | 4,300,000 | (778,373 | ) | — | (778,373 | ) | ||||||||||||||||||||||
6-Month EURIBOR |
Semi-Annually | Fixed 1.222% |
Annually | 4/04/32 | EUR | 1,350,000 | (205,465 | ) | — | (205,465 | ) | ||||||||||||||||||||||
6-Month EURIBOR |
Semi-Annually | Fixed 1.626% |
Annually | 4/21/32 | EUR | 946,000 | (113,076 | ) | — | (113,076 | ) | ||||||||||||||||||||||
6-Month EURIBOR |
Semi-Annually | Fixed 1.640% |
Annually | 5/02/32 | EUR | 950,000 | (112,615 | ) | — | (112,615 | ) | ||||||||||||||||||||||
28 Day-MXN-TIIE-Banxico |
Monthly | Fixed 5.499% |
Monthly | 5/04/27 | MXN | 15,000,000 | (106,130 | ) | — | (106,130 | ) | ||||||||||||||||||||||
Fixed 3.090% |
Annually | 6-Month WIBOR |
Semi-Annually | 2/20/28 | PLN | 1,070,000 | 37,001 | — | 37,001 | ||||||||||||||||||||||||
Fixed 2.850% |
Annually | 6-Month WIBOR |
Semi-Annually | 4/06/28 | PLN | 100,000 | 3,733 | — | 3,733 | ||||||||||||||||||||||||
The accompanying notes are an integral part of the financial statements.
64
MassMutual Select T. Rowe Price Bond Asset Fund – Portfolio of Investments (Continued) |
Paid by the Fund |
Received by the Fund |
||||||||||||||||||||||||||||||||
Rate/ Reference |
Frequency |
Rate/ |
Frequency |
Termination |
Notional |
Value |
Upfront |
Unrealized |
|||||||||||||||||||||||||
Fixed 2.920% |
Annually | 6-Month WIBOR |
Semi-Annually | 5/07/28 | PLN | 200,000 | $ | 7,408 | $ | — | $ | 7,408 | |||||||||||||||||||||
Fixed 3.030% |
Annually | 6-Month WIBOR |
Semi-Annually | 5/18/28 | PLN | 300,000 | 10,853 | — | 10,853 | ||||||||||||||||||||||||
Fixed 1.715% |
Annually | 6-Month WIBOR |
Semi-Annually | 9/24/29 | PLN | 1,700,000 | 96,419 | — | 96,419 | ||||||||||||||||||||||||
Fixed 1.780% |
Annually | 6-Month WIBOR |
Semi-Annually | 10/22/29 | PLN | 823,529 | 46,416 | — | 46,416 | ||||||||||||||||||||||||
Fixed 1.775% |
Annually | 6-Month WIBOR |
Semi-Annually | 10/22/29 | PLN | 1,176,471 | 66,373 | — | 66,373 | ||||||||||||||||||||||||
| $ | (1,328,176 | ) | $ | — | $ | (1,328,176 | ) | ||||||||||||||||||||||||||
|
* |
Contracts are subject to a master netting agreement or similar agreement. |
|
** |
Rating represents a weighted average of the ratings of all securities included in the underlying index for the credit default swap. Ratings used in the weighted average are from Moody’s Investors Service, Inc., S&P Global Ratings, or Fitch Ratings, whichever is the highest for each constituent. All ratings are as of the report date and do not reflect subsequent changes. |
|
† |
Payment is based on a percentage of the index. Reference entities are a number of individual issuers comprising the index. |
|
†† |
For each credit derivative with sold protection, the credit ratings of the entities referenced, as rated by any rating organization, are included in the equivalent S&P Global Ratings. The reference entity rating represents the likelihood of a potential payment by the Fund if the referenced entity experiences a credit event as of period end. Notional amounts represent the maximum potential amount of future payments (undiscounted) the Fund could be required to make under the credit derivatives with sold protection. |
Currency Legend
|
AUD |
Australian Dollar |
|
BRL |
Brazilian Real |
|
CAD |
Canadian Dollar |
|
CHF |
Swiss Franc |
|
CLP |
Chilean Peso |
|
CNH |
Offshore Chinese Yuan |
|
CNY |
Chinese Yuan Renminbi |
|
CZK |
Czech Koruna |
|
EUR |
Euro |
|
GBP |
British Pound |
|
HUF |
Hungarian Forint |
|
ILS |
Israeli Shekel |
|
INR |
Indian Rupee |
|
JPY |
Japanese Yen |
|
KRW |
South Korean Won |
|
MXN |
Mexican Peso |
|
MYR |
Malaysian Ringgit |
|
NOK |
Norwegian Krone |
|
PLN |
Polish Zloty |
|
RSD |
Serbian dinar |
|
SEK |
Swedish Krona |
|
SGD |
Singapore Dollar |
|
THB |
Thai Baht |
|
TWD |
Taiwan Dollar |
|
USD |
U.S. Dollar |
|
ZAR |
South African Rand |
The accompanying notes are an integral part of the financial statements.
65
MassMutual Select T. Rowe Price Emerging Markets Bond Fund – Portfolio of Investments |
September 30, 2022 |
Principal |
Value |
|||||||
BONDS & NOTES — 94.4% |
||||||||
CORPORATE DEBT — 31.9% |
||||||||
Bermuda — 0.3% |
||||||||
Ooredoo International Finance Ltd. |
||||||||
2.625% 4/08/31 (a) |
$ | 260,000 | $ | 214,760 | ||||
Brazil — 0.8% |
||||||||
Globo Comunicacao e Participacoes SA |
||||||||
4.875% 1/22/30 (a) |
850,000 | 639,625 | ||||||
British Virgin Islands — 0.3% |
||||||||
State Grid Overseas Investment BVI Ltd. |
||||||||
3.500% 5/04/27 (a) |
200,000 | 190,770 | ||||||
Canada — 0.3% |
||||||||
MEGlobal Canada ULC |
||||||||
5.875% 5/18/30 (a) |
200,000 | 198,000 | ||||||
Cayman Islands — 2.3% |
||||||||
Cosan Overseas Ltd. |
||||||||
8.250% (a) (b) |
100,000 | 98,250 | ||||||
DP World Crescent Ltd. |
||||||||
3.875% 7/18/29 (a) |
300,000 | 271,154 | ||||||
H World Group Ltd., Convertible, |
||||||||
3.000% 5/01/26 |
129,000 | 140,392 | ||||||
Health & Happiness H&H International Holdings Ltd. |
||||||||
5.625% 10/24/24 (a) |
200,000 | 159,000 | ||||||
Lamar Funding Ltd. |
||||||||
3.958% 5/07/25 (a) |
500,000 | 464,343 | ||||||
Lima Metro Line 2 Finance Ltd. |
||||||||
5.875% 7/05/34 (a) |
96,012 | 90,911 | ||||||
Sea Ltd., Convertible, |
||||||||
0.250% 9/15/26 (c) |
305,000 | 211,213 | ||||||
Tencent Holdings Ltd. |
||||||||
3.290% 6/03/60 (a) |
200,000 | 113,940 | ||||||
3.840% 4/22/51 (a) |
275,000 | 179,603 | ||||||
| 1,728,806 | ||||||||
Chile — 3.1% |
||||||||
AES Andes SA 5 year USD Swap + 4.644% |
||||||||
7.125% VRN 3/26/79 (a) |
650,000 | 570,001 | ||||||
Agrosuper SA |
||||||||
4.600% 1/20/32 (a) |
200,000 | 161,964 | ||||||
Banco Santander Chile |
||||||||
3.177% 10/26/31 (a) |
375,000 | 297,566 | ||||||
Celulosa Arauco y Constitucion SA |
||||||||
4.200% 1/29/30 (a) |
200,000 | 164,000 | ||||||
5.150% 1/29/50 (a) |
250,000 | 176,375 | ||||||
Corp. Nacional del Cobre de Chile |
||||||||
3.150% 1/14/30 (a) |
200,000 | 166,716 | ||||||
Principal |
Value |
|||||||
Empresa De Los Ferrocarr |
||||||||
3.068% 8/18/50 (a) |
$ | 450,000 | $ | 252,931 | ||||
Empresa de Transporte de Pasajeros Metro SA |
||||||||
3.693% 9/13/61 (a) |
200,000 | 117,026 | ||||||
4.700% 5/07/50 (a) |
200,000 | 150,720 | ||||||
VTR Comunicaciones SpA |
||||||||
4.375% 4/15/29 (a) |
250,000 | 155,000 | ||||||
5.125% 1/15/28 (a) |
200,000 | 135,000 | ||||||
| 2,347,299 | ||||||||
Colombia — 1.8% |
||||||||
Banco Davivienda SA 10 year CMT + 5.097% |
||||||||
6.650% VRN (a) (b) |
400,000 | 292,493 | ||||||
Banco de Bogota SA |
||||||||
6.250% 5/12/26 (a) |
250,000 | 233,750 | ||||||
Bancolombia SA 5 year CMT + 2.944% |
||||||||
4.625% VRN 12/18/29 (c) |
200,000 | 168,000 | ||||||
Ecopetrol SA |
||||||||
4.625% 11/02/31 |
355,000 | 247,790 | ||||||
5.875% 5/28/45 |
745,000 | 452,513 | ||||||
| 1,394,546 | ||||||||
Hong Kong — 0.2% |
||||||||
Lenovo Group Ltd. |
||||||||
3.421% 11/02/30 (a) |
200,000 | 151,642 | ||||||
India — 1.4% |
||||||||
Adani International Container Terminal Pvt Ltd. |
||||||||
3.000% 2/16/31 (a) |
515,625 | 395,957 | ||||||
Adani Ports & Special Economic Zone Ltd. |
||||||||
4.200% 8/04/27 (a) |
200,000 | 175,080 | ||||||
4.375% 7/03/29 (a) |
200,000 | 166,396 | ||||||
Bharti Airtel Ltd. |
||||||||
3.250% 6/03/31 (a) |
400,000 | 320,492 | ||||||
| 1,057,925 | ||||||||
Indonesia — 0.9% |
||||||||
Bank Negara Indonesia Persero Tbk PT |
||||||||
3.750% 3/30/26 (a) |
213,000 | 188,545 | ||||||
Pertamina Persero PT |
||||||||
5.625% 5/20/43 (a) |
200,000 | 169,226 | ||||||
Perusahaan Perseroan Persero PT Perusahaan Listrik Negara |
||||||||
4.000% 6/30/50 (a) |
200,000 | 120,300 | ||||||
6.150% 5/21/48 (a) |
200,000 | 165,440 | ||||||
| 643,511 | ||||||||
Ireland — 0.4% |
||||||||
LCPR Senior Secured Financing DAC |
||||||||
5.125% 7/15/29 (a) (c) |
400,000 | 301,227 | ||||||
The accompanying notes are an integral part of the financial statements.
66
MassMutual Select T. Rowe Price Emerging Markets Bond Fund – Portfolio of Investments (Continued) |
Principal |
Value |
|||||||
Israel — 0.8% |
||||||||
ICL Group Ltd. |
||||||||
6.375% 5/31/38 (a) |
$ | 150,000 | $ | 142,722 | ||||
ICL Group Ltd. |
||||||||
6.375% 5/31/38 (a) |
200,000 | 190,296 | ||||||
Leviathan Bond Ltd. |
||||||||
6.125% 6/30/25 (a) |
300,000 | 282,000 | ||||||
| 615,018 | ||||||||
Jamaica — 0.2% |
||||||||
TransJamaican Highway Ltd. |
||||||||
5.750% 10/10/36 (a) |
144,155 | 115,950 | ||||||
Kazakhstan — 1.0% |
||||||||
KazMunayGas National Co. JSC |
||||||||
3.500% 4/14/33 (a) |
400,000 | 262,744 | ||||||
5.750% 4/19/47 (a) |
500,000 | 332,682 | ||||||
6.375% 10/24/48 (a) |
230,000 | 159,879 | ||||||
| 755,305 | ||||||||
Mauritius — 0.5% |
||||||||
Greenko Power II Ltd. |
||||||||
4.300% 12/13/28 (a) |
254,150 | 199,508 | ||||||
HTA Group Ltd/Mauritius |
||||||||
7.000% 12/18/25 (a) |
200,000 | 173,500 | ||||||
| 373,008 | ||||||||
Mexico — 9.0% |
||||||||
Axtel SAB de CV |
||||||||
6.375% 11/14/24 (a) |
200,000 | 139,915 | ||||||
Banco Mercantil Del Norte SA |
||||||||
5 year CMT + 4.967% 6.750% VRN (a) (b) |
200,000 | 186,038 | ||||||
10 year CMT + 7.760% 8.375% VRN (a) (b) |
200,000 | 183,000 | ||||||
BBVA Bancomer SA |
||||||||
5 year CMT + 2.650% 5.125% VRN 1/18/33 (a) |
600,000 | 496,299 | ||||||
5 year CMT + 4.308% 5.875% VRN 9/13/34 (a) |
200,000 | 171,147 | ||||||
Cemex SAB de CV |
||||||||
5.450% 11/19/29 (a) |
200,000 | 178,750 | ||||||
Cometa Energia SA de CV |
||||||||
6.375% 4/24/35 (a) |
350,400 | 316,041 | ||||||
Industrias Penoles SAB de CV |
||||||||
4.750% 8/06/50 (a) |
200,000 | 142,400 | ||||||
Infraestructura Energetica Nova SAPI de CV |
||||||||
4.875% 1/14/48 (a) |
300,000 | 206,178 | ||||||
Mexico City Airport Trust |
||||||||
5.500% 7/31/47 (a) |
1,742,000 | 1,088,227 | ||||||
Principal |
Value |
|||||||
Petroleos Mexicanos |
||||||||
4.500% 1/23/26 |
$ | 500,000 | $ | 430,750 | ||||
6.500% 3/13/27 |
1,200,000 | 1,005,000 | ||||||
6.500% 6/02/41 |
3,585,000 | 2,078,583 | ||||||
6.750% 9/21/47 |
400,000 | 223,208 | ||||||
| 6,845,536 | ||||||||
Netherlands — 0.7% |
||||||||
Minejesa Capital BV |
||||||||
5.625% 8/10/37 (a) |
500,000 | 357,500 | ||||||
Petrobras Global Finance BV |
||||||||
5.500% 6/10/51 (c) |
185,000 | 131,500 | ||||||
| 489,000 | ||||||||
Panama — 0.7% |
||||||||
Aeropuerto Internacional de Tocumen SA |
||||||||
4.000% 8/11/41 (a) |
200,000 | 147,642 | ||||||
Banco General SA 10 year CMT + 3.665% |
||||||||
5.250% VRN (a) (b) |
200,000 | 170,827 | ||||||
Banco Nacional de Panama |
||||||||
2.500% 8/11/30 (a) |
310,000 | 227,479 | ||||||
| 545,948 | ||||||||
Paraguay — 0.2% |
||||||||
Telfon Celuar Del Paragu SA |
||||||||
5.875% 4/15/27 (a) |
200,000 | 177,576 | ||||||
Peru — 0.2% |
||||||||
Consorcio Transmantaro SA |
||||||||
4.700% 4/16/34 (a) |
200,000 | 172,613 | ||||||
Philippines — 1.2% |
||||||||
Globe Telecom, Inc. |
||||||||
3.000% 7/23/35 (a) |
400,000 | 285,000 | ||||||
International Container Terminal Services, Inc. |
||||||||
4.750% 6/17/30 (a) |
400,000 | 359,000 | ||||||
Manila Water Co., Inc. |
||||||||
4.375% 7/30/30 (a) |
300,000 | 261,750 | ||||||
| 905,750 | ||||||||
Qatar — 0.4% |
||||||||
Qatar Energy |
||||||||
3.125% 7/12/41 (a) |
450,000 | 328,179 | ||||||
Saudi Arabia — 1.1% |
||||||||
Saudi Arabian Oil Co. |
||||||||
3.500% 4/16/29 (a) |
200,000 | 180,471 | ||||||
4.250% 4/16/39 (a) |
800,000 | 685,000 | ||||||
| 865,471 | ||||||||
Sri Lanka — 0.2% |
||||||||
SriLankan Airlines Ltd. |
||||||||
7.000% 6/25/24 (a) |
300,000 | 174,000 | ||||||
The accompanying notes are an integral part of the financial statements.
67
MassMutual Select T. Rowe Price Emerging Markets Bond Fund – Portfolio of Investments (Continued) |
Principal |
Value |
|||||||
Thailand — 1.2% |
||||||||
Bangkok Bank PCL 5 year CMT + 1.900% |
||||||||
3.733% VRN 9/25/34 (a) |
$ | 375,000 | $ | 307,354 | ||||
Bangkok Bank PCL/Hong Kong 5 year CMT + 2.150% |
||||||||
3.466% VRN 9/23/36 (a) |
200,000 | 154,405 | ||||||
Thaioil Treasury Center Co. Ltd. |
||||||||
3.500% 10/17/49 (a) |
600,000 | 345,156 | ||||||
3.500% 10/17/49 (a) |
200,000 | 115,052 | ||||||
| 921,967 | ||||||||
United Arab Emirates — 1.4% |
||||||||
Acwa Power Management And Investments One Ltd. |
||||||||
5.950% 12/15/39 (a) |
299,400 | 267,647 | ||||||
Emirates NBD Bank PJSC 6 year CMT + 3.656 |
||||||||
6.125% (a) (b) |
200,000 | 192,904 | ||||||
Oztel Holdings SPC Ltd. |
||||||||
6.625% 4/24/28 (a) |
200,000 | 193,396 | ||||||
Ruwais Power Co. PJSC |
||||||||
6.000% 8/31/36 (a) |
400,000 | 429,800 | ||||||
| 1,083,747 | ||||||||
United States — 0.9% |
||||||||
Citgo Holding, Inc. |
||||||||
9.250% 8/01/24 (a) (c) |
165,000 | 163,795 | ||||||
Kosmos Energy Ltd. |
||||||||
7.125% 4/04/26 (a) |
200,000 | 164,000 | ||||||
MercadoLibre, Inc., Convertible, |
||||||||
2.000% 8/15/28 |
90,000 | 177,165 | ||||||
Periama Holdings LLC |
||||||||
5.950% 4/19/26 (a) |
200,000 | 172,500 | ||||||
| 677,460 | ||||||||
Venezuela — 0.4% |
||||||||
Petroleos de Venezuela SA |
||||||||
5.375% 4/12/27 (a) (d) |
900,000 | 18,000 | ||||||
6.000% 5/16/24 (a) (d) |
2,400,000 | 48,000 | ||||||
6.000% 11/15/26 (a) (d) |
1,750,000 | 35,000 | ||||||
8.500% 10/27/20 (a) (d) |
250,000 | 42,500 | ||||||
9.000% 11/17/21 (a) (d) |
4,990,000 | 99,800 | ||||||
9.750% 5/17/35 (a) (d) |
150,000 | 3,000 | ||||||
12.750% 2/17/22 (a) (d) |
1,500,000 | 30,000 | ||||||
| 276,300 | ||||||||
TOTAL CORPORATE DEBT (Cost $33,759,610) |
24,190,939 | |||||||
Principal |
Value |
|||||||
SOVEREIGN DEBT OBLIGATIONS — 62.5% |
||||||||
Albania — 1.1% |
||||||||
Albania Government International Bond |
||||||||
3.500% 6/16/27 EUR (a) (e) |
$ | 190,000 | $ | 161,118 | ||||
3.500% 11/23/31 EUR (a) (e) |
600,000 | 429,074 | ||||||
3.500% 11/23/31 EUR (a) (e) |
390,000 | 278,898 | ||||||
| 869,090 | ||||||||
Angola — 2.4% |
||||||||
Angolan Government International Bond |
||||||||
8.000% 11/26/29 (a) |
200,000 | 150,044 | ||||||
8.250% 5/09/28 (a) |
925,000 | 727,328 | ||||||
8.750% 4/14/32 (a) |
200,000 | 147,900 | ||||||
9.125% 11/26/49 (a) |
300,000 | 201,606 | ||||||
9.500% 11/12/25 (a) |
600,000 | 559,620 | ||||||
| 1,786,498 | ||||||||
Argentina — 0.8% |
||||||||
Argentine Republic Government International Bond |
||||||||
0.000% 12/15/35 |
845,000 | 2,788 | ||||||
0.500% STEP 7/09/30 |
396,224 | 79,577 | ||||||
1.500% STEP 7/09/35 |
649,923 | 118,244 | ||||||
3.875% STEP 1/09/38 |
1,677,891 | 393,901 | ||||||
| 594,510 | ||||||||
Austria — 0.2% |
||||||||
Republic of Austria Government Bond |
||||||||
0.850% 6/30/20 EUR (a) (e) |
400,000 | 166,742 | ||||||
Bahamas — 1.1% |
||||||||
Bahamas Government International Bond |
||||||||
6.000% 11/21/28 (a) |
1,075,000 | 645,017 | ||||||
9.000% 6/16/29 (a) |
300,000 | 208,113 | ||||||
| 853,130 | ||||||||
Bahrain — 2.9% |
||||||||
Bahrain Government International Bond |
||||||||
5.625% 5/18/34 (a) |
900,000 | 703,436 | ||||||
6.750% 9/20/29 (a) |
350,000 | 326,291 | ||||||
7.000% 10/12/28 (a) |
1,075,000 | 1,030,119 | ||||||
7.500% 9/20/47 (a) |
200,000 | 158,430 | ||||||
| 2,218,276 | ||||||||
Barbados — 0.1% |
||||||||
Barbados Government International Bond |
||||||||
6.500% 10/01/29 (a) |
75,000 | 65,986 | ||||||
Benin — 0.3% |
||||||||
Benin Government International Bond |
||||||||
4.875% 1/19/32 EUR (a) (e) |
340,000 | 226,678 | ||||||
The accompanying notes are an integral part of the financial statements.
68
MassMutual Select T. Rowe Price Emerging Markets Bond Fund – Portfolio of Investments (Continued) |
Principal |
Value |
|||||||
Brazil — 0.2% |
||||||||
Brazilian Government International Bond |
||||||||
5.000% 1/27/45 |
$ | 240,000 | $ | 174,292 | ||||
Chile — 0.6% |
||||||||
Bonos de la Tesoreria de la Republica en pesos |
||||||||
4.700% 9/01/30 CLP (a) (e) |
165,000,000 | 56,025 | ||||||
5.800% 6/01/24 CLP (a) (e) |
100,000,000 | 99,984 | ||||||
Chile Government International Bond |
||||||||
3.500% 1/31/34 |
200,000 | 163,435 | ||||||
4.000% 1/31/52 |
200,000 | 146,129 | ||||||
| 465,573 | ||||||||
Colombia — 2.6% |
||||||||
Colombia Government International Bond |
||||||||
3.000% 1/30/30 |
800,000 | 572,969 | ||||||
3.125% 4/15/31 |
400,000 | 277,300 | ||||||
4.125% 5/15/51 |
925,000 | 496,648 | ||||||
4.500% 1/28/26 |
200,000 | 183,050 | ||||||
5.000% 6/15/45 |
350,000 | 211,924 | ||||||
5.625% 2/26/44 |
400,000 | 264,326 | ||||||
| 2,006,217 | ||||||||
Costa Rica — 0.2% |
||||||||
Costa Rica Government International Bond |
||||||||
5.625% 4/30/43 (a) |
200,000 | 142,376 | ||||||
Dominican Republic — 5.6% |
||||||||
Dominican Republic International Bond |
||||||||
4.500% 1/30/30 (a) |
655,000 | 514,965 | ||||||
4.875% 9/23/32 (a) |
1,225,000 | 921,021 | ||||||
4.875% 9/23/32 (a) |
950,000 | 714,261 | ||||||
5.500% 2/22/29 (a) |
165,000 | 142,083 | ||||||
5.875% 1/30/60 (a) |
1,175,000 | 774,387 | ||||||
6.500% 2/15/48 (a) |
300,000 | 220,944 | ||||||
6.850% 1/27/45 (a) |
1,250,000 | 971,416 | ||||||
| 4,259,077 | ||||||||
Ecuador — 1.5% |
||||||||
Ecuador Government International Bond |
||||||||
0.000% 7/31/30 (a) |
165,446 | 47,456 | ||||||
1.500% STEP 7/31/40 (a) |
408,900 | 119,603 | ||||||
2.500% STEP 7/31/35 (a) |
1,358,550 | 447,102 | ||||||
2.500% STEP 7/31/35 (a) |
50,000 | 16,455 | ||||||
5.500% STEP 7/31/30 (a) |
1,002,100 | 471,805 | ||||||
| 1,102,421 | ||||||||
Principal |
Value |
|||||||
Egypt — 1.7% |
||||||||
Egypt Government International Bond |
||||||||
5.875% 2/16/31 (a) |
$ | 200,000 | $ | 115,949 | ||||
5.875% 2/16/31 (a) |
200,000 | 115,950 | ||||||
6.588% 2/21/28 (a) |
250,000 | 174,962 | ||||||
7.600% 3/01/29 (a) |
275,000 | 192,026 | ||||||
8.500% 1/31/47 (a) |
550,000 | 304,963 | ||||||
8.500% 1/31/47 (a) |
640,000 | 354,866 | ||||||
| 1,258,716 | ||||||||
El Salvador — 0.8% |
||||||||
El Salvador Government International Bond |
||||||||
5.875% 1/30/25 (a) |
715,000 | 386,100 | ||||||
6.375% 1/18/27 (a) |
125,000 | 46,225 | ||||||
7.650% 6/15/35 (a) |
100,000 | 33,132 | ||||||
7.650% 6/15/35 (a) |
360,000 | 119,273 | ||||||
| 584,730 | ||||||||
Ghana — 0.2% |
||||||||
Ghana Government International Bond |
||||||||
8.125% 1/18/26 (a) |
100,000 | 50,000 | ||||||
8.125% 1/18/26 (a) |
200,000 | 100,000 | ||||||
| 150,000 | ||||||||
Guatemala — 0.9% |
||||||||
Guatemala Government Bond |
||||||||
4.875% 2/13/28 (a) |
400,000 | 361,142 | ||||||
5.250% 8/10/29 (a) |
200,000 | 179,173 | ||||||
5.375% 4/24/32 (a) |
200,000 | 173,634 | ||||||
| 713,949 | ||||||||
Hungary — 0.3% |
||||||||
Hungary Government International Bond |
||||||||
2.125% 9/22/31 (a) |
355,000 | 242,339 | ||||||
India — 2.1% |
||||||||
Export Import Bank of India |
||||||||
2.250% 1/13/31 (a) |
205,000 | 153,717 | ||||||
3.250% 1/15/30 (a) |
1,500,000 | 1,251,537 | ||||||
Export-Import Bank of India |
||||||||
2.250% 1/13/31 (a) |
200,000 | 149,968 | ||||||
| 1,555,222 | ||||||||
Indonesia — 5.2% |
||||||||
Indonesia Government International Bond |
||||||||
4.625% 4/15/43 (a) |
1,400,000 | 1,187,208 | ||||||
Perusahaan Penerbit SBSN Indonesia |
||||||||
3.800% 6/23/50 (a) |
200,000 | 145,065 | ||||||
4.450% 2/20/29 (a) |
775,000 | 742,062 | ||||||
4.550% 3/29/26 (a) |
1,350,000 | 1,321,347 | ||||||
The accompanying notes are an integral part of the financial statements.
69
MassMutual Select T. Rowe Price Emerging Markets Bond Fund – Portfolio of Investments (Continued) |
Principal |
Value |
|||||||
Perusahaan Penerbit SBSN Indonesia III |
||||||||
2.800% 6/23/30 (a) |
$ | 650,000 | $ | 548,438 | ||||
| 3,944,120 | ||||||||
Ivory Coast — 2.6% |
||||||||
Ivory Coast Government International Bond |
||||||||
6.125% 6/15/33 (a) |
2,200,000 | 1,672,000 | ||||||
6.625% 3/22/48 EUR (a) (e) |
525,000 | 302,284 | ||||||
| 1,974,284 | ||||||||
Jamaica — 1.2% |
||||||||
Jamaica Government International Bond |
||||||||
6.750% 4/28/28 |
200,000 | 207,172 | ||||||
8.000% 3/15/39 |
500,000 | 546,721 | ||||||
8.000% 3/15/39 |
175,000 | 191,352 | ||||||
| 945,245 | ||||||||
Jordan — 1.6% |
||||||||
Jordan Government International Bond |
||||||||
5.850% 7/07/30 (a) |
1,200,000 | 975,000 | ||||||
7.750% 1/15/28 (a) |
240,000 | 226,548 | ||||||
| 1,201,548 | ||||||||
Lebanon — 0.1% |
||||||||
Lebanon Government International Bond |
||||||||
6.000% 1/27/23 (a) (d) |
1,000,000 | 56,700 | ||||||
Mongolia — 0.7% |
||||||||
Mongolia Government International Bond |
||||||||
4.450% 7/07/31 (a) |
750,000 | 519,451 | ||||||
Morocco — 2.2% |
||||||||
Morocco Government International Bond |
||||||||
3.000% 12/15/32 (a) |
600,000 | 420,000 | ||||||
3.000% 12/15/32 (a) |
625,000 | 437,500 | ||||||
4.000% 12/15/50 (a) |
1,425,000 | 811,652 | ||||||
| 1,669,152 | ||||||||
Nigeria — 0.6% |
||||||||
Nigeria Government International Bond |
||||||||
7.875% 2/16/32 (a) |
750,000 | 480,195 | ||||||
Oman — 3.6% |
||||||||
Oman Government International Bond |
||||||||
4.750% 6/15/26 (a) |
600,000 | 558,750 | ||||||
4.750% 6/15/26 (a) |
550,000 | 512,188 | ||||||
5.375% 3/08/27 (a) |
200,000 | 187,819 | ||||||
5.625% 1/17/28 (a) |
200,000 | 185,814 | ||||||
6.500% 3/08/47 (a) |
390,000 | 304,919 | ||||||
6.750% 10/28/27 (a) |
200,000 | 197,250 | ||||||
6.750% 10/28/27 (a) |
400,000 | 394,500 | ||||||
6.750% 1/17/48 (a) |
300,000 | 240,178 | ||||||
7.000% 1/25/51 (a) |
200,000 | 164,797 | ||||||
| 2,746,215 | ||||||||
Principal |
Value |
|||||||
Pakistan — 0.3% |
||||||||
Pakistan Government International Bond |
||||||||
7.875% 3/31/36 (a) |
$ | 562,000 | $ | 202,567 | ||||
Panama — 0.9% |
||||||||
Panama Government International Bond |
||||||||
2.252% 9/29/32 |
650,000 | 458,939 | ||||||
4.500% 1/19/63 |
360,000 | 237,418 | ||||||
| 696,357 | ||||||||
Paraguay — 1.3% |
||||||||
Paraguay Government International Bond |
||||||||
4.950% 4/28/31 (a) |
400,000 | 356,637 | ||||||
5.400% 3/30/50 (a) |
600,000 | 443,830 | ||||||
5.400% 3/30/50 (a) |
200,000 | 147,943 | ||||||
| 948,410 | ||||||||
Peru — 0.9% |
||||||||
Peruvian Government International Bond |
||||||||
2.780% 12/01/60 |
670,000 | 363,538 | ||||||
3.300% 3/11/41 |
300,000 | 206,875 | ||||||
3.550% 3/10/51 |
130,000 | 87,201 | ||||||
| 657,614 | ||||||||
Philippines — 0.7% |
||||||||
Philippine Government International Bond |
||||||||
2.650% 12/10/45 |
900,000 | 556,177 | ||||||
Qatar — 1.4% |
||||||||
Qatar Government International Bond |
||||||||
4.400% 4/16/50 (a) |
200,000 | 175,752 | ||||||
4.400% 4/16/50 (a) |
200,000 | 175,752 | ||||||
4.817% 3/14/49 (a) |
800,000 | 740,000 | ||||||
| 1,091,504 | ||||||||
Romania — 1.9% |
||||||||
Romanian Government International Bond |
||||||||
2.625% 12/02/40 EUR (a) (e) |
50,000 | 24,995 | ||||||
2.875% 4/13/42 EUR (a) (e) |
125,000 | 62,784 | ||||||
3.000% 2/14/31 (a) |
174,000 | 123,328 | ||||||
3.000% 2/14/31 (a) |
500,000 | 354,391 | ||||||
3.375% 1/28/50 EUR (a) (e) |
700,000 | 352,385 | ||||||
4.000% 2/14/51 (a) |
160,000 | 88,806 | ||||||
4.000% 2/14/51 (a) |
722,000 | 400,736 | ||||||
| 1,407,425 | ||||||||
Saudi Arabia — 1.1% |
||||||||
Saudi Government International Bond |
||||||||
2.750% 2/03/32 (a) |
200,000 | 169,011 | ||||||
3.750% 1/21/55 (a) |
400,000 | 295,319 | ||||||
5.000% 4/17/49 (a) |
400,000 | 360,000 | ||||||
| 824,330 | ||||||||
The accompanying notes are an integral part of the financial statements.
70
MassMutual Select T. Rowe Price Emerging Markets Bond Fund – Portfolio of Investments (Continued) |
Principal |
Value |
|||||||
Senegal — 1.8% |
||||||||
Senegal Government International Bond |
||||||||
4.750% 3/13/28 EUR (a) (e) |
$ | 300,000 | $ | 236,947 | ||||
6.250% 5/23/33 (a) |
200,000 | 149,988 | ||||||
6.250% 5/23/33 (a) |
1,350,000 | 1,012,416 | ||||||
| 1,399,351 | ||||||||
Serbia — 1.5% |
||||||||
Serbia Government Bond |
||||||||
2.125% 12/01/30 (a) |
200,000 | 130,400 | ||||||
2.125% 12/01/30 (a) |
1,500,000 | 978,000 | ||||||
| 1,108,400 | ||||||||
South Africa — 1.8% |
||||||||
Republic of South Africa Government International Bond |
||||||||
5.650% 9/27/47 |
210,000 | 134,723 | ||||||
5.875% 4/20/32 |
425,000 | 350,673 | ||||||
6.250% 3/08/41 |
400,000 | 298,360 | ||||||
7.300% 4/20/52 |
760,000 | 579,500 | ||||||
| 1,363,256 | ||||||||
Sri Lanka — 0.8% |
||||||||
Sri Lanka Government International Bond |
||||||||
6.125% 6/03/25 (a) |
200,000 | 53,686 | ||||||
6.125% 6/03/25 (a) |
500,000 | 134,215 | ||||||
6.825% 7/18/26 (a) |
200,000 | 50,163 | ||||||
6.850% 11/03/25 (a) |
1,400,000 | 359,827 | ||||||
| 597,891 | ||||||||
Suriname — 0.6% |
||||||||
Suriname Government International Bond |
||||||||
9.250% 10/26/26 (a) |
631,000 | 490,918 | ||||||
Turkey — 1.6% |
||||||||
Republic of Turkey |
||||||||
8.600% 9/24/27 |
275,000 | 256,768 | ||||||
Turkey Government International Bond |
||||||||
4.250% 4/14/26 |
200,000 | 164,375 | ||||||
4.875% 10/09/26 |
400,000 | 327,403 | ||||||
4.875% 4/16/43 |
450,000 | 253,350 | ||||||
6.000% 1/14/41 |
350,000 | 215,390 | ||||||
| 1,217,286 | ||||||||
Ukraine — 0.3% |
||||||||
Ukraine Government International Bond |
||||||||
0.000% FRN 8/01/41 (a) (f) |
115,000 | 32,056 | ||||||
7.750% 9/01/27 (a) |
800,000 | 157,200 | ||||||
8.994% 2/01/26 (a) |
300,000 | 62,250 | ||||||
| 251,506 | ||||||||
Principal |
Value |
|||||||
Uzbekistan — 1.4% |
||||||||
Republic of Uzbekistan International Bond |
||||||||
3.900% 10/19/31 (a) |
$ | 298,000 | $ | 208,600 | ||||
3.900% 10/19/31 (a) |
450,000 | 315,000 | ||||||
5.375% 2/20/29 (a) |
200,000 | 167,200 | ||||||
5.375% 2/20/29 (a) |
400,000 | 334,400 | ||||||
| 1,025,200 | ||||||||
Venezuela — 0.2% |
||||||||
Venezuela Government International Bond |
||||||||
7.750% 10/13/19 (a) (d) |
1,000,000 | 65,000 | ||||||
9.250% 9/15/27 (d) |
300,000 | 22,650 | ||||||
11.750% 10/21/26 (a) (d) |
300,000 | 21,750 | ||||||
12.750% 8/23/22 (a) (d) |
255,000 | 17,850 | ||||||
| 127,250 | ||||||||
Zambia — 0.6% |
||||||||
Zambia Government International Bond |
||||||||
5.375% 9/20/22 (a) (d) |
1,025,000 | 481,750 | ||||||
TOTAL SOVEREIGN DEBT OBLIGATIONS (Cost $65,457,035) |
47,419,924 | |||||||
TOTAL BONDS & NOTES (Cost $99,216,645) |
71,610,863 | |||||||
Number of |
||||||||
MUTUAL FUNDS — 0.9% |
||||||||
Diversified Financial Services — 0.9% |
||||||||
United States — 0.9% |
||||||||
State Street Navigator Securities Lending Government Money Market Portfolio (g) |
693,325 | 693,325 | ||||||
TOTAL MUTUAL FUNDS (Cost $693,325) |
693,325 | |||||||
TOTAL LONG-TERM INVESTMENTS (Cost $99,909,970) |
72,304,188 | |||||||
The accompanying notes are an integral part of the financial statements.
71
MassMutual Select T. Rowe Price Emerging Markets Bond Fund – Portfolio of Investments (Continued) |
Number of |
Value |
|||||||
SHORT-TERM INVESTMENTS — 3.4% |
||||||||
Mutual Fund — 1.7% |
||||||||
T. Rowe Price Government Reserve Investment Fund |
1,319,119 | $ | 1,319,119 | |||||
Principal |
||||||||
Repurchase Agreement — 1.4% |
||||||||
Fixed Income Clearing Corp., Repurchase Agreement, dated 9/30/22, 0.830% due 10/03/22 (h) |
$ | 1,038,451 | 1,038,451 | |||||
U.S. Treasury Bill — 0.3% |
||||||||
U.S. Treasury Bill |
||||||||
1.962% 3/23/23 (i) (j) |
30,000 | 29,478 | ||||||
2.491% 3/23/23 (i) (j) |
20,000 | 19,652 | ||||||
2.698% 3/23/23 (i) (j) |
210,000 | 206,348 | ||||||
| 255,478 | ||||||||
TOTAL SHORT-TERM INVESTMENTS (Cost $2,614,433) |
2,613,048 | |||||||
TOTAL INVESTMENTS — 98.7% (Cost $102,524,403) (k) |
74,917,236 | |||||||
Other Assets/(Liabilities) — 1.3% |
975,588 | |||||||
NET ASSETS — 100.0% |
$ | 75,892,824 | ||||||
Abbreviation Legend
|
FRN |
Floating Rate Note |
|
STEP |
Step Up Bond |
|
VRN |
Variable Rate Note |
Notes to Portfolio of Investments
Percentages are stated as a percent of net assets.
|
(a) |
Security is exempt from registration under Regulation S or Rule 144A of the Securities Act of 1933. These securities are considered restricted and may be resold in transactions exempt from registration. At September 30, 2022, the aggregate market value of these securities amounted to $57,801,581 or 76.16% of net assets. |
|
(b) |
Security is perpetual and has no stated maturity date. |
|
(c) |
Denotes all or a portion of security on loan. The total value of securities on loan as of September 30, 2022, was $887,271 or 1.17% of net assets. The Fund received $214,377 of non-cash collateral (U.S. Treasury and/or Agency obligations) related to securities lending activity. This amount is not reflected on either the Portfolio of Investments or the Statement of Assets and Liabilities. (Note 2). |
|
(d) |
Security is currently in default due to bankruptcy or failure to make payment of principal or interest of the issuer. Income is not being accrued. At September 30, 2022, these securities amounted to a value of $942,000 or 1.24% of net assets. |
|
(e) |
The principal amount of the security is in foreign currency. The market value is in U.S. dollars. |
|
(f) |
Certain variable rate securities are not based on a published reference rate and spread but are determined by the issuer or agent and are based on current market conditions. These securities do not indicate a reference rate and spread in their description above. The rates shown are the current interest rates at September 30, 2022. |
|
(g) |
Represents investment of security lending cash collateral. (Note 2). |
|
(h) |
Maturity value of $1,038,523. Collateralized by U.S. Government Agency obligations with a rate of 0.000%, maturity date of 3/30/23, and an aggregate market value, including accrued interest, of $1,059,227. |
|
(i) |
The rate shown represents yield-to-maturity. |
|
(j) |
All or a portion of this security is pledged/held as collateral for open derivatives. (Note 2). |
|
(k) |
See Note 6 for aggregate cost for federal tax purposes. |
The accompanying notes are an integral part of the financial statements.
72
MassMutual Select T. Rowe Price Emerging Markets Bond Fund – Portfolio of Investments (Continued) |
Forward contracts
Counterparty |
Settlement |
Currency Purchased |
Currency Sold |
Unrealized |
||||||||||||||||||||
Barclays Bank PLC* |
11/25/22 | EUR | 88,242 | USD | 88,583 | $ | (1,791 | ) | ||||||||||||||||
BNP Paribas SA* |
11/25/22 | EUR | 75,424 | USD | 75,501 | (1,315 | ) | |||||||||||||||||
BNP Paribas SA* |
12/09/22 | USD | 66,821 | CLP | 61,271,200 | 4,269 | ||||||||||||||||||
Citibank N.A.* |
11/25/22 | EUR | 112,000 | USD | 108,172 | 1,989 | ||||||||||||||||||
Deutsche Bank AG* |
11/25/22 | EUR | 75,908 | USD | 77,269 | (2,608 | ) | |||||||||||||||||
Goldman Sachs International* |
12/09/22 | CLP | 8,922,832 | USD | 9,167 | (57 | ) | |||||||||||||||||
HSBC Bank USA* |
11/25/22 | USD | 834,708 | EUR | 807,737 | 40,234 | ||||||||||||||||||
HSBC Bank USA* |
11/25/22 | EUR | 113,000 | USD | 113,537 | (2,392 | ) | |||||||||||||||||
Morgan Stanley & Co. LLC* |
11/25/22 | USD | 821,929 | EUR | 795,681 | 39,313 | ||||||||||||||||||
Morgan Stanley & Co. LLC* |
11/25/22 | EUR | 280,082 | USD | 283,352 | (7,869 | ) | |||||||||||||||||
Morgan Stanley & Co. LLC* |
12/09/22 | USD | 74,513 | CLP | 67,720,800 | 5,377 | ||||||||||||||||||
UBS AG* |
11/25/22 | USD | 1,665,950 | EUR | 1,611,456 | 80,955 | ||||||||||||||||||
| $ | 156,105 | |||||||||||||||||||||||
Futures contracts
|
Expiration |
Number of |
Notional |
Value/ Net |
||||||||||||
Long |
||||||||||||||||
U.S. Treasury Ultra Bond |
12/20/22 | 7 | $ | 1,031,080 | $ | (72,080 | ) | |||||||||
Short |
||||||||||||||||
U.S. Treasury Note 10 Year |
12/20/22 | 35 | $ | (4,068,732 | ) | $ | 146,544 | |||||||||
Centrally Cleared Credit Default Swaps - Sell Protection††
Reference |
Rate |
Payment |
Termination |
Credit |
Notional |
Value |
Upfront |
Unrealized |
||||||||||||||||||||||||||||
CDX.NA.EM Series 38† |
1.000% | Quarterly |
12/20/27 | Not Rated | USD | 225,000 | $ | (22,175 | ) | $ | (18,113 | ) | $ | (4,062 | ) | |||||||||||||||||||||
|
* |
Contracts are subject to a master netting agreement or similar agreement. |
|
† |
Payment is based on a percentage of the index. Reference entities are a number of individual issuers comprising the index. |
|
†† |
For each credit derivative with sold protection, the credit ratings of the entities referenced, as rated by any rating organization, are included in the equivalent S&P Global Ratings. The reference entity rating represents the creditworthiness of the underlying issuer. As the credit rating declines, the likelihood of payment by the fund increases. Notional amounts represent the maximum potential amount of future payments (undiscounted) the Fund could be required to make under the credit derivatives with sold protection. |
Currency Legend
|
CLP |
Chilean Peso |
|
EUR |
Euro |
|
USD |
U.S. Dollar |
The accompanying notes are an integral part of the financial statements.
73
MassMutual Select T. Rowe Price Large Cap Blend Fund – Portfolio of Investments |
September 30, 2022 |
Number of |
Value |
|||||||
EQUITIES — 95.9% |
||||||||
COMMON STOCK — 95.1% |
||||||||
Basic Materials — 0.8% |
||||||||
Chemicals — 0.8% |
||||||||
Air Products & Chemicals, Inc. |
1,679 | $ | 390,754 | |||||
CF Industries Holdings, Inc. |
2,172 | 209,055 | ||||||
FMC Corp. |
1,499 | 158,444 | ||||||
Linde PLC |
9,091 | 2,450,843 | ||||||
Nutrien Ltd. |
121,689 | 10,146,429 | ||||||
PPG Industries, Inc. |
600 | 66,414 | ||||||
RPM International, Inc. |
3,107 | 258,844 | ||||||
The Sherwin-Williams Co. |
8,423 | 1,724,609 | ||||||
| 15,405,392 | ||||||||
Forest Products & Paper — 0.0% |
||||||||
International Paper Co. |
3,468 | 109,936 | ||||||
West Fraser Timber Co. Ltd. |
786 | 56,977 | ||||||
| 166,913 | ||||||||
| 15,572,305 | ||||||||
Communications — 13.2% |
||||||||
Advertising — 0.2% |
||||||||
The Trade Desk, Inc. Class A (a) |
68,243 | 4,077,520 | ||||||
Internet — 12.2% |
||||||||
Alphabet, Inc. Class A (a) |
348,089 | 33,294,713 | ||||||
Alphabet, Inc. Class C (a) |
667,889 | 64,217,527 | ||||||
Amazon.com, Inc. (a) |
778,219 | 87,938,747 | ||||||
Booking Holdings, Inc. (a) |
3,302 | 5,425,879 | ||||||
Coupang, Inc. (a) |
202,820 | 3,381,009 | ||||||
DoorDash, Inc., Class A (a) |
34,226 | 1,692,476 | ||||||
Expedia Group, Inc. (a) |
42,683 | 3,998,970 | ||||||
Match Group, Inc. (a) |
61,342 | 2,929,081 | ||||||
Meta Platforms, Inc. Class A (a) |
66,242 | 8,987,715 | ||||||
Netflix, Inc. (a) |
30,716 | 7,231,775 | ||||||
NortonLifeLock, Inc. |
7,000 | 140,980 | ||||||
Sea Ltd. ADR (a) |
54,758 | 3,069,186 | ||||||
Spotify Technology SA (a) |
47,254 | 4,078,020 | ||||||
| 226,386,078 | ||||||||
Media — 0.3% |
||||||||
Charter Communications, Inc. Class A (a) |
382 | 115,880 | ||||||
Comcast Corp. Class A |
9,105 | 267,049 | ||||||
The Walt Disney Co. (a) |
47,754 | 4,504,635 | ||||||
| 4,887,564 | ||||||||
Telecommunications — 0.5% |
||||||||
Arista Networks, Inc. (a) |
2,400 | 270,936 | ||||||
Cisco Systems, Inc. |
9,361 | 374,440 | ||||||
Corning, Inc. |
11,843 | 343,684 | ||||||
Motorola Solutions, Inc. |
28,477 | 6,377,994 | ||||||
Number of |
Value |
|||||||
T-Mobile US, Inc. (a) |
11,629 | $ | 1,560,263 | |||||
Verizon Communications, Inc. |
16,114 | 611,848 | ||||||
| 9,539,165 | ||||||||
| 244,890,327 | ||||||||
Consumer, Cyclical — 9.6% |
||||||||
Airlines — 0.0% |
||||||||
Southwest Airlines Co. (a) |
9,219 | 284,314 | ||||||
United Airlines Holdings, Inc. (a) |
3,699 | 120,328 | ||||||
| 404,642 | ||||||||
Apparel — 0.0% |
||||||||
NIKE, Inc. Class B |
8,579 | 713,087 | ||||||
Auto Manufacturers — 3.5% |
||||||||
Cummins, Inc. |
15,295 | 3,112,686 | ||||||
Ferrari NV |
42,788 | 7,915,780 | ||||||
PACCAR, Inc. |
5,428 | 454,269 | ||||||
Rivian Automotive, Inc. Class A (a) (b) |
766,190 | 25,215,313 | ||||||
Tesla, Inc. (a) |
109,081 | 28,933,735 | ||||||
| 65,631,783 | ||||||||
Auto Parts & Equipment — 0.0% |
||||||||
Aptiv PLC (a) |
546 | 42,703 | ||||||
Magna International, Inc. |
3,080 | 146,053 | ||||||
| 188,756 | ||||||||
Home Builders — 0.0% |
||||||||
NVR, Inc. (a) |
57 | 227,264 | ||||||
Leisure Time — 0.1% |
||||||||
Peloton Interactive, Inc. Class A (a) (b) |
147,210 | 1,020,165 | ||||||
Lodging — 0.7% |
||||||||
Hilton Worldwide Holdings, Inc. |
4,790 | 577,770 | ||||||
Las Vegas Sands Corp. (a) |
147,539 | 5,535,663 | ||||||
Marriott International, Inc. Class A |
10,790 | 1,512,110 | ||||||
MGM Resorts International |
6,657 | 197,846 | ||||||
Wynn Resorts Ltd. (a) |
70,391 | 4,436,745 | ||||||
| 12,260,134 | ||||||||
Retail — 5.3% |
||||||||
AutoZone, Inc. (a) |
184 | 394,115 | ||||||
Burlington Stores, Inc. (a) |
1,455 | 162,800 | ||||||
Carvana Co. (a) |
43,162 | 876,189 | ||||||
Chipotle Mexican Grill, Inc. (a) |
6,811 | 10,235,298 | ||||||
Costco Wholesale Corp. |
7,103 | 3,354,534 | ||||||
Dollar General Corp. |
45,377 | 10,884,127 | ||||||
Dollar Tree, Inc. (a) |
1,631 | 221,979 | ||||||
Floor & Decor Holdings, Inc. Class A (a) |
33,000 | 2,318,580 | ||||||
The Home Depot, Inc. |
12,886 | 3,555,763 | ||||||
Lowe’s Cos., Inc. |
2,888 | 542,395 | ||||||
Lululemon Athletica, Inc. (a) |
6,105 | 1,706,714 | ||||||
McDonald’s Corp. |
62,230 | 14,358,950 | ||||||
The accompanying notes are an integral part of the financial statements.
74
MassMutual Select T. Rowe Price Large Cap Blend Fund – Portfolio of Investments (Continued) |
Number of |
Value |
|||||||
O’Reilly Automotive, Inc. (a) |
4,841 | $ | 3,404,917 | |||||
Ross Stores, Inc. |
197,602 | 16,651,921 | ||||||
Starbucks Corp. |
6,374 | 537,073 | ||||||
The TJX Cos., Inc. |
68,133 | 4,232,422 | ||||||
Ulta Beauty, Inc. (a) |
4,065 | 1,630,837 | ||||||
Walmart, Inc. |
132,801 | 17,224,290 | ||||||
Yum! Brands, Inc. |
55,402 | 5,891,449 | ||||||
| 98,184,353 | ||||||||
| 178,630,184 | ||||||||
Consumer, Non-cyclical — 24.1% |
||||||||
Agriculture — 1.2% |
||||||||
Altria Group, Inc. |
8,055 | 325,261 | ||||||
Darling Ingredients, Inc. (a) |
2,254 | 149,102 | ||||||
Philip Morris International, Inc. |
261,175 | 21,680,137 | ||||||
| 22,154,500 | ||||||||
Beverages — 1.6% |
||||||||
The Coca-Cola Co. |
109,351 | 6,125,843 | ||||||
Constellation Brands, Inc. Class A |
9,566 | 2,197,119 | ||||||
Keurig Dr Pepper, Inc. |
412,374 | 14,771,237 | ||||||
Monster Beverage Corp. (a) |
55,887 | 4,859,933 | ||||||
PepsiCo, Inc. |
6,623 | 1,081,271 | ||||||
| 29,035,403 | ||||||||
Biotechnology — 0.7% |
||||||||
Amgen, Inc. |
1,118 | 251,997 | ||||||
Argenx SE ADR (a) |
11,880 | 4,194,234 | ||||||
Biogen, Inc. (a) |
1,521 | 406,107 | ||||||
Corteva, Inc. |
2,680 | 153,162 | ||||||
Illumina, Inc. (a) |
422 | 80,513 | ||||||
Moderna, Inc. (a) |
21,506 | 2,543,085 | ||||||
Regeneron Pharmaceuticals, Inc. (a) |
6,008 | 4,138,731 | ||||||
Vertex Pharmaceuticals, Inc. (a) |
6,564 | 1,900,541 | ||||||
| 13,668,370 | ||||||||
Commercial Services — 1.1% |
||||||||
Ant International Co. Ltd., Class C (Acquired 6/07/18, Cost $1,171,890) (a) (c) (d) (e) |
307,471 | 605,718 | ||||||
Block, Inc. (a) |
35,571 | 1,842,096 | ||||||
Booz Allen Hamilton Holding Corp. |
16,209 | 1,496,901 | ||||||
Bright Horizons Family Solutions, Inc. (a) |
2,800 | 161,420 | ||||||
Cintas Corp. |
5,537 | 2,149,408 | ||||||
CoStar Group, Inc. (a) |
3,400 | 236,810 | ||||||
FleetCor Technologies, Inc. (a) |
4,100 | 722,297 | ||||||
Global Payments, Inc. |
37,105 | 4,009,195 | ||||||
S&P Global, Inc. |
2,100 | 641,235 | ||||||
TransUnion |
66,307 | 3,944,603 | ||||||
United Rentals, Inc. (a) |
1,283 | 346,564 | ||||||
Verisk Analytics, Inc. |
24,437 | 4,167,242 | ||||||
Number of |
Value |
|||||||
WillScot Mobile Mini Holdings Corp. (a) |
4,756 | $ | 191,809 | |||||
| 20,515,298 | ||||||||
Cosmetics & Personal Care — 0.8% |
||||||||
Colgate-Palmolive Co. |
1,300 | 91,325 | ||||||
The Estee Lauder Cos., Inc. Class A |
1,891 | 408,267 | ||||||
The Procter & Gamble Co. |
112,328 | 14,181,410 | ||||||
| 14,681,002 | ||||||||
Food — 0.8% |
||||||||
Conagra Brands, Inc. |
5,696 | 185,860 | ||||||
The Hershey Co. |
7,672 | 1,691,446 | ||||||
Mondelez International, Inc. Class A |
217,396 | 11,919,823 | ||||||
Sysco Corp. |
18,872 | 1,334,439 | ||||||
| 15,131,568 | ||||||||
Health Care – Products — 4.5% |
||||||||
Abbott Laboratories |
87,823 | 8,497,753 | ||||||
Align Technology, Inc. (a) |
9,103 | 1,885,322 | ||||||
Avantor, Inc. (a) |
134,375 | 2,633,750 | ||||||
The Cooper Cos., Inc. |
468 | 123,505 | ||||||
Danaher Corp. |
76,826 | 19,843,388 | ||||||
Insulet Corp. (a) |
9,319 | 2,137,779 | ||||||
Intuitive Surgical, Inc. (a) |
53,820 | 10,088,021 | ||||||
Medtronic PLC |
4,499 | 363,294 | ||||||
PerkinElmer, Inc. |
29,170 | 3,510,026 | ||||||
ResMed, Inc. |
4,135 | 902,670 | ||||||
Steris PLC |
15,032 | 2,499,521 | ||||||
Stryker Corp. |
60,101 | 12,172,857 | ||||||
Thermo Fisher Scientific, Inc. |
34,272 | 17,382,416 | ||||||
Waters Corp. (a) |
4,666 | 1,257,627 | ||||||
West Pharmaceutical Services, Inc. |
3,349 | 824,122 | ||||||
Zimmer Biomet Holdings, Inc. |
3,600 | 376,380 | ||||||
| 84,498,431 | ||||||||
Health Care – Services — 6.4% |
||||||||
Centene Corp. (a) |
230,790 | 17,957,770 | ||||||
Charles River Laboratories International, Inc. (a) |
400 | 78,720 | ||||||
Elevance Health, Inc. |
80,003 | 36,340,563 | ||||||
HCA Healthcare, Inc. |
45,958 | 8,446,621 | ||||||
Humana, Inc. |
17,724 | 8,599,508 | ||||||
Molina Healthcare, Inc. (a) |
1,067 | 351,939 | ||||||
Quest Diagnostics, Inc. |
16,961 | 2,080,945 | ||||||
UnitedHealth Group, Inc. |
87,160 | 44,019,286 | ||||||
| 117,875,352 | ||||||||
Household Products & Wares — 0.0% |
||||||||
Avery Dennison Corp. |
1,794 | 291,884 | ||||||
Kimberly-Clark Corp. |
1,732 | 194,919 | ||||||
| 486,803 | ||||||||
The accompanying notes are an integral part of the financial statements.
75
MassMutual Select T. Rowe Price Large Cap Blend Fund – Portfolio of Investments (Continued) |
Number of |
Value |
|||||||
Pharmaceuticals — 7.0% |
||||||||
AbbVie, Inc. |
118,028 | $ | 15,840,538 | |||||
AstraZeneca PLC Sponsored ADR |
294,990 | 16,177,252 | ||||||
Becton Dickinson and Co. |
156,123 | 34,788,888 | ||||||
Bristol-Myers Squibb Co. |
2,161 | 153,625 | ||||||
Cigna Corp. |
37,197 | 10,321,052 | ||||||
CVS Health Corp. |
4,299 | 409,996 | ||||||
DexCom, Inc. (a) |
4,324 | 348,255 | ||||||
Elanco Animal Health, Inc. (a) |
27,840 | 345,494 | ||||||
Eli Lilly & Co. |
56,457 | 18,255,371 | ||||||
Johnson & Johnson |
150,225 | 24,540,756 | ||||||
McKesson Corp. |
292 | 99,242 | ||||||
Merck & Co., Inc. |
6,430 | 553,752 | ||||||
Pfizer, Inc. |
17,078 | 747,333 | ||||||
Sanofi ADR |
111,875 | 4,253,487 | ||||||
Viatris, Inc. |
33,200 | 282,864 | ||||||
Zoetis, Inc. |
14,350 | 2,127,961 | ||||||
| 129,245,866 | ||||||||
| 447,292,593 | ||||||||
Energy — 2.5% |
||||||||
Oil & Gas — 2.0% |
||||||||
Chevron Corp. |
8,654 | 1,243,320 | ||||||
ConocoPhillips |
11,775 | 1,205,054 | ||||||
EOG Resources, Inc. |
4,702 | 525,354 | ||||||
Exxon Mobil Corp. |
273,111 | 23,845,321 | ||||||
Hess Corp. |
3,100 | 337,869 | ||||||
Marathon Petroleum Corp. |
4,468 | 443,806 | ||||||
Pioneer Natural Resources Co. |
1,173 | 253,990 | ||||||
TotalEnergies SE |
193,738 | 9,119,232 | ||||||
TotalEnergies SE Sponsored ADR |
11,088 | 515,814 | ||||||
| 37,489,760 | ||||||||
Oil & Gas Services — 0.1% |
||||||||
Halliburton Co. |
18,851 | 464,112 | ||||||
Pipelines — 0.4% |
||||||||
TC Energy Corp. |
132,449 | 5,336,370 | ||||||
The Williams Cos., Inc. |
83,218 | 2,382,531 | ||||||
| 7,718,901 | ||||||||
| 45,672,773 | ||||||||
Financial — 11.1% |
||||||||
Banks — 3.3% |
||||||||
Bank of America Corp. |
864,057 | 26,094,521 | ||||||
The Bank of New York Mellon Corp. |
4,522 | 174,187 | ||||||
Citigroup, Inc. |
4,300 | 179,181 | ||||||
Citizens Financial Group, Inc. |
2,275 | 78,169 | ||||||
Fifth Third Bancorp |
13,986 | 446,993 | ||||||
First Republic Bank |
2,400 | 313,320 | ||||||
The Goldman Sachs Group, Inc. |
7,545 | 2,211,062 | ||||||
Number of |
Value |
|||||||
Huntington Bancshares, Inc. |
46,327 | $ | 610,590 | |||||
JP Morgan Chase & Co. |
54,445 | 5,689,503 | ||||||
Morgan Stanley |
3,489 | 275,666 | ||||||
Signature Bank |
1,620 | 244,620 | ||||||
State Street Corp. |
4,199 | 255,341 | ||||||
SVB Financial Group (a) |
642 | 215,571 | ||||||
US Bancorp |
1,900 | 76,608 | ||||||
Wells Fargo & Co. |
577,736 | 23,236,542 | ||||||
| 60,101,874 | ||||||||
Diversified Financial Services — 2.4% |
||||||||
American Express Co. |
3,600 | 485,676 | ||||||
Apollo Global Management, Inc. |
3,116 | 144,894 | ||||||
Blue Owl Capital, Inc. (b) |
7,112 | 65,644 | ||||||
The Charles Schwab Corp. |
57,238 | 4,113,695 | ||||||
CME Group, Inc. |
1,827 | 323,617 | ||||||
Intercontinental Exchange, Inc. |
4,775 | 431,421 | ||||||
Maplebear, Inc. (Non-Voting) (Acquired 8/07/20, Cost $14,781) (a) (c) (d) (e) |
319 | 15,465 | ||||||
Maplebear, Inc. (Voting) (Acquired 8/07/20, Cost $282,637) (a) (c) (d) (e) |
6,100 | 295,728 | ||||||
Mastercard, Inc. Class A |
56,773 | 16,142,835 | ||||||
Visa, Inc. Class A |
128,299 | 22,792,317 | ||||||
| 44,811,292 | ||||||||
Insurance — 4.3% |
||||||||
The Allstate Corp. |
26,003 | 3,238,154 | ||||||
American International Group, Inc. |
123,465 | 5,862,118 | ||||||
Assurant, Inc. |
2,321 | 337,172 | ||||||
Berkshire Hathaway, Inc. Class B (a) |
7,327 | 1,956,455 | ||||||
Chubb Ltd. |
127,518 | 23,192,974 | ||||||
Corebridge Financial, Inc. (a) |
59,473 | 1,171,023 | ||||||
Equitable Holdings, Inc. |
14,525 | 382,734 | ||||||
The Hartford Financial Services Group, Inc. |
90,051 | 5,577,759 | ||||||
Marsh & McLennan Cos., Inc. |
1,821 | 271,857 | ||||||
MetLife, Inc. |
133,349 | 8,104,952 | ||||||
The Progressive Corp. |
133,662 | 15,532,861 | ||||||
RenaissanceRe Holdings Ltd. |
3,463 | 486,170 | ||||||
The Travelers Cos., Inc. |
89,748 | 13,749,394 | ||||||
Voya Financial, Inc. |
3,464 | 209,572 | ||||||
| 80,073,195 | ||||||||
Private Equity — 0.0% |
||||||||
Ares Management Corp. Class A |
1,294 | 80,163 | ||||||
Real Estate Investment Trusts (REITS) — 1.1% |
||||||||
Alexandria Real Estate Equities, Inc. |
947 | 132,760 | ||||||
American Homes 4 Rent Class A |
1,700 | 55,777 | ||||||
American Tower Corp. |
1,641 | 352,323 | ||||||
AvalonBay Communities, Inc. |
15,270 | 2,812,581 | ||||||
The accompanying notes are an integral part of the financial statements.
76
MassMutual Select T. Rowe Price Large Cap Blend Fund – Portfolio of Investments (Continued) |
Number of |
Value |
|||||||
Camden Property Trust |
491 | $ | 58,650 | |||||
Equinix, Inc. |
846 | 481,239 | ||||||
Equity LifeStyle Properties, Inc. |
1,601 | 100,607 | ||||||
Equity Residential |
32,146 | 2,160,854 | ||||||
Essex Property Trust, Inc. |
697 | 168,834 | ||||||
Extra Space Storage, Inc. |
1,237 | 213,642 | ||||||
Prologis, Inc. |
98,071 | 9,964,013 | ||||||
Public Storage |
854 | 250,060 | ||||||
Rexford Industrial Realty, Inc. |
3,032 | 157,664 | ||||||
SBA Communications Corp. |
3,344 | 951,869 | ||||||
Simon Property Group, Inc. |
2,665 | 239,184 | ||||||
Sun Communities, Inc. |
196 | 26,525 | ||||||
Welltower, Inc. |
4,199 | 270,080 | ||||||
Weyerhaeuser Co. |
83,825 | 2,394,042 | ||||||
| 20,790,704 | ||||||||
| 205,857,228 | ||||||||
Industrial — 7.2% |
||||||||
Aerospace & Defense — 2.1% |
||||||||
Airbus SE |
55,833 | 4,823,540 | ||||||
The Boeing Co. (a) |
4,283 | 518,586 | ||||||
L3 Harris Technologies, Inc. |
75,680 | 15,728,575 | ||||||
Northrop Grumman Corp. |
20,238 | 9,518,336 | ||||||
Raytheon Technologies Corp. |
626 | 51,244 | ||||||
Teledyne Technologies, Inc. (a) |
23,611 | 7,968,004 | ||||||
TransDigm Group, Inc. |
183 | 96,042 | ||||||
| 38,704,327 | ||||||||
Building Materials — 0.0% |
||||||||
Vulcan Materials Co. |
1,328 | 209,439 | ||||||
Electrical Components & Equipment — 0.3% |
||||||||
AMETEK, Inc. |
498 | 56,478 | ||||||
Emerson Electric Co. |
16,454 | 1,204,762 | ||||||
Generac Holdings, Inc. (a) |
22,835 | 4,067,827 | ||||||
| 5,329,067 | ||||||||
Electronics — 1.1% |
||||||||
Agilent Technologies, Inc. |
2,664 | 323,809 | ||||||
Amphenol Corp. Class A |
97 | 6,495 | ||||||
Fortive Corp. |
3,170 | 184,811 | ||||||
Honeywell International, Inc. |
50,577 | 8,444,842 | ||||||
Hubbell, Inc. |
38,758 | 8,643,034 | ||||||
Mettler-Toledo International, Inc. (a) |
1,490 | 1,615,339 | ||||||
TE Connectivity Ltd. |
16,990 | 1,875,016 | ||||||
| 21,093,346 | ||||||||
Environmental Controls — 0.5% |
||||||||
Republic Services, Inc. |
65,027 | 8,846,273 | ||||||
Waste Connections, Inc. |
3,828 | 517,278 | ||||||
| 9,363,551 | ||||||||
Number of |
Value |
|||||||
Hand & Machine Tools — 0.0% |
||||||||
Stanley Black & Decker, Inc. |
3,300 | $ | 248,193 | |||||
Machinery – Diversified — 0.3% |
||||||||
Dover Corp. |
7,909 | 922,031 | ||||||
IDEX Corp. |
6,245 | 1,248,063 | ||||||
Ingersoll Rand, Inc. |
56,188 | 2,430,693 | ||||||
Otis Worldwide Corp. |
3,630 | 231,594 | ||||||
Rockwell Automation, Inc. |
1,200 | 258,132 | ||||||
| 5,090,513 | ||||||||
Miscellaneous - Manufacturing — 1.6% |
||||||||
Eaton Corp. PLC |
85,704 | 11,429,485 | ||||||
General Electric Co. |
202,746 | 12,552,005 | ||||||
Siemens AG Registered |
38,652 | 3,825,523 | ||||||
Textron, Inc. |
3,948 | 230,011 | ||||||
Trane Technologies PLC |
3,898 | 564,469 | ||||||
| 28,601,493 | ||||||||
Packaging & Containers — 0.1% |
||||||||
Ball Corp. |
3,180 | 153,658 | ||||||
Packaging Corp. of America |
11,446 | 1,285,271 | ||||||
Sealed Air Corp. |
5,691 | 253,306 | ||||||
WestRock Co. |
2,187 | 67,557 | ||||||
| 1,759,792 | ||||||||
Transportation — 1.2% |
||||||||
Canadian Pacific Railway Ltd. |
5,180 | 345,610 | ||||||
CSX Corp. |
379,339 | 10,105,591 | ||||||
FedEx Corp. |
26,430 | 3,924,062 | ||||||
J.B. Hunt Transport Services, Inc. |
1,258 | 196,776 | ||||||
Norfolk Southern Corp. |
8,714 | 1,826,890 | ||||||
Old Dominion Freight Line, Inc. |
18,538 | 4,611,698 | ||||||
Saia, Inc. (a) |
906 | 172,140 | ||||||
Union Pacific Corp. |
4,028 | 784,735 | ||||||
United Parcel Service, Inc. Class B |
1,969 | 318,072 | ||||||
| 22,285,574 | ||||||||
| 132,685,295 | ||||||||
Technology — 20.8% |
||||||||
Computers — 4.7% |
||||||||
Accenture PLC Class A |
19,633 | 5,051,571 | ||||||
Apple, Inc. |
599,040 | 82,787,328 | ||||||
Cognizant Technology Solutions Corp. Class A |
2,257 | 129,642 | ||||||
Fortinet, Inc. (a) |
6,725 | 330,399 | ||||||
Pure Storage, Inc. Class A (a) |
5,105 | 139,724 | ||||||
| 88,438,664 | ||||||||
Semiconductors — 4.1% |
||||||||
Advanced Micro Devices, Inc. (a) |
134,653 | 8,531,614 | ||||||
Analog Devices, Inc. |
16,229 | 2,261,349 | ||||||
Applied Materials, Inc. |
26,358 | 2,159,511 | ||||||
ASML Holding NV |
31,836 | 13,223,082 | ||||||
The accompanying notes are an integral part of the financial statements.
77
MassMutual Select T. Rowe Price Large Cap Blend Fund – Portfolio of Investments (Continued) |
Number of |
Value |
|||||||
Broadcom, Inc. |
18,267 | $ | 8,110,731 | |||||
KLA Corp. |
50,728 | 15,351,815 | ||||||
Lam Research Corp. |
400 | 146,400 | ||||||
Marvell Technology, Inc. |
5,708 | 244,930 | ||||||
Monolithic Power Systems, Inc. |
500 | 181,700 | ||||||
NVIDIA Corp. |
127,300 | 15,452,947 | ||||||
ON Semiconductor Corp. (a) |
6,500 | 405,145 | ||||||
QUALCOMM, Inc. |
55,970 | 6,323,491 | ||||||
Texas Instruments, Inc. |
20,545 | 3,179,955 | ||||||
| 75,572,670 | ||||||||
Software — 12.0% |
||||||||
Activision Blizzard, Inc. |
4,010 | 298,103 | ||||||
Adobe, Inc. (a) |
2,000 | 550,400 | ||||||
Atlassian Corp. PLC Class A (a) |
27,839 | 5,862,615 | ||||||
Bill.com Holdings, Inc. (a) |
8,378 | 1,108,996 | ||||||
Black Knight, Inc. (a) |
92,927 | 6,015,165 | ||||||
Broadridge Financial Solutions, Inc. |
16,296 | 2,351,839 | ||||||
Cadence Design Systems, Inc. (a) |
13,117 | 2,143,711 | ||||||
Canva, Inc. (Acquired 12/17/21-12/22/21, Cost $872,531) (a) (c) (d) (e) |
512 | 488,934 | ||||||
Celonis SE, Escrow Shares (Acquired 8/12/22, Cost $479) (a) (c) (d) (e) |
479 | 479 | ||||||
Celonis SE (Acquired 6/17/21, Cost $435,243) (a) (c) (d) (e) |
1,177 | 435,243 | ||||||
Ceridian HCM Holding, Inc. (a) |
45,433 | 2,538,796 | ||||||
The Descartes Systems Group, Inc. (a) |
1,800 | 114,354 | ||||||
Electronic Arts, Inc. |
12,713 | 1,471,021 | ||||||
Epic Games, Inc. (Acquired 6/18/20-3/29/21, Cost $2,419,150) (a) (c) (d) (e) |
3,660 | 3,037,727 | ||||||
Fiserv, Inc. (a) |
223,517 | 20,914,486 | ||||||
HashiCorp, Inc. Class A (a) |
8,525 | 274,420 | ||||||
Intuit, Inc. |
51,738 | 20,039,162 | ||||||
Microsoft Corp. |
505,254 | 117,673,657 | ||||||
MongoDB, Inc. (a) |
8,964 | 1,779,892 | ||||||
MSCI, Inc. |
639 | 269,524 | ||||||
Roper Technologies, Inc. |
18,182 | 6,538,974 | ||||||
Salesforce, Inc. (a) |
92,650 | 13,326,776 | ||||||
SentinelOne Inc. Class A (a) |
114,058 | 2,915,322 | ||||||
ServiceNow, Inc. (a) |
27,765 | 10,484,342 | ||||||
Stripe, Inc., Class B (Acquired 12/17/19, Cost $295,694) (a) (c) (d) (e) |
18,846 | 434,212 | ||||||
Synopsys, Inc. (a) |
1,950 | 595,745 | ||||||
Veeva Systems, Inc. Class A (a) |
681 | 112,283 | ||||||
Workday, Inc. Class A (a) |
919 | 139,890 | ||||||
Zoom Video Communications, Inc. Class A (a) |
1,670 | 122,895 | ||||||
| 222,038,963 | ||||||||
| 386,050,297 | ||||||||
Number of |
Value |
|||||||
Utilities — 5.8% |
||||||||
Electric — 5.7% |
||||||||
Ameren Corp. |
95,798 | $ | 7,716,529 | |||||
American Electric Power Co., Inc. |
112,862 | 9,756,920 | ||||||
CMS Energy Corp. |
2,389 | 139,135 | ||||||
Dominion Energy, Inc. |
276,744 | 19,125,778 | ||||||
DTE Energy Co. |
53,077 | 6,106,509 | ||||||
Duke Energy Corp. |
21,011 | 1,954,443 | ||||||
Exelon Corp. |
113,347 | 4,245,979 | ||||||
FirstEnergy Corp. |
36,310 | 1,343,470 | ||||||
NextEra Energy, Inc. |
15,092 | 1,183,364 | ||||||
PG&E Corp. (a) |
37,247 | 465,588 | ||||||
Sempra Energy |
86,442 | 12,961,113 | ||||||
The Southern Co. |
468,519 | 31,859,292 | ||||||
WEC Energy Group, Inc. |
29,863 | 2,670,648 | ||||||
Xcel Energy, Inc. |
77,355 | 4,950,720 | ||||||
| 104,479,488 | ||||||||
Gas — 0.1% |
||||||||
NiSource, Inc. |
87,006 | 2,191,681 | ||||||
| 106,671,169 | ||||||||
TOTAL COMMON STOCK (Cost $1,961,198,750) |
1,763,322,171 | |||||||
PREFERRED STOCK — 0.8% |
||||||||
Consumer, Cyclical — 0.5% |
||||||||
Auto Manufacturers — 0.4% |
||||||||
Dr Ing hc F Porsche AG |
44,875 | 3,628,329 | ||||||
Nuro, Inc., Series C (Acquired 10/30/20-3/21/21, Cost $1,236,023) (a) (c) (d) (e) |
94,681 | 1,973,694 | ||||||
Nuro, Inc., Series D (Acquired 10/29/21, Cost $487,977) (a) (c) (d) (e) |
23,409 | 487,977 | ||||||
Waymo LLC, Series A-2 (Acquired 5/08/20, Cost $748,934) (a) (c) (d) (e) |
8,722 | 799,999 | ||||||
| 6,889,999 | ||||||||
Auto Parts & Equipment — 0.1% |
||||||||
GM Cruise Holdings, LLC, Class F (Acquired 5/07/19, Cost $921,625) (a) (c) (d) (e) |
50,500 | 1,464,500 | ||||||
GM Cruise Holdings, LLC, Class G (Acquired 1/21/21, Cost $979,851) (a) (c) (d) (e) |
37,186 | 1,078,394 | ||||||
| 2,542,894 | ||||||||
The accompanying notes are an integral part of the financial statements.
78
MassMutual Select T. Rowe Price Large Cap Blend Fund – Portfolio of Investments (Continued) |
Number of |
Value |
|||||||
Consumer, Non-cyclical — 0.1% |
||||||||
Commercial Services — 0.1% |
||||||||
Redwood Materials, Inc., Series C, (Acquired 5/28/21, Cost $1,059,705) (a) (c) (d) (e) |
22,355 | $ | 1,743,690 | |||||
Financial — 0.0% |
||||||||
Investment Companies — 0.0% |
||||||||
Maplebear, Inc., Series A (Acquired 11/18/20, Cost $53,081) (a) (c) (d) (e) |
870 | 42,178 | ||||||
Maplebear, Inc., Series G (Acquired 7/02/20, Cost $599,129) (a) (c) (d) (e) |
12,458 | 603,964 | ||||||
Maplebear, Inc., Series I, (Acquired 2/26/21, Cost $240,750) (a) (c) (d) (e) |
1,926 | 93,372 | ||||||
| 739,514 | ||||||||
| 739,514 | ||||||||
Industrial — 0.0% |
||||||||
Electrical Components & Equipment — 0.0% |
||||||||
Sila Nanotechnologies, Inc., Series F (Acquired 1/07/21, Cost $760,988) (a) (c) (d) (e) |
18,438 | 574,712 | ||||||
Technology — 0.2% |
||||||||
Software — 0.2% |
||||||||
Canva, Inc., Series A (Acquired 12/17/21, Cost $49,421) (a) (c) (d) (e) |
29 | 27,694 | ||||||
Canva, Inc., Series A-3 (Acquired 12/17/21, Cost $13,633) (a) (c) (d) (e) |
8 | 7,640 | ||||||
Celonis SE, Series D (Acquired 6/17/21, Cost $1,135,255) (a) (c) (d) (e) |
3,070 | 1,135,255 | ||||||
Formagrid, Inc., Series F (Acquired 12/08/21, Cost $1,130,824) (a) (c) (d) (e) |
6,038 | 635,258 | ||||||
Rappi, Inc., Series E (Acquired 9/08/20-9/24/20, Cost $1,092,516) (a) (c) (d) (e) |
18,286 | 942,278 | ||||||
| 2,748,125 | ||||||||
| 2,748,125 | ||||||||
TOTAL PREFERRED STOCK (Cost $14,139,138) |
15,238,934 | |||||||
TOTAL EQUITIES (Cost $1,975,337,888) |
1,778,561,105 | |||||||
Principal |
Value |
|||||||
BONDS & NOTES — 0.0% |
||||||||
CORPORATE DEBT — 0.0% |
||||||||
Commercial Services — 0.0% |
||||||||
Redwood Materials, Inc., Promissory Note (Acquired 6/17/22, Cost $50,373), 0.010% 9/24/23 (a) (c) (d) (e) |
$ | 50,373 | $ | 50,373 | ||||
Software — 0.0% |
||||||||
Celonis SE, Series D Unfunded Commitment (Acquired 8/31/22, Cost $0), 3.000% 1/01/24 (a) (c) (d) (e) |
170,734 | — | ||||||
TOTAL CORPORATE DEBT (Cost $50,373) |
50,373 | |||||||
TOTAL BONDS & NOTES (Cost $50,373) |
50,373 | |||||||
TOTAL LONG-TERM INVESTMENTS (Cost $1,975,388,261) |
1,778,611,478 | |||||||
Number of Shares |
||||||||
SHORT-TERM INVESTMENTS — 4.1% |
||||||||
Mutual Fund — 4.0% |
||||||||
T. Rowe Price Government Reserve Investment Fund |
74,827,930 | 74,827,930 | ||||||
Principal |
||||||||
Repurchase Agreement — 0.1% |
||||||||
Fixed Income Clearing Corp., Repurchase Agreement, dated 9/30/22, 0.830%, due 10/03/22 (f) |
$ | 997,435 | 997,435 | |||||
TOTAL SHORT-TERM INVESTMENTS (Cost $75,825,365) |
75,825,365 | |||||||
TOTAL INVESTMENTS — 100.0% (Cost $2,051,213,626) (g) |
1,854,436,843 | |||||||
Other Assets/(Liabilities) — (0.0)% |
(576,372 | ) | ||||||
NET ASSETS — 100.0% |
$ | 1,853,860,471 | ||||||
Abbreviation Legend
|
ADR |
American Depositary Receipt |
The accompanying notes are an integral part of the financial statements.
79
MassMutual Select T. Rowe Price Large Cap Blend Fund – Portfolio of Investments (Continued) |
Notes to Portfolio of Investments
Percentages are stated as a percent of net assets.
|
(a) |
Non-income producing security. |
|
(b) |
Denotes all or a portion of security on loan. The total value of securities on loan as of September 30, 2022, was $25,197,620 or 1.36% of net assets. The Fund received $25,836,077 of non-cash collateral (U.S. Treasury and/or Agency obligations) related to securities lending activity. This amount is not reflected on either the Portfolio of Investments or the Statement of Assets and Liabilities. (Note 2). |
|
(c) |
Investment is valued using significant unobservable inputs. |
|
(d) |
Restricted security. Certain securities are restricted as to resale. At September 30, 2022, these securities amounted to a value of $16,974,484 or 0.92% of net assets. The Fund generally bears the costs, if any, associated with the disposition of restricted securities. |
|
(e) |
This security is fair valued in good faith in accordance with procedures approved by the Board of Trustees. At September 30, 2022, these securities amounted to a value of $16,974,484 or 0.92% of net assets. |
|
(f) |
Maturity value of $997,504. Collateralized by U.S. Government Agency obligations with a rate of 0.000%, maturity date of 3/30/23, and an aggregate market value, including accrued interest, of $1,017,435. |
|
(g) |
See Note 6 for aggregate cost for federal tax purposes. |
The accompanying notes are an integral part of the financial statements.
80
MassMutual Select T. Rowe Price Limited Duration Inflation Focused Bond Fund – Portfolio of Investments |
September 30, 2022 |
Principal |
Value |
|||||||
BONDS & NOTES — 93.9% |
||||||||
CORPORATE DEBT — 5.3% |
||||||||
Agriculture — 0.1% |
||||||||
Imperial Brands Finance PLC |
||||||||
3.125% 7/26/24 (a) |
$ | 200,000 | $ | 191,350 | ||||
Auto Manufacturers — 0.3% |
||||||||
Nissan Motor Acceptance Co. LLC |
||||||||
1.125% 9/16/24 (a) |
120,000 | 109,087 | ||||||
Toyota Motor Credit Corp. |
||||||||
4.400% 9/20/24 |
395,000 | 392,613 | ||||||
| 501,700 | ||||||||
Banks — 1.3% |
||||||||
Bank of Montreal |
||||||||
4.250% 9/14/24 (b) |
495,000 | 487,209 | ||||||
Citigroup, Inc. |
||||||||
5.610% 9/29/26 |
485,000 | 482,432 | ||||||
Credit Suisse AG |
||||||||
4.750% 8/09/24 |
500,000 | 487,265 | ||||||
Mitsubishi UFJ Financial Group, Inc. 1 year CMT + 1.550% |
||||||||
5.063% VRN 9/12/25 |
400,000 | 395,808 | ||||||
Nordea Bank Abp |
||||||||
4.750% 9/22/25 (a) |
490,000 | 482,127 | ||||||
Santander Holdings SOFR + 2.328% |
||||||||
5.807% VRN 9/09/26 |
230,000 | 224,833 | ||||||
| 2,559,674 | ||||||||
Chemicals — 0.2% |
||||||||
Celanese US Holdings LLC |
||||||||
5.900% 7/05/24 |
480,000 | 473,465 | ||||||
Diversified Financial Services — 0.2% |
||||||||
AerCap Ireland Capital DAC/AerCap Global Aviation Trust |
||||||||
1.750% 10/29/24 |
440,000 | 400,389 | ||||||
Electric — 0.8% |
||||||||
Edison International |
||||||||
4.700% 8/15/25 |
500,000 | 484,662 | ||||||
Enel Finance International NV |
||||||||
1.375% 7/12/26 (a) |
340,000 | 287,352 | ||||||
4.250% 6/15/25 (a) |
200,000 | 191,980 | ||||||
NextEra Energy Capital Holdings, Inc. |
||||||||
4.255% 9/01/24 |
495,000 | 488,018 | ||||||
| 1,452,012 | ||||||||
Entertainment — 0.3% |
||||||||
Warnermedia Holdings, Inc. |
||||||||
3.428% 3/15/24 (a) |
100,000 | 96,641 | ||||||
3.528% 3/15/24 (a) |
110,000 | 106,258 | ||||||
3.638% 3/15/25 (a) |
293,000 | 277,514 | ||||||
| 480,413 | ||||||||
Principal |
Value |
|||||||
Food — 0.3% |
||||||||
Mondelez International Holdings BV |
||||||||
4.250% 9/15/25 (a) |
$ | 200,000 | $ | 195,798 | ||||
Nestle Holdings, Inc. |
||||||||
4.000% 9/12/25 (a) |
320,000 | 315,131 | ||||||
| 510,929 | ||||||||
Health Care – Services — 0.5% |
||||||||
HCA, Inc. |
||||||||
5.375% 2/01/25 |
495,000 | 488,956 | ||||||
Health Care Service Corp. A Mutual Legal Reserve Co. |
||||||||
1.500% 6/01/25 (a) |
545,000 | 495,723 | ||||||
| 984,679 | ||||||||
Machinery – Diversified — 0.1% |
||||||||
John Deere Capital Corp. |
||||||||
4.050% 9/08/25 |
260,000 | 255,666 | ||||||
Media — 0.2% |
||||||||
Charter Communications Operating LLC/Charter Communications Operating Capital |
||||||||
4.908% 7/23/25 |
488,000 | 475,948 | ||||||
Pharmaceuticals — 0.1% |
||||||||
Viatris, Inc. |
||||||||
1.650% 6/22/25 |
235,000 | 208,944 | ||||||
Pipelines — 0.2% |
||||||||
Energy Transfer LP |
||||||||
2.900% 5/15/25 |
505,000 | 469,793 | ||||||
Retail — 0.3% |
||||||||
Dollar General Corp. |
||||||||
4.250% 9/20/24 |
285,000 | 281,658 | ||||||
The Home Depot, Inc. |
||||||||
4.000% 9/15/25 |
75,000 | 73,819 | ||||||
Lowe’s Cos, Inc. |
||||||||
4.400% 9/08/25 |
145,000 | 142,923 | ||||||
| 498,400 | ||||||||
Telecommunications — 0.3% |
||||||||
Sprint Corp. |
||||||||
7.125% 6/15/24 |
475,000 | 482,234 | ||||||
Trucking & Leasing — 0.1% |
||||||||
DAE Funding LLC |
||||||||
1.550% 8/01/24 (a) |
200,000 | 182,774 | ||||||
TOTAL CORPORATE DEBT (Cost $10,302,245) |
10,128,370 | |||||||
MUNICIPAL OBLIGATIONS — 0.4% |
||||||||
California State University, Revenue Bond |
||||||||
0.563% 11/01/24 |
125,000 | 115,228 | ||||||
The accompanying notes are an integral part of the financial statements.
81
MassMutual Select T. Rowe Price Limited Duration Inflation Focused Bond Fund – Portfolio of Investments (Continued) |
Principal |
Value |
|||||||
City & County of Denver Co. Airport System Revenue |
||||||||
Revenue Bond, 0.877% 11/15/23 |
$ | 20,000 | $ | 19,294 | ||||
Revenue Bond, 1.115% 11/15/24 |
30,000 | 27,968 | ||||||
City of Atlanta GA Water & Wastewater Revenue |
||||||||
Revenue Bond, 0.271% 11/01/22 |
15,000 | 14,965 | ||||||
Revenue Bond, 0.407% 11/01/23 |
15,000 | 14,420 | ||||||
Revenue Bond, 0.616% 11/01/24 |
15,000 | 13,851 | ||||||
Dallas Area Rapid Transit |
||||||||
Revenue Bond, 0.397% 12/01/22 |
15,000 | 14,928 | ||||||
Revenue Bond, 0.541% 12/01/23 |
10,000 | 9,592 | ||||||
Revenue Bond, 0.761% 12/01/24 |
10,000 | 9,242 | ||||||
New York Transportation Development Corp., Revenue Bond |
||||||||
1.610% 12/01/22 |
15,000 | 14,922 | ||||||
State of Illinois, General Obligation |
||||||||
2.840% 10/01/23 |
485,000 | 473,646 | ||||||
Tobacco Settlement Finance Authority |
||||||||
Revenue Bond, 1.193% 6/01/23 |
50,000 | 48,961 | ||||||
Revenue Bond, 1.497% 6/01/24 |
65,000 | 61,641 | ||||||
TOTAL MUNICIPAL OBLIGATIONS (Cost $870,000) |
838,658 | |||||||
NON-U.S. GOVERNMENT AGENCY OBLIGATIONS — 5.9% |
||||||||
Automobile Asset-Backed Securities — 0.2% |
||||||||
AmeriCredit Automobile Receivables Trust, Series 2020-3, Class C |
||||||||
1.060% 8/18/26 |
120,000 | 113,540 | ||||||
Santander Drive Auto Receivables Trust, Series 2020-4, Class C |
||||||||
1.010% 1/15/26 |
180,878 | 179,239 | ||||||
Santander Retail Auto Lease Trust, Series 2022-A, Class B |
||||||||
1.610% 1/20/26 (a) |
180,000 | 166,773 | ||||||
| 459,552 | ||||||||
Commercial Mortgage-Backed Securities — 0.6% |
||||||||
BX Commercial Mortgage Trust, Series 2019-IMC, Class C, 1 mo. USD LIBOR + 1.600% |
||||||||
4.418% FRN 4/15/34 (a) |
210,000 | 201,203 | ||||||
Commercial Mortgage Pass-Through Certificates |
||||||||
Series 2014-UBS4, Class AM, 3.968% 8/10/47 |
250,000 | 238,196 | ||||||
Series 2014-UBS2, Class AM, 4.199% 3/10/47 |
100,000 | 96,565 | ||||||
Principal |
Value |
|||||||
Extended Stay America Trust, Series 2021-ESH, Class B, 1 mo. USD LIBOR + 1.380% |
||||||||
4.198% FRN 7/15/38 (a) |
$ | 258,410 | $ | 250,035 | ||||
Fontainebleau Miami Beach Trust, Series 2019-FBLU, Class C |
||||||||
3.750% 12/10/36 (a) |
295,000 | 273,406 | ||||||
New Orleans Hotel Trust, Series 2019-HNLA, Class C, 1 mo. USD LIBOR + 1.589% |
||||||||
4.407% FRN 4/15/32 (a) |
100,000 | 96,077 | ||||||
| 1,155,482 | ||||||||
Other Asset-Backed Securities — 1.1% |
||||||||
BRE Grand Islander Timeshare Issuer LLC, Series 2019-A, Class A |
||||||||
3.280% 9/26/33 (a) |
41,547 | 39,421 | ||||||
Elara HGV Timeshare Issuer LLC, Series 2016-A, Class A |
||||||||
2.730% 4/25/28 (a) |
197,646 | 190,367 | ||||||
HPEFS Equipment Trust, Series 2021-2A, Class C |
||||||||
0.880% 9/20/28 (a) |
360,000 | 340,302 | ||||||
Madison Park Funding XXXVII Ltd., Series 2019-37A, Class AR, 3 mo. USD LIBOR + 1.070% |
||||||||
3.582% FRN 7/15/33 (a) |
475,000 | 460,483 | ||||||
Magnetite XXV Ltd., Series 2020-25A, Class A, 3 mo. USD LIBOR + 1.200% |
||||||||
3.983% FRN 1/25/32 (a) |
250,000 | 243,894 | ||||||
MVW Owner Trust, Series 2018-1A, Class A |
||||||||
3.450% 1/21/36 (a) |
60,281 | 59,350 | ||||||
OZLM VIII Ltd., Series 2014-8A, Class A1R3, 3 mo. USD LIBOR + .980% |
||||||||
3.720% FRN 10/17/29 (a) |
722,470 | 704,560 | ||||||
Sierra Receivables Funding LLC, Series 2019-3A, Class A |
||||||||
2.340% 8/20/36 (a) |
41,001 | 39,760 | ||||||
| 2,078,137 | ||||||||
Student Loans Asset-Backed Securities — 0.6% |
||||||||
Navient Private Education Refi Loan Trust |
||||||||
Series 2021-EA, Class A, 0.970% 12/16/69 (a) |
173,789 | 145,852 | ||||||
Series 2019-GA, Class A, 2.400% 10/15/68 (a) |
118,185 | 108,287 | ||||||
Nelnet Student Loan Trust, Series 2021-CA, Class AFX |
||||||||
1.320% 4/20/62 (a) |
529,841 | 474,431 | ||||||
The accompanying notes are an integral part of the financial statements.
82
MassMutual Select T. Rowe Price Limited Duration Inflation Focused Bond Fund – Portfolio of Investments (Continued) |
Principal |
Value |
|||||||
SMB Private Education Loan Trust |
||||||||
Series 2016-B, Class A2A, 2.430% 2/17/32 (a) |
$ | 96,678 | $ | 93,488 | ||||
Series 2017-B, Class A2A, 2.820% 10/15/35 (a) |
189,921 | 182,087 | ||||||
Series 2017-A, Class A2A, 2.880% 9/15/34 (a) |
61,809 | 59,910 | ||||||
| 1,064,055 | ||||||||
Whole Loan Collateral Collateralized Mortgage Obligations — 3.4% |
||||||||
Angel Oak Mortgage Trust, Series 2019-2, Class A1, |
||||||||
3.628% VRN 3/25/49 (a) (c) |
432 | 430 | ||||||
Bayview MSR Opportunity Master Fund Trust, Series 2021-2, Class A5, |
||||||||
2.500% VRN 6/25/51 (a) (c) |
353,969 | 303,736 | ||||||
COLT Mortgage Loan Trust, Series 2021-6, Class A1, |
||||||||
1.907% VRN 12/25/66 (a) (c) |
560,681 | 485,181 | ||||||
Credit Suisse Mortgage Trust, Series 2021-RPL6, Class A1, |
||||||||
2.000% VRN 10/25/60 (a) (c) |
301,922 | 268,320 | ||||||
Flagstar Mortgage Trust, Series 2021-5INV, Class A5, |
||||||||
2.500% VRN 7/25/51 (a) (c) |
372,331 | 319,492 | ||||||
FWD Securitization Trust, Series 2020-INV1, Class A3, |
||||||||
2.440% VRN 1/25/50 (a) (c) |
62,001 | 56,902 | ||||||
Galton Funding Mortgage Trust |
||||||||
Series 2020-H1, Class A3, 2.617% VRN 1/25/60 (a) (c) |
154,702 | 142,544 | ||||||
Series 2018-1, Class A33, 3.500% VRN 11/25/57 (a) (c) |
58,322 | 55,097 | ||||||
Series 2018-2, Class A31, 4.500% VRN 10/25/58 (a) (c) |
21,750 | 21,125 | ||||||
GS Mortgage-Backed Securities Trust |
||||||||
Series 2021-PJ6, Class A8, 2.500% VRN 11/25/51 (a) (c) |
649,177 | 556,644 | ||||||
Series 2022-GR1, Class A5, 2.500% VRN 6/25/52 (a) (c) |
714,660 | 614,579 | ||||||
JP Morgan Mortgage Trust, Series 2019-INV2, Class A3, |
||||||||
3.500% VRN 2/25/50 (a) (c) |
19,764 | 18,503 | ||||||
Metlife Securitization Trust, Series 2018-1A, Class A, |
||||||||
3.750% VRN 3/25/57 (a) (c) |
90,113 | 85,109 | ||||||
New Residential Mortgage Loan Trust, Series 2019-NQM5, Class A3, |
||||||||
3.065% VRN 11/25/59 (a) (c) |
44,949 | 41,708 | ||||||
NYMT Loan Trust, Series 2022-CP1, Class A1 |
||||||||
2.042% 7/25/61 (a) |
310,732 | 284,814 | ||||||
Principal |
Value |
|||||||
Oceanview Mortgage Trust, Series 2022-1, Class A5, |
||||||||
2.500% VRN 12/25/51 (a) (c) |
$ | 338,412 | $ | 290,386 | ||||
Onslow Bay Financial LLC |
||||||||
Series 2022-NQM1, Class A1, 2.305% VRN 11/25/61 (a) (c) |
273,522 | 228,102 | ||||||
Series 2020-INV1, Class A21, 3.500% VRN 12/25/49 (a) (c) |
31,917 | 28,459 | ||||||
Series 2020-EXP1, Class 1A9, 3.500% VRN 2/25/60 (a) (c) |
63,930 | 56,316 | ||||||
Series 2020-EXP1, Class 2A1, 1 mo. USD LIBOR + .750% 3.834% FRN 2/25/60 (a) |
20,135 | 19,139 | ||||||
Series 2019-EXP3, Class 2A1, 1 mo. USD LIBOR + .900% 3.984% FRN 10/25/59 (a) |
35,093 | 34,047 | ||||||
Series 2019-EXP1, Class 1A3, 4.000% VRN 1/25/59 (a) (c) |
41,239 | 40,178 | ||||||
Series 2019-EXP2, Class 1A3, 4.000% VRN 6/25/59 (a) (c) |
77,715 | 74,314 | ||||||
Series 2019-EXP3, Class 2A2, 1 mo. USD LIBOR + 1.100% 4.184% FRN 10/25/59 (a) |
19,706 | 19,183 | ||||||
Sequoia Mortgage Trust |
||||||||
Series 2017-CH1, Class A2, 3.500% VRN 8/25/47 (a) (c) |
16,621 | 16,033 | ||||||
Series 2017-CH1, Class A13, 4.000% VRN 8/25/47 (a) (c) |
45,191 | 43,905 | ||||||
Series 2018-CH2, Class A3, 4.000% VRN 6/25/48 (a) (c) |
8,543 | 8,170 | ||||||
Series 2018-CH3, Class A2, 4.000% VRN 8/25/48 (a) (c) |
3,982 | 3,941 | ||||||
Series 2018-CH4, Class A2, 4.000% VRN 10/25/48 (a) (c) |
2,037 | 2,016 | ||||||
SG Residential Mortgage Trust |
||||||||
Series 2021-1, Class A1, 1.160% VRN 7/25/61 (a) (c) |
400,351 | 330,298 | ||||||
Series 2019-3, Class A3, 3.082% VRN 9/25/59 (a) (c) |
44,130 | 43,225 | ||||||
Starwood Mortgage Residential Trust |
||||||||
Series 2021-3, Class A1, 1.127% VRN 6/25/56 (a) (c) |
362,913 | 307,060 | ||||||
Series 2020-1, Class A3, 2.562% VRN 2/25/50 (a) (c) |
115,819 | 109,875 | ||||||
Towd Point Mortgage Trust |
||||||||
Series 2017-6, Class A1, 2.750% VRN 10/25/57 (a) (c) |
73,558 | 70,939 | ||||||
Series 2018-2, Class A1, 3.250% VRN 3/25/58 (a) (c) |
84,800 | 82,011 | ||||||
Series 2018-5, Class A1A, 3.250% VRN 7/25/58 (a) (c) |
56,379 | 55,029 | ||||||
Series 2018-3, Class A1, 3.750% VRN 5/25/58 (a) (c) |
47,262 | 45,283 | ||||||
The accompanying notes are an integral part of the financial statements.
83
MassMutual Select T. Rowe Price Limited Duration Inflation Focused Bond Fund – Portfolio of Investments (Continued) |
Principal |
Value |
|||||||
Verus Securitization Trust |
||||||||
Series 2021-3, Class A1, 1.046% VRN 6/25/66 (a) (c) |
$ | 353,250 | $ | 290,505 | ||||
Series 2021-8, Class A2, 2.286% VRN 11/25/66 (a) (c) |
146,839 | 123,214 | ||||||
Series 2020-1, Class A1, 2.417% STEP 1/25/60 (a) |
55,645 | 52,465 | ||||||
Series 2020-1, Class A3, 2.724% STEP 1/25/60 (a) |
129,880 | 123,121 | ||||||
Series 2019-4, Class A3, 3.000% STEP 11/25/59 (a) |
190,459 | 183,028 | ||||||
Series 2019-INV3, Class A3, 3.100% VRN 11/25/59 (a) (c) |
222,191 | 213,246 | ||||||
Wells Fargo Mortgage Backed Securities Trust, Series 2021-RR1, Class A3, |
||||||||
2.500% VRN 12/25/50 (a) (c) |
291,544 | 250,534 | ||||||
| 6,398,206 | ||||||||
TOTAL NON-U.S. GOVERNMENT AGENCY OBLIGATIONS (Cost $12,349,559) |
11,155,432 | |||||||
U.S. GOVERNMENT AGENCY OBLIGATIONS AND INSTRUMENTALITIES (d) — 2.9% |
||||||||
Collateralized Mortgage Obligations — 0.0% |
||||||||
Government National Mortgage Association Series 2019-65, Class B 3.500% 5/20/49 |
54,983 | 51,125 | ||||||
Pass-Through Securities — 2.0% |
||||||||
Government National Mortgage Association II TBA |
||||||||
2.000% 10/20/52 (e) |
2,290,000 | 1,907,498 | ||||||
5.500% 10/20/52 (e) |
1,910,000 | 1,907,016 | ||||||
| 3,814,514 | ||||||||
Whole Loans — 0.9% |
||||||||
Federal Home Loan Mortgage Corp. Structured Agency Credit Risk Debt Notes, Series 2022-DNA1, Class M1A, 30 day SOFR + 1.000% |
||||||||
3.281% FRN 1/25/42 (a) |
602,203 | 583,929 | ||||||
Federal National Mortgage Association Connecticut Avenue Securities Trust |
||||||||
Series 2022-R01, Class 1M1, 30 day SOFR + 1.000% 3.281% FRN 12/25/41 (a) |
337,376 | 329,782 | ||||||
Series 2018-C03, Class 1EB2, 1 mo. USD LIBOR + .850% 3.934% FRN 10/25/30 |
282,056 | 279,930 | ||||||
Principal |
Value |
|||||||
Series 2018-C03, Class 1ED2, 1 mo. USD LIBOR + .850% 3.934% FRN 10/25/30 |
$ | 15,909 | $ | 15,748 | ||||
Series 2017-C04, Class 2ED2, 1 mo. USD LIBOR + 1.100% 4.184% FRN 11/25/29 |
247,684 | 245,540 | ||||||
Series 2017-C05, Class 1ED3, 1 mo. USD LIBOR + 1.200% 4.284% FRN 1/25/30 |
12,999 | 12,924 | ||||||
Series 2017-C02, Class 2ED3, 1 mo. USD LIBOR + 1.350% 4.434% FRN 9/25/29 |
16,533 | 16,525 | ||||||
Series 2017-C06, Class 1M2B, 1 mo. USD LIBOR + 2.650% 5.734% FRN 2/25/30 |
158,282 | 159,168 | ||||||
| 1,643,546 | ||||||||
TOTAL U.S. GOVERNMENT AGENCY OBLIGATIONS AND INSTRUMENTALITIES (Cost $5,523,161) |
5,509,185 | |||||||
U.S. TREASURY OBLIGATIONS — 79.4% |
||||||||
U.S. Treasury Bonds & Notes — 79.4% |
||||||||
U.S. Treasury Inflation Index |
||||||||
0.125% 4/15/25 |
20,232,806 | 19,199,036 | ||||||
0.125% 10/15/25 |
13,755,416 | 13,002,898 | ||||||
0.125% 4/15/26 |
2,685,868 | 2,508,349 | ||||||
0.125% 7/15/26 |
1,625,627 | 1,520,046 | ||||||
0.125% 10/15/26 |
12,225,240 | 11,388,575 | ||||||
0.125% 4/15/27 (b) |
40,614,390 | 37,463,073 | ||||||
0.250% 1/15/25 |
8,464,397 | 8,100,858 | ||||||
0.375% 7/15/25 |
12,750,968 | 12,190,374 | ||||||
0.375% 1/15/27 |
11,237,376 | 10,511,556 | ||||||
0.375% 7/15/27 |
5,069,152 | 4,729,690 | ||||||
0.500% 4/15/24 |
8,712,737 | 8,471,265 | ||||||
0.625% 1/15/24 (f) |
6,070,897 | 5,931,694 | ||||||
0.625% 1/15/26 |
14,286,980 | 13,636,997 | ||||||
0.625% 7/15/32 |
2,251,542 | 2,040,767 | ||||||
| 150,695,178 | ||||||||
TOTAL U.S. TREASURY OBLIGATIONS (Cost $163,419,499) |
150,695,178 | |||||||
TOTAL BONDS & NOTES (Cost $192,464,464) |
178,326,823 | |||||||
The accompanying notes are an integral part of the financial statements.
84
MassMutual Select T. Rowe Price Limited Duration Inflation Focused Bond Fund – Portfolio of Investments (Continued) |
Number of |
Value |
|||||||
MUTUAL FUNDS — 6.2% |
||||||||
Diversified Financial Services — 6.2% |
||||||||
State Street Navigator Securities Lending Government Money Market Portfolio (g) |
11,737,424 | $ | 11,737,424 | |||||
TOTAL MUTUAL FUNDS (Cost $11,737,424) |
11,737,424 | |||||||
TOTAL PURCHASED OPTIONS (#) — 0.0% (Cost $16,865) |
6,047 | |||||||
TOTAL LONG-TERM INVESTMENTS (Cost $204,218,753) |
190,070,294 | |||||||
SHORT-TERM INVESTMENTS — 7.7% |
||||||||
Mutual Fund — 7.3% |
||||||||
T. Rowe Price Government Reserve Investment Fund |
13,894,851 | 13,894,851 | ||||||
Principal |
||||||||
Repurchase Agreement — 0.4% |
||||||||
Fixed Income Clearing Corp., Repurchase Agreement, dated 9/30/22, 0.830%, due 10/03/22 (h) |
$ | 666,805 | 666,805 | |||||
TOTAL SHORT-TERM INVESTMENTS (Cost $14,561,656) |
14,561,656 | |||||||
TOTAL INVESTMENTS — 107.8% (Cost $218,780,409) (i) |
204,631,950 | |||||||
Other Assets/(Liabilities) — (7.8)% |
(14,734,912 | ) | ||||||
NET ASSETS — 100.0% |
$ | 189,897,038 | ||||||
Abbreviation Legend
|
FRN |
Floating Rate Note |
|
STEP |
Step Up Bond |
|
TBA |
To Be Announced |
|
VRN |
Variable Rate Note |
Notes to Portfolio of Investments
Percentages are stated as a percent of net assets.
|
(a) |
Security is exempt from registration under Regulation S or Rule 144A of the Securities Act of 1933. These securities are considered restricted and may be resold in transactions exempt from registration. At September 30, 2022, the aggregate market value of these securities amounted to $14,373,338 or 7.57% of net assets. |
|
(b) |
Denotes all or a portion of security on loan. The total value of securities on loan as of September 30, 2022, was $11,502,544 or 6.06% of net assets. (Note 2). |
|
(c) |
Certain variable rate securities are not based on a published reference rate and spread but are determined by the issuer or agent and are based on current market conditions. These securities do not indicate a reference rate and spread in their description above. The rates shown are the current interest rates at September 30, 2022. |
|
(d) |
May contain securities that are issued by a U.S. Government Agency, but are unsecured and are not guaranteed by a U.S. Government Agency. |
|
(e) |
A portion of this security is purchased on a when-issued, delayed-delivery or forward commitment basis. (Note 2). |
|
(f) |
All or a portion of this security is pledged/held as collateral for open derivatives. (Note 2). |
|
(g) |
Represents investment of security lending cash collateral. (Note 2). |
|
(h) |
Maturity value of $666,851. Collateralized by U.S. Government Agency obligations with a rate of 0.000%, maturity date of 3/30/23, and an aggregate market value, including accrued interest, of $680,154. |
|
(i) |
See Note 6 for aggregate cost for federal tax purposes. |
(#) Exchange-Traded Options Purchased
Description |
Expiration |
Exercise |
No. of |
Notional |
Value |
Premiums |
Unrealized |
|||||||||||||||||||||||||
Call |
||||||||||||||||||||||||||||||||
U.S. Treasury Note 10 Year Future |
10/21/22 | 116.00 | 43 | USD | 4,818,688 | $ | 6,047 | $ | 16,865 | $ | (10,818 | ) | ||||||||||||||||||||
The accompanying notes are an integral part of the financial statements.
85
MassMutual Select T. Rowe Price Limited Duration Inflation Focused Bond Fund – Portfolio of Investments (Continued) |
Forward contracts
Counterparty |
Settlement |
Currency Purchased |
Currency Sold |
Unrealized |
||||||||||||||||||||
Bank of America N.A.* |
10/21/22 | USD | 504,123 | AUD | 725,000 | $ | 40,297 | |||||||||||||||||
Goldman Sachs International* |
10/21/22 | NZD | 325,000 | USD | 206,090 | (24,193 | ) | |||||||||||||||||
Goldman Sachs International* |
10/21/22 | USD | 203,460 | NZD | 325,000 | 21,563 | ||||||||||||||||||
HSBC Bank USA* |
10/21/22 | NZD | 810,000 | USD | 508,150 | (54,808 | ) | |||||||||||||||||
HSBC Bank USA* |
10/21/22 | AUD | 725,000 | USD | 510,132 | (46,306 | ) | |||||||||||||||||
HSBC Bank USA* |
10/21/22 | USD | 503,857 | NZD | 810,000 | 50,515 | ||||||||||||||||||
| $ | (12,932 | ) | ||||||||||||||||||||||
Futures contracts
|
Expiration |
Number of |
Notional |
Value/ Net |
||||||||||||
Long |
||||||||||||||||
U.S. Treasury Ultra 10 Year |
12/20/22 | 23 | $ | 2,739,471 | $ | (14,330 | ) | |||||||||
U.S. Treasury Note 2 Year |
12/30/22 | 51 | 10,545,620 | (70,698 | ) | |||||||||||
U.S. Treasury Note 5 Year |
12/30/22 | 42 | 4,591,660 | (76,332 | ) | |||||||||||
3 Month SOFR |
6/20/23 | 77 | 18,405,364 | (6,214 | ) | |||||||||||
|
$ | (167,574 | ) | |||||||||||||
Short |
||||||||||||||||
U.S. Treasury Note 10 Year |
12/20/22 | 132 | $ | (15,337,499 | ) | $ | 545,249 | |||||||||
Centrally Cleared Interest Rate Swaps
Paid by the Fund |
Received by the Fund |
||||||||||||||||||||||||||||||||
Rate/ Reference |
Frequency |
Rate/ Reference |
Frequency |
Termination |
Notional |
Value |
Upfront |
Unrealized |
|||||||||||||||||||||||||
Fixed 3.135% |
Maturity | U.S. Consumer Price Index |
Maturity | 8/03/23 | USD | 4,650,000 | $ | 251,334 | $ | — | $ | 251,334 | |||||||||||||||||||||
Fixed 2.960% |
Maturity | U.S. Consumer Price Index |
Maturity | 8/02/24 | USD | 1,376,000 | 78,050 | — | 78,050 | ||||||||||||||||||||||||
Fixed 2.952% |
Maturity | U.S. Consumer Price Index |
Maturity | 8/03/24 | USD | 3,133,000 | 177,588 | — | 177,588 | ||||||||||||||||||||||||
Fixed 3.112% |
Maturity | U.S. Consumer Price Index |
Maturity | 8/22/24 | USD | 1,370,000 | (12,128 | ) | — | (12,128 | ) | ||||||||||||||||||||||
Fixed 3.129% |
Maturity | U.S. Consumer Price Index |
Maturity | 8/22/24 | USD | 1,370,000 | (12,559 | ) | — | (12,559 | ) | ||||||||||||||||||||||
Fixed 3.320% |
Maturity | U.S. Consumer Price Index |
Maturity | 8/30/24 | USD | 1,370,000 | (21,439 | ) | — | (21,439 | ) | ||||||||||||||||||||||
Fixed 2.962% |
Maturity | U.S. Consumer Price Index |
Maturity | 9/15/25 | USD | 4,046,000 | (50,998 | ) | — | (50,998 | ) | ||||||||||||||||||||||
Fixed 2.715% |
Maturity | U.S. Consumer Price Index |
Maturity | 10/03/25 | USD | 1,383,000 | (6,674 | ) | — | (6,674 | ) | ||||||||||||||||||||||
Fixed 2.739% |
Maturity | U.S. Consumer Price Index |
Maturity | 10/03/25 | USD | 891,000 | (4,903 | ) | — | (4,903 | ) | ||||||||||||||||||||||
| $ | 398,271 | $ | — | $ | 398,271 | ||||||||||||||||||||||||||||
The accompanying notes are an integral part of the financial statements.
86
MassMutual Select T. Rowe Price Limited Duration Inflation Focused Bond Fund – Portfolio of Investments (Continued) |
OTC Interest Rate Swaps
Paid by the Fund |
Received by the Fund |
|||||||||||||||||||||||||||||||||||||||
Rate/ |
Frequency |
Rate/ |
Frequency |
Counterparty |
Termination |
Notional |
Value |
Upfront |
Unrealized |
|||||||||||||||||||||||||||||||
Fixed 1.600% |
Maturity | U.S. Consumer Price Index | Maturity | Bank of America N.A.* | 2/21/23 | USD | 3,638,000 | $ | 372,697 | $ | — | $ | 372,697 | |||||||||||||||||||||||||||
Fixed 1.740% |
Maturity | U.S. Consumer Price Index | Maturity | Barclays Bank PLC* | 12/16/22 | USD | 2,800,000 | 280,806 | — | 280,806 | ||||||||||||||||||||||||||||||
Fixed 1.422% |
Maturity | U.S. Consumer Price Index | Maturity | Citibank N.A.* | 10/07/22 | USD | 3,420,000 | 380,864 | — | 380,864 | ||||||||||||||||||||||||||||||
Fixed 1.434% |
Maturity | U.S. Consumer Price Index | Maturity | Citibank N.A.* | 10/08/22 | USD | 1,710,000 | 189,688 | — | 189,688 | ||||||||||||||||||||||||||||||
Fixed 1.435% |
Maturity | U.S. Consumer Price Index | Maturity | Citibank N.A.* | 10/08/22 | USD | 1,710,000 | 189,636 | — | 189,636 | ||||||||||||||||||||||||||||||
Fixed 1.593% |
Maturity | U.S. Consumer Price Index | Maturity | Citibank N.A.* | 2/18/23 | USD | 1,311,000 | 134,221 | — | 134,221 | ||||||||||||||||||||||||||||||
Fixed 1.596% |
Maturity | U.S. Consumer Price Index | Maturity | Citibank N.A.* | 2/18/23 | USD | 1,789,000 | 182,968 | — | 182,968 | ||||||||||||||||||||||||||||||
Fixed 1.592% |
Maturity | U.S. Consumer Price Index | Maturity | Citibank N.A.* | 2/20/23 | USD | 2,867,000 | 294,300 | — | 294,300 | ||||||||||||||||||||||||||||||
Fixed 1.487% |
Maturity | U.S. Consumer Price Index | Maturity | Citibank N.A.* | 2/26/23 | USD | 2,061,000 | 218,499 | — | 218,499 | ||||||||||||||||||||||||||||||
Fixed 1.605% |
Maturity | U.S. Consumer Price Index | Maturity | Goldman Sachs International* | 2/21/23 | USD | 2,993,000 | 306,162 | — | 306,162 | ||||||||||||||||||||||||||||||
Fixed 1.565% |
Maturity | U.S. Consumer Price Index | Maturity | HSBC Bank USA* | 2/25/23 | USD | 2,241,000 | 232,142 | — | 232,142 | ||||||||||||||||||||||||||||||
Fixed 2.290% |
Maturity | U.S. Consumer Price Index | Maturity | UBS AG* | 6/05/23 | USD | 1,700,000 | 132,920 | — | 132,920 | ||||||||||||||||||||||||||||||
| $ | 2,914,903 | $ | — | $ | 2,914,903 | |||||||||||||||||||||||||||||||||||
|
* |
Contracts are subject to a master netting agreement or similar agreement. |
Currency Legend
|
AUD |
Australian Dollar |
|
NZD |
New Zealand Dollar |
|
USD |
U.S. Dollar |
The accompanying notes are an integral part of the financial statements.
87
MassMutual Select T. Rowe Price Real Assets Fund – Portfolio of Investments |
September 30, 2022 |
Number of |
Value |
|||||||
EQUITIES — 91.2% |
||||||||
COMMON STOCK — 90.1% |
||||||||
Australia — 8.6% |
||||||||
ALS Ltd. |
175,484 | $ | 1,129,790 | |||||
BHP Group Ltd. |
330,686 | 8,235,703 | ||||||
BlueScope Steel Ltd. |
93,462 | 904,188 | ||||||
Goodman Group |
63,133 | 630,789 | ||||||
IGO Ltd. |
138,188 | 1,204,556 | ||||||
Northern Star Resources Ltd. |
339,276 | 1,710,452 | ||||||
OZ Minerals Ltd. |
23,473 | 385,315 | ||||||
Perseus Mining Ltd. |
1,156,865 | 1,139,523 | ||||||
Rio Tinto Ltd. |
20,282 | 1,207,039 | ||||||
Scentre Group |
281,941 | 453,828 | ||||||
South32 Ltd. |
225,315 | 520,790 | ||||||
Tietto Minerals Ltd. (a) |
1,875,595 | 523,781 | ||||||
| 18,045,754 | ||||||||
Austria — 0.0% |
||||||||
Mayr Melnhof Karton AG |
183 | 23,488 | ||||||
Belgium — 0.2% |
||||||||
Warehouses De Pauw CVA |
17,574 | 426,905 | ||||||
Bermuda — 0.4% |
||||||||
Hongkong Land Holdings Ltd. |
170,100 | 746,193 | ||||||
Brazil — 0.5% |
||||||||
Vale SA |
81,541 | 1,088,957 | ||||||
Canada — 7.9% |
||||||||
Canadian Apartment Properties |
9,555 | 291,212 | ||||||
Canadian National Railway Co. |
6,270 | 677,134 | ||||||
Canadian Natural Resources Ltd. (b) |
11,123 | 517,761 | ||||||
Canadian Pacific Railway Ltd. |
9,333 | 622,698 | ||||||
ERO Copper Corp. (a) (b) |
21,559 | 238,322 | ||||||
Franco-Nevada Corp. |
9,191 | 1,097,850 | ||||||
K92 Mining, Inc. (a) |
464,336 | 2,655,557 | ||||||
Karora Resources, Inc. (a) |
291,722 | 601,880 | ||||||
Nutrien Ltd. |
37,340 | 3,113,409 | ||||||
Orla Mining Ltd. (a) |
119,037 | 388,646 | ||||||
Rhyolite Resources Ltd. (a) |
214,075 | 33,320 | ||||||
Summit Industrial Income REIT |
74,237 | 919,532 | ||||||
TC Energy Corp. |
18,415 | 741,940 | ||||||
Toromont Industries Ltd. |
18,291 | 1,273,292 | ||||||
Victoria Gold Corp. (a) |
95,922 | 568,720 | ||||||
Wesdome Gold Mines Ltd. (a) |
321,351 | 2,172,815 | ||||||
West Fraser Timber Co. Ltd. |
2,903 | 210,010 | ||||||
Wheaton Precious Metals Corp. |
14,778 | 478,532 | ||||||
| 16,602,630 | ||||||||
Cayman Islands — 0.5% |
||||||||
China Resources Mixc Lifestyle Services Ltd. (c) |
51,600 | 197,692 | ||||||
Number of |
Value |
|||||||
H World Group Ltd. |
50,700 | $ | 172,644 | |||||
Wharf Real Estate Investment Co. Ltd. |
132,000 | 596,117 | ||||||
| 966,453 | ||||||||
Denmark — 0.3% |
||||||||
Bakkafrost P/F |
10,041 | 397,666 | ||||||
ROCKWOOL International A/S Class B |
1,394 | 218,534 | ||||||
| 616,200 | ||||||||
Finland — 1.1% |
||||||||
Kojamo OYJ |
39,531 | 502,390 | ||||||
Metso Outotec OYJ |
182,791 | 1,211,298 | ||||||
UPM-Kymmene OYJ |
20,751 | 659,412 | ||||||
| 2,373,100 | ||||||||
France — 2.0% |
||||||||
Air Liquide SA |
2,811 | 320,079 | ||||||
Gecina SA |
2,033 | 158,017 | ||||||
Legrand SA |
4,183 | 270,259 | ||||||
Schneider Electric SE |
3,720 | 417,350 | ||||||
TotalEnergies SE |
56,062 | 2,638,834 | ||||||
Verallia SA (c) |
17,005 | 381,239 | ||||||
| 4,185,778 | ||||||||
Hong Kong — 0.3% |
||||||||
Sun Hung Kai Properties Ltd. |
51,000 | 560,754 | ||||||
Ireland — 0.8% |
||||||||
Linde PLC |
5,960 | 1,606,756 | ||||||
Japan — 2.5% |
||||||||
Daiwa Office Investment Corp. |
100 | 464,942 | ||||||
Hoshino Resorts REIT, Inc. |
44 | 204,309 | ||||||
Industrial & Infrastructure Fund Investment Corp. (b) |
494 | 558,755 | ||||||
Katitas Co. Ltd. (b) |
11,700 | 260,642 | ||||||
Kyoritsu Maintenance Co. Ltd. (b) |
10,800 | 446,990 | ||||||
Mitsui Fudosan Co. Ltd. |
62,000 | 1,181,854 | ||||||
Mitsui Fudosan Logistics Park, Inc. |
92 | 314,816 | ||||||
Nippon Steel Corp. |
78,500 | 1,092,639 | ||||||
Shin-Etsu Chemical Co. Ltd. |
2,100 | 208,538 | ||||||
Tokyo Tatemono Co. Ltd. |
30,900 | 440,121 | ||||||
| 5,173,606 | ||||||||
Kazakhstan — 0.3% |
||||||||
NAC Kazatomprom JSC |
27,627 | 692,584 | ||||||
Luxembourg — 0.5% |
||||||||
Ardagh Metal Packaging SA (b) |
45,374 | 219,610 | ||||||
Shurgard Self Storage SA |
9,386 | 382,421 | ||||||
Tenaris SA ADR |
14,119 | 364,835 | ||||||
| 966,866 | ||||||||
Mexico — 0.5% |
||||||||
Grupo Mexico SAB de CV Series B |
336,409 | 1,136,202 | ||||||
The accompanying notes are an integral part of the financial statements.
88
MassMutual Select T. Rowe Price Real Assets Fund – Portfolio of Investments (Continued) |
Number of |
Value |
|||||||
Netherlands — 0.3% |
||||||||
Akzo Nobel NV |
8,068 | $ | 455,004 | |||||
Koninklijke DSM NV |
1,482 | 168,088 | ||||||
| 623,092 | ||||||||
Norway — 1.7% |
||||||||
Aker BP ASA |
20,985 | 601,721 | ||||||
Equinor ASA |
62,186 | 2,051,117 | ||||||
Norsk Hydro ASA |
137,882 | 741,733 | ||||||
TGS ASA |
17,174 | 209,209 | ||||||
| 3,603,780 | ||||||||
Portugal — 0.3% |
||||||||
Galp Energia SGPS SA |
77,286 | 740,705 | ||||||
Republic of Korea — 0.3% |
||||||||
POSCO Holdings, Inc. |
5,021 | 739,310 | ||||||
Russia — 0.0% |
||||||||
Alrosa PJSC (d) (e) |
688,100 | — | ||||||
MMC Norlisk Nickel PJSC (d) (e) |
2,654 | — | ||||||
Polyus PJSC (d) (e) |
2,282 | — | ||||||
| — | ||||||||
Singapore — 0.6% |
||||||||
CapitaLand Mall Trust |
273,900 | 364,152 | ||||||
Digital Core REIT Management Pte Ltd. (b) |
685,900 | 478,830 | ||||||
Lendlease Global Commercial REIT |
671,000 | 354,105 | ||||||
| 1,197,087 | ||||||||
South Africa — 0.2% |
||||||||
Impala Platinum Holdings Ltd. (b) |
11,401 | 105,790 | ||||||
Sibanye Stillwater Ltd. |
98,905 | 228,913 | ||||||
| 334,703 | ||||||||
Spain — 0.3% |
||||||||
Cellnex Telecom SA (c) |
13,541 | 417,488 | ||||||
Iberdrola SA |
20,448 | 190,092 | ||||||
| 607,580 | ||||||||
Sweden — 3.3% |
||||||||
Alfa Laval AB |
14,096 | 348,244 | ||||||
Boliden AB |
98,282 | 3,039,566 | ||||||
Epiroc AB Class A |
78,234 | 1,119,035 | ||||||
Epiroc AB Class B |
34,720 | 436,692 | ||||||
Fabege AB |
35,791 | 241,479 | ||||||
Sandvik AB |
103,496 | 1,409,356 | ||||||
Svenska Cellulosa AB Class B |
28,847 | 365,827 | ||||||
| 6,960,199 | ||||||||
Switzerland — 0.1% |
||||||||
Sika AG Registered |
1,420 | 284,352 | ||||||
United Kingdom — 4.3% |
||||||||
Big Yellow Group PLC |
17,870 | 210,431 | ||||||
Central Asia Metals PLC |
250,514 | 604,882 | ||||||
Number of |
Value |
|||||||
Derwent London PLC |
18,654 | $ | 417,021 | |||||
Great Portland Estates PLC |
75,276 | 368,383 | ||||||
InterContinental Hotels Group PLC |
11,111 | 533,057 | ||||||
Mondi PLC |
14,626 | 225,922 | ||||||
Persimmon PLC |
12,977 | 178,654 | ||||||
Rio Tinto PLC |
60,773 | 3,291,679 | ||||||
Shell PLC |
38,008 | 945,650 | ||||||
TechnipFMC PLC (a) |
44,367 | 375,345 | ||||||
The UNITE Group PLC |
45,783 | 434,144 | ||||||
The Weir Group PLC |
101,904 | 1,569,652 | ||||||
| 9,154,820 | ||||||||
United States — 52.3% |
||||||||
Acadia Realty Trust |
69,502 | 877,115 | ||||||
AGCO Corp. |
2,941 | 282,836 | ||||||
Air Products & Chemicals, Inc. |
3,626 | 843,879 | ||||||
Alaska Air Group, Inc. (a) |
7,499 | 293,586 | ||||||
Albemarle Corp. |
1,609 | 425,484 | ||||||
Alexandria Real Estate Equities, Inc. |
15,765 | 2,210,095 | ||||||
Allegiant Travel Co. (a) |
4,480 | 326,950 | ||||||
Ameren Corp. |
4,000 | 322,200 | ||||||
American Homes 4 Rent Class A |
59,488 | 1,951,801 | ||||||
American Tower Corp. |
13,950 | 2,995,065 | ||||||
Apartment Income REIT Corp. |
12,552 | 484,758 | ||||||
Apple Hospitality REIT, Inc. |
96,611 | 1,358,351 | ||||||
AvalonBay Communities, Inc. |
14,930 | 2,749,957 | ||||||
Avery Dennison Corp. |
2,505 | 407,564 | ||||||
Baker Hughes Co. |
13,450 | 281,912 | ||||||
Ball Corp. |
21,806 | 1,053,666 | ||||||
Cactus, Inc. Class A |
11,505 | 442,137 | ||||||
Camden Property Trust |
14,069 | 1,680,542 | ||||||
Caterpillar, Inc. |
12,837 | 2,106,295 | ||||||
CF Industries Holdings, Inc. |
8,395 | 808,019 | ||||||
ChampionX Corp. |
18,500 | 362,045 | ||||||
Chevron Corp. |
13,837 | 1,987,962 | ||||||
CMS Energy Corp. |
4,340 | 252,762 | ||||||
ConocoPhillips |
34,959 | 3,577,704 | ||||||
Crown Castle, Inc. |
10,007 | 1,446,512 | ||||||
Crown Holdings, Inc. |
5,366 | 434,807 | ||||||
CSX Corp. |
20,517 | 546,573 | ||||||
CubeSmart |
54,519 | 2,184,031 | ||||||
Cummins, Inc. |
3,364 | 684,608 | ||||||
Darling Ingredients, Inc. (a) |
14,256 | 943,034 | ||||||
Deere & Co. |
3,179 | 1,061,436 | ||||||
Delta Air Lines, Inc. (a) |
18,083 | 507,409 | ||||||
Devon Energy Corp. |
28,734 | 1,727,775 | ||||||
Dominion Energy, Inc. |
4,582 | 316,662 | ||||||
Douglas Emmett, Inc. |
42,298 | 758,403 | ||||||
EastGroup Properties, Inc. |
7,347 | 1,060,466 | ||||||
Element Solutions, Inc. |
22,581 | 367,393 | ||||||
The accompanying notes are an integral part of the financial statements.
89
MassMutual Select T. Rowe Price Real Assets Fund – Portfolio of Investments (Continued) |
Number of |
Value |
|||||||
Entegris, Inc. |
2,488 | $ | 206,554 | |||||
EOG Resources, Inc. |
19,547 | 2,183,986 | ||||||
Equinix, Inc. |
7,337 | 4,173,579 | ||||||
Equitrans Midstream Corp. |
53,160 | 397,637 | ||||||
Equity LifeStyle Properties, Inc. |
47,815 | 3,004,695 | ||||||
Equity Residential |
37,442 | 2,516,851 | ||||||
Essex Property Trust, Inc. |
8,138 | 1,971,268 | ||||||
Extra Space Storage, Inc. |
2,400 | 414,504 | ||||||
Federal Realty Investment Trust |
2,065 | 186,098 | ||||||
FMC Corp. |
8,497 | 898,133 | ||||||
Frontier Group Holdings, Inc. (a) |
57,385 | 556,635 | ||||||
Halliburton Co. |
14,206 | 349,752 | ||||||
Hess Corp. |
14,039 | 1,530,111 | ||||||
Hilton Worldwide Holdings, Inc. |
10,248 | 1,236,114 | ||||||
Host Hotels & Resorts, Inc. |
29,355 | 466,157 | ||||||
The Howard Hughes Corp. (a) |
3,614 | 200,180 | ||||||
Hubbell, Inc. |
3,184 | 710,032 | ||||||
International Paper Co. |
16,333 | 517,756 | ||||||
JetBlue Airways Corp. (a) |
30,447 | 201,864 | ||||||
Kilroy Realty Corp. |
17,539 | 738,567 | ||||||
Kimco Realty Corp. |
13,891 | 255,733 | ||||||
Liberty Energy, Inc. (a) |
17,855 | 226,401 | ||||||
Magnolia Oil & Gas Corp. Class A |
29,573 | 585,841 | ||||||
Marriott International, Inc. Class A |
3,111 | 435,976 | ||||||
Martin Marietta Materials, Inc. |
2,750 | 885,748 | ||||||
Newmont Corp. |
275 | 11,558 | ||||||
NextEra Energy, Inc. |
5,623 | 440,900 | ||||||
Norfolk Southern Corp. |
4,471 | 937,345 | ||||||
Nucor Corp. |
18,462 | 1,975,249 | ||||||
Packaging Corp. of America |
7,932 | 890,684 | ||||||
Pebblebrook Hotel Trust |
48,732 | 707,101 | ||||||
Pioneer Natural Resources Co. |
8,314 | 1,800,231 | ||||||
Prologis, Inc. |
46,688 | 4,743,501 | ||||||
Public Storage |
14,148 | 4,142,676 | ||||||
Quanta Services, Inc. |
3,793 | 483,190 | ||||||
Rayonier, Inc. |
26,457 | 792,916 | ||||||
Regency Centers Corp. |
31,581 | 1,700,637 | ||||||
Reliance Steel & Aluminum Co. |
17,931 | 3,127,346 | ||||||
Rexford Industrial Realty, Inc. |
37,703 | 1,960,556 | ||||||
Royal Gold, Inc. |
1,988 | 186,514 | ||||||
RPM International, Inc. |
10,239 | 853,011 | ||||||
SBA Communications Corp. |
8,640 | 2,459,376 | ||||||
Sempra Energy |
4,180 | 626,749 | ||||||
The Sherwin-Williams Co. |
6,148 | 1,258,803 | ||||||
Shoals Technologies Group, Inc. Class A (a) |
22,116 | 476,600 | ||||||
Simon Property Group, Inc. |
25,480 | 2,286,830 | ||||||
SL Green Realty Corp. (b) |
12,339 | 495,534 | ||||||
The Southern Co. |
8,652 | 588,336 | ||||||
Number of |
Value |
|||||||
Southern Copper Corp. |
19,073 | $ | 855,233 | |||||
Southwest Airlines Co. (a) |
16,219 | 500,194 | ||||||
Steel Dynamics, Inc. |
27,357 | 1,940,979 | ||||||
Sun Country Airlines Holdings, Inc. (a) |
36,393 | 495,309 | ||||||
Terreno Realty Corp. |
30,495 | 1,615,930 | ||||||
Union Pacific Corp. |
5,170 | 1,007,219 | ||||||
United Airlines Holdings, Inc. (a) |
14,314 | 465,634 | ||||||
Ventas, Inc. |
29,270 | 1,175,776 | ||||||
Vulcan Materials Co. |
7,816 | 1,232,661 | ||||||
Welltower, Inc. |
33,247 | 2,138,447 | ||||||
WestRock Co. |
8,442 | 260,773 | ||||||
Weyerhaeuser Co. |
7,632 | 217,970 | ||||||
Xcel Energy, Inc. |
4,001 | 256,063 | ||||||
| 110,079,797 | ||||||||
TOTAL COMMON STOCK (Cost $220,843,423) |
189,537,651 | |||||||
PREFERRED STOCK — 1.1% |
||||||||
United States — 1.1% |
||||||||
Jetti Holdings, Inc., Series C, (Acquired 5/24/21-6/30/21, Cost $130,426) |
||||||||
(d) (e) (f) |
2,253 | 299,406 | ||||||
KoBold Metals, Inc., Series B-1, (Acquired 1/10/22,Cost $670,800) (d) (e) (f) |
24,472 | 670,800 | ||||||
Lilac Solutions, Inc., Series B, (Acquired 9/08/21,Cost $329,342) |
||||||||
(d) (e) (f) |
25,087 | 342,438 | ||||||
NextEra Energy, Inc. Convertible 5.279% |
18,013 | 896,687 | ||||||
| 2,209,331 | ||||||||
TOTAL PREFERRED STOCK (Cost $1,992,987) |
2,209,331 | |||||||
TOTAL EQUITIES (Cost $222,836,410) |
191,746,982 | |||||||
MUTUAL FUNDS — 5.2% |
||||||||
United States — 5.2% |
||||||||
Industrial Select Sector SPDR Fund (b) |
29,594 | 2,451,567 | ||||||
iShares MSCI Global Metals & Mining Producers ETF |
34,821 | 1,184,959 | ||||||
SPDR S&P Homebuilders ETF (b) |
18,861 | 1,031,508 | ||||||
SPDR S&P Oil & Gas Exploration & Production ETF |
6,166 | 769,023 | ||||||
The accompanying notes are an integral part of the financial statements.
90
MassMutual Select T. Rowe Price Real Assets Fund – Portfolio of Investments (Continued) |
Number of |
Value |
|||||||
State Street Navigator Securities Lending Government Money Market Portfolio (g) |
5,007,776 | $ | 5,007,776 | |||||
VanEck Oil Services ETF (b) |
2,574 | 543,655 | ||||||
| 10,988,488 | ||||||||
TOTAL MUTUAL FUNDS (Cost $12,080,514) |
10,988,488 | |||||||
TOTAL LONG-TERM INVESTMENTS (Cost $234,916,924) |
202,735,470 | |||||||
SHORT-TERM INVESTMENTS — 4.9% |
||||||||
Mutual Fund — 3.9% |
||||||||
T. Rowe Price Government Reserve Investment Fund |
8,257,913 | 8,257,913 | ||||||
Principal |
||||||||
Repurchase Agreement — 0.2% |
||||||||
Fixed Income Clearing Corp., Repurchase Agreement, dated 9/30/22, 0.830%, due 10/03/22 (h) |
$ | 508,779 | 508,779 | |||||
U.S. Treasury Bill — 0.8% |
||||||||
U.S. Treasury Bill |
||||||||
3.324% 2/16/23 (i) |
1,490,000 | 1,469,968 | ||||||
3.607% 2/16/23 (i) (j) |
100,000 | 98,654 | ||||||
| 1,568,622 | ||||||||
TOTAL SHORT-TERM INVESTMENTS (Cost $10,336,893) |
10,335,314 | |||||||
TOTAL INVESTMENTS — 101.3% (Cost $245,253,817) (k) |
213,070,784 | |||||||
Other Assets/(Liabilities) — (1.3)% |
(2,731,384 | ) | ||||||
NET ASSETS — 100.0% |
$ | 210,339,400 | ||||||
Abbreviation Legend
|
ADR |
American Depositary Receipt |
|
ETF |
Exchange-Traded Fund |
|
REIT |
Real Estate Investment Trust |
Notes to Portfolio of Investments
Percentages are stated as a percent of net assets.
|
(a) |
Non-income producing security. |
|
(b) |
Denotes all or a portion of security on loan. The total value of securities on loan as of September 30, 2022, was $7,316,254 or 3.48% of net assets. The Fund received $2,537,338 of non-cash collateral (U.S. Treasury and/or Agency obligations) related to securities lending activity. This amount is not reflected on either the Portfolio of Investments or the Statement of Assets and Liabilities. (Note 2). |
|
(c) |
Security is exempt from registration under Regulation S or Rule 144A of the Securities Act of 1933. These securities are considered restricted and may be resold in transactions exempt from registration. At September 30, 2022, the aggregate market value of these securities amounted to $996,419 or 0.47% of net assets. |
|
(d) |
Investment is valued using significant unobservable inputs. |
|
(e) |
This security is fair valued in good faith in accordance with procedures approved by the Board of Trustees. At September 30, 2022, these securities amounted to a value of $1,312,644 or 0.62% of net assets. |
|
(f) |
Restricted security. Certain securities are restricted as to resale. At September 30, 2022, these securities amounted to a value of $1,312,644 or 0.62% of net assets. The Fund generally bears the costs, if any, associated with the disposition of restricted securities. |
|
(g) |
Represents investment of security lending cash collateral. (Note 2). |
|
(h) |
Maturity value of $508,814. Collateralized by U.S. Government Agency obligations with a rate of 0.000%, maturity date of 3/30/23, and an aggregate market value, including accrued interest, of $518,969. |
|
(i) |
The rate shown represents yield-to-maturity. |
|
(j) |
All or a portion of this security is pledged/held as collateral for open derivatives. (Note 2). |
|
(k) |
See Note 6 for aggregate cost for federal tax purposes. |
Sector weightings, as a percentage of net assets, is as follows:
Financial |
33.3 | % | ||
Basic Materials |
28.0 | % | ||
Energy |
11.6 | % | ||
Industrial |
11.0 | % | ||
Mutual Funds |
5.2 | % | ||
Consumer, Cyclical |
4.0 | % | ||
Utilities |
1.8 | % | ||
Consumer, Non-cyclical |
1.1 | % | ||
Technology |
0.4 | % | ||
Total Long-Term Investments |
96.4 | % | ||
Short-Term Investments and Other Assets and Liabilities |
3.6 | % | ||
Net Assets |
100.0 | % |
The accompanying notes are an integral part of the financial statements.
91
MassMutual Select T. Rowe Price Real Assets Fund – Portfolio of Investments (Continued) |
Forward contracts
Counterparty |
Settlement |
Currency Purchased |
Currency Sold |
Unrealized |
||||||||||||||||||||
Bank of America N.A.* |
10/14/22 | NOK | 11,199,430 | USD | 1,118,794 | $ | (90,243 | ) | ||||||||||||||||
Bank of America N.A.* |
10/14/22 | CAD | 1,159,170 | USD | 889,147 | (50,008 | ) | |||||||||||||||||
BNP Paribas SA* |
10/04/22 | USD | 1,145,313 | BRL | 6,139,450 | 7,187 | ||||||||||||||||||
BNP Paribas SA* |
10/04/22 | BRL | 6,139,450 | USD | 1,135,547 | 2,579 | ||||||||||||||||||
BNP Paribas SA* |
11/03/22 | BRL | 6,139,450 | USD | 1,137,504 | (7,597 | ) | |||||||||||||||||
Deutsche Bank AG* |
10/14/22 | USD | 1,076,361 | SEK | 11,506,470 | 39,072 | ||||||||||||||||||
JP Morgan Chase Bank N.A.* |
10/04/22 | BRL | 6,139,450 | USD | 1,195,248 | (57,122 | ) | |||||||||||||||||
JP Morgan Chase Bank N.A.* |
10/04/22 | USD | 1,135,547 | BRL | 6,139,450 | (2,579 | ) | |||||||||||||||||
Morgan Stanley & Co. LLC* |
10/14/22 | NOK | 11,191,470 | EUR | 1,114,977 | (65,659 | ) | |||||||||||||||||
Wells Fargo Bank N.A.* |
10/14/22 | USD | 869,637 | CAD | 1,159,170 | 30,498 | ||||||||||||||||||
| $ | (193,872 | ) | ||||||||||||||||||||||
Futures contracts
|
Expiration |
Number of |
Notional |
Value/ Net |
||||||||||||
Long |
||||||||||||||||
Hang Seng Index |
10/28/22 | 8 | $ | 906,619 | $ | (29,637 | ) | |||||||||
S&P TSX 60 Index |
12/15/22 | 6 | 1,033,633 | (64,147 | ) | |||||||||||
Xae Energy |
12/16/22 | 122 | 10,125,312 | (932,612 | ) | |||||||||||
|
$ | (1,026,396 | ) | |||||||||||||
Short |
||||||||||||||||
Nasdaq 100 E Mini Index |
12/16/22 | 17 | $ | (4,256,923 | ) | $ | 504,853 | |||||||||
S&P 500 E Mini Index |
12/16/22 | 23 | (4,654,444 | ) | 512,719 | |||||||||||
U.S. Treasury Note 10 Year |
12/20/22 | 14 | (1,642,793 | ) | 73,918 | |||||||||||
U.S. Treasury Ultra Long Bond |
12/20/22 | 5 | (738,588 | ) | 53,587 | |||||||||||
|
$ | 1,145,077 | ||||||||||||||
OTC Total Return Swaps
Paid by the Fund |
Received by the Fund |
|||||||||||||||||||||||||||||||||||||||||||
Rate/ |
No. of |
Frequency |
Rate/ |
No. of |
Frequency |
Counterparty |
Termination |
Value |
Upfront |
Unrealized |
||||||||||||||||||||||||||||||||||
1Day-SOFR+42 bp |
USD | 549,162 | Monthly | Xtrackers Harvest CSI 300 China A-Shares ETF | 18,509 | Monthly | Citibank N.A.* | 1/16/24 | $ | (47,754 | ) | $ | — | $ | (47,754 | ) | ||||||||||||||||||||||||||||
1Day-SOFR+42 bp |
USD | 271,774 | Monthly | iShares MSCI China ETF | 5,730 | Monthly | Citibank N.A.* | 1/16/24 | (27,905 | ) | — | (27,905 | ) | |||||||||||||||||||||||||||||||
1Day-SOFR+42 bp |
USD | 651,892 | Monthly | KraneShares CSI China Internet ETF | 23,534 | Monthly | Citibank N.A.* | 1/18/24 | (72,014 | ) | — | (72,014 | ) | |||||||||||||||||||||||||||||||
The accompanying notes are an integral part of the financial statements.
92
MassMutual Select T. Rowe Price Real Assets Fund – Portfolio of Investments (Continued) |
OTC Total Return Swaps (Continued)
Paid by the Fund |
Received by the Fund |
|||||||||||||||||||||||||||||||||||||||||||
Rate/ |
No. of |
Frequency |
Rate/ |
No. of |
Frequency |
Counterparty |
Termination |
Value |
Upfront |
Unrealized |
||||||||||||||||||||||||||||||||||
1Day-SOFR+42 bp |
USD | 681,223 | Monthly | Xtrackers Harvest CSI 300 China A-Shares ETF | 22,960 | Monthly | Citibank N.A.* | 1/18/24 | $ | (59,237 | ) | $ | — | $ | (59,237 | ) | ||||||||||||||||||||||||||||
1Day-SOFR+42 bp |
USD | 660,605 | Monthly | iShares MSCI China ETF | 13,928 | Monthly | Citibank N.A.* | 1/18/24 | (67,829 | ) | — | (67,829 | ) | |||||||||||||||||||||||||||||||
| $ | (274,739 | ) | $ | — | $ | (274,739 | ) | |||||||||||||||||||||||||||||||||||||
* Contracts are subject to a master netting agreement or similar agreement.
Currency Legend
|
BRL |
Brazilian Real |
|
CAD |
Canadian Dollar |
|
EUR |
Euro |
|
NOK |
Norwegian Krone |
|
SEK |
Swedish Krona |
|
USD |
United States Dollar |
The accompanying notes are an integral part of the financial statements.
93
MassMutual Select T. Rowe Price Small and Mid Cap Blend Fund – Portfolio of Investments |
September 30, 2022 |
Number of |
Value |
|||||||
EQUITIES — 94.9% |
||||||||
COMMON STOCK — 92.5% |
||||||||
Basic Materials — 2.8% |
||||||||
Chemicals — 0.9% |
||||||||
AgroFresh Solutions, Inc. (a) |
60,688 | $ | 91,032 | |||||
Element Solutions, Inc. |
104,768 | 1,704,575 | ||||||
Hawkins, Inc. |
7,626 | 297,338 | ||||||
Orion Engineered Carbons SA |
30,529 | 407,562 | ||||||
PPG Industries, Inc. |
5,230 | 578,909 | ||||||
Quaker Chemical Corp. (b) |
8,488 | 1,225,497 | ||||||
RPM International, Inc. |
16,600 | 1,382,946 | ||||||
| 5,687,859 | ||||||||
Forest Products & Paper — 0.1% |
||||||||
Clearwater Paper Corp. (a) |
12,119 | 455,675 | ||||||
West Fraser Timber Co. Ltd. |
4,079 | 295,084 | ||||||
| 750,759 | ||||||||
Iron & Steel — 0.2% |
||||||||
Carpenter Technology Corp. |
15,525 | 483,448 | ||||||
Reliance Steel & Aluminum Co. |
3,543 | 617,935 | ||||||
| 1,101,383 | ||||||||
Mining — 1.6% |
||||||||
AngloGold Ashanti Ltd. Sponsored ADR |
92,915 | 1,284,085 | ||||||
Cameco Corp. |
109,756 | 2,909,632 | ||||||
Constellium SE (a) |
98,584 | 999,642 | ||||||
ERO Copper Corp. (a) (b) |
13,723 | 151,700 | ||||||
Franco-Nevada Corp. |
20,493 | 2,447,855 | ||||||
Freeport-McMoRan, Inc. |
22,586 | 617,275 | ||||||
Fresnillo PLC |
217,635 | 1,859,644 | ||||||
Gold Fields Ltd. Sponsored ADR (b) |
87,788 | 710,205 | ||||||
| 10,980,038 | ||||||||
| 18,520,039 | ||||||||
Communications — 3.4% |
||||||||
Advertising — 0.5% |
||||||||
Advantage Solutions, Inc. (a) |
67,419 | 143,603 | ||||||
Boston Omaha Corp. Class A (a) |
19,960 | 459,878 | ||||||
The Trade Desk, Inc. Class A (a) |
39,900 | 2,384,025 | ||||||
| 2,987,506 | ||||||||
Internet — 0.6% |
||||||||
Bumble, Inc. Class A (a) |
14,599 | 313,733 | ||||||
Deliveroo PLC (a) (c) |
146,067 | 136,979 | ||||||
Farfetch Ltd. Class A (a) |
59,019 | 439,692 | ||||||
Figs, Inc. Class A (a) (b) |
28,884 | 238,293 | ||||||
Match Group, Inc. (a) |
9,900 | 472,725 | ||||||
Open Lending Corp. Class A (a) |
100,599 | 808,816 | ||||||
Opendoor Technologies, Inc. (a) |
41,650 | 129,531 | ||||||
Poshmark, Inc. Class A (a) |
12,732 | 199,510 | ||||||
Number of |
Value |
|||||||
Rover Group, Inc., Earnout Shares 16.00 (Acquired 8/02/21, Cost $0) (a) (d) (e) (f) |
15,883 | $ | 331 | |||||
Spotify Technology SA (a) |
8,900 | 768,070 | ||||||
Upwork, Inc. (a) |
16,133 | 219,731 | ||||||
| 3,727,411 | ||||||||
Media — 1.6% |
||||||||
Cable One, Inc. |
1,947 | 1,660,888 | ||||||
DISH Network Corp. Class A (a) |
44,484 | 615,214 | ||||||
Fox Corp. Class A |
9,710 | 297,903 | ||||||
Liberty Media Corp-Liberty Formula One Class C (a) |
28,800 | 1,684,800 | ||||||
News Corp. Class A |
237,060 | 3,581,977 | ||||||
Paramount Global Class B (b) |
79,776 | 1,518,935 | ||||||
Saga Communications, Inc. Class A |
4,594 | 120,133 | ||||||
Scholastic Corp. |
45,652 | 1,404,255 | ||||||
| 10,884,105 | ||||||||
Telecommunications — 0.7% |
||||||||
Arista Networks, Inc. (a) |
8,377 | 945,680 | ||||||
Corning, Inc. |
62,724 | 1,820,250 | ||||||
DigitalBridge Group, Inc. (b) |
33,452 | 418,485 | ||||||
Harmonic, Inc. (a) |
73,709 | 963,377 | ||||||
Infinera Corp. (a) (b) |
6,488 | 31,402 | ||||||
Motorola Solutions, Inc. |
3,587 | 803,380 | ||||||
| 4,982,574 | ||||||||
| 22,581,596 | ||||||||
Consumer, Cyclical — 9.7% |
||||||||
Airlines — 0.5% |
||||||||
Allegiant Travel Co. (a) |
8,061 | 588,292 | ||||||
Southwest Airlines Co. (a) |
85,972 | 2,651,376 | ||||||
Sun Country Airlines Holdings, Inc. (a) |
10,891 | 148,227 | ||||||
| 3,387,895 | ||||||||
Apparel — 0.7% |
||||||||
adidas AG |
2,881 | 334,342 | ||||||
Deckers Outdoor Corp. (a) |
1,700 | 531,437 | ||||||
On Holding AG, Class A (a) |
10,472 | 168,076 | ||||||
Ralph Lauren Corp. |
30,181 | 2,563,272 | ||||||
Skechers U.S.A., Inc. Class A (a) |
17,306 | 548,946 | ||||||
Steven Madden Ltd. |
15,878 | 423,466 | ||||||
| 4,569,539 | ||||||||
Auto Manufacturers — 1.0% |
||||||||
Blue Bird Corp. (a) |
13,328 | 111,289 | ||||||
General Motors Co. |
51,862 | 1,664,252 | ||||||
PACCAR, Inc. |
33,495 | 2,803,196 | ||||||
Rivian Automotive, Inc. Class A (a) |
56,788 | 1,868,893 | ||||||
| 6,447,630 | ||||||||
The accompanying notes are an integral part of the financial statements.
94
MassMutual Select T. Rowe Price Small and Mid Cap Blend Fund – Portfolio of Investments (Continued) |
Number of |
Value |
|||||||
Auto Parts & Equipment — 0.1% |
||||||||
Dorman Products, Inc. (a) |
6,010 | $ | 493,541 | |||||
Visteon Corp. (a) |
3,371 | 357,529 | ||||||
| 851,070 | ||||||||
Distribution & Wholesale — 0.5% |
||||||||
IAA, Inc. (a) |
12,177 | 387,837 | ||||||
Pool Corp. |
328 | 104,373 | ||||||
SiteOne Landscape Supply, Inc. (a) |
20,584 | 2,143,618 | ||||||
ThredUp, Inc. Class A (a) |
25,521 | 46,959 | ||||||
Univar Solutions, Inc. (a) |
24,942 | 567,181 | ||||||
| 3,249,968 | ||||||||
Entertainment — 0.6% |
||||||||
Cinemark Holdings, Inc. (a) |
16,212 | 196,327 | ||||||
DraftKings, Inc. Class A (a) |
27,300 | 413,322 | ||||||
Genius Sports Ltd. (a) |
15,822 | 58,067 | ||||||
Madison Square Garden Entertainment Corp. (a) |
14,049 | 619,421 | ||||||
Madison Square Garden Sports Corp. (a) |
4,604 | 629,183 | ||||||
Marriott Vacations Worldwide Corp. |
6,456 | 786,728 | ||||||
Red Rock Resorts, Inc. Class A |
4,601 | 157,630 | ||||||
Vail Resorts, Inc. |
5,000 | 1,078,200 | ||||||
| 3,938,878 | ||||||||
Food Services — 0.2% |
||||||||
Compass Group PLC |
67,998 | 1,359,226 | ||||||
Home Builders — 0.4% |
||||||||
Cavco Industries, Inc. (a) |
5,028 | 1,034,561 | ||||||
Horizon Global Corp. (a) |
39,691 | 48,820 | ||||||
LCI Industries |
3,585 | 363,734 | ||||||
Meritage Home Corp. (a) |
9,457 | 664,543 | ||||||
Skyline Champion Corp. (a) |
12,796 | 676,525 | ||||||
| 2,788,183 | ||||||||
Housewares — 0.1% |
||||||||
The Scotts Miracle-Gro Co. |
17,639 | 754,067 | ||||||
Leisure Time — 0.0% |
||||||||
Rad Power Bikes, Inc., Class A (Acquired 1/22/21, Cost $69,082) (a) (d) (e) (f) |
14,321 | 87,072 | ||||||
Lodging — 0.7% |
||||||||
Hilton Worldwide Holdings, Inc. |
22,200 | 2,677,764 | ||||||
MGM Resorts International |
59,800 | 1,777,256 | ||||||
Wyndham Hotels & Resorts, Inc. |
5,900 | 361,965 | ||||||
| 4,816,985 | ||||||||
Retail — 4.9% |
||||||||
Bath & Body Works, Inc. |
44,428 | 1,448,353 | ||||||
Beacon Roofing Supply, Inc. (a) |
25,958 | 1,420,422 | ||||||
Best Buy Co., Inc. |
19,236 | 1,218,408 | ||||||
BJ’s Restaurants, Inc. (a) |
25,908 | 617,906 | ||||||
Number of |
Value |
|||||||
Burlington Stores, Inc. (a) |
37,955 | $ | 4,246,785 | |||||
Casey’s General Stores, Inc. |
9,900 | 2,004,948 | ||||||
Chipotle Mexican Grill, Inc. (a) |
1,520 | 2,284,195 | ||||||
Chuy’s Holdings, Inc. (a) |
16,292 | 377,649 | ||||||
Dollar General Corp. |
9,900 | 2,374,614 | ||||||
Dollar Tree, Inc. (a) |
13,200 | 1,796,520 | ||||||
Domino’s Pizza, Inc. |
3,950 | 1,225,290 | ||||||
Dutch Bros, Inc., Class A (a) (b) |
4,763 | 148,367 | ||||||
Fiesta Restaurant Group, Inc. (a) |
31,292 | 198,391 | ||||||
Five Below, Inc. (a) |
8,839 | 1,216,865 | ||||||
Floor & Decor Holdings, Inc. Class A (a) |
19,500 | 1,370,070 | ||||||
Framebridge Future Contingency Payments (Acquired 5/19/20-11/10/20, Cost $10,553) (a) (d) (e) (f) |
10,553 | 3,170 | ||||||
Hibbett, Inc. |
3,006 | 149,729 | ||||||
LL Flooring Holdings, Inc. (a) |
26,112 | 180,956 | ||||||
Lululemon Athletica, Inc. (a) |
1,300 | 363,428 | ||||||
O’Reilly Automotive, Inc. (a) |
2,300 | 1,617,705 | ||||||
Ollie’s Bargain Outlet Holdings, Inc. (a) |
26,296 | 1,356,874 | ||||||
Papa John’s International, Inc. |
22,992 | 1,609,670 | ||||||
Petco Health & Wellness Co., Inc. (a) |
19,082 | 212,955 | ||||||
Red Robin Gourmet Burgers, Inc. (a) |
8,196 | 55,159 | ||||||
RH (a) |
1,026 | 252,468 | ||||||
Ross Stores, Inc. |
8,700 | 733,149 | ||||||
Rush Enterprises, Inc. Class A |
12,573 | 551,452 | ||||||
Ruth’s Hospitality Group, Inc. |
14,708 | 247,977 | ||||||
Sweetgreen, Inc. Class A (a) (b) |
38,118 | 705,183 | ||||||
Warby Parker, Inc. Class A (a) |
61,400 | 819,076 | ||||||
Wingstop, Inc. |
8,415 | 1,055,409 | ||||||
Winmark Corp. |
2,566 | 555,128 | ||||||
Yum! Brands, Inc. |
800 | 85,072 | ||||||
| 32,503,343 | ||||||||
Textiles — 0.0% |
||||||||
Bombas LLC. (Acquired 2/12/21, Cost $183,470) (a) (d) (e) (f) |
41,514 | 203,419 | ||||||
| 64,957,275 | ||||||||
Consumer, Non-cyclical — 25.1% |
||||||||
Agriculture — 0.3% |
||||||||
Bunge Ltd. |
19,961 | 1,648,180 | ||||||
Pax Labs, Inc., Class A (Acquired 4/18/19, Cost $218,578) (a) (d) (e) (f) |
58,048 | 38,312 | ||||||
| 1,686,492 | ||||||||
Beverages — 1.0% |
||||||||
The Boston Beer Co., Inc. Class A (a) |
6,441 | 2,084,630 | ||||||
Carlsberg A/S Class B |
13,881 | 1,619,628 | ||||||
Coca-Cola Consolidated, Inc. |
2,004 | 825,107 | ||||||
Constellation Brands, Inc. Class A |
2,952 | 678,015 | ||||||
The accompanying notes are an integral part of the financial statements.
95
MassMutual Select T. Rowe Price Small and Mid Cap Blend Fund – Portfolio of Investments (Continued) |
Number of |
Value |
|||||||
Monster Beverage Corp. (a) |
14,621 | $ | 1,271,442 | |||||
| 6,478,822 | ||||||||
Biotechnology — 4.8% |
||||||||
Abcam PLC (a) |
28,992 | 432,491 | ||||||
Abcam PLC Sponsored ADR (a) (b) |
27,805 | 416,797 | ||||||
ACADIA Pharmaceuticals, Inc. (a) |
5,227 | 85,514 | ||||||
Akero Therapeutics, Inc. (a) (b) |
3,405 | 115,940 | ||||||
Allogene Therapeutics, Inc. (a) (b) |
10,030 | 108,324 | ||||||
Alnylam Pharmaceuticals, Inc. (a) |
15,497 | 3,101,880 | ||||||
Apellis Pharmaceuticals, Inc. (a) |
34,534 | 2,358,672 | ||||||
Argenx SE ADR (a) |
12,559 | 4,433,955 | ||||||
Avid Bioservices, Inc. (a) |
10,600 | 202,672 | ||||||
Avidity Biosciences, Inc. (a) (b) |
31,121 | 508,206 | ||||||
BeiGene Ltd. ADR (a) |
759 | 102,328 | ||||||
Bicycle Therapeutics PLC ADR (a) (b) |
831 | 19,329 | ||||||
Blueprint Medicines Corp. (a) |
19,944 | 1,314,110 | ||||||
C4 Therapeutics, Inc. (a) |
10,842 | 95,084 | ||||||
Cerevel Therapeutics Holdings, Inc. (a) |
20,056 | 566,783 | ||||||
Certara, Inc. (a) |
10,621 | 141,047 | ||||||
CinCor Pharma, Inc. (a) |
1,598 | 52,446 | ||||||
Corteva, Inc. |
28,662 | 1,638,033 | ||||||
CRISPR Therapeutics AG (a) (b) |
11,753 | 768,059 | ||||||
Day One Biopharmaceuticals, Inc. (a) |
4,153 | 83,185 | ||||||
Denali Therapeutics, Inc. (a) |
8,819 | 270,655 | ||||||
DICE Therapeutics, Inc. (a) |
5,194 | 105,334 | ||||||
Entrada Therapeutics, Inc. (a) (b) |
6,271 | 98,831 | ||||||
Exelixis, Inc. (a) |
27,657 | 433,662 | ||||||
Exscientia PLC (a) (b) |
1,673 | 13,735 | ||||||
Fate Therapeutics, Inc. (a) (b) |
6,240 | 139,838 | ||||||
Generation Bio Co., (a) |
34,221 | 181,714 | ||||||
HilleVax, Inc. (a) |
7,986 | 136,481 | ||||||
Icosavax, Inc. (a) (b) |
22,585 | 71,369 | ||||||
Ideaya Biosciences, Inc. (a) |
4,901 | 73,123 | ||||||
IGM Biosciences, Inc. (a) (b) |
9,048 | 205,752 | ||||||
Imago Biosciences, Inc. (a) (b) |
3,324 | 50,026 | ||||||
Incyte Corp. (a) |
1,863 | 124,150 | ||||||
Insmed, Inc. (a) |
66,182 | 1,425,560 | ||||||
Intellia Therapeutics, Inc. (a) |
5,830 | 326,247 | ||||||
Ionis Pharmaceuticals, Inc. (a) |
49,558 | 2,191,950 | ||||||
Iovance Biotherapeutics, Inc. (a) |
4,659 | 44,633 | ||||||
IVERIC bio, Inc. (a) |
3,670 | 65,840 | ||||||
Karuna Therapeutics, Inc. (a) |
7,565 | 1,701,595 | ||||||
Kymera Therapeutics, Inc. (a) |
22,224 | 483,817 | ||||||
MacroGenics, Inc. (a) |
20,074 | 69,456 | ||||||
MeiraGTx Holdings PLC (a) |
5,622 | 47,281 | ||||||
Mirati Therapeutics, Inc. (a) |
1,414 | 98,754 | ||||||
Monte Rosa Therapeutics, Inc. (a) |
18,919 | 154,568 | ||||||
NeoGenomics, Inc. (a) |
17,674 | 152,173 | ||||||
Number of |
Value |
|||||||
Nkarta, Inc. (a) |
25,929 | $ | 341,226 | |||||
Nurix Therapeutics, Inc. (a) |
15,020 | 195,711 | ||||||
Olink Holding AB ADR (a) (b) |
17,080 | 207,351 | ||||||
Pardes Biosciences, Inc. (a) |
882 | 1,632 | ||||||
Pliant Therapeutics, Inc. (a) |
1,800 | 37,602 | ||||||
Prothena Corp. PLC (a) |
13,401 | 812,503 | ||||||
PTC Therapeutics, Inc. (a) |
2,845 | 142,819 | ||||||
RAPT Therapeutics, Inc. (a) |
13,234 | 318,410 | ||||||
Relay Therapeutics, Inc. (a) |
20,964 | 468,965 | ||||||
Replimune Group, Inc. (a) |
16,190 | 279,601 | ||||||
Revolution Medicines, Inc. (a) |
4,846 | 95,563 | ||||||
Rocket Pharmaceuticals, Inc. (a) |
1,734 | 27,675 | ||||||
Sage Therapeutics, Inc. (a) |
2,521 | 98,722 | ||||||
Sana Biotechnology, Inc. (a) (b) |
4,453 | 26,718 | ||||||
Scholar Rock Holding Corp. (a) |
27,439 | 190,152 | ||||||
Seagen, Inc. (a) |
5,300 | 725,199 | ||||||
Seer, Inc. (a) |
15,259 | 118,105 | ||||||
Senti Biosciences, Inc. (a) |
5,462 | 11,853 | ||||||
Syndax Pharmaceuticals, Inc. (a) |
6,228 | 149,659 | ||||||
Tenaya Therapeutics, Inc. (a) |
15,277 | 44,303 | ||||||
Twist Bioscience Corp. (a) |
3,772 | 132,925 | ||||||
Ultragenyx Pharmaceutical, Inc. (a) |
18,563 | 768,694 | ||||||
Ventyx Biosciences, Inc. (a) |
1,275 | 44,510 | ||||||
Verve Therapeutics, Inc. (a) |
8,509 | 292,284 | ||||||
Xencor, Inc. (a) |
28,938 | 751,809 | ||||||
Zai Lab Ltd. ADR (a) |
2,756 | 94,255 | ||||||
Zentalis Pharmaceuticals, Inc. (a) |
17,253 | 373,700 | ||||||
| 31,963,345 | ||||||||
Commercial Services — 5.5% |
||||||||
ABM Industries, Inc. |
5,382 | 205,754 | ||||||
Altus Group Ltd. (b) |
3,533 | 114,531 | ||||||
American Public Education, Inc. (a) |
14,556 | 133,042 | ||||||
Ashtead Group PLC |
21,484 | 959,172 | ||||||
Booz Allen Hamilton Holding Corp. |
31,689 | 2,926,479 | ||||||
Bright Horizons Family Solutions, Inc. (a) |
34,507 | 1,989,329 | ||||||
Clarivate PLC (a) |
114,480 | 1,074,967 | ||||||
CoStar Group, Inc. (a) |
47,048 | 3,276,893 | ||||||
Equifax, Inc. |
11,300 | 1,937,159 | ||||||
FleetCor Technologies, Inc. (a) |
11,700 | 2,061,189 | ||||||
FTI Consulting, Inc. (a) |
1,765 | 292,478 | ||||||
Global Payments, Inc. |
10,404 | 1,124,152 | ||||||
Green Dot Corp. Class A (a) |
14,521 | 275,609 | ||||||
Herc Holdings, Inc. |
1,211 | 125,799 | ||||||
Huron Consulting Group, Inc. (a) |
4,914 | 325,553 | ||||||
Legalzoom.com Inc. (a) (b) |
14,353 | 123,005 | ||||||
MarketAxess Holdings, Inc. |
6,575 | 1,462,872 | ||||||
Monro, Inc. |
24,527 | 1,065,943 | ||||||
Multiplan Corp. (a) (b) |
150,201 | 429,575 | ||||||
The accompanying notes are an integral part of the financial statements.
96
MassMutual Select T. Rowe Price Small and Mid Cap Blend Fund – Portfolio of Investments (Continued) |
Number of |
Value |
|||||||
Paylocity Holding Corp. (a) |
24,364 | $ | 5,885,855 | |||||
Payoneer Global, Inc. (a) |
137,986 | 834,815 | ||||||
PROG Holdings, Inc. (a) |
11,025 | 165,155 | ||||||
Rent the Runway, Inc. Class A (a) |
14,550 | 32,010 | ||||||
Rentokil Initial PLC |
251,406 | 1,327,523 | ||||||
SEACOR Marine Holdings Inc. (a) |
50,253 | 282,422 | ||||||
Strategic Education, Inc. |
29,766 | 1,827,930 | ||||||
Toast, Inc., Class A (a) |
150,164 | 2,510,742 | ||||||
TransUnion |
23,400 | 1,392,066 | ||||||
United Rentals, Inc. (a) |
2,600 | 702,312 | ||||||
Verisk Analytics, Inc. |
9,200 | 1,568,876 | ||||||
WillScot Mobile Mini Holdings Corp. (a) |
5,865 | 236,535 | ||||||
| 36,669,742 | ||||||||
Cosmetics & Personal Care — 0.0% |
||||||||
Olaplex Holdings, Inc. (a) |
5,448 | 52,028 | ||||||
Food — 1.9% |
||||||||
Cal-Maine Foods, Inc. |
6,797 | 377,845 | ||||||
Campbell Soup Co. |
31,486 | 1,483,621 | ||||||
Flowers Foods, Inc. |
150,541 | 3,716,857 | ||||||
Grocery Outlet Holding Corp. (a) |
904 | 30,094 | ||||||
Nomad Foods Ltd. (a) |
62,204 | 883,297 | ||||||
Post Holdings, Inc. (a) |
13,821 | 1,132,078 | ||||||
The Simply Good Foods Co. (a) |
16,404 | 524,764 | ||||||
Sysco Corp. |
37,690 | 2,665,060 | ||||||
TreeHouse Foods, Inc. (a) |
25,430 | 1,078,741 | ||||||
Utz Brands, Inc. |
48,242 | 728,454 | ||||||
| 12,620,811 | ||||||||
Health Care – Products — 5.6% |
||||||||
Adaptive Biotechnologies Corp. (a) |
3,894 | 27,725 | ||||||
Alcon, Inc. |
21,000 | 1,221,780 | ||||||
AtriCure, Inc. (a) |
7,996 | 312,644 | ||||||
Atrion Corp. |
940 | 531,100 | ||||||
Avantor, Inc. (a) |
109,800 | 2,152,080 | ||||||
Bruker Corp. |
62,613 | 3,322,246 | ||||||
The Cooper Cos., Inc. |
7,800 | 2,058,420 | ||||||
Cvrx, Inc. (a) (b) |
4,148 | 38,701 | ||||||
Dentsply Sirona, Inc. |
69,615 | 1,973,585 | ||||||
Exact Sciences Corp. (a) |
10,000 | 324,900 | ||||||
Hologic, Inc. (a) |
92,455 | 5,965,197 | ||||||
ICU Medical, Inc. (a) |
10,524 | 1,584,914 | ||||||
Koninklijke Philips NV |
112,001 | 1,730,029 | ||||||
Lantheus Holdings, Inc. (a) |
7,562 | 531,836 | ||||||
Nevro Corp. (a) |
3,797 | 176,940 | ||||||
Novocure Ltd. (a) |
1,539 | 116,933 | ||||||
Pacific Biosciences of California, Inc. (a) (b) |
53,549 | 310,852 | ||||||
Penumbra, Inc. (a) |
2,476 | 469,450 | ||||||
Number of |
Value |
|||||||
PROCEPT BioRobotics Corp. (a) |
17,229 | $ | 714,314 | |||||
Quidelortho Corp. (a) |
25,756 | 1,841,039 | ||||||
Rapid Micro Biosystems, Inc., Class A (a) (b) |
16,139 | 52,129 | ||||||
Repligen Corp. (a) |
8,616 | 1,612,140 | ||||||
Sartorius Stedim Biotech |
933 | 285,211 | ||||||
Shockwave Medical, Inc. (a) |
1,363 | 379,010 | ||||||
Teleflex, Inc. |
16,740 | 3,372,440 | ||||||
Utah Medical Products, Inc. |
3,032 | 258,660 | ||||||
West Pharmaceutical Services, Inc. |
11,579 | 2,849,360 | ||||||
Zimmer Biomet Holdings, Inc. |
27,268 | 2,850,869 | ||||||
| 37,064,504 | ||||||||
Health Care – Services — 3.2% |
||||||||
Acadia Healthcare Co., Inc. (a) |
31,900 | 2,493,942 | ||||||
Agiliti, Inc. (a) (b) |
23,415 | 335,069 | ||||||
agilon health, Inc. (a) |
9,461 | 221,577 | ||||||
Catalent, Inc. (a) |
47,612 | 3,445,204 | ||||||
Centene Corp. (a) |
23,839 | 1,854,912 | ||||||
Charles River Laboratories International, Inc. (a) |
7,676 | 1,510,637 | ||||||
dentalcorp Holdings Ltd. (a) |
18,724 | 107,761 | ||||||
The Ensign Group, Inc. |
8,148 | 647,766 | ||||||
Eurofins Scientific SE |
8,516 | 504,988 | ||||||
Flame Biosciences, Inc. (Acquired 9/28/20, Cost $60,083) (a) (d) (e) (f) |
9,173 | 42,104 | ||||||
Fresenius SE & Co. KGaA |
36,702 | 786,129 | ||||||
Innovage Holding Corp. (a) (b) |
41,040 | 241,315 | ||||||
ModivCare, Inc. (a) |
5,707 | 568,874 | ||||||
Molina Healthcare, Inc. (a) |
9,312 | 3,071,470 | ||||||
The Pennant Group, Inc. (a) |
29,722 | 309,406 | ||||||
Select Medical Holdings Corp. |
222,692 | 4,921,493 | ||||||
Surgery Partners, Inc. (a) |
6,977 | 163,262 | ||||||
U.S. Physical Therapy, Inc. |
5,200 | 395,304 | ||||||
| 21,621,213 | ||||||||
Household Products & Wares — 0.6% |
||||||||
Avery Dennison Corp. |
12,500 | 2,033,750 | ||||||
Kimberly-Clark Corp. |
7,540 | 848,552 | ||||||
Reynolds Consumer Products, Inc. |
42,400 | 1,102,824 | ||||||
| 3,985,126 | ||||||||
Pharmaceuticals — 2.2% |
||||||||
Agios Pharmaceuticals, Inc. (a) |
7,849 | 221,970 | ||||||
Alector, Inc. (a) |
2,225 | 21,049 | ||||||
Alkermes PLC (a) |
45,730 | 1,021,151 | ||||||
Arvinas, Inc. (a) |
10,884 | 484,229 | ||||||
Ascendis Pharma A/S ADR (a) |
15,973 | 1,649,372 | ||||||
BellRing Brands, Inc. (a) |
41,015 | 845,319 | ||||||
Cardinal Health, Inc. |
47,994 | 3,200,240 | ||||||
Centessa Pharmaceuticals PLC ADR (a) (b) |
3,637 | 14,621 | ||||||
The accompanying notes are an integral part of the financial statements.
97
MassMutual Select T. Rowe Price Small and Mid Cap Blend Fund – Portfolio of Investments (Continued) |
Number of |
Value |
|||||||
Elanco Animal Health, Inc. (a) |
58,871 | $ | 730,589 | |||||
Embecta Corp. |
22,903 | 659,377 | ||||||
Enanta Pharmaceuticals, Inc. (a) |
228 | 11,826 | ||||||
Galapagos NV (a) |
12,860 | 550,278 | ||||||
Gyroscope Therapeutics, Milesone Payment 1 (Acquired 2/18/22, Cost $31,900) (a) (d) (e) (f) |
31,900 | 11,076 | ||||||
Gyroscope Therapeutics, Milesone Payment 2 (Acquired 2/18/22, Cost $21,260) (a) (d) (e) (f) |
21,260 | 3,076 | ||||||
Gyroscope Therapeutics, Milesone Payment 3 (Acquired 2/18/22, Cost $21,260) (a) (d) (e) (f) |
21,260 | 2,564 | ||||||
Immuneering Corp. Class A (a) |
8,525 | 122,078 | ||||||
Kura Oncology, Inc. (a) |
18,875 | 257,832 | ||||||
Longboard Pharmaceuticals, Inc. (a) |
3,060 | 11,383 | ||||||
Lyell Immunopharma, Inc. (a) |
7,678 | 56,280 | ||||||
Morphic Holding, Inc. (a) |
6,791 | 192,185 | ||||||
Neurocrine Biosciences, Inc. (a) |
4,757 | 505,241 | ||||||
Option Care Health, Inc. (a) |
52,921 | 1,665,424 | ||||||
Patterson Cos., Inc. |
60,882 | 1,462,386 | ||||||
Perrigo Co. PLC |
5,800 | 206,828 | ||||||
Prometheus Biosciences, Inc. (a) |
2,850 | 168,179 | ||||||
Reata Pharmaceuticals, Inc. Class A (a) (b) |
3,018 | 75,842 | ||||||
Repare Therapeutics, Inc. (a) (b) |
12,511 | 151,758 | ||||||
Viatris, Inc. |
64,758 | 551,738 | ||||||
| 14,853,891 | ||||||||
| 166,995,974 | ||||||||
Diversified — 0.2% |
||||||||
Holding Companies-Diversified — 0.0% |
||||||||
Dynamics Special Purpose Corp., Founders Shares (Acquired 12/22/21, Cost $0) (a) (d) (e) |
607 | 1,251 | ||||||
Holding Company – Diversified — 0.2% |
||||||||
Big Sky Growth Partners, Inc. (a) |
32,563 | 318,140 | ||||||
Conyers Park III Acquisition Corp. (a) |
31,244 | 305,254 | ||||||
KKR Acquisition Holdings I Corp. (a) |
24,852 | 245,041 | ||||||
Post Holdings Partnering Corp. (a) |
21,493 | 208,912 | ||||||
Professional Holding Corp. Class A (a) |
4,276 | 110,919 | ||||||
Revolution Healthcare Acquisition Corp. (a) |
8,585 | 84,305 | ||||||
| 1,272,571 | ||||||||
| 1,273,822 | ||||||||
Energy — 4.1% |
||||||||
Energy – Alternate Sources — 0.4% |
||||||||
Array Technologies, Inc. (a) |
16,428 | 272,376 | ||||||
NextEra Energy Partners LP |
13,475 | 974,377 | ||||||
REX American Resources Corp. (a) |
4,659 | 130,079 | ||||||
Number of |
Value |
|||||||
Shoals Technologies Group, Inc. Class A (a) |
47,563 | $ | 1,024,983 | |||||
| 2,401,815 | ||||||||
Oil & Gas — 1.4% |
||||||||
Advantage Energy Ltd. (a) |
68,447 | 492,040 | ||||||
Canadian Natural Resources Ltd. |
17,648 | 821,867 | ||||||
Coterra Energy, Inc. |
29,700 | 775,764 | ||||||
Devon Energy Corp. |
15,412 | 926,724 | ||||||
Diamondback Energy, Inc. |
7,811 | 940,913 | ||||||
Imperial Oil Ltd. |
22,829 | 987,811 | ||||||
Kimbell Royalty Partners LP |
13,195 | 224,051 | ||||||
Magnolia Oil & Gas Corp. Class A |
101,824 | 2,017,133 | ||||||
Matador Resources Co. |
23,391 | 1,144,288 | ||||||
Pioneer Natural Resources Co. |
4,900 | 1,060,997 | ||||||
Venture Global LNG, Inc., Series B (Acquired 3/08/18, Cost $33,220) (a) (d) (e) (f) |
11 | 162,748 | ||||||
Venture Global LNG, Inc., Series C (Acquired 3/08/18, Cost $27,180) (a) (d) (e) (f) |
9 | 133,157 | ||||||
| 9,687,493 | ||||||||
Oil & Gas Services — 1.7% |
||||||||
Aris Water Solution, Inc. Class A |
20,801 | 265,421 | ||||||
ChampionX Corp. |
25,115 | 491,500 | ||||||
Enerflex Ltd. (b) |
59,604 | 255,874 | ||||||
Expro Group Holdings NV (a) |
126,425 | 1,610,654 | ||||||
Liberty Energy, Inc. (a) |
72,364 | 917,575 | ||||||
NexTier Oilfield Solutions, Inc. (a) |
68,274 | 505,228 | ||||||
Nov, Inc. |
73,942 | 1,196,382 | ||||||
Ranger Energy Services, Inc. (a) |
32,296 | 315,855 | ||||||
TechnipFMC PLC (a) |
500,636 | 4,235,381 | ||||||
Tidewater, Inc. (a) |
73,306 | 1,590,740 | ||||||
| 11,384,610 | ||||||||
Pipelines — 0.6% |
||||||||
Cheniere Energy, Inc. |
9,900 | 1,642,509 | ||||||
Equitrans Midstream Corp. |
317,421 | 2,374,309 | ||||||
| 4,016,818 | ||||||||
| 27,490,736 | ||||||||
Financial — 17.1% |
||||||||
Banks — 6.6% |
||||||||
BankUnited, Inc. |
45,328 | 1,548,858 | ||||||
Blue Foundry Bancorp (a) |
20,556 | 229,199 | ||||||
Burke & Herbert Bank & Trust Co. |
98 | 220,500 | ||||||
Cadence Bank |
22,038 | 559,986 | ||||||
Coastal Financial Corp. (a) |
5,001 | 198,740 | ||||||
Columbia Banking System, Inc. |
25,983 | 750,649 | ||||||
CRB Group, Inc. (Acquired 4/14/22, Cost $73,283) (a) (d) (e) (f) |
697 | 73,283 | ||||||
The accompanying notes are an integral part of the financial statements.
98
MassMutual Select T. Rowe Price Small and Mid Cap Blend Fund – Portfolio of Investments (Continued) |
Number of |
Value |
|||||||
CrossFirst Bankshares, Inc. (a) |
31,022 | $ | 404,837 | |||||
Dime Community Bancshares, Inc. |
15,759 | 461,424 | ||||||
Dogwood State Bank, (Non-Voting) (Acquired 5/06/19, Cost $53,690) (a) (d) (e) (f) |
5,369 | 96,642 | ||||||
Dogwood State Bank, (Voting) (Acquired 5/06/19, Cost $26,370) (a) (d) (e) (f) |
2,637 | 47,466 | ||||||
East West Bancorp, Inc. |
16,539 | 1,110,428 | ||||||
Eastern Bankshares, Inc. |
18,882 | 370,842 | ||||||
Equity Bancshares, Inc. Class A |
9,517 | 281,989 | ||||||
Farmers & Merchants Bank of Long Beach/Long Beach CA (b) |
31 | 241,800 | ||||||
FB Financial Corp. |
31,018 | 1,185,198 | ||||||
Fifth Third Bancorp |
108,199 | 3,458,040 | ||||||
The First Bancshares, Inc. |
19,085 | 570,069 | ||||||
Five Star Bancorp |
9,617 | 272,738 | ||||||
Glacier Bancorp, Inc. |
11,500 | 564,995 | ||||||
HarborOne Bancorp, Inc. |
35,190 | 472,250 | ||||||
Heritage Commerce Corp. |
37,932 | 430,149 | ||||||
Home BancShares, Inc. |
62,295 | 1,402,260 | ||||||
Independent Bank Corp. |
11,472 | 855,008 | ||||||
Independent Bank Group, Inc. |
10,746 | 659,697 | ||||||
John Marshall Bancorp, Inc. (b) |
11,333 | 278,338 | ||||||
Kearny Financial Corp. |
48,462 | 514,666 | ||||||
Live Oak Bancshares, Inc. |
43,115 | 1,319,319 | ||||||
Metropolitan Bank Holding Corp. (a) |
2,773 | 178,470 | ||||||
National Bank Holdings Corp. Class A |
19,200 | 710,208 | ||||||
Origin Bancorp, Inc. |
21,334 | 820,719 | ||||||
P10, Inc. |
26,284 | 276,508 | ||||||
PCSB Financial Corp. |
6,520 | 116,904 | ||||||
Pinnacle Financial Partners, Inc. |
23,901 | 1,938,371 | ||||||
Ponce Financial Group, Inc. (a) (b) |
21,067 | 192,974 | ||||||
Popular, Inc. |
41,103 | 2,961,882 | ||||||
Preferred Bank |
8,200 | 534,886 | ||||||
Provident Bancorp, Inc. |
13,162 | 188,348 | ||||||
Sandy Spring Bancorp, Inc. |
16,551 | 583,588 | ||||||
Signature Bank |
15,310 | 2,311,810 | ||||||
Southern First Bancshares, Inc. (a) |
4,406 | 183,554 | ||||||
SouthState Corp. |
21,250 | 1,681,300 | ||||||
State Street Corp. |
58,417 | 3,552,338 | ||||||
SVB Financial Group (a) |
892 | 299,516 | ||||||
Texas Capital Bancshares, Inc. (a) |
18,696 | 1,103,625 | ||||||
Towne Bank |
26,103 | 700,343 | ||||||
Veritex Holdings, Inc. |
22,550 | 599,605 | ||||||
Walker & Dunlop, Inc. |
5,312 | 444,774 | ||||||
Webster Financial Corp. |
55,883 | 2,525,912 | ||||||
Westamerica Bancorp. |
19,125 | 1,000,046 | ||||||
Western Alliance Bancorp |
36,684 | 2,411,606 | ||||||
| 43,896,657 | ||||||||
Number of |
Value |
|||||||
Diversified Financial Services — 2.0% |
||||||||
Air Lease Corp. |
18,647 | $ | 578,243 | |||||
Apiture, Inc. (Acquired 7/01/20-6/30/22, Cost $97,636) (a) (d) (e) (f) |
6,130 | 101,865 | ||||||
Assetmark Financial Holdings, Inc. (a) |
18,299 | 334,689 | ||||||
Cboe Global Markets, Inc. |
14,094 | 1,654,213 | ||||||
Columbia Financial, Inc. (a) |
8,780 | 185,521 | ||||||
Encore Capital Group, Inc. (a) |
6,936 | 315,449 | ||||||
Grasshopper Bancorp, Inc. (Acquired 5/02/19, Cost $83,390) (a) (d) (e) (f) |
8,339 | 33,356 | ||||||
Hannon Armstrong Sustainable Infrastructure Capital, Inc. |
24,261 | 726,132 | ||||||
Houlihan Lokey, Inc. |
9,567 | 721,160 | ||||||
Intercontinental Exchange, Inc. |
800 | 72,280 | ||||||
Lazard Ltd. Class A |
29,058 | 924,916 | ||||||
NerdWallet, Inc. Class A (a) |
13,527 | 119,984 | ||||||
OneMain Holdings, Inc. |
24,825 | 732,834 | ||||||
OTC Markets Group, Inc. Class A |
4,941 | 272,002 | ||||||
PennyMac Financial Services, Inc. |
32,262 | 1,384,040 | ||||||
PRA Group, Inc. (a) |
19,501 | 640,803 | ||||||
Radian Group, Inc. |
39,075 | 753,757 | ||||||
Raymond James Financial, Inc. |
6,750 | 667,035 | ||||||
Stash Financial, Inc. (Acquired 1/06/21-1/26/21, Cost $15,690) (a) (d) (e) (f) |
487 | 17,050 | ||||||
StepStone Group, Inc. Class A |
36,870 | 903,684 | ||||||
TMX Group Ltd. |
4,110 | 378,048 | ||||||
Tradeweb Markets, Inc. Class A |
24,100 | 1,359,722 | ||||||
Virtus Investment Partners, Inc. |
3,026 | 482,708 | ||||||
| 13,359,491 | ||||||||
Insurance — 3.7% |
||||||||
Assurant, Inc. |
21,395 | 3,108,052 | ||||||
Axis Capital Holdings Ltd. |
41,973 | 2,062,973 | ||||||
Brown & Brown, Inc. |
40,229 | 2,433,050 | ||||||
BRP Group, Inc. Class A (a) |
37,896 | 998,560 | ||||||
CNA Financial Corp. |
47,099 | 1,737,953 | ||||||
Essent Group Ltd. |
10,036 | 349,955 | ||||||
The Hanover Insurance Group, Inc. |
5,690 | 729,117 | ||||||
Jackson Financial, Inc., Class A |
36,895 | 1,023,836 | ||||||
James River Group Holdings Ltd. |
23,853 | 544,087 | ||||||
Kemper Corp. |
58,457 | 2,411,936 | ||||||
Loews Corp. |
48,032 | 2,393,915 | ||||||
Marsh & McLennan Cos., Inc. |
6,460 | 964,413 | ||||||
Palomar Holdings, Inc. (a) |
7,618 | 637,779 | ||||||
ProAssurance Corp. |
15,438 | 301,195 | ||||||
RenaissanceRe Holdings Ltd. |
20,613 | 2,893,859 | ||||||
Ryan Specialty Holdings, Inc. (a) |
11,082 | 450,151 | ||||||
Selective Insurance Group, Inc. |
18,555 | 1,510,377 | ||||||
| 24,551,208 | ||||||||
The accompanying notes are an integral part of the financial statements.
99
MassMutual Select T. Rowe Price Small and Mid Cap Blend Fund – Portfolio of Investments (Continued) |
Number of |
Value |
|||||||
Investment Companies — 0.2% |
||||||||
Groupe Bruxelles Lambert NV |
16,707 | $ | 1,160,983 | |||||
Private Equity — 0.3% |
||||||||
KKR & Co., Inc. |
43,400 | 1,866,200 | ||||||
Real Estate — 0.6% |
||||||||
eXp World Holdings, Inc. (b) |
7,225 | 80,992 | ||||||
FirstService Corp. |
21,524 | 2,561,571 | ||||||
McGrath RentCorp |
5,738 | 481,189 | ||||||
The St. Joe Co. |
16,326 | 522,922 | ||||||
Tricon Residential, Inc. |
78,293 | 677,234 | ||||||
| 4,323,908 | ||||||||
Real Estate Investment Trusts (REITS) — 3.4% |
||||||||
Apartment Investment and Management Co. Class A |
169,450 | 1,236,985 | ||||||
Apple Hospitality REIT, Inc. |
37,771 | 531,060 | ||||||
Community Healthcare Trust, Inc. |
7,072 | 231,608 | ||||||
CubeSmart |
30,394 | 1,217,584 | ||||||
EastGroup Properties, Inc. |
14,971 | 2,160,914 | ||||||
Equity Commonwealth |
82,713 | 2,014,889 | ||||||
Equity Residential |
13,587 | 913,318 | ||||||
Essential Properties Realty Trust, Inc. |
26,009 | 505,875 | ||||||
First Industrial Realty Trust, Inc. |
7,828 | 350,773 | ||||||
Flagship Communities |
5,389 | 80,781 | ||||||
Independence Realty Trust, Inc. |
3,600 | 60,228 | ||||||
JBG SMITH Properties |
44,175 | 820,771 | ||||||
NexPoint Diversified Real Estate Trust |
4,387 | 55,057 | ||||||
NexPoint Residential Trust, Inc. |
2,076 | 95,932 | ||||||
Omega Healthcare Investors, Inc. |
9,421 | 277,825 | ||||||
Pebblebrook Hotel Trust |
28,341 | 411,228 | ||||||
PennyMac Mortgage Investment Trust (b) |
31,955 | 376,430 | ||||||
PotlatchDeltic Corp. |
12,807 | 525,599 | ||||||
Rayonier, Inc. |
55,780 | 1,671,727 | ||||||
Regency Centers Corp. |
27,555 | 1,483,837 | ||||||
Rexford Industrial Realty, Inc. |
29,822 | 1,550,744 | ||||||
Safehold, Inc. (b) |
12,797 | 338,609 | ||||||
Saul Centers, Inc. |
15,030 | 563,625 | ||||||
SBA Communications Corp. |
762 | 216,903 | ||||||
Simon Property Group, Inc. |
1,846 | 165,678 | ||||||
Terreno Realty Corp. |
26,874 | 1,424,053 | ||||||
UMH Properties, Inc. |
5,163 | 83,382 | ||||||
Vornado Realty Trust |
34,098 | 789,710 | ||||||
Washington Real Estate Investment Trust |
34,829 | 611,597 | ||||||
Weyerhaeuser Co. |
58,751 | 1,677,929 | ||||||
| 22,444,651 | ||||||||
Number of |
Value |
|||||||
Savings & Loans — 0.3% |
||||||||
Capitol Federal Financial, Inc. |
24,111 | $ | 200,121 | |||||
FS Bancorp, Inc. |
6,123 | 166,913 | ||||||
Pacific Premier Bancorp, Inc. |
29,909 | 925,983 | ||||||
WSFS Financial Corp. |
20,974 | 974,452 | ||||||
| 2,267,469 | ||||||||
| 113,870,567 | ||||||||
Industrial — 15.3% |
||||||||
Aerospace & Defense — 0.8% |
||||||||
Rolls-Royce Holdings PLC (a) |
1,658,880 | 1,274,842 | ||||||
Spirit AeroSystems Holdings, Inc. Class A |
59,645 | 1,307,418 | ||||||
Teledyne Technologies, Inc. (a) |
6,691 | 2,258,012 | ||||||
Triumph Group, Inc. (a) |
62,533 | 537,159 | ||||||
| 5,377,431 | ||||||||
Building Materials — 1.5% |
||||||||
Gibraltar Industries, Inc. (a) |
9,742 | 398,740 | ||||||
JELD-WEN Holding, Inc. (a) |
16,793 | 146,939 | ||||||
Martin Marietta Materials, Inc. |
5,831 | 1,878,107 | ||||||
Mohawk Industries, Inc. (a) |
15,049 | 1,372,318 | ||||||
SPX Technologies, Inc. (a) |
24,424 | 1,348,693 | ||||||
Summit Materials, Inc. Class A (a) |
80,689 | 1,933,308 | ||||||
Trex Co., Inc. (a) |
12,897 | 566,694 | ||||||
UFP Industries, Inc. |
12,972 | 936,060 | ||||||
Vulcan Materials Co. |
7,301 | 1,151,441 | ||||||
| 9,732,300 | ||||||||
Electrical Components & Equipment — 0.5% |
||||||||
Belden, Inc. |
18,047 | 1,083,181 | ||||||
Insteel Industries, Inc. |
5,411 | 143,554 | ||||||
Littelfuse, Inc. |
8,811 | 1,750,658 | ||||||
Novanta, Inc. (a) |
4,599 | 531,874 | ||||||
| 3,509,267 | ||||||||
Electronics — 2.4% |
||||||||
Agilent Technologies, Inc. |
31,000 | 3,768,050 | ||||||
Amphenol Corp. Class A |
18,200 | 1,218,672 | ||||||
Brady Corp. Class A |
14,070 | 587,141 | ||||||
CTS Corp. |
18,843 | 784,811 | ||||||
Fortive Corp. |
39,900 | 2,326,170 | ||||||
Hubbell, Inc. |
4,137 | 922,551 | ||||||
Keysight Technologies, Inc. (a) |
17,100 | 2,690,856 | ||||||
Knowles Corp. (a) |
14,591 | 177,572 | ||||||
National Instruments Corp. |
86,189 | 3,252,773 | ||||||
| 15,728,596 | ||||||||
Environmental Controls — 0.5% |
||||||||
Stericycle, Inc. (a) |
18,372 | 773,645 | ||||||
Tetra Tech, Inc. |
4,525 | 581,598 | ||||||
Waste Connections, Inc. |
12,379 | 1,672,774 | ||||||
| 3,028,017 | ||||||||
The accompanying notes are an integral part of the financial statements.
100
MassMutual Select T. Rowe Price Small and Mid Cap Blend Fund – Portfolio of Investments (Continued) |
Number of |
Value |
|||||||
Hand & Machine Tools — 0.6% |
||||||||
Cadre Holdings, Inc. |
7,823 | $ | 188,221 | |||||
Enerpac Tool Group Corp. |
42,488 | 757,561 | ||||||
MSA Safety, Inc. |
5,893 | 643,987 | ||||||
Regal Rexnord Corp. |
7,824 | 1,098,177 | ||||||
Stanley Black & Decker, Inc. |
17,505 | 1,316,551 | ||||||
| 4,004,497 | ||||||||
Machinery – Construction & Mining — 0.1% |
||||||||
BWX Technologies, Inc. |
13,500 | 679,995 | ||||||
Machinery – Diversified — 2.9% |
||||||||
Alamo Group, Inc. |
3,162 | 386,618 | ||||||
Cactus, Inc. Class A |
20,572 | 790,582 | ||||||
CIRCOR International, Inc. (a) |
21,597 | 356,134 | ||||||
Cognex Corp. |
16,800 | 696,360 | ||||||
CSW Industrials, Inc. |
8,700 | 1,042,260 | ||||||
Enovis Corp. (a) |
19,833 | 913,706 | ||||||
Esab Corp. |
24,146 | 805,511 | ||||||
Graco, Inc. |
10,625 | 636,969 | ||||||
Hydrofarm Holdings Group, Inc. (a) |
1,646 | 3,193 | ||||||
IDEX Corp. |
13,133 | 2,624,630 | ||||||
Ingersoll Rand, Inc. |
149,062 | 6,448,422 | ||||||
Marel HF |
27,870 | 86,424 | ||||||
The Middleby Corp. (a) |
6,834 | 875,914 | ||||||
Mueller Water Products, Inc. Class A |
38,781 | 398,281 | ||||||
Rockwell Automation, Inc. |
5,767 | 1,240,539 | ||||||
Thermon Group Holdings, Inc. (a) |
24,000 | 369,840 | ||||||
The Toro Co. |
15,591 | 1,348,310 | ||||||
Zurn Elkay Water Solutions Corp. |
16,325 | 399,962 | ||||||
| 19,423,655 | ||||||||
Metal Fabricate & Hardware — 1.0% |
||||||||
AZZ, Inc. |
15,949 | 582,298 | ||||||
Helios Technologies, Inc. |
17,979 | 909,737 | ||||||
RBC Bearings, Inc. (a) |
12,740 | 2,647,499 | ||||||
Strattec Security Corp. (a) |
3,912 | 81,370 | ||||||
Valmont Industries, Inc. |
2,333 | 626,691 | ||||||
Xometry, Inc. Class A (a) |
31,977 | 1,815,974 | ||||||
| 6,663,569 | ||||||||
Miscellaneous - Manufacturing — 2.0% |
||||||||
Alstom SA |
46,366 | 745,575 | ||||||
ESCO Technologies, Inc. |
16,654 | 1,223,070 | ||||||
Federal Signal Corp. |
16,027 | 598,128 | ||||||
Haynes International, Inc. |
10,135 | 355,941 | ||||||
John Bean Technologies Corp. |
8,402 | 722,572 | ||||||
Myers Industries, Inc. |
27,235 | 448,560 | ||||||
Textron, Inc. |
128,628 | 7,493,867 | ||||||
Trane Technologies PLC |
11,463 | 1,659,957 | ||||||
| 13,247,670 | ||||||||
Number of |
Value |
|||||||
Packaging & Containers — 0.9% |
||||||||
Ball Corp. |
71,902 | $ | 3,474,305 | |||||
Ranpak Holdings Corp. (a) |
8,272 | 28,290 | ||||||
Sealed Air Corp. |
35,400 | 1,575,654 | ||||||
WestRock Co. |
35,637 | 1,100,827 | ||||||
| 6,179,076 | ||||||||
Transportation — 2.1% |
||||||||
C.H. Robinson Worldwide, Inc. |
17,473 | 1,682,825 | ||||||
International Seaways, Inc. |
9,303 | 326,814 | ||||||
J.B. Hunt Transport Services, Inc. |
36,108 | 5,648,013 | ||||||
Landstar System, Inc. |
8,353 | 1,205,923 | ||||||
Matson, Inc. |
167 | 10,274 | ||||||
Old Dominion Freight Line, Inc. |
12,317 | 3,064,100 | ||||||
Saia, Inc. (a) |
11,044 | 2,098,360 | ||||||
US Xpress Enterprises, Inc. Class A (a) (b) |
23,308 | 57,338 | ||||||
| 14,093,647 | ||||||||
| 101,667,720 | ||||||||
Technology — 12.1% |
||||||||
Computers — 1.8% |
||||||||
Coalition, Inc. (Acquired 9/13/21, Cost $4,230) (a) (d) (e) (f) |
256 | 5,513 | ||||||
Conduent, Inc. (a) |
49,081 | 163,930 | ||||||
Crowdstrike Holdings, Inc. Class A (a) |
7,600 | 1,252,556 | ||||||
Endava PLC Sponsored ADR (a) |
21,036 | 1,696,133 | ||||||
Fortinet, Inc. (a) |
53,200 | 2,613,716 | ||||||
Globant SA (a) |
7,624 | 1,426,298 | ||||||
Leidos Holdings, Inc. |
7,200 | 629,784 | ||||||
PAR Technology Corp. (a) (b) |
19,994 | 590,423 | ||||||
Parsons Corp. (a) |
27,949 | 1,095,601 | ||||||
Thoughtworks Holding, Inc. (a) |
3,392 | 35,582 | ||||||
Western Digital Corp. (a) |
69,331 | 2,256,724 | ||||||
| 11,766,260 | ||||||||
Semiconductors — 3.0% |
||||||||
Entegris, Inc. |
43,053 | 3,574,260 | ||||||
KLA Corp. |
8,400 | 2,542,092 | ||||||
Lattice Semiconductor Corp. (a) |
55,818 | 2,746,804 | ||||||
MACOM Technology Solutions Holdings, Inc. (a) |
5,815 | 301,159 | ||||||
Marvell Technology, Inc. |
111,196 | 4,771,420 | ||||||
MaxLinear, Inc. (a) |
9,875 | 322,123 | ||||||
Microchip Technology, Inc. |
74,100 | 4,522,323 | ||||||
Monolithic Power Systems, Inc. |
232 | 84,309 | ||||||
Onto Innovation, Inc. (a) |
11,049 | 707,688 | ||||||
Wolfspeed, Inc. (a) |
4,000 | 413,440 | ||||||
| 19,985,618 | ||||||||
The accompanying notes are an integral part of the financial statements.
101
MassMutual Select T. Rowe Price Small and Mid Cap Blend Fund – Portfolio of Investments (Continued) |
Number of |
Value |
|||||||
Software — 7.3% |
||||||||
Agilysys, Inc. (a) |
3,617 | $ | 200,201 | |||||
Alignment Healthcare, Inc. (a) |
54,053 | 639,987 | ||||||
Amplitude, Inc. (a) (b) |
12,844 | 198,697 | ||||||
Atlassian Corp. PLC Class A (a) |
23,377 | 4,922,962 | ||||||
Bill.com Holdings, Inc. (a) |
13,631 | 1,804,335 | ||||||
Black Knight, Inc. (a) |
26,700 | 1,728,291 | ||||||
Blackline, Inc. (a) |
6,272 | 375,693 | ||||||
Braze, Inc. (a) |
3,450 | 120,163 | ||||||
Broadridge Financial Solutions, Inc. |
4,000 | 577,280 | ||||||
CCC Intelligent Solutions Holdings, Inc. (a) |
97,484 | 887,104 | ||||||
Ceridian HCM Holding, Inc. (a) |
35,194 | 1,966,641 | ||||||
Checkr, Inc. (Acquired 6/29/18-12/02/19, Cost $116,452) (a) (d) (e) (f) |
15,444 | 118,919 | ||||||
Clear Secure Inc. Class A (a) (b) |
53,952 | 1,233,343 | ||||||
Clearwater Analytics Holdings, Inc. Class A (a) |
14,030 | 235,564 | ||||||
Coupa Software, Inc. (a) |
8,670 | 509,796 | ||||||
Databricks, Inc. (Acquired 7/24/20-8/28/20, Cost $24,732) (a) (d) (e) (f) |
1,545 | 85,428 | ||||||
Datadog, Inc. Class A (a) |
10,618 | 942,666 | ||||||
Definitive Healthcare Corp. (a) |
8,670 | 134,732 | ||||||
The Descartes Systems Group, Inc. (a) |
37,567 | 2,386,631 | ||||||
DocuSign, Inc. (a) |
8,200 | 438,454 | ||||||
DoubleVerify Holdings, Inc. (a) |
37,466 | 1,024,695 | ||||||
Doximity, Inc. Class A (a) (b) |
21,851 | 660,337 | ||||||
Duolingo, Inc. (a) |
7,033 | 669,753 | ||||||
Fair Isaac Corp. (a) |
3,000 | 1,236,030 | ||||||
Five9, Inc. (a) |
2,371 | 177,778 | ||||||
Ginkgo Bioworks, Inc., Earnout Shares 15.00 (Acquired 9/17/21, Cost $0) (a) (d) (e) (f) |
874 | 1,045 | ||||||
Ginkgo Bioworks, Inc., Earnout Shares 17.50 (Acquired 9/17/21, Cost $0) (a) (d) (e) (f) |
874 | 954 | ||||||
Ginkgo Bioworks, Inc., Earnout Shares 20.00 (Acquired 9/17/21, Cost $0) (a) (d) (e) (f) |
874 | 877 | ||||||
Gusto, Inc. (Acquired 8/18/20-11/09/20, Cost $204,799) (a) (d) (e) (f) |
15,332 | 288,702 | ||||||
HashiCorp, Inc. Class A (a) |
8,042 | 258,872 | ||||||
HubSpot, Inc. (a) |
9,539 | 2,576,675 | ||||||
Manhattan Associates, Inc. (a) |
4,889 | 650,384 | ||||||
Megaport Ltd. (a) (b) |
48,400 | 234,711 | ||||||
Monday.com Ltd. (a) |
3,371 | 382,069 | ||||||
MongoDB, Inc. (a) |
800 | 158,848 | ||||||
MSCI, Inc. |
2,407 | 1,015,248 | ||||||
nCino, Inc. (a) (b) |
21,829 | 744,587 | ||||||
Number of |
Value |
|||||||
Outset Medical, Inc. (a) |
19,330 | $ | 307,927 | |||||
Paycom Software, Inc. (a) |
873 | 288,081 | ||||||
Paycor HCM, Inc. (a) |
31,931 | 943,880 | ||||||
Phreesia, Inc. (a) |
18,422 | 469,393 | ||||||
Privia Health Group, Inc. (a) |
18,578 | 632,767 | ||||||
Procore Technologies, Inc. (a) |
16,946 | 838,488 | ||||||
PTC, Inc. (a) |
11,500 | 1,202,900 | ||||||
Roper Technologies, Inc. |
10,146 | 3,648,907 | ||||||
Schrodinger, Inc. (a) |
782 | 19,534 | ||||||
SentinelOne Inc. Class A (a) |
15,567 | 397,892 | ||||||
ServiceTitan, Inc. (Acquired 11/09/18-5/04/21, Cost $29,280) (a) (d) (e) (f) |
637 | 43,896 | ||||||
Socure, Inc. (Acquired 12/22/21, Cost $62,185) (a) (d) (e) (f) |
3,870 | 47,291 | ||||||
SS&C Technologies Holdings, Inc |
15,665 | 748,004 | ||||||
Synopsys, Inc. (a) |
6,600 | 2,016,366 | ||||||
Tanium, Inc., Class B (Acquired 9/24/20, Cost $30,277) (a) (d) (e) (f) |
2,657 | 20,432 | ||||||
Themis Solutions, Inc. (Acquired 4/14/21, Cost $108,219) (a) (d) (e) (f) |
4,820 | 97,846 | ||||||
Veeva Systems, Inc. Class A (a) |
34,661 | 5,714,906 | ||||||
Vimeo, Inc. (a) |
47,482 | 189,928 | ||||||
Workiva, Inc. (a) |
10,091 | 785,080 | ||||||
Xero Ltd. (a) |
17,878 | 821,625 | ||||||
| 48,823,595 | ||||||||
| 80,575,473 | ||||||||
Utilities — 2.7% |
||||||||
Electric — 1.9% |
||||||||
CenterPoint Energy, Inc. |
32,720 | 922,050 | ||||||
FirstEnergy Corp. |
96,774 | 3,580,638 | ||||||
IDACORP, Inc. |
20,229 | 2,002,873 | ||||||
MGE Energy, Inc. |
16,698 | 1,095,890 | ||||||
NorthWestern Corp. |
5,254 | 258,917 | ||||||
PG&E Corp. (a) |
372,340 | 4,654,250 | ||||||
PNM Resources, Inc. |
10,057 | 459,907 | ||||||
| 12,974,525 | ||||||||
Gas — 0.6% |
||||||||
Chesapeake Utilities Corp. |
12,906 | 1,489,223 | ||||||
ONE Gas, Inc. |
13,960 | 982,644 | ||||||
RGC Resources, Inc. |
7,280 | 153,317 | ||||||
Southwest Gas Holdings, Inc. |
18,674 | 1,302,512 | ||||||
| 3,927,696 | ||||||||
Water — 0.2% |
||||||||
Artesian Resources Corp. Class A |
1,393 | 67,032 | ||||||
California Water Service Group |
14,731 | 776,177 | ||||||
The accompanying notes are an integral part of the financial statements.
102
MassMutual Select T. Rowe Price Small and Mid Cap Blend Fund – Portfolio of Investments (Continued) |
Number of |
Value |
|||||||
SJW Group |
11,443 | $ | 659,118 | |||||
| 1,502,327 | ||||||||
| 18,404,548 | ||||||||
TOTAL COMMON STOCK (Cost $639,383,864) |
616,337,750 | |||||||
PREFERRED STOCK — 2.4% |
||||||||
Communications — 0.1% |
||||||||
Internet — 0.1% |
||||||||
1661, Inc., Series F (Acquired 5/28/21, Cost $288,836) (a) (d) (e) (f) |
49,629 | 91,317 | ||||||
Evolve Vacation Rental Network, Inc., Series 8 (Acquired 3/29/18, Cost $44,816) (a) (d) (e) (f) |
5,266 | 101,986 | ||||||
Evolve Vacation Rental Network, Inc., Series 9 (Acquired 5/29/20, Cost $20,111) (a) (d) (e) (f) |
3,470 | 67,203 | ||||||
Minted, Inc., Series E (Acquired 10/30/18, Cost $113,257) (a) (d) (e) (f) |
8,410 | 113,956 | ||||||
SecurityScorecard, Inc., Series E (Acquired 3/05/21, Cost $262,495) (a) (d) (e) (f) |
51,969 | 253,609 | ||||||
| 628,071 | ||||||||
Consumer, Cyclical — 0.1% |
||||||||
Auto Manufacturers — 0.1% |
||||||||
Nuro, Inc., Series C, (Acquired 10/30/20-3/02/21, Cost $282,254) |
||||||||
(a) (d) (e) (f) |
21,621 | 450,705 | ||||||
Nuro, Inc., Series D, (Acquired 10/29/21, Cost $252,025) |
||||||||
(a) (d) (e) (f) |
12,090 | 252,025 | ||||||
| 702,730 | ||||||||
Leisure Time — 0.0% |
||||||||
Rad Power Bikes, Inc., Series C, (Acquired 1/22/21, Cost $69,082) |
||||||||
(a) (d) (e) (f) |
14,321 | 87,072 | ||||||
Rad Power Bikes, Inc., Series D, (Acquired 9/16/21, Cost $107,722) |
||||||||
(a) (d) (e) (f) |
11,240 | 68,339 | ||||||
| 155,411 | ||||||||
Retail — 0.0% |
||||||||
OfferUp, Inc., Series F, (Acquired 7/01/20, Cost $9,217) |
||||||||
(a) (d) (e) (f) |
4,025 | 2,737 | ||||||
| 860,878 | ||||||||
Number of |
Value |
|||||||
Consumer, Non-cyclical — 1.1% |
||||||||
Agriculture — 0.1% |
||||||||
Farmer’s Business Network, Inc., Series E, (Acquired 2/11/19, Cost $191,081) (a) (d) (e) (f) |
8,198 | $ | 509,570 | |||||
Farmer’s Business Network, Inc., Series F, (Acquired 7/31/20, Cost $172,258) (a) (d) (e) (f) |
5,211 | 323,904 | ||||||
| 833,474 | ||||||||
Biotechnology — 0.3% |
||||||||
Genesis Therapeutics, Inc., Series A, (Acquired 11/24/20, Cost $25,262) (a) (d) (e) (f) |
4,946 | 25,262 | ||||||
Inscripta, Inc., Series E, (Acquired 3/30/21, Cost $148,812) (a) (d) (e) (f) |
16,853 | 94,040 | ||||||
Insitro, Inc., Series B, (Acquired 5/21/20, Cost $34,456) (a) (d) (e) (f) |
5,530 | 101,150 | ||||||
Insitro, Inc., Series C, (Acquired 4/07/21, Cost $62,208) (a) (d) (e) (f) |
3,401 | 62,208 | ||||||
Kardium, Inc., Series D-5, (Acquired 11/29/18, Cost $29,906) (a) (d) (e) (f) |
30,866 | 31,355 | ||||||
Kardium, Inc., Series D-6, (Acquired 1/08/21, Cost $145,349) (a) (d) (e) (f) |
143,083 | 145,349 | ||||||
Laronde, Inc., Series B, (Acquired 7/28/21, Cost $109,340) (a) (d) (e) (f) |
3,905 | 21,868 | ||||||
National Resilience, Inc., Series B, (Acquired 10/23/20, Cost $263,720) (a) (d) (e) (f) |
19,306 | 1,172,453 | ||||||
National Resilience, Inc., Series C, (Acquired 6/09/21, Cost $315,045) (a) (d) (e) (f) |
7,094 | 430,819 | ||||||
Tessera Therapeutics, Inc., Series C, (Acquired 2/25/22, Cost $34,499) (a) (d) (e) (f) |
1,687 | 34,499 | ||||||
Treeline Biosciences, Inc., Series A, (Acquired 4/09/21, Cost $40,640) (a) (d) (e) (f) |
5,192 | 40,640 | ||||||
| 2,159,643 | ||||||||
Commercial Services — 0.1% |
||||||||
Honor Technology, Inc., Series D, (Acquired 10/16/20, Cost $225,290) (a) (d) (e) (f) |
93,556 | 270,377 | ||||||
Honor Technology, Inc., Series E, (Acquired 9/29/21, Cost $116,646) (a) (d) (e) (f) |
36,897 | 106,632 | ||||||
The accompanying notes are an integral part of the financial statements.
103
MassMutual Select T. Rowe Price Small and Mid Cap Blend Fund – Portfolio of Investments (Continued) |
Number of |
Value |
|||||||
Redwood Materials, Inc., Series C, (Acquired 5/28/21, Cost $214,074) (a) (d) (e) (f) |
4,516 | $ | 352,248 | |||||
| 729,257 | ||||||||
Food — 0.3% |
||||||||
Cava Group, Inc., Series E, (Acquired 6/23/20-3/26/21, Cost $475,884) (a) (d) (e) (f) |
18,159 | 1,061,575 | ||||||
Cava Group, Inc., Series F, (Acquired 3/26/21, Cost $512,596) (a) (d) (e) (f) |
13,622 | 796,342 | ||||||
| 1,857,917 | ||||||||
Health Care – Products — 0.1% |
||||||||
Cleerly, Inc. Series C, (Acquired 7/08/22, Cost $200,211) (a) (d) (e) (f) |
16,995 | 200,211 | ||||||
Prime Medicine, Inc., Series B, (Acquired 4/19/21, Cost $40,943) (a) (d) (e) (f) |
9,347 | 40,943 | ||||||
Ring Therapeutics, Inc., Series B, (Acquired 4/12/21, Cost $50,885) (a) (d) (e) (f) |
5,531 | 50,885 | ||||||
Tempus Labs, Inc., Series D, (Acquired 3/16/18, Cost $21,326) (a) (d) (e) (f) |
2,275 | 133,952 | ||||||
Tempus Labs, Inc., Series E, (Acquired 8/23/18, Cost $29,149) (a) (d) (e) (f) |
1,741 | 105,226 | ||||||
Tempus Labs, Inc., Series F, (Acquired 4/30/19, Cost $17,059) (a) (d) (e) (f) |
689 | 42,194 | ||||||
Tempus Labs, Inc., Series G, (Acquired 2/06/20, Cost $19,176) (a) (d) (e) (f) |
500 | 30,990 | ||||||
Tempus Labs, Inc., Series G-2, (Acquired 11/19/20, Cost $26,075) (a) (d) (e) (f) |
455 | 25,576 | ||||||
| 629,977 | ||||||||
Health Care – Services — 0.1% |
||||||||
Caris Life Sciences, Inc., Series C, (Acquired 8/14/20, Cost $125,312) (a) (d) (e) (f) |
45,403 | 298,752 | ||||||
Caris Life Sciences, Inc., Series D, (Acquired 5/11/21, Cost $378,132) (a) (d) (e) (f) |
46,683 | 307,174 | ||||||
| 605,926 | ||||||||
Pharmaceuticals — 0.1% |
||||||||
Capsule Corporation, Series D, (Acquired 4/07/21, Cost $144,670) (a) (d) (e) (f) |
9,983 | 123,190 | ||||||
Haul Hub, Inc., Series B, (Acquired 2/14/20-3/03/21, Cost $108,854) (a) (d) (e) (f) |
7,466 | 140,883 | ||||||
Number of |
Value |
|||||||
Haul Hub, Inc., Series C, (Acquired 4/14/22, Cost $43,061) (a) (d) (e) (f) |
2,282 | $ | 43,061 | |||||
| 307,134 | ||||||||
| 7,123,328 | ||||||||
Financial — 0.2% |
||||||||
Banks — 0.0% |
||||||||
CRB Group, Inc., Series D, (Acquired 1/28/22, Cost $255,280) (a) (d) (e) (f) |
2,428 | 255,280 | ||||||
Diversified Financial Services — 0.2% |
||||||||
Color Health Inc., Series E, (Acquired 10/26/21, Cost $15,095) (a) (d) (e) (f) |
151 | 15,095 | ||||||
Color Health, Inc., Series D, (Acquired 12/17/20, Cost $43,490) (a) (d) (e) (f) |
1,155 | 115,464 | ||||||
Color Health, Inc., Series D-1, (Acquired 1/13/20, Cost $56,632) (a) (d) (e) (f) |
2,655 | 265,418 | ||||||
Convoy, Inc., Series C, (Acquired 9/14/18, Cost $127,740) (a) (d) (e) (f) |
17,990 | 93,188 | ||||||
Convoy, Inc., Series D, (Acquired 10/30/19, Cost $417,858) (a) (d) (e) (f) |
30,861 | 159,860 | ||||||
Convoy, Inc., Series E, (Acquired 9/30/21, Cost $72,706) (a) (d) (e) (f) |
4,407 | 22,828 | ||||||
Stash Financial, Inc., Series F, (Acquired 4/24/20, Cost $126,801) (a) (d) (e) (f) |
5,060 | 177,151 | ||||||
Stash Financial, Inc., Series G, (Acquired 1/26/21, Cost $174,908) (a) (d) (e) (f) |
4,667 | 163,392 | ||||||
| 1,012,396 | ||||||||
Insurance — 0.0% |
||||||||
Go Maps, Inc., Series B-1, (Acquired 5/15/19-7/29/20, Cost $9,665) (a) (d) (e) (f) |
755 | 763 | ||||||
Investment Companies — 0.0% |
||||||||
Maplebear, Inc., Series E, (Acquired 11/19/21-12/01/21, Cost $348,680) (a) (d) (e) (f) |
2,900 | 140,592 | ||||||
Maplebear, Inc., Series I, (Acquired 2/26/21, Cost $58,500) (a) (d) (e) (f) |
468 | 22,689 | ||||||
| 163,281 | ||||||||
| 1,431,720 | ||||||||
Industrial — 0.3% |
||||||||
Aerospace & Defense — 0.1% |
||||||||
ABL Space Systems Company, Series B (Acquired 3/24/21, Cost $328,985) (a) (d) (e) (f) |
7,305 | 496,712 | ||||||
The accompanying notes are an integral part of the financial statements.
104
MassMutual Select T. Rowe Price Small and Mid Cap Blend Fund – Portfolio of Investments (Continued) |
Number of |
Value |
|||||||
Electrical Components & Equipment — 0.1% |
||||||||
CelLink, Inc., Series D (Acquired 1/20/22, Cost $223,836) (a) (d) (e) (f) |
10,749 | $ | 223,836 | |||||
Sila Nanotechnologies, Inc., Series F (Acquired 1/07/21, Cost $505,509) (a) (d) (e) (f) |
12,248 | 381,770 | ||||||
| 605,606 | ||||||||
Electronics — 0.1% |
||||||||
Sartorius AG 0.130% |
1,505 | 525,649 | ||||||
| 1,627,967 | ||||||||
Technology — 0.6% |
||||||||
Computers — 0.1% |
||||||||
Coalition, Inc., Series E (Acquired 9/07/21, Cost $253,711) (a) (d) (e) (f) |
15,355 | 330,667 | ||||||
Mesosphere, Inc., Series D (Acquired 5/04/18, Cost $72,584) (a) (d) (e) (f) |
6,566 | 4,399 | ||||||
| 335,066 | ||||||||
Software — 0.5% |
||||||||
Checkr, Inc., Series C (Acquired 4/10/18, Cost $106,628) (a) (d) (e) (f) |
23,433 | 180,434 | ||||||
Checkr, Inc., Series D (Acquired 9/06/19, Cost $308,786) (a) (d) (e) (f) |
30,627 | 235,828 | ||||||
Databricks, Inc., Series F (Acquired 10/22/19, Cost $104,923) (a) (d) (e) (f) |
7,329 | 405,245 | ||||||
Databricks, Inc., Series G (Acquired 2/01/21, Cost $128,414) (a) (d) (e) (f) |
2,172 | 120,097 | ||||||
Databricks, Inc., Series H (Acquired 8/31/21, Cost $121,028) (a) (d) (e) (f) |
1,647 | 91,068 | ||||||
DTX Company, Series A-1 (Acquired 4/02/22, Cost $31,212) (a) (d) (e) (f) |
17,154 | 31,212 | ||||||
Eikon Therapeutics, Inc., Series B (Acquired 3/12/21, Cost $89,186) (a) (d) (e) (f) |
5,042 | 89,186 | ||||||
Epirus, Inc., Series C-2 (Acquired 1/28/21, Cost $324,592) (a) (d) (e) (f) |
58,131 | 324,592 | ||||||
Flexe, Inc., Series C (Acquired 11/18/20, Cost $134,849) (a) (d) (e) (f) |
11,083 | 226,033 | ||||||
Flexe, Inc., Series D (Acquired 7/04/22, Cost $73,849) (a) (d) (e) (f) |
3,621 | 73,849 | ||||||
Gusto, Inc., Series B (Acquired 8/18/20, Cost $49,238) (a) (d) (e) (f) |
3,644 | 68,617 | ||||||
Number of |
Value |
|||||||
Gusto, Inc., Series B-2 (Acquired 8/18/20, Cost $91,936) (a) (d) (e) (f) |
6,804 | $ | 128,119 | |||||
Gusto, Inc., Series C (Acquired 7/16/18, Cost $84,209) (a) (d) (e) (f) |
11,076 | 208,561 | ||||||
Gusto, Inc., Series D (Acquired 7/16/19, Cost $187,638) (a) (d) (e) (f) |
14,095 | 265,409 | ||||||
JetClosing, Inc., Series A (Acquired 5/25/18, Cost $22,781) (a) (d) (e) (f) |
11,678 | — | ||||||
JetClosing, Inc., Series B-1 (Acquired 7/13/20-2/25/21, Cost $36,276) (a) (d) (e) (f) |
27,130 | — | ||||||
JetClosing, Inc., Series B-2 (Acquired 2/06/20, Cost $5,769) (a) (d) (e) (f) |
5,185 | — | ||||||
KoBold Metals, Inc., Series B-1 (Acquired 1/10/22, Cost $244,807) (a) (d) (e) (f) |
8,931 | 244,807 | ||||||
Seismic Software, Inc., Series E (Acquired 12/13/18, Cost $117,981) (a) (d) (e) (f) |
18,715 | 193,700 | ||||||
Seismic Software, Inc., Series F (Acquired 9/25/20-3/24/21, Cost $18,592) (a) (d) (e) (f) |
2,115 | 21,890 | ||||||
ServiceTitan, Inc., Series A-1 (Acquired 11/09/18, Cost $263) (a) (d) (e) (f) |
10 | 689 | ||||||
ServiceTitan, Inc., Series D (Acquired 11/09/18, Cost $124,743) (a) (d) (e) (f) |
4,744 | 326,909 | ||||||
ServiceTitan, Inc., Series E (Acquired 4/23/20, Cost $7,435) (a) (d) (e) (f) |
220 | 15,160 | ||||||
ServiceTitan, Inc., Series F (Acquired 3/25/21, Cost $25,650) (a) (d) (e) (f) |
239 | 16,469 | ||||||
Socure, Inc., Series A (Acquired 12/22/21, Cost $75,555) (a) (d) (e) (f) |
4,702 | 57,458 | ||||||
Socure, Inc., Series A-1 (Acquired 12/22/21, Cost $62,025) (a) (d) (e) (f) |
3,860 | 47,169 | ||||||
Socure, Inc., Series B (Acquired 12/22/21, Cost $1,109) (a) (d) (e) (f) |
69 | 843 | ||||||
Socure, Inc., Series E (Acquired 10/27/21, Cost $143,750) (a) (d) (e) (f) |
8,946 | 109,320 | ||||||
Themis Solutions, Inc., Series AA (Acquired 4/14/21, Cost $24,473) (a) (d) (e) (f) |
1,090 | 22,127 | ||||||
Themis Solutions, Inc., Series AB (Acquired 4/14/21, Cost $2,694) (a) (d) (e) (f) |
120 | 2,436 | ||||||
The accompanying notes are an integral part of the financial statements.
105
MassMutual Select T. Rowe Price Small and Mid Cap Blend Fund – Portfolio of Investments (Continued) |
Number of |
Value |
|||||||
Themis Solutions, Inc., Series B (Acquired 4/14/21, Cost $2,694) (a) (d) (e) (f) |
120 | $ | 2,436 | |||||
Themis Solutions, Inc., Series E (Acquired 4/14/21, Cost $309,164) (a) (d) (e) (f) |
13,770 | 279,531 | ||||||
| 3,789,194 | ||||||||
| 4,124,260 | ||||||||
TOTAL PREFERRED STOCK (Cost $12,179,977) |
15,796,224 | |||||||
TOTAL EQUITIES (Cost $651,563,841) |
632,133,974 | |||||||
RIGHTS — 0.0% |
||||||||
Consumer, Non-cyclical — 0.0% |
||||||||
Pharmaceuticals — 0.0% |
||||||||
Progenic Pharmaceuticals, Inc., CVR (a) (d) (f) |
25,104 | 28,892 | ||||||
TOTAL RIGHTS (Cost $0) |
28,892 | |||||||
WARRANTS — 0.0% |
||||||||
Communications — 0.0% |
||||||||
Advertising — 0.0% |
||||||||
Advantage Solutions, Inc., Expires 10/28/25 (a) |
3,668 | 367 | ||||||
Consumer, Non-cyclical — 0.0% |
||||||||
Pharmaceuticals — 0.0% |
||||||||
EQRx, Inc. (a) |
1,166 | 956 | ||||||
Diversified — 0.0% |
||||||||
Holding Company – Diversified — 0.0% |
||||||||
Bluescape Opportunities Acquisition Corp. (a) |
15,355 | 2,157 | ||||||
Financial — 0.0% |
||||||||
Banks — 0.0% |
||||||||
Dogwood State Bank (Acquired 5/06/19, Cost $0) (a) (d) (e) (f) |
800 | 6,456 | ||||||
Diversified Financial Services — 0.0% |
||||||||
Grasshopper Bancorp, Inc. (Acquired 10/15/18, Cost $0) (a) (d) (e) (f) |
1,432 | 1,031 | ||||||
Insurance — 0.0% |
||||||||
Hagerty Group, LLC. (Acquired 8/18/21, Cost $4,451) (a) (d) (e) |
3,040 | 6,870 | ||||||
| 14,357 | ||||||||
TOTAL WARRANTS (Cost $12,309) |
17,837 | |||||||
Number of |
Value |
|||||||
MUTUAL FUNDS — 0.9% |
||||||||
Diversified Financial Services — 0.9% |
||||||||
State Street Navigator Securities Lending Government Money Market Portfolio (g) |
5,671,215 | $ | 5,671,215 | |||||
TOTAL MUTUAL FUNDS (Cost $5,671,215) |
5,671,215 | |||||||
TOTAL LONG-TERM INVESTMENTS (Cost $657,247,365) |
637,851,918 | |||||||
SHORT-TERM INVESTMENTS — 5.2% |
||||||||
Mutual Fund — 5.1% |
||||||||
T. Rowe Price Government Reserve Investment Fund |
33,845,374 | 33,845,374 | ||||||
Principal |
||||||||
Repurchase Agreement — 0.1% |
||||||||
Fixed Income Clearing Corp., Repurchase Agreement, dated 9/30/22, 0.830%, due 10/03/22 (h) |
$ | 999,387 | 999,387 | |||||
TOTAL SHORT-TERM INVESTMENTS (Cost $34,844,761) |
34,844,761 | |||||||
TOTAL INVESTMENTS — 101.0% (Cost $692,092,126) (i) |
672,696,679 | |||||||
Other Assets/(Liabilities) — (1.0)% |
(6,757,274 | ) | ||||||
NET ASSETS — 100.0% |
$ | 665,939,405 | ||||||
Abbreviation Legend
|
ADR |
American Depositary Receipt |
Notes to Portfolio of Investments
Percentages are stated as a percent of net assets.
|
(a) |
Non-income producing security. |
|
(b) |
Denotes all or a portion of security on loan. The total value of securities on loan as of September 30, 2022, was $13,117,678 or 1.97% of net assets. The Fund received $7,817,077 of non-cash collateral (U.S. Treasury and/or Agency obligations) related to securities lending activity. This amount is not reflected on either the Portfolio of Investments or the Statement of Assets and Liabilities. (Note 2). |
The accompanying notes are an integral part of the financial statements.
106
MassMutual Select T. Rowe Price Small and Mid Cap Blend Fund – Portfolio of Investments (Continued) |
Notes to Portfolio of Investments (continued)
|
(c) |
Security is exempt from registration under Regulation S or Rule 144A of the Securities Act of 1933. These securities are considered restricted and may be resold in transactions exempt from registration. At September 30, 2022, the aggregate market value of these securities amounted to $136,979 or 0.02% of net assets. |
|
(d) |
This security is fair valued in good faith in accordance with procedures approved by the Board of Trustees. At September 30, 2022, these securities amounted to a value of $17,082,669 or 2.57% of net assets. |
|
(e) |
Restricted security. Certain securities are restricted as to resale. At September 30, 2022, these securities amounted to a value of $17,053,779 or 2.56% of net assets. The Fund generally bears the costs, if any, associated with the disposition of restricted securities. |
|
(f) |
Investment is valued using significant unobservable inputs. |
|
(g) |
Represents investment of security lending cash collateral. (Note 2). |
|
(h) |
Maturity value of $999,456. Collateralized by U.S. Government Agency obligations with a rate of 0.000%, maturity date of 3/30/23, and an aggregate market value, including accrued interest, of $1,019,397. |
|
(i) |
See Note 6 for aggregate cost for federal tax purposes. |
The accompanying notes are an integral part of the financial statements.
107
MassMutual Select T. Rowe Price U.S. Treasury Long-Term Index Fund – Portfolio of Investments |
September 30, 2022 |
Principal |
Value |
|||||||
BONDS & NOTES — 99.3% |
||||||||
U.S. GOVERNMENT AGENCY OBLIGATIONS AND INSTRUMENTALITIES (a) — 3.0% |
||||||||
Collateralized Mortgage Obligations — 0.7% |
||||||||
Government National Mortgage Association |
||||||||
Series 2020-7, Class KE, 2.500% 1/20/50 |
$ | 191,876 | $ | 168,582 | ||||
Series 2016-121, Class JF, 1 mo. USD LIBOR + 0.400% 3.414% FRN 9/20/46 |
184,719 | 181,707 | ||||||
Series 2019-78, Class FB, 1 mo. USD LIBOR + 0.400% 3.414% FRN 6/20/49 |
101,959 | 100,205 | ||||||
Series 2019-112, Class GF, 1 mo. USD LIBOR + 0.430% 3.444% FRN 9/20/49 |
95,751 | 94,159 | ||||||
Series 2019-103, Class CF, 1 mo. USD LIBOR + 0.450% 3.464% FRN 8/20/49 |
192,334 | 189,418 | ||||||
Series 2019-111, Class FB, 1 mo. USD LIBOR + 0.450% 3.464% FRN 9/20/49 |
72,700 | 71,853 | ||||||
Series 2019-125, Class DF, 1 mo. USD LIBOR + 0.450% 3.464% FRN 10/20/49 |
153,587 | 151,390 | ||||||
| 957,314 | ||||||||
Pass-Through Securities — 2.3% |
||||||||
Government National Mortgage Association II |
||||||||
Pool #MA7534 2.500% 8/20/51 |
93,501 | 80,732 | ||||||
Pool #MA7705 2.500% 11/20/51 |
178,190 | 153,619 | ||||||
Pool #MA7767 2.500% 12/20/51 |
537,548 | 463,257 | ||||||
Pool #MA4484 3.000% 6/20/32 |
139,143 | 129,611 | ||||||
Pool #MA6381 3.000% 1/20/35 |
72,261 | 67,220 | ||||||
Pool #MA6630 3.000% 5/20/35 |
32,924 | 30,606 | ||||||
Pool #MA6209 3.000% 10/20/49 |
18,016 | 15,630 | ||||||
Pool #MA6399 3.000% 1/20/50 |
40,829 | 35,421 | ||||||
Pool #MA6464 3.000% 2/20/50 |
92,631 | 80,361 | ||||||
Pool #MA6531 3.000% 3/20/50 |
56,562 | 48,911 | ||||||
Pool #MA7650 3.000% 10/20/51 |
205,493 | 182,656 | ||||||
Pool #BQ0937 3.500% 9/20/49 |
66,648 | 61,055 | ||||||
Pool #BQ7205 3.500% 10/20/49 |
38,726 | 35,428 | ||||||
Pool #BS3713 3.500% 1/20/50 |
131,190 | 120,180 | ||||||
Pool #BS3771 3.500% 2/20/50 |
91,506 | 83,672 | ||||||
Pool #MA4588 4.500% 7/20/47 |
111,319 | 108,429 | ||||||
Pool #MA4781 5.000% 10/20/47 |
51,368 | 51,583 | ||||||
Pool #MA4840 5.000% 11/20/47 |
39,838 | 40,005 | ||||||
Pool #MA5653 5.000% 12/20/48 |
123,790 | 123,013 | ||||||
Pool #MA5820 5.500% 3/20/49 |
16,577 | 16,884 | ||||||
Principal |
Value |
|||||||
Government National Mortgage Association II TBA |
||||||||
2.000% 10/20/52 (b) |
$ | 580,000 | $ | 483,122 | ||||
5.500% 10/20/52 (b) |
490,000 | 489,234 | ||||||
| 2,900,629 | ||||||||
TOTAL U.S. GOVERNMENT AGENCY OBLIGATIONS AND INSTRUMENTALITIES (Cost $4,173,509) |
3,857,943 | |||||||
U.S. TREASURY OBLIGATIONS — 96.3% |
||||||||
U.S. Treasury Bonds & Notes — 96.3% |
||||||||
U.S. Treasury Bond |
||||||||
1.125% 5/15/40 |
3,490,000 | 2,179,614 | ||||||
1.125% 8/15/40 |
6,270,000 | 3,881,522 | ||||||
1.250% 5/15/50 |
3,770,000 | 2,108,844 | ||||||
1.375% 11/15/40 |
6,110,000 | 3,948,587 | ||||||
1.375% 8/15/50 |
7,400,000 | 4,286,219 | ||||||
1.625% 11/15/50 |
3,580,000 | 2,221,837 | ||||||
1.750% 8/15/41 |
6,940,000 | 4,746,310 | ||||||
1.875% 2/15/41 |
7,480,000 | 5,296,775 | ||||||
1.875% 2/15/51 |
6,875,000 | 4,550,391 | ||||||
1.875% 11/15/51 |
6,760,000 | 4,470,050 | ||||||
2.000% 11/15/41 |
7,760,000 | 5,554,463 | ||||||
2.000% 2/15/50 |
4,050,000 | 2,783,109 | ||||||
2.000% 8/15/51 |
3,700,000 | 2,526,985 | ||||||
2.250% 5/15/41 |
7,690,000 | 5,813,159 | ||||||
2.250% 8/15/46 |
2,505,000 | 1,805,557 | ||||||
2.250% 8/15/49 |
2,550,000 | 1,865,883 | ||||||
2.250% 2/15/52 |
13,760,000 | 9,995,351 | ||||||
2.375% 2/15/42 |
24,150,000 | 18,512,484 | ||||||
2.375% 11/15/49 |
2,220,000 | 1,671,938 | ||||||
2.375% 5/15/51 |
2,440,000 | 1,825,425 | ||||||
2.500% 2/15/46 |
1,700,000 | 1,291,734 | ||||||
2.500% 5/15/46 |
3,925,000 | 2,977,481 | ||||||
2.875% 11/15/46 |
1,700,000 | 1,389,484 | ||||||
2.875% 5/15/49 |
2,480,000 | 2,068,475 | ||||||
2.875% 5/15/52 |
3,985,000 | 3,343,042 | ||||||
3.000% 11/15/45 |
850,000 | 709,883 | ||||||
3.000% 2/15/47 |
1,560,000 | 1,305,525 | ||||||
3.000% 5/15/47 |
1,200,000 | 1,005,563 | ||||||
3.000% 8/15/48 |
2,330,000 | 1,972,491 | ||||||
3.000% 2/15/49 |
2,480,000 | 2,118,075 | ||||||
3.000% 8/15/52 |
2,030,000 | 1,753,095 | ||||||
3.125% 5/15/48 (c) |
4,125,000 | 3,571,348 | ||||||
3.250% 5/15/42 |
1,945,000 | 1,726,492 | ||||||
3.375% 8/15/42 (d) |
1,700,000 | 1,540,625 | ||||||
3.375% 11/15/48 |
2,330,000 | 2,123,212 | ||||||
The accompanying notes are an integral part of the financial statements.
108
MassMutual Select T. Rowe Price U.S. Treasury Long-Term Index Fund – Portfolio of Investments (Continued) |
Principal |
Value |
|||||||
U.S. Treasury Note |
||||||||
2.750% 8/15/32 |
$ | 3,325,000 | $ | 3,039,258 | ||||
| 121,980,286 | ||||||||
TOTAL U.S. TREASURY OBLIGATIONS (Cost $166,052,411) |
121,980,286 | |||||||
TOTAL BONDS & NOTES (Cost $170,225,920) |
125,838,229 | |||||||
Number of |
||||||||
MUTUAL FUNDS — 0.3% |
||||||||
Diversified Financial Services — 0.3% |
||||||||
State Street Navigator Securities Lending Government Money Market Portfolio (e) |
375,215 | 375,215 | ||||||
TOTAL MUTUAL FUNDS (Cost $375,215) |
375,215 | |||||||
TOTAL PURCHASED OPTIONS (#) — 0.0% (Cost $11,374) |
4,078 | |||||||
TOTAL LONG-TERM INVESTMENTS (Cost $170,612,509) |
126,217,522 | |||||||
SHORT-TERM INVESTMENTS — 1.3% |
||||||||
Mutual Fund — 0.5% |
||||||||
T. Rowe Price Government Reserve Investment Fund |
605,545 | 605,545 | ||||||
Principal |
Value |
|||||||
Repurchase Agreement — 0.8% |
||||||||
Fixed Income Clearing Corp., Repurchase Agreement, dated 9/30/22, 0.830%, due 10/03/22 (f) |
$ | 1,003,737 | $ | 1,003,737 | ||||
TOTAL SHORT-TERM INVESTMENTS (Cost $1,609,282) |
1,609,282 | |||||||
TOTAL INVESTMENTS — 100.9% (Cost $172,221,791) (g) |
127,826,804 | |||||||
Other Assets/(Liabilities) — (0.9)% |
(1,118,055 | ) | ||||||
NET ASSETS — 100.0% |
$ | 126,708,749 | ||||||
Abbreviation Legend
|
FRN |
Floating Rate Note |
|
TBA |
To Be Announced |
Notes to Portfolio of Investments
Percentages are stated as a percent of net assets.
|
(a) |
May contain securities that are issued by a U.S. Government Agency, but are unsecured and are not guaranteed by a U.S. Government Agency. |
|
(b) |
A portion of this security is purchased on a when-issued, delayed-delivery or forward commitment basis. (Note 2). |
|
(c) |
All or a portion of this security is pledged/held as collateral for open derivatives. (Note 2). |
|
(d) |
Denotes all or a portion of security on loan. The total value of securities on loan as of September 30, 2022, was $367,765 or 0.29% of net assets. (Note 2). |
|
(e) |
Represents investment of security lending cash collateral. (Note 2). |
|
(f) |
Maturity value of $1,003,806. Collateralized by U.S. Government Agency obligations with a rate of 0.000%, maturity date of 3/30/23, and an aggregate market value, including accrued interest, of $1,023,909. |
|
(g) |
See Note 6 for aggregate cost for federal tax purposes. |
(#) Exchange-Traded Options Purchased
Description |
Expiration |
Exercise |
No. of |
Notional |
Value |
Premiums |
Unrealized |
|||||||||||||||||||||||||
Call |
||||||||||||||||||||||||||||||||
U.S. Treasury Note 10 Year Future |
10/21/22 | 116.00 | 29 | USD | 3,249,813 | $ | 4,078 | $ | 11,374 | $ | (7,296 | ) | ||||||||||||||||||||
The accompanying notes are an integral part of the financial statements.
109
MassMutual Select T. Rowe Price U.S. Treasury Long-Term Index Fund – Portfolio of Investments (Continued) |
Futures contracts
|
Expiration |
Number of |
Notional |
Value/ Net |
||||||||||||
Long |
||||||||||||||||
U.S. Treasury Note 10 Year |
12/20/22 | 133 | $ | 15,460,175 | $ | (555,862 | ) | |||||||||
Short |
||||||||||||||||
U.S. Treasury Ultra 10 Year |
12/20/22 | 13 | $ | (1,553,381 | ) | $ | 13,084 | |||||||||
U.S. Treasury Note 2 Year |
12/30/22 | 10 | (2,055,596 | ) | 1,690 | |||||||||||
U.S. Treasury Note 5 Year |
12/30/22 | 138 | (15,204,763 | ) | 368,685 | |||||||||||
|
$ | 383,459 | ||||||||||||||
Currency Legend
|
USD |
U.S. Dollar |
The accompanying notes are an integral part of the financial statements.
110
[THIS PAGE INTENTIONALLY LEFT BLANK]
MassMutual Funds – Financial Statements |
MM Equity |
MassMutual |
|||||||
Assets: |
||||||||
Investments, at value (Note 2) (a) |
$ | 298,406,752 | $ | 584,816,013 | ||||
Repurchase agreements, at value (Note 2) (b) |
4,174,155 | 3,082,003 | ||||||
Total investments (c) |
302,580,907 | 587,898,016 | ||||||
Cash |
8,385 | — | ||||||
Foreign currency, at value (d) |
— | 526,196 | ||||||
Receivables from: |
||||||||
Investments sold |
||||||||
Regular delivery |
539,886 | 4,178,690 | ||||||
Delayed delivery |
— | 2,396,642 | ||||||
Open forward contracts (Note 2) |
— | 8,771,169 | ||||||
Fund shares sold |
100,351 | 74,318 | ||||||
Investment adviser (Note 3) |
— | 49,069 | ||||||
Cash collateral pledged for open derivatives (Note 2) |
410,000 | 125,000 | ||||||
Variation margin on open derivative instruments (Note 2) |
— | 1,010,963 | ||||||
Interest and dividends |
349,275 | 2,061,153 | ||||||
Foreign tax reclaims |
279,073 | 55,515 | ||||||
Open swap agreements, at value (Note 2) |
— | 80 | ||||||
Total assets |
304,267,877 | 607,146,811 | ||||||
Liabilities: |
||||||||
Payables for: |
||||||||
Investments purchased |
||||||||
Regular delivery |
565,759 | 989,077 | ||||||
Delayed delivery |
— | 28,192,761 | ||||||
Cash collateral held for open derivatives (Note 2) |
— | 2,466,000 | ||||||
Open forward contracts (Note 2) |
— | 1,150,880 | ||||||
Interest and dividends |
— | — | ||||||
Fund shares repurchased |
84,438 | 284,120 | ||||||
Cash collateral held for securities on loan (Note 2) |
146,204 | 14,276,024 | ||||||
Open swap agreements, at value (Note 2) |
— | 44,815 | ||||||
Trustees’ fees and expenses (Note 3) |
36,082 | 24,028 | ||||||
Variation margin on open derivative instruments (Note 2) |
64,607 | 11,636 | ||||||
Affiliates (Note 3): |
||||||||
Administration fees |
14,415 | 90,548 | ||||||
Investment advisory fees |
48,178 | — | ||||||
Due to custodian |
— | 885,975 | ||||||
Accrued expense and other liabilities |
33,885 | 240,199 | ||||||
Total liabilities |
993,568 | 48,656,063 | ||||||
Net assets |
$ | 303,274,309 | $ | 558,490,748 | ||||
Net assets consist of: |
||||||||
Paid-in capital |
$ | 246,308,004 | $ | 665,882,453 | ||||
Accumulated earnings (loss) |
56,966,305 | (107,391,705 | ) | |||||
Net assets |
$ | 303,274,309 | $ | 558,490,748 | ||||
(a) |
Cost of investments: |
$ | 281,995,156 | $ | 669,419,751 | ||||
(b) |
Cost of repurchase agreements: |
$ | 4,174,155 | $ | 3,082,003 | ||||
(c) |
Securities on loan with market value of: |
$ | 149,001 | $ | 14,463,396 | ||||
(d) |
Cost of foreign currency: |
$ | — | $ | 533,727 |
The accompanying notes are an integral part of the financial statements.
112
MassMutual |
MassMutual |
MassMutual |
MassMutual |
MassMutual |
MassMutual |
||||||||||||||||||
| $ | 73,878,785 | $ | 1,853,439,408 | $ | 203,965,145 | $ | 212,562,005 | $ | 671,697,292 | $ | 126,823,067 | ||||||||||||
| 1,038,451 | 997,435 | 666,805 | 508,779 | 999,387 | 1,003,737 | ||||||||||||||||||
| 74,917,236 | 1,854,436,843 | 204,631,950 | 213,070,784 | 672,696,679 | 127,826,804 | ||||||||||||||||||
| 132,667 | 2,612 | 270,000 | 577,218 | 14,157 | — | ||||||||||||||||||
| 2,662 | 295 | 490 | 425,811 | 41,895 | — | ||||||||||||||||||
| 159,755 | 7,923,203 | — | 1,466,474 | 2,616,067 | 1,983,515 | ||||||||||||||||||
| — | — | — | — | — | — | ||||||||||||||||||
| 172,137 | — | 112,375 | 79,336 | — | — | ||||||||||||||||||
| 8,549 | 881,132 | 13,895 | 106,590 | 306,149 | 23,945 | ||||||||||||||||||
| 17,019 | 74,683 | 22,548 | 19,262 | 50,345 | 15,625 | ||||||||||||||||||
| — | — | — | — | — | — | ||||||||||||||||||
| 2,493 | — | 175,522 | 70,054 | — | — | ||||||||||||||||||
| 1,474,993 | 1,467,932 | 239,570 | 679,014 | 540,386 | 838,275 | ||||||||||||||||||
| — | 47,722 | — | 24,534 | 51,591 | — | ||||||||||||||||||
| — | — | 2,914,903 | — | — | — | ||||||||||||||||||
| 76,887,511 | 1,864,834,422 | 208,381,253 | 216,519,077 | 676,317,269 | 130,688,164 | ||||||||||||||||||
| 114,892 | 10,038,943 | — | 438,261 | 4,296,015 | 2,466,974 | ||||||||||||||||||
| — | — | 3,798,526 | — | — | 968,301 | ||||||||||||||||||
| — | — | 2,190,000 | — | — | — | ||||||||||||||||||
| 16,032 | — | 125,307 | 273,208 | — | — | ||||||||||||||||||
| — | — | 398,271 | — | — | — | ||||||||||||||||||
| 47,993 | 623,557 | 120,208 | 75,383 | 216,721 | 64,175 | ||||||||||||||||||
| 693,325 | — | 11,737,424 | 5,007,776 | 5,671,215 | 375,215 | ||||||||||||||||||
| — | — | — | 274,739 | — | — | ||||||||||||||||||
| 3,445 | 59,529 | 7,384 | 4,630 | 25,167 | 4,701 | ||||||||||||||||||
| — | — | — | — | — | 7,273 | ||||||||||||||||||
| 21,062 | 35,116 | 16,805 | 13,650 | 16,809 | 9,499 | ||||||||||||||||||
| — | — | — | — | — | — | ||||||||||||||||||
| — | — | — | — | — | — | ||||||||||||||||||
| 97,938 | 216,806 | 90,290 | 92,030 | 151,937 | 83,277 | ||||||||||||||||||
| 994,687 | 10,973,951 | 18,484,215 | 6,179,677 | 10,377,864 | 3,979,415 | ||||||||||||||||||
| $ | 75,892,824 | $ | 1,853,860,471 | $ | 189,897,038 | $ | 210,339,400 | $ | 665,939,405 | $ | 126,708,749 | ||||||||||||
| $ | 108,407,030 | $ | 1,880,361,526 | $ | 199,840,826 | $ | 229,107,675 | $ | 641,049,497 | $ | 179,316,786 | ||||||||||||
| (32,514,206 | ) | (26,501,055 | ) | (9,943,788 | ) | (18,768,275 | ) | 24,889,908 | (52,608,037 | ) | |||||||||||||
| $ | 75,892,824 | $ | 1,853,860,471 | $ | 189,897,038 | $ | 210,339,400 | $ | 665,939,405 | $ | 126,708,749 | ||||||||||||
| $ | 101,485,952 | $ | 2,050,216,191 | $ | 218,113,604 | $ | 244,745,038 | $ | 691,092,739 | $ | 171,218,054 | ||||||||||||
| $ | 1,038,451 | $ | 997,435 | $ | 666,805 | $ | 508,779 | $ | 999,387 | $ | 1,003,737 | ||||||||||||
| $ | 887,271 | $ | 25,197,620 | $ | 11,502,544 | $ | 7,316,254 | $ | 13,117,678 | $ | 367,765 | ||||||||||||
| $ | 2,640 | $ | 289 | $ | 502 | $ | 434,638 | $ | 42,301 | $ | — |
The accompanying notes are an integral part of the financial statements.
113
MassMutual Funds – Financial Statements (Continued) |
Statements of Assets and Liabilities |
MM Equity |
MassMutual |
|||||||
Class I shares: |
||||||||
Net assets |
$ | 303,274,309 | $ | 558,490,748 | ||||
Shares outstanding (a) |
43,351,333 | 64,725,295 | ||||||
Net asset value, offering price and redemption price per share |
$ | 7.00 | $ | 8.63 | ||||
(a) |
Authorized unlimited number of shares with no par value. |
The accompanying notes are an integral part of the financial statements.
114
MassMutual |
MassMutual |
MassMutual |
MassMutual |
MassMutual |
MassMutual |
||||||||||||||||||
| $ | 75,892,824 | $ | 1,853,860,471 | $ | 189,897,038 | $ | 210,339,400 | $ | 665,939,405 | $ | 126,708,749 | ||||||||||||
| 11,146,531 | 165,015,878 | 19,277,281 | 20,332,660 | 60,462,673 | 23,176,440 | ||||||||||||||||||
| $ | 6.81 | $ | 11.23 | $ | 9.85 | $ | 10.34 | $ | 11.01 | $ | 5.47 | ||||||||||||
The accompanying notes are an integral part of the financial statements.
115
MassMutual Funds – Financial Statements (Continued) |
Statements of Operations |
MM Equity |
MassMutual |
|||||||
Investment income (Note 2): |
||||||||
Dividends (a) |
$ | 5,455,044 | $ | 26,832 | ||||
Interest (b) |
6,154 | 15,190,431 | ||||||
Securities lending net income |
483 | 28,490 | ||||||
Non cash income |
— | — | ||||||
Total investment income |
5,461,681 | 15,245,753 | ||||||
Expenses (Note 3): |
||||||||
Investment advisory fees |
686,915 | — | ||||||
Custody fees |
52,181 | 261,002 | ||||||
Audit fees |
51,651 | 68,796 | ||||||
Legal fees |
9,504 | 18,102 | ||||||
Proxy fees |
1,337 | 1,337 | ||||||
Accounting & Administration fees |
18,971 | 123,319 | ||||||
Shareholder reporting fees |
32,364 | 22,289 | ||||||
Trustees’ fees |
19,187 | 34,794 | ||||||
Registration and filing fees |
17 | 33 | ||||||
Transfer agent fees |
2,968 | 2,966 | ||||||
Total expenses |
875,095 | 532,638 | ||||||
Expenses waived (Note 3): |
||||||||
Class I fees reimbursed by adviser |
— | (532,638 | ) | |||||
Net expenses: |
875,095 | — | ||||||
Net investment income (loss) |
4,586,586 | 15,245,753 | ||||||
Realized and unrealized gain (loss): |
||||||||
Net realized gain (loss) on: |
||||||||
Investment transactions |
44,722,405 | (36,739,693 | ) | |||||
Futures contracts |
(1,435,975 | ) | (15,126,292 | ) | ||||
Written options |
— | (41,897 | ) | |||||
Swap agreements |
— | (194,223 | ) | |||||
Foreign currency transactions |
157 | (337,566 | ) | |||||
Forward contracts |
— | 22,620,409 | ||||||
Net realized gain (loss) |
43,286,587 | (29,819,262 | ) | |||||
Net change in unrealized appreciation (depreciation) on: |
||||||||
Investment transactions |
(96,988,132 | ) | (90,849,276 | )* | ||||
Futures contracts |
(219,418 | ) | (1,789,849 | ) | ||||
Written options |
— | (16,420 | ) | |||||
Swap agreements |
— | (2,156,174 | ) | |||||
Translation of assets and liabilities in foreign currencies |
(34,192 | ) | (144,705 | ) | ||||
Forward contracts |
— | 4,821,100 | ||||||
Net change in unrealized appreciation (depreciation) |
(97,241,742 | ) | (90,135,324 | ) | ||||
Net realized gain (loss) and change in unrealized appreciation (depreciation) |
(53,955,155 | ) | (119,954,586 | ) | ||||
Net increase (decrease) in net assets resulting from operations |
$ | (49,368,569 | ) | $ | (104,708,833 | ) | ||
(a) |
Net of foreign withholding tax of: |
$ | 8,217 | $ | (8,104 | ) | |||
(b) |
Net of foreign withholding tax of: |
$ | — | $ | 9,469 | ||||
* |
Net of net increase (decrease) in accrued foreign capital gains tax of: |
$ | — | $ | 15,492 |
The accompanying notes are an integral part of the financial statements.
116
MassMutual |
MassMutual |
MassMutual |
MassMutual |
MassMutual |
MassMutual |
||||||||||||||||||
| $ | — | $ | 24,706,105 | $ | — | $ | 6,375,378 | $ | 8,140,270 | $ | — | ||||||||||||
| 4,889,787 | 379,953 | 15,831,307 | 57,813 | 266,045 | 2,915,331 | ||||||||||||||||||
| 5,069 | 49,603 | 5,684 | 57,192 | 191,579 | 4,242 | ||||||||||||||||||
| — | — | — | 1,327,572 | — | — | ||||||||||||||||||
| 4,894,856 | 25,135,661 | 15,836,991 | 7,817,955 | 8,597,894 | 2,919,573 | ||||||||||||||||||
| — | — | — | — | — | — | ||||||||||||||||||
| 54,122 | 202,610 | 65,592 | 70,013 | 115,718 | 45,211 | ||||||||||||||||||
| 65,383 | 48,909 | 53,013 | 53,162 | 47,480 | 52,099 | ||||||||||||||||||
| 2,159 | 59,988 | 7,559 | 7,529 | 21,803 | 2,926 | ||||||||||||||||||
| 1,337 | 1,337 | 1,337 | 1,337 | 1,337 | 1,337 | ||||||||||||||||||
| 29,486 | 44,868 | 24,161 | 19,586 | 22,508 | 14,077 | ||||||||||||||||||
| 17,386 | 33,034 | 14,745 | 16,562 | 20,360 | 13,522 | ||||||||||||||||||
| 4,590 | 107,891 | 13,202 | 8,957 | 40,701 | 5,914 | ||||||||||||||||||
| — | — | — | — | — | 6 | ||||||||||||||||||
| 2,968 | 2,968 | 2,968 | 2,968 | 2,968 | 2,968 | ||||||||||||||||||
| 177,431 | 501,605 | 182,577 | 180,114 | 272,875 | 138,060 | ||||||||||||||||||
| (177,431 | ) | (501,605 | ) | (182,577 | ) | (180,114 | ) | (272,875 | ) | (138,060 | ) | ||||||||||||
| — | — | — | — | — | — | ||||||||||||||||||
| 4,894,856 | 25,135,661 | 15,836,991 | 7,817,955 | 8,597,894 | 2,919,573 | ||||||||||||||||||
| (6,819,804 | ) | 187,703,748 | (9,409,388 | ) | 6,991,811 | 52,162,823 | (1,760,998 | ) | |||||||||||||||
| 155,665 | — | (1,410,806 | ) | 2,268,375 | — | (961,343 | ) | ||||||||||||||||
| — | — | (151,844 | ) | — | — | (58,049 | ) | ||||||||||||||||
| (71,487 | ) | — | 1,512,297 | (456,653 | ) | — | — | ||||||||||||||||
| (8,579 | ) | (8,293 | ) | (85 | ) | (68,738 | ) | (14,077 | ) | — | |||||||||||||
| 379,507 | — | (226,913 | ) | (525,519 | ) | — | — | ||||||||||||||||
| (6,364,698 | ) | 187,695,455 | (9,686,739 | ) | 8,209,276 | 52,148,746 | (2,780,390 | ) | |||||||||||||||
| (25,569,773 | ) | (755,290,216 | ) | (17,976,406 | ) | (50,684,334 | ) | (250,125,324 | ) | (41,626,092 | ) | ||||||||||||
| 162,099 | — | 393,090 | 61,466 | — | (185,724 | ) | |||||||||||||||||
| — | — | — | — | — | (238 | ) | |||||||||||||||||
| 9,720 | — | 1,131,978 | (274,739 | ) | — | — | |||||||||||||||||
| (5,197 | ) | 19,474 | 1,650 | (38,802 | ) | (7,947 | ) | — | |||||||||||||||
| 130,872 | — | 4,390 | (193,872 | ) | — | — | |||||||||||||||||
| (25,272,279 | ) | (755,270,742 | ) | (16,445,298 | ) | (51,130,281 | ) | (250,133,271 | ) | (41,812,054 | ) | ||||||||||||
| (31,636,977 | ) | (567,575,287 | ) | (26,132,037 | ) | (42,921,005 | ) | (197,984,525 | ) | (44,592,444 | ) | ||||||||||||
| $ | (26,742,121 | ) | $ | (542,439,626 | ) | $ | (10,295,046 | ) | $ | (35,103,050 | ) | $ | (189,386,631 | ) | $ | (41,672,871 | ) | ||||||
| $ | — | $ | 217,993 | $ | — | $ | 250,361 | $ | 127,925 | $ | — | ||||||||||||
| $ | — | $ | — | $ | — | $ | — | $ | — | $ | — | ||||||||||||
| $ | — | $ | — | $ | — | $ | — | $ | — | $ | — |
The accompanying notes are an integral part of the financial statements.
117
MassMutual Funds – Financial Statements (Continued) |
MM Equity Asset |
||||||||
Year |
Year |
|||||||
Increase (Decrease) in Net Assets: |
||||||||
Operations: |
||||||||
Net investment income (loss) |
$ | 4,586,586 | $ | 5,254,652 | ||||
Net realized gain (loss) |
43,286,587 | 77,516,537 | ||||||
Net change in unrealized appreciation (depreciation) |
(97,241,742 | ) | 37,925,439 | |||||
Net increase (decrease) in net assets resulting from operations |
(49,368,569 | ) | 120,696,628 | |||||
Distributions to shareholders (Note 2): |
||||||||
Class I |
(81,089,970 | ) | (54,878,368 | ) | ||||
Total distributions |
(81,089,970 | ) | (54,878,368 | ) | ||||
Net fund share transactions (Note 5): |
||||||||
Class I |
35,923,057 | (91,092,057 | ) | |||||
Increase (decrease) in net assets from fund share transactions |
35,923,057 | (91,092,057 | ) | |||||
Total increase (decrease) in net assets |
(94,535,482 | ) | (25,273,797 | ) | ||||
Net assets |
||||||||
Beginning of year |
397,809,791 | 423,083,588 | ||||||
End of year |
$ | 303,274,309 | $ | 397,809,791 | ||||
The accompanying notes are an integral part of the financial statements.
118
MassMutual Select |
MassMutual Select |
MassMutual Select |
|||||||||||||||||||||
Year |
Year |
Year |
Year |
Year |
Year |
||||||||||||||||||
| $ | 15,245,753 | $ | 14,975,352 | $ | 4,894,856 | $ | 5,802,001 | $ | 25,135,661 | $ | 21,242,490 | ||||||||||||
| (29,819,262 | ) | 8,477,749 | (6,364,698 | ) | 2,344,031 | 187,695,455 | 373,384,641 | ||||||||||||||||
| (90,135,324 | ) | (14,093,209 | ) | (25,272,279 | ) | 792,592 | (755,270,742 | ) | 229,911,478 | ||||||||||||||
| (104,708,833 | ) | 9,359,892 | (26,742,121 | ) | 8,938,624 | (542,439,626 | ) | 624,538,609 | |||||||||||||||
| (25,803,449 | ) | (25,814,917 | ) | (5,878,302 | ) | (6,332,004 | ) | (407,155,724 | ) | (15,903,325 | ) | ||||||||||||
| (25,803,449 | ) | (25,814,917 | ) | (5,878,302 | ) | (6,332,004 | ) | (407,155,724 | ) | (15,903,325 | ) | ||||||||||||
| (125,107,682 | ) | 79,650,846 | 1,336,110 | (5,408,000 | ) | 493,829,914 | (71,726,009 | ) | |||||||||||||||
| (125,107,682 | ) | 79,650,846 | 1,336,110 | (5,408,000 | ) | 493,829,914 | (71,726,009 | ) | |||||||||||||||
| (255,619,964 | ) | 63,195,821 | (31,284,313 | ) | (2,801,380 | ) | (455,765,436 | ) | 536,909,275 | ||||||||||||||
| 814,110,712 | 750,914,891 | 107,177,137 | 109,978,517 | 2,309,625,907 | 1,772,716,632 | ||||||||||||||||||
| $ | 558,490,748 | $ | 814,110,712 | $ | 75,892,824 | $ | 107,177,137 | $ | 1,853,860,471 | $ | 2,309,625,907 | ||||||||||||
The accompanying notes are an integral part of the financial statements.
119
MassMutual Funds – Financial Statements (Continued) |
Statements of Changes in Net Assets |
MassMutual Select |
||||||||
Year |
Year |
|||||||
Increase (Decrease) in Net Assets: |
||||||||
Operations: |
||||||||
Net investment income (loss) |
$ | 15,836,991 | $ | 9,637,353 | ||||
Net realized gain (loss) |
(9,686,739 | ) | 4,801,312 | |||||
Net change in unrealized appreciation (depreciation) |
(16,445,298 | ) | 1,851,147 | |||||
Net increase (decrease) in net assets resulting from operations |
(10,295,046 | ) | 16,289,812 | |||||
Distributions to shareholders (Note 2): |
||||||||
Class I |
(18,493,933 | ) | (6,011,297 | ) | ||||
Total distributions |
(18,493,933 | ) | (6,011,297 | ) | ||||
Net fund share transactions (Note 5): |
||||||||
Class I |
(54,174,044 | ) | 76,140,858 | |||||
Increase (decrease) in net assets from fund share transactions |
(54,174,044 | ) | 76,140,858 | |||||
Total increase (decrease) in net assets |
(82,963,023 | ) | 86,419,373 | |||||
Net assets |
||||||||
Beginning of year |
272,860,061 | 186,440,688 | ||||||
End of year |
$ | 189,897,038 | $ | 272,860,061 | ||||
The accompanying notes are an integral part of the financial statements.
120
MassMutual Select |
MassMutual Select |
MassMutual Select |
|||||||||||||||||||||
Year |
Year |
Year |
Year |
Year |
Year |
||||||||||||||||||
| $ | 7,817,955 | $ | 4,380,467 | $ | 8,597,894 | $ | 8,851,693 | $ | 2,919,573 | $ | 1,650,103 | ||||||||||||
| 8,209,276 | 13,887,744 | 52,148,746 | 111,677,372 | (2,780,390 | ) | (1,861,894 | ) | ||||||||||||||||
| (51,130,281 | ) | 17,574,384 | (250,133,271 | ) | 159,208,298 | (41,812,054 | ) | (9,138,987 | ) | ||||||||||||||
| (35,103,050 | ) | 35,842,595 | (189,386,631 | ) | 279,737,363 | (41,672,871 | ) | (9,350,778 | ) | ||||||||||||||
| (14,576,042 | ) | (2,480,008 | ) | (120,935,066 | ) | (46,818,583 | ) | (1,934,574 | ) | (33,769,639 | ) | ||||||||||||
| (14,576,042 | ) | (2,480,008 | ) | (120,935,066 | ) | (46,818,583 | ) | (1,934,574 | ) | (33,769,639 | ) | ||||||||||||
| 97,651,890 | 29,418,630 | 65,387,523 | (69,363,053 | ) | 61,065,313 | 84,963,305 | |||||||||||||||||
| 97,651,890 | 29,418,630 | 65,387,523 | (69,363,053 | ) | 61,065,313 | 84,963,305 | |||||||||||||||||
| 47,972,798 | 62,781,217 | (244,934,174 | ) | 163,555,727 | 17,457,868 | 41,842,888 | |||||||||||||||||
| 162,366,602 | 99,585,385 | 910,873,579 | 747,317,852 | 109,250,881 | 67,407,993 | ||||||||||||||||||
| $ | 210,339,400 | $ | 162,366,602 | $ | 665,939,405 | $ | 910,873,579 | $ | 126,708,749 | $ | 109,250,881 | ||||||||||||
The accompanying notes are an integral part of the financial statements.
121
MM Equity Asset Fund – Financial Statements (Continued) |
Financial Highlights (For a share outstanding throughout each period) |
Income (loss) from investment |
Less distributions to shareholders |
Ratios / Supplemental Data |
|||||||||||
Net |
Net |
Net |
Total |
From net |
From net |
Total |
Net |
Total |
Net |
Ratio of |
Ratio of |
Net |
|
Class I |
|||||||||||||
9/30/22 |
$ 10.12 |
$ 0.10 |
$ (1.05) |
$ (0.95) |
$ (0.13) |
$ (2.04) |
$ (2.17) |
$ 7.00 |
(14.16%) |
$ 303,274 |
0.23% |
N/A |
1.20% |
9/30/21 |
8.79 |
0.11 |
2.38 |
2.49 |
(0.14) |
(1.02) |
(1.16) |
10.12 |
30.90% |
397,810 |
0.22% |
N/A |
1.20% |
9/30/20 |
7.90 |
0.12 |
1.25 |
1.37 |
(0.11) |
(0.37) |
(0.48) |
8.79 |
17.91% |
423,084 |
0.24% |
N/A |
1.48% |
9/30/19 |
12.36 |
0.12 |
(0.49)aa |
(0.37) |
(0.50) |
(3.59) |
(4.09) |
7.90 |
3.10% |
489,569 |
0.24% |
0.21% |
1.48% |
9/30/18 |
11.85 |
0.24 |
0.99 |
1.23 |
(0.26) |
(0.46) |
(0.72) |
12.36 |
10.73% |
497,747 |
0.26% |
0.25% |
1.99% |
Year ended September 30 |
|||||
2022 |
2021 |
2020 |
2019 |
2018 |
|
Portfolio turnover rate |
39% |
29% |
60% |
49% |
37% |
|
c |
Per share amount calculated on the average shares method. |
|
j |
Computed after giving effect to an agreement by MML Advisers to waive certain fees and expenses of the Fund. |
|
l |
Employee retirement benefit plans that invest plan assets in the Separate Investment Accounts (SIAs) may be subject to certain charges as set forth in their respective Plan Documents. Total return figures would be lower for the periods presented if they reflected these charges. |
|
m |
Total return excludes sales charges, if any, and would be lower for the period presented if it reflected these charges. |
|
aa |
The amount shown for a share outstanding does not correspond with the aggregate net realized and unrealized gain (loss) for the period due to the timing of purchases and redemptions of Fund shares in relation to the fluctuating market values of the Fund. |
The accompanying notes are an integral part of the financial statements.
122
MassMutual Select T. Rowe Price Bond Asset Fund – Financial Statements (Continued) |
Financial Highlights (For a share outstanding throughout each period) |
Income (loss) from investment |
Less distributions to shareholders |
Ratios / Supplemental Data |
|||||||||||
Net |
Net |
Net |
Total |
From net |
From net |
Total |
Net |
Total |
Net |
Ratio of |
Ratio of |
Net |
|
Class I |
|||||||||||||
9/30/22 |
$ 10.43 |
$ 0.21 |
$ (1.67) |
$ (1.46) |
$ (0.31) |
$ (0.03) |
$ (0.34) |
$ 8.63 |
(14.50%) |
$ 558,491 |
0.08% |
0.00% |
2.19% |
9/30/21 |
10.65 |
0.20 |
(0.07) |
0.13 |
(0.16) |
(0.19) |
(0.35) |
10.43 |
1.26% |
814,111 |
0.07% |
0.00% |
1.89% |
9/30/20 |
10.59 |
0.24 |
0.18 |
0.42 |
(0.31) |
(0.05) |
(0.36) |
10.65 |
4.15% |
750,915 |
0.45% |
0.33% |
2.32% |
9/30/19 |
9.94 |
0.29 |
0.69 |
0.98 |
(0.33) |
— |
(0.33) |
10.59 |
10.21% |
670,362 |
0.56% |
0.40% |
2.90% |
9/30/18g |
10.00 |
0.18 |
(0.24) |
(0.06) |
— |
— |
— |
9.94 |
(0.60%)b |
512,086 |
0.51%a |
0.43%a |
2.78%a |
Year ended September 30 |
|||||
2022 |
2021 |
2020 |
2019 |
Period ended |
|
Portfolio turnover rate |
290% |
255% |
157% |
287% |
170% |
|
a |
Annualized. |
|
b |
Percentage represents the results for the period and is not annualized. |
|
c |
Per share amount calculated on the average shares method. |
|
g |
For the period February 9, 2018 (commencement of operations) through September 30, 2018. |
|
j |
Computed after giving effect to an agreement by MML Advisers to waive certain fees and expenses of the Fund. |
|
l |
Employee retirement benefit plans that invest plan assets in the Separate Investment Accounts (SIAs) may be subject to certain charges as set forth in their respective Plan Documents. Total return figures would be lower for the periods presented if they reflected these charges. |
|
m |
Total return excludes sales charges, if any, and would be lower for the period presented if it reflected these charges. |
The accompanying notes are an integral part of the financial statements.
123
MassMutual Select T. Rowe Price Emerging Markets Bond Fund – Financial Statements (Continued) |
Financial Highlights (For a share outstanding throughout each period) |
Income (loss) from investment |
Less distributions to shareholders |
Ratios / Supplemental Data |
|||||||||||
Net |
Net |
Net |
Total |
From net |
From net |
Total |
Net |
Total |
Net |
Ratio of |
Ratio of |
Net |
|
Class I |
|||||||||||||
9/30/22 |
$ 9.73 |
$ 0.44 |
$ (2.82) |
$ (2.38) |
$ (0.54) |
$ — |
$ (0.54) |
$ 6.81 |
(25.84%) |
$ 75,893 |
0.19% |
0.00% |
5.29% |
9/30/21 |
9.50 |
0.51 |
0.31 |
0.82 |
(0.59) |
— |
(0.59) |
9.73 |
8.74% |
107,177 |
0.17% |
0.00% |
5.29% |
9/30/20 |
9.91 |
0.50 |
(0.41) |
0.09 |
(0.50) |
— |
(0.50) |
9.50 |
0.88% |
109,979 |
0.76% |
0.58% |
5.29% |
9/30/19 |
9.64 |
0.53 |
0.06 |
0.59 |
(0.32) |
— |
(0.32) |
9.91 |
6.35% |
110,630 |
0.92% |
0.70% |
5.45% |
9/30/18g |
10.00 |
0.33 |
(0.69) |
(0.36) |
— |
— |
— |
9.64 |
(3.60%)b |
75,004 |
1.01%a |
0.70%a |
5.30%a |
Year ended September 30 |
|||||
2022 |
2021 |
2020 |
2019 |
Period ended |
|
Portfolio turnover rate |
37% |
49% |
56% |
39% |
37% |
|
a |
Annualized. |
|
b |
Percentage represents the results for the period and is not annualized. |
|
c |
Per share amount calculated on the average shares method. |
|
g |
For the period February 9, 2018 (commencement of operations) through September 30, 2018. |
|
j |
Computed after giving effect to an agreement by MML Advisers to waive certain fees and expenses of the Fund. |
|
l |
Employee retirement benefit plans that invest plan assets in the Separate Investment Accounts (SIAs) may be subject to certain charges as set forth in their respective Plan Documents. Total return figures would be lower for the periods presented if they reflected these charges. |
|
m |
Total return excludes sales charges, if any, and would be lower for the period presented if it reflected these charges. |
The accompanying notes are an integral part of the financial statements.
124
MassMutual Select T. Rowe Price Large Cap Blend Fund – Financial Statements (Continued) |
Financial Highlights (For a share outstanding throughout each period) |
Income (loss) from investment |
Less distributions to shareholders |
Ratios / Supplemental Data |
|||||||||||
Net |
Net |
Net |
Total |
From net |
From net |
Total |
Net |
Total |
Net |
Ratio of |
Ratio of |
Net |
|
Class I |
|||||||||||||
9/30/22 |
$ 17.43 |
$ 0.16 |
$ (3.36) |
$ (3.20) |
$ (0.15) |
$ (2.85) |
$ (3.00) |
$ 11.23 |
(22.96%) |
$ 1,853,860 |
0.02% |
0.00% |
1.13% |
9/30/21 |
13.00 |
0.16 |
4.39 |
4.55 |
(0.12) |
— |
(0.12) |
17.43 |
35.17% |
2,309,626 |
0.02% |
0.00% |
0.97% |
9/30/20 |
11.36 |
0.11 |
1.65 |
1.76 |
(0.12) |
— |
(0.12) |
13.00 |
15.60% |
1,772,717 |
0.51% |
0.44% |
0.91% |
9/30/19 |
10.87 |
0.12 |
0.45 |
0.57 |
(0.08) |
— |
(0.08) |
11.36 |
5.39% |
1,280,663 |
0.65% |
0.56% |
1.09% |
9/30/18g |
10.00 |
0.07 |
0.80 |
0.87 |
— |
— |
— |
10.87 |
8.70%b |
923,050 |
0.64%a |
0.58%a |
1.11%a |
Year ended September 30 |
|||||
2022 |
2021 |
2020 |
2019 |
Period ended |
|
Portfolio turnover rate |
121% |
65% |
90% |
67% |
64%q |
|
a |
Annualized. |
|
b |
Percentage represents the results for the period and is not annualized. |
|
c |
Per share amount calculated on the average shares method. |
|
g |
For the period February 9, 2018 (commencement of operations) through September 30, 2018. |
|
j |
Computed after giving effect to an agreement by MML Advisers to waive certain fees and expenses of the Fund. |
|
l |
Employee retirement benefit plans that invest plan assets in the Separate Investment Accounts (SIAs) may be subject to certain charges as set forth in their respective Plan Documents. Total return figures would be lower for the periods presented if they reflected these charges. |
|
m |
Total return excludes sales charges, if any, and would be lower for the period presented if it reflected these charges. |
|
q |
Portfolio turnover excludes securities received from subscriptions in-kind. Securities received from subscriptions in-kind had no impact on portfolio turnover |
The accompanying notes are an integral part of the financial statements.
125
MassMutual Select T. Rowe Price Limited Duration Inflation Focused Bond Fund – Financial Statements (Continued) |
Financial Highlights (For a share outstanding throughout each period) |
Income (loss) from investment |
Less distributions to shareholders |
Ratios / Supplemental Data |
|||||||||||
Net |
Net |
Net |
Total |
From net |
From net |
Total |
Net |
Total |
Net |
Ratio of |
Ratio of |
Net |
|
Class I |
|||||||||||||
9/30/22 |
$ 11.02 |
$ 0.63 |
$ (1.13) |
$ (0.50) |
$ (0.53) |
$ (0.14) |
$ (0.67) |
$ 9.85 |
(4.82%) |
$ 189,897 |
0.07% |
0.00% |
5.97% |
9/30/21 |
10.64 |
0.42 |
0.30 |
0.72 |
(0.19) |
(0.15) |
(0.34) |
11.02 |
6.96% |
272,860 |
0.07% |
0.00% |
3.93% |
9/30/20 |
10.27 |
0.15 |
0.41 |
0.56 |
(0.19) |
(0.00)d |
(0.19) |
10.64 |
5.58% |
186,441 |
0.37% |
0.13% |
1.48% |
9/30/19 |
10.09 |
0.25 |
0.14 |
0.39 |
(0.21) |
— |
(0.21) |
10.27 |
3.95% |
199,074 |
0.44% |
0.16% |
2.50% |
9/30/18g |
10.00 |
0.22 |
(0.13) |
0.09 |
— |
— |
— |
10.09 |
0.90%b |
116,512 |
0.46%a |
0.30%a |
3.36%a |
Year ended September 30 |
|||||
2022 |
2021 |
2020 |
2019 |
Period ended |
|
Portfolio turnover rate |
176% |
193% |
156% |
135% |
66% |
|
a |
Annualized. |
|
b |
Percentage represents the results for the period and is not annualized. |
|
c |
Per share amount calculated on the average shares method. |
|
d |
Amount is less than $0.005 per share. |
|
g |
For the period February 9, 2018 (commencement of operations) through September 30, 2018. |
|
j |
Computed after giving effect to an agreement by MML Advisers to waive certain fees and expenses of the Fund. |
|
l |
Employee retirement benefit plans that invest plan assets in the Separate Investment Accounts (SIAs) may be subject to certain charges as set forth in their respective Plan Documents. Total return figures would be lower for the periods presented if they reflected these charges. |
|
m |
Total return excludes sales charges, if any, and would be lower for the period presented if it reflected these charges. |
The accompanying notes are an integral part of the financial statements.
126
MassMutual Select T. Rowe Price Real Assets Fund – Financial Statements (Continued) |
Financial Highlights (For a share outstanding throughout each period) |
Income (loss) from investment |
Less distributions to shareholders |
Ratios / Supplemental Data |
|||||||||||
Net |
Net |
Net |
Total |
From net |
From net |
Total |
Net |
Total |
Net |
Ratio of |
Ratio of |
Net |
|
Class I |
|||||||||||||
9/30/22 |
$ 12.85 |
$ 0.49 |
$ (1.86) |
$ (1.37) |
$ (0.36) |
$ (0.78) |
$ (1.14) |
$ 10.34 |
(12.24%) |
$ 210,339 |
0.09% |
0.00% |
3.93% |
9/30/21 |
9.83 |
0.37 |
2.89 |
3.26 |
(0.24) |
— |
(0.24) |
12.85 |
33.66% |
162,367 |
0.13% |
0.00% |
3.04% |
9/30/20 |
10.49 |
0.23 |
(0.60) |
(0.37) |
(0.29) |
— |
(0.29) |
9.83 |
(3.77%) |
99,585 |
0.69% |
0.50% |
2.33% |
9/30/19 |
10.56 |
0.27 |
(0.16) |
0.11 |
(0.18) |
— |
(0.18) |
10.49 |
1.26% |
82,224 |
0.86% |
0.61% |
2.60% |
9/30/18g |
10.00 |
0.19 |
0.37 |
0.56 |
— |
— |
— |
10.56 |
5.60%b |
61,160 |
1.00%a |
0.61%a |
2.86%a |
Year ended September 30 |
|||||
2022 |
2021 |
2020 |
2019 |
Period ended |
|
Portfolio turnover rate |
43% |
57% |
32% |
40% |
13%q |
|
a |
Annualized. |
|
b |
Percentage represents the results for the period and is not annualized. |
|
c |
Per share amount calculated on the average shares method. |
|
g |
For the period February 9, 2018 (commencement of operations) through September 30, 2018. |
|
j |
Computed after giving effect to an agreement by MML Advisers to waive certain fees and expenses of the Fund. |
|
l |
Employee retirement benefit plans that invest plan assets in the Separate Investment Accounts (SIAs) may be subject to certain charges as set forth in their respective Plan Documents. Total return figures would be lower for the periods presented if they reflected these charges. |
|
m |
Total return excludes sales charges, if any, and would be lower for the period presented if it reflected these charges. |
|
q |
Portfolio turnover excludes securities received from subscriptions in-kind. Securities received from subscriptions in-kind had no impact on portfolio turnover. |
The accompanying notes are an integral part of the financial statements.
127
MassMutual Select T. Rowe Price Small and Mid Cap Blend Fund – Financial Statements (Continued) |
Financial Highlights (For a share outstanding throughout each period) |
Income (loss) from investment |
Less distributions to shareholders |
Ratios / Supplemental Data |
|||||||||||
Net |
Net |
Net |
Total |
From net |
From net |
Total |
Net |
Total |
Net |
Ratio of |
Ratio of |
Net |
|
Class I |
|||||||||||||
9/30/22 |
$ 16.20 |
$ 0.14 |
$ (3.18) |
$ (3.04) |
$ (0.16) |
$ (1.99) |
$ (2.15) |
$ 11.01 |
(21.64%) |
$ 665,939 |
0.03% |
0.00% |
1.04% |
9/30/21 |
12.41 |
0.15 |
4.43 |
4.58 |
(0.10) |
(0.69) |
(0.79) |
16.20 |
37.99% |
910,874 |
0.04% |
0.00% |
0.97% |
9/30/20 |
11.44 |
0.07 |
1.18 |
1.25 |
(0.07) |
(0.21) |
(0.28) |
12.41 |
10.97% |
747,318 |
0.61% |
0.53% |
0.58% |
9/30/19 |
11.47 |
0.07 |
0.09 |
0.16 |
(0.04) |
(0.15) |
(0.19) |
11.44 |
1.72% |
632,662 |
0.76% |
0.65% |
0.59% |
9/30/18g |
10.00 |
0.03 |
1.44 |
1.47 |
— |
— |
— |
11.47 |
14.70%b |
473,030 |
0.75%a |
0.65%a |
0.40%a |
Year ended September 30 |
|||||
2022 |
2021 |
2020 |
2019 |
Period ended |
|
Portfolio turnover rate |
34% |
28% |
41% |
33% |
22%q |
|
a |
Annualized. |
|
b |
Percentage represents the results for the period and is not annualized. |
|
c |
Per share amount calculated on the average shares method. |
|
g |
For the period February 9, 2018 (commencement of operations) through September 30, 2018. |
|
j |
Computed after giving effect to an agreement by MML Advisers to waive certain fees and expenses of the Fund. |
|
l |
Employee retirement benefit plans that invest plan assets in the Separate Investment Accounts (SIAs) may be subject to certain charges as set forth in their respective Plan Documents. Total return figures would be lower for the periods presented if they reflected these charges. |
|
m |
Total return excludes sales charges, if any, and would be lower for the period presented if it reflected these charges. |
|
q |
Portfolio turnover excludes securities received from subscriptions in-kind. Securities received from subscriptions in-kind had no impact on portfolio turnover. |
The accompanying notes are an integral part of the financial statements.
128
MassMutual Select T. Rowe Price U.S. Treasury Long-Term Index Fund – Financial Statements (Continued) |
Financial Highlights (For a share outstanding throughout each period) |
Income (loss) from investment |
Less distributions to shareholders |
Ratios / Supplemental Data |
|||||||||||
Net |
Net |
Net |
Total |
From net |
From net |
Total |
Net |
Total |
Net |
Ratio of |
Ratio of |
Net |
|
Class I |
|||||||||||||
9/30/22 |
$ 7.62 |
$ 0.15 |
$ (2.17) |
$ (2.02) |
$ (0.13) |
$ — |
$ (0.13) |
$ 5.47 |
(26.97%) |
$ 126,709 |
0.11% |
0.00% |
2.29% |
9/30/21 |
13.07 |
0.14 |
(1.17) |
(1.03) |
(0.16) |
(4.26) |
(4.42) |
7.62 |
(10.55%) |
109,251 |
0.15% |
0.00% |
1.69% |
9/30/20 |
12.25 |
0.25 |
1.45 |
1.70 |
(0.31) |
(0.57) |
(0.88) |
13.07 |
15.26% |
67,408 |
0.42% |
0.13% |
2.07% |
9/30/19 |
10.03 |
0.30 |
2.12 |
2.42 |
(0.20) |
— |
(0.20) |
12.25 |
24.53% |
153,801 |
0.43% |
0.16% |
2.74% |
9/30/18g |
10.00 |
0.18 |
(0.15) |
0.03 |
— |
— |
— |
10.03 |
0.30%b |
113,795 |
0.46%a |
0.30%a |
2.72%a |
Year ended September 30 |
|||||
2022 |
2021 |
2020 |
2019 |
Period ended |
|
Portfolio turnover rate |
102% |
116% |
206% |
155% |
37% |
|
a |
Annualized. |
|
b |
Percentage represents the results for the period and is not annualized. |
|
c |
Per share amount calculated on the average shares method. |
|
g |
For the period February 9, 2018 (commencement of operations) through September 30, 2018. |
|
j |
Computed after giving effect to an agreement by MML Advisers to waive certain fees and expenses of the Fund. |
|
l |
Employee retirement benefit plans that invest plan assets in the Separate Investment Accounts (SIAs) may be subject to certain charges as set forth in their respective Plan Documents. Total return figures would be lower for the periods presented if they reflected these charges. |
|
m |
Total return excludes sales charges, if any, and would be lower for the period presented if it reflected these charges. |
The accompanying notes are an integral part of the financial statements.
129
|
1. |
The Funds |
MassMutual Select Funds (the “Trust”) is registered under the Investment Company Act of 1940, as amended (the “1940 Act”), as an open-end management investment company. The Trust is organized under the laws of the Commonwealth of Massachusetts as a Massachusetts business trust pursuant to an Agreement and Declaration of Trust dated May 28, 1993, as amended and restated as of November 21, 2011, as it may be further amended from time to time. The Trust consists of 51 series, including the following eight series listed below (each individually referred to as a “Fund” or collectively as the “Funds”):
MM Equity Asset Fund (“Equity Asset Fund”)
MassMutual Select T. Rowe Price Bond Asset Fund (“MM Select T. Rowe Price Bond Asset Fund”)
MassMutual Select T. Rowe Price Emerging Markets Bond Fund (“MM Select T. Rowe Price Emerging Markets Bond Fund”)
MassMutual Select T. Rowe Price Large Cap Blend Fund (“MM Select T. Rowe Price Large Cap Blend Fund”)
MassMutual Select T. Rowe Price Limited Duration Inflation Focused Bond Fund (“MM Select T. Rowe Price Limited Duration Inflation Focused Bond Fund”)
MassMutual Select T. Rowe Price Real Assets Fund (“MM Select T. Rowe Price Real Assets Fund”)
MassMutual Select T. Rowe Price Small and Mid Cap Blend Fund (“MM Select T. Rowe Price Small and Mid Cap Blend Fund”)
MassMutual Select T. Rowe Price U.S. Treasury Long-Term Index Fund (“MM Select T. Rowe Price U.S. Treasury Long-Term Index Fund”)
|
2. |
Significant Accounting Policies |
The following is a summary of significant accounting policies followed consistently by each Fund in the preparation of the financial statements in conformity with accounting principles generally accepted in the United States of America (“generally accepted accounting principles”). The preparation of the financial statements in accordance with generally accepted accounting principles requires management to make estimates and assumptions that affect the reported amounts and disclosures in the financial statements. Actual results could differ from those estimates.
Each Fund is an investment company and accordingly follows the investment company accounting and reporting guidance of the Financial Accounting Standards Board (“FASB”) Accounting Standards Codification Topic 946, Financial Services – Investment Companies.
Investment Valuation
The net asset value of each Fund’s shares is determined once daily as of the close of regular trading on the New York Stock Exchange (“NYSE”), on each day the NYSE is open for trading (a “business day”). The NYSE normally closes at 4:00 p.m. Eastern Time, but may close earlier on some days. If the NYSE is scheduled to close early, the business day will be considered to end as of the time of the NYSE’s scheduled close. A Fund will not treat an intraday disruption in NYSE trading or other event that causes an unscheduled closing of the NYSE as a close of business of the NYSE for these purposes; instead, MML Investment Advisers, LLC (“MML Advisers”) will determine the fair value of a Fund’s securities in accordance with MML Advisers’ fair valuation policy and procedures. On holidays and other days when the NYSE is closed, each Fund’s net asset value generally is not calculated and the Funds do not anticipate accepting buy or sell orders. However, the value of each Fund’s assets may still be affected on such days to the extent that a Fund holds foreign securities that trade on days that foreign securities markets are open.
Equity securities and derivative contracts that are actively traded on a national securities exchange or contract market are valued on the basis of information furnished by a pricing service, which provides the last reported sale price, or, in the case of futures contracts, the settlement price, for securities or derivatives listed on the exchange or contract market or the official closing price on the NASDAQ National Market System (“NASDAQ System”), or in the case of over-the-counter (“OTC”) securities for which an official closing price is unavailable or not reported on the NASDAQ System, the last reported bid price. Portfolio securities traded on more than one national securities exchange are valued at the last price at the close of the exchange representing the principal market for such securities. Debt securities are valued on the basis of valuations furnished by a pricing service, which generally determines valuations taking into account factors such as institutional-size trading in similar securities, yield, quality, coupon rate, maturity, type of issue, trading characteristics, and other market data. Shares of other open-end mutual funds are valued at their closing net asset values as reported on each business day.
130
Notes to Financial Statements (Continued) |
Investments for which market quotations are readily available are marked to market daily based on those quotations. Market quotations may be provided by third-party vendors or market makers, and may be determined on the basis of a variety of factors, such as broker quotations, financial modeling, and other market data, such as market indexes and yield curves, counterparty information, and foreign exchange rates. U.S. Government and agency securities may be valued on the basis of market quotations or using a model that may incorporate market observable data such as reported sales of similar securities, broker quotes, yields, bids, offers, quoted market prices, and reference data. The fair values of OTC derivative contracts, including forward, swap, and option contracts related to interest rates, foreign currencies, credit standing of reference entities, equity prices, or commodity prices, may be based on market quotations or may be modeled using a series of techniques, including simulation models, depending on the contract and the terms of the transaction. The fair values of asset-backed securities and mortgage-backed securities are estimated based on models that consider the estimated cash flows of each debt tranche of the issuer, established benchmark yield, and estimated tranche-specific spread to the benchmark yield based on the unique attributes of the tranche, including, but not limited to, prepayment speed assumptions and attributes of the collateral.
The Board of Trustees (“Trustees”) have designated MML Advisers as the Funds’ “valuation designee,” responsible for determining the fair value, in good faith, of securities and other instruments held by the Funds for which market quotations are not readily available or for which such market quotations or values are considered by MML Advisers or a subadviser to be unreliable (including, for example, certain foreign securities, thinly-traded securities, certain restricted securities, certain initial public offerings, or securities whose values may have been affected by a significant event). It is possible that a significant amount of a Fund’s assets will be subject to fair valuation in accordance with MML Advisers’ fair valuation policy and procedures. The fair value determined for an investment by MML Advisers may differ from recent market prices for the investment and may be significantly different from the value realized upon the sale of such investment.
The Funds may invest in securities that are traded principally in foreign markets and that trade on weekends and other days when the Funds do not price their shares. As a result, the values of the Funds’ portfolio securities may change on days when the prices of the Funds’ shares are not calculated. The prices of the Funds’ shares will reflect any such changes when the prices of the Funds’ shares are next calculated, which is the next business day. The Funds may use fair value pricing more frequently for securities primarily traded in foreign markets because, among other things, most foreign markets close well before the Funds value their securities. The earlier close of these foreign markets gives rise to the possibility that significant events, including broad market moves, may have occurred in the interim. The Funds’ investments may be priced based on fair values provided by a third-party vendor, based on certain factors and methodologies applied by such vendor, in the event that there is movement in the U.S. market, between the close of the foreign market and the time the Funds calculate their net asset values. All assets and liabilities expressed in foreign currencies are converted into U.S. dollars at the mean between the buying and selling rates of such currencies against the U.S. dollar at the end of each business day.
Investments in equity or debt issued by privately held companies or funds (“Private Company” or collectively, the “Private Companies”) and any other investments fair valued using significant unobservable inputs may be fair valued using one or a combination of, but not limited to, the following inputs:
Market approach: (i) recent market transactions, including subsequent rounds of financing, in the underlying investment or comparable issuers; (ii) recapitalizations and other transactions across the capital structure; and (iii) market multiples of comparable issuers.
Income approach: (i) future cash flows discounted to present value and adjusted as appropriate for liquidity, credit, and/or market risks; (ii) quoted prices for similar investments or assets in active markets; and (iii) other risk factors, such as interest rates, yield curves, volatilities, prepayment speeds, loss severities, credit risks, recovery rates, liquidation amounts, and/or default rates.
Cost approach: (i) audited or unaudited financial statements, investor communications, and financial or operational metrics issued by the Private Company; (ii) changes in the valuation of relevant indexes or publicly traded companies comparable to the Private Company; (iii) relevant news and other public sources; and (iv) known secondary market transactions in the Private Company’s interests and merger or acquisition activity in companies comparable to the Private Company.
131
Notes to Financial Statements (Continued) |
Investments in series of preferred stock issued by Private Companies are typically valued utilizing the Market approach in determining the enterprise value of the company. Such investments often contain rights and preferences that differ from other series of preferred and common stock of the same issuer. Valuation techniques such as the current value method (“CVM”), an option pricing model (“OPM”), a probability weighted expected return model (“PWERM”), or a hybrid of those techniques are used in allocating enterprise value of the company, as deemed appropriate under the circumstances. The CVM allocates value among the various parts of a company’s capital structure assuming that the value of convertible preferred stock is represented by the most favorable claim the preferred stockholders have on the enterprise value as of the valuation date. The use of OPM and PWERM techniques involve a determination of the exit scenarios of the investment in order to appropriately allocate the enterprise value of the company among the various parts of its capital structure.
The Private Companies are not subject to the public company disclosure, timing, and reporting standards as other investments held by a Fund. Typically, the most recently available information for a Private Company is as of a date that is earlier than the date a Fund is calculating its net asset value. This factor may result in a difference between the value of the investment and the price a Fund could receive upon the sale of the investment.
Fair value is defined as the price that would be received to sell an asset or paid to transfer a liability in an orderly transaction between market participants at the measurement date. A three-tier hierarchy is utilized to maximize the use of observable market data inputs and minimize the use of unobservable inputs and to establish classification of fair value measurements for disclosure purposes. Inputs refer broadly to the assumptions that market participants would use in pricing the asset or liability, including assumptions about risk, for example, the risk inherent in a particular valuation technique used to measure fair value (such as a pricing model) and/or the risk inherent in the inputs to the valuation technique. Inputs may be observable or unobservable. Observable inputs are inputs that reflect the assumptions market participants would use in pricing the asset or liability and are developed based on market data obtained from sources independent of the reporting entity. Unobservable inputs are inputs that reflect the reporting entity’s own assumptions about the assumptions market participants would use in pricing the asset or liability and are developed based on the best information available in the circumstances. The three-tier hierarchy of inputs is summarized in the three broad Levels listed below. The inputs or methodology used for valuing investments are not necessarily an indication of the risk associated with investing in those investments and the determination of the significance of a particular input to the fair value measurement in its entirety requires judgment and consideration of factors specific to each security.
Level 1 – quoted prices (unadjusted) in active markets for identical investments that the Funds can access at the measurement date
Level 2 – other significant observable inputs (including quoted prices for similar investments, interest rates, prepayment speeds, credit risk, etc.)
Level 3 – significant unobservable inputs, to the extent observable inputs are not available (including the Funds’ own assumptions in determining the fair value of investments)
The availability of observable inputs can vary from security to security and is affected by a wide variety of factors, including, for example, the type of security, whether the security is new and not yet established in the marketplace, the liquidity of markets, and other characteristics particular to the security. To the extent that valuation is based on models or inputs that are less observable or unobservable in the market, the determination of fair value requires more judgment. Accordingly, the degree of judgment exercised in determining fair value is greatest for instruments categorized in Level 3.
Changes in valuation techniques may result in transfers in or out of an investment’s assigned Level within the hierarchy. In addition, in periods of market dislocation, the observability of prices and inputs may be reduced for many instruments. This condition, as well as changes related to liquidity of investments, could cause a security to be reclassified between Levels.
In certain cases, the inputs used to measure fair value may fall into different Levels of the fair value hierarchy. In such cases, for disclosure purposes, the Level in the fair value hierarchy within which the fair value measurement falls is determined based on the lowest Level input that is significant to the overall fair value measurement.
132
Notes to Financial Statements (Continued) |
The following is the aggregate value by input level, as of September 30, 2022, for the Funds’ investments:
Level 1 |
Level 2 |
Level 3 |
Total |
|||||||||||||
Equity Asset Fund |
||||||||||||||||
Asset Investments |
||||||||||||||||
Common Stock |
$ | 298,247,260 | $ | 13,288 | * | $ | — | $ | 298,260,548 | |||||||
Rights |
— | — | — | +,** | — | |||||||||||
Mutual Funds |
146,204 | — | — | 146,204 | ||||||||||||
Short-Term Investments |
— | 4,174,155 | — | 4,174,155 | ||||||||||||
Total Investments |
$ | 298,393,464 | $ | 4,187,443 | $ | — | $ | 302,580,907 | ||||||||
Liability Derivatives |
||||||||||||||||
Futures Contracts |
$ | (423,966 | ) | — | $ | — | $ | (423,966 | ) | |||||||
MM Select T. Rowe Price Bond Asset Fund |
||||||||||||||||
Asset Investments |
||||||||||||||||
Bank Loans (Less Unfunded Loan Commitments) |
$ | — | $ | 9,672,196 | $ | — | $ | 9,672,196 | ||||||||
Corporate Debt |
— | 155,174,996 | — | 155,174,996 | ||||||||||||
Municipal Obligations |
— | 368,163 | — | 368,163 | ||||||||||||
Non-U.S. Government Agency Obligations |
— | 53,029,439 | — | 53,029,439 | ||||||||||||
Sovereign Debt Obligations |
— | 101,045,141 | — | 101,045,141 | ||||||||||||
U.S. Government Agency Obligations and Instrumentalities |
— | 115,971,832 | — | 115,971,832 | ||||||||||||
U.S. Treasury Obligations |
— | 96,181,993 | — | 96,181,993 | ||||||||||||
Mutual Funds |
14,276,024 | — | — | 14,276,024 | ||||||||||||
Short-Term Investments |
37,014,156 | 5,167,629 | — | 42,181,785 | ||||||||||||
Unfunded Loan Commitments*** |
— | (3,553 | ) | — | (3,553 | ) | ||||||||||
Total Investments |
$ | 51,290,180 | $ | 536,607,836 | $ | — | $ | 587,898,016 | ||||||||
Asset Derivatives |
||||||||||||||||
Forward Contracts |
$ | — | $ | 8,771,169 | $ | — | $ | 8,771,169 | ||||||||
Futures Contracts |
132,931 | — | — | 132,931 | ||||||||||||
Swap Agreements |
— | 890,938 | — | 890,938 | ||||||||||||
Total |
$ | 132,931 | $ | 9,662,107 | $ | — | $ | 9,795,038 | ||||||||
Liability Derivatives |
||||||||||||||||
Forward Contracts |
$ | — | $ | (1,150,880 | ) | $ | — | $ | (1,150,880 | ) | ||||||
Futures Contracts |
(2,560,145 | ) | — | — | (2,560,145 | ) | ||||||||||
Swap Agreements |
— | (2,180,252 | ) | — | (2,180,252 | ) | ||||||||||
Total |
$ | (2,560,145 | ) | $ | (3,331,132 | ) | $ | — | $ | (5,891,277 | ) | |||||
MM Select T. Rowe Price Emerging Markets Bond Fund |
||||||||||||||||
Asset Investments |
||||||||||||||||
Corporate Debt |
$ | — | $ | 24,190,939 | $ | — | $ | 24,190,939 | ||||||||
Sovereign Debt Obligations |
— | 47,419,924 | — | 47,419,924 | ||||||||||||
Mutual Funds |
693,325 | — | — | 693,325 | ||||||||||||
Short-Term Investments |
1,319,119 | 1,293,929 | — | 2,613,048 | ||||||||||||
Total Investments |
$ | 2,012,444 | $ | 72,904,792 | $ | — | $ | 74,917,236 | ||||||||
Asset Derivatives |
||||||||||||||||
Forward Contract |
$ | — | $ | 172,137 | $ | — | $ | 172,137 | ||||||||
Futures Contracts |
146,544 | — | — | 146,544 | ||||||||||||
Total |
$ | 146,544 | $ | 172,137 | $ | — | $ | 318,681 | ||||||||
Liability Derivatives |
||||||||||||||||
Forward Contract |
$ | — | $ | (16,032 | ) | $ | — | $ | (16,032 | ) | ||||||
Futures Contracts |
(72,080 | ) | — | — | (72,080 | ) | ||||||||||
Swap Agreements |
— | (22,175 | ) | — | (22,175 | ) | ||||||||||
Total |
$ | (72,080 | ) | $ | (38,207 | ) | $ | — | $ | (110,287 | ) | |||||
133
Notes to Financial Statements (Continued) |
Level 1 |
Level 2 |
Level 3 |
Total |
|||||||||||||
MM Select T. Rowe Price Large Cap Blend Fund |
||||||||||||||||
Asset Investments |
||||||||||||||||
Common Stock |
$ | 1,738,398,274 | $ | 19,610,391 | * | $ | 5,313,506 | ** | $ | 1,763,322,171 | ||||||
Preferred Stock |
3,628,329 | — | 11,610,605 | ** | 15,238,934 | |||||||||||
Corporate Debt |
— | — | 50,373 | ** | 50,373 | |||||||||||
Short-Term Investments |
74,827,930 | 997,435 | — | 75,825,365 | ||||||||||||
Total Investments |
$ | 1,816,854,533 | $ | 20,607,826 | $ | 16,974,484 | $ | 1,854,436,843 | ||||||||
MM Select T. Rowe Price Limited Duration Inflation Focused Bond Fund |
||||||||||||||||
Asset Investments |
||||||||||||||||
Corporate Debt |
$ | — | $ | 10,128,370 | $ | — | $ | 10,128,370 | ||||||||
Municipal Obligations |
— | 838,658 | — | 838,658 | ||||||||||||
Non-U.S. Government Agency Obligations |
— | 11,155,432 | — | 11,155,432 | ||||||||||||
U.S. Government Agency Obligations and Instrumentalities |
— | 5,509,185 | — | 5,509,185 | ||||||||||||
U.S. Treasury Obligations |
— | 150,695,178 | — | 150,695,178 | ||||||||||||
Mutual Funds |
11,737,424 | — | — | 11,737,424 | ||||||||||||
Purchased Options |
6,047 | — | — | 6,047 | ||||||||||||
Short-Term Investments |
13,894,851 | 666,805 | — | 14,561,656 | ||||||||||||
Total Investments |
$ | 25,638,322 | $ | 178,993,628 | $ | — | $ | 204,631,950 | ||||||||
Asset Derivatives |
||||||||||||||||
Forward Contracts |
$ | — | $ | 112,375 | $ | — | $ | 112,375 | ||||||||
Futures Contracts |
545,249 | — | — | 545,249 | ||||||||||||
Swap Agreements |
— | 3,421,875 | — | 3,421,875 | ||||||||||||
Total |
$ | 545,249 | $ | 3,534,250 | $ | — | $ | 4,079,499 | ||||||||
Liability Derivatives |
||||||||||||||||
Forward Contracts |
$ | — | $ | (125,307 | ) | $ | — | $ | (125,307 | ) | ||||||
Futures Contracts |
(167,574 | ) | — | — | (167,574 | ) | ||||||||||
Swap Agreements |
— | (108,701 | ) | — | (108,701 | ) | ||||||||||
Total |
$ | (167,574 | ) | $ | (234,008 | ) | $ | — | $ | (401,582 | ) | |||||
MM Select T. Rowe Price Real Assets Fund |
||||||||||||||||
Asset Investments |
||||||||||||||||
Common Stock* |
||||||||||||||||
Australia |
$ | — | $ | 18,045,754 | $ | — | $ | 18,045,754 | ||||||||
Austria |
— | 23,488 | — | 23,488 | ||||||||||||
Belgium |
— | 426,905 | — | 426,905 | ||||||||||||
Bermuda |
— | 746,193 | — | 746,193 | ||||||||||||
Brazil |
1,088,957 | — | — | 1,088,957 | ||||||||||||
Canada |
16,602,630 | — | — | 16,602,630 | ||||||||||||
Cayman Islands |
— | 966,453 | — | 966,453 | ||||||||||||
Denmark |
— | 616,200 | — | 616,200 | ||||||||||||
Finland |
— | 2,373,100 | — | 2,373,100 | ||||||||||||
France |
— | 4,185,778 | — | 4,185,778 | ||||||||||||
Hong Kong |
— | 560,754 | — | 560,754 | ||||||||||||
Ireland |
1,606,756 | — | — | 1,606,756 | ||||||||||||
Japan |
— | 5,173,606 | — | 5,173,606 | ||||||||||||
Kazakhstan |
— | 692,584 | — | 692,584 | ||||||||||||
Luxembourg |
584,445 | 382,421 | — | 966,866 | ||||||||||||
Mexico |
1,136,202 | — | — | 1,136,202 | ||||||||||||
Netherlands |
— | 623,092 | — | 623,092 | ||||||||||||
Norway |
— | 3,603,780 | — | 3,603,780 | ||||||||||||
Portugal |
— | 740,705 | — | 740,705 | ||||||||||||
Republic of Korea |
— | 739,310 | — | 739,310 | ||||||||||||
Russia |
— | — | — | +,** | — | |||||||||||
134
Notes to Financial Statements (Continued) |
Level 1 |
Level 2 |
Level 3 |
Total |
|||||||||||||
MM Select T. Rowe Price Real Assets Fund (Continued) |
||||||||||||||||
Asset Investments (Continued) |
||||||||||||||||
Common Stock* (Continued) |
||||||||||||||||
Singapore |
$ | — | $ | 1,197,087 | $ | — | $ | 1,197,087 | ||||||||
South Africa |
— | 334,703 | — | 334,703 | ||||||||||||
Spain |
— | 607,580 | — | 607,580 | ||||||||||||
Sweden |
— | 6,960,199 | — | 6,960,199 | ||||||||||||
Switzerland |
— | 284,352 | — | 284,352 | ||||||||||||
United Kingdom |
375,345 | 8,779,475 | — | 9,154,820 | ||||||||||||
United States |
110,079,797 | — | — | 110,079,797 | ||||||||||||
Preferred Stock |
||||||||||||||||
United States |
896,687 | — | 1,312,644 | ** | 2,209,331 | |||||||||||
Mutual Funds |
10,988,488 | — | — | 10,988,488 | ||||||||||||
Short-Term Investments |
8,257,913 | 2,077,401 | — | 10,335,314 | ||||||||||||
Total Investments |
$ | 151,617,220 | $ | 60,140,920 | $ | 1,312,644 | $ | 213,070,784 | ||||||||
Asset Derivatives |
||||||||||||||||
Forward Contracts |
$ | — | $ | 79,336 | $ | — | $ | 79,336 | ||||||||
Futures Contracts |
1,145,077 | — | — | 1,145,077 | ||||||||||||
Total |
$ | 1,145,077 | $ | 79,336 | $ | — | $ | 1,224,413 | ||||||||
Liability Derivatives |
||||||||||||||||
Forward Contracts |
$ | — | $ | (273,208 | ) | $ | — | $ | (273,208 | ) | ||||||
Futures Contracts |
(1,026,396 | ) | — | — | (1,026,396 | ) | ||||||||||
Swap Agreements |
— | (274,739 | ) | — | (274,739 | ) | ||||||||||
Total |
$ | (1,026,396 | ) | $ | (547,947 | ) | $ | — | $ | (1,574,343 | ) | |||||
MM Select T. Rowe Price Small and Mid Cap Blend Fund |
||||||||||||||||
Asset Investments |
||||||||||||||||
Common Stock |
$ | 598,087,103 | $ | 16,483,053 | * | $ | 1,767,594 | $ | 616,337,750 | |||||||
Preferred Stock |
— | 525,649 | * | 15,270,575 | 15,796,224 | |||||||||||
Rights |
— | — | 28,892 | 28,892 | ||||||||||||
Warrants |
3,480 | 6,870 | 7,487 | 17,837 | ||||||||||||
Mutual Funds |
5,671,215 | — | — | 5,671,215 | ||||||||||||
Short-Term Investments |
33,845,374 | 999,387 | — | 34,844,761 | ||||||||||||
Total Investments |
$ | 637,607,172 | $ | 18,014,959 | $ | 17,074,548 | $ | 672,696,679 | ||||||||
MM Select T. Rowe Price U.S. Treasury Long-Term Index Fund |
||||||||||||||||
Asset Investments |
||||||||||||||||
U.S. Government Agency Obligations and Instrumentalities |
$ | — | $ | 3,857,943 | $ | — | $ | 3,857,943 | ||||||||
U.S. Treasury Obligations |
— | 121,980,286 | — | 121,980,286 | ||||||||||||
Mutual Funds |
375,215 | — | — | 375,215 | ||||||||||||
Purchased Options |
4,078 | — | — | 4,078 | ||||||||||||
Short-Term Investments |
605,545 | 1,003,737 | — | 1,609,282 | ||||||||||||
Total Investments |
$ | 984,838 | $ | 126,841,966 | $ | — | $ | 127,826,804 | ||||||||
Asset Derivatives |
||||||||||||||||
Futures Contracts |
$ | 383,459 | $ | — | $ | — | $ | 383,459 | ||||||||
Liability Derivatives |
||||||||||||||||
Futures Contracts |
$ | (555,862 | ) | $ | — | $ | — | $ | (555,862 | ) | ||||||
|
* |
Includes foreign equity securities whose values were adjusted to reflect market trading of comparable securities or other correlated instruments after the close of trading in their respective foreign markets, as applicable. |
|
** |
Level 3 investments at September 30, 2022 in relation to net assets were not significant. |
|
*** |
Unfunded loan commitments are valued at the unrealized appreciation (depreciation) on the commitment. |
|
+ |
Represents a security at $0 value as of September 30, 2022. |
135
Notes to Financial Statements (Continued) |
For certain Fund(s) the Statement of Assets and Liabilities shows receivables from investments sold on a delayed delivery basis, cash collateral pledged for open derivatives, as well as, any applicable liabilities for investments purchased on a delayed delivery basis, amounts due to custodian, cash collateral held for open derivatives, and cash collateral held for securities on loan. These amounts approximate fair value and would be categorized at Level 2 for each applicable Fund as of September 30, 2022.
The Funds, with the exception of the MM Select T. Rowe Price Real Assets Fund and MM Select T. Rowe Price Small and Mid Cap Blend Fund, had no Level 3 transfers during the year ended September 30, 2022. The MM Select T. Rowe Price Small and Mid Cap Blend Fund had Level 3 transfers during the year ended September 30, 2022; however, none of the transfers individually or collectively had a material impact on the MM Select T. Rowe Price Small and Mid Cap Blend Fund.
The following table shows the Level 3 transfers for the MM Select T. Rowe Price Real Assets Fund for the year ended September 30, 2022:
Transfers In * |
Transfers Out * |
|||||||
Level 3 - |
Level 2 - |
|||||||
MM Select T. Rowe Price Real Assets Fund |
$ | 2,457,770 | $ | (2,457,770 | ) | |||
|
* |
Transfers into Level 3 were attributable to a lack of observable market data. |
Following is a reconciliation of investments for which significant unobservable inputs (Level 3) were used in determining value:
Asset Valuation Inputs |
||||||||||||||||||||||||||||||||||||||||
Investments in Securities |
||||||||||||||||||||||||||||||||||||||||
Balance |
Accrued |
Realized |
Change in |
Purchases |
(Sales) |
Transfers |
Transfers |
Balance |
Net Change |
|||||||||||||||||||||||||||||||
MM Select T. Rowe Price Small and Mid Cap Blend Fund |
||||||||||||||||||||||||||||||||||||||||
Common Stock |
$ | 2,687,443 | $ | — | $ | 126,357 | $ | (651,946 | ) | $ | 220,357 | $ | (637,029 | ) | $ | 22,412 | $ | — | $ | 1,767,594 | $ | (525,571 | ) | |||||||||||||||||
Preferred Stock |
20,626,567 | — | 126,696 | (5,975,879 | ) | 2,418,768 | (1,925,577 | ) | — | — | 15,270,575 | (1,472,745 | ) | |||||||||||||||||||||||||||
Warrants |
3,176 | — | — | 4,311 | — | — | — | — | 7,487 | 4,311 | ||||||||||||||||||||||||||||||
Rights |
1,218 | — | — | 27,674 | — | — | — | — | 28,892 | 27,674 | ||||||||||||||||||||||||||||||
| $ | 23,318,404 | $ | — | $ | 253,053 | $ | (6,595,840 | ) | $ | 2,639,125 | $ | (2,562,606 | ) | $ | 22,412 | $ | — | $ | 17,074,548 | $ | (1,966,331 | ) | ||||||||||||||||||
The MM Select T. Rowe Price Small and Mid Cap Blend Fund may fair value certain of its Level 3 investments using acquisition cost, although the transaction may not have occurred during the current reporting period. These investments are generally privately held investments, but may include defaulted securities and new debt issuances. There may not be a secondary market for such investments, and/or there are a limited number of investors. The determination to fair value such investments at cost is based upon factors consistent with the principles of fair value measurement that are reasonably available to the Valuation Committee. Valuations are reviewed by members of the Valuation Committee utilizing available market information to determine if the carrying value of these investments should be adjusted. Such market data may include, but is not limited to, observations of the trading multiples of public companies considered comparable to the private companies being valued, financial or operational
136
Notes to Financial Statements (Continued) |
information released by the company, and/or news or corporate events that affect the investment, also referred to as enterprise value (EV) to earnings before interest, taxes, depreciation, and amortization (EBITDA) ratios. Valuations may be adjusted to account for company-specific issues, the lack of liquidity inherent in a nonpublic investment, and the fact that comparable public companies are not identical to the investments being fair valued by the MM Select T. Rowe Price Small and Mid Cap Blend Fund. All market variables are assessed on a regular frequency and calibrated as necessary.
The table excludes securities which were classified as level 3 based upon a broker quote.
Security Description |
Fair Value |
Valuation |
Unobservable Input |
Range of |
Weighted |
|||||||||
MM Select T. Rowe Price Small and Mid Cap Blend Fund |
||||||||||||||
Common Stock |
$ | 1,767,594 | ||||||||||||
Market approach |
Transaction price |
$3.77 - $105.14 | $32.40 |
|||||||||||
EV / Sales |
1.4x - 16.8x | 7.1x |
||||||||||||
EV / GP |
4.5x - 23.2x | 11.3x |
||||||||||||
EV/ EBITDA |
2.4x - 26.9x | 11.9x |
||||||||||||
Discount factor |
0.006244 - 0.3833 | 0.3175 |
||||||||||||
PV of remaining future contingent payments less discount for timing and probability |
$0.12 - $0.35 | $0.28 |
||||||||||||
Preferred Stock |
$ | 15,270,575 | Market approach |
Transaction price |
$0.00 - $125.00 | $42.03 |
||||||||
Transaction price +/- capital structure adjustment |
$56.21 - $61.98 | $59.74 |
||||||||||||
EV/ Sales |
0.8x - 16.8x | 5.98x |
||||||||||||
EV Sales LTM |
2.4x | — |
||||||||||||
EV/ GMV |
0.29x - 0.6x | 0.36x |
||||||||||||
EV/ GP |
2.3x - 23.2x | 11.0x |
||||||||||||
EV/GP LTM |
3.4x | — |
||||||||||||
EV/ EBITDA |
4.3x - 26.9x | 17.6x |
||||||||||||
Probability of zero outcome |
50% - 80% | 79.4% |
||||||||||||
Implied Discount |
30% | — |
||||||||||||
Warrants |
||||||||||||||
| $ | 7,487 | Black-Scholes option pricing model |
Risk-free rate |
2.5% - 3.0% | 2.9% |
|||||||||
Volatility |
37.7% - 41.1% | 38.2% |
||||||||||||
Time to Expiration |
1.6 - 6 | 2.2 |
||||||||||||
Rights |
||||||||||||||
| $ | 28,892 | Market approach |
PV of future payments |
$1.15 | $— |
|||||||||
Total |
$ | 17,074,548 | ||||||||||||
|
(a) |
A significant change in unobservable input would have resulted in a correlated (inverse) significant change to value. |
Abbreviation Legend
EV/ GP - financial ratio of comparable public companies’ enterprise value to gross profit; measures the value of a comparable company in terms of its gross profit for a given year
EV/ GMV - financial ratio of comparable public companies’ enterprise value to gross market value; measures the value of a comparable company in terms of its gross profit for a given year
137
Notes to Financial Statements (Continued) |
EV/ Sales - financial ratio of comparable public companies’ enterprise value to sales; measures the value of a comparable company in terms of its sales for a given year
EV/ EBITDA - financial ratio of comparable public companies’ enterprise value to earnings; measures the value of a comparable company in terms of its expected earnings for a given year
EV/ Sales LTM- financial ratio of comparable public companies’ enterprise value to sales last twelve months; measures the value of a comparable company in terms of its sales for the last twelve months
EV/ GP LTM- financial ratio of comparable public companies’ enterprise value to gross profit last twelve months; measures the value of a comparable company in terms of its gross profit for the last twelve months
PV - present value; current value of a future stream of cash flows assuming a specified rate of return
Derivative Instruments
Derivatives are financial instruments whose values are based on the values of one or more underlying indicators, such as a security, asset, currency, interest rate, or index. Derivative transactions can create investment leverage and may be highly volatile. Losses from derivatives can be substantially greater than the derivatives’ original cost and can sometimes be unlimited. A Fund may not be able to close out a derivative transaction at a favorable time or price.
At September 30, 2022, and during the year then ended, the Fund(s) had the following derivatives and transactions in derivatives, grouped into the indicated risk categories:
Credit |
Equity |
Foreign |
Interest/ |
Total |
||||||||||||||||
Equity Asset Fund |
||||||||||||||||||||
Liability Derivatives |
||||||||||||||||||||
Futures Contracts^^ |
$ | — | $ | (423,966 | ) | $ | — | $ | — | $ | (423,966 | ) | ||||||||
Realized Gain (Loss)# |
||||||||||||||||||||
Futures Contracts |
$ | — | $ | (1,435,975 | ) | $ | — | $ | — | $ | (1,435,975 | ) | ||||||||
Change in Appreciation (Depreciation)## |
||||||||||||||||||||
Futures Contracts |
$ | — | $ | (219,418 | ) | $ | — | $ | — | $ | (219,418 | ) | ||||||||
MM Select T. Rowe Price Bond Asset Fund |
||||||||||||||||||||
Asset Derivatives |
||||||||||||||||||||
Forward Contracts* |
$ | — | $ | — | $ | 8,771,169 | $ | — | $ | 8,771,169 | ||||||||||
Futures Contracts^^ |
— | — | — | 132,931 | 132,931 | |||||||||||||||
Swap Agreements* |
80 | — | — | — | 80 | |||||||||||||||
Swap Agreements^^,^^^ |
409,020 | — | — | 481,838 | 890,858 | |||||||||||||||
Total Value |
$ | 409,100 | $ | — | $ | 8,771,169 | $ | 614,769 | $ | 9,795,038 | ||||||||||
Liability Derivatives |
||||||||||||||||||||
Forward Contracts^ |
$ | — | $ | — | $ | (1,150,880 | ) | $ | — | $ | (1,150,880 | ) | ||||||||
Futures Contracts^^ |
— | — | — | (2,560,145 | ) | (2,560,145 | ) | |||||||||||||
Swap Agreements^ |
(44,815 | ) | — | — | — | (44,815 | ) | |||||||||||||
Swap Agreements^^,^^^ |
(325,423 | ) | — | — | (1,810,014 | ) | (2,135,437 | ) | ||||||||||||
Total Value |
$ | (370,238 | ) | $ | — | $ | (1,150,880 | ) | $ | (4,370,159 | ) | $ | (5,891,277 | ) | ||||||
Realized Gain (Loss)# |
||||||||||||||||||||
Purchased Options |
$ | — | $ | (85,314 | ) | $ | 1,484 | $ | — | $ | (83,830 | ) | ||||||||
Forward Contracts |
— | — | 22,620,409 | — | 22,620,409 | |||||||||||||||
Futures Contracts |
— | — | — | (15,126,292 | ) | (15,126,292 | ) | |||||||||||||
Swap Agreements |
(696,072 | ) | — | — | 501,849 | (194,223 | ) | |||||||||||||
Written Options |
— | — | (41,897 | ) | — | (41,897 | ) | |||||||||||||
Total Realized Gain (Loss) |
$ | (696,072 | ) | $ | (85,314 | ) | $ | 22,579,996 | $ | (14,624,443 | ) | $ | 7,174,167 | |||||||
138
Notes to Financial Statements (Continued) |
Credit |
Equity |
Foreign |
Interest/ |
Total |
||||||||||||||||
MM Select T. Rowe Price Bond Asset Fund (Continued) |
||||||||||||||||||||
Change in Appreciation (Depreciation)## |
||||||||||||||||||||
Purchased Options |
$ | — | $ | — | $ | 31,326 | $ | — | $ | 31,326 | ||||||||||
Forward Contracts |
— | — | 4,821,100 | — | 4,821,100 | |||||||||||||||
Futures Contracts |
— | — | — | (1,789,849 | ) | (1,789,849 | ) | |||||||||||||
Swap Agreements |
(16,791 | ) | — | — | (2,139,383 | ) | (2,156,174 | ) | ||||||||||||
Written Options |
— | — | (16,420 | ) | — | (16,420 | ) | |||||||||||||
Total Change in Appreciation (Depreciation) |
$ | (16,791 | ) | $ | — | $ | 4,836,006 | $ | (3,929,232 | ) | $ | 889,983 | ||||||||
MM Select T. Rowe Price Emerging Markets Bond Fund |
||||||||||||||||||||
Asset Derivatives |
||||||||||||||||||||
Forward Contracts* |
$ | — | $ | — | $ | 172,137 | $ | — | $ | 172,137 | ||||||||||
Futures Contracts^^ |
— | — | — | 146,544 | 146,544 | |||||||||||||||
Total Value |
$ | — | $ | — | $ | 172,137 | $ | 146,544 | $ | 318,681 | ||||||||||
Liability Derivatives |
||||||||||||||||||||
Forward Contracts^ |
$ | — | $ | — | $ | (16,032 | ) | $ | — | $ | (16,032 | ) | ||||||||
Futures Contracts^^ |
— | — | — | (72,080 | ) | (72,080 | ) | |||||||||||||
Swap Agreements^^,^^^ |
(22,175 | ) | — | — | — | (22,175 | ) | |||||||||||||
Total Value |
$ | (22,175 | ) | $ | — | $ | (16,032 | ) | $ | (72,080 | ) | $ | (110,287 | ) | ||||||
Realized Gain (Loss)# |
||||||||||||||||||||
Forward Contracts |
$ | — | $ | — | $ | 379,507 | $ | — | $ | 379,507 | ||||||||||
Futures Contracts |
— | — | — | 155,665 | 155,665 | |||||||||||||||
Swap Agreements |
(71,487 | ) | — | — | — | (71,487 | ) | |||||||||||||
Total Realized Gain (Loss) |
$ | (71,487 | ) | $ | — | $ | 379,507 | $ | 155,665 | $ | 463,685 | |||||||||
Change in Appreciation (Depreciation)## |
||||||||||||||||||||
Forward Contracts |
$ | — | $ | — | $ | 130,872 | $ | — | $ | 130,872 | ||||||||||
Futures Contracts |
— | — | — | 162,099 | 162,099 | |||||||||||||||
Swap Agreements |
9,720 | — | — | — | 9,720 | |||||||||||||||
Total Change in Appreciation (Depreciation) |
$ | 9,720 | $ | — | $ | 130,872 | $ | 162,099 | $ | 302,691 | ||||||||||
MM Select T. Rowe Price Limited Duration Inflation Focused Bond Fund |
||||||||||||||||||||
Asset Derivatives |
||||||||||||||||||||
Purchased Options*,^^^ |
$ | — | $ | — | $ | — | $ | 6,047 | $ | 6,047 | ||||||||||
Forward Contracts* |
— | — | 112,375 | — | 112,375 | |||||||||||||||
Futures Contracts^^ |
— | — | — | 545,249 | 545,249 | |||||||||||||||
Swap Agreements* |
— | — | — | 2,914,903 | 2,914,903 | |||||||||||||||
Swap Agreements^^,^^^ |
— | — | — | 506,972 | 506,972 | |||||||||||||||
Total Value |
$ | — | $ | — | $ | 112,375 | $ | 3,973,171 | $ | 4,085,546 | ||||||||||
Liability Derivatives |
||||||||||||||||||||
Forward Contracts^ |
$ | — | $ | — | $ | (125,307 | ) | $ | — | $ | (125,307 | ) | ||||||||
Futures Contracts^^ |
— | — | — | (167,574 | ) | (167,574 | ) | |||||||||||||
Swap Agreements^^,^^^ |
— | — | — | (108,701 | ) | (108,701 | ) | |||||||||||||
Total Value |
$ | — | $ | — | $ | (125,307 | ) | $ | (276,275 | ) | $ | (401,582 | ) | |||||||
Realized Gain (Loss)# |
||||||||||||||||||||
Purchased Options |
$ | — | $ | — | $ | — | $ | 75,989 | $ | 75,989 | ||||||||||
Forward Contracts |
— | — | (226,913 | ) | — | (226,913 | ) | |||||||||||||
Futures Contracts |
— | — | — | (1,410,806 | ) | (1,410,806 | ) | |||||||||||||
Swap Agreements |
(617 | ) | — | — | 1,512,914 | 1,512,297 | ||||||||||||||
Written Options |
— | — | — | (151,844 | ) | (151,844 | ) | |||||||||||||
Total Realized Gain (Loss) |
$ | (617 | ) | $ | — | $ | (226,913 | ) | $ | 26,253 | $ | (201,277 | ) | |||||||
139
Notes to Financial Statements (Continued) |
Credit |
Equity |
Foreign |
Interest/ |
Total |
||||||||||||||||
MM Select T. Rowe Price Limited Duration Inflation Focused Bond Fund (Continued) |
||||||||||||||||||||
Change in Appreciation (Depreciation)## |
||||||||||||||||||||
Purchased Options |
$ | — | $ | — | $ | — | $ | (10,818 | ) | $ | (10,818 | ) | ||||||||
Forward Contracts |
— | — | 4,390 | — | 4,390 | |||||||||||||||
Futures Contracts |
— | — | — | 393,090 | 393,090 | |||||||||||||||
Swap Agreements |
385 | — | — | 1,131,593 | 1,131,978 | |||||||||||||||
Total Change in Appreciation (Depreciation) |
$ | 385 | $ | — | $ | 4,390 | $ | 1,513,865 | $ | 1,518,640 | ||||||||||
MM Select T. Rowe Price Real Assets Fund |
||||||||||||||||||||
Asset Derivatives |
||||||||||||||||||||
Forward Contracts* |
$ | — | $ | — | $ | 79,336 | $ | — | $ | 79,336 | ||||||||||
Futures Contracts^^ |
— | 1,017,572 | — | 127,505 | 1,145,077 | |||||||||||||||
Total Value |
$ | — | $ | 1,017,572 | $ | 79,336 | $ | 127,505 | $ | 1,224,413 | ||||||||||
Liability Derivatives |
||||||||||||||||||||
Forward Contracts^ |
$ | — | $ | — | $ | (273,208 | ) | $ | — | $ | (273,208 | ) | ||||||||
Futures Contracts^^ |
— | (1,026,396 | ) | — | — | (1,026,396 | ) | |||||||||||||
Swap Agreements^ |
— | (274,739 | ) | — | — | (274,739 | ) | |||||||||||||
Total Value |
$ | — | $ | (1,301,135 | ) | $ | (273,208 | ) | $ | — | $ | (1,574,343 | ) | |||||||
Realized Gain (Loss)# |
||||||||||||||||||||
Purchased Options |
$ | — | $ | (379,126 | ) | $ | — | $ | — | $ | (379,126 | ) | ||||||||
Forward Contracts |
— | — | (525,519 | ) | — | (525,519 | ) | |||||||||||||
Futures Contracts |
— | 1,438,017 | — | 830,358 | 2,268,375 | |||||||||||||||
Swap Agreements |
— | (441,907 | ) | — | (14,746 | ) | (456,653 | ) | ||||||||||||
Total Realized Gain (Loss) |
$ | — | $ | 616,984 | $ | (525,519 | ) | $ | 815,612 | $ | 907,077 | |||||||||
Change in Appreciation (Depreciation)## |
||||||||||||||||||||
Forward Contracts |
$ | — | $ | — | $ | (193,872 | ) | $ | — | $ | (193,872 | ) | ||||||||
Futures Contracts |
— | (15,464 | ) | — | 76,930 | 61,466 | ||||||||||||||
Swap Agreements |
— | (274,739 | ) | — | — | (274,739 | ) | |||||||||||||
Total Change in Appreciation (Depreciation) |
$ | — | $ | (290,203 | ) | $ | (193,872 | ) | $ | 76,930 | $ | (407,145 | ) | |||||||
MM Select T. Rowe Price U.S. Treasury Long-Term Index Fund |
||||||||||||||||||||
Asset Derivatives |
||||||||||||||||||||
Purchased Options*,^^^ |
$ | — | $ | — | $ | — | $ | 4,078 | $ | 4,078 | ||||||||||
Futures Contracts^^ |
— | — | — | 383,459 | 383,459 | |||||||||||||||
Total Value |
$ | — | $ | — | $ | — | $ | 387,537 | $ | 387,537 | ||||||||||
Liability Derivatives |
||||||||||||||||||||
Futures Contracts^^ |
$ | — | $ | — | $ | — | $ | (555,862 | ) | $ | (555,862 | ) | ||||||||
Realized Gain (Loss)# |
||||||||||||||||||||
Purchased Options |
$ | — | $ | — | $ | — | $ | 79,262 | $ | 79,262 | ||||||||||
Futures Contracts |
— | — | — | (961,343 | ) | (961,343 | ) | |||||||||||||
Written Options |
— | — | — | (58,049 | ) | (58,049 | ) | |||||||||||||
Total Realized Gain (Loss) |
$ | — | $ | — | $ | — | $ | (940,130 | ) | $ | (940,130 | ) | ||||||||
Change in Appreciation (Depreciation)## |
||||||||||||||||||||
Purchased Options |
$ | — | $ | — | $ | — | $ | (7,296 | ) | $ | (7,296 | ) | ||||||||
Futures Contracts |
— | — | — | (185,724 | ) | (185,724 | ) | |||||||||||||
Written Options |
— | — | — | (238 | ) | (238 | ) | |||||||||||||
Total Change in Appreciation (Depreciation) |
$ | — | $ | — | $ | — | $ | (193,258 | ) | $ | (193,258 | ) | ||||||||
|
* |
Statements of Assets and Liabilities location: Investments, at value, or Receivables from: open forward contracts or open swap agreements, at value, as applicable. |
140
Notes to Financial Statements (Continued) |
|
^ |
Statements of Assets and Liabilities location: Payables for: open forward contracts and open swap agreements, at value, as applicable. |
|
^^ |
Cumulative appreciation (depreciation) on futures contracts and centrally cleared swaps is reported in “Futures Contracts” and “Swap Agreements” in each applicable Fund’s Portfolio of Investments. Only current day’s variation margin, if any, is reported within the Statements of Assets and Liabilities. |
|
^^^ |
Represents centrally cleared swaps or exchange-traded purchased options which are not subject to a master netting agreement or similar agreement. |
|
# |
Statements of Operations location: Amounts are included in net realized gain (loss) on: investment transactions, forward contracts, futures contracts, swap agreements, or written options, as applicable. |
|
## |
Statements of Operations location: Amounts are included in net change in unrealized appreciation (depreciation) on: investment transactions, forward contracts, futures contracts, swap agreements, or written options, as applicable. |
For the year ended September 30, 2022, the average number of contracts, notional amounts, or shares/units for each derivative type was as follows:
Average Number of Contracts, Notional Amounts, or Shares/Units † |
||||||||||||||||||||
Fund Name |
Futures |
Forward |
Swap |
Purchased |
Written |
|||||||||||||||
Equity Asset Fund |
21 | $ | — | $ | — | — | — | |||||||||||||
MM Select T. Rowe Price Bond Asset Fund |
1,648 | 230,490,547 | 340,477,236 | 10,548,148 | 3,815,750 | |||||||||||||||
MM Select T. Rowe Price Emerging Markets Bond Fund |
69 | 3,190,520 | 718,750 | — | — | |||||||||||||||
MM Select T. Rowe Price Limited Duration Inflation Focused Bond Fund |
527 | 13,395,845 | 47,457,000 | 91 | 106 | |||||||||||||||
MM Select T. Rowe Price Real Assets Fund |
149 | 11,829,414 | 84,661 | 113 | — | |||||||||||||||
MM Select T. Rowe Price U.S. Treasury Long-Term Index Fund |
291 | — | — | 48 | 45 | |||||||||||||||
|
† |
Amount(s) disclosed represent average number of contracts for futures contracts, notional amounts for forward contracts and swap agreements, or shares/units outstanding for purchased options and written options, based on absolute values, which is indicative of volume of this derivative type, for the months that the Fund held such derivatives during the year ended September 30, 2022. |
The Portfolio of Investments included in a Fund’s financial statements shows the assets or liabilities of the Fund associated with individual derivatives transactions. The terms of many of those transactions contemplate that derivatives receivables and payables between the same two parties may be netted and that the parties will collateralize certain obligations. The following tables provide an illustration of the possible effect of netting provisions and of collateral (delivered or received) on a Fund’s derivatives exposure as of September 30, 2022. Netting arrangements vary among different counterparties, and the actual disposition of derivatives receivables and payables, and of collateral, in a bankruptcy or insolvency can be complicated and difficult to predict.
141
Notes to Financial Statements (Continued) |
The following table presents derivative assets by counterparty net of amounts available for offset under a master netting agreement (“MNA”) or similar agreement and net of the related collateral received by the Fund(s) as of September 30, 2022.
Counterparty |
Derivative Assets |
Financial |
Collateral |
Net Amount* |
||||||||||||
MM Select T. Rowe Price Bond Asset Fund |
||||||||||||||||
Barclays Bank PLC |
$ | 189,007 | $ | (1,593 | ) | $ | (100,000 | ) | $ | 87,414 | ||||||
BNP Paribas SA |
1,643,083 | (84,753 | ) | (1,558,330 | ) | — | ||||||||||
Citibank N.A. |
435,020 | (185,986 | ) | (249,034 | ) | — | ||||||||||
Deutsche Bank AG |
25,501 | (25,501 | ) | — | — | |||||||||||
Goldman Sachs International |
161,825 | (161,825 | ) | — | — | |||||||||||
HSBC Bank USA |
1,619,121 | (32,781 | ) | (1,586,340 | ) | — | ||||||||||
JP Morgan Chase Bank N.A. |
33,226 | (7,030 | ) | — | 26,196 | |||||||||||
Morgan Stanley & Co. LLC |
349,415 | (3,144 | ) | (206,000 | ) | 140,271 | ||||||||||
Royal Bank of Canada |
719 | — | — | 719 | ||||||||||||
State Street Bank and Trust |
1,571,062 | (381,427 | ) | — | 1,189,635 | |||||||||||
UBS AG |
2,743,270 | (228,060 | ) | (2,515,210 | ) | — | ||||||||||
| $ | 8,771,249 | $ | (1,112,100 | ) | $ | (6,214,914 | ) | $ | 1,444,235 | |||||||
MM Select T. Rowe Price Emerging Markets Bond Fund |
||||||||||||||||
BNP Paribas SA |
$ | 4,269 | $ | (1,315 | ) | $ | — | $ | 2,954 | |||||||
Citibank N.A. |
1,989 | — | — | 1,989 | ||||||||||||
HSBC Bank USA |
40,234 | (2,392 | ) | — | 37,842 | |||||||||||
Morgan Stanley & Co. LLC |
44,690 | (7,869 | ) | — | 36,821 | |||||||||||
UBS AG |
80,955 | — | — | 80,955 | ||||||||||||
| $ | 172,137 | $ | (11,576 | ) | $ | — | $ | 160,561 | ||||||||
MM Select T. Rowe Price Limited Duration Inflation Focused Bond Fund |
||||||||||||||||
Bank of America N.A. |
$ | 412,994 | $ | — | $ | (260,000 | ) | $ | 152,994 | |||||||
Barclays Bank PLC |
280,806 | — | (206,442 | ) | 74,364 | |||||||||||
Citibank N.A. |
1,590,176 | — | (1,590,176 | ) | — | |||||||||||
Goldman Sachs International |
327,725 | (24,193 | ) | (300,000 | ) | 3,532 | ||||||||||
HSBC Bank USA |
282,657 | (101,114 | ) | — | 181,543 | |||||||||||
UBS AG |
132,920 | — | — | 132,920 | ||||||||||||
| $ | 3,027,278 | $ | (125,307 | ) | $ | (2,356,618 | ) | $ | 545,353 | |||||||
MM Select T. Rowe Price Real Assets Fund |
||||||||||||||||
BNP Paribas SA |
$ | 9,766 | $ | (7,597 | ) | $ | — | $ | 2,169 | |||||||
Deutsche Bank AG |
39,072 | — | — | 39,072 | ||||||||||||
Wells Fargo Bank N.A. |
30,498 | — | — | 30,498 | ||||||||||||
| $ | 79,336 | $ | (7,597 | ) | $ | — | $ | 71,739 | ||||||||
142
Notes to Financial Statements (Continued) |
The following table presents derivative liabilities by counterparty net of amounts available for offset under an MNA or similar agreement and net of the related collateral pledged by the Fund(s) as of September 30, 2022.
Counterparty |
Derivative |
Financial |
Collateral |
Net Amount** |
||||||||||||
MM Select T. Rowe Price Bond Asset Fund |
||||||||||||||||
Bank of America N.A. |
$ | (38,440 | ) | $ | — | $ | — | $ | (38,440 | ) | ||||||
Barclays Bank |
(1,593 | ) | 1,593 | — | — | |||||||||||
BNP Paribas SA |
(84,753 | ) | 84,753 | — | — | |||||||||||
Citibank N.A. |
(185,986 | ) | 185,986 | — | — | |||||||||||
Deutsche Bank AG |
(49,521 | ) | 25,501 | — | (24,020 | ) | ||||||||||
Goldman Sachs International |
(182,960 | ) | 161,825 | — | (21,135 | ) | ||||||||||
HSBC Bank USA |
(32,781 | ) | 32,781 | — | — | |||||||||||
JP Morgan Chase Bank N.A. |
(7,030 | ) | 7,030 | — | — | |||||||||||
Morgan Stanley & Co. LLC |
(3,144 | ) | 3,144 | — | — | |||||||||||
State Street Bank and Trust |
(381,427 | ) | 381,427 | — | — | |||||||||||
UBS AG |
(228,060 | ) | 228,060 | — | — | |||||||||||
| $ | (1,195,695 | ) | $ | 1,112,100 | $ | — | $ | (83,595 | ) | |||||||
T. Rowe Price Emerging Markets Bond Fund |
||||||||||||||||
Barclays Bank PLC |
$ | (1,791 | ) | $ | — | $ | — | $ | (1,791 | ) | ||||||
BNP Paribas SA |
(1,315 | ) | 1,315 | — | — | |||||||||||
Deutsche Bank AG |
(2,608 | ) | — | — | (2,608 | ) | ||||||||||
Goldman Sachs International |
(57 | ) | — | — | (57 | ) | ||||||||||
HSBC Bank USA |
(2,392 | ) | 2,392 | — | — | |||||||||||
Morgan Stanley & Co. LLC |
(7,869 | ) | 7,869 | — | — | |||||||||||
| $ | (16,032 | ) | $ | 11,576 | $ | — | $ | (4,456 | ) | |||||||
MM Select T. Rowe Price Limited Duration Inflation Focused Bond Fund |
||||||||||||||||
Goldman Sachs International |
$ | (24,193 | ) | $ | 24,193 | $ | — | $ | — | |||||||
HSBC Bank USA |
(101,114 | ) | 101,114 | — | — | |||||||||||
| $ | (125,307 | ) | $ | 125,307 | $ | — | $ | — | ||||||||
MM Select T. Rowe Price Real Assets Fund |
||||||||||||||||
Bank of America N.A. |
$ | (140,251 | ) | $ | — | $ | — | $ | (140,251 | ) | ||||||
BNP Paribas SA |
(7,597 | ) | 7,597 | — | — | |||||||||||
Citibank N.A. |
(274,739 | ) | — | — | (274,739 | ) | ||||||||||
JP Morgan Chase Bank N.A. |
(59,701 | ) | — | — | (59,701 | ) | ||||||||||
Morgan Stanley & Co. LLC |
(65,659 | ) | — | — | (65,659 | ) | ||||||||||
| $ | (547,947 | ) | $ | 7,597 | $ | — | $ | (540,350 | ) | |||||||
|
* |
Represents the net amount receivable from the counterparty in the event of default. |
|
** |
Represents the net amount payable to the counterparty in the event of default. |
|
*** |
The amount presented here may be less than the total amount of collateral received/pledged as the net amount of derivative assets and liabilities for a counterparty cannot be less than $0. |
|
† |
The amount presented here may be less than the total amount shown in the Statements of Assets and Liabilities as some derivatives held by the counterparty are not covered within an MNA or similar agreement. |
143
Notes to Financial Statements (Continued) |
Such agreements typically permit a single net payment in the event of default, including the bankruptcy or insolvency of the counterparty. The Fund(s) and counterparties may not be permitted to sell, re-pledge, or use the collateral they receive. In the event that cash collateral is restricted for use, the balance will be reflected as restricted cash within the Statement of Assets and Liabilities.
Further details regarding the derivatives and other investments held by the Fund(s) during the year ended September 30, 2022, are discussed below.
Foreign Currency Exchange Transactions
A Fund may enter into foreign currency exchange transactions for hedging purposes in order to protect against uncertainty in the level of future foreign currency exchange rates, or for other, non-hedging purposes.
A Fund may enter into foreign currency exchange transactions, including foreign currency forward contracts. These contracts call for the Fund to deliver in the future an amount of one currency in return for an amount of another currency, at an exchange rate determined at the time the contract is entered into. Forward contracts are private contractual arrangements and a Fund is subject to the risk that its counterparty will not, or will not be able to, perform its obligations. This type of arrangement may require the Fund to post margin. A Fund may also buy and sell options on currencies. When the Fund buys an option, its loss should generally be limited to the amount of the premium paid and any transaction costs. If a Fund sells an option on a currency, it is subject generally to the same risks as if it had entered into a futures contract or forward contract with respect to that currency. A Fund may enter into foreign currency exchange transactions in order to hedge against changes in the values of the assets or liabilities denominated in one or more foreign currencies, or otherwise to increase or reduce a Fund’s exposure to various foreign currencies. The use of foreign currency exchange transactions may create investment leverage.
Whenever a Fund enters into a foreign currency exchange transaction, it is subject to the risk that the value of the transaction will move in a direction unfavorable to it. When the Fund uses the transactions for hedging purposes, it is likely that the Fund will have an asset or liability that will offset any loss (or gain) on the transactions, at least in part. If a Fund enters into foreign currency exchange transactions other than for hedging purposes (for example, seeking to profit from an anticipated change in the values of currencies by creating directional exposures in the portfolio with respect to one or more currencies), it will generally be subject to the same risks, but is less likely to have assets or liabilities that will offset any losses on the transactions. There can be no assurance that a Fund will be able to terminate any foreign currency exchange transaction prior to its maturity in order to limit its loss on the transaction.
Forward foreign currency contracts are marked to market daily and the change in their value is recorded by the Funds as an unrealized gain or loss. Forward foreign currency contracts are valued at the settlement price established through dealers or other market sources on the day which they are traded. When a forward foreign currency contract is extinguished, through delivery or offset by entering into another forward foreign currency contract, the Funds record a realized gain or loss equal to the difference between the value of the contract at the time it was opened and the value of the contract at the time it was extinguished or offset. The notional or contractual amounts of these instruments do not necessarily represent the amounts potentially subject to risk. The measurement of the risk associated with these instruments is meaningful only when all related and offsetting transactions and counterparty risks are considered. For information regarding the accounting treatment of options, see “Options, Rights, and Warrants” below.
A Fund’s current exposure to a counterparty is the unrealized appreciation/(depreciation) on the contract.
Futures Contracts
A Fund may seek to manage a variety of different risks, such as interest rate risk, equity price risk, and currency risk, through the use of futures contracts and related options.
Futures Contracts. A Fund may use interest rate futures contracts to adjust the interest rate sensitivity (duration) of its portfolio or the credit exposure of the portfolio. Interest rate futures contracts obligate the long or short holder to take or make delivery of a specified quantity of a financial instrument, such as a specific fixed income security, during a specified future period at
144
Notes to Financial Statements (Continued) |
a specified price. A Fund may use index futures contracts to hedge against broad market risks to its portfolio or to gain broad market exposure when it holds uninvested cash or as an inexpensive substitute for cash investments directly in securities or other assets, including commodities and precious metals. Securities index futures contracts are contracts to buy or sell units of a securities index at a specified future date at a price agreed upon when the contract is made and are settled in cash. Positions in futures contracts may be closed out only on an exchange or board of trade which provides a market for such futures. Because futures contracts are exchange-traded, they typically have minimal exposure to counterparty risk.
Parties to a futures contract are not required to post the entire notional amount of the contract, but rather a small percentage of that amount (by way of margin), both at the time they enter into futures transactions, and then on a daily basis if their positions decline in value; as a result, futures contracts are highly leveraged. Such payments are known as variation margin and are recorded by the Funds as unrealized gains or losses. Because futures markets are highly leveraged, they can be extremely volatile, and there can be no assurance that the pricing of a futures contract will correlate precisely with the pricing of the asset or index underlying it or the asset or liability of the Fund that is the subject of the hedge. It may not always be possible for a Fund to enter into a closing transaction with respect to a futures contract it has entered into, at a favorable time or price. When a Fund enters into a futures transaction, it is subject to the risk that the value of the futures contract will move in a direction unfavorable to it. When a Fund uses futures contracts for hedging purposes, it is likely that the Fund will have an asset or liability that will offset any loss (or gain) on the transactions, at least in part.
Options on Futures Contracts. If a Fund buys an option on a futures contract, it will have the right to assume a futures contract at a particular price during the course of the option. Its potential loss should generally be limited to the amount of the premium paid and any transaction costs. If a Fund sells an option on a futures contract, it is subject generally to the same risks as if it had entered into a futures contract underlying the option itself.
When a futures contract is closed, the Fund records a realized gain or loss equal to the difference between the value of the contract at the time it was opened and the value at the time it was closed. Futures contracts are valued at the settlement price established each day by the board of trade or exchange on which they are traded. For information regarding the accounting treatment of options, see “Options, Rights, and Warrants” below.
Swap Agreements
Swap agreements are typically two-party contracts entered into primarily by institutional investors. In a standard “swap” transaction, two parties agree to exchange the returns (or differentials in rates of return) earned or realized on particular predetermined investments or instruments or rates, which may be adjusted for an interest factor. The gross returns to be exchanged or “swapped” between the parties are generally calculated with respect to a “notional amount,” (i.e., the return on or increase in value of a particular dollar amount invested at a particular interest rate or in a “basket” of securities representing a particular index).
Interest Rate Swaps. When a Fund enters into an interest rate swap, it typically agrees to make payments to its counterparty based on a specified long- or short-term interest rate, and will receive payments from its counterparty based on another interest rate. Other forms of interest rate swap agreements include, among others, interest rate caps, under which, in return for a specified payment stream, one party agrees to make payments to the other to the extent that interest rates exceed a specified rate, or “cap”; interest rate floors, under which, in return for a specified payment stream, one party agrees to make payments to the other to the extent that interest rates fall below a specified rate, or “floor”; and interest rate collars, under which a party sells a cap and purchases a floor or vice versa in an attempt to protect itself against interest rate movements exceeding given minimum or maximum levels. A Fund may enter into an interest rate swap in order, for example, to hedge against the effect of interest rate changes on the value of specific securities in its portfolio, or to adjust the interest rate sensitivity (duration) or the credit exposure of its portfolio overall, or otherwise as a substitute for a direct investment in debt securities.
Total Return Swaps. A Fund also may enter into total return swaps. In a total return swap, one party typically agrees to pay to the other a short-term interest rate in return for a payment at one or more times in the future based on the increase in the value of an underlying security or other asset, or index of securities or assets; if the underlying security, asset, or index declines in value, the party that pays the short-term interest rate must also pay to its counterparty a payment based on the amount of the decline. A Fund
145
Notes to Financial Statements (Continued) |
may take either side of such a swap, and so may take a long or short position in the underlying security, asset, or index. A Fund may enter into a total return swap to hedge against an exposure in its portfolio — such as interest rate risk (including to adjust the duration or credit quality of a Fund’s bond portfolio), equity risk, or credit risk — or generally to put cash to work efficiently in the markets in anticipation of, or as a replacement for, cash investments. A Fund may also enter into a total return swap to gain exposure to securities or markets in which it might not be able to invest directly (in so-called market access transactions).
Credit Default Swaps. A Fund also may enter into credit default swap transactions, as a “buyer” or “seller” of credit protection. In a credit default swap, one party provides what is in effect insurance against a default or other adverse credit event affecting an issuer of debt securities (typically referred to as a “reference entity”). In general, the buyer of credit protection is obligated to pay the protection seller an upfront amount or a periodic stream of payments over the term of the swap. If a “credit event” occurs, the buyer has the right to deliver to the seller bonds or other obligations of the reference entity (with a value up to the full notional value of the swap), and to receive a payment equal to the par value of the bonds or other obligations. Credit events that would trigger a request that the seller make payment are specific to each credit default swap agreement, but generally include bankruptcy, failure to pay, restructuring, acceleration, default, or repudiation/moratorium. When a Fund buys protection, it may or may not own securities of the reference entity. If it does own securities of the reference entity, the swap serves as a hedge against a decline in the value of the securities due to the occurrence of a credit event involving the issuer of the securities. If the Fund does not own securities of the reference entity, the credit default swap may be seen to create a short position in the reference entity. If a Fund is a buyer and no credit event occurs, the Fund will typically recover nothing under the swap, but will have had to pay the required upfront payment and stream of continuing payments under the swap. When a Fund sells protection under a credit default swap, the position may have the effect of creating leverage in the Fund’s portfolio through the Fund’s indirect long exposure to the issuer or securities on which the swap is written. When a Fund sells protection, it may do so either to earn additional income or to create a “synthetic” long position.
Whenever a Fund enters into a swap agreement, it takes on counterparty risk — the risk that its counterparty will be unable or unwilling to meet its obligations under the swap agreement. The Fund also takes the risk that the market will move against its position in the swap agreement. In the case of an interest rate swap, the value of the swap may increase or decrease depending on changes in interest rates. In the case of a total return swap, the swap will change in value depending on the change in value of the asset or index on which the swap is written. In the case of a credit default swap, the swap will become more or less valuable depending on the credit of the issuer of the underlying security, and, if a credit event occurs under a swap where the Fund is the seller of credit protection, the Fund could be required to purchase the security at par value, resulting in a significant loss to the Fund. When the Fund enters into any type of swap for hedging purposes, it is likely that the Fund will have an asset or liability that will offset any loss (or gain) on the swap, at least in part. Swap agreements may be non-transferable or otherwise highly illiquid, and a Fund may not be able to terminate or transfer a swap agreement at any particular time or at an acceptable price.
Centrally Cleared Swaps. Certain clearinghouses currently offer clearing for limited types of derivatives transactions, principally certain interest rate swaps, certain index swaps, and credit derivatives. In a cleared derivative transaction, a Fund typically enters into the transaction with a financial institution counterparty, and performance of the transaction is effectively guaranteed by a central clearinghouse, thereby reducing or eliminating the Fund’s exposure to the credit risk of its original counterparty. The Fund will be required to post amounts (“initial margin”) with the clearinghouse or at the instruction of the clearinghouse. The initial margin required by a clearinghouse may be greater than the initial margin the Fund would be required to post in an uncleared transaction. If cash is deposited as the initial margin, it is shown as collateral on a Fund’s Statement of Assets and Liabilities. Swap agreements are marked-to-market daily and subsequent payments (“variation margin”) are made or received by a Fund depending on whether unrealized gains or losses are incurred. These amounts are reflected as receivables or payables on a Fund’s Statement of Assets and Liabilities (“Variation margin on open derivative instruments”) and as a component of net change in unrealized appreciation (depreciation) on a Fund’s Statement of Operations. Only a limited number of transaction types are currently eligible for clearing.
During the term of a swap transaction, changes in the value of the swap are recognized as unrealized gains or losses by marking to market to reflect the market value of the swap. When the swap is terminated, a Fund will record a realized gain or loss equal to the difference, if any, between the proceeds from (or cost of) the closing transaction and a Fund’s basis in the agreement. Upfront swap premium payments paid or received by a Fund, if any, are recorded within the value of the open swap agreement on the Fund’s Statement of Assets and Liabilities and represent payments paid or received upon entering into the swap agreement
146
Notes to Financial Statements (Continued) |
to compensate for differences between stated terms of the swap agreement and prevailing market conditions (credit spreads, currency exchange rates, and other relevant factors). These upfront payments are recorded as realized gain or loss on the Fund’s Statement of Operations upon termination or maturity of the swap agreement.
During the term of a swap transaction, the periodic net payments can be made for a set period of time or may be triggered by a predetermined credit event. The net periodic payments may be based on a fixed or variable interest rate, the change in market value of a specified security, basket of securities or index, or the return generated by a security. These periodic payments received or made by the Funds are recorded in the accompanying Statements of Operations as realized gains and losses, respectively.
A Fund’s current exposure to a counterparty is the fair value of the transaction.
Options, Rights, and Warrants
A Fund may purchase and sell put and call options on portfolio securities or an index of securities to enhance investment performance or to protect against changes in market prices. A Fund that invests in debt securities may also purchase and sell put and call options to adjust the interest rate sensitivity of its portfolio or the credit exposure of the portfolio.
Call Options. A call option gives the holder the right to purchase, and obligates the writer to sell, a security at the strike price at any time before the expiration date in the case of an American-style option or only on the expiration date in the case of a European-style option.
Put Options. A put option gives the holder the right to sell, and obligates the writer to buy, a security at the exercise price.
Writing put and call options. A Fund may write call options on a security it owns, in a “directional” strategy hoping to realize a greater current return through the receipt of premiums. In return for the option premium, the Fund takes the risk that it will have to forego any increase in the value of the security over the strike price. When a Fund has written a call option on a security it does not own, its exposure on such an option is theoretically unlimited. A Fund may enter into closing purchase transactions in order to realize a profit or limit a loss on a previously written call option or, in the case of a call option on a security it owns, to free itself to sell the underlying security or to write another call on the security, or protect a security from being called in an unexpected market rise. Any profits from a closing purchase transaction in the case of a call option on a security a Fund owns may be offset by a decline in the value of the underlying security. Conversely, because increases in the market price of a call option will generally reflect increases in the market price of the underlying security, any loss resulting from a closing purchase transaction relating to a call option on a security a Fund owns is likely to be offset in whole or in part by unrealized appreciation of the underlying security owned by the Fund. A Fund may not be able to close out a call option that it has previously written. A Fund may write put options in order to enhance its current return by taking a long directional position as to a security or index of securities. By writing a put option, the Fund assumes the risk that it may be required to purchase the underlying security for an exercise price higher than its then current market value, resulting in a potential capital loss unless the security later appreciates in value. A Fund may terminate a put option that it has written before it expires by entering into a closing purchase transaction. Any loss from this transaction may be partially or entirely offset by the premium received on the terminated option. A Fund may not be able to close out a put option that it has previously written.
When a Fund writes a call or put option, an amount equal to the premium received is recorded as a liability. Premiums received from writing options which expire are treated as realized gains. Premiums received from writing options which are exercised or closed are added to the proceeds or offset against the amount paid on the underlying investment to determine the realized gain or loss.
Purchasing put and call options. A Fund may purchase put options to protect portfolio holdings against a decline in market value of a security or securities held by it. A Fund may also purchase a put option hoping to profit from an anticipated decline in the value of the underlying security. If the Fund holds the security underlying the option, the option premium and any transaction costs will reduce any profit the Fund might have realized had it sold the underlying security instead of buying the put option. A Fund may purchase call options to hedge against an increase in the price of securities that the Fund wants ultimately to buy. A Fund may also purchase a call option as a long directional investment hoping to profit from an anticipated increase in the
147
Notes to Financial Statements (Continued) |
value of the underlying security. In order for a call option to be profitable, the market price of the underlying security must rise sufficiently above the exercise price to cover the premium and transaction costs. These costs will reduce any profit the Fund might have realized had it bought the underlying security at the time it purchased the call option.
When a Fund purchases an option, it runs the risk that it will lose its entire investment in the option in a relatively short period of time, unless the Fund exercises the option or enters into a closing sale transaction before the option’s expiration. If the price of the underlying security does not rise (in the case of a call) or fall (in the case of a put) to an extent sufficient to cover the option premium and transaction costs, the Fund will lose part or all of its investment in the option. This contrasts with an investment by a Fund in the underlying security, since the Fund will not realize a loss if the security’s price does not change. Premiums paid for purchasing options that expire are treated as realized losses.
Exchange Traded Options. Exchange traded options purchased or sold by a Fund may be traded on a securities or options exchange or market. Such options typically have minimal exposure to counterparty risk. However, an exchange or market may at times find it necessary to impose restrictions on particular types of options transactions, such as opening transactions. If an underlying security ceases to meet qualifications imposed by the market or the Options Clearing Corporation, new series of options on that security will no longer be opened to replace expiring series, and opening transactions in existing series may be prohibited. Exchange traded options are valued at the last sale price, or if no sales are reported, the last bid price.
OTC Options. OTC options purchased or sold by a Fund are not traded on securities or options exchanges or backed by clearinghouses. Rather, they are entered into directly between a Fund and the counterparty to the option. In the case of an OTC option purchased by the Fund, the value of the option to the Fund will depend on the willingness and ability of the option writer to perform its obligations to the Fund. In addition, OTC options may not be transferable and there may be little or no secondary market for them, so they may be considered illiquid. It may not be possible to enter into closing transactions with respect to OTC options or otherwise to terminate such options, and as a result a Fund may be required to remain obligated on an unfavorable OTC option until its expiration. OTC options are valued using prices supplied by a primary pricing source, selected pursuant to procedures approved by the Trustees.
Rights and Warrants. A Fund may purchase or hold warrants or rights in order to gain exposure to the underlying security without owning the security, including, for example, cases where the Fund hopes to lock in the price today of a security it may wish to purchase in the future. Warrants generally give the holder the right, but not the obligation, to buy a security at a stated price. In order for a warrant to be profitable, the market price of the underlying security must rise sufficiently above the exercise price to cover any premium and transaction costs. Rights may similarly confer on the holder the right to purchase or acquire securities, including through participation in a so-called rights offering. Bonds may be issued with warrants or other rights attached to purchase or acquire equity or other debt securities, typically of the bond issuer. The market prices of bonds with warrants or rights attached to purchase equity securities or bonds may, to some degree, reflect changes in the values of the underlying securities.
When a Fund purchases or otherwise acquires warrants or other rights, it runs the risk that it will lose its entire investment in the warrants or rights, unless the Fund exercises the warrant or right, acquires the underlying securities, or enters into a closing transaction before expiration. If the price of the underlying security does not rise to an extent sufficient to cover any premium and transaction costs, the Fund will lose part or all of its investment. Any premiums or purchase price paid for warrants or other rights that expire are treated as realized losses. Warrants and similar rights differ from options in that they are typically written by the issuer of the security underlying the warrant or right. Although some warrants and rights may be non-transferable, others may be traded over-the-counter or on an exchange.
Hybrid Instruments
A hybrid instrument may be a debt security, preferred stock, warrant, convertible security, certificate of deposit, or other evidence of indebtedness on which a portion of or all interest payments, and/or the principal or stated amount payable at maturity, redemption, or retirement, is determined by reference to one or more underlying assets, indexes, economic factors, or other benchmarks. Because hybrid instruments may be designed to provide indirect exposures to virtually any type of derivative instrument, a Fund may invest in a hybrid instrument for any purpose it might engage in derivatives transactions. Hybrid instruments may take a number of forms, including, for example, debt instruments with interest or principal payments or
148
Notes to Financial Statements (Continued) |
redemption terms determined by reference to the value of an index, security, or other measure at a future time, preferred stock with dividend rates determined by reference to the value of a currency, or convertible securities where the conversion terms relate to a particular commodity. The risks of investing in a hybrid instrument may, depending on the nature of the instrument, reflect a combination of the risks of investing in securities, options, futures, currencies or other types of investments, and will depend upon the terms of the instrument. Such risks generally depend upon factors unrelated to the operations or credit quality of the issuer of the hybrid instrument, and may not be foreseen by the purchaser, such as financial or market developments, economic and political events, the supply and demand of the underlying assets, and interest rate movements. Hybrid instruments may be highly volatile and their use by a Fund may not be successful. The terms of a hybrid instrument may create investment leverage. Hybrid instruments are typically privately issued, presenting credit risk of the issuer, and may be highly illiquid and difficult to value.
Inflation-Linked Securities
Inflation-linked securities are typically fixed income securities whose principal values are periodically adjusted according to a measure of inflation. If the index measuring inflation falls, the principal value of an inflation-linked security will be adjusted downward, and consequently the interest payable on the security (calculated with respect to a smaller principal amount) will be reduced. Repayment of the original principal of the security upon maturity (as adjusted for inflation) is guaranteed in the case of U.S. Treasury inflation-linked securities. For securities that do not provide a similar guarantee, the adjusted principal value of the security repaid at maturity may be less than the original principal.
Alternatively, the interest rates payable on certain inflation-linked securities may be adjusted according to a measure of inflation. As a result, the principal values of such securities do not adjust according to the rate of inflation, although the interest payable on such securities may decline during times of falling inflation.
The values of inflation-linked securities are expected to change in response to changes in real interest rates. Real interest rates are tied to the relationship between nominal interest rates and the rate of inflation. If nominal interest rates increase at a faster rate than inflation, real interest rates may rise, leading to a decrease in value of inflation-linked securities. Inflation-linked securities may cause a potential cash flow mismatch to investors, because an increase in the principal amount of an inflation-linked security will be treated as interest income currently subject to tax at ordinary income rates even though investors will not receive repayment of principal until maturity. If a Fund invests in such securities, it will be required to distribute such interest income in order to qualify for treatment as a regulated investment company and eliminate the Fund-level tax, without a corresponding receipt of cash, and therefore may be required to dispose of portfolio securities at a time when it may not be advantageous to do so in order to make such distributions.
Bank Loans
A Fund may invest in bank loans including, for example, corporate loans, loan participations, direct debt, bank debt, and bridge debt. A Fund may invest in a loan by lending money to a borrower directly as part of a syndicate of lenders. In a syndicated loan, the agent that originated and structured the loan typically administers and enforces the loan on behalf of the syndicate. Failure by the agent to fulfill its obligations may delay or adversely affect receipt of payment by a Fund. A Fund may also invest in loans through novations, assignments, and participation interests. In a novation, a Fund typically assumes all of the rights of a lending institution in a loan, including the right to receive payments of principal and interest and other amounts directly from the borrower and to enforce its rights as a lender directly against the borrower. When a Fund takes an assignment of a loan, the Fund acquires some or all of the interest of another lender (or assignee) in the loan. In such cases, the Fund may be required generally to rely upon the assignor to demand payment and enforce rights under the loan. If a Fund acquires a participation in the loan, the Fund purchases an indirect interest in a loan held by a third party and the Fund typically will have a contractual relationship only with the third party loan investor, not with the borrower. As a result, a Fund may have the right to receive payments of principal, interest, and any fees to which it is entitled only from the loan investor selling the participation and only upon receipt by such loan investor of such payments from the borrower. In such cases, a Fund assumes the credit risk of both the borrower and the loan investor selling the participation, and the Fund may be unable to realize some or all of the value of its interest in the loan in the event of the insolvency of the third party.
149
Notes to Financial Statements (Continued) |
Changes in the financial condition of the borrower or economic conditions or other circumstances may reduce the capacity of the borrower to make principal and interest payments on such instruments and may lead to defaults. The value of any collateral securing a bank loan may decline after the Fund invests, and there is a risk that the value of the collateral may not be sufficient to cover the amount owed to the Fund.
The MM Select T. Rowe Price Bond Asset Fund entered into certain loan agreements which are unfunded. The MM Select T. Rowe Price Bond Asset Fund is obligated to fund these commitments at the borrower’s discretion. These commitments are disclosed in the MM Select T. Rowe Price Bond Asset Fund’s Portfolio of Investments. At September 30, 2022, the MM Select T. Rowe Price Bond Asset Fund had sufficient cash and/or securities to cover these commitments.
Repurchase Agreements
Each Fund may enter into repurchase agreements with certain banks and broker-dealers whereby a Fund acquires a security for cash and obtains a simultaneous commitment from the seller to repurchase the security at an agreed upon price and date. A Fund, through its custodian, takes possession of the securities collateralizing the repurchase agreement in a segregated account. Repurchase agreements must be fully collateralized at all times, but involve some risk to a Fund if the other party should default on its obligation and the Fund is delayed or prevented from recovering the collateral, or if the Fund is required to return collateral to a borrower at a time when it may realize a loss on the investment of that collateral.
When-Issued, Delayed-Delivery, Forward Commitment, and To-Be-Announced Transactions
A Fund may enter into when-issued, delayed-delivery, forward commitment, or to-be-announced (“TBA”) transactions (collectively, the “Forward Transactions”) in order to lock in the purchase price of the underlying security, or in order to adjust the interest rate exposure of the Fund’s existing portfolio. In Forward Transactions, a Fund commits to purchase or sell particular securities, with payment and delivery to take place at a future date. In the case of TBA purchase commitments, the unit price and the estimated principal amount are established when the Fund enters into a commitment, with the actual principal amount being within a specified range of the estimate. Although a Fund does not typically pay for the securities in these types of transactions until they are delivered, it immediately assumes the risks of ownership, including the risk of price fluctuation. As a result, each of these types of transactions may create investment leverage in a Fund’s portfolio and increase the volatility of the Fund. If a Fund’s counterparty fails to deliver a security purchased in a Forward Transaction, there may be a loss, and the Fund may have missed an opportunity to make an alternative investment.
These securities are valued on the basis of valuations furnished by a pricing service, selected pursuant to procedures approved by the Trustees, which determines valuations taking into account appropriate factors such as institutional-size trading in similar groups of securities, yield, quality, coupon rate, maturity, type of issue, trading characteristics, and other market data. Securities for which no market quotation is available are valued at fair value in accordance with procedures approved by the Trustees. The Funds record on a daily basis the unrealized appreciation (depreciation) based upon changes in the values of these securities. When a Forward Transaction is closed, the Funds record a realized gain or loss equal to the difference between the value of the transaction at the time it was opened and the value of the transaction at the time it was closed.
Dollar Roll Transactions
A Fund may enter into dollar roll transactions, in which the Fund sells mortgage-backed securities for delivery in the current month and simultaneously contracts to purchase substantially similar securities on a specified future date from the same party. A Fund may invest in dollar rolls in order to benefit from anticipated changes in pricing for the mortgage-backed securities during the term of the transaction, or for the purpose of creating investment leverage. In a dollar roll, the securities that are to be purchased will be of the same type as the securities sold, but will be supported by different pools of mortgages.
Dollar rolls involve the risk that the Fund’s counterparty will be unable to deliver the mortgage-backed securities underlying the dollar roll at the fixed time. If the counterparty files for bankruptcy or becomes insolvent, a Fund’s use of the transaction proceeds may be restricted pending a determination by the counterparty or its representative, whether to enforce the Fund’s obligation to
150
Notes to Financial Statements (Continued) |
repurchase the securities. A Fund can incur a loss on a dollar roll transaction (either because its counterparty fails to perform or because the value of the mortgages subject to the transaction declines) and on the investments made by the Fund with the proceeds of the dollar roll transaction.
A Fund accounts for a dollar roll transaction as a purchase and sale whereby the difference in the sales price and purchase price of the security sold is recorded as a realized gain (loss). If certain criteria are met, these dollar roll transactions may be considered financing transactions, whereby the difference in the sales price and the future purchase price is recorded as an adjustment to interest income. Dollar roll transactions generally have the effect of creating leverage in a Fund’s portfolio.
Securities Lending
Each Fund may lend its securities; however, lending cannot exceed 33% of the total assets of the Fund taken at current value. The Funds’ securities lending activities are governed by a Securities Lending Agency Agreement (“Lending Agreement”) between each Fund and the lending agent (“Agent”). The Lending Agreement authorizes the Agent to lend portfolio securities held by a Fund to approved borrowers (each, a “Borrower”).
Each Fund expects that in connection with any securities on loan, the loan will be secured continuously by collateral consisting of cash (U.S. currency) and/or securities (U.S. Treasury and Agency obligations) adjusted daily to have value at least equal to the current market value of the securities loaned. The market value of the loaned securities is determined at the close of business of a Fund and any additional collateral is delivered to the Fund the next business day. The Funds bear the risk of loss with respect to the investment of cash collateral. As with other extensions of credit, the Funds may bear the risk of delay in recovery of the loaned securities or even loss of rights in the collateral should the Borrower of the securities fail financially. Pursuant to the Lending Agreement, the Agent has provided indemnification to the Funds in the event of default by a Borrower with respect to a loan. The Funds receive compensation for lending their securities in the form of a securities loan fee paid by the Borrower, as well as a share of the income earned on investment of the cash collateral received for the loaned securities. At September 30, 2022, the Funds’ collateral was equal to or greater than 100% of the market value of securities on loan and all of the Funds’ cash collateral was invested in the State Street Navigator Securities Lending Government Money Market Portfolio.
Subject to the terms of the Lending Agreement and the agreement between the Agent and the applicable Borrower (“Borrowing Agreement”), security loans can be terminated by the Agent, the Fund, or the Borrower and the related securities must be returned within the earlier of the customary settlement period for such securities or the period of time specified in the Borrowing Agreement.
The Funds employ the Agent to implement their securities lending program and the Agent receives a fee from the Funds for its services. In addition, the Funds may be required to pay a rebate to the Borrower. Accordingly, a Fund’s compensation for lending its securities is reduced by any such fees or rebate paid to the Agent or Borrower, respectively. Income received by the Funds in securities lending transactions during the year ended September 30, 2022, is reflected as securities lending income on the Statement of Operations.
Accounting for Investment Transactions
Investment transactions are accounted for on the trade date. Realized gains and losses on sales of investments and unrealized appreciation and depreciation of investments are computed by the specific identification cost method. Proceeds received from litigation, if any, are included in realized gains on investment transactions for any investments that are no longer held in the portfolio and as a reduction in cost for investments that continue to be held in the portfolio. Interest income, adjusted for amortization of discounts and premiums on debt securities, is earned from the settlement date and is recorded on the accrual basis. Dividend income and realized capital gain distributions are recorded on the ex-dividend date. Withholding taxes on foreign interest, dividends, and capital gains have been provided for in accordance with the applicable country’s tax rules and rates. Foreign dividend income is recorded on the ex-dividend date or as soon as practicable after the Fund determines the existence of a dividend declaration after exercising reasonable due diligence. Distributions received on securities that represent a return of capital or capital gains are recorded as a reduction of cost of investments and/or as a realized gain.
151
Notes to Financial Statements (Continued) |
Foreign Currency Translation
The books and records of the Funds are maintained in U.S. dollars. The market values of foreign currencies, foreign securities, and other assets and liabilities denominated in foreign currencies are translated into U.S. dollars at the mean of the buying and selling rates of such currencies against the U.S. dollar at the end of each business day. Purchases and sales of foreign securities and income and expense items are translated at the rates of exchange prevailing on the respective dates of such transactions. The Funds do not isolate that portion of the results of operations arising from changes in the exchange rates from that portion arising from changes in the market prices of securities. Net realized foreign currency gains and losses resulting from changes in exchange rates include foreign currency gains and losses between trade date and settlement date on investment securities transactions, foreign currency transactions, and the difference between the amounts of dividends or interest recorded on the books of the Funds and the amount actually received.
Foreign Securities
The MM Select T. Rowe Price Real Assets Fund invests a significant amount of its assets in foreign securities and the MM Select T. Rowe Price Emerging Markets Bond Fund invests substantially all of its assets in foreign securities. The other Funds may also invest in foreign securities. Foreign securities, including American Depositary Receipts, are subject to additional risks compared to securities of U.S. issuers, including international trade, currency, political, regulatory, public health, and diplomatic risks. In addition, fluctuations in currency exchange rates may favorably or unfavorably affect the values of foreign securities and the price of a Fund’s shares. Emerging markets securities are subject to greater risks than securities issued in developed foreign markets, including less liquidity, less stringent investor protection and disclosure standards, less reliable settlement practices, greater price volatility, higher relative rates of inflation, greater political, economic, and social instability, greater custody and operational risks, greater risk of new or inconsistent government treatment of or restrictions on issuers and instruments, and greater volatility in currency exchange rates, and are more susceptible to environmental problems.
Federal Income Tax
It is each Fund’s intent to continue to comply with the provisions of Subchapter M of the Internal Revenue Code of 1986, as amended (the “Code”), applicable to a regulated investment company. Under such provisions, the Funds would not be subject to federal income taxes on their ordinary income and net realized capital gains to the extent they are distributed or deemed to have been distributed to their shareholders. Therefore, the Funds have not made any provision for federal income tax.
Dividends and Distributions to Shareholders
Dividends from net investment income and distributions of any net realized capital gains of each Fund are declared and paid annually and at other times as may be required to satisfy tax or regulatory requirements.
Distributions to shareholders are recorded on the ex-dividend date. Income and capital gain distributions are determined in accordance with income tax regulations, which may differ from generally accepted accounting principles. As a result, net investment income and net realized capital gains on investment transactions for a reporting period may differ significantly from distributions during such period.
|
3. |
Advisory Fees and Other Transactions |
Investment Advisory Fees and Investment Subadvisers
MML Investment Advisers, LLC (“MML Advisers”), a wholly-owned subsidiary of Massachusetts Mutual Life Insurance Company (“MassMutual”), serves as investment adviser to each Fund. Under the investment advisory agreements between MML Advisers and the Trust on behalf of each Fund, MML Advisers is responsible for providing investment management services for each Fund. In return for these services, MML Advisers receives advisory fees, based upon each Fund’s average daily net assets, computed and accrued daily and payable monthly, at the annual rates shown in the following table.
152
Notes to Financial Statements (Continued) |
MML Advisers has also entered into investment subadvisory agreements for each Fund with the unaffiliated investment subadviser shown in the following table.
Fund |
Investment Advisory Fee |
Investment Subadviser(s) |
Equity Asset Fund |
0.18% |
J.P. Morgan Investment Management Inc. |
MM Select T. Rowe Price Bond Asset Fund* |
0.00% |
T. Rowe Price Associates, Inc. |
MM Select T. Rowe Price Emerging Markets Bond Fund |
0.00% |
T. Rowe Price Associates, Inc. |
MM Select T. Rowe Price Large Cap Blend Fund |
0.00% |
T. Rowe Price Associates, Inc. |
MM Select T. Rowe Price Limited Duration Inflation Focused Bond Fund |
0.00% |
T. Rowe Price Associates, Inc. |
MM Select T. Rowe Price Real Assets Fund** |
0.00% |
T. Rowe Price Associates, Inc. |
MM Select T. Rowe Price Small and Mid Cap Blend Fund*** |
0.00% |
T. Rowe Price Associates, Inc. |
MM Select T. Rowe Price U.S. Treasury Long-Term Index Fund |
0.00% |
T. Rowe Price Associates, Inc. |
|
* |
T. Rowe Price International Ltd serves as a sub-subadviser of the Fund. |
|
** |
T. Rowe Price Japan, Inc. serves as a sub-subadviser of the Fund. |
|
*** |
T. Rowe Price Investment Management, Inc. serves as a sub-subadviser of the Fund. |
MML Advisers pays any subadvisory fees to the subadvisers based upon the average daily net assets of the Fund. The Funds’ subadvisory fees, if applicable, are paid monthly by MML Advisers out of the advisory fees.
Expense Caps and Waivers
MML Advisers agreed to cap the fees and expenses of the Funds noted below (other than extraordinary legal and other expenses, Acquired Fund Fees and Expenses#, interest expense, expenses related to borrowings, securities lending, leverage, taxes, and brokerage, short sale dividend and loan expense, or other non-recurring or unusual expenses such as organizational expenses and shareholder meeting expenses, as applicable) through January 31, 2023, based upon the average daily net assets of the Funds, as follows:
Class I |
|
MM Select T. Rowe Price Bond Asset Fund |
0.00% |
MM Select T. Rowe Price Emerging Markets Bond Fund |
0.00% |
MM Select T. Rowe Price Large Cap Blend Fund |
0.00% |
MM Select T. Rowe Price Limited Duration Inflation Focused Bond Fund |
0.00% |
MM Select T. Rowe Price Real Assets Fund |
0.00% |
MM Select T. Rowe Price Small and Mid Cap Blend Fund |
0.00% |
MM Select T. Rowe Price U.S. Treasury Long-Term Index Fund |
0.00% |
|
# |
Acquired Fund Fees and Expenses are borne indirectly by a Fund through investments in other pooled investment vehicles. |
Expense caps and waiver amounts are reflected as a reduction of expenses on the Statements of Operations.
153
Notes to Financial Statements (Continued) |
Rebated Brokerage Commissions
The Funds listed below have entered into agreements with certain brokers whereby the brokers will rebate to the Funds, in cash, a portion of brokerage commissions. Rebated brokerage commissions are amounts earned by the Funds and are included with realized gain or loss on investment transactions presented in the Statements of Operations. For the year ended September 30, 2022, brokerage commissions rebated under these agreements were as follows:
Rebated |
||||
Equity Asset Fund |
$ | 2,557 | ||
Deferred Compensation
Trustees of the Funds who are not officers or employees of MassMutual may elect to defer receipt of their annual fees in accordance with terms of a Non-Qualified Deferred Compensation Plan. Amounts deferred shall accrue interest or earnings and shall be recorded on the Funds’ books as other liabilities. Deferred compensation is included within Trustees’ fees and expenses in the Statements of Assets and Liabilities.
Other
Certain officers and trustees of the Funds may also be employees of MassMutual. The compensation of a trustee who is not an employee of MassMutual is borne by the Funds.
The following table shows beneficial ownership of Funds’ shares by related parties at September 30, 2022:
Total % Ownership |
|
Equity Asset Fund |
100.0% |
MM Select T. Rowe Price Bond Asset Fund |
100.0% |
MM Select T. Rowe Price Emerging Markets Bond Fund |
100.0% |
MM Select T. Rowe Price Large Cap Blend Fund |
100.0% |
MM Select T. Rowe Price Limited Duration Inflation Focused Bond Fund |
100.0% |
MM Select T. Rowe Price Real Assets Fund |
100.0% |
MM Select T. Rowe Price Small And Mid Cap Blend Fund |
100.0% |
MM Select T. Rowe Price U.S. Treasury Long-Term Index Fund |
100.0% |
154
Notes to Financial Statements (Continued) |
|
4. |
Purchases and Sales of Investments |
Cost of purchases and proceeds from sales of investment securities (excluding short-term investments) for the year ended September 30, 2022, were as follows:
Purchases |
Sales |
|||||||||||||||
Long- |
Other |
Long- |
Other |
|||||||||||||
Equity Asset Fund |
$ | — | $ | 145,009,544 | $ | — | $ | 184,152,230 | ||||||||
MM Select T. Rowe Price Bond Asset Fund |
1,755,003,355 | 171,902,736 | 1,792,042,348 | 244,978,108 | ||||||||||||
MM Select T. Rowe Price Emerging Markets Bond Fund |
— | 33,553,865 | — | 32,837,840 | ||||||||||||
MM Select T. Rowe Price Large Cap Blend Fund |
— | 2,691,783,020 | — | 2,632,923,628 | ||||||||||||
MM Select T. Rowe Price Limited Duration Inflation Focused Bond Fund |
430,698,057 | 15,391,164 | 496,990,195 | 22,817,831 | ||||||||||||
MM Select T. Rowe Price Real Assets Fund |
— | 167,941,507 | — | 81,419,593 | ||||||||||||
MM Select T. Rowe Price Small and Mid Cap Blend Fund |
— | 272,613,596 | — | 323,168,470 | ||||||||||||
MM Select T. Rowe Price U.S. Treasury Long-Term Index Fund |
191,203,136 | — | 130,574,115 | — | ||||||||||||
The Funds may purchase from, or sell securities to, other affiliated Funds under procedures adopted by the Trustees. These procedures have been designed to ensure that cross trades conducted by the Funds comply with Rule 17a-7 under the 1940 Act. The cross trades disclosed in the table below are included within the respective purchases and sales amounts shown in the table above, as applicable.
Purchases |
Sales |
Realized |
||||||||||
MM Select T. Rowe Price Bond Asset Fund |
$ | — | $ | 2,097,564 | $ | (213,837 | ) | |||||
MM Select T. Rowe Price Small and Mid Cap Blend Fund |
839,208 | 577,619 | 111,230 | |||||||||
|
5. |
Capital Share Transactions |
Changes in shares outstanding for each Fund were as follows:
Year Ended September 30, 2022 |
Year Ended September 30, 2021 |
|||||||||||||||
Shares |
Amount |
Shares |
Amount |
|||||||||||||
Equity Asset Fund Class I |
||||||||||||||||
Sold |
12,826,056 | $ | 108,281,336 | 8,481,878 | $ | 81,273,129 | ||||||||||
Issued as reinvestment of dividends |
9,040,131 | 81,089,970 | 6,517,621 | 54,878,368 | ||||||||||||
Redeemed |
(17,806,773 | ) | (153,448,249 | ) | (23,818,829 | ) | (227,243,554 | ) | ||||||||
Net increase (decrease) |
4,059,414 | $ | 35,923,057 | (8,819,330 | ) | $ | (91,092,057 | ) | ||||||||
MM Select T. Rowe Price Bond Asset Fund Class I |
||||||||||||||||
Sold |
6,595,443 | $ | 64,637,377 | 18,070,859 | $ | 189,555,100 | ||||||||||
Issued as reinvestment of dividends |
2,547,231 | 25,803,449 | 2,470,327 | 25,814,917 | ||||||||||||
Redeemed |
(22,469,805 | ) | (215,548,508 | ) | (12,964,512 | ) | (135,719,171 | ) | ||||||||
Net increase (decrease) |
(13,327,131 | ) | $ | (125,107,682 | ) | 7,576,674 | $ | 79,650,846 | ||||||||
155
Notes to Financial Statements (Continued) |
Year Ended September 30, 2022 |
Year Ended September 30, 2021 |
|||||||||||||||
Shares |
Amount |
Shares |
Amount |
|||||||||||||
MM Select T. Rowe Price Emerging Markets Bond Fund Class I |
||||||||||||||||
Sold |
2,286,899 | $ | 18,445,413 | 2,059,531 | $ | 19,927,162 | ||||||||||
Issued as reinvestment of dividends |
650,255 | 5,878,302 | 658,213 | 6,332,004 | ||||||||||||
Redeemed |
(2,809,835 | ) | (22,987,605 | ) | (3,276,208 | ) | (31,667,166 | ) | ||||||||
Net increase (decrease) |
127,319 | $ | 1,336,110 | (558,464 | ) | $ | (5,408,000 | ) | ||||||||
MM Select T. Rowe Price Large Cap Blend Fund Class I |
||||||||||||||||
Sold |
38,140,999 | $ | 536,673,778 | 20,764,352 | $ | 325,534,587 | ||||||||||
Issued as reinvestment of dividends |
26,559,408 | 407,155,724 | 1,103,631 | 15,903,325 | ||||||||||||
Redeemed |
(32,177,412 | ) | (449,999,588 | ) | (25,710,532 | ) | (413,163,921 | ) | ||||||||
Net increase (decrease) |
32,522,995 | $ | 493,829,914 | (3,842,549 | ) | $ | (71,726,009 | ) | ||||||||
MM Select T. Rowe Price Limited Duration Inflation Focused Bond Fund Class I |
||||||||||||||||
Sold |
8,152,291 | $ | 88,123,958 | 13,823,027 | $ | 147,572,333 | ||||||||||
Issued as reinvestment of dividends |
1,778,263 | 18,493,933 | 575,795 | 6,011,297 | ||||||||||||
Redeemed |
(15,414,432 | ) | (160,791,935 | ) | (7,155,431 | ) | (77,442,772 | ) | ||||||||
Net increase (decrease) |
(5,483,878 | ) | $ | (54,174,044 | ) | 7,243,391 | $ | 76,140,858 | ||||||||
MM Select T. Rowe Price Real Assets Fund Class I |
||||||||||||||||
Sold |
8,825,504 | $ | 111,462,520 | 3,625,804 | $ | 43,104,715 | ||||||||||
Issued as reinvestment of dividends |
1,155,912 | 14,576,042 | 227,733 | 2,480,008 | ||||||||||||
Redeemed |
(2,286,948 | ) | (28,386,672 | ) | (1,346,757 | ) | (16,166,093 | ) | ||||||||
Net increase (decrease) |
7,694,468 | $ | 97,651,890 | 2,506,780 | $ | 29,418,630 | ||||||||||
MM Select T. Rowe Price Small and Mid Cap Blend Fund Class I |
||||||||||||||||
Sold |
8,963,149 | $ | 120,798,855 | 7,958,789 | $ | 117,789,409 | ||||||||||
Issued as reinvestment of dividends |
8,589,138 | 120,935,066 | 3,395,111 | 46,818,583 | ||||||||||||
Redeemed |
(13,303,227 | ) | (176,346,398 | ) | (15,343,600 | ) | (233,971,045 | ) | ||||||||
Net increase (decrease) |
4,249,060 | $ | 65,387,523 | (3,989,700 | ) | $ | (69,363,053 | ) | ||||||||
MM Select T. Rowe Price U.S. Treasury Long-Term Index Fund Class I |
||||||||||||||||
Sold |
13,442,628 | $ | 92,251,410 | 7,053,603 | $ | 67,462,524 | ||||||||||
Issued as reinvestment of dividends |
248,980 | 1,934,574 | 4,083,390 | 33,769,639 | ||||||||||||
Redeemed |
(4,852,378 | ) | (33,120,671 | ) | (1,957,953 | ) | (16,268,858 | ) | ||||||||
Net increase (decrease) |
8,839,230 | $ | 61,065,313 | 9,179,040 | $ | 84,963,305 | ||||||||||
156
Notes to Financial Statements (Continued) |
|
6. |
Federal Income Tax Information |
At September 30, 2022, the aggregate cost of investments and the unrealized appreciation (depreciation) in the value of all investments owned by the Fund(s), as computed on a federal income tax basis, were as follows:
Federal Income |
Tax Basis |
Tax Basis |
Net Unrealized |
|||||||||||||
Equity Asset Fund |
$ | 289,402,191 | $ | 36,927,965 | $ | (24,173,215 | ) | $ | 12,754,750 | |||||||
MM Select T. Rowe Price Bond Asset Fund |
680,595,809 | 2,316,389 | (91,105,769 | ) | (88,789,380 | ) | ||||||||||
MM Select T. Rowe Price Emerging Markets Bond Fund |
103,696,177 | 209,731 | (28,762,165 | ) | (28,552,434 | ) | ||||||||||
MM Select T. Rowe Price Large Cap Blend Fund |
2,090,452,609 | 59,429,006 | (295,444,772 | ) | (236,015,766 | ) | ||||||||||
MM Select T. Rowe Price Limited Duration Inflation Focused Bond Fund |
221,463,383 | 526,794 | (13,691,128 | ) | (13,164,334 | ) | ||||||||||
MM Select T. Rowe Price Real Assets Fund |
246,720,858 | 6,920,845 | (40,920,849 | ) | (34,000,004 | ) | ||||||||||
MM Select T. Rowe Price Small and Mid Cap Blend Fund |
700,508,564 | 74,366,965 | (102,178,850 | ) | (27,811,885 | ) | ||||||||||
MM Select T. Rowe Price U.S. Treasury Long-Term Index Fund |
173,465,012 | 6,089 | (45,816,700 | ) | (45,810,611 | ) | ||||||||||
Net capital loss carryforwards may be applied against any net realized taxable gains in succeeding years, subject to the carryforward period limitations, where applicable. Capital losses may be carried forward indefinitely, and retain the character of the original loss.
At September 30, 2022, the following Fund(s) had accumulated capital loss carryforwards:
Short Term |
Long Term |
|||||||
MM Select T. Rowe Price Emerging Markets Bond Fund |
$ | 2,679,272 | $ | 5,082,079 | ||||
MM Select T. Rowe Price U.S. Treasury Long-Term Index Fund |
2,492,591 | 7,337,675 | ||||||
The following Fund(s) elected to defer to the fiscal year beginning October 1, 2022, post-October capital losses:
Post-October |
||||
MM Select T. Rowe Price Bond Asset Fund |
$ | 50,762,880 | ||
MM Select T. Rowe Price Limited Duration Inflation Focused Bond Fund |
13,093,061 | |||
Generally accepted accounting principles in the United States of America require that only distributions in excess of tax basis earnings and profits be reported in the financial statements as a return of capital.
157
Notes to Financial Statements (Continued) |
The tax character of distributions (including capital gain dividends, if any, designated pursuant to Section 852 of the Code) paid during the year ended September 30, 2022, was as follows:
Ordinary |
Long Term |
|||||||
Equity Asset Fund |
$ | 15,272,413 | $ | 65,817,557 | ||||
MM Select T. Rowe Price Bond Asset Fund |
24,045,723 | 1,757,726 | ||||||
MM Select T. Rowe Price Emerging Markets Bond Fund |
5,878,302 | — | ||||||
MM Select T. Rowe Price Large Cap Blend Fund |
140,955,247 | 266,200,477 | ||||||
MM Select T. Rowe Price Limited Duration Inflation Focused Bond Fund |
15,969,168 | 2,524,765 | ||||||
MM Select T. Rowe Price Real Assets Fund |
6,076,480 | 8,499,562 | ||||||
MM Select T. Rowe Price Small and Mid Cap Blend Fund |
25,974,162 | 94,960,904 | ||||||
MM Select T. Rowe Price U.S. Treasury Long-Term Index Fund |
1,934,574 | — | ||||||
The tax character of distributions (including capital gain dividends, if any, designated pursuant to Section 852 of the Code) paid during the year ended September 30, 2021, was as follows:
Ordinary |
Long Term |
|||||||
Equity Asset Fund |
$ | 6,441,250 | $ | 48,437,118 | ||||
MM Select T. Rowe Price Bond Asset Fund |
15,115,881 | 10,699,036 | ||||||
MM Select T. Rowe Price Emerging Markets Bond Fund |
6,332,004 | — | ||||||
MM Select T. Rowe Price Large Cap Blend Fund |
15,903,325 | — | ||||||
MM Select T. Rowe Price Limited Duration Inflation Focused Bond Fund |
4,626,676 | 1,384,621 | ||||||
MM Select T. Rowe Price Real Assets Fund |
2,480,008 | — | ||||||
MM Select T. Rowe Price Small and Mid Cap Blend Fund |
15,289,172 | 31,529,411 | ||||||
MM Select T. Rowe Price U.S. Treasury Long-Term Index Fund |
13,043,146 | 20,726,493 | ||||||
Capital accounts within the financial statements are periodically adjusted for permanent differences between book and tax accounting. These adjustments have no impact on net assets or the results of operations. Temporary book and tax accounting differences will reverse in subsequent periods. At September 30, 2022, temporary book and tax accounting differences were primarily attributable to the deferral of wash sale losses, deferred Trustee compensation, and other temporary basis adjustments.
158
Notes to Financial Statements (Continued) |
At September 30, 2022, the components of distributable earnings on a tax basis were as follows:
Undistributed |
Undistributed |
Other |
Unrealized |
Total |
||||||||||||||||
Equity Asset Fund |
$ | 3,239,827 | $ | 41,023,653 | $ | (30,365 | ) | $ | 12,733,190 | $ | 56,966,305 | |||||||||
MM Select T. Rowe Price Bond Asset Fund |
32,364,349 | — | (50,776,451 | ) | (88,979,603 | ) | (107,391,705 | ) | ||||||||||||
MM Select T. Rowe Price Emerging Markets Bond Fund |
3,805,330 | (7,761,351 | ) | (2,057 | ) | (28,556,128 | ) | (32,514,206 | ) | |||||||||||
MM Select T. Rowe Price Large Cap Blend Fund |
16,054,011 | 193,468,487 | (26,119 | ) | (235,997,434 | ) | (26,501,055 | ) | ||||||||||||
MM Select T. Rowe Price Limited Duration Inflation Focused Bond Fund |
16,304,561 | — | (13,096,478 | ) | (13,151,871 | ) | (9,943,788 | ) | ||||||||||||
MM Select T. Rowe Price Real Assets Fund |
5,138,964 | 10,148,604 | (1,695 | ) | (34,054,148 | ) | (18,768,275 | ) | ||||||||||||
MM Select T. Rowe Price Small and Mid Cap Blend Fund |
5,077,220 | 47,644,453 | (12,816 | ) | (27,818,949 | ) | 24,889,908 | |||||||||||||
MM Select T. Rowe Price U.S. Treasury Long-Term Index Fund |
3,035,612 | (9,830,266 | ) | (2,772 | ) | (45,810,611 | ) | (52,608,037 | ) | |||||||||||
During the year ended September 30, 2022, the following amounts were reclassified due to permanent differences between book and tax accounting:
Paid-in |
Accumulated |
Undistributed |
||||||||||
Equity Asset Fund |
$ | — | $ | 235,435 | $ | (235,435 | ) | |||||
MM Select T. Rowe Price Bond Asset Fund |
13,983 | (17,914,038 | ) | 17,900,055 | ||||||||
MM Select T. Rowe Price Emerging Markets Bond Fund |
— | (61,854 | ) | 61,854 | ||||||||
MM Select T. Rowe Price Large Cap Blend Fund |
— | 3,912,681 | (3,912,681 | ) | ||||||||
MM Select T. Rowe Price Limited Duration Inflation Focused Bond Fund |
— | (3,544,309 | ) | 3,544,309 | ||||||||
MM Select T. Rowe Price Real Assets Fund |
(4,573 | ) | 1,082,166 | (1,077,593 | ) | |||||||
MM Select T. Rowe Price Small and Mid Cap Blend Fund |
(47,980 | ) | 672,019 | (624,039 | ) | |||||||
MM Select T. Rowe Price U.S. Treasury Long-Term Index Fund |
— | (116,615 | ) | 116,615 | ||||||||
The Funds did not have any unrecognized tax benefits at September 30, 2022, nor were there any increases or decreases in unrecognized tax benefits for the year then ended. The Funds recognize interest and penalties, if any, related to unrecognized tax benefits as an income tax expense in the Statements of Operations. During the year ended September 30, 2022, the Funds did not incur any such interest or penalties. The Funds are subject to examination by U.S. federal and state tax authorities for returns filed for the prior three fiscal years. Foreign taxes are provided for based on the Funds’ understanding of the tax rules and rates that exist in the foreign markets in which they invest.
159
Notes to Financial Statements (Continued) |
|
7. |
Indemnifications |
Under the Funds’ organizational documents, current and former Trustees and Officers are provided with specified rights to indemnification against liabilities arising in connection with the performance of their duties to the Funds, and shareholders are indemnified against personal liability for obligations of the Funds. In the normal course of business, the Funds may also enter into contracts that provide general indemnifications. The Funds’ maximum exposure under these arrangements is unknown as this would be dependent on future claims that may be made against the Funds. The risk of material loss from such claims is considered remote.
|
8. |
New Accounting Pronouncements |
In January 2021, FASB issued Accounting Standards Update 2021-01 — Reference Rate Reform (Topic 848) — Scope (“ASU 2021-01”) as an update to Accounting Standards Update 2020-04 — Reference Rate Reform (Topic 848) — Facilitation of the Effects of Reference Rate Reform on Financial Reporting (“ASU 2020-04”) in order to make certain clarifications. ASU 2020-04 and ASU 2021-01 provide optional temporary financial reporting relief from the effect of certain types of contract modifications due to the planned discontinuation of the London Interbank Offered Rate (“LIBOR”) and other interbank-offered based reference rates. The temporary relief provided by ASU 2020-04 and ASU 2021-01 is effective for certain reference rate-related contract modifications that occur during the period March 12, 2020 through December 31, 2022. Management does not believe the impact of adopting ASU 2020-04 and ASU 2021-01 will have a material impact on the financial statements.
In June 2022, FASB issued Accounting Standards Update 2022-03 — Fair Value Measurement (Topic 820) — Fair Value Measurement of Equity Securities Subject to Contractual Sale Restrictions (“ASU 2022-03”). ASU 2022-03 clarifies the guidance in Topic 820 to indicate that a contractual sale restriction should not be considered in the fair value of an equity security subject to such a restriction, and requires entities with investments in equity securities subject to contractual sale restrictions to disclose certain qualitative and quantitative information about such securities. ASU 2022-03 is effective for fiscal years, and interim periods within those fiscal years, beginning after December 15, 2023, and allows for early adoption. ASU 2022-03 will only be applicable to an equity security in which the contractual arrangement that restricts its sale is executed or modified on or after the adoption date. Management is currently evaluating the impact of applying this update.
|
9. |
Coronavirus (COVID-19) Pandemic |
The global pandemic outbreak of the novel coronavirus known as COVID-19 and efforts to contain its spread have produced, and will likely continue to produce, substantial market volatility, severe market dislocations and liquidity constraints in many markets, exchange trading suspensions and closures, higher default rates, and global business disruption, and they may result in future significant adverse effects, such as declines in global financial markets and a substantial economic downturn or recession throughout the world. Such factors may have a significant adverse effect on a Fund’s performance and have the potential to impair the ability of a Fund’s investment adviser, subadviser, or other service providers to serve the Fund and could lead to disruptions that negatively impact the Fund.
|
10. |
Russia-Ukraine War |
In February 2022, Russia commenced a large-scale military attack on Ukraine. The outbreak of hostilities between the two countries could result in more widespread conflict and could have a severe adverse effect on the regional and the global financial markets and economies. One or more of the Funds hold positions in securities or other instruments that are economically tied to Russia. Investments in Russia are subject to political, economic, legal, market, and currency risks, as well as the risks related to the economic sanctions on Russia, Russian individuals, and Russian corporate and banking entities imposed by the United States and/or other countries. Such sanctions — which affect companies in many sectors, including energy, financial services, and defense, among others — could adversely affect the global energy and financial markets and, thus, could affect the value of a Fund’s investments, even beyond any direct exposure the Fund may have to Russian issuers or the adjoining geographic regions. Such sanctions may also result in a decline in the value and liquidity of Russian securities and a weakening of the ruble, and will impair a Fund’s ability to buy, sell, receive, or deliver Russian securities. In addition, certain transactions have
160
Notes to Financial Statements (Continued) |
been or may be prohibited and/or existing investments have or may become illiquid (e.g., because transacting in certain existing investments is prohibited), which could cause a Fund to sell other portfolio holdings at a disadvantageous time or price in order to meet shareholder redemptions.
|
11. |
Subsequent Events |
In preparation of these financial statements, management has evaluated the events and transactions subsequent to September 30, 2022, through the date when the financial statements were issued, and determined that there are no subsequent events or transactions that would require adjustments to or disclosures in the Funds’ financial statements other than those disclosed below.
Effective November 1, 2022, T. Rowe Price Hong Kong Limited was added as a sub-subadviser of the MM Select T. Rowe Price Bond Asset Fund and the MM Select T. Rowe Price Limited Duration Inflation Focused Bond Fund.
Effective November 1, 2022, T. Rowe Price International Ltd was added as a sub-subadviser of the MM Select T. Rowe Price Limited Duration Inflation Focused Bond Fund.
161
To the Board of Trustees of MassMutual Select Funds and Shareholders of MM Equity Asset Fund, MassMutual Select T. Rowe Price Bond Asset Fund, MassMutual Select T. Rowe Price Emerging Markets Bond Fund, MassMutual Select T. Rowe Price Large Cap Blend Fund, MassMutual Select T. Rowe Price Limited Duration Inflation Focused Bond Fund, MassMutual Select T. Rowe Price Real Assets Fund, MassMutual Select T. Rowe Price Small and Mid Cap Blend Fund, and MassMutual Select T. Rowe Price U.S. Treasury Long-Term Index Fund (collectively, the “Funds”):
Opinion on the Financial Statements and Financial Highlights
We have audited the accompanying statements of assets and liabilities of the Funds, including the portfolios of investments, as of September 30, 2022, the related statements of operations for the year then ended, the statements of changes in net assets for each of the two years in the period then ended, the financial highlights for the periods indicated in the table below, and the related notes. In our opinion, the financial statements and financial highlights present fairly, in all material respects, the financial position of each of the Funds as of September 30, 2022, and the results of their operations for the year then ended, the changes in their net assets for each of the two years in the period then ended, and the financial highlights for the periods listed in the table below, in conformity with accounting principles generally accepted in the United States of America.
Individual Fund Comprising the MassMutual Select Funds |
Financial Highlights |
MM Equity Asset Fund |
For each of the five years in the period ended September 30, 2022 |
MassMutual Select T. Rowe Price Bond Asset Fund,
MassMutual Select T. Rowe Price Emerging Markets Bond Fund,
MassMutual Select T. Rowe Price Large Cap Blend Fund,
MassMutual Select T. Rowe Price Limited Duration Inflation Focused Bond Fund,
MassMutual Select T. Rowe Price Real Assets Fund,
MassMutual Select T. Rowe Price Small and Mid Cap Blend Fund, and
MassMutual Select T. Rowe Price U.S. Treasury Long-Term Index Fund |
For each of the four years in the period ended September 30, 2022, and for the period February 9, 2018 (commencement of operations) through September 30, 2018 |
Basis for Opinion
These financial statements and financial highlights are the responsibility of the Funds’ management. Our responsibility is to express an opinion on the Funds’ financial statements and financial highlights based on our audits. We are a public accounting firm registered with the Public Company Accounting Oversight Board (United States) (PCAOB) and are required to be independent with respect to the Funds in accordance with the U.S. federal securities laws and the applicable rules and regulations of the Securities and Exchange Commission and the PCAOB.
We conducted our audits in accordance with the standards of the PCAOB. Those standards require that we plan and perform the audit to obtain reasonable assurance about whether the financial statements and financial highlights are free of material misstatement, whether due to error or fraud. The Funds are not required to have, nor were we engaged to perform, an audit of their internal control over financial reporting. As part of our audits we are required to obtain an understanding of internal control over financial reporting but not for the purpose of expressing an opinion on the effectiveness of the Funds’ internal control over financial reporting. Accordingly, we express no such opinion.
Our audits included performing procedures to assess the risks of material misstatement of the financial statements and financial highlights, whether due to error or fraud, and performing procedures that respond to those risks. Such procedures included examining, on a test basis, evidence regarding the amounts and disclosures in the financial statements and financial highlights.
162
Report of Independent Registered Public Accounting Firm (Continued) |
Our audits also included evaluating the accounting principles used and significant estimates made by management, as well as evaluating the overall presentation of the financial statements and financial highlights. Our procedures included confirmation of securities owned as of September 30, 2022, by correspondence with the custodian, brokers and agent banks; when replies were not received from brokers and agent banks, we performed other auditing procedures. We believe that our audits provide a reasonable basis for our opinion.
/s/ Deloitte & Touche LLP
Boston, Massachusetts
November 28, 2022
We have served as the auditor of one or more MassMutual investment companies since 1995.
163
The following table lists the Trust’s Trustees and Principal Officers; their address and year of birth; their position with the Trust; the length of time holding that position with the Trust; their principal occupation(s) during at least the past five years; the number of portfolios in the fund complex they oversee; and other directorships they hold in companies subject to registration or reporting requirements of the Securities Exchange Act of 1934 (generally called “public companies”) or in registered investment companies. The Trust’s Statement of Additional Information includes additional information about the Trust’s Trustees and is available, without charge, upon request by calling 1-888-309-3539 or by writing MassMutual Select Funds, c/o Massachusetts Mutual Life Insurance Company, 1295 State Street, Springfield, Massachusetts 01111-0001, Attention: Investment Management Solutions.
Independent Trustees
Name, Address*, |
Position(s) |
Term of |
Principal Occupation(s) |
Number of |
Other Directorships |
Allan W. Blair Year of birth: 1948 |
Trustee |
Since 2003 |
Retired. |
108 |
Trustee (since 2012), MassMutual Premier Funds (open-end investment company); Trustee (since 2021), MassMutual Advantage Funds (open-end investment company); Trustee (since 2003), MML Series Investment Fund (open-end investment company); Trustee (since 2012), MML Series Investment Fund II (open-end investment company). |
Nabil N. El-Hage Year of birth: 1958 |
Trustee |
Since 2012 |
Founder and CEO (since 2018), AEE International LLC (a Puerto Rico LLC); Founder and sole member (2016-2018), PR Academy of Executive Education LLC (a Puerto Rico LLC). |
108 |
Trustee (since 2003), Chairman (2006-2012), MassMutual Premier Funds (open-end investment company); Trustee (since 2021), MassMutual Advantage Funds (open-end investment company); Trustee (since 2012), MML Series Investment Fund (open-end investment company); Trustee (since 2005), Chairman (2006-2012), MML Series Investment Fund II (open-end investment company). |
Maria D. Furman Year of birth: 1954 |
Trustee |
Since 2012 |
Retired. |
108 |
Trustee (since 2004), MassMutual Premier Funds (open-end investment company); Trustee (since 2021), MassMutual Advantage Funds (open-end investment company); Trustee (since 2012), MML Series Investment Fund (open-end investment company); Trustee (since 2005), MML Series Investment Fund II (open-end investment company). |
R. Bradford Malt Year of birth: 1954 |
Trustee |
Since 2022 |
Chairman (2004-2019), Management Committee (1993-2019), Partner (1987-2019), Associate (1979-1987), Ropes & Gray LLP (counsel to the Trust and MassMutual). |
108 |
Trustee (since 2022), MassMutual Premier Funds (open-end investment company); Trustee (since 2022), MassMutual Advantage Funds (open-end investment company); Trustee (since 2022), MML Series Investment Fund (open-end investment company); Trustee (since 2022), MML Series Investment Fund II (open-end investment company). |
164
Trustees and Principal Officers (Unaudited) (Continued) |
Name, Address*, and Year of Birth |
Position(s) |
Term of |
Principal Occupation(s) |
Number of |
Other Directorships |
C. Ann Merrifield Year of birth: 1951 |
Trustee |
Since 2012 |
Retired. |
108 |
Director (since 2020), Lead Director (2020-2022), Chairperson (since 2020) of the Nominating and Governance Committee, Member (since 2020) and Chairperson (2020-2022) of the Compensation Committee, and Member (2020-2022) of the Audit Committee, Lyra Therapeutics (a clinical-stage specialty pharmaceutical company); Chairperson (since 2017), Director (since 2014), InVivo Therapeutics (research and clinical-stage biomaterials and biotechnology company); Trustee (since 2004), MassMutual Premier Funds (open-end investment company); Trustee (since 2021), MassMutual Advantage Funds (open-end investment company); Trustee (since 2012), MML Series Investment Fund (open-end investment company); Trustee (since 2005), MML Series Investment Fund II (open-end investment company). |
Cynthia R. Plouché Year of birth: 1957 |
Trustee |
Since 2022 |
Retired; Assessor (2014-2018), Moraine Township (property assessment). |
108 |
Trustee (since 2014), Northern Trust Funds (open-end investment companies); Trustee (since 2022), MassMutual Premier Funds (open-end investment company); Trustee (since 2022), MassMutual Advantage Funds (open-end investment company); Trustee (since 2022), MML Series Investment Fund (open-end investment company); Trustee (since 2022), MML Series Investment Fund II (open-end investment company). |
Jason J. Price Year of birth: 1973 |
Trustee |
Since 2022 |
Co-Founder and Chairman of the Board (2017-2021), NXTHVN (arts organization); Principal (2012-2017), Exaltare Capital Partners, LLC (private equity firm). |
108 |
Trustee (since 2022), MassMutual Premier Funds (open-end investment company); Trustee (since 2022), MassMutual Advantage Funds (open-end investment company); Trustee (since 2022), MML Series Investment Fund (open-end investment company); Trustee (since 2022), MML Series Investment Fund II (open-end investment company). |
165
Trustees and Principal Officers (Unaudited) (Continued) |
Name, Address*, and Year of Birth |
Position(s) |
Term of |
Principal Occupation(s) |
Number of |
Other Directorships |
Susan B. Sweeney Year of birth: 1952 |
Chairperson
Trustee |
Since 2022
Since |
Retired. |
110^ |
Trustee (since 2012), Barings Corporate Investors (closed-end investment company); Trustee (since 2012), Barings Participation Investors (closed-end investment company); Chairperson (since 2022), Trustee (since 2012), MassMutual Premier Funds (open-end investment company); Chairperson (since 2022), Trustee (since 2021), MassMutual Advantage Funds (open-end investment company); Chairperson (since 2022), Trustee (since 2009), MML Series Investment Fund (open-end investment company); Chairperson (since 2022), Trustee (since 2012), MML Series Investment Fund II (open-end investment company). |
Interested Trustees
Name, Address*, |
Position(s) |
Term of |
Principal Occupation(s) |
Number of |
Other Directorships |
Michael R. Fanning^^ Year of birth: 1963 |
Trustee |
Since 2021 |
Head of MassMutual U.S. (since 2016), Executive Vice President (2016-2018), Member of MassMutual’s Executive Leadership Team (since 2008), MassMutual. |
108 |
Director (since 2016), MML Advisers; Trustee (since 2021), MassMutual Premier Funds (open-end investment company); Trustee (since 2021), MassMutual Advantage Funds (open-end investment company); Trustee (since 2021), MML Series Investment Fund (open-end investment company); Trustee (since 2021), MML Series Investment Fund II (open-end investment company). |
Clifford M, Noreen^^^ Year of birth: 1957 |
Trustee |
Since 2021 |
Head of Global Investment Strategy (since 2019), Deputy Chief Investment Officer and Managing Director (2016-2018), MassMutual; President (2008-2016), Vice Chairman (2007-2008), Member of the Board of Managers (2006-2016), Managing Director (2000-2016), Barings LLC. |
110^ |
Chairman (since 2009), Trustee (since 2005), President (2005-2009), CI Subsidiary Trust and PI Subsidiary Trust; Chairman and Trustee (since 2009), President (2005-2009), Vice President (1993-2005), Barings Corporate Investors (closed-end investment company); Chairman and Trustee (since 2009), President (2005-2009), Vice President (1993-2005), Barings Participation Investors (closed-end investment company); Trustee (since 2021), MassMutual Premier Funds (open-end investment company); Trustee (since 2021), MassMutual Advantage Funds (open-end investment company); Trustee (since 2021), MML Series Investment Fund (open-end investment company); Trustee (since 2021), MML Series Investment Fund II (open-end investment company). |
166
Trustees and Principal Officers (Unaudited) (Continued) |
Principal Officers
Name, Address*, |
Position(s) |
Term of |
Principal Occupation(s) |
Number of |
Andrea Anastasio Year of birth: 1974 |
Vice President |
Since 2021 |
Vice President (since 2021), MML Advisers; Head of Investment Management Solutions (since 2021), MassMutual; Head of Investment Strategy and Research, North America (2019-2021), Head of Investment Product Management (2016- 2019), State Street Global Advisors; Vice President (since 2021), MassMutual Premier Funds (open-end investment company); Vice President (since 2021), MassMutual Advantage Funds (open-end investment company); Vice President (since 2021), MML Series Investment Fund (open-end investment company); Vice President (since 2021), MML Series Investment Fund II (open-end investment company). |
108 |
Andrew M. Goldberg Year of birth: 1966 |
Vice President, Secretary, and Chief Legal Officer
Assistant Secretary |
Since 2008
2001- 2008 |
Lead Counsel, Investment Adviser & Mutual Funds (since 2018), Assistant Vice President and Counsel (2004-2018), MassMutual; Secretary (since 2015), Assistant Secretary (2013-2015), MML Advisers; Vice President, Secretary (formerly known as “Clerk”), and Chief Legal Officer (since 2008), Assistant Clerk (2004-2008), MassMutual Premier Funds (open-end investment company); Vice President, Secretary, and Chief Legal Officer (since 2021), MassMutual Advantage Funds (open-end investment company); Vice President, Secretary, and Chief Legal Officer (since 2008), Assistant Secretary (2001-2008), MML Series Investment Fund (open-end investment company); Vice President, Secretary (formerly known as “Clerk”), and Chief Legal Officer (since 2008), Assistant Clerk (2005-2008), MML Series Investment Fund II (open-end investment company). |
108 |
Renee Hitchcock Year of birth: 1970 |
Chief Financial Officer and Treasurer
Assistant Treasurer |
Since 2016
2007- 2016 |
Head of Mutual Fund Administration (since 2018), Assistant Vice President (2015-2018), MassMutual; Chief Financial Officer and Treasurer (since 2016), Assistant Treasurer (2007-2016), MassMutual Premier Funds (open-end investment company); Chief Financial Officer and Treasurer (since 2021), MassMutual Advantage Funds (open-end investment company); Chief Financial Officer and Treasurer (since 2016), Assistant Treasurer (2007-2016), MML Series Investment Fund (open-end investment company); Chief Financial Officer and Treasurer (since 2016), Assistant Treasurer (2007-2016), MML Series Investment Fund II (open-end investment company). |
108 |
Paul LaPiana Year of birth: 1969 |
President |
Since |
President (since 2021), MML Advisers; Head of MassMutual U.S. Product (since 2019), Head of Field Management (2016-2019), MassMutual; President (since 2021), MassMutual Premier Funds (open-end investment company); President (since 2021), MassMutual Advantage Funds (open-end investment company); President (since 2021), MML Series Investment Fund (open-end investment company); President (since 2021), MML Series Investment Fund II (open-end investment company). |
108 |
Jill Nareau Robert Year of birth: 1972 |
Vice President and Assistant Secretary
Assistant Secretary |
Since 2017
2008- 2017 |
Lead Counsel, Investment Adviser & Mutual Funds (since 2018), Assistant Vice President and Counsel (2009-2018), MassMutual; Assistant Secretary (since 2015), MML Advisers; Vice President and Assistant Secretary (since 2017), Assistant Secretary (formerly known as “Assistant Clerk”) (2008-2017), MassMutual Premier Funds (open-end investment company); Vice President and Assistant Secretary (since 2021), MassMutual Advantage Funds (open-end investment company); Vice President and Assistant Secretary (since 2017), Assistant Secretary (2008-2017), MML Series Investment Fund (open-end investment company); Vice President and Assistant Secretary (since 2017), Assistant Secretary (formerly known as “Assistant Clerk”) (2008-2017), MML Series Investment Fund II (open-end investment company). |
108 |
167
Trustees and Principal Officers (Unaudited) (Continued) |
Name, Address*, and Year of Birth |
Position(s) |
Term of |
Principal Occupation(s) |
Number of |
Douglas Steele Year of birth: 1975 |
Vice President |
Since 2016 |
Head of Product Management (since 2021), Vice President (since 2017), Head of Investment Management (2017-2021), Head of Investment Due Diligence (2016-2017), MML Advisers; Head of Product Management (since 2021), Head of Manager Research (2021), Head of Investment Management (2017-2021), Assistant Vice President (2013-2017), MassMutual; Vice President (since 2016), MassMutual Premier Funds (open-end investment company); Vice President (since 2021), MassMutual Advantage Funds (open-end investment company); Vice President (since 2016), MML Series Investment Fund (open-end investment company); Vice President (since 2016), MML Series Investment Fund II (open-end investment company). |
108 |
Philip S. Wellman Year of birth: 1964 |
Vice President and Chief Compliance Officer |
Since 2007 |
Vice President and Chief Compliance Officer (since 2013), MML Advisers; Head of Mutual Funds & RIA Compliance (since 2018), Vice President, Associate General Counsel, and Chief Compliance Officer (Mutual Funds) (2014-2018), MassMutual; Vice President and Chief Compliance Officer (since 2007), MassMutual Premier Funds (open-end investment company); Vice President and Chief Compliance Officer (since 2021), MassMutual Advantage Funds (open-end investment company); Vice President and Chief Compliance Officer (since 2007), MML Series Investment Fund (open-end investment company); Vice President and Chief Compliance Officer (since 2007), MML Series Investment Fund II (open-end investment company). |
108 |
|
* |
The address of each Trustee and Principal Officer is the same as that for the Trust; 1295 State Street, Springfield, Massachusetts 01111-0001. |
|
** |
Each Trustee of the Trust serves until the next meeting of shareholders called for the purpose of electing Trustees and until the election and qualification of his or her successor or until he or she dies, resigns, or is removed. Notwithstanding the foregoing, unless the Trustees determine that it is desirable and in the best interest of the Trust that an exception to the retirement policy of the Trust be made, a Trustee shall retire and cease to serve as a Trustee upon the conclusion of the calendar year in which such Trustee attains the age of seventy-five years, however, an interested Trustee of the Trust shall no longer serve as a Trustee if or when they are no longer an employee of MassMutual or an affiliate. |
|
|
The Chairperson is elected to hold such office for a term of three years or until their successor is elected and qualified to carry out the duties and responsibilities of their office, or until he or she retires, dies, resigns, is removed, or becomes disqualified, and any such Chairperson may not serve more than two consecutive terms. The Chairperson shall hold office at the pleasure of the Trustees. |
|
^ |
Barings Participation Investors and Barings Corporate Investors are deemed to be a part of the Fund Complex, because they are managed by Barings LLC, an affiliate of MML Advisers. |
|
^^ |
Mr. Fanning is an “Interested Person,” as that term is defined in the 1940 Act, as an employee of MassMutual. |
|
^^^ |
Mr. Noreen is an “Interested Person,” as that term is defined in the 1940 Act, as an employee of MassMutual. |
|
# |
The President, Treasurer, and Secretary and such other officers as the Trustees may in their discretion from time to time elect are elected to hold such office until their successor is elected and qualified to carry out the duties and responsibilities of their office, or until he or she dies, resigns, is removed, or becomes disqualified. Each officer shall hold office at the pleasure of the Trustees. |
168
For corporate shareholders, a portion of the ordinary dividends paid during the Fund(s)’ year ended September 30, 2022, qualified for the dividends received deduction, as follows:
Dividends |
||||
Equity Asset Fund |
41.28 | % | ||
MM Select T. Rowe Price Bond Asset Fund |
0.04 | % | ||
MM Select T. Rowe Price Large Cap Blend Fund |
17.63 | % | ||
MM Select T. Rowe Price Real Assets Fund |
12.61 | % | ||
MM Select T. Rowe Price Small and Mid Cap Blend Fund |
28.60 | % | ||
Under Section 854(b)(2) of the Code, the Fund(s) hereby designate the maximum amounts as qualified dividends for purposes of the maximum rate under Section 1(h)(11) of the Code for the year ended September 30, 2022.
The Fund(s) intend to pass through the maximum amount allowable as Section 163(j) Interest Dividends as defined in the Treasury Regulations §1.163(j)-1(b).
169
A description of the policies and procedures that each Fund’s investment adviser and subadviser use to vote proxies relating to the Fund’s portfolio securities is available, without charge, upon request, by calling 1-888-309-3539, and on the Securities and Exchange Commission’s (“SEC”) EDGAR database on its website at http://www.sec.gov.
Information regarding how the Funds voted proxies relating to portfolio securities during the most recent 12-month period ended June 30 is available, without charge, upon request, on the MassMutual website at http://www.massmutual.com/funds and on the SEC’s EDGAR database on its website at http://www.sec.gov.
The Funds file their complete schedule of portfolio holdings with the SEC for the first and third quarters of each fiscal year as an exhibit to their reports on Form N-PORT. The Funds’ Forms N-PORT are available on the SEC’s EDGAR database on its website at http://www.sec.gov. In addition, the Funds make the complete schedule of portfolio holdings from their filings on Form N-PORT available to shareholders at http://www.massmutual.com/funds.
Trustees’ Approval of Investment Advisory Contracts
At their meetings in May and June 2022, the Contract Committee (the “Committee”) and the Trustees, including the Trustees who are not “interested persons” (as such term is defined in the 1940 Act) of the Trust, MML Advisers, or the subadvisers (the “Independent Trustees”), re-approved the existing advisory and subadvisory agreements (collectively, the “Contracts”) for each of the Equity Asset Fund, MM Select T. Rowe Price Bond Asset Fund, MM Select T. Rowe Price Emerging Markets Bond Fund, MM Select T. Rowe Price Large Cap Blend Fund, MM Select T. Rowe Price Limited Duration Inflation Focused Bond Fund, MM Select T. Rowe Price Real Assets Fund, MM Select T. Rowe Price Small and Mid Cap Blend Fund, and MM Select T. Rowe Price U.S. Treasury Long-Term Index Fund. In preparation for the meetings, the Trustees requested, and MML Advisers and the subadvisers provided in advance, certain materials relevant to the consideration of the Contracts (the “Meeting Materials”). In all of their deliberations, the Trustees were advised by independent counsel.
The Committee received in advance of the meetings (i) a memorandum from MML Advisers discussing the nature and quality of the services it provides as investment adviser to the Funds; (ii) a profitability analysis prepared by MML Advisers; and (iii) a fee and performance study report (the “Third-Party Report”) with respect to each Fund prepared by an independent third-party vendor (the “Third-Party”). The Third-Party Report provided detailed comparative advisory fee, total expense, and performance information for each Fund to assist the Committee in its evaluation of the Contracts. The Committee also considered information presented to it throughout the year regarding MML Advisers and each of the subadvisers.
The Committee considered the nature, scope, and quality of services MML Advisers provides to the Funds, including: (i) the financial condition, stability, and business strategy of MML Advisers; (ii) the capabilities of MML Advisers with respect to regulatory compliance and its ability to monitor compliance with the investment policies of the Funds; (iii) MML Advisers’ ability to provide investment oversight and provide for administrative and shareholder services to the Funds; and (iv) the experience and qualifications of the personnel of MML Advisers that perform, or oversee the performance of, the services provided to the Funds, and the needs of the Funds for administrative and shareholder services. The Committee noted that it had received in the Meeting Materials or during the course of the past year: (i) detailed information regarding MML Advisers’ ability to provide investment oversight and provide for administrative and shareholder services to the Funds; and (ii) a wide range of information about the subadvisers and their personnel with responsibility for providing services to the Funds and the fees payable to each subadviser by MML Advisers. MML Advisers reviewed with the Committee in detail the work MML Advisers does in its oversight roles, the expertise it brings to these roles, the size of its teams, and the financial commitment it has made to provide those services.
The Committee then reviewed and considered, for each Fund separately, the detailed information presented in the Third-Party Report regarding: (i) Fund expenses, including, among other things, both the Fund’s net advisory fee and total net expense ratio against peer funds; and (ii) the Fund’s relative performance (over various time periods against funds in its “category” and a benchmark index). In connection with the Committee’s review, MML Advisers provided commentary and analysis regarding
170
Other Information (Unaudited) (Continued) |
each Fund’s expenses and performance and a recommendation as to the action to be taken by the Committee. Throughout the discussion, MML Advisers responded to Committee members’ questions and provided additional information concerning each Fund.
The Committee reviewed the expense and performance information for each Fund. (References to any one- or three-year period below are to periods ended December 31, 2021. In all cases, the comparative expense information is that of a Fund’s “peer group” and the comparative performance information is that of a Fund’s “performance category.”)
The Committee considered that the total net expense ratios for all of the Funds were in the 1st comparative percentile of their peer groups, and that each Fund had net advisory fees in the first comparative percentile of their peer groups, except for the Equity Asset Fund which had a net advisory fee in the top comparative decile of its peer group. The Committee determined on the basis of these factors that the levels of the Funds’ net advisory fees, and the total net expenses of the Funds generally, were consistent with the continuation of their advisory agreements.
The Committee considered that the Equity Asset Fund had achieved three-year investment performance in the 9th comparative percentile of its performance category.
As to the MM Select T. Rowe Price Bond Asset Fund, MM Select T. Rowe Price Emerging Markets Bond Fund, MM Select T. Rowe Price Large Cap Blend Fund, and MM Select T. Rowe Price Real Assets Fund, the Committee considered that each of the Funds had achieved three-year investment performance at or above the medians of their performance categories, or within the top sixty percent of their performance categories.
As to the MM Select T. Rowe Price Limited Duration Inflation Focused Bond Fund, MM Select T. Rowe Price Small and Mid Cap Blend Fund, and MM Select T. Rowe Price U.S. Treasury Long-Term Index Fund, the Committee considered that although each Fund experienced three-year investment performance outside the top sixty percent of its performance category, each Fund also experienced improved performance for the one-year period to the 31st, 26th, and 50th comparative percentiles of its performance category, respectively. The Committee also considered MML Advisers’ statement that the three-year underperformance of each of the MM Select T. Rowe Price Limited Duration Inflation Focused Bond Fund and MM Select T. Rowe Price U.S. Treasury Long-Term Index Fund was due in substantial part to differences in duration positioning relative to its respective performance category.
The Committee also reviewed and considered information included in the Meeting Materials, or discussed at the meeting and during the course of the year, concerning economies of scale and the profitability of MML Advisers’ advisory relationship with the various Funds, including: (i) a description of MML Advisers’ revenues from the Funds (including advisory fees and administrative and shareholder services fees, as applicable) and the expense allocation methodology employed by MML Advisers; and (ii) profitability information for each individual Fund. The discussions included consideration of the intangible benefits derived by MML Advisers and its affiliates resulting from their relationships with the Funds and any so-called “fallout benefits” to MML Advisers (which were not considered to be substantial in any event), such as any reputational value derived from serving as investment adviser to the Funds, and benefits accruing to subadvisers due to so-called “soft-dollar arrangements.”
Prior to the votes being taken to approve the Contracts, the Committee met separately in executive session to discuss the appropriateness of such contracts. The Committee weighed the foregoing matters in light of the advice given to them by their independent legal counsel as to the law applicable to the review of investment advisory contracts. In arriving at a decision, the Committee did not identify any single matter as all-important or controlling. The foregoing summary does not detail all of the matters considered.
As to each of the Funds, the Committee concluded that: (i) overall, it was satisfied with the nature, extent, and quality of services provided, and expected to be provided in the future, under the Contracts, including the level of MML Advisers’ oversight of each Fund and the subadvisory process; (ii) MML Advisers’ levels of profitability from its relationship with the various Funds are not excessive and the advisory fees payable under the advisory agreements and each Fund’s total net expenses are fair and reasonable; (iii) the investment processes, research capabilities, and philosophies of the subadvisers generally appear well suited to the Funds, given their investment objectives and policies; (iv) either the relative or absolute performance of a Fund (in
171
Other Information (Unaudited) (Continued) |
each case, taking into account the applicable investment strategy and risk profile of the Fund), or the steps MML Advisers has proposed in respect of the underperformance of a Fund, are sufficient to warrant continuation of the Contracts for each of the Funds; and (v) the terms of the Contracts are fair and reasonable with respect to each Fund and are in the best interests of each Fund’s shareholders.
At their meeting in September 2022, the Trustees, including the Independent Trustees, reviewed and approved a proposal to make a change to the existing subadvisory agreement with T. Rowe Price Associates, Inc. (“T. Rowe Price”) for the MM Select Limited Duration Inflation Focused Bond Fund (the “Fund” and the “Amended Subadvisory Agreement”) intended to permit T. Rowe Price to delegate to its advisory affiliates. The Trustees considered, among other things, that any such delegation by T. Rowe Price would be subject to the consent of MML Advisers and the Board. At the same time, the Trustees, including the Independent Trustees, approved (i) a subadvisory agreement between T. Rowe Price and T. Rowe Price Hong Kong Limited (the “New Hong Kong Sub-Subadvisory Agreement”) for the Fund and the MM Select T. Rowe Price Bond Asset Fund and (ii) a subadvisory agreement between T. Rowe Price and T. Rowe Price International Ltd (the “New International Sub-Subadvisory Agreement”) for the Fund. The Trustees considered, among other things, that the New Hong Kong Sub-Subadvisory Agreement and New International Sub-Subadvisory Agreement would each not result in any changes in the fees payable by the respective Funds or MML Advisers and that the services provided would continue to be subject to the supervision of T. Rowe Price. The Trustees concluded that the Amended Subadvisory Agreement, New Hong Kong Sub-Subadvisory Agreement, and New International Sub-Subadvisory Agreement are in the best interests of each Fund and its respective shareholders. In their deliberations, the Trustees were advised by independent counsel.
Prior to the votes being taken to approve the Amended Subadvisory Agreement, New Hong Kong Sub-Subadvisory Agreement, and New International Sub-Subadvisory Agreement discussed above, the Independent Trustees met separately in executive session to discuss the appropriateness of such contracts. The Independent Trustees weighed the foregoing matters in light of the advice given to them by their independent legal counsel as to the law applicable to the review of investment advisory contracts. In arriving at a decision, the Trustees, including the Independent Trustees, did not identify any single matter as all-important or controlling. The foregoing summary does not detail all of the matters considered.
The Amended Subadvisory Agreement, New Hong Kong Sub-Subadvisory Agreement, and New International Sub-Subadvisory Agreement each became effective on November 1, 2022.
172
Other Information (Unaudited) (Continued) |
Submission of Matters to a Vote of Security Holders
A Special Meeting of Shareholders of the Trust was held on May 25, 2022 and on the adjournment dates of June 9, 2022, July 28, 2022, and September 14, 2022. The Notice of Meeting of Shareholders, and a Proxy Statement and voting instruction card, were first mailed, or otherwise made available, on or about April 8, 2022 to shareholders of record as of February 25, 2022. The results of the vote on the matters submitted to shareholders at the Special Meeting are as follows:
Proposal 1: |
To elect Allan W. Blair, Nabil N. El-Hage, Michael R. Fanning, Maria D. Furman, R. Bradford Malt, C. Ann Merrifield, Clifford M. Noreen, Cynthia R. Plouché, Jason J. Price, and Susan B. Sweeney as Trustees of each Trust of which the Funds are series for an indefinite term of office.* |
This matter was approved by the Trust’s shareholders on June 9, 2022. The results of the votes were as follows:
Shares Voted |
Shares For |
% of Shares |
Withhold |
% of Shares |
|
Allan W. Blair |
1,062,272,572.058 |
1,055,134,595.262 |
42.213% |
7,137,976.796 |
0.285% |
Nabil N. El-Hage |
1,062,272,572.058 |
1,055,187,057.064 |
42.215% |
7,085,514.994 |
0.283% |
Michael R. Fanning |
1,062,272,572.058 |
1,054,435,784.031 |
42.185% |
7,836,788.027 |
0.313% |
Maria D. Furman |
1,062,272,572.058 |
1,055,334,004.749 |
42.221% |
6,938,567.309 |
0.277% |
R. Bradford Malt |
1,062,272,572.058 |
1,054,410,988.847 |
42.184% |
7,861,583.211 |
0.314% |
C. Ann Merrifield |
1,062,272,572.058 |
1,054,614,232.611 |
42.192% |
7,658,339.447 |
0.306% |
Clifford M. Noreen |
1,062,272,572.058 |
1,054,519,598.373 |
42.188% |
7,752,973.685 |
0.310% |
Cynthia R. Plouché |
1,062,272,572.058 |
1,055,673,410.167 |
42.234% |
6,599,161.891 |
0.264% |
Jason J. Price |
1,062,272,572.058 |
1,055,486,383.752 |
42.227% |
6,786,188.306 |
0.271% |
Susan B. Sweeney |
1,062,272,572.058 |
1,055,272,106.456 |
42.218% |
7,000,465.602 |
0.280% |
|
* |
Denotes Trust-wide proposal and voting results. |
173
Other Information (Unaudited) (Continued) |
Fund Expenses September 30, 2022
Expense Examples:
The following information is in regards to expenses for the six months ended September 30, 2022:
As a shareholder of the Funds, you incur ongoing costs, including advisory fees and other Fund expenses. These examples are intended to help you understand your ongoing costs (in dollars) of investing in the Funds and to compare these costs with the ongoing costs of investing in other mutual funds. These examples are based on an investment of $1,000 invested for the six months ended September 30, 2022.
Actual Expenses:
The first four columns of the table below provide information about actual account values and actual expenses. You may use this information, together with the amount you invested, to estimate the expenses that you paid over the period. Simply divide your account value by $1,000 (for example, an $8,600 account value divided by $1,000 = 8.6), then multiply the result by the number under the heading entitled “Operating Expenses Incurred” to estimate the expenses you paid on your account during this period.
Hypothetical Example for Comparison Purposes:
The last two columns of the table below provide information about hypothetical account values and hypothetical expenses based on the Fund’s actual expense ratio and an assumed rate of return of 5% per year before expenses, which is not the Fund’s actual return. The hypothetical account values and expenses may not be used to estimate the actual ending account balance or expenses you paid for the period. You may use this information to compare the ongoing costs of investing in the Fund and other funds. To do so, compare this 5% hypothetical example with the 5% hypothetical examples that appear in the shareholder reports of the other funds.
Please note that the expenses shown in the table are meant to highlight your ongoing costs only and do not reflect any transactional costs. Therefore, the last two columns of the table are useful in comparing ongoing costs only, and will not help you determine the relative total costs of owning different funds. In addition, if these transactional costs were included, your costs would have been higher.
Beginning Value |
Annualized Expense |
Ending Value (Based on Actual Returns and Expenses) |
Operating Expenses Incurred* |
Ending Value (Based on Hypothetical Returns and Expenses) |
Operating Expenses Incurred* |
|
Equity Asset Fund |
||||||
Class I |
$1,000 |
0.23% |
$800.90 |
$1.04 |
$1,023.90 |
$1.17 |
MM Select T. Rowe Price Bond Asset Fund |
||||||
Class I |
1,000 |
0.00% |
899.00 |
0.00 |
1,025.10 |
0.00 |
MM Select T. Rowe Price Emerging Markets Bond Fund |
||||||
Class I |
1,000 |
0.00% |
822.50 |
0.00 |
1,025.10 |
0.00 |
MM Select T. Rowe Price Large Cap Blend Fund |
||||||
Class I |
1,000 |
0.00% |
783.10 |
0.00 |
1,025.10 |
0.00 |
MM Select T. Rowe Price Limited Duration Inflation Focused Bond Fund |
||||||
Class I |
1,000 |
0.00% |
944.40 |
0.00 |
1,025.10 |
0.00 |
MM Select T. Rowe Price Real Assets Fund |
||||||
Class I |
1,000 |
0.00% |
766.50 |
0.00 |
1,025.10 |
0.00 |
174
Other Information (Unaudited) (Continued) |
Beginning Value |
Annualized Expense |
Ending Value (Based on Actual Returns and Expenses) |
Operating Expenses Incurred* |
Ending Value (Based on Hypothetical Returns and Expenses) |
Operating Expenses Incurred* |
|
MM Select T. Rowe Price Small and Mid Cap Blend Fund |
||||||
Class I |
$1,000 |
0.00% |
$813.10 |
$0.00 |
$1,025.10 |
$0.00 |
MM Select T. Rowe Price U.S. Treasury Long-Term Index Fund |
||||||
Class I |
1,000 |
0.00% |
789.30 |
0.00 |
1,025.10 |
0.00 |
|
* |
Expenses are calculated using the annualized expense ratio for the six months ended September 30, 2022, multiplied by the average account value over the period, multiplied by 183 days in the period, divided by 365 days in the year, unless stated otherwise. |
175
Underwriter:
MML Distributors, LLC
1295 State Street
Springfield, Massachusetts 01111-0001

©2022 Massachusetts Mutual Life Insurance Company (MassMutual®), Springfield, MA 01111-0001. |
MM202311-303392 |
| (b) | Not applicable to this filing. |
Item 2. Code of Ethics.
As of September 30, 2022, the Registrant adopted a Code of Ethics that applies to the Principal Executive Officer, Principal Financial Officer, and other senior financial officers pursuant to the Sarbanes-Oxley Act of 2002. For the year ended September 30, 2022, the Code of Ethics was amended to i) cover new registrants and ii) remove a registrant no longer subject to the Code of Ethics, and the Registrant did not grant any waivers, including implicit waivers, from any provisions of the Code of Ethics. A copy of its Code of Ethics is filed with this Form N-CSR under Item 13(a)(1).
Item 3. Audit Committee Financial Expert.
The Registrant’s Board of Trustees has determined that Nabil N. El-Hage, a member of the Audit Committee, is an audit committee financial expert as defined by the Securities and Exchange Commission (the “SEC”). Mr. El-Hage is “independent” as defined by the SEC for purposes of audit committee financial expert determinations.
Item 4. Principal Accountant Fees and Services.
References below to Deloitte & Touche LLP include its affiliates where applicable.
| (a) | AUDIT FEES: The aggregate fees billed to the Registrant for professional services rendered by its independent auditors, Deloitte & Touche LLP, for the audit of the Registrant’s annual financial statements for the fiscal years ended 2022 and 2021 were $1,801,058 and $1,800,382, respectively. |
| (b) | AUDIT-RELATED FEES: No such fees were billed to the Registrant by Deloitte & Touche LLP for the fiscal years ended 2022 and 2021. No such fees were billed to the Registrant’s adviser and any entity controlling, controlled by, or under common control with the adviser that provides ongoing services to the Registrant by Deloitte & Touche LLP* for the fiscal years ended 2022 and 2021. |
| (c) | TAX FEES: The aggregate fees billed to the Registrant for professional services rendered by Deloitte & Touche LLP for the review of Form 1120-RIC, Form 8613, excise distribution projections, distribution calculation and reasonable out of pocket expenses for the fiscal years ended 2022 and 2021 were $104,206 and $68,184, respectively. No such fees were billed to the Registrant’s adviser and any entity controlling, controlled by, or under common control with the adviser that provides ongoing services to the Registrant by Deloitte & Touche LLP* for the fiscal years ended 2022 and 2021. |
| (d) | ALL OTHER FEES: No such fees were billed to the Registrant by Deloitte & Touche LLP for the fiscal years ended 2022 and 2021. No such fees were billed to the Registrant’s adviser and any entity controlling, controlled by, or under common control with the adviser that provides ongoing services to the Registrant by Deloitte & Touche LLP* for the fiscal years ended 2022 and 2021. |
| (e) | (1) AUDIT COMMITTEE PRE-APPROVAL POLICY: All services to be performed for the Registrant by Deloitte & Touche LLP must be pre-approved by the audit committee. All services performed during the fiscal years ended 2022 and 2021 were pre-approved by the committee. |
(2) Not applicable.
| (f) | Not applicable. |
| (g) | The aggregate non-audit fees billed by Deloitte & Touche LLP for services rendered to the Registrant, the Registrant’s adviser and any entity controlling, controlled by, or under common control with the adviser that provides ongoing services to the Registrant, for the fiscal years ended 2022 and 2021 were $1,321,868 and $2,420,119, respectively. |
| * | Refers to fees that were required to be approved by the audit committee for services that relate directly to the operations and financial reporting of the Registrant. |
| (h) | The audit committee considers whether the provision of non-audit services by Deloitte & Touche LLP to the Registrant's adviser and any entity controlling, controlled by, or under common control with the adviser that provides ongoing services to the Registrant that were not pre-approved pursuant to paragraph (c)(7)(ii) of Rule 2-01 of Regulation S-X is compatible with maintaining Deloitte & Touche LLP's independence. |
| (i) | Not applicable. |
| (j) | Not applicable. |
Item 5. Audit Committee of Listed Registrants.
Not applicable to this filing.
Item 6. Investments.
(a) Please see portfolio of investments contained in the Reports to Stockholders included under Item 1 of this formN-CSR.
(b) Not applicable to this filing.
Item 7. Disclosure of Proxy Voting Policies and Procedures for Closed-End Management Investment Companies.
Not applicable to this filing.
Item 8. Portfolio Managers of Closed-End Management Investment Companies.
Not applicable to this filing.
Item 9. Purchases of Equity Securities by Closed-End Management Investment Company and Affiliated Purchasers.
Not applicable to this filing.
Item 10. Submission of Matters to a Vote of Security Holders.
Not applicable to this filing.
Item 11. Controls and Procedures.
(a) The Registrant’s Principal Executive Officer and Principal Financial Officer have concluded that the Registrant’s disclosure controls and procedures (as defined in Rule 30a-3(c) under the Investment Company Act of 1940, as amended (the “1940 Act”) (17 CFR 270.30a-3(c))) are effective, as of a date within 90 days of the filing date of this Form N-CSR, to provide reasonable assurance that the information required to be disclosed by the Registrant on Form N-CSR is recorded, processed, summarized, and reported within the time periods specified in the SEC’s rules and forms, based on their evaluation of these disclosure controls and procedures required by Rule 30a-3(b) under the 1940 Act (17 CFR 270.30a-3(b)) and Rules 13a-15(b) or 15d-15(b) under the Securities Exchange Act of 1934 (17 CFR 240.13a-15(b) or 240.15d-15(b)).
(b) There were no changes in the Registrant’s internal control over financial reporting (as defined in Rule 30a-3(d) under the 1940 Act (17 CFR 270.30a-3(d))) that occurred during the period covered by this report that has materially affected, or is reasonably likely to materially affect, the Registrant’s internal control over financial reporting.
Item 12. Disclosure of Securities Lending Activities for Closed-End Management Investment Companies
Not applicable to this filing.
Item 13. Exhibits.
(a)(1) Code of Ethics (Item 2) is attached.
(a)(3) Not applicable to this filing.
(a)(4) Not applicable to this filing.
SIGNATURES
Pursuant to the requirements of the Securities Exchange Act of 1934 and the Investment Company Act of 1940, the registrant has duly caused this report to be signed on its behalf by the undersigned, thereunto duly authorized.
| (Registrant) | MassMutual Select Funds | |
| By (Signature and Title) | /s/ Paul LaPiana | |
| Paul LaPiana, President and Principal Executive Officer | ||
| Date | 12/2/2022 |
Pursuant to the requirements of the Securities Exchange Act of 1934 and the Investment Company Act of 1940, this report has been signed below by the following persons on behalf of the registrant and in the capacities and on the dates indicated.
| By (Signature and Title) | /s/ Paul LaPiana | ||
| Paul LaPiana, President and Principal Executive Officer | |||
| Date | 12/2/2022 |
||
| By (Signature and Title) | /s/ Renee Hitchcock | ||
| Renée Hitchcock, Treasurer and Principal Financial Officer | |||
| Date | 12/2/2022 |
||