 Lithium
Day A deep dive into Albemarle’s lithium business
September 2015 Exhibit 99.1 |
 Today’s Participants
2 Scott Tozier Senior Vice President & Chief Financial Officer Albemarle Corporate Overview Luke Kissam President & Chief Executive Officer Performance Chemicals Overview David Klanecky Vice President, Energy Solutions Energy Storage Applications – Market Dynamic & Growth Potential Raphael Crawford Vice President, Synthesis & Polymers Solutions Lithium Organometallics – An Important Specialty Business John Mitchell Vice President, Performance Materials Albemarle’s Global Position in Lithium |
 Some of the information presented in this presentation and the conference call and discussions that follow, including, without limitation, statements with respect to the transaction with Rockwood and the anticipated consequences and benefits of the transaction, product development, changes in productivity, market trends, price, expected growth and earnings, input costs, surcharges, tax rates, stock repurchases, dividends, cash flow generation, costs and cost synergies, portfolio diversification, economic trends, outlook and all other information relating to matters that are not historical facts may constitute forward-looking statements within the meaning of the Private Securities Litigation Reform Act of 1995. There can be no assurance that actual results will not differ materially. Factors that could cause actual results to differ materially include, without limitation: changes in economic and business conditions; changes in financial and operating performance of our major customers and industries and markets served by us; the timing of orders received from customers; the gain or loss of significant customers; competition from other manufacturers; changes in the demand for our products; limitations or prohibitions on the manufacture and sale of our products; availability of raw materials; changes in the cost of raw materials and energy; changes in our markets in general; fluctuations in foreign currencies; changes in laws and government regulation impacting our operations or our products; the occurrence of claims or litigation; the occurrence of natural disasters; the inability to maintain current levels of product or premises liability insurance or the denial of such coverage; political unrest affecting the global economy; political instability affecting our manufacturing operations or joint ventures; changes in accounting standards; the inability to achieve results from our global manufacturing cost reduction initiatives as well as our ongoing continuous improvement and rationalization programs; changes in the jurisdictional mix of our earnings and changes in tax laws and rates; changes in monetary policies, inflation or interest rates; volatility and substantial uncertainties in the debt and equity markets; technology or intellectual property infringement; decisions we may make in the future; the ability to successfully operate and integrate Rockwood’s operations and realize estimated synergies; and the other factors detailed from time to time in the reports we file with the SEC, including those described under "Risk Factors" in the joint proxy statement / prospectus we filed in connection with the transaction with Rockwood, and in our Annual Report on Form 10-K and our Quarterly Reports on Form 10-Q. These forward-looking statements speak only as of the date of this presentation. We assume no obligation to provide any revisions to any forward-looking statements should circumstances change, except as otherwise required by securities and other applicable laws. Forward-looking Statements 3 |
 It should be noted that adjusted net income attributable to Albemarle Corporation (“adjusted earnings”), adjusted diluted earnings per share, adjusted effective income tax rates, segment operating profit, segment income, EBITDA, adjusted EBITDA, adjusted EBITDA by operating segment, EBITDA margin and adjusted EBITDA margin are financial measures that are not required by, or presented in accordance with, accounting principles generally accepted in the United States, or GAAP. These measures are presented here to provide additional useful measurements to review our operations, provide transparency to investors and enable period-to-period comparability of financial performance. A description of these and other non-GAAP financial measures that we use to evaluate our operations and financial performance, and reconciliation of these non-GAAP financial measures to the most directly comparable financial measures calculated and reported in accordance with GAAP, can be found in the Appendix to this presentation, which is posted in the Investors section of our website at www.albemarle.com,
under “Non-GAAP Reconciliations” under “Financials.” 4 Non-GAAP Financial Measures |
 Corporate Overview Scott Tozier Senior Vice President & Chief Financial Officer |
 6 Leadership Across Attractive Growth Segments #2 $816 $193 24% Chemetall Surface Treatment Global Ranking TTM 2Q 2015 Sales Adj. EBITDA (1) % Margin (1) Key Competitors Performance Chemicals #1 $483 $200 41% Growth 2.0x – 3.0x GDP Refining Solutions #1/2 1.0x – 2.0x GDP #1/2 1.0x – 1.5x GDP 1.0x – 2.0x GDP Characteristics • Mineral extraction and processing businesses • Low cost position on global cost curve • Vertically integrated • High demand growth • Technology and applications driven • Critical customer service • Ability to differentiate offering • Strong free cash flow $797 $219 28% $326 $93 29% Source: Company information. (1) Non-GAAP measure. See non-GAAP reconciliations in Appendix. (2) PCS segment also includes Curatives. Note: PCS is considered by management estimates to have leading positions in organometallics, MAO, and
custom single site catalysts/metallocenes
Lithium Bromine PCS 2 #1/2 $824 $238 29% ~1.0x GDP |
 2015
Commitments Synergies of $50M in 2015 & $100M in 2016 with costs to
achieve of $250M -
$275M (including acquisition costs)
Divest non-core assets
Refinance Rockwood 2020s
Adjusted Free Cash Flow* of $450-$550M
Adjusted EPS* of $3.65 to $4.05
7 *Non-GAAP measure. See non-GAAP reconciliations in Appendix. |
 Synergies
Exceeding Expectations – Approaching $120M in 2016
8 • Corporate Costs » Estimated savings ~$45M in 2016 » Actions already taken will result in ~$35M in 2016 • Executive consolidation • Insurance policy renegotiations • Assets & Manufacturing » Estimated savings ~$30M in 2016 » Actions already taken will result in ~$10M+ in 2016 • Site Rationalizations: Princeton and partial New Johnsonville closures • Raw material contracts • Continued review of global footprint • Non-Raw Material Sourcing » Estimated savings ~$20M in 2016 » Actions already taken will result in ~$5M+ in 2016 • Entered into and executed specific logistic contracts and processes • Global network optimization project • Global consolidation of software and hardware licenses • Contract renegotiations for packaging and plant supplies • Organization Structure » Estimated savings ~$25M in 2016 » Actions already taken will result in ~$15M+ in 2016 • Additional opportunities to combine business functions • Back office consolidations 2015 Sources Corporate Costs Assets & Manufacturing Non-RM Sourcing Org. Structure 2016 Sources Corporate Costs Assets & Manufacturing Non-RM Sourcing Org. Structure |
 • Expect to reach target Net-Debt-to-Adjusted EBITDA leverage of ~2.5x between Q3 2017 and year end 2018 • FCF Key Assumptions and Impacts: » Tax rate of ~27% » Interest Expense ~$90M, down from ~$130M on refinancing of Rockwood 2020s » CAPEX in the range of 4-6% of revenue plus LiOH2
plant » One-time acquisition and integration costs of $50 - $75M and one-time tax payment ~$50M in 2016 » No operating income from divested businesses; proceeds go to deleveraging » Opportunity for working capital reduction • Raised dividend by 5% in Q1 2015 – 21 st straight dividend increase » Expect similar increases until target reached 1 Non-GAAP measure. See Non-GAAP reconciliations in Appendix. 2 Net-Debt-to-Adjusted EBITDA ratio is based on the bank covenant definition.
Free Cash Flow 1 $600M - $900M Net-Debt-to-Adj. EBITDA 2 $550M - $650M $450M - $550M Working Capital Upside Opportunity to Further Improve FCF ~$50 Acq. Taxes ~$50-75 Acq. Costs ~$100 Acq. Taxes ~$200 Acq. Costs $150 - $250 FCF $450 - $550 FCF 2015 Adjusted FCF Outlook 2016 FCF Outlook 3 - 5 Year Adjusted FCF Outlook 2015 2016 2017 2018 Bull Bear Target 9 Clear Path to Deleverage with Strong Free Cash Flow |
 Divest
Non-core Assets to Focus on Core Growth 10
Allows for focus and resources on our core businesses to accelerate growth
• The three businesses in aggregate generated revenue of about $550M and adjusted EBITDA of about $100M for 2014 • All are solid businesses, but do not factor into long-term growth plans • Goal is to complete the divestitures by end of 2015 • Proceeds from the divestitures to be used for debt reduction • Minerals and Metal Sulfide have performed in line with our expectations from the beginning of the year, but Fine Chemistry Services is down significantly vs. 2014 Minerals Fine Chemistry Services Metal Sulfide • Robust & differentiated portfolio of mineral flame retardants – products used in wire and cable, electronic and electrical components and non-FRs product used in building materials, mass transportation, paints & varnishes and paper with organic binder » Revenue: ~$250M » EBITDA Margins: ~10% • Custom synthesis manufacturing of pharma products, agricultural actives and intermediates, agrichemicals, oil base lubricants and specialty chemicals industries » Revenue: ~$200M » EBITDA Margins: upper 20% • Full-service supplier of both natural and synthetic metal sulfide. Metal sulfides have applications in the friction, abrasive, lubricant and other industries » Revenue: ~$100M » EBITDA Margins: high teens |
 Refinance Rockwood 2020s
11 Existing and pro forma capitalization ($ millions) Actual Jun-15 Pro Forma Jun-15 % of cap xEBITDA Cash and cash equivalents $207 $164 Existing $1,000mm R/C -- -- New $300 million 364-dayTerm Loan A -- 300 New $950 million 5-year Term Loan A -- 950 Commercial paper notes 418 418 Rockwood senior notes 1,250 -- Other senior notes 2,157 2,157 Other debt 136 136 Total Debt $3,961 $3,961 41% 3.7x Market equity (as of 8/14/15) $5,735 $5,735 59% Total Capitalization $9,695 $9,695 100% Existing and pro forma capitalization ($ millions) Sources Uses Cash $43 Refinance existing 4.625% senior notes $1,250 New 364-day Term Loan A 300 Call premium $43 New 5-year Term Loan A 950 Total $1,293 Total $1,293 Note: excludes fees and expenses |
 Reaffirming Full Year 2015 Guidance
12 Division Initial Outlook Updated Outlook Business Environment Refining Solutions Heavy Oil Upgrading • Volume growth on increased transportation fuel demand and new business. Secured 100% of business subject to commercial trials in 1H of year with multi-year contracts Clean Fuel Technologies • Delayed change outs and cost control measures by refiners as well as weaker mix and fewer first fills • Euro-based competitor pricing pressure Performance Chemicals Bromine • Drilling completion fluids volumes for 1 st half held up okay in GOM, but weak rest of world. Expect decline in 2 nd half • Net benefit expected from previously announced 30% price increase Lithium • Meaningful growth driven by combination of full year Talison earnings, strong demand and improved pricing for battery grade lithium PCS / Curatives • Outlook for polyolefins remain strong with solid growth and increased demand expected • Competitive environment and demand for Curatives leading to further improvement for full year Surface Treatment Surface Treatment • Solid underlying market growth in most segments, product mix improvement, positive price improvement and acquisition benefits Total Company • YoY FX impact ~$250M on Sales and $50 – $60M on EBITDA • Sales $3.6b to $3.8b – flat to up 3% - ex FX • Raising Adjusted EBITDA to $940M to $1,000M – up 3-11% ex FX • Margins increasing to 24%-26% excluding Q1 FX gain • Free Cash Flow $150M to $250M • Reaffirming Adjusted EPS of $3.65 to $4.05 despite headwind of $0.03 – $0.05 due to higher annual tax rate and depreciation Better than 2014 Worse than 2014 Similar to 2014 |
 On Track
to Meet our 2015 Commitments Synergies of $50MM in 2015 & $100M in
2016 with costs to achieve of $250M -
$275M (including acquisition costs)
Divest non-core assets
Refinance Rockwood 2020s
Adjusted Free Cash Flow of $450-$550M
Adjusted EPS of $3.65 to $4.05
13 |
 Performance Chemicals Luke Kissam President & Chief Executive Officer |
 Performance Chemicals Growing in All Three Businesses
Segment Adjusted EBITDA Growth Current Outlook Lithium Driven by volume growth in battery grade products, increased pricing in battery grade and other lithium products and the impact of the Talison JV Bromine Improved pricing across the portfolio and volume improvement in our flame retardants business PCS / Curatives Business is stable with recent spikes driven by strong curatives demand and pricing and one-time orders 15 -20.0% -15.0% -10.0% -5.0% 0.0% 5.0% 10.0% 15.0% 20.0% 25.0% 30.0% Q1 '14 Q2 '14 Q3 '14 Q4 '14 Q1 '15 Q2 '15 -40.0% -30.0% -20.0% -10.0% 0.0% 10.0% 20.0% 30.0% 40.0% Q1 '14 Q2 '14 Q3 '14 Q4 '14 Q1 '15 Q2 '15 -40.0% -20.0% 0.0% 20.0% 40.0% 60.0% 80.0% Q1 '14 Q2 '14 Q3 '14 Q4 '14 Q1 '15 Q2 '15 |
 Performance Chemicals Leadership Team
With over 275
years of combined experience, our leadership team remains focused and will
continue to drive the same growth and financial performance we have come to
expect 16
Dr. Ron Zumstein Manufacturing Dr. Dave Clary Research & Technology Dr. Marcus Brune Finance Jake Wilson Legal Susan Shepherd HR Functional Excellence 28yrs 30yrs 24yrs 13yrs 29yrs Ahmad Khalifeh JBC GM Stephen Elgueta Chile GM Key Country Leaders 36yrs 25yrs John Mitchell Performance Materials Dr. David Klanecky Energy Solutions Troy DeSoto Fire Safety Solutions & Curatives Raphael Crawford Synthesis & Polymer Solutions Business Heads 24yrs 22yrs 26yrs 18yrs |
 Lithium
Vision and Strategy Our Vision
To extend our position as the leading lithium company in the world
Customers / Markets • Maintain share in historical core markets • Capture 50% of incremental growth in energy storage market Supply • Security of supply of low-cost, high quality Li resources • Maintain world-class supply chain and process technologies Technology • Strong focus on innovation and cooperation with our customers to develop next-generation Li based materials • Process technology breakthroughs for the production of high-quality / low-cost Li compounds Our Strategy 17 |
 Lithium
– Historical Financial Performance
Adjusted EBITDA • Lithium continues to exceed expectations driven by volume growth in battery grade products
• Talison JV performance better than expected on both volumes and margins • Overall pricing up 3% in Q2 2015 before FX with battery grade products up 5% 2015 Performance Drivers Net Sales $200 $250 $300 $350 $400 $450 $500 2009 2010 2011 2012 2013 2014 2015** 30% 32% 34% 36% 38% 40% 42% 44% $100 $125 $150 $175 $200 2009 2010 2011 2012 2013 2014 2015* Adj. EBITDA % Margin $M $M 18 * LTM from Q2 2015 |
 Mega-Trends Driving Lithium Growth
19 • New active pharmaceutical ingredients • New agro ingredients & resistance • Reduction of greenhouse gas • Miniaturization of electronic devices • Extended range of electronic devices • High-power electronic devices • Exponential growth of transportation • Renewable energy concepts • Smart grid & energy storage • Less energy and water • Fewer chemicals & simpler processes Lithium creates sustainable future technologies |
 Potential Lithium Demand Delivers Significant Upside
20 Source: Rockwood Lithium estimates and market surveys from BCG, Bloomberg, Avicenne, Roland Berger, Pike Research, Frauenhofer IST, Deutsche Bank
Research, McKinsey, CTI, Anderman, JD Powers
Albemarle expects to capture 50% of lithium growth |
 Breadth
of Albemarle Product Portfolio Leads to #1 Overall Position
21 Application 2014 Market Size Growth Rate Products Glass/Ceramics 46KT GDP • Spodumene • Li 2 CO 3 Greases / Lubricants 18KT GDP • LiOH Chemical Synthesis 11KT GDP • Li Organometallics fed by Li Metal LiCl Portable Electronics & Other Handhelds 48KT 16% (Base Case) • BG Li 2 CO 3 • BG LiOH • BG Li Metal • BG Electrolyte Salts • BG LiCl • BG Alloys • BG Specialty Compounds Hybrids Battery Electric Vehicle (BEV) Grid and Other Power Storage Applications Total Global LCE Market: 160kT (2014) Source: Internal |
 Core
Messages 22
1 Albemarle is the leader in lithium, one of the highest growth markets in the
specialty chemicals industry
2 Our unique natural resource position, derivatization capabilities and technology leadership allow Albemarle to execute its growth strategy
3 We can sustain the Albemarle advantage because our unique position is difficult to replicate and
has taken more than 100 years to establish |
 Energy
Storage Applications – Market Dynamic & Growth
Potential David Klanecky
Vice President, Energy Solutions |
 Without
Li-Ion Batteries, There Would be No… 24
1992 1st Mass Produced Li- Ion Battery Cell 2007 iPhone debuts Smartphones | Tablets | Laptops | xEV’s
| Wearables
2003 Cell phones become mainstream Without Li-Ion Batteries, there would be no… Apple | Samsung | Tesla ...as we know them today. 2008 Tesla debuts its Roadster In 5 years, Li-Ion batteries went from a
niche end-use to the #1 consuming market
for Lithium with explosive growth from
consumer electronics and expansion into transportation, grid and consumer devices 2015 & Beyond Power tools & wearables create additional demand for Li-ion batteries |
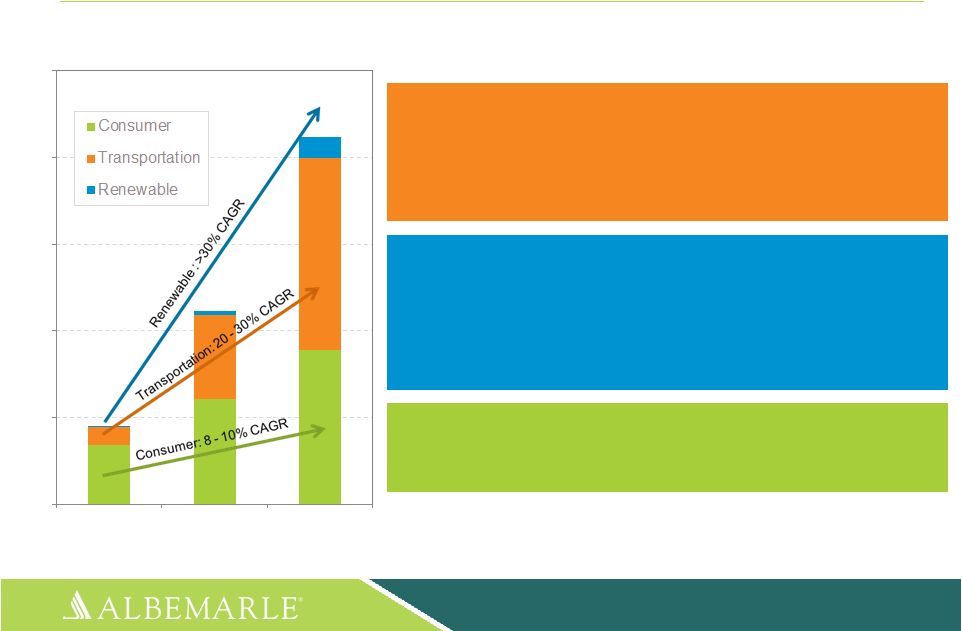
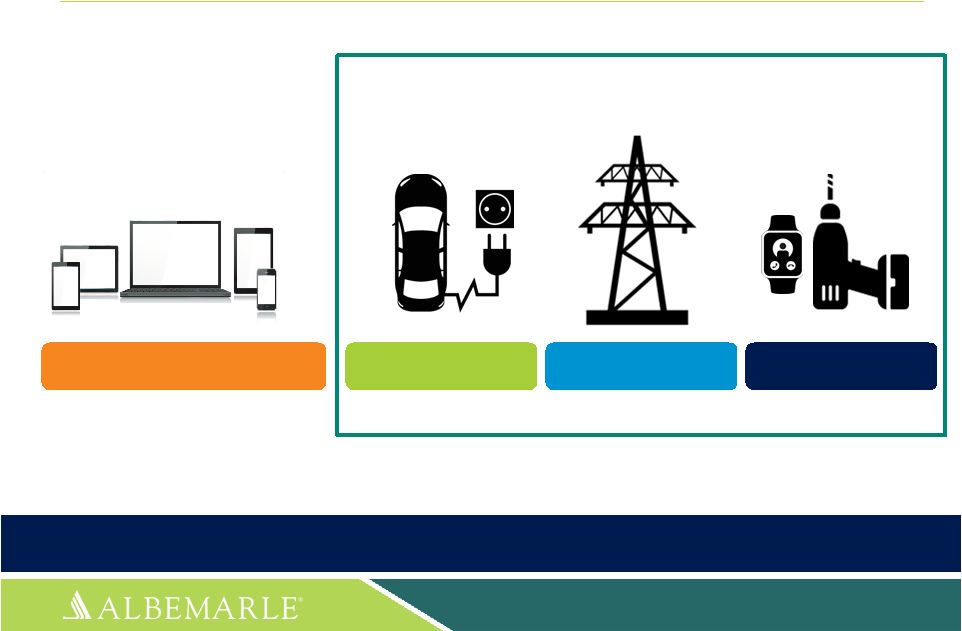 Consumer
Electronics Previously, there was one
major industry investing in
batteries…. 8 - 10% CAGR Mass Uptake in Battery Markets 25 Transportation 20 - 30% CAGR Energy Storage >30% CAGR Replicating Success “We are at a dawn of a new era with ‘unprecedented technological & regulatory change’ set to come in the next 5 years…” (Deutsche Bank, Dec 2014) Consumer Devices >15% CAGR Source for projected CAGRs: Signumbox, 2015 |
 Li-Ion Battery Market Has Yet to Reach Maturity and
Continues to Find New Applications
26 |
 Lithium
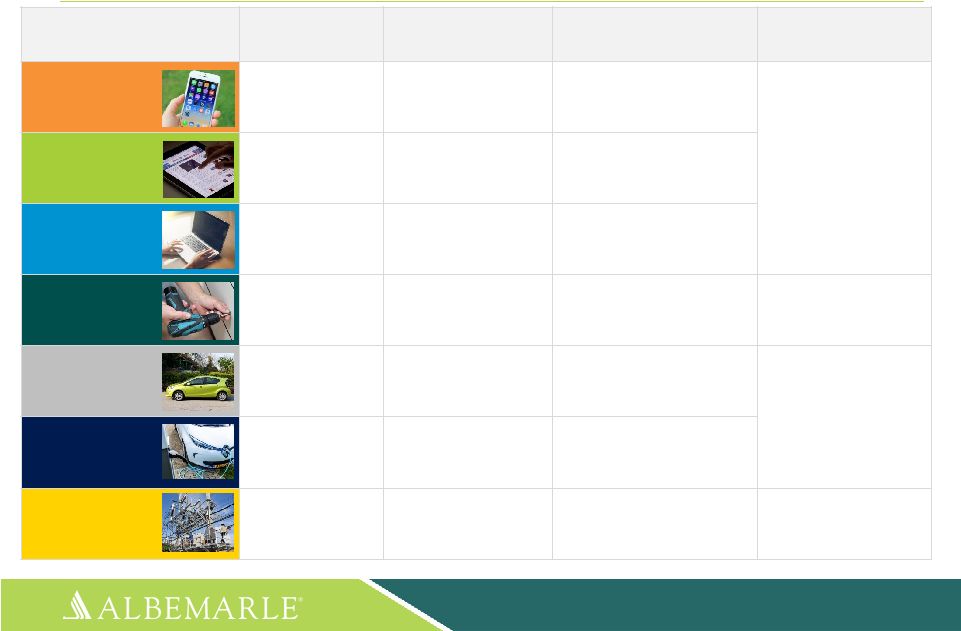
Requirements Across End-use Applications 27
Example: 1,200 million smartphones sold in 2014… each containing 7g Li (LCE)
basis… equating to 8,400 MT Li, LCE Basis 2014 Sales
(M Units) Li Content per Unit (LCE Basis) 2014 Total Li Content (LCE Basis) Projected CAGR (2014 – 2024) Smartphone 1,200 5 – 7 grams 8,400 MT 8-10% Tablet 260 20 – 30 grams 7,800 MT Notebook 170 35 – 45 grams 7,650 MT Power Tools 65 40 – 60 grams 3,900 MT >15% HEV 1.8 5 kilograms 9,000 MT 20-30% PHEV & BEV 0.3 40 – 80 kilograms 18,000 MT Stationary [650 MWh Installed] 1.5 MT 1,000 MT >30% Source: Signumbox, 2015 |
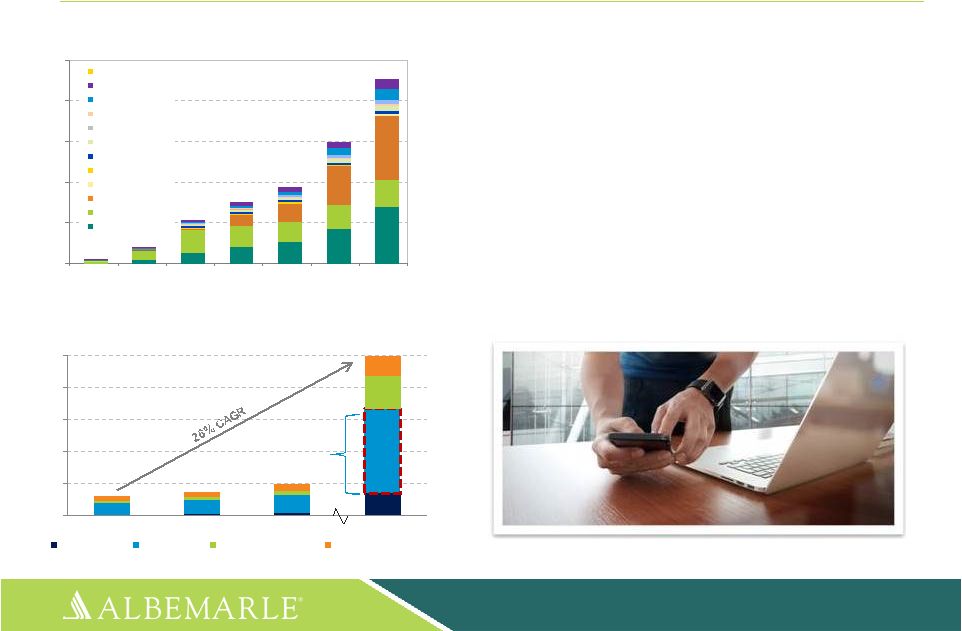
 0 20,000 40,000 60,000 80,000 100,000 120,000 140,000 2010 2015 0 10,000 20,000 30,000 40,000 50,000 60,000 70,000 2010 2015 0 200,000 400,000 600,000 800,000 1,000,000 1,200,000 1,400,000 2010 2015 0 5 10 15 20 25 2010 2015 PHEV 20% CAGR PHEV 86% CAGR EV 46% CAGR Transportation Contributing to Li-Ion Battery Growth 28 Electric Vehicle Sales (US) – All OEMs Cost of Li-Ion batteries has declined 14% per year over the last 15 years Battery Type Battery Costs 1,800 1,600 1,400 1,200 1,000 800 600 400 200 2005 2010 2015 2020 2030 2025 HEV 10% CAGR New Model Launches (US) – All OEMs Source: Christophe Pillot, Avicenne Report 2015 0 5 10 15 20 25 2010 2015 EV 38% CAGR 0 10 20 30 40 50 60 70 2010 2015 HEV 12% CAGR Nissan Tesla GM Ford Toyota Other Sources: Lux Research & US DOE Alternative Fuels Data Center, Accessed 3Q, 2015
Nissan Tesla GM Ford Toyota Other Source: Nature Climate Change, 2015 Sources: Lux Research & US DOE Alternative Fuels Data Center, Accessed 3Q, 2015 |
 Consumer
Electronics & Devices Contributing to Li-Ion Battery
Growth 29
• 7.7 billion mobile phones/tablets in use • 1 smartphone for every
4.5 people on the planet • Average person spends
4 hours/day on their smartphone • 191 billion e-mails are sent/received each day • 140 million mobile search queries/day seamless communications on control over a range of other IoT products 0 20000 40000 60000 80000 100000 2000 2005 2010 2013 2015 2020 2025 Others Power Tools Household Toys MPS Video Games Digital Camera Camcorders Cordless Phones Tablets Portable PCs Cellular Phones Consumer Electronics & Devices LIB Market, by Application MWh Source: Bloomberg, Accessed Q3 2015 0 5 10 15 20 25 2013 2014 2015f 2020f Automotive Consumer Generic business Vertical business Billions Internet of Things (IoT) Units Installed Source: AT Kearney, Accessed Q3 2015 Consumer Connectivity |
 Renewable Energy Storage Contributing to Li-Ion Battery
Growth 30 Stationary Energy Storage Revenues by Technology $B Energy storage unlocks value in existing assets by increasing low rates of utilization
Source; Lux Research; June 2014
Over the next 15 years, ~$1.4 trillion of
future US infrastructure will be underutilized without storage $0.00 $0.50 $1.00 $1.50 $2.00 $2.50 $3.00 2014 2015 2016 2017 2018 2019 2020 All Others Lithium Ion Solar: ~17% CAGR Wind: ~10% CAGR Renewable Energy Growth (2013 – 2020) |
 Li-Ion Battery Growth Accelerated with Industry Leaders
31 |
 Transportation is Potential Game Changer, but Renewable Storage also has High Potential Consumer Electronics & Devices • Slowing demand for laptops and conventional mobile phones are offset by robust demand growth for smart phones, tablets and wearables, driven by trend towards higher-capacity batteries Consumer Electronics & Devices • Slowing demand for laptops and conventional mobile phones are offset by robust demand growth for smart phones, tablets and wearables, driven by trend towards higher-capacity batteries Transportation (PHEV/HEV/EV/2-wheelers) • Fast-growing market for hybrids and electric vehicles driven by regulations/targets on CO 2 emissions, falling battery costs, improved driving range and expanding charging infrastructure, desire for an enhanced driving experience • Auto penetration: 1 - 2%, base case scenario Transportation (PHEV/HEV/EV/2-wheelers) • Fast-growing market for hybrids and electric vehicles driven by regulations/targets on CO 2 emissions, falling battery costs, improved driving range and expanding charging infrastructure, desire for an enhanced driving experience • Auto penetration: 1 - 2%, base case scenario Renewable (Grid storage) • Driven by growth in renewable energy and need for resources to provide system flexibility and balance supply/demand • Global installed base of ~1.1 GW Jan. 2015), projected annual installations reaching up to >15 GW by 2025 Renewable (Grid storage) • Driven by growth in renewable energy and need for resources to provide system flexibility and balance supply/demand • Global installed base of ~1.1 GW Jan. 2015), projected annual installations reaching up to >15 GW by 2025 0 50 100 150 200 250 2014 2019 2024 Battery LCE Long-term Demand Outlook Base case scenario: 16% CAGR Consumer Transportation Renewable Source: SAI lithium assessment for Albemarle (2015), sector reports, SAI analysis and estimates
KT 32 |
 Strategic Investments to Meet Market Demand
• Located in La Negra, Chile • 20kT battery grade lithium carbonate • Produces lowest-cost, highest-quality battery grade material in the industry • Commissioning phase • Will be the most technologically advanced mineral conversion plant ever built • Up to 50kT battery grade lithium derivatives – Li 2 CO 3 and LiOH • Fed from the highest quality Spodumene resource in the world • Expected startup: 2020 33 Battery Grade Li 2 CO 3 Plant Planned Battery Grade Li Derivative Plant |
 Lithium Organometallics –
An Important Specialty Business
Raphael Crawford Vice President, Synthesis & Polymers Solutions |
 • Organometallics is a quality business for Albemarle, delivering growth with great EBITDA
margins • We now have expanded sales coverage for major synthetic rubber producers, allowing us
to streamline our sales operations and achieve sales synergy targets
• Synergies for capacity rationalization are in motion, further improving our industry-leading
low cost position for lithium supply economics and world-scale
production •
We have made significant R&D investments in organometallics research across our
lithium and aluminum businesses, positioning us to continue our
leadership in the market place
The New Albemarle is a Clear Market Leader in Organometallics Chemistry from the Combination of the Lithium and Aluminum Franchises New labs in Frankfurt R&D Center 35 Major producers include: |
 Synthetic Rubber 36 • time • surface area • catalysts • temperature • pressure • agitation • concentration Albemarle’s Lithium Organometallics are Highly Valuable Tools in Organic Synthesis and Specialty Polymer Production Lithium organometallic reagents were the perfect match to broaden the Albemarle aluminum, zinc
and magnesium organometallics specialties portfolio
Lithium organometallics are both highly predictable as well as efficient in specific
application uses
Pharma Actives AgChem Actives Block Copolymers Raw Materials & Intermediates Li Organometallics Initiators & Reagents |
 Population Growth and Rise of Middle Class
• India and China driving consumerism • Production and consumption shift to Asia Global Healthcare Infrastructure • Cost pressure in developing
countries;
API manufacturing shift to India/China
• Changes in synthetic routes • Shift from brands to generic Sustainability • Global regulation of tire industry to decrease CO 2 emission • Increased efficiency in agriculture needed Macro-Drivers Growing Consumerism as well as Trends in Regulation, Sustainability and Healthcare Drive End-market Lithium Organometallics Demand 37 Albemarle Lithium Organometallics • Play a vital role in solving these macroeconomic challenges by enabling: » Novel pharmaceutical API development and agrochemical synthesis » Ultra-high performance synthetic rubber |
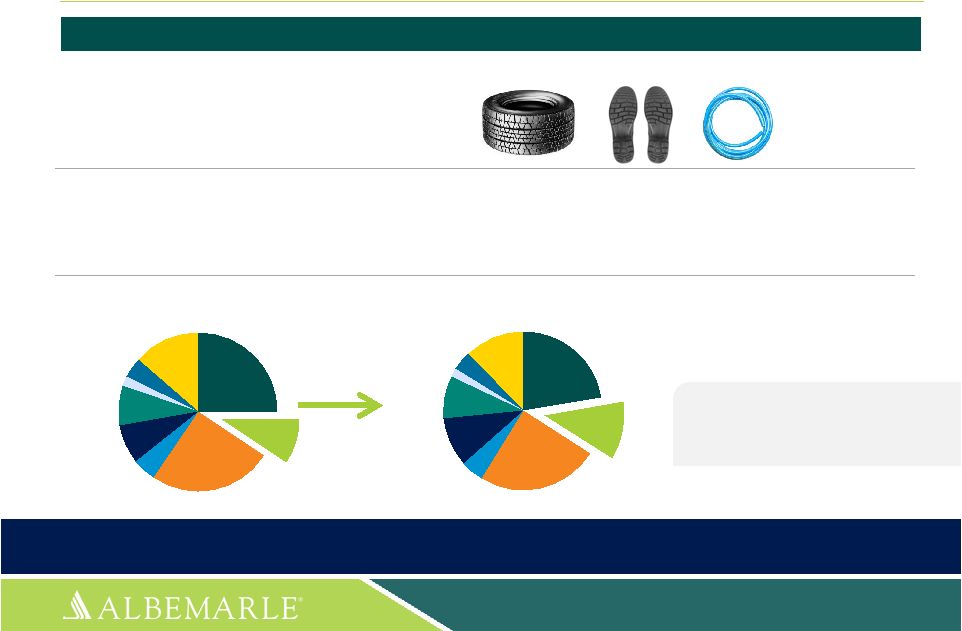 Synthetic Rubbers are a Growing End-use Market for Albemarle’s
Lithium Organometallic Polymer Initiators
Growing global population and middle class drives higher consumption of rubber
goods: •
Tires/tubes • Footwear • Packing/shrink film • Asphalt modifier • Roofing • Adhesives Increasingly strict regulations for tire performance: • Accelerates technology change in synthetic rubber production from Emulsion- to Solution-Styrene Butadiene Rubber (SBR) processes • For meeting these new regulations, our organolithium compounds are the preferred tool for Solution-SBR
2014 Global Synthetic Rubber Capacity by Type, kMT (Total 19.0 mMT) Est. 2017 Global Synthetic Rubber Capacity by Type, kMT (Total 22.0 mMT) Global Market Growth (CAGR): Total Synthetic Rubber: 5.1% (2023) S-SBR: ~10 % (2018) 38 Albemarle is well-prepared with high quality lithium initiators and global logistics to
serve the growing demand at operating and future rubber plants
Key starting material in high-performance synthetic rubber and aligned with new tire
specs ESBR;
4748 SSBR; 1743 BR; 4774 IR; 921 EPDM; 1476 IIR; 1539 CR; 377 NBR; 793 SBC; 2550 ESBR; 4908 SSBR; 2566 BR; 5457 IR; 1025 EPDM; 2166 IIR; 1926 CR; 402 NBR; 856 SBC; 2660 Source: IISRP Worldwide Rubber Statistics 2014 |
 Like
Albemarle’s Polyolefin Catalysts, Lithium Organometallics for
Synthesis is a High-touch, Pipeline-driven Business
39 * At product maturity; assumes 100% success Polyolefin Catalysts & Components Pharma API & AgChem Synthesis Application Custom catalyst products for specialty resin applications Proven tools for multiple high-value synthetic processes Projected Market Growth Rate* 7 - 10% 4 - 6% Typical Customer Project Sponsors Senior polymer scientists and engineers at plants and R&D Senior synthesis chemists at plants and R&D % of Sales Team with PhDs 40% 55% # Active Customer Projects >70 >100 Pipeline Revenue Value* ~$90MM ~$25MM Source: IMS Market Prognosis, September 2014 |
 The
Albemarle Lithium Organometallic Sites are Strategically Located Close to
Important End-markets Langelsheim, DE:
Butyllithium Lithium Specialties Taichung, TW:
Butyllithium Frankfurt, DE:
R&D New Johnsonville, TN:
Lithium Specialties
Li Organometallics 40 Additionally, Albemarle’s broader network of organometallics production and distribution capabilities
provide a competitive advantage
Al Organometallics |
 Only
Producer with Al & Li Chemistry Portfolio Polymers •
Overlapping polymer end-markets for synthetic rubber and elastomer
applications • Already enhancing customer relationships to drive new sales to synthetic rubber producers, with impact in 2015 • 2016 commitments for sales synergies from major customers Common Manufacturing and Logistics Creates Asset Synergies • Larger organometallics network enables immediate supply synergies • Rationalizing butyllithium capacity in Tennessee • Leveraging the portable tank fleet across the broader portfolio • Next phase: Additional opportunities to optimize Li and Al Specialties production Combining Lithium-based and Aluminum-based Organometallics Gives Albemarle a Unique, Advantaged Position in the Industry 41 |
 The
Albemarle Lithium Organometallics Business is in the Best Position to
Outpace the Competition in the Short and Long Term •
Most extensive global manufacturing and sales presence in organometallics
• Extensive pipeline of agriculture and pharma synthesis projects • Back-integrated, lowest-cost position due to Chilean lithium supply position
• Global 24/7 customer technical service coverage – leveraging the critical mass of the combined Albemarle organometallics franchise • Organometallic chemistry and production expertise – leveraging investment across product families 42 |
 Albemarle’s Global Position in
Lithium John Mitchell Vice President, Performance Materials |
 Leadership in Lithium due to Albemarle’s Unique Position
44 Leading Natural Resources Extensive Derivative Capability Strength of Supply Chain Reliability Process Innovation Expertise Low Cost Position |
 Leader
in High Quality Diversified Natural Resources Hard Rock
Minerals SQM
36% Albemarle 34% FMC 21% Chinese & Others 9% Talison 78% Chinese 21% Others 1% Brine Talison 31% Albemarle 20% SQM 22% FMC 13% Chinese 13% Others 1% Source: SAI Report 2015, Internal Estimates 45 LCE Mined in 2014 160,000 MT 2014 Brine LCE Production Share 2014 Spodumene LCE Production Share 98kT 62kT Natural Resource Position Albemarle >35% Total LCE’s Mined |
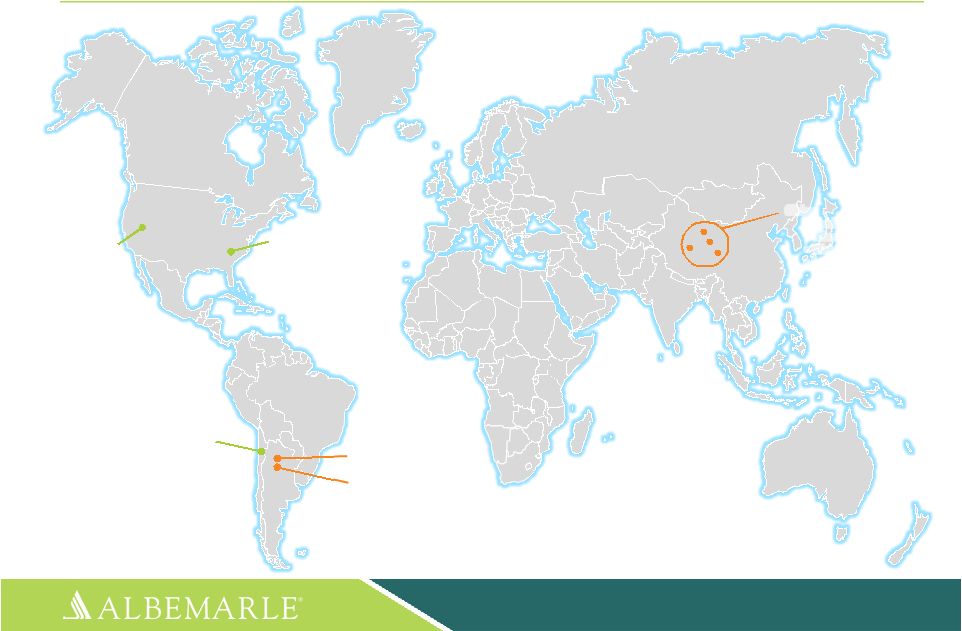
 Two
World-class Lithium Brine Resources Operated by Albemarle
Salar de Atacama, Chile
• Largest active lithium brine resource globally • Highest LiCl concentration • Highest evaporation rates • Favorable brine chemistry Silver Peak, Nevada, U.S.A. • First operational brine resource globally • Only U.S. operational lithium brine source • Favorable brine chemistry • Established Infrastructure 46 Natural Resource Position |
 Two
World-class Lithium Brine Resources in Development Magnolia,
Arkansas U.S.A. •
Unique to only Albemarle
• By-product brine from bromine operation • Ability to leverage infrastructure • No mining cost • By-product enhancements given bromine derivations 47 Salares 7, Atacama Chile • Early stage exploration project • Part of Talison joint venture • Positive results for lithium and potassium Natural Resource Position |
 Two World-class Hardrock Resources Globally Owned by Albemarle Greenbushes, Australia • Large reserve – 50 year mine life • Scale advantage – largest active • Best ore quality globally: 2.8 – 3.3% Li 2 O • Low iron content for TG market • CG grain size and quality is superior Kings Mountain, NC, U.S.A. • Large reserve 380 kT LCE • Second best ore quality globally: 1.8 - 2.0% Li 2 O • Inactive mine since mid 1980’s 48 Natural Resource Position |
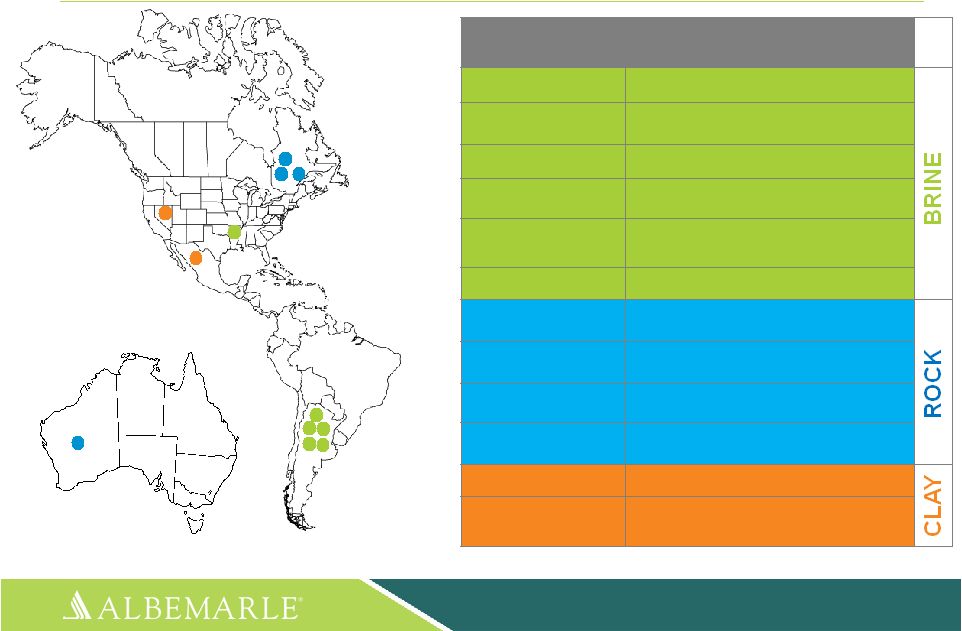
 Albemarle’s Brine Resources are Geographically Well-
positioned (Chile & USA)
Chile Salar de Atacama Albemarle Best Brine Source Globally Shared by Albemarle US Magnolia, AR Albemarle Source linked to Bromine Plant US Silver Peak, NV Albemarle Low Concentration Argentina Salar de Hombre Muerto Salar de Olaroz • Weather Risk • High Altitude Issue • Infrastructure Challenges • Country Risk China • Various Salars Brine Chemistry Issues • Weather Risk • Infrastructure Challenges Source: USGS, Roskill, Internal 49 Natural Resource Position |
 Albemarle’s Hardrock
Mining Resources are Geographically Well-positioned (Australia & USA) US North Carolina Albemarle Mine Currently Inactive China Various Small Mines 21% of Total Production Australia Greenbushes Mine 78% Total Production Zimbabwe Bikita Mine 1% Global Production 50 Natural Resource Position |
 Albemarle Resources –
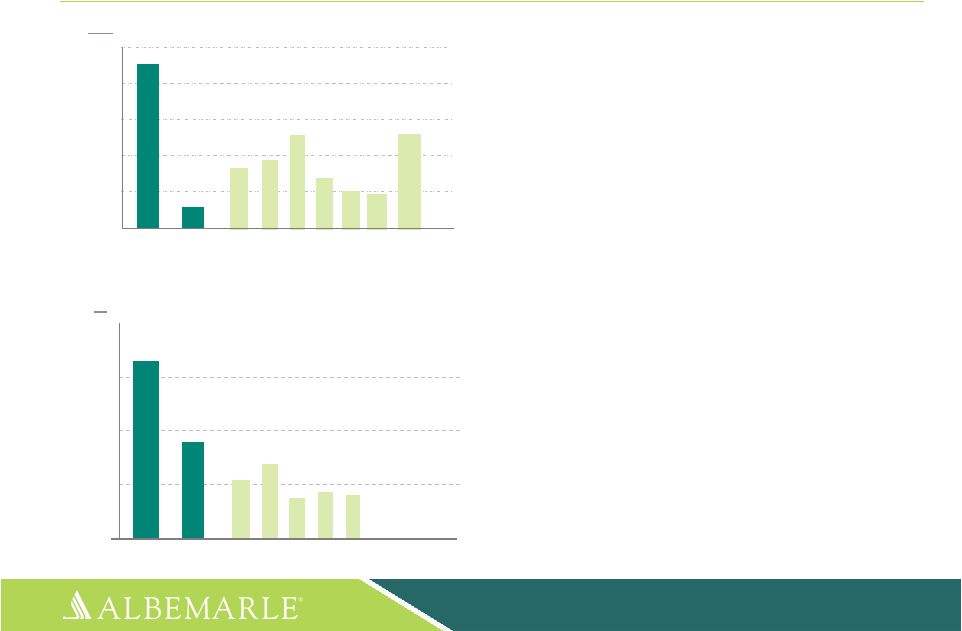
High Concentration and Much More
51 • Chemical composition • Hydrogeology • Climate • Infrastructure • Utility requirements • Environmental • Social responsibility • Mine scale • Reserve size Natural Resource Position Lithium Concentrate in Brine Silver Peak (ALB Li) Atacama (ALB Li & SQM) ppm 2000 1600 1200 400 0 800 Li 2 O Concentration in Hardrock 2.8% - 3.3% 1.8% % 4.0 3.0 2.0 1.0 0.0 ALB Kings Mt. ALB Greenbushes Other Brine Sources Other Rock Sources |
 Resource Size Climate Chemistry Infrastructure / Location Tailings Management Country Risk Fresh Water Intensity / Availability Energy Intensity / Availability Scale of Mine Atacama, Chile Argentina Example: Resource Competitiveness Assessment 52 Natural Resource Position |
 Lithium
Resource Projects in Development 53
• xx Source: Company reports and press releases Company Project status Albemarle Pilot Plant Orocobre (started 2007) Li 2 CO 3 Market Production
2015-2016 Lithium Americas Pilot plant Galaxy Resources Feasibility ADY Resources Feasibility Rodinia Feasibility Critical Elements Corporation Exploration RB Energy Li 2 CO 3 Shut-down Receivership Nemaska Post Feasibility Neometals (Reed Resources) Pilot Western Lithium Demo plant Bacanora Minerals Feasibility Natural Resource Position |
 Lithium
Resource Development is Not Easy and Takes Time 54
Exploration Feasibility Pilot Design Construction Production Simbol Canada Lithium Galaxy Mt Cattlin Albemarle Magnolia Lithium Americas Bacanora Minerals Western Lithium Bankrupt Bankrupt Closed Ready for plant design Brine Spodumene Spodumene Brine Brine Hectorite Nemaska Lithium Hectorite Spodumene Plant Natural Resource Position $120 million spent collectively <$20 million in cash reserves combined Main focus is fundraising |
 Ability
to Produce Value-added Lithium Derivatives is Unmatched
55 Life-Science Products Battery Products Other Products • Ability to optimize Li derivatives • Providing lithium compounds throughout all stages of the value chain • Over 800 different SKUs Lithium Metal Lithium Metal LDA LDA LHS LHS Li-t- Butoxide Li-t- Butoxide Li- Amide Li- Amide Li- Salicylate Li- Salicylate Li-tri (t-butoxy)- alanate Li-tri (t-butoxy)- alanate Li- Citrate Li- Citrate Li- Benzoate Li- Benzoate Li- Acetate Li- Acetate Li- Zeolite Li- Zeolite Potash Potash Bischofite Bischofite Li- Sulphate Li- Sulphate Li- Nitrate Li- Nitrate Li- Phosphate Li- Phosphate Li- Silicate Li- Silicate Li-Tetra- borate Li-Tetra- borate Li- Chromate Li- Chromate Sabalith Sabalith Li- Nitride Li- Nitride Li- Bromide Li- Bromide Li- Fluoride Li- Fluoride Li- Peroxide Li- Peroxide CO2- Absorption Products CO2- Absorption Products Li- Iodide Li- Iodide Li- Perchlorate Li- Perchlorate LiBOB LiBOB Anodes Anodes Foils Foils Lithium Chloride Lithium Chloride Brines Brines Lithium Carbonate Lithium Carbonate Lithium Hydroxide Lithium Hydroxide Ores (Spodumene) Ores (Spodumene) Li- Alanate Li- Alanate Li- Hydride Li- Hydride Li-Acetylide Li-Acetylide Methyl- lithium Methyl- lithium Phenyl- lithium Phenyl- lithium Butyl- lithium Butyl- lithium Li- Methoxide Li- Methoxide Extensive Derivative Capability |
 Unmatched Vertical Integration from Natural Resource to Lithium Specialty
56 Albemarle SQM FMC Tianqi Ganfeng Operating Brine Resource Operating Hardrock Resource Spodumene TG Lithium Carbonate TG/BG Lithium Hydroxide TG Lithium Hydroxide BG Lithium Chloride Li Metal Bulk Li Metal Battery Products Butyllithium Specialty Organics Specialty Lithium Salts Extensive Derivative Capability Source: Internal |
 Leading
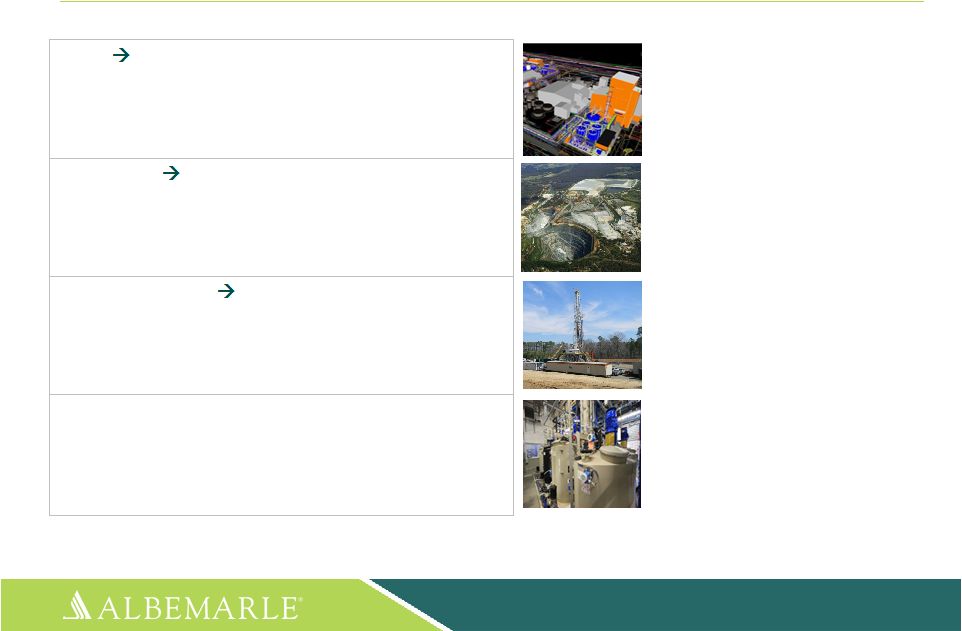
Process Innovation & Expertise 57
Brine Battery Grade Lithium Carbonate Expansion • Significant quality improvement • Significant yield advantage Hard Rock Battery Grade Lithium Salts • Projected lower cost vs. carbonate route • Aligns resource strength to value-added derivative • Process technology improvements Smackover Brine Lithium Salts • Leverage existing mining & chemical operations • Process interdependency advantage High Purity Lithium Metal Production • Lowest impurity profile • Optimization of process interdependencies Process Innovation Expertise Lower Cost Higher Quality Most Reliable |
 Proven
Lithium Engineering…Only Further Enhanced 58
2008 SQM Expansion 12kT TG Li 2 CO 3 2012 Albemarle 5kT BG LiOH 2014 Canada Li 20kT Li 2 CO 3 2014 Galaxy Jiangsu 17kT Li 2 CO 3 2015 Orocobre 17kT Argentina Brine 2015 Albemarle 20kT BG Li 2 CO 3 2005 SQM 6kT TG LiOH Successful Projects Projects in Start-up Failed Projects CLOSED SOLD CLOSED Bankrupt Process Innovation Expertise |
 Global
Supply Chain Strength For Battery Markets 59
Salar de Atacama, Chile
LaNegra, Chile Kings Mountain, NC, USA Silver Peak, NV, USA Langelsheim, Germany Frankfurt, Germany Greenbushes, Australia Established Battery Growth Market Tesla 35 GWh LG Foxconn LG Samsung Panasonic BYD Global Technical Centers Production Sites Battery Plants Supply Chain Reliability Emerging Battery Growth Market |
 Manufacturing Excellence in Lithium for over 100 years
60 Our People… Our Culture… Our Execution Focus… • Safety above all • We care about the communities we work in • Low cost • High quality • Most reliable • The world’s lithium experts Supply Chain Reliability |
 Cost
Advantage Continues to be Extended Li Carbonate Cost Curve
2020 Co-market cost leader: Albemarle
Market cost leader: Albemarle
• Best lithium resources globally • Superior derivative process technology • Scale & supply chain advantage Why? Cost Leader Li Hydroxide Cost Curve 2020 Capacity Capacity 61 |
 Leadership in Lithium due to Albemarle’s Unique Position
62 Leading Natural Resources • Diverse, large and high quality natural resources • Geographically situated in low-risk environments with good infrastructure • Large scale for excellent economics Extensive Derivative Capability • Broad value-added derivative portfolio • Strongest vertical position from resource to specialty • Ability to innovate with customers for next-generation lithium materials Strength of Supply Chain Reliability • Unmatched global footprint and ability to serve growth markets • 100 years of lithium manufacturing experience Process Innovation • Deep and broad process technology expertise • Scale of expertise has grown with merger adding to continues improvement • Strong experience in successfully commercializing new projects A Low Cost Position • While providing the highest quality products • With the lithium industry’s most reliable and sustainable supply network |
 63 Albemarle Lithium Core Strengths Translated to Value • Natural Resource Management • Process Innovation • Project Execution Experience • Supply Chain Strength • Manufacturing Excellence • Our Team Strengths Strengths • Cost Leadership • Premium Quality Products • Security of Supply • Long-term Sustainable Partnership • Ability to Innovate (Resources and Capability) » Advanced Materials for Batteries » Organometallics and Catalyst for Synthesis Value Value |
 Closing |
 Core
Messages 65
1 Albemarle is the leader in lithium, one of the highest growth markets in the
specialty chemicals industry
2 Our unique natural resource position, derivatization capabilities and technology leadership allow Albemarle to execute its growth strategy
3 We can sustain the Albemarle advantage because our unique position is difficult to replicate and
has taken more than 100 years to establish |
 • World class Health, Safety & Environmental performance • Double-digit earnings growth • Maintain historical EBITDA margin • Results-oriented, people-focused organization • Continued leadership positions in incumbent markets with market share expansion in Energy Storage Our Expectations 66 MT |
 Appendix Non-GAAP Reconciliations |
 Non-GAAP Financial Measures
It should be noted that adjusted net income attributable to Albemarle Corporation (“adjusted earnings”), adjusted diluted earnings per share, adjusted effective income tax rates, segment operating profit, segment income, EBITDA, adjusted EBITDA, adjusted EBITDA by operating segment, EBITDA margin and adjusted EBITDA margin are financial measures that are not required by, or presented in accordance with, accounting principles generally accepted in the United States, or GAAP. These measures are presented here to provide additional useful measurements to review our operations, provide transparency to investors and enable period-to-period comparability of financial performance. A description of these and other non-GAAP financial measures that we use to evaluate our operations and financial performance, and reconciliation of these non-GAAP financial measures to the most directly comparable financial measures calculated and reported in accordance with GAAP, can be found herein. 68 |
 Net
Income and EBITDA 69
($ in thousands) See above for a reconciliation of adjusted net income attributable to Albemarle Corporation (“adjusted earnings”), EBITDA and adjusted
EBITDA, the non-GAAP financial measures, to Net income attributable
to Albemarle Corporation, the most directly comparable financial measure calculated and reported in accordance with GAAP. Adjusted net income attributable to Albemarle Corporation is defined as Net income attributable to Albemarle Corporation before
discontinued operations and the special and non-operating pension and
OPEB items as listed above. EBITDA is defined as Net income attributable to Albemarle Corporation before interest and financing expenses, income taxes, depreciation and amortization. Adjusted EBITDA is defined as EBITDA before
discontinued operations and the special and non-operating pension and
OPEB items as listed below. Three Months Ended
Six Months Ended June 30, June 30, 2015 2014 2015 2014 Net income attributable to Albemarle Corporation $ 52,147 $ 22,447 $ 95,262 $ 79,030 Add back: Non-operating pension and OPEB items (net of tax) (862) (855) (3,089) 8,089 Special items (net of tax) 43,807 5,189 130,123 16,334 Loss from discontinued operations (net of tax) — 60,025 — 61,794 Adjusted net income attributable to Albemarle Corporation $ 95,092 $ 86,806 $ 222,296 $ 165,247 Net income attributable to Albemarle Corporation $ 52,147 $ 22,447 $ 95,262 $ 79,030 Add back: Interest and financing expenses 33,182 8,733 68,928 17,506 Income tax expense (from continuing and discontinued operations) 17,139 1,624 31,279 14,070 Depreciation and amortization 67,483 24,905 131,469 52,714 EBITDA 169,951 57,709 326,938 163,320 Non-operating pension and OPEB items (1,314) (1,370) (4,823) 12,701 Special items (excluding special items associated with interest expense) 61,444 8,175 173,594 25,175 Loss from discontinued operations — 80,174 — 82,687 Less depreciation and amortization from discontinued operations — — — (3,165) Adjusted EBITDA $ 230,081 $ 144,688 $ 495,709 $ 280,718 Net sales $ 931,485 $ 604,721 $ 1,815,889 $ 1,204,564 EBITDA margin 18.2% 9.5% 18.0% 13.6% Adjusted EBITDA margin 24.7% 23.9% 27.3% 23.3% |
 EBITDA
Supplemental 70
($ in thousands) See above for a reconciliation of adjusted EBITDA on a segment basis, the non-GAAP financial measure, to net income attributable
to Albemarle Corporation
(“earnings”), the most directly comparable financial measure calculated and
reporting in accordance with GAAP. Adjusted earnings on a segment basis is defined as earnings before discontinued operations and the special and non-operating pension and OPEB items as listed above. EBITDA is
defined as earnings before interest and
financing expenses, income taxes, and depreciation and amortization. Adjusted EBITDA is defined as EBITDA before discontinued operations and the special and non-operating pension and OPEB items as listed above.
Performance Chemicals Refining Solutions Chemetall Surface Treatment All Other Corporate Total Three months ended June 30, 2015 (Actual): Net income (loss) attributable to Albemarle Corporation $ 83,016 39,717 26,254 $ 3,612 (100,452 $ 52,147 Depreciation and amortization 31,843 8,483 19,111 5,724 2,322 67,483 Special items (excluding special items associated with interest expense) 33,823 — 3,077 378 24,166 61,444 Interest and financing expenses — — — — 33,182 33,182 Income tax expense — — — — 17,139 17,139 Non-operating pension and OPEB items — — — — (1,314 (1,314) Adjusted EBITDA $ 148,682 48,200 48,442 $ 9,714 (24,957 $ 230,081 Three months ended June 30, 2014 (Actual): Net income (loss) attributable to Albemarle Corporation $ 63,861 58,703 — $ 18,393 (118,510 $ 22,447 Depreciation and amortization 13,093 7,848 — 3,423 541 24,905 Special items — — — — 8,175 8,175 Interest and financing expenses — — — — 8,733 8,733 Income tax expense — — — — 21,773 21,773 Loss from discontinued operations (net of tax) — — — — 60,025 60,025 Non-operating pension and OPEB items — — — — (1,370 (1,370) Adjusted EBITDA $ 76,954 66,551 — $ 21,816 (20,633 $ 144,688 |
 EBITDA
Supplemental 71
($ in thousands) See above for a reconciliation of adjusted EBITDA on a segment basis, the non-GAAP financial measure, to net income attributable
to Albemarle Corporation
(“earnings”), the most directly comparable financial measure calculated and
reporting in accordance with GAAP. Adjusted earnings on a segment basis is defined as earnings before discontinued operations and the special and non-operating pension and OPEB items as listed above. EBITDA is
defined as earnings before
interest and financing expenses, income taxes, and depreciation and amortization. Adjusted EBITDA is defined as EBITDA before discontinued operations and the special and non-operating pension and OPEB items as listed above. Performance Chemicals Refining Solutions Chemetall Surface Treatment All Other Corporate Total Three months ended June 30, 2014 (Pro forma): Net income (loss) attributable to Albemarle Corporation 94,304 58,703 41,193 $ 24,253 (149,269 $ 69,184 Depreciation and amortization 25,149 7,848 7,879 4,373 5,513 50,762 Special items — — — — 7,907 7,907 Interest and financing expenses — — — — 22,333 22,333 Income tax expense — — — — 34,073 34,073 Loss from discontinued operations (net of tax) — — — — 47,425 47,425 Non-operating pension and OPEB items — — — — (1,332 (1,332) Adjusted EBITDA 119,453 66,551 49,072 $ 28,626 (33,350 $ 230,352 |
 EBITDA
Supplemental 72
($ in thousands) See above for a reconciliation of adjusted EBITDA on a segment basis, the non-GAAP financial measure, to net income attributable to Albemarle
Corporation (“earnings”), the most directly comparable
financial measure calculated and reporting in accordance with GAAP. Adjusted earnings on a segment basis is defined as earnings before discontinued operations and the special and non-operating pension and OPEB items as listed above. EBITDA is
defined as earnings before
interest and financing expenses, income taxes, and depreciation and amortization. Adjusted EBITDA is defined as EBITDA before discontinued operations and the special and non-operating pension and OPEB items as listed above. Performance Chemicals Refining Solutions Chemetall Surface Treatment All Other Corporate Total Six months ended June 30, 2015 (Actual): Net income (loss) attributable to Albemarle Corporation $ 154,679 73,800 37,109 9,027 (179,353) 95,262 Depreciation and amortization 62,126 16,593 37,307 11,222 4,221 131,469 Special items (excluding special items associated with interest expense) 62,405 — 20,030 3,029 88,130 173,594 Interest and financing expenses — — — — 68,928 68,928 Income tax expense — — — — 31,279 31,279 Non-operating pension and OPEB items — — — — (4,823) (4,823) Adjusted EBITDA $ 279,210 90,393 94,446 23,278 8,382 495,709 Six months ended June 30, 2014 (Actual): Net income (loss) attributable to Albemarle Corporation $ 125,190 111,057 — 35,724 (192,941) 79,030 Depreciation and amortization 25,149 16,528 — 6,787 1,085 49,549 Special items — — — — 25,175 25,175 Interest and financing expenses — — — — 17,506 17,506 Income tax expense — — — — 34,963 34,963 Loss from discontinued operations (net of tax) — — — — 61,794 61,794 Non-operating pension and OPEB items — — — — 12,701 12,701 Adjusted EBITDA $ 150,339 127,585 — 42,511 (39,717) 280,718 |
 EBITDA
Supplemental 73
($ in thousands) See above for a reconciliation of adjusted EBITDA on a segment basis, the non-GAAP financial measure, to net income attributable
to Albemarle Corporation
(“earnings”), the most directly comparable financial measure calculated and
reporting in accordance with GAAP. Adjusted earnings on a segment basis is defined as earnings before discontinued operations and the special and non-operating pension and OPEB items as listed above. EBITDA is
defined as earnings before
interest and financing expenses, income taxes, and depreciation and amortization. Adjusted EBITDA is defined as EBITDA before discontinued operations and the special and non-operating pension and OPEB items as listed above.
Performance Chemicals Refining Solutions Chemetall Surface Treatment All Other Corporate Total Six months ended June 30, 2014 (Pro forma): Net income (loss) attributable to Albemarle Corporation 185,907 $ 111,057 $ 79,917 47,557 $ (319,517) 104,921 Depreciation and amortization 48,732 16,528 15,599 8,681 11,068 100,608 Special items — — — — 31,377 31,377 Interest and financing expenses — — — — 45,306 45,306 Income tax expense — — — — 60,063 60,063 Loss from discontinued operations (net of tax) — — — — 91,694 91,694 Non-operating pension and OPEB items — — — — 12,733 12,733 Adjusted EBITDA 234,639 $ 127,585 $ 95,516 56,238 $ (67,276) 446,702 |
 EBITDA
Supplemental 74
($ in thousands) See above for a reconciliation of adjusted EBITDA on a segment basis, the non-GAAP financial measure, to net income attributable
to Albemarle Corporation
(“earnings”), the most directly comparable financial measure calculated and
reporting in accordance with GAAP. Adjusted earnings on a segment basis is defined as earnings before discontinued operations and the special and non-operating pension and OPEB items as listed above. EBITDA is
defined as earnings before
interest and financing expenses, income taxes, and depreciation and amortization. Adjusted EBITDA is defined as EBITDA before discontinued operations and the special and non-operating pension and OPEB items as listed above.
Bromine Lithium PCS Total Performance Chemicals Three months ended June 30, 2015 (Actual): Net income (loss) attributable to Albemarle Corporation 60,486 $ (213) $ 22,743 $ 83,016 Depreciation and amortization 8,211 20,035 3,597 31,843 Special items — 33,823 — 33,823 Adjusted EBITDA 68,697 $ 53,645 $ 26,340 $ 148,682 Three months ended June 30, 2014 (Actual): Net income (loss) attributable to Albemarle Corporation 43,623 $ — $ 20,238 $ 63,861 Depreciation and amortization 8,907 — 4,186 13,093 Adjusted EBITDA 52,530 $ — $ 24,424 $ 76,954 Three months ended June 30, 2014 (Pro Forma): Net income (loss) attributable to Albemarle Corporation 43,623 $ 30,443 $ 20,238 $ 94,304 Depreciation and amortization 8,907 12,056 4,186 25,149 Adjusted EBITDA 52,530 $ 42,499 $ 24,424 $ 119,453 |
 EBITDA
Supplemental 75
($ in thousands) See above for a reconciliation of adjusted EBITDA on a segment basis, the non-GAAP financial measure, to net income attributable
to Albemarle Corporation
(“earnings”), the most directly comparable financial measure calculated and
reporting in accordance with GAAP. Adjusted earnings on a segment basis is defined as earnings before discontinued operations and the special and non-operating pension and OPEB items as listed above. EBITDA is
defined as earnings before
interest and financing expenses, income taxes, and depreciation and amortization. Adjusted EBITDA is defined as EBITDA before discontinued operations and the special and non-operating pension and OPEB items as listed above.
Bromine Lithium PCS Total Performance Chemicals Six months ended June 30, 2015 (Actual): Net income (loss) attributable to Albemarle Corporation $ 104,958 $ 3,715 $ 46,006 154,679 Depreciation and amortization 16,672 38,103 7,351 62,126 Special items — 62,405 — 62,405 Adjusted EBITDA $ 121,630 $ 104,223 $ 53,357 279,210 Six months ended June 30, 2014 (Actual): Net income (loss) attributable to Albemarle Corporation $ 91,657 $ — $ 33,533 125,190 Depreciation and amortization 17,590 — 7,559 25,149 Adjusted EBITDA $ 109,247 $ — $ 41,092 150,339 Six months ended June 30, 2014 (Pro Forma): Net income (loss) attributable to Albemarle Corporation $ 91,657 $ 60,717 $ 33,533 185,907 Depreciation and amortization 17,590 23,583 7,559 48,732 Adjusted EBITDA $ 109,247 $ 84,300 $ 41,092 234,639 |
 EBITDA
Supplemental 76
1 This supplemental is for net-debt-to-adjusted EBITDA ratio based on the bank covenant
definition. Twelve Months Ended Three Months Ended 30-Jun-15 30-Jun-15 March 31, 2015 December 31, 2014 September 30, 2014 Adjusted EBITDA 957,409 230,081 265,628 225,500 236,200 Net income attributable to to noncontrolling interests 24,259 7,219 4,034 4,460 8,546 Equity in net income of unconsolidated investments (net of tax) (63,359) (15,794) (18,244) (15,577) (13,744) Dividends received from unconsolidated investments 111,191 42,478 3,048 39,328 26,337 Runrate synergies adjustment 28,909 28,909 - - - Consolidated EBITDA 1,058,409 292,893 254,466 253,711 257,339 Total Long Term Debt 3,990,308 Off balance sheet obligations and other 57,666 Attributable principal amount of capital leases and synthetic leases 21,861 Consolidated Funded Debt 4,069,835 Less Cash 207,238 Consolidated Funded Net Debt 3,862,597 Consolidated Funded Net Debt to Consolidated EBITDA Ratio 3.6 |
 Diluted
EPS 77 1 Totals may not add due to rounding Three Months Ended Six Months Ended June 30, June 30, 2015 2014 2015 2014 Diluted earnings per share $ 0.46 $ 0.28 $ 0.86 $ 0.99 Non-operating pension and OPEB items (0.01)
(0.01 ) (0.03 ) 0.10 Special items 0.39 0.07 1.18 0.21 Discontinued operations — 0.76 — 0.78 Adjusted Diluted earnings per share $ 0.84 $ 1.10 $ 2.01 $ 2.08 1 |
 Equity
Income and Minority Interest Q1
Q2 Equity Minority Equity Minority Income Interest Income Interest Performance Chemicals* 1,765 (4,034) (625) (7,219) Refining Solutions 5,012 - 3,658 - Chemetall 1,291 - 650 - All Other 2,324 - 2,111 - Corporate - - - - 10,392 (4,034) 5,794 (7,219) * Includes Inventory Step-Up PC - As Reported Equity Income 1,765 (625) Inventory Step-Up 7,851 10,000 PC - As Adjusted Equity Income 9,616 9,375 As Reported Equity Income 10,392 5,794 Inventory Step-Up 7,851 10,000 As Adjusted Equity Income 18,243 15,794 78 |
 79 www.albemarle.com |