UNITED STATES
SECURITIES AND EXCHANGE COMMISSION
Washington, D.C. 20549
FORM N-CSR
CERTIFIED SHAREHOLDER REPORT OF REGISTERED
MANAGEMENT INVESTMENT COMPANIES
Investment Company Act file number: 811-08194
FINANCIAL INVESTORS TRUST
(Exact name of registrant as specified in charter)
1290 Broadway, Suite 1000, Denver, Colorado 80203
(Address of principal executive offices) (Zip code)
Cara Owen, Esq., Secretary
Financial Investors Trust
1290 Broadway, Suite 1000
Denver, Colorado 80203
(Name and address of agent for service)
Registrant’s telephone number, including area code: 303-623-2577
Date of fiscal year end: October 31
Date of reporting period: April 30, 2021
| Item 1. | Reports to Stockholders. |
(a)

Table of Contents
| Disclosure of Fund Expenses | 1 |
| ALPS | CoreCommodity Management CompleteCommodities® Strategy Fund | |
| Management Commentary | 7 |
| Performance Update | 9 |
| Consolidated Statement of Investments | 11 |
| Consolidated Statement of Assets and Liabilities | 16 |
| Consolidated Statement of Operations | 17 |
| Consolidated Statements of Changes in Net Assets | 18 |
| Consolidated Financial Highlights | 19 |
| ALPS | Kotak India Growth Fund | |
| Management Commentary | 23 |
| Performance Update | 26 |
| Statement of Investments | 28 |
| Statement of Assets and Liabilities | 30 |
| Statement of Operations | 31 |
| Statements of Changes in Net Assets | 32 |
| Financial Highlights | 33 |
| ALPS | Smith Funds | |
| Management Commentary | 38 |
| Performance Update | 43 |
| Statements of Investments | 51 |
| Statements of Assets and Liabilities | 97 |
| Statements of Operations | 99 |
| Statement of Changes in Net Assets | 100 |
| Financial Highlights | 104 |
| ALPS | Red Rocks Global Opportunity Fund | |
| Management Commentary | 120 |
| Performance Update | 122 |
| Statement of Investments | 125 |
| Statement of Assets and Liabilities | 127 |
| Statement of Operations | 128 |
| Statements of Changes in Net Assets | 129 |
| Financial Highlights | 130 |
| Clough China Fund | |
| Management Commentary | 135 |
| Performance Update | 137 |
| Statement of Investments | 139 |
| Statement of Assets and Liabilities | 142 |
| Statement of Operations | 143 |
| Statements of Changes in Net Assets | 144 |
| Financial Highlights | 145 |
| RiverFront Global Allocation Series | |
| Management Commentary | 149 |
| Performance Update | 151 |
| Statements of Investments | 157 |
| Statements of Assets and Liabilities | 160 |
| Statements of Operations | 162 |
| Statements of Changes in Net Assets | 163 |
| Financial Highlights | 166 |
| Notes to Financial Statements | 180 |
| Additional Information | 208 |
| Liquidity Risk Management Program | 209 |
As permitted by regulations adopted by the U.S. Securities and Exchange Commission, paper copies of the Funds’ annual and semiannual shareholder reports will no longer be sent by mail, unless you specifically request paper copies of the reports from your financial intermediary (such as a broker-dealer or bank). Instead, the reports will be made available on the Funds’ website (www.alpsfunds.com), and you will be notified by mail each time a report is posted and provided with a website link to access the report.
If you already elected to receive shareholder reports electronically, you will not be affected by this change and you need not take any action. You may elect to receive shareholder reports and other communications from a Fund electronically anytime by contacting your financial intermediary.
You may elect to receive all future reports in paper free of charge. You can contact your financial intermediary to request that you continue to receive paper copies of your shareholder reports. Your election to receive reports in paper will apply to all funds held in your account with your financial intermediary.
alpsfunds.com
Disclosure of Fund Expenses
April 30, 2021 (Unaudited)
Board Examples. As a shareholder of the Funds, you incur two types of costs: (1) transaction costs, including applicable sales charges (loads) and redemption fees; and (2) ongoing costs, including management fees, distribution and service (12b-1) fees, shareholder service fees and other Fund expenses. The following examples are intended to help you understand your ongoing costs (in dollars) of investing in the Funds and to compare these costs with the ongoing costs of investing in other mutual funds. The examples are based on an investment of $1,000 invested on November 1, 2020 and held until April 30, 2021.
Actual Expenses. The first line under each class in the table below provides information about actual account values and actual expenses. You may use the information in this line, together with the amount you invested, to estimate the expenses that you paid over the period. Simply divide your account value by $1,000 (for example, an $8,600 account value divided by $1,000 = 8.6), then multiply the result by the number in the first line under the heading “Expenses Paid During Period November 1, 2020 – April 30, 2021” to estimate the expenses you paid on your account during this period.
Hypothetical Example for Comparison Purposes. The second line under each class in the table below provides information about hypothetical account values and hypothetical expenses based on the Fund’s actual expense ratio and an assumed rate of return of 5% per year before expenses, which is not the Fund’s actual return. The hypothetical account values and expenses may not be used to estimate the actual ending account balance or expenses you paid for the period. You may use this information to compare the ongoing costs of investing in the Funds and other mutual funds. To do so, compare these 5% hypothetical examples with the 5% hypothetical examples that appear in the shareholder reports of the other funds.
Please note that the expenses shown in the table are meant to highlight your ongoing costs only and do not reflect any transactional costs, such as sales charges or redemption fees. Therefore, the second line under each class in the table below is useful in comparing ongoing costs only, and will not help you determine the relative total costs of owning different funds. In addition, if these transactional costs were included, your costs would have been higher.
1 | April 30, 2021
Disclosure of Fund Expenses
April 30, 2021 (Unaudited)
| Beginning Account Value November 1, 2020 | Ending Account Value April 30, 2021 | Expense Ratio(a) | Expenses Paid During Period November 1, 2020 - April 30, 2021(b) | |
| ALPS | CoreCommodity Management CompleteCommodities® Strategy Fund(c) | ||||
| Investor Class | ||||
| Actual | $ 1,000.00 | $ 1,382.10 | 1.40% | $ 8.27 |
| Hypothetical (5% return before expenses) | $ 1,000.00 | $ 1,017.85 | 1.40% | $ 7.00 |
| Class A | ||||
| Actual | $ 1,000.00 | $ 1,379.90 | 1.38% | $ 8.14 |
| Hypothetical (5% return before expenses) | $ 1,000.00 | $ 1,017.95 | 1.38% | $ 6.90 |
| Class C | ||||
| Actual | $ 1,000.00 | $ 1,376.50 | 2.02% | $ 11.90 |
| Hypothetical (5% return before expenses) | $ 1,000.00 | $ 1,014.78 | 2.02% | $ 10.09 |
| Class I | ||||
| Actual | $ 1,000.00 | $ 1,383.90 | 1.10% | $ 6.50 |
| Hypothetical (5% return before expenses) | $ 1,000.00 | $ 1,019.34 | 1.10% | $ 5.51 |
| ALPS | Kotak India Growth Fund | ||||
| Investor Class | ||||
| Actual | $ 1,000.00 | $ 1,248.00 | 1.38% | $ 7.69 |
| Hypothetical (5% return before expenses) | $ 1,000.00 | $ 1,017.95 | 1.38% | $ 6.90 |
| Class A | ||||
| Actual | $ 1,000.00 | $ 1,247.80 | 1.39% | $ 7.75 |
| Hypothetical (5% return before expenses) | $ 1,000.00 | $ 1,017.90 | 1.39% | $ 6.95 |
| Class C | ||||
| Actual | $ 1,000.00 | $ 1,244.40 | 2.00% | $ 11.13 |
| Hypothetical (5% return before expenses) | $ 1,000.00 | $ 1,014.88 | 2.00% | $ 9.99 |
| Class I | ||||
| Actual | $ 1,000.00 | $ 1,250.60 | 1.00% | $ 5.58 |
| Hypothetical (5% return before expenses) | $ 1,000.00 | $ 1,019.84 | 1.00% | $ 5.01 |
| Class II | ||||
| Actual | $ 1,000.00 | $ 1,252.30 | 0.75% | $ 4.19 |
| Hypothetical (5% return before expenses) | $ 1,000.00 | $ 1,021.08 | 0.75% | $ 3.76 |
2 | April 30, 2021
Disclosure of Fund Expenses
April 30, 2021 (Unaudited)
| Beginning Account Value November 1, 2020 | Ending Account Value April 30, 2021 | Expense Ratio(a) | Expenses Paid During Period November 1, 2020 - April 30, 2021(b) | |
| ALPS | Smith Short Duration Bond Fund | ||||
| Investor Class | ||||
| Actual | $ 1,000.00 | $ 1,008.00 | 0.77% | $ 3.83 |
| Hypothetical (5% return before expenses) | $ 1,000.00 | $ 1,020.98 | 0.77% | $ 3.86 |
| Class A | ||||
| Actual | $ 1,000.00 | $ 1,008.00 | 0.77% | $ 3.83 |
| Hypothetical (5% return before expenses) | $ 1,000.00 | $ 1,020.98 | 0.77% | $ 3.86 |
| Class C | ||||
| Actual | $ 1,000.00 | $ 1,004.50 | 1.49% | $ 7.41 |
| Hypothetical (5% return before expenses) | $ 1,000.00 | $ 1,017.41 | 1.49% | $ 7.45 |
| Class I | ||||
| Actual | $ 1,000.00 | $ 1,009.50 | 0.49% | $ 2.44 |
| Hypothetical (5% return before expenses) | $ 1,000.00 | $ 1,022.36 | 0.49% | $ 2.46 |
| ALPS | Smith Total Return Bond Fund | ||||
| Investor Class | ||||
| Actual | $ 1,000.00 | $ 1,002.40 | 0.96% | $ 4.77 |
| Hypothetical (5% return before expenses) | $ 1,000.00 | $ 1,020.03 | 0.96% | $ 4.81 |
| Class A | ||||
| Actual | $ 1,000.00 | $ 1,002.40 | 0.95% | $ 4.72 |
| Hypothetical (5% return before expenses) | $ 1,000.00 | $ 1,020.08 | 0.95% | $ 4.76 |
| Class C | ||||
| Actual | $ 1,000.00 | $ 999.00 | 1.67% | $ 8.28 |
| Hypothetical (5% return before expenses) | $ 1,000.00 | $ 1,016.51 | 1.67% | $ 8.35 |
| Class I | ||||
| Actual | $ 1,000.00 | $ 1,003.90 | 0.67% | $ 3.33 |
| Hypothetical (5% return before expenses) | $ 1,000.00 | $ 1,021.47 | 0.67% | $ 3.36 |
3 | April 30, 2021
Disclosure of Fund Expenses
April 30, 2021 (Unaudited)
| Beginning Account Value September 16, 2020 | Ending Account Value April 30, 2021 | Expense Ratio(a) | Expenses Paid During Period September 16, 2020 - April 30, 2021(b) | |
| ALPS | Smith Credit Opportunities Fund | ||||
| Investor Class | ||||
| Actual | $ 1,000.00 | $ 1,057.00 | 1.19% | $ 6.07 |
| Hypothetical (5% return before expenses) | $ 1,000.00 | $ 1,018.89 | 1.19% | $ 5.96 |
| Class A | ||||
| Actual | $ 1,000.00 | $ 1,057.00 | 1.17% | $ 5.97 |
| Hypothetical (5% return before expenses) | $ 1,000.00 | $ 1,018.99 | 1.17% | $ 5.86 |
| Class C | ||||
| Actual | $ 1,000.00 | $ 1,053.30 | 1.90% | $ 9.67 |
| Hypothetical (5% return before expenses) | $ 1,000.00 | $ 1,015.37 | 1.90% | $ 9.49 |
| Class I | ||||
| Actual | $ 1,000.00 | $ 1,058.50 | 0.90% | $ 4.59 |
| Hypothetical (5% return before expenses) | $ 1,000.00 | $ 1,020.33 | 0.90% | $ 4.51 |
| ALPS | Smith Balanced Opportunity Fund | ||||
| Investor Class | ||||
| Actual | $ 1,000.00 | $ 1,193.90 | 1.13% | $ 6.15 |
| Hypothetical (5% return before expenses) | $ 1,000.00 | $ 1,019.19 | 1.13% | $ 5.66 |
| Class A | ||||
| Actual | $ 1,000.00 | $ 1,193.90 | 1.12% | $ 6.09 |
| Hypothetical (5% return before expenses) | $ 1,000.00 | $ 1,019.24 | 1.12% | $ 5.61 |
| Class C | ||||
| Actual | $ 1,000.00 | $ 1,188.30 | 1.85% | $ 10.04 |
| Hypothetical (5% return before expenses) | $ 1,000.00 | $ 1,015.62 | 1.85% | $ 9.25 |
| Class I | ||||
| Actual | $ 1,000.00 | $ 1,195.60 | 0.85% | $ 4.63 |
| Hypothetical (5% return before expenses) | $ 1,000.00 | $ 1,020.58 | 0.85% | $ 4.26 |
4 | April 30, 2021
Disclosure of Fund Expenses
April 30, 2021 (Unaudited)
| Beginning Account Value November 1, 2020 | Ending Account Value April 30, 2021 | Expense Ratio(a) | Expenses Paid During Period November 1, 2020 - April 30, 2021(b) | |
| ALPS | Red Rocks Global Opportunity Fund | ||||
| Investor Class | ||||
| Actual | $ 1,000.00 | $ 1,354.00 | 1.55% | $ 9.05 |
| Hypothetical (5% return before expenses) | $ 1,000.00 | $ 1,017.11 | 1.55% | $ 7.75 |
| Class A | ||||
| Actual | $ 1,000.00 | $ 1,352.00 | 1.53% | $ 8.92 |
| Hypothetical (5% return before expenses) | $ 1,000.00 | $ 1,017.21 | 1.53% | $ 7.65 |
| Class C | ||||
| Actual | $ 1,000.00 | $ 1,349.40 | 2.25% | $ 13.11 |
| Hypothetical (5% return before expenses) | $ 1,000.00 | $ 1,013.64 | 2.25% | $ 11.23 |
| Class I | ||||
| Actual | $ 1,000.00 | $ 1,354.10 | 1.25% | $ 7.30 |
| Hypothetical (5% return before expenses) | $ 1,000.00 | $ 1,018.60 | 1.25% | $ 6.26 |
| Class R | ||||
| Actual | $ 1,000.00 | $ 1,353.80 | 1.69% | $ 9.86 |
| Hypothetical (5% return before expenses) | $ 1,000.00 | $ 1,016.41 | 1.69% | $ 8.45 |
| Clough China Fund | ||||
| Investor Class | ||||
| Actual | $ 1,000.00 | $ 1,170.50 | 1.60% | $ 8.61 |
| Hypothetical (5% return before expenses) | $ 1,000.00 | $ 1,016.86 | 1.60% | $ 8.00 |
| Class A | ||||
| Actual | $ 1,000.00 | $ 1,170.60 | 1.60% | $ 8.61 |
| Hypothetical (5% return before expenses) | $ 1,000.00 | $ 1,016.86 | 1.60% | $ 8.00 |
| Class C | ||||
| Actual | $ 1,000.00 | $ 1,166.70 | 2.35% | $ 12.62 |
| Hypothetical (5% return before expenses) | $ 1,000.00 | $ 1,013.14 | 2.35% | $ 11.73 |
| Class I | ||||
| Actual | $ 1,000.00 | $ 1,172.10 | 1.35% | $ 7.27 |
| Hypothetical (5% return before expenses) | $ 1,000.00 | $ 1,018.10 | 1.35% | $ 6.76 |
5 | April 30, 2021
Disclosure of Fund Expenses
April 30, 2021 (Unaudited)
| Beginning Account Value November 1, 2020 | Ending Account Value April 30, 2021 | Expense Ratio(a) | Expenses Paid During Period November 1, 2020 - April 30, 2021(b) | |
| RiverFront Asset Allocation Moderate | ||||
| Investor Class | ||||
| Actual | $ 1,000.00 | $ 1,126.30 | 0.50% | $ 2.64 |
| Hypothetical (5% return before expenses) | $ 1,000.00 | $ 1,022.32 | 0.50% | $ 2.51 |
| Class A | ||||
| Actual | $ 1,000.00 | $ 1,126.50 | 0.50% | $ 2.64 |
| Hypothetical (5% return before expenses) | $ 1,000.00 | $ 1,022.32 | 0.50% | $ 2.51 |
| Class C | ||||
| Actual | $ 1,000.00 | $ 1,122.60 | 1.25% | $ 6.58 |
| Hypothetical (5% return before expenses) | $ 1,000.00 | $ 1,018.60 | 1.25% | $ 6.26 |
| Class I | ||||
| Actual | $ 1,000.00 | $ 1,127.40 | 0.25% | $ 1.32 |
| Hypothetical (5% return before expenses) | $ 1,000.00 | $ 1,023.55 | 0.25% | $ 1.25 |
| RiverFront Asset Allocation Aggressive | ||||
| Investor Class | ||||
| Actual | $ 1,000.00 | $ 1,251.40 | 0.50% | $ 2.79 |
| Hypothetical (5% return before expenses) | $ 1,000.00 | $ 1,022.32 | 0.50% | $ 2.51 |
| Class A | ||||
| Actual | $ 1,000.00 | $ 1,251.80 | 0.50% | $ 2.79 |
| Hypothetical (5% return before expenses) | $ 1,000.00 | $ 1,022.32 | 0.50% | $ 2.51 |
| Class C | ||||
| Actual | $ 1,000.00 | $ 1,246.80 | 1.25% | $ 6.96 |
| Hypothetical (5% return before expenses) | $ 1,000.00 | $ 1,018.60 | 1.25% | $ 6.26 |
| Class I | ||||
| Actual | $ 1,000.00 | $ 1,252.70 | 0.25% | $ 1.40 |
| Hypothetical (5% return before expenses) | $ 1,000.00 | $ 1,023.55 | 0.25% | $ 1.25 |
| Investor Class II | ||||
| Actual | $ 1,000.00 | $ 1,252.00 | 0.50% | $ 2.79 |
| Hypothetical (5% return before expenses) | $ 1,000.00 | $ 1,022.32 | 0.50% | $ 2.51 |
| Class L | ||||
| Actual | $ 1,000.00 | $ 1,253.30 | 0.25% | $ 1.40 |
| Hypothetical (5% return before expenses) | $ 1,000.00 | $ 1,023.55 | 0.25% | $ 1.25 |
| RiverFront Asset Allocation Growth & Income | ||||
| Investor Class | ||||
| Actual | $ 1,000.00 | $ 1,177.80 | 0.50% | $ 2.70 |
| Hypothetical (5% return before expenses) | $ 1,000.00 | $ 1,022.32 | 0.50% | $ 2.51 |
| Class A | ||||
| Actual | $ 1,000.00 | $ 1,177.20 | 0.50% | $ 2.70 |
| Hypothetical (5% return before expenses) | $ 1,000.00 | $ 1,022.32 | 0.50% | $ 2.51 |
| Class C | ||||
| Actual | $ 1,000.00 | $ 1,173.30 | 1.25% | $ 6.74 |
| Hypothetical (5% return before expenses) | $ 1,000.00 | $ 1,018.60 | 1.25% | $ 6.26 |
| Class I | ||||
| Actual | $ 1,000.00 | $ 1,179.80 | 0.25% | $ 1.35 |
| Hypothetical (5% return before expenses) | $ 1,000.00 | $ 1,023.55 | 0.25% | $ 1.25 |
| (a) | Annualized, based on the Fund's most recent fiscal half year expenses. |
| (b) | Expenses are equal to the Fund's annualized expense ratio multiplied by the average account value over the period, multiplied by the number of days in the most recent fiscal half year (181), divided by 365. |
| (c) | Includes expenses of the CoreCommodity Management Cayman Commodity Fund Ltd. (wholly-owned subsidiary), exclusive of the subsidiary's management fee. |
6 | April 30, 2021
| ALPS | CoreCommodity Management | |
| CompleteCommodities® Strategy Fund | |
| Management Commentary | April 30, 2021 (Unaudited) |
The six months ending April 30, 2021 produced a positive return for commodities. The Bloomberg Commodity Index Total Return (“BCOMTR”), the Fund’s benchmark, ended higher by +25.81% for the period. ALPS | CoreCommodity Management CompleteCommodities® Strategy Fund (“I” Shares—“JCRIX” or the “Fund”) delivered a net positive return of 38.39% for the period, (JCRAX gained 38.21%, JCCSX was up 30.47% at MOP JCRCX was up 36.65% with CDSC). The Fund outperformed its benchmark, BCOMTR, by 12.58% after fees during the period.
The unprecedented response to the COVID-19 virus resulted in lockdowns across a majority of the global population and restricted significant amounts commerce and trade throughout most of Q1 and Q2 of 2020. The demand destruction that ensued was particularly damaging to many commodity markets. However, as the world began its gradual recovery and medical treatments proved tremendously effective in combating the disease, economic expectations shifted dramatically. Renewed hope for re-engagement of the global economy, reflation of dormant demand, and an anticipated return to above-trend economic growth lifted market spirits. The six month period of time under examinationreflects constructive forces that helped to lift prices of many commodities from historically low levels.
From the end of October 2020 until the end of April 2021, the value of the US Dollar as measured by the US Dollar Index (DXY) fell by -2.93%. Most commodities are priced in US Dollars. Lower US Dollar values usually translate into somewhat higher commodity prices. On the other hand, US 10-Year Treasury Notes expanded in yield from about 87 basis points to approximately 162.5 basis points over the same time frame. As assets that trade at spot prices primarily concerned with the prevailing supply/demand outlook, commodities have generally been immune to the deteriorating effects of a rising rate environment. In line with historical relationships, commodity price appreciation coincided with rising yields through April month-end. This fact suggests that the commodity rally was strongly fundamental in nature and resistant to the higher interest rate environment.
Agricultural commodities led all sectors within the Bloomberg Commodity Index (BCOM). The agricultural commodities within the BCOM registered a gain of 37.70%, applying the requisite index weighting. Adverse weather conditions and a resurgent African Swine Flu were detrimental to supplies of key food items. Supply shortages were further exacerbated by disruptions to transportation and logistics. Certain agricultural commodities posted large gains during the period. Soybean oil rallied 97.30%, corn prices rose by 70.36% and soybeans added 45.34%. Lean hog prices gained 39.0% as feed prices increased and deadly disease threatened China’s beleaguered hog herd. Despite the aforementioned performance, there is still sizeable room for progress in pre-pandemic activities, such as tourism and public dining. Consequently, cocoa prices added just 6.83% and live cattle prices were nearly unchanged, adding just 0.22%. Frozen concentrated orange juice was one of only a few commodities that fell in price in the period, -7.30%. The Fund’s performance relative to the benchmark was enhanced by the agricultural equities. They rose collectively by 45.8%.
The second highest sector performance within the BCOM occurred in base metals, up 29.7%. Copper led all metals to the upside, posting a 46.42% gain on the London Metals Exchange (LME). Aluminum gained 27.32% and nickel added 16.03%. The new Biden Administration has signaled its intentions to fund a large infrastructure effort. We believe base metals are likely to figure prominently in those plans. Additionally, we believe that efforts to re-stock the domestic housing market, electrify the global power grid, and support a rapidly expanding EV fleet all necessitate the use of more industrial metals to satisfy the expected expansion of demand.
Industrial metal equities within the Fund’s portfolio performed well during this period, up 86.9%. The prospects for reflation and multiple project build-outs seemed to motivate investment rotation toward this sector in particular.
Energy prices rose within the BCOM by 29.1% collectively. However, there was a distinct divergence in performance comparing petroleum-based energy commodities with natural gas. Reformulated gasoline, a petroleum derivative product, added 84.73%. Compact, passenger vehicles proved to be the transportation of choice for most Americans as apprehension concerning public transportation lingered from COVID-19 fears. Brent North Sea crude oil gained 77.75% while West Texas Intermediate crude oil advanced 75.72%. Heating oil prices rose by 75.44% and the European version, gasoil, climbed by 68.81%. Petroleum demand rebounded as the vaccines were rolled out at a rapid pace.
On the other hand, natural gas prices fell -19.98% for the period. Natural gas was the worst performing commodity within the BCOM. The combination of a relatively benign winter heating season and reduced export volumes of liquefied natural gas on the back of supply line disruptions were largely responsible for the downward price pressure.
Energy equities in the Fund’s portfolio were up 67.4%. Energy producers recovered much of the ground lost during the depths of the demand destruction associated with Q1 and Q2 of 2020.
Precious metals within the BCOM actually fell slightly, -3.3% for the six month time frame ending April 30. Gold lost -6.63%. Higher interest rates weighed on its status as a currency alternative. Fortunately, the Fund held a higher percentage of silver than gold, relative to the benchmark. Silver prices fared better, climbing 8.53%. The Fund also allocated a portion of its precious metals portfolio to platinum. Platinum, which has dual roles as both a precious and industrial metal, rose by 40.98%.
As of the date of this report, the Fund maintains a dynamic combination of commodity futures exposure and commodity equity (or producer) exposure. The composition of the Fund changes from time to time in response to structural and value opportunities identified by the Fund’s Policy Committee. The Fund was fully invested at the end of April. Throughout most of the first and second quarters of 2020, the Fund held a near historically low percentage in
7 | April 30, 2021
| ALPS | CoreCommodity Management | |
| CompleteCommodities® Strategy Fund | |
| Management Commentary | April 30, 2021 (Unaudited) |
commodity equities, approximately 22%, versus approximately 78% in commodity futures. As 2020 progressed, the disproportionate selling of commodity equities during the height of the pandemic created a value opportunity for the Fund. Strong monetary stimulus from the Federal Reserve and other central banks were particularly constructive for commodity equities. The prospects for mass distribution of multiple vaccines also ramped up towards the end of last year. Beginning in late September of 2020, we made a tactical decision to expand equity allocation to approximately 35% while reducing commodity futures exposure appropriately to about 65%.
{The Fund’s top equity holdings at the end of April included CF Industries Holdings Inc (CF US) +79.05% (6 months ending Apr. 30, 2021), Boliden AB (BOL SS) +46.40% (6 months ending Apr. 30, 2021), Vestas Wind Systems A/S +24.11% (VWS DC) (6 months ending Apr. 30, 2021), Quimica Minera Chil-SP ADR (SQM US) +43.56% (6 months ending Apr. 30, 2021), Bluescope Steel Ltd +62.60% (BSL AU) (6 months ending Apr. 30, 2021), Nutrien Ltd. (NTR US) +38.46% (6 months ending Apr. 30, 2021), Vale SA-SP ADR (VALE US) +98.47% (6 months ending Apr. 30, 2021), Plug Power Inc +103.64% (PLUG US) (6 months ending Apr. 30, 2021), Inpex Corp (1605 JP) +48.29% (6 months ending Apr. 30, 2021.}
U.S. Treasury Inflation Protected Securities (“TIPS”) and nominal US Treasuries are held by the Fund to invest excess cash and as collateral for commodity futures related investments held in our Cayman Island subsidiary. As of the date of this report, we have continued to invest Fund assets in TIPS and nominal US Treasuries with limited duration exposure. We made a decision to add a greater proportion of TIPS relative to nominal Treasuries at the beginning of this period. At the time, we strongly believed inflation expectations would rebound as the battle with the COVID-19 virus progressed. The additional inflation sensitivity provided by the TIPS added to the Fund’s overall performance for the six month period under examination. At the end of April, the Fund’s fixed income portfolio had a weighted average maturity of 0.4 years.
As of the date of this report, we believe that commodity fundamentals are poised to strengthen. On a relative basis, commodities still appear inexpensive to other assets that have enjoyed long term appreciation. Persistent global growth trends appear to be intact for the near future, posing a material tailwind for commodity demand. The failure of many companies and countries to invest the necessary capital over many years to source, transport, and deliver vital commodities to markets may take its toll in terms of future shortages and price spikes. Political aspirations and mandates may require massive amounts of commodities to accomplish their goals. Higher commodity prices seem both necessary and likely. In our opinion, the currentup-cycle could be sustained for an extended period of time.
Bob Hyman
Portfolio Manager
CoreCommodity Management, LLC
Past performance if not indicative of future results. “Bloomberg®” and “Bloomberg Commodity IndexSM” are service marks of Bloomberg L.P. (“Bloomberg”) as the case may be. Source for all Index data: Bloomberg L.P. Global. Commodity Sectors and individual commodities are represented by the respective Bloomberg Commodity Sub-Index. This document does not constitute an offer of any commodities, securities or investment advisory services. Any such offer may be made only by means of a disclosure document or similar materials which contain a description of material terms and risks. All expressions of opinion are subject to change without notice in reaction to shifting market conditions. Data contained herein from third-party providers is obtained from what are considered reliable sources. However, its accuracy, completeness or reliability cannot be guaranteed. The economic statistics presented herein are subject to revision by the agencies that issue them. CoreCommodity Management assumes no obligation to provide this information in the future or to advise of changes in this information. Any indices and other financial benchmarks shown are provided for illustrative purposes only, are unmanaged, reflect reinvestment of income and do not reflect the impact of advisory fees. Investors cannot invest directly in an index. All investments are subject to risk.
The views of the authors and information discussed in this commentary are as of the date of publication, are subject to change, and may not reflect the writer's current views. The views expressed are those of the authors only, and represent an assessment of market conditions at a specific point in time, are opinions only and should not be relied upon as investment advice regarding a particular investment or markets in general. Such information does not constitute a recommendation to buy or sell specific securities or investment vehicles. It should not be assumed that any investment will be profitable or will equal the performance of the fund(s) or any securities or any sectors mentioned in this letter. The subject matter contained in this letter has been derived from several sources believed to be reliable and accurate at the time of compilation. Neither ALPS, Advisors, Inc., CoreCommodity Management, LLC, nor the Fund accepts any liability for losses either direct or consequential caused by the use of this information.
Indices do not reflect deductions for fees, expenses, or taxes.
An investor may not invest directly in an index.
Diversification cannot guarantee gain or prevent losses.
Bob Hyman is a registered representative of ALPS Distributors, Inc.
ALPS Portfolio Solutions Distributor, Inc., ALPS Distributors, Inc. and ALPS Advisors Inc. are affiliated.
8 | April 30, 2021
| ALPS | CoreCommodity Management | |
| CompleteCommodities® Strategy Fund | |
| Performance Update | April 30, 2021 (Unaudited) |
Performance of $10,000 Initial Investment (as of April 30, 2021)
Comparison of change in value of a $10,000 investment

The chart above represents historical performance of a hypothetical investment of $10,000 in the Fund since inception. Past performance does not guarantee future results. This chart does not reflect the deduction of taxes that a shareholder would pay on Fund distributions or the redemption of Fund shares.
Average Annual Total Returns (as of April 30, 2021)
| 6 Month | 1 Year | 3 Year | 5 Year | 10 Year | Since Inception^ | Total Expense Ratio | What You Pay* | |
| Investor# (NAV) | 38.21% | 65.20% | 2.50% | 4.28% | -3.82% | 0.23% | 1.45% | 1.45% |
| Class A (NAV) | 37.99% | 64.88% | 2.50% | 4.28% | -3.82% | 0.23% | 1.45% | 1.45% |
| Class A (LOAD) | 30.47% | 55.69% | 0.58% | 3.11% | -4.36% | -0.29% | ||
| Class C (NAV) | 37.65% | 63.98% | 1.82% | 3.60% | -4.44% | -0.39% | 2.05% | 2.05% |
| Class C (LOAD) | 36.65% | 62.98% | 1.82% | 3.60% | -4.44% | -0.39% | ||
| Class I | 38.39% | 65.42% | 2.78% | 4.55% | -3.55% | 0.51% | 1.15% | 1.15% |
| Refinitiv/CoreCommodity CRB Commodity Total Return Index1 | 38.07% | 70.61% | 0.96% | 2.75% | -5.42% | -1.72% | ||
| Bloomberg Commodity TR Index1 | 25.81% | 48.51% | 1.62% | 2.26% | -5.85% | -2.34% |
Performance data quoted represents past performance. Past performance does not guarantee future results. Investment return and principal value of an investment will fluctuate so that an investor's shares, when sold or redeemed, may be worth more or less than the original cost. Current performance data may be higher or lower than actual data quoted. For the most current month-end performance data, please call 1-866-759-5679.
Maximum Offering Price (MOP) for Class A shares includes the Fund’s maximum sales charge of 5.50%. Performance shown at NAV does not include these sales charges and would have been lower had it been taken into account. If you invest $1 million or more, either as a lump sum or through the Fund’s accumulation or letter of intent programs, you can purchase Class A shares without an initial sales charge (load). A Contingent Deferred Sales Charge (“CDSC”) of 1.00% may apply to Class C shares redeemed within the first 12 months after a purchase, and on Class A shares redeemed within the first 18 months after a purchase in excess of $1 million. The Fund imposes a 2.00% redemption fee on shares held for less than 30 days.
Performance less than 1 year is cumulative.
9 | April 30, 2021
| ALPS | CoreCommodity Management | |
| CompleteCommodities® Strategy Fund | |
| Performance Update | April 30, 2021 (Unaudited) |
Performance shown for Class A shares prior to June 12, 2018 reflects the historical performance of the Fund’s Investor shares, calculated using the fees and expenses of Class A shares.
| 1 | The Bloomberg Commodity TR Index (formerly the Dow Jones-UBS Commodity Index) and the Refinitiv/Core Commodity CRB Index are unmanaged indices used as a measurement of change in commodity market conditions based on the performance of a basket of different commodities. Each index is composed of a different basket of commodities, a different weighting of the commodities in the basket, and a different re-balancing schedule. The indices are not actively managed and do not reflect any deduction for fees, expenses or taxes. An investor may not invest directly in an index. |
| ^ | Fund Inception date of June 29, 2010 for Investor Class and Classes C and I; Fund Inception date of June 12, 2018 for Class A. |
| * | What You Pay reflects the Advisor’s decision to contractually limit expenses through February 28, 2022. Please see the prospectus dated February 28, 2021 for additional information. |
| # | Prior to December 1, 2017, Investor Class was known as Class A. |
Investments in securities of Master Limited Partnerships (MLPs) involve risks that differ from an investment in common stock. MLPs are controlled by their general partners, which generally have conflicts of interest and limited fiduciary duties to the MLP, which may permit the general partner to favor its own interests over the MLPs. The benefit you are expected to derive from the Fund’s investment in MLPs depends largely on the MLPs being treated as partnerships for federal income tax purposes. As a partnership, an MLP has no federal income tax liability at the entity level. Therefore, treatment of one or more MLPs as a corporation for federal income tax purposes could affect the Fund’s ability to meet its investment objective and would reduce the amount of cash available to pay or distribute to you. Legislative, judicial, or administrative changes and differing interpretations, possibly on a retroactive basis, could negatively impact the value of an investment in MLPs and therefore the value of your investment in the Fund.
Investing in commodity-related securities involves risk and considerations not present when investing in more conventional securities. The Fund may be more susceptible to high volatility of commodity markets.
Derivatives generally are more sensitive to changes in economic or market conditions than other types of investments; this could result in losses that significantly exceed the Fund's original investment.
The table does not reflect the deduction of taxes that a shareholder would pay on Fund distributions or the redemption of Fund shares.
This Fund is not suitable for all investors, and is subject to investment risks, including possible loss of the principal amount invested.
There is no guarantee that the Fund will continue to hold any one particular security or stay invested in any one particular company. The composition of the Fund's top holdings is subject to change. Performance figures are historical and reflect the change in share price, reinvested distributions, changes in net asset value, sales charges and capital gains distributions, if any.
Not FDIC Insured – No Bank Guarantee – May Lose Value
Asset Type Allocation (as a % of Net Assets) †
| Government Bonds | 41.28% |
| Common Stocks | 31.55% |
| Master Limited Partnerships | 0.05% |
| Cash, Cash Equivalents, & Other Net Assets | 27.12% |
| Total | 100.00% |
| † | Holdings are subject to change, and may not reflect the current or future position of the portfolio. Table presents approximate values only. |
Industry Sector Allocation (as a % of Net Assets) ^

| ^ | Notional Value of Derivative Exposure included |
10 | April 30, 2021
| ALPS | CoreCommodity Management | |
| CompleteCommodities® Strategy Fund | |
| Consolidated Statement of Investments | April 30, 2021 (Unaudited) |
| Shares | Value (Note 2) | |||||||
| COMMON STOCKS (31.55%) | ||||||||
| Argentina (0.03%) | ||||||||
| YPF SA, Sponsored ADR(a) | 73,592 | $ | 278,178 | |||||
| Australia (2.17%) | ||||||||
| Alumina, Ltd. | 1,032,763 | 1,376,370 | ||||||
| Beach Energy, Ltd. | 524,865 | 515,521 | ||||||
| BHP Group, Ltd. | 6,563 | 241,162 | ||||||
| BlueScope Steel, Ltd. | 227,223 | 3,784,396 | ||||||
| Costa Group Holdings, Ltd. | 104,343 | 374,574 | ||||||
| Fortescue Metals Group, Ltd. | 26,544 | 461,925 | ||||||
| GrainCorp, Ltd., Class A | 85,256 | 334,953 | ||||||
| IGO, Ltd. | 132,309 | 763,413 | ||||||
| Iluka Resources, Ltd. | 124,315 | 741,230 | ||||||
| Incitec Pivot, Ltd.(a) | 400,411 | 817,411 | ||||||
| Mineral Resources, Ltd. | 12,584 | 462,893 | ||||||
| Newcrest Mining, Ltd. | 44,276 | 904,545 | ||||||
| Northern Star Resources, Ltd. | 117,513 | 951,431 | ||||||
| Nufarm, Ltd.(a) | 147,504 | 594,284 | ||||||
| OceanaGold Corp.(a) | 204,900 | 341,736 | ||||||
| Oil Search, Ltd. | 73,894 | 216,312 | ||||||
| OZ Minerals, Ltd. | 108,804 | 2,006,586 | ||||||
| Regis Resources, Ltd. | 93,204 | 186,679 | ||||||
| Sandfire Resources NL | 78,872 | 408,301 | ||||||
| Santos, Ltd. | 163,542 | 879,373 | ||||||
| South32, Ltd. | 823,504 | 1,827,034 | ||||||
| St Barbara, Ltd. | 162,515 | 230,982 | ||||||
| Woodside Petroleum, Ltd. | 18,740 | 330,015 | ||||||
| 18,751,126 | ||||||||
| Austria (0.13%) | ||||||||
| OMV AG | 6,908 | 340,595 | ||||||
| voestalpine AG | 18,655 | 809,654 | ||||||
| 1,150,249 | ||||||||
| Brazil (1.13%) | ||||||||
| BRF SA, ADR(a) | 175,332 | 680,288 | ||||||
| Cia de Saneamento Basico do Estado de Sao Paulo, ADR | 79,739 | 626,749 | ||||||
| Gerdau SA, Sponsored ADR | 442,310 | 2,715,783 | ||||||
| Petroleo Brasileiro SA, Sponsored ADR | 253,074 | 2,146,068 | ||||||
| Vale SA, Sponsored ADR | 181,030 | 3,642,323 | ||||||
| 9,811,211 | ||||||||
| Canada (3.73%) | ||||||||
| Agnico Eagle Mines, Ltd. | 14,400 | 899,136 | ||||||
| Alamos Gold, Inc., Class A | 176,991 | 1,415,928 | ||||||
| B2Gold Corp. | 429,603 | 2,062,094 | ||||||
| Ballard Power Systems, Inc.(a) | 76,234 | 1,667,238 | ||||||
| Barrick Gold Corp. | 41,426 | 880,303 | ||||||
| Cameco Corp. | 63,522 | 1,067,805 | ||||||
| Canadian Solar, Inc.(a) | 42,639 | 1,758,432 | ||||||
| Canfor Corp.(a) | 16,900 | 422,105 | ||||||
| Centerra Gold, Inc. | 133,600 | 1,232,579 | ||||||
| First Quantum Minerals, Ltd. | 93,000 | 2,143,506 | ||||||
| Hudbay Minerals, Inc. | 180,500 | 1,348,078 | ||||||
| IAMGOLD Corp.(a) | 84,106 | 263,252 | ||||||
| Shares | Value (Note 2) | |||||||
| Canada (continued) | ||||||||
| Kinross Gold Corp. | 299,511 | $ | 2,108,557 | |||||
| Kirkland Lake Gold, Ltd. | 57,500 | 2,136,456 | ||||||
| Maple Leaf Foods, Inc. | 22,700 | 523,938 | ||||||
| Nutrien, Ltd. | 67,400 | 3,720,530 | ||||||
| Pan American Silver Corp. | 15,868 | 504,920 | ||||||
| Parex Resources, Inc.(a) | 85,000 | 1,600,903 | ||||||
| Pretium Resources, Inc.(a) | 49,531 | 519,580 | ||||||
| Sandstorm Gold, Ltd.(a) | 36,048 | 267,476 | ||||||
| SSR Mining, Inc. | 34,757 | 551,451 | ||||||
| Teck Resources, Ltd., Class B | 127,733 | 2,704,108 | ||||||
| Torex Gold Resources, Inc.(a) | 21,700 | 262,699 | ||||||
| Wheaton Precious Metals Corp. | 30,642 | 1,266,127 | ||||||
| Yamana Gold, Inc. | 201,323 | 924,073 | ||||||
| 32,251,274 | ||||||||
| Chile (0.60%) | ||||||||
| Antofagasta PLC | 53,247 | 1,371,822 | ||||||
| Sociedad Quimica y Minera de Chile SA, Sponsored ADR | 72,636 | 3,830,823 | ||||||
| 5,202,645 | ||||||||
| China (0.19%) | ||||||||
| China Petroleum & Chemical Corp., ADR | 5,780 | 284,318 | ||||||
| Daqo New Energy Corp., ADR(a) | 2,495 | 200,823 | ||||||
| JinkoSolar Holding Co., Ltd., ADR(a) | 23,496 | 868,412 | ||||||
| PetroChina Co., Ltd., ADR | 8,809 | 317,388 | ||||||
| 1,670,941 | ||||||||
| Colombia (0.08%) | ||||||||
| Ecopetrol SA, Sponsored ADR | 56,879 | 672,879 | ||||||
| Cyprus (0.04%) | ||||||||
| Polymetal International PLC | 15,953 | 329,485 | ||||||
| Denmark (0.60%) | ||||||||
| FLSmidth & Co. A/S | 9,925 | 390,877 | ||||||
| Orsted AS(b)(c) | 6,179 | 901,267 | ||||||
| Vestas Wind Systems A/S | 94,425 | 3,941,626 | ||||||
| 5,233,770 | ||||||||
| Faroe Islands (0.06%) | ||||||||
| Bakkafrost P/F | 6,869 | 545,130 | ||||||
| Finland (0.28%) | ||||||||
| Metso Outotec Oyj | 121,017 | 1,359,489 | ||||||
| Outokumpu Oyj(a) | 166,365 | 1,082,072 | ||||||
| 2,441,561 | ||||||||
| France (0.23%) | ||||||||
| Constellium SE(a) | 34,942 | 541,950 | ||||||
| TOTAL SE, Sponsored ADR | 33,270 | 1,473,196 | ||||||
| 2,015,146 | ||||||||
See Notes to Financial Statements.
11 | April 30, 2021
| ALPS | CoreCommodity Management | |
| CompleteCommodities® Strategy Fund | |
| Consolidated Statement of Investments | April 30, 2021 (Unaudited) |
| Shares | Value (Note 2) | |||||||
| Germany (0.52%) | ||||||||
| Bayer AG | 34,961 | $ | 2,262,165 | |||||
| K+S AG | 70,154 | 778,149 | ||||||
| Nordex SE(a) | 10,156 | 293,775 | ||||||
| Salzgitter AG(a) | 10,429 | 332,015 | ||||||
| thyssenkrupp AG(a) | 17,747 | 237,261 | ||||||
| Varta AG(a) | 3,960 | 577,739 | ||||||
| 4,481,104 | ||||||||
| Great Britain (1.63%) | ||||||||
| Anglo American PLC | 24,783 | 1,050,751 | ||||||
| BP PLC, Sponsored ADR | 124,106 | 3,122,508 | ||||||
| CNH Industrial N.V. | 64,438 | 956,260 | ||||||
| Evraz PLC | 91,946 | 815,729 | ||||||
| Kazakhmys PLC | 65,940 | 772,604 | ||||||
| Pentair PLC | 37,537 | 2,421,512 | ||||||
| Rio Tinto PLC, Sponsored ADR | 31,219 | 2,655,488 | ||||||
| Severn Trent PLC | 36,254 | 1,240,193 | ||||||
| Subsea 7 SA | 50,511 | 512,634 | ||||||
| United Utilities Group PLC | 43,789 | 585,514 | ||||||
| 14,133,193 | ||||||||
| India (0.04%) | ||||||||
| Vedanta, Ltd., ADR | 27,652 | 379,938 | ||||||
| Israel (0.07%) | ||||||||
| SolarEdge Technologies, Inc.(a) | 2,438 | 642,511 | ||||||
| Italy (0.07%) | ||||||||
| Eni SpA, Sponsored ADR | 10,981 | 261,787 | ||||||
| ERG SpA | 10,237 | 305,964 | ||||||
| 567,751 | ||||||||
| Japan (2.41%) | ||||||||
| AGC, Inc. | 63,200 | 2,879,824 | ||||||
| Daido Steel Co., Ltd. | 6,200 | 293,860 | ||||||
| GS Yuasa Corp. | 21,600 | 584,024 | ||||||
| Hitachi Metals, Ltd.(a) | 34,000 | 659,530 | ||||||
| Inpex Corp. | 482,033 | 3,290,299 | ||||||
| Japan Petroleum Exploration Co., Ltd. | 19,200 | 356,629 | ||||||
| JFE Holdings, Inc. | 151,700 | 1,996,016 | ||||||
| Kobe Steel, Ltd. | 77,200 | 556,625 | ||||||
| Kubota Corp. | 114,300 | 2,687,812 | ||||||
| Kurita Water Industries, Ltd. | 10,016 | 461,896 | ||||||
| Maruha Nichiro Corp. | 5,600 | 127,997 | ||||||
| Maruichi Steel Tube, Ltd. | 5,300 | 132,730 | ||||||
| Morinaga Milk Industry Co., Ltd. | 6,500 | 355,659 | ||||||
| NGK Insulators, Ltd. | 22,100 | 402,609 | ||||||
| Nippon Steel Corp. | 102,590 | 1,790,092 | ||||||
| Nippon Suisan Kaisha, Ltd. | 91,900 | 429,691 | ||||||
| Sumitomo Forestry Co., Ltd. | 28,759 | 665,754 | ||||||
| Sumitomo Metal Mining Co., Ltd. | 51,300 | 2,177,516 | ||||||
| Tokyo Steel Manufacturing Co., Ltd. | 50,500 | 489,336 | ||||||
| Yamato Kogyo Co., Ltd. | 14,400 | 433,489 | ||||||
| 20,771,388 | ||||||||
| Shares | Value (Note 2) | |||||||
| Luxembourg (0.34%) | ||||||||
| APERAM SA | 14,100 | $ | 730,453 | |||||
| ArcelorMittal(a) | 24,464 | 716,551 | ||||||
| ArcelorMittal SA(a) | 5,056 | 147,406 | ||||||
| Tenaris SA, ADR | 27,417 | 586,175 | ||||||
| Ternium SA, Sponsored ADR(a) | 19,564 | 764,757 | ||||||
| 2,945,342 | ||||||||
| Malaysia (0.18%) | ||||||||
| Lynas Rare Earths, Ltd.(a) | 361,944 | 1,533,531 | ||||||
| Mexico (0.15%) | ||||||||
| Grupo Mexico SAB de CV, Series B | 285,400 | 1,294,493 | ||||||
| Monaco (0.13%) | ||||||||
| Endeavour Mining Corp. | 53,458 | 1,112,956 | ||||||
| Netherlands (0.56%) | ||||||||
| AMG Advanced Metallurgical Group NV | 4,959 | 190,307 | ||||||
| Core Laboratories N.V. | 48,394 | 1,363,743 | ||||||
| OCI N.V.(a) | 15,679 | 365,882 | ||||||
| Royal Dutch Shell PLC, Class A, Sponsored ADR | 62,508 | 2,375,303 | ||||||
| Royal Dutch Shell PLC, Class B | 2,551 | 45,764 | ||||||
| SBM Offshore N.V. | 27,872 | 485,047 | ||||||
| 4,826,046 | ||||||||
| Norway (1.63%) | ||||||||
| Aker BP ASA | 75,504 | 2,166,069 | ||||||
| DNO ASA(a) | 516,958 | 608,748 | ||||||
| Equinor ASA | 56,530 | 1,151,109 | ||||||
| Leroy Seafood Group ASA | 70,514 | 647,536 | ||||||
| Mowi ASA | 80,496 | 1,988,224 | ||||||
| NEL ASA(a) | 476,921 | 1,385,386 | ||||||
| Norsk Hydro ASA | 274,958 | 1,755,979 | ||||||
| Salmar ASA | 12,666 | 879,194 | ||||||
| TGS NOPEC Geophysical Co. ASA | 50,202 | 764,429 | ||||||
| Yara International ASA | 52,509 | 2,742,151 | ||||||
| 14,088,825 | ||||||||
| Peru (0.34%) | ||||||||
| Cia de Minas Buenaventura SAA, ADR(a) | 24,873 | 241,766 | ||||||
| Southern Copper Corp. | 39,545 | 2,744,818 | ||||||
| 2,986,584 | ||||||||
| South Africa (0.89%) | ||||||||
| African Rainbow Minerals, Ltd. | 36,752 | 687,043 | ||||||
| Anglo Platinum, Ltd. | 4,780 | 654,193 | ||||||
| AngloGold Ashanti, Ltd., Sponsored ADR | 68,785 | 1,415,595 | ||||||
| Gold Fields, Ltd., Sponsored ADR | 209,535 | 1,965,438 | ||||||
| Impala Platinum Holdings, Ltd. | 54,000 | 1,011,041 | ||||||
| Kumba Iron Ore, Ltd. | 15,133 | 686,951 | ||||||
See Notes to Financial Statements.
12 | April 30, 2021
| ALPS | CoreCommodity Management | |
| CompleteCommodities® Strategy Fund | |
| Consolidated Statement of Investments | April 30, 2021 (Unaudited) |
| Shares | Value (Note 2) | |||||||
| South Africa (continued) | ||||||||
| Sasol, Ltd.(a) | 77,701 | $ | 1,307,295 | |||||
| 7,727,556 | ||||||||
| South Korea (0.06%) | ||||||||
| POSCO, Sponsored ADR | 6,691 | 544,714 | ||||||
| Spain (0.39%) | ||||||||
| Acerinox SA | 44,206 | 613,581 | ||||||
| Iberdrola SA | 122,968 | 1,660,971 | ||||||
| Repsol SA | 21,441 | 256,177 | ||||||
| Siemens Gamesa Renewable Energy SA | 24,558 | 888,702 | ||||||
| 3,419,431 | ||||||||
| Sweden (1.52%) | ||||||||
| AAK AB | 17,147 | 393,150 | ||||||
| Boliden AB | 123,731 | 4,820,300 | ||||||
| Epiroc AB, Class A | 59,249 | 1,284,286 | ||||||
| Holmen AB, B Shares | 8,330 | 392,611 | ||||||
| Lundin Energy AB | 90,427 | 2,896,894 | ||||||
| PowerCell Sweden AB(a) | 11,159 | 289,997 | ||||||
| SSAB AB, A Shares(a) | 190,388 | 1,037,002 | ||||||
| Svenska Cellulosa AB SCA, Class B | 118,870 | 2,085,180 | ||||||
| 13,199,420 | ||||||||
| Switzerland (0.05%) | ||||||||
| Bucher Industries AG | 799 | 419,251 | ||||||
| United States (11.30%) | ||||||||
| AGCO Corp. | 14,485 | 2,113,651 | ||||||
| Alcoa Corp.(a) | 77,693 | 2,846,672 | ||||||
| Allegheny Technologies, Inc.(a) | 34,615 | 805,145 | ||||||
| American Water Works Co., Inc. | 9,593 | 1,496,412 | ||||||
| Archer-Daniels-Midland Co. | 24,736 | 1,561,584 | ||||||
| Archrock, Inc. | 62,213 | 581,069 | ||||||
| Array Technologies, Inc.(a) | 22,654 | 637,937 | ||||||
| Baker Hughes Co. | 54,605 | 1,096,468 | ||||||
| Bunge, Ltd. | 35,629 | 3,007,800 | ||||||
| Cabot Oil & Gas Corp. | 37,387 | 623,241 | ||||||
| California Water Service Group | 8,661 | 508,834 | ||||||
| Cal-Maine Foods, Inc. | 14,471 | 540,637 | ||||||
| Century Aluminum Co.(a) | 19,099 | 299,090 | ||||||
| CF Industries Holdings, Inc. | 114,340 | 5,560,353 | ||||||
| ChampionX Corp.(a) | 42,298 | 888,681 | ||||||
| Chevron Corp. | 18,063 | 1,861,753 | ||||||
| Cleveland-Cliffs, Inc. | 14,247 | 254,451 | ||||||
| Commercial Metals Co. | 81,640 | 2,385,521 | ||||||
| Compass Minerals International, Inc. | 7,430 | 504,646 | ||||||
| ConocoPhillips | 50,828 | 2,599,344 | ||||||
| Corteva, Inc. | 62,955 | 3,069,685 | ||||||
| Darling Ingredients, Inc.(a) | 28,675 | 1,991,479 | ||||||
| Deere & Co. | 4,669 | 1,731,499 | ||||||
| Devon Energy Corp. | 43,208 | 1,010,203 | ||||||
| Dril-Quip, Inc.(a) | 7,278 | 223,071 | ||||||
| Enphase Energy, Inc.(a) | 10,981 | 1,529,104 | ||||||
| EOG Resources, Inc. | 35,515 | 2,615,325 | ||||||
| Shares | Value (Note 2) | |||||||
| United States (continued) | ||||||||
| Essential Utilities, Inc. | 4,343 | $ | 204,686 | |||||
| Evoqua Water Technologies Corp.(a) | 30,618 | 875,062 | ||||||
| Exxon Mobil Corp. | 22,980 | 1,315,375 | ||||||
| First Solar, Inc.(a) | 7,288 | 557,751 | ||||||
| FMC Corp. | 25,041 | 2,960,848 | ||||||
| Freeport-McMoRan, Inc. | 25,790 | 972,541 | ||||||
| Fresh Del Monte Produce, Inc. | 10,904 | 307,493 | ||||||
| Green Plains, Inc.(a) | 18,901 | 563,250 | ||||||
| Halliburton Co. | 82,737 | 1,618,336 | ||||||
| Harsco Corp.(a) | 20,191 | 362,025 | ||||||
| Hecla Mining Co. | 30,594 | 180,811 | ||||||
| Helix Energy Solutions Group, Inc.(a) | 72,857 | 312,557 | ||||||
| Helmerich & Payne, Inc. | 96,817 | 2,481,420 | ||||||
| Hess Corp. | 1,266 | 94,330 | ||||||
| HollyFrontier Corp. | 22,080 | 772,800 | ||||||
| Hormel Foods Corp. | 24,059 | 1,111,526 | ||||||
| Ingredion, Inc. | 24,933 | 2,328,992 | ||||||
| Kinder Morgan, Inc. | 5,763 | 98,259 | ||||||
| Livent Corp.(a) | 127,864 | 2,304,109 | ||||||
| Magnolia Oil & Gas Corp., Class A(a) | 91,528 | 1,030,605 | ||||||
| Marathon Oil Corp. | 157,414 | 1,772,482 | ||||||
| Marathon Petroleum Corp. | 24,420 | 1,358,973 | ||||||
| Mosaic Co. | 80,002 | 2,814,470 | ||||||
| Murphy Oil Corp. | 65,937 | 1,116,313 | ||||||
| National Oilwell Varco, Inc.(a) | 84,671 | 1,265,831 | ||||||
| New WEI, Inc.(a) | 68,768 | 103 | ||||||
| Newmont Corp. | 15,233 | 950,692 | ||||||
| Occidental Petroleum Corp. | 14,527 | 368,406 | ||||||
| Oceaneering International, Inc.(a) | 30,405 | 326,854 | ||||||
| Patterson-UTI Energy, Inc. | 187,413 | 1,266,912 | ||||||
| PDC Energy, Inc.(a) | 67,573 | 2,467,090 | ||||||
| Phillips 66 | 8,398 | 679,482 | ||||||
| Pilgrim's Pride Corp.(a) | 45,023 | 1,078,751 | ||||||
| Plug Power, Inc.(a) | 119,667 | 3,411,705 | ||||||
| PotlatchDeltic Corp., REIT | 16,439 | 975,819 | ||||||
| ProPetro Holding Corp.(a) | 114,066 | 1,098,456 | ||||||
| Rayonier, Inc., REIT | 22,544 | 817,896 | ||||||
| Royal Gold, Inc. | 8,866 | 991,751 | ||||||
| RPC, Inc.(a) | 140,085 | 680,813 | ||||||
| Sanderson Farms, Inc. | 8,094 | 1,331,706 | ||||||
| Schlumberger NV | 76,809 | 2,077,683 | ||||||
| Steel Dynamics, Inc. | 4,590 | 248,870 | ||||||
| SunPower Corp.(a) | 41,418 | 1,064,028 | ||||||
| TPI Composites, Inc.(a) | 33,885 | 1,800,988 | ||||||
| Tyson Foods, Inc., Class A | 30,189 | 2,338,138 | ||||||
| United States Steel Corp. | 56,655 | 1,303,632 | ||||||
| Valero Energy Corp. | 15,840 | 1,171,526 | ||||||
| Warrior Met Coal, Inc. | 10,153 | 160,925 | ||||||
| Williams Cos., Inc. | 1,855 | 45,188 | ||||||
| 97,781,914 | ||||||||
| TOTAL COMMON STOCKS | ||||||||
| (Cost $213,599,558) | 273,209,543 | |||||||
See Notes to Financial Statements.
13 | April 30, 2021
| ALPS | CoreCommodity Management | |
| CompleteCommodities® Strategy Fund | |
| Consolidated Statement of Investments | April 30, 2021 (Unaudited) |
| Shares | Value (Note 2) | |||||||
| MASTER LIMITED PARTNERSHIPS (0.05%) | ||||||||
| United States (0.05%) | ||||||||
| Energy Transfer LP | 4,974 | $ | 42,826 | |||||
| Enterprise Products Partners LP | 10,676 | 245,655 | ||||||
| Magellan Midstream Partners LP | 2,054 | 96,066 | ||||||
| MPLX LP | 1,555 | 41,969 | ||||||
| Plains All American Pipeline LP | 3,090 | 28,057 | ||||||
| 454,573 | ||||||||
| TOTAL MASTER LIMITED PARTNERSHIPS | ||||||||
| (Cost $900,221) | 454,573 | |||||||
| RIGHTS (0.00%) | ||||||||
| Australia (0.00%) | ||||||||
| Regis Resources, Ltd., Strike Price $2.70, Expires 5/6/2021 | 30,262 | 0 | ||||||
| TOTAL RIGHTS | ||||||||
| (Cost $–) | 0 | |||||||
| Principal Amount | Value (Note 2) | |||||||
| GOVERNMENT BONDS (41.28%) | ||||||||
| U.S. Treasury Bonds (41.28%) | ||||||||
| United States Treasury Inflation Indexed Bonds | ||||||||
| 0.625%, 7/15/21(d) | $ | 119,422,696 | $ | 120,957,604 | ||||
| 0.125%, 1/15/22(d) | 212,444,273 | 216,824,765 | ||||||
| United States Treasury Notes | ||||||||
| 1.750%, 2/28/22 | 19,500,000 | 19,774,325 | ||||||
| 357,556,694 | ||||||||
| TOTAL GOVERNMENT BONDS | ||||||||
| (Cost $353,300,481) | 357,556,694 | |||||||
| Value (Note 2) | ||||||||
| TOTAL INVESTMENTS (72.88%) | ||||||||
| (Cost $567,800,260) | $ | 631,220,810 | ||||||
| Other Assets In Excess Of Liabilities (27.12%) | 234,873,704 | |||||||
| NET ASSETS - 100.00% | $ | 866,094,514 | ||||||
| (a) | Non-Income Producing Security. |
| (b) | Security exempt from registration under rule 144A of the securities act of 1933. This Security may be resold in transactions exempt from registration, normally to qualified institutional buyers. As of April 30, 2021, the market value of those securities was $901,267 representing 0.10% of the Fund's net assets. |
| (c) | Securities were purchased pursuant to Regulation S under the Securities Act of 1933, which exempts securities offered and sold outside of the United States from registration. Such securities cannot be sold in the United States without either an effective registration statement filed pursuant to the Securities Act of 1933, or pursuant to an exemption from registration. These securities have been deemed liquid under guidelines approved by the Fund's Board of Trustees. As of April 30, 2021 the aggregate market value of those securities was $901,267 representing 0.10% of net assets. |
| (d) | Security, or portion of security, is being held as collateral for total return swap contracts and futures contracts aggregating a total market value of $36,375,845. |
For Fund compliance purposes, the Fund's industry and geographical classifications refer to any one or more of the industry sub-classifications used by one or more widely recognized market indexes or ratings group indexes, and/or as defined by Fund management. This definition may not apply for purposes of this report, which may combine sub-classifications for reporting ease. Industries and regions are shown as a percent of net assets.
See Notes to Financial Statements.
14 | April 30, 2021
| ALPS | CoreCommodity Management | |
| CompleteCommodities® Strategy Fund | |
| Consolidated Statement of Investments | April 30, 2021 (Unaudited) |
FUTURES CONTRACTS
| Description | Counterparty | Position | Contracts | Expiration Date | Notional Amount/ Fair Value (Note 2) | Unrealized Appreciation | ||||||||||
| Brent Crude Future | Morgan Stanley | Long | 541 | 05/28/21 | $ | 36,117,160 | $ | 554,048 | ||||||||
| Cocoa Future | Morgan Stanley | Short | (139) | 07/15/21 | (3,310,980 | ) | 10,383 | |||||||||
| Corn Future | Morgan Stanley | Long | 430 | 07/14/21 | 14,474,875 | 1,056,213 | ||||||||||
| Gasoline Robusta Future | Morgan Stanley | Long | 28 | 05/28/21 | 2,441,729 | 88,800 | ||||||||||
| Gold 100 Oz Future | Morgan Stanley | Long | 235 | 06/28/21 | 41,540,950 | 756,414 | ||||||||||
| Hard Red Winter Wheat Future | Morgan Stanley | Long | 70 | 07/14/21 | 2,462,250 | 249,077 | ||||||||||
| LME Copper Future | Morgan Stanley | Long | 209 | 05/17/21 | 51,377,425 | 3,942,908 | ||||||||||
| LME Nickel Future | Morgan Stanley | Long | 73 | 05/17/21 | 7,730,700 | 570,702 | ||||||||||
| LME Zinc Future | Morgan Stanley | Long | 151 | 05/17/21 | 11,009,788 | 395,898 | ||||||||||
| Low Sulfur Gasoil Future | Morgan Stanley | Long | 278 | 05/12/21 | 14,838,250 | 689,943 | ||||||||||
| Natural Gas Future | Morgan Stanley | Long | 962 | 05/26/21 | 28,196,220 | 1,297,400 | ||||||||||
| Platinum Future | Morgan Stanley | Long | 141 | 07/28/21 | 8,496,660 | 130,211 | ||||||||||
| Soybean Future | Morgan Stanley | Long | 297 | 07/14/21 | 22,783,613 | 638,483 | ||||||||||
| Soybean Meal Future | Morgan Stanley | Long | 96 | 07/14/21 | 4,090,560 | 5,135 | ||||||||||
| Wheat Future | Morgan Stanley | Long | 64 | 07/14/21 | 2,351,200 | 72,246 | ||||||||||
| $ | 244,600,400 | $ | 10,457,861 | |||||||||||||
| Description | Counterparty | Position | Contracts | Expiration Date | Notional Amount/ Fair Value (Note 2) | Unrealized Depreciation | ||||||||||
| Copper Future | Morgan Stanley | Short | (414) | 07/28/21 | $ | (46,243,800 | ) | $ | (2,014,014 | ) | ||||||
| Cotton #2 | Morgan Stanley | Short | (121) | 07/08/21 | (5,328,840 | ) | (138,755 | ) | ||||||||
| LME Aluminum Future | Morgan Stanley | Short | (92) | 09/13/21 | (5,526,900 | ) | (504,966 | ) | ||||||||
| NY Harbor USLD Future | Morgan Stanley | Short | (89) | 05/28/21 | (7,185,931 | ) | (1,180,086 | ) | ||||||||
| Silver Future | Morgan Stanley | Long | 158 | 07/28/21 | 20,439,670 | (114,356 | ) | |||||||||
| Sugar #11 | Morgan Stanley | Short | (120) | 06/30/21 | (2,282,112 | ) | (11,580 | ) | ||||||||
| WTI Crude Future | Morgan Stanley | Short | (736) | 05/20/21 | (46,794,880 | ) | (7,439,796 | ) | ||||||||
| $ | (92,922,793 | ) | $ | (11,403,553 | ) | |||||||||||
TOTAL RETURN SWAP CONTRACTS(a)
| Swap Counterparty | Reference Obligation | Notional Amount | Floating Rate Paid by Fund | Termination Date | Value | Unrealized Depreciation | ||||||||||||
| Citigroup | CRB 3m Fwd TR Index ** | $ | 142,151,725 | USB3MTA + 24 bps* | 9/30/21 | $ | 142,151,729 | $ | 4 | |||||||||
| Societe Generale | CRB 3m Fwd TR Index ** | 52,735,610 | USB3MTA + 28 bps* | 11/30/21 | 52,735,613 | 3 | ||||||||||||
| UBS | CRB 3m Fwd TR Index ** | 119,416,433 | USB3MTA + 25 bps* | 11/30/21 | 119,416,435 | 2 | ||||||||||||
| Bank of America - Merrill Lynch | CRB 3m Fwd TR Index ** | 116,086,524 | USB3MTA + 30 bps* | 6/29/21 | 116,086,470 | (54 | ) | |||||||||||
| 430,390,292 | 430,390,247 | (45 | ) | |||||||||||||||
| (a) | For long positions in the total return swap, the Fund receives payments based on any positive return of the Reference Obligation less the rate paid by the Fund. The Fund makes payments on any negative return of such Reference Obligations plus the rate paid by the fund. For short positions in the total return swap, the Fund makes payments based on any positive return of the Reference Obligation less the rate paid by the Fund. The Fund receives payments on any negative return of such Reference Obligations plus the rate paid by the Fund. |
| * | United States Auction Results 3 Month Treasury Bill High Discount. Total return swap resets monthly. |
| ** | CRB - Commodity Research Bureau |
See Notes to Financial Statements.
15 | April 30, 2021
| ALPS | CoreCommodity Management | |
| CompleteCommodities® Strategy Fund | |
| Consolidated Statement of Assets and Liabilities | April 30, 2021 (Unaudited) |
| ASSETS | ||||
| Investments, at value | $ | 631,220,810 | ||
| Cash | 191,955,708 | |||
| Foreign currency, at value (Cost $988,695) | 990,377 | |||
| Unrealized appreciation on total return swap contracts | 9 | |||
| Receivable for shares sold | 7,704,086 | |||
| Receivable for variation margin on futures contracts | 3,826,081 | |||
| Receivable due from broker for total return swap contracts | 29,501,809 | |||
| Deposit with broker for futures contracts (Note 3) | 2,183,581 | |||
| Dividends and interest receivable | 827,009 | |||
| Prepaid expenses and other assets | 13,278 | |||
| Total Assets | 868,222,748 | |||
| LIABILITIES | ||||
| Payable for shares redeemed | 1,218,969 | |||
| Unrealized depreciation on total return swap contracts | 54 | |||
| Investment advisory fees payable | 564,048 | |||
| Administration and transfer agency fees payable | 207,597 | |||
| Distribution and services fees payable | 43,407 | |||
| Trustees' fees and expenses payable | 4,892 | |||
| Professional fees payable | 24,125 | |||
| Accrued expenses and other liabilities | 65,142 | |||
| Total Liabilities | 2,128,234 | |||
| NET ASSETS | $ | 866,094,514 | ||
| NET ASSETS CONSIST OF | ||||
| Paid-in capital | $ | 785,424,987 | ||
| Total distributable earnings | 80,669,527 | |||
| NET ASSETS | $ | 866,094,514 | ||
| INVESTMENTS, AT COST | $ | 567,800,260 | ||
| PRICING OF SHARES | ||||
| Investor Class: | ||||
| Net Asset Value, offering and redemption price per share | $ | 8.35 | ||
| Net Assets | $ | 77,458,203 | ||
| Shares of beneficial interest outstanding (unlimited number of shares, no par value common stock authorized) | 9,279,215 | |||
| Class A: | ||||
| Net Asset Value, offering and redemption price per share | $ | 8.35 | ||
| Net Assets | $ | 4,453,571 | ||
| Shares of beneficial interest outstanding (unlimited number of shares, no par value common stock authorized) | 533,065 | |||
| Maximum offering price per share ((NAV/0.9450), based on maximum sales charge of 5.50% of the offering price) | $ | 8.84 | ||
| Class C: | ||||
| Net Asset Value, offering and redemption price per share(a) | $ | 7.87 | ||
| Net Assets | $ | 5,181,379 | ||
| Shares of beneficial interest outstanding (unlimited number of shares, no par value common stock authorized) | 658,200 | |||
| Class I: | ||||
| Net Asset Value, offering and redemption price per share | $ | 8.44 | ||
| Net Assets | $ | 779,001,361 | ||
| Shares of beneficial interest outstanding (unlimited number of shares, no par value common stock authorized) | 92,326,887 | |||
| (a) | Redemption price per share may be reduced for any applicable contingent deferred sales charge. For a description of a possible sales charge, please see the Fund's Prospectus. |
See Notes to Financial Statements.
16 | April 30, 2021
| ALPS | CoreCommodity Management | |
| CompleteCommodities® Strategy Fund | |
| Consolidated Statement of Operations | For the Six Months Ended April 30, 2021 (Unaudited) |
| INVESTMENT INCOME | ||||
| Dividends | $ | 2,709,467 | ||
| Foreign taxes withheld on dividends | (207,787 | ) | ||
| Interest and other income, net of premium amortization and accretion of discount | 3,747,955 | |||
| Total Investment Income | 6,249,635 | |||
| EXPENSES | ||||
| Investment advisory fees | 2,721,334 | |||
| Investment advisory fees - subsidiary (Note 8) | 577,929 | |||
| Administrative fees | 366,142 | |||
| Transfer agency fees | 268,828 | |||
| Distribution and service fees | ||||
| Investor Class | 123,136 | |||
| Class A | 4,645 | |||
| Class C | 16,017 | |||
| Professional fees | 23,045 | |||
| Reports to shareholders and printing fees | 17,963 | |||
| State registration fees | 29,413 | |||
| Insurance fees | 3,314 | |||
| Custody fees | 26,181 | |||
| Trustees' fees and expenses | 16,766 | |||
| Repayment of previously waived fees | ||||
| Class C | 112 | |||
| Miscellaneous expenses | 15,877 | |||
| Total Expenses | 4,210,702 | |||
| Less fees waived/reimbursed by investment advisor (Note 8) | ||||
| Waiver of investment advisory fees - subsidiary | (577,929 | ) | ||
| Net Expenses | 3,632,773 | |||
| Net Investment Income | 2,616,862 | |||
| Net realized gain on investments | 19,098,960 | |||
| Net realized gain on futures contracts | 4,565,164 | |||
| Net realized gain on total return swap contracts | 90,805,142 | |||
| Net realized gain on foreign currency transactions | 19,899 | |||
| Net Realized Gain | 114,489,165 | |||
| Net change in unrealized appreciation on investments | 74,631,112 | |||
| Net change in unrealized appreciation on futures contracts | 4,689,671 | |||
| Net change in unrealized appreciation on total return swap contracts | 284 | |||
| Net change in unrealized appreciation on translation of assets and liabilities denominated in foreign currencies | 1,745 | |||
| Net Change in Unrealized Appreciation | 79,322,812 | |||
| NET REALIZED AND UNREALIZED GAIN ON INVESTMENTS | 193,811,977 | |||
| NET INCREASE IN NET ASSETS RESULTING FROM OPERATIONS | $ | 196,428,839 | ||
See Notes to Financial Statements.
17 | April 30, 2021
| ALPS | CoreCommodity Management |
| CompleteCommodities® Strategy Fund |
| Consolidated Statements of Changes in Net Assets |
| For the Six Months Ended April 30, 2021 (Unaudited) | For the Year Ended October 31, 2020 | |||||||
| OPERATIONS | ||||||||
| Net investment income | $ | 2,616,862 | $ | 2,937,921 | ||||
| Net realized gain/(loss) | 114,489,165 | (53,797,734 | ) | |||||
| Net change in unrealized appreciation | 79,322,812 | 8,098,709 | ||||||
| Net Increase/(Decrease) in Net Assets Resulting from Operations | 196,428,839 | (42,761,104 | ) | |||||
| TOTAL DISTRIBUTIONS | ||||||||
| From distributable earnings | ||||||||
| Investor Class | (174,393 | ) | (375,275 | ) | ||||
| Class A | (5,446 | ) | (7,077 | ) | ||||
| Class C | (5,670 | ) | (53,444 | ) | ||||
| Class I | (1,745,843 | ) | (4,950,473 | ) | ||||
| Net Decrease in Net Assets from Distributions | (1,931,352 | ) | (5,386,269 | ) | ||||
| BENEFICIAL INTEREST TRANSACTIONS (NOTE 6) | ||||||||
| Shares sold | ||||||||
| Investor Class | 16,908,222 | 21,811,745 | ||||||
| Class A | 2,897,210 | 856,402 | ||||||
| Class C | 2,752,477 | 336,823 | ||||||
| Class I | 233,095,917 | 187,684,821 | ||||||
| Dividends reinvested | ||||||||
| Investor Class | 167,790 | 358,287 | ||||||
| Class A | 2,437 | 5,821 | ||||||
| Class C | 4,530 | 28,534 | ||||||
| Class I | 1,555,689 | 3,950,674 | ||||||
| Shares redeemed, net of redemption fees | ||||||||
| Investor Class | (8,067,580 | ) | (9,300,933 | ) | ||||
| Class A | (350,909 | ) | (304,997 | ) | ||||
| Class C | (831,803 | ) | (3,677,008 | ) | ||||
| Class I | (68,457,671 | ) | (208,665,894 | ) | ||||
| Net Increase/(Decrease) in Net Assets Derived from Beneficial Interest Transactions | 179,676,309 | (6,915,725 | ) | |||||
| Net increase/(decrease) in net assets | 374,173,796 | (55,063,098 | ) | |||||
| NET ASSETS | ||||||||
| Beginning of period | 491,920,718 | 546,983,816 | ||||||
| End of period | $ | 866,094,514 | $ | 491,920,718 | ||||
See Notes to Financial Statements.
18 | April 30, 2021
| ALPS | CoreCommodity Management |
| CompleteCommodities® Strategy Fund – Investor Class |
| Consolidated Financial Highlights |
Selected data for a share of beneficial interest outstanding throughout the periods indicated:
| For the Six Months Ended April 30, 2021 (Unaudited) | For the Year Ended October 31, 2020 | For the Year Ended October 31, 2019 | For the Year Ended October 31, 2018(a) | For the Year Ended October 31, 2017 | For the Year Ended October 31, 2016 | |||||||||||||||||||
| Net asset value, beginning of period(b) | $ | 6.06 | $ | 6.68 | $ | 7.54 | $ | 7.64 | $ | 7.29 | $ | 7.15 | ||||||||||||
| INCOME/(LOSS) FROM INVESTMENT OPERATIONS: | ||||||||||||||||||||||||
| Net investment income/(loss)(c) | 0.02 | 0.02 | 0.06 | 0.05 | (0.01 | )(d) | (0.03 | )(d) | ||||||||||||||||
| Net realized and unrealized gain/(loss) | 2.29 | (0.58 | ) | (0.71 | ) | 0.04 | 0.36 | 0.17 | ||||||||||||||||
| Total from investment operations | 2.31 | (0.56 | ) | (0.65 | ) | 0.09 | 0.35 | 0.14 | ||||||||||||||||
| DISTRIBUTIONS: | ||||||||||||||||||||||||
| From net investment income | (0.02 | ) | (0.06 | ) | (0.21 | ) | (0.19 | ) | (0.00 | )(e) | – | |||||||||||||
| Total distributions | (0.02 | ) | (0.06 | ) | (0.21 | ) | (0.19 | ) | (0.00 | )(e) | – | |||||||||||||
| REDEMPTION FEES ADDED TO PAID-IN CAPITAL (NOTE 6) | 0.00 | (e) | 0.00 | (e) | 0.00 | (e) | 0.00 | (e) | 0.00 | (e) | 0.00 | (e) | ||||||||||||
| Net increase/(decrease) in net asset value | 2.29 | (0.62 | ) | (0.86 | ) | (0.10 | ) | 0.35 | 0.14 | |||||||||||||||
| Net asset value, end of period | $ | 8.35 | $ | 6.06 | $ | 6.68 | $ | 7.54 | $ | 7.64 | $ | 7.29 | ||||||||||||
| TOTAL RETURN(f) | 38.21 | % | (8.44 | )% | (8.71 | )% | 1.23 | % | 4.85 | % | 1.96 | % | ||||||||||||
| RATIOS/SUPPLEMENTAL DATA: | ||||||||||||||||||||||||
| Net assets, end of period (000s) | $ | 77,458 | $ | 49,060 | $ | 39,226 | $ | 48,728 | $ | 47,845 | $ | 29,468 | ||||||||||||
| Ratio of expenses to average net assets excluding fee waivers and reimbursements | 1.40 | %(g)(h) | 1.40 | %(h) | 1.39 | %(h) | 1.40 | %(h) | 1.38 | % | 1.41 | % | ||||||||||||
| Ratio of expenses to average net assets including fee waivers and reimbursements | 1.40 | %(g) | 1.40 | % | 1.39 | % | 1.40 | % | 1.38 | % | 1.41 | % | ||||||||||||
| Ratio of net investment income/(loss) to average net assets | 0.52 | %(g) | 0.42 | % | 0.82 | % | 0.66 | % | (0.10 | )% | (0.48 | )% | ||||||||||||
| Portfolio turnover rate(i) | 23 | % | 98 | % | 81 | % | 42 | % | 66 | % | 50 | % | ||||||||||||
| (a) | Prior to December 1, 2017, Investor Class was known as Class A. |
| (b) | Per share amounts and ratios to average net assets include income and expenses of the CoreCommodity Management Cayman Commodity Fund Ltd. (wholly-owned subsidiary). |
| (c) | Calculated using the average shares method. |
| (d) | The per share amount does not correspond to activity reflected in the Statement of Operations due to class specific expenses during the period. |
| (e) | Less than $0.005 or ($0.005) per share. |
| (f) | Total returns are for the period indicated and have not been annualized. Total returns would have been lower had certain expenses not been waived during the period. Returns shown do not reflect the deduction of taxes that a shareholder would pay on Fund distributions or the redemption of Fund shares. |
| (g) | Annualized. |
| (h) | The ratio of operating expenses excluding fee waiver/reimbursements to average net assets is calculated excluding the waived Subsidiary management fee (see Note 8 for additional detail). The ratio inclusive of that fee would be for the period ended April 30, 2021, October 31, 2020, October 31, 2019 and October 31, 2018, respectively, 1.58%, 1.58%, 1.54% and 1.56%. |
| (i) | Portfolio turnover rate for periods less than one full year have not been annualized. |
See Notes to Financial Statements.
19 | April 30, 2021
| ALPS | CoreCommodity Management |
| CompleteCommodities® Strategy Fund – Class A |
| Consolidated Financial Highlights |
Selected data for a share of beneficial interest outstanding throughout the periods indicated:
| For the Six Months Ended April 30, 2021 (Unaudited) | For the Year Ended October 31, 2020 | For the Year Ended October 31, 2019 | For the Period June 12, 2018 (Commencement of Operations) to October 31, 2018 | |||||||||||||
| Net asset value, beginning of period(a) | $ | 6.07 | $ | 6.68 | $ | 7.54 | $ | 8.16 | ||||||||
| INCOME FROM INVESTMENT OPERATIONS: | ||||||||||||||||
| Net investment income(b) | 0.03 | 0.04 | 0.07 | (0.00 | )(c) | |||||||||||
| Net realized and unrealized gain/(loss) | 2.27 | (0.59 | ) | (0.72 | ) | (0.62 | ) | |||||||||
| Total from investment operations | 2.30 | (0.55 | ) | (0.65 | ) | (0.62 | ) | |||||||||
| DISTRIBUTIONS: | ||||||||||||||||
| From net investment income | (0.02 | ) | (0.06 | ) | (0.21 | ) | – | |||||||||
| Total distributions | (0.02 | ) | (0.06 | ) | (0.21 | ) | – | |||||||||
| REDEMPTION FEES ADDED TO PAID-IN CAPITAL (NOTE 6) | – | 0.00 | (c) | – | – | |||||||||||
| Net increase/(decrease) in net asset value | 2.28 | (0.61 | ) | (0.86 | ) | (0.62 | ) | |||||||||
| Net asset value, end of period | $ | 8.35 | $ | 6.07 | $ | 6.68 | $ | 7.54 | ||||||||
| TOTAL RETURN(d) | 37.99 | % | (8.29 | )% | (8.71 | )% | (7.60 | )% | ||||||||
| RATIOS/SUPPLEMENTAL DATA: | ||||||||||||||||
| Net assets, end of period (000s) | $ | 4,454 | $ | 1,254 | $ | 751 | $ | 191 | ||||||||
| Ratio of expenses to average net assets excluding fee waivers and reimbursements | 1.38 | %(e)(f) | 1.34 | %(f) | 1.40 | %(f) | 1.48 | %(e)(f) | ||||||||
| Ratio of expenses to average net assets including fee waivers and reimbursements | 1.38 | %(e) | 1.34 | % | 1.40 | % | 1.45 | %(e) | ||||||||
| Ratio of net investment income/(loss) to average net assets | 0.75 | %(e) | 0.62 | % | 0.99 | % | (0.10 | )%(e) | ||||||||
| Portfolio turnover rate(g) | 23 | % | 98 | % | 81 | % | 42 | % | ||||||||
| (a) | Per share amounts and ratios to average net assets include income and expenses of the CoreCommodity Management Cayman Commodity Fund Ltd. (wholly-owned subsidiary). |
| (b) | Calculated using the average shares method. |
| (c) | Less than $0.005 or ($0.005) per share. |
| (d) | Total returns are for the period indicated and have not been annualized. Total returns would have been lower had certain expenses not been waived during the period. Returns shown do not reflect the deduction of taxes that a shareholder would pay on Fund distributions or the redemption of Fund shares. Returns shown exclude any applicable sales charges. |
| (e) | Annualized. |
| (f) | The ratio of operating expenses excluding fee waiver/reimbursements to average net assets is calculated excluding the waived Subsidiary management fee (see Note 8 for additional detail). The ratio inclusive of that fee would be for the period ended April 30, 2021, October 31, 2020, October 31, 2019 and October 31, 2018, respectively, 1.56%, 1.52%, 1.55 % and 1.64%. |
| (g) | Portfolio turnover rate for periods less than one full year have not been annualized. |
See Notes to Financial Statements.
20 | April 30, 2021
| ALPS | CoreCommodity Management |
| CompleteCommodities® Strategy Fund – Class C |
| Consolidated Financial Highlights |
Selected data for a share of beneficial interest outstanding throughout the periods indicated:
| For the Six Months Ended April 30, 2021 (Unaudited) | For the Year Ended October 31, 2020 | For the Year Ended October 31, 2019 | For the Year Ended October 31, 2018 | For the Year Ended October 31, 2017 | For the Year Ended October 31, 2016 | |||||||||||||||||||
| Net asset value, beginning of period(a) | $ | 5.73 | $ | 6.35 | $ | 7.22 | $ | 7.36 | $ | 7.07 | $ | 6.98 | ||||||||||||
| INCOME/(LOSS) FROM INVESTMENT OPERATIONS: | ||||||||||||||||||||||||
| Net investment income/(loss)(b) | 0.00 | (c) | (0.02 | )(d) | 0.01 | (0.00 | )(c)(d) | (0.06 | )(d) | (0.08 | )(d) | |||||||||||||
| Net realized and unrealized gain/(loss) | 2.15 | (0.54 | ) | (0.68 | ) | 0.04 | 0.35 | 0.17 | ||||||||||||||||
| Total from investment operations | 2.15 | (0.56 | ) | (0.67 | ) | 0.04 | 0.29 | 0.09 | ||||||||||||||||
| DISTRIBUTIONS: | ||||||||||||||||||||||||
| From net investment income | (0.01 | ) | (0.06 | ) | (0.20 | ) | (0.18 | ) | – | – | ||||||||||||||
| Total distributions | (0.01 | ) | (0.06 | ) | (0.20 | ) | (0.18 | ) | – | – | ||||||||||||||
| REDEMPTION FEES ADDED TO PAID-IN CAPITAL (NOTE 6) | – | – | 0.00 | (c) | – | – | – | |||||||||||||||||
| Net increase/(decrease) in net asset value | 2.14 | (0.62 | ) | (0.87 | ) | (0.14 | ) | 0.29 | 0.09 | |||||||||||||||
| Net asset value, end of period | $ | 7.87 | $ | 5.73 | $ | 6.35 | $ | 7.22 | $ | 7.36 | $ | 7.07 | ||||||||||||
| TOTAL RETURN(e) | 37.65 | % | (8.97 | )% | (9.35 | )% | 0.62 | % | 4.10 | % | 1.29 | % | ||||||||||||
| RATIOS/SUPPLEMENTAL DATA: | ||||||||||||||||||||||||
| Net assets, end of period (000s) | $ | 5,181 | $ | 2,354 | $ | 6,702 | $ | 9,510 | $ | 7,642 | $ | 7,260 | ||||||||||||
| Ratio of expenses to average net assets excluding fee waivers and reimbursements | 2.02 | %(f)(g) | 2.05 | %(g) | 2.05 | %(g) | 2.05 | %(g) | 2.05 | % | 2.05 | % | ||||||||||||
| Ratio of expenses to average net assets including fee waivers and reimbursements | 2.02 | %(f) | 2.05 | % | 2.05 | % | 2.05 | % | 2.05 | % | 2.05 | % | ||||||||||||
| Ratio of net investment income/(loss) to average net assets | 0.04 | %(f) | (0.28 | )% | 0.17 | % | (0.04 | )% | (0.81 | )% | (1.13 | )% | ||||||||||||
| Portfolio turnover rate(h) | 23 | % | 98 | % | 81 | % | 42 | % | 66 | % | 50 | % | ||||||||||||
| (a) | Per share amounts and ratios to average net assets include income and expenses of the CoreCommodity Management Cayman Commodity Fund Ltd. (wholly-owned subsidiary). |
| (b) | Calculated using the average shares method. |
| (c) | Less than $0.005 or ($0.005) per share. |
| (d) | The per share amount does not correspond to activity reflected in the Statement of Operations due to class specific expenses during the period. |
| (e) | Total returns are for the period indicated and have not been annualized. Total returns would have been lower had certain expenses not been waived during the period. Returns shown do not reflect the deduction of taxes that a shareholder would pay on Fund distributions or the redemption of Fund shares. Returns shown exclude any applicable sales charges. |
| (f) | Annualized. |
| (g) | The ratio of operating expenses excluding fee waiver/reimbursements to average net assets is calculated excluding the waived Subsidiary management fee (see Note 8 for additional detail). The ratio inclusive of that fee would be for the period ended April 30, 2021, October 31, 2020, October 31, 2019 and October 31, 2018, respectively, 2.20%, 2.23%, 2.20% and 2.21%. |
| (h) | Portfolio turnover rate for periods less than one full year have not been annualized. |
See Notes to Financial Statements.
21 | April 30, 2021
| ALPS | CoreCommodity Management |
| CompleteCommodities® Strategy Fund – Class I |
| Consolidated Financial Highlights |
Selected data for a share of beneficial interest outstanding throughout the periods indicated:
| For the Six Months Ended April 30, 2021 (Unaudited) | For the Year Ended October 31, 2020 | For the Year Ended October 31, 2019 | For the Year Ended October 31, 2018 | For the Year Ended October 31, 2017 | For the Year Ended October 31, 2016 | |||||||||||||||||||
| Net asset value, beginning of period(a) | $ | 6.12 | $ | 6.73 | $ | 7.58 | $ | 7.67 | $ | 7.31 | $ | 7.15 | ||||||||||||
| INCOME/(LOSS) FROM INVESTMENT OPERATIONS: | ||||||||||||||||||||||||
| Net investment income/(loss)(b) | 0.03 | 0.04 | 0.08 | 0.07 | 0.01 | (0.02 | ) | |||||||||||||||||
| Net realized and unrealized gain/(loss) | 2.31 | (0.58 | ) | (0.72 | ) | 0.03 | 0.36 | 0.18 | ||||||||||||||||
| Total from investment operations | 2.34 | (0.54 | ) | (0.64 | ) | 0.10 | 0.37 | 0.16 | ||||||||||||||||
| DISTRIBUTIONS: | ||||||||||||||||||||||||
| From net investment income | (0.02 | ) | (0.07 | ) | (0.21 | ) | (0.19 | ) | (0.01 | ) | – | |||||||||||||
| Total distributions | (0.02 | ) | (0.07 | ) | (0.21 | ) | (0.19 | ) | (0.01 | ) | – | |||||||||||||
| REDEMPTION FEES ADDED TO PAID-IN CAPITAL (NOTE 6) | 0.00 | (c) | 0.00 | (c) | 0.00 | (c) | 0.00 | (c) | 0.00 | (c) | 0.00 | (c) | ||||||||||||
| Net increase/(decrease) in net asset value | 2.32 | (0.61 | ) | (0.85 | ) | (0.09 | ) | 0.36 | 0.16 | |||||||||||||||
| Net asset value, end of period | $ | 8.44 | $ | 6.12 | $ | 6.73 | $ | 7.58 | $ | 7.67 | $ | 7.31 | ||||||||||||
| TOTAL RETURN(d) | 38.39 | % | (8.18 | )% | (8.48 | )% | 1.42 | % | 5.03 | % | 2.24 | % | ||||||||||||
| RATIOS/SUPPLEMENTAL DATA: | ||||||||||||||||||||||||
| Net assets, end of period (000s) | $ | 779,001 | $ | 439,254 | $ | 500,305 | $ | 647,195 | $ | 482,710 | $ | 463,741 | ||||||||||||
| Ratio of expenses to average net assets excluding fee waivers and reimbursements | 1.10 | %(e)(f) | 1.15 | %(f) | 1.14 | %(f) | 1.13 | %(f) | 1.15 | % | 1.15 | % | ||||||||||||
| Ratio of expenses to average net assets including fee waivers and reimbursements | 1.10 | %(e) | 1.15 | % | 1.14 | % | 1.13 | % | 1.15 | % | 1.15 | % | ||||||||||||
| Ratio of net investment income/(loss) to average net assets | 0.85 | %(e) | 0.64 | % | 1.09 | % | 0.90 | % | 0.08 | % | (0.22 | )% | ||||||||||||
| Portfolio turnover rate(g) | 23 | % | 98 | % | 81 | % | 42 | % | 66 | % | 50 | % | ||||||||||||
| (a) | Per share amounts and ratios to average net assets include income and expenses of the CoreCommodity Management Cayman Commodity Fund Ltd. (wholly-owned subsidiary). |
| (b) | Calculated using the average shares method. |
| (c) | Less than $0.005 or ($0.005) per share. |
| (d) | Total returns are for the period indicated and have not been annualized. Total returns would have been lower had certain expenses not been waived during the period. Returns shown do not reflect the deduction of taxes that a shareholder would pay on Fund distributions or the redemption of Fund shares. |
| (e) | Annualized. |
| (f) | The ratio of operating expenses excluding fee waiver/reimbursements to average net assets is calculated excluding the waived Subsidiary management fee (see Note 8 for additional detail). The ratio inclusive of that fee would be for the period ended April 30, 2021, October 31, 2020, October 31, 2019 and October 31, 2018, respectively, 1.28%, 1.33%, 1.29% and 1.29%. |
| (g) | Portfolio turnover rate for periods less than one full year have not been annualized. |
See Notes to Financial Statements.
22 | April 30, 2021
ALPS | Kotak India Growth Fund
| Management Commentary | April 30, 2021 (Unaudited) |
Performance
ALPS I Kotak India Growth Fund (the “Fund") was launched on February 14, 2011. During the 6-month period ended 30th April 2021 (hereinafter also referred to as the “period”), the Fund's Class A Shares, INDAX, delivered a total return of 24.80% at Net Asset Value, Class C, INFCX, delivered 24.44% with CDSC, Class I, INDIX, delivered 25.06% and Class II, INDSX, delivered 25.23%. The Fund underperformed its benchmark, the Nifty 500 Index ("NSE500"), which returned 29.57% during the period without taking into account sales charges for Class A and C Shares.
Moving into the last two months of 2020, US elections and Biden’s victory have been commanding the headlines. Coupled with positive announcements of successful Phase 3 trials of three vaccine candidates, the world bids a difficult 2020 goodbye, with global markets hitting record highs and ended 2020 with a bang, driven by positive macro catalysts – a Brexit deal, ongoing vaccine distribution and a US fiscal stimulus package, which saw removal of some downside risks.
The chaos from social and economic uncertainties stemming from the COVID-19 pandemic continues into 2021. While the world still faces the uphill task of mitigating the challenge from the renewed surge of COVID-19 vaccine withstanding, there are signs of normalcy emerging in most facets of the economy. Global developments in the first quarter of 2021 have seen a dispersion in economic performance and COVID-19 infection rates. Global equities augment well, supported by the large US fiscal stimulus package of US$1.9trn (and subsequently with a follow up of an additional promised US$2tn in infrastructure spending) as well as vaccine rollout across the world. However, with the globe divided into the COVID-19 vaccines “haves” and “have-nots” as well as the rampant spread of mutant variations of the virus, many countries (including India) are battling with a second and third wave of the pandemic.
The United States is leading the fiscal firepower and though the stimulus by the rest of the world are comparatively less muted this year as compared to 2020, countries may benefit from the spillover effects of the US stimulus. Some Central Banks and Governments around the world took on additional measures such as: (1) Japan: The Bank of Japan unveiled a set of few policy tweaks aimed at giving itself more flexibility to revive inflation. While leaving its main policy rates unchanged, the central bank decided that the band around its 10-year bond yield target would be around 0% (+/- 0.25%). It also scrapped a buying target for stock funds. (2) US: The Federal Open Market Committee (FOMC) in its latest monetary policy meeting kept the policy rate unchanged at 0-0.25% and reiterated that it would continue to buy bonds at a rate of US$120bn per month until substantial further progress was made towards its goals. The Fed members also signaled that they expect to keep interest rates close to zero until at least 2024, even as they sharply upgraded their growth and inflation forecasts because of a massive fiscal stimulus and an accelerating vaccine rollout. (3) UK: The UK government announced a US$6.2bn support package. The Bank of England (BoE) kept the policy rate unchanged at 0.1% and decided to continue with its existing program of UK government bond
purchases, maintaining the target for the stock of these government bond purchases at GBP875bn and so the total target stock of asset purchases at GBP895bn. The central bank upgraded its outlook for the UK economy, but stressed it was in no hurry to reduce its support to boost the recovery from the coronavirus crisis. With new COVID-19 cases having fallen markedly and with the vaccination program proceeding at a rapid pace, the restrictions are getting eased earlier than anticipated.
Looking back at India, amid volatile sessions and a surge in COVID-19 cases, the Indian market had fared well. Frontline Nifty Index gained 27.75%, the midcap segment saw a gain of 42.89% and the broad-based NSE500 Index gained 30.32% during the period (all in USD terms).
Fitch affirmed India’s BBB- rating with a negative outlook and forecasted a growth of 12.8% in FY22 (fiscal year ending March 2022). World Bank raised India’s FY2022 GDP forecast to 10.1% from 5.4% it had projected in January. The Indian Government’s growth-oriented Union Budget (announced on 1st Feb 2021) focuses on growth and has accordingly, relaxed the government’s medium-term fiscal consolidation targets. The government has rationalized expenditure from high FY2021 (fiscal year ending March 2021) levels, while providing meaningfully higher support versus FY2020 levels. The government’s bigger focus remains on supply-side reforms with the objective of kick-starting the investment cycle, critical for India’s medium-term growth prospects.
Some of the key budget themes from the Union Budget are: (1) Expansionary budget with a focus on growth: Emphasizing the importance of Atmanirbhar Bharat (‘Self-Reliant India’) in order to boost manufacturing in India which in turn would provide the necessary boost for job creation. (2) Strategic disinvestment: The government has outlined the policy of strategic disinvestment of public sector enterprises. The policy provides a clear roadmap for disinvestment in all non-strategic and strategic sectors and has identified four areas that are strategic where bare minimum Central Public Sector Entities (CPSEs) will be maintained and the rest privatized. (3) Infrastructure development: The emphasis on infrastructure development in the budget with focus in allocation to roads and railways, as well as creation of a Development Financial Institution (DFI) which will provide long term capital for the National Infrastructure Pipeline (NIP) projects. (4) Proposal to set up an Asset Reconstruction Company (ARC): In order to solve bad loan problems of the Public Sector Banks and strengthen the balance sheets, the government further proposes to set up an ARC for aggregating/pooling bad loans of state banks.
Despite the fierce second wave which started in mid-February in the state of Maharashtra and spread rapidly to other states, India’s business cycle remains on an uptrend. Instead of re-implementing strict lockdowns like the ones put into place a year ago, imposition of local restrictions is now left to the states and less strict than last year. This may cushion the impact of activities to some extent. India’s April Manufacturing Purchasing Managers’ Index (PMI) momentum is unmoved by COVID-19 restrictions and stood at 55.5
23 | April 30, 2021
ALPS | Kotak India Growth Fund
| Management Commentary | April 30, 2021 (Unaudited) |
against 55.4 in March (after declining to a seven-month low) led by external demand. However, with the intensification of COVID-19, fresh domestic factory orders and output eased to an eight month lows.
Looking at economic numbers, India’s real GDP growth rose to 1.6% in the January to March 2021 quarter compared to a 0.5% expansion in the previous quarter. However, the rapid spurt in COVID-19 cases, imposition of localized lockdowns, night curfews and other restrictions, weak macroeconomic data, elevated crude prices and jump in bond yield weighed sentiment.
Current account balance in 3QFY21 (Note: October to December 2020 quarter) registered a deficit of US$1.7bn (0.2% of GDP) as against a surplus of US$15.5bn in 2QFY21 (2.4% of GDP) and a deficit of US$2.bn (0.4% of GDP) in the same period last year. This was due to a widening of the trade deficit to US$34.5bn (US$14.8bn in the July to September 2020 quarter) on the back of higher import bill of US$112bn (US$90bn in July to September 2020 quarter), while exports remained broadly unchanged at US$77bn.
April Consumer Price Index (CPI) inflation moderated to 4.29% as against 5.52% in March. Sequentially, CPI inflation rose 0.7% after an increase of 0.1% in March. Wholesale Price Index (WPI) inflation came in at 10.5% in April (7.4% in March), aided by low base and a spike in input costs. On a sequential basis, WPI inflation rose 1.9%, with items such as base metals (3.2%), manufactured food (3.2%), and chemicals and products (1.6%) registering sequential increases.
To reiterate, despite headwinds arising from the second wave of COVID-19 and high inflation, the Union Budget serves to be a budget for all. Market outlook moving forward will depend on the ability by the government to bring their commitments to reality and the continuous race between COVID-19 and the vaccination cycle.
Market Outlook and Valuation
India is going through one of its worst moments. The scale of the pandemic has overwhelmed the moderate healthcare system and despite India being called as pharmacy of the world, the healthcare system in India is found wanting on basic healthcare needs. This hopefully will lead to rapid efforts in build our healthcare infrastructure. Meanwhile we expect significant pick up in vaccinations by mid of May and hopefully the vulnerable 45+ population will see significant coverage by June end / July.
India’s ~50 most populated cities account for 14% of population but ~45% of active COVID-19 cases. These cities contribute to one-third of India’s GDP. These cities have vaccinated ~22% (~4.7%) of adult population with the first (second) dose. A targeted approach to vaccinate these cities will limit the economic fallout (Source - Citi India). Meanwhile, local lockdowns, strict compliance, and better healthcare facilities may ease the situation as seen in the city of Mumbai where new cases have already declined to 1/3rd of recent peak.
As we have noted, this second wave will likely moderate the pace of recovery and impact corporate earnings in the near term. In the first wave and lockdowns, the economy grappled with the unknown and economic activity was severely impacted and now both businesses and consumers have benefitted of working through the strictest of lockdowns globally last year in India. Businesses have also tightened their belts and at the same time, used technology, automation and digital platforms to improve product / service delivery efficiently. The recent quarterly corporate results, though not impacted by the second wave, showed better profitability trends across sectors.
As we have seen over the past few years, almost every policy change and disturbance / shock has enabled well run businesses to gain market share. Market leaders are gaining market share across industries over the past few years and COVID-19 has accelerated the shift and the second wave will do that further. As we have repeatedly pointed out, the unorganized market in India has a very large overall footprint and is losing that share rapidly. We believe these are profitable market share gains to businesses that the Fund owns. We are cognizant that most of the companies in which the Fund invests will take a hit from our earlier expected revenues and profitability in the current quarter and maybe even the next, but we believe that they will consolidate market share and the long-term value of these franchises will improve. Additionally, we draw some comfort that the banking system is better prepared to handle stress. Most banks have seen improvement in their liability franchise and some have raised capital and created COVID-19 provisioning buffers. Recently, the central bank has announced additional liquidity measures especially targeted towards small finance.
Sentiments are weak towards India and this could lead to volatility in the short term. We saw volatility in the forex markets during April where INR depreciated swiftly and then regained most of its losses. It is our belief that this volatility is there to stay until we see the second wave normalizing and vaccination picking up. We remain with our base case assumption of local lockdowns and not a strict national lockdown, though one cannot rule out the possibility. We are hopeful that formalization of the economy and digitization will gain momentum, and will also be discriminating for businesses. As long as one sticks to businesses that can potentially benefit from these trends to create long term value, this volatility can possibly provide opportunities for long term investors.
Once again, while we are deeply concerned about the current healthcare situation, and urge everyone to remain safe, we remain optimistic on India’s ability to bounce back.
Mr. Nitin Tejpal Jain
Fund Manager
Kotak Mahindra Asset Management (Singapore) Pte Ltd.
24 | April 30, 2021
ALPS | Kotak India Growth Fund
| Management Commentary | April 30, 2021 (Unaudited) |
The views above are based on publicly available data, Kotak Group internal estimates and are based on the views of the research team at Kotak group.
The views of the author and information discussed in this commentary are as of the date of publication, are subject to change, and may not reflect the writer's current views. The views expressed are those of the author only, and represent an assessment of market conditions at a specific point in time, are opinions only and should not be relied upon as investment advice regarding a particular investment or markets in general. Such information does not constitute a recommendation to buy or sell specific securities or investment vehicles. It should not be assumed that any investment will be profitable or will equal the performance of the fund or any securities or any sectors mentioned in this letter. The subject matter contained in this letter has been derived from several sources believed to be reliable and accurate at the time of compilation. Neither ALPS Advisors, Inc., Kotak Mahindra Asset Management (Singapore) Pte Ltd., nor the Fund accepts any liability for losses either direct or consequential caused by the use of this information.
Diversification cannot guarantee gain or prevent losses.
Past performance is no guarantee of future results. Dividends are not guaranteed and are subject to change or elimination. Investments in international and emerging markets securities include exposure to risks such as currency fluctuations, foreign taxes and regulations, and the potential for illiquid markets and political instability.
ALPS Portfolio Solutions Distributor, Inc., ALPS Distributors, Inc. and ALPS Advisors Inc. are affiliated.
25 | April 30, 2021
ALPS | Kotak India Growth Fund
| Performance Update | April 30, 2021 (Unaudited) |
Performance of $10, 000 Initial Investment (as of April 30, 2021)
Comparison of change in value of a $10,000 investment

The chart above represents historical performance of a hypothetical investment of $10,000 in the Fund since inception. Past performance does not guarantee future results. This chart does not reflect the deduction of taxes that a shareholder would pay on Fund distributions or the redemption of Fund shares.
Average Annual Total Returns (as of April 30, 2021)
| 6 Month | 1 Year | 3 Year | 5 Year | 10 Year | Since Inception^ | Total Expense Ratio | What You Pay* | |
| Investor# (NAV) | 24.80% | 55.82% | 6.52% | 11.29% | 7.60% | 7.80% | 1.77% | 1.40% |
| Class A (NAV) | 24.78% | 55.24% | 6.32% | 11.17% | 7.54% | 7.74% | 1.76% | 1.40% |
| Class A (LOAD) | 17.94% | 46.69% | 4.34% | 9.91% | 6.94% | 7.14% | ||
| Class C (NAV) | 24.44% | 54.24% | 5.62% | 10.39% | 6.82% | 7.01% | 2.37% | 2.00% |
| Class C (LOAD) | 23.44% | 53.24% | 5.62% | 10.39% | 6.82% | 7.01% | ||
| Class I | 25.06% | 55.73% | 6.67% | 11.50% | 7.90% | 8.10% | 1.36% | 1.00% |
| Class II | 25.23% | 56.15% | 6.80% | 11.58% | 7.94% | 8.13% | 1.18% | 0.75% |
| Nifty 500 Index1 | 30.65% | 58.78% | 6.40% | 11.33% | 5.79% | 6.56% | ||
| Morningstar India Index2 | 28.72% | 57.77% | 7.45% | 12.36% | 6.01% | 6.70% |
Performance data quoted represents past performance. Past performance does not guarantee future results. Investment return and principal value of an investment will fluctuate so that an investor’s shares, when sold or redeemed, may be worth more or less than the original cost. Current performance data may be higher or lower than actual data quoted. For the most current month-end performance data, please call 1-866-759-5679.
Maximum Offering Price (MOP) for Class A shares includes the Fund’s maximum sales charge of 5.50%. Performance shown at NAV does not include these sales charges and would have been lower had it been taken into account. If you invest $1 million or more, either as a lump sum or through the Fund’s accumulation or letter of intent programs, you can purchase Class A shares without an initial sales charge (load). A Contingent Deferred Sales Charge (“CDSC”) of 1.00% may apply to Class C shares redeemed within the first 12 months after a purchase, and on Class A shares redeemed within the first 18 months after a purchase in excess of $1 million. The Fund imposes a 2.00% redemption fee on shares held for less than 30 days.
26 | April 30, 2021
ALPS | Kotak India Growth Fund
| Performance Update | April 30, 2021 (Unaudited) |
Performance shown for Class A shares prior to June 12, 2018 reflects the historical performance of the Fund’s Investor shares, calculated using the fees and expenses of Class A shares. Performance shown for Class II shares prior to December 19, 2019 reflects the historical performance of the Fund’s Class I shares, calculated using the fees and expenses of Class II shares.
| 1 | Nifty 500 Index (formerly the CNX 500 Index) - India's first broad based benchmark of the Indian capital market. The Nifty 500 companies are disaggregated into 72 industry indices. Industry weightages in the index reflect the industry weightages in the market. The index is not actively managed and does not reflect any deduction for fees, expenses or taxes. An investor may not invest directly in an index. |
| 2 | Morningstar India NR Index: measures the performance of India's equity markets targeting the top 97% of stocks by market capitalization. |
| ^ | Fund Inception date of February 14, 2011 for Investor Class and Classes C and I; Fund Inception date of June 12, 2018 for Class A; Fund Inception date of December 19, 2019 for Class II. |
| * | What You Pay reflects the Advisor's and Sub-Advisor’s decision to contractually limit expenses through February 28, 2022. Please see the prospectus dated February 28, 2021 for additional information. |
| # | Prior to December 1, 2017, Investor Class was known as Class A. |
The table does not reflect the deduction of taxes that a shareholder would pay on Fund distributions or the redemption of Fund shares.
This Fund is not suitable for all investors and is subject to investment risks, including possible loss of the principal amount invested.
There is no guarantee that the Fund will continue to hold any one particular security or stay invested in any one particular company. The composition of the Fund's top holdings is subject to change. Performance figures are historical and reflect the change in share price, reinvested distributions, changes in net asset value, sales charges and capital gains distributions, if any.
Not FDIC Insured – No Bank Guarantee – May Lose Value
Investing in India involves risk and considerations not present when investing in more established securities markets. The Fund may be more susceptible to economic, market, political and local risks of the region than a fund that is more geographically diversified. Investments in India are subject to a number of risks including, but not limited to, risk of losing some or all of the capital invested, high market volatility, variable market liquidity, geopolitical risks (including political instability), exchange rate fluctuations (between the currency of the fund’s share class and the Indian Rupee), changes in tax regime and restrictions on investment activities of foreign investors.
Top Ten Holdings (as a % of Net Assets) †
| Infosys, Ltd. | 7.88% |
| Reliance Industries, Ltd. | 5.83% |
| ICICI Bank, Ltd. | 5.44% |
| HDFC Bank, Ltd. | 5.09% |
| Axis Bank, Ltd. | 3.43% |
| Tata Consultancy Services, Ltd. | 3.39% |
| Housing Development Finance Corp., Ltd. | 2.85% |
| Hindustan Unilever, Ltd. | 2.61% |
| SBI Cards & Payment Services, Ltd. | 2.56% |
| Tech Mahindra, Ltd. | 2.49% |
| Top Ten Holdings | 41.57% |
| † | Holdings are subject to change, and may not reflect the current or future position of the portfolio. Table presents approximate values only. |
Industry Sector Allocation (as a % of Net Assets)

27 | April 30, 2021
ALPS | Kotak India Growth Fund
| Statement of Investments | April 30, 2021 (Unaudited) |
| Shares | Value (Note 2) | |||||||
| COMMON STOCKS (98.21%) | ||||||||
| Communication Services (2.17%) | ||||||||
| Entertainment (0.22%) | ||||||||
| Nazara Technologies, Ltd.(a) | 30,000 | $ | 703,399 | |||||
| Wireless Telecommunication Services (1.95%) | ||||||||
| Bharti Airtel, Ltd. | 876,746 | 6,340,846 | ||||||
| TOTAL COMMUNICATION SERVICES | 7,044,245 | |||||||
| Consumer Discretionary (8.58%) | ||||||||
| Auto Components (1.75%) | ||||||||
| MRF, Ltd. | 3,338 | 3,630,790 | ||||||
| Varroc Engineering, Ltd.(a)(b)(c) | 408,345 | 2,038,375 | ||||||
| 5,669,165 | ||||||||
| Automobiles (1.98%) | ||||||||
| Mahindra & Mahindra, Ltd. | 264,434 | 2,678,996 | ||||||
| Maruti Suzuki India, Ltd. | 42,917 | 3,733,992 | ||||||
| 6,412,988 | ||||||||
| Hotels, Restaurants & Leisure (0.89%) | ||||||||
| Jubilant Foodworks, Ltd.(a) | 74,500 | 2,902,287 | ||||||
| Household Durables (2.81%) | ||||||||
| Crompton Greaves Consumer Electricals, Ltd. | 1,159,692 | 6,012,712 | ||||||
| Dixon Technologies India, Ltd.(c) | 5,000 | 283,090 | ||||||
| Orient Electric, Ltd. | 773,639 | 2,810,692 | ||||||
| 9,106,494 | ||||||||
| Textiles, Apparel & Luxury Goods (1.15%) | ||||||||
| Titan Co., Ltd. | 185,000 | 3,718,792 | ||||||
| TOTAL CONSUMER DISCRETIONARY | 27,809,726 | |||||||
| Consumer Staples (6.94%) | ||||||||
| Beverages (0.43%) | ||||||||
| United Spirits, Ltd.(a) | 199,991 | 1,400,277 | ||||||
| Food Products (0.89%) | ||||||||
| Britannia Industries, Ltd. | 61,961 | 2,880,689 | ||||||
| Household Products (2.61%) | ||||||||
| Hindustan Unilever, Ltd. | 267,136 | 8,472,904 | ||||||
| Personal Products (3.01%) | ||||||||
| Dabur India, Ltd. | 659,940 | 4,789,793 | ||||||
| Emami, Ltd. | 748,574 | 4,961,150 | ||||||
| 9,750,943 | ||||||||
| TOTAL CONSUMER STAPLES | 22,504,813 | |||||||
| Shares | Value (Note 2) | |||||||
| Energy (6.84%) | ||||||||
| Oil, Gas & Consumable Fuels (6.84%) | ||||||||
| Petronet LNG, Ltd. | 1,016,127 | $ | 3,286,861 | |||||
| Reliance Industries, Ltd. | 745,130 | 18,906,194 | ||||||
| 22,193,055 | ||||||||
| TOTAL ENERGY | 22,193,055 | |||||||
| Financials (31.48%) | ||||||||
| Banks (17.22%) | ||||||||
| AU Small Finance Bank, Ltd.(a)(b)(c) | 389,648 | 5,266,581 | ||||||
| Axis Bank, Ltd.(a) | 1,157,374 | 11,125,743 | ||||||
| HDFC Bank, Ltd., ADR(a) | 98,550 | 6,926,094 | ||||||
| HDFC Bank, Ltd.(a) | 504,460 | 9,584,730 | ||||||
| ICICI Bank, Ltd., Sponsored ADR(a) | 575,349 | 9,378,188 | ||||||
| ICICI Bank, Ltd.(a) | 1,020,367 | 8,265,454 | ||||||
| State Bank of India(a) | 1,110,864 | 5,284,556 | ||||||
| 55,831,346 | ||||||||
| Consumer Finance (4.64%) | ||||||||
| Bajaj Finance, Ltd.(a) | 91,750 | 6,734,626 | ||||||
| SBI Cards & Payment Services, Ltd. | 627,189 | 8,314,407 | ||||||
| 15,049,033 | ||||||||
| Insurance (3.77%) | ||||||||
| HDFC Life Insurance Co., Ltd.(a)(b)(c) | 337,231 | 3,022,853 | ||||||
| ICICI Lombard General Insurance Co., Ltd.(b)(c) | 178,530 | 3,403,187 | ||||||
| Max Financial Services, Ltd.(a) | 480,117 | 5,798,383 | ||||||
| 12,224,423 | ||||||||
| Real Estate Management & Development (0.83%) | ||||||||
| Oberoi Realty, Ltd.(a) | 364,499 | 2,690,150 | ||||||
| Thrifts & Mortgage Finance (5.02%) | ||||||||
| Aavas Financiers, Ltd.(a) | 230,016 | 7,053,494 | ||||||
| Housing Development Finance Corp., Ltd. | 283,355 | 9,227,538 | ||||||
| 16,281,032 | ||||||||
| TOTAL FINANCIALS | 102,075,984 | |||||||
| Health Care (7.86%) | ||||||||
| Health Care Providers & Services (3.17%) | ||||||||
| Dr Lal PathLabs, Ltd.(b)(c) | 71,039 | 2,808,121 | ||||||
| Fortis Healthcare, Ltd.(a) | 1,093,616 | 3,103,973 | ||||||
| Max Healthcare Institute, Ltd.(a) | 1,423,353 | 4,357,612 | ||||||
| 10,269,706 | ||||||||
| Pharmaceuticals (4.69%) | ||||||||
| Alkem Laboratories, Ltd. | 91,098 | 3,390,331 | ||||||
| Aurobindo Pharma, Ltd. | 380,805 | 5,037,699 | ||||||
| Cadila Healthcare, Ltd.(a) | 447,314 | 3,445,870 | ||||||
See Notes to Financial Statements.
28 | April 30, 2021
ALPS | Kotak India Growth Fund
| Statement of Investments | April 30, 2021 (Unaudited) |
| Shares | Value (Note 2) | |||||||
| Pharmaceuticals (continued) | ||||||||
| Cipla, Ltd.(a) | 271,457 | $ | 3,332,760 | |||||
| 15,206,660 | ||||||||
| TOTAL HEALTH CARE | 25,476,366 | |||||||
| Industrials (9.16%) | ||||||||
| Air Freight & Logistics (0.88%) | ||||||||
| Mahindra Logistics, Ltd.(b)(c) | 397,661 | 2,863,008 | ||||||
| Building Products (1.50%) | ||||||||
| Kajaria Ceramics, Ltd. | 394,166 | 4,851,209 | ||||||
| Commercial Services & Supplies (0.94%) | ||||||||
| Indian Railway Catering & Tourism Corp., Ltd. | 126,167 | 3,046,396 | ||||||
| Construction & Engineering (2.55%) | ||||||||
| Kalpataru Power Transmission, Ltd. | 604,364 | 3,000,894 | ||||||
| Larsen & Toubro, Ltd. | 291,649 | 5,264,874 | ||||||
| 8,265,768 | ||||||||
| Electrical Equipment (1.95%) | ||||||||
| ABB India, Ltd. | 50,000 | 930,671 | ||||||
| V-Guard Industries, Ltd.(a) | 1,793,261 | 5,393,067 | ||||||
| 6,323,738 | ||||||||
| Trading Companies & Distributors (1.34%) | ||||||||
| IndiaMart InterMesh, Ltd.(a)(b)(c) | 40,527 | 4,341,697 | ||||||
| TOTAL INDUSTRIALS | 29,691,816 | |||||||
| Information Technology (15.07%) | ||||||||
| IT Services (15.07%) | ||||||||
| Infosys, Ltd., Sponsored ADR | 472,176 | 8,536,942 | ||||||
| Infosys, Ltd. | 936,794 | 17,025,018 | ||||||
| Persistent Systems, Ltd. | 154,988 | 4,256,168 | ||||||
| Tata Consultancy Services, Ltd. | 268,228 | 10,976,848 | ||||||
| Tech Mahindra, Ltd. | 624,024 | 8,075,085 | ||||||
| 48,870,061 | ||||||||
| TOTAL INFORMATION TECHNOLOGY | 48,870,061 | |||||||
| Materials (8.38%) | ||||||||
| Chemicals (3.45%) | ||||||||
| Kansai Nerolac Paints, Ltd. | 434,371 | 3,253,784 | ||||||
| Laxmi Organic Industries, Ltd.(a)(c) | 675,465 | 1,895,378 | ||||||
| SRF, Ltd. | 69,677 | 6,038,787 | ||||||
| 11,187,949 | ||||||||
| Construction Materials (4.93%) | ||||||||
| JK Cement, Ltd.(a) | 100,459 | 3,800,855 | ||||||
| Ramco Cements, Ltd. | 465,569 | 6,185,395 | ||||||
| Shree Cement, Ltd.(a) | 8,801 | 3,310,935 | ||||||
| Shares | Value (Note 2) | |||||||
| Construction Materials (continued) | ||||||||
| UltraTech Cement, Ltd. | 31,649 | $ | 2,678,167 | |||||
| 15,975,352 | ||||||||
| TOTAL MATERIALS | 27,163,301 | |||||||
| Real Estate (0.71%) | ||||||||
| Real Estate Management & Development (0.71%) | ||||||||
| Brigade Enterprises, Ltd.(a) | 688,422 | 2,321,481 | ||||||
| TOTAL REAL ESTATE | 2,321,481 | |||||||
| Utilities (1.02%) | ||||||||
| Gas Utilities (1.02%) | ||||||||
| Indraprastha Gas, Ltd. | 484,013 | 3,318,675 | ||||||
| TOTAL UTILITIES | 3,318,675 | |||||||
| TOTAL COMMON STOCKS | ||||||||
| (Cost $263,135,194) | 318,469,523 | |||||||
| TOTAL INVESTMENTS (98.21%) | ||||||||
| (Cost $263,135,194) | $ | 318,469,523 | ||||||
| Other Assets In Excess Of Liabilities (1.79%) | 5,805,323 | |||||||
| NET ASSETS (100.00%) | $ | 324,274,846 | ||||||
| (a) | Non-Income Producing Security. |
| (b) | Security exempt from registration under Rule 144A of the Securities Act of 1933. This security may be resold in transactions exempt from registration, normally to qualified institutional buyers. As of April 30, 2021, the aggregate market value of those securities was $23,743,822, representing 7.32% of net assets. |
| (c) | Securities were purchased pursuant to Regulation S under the Securities Act of 1933, which exempts securities offered and sold outside of the United States from registration. Such securities cannot be sold in the United States without either an effective registration statement filed pursuant to the Securities Act of 1933, or pursuant to an exemption from registration. These securities have been deemed liquid under guidelines approved by the Fund's Board of Trustees. As of April 30, 2021 the aggregate market value of those securities was 25,922,290 representing 7.99% of net assets. |
For Fund compliance purposes, the Fund's industry classifications refer to any one or more of the industry sub-classifications used by one or more widely recognized market indexes or ratings group indexes, and/or as defined by Fund management. This definition may not apply for purposes of this report, which may combine industry sub-classifications for reporting ease. Industries are shown as a percent of net assets.
See Notes to Financial Statements.
29 | April 30, 2021
ALPS | Kotak India Growth Fund
| Statement of Assets and Liabilities | April 30, 2021 (Unaudited) |
| ASSETS | ||||
| Investments, at value | $ | 318,469,523 | ||
| Cash | 516,147 | |||
| Foreign currency, at value (Cost $12,933,079) | 12,738,898 | |||
| Receivable for investments sold | 769,724 | |||
| Receivable for shares sold | 6,763 | |||
| Dividends receivable | 539 | |||
| Prepaid expenses and other assets | 31,022 | |||
| Total Assets | 332,532,616 | |||
| LIABILITIES | ||||
| Payable for investments purchased | 615,534 | |||
| Payable for shares redeemed | 46,871 | |||
| Payable for foreign capital gains tax | 7,307,091 | |||
| Investment advisory fees payable | 145,145 | |||
| Administration and transfer agency fees payable | 100,669 | |||
| Distribution and services fees payable | 4,242 | |||
| Trustees' fees and expenses payable | 2,237 | |||
| Professional fees payable | 13,225 | |||
| Accrued expenses and other liabilities | 22,756 | |||
| Total Liabilities | 8,257,770 | |||
| NET ASSETS | $ | 324,274,846 | ||
| NET ASSETS CONSIST OF | ||||
| Paid-in capital | $ | 293,374,647 | ||
| Total distributable earnings | 30,900,199 | |||
| NET ASSETS | $ | 324,274,846 | ||
| INVESTMENTS, AT COST | $ | 263,135,194 | ||
| PRICING OF SHARES | ||||
| Investor Class: | ||||
| Net Asset Value, offering and redemption price per share | $ | 15.80 | ||
| Net Assets | $ | 2,885,637 | ||
| Shares of beneficial interest outstanding (unlimited number of shares, no par value common stock authorized) | 182,678 | |||
| Class A: | ||||
| Net Asset Value, offering and redemption price per share | $ | 15.71 | ||
| Net Assets | $ | 955,844 | ||
| Shares of beneficial interest outstanding (unlimited number of shares, no par value common stock authorized) | 60,830 | |||
| Maximum offering price per share ((NAV/0.9450), based on maximum sales charge of 5.50% of the offering price) | $ | 16.63 | ||
| Class C: | ||||
| Net Asset Value, offering and redemption price per share(a) | $ | 14.56 | ||
| Net Assets | $ | 1,439,147 | ||
| Shares of beneficial interest outstanding (unlimited number of shares, no par value common stock authorized) | 98,850 | |||
| Class I: | ||||
| Net Asset Value, offering and redemption price per share | $ | 16.32 | ||
| Net Assets | $ | 14,999,871 | ||
| Shares of beneficial interest outstanding (unlimited number of shares, no par value common stock authorized) | 919,286 | |||
| Class II: | ||||
| Net Asset Value, offering and redemption price per share | $ | 16.38 | ||
| Net Assets | $ | 303,994,347 | ||
| Shares of beneficial interest outstanding (unlimited number of shares, no par value common stock authorized) | 18,561,132 | |||
| (a) | Redemption price per share may be reduced for any applicable contingent deferred sales charge. For a description of a possible sales charge, please see the Fund's Prospectus. |
See Notes to Financial Statements.
30 | April 30, 2021
ALPS | Kotak India Growth Fund
| Statement of Operations | For the Six Months Ended April 30, 2021 (Unaudited) |
| INVESTMENT INCOME | ||||
| Dividends | $ | 616,255 | ||
| Foreign taxes withheld on dividends | (166,693 | ) | ||
| Total Investment Income | 449,562 | |||
| EXPENSES | ||||
| Investment advisory fees | 826,218 | |||
| Administrative fees | 206,928 | |||
| Transfer agency fees | 1,089 | |||
| Distribution and service fees | ||||
| Investor Class | 5,666 | |||
| Class A | 1,630 | |||
| Class C | 7,433 | |||
| Professional fees | 20,857 | |||
| Reports to shareholders and printing fees | 3,886 | |||
| State registration fees | 36,281 | |||
| Insurance fees | 1,158 | |||
| Custody fees | 72,938 | |||
| Trustees' fees and expenses | 4,424 | |||
| Repayment of previously waived fees | ||||
| Investor Class | 911 | |||
| Class A | 284 | |||
| Class C | 433 | |||
| Class I | 8,135 | |||
| Miscellaneous expenses | 12,236 | |||
| Total Expenses | 1,210,507 | |||
| Less fees waived/reimbursed by investment advisor (Note 8) | ||||
| Investor Class | (75 | ) | ||
| Class A | (3 | ) | ||
| Class C | (67 | ) | ||
| Class I | (641 | ) | ||
| Class II | (198,759 | ) | ||
| Net Expenses | 1,010,962 | |||
| Net Investment Loss | (561,400 | ) | ||
| Net realized gain on investments | 8,677,684 | |||
| Net realized loss on foreign currency transactions | (512,799 | ) | ||
| Net Realized Gain | 8,164,885 | |||
| Net change in unrealized appreciation on investments | 38,646,163 | |||
| Net change in unrealized depreciation on translation of assets and liabilities denominated in foreign currencies | (36,889 | ) | ||
| Net change in unrealized foreign capital gains tax | (6,599,962 | ) | ||
| Net Change in Unrealized Appreciation | 32,009,312 | |||
| NET REALIZED AND UNREALIZED GAIN ON INVESTMENTS | 40,174,197 | |||
| NET INCREASE IN NET ASSETS RESULTING FROM OPERATIONS | $ | 39,612,797 | ||
See Notes to Financial Statements.
31 | April 30, 2021
ALPS | Kotak India Growth Fund
Statements of Changes in Net Assets
| For the Six Months Ended April 30, 2021 (Unaudited) | For the Year Ended October 31, 2020 | |||||||
| OPERATIONS | ||||||||
| Net investment income/(loss) | $ | (561,400 | ) | $ | 124,008 | |||
| Net realized gain/(loss) | 8,164,885 | (24,490,375 | ) | |||||
| Net change in unrealized appreciation | 32,009,312 | 12,127,968 | ||||||
| Net Increase/(Decrease) in Net Assets Resulting from Operations | 39,612,797 | (12,238,399 | ) | |||||
| TOTAL DISTRIBUTIONS | ||||||||
| From distributable earnings | ||||||||
| Investor Class | – | (59,531 | ) | |||||
| Class A | – | (1,250 | ) | |||||
| Class C | – | (30,127 | ) | |||||
| Class I | – | (272,204 | ) | |||||
| Net Decrease in Net Assets from Distributions | – | (363,112 | ) | |||||
| BENEFICIAL INTEREST TRANSACTIONS (NOTE 6) | ||||||||
| Shares sold | ||||||||
| Investor Class | 364,027 | 14,097,079 | ||||||
| Class A | 753,705 | 17,539 | ||||||
| Class C | 9,000 | 87,547 | ||||||
| Class I | 3,522,680 | 5,770,524 | ||||||
| Class II | 135,000,000 | 175,000,000 | ||||||
| Dividends reinvested | ||||||||
| Investor Class | – | 46,092 | ||||||
| Class A | – | 1,120 | ||||||
| Class C | – | 29,759 | ||||||
| Class I | – | 237,513 | ||||||
| Shares redeemed, net of redemption fees | ||||||||
| Investor Class | (840,794 | ) | (16,813,642 | ) | ||||
| Class A | (37,793 | ) | (21,865 | ) | ||||
| Class C | (768,829 | ) | (348,993 | ) | ||||
| Class I | (15,977,945 | ) | (6,746,874 | ) | ||||
| Class II | – | (25,000,000 | ) | |||||
| Net Increase in Net Assets Derived from Beneficial Interest Transactions | 122,024,051 | 146,355,799 | ||||||
| Net increase in net assets | 161,636,848 | 133,754,288 | ||||||
| NET ASSETS | ||||||||
| Beginning of period | 162,637,998 | 28,883,710 | ||||||
| End of period | $ | 324,274,846 | $ | 162,637,998 | ||||
See Notes to Financial Statements.
32 | April 30, 2021
ALPS | Kotak India Growth Fund – Investor Class
Financial Highlights
Selected data for a share of beneficial interest outstanding throughout the periods indicated:
| For the Six Months Ended April 30, 2021 (Unaudited) | For the Year Ended October 31, 2020 | For the Year Ended October 31, 2019 | For the Year Ended October 31, 2018(a) | For the Year Ended October 31, 2017 | For the Year Ended October 31, 2016 | |||||||||||||||||||
| Net asset value, beginning of period | $ | 12.66 | $ | 13.02 | (b) | $ | 11.73 | (b) | $ | 14.53 | (b) | $ | 12.32 | (b) | $ | 12.57 | (b) | |||||||
| INCOME/(LOSS) FROM INVESTMENT OPERATIONS: | ||||||||||||||||||||||||
| Net investment loss(c) | (0.27 | ) | (0.07 | )(d) | (0.10 | ) | (0.13 | ) | (0.10 | ) | (0.09 | ) | ||||||||||||
| Net realized and unrealized gain/(loss) | 3.41 | (0.93 | ) | 2.19 | (2.26 | ) | 2.45 | 1.45 | ||||||||||||||||
| Total from investment operations | 3.14 | (1.00 | ) | 2.09 | (2.39 | ) | 2.35 | 1.36 | ||||||||||||||||
| DISTRIBUTIONS: | ||||||||||||||||||||||||
| From net realized gains | – | (0.17 | ) | (0.80 | ) | (0.41 | ) | (0.14 | ) | (1.61 | ) | |||||||||||||
| Total distributions | – | (0.17 | ) | (0.80 | ) | (0.41 | ) | (0.14 | ) | (1.61 | ) | |||||||||||||
| REDEMPTION FEES ADDED TO PAID-IN CAPITAL (NOTE 6) | 0.00 | (e) | 0.81 | 0.00 | (e) | 0.00 | (e) | 0.00 | (e) | 0.00 | (e) | |||||||||||||
| Net increase/(decrease) in net asset value | 3.14 | (0.36 | ) | 1.29 | (2.80 | ) | 2.21 | (0.25 | ) | |||||||||||||||
| Net asset value, end of period | $ | 15.80 | $ | 12.66 | $ | 13.02 | $ | 11.73 | $ | 14.53 | $ | 12.32 | ||||||||||||
| TOTAL RETURN(f) | 24.80 | % | (1.48 | )% | 18.58 | % | (16.91 | )% | 19.45 | % | 13.31 | % | ||||||||||||
| RATIOS/SUPPLEMENTAL DATA: | ||||||||||||||||||||||||
| Net assets, end of period (000s) | $ | 2,886 | $ | 2,704 | $ | 4,604 | $ | 5,821 | $ | 9,538 | $ | 5,772 | ||||||||||||
| Ratio of expenses to average net assets excluding fee waivers and reimbursements | 1.39 | %(g) | 1.72 | % | 3.27 | % | 2.80 | % | 2.95 | % | 3.83 | % | ||||||||||||
| Ratio of expenses to average net assets including fee waivers and reimbursements | 1.38 | %(g) | 1.40 | %(h) | 1.91 | % | 1.93 | % | 1.90 | % | 1.90 | % | ||||||||||||
| Ratio of net investment loss to average net assets | (1.00 | )%(g) | (0.64 | )% | (0.79 | )% | (0.91 | )% | (0.74 | )% | (0.86 | )% | ||||||||||||
| Portfolio turnover rate(i) | 14 | % | 90 | % | 56 | % | 24 | % | 30 | % | 23 | % | ||||||||||||
| (a) | Prior to December 1, 2017, Investor Class was known as Class A. |
| (b) | Per share amounts and ratios to average net assets include income and expenses of the Kotak Mauritius Portfolio (wholly-owned subsidiary). |
| (c) | Calculated using the average shares method. |
| (d) | The per share amount does not correspond to activity reflected in the Statement of Operations due to class specific expenses during the period. |
| (e) | Less than $0.005 or ($0.005) per share. |
| (f) | Total returns are for the period indicated and have not been annualized. Total returns would have been lower had certain expenses not been waived during the period. Returns shown do not reflect the deduction of taxes that a shareholder would pay on Fund distributions or the redemption of Fund shares. |
| (g) | Annualized. |
| (h) | Effective December 2, 2019, the net expense limitation agreement changed from 1.60% to 1.00%, excluding, among other fees and expenses, 12b-1 fees and shareholder service fees. Refer to Note 8. |
| (i) | Portfolio turnover rate for periods less than one full year have not been annualized. |
See Notes to Financial Statements.
33 | April 30, 2021
ALPS | Kotak India Growth Fund – Class A
Financial Highlights
Selected data for a share of beneficial interest outstanding throughout the periods indicated:
| For the Six Months Ended April 30, 2021 (Unaudited) | For the Year Ended October 31, 2020 | For the Year Ended October 31, 2019 | For the Period June 12, 2018 (Commencement of Operations) to October 31, 2018 | |||||||||||||
| Net asset value, beginning of period | $ | 12.59 | $ | 12.99 | (a) | $ | 11.72 | (a) | $ | 13.90 | (a) | |||||
| INCOME FROM INVESTMENT OPERATIONS: | ||||||||||||||||
| Net investment loss(b) | (0.02 | ) | (0.07 | )(c) | (0.06 | ) | (0.04 | ) | ||||||||
| Net realized and unrealized gain/(loss) | 3.14 | (0.16 | ) | 2.13 | (2.14 | ) | ||||||||||
| Total from investment operations | 3.12 | (0.23 | ) | 2.07 | (2.18 | ) | ||||||||||
| DISTRIBUTIONS: | ||||||||||||||||
| From net realized gains | – | (0.17 | ) | (0.80 | ) | – | ||||||||||
| Total distributions | – | (0.17 | ) | (0.80 | ) | – | ||||||||||
| Net increase/(decrease) in net asset value | 3.12 | (0.40 | ) | 1.27 | (2.18 | ) | ||||||||||
| Net asset value, end of period | $ | 15.71 | $ | 12.59 | $ | 12.99 | $ | 11.72 | ||||||||
| TOTAL RETURN(d) | 24.78 | % | (1.80 | )% | 18.41 | % | (15.68 | )% | ||||||||
| RATIOS/SUPPLEMENTAL DATA: | ||||||||||||||||
| Net assets, end of period (000s) | $ | 956 | $ | 89 | $ | 96 | $ | 8 | ||||||||
| Ratio of expenses to average net assets excluding fee waivers and reimbursements | 1.39 | %(e) | 1.62 | % | 3.24 | % | 3.16 | %(e) | ||||||||
| Ratio of expenses to average net assets including fee waivers and reimbursements | 1.39 | %(e) | 1.31 | %(f) | 1.94 | % | 2.00 | %(e) | ||||||||
| Ratio of net investment loss to average net assets | (1.07 | )%(e) | (0.56 | )% | (0.52 | )% | (0.79 | )%(e) | ||||||||
| Portfolio turnover rate(g) | 14 | % | 90 | % | 56 | % | 24 | % | ||||||||
| (a) | Per share amounts and ratios to average net assets include income and expenses of the Kotak Mauritius Portfolio (wholly-owned subsidiary). |
| (b) | Calculated using the average shares method. |
| (c) | The per share amount does not correspond to activity reflected in the Statement of Operations due to class specific expenses during the period. |
| (d) | Total returns are for the period indicated and have not been annualized. Total returns would have been lower had certain expenses not been waived during the period. Returns shown do not reflect the deduction of taxes that a shareholder would pay on Fund distributions or the redemption of Fund shares. Returns shown exclude any applicable sales charges. |
| (e) | Annualized. |
| (f) | Effective December 2, 2019, the net expense limitation agreement changed from 1.60% to 1.00%, excluding, among other fees and expenses, 12b-1 fees and shareholder service fees. Refer to Note 8. |
| (g) | Portfolio turnover rate for periods less than one full year have not been annualized. |
See Notes to Financial Statements.
34 | April 30, 2021
ALPS | Kotak India Growth Fund – Class C
Financial Highlights
Selected data for a share of beneficial interest outstanding throughout the periods indicated:
| For the Six Months Ended April 30, 2021 (Unaudited) | For the Year Ended October 31, 2020 | For the Year Ended October 31, 2019 | For the Year Ended October 31, 2018 | For the Year Ended October 31, 2017 | For the Year Ended October 31, 2016 | |||||||||||||||||||
| Net asset value, beginning of period | $ | 11.70 | $ | 12.18 | (a) | $ | 11.10 | (a) | $ | 13.87 | (a) | $ | 11.85 | (a) | $ | 12.23 | (a) | |||||||
| INCOME/(LOSS) FROM INVESTMENT OPERATIONS: | ||||||||||||||||||||||||
| Net investment loss(b) | (0.11 | ) | (0.14 | )(c) | (0.17 | ) | (0.21 | ) | (0.18 | ) | (0.16 | ) | ||||||||||||
| Net realized and unrealized gain/(loss) | 2.97 | (0.17 | ) | 2.05 | (2.15 | ) | 2.34 | 1.39 | ||||||||||||||||
| Total from investment operations | 2.86 | (0.31 | ) | 1.88 | (2.36 | ) | 2.16 | 1.23 | ||||||||||||||||
| DISTRIBUTIONS: | ||||||||||||||||||||||||
| From net realized gains | – | (0.17 | ) | (0.80 | ) | (0.41 | ) | (0.14 | ) | (1.61 | ) | |||||||||||||
| Total distributions | – | (0.17 | ) | (0.80 | ) | (0.41 | ) | (0.14 | ) | (1.61 | ) | |||||||||||||
| REDEMPTION FEES ADDED TO PAID-IN CAPITAL (NOTE 6) | – | – | 0.00 | (d) | – | – | 0.00 | (d) | ||||||||||||||||
| Net increase/(decrease) in net asset value | 2.86 | (0.48 | ) | 1.08 | (2.77 | ) | 2.02 | (0.38 | ) | |||||||||||||||
| Net asset value, end of period | $ | 14.56 | $ | 11.70 | $ | 12.18 | $ | 11.10 | $ | 13.87 | $ | 11.85 | ||||||||||||
| TOTAL RETURN(e) | 24.44 | % | (2.58 | )% | 17.69 | % | (17.52 | )% | 18.60 | % | 12.51 | % | ||||||||||||
| RATIOS/SUPPLEMENTAL DATA: | ||||||||||||||||||||||||
| Net assets, end of period (000s) | $ | 1,439 | $ | 1,868 | $ | 2,195 | $ | 2,024 | $ | 2,140 | $ | 1,925 | ||||||||||||
| Ratio of expenses to average net assets excluding fee waivers and reimbursements | 2.01 | %(f) | 2.37 | % | 3.97 | % | 3.51 | % | 3.69 | % | 4.54 | % | ||||||||||||
| Ratio of expenses to average net assets including fee waivers and reimbursements | 2.00 | %(f) | 2.06 | %(g) | 2.60 | % | 2.60 | % | 2.60 | % | 2.60 | % | ||||||||||||
| Ratio of net investment loss to average net assets | (1.59 | )%(f) | (1.29 | )% | (1.47 | )% | (1.57 | )% | (1.48 | )% | (1.56 | )% | ||||||||||||
| Portfolio turnover rate(h) | 14 | % | 90 | % | 56 | % | 24 | % | 30 | % | 23 | % | ||||||||||||
| (a) | Per share amounts and ratios to average net assets include income and expenses of the Kotak Mauritius Portfolio (wholly-owned subsidiary). |
| (b) | Calculated using the average shares method. |
| (c) | The per share amount does not correspond to activity reflected in the Statement of Operations due to class specific expenses during the period. |
| (d) | Less than $0.005 or ($0.005) per share. |
| (e) | Total returns are for the period indicated and have not been annualized. Total returns would have been lower had certain expenses not been waived during the period. Returns shown do not reflect the deduction of taxes that a shareholder would pay on Fund distributions or the redemption of Fund shares. Returns shown exclude any applicable sales charges. |
| (f) | Annualized. |
| (g) | Effective December 2, 2019, the net expense limitation agreement changed from 1.60% to 1.00%, excluding, among other fees and expenses, 12b-1 fees and shareholder service fees. Refer to Note 8. |
| (h) | Portfolio turnover rate for periods less than one full year have not been annualized. |
See Notes to Financial Statements.
35 | April 30, 2021
ALPS | Kotak India Growth Fund – Class I
Financial Highlights
Selected data for a share of beneficial interest outstanding throughout the periods indicated:
| For the Six Months Ended April 30, 2021 (Unaudited) | For the Year Ended October 31, 2020 | For the Year Ended October 31, 2019 | For the Year Ended October 31, 2018 | For the Year Ended October 31, 2017 | For the Year Ended October 31, 2016 | |||||||||||||||||||
| Net asset value, beginning of period | $ | 13.05 | $ | 13.43 | (a) | $ | 12.05 | (a) | $ | 14.87 | (a) | $ | 12.58 | (a) | $ | 12.76 | (a) | |||||||
| INCOME/(LOSS) FROM INVESTMENT OPERATIONS: | ||||||||||||||||||||||||
| Net investment loss(b) | (0.05 | ) | (0.03 | )(c) | (0.05 | ) | (0.08 | ) | (0.06 | ) | (0.06 | ) | ||||||||||||
| Net realized and unrealized gain/(loss) | 3.32 | (0.18 | ) | 2.23 | (2.33 | ) | 2.48 | 1.49 | ||||||||||||||||
| Total from investment operations | 3.27 | (0.21 | ) | 2.18 | (2.41 | ) | 2.42 | 1.43 | ||||||||||||||||
| DISTRIBUTIONS: | ||||||||||||||||||||||||
| From net realized gains | – | (0.17 | ) | (0.80 | ) | (0.41 | ) | (0.14 | ) | (1.61 | ) | |||||||||||||
| Total distributions | – | (0.17 | ) | (0.80 | ) | (0.41 | ) | (0.14 | ) | (1.61 | ) | |||||||||||||
| REDEMPTION FEES ADDED TO PAID-IN CAPITAL (NOTE 6) | 0.00 | (d) | 0.00 | (d) | – | 0.00 | (d) | 0.01 | 0.00 | (d) | ||||||||||||||
| Net increase/(decrease) in net asset value | 3.27 | (0.38 | ) | 1.38 | (2.82 | ) | 2.29 | (0.18 | ) | |||||||||||||||
| Net asset value, end of period | $ | 16.32 | $ | 13.05 | $ | 13.43 | $ | 12.05 | $ | 14.87 | $ | 12.58 | ||||||||||||
| TOTAL RETURN(e) | 25.06 | % | (1.59 | )% | 18.85 | % | (16.66 | )% | 19.68 | % | 13.70 | % | ||||||||||||
| RATIOS/SUPPLEMENTAL DATA: | ||||||||||||||||||||||||
| Net assets, end of period (000s) | $ | 15,000 | $ | 21,861 | $ | 21,989 | $ | 13,746 | $ | 19,891 | $ | 9,772 | ||||||||||||
| Ratio of expenses to average net assets excluding fee waivers and reimbursements | 1.00 | %(f) | 1.36 | % | 2.93 | % | 2.48 | % | 2.65 | % | 3.54 | % | ||||||||||||
| Ratio of expenses to average net assets including fee waivers and reimbursements | 1.00 | %(f) | 1.06 | %(g) | 1.60 | % | 1.60 | % | 1.60 | % | 1.60 | % | ||||||||||||
| Ratio of net investment loss to average net assets | (0.61 | )%(f) | (0.28 | )% | (0.39 | )% | (0.57 | )% | (0.45 | )% | (0.56 | )% | ||||||||||||
| Portfolio turnover rate(h) | 14 | % | 90 | % | 56 | % | 24 | % | 30 | % | 23 | % | ||||||||||||
| (a) | Per share amounts and ratios to average net assets include income and expenses of the Kotak Mauritius Portfolio (wholly-owned subsidiary). |
| (b) | Calculated using the average shares method. |
| (c) | The per share amount does not correspond to activity reflected in the Statement of Operations due to class specific expenses during the period. |
| (d) | Less than $0.005 or ($0.005) per share. |
| (e) | Total returns are for the period indicated and have not been annualized. Total returns would have been lower had certain expenses not been waived during the period. Returns shown do not reflect the deduction of taxes that a shareholder would pay on Fund distributions or the redemption of Fund shares. |
| (f) | Annualized. |
| (g) | Effective December 2, 2019, the net expense limitation agreement changed from 1.60% to 1.00%, excluding, among other fees and expenses, 12b-1 fees and shareholder service fees. Refer to Note 8. |
| (h) | Portfolio turnover rate for periods less than one full year have not been annualized. |
See Notes to Financial Statements.
36 | April 30, 2021
ALPS | Kotak India Growth Fund – Class II
Financial Highlights
Selected data for a share of beneficial interest outstanding throughout the periods indicated:
| For the Six Months Ended April 30, 2021 (Unaudited) | For the Period December 19, 2019 (Commencement of Operations) to October 31, 2020 | |||||||
| Net asset value, beginning of period | $ | 13.08 | $ | 13.50 | (a) | |||
| INCOME FROM INVESTMENT OPERATIONS: | ||||||||
| Net investment income/(loss)(b) | (0.03 | ) | 0.02 | |||||
| Net realized and unrealized gain/(loss) | 3.33 | (0.44 | ) | |||||
| Total from investment operations | 3.30 | (0.42 | ) | |||||
| Net increase/(decrease) in net asset value | 3.30 | (0.42 | ) | |||||
| Net asset value, end of period | $ | 16.38 | $ | 13.08 | ||||
| TOTAL RETURN(c) | 25.23 | % | (3.11 | )% | ||||
| RATIOS/SUPPLEMENTAL DATA: | ||||||||
| Net assets, end of period (000s) | $ | 303,994 | $ | 136,115 | ||||
| Ratio of expenses to average net assets excluding fee waivers and reimbursements | 0.93 | %(d) | 1.18 | %(d) | ||||
| Ratio of expenses to average net assets including fee waivers and reimbursements | 0.75 | %(d) | 0.75 | %(d) | ||||
| Ratio of net investment income/(loss) to average net assets | (0.40 | )%(d) | 0.24 | %(d) | ||||
| Portfolio turnover rate(e) | 14 | % | 90 | % | ||||
| (a) | Per share amounts and ratios to average net assets include income and expenses of the Kotak Mauritius Portfolio (wholly-owned subsidiary). |
| (b) | Calculated using the average shares method. |
| (c) | Total returns are for the period indicated and have not been annualized. Total returns would have been lower had certain expenses not been waived during the period. Returns shown do not reflect the deduction of taxes that a shareholder would pay on Fund distributions or the redemption of Fund shares. |
| (d) | Annualized. |
| (e) | Portfolio turnover rate for periods less than one full year have not been annualized. |
See Notes to Financial Statements.
37 | April 30, 2021
ALPS | Smith Funds
| Management Commentary | April 30, 2021 (Unaudited) |
Dear Shareholder,
The ALPS | Smith Total Return Fund and ALPS | Smith Short Duration Fund were launched on June 29, 2018. We followed with the launch of The ALPS | Smith Balanced Opportunity Fund and ALPS | Smith Credit Opportunities Fund on September 15, 2020. We welcome you as a shareholder to the Funds and thank you for your trust. Our process is centered around performance, relationships and investing excellence. Our goal is to provide shareholders with a consistent, risk-adjusted return with a keen focus on capital preservation.
Total Return
The ALPS | Smith Total Return Bond Fund Class I marked a positive return of 431bps in the twelve-months ending April 30, 2021, while outperforming its benchmark, the Bloomberg Barclays U.S. Aggregate Index, by 458bps. For the six months ending April 30, 2021, the Fund outperformed the index by 77bps and 202bps on an annualized basis since the inception of the fund on June 29, 2018. The outperformance during the six month period was attributed to duration management in Treasuries during the rapid sell-off in interest rates in the beginning of 2021 as well as the Fund’s continued overweight in corporate credit assets during the rally in spreads beginning in June 2020 through April 30, 2021. Valuations were supported by the massive fiscal and monetary stimulus announced and implemented during the second fiscal quarter. Coordinated global Central Bank stimulus and Quantitative Easing operations, as well as large Fiscal stimulus, led to a rapid recovery for risk assets across the spectrum. The overall performance since inception through April 30, 2021 was achieved by focusing on active portfolio positioning, duration management, security selection and bottom-up fundamental credit analysis.
Short Duration
The ALPS | Smith Short Duration Bond Fund Class I marked a positive return of 427bps in the twelve-months ending April 30, 2021, outperforming its benchmark, the Bloomberg Barclays 1-3 Year U.S. Government/Credit Index, by 325bps. For the six months ending April 30, 2021, the Fund outperformed the Index by 2bps and 135bps on an annualized basis since the inception of the Fund on June 29, 2018. As a continuing theme, the Fund’s overallocation to corporate and securitized assets allowed the Fund to out-yield the Index. Additionally, individual security selection within corporate credit was a large component of the excess returns generated in the six month period. With the overall flatness of the front-end U.S. Treasury curve, duration management has provided less relative outperformance given the muted moves in these tenors. In this environment, the Fund maintained its focus on capital preservation. While being overweight on credit by a percentage basis vs. the benchmark, the Fund shortened its credit duration positioning as valuations continued to compress and tried to shield investors from the relative losses associated with the interest rate sell-off more specific to the 3yr and 5yr tenors for this Fund.
Credit Opportunities
The ALPS | Smith Credit Opportunities Fund Class I marked a positive return of 585bps in the six month period ending April 30, 2021, while outperforming its benchmark, a 50/50 blend of the Bloomberg Barclays U.S. Aggregate Index and the Bloomberg Barclays U.S. Corporate High Yield Index, by 271bps. The Fund outperformed the
Index by 303bps since the inception of the Fund on September 15, 2020. The outperformance of the Fund since inception was in part a function of its overweight in corporate credit, as the asset class continued to recover from the pandemic-induced sell-off from earlier in the year. Fiscal and monetary measures have further bolstered credit market instruments, a continuation of the trend since early in the crisis. The fund’s return was also aided by security selection, as positions in both investment grade and high yield rating categories across a variety of sectors that had suffered earlier in the pandemic continued to post particularly strong performance.
Balanced Opportunity
The ALPS | Smith Balanced Opportunity Fund Class I marked a positive return of 1,956bps in the six months ending April 30, 2021, while outperforming its benchmark, a blend of 55% Russell 1000 / 45% Bloomberg Barclays U.S. Aggregate Bond, by 460bps. The Fund outperformed the Index by 558bps since the inception of the Fund on September 15, 2020. The performance within the Fixed Income sleeve during the six month period ended April 30, 2021 was attributed to the Fund’s relative defensive duration positioning and an overweight in corporate credit assets, as well as corporate and securitized security selection during the snap-back in risk asset valuations. Valuations continued to be supported by the massive fiscal and monetary stimulus announced and implemented during the second quarter of 2020. The Fund’s overall performance since inception was achieved by focusing on active portfolio positioning, duration management, security selection, bottom-up fundamental credit analysis and active asset allocation between the Fixed Income and Equity sleeves.
Macro Commentary
While the beginning of the COVID-19 pandemic led to a global shutdown, it was followed by coordinated and aggressive fiscal and monetary stimulus. By June 2020 optimism was rising around the flattening of the virus curve and cities reopening. Data was starting to improve and the combination of fiscal and monetary policy support into improving sentiment lifted risk assets. The optimism started to wane in July as sentiment data points stalled; high frequency data including jobless claims, restaurant bookings and airline travel paused while the government statistics pointed to an uneven recovery. The third quarter followed with continued setbacks, stalled or rolled-back re-openings, and an increase in COVID-19 cases. The second and arguably third wave of COVID-19 hit throughout pockets of the U.S. into the end of the year. It was, however, met with the approval of multiple COVID-19 vaccines, the start of vaccine distribution as well as the election win by President-Elect Joe Biden in November 2020. This once again created positive sentiment in the marketplace that was further reinforced by the “Blue Wave” election win in January 2021, another $1.9 trillion in relief via the American Rescue Plan in March 2021 (COVID stimulus currently sits at $5.3 trillion) and continued monetary support into increased vaccine distribution and pent-up demand. GDP estimates were revised higher, with the market reaction turning favorable for risk assets once again, Treasury yields rose, and inflation expectations moved higher. At the tail end of the first quarter Biden proposed the American Jobs Plan, consisting of over $2 trillion for infrastructure, and the American Families Plan, consisting of $1.8 trillion to support families. Resolution on the proposed bills is expected to occur during the third quarter of 2021.
38 | April 30, 2021
ALPS | Smith Funds
| Management Commentary | April 30, 2021 (Unaudited) |
Manufacturing and Housing have been bright spots throughout the recovery with housing the beneficiary of changing family needs during the shutdown as well as the support of low interest rates. The hospitality industry - restaurants, travel, entertainment – as well as education and brick and mortar retailers, have struggled throughout the pandemic but are optimistic as increased vaccine distribution has translated into reopening local economies. Confidence is recovering; employment is finally starting to improve, and consumers are spending – further enhanced as the Savings Rate rose to 27.6% in March - due to the support of the fiscal stimulus. The first quarter 2021 GDP rose 6.4% with expectations that the second quarter will be up 10%.
Inflation has been on the market’s mind at least since the 2020 election results and expectations rose on the heels of the “Blue Wave” results in January. In our view, reopening an economy and unleashing pent-up demand with the combination of massive fiscal policy and a highly accommodative Federal Reserve is not only a great economic experiment, but one ripe with risks. The market spent much of the first quarter of 2021 assessing if the result of this experiment will end in significant inflation. The concerns around higher inflation are not without merit given the inflation around us in our everyday life. But the Fed, and thus far the data, suggest the upcoming inflationary pressures will be transitory due to rebasing, reopening, and bottlenecks that prove transitory. Given we have not achieved sustainable inflation for many decades, the Fed does have history on its side.
The market is “feeling” inflation. Inflation expectations via the Fed’s 5yr-5yr forward inflation expectation rate are back to levels from 2014, the 10-yr breakeven rate is back to 2013 levels and The University of Michigan’s 1-yr ahead inflation expectations are back to levels from 2012.
The reality is, we do have pockets of inflation – we expect that the combination of the recovery and the base effect will temporarily lift inflation before we normalize in 2022. We know the supply/demand imbalance due to the pandemic did impact sectors differently. Vehicles and appliances cost more but lodging and airline fares fell dramatically. Anecdotally, companies are either passing prices along to the consumer or taking a hit to margins. But the real story lies with labor. Finding and hiring qualified workers remains a challenge across many industries suggesting wage increases could lie on the horizon. As more individuals are hired, we work through supply chain issues, and the economy is fully reopened, inflation could normalize and even turn higher.
The Fed believes that the temporary price increases are transitory due to the “base effect” and “bottlenecks” in the supply chain. On April 28, 2021, Powell stated “If inflation were to move persistently and materially above 2%, the Fed would use its tools to bring inflation down… We understand our job… No one should doubt the Fed would move to contain inflation.” The Fed is committed to being on hold until at least 2023, additionally, regarding purchases, they will continue to “adjust the pace of Treasury securities and agency mortgage-backed securities at least at the current pace to sustain smooth market functioning and help foster accommodative financial conditions, thereby supporting the flow of credit to households and businesses.” We believe it is important to remember that Core PCE
has averaged 1.93% YoY going back to 1990, allowing the Fed the flexibility to let inflation run above their 2% mandate while employment recovers. We remind investors that longer term inflation is largely driven by aggregate demand versus aggregate supply, but changes in short term expectations can have significant impact on valuations in both stocks and bonds. As we look ahead and move past an unprecedented time due to the pandemic, as of the date of this report, we believe that the duration and durability of the current economic recovery will be more robust than the consensus. And while our view of a stronger, longer, and potentially more durable recovery are a central theme, we still acknowledge that risks remain. As confidence and confirmation around the recovery accelerates, we see opportunities for this theme to gain greater momentum in the marketplace. We believe the recovery will start to gain momentum and one of the residual outcomes of greater confidence in the recovery will be the return of shareholder-friendly activities. Increased dividends, share repurchases, mergers and acquisitions, and more aggressive investment seem like logical outcomes. However, we could also see a wave of deleveraging from both accelerating growth and focused debt reduction. We believe the focus on efficiency and productivity during the pandemic should feed higher margins, greater free cash flow generation, and a lot of optionality for management teams. Our ongoing belief in mini-cycles and the speed of capital has our attention. Not a day goes by without evidence of these themes. The relationship between stocks and bonds will be an ongoing focus as well. We find this to be one of the more important considerations in thinking about risk management and managing through these dynamic markets.
Portfolio Positioning
Despite the recent rise in U.S. Treasury yields due to increasing stimulus expectations, continued monetary policy support, and ramping concerns surrounding inflation, the Funds remained underweight duration versus their respective benchmarks during the period and in our opinion, have been nimble in using longer duration securities within the Funds’ portfolios. While we are encouraged by the return to positive real rates for longer duration U.S. Treasuries, as of the date of this report, we continue to focus on the combined impact of Fiscal and Monetary stimulus on both real inflation as well as changes in the markets expectations surrounding inflation. We are also focused on the shape of the curve as the front-end is extremely flat, however concerns around the Fed’s ability to control inflation are gathering and may eventually impact longer duration Treasuries. We remain proactive in managing our longer duration U.S. Treasury position.
We made changes to the Funds' credit portfolios this year. Coming into 2021 we were optimistic around the potential for continued progress in the global reopening and economic recovery. Despite some fits and starts in this process, as of the date of this report, we remain positive on the improving tone of both the domestic as well as the global economy going forward. However, as part of this we witnessed risk asset spreads, be it Investment Grade or High Yield Credit, as well as Agency and Non-Agency MBS and CMBS, quickly moving toward decade, if not all-time lows given the wall of liquidity in the market and the prevailing stance on risk taking. As such we reduced both the overall credit weighting as well as the duration profile of certain Funds’ credit sleeves during the period, specifically in both the ALPS | Smith Balanced Opportunity Fund and ALPS |
39 | April 30, 2021
ALPS | Smith Funds
| Management Commentary | April 30, 2021 (Unaudited) |
Smith Total Return Fund. This reduction has allowed us to focus our exposure on where we see continued fundamental tailwinds to sector or individual company’s credit profiles. While we continue to like credit despite the massive tightening in spreads, as it remains one of the few asset classes within Fixed Income providing yield, we believe this decreased risk exposure will allow the portfolio to be more resilient and opportunistic when looking towards the potential for unexpected outcomes combined with stretched valuations. As of the date of this report, we continue to target investing in companies with management teams who focus on managing through downside scenarios, giving themselves optionality as well as downside protection. We remain encouraged by the number of companies continuing to balance capital allocation actions that benefit both debt and equity holders, but absent another significant risk flare, we would expect this trend to continue to shift more in favor of equity holders. All these factors have continued to drive our disciplined process centered around risk-adjusted returns and capital preservation while seeking to balance the overall need for yield across all developed markets.
Short duration high yield continues to be a focus at Smith Capital Investors. In our opinion, this area of the market has much less forecasting error embedded in its analysis as it is a liquidity analysis evaluation over a very short period vs. longer-term projections on industries, commodity prices, and competitive dynamics facing a sector/company. In our opinion, we are not being compensated to extend out the curve given flat U.S. Treasury maturities out to 5 years, and therefore these types of assets result in extremely attractive risk-adjusted return profiles.
Within the Funds’ securitized allocations, we continue to allocate to agency-mortgage-backed collateralized mortgage obligations (CMOs) and agency guaranteed commercial mortgage-backed securities (CMBS) where valuations are appropriate. In the previous six month period, we witnessed spreads reaching new lows as the demand from the Federal Reserve and commercial banks overwhelmed the supply dynamic. While we still find that select CMOs and Agency CMBS provide better convexity, exhibit less change in duration given changes in interest rates and prepayment speeds, and provide higher option-adjusted spreads and yield, these opportunities have become harder to come by. As such, the Funds’ overall weightings to this asset class passively decreased during the period as we did not reinvest in paydowns or allocate new money to this space given our unfavorable view of generic asset class risk-adjusted return potential. Additionally, with the significant rise in interest rates during the beginning of 2021, we witnessed a large-scale duration extension of the Agency MBS market, exactly at the time investors were searching for shorter duration options. We were aided in this volatility by our continued focus on seeking to select securities that perform well through a wide band of underlying assumptions rather than a specific directional view.
Fixed Income Themes
Stock-Bond Correlation – Over very long periods of time, stocks and bonds have displayed a positive correlation, which academics would attribute to the discount rate driving the value of a corporation’s cash flows and hence, stock price. However, since the late 1990s, stocks and bonds have been negatively correlated, driven by flight-to-quality characteristics of bond prices. This has been a
form of nirvana for investors, as both bonds and stocks produced solidly positive returns in the historic context of the market while the negative correlation between the asset classes reduced portfolio volatility.
Similar to the rate sell-off in the second half of 2016, as the Treasury market sharply sold off in the first quarter of 2021, the stock-bond correlation turned positive. Higher rates, and perhaps more importantly the pace of the move, weighed on equities and pushed both markets down (at times) and flipped the correlation to positive. This reminds us of the positive tailwind that rates (and easy monetary policy) were for equities during 2020 and indeed for the last twenty years, as sell-offs rarely upset the gravitational pull of the zero-bound and allow stock investors to discount cash flows at ever lower rates.
If it is inevitable that rates are headed higher (granted it is not), spurred by increases in real rates, inflation (real or perceived), or both, we could be entering a completely different correlation regime than investors have experienced the last twenty years, but one that would be consistent with the long-run history of markets.
Meaningful upward shifts in interest rates have been few and far between for most of today’s market participants. If the strength we see on the horizon for the economy and the inflation outlook plays out close to expectations, investors could be exposed to bond market weakness bleeding into risk assets, causing mark-to-market pain but also drawing broader questions regarding portfolio construction in an era of positive stock-bond correlations.
As of the date of this report, we view the recent back up in rates and a return to positive real rates in the long end of the market as very healthy. We believe watching the correlation and relationships between bonds and stocks is absolutely critical.
Capital Allocations – Over the course of the past year, enormous amounts of liquidity were raised and/or preserved in the face of surfacing uncertainty. For some companies, liquidity stockpiling proved necessary. At other companies, it is proving to be a wise cautionary step, but perhaps also excessive. With excess, underpinned by increasing assurance of a better future, often comes optionality. As we look out over the next few months, we continue to believe the already hastening pace of M&A, dividend increases, new share repurchase authorizations, etc. will quicken. Understanding how changing capital allocation decisions can impact a creditor is important from our perspective. Additionally, we believe sifting through and understanding the nuances will be key.
As we work through the 1Q21 earnings season we are getting more and more confirming data points that corporate confidence is increasing as of the end of the period. And, with that, as of the date of this report, we are seeing shifting capital allocation decisions, which we would characterize broadly as a transition from defensive optionality to offensive optionality. Ultimately, we monitor the changing of these tides because we believe there are real investment implications behind the swells – investors who can successfully navigate the changing risk versus opportunity landscape can create better outcomes over time.
40 | April 30, 2021
ALPS | Smith Funds
| Management Commentary | April 30, 2021 (Unaudited) |
We also see management teams that may use excessive liquidity and capital to right-size their capital structures via debt reduction and/or cleaning up short-term maturities. As we move into a more shareholder-friendly environment, we are reminded of the importance of security selection and, more importantly, security avoidance.
Credit – Back to All-time Tights – The Bloomberg Barclays U.S. Corporate Investment Grade and High Yield Indices are trading at or near record-low option adjusted spreads (OAS) over the trailing 10-year period. As students of history, we are cognizant that investing new capital at record-low valuations has not been a great formula for generating strong future returns. We find ourselves focusing on the drivers of current credit valuations and the durability of these factors to navigate the current risk-versus-reward environment as effectively as possible.
The strongest driver of spread tightening over the past year has been accommodative monetary and fiscal stimulus. Looking forward, the Fed appears unlikely to shift its accommodative stance unless underlying economic data trends move sharply above current expectations. The outlook on the fiscal side is less clear, but the economic impact of a sustainable recovery led by large-scale infrastructure spending may offset the impact of a higher tax drag.
Another powerful driver of performance during the period was the economic rebound following the sharp declines of early 2020. The fundamental outlook for corporate earnings has been improving, not only due to this resurgence in activity but also due to the adoption of leaner and more efficient operating models that are largely expected to drive higher margin profiles in the future. The improving outlook appears to have some runway given strong consumer confidence, the highly liquid corporate and consumer balance sheets that exist today, as well as the potential for pent-up demand being unleashed across a number of industries as COVID-related restrictions continue to ease.
In our view, the above factors have created a strong technical backdrop for corporate credit, with significant inflows driving elevated buying activity. While historically tight valuations may impact future flows, other factors driving inflows into corporate credit remain in place – namely the need for yield in a yield-starved world and the relative attractiveness of U.S. corporate credit versus other alternatives.
MBS – MBS has been highlighted by many as one of the few bright spots during the six month period. Year-to-date ending April 30, 2021, the Bloomberg Barclays U.S. MBS Index (MBS) has outperformed the Bloomberg Barclays U.S. Aggregate Bond Index (the “Agg”) by ~250 bps.
However, this does not tell the entire story as the MBS index has a duration that has averaged ~2 years YTD while the duration of the Agg is ~6 years. From an excess return perspective, which adjusts for this duration differential, the Bloomberg Barclays MBS Index’s outperformance versus the Agg is much smaller at only +30 bps. Also, comparing the MBS index to broad fixed income market indices with a similar short duration, MBS underperformed the Bloomberg
Barclays 1-5 Year U.S. Credit Index (with a duration of 2.8 years), by 5 bps YTD.
Looking forward we see the case for continued MBS outperformance to be tricky at best. MBS OAS is currently at 10 bps, while the nominal spread (which does not account for the option MBS investors are short) is only 34 bps. Both measures are very low by historical standards, leaving little room in our minds for excess return beyond pure duration positioning. With the MBS market currently running into high levels of negative convexity due to higher rates, even that duration trade is being questioned. The move in interest rates has caused the MBS index duration to extend from under 2 years to 3.6 years in about a month. Any further interest rate sell-off will continue pushing MBS durations higher, increasing the negative return potential from higher rates. The performance of mortgages has been driven much more by duration differentials rather than excess outperformance from the asset class. At April 30, 2021 stretched valuations and elevated convexity risk levels, we do not see this outperformance being sustainable going forward. As is often with markets, peeling back the variables affecting performance, especially relative performance, can tell a different story than a headline.
Interest Rates – Price action from U.S. Treasuries was ahead of the market in the first few months of the 2021, providing a healthy reminder that recovery was indeed in our future. After a fast and furious sell-off in U.S. Treasuries (yields moving higher), rates rallied before finally reaching a point of consolidation by mid-March. There are many reasons for this pause, similar to the move higher in yields reflecting a healthy confidence in the future recovery, the recent pause also reflects a healthy repricing of risk-free assets. The timing, however, did not necessarily line up with the positive momentum from the economic data (remember economic data does lag) and therefore was a good reminder that this leg of the recovery is priced into the market and we are now in the validation phase. While in the validation phase, active management of duration and curves becomes even more important.
U.S. Treasury yields moved higher in a fast and furious manner starting with the ‘Blue Wave’ results in January. This was further supported by the efficacy of the vaccine, additional fiscal stimulus, and prospects of economic reopening, all pointing to improving growth and inflation expectations. The street upgraded growth forecasts, inflation expectations rose, and the market challenged the Fed’s view that they would be able to control inflation.
In an interesting turn of events, Treasuries started to rally and then consolidate right as the economic data was gaining positive upward momentum. This suggests a good amount of positive news was already priced into the Treasury market. This was not the entire story however as a collision of forces including fatigue, short-covering, global tensions, demand from Japan, pension buying, and the fourth wave from COVID-19 globally likely all impacted Treasury demand.
Our fundamental thesis remains intact: we are reopening, pent-up demand is being unleashed, the vaccine is being distributed, and as of the date of this report, continue to have supportive fiscal and monetary policy. That being said, the rally reminded us we still live
41 | April 30, 2021
ALPS | Smith Funds
| Management Commentary | April 30, 2021 (Unaudited) |
within a two-steps forward, one-step back environment. The virus remains a risk, and there is always a possibility the market will disconnect from the Fed, or inflation, debt, and deficit fears will rise once again.
In a world of heightened risk and uncertainty, we continue to acknowledge what can go wrong, but also how far the economy has come with the support of both fiscal and monetary policy. The repricing and recovery in markets over the twelve months ending April 30, 2021 led to an opportunity to generate returns during the period. We ask ourselves what a stronger, longer, and more durable recovery would mean for fixed income, but also question the risks associated with any perception of permanent scarring and less stability in the recovery. We strongly feel we are in the validation phase of the recovery which allows for more two-way flows, creating new opportunities. We believe there are still opportunities in the fixed income space via fundamentally improving credit stories and actively managing duration and interest rate risks. Given how far markets have improved, and the expected volatility on the horizon, we reoriented the funds’ portfolios during the period to provide more optionality for future opportunities.
We find ourselves defaulting to our three pillars when launching the firm – Investment Excellence, Relationships/People and Intentional Culture and are always looking for ways to improve in these areas.
With great appreciation and gratitude,
 |
 |
| R. Gibson Smith | Eric C. Bernum, CFA |
| Portfolio Manager | Portfolio Manager |
 |
|
| Steve Zamsky | |
| Portfolio Manager |
Past performance is no guarantee of future results. Dividends are not guaranteed and are subject to change or elimination. Investments in international and emerging markets securities include exposure to risks such as currency fluctuations, foreign taxes and regulations, and the potential for illiquid markets and political instability.
The views of the author and information discussed in this commentary are as of the date of publication, are subject to change, and may not reflect the writer's current views. The views expressed are those of the author only, and represent an assessment of market conditions at a specific point in time, are opinions only and should not be relied upon as investment advice regarding a particular investment or markets in general. Such information does not constitute a recommendation to buy or sell specific securities or investment vehicles. It should not be assumed that any investment will be profitable or will equal the performance of the fund(s) or any securities or any sectors mentioned in this letter. The subject matter contained in this letter has been derived from several sources
believed to be reliable and accurate at the time of compilation. Neither ALPS Advisors, Inc., Smith Capital Investors, LLC, nor the Funds accepts any liability for losses either direct or consequential caused by the use of this information.
Indices do not reflect deductions for fees, expenses, or taxes.
An investor may not invest directly in an index.
Diversification cannot guarantee gain or prevent losses.
Gibson Smith is a registered representative of ALPS Distributors, Inc.
Eric Bernum is a registered representative of ALPS Distributors, Inc.
ALPS Portfolio Solutions Distributor, Inc., ALPS Distributors, Inc. and ALPS Advisors Inc. are affiliated.
42 | April 30, 2021
ALPS | Smith Short Duration Bond Fund
| Performance Update | April 30, 2021 (Unaudited) |
Performance of $100,000 Initial Investment (as of April 30, 2021)
Comparison of change in value of a $100,000 investment

The chart above represents historical performance of a hypothetical investment of $100,000 in the Fund since inception. Past performance does not guarantee future results. This chart does not reflect the deduction of taxes that a shareholder would pay on Fund distributions or the redemption of Fund shares.
Average Annual Total Returns (as of April 30, 2021)
| 6 Month | 1 Year | Since Inception^ | Total Expense Ratio | What You Pay* | |
| Class I | 0.95% | 4.27% | 4.49% | 0.70% | 0.49% |
| Investor (NAV) | 0.80% | 4.00% | 4.20% | 0.96% | 0.79% |
| Class A (NAV) | 0.80% | 3.98% | 4.17% | 0.96% | 0.79% |
| Class A (MOP) | -1.43% | -1.72% | 2.12% | ||
| Class C (NAV) | 0.45% | 3.27% | 3.45% | 1.67% | 1.49% |
| Class C (CDSC) | -0.55% | 2.27% | 3.45% | ||
| Bloomberg Barclays U.S. Government/Credit Bond Index¹ | -2.06% | -0.46% | 5.74% | ||
| Bloomberg Barclays 1-3 Year Government/Credit Bond Index² | 0.23% | 1.02% | 3.14% |
Performance data quoted represents past performance. Past performance does not guarantee future results. Investment return and principal value of an investment will fluctuate so that an investor's shares, when sold or redeemed, may be worth more or less than the original cost. Current performance data may be higher or lower than actual data quoted. For the most current month-end performance data, please call 1-866-759-5679.
Effective September 1, 2020 the Maximum Offering Price (MOP) for Class A shares includes the Fund’s maximum sales charge of 2.25%. Prior to September 1, 2020 the sales charge was 5.50%. Performance shown at NAV does not include these sales charges and would have been lower had it been taken into account. If you invest $500 thousand or more, either as a lump sum or through the Fund’s accumulation or letter of intent programs, you can purchase Class A shares without an initial sales charge (load). A Contingent Deferred Sales Charge (“CDSC”) of 1.00% may apply to Class C shares redeemed within the first 12 months after a purchase, and on Class A shares redeemed within the first 18 months after a purchase in excess of $1 million.
Performance less than 1 year is cumulative.
43 | April 30, 2021
ALPS | Smith Short Duration Bond Fund
| Performance Update | April 30, 2021 (Unaudited) |
| 1 | The Bloomberg Barclays US Government/Credit Index: composed of all publicly issued, fixed-rate, nonconvertible, investment-grade corporate debt. Issues are rated at least Baa by Moody's Investors Service or BBB by Standard & Poor's, if unrated by Moody's. Collateralized Mortgage Obligations (CMOs) are not included. Total return comprises price appreciation/depreciation and income as a percentage of the original investment. The index is not actively managed and does not reflect any deductions for fees, expenses or taxes. An investor may not invest directly in an index. |
| 2 | The Bloomberg Barclays 1-3 Yr US Gov/Credit TR Index Unhedged: an index that includes all medium and larger issues of U.S. government, investment-grade corporate, and investment-grade international dollar-denominated bonds that have maturities of between 1 and 3 years and are publicly issued. The index is not actively managed and does not reflect any deductions for fees, expenses or taxes. An investor may not invest directly in an index. |
| ^ | Fund Inception date of June 29, 2018. |
| * | What You Pay reflects the Advisor’s decision to contractually limit expenses through February 28, 2022. Please see the prospectus dated February 28, 2021 for additional information. |
The table does not reflect the deduction of taxes that a shareholder would pay on Fund distributions or the redemption of Fund shares.
This Fund is not suitable for all investors, and is subject to investment risks, including possible loss of the principal amount invested.
There is no guarantee that the Fund will continue to hold any one particular security or stay invested in any one particular company. The composition of the Fund's top holdings is subject to change. Performance figures are historical and reflect the change in share price, reinvested distributions, changes in net asset value, sales charges and capital gains distributions, if any.
Not FDIC Insured – No Bank Guarantee – May Lose Value
| Asset Type Allocation (as a % of Net Assets) † | |
| Corporate Bond | 73.89% |
| Government Bond | 19.47% |
| Mortgage-Backed Securities | 3.33% |
| Collateralized Mortgage Obligations | 0.65% |
| Commercial Mortgage-Backed Securities | 0.32% |
| Municipal Bond | 0.07% |
| Cash, Cash Equivalents, & Other Net Assets | 2.27% |
| Total | 100.00% |
| † | Holdings are subject to change, and may not reflect the current or future position of the portfolio. Table presents approximate values only. |
| Top Ten Holdings (as a % of Net Assets) † | |
| U.S. Treasury Note 0.125% 12/31/2022 | 4.07% |
| U.S. Treasury Note 0.125% 03/31/2023 | 2.98% |
| U.S. Treasury Note 0.125% 02/28/2023 | 2.72% |
| U.S. Treasury Note 0.125% 09/30/2022 | 2.70% |
| U.S. Treasury Note 0.125% 11/30/2022 | 2.69% |
| U.S. Treasury Note 0.125% 01/31/2023 | 2.37% |
| Lumen Technologies, Inc. 6.45% 06/15/2021 | 1.49% |
| Steel Dynamics, Inc. 5% 12/15/2026 | 1.45% |
| Viatris, Inc. 1.125% 06/22/2022 | 1.40% |
| Jaguar Holding Co. II / PPD Development LP 4.625% 06/15/2025 | 1.21% |
| Top Ten Holdings | 23.08% |
| † | Holdings are subject to change, and may not reflect the current or future position of the portfolio. Table presents approximate values only. |
Industry Sector Allocation (as a % of Net Assets)
| Sovereign | 19.47% |
| Financial Services | 7.51% |
| Automobiles Manufacturing | 7.18% |
| Banks | 5.81% |
| Utilities | 5.75% |
| Pharmaceuticals | 5.05% |
| Diversified Banks | 4.58% |
| Mortgage Securities | 4.30% |
| Consumer Finance | 3.22% |
| Health Care Facilities & Services | 2.96% |
| Pipeline | 2.79% |
| Aerospace & Defense | 2.26% |
| Refining & Marketing | 2.11% |
| Wireline Telecommunications Services | 1.98% |
| Cable & Satellite | 1.71% |
| Software & Services | 1.47% |
| Metals & Mining | 1.45% |
| Commercial Finance | 1.33% |
| Supermarkets & Pharmacies | 1.31% |
| Chemicals | 1.21% |
| Wireless Telecommunications Services | 1.12% |
| Medical Equipment & Devices Manufacturing | 1.06% |
| Retail - Consumer Discretionary | 1.06% |
| Other Industries (each less than 1%) | 11.04%* |
| Cash Equivalents & Other Net Assets | 2.27% |
| Total | 100.00% |
| * | See Statement of Investments for detailed breakout of other industries. |
44 | April 30, 2021
ALPS | Smith Total Return Bond Fund
| Performance Update | April 30, 2021 (Unaudited) |
Performance of $100,000 Initial Investment (as of April 30, 2021)
Comparison of change in value of a $100,000 investment

The chart above represents historical performance of a hypothetical investment of $100,000 in the Fund since inception. Past performance does not guarantee future results. This chart does not reflect the deduction of taxes that a shareholder would pay on Fund distributions or the redemption of Fund shares.
Average Annual Total Returns (as of April 30, 2021)
| 6 Month | 1 Year | Since Inception^ | Total Expense Ratio | What You Pay* | |
| Class I | 0.39% | 4.31% | 7.30% | 0.72% | 0.67% |
| Investor (NAV) | 0.24% | 3.92% | 6.96% | 1.02% | 0.97% |
| Class A (NAV) | 0.24% | 3.92% | 6.98% | 1.01% | 0.97% |
| Class A (MOP) | -1.98% | -1.80% | 4.88% | ||
| Class C (NAV) | -0.10% | 3.20% | 6.23% | 1.72% | 1.67% |
| Class C (CDSC) | -1.08% | 2.20% | 6.23% | ||
| Bloomberg Barclays US Aggregate Bond Index1 | -1.52% | -0.27% | 5.28% |
Performance data quoted represents past performance. Past performance does not guarantee future results. Investment return and principal value of an investment will fluctuate so that an investor's shares, when sold or redeemed, may be worth more or less than the original cost. Current performance data may be higher or lower than actual data quoted. For the most current month-end performance data, please call 1-866-759-5679.
Effective September 1, 2020 the Maximum Offering Price (MOP) for Class A shares includes the Fund’s maximum sales charge of 2.25%. Prior to September 1, 2020 the sales charge was 5.50%. Performance shown at NAV does not include these sales charges and would have been lower had it been taken into account. If you invest $500 thousand or more, either as a lump sum or through the Fund’s accumulation or letter of intent programs, you can purchase Class A shares without an initial sales charge (load). A Contingent Deferred Sales Charge (“CDSC”) of 1.00% may apply to Class C shares redeemed within the first 12 months after a purchase, and on Class A shares redeemed within the first 18 months after a purchase in excess of $1 million.
Performance less than 1 year is cumulative.
45 | April 30, 2021
ALPS | Smith Total Return Bond Fund
| Performance Update | April 30, 2021 (Unaudited) |
| 1 | The Bloomberg Barclays U.S. Aggregate Bond Index provides a measure of the performance of the U.S. dollar denominated investment grade bond market, which includes investment grade government bonds, investment grade corporate bonds, mortgage pass through securities, commercial mortgage backed securities and asset backed securities that are publicly for sale in the United States. The index is not actively managed and does not reflect any deductions for fees, expenses or taxes. An investor may not invest directly in an index. |
| ^ | Fund Inception date of June 29, 2018. |
| * | What You Pay reflects the Advisor’s decision to contractually limit expenses through February 28, 2022. Please see the prospectus dated February 28, 2021 for additional information. |
The table does not reflect the deduction of taxes that a shareholder would pay on Fund distributions or the redemption of Fund shares.
This Fund is not suitable for all investors, and is subject to investment risks, including possible loss of the principal amount invested.
There is no guarantee that the Fund will continue to hold any one particular security or stay invested in any one particular company. The composition of the Fund's top holdings is subject to change. Performance figures are historical and reflect the change in share price, reinvested distributions, changes in net asset value, sales charges and capital gains distributions, if any.
Not FDIC Insured – No Bank Guarantee – May Lose Value
Asset Type Allocation (as a % of Net Assets) †
| Corporate Bond | 57.04% |
| Government Bond | 22.42% |
| Collateralized Mortgage Obligations | 8.11% |
| Mortgage-Backed Securities | 5.95% |
| Commercial Mortgage-Backed Securities | 3.21% |
| Preferred Stock | 0.60% |
| Cash, Cash Equivalents, & Other Net Assets | 2.67% |
| Total | 100.00% |
| † | Holdings are subject to change, and may not reflect the current or future position of the portfolio. Table presents approximate values only. |
Top Ten Holdings (as a % of Net Assets) †
| U.S. Treasury Note 0.75% 03/31/2026 | 3.16% |
| U.S. Treasury Note 0.5% 02/28/2026 | 2.89% |
| U.S. Treasury Bond 1.875% 02/15/2051 | 2.66% |
| U.S. Treasury Bond 1.125% 02/15/2031 | 2.56% |
| U.S. Treasury Note 0.625% 08/15/2030 | 2.42% |
| U.S. Treasury Note 0.125% 12/15/2023 | 1.93% |
| U.S. Treasury Bond 1.375% 08/15/2050 | 1.45% |
| U.S. Treasury Bond 1.375% 11/15/2040 | 1.40% |
| U.S. Treasury Note 0.125% 01/31/2023 | 1.39% |
| U.S. Treasury Bond 0.875% 11/15/2030 | 1.37% |
| Top Ten Holdings | 21.23% |
| † | Holdings are subject to change, and may not reflect the current or future position of the portfolio. Table presents approximate values only. |
Industry Sector Allocation (as a % of Net Assets)
| Sovereign | 22.42% |
| Mortgage Securities | 17.27% |
| Banks | 5.28% |
| Pharmaceuticals | 4.55% |
| Financial Services | 4.37% |
| Automobiles Manufacturing | 3.55% |
| Diversified Banks | 3.50% |
| Consumer Finance | 2.87% |
| Pipeline | 2.77% |
| Aerospace & Defense | 2.57% |
| Software & Services | 2.26% |
| Cable & Satellite | 2.24% |
| Utilities | 2.08% |
| Commercial Finance | 1.87% |
| Semiconductors | 1.50% |
| Health Care Facilities & Services | 1.49% |
| Power Generation | 1.46% |
| Airlines | 1.42% |
| Refining & Marketing | 1.40% |
| Wireless Telecommunications Services | 1.37% |
| Publishing & Broadcasting | 1.04% |
| Other Industries (each less than 1%) | 10.05%* |
| Cash Equivalents & Other Net Assets | 2.67% |
| Total | 100.00% |
| * | See Statement of Investments for detailed breakout of other industries. |
46 | April 30, 2021
ALPS | Smith Credit Opportunities Fund
| Performance Update | April 30, 2021 (Unaudited) |
Performance of $100,000 Initial Investment (as of April 30, 2021)
Comparison of change in value of a $100,000 investment
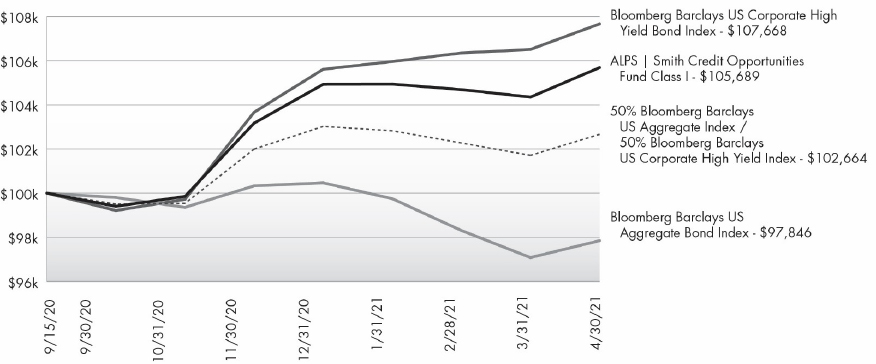
The chart above represents historical performance of a hypothetical investment of $100,000 in the Fund since inception. Past performance does not guarantee future results. This chart does not reflect the deduction of taxes that a shareholder would pay on Fund distributions or the redemption of Fund shares.
Average Annual Total Returns (as of April 30, 2021)
| 6 Month | Since Inception^ | Total Expense Ratio | What You Pay* | |
| Class I | 5.85% | 5.69% | 1.02% | 0.90% |
| Investor (NAV) | 5.70% | 5.46% | 1.32% | 1.20% |
| Class A (NAV) | 5.70% | 5.46% | 1.32% | 1.20% |
| Class A (MOP) | 3.31% | 3.09% | ||
| Class C (NAV) | 5.33% | 5.00% | 2.02% | 1.90% |
| Class C (CDSC) | 4.33% | 4.00% | ||
| 50% Bloomberg Barclays US Aggregate Index / 50% Bloomberg Barclays US Corporate High Yield Index1,2 | 3.14% | 2.66% | ||
| Bloomberg Barclays US Aggregate Bond Index | -1.52% | -2.15% | ||
| Bloomberg Barclays US Corporate High Yield Bond Index | 7.97% | 7.67% |
Performance data quoted represents past performance. Past performance does not guarantee future results. Investment return and principal value of an investment will fluctuate so that an investor's shares, when sold or redeemed, may be worth more or less than the original cost. Current performance data may be higher or lower than actual data quoted. For the most current month-end performance data, please call 1-866-759-5679.
Maximum Offering Price (MOP) for Class A shares includes the Fund’s maximum sales charge of 2.25%. Performance shown at NAV does not include these sales charges and would have been lower had it been taken into account. If you invest $500 thousand or more, either as a lump sum or through the Fund’s accumulation or letter of intent programs, you can purchase Class A shares without an initial sales charge (load). A Contingent Deferred Sales Charge (“CDSC”) of 1.00% may apply to Class C shares redeemed within the first 12 months after a purchase, and on Class A shares redeemed within the first 18 months after a purchase in excess of $1 million.
Performance less than 1 year is cumulative.
47 | April 30, 2021
ALPS | Smith Credit Opportunities Fund
| Performance Update | April 30, 2021 (Unaudited) |
| 1 | Bloomberg Barclays US Aggregate Bond Index: provides a measure of the performance of the U.S. dollar denominated investment grade bond market, which includes investment grade government bonds, investment grade corporate bonds, mortgage pass through securities, commercial mortgage backed securities and asset backed securities that are publicly for sale in the United States. The index is not actively managed and does not reflect any deduction for fees, expenses or taxes. An investor may not invest directly in an index. |
| 2 | Bloomberg Barclays US Corporate High Yield Index measures the USD-denominated, high yield, fixed-rate corporate bond market. The index is not actively managed and does not reflect any deduction for fees, expenses or taxes. An investor may not invest directly in an index. |
| ^ | Fund Inception date of September 15, 2020. The Fund has limited operating history. |
| * | What You Pay reflects the Advisor’s decision to contractually limit expenses through February 28, 2022. Please see the prospectus dated February 28, 2021 for additional information. |
The table does not reflect the deduction of taxes that a shareholder would pay on Fund distributions or the redemption of Fund shares.
This Fund is not suitable for all investors, and is subject to investment risks, including possible loss of the principal amount invested.
There is no guarantee that the Fund will continue to hold any one particular security or stay invested in any one particular company. The composition of the Fund's top holdings is subject to change. Performance figures are historical and reflect the change in share price, reinvested distributions, changes in net asset value, sales charges and capital gains distributions, if any.
Not FDIC Insured – No Bank Guarantee – May Lose Value
Asset Type Allocation (as a % of Net Assets) †
| Corporate Bond | 77.15% |
| Government Bond | 10.48% |
| Exchange Traded Funds | 4.15% |
| Preferred Stock | 1.60% |
| Common Stock | 0.16% |
| Cash, Cash Equivalents, & Other Net Assets | 6.46% |
| Total | 100.00% |
| † | Holdings are subject to change, and may not reflect the current or future position of the portfolio. Table presents approximate values only. |
Top Ten Holdings (as a % of Net Assets) †
| Invesco Senior Loan ETF | 2.71% |
| U.S. Treasury Note 0.125% 02/28/2023 | 1.74% |
| CCO Holdings LLC / CCO Holdings Capital Corp. 4.5% 05/01/2032 | 1.73% |
| U.S. Treasury Note 1.125% 02/29/2028 | 1.69% |
| Bausch Health Cos., Inc. 6.125% 04/15/2025 | 1.65% |
| U.S. Treasury Note 0.75% 03/31/2026 | 1.53% |
| Nissan Motor Co., Ltd. 4.81% 09/17/2030 | 1.53% |
| U.S. Treasury Note 0.375% 01/31/2026 | 1.44% |
| iShares iBoxx High Yield Corporate Bond ETF | 1.44% |
| FS KKR Capital Corp. 3.4% 01/15/2026 | 1.36% |
| Top Ten Holdings | 16.82% |
| † | Holdings are subject to change, and may not reflect the current or future position of the portfolio. Table presents approximate values only. |
Industry Sector Allocation (as a % of Net Assets)
| Sovereign | 10.48% |
| Financial Services | 6.10% |
| Pipeline | 4.97% |
| Automobiles Manufacturing | 4.46% |
| Real Estate | 4.31% |
| Pharmaceuticals | 3.85% |
| Utilities | 3.75% |
| Consumer Finance | 3.67% |
| Commercial Finance | 3.54% |
| Publishing & Broadcasting | 3.52% |
| Casinos & Gaming | 3.29% |
| Airlines | 3.26% |
| Banks | 2.11% |
| Refining & Marketing | 1.93% |
| Chemicals | 1.75% |
| Cable & Satellite | 1.74% |
| Power Generation | 1.74% |
| Industrial Other | 1.69% |
| Software & Services | 1.62% |
| Exploration & Production | 1.59% |
| Industrials | 1.44% |
| Advertising & Marketing | 1.42% |
| Waste & Environment Services & Equipment | 1.31% |
| Internet Media | 1.29% |
| Wireline Telecommunications Services | 1.22% |
| Consumer Discretionary | 1.13% |
| Department Stores | 1.12% |
| Homebuilders | 1.09% |
| Other Industries (each less than 1%) | 14.15%* |
| Cash Equivalents & Other Net Assets | 6.46% |
| Total | 100.00% |
| * | See Statement of Investments for detailed breakout of other industries. |
48 | April 30, 2021
| ALPS | Smith Balanced Opportunity Fund | |
| Performance Update | April 30, 2021 (Unaudited) |
Performance of $100,000 Initial Investment (as of April 30, 2021)
Comparison of change in value of a $100,000 investment

The chart above represents historical performance of a hypothetical investment of $100,000 in the Fund since inception. Past performance does not guarantee future results. This chart does not reflect the deduction of taxes that a shareholder would pay on Fund distributions or the redemption of Fund shares.
Average Annual Total Returns (as of April 30, 2021)
| 6 Month | Since Inception^ | Total Expense Ratio | What You Pay* | |
| Class I | 19.56% | 18.19% | 1.03% | 0.85% |
| Investor (NAV) | 19.39% | 17.98% | 1.33% | 1.15% |
| Class A (NAV) | 19.39% | 18.00% | 1.33% | 1.15% |
| Class A (MOP) | 15.53% | 14.12% | ||
| Class C (NAV) | 18.95%+ | 17.40% | 2.03% | 1.85% |
| Class C (CDSC) | 17.95% | 16.40% | ||
| 55% Bloomberg U.S. 1000 TR Index / 45% Bloomberg Barclays U.S. Aggregate Bond Index1,3 | 14.96% | 12.61% | ||
| 55% Russell 1000 Index TR / 45% Bloomberg Barclays U.S. Aggregate Bond Index2,3 | 15.00% | 12.58% | ||
| Bloomberg Barclays U.S. Aggregate Bond Index | -1.52% | -2.15% | ||
| Russell 1000® Index TR | 30.03% | 25.73% | ||
| Bloomberg U.S. 1000 TR Index | 29.95% | 25.78% |
Performance data quoted represents past performance. Past performance does not guarantee future results. Investment return and principal value of an investment will fluctuate so that an investor's shares, when sold or redeemed, may be worth more or less than the original cost. Current performance data may be higher or lower than actual data quoted. For the most current month-end performance data, please call 1-866-759-5679.
Maximum Offering Price (MOP) for Class A shares includes the Fund’s maximum sales charge of 3.25%. Performance shown at NAV does not include these sales charges and would have been lower had it been taken into account. If you invest $500 thousand or more, either as a lump sum or through the Fund’s accumulation or letter of intent programs, you can purchase Class A shares without an initial sales charge (load). A Contingent Deferred Sales Charge (“CDSC”) of 1.00% may apply to Class C shares redeemed within the first 12 months after a purchase, and on Class A shares redeemed within the first 18 months after a purchase in excess of $1 million.
Performance less than 1 year is cumulative.
49 | April 30, 2021
| ALPS | Smith Balanced Opportunity Fund | |
| Performance Update | April 30, 2021 (Unaudited) |
| 1 | Effective February 1, 2021, the Bloomberg U.S. 1000 TR Index replaced the Russell 1000 Index TR component. The Bloomberg U.S. 1000 Total Return Index is a float market-cap weighted benchmark of the 1000 most highly capitalized US companies. The index is not actively managed and does not reflect any deduction for fees, expenses or taxes. An investor may not invest directly in an index. |
| 2 | The Russell 1000 Index Total Return is a stock market index that tracks the highest-ranking 1,000 stocks in the Russell 3000 Index, which represent about 90% of the total market capitalization of the index. The index is not actively managed and does not reflect any deduction for fees, expenses or taxes. An investor may not invest directly in an index. |
| 3 | Bloomberg Barclays U.S. Aggregate Bond Index: provides a measure of the performance of the U.S. dollar denominated investment grade bond market, which includes investment grade government bonds, investment grade corporate bonds, mortgage pass through securities, commercial mortgage backed securities and asset backed securities that are publicly for sale in the United States. The index is not actively managed and does not reflect any deduction for fees, expenses or taxes. An investor may not invest directly in an index. |
| ^ | Fund Inception date of September 15, 2020. The Fund has limited operating history. |
| * | What You Pay reflects the Advisor’s decision to contractually limit expenses through February 28, 2022. Please see the prospectus dated February 28, 2021 for additional information. |
| + | Excludes adjustments in accordance with accounting principles generally accepted in the United States of America and as such, the net asset value and total return for shareholder transactions reported to the market may differ from the net asset value for financial reporting purposes. |
The table does not reflect the deduction of taxes that a shareholder would pay on Fund distributions or the redemption of Fund shares.
This Fund is not suitable for all investors, and is subject to investment risks, including possible loss of the principal amount invested.
There is no guarantee that the Fund will continue to hold any one particular security or stay invested in any one particular company. The composition of the Fund's top holdings is subject to change. Performance figures are historical and reflect the change in share price, reinvested distributions, changes in net asset value, sales charges and capital gains distributions, if any. Not FDIC Insured – No Bank Guarantee – May Lose Value
Asset Type Allocation (as a % of Net Assets) †
| Common Stock | 65.48% |
| Corporate Bond | 14.03% |
| Government Bond | 9.16% |
| Collateralized Mortgage Obligations | 5.77% |
| Mortgage-Backed Securities | 1.02% |
| Cash, Cash Equivalents, & Other Net Assets | 4.54% |
| Total | 100.00% |
| † | Holdings are subject to change, and may not reflect the current or future position of the portfolio. Table presents approximate values only. |
Top Ten Holdings (as a % of Net Assets) †
| Microsoft Corp. | 2.77% |
| Alphabet, Inc. | 2.63% |
| UnitedHealth Group, Inc. | 2.52% |
| Apple, Inc. | 2.40% |
| JPMorgan Chase & Co. | 2.39% |
| Amazon.com, Inc. | 2.13% |
| Mastercard, Inc. | 1.75% |
| Facebook, Inc. | 1.59% |
| U.S. Treasury Note 0.75% 03/31/2026 | 1.44% |
| Medtronic PLC | 1.39% |
| Top Ten Holdings | 21.01% |
| † | Holdings are subject to change, and may not reflect the current or future position of the portfolio. Table presents approximate values only |
Industry Sector Allocation (as a % of Net Assets)
| Health Care | 10.41 | % | ||
| Sovereign | 9.16 | % | ||
| Media | 7.22 | % | ||
| Software & Tech Services | 6.88 | % | ||
| Mortgage Securities | 6.79 | % | ||
| Tech Hardware & Semiconductors | 6.05 | % | ||
| Financial Services | 5.29 | % | ||
| Industrial Products | 5.17 | % | ||
| Retail & Wholesale - Staples | 3.86 | % | ||
| Consumer Discretionary Services | 3.68 | % | ||
| Consumer Discretionary Products | 3.08 | % | ||
| Retail & Whsle - Discretionary | 3.08 | % | ||
| Banking | 2.39 | % | ||
| Consumer Staple Products | 2.16 | % | ||
| Materials | 2.15 | % | ||
| Insurance | 1.77 | % | ||
| Industrial Services | 1.45 | % | ||
| Oil & Gas | 1.35 | % | ||
| Pharmaceuticals | 1.33 | % | ||
| Diversified Banks | 1.22 | % | ||
| Other Industries (each less than 1%) | 10.97 | %* | ||
| Cash Equivalents & Other Net Assets | 4.54 | % | ||
| Total | 100.00 | % |
| * | See Statement of Investments for detailed breakout of other industries. |
50 | April 30, 2021
| ALPS | Smith Short Duration Bond Fund | |
| Statement of Investments | April 30, 2021 (Unaudited) |
| Principal Amount | Value (Note 2) | |||||||
| COLLATERALIZED MORTGAGE OBLIGATIONS (0.65%) | ||||||||
| Fannie Mae | ||||||||
| Series 1992-180, Class F, | ||||||||
| 1M US L + 1.15%, | ||||||||
| 10/25/2022(a) | $ | 6,507 | $ | 6,543 | ||||
| Series 1992-49, Class L, | ||||||||
| 7.000%, 04/25/2022 | 13,829 | 14,103 | ||||||
| Series 1992-52, Class FD, | ||||||||
| 1M US L + 0.02%, | ||||||||
| 09/25/2022(a) | 3,236 | 3,221 | ||||||
| Series 1992-62, Class FA, | ||||||||
| 1M US L + 0.90%, | ||||||||
| 10/25/2022(a) | 21,035 | 20,994 | ||||||
| Series 1992-73, Class FC, | ||||||||
| 1M US L + 0.75%, | ||||||||
| 05/25/2022(a) | 881 | 880 | ||||||
| Series 1992-8, Class FA, | ||||||||
| 1M US L + 0.83%, | ||||||||
| 01/25/2022(a) | 386 | 386 | ||||||
| Series 1992-89, Class FB, | ||||||||
| 1M US L + 0.50%, | ||||||||
| 06/25/2022(a) | 666 | 665 | ||||||
| Series 1993-184, Class M, | ||||||||
| –%, 09/25/2023 | 10,810 | 10,672 | ||||||
| Series 1993-189, Class FB, | ||||||||
| 10Y US TI + -0.65%, | ||||||||
| 10/25/2023(a) | 5,735 | 5,656 | ||||||
| Series 1993-230, Class FA, | ||||||||
| 1M US L + 0.60%, | ||||||||
| 12/25/2023(a) | 31,986 | 31,879 | ||||||
| Series 1993-255, Class E, | ||||||||
| 7.100%, 12/25/2023 | 45,186 | 48,011 | ||||||
| Series 1993-27, Class FC, | ||||||||
| 1M US L + 0.90%, | ||||||||
| 08/25/2023(a) | 2,685 | 2,684 | ||||||
| Series 1993-31, Class PN, | ||||||||
| 7.000%, 09/25/2023 | 90,439 | 95,175 | ||||||
| Series 1993-97, Class FA, | ||||||||
| 1M US L + 1.25%, | ||||||||
| 05/25/2023(a) | 6,017 | 5,986 | ||||||
| Series 1994-18, Class FA, | ||||||||
| 1M US L + 0.60%, | ||||||||
| 02/25/2024(a) | 12,980 | 13,027 | ||||||
| Series 1994-22, Class F, | ||||||||
| 1M US L + 1.20%, | ||||||||
| 01/25/2024(a) | 85,709 | 86,512 | ||||||
| Series 1994-3, Class FB, | ||||||||
| 1M US L + 0.65%, | ||||||||
| 01/25/2024(a) | 29,551 | 29,667 | ||||||
| Series 1994-3, Class FA, | ||||||||
| 1M US L + 0.65%, | ||||||||
| 03/25/2024(a) | 5,417 | 5,436 | ||||||
| Series 1994-61, Class E, | ||||||||
| 7.500%, 04/25/2024 | 38,115 | 40,532 | ||||||
| Principal | Value | |||||||
| Amount | (Note 2) | |||||||
| Series 1994-75, Class K, | ||||||||
| 7.000%, 04/25/2024 | $ | 24,299 | $ | 26,034 | ||||
| Series 1994-77, Class FB, | ||||||||
| 1M US L + 1.50%, | ||||||||
| 04/25/2024(a) | 88,020 | 89,182 | ||||||
| Series 1997-12, Class FA, | ||||||||
| 1M US L + 1.00%, | ||||||||
| 04/18/2027(a) | 28,357 | 28,767 | ||||||
| Series 1997-49, Class F, | ||||||||
| 1M US L + 0.50%, | ||||||||
| 06/17/2027(a) | 43,246 | 43,425 | ||||||
| Series 2003-39, Class PG, | ||||||||
| 5.500%, 05/25/2023 | 33,210 | 34,342 | ||||||
| Series 2003-49, Class YC, | ||||||||
| 4.000%, 06/25/2023 | 18,432 | 18,866 | ||||||
| Series 2004-53, Class NC, | ||||||||
| 5.500%, 07/25/2024 | 14,223 | 14,813 | ||||||
| Series 2004-95, Class AK, | ||||||||
| 5.500%, 01/25/2025 | 21,483 | 22,808 | ||||||
| Series 2005-121, Class DY, | ||||||||
| 5.500%, 01/25/2026 | 21,986 | 23,449 | ||||||
| Series 2006-22, Class CE, | ||||||||
| 4.500%, 08/25/2023 | 10,969 | 11,330 | ||||||
| Series 2011-104, Class DA, | ||||||||
| 2.000%, 10/25/2021 | 11 | 11 | ||||||
| Series 2011-141, Class CA, | ||||||||
| 2.000%, 12/25/2025 | 26,478 | 26,642 | ||||||
| Series 2011-40, Class KA, | ||||||||
| 3.500%, 03/25/2026 | 86,600 | 91,538 | ||||||
| Series 2011-44, Class EB, | ||||||||
| 3.000%, 05/25/2026 | 38,212 | 39,918 | ||||||
| Series 2011-61, Class B, | ||||||||
| 3.000%, 07/25/2026 | 63,163 | 66,062 | ||||||
| Series 2011-66, Class QE, | ||||||||
| 2.000%, 07/25/2021 | 19 | 19 | ||||||
| Series 2011-80, Class KB, | ||||||||
| 3.500%, 08/25/2026 | 75,046 | 79,438 | ||||||
| Series 2012-1, Class GB, | ||||||||
| 2.000%, 02/25/2022 | 3,883 | 3,894 | ||||||
| Series 2012-47, Class HA, | ||||||||
| 1.500%, 05/25/2027 | 82,641 | 84,095 | ||||||
| 1,126,662 | ||||||||
| Freddie Mac | ||||||||
| Series 1992-1242, Class C, | ||||||||
| 1M US L + 0.55%, | ||||||||
| 04/15/2022(a) | 2,315 | 2,312 | ||||||
| Series 1993-1487, Class O, | ||||||||
| 1M US L + 0.75%, | ||||||||
| 03/15/2023(a) | 9,639 | 9,673 | ||||||
| Series 1993-1534, Class J, | ||||||||
| 1M US L + 0.90%, | ||||||||
| 06/15/2023(a) | 13,402 | 13,473 | ||||||
| Series 1993-1560, Class Z, | ||||||||
| 7.000%, 08/15/2023 | 14,159 | 14,815 | ||||||
See Notes to Financial Statements.
51 | April 30, 2021
|
ALPS | Smith Short Duration Bond Fund |
|
| Statement of Investments | April 30, 2021 (Unaudited) |
| Principal | Value | |||||||
| Amount | (Note 2) | |||||||
| Series 1993-1567, Class A, | ||||||||
| 1M US L + 0.40%, | ||||||||
| 08/15/2023(a) | $ | 49,281 | $ | 49,241 | ||||
| Series 1993-1584, Class L, | ||||||||
| 6.500%, 09/15/2023 | 24,593 | 26,014 | ||||||
| Series 1993-1602, Class PJ, | ||||||||
| 6.500%, 10/15/2023 | 28,840 | 30,253 | ||||||
| Series 1993-1611, Class Z, | ||||||||
| 6.500%, 11/15/2023 | 14,284 | 15,198 | ||||||
| Series 1993-1628, Class LZ, | ||||||||
| 6.500%, 12/15/2023 | 8,644 | 9,164 | ||||||
| Series 1993-1630, Class PK, | ||||||||
| 6.000%, 11/15/2023 | 16,308 | 17,238 | ||||||
| Series 1993-1632, Class FB, | ||||||||
| 1M US L + 1.20%, | ||||||||
| 11/15/2023(a) | 20,733 | 20,916 | ||||||
| Series 1993-1636, Class F, | ||||||||
| 1M US L + 0.65%, | ||||||||
| 11/15/2023(a) | 16,161 | 16,222 | ||||||
| Series 1993-21, Class F, | ||||||||
| 1M US L + 0.50%, | ||||||||
| 10/25/2023(a) | 19,567 | 19,608 | ||||||
| Series 1993-24, Class FJ, | ||||||||
| 1M US L + 0.50%, | ||||||||
| 11/25/2023(a) | 87,792 | 87,978 | ||||||
| Series 1994-1673, Class FB, | ||||||||
| 10Y US TI + -0.50%, | ||||||||
| 02/15/2024(a) | 7,004 | 6,950 | ||||||
| Series 1994-1699, Class FB, | ||||||||
| 1M US L + 1.00%, | ||||||||
| 03/15/2024(a) | 11,781 | 11,795 | ||||||
| Series 1994-1707, Class F, | ||||||||
| 1M US L + 0.70%, | ||||||||
| 03/15/2024(a) | 16,241 | 16,312 | ||||||
| Series 1994-1744, Class FD, | ||||||||
| 1M US L + 1.98%, | ||||||||
| 08/15/2024(a) | 45,797 | 46,811 | ||||||
| Series 1994-32, Class PN, | ||||||||
| 7.500%, 04/25/2024 | 140,379 | 149,248 | ||||||
| Series 1994-43, Class PH, | ||||||||
| 6.500%, 10/17/2024 | 24,289 | 25,705 | ||||||
| Series 1996-1810, Class D, | ||||||||
| 6.000%, 02/15/2026 | 20,133 | 21,597 | ||||||
| Series 1996-1885, Class FA, | ||||||||
| 1M US L + 0.45%, | ||||||||
| 09/15/2026(a) | 8,694 | 8,720 | ||||||
| Series 1997-1983, Class Z, | ||||||||
| 6.500%, 12/15/2023 | 14,210 | 15,116 | ||||||
| Series 2002-2528, Class KM, | ||||||||
| 5.500%, 11/15/2022 | 30,829 | 31,624 | ||||||
| Series 2003-2634, Class PT, | ||||||||
| 5.000%, 06/15/2023 | 11,556 | 11,865 | ||||||
| Series 2004-2877, Class AL, | ||||||||
| 5.000%, 10/15/2024 | 4,875 | 5,094 | ||||||
| Series 2005-3005, Class ED, | ||||||||
| 5.000%, 07/15/2025 | 81,753 | 86,847 | ||||||
| Principal | Value | |||||||
| Amount | (Note 2) | |||||||
| Series 2006-3104, Class DH, | ||||||||
| 5.000%, 01/15/2026 | $ | 43,940 | $ | 46,971 | ||||
| Series 2009-3575, Class EB, | ||||||||
| 4.000%, 09/15/2024 | 18,121 | 18,802 | ||||||
| Series 2010-3661, Class B, | ||||||||
| 4.000%, 04/15/2025 | 20,775 | 21,709 | ||||||
| Series 2010-3670, Class LX, | ||||||||
| 2.000%, 05/15/2025 | 15 | 15 | ||||||
| Series 2010-3710, Class MG, | ||||||||
| 4.000%, 08/15/2025(b) | 29,135 | 31,524 | ||||||
| Series 2010-3718, Class BE, | ||||||||
| 2.500%, 02/15/2025 | 753 | 753 | ||||||
| Series 2010-3737, Class NA, | ||||||||
| 3.500%, 06/15/2025 | 91,094 | 91,746 | ||||||
| Series 2010-3779, Class KJ, | ||||||||
| 2.750%, 11/15/2025 | 54,268 | 56,074 | ||||||
| Series 2011-3822, Class VE, | ||||||||
| 4.000%, 05/15/2022 | 151,485 | 153,906 | ||||||
| Series 2011-3829, Class BE, | ||||||||
| 3.500%, 03/15/2026 | 25,495 | 26,906 | ||||||
| Series 2011-3845, Class FQ, | ||||||||
| 1M US L + 0.25%, | ||||||||
| 02/15/2026(a) | 7,644 | 7,636 | ||||||
| Series 2011-3872, Class ND, | ||||||||
| 2.000%, 12/15/2021 | 1,444 | 1,446 | ||||||
| Series 2011-3874, Class DW, | ||||||||
| 3.500%, 06/15/2021 | 228 | 228 | ||||||
| Series 2011-3907, Class FM, | ||||||||
| 1M US L + 0.35%, | ||||||||
| 05/15/2026(a) | 15,652 | 15,661 | ||||||
| Series 2011-3945, Class BJ, | ||||||||
| 2.000%, 03/15/2026 | 36,829 | 37,159 | ||||||
| Series 2012-4003, Class BG, | ||||||||
| 2.000%, 10/15/2026 | 73,234 | 75,143 | ||||||
| Series 2013-4177, Class NB, | ||||||||
| 1.500%, 03/15/2028 | 37,273 | 37,963 | ||||||
| 1,393,431 | ||||||||
| Ginnie Mae | ||||||||
| Series 2010-101, Class GU, | ||||||||
| 4.000%, 08/20/2025(b) | 32,207 | 34,091 | ||||||
| Series 2012-47, Class VA, | ||||||||
| 3.500%, 07/20/2023 | 40,784 | 41,040 | ||||||
| Series 2013-53, Class KN, | ||||||||
| 1.500%, 08/20/2025 | 34,527 | 35,093 | ||||||
| 110,224 | ||||||||
| TOTAL COLLATERALIZED MORTGAGE OBLIGATIONS | ||||||||
| (Cost $2,594,514) | 2,630,317 | |||||||
| Principal | Value | |||||||
| Amount | (Note 2) | |||||||
| COMMERCIAL MORTGAGE-BACKED SECURITIES (0.32%) | ||||||||
| Fannie Mae-Aces | ||||||||
| Series 2012-M1, Class A2, | ||||||||
| 2.729%, 10/25/2021 | 38,037 | 38,283 | ||||||
See Notes to Financial Statements.
52 | April 30, 2021
| ALPS | Smith Short Duration Bond Fund | |
| Statement of Investments | April 30, 2021 (Unaudited) |
| Principal | Value | |||||||
| Amount | (Note 2) | |||||||
| Series 2012-M10, Class AFL, | ||||||||
| 1M US L + 0.45%, | ||||||||
| 09/25/2022(a) | $ | 45,283 | $ | 45,297 | ||||
| Series 2013-M14, Class APT, | ||||||||
| 2.634%, 04/25/2023(a) | 7,827 | 8,063 | ||||||
| Series 2013-M3, Class A2, | ||||||||
| 2.509%, 11/25/2022(a) | 289,655 | 296,016 | ||||||
| Series 2016-M13, Class FA, | ||||||||
| 1M US L + 0.67%, | ||||||||
| 11/25/2023(a) | 23,329 | 23,412 | ||||||
| 411,071 | ||||||||
| Freddie Mac Multifamily | ||||||||
| Structured Pass Through | ||||||||
| Certificates | ||||||||
| Series 2012-K023, Class X1, | ||||||||
| 1.340%, 08/25/2022(a) | 3,659,319 | 49,026 | ||||||
| Series 2013-K026, Class X1, | ||||||||
| 1.073%, 11/25/2022(a) | 5,559,612 | 70,645 | ||||||
| Series 2015-KF07, Class A, | ||||||||
| 1M US L + 0.29%, | ||||||||
| 02/25/2025(a) | 31,642 | 31,514 | ||||||
| Series 2015-KF12, Class A, | ||||||||
| 1M US L + 0.70%, | ||||||||
| 09/25/2022(a) | 59,174 | 59,264 | ||||||
| Series 2016-KF14, Class A, | ||||||||
| 1M US L + 0.65%, | ||||||||
| 01/25/2023(a) | 142,012 | 142,236 | ||||||
| Series 2016-KJ08, Class A2, | ||||||||
| 2.356%, 08/25/2022 | 341,708 | 345,822 | ||||||
| Series 2017-J15L, Class AFL, | ||||||||
| 1M US L + 0.35%, | ||||||||
| 08/25/2025(a) | 11,220 | 11,178 | ||||||
| Series 2017-K725, Class A1, | ||||||||
| 2.666%, 05/25/2023 | 32,717 | 33,396 | ||||||
| Series 2017-K728, Class A2, | ||||||||
| 3.064%, 08/25/2024(a) | 117,000 | 125,535 | ||||||
| 868,616 | ||||||||
| TOTAL COMMERCIAL MORTGAGE-BACKED SECURITIES | ||||||||
| (Cost $1,260,313) | 1,279,687 | |||||||
| Principal | Value | |||||||
| Amount | (Note 2) | |||||||
| MORTGAGE-BACKED SECURITIES (3.33%) | ||||||||
| Fannie Mae Pool | ||||||||
| Series 2009-958485, | ||||||||
| 5.500%, 03/01/2024 | 2,458,557 | 2,735,260 | ||||||
| Series 2011-MA0717, | ||||||||
| 3.500%, 04/01/2026 | 34,983 | 37,029 | ||||||
| Series 2012-471513, | ||||||||
| 2.900%, 06/01/2022 | 81,918 | 83,238 | ||||||
| Series 2012-471690, | ||||||||
| 2.790%, 07/01/2022 | 156,093 | 158,801 | ||||||
| Series 2012-AL2293, | ||||||||
| 4.232%, 06/01/2021(a) | 41,538 | 41,552 | ||||||
| Principal | Value | |||||||
| Amount | (Note 2) | |||||||
| Series 2012-AM1076, | ||||||||
| 2.920%, 10/01/2024 | $ | 237,505 | $ | 237,450 | ||||
| Series 2013-AM4125, | ||||||||
| 3.740%, 08/01/2023 | 230,000 | 243,572 | ||||||
| Series 2015-AM7670, | ||||||||
| 2.850%, 01/01/2025 | 119,312 | 121,456 | ||||||
| Series 2015-AM9288, | ||||||||
| 2.930%, 07/01/2025 | 1,358,110 | 1,400,582 | ||||||
| Series 2016-AL8938, | ||||||||
| 2.708%, 04/01/2022(a) | 40,973 | 41,230 | ||||||
| Series 2016-AL8941, | ||||||||
| 2.819%, 01/01/2024(a) | 60,620 | 63,612 | ||||||
| Series 2016-AN1413, | ||||||||
| 2.490%, 05/01/2026 | 145,086 | 154,374 | ||||||
| Series 2017-AN5196, | ||||||||
| 2.910%, 04/01/2024 | 150,000 | 152,520 | ||||||
| Series 2017-AN6641, | ||||||||
| 2.710%, 12/01/2023 | 1,692,064 | 1,779,212 | ||||||
| Series 2017-AN6645, | ||||||||
| 2.600%, 09/01/2024 | 250,000 | 256,175 | ||||||
| Series 2018-AN8096, | ||||||||
| 3.020%, 06/01/2024 | 305,000 | 306,504 | ||||||
| Series 2018-AN8203, | ||||||||
| 2.950%, 01/01/2025 | 2,942,738 | 3,072,464 | ||||||
| Series 2018-BL0760, | ||||||||
| 3.790%, 12/01/2025 | 590,000 | 641,220 | ||||||
| Series 2019-BL2449, | ||||||||
| 2.890%, 02/01/2025 | 292,150 | 313,528 | ||||||
| Series 2019-BL2539, | ||||||||
| 3.050%, 05/01/2024 | 141,182 | 146,657 | ||||||
| 11,986,436 | ||||||||
| Freddie Mac Gold Pool | ||||||||
| Series 2012-T40090, | ||||||||
| 3.000%, 05/01/2027 | 115,111 | 121,339 | ||||||
| Freddie Mac Pool | ||||||||
| Series 2017-WN2000, | ||||||||
| 2.700%, 08/01/2023 | 1,400,000 | 1,417,960 | ||||||
| TOTAL MORTGAGE-BACKED SECURITIES | ||||||||
| (Cost $13,445,827) | 13,525,735 | |||||||
| CORPORATE BONDS (73.89%) | ||||||||
| Aerospace & Defense (2.26%) | ||||||||
| Boeing Co. | ||||||||
| 4.51%, 05/01/2023 | 3,000,000 | 3,204,671 | ||||||
| Teledyne Technologies, Inc. | ||||||||
| 0.65%, 04/01/2023 | 3,000,000 | 2,999,387 | ||||||
| 0.95%, 04/01/2024 | 3,000,000 | 3,001,151 | ||||||
| Total Aerospace & Defense | 9,205,209 | |||||||
| Airlines (0.38%) | ||||||||
| Southwest Airlines Co. | ||||||||
| 4.75%, 05/04/2023 | 500,000 | 540,925 | ||||||
See Notes to Financial Statements.
53 | April 30, 2021
| ALPS | Smith Short Duration Bond Fund | |
| Statement of Investments | April 30, 2021 (Unaudited) |
| Principal | Value | |||||||
| Amount | (Note 2) | |||||||
| United Airlines, Inc. | ||||||||
| 4.38%, 04/15/2026(c) | $ | 1,000,000 | $ | 1,013,662 | ||||
| Total Airlines | 1,554,587 | |||||||
| Apparel & Textile Products (0.23%) | ||||||||
| Ralph Lauren Corp. | ||||||||
| 1.70%, 06/15/2022 | 925,000 | 940,294 | ||||||
| Automobiles Manufacturing (7.18%) | ||||||||
| American Honda Finance Corp. | ||||||||
| 0.65%, 09/08/2023 | 1,500,000 | 1,509,292 | ||||||
| Ford Motor Co. | ||||||||
| 8.50%, 04/21/2023 | 2,695,000 | 3,021,769 | ||||||
| Ford Motor Credit Co. LLC | ||||||||
| 3.38%, 11/13/2025 | 465,000 | 476,476 | ||||||
| 3.81%, 10/12/2021 | 1,000,000 | 1,011,405 | ||||||
| 5.88%, 08/02/2021 | 4,800,000 | 4,851,600 | ||||||
| General Motors Co. | ||||||||
| 5.40%, 10/02/2023 | 2,250,000 | 2,490,093 | ||||||
| General Motors Financial Co., Inc. | ||||||||
| 1.05%, 03/08/2024 | 3,750,000 | 3,759,191 | ||||||
| 5.10%, 01/17/2024 | 1,200,000 | 1,327,742 | ||||||
| Kia Corp. | ||||||||
| 1.00%, 04/16/2024(c) | 2,850,000 | 2,867,335 | ||||||
| Nissan Motor Acceptance Corp. | ||||||||
| 1.05%, 03/08/2024(c) | 2,000,000 | 2,000,608 | ||||||
| Nissan Motor Co., Ltd. | ||||||||
| 3.04%, 09/15/2023(c) | 2,685,000 | 2,810,767 | ||||||
| Volkswagen Group of America | ||||||||
| Finance LLC | ||||||||
| 0.75%, 11/23/2022(c) | 1,500,000 | 1,505,338 | ||||||
| 0.88%, 11/22/2023(c) | 1,500,000 | 1,507,378 | ||||||
| Total Automobiles Manufacturing | 29,138,994 | |||||||
| Banks (5.81%) | ||||||||
| Associated Bank NA/Green Bay WI | ||||||||
| 3.50%, 08/13/2021 | 2,150,000 | 2,163,172 | ||||||
| CIT Group, Inc. | ||||||||
| 1D US SOFR + 3.83%, | ||||||||
| 06/19/2024(a) | 2,455,000 | 2,599,231 | ||||||
| Citizens Financial Group, Inc. | ||||||||
| 4.15%, 09/28/2022(c) | 400,000 | 417,881 | ||||||
| Cooperatieve Rabobank UA | ||||||||
| 3.95%, 11/09/2022 | 2,686,000 | 2,821,425 | ||||||
| Credit Suisse AG | ||||||||
| 1.00%, 05/05/2023 | 850,000 | 858,026 | ||||||
| Danske Bank A/S | ||||||||
| 5.00%, 01/12/2022(c) | 950,000 | 978,247 | ||||||
| 5.38%, 01/12/2024(c) | 250,000 | 278,665 | ||||||
| 1Y US TI + 1.03%, | ||||||||
| 12/08/2023(a)(c) | 1,000,000 | 1,005,250 | ||||||
| 3M US L + 1.249%, | ||||||||
| 09/20/2022(a)(c) | 628,000 | 633,143 | ||||||
| Discover Bank | ||||||||
| 3.35%, 02/06/2023 | 1,110,000 | 1,162,063 | ||||||
| First Horizon Corp. | ||||||||
| 3.55%, 05/26/2023 | 500,000 | 528,218 | ||||||
| Principal | Value | |||||||
| Amount | (Note 2) | |||||||
| FNB Corp. | ||||||||
| 2.20%, 02/24/2023 | $ | 200,000 | $ | 203,558 | ||||
| Lloyds Banking Group PLC | ||||||||
| 1Y US TI + 0.55%, | ||||||||
| 05/11/2024(a) | 2,000,000 | 2,003,255 | ||||||
| National Bank of Canada | ||||||||
| 1Y US TI + 0.40%, | ||||||||
| 11/15/2024(a) | 3,000,000 | 2,991,079 | ||||||
| Synchrony Bank | ||||||||
| 3.00%, 06/15/2022 | 1,525,000 | 1,566,095 | ||||||
| Synovus Bank/Columbus GA | ||||||||
| 1D US SOFR + 0.95%, | ||||||||
| 02/10/2023(a) | 2,750,000 | 2,776,013 | ||||||
| US Bank NA | ||||||||
| 3.45%, 11/16/2021 | 250,000 | 253,656 | ||||||
| Wells Fargo & Co. | ||||||||
| 4.13%, 08/15/2023 | 300,000 | 324,438 | ||||||
| Total Banks | 23,563,415 | |||||||
| Biotechnology (0.25%) | ||||||||
| Roche Holdings, Inc. | ||||||||
| 1D US SOFR + 0.24%, | ||||||||
| 03/05/2024(a)(c) | 1,000,000 | 1,001,090 | ||||||
| Cable & Satellite (1.71%) | ||||||||
| Charter Communications | ||||||||
| Operating LLC / Charter | ||||||||
| Communications Operating | ||||||||
| Capital | ||||||||
| 3M US L + 1.65%, | ||||||||
| 02/01/2024(a) | 2,030,000 | 2,085,316 | ||||||
| Sirius XM Radio, Inc. | ||||||||
| 3.88%, 08/01/2022(c) | 1,250,000 | 1,257,750 | ||||||
| Time Warner Cable LLC | ||||||||
| 4.00%, 09/01/2021 | 750,000 | 752,077 | ||||||
| Videotron, Ltd. | ||||||||
| 5.00%, 07/15/2022 | 2,700,000 | 2,819,813 | ||||||
| Total Cable & Satellite | 6,914,956 | |||||||
| Casinos & Gaming (0.31%) | ||||||||
| MGM Resorts International | ||||||||
| 7.75%, 03/15/2022 | 1,186,000 | 1,248,805 | ||||||
| Chemicals (1.21%) | ||||||||
| LYB International Finance III LLC | ||||||||
| 3M US L + 1.00%, | ||||||||
| 10/01/2023(a) | 3,400,000 | 3,408,021 | ||||||
| Nutrition & Biosciences, Inc. | ||||||||
| 0.70%, 09/15/2022(c) | 1,500,000 | 1,503,500 | ||||||
| Total Chemicals | 4,911,521 | |||||||
| Commercial Finance (1.33%) | ||||||||
| AerCap Ireland Capital DAC / | ||||||||
| AerCap Global Aviation Trust | ||||||||
| 3.15%, 02/15/2024 | 1,255,000 | 1,319,424 | ||||||
| 6.50%, 07/15/2025 | 600,000 | 706,426 | ||||||
See Notes to Financial Statements.
54 | April 30, 2021
| ALPS | Smith Short Duration Bond Fund | |
| Statement of Investments | April 30, 2021 (Unaudited) |
| Principal | Value | |||||||
| Amount | (Note 2) | |||||||
| Avolon Holdings Funding, Ltd. | ||||||||
| 3.63%, 05/01/2022(c) | $ | 730,000 | $ | 745,410 | ||||
| 4.25%, 04/15/2026(c) | 350,000 | 373,561 | ||||||
| Park Aerospace Holdings, Ltd. | ||||||||
| 5.25%, 08/15/2022(c) | 2,121,000 | 2,217,484 | ||||||
| Total Commercial Finance | 5,362,305 | |||||||
| Consumer Finance (3.22%) | ||||||||
| Ally Financial, Inc. | ||||||||
| 1.45%, 10/02/2023 | 3,730,000 | 3,791,054 | ||||||
| Capital One Bank USA NA | ||||||||
| 1D US SOFR + 0.616%, | ||||||||
| 01/27/2023(a) | 300,000 | 303,440 | ||||||
| Capital One Financial Corp. | ||||||||
| 2.60%, 05/11/2023 | 400,000 | 416,398 | ||||||
| Fidelity National Information | ||||||||
| Services, Inc. | ||||||||
| 0.38%, 03/01/2023 | 2,000,000 | 1,997,238 | ||||||
| 0.60%, 03/01/2024 | 2,000,000 | 1,996,665 | ||||||
| OneMain Finance Corp. | ||||||||
| 6.13%, 05/15/2022 | 2,000,000 | 2,097,500 | ||||||
| 8.88%, 06/01/2025 | 1,302,000 | 1,443,104 | ||||||
| PayPal Holdings, Inc. | ||||||||
| 1.35%, 06/01/2023 | 1,000,000 | 1,018,917 | ||||||
| Total Consumer Finance | 13,064,316 | |||||||
| Department Stores (0.98%) | ||||||||
| Nordstrom, Inc. | ||||||||
| 2.30%, 04/08/2024(c) | 4,000,000 | 4,015,278 | ||||||
| Diversified Banks (4.58%) | ||||||||
| Bank of America Corp. | ||||||||
| 1D US SOFR + 0.69%, | ||||||||
| 04/22/2025(a) | 4,000,000 | 4,012,919 | ||||||
| 3M US L + 1.021%, | ||||||||
| 04/24/2023(a) | 1,550,000 | 1,586,767 | ||||||
| Barclays PLC | ||||||||
| 1Y US TI + 0.80%, | ||||||||
| 12/10/2024(a) | 3,000,000 | 3,006,016 | ||||||
| Citigroup, Inc. | ||||||||
| 4.30%, 11/20/2026 | 750,000 | 845,280 | ||||||
| 1D US SOFR + 0.669%, | ||||||||
| 05/01/2025(a) | 2,000,000 | 2,007,413 | ||||||
| JPMorgan Chase & Co. | ||||||||
| 1D US SOFR + 0.60%, | ||||||||
| 09/16/2024(a) | 2,500,000 | 2,504,849 | ||||||
| 1D US SOFR + 1.46%, | ||||||||
| 06/01/2024(a) | 1,500,000 | 1,529,233 | ||||||
| Mizuho Financial Group, Inc. | ||||||||
| 0.87% - 1D US SOFR%, | ||||||||
| 09/08/2024(a) | 1,000,000 | 1,003,111 | ||||||
| 1.25% - 1D US SOFR%, | ||||||||
| 07/10/2024(a) | 1,000,000 | 1,011,902 | ||||||
| Natwest Group PLC | ||||||||
| 1Y US TI + 2.15%, | ||||||||
| 05/22/2024(a) | 1,000,000 | 1,032,839 | ||||||
| Total Diversified Banks | 18,540,329 | |||||||
| Principal | Value | |||||||
| Amount | (Note 2) | |||||||
| Electrical Equipment Manufacturing (0.27%) | ||||||||
| Otis Worldwide Corp. | ||||||||
| 3M US L + 0.45%, | ||||||||
| 04/05/2023(a) | $ | 100,000 | $ | 99,972 | ||||
| Siemens Financieringsmaatschappij | ||||||||
| NV | ||||||||
| 0.40%, 03/11/2023(c) | 1,000,000 | 1,002,451 | ||||||
| Total Electrical Equipment Manufacturing | 1,102,423 | |||||||
| Entertainment Content (0.06%) | ||||||||
| Fox Corp. | ||||||||
| 3.67%, 01/25/2022 | 250,000 | 256,066 | ||||||
| Exploration & Production (0.74%) | ||||||||
| Diamondback Energy, Inc. | ||||||||
| 0.90%, 03/24/2023 | 3,000,000 | 3,001,456 | ||||||
| Financial Services (7.51%) | ||||||||
| Ameriprise Financial, Inc. | ||||||||
| 3.00%, 03/22/2022 | 250,000 | 256,110 | ||||||
| Credit Suisse Group AG | ||||||||
| 3.57%, 01/09/2023(c) | 4,038,000 | 4,113,922 | ||||||
| Goldman Sachs Group, Inc. | ||||||||
| 0.52%, 03/08/2023 | 2,000,000 | 2,002,196 | ||||||
| 3M US L + 1.053%, | ||||||||
| 06/05/2023(a) | 800,000 | 821,100 | ||||||
| Series VAR | ||||||||
| 1D US SOFR + 0.538%, | ||||||||
| 11/17/2023(a) | 1,865,000 | 1,867,805 | ||||||
| Series FXD | ||||||||
| 0.48%, 01/27/2023 | 3,000,000 | 3,002,046 | ||||||
| Intercontinental Exchange, Inc. | ||||||||
| 0.70%, 06/15/2023 | 1,350,000 | 1,357,749 | ||||||
| Series FRN | ||||||||
| 3M US L + 0.65%, | ||||||||
| 06/15/2023(a) | 1,350,000 | 1,351,782 | ||||||
| Morgan Stanley | ||||||||
| 2.75%, 05/19/2022 | 75,000 | 76,942 | ||||||
| 4.88%, 11/01/2022 | 500,000 | 532,710 | ||||||
| 1D US SOFR + 0.455%, | ||||||||
| 01/25/2024(a) | 3,000,000 | 2,999,045 | ||||||
| 1D US SOFR + 0.466%, | ||||||||
| 11/10/2023(a) | 1,855,000 | 1,857,544 | ||||||
| 1D US SOFR + 0.616%, | ||||||||
| 04/05/2024(a) | 2,000,000 | 2,005,310 | ||||||
| Series GMTN | ||||||||
| 3.13%, 01/23/2023 | 550,000 | 575,962 | ||||||
| 3.70%, 10/23/2024 | 1,200,000 | 1,313,306 | ||||||
| Nasdaq, Inc. | ||||||||
| 0.45%, 12/21/2022 | 2,000,000 | 2,000,909 | ||||||
| National Securities Clearing Corp. | ||||||||
| 0.40%, 12/07/2023(c) | 1,980,000 | 1,980,148 | ||||||
| TD Ameritrade Holding Corp. | ||||||||
| 3M US L + 0.43%, | ||||||||
| 11/01/2021(a) | 200,000 | 200,392 | ||||||
See Notes to Financial Statements.
55 | April 30, 2021
| ALPS | Smith Short Duration Bond Fund | |
| Statement of Investments | April 30, 2021 (Unaudited) |
| Principal | Value | |||||||
| Amount | (Note 2) | |||||||
| UBS AG/London | ||||||||
| 1.75%, 04/21/2022(c) | $ | 700,000 | $ | 709,195 | ||||
| UBS Group AG | ||||||||
| 1Y US TI + 0.83%, | ||||||||
| 07/30/2024(a)(c) | 1,000,000 | 1,006,860 | ||||||
| USAA Capital Corp. | ||||||||
| 1.50%, 05/01/2023(c) | 500,000 | 511,184 | ||||||
| Total Financial Services | 30,542,217 | |||||||
| Food & Beverage (0.69%) | ||||||||
| Keurig Dr Pepper, Inc. | ||||||||
| 0.75%, 03/15/2024 | 1,000,000 | 1,000,916 | ||||||
| Lamb Weston Holdings, Inc. | ||||||||
| 4.63%, 11/01/2024(c) | 1,723,000 | 1,790,714 | ||||||
| Total Food & Beverage | 2,791,630 | |||||||
| Forest & Paper Products Manufacturing (0.43%) | ||||||||
| Georgia-Pacific LLC | ||||||||
| 0.63%, 05/15/2024(c) | 1,750,000 | 1,746,258 | ||||||
| Hardware (0.25%) | ||||||||
| Dell International LLC / EMC Corp. | ||||||||
| 7.13%, 06/15/2024(c) | 1,000,000 | 1,028,475 | ||||||
| Health Care Facilities & Services (2.96%) | ||||||||
| AmerisourceBergen Corp. | ||||||||
| 0.74%, 03/15/2023 | 2,000,000 | 2,005,664 | ||||||
| Cigna Corp. | ||||||||
| 0.61%, 03/15/2024 | 2,000,000 | 1,999,226 | ||||||
| HCA, Inc. | ||||||||
| 4.75%, 05/01/2023 | 1,387,000 | 1,494,787 | ||||||
| 5.00%, 03/15/2024 | 500,000 | 557,222 | ||||||
| Series 1 | ||||||||
| 5.88%, 05/01/2023 | 1,000,000 | 1,092,908 | ||||||
| Jaguar Holding Co. II / PPD | ||||||||
| Development LP | ||||||||
| 4.63%, 06/15/2025(c) | 4,670,000 | 4,914,848 | ||||||
| Total Health Care Facilities & Services | 12,064,655 | |||||||
| Homebuilders (0.46%) | ||||||||
| Forestar Group, Inc. | ||||||||
| 3.85%, 05/15/2026(c) | 1,835,000 | 1,858,231 | ||||||
| Industrial Other (0.62%) | ||||||||
| Element Fleet Management Corp. | ||||||||
| 1.60%, 04/06/2024(c) | 1,470,000 | 1,487,498 | ||||||
| Honeywell International, Inc. | ||||||||
| 3M US L + 0.23%, | ||||||||
| 08/19/2022(a) | 1,000,000 | 1,000,707 | ||||||
| Total Industrial Other | 2,488,205 | |||||||
| Leisure Products Manufacturing (0.51%) | ||||||||
| Mattel, Inc. | ||||||||
| 3.15%, 03/15/2023 | 2,000,000 | 2,057,750 | ||||||
| Principal | Value | |||||||
| Amount | (Note 2) | |||||||
| Managed Care (0.25%) | ||||||||
| Anthem, Inc. | ||||||||
| 0.45%, 03/15/2023 | $ | 1,000,000 | $ | 1,001,745 | ||||
| Medical Equipment & Devices Manufacturing (1.06%) | ||||||||
| Illumina, Inc. | ||||||||
| 0.55%, 03/23/2023 | 2,000,000 | 2,000,815 | ||||||
| Zimmer Biomet Holdings, Inc. | ||||||||
| 3.38%, 11/30/2021 | 2,300,000 | 2,322,411 | ||||||
| Total Medical Equipment & Devices Manufacturing | 4,323,226 | |||||||
| Metals & Mining (1.45%) | ||||||||
| Steel Dynamics, Inc. | ||||||||
| 5.00%, 12/15/2026 | 5,592,000 | 5,878,859 | ||||||
| Pharmaceuticals (5.05%) | ||||||||
| AbbVie, Inc. | ||||||||
| 2.15%, 11/19/2021 | 500,000 | 504,958 | ||||||
| 2.30%, 11/21/2022 | 1,286,000 | 1,323,854 | ||||||
| 2.60%, 11/21/2024 | 500,000 | 529,747 | ||||||
| Bausch Health Cos., Inc. | ||||||||
| 6.13%, 04/15/2025(c) | 1,600,000 | 1,635,648 | ||||||
| 7.00%, 03/15/2024(c) | 2,925,000 | 3,002,790 | ||||||
| Elanco Animal Health, Inc. | ||||||||
| 4.91%, 08/27/2021 | 4,068,000 | 4,113,337 | ||||||
| Utah Acquisition Sub, Inc. | ||||||||
| 3.15%, 06/15/2021 | 1,987,000 | 1,991,247 | ||||||
| Viatris, Inc. | ||||||||
| 1.13%, 06/22/2022(c) | 5,635,000 | 5,672,901 | ||||||
| Zoetis, Inc. | ||||||||
| 3.25%, 08/20/2021 | 1,655,000 | 1,669,471 | ||||||
| Total Pharmaceuticals | 20,443,953 | |||||||
| Pipeline (2.79%) | ||||||||
| Buckeye Partners LP | ||||||||
| 4.15%, 07/01/2023 | 340,000 | 352,963 | ||||||
| 4.35%, 10/15/2024 | 750,000 | 785,156 | ||||||
| Energy Transfer LP / Regency | ||||||||
| Energy Finance Corp. | ||||||||
| 5.88%, 03/01/2022 | 1,390,000 | 1,431,875 | ||||||
| Gray Oak Pipeline LLC | ||||||||
| 2.00%, 09/15/2023(c) | 1,749,000 | 1,784,271 | ||||||
| Midwest Connector Capital Co. LLC | ||||||||
| 3.63%, 04/01/2022(c) | 4,000,000 | 4,059,179 | ||||||
| 3.90%, 04/01/2024(c) | 775,000 | 806,608 | ||||||
| Western Midstream Operating LP | ||||||||
| 4.35%, 02/01/2025 | 250,000 | 264,688 | ||||||
| 3M US L + 2.10%, | ||||||||
| 01/13/2023(a) | 1,849,000 | 1,831,110 | ||||||
| Total Pipeline | 11,315,850 | |||||||
| Power Generation (0.96%) | ||||||||
| Alexander Funding Trust | ||||||||
| 1.84%, 11/15/2023(c) | 3,369,000 | 3,417,162 | ||||||
| NRG Energy, Inc. | ||||||||
| 2.00%, 12/02/2025(c) | 500,000 | 503,669 | ||||||
| Total Power Generation | 3,920,831 | |||||||
See Notes to Financial Statements.
56 | April 30, 2021
| ALPS | Smith Short Duration Bond Fund | |
| Statement of Investments | April 30, 2021 (Unaudited) |
| Principal | Value | |||||||
| Amount | (Note 2) | |||||||
| Railroad (0.57%) | ||||||||
| Westinghouse Air Brake | ||||||||
| Technologies Corp. | ||||||||
| 3.20%, 06/15/2025 | $ | 2,169,000 | $ | 2,315,868 | ||||
| Real Estate (0.66%) | ||||||||
| GLP Capital LP / GLP Financing II, Inc. | ||||||||
| 5.38%, 11/01/2023 | 620,000 | 683,063 | ||||||
| Public Storage | ||||||||
| 1D US SOFR + 0.47%, | ||||||||
| 04/23/2024(a) | 2,000,000 | 2,002,195 | ||||||
| Total Real Estate | 2,685,258 | |||||||
| Refining & Marketing (2.11%) | ||||||||
| HollyFrontier Corp. | ||||||||
| 2.63%, 10/01/2023 | 2,000,000 | 2,071,862 | ||||||
| Phillips 66 | ||||||||
| 3M US L + 0.62%, | ||||||||
| 02/15/2024(a) | 1,865,000 | 1,868,566 | ||||||
| Valero Energy Corp. | ||||||||
| 3M US L + 1.15%, | ||||||||
| 09/15/2023(a) | 4,594,000 | 4,605,569 | ||||||
| Total Refining & Marketing | 8,545,997 | |||||||
| Restaurants (0.77%) | ||||||||
| 1011778 BC ULC / New Red | ||||||||
| Finance, Inc. | ||||||||
| 4.25%, 05/15/2024(c) | 1,710,000 | 1,734,487 | ||||||
| Yum! Brands, Inc. | ||||||||
| 7.75%, 04/01/2025(c) | 1,250,000 | 1,367,188 | ||||||
| Total Restaurants | 3,101,675 | |||||||
| Retail - Consumer Discretionary (1.06%) | ||||||||
| Gap, Inc. | ||||||||
| 8.38%, 05/15/2023(c) | 500,000 | 569,375 | ||||||
| 8.63%, 05/15/2025(c) | 2,147,000 | 2,378,769 | ||||||
| QVC, Inc. | ||||||||
| 4.38%, 03/15/2023 | 1,250,000 | 1,323,131 | ||||||
| Total Retail - Consumer Discretionary | 4,271,275 | |||||||
| Semiconductors (0.90%) | ||||||||
| Microchip Technology, Inc. | ||||||||
| 0.97%, 02/15/2024(c) | 1,000,000 | 999,113 | ||||||
| 3.92%, 06/01/2021 | 2,647,000 | 2,653,924 | ||||||
| Total Semiconductors | 3,653,037 | |||||||
| Software & Services (1.47%) | ||||||||
| Intuit, Inc. | ||||||||
| 0.65%, 07/15/2023 | 1,000,000 | 1,008,160 | ||||||
| Roper Technologies, Inc. | ||||||||
| 0.45%, 08/15/2022 | 1,365,000 | 1,367,043 | ||||||
| Verisk Analytics, Inc. | ||||||||
| 5.80%, 05/01/2021 | 3,581,000 | 3,581,000 | ||||||
| Total Software & Services | 5,956,203 | |||||||
| Principal | Value | |||||||
| Amount | (Note 2) | |||||||
| Supermarkets & Pharmacies (1.31%) | ||||||||
| 7-Eleven, Inc. | ||||||||
| 0.63%, 02/10/2023(c) | $ | 500,000 | $ | 500,573 | ||||
| 0.80%, 02/10/2024(c) | 2,000,000 | 1,998,018 | ||||||
| 3M US L + 0.45%, | ||||||||
| 08/10/2022(a)(c) | 1,500,000 | 1,500,975 | ||||||
| Albertsons Cos. Inc / Safeway, Inc. | ||||||||
| / New Albertsons LP / | ||||||||
| Albertsons LLC | ||||||||
| 3.50%, 02/15/2023(c) | 1,271,000 | 1,308,380 | ||||||
| Total Supermarkets & Pharmacies | 5,307,946 | |||||||
| Transportation & Logistics (0.50%) | ||||||||
| PACCAR Financial Corp. | ||||||||
| 0.35%, 08/11/2023 | 1,000,000 | 998,557 | ||||||
| 0.80%, 06/08/2023 | 1,000,000 | 1,009,377 | ||||||
| Total Transportation & Logistics | 2,007,934 | |||||||
| Utilities (5.75%) | ||||||||
| Atmos Energy Corp. | ||||||||
| 3M US L + 0.38%, | ||||||||
| 03/09/2023(a) | 1,795,000 | 1,796,107 | ||||||
| CenterPoint Energy Resources | ||||||||
| Corp. | ||||||||
| 0.70%, 03/02/2023 | 500,000 | 500,344 | ||||||
| Dominion Energy, Inc. | ||||||||
| 2.72%, 08/15/2021(b) | 2,028,000 | 2,041,439 | ||||||
| Duke Energy Progress LLC | ||||||||
| Series A | ||||||||
| 3M US L + 0.18%, | ||||||||
| 02/18/2022(a) | 500,000 | 499,961 | ||||||
| Exelon Corp. | ||||||||
| 3.50%, 06/01/2022 | 435,000 | 448,234 | ||||||
| NextEra Energy Capital Holdings, Inc. | ||||||||
| 0.65%, 03/01/2023 | 4,000,000 | 4,013,501 | ||||||
| ONE Gas, Inc. | ||||||||
| 0.85%, 03/11/2023 | 3,000,000 | 3,002,976 | ||||||
| Pacific Gas and Electric Co. | ||||||||
| 1.37%, 03/10/2023 | 1,000,000 | 1,000,425 | ||||||
| 3M US L + 1.38%, | ||||||||
| 11/15/2021(a) | 3,950,000 | 3,963,351 | ||||||
| Southern California Edison Co. | ||||||||
| 0.70%, 04/03/2023 | 3,000,000 | 3,006,157 | ||||||
| WEC Energy Group, Inc. | ||||||||
| 0.80%, 03/15/2024 | 3,000,000 | 3,006,331 | ||||||
| Total Utilities | 23,278,826 | |||||||
| Waste & Environment Services & Equipment (0.18%) | ||||||||
| GFL Environmental, Inc. | ||||||||
| 4.25%, 06/01/2025(c) | 700,000 | 722,313 | ||||||
| Wireless Telecommunications Services (1.12%) | ||||||||
| AT&T, Inc. | ||||||||
| 0.90%, 03/25/2024 | 2,000,000 | 2,004,884 | ||||||
| Sprint Corp. | ||||||||
| 7.88%, 09/15/2023 | 2,239,000 | 2,555,259 | ||||||
| Total Wireless Telecommunications Services | 4,560,143 | |||||||
See Notes to Financial Statements.
57 | April 30, 2021
| ALPS | Smith Short Duration Bond Fund | |
| Statement of Investments | April 30, 2021 (Unaudited) |
| Principal | Value | |||||||
| Amount | (Note 2) | |||||||
| Wireline Telecommunications Services (1.98%) | ||||||||
| Lumen Technologies, Inc. | ||||||||
| Series S | ||||||||
| 6.45%, 06/15/2021 | $ | 6,000,000 | $ | 6,036,000 | ||||
| NTT Finance Corp. | ||||||||
| 0.37%, 03/03/2023(c) | 2,000,000 | 2,001,971 | ||||||
| Total Wireline Telecommunications Services | 8,037,971 | |||||||
| TOTAL CORPORATE BONDS | ||||||||
| (Cost $297,769,402) | 299,727,375 | |||||||
| GOVERNMENT BONDS (19.47%) | ||||||||
| U.S. Treasury Bonds (19.47%) | ||||||||
| United States Treasury Notes | ||||||||
| 0.13%, 09/30/2022 | 10,960,000 | 10,964,281 | ||||||
| 0.13%, 11/30/2022 | 10,905,000 | 10,906,278 | ||||||
| 0.13%, 12/31/2022 | 16,502,000 | 16,500,067 | ||||||
| 0.13%, 01/31/2023 | 9,634,000 | 9,631,742 | ||||||
| 0.13%, 02/28/2023 | 11,032,000 | 11,027,906 | ||||||
| 0.13%, 03/31/2023 | 12,106,000 | 12,100,325 | ||||||
| 0.13%, 04/30/2023 | 3,976,000 | 3,973,282 | ||||||
| 0.38%, 04/15/2024 | 3,855,000 | 3,859,969 | ||||||
| Total U.S. Treasury Bonds | 78,963,850 | |||||||
| TOTAL GOVERNMENT BONDS | ||||||||
| (Cost $78,965,172) | 78,963,850 | |||||||
| MUNICIPAL BONDS (0.07%) | ||||||||
| State of Michigan | ||||||||
| 1.80%, 05/01/2021 | 285,000 | 285,000 | ||||||
| TOTAL MUNICIPAL BONDS | ||||||||
| (Cost $285,000) | 285,000 | |||||||
| 7-Day | Value | |||||||||||
| Yield | Shares | (Note 2) | ||||||||||
| SHORT TERM INVESTMENTS (2.96%) | ||||||||||||
| Money Market Fund (2.96%) | ||||||||||||
| Morgan Stanley Institutional Liquidity Funds - Government Portfolio | 0.030 | % | 12,012,510 | 12,012,510 | ||||||||
| TOTAL SHORT TERM INVESTMENTS | ||||||||||||
| (Cost $12,012,510) | 12,012,510 | |||||||||||
| TOTAL INVESTMENTS (100.69%) | ||||||||||||
| (Cost $406,332,738) | $ | 408,424,474 | ||||||||||
| Liabilities In Excess Of Other Assets (-0.69%) | (2,785,606 | ) | ||||||||||
| NET ASSETS (100.00%) | $ | 405,638,868 | ||||||||||
Investment Abbreviations:
LIBOR - London Interbank Offered Rate
SOFR - Secured Overnight Financing Rate
Reference Rates:
1M US L - 1 Month LIBOR as of April 30, 2021 was 0.11%
3M US L - 3 Month LIBOR as of April 30, 2021 was 0.18%
1D US SOFR - 1 Day SOFR as of April 30, 2021 was 0.01%
1Y US TI - 1 Year US Treasury Index as of April 30, 2021 was 0.05%
10Y US TI - 10 Year US Treasury Index as of April 30, 2021 was 1.65%
| (a) | Floating or variable rate security. The reference rate is described above. The rate in effect as of April 30, 2021 is based on the reference rate plus the displayed spread as of the security's last reset date. |
| (b) | Step bond. Coupon changes periodically based upon a predetermined schedule. Interest rate disclosed is that which is in effect as of April 30, 2021. |
| (c) | Security exempt from registration under Rule 144A of the Securities Act of 1933. This security may be resold in transactions exempt from registration, normally to qualified institutional buyers. As of April 30, 2021, the aggregate market value of those securities was $84,245,521, representing 20.77% of net assets. |
See Notes to Financial Statements.
58 | April 30, 2021
| ALPS | Smith Total Return Bond Fund | |
| Statement of Investments | April 30, 2021 (Unaudited) |
| Principal | Value | |||||||
| Amount | (Note 2) | |||||||
| COLLATERALIZED MORTGAGE OBLIGATIONS (8.11%) | ||||||||
| Fannie Mae | ||||||||
| Series 1993-31, Class PN, | ||||||||
| 7.000%, 09/25/2023 | $ | 180,877 | $ | 190,349 | ||||
| Series 1997-22, Class F, | ||||||||
| 0.795%, 03/25/2027(a) | 23,412 | 23,454 | ||||||
| Series 1997-76, Class FO, | ||||||||
| 1M US L + 0.50%, | ||||||||
| 09/17/2027(a) | 23,374 | 23,452 | ||||||
| Series 1999-58, Class F, | ||||||||
| 1M US L + 0.40%, | ||||||||
| 11/18/2029(a) | 62,445 | 62,639 | ||||||
| Series 2000-40, Class FA, | ||||||||
| 1M US L + 0.50%, | ||||||||
| 07/25/2030(a) | 21,868 | 21,743 | ||||||
| Series 2000-45, Class F, | ||||||||
| 1M US L + 0.45%, | ||||||||
| 12/25/2030(a) | 23,806 | 23,919 | ||||||
| Series 2001-27, Class F, | ||||||||
| 1M US L + 0.50%, | ||||||||
| 06/25/2031(a) | 17,394 | 17,482 | ||||||
| Series 2001-29, Class Z, | ||||||||
| 6.500%, 07/25/2031 | 68,036 | 78,745 | ||||||
| Series 2001-51, Class OD, | ||||||||
| 6.500%, 10/25/2031 | 53,276 | 56,784 | ||||||
| Series 2001-52, Class XZ, | ||||||||
| 6.500%, 10/25/2031 | 38,437 | 45,224 | ||||||
| Series 2001-59, Class F, | ||||||||
| 1M US L + 0.60%, | ||||||||
| 11/25/2031(a) | 148,143 | 149,947 | ||||||
| Series 2001-60, Class OF, | ||||||||
| 1M US L + 0.95%, | ||||||||
| 10/25/2031(a) | 17,750 | 18,186 | ||||||
| Series 2001-63, Class FD, | ||||||||
| 1M US L + 0.60%, | ||||||||
| 12/18/2031(a) | 20,792 | 20,961 | ||||||
| Series 2001-63, Class TC, | ||||||||
| 6.000%, 12/25/2031 | 27,844 | 32,125 | ||||||
| Series 2001-68, Class PH, | ||||||||
| 6.000%, 12/25/2031 | 23,917 | 27,507 | ||||||
| Series 2001-71, Class FE, | ||||||||
| 1M US L + 0.65%, | ||||||||
| 11/25/2031(a) | 99,781 | 101,069 | ||||||
| Series 2001-71, Class FS, | ||||||||
| 1M US L + 0.60%, | ||||||||
| 11/25/2031(a) | 81,600 | 80,782 | ||||||
| Series 2001-81, Class GE, | ||||||||
| 6.000%, 01/25/2032 | 20,416 | 23,612 | ||||||
| Series 2002-11, Class JF, | ||||||||
| 1M US L + 0.73%, | ||||||||
| 03/25/2032(a) | 62,756 | 63,750 | ||||||
| Series 2002-12, Class FH, | ||||||||
| 1M US L + 1.05%, | ||||||||
| 01/25/2032(a) | 71,548 | 73,287 | ||||||
| Principal | Value | |||||||
| Amount | (Note 2) | |||||||
| Series 2002-13, Class FE, | ||||||||
| 1M US L + 0.90%, | ||||||||
| 03/25/2032(a) | $ | 75,544 | $ | 76,849 | ||||
| Series 2002-16, Class TM, | ||||||||
| 7.000%, 04/25/2032 | 17,434 | 20,539 | ||||||
| Series 2002-17, Class JF, | ||||||||
| 1M US L + 1.00%, | ||||||||
| 04/25/2032(a) | 37,616 | 38,500 | ||||||
| Series 2002-18, Class FD, | ||||||||
| 1M US L + 0.80%, | ||||||||
| 02/25/2032(a) | 65,775 | 67,037 | ||||||
| Series 2002-23, Class FA, | ||||||||
| 1M US L + 0.90%, | ||||||||
| 04/25/2032(a) | 57,270 | 58,657 | ||||||
| Series 2002-34, Class EO, | ||||||||
| –%, 05/18/2032(b) | 71,065 | 68,929 | ||||||
| Series 2002-36, Class FS, | ||||||||
| 1M US L + 0.50%, | ||||||||
| 06/25/2032(a) | 59,033 | 59,257 | ||||||
| Series 2002-44, Class FJ, | ||||||||
| 1M US L + 1.00%, | ||||||||
| 04/25/2032(a) | 100,830 | 103,204 | ||||||
| Series 2002-47, Class FC, | ||||||||
| 1M US L + 0.60%, | ||||||||
| 11/25/2031(a) | 19,551 | 19,747 | ||||||
| Series 2002-48, Class F, | ||||||||
| 1M US L + 1.00%, | ||||||||
| 07/25/2032(a) | 63,839 | 65,361 | ||||||
| Series 2002-49, Class FC, | ||||||||
| 1M US L + 1.00%, | ||||||||
| 11/18/2031(a) | 40,497 | 41,476 | ||||||
| Series 2002-60, Class FV, | ||||||||
| 1M US L + 1.00%, | ||||||||
| 04/25/2032(a) | 139,626 | 142,945 | ||||||
| Series 2002-63, Class EZ, | ||||||||
| 6.000%, 10/25/2032 | 11,164 | 12,859 | ||||||
| Series 2002-68, Class AF, | ||||||||
| 1M US L + 1.00%, | ||||||||
| 10/25/2032(a) | 28,126 | 28,796 | ||||||
| Series 2002-7, Class FC, | ||||||||
| 1M US L + 0.75%, | ||||||||
| 01/25/2032(a) | 82,675 | 84,098 | ||||||
| Series 2002-71, Class AQ, | ||||||||
| 4.000%, 11/25/2032 | 78,403 | 84,757 | ||||||
| Series 2002-8, Class FA, | ||||||||
| 1M US L + 0.75%, | ||||||||
| 03/18/2032(a) | 25,290 | 25,799 | ||||||
| Series 2002-80, Class CZ, | ||||||||
| 4.500%, 09/25/2032 | 91,819 | 106,750 | ||||||
| Series 2002-9, Class FW, | ||||||||
| 1M US L + 0.55%, | ||||||||
| 03/25/2032(a) | 19,925 | 19,883 | ||||||
| Series 2002-91, Class F, | ||||||||
| 1M US L + 0.55%, | ||||||||
| 01/25/2033(a) | 30,645 | 30,926 | ||||||
See Notes to Financial Statements.
59 | April 30, 2021
| ALPS | Smith Total Return Bond Fund | |
| Statement of Investments | April 30, 2021 (Unaudited) |
| Principal | Value | |||||||
| Amount | (Note 2) | |||||||
| Series 2003-107, Class FD, | ||||||||
| 1M US L + 0.50%, | ||||||||
| 11/25/2033(a) | $ | 19,418 | $ | 19,583 | ||||
| Series 2003-110, Class CK, | ||||||||
| 3.000%, 11/25/2033 | 34,622 | 36,705 | ||||||
| Series 2003-116, Class FA, | ||||||||
| 1M US L + 0.40%, | ||||||||
| 11/25/2033(a) | 40,577 | 40,803 | ||||||
| Series 2003-119, Class FH, | ||||||||
| 1M US L + 0.50%, | ||||||||
| 12/25/2033(a) | 52,646 | 53,376 | ||||||
| Series 2003-119, Class ZP, | ||||||||
| 4.000%, 12/25/2033 | 30,071 | 32,616 | ||||||
| Series 2003-128, Class MF, | ||||||||
| 1M US L + 0.60%, | ||||||||
| 01/25/2034(a) | 81,862 | 81,076 | ||||||
| Series 2003-131, Class CH, | ||||||||
| 5.500%, 01/25/2034 | 125,779 | 140,506 | ||||||
| Series 2003-134, Class FC, | ||||||||
| 1M US L + 0.60%, | ||||||||
| 12/25/2032(a) | 43,869 | 44,620 | ||||||
| Series 2003-14, Class AP, | ||||||||
| 4.000%, 03/25/2033 | 148,291 | 154,820 | ||||||
| Series 2003-14, Class AN, | ||||||||
| 3.500%, 03/25/2033 | 98,860 | 103,207 | ||||||
| Series 2003-19, Class MB, | ||||||||
| 4.000%, 05/25/2031 | 53,836 | 59,110 | ||||||
| Series 2003-21, Class OG, | ||||||||
| 4.000%, 01/25/2033 | 49,831 | 53,478 | ||||||
| Series 2003-22, Class BZ, | ||||||||
| 6.000%, 04/25/2033 | 28,389 | 32,685 | ||||||
| Series 2003-27, Class EK, | ||||||||
| 5.000%, 04/25/2033 | 38,414 | 44,221 | ||||||
| Series 2003-30, Class JQ, | ||||||||
| 5.500%, 04/25/2033 | 39,294 | 44,836 | ||||||
| Series 2003-32, Class UJ, | ||||||||
| 5.500%, 05/25/2033 | 56,372 | 63,704 | ||||||
| Series 2003-41, Class OZ, | ||||||||
| 3.750%, 05/25/2033 | 122,623 | 132,527 | ||||||
| Series 2003-42, Class JH, | ||||||||
| 5.500%, 05/25/2033 | 108,948 | 122,224 | ||||||
| Series 2003-46, Class PJ, | ||||||||
| 5.500%, 06/25/2033 | 50,771 | 56,989 | ||||||
| Series 2003-47, Class PE, | ||||||||
| 5.750%, 06/25/2033 | 51,099 | 58,598 | ||||||
| Series 2003-64, Class JK, | ||||||||
| 3.500%, 07/25/2033 | 75,787 | 82,796 | ||||||
| Series 2003-64, Class ZC, | ||||||||
| 5.000%, 07/25/2033 | 43,281 | 49,566 | ||||||
| Series 2003-71, Class HD, | ||||||||
| 5.500%, 08/25/2033 | 230,000 | 253,304 | ||||||
| Series 2003-76, Class EZ, | ||||||||
| 5.000%, 08/25/2033 | 199,070 | 220,724 | ||||||
| Series 2003-94, Class CE, | ||||||||
| 5.000%, 10/25/2033 | 17,354 | 18,844 | ||||||
| Principal | Value | |||||||
| Amount | (Note 2) | |||||||
| Series 2004-101, Class TB, | ||||||||
| 5.500%, 01/25/2035 | $ | 167,285 | $ | 187,228 | ||||
| Series 2004-14, Class QB, | ||||||||
| 5.250%, 03/25/2034 | 192,000 | 217,026 | ||||||
| Series 2004-17, Class BA, | ||||||||
| 6.000%, 04/25/2034 | 118,388 | 144,805 | ||||||
| Series 2004-17, Class DZ, | ||||||||
| 5.500%, 04/25/2034 | 38,891 | 43,217 | ||||||
| Series 2004-26, Class CG, | ||||||||
| 4.500%, 08/25/2033 | 19,104 | 19,823 | ||||||
| Series 2004-36, Class FA, | ||||||||
| 1M US L + 0.40%, | ||||||||
| 05/25/2034(a) | 42,611 | 42,845 | ||||||
| Series 2004-36, Class CB, | ||||||||
| 5.000%, 05/25/2034 | 108,662 | 121,995 | ||||||
| Series 2004-53, Class FC, | ||||||||
| 1M US L + 0.45%, | ||||||||
| 07/25/2034(a) | 267,077 | 262,228 | ||||||
| Series 2004-54, Class FL, | ||||||||
| 1M US L + 0.40%, | ||||||||
| 07/25/2034(a) | 190,936 | 192,640 | ||||||
| Series 2004-60, Class AC, | ||||||||
| 5.500%, 04/25/2034 | 108,000 | 119,642 | ||||||
| Series 2004-68, Class LC, | ||||||||
| 5.000%, 09/25/2029 | 59,310 | 66,303 | ||||||
| Series 2004-77, Class AY, | ||||||||
| 4.500%, 10/25/2034 | 25,796 | 28,843 | ||||||
| Series 2004-82, Class HK, | ||||||||
| 5.500%, 11/25/2034 | 72,147 | 83,822 | ||||||
| Series 2004-92, Class TB, | ||||||||
| 5.500%, 12/25/2034 | 116,735 | 130,724 | ||||||
| Series 2005-110, Class MP, | ||||||||
| 5.500%, 12/25/2035 | 34,708 | 39,006 | ||||||
| Series 2005-120, Class FE, | ||||||||
| 1M US L + 0.52%, | ||||||||
| 01/25/2036(a) | 31,804 | 32,327 | ||||||
| Series 2005-122, Class PY, | ||||||||
| 6.000%, 01/25/2036 | 324,000 | 374,360 | ||||||
| Series 2005-17, Class EX, | ||||||||
| 5.250%, 03/25/2035 | 25,000 | 29,073 | ||||||
| Series 2005-17, Class EZ, | ||||||||
| 4.500%, 03/25/2035 | 144,696 | 153,850 | ||||||
| Series 2005-22, Class DA, | ||||||||
| 5.500%, 12/25/2034 | 6,424 | 6,477 | ||||||
| Series 2005-29, Class ZA, | ||||||||
| 5.500%, 04/25/2035 | 90,730 | 101,439 | ||||||
| Series 2005-3, Class CH, | ||||||||
| 5.250%, 02/25/2035 | 105,147 | 115,955 | ||||||
| Series 2005-3, Class CP, | ||||||||
| 5.500%, 10/25/2034 | 469 | 458 | ||||||
| Series 2005-35, Class DZ, | ||||||||
| 5.000%, 04/25/2035 | 207,204 | 234,813 | ||||||
| Series 2005-48, Class TD, | ||||||||
| 5.500%, 06/25/2035 | 166,613 | 187,981 | ||||||
See Notes to Financial Statements.
60 | April 30, 2021
| ALPS | Smith Total Return Bond Fund | |
| Statement of Investments | April 30, 2021 (Unaudited) |
| Principal | Value | |||||||
| Amount | (Note 2) | |||||||
| Series 2005-59, Class DF, | ||||||||
| 1M US L + 0.20%, | ||||||||
| 05/25/2035(a) | $ | 4,271 | $ | 4,282 | ||||
| Series 2005-62, Class GZ, | ||||||||
| 5.750%, 07/25/2035 | 481,924 | 573,828 | ||||||
| Series 2005-62, Class JC, | ||||||||
| 5.000%, 05/25/2035 | 8,744 | 9,032 | ||||||
| Series 2005-62, Class ZD, | ||||||||
| 5.000%, 06/25/2035 | 110,172 | 117,883 | ||||||
| Series 2005-62, Class JE, | ||||||||
| 5.000%, 06/25/2035 | 80,329 | 82,974 | ||||||
| Series 2005-64, Class PL, | ||||||||
| 5.500%, 07/25/2035 | 133,879 | 151,587 | ||||||
| Series 2005-68, Class CZ, | ||||||||
| 5.500%, 08/25/2035 | 469,541 | 535,824 | ||||||
| Series 2005-68, Class BE, | ||||||||
| 5.250%, 08/25/2035 | 97,000 | 111,197 | ||||||
| Series 2005-68, Class PG, | ||||||||
| 5.500%, 08/25/2035 | 47,459 | 54,170 | ||||||
| Series 2005-69, Class GZ, | ||||||||
| 4.500%, 08/25/2035 | 60,455 | 63,911 | ||||||
| Series 2005-7, Class MZ, | ||||||||
| 4.750%, 02/25/2035 | 98,869 | 105,867 | ||||||
| Series 2005-70, Class NA, | ||||||||
| 5.500%, 08/25/2035 | 20,074 | 22,374 | ||||||
| Series 2005-70, Class KP, | ||||||||
| 5.000%, 06/25/2035 | 70,789 | 79,429 | ||||||
| Series 2005-72, Class FB, | ||||||||
| 1M US L + 0.25%, | ||||||||
| 08/25/2035(a) | 26,250 | 26,323 | ||||||
| Series 2005-79, Class DB, | ||||||||
| 5.500%, 09/25/2035 | 96,147 | 107,441 | ||||||
| Series 2005-84, Class XM, | ||||||||
| 5.750%, 10/25/2035 | 82,471 | 93,612 | ||||||
| Series 2005-89, Class F, | ||||||||
| 1M US L + 0.30%, | ||||||||
| 10/25/2035(a) | 33,007 | 32,459 | ||||||
| Series 2005-99, Class FA, | ||||||||
| 1M US L + 0.30%, | ||||||||
| 11/25/2035(a) | 50,625 | 50,765 | ||||||
| Series 2005-99, Class ZA, | ||||||||
| 5.500%, 12/25/2035 | 104,862 | 127,955 | ||||||
| Series 2006-112, Class QC, | ||||||||
| 5.500%, 11/25/2036 | 31,146 | 36,408 | ||||||
| Series 2006-114, Class HE, | ||||||||
| 5.500%, 12/25/2036 | 132,505 | 154,599 | ||||||
| Series 2006-115, Class EF, | ||||||||
| 1M US L + 0.36%, | ||||||||
| 12/25/2036(a) | 23,491 | 23,134 | ||||||
| Series 2006-16, Class HZ, | ||||||||
| 5.500%, 03/25/2036 | 496,223 | 556,791 | ||||||
| Series 2006-39, Class EF, | ||||||||
| 1M US L + 0.40%, | ||||||||
| 05/25/2036(a) | 23,667 | 23,257 | ||||||
| Principal | Value | |||||||
| Amount | (Note 2) | |||||||
| Series 2006-46, Class UD, | ||||||||
| 5.500%, 06/25/2036 | $ | 33,000 | $ | 38,698 | ||||
| Series 2006-48, Class TF, | ||||||||
| 1M US L + 0.40%, | ||||||||
| 06/25/2036(a) | 48,057 | 48,552 | ||||||
| Series 2006-48, Class DZ, | ||||||||
| 6.000%, 06/25/2036 | 78,140 | 112,248 | ||||||
| Series 2006-56, Class F, | ||||||||
| 1M US L + 0.30%, | ||||||||
| 07/25/2036(a) | 18,598 | 18,686 | ||||||
| Series 2006-63, Class QH, | ||||||||
| 5.500%, 07/25/2036 | 45,257 | 52,071 | ||||||
| Series 2006-71, Class ZH, | ||||||||
| 6.000%, 07/25/2036 | 64,423 | 76,100 | ||||||
| Series 2006-95, Class FH, | ||||||||
| 1M US L + 0.45%, | ||||||||
| 10/25/2036(a) | 41,319 | 40,849 | ||||||
| Series 2007-100, Class YF, | ||||||||
| 1M US L + 0.55%, | ||||||||
| 10/25/2037(a) | 23,332 | 23,215 | ||||||
| Series 2007-109, Class GF, | ||||||||
| 1M US L + 0.68%, | ||||||||
| 12/25/2037(a) | 72,738 | 72,729 | ||||||
| Series 2007-111, Class FC, | ||||||||
| 1M US L + 0.60%, | ||||||||
| 12/25/2037(a) | 48,944 | 49,769 | ||||||
| Series 2007-117, Class FM, | ||||||||
| 1M US L + 0.70%, | ||||||||
| 01/25/2038(a) | 74,186 | 76,104 | ||||||
| Series 2007-12, Class ZA, | ||||||||
| 6.000%, 03/25/2037 | 141,639 | 177,465 | ||||||
| Series 2007-14, Class GZ, | ||||||||
| 5.500%, 03/25/2037 | 396,213 | 448,971 | ||||||
| Series 2007-30, Class MB, | ||||||||
| 4.250%, 04/25/2037 | 96,184 | 102,083 | ||||||
| Series 2007-33, Class HE, | ||||||||
| 5.500%, 04/25/2037 | 62,026 | 70,199 | ||||||
| Series 2007-34, Class F, | ||||||||
| 1M US L + 0.39%, | ||||||||
| 04/25/2037(a) | 39,720 | 40,126 | ||||||
| Series 2007-41, Class FA, | ||||||||
| 1M US L + 0.40%, | ||||||||
| 05/25/2037(a) | 32,496 | 32,787 | ||||||
| Series 2007-51, Class CP, | ||||||||
| 5.500%, 06/25/2037 | 40,097 | 45,801 | ||||||
| Series 2007-51, Class PB, | ||||||||
| 5.500%, 06/25/2037 | 32,000 | 36,285 | ||||||
| Series 2007-55, Class PH, | ||||||||
| 6.000%, 06/25/2047 | 557,718 | 663,951 | ||||||
| Series 2007-57, Class FA, | ||||||||
| 1M US L + 0.23%, | ||||||||
| 06/25/2037(a) | 36,823 | 36,920 | ||||||
| Series 2007-6, Class FC, | ||||||||
| 1M US L + 0.42%, | ||||||||
| 02/25/2037(a) | 51,863 | 52,368 | ||||||
See Notes to Financial Statements.
61 | April 30, 2021
| ALPS | Smith Total Return Bond Fund | |
| Statement of Investments | April 30, 2021 (Unaudited) |
| Principal | Value | |||||||
| Amount | (Note 2) | |||||||
| Series 2007-63, Class FC, | ||||||||
| 1M US L + 0.35%, | ||||||||
| 07/25/2037(a) | $ | 31,363 | $ | 31,574 | ||||
| Series 2007-65, Class ZE, | ||||||||
| 5.500%, 07/25/2037 | 191,903 | 210,765 | ||||||
| Series 2007-65, Class KF, | ||||||||
| 1M US L + 0.38%, | ||||||||
| 07/25/2037(a) | 64,441 | 63,512 | ||||||
| Series 2007-70, Class FA, | ||||||||
| 1M US L + 0.35%, | ||||||||
| 07/25/2037(a) | 43,158 | 42,376 | ||||||
| Series 2007-85, Class FL, | ||||||||
| 1M US L + 0.54%, | ||||||||
| 09/25/2037(a) | 50,384 | 51,347 | ||||||
| Series 2007-85, Class FC, | ||||||||
| 1M US L + 0.54%, | ||||||||
| 09/25/2037(a) | 144,141 | 146,210 | ||||||
| Series 2007-86, Class FA, | ||||||||
| 1M US L + 0.45%, | ||||||||
| 09/25/2037(a) | 47,480 | 47,897 | ||||||
| Series 2007-9, Class FB, | ||||||||
| 1M US L + 0.35%, | ||||||||
| 03/25/2037(a) | 34,885 | 34,468 | ||||||
| Series 2008-18, Class FA, | ||||||||
| 1M US L + 0.90%, | ||||||||
| 03/25/2038(a) | 186,393 | 186,324 | ||||||
| Series 2008-24, Class WD, | ||||||||
| 5.500%, 02/25/2038 | 124,095 | 142,447 | ||||||
| Series 2008-25, Class EF, | ||||||||
| 1M US L + 0.95%, | ||||||||
| 04/25/2038(a) | 66,018 | 67,865 | ||||||
| Series 2008-46, Class LA, | ||||||||
| 5.500%, 06/25/2038 | 15,939 | 17,955 | ||||||
| Series 2008-66, Class FT, | ||||||||
| 1M US L + 0.95%, | ||||||||
| 08/25/2038(a) | 36,938 | 37,890 | ||||||
| Series 2008-86, Class FC, | ||||||||
| 1M US L + 1.10%, | ||||||||
| 12/25/2038(a) | 318,488 | 319,397 | ||||||
| Series 2009-10, Class AB, | ||||||||
| 5.000%, 03/25/2024 | 78,785 | 81,484 | ||||||
| Series 2009-103, Class FM, | ||||||||
| 1M US L + 0.70%, | ||||||||
| 11/25/2039(a) | 66,788 | 67,821 | ||||||
| Series 2009-104, Class FA, | ||||||||
| 1M US L + 0.80%, | ||||||||
| 12/25/2039(a) | 60,647 | 58,990 | ||||||
| Series 2009-11, Class MP, | ||||||||
| 7.000%, 03/25/2049 | 192,898 | 228,693 | ||||||
| Series 2009-110, Class FG, | ||||||||
| 1M US L + 0.75%, | ||||||||
| 01/25/2040(a) | 157,868 | 161,229 | ||||||
| Series 2009-111, Class CY, | ||||||||
| 5.000%, 03/25/2038 | 133,000 | 151,732 | ||||||
| Series 2009-36, Class MX, | ||||||||
| 5.000%, 06/25/2039 | 58,000 | 67,512 | ||||||
| Principal | Value | |||||||
| Amount | (Note 2) | |||||||
| Series 2009-47, Class BN, | ||||||||
| 4.500%, 07/25/2039 | $ | 54,679 | $ | 59,757 | ||||
| Series 2009-62, Class WA, | ||||||||
| 5.571%, 08/25/2039(a) | 95,494 | 107,096 | ||||||
| Series 2009-68, Class FD, | ||||||||
| 1M US L + 1.25%, | ||||||||
| 09/25/2039(a) | 64,415 | 65,675 | ||||||
| Series 2009-70, Class CO, | ||||||||
| –%, 01/25/2037(b) | 112,246 | 102,043 | ||||||
| Series 2009-70, Class FA, | ||||||||
| 1M US L + 1.20%, | ||||||||
| 09/25/2039(a) | 41,802 | 42,300 | ||||||
| Series 2009-86, Class OT, | ||||||||
| –%, 10/25/2037(b) | 50,497 | 44,886 | ||||||
| Series 2009-87, Class FG, | ||||||||
| 1M US L + 0.75%, | ||||||||
| 11/25/2039(a) | 71,493 | 72,809 | ||||||
| Series 2009-90, Class UZ, | ||||||||
| 4.500%, 11/25/2039 | 586,672 | 681,663 | ||||||
| Series 2010-1, Class WA, | ||||||||
| 6.211%, 02/25/2040(a) | 30,666 | 35,059 | ||||||
| Series 2010-102, Class HA, | ||||||||
| 4.000%, 09/25/2050 | 70,232 | 76,746 | ||||||
| Series 2010-103, Class DZ, | ||||||||
| 4.500%, 09/25/2040 | 196,984 | 235,006 | ||||||
| Series 2010-103, Class PJ, | ||||||||
| 4.500%, 09/25/2040 | 50,000 | 55,062 | ||||||
| Series 2010-111, Class FC, | ||||||||
| 1M US L + 0.52%, | ||||||||
| 10/25/2040(a) | 78,047 | 77,406 | ||||||
| Series 2010-118, Class GF, | ||||||||
| 1M US L + 0.55%, | ||||||||
| 10/25/2039(a) | 81,484 | 81,881 | ||||||
| Series 2010-118, Class LZ, | ||||||||
| 4.750%, 10/25/2040 | 54,233 | 58,390 | ||||||
| Series 2010-122, Class JA, | ||||||||
| 7.000%, 07/25/2040 | 46,934 | 52,562 | ||||||
| Series 2010-123, Class KU, | ||||||||
| 4.500%, 11/25/2040 | 224,836 | 246,354 | ||||||
| Series 2010-123, Class FL, | ||||||||
| 1M US L + 0.43%, | ||||||||
| 11/25/2040(a) | 30,598 | 30,906 | ||||||
| Series 2010-129, Class PZ, | ||||||||
| 4.500%, 11/25/2040 | 91,542 | 95,915 | ||||||
| Series 2010-137, Class XP, | ||||||||
| 4.500%, 10/25/2040 | 47,473 | 48,071 | ||||||
| Series 2010-14, Class FJ, | ||||||||
| 1M US L + 0.60%, | ||||||||
| 03/25/2040(a) | 67,245 | 67,914 | ||||||
| Series 2010-141, Class AL, | ||||||||
| 4.000%, 12/25/2040 | 78,480 | 81,530 | ||||||
| Series 2010-141, Class FB, | ||||||||
| 1M US L + 0.47%, | ||||||||
| 12/25/2040(a) | 62,185 | 63,085 | ||||||
| Series 2010-141, Class MN, | ||||||||
| 4.000%, 12/25/2040 | 90,000 | 99,115 | ||||||
See Notes to Financial Statements.
62 | April 30, 2021
| ALPS | Smith Total Return Bond Fund | |
| Statement of Investments | April 30, 2021 (Unaudited) |
| Principal | Value | |||||||
| Amount | (Note 2) | |||||||
| Series 2010-142, Class FM, | ||||||||
| 1M US L + 0.47%, | ||||||||
| 12/25/2040(a) | $ | 23,994 | $ | 24,388 | ||||
| Series 2010-158, Class KF, | ||||||||
| 1M US L + 0.50%, | ||||||||
| 04/25/2040(a) | 42,303 | 42,441 | ||||||
| Series 2010-16, Class PL, | ||||||||
| 5.000%, 03/25/2040 | 71,000 | 84,021 | ||||||
| Series 2010-33, Class KN, | ||||||||
| 4.500%, 03/25/2040 | 91,514 | 97,894 | ||||||
| Series 2010-37, Class CY, | ||||||||
| 5.000%, 04/25/2040 | 56,469 | 64,263 | ||||||
| Series 2010-38, Class KD, | ||||||||
| 4.500%, 09/25/2039 | 16,054 | 16,452 | ||||||
| Series 2010-39, Class EF, | ||||||||
| 1M US L + 0.52%, | ||||||||
| 06/25/2037(a) | 58,380 | 59,312 | ||||||
| Series 2010-45, Class WD, | ||||||||
| 5.000%, 05/25/2040 | 180,000 | 208,268 | ||||||
| Series 2010-54, Class LX, | ||||||||
| 5.000%, 06/25/2040 | 272,000 | 321,178 | ||||||
| Series 2010-58, Class FY, | ||||||||
| 1M US L + 0.73%, | ||||||||
| 06/25/2040(a) | 75,699 | 75,691 | ||||||
| Series 2010-64, Class DM, | ||||||||
| 5.000%, 06/25/2040 | 71,696 | 81,010 | ||||||
| Series 2010-67, Class BD, | ||||||||
| 4.500%, 06/25/2040 | 591,993 | 652,968 | ||||||
| Series 2010-68, Class WB, | ||||||||
| 4.500%, 07/25/2040 | 45,000 | 50,938 | ||||||
| Series 2010-82, Class WZ, | ||||||||
| 5.000%, 08/25/2040 | 341,962 | 409,436 | ||||||
| Series 2010-9, Class ME, | ||||||||
| 5.000%, 02/25/2040 | 1,167,000 | 1,369,469 | ||||||
| Series 2011-104, Class KH, | ||||||||
| 2.000%, 03/25/2039 | 8,362 | 8,459 | ||||||
| Series 2011-114, Class B, | ||||||||
| 3.500%, 11/25/2041 | 273,451 | 295,850 | ||||||
| Series 2011-121, Class JP, | ||||||||
| 4.500%, 12/25/2041 | 171,504 | 180,419 | ||||||
| Series 2011-130, Class KB, | ||||||||
| 4.000%, 12/25/2041 | 82,790 | 90,338 | ||||||
| Series 2011-132, Class PE, | ||||||||
| 4.500%, 12/25/2041 | 46,680 | 51,431 | ||||||
| Series 2011-145, Class JA, | ||||||||
| 4.500%, 12/25/2041 | 33,455 | 35,180 | ||||||
| Series 2011-15, Class AF, | ||||||||
| 1M US L + 0.51%, | ||||||||
| 03/25/2041(a) | 37,220 | 37,320 | ||||||
| Series 2011-17, Class PD, | ||||||||
| 4.000%, 03/25/2041 | 14,364 | 15,031 | ||||||
| Series 2011-26, Class PA, | ||||||||
| 4.500%, 04/25/2041 | 158,109 | 175,054 | ||||||
| Series 2011-27, Class ZD, | ||||||||
| 2.500%, 09/25/2040 | 156,937 | 159,729 | ||||||
| Principal | Value | |||||||
| Amount | (Note 2) | |||||||
| Series 2011-3, Class FA, | ||||||||
| 1M US L + 0.68%, | ||||||||
| 02/25/2041(a) | $ | 252,248 | $ | 250,074 | ||||
| Series 2011-43, Class B, | ||||||||
| 3.500%, 05/25/2031 | 34,139 | 37,162 | ||||||
| Series 2011-45, Class ZA, | ||||||||
| 4.000%, 05/25/2031 | 33,497 | 36,385 | ||||||
| Series 2011-47, Class GF, | ||||||||
| 1M US L + 0.57%, | ||||||||
| 06/25/2041(a) | 157,988 | 156,783 | ||||||
| Series 2011-5, Class PO, | ||||||||
| –%, 09/25/2040(b) | 14,940 | 12,357 | ||||||
| Series 2011-55, Class BZ, | ||||||||
| 3.500%, 06/25/2041 | 305,472 | 334,659 | ||||||
| Series 2011-74, Class UB, | ||||||||
| 4.000%, 07/25/2040 | 273,265 | 294,344 | ||||||
| Series 2011-75, Class HP, | ||||||||
| 2.500%, 07/25/2040 | 30,109 | 30,622 | ||||||
| Series 2011-86, Class AF, | ||||||||
| 1M US L + 0.50%, | ||||||||
| 02/25/2040(a) | 53,683 | 53,628 | ||||||
| Series 2011-86, Class NF, | ||||||||
| 1M US L + 0.55%, | ||||||||
| 09/25/2041(a) | 38,371 | 39,042 | ||||||
| Series 2011-93, Class GA, | ||||||||
| 4.000%, 04/25/2039 | 39,389 | 41,865 | ||||||
| Series 2011-93, Class ST, | ||||||||
| 4.000%, 09/25/2041 | 32,551 | 35,490 | ||||||
| Series 2012-100, Class DB, | ||||||||
| 3.000%, 09/25/2042 | 150,000 | 152,768 | ||||||
| Series 2012-111, Class B, | ||||||||
| 7.000%, 10/25/2042 | 129,291 | 156,498 | ||||||
| Series 2012-120, Class AH, | ||||||||
| 2.500%, 02/25/2032 | 73,657 | 75,936 | ||||||
| Series 2012-125, Class KZ, | ||||||||
| 3.000%, 11/25/2042 | 20,879 | 19,811 | ||||||
| Series 2012-128, Class NP, | ||||||||
| 2.500%, 11/25/2042 | 32,115 | 32,052 | ||||||
| Series 2012-129, Class HT, | ||||||||
| 2.000%, 12/25/2032 | 74,796 | 71,952 | ||||||
| Series 2012-13, Class JP, | ||||||||
| 4.500%, 02/25/2042 | 843,043 | 889,793 | ||||||
| Series 2012-131, Class FG, | ||||||||
| 1M US L + 0.35%, | ||||||||
| 09/25/2042(a) | 25,378 | 24,807 | ||||||
| Series 2012-137, Class CF, | ||||||||
| 1M US L + 0.30%, | ||||||||
| 08/25/2041(a) | 54,267 | 54,222 | ||||||
| Series 2012-139, Class GB, | ||||||||
| 2.500%, 12/25/2042 | 210,538 | 185,455 | ||||||
| Series 2012-14, Class FL, | ||||||||
| 1M US L + 0.45%, | ||||||||
| 12/25/2040(a) | 12,156 | 12,208 | ||||||
| Series 2012-14, Class MH, | ||||||||
| 2.000%, 12/25/2040 | 48,380 | 49,146 | ||||||
See Notes to Financial Statements.
63 | April 30, 2021
| ALPS | Smith Total Return Bond Fund | |
| Statement of Investments | April 30, 2021 (Unaudited) |
| Principal | Value | |||||||
| Amount | (Note 2) | |||||||
| Series 2012-144, Class JT, | ||||||||
| 2.500%, 06/25/2042 | $ | 3,065 | $ | 2,977 | ||||
| Series 2012-149, Class DA, | ||||||||
| 1.750%, 01/25/2043 | 47,798 | 48,659 | ||||||
| Series 2012-149, Class KB, | ||||||||
| 3.000%, 01/25/2043 | 144,000 | 148,849 | ||||||
| Series 2012-149, Class ZA, | ||||||||
| 3.000%, 01/25/2041 | 220,511 | 227,395 | ||||||
| Series 2012-152, Class PB, | ||||||||
| 3.500%, 01/25/2043 | 55,000 | 58,902 | ||||||
| Series 2012-20, Class TD, | ||||||||
| 4.500%, 02/25/2042 | 135,325 | 141,236 | ||||||
| Series 2012-33, Class F, | ||||||||
| 1M US L + 0.52%, | ||||||||
| 04/25/2042(a) | 54,742 | 54,053 | ||||||
| Series 2012-37, Class BF, | ||||||||
| 1M US L + 0.50%, | ||||||||
| 12/25/2035(a) | 79,033 | 80,254 | ||||||
| Series 2012-46, Class YB, | ||||||||
| 3.500%, 05/25/2042 | 91,337 | 90,831 | ||||||
| Series 2012-47, Class HF, | ||||||||
| 1M US L + 0.40%, | ||||||||
| 05/25/2027(a) | 112,506 | 112,245 | ||||||
| Series 2012-49, Class TG, | ||||||||
| 2.000%, 07/25/2041 | 184,681 | 189,276 | ||||||
| Series 2012-50, Class HC, | ||||||||
| 2.000%, 03/25/2042 | 80,724 | 82,634 | ||||||
| Series 2012-56, Class WB, | ||||||||
| 3.500%, 05/25/2042 | 100,000 | 104,724 | ||||||
| Series 2012-56, Class UB, | ||||||||
| 4.000%, 06/25/2042 | 416,000 | 451,352 | ||||||
| Series 2012-70, Class WC, | ||||||||
| 3.000%, 07/25/2042 | 122,000 | 115,376 | ||||||
| Series 2012-80, Class GZ, | ||||||||
| 3.000%, 08/25/2042 | 561,969 | 582,711 | ||||||
| Series 2012-82, Class E, | ||||||||
| 2.000%, 04/25/2042 | 56,612 | 58,542 | ||||||
| Series 2012-83, Class LD, | ||||||||
| 2.000%, 04/25/2041 | 154,885 | 157,393 | ||||||
| Series 2012-83, Class AC, | ||||||||
| 3.000%, 08/25/2042 | 50,000 | 51,071 | ||||||
| Series 2012-94, Class KF, | ||||||||
| 1M US L + 0.35%, | ||||||||
| 05/25/2038(a) | 23,818 | 23,864 | ||||||
| Series 2012-98, Class ZP, | ||||||||
| 6.000%, 09/25/2042 | 587,947 | 790,961 | ||||||
| Series 2012-99, Class LA, | ||||||||
| 3.500%, 06/25/2042 | 199,516 | 200,643 | ||||||
| Series 2013-100, Class DH, | ||||||||
| 3.000%, 09/25/2031 | 96,843 | 99,060 | ||||||
| Series 2013-104, Class CY, | ||||||||
| 5.000%, 10/25/2043 | 50,000 | 58,988 | ||||||
| Series 2013-108, Class GU, | ||||||||
| 3.000%, 10/25/2033 | 55,000 | 58,190 | ||||||
| Principal | Value | |||||||
| Amount | (Note 2) | |||||||
| Series 2013-111, Class PA, | ||||||||
| 2.000%, 12/25/2042 | $ | 156,703 | $ | 157,276 | ||||
| Series 2013-114, Class LM, | ||||||||
| 4.000%, 03/25/2042 | 300,000 | 326,242 | ||||||
| Series 2013-129, Class WL, | ||||||||
| 2.000%, 12/25/2027 | 18,722 | 19,076 | ||||||
| Series 2013-13, Class WA, | ||||||||
| 2.500%, 07/25/2042 | 36,442 | 35,031 | ||||||
| Series 2013-130, Class FB, | ||||||||
| 1M US L + 0.45%, | ||||||||
| 01/25/2044(a) | 65,117 | 65,794 | ||||||
| Series 2013-136, Class QB, | ||||||||
| 3.500%, 03/25/2042 | 300,000 | 317,681 | ||||||
| Series 2013-17, Class YM, | ||||||||
| 4.000%, 03/25/2033 | 22,094 | 24,324 | ||||||
| Series 2013-2, Class QF, | ||||||||
| 1M US L + 0.50%, | ||||||||
| 02/25/2043(a) | 24,896 | 25,149 | ||||||
| Series 2013-35, Class CV, | ||||||||
| 3.000%, 02/25/2043 | 100,000 | 106,469 | ||||||
| Series 2013-40, Class KD, | ||||||||
| 1.750%, 04/25/2042 | 34,944 | 34,642 | ||||||
| Series 2013-52, Class GM, | ||||||||
| 5.000%, 06/25/2043 | 89,000 | 96,364 | ||||||
| Series 2013-53, Class CV, | ||||||||
| 3.500%, 05/25/2030 | 129,530 | 134,261 | ||||||
| Series 2013-56, Class HB, | ||||||||
| 2.500%, 06/25/2043 | 22,278 | 21,822 | ||||||
| Series 2013-68, Class LE, | ||||||||
| 2.000%, 04/25/2043 | 165,825 | 169,666 | ||||||
| Series 2013-68, Class P, | ||||||||
| 3.500%, 10/25/2042 | 269,697 | 275,196 | ||||||
| Series 2013-72, Class AF, | ||||||||
| 1M US L + 0.25%, | ||||||||
| 11/25/2042(a) | 18,289 | 18,323 | ||||||
| Series 2013-72, Class YA, | ||||||||
| 3.000%, 06/25/2033 | 25,420 | 25,315 | ||||||
| Series 2013-9, Class CB, | ||||||||
| 5.500%, 04/25/2042 | 18,520 | 21,313 | ||||||
| Series 2013-91, Class PB, | ||||||||
| 4.000%, 09/25/2043 | 100,000 | 107,538 | ||||||
| Series 2013-98, Class CJ, | ||||||||
| 2.500%, 07/25/2030 | 77,417 | 78,308 | ||||||
| Series 2014-12, Class GV, | ||||||||
| 3.500%, 03/25/2027 | 125,687 | 130,015 | ||||||
| Series 2014-21, Class MA, | ||||||||
| 2.000%, 09/25/2041 | 164,635 | 169,984 | ||||||
| Series 2014-26, Class YW, | ||||||||
| 3.500%, 04/25/2044 | 50,538 | 54,855 | ||||||
| Series 2014-3, Class BM, | ||||||||
| 2.500%, 06/25/2043 | 50,000 | 51,354 | ||||||
| Series 2014-49, Class CA, | ||||||||
| 3.000%, 08/25/2044 | 163,463 | 173,467 | ||||||
See Notes to Financial Statements.
64 | April 30, 2021
| ALPS | Smith Total Return Bond Fund | |
| Statement of Investments | April 30, 2021 (Unaudited) |
| Principal | Value | |||||||
| Amount | (Note 2) | |||||||
| Series 2014-73, Class FA, | ||||||||
| 1M US L + 0.35%, | ||||||||
| 11/25/2044(a) | $ | 23,440 | $ | 23,027 | ||||
| Series 2014-81, Class GC, | ||||||||
| 3.000%, 03/25/2038 | 74,421 | 76,431 | ||||||
| Series 2014-82, Class LA, | ||||||||
| 3.000%, 09/25/2039 | 19,332 | 19,352 | ||||||
| Series 2014-88, Class ER, | ||||||||
| 2.500%, 02/25/2036 | 49,940 | 52,458 | ||||||
| Series 2015-31, Class UB, | ||||||||
| 2.500%, 01/25/2033 | 114 | 114 | ||||||
| Series 2015-44, Class J, | ||||||||
| 3.500%, 12/25/2040 | 230,256 | 233,681 | ||||||
| Series 2015-51, Class CD, | ||||||||
| 3.000%, 07/25/2044 | 238,596 | 249,409 | ||||||
| Series 2015-94, Class EP, | ||||||||
| 3.000%, 07/25/2043 | 94,860 | 95,472 | ||||||
| Series 2016-14, Class NC, | ||||||||
| 2.500%, 03/25/2046 | 2,643,060 | 2,697,740 | ||||||
| Series 2016-27, Class HK, | ||||||||
| 3.000%, 01/25/2041 | 451,161 | 481,882 | ||||||
| Series 2016-33, Class LE, | ||||||||
| 2.500%, 11/25/2033 | 67,548 | 70,844 | ||||||
| Series 2016-48, Class UF, | ||||||||
| 1M US L + 0.40%, | ||||||||
| 08/25/2046(a) | 112,251 | 110,317 | ||||||
| Series 2016-55, Class EA, | ||||||||
| 1.750%, 07/25/2043 | 1,182,610 | 1,184,573 | ||||||
| Series 2016-75, Class FC, | ||||||||
| 1M US L + 0.40%, | ||||||||
| 10/25/2046(a) | 41,431 | 40,818 | ||||||
| Series 2016-8, Class CB, | ||||||||
| 3.500%, 03/25/2046 | 525,000 | 583,356 | ||||||
| Series 2016-85, Class BA, | ||||||||
| 2.500%, 11/25/2046 | 29,895 | 28,755 | ||||||
| Series 2016-9, Class D, | ||||||||
| 3.000%, 03/25/2046 | 54,031 | 57,194 | ||||||
| Series 2016-91, Class CK, | ||||||||
| 3.000%, 12/25/2046 | 26,583 | 26,353 | ||||||
| Series 2016-93, Class LA, | ||||||||
| 3.000%, 08/25/2042 | 73,892 | 74,325 | ||||||
| Series 2017-1, Class AP, | ||||||||
| 3.500%, 05/25/2043 | 103,479 | 104,351 | ||||||
| Series 2017-1, Class JP, | ||||||||
| 3.500%, 04/25/2045 | 295,135 | 301,513 | ||||||
| Series 2017-10, Class FA, | ||||||||
| 1M US L + 0.40%, | ||||||||
| 03/25/2047(a) | 50,371 | 49,552 | ||||||
| Series 2017-107, Class GA, | ||||||||
| 3.000%, 08/25/2045 | 248,803 | 252,174 | ||||||
| Series 2017-15, Class PE, | ||||||||
| 3.500%, 04/25/2046 | 91,070 | 95,443 | ||||||
| Series 2017-15, Class MA, | ||||||||
| 3.000%, 02/25/2042 | 18,148 | 18,138 | ||||||
| Principal | Value | |||||||
| Amount | (Note 2) | |||||||
| Series 2017-16, Class JA, | ||||||||
| 3.000%, 02/25/2043 | $ | 26,304 | $ | 26,437 | ||||
| Series 2017-19, Class B, | ||||||||
| 3.000%, 01/25/2047 | 122,661 | 127,414 | ||||||
| Series 2017-22, Class DA, | ||||||||
| 4.000%, 08/25/2044 | 91,411 | 94,235 | ||||||
| Series 2017-35, Class AH, | ||||||||
| 3.500%, 04/25/2053 | 41,878 | 43,266 | ||||||
| Series 2017-38, Class JA, | ||||||||
| 3.000%, 03/25/2047 | 232,330 | 241,549 | ||||||
| Series 2017-40, Class GL, | ||||||||
| 3.500%, 03/25/2043 | 26,958 | 27,048 | ||||||
| Series 2017-45, Class KD, | ||||||||
| 3.500%, 02/25/2044 | 68,804 | 69,836 | ||||||
| Series 2017-46, Class AB, | ||||||||
| 3.500%, 07/25/2049 | 75,728 | 76,969 | ||||||
| Series 2017-52, Class KD, | ||||||||
| 2.750%, 04/25/2044 | 31,255 | 31,297 | ||||||
| Series 2017-56, Class BA, | ||||||||
| 3.000%, 03/25/2045 | 186,319 | 192,764 | ||||||
| Series 2017-59, Class DC, | ||||||||
| 3.500%, 05/25/2044 | 135,557 | 137,458 | ||||||
| Series 2017-90, Class VA, | ||||||||
| 3.500%, 02/25/2029 | 250,931 | 251,731 | ||||||
| Series 2018-11, Class BC, | ||||||||
| 3.750%, 05/25/2044 | 279,847 | 281,899 | ||||||
| Series 2018-16, Class HA, | ||||||||
| 3.000%, 07/25/2043 | 75,795 | 76,798 | ||||||
| Series 2018-19, Class KB, | ||||||||
| 3.000%, 04/25/2046 | 198,020 | 203,998 | ||||||
| Series 2018-2, Class HD, | ||||||||
| 3.000%, 02/25/2047 | 121,042 | 124,459 | ||||||
| Series 2018-24, Class BA, | ||||||||
| 3.500%, 09/25/2045 | 169,132 | 174,260 | ||||||
| Series 2018-38, Class PA, | ||||||||
| 3.500%, 06/25/2047 | 43,484 | 45,367 | ||||||
| Series 2018-39, Class FG, | ||||||||
| 1M US L + 0.25%, | ||||||||
| 11/25/2033(a) | 162,441 | 163,295 | ||||||
| Series 2018-41, Class PZ, | ||||||||
| 4.000%, 06/25/2048 | 877,474 | 995,718 | ||||||
| Series 2018-43, Class FE, | ||||||||
| 1M US L + 0.25%, | ||||||||
| 09/25/2038(a) | 57,163 | 55,996 | ||||||
| Series 2018-45, Class GA, | ||||||||
| 3.000%, 06/25/2048 | 84,899 | 88,737 | ||||||
| Series 2018-5, Class JP, | ||||||||
| 3.000%, 09/25/2047 | 119,736 | 120,515 | ||||||
| Series 2018-56, Class CH, | ||||||||
| 3.000%, 08/25/2048 | 68,003 | 71,476 | ||||||
| Series 2018-60, Class KL, | ||||||||
| 4.000%, 08/25/2048 | 96,000 | 107,194 | ||||||
| Series 2018-67, Class DY, | ||||||||
| 4.000%, 09/25/2048 | 304,029 | 341,845 | ||||||
See Notes to Financial Statements.
65 | April 30, 2021
| ALPS | Smith Total Return Bond Fund | |
| Statement of Investments | April 30, 2021 (Unaudited) |
| Principal | Value | |||||||
| Amount | (Note 2) | |||||||
| Series 2018-77, Class BA, | ||||||||
| 3.000%, 04/25/2044 | $ | 96,908 | $ | 97,409 | ||||
| Series 2018-83, Class LH, | ||||||||
| 4.000%, 11/25/2048 | 51,517 | 54,300 | ||||||
| Series 2018-94, Class KD, | ||||||||
| 3.500%, 12/25/2048 | 125,489 | 131,949 | ||||||
| Series 2019-10, Class MA, | ||||||||
| 3.000%, 03/25/2049 | 206,089 | 214,371 | ||||||
| Series 2019-13, Class MH, | ||||||||
| 3.000%, 03/25/2049 | 1,029,229 | 1,094,739 | ||||||
| Series 2019-37, Class AE, | ||||||||
| 6.000%, 07/25/2043 | 751,808 | 758,529 | ||||||
| Series 2019-55, Class MQ, | ||||||||
| 3.500%, 10/25/2049 | 1,599,360 | 1,680,221 | ||||||
| Series 2019-56, Class CA, | ||||||||
| 3.000%, 10/25/2042 | 33,326 | 33,292 | ||||||
| Series 2019-60, Class BF, | ||||||||
| 1M US L + 0.45%, | ||||||||
| 10/25/2049(a) | 29,712 | 29,896 | ||||||
| Series 2019-65, Class HA, | ||||||||
| 2.500%, 11/25/2049 | 301,323 | 311,471 | ||||||
| Series 2020-10, Class B, | ||||||||
| 3.000%, 03/25/2050 | 648,969 | 667,089 | ||||||
| Series 2020-11, Class EA, | ||||||||
| 3.000%, 05/25/2043 | 155,682 | 156,556 | ||||||
| 48,100,887 | ||||||||
| Freddie Mac | ||||||||
| Series 1994-1665, Class KZ, | ||||||||
| 6.500%, 01/15/2024 | 5,700 | 6,088 | ||||||
| Series 1996-1863, Class Z, | ||||||||
| 6.500%, 07/15/2026 | 11,868 | 12,619 | ||||||
| Series 1997-1935, Class FK, | ||||||||
| 1M US L + 0.70%, | ||||||||
| 02/15/2027(a) | 17,939 | 18,083 | ||||||
| Series 1997-1980, Class Z, | ||||||||
| 7.000%, 07/15/2027 | 20,251 | 23,051 | ||||||
| Series 1998-2034, Class Z, | ||||||||
| 6.500%, 02/15/2028 | 24,425 | 26,817 | ||||||
| Series 1998-2035, Class PC, | ||||||||
| 6.950%, 03/15/2028 | 7,212 | 8,170 | ||||||
| Series 1998-2053, Class Z, | ||||||||
| 6.500%, 04/15/2028 | 22,950 | 25,699 | ||||||
| Series 1998-2060, Class Z, | ||||||||
| 6.500%, 05/15/2028 | 13,875 | 15,787 | ||||||
| Series 1998-2079, Class FA, | ||||||||
| 1M US L + 0.50%, | ||||||||
| 07/17/2028(a) | 6,334 | 6,347 | ||||||
| Series 1998-2095, Class PE, | ||||||||
| 6.000%, 11/15/2028 | 24,456 | 27,610 | ||||||
| Series 1998-2102, Class Z, | ||||||||
| 6.000%, 12/15/2028 | 80,863 | 91,253 | ||||||
| Series 1999-2115, Class FB, | ||||||||
| 1M US L + 0.45%, | ||||||||
| 01/15/2029(a) | 46,430 | 46,579 | ||||||
| Principal | Value | |||||||
| Amount | (Note 2) | |||||||
| Series 1999-2126, Class CB, | ||||||||
| 6.250%, 02/15/2029 | $ | 36,830 | $ | 41,090 | ||||
| Series 1999-2137, Class TH, | ||||||||
| 6.500%, 03/15/2029 | 8,619 | 9,844 | ||||||
| Series 1999-2154, Class PL, | ||||||||
| 6.500%, 05/15/2029 | 37,279 | 42,813 | ||||||
| Series 2000-2224, Class CB, | ||||||||
| 8.000%, 03/15/2030 | 9,889 | 11,572 | ||||||
| Series 2001-2274, | ||||||||
| Class ZM, | ||||||||
| 6.500%, 01/15/2031 | 15,569 | 17,606 | ||||||
| Series 2001-2279, Class Z, | ||||||||
| 6.000%, 01/15/2031 | 17,120 | 19,242 | ||||||
| Series 2001-2320, Class FI, | ||||||||
| 1M US L + 0.50%, | ||||||||
| 09/15/2029(a) | 45,199 | 45,461 | ||||||
| Series 2001-2322, Class FV, | ||||||||
| 1M US L + 0.50%, | ||||||||
| 06/15/2030(a) | 36,554 | 36,059 | ||||||
| Series 2001-2324, Class PZ, | ||||||||
| 6.500%, 06/15/2031 | 174,416 | 205,634 | ||||||
| Series 2001-2334, Class KB, | ||||||||
| 6.500%, 05/15/2028 | 128,337 | 144,709 | ||||||
| Series 2001-2341, Class FP, | ||||||||
| 1M US L + 0.90%, | ||||||||
| 07/15/2031(a) | 43,441 | 44,402 | ||||||
| Series 2001-2367, Class FA, | ||||||||
| 1M US L + 0.525%, | ||||||||
| 06/15/2031(a) | 40,565 | 40,868 | ||||||
| Series 2001-2372, Class F, | ||||||||
| 1M US L + 0.50%, | ||||||||
| 10/15/2031(a) | 35,152 | 35,334 | ||||||
| Series 2001-2388, Class FR, | ||||||||
| 1M US L + 0.65%, | ||||||||
| 06/15/2031(a) | 26,990 | 27,300 | ||||||
| Series 2001-2388, Class FB, | ||||||||
| 1M US L + 0.60%, | ||||||||
| 01/15/2029(a) | 31,412 | 31,672 | ||||||
| Series 2001-2391, Class HF, | ||||||||
| 1M US L + 0.55%, | ||||||||
| 06/15/2031(a) | 13,920 | 14,035 | ||||||
| Series 2001-2396, | ||||||||
| Class FM, | ||||||||
| 1M US L + 0.45%, | ||||||||
| 12/15/2031(a) | 58,889 | 59,078 | ||||||
| Series 2001-2396, Class FN, | ||||||||
| 1M US L + 0.65%, | ||||||||
| 12/15/2031(a) | 138,842 | 141,078 | ||||||
| Series 2002-2411, Class F, | ||||||||
| 1M US L + 0.55%, | ||||||||
| 02/15/2032(a) | 34,284 | 34,629 | ||||||
| Series 2002-2412, Class OF, | ||||||||
| 1M US L + 0.95%, | ||||||||
| 12/15/2031(a) | 43,025 | 44,044 | ||||||
See Notes to Financial Statements.
66 | April 30, 2021
| ALPS | Smith Total Return Bond Fund | |
| Statement of Investments | April 30, 2021 (Unaudited) |
| Principal | Value | |||||||
| Amount | (Note 2) | |||||||
| Series 2002-2417, Class FY, | ||||||||
| 1M US L + 0.60%, | ||||||||
| 12/15/2031(a) | $ | 13,889 | $ | 13,692 | ||||
| Series 2002-2424, Class FY, | ||||||||
| 1M US L + 0.45%, | ||||||||
| 03/15/2032(a) | 69,642 | 69,856 | ||||||
| Series 2002-2430, | ||||||||
| Class WF, | ||||||||
| 6.500%, 03/15/2032 | 12,419 | 14,679 | ||||||
| Series 2002-2433, Class FA, | ||||||||
| 1M US L + 0.95%, | ||||||||
| 02/15/2032(a) | 53,403 | 54,655 | ||||||
| Series 2002-2460, Class FA, | ||||||||
| 1M US L + 1.00%, | ||||||||
| 03/15/2032(a) | 93,361 | 95,530 | ||||||
| Series 2002-2466, Class FV, | ||||||||
| 1M US L + 0.55%, | ||||||||
| 03/15/2032(a) | 88,274 | 89,050 | ||||||
| Series 2002-2470, Class EF, | ||||||||
| 1M US L + 1.00%, | ||||||||
| 03/15/2032(a) | 100,087 | 101,975 | ||||||
| Series 2002-2478, Class FD, | ||||||||
| 1M US L + 1.00%, | ||||||||
| 02/15/2032(a) | 28,486 | 28,595 | ||||||
| Series 2002-2481, Class FE, | ||||||||
| 1M US L + 1.00%, | ||||||||
| 03/15/2032(a) | 28,281 | 28,938 | ||||||
| Series 2002-2488, Class FU, | ||||||||
| 1M US L + 0.60%, | ||||||||
| 03/15/2032(a) | 84,933 | 84,614 | ||||||
| Series 2002-2494, Class F, | ||||||||
| 1M US L + 1.05%, | ||||||||
| 06/15/2031(a) | 53,889 | 55,160 | ||||||
| Series 2002-2495, Class ZB, | ||||||||
| 4.500%, 09/15/2032 | 52,542 | 57,836 | ||||||
| Series 2002-2510, Class FE, | ||||||||
| 1M US L + 0.40%, | ||||||||
| 10/15/2032(a) | 46,953 | 47,036 | ||||||
| Series 2002-2513, Class AF, | ||||||||
| 1M US L + 1.00%, | ||||||||
| 02/15/2032(a) | 76,142 | 77,922 | ||||||
| Series 2002-2516, Class FD, | ||||||||
| 1M US L + 1.00%, | ||||||||
| 02/15/2032(a) | 72,360 | 74,091 | ||||||
| Series 2002-2517, Class FR, | ||||||||
| 1M US L + 0.35%, | ||||||||
| 10/15/2032(a) | 19,850 | 19,887 | ||||||
| Series 2002-2524, Class DH, | ||||||||
| 6.000%, 11/15/2032 | 33,000 | 39,084 | ||||||
| Series 2002-2535, | ||||||||
| Class AW, | ||||||||
| 5.500%, 12/15/2032 | 16,258 | 18,471 | ||||||
| Series 2002-2538, Class F, | ||||||||
| 1M US L + 0.60%, | ||||||||
| 12/15/2032(a) | 213,049 | 216,889 | ||||||
| Principal | Value | |||||||
| Amount | (Note 2) | |||||||
| Series 2002-2541, Class BL, | ||||||||
| 5.500%, 12/15/2032 | $ | 63,181 | $ | 69,924 | ||||
| Series 2003-2554, | ||||||||
| Class MN, | ||||||||
| 5.500%, 01/15/2033 | 67,162 | 76,672 | ||||||
| Series 2003-2557, Class HL, | ||||||||
| 5.300%, 01/15/2033 | 141,993 | 159,774 | ||||||
| Series 2003-2557, | ||||||||
| Class NU, | ||||||||
| 5.250%, 03/15/2032 | 80,947 | 90,477 | ||||||
| Series 2003-2557, | ||||||||
| Class WF, | ||||||||
| 1M US L + 0.40%, | ||||||||
| 01/15/2033(a) | 46,440 | 46,615 | ||||||
| Series 2003-2568, Class D, | ||||||||
| 5.500%, 02/15/2033 | 46,449 | 51,891 | ||||||
| Series 2003-2571, Class FY, | ||||||||
| 1M US L + 0.75%, | ||||||||
| 12/15/2032(a) | 30,607 | 31,244 | ||||||
| Series 2003-2587, | ||||||||
| Class FW, | ||||||||
| 1M US L + 0.47%, | ||||||||
| 03/15/2033(a) | 66,086 | 65,965 | ||||||
| Series 2003-2590, Class OZ, | ||||||||
| 4.000%, 03/15/2033 | 236,764 | 262,124 | ||||||
| Series 2003-2590, Class QY, | ||||||||
| 3.750%, 04/15/2028 | 17,986 | 18,771 | ||||||
| Series 2003-2614, Class FV, | ||||||||
| 1M US L + 1.50%, | ||||||||
| 05/15/2033(a) | 322,404 | 333,432 | ||||||
| Series 2003-2624, | ||||||||
| Class QH, | ||||||||
| 5.000%, 06/15/2033 | 19,357 | 21,688 | ||||||
| Series 2003-2626, Class ZX, | ||||||||
| 5.000%, 06/15/2033 | 183,825 | 209,249 | ||||||
| Series 2003-2627, Class CN, | ||||||||
| 5.000%, 06/15/2033 | 53,393 | 59,876 | ||||||
| Series 2003-2631, Class DB, | ||||||||
| 5.000%, 06/15/2033 | 148,000 | 170,319 | ||||||
| Series 2003-2647, Class A, | ||||||||
| 3.250%, 04/15/2032 | 94,560 | 101,266 | ||||||
| Series 2003-2648, | ||||||||
| Class WZ, | ||||||||
| 5.000%, 07/15/2033 | 242,457 | 279,098 | ||||||
| Series 2003-2668, Class LH, | ||||||||
| 5.000%, 09/15/2033 | 36,064 | 40,566 | ||||||
| Series 2003-2707, Class FH, | ||||||||
| 1M US L + 0.65%, | ||||||||
| 04/15/2032(a) | 53,711 | 54,514 | ||||||
| Series 2003-2717, Class LH, | ||||||||
| 5.500%, 12/15/2033 | 8,602 | 9,474 | ||||||
| Series 2003-2725, Class TA, | ||||||||
| 4.500%, 12/15/2033 | 97,000 | 109,430 | ||||||
| Series 2004-2750, Class TC, | ||||||||
| 5.250%, 02/15/2034 | 13,208 | 14,571 | ||||||
67 | April 30, 2021
| ALPS | Smith Total Return Bond Fund | |
| Statement of Investments | April 30, 2021 (Unaudited) |
| Principal | Value | |||||||
| Amount | (Note 2) | |||||||
| Series 2004-2768, | ||||||||
| Class PW, | ||||||||
| 4.250%, 03/15/2034 | $ | 184,753 | $ | 195,471 | ||||
| Series 2004-2802, | ||||||||
| Class OH, | ||||||||
| 6.000%, 05/15/2034 | 32,654 | 36,615 | ||||||
| Series 2004-2835, Class KZ, | ||||||||
| 5.500%, 08/15/2034 | 58,257 | 67,682 | ||||||
| Series 2004-2893, Class PE, | ||||||||
| 5.000%, 11/15/2034 | 19,327 | 21,968 | ||||||
| Series 2004-2901, Class KB, | ||||||||
| 5.000%, 12/15/2034 | 56,599 | 62,910 | ||||||
| Series 2005-2927, Class EZ, | ||||||||
| 5.500%, 02/15/2035 | 44,350 | 48,047 | ||||||
| Series 2005-2929, Class PG, | ||||||||
| 5.000%, 02/15/2035 | 39,857 | 45,315 | ||||||
| Series 2005-2933, Class HD, | ||||||||
| 5.500%, 02/15/2035 | 49,173 | 55,552 | ||||||
| Series 2005-2953, Class PG, | ||||||||
| 5.500%, 03/15/2035 | 27,653 | 32,216 | ||||||
| Series 2005-2962, Class KF, | ||||||||
| 1M US L + 0.20%, | ||||||||
| 04/15/2035(a) | 24,304 | 24,335 | ||||||
| Series 2005-2980, Class QA, | ||||||||
| 6.000%, 05/15/2035 | 55,709 | 64,169 | ||||||
| Series 2005-2996, Class GX, | ||||||||
| 5.500%, 06/15/2035 | 72,000 | 84,663 | ||||||
| Series 2005-3012, Class ZE, | ||||||||
| 5.750%, 08/15/2035 | 59,922 | 67,799 | ||||||
| Series 2005-3028, | ||||||||
| Class FM, | ||||||||
| 1M US L + 0.25%, | ||||||||
| 09/15/2035(a) | 18,274 | 18,320 | ||||||
| Series 2005-3028, Class PG, | ||||||||
| 5.500%, 09/15/2035 | 50,396 | 57,242 | ||||||
| Series 2005-3028, Class ZE, | ||||||||
| 5.500%, 09/15/2035 | 776,926 | 832,774 | ||||||
| Series 2005-3033, | ||||||||
| Class WY, | ||||||||
| 5.500%, 09/15/2035 | 75,185 | 84,969 | ||||||
| Series 2005-3036, Class NE, | ||||||||
| 5.000%, 09/15/2035 | 150,408 | 171,924 | ||||||
| Series 2005-3042, Class PZ, | ||||||||
| 5.750%, 09/15/2035 | 139,345 | 170,079 | ||||||
| Series 2005-3052, | ||||||||
| Class WH, | ||||||||
| 5.500%, 10/15/2035 | 17,382 | 19,770 | ||||||
| Series 2005-3059, | ||||||||
| Class ZM, | ||||||||
| 5.000%, 02/15/2035 | 134,899 | 151,649 | ||||||
| Series 2005-3068, Class Z, | ||||||||
| 5.500%, 11/15/2035 | 249,822 | 293,839 | ||||||
| Series 2005-3070, Class FT, | ||||||||
| 1M US L + 0.35%, | ||||||||
| 11/15/2035(a) | 27,047 | 27,257 | ||||||
| Principal | Value | |||||||
| Amount | (Note 2) | |||||||
| Series 2005-3072, Class NF, | ||||||||
| 1M US L + 0.50%, | ||||||||
| 11/15/2035(a) | $ | 54,056 | $ | 53,509 | ||||
| Series 2005-3085, Class FE, | ||||||||
| 1M US L + 0.80%, | ||||||||
| 08/15/2035(a) | 66,687 | 68,287 | ||||||
| Series 2006-3098, Class PG, | ||||||||
| 5.000%, 01/15/2036 | 101,107 | 115,486 | ||||||
| Series 2006-3122, | ||||||||
| Class OH, | ||||||||
| –%, 03/15/2036(b) | 19,544 | 18,197 | ||||||
| Series 2006-3123, Class HT, | ||||||||
| 5.000%, 03/15/2026 | 47,012 | 50,224 | ||||||
| Series 2006-3136, Class KF, | ||||||||
| 1M US L + 0.30%, | ||||||||
| 04/15/2036(a) | 35,894 | 36,042 | ||||||
| Series 2006-3137, Class XP, | ||||||||
| 6.000%, 04/15/2036 | 27,802 | 32,914 | ||||||
| Series 2006-3143, Class BC, | ||||||||
| 5.500%, 02/15/2036 | 136,369 | 158,874 | ||||||
| Series 2006-3145, Class FN, | ||||||||
| 1M US L + 0.43%, | ||||||||
| 04/15/2036(a) | 17,379 | 17,562 | ||||||
| Series 2006-3148, Class CY, | ||||||||
| 6.000%, 04/15/2036 | 27,898 | 32,041 | ||||||
| Series 2006-3153, Class UG, | ||||||||
| 1M US L + 0.45%, | ||||||||
| 05/15/2036(a) | 31,148 | 31,445 | ||||||
| Series 2006-3154, Class PN, | ||||||||
| 5.500%, 05/15/2036 | 88,155 | 101,414 | ||||||
| Series 2006-3201, Class FL, | ||||||||
| 1M US L + 0.60%, | ||||||||
| 08/15/2036(a) | 126,887 | 125,989 | ||||||
| Series 2006-3202, Class HF, | ||||||||
| 1M US L + 0.35%, | ||||||||
| 08/15/2036(a) | 63,549 | 63,985 | ||||||
| Series 2006-3204, | ||||||||
| Class ZM, | ||||||||
| 5.000%, 08/15/2034 | 141,769 | 161,131 | ||||||
| Series 2006-3206, Class FE, | ||||||||
| 1M US L + 0.40%, | ||||||||
| 08/15/2036(a) | 69,508 | 68,603 | ||||||
| Series 2006-3236, Class EF, | ||||||||
| 1M US L + 0.30%, | ||||||||
| 11/15/2036(a) | 17,657 | 17,341 | ||||||
| Series 2006-3237, Class CD, | ||||||||
| 5.500%, 09/15/2036 | 198,000 | 216,813 | ||||||
| Series 2006-3237, Class CE, | ||||||||
| 5.500%, 11/15/2036 | 59,000 | 71,859 | ||||||
| Series 2006-3249, Class CB, | ||||||||
| 4.250%, 12/15/2036 | 439,348 | 485,918 | ||||||
| Series 2007-3262, Class FT, | ||||||||
| 1M US L + 0.27%, | ||||||||
| 01/15/2037(a) | 76,324 | 74,692 | ||||||
See Notes to Financial Statements.
68 | April 30, 2021
| ALPS | Smith Total Return Bond Fund | |
| Statement of Investments | April 30, 2021 (Unaudited) |
| Principal | Value | |||||||
| Amount | (Note 2) | |||||||
| Series 2007-3279, Class FB, | ||||||||
| 1M US L + 0.32%,02/15/2037(a) | $ | 104,113 | $ | 102,258 | ||||
| Series 2007-3284, Class AZ, | ||||||||
| 4.500%, 03/15/2037 | 81,445 | 89,287 | ||||||
| Series 2007-3301, Class FY, | ||||||||
| 1M US L + 0.42%, 04/15/2037(a) | 31,377 | 31,751 | ||||||
| Series 2007-3311, Class DF, | ||||||||
| 1M US L + 0.34%, 05/15/2037(a) | 158,212 | 159,335 | ||||||
| Series 2007-3312, Class PA, | ||||||||
| 5.500%, 05/15/2037 | 25,521 | 28,887 | ||||||
| Series 2007-3316, Class FB, | ||||||||
| 1M US L + 0.30%, 08/15/2035(a) | 47,289 | 46,509 | ||||||
| Series 2007-3349, Class HG, | ||||||||
| 5.500%, 07/15/2037 | 26,112 | 30,206 | ||||||
| Series 2007-3361, Class AF, | ||||||||
| 1M US L + 0.35%, 11/15/2036(a) | 106,359 | 104,619 | ||||||
| Series 2007-3367, Class YF, | ||||||||
| 1M US L + 0.55%, 09/15/2037(a) | 24,326 | 24,150 | ||||||
| Series 2007-3368, Class AF, | ||||||||
| 1M US L + 0.72%, 09/15/2037(a) | 89,698 | 91,364 | ||||||
| Series 2007-3378, Class FA, | ||||||||
| 1M US L + 0.58%, 06/15/2037(a) | 43,327 | 44,095 | ||||||
| Series 2007-3380, | ||||||||
| Class FM, | ||||||||
| 1M US L + 0.59%, 10/15/2037(a) | 28,814 | 29,319 | ||||||
| Series 2007-3382, Class FG, | ||||||||
| 1M US L + 0.60%, 11/15/2037(a) | 49,892 | 50,738 | ||||||
| Series 2007-3382, Class FL, | ||||||||
| 1M US L + 0.70%, 11/15/2037(a) | 112,094 | 111,507 | ||||||
| Series 2007-3387, Class PF, | ||||||||
| 1M US L + 0.42%, 11/15/2037(a) | 40,341 | 40,809 | ||||||
| Series 2007-3388, Class FJ, | ||||||||
| 1M US L + 0.70%, 11/15/2037(a) | 186,537 | 190,260 | ||||||
| Series 2008-3404, Class DC, | ||||||||
| 5.500%, 01/15/2038 | 122,000 | 140,702 | ||||||
| Series 2008-3405, Class PE, | ||||||||
| 5.000%, 01/15/2038 | 70,794 | 81,397 | ||||||
| Series 2008-3409, Class DB, | ||||||||
| 6.000%, 01/15/2038 | 217,729 | 256,369 | ||||||
| Series 2008-3411, Class FL, | ||||||||
| 1M US L + 0.70%, 02/15/2038(a) | 34,225 | 34,232 | ||||||
| Principal | Value | |||||||
| Amount | (Note 2) | |||||||
| Series 2008-3415, Class DF, | ||||||||
| 1M US L + 0.70%, 08/15/2035(a) | $ | 138,428 | $ | 137,801 | ||||
| Series 2008-3415, Class PC, | ||||||||
| 5.000%, 12/15/2037 | 47,696 | 53,932 | ||||||
| Series 2008-3415, Class TF, | ||||||||
| 1M US L + 0.74%, 08/15/2035(a) | 68,562 | 70,102 | ||||||
| Series 2008-3469, Class CF, | ||||||||
| 1M US L + 0.79%, 07/15/2038(a) | 105,286 | 102,722 | ||||||
| Series 2009-3536, | ||||||||
| Class FM, | ||||||||
| 1M US L + 1.00%, 05/15/2039(a) | 40,969 | 42,192 | ||||||
| Series 2009-3539, Class B, | ||||||||
| 4.500%, 06/15/2029 | 44,000 | 48,761 | ||||||
| Series 2009-3545, Class FA, | ||||||||
| 1M US L + 0.85%, 06/15/2039(a) | 118,877 | 118,854 | ||||||
| Series 2009-3548, Class ZE, | ||||||||
| 5.500%, 12/15/2032 | 249,648 | 288,710 | ||||||
| Series 2009-3549, Class FA, | ||||||||
| 1M US L + 1.20%, 07/15/2039(a) | 53,469 | 54,583 | ||||||
| Series 2009-3564, Class NB, | ||||||||
| 5.000%, 08/15/2039 | 349,000 | 395,238 | ||||||
| Series 2009-3574, Class D, | ||||||||
| 5.000%, 09/15/2039 | 111,655 | 126,996 | ||||||
| Series 2009-3584, Class FA, | ||||||||
| 1M US L + 0.70%, 12/15/2036(a) | 39,763 | 40,534 | ||||||
| Series 2009-3587, Class DA, | ||||||||
| 4.500%, 10/15/2039 | 183,274 | 200,256 | ||||||
| Series 2009-3604, Class PO, | ||||||||
| –%, 05/15/2036(b) | 97,396 | 87,890 | ||||||
| Series 2009-3605, Class BF, | ||||||||
| 1M US L + 0.86%, 11/15/2039(a) | 196,617 | 201,798 | ||||||
| Series 2009-3611, Class FH, | ||||||||
| 1M US L + 0.75%, 07/15/2034(a) | 17,616 | 18,003 | ||||||
| Series 2010-3620, Class EL, | ||||||||
| 4.000%, 01/15/2030 | 38,530 | 41,910 | ||||||
| Series 2010-3626, | ||||||||
| Class ME, | ||||||||
| 5.000%, 01/15/2040 | 405,000 | 452,959 | ||||||
| Series 2010-3631, Class PA, | ||||||||
| 4.000%, 02/15/2040 | 181,940 | 202,559 | ||||||
| Series 2010-3653, Class B, | ||||||||
| 4.500%, 04/15/2030 | 106,529 | 117,164 | ||||||
| Series 2010-3662, Class PJ, | ||||||||
| 5.000%, 04/15/2040 | 116,650 | 132,587 | ||||||
| Series 2010-3664, Class DA, | ||||||||
| 4.000%, 11/15/2037 | 146,247 | 154,497 | ||||||
See Notes to Financial Statements.
| 69 | April 30, 2021 |
| ALPS | Smith Total Return Bond Fund | |
| Statement of Investments | April 30, 2021 (Unaudited) |
| Principal | Value | |||||||
| Amount | (Note 2) | |||||||
| Series 2010-3704, Class DC, | ||||||||
| 4.000%, 11/15/2036 | $ | 78,315 | $ | 80,949 | ||||
| Series 2010-3737, Class GB, | ||||||||
| 4.500%, 04/15/2039 | 58,635 | 60,422 | ||||||
| Series 2010-3747, Class CY, | ||||||||
| 4.500%, 10/15/2040 | 400,000 | 446,710 | ||||||
| Series 2010-3762, | ||||||||
| Class WP, | ||||||||
| 4.000%, 12/15/2039 | 33,126 | 34,873 | ||||||
| Series 2010-3770, Class JZ, | ||||||||
| 4.000%, 12/15/2040 | 10,545,454 | 11,804,279 | ||||||
| Series 2010-3770, Class GA, | ||||||||
| 4.500%, 10/15/2040 | 360,467 | 415,626 | ||||||
| Series 2011-3792, Class DF, | ||||||||
| 1M US L + 0.40%, 11/15/2040(a) | 34,515 | 34,354 | ||||||
| Series 2011-3798, Class PJ, | ||||||||
| 4.000%, 01/15/2041 | 87,624 | 96,136 | ||||||
| Series 2011-3800, Class AF, | ||||||||
| 1M US L + 0.50%, 02/15/2041(a) | 29,484 | 29,936 | ||||||
| Series 2011-3819, Class ZQ, | ||||||||
| 6.000%, 04/15/2036 | 24,188 | 28,654 | ||||||
| Series 2011-3822, Class FY, | ||||||||
| 1M US L + 0.40%, 02/15/2033(a) | 21,872 | 22,076 | ||||||
| Series 2011-3830, Class NB, | ||||||||
| 4.500%, 02/15/2039 | 76,529 | 79,755 | ||||||
| Series 2011-3843, Class PZ, | ||||||||
| 5.000%, 04/15/2041 | 625,864 | 738,134 | ||||||
| Series 2011-3843, Class FE, | ||||||||
| 1M US L + 0.55%, 04/15/2041(a) | 66,261 | 67,453 | ||||||
| Series 2011-3852, | ||||||||
| Class QN, | ||||||||
| 27.21053% - 1M US L%, | ||||||||
| 05/15/2041(a) | 72,549 | 76,489 | ||||||
| Series 2011-3852, Class TP, | ||||||||
| 27.50% - 1M US L%, | ||||||||
| 05/15/2041(a) | 45,422 | 48,710 | ||||||
| Series 2011-3857, Class ZP, | ||||||||
| 5.000%, 05/15/2041 | 915,123 | 1,096,815 | ||||||
| Series 2011-3862, | ||||||||
| Class MA, | ||||||||
| 5.000%, 04/15/2041 | 163,223 | 181,088 | ||||||
| Series 2011-3891, Class BF, | ||||||||
| 1M US L + 0.55%, 07/15/2041(a) | 60,273 | 61,225 | ||||||
| Series 2011-3894, Class ZA, | ||||||||
| 4.500%, 07/15/2041 | 173,814 | 191,795 | ||||||
| Series 2011-3905, Class BZ, | ||||||||
| 3.000%, 08/15/2041 | 160,313 | 163,536 | ||||||
| Series 2011-3910, Class JG, | ||||||||
| 2.750%, 12/15/2037 | 31,287 | 31,507 | ||||||
| Series 2011-3919, Class DL, | ||||||||
| 4.000%, 08/15/2030 | 298,000 | 327,875 | ||||||
| Principal | Value | |||||||
| Amount | (Note 2) | |||||||
| Series 2011-3935, Class JZ, | ||||||||
| 4.500%, 10/15/2041 | $ | 979,072 | $ | 1,126,389 | ||||
| Series 2011-3939, Class AZ, | ||||||||
| 4.000%, 03/15/2041 | 301,450 | 324,040 | ||||||
| Series 2011-3939, Class BZ, | ||||||||
| 4.500%, 06/15/2041 | 1,068,823 | 1,129,430 | ||||||
| Series 2011-3951, Class JB, | ||||||||
| 4.000%, 08/15/2041 | 20,534 | 20,655 | ||||||
| Series 2011-3957, Class HZ, | ||||||||
| 4.000%, 11/15/2041 | 1,058,001 | 1,107,444 | ||||||
| Series 2011-3958, Class PJ, | ||||||||
| 4.500%, 09/15/2041 | 247,085 | 258,424 | ||||||
| Series 2011-3959, | ||||||||
| Class MB, | ||||||||
| 4.500%, 11/15/2041 | 44,199 | 51,646 | ||||||
| Series 2011-3962, Class FB, | ||||||||
| 1M US L + 0.50%, 10/15/2039(a) | 14,194 | 14,220 | ||||||
| Series 2011-3963, Class JB, | ||||||||
| 4.500%, 11/15/2041 | 150,000 | 164,775 | ||||||
| Series 2011-3969, Class JP, | ||||||||
| 4.500%, 09/15/2041 | 82,620 | 88,616 | ||||||
| Series 2011-3970, Class HA, | ||||||||
| 3.000%, 02/15/2026 | 5,648 | 5,666 | ||||||
| Series 2012-3979, Class GA, | ||||||||
| 3.500%, 05/15/2030 | 9,109 | 9,153 | ||||||
| Series 2012-3984, Class DF, | ||||||||
| 1M US L + 0.55%, 01/15/2042(a) | 57,642 | 57,096 | ||||||
| Series 2012-3989, Class JW, | ||||||||
| 3.500%, 01/15/2042 | 255,000 | 276,573 | ||||||
| Series 2012-3997, Class EB, | ||||||||
| 3.500%, 12/15/2041 | 47,813 | 46,976 | ||||||
| Series 2012-3997, Class EC, | ||||||||
| 3.500%, 02/15/2042 | 124,000 | 126,441 | ||||||
| Series 2012-3997, Class FQ, | ||||||||
| 1M US L + 0.50%, 02/15/2042(a) | 62,993 | 63,654 | ||||||
| Series 2012-4001, | ||||||||
| Class FM, | ||||||||
| 1M US L + 0.50%, 02/15/2042(a) | 40,877 | 40,334 | ||||||
| Series 2012-4011, Class DB, | ||||||||
| 4.000%, 09/15/2041 | 239,854 | 264,046 | ||||||
| Series 2012-4012, Class GC, | ||||||||
| 3.500%, 06/15/2040 | 63,000 | 66,102 | ||||||
| Series 2012-4012, Class GJ, | ||||||||
| 2.500%, 06/15/2038 | 15,674 | 15,715 | ||||||
| Series 2012-4012, Class NF, | ||||||||
| 1M US L + 0.45%, 12/15/2038(a) | 12,682 | 12,708 | ||||||
| Series 2012-4020, Class PG, | ||||||||
| 2.500%, 03/15/2027 | 18,193 | 18,948 | ||||||
| Series 2012-4037, Class CA, | ||||||||
| 3.000%, 04/15/2027 | 52,237 | 56,624 | ||||||
See Notes to Financial Statements.
| 70 | April 30, 2021 |
| ALPS | Smith Total Return Bond Fund | |
| Statement of Investments | April 30, 2021 (Unaudited) |
| Principal | Value | |||||||
| Amount | (Note 2) | |||||||
| Series 2012-4039, Class LT, | ||||||||
| 3.500%, 05/15/2042 | $ | 113,000 | $ | 114,808 | ||||
| Series 2012-4050, Class ND, | ||||||||
| 2.500%, 09/15/2041 | 73,066 | 74,750 | ||||||
| Series 2012-4062, | ||||||||
| Class MZ, | ||||||||
| 3.500%, 06/15/2042 | 136,168 | 142,227 | ||||||
| Series 2012-4064, Class AY, | ||||||||
| 3.000%, 06/15/2027 | 48,000 | 51,844 | ||||||
| Series 2012-4068, Class PE, | ||||||||
| 3.000%, 06/15/2042 | 224,000 | 237,027 | ||||||
| Series 2012-4075, Class PB, | ||||||||
| 3.000%, 07/15/2042 | 42,000 | 44,747 | ||||||
| Series 2012-4076, | ||||||||
| Class MV, | ||||||||
| 3.000%, 04/15/2031 | 69,000 | 73,261 | ||||||
| Series 2012-4094, | ||||||||
| Class CW, | ||||||||
| 2.000%, 08/15/2042 | 429,165 | 443,766 | ||||||
| Series 2012-4097, Class CU, | ||||||||
| 1.500%, 08/15/2027 | 25,000 | 24,581 | ||||||
| Series 2012-4097, Class UF, | ||||||||
| 1M US L + 0.35%, 08/15/2032(a) | 84,776 | 84,569 | ||||||
| Series 2012-4104, Class AJ, | ||||||||
| 1.500%, 09/15/2027 | 43,917 | 44,999 | ||||||
| Series 2012-4120, Class TC, | ||||||||
| 1.500%, 10/15/2027 | 15,677 | 15,949 | ||||||
| Series 2012-4122, Class BA, | ||||||||
| 3.113%, 05/15/2040 | 238,278 | 250,189 | ||||||
| Series 2012-4133, Class TA, | ||||||||
| 3.000%, 11/15/2042 | 538,937 | 493,464 | ||||||
| Series 2012-4141, Class PL, | ||||||||
| 2.500%, 12/15/2042 | 100,000 | 97,003 | ||||||
| Series 2013-4160, Class HB, | ||||||||
| 2.500%, 12/15/2032 | 32,267 | 33,386 | ||||||
| Series 2013-4170, | ||||||||
| Class FW, | ||||||||
| 1M US L + 0.95%, 01/15/2033(a) | 39,307 | 39,780 | ||||||
| Series 2013-4176, Class YD, | ||||||||
| 3.000%, 03/15/2043 | 50,000 | 51,867 | ||||||
| Series 2013-4185, Class PB, | ||||||||
| 3.000%, 03/15/2043 | 450,000 | 479,274 | ||||||
| Series 2013-4189, | ||||||||
| Class MD, | ||||||||
| 3.000%, 06/15/2033 | 35,241 | 35,492 | ||||||
| Series 2013-4203, Class DJ, | ||||||||
| 2.500%, 04/15/2033 | 81,843 | 83,647 | ||||||
| Series 2013-4218, Class DG, | ||||||||
| 2.500%, 07/15/2042 | 255,492 | 265,955 | ||||||
| Series 2013-4218, Class KB, | ||||||||
| 2.250%, 11/15/2039 | 45,273 | 45,433 | ||||||
| Series 2013-4220, Class EH, | ||||||||
| 2.500%, 06/15/2028 | 69,358 | 72,061 | ||||||
| Principal | Value | |||||||
| Amount | (Note 2) | |||||||
| Series 2013-4231, Class FD, | ||||||||
| 1M US L + 0.35%, 10/15/2032(a) | $ | 23,328 | $ | 23,051 | ||||
| Series 2013-4246, Class PB, | ||||||||
| 4.000%, 09/15/2043 | 493,003 | 541,014 | ||||||
| Series 2013-4257, Class A, | ||||||||
| 2.500%, 10/15/2027 | 57,334 | 58,864 | ||||||
| Series 2013-4259, | ||||||||
| Class MG, | ||||||||
| 3.000%, 08/15/2041 | 45,739 | 46,561 | ||||||
| Series 2013-4265, Class FD, | ||||||||
| 1M US L + 0.40%, 01/15/2035(a) | 89,432 | 90,216 | ||||||
| Series 2014-4293, | ||||||||
| Class NM, | ||||||||
| 4.500%, 06/15/2043 | 48,225 | 52,142 | ||||||
| Series 2014-4294, Class PF, | ||||||||
| 1M US L + 0.40%, 01/15/2044(a) | 22,723 | 22,906 | ||||||
| Series 2014-4301, Class U, | ||||||||
| 3.500%, 07/15/2032 | 94,574 | 98,867 | ||||||
| Series 2014-4302, Class DA, | ||||||||
| 3.000%, 07/15/2039 | 119,099 | 119,968 | ||||||
| Series 2014-4305, | ||||||||
| Class MA, | ||||||||
| 3.000%, 08/15/2038 | 192,383 | 192,658 | ||||||
| Series 2014-4320, Class AP, | ||||||||
| 3.500%, 07/15/2039 | 184,683 | 198,216 | ||||||
| Series 2014-4324, Class AY, | ||||||||
| 3.000%, 04/15/2029 | 568,738 | 610,248 | ||||||
| Series 2014-4333, Class PB, | ||||||||
| 2.500%, 10/15/2043 | 102,513 | 103,992 | ||||||
| Series 2014-4337, Class VJ, | ||||||||
| 3.500%, 06/15/2027 | 31,489 | 32,152 | ||||||
| Series 2014-4368, Class BE, | ||||||||
| 2.500%, 05/15/2031 | 143,865 | 145,198 | ||||||
| Series 2014-4370, Class AC, | ||||||||
| 3.000%, 08/15/2037 | 111,014 | 111,265 | ||||||
| Series 2014-4370, Class PC, | ||||||||
| 2.500%, 09/15/2041 | 93,799 | 95,962 | ||||||
| Series 2015-4459, Class CA, | ||||||||
| 5.000%, 12/15/2034 | 38,229 | 42,242 | ||||||
| Series 2015-4461, Class EA, | ||||||||
| 2.000%, 07/15/2037 | 146,210 | 150,116 | ||||||
| Series 2015-4470, Class AQ, | ||||||||
| 3.000%, 06/15/2041 | 102,593 | 104,315 | ||||||
| Series 2015-4498, Class JA, | ||||||||
| 2.500%, 04/15/2037 | 174,270 | 178,131 | ||||||
| Series 2015-4504, Class DN, | ||||||||
| 3.000%, 10/15/2040 | 29,618 | 29,753 | ||||||
| Series 2015-4531, Class PA, | ||||||||
| 3.500%, 05/15/2043 | 135,132 | 139,669 | ||||||
| Series 2016-4555, Class CP, | ||||||||
| 3.000%, 04/15/2045 | 1,021,577 | 1,067,174 | ||||||
| Series 2016-4564, Class QA, | ||||||||
| 3.000%, 07/15/2029 | 99,743 | 103,416 | ||||||
See Notes to Financial Statements.
| 71 | April 30, 2021 |
| ALPS | Smith Total Return Bond Fund | |
| Statement of Investments | April 30, 2021 (Unaudited) |
| Principal | Value | |||||||
| Amount | (Note 2) | |||||||
| Series 2016-4590, Class AK, | ||||||||
| 3.500%, 08/15/2027 | $ | 119,849 | $ | 126,928 | ||||
| Series 2016-4594, Class JD, | ||||||||
| 3.000%, 12/15/2042 | 31,000 | 30,413 | ||||||
| Series 2016-4630, Class EA, | ||||||||
| 3.000%, 09/15/2041 | 259,149 | 263,710 | ||||||
| Series 2016-4639, Class HZ, | ||||||||
| 3.250%, 04/15/2053(c) | 643,919 | 676,569 | ||||||
| Series 2017-4646, Class D, | ||||||||
| 3.500%, 01/15/2042 | 68,562 | 68,908 | ||||||
| Series 2017-4655, Class HA, | ||||||||
| 3.500%, 01/15/2042 | 77,898 | 77,952 | ||||||
| Series 2017-4655, Class LA, | ||||||||
| 3.500%, 03/15/2042 | 55,870 | 55,963 | ||||||
| Series 2017-4655, Class KA, | ||||||||
| 3.500%, 03/15/2042 | 19,211 | 19,243 | ||||||
| Series 2017-4660, Class B, | ||||||||
| 3.000%, 04/15/2040 | 75,352 | 75,709 | ||||||
| Series 2017-4661, Class CT, | ||||||||
| 3.000%, 04/15/2042 | 827,809 | 835,088 | ||||||
| Series 2017-4664, Class LC, | ||||||||
| 3.500%, 09/15/2040 | 112,893 | 113,848 | ||||||
| Series 2017-4664, Class UE, | ||||||||
| 3.000%, 05/15/2043 | 319,768 | 327,425 | ||||||
| Series 2017-4667, Class EJ, | ||||||||
| 3.000%, 04/15/2042 | 48,121 | 48,241 | ||||||
| Series 2017-4672, | ||||||||
| Class QD, | ||||||||
| 3.000%, 08/15/2045 | 213,521 | 218,215 | ||||||
| Series 2017-4673, Class KA, | ||||||||
| 3.500%, 08/15/2042 | 453,516 | 456,137 | ||||||
| Series 2017-4705, Class A, | ||||||||
| 4.500%, 09/15/2042 | 62,124 | 64,038 | ||||||
| Series 2017-4710, Class PA, | ||||||||
| 3.000%, 04/15/2045 | 289,004 | 298,498 | ||||||
| Series 2018-4764, | ||||||||
| Class MA, | ||||||||
| 3.500%, 07/15/2043 | 445,017 | 447,509 | ||||||
| Series 2018-4766, Class GD, | ||||||||
| 3.500%, 03/15/2044 | 5,270 | 5,316 | ||||||
| Series 2018-4767, Class CA, | ||||||||
| 4.000%, 11/15/2045 | 140,103 | 143,927 | ||||||
| Series 2018-4767, Class Z, | ||||||||
| 3.000%, 12/15/2047 | 34,085 | 33,558 | ||||||
| Series 2018-4787, Class PY, | ||||||||
| 4.000%, 05/15/2048 | 104,811 | 112,379 | ||||||
| Series 2018-4800, Class JA, | ||||||||
| 3.500%, 03/15/2047 | 513,552 | 522,423 | ||||||
| Series 2018-4821, Class VA, | ||||||||
| 4.000%, 10/15/2029 | 119,965 | 127,647 | ||||||
| Series 2018-4825, Class VA, | ||||||||
| 4.000%, 05/15/2029 | 102,557 | 103,578 | ||||||
| Series 2018-4830, Class DA, | ||||||||
| 4.500%, 11/15/2044 | 4,163 | 4,161 | ||||||
| Principal | Value | |||||||
| Amount | (Note 2) | |||||||
| Series 2018-4839, Class AE, | ||||||||
| 4.000%, 04/15/2051 | $ | 438,146 | $ | 480,810 | ||||
| Series 2018-4840, Class BD, | ||||||||
| 4.000%, 07/15/2044 | 29,800 | 29,946 | ||||||
| Series 2018-4846, Class PA, | ||||||||
| 4.000%, 06/15/2047 | 39,919 | 41,473 | ||||||
| Series 2019-4863, Class AJ, | ||||||||
| 3.500%, 07/15/2038 | 76,100 | 81,250 | ||||||
| Series 2019-4924, Class GA, | ||||||||
| 3.000%, 08/25/2043 | 2,242,708 | 2,255,424 | ||||||
| Series 2019-4927, Class GA, | ||||||||
| 3.000%, 12/25/2043 | 235,296 | 236,644 | ||||||
| Series 2020-4949, Class EA, | ||||||||
| 3.000%, 08/25/2035 | 983,451 | 995,793 | ||||||
| Series 3588, Class CW, | ||||||||
| 2.540%, 10/25/2037(a) | 459,630 | 470,876 | ||||||
| 53,206,052 | ||||||||
| Freddie Mac Whole Loan | ||||||||
| Securities Trust 2017-SC02 | ||||||||
| Series 2017-SC02, | ||||||||
| Class 1A1, | ||||||||
| 3.000%, 05/25/2047 | 69,043 | 69,300 | ||||||
| Ginnie Mae | ||||||||
| Series 2002-72, Class FB, | ||||||||
| 1M US L + 0.40%, 10/20/2032(a) | 46,143 | 46,129 | ||||||
| Series 2003-23, Class F, | ||||||||
| 1M US L + 0.45%, 12/16/2029(a) | 53,174 | 53,185 | ||||||
| Series 2003-25, Class FC, | ||||||||
| 1M US L + 0.40%, 08/26/2023(a) | 132,648 | 132,916 | ||||||
| Series 2003-42, Class FE, | ||||||||
| 1M US L + 0.40%, 01/16/2030(a) | 32,076 | 32,081 | ||||||
| Series 2003-98, Class FY, | ||||||||
| 1M US L + 0.35%, 09/20/2033(a) | 65,732 | 65,898 | ||||||
| Series 2004-1, Class TE, | ||||||||
| 5.000%, 06/20/2033 | 37,550 | 41,064 | ||||||
| Series 2004-15, Class AY, | ||||||||
| 5.500%, 02/20/2034 | 133,352 | 143,533 | ||||||
| Series 2004-26, Class ED, | ||||||||
| 5.500%, 04/16/2034 | 104,139 | 114,548 | ||||||
| Series 2004-34, Class QL, | ||||||||
| 5.500%, 05/16/2034 | 89,000 | 104,227 | ||||||
| Series 2004-55, Class MC, | ||||||||
| 5.500%, 07/20/2034 | 47,774 | 52,957 | ||||||
| Series 2004-7, Class Z, | ||||||||
| 5.500%, 01/16/2034 | 1,288,444 | 1,491,757 | ||||||
| Series 2004-87, Class BC, | ||||||||
| 4.500%, 10/20/2034 | 21,674 | 22,949 | ||||||
| Series 2005-11, Class PL, | ||||||||
| 5.000%, 02/20/2035 | 50,218 | 55,433 | ||||||
See Notes to Financial Statements.
| 72 | April 30, 2021 |
| ALPS | Smith Total Return Bond Fund | |
| Statement of Investments | April 30, 2021 (Unaudited) |
| Principal | Value | |||||||
| Amount | (Note 2) | |||||||
| Series 2005-13, Class NB, | ||||||||
| 5.000%, 02/20/2035 | $ | 18,396 | $ | 20,177 | ||||
| Series 2005-13, Class BG, | ||||||||
| 5.000%, 02/20/2035 | 244,034 | 268,774 | ||||||
| Series 2005-3, Class QB, | ||||||||
| 5.000%, 01/16/2035 | 146,757 | 161,209 | ||||||
| Series 2005-3, Class JM, | ||||||||
| 4.750%, 01/20/2035 | 89,569 | 99,385 | ||||||
| Series 2005-3, Class OC, | ||||||||
| 5.000%, 01/20/2035 | 242,840 | 263,869 | ||||||
| Series 2005-3, Class JL, | ||||||||
| 5.000%, 12/16/2034 | 100,000 | 111,940 | ||||||
| Series 2005-45, Class BF, | ||||||||
| 1M US L + 0.30%, 06/20/2035(a) | 54,533 | 53,333 | ||||||
| Series 2005-49, Class B, | ||||||||
| 5.500%, 06/20/2035 | 73,197 | 81,584 | ||||||
| Series 2005-51, Class DC, | ||||||||
| 5.000%, 07/20/2035 | 182,666 | 198,670 | ||||||
| Series 2005-56, Class BD, | ||||||||
| 5.000%, 07/20/2035 | 59,729 | 67,612 | ||||||
| Series 2005-56, Class JA, | ||||||||
| 5.000%, 05/17/2035 | 21,430 | 23,761 | ||||||
| Series 2005-69, Class WD, | ||||||||
| 5.000%, 05/18/2035 | 72,955 | 78,934 | ||||||
| Series 2005-73, Class PH, | ||||||||
| 5.000%, 09/20/2035 | 162,000 | 174,983 | ||||||
| Series 2005-92, Class PB, | ||||||||
| 6.000%, 12/20/2035 | 59,377 | 68,819 | ||||||
| Series 2006-10, Class PB, | ||||||||
| 5.500%, 03/20/2036 | 66,100 | 75,837 | ||||||
| Series 2006-38, Class OH, | ||||||||
| 6.500%, 08/20/2036 | 28,000 | 33,288 | ||||||
| Series 2007-18, Class B, | ||||||||
| 5.500%, 05/20/2035 | 125,389 | 141,169 | ||||||
| Series 2007-18, Class PH, | ||||||||
| 5.500%, 03/20/2035 | 137,000 | 159,593 | ||||||
| Series 2007-35, Class TE, | ||||||||
| 6.000%, 06/20/2037 | 163,518 | 188,002 | ||||||
| Series 2007-35, Class NE, | ||||||||
| 6.000%, 06/16/2037 | 70,779 | 81,555 | ||||||
| Series 2007-40, Class FY, | ||||||||
| 1M US L + 0.33%, 07/16/2037(a) | 56,913 | 56,422 | ||||||
| Series 2007-44, Class PH, | ||||||||
| 6.000%, 07/20/2037 | 131,330 | 147,924 | ||||||
| Series 2007-57, Class Z, | ||||||||
| 5.500%, 10/20/2037 | 545,381 | 675,122 | ||||||
| Series 2007-6, Class LE, | ||||||||
| 5.500%, 02/20/2037 | 73,855 | 83,237 | ||||||
| Series 2007-7, Class PG, | ||||||||
| 5.000%, 02/16/2037 | 41,061 | 45,087 | ||||||
| Series 2007-79, Class FC, | ||||||||
| 1M US L + 0.44%, 12/20/2037(a) | 179,908 | 176,805 | ||||||
| Principal | Value | |||||||
| Amount | (Note 2) | |||||||
| Series 2008-13, Class FB, | ||||||||
| 1M US L + 0.50%, 02/20/2038(a) | $ | 37,265 | $ | 36,755 | ||||
| Series 2008-20, Class CE, | ||||||||
| 5.500%, 06/16/2037 | 100,000 | 113,429 | ||||||
| Series 2008-31, Class PC, | ||||||||
| 5.500%, 04/20/2038 | 81,256 | 89,647 | ||||||
| Series 2008-33, Class PB, | ||||||||
| 5.500%, 04/20/2038 | 60,077 | 68,008 | ||||||
| Series 2008-37, Class L, | ||||||||
| 6.000%, 04/20/2038 | 56,636 | 63,937 | ||||||
| Series 2008-38, Class PL, | ||||||||
| 5.500%, 05/20/2038 | 85,129 | 94,395 | ||||||
| Series 2008-38, Class PN, | ||||||||
| 5.500%, 05/20/2038 | 60,670 | 68,847 | ||||||
| Series 2008-38, Class BG, | ||||||||
| 5.000%, 05/16/2038 | 55,601 | 60,570 | ||||||
| Series 2008-40, Class PL, | ||||||||
| 5.250%, 05/16/2038 | 100,000 | 123,635 | ||||||
| Series 2008-41, Class PE, | ||||||||
| 5.500%, 05/20/2038 | 85,388 | 94,821 | ||||||
| Series 2008-47, Class ML, | ||||||||
| 5.250%, 06/16/2038 | 40,359 | 44,868 | ||||||
| Series 2008-49, Class PB, | ||||||||
| 4.750%, 06/20/2038 | 42,165 | 46,598 | ||||||
| Series 2008-50, Class KB, | ||||||||
| 6.000%, 06/20/2038 | 275,181 | 310,030 | ||||||
| Series 2008-51, Class FG, | ||||||||
| 1M US L + 0.77%, 06/16/2038(a) | 89,535 | 88,880 | ||||||
| Series 2008-51, Class PH, | ||||||||
| 5.250%, 06/20/2038 | 68,998 | 76,883 | ||||||
| Series 2008-55, Class PL, | ||||||||
| 5.500%, 06/20/2038 | 45,947 | 50,732 | ||||||
| Series 2008-58, Class PE, | ||||||||
| 5.500%, 07/16/2038 | 129,845 | 147,621 | ||||||
| Series 2008-60, Class JP, | ||||||||
| 5.500%, 07/20/2038 | 78,000 | 89,956 | ||||||
| Series 2008-60, Class JN, | ||||||||
| 5.500%, 07/20/2038 | 176,076 | 198,031 | ||||||
| Series 2008-65, Class PG, | ||||||||
| 6.000%, 08/20/2038 | 205,372 | 232,470 | ||||||
| Series 2008-66, Class FN, | ||||||||
| 1M US L + 0.95%, 08/20/2038(a) | 73,054 | 74,351 | ||||||
| Series 2008-7, Class PQ, | ||||||||
| 5.000%, 02/20/2038 | 115,674 | 126,754 | ||||||
| Series 2008-76, Class QE, | ||||||||
| 5.750%, 09/20/2038 | 58,000 | 67,108 | ||||||
| Series 2008-77, Class FC, | ||||||||
| 1M US L + 0.70%, 09/20/2038(a) | 74,160 | 75,031 | ||||||
| Series 2008-85, Class PG, | ||||||||
| 5.250%, 10/20/2038 | 50,204 | 50,642 | ||||||
See Notes to Financial Statements.
| 73 | April 30, 2021 |
| ALPS | Smith Total Return Bond Fund | |
| Statement of Investments | April 30, 2021 (Unaudited) |
| Principal Amount | Value (Note 2) | |||||||
| Series 2008-89, Class JD, | ||||||||
| 6.000%, 08/20/2038 | $ | 25,304 | $ | 28,074 | ||||
| Series 2008-89, Class JC, | ||||||||
| 5.500%, 08/20/2038 | 64,501 | 71,008 | ||||||
| Series 2008-9, Class FA, | ||||||||
| 1M US L + 0.50%, 02/20/2038(a) | 25,861 | 26,105 | ||||||
| Series 2009-1, Class FA, | ||||||||
| 1M US L + 1.05%, 01/20/2039(a) | 103,811 | 105,996 | ||||||
| Series 2009-10, Class PH, | ||||||||
| 4.500%, 02/20/2039 | 30,000 | 33,352 | ||||||
| Series 2009-10, Class NB, | ||||||||
| 5.000%, 02/16/2039 | 110,038 | 122,029 | ||||||
| Series 2009-118, Class PY, | ||||||||
| 5.000%, 12/16/2039 | 34,648 | 39,394 | ||||||
| Series 2009-12, Class NB, | ||||||||
| 5.000%, 03/20/2039 | 86,825 | 96,432 | ||||||
| Series 2009-13, Class E, | ||||||||
| 4.500%, 03/16/2039 | 141,827 | 157,152 | ||||||
| Series 2009-15, Class FM, | ||||||||
| 1M US L + 1.04%, 03/20/2039(a) | 89,021 | 90,628 | ||||||
| Series 2009-24, Class WB, | ||||||||
| 5.000%, 03/20/2039 | 164,002 | 182,303 | ||||||
| Series 2009-40, Class AD, | ||||||||
| 4.500%, 06/20/2039 | 309,000 | 348,210 | ||||||
| Series 2009-47, Class LT, | ||||||||
| 5.000%, 06/20/2039 | 142,923 | 156,193 | ||||||
| Series 2009-55, Class FN, | ||||||||
| 1M US L + 1.00%, 07/20/2039(a) | 36,649 | 37,332 | ||||||
| Series 2009-58, Class PA, | ||||||||
| 4.500%, 07/20/2039 | 135,226 | 149,266 | ||||||
| Series 2009-61, Class AP, | ||||||||
| 4.000%, 08/20/2039 | 65,401 | 70,662 | ||||||
| Series 2009-61, Class MP, | ||||||||
| 5.000%, 08/20/2039 | 59,519 | 65,983 | ||||||
| Series 2009-65, Class QM, | ||||||||
| 3.500%, 12/20/2038 | 21,018 | 21,524 | ||||||
| Series 2009-69, Class PH, | ||||||||
| 5.500%, 08/16/2039 | 82,000 | 96,887 | ||||||
| Series 2009-75, Class GZ, | ||||||||
| 4.500%, 09/20/2039 | 158,147 | 173,962 | ||||||
| Series 2009-76, Class JB, | ||||||||
| 4.500%, 07/20/2039 | 48,917 | 51,053 | ||||||
| Series 2009-83, Class TF, | ||||||||
| 1M US L + 0.90%, 08/20/2039(a) | 45,925 | 46,788 | ||||||
| Series 2009-94, Class FA, | ||||||||
| 1M US L + 0.70%, 10/16/2039(a) | 98,263 | 97,561 | ||||||
| Series 2010-111, Class FA, | ||||||||
| 1M US L + 0.35%, 09/20/2040(a) | 72,998 | 71,569 | ||||||
| Principal Amount | Value (Note 2) | |||||||
| Series 2010-14, Class HA, | ||||||||
| 4.500%, 02/16/2040 | $ | 220,240 | $ | 245,275 | ||||
| Series 2010-14, Class A, | ||||||||
| 4.500%, 06/16/2039 | 16,194 | 16,898 | ||||||
| Series 2010-157, Class OP, | ||||||||
| –%, 12/20/2040(b) | 15,465 | 13,757 | ||||||
| Series 2010-167, Class WL, | ||||||||
| 4.500%, 09/20/2040 | 305,000 | 341,053 | ||||||
| Series 2010-169, Class JZ, | ||||||||
| 4.000%, 12/20/2040 | 415,559 | 434,477 | ||||||
| Series 2010-19, Class GW, | ||||||||
| 4.750%, 02/20/2040 | 108,305 | 119,474 | ||||||
| Series 2010-25, Class BL, | ||||||||
| 4.250%, 10/16/2039 | 61,130 | 62,887 | ||||||
| Series 2010-62, Class AF, | ||||||||
| 1M US L + 0.45%, 04/16/2034(a) | 40,148 | 40,291 | ||||||
| Series 2010-76, Class NC, | ||||||||
| 4.500%, 06/20/2040 | 156,000 | 165,246 | ||||||
| Series 2010-84, Class YB, | ||||||||
| 4.000%, 07/20/2040 | 25,854 | 27,606 | ||||||
| Series 2010-H01, Class FA, | ||||||||
| 1M US L + 0.82%, 01/20/2060(a) | 51,122 | 51,653 | ||||||
| Series 2010-H10, Class FC, | ||||||||
| 1M US L + 1.00%, 05/20/2060(a) | 247,274 | 251,015 | ||||||
| Series 2010-H20, Class AF, | ||||||||
| 1M US L + 0.33%, 10/20/2060(a) | 265,622 | 265,915 | ||||||
| Series 2010-H22, Class FE, | ||||||||
| 1M US L + 0.35%, 05/20/2059(a) | 13,923 | 13,933 | ||||||
| Series 2010-H27, Class FA, | ||||||||
| 1M US L + 0.38%, 12/20/2060(a) | 67,677 | 67,842 | ||||||
| Series 2011-100, Class MY, | ||||||||
| 4.000%, 07/20/2041 | 156,528 | 172,376 | ||||||
| Series 2011-128, Class MD, | ||||||||
| 4.000%, 10/20/2040 | 140,000 | 148,282 | ||||||
| Series 2011-19, Class MG, | ||||||||
| 3.000%, 06/16/2040 | 3,333 | 3,360 | ||||||
| Series 2011-43, Class ZQ, | ||||||||
| 5.500%, 01/16/2033 | 98,787 | 106,045 | ||||||
| Series 2011-59, Class QC, | ||||||||
| 4.000%, 12/20/2040 | 132,987 | 137,993 | ||||||
| Series 2011-66, Class UA, | ||||||||
| 4.000%, 05/16/2041 | 156,712 | 164,761 | ||||||
| Series 2011-71, Class ZC, | ||||||||
| 5.500%, 07/16/2034 | 212,789 | 238,737 | ||||||
| Series 2011-97, Class WA, | ||||||||
| 6.112%, 11/20/2038(a) | 65,333 | 74,760 | ||||||
| Series 2011-H01, Class AF, | ||||||||
| 1M US L + 0.45%, 11/20/2060(a) | 264,284 | 265,320 | ||||||
See Notes to Financial Statements.
| 74 | April 30, 2021 |
| ALPS | Smith Total Return Bond Fund | |
| Statement of Investments | April 30, 2021 (Unaudited) |
| Principal Amount | Value (Note 2) | |||||||
| Series 2011-H02, Class BA, | ||||||||
| 4.450%, 02/20/2061(a) | $ | 18,815 | $ | 19,080 | ||||
| Series 2011-H11, Class FB, | ||||||||
| 1M US L + 0.50%, 04/20/2061(a) | 145,946 | 146,633 | ||||||
| Series 2011-H11, Class FA, | ||||||||
| 1M US L + 0.50%, 03/20/2061(a) | 94,349 | 94,833 | ||||||
| Series 2011-H15, Class FA, | ||||||||
| 1M US L + 0.45%, 06/20/2061(a) | 67,102 | 67,358 | ||||||
| Series 2012-32, Class PE, | ||||||||
| 3.500%, 03/16/2042 | 80,000 | 87,857 | ||||||
| Series 2012-36, Class MA, | ||||||||
| 3.000%, 06/20/2039 | 23,246 | 23,329 | ||||||
| Series 2012-38, Class PL, | ||||||||
| 3.250%, 01/20/2041 | 100,000 | 102,016 | ||||||
| Series 2012-47, Class VA, | ||||||||
| 3.500%, 07/20/2023 | 138,080 | 138,946 | ||||||
| Series 2012-51, Class VM, | ||||||||
| 3.500%, 04/16/2025 | 107,083 | 112,358 | ||||||
| Series 2012-68, Class GE, | ||||||||
| 3.000%, 05/20/2042 | 17,199 | 17,151 | ||||||
| Series 2012-76, Class GF, | ||||||||
| 1M US L + 0.30%, 06/16/2042(a) | 18,630 | 18,672 | ||||||
| Series 2012-84, Class YC, | ||||||||
| 2.500%, 07/20/2042 | 17,866 | 16,583 | ||||||
| Series 2012-H08, Class FC, | ||||||||
| 1M US L + 0.57%, 04/20/2062(a) | 751,948 | 756,303 | ||||||
| Series 2012-H14, Class FK, | ||||||||
| 1M US L + 0.58%, 07/20/2062(a) | 212,733 | 213,937 | ||||||
| Series 2012-H20, Class PT, | ||||||||
| 0.941%, 07/20/2062(a) | 104,855 | 104,742 | ||||||
| Series 2012-H24, Class FE, | ||||||||
| 1M US L + 0.60%, 10/20/2062(a) | 1,840 | 1,856 | ||||||
| Series 2013-100, Class MA, | ||||||||
| 3.500%, 02/20/2043 | 107,174 | 110,473 | ||||||
| Series 2013-115, Class PM, | ||||||||
| 4.000%, 08/20/2043 | 400,000 | 442,016 | ||||||
| Series 2013-151, Class VA, | ||||||||
| 3.000%, 08/20/2043 | 192,126 | 194,292 | ||||||
| Series 2013-22, Class GB, | ||||||||
| 2.500%, 08/20/2042 | 120,000 | 119,594 | ||||||
| Series 2013-69, Class NA, | ||||||||
| 2.000%, 09/20/2042 | 189,019 | 190,791 | ||||||
| Series 2013-98, Class KF, | ||||||||
| 1M US L + 0.30%, 11/20/2041(a) | 28,138 | 28,175 | ||||||
| Series 2013-99, Class MF, | ||||||||
| 1M US L + 0.30%, 07/20/2043(a) | 104,401 | 102,384 | ||||||
| Principal Amount | Value (Note 2) | |||||||
| Series 2013-H01, Class FA, | ||||||||
| 1.650%, 01/20/2063 | $ | 14,816 | $ | 14,844 | ||||
| Series 2013-H04, Class BA, | ||||||||
| 1.650%, 02/20/2063 | 31,869 | 31,957 | ||||||
| Series 2013-H09, Class HA, | ||||||||
| 1.650%, 04/20/2063 | 45,126 | 45,295 | ||||||
| Series 2013-H18, Class EA, | ||||||||
| 1M US L + 0.50%, 07/20/2063(a) | 107,301 | 107,721 | ||||||
| Series 2014-53, Class JM, | ||||||||
| 7.080%, 04/20/2039(a) | 352,164 | 414,358 | ||||||
| Series 2014-98, Class HE, | ||||||||
| 3.000%, 07/20/2044 | 53,984 | 54,986 | ||||||
| Series 2014-H10, Class TA, | ||||||||
| 1M US L + 0.60%, 04/20/2064(a) | 397,266 | 401,529 | ||||||
| Series 2014-H15, Class FA, | ||||||||
| 1M US L + 0.50%, 07/20/2064(a) | 27,358 | 27,562 | ||||||
| Series 2014-H16, Class FL, | ||||||||
| 1M US L + 0.47%, 07/20/2064(a) | 514,649 | 501,654 | ||||||
| Series 2015-190, Class LE, | ||||||||
| 3.500%, 06/20/2045 | 94,750 | 96,648 | ||||||
| Series 2015-63, Class KA, | ||||||||
| 3.000%, 04/20/2040 | 33,494 | 33,570 | ||||||
| Series 2015-65, Class MA, | ||||||||
| 3.000%, 12/20/2043 | 89,926 | 90,399 | ||||||
| Series 2015-84, Class QA, | ||||||||
| 3.500%, 06/20/2045 | 497,326 | 526,726 | ||||||
| Series 2015-H09, Class FA, | ||||||||
| 1M US L + 0.62%, 04/20/2065(a) | 282,932 | 279,014 | ||||||
| Series 2015-H12, Class FB, | ||||||||
| 1M US L + 0.60%, 05/20/2065(a) | 111,238 | 112,308 | ||||||
| Series 2015-H15, Class FC, | ||||||||
| 1M US L + 0.58%, 06/20/2065(a) | 154,481 | 152,220 | ||||||
| Series 2015-H22, Class FC, | ||||||||
| 1M US L + 0.60%, 09/20/2065(a) | 63,461 | 64,131 | ||||||
| Series 2015-H26, Class FA, | ||||||||
| 1M US L + 0.52%, 10/20/2065(a) | 66,558 | 67,109 | ||||||
| Series 2015-H26, Class FG, | ||||||||
| 1M US L + 0.52%, 10/20/2065(a) | 333,359 | 334,705 | ||||||
| Series 2015-H29, Class FA, | ||||||||
| 1M US L + 0.70%, 10/20/2065(a) | 17,288 | 17,348 | ||||||
| Series 2015-H30, Class FE, | ||||||||
| 1M US L + 0.60%, 11/20/2065(a) | 68,867 | 69,629 | ||||||
See Notes to Financial Statements.
| 75 | April 30, 2021 |
| ALPS | Smith Total Return Bond Fund | |
| Statement of Investments | April 30, 2021 (Unaudited) |
| Principal Amount | Value (Note 2) | |||||||
| Series 2015-H31, Class FT, | ||||||||
| 1M US L + 0.65%, 11/20/2065(a) | $ | 118,671 | $ | 119,119 | ||||
| Series 2015-H32, Class FH, | ||||||||
| 1M US L + 0.66%, 12/20/2065(a) | 239,615 | 242,681 | ||||||
| Series 2016-116, Class GV, | ||||||||
| 3.000%, 05/20/2026 | 55,880 | 59,052 | ||||||
| Series 2016-120, Class KA, | ||||||||
| 2.000%, 09/20/2046 | 12,670 | 12,562 | ||||||
| Series 2016-82, Class BA, | ||||||||
| 3.000%, 09/20/2045 | 278,854 | 284,415 | ||||||
| Series 2016-H06, Class FC, | ||||||||
| 1M US L + 0.92%, 02/20/2066(a) | 208,116 | 212,145 | ||||||
| Series 2016-H08, Class FT, | ||||||||
| 1M US L + 0.72%, 02/20/2066(a) | 489,293 | 493,029 | ||||||
| Series 2016-H11, Class F, | ||||||||
| 1M US L + 0.80%, 05/20/2066(a) | 707,948 | 720,193 | ||||||
| Series 2016-H13, Class FT, | ||||||||
| 1M US L + 0.58%, 05/20/2066(a) | 41,631 | 41,797 | ||||||
| Series 2016-H14, Class FA, | ||||||||
| 1M US L + 0.80%, 06/20/2066(a) | 183,057 | 186,254 | ||||||
| Series 2016-H15, Class FA, | ||||||||
| 1M US L + 0.80%, 07/20/2066(a) | 780,508 | 793,379 | ||||||
| Series 2016-H17, Class FK, | ||||||||
| 1M US L + 0.85%, 07/20/2066(a) | 107,976 | 110,095 | ||||||
| Series 2016-H17, Class FC, | ||||||||
| 1M US L + 0.83%, 08/20/2066(a) | 220,215 | 224,396 | ||||||
| Series 2016-H20, Class PT, | ||||||||
| 3.186%, 09/20/2066(a) | 730,532 | 781,061 | ||||||
| Series 2016-H23, Class F, | ||||||||
| 1M US L + 0.75%, 10/20/2066(a) | 279,126 | 283,567 | ||||||
| Series 2016-H24, Class FG, | ||||||||
| 1M US L + 0.75%, 10/20/2066(a) | 395,746 | 392,170 | ||||||
| Series 2017-150, Class JE, | ||||||||
| 3.000%, 07/20/2047 | 193,728 | 199,981 | ||||||
| Series 2017-36, Class MJ, | ||||||||
| 3.000%, 03/20/2047 | 102,022 | 107,558 | ||||||
| Series 2017-56, Class AZ, | ||||||||
| 3.000%, 04/20/2047 | 107,697 | 113,034 | ||||||
| Series 2017-73, Class JT, | ||||||||
| 2.750%, 09/20/2046 | 94,498 | 97,451 | ||||||
| Series 2017-H06, Class FE, | ||||||||
| 1M US L + 0.55%, 02/20/2067(a) | 119,430 | 120,383 | ||||||
| Principal Amount | Value (Note 2) | |||||||
| Series 2017-H15, Class FC, | ||||||||
| 1M US L + 0.47%, 06/20/2067(a) | $ | 321,664 | $ | 315,594 | ||||
| Series 2017-H17, Class FG, | ||||||||
| 1M US L + 0.50%, 08/20/2067(a) | 52,327 | 52,598 | ||||||
| Series 2018-36, Class CZ, | ||||||||
| 4.000%, 03/20/2048 | 251,333 | 278,407 | ||||||
| Series 2018-37, Class C, | ||||||||
| 2.500%, 01/20/2046 | 326,740 | 346,467 | ||||||
| Series 2019-111, Class TE, | ||||||||
| 2.000%, 09/20/2049 | 164,916 | 169,165 | ||||||
| Series 2019-29, Class JB, | ||||||||
| 4.500%, 12/20/2046 | 391,989 | 399,042 | ||||||
| Series 2019-61, Class K, | ||||||||
| 3.500%, 07/20/2048 | 73,899 | 74,848 | ||||||
| Series 2020-125, Class GA, | ||||||||
| 2.500%, 03/20/2050 | 745,335 | 770,097 | ||||||
| Series 2020-125, Class GC, | ||||||||
| 2.500%, 08/20/2050 | 203,045 | 204,874 | ||||||
| Series 2020-32, Class UM, | ||||||||
| 2.500%, 03/20/2050 | 2,711,973 | 2,815,787 | ||||||
| Series 2020-5, Class LC, | ||||||||
| 3.500%, 10/20/2049 | 532,855 | 549,466 | ||||||
| Series 2020-61, Class AB, | ||||||||
| 3.000%, 05/20/2048 | 623,416 | 640,940 | ||||||
| Series 2020-62, Class PD, | ||||||||
| 3.000%, 05/20/2050 | 1,092,491 | 1,125,302 | ||||||
| Series 2020-98, Class CE, | ||||||||
| 3.000%, 07/20/2050 | 3,992,164 | 4,127,410 | ||||||
| 38,173,597 | ||||||||
| TOTAL COLLATERALIZED MORTGAGE OBLIGATIONS | ||||||||
| (Cost $137,700,114) | 139,549,836 | |||||||
| Principal Amount | Value (Note 2) | |||||||
| COMMERCIAL MORTGAGE-BACKED SECURITIES (3.21%) | ||||||||
| Fannie Mae-Aces | ||||||||
| Series 2013-M6, Class 1AC, | ||||||||
| 3.534%, 02/25/2043(a) | 19,009,088 | 21,091,903 | ||||||
| Series 2016-M3, | ||||||||
| Class ASQ2, | ||||||||
| 2.263%, 02/25/2023 | 44,488 | 44,779 | ||||||
| Series 2017-M15, Class A1, | ||||||||
| 3.058%, 09/25/2027(a) | 4,343,589 | 4,672,552 | ||||||
| Series 2018-M12, Class A1, | ||||||||
| 3.546%, 08/25/2030 | 4,687,534 | 5,239,107 | ||||||
| Series 2018-M13, Class A1, | ||||||||
| 3.820%, 03/25/2030(a) | 3,961,842 | 4,489,620 | ||||||
| Series 2018-M8, Class A1, | ||||||||
| 3.436%, 06/25/2028(a) | 7,304,763 | 8,059,238 | ||||||
| Series 2019-M10, Class A1, | ||||||||
| 2.000%, 04/25/2030 | 1,725,627 | 1,792,973 | ||||||
See Notes to Financial Statements.
| 76 | April 30, 2021 |
| ALPS | Smith Total Return Bond Fund | |
| Statement of Investments | April 30, 2021 (Unaudited) |
| Principal Amount | Value (Note 2) | |||||||
| Series 2019-M14, Class A1, | ||||||||
| 2.304%, 06/25/2029 $ | 159,271 | $ | 167,780 | |||||
| Series 2019-M24, | ||||||||
| Class 2XA, | ||||||||
| 1.276%, 03/25/2031(a)(d) | 2,347,651 | 217,889 | ||||||
| Series 2020-M10, Class X1, | ||||||||
| 1.922%, 12/25/2030(a)(d) | 808,906 | 106,460 | ||||||
| Series 2020-M10, Class X4, | ||||||||
| 0.965%, 07/25/2032(a)(d) | 56,005,017 | 4,200,208 | ||||||
| Series 2020-M13, Class X2, | ||||||||
| 1.402%, 09/25/2030(a)(d) | 2,422,709 | 206,558 | ||||||
| 50,289,067 | ||||||||
| Freddie Mac Multifamily Structured Pass Through Certificates | ||||||||
| Series 2014-KF05, Class A, | ||||||||
| 1M US L + 0.35%, 09/25/2021(a) | 345,845 | 345,928 | ||||||
| Series 2018-J19L, Class AFL, | ||||||||
| 1M US L + 0.23%, 11/25/2027(a) | 242,490 | 241,670 | ||||||
| Series 2019-KLU2, Class X1, | ||||||||
| 1.166%, 08/25/2029(a) | 63,499,402 | 4,453,677 | ||||||
| 5,041,275 | ||||||||
| TOTAL COMMERCIAL MORTGAGE-BACKED SECURITIES | ||||||||
| (Cost $55,157,652) | 55,330,342 | |||||||
| Principal Amount | Value (Note 2) | |||||||
| MORTGAGE-BACKED SECURITIES (5.95%) | ||||||||
| Fannie Mae Pool | ||||||||
| Series 2003-386375, | ||||||||
| 4.790%, 08/01/2028 | 422,219 | 421,974 | ||||||
| Series 2005-843080, | ||||||||
| 6.000%, 12/01/2034 | 132,893 | 144,216 | ||||||
| Series 2007-943003, | ||||||||
| 5.500%, 08/01/2047 | 94,041 | 102,227 | ||||||
| Series 2009-463331, | ||||||||
| 5.250%, 08/01/2029 | 655,641 | 753,646 | ||||||
| Series 2009-930895, | ||||||||
| 4.500%, 03/01/2039 | 188,838 | 203,595 | ||||||
| Series 2009-931707, | ||||||||
| 4.500%, 08/01/2039 | 120,164 | 130,711 | ||||||
| Series 2009-958348, | ||||||||
| 5.440%, 04/01/2027 | 140,583 | 155,829 | ||||||
| Series 2009-958878, | ||||||||
| 5.750%, 07/01/2027 | 1,387,979 | 1,548,635 | ||||||
| Series 2010-466566, | ||||||||
| 4.270%, 11/01/2025 | 248,519 | 278,462 | ||||||
| Series 2011-467068, | ||||||||
| 6.130%, 01/01/2026 | 1,568,854 | 1,855,133 | ||||||
| Series 2011-468477, | ||||||||
| 4.590%, 08/01/2026 | 417,132 | 463,206 | ||||||
| Principal Amount | Value (Note 2) | |||||||
| Series 2011-469013, | ||||||||
| 5.470%, 08/01/2026 | $ | 1,036,016 | $ | 1,200,405 | ||||
| Series 2011-AH9290, | ||||||||
| 4.000%, 04/01/2041 | 50,370 | 53,326 | ||||||
| Series 2012-470020, | ||||||||
| 4.200%, 01/01/2030 | 1,606,412 | 1,861,318 | ||||||
| Series 2012-AM0279, | ||||||||
| 3.210%, 08/01/2027 | 304,499 | 313,913 | ||||||
| Series 2012-AM1387, | ||||||||
| 3.260%, 11/01/2032 | 124,169 | 136,028 | ||||||
| Series 2012-MA1214, | ||||||||
| 3.000%, 10/01/2042 | 1,093,638 | 1,132,737 | ||||||
| Series 2013-AM 4236, | ||||||||
| 3.940%, 08/01/2025 | 224,885 | 250,720 | ||||||
| Series 2013-AM3154, | ||||||||
| 3.250%, 05/01/2028 | 370,865 | 402,858 | ||||||
| Series 2013-AM3162, | ||||||||
| 3.000%, 04/01/2025 | 770,528 | 797,809 | ||||||
| Series 2013-AM4329, | ||||||||
| 3.870%, 10/01/2025 | 201,797 | 225,352 | ||||||
| Series 2013-AM4781, | ||||||||
| 4.180%, 11/01/2028 | 1,246,418 | 1,424,397 | ||||||
| Series 2013-AM4991, | ||||||||
| 3.970%, 12/01/2025 | 166,020 | 186,153 | ||||||
| Series 2013-AR2289, | ||||||||
| 3.000%, 02/01/2033 | 328,646 | 347,709 | ||||||
| Series 2013-AT9663, | ||||||||
| 2.500%, 07/01/2043 | 606,034 | 628,323 | ||||||
| Series 2013-MA1586, | ||||||||
| 3.000%, 08/01/2043 | 232,421 | 249,373 | ||||||
| Series 2014-AM4198, | ||||||||
| 3.550%, 03/01/2024 | 97,938 | 105,563 | ||||||
| Series 2014-AM5473, | ||||||||
| 3.760%, 03/01/2024 | 545,000 | 591,552 | ||||||
| Series 2014-AM7274, | ||||||||
| 3.000%, 12/01/2024 | 1,200,000 | 1,220,333 | ||||||
| Series 2015-AM8666, | ||||||||
| 2.960%, 06/01/2030 | 183,015 | 194,705 | ||||||
| Series 2015-AM8918, | ||||||||
| 3.250%, 09/01/2030 | 731,000 | 811,149 | ||||||
| Series 2015-AM9173, | ||||||||
| 3.110%, 06/01/2027 | 247,288 | 248,045 | ||||||
| Series 2015-AM9830, | ||||||||
| 3.190%, 09/01/2027 | 364,040 | 390,420 | ||||||
| Series 2016-AL8405, | ||||||||
| 4.500%, 05/01/2041 | 251,637 | 273,554 | ||||||
| Series 2016-AN0665, | ||||||||
| 3.070%, 02/01/2026 | 198,066 | 215,859 | ||||||
| Series 2016-AN0774, | ||||||||
| 3.210%, 01/01/2026 | 180,699 | 197,324 | ||||||
| Series 2016-AN2228, | ||||||||
| 2.520%, 08/01/2026 | 190,000 | 200,656 | ||||||
| Series 2016-AN3542, | ||||||||
| 3.410%, 11/01/2046 | 369,764 | 400,357 | ||||||
See Notes to Financial Statements.
| 77 | April 30, 2021 |
| ALPS | Smith Total Return Bond Fund | |
| Statement of Investments | April 30, 2021 (Unaudited) |
| Principal Amount | Value (Note 2) | |||||||
| Series 2016-AN3749, | ||||||||
| 2.520%, 12/01/2026 | $ | 469,470 | $ | 498,278 | ||||
| Series 2016-BC0943, | ||||||||
| 3.500%, 05/01/2046 | 471,965 | 519,197 | ||||||
| Series 2017-AN4431, | ||||||||
| 3.220%, 01/01/2027 | 85,000 | 93,765 | ||||||
| Series 2017-AN4469, | ||||||||
| 3.640%, 01/01/2029 | 701,964 | 794,135 | ||||||
| Series 2017-AN4529, | ||||||||
| 3.620%, 01/01/2027 | 843,271 | 945,708 | ||||||
| Series 2017-AN4606, | ||||||||
| 3.510%, 02/01/2027 | 805,534 | 883,861 | ||||||
| Series 2017-AN4833, | ||||||||
| 3.320%, 04/01/2027 | 95,000 | 105,464 | ||||||
| Series 2017-AN5279, | ||||||||
| 3.340%, 04/01/2029 | 467,486 | 469,063 | ||||||
| Series 2017-AN5742, | ||||||||
| 3.190%, 05/01/2030 | 141,049 | 155,222 | ||||||
| Series 2017-AN5796, | ||||||||
| 3.030%, 06/01/2027 | 220,000 | 237,887 | ||||||
| Series 2017-AN6304, | ||||||||
| 3.100%, 10/01/2027 | 275,000 | 302,532 | ||||||
| Series 2017-AN6670, | ||||||||
| 3.210%, 09/01/2027 | 1,952,471 | 2,052,954 | ||||||
| Series 2017-AN7060, | ||||||||
| 2.930%, 10/01/2027 | 1,630,000 | 1,760,350 | ||||||
| Series 2017-AN7234, | ||||||||
| 3.010%, 12/01/2027 | 1,000,000 | 1,079,733 | ||||||
| Series 2017-AN7384, | ||||||||
| 2.880%, 12/01/2027 | 49,717 | 54,128 | ||||||
| Series 2017-AN7547, | ||||||||
| 3.370%, 11/01/2027 | 1,129,444 | 1,187,568 | ||||||
| Series 2017-AN7823, | ||||||||
| 2.890%, 12/01/2027 | 235,000 | 255,524 | ||||||
| Series 2017-CA0522, | ||||||||
| 3.000%, 10/01/2047 | 528,214 | 545,326 | ||||||
| Series 2018-109435, | ||||||||
| 3.890%, 08/01/2028 | 1,926,999 | 2,154,948 | ||||||
| Series 2018-109741, | ||||||||
| 3.730%, 11/01/2025 | 11,350,000 | 12,318,329 | ||||||
| Series 2018-387770, | ||||||||
| 3.625%, 07/01/2028 | 2,570,000 | 2,862,567 | ||||||
| Series 2018-387853, | ||||||||
| 3.455%, 08/01/2025 | 175,000 | 184,203 | ||||||
| Series 2018-387904, | ||||||||
| 3.840%, 08/01/2028 | 685,570 | 788,352 | ||||||
| Series 2018-387905, | ||||||||
| 3.600%, 01/01/2027 | 739,737 | 826,155 | ||||||
| Series 2018-387983, | ||||||||
| 3.630%, 08/01/2028 | 2,000,000 | 2,227,227 | ||||||
| Series 2018-AN8198, | ||||||||
| 3.140%, 01/01/2028 | 300,000 | 326,968 | ||||||
| Series 2018-AN8272, | ||||||||
| 3.170%, 02/01/2028 | 100,000 | 109,121 | ||||||
| Principal Amount | Value (Note 2) | |||||||
| Series 2018-AN8486, | ||||||||
| 3.330%, 04/01/2030 | $ | 333,457 | $ | 371,052 | ||||
| Series 2018-AN8493, | ||||||||
| 3.300%, 02/01/2030 | 434,684 | 472,776 | ||||||
| Series 2018-AN8982, | ||||||||
| 3.440%, 05/01/2028 | 1,000,000 | 1,101,507 | ||||||
| Series 2018-AN9038, | ||||||||
| 3.460%, 05/01/2028 | 135,000 | 146,005 | ||||||
| Series 2018-AN924, | ||||||||
| 4.210%, 05/01/2033 | 641,566 | 713,221 | ||||||
| Series 2018-AN9354, | ||||||||
| 3.640%, 06/01/2028 | 1,565,000 | 1,738,562 | ||||||
| Series 2018-AN9976, | ||||||||
| 3.960%, 02/01/2030 | 470,000 | 543,752 | ||||||
| Series 2018-BI0404, | ||||||||
| 4.100%, 11/01/2028 | 3,971,826 | 4,434,634 | ||||||
| Series 2018-BL0119, | ||||||||
| 4.090%, 11/01/2026 | 792,120 | 902,259 | ||||||
| Series 2018-BL0212, | ||||||||
| 3.820%, 07/01/2027 | 44,627 | 50,458 | ||||||
| Series 2018-BL0550, | ||||||||
| 3.770%, 11/01/2028 | 660,000 | 758,061 | ||||||
| Series 2018-BL0907, | ||||||||
| 3.880%, 12/01/2028 | 450,000 | 518,719 | ||||||
| Series 2019-BI2928, | ||||||||
| 3.410%, 07/01/2027 | 835,207 | 928,009 | ||||||
| Series 2019-BL1188, | ||||||||
| 3.480%, 02/01/2026 | 200,000 | 220,907 | ||||||
| Series 2019-BL1300, | ||||||||
| 4.200%, 01/01/2029 | 1,375,000 | 1,565,731 | ||||||
| Series 2019-BL1451, | ||||||||
| 3.760%, 02/01/2029 | 685,000 | 763,372 | ||||||
| Series 2019-BL1567, | ||||||||
| 3.590%, 02/01/2029 | 1,775,000 | 1,976,359 | ||||||
| Series 2019-BL1596, | ||||||||
| 3.480%, 03/01/2029 | 169,299 | 191,133 | ||||||
| Series 2019-BL2236, | ||||||||
| 3.640%, 10/01/2029 | 1,100,000 | 1,230,825 | ||||||
| Series 2019-BL2356, | ||||||||
| 3.020%, 05/01/2026 | 165,000 | 176,620 | ||||||
| Series 2019-BL2460, | ||||||||
| 3.400%, 05/01/2029 | 592,818 | 645,081 | ||||||
| Series 2019-BL3182, | ||||||||
| 2.980%, 07/01/2029 | 257,363 | 279,044 | ||||||
| Series 2019-BM6011, | ||||||||
| 3.357%, 11/01/2026(a) | 169,227 | 181,619 | ||||||
| Series 2019-BM6152, | ||||||||
| 3.500%, 06/01/2044 | 1,796,685 | 1,976,915 | ||||||
| Series 2019-MA3784, | ||||||||
| 3.500%, 09/01/2049 | 5,054,932 | 5,292,155 | ||||||
| 81,034,913 | ||||||||
| Freddie Mac Gold Pool | ||||||||
| Series 2013-G80393, | ||||||||
| 5.000%, 08/20/2036 | 189,325 | 210,578 | ||||||
See Notes to Financial Statements.
| 78 | April 30, 2021 |
| ALPS | Smith Total Return Bond Fund | |
| Statement of Investments | April 30, 2021 (Unaudited) |
| Principal Amount | Value (Note 2) | |||||||
| Series 2013-T65180, | ||||||||
| 3.000%, 11/01/2043 | $ | 193,698 | $ | 201,312 | ||||
| Series 2015-U49046, | ||||||||
| 4.000%, 02/01/2029 | 112,430 | 121,233 | ||||||
| 533,123 | ||||||||
| Freddie Mac Pool | ||||||||
| Series 2005-002936, | ||||||||
| Class FC, | ||||||||
| 1M US L + 0.40%, 03/15/2029(a) | 30,022 | 30,199 | ||||||
| Series 2017-WN2000, | ||||||||
| 2.700%, 08/01/2023 | 10,700,000 | 10,837,266 | ||||||
| 10,867,465 | ||||||||
| Ginnie Mae II Pool | ||||||||
| Series 2012-, | ||||||||
| 3.500%, 03/20/2042 | 550,236 | 579,057 | ||||||
| Series 2012-5302+, | ||||||||
| 3.500%, 02/20/2042 | 398,947 | 419,789 | ||||||
| Series 2013-, | ||||||||
| 3.250%, 04/20/2033 | 453,106 | 478,902 | ||||||
| 3.500%, 04/20/2043 | 432,269 | 452,806 | ||||||
| Series 2013-MA1149, | ||||||||
| 3.000%, 07/20/2043 | 22,033 | 22,828 | ||||||
| Series 2016-MA3588, | ||||||||
| 3.500%, 04/20/2046 | 643,110 | 672,855 | ||||||
| Series 2016-MA3793, | ||||||||
| 3.500%, 07/20/2046 | 1,649,885 | 1,726,161 | ||||||
| Series 2016-MA3865, | ||||||||
| 3.500%, 08/20/2046 | 1,493,059 | 1,562,090 | ||||||
| Series 2019-784688, | ||||||||
| 5.000%, 02/20/2049 | 3,331,851 | 3,670,882 | ||||||
| Series 2019-MA5864, | ||||||||
| 3.000%, 04/20/2049 | 114,220 | 117,758 | ||||||
| Series 2019-MA5920, | ||||||||
| 3.000%, 05/20/2049 | 66,779 | 68,847 | ||||||
| Series 2019-MA5936, | ||||||||
| 6.500%, 05/20/2049 | 101,873 | 120,079 | ||||||
| 9,892,054 | ||||||||
| TOTAL MORTGAGE-BACKED SECURITIES | ||||||||
| (Cost $101,380,525) | 102,327,555 | |||||||
| CORPORATE BONDS (57.04%) | ||||||||
| Aerospace & Defense (2.57%) | ||||||||
| Boeing Co. | ||||||||
| 4.51%, 05/01/2023 | 6,490,000 | 6,932,772 | ||||||
| L3Harris Technologies, Inc. | ||||||||
| 3.85%, 12/15/2026 | 3,544,000 | 3,963,763 | ||||||
| Teledyne Technologies, Inc. | ||||||||
| 0.65%, 04/01/2023 | 4,985,000 | 4,983,982 | ||||||
| 0.95%, 04/01/2024 | 4,985,000 | 4,986,912 | ||||||
| 1.60%, 04/01/2026 | 7,975,000 | 8,005,588 | ||||||
| 2.25%, 04/01/2028 | 9,970,000 | 10,025,751 | ||||||
| TransDigm, Inc. | ||||||||
| 6.25%, 03/15/2026(e) | 5,000,000 | 5,300,000 | ||||||
| Total Aerospace & Defense | 44,198,768 | |||||||
| Principal Amount | Value (Note 2) | |||||||
| Airlines (1.42%) | ||||||||
| Alaska Airlines 2020-1 Class A | ||||||||
| Pass Through Trust | ||||||||
| 4.80%, 08/15/2027(e) | $ | 5,764,835 | $ | 6,379,055 | ||||
| Alaska Airlines 2020-1 Class B | ||||||||
| Pass Through Trust | ||||||||
| 8.00%, 08/15/2025(e) | 4,194,020 | 4,697,708 | ||||||
| British Airways 2020-1 Class A | ||||||||
| Pass Through Trust | ||||||||
| 4.25%, 11/15/2032(e) | 1,348,320 | 1,435,154 | ||||||
| Southwest Airlines Co. | ||||||||
| 5.25%, 05/04/2025 | 4,455,000 | 5,105,153 | ||||||
| United Airlines 2020-1 Class A | ||||||||
| Pass Through Trust | ||||||||
| Series 20-1 | ||||||||
| 5.88%, 10/15/2027 | 4,353,799 | 4,825,898 | ||||||
| United Airlines, Inc. | ||||||||
| 4.38%, 04/15/2026(e) | 1,993,000 | 2,020,227 | ||||||
| Total Airlines | 24,463,195 | |||||||
| Apparel & Textile Products (0.12%) | ||||||||
| Hanesbrands, Inc. | ||||||||
| 5.38%, 05/15/2025(e) | 2,000,000 | 2,107,500 | ||||||
| Automobiles Manufacturing (3.55%) | ||||||||
| Ford Motor Co. | ||||||||
| 5.29%, 12/08/2046 | 4,910,000 | 5,181,548 | ||||||
| 8.50%, 04/21/2023 | 500,000 | 560,625 | ||||||
| 9.00%, 04/22/2025 | 8,500,000 | 10,391,249 | ||||||
| Ford Motor Credit Co. LLC | ||||||||
| 3.38%, 11/13/2025 | 6,500,000 | 6,660,420 | ||||||
| 3.81%, 10/12/2021 | 2,500,000 | 2,528,513 | ||||||
| 4.00%, 11/13/2030 | 6,965,000 | 7,122,339 | ||||||
| 5.88%, 08/02/2021 | 3,422,000 | 3,458,787 | ||||||
| General Motors Co. | ||||||||
| 5.00%, 04/01/2035 | 5,348,000 | 6,288,003 | ||||||
| Nissan Motor Co., Ltd. | ||||||||
| 4.81%, 09/17/2030(e) | 15,300,000 | 17,005,578 | ||||||
| Volkswagen Group of America | ||||||||
| Finance LLC | ||||||||
| 0.75%, 11/23/2022(e) | 995,000 | 998,541 | ||||||
| 0.88%, 11/22/2023(e) | 995,000 | 999,894 | ||||||
| Total Automobiles Manufacturing | 61,195,497 | |||||||
| Banks (5.28%) | ||||||||
| Associated Bank NA/Green Bay | ||||||||
| WI | ||||||||
| 3.50%, 08/13/2021 | 1,800,000 | 1,811,027 | ||||||
| 4.25%, 01/15/2025 | 934,000 | 1,020,603 | ||||||
| Bank of New Zealand | ||||||||
| 2.00%, 02/21/2025(e) | 7,375,000 | 7,637,055 | ||||||
| CIT Group, Inc. | ||||||||
| 1D US SOFR + 3.83%, | ||||||||
| 06/19/2024(a) | 12,890,000 | 13,647,287 | ||||||
| Citizens Financial Group, Inc. | ||||||||
| Series F | ||||||||
| 5Y US TI + 5.313%(a)(f) | 3,000,000 | 3,326,250 | ||||||
See Notes to Financial Statements.
| 79 | April 30, 2021 |
| ALPS | Smith Total Return Bond Fund | |
| Statement of Investments | April 30, 2021 (Unaudited) |
| Principal Amount | Value (Note 2) | |||||||
| Comerica, Inc. | ||||||||
| 5Y US TI + 5.291%(a)(f) | $ | 2,000,000 | $ | 2,227,500 | ||||
| Cooperatieve Rabobank UA | ||||||||
| 3.75%, 07/21/2026 | 4,500,000 | 4,932,550 | ||||||
| 3.95%, 11/09/2022 | 675,000 | 709,033 | ||||||
| Credit Suisse AG | ||||||||
| 1.00%, 05/05/2023 | 3,150,000 | 3,179,745 | ||||||
| Danske Bank A/S | ||||||||
| 5.00%, 01/12/2022(e) | 4,625,000 | 4,762,519 | ||||||
| 5.38%, 01/12/2024(e) | 1,000,000 | 1,114,662 | ||||||
| 1Y US TI + 1.03%, 12/08/2023(a)(e) | 2,000,000 | 2,010,499 | ||||||
| 1Y US TI + 1.35%, 09/11/2026(a)(e) | 6,500,000 | 6,470,124 | ||||||
| 3M US L + 1.249%, 09/20/2022(a)(e) | 1,000,000 | 1,008,190 | ||||||
| First Horizon Corp. | ||||||||
| 3.55%, 05/26/2023 | 2,500,000 | 2,641,091 | ||||||
| FNB Corp. | ||||||||
| 2.20%, 02/24/2023 | 1,800,000 | 1,832,018 | ||||||
| PNC Financial Services Group, Inc. | ||||||||
| 1D US SOFR + 0.98%, 04/23/2032(a) | 4,982,000 | 4,961,749 | ||||||
| Synovus Bank/Columbus GA | ||||||||
| 1D US SOFR + 0.95%, 02/10/2023(a) | 6,235,000 | 6,293,978 | ||||||
| Truist Bank | ||||||||
| 5Y US TI + 1.15%, 09/17/2029(a) | 4,750,000 | 5,003,270 | ||||||
| UniCredit SpA | ||||||||
| 1Y US TI + 2.30%, 09/22/2026(a)(e) | 8,500,000 | 8,577,443 | ||||||
| Wells Fargo & Co. | ||||||||
| 4.10%, 06/03/2026 | 6,800,000 | 7,647,682 | ||||||
| Total Banks | 90,814,275 | |||||||
| Cable & Satellite (2.24%) | ||||||||
| CCO Holdings LLC / CCO Holdings | ||||||||
| Capital Corp. | ||||||||
| 4.25%, 02/01/2031(e) | 8,427,000 | 8,437,534 | ||||||
| 4.50%, 06/01/2033(e) | 5,978,000 | 6,032,220 | ||||||
| Charter Communications Operating LLC / Charter Communications Operating Capital | ||||||||
| 3.85%, 04/01/2061 | 4,980,000 | 4,580,639 | ||||||
| 5.05%, 03/30/2029 | 8,017,000 | 9,297,572 | ||||||
| 3M US L + 1.65%, 02/01/2024(a) | 500,000 | 513,625 | ||||||
| Sirius XM Radio, Inc. | ||||||||
| 3.88%, 08/01/2022(e) | 4,770,000 | 4,799,574 | ||||||
| Time Warner Cable LLC | ||||||||
| 4.00%, 09/01/2021 | 4,797,000 | 4,810,283 | ||||||
| Total Cable & Satellite | 38,471,447 | |||||||
| Principal Amount | Value (Note 2) | |||||||
| Casinos & Gaming (0.46%) | ||||||||
| MGM Resorts International | ||||||||
| 5.50%, 04/15/2027 | $ | 3,985,000 | $ | 4,353,613 | ||||
| 7.75%, 03/15/2022 | 3,348,000 | 3,525,293 | ||||||
| Total Casinos & Gaming | 7,878,906 | |||||||
| Chemicals (0.63%) | ||||||||
| Kraton Polymers LLC / Kraton | ||||||||
| Polymers Capital Corp. | ||||||||
| 4.25%, 12/15/2025(e) | 3,685,000 | 3,745,029 | ||||||
| LYB International Finance III LLC | ||||||||
| 3M US L + 1.00%, 10/01/2023(a) | 7,110,000 | 7,126,773 | ||||||
| Total Chemicals | 10,871,802 | |||||||
| Commercial Finance (1.87%) | ||||||||
| AerCap Ireland Capital DAC / | ||||||||
| AerCap Global Aviation Trust | ||||||||
| 3.15%, 02/15/2024 | 5,365,000 | 5,640,408 | ||||||
| 3.50%, 01/15/2025 | 1,225,000 | 1,298,446 | ||||||
| 4.63%, 10/15/2027 | 925,000 | 1,031,319 | ||||||
| 6.50%, 07/15/2025 | 7,493,000 | 8,822,081 | ||||||
| Avolon Holdings Funding, Ltd. | ||||||||
| 2.13%, 02/21/2026(e) | 996,000 | 974,199 | ||||||
| 2.75%, 02/21/2028(e) | 996,000 | 969,793 | ||||||
| 4.25%, 04/15/2026(e) | 5,410,000 | 5,774,190 | ||||||
| 5.50%, 01/15/2026(e) | 1,900,000 | 2,129,238 | ||||||
| Park Aerospace Holdings, Ltd. | ||||||||
| 4.50%, 03/15/2023(e) | 1,850,000 | 1,942,300 | ||||||
| 5.25%, 08/15/2022(e) | 3,283,000 | 3,432,343 | ||||||
| Total Commercial Finance | 32,014,317 | |||||||
| Consumer Finance (2.87%) | ||||||||
| Ally Financial, Inc. | ||||||||
| 1.45%, 10/02/2023 | 990,000 | 1,006,205 | ||||||
| Series B | ||||||||
| 5Y US TI + 3.87%(a)(f) | 4,301,000 | 4,370,676 | ||||||
| American Express Co. | ||||||||
| Series B | ||||||||
| 3M US L + 3.43%(a)(f) | 8,530,000 | 8,550,046 | ||||||
| Discover Financial Services | ||||||||
| Series D | ||||||||
| 5Y US TI + 5.78%(a)(f) | 5,000,000 | 5,656,250 | ||||||
| OneMain Finance Corp. | ||||||||
| 5.38%, 11/15/2029 | 3,500,000 | 3,781,768 | ||||||
| 8.88%, 06/01/2025 | 9,677,000 | 10,725,744 | ||||||
| Quicken Loans LLC | ||||||||
| 3.63%, 03/01/2029(e) | 3,700,000 | 3,605,188 | ||||||
| 3.88%, 03/01/2031(e) | 2,000,000 | 1,947,830 | ||||||
| 5.25%, 01/15/2028(e) | 4,190,000 | 4,425,688 | ||||||
| Synchrony Financial | ||||||||
| 3.70%, 08/04/2026 | 3,192,000 | 3,470,755 | ||||||
| 4.25%, 08/15/2024 | 1,700,000 | 1,857,567 | ||||||
| Total Consumer Finance | 49,397,717 | |||||||
See Notes to Financial Statements.
| 80 | April 30, 2021 |
| ALPS | Smith Total Return Bond Fund | |
| Statement of Investments | April 30, 2021 (Unaudited) |
| Principal Amount | Value (Note 2) | |||||||
| Consumer Services (0.29%) | ||||||||
| Sodexo, Inc. | ||||||||
| 2.72%, 04/16/2031(e) | $ | 5,000,000 | $ | 4,970,746 | ||||
| Department Stores (0.50%) | ||||||||
| Nordstrom, Inc. | ||||||||
| 4.25%, 08/01/2031(e) | 8,425,000 | 8,545,015 | ||||||
| Diversified Banks (3.50%) | ||||||||
| Bank of America Corp. | ||||||||
| 4.45%, 03/03/2026 | 6,532,000 | 7,403,231 | ||||||
| 1D US SOFR + 0.96%, 07/22/2027(a) | 9,366,000 | 9,457,670 | ||||||
| 1D US SOFR + 1.32%, 04/22/2032(a) | 4,300,000 | 4,355,275 | ||||||
| 1D US SOFR + 1.37%, 10/24/2031(a) | 6,700,000 | 6,361,846 | ||||||
| 1D US SOFR + 1.58%, 04/22/2042(a) | 2,989,000 | 3,054,097 | ||||||
| Citigroup, Inc. | ||||||||
| 4.30%, 11/20/2026 | 7,008,000 | 7,898,292 | ||||||
| 1D US SOFR + 1.17%, 05/01/2032(a) | 1,993,000 | 1,993,450 | ||||||
| JPMorgan Chase & Co. | ||||||||
| 1D US SOFR + 1.25%, 04/22/2032(a) | 2,989,000 | 3,003,731 | ||||||
| 1D US SOFR + 1.46%, 04/22/2042(a) | 10,509,000 | 10,541,564 | ||||||
| 1D US SOFR + 2.04%, 04/22/2031(a) | 4,000,000 | 4,044,499 | ||||||
| Natwest Group PLC | ||||||||
| 1Y US TI + 2.55%, 05/22/2028(a) | 2,000,000 | 2,095,511 | ||||||
| Total Diversified Banks | 60,209,166 | |||||||
| Electrical Equipment Manufacturing (0.26%) | ||||||||
| Otis Worldwide Corp. | ||||||||
| 3M US L + 0.45%, 04/05/2023(a) | 900,000 | 899,748 | ||||||
| Trimble, Inc. | ||||||||
| 4.75%, 12/01/2024 | 3,254,000 | 3,650,681 | ||||||
| Total Electrical Equipment Manufacturing | 4,550,429 | |||||||
| Exploration & Production (0.18%) | ||||||||
| Diamondback Energy, Inc. | ||||||||
| 4.40%, 03/24/2051 | 2,990,000 | 3,144,225 | ||||||
| Financial Services (4.37%) | ||||||||
| Carlyle Finance Subsidiary LLC | ||||||||
| 3.50%, 09/19/2029(e) | 2,000,000 | 2,110,933 | ||||||
| Credit Suisse Group AG | ||||||||
| 3.57%, 01/09/2023(e) | 9,021,000 | 9,190,610 | ||||||
| 1D US SOFR + 2.044%, 06/05/2026(a)(e) | 3,000,000 | 3,067,768 | ||||||
| 5Y US TI + 4.82%(a)(e)(f) | 7,875,000 | 8,569,221 | ||||||
| Principal Amount | Value (Note 2) | |||||||
| Goldman Sachs Group, Inc. | ||||||||
| 3.50%, 04/01/2025 | $ | 7,006,000 | $ | 7,623,690 | ||||
| 1D US SOFR + 1.51%, 04/22/2042(a) | 2,989,000 | 3,021,826 | ||||||
| LPL Holdings, Inc. | ||||||||
| 4.00%, 03/15/2029(e) | 2,990,000 | 2,993,738 | ||||||
| Morgan Stanley | ||||||||
| Series GMTN | ||||||||
| 1D US SOFR + 1.14%, 01/22/2031(a) | 9,000,000 | 9,205,722 | ||||||
| 1D US SOFR + 0.88%, 05/04/2027(a) | 3,986,000 | 4,006,994 | ||||||
| 1D US SOFR + 1.02%, 04/28/2032(a) | 7,972,000 | 7,558,331 | ||||||
| 1D US SOFR + 1.49%, 04/22/2042(a) | 1,843,000 | 1,870,238 | ||||||
| Nasdaq, Inc. | ||||||||
| 0.45%, 12/21/2022 | 2,990,000 | 2,991,358 | ||||||
| Raymond James Financial, Inc. | ||||||||
| 4.65%, 04/01/2030 | 9,000,000 | 10,653,923 | ||||||
| UBS AG/London | ||||||||
| 1.75%, 04/21/2022(e) | 1,500,000 | 1,519,704 | ||||||
| UBS Group AG | ||||||||
| 1Y US TI + 0.83%, 07/30/2024(a)(e) | 1,000,000 | 1,006,860 | ||||||
| Total Financial Services | 75,390,916 | |||||||
| Food & Beverage (0.15%) | ||||||||
| Lamb Weston Holdings, Inc. | ||||||||
| 4.63%, 11/01/2024(e) | 2,490,000 | 2,587,857 | ||||||
| Health Care Facilities & Services (1.49% ) | ||||||||
| HCA, Inc. | ||||||||
| 3.50%, 09/01/2030 | 3,500,000 | 3,599,662 | ||||||
| 4.13%, 06/15/2029 | 3,000,000 | 3,337,726 | ||||||
| 4.50%, 02/15/2027 | 3,680,000 | 4,158,115 | ||||||
| 5.25%, 04/15/2025 | 1,737,000 | 1,998,116 | ||||||
| 5.25%, 06/15/2049 | 3,110,000 | 3,832,041 | ||||||
| Jaguar Holding Co. II / PPD | ||||||||
| Development LP | ||||||||
| 4.63%, 06/15/2025(e) | 8,300,000 | 8,735,169 | ||||||
| Total Health Care Facilities & Services | 25,660,829 | |||||||
| Home & Office Products Manufacturing (0.21%) | ||||||||
| Newell Brands, Inc. | ||||||||
| 4.70%, 04/01/2026 | 3,237,000 | 3,613,301 | ||||||
| Home Improvement (0.29%) | ||||||||
| Whirlpool Corp. | ||||||||
| 2.40%, 05/15/2031 | 4,982,000 | 4,962,660 | ||||||
| Homebuilders (0.53%) | ||||||||
| Shea Homes LP / Shea Homes | ||||||||
| Funding Corp. | ||||||||
| 4.75%, 04/01/2029(e) | 3,500,000 | 3,548,213 | ||||||
See Notes to Financial Statements.
| 81 | April 30, 2021 |
| ALPS | Smith Total Return Bond Fund | |
| Statement of Investments | April 30, 2021 (Unaudited) |
| Principal Amount | Value (Note 2) | |||||||
| Tri Pointe Homes, Inc. | ||||||||
| 5.70%, 06/15/2028 | $ | 5,000,000 | $ | 5,565,650 | ||||
| Total Homebuilders | 9,113,863 | |||||||
| Medical Equipment & Devices Manufacturing (0.63%) | ||||||||
| Avantor Funding, Inc. | ||||||||
| 4.63%, 07/15/2028(e) | 6,500,000 | 6,816,875 | ||||||
| STERIS Irish FinCo UnLtd Co. | ||||||||
| 2.70%, 03/15/2031 | 1,993,000 | 1,990,240 | ||||||
| 3.75%, 03/15/2051 | 1,993,000 | 2,021,358 | ||||||
| Total Medical Equipment & Devices Manufacturing | 10,828,473 | |||||||
| Metals & Mining (0.57%) | ||||||||
| Steel Dynamics, Inc. | ||||||||
| 5.00%, 12/15/2026 | 9,265,000 | 9,740,276 | ||||||
| Pharmaceuticals (4.55%) | ||||||||
| AbbVie, Inc. | ||||||||
| 2.15%, 11/19/2021 | 3,250,000 | 3,282,224 | ||||||
| 2.95%, 11/21/2026 | 4,000,000 | 4,287,093 | ||||||
| 3.60%, 05/14/2025 | 600,000 | 656,265 | ||||||
| Bausch Health Cos., Inc. | ||||||||
| 6.13%, 04/15/2025(e) | 16,680,000 | 17,051,630 | ||||||
| 7.00%, 03/15/2024(e) | 4,491,000 | 4,610,438 | ||||||
| Elanco Animal Health, Inc. | ||||||||
| 4.91%, 08/27/2021 | 4,724,000 | 4,776,649 | ||||||
| 5.90%, 08/28/2028 | 2,003,000 | 2,280,215 | ||||||
| Organon Finance 1 LLC | ||||||||
| 4.13%, 04/30/2028(e) | 16,167,000 | 16,583,139 | ||||||
| 5.13%, 04/30/2031(e) | 7,574,000 | 7,868,250 | ||||||
| Viatris, Inc. | ||||||||
| 1.13%, 06/22/2022(e) | 16,829,000 | 16,942,194 | ||||||
| Total Pharmaceuticals | 78,338,097 | |||||||
| Pipeline (2.77%) | ||||||||
| Buckeye Partners LP | ||||||||
| 3.95%, 12/01/2026 | 620,000 | 620,775 | ||||||
| 4.13%, 12/01/2027 | 5,626,000 | 5,573,256 | ||||||
| 4.15%, 07/01/2023 | 3,800,000 | 3,944,875 | ||||||
| 4.35%, 10/15/2024 | 2,440,000 | 2,554,375 | ||||||
| 5.60%, 10/15/2044 | 2,828,000 | 2,727,253 | ||||||
| Energy Transfer LP | ||||||||
| 4.20%, 04/15/2027 | 2,215,000 | 2,421,667 | ||||||
| Series B | ||||||||
| 3M US L + 4.16%(a)(f) | 2,506,000 | 2,368,170 | ||||||
| Midwest Connector Capital Co. | ||||||||
| LLC | ||||||||
| 3.63%, 04/01/2022(e) | 9,960,000 | 10,107,356 | ||||||
| 3.90%, 04/01/2024(e) | 4,975,000 | 5,177,904 | ||||||
| 4.63%, 04/01/2029(e) | 2,001,000 | 2,068,923 | ||||||
| Western Midstream Operating | ||||||||
| LP | ||||||||
| 4.35%, 02/01/2025 | 7,165,000 | 7,585,944 | ||||||
| 3M US L + 2.10%, 01/13/2023(a) | 2,630,000 | 2,604,553 | ||||||
| Total Pipeline | 47,755,051 | |||||||
| Principal Amount | Value (Note 2) | |||||||
| Power Generation (1.46%) | ||||||||
| Alexander Funding Trust | ||||||||
| 1.84%, 11/15/2023(e) | $ | 5,975,000 | $ | 6,060,417 | ||||
| NRG Energy, Inc. | ||||||||
| 2.00%, 12/02/2025(e) | 5,030,000 | 5,066,914 | ||||||
| 2.45%, 12/02/2027(e) | 5,030,000 | 5,049,425 | ||||||
| Vistra Operations Co. LLC | ||||||||
| 5.50%, 09/01/2026(e) | 8,626,000 | 8,922,562 | ||||||
| Total Power Generation | 25,099,318 | |||||||
| Property & Casualty Insurance (0.34%) | ||||||||
| Fairfax US, Inc. | ||||||||
| 4.88%, 08/13/2024(e) | 2,000,000 | 2,205,610 | ||||||
| Liberty Mutual Group, Inc. | ||||||||
| 4.30%, 02/01/2061(e) | 4,000,000 | 3,682,904 | ||||||
| Total Property & Casualty Insurance | 5,888,514 | |||||||
| Publishing & Broadcasting (1.04%) | ||||||||
| Nexstar Broadcasting, Inc. | ||||||||
| 4.75%, 11/01/2028(e) | 8,000,000 | 8,160,000 | ||||||
| Scripps Escrow II, Inc. | ||||||||
| 3.88%, 01/15/2029(e) | 9,960,000 | 9,911,942 | ||||||
| Total Publishing & Broadcasting | 18,071,942 | |||||||
| Railroad (0.89%) | ||||||||
| Westinghouse Air Brake | ||||||||
| Technologies Corp. | ||||||||
| 3.20%, 06/15/2025 | 10,721,000 | 11,446,945 | ||||||
| 4.95%, 09/15/2028 | 3,304,000 | 3,804,653 | ||||||
| Total Railroad | 15,251,598 | |||||||
| Real Estate (0.86%) | ||||||||
| Cushman & Wakefield US | ||||||||
| Borrower LLC | ||||||||
| 6.75%, 05/15/2028(e) | 2,000,000 | 2,146,250 | ||||||
| Howard Hughes Corp. | ||||||||
| 4.13%, 02/01/2029(e) | 3,840,000 | 3,810,720 | ||||||
| MGM Growth Properties | ||||||||
| Operating Partnership LP / | ||||||||
| MGP Finance Co.-Issuer, | ||||||||
| Inc. | ||||||||
| 4.63%, 06/15/2025(e) | 5,500,000 | 5,862,725 | ||||||
| Public Storage | ||||||||
| 2.30%, 05/01/2031 | 2,989,000 | 2,992,368 | ||||||
| Total Real Estate | 14,812,063 | |||||||
| Refining & Marketing (1.40%) | ||||||||
| HollyFrontier Corp. | ||||||||
| 4.50%, 10/01/2030 | 3,000,000 | 3,136,096 | ||||||
| 5.88%, 04/01/2026 | 3,337,000 | 3,834,421 | ||||||
| Valero Energy Corp. | ||||||||
| 3M US L + 1.15%, 09/15/2023(a) | 17,005,000 | 17,047,823 | ||||||
| Total Refining & Marketing | 24,018,340 | |||||||
| Restaurants (0.72%) | ||||||||
| 1011778 BC ULC / New Red | ||||||||
| Finance, Inc. | ||||||||
| 4.25%, 05/15/2024(e) | 4,215,000 | 4,275,359 | ||||||
See Notes to Financial Statements.
| 82 | April 30, 2021 |
| ALPS | Smith Total Return Bond Fund | |
| Statement of Investments | April 30, 2021 (Unaudited) |
| Principal Amount | Value (Note 2) | |||||||
| Yum! Brands, Inc. | ||||||||
| 7.75%, 04/01/2025(e) | $ | 7,437,000 | $ | 8,134,218 | ||||
| Total Restaurants | 12,409,577 | |||||||
| Retail - Consumer Discretionary (0.47%) | ||||||||
| Gap, Inc. | ||||||||
| 8.38%, 05/15/2023(e) | 500,000 | 569,375 | ||||||
| 8.63%, 05/15/2025(e) | 5,729,000 | 6,347,446 | ||||||
| 8.88%, 05/15/2027(e) | 1,000,000 | 1,168,750 | ||||||
| Total Retail - Consumer Discretionary | 8,085,571 | |||||||
| Semiconductors (1.50%) | ||||||||
| Marvell Technology, Inc. | ||||||||
| 1.65%, 04/15/2026(e) | 2,770,000 | 2,763,413 | ||||||
| 2.45%, 04/15/2028(e) | 1,843,000 | 1,855,650 | ||||||
| 2.95%, 04/15/2031(e) | 2,770,000 | 2,774,825 | ||||||
| Microchip Technology, Inc. | ||||||||
| 0.97%, 02/15/2024(e) | 3,985,000 | 3,981,465 | ||||||
| 3.92%, 06/01/2021 | 14,502,000 | 14,539,935 | ||||||
| Total Semiconductors | 25,915,288 | |||||||
| Software & Services (2.26%) | ||||||||
| Black Knight InfoServ LLC | ||||||||
| 3.63%, 09/01/2028(e) | 7,931,000 | 7,769,287 | ||||||
| Booz Allen Hamilton, Inc. | ||||||||
| 3.88%, 09/01/2028(e) | 2,500,000 | 2,499,563 | ||||||
| CoStar Group, Inc. | ||||||||
| 2.80%, 07/15/2030(e) | 10,000,000 | 9,909,587 | ||||||
| Leidos, Inc. | ||||||||
| 4.38%, 05/15/2030(e) | 7,857,000 | 8,778,468 | ||||||
| Roper Technologies, Inc. | ||||||||
| 0.45%, 08/15/2022 | 1,635,000 | 1,637,447 | ||||||
| Verisk Analytics, Inc. | ||||||||
| 5.80%, 05/01/2021 | 8,177,000 | 8,177,000 | ||||||
| Total Software & Services | 38,771,352 | |||||||
| Supermarkets & Pharmacies (0.36%) | ||||||||
| Albertsons Cos. Inc / Safeway, Inc. / New Albertsons LP / | ||||||||
| Albertsons LLC | ||||||||
| 4.63%, 01/15/2027(e) | 2,990,000 | 3,113,338 | ||||||
| Kroger Co. | ||||||||
| 2.65%, 10/15/2026 | 2,860,000 | 3,040,571 | ||||||
| Total Supermarkets & Pharmacies | 6,153,909 | |||||||
| Transportation & Logistics (0.44%) | ||||||||
| FedEx Corp. 2020-1 Class AA Pass Through Trust | ||||||||
| 1.88%, 02/20/2034 | 7,694,623 | 7,582,003 | ||||||
| Utilities (2.08%) | ||||||||
| Atmos Energy Corp. | ||||||||
| 3M US L + 0.38%, 03/09/2023(a) | 1,993,000 | 1,994,229 | ||||||
| Dominion Energy, Inc. | ||||||||
| 2.72%, 08/15/2021(c) | 2,300,000 | 2,315,241 | ||||||
| 3.07%, 08/15/2024(c) | 1,500,000 | 1,600,378 | ||||||
| Edison International | ||||||||
| Series A | ||||||||
| 5Y US TI + 4.70%(a)(f) | 4,507,000 | 4,674,074 | ||||||
| Principal Amount | Value (Note 2) | |||||||
| Exelon Corp. | ||||||||
| 3.50%, 06/01/2022 | $ | 2,673,000 | $ | 2,754,323 | ||||
| NextEra Energy Capital Holdings, Inc. | ||||||||
| 2.40%, 09/01/2021 | 1,000,000 | 1,007,116 | ||||||
| ONE Gas, Inc. | ||||||||
| 0.85%, 03/11/2023 | 6,975,000 | 6,981,918 | ||||||
| Pacific Gas and Electric Co. | ||||||||
| 1.37%, 03/10/2023 | 3,990,000 | 3,991,695 | ||||||
| 3M US L + 1.38%, 11/15/2021(a) | 7,510,000 | 7,535,384 | ||||||
| Southern California Edison Co. | ||||||||
| 1.10%, 04/01/2024 | 2,990,000 | 3,016,136 | ||||||
| Total Utilities | 35,870,494 | |||||||
| Waste & Environment Services & Equipment (0.31%) | ||||||||
| GFL Environmental, Inc. | ||||||||
| 3.75%, 08/01/2025(e) | 1,000,000 | 1,019,410 | ||||||
| 4.25%, 06/01/2025(e) | 4,254,000 | 4,389,596 | ||||||
| Total Waste & Environment Services & Equipment | 5,409,006 | |||||||
| Wireless Telecommunications Services (1.37%) | ||||||||
| AT&T, Inc. | ||||||||
| 1.70%, 03/25/2026 | 1,995,000 | 2,004,724 | ||||||
| 2.75%, 06/01/2031 | 9,000,000 | 8,995,061 | ||||||
| 4.30%, 12/15/2042 | 4,500,000 | 4,933,030 | ||||||
| Sprint Corp. | ||||||||
| 7.88%, 09/15/2023 | 6,792,000 | 7,751,370 | ||||||
| Total Wireless Telecommunications Services | 23,684,185 | |||||||
| Wireline Telecommunications Services (0.24%) | ||||||||
| Lumen Technologies, Inc. | ||||||||
| Series S | ||||||||
| 6.45%, 06/15/2021 | 3,000,000 | 3,018,000 | ||||||
| NTT Finance Corp. | ||||||||
| 0.37%, 03/03/2023(e) | 996,000 | 996,982 | ||||||
| Total Wireline Telecommunications Services | 4,014,982 | |||||||
| TOTAL CORPORATE BONDS | ||||||||
| (Cost $959,919,940) | 981,862,470 | |||||||
| GOVERNMENT BONDS (22.42%) | ||||||||
| U.S. Treasury Bonds (22.42%) | ||||||||
| United States Treasury Bonds | ||||||||
| 0.88%, 11/15/2030 | 25,266,000 | 23,631,606 | ||||||
| 1.13%, 02/15/2031 | 46,045,000 | 43,976,572 | ||||||
| 1.13%, 05/15/2040 | 3,874,000 | 3,241,751 | ||||||
| 1.38%, 11/15/2040 | 27,720,000 | 24,159,713 | ||||||
| 1.38%, 08/15/2050 | 31,128,000 | 24,963,197 | ||||||
| 1.88%, 02/15/2051 | 50,354,000 | 45,814,272 | ||||||
See Notes to Financial Statements.
| 83 | April 30, 2021 |
| ALPS | Smith Total Return Bond Fund | |
| Statement of Investments | April 30, 2021 (Unaudited) |
| Principal Amount | Value (Note 2) | |||||||
| United States Treasury Notes | ||||||||
| 0.13%, 01/31/2023 | $ | 23,906,000 | $ | 23,900,397 | ||||
| 0.13%, 04/30/2023 | 17,143,000 | 17,131,281 | ||||||
| 0.13%, 12/15/2023 | 33,353,000 | 33,233,138 | ||||||
| 0.50%, 02/28/2026 | 50,448,000 | 49,695,221 | ||||||
| 0.63%, 08/15/2030 | 45,411,000 | 41,622,020 | ||||||
| 0.75%, 03/31/2026 | 54,637,000 | 54,427,842 | ||||||
| Total U.S. Treasury Bonds | 385,797,010 | |||||||
| TOTAL GOVERNMENT BONDS | ||||||||
| (Cost $390,635,673) | 385,797,010 | |||||||
| Shares | Value (Note 2) | |||||||
| PREFERRED STOCK (0.60%) | ||||||||
| Consumer Discretionary (0.51%) | ||||||||
| Retail - Consumer Discretionary (0.51%) | ||||||||
| Qurate Retail, Inc. | 83,200 | 8,702,720 | ||||||
| TOTAL Consumer Discretionary | 8,702,720 | |||||||
| Financials (0.09%) | ||||||||
| Banks (0.09%) | ||||||||
| Wells Fargo & Co.(f) | 60,000 | 1,543,800 | ||||||
| TOTAL Financials | 1,543,800 | |||||||
| TOTAL PREFERRED STOCK | ||||||||
| (Cost $9,804,609) | 10,246,520 | |||||||
| 7-Day Yield | Shares | Value (Note 2) | ||||||||||
| SHORT TERM INVESTMENTS (2.42%) | ||||||||||||
| Money Market Fund (2.42%) | ||||||||||||
| Morgan Stanley | ||||||||||||
| Institutional | ||||||||||||
| Liquidity Funds - | ||||||||||||
| Government | ||||||||||||
| Portfolio | 0.030 | % | 41,624,135 | 41,624,135 | ||||||||
| TOTAL SHORT TERM INVESTMENTS | ||||||||||||
| (Cost $41,624,135) | 41,624,135 | |||||||||||
| Value (Note 2) | ||||
| TOTAL INVESTMENTS (99.75%) | ||||
| (Cost $1,696,222,648) | $ | 1,716,737,868 | ||
| Other Assets In Excess Of Liabilities (0.25%) | 4,321,713 | |||
| NET ASSETS (100.00%) | $ | 1,721,059,581 | ||
Investment Abbreviations:
LIBOR - London Interbank Offered Rate
SOFR - Secured Overnight Financing Rate
Reference Rates:
1M US L - 1 Month LIBOR as of April 30, 2021 was 0.11%
3M US L - 3 Month LIBOR as of April 30, 2021 was 0.18%
1D US SOFR - 1 Day SOFR as of April 30, 2021 was 0.01%
1Y US TI - 1 Year US Treasury Index as of April 30, 2021 was 0.05%
5Y US TI - 5 Year US Treasury Index as of April 30, 2021 was 0.86%
| (a) | Floating or variable rate security. The reference rate is described above. The rate in effect as of April 30, 2021 is based on the reference rate plus the displayed spread as of the security's last reset date. |
| (b) | Issued with zero coupon. |
| (c) | Step bond. Coupon changes periodically based upon a predetermined schedule. Interest rate disclosed is that which is in effect as of April 30, 2021. |
| (d) | Interest only security. |
| (e) | Security exempt from registration under Rule 144A of the Securities Act of 1933. This security may be resold in transactions exempt from registration, normally to qualified institutional buyers. As of April 30, 2021, the aggregate market value of those securities was $396,038,019, representing 23.01% of net assets. |
| (f) | Perpetual. | |
| See Notes to Financial Statements. | ||
See Notes to Financial Statements.
| 84 | April 30, 2021 |
| ALPS | Smith Credit Opportunities Fund | |
| Statement of Investments | April 30, 2021 (Unaudited) |
| Shares | Value (Note 2) | |||||||
| COMMON STOCKS (0.16%) | ||||||||
| Communications (0.16%) | ||||||||
| Telecommunications (0.16%) | ||||||||
| AT&T, Inc. | 8,156 | $ | 256,180 | |||||
| TOTAL Communications | 256,180 | |||||||
| TOTAL COMMON STOCKS | ||||||||
| (Cost $234,592) | 256,180 | |||||||
| Shares | (Note 2) | |||||||
| EXCHANGE TRADED FUNDS (4.15%) | ||||||||
| iShares iBoxx High Yield Corporate | ||||||||
| Bond ETF | 25,962 | 2,270,117 | ||||||
| Invesco Senior Loan ETF | 193,203 | 4,279,447 | ||||||
| TOTAL EXCHANGE TRADED FUNDS | ||||||||
| (Cost $6,562,419) | 6,549,564 | |||||||
| Shares | Value (Note 2) | |||||||
| CORPORATE BONDS (77.15%) | ||||||||
| Advertising & Marketing (1.42%) | ||||||||
| Outfront Media Capital LLC / | ||||||||
| Outfront Media Capital Corp. | ||||||||
| 4.25%, 01/15/2029(a) | 900,000 | 895,320 | ||||||
| 5.00%, 08/15/2027(a) | 1,300,000 | 1,342,250 | ||||||
| Total Advertising & Marketing | 2,237,570 | |||||||
| Aerospace & Defense (0.93%) | ||||||||
| Boeing Co. | ||||||||
| 2.20%, | 750,000 | 751,495 | ||||||
| 4.51%, 05/01/2023 | 500,000 | 534,112 | ||||||
| TransDigm, Inc. | ||||||||
| 6.25%, 03/15/2026(a) | 175,000 | 185,500 | ||||||
| Total Aerospace & Defense | 1,471,107 | |||||||
| Airlines (3.26%) | ||||||||
| Alaska Airlines 2020-1 Class A Pass Through Trust | ||||||||
| 4.80%, 08/15/2027(a) | 360,302 | 398,691 | ||||||
| Alaska Airlines 2020-1 Class B Pass Through Trust | ||||||||
| 8.00%, 08/15/2025(a) | 1,215,986 | 1,362,022 | ||||||
| British Airways 2020-1 Class A Pass Through Trust | ||||||||
| 4.25%, 11/15/2032(a) | 632,025 | 672,729 | ||||||
| British Airways 2020-1 Class B Pass Through Trust | ||||||||
| 8.38%, 11/15/2028(a) | 74,168 | 85,178 | ||||||
| United Airlines 2020-1 Class A Pass Through Trust | ||||||||
| Series 20-1 | ||||||||
| 5.88%, 10/15/2027 | 1,427,475 | 1,582,261 | ||||||
| Shares | Value (Note 2) | |||||||
| United Airlines, Inc. | ||||||||
| 4.63%, 04/15/2029(a) | $ | 1,000,000 | $ | 1,040,450 | ||||
| Total Airlines | 5,141,331 | |||||||
| Automobiles Manufacturing (4.46%) | ||||||||
| Ford Motor Co. | ||||||||
| 5.29%, 12/08/2046 | 300,000 | 316,592 | ||||||
| 8.50%, 04/21/2023 | 370,000 | 414,863 | ||||||
| 9.00%, 04/22/2025 | 750,000 | 916,875 | ||||||
| Ford Motor Credit Co. LLC | ||||||||
| 3.66%, 09/08/2024 | 1,400,000 | 1,460,388 | ||||||
| 4.00%, 11/13/2030 | 450,000 | 460,166 | ||||||
| General Motors Co. | ||||||||
| 5.00%, 04/01/2035 | 905,000 | 1,064,069 | ||||||
| Nissan Motor Co., Ltd. | ||||||||
| 4.81%, 09/17/2030(a) | 2,175,000 | 2,417,459 | ||||||
| Total Automobiles Manufacturing | 7,050,412 | |||||||
| Banks (2.11%) | ||||||||
| Synovus Bank/Columbus GA | ||||||||
| 5Y US TI + 3.63%, 10/29/2030(b) | 1,250,000 | 1,329,688 | ||||||
| UniCredit SpA | ||||||||
| 5Y US TI + 4.75%, 06/30/2035(a)(b) | 1,850,000 | 1,987,624 | ||||||
| Total Banks | 3,317,312 | |||||||
| Cable & Satellite (1.74%) | ||||||||
| CCO Holdings LLC / CCO Holdings | ||||||||
| Capital Corp. | ||||||||
| 4.50%, 05/01/2032(a) | 2,700,000 | 2,730,375 | ||||||
| Casinos & Gaming (3.29%) | ||||||||
| Boyd Gaming Corp. | ||||||||
| 4.75%, 12/01/2027 | 1,500,000 | 1,539,653 | ||||||
| 8.63%, 06/01/2025(a) | 575,000 | 637,888 | ||||||
| International Game Technology PLC | ||||||||
| 4.13%, 04/15/2026(a) | 250,000 | 257,915 | ||||||
| MGM Resorts International | ||||||||
| 4.75%, 10/15/2028 | 1,150,000 | 1,214,619 | ||||||
| Station Casinos LLC | ||||||||
| 5.00%, 10/01/2025(a) | 1,525,000 | 1,548,827 | ||||||
| Total Casinos & Gaming | 5,198,902 | |||||||
| Chemicals (1.75%) | ||||||||
| Chemours Co. | ||||||||
| 5.75%, 11/15/2028(a) | 1,350,000 | 1,435,940 | ||||||
| Kraton Polymers LLC / Kraton | ||||||||
| Polymers Capital Corp. | ||||||||
| 4.25%, 12/15/2025(a) | 1,300,000 | 1,321,177 | ||||||
| Total Chemicals | 2,757,117 | |||||||
| Commercial Finance (3.54%) | ||||||||
| AerCap Ireland Capital DAC / AerCap | ||||||||
| Global Aviation Trust | ||||||||
| 1.75%, 01/30/2026 | 600,000 | 588,685 | ||||||
| 4.63%, 10/15/2027 | 220,000 | 245,287 | ||||||
| Aircastle, Ltd. | ||||||||
| 2.85%, 01/26/2028(a) | 1,725,000 | 1,694,159 | ||||||
See Notes to Financial Statements.
| 85 | April 30, 2021 |
| ALPS | Smith Credit Opportunities Fund | |
| Statement of Investments | April 30, 2021 (Unaudited) |
| Shares | Value (Note 2) | |||||||
| Antares Holdings LP | ||||||||
| 3.95%, 07/15/2026(a) | $ | 500,000 | $ | 513,982 | ||||
| Avolon Holdings Funding, Ltd. | ||||||||
| 2.75%, 02/21/2028(a) | 1,625,000 | 1,582,241 | ||||||
| 3.25%, 02/15/2027(a) | 200,000 | 203,800 | ||||||
| 4.25%, 04/15/2026(a) | 710,000 | 757,796 | ||||||
| Park Aerospace Holdings, Ltd. | ||||||||
| 5.25%, 08/15/2022(a) | 14,000 | 14,637 | ||||||
| Total Commercial Finance | 5,600,587 | |||||||
| Consumer Finance (3.67%) | ||||||||
| Ally Financial, Inc. | ||||||||
| Series B | ||||||||
| 5Y US TI + 3.87%(b)(c) | 684,000 | 695,081 | ||||||
| American Express Co. | ||||||||
| Series B | ||||||||
| 3M US L + 3.43%(b)(c) | 1,050,000 | 1,052,468 | ||||||
| LD Holdings Group LLC | ||||||||
| 6.50%, 11/01/2025(a) | 1,300,000 | 1,371,265 | ||||||
| OneMain Finance Corp. | ||||||||
| 5.38%, 11/15/2029 | 300,000 | 324,152 | ||||||
| 8.88%, 06/01/2025 | 875,000 | 969,828 | ||||||
| PennyMac Financial Services, Inc. | ||||||||
| 4.25%, 02/15/2029(a) | 250,000 | 239,694 | ||||||
| Quicken Loans LLC | ||||||||
| 3.63%, 03/01/2029(a) | 850,000 | 828,219 | ||||||
| 5.25%, 01/15/2028(a) | 300,000 | 316,875 | ||||||
| Total Consumer Finance | 5,797,582 | |||||||
| Consumer Products (0.83%) | ||||||||
| Kronos Acquisition Holdings, Inc. / | ||||||||
| KIK Custom Products, Inc. | ||||||||
| 5.00%, 12/31/2026(a) | 1,300,000 | 1,313,098 | ||||||
| Consumer Services (0.94%) | ||||||||
| WW International, Inc. | ||||||||
| 4.50%, 04/15/2029(a) | 1,500,000 | 1,481,475 | ||||||
| Containers & Packaging (0.32%) | ||||||||
| TriMas Corp. | ||||||||
| 4.13%, 04/15/2029(a) | 500,000 | 499,373 | ||||||
| Department Stores (1.12%) | ||||||||
| NMG Holding Co. Inc / Neiman | ||||||||
| Marcus Group LLC | ||||||||
| 7.13%, 04/01/2026(a) | 650,000 | 665,691 | ||||||
| Nordstrom, Inc. | ||||||||
| 4.25%, 08/01/2031(a) | 1,095,000 | 1,110,599 | ||||||
| Total Department Stores | 1,776,290 | |||||||
| Diversified Banks (0.90%) | ||||||||
| Bank of America Corp. | ||||||||
| 1D US SOFR + 1.32%, 04/22/2032(b) | 685,000 | 693,805 | ||||||
| Shares | Value (Note 2) | |||||||
| JPMorgan Chase & Co. | ||||||||
| 1D US SOFR + 1.25%, 04/22/2032(b) | $ | 725,000 | $ | 728,573 | ||||
| Total Diversified Banks | 1,422,378 | |||||||
| Electrical Equipment Manufacturing (0.94%) | ||||||||
| Vontier Corp. | ||||||||
| 2.95%, 04/01/2031(a) | 1,500,000 | 1,478,745 | ||||||
| Exploration & Production (1.59%) | ||||||||
| Diamondback Energy, Inc. | ||||||||
| 4.40%, 03/24/2051 | 200,000 | 210,316 | ||||||
| Hilcorp Energy I LP / Hilcorp Finance Co. | ||||||||
| 5.75%, 02/01/2029(a) | 1,175,000 | 1,198,329 | ||||||
| 6.00%, 02/01/2031(a) | 100,000 | 103,253 | ||||||
| Murphy Oil Corp. | ||||||||
| 6.38%, 07/15/2028 | 1,000,000 | 1,016,250 | ||||||
| Total Exploration & Production | 2,528,148 | |||||||
| Financial Services (6.10%) | ||||||||
| Compass Group Diversified Holdings LLC | ||||||||
| 5.25%, 04/16/2029(a) | 900,000 | 950,625 | ||||||
| Credit Suisse Group AG | ||||||||
| 3.57%, 01/09/2023(a) | 300,000 | 305,641 | ||||||
| 5Y US TI + 3.55%(a)(b)(c) | 1,275,000 | 1,220,813 | ||||||
| 5Y US TI + 4.82%(a)(b)(c) | 625,000 | 680,097 | ||||||
| FS KKR Capital Corp. | ||||||||
| 3.40%, 01/15/2026 | 2,100,000 | 2,149,420 | ||||||
| Golub Capital BDC, Inc. | ||||||||
| 2.50%, 08/24/2026 | 1,750,000 | 1,739,571 | ||||||
| 3.38%, 04/15/2024 | 800,000 | 833,655 | ||||||
| LPL Holdings, Inc. | ||||||||
| 4.00%, 03/15/2029(a) | 1,350,000 | 1,351,688 | ||||||
| Morgan Stanley | ||||||||
| 1D US SOFR + 1.49%, 04/22/2042(b) | 150,000 | 152,217 | ||||||
| Owl Rock Capital Corp. | ||||||||
| 2.63%, 01/15/2027 | 250,000 | 248,941 | ||||||
| Total Financial Services | 9,632,668 | |||||||
| Forest & Paper Products Manufacturing | (0.97 | %) | ||||||
| Mercer International, Inc. | ||||||||
| 5.13%, 02/01/2029(a) | 350,000 | 362,250 | ||||||
| Resolute Forest Products, Inc. | ||||||||
| 4.88%, 03/01/2026(a) | 1,150,000 | 1,174,438 | ||||||
| Total Forest & Paper Products Manufacturing | 1,536,688 | |||||||
| Hardware (0.65%) | ||||||||
| NCR Corp. | ||||||||
| 5.13%, 04/15/2029(a) | 1,000,000 | 1,030,000 | ||||||
| Health Care Facilities & Services (0.44%) | ||||||||
| HCA, Inc. | ||||||||
| 5.25%, 06/15/2049 | 235,000 | 289,559 | ||||||
| 5.88%, 02/15/2026 | 200,000 | 230,000 | ||||||
See Notes to Financial Statements.
| 86 | April 30, 2021 |
| ALPS | Smith Credit Opportunities Fund | |
| Statement of Investments | April 30, 2021 (Unaudited) |
| Shares | Value (Note 2) | |||||||
| Jaguar Holding Co. II / PPD | ||||||||
| Development LP | ||||||||
| 4.63%, 06/15/2025(a) | $ | 170,000 | $ | 178,913 | ||||
| Total Health Care Facilities & Services | 698,472 | |||||||
| Home Improvement (0.33%) | ||||||||
| WASH Multifamily Acquisition, Inc. | ||||||||
| 5.75%, 04/15/2026(a) | 500,000 | 520,000 | ||||||
| Homebuilders (1.09%) | ||||||||
| Forestar Group, Inc. | ||||||||
| 3.85%, 05/15/2026(a) | 665,000 | 673,419 | ||||||
| Shea Homes LP / Shea Homes | ||||||||
| Funding Corp. | ||||||||
| 4.75%, 02/15/2028(a) | 125,000 | 127,422 | ||||||
| 4.75%, 04/01/2029(a) | 900,000 | 912,397 | ||||||
| Total Homebuilders | 1,713,238 | |||||||
| Industrial Other (1.69%) | ||||||||
| Dycom Industries, Inc. | ||||||||
| 4.50%, 04/15/2029(a) | 750,000 | 762,188 | ||||||
| Element Fleet Management Corp. | ||||||||
| 1.60%, 04/06/2024(a) | 530,000 | 536,309 | ||||||
| H&E Equipment Services, Inc. | ||||||||
| 3.88%, 12/15/2028(a) | 1,400,000 | 1,368,500 | ||||||
| Total Industrial Other | 2,666,997 | |||||||
| Internet Media (1.29%) | ||||||||
| Endure Digital, Inc. | ||||||||
| 6.00%, 02/15/2029(a) | 1,000,000 | 959,865 | ||||||
| Uber Technologies, Inc. | ||||||||
| 8.00%, 11/01/2026(a) | 1,000,000 | 1,083,450 | ||||||
| Total Internet Media | 2,043,315 | |||||||
| Leisure Products Manufacturing (0.63%) | ||||||||
| Vista Outdoor, Inc. | ||||||||
| 4.50%, 03/15/2029(a) | 1,000,000 | 1,000,660 | ||||||
| Metals & Mining (0.99%) | ||||||||
| TMS International Corp. | ||||||||
| 6.25%, 04/15/2029(a) | 500,000 | 520,625 | ||||||
| United States Steel Corp. | ||||||||
| 6.88%, 03/01/2029 | 1,000,000 | 1,045,200 | ||||||
| Total Metals & Mining | 1,565,825 | |||||||
| Pharmaceuticals (3.85%) | ||||||||
| Bausch Health Cos., Inc. | ||||||||
| 6.13%, 04/15/2025(a) | 2,550,000 | 2,606,814 | ||||||
| Elanco Animal Health, Inc. | ||||||||
| 4.91%, 08/27/2021 | 25,000 | 25,279 | ||||||
| 5.90%, 08/28/2028 | 200,000 | 227,680 | ||||||
| Organon Finance 1 LLC | ||||||||
| 4.13%, 04/30/2028(a) | 775,000 | 794,949 | ||||||
| 5.13%, 04/30/2031(a) | 1,400,000 | 1,454,390 | ||||||
| Prestige Brands, Inc. | ||||||||
| 3.75%, 04/01/2031(a) | 1,000,000 | 961,215 | ||||||
| Total Pharmaceuticals | 6,070,327 | |||||||
| Shares | Value (Note 2) | |||||||
| Pipeline (4.97%) | ||||||||
| Buckeye Partners LP | ||||||||
| 3.95%, 12/01/2026 | $ | 735,000 | $ | 735,919 | ||||
| 4.13%, 12/01/2027 | 915,000 | 906,422 | ||||||
| 4.15%, 07/01/2023 | 200,000 | 207,625 | ||||||
| 4.35%, 10/15/2024 | 700,000 | 732,813 | ||||||
| 5.60%, 10/15/2044 | 160,000 | 154,300 | ||||||
| Energy Transfer LP | ||||||||
| 4.20%, 04/15/2027 | 750,000 | 819,978 | ||||||
| Series B | ||||||||
| 3M US L + 4.16%(b)(c) | 875,000 | 826,875 | ||||||
| Genesis Energy LP / Genesis Energy | ||||||||
| Finance Corp. | ||||||||
| 8.00%, 01/15/2027 | 925,000 | 954,133 | ||||||
| Midwest Connector Capital Co. LLC | ||||||||
| 3.90%, 04/01/2024(a) | 275,000 | 286,216 | ||||||
| 4.63%, 04/01/2029(a) | 934,000 | 965,703 | ||||||
| Western Midstream Operating LP | ||||||||
| 4.35%, 02/01/2025 | 525,000 | 555,844 | ||||||
| 3M US L + 2.10%, 01/13/2023(b) | 700,000 | 693,227 | ||||||
| Total Pipeline | 7,839,055 | |||||||
| Power Generation (1.74%) | ||||||||
| Alexander Funding Trust | ||||||||
| 1.84%, 11/15/2023(a) | 1,350,000 | 1,369,299 | ||||||
| Vistra Operations Co. LLC | ||||||||
| 5.50%, 09/01/2026(a) | 1,325,000 | 1,370,553 | ||||||
| Total Power Generation | 2,739,852 | |||||||
| Publishing & Broadcasting (3.52%) | ||||||||
| Gray Television, Inc. | ||||||||
| 4.75%, 10/15/2030(a) | 2,000,000 | 2,002,500 | ||||||
| Nexstar Broadcasting, Inc. | ||||||||
| 4.75%, 11/01/2028(a) | 1,600,000 | 1,632,000 | ||||||
| Scripps Escrow II, Inc. | ||||||||
| 5.38%, 01/15/2031(a) | 1,900,000 | 1,930,837 | ||||||
| Total Publishing & Broadcasting | 5,565,337 | |||||||
| Railroad (0.14%) | ||||||||
| Westinghouse Air Brake | ||||||||
| Technologies Corp. | ||||||||
| 3.20%, 06/15/2025 | 200,000 | 213,542 | ||||||
| Real Estate (4.31%) | ||||||||
| Cushman & Wakefield US Borrower LLC | ||||||||
| 6.75%, 05/15/2028(a) | 1,975,000 | 2,119,422 | ||||||
| GLP Capital LP / GLP Financing II, Inc. | ||||||||
| 5.30%, 01/15/2029 | 1,300,000 | 1,481,162 | ||||||
| Howard Hughes Corp. | ||||||||
| 4.13%, 02/01/2029(a) | 1,075,000 | 1,066,803 | ||||||
| 4.38%, 02/01/2031(a) | 160,000 | 158,600 | ||||||
| Kennedy-Wilson, Inc. | ||||||||
| 5.00%, 03/01/2031 | 1,050,000 | 1,088,603 | ||||||
| MGM Growth Properties Operating | ||||||||
| Partnership LP / MGP Finance | ||||||||
| Co.-Issuer, Inc. | ||||||||
| 4.63%, 06/15/2025(a) | 200,000 | 213,190 | ||||||
See Notes to Financial Statements.
| 87 | April 30, 2021 |
| ALPS | Smith Credit Opportunities Fund | |
| Statement of Investments | April 30, 2021 (Unaudited) |
| Shares | Value (Note 2) | |||||||
| Realogy Group LLC / Realogy Co.- Issuer Corp. | ||||||||
| 5.75%, 01/15/2029(a) | $ | 650,000 | $ | 675,428 | ||||
| Total Real Estate | 6,803,208 | |||||||
| Refining & Marketing (1.93%) | ||||||||
| HollyFrontier Corp. | ||||||||
| 4.50%, 10/01/2030 | 750,000 | 784,024 | ||||||
| 5.88%, 04/01/2026 | 325,000 | 373,445 | ||||||
| Parkland Corp. | ||||||||
| 4.50%, 10/01/2029(a) | 1,000,000 | 1,021,900 | ||||||
| Valero Energy Corp. | ||||||||
| 3M US L + 1.15%, 09/15/2023(b) | 850,000 | 852,141 | ||||||
| Total Refining & Marketing | 3,031,510 | |||||||
| Restaurants (0.88%) | ||||||||
| 1011778 BC ULC / New Red Finance, Inc. | ||||||||
| 4.25%, 05/15/2024(a) | 1,350,000 | 1,369,331 | ||||||
| Retail - Consumer Discretionary (0.80%) | ||||||||
| Carvana Co. | ||||||||
| 5.50%, 04/15/2027(a) | 1,000,000 | 1,013,300 | ||||||
| Petsmart, Inc. | ||||||||
| 4.75%, 02/15/2028(a) | 250,000 | 258,229 | ||||||
| Total Retail - Consumer Discretionary | 1,271,529 | |||||||
| Retail - Consumer Staples (0.75%) | ||||||||
| United Natural Foods, Inc. | ||||||||
| 6.75%, 10/15/2028(a) | 1,100,000 | 1,186,697 | ||||||
| Semiconductors (0.37%) | ||||||||
| Marvell Technology, Inc. | ||||||||
| 1.65%, 04/15/2026(a) | 220,000 | 219,477 | ||||||
| 2.45%, 04/15/2028(a) | 150,000 | 151,030 | ||||||
| 2.95%, 04/15/2031(a) | 220,000 | 220,383 | ||||||
| Total Semiconductors | 590,890 | |||||||
| Software & Services (1.62%) | ||||||||
| Black Knight InfoServ LLC | ||||||||
| 3.63%, 09/01/2028(a) | 1,175,000 | 1,151,042 | ||||||
| Playtika Holding Corp. | ||||||||
| 4.25%, 03/15/2029(a) | 1,400,000 | 1,392,999 | ||||||
| Total Software & Services | 2,544,041 | |||||||
| Supermarkets & Pharmacies (0.97%) | ||||||||
| Albertsons Cos. Inc / Safeway, Inc. / | ||||||||
| New Albertsons LP / Albertsons LLC | ||||||||
| 3.50%, 03/15/2029(a) | 825,000 | 793,064 | ||||||
| 4.63%, 01/15/2027(a) | 700,000 | 728,875 | ||||||
| Total Supermarkets & Pharmacies | 1,521,939 | |||||||
| Transportation & Logistics (0.74%) | ||||||||
| Meritor, Inc. | ||||||||
| 4.50%, 12/15/2028(a) | 1,150,000 | 1,166,531 | ||||||
| Shares | Value (Note 2) | |||||||
| Utilities (1.04%) | ||||||||
| Edison International | ||||||||
| Series A | ||||||||
| 5Y US TI + 4.70%(b)(c) | $ | 698,000 | $ | 723,875 | ||||
| Superior Plus LP / Superior General | ||||||||
| Partner, Inc. | ||||||||
| 4.50%, 03/15/2029(a) | 900,000 | 919,256 | ||||||
| Total Utilities | 1,643,131 | |||||||
| Waste & Environment Services & Equipment (1.31%) | ||||||||
| GFL Environmental, Inc. | ||||||||
| 4.00%, 08/01/2028(a) | 1,950,000 | 1,868,587 | ||||||
| 4.25%, 06/01/2025(a) | 200,000 | 206,375 | ||||||
| Total Waste & Environment Services & Equipment | 2,074,962 | |||||||
| Wireline Telecommunications Services (1.22%) | ||||||||
| Consolidated Communications, Inc. | ||||||||
| 5.00%, 10/02/2028(a) | 1,500,000 | 1,524,375 | ||||||
| Frontier Communications Corp. | ||||||||
| 5.00%, 05/01/2028(a) | 400,000 | 409,190 | ||||||
| Total Wireline Telecommunications Services | 1,933,565 | |||||||
| TOTAL CORPORATE BONDS | ||||||||
| (Cost $120,614,339) | 121,775,112 | |||||||
| Shares | Value (Note 2) | |||||||
| GOVERNMENT BONDS (10.48%) | ||||||||
| U.S. Treasury Bonds (10.48%) | ||||||||
| United States Treasury Bonds | ||||||||
| 1.88%, 02/15/2051 | 2,240,000 | 2,038,050 | ||||||
| United States Treasury Notes | ||||||||
| 0.13%, 02/28/2023 | 2,750,000 | 2,748,980 | ||||||
| 0.13%, 03/31/2023 | 1,672,000 | 1,671,216 | ||||||
| 0.13%, 04/30/2023 | 1,502,000 | 1,500,973 | ||||||
| 0.38%, 01/31/2026 | 2,318,000 | 2,272,274 | ||||||
| 0.50%, 02/28/2026 | 1,246,000 | 1,227,407 | ||||||
| 0.75%, 03/31/2026 | 2,429,000 | 2,419,702 | ||||||
| 1.13%, 02/29/2028 | 2,689,000 | 2,662,530 | ||||||
| Total U.S. Treasury Bonds | 16,541,132 | |||||||
| TOTAL GOVERNMENT BONDS | ||||||||
| (Cost $16,603,771) | 16,541,132 | |||||||
| Shares | Value (Note 2) | |||||||
| PREFERRED STOCK (1.60%) | ||||||||
| Consumer Discretionary (1.13%) | ||||||||
| Retail - Consumer Discretionary (1.13%) | ||||||||
| Qurate Retail, Inc. | 17,000 | 1,778,200 | ||||||
| TOTAL Consumer Discretionary | 1,778,200 | |||||||
| Financials (0.47%) | ||||||||
| Banks (0.47%) | ||||||||
| US Bancorp(c) | 7,000 | 174,580 | ||||||
See Notes to Financial Statements.
| 88 | April 30, 2021 |
| ALPS | Smith Credit Opportunities Fund | |
| Statement of Investments | April 30, 2021 (Unaudited) |
| Shares | Value (Note 2) | |||||||
| Wells Fargo & Co.(c) | 22,100 | $ | 568,633 | |||||
| 743,213 | ||||||||
| TOTAL Financials | 743,213 | |||||||
| TOTAL PREFERRED STOCK | ||||||||
| (Cost $2,447,884) | 2,521,413 | |||||||
| 7-Day | Value | |||||||||||
| Yield | Shares | (Note 2) | ||||||||||
| SHORT TERM INVESTMENTS (1.46%) | ||||||||||||
| Money Market Fund (1.46%) | ||||||||||||
| Morgan Stanley | ||||||||||||
| Institutional Liquidity | ||||||||||||
| Funds - Government | ||||||||||||
| Portfolio | 0.030 | % | 2,303,925 | 2,303,925 | ||||||||
| TOTAL SHORT TERM INVESTMENTS | ||||||||||||
| (Cost $2,303,925) | 2,303,925 | |||||||||||
| TOTAL INVESTMENTS (95.00%) | ||||||||||||
| (Cost $148,766,930) | $ | 149,947,326 | ||||||||||
| Other Assets In Excess Of Liabilities (5.00%) | 7,895,943 | |||||||||||
| NET ASSETS (100.00%) | $ | 157,843,269 | ||||||||||
Investment Abbreviations:
LIBOR - London Interbank Offered Rate
SOFR - Secured Overnight Financing Rate
Reference Rates:
3M US L - 3 Month LIBOR as of April 30, 2021 was 0.18%
1D US SOFR - 1 Day SOFR as of April 30, 2021 was 0.01%
5Y US TI - 5 Year US Treasury Index as of April 30, 2021 was 0.86%
| (a) | Security exempt from registration under Rule 144A of the Securities Act of 1933. This security may be resold in transactions exempt from registration, normally to qualified institutional buyers. As of April 30, 2021, the aggregate market value of those securities was $84,620,436, representing 53.61% of net assets. |
| (b) | Floating or variable rate security. The reference rate is described above. The rate in effect as of April 30, 2021 is based on the reference rate plus the displayed spread as of the security's last reset date. |
| (c) | Perpetual maturity. This security has no contractual maturity date, is not redeemable and contractually pays an indefinite stream of interest. |
See Notes to Financial Statements.
| 89 | April 30, 2021 |
| ALPS | Smith Balanced Opportunity Fund | |
| Statement of Investments | April 30, 2021 (Unaudited) |
| Shares | Value (Note 2) | |||||||
| COMMON STOCKS (65.48%) | ||||||||
| Communications (7.22%) | ||||||||
| Media (7.22%) | ||||||||
| Activision Blizzard, Inc. | 1,785 | $ | 162,774 | |||||
| Alphabet, Inc., Class A(a) | 237 | 557,779 | ||||||
| Facebook, Inc., Class A(a) | 1,037 | 337,107 | ||||||
| IAC/InterActiveCorp(a) | 465 | 117,864 | ||||||
| Spotify Technology SA(a) | 300 | 75,636 | ||||||
| ViacomCBS, Inc. | 1,952 | 80,071 | ||||||
| Walt Disney Co.(a) | 1,074 | 199,786 | ||||||
| 1,531,017 | ||||||||
| TOTAL Communications | 1,531,017 | |||||||
| Consumer Discretionary (9.84%) | ||||||||
| Consumer Discretionary Products (3.08%) | ||||||||
| Bayerische Motoren Werke AG, ADR | 3,180 | 106,028 | ||||||
| Brunswick Corp. | 1,522 | 163,051 | ||||||
| Lennar Corp., Class A | 1,481 | 153,432 | ||||||
| Scotts Miracle-Gro Co. | 454 | 104,947 | ||||||
| YETI Holdings, Inc.(a) | 1,468 | 125,397 | ||||||
| 652,855 | ||||||||
| Consumer Discretionary Services (3.68%) | ||||||||
| Carnival Corp.(a) | 6,050 | 169,158 | ||||||
| Marriott International, Inc., Class A(a) | 1,284 | 190,700 | ||||||
| McDonald's Corp. | 937 | 221,207 | ||||||
| Starbucks Corp. | 1,733 | 198,411 | ||||||
| 779,476 | ||||||||
| Retail & Whsle - Discretionary (3.08%) | ||||||||
| Amazon.com, Inc.(a) | 130 | 450,765 | ||||||
| Lowe's Cos., Inc. | 1,026 | 201,353 | ||||||
| 652,118 | ||||||||
| TOTAL Consumer Discretionary | 2,084,449 | |||||||
| Consumer Staples (6.02%) | ||||||||
| Consumer Staple Products (2.16%) | ||||||||
| Estee Lauder Cos., Inc., Class A | 697 | 218,719 | ||||||
| Procter & Gamble Co. | 1,794 | 239,355 | ||||||
| 458,074 | ||||||||
| Retail & Wholesale - Staples (3.86%) | ||||||||
| Costco Wholesale Corp. | 535 | 199,068 | ||||||
| ITOCHU Corp., ADR | 2,412 | 150,509 | ||||||
| Target Corp. | 1,131 | 234,411 | ||||||
| Shares | Value (Note 2) | |||||||
| Walmart, Inc. | 1,680 | $ | 235,049 | |||||
| 819,037 | ||||||||
| TOTAL Consumer Staples | 1,277,111 | |||||||
| Energy (1.35%) | ||||||||
| Oil & Gas (1.35%) | ||||||||
| Enbridge, Inc. | 7,412 | 285,881 | ||||||
| TOTAL Energy | 285,881 | |||||||
| Financials (8.15%) | ||||||||
| Banking (2.39%) | ||||||||
| JPMorgan Chase & Co. | 3,290 | 506,035 | ||||||
| Financial Services (3.99%) | ||||||||
| Ally Financial, Inc. | 4,440 | 228,438 | ||||||
| Intercontinental Exchange, Inc. | 1,903 | 224,002 | ||||||
| LPL Financial Holdings, Inc. | 1,305 | 204,493 | ||||||
| T Rowe Price Group, Inc. | 1,053 | 188,698 | ||||||
| 845,631 | ||||||||
| Insurance (1.77%) | ||||||||
| Prudential Financial, Inc. | 2,315 | 232,334 | ||||||
| Reinsurance Group of America, Inc. | 1,095 | 142,930 | ||||||
| 375,264 | ||||||||
| TOTAL Financials | 1,726,930 | |||||||
| Health Care (10.41%) | ||||||||
| Health Care (10.41%) | ||||||||
| Abbott Laboratories | 2,032 | 244,003 | ||||||
| Danaher Corp. | 997 | 253,178 | ||||||
| HCA Healthcare, Inc. | 1,175 | 236,246 | ||||||
| IQVIA Holdings, Inc.(a) | 835 | 195,966 | ||||||
| Medtronic PLC | 2,248 | 294,308 | ||||||
| Thermo Fisher Scientific, Inc. | 510 | 239,817 | ||||||
| UnitedHealth Group, Inc. | 1,339 | 533,992 | ||||||
| Zoetis, Inc. | 1,212 | 209,712 | ||||||
| 2,207,222 | ||||||||
| TOTAL Health Care | 2,207,222 | |||||||
| Industrials (6.62%) | ||||||||
| Industrial Products (5.17%) | ||||||||
| Boeing Co.(a) | 937 | 219,548 | ||||||
| Caterpillar, Inc. | 859 | 195,946 | ||||||
| Deere & Co. | 730 | 270,721 | ||||||
| ITT, Inc. | 1,176 | 110,909 | ||||||
| Middleby Corp.(a) | 532 | 96,462 | ||||||
| TE Connectivity, Ltd. | 1,505 | 202,377 | ||||||
| 1,095,963 | ||||||||
See Notes to Financial Statements.
| 90 | April 30, 2021 |
| ALPS | Smith Balanced Opportunity Fund | |
| Statement of Investments | April 30, 2021 (Unaudited) |
| Shares | Value (Note 2) | |||||||
| Industrial Services (1.45%) | ||||||||
| Norfolk Southern Corp. | 567 | $ | 158,329 | |||||
| Southwest Airlines Co.(a) | 2,369 | 148,726 | ||||||
| 307,055 | ||||||||
| TOTAL Industrials | 1,403,018 | |||||||
| Materials (2.15%) | ||||||||
| Materials (2.15%) | ||||||||
| Anglo American PLC, ADR | 4,690 | 100,647 | ||||||
| Celanese Corp. | 508 | 79,578 | ||||||
| Freeport-McMoRan, Inc. | 2,805 | 105,777 | ||||||
| Linde PLC | 390 | 111,478 | ||||||
| LyondellBasell Industries NV | 565 | 58,613 | ||||||
| 456,093 | ||||||||
| TOTAL Materials | 456,093 | |||||||
| Real Estate (0.79%) | ||||||||
| Real Estate (0.79%) | ||||||||
| Equity LifeStyle Properties, Inc. | 2,401 | 166,629 | ||||||
| TOTAL Real Estate | 166,629 | |||||||
| Technology (12.93%) | ||||||||
| Software & Tech Services (6.88%) | ||||||||
| Fidelity National Information Services, Inc. | 1,573 | 240,512 | ||||||
| Mastercard, Inc., Class A | 971 | 370,980 | ||||||
| Microsoft Corp. | 2,327 | 586,823 | ||||||
| PayPal Holdings, Inc.(a) | 413 | 108,326 | ||||||
| Synopsys, Inc.(a) | 608 | 150,212 | ||||||
| 1,456,853 | ||||||||
| Tech Hardware & Semiconductors (6.05%) | ||||||||
| Advanced Micro Devices, Inc.(a) | 1,524 | 124,389 | ||||||
| Apple, Inc. | 3,875 | 509,408 | ||||||
| Lam Research Corp. | 190 | 117,886 | ||||||
| Taiwan Semiconductor Manufacturing Co., Ltd., ADR | 2,421 | 282,628 | ||||||
| Texas Instruments, Inc. | 1,383 | 249,645 | ||||||
| 1,283,956 | ||||||||
| TOTAL Technology | 2,740,809 | |||||||
| TOTAL COMMON STOCKS | ||||||||
| (Cost $11,474,261) | 13,879,159 | |||||||
| Principal Amount |
Value (Note 2) | |
| COLLATERALIZED MORTGAGE OBLIGATIONS (5.77%) | ||
| Fannie Mae | ||
| Principal Amount | Value (Note 2) | |||||||
| Series 1997-10, Class FA, | ||||||||
| 1M US L + 0.60%, 03/18/2027(b) | $ | 11,927 | $ | 11,988 | ||||
| Series 1999-52, Class NF, | ||||||||
| 1M US L + 1.15%, 10/25/2023(b) | 9,495 | 9,579 | ||||||
| Series 2002-22, Class GC, | ||||||||
| 6.500%, 04/25/2032 | 10,805 | 12,841 | ||||||
| Series 2002-58, Class PG, | ||||||||
| 6.000%, 09/25/2032 | 17,167 | 20,189 | ||||||
| Series 2003-117, Class KB, | ||||||||
| 6.000%, 12/25/2033 | 9,051 | 10,640 | ||||||
| Series 2003-87, Class SL, | ||||||||
| 9.10% -1M US L%, 07/25/2033(b) | 55,143 | 65,071 | ||||||
| Series 2004-60, Class JC, | ||||||||
| 5.500%, 04/25/2034 | 18,989 | 20,843 | ||||||
| Series 2005-27, Class GH, | ||||||||
| 5.500%, 04/25/2035 | 90,000 | 106,908 | ||||||
| Series 2007-104, Class ZE, | ||||||||
| 6.000%, 08/25/2037 | 24,837 | 28,997 | ||||||
| Series 2007-22, Class A, | ||||||||
| 5.500%, 03/25/2037 | 11,741 | 13,565 | ||||||
| Series 2007-55, Class PH, | ||||||||
| 6.000%, 06/25/2047 | 38,265 | 45,554 | ||||||
| Series 2008-1, Class LF, | ||||||||
| 1M US L + 0.70%, 05/25/2037(b) | 28,280 | 28,026 | ||||||
| Series 2009-12, Class LC, | ||||||||
| 8.805%, 06/25/2037(b) | 21,554 | 27,211 | ||||||
| Series 2009-51, Class BZ, | ||||||||
| 4.500%, 07/25/2039 | 43,375 | 48,459 | ||||||
| Series 2010-98, Class BH, | ||||||||
| 5.500%, 09/25/2040 | 44,189 | 51,045 | ||||||
| Series 2013-103, Class H, | ||||||||
| 4.500%, 03/25/2038 | 10,297 | 10,319 | ||||||
| Series 2013-18, Class MY, | ||||||||
| 3.000%, 03/25/2033 | 15,000 | 15,881 | ||||||
| Series 2013-61, Class NY, | ||||||||
| 3.000%, 06/25/2033 | 35,000 | 37,478 | ||||||
| Series 2014-21, Class MA, | ||||||||
| 2.000%, 09/25/2041 | 23,188 | 23,941 | ||||||
| 588,535 | ||||||||
| Freddie Mac | ||||||||
| Series 1996-1843, Class Z, | ||||||||
| 7.000%, 04/15/2026 | 11,240 | 12,027 | ||||||
| Series 2002-2538, Class FB, | ||||||||
| 1M US L + 0.40%, 12/15/2032(b) | 9,350 | 9,376 | ||||||
| Series 2003-2626, Class FQ, | ||||||||
| 1M US L + 1.00%, 06/15/2023(b) | 8,626 | 8,652 | ||||||
| Series 2003-2635, Class E, | ||||||||
| 3.500%, 04/15/2033 | 1,294 | 1,296 | ||||||
See Notes to Financial Statements.
| 91 | April 30, 2021 |
| ALPS | Smith Balanced Opportunity Fund | |
| Statement of Investments | April 30, 2021 (Unaudited) |
| Principal Amount | Value (Note 2) | |||||||
| Series 2005-2977, Class AT, | ||||||||
| 4.500%, 05/15/2025 | $ | 18,383 | $ | 19,308 | ||||
| Series 2005-2993, Class TF, | ||||||||
| 1M US L + 0.35%, 06/15/2025(b) | 8,780 | 8,770 | ||||||
| Series 2006-3174, Class LF, | ||||||||
| 1M US L + 0.35%, 05/15/2036(b) | 16,127 | 16,214 | ||||||
| Series 2008-3409, Class DB, | ||||||||
| 6.000%, 01/15/2038 | 21,367 | 25,159 | ||||||
| Series 2009-3572, Class KT, | ||||||||
| 4.500%, 09/15/2039 | 19,798 | 21,319 | ||||||
| Series 2010-3645, Class WD, | ||||||||
| 4.500%, 02/15/2040 | 19,000 | 20,315 | ||||||
| Series 2010-3699, Class LC, | ||||||||
| 4.000%, 03/15/2040 | 9,003 | 9,751 | ||||||
| Series 2010-3721, Class FB, | ||||||||
| 1M US L + 0.50%, 09/15/2040(b) | 15,900 | 16,154 | ||||||
| Series 2010-3759, Class PY, | ||||||||
| 4.000%, 11/15/2040 | 25,000 | 27,452 | ||||||
| Series 2010-3770, Class JZ, | ||||||||
| 4.000%, 12/15/2040 | 30,216 | 33,823 | ||||||
| Series 2011-3954, Class PG, | ||||||||
| 2.500%, 07/15/2041 | 42,157 | 43,980 | ||||||
| Series 2012-3987, Class LP, | ||||||||
| 3.500%, 01/15/2042 | 26,000 | 28,338 | ||||||
| Series 2012-4032, Class AD, | ||||||||
| 2.000%, 10/15/2041 | 27,247 | 27,893 | ||||||
| Series 2012-4064, Class TL, | ||||||||
| 4.000%, 03/15/2042 | 11,687 | 11,913 | ||||||
| Series 2013-4226, Class GZ, | ||||||||
| 3.000%, 07/15/2043 | 23,680 | 24,599 | ||||||
| Series 2015-4498, Class JA, | ||||||||
| 2.500%, 04/15/2037 | 45,841 | 46,856 | ||||||
| 413,195 | ||||||||
| Ginnie Mae | ||||||||
| Series 2005-91, Class PD, | ||||||||
| 5.500%, 12/20/2035 | 15,028 | 17,092 | ||||||
| Series 2007-70, Class FC, | ||||||||
| 1M US L + 0.47%, 11/20/2037(b) | 24,474 | 24,682 | ||||||
| Series 2008-2, Class PC, | ||||||||
| 4.750%, 01/20/2038 | 10,202 | 11,397 | ||||||
| Series 2008-46, Class FA, | ||||||||
| 1M US L + 0.60%, 05/20/2038(b) | 10,000 | 10,064 | ||||||
| Series 2008-60, Class JP, | ||||||||
| 5.500%, 07/20/2038 | 31,000 | 35,752 | ||||||
| Series 2011-H23, Class HA, | ||||||||
| 3.000%, 12/20/2061 | 6,899 | 7,210 | ||||||
| Series 2012-39, Class GA, | ||||||||
| 3.000%, 10/16/2040 | 12,849 | 13,362 | ||||||
| Series 2013-149, Class BP, | ||||||||
| 3.500%, 10/20/2043 | 50,000 | 54,984 | ||||||
| Principal Amount | Value (Note 2) | |||||||
| Series 2019-162, Class GA, | ||||||||
| 3.000%, 10/20/2049 | $ | 27,860 | $ | 28,475 | ||||
| Series 2019-29, Class JB, | ||||||||
| 4.500%, 12/20/2046 | 8,000 | 8,144 | ||||||
| Series 2020-5, Class LC, | ||||||||
| 3.500%, 10/20/2049 | 10,875 | 11,214 | ||||||
| 222,376 | ||||||||
| TOTAL COLLATERALIZED MORTGAGE OBLIGATIONS | ||||||||
| (Cost $1,209,461) | 1,224,106 | |||||||
| Principal | Value | |||||||
| Amount | (Note 2) | |||||||
| MORTGAGE-BACKED SECURITIES (1.02%) | ||||||||
| Fannie Mae Pool | ||||||||
| Series 2012-AM0762, | ||||||||
| 3.290%, 09/01/2032 | 8,484 | 9,392 | ||||||
| Series 2012-AM1671, | ||||||||
| 2.100%, 12/01/2027 | 35,744 | 37,176 | ||||||
| Series 2015-AM8645, | ||||||||
| 2.690%, 05/01/2027 | 21,955 | 23,623 | ||||||
| Series 2015-AM8674, | ||||||||
| 2.810%, 04/01/2025 | 20,000 | 21,460 | ||||||
| Series 2017-AN6670, | ||||||||
| 3.210%, 09/01/2027 | 29,733 | 31,263 | ||||||
| Series 2018-109741, | ||||||||
| 3.730%, 11/01/2025 | 50,000 | 54,266 | ||||||
| Series 2018-BL0212, | ||||||||
| 3.820%, 07/01/2027 | 34,710 | 39,245 | ||||||
| 216,425 | ||||||||
| TOTAL MORTGAGE-BACKED SECURITIES | ||||||||
| (Cost $213,757) | 216,425 | |||||||
| CORPORATE BONDS (14.03%) | ||||||||
| Aerospace & Defense (0.45%) | ||||||||
| Boeing Co. | ||||||||
| 4.51%, 05/01/2023 | 10,000 | 10,682 | ||||||
| Teledyne Technologies, Inc. | ||||||||
| 0.65%, 04/01/2023 | 15,000 | 14,997 | ||||||
| 0.95%, 04/01/2024 | 15,000 | 15,006 | ||||||
| 1.60%, 04/01/2026 | 25,000 | 25,096 | ||||||
| 2.25%, 04/01/2028 | 30,000 | 30,168 | ||||||
| Total Aerospace & Defense | 95,949 | |||||||
| Airlines (0.50%) | ||||||||
| Alaska Airlines 2020-1 Class A Pass Through Trust | ||||||||
| 4.80%, 08/15/2027(c) | 24,015 | 26,573 | ||||||
| Alaska Airlines 2020-1 Class B Pass Through Trust | ||||||||
| 8.00%, 08/15/2025(c) | 14,465 | 16,202 | ||||||
| British Airways 2020-1 Class A Pass Through Trust | ||||||||
| 4.25%, 11/15/2032(c) | 6,019 | 6,407 | ||||||
| Southwest Airlines Co. | ||||||||
| 5.25%, 05/04/2025 | 20,000 | 22,919 | ||||||
See Notes to Financial Statements.
| 92 | April 30, 2021 |
| ALPS | Smith Balanced Opportunity Fund | |
| Statement of Investments | April 30, 2021 (Unaudited) |
| Principal Amount | Value (Note 2) | |||||||
| United Airlines 2020-1 Class A Pass Through Trust | ||||||||
| Series 20-1 | ||||||||
| 5.88%, 10/15/2027 | $ | 24,396 | $ | 27,041 | ||||
| United Airlines, Inc. | ||||||||
| 4.38%, 04/15/2026(c) | 7,000 | 7,096 | ||||||
| Total Airlines | 106,238 | |||||||
| Automobiles Manufacturing (0.71%) | ||||||||
| Ford Motor Co. | ||||||||
| 5.29%, 12/08/2046 | 20,000 | 21,106 | ||||||
| 8.50%, 04/21/2023 | 20,000 | 22,425 | ||||||
| Ford Motor Credit Co. LLC | ||||||||
| 3.38%, 11/13/2025 | 35,000 | 35,863 | ||||||
| 4.00%, 11/13/2030 | 35,000 | 35,791 | ||||||
| General Motors Co. | ||||||||
| 5.00%, 04/01/2035 | 22,000 | 25,867 | ||||||
| Volkswagen Group of America | ||||||||
| Finance LLC | ||||||||
| 0.75%, 11/23/2022(c) | 5,000 | 5,018 | ||||||
| 0.88%, 11/22/2023(c) | 5,000 | 5,025 | ||||||
| Total Automobiles Manufacturing | 151,095 | |||||||
| Banks (0.77%) | ||||||||
| CIT Group, Inc. | ||||||||
| 1D US SOFR + 3.83%, 06/19/2024(b) | 30,000 | 31,763 | ||||||
| Citizens Financial Group, Inc. | ||||||||
| 4.15%, 09/28/2022(c) | 30,000 | 31,341 | ||||||
| PNC Financial Services Group, Inc. | ||||||||
| 1D US SOFR + 0.98%, 04/23/2032(b) | 18,000 | 17,927 | ||||||
| Synovus Bank/Columbus GA | ||||||||
| 1D US SOFR + 0.95%, 02/10/2023(b) | 15,000 | 15,142 | ||||||
| Truist Bank | ||||||||
| 5Y US TI + 1.15%, 09/17/2029(b) | 25,000 | 26,333 | ||||||
| Wells Fargo & Co. | ||||||||
| 4.10%, 06/03/2026 | 35,000 | 39,362 | ||||||
| Total Banks | 161,868 | |||||||
| Cable & Satellite (0.53%) | ||||||||
| CCO Holdings LLC / CCO Holdings | ||||||||
| Capital Corp. | ||||||||
| 4.25%, 02/01/2031(c) | 10,000 | 10,013 | ||||||
| 4.50%, 06/01/2033(c) | 22,000 | 22,200 | ||||||
| Charter Communications Operating LLC / Charter Communications | ||||||||
| Operating Capital | ||||||||
| 3.85%, 04/01/2061 | 20,000 | 18,396 | ||||||
| 5.05%, 03/30/2029 | 33,000 | 38,271 | ||||||
| Sirius XM Radio, Inc. | ||||||||
| 3.88%, 08/01/2022(c) | 5,000 | 5,031 | ||||||
| Time Warner Cable LLC | ||||||||
| 4.00%, 09/01/2021 | 20,000 | 20,055 | ||||||
| Total Cable & Satellite | 113,966 | |||||||
| Principal Amount | Value (Note 2) | |||||||
| Casinos & Gaming (0.13%) | ||||||||
| MGM Resorts International | ||||||||
| 5.50%, 04/15/2027 | $ | 15,000 | $ | 16,387 | ||||
| 7.75%, 03/15/2022 | 10,000 | 10,530 | ||||||
| Total Casinos & Gaming | 26,917 | |||||||
| Chemicals (0.21%) | ||||||||
| Kraton Polymers LLC / Kraton | ||||||||
| Polymers Capital Corp. | ||||||||
| 4.25%, 12/15/2025(c) | 15,000 | 15,244 | ||||||
| LYB International Finance III LLC | ||||||||
| 3M US L + 1.00%, 10/01/2023(b) | 30,000 | 30,071 | ||||||
| Total Chemicals | 45,315 | |||||||
| Commercial Finance (0.61%) | ||||||||
| AerCap Ireland Capital DAC / | ||||||||
| AerCap Global Aviation Trust | ||||||||
| 3.15%, 02/15/2024 | 22,000 | 23,129 | ||||||
| 4.63%, 10/15/2027 | 5,000 | 5,575 | ||||||
| 6.50%, 07/15/2025 | 25,000 | 29,435 | ||||||
| Avolon Holdings Funding, Ltd. | ||||||||
| 2.13%, 02/21/2026(c) | 4,000 | 3,912 | ||||||
| 2.75%, 02/21/2028(c) | 4,000 | 3,895 | ||||||
| 3.63%, 05/01/2022(c) | 20,000 | 20,422 | ||||||
| 4.25%, 04/15/2026(c) | 25,000 | 26,683 | ||||||
| Park Aerospace Holdings, Ltd. | ||||||||
| 5.25%, 08/15/2022(c) | 17,000 | 17,773 | ||||||
| Total Commercial Finance | 130,824 | |||||||
| Consumer Finance (0.82%) | ||||||||
| Ally Financial, Inc. | ||||||||
| 1.45%, 10/02/2023 | 10,000 | 10,164 | ||||||
| Series B | ||||||||
| 5Y US TI + 3.87%(b)(d) | 15,000 | 15,243 | ||||||
| American Express Co. | ||||||||
| Series B | ||||||||
| 3M US L + 3.43%(b)(d) | 50,000 | 50,118 | ||||||
| Discover Financial Services | ||||||||
| Series D | ||||||||
| 5Y US TI + 5.78%(b)(d) | 15,000 | 16,969 | ||||||
| OneMain Finance Corp. | ||||||||
| 8.88%, 06/01/2025 | 46,000 | 50,984 | ||||||
| Quicken Loans LLC | ||||||||
| 3.63%, 03/01/2029(c) | 20,000 | 19,488 | ||||||
| 5.25%, 01/15/2028(c) | 10,000 | 10,563 | ||||||
| Total Consumer Finance | 173,529 | |||||||
| Department Stores (0.14%) | ||||||||
| Nordstrom, Inc. | ||||||||
| 4.25%, 08/01/2031(c) | 30,000 | 30,427 | ||||||
See Notes to Financial Statements.
| 93 | April 30, 2021 |
| ALPS | Smith Balanced Opportunity Fund | |
| Statement of Investments | April 30, 2021 (Unaudited) |
| Principal Amount | Value (Note 2) | |||||||
| Diversified Banks (1.22%) | ||||||||
| Bank of America Corp. | ||||||||
| 4.45%, 03/03/2026 | $ | 25,000 | $ | 28,334 | ||||
| 1D US SOFR + 0.96%, 07/22/2027(b) | 34,000 | 34,333 | ||||||
| 1D US SOFR + 1.32%, 04/22/2032(b) | 15,000 | 15,193 | ||||||
| 1D US SOFR + 1.53%, 07/23/2031(b) | 25,000 | 23,734 | ||||||
| 1D US SOFR + 1.58%, 04/22/2042(b) | 11,000 | 11,240 | ||||||
| Citigroup, Inc. | ||||||||
| 4.30%, 11/20/2026 | 30,000 | 33,811 | ||||||
| 1D US SOFR + 1.17%, 05/01/2032(b) | 7,000 | 7,002 | ||||||
| JPMorgan Chase & Co. | ||||||||
| 1D US SOFR + 1.25%, 04/22/2032(b) | 11,000 | 11,054 | ||||||
| 1D US SOFR + 1.46%, 06/01/2024(b) | 30,000 | 30,585 | ||||||
| 1D US SOFR + 1.46%, 04/22/2042(b) | 41,000 | 41,126 | ||||||
| 1D US SOFR + 2.04%, 04/22/2031(b) | 25,000 | 25,278 | ||||||
| Total Diversified Banks | 261,690 | |||||||
| Exploration & Production (0.05%) | ||||||||
| Diamondback Energy, Inc. | ||||||||
| 4.40%, 03/24/2051 | 10,000 | 10,516 | ||||||
| Financial Services (1.30%) | ||||||||
| Credit Suisse Group AG | ||||||||
| 3.57%, 01/09/2023(c) | 37,000 | 37,696 | ||||||
| Goldman Sachs Group, Inc. | ||||||||
| 3.50%, 04/01/2025 | 30,000 | 32,645 | ||||||
| 1D US SOFR + 1.51%, 04/22/2042(b) | 11,000 | 11,121 | ||||||
| LPL Holdings, Inc. | ||||||||
| 4.00%, 03/15/2029(c) | 10,000 | 10,013 | ||||||
| Morgan Stanley | ||||||||
| Series GMTN | ||||||||
| 1D US SOFR + 1.14%, 01/22/2031(b) | 35,000 | 35,800 | ||||||
| Series I | ||||||||
| 1D US SOFR + 0.75%, 10/21/2025(b) | 10,000 | 9,994 | ||||||
| 1D US SOFR + 0.88%, 05/04/2027(b) | 14,000 | 14,074 | ||||||
| 1D US SOFR + 1.02%, 04/28/2032(b) | 28,000 | 26,547 | ||||||
| 1D US SOFR + 1.49%, 04/22/2042(b) | 7,000 | 7,103 | ||||||
| Nasdaq, Inc. | ||||||||
| 0.45%, 12/21/2022 | 10,000 | 10,005 | ||||||
| National Securities Clearing Corp. | ||||||||
| 0.40%, 12/07/2023(c) | 20,000 | 20,002 | ||||||
| Principal Amount | Value (Note 2) | |||||||
| Raymond James Financial, Inc. | ||||||||
| 4.65%, 04/01/2030 | $ | 50,000 | $ | 59,187 | ||||
| Total Financial Services | 274,187 | |||||||
| Food & Beverage (0.05%) | ||||||||
| Lamb Weston Holdings, Inc. | ||||||||
| 4.63%, 11/01/2024(c) | 10,000 | 10,393 | ||||||
| Health Care Facilities & Services (0.37%) | ||||||||
| HCA, Inc. | ||||||||
| 4.50%, 02/15/2027 | 25,000 | 28,248 | ||||||
| 5.25%, 06/15/2049 | 15,000 | 18,483 | ||||||
| Jaguar Holding Co. II / PPD Development LP | ||||||||
| 4.63%, 06/15/2025(c) | 30,000 | 31,573 | ||||||
| Total Health Care Facilities & Services | 78,304 | |||||||
| Home & Office Products Manufacturing (0.07%) | ||||||||
| Newell Brands, Inc. | ||||||||
| 4.70%, 04/01/2026 | 13,000 | 14,511 | ||||||
| Home Improvement (0.08%) | ||||||||
| Whirlpool Corp. | ||||||||
| 2.40%, 05/15/2031 | 18,000 | 17,930 | ||||||
| Industrial Other (0.12%) | ||||||||
| Honeywell International, Inc. | ||||||||
| 0.48%, 08/19/2022 | 25,000 | 25,023 | ||||||
| Medical Equipment & Devices Manufacturing (0.07%) | ||||||||
| STERIS Irish FinCo UnLtd Co. | ||||||||
| 2.70%, 03/15/2031 | 7,000 | 6,990 | ||||||
| 3.75%, 03/15/2051 | 7,000 | 7,100 | ||||||
| Total Medical Equipment & Devices Manufacturing | 14,090 | |||||||
| Metals & Mining (0.17%) | ||||||||
| Steel Dynamics, Inc. | ||||||||
| 5.00%, 12/15/2026 | 35,000 | 36,795 | ||||||
| Pharmaceuticals (1.33%) | ||||||||
| AbbVie, Inc. | ||||||||
| 2.95%, 11/21/2026 | 25,000 | 26,794 | ||||||
| Bausch Health Cos., Inc. | ||||||||
| 6.13%, 04/15/2025(c) | 67,000 | 68,494 | ||||||
| 7.00%, 03/15/2024(c) | 9,000 | 9,239 | ||||||
| Elanco Animal Health, Inc. | ||||||||
| 4.91%, 08/27/2021 | 30,000 | 30,334 | ||||||
| Organon Finance 1 LLC | ||||||||
| 4.13%, 04/30/2028(c) | 58,000 | 59,493 | ||||||
| 5.13%, 04/30/2031(c) | 26,000 | 27,010 | ||||||
| Viatris, Inc. | ||||||||
| 1.13%, 06/22/2022(c) | 61,000 | 61,410 | ||||||
| Total Pharmaceuticals | 282,774 | |||||||
See Notes to Financial Statements.
| 94 | April 30, 2021 |
| ALPS | Smith Balanced Opportunity Fund | |
| Statement of Investments | April 30, 2021 (Unaudited) |
| Principal Amount | Value (Note 2) | |||||||
| Pipeline (0.65%) | ||||||||
| Buckeye Partners LP | ||||||||
| 4.13%, 12/01/2027 | $ | 21,000 | $ | 20,803 | ||||
| 4.35%, 10/15/2024 | 10,000 | 10,469 | ||||||
| 5.60%, 10/15/2044 | 12,000 | 11,573 | ||||||
| Energy Transfer LP | ||||||||
| 4.20%, 04/15/2027 | 25,000 | 27,332 | ||||||
| Midwest Connector Capital Co. LLC | ||||||||
| 3.63%, 04/01/2022(c) | 25,000 | 25,370 | ||||||
| 3.90%, 04/01/2024(c) | 25,000 | 26,019 | ||||||
| 4.63%, 04/01/2029(c) | 5,000 | 5,170 | ||||||
| Western Midstream Operating LP | ||||||||
| 4.35%, 02/01/2025 | 10,000 | 10,588 | ||||||
| Total Pipeline | 137,324 | |||||||
| Power Generation (0.45%) | ||||||||
| Alexander Funding Trust | ||||||||
| 1.84%, 11/15/2023(c) | 25,000 | 25,357 | ||||||
| NRG Energy, Inc. | ||||||||
| 2.00%, 12/02/2025(c) | 20,000 | 20,147 | ||||||
| 2.45%, 12/02/2027(c) | 20,000 | 20,077 | ||||||
| Vistra Operations Co. LLC | ||||||||
| 5.50%, 09/01/2026(c) | 29,000 | 29,998 | ||||||
| Total Power Generation | 95,579 | |||||||
| Publishing & Broadcasting (0.32%) | ||||||||
| Nexstar Broadcasting, Inc. | ||||||||
| 4.75%, 11/01/2028(c) | 25,000 | 25,500 | ||||||
| Scripps Escrow II, Inc. | ||||||||
| 3.88%, 01/15/2029(c) | 40,000 | 39,807 | ||||||
| Total Publishing & Broadcasting | 65,307 | |||||||
| Railroad (0.33%) | ||||||||
| Westinghouse Air Brake Technologies Corp. | ||||||||
| 3.20%, 06/15/2025 | 50,000 | 53,386 | ||||||
| 4.95%, 09/15/2028 | 15,000 | 17,273 | ||||||
| Total Railroad | 70,659 | |||||||
| Real Estate (0.05%) | ||||||||
| Public Storage | ||||||||
| 2.30%, 05/01/2031 | 11,000 | 11,012 | ||||||
| Refining & Marketing (0.43%) | ||||||||
| HollyFrontier Corp. | ||||||||
| 5.88%, 04/01/2026 | 13,000 | 14,938 | ||||||
| Valero Energy Corp. | ||||||||
| 3M US L + 1.15%, 09/15/2023(b) | 76,000 | 76,191 | ||||||
| Total Refining & Marketing | 91,129 | |||||||
| Restaurants (0.09%) | ||||||||
| 1011778 BC ULC / New Red Finance, Inc. | ||||||||
| 4.25%, 05/15/2024(c) | 5,000 | 5,072 | ||||||
| Yum! Brands, Inc. | ||||||||
| 7.75%, 04/01/2025(c) | 13,000 | 14,219 | ||||||
| Total Restaurants | 19,291 | |||||||
| Principal Amount | Value (Note 2) | |||||||
| Retail - Consumer Discretionary (0.13%) | ||||||||
| Gap, Inc. | ||||||||
| 8.63%, 05/15/2025(c) | $ | 24,000 | $ | 26,591 | ||||
| Semiconductors (0.20%) | ||||||||
| Marvell Technology, Inc. | ||||||||
| 1.65%, 04/15/2026(c) | 10,000 | 9,976 | ||||||
| 2.45%, 04/15/2028(c) | 7,000 | 7,048 | ||||||
| 2.95%, 04/15/2031(c) | 10,000 | 10,017 | ||||||
| Microchip Technology, Inc. | ||||||||
| 0.97%, 02/15/2024(c) | 15,000 | 14,987 | ||||||
| Total Semiconductors | 42,028 | |||||||
| Software & Services (0.39%) | ||||||||
| Leidos, Inc. | ||||||||
| 4.38%, 05/15/2030(c) | 50,000 | 55,864 | ||||||
| Verisk Analytics, Inc. | ||||||||
| 5.80%, 05/01/2021 | 28,000 | 28,000 | ||||||
| Total Software & Services | 83,864 | |||||||
| Supermarkets & Pharmacies (0.05%) | ||||||||
| Albertsons Cos. Inc / Safeway, Inc. / New Albertsons LP / Albertsons LLC | ||||||||
| 4.63%, 01/15/2027(c) | 10,000 | 10,413 | ||||||
| Transportation & Logistics (0.23%) | ||||||||
| FedEx Corp. 2020-1 Class AA Pass Through Trust | ||||||||
| 1.88%, 02/20/2034 | 48,663 | 47,951 | ||||||
| Utilities (0.44%) | ||||||||
| Atmos Energy Corp. | ||||||||
| 3M US L + 0.38%, 03/09/2023(b) | 7,000 | 7,004 | ||||||
| Edison International | ||||||||
| Series A | ||||||||
| 5Y US TI + 4.70%(b)(d) | 15,000 | 15,556 | ||||||
| ONE Gas, Inc. | ||||||||
| 0.85%, 03/11/2023 | 25,000 | 25,025 | ||||||
| Pacific Gas and Electric Co. | ||||||||
| 1.37%, 03/10/2023 | 10,000 | 10,004 | ||||||
| 3M US L + 1.38%, 11/15/2021(b) | 25,000 | 25,085 | ||||||
| Southern California Edison Co. | ||||||||
| 1.10%, 04/01/2024 | 10,000 | 10,087 | ||||||
| Total Utilities | 92,761 | |||||||
| Waste & Environment Services & Equipment (0.13%) | ||||||||
| GFL Environmental, Inc. | ||||||||
| 4.25%, 06/01/2025(c) | 25,000 | 25,796 | ||||||
| Wireless Telecommunications Services (0.42%) | ||||||||
| AT&T, Inc. | ||||||||
| 1.70%, 03/25/2026 | 5,000 | 5,024 | ||||||
| 4.30%, 12/15/2042 | 50,000 | 54,812 | ||||||
See Notes to Financial Statements.
| 95 | April 30, 2021 |
| ALPS | Smith Balanced Opportunity Fund | |
| Statement of Investments | April 30, 2021 (Unaudited) |
| Principal Amount | Value (Note 2) | |||||||
| Sprint Corp. | ||||||||
| 7.88%, 09/15/2023 | $ | 25,000 | $ | 28,531 | ||||
| Total Wireless Telecommunications Services | 88,367 | |||||||
| Wireline Telecommunications Services (0.02%) | ||||||||
| NTT Finance Corp. | ||||||||
| 0.37%, 03/03/2023(c) | 4,000 | 4,004 | ||||||
| TOTAL CORPORATE BONDS | ||||||||
| (Cost $2,959,404) | 2,974,417 | |||||||
| GOVERNMENT BONDS (9.16%) | ||||||||
| U.S. Treasury Bonds (9.16%) | ||||||||
| United States Treasury Bonds | ||||||||
| 0.88%, 11/15/2030 | 160,000 | 149,650 | ||||||
| 1.13%, 02/15/2031 | 141,000 | 134,666 | ||||||
| 1.13%, 08/15/2040 | 112,000 | 93,389 | ||||||
| 1.38%, 11/15/2040 | 17,000 | 14,817 | ||||||
| 1.38%, 08/15/2050 | 37,000 | 29,672 | ||||||
| 1.88%, 02/15/2051 | 250,000 | 227,461 | ||||||
| United States Treasury Notes | ||||||||
| 0.13%, 03/31/2023 | 110,000 | 109,948 | ||||||
| 0.13%, 04/30/2023 | 72,000 | 71,951 | ||||||
| 0.13%, 12/15/2023 | 178,000 | 177,360 | ||||||
| 0.25%, 03/15/2024 | 184,000 | 183,698 | ||||||
| 0.50%, 02/28/2026 | 270,000 | 265,971 | ||||||
| 0.63%, 08/15/2030 | 194,000 | 177,813 | ||||||
| 0.75%, 03/31/2026 | 307,000 | 305,825 | ||||||
| Total U.S. Treasury Bonds | 1,942,221 | |||||||
| TOTAL GOVERNMENT BONDS | ||||||||
| (Cost $1,960,976) | 1,942,221 | |||||||
| Yield 7-Day | Shares | Value (Note 2) | ||||||||||
| SHORT TERM INVESTMENTS (8.38%) | ||||||||||||
| Money Market Fund (8.38%) | ||||||||||||
| Morgan Stanley | ||||||||||||
| Institutional | ||||||||||||
| Liquidity Funds - | ||||||||||||
| Government | ||||||||||||
| Portfolio | 0.030 | % | 263,417 | 263,417 | ||||||||
| State Street Institutional | ||||||||||||
| Treasury Plus | ||||||||||||
| Money Market Fund | 0.020 | % | 1,514,141 | 1,514,140 | ||||||||
| 1,777,557 | ||||||||||||
| TOTAL SHORT TERM INVESTMENTS | ||||||||||||
| (Cost $1,777,557) | 1,777,557 | |||||||||||
| TOTAL INVESTMENTS (103.84%) | ||||||||||||
| (Cost $19,595,416) | $ | 22,013,885 | ||||||||||
| Liabilities In Excess Of Other Assets (-3.84%) | (813,817 | ) | ||||||||||
| NET ASSETS (100.00%) | $ | 21,200,068 | ||||||||||
Investment Abbreviations:
LIBOR - London Interbank Offered Rate
SOFR - Secured Overnight Financing Rate
Reference Rates:
1M US L - 1 Month LIBOR as of April 30, 2021 was 0.11%
3M US L - 3 Month LIBOR as of April 30, 2021 was 0.18%
1D US SOFR - 1 Day SOFR as of April 30, 2021 was 0.01%
5Y US TI - 5 Year US Treasury Index as of April 30, 2021 was 0.86%
| (a) | Non-Income Producing Security. |
| (b) | Floating or variable rate security. The reference rate is described above. The rate in effect as of April 30, 2021 is based on the reference rate plus the displayed spread as of the security's last reset date. |
| (c) | Security exempt from registration under Rule 144A of the Securities Act of 1933. This security may be resold in transactions exempt from registration, normally to qualified institutional buyers. As of April 30, 2021, the aggregate market value of those securities was $1,020,068, representing 4.81% of net assets. |
| (d) | Perpetual maturity. This security has no contractual maturity date, is not redeemable and contractually pays an indefinite stream of interest. |
See Notes to Financial Statements.
| 96 | April 30, 2021 |
| ALPS | Smith Funds | |
| Statements of Assets and Liabilities | April 30, 2021 (Unaudited) |
| ALPS | Smith Short Duration Bond Fund | ALPS | Smith Total Return Bond Fund | ALPS | Smith Credit Opportunities Fund | ALPS | Smith Balanced Opportunity Fund | |||||||||||||
| ASSETS | ||||||||||||||||
| Investments, at value | $ | 408,424,474 | $ | 1,716,737,868 | $ | 149,947,326 | $ | 22,013,885 | ||||||||
| Receivable for investments sold | 451,396 | 22,386,499 | 50,185 | 37,856 | ||||||||||||
| Receivable for shares sold | 7,442,553 | 5,029,961 | 16,812,857 | – | ||||||||||||
| Interest receivable | 2,058,754 | 9,875,959 | 1,198,278 | 40,208 | ||||||||||||
| Receivable due from advisor | – | – | – | 9,429 | ||||||||||||
| Prepaid expenses and other assets | 27,943 | 41,570 | 79,484 | 15,118 | ||||||||||||
| Total Assets | 418,405,120 | 1,754,071,857 | 168,088,130 | 22,116,496 | ||||||||||||
| LIABILITIES | ||||||||||||||||
| Payable for investments purchased | 12,157,546 | 24,289,498 | 10,080,837 | 842,425 | ||||||||||||
| Payable for shares redeemed | 472,226 | 7,789,395 | 41,450 | – | ||||||||||||
| Investment advisory fees payable | 88,581 | 685,641 | 83,851 | – | ||||||||||||
| Administration and transfer agency fees payable | 7,945 | 100,665 | 19,789 | 55,738 | ||||||||||||
| Distribution and services fees payable | 12,185 | 14,539 | 2,996 | 1,149 | ||||||||||||
| Trustees' fees and expenses payable | 3,502 | 23,776 | 422 | 236 | ||||||||||||
| Professional fees payable | 12,880 | 22,759 | 12,756 | 12,657 | ||||||||||||
| Custody fees payable | 2,554 | 18,531 | 2,156 | 2,906 | ||||||||||||
| Accrued expenses and other liabilities | 8,833 | 67,472 | 604 | 1,317 | ||||||||||||
| Total Liabilities | 12,766,252 | 33,012,276 | 10,244,861 | 916,428 | ||||||||||||
| NET ASSETS | $ | 405,638,868 | $ | 1,721,059,581 | $ | 157,843,269 | $ | 21,200,068 | ||||||||
| NET ASSETS CONSIST OF | ||||||||||||||||
| Paid-in capital | $ | 402,582,858 | $ | 1,707,925,382 | $ | 156,193,695 | $ | 18,389,169 | ||||||||
| Total distributable earnings | 3,056,010 | 13,134,199 | 1,649,574 | 2,810,899 | ||||||||||||
| NET ASSETS | $ | 405,638,868 | $ | 1,721,059,581 | $ | 157,843,269 | $ | 21,200,068 | ||||||||
| INVESTMENTS, AT COST | $ | 406,332,738 | $ | 1,696,222,648 | $ | 148,766,930 | $ | 19,595,416 | ||||||||
See Notes to Financial Statements.
| 97 | April 30, 2021 |
| ALPS | Smith Funds | |
| Statements of Assets and Liabilities | April 30, 2021 (Unaudited) |
| PRICING OF SHARES | ||||||||||||||||
| Investor Class: | ||||||||||||||||
| Net Asset Value, offering and redemption price per share | $ | 10.60 | $ | 11.21 | $ | 10.39 | $ | 11.77 | ||||||||
| Net Assets | $ | 16,141,098 | $ | 8,875,197 | $ | 7,646,288 | $ | 724,188 | ||||||||
| Shares of beneficial interest outstanding (unlimited number of shares, no par value common stock authorized) | 1,523,060 | 791,806 | 736,131 | 61,537 | ||||||||||||
| Class A: | ||||||||||||||||
| Net Asset Value, offering and redemption price per share | $ | 10.59 | $ | 11.21 | $ | 10.39 | $ | 11.77 | ||||||||
| Net Assets | $ | 12,012,282 | $ | 16,965,309 | $ | 1,203,361 | $ | 1,176,597 | ||||||||
| Shares of beneficial interest outstanding (unlimited number of shares, no par value common stock authorized) | 1,133,887 | 1,513,076 | 115,829 | 100,000 | ||||||||||||
| Maximum offering price per share | $ | 10.83 | (a) | $ | 11.47 | (a) | $ | 10.63 | (a) | $ | 12.17 | (b) | ||||
| Class C: | ||||||||||||||||
| Net Asset Value, offering and redemption price per share(c) | $ | 10.58 | $ | 11.19 | $ | 10.39 | $ | 11.74 | ||||||||
| Net Assets | $ | 3,178,627 | $ | 7,949,799 | $ | 519,413 | $ | 587,181 | ||||||||
| Shares of beneficial interest outstanding (unlimited number of shares, no par value common stock authorized) | 300,557 | 710,564 | 50,000 | 50,000 | ||||||||||||
| Class I: | ||||||||||||||||
| Net Asset Value, offering and redemption price per share | $ | 10.60 | $ | 11.21 | $ | 10.40 | $ | 11.77 | ||||||||
| Net Assets | $ | 374,306,861 | $ | 1,687,269,276 | $ | 148,474,207 | $ | 18,712,102 | ||||||||
| Shares of beneficial interest outstanding (unlimited number of shares, no par value common stock authorized) | 35,303,410 | 150,577,988 | 14,281,603 | 1,590,155 | ||||||||||||
| (a) | (NAV/0.9775), based on maximum sales charge of 2.25% of the offering price. |
| (b) | (NAV/0.9675), based on maximum sales charge of 3.25% of the offering price. |
| (c) | Redemption price per share may be reduced for any applicable contingent deferred sales charge. For a description of a possible sales charge, please see the Fund's Prospectus. |
See Notes to Financial Statements.
| 98 | April 30, 2021 |
ALPS | Smith Funds
| Statements of Operations | For the Six Months Ended April 30, 2021 (Unaudited) |
| ALPS | Smith Short Duration Bond Fund | ALPS | Smith Total Return Bond Fund | ALPS | Smith Credit Opportunities Fund(a) | ALPS | Smith Balanced Opportunity Fund(a) | |||||||||||||
| INVESTMENT INCOME | ||||||||||||||||
| Dividends | $ | 14,611 | $ | 320,878 | $ | 65,808 | $ | 77,522 | ||||||||
| Foreign taxes withheld on dividends | (3,651 | ) | (13,059 | ) | (1,036 | ) | (1,430 | ) | ||||||||
| Interest | 1,816,398 | 19,652,555 | 1,040,337 | 53,789 | ||||||||||||
| Total Investment Income | 1,827,358 | 19,960,374 | 1,105,109 | 129,881 | ||||||||||||
| EXPENSES | ||||||||||||||||
| Investment advisory fees | 519,529 | 4,311,443 | 242,993 | 61,409 | ||||||||||||
| Administrative fees | 144,725 | 728,229 | 43,754 | 57,165 | ||||||||||||
| Transfer agency fees | 60,010 | 298,985 | 2,398 | 1,608 | ||||||||||||
| Distribution and service fees | ||||||||||||||||
| Investor Class | 18,658 | 14,856 | 4,247 | 926 | ||||||||||||
| Class A | 13,126 | 22,762 | 1,517 | 1,486 | ||||||||||||
| Class C | 12,866 | 38,289 | 2,559 | 2,724 | ||||||||||||
| Professional fees | 15,698 | 35,058 | 14,348 | 14,157 | ||||||||||||
| Reports to shareholders and printing fees | 3,775 | 33,013 | 999 | 805 | ||||||||||||
| State registration fees | 39,960 | 74,072 | 3,863 | 3,001 | ||||||||||||
| Insurance fees | 1,161 | 9,425 | 123 | 92 | ||||||||||||
| Custody fees | 6,011 | 33,829 | 3,570 | 8,093 | ||||||||||||
| Trustees' fees and expenses | 5,186 | 40,822 | 777 | 437 | ||||||||||||
| Miscellaneous expenses | 5,396 | 14,853 | 4,138 | 4,048 | ||||||||||||
| Total Expenses | 846,101 | 5,655,636 | 325,286 | 155,951 | ||||||||||||
| Less fees waived/reimbursed by investment advisor (Note 8) | ||||||||||||||||
| Investor Class | (5,636 | ) | (178 | ) | (463 | ) | (2,834 | ) | ||||||||
| Class A | (2,076 | ) | (695 | ) | (719 | ) | (4,635 | ) | ||||||||
| Class C | (614 | ) | (1,129 | ) | (341 | ) | (2,313 | ) | ||||||||
| Class I | (92,583 | ) | (270,589 | ) | (20,722 | ) | (66,297 | ) | ||||||||
| Net Expenses | 745,192 | 5,383,045 | 303,041 | 79,872 | ||||||||||||
| Net Investment Income | 1,082,166 | 14,577,329 | 802,068 | 50,009 | ||||||||||||
| Net realized gain/(loss) on investments | 990,286 | (2,266,199 | ) | 499,394 | 422,865 | |||||||||||
| Net realized gain on foreign currency transactions | – | – | – | 32 | ||||||||||||
| Net Realized Gain/(Loss) | 990,286 | (2,266,199 | ) | 499,394 | 422,897 | |||||||||||
| Net change in unrealized appreciation/(depreciation) on investments | 21,444 | (10,844,924 | ) | 1,295,751 | 2,554,488 | |||||||||||
| Net Change in Unrealized Appreciation/(Depreciation) | 21,444 | (10,844,924 | ) | 1,295,751 | 2,554,488 | |||||||||||
| NET REALIZED AND UNREALIZED GAIN/(LOSS) ON INVESTMENTS | 1,011,730 | (13,111,123 | ) | 1,795,145 | 2,977,385 | |||||||||||
| NET INCREASE IN NET ASSETS RESULTING FROM OPERATIONS | $ | 2,093,896 | $ | 1,466,206 | $ | 2,597,213 | $ | 3,027,394 | ||||||||
| (a) | For the period September 16, 2020 (Inception) to April 30, 2021. |
See Notes to Financial Statements.
99 | April 30, 2021
ALPS | Smith Short Duration Bond Fund
Statement of Changes in Net Assets
| For the Six Months Ended April 30, 2021 (Unaudited) | For the Year Ended October 31, 2020 | |||||||
| OPERATIONS | ||||||||
| Net investment income | $ | 1,082,166 | $ | 1,369,569 | ||||
| Net realized gain | 990,286 | 1,602,831 | ||||||
| Net change in unrealized appreciation | 21,444 | 1,684,442 | ||||||
| Net Increase in Net Assets Resulting from Operations | 2,093,896 | 4,656,842 | ||||||
| DISTRIBUTIONS | ||||||||
| From distributable earnings | ||||||||
| Investor Class | (128,980 | ) | (21,527 | ) | ||||
| Class A | (87,032 | ) | (21,429 | ) | ||||
| Class C | (17,210 | ) | (9,016 | ) | ||||
| Class I | (2,446,867 | ) | (1,765,667 | ) | ||||
| Net Decrease in Net Assets from Distributions | (2,680,089 | ) | (1,817,639 | ) | ||||
| BENEFICIAL INTEREST TRANSACTIONS (NOTE 6) | ||||||||
| Shares sold | ||||||||
| Investor Class | 13,457,142 | 8,786,055 | ||||||
| Class A | 8,560,258 | 3,316,195 | ||||||
| Class C | 976,784 | 1,845,022 | ||||||
| Class I | 264,216,850 | 159,410,823 | ||||||
| Dividends reinvested | ||||||||
| Investor Class | 83,431 | 16,577 | ||||||
| Class A | 82,614 | 18,236 | ||||||
| Class C | 16,821 | 8,286 | ||||||
| Class I | 1,746,616 | 1,187,091 | ||||||
| Shares redeemed, net of redemption fees | ||||||||
| Investor Class | (6,456,568 | ) | (230,669 | ) | ||||
| Class A | (296,975 | ) | (148,329 | ) | ||||
| Class C | (5 | ) | (185,508 | ) | ||||
| Class I | (57,974,982 | ) | (41,453,423 | ) | ||||
| Net Increase in Net Assets Derived from Beneficial Interest Transactions | 224,411,986 | 132,570,356 | ||||||
| Net increase in net assets | 223,825,793 | 135,409,559 | ||||||
| NET ASSETS | ||||||||
| Beginning of period | 181,813,075 | 46,403,516 | ||||||
| End of period | $ | 405,638,868 | $ | 181,813,075 | ||||
See Notes to Financial Statements.
100 | April 30, 2021
ALPS | Smith Total Return Bond Fund
Statement of Changes in Net Assets
| For the Six Months Ended April 30, 2021 (Unaudited) | For the Year Ended October 31, 2020 | |||||||
| OPERATIONS | ||||||||
| Net investment income | $ | 14,577,329 | $ | 17,728,925 | ||||
| Net realized gain/(loss) | (2,266,199 | ) | 20,708,790 | |||||
| Net change in unrealized appreciation/(depreciation) | (10,844,924 | ) | 24,830,792 | |||||
| Net Increase in Net Assets Resulting from Operations | 1,466,206 | 63,268,507 | ||||||
| DISTRIBUTIONS | ||||||||
| From distributable earnings | ||||||||
| Investor Class | (257,826 | ) | (136,099 | ) | ||||
| Class A | (391,842 | ) | (252,408 | ) | ||||
| Class C | (162,144 | ) | (59,370 | ) | ||||
| Class I | (38,668,399 | ) | (22,139,600 | ) | ||||
| Net Decrease in Net Assets from Distributions | (39,480,211 | ) | (22,587,477 | ) | ||||
| BENEFICIAL INTEREST TRANSACTIONS (NOTE 6) | ||||||||
| Shares sold | ||||||||
| Investor Class | 2,663,179 | 9,570,405 | ||||||
| Class A | 6,560,660 | 7,720,559 | ||||||
| Class C | 1,886,072 | 5,311,853 | ||||||
| Class I | 579,485,467 | 1,096,771,120 | ||||||
| Dividends reinvested | ||||||||
| Investor Class | 217,790 | 120,845 | ||||||
| Class A | 358,976 | 240,768 | ||||||
| Class C | 125,376 | 55,429 | ||||||
| Class I | 26,615,208 | 15,005,297 | ||||||
| Shares redeemed, net of redemption fees | ||||||||
| Investor Class | (3,869,413 | ) | (3,975,002 | ) | ||||
| Class A | (4,577,861 | ) | (1,264,314 | ) | ||||
| Class C | (373,864 | ) | (733,489 | ) | ||||
| Class I | (213,435,927 | ) | (185,793,976 | ) | ||||
| Net Increase in Net Assets Derived from Beneficial Interest Transactions | 395,655,663 | 943,029,495 | ||||||
| Net increase in net assets | 357,641,658 | 983,710,525 | ||||||
| NET ASSETS | ||||||||
| Beginning of period | 1,363,417,923 | 379,707,398 | ||||||
| End of period | $ | 1,721,059,581 | $ | 1,363,417,923 | ||||
See Notes to Financial Statements.
101 | April 30, 2021
ALPS | Smith Credit Opportunities Fund
Statement of Changes in Net Assets
| For the Six Months Ended April 30, 2021 (Unaudited) | For the Period September 16, 2020 (Commencement of Operations) to October 31, 2020 | |||||||
| OPERATIONS | ||||||||
| Net investment income | $ | 802,068 | $ | 42,824 | ||||
| Net realized gain | 499,394 | 43,945 | ||||||
| Net change in unrealized appreciation/(depreciation) | 1,295,751 | (115,355 | ) | |||||
| Net Increase/(Decrease) in Net Assets Resulting from Operations | 2,597,213 | (28,586 | ) | |||||
| DISTRIBUTIONS | ||||||||
| From distributable earnings | ||||||||
| Investor Class | (31,898 | ) | (1,183 | ) | ||||
| Class A | (14,903 | ) | (1,780 | ) | ||||
| Class C | (5,001 | ) | (450 | ) | ||||
| Class I | (826,988 | ) | (37,948 | ) | ||||
| Net Decrease in Net Assets from Distributions | (878,790 | ) | (41,361 | ) | ||||
| BENEFICIAL INTEREST TRANSACTIONS (NOTE 6) | ||||||||
| Shares sold | ||||||||
| Investor Class | 7,208,974 | 701,936 | ||||||
| Class A | 161,677 | 1,000,000 | ||||||
| Class C | – | 500,000 | ||||||
| Class I | 126,692,019 | 25,436,680 | ||||||
| Dividends reinvested | ||||||||
| Investor Class | 23,467 | – | ||||||
| Class A | 1,295 | – | ||||||
| Class I | 386,230 | 1,273 | ||||||
| Shares redeemed | ||||||||
| Investor Class | (341,605 | ) | (175 | ) | ||||
| Class I | (5,251,687 | ) | (325,291 | ) | ||||
| Net Increase in Net Assets Derived from Beneficial Interest Transactions | 128,880,370 | 27,314,423 | ||||||
| Net increase in net assets | 130,598,793 | 27,244,476 | ||||||
| NET ASSETS | ||||||||
| Beginning of period | 27,244,476 | – | ||||||
| End of period | $ | 157,843,269 | $ | 27,244,476 | ||||
See Notes to Financial Statements.
102 | April 30, 2021
ALPS | Smith Balanced Opportunity Fund
Statement of Changes in Net Assets
| For the Six Months Ended April 30, 2021 (Unaudited) | For the Period September 16, 2020 (Commencement of Operations) to October 31, 2020 | |||||||
| OPERATIONS | ||||||||
| Net investment income | $ | 50,009 | $ | 8,275 | ||||
| Net realized gain/(loss) | 422,897 | (23,561 | ) | |||||
| Net change in unrealized appreciation/(depreciation) | 2,554,488 | (136,019 | ) | |||||
| Net Increase/(Decrease) in Net Assets Resulting from Operations | 3,027,394 | (151,305 | ) | |||||
| DISTRIBUTIONS | ||||||||
| From distributable earnings | ||||||||
| Investor Class | (1,436 | ) | (116 | ) | ||||
| Class A | (2,353 | ) | (415 | ) | ||||
| Class I | (54,893 | ) | (6,578 | ) | ||||
| Net Decrease in Net Assets from Distributions | (58,682 | ) | (7,109 | ) | ||||
| BENEFICIAL INTEREST TRANSACTIONS (NOTE 6) | ||||||||
| Shares sold | ||||||||
| Investor Class | 7,521 | 610,109 | ||||||
| Class A | – | 1,000,000 | ||||||
| Class C | – | 500,000 | ||||||
| Class I | 3,838,146 | 12,420,000 | ||||||
| Dividends reinvested | ||||||||
| Investor Class | 141 | – | ||||||
| Class I | 20,846 | 692 | ||||||
| Shares redeemed | ||||||||
| Investor Class | (52 | ) | – | |||||
| Class I | (7,633 | ) | – | |||||
| Net Increase in Net Assets Derived from Beneficial Interest Transactions | 3,858,969 | 14,530,801 | ||||||
| Net increase in net assets | 6,827,681 | 14,372,387 | ||||||
| NET ASSETS | ||||||||
| Beginning of period | 14,372,387 | – | ||||||
| End of period | $ | 21,200,068 | $ | 14,372,387 | ||||
See Notes to Financial Statements.
103 | April 30, 2021
ALPS | Smith Short Duration Bond Fund – Investor Class
Financial Highlights
Selected data for a share of beneficial interest outstanding throughout the periods indicated:
| For the Six Months Ended April 30, 2021 (Unaudited) | For the Year Ended October 31, 2020 | For the Year Ended October 31, 2019 | For the Period July 2, 2018 (Commencement of Operations) to October 31, 2018 | |||||||||||||
| Net asset value, beginning of period | $ | 10.62 | $ | 10.25 | $ | 9.98 | $ | 10.00 | ||||||||
| INCOME FROM INVESTMENT OPERATIONS: | ||||||||||||||||
| Net investment income(a) | 0.03 | 0.11 | 0.23 | 0.07 | ||||||||||||
| Net realized and unrealized gain/(loss) | 0.06 | 0.48 | 0.27 | (0.04 | ) | |||||||||||
| Total from investment operations | 0.09 | 0.59 | 0.50 | 0.03 | ||||||||||||
| DISTRIBUTIONS: | ||||||||||||||||
| From net investment income | (0.03 | ) | (0.14 | ) | (0.22 | ) | (0.05 | ) | ||||||||
| From net realized gains | (0.08 | ) | (0.08 | ) | (0.01 | ) | – | |||||||||
| Total distributions | (0.11 | ) | (0.22 | ) | (0.23 | ) | (0.05 | ) | ||||||||
| Net increase/(decrease) in net asset value | (0.02 | ) | 0.37 | 0.27 | (0.02 | ) | ||||||||||
| Net asset value, end of period | $ | 10.60 | $ | 10.62 | $ | 10.25 | $ | 9.98 | ||||||||
| TOTAL RETURN(b) | 0.80 | % | 5.85 | % | 5.04 | % | 0.25 | % | ||||||||
| RATIOS/SUPPLEMENTAL DATA: | ||||||||||||||||
| Net assets, end of period (000s) | $ | 16,141 | $ | 9,100 | $ | 519 | $ | 491 | ||||||||
| Ratio of expenses to average net assets excluding fee waivers and reimbursements | 0.85 | %(c) | 0.95 | % | 1.10 | % | 2.79 | %(c) | ||||||||
| Ratio of expenses to average net assets including fee waivers and reimbursements | 0.77 | %(c) | 0.78 | % | 0.76 | % | 0.89 | %(c) | ||||||||
| Ratio of net investment income to average net assets | 0.52 | %(c) | 1.02 | % | 2.22 | % | 1.93 | %(c) | ||||||||
| Portfolio turnover rate(d) | 112 | % | 457 | % | 639 | % | 266 | % | ||||||||
| (a) | Calculated using the average shares method. |
| (b) | Total returns are for the period indicated and have not been annualized. Total returns would have been lower had certain expenses not been waived during the period. Returns shown do not reflect the deduction of taxes that a shareholder would pay on Fund distributions or the redemption of Fund shares. |
| (c) | Annualized. |
| (d) | Portfolio turnover rate for periods less than one full year have not been annualized. |
See Notes to Financial Statements.
104 | April 30, 2021
ALPS | Smith Short Duration Bond Fund – Class A
Financial Highlights
Selected data for a share of beneficial interest outstanding throughout the periods indicated:
| For the Six Months Ended April 30, 2021 (Unaudited) | For the Year Ended October 31, 2020 | For the Year Ended October 31, 2019 | For the Period July 2, 2018 (Commencement of Operations) to October 31, 2018 | |||||||||||||
| Net asset value, beginning of period | $ | 10.61 | $ | 10.24 | $ | 9.98 | $ | 10.00 | ||||||||
| INCOME FROM INVESTMENT OPERATIONS: | ||||||||||||||||
| Net investment income(a) | 0.03 | 0.12 | 0.22 | 0.06 | ||||||||||||
| Net realized and unrealized gain/(loss) | 0.06 | 0.47 | 0.27 | (0.03 | ) | |||||||||||
| Total from investment operations | 0.09 | 0.59 | 0.49 | 0.03 | ||||||||||||
| DISTRIBUTIONS: | ||||||||||||||||
| From net investment income | (0.03 | ) | (0.14 | ) | (0.22 | ) | (0.05 | ) | ||||||||
| From net realized gains | (0.08 | ) | (0.08 | ) | (0.01 | ) | – | |||||||||
| Total distributions | (0.11 | ) | (0.22 | ) | (0.23 | ) | (0.05 | ) | ||||||||
| REDEMPTION FEES ADDED TO PAID-IN CAPITAL (NOTE 6) | – | – | 0.00 | (b) | – | |||||||||||
| Net increase/(decrease) in net asset value | (0.02 | ) | 0.37 | 0.26 | (0.02 | ) | ||||||||||
| Net asset value, end of period | $ | 10.59 | $ | 10.61 | $ | 10.24 | $ | 9.98 | ||||||||
| TOTAL RETURN(c) | 0.80 | % | 5.84 | % | 4.96 | % | 0.27 | % | ||||||||
| RATIOS/SUPPLEMENTAL DATA: | ||||||||||||||||
| Net assets, end of period (000s) | $ | 12,012 | $ | 3,702 | $ | 471 | $ | 110 | ||||||||
| Ratio of expenses to average net assets excluding fee waivers and reimbursements | 0.81 | %(d) | 0.94 | % | 1.09 | % | 4.28 | %(d) | ||||||||
| Ratio of expenses to average net assets including fee waivers and reimbursements | 0.77 | %(d) | 0.77 | % | 0.74 | % | 0.89 | %(d) | ||||||||
| Ratio of net investment income to average net assets | 0.51 | %(d) | 1.10 | % | 2.17 | % | 1.86 | %(d) | ||||||||
| Portfolio turnover rate(e) | 112 | % | 457 | % | 639 | % | 266 | % | ||||||||
| (a) | Calculated using the average shares method. |
| (b) | Less than $0.005 or ($0.005) per share. |
| (c) | Total returns are for the period indicated and have not been annualized. Total returns would have been lower had certain expenses not been waived during the period. Returns shown do not reflect the deduction of taxes that a shareholder would pay on Fund distributions or the redemption of Fund shares. Returns shown exclude any applicable sales charges. |
| (d) | Annualized. |
| (e) | Portfolio turnover rate for periods less than one full year have not been annualized. |
See Notes to Financial Statements.
105 | April 30, 2021
ALPS | Smith Short Duration Bond Fund – Class C
Financial Highlights
Selected data for a share of beneficial interest outstanding throughout the periods indicated:
| For the Six Months Ended April 30, 2021 (Unaudited) | For the Year Ended October 31, 2020 | For the Year Ended October 31, 2019 | For the Period July 2, 2018 (Commencement of Operations) to October 31, 2018 | |||||||||||||
| Net asset value, beginning of period | $ | 10.61 | $ | 10.24 | $ | 9.98 | $ | 10.00 | ||||||||
| INCOME FROM INVESTMENT OPERATIONS: | ||||||||||||||||
| Net investment income/(loss)(a) | (0.01 | ) | 0.05 | 0.15 | 0.05 | |||||||||||
| Net realized and unrealized gain/(loss) | 0.06 | 0.47 | 0.27 | (0.04 | ) | |||||||||||
| Total from investment operations | 0.05 | 0.52 | 0.42 | 0.01 | ||||||||||||
| DISTRIBUTIONS: | ||||||||||||||||
| From net investment income | (0.00 | )(b) | (0.07 | ) | (0.15 | ) | (0.03 | ) | ||||||||
| From net realized gains | (0.08 | ) | (0.08 | ) | (0.01 | ) | – | |||||||||
| Total distributions | (0.08 | ) | (0.15 | ) | (0.16 | ) | (0.03 | ) | ||||||||
| Net increase/(decrease) in net asset value | (0.03 | ) | 0.37 | 0.26 | (0.02 | ) | ||||||||||
| Net asset value, end of period | $ | 10.58 | $ | 10.61 | $ | 10.24 | $ | 9.98 | ||||||||
| TOTAL RETURN(c) | 0.45 | % | 5.10 | % | 4.19 | % | 0.09 | % | ||||||||
| RATIOS/SUPPLEMENTAL DATA: | ||||||||||||||||
| Net assets, end of period (000s) | $ | 3,179 | $ | 2,193 | $ | 497 | $ | 370 | ||||||||
| Ratio of expenses to average net assets excluding fee waivers and reimbursements | 1.54 | %(d) | 1.67 | % | 1.83 | % | 3.54 | %(d) | ||||||||
| Ratio of expenses to average net assets including fee waivers and reimbursements | 1.49 | %(d) | 1.49 | % | 1.49 | % | 1.48 | %(d) | ||||||||
| Ratio of net investment income/(loss) to average net assets | (0.20 | )%(d) | 0.46 | % | 1.48 | % | 1.35 | %(d) | ||||||||
| Portfolio turnover rate(e) | 112 | % | 457 | % | 639 | % | 266 | % | ||||||||
| (a) | Calculated using the average shares method. |
| (b) | Less than $0.005 or ($0.005) per share. |
| (c) | Total returns are for the period indicated and have not been annualized. Total returns would have been lower had certain expenses not been waived during the period. Returns shown do not reflect the deduction of taxes that a shareholder would pay on Fund distributions or the redemption of Fund shares. Returns shown exclude any applicable sales charges. |
| (d) | Annualized. |
| (e) | Portfolio turnover rate for periods less than one full year have not been annualized. |
See Notes to Financial Statements.
106 | April 30, 2021
ALPS | Smith Short Duration Bond Fund – Class I
Financial Highlights
Selected data for a share of beneficial interest outstanding throughout the periods indicated:
| For the Six Months Ended April 30, 2021 (Unaudited) | For the Year Ended October 31, 2020 | For the Year Ended October 31, 2019 | For the Period July 2, 2018 (Commencement of Operations) to October 31, 2018 | |||||||||||||
| Net asset value, beginning of period | $ | 10.62 | $ | 10.25 | $ | 9.99 | $ | 10.00 | ||||||||
| INCOME FROM INVESTMENT OPERATIONS: | ||||||||||||||||
| Net investment income(a) | 0.04 | 0.16 | 0.25 | 0.08 | ||||||||||||
| Net realized and unrealized gain/(loss) | 0.06 | 0.46 | 0.26 | (0.03 | ) | |||||||||||
| Total from investment operations | 0.10 | 0.62 | 0.51 | 0.05 | ||||||||||||
| DISTRIBUTIONS: | ||||||||||||||||
| From net investment income | (0.04 | ) | (0.17 | ) | (0.25 | ) | (0.06 | ) | ||||||||
| From net realized gains | (0.08 | ) | (0.08 | ) | (0.01 | ) | – | |||||||||
| Total distributions | (0.12 | ) | (0.25 | ) | (0.26 | ) | (0.06 | ) | ||||||||
| REDEMPTION FEES ADDED TO PAID-IN CAPITAL (NOTE 6) | – | 0.00 | (b) | 0.01 | 0.00 | (b) | ||||||||||
| Net increase/(decrease) in net asset value | (0.02 | ) | 0.37 | 0.26 | (0.01 | ) | ||||||||||
| Net asset value, end of period | $ | 10.60 | $ | 10.62 | $ | 10.25 | $ | 9.99 | ||||||||
| TOTAL RETURN(c) | 0.95 | % | 6.12 | % | 5.21 | % | 0.50 | % | ||||||||
| RATIOS/SUPPLEMENTAL DATA: | ||||||||||||||||
| Net assets, end of period (000s) | $ | 374,307 | $ | 166,817 | $ | 44,916 | $ | 13,601 | ||||||||
| Ratio of expenses to average net assets excluding fee waivers and reimbursements | 0.56 | %(d) | 0.70 | % | 0.82 | % | 1.70 | %(d) | ||||||||
| Ratio of expenses to average net assets including fee waivers and reimbursements | 0.49 | %(d) | 0.49 | % | 0.49 | % | 0.49 | %(d) | ||||||||
| Ratio of net investment income to average net assets | 0.79 | %(d) | 1.52 | % | 2.46 | % | 2.36 | %(d) | ||||||||
| Portfolio turnover rate(e) | 112 | % | 457 | % | 639 | % | 266 | % | ||||||||
| (a) | Calculated using the average shares method. |
| (b) | Less than $0.005 or ($0.005) per share. |
| (c) | Total returns are for the period indicated and have not been annualized. Total returns would have been lower had certain expenses not been waived during the period. Returns shown do not reflect the deduction of taxes that a shareholder would pay on Fund distributions or the redemption of Fund shares. |
| (d) | Annualized. |
| (e) | Portfolio turnover rate for periods less than one full year have not been annualized. |
See Notes to Financial Statements.
107 | April 30, 2021
ALPS | Smith Total Return Bond Fund – Investor Class
Financial Highlights
Selected data for a share of beneficial interest outstanding throughout the periods indicated:
| For the Six Months Ended April 30, 2021 (Unaudited) | For the Year Ended October 31, 2020 | For the Year Ended October 31, 2019 | For the Period July 2, 2018 (Commencement of Operations) to October 31, 2018 | |||||||||||||
| Net asset value, beginning of period | $ | 11.46 | $ | 10.99 | $ | 10.05 | $ | 10.00 | ||||||||
| INCOME FROM INVESTMENT OPERATIONS: | ||||||||||||||||
| Net investment income(a) | 0.09 | 0.19 | 0.22 | 0.07 | ||||||||||||
| Net realized and unrealized gain/(loss) | (0.06 | ) | 0.57 | 0.95 | 0.03 | |||||||||||
| Total from investment operations | 0.03 | 0.76 | 1.17 | 0.10 | ||||||||||||
| DISTRIBUTIONS: | ||||||||||||||||
| From net investment income | (0.09 | ) | (0.19 | ) | (0.21 | ) | (0.05 | ) | ||||||||
| From net realized gains | (0.19 | ) | (0.10 | ) | (0.02 | ) | – | |||||||||
| Total distributions | (0.28 | ) | (0.29 | ) | (0.23 | ) | (0.05 | ) | ||||||||
| REDEMPTION FEES ADDED TO PAID-IN CAPITAL (NOTE 6) | – | 0.00 | (b) | 0.00 | (b) | – | ||||||||||
| Net increase/(decrease) in net asset value | (0.25 | ) | 0.47 | 0.94 | 0.05 | |||||||||||
| Net asset value, end of period | $ | 11.21 | $ | 11.46 | $ | 10.99 | $ | 10.05 | ||||||||
| TOTAL RETURN(c) | 0.24 | % | 6.95 | % | 11.77 | % | 1.00 | % | ||||||||
| RATIOS/SUPPLEMENTAL DATA: | ||||||||||||||||
| Net assets, end of period (000s) | $ | 8,875 | $ | 10,109 | $ | 4,121 | $ | 345 | ||||||||
| Ratio of expenses to average net assets excluding fee waivers and reimbursements | 0.96 | %(d) | 1.01 | % | 1.07 | % | 2.97 | %(d) | ||||||||
| Ratio of expenses to average net assets including fee waivers and reimbursements | 0.96 | %(d) | 0.96 | % | 0.96 | % | 1.07 | %(d) | ||||||||
| Ratio of net investment income to average net assets | 1.57 | %(d) | 1.66 | % | 2.05 | % | 2.20 | %(d) | ||||||||
| Portfolio turnover rate(e) | 126 | % | 360 | % | 489 | % | 345 | % | ||||||||
| (a) | Calculated using the average shares method. |
| (b) | Less than $0.005 or ($0.005) per share. |
| (c) | Total returns are for the period indicated and have not been annualized. Total returns would have been lower had certain expenses not been waived during the period. Returns shown do not reflect the deduction of taxes that a shareholder would pay on Fund distributions or the redemption of Fund shares. |
| (d) | Annualized. |
| (e) | Portfolio turnover rate for periods less than one full year have not been annualized. |
See Notes to Financial Statements.
108 | April 30, 2021
ALPS | Smith Total Return Bond Fund – Class A
Financial Highlights
Selected data for a share of beneficial interest outstanding throughout the periods indicated:
| For the Six Months Ended April 30, 2021 (Unaudited) | For the Year Ended October 31, 2020 | For the Year Ended October 31, 2019 | For the Period July 2, 2018 (Commencement of Operations) to October 31, 2018 | |||||||||||||
| Net asset value, beginning of period | $ | 11.46 | $ | 10.99 | $ | 10.05 | $ | 10.00 | ||||||||
| INCOME FROM INVESTMENT OPERATIONS: | ||||||||||||||||
| Net investment income(a) | 0.09 | 0.19 | 0.21 | 0.07 | ||||||||||||
| Net realized and unrealized gain/(loss) | (0.06 | ) | 0.57 | 0.97 | 0.03 | |||||||||||
| Total from investment operations | 0.03 | 0.76 | 1.18 | 0.10 | ||||||||||||
| DISTRIBUTIONS: | ||||||||||||||||
| From net investment income | (0.09 | ) | (0.19 | ) | (0.22 | ) | (0.05 | ) | ||||||||
| From net realized gains | (0.19 | ) | (0.10 | ) | (0.02 | ) | – | |||||||||
| Total distributions | (0.28 | ) | (0.29 | ) | (0.24 | ) | (0.05 | ) | ||||||||
| REDEMPTION FEES ADDED TO PAID-IN CAPITAL (NOTE 6) | – | 0.00 | (b) | 0.00 | (b) | – | ||||||||||
| Net increase/(decrease) in net asset value | (0.25 | ) | 0.47 | 0.94 | 0.05 | |||||||||||
| Net asset value, end of period | $ | 11.21 | $ | 11.46 | $ | 10.99 | $ | 10.05 | ||||||||
| TOTAL RETURN(c) | 0.24 | % | 6.96 | % | 11.79 | % | 1.04 | % | ||||||||
| RATIOS/SUPPLEMENTAL DATA: | ||||||||||||||||
| Net assets, end of period (000s) | $ | 16,965 | $ | 15,016 | $ | 7,929 | $ | 136 | ||||||||
| Ratio of expenses to average net assets excluding fee waivers and reimbursements | 0.96 | %(d) | 0.99 | % | 1.05 | % | 3.96 | %(d) | ||||||||
| Ratio of expenses to average net assets including fee waivers and reimbursements | 0.95 | %(d) | 0.95 | % | 0.95 | % | 1.07 | %(d) | ||||||||
| Ratio of net investment income to average net assets | 1.58 | %(d) | 1.66 | % | 1.91 | % | 2.10 | %(d) | ||||||||
| Portfolio turnover rate(e) | 126 | % | 360 | % | 489 | % | 345 | % | ||||||||
| (a) | Calculated using the average shares method. |
| (b) | Less than $0.005 or ($0.005) per share. |
| (c) | Total returns are for the period indicated and have not been annualized. Total returns would have been lower had certain expenses not been waived during the period. Returns shown do not reflect the deduction of taxes that a shareholder would pay on Fund distributions or the redemption of Fund shares. Returns shown exclude any applicable sales charges. |
| (d) | Annualized. |
| (e) | Portfolio turnover rate for periods less than one full year have not been annualized. |
See Notes to Financial Statements.
109 | April 30, 2021
ALPS | Smith Total Return Bond Fund – Class C
Financial Highlights
Selected data for a share of beneficial interest outstanding throughout the periods indicated:
| For the Six Months Ended April 30, 2021 (Unaudited) | For the Year Ended October 31, 2020 | For the Year Ended October 31, 2019 | For the Period July 2, 2018 (Commencement of Operations) to October 31, 2018 | |||||||||||||
| Net asset value, beginning of period | $ | 11.44 | $ | 10.97 | $ | 10.04 | $ | 10.00 | ||||||||
| INCOME FROM INVESTMENT OPERATIONS: | ||||||||||||||||
| Net investment income(a) | 0.05 | 0.11 | 0.13 | 0.05 | ||||||||||||
| Net realized and unrealized gain/(loss) | (0.05 | ) | 0.57 | 0.97 | 0.03 | |||||||||||
| Total from investment operations | – | 0.68 | 1.10 | 0.08 | ||||||||||||
| DISTRIBUTIONS: | ||||||||||||||||
| From net investment income | (0.06 | ) | (0.11 | ) | (0.15 | ) | (0.04 | ) | ||||||||
| From net realized gains | (0.19 | ) | (0.10 | ) | (0.02 | ) | – | |||||||||
| Total distributions | (0.25 | ) | (0.21 | ) | (0.17 | ) | (0.04 | ) | ||||||||
| Net increase/(decrease) in net asset value | (0.25 | ) | 0.47 | 0.93 | 0.04 | |||||||||||
| Net asset value, end of period | $ | 11.19 | $ | 11.44 | $ | 10.97 | $ | 10.04 | ||||||||
| TOTAL RETURN(b) | (0.10 | )% | 6.23 | % | 10.98 | % | 0.79 | % | ||||||||
| RATIOS/SUPPLEMENTAL DATA: | ||||||||||||||||
| Net assets, end of period (000s) | $ | 7,950 | $ | 6,508 | $ | 1,727 | $ | 121 | ||||||||
| Ratio of expenses to average net assets excluding fee waivers and reimbursements | 1.70 | %(c) | 1.72 | % | 1.79 | % | 4.69 | %(c) | ||||||||
| Ratio of expenses to average net assets including fee waivers and reimbursements | 1.67 | %(c) | 1.67 | % | 1.67 | % | 1.67 | %(c) | ||||||||
| Ratio of net investment income to average net assets | 0.85 | %(c) | 0.94 | % | 1.20 | % | 1.49 | %(c) | ||||||||
| Portfolio turnover rate(d) | 126 | % | 360 | % | 489 | % | 345 | % | ||||||||
| (a) | Calculated using the average shares method. |
| (b) | Total returns are for the period indicated and have not been annualized. Total returns would have been lower had certain expenses not been waived during the period. Returns shown do not reflect the deduction of taxes that a shareholder would pay on Fund distributions or the redemption of Fund shares. Returns shown exclude any applicable sales charges. |
| (c) | Annualized. |
| (d) | Portfolio turnover rate for periods less than one full year have not been annualized. |
See Notes to Financial Statements.
110 | April 30, 2021
ALPS | Smith Total Return Bond Fund – Class I
Financial Highlights
Selected data for a share of beneficial interest outstanding throughout the periods indicated:
| For the Six Months Ended April 30, 2021 (Unaudited) | For the Year Ended October 31, 2020 | For the Year Ended October 31, 2019 | For the Period July 2, 2018 (Commencement of Operations) to October 31, 2018 | |||||||||||||
| Net asset value, beginning of period | $ | 11.46 | $ | 10.99 | $ | 10.04 | $ | 10.00 | ||||||||
| INCOME FROM INVESTMENT OPERATIONS: | ||||||||||||||||
| Net investment income(a) | 0.10 | 0.22 | 0.24 | 0.09 | ||||||||||||
| Net realized and unrealized gain/(loss) | (0.05 | ) | 0.57 | 0.97 | 0.02 | |||||||||||
| Total from investment operations | 0.05 | 0.79 | 1.21 | 0.11 | ||||||||||||
| DISTRIBUTIONS: | ||||||||||||||||
| From net investment income | (0.11 | ) | (0.22 | ) | (0.24 | ) | (0.07 | ) | ||||||||
| From net realized gains | (0.19 | ) | (0.10 | ) | (0.02 | ) | – | |||||||||
| Total distributions | (0.30 | ) | (0.32 | ) | (0.26 | ) | (0.07 | ) | ||||||||
| REDEMPTION FEES ADDED TO PAID-IN CAPITAL (NOTE 6) | – | 0.00 | (b) | 0.00 | (b) | – | ||||||||||
| Net increase/(decrease) in net asset value | (0.25 | ) | 0.47 | 0.95 | 0.04 | |||||||||||
| Net asset value, end of period | $ | 11.21 | $ | 11.46 | $ | 10.99 | $ | 10.04 | ||||||||
| TOTAL RETURN(c) | 0.39 | % | 7.26 | % | 12.19 | % | 1.09 | % | ||||||||
| RATIOS/SUPPLEMENTAL DATA: | ||||||||||||||||
| Net assets, end of period (000s) | $ | 1,687,269 | $ | 1,331,786 | $ | 365,930 | $ | 10,495 | ||||||||
| Ratio of expenses to average net assets excluding fee waivers and reimbursements | 0.70 | %(d) | 0.72 | % | 0.76 | % | 2.18 | %(d) | ||||||||
| Ratio of expenses to average net assets including fee waivers and reimbursements | 0.67 | %(d) | 0.67 | % | 0.67 | % | 0.67 | %(d) | ||||||||
| Ratio of net investment income to average net assets | 1.85 | %(d) | 1.94 | % | 2.22 | % | 2.64 | %(d) | ||||||||
| Portfolio turnover rate(e) | 126 | % | 360 | % | 489 | % | 345 | % | ||||||||
| (a) | Calculated using the average shares method. |
| (b) | Less than $0.005 or ($0.005) per share. |
| (c) | Total returns are for the period indicated and have not been annualized. Total returns would have been lower had certain expenses not been waived during the period. Returns shown do not reflect the deduction of taxes that a shareholder would pay on Fund distributions or the redemption of Fund shares. |
| (d) | Annualized. |
| (e) | Portfolio turnover rate for periods less than one full year have not been annualized. |
See Notes to Financial Statements.
111 | April 30, 2021
ALPS | Smith Credit Opportunities Fund – Investor Class
Financial Highlights
Selected data for a share of beneficial interest outstanding throughout the periods indicated:
| For the Six Months Ended April 30, 2021 (Unaudited) | For the Period September 16, 2020 (Commencement of Operations) to October 31, 2020 | |||||||
| Net asset value, beginning of period | $ | 9.96 | $ | 10.00 | ||||
| INCOME FROM INVESTMENT OPERATIONS: | ||||||||
| Net investment income(a) | 0.11 | 0.02 | ||||||
| Net realized and unrealized gain/(loss) | 0.46 | (0.04 | ) | |||||
| Total from investment operations | 0.57 | (0.02 | ) | |||||
| DISTRIBUTIONS: | ||||||||
| From net investment income | (0.12 | ) | (0.02 | ) | ||||
| From net realized gains | (0.02 | ) | – | |||||
| Total distributions | (0.14 | ) | (0.02 | ) | ||||
| Net increase/(decrease) in net asset value | 0.43 | (0.04 | ) | |||||
| Net asset value, end of period | $ | 10.39 | $ | 9.96 | ||||
| TOTAL RETURN(b) | 5.70 | % | (0.23 | )% | ||||
| RATIOS/SUPPLEMENTAL DATA: | ||||||||
| Net assets, end of period (000s) | $ | 7,646 | $ | 699 | ||||
| Ratio of expenses to average net assets excluding fee waivers and reimbursements | 1.23 | %(c) | 2.36 | %(c) | ||||
| Ratio of expenses to average net assets including fee waivers and reimbursements | 1.19 | %(c) | 1.20 | %(c) | ||||
| Ratio of net investment income to average net assets | 2.10 | %(c) | 1.37 | %(c) | ||||
| Portfolio turnover rate(d) | 151 | % | 66 | % | ||||
| (a) | Calculated using the average shares method. |
| (b) | Total returns are for the period indicated and have not been annualized. Total returns would have been lower had certain expenses not been waived during the period. Returns shown do not reflect the deduction of taxes that a shareholder would pay on Fund distributions or the redemption of Fund shares. |
| (c) | Annualized. |
| (d) | Portfolio turnover rate for periods less than one full year have not been annualized. |
See Notes to Financial Statements.
112 | April 30, 2021
ALPS | Smith Credit Opportunities Fund – Class A
Financial Highlights
Selected data for a share of beneficial interest outstanding throughout the periods indicated:
| For the Six Months Ended April 30, 2021 (Unaudited) | For the Period September 16, 2020 (Commencement of Operations) to October 31, 2020 | |||||||
| Net asset value, beginning of period | $ | 9.96 | $ | 10.00 | ||||
| INCOME FROM INVESTMENT OPERATIONS: | ||||||||
| Net investment income(a) | 0.12 | 0.02 | ||||||
| Net realized and unrealized gain/(loss) | 0.45 | (0.04 | ) | |||||
| Total from investment operations | 0.57 | (0.02 | ) | |||||
| DISTRIBUTIONS: | ||||||||
| From net investment income | (0.12 | ) | (0.02 | ) | ||||
| From net realized gains | (0.02 | ) | – | |||||
| Total distributions | (0.14 | ) | (0.02 | ) | ||||
| Net increase/(decrease) in net asset value | 0.43 | (0.04 | ) | |||||
| Net asset value, end of period | $ | 10.39 | $ | 9.96 | ||||
| TOTAL RETURN(b) | 5.70 | % | (0.22 | )% | ||||
| RATIOS/SUPPLEMENTAL DATA: | ||||||||
| Net assets, end of period (000s) | $ | 1,203 | $ | 996 | ||||
| Ratio of expenses to average net assets excluding fee waivers and reimbursements | 1.30 | %(c) | 2.38 | %(c) | ||||
| Ratio of expenses to average net assets including fee waivers and reimbursements | 1.17 | %(c) | 1.20 | %(c) | ||||
| Ratio of net investment income to average net assets | 2.32 | %(c) | 1.33 | %(c) | ||||
| Portfolio turnover rate(d) | 151 | % | 66 | % | ||||
| (a) | Calculated using the average shares method. |
| (b) | Total returns are for the period indicated and have not been annualized. Total returns would have been lower had certain expenses not been waived during the period. Returns shown do not reflect the deduction of taxes that a shareholder would pay on Fund distributions or the redemption of Fund shares. Returns shown exclude any applicable sales charges. |
| (c) | Annualized. |
| (d) | Portfolio turnover rate for periods less than one full year have not been annualized. |
See Notes to Financial Statements.
113 | April 30, 2021
ALPS | Smith Credit Opportunities Fund – Class C
Financial Highlights
Selected data for a share of beneficial interest outstanding throughout the periods indicated:
| For the Six Months Ended April 30, 2021 (Unaudited) | For the Period September 16, 2020 (Commencement of Operations) to October 31, 2020 | |||||||
| Net asset value, beginning of period | $ | 9.96 | $ | 10.00 | ||||
| INCOME FROM INVESTMENT OPERATIONS: | ||||||||
| Net investment income(a) | 0.08 | 0.01 | ||||||
| Net realized and unrealized gain/(loss) | 0.45 | (0.04 | ) | |||||
| Total from investment operations | 0.53 | (0.03 | ) | |||||
| DISTRIBUTIONS: | ||||||||
| From net investment income | (0.08 | ) | (0.01 | ) | ||||
| From net realized gains | (0.02 | ) | – | |||||
| Total distributions | (0.10 | ) | (0.01 | ) | ||||
| Net increase/(decrease) in net asset value | 0.43 | (0.04 | ) | |||||
| Net asset value, end of period | $ | 10.39 | $ | 9.96 | ||||
| TOTAL RETURN(b) | 5.33 | % | (0.31 | )% | ||||
| RATIOS/SUPPLEMENTAL DATA: | ||||||||
| Net assets, end of period (000s) | $ | 519 | $ | 498 | ||||
| Ratio of expenses to average net assets excluding fee waivers and reimbursements | 2.03 | %(c) | 3.09 | %(c) | ||||
| Ratio of expenses to average net assets including fee waivers and reimbursements | 1.90 | %(c) | 1.90 | %(c) | ||||
| Ratio of net investment income to average net assets | 1.59 | %(c) | 0.63 | %(c) | ||||
| Portfolio turnover rate(d) | 151 | % | 66 | % | ||||
| (a) | Calculated using the average shares method. |
| (b) | Total returns are for the period indicated and have not been annualized. Total returns would have been lower had certain expenses not been waived during the period. Returns shown do not reflect the deduction of taxes that a shareholder would pay on Fund distributions or the redemption of Fund shares. Returns shown exclude any applicable sales charges. |
| (c) | Annualized. |
| (d) | Portfolio turnover rate for periods less than one full year have not been annualized. |
See Notes to Financial Statements.
114 | April 30, 2021
ALPS | Smith Credit Opportunities Fund – Class I
Financial Highlights
Selected data for a share of beneficial interest outstanding throughout the periods indicated:
| For the Six Months Ended April 30, 2021 (Unaudited) | For the Period September 16, 2020 (Commencement of Operations) to October 31, 2020 | |||||||
| Net asset value, beginning of period | $ | 9.97 | $ | 10.00 | ||||
| INCOME FROM INVESTMENT OPERATIONS: | ||||||||
| Net investment income(a) | 0.13 | 0.02 | ||||||
| Net realized and unrealized gain/(loss) | 0.45 | (0.03 | ) | |||||
| Total from investment operations | 0.58 | (0.01 | ) | |||||
| DISTRIBUTIONS: | ||||||||
| From net investment income | (0.13 | ) | (0.02 | ) | ||||
| From net realized gains | (0.02 | ) | – | |||||
| Total distributions | (0.15 | ) | (0.02 | ) | ||||
| Net increase/(decrease) in net asset value | 0.43 | (0.03 | ) | |||||
| Net asset value, end of period | $ | 10.40 | $ | 9.97 | ||||
| TOTAL RETURN(b) | 5.85 | % | (0.15 | )% | ||||
| RATIOS/SUPPLEMENTAL DATA: | ||||||||
| Net assets, end of period (000s) | $ | 148,474 | $ | 25,051 | ||||
| Ratio of expenses to average net assets excluding fee waivers and reimbursements | 0.97 | %(c) | 1.86 | %(c) | ||||
| Ratio of expenses to average net assets including fee waivers and reimbursements | 0.90 | %(c) | 0.90 | %(c) | ||||
| Ratio of net investment income to average net assets | 2.48 | %(c) | 1.79 | %(c) | ||||
| Portfolio turnover rate(d) | 151 | % | 66 | % | ||||
| (a) | Calculated using the average shares method. |
| (b) | Total returns are for the period indicated and have not been annualized. Total returns would have been lower had certain expenses not been waived during the period. Returns shown do not reflect the deduction of taxes that a shareholder would pay on Fund distributions or the redemption of Fund shares. |
| (c) | Annualized. |
| (d) | Portfolio turnover rate for periods less than one full year have not been annualized. |
See Notes to Financial Statements.
115 | April 30, 2021
ALPS | Smith Balanced Opportunity Fund – Investor Class
Financial Highlights
Selected data for a share of beneficial interest outstanding throughout the periods indicated:
| For the Six Months Ended April 30, 2021 (Unaudited) | For the Period September 16, 2020 (Commencement of Operations) to October 31, 2020 | |||||||
| Net asset value, beginning of period | $ | 9.88 | $ | 10.00 | ||||
| INCOME FROM INVESTMENT OPERATIONS: | ||||||||
| Net investment income(a) | 0.02 | 0.00 | (b) | |||||
| Net realized and unrealized gain/(loss) | 1.89 | (0.12 | ) | |||||
| Total from investment operations | 1.91 | (0.12 | ) | |||||
| DISTRIBUTIONS: | ||||||||
| From net investment income | (0.02 | ) | (0.00 | )(b) | ||||
| Total distributions | (0.02 | ) | (0.00 | )(b) | ||||
| Net increase/(decrease) in net asset value | 1.89 | (0.12 | ) | |||||
| Net asset value, end of period | $ | 11.77 | $ | 9.88 | ||||
| TOTAL RETURN(c) | 19.39 | % | (1.18 | )% | ||||
| RATIOS/SUPPLEMENTAL DATA: | ||||||||
| Net assets, end of period (000s) | $ | 724 | $ | 601 | ||||
| Ratio of expenses to average net assets excluding fee waivers and reimbursements | 1.98 | %(d) | 3.00 | %(d) | ||||
| Ratio of expenses to average net assets including fee waivers and reimbursements | 1.13 | %(d) | 1.15 | %(d) | ||||
| Ratio of net investment income to average net assets | 0.35 | %(d) | 0.25 | %(d) | ||||
| Portfolio turnover rate(e) | 68 | % | 26 | % | ||||
| (a) | Calculated using the average shares method. |
| (b) | Less than $0.005 or ($0.005) per share. |
| (c) | Total returns are for the period indicated and have not been annualized. Total returns would have been lower had certain expenses not been waived during the period. Returns shown do not reflect the deduction of taxes that a shareholder would pay on Fund distributions or the redemption of Fund shares. |
| (d) | Annualized. |
| (e) | Portfolio turnover rate for periods less than one full year have not been annualized. |
See Notes to Financial Statements.
116 | April 30, 2021
ALPS | Smith Balanced Opportunity Fund – Class A
Financial Highlights
Selected data for a share of beneficial interest outstanding throughout the periods indicated:
| For the Six Months Ended April 30, 2021 (Unaudited) | For the Period September 16, 2020 (Commencement of Operations) to October 31, 2020 | |||||||
| Net asset value, beginning of period | $ | 9.88 | $ | 10.00 | ||||
| INCOME FROM INVESTMENT OPERATIONS: | ||||||||
| Net investment income(a) | 0.02 | 0.00 | (b) | |||||
| Net realized and unrealized gain/(loss) | 1.89 | (0.12 | ) | |||||
| Total from investment operations | 1.91 | (0.12 | ) | |||||
| DISTRIBUTIONS: | ||||||||
| From net investment income | (0.02 | ) | (0.00 | )(b) | ||||
| Total distributions | (0.02 | ) | (0.00 | )(b) | ||||
| Net increase/(decrease) in net asset value | 1.89 | (0.12 | ) | |||||
| Net asset value, end of period | $ | 11.77 | $ | 9.88 | ||||
| TOTAL RETURN(c) | 19.39 | % | (1.16 | )% | ||||
| RATIOS/SUPPLEMENTAL DATA: | ||||||||
| Net assets, end of period (000s) | $ | 1,177 | $ | 988 | ||||
| Ratio of expenses to average net assets excluding fee waivers and reimbursements | 1.97 | %(d) | 3.03 | %(d) | ||||
| Ratio of expenses to average net assets including fee waivers and reimbursements | 1.12 | %(d) | 1.15 | %(d) | ||||
| Ratio of net investment income to average net assets | 0.36 | %(d) | 0.26 | %(d) | ||||
| Portfolio turnover rate(e) | 68 | % | 26 | % | ||||
| (a) | Calculated using the average shares method. |
| (b) | Less than $0.005 or ($0.005) per share. |
| (c) | Total returns are for the period indicated and have not been annualized. Total returns would have been lower had certain expenses not been waived during the period. Returns shown do not reflect the deduction of taxes that a shareholder would pay on Fund distributions or the redemption of Fund shares. Returns shown exclude any applicable sales charges. |
| (d) | Annualized. |
| (e) | Portfolio turnover rate for periods less than one full year have not been annualized. |
See Notes to Financial Statements.
117 | April 30, 2021
ALPS | Smith Balanced Opportunity Fund – Class C
Financial Highlights
Selected data for a share of beneficial interest outstanding throughout the periods indicated:
| For the Six Months Ended April 30, 2021 (Unaudited) | For the Period September 16, 2020 (Commencement of Operations) to October 31, 2020 | |||||||
| Net asset value, beginning of period | $ | 9.88 | $ | 10.00 | ||||
| INCOME FROM INVESTMENT OPERATIONS: | ||||||||
| Net investment loss(a) | (0.02 | ) | (0.01 | ) | ||||
| Net realized and unrealized gain/(loss) | 1.88 | (0.11 | ) | |||||
| Total from investment operations | 1.86 | (0.12 | ) | |||||
| Net increase/(decrease) in net asset value | 1.86 | (0.12 | ) | |||||
| Net asset value, end of period | $ | 11.74 | $ | 9.88 | ||||
| TOTAL RETURN(b) | 18.83 | % | (1.20 | )% | ||||
| RATIOS/SUPPLEMENTAL DATA: | ||||||||
| Net assets, end of period (000s) | $ | 587 | $ | 494 | ||||
| Ratio of expenses to average net assets excluding fee waivers and reimbursements | 2.70 | %(c) | 3.73 | %(c) | ||||
| Ratio of expenses to average net assets including fee waivers and reimbursements | 1.85 | %(c) | 1.85 | %(c) | ||||
| Ratio of net investment loss to average net assets | (0.37 | )%(c) | (0.44 | )%(c) | ||||
| Portfolio turnover rate(d) | 68 | % | 26 | % | ||||
| (a) | Calculated using the average shares method. |
| (b) | Total returns are for the period indicated and have not been annualized. Total returns would have been lower had certain expenses not been waived during the period. Returns shown do not reflect the deduction of taxes that a shareholder would pay on Fund distributions or the redemption of Fund shares. Returns shown exclude any applicable sales charges. |
| (c) | Annualized. |
| (d) | Portfolio turnover rate for periods less than one full year have not been annualized. |
See Notes to Financial Statements.
118 | April 30, 2021
ALPS | Smith Balanced Opportunity Fund – Class I
Financial Highlights
Selected data for a share of beneficial interest outstanding throughout the periods indicated:
| For the Six Months Ended April 30, 2021 (Unaudited) | For the Period September 16, 2020 (Commencement of Operations) to October 31, 2020 | |||||||
| Net asset value, beginning of period | $ | 9.88 | $ | 10.00 | ||||
| INCOME FROM INVESTMENT OPERATIONS: | ||||||||
| Net investment income(a) | 0.03 | 0.01 | ||||||
| Net realized and unrealized gain/(loss) | 1.90 | (0.12 | ) | |||||
| Total from investment operations | 1.93 | (0.11 | ) | |||||
| DISTRIBUTIONS: | ||||||||
| From net investment income | (0.04 | ) | (0.01 | ) | ||||
| Total distributions | (0.04 | ) | (0.01 | ) | ||||
| Net increase/(decrease) in net asset value | 1.89 | (0.12 | ) | |||||
| Net asset value, end of period | $ | 11.77 | $ | 9.88 | ||||
| TOTAL RETURN(b) | 19.56 | % | (1.15 | )% | ||||
| RATIOS/SUPPLEMENTAL DATA: | ||||||||
| Net assets, end of period (000s) | $ | 18,712 | $ | 12,289 | ||||
| Ratio of expenses to average net assets excluding fee waivers and reimbursements | 1.72 | %(c) | 2.69 | %(c) | ||||
| Ratio of expenses to average net assets including fee waivers and reimbursements | 0.85 | %(c) | 0.85 | %(c) | ||||
| Ratio of net investment income to average net assets | 0.63 | %(c) | 0.57 | %(c) | ||||
| Portfolio turnover rate(d) | 68 | % | 26 | % | ||||
| (a) | Calculated using the average shares method. |
| (b) | Total returns are for the period indicated and have not been annualized. Total returns would have been lower had certain expenses not been waived during the period. Returns shown do not reflect the deduction of taxes that a shareholder would pay on Fund distributions or the redemption of Fund shares. |
| (c) | Annualized. |
| (d) | Portfolio turnover rate for periods less than one full year have not been annualized. |
See Notes to Financial Statements.
119 | April 30, 2021
ALPS | Red Rocks Global Opportunity Fund
| Management Commentary | April 30, 2021 (Unaudited) |
2021 – H1 Commentary and Outlook
The first half of 2021 was notable for the reflation trade with strong performance from cyclical and value-type companies that were hurt the most by the pandemic. These companies were spurred on by continued government fiscal and monetary support as well as the incremental reopening of businesses following the vaccine rollout. Growth and inflation continue to creep upwards, pushing long-term interest rates higher. We believe this bodes well for financials such as banks and lenders, as the increase in lending spreads improves their profitability, and much less so for high valuation growth companies as increased discount rates could leave them vulnerable to rising costs of capital. The Fed maintains that inflation will prove transitory as bottlenecks created by the pandemic alleviate and manufacturing catches up to demand. In our view, this may take a few months to play out but “inflation watch” has become the cornerstone of the equity markets.
H1 2021 Markets Review
Equities continued marching higher in the first half as central banks around the world reinforced their commitment to loose monetary policy and governments provided massive fiscal stimulus. The United States approved the third round of stimulus payments. This excess liquidity gave rise to fear of rampant inflation which sparked interest rates to jump higher as the 10-year Treasury note yields finished the half at 1.63% up from 0.87%.
Technology and healthcare sectors gave up leadership as the stock market broadened with vaccine rollout accelerating. Energy and financials were notable strengths. Within financials, lenders were particularly strong as a steeper yield curve helps their profits.
H1 2021 Portfolio Review
For the six months ending April 30, 2021, the Fund’s Investor shares (LPEFX) returned 35.40%, compared with 30.16% and 49.07% for the Morningstar Developed Markets Index (the Fund’s primary benchmark) and the Global Listed Private Equity Index (the Fund’s secondary benchmark), respectively.
The Fund missed out on strong performance in energy, consumer discretionary and materials versus our benchmark with smaller allocations.
Net contributors to performance included:
• IAC/InteractiveCorp
• Intermediate Capital
• KKR & Co
Net detractors from performance included:
• Prosus NV
• Taiwan Semiconductor
• Alibaba Group
We exited 10 names, added 13, and ended the period with 50 holdings.
Outlook
As of the date of this report, consumer prices have recovered to pre-COVID levels. Price jumps and selected bottlenecks in the supply chain are noticeable in pockets of the economy such as lumber, copper, and shipping rates. We believe, however, that while the overall level of inflation may rise in the near-term, it will not persist and we believe that the recent spike of interest rates will likely overshoot and settle back down as inflation fears fade later in the year and into 2022. The recent outperformance of banks should begin to mitigate as this becomes more likely.
Excess capital in equity markets have been driving a feeding frenzy into crowded sectors with very poor fundamentals. To justify these lofty valuations, earnings reports will likely need to exceed investor expectations over the next couple of quarters. Fortunately, as of the date of this report, stocks held by the Fund continue to trade at reasonable valuations due to their complexity, balance sheet strength, and long term superior capital allocation.
We target companies we call “capital allocators” with management teams, incentives, and shareholder alignment that we believe create exceptional value over mid to long time horizons. These companies are often holding companies, conglomerates, and publicly traded private equity portfolios.
In our opinion, the current market climate is well suited for the Fund’s portfolio companies. In particular, record M&A acts as an accelerant for the Fund’s portfolio companies, allowing them to rotate their underlying holdings and harvest gains. Given relative valuations, M&A tailwinds, and a focus on return on capital, we believe that the Fund’s portfolio is positioned well for this environment. As this new bull market matures, coming off the quick and deep downdraft of the pandemic, we expect the Fund’s portfolio to play catch up as investors return to a longer term view of excellent capital allocators. The market and many investors seem very short term oriented, reacting to the next big news in various sectors both positive and negative. As pure speculation (a hallmark of early bull markets) gradually dissipates, we expect more rational valuations and attitudes will re-emerge about what constitutes good, solid equity investments. In that vein we appreciate your loyalty and patience.
| Andrew Drummond | Kirk McCown |
| Portfolio Manager | Portfolio Manager |
120 | April 30, 2021
ALPS | Red Rocks Global Opportunity Fund
| Management Commentary | April 30, 2021 (Unaudited) |
The views of the authors and information discussed in this commentary are as of the date of publication, are subject to change, and may not reflect the writer's current views. The views expressed are those of the authors only, and represent an assessment of market conditions at a specific point in time, are opinions only and should not be relied upon as investment advice regarding a particular investment or markets in general. Such information does not constitute a recommendation to buy or sell specific securities or investment vehicles. It should not be assumed that any investment will be profitable or will equal the performance of the fund(s) or any securities or any sectors mentioned in this letter. The subject matter contained in this letter has been derived from several sources believed to be reliable and accurate at the time of compilation. Neither ALPS, Advisors, Inc., Red Rocks Capital, LLC, nor the Fund accepts any liability for losses either direct or consequential caused by the use of this information.
Diversification cannot guarantee gain or prevent losses.
Past performance is no guarantee of future results. Dividends are not guaranteed and are subject to change or elimination. Investments in international and emerging markets securities include exposure to risks such as currency fluctuations, foreign taxes and regulations, and the potential for illiquid markets and political instability.
ALPS Portfolio Solutions Distributor, Inc., ALPS Distributors, Inc. and ALPS Advisors Inc. are affiliated.
121 | April 30, 2021
ALPS | Red Rocks Global Opportunity Fund
| Performance Update | April 30, 2021 (Unaudited) |
Performance of $10,000 Initial Investment (as of April 30, 2021)
Comparison of change in value of a $10,000 investment
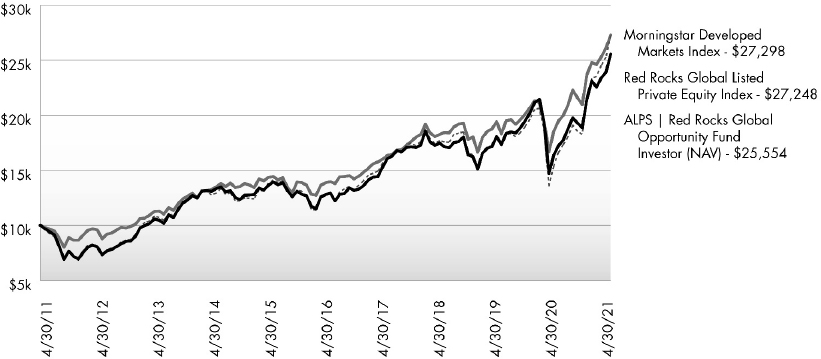
The chart above represents historical performance of a hypothetical investment of $10,000 in the Fund. Past performance does not guarantee future results. This chart does not reflect the deduction of taxes that a shareholder would pay on Fund distributions or the redemption of Fund shares.
Average Annual Total Returns (as of April 30, 2021)
| 6 Month | 1 Year | 3 Year | 5 Year | 10 Year | Total Expense Ratio | What You Pay* | |
| Investor# (NAV) | 35.40% | 56.16% | 13.50% | 14.85% | 9.84% | 2.45% | 2.45% |
| Class A (NAV) | 35.20% | 56.27% | 13.51% | 14.85% | 9.84% | 2.49% | 2.49% |
| Class A (MOP) | 27.67% | 47.80% | 11.39% | 13.54% | 9.23% | ||
| Class C (NAV) | 34.94% | 54.88% | 12.61% | 13.98% | 9.03% | 3.11% | 3.11% |
| Class C (CDSC) | 33.94% | 53.88% | 12.61% | 13.98% | 9.03% | ||
| Class I | 35.41% | 56.48% | 13.76% | 15.12% | 10.13% | 2.11% | 2.11% |
| Class R | 35.12%+ | 55.95% | 13.27% | 14.62% | 9.69% | 2.57% | 2.57% |
| Morningstar Developed Markets Index1 | 30.16% | 47.39% | 14.34% | 14.50% | 10.56% | ||
| Red Rocks Global Listed Private Equity Index2 | 49.07% | 77.13% | 15.46% | 16.52% | 10.54% |
Performance data quoted represents past performance. Past performance does not guarantee future results. Investment return and principal value of an investment will fluctuate so that an investor’s shares, when sold or redeemed, may be worth more or less than the original cost. Current performance data may be higher or lower than actual data quoted. For the most current month-end performance data, please call 1-866-759-5679.
Maximum Offering Price (MOP) for Class A shares includes the Fund’s maximum sales charge of 5.50%. Performance shown at NAV does not include these sales charges and would have been lower had it been taken into account. If you invest $1 million or more, either as a lump sum or through the Fund’s accumulation or letter of intent programs, you can purchase Class A shares without an initial sales charge (load). A Contingent Deferred Sales Charge (“CDSC”) of 1.00% may apply to Class C shares redeemed within the first 12 months after a purchase, and on Class A shares redeemed within the first 18 months after a purchase in excess of $1 million. The Fund imposes a 2.00% redemption fee on shares held for less than 90 days.
122 | April 30, 2021
ALPS | Red Rocks Global Opportunity Fund
| Performance Update | April 30, 2021 (Unaudited) |
Performance shown for Class A shares prior to June 12, 2018 reflects the historical performance of the Fund’s Investor shares, calculated using the fees and expenses of Class A shares.
Fund Inception date of December 31, 2007 for Investor Class, Class I, and Class R; Fund Inception date June 30, 2010 for Class C; Fund Inception date June 12, 2018 for Class A.
| 1 | The Morningstar Developed Market Index measures the performance of developed regional markets targeting the top 97% of stocks by market capitalization. The index is not actively managed and does not reflect any deduction for fees, expenses or taxes. An investor may not invest directly in an index. |
| 2 | The Red Rocks Global Listed Private Equity Index includes securities, ADRs and GDRs of 40 to 75 private equity companies, including business development companies, master limited partnerships and other vehicles whose principal business is to invest in, lend capital to or provide services to privately held companies. The Red Rocks Global Listed Private Equity Index is managed by the Fund’s Sub-Advisor. An investor may not invest directly in an index. |
| * | What You Pay reflects the Advisor's and Sub-Advisor’s decision to contractually limit expenses through February 28, 2022, and Acquired Fund Fees and Expenses of 0.79%. Please see the current prospectus dated February 28, 2021 for additional information. |
| # | Prior to December 1, 2017, Investor Class was known as Class A. |
| + | Excludes adjustments in accordance with accounting principles generally accepted in the United States of America and as such, the net asset value and total return for shareholder transactions reported to the market may differ from the net asset value for financial reporting purposes. |
Prior to March 31, 2020, the ALPS | Red Rocks Global Opportunity Fund was known as the ALPS | Red Rocks Listed Private Equity Fund.
The table does not reflect the deduction of taxes that a shareholder would pay on Fund distributions or the redemption of Fund shares.
This Fund is not suitable for all investors and is subject to investment risks, including possible loss of the principal amount invested.
Listed Private Equity Companies are subject to various risks depending on their underlying investments, which could include, but are not limited to, additional liquidity risk, industry risk, non-U.S. security risk, currency risk, credit risk, managed portfolio risk and derivatives risk (derivatives risk is the risk that the value of the Listed Private Equity Companies’ derivative investments will fall because of pricing difficulties or lack of correlation with the underlying investment).
There are inherent risks in investing in private equity companies, which encompass financial institutions or vehicles whose principal business is to invest in and lend capital to privately held companies. Generally, little public information exists for private and thinly traded companies, and there is a risk that investors may not be able to make a fully informed investment decision.
Listed Private Equity Companies may have relatively concentrated investment portfolios, consisting of a relatively small number of holdings. A consequence of this limited number of investments is that the aggregate returns realized may be adversely impacted by the poor performance of a small number of investments, or even a single investment, particularly if a company experiences the need to write down the value of an investment.
Certain of the Fund’s investments may be exposed to liquidity risk due to low trading volume, lack of a market maker or legal restrictions limiting the ability of the Fund to sell particular securities at an advantageous price and/or time. As a result, these securities may be more difficult to value. Foreign investing involves special risks, such as currency fluctuations and political uncertainty. The Fund invests in derivatives and is subject to the risk that the value of those derivative investments will fall because of pricing difficulties or lack of correlation with the underlying investment.
There is no guarantee that the Fund will continue to hold any one particular security or stay invested in any one particular company. The composition of the Fund's top holdings is subject to change. Performance figures are historical and reflect the change in share price, reinvested distributions, changes in net asset value, sales charges and capital gains distributions, if any.
Not FDIC Insured – No Bank Guarantee – May Lose Value
123 | April 30, 2021
ALPS | Red Rocks Global Opportunity Fund
| Performance Update | April 30, 2021 (Unaudited) |
Top Ten Holdings (as a % of Net Assets) †
| IAC/InterActiveCorp | 4.94% |
| KKR & Co., Inc. | 4.20% |
| HarbourVest Global Private Equity, Ltd. | 4.00% |
| Partners Group Holding AG | 3.88% |
| Brederode SA | 3.82% |
| 3i Group PLC | 3.80% |
| Blackstone Group, Inc. | 3.72% |
| Intermediate Capital Group PLC | 3.43% |
| HBM Healthcare Investments AG | 3.41% |
| HgCapital Trust PLC | 3.27% |
| Top Ten Holdings | 38.47% |
| † | Holdings are subject to change and my not reflect the current or future position of the portfolio. Table presents indicative values only. |
Industry Sector Allocation (as a % of Net Assets)
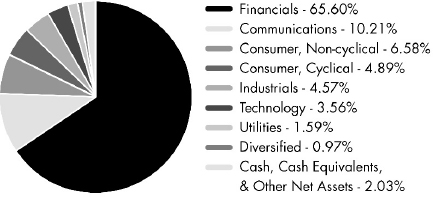
124 | April 30, 2021
ALPS | Red Rocks Global Opportunity Fund
| Statement of Investments | April 30, 2021 (Unaudited) |
| Shares | Value (Note 2) | |||||||
| CLOSED-END FUNDS (18.81%) | ||||||||
| Apax Global Alpha, Ltd.(a) | 365,000 | $ | 1,043,431 | |||||
| HarbourVest Global Private Equity, Ltd.(b) | 149,200 | 4,254,968 | ||||||
| HBM Healthcare Investments AG, Class A | 10,091 | 3,626,364 | ||||||
| HgCapital Trust PLC | 751,370 | 3,476,211 | ||||||
| ICG Enterprise Trust PLC | 102,000 | 1,526,644 | ||||||
| Pantheon International PLC Fund(b) | 75,806 | 2,774,322 | ||||||
| Princess Private Equity Holding, Ltd. | 102,600 | 1,603,568 | ||||||
| Standard Life Private Equity Trust PLC | 258,400 | 1,714,093 | ||||||
| TOTAL CLOSED-END FUNDS | ||||||||
| (Cost $12,905,410) | 20,019,601 | |||||||
| COMMON STOCKS (79.16%) | ||||||||
| Communications (10.21%) | ||||||||
| Internet (1.34%) | ||||||||
| Alibaba Group Holding, Ltd., Sponsored ADR(b) | 6,200 | 1,431,890 | ||||||
| Media (8.87%) | ||||||||
| IAC/InterActiveCorp(b) | 20,750 | 5,259,502 | ||||||
| Liberty Broadband Corp., Class C(b) | 13,400 | 2,180,448 | ||||||
| Liberty Media Corp.-Liberty SiriusXM, Class A(b) | 44,200 | 1,997,398 | ||||||
| 9,437,348 | ||||||||
| TOTAL COMMUNICATIONS | 10,869,238 | |||||||
| Consumer, Cyclical (4.89%) | ||||||||
| Entertainment (3.51%) | ||||||||
| Betsson AB | 127,000 | 1,153,925 | ||||||
| Entain PLC(b) | 53,300 | 1,245,970 | ||||||
| Kindred Group PLC(b) | 77,500 | 1,333,871 | ||||||
| 3,733,766 | ||||||||
| Retail (1.38%) | ||||||||
| Costco Wholesale Corp. | 3,950 | 1,469,755 | ||||||
| TOTAL CONSUMER, CYCLICAL | 5,203,521 | |||||||
| Consumer, Non-Cyclical (6.58%) | ||||||||
| Healthcare-Products (4.34%) | ||||||||
| Hologic, Inc.(b) | 20,400 | 1,337,220 | ||||||
| Stryker Corp. | 5,500 | 1,444,465 | ||||||
| Thermo Fisher Scientific, Inc. | 3,900 | 1,833,897 | ||||||
| 4,615,582 | ||||||||
| Shares | Value (Note 2) | |||||||
| Healthcare-Services (2.24%) | ||||||||
| Chemed Corp. | 5,000 | $ | 2,383,050 | |||||
| TOTAL CONSUMER, NON-CYCLICAL | 6,998,632 | |||||||
| Diversified (0.97%) | ||||||||
| Holding Companies-Diversified Operations (0.97%) | ||||||||
| Schouw & Co. A/S | 9,700 | 1,035,810 | ||||||
| TOTAL DIVERSIFIED | 1,035,810 | |||||||
| Financials (46.79%) | ||||||||
| Diversified Financial Services (27.04%) | ||||||||
| Apollo Global Management, Inc. | 38,200 | 2,115,134 | ||||||
| Ares Management LP, Class A | 23,000 | 1,207,960 | ||||||
| Blackstone Group, Inc., Class A | 44,700 | 3,955,503 | ||||||
| Cannae Holdings, Inc.(b) | 77,000 | 3,056,900 | ||||||
| Carlyle Group, Inc. | 48,500 | 2,069,010 | ||||||
| EXOR N.V. | 17,000 | 1,395,242 | ||||||
| Intermediate Capital Group PLC | 121,000 | 3,652,955 | ||||||
| KKR & Co., Inc., Class A | 79,000 | 4,469,820 | ||||||
| Mastercard, Inc., Class A | 3,875 | 1,480,482 | ||||||
| Partners Group Holding AG | 2,900 | 4,130,954 | ||||||
| StepStone Group, Inc., Class A | 37,400 | 1,245,420 | ||||||
| 28,779,380 | ||||||||
| Investment Companies (9.75%) | ||||||||
| 3i Group PLC | 228,500 | 4,047,126 | ||||||
| Chrysalis Investments, Ltd.(b) | 362,000 | 987,377 | ||||||
| FS KKR Capital Corp. II | 38,000 | 777,860 | ||||||
| Investor AB, B Shares | 33,200 | 2,818,235 | ||||||
| Kinnevik AB, B Shares | 31,700 | 1,749,575 | ||||||
| 10,380,173 | ||||||||
| Private Equity (8.33%) | ||||||||
| Altamir | 34,600 | 992,113 | ||||||
| Brederode SA | 33,180 | 4,061,492 | ||||||
| Clairvest Group, Inc. | 12,700 | 635,439 | ||||||
| Ratos AB, B Shares | 277,000 | 1,630,137 | ||||||
| SuRo Capital Corp. | 106,000 | 1,542,300 | ||||||
| 8,861,481 | ||||||||
| Real Estate (1.67%) | ||||||||
| Brookfield Asset Management, | ||||||||
| Inc., Class A | 39,000 | 1,777,620 | ||||||
| TOTAL FINANCIALS | 49,798,654 | |||||||
| Industrials (4.57%) | ||||||||
| Electronics (0.99%) | ||||||||
| Lagercrantz Group AB, B Shares | 102,000 | 1,052,466 | ||||||
See Notes to Financial Statements.
125 | April 30, 2021
ALPS | Red Rocks Global Opportunity Fund
| Statement of Investments | April 30, 2021 (Unaudited) |
| Shares | Value (Note 2) | |||||||
| Machinery-Diversified (1.11%) | ||||||||
| IDEX Corp. | 5,275 | $ | 1,182,655 | |||||
| Miscellaneous Manufacturers (2.47%) | ||||||||
| Colfax Corp.(b) | 23,900 | 1,080,041 | ||||||
| Danaher Corp. | 6,100 | 1,549,034 | ||||||
| 2,629,075 | ||||||||
| TOTAL INDUSTRIALS | 4,864,196 | |||||||
| Technology (3.56%) | ||||||||
| Software (3.56%) | ||||||||
| Constellation Software, Inc. | 1,100 | 1,614,386 | ||||||
| Fidelity National Information Services, Inc. | 14,200 | 2,171,180 | ||||||
| 3,785,566 | ||||||||
| TOTAL TECHNOLOGY | 3,785,566 | |||||||
| Utilities (1.59%) | ||||||||
| Electric (1.59%) | ||||||||
| Brookfield Infrastructure Partners LP | 31,400 | 1,688,378 | ||||||
| TOTAL UTILITIES | 1,688,378 | |||||||
| TOTAL COMMON STOCKS | ||||||||
| (Cost $59,673,587) | 84,243,995 | |||||||
| 7-Day Yield | Shares | Value (Note 2) | ||||||||||
| SHORT-TERM INVESTMENTS (1.68%) | ||||||||||||
| Money Market Fund (1.68%) | ||||||||||||
| State Street Institutional Treasury Plus Money Market Fund | 0.020 | % | 1,785,765 | 1,785,765 | ||||||||
| TOTAL MONEY MARKET FUND | 1,785,765 | |||||||||||
| TOTAL SHORT-TERM INVESTMENTS | ||||||||||||
| (Cost $1,785,765) | 1,785,765 | |||||||||||
| TOTAL INVESTMENTS (99.65%) | ||||||||||||
| (Cost $74,364,762) | $ | 106,049,361 | ||||||||||
| Other Assets In Excess Of Liabilities (0.35%) | 375,410 | |||||||||||
| NET ASSETS (100.00%) | $ | 106,424,771 | ||||||||||
| (a) | Security exempt from registration under Rule 144A of the Securities Act of 1933. This security may be resold in transactions exempt from registration, normally to qualified institutional buyers. As of April 30, 2021, the aggregate market value of those securities was $1,043,431, representing 0.98% of net assets. |
| (b) | Non-Income Producing Security. |
For Fund compliance purposes, the Fund's industry classifications refer to any one or more of the industry sub-classifications used by one or more widely recognized market indexes or ratings group indexes, and/or as defined by Fund management. This definition may not apply for purposes of this report, which may combine industry sub-classifications for reporting ease. Industries are shown as a percent of net assets.
See Notes to Financial Statements.
126 | April 30, 2021
ALPS | Red Rocks Global Opportunity Fund
| Statement of Assets and Liabilities | April 30, 2021 (Unaudited) |
| ASSETS | ||||
| Investments, at value | $ | 106,049,361 | ||
| Receivable for shares sold | 25,713 | |||
| Dividends receivable | 518,340 | |||
| Prepaid expenses and other assets | 33,379 | |||
| Total Assets | 106,626,793 | |||
| LIABILITIES | ||||
| Payable for shares redeemed | 15,784 | |||
| Investment advisory fees payable | 77,318 | |||
| Administration and transfer agency fees payable | 33,249 | |||
| Distribution and services fees payable | 28,101 | |||
| Trustees' fees and expenses payable | 1,375 | |||
| Professional fees payable | 15,540 | |||
| Custody fees payable | 12,212 | |||
| Accrued expenses and other liabilities | 18,443 | |||
| Total Liabilities | 202,022 | |||
| NET ASSETS | $ | 106,424,771 | ||
| NET ASSETS CONSIST OF | ||||
| Paid-in capital | $ | 72,126,063 | ||
| Total distributable earnings | 34,298,708 | |||
| NET ASSETS | $ | 106,424,771 | ||
| INVESTMENTS, AT COST | $ | 74,364,762 | ||
| PRICING OF SHARES | ||||
| Investor Class: | ||||
| Net Asset Value, offering and redemption price per share | $ | 8.41 | ||
| Net Assets | $ | 19,426,413 | ||
| Shares of beneficial interest outstanding (unlimited number of shares, no par value common stock authorized) | 2,309,944 | |||
| Class A: | ||||
| Net Asset Value, offering and redemption price per share | $ | 8.37 | ||
| Net Assets | $ | 3,499,585 | ||
| Shares of beneficial interest outstanding (unlimited number of shares, no par value common stock authorized) | 417,951 | |||
| Maximum offering price per share ((NAV/0.9450), based on maximum sales charge of 5.50% of the offering price) | $ | 8.86 | ||
| Class C: | ||||
| Net Asset Value, offering and redemption price per share(a) | $ | 7.72 | ||
| Net Assets | $ | 10,605,915 | ||
| Shares of beneficial interest outstanding (unlimited number of shares, no par value common stock authorized) | 1,373,462 | |||
| Class I: | ||||
| Net Asset Value, offering and redemption price per share | $ | 8.60 | ||
| Net Assets | $ | 66,359,728 | ||
| Shares of beneficial interest outstanding (unlimited number of shares, no par value common stock authorized) | 7,714,174 | |||
| Class R: | ||||
| Net Asset Value, offering and redemption price per share | $ | 6.73 | ||
| Net Assets | $ | 6,533,130 | ||
| Shares of beneficial interest outstanding (unlimited number of shares, no par value common stock authorized) | 970,850 | |||
| (a) | Redemption price per share may be reduced for any applicable contingent deferred sales charge. For a description of a possible sales charge, please see the Fund's Prospectus. |
See Notes to Financial Statements.
127 | April 30, 2021
ALPS | Red Rocks Global Opportunity Fund
| Statement of Operations | For the Six Months Ended April 30, 2021 (Unaudited) |
| INVESTMENT INCOME | ||||
| Dividends | $ | 723,745 | ||
| Foreign taxes withheld on dividends | (13,680 | ) | ||
| Total Investment Income | 710,065 | |||
| EXPENSES | ||||
| Investment advisory fees | 423,544 | |||
| Administrative fees | 49,201 | |||
| Transfer agency fees | 57,499 | |||
| Distribution and service fees | ||||
| Investor Class | 32,353 | |||
| Class A | 5,334 | |||
| Class C | 51,253 | |||
| Class R | 15,235 | |||
| Professional fees | 15,782 | |||
| Reports to shareholders and printing fees | 9,254 | |||
| State registration fees | 36,277 | |||
| Insurance fees | 588 | |||
| Custody fees | 14,321 | |||
| Trustees' fees and expenses | 2,956 | |||
| Miscellaneous expenses | 9,059 | |||
| Total Expenses | 722,656 | |||
| Less fees waived/reimbursed by investment advisor (Note 8) | ||||
| Class I | (3,612 | ) | ||
| Net Expenses | 719,044 | |||
| Net Investment Loss | (8,979 | ) | ||
| Net realized gain on investments | 9,282,991 | |||
| Net realized loss on foreign currency transactions | (6,905 | ) | ||
| Net Realized Gain | 9,276,086 | |||
| Net change in unrealized appreciation on investments | 20,486,794 | |||
| Net change in unrealized appreciation on translation of assets and liabilities denominated in foreign currencies | 11,555 | |||
| Net Change in Unrealized Appreciation | 20,498,349 | |||
| NET REALIZED AND UNREALIZED GAIN ON INVESTMENTS | 29,774,435 | |||
| NET INCREASE IN NET ASSETS RESULTING FROM OPERATIONS | $ | 29,765,456 | ||
See Notes to Financial Statements.
128 | April 30, 2021
ALPS | Red Rocks Global Opportunity Fund
Statements of Changes in Net Assets
| For the Six Months Ended April 30, 2021 (Unaudited) | For the Year Ended October 31, 2020(a) | |||||||
| OPERATIONS | ||||||||
| Net investment income/(loss) | $ | (8,979 | ) | $ | 1,283,746 | |||
| Net realized gain | 9,276,086 | 10,777,543 | ||||||
| Net change in unrealized appreciation/(depreciation) | 20,498,349 | (22,128,678 | ) | |||||
| Net Increase/(Decrease) in Net Assets Resulting from Operations | 29,765,456 | (10,067,389 | ) | |||||
| TOTAL DISTRIBUTIONS | ||||||||
| From distributable earnings | ||||||||
| Investor Class | (718,013 | ) | (3,586,004 | ) | ||||
| Class A | (119,340 | ) | (115,589 | ) | ||||
| Class C | (439,224 | ) | (2,358,134 | ) | ||||
| Class I | (2,461,060 | ) | (19,020,392 | ) | ||||
| Class R | (291,941 | ) | (961,289 | ) | ||||
| Net Decrease in Net Assets from Distributions | (4,029,578 | ) | (26,041,408 | ) | ||||
| BENEFICIAL INTEREST TRANSACTIONS (NOTE 6) | ||||||||
| Shares sold | ||||||||
| Investor Class | 770,226 | 5,255,428 | ||||||
| Class A | 643,179 | 3,213,948 | ||||||
| Class C | 30,972 | 641,538 | ||||||
| Class I | 4,821,404 | 26,449,314 | ||||||
| Class R | 144,674 | 883,978 | ||||||
| Dividends reinvested | ||||||||
| Investor Class | 569,108 | 2,760,858 | ||||||
| Class A | 83,596 | 79,919 | ||||||
| Class C | 367,738 | 1,803,296 | ||||||
| Class I | 2,258,632 | 15,657,972 | ||||||
| Class R | 291,941 | 959,137 | ||||||
| Shares redeemed, net of redemption fees | ||||||||
| Investor Class | (2,071,569 | ) | (12,347,153 | ) | ||||
| Class A | (545,368 | ) | (1,413,331 | ) | ||||
| Class C | (1,422,299 | ) | (6,439,102 | ) | ||||
| Class I | (12,989,122 | ) | (100,944,449 | ) | ||||
| Class R | (630,779 | ) | (1,261,496 | ) | ||||
| Net Decrease in Net Assets Derived from Beneficial Interest Transactions | (7,677,667 | ) | (64,700,143 | ) | ||||
| Net increase/(decrease) in net assets | 18,058,211 | (100,808,940 | ) | |||||
| NET ASSETS | ||||||||
| Beginning of period | 88,366,560 | 189,175,500 | ||||||
| End of period | $ | 106,424,771 | $ | 88,366,560 | ||||
| (a) | Prior to March 31, 2020, the ALPS/Red Rocks Global Opportunity Fund was known as the ALPS/Red Rocks Listed Private Equity Fund. |
See Notes to Financial Statements.
129 | April 30, 2021
ALPS | Red Rocks Global Opportunity Fund – Investor Class
Financial Highlights
Selected data for a share of beneficial interest outstanding throughout the periods indicated:
| For the Six Months Ended April 30, 2021 (Unaudited) | For the Year Ended October 31, 2020(a) | For the Year Ended October 31, 2019 | For the Year Ended October 31, 2018(b) | For the Year Ended October 31, 2017 | For the Year Ended October 31, 2016 | |||||||||||||||||||
| Net asset value, beginning of period | $ | 6.47 | $ | 7.71 | $ | 6.79 | $ | 8.05 | $ | 6.29 | $ | 6.76 | ||||||||||||
| INCOME/(LOSS) FROM INVESTMENT OPERATIONS: | ||||||||||||||||||||||||
| Net investment income/(loss)(c) | (0.00 | )(d) | 0.06 | 0.12 | 0.06 | 0.12 | 0.06 | |||||||||||||||||
| Net realized and unrealized gain/(loss) | 2.24 | (0.23 | ) | 1.09 | (0.37 | ) | 1.74 | (0.04 | ) | |||||||||||||||
| Total from investment operations | 2.24 | (0.17 | ) | 1.21 | (0.31 | ) | 1.86 | 0.02 | ||||||||||||||||
| DISTRIBUTIONS: | ||||||||||||||||||||||||
| From net investment income | – | (0.60 | ) | (0.06 | ) | (0.70 | ) | (0.10 | ) | (0.22 | ) | |||||||||||||
| From net realized gains | (0.30 | ) | (0.47 | ) | (0.23 | ) | (0.25 | ) | – | (0.27 | ) | |||||||||||||
| Total distributions | (0.30 | ) | (1.07 | ) | (0.28 | ) | (0.95 | ) | (0.10 | ) | (0.49 | ) | ||||||||||||
| REDEMPTION FEES ADDED TO PAID-IN CAPITAL (NOTE 6) | 0.00 | (d) | 0.00 | (d) | 0.00 | (d) | 0.00 | (d) | 0.00 | (d) | 0.00 | (d) | ||||||||||||
| Net increase/(decrease) in net asset value | 1.94 | (1.24 | ) | 0.92 | (1.26 | ) | 1.76 | (0.47 | ) | |||||||||||||||
| Net asset value, end of period | $ | 8.41 | $ | 6.47 | $ | 7.71 | $ | 6.79 | $ | 8.05 | $ | 6.29 | ||||||||||||
| TOTAL RETURN(e) | 35.40 | % | (3.20 | )% | 18.77 | % | (4.23 | )% | 29.97 | % | 0.76 | % | ||||||||||||
| RATIOS/SUPPLEMENTAL DATA: | ||||||||||||||||||||||||
| Net assets, end of period (000s) | $ | 19,426 | $ | 15,580 | $ | 25,061 | $ | 35,775 | $ | 55,538 | $ | 128,920 | ||||||||||||
| Ratio of expenses to average net assets excluding fee waivers and reimbursements(f) | 1.55 | %(g) | 1.47 | % | 1.44 | % | 1.40 | % | 1.38 | % | 1.47 | % | ||||||||||||
| Ratio of expenses to average net assets including fee waivers and reimbursements(f) | 1.55 | %(g) | 1.47 | % | 1.44 | % | 1.40 | % | 1.38 | % | 1.47 | % | ||||||||||||
| Ratio of net investment income/(loss) to average net assets(f) | (0.12 | )%(g) | 0.86 | % | 1.71 | % | 0.86 | % | 1.63 | % | 1.07 | % | ||||||||||||
| Portfolio turnover rate(h) | 34 | % | 41 | % | 28 | % | 29 | % | 31 | % | 30 | % | ||||||||||||
| (a) | Prior to March 31, 2020, the ALPS/Red Rocks Global Opportunity Fund was known as the ALPS/Red Rocks Listed Private Equity Fund. |
| (b) | Prior to December 1, 2017, Investor Class was known as Class A. |
| (c) | Calculated using the average shares method. |
| (d) | Less than $0.005 or ($0.005) per share. |
| (e) | Total returns are for the period indicated and have not been annualized. Total returns would have been lower had certain expenses not been waived during the period. Returns shown do not reflect the deduction of taxes that a shareholder would pay on Fund distributions or the redemption of Fund shares. |
| (f) | The ratios exclude the impact of expenses of the underlying funds in which the Fund invests as represented in the Statement of Investments. |
| (g) | Annualized. |
| (h) | Portfolio turnover rate for periods less than one full year have not been annualized. |
See Notes to Financial Statements.
130 | April 30, 2021
ALPS | Red Rocks Global Opportunity Fund – Class A
Financial Highlights
Selected data for a share of beneficial interest outstanding throughout the periods indicated:
| For the Six Months Ended April 30, 2021 (Unaudited) | For the Year Ended October 31, 2020(a) | For the Year Ended October 31, 2019 | For the Period June 12, 2018 (Commencement of Operations) to October 31, 2018 | |||||||||||||
| Net asset value, beginning of period | $ | 6.45 | $ | 7.67 | $ | 6.79 | $ | 7.23 | ||||||||
| INCOME FROM INVESTMENT OPERATIONS: | ||||||||||||||||
| Net investment income(b) | (0.00 | )(c) | 0.04 | 0.20 | 0.01 | |||||||||||
| Net realized and unrealized gain/(loss) | 2.22 | (0.20 | ) | 0.99 | (0.45 | ) | ||||||||||
| Total from investment operations | 2.22 | (0.16 | ) | 1.19 | (0.44 | ) | ||||||||||
| DISTRIBUTIONS: | ||||||||||||||||
| From net investment income | – | (0.60 | ) | (0.08 | ) | – | ||||||||||
| From net realized gains | (0.30 | ) | (0.47 | ) | (0.23 | ) | – | |||||||||
| Total distributions | (0.30 | ) | (1.07 | ) | (0.31 | ) | – | |||||||||
| REDEMPTION FEES ADDED TO PAID-IN CAPITAL (NOTE 6) | 0.00 | (c) | 0.01 | – | – | |||||||||||
| Net increase/(decrease) in net asset value | 1.92 | (1.22 | ) | 0.88 | (0.44 | ) | ||||||||||
| Net asset value, end of period | $ | 8.37 | $ | 6.45 | $ | 7.67 | $ | 6.79 | ||||||||
| TOTAL RETURN(d) | 35.20 | % | (2.92 | )% | 18.64 | % | (6.09 | )% | ||||||||
| RATIOS/SUPPLEMENTAL DATA: | ||||||||||||||||
| Net assets, end of period (000s) | $ | 3,500 | $ | 2,544 | $ | 790 | $ | 9 | ||||||||
| Ratio of expenses to average net assets excluding fee waivers and reimbursements(e) | 1.53 | %(f) | 1.51 | % | 1.48 | % | 1.48 | %(f) | ||||||||
| Ratio of expenses to average net assets including fee waivers and reimbursements(e) | 1.53 | %(f) | 1.51 | % | 1.48 | % | 1.48 | %(f) | ||||||||
| Ratio of net investment income/(loss) to average net assets(e) | (0.12 | )%(f) | 0.62 | % | 2.74 | % | 0.37 | %(f) | ||||||||
| Portfolio turnover rate(g) | 34 | % | 41 | % | 28 | % | 29 | % | ||||||||
| (a) | Prior to March 31, 2020, the ALPS/Red Rocks Global Opportunity Fund was known as the ALPS/Red Rocks Listed Private Equity Fund. |
| (b) | Calculated using the average shares method. |
| (c) | Less than $0.005 or ($0.005) per share. |
| (d) | Total returns are for the period indicated and have not been annualized. Total returns would have been lower had certain expenses not been waived during the period. Returns shown do not reflect the deduction of taxes that a shareholder would pay on Fund distributions or the redemption of Fund shares. Returns shown exclude any applicable sales charges. |
| (e) | The ratios exclude the impact of expenses of the underlying funds in which the Fund invests as represented in the Statement of Investments. |
| (f) | Annualized. |
| (g) | Portfolio turnover rate for periods less than one full year have not been annualized. |
See Notes to Financial Statements.
131 | April 30, 2021
ALPS | Red Rocks Global Opportunity Fund – Class C
Financial Highlights
Selected data for a share of beneficial interest outstanding throughout the periods indicated:
| For the Six Months Ended April 30, 2021 (Unaudited) | For the Year Ended October 31, 2020(a) | For the Year Ended October 31, 2019 | For the Year Ended October 31, 2018 | For the Year Ended October 31, 2017 | For the Year Ended October 31, 2016 | |||||||||||||||||||
| Net asset value, beginning of period | $ | 5.98 | $ | 7.25 | $ | 6.41 | $ | 7.66 | $ | 6.04 | $ | 6.53 | ||||||||||||
| INCOME/(LOSS) FROM INVESTMENT OPERATIONS: | ||||||||||||||||||||||||
| Net investment income/(loss)(b) | (0.03 | ) | 0.01 | 0.06 | 0.01 | 0.06 | 0.03 | |||||||||||||||||
| Net realized and unrealized gain/(loss) | 2.07 | (0.22 | ) | 1.03 | (0.34 | ) | 1.65 | (0.03 | ) | |||||||||||||||
| Total from investment operations | 2.04 | (0.21 | ) | 1.09 | (0.33 | ) | 1.71 | – | ||||||||||||||||
| DISTRIBUTIONS: | ||||||||||||||||||||||||
| From net investment income | – | (0.59 | ) | (0.02 | ) | (0.67 | ) | (0.09 | ) | (0.22 | ) | |||||||||||||
| From net realized gains | (0.30 | ) | (0.47 | ) | (0.23 | ) | (0.25 | ) | – | (0.27 | ) | |||||||||||||
| Total distributions | (0.30 | ) | (1.06 | ) | (0.25 | ) | (0.92 | ) | (0.09 | ) | (0.49 | ) | ||||||||||||
| REDEMPTION FEES ADDED TO PAID-IN CAPITAL (NOTE 6) | – | 0.00 | (c) | 0.00 | (c) | – | 0.00 | (c) | 0.00 | (c) | ||||||||||||||
| Net increase/(decrease) in net asset value | 1.74 | (1.27 | ) | 0.84 | (1.25 | ) | 1.62 | (0.49 | ) | |||||||||||||||
| Net asset value, end of period | $ | 7.72 | $ | 5.98 | $ | 7.25 | $ | 6.41 | $ | 7.66 | $ | 6.04 | ||||||||||||
| TOTAL RETURN(d) | 34.94 | % | (4.01 | )% | 17.83 | % | (4.88 | )% | 28.79 | % | 0.34 | % | ||||||||||||
| RATIOS/SUPPLEMENTAL DATA: | ||||||||||||||||||||||||
| Net assets, end of period (000s) | $ | 10,606 | $ | 9,061 | $ | 16,256 | $ | 18,847 | $ | 18,981 | $ | 14,784 | ||||||||||||
| Ratio of expenses to average net assets excluding fee waivers and reimbursements(e) | 2.25 | %(f) | 2.22 | % | 2.16 | % | 2.12 | % | 2.13 | % | 2.16 | % | ||||||||||||
| Ratio of expenses to average net assets including fee waivers and reimbursements(e) | 2.25 | %(f) | 2.22 | % | 2.16 | % | 2.12 | % | 2.13 | % | 2.16 | % | ||||||||||||
| Ratio of net investment income/(loss) to average net assets(e) | (0.83 | )%(f) | 0.12 | % | 0.86 | % | 0.15 | % | 0.83 | % | 0.49 | % | ||||||||||||
| Portfolio turnover rate(g) | 34 | % | 41 | % | 28 | % | 29 | % | 31 | % | 30 | % | ||||||||||||
| (a) | Prior to March 31, 2020, the ALPS/Red Rocks Global Opportunity Fund was known as the ALPS/Red Rocks Listed Private Equity Fund. |
| (b) | Calculated using the average shares method. |
| (c) | Less than $0.005 or ($0.005) per share. |
| (d) | Total returns are for the period indicated and have not been annualized. Total returns would have been lower had certain expenses not been waived during the period. Returns shown do not reflect the deduction of taxes that a shareholder would pay on Fund distributions or the redemption of Fund shares. Returns shown exclude any applicable sales charges. |
| (e) | The ratios exclude the impact of expenses of the underlying funds in which the Fund invests as represented in the Statement of Investments. |
| (f) | Annualized. |
| (g) | Portfolio turnover rate for periods less than one full year have not been annualized. |
See Notes to Financial Statements.
132 | April 30, 2021
ALPS | Red Rocks Global Opportunity Fund – Class I
Financial Highlights
Selected data for a share of beneficial interest outstanding throughout the periods indicated:
| For the Six Months Ended April 30, 2021 (Unaudited) | For the Year Ended October 31, 2020(a) | For the Year Ended October 31, 2019 | For the Year Ended October 31, 2018 | For the Year Ended October 31, 2017 | For the Year Ended October 31, 2016 | |||||||||||||||||||
| Net asset value, beginning of period | $ | 6.61 | $ | 7.84 | $ | 6.92 | $ | 8.18 | $ | 6.39 | $ | 6.83 | ||||||||||||
| INCOME/(LOSS) FROM INVESTMENT OPERATIONS: | ||||||||||||||||||||||||
| Net investment income(b) | 0.01 | 0.07 | 0.13 | 0.09 | 0.13 | 0.09 | ||||||||||||||||||
| Net realized and unrealized gain/(loss) | 2.28 | (0.23 | ) | 1.10 | (0.37 | ) | 1.76 | (0.03 | ) | |||||||||||||||
| Total from investment operations | 2.29 | (0.16 | ) | 1.23 | (0.28 | ) | 1.89 | 0.06 | ||||||||||||||||
| DISTRIBUTIONS: | ||||||||||||||||||||||||
| From net investment income | – | (0.60 | ) | (0.08 | ) | (0.73 | ) | (0.10 | ) | (0.23 | ) | |||||||||||||
| From net realized gains | (0.30 | ) | (0.47 | ) | (0.23 | ) | (0.25 | ) | – | (0.27 | ) | |||||||||||||
| Total distributions | (0.30 | ) | (1.07 | ) | (0.31 | ) | (0.98 | ) | (0.10 | ) | (0.50 | ) | ||||||||||||
| REDEMPTION FEES ADDED TO PAID-IN CAPITAL (NOTE 6) | 0.00 | (c) | 0.00 | (c) | 0.00 | (c) | 0.00 | (c) | 0.00 | (c) | 0.00 | (c) | ||||||||||||
| Net increase/(decrease) in net asset value | 1.99 | (1.23 | ) | 0.92 | (1.26 | ) | 1.79 | (0.44 | ) | |||||||||||||||
| Net asset value, end of period | $ | 8.60 | $ | 6.61 | $ | 7.84 | $ | 6.92 | $ | 8.18 | $ | 6.39 | ||||||||||||
| TOTAL RETURN(d) | 35.41 | % | (2.93 | )% | 18.98 | % | (3.87 | )% | 30.09 | % | 1.27 | % | ||||||||||||
| RATIOS/SUPPLEMENTAL DATA: | ||||||||||||||||||||||||
| Net assets, end of period (000s) | $ | 66,360 | $ | 55,950 | $ | 141,286 | $ | 174,034 | $ | 138,572 | $ | 180,892 | ||||||||||||
| Ratio of expenses to average net assets excluding fee waivers and reimbursements(e) | 1.26 | %(f) | 1.22 | % | 1.19 | % | 1.15 | % | 1.16 | % | 1.18 | % | ||||||||||||
| Ratio of expenses to average net assets including fee waivers and reimbursements(e) | 1.25 | %(f) | 1.22 | % | 1.19 | % | 1.15 | % | 1.16 | % | 1.18 | % | ||||||||||||
| Ratio of net investment income to average net assets(e) | 0.18 | %(f) | 1.08 | % | 1.80 | % | 1.15 | % | 1.85 | % | 1.48 | % | ||||||||||||
| Portfolio turnover rate(g) | 34 | % | 41 | % | 28 | % | 29 | % | 31 | % | 30 | % | ||||||||||||
| (a) | Prior to March 31, 2020, the ALPS/Red Rocks Global Opportunity Fund was known as the ALPS/Red Rocks Listed Private Equity Fund. |
| (b) | Calculated using the average shares method. |
| (c) | Less than $0.005 or ($0.005) per share. |
| (d) | Total returns are for the period indicated and have not been annualized. Total returns would have been lower had certain expenses not been waived during the period. Returns shown do not reflect the deduction of taxes that a shareholder would pay on Fund distributions or the redemption of Fund shares. Returns shown exclude any applicable sales charges. |
| (e) | The ratios exclude the impact of expenses of the underlying funds in which the Fund invests as represented in the Statement of Investments. |
| (f) | Annualized. |
| (g) | Portfolio turnover rate for periods less than one full year have not been annualized. |
See Notes to Financial Statements.
133 | April 30, 2021
ALPS | Red Rocks Global Opportunity Fund – Class R
Financial Highlights
Selected data for a share of beneficial interest outstanding throughout the periods indicated:
| For the Six Months Ended April 30, 2021 (Unaudited) | For the Year Ended October 31, 2020(a) | For the Year Ended October 31, 2019 | For the Year Ended October 31, 2018 | For the Year Ended October 31, 2017 | For the Year Ended October 31, 2016 | |||||||||||||||||||
| Net asset value, beginning of period | $ | 5.23 | $ | 6.45 | $ | 5.75 | $ | 6.97 | $ | 5.48 | $ | 5.96 | ||||||||||||
| INCOME/(LOSS) FROM INVESTMENT OPERATIONS: | ||||||||||||||||||||||||
| Net investment income/(loss)(b) | (0.01 | ) | 0.03 | 0.09 | 0.04 | 0.09 | 0.06 | |||||||||||||||||
| Net realized and unrealized gain/(loss) | 1.81 | (0.18 | ) | 0.90 | (0.30 | ) | 1.50 | (0.05 | ) | |||||||||||||||
| Total from investment operations | 1.80 | (0.15 | ) | 0.99 | (0.26 | ) | 1.59 | 0.01 | ||||||||||||||||
| DISTRIBUTIONS: | ||||||||||||||||||||||||
| From net investment income | – | (0.60 | ) | (0.06 | ) | (0.71 | ) | (0.10 | ) | (0.22 | ) | |||||||||||||
| From net realized gains | (0.30 | ) | (0.47 | ) | (0.23 | ) | (0.25 | ) | – | (0.27 | ) | |||||||||||||
| Total distributions | (0.30 | ) | (1.07 | ) | (0.29 | ) | (0.96 | ) | (0.10 | ) | (0.49 | ) | ||||||||||||
| Net increase/(decrease) in net asset value | 1.50 | (1.22 | ) | 0.70 | (1.22 | ) | 1.49 | (0.48 | ) | |||||||||||||||
| Net asset value, end of period | $ | 6.73 | $ | 5.23 | $ | 6.45 | $ | 5.75 | $ | 6.97 | $ | 5.48 | ||||||||||||
| TOTAL RETURN(c) | 35.38 | % | (3.56 | )% | 18.47 | % | (4.31 | )% | 29.51 | % | 0.67 | % | ||||||||||||
| RATIOS/SUPPLEMENTAL DATA: | ||||||||||||||||||||||||
| Net assets, end of period (000s) | $ | 6,533 | $ | 5,231 | $ | 5,782 | $ | 4,684 | $ | 4,236 | $ | 2,852 | ||||||||||||
| Ratio of expenses to average net assets excluding fee waivers and reimbursements(d) | 1.69 | %(e) | 1.68 | % | 1.61 | % | 1.57 | % | 1.56 | % | 1.63 | % | ||||||||||||
| Ratio of expenses to average net assets including fee waivers and reimbursements(d) | 1.69 | %(e) | 1.68 | % | 1.61 | % | 1.57 | % | 1.56 | % | 1.63 | % | ||||||||||||
| Ratio of net investment income/(loss) to average net assets(d) | (0.28 | )%(e) | 0.61 | % | 1.51 | % | 0.70 | % | 1.43 | % | 1.05 | % | ||||||||||||
| Portfolio turnover rate(f) | 34 | % | 41 | % | 28 | % | 29 | % | 31 | % | 30 | % | ||||||||||||
| (a) | Prior to March 31, 2020, the ALPS/Red Rocks Global Opportunity Fund was known as the ALPS/Red Rocks Listed Private Equity Fund. |
| (b) | Calculated using the average shares method. |
| (c) | Total returns are for the period indicated and have not been annualized. Total returns would have been lower had certain expenses not been waived during the period. Returns shown do not reflect the deduction of taxes that a shareholder would pay on Fund distributions or the redemption of Fund shares. Returns shown exclude any applicable sales charges. |
| (d) | The ratios exclude the impact of expenses of the underlying funds in which the Fund invests as represented in the Statement of Investments. |
| (e) | Annualized. |
| (f) | Portfolio turnover rate for periods less than one full year have not been annualized. |
See Notes to Financial Statements.
134 | April 30, 2021
Clough China Fund
| Management Commentary | April 30, 2021 (Unaudited) |
The Clough China Fund (the “Fund”) had a net return of 17.17% for Class I, compared to 7.98% for the Morningstar China Index, the Fund’s benchmark, for the semiannual period November 1, 2020 to April 30, 2021. From an individual stock perspective over the period, the Fund’s investments in Bilibili Inc. – Sponsored ADR (“Bilibili”) , Xinyi Glass Holdings Ltd. (“Xinyi Glass”), Wuxi Biologics Cayman Inc. (“Wuxi Bio”), Pinduoduo Inc. – Sponsored ADR (“Pinduoduo”) and Moderna Inc. (“Moderna”) contributed most positively to the Fund’s performance, while investments in AliBaba Group Holding Ltd. (“Alibaba”), China Oilfield Services Ltd. (“China Oilfield”), Baidu Inc. – Sponsored ADR (“Baidu”), Ping An Healthcare and Technology Co Ltd. (“Ping An Health”) and Postal Savings Bank of China Co Ltd. (“Postal Savings Bank”) detracted the most from Fund performance during the period.
Over this period, the market experienced volatility sharply appreciating approximately 25% through mid-February and then declining approximately 16% through the end of the period. On one hand, as vaccines were approved and started to be rolled out, stocks levered to the economy reopening appreciated. On the other hand, the market has started to worry about the risks of higher inflation and interest rates, thereby affecting the multiples of these stocks. These concerns have also led to value outperforming growth recently.
The Fund’s top contributors for the semiannual period:
| 1. | Bilibili is a platform similar to Instagram and is very popular with the younger demographic in China. To the best of our knowledge, it is the only company that can boast of having Alibaba, Tencent and Sony as its investors. As of the date of this report, we believe it remains very undervalued on a market capitalization/monthly active users (“MAU”) basis when compared to global video distribution platforms. |
| 2. | Xinyi Glass has been a positive performer for the Fund. The company manufactures glass for property projects as well as automobiles. As of the date of this report, we see glass demand across end markets continuing to be strong while supply may tighten, as it may take a long time for new supply to come online. |
| 3. | As of April 30, 2021, Wuxi Bio is a core holding for the Fund. It is a pharmaceutical testing and trial company which benefits from two trends: a) trials are increasingly being performed offshore in geographies like China; and b) domestic Chinese drug development industry is growing rapidly. |
| 4. | Pinduoduo is a structural share gainer of Chinese e-commerce through their wide range of online merchandise. However, 2020 was a banner year for e-commerce and it may be hard for them to beat expectations going forward. |
| 5. | Moderna is one of the leading COVID vaccine makers in the world. The success of their product we believe is key to the economic recovery globally. |
The Fund’s top detractors for the semiannual period:
| 1. | Alibaba - has historically been one of the Fund’s larger positions given our belief in the Chinese consumer and the company’s dominant position in e-commerce. However, the company is facing increasing regulatory scrutiny, whether related to the IPO of its financial arm, Ant Financial Group Co Ltd. or for pursuing monopolistic practices in its e-commerce business, has led to the underperformance of the stock during the period. |
| 2. | China Oilfield is highly levered to the movement in oil prices. As oil prices move up, the utilization of its equipment increases, and profitability also increases. The stock, however, has been caught up in the energy sector’s recent volatility, resulting in its underperformance during the period. |
| 3. | As of April 30, 2021, Postal Savings Bank is one of the Fund’s core banking positions. The stock declined due to a selloff in the market, but as of the date of this report, we like their core deposit franchise as well as their positioning for growth in China’s Tier 3 and 4 cities. |
| 4. | We believe Ping An Health is building an exciting online health platform for China. However, it has been caught up in the selloff of growth stocks and underperformed the market during the period. |
| 5. | We think Baidu’s business is doing well fundamentally between their intellectual property (“IP”) in the automotive space gaining interest and the advertising rebound that is occurring as the Chinese economy opens up after the pandemic. However, there was a technical selloff in the stock late in March, as a levered investor had to unwind. As of the date of this report, we still like the risk reward here. |
The People’s Bank of China (“PBOC”) has been the least profligate of the central banks in throwing liquidity at its economy and that has caused its stock market to underperform. The trade war is obviously taking a toll as well. We think the PBOC is doing the right thing by reining in the excesses in lending, particularly with reports of an increasing number of marginal state-owned enterprises (“SOEs”) being allowed to default on their loans.
There are still many good reasons why we believe China will be the best performing global equity market over the decade. It has the largest and fastest growing middle class, world class infrastructure and a trained labor force, current account and trade surpluses and rising productivity which allow it to both move up the value-added chain and offset rising labor costs.
We look at Chinese equities as a tale of two markets. One is made up of a pool of SOEs that came public in the 1990s and 2000s. For the most part, they are in declining industries and valuations are eroding as low profits and declining balance sheets drain away returns. The other is made up of a vibrant and growing private sector with the greatest proliferation of new companies in the consumer, healthcare and technology sectors on the planet. China’s
135 | April 30, 2021
Clough China Fund
| Management Commentary | April 30, 2021 (Unaudited) |
enormous savings rate can fund government and private borrowing ad infinitum. A global enterprise cannot ignore China. Its economy is simply too large and most global companies that are in China will remain there. KKR & Co Inc. just raised a $15 billion private equity fund focused on investing in Asia.
Negative news flow about more restrictive regulatory policies toward Alibaba Group Holdings Ltd., and likely other e-commerce and social media companies, is also affecting the stocks. However, similar policy proposals are being floated in both Europe and the U.S., outlining a similar threat for America’s equally powerful on-line giants. Our view is that both the Chinese and American companies will adapt to a shifting regulatory world and the likely result of these policies is they simply add to the competitive moat these companies enjoy.
Anupam Bose, Portfolio Manager
Chuck Clough, Portfolio Manager
Investments in international and emerging markets securities include exposure to risks such as currency fluctuations, foreign taxes and regulations, and the potential for illiquid markets and political instability.
The views of the authors and information discussed in this commentary are as of the date of publication, are subject to change, and may not reflect the writer's current views. The views expressed are those of the authors only, and represent an assessment of market conditions at a specific point in time, are opinions only and should not be relied upon as investment advice regarding a particular investment or markets in general. Such information does not constitute a recommendation to buy or sell specific securities or investment vehicles. It should not be assumed that any investment will be profitable or will equal the performance of the fund(s) or any securities or any sectors mentioned in this letter. The subject matter contained in this letter has been derived from several sources believed to be reliable and accurate at the time of compilation. Neither ALPS, Advisors, Inc., Clough Capital Partners, LP, nor the Fund accepts any liability for losses either direct or consequential caused by the use of this information.
Past performance is no guarantee of future results. Dividends are not guaranteed and are subject to change or elimination. Investments in international and emerging markets securities include exposure to risks such as currency fluctuations, foreign taxes and regulations, and the potential for illiquid markets and political instability.
ALPS Portfolio Solutions Distributor, Inc., ALPS Distributors, Inc. and ALPS Advisors Inc. are affiliated.
136 | April 30, 2021
Clough China Fund
| Performance Update | April 30, 2021 (Unaudited) |
Performance of $100,000 Initial Investment (as of April 30, 2021)
Comparison of change in value of a $100,000 investment over 10 years
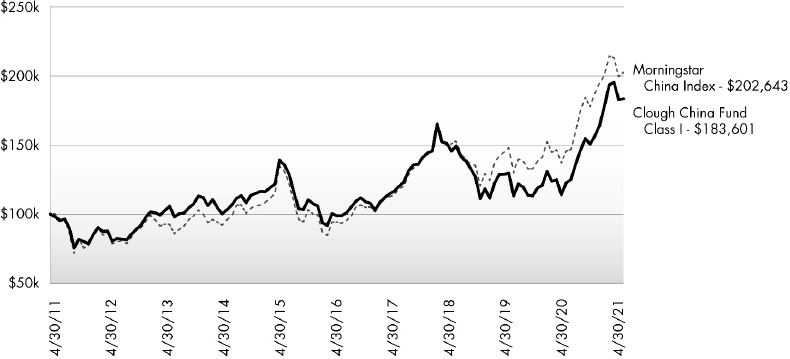
The chart above represents historical performance of a hypothetical investment of $100,000 in the Fund. Past performance does not guarantee future results. This chart does not reflect the deduction of taxes that a shareholder would pay on Fund distributions or the redemption of Fund shares.
Average Annual Total Returns (as of April 30, 2021)
| 6 Month5 | 1 Year | 3 Year | 5 Year | 10 Year | Since Inception1 | Total Expense Ratio | What You Pay2 | |
| Class I (NAV) | 17.17% | 49.64% | 8.00% | 13.17% | 6.26% | 11.20% | 1.66% | 1.35% |
| Investor 3 (NAV) | 17.01% | 49.31% | 7.73% | 12.90% | 5.96% | 10.80% | 1.89% | 1.60% |
| Class A (NAV) | 16.97% | 49.28% | 7.69% | 12.88% | 5.95% | 10.79% | 1.82% | 1.60% |
| Class A (MOP) | 10.54% | 41.10% | 5.68% | 11.61% | 5.35% | 10.38% | ||
| Class C (NAV) | 16.57% | 48.17% | 6.93% | 12.06% | 5.17% | 9.97% | 2.69% | 2.35% |
| Class C (CDSC) | 15.57% | 47.17% | 6.93% | 12.06% | 5.17% | 9.97% | ||
| Morningstar China Index4 | 7.98% | 38.96% | 10.30% | 16.51% | 7.32% | 11.99% |
Performance data quoted represents past performance. Past performance does not guarantee future results and current performance may be lower or higher than the performance quoted. Investment return and principal value of an investment will fluctuate so that an investor’s shares, when sold, may be worth more or less than the original cost. Performance reflects the deduction of management fees and other applicable expenses and includes reinvested distributions and capital gains. The Fund imposes a 2.00% redemption fee on shares held for less than 30 days. Performance shown does not include the redemption fee, which, if reflected, would reduce the performance quoted. For the most current month-end performance data please call 1.866.759.5679.
Maximum Offering Price (MOP) for Class A shares includes the Fund’s maximum sales charge of 5.50%. Contingent Deferred Sales Charge (CDSC) performance for Class C shares includes a 1.00% CDSC on Class C shares redeemed within 12 months of purchase. Performance shown at Net Asset Value (NAV) does not include these sales charges and would have been lower had it been taken into account.
On January 15, 2010, the Old Mutual China Fund (the “Predecessor Fund”) was reorganized into the Clough China Fund (the “Fund”). The historical performance shown for periods prior to January 15, 2010 reflects the historical information for the Predecessor Fund. Clough Capital Partners L.P. did not serve as investment advisor or sub-advisor to the Predecessor Fund.
137 | April 30, 2021
Clough China Fund
| Performance Update | April 30, 2021 (Unaudited) |
Performance for Class A shares prior to June 12, 2018 reflects the historical performance of the respective Fund’s Investor Class shares, calculated using the fees and expenses of Class A shares.
| 1 | Predecessor Fund Inception date of December 30, 2005. |
| 2 | What You Pay reflects the Advisor’s decision to contractually limit expenses through February 28, 2022. Please see the prospectus dated February 28, 2021 for additional information. |
| 3 | Prior to December 1, 2017, Investor Class was known as Class A. |
| 4 | The Morningstar China Index measures the performance of China's equity markets targeting the top 97% of stocks by market capitalization. The index is not actively managed and does not reflect any deduction for fees, expenses or taxes. One may not invest directly in an index. |
| 5 | Excludes adjustments in accordance with accounting principles generally accepted in the United States of America and as such, the net asset value and total return for shareholder transactions reported to the market may differ from the net asset value for financial reporting purposes. |
The Fund is “non-diversified” and will generally be more volatile than diversified funds.
The table does not reflect the deduction of taxes that a shareholder would pay on Fund distributions or the redemption of Fund shares.
This Fund is not suitable for all investors and is subject to investment risks, including possible loss of the principal amount invested.
There is no guarantee that the Fund will continue to hold any one particular security or stay invested in any one particular company. The composition of the Fund's top holdings is subject to change. Performance figures are historical and reflect the change in share price, reinvested distributions, changes in net asset value, sales charges and capital gains distributions, if any.
Not FDIC Insured – No Bank Guarantee – May Lose Value
Investing in China and Hong Kong involves risk and considerations not present when investing in more established securities markets. The Fund may be more susceptible to the economic, market, political and local risks of these regions than a fund that is more geographically diversified.
Top Ten Holdings (as a % of Net Assets)†
| Tencent Holdings, Ltd. | 13.22% |
| Alibaba Group Holding, Ltd. | 9.53% |
| Xinyi Glass Holdings, Ltd. | 3.41% |
| AIA Group, Ltd. | 3.30% |
| Meituan | 3.13% |
| China Construction Bank Corp. | 2.53% |
| Wuxi Biologics Cayman, Inc. | 2.36% |
| NetEase, Inc. | 2.04% |
| Micron Technology, Inc. | 2.03% |
| Powerlong Commercial Management Holdings, Ltd. | 2.00% |
| Top Ten Holdings | 43.55% |
| † | Holdings are subject to change. Calculated as a percent of net assets. Exposure figures reported include the notional value of total return swaps and exclude cash and cash equivalents. |
Sector Allocation^ (as a % of Net Assets)
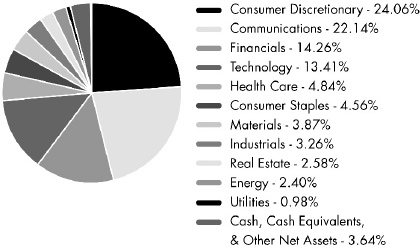
| ^ | Holdings are subject to change. Calculated as a percent of net assets. Exposure figures reported include the notional value of total return swaps. |
138 | April 30, 2021
Clough China Fund
| Statement of Investments | April 30, 2021 (Unaudited) |
| Shares | Value (Note 2) | |||||||
| COMMON STOCKS (87.77%) | ||||||||
| Communications (22.14%) | ||||||||
| Entertainment Content (2.40%) | ||||||||
| Bilibili, Inc., Sponsored ADR(a) | 1,500 | $ | 166,290 | |||||
| NetEase, Inc., ADR(b) | 8,525 | 955,312 | ||||||
| 1,121,602 | ||||||||
| Internet Media & Services (18.40%) | ||||||||
| Baidu, Inc., Sponsored ADR(a) | 4,100 | 862,353 | ||||||
| Meituan, Class B(a) | 38,200 | 1,462,079 | ||||||
| Tencent Holdings, Ltd. | 77,500 | 6,182,333 | ||||||
| Tencent Music Entertainment Group, ADR(a) | 5,400 | 94,068 | ||||||
| 8,600,833 | ||||||||
| Telecommunications (1.34%) | ||||||||
| 21Vianet Group, Inc., ADR(a) | 11,900 | 332,129 | ||||||
| GDS Holdings, Ltd., ADR(a) | 3,552 | 294,709 | ||||||
| 626,838 | ||||||||
| TOTAL COMMUNICATIONS | 10,349,273 | |||||||
| Consumer Discretionary (23.80%) | ||||||||
| Apparel & Textile Products (1.38%) | ||||||||
| Samsonite International SA(a) | 291,900 | 540,228 | ||||||
| Shenzhou International Group Holdings, Ltd. | 4,800 | 105,595 | ||||||
| 645,823 | ||||||||
| Automotive (0.54%) | ||||||||
| Tesla, Inc.(a) | 355 | 251,851 | ||||||
| Consumer Services (0.99%) | ||||||||
| Cathay Media And Education Group, Inc.(a) | 578,000 | 465,223 | ||||||
| E-Commerce Discretionary (13.12%) | ||||||||
| Alibaba Group Holding, Ltd., Sponsored ADR(a)(b) | 19,291 | 4,455,256 | ||||||
| Hong Kong Television Network, Ltd.(a) | 368,000 | 507,486 | ||||||
| JD.com, Inc., ADR(a) | 12,000 | 928,320 | ||||||
| Pinduoduo, Inc., ADR(a) | 1,800 | 241,074 | ||||||
| 6,132,136 | ||||||||
| Leisure Facilities & Services (3.80%) | ||||||||
| Sands China, Ltd.(a) | 174,000 | 823,378 | ||||||
| Shangri-La Asia, Ltd.(a) | 754,000 | 717,788 | ||||||
| Yum China Holdings, Inc. | 3,750 | 235,984 | ||||||
| 1,777,150 | ||||||||
| Retail - Discretionary (3.97%) | ||||||||
| ANTA Sports Products, Ltd. | 16,000 | 285,415 | ||||||
| Giordano International, Ltd. | 2,044,000 | 409,801 | ||||||
| Shares | Value (Note 2) | |||||||
| Li Ning Co., Ltd. | 95,343 | $ | 773,773 | |||||
| Lifestyle International Holdings, Ltd.(a) | 479,500 | 388,469 | ||||||
| 1,857,458 | ||||||||
| TOTAL CONSUMER DISCRETIONARY | 11,129,641 | |||||||
| Consumer Staples (0.84%) | ||||||||
| Retail - Consumer Staples (0.84%) | ||||||||
| JD Health International, Inc.(a)(c) | 7,558 | 116,690 | ||||||
| Ping An Healthcare and Technology Co., Ltd.(a) | 23,700 | 276,528 | ||||||
| 393,218 | ||||||||
| TOTAL CONSUMER STAPLES | 393,218 | |||||||
| Energy (1.26%) | ||||||||
| Oil & Gas Services & Equip (1.26%) | ||||||||
| China Oilfield Services, Ltd., Class H | 644,000 | 588,419 | ||||||
| TOTAL ENERGY | 588,419 | |||||||
| Financials (14.06%) | ||||||||
| Banking (7.14%) | ||||||||
| Bank of China, Ltd., Class H | 1,424,437 | 565,143 | ||||||
| China Construction Bank Corp., Class H | 1,501,080 | 1,184,865 | ||||||
| China Merchants Bank Co., Ltd., Class H | 62,000 | 498,010 | ||||||
| Industrial & Commercial Bank of China, Ltd., Class H | 993,967 | 644,977 | ||||||
| Postal Savings Bank of China Co., Ltd., Class H | 688,000 | 446,214 | ||||||
| 3,339,209 | ||||||||
| Institutional Financial Services (1.83%) | ||||||||
| Hong Kong Exchanges and Clearing, Ltd. | 14,200 | 856,417 | ||||||
| Insurance (5.09%) | ||||||||
| AIA Group, Ltd. | 121,392 | 1,540,777 | ||||||
| Ping An Insurance Group Co. of China, Ltd., Class H | 76,765 | 836,913 | ||||||
| 2,377,690 | ||||||||
| TOTAL FINANCIALS | 6,573,316 | |||||||
| Health Care (3.74%) | ||||||||
| Biotech & Pharma (1.39%) | ||||||||
| Moderna, Inc.(a) | 1,250 | 223,525 | ||||||
| Zai Lab, Ltd., ADR(a) | 2,560 | 425,497 | ||||||
| 649,022 | ||||||||
See Notes to Financial Statements.
139 | April 30, 2021
Clough China Fund
| Statement of Investments | April 30, 2021 (Unaudited) |
| Shares | Value (Note 2) | |||||||
| Health Care Facilities & Services (2.35%) | ||||||||
| Wuxi Biologics Cayman, Inc.(a) | 78,500 | $ | 1,101,967 | |||||
| TOTAL HEALTH CARE | 1,750,989 | |||||||
| Industrials (1.90%) | ||||||||
| Machinery (0.21%) | ||||||||
| Haitian International Holdings, Ltd. | 24,000 | 97,646 | ||||||
| Transportation & Logistics (1.69%) | ||||||||
| China Merchants Port Holdings Co., Ltd. | 494,000 | 790,328 | ||||||
| TOTAL INDUSTRIALS | 887,974 | |||||||
| Materials (3.87%) | ||||||||
| Construction Materials (3.41%) | ||||||||
| Xinyi Glass Holdings, Ltd. | 450,000 | 1,594,352 | ||||||
| Metals & Mining (0.46%) | ||||||||
| Aluminum Corp. of China, Ltd.(a) | 412,000 | 212,895 | ||||||
| TOTAL MATERIALS | 1,807,247 | |||||||
| Real Estate (2.58%) | ||||||||
| Real Estate Owners & Developers (0.58%) | ||||||||
| KWG Group Holdings, Ltd. | 169,228 | 271,108 | ||||||
| Real Estate Services (2.00%) | ||||||||
| Powerlong Commercial | ||||||||
| Management Holdings, Ltd. | 238,500 | 934,830 | ||||||
| TOTAL REAL ESTATE | 1,205,938 | |||||||
| Technology (12.60%) | ||||||||
| Semiconductors (8.51%) | ||||||||
| Applied Materials, Inc. | 4,900 | 650,279 | ||||||
| Broadcom, Inc. | 770 | 351,274 | ||||||
| Infineon Technologies AG | 11,162 | 447,605 | ||||||
| Intel Corp. | 7,400 | 425,722 | ||||||
| Lam Research Corp.(b) | 675 | 418,804 | ||||||
| MediaTek, Inc. | 7,000 | 293,458 | ||||||
| Micron Technology, Inc.(a) | 11,000 | 946,770 | ||||||
| Taiwan Semiconductor Manufacturing Co., Ltd. | 21,000 | 442,252 | ||||||
| 3,976,164 | ||||||||
| Technology Hardware (4.09%) | ||||||||
| Hon Hai Precision Industry Co., Ltd. | 192,000 | 789,321 | ||||||
| Samsung Electronics Co., Ltd. | 11,194 | 815,880 | ||||||
| Shares | Value (Note 2) | |||||||||||
| Silergy Corp. | 3,000 | $ | 308,341 | |||||||||
| 1,913,542 | ||||||||||||
| TOTAL TECHNOLOGY | 5,889,706 | |||||||||||
| Utilities (0.98%) | ||||||||||||
| Gas & Water Utilities (0.98%) | ||||||||||||
| Kunlun Energy Co., Ltd. | 428,000 | 457,632 | ||||||||||
| TOTAL UTILITIES | 457,632 | |||||||||||
| TOTAL COMMON STOCKS | ||||||||||||
| (Cost $28,122,587) | 41,033,353 | |||||||||||
| SHORT TERM INVESTMENTS (10.09%) | ||||||||||||
| Money Market Fund (10.09%) | ||||||||||||
| Blackrock Liquidity Funds, T-Fund | 0.027 | % | 4,720,007 | 4,720,007 | ||||||||
| TOTAL SHORT TERM INVESTMENTS | ||||||||||||
| (Cost $4,720,007) | 4,720,007 | |||||||||||
| TOTAL INVESTMENTS (97.86%) | ||||||||||||
| (Cost $32,842,594) | $ | 45,753,360 | ||||||||||
| Other Assets In Excess Of Liabilities (2.14%)(d) | 999,851 | |||||||||||
| NET ASSETS (100.00%) | $ | 46,753,211 | ||||||||||
| (a) | Non-Income Producing Security. |
| (b) | Security, or portion of security, is being held as collateral for total return swap contracts aggregating a total market value of $1,665,393. |
| (c) | Security, or a portion of security, is exempt from registration under Rule 144A of the Securities Act of 1933. This security may be resold in transactions exempt from registration, normally to qualified institutional buyers. As of April 30, 2021, the aggregate market value of those securities was $11,703, representing 0.03% of net assets. |
| (d) | Includes cash which is being held as collateral for total return swap contracts in the amount of $1,068. |
See Notes to Financial Statements.
140 | April 30, 2021
Clough China Fund
| Statement of Investments | April 30, 2021 (Unaudited) |
TOTAL RETURN SWAP CONTRACTS(a)
| Swap Counterparty | Reference Obligation | Notional Amount | Floating Rate/Fixed Amount Paid by Fund* | Termination Date | Value | Unrealized Appreciation | ||||||||||||
| Morgan Stanley | Boe Technology Group Co., Ltd. | $ | 238,156 | 1D FEDEF + 250 BPS | 1/3/2022 | $ | 242,276 | $ | 4,120 | |||||||||
| Morgan Stanley | China International Travel SER | 79,459 | 1D FEDEF + 250 BPS | 1/3/2022 | 119,656 | 40,197 | ||||||||||||
| Morgan Stanley | Contemporary Amperex Technology Co., Ltd. | 376,456 | 1D FEDEF + 250 BPS | 1/3/2022 | 533,835 | 157,379 | ||||||||||||
| Morgan Stanley | Goetrek, Inc. | 139,070 | 1D FEDEF + 250 BPS | 1/3/2022 | 139,813 | 743 | ||||||||||||
| Morgan Stanley | Kweichow Moutai Co., Ltd. | 553,866 | 1D FEDEF + 250 BPS | 1/3/2022 | 755,702 | 201,836 | ||||||||||||
| Morgan Stanley | Proya Cosmetics Co., Ltd. | 188,363 | 1D FEDEF + 250 BPS | 1/3/2022 | 220,266 | 31,903 | ||||||||||||
| Morgan Stanley | Shenzhen Mindray Bio-Med Electronics Co., Ltd. | 366,815 | 1D FEDEF + 250 BPS | 1/3/2022 | 511,640 | 144,825 | ||||||||||||
| Morgan Stanley | Wuliangye Yibin Co., Ltd. | 612,764 | 1D FEDEF + 255 BPS | 1/3/2022 | 761,879 | 149,115 | ||||||||||||
| Morgan Stanley | Zoomlion Heavy Industry Science & Tech, Ltd. | 293,739 | 1D FEDEF + 255 BPS | 1/3/2022 | 416,903 | 123,164 | ||||||||||||
| $ | 2,848,688 | $ | 3,701,970 | $ | 853,282 | |||||||||||||
| Swap Counterparty | Reference Obligation | Notional Amount | Floating Rate/Fixed Amount Paid by Fund* | Termination Date | Value | Unrealized Depreciation | ||||||||||||
| Morgan Stanley | Ping An Bank Co., Ltd. | $ | 95,583 | 1D FEDEF + 250 BPS | 1/3/2022 | $ | 95,370 | $ | (213 | ) | ||||||||
| Morgan Stanley | Zoomlion Heavy Industry Science & Tech, Ltd. | 241,576 | 1D FEDEF + 250 BPS | 1/3/2022 | 220,451 | (21,125 | ) | |||||||||||
| $ | 337,159 | $ | 315,821 | $ | (21,338 | ) | ||||||||||||
| (a) | For long positions in the total return swap, the Fund receives payments based on any positive return of the Reference Obligation less the rate paid by the Fund. The Fund makes payments on any negative return of such Reference Obligations plus the rate paid by the Fund. For the short positions in the total return swap, the Fund makes payments based on any positive return of the Reference Obligation less the rate received by the Fund. The Fund receives payments on any negative return of such Reference Obligations plus the rate received by the Fund. |
| * | Payments made when swap contract closes. |
Investment Abbreviations:
1D FEDEF - Federal Funds Effective Rate (Daily)
For Fund compliance purposes, the Fund's industry classifications refer to any one or more of the industry sub-classifications used by one or more widely recognized market indexes or ratings group indexes, and/or as defined by Fund management. This definition may not apply for purposes of this report, which may combine industry sub-classifications for reporting ease. Industries are shown as a percent of net assets.
See Notes to Financial Statements.
141 | April 30, 2021
Clough China Fund
| Statement of Assets and Liabilities | April 30, 2021 (Unaudited) |
| ASSETS | ||||
| Investments, at value | $ | 45,753,360 | ||
| Cash collateral pledged for total return swap contracts (Note 3) | 1,068 | |||
| Unrealized appreciation on total return swap contracts | 853,282 | |||
| Receivable for investments sold | 711,374 | |||
| Receivable for shares sold | 6,657 | |||
| Dividends receivable | 19,608 | |||
| Prepaid expenses and other assets | 28,700 | |||
| Total Assets | 47,374,049 | |||
| LIABILITIES | ||||
| Payable for investments purchased | 488,200 | |||
| Payable due to broker for total return swap contracts | 30,649 | |||
| Unrealized depreciation on total return swap contracts | 21,338 | |||
| Investment advisory fees payable | 32,773 | |||
| Administration and transfer agency fees payable | 13,588 | |||
| Distribution and services fees payable | 3,976 | |||
| Trustees' fees and expenses payable | 520 | |||
| Professional fees payable | 15,830 | |||
| Accrued expenses and other liabilities | 13,964 | |||
| Total Liabilities | 620,838 | |||
| NET ASSETS | $ | 46,753,211 | ||
| NET ASSETS CONSIST OF | ||||
| Paid-in capital | $ | 28,125,420 | ||
| Total distributable earnings | 18,627,791 | |||
| NET ASSETS | $ | 46,753,211 | ||
| INVESTMENTS, AT COST | $ | 32,842,594 | ||
| PRICING OF SHARES | ||||
| Investor Class: | ||||
| Net Asset Value, offering and redemption price per share | $ | 28.16 | ||
| Net Assets | $ | 12,446,464 | ||
| Shares of beneficial interest outstanding (unlimited number of shares, no par value common stock authorized) | 441,987 | |||
| Class A: | ||||
| Net Asset Value, offering and redemption price per share | $ | 28.14 | ||
| Net Assets | $ | 2,125,872 | ||
| Shares of beneficial interest outstanding (unlimited number of shares, no par value common stock authorized) | 75,535 | |||
| Maximum offering price per share ((NAV/0.9450), based on maximum sales charge of 5.50% of the offering price) | $ | 29.78 | ||
| Class C: | ||||
| Net Asset Value, offering and redemption price per share(a) | $ | 25.72 | ||
| Net Assets | $ | 1,147,291 | ||
| Shares of beneficial interest outstanding (unlimited number of shares, no par value common stock authorized) | 44,613 | |||
| Class I: | ||||
| Net Asset Value, offering and redemption price per share | $ | 29.23 | ||
| Net Assets | $ | 31,033,584 | ||
| Shares of beneficial interest outstanding (unlimited number of shares, no par value common stock authorized) | 1,061,789 | |||
| (a) | Redemption price per share may be reduced for any applicable contingent deferred sales charge. For a description of a possible sales charge, please see the Fund's Prospectus. |
See Notes to Financial Statements.
142 | April 30, 2021
Clough China Fund
| Statement of Operations | For the Six Months Ended April 30, 2021 (Unaudited) |
| INVESTMENT INCOME | ||||
| Dividends | $ | 70,719 | ||
| Foreign taxes withheld on dividends | (5,997 | ) | ||
| Total Investment Income | 64,722 | |||
| EXPENSES | ||||
| Investment advisory fees | 234,207 | |||
| Administrative fees | 46,979 | |||
| Transfer agency fees | 12,103 | |||
| Distribution and service fees | ||||
| Investor Class | 15,476 | |||
| Class A | 2,776 | |||
| Class C | 5,941 | |||
| Professional fees | 14,096 | |||
| Reports to shareholders and printing fees | 1,761 | |||
| State registration fees | 26,532 | |||
| Insurance fees | 262 | |||
| Custody fees | 10,320 | |||
| Trustees' fees and expenses | 1,093 | |||
| Miscellaneous expenses | 6,561 | |||
| Total Expenses | 378,107 | |||
| Less fees waived/reimbursed by investment advisor (Note 8) | ||||
| Investor Class | (9,056 | ) | ||
| Class A | (1,256 | ) | ||
| Class C | (976 | ) | ||
| Class I | (26,173 | ) | ||
| Net Expenses | 340,646 | |||
| Net Investment Loss | (275,924 | ) | ||
| Net realized gain on investments | 4,810,733 | |||
| Net realized gain on total return swap contracts | 1,562,594 | |||
| Net realized loss on foreign currency transactions | (7,116 | ) | ||
| Net Realized Gain | 6,366,211 | |||
| Net change in unrealized appreciation on investments | 766,459 | |||
| Net change in unrealized depreciation on total return swap contracts | (10,936 | ) | ||
| Net change in unrealized depreciation on translation of assets and liabilities denominated in foreign currencies | (438 | ) | ||
| Net Change in Unrealized Appreciation | 755,085 | |||
| NET REALIZED AND UNREALIZED GAIN ON INVESTMENTS | 7,121,296 | |||
| NET INCREASE IN NET ASSETS RESULTING FROM OPERATIONS | $ | 6,845,372 | ||
See Notes to Financial Statements.
143 | April 30, 2021
Clough China Fund
Statements of Changes in Net Assets
| For the Six Months Ended April 30, 2021 (Unaudited) | For the Year Ended October 31, 2020 | |||||||
| OPERATIONS | ||||||||
| Net investment loss | $ | (275,924 | ) | $ | (217,890 | ) | ||
| Net realized gain | 6,366,211 | 1,565,731 | ||||||
| Net change in unrealized appreciation | 755,085 | 8,719,672 | ||||||
| Net Increase in Net Assets Resulting from Operations | 6,845,372 | 10,067,513 | ||||||
| TOTAL DISTRIBUTIONS | ||||||||
| From distributable earnings | ||||||||
| Investor Class | (478,797 | ) | (1,009,421 | ) | ||||
| Class A | (85,029 | ) | (138,883 | ) | ||||
| Class C | (50,620 | ) | (187,446 | ) | ||||
| Class I | (1,175,251 | ) | (2,056,110 | ) | ||||
| Net Decrease in Net Assets from Distributions | (1,789,697 | ) | (3,391,860 | ) | ||||
| BENEFICIAL INTEREST TRANSACTIONS (NOTE 6) | ||||||||
| Shares sold | ||||||||
| Investor Class | 684,372 | 566,840 | ||||||
| Class A | 112,512 | 660,972 | ||||||
| Class C | 32,614 | 41,193 | ||||||
| Class I | 567,836 | 960,060 | ||||||
| Dividends reinvested | ||||||||
| Investor Class | 293,923 | 566,209 | ||||||
| Class A | 35,673 | 74,412 | ||||||
| Class C | 45,912 | 107,944 | ||||||
| Class I | 1,131,783 | 1,967,974 | ||||||
| Shares redeemed, net of redemption fees | ||||||||
| Investor Class | (482,868 | ) | (2,835,340 | ) | ||||
| Class A | (309,784 | ) | (354,229 | ) | ||||
| Class C | (172,944 | ) | (1,207,676 | ) | ||||
| Class I | (692,361 | ) | (2,972,486 | ) | ||||
| Net Increase/(Decrease) in Net Assets Derived from Beneficial Interest Transactions | 1,246,668 | (2,424,127 | ) | |||||
| Net increase in net assets | 6,302,343 | 4,251,526 | ||||||
| NET ASSETS | ||||||||
| Beginning of period | 40,450,868 | 36,199,342 | ||||||
| End of period | $ | 46,753,211 | $ | 40,450,868 | ||||
See Notes to Financial Statements.
144 | April 30, 2021
Clough China Fund – Investor Class
Financial Highlights
Selected data for a share of beneficial interest outstanding throughout the periods indicated:
| For the Six Months Ended April 30, 2021 (Unaudited) | For the Year Ended October 31, 2020 | For the Year Ended October 31, 2019 | For the Year Ended October 31, 2018(a) | For the Year Ended October 31, 2017 | For the Year Ended October 31, 2016 | |||||||||||||||||||
| Net asset value, beginning of period | $ | 25.09 | $ | 20.96 | $ | 21.36 | $ | 27.22 | $ | 21.07 | $ | 21.74 | ||||||||||||
| INCOME/(LOSS) FROM INVESTMENT OPERATIONS: | ||||||||||||||||||||||||
| Net investment income/(loss)(b) | (0.19 | ) | (0.16 | ) | 0.13 | (0.08 | ) | 0.08 | 0.04 | |||||||||||||||
| Net realized and unrealized gain/(loss) | 4.39 | 6.30 | 1.16 | (5.71 | ) | 6.09 | (0.40 | ) | ||||||||||||||||
| Total from investment operations | 4.20 | 6.14 | 1.29 | (5.79 | ) | 6.17 | (0.36 | ) | ||||||||||||||||
| DISTRIBUTIONS: | ||||||||||||||||||||||||
| From net investment income | (0.22 | ) | (0.38 | ) | – | (0.07 | ) | (0.02 | ) | (0.31 | ) | |||||||||||||
| From net realized gains | (0.91 | ) | (1.63 | ) | (1.69 | ) | – | – | – | |||||||||||||||
| Total distributions | (1.13 | ) | (2.01 | ) | (1.69 | ) | (0.07 | ) | (0.02 | ) | (0.31 | ) | ||||||||||||
| REDEMPTION FEES ADDED TO PAID-IN CAPITAL (NOTE 6) | 0.00 | (c) | 0.00 | (c) | – | 0.00 | (c) | – | 0.00 | (c) | ||||||||||||||
| Net increase/(decrease) in net asset value | 3.07 | 4.13 | (0.40 | ) | (5.86 | ) | 6.15 | (0.67 | ) | |||||||||||||||
| Net asset value, end of period | $ | 28.16 | $ | 25.09 | $ | 20.96 | $ | 21.36 | $ | 27.22 | $ | 21.07 | ||||||||||||
| TOTAL RETURN(d) | 17.05 | % | 31.24 | % | 6.61 | % | (21.32 | )% | 29.32 | % | (1.61 | )% | ||||||||||||
| RATIOS/SUPPLEMENTAL DATA: | ||||||||||||||||||||||||
| Net assets, end of period (000s) | $ | 12,446 | $ | 10,626 | $ | 10,633 | $ | 11,879 | $ | 17,523 | $ | 18,358 | ||||||||||||
| Ratio of expenses to average net assets excluding fee waivers and reimbursements | 1.75 | %(e) | 2.16 | % | 2.23 | % | 2.10 | % | 2.05 | % | 2.04 | % | ||||||||||||
| Ratio of expenses to average net assets including fee waivers and reimbursements | 1.60 | %(e) | 1.87 | %(f) | 1.95 | % | 1.95 | % | 1.95 | % | 1.95 | % | ||||||||||||
| Ratio of net investment income/(loss) to average net assets | (1.32 | )%(e) | (0.74 | )% | 0.61 | % | (0.30 | )% | 0.34 | % | 0.18 | % | ||||||||||||
| Portfolio turnover rate(g) | 49 | % | 120 | % | 344 | % | 131 | % | 71 | % | 126 | % | ||||||||||||
| (a) | Prior to December 1, 2017, Investor Class was known as Class A. |
| (b) | Calculated using the average shares method. |
| (c) | Less than $0.005 or ($0.005) per share. |
| (d) | Total returns are for the period indicated and have not been annualized. Total returns would have been lower had certain expenses not been waived during the period. Returns shown do not reflect the deduction of taxes that a shareholder would pay on Fund distributions or the redemption of Fund shares. |
| (e) | Annualized. |
| (f) | Effective August 18, 2020, the net expense limitation agreement changed from 1.95% to 1.60%. Refer to Note 8. |
| (g) | Portfolio turnover rate for periods less than one full year have not been annualized. |
See Notes to Financial Statements.
145 | April 30, 2021
Clough China Fund – Class A
Financial Highlights
Selected data for a share of beneficial interest outstanding throughout the periods indicated:
| For the Six Months Ended April 30, 2021 (Unaudited) | For the Year Ended October 31, 2020 | For the Year Ended October 31, 2019 | For the Period June 12, 2018 (Commencement of Operations) to October 31, 2018 | |||||||||||||
| Net asset value, beginning of period | $ | 25.07 | $ | 20.95 | $ | 21.36 | $ | 29.95 | ||||||||
| INCOME FROM INVESTMENT OPERATIONS: | ||||||||||||||||
| Net investment income/(loss)(a) | (0.19 | ) | (0.17 | ) | 0.56 | 0.14 | ||||||||||
| Net realized and unrealized gain/(loss) | 4.39 | 6.30 | 0.72 | (8.73 | ) | |||||||||||
| Total from investment operations | 4.20 | 6.13 | 1.28 | (8.59 | ) | |||||||||||
| DISTRIBUTIONS: | ||||||||||||||||
| From net investment income | (0.22 | ) | (0.38 | ) | – | – | ||||||||||
| From net realized gains | (0.91 | ) | (1.63 | ) | (1.69 | ) | – | |||||||||
| Total distributions | (1.13 | ) | (2.01 | ) | (1.69 | ) | – | |||||||||
| Net increase/(decrease) in net asset value | 3.07 | 4.12 | (0.41 | ) | (8.59 | ) | ||||||||||
| Net asset value, end of period | $ | 28.14 | $ | 25.07 | $ | 20.95 | $ | 21.36 | ||||||||
| TOTAL RETURN(b) | 17.06 | % | 31.20 | % | 6.56 | % | (28.68 | )% | ||||||||
| RATIOS/SUPPLEMENTAL DATA: | ||||||||||||||||
| Net assets, end of period (000s) | $ | 2,126 | $ | 2,044 | $ | 1,404 | $ | 7 | ||||||||
| Ratio of expenses to average net assets excluding fee waivers and reimbursements | 1.71 | %(c) | 2.09 | % | 2.22 | % | 2.22 | %(c) | ||||||||
| Ratio of expenses to average net assets including fee waivers and reimbursements | 1.60 | %(c) | 1.85 | %(d) | 1.95 | % | 1.95 | %(c) | ||||||||
| Ratio of net investment income/(loss) to average net assets | (1.33 | )%(c) | (0.77 | )% | 2.68 | % | 1.47 | %(c) | ||||||||
| Portfolio turnover rate(e) | 49 | % | 120 | % | 344 | % | 131 | % | ||||||||
| (a) | Calculated using the average shares method. |
| (b) | Total returns are for the period indicated and have not been annualized. Total returns would have been lower had certain expenses not been waived during the period. Returns shown do not reflect the deduction of taxes that a shareholder would pay on Fund distributions or the redemption of Fund shares. Returns shown exclude any applicable sales charges. |
| (c) | Annualized. |
| (d) | Effective August 18, 2020, the net expense limitation agreement changed from 1.95% to 1.60%. Refer to Note 8. |
| (e) | Portfolio turnover rate for periods less than one full year have not been annualized. |
See Notes to Financial Statements.
146 | April 30, 2021
Clough China Fund – Class C
Financial Highlights
Selected data for a share of beneficial interest outstanding throughout the periods indicated:
| For the Six Months Ended April 30, 2021 (Unaudited) | For the Year Ended October 31, 2020 | For the Year Ended October 31, 2019 | For the Year Ended October 31, 2018 | For the Year Ended October 31, 2017 | For the Year Ended October 31, 2016 | |||||||||||||||||||
| Net asset value, beginning of period | $ | 23.05 | $ | 19.52 | $ | 20.14 | $ | 25.80 | $ | 20.10 | $ | 20.72 | ||||||||||||
| INCOME/(LOSS) FROM INVESTMENT OPERATIONS: | ||||||||||||||||||||||||
| Net investment loss(a) | (0.27 | ) | (0.29 | ) | (0.14 | ) | (0.28 | ) | (0.12 | )(b) | (0.10 | ) | ||||||||||||
| Net realized and unrealized gain/(loss) | 4.04 | 5.80 | 1.21 | (5.38 | ) | 5.82 | (0.39 | ) | ||||||||||||||||
| Total from investment operations | 3.77 | 5.51 | 1.07 | (5.66 | ) | 5.70 | (0.49 | ) | ||||||||||||||||
| DISTRIBUTIONS: | ||||||||||||||||||||||||
| From net investment income | (0.19 | ) | (0.35 | ) | – | – | – | (0.13 | ) | |||||||||||||||
| From net realized gains | (0.91 | ) | (1.63 | ) | (1.69 | ) | – | – | – | |||||||||||||||
| Total distributions | (1.10 | ) | (1.98 | ) | (1.69 | ) | – | – | (0.13 | ) | ||||||||||||||
| REDEMPTION FEES ADDED TO PAID-IN CAPITAL (NOTE 6) | – | 0.00 | (c) | – | – | 0.00 | (c) | 0.00 | (c) | |||||||||||||||
| Net increase/(decrease) in net asset value | 2.67 | 3.53 | (0.62 | ) | (5.66 | ) | 5.70 | (0.62 | ) | |||||||||||||||
| Net asset value, end of period | $ | 25.72 | $ | 23.05 | $ | 19.52 | $ | 20.14 | $ | 25.80 | $ | 20.10 | ||||||||||||
| TOTAL RETURN(d) | 16.67 | % | 30.22 | % | 5.85 | % | (21.94 | )% | 28.36 | % | (2.34 | )% | ||||||||||||
| RATIOS/SUPPLEMENTAL DATA: | ||||||||||||||||||||||||
| Net assets, end of period (000s) | $ | 1,147 | $ | 1,113 | $ | 1,968 | $ | 4,245 | $ | 6,610 | $ | 8,352 | ||||||||||||
| Ratio of expenses to average net assets excluding fee waivers and reimbursements | 2.51 | %(e) | 2.96 | % | 2.98 | % | 2.85 | % | 2.85 | % | 2.83 | % | ||||||||||||
| Ratio of expenses to average net assets including fee waivers and reimbursements | 2.35 | %(e) | 2.65 | %(f) | 2.70 | % | 2.70 | % | 2.70 | % | 2.70 | % | ||||||||||||
| Ratio of net investment loss to average net assets | (2.08 | )%(e) | (1.49 | )% | (0.69 | )% | (1.07 | )% | (0.54 | )% | (0.52 | )% | ||||||||||||
| Portfolio turnover rate(g) | 49 | % | 120 | % | 344 | % | 131 | % | 71 | % | 126 | % | ||||||||||||
| (a) | Calculated using the average shares method. |
| (b) | The per share amount does not correspond to activity reflected in the Statement of Operations due to class specific expenses during the period. |
| (c) | Less than $0.005 or ($0.005) per share. |
| (d) | Total returns are for the period indicated and have not been annualized. Total returns would have been lower had certain expenses not been waived during the period. Returns shown do not reflect the deduction of taxes that a shareholder would pay on Fund distributions or the redemption of Fund shares. Returns shown exclude any applicable sales charges. |
| (e) | Annualized. |
| (f) | Effective August 18, 2020, the net expense limitation agreement changed from 2.70% to 2.35%. Refer to Note 8. |
| (g) | Portfolio turnover rate for periods less than one full year have not been annualized. |
See Notes to Financial Statements.
147 | April 30, 2021
Clough China Fund – Class I
Financial Highlights
Selected data for a share of beneficial interest outstanding throughout the periods indicated:
| For the Six Months Ended April 30, 2021 (Unaudited) | For the Year Ended October 31, 2020 | For the Year Ended October 31, 2019 | For the Year Ended October 31, 2018 | For the Year Ended October 31, 2017 | For the Year Ended October 31, 2016 | |||||||||||||||||||
| Net asset value, beginning of period | $ | 25.98 | $ | 21.59 | $ | 21.90 | $ | 27.92 | $ | 21.60 | $ | 22.28 | ||||||||||||
| INCOME/(LOSS) FROM INVESTMENT OPERATIONS: | ||||||||||||||||||||||||
| Net investment income/(loss)(a) | (0.16 | ) | (0.10 | ) | 0.20 | (0.05 | ) | 0.15 | 0.09 | |||||||||||||||
| Net realized and unrealized gain/(loss) | 4.55 | 6.51 | 1.18 | (5.83 | ) | 6.23 | (0.39 | ) | ||||||||||||||||
| Total from investment operations | 4.39 | 6.41 | 1.38 | (5.88 | ) | 6.38 | (0.30 | ) | ||||||||||||||||
| DISTRIBUTIONS: | ||||||||||||||||||||||||
| From net investment income | (0.23 | ) | (0.39 | ) | – | (0.14 | ) | (0.06 | ) | (0.38 | ) | |||||||||||||
| From net realized gains | (0.91 | ) | (1.63 | ) | (1.69 | ) | – | – | – | |||||||||||||||
| Total distributions | (1.14 | ) | (2.02 | ) | (1.69 | ) | (0.14 | ) | (0.06 | ) | (0.38 | ) | ||||||||||||
| REDEMPTION FEES ADDED TO PAID-IN CAPITAL (NOTE 6) | – | – | – | – | 0.00 | (b) | 0.00 | (b) | ||||||||||||||||
| Net increase/(decrease) in net asset value | 3.25 | 4.39 | (0.31 | ) | (6.02 | ) | 6.32 | (0.68 | ) | |||||||||||||||
| Net asset value, end of period | $ | 29.23 | $ | 25.98 | $ | 21.59 | $ | 21.90 | $ | 27.92 | $ | 21.60 | ||||||||||||
| TOTAL RETURN(c) | 17.21 | % | 31.60 | % | 6.87 | % | (21.17 | )% | 29.64 | % | (1.31 | )% | ||||||||||||
| RATIOS/SUPPLEMENTAL DATA: | ||||||||||||||||||||||||
| Net assets, end of period (000s) | $ | 31,034 | $ | 26,668 | $ | 22,195 | $ | 21,655 | $ | 35,191 | $ | 33,605 | ||||||||||||
| Ratio of expenses to average net assets excluding fee waivers and reimbursements | 1.52 | %(d) | 1.93 | % | 1.99 | % | 1.86 | % | 1.83 | % | 1.82 | % | ||||||||||||
| Ratio of expenses to average net assets including fee waivers and reimbursements | 1.35 | %(d) | 1.62 | %(e) | 1.70 | % | 1.70 | % | 1.70 | % | 1.70 | % | ||||||||||||
| Ratio of net investment income/(loss) to average net assets | (1.07 | )%(d) | (0.46 | )% | 0.93 | % | (0.17 | )% | 0.61 | % | 0.46 | % | ||||||||||||
| Portfolio turnover rate(f) | 49 | % | 120 | % | 344 | % | 131 | % | 71 | % | 126 | % | ||||||||||||
| (a) | Calculated using the average shares method. |
| (b) | Less than $0.005 or ($0.005) per share. |
| (c) | Total returns are for the period indicated and have not been annualized. Total returns would have been lower had certain expenses not been waived during the period. Returns shown do not reflect the deduction of taxes that a shareholder would pay on Fund distributions or the redemption of Fund shares. |
| (d) | Annualized. |
| (e) | Effective August 18, 2020, the net expense limitation agreement changed from 1.70% to 1.35%. Refer to Note 8. |
| (f) | Portfolio turnover rate for periods less than one full year have not been annualized. |
See Notes to Financial Statements.
148 | April 30, 2021
| RiverFront Global Allocation Series | |
| Management Commentary | April 30, 2021 (Unaudited) |
Six Months in Review:
The six months that encompassed November 2020 to April 2021 was very much a bull market with the S&P 500 index up almost 30% (the index was up over 10% in the month of November alone). US election uncertainty abated and while the Democrats gained control of the presidency, the house and the senate, their agenda has been limited (so far) by moderates such as Joe Manchin and Kyrsten Sinema. There continues to be negotiation on who will foot the bill of a new proposed infrastructure spending plan (and what the definition of “infrastructure” is); however, it seems that corporate tax rates will be increasing, albeit only in a moderate magnitude, in our view.
On December 21, 2020, US Congress passed a $900 billion stimulus and relief bill which further injected cash directly into the economy (at the time, it was the fourth such bill that had been passed since the pandemic began). On March 11, 2021, President Biden signed the American Rescue Plan Act which implemented a further $1.9 trillion in stimulus and relief. These stimulus plans have been well-received by the stock market. Moreover, even with this unprecedented stimulus and money printing, inflation has seemed under control for most of the examination period (e.g., March YoY CPI growth was 2.6%). However, in April, inflation has ticked-up significantly with YoY CPI up 4.2%. As of the date of this report, the unemployment rate in the US has stabilized at 6.1% (down from 6.7% at the start of this examination period and flat from February of 6.2%). The 10-Year Treasury Yield doubled over the period from 87 basis points to 1.65% and high yield spreads compressed significantly.
As of the date of this report, there have been over 31 million COVID cases in the United States with 561,000 deaths attributed to the virus1. The epidemic has come under control in developed nations such as the United States, where over 30% of the population has been fully vaccinated. However, in other parts of the world that have worse medical treatment capabilities and little to no vaccine availability, the current virus impact is palpable. For instance, over the 30 day period ending May 12, in India, total cases are up 73%.
Outlook:
A little over twelve months ago, investors were looking for signs that the bull market and multi-year economic expansion were coming to an end. The onset of COVID-19 put an end to both, but now investors are focused on a new expansion and a new bull market with different dynamics. As we have navigated back and forth between optimism and pessimism, we have also seen leadership changes across asset classes and investment styles. The combination of massive amounts of global stimulus, accommodative central banks, and widespread distribution of the vaccine has helped fuel broader participation beyond just US large cap and growth sectors; over the first quarter, mid- and small-cap US stocks outpaced large-cap stocks and value sectors performed better than growth sectors. Moving forward, we expect this rotation to continue. Specifically, we expect sectors that should benefit from the recovery and from new policies emanating from the Biden administration to outperform.
These include materials, energy, industrials, cyclical consumer discretionary, and financials. On the other hand, we still believe that quality branded consumer companies and technology companies offer resilience in a variety of economic conditions.
Internationally, we believe economies outside of the US are recovering more slowly. We are encouraged by improving economic indicators in Europe and Asia but will likely wait to see confirmation of sustained improvement before increasing allocations there.
Due to system limitations regarding actual index reporting, we use the following ETFs: iShares Core S&P 500 ETF (IVV), iShares MSCI EAFE ETF (EFA), iShares MSCI ACWI ETF (ACWI) and iShares Core US Aggregate Bond ETF (AGG) as proxies for the following indices: S&P 500 Index; MSCI Europe, Australasia, and Far East Index; MSCI All Country World Index and Bloomberg Barclays US Aggregate Bond Index for purposes of discussing attribution.
RiverFront Asset Allocation Moderate
The portfolio outperformed relative to its benchmark (40% S&P 500 Index TR/10% MSCI EAFE (NR) USD Index/50% Bloomberg Barclays Agg) for the six month period ended April 30, 2021. The top themes that affected performance during the period are listed below:
Contributors:
| · | Overweight allocation to domestic equities |
| · | Underweight allocation to traditional fixed income |
| · | Selection within broad fixed income |
Detractors:
| · | Selection within domestic equities |
| · | Overweight allocation to alternative fixed income |
| · | Selection within international equities |
RiverFront Asset Allocation Growth and Income
The portfolio underperformed relative to its benchmark (70% ACWI and 30% Bloomberg Barclays US Aggregate) for the six month period. The top themes that affected performance during the six month period are listed below:
Contributors:
| · | Selection within broad fixed income |
| · | Underweight allocation to broad fixed income |
| · | Underweight allocation to traditional fixed income |
Detractors:
| · | Selection within domestic equities |
| · | Overweight allocation to alternative fixed income |
| · | Selection within developed international equities |
149 | April 30, 2021
| RiverFront Global Allocation Series | |
| Management Commentary | April 30, 2021 (Unaudited) |
RiverFront Asset Allocation Aggressive
The portfolio underperformed relative to its benchmark (MSCI All Country World Index – NR) for the six month period. No positive contributors were recognized during the six month period. The top themes that detracted from performance during the six month period are listed below:
Detractors:
| · | Selection within domestic equities |
| · | Selection within developed international equities |
| · | Overweight allocation to emerging market equities |
Scott Hays, CFA
Senior Portfolio Manager
| (1) | According to following article published April 28, 2021: https://www.investopedia.com/government-stimulus-efforts-to-fight-the-covid-19-crisis-4799723 |
Past performance is no guarantee of future results. Dividends are not guaranteed and are subject to change or elimination. Investments in international and emerging markets securities include exposure to risks such as currency fluctuations, foreign taxes and regulations, and the potential for illiquid markets and political instability.
The views of the author and information discussed in this commentary are as of the date of publication, are subject to change, and may not reflect the writer's current views. The views expressed are those of the author only, and represent an assessment of market conditions at a specific point in time, are opinions only and should not be relied upon as investment advice regarding a particular investment or markets in general. Such information does not constitute a recommendation to buy or sell specific securities or investment vehicles. It should not be assumed that any investment will be profitable or will equal the performance of the fund(s) or any securities or any sectors mentioned in this letter. The subject matter contained in this letter has been derived from several sources believed to be reliable and accurate at the time of compilation. Neither ALPS Advisors, Inc., RiverFront Investment Group, LLC, nor the Funds accepts any liability for losses either direct or consequential caused by the use of this information.
Indices do not reflect deductions for fees, expenses, or taxes.
An investor may not invest directly in an index.
Diversification cannot guarantee gain or prevent losses.
ALPS Portfolio Solutions Distributor, Inc., ALPS Distributors, Inc. and ALPS Advisors Inc. are affiliated.
150 | April 30, 2021
|
RiverFront Asset Allocation Aggressive |
|
| Performance Update | April 30, 2021 (Unaudited) |
Performance of $10,000 Initial Investment (as of April 30, 2021)
Comparison of change in value of a $10,000 investment
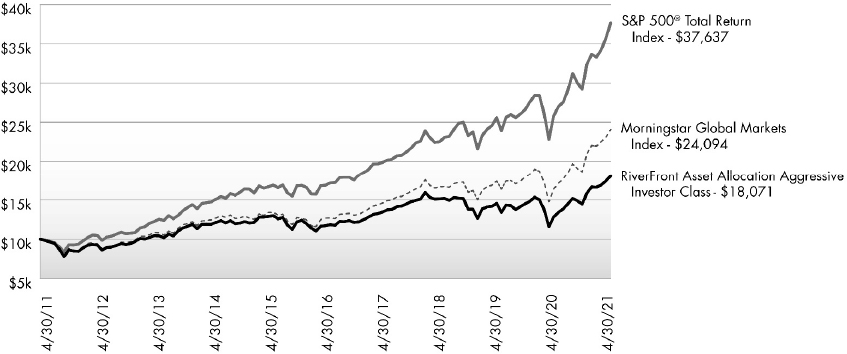
The chart above represents historical performance of a hypothetical investment of $10,000 in the Fund since inception. Past performance does not guarantee future results. This chart does not reflect the deduction of taxes that a shareholder would pay on Fund distributions or the redemption of Fund shares.
Average Annual Total Returns (as of April 30, 2021)
| 6 Month | 1 Year | 3 Years | 5 Years | 10 Years | Since Inception^ | Total Expense Ratio | What You Pay* | |
| Investor# (NAV) | 25.14% | 40.97% | 6.09% | 9.06% | 6.10% | 8.93% | 1.15% | 1.15% |
| Class A (NAV) | 25.18% | 41.02% | 6.09% | 9.06% | 6.11% | 8.92% | 1.15% | 1.15% |
| Class A (MOP) | 18.32% | 33.26% | 4.10% | 7.83% | 5.51% | 8.43% | ||
| Class C (NAV) | 24.68% | 40.05% | 5.30% | 8.24% | 5.32% | 8.12% | 1.90% | 1.90% |
| Class C (CDSC) | 23.68% | 39.05% | 5.30% | 8.24% | 5.32% | 8.12% | ||
| Class I (NAV) | 25.27% | 41.42% | 6.36% | 9.34% | 6.35% | 9.19% | 0.90% | 0.90% |
| Investor II (NAV) | 25.20% | 41.06% | 6.08% | 9.05% | 6.10% | 8.91% | 1.15% | 1.15% |
| Class L1 (NAV) | 25.33% | 41.40% | 6.37% | 9.32% | 6.37% | 9.19% | 0.90% | 0.90% |
| Morningstar Global Markets Index2 | 29.19% | 47.26% | 13.06% | 13.72% | 9.19% | 12.40% | ||
| S&P 500® Total Return Index3 | 28.86% | 45.98% | 18.67% | 17.42% | 14.17% | 15.05% |
Performance data quoted represents past performance. Past performance does not guarantee future results. Investment return and principal value of an investment will fluctuate so that an investor's shares, when sold or redeemed, may be worth more or less than the original cost. Current performance data may be higher or lower than actual data quoted. For the most current month-end performance data, please call 1-866-759-5679.
Maximum Offering Price (MOP) for Class A shares includes the Fund’s maximum sales charge of 5.50%. Performance shown at NAV does not include these sales charges and would have been lower had it been taken into account. If you invest $1 million or more, either as a lump sum or through the Fund’s accumulation or letter of intent programs, you can purchase Class A shares without an initial sales charge (load). A Contingent Deferred Sales Charge (“CDSC”) of 1.00% may apply to Class C shares redeemed within the first 12 months after a purchase, and on Class A shares redeemed within the first 18 months after a purchase in excess of $1 million.
Performance less than 1 year is cumulative.
151 | April 30, 2021
| RiverFront Asset Allocation Aggressive | |
| Performance Update | April 30, 2021 (Unaudited) |
Performance shown for Class A shares prior to June 12, 2018 reflects the historical performance of the Fund’s Investor shares, calculated using the fees and expenses of Class A shares.
The Investor Class, Class A, Class C, I and L shares performance shown for periods prior to September 27, 2010 reflects the performance of the Baird Funds, Inc. – RiverFront Long-Term Growth Fund’s Institutional Class shares (as result of the reorganization of the Baird Funds, Inc. – RiverFront Long-Term Growth Fund into the Fund).
The Investor II Class performance shown for periods prior to September 27, 2010 reflects the performance of the Baird Funds, Inc. – RiverFront Long-Term Growth Fund’s Investor Class shares (as result of the reorganization of the Baird Funds, Inc. – RiverFront Long-Term Growth Fund into the Fund).
| 1 | Prior to close of business on September 24, 2010, Class L was known as Institutional Class of the Baird Funds, Inc. - RiverFront Long-Term Growth Fund. |
| 2 | The Morningstar Global Market Index measures the performance of performance of the stocks located in the developed and emerging countries across the world. Stocks in the index are weighted by their float capital, which removes corporate cross ownership, government holdings and other locked-in shares. The index is not actively managed and does not reflect any deduction for fees, expenses or taxes. An investor may not invest directly in an index. |
| 3 | S&P 500® Total Return Index is the Standard & Poor's composite index of 500 stocks, a widely recognized, unmanaged index of common stock prices. The index is not actively managed and does not reflect any deduction for fees, expenses or taxes. An investor may not invest directly in an index. |
| ^ | Fund Inception date of October 28, 2008 for Investor Class II and Class L; Fund Inception date September 27, 2010 for Investor Class and Classes C and I; Fund Inception date June 12, 2018 for Class A. |
| * | What You Pay reflects Acquired Fund Fees and Expenses of 0.65%. Please see the prospectus dated February 28, 2021 for additional information. |
| # | Prior to December 1, 2017, Investor Class was known as Class A. |
Prior to February 28, 2018, the RiverFront Asset Allocation Aggressive was known as the RiverFront Global Growth Fund.
The table does not reflect the deduction of taxes that a shareholder would pay on Fund distributions or the redemption of Fund shares.
This Fund is not suitable for all investors and is subject to investment risks, including possible loss of the principal amount invested.
There is no guarantee that the Fund will continue to hold any one particular security or stay invested in any one particular company. The composition of the Fund's top holdings is subject to change. Performance figures are historical and reflect the change in share price, reinvested distributions, changes in net asset value, sales charges and capital gains distributions, if any.
Not FDIC Insured – No Bank Guarantee – May Lose Value
Top Ten Holdings (as a % of Net Assets) †
| RiverFront Dynamic US Dividend Advantage ETF | 30.82% |
| RiverFront Dynamic US Flex-Cap ETF | 29.41% |
| First Trust RiverFront Dynamic Developed International ETF | 16.06% |
| First Trust RiverFront Dynamic Emerging Markets ETF | 11.49% |
| First Trust RiverFront Dynamic Europe ETF | 6.47% |
| First Trust RiverFront Dynamic Asia Pacific ETF | 3.13% |
| Top Ten Holdings | 97.38% |
| † | Holdings are subject to change, and may not reflect the current or future position of the portfolio. Table presents indicative values only. Excludes cash & cash equivalents. |
Portfolio Composition (as a % of Net Assets)
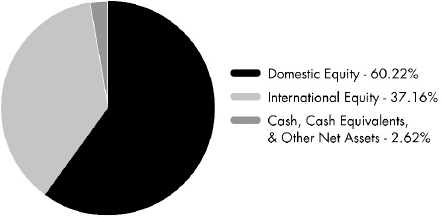
152 | April 30, 2021
| RiverFront Asset Allocation Growth & Income | |
| Performance Update | April 30, 2021 (Unaudited) |
Performance of $10,000 Initial Investment (as of April 30, 2021)
Comparison of change in value of a $10,000 investment
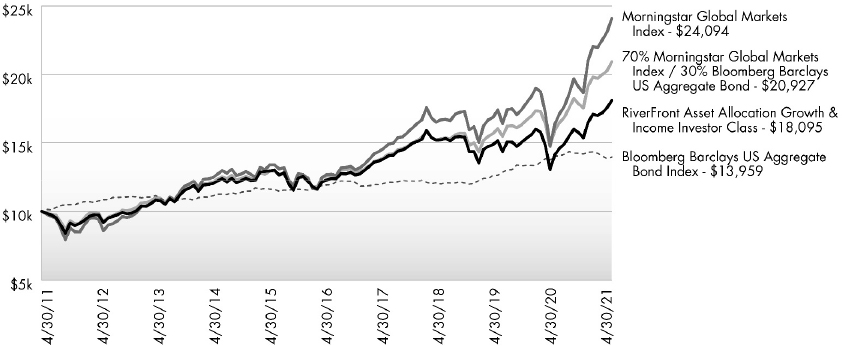
The chart above represents historical performance of a hypothetical investment of $10,000 in the Fund since inception. Past performance does not guarantee future results. This chart does not reflect the deduction of taxes that a shareholder would pay on Fund distributions or the redemption of Fund shares.
Average Annual Total Returns (as of April 30, 2021)
| 6 Month | 1 Year | 3 Years | 5 Years | 10 Years | Since Inception^ | Total Expense Ratio | What You Pay* | |
| Investor# (NAV) | 17.78% | 28.13% | 5.95% | 8.06% | 6.11% | 7.32% | 1.10% | 1.10% |
| Class A (NAV) | 17.72% | 28.08% | 5.93% | 8.05% | 6.11% | 7.31% | 1.10% | 1.10% |
| Class A (MOP) | 11.23% | 20.99% | 3.96% | 6.83% | 5.51% | 6.75% | ||
| Class C (NAV) | 17.33% | 27.29% | 5.14% | 7.26% | 5.31% | 6.51% | 1.85% | 1.85% |
| Class C (CDSC) | 16.33% | 26.29% | 5.14% | 7.26% | 5.31% | 6.51% | ||
| Class I (NAV) | 17.98% | 28.48% | 6.20% | 8.32% | 6.37% | 7.58% | 0.85% | 0.85% |
| Morningstar Global Markets Index1 | 29.19% | 47.26% | 13.06% | 13.72% | 9.19% | 10.65% | ||
| Bloomberg Barclays US Aggregate Bond Index2 | -1.52% | -0.27% | 5.19% | 3.19% | 3.39% | 3.34% | ||
| 70% Morningstar Global Markets Index / 30% Bloomberg Barclays US Aggregate Bond1,2 | 19.31% | 31.39% | 11.04% | 10.72% | 7.66% | 8.66% |
Performance data quoted represents past performance. Past performance does not guarantee future results. Investment return and principal value of an investment will fluctuate so that an investor's shares, when sold or redeemed, may be worth more or less than the original cost. Current performance data may be higher or lower than actual data quoted. For the most current month-end performance data, please call 1-866-759-5679.
Maximum Offering Price (MOP) for Class A shares includes the Fund’s maximum sales charge of 5.50%. Performance shown at NAV does not include these sales charges and would have been lower had it been taken into account. If you invest $1 million or more, either as a lump sum or through the Fund’s accumulation or letter of intent programs, you can purchase Class A shares without an initial sales charge (load). A Contingent Deferred Sales Charge (“CDSC”) of 1.00% may apply to Class C shares redeemed within the first 12 months after a purchase, and on Class A shares redeemed within the first 18 months after a purchase in excess of $1 million.
153 | April 30, 2021
| RiverFront Asset Allocation Growth & Income | |
| Performance Update | April 30, 2021 (Unaudited) |
Performance shown for Class A shares prior to June 12, 2018 reflects the historical performance of the Fund’s Investor shares, calculated using the fees and expenses of Class A shares.
| 1 | The Morningstar Global Market Index measures the performance of performance of the stocks located in the developed and emerging countries across the world. Stocks in the index are weighted by their float capital, which removes corporate cross ownership, government holdings and other locked-in shares. The index is not actively managed and does not reflect any deduction for fees, expenses or taxes. An investor may not invest directly in an index. |
| 2 | The Barclays U.S. Aggregate Bond Index is a broad-based benchmark that measures the investment grade, U.S. dollar-denominated, fixed-rate taxable bond market, including Treasuries, government-related and corporate securities, MBS (agency fixed-rate and hybrid ARM passthroughs), ABS, and CMBS. The index is not actively managed and does not reflect any deductions for fees, expenses or taxes. An investor may not invest directly in an index. |
| ^ | Fund Inception date of August 2, 2010 for Investor Class and Classes C and I; Fund Inception date of June 12, 2018 for Class A. |
| * | What You Pay reflects Acquired Fund Fees and Expenses of 0.60%. Please see the prospectus dated February 28, 2021 for additional information. |
| # | Prior to December 1, 2017, Investor Class was known as Class A. |
Prior to February 28, 2018, the RiverFront Asset Allocation Growth & Income was known as the RiverFront Dynamic Equity Income Fund.
The table does not reflect the deduction of taxes that a shareholder would pay on Fund distributions or the redemption of Fund shares.
This Fund is not suitable for all investors and is subject to investment risks, including possible loss of the principal amount invested.
There is no guarantee that the Fund will continue to hold any one particular security or stay invested in any one particular company. The composition of the Fund's top holdings is subject to change. Performance figures are historical and reflect the change in share price, reinvested distributions, changes in net asset value, sales charges and capital gains distributions, if any.
Not FDIC Insured – No Bank Guarantee – May Lose Value
Top Ten Holdings (as a % of Net Assets) †
| RiverFront Dynamic US Dividend Advantage ETF | 30.59% |
| First Trust RiverFront Dynamic Developed International ETF | 21.83% |
| RiverFront Dynamic Core Income ETF | 20.13% |
| RiverFront Dynamic US Flex-Cap ETF | 13.76% |
| First Trust RiverFront Dynamic Emerging Markets ETF | 8.69% |
| RiverFront Dynamic Unconstrained Income ETF | 1.65% |
| Riverfront Strategic Income Fund | 1.45% |
| Top Ten Holdings | 98.10% |
| † | Holdings are subject to change, and may not reflect the current or future position of the portfolio. Table presents indicative values only. Excludes cash & cash equivalents. |
Portfolio Composition (as a % of Net Assets)
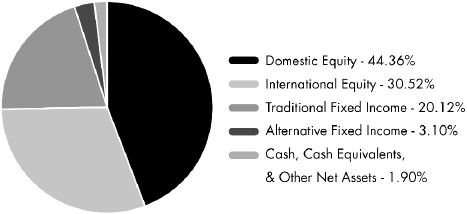
154 | April 30, 2021
| RiverFront Asset Allocation Moderate | |
| Performance Update | April 30, 2021 (Unaudited) |
Performance of $10,000 Initial Investment (as of April 30, 2021)
Comparison of change in value of a $10,000 investment
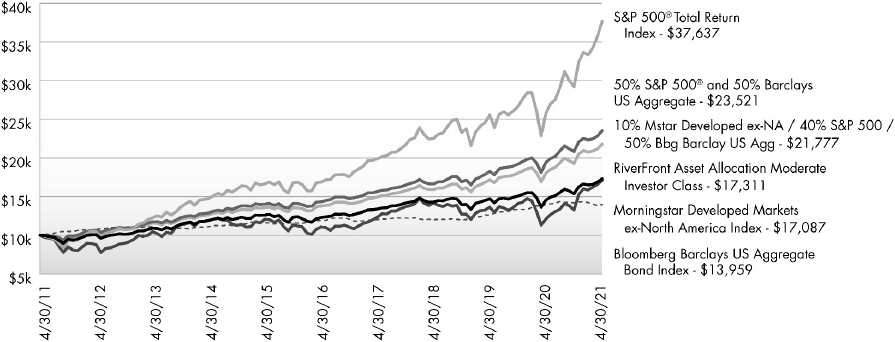
The chart above represents historical performance of a hypothetical investment of $10,000 in the Fund since inception. Past performance does not guarantee future results. This chart does not reflect the deduction of taxes that a shareholder would pay on Fund distributions or the redemption of Fund shares.
Average Annual Total Returns (as of April 30, 2021)
| 6 Month | 1 Year | 3 Years | 5 Years | 10 Years | Since Inception^ | Total Expense Ratio | What You Pay* | |
| Investor# (NAV) | 12.63% | 19.04% | 6.55% | 7.11% | 5.64% | 6.33% | 1.02% | 1.02% |
| Class A (NAV) | 12.65% | 19.08% | 6.56% | 7.11% | 5.64% | 6.33% | 1.02% | 1.02% |
| Class A (MOP) | 6.46% | 12.55% | 4.56% | 5.90% | 5.05% | 5.78% | ||
| Class C (NAV) | 12.26% | 18.29% | 5.75% | 6.32% | 4.85% | 5.54% | 1.77% | 1.77% |
| Class C (CDSC) | 11.26% | 17.29% | 5.75% | 6.32% | 4.85% | 5.54% | ||
| Class I (NAV) | 12.74% | 19.30% | 6.81% | 7.37% | 5.90% | 6.59% | 0.77% | 0.77% |
| S&P 500® Total Return Index1 | 28.86% | 45.98% | 18.67% | 17.42% | 14.17% | 15.33% | ||
| Bloomberg Barclays US Aggregate Bond Index2 | -1.52% | -0.27% | 5.19% | 3.19% | 3.39% | 3.34% | ||
| Morningstar Developed Markets ex-North America Index3 | 28.91% | 41.28% | 6.42% | 9.05% | 5.50% | 7.05% | ||
| 10% Mstar Developed ex-NA / 40% S&P 500 / 50% Bbg Barclay US Agg1,2,3 | 12.91% | 20.71% | 11.02% | 9.61% | 8.09% | 8.76% |
Performance data quoted represents past performance. Past performance does not guarantee future results. Investment return and principal value of an investment will fluctuate so that an investor's shares, when sold or redeemed, may be worth more or less than the original cost. Current performance data may be higher or lower than actual data quoted. For the most current month-end performance data, please call 1-866-759-5679.
Maximum Offering Price (MOP) for Class A shares includes the Fund’s maximum sales charge of 5.50%. Performance shown at NAV does not include these sales charges and would have been lower had it been taken into account. If you invest $1 million or more, either as a lump sum or through the Fund’s accumulation or letter of intent programs, you can purchase Class A shares without an initial sales charge (load). A Contingent Deferred Sales Charge (“CDSC”) of 1.00% may apply to Class C shares redeemed within the first 12 months after a purchase, and on Class A shares redeemed within the first 18 months after a purchase in excess of $1 million.
155 | April 30, 2021
| RiverFront Asset Allocation Moderate | |
| Performance Update | April 30, 2021 (Unaudited) |
Performance shown for Class A shares prior to June 12, 2018 reflects the historical performance of the Fund’s Investor shares, calculated using the fees and expenses of Class A shares.
| 1 | S&P 500® Total Return Index is the Standard & Poor's composite index of 500 stocks, a widely recognized, unmanaged index of common stock prices. The index is not actively managed and does not reflect any deduction for fees, expenses or taxes. An investor may not invest directly in an index. |
| 2 | The Barclays U.S. Aggregate Bond Index is a broad-based benchmark that measures the investment grade, U.S. dollar-denominated, fixed-rate taxable bond market, including Treasuries, government-related and corporate securities, MBS (agency fixed-rate and hybrid ARM passthroughs), ABS, and CMBS. The index is not actively managed and does not reflect any deductions for fees, expenses or taxes. An investor may not invest directly in an index. |
| 3 | The Morningstar Developed Markets ex-North America Index measures the performance of companies in developed markets ex-North America. It covers approximately 97% of the full market capitalization in the Developed Markets ex-North America. The index is not actively managed and does not reflect any deductions for fees, expenses or taxes. An investor may not invest directly in an index. |
| ^ | Fund Inception date of August 2, 2010 for Investor Class and Classes C and I; Fund Inception date of June 12, 2018 for Class A. |
| * | What You Pay reflects Acquired Fund Fees and Expenses of 0.52%. Please see the prospectus dated February 28, 2021 for additional information. |
| # | Prior to December 1, 2017, Investor Class was known as Class A. |
Prior to February 28, 2018, the RiverFront Asset Allocation Moderate was known as the RiverFront Moderate Growth & Income Fund.
The table does not reflect the deduction of taxes that a shareholder would pay on Fund distributions or the redemption of Fund shares.
This Fund is not suitable for all investors and is subject to investment risks, including possible loss of the principal amount invested.
There is no guarantee that the Fund will continue to hold any one particular security or stay invested in any one particular company. The composition of the Fund's top holdings is subject to change. Performance figures are historical and reflect the change in share price, reinvested distributions, changes in net asset value, sales charges and capital gains distributions, if any.
Not FDIC Insured – No Bank Guarantee – May Lose Value
Top Ten Holdings (as a % of Net Assets) †
| RiverFront Dynamic Core Income ETF | 39.60% |
| RiverFront Dynamic US Dividend Advantage ETF | 33.60% |
| First Trust RiverFront Dynamic Developed International ETF | 11.57% |
| RiverFront Dynamic US Flex-Cap ETF | 10.45% |
| RiverFront Dynamic Unconstrained Income ETF | 1.68% |
| Riverfront Strategic Income Fund | 1.47% |
| Top Ten Holdings | 98.37% |
| † | Holdings are subject to change, and may not reflect the current or future position of the portfolio. Table presents indicative values only. Excludes cash & cash equivalents. |
Portfolio Composition (as a % of Net Assets)
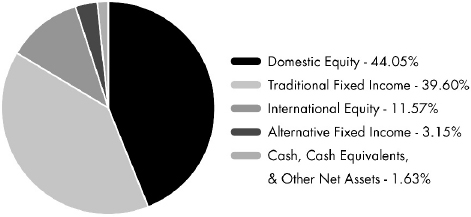
156 | April 30, 2021
| RiverFront Asset Allocation Aggressive | |
| Statement of Investments | April 30, 2021 (Unaudited) |
| Value | ||||||||
| Shares | (Note 2) | |||||||
| EXCHANGE TRADED FUNDS (97.38%) | ||||||||
| Equity (97.38%) | ||||||||
| First Trust RiverFront Dynamic Asia Pacific ETF(a) | 14,735 | $ | 844,578 | |||||
| First Trust RiverFront Dynamic Developed International ETF(a) | 63,467 | 4,330,988 | ||||||
| First Trust RiverFront Dynamic Emerging Markets ETF(a) | 42,019 | 3,098,405 | ||||||
| First Trust RiverFront Dynamic Europe ETF(a) | 24,331 | 1,743,681 | ||||||
| RiverFront Dynamic US Dividend Advantage ETF(a) | 196,376 | 8,309,317 | ||||||
| RiverFront Dynamic US Flex-Cap ETF(a) | 183,874 | 7,927,893 | ||||||
| 26,254,862 | ||||||||
| TOTAL EXCHANGE TRADED FUNDS | ||||||||
| (Cost $20,548,812) | 26,254,862 | |||||||
| 7-Day | Value | |||||||||||
| Yield | Shares | (Note 2) | ||||||||||
| SHORT-TERM INVESTMENTS (2.67%) | ||||||||||||
| Money Market Fund (2.67%) | ||||||||||||
| State Street Institutional Treasury Plus Money Market Fund | 0.020 | % | 719,325 | 719,325 | ||||||||
| TOTAL MONEY MARKET FUND | 719,325 | |||||||||||
| TOTAL SHORT-TERM INVESTMENTS | ||||||||||||
| (Cost $719,325) | 719,325 | |||||||||||
| TOTAL INVESTMENTS (100.05%) | ||||||||||||
| (Cost $21,268,137) | $ | 26,974,187 | ||||||||||
| Liabilities In Excess Of Other Assets (-0.05%) | (14,204 | ) | ||||||||||
| NET ASSETS (100.00%) | $ | 26,959,983 | ||||||||||
| (a) | Affiliated Company. See Note 7 in Notes to Financial Statements. |
For Fund compliance purposes, the Fund's industry classifications refer to any one or more of the industry sub-classifications used by one or more widely recognized market indexes or ratings group indexes, and/or as defined by Fund management. This definition may not apply for purposes of this report, which may combine industry sub-classifications for reporting ease. Industries are shown as a percent of net assets.
See Notes to Financial Statements.
157 | April 30, 2021
| RiverFront Asset Allocation Growth & Income | |
| Statement of Investments | April 30, 2021 (Unaudited) |
| Value | ||||||||
| Shares | (Note 2) | |||||||
| EXCHANGE TRADED FUNDS (98.10%) | ||||||||
| Debt (23.22%) | ||||||||
| RiverFront Dynamic Core Income ETF(a) | 499,504 | $ | 12,652,486 | |||||
| RiverFront Dynamic Unconstrained Income ETF(a) | 40,215 | 1,035,134 | ||||||
| Riverfront Strategic Income Fund(a) | 36,630 | 910,622 | ||||||
| 14,598,242 | ||||||||
| Equity (74.88%) | ||||||||
| First Trust RiverFront Dynamic Developed International ETF(a) | 201,094 | 13,722,654 | ||||||
| First Trust RiverFront Dynamic Emerging Markets ETF(a) | 74,058 | 5,460,904 | ||||||
| RiverFront Dynamic US Dividend Advantage ETF(a) | 454,477 | 19,230,422 | ||||||
| RiverFront Dynamic US Flex-Cap ETF(a) | 200,604 | 8,649,222 | ||||||
| 47,063,202 | ||||||||
| TOTAL EXCHANGE TRADED FUNDS | ||||||||
| (Cost $49,870,698) | 61,661,444 | |||||||
| 7-Day | Value | |||||||||||
| Yield | Shares | (Note 2) | ||||||||||
| SHORT-TERM INVESTMENTS (2.06%) | ||||||||||||
| Money Market Fund (2.06%) | ||||||||||||
| State Street Institutional Treasury Plus Money Market Fund | 0.020 | % | 1,293,007 | 1,293,007 | ||||||||
| TOTAL MONEY MARKET FUND | 1,293,007 | |||||||||||
| TOTAL SHORT-TERM INVESTMENTS | ||||||||||||
| (Cost $1,293,007) | 1,293,007 | |||||||||||
| TOTAL INVESTMENTS (100.16%) | ||||||||||||
| (Cost $51,163,705) | $ | 62,954,451 | ||||||||||
| Liabilities In Excess Of Other Assets (-0.16%) | (103,310 | ) | ||||||||||
| NET ASSETS (100.00%) | $ | 62,851,141 | ||||||||||
| (a) | Affiliated Company. See Note 7 in Notes to Financial Statements. |
For Fund compliance purposes, the Fund's industry classifications refer to any one or more of the industry sub-classifications used by one or more widely recognized market indexes or ratings group indexes, and/or as defined by Fund management. This definition may not apply for purposes of this report, which may combine industry sub-classifications for reporting ease. Industries are shown as a percent of net assets.
See Notes to Financial Statements.
158 | April 30, 2021
| RiverFront Asset Allocation Moderate | |
| Statement of Investments | April 30, 2021 (Unaudited) |
| Value | ||||||||
| Shares | (Note 2) | |||||||
| EXCHANGE TRADED FUNDS (98.37%) | ||||||||
| Debt (42.75%) | ||||||||
| RiverFront Dynamic Core Income ETF(a) | 770,132 | $ | 19,507,521 | |||||
| RiverFront Dynamic Unconstrained Income ETF(a) | 32,160 | 827,798 | ||||||
| Riverfront Strategic Income Fund(a) | 29,070 | 722,680 | ||||||
| 21,057,999 | ||||||||
| Equity (55.62%) | ||||||||
| First Trust RiverFront Dynamic | ||||||||
| Developed International ETF(a) | 83,505 | 5,698,381 | ||||||
| RiverFront Dynamic US Dividend | ||||||||
| Advantage ETF(a) | 391,173 | 16,551,821 | ||||||
| RiverFront Dynamic US Flex-Cap ETF(a) | 119,402 | 5,148,125 | ||||||
| 27,398,327 | ||||||||
| TOTAL EXCHANGE TRADED FUNDS | ||||||||
| (Cost $41,081,591) | 48,456,326 | |||||||
| 7-Day | Value | |||||||||||
| Yield | Shares | (Note 2) | ||||||||||
| SHORT-TERM INVESTMENTS (1.69%) | ||||||||||||
| Money Market Fund (1.69%) | ||||||||||||
| State Street Institutional Treasury Plus Money Market Fund | 0.020 | % | 833,336 | 833,336 | ||||||||
| TOTAL MONEY MARKET FUND | 833,336 | |||||||||||
| TOTAL SHORT-TERM INVESTMENTS | ||||||||||||
| (Cost $833,336) | 833,336 | |||||||||||
| TOTAL INVESTMENTS (100.06%) | ||||||||||||
| (Cost $41,914,927) | $ | 49,289,662 | ||||||||||
| Liabilities In Excess Of Other Assets (-0.06%) | (31,869 | ) | ||||||||||
| NET ASSETS (100.00%) | $ | 49,257,793 | ||||||||||
| (a) | Affiliated Company. See Note 7 in Notes to Financial Statements. |
For Fund compliance purposes, the Fund's industry classifications refer to any one or more of the industry sub-classifications used by one or more widely recognized market indexes or ratings group indexes, and/or as defined by Fund management. This definition may not apply for purposes of this report, which may combine industry sub-classifications for reporting ease. Industries are shown as a percent of net assets.
See Notes to Financial Statements.
159 | April 30, 2021
| RiverFront Global Allocation Series | |
| Statements of Assets and Liabilities | April 30, 2021 (Unaudited) |
| RiverFront Asset Allocation Aggressive | RiverFront Asset Allocation Growth & Income | RiverFront Asset Allocation Moderate | ||||||||||
| ASSETS | ||||||||||||
| Investments, at value | $ | 719,325 | $ | 1,293,007 | $ | 833,336 | ||||||
| Investments in affiliates, at value | 26,254,862 | 61,661,444 | 48,456,326 | |||||||||
| Receivable for shares sold | – | 250 | 7,526 | |||||||||
| Dividends and interest receivable | 13 | 16 | 17 | |||||||||
| Total Assets | 26,974,200 | 62,954,717 | 49,297,205 | |||||||||
| LIABILITIES | ||||||||||||
| Payable for shares redeemed | – | 64,898 | 4,149 | |||||||||
| Unitary administrative fees payable | 10,941 | 26,036 | 20,349 | |||||||||
| Distribution and services fees payable | 3,276 | 12,642 | 14,914 | |||||||||
| Total Liabilities | 14,217 | 103,576 | 39,412 | |||||||||
| NET ASSETS | $ | 26,959,983 | $ | 62,851,141 | $ | 49,257,793 | ||||||
| NET ASSETS CONSIST OF | ||||||||||||
| Paid-in capital | $ | 24,411,559 | $ | 57,114,488 | $ | 42,847,887 | ||||||
| Total distributable earnings | 2,548,424 | 5,736,653 | 6,409,906 | |||||||||
| NET ASSETS | $ | 26,959,983 | $ | 62,851,141 | $ | 49,257,793 | ||||||
| INVESTMENTS, AT COST | $ | 719,325 | $ | 1,293,007 | $ | 833,336 | ||||||
| INVESTMENTS IN AFFILIATES, AT COST | $ | 20,548,812 | $ | 49,870,698 | $ | 41,081,591 | ||||||
See Notes to Financial Statements.
160 | April 30, 2021
| RiverFront Global Allocation Series | |
| Statements of Assets and Liabilities (continued) | April 30, 2021 (Unaudited) |
| RiverFront Asset Allocation Aggressive | RiverFront Asset Allocation Growth & Income | RiverFront Asset Allocation Moderate | ||||||||||
| PRICING OF SHARES | ||||||||||||
| Investor Class: | ||||||||||||
| Net Asset Value, offering and redemption price per share | $ | 13.97 | $ | 13.88 | $ | 11.76 | ||||||
| Net Assets | $ | 1,765,858 | $ | 7,104,424 | $ | 4,244,700 | ||||||
| Shares of beneficial interest outstanding (unlimited number of shares, no par value common stock authorized) | 126,405 | 511,901 | 360,813 | |||||||||
| Class A: | ||||||||||||
| Net Asset Value, offering and redemption price per share | $ | 13.86 | $ | 13.86 | $ | 11.75 | ||||||
| Net Assets | $ | 1,577,057 | $ | 5,835,874 | $ | 10,004,355 | ||||||
| Shares of beneficial interest outstanding (unlimited number of shares, no par value common stock authorized) | 113,795 | 420,936 | 851,477 | |||||||||
| Maximum offering price per share ((NAV/0.9450), based on maximum sales charge of 5.50% of the offering price) | $ | 14.67 | $ | 14.67 | $ | 12.43 | ||||||
| Class C: | ||||||||||||
| Net Asset Value, offering and redemption price per share(a) | $ | 13.01 | $ | 13.40 | $ | 11.58 | ||||||
| Net Assets | $ | 2,916,843 | $ | 11,993,671 | $ | 14,493,235 | ||||||
| Shares of beneficial interest outstanding (unlimited number of shares, no par value common stock authorized) | 224,248 | 895,278 | 1,252,081 | |||||||||
| Class I: | ||||||||||||
| Net Asset Value, offering and redemption price per share | $ | 14.29 | $ | 13.83 | $ | 11.77 | ||||||
| Net Assets | $ | 3,048,793 | $ | 37,917,172 | $ | 20,515,504 | ||||||
| Shares of beneficial interest outstanding (unlimited number of shares, no par value common stock authorized) | 213,373 | 2,741,955 | 1,742,873 | |||||||||
| Investor Class II: | ||||||||||||
| Net Asset Value, offering and redemption price per share | $ | 13.85 | N/A | N/A | ||||||||
| Net Assets | $ | 927,170 | N/A | N/A | ||||||||
| Shares of beneficial interest outstanding (unlimited number of shares, no par value common stock authorized) | 66,956 | N/A | N/A | |||||||||
| Class L: | ||||||||||||
| Net Asset Value, offering and redemption price per share | $ | 14.26 | N/A | N/A | ||||||||
| Net Assets | $ | 16,724,263 | N/A | N/A | ||||||||
| Shares of beneficial interest outstanding (unlimited number of shares, no par value common stock authorized) | 1,172,815 | N/A | N/A | |||||||||
| (a) | Redemption price per share may be reduced for any applicable contingent deferred sales charge. For a description of a possible sales charge, please see the Fund's Prospectus. |
See Notes to Financial Statements.
161 | April 30, 2021
| RiverFront Global Allocation Series | |
| Statements of Operations | For the Six Months Ended April 30, 2021 (Unaudited) |
| RiverFront Asset Allocation Aggressive | RiverFront Asset Allocation Growth & Income | RiverFront Asset Allocation Moderate | ||||||||||
| INVESTMENT INCOME | ||||||||||||
| Dividends | $ | 69 | $ | 124 | $ | 121 | ||||||
| Dividends from affiliated securities | 172,891 | 460,353 | 411,672 | |||||||||
| Total Investment Income | 172,960 | 460,477 | 411,793 | |||||||||
| EXPENSES | ||||||||||||
| Unitary administrative fees | 31,432 | 76,951 | 60,651 | |||||||||
| Distribution and service fees | ||||||||||||
| Investor Class | 2,240 | 8,896 | 5,171 | |||||||||
| Class A | 1,601 | 6,739 | 11,018 | |||||||||
| Class C | 15,509 | 64,221 | 78,296 | |||||||||
| Investor Class II | 1,072 | – | – | |||||||||
| Total Expenses | 51,854 | 156,807 | 155,136 | |||||||||
| Net Expenses | 51,854 | 156,807 | 155,136 | |||||||||
| Net Investment Income | 121,106 | 303,670 | 256,657 | |||||||||
| Net realized gain on investments - affiliated securities | 208,546 | 1,259,623 | 893,183 | |||||||||
| Net realized gain | 208,546 | 1,259,623 | 893,183 | |||||||||
| Net change in unrealized appreciation on investments - affiliated securities | 5,244,280 | 8,541,735 | 4,594,802 | |||||||||
| Net change in unrealized appreciation | 5,244,280 | 8,541,735 | 4,594,802 | |||||||||
| NET REALIZED AND UNREALIZED GAIN ON INVESTMENTS | 5,452,826 | 9,801,358 | 5,487,985 | |||||||||
| NET INCREASE IN NET ASSETS RESULTING FROM OPERATIONS | $ | 5,573,932 | $ | 10,105,028 | $ | 5,744,642 | ||||||
See Notes to Financial Statements.
162 | April 30, 2021
| RiverFront Asset Allocation Aggressive |
| Statements of Changes in Net Assets |
| For the Six Months Ended April 30, 2021 (Unaudited) | For the Year Ended October 31, 2020 | |||||||
| OPERATIONS | ||||||||
| Net investment income | $ | 121,106 | $ | 416,786 | ||||
| Net realized gain/(loss) | 208,546 | (1,857,082 | ) | |||||
| Net change in unrealized appreciation | 5,244,280 | 842,445 | ||||||
| Net Increase/(Decrease) in Net Assets Resulting from Operations | 5,573,932 | (597,851 | ) | |||||
| TOTAL DISTRIBUTIONS | ||||||||
| From distributable earnings | ||||||||
| Investor Class | (21,922 | ) | (79,044 | ) | ||||
| Class A | (14,110 | ) | (16,860 | ) | ||||
| Class C | (42,875 | ) | (89,159 | ) | ||||
| Class I | (40,375 | ) | (101,058 | ) | ||||
| Investor Class II | (11,166 | ) | (24,038 | ) | ||||
| Class L | (191,732 | ) | (358,372 | ) | ||||
| Net Decrease in Net Assets from Distributions | (322,180 | ) | (668,531 | ) | ||||
| BENEFICIAL INTEREST TRANSACTIONS (NOTE 6) | ||||||||
| Shares sold | ||||||||
| Investor Class | 93,072 | 27,937 | ||||||
| Class A | 478,698 | 414,965 | ||||||
| Class C | 105,906 | 112,219 | ||||||
| Class I | – | 475,259 | ||||||
| Investor Class II | 6,862 | 31,382 | ||||||
| Class L | 1,424,213 | 1,329,923 | ||||||
| Dividends reinvested | ||||||||
| Investor Class | 21,114 | 76,357 | ||||||
| Class A | 14,110 | 16,860 | ||||||
| Class C | 42,795 | 88,963 | ||||||
| Class I | 38,987 | 99,066 | ||||||
| Investor Class II | 11,024 | 17,702 | ||||||
| Class L | 190,865 | 357,175 | ||||||
| Shares redeemed | ||||||||
| Investor Class | (609,688 | ) | (1,877,602 | ) | ||||
| Class A | (150,038 | ) | (199,699 | ) | ||||
| Class C | (1,045,289 | ) | (1,664,423 | ) | ||||
| Class I | (581,835 | ) | (4,411,082 | ) | ||||
| Investor Class II | (6,880 | ) | (524,176 | ) | ||||
| Class L | (1,286,765 | ) | (5,856,097 | ) | ||||
| Net Decrease in Net Assets Derived from Beneficial Interest Transactions | (1,252,849 | ) | (11,485,271 | ) | ||||
| Net increase/(decrease) in net assets | 3,998,903 | (12,751,653 | ) | |||||
| NET ASSETS | ||||||||
| Beginning of period | 22,961,080 | 35,712,733 | ||||||
| End of period | $ | 26,959,983 | $ | 22,961,080 | ||||
See Notes to Financial Statements.
163 | April 30, 2021
| RiverFront Asset Allocation Growth & Income |
| Statements of Changes in Net Assets |
| For the Six Months Ended April 30, 2021 (Unaudited) | For the Year Ended October 31, 2020 | |||||||
| OPERATIONS | ||||||||
| Net investment income | $ | 303,670 | $ | 1,044,927 | ||||
| Net realized gain/(loss) | 1,259,623 | (3,546,085 | ) | |||||
| Net change in unrealized appreciation | 8,541,735 | 1,850,356 | ||||||
| Net Increase/(Decrease) in Net Assets Resulting from Operations | 10,105,028 | (650,802 | ) | |||||
| TOTAL DISTRIBUTIONS | ||||||||
| From distributable earnings | ||||||||
| Investor Class | (33,311 | ) | (134,202 | ) | ||||
| Class A | (25,416 | ) | (67,887 | ) | ||||
| Class C | (34,878 | ) | (213,573 | ) | ||||
| Class I | (206,807 | ) | (767,779 | ) | ||||
| Net Decrease in Net Assets from Distributions | (300,412 | ) | (1,183,441 | ) | ||||
| BENEFICIAL INTEREST TRANSACTIONS (NOTE 6) | ||||||||
| Shares sold | ||||||||
| Investor Class | 38,543 | 123,506 | ||||||
| Class A | 1,181,535 | 1,864,486 | ||||||
| Class C | 260,966 | 798,015 | ||||||
| Class I | 2,161,927 | 4,243,529 | ||||||
| Dividends reinvested | ||||||||
| Investor Class | 31,923 | 129,440 | ||||||
| Class A | 25,202 | 67,753 | ||||||
| Class C | 34,506 | 211,358 | ||||||
| Class I | 203,381 | 755,180 | ||||||
| Shares redeemed | ||||||||
| Investor Class | (900,020 | ) | (2,188,662 | ) | ||||
| Class A | (670,895 | ) | (1,243,469 | ) | ||||
| Class C | (4,053,705 | ) | (6,701,534 | ) | ||||
| Class I | (4,728,063 | ) | (18,874,405 | ) | ||||
| Net Decrease in Net Assets Derived from Beneficial Interest Transactions | (6,414,700 | ) | (20,814,803 | ) | ||||
| Net increase/(decrease) in net assets | 3,389,916 | (22,649,046 | ) | |||||
| NET ASSETS | ||||||||
| Beginning of period | 59,461,225 | 82,110,271 | ||||||
| End of period | $ | 62,851,141 | $ | 59,461,225 | ||||
See Notes to Financial Statements.
164 | April 30, 2021
| RiverFront Asset Allocation Moderate |
| Statements of Changes in Net Assets |
| For the Six Months Ended April 30, 2021 (Unaudited) | For the Year Ended October 31, 2020 | |||||||
| OPERATIONS | ||||||||
| Net investment income | $ | 256,657 | $ | 691,629 | ||||
| Net realized gain/(loss) | 893,183 | (102,437 | ) | |||||
| Net change in unrealized appreciation | 4,594,802 | 453,892 | ||||||
| Net Increase in Net Assets Resulting from Operations | 5,744,642 | 1,043,084 | ||||||
| TOTAL DISTRIBUTIONS | ||||||||
| From distributable earnings | ||||||||
| Investor Class | (23,407 | ) | (66,700 | ) | ||||
| Class A | (50,663 | ) | (101,776 | ) | ||||
| Class C | (38,590 | ) | (168,779 | ) | ||||
| Class I | (132,209 | ) | (381,939 | ) | ||||
| Net Decrease in Net Assets from Distributions | (244,869 | ) | (719,194 | ) | ||||
| BENEFICIAL INTEREST TRANSACTIONS (NOTE 6) | ||||||||
| Shares sold | ||||||||
| Investor Class | 191,441 | 167,869 | ||||||
| Class A | 2,062,643 | 3,641,533 | ||||||
| Class C | 89,141 | 455,274 | ||||||
| Class I | 1,506,732 | 2,685,022 | ||||||
| Dividends reinvested | ||||||||
| Investor Class | 23,308 | 66,302 | ||||||
| Class A | 50,177 | 100,652 | ||||||
| Class C | 36,722 | 162,523 | ||||||
| Class I | 125,946 | 365,144 | ||||||
| Shares redeemed | ||||||||
| Investor Class | (317,423 | ) | (1,546,495 | ) | ||||
| Class A | (761,383 | ) | (2,067,955 | ) | ||||
| Class C | (3,798,739 | ) | (11,137,381 | ) | ||||
| Class I | (2,396,736 | ) | (9,739,924 | ) | ||||
| Net Decrease in Net Assets Derived from Beneficial Interest Transactions | (3,188,171 | ) | (16,847,436 | ) | ||||
| Net increase/(decrease) in net assets | 2,311,602 | (16,523,546 | ) | |||||
| NET ASSETS | ||||||||
| Beginning of period | 46,946,191 | 63,469,737 | ||||||
| End of period | $ | 49,257,793 | $ | 46,946,191 | ||||
See Notes to Financial Statements.
165 | April 30, 2021
| RiverFront Asset Allocation Aggressive – Investor Class |
| Financial Highlights |
Selected data for a share of beneficial interest outstanding throughout the periods indicated:
| For the Six Months Ended April 30, 2021 (Unaudited) | For the Year Ended October 31, 2020 | For the Year Ended October 31, 2019 | For the Year Ended October 31, 2018(a)(b) | For the Year Ended October 31, 2017 | For the Year Ended October 31, 2016 | |||||||||||||||||||
| Net asset value, beginning of period | $ | 11.31 | $ | 11.57 | $ | 14.59 | $ | 16.27 | $ | 13.54 | $ | 13.95 | ||||||||||||
| INCOME/(LOSS) FROM INVESTMENT OPERATIONS: | ||||||||||||||||||||||||
| Net investment income(c) | 0.06 | 0.17 | 0.17 | 0.25 | 0.16 | 0.23 | ||||||||||||||||||
| Net realized and unrealized gain/(loss) | 2.77 | (0.19 | ) | 0.08 | (1.27 | ) | 2.76 | (0.31 | ) | |||||||||||||||
| Total from investment operations | 2.83 | (0.02 | ) | 0.25 | (1.02 | ) | 2.92 | (0.08 | ) | |||||||||||||||
| DISTRIBUTIONS: | ||||||||||||||||||||||||
| From net investment income | (0.17 | ) | (0.24 | ) | (0.19 | ) | (0.21 | ) | (0.19 | ) | (0.20 | ) | ||||||||||||
| From net realized gains | – | – | (3.08 | ) | (0.45 | ) | – | (0.13 | ) | |||||||||||||||
| Total distributions | (0.17 | ) | (0.24 | ) | (3.27 | ) | (0.66 | ) | (0.19 | ) | (0.33 | ) | ||||||||||||
| Net increase/(decrease) in net asset value | 2.66 | (0.26 | ) | (3.02 | ) | (1.68 | ) | 2.73 | (0.41 | ) | ||||||||||||||
| Net asset value, end of period | $ | 13.97 | $ | 11.31 | $ | 11.57 | $ | 14.59 | $ | 16.27 | $ | 13.54 | ||||||||||||
| TOTAL RETURN(d) | 25.14 | % | (0.33 | )% | 5.05 | % | (6.62 | )% | 21.81 | % | (0.57 | )% | ||||||||||||
| RATIOS/SUPPLEMENTAL DATA: | ||||||||||||||||||||||||
| Net assets, end of period (000s) | $ | 1,766 | $ | 1,862 | $ | 3,914 | $ | 4,491 | $ | 8,935 | $ | 9,618 | ||||||||||||
| Ratio of expenses to average net assets excluding fee waivers and reimbursements | 0.50 | %(e) | 0.50 | % | 0.50 | % | 0.93 | % | 1.45 | % | 1.40 | % | ||||||||||||
| Ratio of expenses to average net assets including fee waivers and reimbursements | 0.50 | %(e) | 0.50 | % | 0.50 | % | 0.75 | %(f) | 1.15 | % | 1.15 | % | ||||||||||||
| Ratio of net investment income to average net assets | 0.92 | %(e) | 1.47 | % | 1.47 | % | 1.56 | % | 1.09 | % | 1.77 | % | ||||||||||||
| Portfolio turnover rate(g) | 2 | % | 22 | % | 18 | % | 200 | % | 60 | % | 113 | % | ||||||||||||
| (a) | Prior to December 1, 2017, Investor Class was known as Class A. |
| (b) | Prior to February 28, 2018, the RiverFront Asset Allocation Aggressive was known as the RiverFront Global Growth Fund. |
| (c) | Calculated using the average shares method. |
| (d) | Total returns are for the period indicated and have not been annualized. Total returns would have been lower had certain expenses not been waived during the period. Returns shown do not reflect the deduction of taxes that a shareholder would pay on Fund distributions or the redemption of Fund shares. |
| (e) | Annualized. |
| (f) | Effective February 28, 2018, pursuant to the Administrative Services Agreement, the Fund pays an annual unitary administrative fee, which is based on the Fund’s average daily net assets, and will no longer pay a management fee or contractually limit the Fund’s total annual expenses. Refer to Note 8. |
| (g) | Portfolio turnover rate for periods less than one full year have not been annualized. |
See Notes to Financial Statements.
166 | April 30, 2021
| RiverFront Asset Allocation Aggressive – Class A |
| Financial Highlights |
Selected data for a share of beneficial interest outstanding throughout the periods indicated:
| For the Six Months Ended April 30, 2021 (Unaudited) | For the Year Ended October 31, 2020 | For the Year Ended October 31, 2019 | For the Period June 12, 2018 (Commencement of Operations) to October 31, 2018 | |||||||||||||
| Net asset value, beginning of period | $ | 11.22 | $ | 11.48 | $ | 14.51 | $ | 16.35 | ||||||||
| INCOME FROM INVESTMENT OPERATIONS: | ||||||||||||||||
| Net investment income(a) | 0.05 | 0.15 | 0.21 | 0.16 | ||||||||||||
| Net realized and unrealized gain/(loss) | 2.76 | (0.17 | ) | 0.03 | (2.00 | ) | ||||||||||
| Total from investment operations | 2.81 | (0.02 | ) | 0.24 | (1.84 | ) | ||||||||||
| DISTRIBUTIONS: | ||||||||||||||||
| From net investment income | (0.17 | ) | (0.24 | ) | (0.19 | ) | – | |||||||||
| From net realized gains | – | – | (3.08 | ) | – | |||||||||||
| Total distributions | (0.17 | ) | (0.24 | ) | (3.27 | ) | – | |||||||||
| Net increase/(decrease) in net asset value | 2.64 | (0.26 | ) | (3.03 | ) | (1.84 | ) | |||||||||
| Net asset value, end of period | $ | 13.86 | $ | 11.22 | $ | 11.48 | $ | 14.51 | ||||||||
| TOTAL RETURN(b) | 25.18 | % | (0.33 | )% | 5.01 | % | (11.25 | )% | ||||||||
| RATIOS/SUPPLEMENTAL DATA: | ||||||||||||||||
| Net assets, end of period (000s) | $ | 1,577 | $ | 989 | $ | 756 | $ | 9 | ||||||||
| Ratio of expenses to average net assets excluding fee waivers and reimbursements | 0.50 | %(c) | 0.50 | % | 0.50 | % | 0.50 | %(c) | ||||||||
| Ratio of expenses to average net assets including fee waivers and reimbursements | 0.50 | %(c) | 0.50 | % | 0.50 | % | 0.50 | %(c) | ||||||||
| Ratio of net investment income to average net assets | 0.79 | %(c) | 1.38 | % | 1.88 | % | 2.66 | %(c) | ||||||||
| Portfolio turnover rate(d) | 2 | % | 22 | % | 18 | % | 200 | % | ||||||||
| (a) | Calculated using the average shares method. |
| (b) | Total returns are for the period indicated and have not been annualized. Total returns would have been lower had certain expenses not been waived during the period. Returns shown do not reflect the deduction of taxes that a shareholder would pay on Fund distributions or the redemption of Fund shares. Returns shown exclude any applicable sales charges. |
| (c) | Annualized. |
| (d) | Portfolio turnover rate for periods less than one full year have not been annualized. |
See Notes to Financial Statements.
167 | April 30, 2021
| RiverFront Asset Allocation Aggressive – Class C |
| Financial Highlights |
Selected data for a share of beneficial interest outstanding throughout the periods indicated:
| For the Six Months Ended April 30, 2021 (Unaudited) | For the Year Ended October 31, 2020 | For the Year Ended October 31, 2019 | For the Year Ended October 31, 2018(a) | For the Year Ended October 31, 2017 | For the Year Ended October 31, 2016 | |||||||||||||||||||
| Net asset value, beginning of period | $ | 10.57 | $ | 10.89 | $ | 14.01 | $ | 15.73 | $ | 13.18 | $ | 13.67 | ||||||||||||
| INCOME/(LOSS) FROM INVESTMENT OPERATIONS: | ||||||||||||||||||||||||
| Net investment income(b) | 0.01 | 0.07 | 0.08 | 0.12 | 0.04 | 0.12 | ||||||||||||||||||
| Net realized and unrealized gain/(loss) | 2.58 | (0.17 | ) | 0.05 | (1.20 | ) | 2.68 | (0.30 | ) | |||||||||||||||
| Total from investment operations | 2.59 | (0.10 | ) | 0.13 | (1.08 | ) | 2.72 | (0.18 | ) | |||||||||||||||
| DISTRIBUTIONS: | ||||||||||||||||||||||||
| From net investment income | (0.15 | ) | (0.22 | ) | (0.17 | ) | (0.19 | ) | (0.17 | ) | (0.18 | ) | ||||||||||||
| From net realized gains | – | – | (3.08 | ) | (0.45 | ) | – | (0.13 | ) | |||||||||||||||
| Total distributions | (0.15 | ) | (0.22 | ) | (3.25 | ) | (0.64 | ) | (0.17 | ) | (0.31 | ) | ||||||||||||
| Net increase/(decrease) in net asset value | 2.44 | (0.32 | ) | (3.12 | ) | (1.72 | ) | 2.55 | (0.49 | ) | ||||||||||||||
| Net asset value, end of period | $ | 13.01 | $ | 10.57 | $ | 10.89 | $ | 14.01 | $ | 15.73 | $ | 13.18 | ||||||||||||
| TOTAL RETURN(c) | 24.68 | % | (1.04 | )% | 4.23 | % | (7.24 | )% | 20.87 | % | (1.31 | )% | ||||||||||||
| RATIOS/SUPPLEMENTAL DATA: | ||||||||||||||||||||||||
| Net assets, end of period (000s) | $ | 2,917 | $ | 3,147 | $ | 4,758 | $ | 8,597 | $ | 10,408 | $ | 11,447 | ||||||||||||
| Ratio of expenses to average net assets excluding fee waivers and reimbursements | 1.25 | %(d) | 1.25 | % | 1.25 | % | 1.63 | % | 2.20 | % | 2.16 | % | ||||||||||||
| Ratio of expenses to average net assets including fee waivers and reimbursements | 1.25 | %(d) | 1.25 | % | 1.25 | % | 1.47 | %(e) | 1.90 | % | 1.90 | % | ||||||||||||
| Ratio of net investment income to average net assets | 0.18 | %(d) | 0.69 | % | 0.71 | % | 0.80 | % | 0.29 | % | 0.92 | % | ||||||||||||
| Portfolio turnover rate(f) | 2 | % | 22 | % | 18 | % | 200 | % | 60 | % | 113 | % | ||||||||||||
| (a) | Prior to February 28, 2018, the RiverFront Asset Allocation Aggressive was known as the RiverFront Global Growth Fund. |
| (b) | Calculated using the average shares method. |
| (c) | Total returns are for the period indicated and have not been annualized. Total returns would have been lower had certain expenses not been waived during the period. Returns shown do not reflect the deduction of taxes that a shareholder would pay on Fund distributions or the redemption of Fund shares. Returns shown exclude any applicable sales charges. |
| (d) | Annualized. |
| (e) | Effective February 28, 2018, pursuant to the Administrative Services Agreement, the Fund pays an annual unitary administrative fee, which is based on the Fund’s average daily net assets, and will no longer pay a management fee or contractually limit the Fund’s total annual expenses. Refer to Note 8. |
| (f) | Portfolio turnover rate for periods less than one full year have not been annualized. |
See Notes to Financial Statements.
168 | April 30, 2021
| RiverFront Asset Allocation Aggressive – Class I |
| Financial Highlights |
Selected data for a share of beneficial interest outstanding throughout the periods indicated:
| For the Six Months Ended April 30, 2021 (Unaudited) | For the Year Ended October 31, 2020 | For the Year Ended October 31, 2019 | For the Year Ended October 31, 2018(a) | For the Year Ended October 31, 2017 | For the Year Ended October 31, 2016 | |||||||||||||||||||
| Net asset value, beginning of period | $ | 11.56 | $ | 11.79 | $ | 14.78 | $ | 16.43 | $ | 13.65 | $ | 14.03 | ||||||||||||
| INCOME/(LOSS) FROM INVESTMENT OPERATIONS: | ||||||||||||||||||||||||
| Net investment income(b) | 0.08 | 0.20 | 0.21 | 0.29 | 0.19 | 0.26 | ||||||||||||||||||
| Net realized and unrealized gain/(loss) | 2.82 | (0.19 | ) | 0.07 | (1.27 | ) | 2.78 | (0.30 | ) | |||||||||||||||
| Total from investment operations | 2.90 | 0.01 | 0.28 | (0.98 | ) | 2.97 | (0.04 | ) | ||||||||||||||||
| DISTRIBUTIONS: | ||||||||||||||||||||||||
| From net investment income | (0.17 | ) | (0.24 | ) | (0.19 | ) | (0.22 | ) | (0.19 | ) | (0.21 | ) | ||||||||||||
| From net realized gains | – | – | (3.08 | ) | (0.45 | ) | – | (0.13 | ) | |||||||||||||||
| Total distributions | (0.17 | ) | (0.24 | ) | (3.27 | ) | (0.67 | ) | (0.19 | ) | (0.34 | ) | ||||||||||||
| Net increase/(decrease) in net asset value | 2.73 | (0.23 | ) | (2.99 | ) | (1.65 | ) | 2.78 | (0.38 | ) | ||||||||||||||
| Net asset value, end of period | $ | 14.29 | $ | 11.56 | $ | 11.79 | $ | 14.78 | $ | 16.43 | $ | 13.65 | ||||||||||||
| TOTAL RETURN(c) | 25.27 | % | (0.02 | )% | 5.29 | % | (6.33 | )% | 22.05 | % | (0.31 | )% | ||||||||||||
| RATIOS/SUPPLEMENTAL DATA: | ||||||||||||||||||||||||
| Net assets, end of period (000s) | $ | 3,049 | $ | 2,945 | $ | 7,003 | $ | 12,701 | $ | 13,873 | $ | 10,140 | ||||||||||||
| Ratio of expenses to average net assets excluding fee waivers and reimbursements | 0.25 | %(d) | 0.25 | % | 0.25 | % | 0.62 | % | 1.20 | % | 1.15 | % | ||||||||||||
| Ratio of expenses to average net assets including fee waivers and reimbursements | 0.25 | %(d) | 0.25 | % | 0.25 | % | 0.46 | %(e) | 0.90 | % | 0.90 | % | ||||||||||||
| Ratio of net investment income to average net assets | 1.14 | %(d) | 1.73 | % | 1.77 | % | 1.79 | % | 1.29 | % | 1.98 | % | ||||||||||||
| Portfolio turnover rate(f) | 2 | % | 22 | % | 18 | % | 200 | % | 60 | % | 113 | % | ||||||||||||
| (a) | Prior to February 28, 2018, the RiverFront Asset Allocation Aggressive was known as the RiverFront Global Growth Fund. |
| (b) | Calculated using the average shares method. |
| (c) | Total returns are for the period indicated and have not been annualized. Total returns would have been lower had certain expenses not been waived during the period. Returns shown do not reflect the deduction of taxes that a shareholder would pay on Fund distributions or the redemption of Fund shares. |
| (d) | Annualized. |
| (e) | Effective February 28, 2018, pursuant to the Administrative Services Agreement, the Fund pays an annual unitary administrative fee, which is based on the Fund’s average daily net assets, and will no longer pay a management fee or contractually limit the Fund’s total annual expenses. Refer to Note 8. |
| (f) | Portfolio turnover rate for periods less than one full year have not been annualized. |
See Notes to Financial Statements.
169 | April 30, 2021
| RiverFront Asset Allocation Aggressive – Investor Class II |
| Financial Highlights |
Selected data for a share of beneficial interest outstanding throughout the periods indicated:
| For the Six Months Ended April 30, 2021 (Unaudited) | For the Year Ended October 31, 2020 | For the Year Ended October 31, 2019 | For the Year Ended October 31, 2018(a)(b) | For the Year Ended October 31, 2017 | For the Year Ended October 31, 2016 | |||||||||||||||||||
| Net asset value, beginning of period | $ | 11.21 | $ | 11.47 | $ | 14.50 | $ | 16.18 | $ | 13.47 | $ | 13.87 | ||||||||||||
| INCOME/(LOSS) FROM INVESTMENT OPERATIONS: | ||||||||||||||||||||||||
| Net investment income(c) | 0.06 | 0.16 | 0.18 | 0.25 | 0.15 | 0.23 | ||||||||||||||||||
| Net realized and unrealized gain/(loss) | 2.75 | (0.18 | ) | 0.06 | (1.27 | ) | 2.75 | (0.30 | ) | |||||||||||||||
| Total from investment operations | 2.81 | (0.02 | ) | 0.24 | (1.02 | ) | 2.90 | (0.07 | ) | |||||||||||||||
| DISTRIBUTIONS: | ||||||||||||||||||||||||
| From net investment income | (0.17 | ) | (0.24 | ) | (0.19 | ) | (0.21 | ) | (0.19 | ) | (0.20 | ) | ||||||||||||
| From net realized gains | – | – | (3.08 | ) | (0.45 | ) | – | (0.13 | ) | |||||||||||||||
| Total distributions | (0.17 | ) | (0.24 | ) | (3.27 | ) | (0.66 | ) | (0.19 | ) | (0.33 | ) | ||||||||||||
| Net increase/(decrease) in net asset value | 2.64 | (0.26 | ) | (3.03 | ) | (1.68 | ) | 2.71 | (0.40 | ) | ||||||||||||||
| Net asset value, end of period | $ | 13.85 | $ | 11.21 | $ | 11.47 | $ | 14.50 | $ | 16.18 | $ | 13.47 | ||||||||||||
| TOTAL RETURN(d) | 25.20 | % | (0.33 | )% | 5.02 | % | (6.66 | )% | 21.77 | % | (0.51 | )% | ||||||||||||
| RATIOS/SUPPLEMENTAL DATA: | ||||||||||||||||||||||||
| Net assets, end of period (000s) | $ | 927 | $ | 741 | $ | 1,255 | $ | 2,043 | $ | 3,451 | $ | 4,667 | ||||||||||||
| Ratio of expenses to average net assets excluding fee waivers and reimbursements | 0.50 | %(e) | 0.50 | % | 0.50 | % | 0.91 | % | 1.45 | % | 1.40 | % | ||||||||||||
| Ratio of expenses to average net assets including fee waivers and reimbursements | 0.50 | %(e) | 0.50 | % | 0.50 | % | 0.74 | %(f) | 1.15 | % | 1.15 | % | ||||||||||||
| Ratio of net investment income to average net assets | 0.88 | %(e) | 1.41 | % | 1.53 | % | 1.58 | % | 1.04 | % | 1.75 | % | ||||||||||||
| Portfolio turnover rate(g) | 2 | % | 22 | % | 18 | % | 200 | % | 60 | % | 113 | % | ||||||||||||
| (a) | Prior to February 28, 2018, the RiverFront Asset Allocation Aggressive was known as the RiverFront Global Growth Fund. |
| (b) | Prior to December 1, 2017, Investor Class II was known as Investor Class. |
| (c) | Calculated using the average shares method. |
| (d) | Total returns are for the period indicated and have not been annualized. Total returns would have been lower had certain expenses not been waived during the period. Returns shown do not reflect the deduction of taxes that a shareholder would pay on Fund distributions or the redemption of Fund shares. |
| (e) | Annualized. |
| (f) | Effective February 28, 2018, pursuant to the Administrative Services Agreement, the Fund pays an annual unitary administrative fee, which is based on the Fund’s average daily net assets, and will no longer pay a management fee or contractually limit the Fund’s total annual expenses. Refer to Note 8. |
| (g) | Portfolio turnover rate for periods less than one full year have not been annualized. |
See Notes to Financial Statements.
170 | April 30, 2021
| RiverFront Asset Allocation Aggressive – Class L |
| Financial Highlights |
Selected data for a share of beneficial interest outstanding throughout the periods indicated:
| For the Six Months Ended April 30, 2021 (Unaudited) | For the Year Ended October 31, 2020 | For the Year Ended October 31, 2019 | For the Year Ended October 31, 2018(a) | For the Year Ended October 31, 2017 | For the Year Ended October 31, 2016 | |||||||||||||||||||
| Net asset value, beginning of period | $ | 11.53 | $ | 11.77 | $ | 14.76 | $ | 16.41 | $ | 13.63 | $ | 14.01 | ||||||||||||
| INCOME/(LOSS) FROM INVESTMENT OPERATIONS: | ||||||||||||||||||||||||
| Net investment income(b) | 0.07 | 0.19 | 0.21 | 0.30 | 0.19 | 0.25 | ||||||||||||||||||
| Net realized and unrealized gain/(loss) | 2.83 | (0.19 | ) | 0.07 | (1.28 | ) | 2.78 | (0.29 | ) | |||||||||||||||
| Total from investment operations | 2.90 | – | 0.28 | (0.98 | ) | 2.97 | (0.04 | ) | ||||||||||||||||
| DISTRIBUTIONS: | ||||||||||||||||||||||||
| From net investment income | (0.17 | ) | (0.24 | ) | (0.19 | ) | (0.22 | ) | (0.19 | ) | (0.21 | ) | ||||||||||||
| From net realized gains | – | – | (3.08 | ) | (0.45 | ) | – | (0.13 | ) | |||||||||||||||
| Total distributions | (0.17 | ) | (0.24 | ) | (3.27 | ) | (0.67 | ) | (0.19 | ) | (0.34 | ) | ||||||||||||
| Net increase/(decrease) in net asset value | 2.73 | (0.24 | ) | (2.99 | ) | (1.65 | ) | 2.78 | (0.38 | ) | ||||||||||||||
| Net asset value, end of period | $ | 14.26 | $ | 11.53 | $ | 11.77 | $ | 14.76 | $ | 16.41 | $ | 13.63 | ||||||||||||
| TOTAL RETURN(c) | 25.33 | % | (0.11 | )% | 5.30 | % | (6.34 | )% | 22.08 | % | (0.31 | )% | ||||||||||||
| RATIOS/SUPPLEMENTAL DATA: | ||||||||||||||||||||||||
| Net assets, end of period (000s) | $ | 16,724 | $ | 13,277 | $ | 18,026 | $ | 19,449 | $ | 25,309 | $ | 22,552 | ||||||||||||
| Ratio of expenses to average net assets excluding fee waivers and reimbursements | 0.25 | %(d) | 0.25 | % | 0.25 | % | 0.63 | % | 1.20 | % | 1.16 | % | ||||||||||||
| Ratio of expenses to average net assets including fee waivers and reimbursements | 0.25 | %(d) | 0.25 | % | 0.25 | % | 0.47 | %(e) | 0.90 | % | 0.90 | % | ||||||||||||
| Ratio of net investment income to average net assets | 1.11 | %(d) | 1.68 | % | 1.77 | % | 1.82 | % | 1.27 | % | 1.90 | % | ||||||||||||
| Portfolio turnover rate(f) | 2 | % | 22 | % | 18 | % | 200 | % | 60 | % | 113 | % | ||||||||||||
| (a) | Prior to February 28, 2018, the RiverFront Asset Allocation Aggressive was known as the RiverFront Global Growth Fund. |
| (b) | Calculated using the average shares method. |
| (c) | Total returns are for the period indicated and have not been annualized. Total returns would have been lower had certain expenses not been waived during the period. Returns shown do not reflect the deduction of taxes that a shareholder would pay on Fund distributions or the redemption of Fund shares. |
| (d) | Annualized. |
| (e) | Effective February 28, 2018, pursuant to the Administrative Services Agreement, the Fund pays an annual unitary administrative fee, which is based on the Fund’s average daily net assets, and will no longer pay a management fee or contractually limit the Fund’s total annual expenses. Refer to Note 8. |
| (f) | Portfolio turnover rate for periods less than one full year have not been annualized. |
See Notes to Financial Statements.
171 | April 30, 2021
| RiverFront Asset Allocation Growth & Income – Investor Class |
| Financial Highlights |
Selected data for a share of beneficial interest outstanding throughout the periods indicated:
| For the Six Months Ended April 30, 2021 (Unaudited) | For the Year Ended October 31, 2020 | For the Year Ended October 31, 2019 | For the Year Ended October 31, 2018(a)(b) | For the Year Ended October 31, 2017 | For the Year Ended October 31, 2016 | |||||||||||||||||||
| Net asset value, beginning of period | $ | 11.84 | $ | 12.02 | $ | 13.37 | $ | 14.48 | $ | 12.38 | $ | 12.63 | ||||||||||||
| INCOME/(LOSS) FROM INVESTMENT OPERATIONS: | ||||||||||||||||||||||||
| Net investment income(c) | 0.07 | 0.18 | 0.23 | 0.25 | 0.17 | 0.21 | ||||||||||||||||||
| Net realized and unrealized gain/(loss) | 2.03 | (0.16 | ) | 0.41 | (0.80 | ) | 2.09 | (0.00 | )(d) | |||||||||||||||
| Total from investment operations | 2.10 | 0.02 | 0.64 | (0.55 | ) | 2.26 | 0.21 | |||||||||||||||||
| DISTRIBUTIONS: | ||||||||||||||||||||||||
| From net investment income | (0.06 | ) | (0.20 | ) | (0.21 | ) | (0.24 | ) | (0.16 | ) | (0.21 | ) | ||||||||||||
| From net realized gains | – | – | (1.78 | ) | (0.32 | ) | – | (0.25 | ) | |||||||||||||||
| Total distributions | (0.06 | ) | (0.20 | ) | (1.99 | ) | (0.56 | ) | (0.16 | ) | (0.46 | ) | ||||||||||||
| Net increase/(decrease) in net asset value | 2.04 | (0.18 | ) | (1.35 | ) | (1.11 | ) | 2.10 | (0.25 | ) | ||||||||||||||
| Net asset value, end of period | $ | 13.88 | $ | 11.84 | $ | 12.02 | $ | 13.37 | $ | 14.48 | $ | 12.38 | ||||||||||||
| TOTAL RETURN(e) | 17.78 | % | 0.27 | % | 6.71 | % | (4.03 | )% | 18.37 | % | 1.80 | % | ||||||||||||
| RATIOS/SUPPLEMENTAL DATA: | ||||||||||||||||||||||||
| Net assets, end of period (000s) | $ | 7,104 | $ | 6,802 | $ | 8,864 | $ | 9,062 | $ | 19,123 | $ | 20,227 | ||||||||||||
| Ratio of expenses to average net assets excluding fee waivers and reimbursements | 0.50 | %(f) | 0.50 | % | 0.50 | % | 0.85 | % | 1.37 | % | 1.35 | % | ||||||||||||
| Ratio of expenses to average net assets including fee waivers and reimbursements | 0.50 | %(f) | 0.50 | % | 0.50 | % | 0.74 | %(g) | 1.15 | % | 1.15 | % | ||||||||||||
| Ratio of net investment income to average net assets | 0.99 | %(f) | 1.57 | % | 1.91 | % | 1.70 | % | 1.24 | % | 1.74 | % | ||||||||||||
| Portfolio turnover rate(h) | 7 | % | 33 | % | 62 | % | 224 | % | 63 | % | 129 | % | ||||||||||||
| (a) | Prior to December 1, 2017, Investor Class was known as Class A. |
| (b) | Prior to February 28, 2018, the RiverFront Asset Allocation Growth & Income was known as the RiverFront Dynamic Equity Income Fund. |
| (c) | Calculated using the average shares method. |
| (d) | Less than $0.005 or ($0.005) per share. |
| (e) | Total returns are for the period indicated and have not been annualized. Total returns would have been lower had certain expenses not been waived during the period. Returns shown do not reflect the deduction of taxes that a shareholder would pay on Fund distributions or the redemption of Fund shares. |
| (f) | Annualized. |
| (g) | Effective February 28, 2018, pursuant to the Administrative Services Agreement, the Fund pays an annual unitary administrative fee, which is based on the Fund’s average daily net assets, and will no longer pay a management fee or contractually limit the Fund’s total annual expenses. Refer to Note 8. |
| (h) | Portfolio turnover rate for periods less than one full year have not been annualized. |
See Notes to Financial Statements.
172 | April 30, 2021
| RiverFront Asset Allocation Growth & Income – Class A |
| Financial Highlights |
Selected data for a share of beneficial interest outstanding throughout the periods indicated:
| For the Six Months Ended April 30, 2021 (Unaudited) | For the Year Ended October 31, 2020 | For the Year Ended October 31, 2019 | For the Period June 12, 2018 (Commencement of Operations) to October 31, 2018 | |||||||||||||
| Net asset value, beginning of period | $ | 11.83 | $ | 12.01 | $ | 13.36 | $ | 14.70 | ||||||||
| INCOME FROM INVESTMENT OPERATIONS: | ||||||||||||||||
| Net investment income(a) | 0.06 | 0.18 | 0.25 | 0.15 | ||||||||||||
| Net realized and unrealized gain/(loss) | 2.03 | (0.16 | ) | 0.39 | (1.34 | ) | ||||||||||
| Total from investment operations | 2.09 | 0.02 | 0.64 | (1.19 | ) | |||||||||||
| DISTRIBUTIONS: | ||||||||||||||||
| From net investment income | (0.06 | ) | (0.20 | ) | (0.21 | ) | (0.15 | ) | ||||||||
| From net realized gains | – | – | (1.78 | ) | – | |||||||||||
| Total distributions | (0.06 | ) | (0.20 | ) | (1.99 | ) | (0.15 | ) | ||||||||
| Net increase/(decrease) in net asset value | 2.03 | (0.18 | ) | (1.35 | ) | (1.34 | ) | |||||||||
| Net asset value, end of period | $ | 13.86 | $ | 11.83 | $ | 12.01 | $ | 13.36 | ||||||||
| TOTAL RETURN(b) | 17.72 | % | 0.28 | % | 6.78 | % | (8.13 | )% | ||||||||
| RATIOS/SUPPLEMENTAL DATA: | ||||||||||||||||
| Net assets, end of period (000s) | $ | 5,836 | $ | 4,489 | $ | 3,839 | $ | 13 | ||||||||
| Ratio of expenses to average net assets excluding fee waivers and reimbursements | 0.50 | %(c) | 0.50 | % | 0.50 | % | 0.50 | %(c) | ||||||||
| Ratio of expenses to average net assets including fee waivers and reimbursements | 0.50 | %(c) | 0.50 | % | 0.50 | % | 0.50 | %(c) | ||||||||
| Ratio of net investment income to average net assets | 0.99 | %(c) | 1.52 | % | 2.13 | % | 2.65 | %(c) | ||||||||
| Portfolio turnover rate(d) | 7 | % | 33 | % | 62 | % | 224 | % | ||||||||
| (a) | Calculated using the average shares method. |
| (b) | Total returns are for the period indicated and have not been annualized. Total returns would have been lower had certain expenses not been waived during the period. Returns shown do not reflect the deduction of taxes that a shareholder would pay on Fund distributions or the redemption of Fund shares. Returns shown exclude any applicable sales charges. |
| (c) | Annualized. |
| (d) | Portfolio turnover rate for periods less than one full year have not been annualized. |
See Notes to Financial Statements.
173 | April 30, 2021
| RiverFront Asset Allocation Growth & Income – Class C |
| Financial Highlights |
Selected data for a share of beneficial interest outstanding throughout the periods indicated:
| For the Six Months Ended April 30, 2021 (Unaudited) | For the Year Ended October 31, 2020 | For the Year Ended October 31, 2019 | For the Year Ended October 31, 2018(a) | For the Year Ended October 31, 2017 | For the Year Ended October 31, 2016 | |||||||||||||||||||
| Net asset value, beginning of period | $ | 11.45 | $ | 11.65 | $ | 13.03 | $ | 14.16 | $ | 12.15 | $ | 12.44 | ||||||||||||
| INCOME/(LOSS) FROM INVESTMENT OPERATIONS: | ||||||||||||||||||||||||
| Net investment income(b) | 0.02 | 0.09 | 0.13 | 0.14 | 0.07 | 0.13 | ||||||||||||||||||
| Net realized and unrealized gain/(loss) | 1.96 | (0.15 | ) | 0.40 | (0.78 | ) | 2.05 | (0.02 | ) | |||||||||||||||
| Total from investment operations | 1.98 | (0.06 | ) | 0.53 | (0.64 | ) | 2.12 | 0.11 | ||||||||||||||||
| DISTRIBUTIONS: | ||||||||||||||||||||||||
| From net investment income | (0.03 | ) | (0.14 | ) | (0.13 | ) | (0.17 | ) | (0.11 | ) | (0.15 | ) | ||||||||||||
| From net realized gains | – | – | (1.78 | ) | (0.32 | ) | – | (0.25 | ) | |||||||||||||||
| Total distributions | (0.03 | ) | (0.14 | ) | (1.91 | ) | (0.49 | ) | (0.11 | ) | (0.40 | ) | ||||||||||||
| Net increase/(decrease) in net asset value | 1.95 | (0.20 | ) | (1.38 | ) | (1.13 | ) | 2.01 | (0.29 | ) | ||||||||||||||
| Net asset value, end of period | $ | 13.40 | $ | 11.45 | $ | 11.65 | $ | 13.03 | $ | 14.16 | $ | 12.15 | ||||||||||||
| TOTAL RETURN(c) | 17.33 | % | (0.44 | )% | 5.91 | % | (4.74 | )% | 17.53 | % | 0.97 | % | ||||||||||||
| RATIOS/SUPPLEMENTAL DATA: | ||||||||||||||||||||||||
| Net assets, end of period (000s) | $ | 11,994 | $ | 13,642 | $ | 19,798 | $ | 23,111 | $ | 26,514 | $ | 32,217 | ||||||||||||
| Ratio of expenses to average net assets excluding fee waivers and reimbursements | 1.25 | %(d) | 1.25 | % | 1.25 | % | 1.57 | % | 2.12 | % | 2.10 | % | ||||||||||||
| Ratio of expenses to average net assets including fee waivers and reimbursements | 1.25 | %(d) | 1.25 | % | 1.25 | % | 1.47 | %(e) | 1.90 | % | 1.90 | % | ||||||||||||
| Ratio of net investment income to average net assets | 0.25 | %(d) | 0.82 | % | 1.15 | % | 1.01 | % | 0.51 | % | 1.08 | % | ||||||||||||
| Portfolio turnover rate(f) | 7 | % | 33 | % | 62 | % | 224 | % | 63 | % | 129 | % | ||||||||||||
| (a) | Prior to February 28, 2018, the RiverFront Asset Allocation Growth & Income was known as the RiverFront Dynamic Equity Income Fund. |
| (b) | Calculated using the average shares method. |
| (c) | Total returns are for the period indicated and have not been annualized. Total returns would have been lower had certain expenses not been waived during the period. Returns shown do not reflect the deduction of taxes that a shareholder would pay on Fund distributions or the redemption of Fund shares. Returns shown exclude any applicable sales charges. |
| (d) | Annualized. |
| (e) | Effective February 28, 2018, pursuant to the Administrative Services Agreement, the Fund pays an annual unitary administrative fee, which is based on the Fund’s average daily net assets, and will no longer pay a management fee or contractually limit the Fund’s total annual expenses. Refer to Note 8. |
| (f) | Portfolio turnover rate for periods less than one full year have not been annualized. |
See Notes to Financial Statements.
174 | April 30, 2021
| RiverFront Asset Allocation Growth & Income – Class I |
| Financial Highlights |
Selected data for a share of beneficial interest outstanding throughout the periods indicated:
| For the Six Months Ended April 30, 2021 (Unaudited) | For the Year Ended October 31, 2020 | For the Year Ended October 31, 2019 | For the Year Ended October 31, 2018(a) | For the Year Ended October 31, 2017 | For the Year Ended October 31, 2016 | |||||||||||||||||||
| Net asset value, beginning of period | $ | 11.79 | $ | 11.97 | $ | 13.31 | $ | 14.42 | $ | 12.31 | $ | 12.56 | ||||||||||||
| INCOME/(LOSS) FROM INVESTMENT OPERATIONS: | ||||||||||||||||||||||||
| Net investment income(b) | 0.08 | 0.22 | 0.26 | 0.29 | 0.20 | 0.25 | ||||||||||||||||||
| Net realized and unrealized gain/(loss) | 2.04 | (0.18 | ) | 0.41 | (0.82 | ) | 2.09 | (0.01 | ) | |||||||||||||||
| Total from investment operations | 2.12 | 0.04 | 0.67 | (0.53 | ) | 2.29 | 0.24 | |||||||||||||||||
| DISTRIBUTIONS: | ||||||||||||||||||||||||
| From net investment income | (0.08 | ) | (0.22 | ) | (0.23 | ) | (0.26 | ) | (0.18 | ) | (0.24 | ) | ||||||||||||
| From net realized gains | – | – | (1.78 | ) | (0.32 | ) | – | (0.25 | ) | |||||||||||||||
| Total distributions | (0.08 | ) | (0.22 | ) | (2.01 | ) | (0.58 | ) | (0.18 | ) | (0.49 | ) | ||||||||||||
| Net increase/(decrease) in net asset value | 2.04 | (0.18 | ) | (1.34 | ) | (1.11 | ) | 2.11 | (0.25 | ) | ||||||||||||||
| Net asset value, end of period | $ | 13.83 | $ | 11.79 | $ | 11.97 | $ | 13.31 | $ | 14.42 | $ | 12.31 | ||||||||||||
| TOTAL RETURN(c) | 17.98 | % | 0.46 | % | 7.07 | % | (3.88 | )% | 18.75 | % | 2.01 | % | ||||||||||||
| RATIOS/SUPPLEMENTAL DATA: | ||||||||||||||||||||||||
| Net assets, end of period (000s) | $ | 37,917 | $ | 34,529 | $ | 49,610 | $ | 51,749 | $ | 33,484 | $ | 28,833 | ||||||||||||
| Ratio of expenses to average net assets excluding fee waivers and reimbursements | 0.25 | %(d) | 0.25 | % | 0.25 | % | 0.53 | % | 1.12 | % | 1.10 | % | ||||||||||||
| Ratio of expenses to average net assets including fee waivers and reimbursements | 0.25 | %(d) | 0.25 | % | 0.25 | % | 0.44 | %(e) | 0.90 | % | 0.90 | % | ||||||||||||
| Ratio of net investment income to average net assets | 1.24 | %(d) | 1.83 | % | 2.17 | % | 2.04 | % | 1.50 | % | 2.06 | % | ||||||||||||
| Portfolio turnover rate(f) | 7 | % | 33 | % | 62 | % | 224 | % | 63 | % | 129 | % | ||||||||||||
| (a) | Prior to February 28, 2018, the RiverFront Asset Allocation Growth & Income was known as the RiverFront Dynamic Equity Income Fund. |
| (b) | Calculated using the average shares method. |
| (c) | Total returns are for the period indicated and have not been annualized. Total returns would have been lower had certain expenses not been waived during the period. Returns shown do not reflect the deduction of taxes that a shareholder would pay on Fund distributions or the redemption of Fund shares. |
| (d) | Annualized. |
| (e) | Effective February 28, 2018, pursuant to the Administrative Services Agreement, the Fund pays an annual unitary administrative fee, which is based on the Fund’s average daily net assets, and will no longer pay a management fee or contractually limit the Fund’s total annual expenses. Refer to Note 8. |
| (f) | Portfolio turnover rate for periods less than one full year have not been annualized. |
See Notes to Financial Statements.
175 | April 30, 2021
| RiverFront Asset Allocation Moderate – Investor Class |
| Financial Highlights |
Selected data for a share of beneficial interest outstanding throughout the periods indicated:
| For the Six Months Ended April 30, 2021 (Unaudited) | For the Year Ended October 31, 2020 | For the Year Ended October 31, 2019 | For the Year Ended October 31, 2018(a)(b) | For the Year Ended October 31, 2017 | For the Year Ended October 31, 2016 | |||||||||||||||||||
| Net asset value, beginning of period | $ | 10.50 | $ | 10.46 | $ | 11.54 | $ | 12.47 | $ | 11.22 | $ | 11.48 | ||||||||||||
| INCOME/(LOSS) FROM INVESTMENT OPERATIONS: | ||||||||||||||||||||||||
| Net investment income(c) | 0.07 | 0.15 | 0.21 | 0.22 | 0.18 | 0.21 | ||||||||||||||||||
| Net realized and unrealized gain/(loss) | 1.25 | 0.05 | 0.49 | (0.36 | ) | 1.23 | (0.01 | ) | ||||||||||||||||
| Total from investment operations | 1.32 | 0.20 | 0.70 | (0.14 | ) | 1.41 | 0.20 | |||||||||||||||||
| DISTRIBUTIONS: | ||||||||||||||||||||||||
| From net investment income | (0.06 | ) | (0.16 | ) | (0.20 | ) | (0.22 | ) | (0.16 | ) | (0.21 | ) | ||||||||||||
| From net realized gains | – | – | (1.58 | ) | (0.57 | ) | – | (0.25 | ) | |||||||||||||||
| Total distributions | (0.06 | ) | (0.16 | ) | (1.78 | ) | (0.79 | ) | (0.16 | ) | (0.46 | ) | ||||||||||||
| Net increase/(decrease) in net asset value | 1.26 | 0.04 | (1.08 | ) | (0.93 | ) | 1.25 | (0.26 | ) | |||||||||||||||
| Net asset value, end of period | $ | 11.76 | $ | 10.50 | $ | 10.46 | $ | 11.54 | $ | 12.47 | $ | 11.22 | ||||||||||||
| TOTAL RETURN(d) | 12.63 | % | 1.95 | % | 7.99 | % | (1.32 | )% | 12.67 | % | 1.81 | % | ||||||||||||
| RATIOS/SUPPLEMENTAL DATA: | ||||||||||||||||||||||||
| Net assets, end of period (000s) | $ | 4,245 | $ | 3,883 | $ | 5,162 | $ | 8,244 | $ | 13,311 | $ | 22,679 | ||||||||||||
| Ratio of expenses to average net assets excluding fee waivers and reimbursements | 0.50 | %(e) | 0.50 | % | 0.50 | % | 0.84 | % | 1.33 | % | 1.31 | % | ||||||||||||
| Ratio of expenses to average net assets including fee waivers and reimbursements | 0.50 | %(e) | 0.50 | % | 0.50 | % | 0.74 | %(f) | 1.15 | % | 1.15 | % | ||||||||||||
| Ratio of net investment income to average net assets | 1.19 | %(e) | 1.46 | % | 2.00 | % | 1.78 | % | 1.49 | % | 1.87 | % | ||||||||||||
| Portfolio turnover rate(g) | 9 | % | 20 | % | 41 | % | 209 | % | 56 | % | 132 | % | ||||||||||||
| (a) | Prior to December 1, 2017, Investor Class was known as Class A. |
| (b) | Prior to February 28, 2018, the RiverFront Asset Allocation Moderate was known as the RiverFront Moderate Growth & Income Fund. |
| (c) | Calculated using the average shares method. |
| (d) | Total returns are for the period indicated and have not been annualized. Total returns would have been lower had certain expenses not been waived during the period. Returns shown do not reflect the deduction of taxes that a shareholder would pay on Fund distributions or the redemption of Fund shares. |
| (e) | Annualized. |
| (f) | Effective February 28, 2018, pursuant to the Administrative Services Agreement, the Fund pays an annual unitary administrative fee, which is based on the Fund’s average daily net assets, and will no longer pay a management fee or contractually limit the Fund’s total annual expenses. Refer to Note 8. |
| (g) | Portfolio turnover rate for periods less than one full year have not been annualized. |
See Notes to Financial Statements.
176 | April 30, 2021
| RiverFront Asset Allocation Moderate – Class A |
| Financial Highlights |
Selected data for a share of beneficial interest outstanding throughout the periods indicated:
| For the Six Months Ended April 30, 2021 (Unaudited) | For the Year Ended October 31, 2020 | For the Year Ended October 31, 2019 | For the Period June 12, 2018 (Commencement of Operations) to October 31, 2018 | |||||||||||||
| Net asset value, beginning of period | $ | 10.49 | $ | 10.45 | $ | 11.53 | $ | 12.28 | ||||||||
| INCOME FROM INVESTMENT OPERATIONS: | ||||||||||||||||
| Net investment income(a) | 0.07 | 0.15 | 0.20 | 0.11 | ||||||||||||
| Net realized and unrealized gain/(loss) | 1.25 | 0.05 | 0.51 | (0.74 | ) | |||||||||||
| Total from investment operations | 1.32 | 0.20 | 0.71 | (0.63 | ) | |||||||||||
| DISTRIBUTIONS: | ||||||||||||||||
| From net investment income | (0.06 | ) | (0.16 | ) | (0.21 | ) | (0.12 | ) | ||||||||
| From net realized gains | – | – | (1.58 | ) | – | |||||||||||
| Total distributions | (0.06 | ) | (0.16 | ) | (1.79 | ) | (0.12 | ) | ||||||||
| Net increase/(decrease) in net asset value | 1.26 | 0.04 | (1.08 | ) | (0.75 | ) | ||||||||||
| Net asset value, end of period | $ | 11.75 | $ | 10.49 | $ | 10.45 | $ | 11.53 | ||||||||
| TOTAL RETURN(b) | 12.65 | % | 1.96 | % | 8.07 | % | (5.15 | )% | ||||||||
| RATIOS/SUPPLEMENTAL DATA: | ||||||||||||||||
| Net assets, end of period (000s) | $ | 10,004 | $ | 7,680 | $ | 5,933 | $ | 9 | ||||||||
| Ratio of expenses to average net assets excluding fee waivers and reimbursements | 0.50 | %(c) | 0.50 | % | 0.50 | % | 0.50 | %(c) | ||||||||
| Ratio of expenses to average net assets including fee waivers and reimbursements | 0.50 | %(c) | 0.50 | % | 0.50 | % | 0.50 | %(c) | ||||||||
| Ratio of net investment income to average net assets | 1.19 | %(c) | 1.43 | % | 1.92 | % | 2.44 | %(c) | ||||||||
| Portfolio turnover rate(d) | 9 | % | 20 | % | 41 | % | 209 | % | ||||||||
| (a) | Calculated using the average shares method. |
| (b) | Total returns are for the period indicated and have not been annualized. Total returns would have been lower had certain expenses not been waived during the period. Returns shown do not reflect the deduction of taxes that a shareholder would pay on Fund distributions or the redemption of Fund shares. Returns shown exclude any applicable sales charges. |
| (c) | Annualized. |
| (d) | Portfolio turnover rate for periods less than one full year have not been annualized. |
See Notes to Financial Statements.
177 | April 30, 2021
| RiverFront Asset Allocation Moderate – Class C |
| Financial Highlights |
Selected data for a share of beneficial interest outstanding throughout the periods indicated:
| For the Six Months Ended April 30, 2021 (Unaudited) | For the Year Ended October 31, 2020 | For the Year Ended October 31, 2019 | For the Year Ended October 31, 2018(a) | For the Year Ended October 31, 2017 | For the Year Ended October 31, 2016 | |||||||||||||||||||
| Net asset value, beginning of period | $ | 10.34 | $ | 10.30 | $ | 11.39 | $ | 12.34 | $ | 11.12 | $ | 11.39 | ||||||||||||
| INCOME/(LOSS) FROM INVESTMENT OPERATIONS: | ||||||||||||||||||||||||
| Net investment income(b) | 0.03 | 0.07 | 0.13 | 0.12 | 0.08 | 0.13 | ||||||||||||||||||
| Net realized and unrealized gain/(loss) | 1.24 | 0.05 | 0.49 | (0.36 | ) | 1.24 | (0.02 | ) | ||||||||||||||||
| Total from investment operations | 1.27 | 0.12 | 0.62 | (0.24 | ) | 1.32 | 0.11 | |||||||||||||||||
| DISTRIBUTIONS: | ||||||||||||||||||||||||
| From net investment income | (0.03 | ) | (0.08 | ) | (0.13 | ) | (0.14 | ) | (0.10 | ) | (0.13 | ) | ||||||||||||
| From net realized gains | – | – | (1.58 | ) | (0.57 | ) | – | (0.25 | ) | |||||||||||||||
| Total distributions | (0.03 | ) | (0.08 | ) | (1.71 | ) | (0.71 | ) | (0.10 | ) | (0.38 | ) | ||||||||||||
| Net increase/(decrease) in net asset value | 1.24 | 0.04 | (1.09 | ) | (0.95 | ) | 1.22 | (0.27 | ) | |||||||||||||||
| Net asset value, end of period | $ | 11.58 | $ | 10.34 | $ | 10.30 | $ | 11.39 | $ | 12.34 | $ | 11.12 | ||||||||||||
| TOTAL RETURN(c) | 12.26 | % | 1.21 | % | 7.23 | % | (2.16 | )% | 11.94 | % | 1.03 | % | ||||||||||||
| RATIOS/SUPPLEMENTAL DATA: | ||||||||||||||||||||||||
| Net assets, end of period (000s) | $ | 14,493 | $ | 16,353 | $ | 26,831 | $ | 40,792 | $ | 51,231 | $ | 63,480 | ||||||||||||
| Ratio of expenses to average net assets excluding fee waivers and reimbursements | 1.25 | %(d) | 1.25 | % | 1.25 | % | 1.56 | % | 2.08 | % | 2.06 | % | ||||||||||||
| Ratio of expenses to average net assets including fee waivers and reimbursements | 1.25 | %(d) | 1.25 | % | 1.25 | % | 1.47 | %(e) | 1.90 | % | 1.90 | % | ||||||||||||
| Ratio of net investment income to average net assets | 0.45 | %(d) | 0.72 | % | 1.27 | % | 1.03 | % | 0.70 | % | 1.14 | % | ||||||||||||
| Portfolio turnover rate(f) | 9 | % | 20 | % | 41 | % | 209 | % | 56 | % | 132 | % | ||||||||||||
| (a) | Prior to February 28, 2018, the RiverFront Asset Allocation Moderate was known as the RiverFront Moderate Growth & Income Fund. |
| (b) | Calculated using the average shares method. |
| (c) | Total returns are for the period indicated and have not been annualized. Total returns would have been lower had certain expenses not been waived during the period. Returns shown do not reflect the deduction of taxes that a shareholder would pay on Fund distributions or the redemption of Fund shares. Returns shown exclude any applicable sales charges. |
| (d) | Annualized. |
| (e) | Effective February 28, 2018, pursuant to the Administrative Services Agreement, the Fund pays an annual unitary administrative fee, which is based on the Fund’s average daily net assets, and will no longer pay a management fee or contractually limit the Fund’s total annual expenses. Refer to Note 8. |
| (f) | Portfolio turnover rate for periods less than one full year have not been annualized. |
See Notes to Financial Statements.
178 | April 30, 2021
| RiverFront Asset Allocation Moderate – Class I |
| Financial Highlights |
Selected data for a share of beneficial interest outstanding throughout the periods indicated:
| For the Six Months Ended April 30, 2021 (Unaudited) | For the Year Ended October 31, 2020 | For the Year Ended October 31, 2019 | For the Year Ended October 31, 2018(a) | For the Year Ended October 31, 2017 | For the Year Ended October 31, 2016 | |||||||||||||||||||
| Net asset value, beginning of period | $ | 10.51 | $ | 10.47 | $ | 11.54 | $ | 12.48 | $ | 11.21 | $ | 11.47 | ||||||||||||
| INCOME/(LOSS) FROM INVESTMENT OPERATIONS: | ||||||||||||||||||||||||
| Net investment income(b) | 0.08 | 0.18 | 0.23 | 0.25 | 0.20 | 0.24 | ||||||||||||||||||
| Net realized and unrealized gain/(loss) | 1.26 | 0.04 | 0.50 | (0.37 | ) | 1.25 | (0.01 | ) | ||||||||||||||||
| Total from investment operations | 1.34 | 0.22 | 0.73 | (0.12 | ) | 1.45 | 0.23 | |||||||||||||||||
| DISTRIBUTIONS: | ||||||||||||||||||||||||
| From net investment income | (0.08 | ) | (0.18 | ) | (0.22 | ) | (0.25 | ) | (0.18 | ) | (0.24 | ) | ||||||||||||
| From net realized gains | – | – | (1.58 | ) | (0.57 | ) | – | (0.25 | ) | |||||||||||||||
| Total distributions | (0.08 | ) | (0.18 | ) | (1.80 | ) | (0.82 | ) | (0.18 | ) | (0.49 | ) | ||||||||||||
| Net increase/(decrease) in net asset value | 1.26 | 0.04 | (1.07 | ) | (0.94 | ) | 1.27 | (0.26 | ) | |||||||||||||||
| Net asset value, end of period | $ | 11.77 | $ | 10.51 | $ | 10.47 | $ | 11.54 | $ | 12.48 | $ | 11.21 | ||||||||||||
| TOTAL RETURN(c) | 12.74 | % | 2.19 | % | 8.36 | % | (1.16 | )% | 13.05 | % | 2.05 | % | ||||||||||||
| RATIOS/SUPPLEMENTAL DATA: | ||||||||||||||||||||||||
| Net assets, end of period (000s) | $ | 20,516 | $ | 19,030 | $ | 25,544 | $ | 28,228 | $ | 30,913 | $ | 43,056 | ||||||||||||
| Ratio of expenses to average net assets excluding fee waivers and reimbursements | 0.25 | %(d) | 0.25 | % | 0.25 | % | 0.56 | % | 1.08 | % | 1.06 | % | ||||||||||||
| Ratio of expenses to average net assets including fee waivers and reimbursements | 0.25 | %(d) | 0.25 | % | 0.25 | % | 0.47 | %(e) | 0.90 | % | 0.90 | % | ||||||||||||
| Ratio of net investment income to average net assets | 1.44 | %(d) | 1.71 | % | 2.25 | % | 2.02 | % | 1.71 | % | 2.16 | % | ||||||||||||
| Portfolio turnover rate(f) | 9 | % | 20 | % | 41 | % | 209 | % | 56 | % | 132 | % | ||||||||||||
| (a) | Prior to February 28, 2018, the RiverFront Asset Allocation Moderate was known as the RiverFront Moderate Growth & Income Fund. |
| (b) | Calculated using the average shares method. |
| (c) | Total returns are for the period indicated and have not been annualized. Total returns would have been lower had certain expenses not been waived during the period. Returns shown do not reflect the deduction of taxes that a shareholder would pay on Fund distributions or the redemption of Fund shares. |
| (d) | Annualized. |
| (e) | Effective February 28, 2018, pursuant to the Administrative Services Agreement, the Fund pays an annual unitary administrative fee, which is based on the Fund’s average daily net assets, and will no longer pay a management fee or contractually limit the Fund’s total annual expenses. Refer to Note 8. |
| (f) | Portfolio turnover rate for periods less than one full year have not been annualized. |
See Notes to Financial Statements.
179 | April 30, 2021
| Notes to Financial Statements | |
| April 30, 2021 (Unaudited) |
1. ORGANIZATION
Financial Investors Trust (the “Trust”), a Delaware statutory trust, is an open-end management investment company registered under the Investment Company Act of 1940, as amended (“1940 Act”). The Trust consists of multiple separate portfolios or series. This annual report includes the financial statements and financial highlights of the following 11 funds: ALPS | CoreCommodity Management CompleteCommodities® Strategy Fund, ALPS | Kotak India Growth Fund, ALPS | Red Rocks Global Opportunity Fund, Clough China Fund, RiverFront Asset Allocation Aggressive, RiverFront Asset Allocation Growth & Income, RiverFront Asset Allocation Moderate, ALPS | Smith Total Return Bond Fund and ALPS | Smith Short Duration Bond, ALPS | Smith Balanced Opportunity Fund, and ALPS | Smith Credit Opportunities Fund Fund (each, a “Fund” and collectively, the “Funds”). Prior to March 31, 2020, the ALPS | Red Rocks Global Opportunity Fund was known as the ALPS | Red Rocks Listed Private Equity Fund.
The ALPS | CoreCommodity Management CompleteCommodities® Strategy Fund seeks to maximize real returns (returns after inflation), consistent with prudent investment management. ALPS | Kotak India Growth Fund’s investment goal is long-term capital appreciation. ALPS | Red Rocks Global Opportunity Fund seeks to maximize total return, which consists of appreciation on its investments and a variable income stream. The Clough China Fund seeks to provide investors with long-term capital appreciation. Effective February 28, 2018, the RiverFront Asset Allocation Aggressive seeks to achieve long-term capital appreciation, RiverFront Asset Allocation Growth & Income seeks to achieve long-term growth and income, the RiverFront Asset Allocation Moderate has two primary investment objectives- it seeks (1) to provide a level of current income that exceeds the average yield on U.S. stocks, and (2) growth of capital. The ALPS | Smith Total Return Bond Fund seeks to obtain maximum total return, consistent with preservation of capital. The ALPS | Smith Short Duration Bond Fund seeks as high a level of current income as is consistent with preservation of capital. The ALPS | Smith Balanced Opportunity Fund seeks long-term capital growth, consistent with presercation of capital and balanced by current income. The ALPS | Smith Credit Opportunities Fund seeks to obtain maximum risk-adjusted return with a secondary focus on high current income.
The classes of each Fund differ principally in the applicable distribution and shareholder service fees. Shareholders of each class also bear certain expenses that pertain to that particular class. All shareholders bear the common expenses of the Fund and earn income and realized gains/losses from the Fund pro rata based on the average daily net assets of each class, without distinction between share classes. Dividends to shareholders are determined separately for each class based on income and expenses allocable to each class. Realized gain distributions to shareholders are allocated to each class pro rata based on the shares outstanding of each class on the date of distribution. Differences in per share dividend rates generally result from differences in separate class expenses, including distribution and shareholder service fees, if applicable.
Basis of Consolidation for the ALPS | CoreCommodity Management CompleteCommodities® Strategy Fund
CoreCommodity Management Cayman Commodity Fund Ltd. (the “Subsidiary”), a Cayman Islands exempted company, was incorporated on April 23, 2010 and is a wholly owned subsidiary of the ALPS | CoreCommodity Management CompleteCommodities® Strategy Fund (the “CoreCommodity Fund”). The Subsidiary acts as an investment vehicle for the CoreCommodity Fund in order to effect certain commodity-related investments on behalf of the CoreCommodity Fund. CoreCommodity Fund is the sole shareholder of the Subsidiary pursuant to a subscription agreement dated as of June 14, 2010, and it is intended that the CoreCommodity Fund will remain the sole shareholder and will continue to wholly own and control the Subsidiary. Under the Articles of Association of the Subsidiary, shares issued by the Subsidiary confer upon a shareholder the right to vote at general meetings of the Subsidiary and certain rights in connection with any winding-up or repayment of capital, as well as the right to participate in the profits or assets of the Subsidiary. The CoreCommodity Fund may invest up to 25% of its total assets in shares of the Subsidiary. As a wholly owned subsidiary of the CoreCommodity Fund, the financial statements of the Subsidiary are included in the consolidated financial statements and financial highlights of the CoreCommodity Fund. All investments held by the Subsidiary are disclosed in the accounts of the CoreCommodity Fund. As of April 30, 2021, net assets of the CoreCommodity Fund were $866,094,514 of which $176,104,436 or 20.33%, represented the CoreCommodity Fund’s ownership of all issued shares and voting rights of the Subsidiary.
2. SIGNIFICANT ACCOUNTING POLICIES
The following is a summary of significant accounting policies consistently followed by each Fund in the preparation of its financial statements. Each Fund is considered an investment company for financial reporting purposes, and follows accounting policies in conformity with accounting principles generally accepted in the United States of America (“U.S. GAAP”), including policies specific to investment companies. The preparation of financial statements in conformity with U.S. GAAP requires management to make certain estimates and assumptions that affect the reported amounts of assets and liabilities and disclosures of contingent assets and liabilities at the date of the financial statements and the reported amounts of revenue and expenses during the period. Actual results could differ from those estimates. The following is a summary of significant accounting policies consistently followed by the Funds and subsidiaries, as applicable, in preparation of their financial statements. The Funds are considered investment companies under U.S. GAAP and follows the accounting and reporting guidance applicable to investment companies in the Financial Accounting Standards Board Accounting Standards Codification Topic 946.
180 | April 30, 2021
| Notes to Financial Statements | |
| April 30, 2021 (Unaudited) |
Investment Valuation: The Funds generally value their securities based on market prices determined at the close of regular trading on the New York Stock Exchange (“NYSE”), normally 4:00 p.m. Eastern Time, on each day the NYSE is open for trading. For equity securities and mutual funds that are traded on an exchange, the market price is usually the closing sale or official closing price on that exchange.
The market price for debt obligations is generally the price supplied by an independent third-party pricing service approved by the Board, which may use a matrix, formula or other objective method that takes into consideration quotations from dealers, market transactions in comparable investments, market indices and yield curves. If vendors are unable to supply a price, or if the price supplied is deemed to be unreliable, the market price may be determined using quotations received from one or more brokers-dealers that make a market in the security. Investments in non-exchange traded funds are fair valued at their respective net asset values. Bonds may be purchased and held as odd lots. Pricing vendors generally value securities assuming orderly transactions of institutional round lot sizes, but a Fund may hold or transact in such securities in smaller, odd lot sizes. Special valuation considerations may apply with respect to a Fund’s odd-lot positions, as the Fund may receive different prices when it sells such positions than it would receive for sales of institutional round lot positions. The ALPS | Smith Total Return Bond Fund, ALPS | Smith Short Duration Bond Fund, ALPS | Smith Balanced Opportunity Fund, and ALPS | Smith Credit Opportunities Fund have odd lot pricing policies it employs to value odd lot securities.
Futures contracts that are listed or traded on a national securities exchange, commodities exchange, contract market or comparable over the counter market, and that are freely transferable, are valued at their closing settlement price on the exchange on which they are primarily traded or based upon the current settlement price for a like instrument acquired on the day on which the instrument is being valued. A settlement price may not be used if the market makes a limit move with respect to a particular commodity. Over-the-counter swap contracts are valued based on quotes received from independent pricing services or one or more dealers that make markets in such investments.
Option contracts are valued using the National Best Bid and Offer price (“NBBO”). In the event there is no NBBO price available, option contracts are valued at the mean between the last bid and ask.
For ALPS | Kotak India Growth Fund, ALPS | Red Rocks Global Opportunity Fund, and Clough China Fund, who hold equity securities that are primarily traded on foreign securities exchanges, such securities are valued at the closing values of such securities on their respective foreign exchanges, except when an event occurs subsequent to the close of the foreign exchange and the close of the NYSE that was likely to have changed such value. In such an event, the fair value of those securities are determined in good faith through consideration of other factors in accordance with procedures established by and under the general supervision of the Board. The Funds will use a fair valuation model provided by an independent pricing service, which is intended to reflect fair value when a security’s value or a meaningful portion of the Fund’s portfolio is believed to have been materially affected by an valuation event that has occurred between the close of the exchange or market on which the security is traded and the close of the regular trading day on the NYSE.
Forward currency exchange contracts have a value determined by the current foreign currency exchange forward rates. The foreign currency exchange forward rates are calculated using an automated system that estimates rates on the basis of the current day foreign currency exchange rates and forward foreign currency exchange rates supplied by a pricing service. Foreign exchange rates and forward foreign currency exchange rates may generally be obtained at the close of the NYSE, normally 4:00 p.m. Eastern Time.
When such prices or quotations are not available, or when the Fair Value Committee appointed by the Board believes that they are unreliable, securities may be priced using fair value procedures approved by the Board. The fair valuation policies and procedures (“FV Procedures”) have been adopted by the Board for the fair valuation of portfolio assets held by the Fund(s) in the event that (1) market quotations for the current price of a portfolio security or asset are not readily available, or (2) available market quotations that would otherwise be used to value a portfolio security or asset in accordance with the Fund’s Pricing Procedures appear to be unreliable. The Pricing Procedures reflect certain pricing methodologies (or “logics”) that are not “readily available market quotations” and thus are viewed and treated as fair valuations. The Fair Value Committee routinely meets to discuss fair valuations of portfolio securities and other instruments held by the Fund(s).
Fair Value Measurements: The Funds disclose the classification of their fair value measurements following a three-tier hierarchy based on the inputs used to measure fair value. Inputs refer broadly to the assumptions that market participants would use in pricing the asset or liability, including assumptions about risk. Inputs may be observable or unobservable. Observable inputs reflect the assumptions market participants would use in pricing the asset or liability that are developed based on market data obtained from sources independent of the reporting entity. Unobservable inputs reflect the reporting entity’s own assumptions about the assumptions market participants would use in pricing the asset or liability that are developed based on the best information available.
181 | April 30, 2021
| Notes to Financial Statements | |
| April 30, 2021 (Unaudited) |
Various inputs are used in determining the value of each Fund’s investments as of the end of the reporting period. When inputs used fall into different levels of the fair value hierarchy, the level in the hierarchy within which the fair value measurement falls is determined based on the lowest level input that is significant to the fair value measurement in its entirety. The designated input levels are not necessarily an indication of the risk or liquidity associated with these investments. These inputs are categorized in the following hierarchy under applicable financial accounting standards:
| Level 1 – | Unadjusted quoted prices in active markets for identical investments, unrestricted assets or liabilities that a Fund has the ability to access at the measurement date; |
| Level 2 – | Quoted prices which are not active, quoted prices for similar assets or liabilities in active markets or inputs other than quoted prices that are observable (either directly or indirectly) for substantially the full term of the asset or liability; and |
| Level 3 – | Significant unobservable prices or inputs (including the Fund’s own assumptions in determining the fair value of investments) where there is little or no market activity for the asset or liability at the measurement date. |
The following is a summary of each Fund’s investments/financial instruments in the fair value hierarchy as of April 30, 2021:
| Investments in Securities at Value | Level 1 - Unadjusted Quoted Prices | Level 2 - Other Significant Observable Inputs | Level 3 - Significant Unobservable Inputs | Total | ||||||||||||
| ALPS | CoreCommodity Management CompleteCommodities® Strategy Fund | ||||||||||||||||
| Common Stocks(a) | ||||||||||||||||
| United States | $ | 97,781,811 | $ | 103 | $ | – | $ | 97,781,914 | ||||||||
| Other | 175,427,629 | – | – | 175,427,629 | ||||||||||||
| Master Limited Partnerships(a) | 454,573 | – | – | 454,573 | ||||||||||||
| Rights | – | – | – | – | ||||||||||||
| Government Bonds | – | 357,556,694 | – | 357,556,694 | ||||||||||||
| Total | $ | 273,664,013 | $ | 357,556,797 | $ | – | $ | 631,220,810 | ||||||||
| Other Financial Instruments | ||||||||||||||||
| Assets | ||||||||||||||||
| Futures Contracts | $ | 10,457,861 | $ | – | $ | – | $ | 10,457,861 | ||||||||
| Liabilities | ||||||||||||||||
| Total Return Swap Contracts | – | (45 | ) | – | (45 | ) | ||||||||||
| Futures Contracts | (11,403,553 | ) | – | – | (11,403,553 | ) | ||||||||||
| Total | $ | (945,692 | ) | $ | (45 | ) | $ | – | $ | (945,737 | ) | |||||
| Investments in Securities at Value | Level 1 - Unadjusted Quoted Prices | Level 2 - Other Significant Observable Inputs | Level 3 - Significant Unobservable Inputs | Total | ||||||||||||
| ALPS | Kotak India Growth Fund | ||||||||||||||||
| Common Stocks | ||||||||||||||||
| Communication Services | $ | 703,399 | $ | 6,340,846 | $ | – | $ | 7,044,245 | ||||||||
| Consumer Discretionary | – | 27,809,726 | – | 27,809,726 | ||||||||||||
| Consumer Staples | – | 22,504,813 | – | 22,504,813 | ||||||||||||
| Energy | – | 22,193,055 | – | 22,193,055 | ||||||||||||
| Financials | 16,304,282 | 85,771,702 | – | 102,075,984 | ||||||||||||
| Health Care | – | 25,476,366 | – | 25,476,366 | ||||||||||||
| Industrials | – | 29,691,816 | – | 29,691,816 | ||||||||||||
| Information Technology | 8,536,942 | 40,333,119 | – | 48,870,061 | ||||||||||||
| Materials | 1,895,378 | 25,267,923 | – | 27,163,301 | ||||||||||||
| Real Estate | – | 2,321,481 | – | 2,321,481 | ||||||||||||
| Utilities | – | 3,318,675 | – | 3,318,675 | ||||||||||||
| Total | $ | 27,440,001 | $ | 291,029,522 | $ | – | $ | 318,469,523 | ||||||||
182 | April 30, 2021
| Notes to Financial Statements | |
| April 30, 2021 (Unaudited) |
| Investments in Securities at Value | Level 1 - Unadjusted Quoted Prices | Level 2 - Other Significant Observable Inputs | Level 3 - Significant Unobservable Inputs | Total | ||||||||||||
| ALPS | Smith Short Duration Bond Fund | ||||||||||||||||
| Collateralized Mortgage Obligations | $ | – | $ | 2,630,317 | $ | – | $ | 2,630,317 | ||||||||
| Commercial Mortgage-Backed Securities | – | 1,279,687 | – | 1,279,687 | ||||||||||||
| Mortgage-Backed Securities | – | 13,525,735 | – | 13,525,735 | ||||||||||||
| Corporate Bonds | – | 299,727,375 | – | 299,727,375 | ||||||||||||
| Government Bonds | – | 78,963,850 | – | 78,963,850 | ||||||||||||
| Municipal Bonds | – | 285,000 | – | 285,000 | ||||||||||||
| Short Term Investments | 12,012,510 | – | – | 12,012,510 | ||||||||||||
| Total | $ | 12,012,510 | $ | 396,411,964 | $ | – | $ | 408,424,474 | ||||||||
| Investments in Securities at Value | Level 1 - Unadjusted Quoted Prices | Level 2 - Other Significant Observable Inputs | Level 3 - Significant Unobservable Inputs | Total | ||||||||||||
| ALPS | Smith Total Return Bond Fund | ||||||||||||||||
| Collateralized Mortgage Obligations | $ | – | $ | 139,549,836 | $ | – | $ | 139,549,836 | ||||||||
| Commercial Mortgage-Backed Securities | – | 55,330,342 | – | 55,330,342 | ||||||||||||
| Mortgage-Backed Securities | – | 102,327,555 | – | 102,327,555 | ||||||||||||
| Corporate Bonds | – | 981,862,470 | – | 981,862,470 | ||||||||||||
| Government Bonds | – | 385,797,010 | – | 385,797,010 | ||||||||||||
| Preferred Stock | 10,246,520 | – | – | 10,246,520 | ||||||||||||
| Short Term Investments | 41,624,135 | – | – | 41,624,135 | ||||||||||||
| Total | $ | 51,870,655 | $ | 1,664,867,213 | $ | – | $ | 1,716,737,868 | ||||||||
| Investments in Securities at Value | Level 1 - Unadjusted Quoted Prices | Level 2 - Other Significant Observable Inputs | Level 3 - Significant Unobservable Inputs | Total | ||||||||||||
| ALPS | Smith Credit Opportunities Fund | ||||||||||||||||
| Common Stocks(a) | $ | 256,180 | $ | – | $ | – | $ | 256,180 | ||||||||
| Exchange Traded Funds | 6,549,564 | – | – | 6,549,564 | ||||||||||||
| Corporate Bonds | – | 121,775,112 | – | 121,775,112 | ||||||||||||
| Government Bonds | – | 16,541,132 | – | 16,541,132 | ||||||||||||
| Preferred Stock | 2,521,413 | – | – | 2,521,413 | ||||||||||||
| Short Term Investments | 2,303,925 | – | – | 2,303,925 | ||||||||||||
| Total | $ | 11,631,082 | $ | 138,316,244 | $ | – | $ | 149,947,326 | ||||||||
| Investments in Securities at Value | Level 1 - Unadjusted Quoted Prices | Level 2 - Other Significant Observable Inputs | Level 3 - Significant Unobservable Inputs | Total | ||||||||||||
| ALPS | Smith Balanced Opportunity Fund | ||||||||||||||||
| Common Stocks(a) | $ | 13,879,159 | $ | – | $ | – | $ | 13,879,159 | ||||||||
| Collateralized Mortgage Obligations | – | 1,224,106 | – | 1,224,106 | ||||||||||||
| Mortgage-Backed Securities | – | 216,425 | – | 216,425 | ||||||||||||
| Corporate Bonds | – | 2,974,417 | – | 2,974,417 | ||||||||||||
| Government Bonds | – | 1,942,221 | – | 1,942,221 | ||||||||||||
| Short Term Investments | 1,777,557 | – | – | 1,777,557 | ||||||||||||
| Total | $ | 15,656,716 | $ | 6,357,169 | $ | – | $ | 22,013,885 | ||||||||
183 | April 30, 2021
| Notes to Financial Statements | |
| April 30, 2021 (Unaudited) |
| Investments in Securities at Value | Level 1 - Unadjusted Quoted Prices | Level 2 - Other Significant Observable Inputs | Level 3 - Significant Unobservable Inputs | Total | ||||||||||||
| ALPS | Red Rocks Global Opportunity Fund | ||||||||||||||||
| Closed-End Funds | $ | 12,109,069 | $ | 7,910,532 | $ | – | $ | 20,019,601 | ||||||||
| Common Stocks | ||||||||||||||||
| Communications | 10,869,238 | – | – | 10,869,238 | ||||||||||||
| Consumer, Cyclical | 1,469,755 | 3,733,766 | – | 5,203,521 | ||||||||||||
| Consumer, Non-cyclical | 6,998,632 | – | – | 6,998,632 | ||||||||||||
| Diversified | – | 1,035,810 | – | 1,035,810 | ||||||||||||
| Financials | 26,312,938 | 23,485,716 | – | 49,798,654 | ||||||||||||
| Industrials | 4,864,196 | – | – | 4,864,196 | ||||||||||||
| Technology | 3,785,566 | – | – | 3,785,566 | ||||||||||||
| Utilities | 1,688,378 | – | – | 1,688,378 | ||||||||||||
| Short-Term Investments | 1,785,765 | – | – | 1,785,765 | ||||||||||||
| Total | $ | 69,883,537 | $ | 36,165,824 | $ | – | $ | 106,049,361 | ||||||||
| Investments in Securities at Value | Level 1 - Unadjusted Quoted Prices | Level 2 - Other Significant Observable Inputs | Level 3 - Significant Unobservable Inputs | Total | ||||||||||||
| Clough China Fund | ||||||||||||||||
| Common Stocks | ||||||||||||||||
| Communications | $ | 2,704,861 | $ | 6,182,333 | $ | – | $ | 8,887,194 | ||||||||
| Consumer Discretionary | 5,876,501 | 6,715,219 | – | 12,591,720 | ||||||||||||
| Consumer Staples | – | 393,218 | – | 393,218 | ||||||||||||
| Energy | – | 588,419 | – | 588,419 | ||||||||||||
| Financials | – | 6,573,316 | – | 6,573,316 | ||||||||||||
| Health Care | 649,022 | 1,101,967 | – | 1,750,989 | ||||||||||||
| Industrials | – | 887,974 | – | 887,974 | ||||||||||||
| Materials | – | 1,807,247 | – | 1,807,247 | ||||||||||||
| Real Estate | – | 1,205,938 | – | 1,205,938 | ||||||||||||
| Technology | 2,792,849 | 3,096,857 | – | 5,889,706 | ||||||||||||
| Utilities | – | 457,632 | – | 457,632 | ||||||||||||
| Short Term Investments | 4,720,007 | – | – | 4,720,007 | ||||||||||||
| Total | $ | 16,743,240 | $ | 29,010,120 | $ | – | $ | 45,753,360 | ||||||||
| Other Financial Instruments | ||||||||||||||||
| Assets: | ||||||||||||||||
| Total Return Swap Contracts | $ | – | $ | 853,282 | $ | – | $ | 853,282 | ||||||||
| Liabilities: | ||||||||||||||||
| Total Return Swap Contracts | – | (21,338 | ) | – | (21,338 | ) | ||||||||||
| Total | $ | – | $ | 831,944 | $ | – | $ | 831,944 | ||||||||
| Investments in Securities at Value | Level 1 - Unadjusted Quoted Prices | Level 2 - Other Significant Observable Inputs | Level 3 - Significant Unobservable Inputs | Total | ||||||||||||
| RiverFront Asset Allocation Aggressive | ||||||||||||||||
| Exchange Traded Funds | $ | 26,254,862 | $ | – | $ | – | $ | 26,254,862 | ||||||||
| Short-Term Investments | 719,325 | – | – | 719,325 | ||||||||||||
| Total | $ | 26,974,187 | $ | – | $ | – | $ | 26,974,187 | ||||||||
| Investments in Securities at Value | Level 1 - Unadjusted Quoted Prices | Level 2 - Other Significant Observable Inputs | Level 3 - Significant Unobservable Inputs | Total | ||||||||||||
| RiverFront Asset Allocation Growth & Income | ||||||||||||||||
| Exchange Traded Funds | $ | 61,661,444 | $ | – | $ | – | $ | 61,661,444 | ||||||||
| Short-Term Investments | 1,293,007 | – | – | 1,293,007 | ||||||||||||
| Total | $ | 62,954,451 | $ | – | $ | – | $ | 62,954,451 | ||||||||
184 | April 30, 2021
| Notes to Financial Statements | |
| April 30, 2021 (Unaudited) |
| Investments in Securities at Value | Level 1 - Unadjusted Quoted Prices | Level 2 - Other Significant Observable Inputs | Level 3 - Significant Unobservable Inputs | Total | ||||||||||||
| RiverFront Asset Allocation Moderate | ||||||||||||||||
| Exchange Traded Funds | $ | 48,456,326 | $ | – | $ | – | $ | 48,456,326 | ||||||||
| Short-Term Investments | 833,336 | – | – | 833,336 | ||||||||||||
| Total | $ | 49,289,662 | $ | – | $ | – | $ | 49,289,662 | ||||||||
| (a) | For detailed descriptions of country, sector and/or industry, see the accompanying Statement of Investments or Consolidated Statement of Investments. |
Fund and Class Expenses: Some expenses of the Trust can be directly attributed to a Fund or a specific share class of a Fund. Expenses which cannot be directly attributed are apportioned among all Funds in the Trust based on average net assets of each share class within a Fund.
Federal Income Taxes: The Funds comply with the requirements under Subchapter M of the Internal Revenue Code of 1986, as amended (the “Code”) applicable to regulated investment companies and intend to distribute substantially all of their net taxable income and net capital gains, if any, each year. The Funds are not subject to income taxes to the extent such distributions are made.
The Funds file U.S. federal, state, and local tax returns as required. The Funds’ tax returns are subject to examination by the relevant tax authorities until expiration of the applicable statute of limitations which is generally three years after the filing of the tax return, but may extend to four years in certain jurisdictions. Tax returns for open years have incorporated no uncertain tax positions that require a provision for income taxes.
Distributions to Shareholders: Each Fund, except, RiverFront Asset Allocation Growth & Income, RiverFront Asset Allocation Moderate, ALPS | Smith Total Return Bond Fund, ALPS | Smith Short Duration Bond Fund, ALPS | Smith Balanced Opportunity Fund, and ALPS | Smith Credit Opportunities Fund normally pays dividends and distributes capital gains, if any, on an annual basis. RiverFront Asset Allocation Growth & Income and RiverFront Asset Allocation Moderate normally pay dividends, if any, on a quarterly basis and distribute capital gains annually. ALPS | Smith Total Return Bond Fund, ALPS | Smith Short Duration Bond Fund, ALPS | Smith Balanced Opportunity Fund, and ALPS | Smith Credit Opportunities Fund declare and distribute dividends, if any, on a monthly basis and capital gains, if any, on at least an annual basis. Income dividend distributions are derived from interest, dividends, and other income a Fund receives from its investments, including distributions of short-term capital gains. Capital gain distributions are derived from gains realized when a Fund sells a security it has owned for more than a year or from long-term capital gain distributions from underlying investments. Each Fund may make additional distributions and dividends at other times if its portfolio manager or managers believe doing so may be necessary for the Fund to avoid or reduce taxes.
Commodity-Linked Notes: The ALPS | CoreCommodity Management CompleteCommodities® Strategy Fund may invest in commodity-linked notes which are derivative instruments that have characteristics of a debt security and of a commodity-linked derivative. A commodity-linked note typically provides for interest payments and a principal payment at maturity linked to the price movement of the underlying commodity, commodity index or commodity futures or option contract. Commodity-linked notes may be principal protected, partially protected, or offer no principal protection. The value of these notes will rise and fall in response to changes in the underlying commodity or related index or investment. These notes are often leveraged, increasing the volatility of each note’s value relative to the change in the underlying linked index. Commodity index-linked investments may be more volatile and less liquid than the underlying index and their value may be affected by the performance of the commodities as well as other factors, including liquidity, quality, maturity and other economic variables. Commodity-linked notes are typically issued by a bank or other financial institution and are sometimes referred to as structured notes because the terms of the notes may be structured by the issuer and the purchaser of the notes to accommodate the specific investment requirements of the purchaser.
Exchange Traded Funds (ETFs): Each Fund may invest in shares of ETFs and other similar instruments if the investment manager chooses to adjust a Fund’s exposure to the general market or industry sectors and to manage a Fund’s risk exposure. ETFs differ from traditional index funds in that their shares are listed on a securities exchange and can be traded intraday. ETF shares are shares of exchange traded investment companies that are registered under the 1940 Act and hold a portfolio of common stocks designed to track the performance of a particular index. Limitations of the 1940 Act may prohibit a Fund from acquiring more than 3% of the outstanding shares of certain ETFs. Instruments that are similar to ETFs represent beneficial ownership interests in specific “baskets” of stocks of companies within a particular industry sector or group. These securities may also be exchange traded, but unlike ETFs, the issuers of these securities are not registered as investment companies.
The portfolio manager may decide to purchase or sell short ETF shares or options on ETF shares for the same reasons it would purchase or sell (and as an alternative to purchasing or selling) futures contracts – to obtain exposure to the stock market or a particular segment of the stock market, or to hedge a Fund’s portfolio against such exposures. Depending on the market, the holding period and other factors, the use of ETF shares and options thereon can be less costly than the use of index options or stock index futures. In addition, ETF shares and options thereon can typically be purchased
185 | April 30, 2021
| Notes to Financial Statements | |
| April 30, 2021 (Unaudited) |
in smaller amounts than are available for futures contracts and can offer exposure to market sectors and styles for which there is no suitable or liquid futures contract.
Investment Transactions and Investment Income: Investment transactions are accounted for on the date the investments are purchased or sold (trade date basis). Net realized gains and losses from investment transactions are reported on an identified cost basis. Interest income, which includes accretion of discounts and amortization of premiums, is accrued and recorded as earned. Dividend income is recognized on the ex-dividend date or for certain foreign securities, as soon as information is available to each Fund.
Foreign Securities: Each Fund may directly purchase securities of foreign issuers. Investing in securities of foreign issuers involves special risks not typically associated with investing in securities of U.S. issuers. The risks include possible reevaluation of currencies, the inability to repatriate foreign currency, less complete financial information about companies and possible future adverse political and economic developments.
Moreover, securities of many foreign issuers and their markets may be less liquid and their prices more volatile than those of securities of comparable U.S. issuers.
Foreign Currency Translation: The books and records of the Funds are maintained in U.S. dollars. Investment valuations and other assets and liabilities initially expressed in foreign currencies are converted each business day into U.S. dollars based upon current exchange rates. The portion of realized and unrealized gains or losses on investments due to fluctuations in foreign currency exchange rates is not separately disclosed and is included in realized and unrealized gains or losses on investments, when applicable.
Foreign Currency Spot Contracts: The Funds may enter into foreign currency spot contracts to facilitate transactions in foreign securities or to convert foreign currency receipts into U.S. dollars. A foreign currency spot contract is an agreement between two parties to buy and sell currencies at the current market rate, for settlement generally within two business days. The U.S. dollar value of the contracts is determined using current currency exchange rates supplied by a pricing service. The contract is marked-to-market daily for settlements beyond one day and any change in market value is recorded as an unrealized gain or loss. When the contract is closed, the Fund records a realized gain or loss equal to the difference between the value on the open and close date. Losses may arise from changes in the value of the foreign currency, or if the counterparties do not perform under the contract’s terms. The maximum potential loss from such contracts is the aggregate face value in U.S. dollars at the time the contract was opened.
Real Estate Investment Trusts (“REITs”): The Funds may invest a portion of their assets in REITs and are subject to certain risks associated with direct investment in REITs. REITs may be affected by changes in the value of their underlying properties and by defaults by borrowers or tenants. REITs depend generally on their ability to generate cash flow to make distributions to shareowners, and certain REITs have self-liquidation provisions by which mortgages held may be paid in full and distributions of capital returns may be made at any time. In addition, the performance of a REIT may be affected by its failure to qualify for tax-free pass-through of income under the Code, or its failure to maintain exemption from registration under the 1940 Act. Distributions that the Fund receives from REITs can be classified as ordinary income, capital gain income or return of capital by the REITs that make these distributions to the Fund. However, it is not possible for the Fund to characterize distributions received from REITs during interim periods because the REIT issuers do not report their tax characterizations until subsequent to year end. During interim periods, the REIT distributions are accounted for as ordinary income until the re characterizations are made subsequent to year end.
Treasury Inflation Protected-Securities (“TIPS”): The Funds may invest in TIPS, including structured bonds in which the principal amount is adjusted daily to keep pace with inflation, as measured by the U.S. Consumer Pricing Index for Urban Consumers. The adjustments to principal due to inflation/deflation are reflected as increases/decreases to interest income with a corresponding adjustment to cost. Such adjustments may have a significant impact on a Fund’s distributions and may result in a return of capital to shareholders. The repayment of the original bond principal upon maturity is guaranteed by the full faith and credit of the U.S. Government.
Loan Participations and Assignments: Certain Funds may invest in loan participations and assignments. The Fund considers loan participations and assignments to be investments in debt securities. Loan participations typically will result in the Fund having a contractual relationship only with the lender, not with the borrower. The Fund will have the right to receive payments of principal, interest and any fees to which it is entitled only from the lender selling the participation and only upon receipt by the lender of the payments from the borrower. Under a loan participation, the Fund generally will have no right to enforce compliance by the borrower with the terms of the loan agreement relating to the loan, nor any rights of set-off against the borrower, and the Fund may not benefit directly from any collateral supporting the loan in which it has purchased the participation. As a result, the Fund will assume the credit risk of both the borrower and the lender that is selling the participation. In the event of the insolvency of the lender selling a participation, the Fund may be treated as a general creditor of the lender and may not benefit from any set-off between the lender and the borrower. When the Fund purchases assignments of loans from lenders, the Fund will acquire direct rights against the borrower on the loan, except that under certain circumstances such rights may be more limited than those held by the assigning lender.
186 | April 30, 2021
| Notes to Financial Statements | |
| April 30, 2021 (Unaudited) |
Master Limited Partnerships: Certain Funds may invest in MLPs, which are publicly traded partnerships engaged in the transportation, storage and processing of minerals and natural resources. By confining their operations to these specific activities, their interests, or units, are able to trade on public securities exchanges exactly like the shares of a corporation, without entity level taxation. To qualify as a MLP and to not be taxed as a corporation, a partnership must receive at least 90% of its income from qualifying sources as set forth in Section 7704(d) of the Code. These qualifying sources include natural resource based activities such as the processing, transportation and storage of mineral or natural resources. MLPs generally have two classes of owners, the general partner and limited partners. The general partner of an MLP is typically owned by a major energy company, an investment fund, the direct management of the MLP, or is an entity owned by one or more of such parties. The general partner may be structured as a private or publicly traded corporation or other entity. The general partner typically controls the operations and management of the MLP through an up to 2% equity interest in the MLP plus, in many cases, ownership of common units and subordinated units. Limited partners typically own the remainder of the partnership, through ownership of common units, and have a limited role in the partnership’s operations and management. MLPs are typically structured such that common units and general partner interests have first priority to receive quarterly cash distributions up to an established minimum amount (“minimum quarterly distributions” or “MQD”). Common and general partner interests also accrue arrearages in distributions to the extent the MQD is not paid. Once common and general partner interests have been paid, subordinated units receive distributions of up to the MQD; however, subordinated units do not accrue arrearages. Distributable cash in excess of the MQD is paid to both common and subordinated units and is distributed to both common and subordinated units generally on a pro rata basis. The general partner is also eligible to receive incentive distributions if the general partner operates the business in a manner which results in distributions paid per common unit surpassing specified target levels. As the general partner increases cash distributions to the limited partners, the general partner receives an increasingly higher percentage of the incremental cash distributions.
Libor Risk: In March 2020, the FASB issued ASU No. 2020-04, Reference Rate Reform (Topic 848): Facilitation of the Effects of Reference Rate Reform on Financial Reporting. The Fund’ investments, payment obligations, and financing terms may be based on floating rates, such as the London Interbank Offered Rate, or “LIBOR,”which is the offered rate for short-term Eurodollar deposits between major international banks. On November 30, 2020, the administrator of LIBOR announced its intention to delay the phase out of the majority of the U.S. dollar LIBOR publications until June 30, 2023, with the remainder of LIBOR publications to still end at the end of 2020.
COVID-19 Risks: A recent outbreak of respiratory disease caused by a novel coronavirus was first detected in December 2019 and has now been detected internationally. This coronavirus has resulted in closing borders, enhanced health screenings, healthcare service preparation and delivery, quarantines, cancellations, disruptions to supply chains and customer activity, as well as general concern and uncertainty. The impact of this coronavirus, and other epidemics and pandemics that may arise in the future, could affect the economies of many nations, individual companies, their securities (including equity and debt), and the market in general in ways that cannot necessarily be foreseen at the present time. In addition, the impact of infectious diseases in developing or emerging market countries may be greater due to less established health care systems. Health crises caused by the recent coronavirus outbreak may exacerbate other pre-existing political, social and economic risks in certain countries. The impact of the outbreak may be short term or may last for an extended period of time.
3. DERIVATIVE INSTRUMENTS
As a part of their investment strategy, the Funds are permitted to enter in various types of derivatives contracts. In doing so, the Funds employ strategies in differing combinations to permit them to increase, decrease, or change the level or types of exposure to market factors. Central to those strategies are features inherent in derivatives that make them more attractive for this purpose than equity or debt securities; they require little or no initial cash investment, they focus exposure on only certain selected risk factors, and they may not require the ultimate receipt or delivery of the underlying security (or securities) to the contract. This may allow the Funds to pursue their objectives more quickly and efficiently than if they were to make direct purchases or sales of securities capable of affecting a similar response to market factors.
Cash collateral is being pledged to cover derivative obligations of the Funds and cash collateral received from the counterparty, if any, is reported separately on the Statements of Assets and Liabilities as cash pledged as collateral and cash received as collateral, respectively. Non-cash collateral pledged by the Funds, if any, is noted in the Statements of Investments.
Risk of Investing in Derivatives: The Funds’ use of derivatives can result in losses due to unanticipated changes in the market risk factors and the overall market. In instances where the Funds are using derivatives to decrease, or hedge, exposures to market risk factors for securities held by the Funds, there are also risks that those derivatives may not perform as expected resulting in losses for the combined or hedged positions.
Derivatives may have little or no initial cash investment relative to their market value exposure and therefore can produce significant gains or losses in excess of their cost. This use of embedded leverage allows the Fund to increase its market value exposure relative to its net assets and can substantially increase the volatility of the Funds’ performance.
187 | April 30, 2021
| Notes to Financial Statements | |
| April 30, 2021 (Unaudited) |
Additional associated risks from investing in derivatives also exist and potentially could have significant effects on the valuation of the derivative and the Funds. Typically, the associated risks are not the risks that the Funds are attempting to increase or decrease exposure to, per their investment objectives, but are the additional risks from investing in derivatives.
Examples of these associated risks are liquidity risk, which is the risk that the Funds will not be able to sell or close out the derivative in a timely manner, and counterparty credit risk, which is the risk that the counterparty will not fulfill its obligation to the Funds. In addition, use of derivatives may increase or decrease exposure to the following risk factors:
Equity Risk: Equity risk relates to the change in value of equity securities as they relate to increases or decreases in the general market. Associated risks can be different for each type of derivative and are discussed by each derivative type in the notes that follow.
Commodity Risk: Exposure to the commodities markets may subject the Funds to greater volatility than investments in traditional securities. Prices of various commodities may also be affected by factors, such as drought, floods, weather, livestock disease, embargoes, tariffs and other regulatory developments, which are unpredictable. The prices of commodities can also fluctuate widely due to supply and demand disruptions in major producing or consuming regions.
Foreign Currency Risk: Currency trading involves significant risks, including market risk, interest rate risk, country risk, counterparty credit risk and short sale risk. Market risk results from the price movement of foreign currency values in response to shifting market supply and demand. Interest rate risk arises whenever a country changes its stated interest rate target associated with its currency. Country risk arises because virtually every country has interfered with international transactions in its currency.
Interest Rate Risk: Interest rate risk is the risk that fixed income securities will decline in value because of changes in interest rates. As nominal interest rates rise, the value of fixed income securities held by the Funds are likely to decrease. Securities with longer durations tend to be more sensitive to changes in interest rates, and are usually more volatile than securities.
Swap Contracts: Each Fund may enter into swap transactions for hedging purposes or to seek to increase total return. At the present time, the CoreCommodity Fund and Clough China Fund primarily enter into swap transactions for the purpose of increasing total return. Swap agreements may be executed in a multilateral or other trade facility program, such as a registered exchange (“centrally cleared swaps”) or may be privately negotiated in the over-the counter market. The duration of a swap agreement typically ranges from a few weeks to more than one year. In a centrally cleared swap, immediately following execution of the swap agreement, the swap agreement is novated to a central counterparty (the “CCP”) and the Fund’s counterparty on the swap agreement becomes the CCP. Risks may arise as a result of the failure of the counterparty to the swap contract to comply with the terms of the swap contract. The loss incurred by the failure of a counterparty is generally limited to the net payment to be received by the Funds and/or the termination value at the end of the contract. Therefore, the Funds consider the creditworthiness of each counterparty to a contract in evaluating potential credit risk. Although centrally cleared swaps typically present less counterparty risk than non-centrally cleared swaps, a Fund that has entered into centrally cleared swaps is subject to the risk of the failure of the CCP.
Additionally, risks may arise from unanticipated movements in interest rates or in the value of the underlying reference asset or index. Entering into these agreements involves, to varying degrees, market risk, liquidity risk and elements of credit, legal and documentation risk that are not directly reflected in the amounts recognized in the Statements of Assets and Liabilities.
The Funds may pay or receive cash as collateral on these contracts which may be recorded as an asset and/or liability. The Funds must set aside liquid assets, or engage in other appropriate measures, to cover its obligations under these contracts. Swaps are marked to market daily using either pricing vendor quotations, counterparty prices or model prices and the change in value, if any, is recorded as an unrealized gain or loss. Upfront payments made and/or received by the Funds are recorded as an asset and/or liability and realized gains or losses are recognized ratably over the contract’s term/event, with the exception of forward starting interest rate swaps, whose realized gains or losses are recognized ratably from the effective start date. Periodic payments received or made on swap contracts are recorded as realized gains or losses. Gains or losses are realized upon termination of a swap contract and are recorded on the Statement of Operations.
Total return swaps are agreements in which there is an exchange of cash flows whereby one party commits to make payments based on the total return (coupons plus capital gains/losses) of an underlying instrument in exchange for fixed or floating rate interest payments. To the extent the total return of the instrument or index underlying the transaction exceeds or falls short of the offsetting interest rate obligation, the Fund will receive a payment from or make a payment to the counterparty. Credit default swaps are a type of swap agreement in which the protection “buyer” is generally obligated to pay the protection “seller” an upfront and/ or a periodic stream of payments over the term of the contract provided that no credit event, such as a default, on a reference obligation has occurred. Credit default swaps (“CDS”) are typically two-party financial contracts that transfer credit exposure between the two parties. Under a typical CDS, one party (the “seller”) receives pre-determined periodic payments from the other party
188 | April 30, 2021
| Notes to Financial Statements | |
| April 30, 2021 (Unaudited) |
(the “buyer”). The seller agrees to make compensating specific payments to the buyer if a negative credit event occurs, such as the bankruptcy or default by the issuer of the underlying debt instrument. Swap agreements held at April 30, 2021 are disclosed after the Statement of Investments.
The average notional amount of the swap positions held in the ALPS | CoreCommodity Management CompleteCommodities® Strategy Fund for the six-month period ended April 30, 2021 was $304,328,142. The average notional amount of the swap positions held in the Clough China Fund for the six-month period ended April 30, 2021 was $3,097,246.
Futures: Each Fund may invest in futures contracts in accordance with their investment objectives. Each Fund does so for a variety of reasons including for cash management, hedging or non-hedging purposes in an attempt to achieve the Fund’s investment objective. A futures contract provides for the future sale by one party and purchase by another party of a specified quantity of the security or other financial instrument at a specified price and time. A futures contract on an index is an agreement pursuant to which two parties agree to take or make delivery of an amount of cash equal to the difference between the value of the index at the close of the last trading day of the contract and the price at which the index contract was originally written. Futures transactions may result in losses in excess of the amount invested in the futures contract. There can be no guarantee that there will be a correlation between price movements in the hedging vehicle and in the portfolio securities being hedged. An incorrect correlation could result in a loss on both the hedged securities in a Fund and the hedging vehicle so that the portfolio return might have been greater had hedging not been attempted. There can be no assurance that a liquid market will exist at a time when a Fund seeks to close out a futures contract or a futures option position. Lack of a liquid market for any reason may prevent a Fund from liquidating an unfavorable position, and the Fund would remain obligated to meet margin requirements until the position is closed. In addition, a Fund could be exposed to risk if the counterparties to the contracts are unable to meet the terms of their contracts. With exchange traded futures, there is minimal counterparty credit risk to the Funds since futures are exchange traded and the exchange’s clearinghouse, as counterparty to all exchange traded futures, guarantees the futures against default.
When a purchase or sale of a futures contract is made by a Fund, the Fund is required to deposit with its custodian (or broker, if legally permitted) a specified amount of liquid assets (“initial margin”). The margin required for a futures contract is set by the exchange on which the contract is traded and may be modified during the term of the contract. The initial margin is in the nature of a performance bond or good faith deposit on the futures contract that is returned to a Fund upon termination of the contract, assuming all contractual obligations have been satisfied. These amounts are included in Deposit with broker for futures contracts on the Statement of Assets and Liabilities. Each day a Fund may pay or receive cash, called “variation margin,” equal to the daily change in value of the futures contract. Such payments or receipts are recorded for financial statement purposes as unrealized gains or losses by a Fund. Variation margin does not represent a borrowing or loan by a Fund but is instead a settlement between a Fund and the broker of the amount one would owe the other if the futures contract expired. When the contract is closed, a Fund records a realized gain or loss equal to the difference between the value of the contract at the time it was opened and the value at the time it was closed.
The average value of futures contracts held in the ALPS | CoreCommodity Management CompleteCommodities® Strategy Fund for the six-month period ended April 30, 2021, was $238,430,680 for long futures and $109,909,505 for short futures.
Option Contracts: Each Fund may enter into options transactions for hedging purposes and for non-hedging purposes such as seeking to enhance return. Each Fund may write covered put and call options on any stocks or stock indices, currencies traded on domestic and foreign securities exchanges, or futures contracts on stock indices, interest rates and currencies traded on domestic and, to the extent permitted by the CFTC, foreign exchanges. A call option on an asset written by a Fund obligates the Fund to sell the specified asset to the holder (purchaser) at a stated price (the exercise price) if the option is exercised before a specified date (the expiration date). A put option on an asset written by a Fund obligates the Fund to buy the specified asset from the purchaser at the exercise price if the option is exercised before the expiration date. Premiums received when writing options are recorded as liabilities and are subsequently adjusted to the current value of the options written. Premiums received from writing options that expire are treated as realized gains. Premiums received from writing options, which are either exercised or closed, are offset against the proceeds received or amount paid on the transaction to determine realized gains or losses which are recorded on the Statement of Operations.
189 | April 30, 2021
| Notes to Financial Statements | |
| April 30, 2021 (Unaudited) |
Derivatives Instruments: The following tables disclose the amounts related to each Fund’s use of derivative instruments.
The effect of derivatives instruments on the Statement of Assets and Liabilities for the six-month period ended April 30, 2021:
| Risk Exposure | Asset Location | Fair Value | Liability Location | Fair Value | ||||||||
| ALPS | CoreCommodity Management CompleteCommodities® Strategy Fund(a) | ||||||||||||
| Commodity Contracts (Futures Contracts) |
Unrealized appreciation on futures contracts(b) | $ | 10,457,862 | Unrealized depreciation on futures contracts(b) | $ | (11,403,553 | ) | |||||
| Commodity Contracts (Total Return Swap Contracts) |
Unrealized appreciation on total return swap contracts | 9 | Unrealized depreciation on total return swap contracts | (54 | ) | |||||||
| Total | $ | 10,457,871 | $ | (11,403,607 | ) | |||||||
| Risk Exposure | Asset Location | Fair Value | Liability Location | Fair Value | ||||||||
| Clough China Fund | ||||||||||||
| Equity Contracts (Total Return Swap Contracts) |
Unrealized appreciation on total return swap contracts | $ | 853,282 | Unrealized depreciation on total return swap contracts | $ | (21,338 | ) | |||||
| Total | $ | 853,282 | $ | (21,338 | ) | |||||||
| (a) | The ALPS | CoreCommodity Management CompleteCommodities® Strategy Fund consolidates the statements of assets and liabilities. |
| (b) | Represents cumulative appreciation (depreciation) of futures contracts as reported in the Consolidated Statement of Investments. Only the current day's net variation margin is reported within the Consolidated Statement of Assets and Liabilities. |
The effect of derivatives instruments on the Statement of Operations for six-month period ended April 30, 2021:
| Risk Exposure | Statement of Operations Location | Realized Gain/(Loss) on Derivatives Recognized in Income | Change in Unrealized Appreciation/(Depreciation) on Derivatives Recognized in Income | |||||||
| ALPS | CoreCommodity Management CompleteCommodities® Strategy Fund(a) | ||||||||||
| Equity and Commodity Contracts (Futures Contracts) | Net realized gain on futures contracts/ Net change in unrealized depreciation on futures contracts | $ | 4,565,164 | $ | 4,689,671 | |||||
| Commodity Contracts (Total Return Swap Contracts) | Net realized loss on total return swap contracts/ Net change in unrealized depreciation on total return swap contracts | 90,805,142 | 284 | |||||||
| Total | $ | 95,370,306 | $ | 4,689,955 | ||||||
| Clough China Fund | ||||||||||
| Equity Contracts (Total Return Swap Contracts) | Net realized gain on total return swap contracts/Net change in unrealized appreciation on total return swap contracts | $ | 1,562,594 | $ | (10,936 | ) | ||||
| Total | $ | 1,562,594 | $ | (10,936 | ) | |||||
| (a) | The ALPS | CoreCommodity Management CompleteCommodities® Strategy Fund consolidates the statements of operations. |
Certain derivative contracts are executed under either standardized netting agreements or, for exchange-traded derivatives, the relevant contracts for a particular exchange which contain enforceable netting provisions. A derivative netting arrangement creates an enforceable right of set-off that becomes effective, and affects the realization of settlement on individual assets, liabilities and collateral amounts, only following a specified event of default or early termination. Default events may include the failure to make payments or deliver securities timely, material adverse changes in financial condition or insolvency, the breach of minimum regulatory capital requirements, or loss of license, charter or other legal authorization necessary to perform under the contract.
190 | April 30, 2021
| Notes to Financial Statements | |
| April 30, 2021 (Unaudited) |
The following table presents financial instruments that are subject to enforceable netting arrangements or other similar agreements as of April 30, 2021:
Offsetting of Derivatives Asset
April 30, 2021
| Gross Amounts Not Offset in the Statement of Financial Position | ||||||||||||||||||||||||
| Gross Amounts of Recognized Assets | Gross Amounts Offset in the Statement of Assets and Liabilities | Net Amounts Presented in the Statement of Assets and Liabilities | Financial Instruments | Cash Collateral Received(a) | Net Amount | |||||||||||||||||||
| ALPS | CoreCommodity Management CompleteCommodities® Strategy Fund | ||||||||||||||||||||||||
| Total Return Swap Contracts | $ | 9 | $ | – | $ | 9 | $ | – | $ | – | $ | 9 | ||||||||||||
| Total | $ | 9 | $ | – | $ | 9 | $ | – | $ | – | $ | 9 | ||||||||||||
| Clough China Fund | ||||||||||||||||||||||||
| Total Return Swap Contracts | $ | 853,282 | $ | – | $ | 853,282 | $ | (21,338 | ) | $ | – | $ | 831,944 | |||||||||||
| Total | $ | 853,282 | $ | – | $ | 853,282 | $ | (21,338 | ) | $ | – | $ | 831,944 | |||||||||||
| (a) | These amounts are limited to the derivative asset/liability balance and, accordingly, do not include excess collateral received/pledged. |
| Offsetting of Derivatives Liability |
| April 30, 2021 |
| Gross Amounts Not Offset in the Statement of Financial Position | ||||||||||||||||||||||||
| Gross Amounts of Recognized Liabilities | Gross Amounts Offset in the Statement of Assets and Liabilities | Net Amounts Presented in the Statement of Assets and Liabilities | Financial Instruments(a) | Cash Collateral Pledged(a) | Net Amount | |||||||||||||||||||
| ALPS | CoreCommodity Management CompleteCommodities® Strategy Fund | ||||||||||||||||||||||||
| Total Return Swap Contracts | $ | 54 | $ | – | $ | 54 | $ | – | $ | (54 | ) | $ | – | |||||||||||
| Total | $ | 54 | $ | – | $ | 54 | $ | – | $ | (54 | ) | $ | – | |||||||||||
| Clough China Fund | ||||||||||||||||||||||||
| Total Return Swap Contracts | $ | 21,338 | $ | – | $ | 21,338 | $ | (21,338 | ) | $ | – | $ | – | |||||||||||
| Total | $ | 21,338 | $ | – | $ | 21,338 | $ | (21,338 | ) | $ | – | $ | – | |||||||||||
4. TAX BASIS INFORMATION
Tax Basis of Distributions to Shareholders: The character of distributions made during the year from net investment income or net realized gains may differ from its ultimate characterization for federal income tax purposes. Also, due to the timing of dividend distributions, the fiscal year in which amounts are distributed may differ from the fiscal year in which the income or realized gain were recorded by a Fund. The amounts and characteristics of tax basis distributions and composition of distributable earnings/ (accumulated losses) are finalized at fiscal year-end. Accordingly, tax basis balances have not been determined as of April 30, 2021.
191 | April 30, 2021
| Notes to Financial Statements | |
| April 30, 2021 (Unaudited) |
The tax character of distributions paid by the Funds for the fiscal year ended October 31, 2020 were as follows:
| Fund | Ordinary Income | Long-Term Capital Gain | ||||||
| ALPS | CoreCommodity Management CompleteCommodities® Strategy Fund | $ | 5,386,269 | $ | – | ||||
| ALPS | Kotak India Growth Fund | – | 363,112 | ||||||
| ALPS | Smith Short Duration Bond Fund | 1,810,242 | 7,397 | ||||||
| ALPS | Smith Total Return Bond Fund | 22,579,307 | 8,170 | ||||||
| ALPS | Smith Credit Opportunities Fund | 41,361 | – | ||||||
| ALPS | Smith Balanced Opportunity Fund | 7,109 | – | ||||||
| ALPS | Red Rocks Global Opportunity Fund | 14,647,308 | 11,394,100 | ||||||
| Clough China Fund | 648,314 | 2,743,546 | ||||||
| RiverFront Asset Allocation Moderate | 719,194 | – | ||||||
| RiverFront Asset Allocation Aggressive | 668,533 | – | ||||||
| RiverFront Asset Allocation Growth & Income | 1,183,441 | – | ||||||
Unrealized Appreciation and Depreciation on Investments: As of April 30, 2021, the costs of investments for federal income tax purposes and accumulated net unrealized appreciation/(depreciation) on investments were as follows:
| Fund | Gross Appreciation (excess of value over tax cost) | Gross Depreciation (excess of tax cost over value) | Net Unrealized Appreciation/ (Depreciation) | Cost of Investments for Income Tax Purposes | ||||||||||||
| ALPS | CoreCommodity Management CompleteCommodities® Strategy Fund | $ | 85,972,279 | $ | (26,237,201 | ) | $ | 59,735,078 | $ | 570,539,996 | |||||||
| ALPS | Kotak India Growth Fund | 49,677,700 | (13,582,336 | ) | 36,095,364 | 275,067,068 | |||||||||||
| ALPS | Smith Short Duration Bond Fund | 2,191,287 | (103,343 | ) | 2,087,944 | 406,336,530 | |||||||||||
| ALPS | Smith Total Return Bond Fund | 25,241,905 | (10,500,085 | ) | 14,741,820 | 1,701,996,048 | |||||||||||
| ALPS | Smith Credit Opportunities Fund | 1,685,792 | (510,538 | ) | 1,175,254 | 148,772,072 | |||||||||||
| ALPS | Smith Balanced Opportunity Fund | 2,503,512 | (105,299 | ) | 2,398,213 | 19,615,672 | |||||||||||
| ALPS | Red Rocks Global Opportunity Fund | 31,588,364 | (593,950 | ) | 30,994,414 | 75,054,947 | |||||||||||
| Clough China Fund | 19,789,325 | (6,290,983 | ) | 13,498,342 | 33,086,962 | |||||||||||
| RiverFront Asset Allocation Moderate | 6,940,411 | (7,337 | ) | 6,933,074 | 42,356,588 | |||||||||||
| RiverFront Asset Allocation Aggressive | 5,420,087 | (41,062 | ) | 5,379,025 | 21,595,162 | |||||||||||
| RiverFront Asset Allocation Growth & Income | 11,051,164 | (3,599 | ) | 11,047,565 | 51,906,886 | |||||||||||
5. SECURITIES TRANSACTIONS
Purchases and sales of securities, excluding short-term securities and U.S. Government Obligations during the six-month period ended April 30, 2021 were as follows:
| Fund | Purchases of Securities | Proceeds from Sales of Securities | ||||||
| ALPS | CoreCommodity Management CompleteCommodities® Strategy Fund(a) | $ | 93,134,862 | $ | 55,462,296 | ||||
| ALPS | Kotak India Growth Fund | 145,664,165 | 35,119,382 | ||||||
| ALPS | Smith Short Duration Bond Fund | 213,347,522 | 127,418,835 | ||||||
| ALPS | Smith Total Return Bond Fund | 775,997,210 | 675,880,925 | ||||||
| ALPS | Smith Credit Opportunities Fund | 155,954,953 | 60,873,769 | ||||||
| ALPS | Smith Balanced Opportunity Fund | 9,607,281 | 5,953,888 | ||||||
| ALPS | Red Rocks Global Opportunity Fund | 33,092,081 | 43,818,392 | ||||||
| Clough China Fund | 20,769,884 | 21,921,665 | ||||||
| RiverFront Asset Allocation Moderate | 4,316,364 | 7,112,853 | ||||||
| RiverFront Asset Allocation Aggressive | 360,575 | 1,948,950 | ||||||
| RiverFront Asset Allocation Growth & Income | 4,042,719 | 10,287,163 | ||||||
192 | April 30, 2021
| Notes to Financial Statements | |
| April 30, 2021 (Unaudited) |
Purchases and sales of U.S. Government Obligations during the six-month period ended April 30, 2021 were as follows:
| Fund | Purchases of Securities | Proceeds from Sales of Securities | ||||||
| ALPS | CoreCommodity Management CompleteCommodities® Strategy Fund(a) | $ | 113,993,161 | $ | 74,102,095 | ||||
| ALPS | Smith Short Duration Bond Fund | 133,544,988 | 98,142,522 | ||||||
| ALPS | Smith Total Return Bond Fund | 1,115,997,257 | 916,724,915 | ||||||
| ALPS | Smith Credit Opportunities Fund | 39,592,529 | 25,474,129 | ||||||
| ALPS | Smith Balanced Opportunity Fund | 4,594,295 | 4,924,477 | ||||||
| (a) | Purchases and sales for ALPS | CoreCommodity Management CompleteCommodities® Strategy Fund are consolidated and include the balances of CoreCommodity Management Cayman Commodity Fund, Ltd. (wholly owned subsidiary). |
6. BENEFICIAL INTEREST TRANSACTIONS
Shares redeemed within 90 days of purchase for ALPS | Red Rocks Global Opportunity Fund and 30 days of purchase for ALPS | CoreCommodity Management CompleteCommodities® Strategy Fund, ALPS | Kotak India Growth Fund, and Clough China Fund, may incur a 2% short-term redemption fee deducted from the redemption amount. RiverFront Asset Allocation Aggressive Fund, RiverFront Asset Allocation Growth & Income Fund, RiverFront Asset Allocation Moderate Fund, ALPS | Smith Short Duration Bond, ALPS | Smith Total Return Bond Fund, ALPS | Smith Credit Opportunities Fund and ALPS | Smith Balanced Opportunity Fund do not incur redemption fees.
Effective December 1, 2017, Class A shares were renamed Investor Class shares for all Funds. Such shares will be offered without an initial sales charge or a contingent deferred sales charge. The RiverFront Asset Allocation Aggressive existing Investor shares were renamed Investor Class II shares.
For the sixth-month period ended April 30, 2021, the amounts listed below were retained by the Funds. These amounts are reflected in “Shares redeemed” in the Statements of Changes in Net Assets.
| Redemption Fee Retained | ||||||||
| Fund | For the Six Months Ended April 30, 2021 (Unaudited) | For the Year Ended October 31, 2020 | ||||||
| ALPS | CoreCommodity Management CompleteCommodities® Strategy Fund - Investor Class | $ | 3,556 | $ | 3,872 | ||||
| ALPS | CoreCommodity Management CompleteCommodities® Strategy Fund - Class A | – | 38 | ||||||
| ALPS | CoreCommodity Management CompleteCommodities® Strategy Fund - Class I | 2,066 | 6,370 | ||||||
| ALPS | Kotak India Growth Fund - Investor Class | 50 | 286,145 | ||||||
| ALPS | Kotak India Growth Fund - Class I | 924 | 550 | ||||||
| ALPS | Smith Short Duration Bond Fund - Class I | – | 2,157 | ||||||
| ALPS | Smith Total Return Bond Fund - Investor Class | – | 20 | ||||||
| ALPS | Smith Total Return Bond Fund - Class A | – | 4,313 | ||||||
| ALPS | Smith Total Return Bond Fund - Class I | – | 29,289 | ||||||
| ALPS | Red Rocks Global Opportunity Fund - Investor Class | 170 | 12,646 | ||||||
| ALPS | Red Rocks Global Opportunity Fund - Class A | 21 | 1,933 | ||||||
| ALPS | Red Rocks Global Opportunity Fund - Class C | – | 367 | ||||||
| ALPS | Red Rocks Global Opportunity Fund - Class I | 39 | 16,589 | ||||||
| Clough China Fund - Investor Class | 268 | 133 | ||||||
| Clough China Fund - Class C | – | 1 | ||||||
193 | April 30, 2021
| Notes to Financial Statements | |
| April 30, 2021 (Unaudited) |
Transactions in shares of capital stock were as follows:
| ALPS | CoreCommodity Management CompleteCommodities® Strategy Fund | ||||||||
| For the Six Months Ended April 30, 2021 (Unaudited) | For the Year Ended October 31, 2020 | |||||||
| Investor Class | ||||||||
| Shares sold | 2,215,852 | 3,723,036 | ||||||
| Dividends reinvested | 24,142 | 52,689 | ||||||
| Shares redeemed | (1,054,304 | ) | (1,557,348 | ) | ||||
| Net increase in shares outstanding | 1,185,690 | 2,218,377 | ||||||
| Class A | ||||||||
| Shares sold | 373,605 | 141,752 | ||||||
| Dividends reinvested | 351 | 855 | ||||||
| Shares redeemed | (47,551 | ) | (48,458 | ) | ||||
| Net increase in shares outstanding | 326,405 | 94,149 | ||||||
| Class C | ||||||||
| Shares sold | 364,071 | 55,316 | ||||||
| Dividends reinvested | 689 | 4,410 | ||||||
| Shares redeemed | (117,431 | ) | (704,431 | ) | ||||
| Net increase/(decrease) in shares outstanding | 247,329 | (644,705 | ) | |||||
| Class I | ||||||||
| Shares sold | 29,472,100 | 31,313,307 | ||||||
| Dividends reinvested | 221,924 | 575,900 | ||||||
| Shares redeemed | (9,131,255 | ) | (34,485,123 | ) | ||||
| Net increase/(decrease) in shares outstanding | 20,562,769 | (2,595,916 | ) | |||||
194 | April 30, 2021
| Notes to Financial Statements | |
| April 30, 2021 (Unaudited) |
| ALPS | Kotak India Growth Fund | ||||||||
| For the Six Months Ended April 30, 2021 (Unaudited) | For the Year Ended October 31, 2020 | |||||||
| Investor Class | ||||||||
| Shares sold | 23,448 | 1,469,294 | ||||||
| Dividends reinvested | – | 3,593 | ||||||
| Shares redeemed | (54,454 | ) | (1,612,826 | ) | ||||
| Net decrease in shares outstanding | (31,006 | ) | (139,939 | ) | ||||
| Class A | ||||||||
| Shares sold | 56,164 | 1,521 | ||||||
| Dividends reinvested | – | 88 | ||||||
| Shares redeemed | (2,420 | ) | (1,914 | ) | ||||
| Net increase/(decrease) in shares outstanding | 53,744 | (305 | ) | |||||
| Class C | ||||||||
| Shares sold | 669 | 7,894 | ||||||
| Dividends reinvested | – | 2,484 | ||||||
| Shares redeemed | (61,517 | ) | (30,928 | ) | ||||
| Net decrease in shares outstanding | (60,848 | ) | (20,550 | ) | ||||
| Class I | ||||||||
| Shares sold | 233,136 | 547,548 | ||||||
| Dividends reinvested | – | 17,939 | ||||||
| Shares redeemed | (989,353 | ) | (527,423 | ) | ||||
| Net increase/(decrease) in shares outstanding | (756,217 | ) | 38,064 | |||||
| Class II(a) | ||||||||
| Shares sold | 8,155,415 | 13,368,943 | ||||||
| Shares redeemed | – | (2,963,226 | ) | |||||
| Net increase in shares outstanding | 8,155,415 | 10,405,717 | ||||||
| ALPS | Smith Short Duration Bond Fund | ||||||||
| For the Six Months Ended April 30, 2021 (Unaudited) | For the Year Ended October 31, 2020 | |||||||
| Investor Class | ||||||||
| Shares sold | 1,267,468 | 826,795 | ||||||
| Dividends reinvested | 7,870 | 1,587 | ||||||
| Shares redeemed | (609,154 | ) | (22,188 | ) | ||||
| Net increase in shares outstanding | 666,184 | 806,194 | ||||||
| Class A | ||||||||
| Shares sold | 805,319 | 315,200 | ||||||
| Dividends reinvested | 7,794 | 1,745 | ||||||
| Shares redeemed | (28,026 | ) | (14,094 | ) | ||||
| Net increase in shares outstanding | 785,087 | 302,851 | ||||||
| Class C | ||||||||
| Shares sold | 92,197 | 175,014 | ||||||
| Dividends reinvested | 1,588 | 806 | ||||||
| Shares redeemed | – | (17,601 | ) | |||||
| Net increase in shares outstanding | 93,785 | 158,219 | ||||||
| Class I | ||||||||
| Shares sold | 24,901,675 | 15,201,725 | ||||||
| Dividends reinvested | 164,746 | 114,292 | ||||||
| Shares redeemed | (5,463,521 | ) | (3,995,650 | ) | ||||
| Net increase in shares outstanding | 19,602,900 | 11,320,367 | ||||||
195 | April 30, 2021
| Notes to Financial Statements | |
| April 30, 2021 (Unaudited) |
| ALPS | Smith Total Return Bond Fund | ||||||||
| For the Six Months Ended April 30, 2021 (Unaudited) | For the Year Ended October 31, 2020 | |||||||
| Investor Class | ||||||||
| Shares sold | 235,364 | 851,183 | ||||||
| Dividends reinvested | 19,068 | 10,771 | ||||||
| Shares redeemed | (344,673 | ) | (354,961 | ) | ||||
| Net increase/(decrease) in shares outstanding | (90,241 | ) | 906,993 | |||||
| Class A | ||||||||
| Shares sold | 575,177 | 680,483 | ||||||
| Dividends reinvested | 31,433 | 21,602 | ||||||
| Shares redeemed | (403,242 | ) | (114,005 | ) | ||||
| Net increase in shares outstanding | 203,368 | 588,080 | ||||||
| Class C | ||||||||
| Shares sold | 164,067 | 470,809 | ||||||
| Dividends reinvested | 10,985 | 4,985 | ||||||
| Shares redeemed | (33,267 | ) | (64,416 | ) | ||||
| Net increase in shares outstanding | 141,785 | 411,378 | ||||||
| Class I | ||||||||
| Shares sold | 50,878,469 | 98,260,437 | ||||||
| Dividends reinvested | 2,333,491 | 1,340,528 | ||||||
| Shares redeemed | (18,861,127 | ) | (16,682,072 | ) | ||||
| Net increase in shares outstanding | 34,350,833 | 82,918,893 | ||||||
| ALPS | Smith Credit Opportunities Fund | ||||||||
| For the Six Months Ended April 30, 2021 (Unaudited) | For the Period January 1, 2014 (Commencement) to October 31, 2020 | |||||||
| Investor Class | ||||||||
| Shares sold | 696,647 | 70,203 | ||||||
| Dividends reinvested | 2,272 | – | ||||||
| Shares redeemed | (32,974 | ) | (17 | ) | ||||
| Net increase in shares outstanding | 665,945 | 70,186 | ||||||
| Class A | ||||||||
| Shares sold | 15,704 | 100,000 | ||||||
| Dividends reinvested | 125 | – | ||||||
| Net increase in shares outstanding | 15,829 | 100,000 | ||||||
| Class C | ||||||||
| Shares sold | – | 50,000 | ||||||
| Net increase in shares outstanding | – | 50,000 | ||||||
| Class I | ||||||||
| Shares sold | 12,238,009 | 2,545,943 | ||||||
| Dividends reinvested | 37,357 | 128 | ||||||
| Shares redeemed | (507,283 | ) | (32,551 | ) | ||||
| Net increase in shares outstanding | 11,768,083 | 2,513,520 | ||||||
196 | April 30, 2021
| Notes to Financial Statements | |
| April 30, 2021 (Unaudited) |
| ALPS | Smith Balanced Opportunity Fund | ||||||||
| For the Six Months Ended April 30, 2021 (Unaudited) | For the Period January 1, 2014 (Commencement) to October 31, 2020 | |||||||
| Investor Class | ||||||||
| Shares sold | 674 | 60,855 | ||||||
| Dividends reinvested | 13 | – | ||||||
| Shares redeemed | (5 | ) | – | |||||
| Net increase in shares outstanding | 682 | 60,855 | ||||||
| Class A | ||||||||
| Shares sold | – | 100,000 | ||||||
| Net increase in shares outstanding | – | 100,000 | ||||||
| Class C | ||||||||
| Shares sold | – | 50,000 | ||||||
| Net increase in shares outstanding | – | 50,000 | ||||||
| Class I | ||||||||
| Shares sold | 345,337 | 1,243,550 | ||||||
| Dividends reinvested | 1,887 | 70 | ||||||
| Shares redeemed | (689 | ) | – | |||||
| Net increase in shares outstanding | 346,535 | 1,243,620 | ||||||
| ALPS | Red Rocks Global Opportunity Fund | ||||||||
| For the Six Months Ended April 30, 2021 (Unaudited) | For the Year Ended October 31, 2020 | |||||||
| Investor Class | ||||||||
| Shares sold | 101,251 | 746,089 | ||||||
| Dividends reinvested | 78,824 | 396,106 | ||||||
| Shares redeemed | (277,102 | ) | (1,986,245 | ) | ||||
| Net decrease in shares outstanding | (97,027 | ) | (844,050 | ) | ||||
| Class A | ||||||||
| Shares sold | 82,333 | 502,233 | ||||||
| Dividends reinvested | 11,627 | 11,532 | ||||||
| Shares redeemed | (70,641 | ) | (222,154 | ) | ||||
| Net increase in shares outstanding | 23,319 | 291,611 | ||||||
| Class C | ||||||||
| Shares sold | 4,511 | 100,932 | ||||||
| Dividends reinvested | 55,299 | 277,858 | ||||||
| Shares redeemed | (200,433 | ) | (1,107,493 | ) | ||||
| Net decrease in shares outstanding | (140,623 | ) | (728,703 | ) | ||||
| Class I | ||||||||
| Shares sold | 609,700 | 3,948,906 | ||||||
| Dividends reinvested | 306,048 | 2,205,348 | ||||||
| Shares redeemed | (1,671,128 | ) | (15,717,303 | ) | ||||
| Net decrease in shares outstanding | (755,380 | ) | (9,563,049 | ) | ||||
| Class R | ||||||||
| Shares sold | 23,611 | 172,726 | ||||||
| Dividends reinvested | 50,509 | 169,759 | ||||||
| Shares redeemed | (102,541 | ) | (240,276 | ) | ||||
| Net increase/(decrease) in shares outstanding | (28,421 | ) | 102,209 | |||||
197 | April 30, 2021
| Notes to Financial Statements | |
| April 30, 2021 (Unaudited) |
| Clough China Fund | ||||||||
| For the Six Months Ended April 30, 2021 (Unaudited) | For the Year Ended October 31, 2020 | |||||||
| Investor Class | ||||||||
| Shares sold | 23,935 | 26,030 | ||||||
| Dividends reinvested | 11,125 | 27,169 | ||||||
| Shares redeemed | (16,642 | ) | (136,999 | ) | ||||
| Net increase/(decrease) in shares outstanding | 18,418 | (83,800 | ) | |||||
| Class A | ||||||||
| Shares sold | 3,920 | 28,884 | ||||||
| Dividends reinvested | 1,351 | 3,571 | ||||||
| Shares redeemed | (11,260 | ) | (17,923 | ) | ||||
| Net increase/(decrease) in shares outstanding | (5,989 | ) | 14,532 | |||||
| Class C | ||||||||
| Shares sold | 1,135 | 2,134 | ||||||
| Dividends reinvested | 1,898 | 5,599 | ||||||
| Shares redeemed | (6,686 | ) | (60,290 | ) | ||||
| Net decrease in shares outstanding | (3,653 | ) | (52,557 | ) | ||||
| Class I | ||||||||
| Shares sold | 18,150 | 45,424 | ||||||
| Dividends reinvested | 41,321 | 91,364 | ||||||
| Shares redeemed | (24,224 | ) | (138,066 | ) | ||||
| Net increase/(decrease) in shares outstanding | 35,247 | (1,278 | ) | |||||
198 | April 30, 2021
| Notes to Financial Statements | |
| April 30, 2021 (Unaudited) |
| RiverFront Asset Allocation Aggressive | ||||||||
| For the Six Months Ended April 30, 2021 (Unaudited) | For the Year Ended October 31, 2020 | |||||||
| Investor Class | ||||||||
| Shares sold | 7,262 | 2,440 | ||||||
| Dividends reinvested | 1,657 | 6,342 | ||||||
| Shares redeemed | (47,107 | ) | (182,440 | ) | ||||
| Net decrease in shares outstanding | (38,188 | ) | (173,658 | ) | ||||
| Class A | ||||||||
| Shares sold | 36,295 | 38,409 | ||||||
| Dividends reinvested | 1,116 | 1,412 | ||||||
| Shares redeemed | (11,732 | ) | (17,567 | ) | ||||
| Net increase in shares outstanding | 25,679 | 22,254 | ||||||
| Class C | ||||||||
| Shares sold | 8,657 | 10,908 | ||||||
| Dividends reinvested | 3,599 | 7,859 | ||||||
| Shares redeemed | (85,738 | ) | (157,814 | ) | ||||
| Net decrease in shares outstanding | (73,482 | ) | (139,047 | ) | ||||
| Class I | ||||||||
| Shares sold | – | 42,140 | ||||||
| Dividends reinvested | 2,994 | 8,074 | ||||||
| Shares redeemed | (44,438 | ) | (389,251 | ) | ||||
| Net decrease in shares outstanding | (41,444 | ) | (339,037 | ) | ||||
| Investor II | ||||||||
| Shares sold | 515 | 2,707 | ||||||
| Dividends reinvested | 873 | 1,484 | ||||||
| Shares redeemed | (521 | ) | (47,500 | ) | ||||
| Net increase/(decrease) in shares outstanding | 867 | (43,309 | ) | |||||
| Class L | ||||||||
| Shares sold | 105,063 | 113,431 | ||||||
| Dividends reinvested | 14,693 | 29,157 | ||||||
| Shares redeemed | (97,984 | ) | (522,923 | ) | ||||
| Net increase/(decrease) in shares outstanding | 21,772 | (380,335 | ) | |||||
199 | April 30, 2021
| Notes to Financial Statements | |
| April 30, 2021 (Unaudited) |
| RiverFront Asset Allocation Growth & Income | ||||||||
| For the Six Months Ended April 30, 2021 (Unaudited) | For the Year Ended October 31, 2020 | |||||||
| Investor Class | ||||||||
| Shares sold | 2,938 | 10,492 | ||||||
| Dividends reinvested | 2,445 | 11,414 | ||||||
| Shares redeemed | (68,054 | ) | (184,808 | ) | ||||
| Net decrease in shares outstanding | (62,671 | ) | (162,902 | ) | ||||
| Class A | ||||||||
| Shares sold | 89,733 | 159,284 | ||||||
| Dividends reinvested | 1,932 | 5,987 | ||||||
| Shares redeemed | (50,272 | ) | (105,466 | ) | ||||
| Net increase in shares outstanding | 41,393 | 59,805 | ||||||
| Class C | ||||||||
| Shares sold | 20,146 | 69,052 | ||||||
| Dividends reinvested | 2,743 | 19,111 | ||||||
| Shares redeemed | (319,497 | ) | (595,631 | ) | ||||
| Net decrease in shares outstanding | (296,608 | ) | (507,468 | ) | ||||
| Class I | ||||||||
| Shares sold | 162,175 | 356,030 | ||||||
| Dividends reinvested | 15,615 | 66,670 | ||||||
| Shares redeemed | (363,607 | ) | (1,640,532 | ) | ||||
| Net decrease in shares outstanding | (185,817 | ) | (1,217,832 | ) | ||||
| RiverFront Asset Allocation Moderate | ||||||||
| For the Six Months Ended April 30, 2021 (Unaudited) | For the Year Ended October 31, 2020 | |||||||
| Investor Class | ||||||||
| Shares sold | 16,978 | 15,746 | ||||||
| Dividends reinvested | 2,065 | 6,563 | ||||||
| Shares redeemed | (27,903 | ) | (145,967 | ) | ||||
| Net decrease in shares outstanding | (8,860 | ) | (123,658 | ) | ||||
| Class A | ||||||||
| Shares sold | 182,366 | 351,122 | ||||||
| Dividends reinvested | 4,447 | 9,942 | ||||||
| Shares redeemed | (67,368 | ) | (196,595 | ) | ||||
| Net increase in shares outstanding | 119,445 | 164,469 | ||||||
| Class C | ||||||||
| Shares sold | 8,098 | 44,622 | ||||||
| Dividends reinvested | 3,308 | 16,302 | ||||||
| Shares redeemed | (340,734 | ) | (1,083,506 | ) | ||||
| Net decrease in shares outstanding | (329,328 | ) | (1,022,582 | ) | ||||
| Class I | ||||||||
| Shares sold | 133,046 | 254,684 | ||||||
| Dividends reinvested | 11,154 | 36,154 | ||||||
| Shares redeemed | (212,332 | ) | (920,184 | ) | ||||
| Net decrease in shares outstanding | (68,132 | ) | (629,346 | ) | ||||
| (a) | Class II commenced operations on December 19, 2019. |
200 | April 30, 2021
| Notes to Financial Statements | |
| April 30, 2021 (Unaudited) |
7. AFFILIATED COMPANIES
The Funds may invest in certain securities that are considered securities issued by affiliated companies. As defined by the Investment Company Act of 1940, an affiliated person, including an affiliated company, is one in which a Fund owns 5% or more of the outstanding voting securities, or a company which is under common ownership or control with the Fund. The purchases, sales, dividend income, realized gains or losses, change in unrealized gains or losses, shares and value of investments in affiliated companies for the six-month period ended April 30, 2021 were as follows:
| RiverFront Asset Allocation Aggressive | Market Value as of October 31, 2020 | Purchases | Sales | Market Value as of April 30, 2021 | Share Balance as of April 30, 2021 | Dividends | Change in Unrealized Gain (Loss) | Realized Gain/Loss | ||||||||||||||||||||||||
| First Trust RiverFront Dynamic Asia Pacific ETF | $ | 783,725 | – | $ | (58,194 | ) | $ | 844,578 | 14,735 | $ | 7,661 | $ | 124,089 | $ | (5,042 | ) | ||||||||||||||||
| First Trust RiverFront Dynamic Developed International ETF | 3,394,461 | 360,575 | (265,448 | ) | 4,330,988 | 63,467 | 21,937 | 833,332 | 8,068 | |||||||||||||||||||||||
| First Trust RiverFront Dynamic Emerging Markets ETF | 2,753,585 | – | (207,058 | ) | 3,098,405 | 42,019 | 5,702 | 531,107 | 20,771 | |||||||||||||||||||||||
| First Trust RiverFront Dynamic Europe ETF | 1,451,594 | – | (113,513 | ) | 1,743,681 | 24,331 | 16,818 | 408,154 | (2,554 | ) | ||||||||||||||||||||||
| RiverFront Dynamic US Dividend Advantage ETF | 7,066,248 | – | (548,967 | ) | 8,309,317 | 196,376 | 64,001 | 1,714,845 | 77,191 | |||||||||||||||||||||||
| RiverFront Dynamic US Flex-Cap ETF | 6,940,799 | – | (755,771 | ) | 7,927,893 | 183,874 | 56,772 | 1,632,753 | 110,112 | |||||||||||||||||||||||
| 22,390,412 | 360,575 | (1,948,951 | ) | 26,254,862 | 524,802 | 172,891 | 5,244,280 | 208,546 | ||||||||||||||||||||||||
| RiverFront Asset Allocation Growth & Income | Market Value as of October 31, 2020 | Purchases | Sales | Market Value as of April 30, 2021 | Share Balance as of April 30, 2021 | Dividends | Change in Unrealized Gain (Loss) | Realized Gain/Loss | ||||||||||||||||||||||||
| RiverFront Dynamic Core Income ETF | $ | 13,323,893 | $ | 876,918 | $ | (1,231,102 | ) | $ | 12,652,486 | 499,504 | $ | 109,790 | $ | (378,067 | ) | $ | 60,844 | |||||||||||||||
| RiverFront Dynamic Unconstrained Income ETF | 1,120,785 | – | (112,740 | ) | 1,035,134 | 40,215 | 21,331 | 24,789 | 2,300 | |||||||||||||||||||||||
| Riverfront Strategic Income Fund | 1,752,818 | – | (856,917 | ) | 910,622 | 36,630 | 20,720 | 6,488 | 8,233 | |||||||||||||||||||||||
| First Trust RiverFront Dynamic Developed International ETF | 9,191,264 | 3,165,818 | (1,029,891 | ) | 13,722,654 | 201,094 | 66,315 | 2,351,803 | 43,660 | |||||||||||||||||||||||
| First Trust RiverFront Dynamic Emerging Markets ETF | 5,062,398 | – | (625,082 | ) | 5,460,904 | 74,058 | 10,484 | 907,340 | 116,248 | |||||||||||||||||||||||
| RiverFront Dynamic US Dividend Advantage ETF | 20,058,777 | – | (5,566,262 | ) | 19,230,422 | 454,477 | 170,735 | 3,848,664 | 889,243 | |||||||||||||||||||||||
| RiverFront Dynamic US Flex-Cap ETF | 7,594,579 | – | (865,170 | ) | 8,649,222 | 200,604 | 60,978 | 1,780,718 | 139,095 | |||||||||||||||||||||||
| 58,104,514 | 4,042,736 | (10,287,164 | ) | 61,661,444 | 1,506,582 | 460,353 | 8,541,735 | 1,259,623 | ||||||||||||||||||||||||
201 | April 30, 2021
| Notes to Financial Statements | |
| April 30, 2021 (Unaudited) |
| RiverFront Asset Allocation Moderate | Market Value as of October 31, 2020 | Purchases | Sales | Market Value as of April 30, 2021 | Share Balance as of April 30, 2021 | Dividends | Change in Unrealized Gain (Loss) | Realized Gain/Loss | ||||||||||||||||||||||||
| RiverFront Dynamic Core Income ETF | $ | 19,601,582 | $ | 1,637,282 | $ | (1,244,449 | ) | $ | 19,507,521 | 770,132 | $ | 167,290 | $ | (565,676 | ) | $ | 78,782 | |||||||||||||||
| RiverFront Dynamic Unconstrained Income ETF | 858,377 | – | (51,416 | ) | 827,798 | 32,160 | 16,786 | 20,243 | 594 | |||||||||||||||||||||||
| Riverfront Strategic Income Fund | 1,394,780 | – | (683,440 | ) | 722,680 | 29,070 | 16,849 | 5,126 | 6,214 | |||||||||||||||||||||||
| First Trust RiverFront Dynamic Developed International ETF | 2,499,730 | 2,679,083 | (238,070 | ) | 5,698,381 | 83,505 | 24,681 | 748,899 | 8,739 | |||||||||||||||||||||||
| RiverFront Dynamic US Dividend Advantage ETF | 16,246,515 | – | (3,634,984 | ) | 16,551,821 | 391,173 | 143,508 | 3,343,456 | 596,834 | |||||||||||||||||||||||
| RiverFront Dynamic US Flex-Cap ETF | 5,163,846 | – | (1,260,495 | ) | 5,148,125 | 119,402 | 42,558 | 1,042,754 | 202,020 | |||||||||||||||||||||||
| 45,764,830 | 4,316,365 | (7,112,854 | ) | 48,456,326 | 1,425,442 | 411,672 | 4,594,802 | 893,183 | ||||||||||||||||||||||||
8. MANAGEMENT AND RELATED-PARTY TRANSACTIONS
ALPS Advisors, Inc. (the “AAI”) acts as the Portfolios’ investment adviser. AAI is an indirect wholly owned subsidiary of DST Systems, Inc. (“DST”). DST is a wholly-owned subsidiary of SS&C Technologies Holdings, Inc. (“SS&C”), a publicly traded company listed on the NASDAQ Global Select Market.
AAI has delegated daily management of the Funds listed below to the corresponding Sub-Advisor(s) listed in the table below. Each Sub-Advisor manages the investments of the Fund in accordance with its investment objective, policies and limitations and investment guidelines established jointly by AAI and the Board.
| Fund | Sub-Advisor(s) |
| ALPS | CoreCommodity Management CompleteCommodities® Strategy Fund |
CoreCommodity Management, LLC |
| ALPS | Kotak India Growth Fund | Kotak Mahindra Asset Management (Singapore) Pte. Ltd |
| ALPS | Smith Short Duration Bond Fund | Smith Capital Investors, LLC |
| ALPS | Smith Total Return Bond Fund | Smith Capital Investors, LLC |
| ALPS | Red Rocks Global Opportunity Fund | Red Rocks Capital, LLC(a) |
| Clough China Fund | Clough Capital Partners, LP |
| RiverFront Asset Allocation Aggressive | RiverFront Investment Group, LLC |
| RiverFront Asset Allocation Growth & Income | RiverFront Investment Group, LLC |
| RiverFront Asset Allocation Moderate | RiverFront Investment Group, LLC |
| (a) | Red Rocks Capital, LLC is a subsidiary of ALPS Advisors, Inc. |
202 | April 30, 2021
| Notes to Financial Statements | |
| April 30, 2021 (Unaudited) |
Pursuant to the Investment Advisory Agreement (the “Advisory Agreement”), the Funds listed below pay AAI an annual management fee which is based on each Fund’s average daily net assets. The management fee is paid on a monthly basis. The following table reflects the Funds’ contractual management fee rates (expressed as an annual rate).
| Fund | Contractual Management Fee |
| ALPS | CoreCommodity Management CompleteCommodities® Strategy Fund | 0.85% |
| ALPS | Kotak India Growth Fund | 0.65% |
| ALPS | Smith Short Duration Bond Fund | 0.37% |
| ALPS | Smith Total Return Bond Fund | 0.55% |
| ALPS | Red Rocks Global Opportunity Fund | 0.85% |
| Clough China Fund | 1.35% |
Pursuant to the Administrative Services Agreement, the Riverfront Funds listed below pay an annual unitary administrative fee which is based on each Fund’s average daily net assets. The unitary administrative fee is paid on a monthly basis. The following table reflects the Funds’ contractual unitary administrative fee rates (expressed as an annual rate).
| Fund | Contractual Unitary Fee |
| RiverFront Asset Allocation Aggressive | 0.25% |
| RiverFront Asset Allocation Growth & Income | 0.25% |
| RiverFront Asset Allocation Moderate | 0.25% |
Pursuant to an Investment Sub-advisory Agreement, AAI pays the Sub-Advisors of the Funds listed below an annual sub-advisory management fee which is based on each Fund’s average daily assets. AAI is required to pay all fees due to each Sub-Advisor out of the management fee AAI receives from each Fund listed below. The following table reflects the Funds’ contractual sub-advisory fee rates.
| Fund | Average Daily Net Assets of the Fund | Contractual Sub-Advisory Fee | ||||
| ALPS | CoreCommodity Management CompleteCommodities® Strategy Fund | All Asset Levels | 0.75% | ||||
| ALPS | Kotak India Growth Fund | All Asset Levels | 0.56% | ||||
| ALPS | Smith Short Duration Bond Fund | All Asset Levels | 0.29% | ||||
| ALPS | Smith Total Return Bond Fund | All Asset Levels | 0.42% | ||||
| ALPS | Red Rocks Global Opportunity Fund | All Asset Levels | 0.57% | ||||
| Clough China Fund | All Asset Levels | 0.90% | ||||
ALPS | CoreCommodity Management CompleteCommodities® Strategy Fund
AAI and CoreCommodity Management LLC have contractually agreed to limit the amount of the Fund’s total annual expenses, exclusive of distribution and service (12b-1) fees, shareholder services fees, acquired fund fees and expenses, brokerage commissions, interest expense, taxes and extraordinary expenses that exceed the following annual rates below.
ALPS | Kotak India Growth Fund
Prior to April 1, 2017, AAI and Kotak Mahindra (UK) Limited have contractually agreed to limit the amount of the Fund’s total annual expenses, exclusive of distribution and service (12b-1) fees, shareholder services fees, acquired fund fees and expenses, brokerage expenses, interest expenses, taxes and extraordinary expenses that exceed the following annual rates below. Effective April 1, 2017, Kotak entered into a Novation Agreement with the Fund, AAI and Kotak Mahindra Asset Management (Singapore) Pte. Ltd. (“KMAMS”), another wholly owned subsidiary of Kotak Mahindra Bank Limited, whereby KMAMS will assume all of Kotak’s rights and obligations under the current Sub-Advisory Agreement.
ALPS | Smith Short Duration Bond Fund
AAI and Smith Capital Investors, LLC have agreed contractually to limit the amount of the Fund’s total annual expenses, exclusive of distribution and service (12b-1) fees, shareholder service fees, acquired fund fees and expenses, brokerage expenses, interest expenses, taxes and extraordinary expenses that exceed the following annual rates below.
203 | April 30, 2021
| Notes to Financial Statements | |
| April 30, 2021 (Unaudited) |
ALPS | Smith Total Return Bond Fund
AAI and Smith Capital Investors, LLC have agreed contractually to limit the amount of the Fund’s total annual expenses, exclusive of distribution and service (12b-1) fees, shareholder service fees, acquired fund fees and expenses, brokerage expenses, interest expenses, taxes and extraordinary expenses that exceed the following annual rates below.
ALPS | Smith Credit Opportunities Fund
AAI and Smith Capital Investors, LLC have agreed contractually to limit the amount of the Fund’s total annual expenses, exclusive of distribution and service (12b-1) fees, shareholder service fees, acquired fund fees and expenses, brokerage expenses, interest expenses, taxes and extraordinary expenses that exceed the following annual rates below.
ALPS | Smith Balanced Opportunity Bond Fund
AAI and Smith Capital Investors, LLC have agreed contractually to limit the amount of the Fund’s total annual expenses, exclusive of distribution and service (12b-1) fees, shareholder service fees, acquired fund fees and expenses, brokerage expenses, interest expenses, taxes and extraordinary expenses that exceed the following annual rates below.
ALPS | Red Rocks Global Opportunity Fund
AAI and Red Rocks Capital LLC have contractually agreed to limit the amount of the Fund’s total annual expenses, exclusive of distribution and service (12b-1) fees, acquired fund fees and expenses, shareholder service fees, brokerage expenses, interest expense, taxes and extraordinary expenses that exceed the following annual rates below.
Clough China Fund
AAI has contractually agreed to limit the amount of the Fund’s total annual expenses, exclusive of acquired fund fees and expenses, interest, taxes, brokerage costs and commissions, dividend and interest expense on short sales, litigation, indemnification and extraordinary expenses as determined under generally accepted accounting principles that exceed the following annual rates below.
Expense limitation ratios from the current agreements are listed below. Fees waived or reimbursed for the six-month period ended April 30, 2021 are disclosed on the Statement of Operations or Consolidated Statement of Operations.
| Fund | Investor Class | Class A | Class C | Class I | Class II | Class R | ||||||||||||||||||
| ALPS | CoreCommodity Management CompleteCommodities® Strategy Fund | 1.05 | % | 1.05 | % | 1.05 | % | 1.15 | % | N/A | N/A | ||||||||||||||
| ALPS | Kotak India Growth Fund | 1.00 | % | 1.00 | % | 1.00 | % | 1.00 | % | 0.75 | % | N/A | |||||||||||||
| ALPS | Smith Short Duration Bond Fund | 0.49 | % | 0.49 | % | 0.49 | % | 0.49 | % | N/A | N/A | ||||||||||||||
| ALPS | Smith Total Return Bond Fund | 0.67 | % | 0.67 | % | 0.67 | % | 0.67 | % | N/A | N/A | ||||||||||||||
| ALPS | Red Rocks Global Opportunity Fund | 1.25 | % | 1.25 | % | 1.25 | % | 1.25 | % | N/A | 1.25 | % | |||||||||||||
| Clough China Fund | 1.95 | % | 1.95 | % | 2.70 | % | 1.70 | % | N/A | N/A | ||||||||||||||
204 | April 30, 2021
| Notes to Financial Statements | |
| April 30, 2021 (Unaudited) |
The Advisor(s) and each Sub-Advisor are permitted to recover expenses they have waived or reimbursed, on a class-by-class basis, through the agreements described above to the extent that expenses in later periods fall below the annual limits set forth in these agreements. The ALPS | CoreCommodity Management CompleteCommodities® Strategy Fund, ALPS | Kotak India Growth Fund, ALPS | Smith Short Duration Bond Fund, ALPS | Smith Total Return Bond Fund, ALPS | Smith Balanced Opportunity Fund, ALPS | Smith Credit Opportunities Fund, ALPS | Red Rocks Global Opportunity Fund, and Clough China Fund are not obligated to pay any deferred fees and expenses more than thirty-six months after the date on which the fees was waived or expenses were deferred, as calculated on a monthly basis. As of the six-month period ended April 30, 2021, the Advisor and Sub-Advisor(s) may seek reimbursement of previously waived and reimbursed fees as follows:
| Expires | Expires | Expires | Expires | |||||||||||||||||
| Fund | 10/31/21 | 10/31/22 | 10/31/23 | 10/31/24 | Total | |||||||||||||||
| ALPS | Kotak India Growth Fund - Investor Class | 42,345 | 74,543 | 12,723 | 75 | 129,686 | |||||||||||||||
| ALPS | Kotak India Growth Fund - Class A | N/A | 293 | 243 | 3 | 539 | |||||||||||||||
| ALPS | Kotak India Growth Fund - Class C | 12,864 | 29,613 | 5,802 | 67 | 48,346 | |||||||||||||||
| ALPS | Kotak India Growth Fund - Class I | 97,457 | 229,275 | 60,338 | 641 | 387,711 | |||||||||||||||
| ALPS | Kotak India Growth Fund - Class II | N/A | N/A | 411,967 | 198,759 | 610,726 | |||||||||||||||
| ALPS | Smith Short Duration Bond Fund - Investor Class | 2,130 | 1,603 | 2,510 | 5,636 | 11,878 | |||||||||||||||
| ALPS | Smith Short Duration Bond Fund - Class A | 1,214 | 752 | 2,600 | 2,076 | 6,643 | |||||||||||||||
| ALPS | Smith Short Duration Bond Fund - Class C | 1,236 | 1,398 | 1,915 | 614 | 5,162 | |||||||||||||||
| ALPS | Smith Short Duration Bond Fund - Class I | 33,418 | 105,940 | 184,309 | 92,583 | 416,250 | |||||||||||||||
| ALPS | Smith Total Return Bond Fund - Investor Class | 1,061 | 2,913 | 3,483 | 178 | 7,635 | |||||||||||||||
| ALPS | Smith Total Return Bond Fund - Class A | 1,197 | 1,933 | 4,094 | 695 | 7,919 | |||||||||||||||
| ALPS | Smith Total Return Bond Fund - Class C | 1,187 | 459 | 2,094 | 1,129 | 4,869 | |||||||||||||||
| ALPS | Smith Total Return Bond Fund - Class I | 37,658 | 128,360 | 461,477 | 270,589 | 898,084 | |||||||||||||||
| ALPS | Smith Credit Opportunities Fund - Investor Class | N/A | N/A | 972 | 463 | 1,435 | |||||||||||||||
| ALPS | Smith Credit Opportunities Fund - Class A | N/A | N/A | 1,487 | 719 | 2,206 | |||||||||||||||
| ALPS | Smith Credit Opportunities Fund - Class C | N/A | N/A | 743 | 341 | 1,084 | |||||||||||||||
| ALPS | Smith Credit Opportunities Fund - Class I | N/A | N/A | 21,266 | 20,722 | 41,988 | |||||||||||||||
| ALPS | Smith Balanced Opportunity Fund - Investor Class | N/A | N/A | 1,277 | 2,834 | 4,111 | |||||||||||||||
| ALPS | Smith Balanced Opportunity Fund - Class A | N/A | N/A | 2,362 | 4,635 | 6,997 | |||||||||||||||
| ALPS | Smith Balanced Opportunity Fund - Class C | N/A | N/A | 1,181 | 2,313 | 3,494 | |||||||||||||||
| ALPS | Smith Balanced Opportunity Fund - Class I | N/A | N/A | 26,090 | 66,297 | 92,386 | |||||||||||||||
| ALPS | Red Rocks Global Opportunity Fund - Investor Class | N/A | N/A | N/A | N/A | N/A | |||||||||||||||
| ALPS | Red Rocks Global Opportunity Fund - Class A | N/A | N/A | N/A | N/A | N/A | |||||||||||||||
| ALPS | Red Rocks Global Opportunity Fund - Class C | N/A | N/A | N/A | N/A | N/A | |||||||||||||||
| ALPS | Red Rocks Global Opportunity Fund - Class I | N/A | N/A | N/A | 3,612 | 3,612 | |||||||||||||||
| ALPS | Red Rocks Global Opportunity Fund - Class R | N/A | N/A | N/A | N/A | N/A | |||||||||||||||
| Clough China Fund - Investor Class | 20,556 | 31,929 | 28,455 | 9,056 | 89,996 | |||||||||||||||
| Clough China Fund - Class A | 9 | 1,835 | 3,661 | 1,256 | 6,761 | |||||||||||||||
| Clough China Fund - Class C | 7,062 | 8,760 | 4,818 | 976 | 21,617 | |||||||||||||||
| Clough China Fund - Class I | 37,346 | 66,102 | 73,774 | 26,173 | 203,395 | |||||||||||||||
The CoreCommodity Management Cayman Commodity Fund Ltd. (the “Subsidiary”) has each entered into a separate advisory agreement (the “Subsidiary Advisory Agreement”) with CoreCommodity Management, LLC for the management of the Subsidiary’s portfolio pursuant to which the Subsidiary is obligated to pay the CoreCommodity Management, LLC a management fee at the same rate that the Fund pays the Adviser for investment advisory services provided to the Funds. CoreCommodity Management, LLC has agreed to waive the advisory fee it receives from the Fund in an amount equal to the management fee paid by the Subsidiary. This agreement may be terminated based on the terms of the Subsidiary Advisory Agreement. For the six-months ended April 30, 2021, this amount equaled $557,929 and is disclosed in the Consolidated Statements of Operations. These waivers are not subject to reimbursement/recoupment.
ALPS | CoreCommodity Management CompleteCommodities® Strategy Fund recovered $6 of reimbursed expenses and ALPS | Kotak India Growth Fund recovered $9,763 of reimbursed expenses during the six-month period ended April 30, 2021.
The Riverfront Funds do not pay a management fee or contractually limit the amount of each Fund’s total annual expenses.
205 | April 30, 2021
| Notes to Financial Statements | |
| April 30, 2021 (Unaudited) |
Kotak Mahindra Asset Management (Singapore) Pte. Ltd. executed purchase and sale trades in the ALPS/Kotak India Growth Fund with the sub-adviser’s affiliated broker-dealer, Kotak Securities, (the “affiliate broker”). Fund commissions paid to the affiliate broker were $22,500 during the six-month period ended April 30, 2021.
ALPS Portfolio Solutions Distributor, Inc. (the “Distributor”) acts as the distributor of the Funds’ shares pursuant to a Distribution Agreement with the Trust. Shares are sold on a continuous basis by the Distributor, as agent for the Funds, and the Distributor has agreed to use its best efforts to solicit orders for the sale of Funds’ shares, although it is not obliged to sell any particular amount of shares. The Distributor is not entitled to any compensation for its services. The Distributor is registered as a broker -dealer with the Securities and Exchange Commission.
Distribution and Services (12b-1) Plans
Each Fund has adopted Distribution and Services Plans (the “Plans”) pursuant to Rule 12b-1 of the 1940 Act for its Investor Class, Class A, Class C and Class R (ALPS | Red Rocks Global Opportunity Fund only) and Investor Class II (Asset Allocation Aggressive Fund only) shares. The Plans allows a Fund to use Investor Class, Class A, Class C, Class R and Investor Class II assets to pay fees in connection with the distribution and marketing of Investor Class, Class A, Class C, Class R and Investor Class II shares and/or the provision of shareholder services to Investor Class, Class A, Class C, Class R and Investor Class II shareholders. The Plans permit payment for services in connection with the administration of plans or programs that use Investor Class, Class A, Class C, Class R and Investor Class II shares of a Fund, if any, as their funding medium and for related expenses. The Plans permit a Fund to make total payments at an annual rate of up to 0.25% of a Fund’s average daily net assets attributable to its Investor Class, Class A and Investor Class II shares, 0.75% of a Fund’s average daily net assets attributable to its Class C shares and 0.50% of the ALPS | Red Rocks Global Opportunity Fund’s average daily net assets attributable to its Class R shares.
Under the terms of the Plans, the Trust is authorized to make payments to the Distributor for remittance to financial intermediaries, as compensation for distribution and/or shareholder ongoing services performed by such entities for beneficial shareholders of the Fund. The Distributor is entitled to retain some or all fees payable under the Plans in certain circumstances, including when there is no broker of record or when certain qualification standards have not been met by the broker of record.
Shareholder Services Plans
Each Fund has adopted a shareholder services plan with respect to their Investor Class shares (the “Investor Class Shareholder Services Plan”). Under the Investor Class Shareholder Services Plan, the Funds are authorized to compensate certain financial intermediaries, including broker dealers and Fund affiliates (“Participating Organizations”), an aggregate fee in an amount not to exceed on an annual basis 0.15% of the average daily net asset value of Investor Class shares of the Funds attributable to or held in the name of the Participating Organizations pursuant to an agreement with a such Participating Organizations (the “Agreement”). Each Agreement will set forth the non-distribution related shareholder services to be performed by the Participating Organizations for the benefit of a Fund’s shareholders who have elected to have such Participating Organizations service their accounts. Any amount of such payment not paid to Participating Organizations during a Fund’s fiscal year for such service activities shall be reimbursed to the Fund as soon as practicable. Shareholder Services Plan fees are included with distribution and service fees in the Statements of Operations. Investor Class Shareholder Services Plan fees recaptured pursuant to the Services Plan for the six-month period ended April 30, 2021 are included as an offset to distribution and service fees as disclosed in the Statements of Operations.
Each Fund has adopted a shareholder services plan with respect to their Class A shares (the “Class A Shareholder Services Plan”). Under the Class A Shareholder Services Plan, the Funds are authorized to compensate certain financial intermediaries, including broker dealers and Fund affiliates, an aggregate fee in an amount not to exceed on an annual basis 0.15% of the average daily net asset value of Class A shares of the Funds attributable to or held in the name of the Participating Organizations pursuant to an agreement with a such Participating Organizations. Each Agreement will set forth the non-distribution related shareholder services to be performed by the Participating Organizations for the benefit of a Fund’s shareholders who have elected to have such Participating Organizations service their accounts. Any amount of such payment not paid to Participating Organizations during a Fund’s fiscal year for such service activities shall be reimbursed to the Fund as soon as practicable. Shareholder Services Plan fees are included with distribution and service fees in the Statements of Operations. Class A Shareholder Services Plan fees recaptured pursuant to the Services Plan for the six-month period ended April 30, 2021 are included as an offset to distribution and service fees as disclosed in the Statements of Operations.
Each Fund has adopted a shareholder services plan with respect to its Class C shares (the “Class C Shareholder Services Plan”). Under the Class C Shareholder Services Plan, the Funds are authorized to pay banks and their affiliates and other institutions, including broker-dealers and Fund affiliates (“Participating Organizations”), an aggregate fee in an amount not to exceed on an annual basis 0.25% for Class C shares of the average daily net asset value of the Class C shares attributable to or held in the name of a Participating Organization for its clients as compensation for providing shareholder service activities, which do not include distribution services, pursuant to an agreement with a Participating Organization. Any amount of such payment not paid to Participating Organizations during a Fund’s fiscal year for such service activities shall be reimbursed to the Fund as soon as practicable after the end of the fiscal year. Class C Shareholder Services Plan fees are included with distribution and service fees on the Statements of Operations.
206 | April 30, 2021
| Notes to Financial Statements | |
| April 30, 2021 (Unaudited) |
Certain intermediaries may charge networking, omnibus account or other administrative fees with respect to transactions in shares of each Fund. Transactions may be processed through the National Securities Clearing Corporation or similar systems or processed on a manual basis. These fees generally are paid by the Fund to the Distributor, which uses such fees to reimburse intermediaries. In the event an intermediary receiving payments from the Distributor on behalf of the Fund converts from a networking structure to an omnibus account structure or otherwise experiences increased costs, fees borne by the Fund may increase. Networking fees are shown in the Statements of Operations, if applicable to the Fund.
ALPS Fund Services, Inc. (“ALPS”) an affiliate of the Distributor serves as administrator to the Funds and the Funds have agreed to pay expenses incurred in connection with their administrative activities. Pursuant to an Administrative Agreement, ALPS provides operational services to the Funds including, but not limited to, fund accounting and fund administration and generally assists in the Funds’ operations. Officers of the Trust are employees of ALPS. The Funds’ administration fee is accrued on a daily basis and paid monthly. Administration fees paid by the Funds for the six-month period ended April 30, 2021 are disclosed in the Statement of Operations.
ALPS is reimbursed by the Funds for certain out-of-pocket expenses.
Trustees
The fees and expenses of the Trustees of the Board are presented in the Statements of Operations.
9. INDEMNIFICATIONS
Under the Trust’s organizational documents, its officers and Trustees are indemnified against certain liability arising out of the performance of their duties to the Trust. Additionally, in the normal course of business, the Trust enters into contracts with service providers that may contain general indemnification clauses which may permit indemnification to the extent permissible under applicable law. The Trust’s maximum exposure under these arrangements is unknown, as this would involve future claims that may be made against the Trust that have not yet occurred.
10. NEW ACCOUNTING PRONOUNCEMENTS
In March 2020, the Financial Accounting Standards Board (FASB) issued Accounting Standards Update (ASU) No. 2020-04, Reference Rate Reform (Topic 848) - Facilitation of the Effects of Reference Rate Reform on Financial Reporting. The amendments in the ASU provides optional temporary financial reporting relief from the effect of certain types of contract modifications due to the planned discontinuation of the London Interbank Offered Rate (LIBOR) and other interbank offered reference rates as of the end of 2021. The ASU is effective for certain reference rate-related contract modifications that occur during the period March 12, 2020 through December 31, 2022. Management has reviewed the requirements and believes the adoption of this ASU will not have a material impact on the financial statements.
In October 2020, FASB issued Accounting Standards Update No. 2020-08 (“ASU 2020-08”), “Receivables -Nonrefundable Fees and Other Costs (Codification Improvements Subtopic 310-20), Premium Amortization on Purchased Callable Debt Securities”. ASU 2020-08 is an update of ASU No. 2017-08, which amends the amortization period of certain purchased callable debt securities held at a premium. ASU 2020-08 updates the amortization period for callable debt securities to be amortized to the next call date. For purposes of this update, the next call date is the first date when a call option at a specified price becomes exercisable. Once that date has passed, the next call date is when the next call option at a specified price becomes exercisable, if applicable. The amendments are effective for fiscal years, and interim periods within those fiscal years, beginning after December 15, 2020. Management has evaluated the implication of the additional disclosure requirement and determined that there is no impact to the Funds’ financial statements.
11. SUBSEQUENT EVENTS
Subsequent events after the date of Statement of Assets and Liabilities have been evaluated through the date the financial statements were issued. Management has determined that there were no subsequent events to report through the issuance of these financial statements.
207 | April 30, 2021
| Additional Information | |
| April 30, 2021 (Unaudited) |
1. FUND HOLDINGS
Each Fund files its complete schedule of portfolio holdings with the Commission for the first and third quarters of each fiscal year as an exhibit to its reports on Form N-PORT. The Funds’ Form N-PORT reports are available on the Commission’s Web site at http://www.sec.gov. The Funds’ Form N-PORTs are also available upon request by calling 1-866-759-5679.
2. FUND PROXY VOTING POLICIES, PROCEDURES AND SUMMARIES
Fund policies and procedures used in determining how to vote proxies and information regarding how each of the Funds voted proxies relating to portfolio securities during the most recent prior 12-month period ending June 30 are available without charge, (1) upon request, by calling (toll-free) (866) 759-5679 and (2) on the SEC’s website at http://www.sec.gov.
208 | April 30, 2021
| Liquidity Risk Management Program | |
| April 30, 2021 (Unaudited) |
The Financial Investors Trust (the “Trust”) has established a liquidity risk management program (the “Program”) to govern the Trust’s approach to managing liquidity risk for each fund in the Trust (each a “Fund”). The Program is overseen by the Liquidity Committee (the “Committee”), a committee comprised of representatives of the Trust’s investment advisers, sub-advisers, and Officers of the Trust. The Trust’s Board of Trustees (the “Board”) has approved the designation of the Committee to oversee the Program.
The Program’s principal objectives include supporting each Fund’s compliance with limits on investments in illiquid assets and mitigating the risk that a Fund will be unable to meet its redemption obligations in a timely manner. The Program also includes a number of elements that support the management and assessment of liquidity risk, including a periodic assessment of factors that influence a Fund’s liquidity and the periodic classification and re-classification of the Fund’s investments into groupings that reflect the Committee’s assessment of their relative liquidity under current market conditions.
At a meeting of the Board held on March 9, 2021the Trustees received a report from the Committee regarding the design and operational effectiveness of the Program since its implementation on December 1, 2018. The Committee determined, and reported to the Board, that the Program is reasonably designed to assess and manage each Fund’s liquidity risk and has operated adequately and effectively to manage each Fund’s liquidity risk since implementation.
The Committee reported that during the period covered by the report, there were no liquidity events that impacted the Funds or their ability to timely meet redemptions without dilution to existing shareholders. Among other things, the Board noted that the Funds are not required to have a highly liquid investment minimum based on their liquidity classifications. The Board further noted that no material changes have been made to the Program since its implementation.
209 | April 30, 2021

Must be accompanied or preceded by a prospectus. Investors are reminded to read the prospectus carefully before investing.
ALPS Portfolio Solutions Distributor, Inc., distributor.
APS001766
alpsfunds.com
1-866-759-5679

(b) Not applicable.
| Item 2. | Code of Ethics. |
Not applicable to this report.
| Item 3. | Audit Committee Financial Expert. |
Not applicable to this report.
| Item 4. | Principal Accountant Fees and Services. |
Not applicable to this report.
| Item 5. | Audit Committee of Listed Registrants. |
Not applicable to the Registrant.
| Item 6. | Investments. |
| (a) | Schedule of Investments in securities of unaffiliated issuers as of the close of the reporting period is included as part of the Reports to Stockholders filed under Item 1(a) of this Form N-CSR. |
| (b) | Not applicable. |
| Item 7. | Disclosure of Proxy Voting Policies and Procedures for Closed-End Management Investment Companies. |
Not applicable to the Registrant.
| Item 8. | Portfolio Managers of Closed-End Management Investment Companies. |
Not applicable to the Registrant.
| Item 9. | Purchases of Equity Securities by Closed-End Management Investment Company and Affiliated Purchasers. |
Not applicable to the Registrant.
| Item 10. | Submission of Matters to a Vote of Security Holders. |
There have been no material changes to the procedures by which shareholders may recommend nominees to the Registrant’s Board of Trustees, where those changes were implemented after the Registrant last provided disclosure in response to the requirements of Item 407(c)(2)(iv) of Regulation S-K, or this Item.
| Item 11. | Controls and Procedures. |
| (a) | The Registrant’s principal executive officer and principal financial officer have concluded that the Registrant’s disclosure controls and procedures (as defined in Rule 30a-3(c) under the Investment Company Act of 1940, as amended) are effective based on their evaluation of these controls and procedures as of a date within 90 days of the filing date of this report. |
| (b) | There was no change in the Registrant’s internal control over financial reporting (as defined in Rule 30a-3(d) under the Investment Company Act of 1940, as amended) that occurred during the period covered by this report that has materially affected, or is reasonably likely to materially affect, the Registrant’s internal control over financial reporting. |
Item 12. Disclosure of Securities Lending Activities for Closed-End Management Investment Companies.
Not applicable to the Registrant.
| Item 13. | Exhibits. |
| (a)(1) | Not applicable to this report. |
| (a)(2) | The certifications required by Rule 30a-2(a) of the Investment Company Act of 1940, as amended, are attached hereto as Exhibit 99.Cert. |
| (a)(3) | Not applicable. |
| (a)(4) | Not applicable. |
SIGNATURES
Pursuant to the requirements of the Securities Exchange Act of 1934 and the Investment Company Act of 1940, the Registrant has duly caused this report to be signed on its behalf by the undersigned, thereunto duly authorized.
| FINANCIAL INVESTORS TRUST | ||
| By: | /s/ Dawn Cotten | |
| Dawn Cotten (Principal Executive Officer) | ||
| President | ||
| Date: | July 9, 2021 | |
Pursuant to the requirements of the Securities Exchange Act of 1934 and the Investment Company Act of 1940, this report has been signed below by the following persons on behalf of the Registrant and in the capacities and on the dates indicated.
| FINANCIAL INVESTORS TRUST | ||
| By: | /s/ Dawn Cotton | |
| Dawn Cotten (Principal Executive Officer) | ||
| President | ||
| Date: | July 9, 2021 | |
| By: | /s/ Jennell Panella | |
| Jennell Panella (Principal Financial Officer) | ||
| Treasurer | ||
| Date: | July 9, 2021 | |