UNITED STATES
SECURITIES AND EXCHANGE COMMISSION
Washington, D.C. 20549
Form N-CSR
CERTIFIED SHAREHOLDER REPORT OF REGISTERED
MANAGEMENT INVESTMENT COMPANIES
Investment Company Act File Number: 811-08134
Eaton Vance Municipals Trust II
(Exact Name of Registrant as Specified in Charter)
Two International Place, Boston, Massachusetts 02110
(Address of Principal Executive Offices)
Deidre E. Walsh
Two International Place, Boston, Massachusetts 02110
(Name and Address of Agent for Services)
(617) 482-8260
(Registrant’s Telephone Number)
January 31
Date of Fiscal Year End
July 31, 2022
Date of Reporting Period
Item 1. Reports to Stockholders

Income Fund

| % Average Annual Total Returns1,2 | Class
Inception Date |
Performance
Inception Date |
Six Months | One Year | Five Years | Ten Years |
| Class A at NAV | 08/07/1995 | 08/07/1995 | (6.18)% | (8.69)% | 2.43% | 3.73% |
| Class A with 3.25% Maximum Sales Charge | — | — | (9.28) | (11.68) | 1.75 | 3.39 |
| Class C at NAV | 06/18/1997 | 08/07/1995 | (6.57) | (9.41) | 1.65 | 3.11 |
| Class C with 1% Maximum Sales Charge | — | — | (7.49) | (10.29) | 1.65 | 3.11 |
| Class I at NAV | 05/09/2007 | 08/07/1995 | (6.06) | (8.45) | 2.68 | 4.00 |
| Class W at NAV | 10/01/2021 | 08/07/1995 | (5.85) | (8.15) | 2.75 | 4.03 |
|
| ||||||
| Bloomberg Municipal Bond Index | — | — | (3.95)% | (6.93)% | 1.88% | 2.49% |
| % Total Annual Operating Expense Ratios3 | Class A | Class C | Class I | Class W |
| Gross | 0.76% | 1.51% | 0.51% | 0.48% |
| Net | 0.76 | 1.51 | 0.51 | 0.09 |
| % Distribution Rates/Yields4 | Class A | Class C | Class I | Class W |
| Distribution Rate | 3.63% | 2.89% | 3.88% | 4.33% |
| Taxable-Equivalent Distribution Rate | 6.13 | 4.88 | 6.55 | 7.32 |
| SEC 30-day Yield | 3.06 | 2.42 | 3.41 | 3.84 |
| Taxable-Equivalent SEC 30-day Yield | 5.17 | 4.09 | 5.76 | 6.49 |
| % Total Leverage5 | |
| Residual Interest Bond (RIB) Financing | 4.85% |
| Credit Quality (% of total investments)*,** |
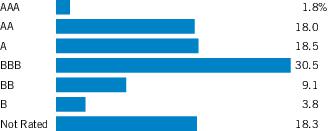
| * | For purposes of the Fund’s rating restrictions, ratings are based on Moody’s Investors Service, Inc. (“Moody’s”), S&P Global Ratings (“S&P”) or Fitch Ratings (“Fitch”), as applicable. If securities are rated differently by the ratings agencies, the highest rating is applied. Ratings, which are subject to change, apply to the creditworthiness of the issuers of the underlying securities and not to the Fund or its shares. Credit ratings measure the quality of a bond based on the issuer’s creditworthiness, with ratings ranging from AAA, being the highest, to D, being the lowest based on S&P’s measures. Ratings of BBB or higher by S&P or Fitch (Baa or higher by Moody’s) are considered to be investment-grade quality. Credit ratings are based largely on the ratings agency’s analysis at the time of rating. The rating assigned to any particular security is not necessarily a reflection of the issuer’s current financial condition and does not necessarily reflect its assessment of the volatility of a security’s market value or of the liquidity of an investment in the security. Holdings designated as “Not Rated” (if any) are not rated by the national ratings agencies stated above. |
| ** | The chart includes the municipal bonds held by a trust that issues residual interest bonds, consistent with the Portfolio of Investments. |
| Beginning
Account Value (2/1/22) |
Ending
Account Value (7/31/22) |
Expenses
Paid During Period* (2/1/22 – 7/31/22) |
Annualized
Expense Ratio | |
| Actual | ||||
| Class A | $1,000.00 | $ 938.20 | $3.99 | 0.83% |
| Class C | $1,000.00 | $ 934.30 | $7.58 | 1.58% |
| Class I | $1,000.00 | $ 939.40 | $2.79 | 0.58% |
| Class W | $1,000.00 | $ 941.50 | $0.67** | 0.14% |
| Hypothetical | ||||
| (5% return per year before expenses) | ||||
| Class A | $1,000.00 | $1,020.68 | $4.16 | 0.83% |
| Class C | $1,000.00 | $1,016.96 | $7.90 | 1.58% |
| Class I | $1,000.00 | $1,021.92 | $2.91 | 0.58% |
| Class W | $1,000.00 | $1,024.10 | $0.70** | 0.14% |
| * | Expenses are equal to the Fund’s annualized expense ratio for the indicated Class, multiplied by the average account value over the period, multiplied by 181/365 (to reflect the one-half year period). The Example assumes that the $1,000 was invested at the net asset value per share determined at the close of business on January 31, 2022. |
| ** | Absent a reimbursement of investment advisory fees by an affiliate, expenses would be higher. |
| Futures Contracts | |||||
| Description | Number
of Contracts |
Position | Expiration
Date |
Notional
Amount |
Value/Unrealized
Appreciation (Depreciation) |
| Interest Rate Futures | |||||
| U.S. 10-Year Treasury Note | (175) | Short | 9/21/22 | $(21,199,609) | $ (338,776) |
| U.S. Long Treasury Bond | (112) | Short | 9/21/22 | (16,128,000) | (519,086) |
| $(857,862) | |||||
| Abbreviations: | |
| AGC | – Assured Guaranty Corp. |
| AGM | – Assured Guaranty Municipal Corp. |
| AMBAC | – AMBAC Financial Group, Inc. |
| AMT | – Interest earned from these securities may be considered a tax preference item for purposes of the Federal Alternative Minimum Tax. |
| BAM | – Build America Mutual Assurance Co. |
| LOC | – Letter of Credit |
| NPFG | – National Public Finance Guarantee Corp. |
| PSF | – Permanent School Fund |
| July 31, 2022 | |
| Assets | |
| Unaffiliated investments, at value (identified cost $1,316,862,656) | $ 1,325,272,090 |
| Cash | 3,233,703 |
| Deposits for derivatives collateral — futures contracts | 741,619 |
| Interest receivable | 13,179,431 |
| Receivable for investments sold | 12,484,394 |
| Receivable for Fund shares sold | 7,722,583 |
| Receivable from affiliate | 9,090 |
| Total assets | $1,362,642,910 |
| Liabilities | |
| Payable for floating rate notes issued | $ 63,829,827 |
| Payable for when-issued securities | 38,220,270 |
| Payable for Fund shares redeemed | 5,957,597 |
| Payable for variation margin on open futures contracts | 121,841 |
| Distributions payable | 614,899 |
| Payable to affiliates: | |
| Investment adviser fee | 448,720 |
| Distribution and service fees | 123,939 |
| Interest expense and fees payable | 172,552 |
| Accrued expenses | 374,681 |
| Total liabilities | $ 109,864,326 |
| Net Assets | $1,252,778,584 |
| Sources of Net Assets | |
| Paid-in capital | $ 1,343,330,474 |
| Accumulated loss | (90,551,890) |
| Net Assets | $1,252,778,584 |
| Class A Shares | |
| Net Assets | $ 335,848,799 |
| Shares Outstanding | 40,125,369 |
| Net
Asset Value and Redemption Price Per Share (net assets ÷ shares of beneficial interest outstanding) |
$ 8.37 |
| Maximum
Offering Price Per Share (100 ÷ 96.75 of net asset value per share) |
$ 8.65 |
| Class C Shares | |
| Net Assets | $ 62,393,119 |
| Shares Outstanding | 8,059,998 |
| Net
Asset Value and Offering Price Per Share* (net assets ÷ shares of beneficial interest outstanding) |
$ 7.74 |
| Class I Shares | |
| Net Assets | $ 833,507,159 |
| Shares Outstanding | 99,479,114 |
| Net
Asset Value, Offering Price and Redemption Price Per Share (net assets ÷ shares of beneficial interest outstanding) |
$ 8.38 |
| July 31, 2022 | |
| Class W Shares | |
| Net Assets | $21,029,507 |
| Shares Outstanding | 2,510,233 |
| Net
Asset Value, Offering Price and Redemption Price Per Share (net assets ÷ shares of beneficial interest outstanding) |
$ 8.38 |
| On sales of $50,000 or more, the offering price of Class A shares is reduced. | |
| * | Redemption price per share is equal to the net asset value less any applicable contingent deferred sales charge. |
| Six Months Ended | |
| July 31, 2022 | |
| Investment Income | |
| Interest income | $ 26,219,907 |
| Total investment income | $ 26,219,907 |
| Expenses | |
| Investment adviser fee | $ 2,821,222 |
| Distribution and service fees: | |
| Class A | 447,308 |
| Class C | 349,982 |
| Trustees’ fees and expenses | 54,250 |
| Custodian fee | 152,558 |
| Transfer and dividend disbursing agent fees | 227,714 |
| Legal and accounting services | 70,307 |
| Printing and postage | 31,149 |
| Registration fees | 56,854 |
| Interest expense and fees | 423,852 |
| Miscellaneous | 66,799 |
| Total expenses | $ 4,701,995 |
| Deduct: | |
| Reimbursement of investment adviser fee — Class W | $ 12,532 |
| Total expense reductions | $ 12,532 |
| Net expenses | $ 4,689,463 |
| Net investment income | $ 21,530,444 |
| Realized and Unrealized Gain (Loss) | |
| Net realized gain (loss): | |
| Investment transactions | $ (46,934,315) |
| Futures contracts | 3,836,248 |
| Net realized loss | $ (43,098,067) |
| Change in unrealized appreciation (depreciation): | |
| Investments | $ (72,047,170) |
| Futures contracts | (1,348,525) |
| Net change in unrealized appreciation (depreciation) | $ (73,395,695) |
| Net realized and unrealized loss | $(116,493,762) |
| Net decrease in net assets from operations | $ (94,963,318) |
| Six
Months Ended July 31, 2022 (Unaudited) |
Year
Ended January 31, 2022 | |
| Increase (Decrease) in Net Assets | ||
| From operations: | ||
| Net investment income | $ 21,530,444 | $ 49,317,836 |
| Net realized gain (loss) | (43,098,067) | 1,422,237 |
| Net change in unrealized appreciation (depreciation) | (73,395,695) | (49,612,939) |
| Net increase (decrease) in net assets from operations | $ (94,963,318) | $ 1,127,134 |
| Distributions to shareholders: | ||
| Class A | $ (6,321,415) | $ (12,582,413) |
| Class C | (971,917) | (2,056,099) |
| Class I | (17,352,061) | (34,798,742) |
| Class W(1) | (128,400) | (1,745) |
| Total distributions to shareholders | $ (24,773,793) | $ (49,438,999) |
| Transactions in shares of beneficial interest: | ||
| Class A | $ (45,975,630) | $ 6,265,917 |
| Class C | (14,142,269) | (12,390,847) |
| Class I | (147,238,604) | 101,468,938 |
| Class W(1) | 20,672,551 | 310,119 |
| Net increase (decrease) in net assets from Fund share transactions | $ (186,683,952) | $ 95,654,127 |
| Net increase (decrease) in net assets | $ (306,421,063) | $ 47,342,262 |
| Net Assets | ||
| At beginning of period | $ 1,559,199,647 | $ 1,511,857,385 |
| At end of period | $1,252,778,584 | $1,559,199,647 |
| (1) | For the period from the commencement of operations, October 1, 2021, to January 31, 2022. |
| Class A | ||||||
| Six
Months Ended July 31, 2022 (Unaudited) |
Year Ended January 31, | |||||
| 2022 | 2021 | 2020 | 2019 | 2018 | ||
| Net asset value — Beginning of period | $ 9.080 | $ 9.360 | $ 9.380 | $ 8.830 | $ 8.880 | $ 8.650 |
| Income (Loss) From Operations | ||||||
| Net investment income(1) | $ 0.129 | $ 0.281 | $ 0.303 | $ 0.327 | $ 0.345 | $ 0.337 |
| Net realized and unrealized gain (loss) | (0.689) | (0.279) | (0.008) (2) | 0.590 | (0.059) | 0.229 |
| Total income (loss) from operations | $ (0.560) | $ 0.002 | $ 0.295 | $ 0.917 | $ 0.286 | $ 0.566 |
| Less Distributions | ||||||
| From net investment income | $ (0.150) | $ (0.282) | $ (0.315) | $ (0.367) | $ (0.336) | $ (0.336) |
| Total distributions | $ (0.150) | $ (0.282) | $ (0.315) | $ (0.367) | $ (0.336) | $ (0.336) |
| Net asset value — End of period | $ 8.370 | $ 9.080 | $ 9.360 | $ 9.380 | $ 8.830 | $ 8.880 |
| Total Return(3) | (6.18)% (4) | (0.02)% | 3.31% | 10.55% | 3.29% | 6.63% |
| Ratios/Supplemental Data | ||||||
| Net assets, end of period (000’s omitted) | $335,849 | $412,905 | $419,256 | $427,334 | $350,923 | $344,822 |
| Ratios (as a percentage of average daily net assets): | ||||||
| Expenses excluding interest and fees | 0.77% (5) | 0.73% | 0.76% | 0.76% | 0.79% | 0.78% |
| Interest and fee expense(6) | 0.06% (5) | 0.03% | 0.06% | 0.13% | 0.17% | 0.14% |
| Total expenses | 0.83% (5) | 0.76% | 0.82% | 0.89% | 0.96% | 0.92% |
| Net investment income | 3.06% (5) | 3.01% | 3.35% | 3.57% | 3.92% | 3.81% |
| Portfolio Turnover | 23% (4) | 22% | 54% | 23% | 32% | 21% |
| (1) | Computed using average shares outstanding. |
| (2) | The per share amount is not in accord with the net realized and unrealized gain (loss) for the period because of the timing of Fund share transactions and the amount of the per share realized and unrealized gains and losses at such time. |
| (3) | Returns are historical and are calculated by determining the percentage change in net asset value with all distributions reinvested and do not reflect the effect of sales charges. |
| (4) | Not annualized. |
| (5) | Annualized. |
| (6) | Interest and fee expense relates to the liability for floating rate notes issued in conjunction with residual interest bond transactions (see Note 1H). |
| Class C | ||||||
| Six
Months Ended July 31, 2022 (Unaudited) |
Year Ended January 31, | |||||
| 2022 | 2021 | 2020 | 2019 | 2018 | ||
| Net asset value — Beginning of period | $ 8.400 | $ 8.660 | $ 8.680 | $ 8.170 | $ 8.210 | $ 8.010 |
| Income (Loss) From Operations | ||||||
| Net investment income(1) | $ 0.090 | $ 0.195 | $ 0.219 | $ 0.239 | $ 0.252 | $ 0.251 |
| Net realized and unrealized gain (loss) | (0.641) | (0.259) | (0.011) (2) | 0.551 | (0.042) | 0.199 |
| Total income (loss) from operations | $ (0.551) | $ (0.064) | $ 0.208 | $ 0.790 | $ 0.210 | $ 0.450 |
| Less Distributions | ||||||
| From net investment income | $ (0.109) | $ (0.196) | $ (0.228) | $ (0.280) | $ (0.250) | $ (0.250) |
| Total distributions | $ (0.109) | $ (0.196) | $ (0.228) | $ (0.280) | $ (0.250) | $ (0.250) |
| Net asset value — End of period | $ 7.740 | $ 8.400 | $ 8.660 | $ 8.680 | $ 8.170 | $ 8.210 |
| Total Return(3) | (6.57)% (4) | (0.78)% | 2.52% | 9.80% | 2.60% | 5.67% |
| Ratios/Supplemental Data | ||||||
| Net assets, end of period (000’s omitted) | $62,393 | $82,817 | $97,724 | $139,608 | $126,049 | $173,844 |
| Ratios (as a percentage of average daily net assets): | ||||||
| Expenses excluding interest and fees | 1.52% (5) | 1.48% | 1.51% | 1.51% | 1.54% | 1.53% |
| Interest and fee expense(6) | 0.06% (5) | 0.03% | 0.06% | 0.13% | 0.17% | 0.14% |
| Total expenses | 1.58% (5) | 1.51% | 1.57% | 1.64% | 1.71% | 1.67% |
| Net investment income | 2.30% (5) | 2.26% | 2.63% | 2.82% | 3.10% | 3.06% |
| Portfolio Turnover | 23% (4) | 22% | 54% | 23% | 32% | 21% |
| (1) | Computed using average shares outstanding. |
| (2) | The per share amount is not in accord with the net realized and unrealized gain (loss) for the period because of the timing of Fund share transactions and the amount of the per share realized and unrealized gains and losses at such time. |
| (3) | Returns are historical and are calculated by determining the percentage change in net asset value with all distributions reinvested and do not reflect the effect of sales charges. |
| (4) | Not annualized. |
| (5) | Annualized. |
| (6) | Interest and fee expense relates to the liability for floating rate notes issued in conjunction with residual interest bond transactions (see Note 1H). |
| Class I | ||||||
| Six
Months Ended July 31, 2022 (Unaudited) |
Year Ended January 31, | |||||
| 2022 | 2021 | 2020 | 2019 | 2018 | ||
| Net asset value — Beginning of period | $ 9.090 | $ 9.370 | $ 9.390 | $ 8.840 | $ 8.880 | $ 8.660 |
| Income (Loss) From Operations | ||||||
| Net investment income(1) | $ 0.140 | $ 0.304 | $ 0.326 | $ 0.349 | $ 0.364 | $ 0.359 |
| Net realized and unrealized gain (loss) | (0.690) | (0.279) | (0.009) (2) | 0.590 | (0.046) | 0.220 |
| Total income (loss) from operations | $ (0.550) | $ 0.025 | $ 0.317 | $ 0.939 | $ 0.318 | $ 0.579 |
| Less Distributions | ||||||
| From net investment income | $ (0.160) | $ (0.305) | $ (0.337) | $ (0.389) | $ (0.358) | $ (0.359) |
| Total distributions | $ (0.160) | $ (0.305) | $ (0.337) | $ (0.389) | $ (0.358) | $ (0.359) |
| Net asset value — End of period | $ 8.380 | $ 9.090 | $ 9.370 | $ 9.390 | $ 8.840 | $ 8.880 |
| Total Return(3) | (6.06)% (4) | 0.24% | 3.57% | 10.81% | 3.67% | 6.77% |
| Ratios/Supplemental Data | ||||||
| Net assets, end of period (000’s omitted) | $833,507 | $1,063,175 | $994,877 | $878,062 | $656,830 | $682,157 |
| Ratios (as a percentage of average daily net assets): | ||||||
| Expenses excluding interest and fees | 0.52% (5) | 0.48% | 0.51% | 0.51% | 0.54% | 0.53% |
| Interest and fee expense(6) | 0.06% (5) | 0.03% | 0.06% | 0.13% | 0.17% | 0.14% |
| Total expenses | 0.58% (5) | 0.51% | 0.57% | 0.64% | 0.71% | 0.67% |
| Net investment income | 3.31% (5) | 3.25% | 3.59% | 3.81% | 4.13% | 4.04% |
| Portfolio Turnover | 23% (4) | 22% | 54% | 23% | 32% | 21% |
| (1) | Computed using average shares outstanding. |
| (2) | The per share amount is not in accord with the net realized and unrealized gain (loss) for the period because of the timing of Fund share transactions and the amount of the per share realized and unrealized gains and losses at such time. |
| (3) | Returns are historical and are calculated by determining the percentage change in net asset value with all distributions reinvested. |
| (4) | Not annualized. |
| (5) | Annualized. |
| (6) | Interest and fee expense relates to the liability for floating rate notes issued in conjunction with residual interest bond transactions (see Note 1H). |
| Class W | ||
| Six
Months Ended July 31, 2022 (Unaudited) |
Period
Ended January 31, 2022(1) | |
| Net asset value — Beginning of period | $ 9.090 | $ 9.320 |
| Income (Loss) From Operations | ||
| Net investment income(2) | $ 0.155 | $ 0.105 |
| Net realized and unrealized loss | (0.686) | (0.224) |
| Total loss from operations | $ (0.531) | $(0.119) |
| Less Distributions | ||
| From net investment income | $ (0.179) | $ (0.111) |
| Total distributions | $ (0.179) | $(0.111) |
| Net asset value — End of period | $ 8.380 | $ 9.090 |
| Total Return(3)(4) | (5.85)% (5) | (1.30)% (5) |
| Ratios/Supplemental Data | ||
| Net assets, end of period (000’s omitted) | $21,030 | $ 302 |
| Ratios (as a percentage of average daily net assets): | ||
| Expenses excluding interest and fees(4) | 0.10% (6) | 0.06% (6) |
| Interest and fee expense(7) | 0.06% (6) | 0.03% (6) |
| Total expenses | 0.16% (6) | 0.09% (6) |
| Net investment income | 3.75% (6) | 3.34% (6) |
| Portfolio Turnover | 23% (5) | 22% (8) |
| (1) | For the period from the commencement of operations, October 1, 2021, to January 31, 2022. |
| (2) | Computed using average shares outstanding. |
| (3) | Returns are historical and are calculated by determining the percentage change in net asset value with all distributions reinvested. |
| (4) | The investment adviser reimbursed the total amount of the advisory fees paid (equal to 0.42% and 0.37% of average daily net assets for the six months ended July 31, 2022 and the period ended January 31, 2022, respectively). Absent this reimbursement, total return would be lower. |
| (5) | Not annualized. |
| (6) | Annualized. |
| (7) | Interest and fee expense relates to the liability for floating rate notes issued in conjunction with residual interest bond transactions (see Note 1H). |
| (8) | For the year ended January 31, 2022. |
| Aggregate cost | $1,255,781,487 |
| Gross unrealized appreciation | $ 37,920,674 |
| Gross unrealized depreciation | (33,117,760) |
| Net unrealized appreciation | $ 4,802,914 |
| Total Daily Net Assets | Annual
Asset Rate |
Total Daily Net Assets | Daily
Income Rate |
| Up to $500 million | 0.3150% | Up to $500 million | 3.1500% |
| $500 million but less than $750 million | 0.2925% | $500 million but less than $1 billion | 2.9250% |
| $750 million but less than $1.5 billion | 0.2700% | $1 billion but less than $1.5 billion | 2.7000% |
| $1.5 billion but less than $2 billion | 0.2475% | $1.5 billion but less than $2 billion | 2.4750% |
| $2 billion but less than $3 billion | 0.2250% | $2 billion but less than $3 billion | 2.2500% |
| $3 billion and over | 0.2025% | $3 billion and over | 2.0250% |
| Six
Months Ended July 31, 2022 (Unaudited) |
Year
Ended January 31, 2022(1) | ||||
| Shares | Amount | Shares | Amount | ||
| Class A | |||||
| Sales | 3,528,916 | $ 29,630,567 | 6,578,951 | $ 61,544,294 | |
| Issued to shareholders electing to receive payments of distributions in Fund shares | 600,921 | 5,102,899 | 1,074,501 | 10,007,784 | |
| Redemptions | (10,095,752) | (86,104,117) | (7,522,378) | (70,258,658) | |
| Converted from Class C shares | 630,711 | 5,395,021 | 532,706 | 4,972,497 | |
| Net increase (decrease) | (5,335,204) | $ (45,975,630) | 663,780 | $ 6,265,917 | |
| Class C | |||||
| Sales | 370,514 | $ 2,899,897 | 1,266,760 | $ 10,948,395 | |
| Issued to shareholders electing to receive payments of distributions in Fund shares | 111,181 | 873,585 | 214,231 | 1,845,479 | |
| Redemptions | (1,598,660) | (12,520,730) | (2,336,171) | (20,212,224) | |
| Converted to Class A shares | (681,912) | (5,395,021) | (575,943) | (4,972,497) | |
| Net decrease | (1,798,877) | $ (14,142,269) | (1,431,123) | $ (12,390,847) | |
| Class I | |||||
| Sales | 32,031,039 | $ 270,056,527 | 39,654,609 | $ 371,004,093 | |
| Issued to shareholders electing to receive payments of distributions in Fund shares | 1,741,352 | 14,819,945 | 3,253,997 | 30,339,525 | |
| Redemptions | (51,228,168) | (432,115,076) | (32,166,004) | (299,874,680) | |
| Net increase (decrease) | (17,455,777) | $(147,238,604) | 10,742,602 | $ 101,468,938 | |
| Six
Months Ended July 31, 2022 (Unaudited) |
Year
Ended January 31, 2022(1) | ||||
| Shares | Amount | Shares | Amount | ||
| Class W | |||||
| Sales | 2,563,271 | $ 21,381,576 | 33,158 | $ 310,000 | |
| Issued to shareholders electing to receive payments of distributions in Fund shares | 14,700 | 122,645 | 13 | 119 | |
| Redemptions | (100,909) | (831,670) | — | — | |
| Net increase | 2,477,062 | $ 20,672,551 | 33,171 | $ 310,119 | |
| (1) | For Class W, for the period from the commencement of operations, October 1, 2021, to January 31, 2022. |
| Fair Value | ||
| Derivative | Asset Derivative | Liability Derivative(1) |
| Futures contracts | $ — | $(857,862) |
| (1) | Only the current day’s variation margin on open futures contracts is reported within the Statement of Assets and Liabilities as Receivable or Payable for variation margin on open futures contracts, as applicable. |
| Derivative | Realized
Gain (Loss) on Derivatives Recognized in Income(1) |
Change
in Unrealized Appreciation (Depreciation) on Derivatives Recognized in Income(2) |
| Futures contracts | $3,836,248 | $(1,348,525) |
| (1) | Statement of Operations location: Net realized gain (loss): Futures contracts. |
| (2) | Statement of Operations location: Change in unrealized appreciation (depreciation): Futures contracts. |
| • | Level 1 – quoted prices in active markets for identical investments |
| • | Level 2 – other significant observable inputs (including quoted prices for similar investments, interest rates, prepayment speeds, credit risk, etc.) |
| • | Level 3 – significant unobservable inputs (including a fund's own assumptions in determining the fair value of investments) |
| Asset Description | Level 1 | Level 2 | Level 3 | Total |
| Corporate Bonds | $ — | $ 25,983,437 | $ — | $ 25,983,437 |
| Tax-Exempt Municipal Obligations | — | 1,231,503,095 | — | 1,231,503,095 |
| Taxable Municipal Obligations | — | 67,785,558 | — | 67,785,558 |
| Total Investments | $ — | $1,325,272,090 | $ — | $ 1,325,272,090 |
| Liability Description | ||||
| Futures Contracts | $ (857,862) | $ — | $ — | $ (857,862) |
| Total | $ (857,862) | $ — | $ — | $ (857,862) |
| Officers | |
| Eric
A. Stein President |
Jill R.
Damon Secretary |
| Deidre
E. Walsh Vice President and Chief Legal Officer |
Richard F.
Froio Chief Compliance Officer |
| James
F. Kirchner Treasurer |
|
| Trustees |
| * | Interested Trustee |
| ** | Mr. Bowser and Ms. Wiser began serving as Trustees effective April 4, 2022. |
| Privacy Notice | April 2021 |
| FACTS | WHAT
DOES EATON VANCE DO WITH YOUR PERSONAL INFORMATION? |
| Why? | Financial companies choose how they share your personal information. Federal law gives consumers the right to limit some but not all sharing. Federal law also requires us to tell you how we collect, share, and protect your personal information. Please read this notice carefully to understand what we do. |
| What? | The
types of personal information we collect and share depend on the product or service you have with us. This information can include:■ Social Security number and income ■ investment experience and risk tolerance ■ checking account number and wire transfer instructions |
| How? | All financial companies need to share customers’ personal information to run their everyday business. In the section below, we list the reasons financial companies can share their customers’ personal information; the reasons Eaton Vance chooses to share; and whether you can limit this sharing. |
| Reasons
we can share your personal information |
Does
Eaton Vance share? |
Can
you limit this sharing? |
| For our everyday business purposes — such as to process your transactions, maintain your account(s), respond to court orders and legal investigations, or report to credit bureaus | Yes | No |
| For our marketing purposes — to offer our products and services to you | Yes | No |
| For joint marketing with other financial companies | No | We don’t share |
| For our investment management affiliates’ everyday business purposes — information about your transactions, experiences, and creditworthiness | Yes | Yes |
| For our affiliates’ everyday business purposes — information about your transactions and experiences | Yes | No |
| For our affiliates’ everyday business purposes — information about your creditworthiness | No | We don’t share |
| For our investment management affiliates to market to you | Yes | Yes |
| For our affiliates to market to you | No | We don’t share |
| For nonaffiliates to market to you | No | We don’t share |
| To
limit our sharing |
Call toll-free 1-800-262-1122 or email: EVPrivacy@eatonvance.comPlease note:If you are a new customer, we can begin sharing your information 30 days from the date we sent this notice. When you are no longer our customer, we continue to share your information as described in this notice. However, you can contact us at any time to limit our sharing. |
| Questions? | Call toll-free 1-800-262-1122 or email: EVPrivacy@eatonvance.com |
| Privacy Notice — continued | April 2021 |
| Who we are | |
| Who is providing this notice? | Eaton Vance Management, Eaton Vance Distributors, Inc., Eaton Vance Trust Company, Eaton Vance Management (International) Limited, Eaton Vance Advisers International Ltd., Eaton Vance Global Advisors Limited, Eaton Vance Management’s Real Estate Investment Group, Boston Management and Research, Calvert Research and Management, Eaton Vance and Calvert Fund Families and our investment advisory affiliates (“Eaton Vance”) (see Investment Management Affiliates definition below) |
| What we do | |
| How
does Eaton Vance protect my personal information? |
To protect your personal information from unauthorized access and use, we use security measures that comply with federal law. These measures include computer safeguards and secured files and buildings. We have policies governing the proper handling of customer information by personnel and requiring third parties that provide support to adhere to appropriate security standards with respect to such information. |
| How
does Eaton Vance collect my personal information? |
We
collect your personal information, for example, when you■ open an account or make deposits or withdrawals from your account ■ buy securities from us or make a wire transfer ■ give us your contact informationWe also collect your personal information from others, such as credit bureaus, affiliates, or other companies. |
| Why can’t I limit all sharing? | Federal
law gives you the right to limit only■ sharing for affiliates’ everyday business purposes — information about your creditworthiness ■ affiliates from using your information to market to you ■ sharing for nonaffiliates to market to youState laws and individual companies may give you additional rights to limit sharing. See below for more on your rights under state law. |
| Definitions | |
| Investment
Management Affiliates |
Eaton Vance Investment Management Affiliates include registered investment advisers, registered broker- dealers, and registered and unregistered funds. Investment Management Affiliates does not include entities associated with Morgan Stanley Wealth Management, such as Morgan Stanley Smith Barney LLC and Morgan Stanley & Co. |
| Affiliates | Companies related by common ownership or control. They can be financial and nonfinancial companies.■ Our affiliates include companies with a Morgan Stanley name and financial companies such as Morgan Stanley Smith Barney LLC and Morgan Stanley & Co. |
| Nonaffiliates | Companies not related by common ownership or control. They can be financial and nonfinancial companies.■ Eaton Vance does not share with nonaffiliates so they can market to you. |
| Joint marketing | A formal agreement between nonaffiliated financial companies that together market financial products or services to you.■ Eaton Vance doesn’t jointly market. |
| Other important information | |
| Vermont: Except as permitted by law, we will not share personal information we collect about Vermont residents with Nonaffiliates unless you provide us with your written consent to share such information.California: Except as permitted by law, we will not share personal information we collect about California residents with Nonaffiliates and we will limit sharing such personal information with our Affiliates to comply with California privacy laws that apply to us. | |


| % Average Annual Total Returns1,2 | Class
Inception Date |
Performance
Inception Date |
Six Months | One Year | Five Years | Ten Years |
| Class A at NAV | 03/27/2009 | 12/31/1998 | (2.34)% | (4.85)% | 0.97% | 1.03% |
| Class A with 3.25% Maximum Sales Charge | — | — | (5.50) | (7.91) | 0.31 | 0.70 |
| Class C at NAV | 03/27/2009 | 12/31/1998 | (2.69) | (5.54) | 0.22 | 0.42 |
| Class C with 1% Maximum Sales Charge | — | — | (3.67) | (6.48) | 0.22 | 0.42 |
| Class I at NAV | 03/27/2009 | 12/31/1998 | (2.21) | (4.61) | 1.20 | 1.28 |
|
| ||||||
| Bloomberg Municipal Managed Money 1–7 Year Bond Index | — | — | (1.00)% | (3.73)% | 1.12% | 1.38% |
| Bloomberg 5 Year Municipal Bond Index | — | — | (1.39) | (4.25) | 1.39 | 1.72 |
| % After-Tax Returns with Maximum Sales Charge | Class
Inception Date |
Performance
Inception Date |
One Year | Five Years | Ten Years |
| Class A After Taxes on Distributions | 03/27/2009 | 12/31/1998 | (8.11)% | 0.13% | 0.53% |
| Class A After Taxes on Distributions and Sale of Fund Shares | — | — | (4.38) | 0.39 | 0.72 |
| Class C After Taxes on Distributions | 03/27/2009 | 12/31/1998 | (6.66) | 0.05 | 0.25 |
| Class C After Taxes on Distributions and Sale of Fund Shares | — | — | (3.77) | 0.20 | 0.39 |
| Class I After Taxes on Distributions | 03/27/2009 | 12/31/1998 | (4.82) | 1.02 | 1.09 |
| Class I After Taxes on Distributions and Sale of Fund Shares | — | — | (2.32) | 1.16 | 1.22 |
| % Total Annual Operating Expense Ratios3 | Class A | Class C | Class I |
| 0.70% | 1.45% | 0.45% |
| % Distribution Rates/Yields4 | Class A | Class C | Class I |
| Distribution Rate | 1.29% | —% | 1.54% |
| SEC 30-day Yield | 1.24 | 0.55 | 1.53 |
| Credit Quality (% of total investments)* |
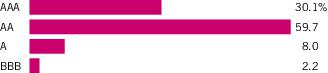
| * | For purposes of the Fund’s rating restrictions, ratings are based on Moody’s Investors Service, Inc. (“Moody’s”), S&P Global Ratings (“S&P”) or Fitch Ratings (“Fitch”), as applicable. If securities are rated differently by the ratings agencies, the highest rating is applied. Ratings, which are subject to change, apply to the creditworthiness of the issuers of the underlying securities and not to the Fund or its shares. Credit ratings measure the quality of a bond based on the issuer’s creditworthiness, with ratings ranging from AAA, being the highest, to D, being the lowest based on S&P’s measures. Ratings of BBB or higher by S&P or Fitch (Baa or higher by Moody’s) are considered to be investment-grade quality. Credit ratings are based largely on the ratings agency’s analysis at the time of rating. The rating assigned to any particular security is not necessarily a reflection of the issuer’s current financial condition and does not necessarily reflect its assessment of the volatility of a security’s market value or of the liquidity of an investment in the security. Holdings designated as “Not Rated” (if any) are not rated by the national ratings agencies stated above. |
| % Average Annual Total Returns1,2 | Class
Inception Date |
Performance
Inception Date |
Six Months | One Year | Five Years | Ten Years |
| Class A at NAV | 02/01/2010 | 02/01/2010 | (3.63)% | (7.02)% | 1.16% | 1.90% |
| Class A with 3.25% Maximum Sales Charge | — | — | (6.77) | (10.05) | 0.49 | 1.57 |
| Class C at NAV | 02/01/2010 | 02/01/2010 | (3.99) | (7.80) | 0.41 | 1.29 |
| Class C with 1% Maximum Sales Charge | — | — | (4.95) | (8.71) | 0.41 | 1.29 |
| Class I at NAV | 02/01/2010 | 02/01/2010 | (3.51) | (6.86) | 1.42 | 2.16 |
|
| ||||||
| Bloomberg Municipal Managed Money Intermediate 1–17 Year Bond Index | — | — | (2.93)% | (6.36)% | 1.68% | 2.18% |
| Bloomberg 7 Year Municipal Bond Index | — | — | (1.90) | (5.18) | 1.72 | 2.23 |
| % After-Tax Returns with Maximum Sales Charge | Class
Inception Date |
Performance
Inception Date |
One Year | Five Years | Ten Years |
| Class A After Taxes on Distributions | 02/01/2010 | 02/01/2010 | (10.21)% | 0.40% | 1.46% |
| Class A After Taxes on Distributions and Sale of Fund Shares | — | — | (5.50) | 0.68 | 1.52 |
| Class C After Taxes on Distributions | 02/01/2010 | 02/01/2010 | (8.84) | 0.32 | 1.18 |
| Class C After Taxes on Distributions and Sale of Fund Shares | — | — | (4.96) | 0.48 | 1.19 |
| Class I After Taxes on Distributions | 02/01/2010 | 02/01/2010 | (7.02) | 1.31 | 2.04 |
| Class I After Taxes on Distributions and Sale of Fund Shares | — | — | (3.51) | 1.47 | 2.05 |
| % Total Annual Operating Expense Ratios3 | Class A | Class C | Class I |
| Gross | 0.92% | 1.67% | 0.67% |
| Net | 0.85 | 1.60 | 0.60 |
| % Distribution Rates/Yields4 | Class A | Class C | Class I |
| Distribution Rate | 1.85% | 1.11% | 2.10% |
| SEC 30-day Yield – Subsidized | 1.80 | 1.12 | 2.10 |
| SEC 30-day Yield – Unsubsidized | 1.68 | 1.00 | 1.98 |
| Credit Quality (% of total investments)* |
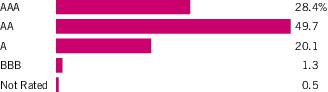
| * | For purposes of the Fund’s rating restrictions, ratings are based on Moody’s Investors Service, Inc. (“Moody’s”), S&P Global Ratings (“S&P”) or Fitch Ratings (“Fitch”), as applicable. If securities are rated differently by the ratings agencies, the highest rating is applied. Ratings, which are subject to change, apply to the creditworthiness of the issuers of the underlying securities and not to the Fund or its shares. Credit ratings measure the quality of a bond based on the issuer’s creditworthiness, with ratings ranging from AAA, being the highest, to D, being the lowest based on S&P’s measures. Ratings of BBB or higher by S&P or Fitch (Baa or higher by Moody’s) are considered to be investment-grade quality. Credit ratings are based largely on the ratings agency’s analysis at the time of rating. The rating assigned to any particular security is not necessarily a reflection of the issuer’s current financial condition and does not necessarily reflect its assessment of the volatility of a security’s market value or of the liquidity of an investment in the security. Holdings designated as “Not Rated” (if any) are not rated by the national ratings agencies stated above. |
| Beginning
Account Value (2/1/22) |
Ending
Account Value (7/31/22) |
Expenses
Paid During Period* (2/1/22 – 7/31/22) |
Annualized
Expense Ratio | |
| Actual | ||||
| Class A | $1,000.00 | $ 976.60 | $3.92 | 0.80% |
| Class C | $1,000.00 | $ 973.10 | $7.58 | 1.55% |
| Class I | $1,000.00 | $ 977.90 | $2.70 | 0.55% |
| Hypothetical | ||||
| (5% return per year before expenses) | ||||
| Class A | $1,000.00 | $1,020.83 | $4.01 | 0.80% |
| Class C | $1,000.00 | $1,017.11 | $7.75 | 1.55% |
| Class I | $1,000.00 | $1,022.07 | $2.76 | 0.55% |
| * | Expenses are equal to the Fund's annualized expense ratio for the indicated Class, multiplied by the average account value over the period, multiplied by 181/365 (to reflect the one-half year period). The Example assumes that the $1,000 was invested at the net asset value per share determined at the close of business on January 31, 2022. |
| Beginning
Account Value (2/1/22) |
Ending
Account Value (7/31/22) |
Expenses
Paid During Period* (2/1/22 – 7/31/22) |
Annualized
Expense Ratio | |
| Actual | ||||
| Class A | $1,000.00 | $ 963.70 | $4.33** | 0.89% |
| Class C | $1,000.00 | $ 960.10 | $7.97** | 1.64% |
| Class I | $1,000.00 | $ 964.90 | $3.12** | 0.64% |
| Hypothetical | ||||
| (5% return per year before expenses) | ||||
| Class A | $1,000.00 | $1,020.38 | $4.46** | 0.89% |
| Class C | $1,000.00 | $1,016.66 | $8.20** | 1.64% |
| Class I | $1,000.00 | $1,021.62 | $3.21** | 0.64% |
| * | Expenses are equal to the Fund's annualized expense ratio for the indicated Class, multiplied by the average account value over the period, multiplied by 181/365 (to reflect the one-half year period). The Example assumes that the $1,000 was invested at the net asset value per share determined at the close of business on January 31, 2022. |
| ** | Absent an allocation of certain expenses to affiliates, expenses would be higher. |
| The percentage shown for each investment category in the Portfolio of Investments is based on net assets. | |
| (1) | Variable rate demand obligation that may be tendered at par on any day for payment the lesser of 5 business days or 7 calendar days. The stated interest rate, which generally resets weekly, is determined by the remarketing agent and represents the rate in effect at July 31, 2022. |
| (2) | Floating rate security. The stated interest rate represents the rate in effect at July 31, 2022. |
| (3) | When-issued/delayed delivery security. |
| (4) | Multi-step coupon security. Interest rate represents the rate in effect at July 31, 2022. |
| (5) | May be deemed to be an affiliated investment company. The rate shown is the annualized seven-day yield as of July 31, 2022. |
| At July 31, 2022, the concentration of the Fund’s investments in the various states, determined as a percentage of net assets, is as follows: | |
| New York | 13.2% |
| Texas | 11.0% |
| Others, representing less than 10% individually | 68.8% |
| The Fund invests primarily in debt securities issued by municipalities. The ability of the issuers of the debt securities to meet their obligations may be affected by economic developments in a specific industry or municipality. At July 31, 2022, 2.0% of total investments are backed by bond insurance of various financial institutions and financial guaranty assurance agencies. The aggregate percentage insured by an individual financial institution or financial guaranty assurance agency ranged from 0.6% to 1.4% of total investments. |
| Abbreviations: | |
| AGM | – Assured Guaranty Municipal Corp. |
| BAM | – Build America Mutual Assurance Co. |
| Liq | – Liquidity Provider |
| LOC | – Letter of Credit |
| PSF | – Permanent School Fund |
| SIFMA | – Securities Industry and Financial Markets Association Municipal Swap Index |
| SPA | – Standby Bond Purchase Agreement |
| July 31, 2022 | ||
| Short-Term
Municipal Bond Fund |
Intermediate-Term
Municipal Bond Fund | |
| Assets | ||
| Unaffiliated investments, at value (identified cost $257,496,556 and 553,256,383, respectively) | $ 257,122,368 | $ 553,680,799 |
| Affiliated investment, at value (identified cost $39,292,077 and 49,867,984, respectively) | 39,292,077 | 49,867,984 |
| Interest receivable | 2,168,039 | 5,535,480 |
| Dividends receivable from affiliated investment | 51,257 | 61,259 |
| Receivable for investments sold | 5,000,000 | 228,418 |
| Receivable for Fund shares sold | 222,940 | 817,056 |
| Receivable from affiliates | — | 145,469 |
| Total assets | $303,856,681 | $610,336,465 |
| Liabilities | ||
| Payable for investments purchased | $ 9,305,886 | $ — |
| Payable for when-issued securities | 18,611,066 | 21,068,731 |
| Payable for Fund shares redeemed | 5,812,680 | 1,959,284 |
| Distributions payable | 90,254 | 573,884 |
| Due to custodian | — | 5,792,454 |
| Payable to affiliates: | ||
| Investment adviser and administration fee | 73,312 | 231,121 |
| Distribution and service fees | 25,092 | 16,677 |
| Accrued expenses | 101,288 | 275,493 |
| Total liabilities | $ 34,019,578 | $ 29,917,644 |
| Net Assets | $269,837,103 | $580,418,821 |
| Sources of Net Assets | ||
| Paid-in capital | $ 277,954,713 | $ 600,851,485 |
| Accumulated loss | (8,117,610) | (20,432,664) |
| Net Assets | $269,837,103 | $580,418,821 |
| Class A Shares | ||
| Net Assets | $ 98,423,677 | $ 52,859,320 |
| Shares Outstanding | 9,690,372 | 4,423,690 |
| Net
Asset Value and Redemption Price Per Share (net assets ÷ shares of beneficial interest outstanding) |
$ 10.16 | $ 11.95 |
| Maximum
Offering Price Per Share (100 ÷ 96.75 of net asset value per share) |
$ 10.50 | $ 12.35 |
| Class C Shares | ||
| Net Assets | $ 3,688,508 | $ 6,312,862 |
| Shares Outstanding | 365,000 | 528,590 |
| Net
Asset Value and Offering Price Per Share* (net assets ÷ shares of beneficial interest outstanding) |
$ 10.11 | $ 11.94 |
| Class I Shares | ||
| Net Assets | $ 167,724,918 | $ 521,246,639 |
| Shares Outstanding | 16,507,681 | 43,578,609 |
| Net
Asset Value, Offering Price and Redemption Price Per Share (net assets ÷ shares of beneficial interest outstanding) |
$ 10.16 | $ 11.96 |
| On sales of $100,000 or more, the offering price of Class A shares is reduced. | |
| * | Redemption price per share is equal to the net asset value less any applicable contingent deferred sales charge. |
| Six Months Ended July 31, 2022 | ||
| Short-Term
Municipal Bond Fund |
Intermediate-Term
Municipal Bond Fund | |
| Investment Income | ||
| Dividend income from affiliated investment | $ 80,237 | $ 108,439 |
| Interest income | 2,372,016 | 6,992,042 |
| Total investment income | $ 2,452,253 | $ 7,100,481 |
| Expenses | ||
| Investment adviser and administration fee | $ 629,442 | $ 1,784,807 |
| Distribution and service fees: | ||
| Class A | 135,337 | 69,178 |
| Class C | 20,207 | 34,966 |
| Trustees’ fees and expenses | 10,422 | 21,144 |
| Custodian fee | 36,714 | 74,202 |
| Transfer and dividend disbursing agent fees | 43,162 | 419,590 |
| Legal and accounting services | 29,252 | 30,538 |
| Printing and postage | 6,458 | 33,670 |
| Registration fees | 33,872 | 50,246 |
| Miscellaneous | 9,083 | 13,496 |
| Total expenses | $ 953,949 | $ 2,531,837 |
| Deduct: | ||
| Waiver and/or reimbursement of expenses by affiliates | $ 8,180 | $ 477,398 |
| Total expense reductions | $ 8,180 | $ 477,398 |
| Net expenses | $ 945,769 | $ 2,054,439 |
| Net investment income | $ 1,506,484 | $ 5,046,042 |
| Realized and Unrealized Gain (Loss) | ||
| Net realized gain (loss): | ||
| Investment transactions | $ (7,891,206) | $ (21,157,931) |
| Net realized loss | $(7,891,206) | $(21,157,931) |
| Change in unrealized appreciation (depreciation): | ||
| Investments | $ (1,324,817) | $ (9,342,280) |
| Net change in unrealized appreciation (depreciation) | $(1,324,817) | $ (9,342,280) |
| Net realized and unrealized loss | $(9,216,023) | $(30,500,211) |
| Net decrease in net assets from operations | $(7,709,539) | $(25,454,169) |
| Six Months Ended July 31, 2022 (Unaudited) | ||
| Short-Term
Municipal Bond Fund |
Intermediate-Term
Municipal Bond Fund | |
| Increase (Decrease) in Net Assets | ||
| From operations: | ||
| Net investment income | $ 1,506,484 | $ 5,046,042 |
| Net realized loss | (7,891,206) | (21,157,931) |
| Net change in unrealized appreciation (depreciation) | (1,324,817) | (9,342,280) |
| Net decrease in net assets from operations | $ (7,709,539) | $ (25,454,169) |
| Distributions to shareholders: | ||
| Class A | $ (489,001) | $ (397,715) |
| Class C | — | (23,798) |
| Class I | (1,023,168) | (4,610,740) |
| Total distributions to shareholders | $ (1,512,169) | $ (5,032,253) |
| Transactions in shares of beneficial interest: | ||
| Class A | $ (17,583,896) | $ (5,972,710) |
| Class C | (783,474) | (1,695,916) |
| Class I | (34,383,888) | (70,511,792) |
| Net decrease in net assets from Fund share transactions | $ (52,751,258) | $ (78,180,418) |
| Net decrease in net assets | $ (61,972,966) | $(108,666,840) |
| Net Assets | ||
| At beginning of period | $ 331,810,069 | $ 689,085,661 |
| At end of period | $269,837,103 | $ 580,418,821 |
| Year Ended January 31, 2022 | ||
| Short-Term
Municipal Bond Fund |
Intermediate-Term
Municipal Bond Fund | |
| Increase (Decrease) in Net Assets | ||
| From operations: | ||
| Net investment income | $ 2,681,286 | $ 8,755,400 |
| Net realized gain | 772,723 | 436,464 |
| Net change in unrealized appreciation (depreciation) | (11,253,128) | (29,594,234) |
| Net decrease in net assets from operations | $ (7,799,119) | $ (20,402,370) |
| Distributions to shareholders: | ||
| Class A | $ (1,469,566) | $ (925,027) |
| Class C | (30,531) | (62,438) |
| Class I | (3,179,062) | (10,113,572) |
| Total distributions to shareholders | $ (4,679,159) | $ (11,101,037) |
| Transactions in shares of beneficial interest: | ||
| Class A | $ (11,725,431) | $ (2,977,634) |
| Class C | (2,666,827) | (2,436,425) |
| Class I | (37,797,402) | 110,138,775 |
| Net increase (decrease) in net assets from Fund share transactions | $ (52,189,660) | $104,724,716 |
| Net increase (decrease) in net assets | $ (64,667,938) | $ 73,221,309 |
| Net Assets | ||
| At beginning of year | $ 396,478,007 | $ 615,864,352 |
| At end of year | $331,810,069 | $689,085,661 |
| Short-Term
Municipal Bond Fund — Class A | ||||||
| Six
Months Ended July 31, 2022 (Unaudited) |
Year Ended January 31, | |||||
| 2022 | 2021 | 2020 | 2019 | 2018 | ||
| Net asset value — Beginning of period | $ 10.450 | $ 10.830 | $ 10.660 | $ 10.350 | $ 10.300 | $ 10.370 |
| Income (Loss) From Operations | ||||||
| Net investment income | $ 0.046 | $ 0.059 | $ 0.077(1) | $ 0.160(1) | $ 0.154(1) | $ 0.149 |
| Net realized and unrealized gain (loss) | (0.290) | (0.316) | 0.401 | 0.308 | 0.049 | (0.074) |
| Total income (loss) from operations | $ (0.244) | $ (0.257) | $ 0.478 | $ 0.468 | $ 0.203 | $ 0.075 |
| Less Distributions | ||||||
| From net investment income | $ (0.046) | $ (0.057) | $ (0.078) | $ (0.158) | $ (0.153) | $ (0.145) |
| From net realized gain | — | (0.066) | (0.230) | — | — | — |
| Total distributions | $ (0.046) | $ (0.123) | $ (0.308) | $ (0.158) | $ (0.153) | $ (0.145) |
| Net asset value — End of period | $10.160 | $ 10.450 | $ 10.830 | $ 10.660 | $ 10.350 | $ 10.300 |
| Total Return(2) | (2.34)% (3) | (2.39)% | 4.51% | 4.56% | 2.00% | 0.71% |
| Ratios/Supplemental Data | ||||||
| Net assets, end of period (000’s omitted) | $ 98,424 | $119,419 | $135,622 | $109,210 | $113,654 | $149,651 |
| Ratios (as a percentage of average daily net assets): | ||||||
| Expenses | 0.80% (4)(5) | 0.80% | 0.82% | 0.88% | 0.91% | 0.90% |
| Net investment income | 0.90% (4) | 0.59% | 0.71% | 1.52% | 1.50% | 1.39% |
| Portfolio Turnover | 50% (3) | 96% | 176% | 51% | 67% | 54% |
| (1) | Computed using average shares outstanding. |
| (2) | Returns are historical and are calculated by determining the percentage change in net asset value with all distributions reinvested and do not reflect the effect of sales charges. |
| (3) | Not annualized. |
| (4) | Annualized. |
| (5) | The investment adviser reduced a portion of its adviser and administration fee (equal to less than 0.01% of average daily net assets for the six months ended July 31, 2022). |
| Short-Term
Municipal Bond Fund — Class C | ||||||
| Six
Months Ended July 31, 2022 (Unaudited) |
Year Ended January 31, | |||||
| 2022 | 2021 | 2020 | 2019 | 2018 | ||
| Net asset value — Beginning of period | $ 10.390 | $ 10.790 | $ 10.640 | $ 10.320 | $ 10.270 | $ 10.340 |
| Income (Loss) From Operations | ||||||
| Net investment income (loss)(1) | $ 0.007 | $ (0.017) | $ 0.005 | $ 0.082 | $ 0.077 | $ 0.067 |
| Net realized and unrealized gain (loss) | (0.287) | (0.317) | 0.387 | 0.317 | 0.049 | (0.071) |
| Total income (loss) from operations | $ (0.280) | $ (0.334) | $ 0.392 | $ 0.399 | $ 0.126 | $ (0.004) |
| Less Distributions | ||||||
| From net investment income | $ — | $ — | $ (0.012) | $ (0.079) | $ (0.076) | $ (0.066) |
| From net realized gain | — | (0.066) | (0.230) | — | — | — |
| Total distributions | $ — | $ (0.066) | $ (0.242) | $ (0.079) | $ (0.076) | $ (0.066) |
| Net asset value — End of period | $10.110 | $10.390 | $10.790 | $10.640 | $10.320 | $10.270 |
| Total Return(2) | (2.69)% (3) | (3.11)% | 3.70% | 3.88% | 1.24% | (0.04)% |
| Ratios/Supplemental Data | ||||||
| Net assets, end of period (000’s omitted) | $ 3,689 | $ 4,603 | $ 7,473 | $ 24,622 | $ 35,832 | $ 52,079 |
| Ratios (as a percentage of average daily net assets): | ||||||
| Expenses | 1.55% (4)(5) | 1.55% | 1.57% | 1.63% | 1.66% | 1.65% |
| Net investment income (loss) | 0.14% (4) | (0.16)% | 0.05% | 0.78% | 0.75% | 0.64% |
| Portfolio Turnover | 50% (3) | 96% | 176% | 51% | 67% | 54% |
| (1) | Computed using average shares outstanding. |
| (2) | Returns are historical and are calculated by determining the percentage change in net asset value with all distributions reinvested and do not reflect the effect of sales charges. |
| (3) | Not annualized. |
| (4) | Annualized. |
| (5) | The investment adviser reduced a portion of its adviser and administration fee (equal to less than 0.01% of average daily net assets for the six months ended July 31, 2022). |
| Short-Term
Municipal Bond Fund — Class I | ||||||
| Six
Months Ended July 31, 2022 (Unaudited) |
Year Ended January 31, | |||||
| 2022 | 2021 | 2020 | 2019 | 2018 | ||
| Net asset value — Beginning of period | $ 10.450 | $ 10.830 | $ 10.660 | $ 10.350 | $ 10.300 | $ 10.370 |
| Income (Loss) From Operations | ||||||
| Net investment income | $ 0.058 | $ 0.086 | $ 0.105 | $ 0.186 | $ 0.181 | $ 0.172 |
| Net realized and unrealized gain (loss) | (0.290) | (0.316) | 0.400 | 0.308 | 0.048 | (0.071) |
| Total income (loss) from operations | $ (0.232) | $ (0.230) | $ 0.505 | $ 0.494 | $ 0.229 | $ 0.101 |
| Less Distributions | ||||||
| From net investment income | $ (0.058) | $ (0.084) | $ (0.105) | $ (0.184) | $ (0.179) | $ (0.171) |
| From net realized gain | — | (0.066) | (0.230) | — | — | — |
| Total distributions | $ (0.058) | $ (0.150) | $ (0.335) | $ (0.184) | $ (0.179) | $ (0.171) |
| Net asset value — End of period | $ 10.160 | $ 10.450 | $ 10.830 | $ 10.660 | $ 10.350 | $ 10.300 |
| Total Return(1) | (2.21)% (2) | (2.14)% | 4.77% | 4.82% | 2.25% | 0.96% |
| Ratios/Supplemental Data | ||||||
| Net assets, end of period (000’s omitted) | $167,725 | $207,787 | $253,382 | $157,176 | $164,679 | $179,156 |
| Ratios (as a percentage of average daily net assets): | ||||||
| Expenses | 0.55% (3)(4) | 0.55% | 0.57% | 0.63% | 0.66% | 0.65% |
| Net investment income | 1.15% (3) | 0.84% | 0.92% | 1.77% | 1.75% | 1.64% |
| Portfolio Turnover | 50% (2) | 96% | 176% | 51% | 67% | 54% |
| (1) | Returns are historical and are calculated by determining the percentage change in net asset value with all distributions reinvested. |
| (2) | Not annualized. |
| (3) | Annualized. |
| (4) | The investment adviser reduced a portion of its adviser and administration fee (equal to less than 0.01% of average daily net assets for the six months ended July 31, 2022). |
| Intermediate-Term
Municipal Bond Fund — Class A | ||||||
| Six
Months Ended July 31, 2022 (Unaudited) |
Year Ended January 31, | |||||
| 2022 | 2021 | 2020 | 2019 | 2018 | ||
| Net asset value — Beginning of period | $ 12.490 | $ 13.070 | $ 12.810 | $ 12.210 | $ 12.160 | $ 12.070 |
| Income (Loss) From Operations | ||||||
| Net investment income | $ 0.086 | $ 0.135 | $ 0.184 | $ 0.228 | $ 0.235 | $ 0.227 |
| Net realized and unrealized gain (loss) | (0.540) | (0.532) | 0.385 | 0.637 | 0.050 | 0.090 |
| Total income (loss) from operations | $ (0.454) | $ (0.397) | $ 0.569 | $ 0.865 | $ 0.285 | $ 0.317 |
| Less Distributions | ||||||
| From net investment income | $ (0.086) | $ (0.135) | $ (0.184) | $ (0.228) | $ (0.235) | $ (0.227) |
| From net realized gain | — | (0.048) | (0.125) | (0.037) | — | — |
| Total distributions | $ (0.086) | $ (0.183) | $ (0.309) | $ (0.265) | $ (0.235) | $ (0.227) |
| Net asset value — End of period | $11.950 | $12.490 | $13.070 | $12.810 | $12.210 | $12.160 |
| Total Return(1)(2) | (3.63)% (3) | (3.08)% | 4.49% | 7.15% | 2.38% | 2.62% |
| Ratios/Supplemental Data | ||||||
| Net assets, end of period (000’s omitted) | $ 52,859 | $ 61,492 | $ 67,422 | $ 50,697 | $ 42,715 | $ 48,494 |
| Ratios (as a percentage of average daily net assets): | ||||||
| Expenses (2) | 0.89% (4)(5) | 0.90% | 0.90% | 0.90% | 0.90% | 0.90% |
| Net investment income | 1.44% (5) | 1.09% | 1.41% | 1.81% | 1.95% | 1.85% |
| Portfolio Turnover | 81% (3) | 61% | 104% | 74% | 86% | 62% |
| (1) | Returns are historical and are calculated by determining the percentage change in net asset value with all distributions reinvested and do not reflect the effect of sales charges. |
| (2) | The investment adviser and administrator and/or sub-adviser reimbursed certain operating expenses (equal to 0.16%, 0.12%, 0.09%, 0.08%, 0.08% and 0.07% of average daily net assets for the six months ended July 31, 2022 and the years ended January 31, 2022, 2021, 2020, 2019 and 2018, respectively). Absent this reimbursement, total return would be lower. |
| (3) | Not annualized. |
| (4) | Includes a reduction by the investment adviser of a portion of its adviser and administration fee due to the Fund's investment in the Liquidity Fund (equal to less than 0.005% of average daily net assets for the six months ended July 31, 2022). |
| (5) | Annualized. |
| Intermediate-Term
Municipal Bond Fund — Class C | ||||||
| Six
Months Ended July 31, 2022 (Unaudited) |
Year Ended January 31, | |||||
| 2022 | 2021 | 2020 | 2019 | 2018 | ||
| Net asset value — Beginning of period | $ 12.480 | $ 13.070 | $ 12.810 | $ 12.210 | $ 12.160 | $ 12.060 |
| Income (Loss) From Operations | ||||||
| Net investment income | $ 0.041 | $ 0.044(1) | $ 0.092(1) | $ 0.133 | $ 0.143 | $ 0.134 |
| Net realized and unrealized gain (loss) | (0.540) | (0.548) | 0.379 | 0.638 | 0.051 | 0.101 |
| Total income (loss) from operations | $ (0.499) | $ (0.504) | $ 0.471 | $ 0.771 | $ 0.194 | $ 0.235 |
| Less Distributions | ||||||
| From net investment income | $ (0.041) | $ (0.038) | $ (0.086) | $ (0.134) | $ (0.144) | $ (0.135) |
| From net realized gain | — | (0.048) | (0.125) | (0.037) | — | — |
| Total distributions | $ (0.041) | $ (0.086) | $ (0.211) | $ (0.171) | $ (0.144) | $ (0.135) |
| Net asset value — End of period | $11.940 | $12.480 | $13.070 | $12.810 | $12.210 | $12.160 |
| Total Return(2)(3) | (3.99)% (4) | (3.88)% | 3.70% | 6.35% | 1.61% | 1.94% |
| Ratios/Supplemental Data | ||||||
| Net assets, end of period (000’s omitted) | $ 6,313 | $ 8,362 | $ 11,226 | $ 22,557 | $ 24,456 | $ 29,221 |
| Ratios (as a percentage of average daily net assets): | ||||||
| Expenses (3) | 1.64% (5)(6) | 1.65% | 1.65% | 1.65% | 1.65% | 1.65% |
| Net investment income | 0.69% (6) | 0.34% | 0.72% | 1.08% | 1.20% | 1.10% |
| Portfolio Turnover | 81% (4) | 61% | 104% | 74% | 86% | 62% |
| (1) | Computed using average shares outstanding. |
| (2) | Returns are historical and are calculated by determining the percentage change in net asset value with all distributions reinvested and do not reflect the effect of sales charges. |
| (3) | The investment adviser and administrator and/or sub-adviser reimbursed certain operating expenses (equal to 0.16%, 0.12%, 0.09%, 0.08%, 0.08% and 0.07% of average daily net assets for the six months ended July 31, 2022 and the years ended January 31, 2022, 2021, 2020, 2019 and 2018, respectively). Absent this reimbursement, total return would be lower. |
| (4) | Not annualized. |
| (5) | Includes a reduction by the investment adviser of a portion of its adviser and administration fee due to the Fund's investment in the Liquidity Fund (equal to less than 0.005% of average daily net assets for the six months ended July 31, 2022). |
| (6) | Annualized. |
| Intermediate-Term
Municipal Bond Fund — Class I | ||||||
| Six
Months Ended July 31, 2022 (Unaudited) |
Year Ended January 31, | |||||
| 2022 | 2021 | 2020 | 2019 | 2018 | ||
| Net asset value — Beginning of period | $ 12.500 | $ 13.090 | $ 12.820 | $ 12.220 | $ 12.180 | $ 12.080 |
| Income (Loss) From Operations | ||||||
| Net investment income | $ 0.101 | $ 0.167 | $ 0.216 | $ 0.260 | $ 0.265 | $ 0.258 |
| Net realized and unrealized gain (loss) | (0.540) | (0.542) | 0.395 | 0.636 | 0.040 | 0.100 |
| Total income (loss) from operations | $ (0.439) | $ (0.375) | $ 0.611 | $ 0.896 | $ 0.305 | $ 0.358 |
| Less Distributions | ||||||
| From net investment income | $ (0.101) | $ (0.167) | $ (0.216) | $ (0.259) | $ (0.265) | $ (0.258) |
| From net realized gain | — | (0.048) | (0.125) | (0.037) | — | — |
| Total distributions | $ (0.101) | $ (0.215) | $ (0.341) | $ (0.296) | $ (0.265) | $ (0.258) |
| Net asset value — End of period | $ 11.960 | $ 12.500 | $ 13.090 | $ 12.820 | $ 12.220 | $ 12.180 |
| Total Return(1)(2) | (3.51)% (3) | (2.90)% | 4.82% | 7.41% | 2.63% | 2.87% |
| Ratios/Supplemental Data | ||||||
| Net assets, end of period (000’s omitted) | $521,247 | $619,232 | $537,216 | $404,214 | $396,647 | $413,436 |
| Ratios (as a percentage of average daily net assets): | ||||||
| Expenses (2) | 0.64% (4)(5) | 0.65% | 0.65% | 0.65% | 0.65% | 0.65% |
| Net investment income | 1.69% (5) | 1.34% | 1.66% | 2.07% | 2.19% | 2.10% |
| Portfolio Turnover | 81% (3) | 61% | 104% | 74% | 86% | 62% |
| (1) | Returns are historical and are calculated by determining the percentage change in net asset value with all distributions reinvested. |
| (2) | The investment adviser and administrator and/or sub-adviser reimbursed certain operating expenses (equal to 0.16%, 0.12%, 0.09%, 0.08%, 0.08% and 0.07% of average daily net assets for the six months ended July 31, 2022 and the years ended January 31, 2022, 2021, 2020, 2019 and 2018, respectively). Absent this reimbursement, total return would be lower. |
| (3) | Not annualized. |
| (4) | Includes a reduction by the investment adviser of a portion of its adviser and administration fee due to the Fund's investment in the Liquidity Fund (equal to less than 0.005% of average daily net assets for the six months ended July 31, 2022). |
| (5) | Annualized. |
| Short-Term
Municipal Bond Fund |
Intermediate-Term
Municipal Bond Fund | |
| Aggregate cost | $296,725,583 | $603,106,488 |
| Gross unrealized appreciation | $ 3,319,379 | $ 9,930,120 |
| Gross unrealized depreciation | (3,630,517) | (9,487,825) |
| Net unrealized appreciation (depreciation) | $ (311,138) | $ 442,295 |
| Short-Term
Municipal Bond Fund |
Intermediate-Term
Municipal Bond Fund | ||||
| Annual Fee Rate | Annual Fee Rate | ||||
| Average Daily Net Assets | As
of July 1, 2022* |
Prior
to July 1, 2022 |
As
of July 1, 2022* |
Prior
to July 1, 2022 | |
| Up to $500 million | 0.3500% | 0.4500% | 0.5000% | 0.6000% | |
| $500 million but less than $1 billion | 0.3500% | 0.4400% | 0.5000% | 0.6000% | |
| $1 billion but less than $2 billion | 0.3375% | 0.4300% | 0.4750% | 0.5750% | |
| $2 billion but less than $5 billion | 0.3250% | 0.4100% | 0.4550% | 0.5500% | |
| $5 billion and over | 0.3175% | 0.4000% | 0.4400% | 0.5300% | |
| * | Reflects a fee reduction pursuant to an amendment to each Fund's investment advisory and administrative agreement effective July 1, 2022. |
| Short-Term
Municipal Bond Fund |
Intermediate-Term
Municipal Bond Fund | |
| Investment Adviser and Administration Fee | $629,442 | $1,784,807 |
| Effective Annual Rate | 0.43% | 0.58% |
| Short-Term
Municipal Bond Fund |
Intermediate-Term
Municipal Bond Fund | |
| EVM's Sub-Transfer Agent Fees | $2,473 | $2,221 |
| EVD's Class A Sales Charges | $ 262 | $ 403 |
| Morgan Stanley affiliated broker-dealers’ Class A Sales Charges | $ — | $1,500 |
| Short-Term
Municipal Bond Fund |
Intermediate-Term
Municipal Bond Fund | |
| Class A Distribution and Service Fees | $135,337 | $69,178 |
| Short-Term
Municipal Bond Fund |
Intermediate-Term
Municipal Bond Fund | |
| Class C Distribution Fees | $15,155 | $26,225 |
| Short-Term
Municipal Bond Fund |
Intermediate-Term
Municipal Bond Fund | |
| Class C Service Fees | $5,052 | $8,741 |
| Short-Term
Municipal Bond Fund |
Intermediate-Term
Municipal Bond Fund | |
| Class A | $5,000 | $ 300 |
| Class C | $ — | $2,000 |
| Short-Term
Municipal Bond Fund |
Intermediate-Term
Municipal Bond Fund | |
| Purchases | ||
| Investments (non-U.S. Government) | $ 134,148,516 | $ 484,787,776 |
| U.S. Government and Agency Securities | 6,161,203 | — |
| Total Purchases | $140,309,719 | $484,787,776 |
| Sales | ||
| Investments (non-U.S. Government) | $ 150,716,318 | $ 464,629,733 |
| U.S. Government and Agency Securities | 42,545,881 | 102,142,964 |
| Total Sales | $193,262,199 | $566,772,697 |
| Short-Term Municipal Bond Fund | ||||||
| Six
Months Ended July 31, 2022 (Unaudited) |
Year
Ended January 31, 2022 | |||||
| Shares | Amount | Shares | Amount | |||
| Class A | ||||||
| Sales | 227,277 | $ 2,302,396 | 1,192,418 | $ 12,793,020 | ||
| Issued to shareholders electing to receive payments of distributions in Fund shares | 40,835 | 413,060 | 116,663 | 1,246,260 | ||
| Redemptions | (2,019,429) | (20,437,492) | (2,532,674) | (27,132,468) | ||
| Converted from Class C shares | 13,731 | 138,140 | 127,144 | 1,367,757 | ||
| Net decrease | (1,737,586) | $(17,583,896) | (1,096,449) | $ (11,725,431) | ||
| Short-Term Municipal Bond Fund (continued) | ||||||
| Six
Months Ended July 31, 2022 (Unaudited) |
Year
Ended January 31, 2022 | |||||
| Shares | Amount | Shares | Amount | |||
| Class C | ||||||
| Sales | 27,974 | $ 278,235 | 50,891 | $ 544,607 | ||
| Issued to shareholders electing to receive payments of distributions in Fund shares | — | — | 2,109 | 22,375 | ||
| Redemptions | (92,274) | (923,569) | (174,871) | (1,866,052) | ||
| Converted to Class A shares | (13,811) | (138,140) | (127,673) | (1,367,757) | ||
| Net decrease | (78,111) | $ (783,474) | (249,544) | $ (2,666,827) | ||
| Class I | ||||||
| Sales | 3,018,577 | $ 30,437,389 | 6,930,959 | $ 74,416,982 | ||
| Issued to shareholders electing to receive payments of distributions in Fund shares | 67,746 | 685,775 | 201,729 | 2,157,637 | ||
| Redemptions | (6,455,917) | (65,507,052) | (10,646,030) | (114,372,021) | ||
| Net decrease | (3,369,594) | $(34,383,888) | (3,513,342) | $ (37,797,402) | ||
| Intermediate-Term Municipal Bond Fund | ||||||
| Six
Months Ended July 31, 2022 (Unaudited) |
Year
Ended January 31, 2022 | |||||
| Shares | Amount | Shares | Amount | |||
| Class A | ||||||
| Sales | 510,004 | $ 6,077,746 | 1,201,456 | $ 15,541,810 | ||
| Issued to shareholders electing to receive payments of distributions in Fund shares | 16,942 | 202,238 | 36,308 | 467,442 | ||
| Redemptions | (1,049,215) | (12,519,270) | (1,501,941) | (19,390,738) | ||
| Converted from Class C shares | 22,239 | 266,576 | 31,216 | 403,852 | ||
| Net decrease | (500,030) | $ (5,972,710) | (232,961) | $ (2,977,634) | ||
| Class C | ||||||
| Sales | 24,372 | $ 289,234 | 80,394 | $ 1,040,821 | ||
| Issued to shareholders electing to receive payments of distributions in Fund shares | 911 | 10,856 | 2,128 | 27,373 | ||
| Redemptions | (144,351) | (1,729,430) | (240,442) | (3,100,767) | ||
| Converted to Class A shares | (22,245) | (266,576) | (31,222) | (403,852) | ||
| Net decrease | (141,313) | $ (1,695,916) | (189,142) | $ (2,436,425) | ||
| Intermediate-Term Municipal Bond Fund (continued) | ||||||
| Six
Months Ended July 31, 2022 (Unaudited) |
Year
Ended January 31, 2022 | |||||
| Shares | Amount | Shares | Amount | |||
| Class I | ||||||
| Sales | 11,032,774 | $ 131,596,017 | 20,658,776 | $ 267,233,472 | ||
| Issued to shareholders electing to receive payments of distributions in Fund shares | 158,666 | 1,895,688 | 325,454 | 4,193,986 | ||
| Redemptions | (17,146,892) | (204,003,497) | (12,498,276) | (161,288,683) | ||
| Net increase (decrease) | (5,955,452) | $ (70,511,792) | 8,485,954 | $ 110,138,775 | ||
| Short-Term
Municipal Bond Fund |
||||||||
| Name | Value,
beginning of period |
Purchases | Sales
proceeds |
Net
realized gain (loss) |
Change
in unrealized appreciation (depreciation) |
Value,
end of period |
Dividend
income |
Shares,
end of period |
| Short-Term Investments | ||||||||
| Liquidity Fund | $ — | $67,561,130 | $(28,269,053) | $ — | $ — | $39,292,077 | $80,237 | 39,292,077 |
| Intermediate-Term
Municipal Bond Fund |
||||||||
| Name | Value,
beginning of period |
Purchases | Sales
proceeds |
Net
realized gain (loss) |
Change
in unrealized appreciation (depreciation) |
Value,
end of period |
Dividend
income |
Shares,
end of period |
| Short-Term Investments | ||||||||
| Liquidity Fund | $ — | $119,575,126 | $(69,707,142) | $ — | $ — | $49,867,984 | $108,439 | 49,867,984 |
| • | Level 1 – quoted prices in active markets for identical investments |
| • | Level 2 – other significant observable inputs (including quoted prices for similar investments, interest rates, prepayment speeds, credit risk, etc.) |
| • | Level 3 – significant unobservable inputs (including a fund's own assumptions in determining the fair value of investments) |
| Short-Term
Municipal Bond Fund |
||||
| Asset Description | Level 1 | Level 2 | Level 3 | Total |
| Tax-Exempt Municipal Obligations | $ — | $ 250,962,396 | $ — | $ 250,962,396 |
| U.S. Treasury Obligations | — | 6,159,972 | — | 6,159,972 |
| Short-Term Investments | 39,292,077 | — | — | 39,292,077 |
| Total Investments | $39,292,077 | $257,122,368 | $ — | $296,414,445 |
| Intermediate-Term
Municipal Bond Fund |
||||
| Asset Description | Level 1 | Level 2 | Level 3 | Total |
| Tax-Exempt Municipal Obligations | $ — | $ 553,680,799 | $ — | $ 553,680,799 |
| Short-Term Investments | 49,867,984 | — | — | 49,867,984 |
| Total Investments | $49,867,984 | $553,680,799 | $ — | $603,548,783 |
| Officers | |
| Eric
A. Stein President |
Jill R.
Damon Secretary |
| Deidre
E. Walsh Vice President, Secretary and Chief Legal Officer |
Richard F.
Froio Chief Compliance Officer |
| James
F. Kirchner Treasurer |
|
| Trustees |
| * | Interested Trustee |
| ** | Mr. Bowser and Ms. Wiser began serving as Trustees effective April 4, 2022. |
| Privacy Notice | April 2021 |
| FACTS | WHAT
DOES EATON VANCE DO WITH YOUR PERSONAL INFORMATION? |
| Why? | Financial companies choose how they share your personal information. Federal law gives consumers the right to limit some but not all sharing. Federal law also requires us to tell you how we collect, share, and protect your personal information. Please read this notice carefully to understand what we do. |
| What? | The
types of personal information we collect and share depend on the product or service you have with us. This information can include:■ Social Security number and income ■ investment experience and risk tolerance ■ checking account number and wire transfer instructions |
| How? | All financial companies need to share customers’ personal information to run their everyday business. In the section below, we list the reasons financial companies can share their customers’ personal information; the reasons Eaton Vance chooses to share; and whether you can limit this sharing. |
| Reasons
we can share your personal information |
Does
Eaton Vance share? |
Can
you limit this sharing? |
| For our everyday business purposes — such as to process your transactions, maintain your account(s), respond to court orders and legal investigations, or report to credit bureaus | Yes | No |
| For our marketing purposes — to offer our products and services to you | Yes | No |
| For joint marketing with other financial companies | No | We don’t share |
| For our investment management affiliates’ everyday business purposes — information about your transactions, experiences, and creditworthiness | Yes | Yes |
| For our affiliates’ everyday business purposes — information about your transactions and experiences | Yes | No |
| For our affiliates’ everyday business purposes — information about your creditworthiness | No | We don’t share |
| For our investment management affiliates to market to you | Yes | Yes |
| For our affiliates to market to you | No | We don’t share |
| For nonaffiliates to market to you | No | We don’t share |
| To
limit our sharing |
Call toll-free 1-800-262-1122 or email: EVPrivacy@eatonvance.comPlease note:If you are a new customer, we can begin sharing your information 30 days from the date we sent this notice. When you are no longer our customer, we continue to share your information as described in this notice. However, you can contact us at any time to limit our sharing. |
| Questions? | Call toll-free 1-800-262-1122 or email: EVPrivacy@eatonvance.com |
| Privacy Notice — continued | April 2021 |
| Who we are | |
| Who is providing this notice? | Eaton Vance Management, Eaton Vance Distributors, Inc., Eaton Vance Trust Company, Eaton Vance Management (International) Limited, Eaton Vance Advisers International Ltd., Eaton Vance Global Advisors Limited, Eaton Vance Management’s Real Estate Investment Group, Boston Management and Research, Calvert Research and Management, Eaton Vance and Calvert Fund Families and our investment advisory affiliates (“Eaton Vance”) (see Investment Management Affiliates definition below) |
| What we do | |
| How
does Eaton Vance protect my personal information? |
To protect your personal information from unauthorized access and use, we use security measures that comply with federal law. These measures include computer safeguards and secured files and buildings. We have policies governing the proper handling of customer information by personnel and requiring third parties that provide support to adhere to appropriate security standards with respect to such information. |
| How
does Eaton Vance collect my personal information? |
We
collect your personal information, for example, when you■ open an account or make deposits or withdrawals from your account ■ buy securities from us or make a wire transfer ■ give us your contact informationWe also collect your personal information from others, such as credit bureaus, affiliates, or other companies. |
| Why can’t I limit all sharing? | Federal
law gives you the right to limit only■ sharing for affiliates’ everyday business purposes — information about your creditworthiness ■ affiliates from using your information to market to you ■ sharing for nonaffiliates to market to youState laws and individual companies may give you additional rights to limit sharing. See below for more on your rights under state law. |
| Definitions | |
| Investment
Management Affiliates |
Eaton Vance Investment Management Affiliates include registered investment advisers, registered broker- dealers, and registered and unregistered funds. Investment Management Affiliates does not include entities associated with Morgan Stanley Wealth Management, such as Morgan Stanley Smith Barney LLC and Morgan Stanley & Co. |
| Affiliates | Companies related by common ownership or control. They can be financial and nonfinancial companies.■ Our affiliates include companies with a Morgan Stanley name and financial companies such as Morgan Stanley Smith Barney LLC and Morgan Stanley & Co. |
| Nonaffiliates | Companies not related by common ownership or control. They can be financial and nonfinancial companies.■ Eaton Vance does not share with nonaffiliates so they can market to you. |
| Joint marketing | A formal agreement between nonaffiliated financial companies that together market financial products or services to you.■ Eaton Vance doesn’t jointly market. |
| Other important information | |
| Vermont: Except as permitted by law, we will not share personal information we collect about Vermont residents with Nonaffiliates unless you provide us with your written consent to share such information.California: Except as permitted by law, we will not share personal information we collect about California residents with Nonaffiliates and we will limit sharing such personal information with our Affiliates to comply with California privacy laws that apply to us. | |


| % Average Annual Total Returns1,2 | Class
Inception Date |
Performance
Inception Date |
Six Months | One Year | Five Years | Ten Years |
| Class A at NAV | 02/01/2010 | 02/01/2010 | (4.16)% | (7.63)% | 1.31% | 2.81% |
| Class A with 3.25% Maximum Sales Charge | — | — | (7.29) | (10.66) | 0.64 | 2.46 |
| Class C at NAV | 02/01/2010 | 02/01/2010 | (4.44) | (8.32) | 0.55 | 2.19 |
| Class C with 1% Maximum Sales Charge | — | — | (5.39) | (9.23) | 0.55 | 2.19 |
| Class I at NAV | 02/01/2010 | 02/01/2010 | (4.04) | (7.41) | 1.56 | 3.06 |
|
| ||||||
| Bloomberg 10 Year Municipal Bond Index | — | — | (2.76)% | (6.09)% | 2.05% | 2.66% |
| Bloomberg 15 Year Municipal Bond Index | — | — | (4.84) | (8.19) | 2.36 | 3.06 |
| % Total Annual Operating Expense Ratios3 | Class A | Class C | Class I |
| Gross | 0.66% | 1.41% | 0.41% |
| Net | 0.65 | 1.40 | 0.40 |
| % Distribution Rates/Yields4 | Class A | Class C | Class I |
| Distribution Rate | 1.79% | 1.05% | 2.04% |
| SEC 30-day Yield – Subsidized | 2.02 | 1.36 | 2.34 |
| SEC 30-day Yield – Unsubsidized | 1.99 | 1.32 | 2.30 |
| Credit Quality (% of total investments)* |

| * | For purposes of the Fund’s rating restrictions, ratings are based on Moody’s Investors Service, Inc. (“Moody’s”), S&P Global Ratings (“S&P”) or Fitch Ratings (“Fitch”), as applicable. If securities are rated differently by the ratings agencies, the highest rating is applied. Ratings, which are subject to change, apply to the creditworthiness of the issuers of the underlying securities and not to the Fund or its shares. Credit ratings measure the quality of a bond based on the issuer’s creditworthiness, with ratings ranging from AAA, being the highest, to D, being the lowest based on S&P’s measures. Ratings of BBB or higher by S&P or Fitch (Baa or higher by Moody’s) are considered to be investment-grade quality. Credit ratings are based largely on the ratings agency’s analysis at the time of rating. The rating assigned to any particular security is not necessarily a reflection of the issuer’s current financial condition and does not necessarily reflect its assessment of the volatility of a security’s market value or of the liquidity of an investment in the security. Holdings designated as “Not Rated” (if any) are not rated by the national ratings agencies stated above. |
| 1 | Bloomberg 10 Year Municipal Bond Index is an unmanaged index of municipal bonds traded in the U.S. with maturities ranging from 8-12 years. Bloomberg 15 Year Municipal Bond Index is an unmanaged index of municipal bonds traded in the U.S. with maturities ranging from 12-17 years. Unless otherwise stated, index returns do not reflect the effect of any applicable sales charges, commissions, expenses, taxes or leverage, as applicable. It is not possible to invest directly in an index. |
| 2 | Total Returns at NAV do not include applicable sales charges. If sales charges were deducted, the returns would be lower. Total Returns shown with maximum sales charges reflect the stated maximum sales charge. Unless otherwise stated, performance does not reflect the deduction of taxes on Fund distributions or redemptions of Fund shares.Effective April 15, 2015, the Fund changed its investment objective and investment strategy. Performance prior to April 15, 2015 reflects the Fund’s performance under its former investment objective and policies.Effective November 5, 2020, Class C shares automatically convert to Class A shares eight years after purchase. The average annual total returns listed for Class C reflect conversion to Class A shares after eight years. Prior to November 5, 2020, Class C shares automatically converted to Class A shares ten years after purchase. |
| 3 | Source: Fund prospectus. Net expense ratios reflect a contractual expense reimbursement that continues through 5/31/23. The expense ratios for the current reporting period can be found in the Financial Highlights section of this report. Performance reflects expenses waived and/or reimbursed, if applicable. Without such waivers and/or reimbursements, performance would have been lower. |
| 4 | The Distribution Rate is based on the Fund’s last regular distribution per share in the period (annualized) divided by the Fund’s NAV at the end of the period. The Fund’s distributions may be comprised of amounts characterized for federal income tax purposes as tax-exempt income, qualified and non-qualified ordinary dividends, capital gains and nondividend distributions, also known as return of capital. The Fund will determine the federal income tax character of distributions paid to a shareholder after the end of the calendar year. This is reported on the IRS form 1099-DIV and provided to the shareholder shortly after each year-end. The Fund’s distributions are determined by the investment adviser based on its current assessment of the Fund’s long-term return potential. As portfolio and market conditions change, the rate of distributions paid by the Fund could change. The SEC Yield is a standardized measure based on the estimated yield to maturity of a fund’s investments over a 30-day period and is based on the maximum offer price at the date specified. The SEC Yield is not based on the distributions made by the Fund, which may differ. Subsidized yield reflects the effect of fee waivers and expense reimbursements. |
| Fund profile subject to change due to active management. |
| Beginning
Account Value (2/1/22) |
Ending
Account Value (7/31/22) |
Expenses
Paid During Period* (2/1/22 – 7/31/22) |
Annualized
Expense Ratio | |
| Actual | ||||
| Class A | $1,000.00 | $ 958.40 | $3.16** | 0.65% |
| Class C | $1,000.00 | $ 955.60 | $6.79** | 1.40% |
| Class I | $1,000.00 | $ 959.60 | $1.94** | 0.40% |
| Hypothetical | ||||
| (5% return per year before expenses) | ||||
| Class A | $1,000.00 | $1,021.57 | $3.26** | 0.65% |
| Class C | $1,000.00 | $1,017.85 | $7.00** | 1.40% |
| Class I | $1,000.00 | $1,022.81 | $2.01** | 0.40% |
| * | Expenses are equal to the Fund's annualized expense ratio for the indicated Class, multiplied by the average account value over the period, multiplied by 181/365 (to reflect the one-half year period). The Example assumes that the $1,000 was invested at the net asset value per share determined at the close of business on January 31, 2022. The Example reflects the expenses of both the Fund and the Portfolio. |
| ** | Absent an allocation of certain expenses to affiliates, expenses would be higher. |
| July 31, 2022 | |
| Assets | |
| Investment in 5-to-15 Year Laddered Municipal Bond Portfolio, at value (identified cost $697,925,427) | $ 690,731,048 |
| Receivable for Fund shares sold | 1,321,254 |
| Receivable from affiliates | 24,517 |
| Total assets | $692,076,819 |
| Liabilities | |
| Payable for Fund shares redeemed | $ 1,687,075 |
| Distributions payable | 221,561 |
| Payable to affiliates: | |
| Distribution and service fees | 35,276 |
| Accrued expenses | 150,461 |
| Total liabilities | $ 2,094,373 |
| Net Assets | $689,982,446 |
| Sources of Net Assets | |
| Paid-in capital | $ 725,663,186 |
| Accumulated loss | (35,680,740) |
| Net Assets | $689,982,446 |
| Class A Shares | |
| Net Assets | $ 69,090,349 |
| Shares Outstanding | 5,723,550 |
| Net
Asset Value and Redemption Price Per Share (net assets ÷ shares of beneficial interest outstanding) |
$ 12.07 |
| Maximum
Offering Price Per Share (100 ÷ 96.75 of net asset value per share) |
$ 12.48 |
| Class C Shares | |
| Net Assets | $ 24,087,366 |
| Shares Outstanding | 1,996,207 |
| Net
Asset Value and Offering Price Per Share* (net assets ÷ shares of beneficial interest outstanding) |
$ 12.07 |
| Class I Shares | |
| Net Assets | $ 596,804,731 |
| Shares Outstanding | 49,473,678 |
| Net
Asset Value, Offering Price and Redemption Price Per Share (net assets ÷ shares of beneficial interest outstanding) |
$ 12.06 |
| On sales of $100,000 or more, the offering price of Class A shares is reduced. | |
| * | Redemption price per share is equal to the net asset value less any applicable contingent deferred sales charge. |
| Six Months Ended | |
| July 31, 2022 | |
| Investment Income | |
| Dividend income allocated from Portfolio | $ 64,271 |
| Interest income allocated from Portfolio | 9,140,719 |
| Expenses allocated from Portfolio | (1,371,269) |
| Total investment income from Portfolio | $ 7,833,721 |
| Expenses | |
| Distribution and service fees: | |
| Class A | $ 92,104 |
| Class C | 132,983 |
| Trustees’ fees and expenses | 250 |
| Custodian fee | 25,977 |
| Transfer and dividend disbursing agent fees | 142,192 |
| Legal and accounting services | 17,516 |
| Printing and postage | 20,813 |
| Registration fees | 44,485 |
| Miscellaneous | 8,124 |
| Total expenses | $ 484,444 |
| Deduct: | |
| Allocation of expenses to affiliates | $ 66,168 |
| Total expense reductions | $ 66,168 |
| Net expenses | $ 418,276 |
| Net investment income | $ 7,415,445 |
| Realized and Unrealized Gain (Loss) from Portfolio | |
| Net realized gain (loss): | |
| Investment transactions | $ (24,110,720) |
| Net realized loss | $(24,110,720) |
| Change in unrealized appreciation (depreciation): | |
| Investments | $ (23,768,011) |
| Net change in unrealized appreciation (depreciation) | $(23,768,011) |
| Net realized and unrealized loss | $(47,878,731) |
| Net decrease in net assets from operations | $(40,463,286) |
| Six
Months Ended July 31, 2022 (Unaudited) |
Year
Ended January 31, 2022 | |
| Increase (Decrease) in Net Assets | ||
| From operations: | ||
| Net investment income | $ 7,415,445 | $ 15,011,060 |
| Net realized gain (loss) | (24,110,720) | 3,489,360 |
| Net change in unrealized appreciation (depreciation) | (23,768,011) | (42,921,803) |
| Net decrease in net assets from operations | $ (40,463,286) | $ (24,421,383) |
| Distributions to shareholders: | ||
| Class A | $ (625,243) | $ (1,170,757) |
| Class C | (125,654) | (222,704) |
| Class I | (6,641,774) | (13,597,794) |
| Total distributions to shareholders | $ (7,392,671) | $ (14,991,255) |
| Transactions in shares of beneficial interest: | ||
| Class A | $ (8,692,524) | $ (3,587,280) |
| Class C | (5,169,915) | (5,093,002) |
| Class I | (186,317,639) | 83,582,567 |
| Net increase (decrease) in net assets from Fund share transactions | $(200,180,078) | $ 74,902,285 |
| Other capital: | ||
| Portfolio transaction fee contributed to Portfolio | $ (368,142) | $ (240,536) |
| Portfolio transaction fee allocated from Portfolio | 367,621 | 249,295 |
| Net increase (decrease) in net assets from other capital | $ (521) | $ 8,759 |
| Net increase (decrease) in net assets | $(248,036,556) | $ 35,498,406 |
| Net Assets | ||
| At beginning of period | $ 938,019,002 | $ 902,520,596 |
| At end of period | $ 689,982,446 | $938,019,002 |
| Class A | ||||||
| Six
Months Ended July 31, 2022 (Unaudited) |
Year Ended January 31, | |||||
| 2022 | 2021 | 2020 | 2019 | 2018 | ||
| Net asset value — Beginning of period | $ 12.700 | $ 13.240 | $ 12.900 | $ 12.220 | $ 12.110 | $ 11.900 |
| Income (Loss) From Operations | ||||||
| Net investment income | $ 0.102 | $ 0.182 | $ 0.213 | $ 0.237 | $ 0.225 | $ 0.210 |
| Net realized and unrealized gain (loss) | (0.630) | (0.540) | 0.340 | 0.680 | 0.110 | 0.210 |
| Total income (loss) from operations | $ (0.528) | $ (0.358) | $ 0.553 | $ 0.917 | $ 0.335 | $ 0.420 |
| Less Distributions | ||||||
| From net investment income | $ (0.102) | $ (0.182) | $ (0.213) | $ (0.237) | $ (0.225) | $ (0.210) |
| Total distributions | $ (0.102) | $ (0.182) | $ (0.213) | $ (0.237) | $ (0.225) | $ (0.210) |
| Net asset value — End of period | $12.070 | $12.700 | $13.240 | $12.900 | $12.220 | $ 12.110 |
| Total Return(1)(2) | (4.16)% (3) | (2.73)% | 4.34% | 7.56% | 2.80% | 3.53% |
| Ratios/Supplemental Data | ||||||
| Net assets, end of period (000’s omitted) | $ 69,090 | $ 81,892 | $ 88,983 | $ 85,608 | $ 87,287 | $104,397 |
| Ratios (as a percentage of average daily net assets):(4) | ||||||
| Expenses (2) | 0.65% (5)(6) | 0.65% | 0.65% | 0.65% | 0.65% | 0.65% |
| Net investment income | 1.71% (6) | 1.39% | 1.65% | 1.88% | 1.87% | 1.72% |
| Portfolio Turnover of the Portfolio | 34% (3) | 22% | 51% | 28% | 78% | 35% |
| (1) | Returns are historical and are calculated by determining the percentage change in net asset value with all distributions reinvested and do not reflect the effect of sales charges. |
| (2) | The investment adviser and administrator and the sub-adviser of the Fund and the investment adviser and the sub-adviser of the Portfolio reimbursed certain operating expenses (equal to 0.03%, 0.01%, 0.03%, 0.02%, 0.04% and 0.05% of average daily net assets for the six months ended July 31, 2022 and the years ended January 31, 2022, 2021, 2020, 2019 and 2018, respectively). Absent this reimbursement, total return would be lower. |
| (3) | Not annualized. |
| (4) | Includes the Fund’s share of the Portfolio’s allocated expenses. |
| (5) | Includes a reduction by the investment adviser and administrator of a portion of the Portfolio's adviser fee due to the Portfolio's investment in the Liquidity Fund (equal to less than 0.005% of average daily net assets for the six months ended July 31, 2022). |
| (6) | Annualized. |
| Class C | ||||||
| Six
Months Ended July 31, 2022 (Unaudited) |
Year Ended January 31, | |||||
| 2022 | 2021 | 2020 | 2019 | 2018 | ||
| Net asset value — Beginning of period | $ 12.690 | $ 13.230 | $ 12.890 | $ 12.220 | $ 12.100 | $ 11.890 |
| Income (Loss) From Operations | ||||||
| Net investment income | $ 0.057 | $ 0.084 | $ 0.116 | $ 0.142 | $ 0.134 | $ 0.118 |
| Net realized and unrealized gain (loss) | (0.620) | (0.540) | 0.340 | 0.670 | 0.120 | 0.210 |
| Total income (loss) from operations | $ (0.563) | $ (0.456) | $ 0.456 | $ 0.812 | $ 0.254 | $ 0.328 |
| Less Distributions | ||||||
| From net investment income | $ (0.057) | $ (0.084) | $ (0.116) | $ (0.142) | $ (0.134) | $ (0.118) |
| Total distributions | $ (0.057) | $ (0.084) | $ (0.116) | $ (0.142) | $ (0.134) | $ (0.118) |
| Net asset value — End of period | $12.070 | $12.690 | $13.230 | $12.890 | $12.220 | $12.100 |
| Total Return(1)(2) | (4.44)% (3) | (3.47)% | 3.56% | 6.68% | 2.12% | 2.75% |
| Ratios/Supplemental Data | ||||||
| Net assets, end of period (000’s omitted) | $ 24,087 | $ 30,795 | $ 37,239 | $ 41,689 | $ 45,309 | $ 55,476 |
| Ratios (as a percentage of average daily net assets):(4) | ||||||
| Expenses (2) | 1.40% (5)(6) | 1.40% | 1.40% | 1.40% | 1.40% | 1.40% |
| Net investment income | 0.95% (6) | 0.64% | 0.91% | 1.13% | 1.11% | 0.96% |
| Portfolio Turnover of the Portfolio | 34% (3) | 22% | 51% | 28% | 78% | 35% |
| (1) | Returns are historical and are calculated by determining the percentage change in net asset value with all distributions reinvested and do not reflect the effect of sales charges. |
| (2) | The investment adviser and administrator and the sub-adviser of the Fund and the investment adviser and the sub-adviser of the Portfolio reimbursed certain operating expenses (equal to 0.03%, 0.01%, 0.03%, 0.02%, 0.04% and 0.05% of average daily net assets for the six months ended July 31, 2022 and the years ended January 31, 2022, 2021, 2020, 2019 and 2018, respectively). Absent this reimbursement, total return would be lower. |
| (3) | Not annualized. |
| (4) | Includes the Fund’s share of the Portfolio’s allocated expenses. |
| (5) | Includes a reduction by the investment adviser and administrator of a portion of the Portfolio's adviser fee due to the Portfolio's investment in the Liquidity Fund (equal to less than 0.005% of average daily net assets for the six months ended July 31, 2022). |
| (6) | Annualized. |
| Class I | ||||||
| Six
Months Ended July 31, 2022 (Unaudited) |
Year Ended January 31, | |||||
| 2022 | 2021 | 2020 | 2019 | 2018 | ||
| Net asset value — Beginning of period | $ 12.690 | $ 13.230 | $ 12.890 | $ 12.210 | $ 12.100 | $ 11.890 |
| Income (Loss) From Operations | ||||||
| Net investment income | $ 0.117 | $ 0.215 | $ 0.245 | $ 0.268 | $ 0.255 | $ 0.240 |
| Net realized and unrealized gain (loss) | (0.630) | (0.540) | 0.340 | 0.680 | 0.110 | 0.210 |
| Total income (loss) from operations | $ (0.513) | $ (0.325) | $ 0.585 | $ 0.948 | $ 0.365 | $ 0.450 |
| Less Distributions | ||||||
| From net investment income | $ (0.117) | $ (0.215) | $ (0.245) | $ (0.268) | $ (0.255) | $ (0.240) |
| Total distributions | $ (0.117) | $ (0.215) | $ (0.245) | $ (0.268) | $ (0.255) | $ (0.240) |
| Net asset value — End of period | $ 12.060 | $ 12.690 | $ 13.230 | $ 12.890 | $ 12.210 | $ 12.100 |
| Total Return(1)(2) | (4.04)% (3) | (2.49)% | 4.60% | 7.83% | 3.06% | 3.79% |
| Ratios/Supplemental Data | ||||||
| Net assets, end of period (000’s omitted) | $596,805 | $825,332 | $776,298 | $596,099 | $472,656 | $510,220 |
| Ratios (as a percentage of average daily net assets):(4) | ||||||
| Expenses (2) | 0.40% (5)(6) | 0.40% | 0.40% | 0.40% | 0.40% | 0.40% |
| Net investment income | 1.95% (6) | 1.64% | 1.89% | 2.12% | 2.11% | 1.94% |
| Portfolio Turnover of the Portfolio | 34% (3) | 22% | 51% | 28% | 78% | 35% |
| (1) | Returns are historical and are calculated by determining the percentage change in net asset value with all distributions reinvested. |
| (2) | The investment adviser and administrator and the sub-adviser of the Fund and the investment adviser and the sub-adviser of the Portfolio reimbursed certain operating expenses (equal to 0.03%, 0.01%, 0.03%, 0.02%, 0.04% and 0.05% of average daily net assets for the six months ended July 31, 2022 and the years ended January 31, 2022, 2021, 2020, 2019 and 2018, respectively). Absent this reimbursement, total return would be lower. |
| (3) | Not annualized. |
| (4) | Includes the Fund’s share of the Portfolio’s allocated expenses. |
| (5) | Includes a reduction by the investment adviser and administrator of a portion of the Portfolio's adviser fee due to the Portfolio's investment in the Liquidity Fund (equal to less than 0.005% of average daily net assets for the six months ended July 31, 2022). |
| (6) | Annualized. |
| Average Daily Net Assets | Annual Fee Rate |
| Up to $1 billion | 0.3200% |
| $1 billion but less than $2.5 billion | 0.3075% |
| $2.5 billion but less than $5 billion | 0.2950% |
| $5 billion and over | 0.2875% |
| Six
Months Ended July 31, 2022 (Unaudited) |
Year
Ended January 31, 2022 | ||||
| Shares | Amount | Shares | Amount | ||
| Class A | |||||
| Sales | 572,976 | $ 6,967,194 | 1,058,328 | $ 13,882,492 | |
| Issued to shareholders electing to receive payments of distributions in Fund shares | 41,133 | 496,738 | 70,602 | 923,920 | |
| Redemptions | (1,355,545) | (16,342,004) | (1,416,785) | (18,585,038) | |
| Converted from Class C shares | 15,699 | 185,548 | 14,622 | 191,346 | |
| Net decrease | (725,737) | $ (8,692,524) | (273,233) | $ (3,587,280) | |
| Class C | |||||
| Sales | 63,641 | $ 771,108 | 253,506 | $ 3,320,306 | |
| Issued to shareholders electing to receive payments of distributions in Fund shares | 8,239 | 99,524 | 13,279 | 173,741 | |
| Redemptions | (486,123) | (5,854,999) | (640,444) | (8,395,703) | |
| Converted to Class A shares | (15,701) | (185,548) | (14,628) | (191,346) | |
| Net decrease | (429,944) | $ (5,169,915) | (388,287) | $ (5,093,002) | |
| Six
Months Ended July 31, 2022 (Unaudited) |
Year
Ended January 31, 2022 | ||||
| Shares | Amount | Shares | Amount | ||
| Class I | |||||
| Sales | 9,915,906 | $ 119,238,111 | 18,257,870 | $ 239,662,679 | |
| Issued to shareholders electing to receive payments of distributions in Fund shares | 443,591 | 5,358,664 | 819,220 | 10,714,522 | |
| Redemptions | (25,928,426) | (310,914,414) | (12,724,163) | (166,794,634) | |
| Net increase (decrease) | (15,568,929) | $(186,317,639) | 6,352,927 | $ 83,582,567 | |
| (3) | Variable rate demand obligation that may be tendered at par on any day for payment the same or next business day. The stated interest rate, which generally resets daily, is determined by the remarketing agent and represents the rate in effect at July 31, 2022. |
| (4) | Amount is less than 0.05%. |
| (5) | Variable rate demand obligation that may be tendered at par on any day for payment the lesser of 5 business days or 7 calendar days. The stated interest rate, which generally resets weekly, is determined by the remarketing agent and represents the rate in effect at July 31, 2022. |
| (6) | May be deemed to be an affiliated investment company. The rate shown is the annualized seven-day yield as of July 31, 2022. |
| At July 31, 2022, the concentration of the Portfolio's investments in the various states and territories, determined as a percentage of net assets, is as follows: | |
| New York | 16.1% |
| Others, representing less than 10% individually | 80.4% |
| The Portfolio invests primarily in debt securities issued by municipalities. The ability of the issuers of the debt securities to meet their obligations may be affected by economic developments in a specific industry or municipality. At July 31, 2022, 4.1% of total investments are backed by bond insurance of various financial institutions and financial guaranty assurance agencies. The aggregate percentage insured by an individual financial institution or financial guaranty assurance agency ranged from 1.0% to 3.1% of total investments. |
| Abbreviations: | |
| AGM | – Assured Guaranty Municipal Corp. |
| BAM | – Build America Mutual Assurance Co. |
| FHLMC | – Federal Home Loan Mortgage Corp. |
| FNMA | – Federal National Mortgage Association |
| GNMA | – Government National Mortgage Association |
| Liq | – Liquidity Provider |
| PSF | – Permanent School Fund |
| SFMR | – Single Family Mortgage Revenue |
| SIFMA | – Securities Industry and Financial Markets Association Municipal Swap Index |
| SOFR | – Secured Overnight Financing Rate |
| SPA | – Standby Bond Purchase Agreement |
| July 31, 2022 | |
| Assets | |
| Unaffiliated investments, at value (identified cost $674,562,257) | $ 667,927,768 |
| Affiliated investment, at value (identified cost $17,379,110) | 17,379,110 |
| Cash | 61,412 |
| Interest receivable | 6,531,230 |
| Dividends receivable from affiliated investment | 37,941 |
| Receivable for investments sold | 19,011,793 |
| Receivable from affiliates | 26,951 |
| Total assets | $710,976,205 |
| Liabilities | |
| Payable for when-issued securities | $ 18,676,031 |
| Payable to affiliate: | |
| Investment adviser fee | 179,970 |
| Accrued expenses | 120,513 |
| Total liabilities | $ 18,976,514 |
| Net Assets applicable to investors' interest in Portfolio | $691,999,691 |
| Six Months Ended | |
| July 31, 2022 | |
| Investment Income | |
| Dividend income from affiliated investment | $ 64,389 |
| Interest income | 9,155,500 |
| Total investment income | $ 9,219,889 |
| Expenses | |
| Investment adviser fee | $ 1,261,621 |
| Trustees’ fees and expenses | 25,603 |
| Custodian fee | 95,780 |
| Legal and accounting services | 30,271 |
| Miscellaneous | 10,207 |
| Total expenses | $ 1,423,482 |
| Deduct: | |
| Waiver and/or reimbursement of expenses by affiliates | $ 50,003 |
| Total expense reductions | $ 50,003 |
| Net expenses | $ 1,373,479 |
| Net investment income | $ 7,846,410 |
| Realized and Unrealized Gain (Loss) | |
| Net realized gain (loss): | |
| Investment transactions | $ (24,150,971) |
| Net realized loss | $(24,150,971) |
| Change in unrealized appreciation (depreciation): | |
| Investments | $ (23,793,611) |
| Net change in unrealized appreciation (depreciation) | $(23,793,611) |
| Net realized and unrealized loss | $(47,944,582) |
| Net decrease in net assets from operations | $(40,098,172) |
| Six
Months Ended July 31, 2022 (Unaudited) |
Year
Ended January 31, 2022 | |
| Increase (Decrease) in Net Assets | ||
| From operations: | ||
| Net investment income | $ 7,846,410 | $ 16,140,421 |
| Net realized gain (loss) | (24,150,971) | 3,510,528 |
| Net change in unrealized appreciation (depreciation) | (23,793,611) | (43,090,606) |
| Net decrease in net assets from operations | $ (40,098,172) | $ (23,439,657) |
| Capital transactions: | ||
| Contributions | $ 19,420,169 | $ 108,966,195 |
| Withdrawals | (225,741,514) | (58,460,755) |
| Portfolio transaction fee | 368,223 | 250,960 |
| Net increase (decrease) in net assets from capital transactions | $(205,953,122) | $ 50,756,400 |
| Net increase (decrease) in net assets | $(246,051,294) | $ 27,316,743 |
| Net Assets | ||
| At beginning of period | $ 938,050,985 | $ 910,734,242 |
| At end of period | $ 691,999,691 | $938,050,985 |
| Six
Months Ended July 31, 2022 (Unaudited) |
Year Ended January 31, | |||||
| Ratios/Supplemental Data | 2022 | 2021 | 2020 | 2019 | 2018 | |
| Ratios (as a percentage of average daily net assets): | ||||||
| Expenses (1) | 0.35% (2)(3) | 0.35% | 0.35% | 0.35% | 0.35% | 0.35% |
| Net investment income | 2.00% (2) | 1.69% | 1.94% | 2.17% | 2.16% | 2.01% |
| Portfolio Turnover | 34% (4) | 22% | 51% | 28% | 78% | 35% |
| Total Return(1) | (4.01)% (4) | (2.44)% | 4.66% | 7.88% | 3.11% | 3.83% |
| Net assets, end of period (000’s omitted) | $692,000 | $938,051 | $910,734 | $729,373 | $612,428 | $676,300 |
| (1) | The investment adviser and sub-adviser reimbursed certain operating expenses (equal to 0.01% of average daily net assets for the six months ended July 31, 2022 and the years ended January 31, 2022, 2021, 2020, 2019 and 2018). Absent this reimbursement, total return would be lower. |
| (2) | Annualized. |
| (3) | The investment adviser reduced a portion of its adviser fee (equal to less than 0.005% of average daily net assets for the six months ended July 31, 2022). |
| (4) | Not annualized. |
| Average Daily Net Assets | Annual Fee Rate |
| Up to $1 billion | 0.3200% |
| $1 billion but less than $2.5 billion | 0.3075% |
| $2.5 billion but less than $5 billion | 0.2950% |
| $5 billion and over | 0.2875% |
| Aggregate cost | $ 691,929,291 |
| Gross unrealized appreciation | $ 9,743,704 |
| Gross unrealized depreciation | (16,366,117) |
| Net unrealized depreciation | $ (6,622,413) |
| Name | Value,
beginning of period |
Purchases | Sales
proceeds |
Net
realized gain (loss) |
Change
in unrealized appreciation (depreciation) |
Value,
end of period |
Dividend
income |
Shares,
end of period |
| Short-Term Investments | ||||||||
| Liquidity Fund | $ — | $92,308,326 | $(74,929,216) | $ — | $ — | $17,379,110 | $64,389 | 17,379,110 |
| • | Level 1 – quoted prices in active markets for identical investments |
| • | Level 2 – other significant observable inputs (including quoted prices for similar investments, interest rates, prepayment speeds, credit risk, etc.) |
| • | Level 3 – significant unobservable inputs (including a fund's own assumptions in determining the fair value of investments) |
| Asset Description | Level 1 | Level 2 | Level 3 | Total |
| Tax-Exempt Municipal Obligations | $ — | $ 667,927,768 | $ — | $ 667,927,768 |
| Short-Term Investments | 17,379,110 | — | — | 17,379,110 |
| Total Investments | $17,379,110 | $667,927,768 | $ — | $685,306,878 |
| Officers of Parametric TABS 5-to-15 Year Laddered Municipal Bond Fund and 5-to-15 Year Laddered Municipal Bond Portfolio | |
| Eric
A. Stein President |
Jill R.
Damon Secretary |
| Deidre
E. Walsh Vice President and Chief Legal Officer |
Richard F.
Froio Chief Compliance Officer |
| James
F. Kirchner Treasurer |
|
| Trustees of Parametric TABS 5-to-15 Year Laddered Municipal Bond Fund and 5-to-15 Year Laddered Municipal Bond Portfolio |
| * | Interested Trustee |
| ** | Mr. Bowser and Ms. Wiser began serving as Trustees effective April 4, 2022. |
| Privacy Notice | April 2021 |
| FACTS | WHAT
DOES EATON VANCE DO WITH YOUR PERSONAL INFORMATION? |
| Why? | Financial companies choose how they share your personal information. Federal law gives consumers the right to limit some but not all sharing. Federal law also requires us to tell you how we collect, share, and protect your personal information. Please read this notice carefully to understand what we do. |
| What? | The
types of personal information we collect and share depend on the product or service you have with us. This information can include:■ Social Security number and income ■ investment experience and risk tolerance ■ checking account number and wire transfer instructions |
| How? | All financial companies need to share customers’ personal information to run their everyday business. In the section below, we list the reasons financial companies can share their customers’ personal information; the reasons Eaton Vance chooses to share; and whether you can limit this sharing. |
| Reasons
we can share your personal information |
Does
Eaton Vance share? |
Can
you limit this sharing? |
| For our everyday business purposes — such as to process your transactions, maintain your account(s), respond to court orders and legal investigations, or report to credit bureaus | Yes | No |
| For our marketing purposes — to offer our products and services to you | Yes | No |
| For joint marketing with other financial companies | No | We don’t share |
| For our investment management affiliates’ everyday business purposes — information about your transactions, experiences, and creditworthiness | Yes | Yes |
| For our affiliates’ everyday business purposes — information about your transactions and experiences | Yes | No |
| For our affiliates’ everyday business purposes — information about your creditworthiness | No | We don’t share |
| For our investment management affiliates to market to you | Yes | Yes |
| For our affiliates to market to you | No | We don’t share |
| For nonaffiliates to market to you | No | We don’t share |
| To
limit our sharing |
Call toll-free 1-800-262-1122 or email: EVPrivacy@eatonvance.comPlease note:If you are a new customer, we can begin sharing your information 30 days from the date we sent this notice. When you are no longer our customer, we continue to share your information as described in this notice. However, you can contact us at any time to limit our sharing. |
| Questions? | Call toll-free 1-800-262-1122 or email: EVPrivacy@eatonvance.com |
| Privacy Notice — continued | April 2021 |
| Who we are | |
| Who is providing this notice? | Eaton Vance Management, Eaton Vance Distributors, Inc., Eaton Vance Trust Company, Eaton Vance Management (International) Limited, Eaton Vance Advisers International Ltd., Eaton Vance Global Advisors Limited, Eaton Vance Management’s Real Estate Investment Group, Boston Management and Research, Calvert Research and Management, Eaton Vance and Calvert Fund Families and our investment advisory affiliates (“Eaton Vance”) (see Investment Management Affiliates definition below) |
| What we do | |
| How
does Eaton Vance protect my personal information? |
To protect your personal information from unauthorized access and use, we use security measures that comply with federal law. These measures include computer safeguards and secured files and buildings. We have policies governing the proper handling of customer information by personnel and requiring third parties that provide support to adhere to appropriate security standards with respect to such information. |
| How
does Eaton Vance collect my personal information? |
We
collect your personal information, for example, when you■ open an account or make deposits or withdrawals from your account ■ buy securities from us or make a wire transfer ■ give us your contact informationWe also collect your personal information from others, such as credit bureaus, affiliates, or other companies. |
| Why can’t I limit all sharing? | Federal
law gives you the right to limit only■ sharing for affiliates’ everyday business purposes — information about your creditworthiness ■ affiliates from using your information to market to you ■ sharing for nonaffiliates to market to youState laws and individual companies may give you additional rights to limit sharing. See below for more on your rights under state law. |
| Definitions | |
| Investment
Management Affiliates |
Eaton Vance Investment Management Affiliates include registered investment advisers, registered broker- dealers, and registered and unregistered funds. Investment Management Affiliates does not include entities associated with Morgan Stanley Wealth Management, such as Morgan Stanley Smith Barney LLC and Morgan Stanley & Co. |
| Affiliates | Companies related by common ownership or control. They can be financial and nonfinancial companies.■ Our affiliates include companies with a Morgan Stanley name and financial companies such as Morgan Stanley Smith Barney LLC and Morgan Stanley & Co. |
| Nonaffiliates | Companies not related by common ownership or control. They can be financial and nonfinancial companies.■ Eaton Vance does not share with nonaffiliates so they can market to you. |
| Joint marketing | A formal agreement between nonaffiliated financial companies that together market financial products or services to you.■ Eaton Vance doesn’t jointly market. |
| Other important information | |
| Vermont: Except as permitted by law, we will not share personal information we collect about Vermont residents with Nonaffiliates unless you provide us with your written consent to share such information.California: Except as permitted by law, we will not share personal information we collect about California residents with Nonaffiliates and we will limit sharing such personal information with our Affiliates to comply with California privacy laws that apply to us. | |


| % Average Annual Total Returns1,2 | Class
Inception Date |
Performance
Inception Date |
Six Months | One Year | Five Years | Since
Inception |
| Class A at NAV | 05/04/2015 | 05/04/2015 | (2.29)% | (4.93)% | 1.25% | 1.67% |
| Class A with 3.25% Maximum Sales Charge | — | — | (5.51) | (8.04) | 0.58 | 1.21 |
| Class C at NAV | 05/04/2015 | 05/04/2015 | (2.66) | (5.64) | 0.49 | 0.92 |
| Class C with 1% Maximum Sales Charge | — | — | (3.63) | (6.58) | 0.49 | 0.92 |
| Class I at NAV | 05/04/2015 | 05/04/2015 | (2.17) | (4.69) | 1.50 | 1.94 |
|
| ||||||
| Bloomberg Short-Intermediate 1-10 Year Municipal Bond Index | — | — | (1.30)% | (3.82)% | 1.47% | 1.69% |
| % Total Annual Operating Expense Ratios3 | Class A | Class C | Class I |
| Gross | 0.78% | 1.53% | 0.53% |
| Net | 0.65 | 1.40 | 0.40 |
| % Distribution Rates/Yields4 | Class A | Class C | Class I |
| Distribution Rate | 1.28% | 0.53% | 1.53% |
| SEC 30-day Yield – Subsidized | 1.55 | 0.87 | 1.85 |
| SEC 30-day Yield – Unsubsidized | 1.42 | 0.73 | 1.72 |
| Credit Quality (% of total investments)* |
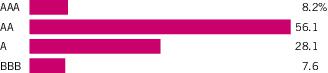
| * | For purposes of the Fund’s rating restrictions, ratings are based on Moody’s Investors Service, Inc. (“Moody’s”), S&P Global Ratings (“S&P”) or Fitch Ratings (“Fitch”), as applicable. If securities are rated differently by the ratings agencies, the highest rating is applied. Ratings, which are subject to change, apply to the creditworthiness of the issuers of the underlying securities and not to the Fund or its shares. Credit ratings measure the quality of a bond based on the issuer’s creditworthiness, with ratings ranging from AAA, being the highest, to D, being the lowest based on S&P’s measures. Ratings of BBB or higher by S&P or Fitch (Baa or higher by Moody’s) are considered to be investment-grade quality. Credit ratings are based largely on the ratings agency’s analysis at the time of rating. The rating assigned to any particular security is not necessarily a reflection of the issuer’s current financial condition and does not necessarily reflect its assessment of the volatility of a security’s market value or of the liquidity of an investment in the security. Holdings designated as “Not Rated” (if any) are not rated by the national ratings agencies stated above. |
| % Average Annual Total Returns1,2 | Class
Inception Date |
Performance
Inception Date |
Six Months | One Year | Five Years | Since
Inception |
| Class A at NAV | 05/04/2015 | 05/04/2015 | (7.44)% | (10.84)% | 2.18% | 3.13% |
| Class A with 3.25% Maximum Sales Charge | — | — | (10.47) | (13.74) | 1.50 | 2.66 |
| Class C at NAV | 05/04/2015 | 05/04/2015 | (7.79) | (11.58) | 1.40 | 2.36 |
| Class C with 1% Maximum Sales Charge | — | — | (8.70) | (12.44) | 1.40 | 2.36 |
| Class I at NAV | 05/04/2015 | 05/04/2015 | (7.24) | (10.53) | 2.44 | 3.41 |
|
| ||||||
| Bloomberg 15 Year Municipal Bond Index | — | — | (4.84)% | (8.19)% | 2.36% | 2.91% |
| % Total Annual Operating Expense Ratios3 | Class A | Class C | Class I |
| Gross | 1.18% | 1.93% | 0.93% |
| Net | 0.65 | 1.40 | 0.40 |
| % Distribution Rates/Yields4 | Class A | Class C | Class I |
| Distribution Rate | 2.33% | 1.59% | 2.57% |
| SEC 30-day Yield – Subsidized | 2.58 | 1.93 | 2.91 |
| SEC 30-day Yield – Unsubsidized | 1.67 | 0.99 | 2.00 |
| Credit Quality (% of total investments)* |
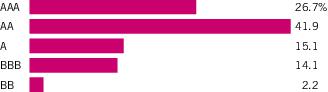
| * | For purposes of the Fund’s rating restrictions, ratings are based on Moody’s Investors Service, Inc. (“Moody’s”), S&P Global Ratings (“S&P”) or Fitch Ratings (“Fitch”), as applicable. If securities are rated differently by the ratings agencies, the highest rating is applied. Ratings, which are subject to change, apply to the creditworthiness of the issuers of the underlying securities and not to the Fund or its shares. Credit ratings measure the quality of a bond based on the issuer’s creditworthiness, with ratings ranging from AAA, being the highest, to D, being the lowest based on S&P’s measures. Ratings of BBB or higher by S&P or Fitch (Baa or higher by Moody’s) are considered to be investment-grade quality. Credit ratings are based largely on the ratings agency’s analysis at the time of rating. The rating assigned to any particular security is not necessarily a reflection of the issuer’s current financial condition and does not necessarily reflect its assessment of the volatility of a security’s market value or of the liquidity of an investment in the security. Holdings designated as “Not Rated” (if any) are not rated by the national ratings agencies stated above. |
| 1 | Bloomberg Short-Intermediate 1-10 Year Municipal Bond Index is an unmanaged index of municipal bonds traded in the U.S. with maturities ranging from 1-10 years. Bloomberg 15 Year Municipal Bond Index is an unmanaged index of municipal bonds traded in the U.S. with maturities ranging from 12-17 years. Unless otherwise stated, index returns do not reflect the effect of any applicable sales charges, commissions, expenses, taxes or leverage, as applicable. It is not possible to invest directly in an index. |
| 2 | Total Returns at NAV do not include applicable sales charges. If sales charges were deducted, the returns would be lower. Total Returns shown with maximum sales charge reflect the stated maximum sales charge. Unless otherwise stated, performance does not reflect the deduction of taxes on Fund distributions or redemptions of Fund shares. Performance since inception for an index, if presented, is the performance since the Fund’s or oldest share class’ inception, as applicable. |
| 3 | Source: Fund prospectus. Net expense ratios reflect a contractual expense reimbursement that continues through 5/31/23. The expense ratios for the current reporting period can be found in the Financial Highlights section of this report. Performance reflects expenses waived and/or reimbursed, if applicable. Without such waivers and/or reimbursements, performance would have been lower. |
| 4 | The Distribution Rate is based on the Fund’s last regular distribution per share in the period (annualized) divided by the Fund’s NAV at the end of the period. The Fund’s distributions may be comprised of amounts characterized for federal income tax purposes as tax-exempt income, qualified and non-qualified ordinary dividends, capital gains and nondividend distributions, also known as return of capital. The Fund will determine the federal income tax character of distributions paid to a shareholder after the end of the calendar year. This is reported on the IRS form 1099-DIV and provided to the shareholder shortly after each year-end. The Fund’s distributions are determined by the investment adviser based on its current assessment of the Fund’s long-term return potential. As portfolio and market conditions change, the rate of distributions paid by the Fund could change. The SEC Yield is a standardized measure based on the estimated yield to maturity of a fund’s investments over a 30-day period and is based on the maximum offer price at the date specified. The SEC Yield is not based on the distributions made by the Fund, which may differ. Subsidized yield reflects the effect of fee waivers and expense reimbursements. |
| Fund profiles subject to change due to active management. |
| Beginning
Account Value (2/1/22) |
Ending
Account Value (7/31/22) |
Expenses
Paid During Period* (2/1/22 – 7/31/22) |
Annualized
Expense Ratio | |
| Actual | ||||
| Class A | $1,000.00 | $ 977.10 | $3.19** | 0.65% |
| Class C | $1,000.00 | $ 973.40 | $6.85** | 1.40% |
| Class I | $1,000.00 | $ 978.30 | $1.96** | 0.40% |
| Hypothetical | ||||
| (5% return per year before expenses) | ||||
| Class A | $1,000.00 | $1,021.57 | $3.26** | 0.65% |
| Class C | $1,000.00 | $1,017.85 | $7.00** | 1.40% |
| Class I | $1,000.00 | $1,022.81 | $2.01** | 0.40% |
| * | Expenses are equal to the Fund's annualized expense ratio for the indicated Class, multiplied by the average account value over the period, multiplied by 181/365 (to reflect the one-half year period). The Example assumes that the $1,000 was invested at the net asset value per share determined at the close of business on January 31, 2022. |
| ** | Absent an allocation of certain expenses to affiliates, expenses would be higher. |
| Beginning
Account Value (2/1/22) |
Ending
Account Value (7/31/22) |
Expenses
Paid During Period* (2/1/22 – 7/31/22) |
Annualized
Expense Ratio | |
| Actual | ||||
| Class A | $1,000.00 | $ 925.60 | $3.10** | 0.65% |
| Class C | $1,000.00 | $ 922.10 | $6.67** | 1.40% |
| Class I | $1,000.00 | $ 927.60 | $1.91** | 0.40% |
| Hypothetical | ||||
| (5% return per year before expenses) | ||||
| Class A | $1,000.00 | $1,021.57 | $3.26** | 0.65% |
| Class C | $1,000.00 | $1,017.85 | $7.00** | 1.40% |
| Class I | $1,000.00 | $1,022.81 | $2.01** | 0.40% |
| * | Expenses are equal to the Fund's annualized expense ratio for the indicated Class, multiplied by the average account value over the period, multiplied by 181/365 (to reflect the one-half year period). The Example assumes that the $1,000 was invested at the net asset value per share determined at the close of business on January 31, 2022. |
| ** | Absent an allocation of certain expenses to affiliates, expenses would be higher. |
| July 31, 2022 | ||
| 1-to-10
Year Laddered Fund |
10-to-20
Year Laddered Fund | |
| Assets | ||
| Unaffiliated investments, at value (identified cost $75,957,748 and 10,410,777, respectively) | $ 75,266,688 | $ 10,200,337 |
| Affiliated investment, at value (identified cost $9,072,724 and 1,013,601, respectively) | 9,072,724 | 1,013,601 |
| Cash | 315 | — |
| Interest receivable | 527,653 | 107,161 |
| Dividends receivable from affiliated investment | 8,251 | 788 |
| Receivable for investments sold | 6,150,553 | 749,937 |
| Receivable for Fund shares sold | 840,257 | — |
| Receivable from affiliates | 20,086 | 16,733 |
| Total assets | $91,886,527 | $12,088,557 |
| Liabilities | ||
| Payable for when-issued securities | $ 5,067,366 | $ 259,560 |
| Payable for Fund shares redeemed | 596,796 | 47,235 |
| Payable to affiliates: | ||
| Investment adviser and administration fee | 21,944 | 3,142 |
| Distribution and service fees | 5,081 | 844 |
| Accrued expenses | 62,479 | 29,412 |
| Total liabilities | $ 5,753,666 | $ 340,193 |
| Net Assets | $86,132,861 | $11,748,364 |
| Sources of Net Assets | ||
| Paid-in capital | $ 87,740,974 | $ 12,760,930 |
| Accumulated loss | (1,608,113) | (1,012,566) |
| Net Assets | $86,132,861 | $11,748,364 |
| Class A Shares | ||
| Net Assets | $ 10,476,871 | $ 3,156,557 |
| Shares Outstanding | 1,018,312 | 306,618 |
| Net
Asset Value and Redemption Price Per Share (net assets ÷ shares of beneficial interest outstanding) |
$ 10.29 | $ 10.29 |
| Maximum
Offering Price Per Share (100 ÷ 96.75 of net asset value per share) |
$ 10.64 | $ 10.64 |
| Class C Shares | ||
| Net Assets | $ 3,345,023 | $ 217,397 |
| Shares Outstanding | 325,103 | 21,118 |
| Net
Asset Value and Offering Price Per Share* (net assets ÷ shares of beneficial interest outstanding) |
$ 10.29 | $ 10.29 |
| Class I Shares | ||
| Net Assets | $ 72,310,967 | $ 8,374,410 |
| Shares Outstanding | 7,020,263 | 813,374 |
| Net
Asset Value, Offering Price and Redemption Price Per Share (net assets ÷ shares of beneficial interest outstanding) |
$ 10.30 | $ 10.30 |
| On sales of $100,000 or more, the offering price of Class A shares is reduced. | |
| * | Redemption price per share is equal to the net asset value less any applicable contingent deferred sales charge. |
| Six Months Ended July 31, 2022 | ||
| 1-to-10
Year Laddered Fund |
10-to-20
Year Laddered Fund | |
| Investment Income | ||
| Dividend income from affiliated investments | $ 21,563 | $ 3,728 |
| Interest income | 755,077 | 198,473 |
| Total investment income | $ 776,640 | $ 202,201 |
| Expenses | ||
| Investment adviser and administration fee | $ 141,720 | $ 24,480 |
| Distribution and service fees: | ||
| Class A | 16,018 | 4,631 |
| Class C | 16,897 | 1,686 |
| Trustees’ fees and expenses | 3,317 | 690 |
| Custodian fee | 15,355 | 9,653 |
| Transfer and dividend disbursing agent fees | 16,921 | 4,271 |
| Legal and accounting services | 20,913 | 18,171 |
| Printing and postage | 4,650 | 43 |
| Registration fees | 27,842 | 21,498 |
| Miscellaneous | 5,499 | 4,046 |
| Total expenses | $ 269,132 | $ 89,169 |
| Deduct: | ||
| Waiver and/or reimbursement of expenses by affiliates | $ 61,729 | $ 52,740 |
| Total expense reductions | $ 61,729 | $ 52,740 |
| Net expenses | $ 207,403 | $ 36,429 |
| Net investment income | $ 569,237 | $ 165,772 |
| Realized and Unrealized Gain (Loss) | ||
| Net realized gain (loss): | ||
| Investment transactions | $ (986,888) | $ (812,012) |
| Investment transactions - affiliated investment | (457) | 230 |
| Net realized loss | $ (987,345) | $ (811,782) |
| Change in unrealized appreciation (depreciation): | ||
| Investments | $ (1,898,236) | $ (806,834) |
| Investments - affiliated investment | 1 | — |
| Net change in unrealized appreciation (depreciation) | $(1,898,235) | $ (806,834) |
| Net realized and unrealized loss | $(2,885,580) | $(1,618,616) |
| Net decrease in net assets from operations | $(2,316,343) | $(1,452,844) |
| Six Months Ended July 31, 2022 (Unaudited) | ||
| 1-to-10
Year Laddered Fund |
10-to-20
Year Laddered Fund | |
| Increase (Decrease) in Net Assets | ||
| From operations: | ||
| Net investment income | $ 569,237 | $ 165,772 |
| Net realized loss | (987,345) | (811,782) |
| Net change in unrealized appreciation (depreciation) | (1,898,235) | (806,834) |
| Net decrease in net assets from operations | $ (2,316,343) | $ (1,452,844) |
| Distributions to shareholders: | ||
| Class A | $ (70,976) | $ (37,455) |
| Class C | (6,158) | (2,105) |
| Class I | (494,093) | (126,453) |
| Total distributions to shareholders | $ (571,227) | $ (166,013) |
| Transactions in shares of beneficial interest: | ||
| Class A | $ (3,596,507) | $ (1,607,476) |
| Class C | (143,145) | (219,371) |
| Class I | (904,014) | (4,710,852) |
| Net decrease in net assets from Fund share transactions | $ (4,643,666) | $ (6,537,699) |
| Net decrease in net assets | $ (7,531,236) | $ (8,156,556) |
| Net Assets | ||
| At beginning of period | $ 93,664,097 | $ 19,904,920 |
| At end of period | $86,132,861 | $11,748,364 |
| Year Ended January 31, 2022 | ||
| 1-to-10
Year Laddered Fund |
10-to-20
Year Laddered Fund | |
| Increase (Decrease) in Net Assets | ||
| From operations: | ||
| Net investment income | $ 977,937 | $ 388,711 |
| Net realized gain | 185,148 | 145,251 |
| Net change in unrealized appreciation (depreciation) | (2,947,009) | (898,194) |
| Net decrease in net assets from operations | $ (1,783,924) | $ (364,232) |
| Distributions to shareholders: | ||
| Class A | $ (172,745) | $ (153,766) |
| Class C | (13,244) | (12,069) |
| Class I | (952,556) | (419,328) |
| Total distributions to shareholders | $ (1,138,545) | $ (585,163) |
| Transactions in shares of beneficial interest: | ||
| Class A | $ (7,808,204) | $ 498,946 |
| Class C | (292,649) | (21,805) |
| Class I | 11,542,612 | (2,241,076) |
| Net increase (decrease) in net assets from Fund share transactions | $ 3,441,759 | $ (1,763,935) |
| Net increase (decrease) in net assets | $ 519,290 | $ (2,713,330) |
| Net Assets | ||
| At beginning of year | $ 93,144,807 | $ 22,618,250 |
| At end of year | $93,664,097 | $19,904,920 |
| 1-to-10 Year Laddered Fund — Class A | ||||||
| Six
Months Ended July 31, 2022 (Unaudited) |
Year Ended January 31, | |||||
| 2022 | 2021 | 2020 | 2019 | 2018 | ||
| Net asset value — Beginning of period | $ 10.590 | $ 10.910 | $ 10.600 | $ 10.240 | $ 10.170 | $ 10.120 |
| Income (Loss) From Operations | ||||||
| Net investment income | $ 0.058 | $ 0.102 | $ 0.132 | $ 0.172 | $ 0.157 | $ 0.129 |
| Net realized and unrealized gain (loss) | (0.301) | (0.303) | 0.308 | 0.360 | 0.070 | 0.050 |
| Total income (loss) from operations | $ (0.243) | $ (0.201) | $ 0.440 | $ 0.532 | $ 0.227 | $ 0.179 |
| Less Distributions | ||||||
| From net investment income | $ (0.057) | $ (0.100) | $ (0.130) | $ (0.172) | $ (0.157) | $ (0.129) |
| From net realized gain | — | (0.019) | — | — | — | — |
| Total distributions | $ (0.057) | $ (0.119) | $ (0.130) | $ (0.172) | $ (0.157) | $ (0.129) |
| Net asset value — End of period | $10.290 | $10.590 | $10.910 | $10.600 | $10.240 | $10.170 |
| Total Return(1)(2) | (2.29)% (3) | (1.87)% | 4.19% | 5.23% | 2.26% | 1.76% |
| Ratios/Supplemental Data | ||||||
| Net assets, end of period (000’s omitted) | $ 10,477 | $ 14,526 | $ 22,853 | $ 19,901 | $ 17,978 | $ 16,877 |
| Ratios (as a percentage of average daily net assets): | ||||||
| Expenses (2) | 0.65% (4)(5) | 0.65% | 0.65% | 0.65% | 0.65% | 0.65% |
| Net investment income | 1.11% (4) | 0.92% | 1.23% | 1.64% | 1.56% | 1.25% |
| Portfolio Turnover | 30% (3) | 34% | 81% | 41% | 91% | 19% |
| (1) | Returns are historical and are calculated by determining the percentage change in net asset value with all distributions reinvested and do not reflect the effect of sales charges. |
| (2) | The investment adviser and administrator and the sub-adviser reimbursed certain operating expenses (equal to 0.13%, 0.13%, 0.16%, 0.18%, 0.20% and 0.24% of average daily net assets for the six months ended July 31, 2022 and the years ended January 31, 2022, 2021, 2020, 2019 and 2018, respectively). Absent this reimbursement, total return would be lower. |
| (3) | Not annualized. |
| (4) | Annualized. |
| (5) | Includes a reduction by the investment adviser and administrator of a portion of its investment adviser and administration fee due to the Fund’s investment in the Liquidity Fund (equal to less than 0.01% of average daily net assets for the six months ended July 31, 2022). |
| 1-to-10 Year Laddered Fund — Class C | ||||||
| Six
Months Ended July 31, 2022 (Unaudited) |
Year Ended January 31, | |||||
| 2022 | 2021 | 2020 | 2019 | 2018 | ||
| Net asset value — Beginning of period | $ 10.590 | $ 10.910 | $ 10.590 | $ 10.240 | $ 10.170 | $ 10.120 |
| Income (Loss) From Operations | ||||||
| Net investment income | $ 0.019 | $ 0.019 | $ 0.053 | $ 0.093 | $ 0.081 | $ 0.052 |
| Net realized and unrealized gain (loss) | (0.300) | (0.302) | 0.318 | 0.350 | 0.070 | 0.050 |
| Total income (loss) from operations | $ (0.281) | $ (0.283) | $ 0.371 | $ 0.443 | $ 0.151 | $ 0.102 |
| Less Distributions | ||||||
| From net investment income | $ (0.019) | $ (0.018) | $ (0.051) | $ (0.093) | $ (0.081) | $ (0.052) |
| From net realized gain | — | (0.019) | — | — | — | — |
| Total distributions | $ (0.019) | $ (0.037) | $ (0.051) | $ (0.093) | $ (0.081) | $ (0.052) |
| Net asset value — End of period | $10.290 | $10.590 | $10.910 | $10.590 | $10.240 | $10.170 |
| Total Return(1)(2) | (2.66)% (3) | (2.60)% | 3.52% | 4.35% | 1.50% | 1.00% |
| Ratios/Supplemental Data | ||||||
| Net assets, end of period (000’s omitted) | $ 3,345 | $ 3,591 | $ 3,994 | $ 3,875 | $ 3,951 | $ 3,638 |
| Ratios (as a percentage of average daily net assets): | ||||||
| Expenses (2) | 1.40% (4)(5) | 1.40% | 1.40% | 1.40% | 1.40% | 1.40% |
| Net investment income | 0.36% (4) | 0.17% | 0.48% | 0.90% | 0.80% | 0.50% |
| Portfolio Turnover | 30% (3) | 34% | 81% | 41% | 91% | 19% |
| (1) | Returns are historical and are calculated by determining the percentage change in net asset value with all distributions reinvested and do not reflect the effect of sales charges. |
| (2) | The investment adviser and administrator and the sub-adviser reimbursed certain operating expenses (equal to 0.13%, 0.13%, 0.16%, 0.18%, 0.20% and 0.24% of average daily net assets for the six months ended July 31, 2022 and the years ended January 31, 2022, 2021, 2020, 2019 and 2018, respectively). Absent this reimbursement, total return would be lower. |
| (3) | Not annualized. |
| (4) | Annualized. |
| (5) | Includes a reduction by the investment adviser and administrator of a portion of its investment adviser and administration fee due to the Fund’s investment in the Liquidity Fund (equal to less than 0.01% of average daily net assets for the six months ended July 31, 2022). |
| 1-to-10 Year Laddered Fund — Class I | ||||||
| Six
Months Ended July 31, 2022 (Unaudited) |
Year Ended January 31, | |||||
| 2022 | 2021 | 2020 | 2019 | 2018 | ||
| Net asset value — Beginning of period | $ 10.600 | $ 10.920 | $ 10.610 | $ 10.250 | $ 10.180 | $ 10.130 |
| Income (Loss) From Operations | ||||||
| Net investment income | $ 0.069 | $ 0.127 | $ 0.159 | $ 0.198 | $ 0.182 | $ 0.156 |
| Net realized and unrealized gain (loss) | (0.299) | (0.301) | 0.308 | 0.360 | 0.070 | 0.050 |
| Total income (loss) from operations | $ (0.230) | $ (0.174) | $ 0.467 | $ 0.558 | $ 0.252 | $ 0.206 |
| Less Distributions | ||||||
| From net investment income | $ (0.070) | $ (0.127) | $ (0.157) | $ (0.198) | $ (0.182) | $ (0.156) |
| From net realized gain | — | (0.019) | — | — | — | — |
| Total distributions | $ (0.070) | $ (0.146) | $ (0.157) | $ (0.198) | $ (0.182) | $ (0.156) |
| Net asset value — End of period | $10.300 | $10.600 | $10.920 | $10.610 | $10.250 | $10.180 |
| Total Return(1)(2) | (2.17)% (3) | (1.62)% | 4.45% | 5.49% | 2.51% | 2.03% |
| Ratios/Supplemental Data | ||||||
| Net assets, end of period (000’s omitted) | $ 72,311 | $ 75,548 | $ 66,298 | $ 47,792 | $ 31,936 | $ 42,106 |
| Ratios (as a percentage of average daily net assets): | ||||||
| Expenses (2) | 0.40% (4)(5) | 0.40% | 0.40% | 0.40% | 0.40% | 0.40% |
| Net investment income | 1.36% (4) | 1.17% | 1.46% | 1.88% | 1.79% | 1.51% |
| Portfolio Turnover | 30% (3) | 34% | 81% | 41% | 91% | 19% |
| (1) | Returns are historical and are calculated by determining the percentage change in net asset value with all distributions reinvested. |
| (2) | The investment adviser and administrator and the sub-adviser reimbursed certain operating expenses (equal to 0.13%, 0.13%, 0.16%, 0.18%, 0.20% and 0.24% of average daily net assets for the six months ended July 31, 2022 and the years ended January 31, 2022, 2021, 2020, 2019 and 2018, respectively). Absent this reimbursement, total return would be lower. |
| (3) | Not annualized. |
| (4) | Annualized. |
| (5) | Includes a reduction by the investment adviser and administrator of a portion of its investment adviser and administration fee due to the Fund’s investment in the Liquidity Fund (equal to less than 0.01% of average daily net assets for the six months ended July 31, 2022). |
| 10-to-20 Year Laddered Fund — Class A | ||||||
| Six
Months Ended July 31, 2022 (Unaudited) |
Year Ended January 31, | |||||
| 2022 | 2021 | 2020 | 2019 | 2018 | ||
| Net asset value — Beginning of period | $ 11.230 | $ 11.730 | $ 11.410 | $ 10.560 | $ 10.530 | $ 10.260 |
| Income (Loss) From Operations | ||||||
| Net investment income | $ 0.106 | $ 0.198 | $ 0.218 | $ 0.275 | $ 0.272 | $ 0.255 |
| Net realized and unrealized gain (loss) | (0.941) | (0.389) | 0.492 | 0.870 | 0.068 | 0.270 |
| Total income (loss) from operations | $ (0.835) | $ (0.191) | $ 0.710 | $ 1.145 | $ 0.340 | $ 0.525 |
| Less Distributions | ||||||
| From net investment income | $ (0.105) | $ (0.198) | $ (0.215) | $ (0.277) | $ (0.271) | $ (0.255) |
| From net realized gain | — | (0.111) | (0.175) | (0.018) | (0.039) | — |
| Total distributions | $ (0.105) | $ (0.309) | $ (0.390) | $ (0.295) | $ (0.310) | $ (0.255) |
| Net asset value — End of period | $10.290 | $11.230 | $11.730 | $11.410 | $10.560 | $10.530 |
| Total Return(1)(2) | (7.44)% (3) | (1.69)% | 6.35% | 10.97% | 3.30% | 5.14% |
| Ratios/Supplemental Data | ||||||
| Net assets, end of period (000’s omitted) | $ 3,157 | $ 5,139 | $ 4,881 | $ 970 | $ 297 | $ 336 |
| Ratios (as a percentage of average daily net assets): | ||||||
| Expenses (2) | 0.65% (4)(5) | 0.65% | 0.65% | 0.65% | 0.65% | 0.65% |
| Net investment income | 2.02% (4) | 1.69% | 1.79% | 2.45% | 2.59% | 2.44% |
| Portfolio Turnover | 34% (3) | 24% | 62% | 33% | 44% | 53% |
| (1) | Returns are historical and are calculated by determining the percentage change in net asset value with all distributions reinvested and do not reflect the effect of sales charges. |
| (2) | The investment adviser and administrator and the sub-adviser reimbursed certain operating expenses (equal to 0.69%, 0.53%, 0.61%, 0.94%, 1.25% and 1.42% of average daily net assets for the six months ended July 31, 2022 and the years ended January 31, 2022, 2021, 2020, 2019 and 2018, respectively). Absent this reimbursement, total return would be lower. |
| (3) | Not annualized. |
| (4) | Annualized. |
| (5) | Includes a reduction by the investment adviser and administrator of a portion of its investment adviser and administration fee due to the Fund’s investment in the Liquidity Fund (equal to less than 0.01% of average daily net assets for the six months ended July 31, 2022). |
| 10-to-20 Year Laddered Fund — Class C | ||||||
| Six
Months Ended July 31, 2022 (Unaudited) |
Year Ended January 31, | |||||
| 2022 | 2021 | 2020 | 2019 | 2018 | ||
| Net asset value — Beginning of period | $ 11.230 | $ 11.730 | $ 11.410 | $ 10.570 | $ 10.540 | $ 10.270 |
| Income (Loss) From Operations | ||||||
| Net investment income | $ 0.072 | $ 0.111 | $ 0.135 | $ 0.193 | $ 0.194 | $ 0.176 |
| Net realized and unrealized gain (loss) | (0.946) | (0.389) | 0.490 | 0.859 | 0.068 | 0.270 |
| Total income (loss) from operations | $ (0.874) | $ (0.278) | $ 0.625 | $ 1.052 | $ 0.262 | $ 0.446 |
| Less Distributions | ||||||
| From net investment income | $ (0.066) | $ (0.111) | $ (0.130) | $ (0.194) | $ (0.193) | $ (0.176) |
| From net realized gain | — | (0.111) | (0.175) | (0.018) | (0.039) | — |
| Total distributions | $ (0.066) | $ (0.222) | $ (0.305) | $ (0.212) | $ (0.232) | $ (0.176) |
| Net asset value — End of period | $10.290 | $11.230 | $11.730 | $11.410 | $10.570 | $10.540 |
| Total Return(1)(2) | (7.79)% (3) | (2.43)% | 5.56% | 10.04% | 2.53% | 4.35% |
| Ratios/Supplemental Data | ||||||
| Net assets, end of period (000’s omitted) | $ 217 | $ 476 | $ 522 | $ 521 | $ 331 | $ 380 |
| Ratios (as a percentage of average daily net assets): | ||||||
| Expenses (2) | 1.40% (4)(5) | 1.40% | 1.40% | 1.40% | 1.40% | 1.40% |
| Net investment income | 1.25% (4) | 0.95% | 1.14% | 1.73% | 1.85% | 1.66% |
| Portfolio Turnover | 34% (3) | 24% | 62% | 33% | 44% | 53% |
| (1) | Returns are historical and are calculated by determining the percentage change in net asset value with all distributions reinvested and do not reflect the effect of sales charges. |
| (2) | The investment adviser and administrator and the sub-adviser reimbursed certain operating expenses (equal to 0.69%, 0.53%, 0.61%, 0.94%, 1.25% and 1.42% of average daily net assets for the six months ended July 31, 2022 and the years ended January 31, 2022, 2021, 2020, 2019 and 2018, respectively). Absent this reimbursement, total return would be lower. |
| (3) | Not annualized. |
| (4) | Annualized. |
| (5) | Includes a reduction by the investment adviser and administrator of a portion of its investment adviser and administration fee due to the Fund’s investment in the Liquidity Fund (equal to less than 0.01% of average daily net assets for the six months ended July 31, 2022). |
| 10-to-20 Year Laddered Fund — Class I | ||||||
| Six
Months Ended July 31, 2022 (Unaudited) |
Year Ended January 31, | |||||
| 2022 | 2021 | 2020 | 2019 | 2018 | ||
| Net asset value — Beginning of period | $ 11.230 | $ 11.730 | $ 11.410 | $ 10.560 | $ 10.530 | $ 10.270 |
| Income (Loss) From Operations | ||||||
| Net investment income | $ 0.121 | $ 0.228 | $ 0.248 | $ 0.304 | $ 0.298 | $ 0.281 |
| Net realized and unrealized gain (loss) | (0.933) | (0.390) | 0.491 | 0.869 | 0.069 | 0.261 |
| Total income (loss) from operations | $ (0.812) | $ (0.162) | $ 0.739 | $ 1.173 | $ 0.367 | $ 0.542 |
| Less Distributions | ||||||
| From net investment income | $ (0.118) | $ (0.227) | $ (0.244) | $ (0.305) | $ (0.298) | $ (0.282) |
| From net realized gain | — | (0.111) | (0.175) | (0.018) | (0.039) | — |
| Total distributions | $ (0.118) | $ (0.338) | $ (0.419) | $ (0.323) | $ (0.337) | $ (0.282) |
| Net asset value — End of period | $10.300 | $11.230 | $11.730 | $11.410 | $10.560 | $10.530 |
| Total Return(1)(2) | (7.24)% (3) | (1.45)% | 6.61% | 11.25% | 3.56% | 5.30% |
| Ratios/Supplemental Data | ||||||
| Net assets, end of period (000’s omitted) | $ 8,374 | $ 14,290 | $ 17,216 | $ 12,708 | $ 8,415 | $ 8,358 |
| Ratios (as a percentage of average daily net assets): | ||||||
| Expenses (2) | 0.40% (4)(5) | 0.40% | 0.40% | 0.40% | 0.40% | 0.40% |
| Net investment income | 2.25% (4) | 1.94% | 2.10% | 2.73% | 2.85% | 2.65% |
| Portfolio Turnover | 34% (3) | 24% | 62% | 33% | 44% | 53% |
| (1) | Returns are historical and are calculated by determining the percentage change in net asset value with all distributions reinvested. |
| (2) | The investment adviser and administrator and the sub-adviser reimbursed certain operating expenses (equal to 0.69%, 0.53%, 0.61%, 0.94%, 1.25% and 1.42% of average daily net assets for the six months ended July 31, 2022 and the years ended January 31, 2022, 2021, 2020, 2019 and 2018, respectively). Absent this reimbursement, total return would be lower. |
| (3) | Not annualized. |
| (4) | Annualized. |
| (5) | Includes a reduction by the investment adviser and administrator of a portion of its investment adviser and administration fee due to the Fund’s investment in the Liquidity Fund (equal to less than 0.01% of average daily net assets for the six months ended July 31, 2022). |
| 1-to-10
Year Laddered Fund |
10-to-20
Year Laddered Fund | |
| Aggregate cost | $ 85,027,798 | $11,424,534 |
| Gross unrealized appreciation | $ 963,292 | $ 171,171 |
| Gross unrealized depreciation | (1,651,678) | (381,767) |
| Net unrealized depreciation | $ (688,386) | $ (210,596) |
| Annual Fee Rate | ||
| Average Daily Net Assets | 1-to-10
Year Laddered Fund |
10-to-20
Year Laddered Fund |
| Up to $1 billion | 0.3200% | 0.3200% |
| $1 billion but less than $2.5 billion | 0.3075% | 0.3075% |
| $2.5 billion but less than $5 billion | 0.2950% | 0.2950% |
| $5 billion and over | 0.2875% | 0.2875% |
| 1-to-10
Year Laddered Fund |
10-to-20
Year Laddered Fund | |
| Investment Adviser and Administration Fee | $141,720 | $24,480 |
| Effective Annual Rate | 0.32% | 0.32% |
| 1-to-10
Year Laddered Fund |
10-to-20
Year Laddered Fund | |
| EVM's Sub-Transfer Agent Fees | $1,024 | $ 580 |
| EVD's Class A Sales Charges | $ 80 | $ — |
| 1-to-10
Year Laddered Fund |
10-to-20
Year Laddered Fund | |
| Class A Distribution and Service Fees | $16,018 | $4,631 |
| 1-to-10
Year Laddered Fund |
10-to-20
Year Laddered Fund | |
| Class C Distribution Fees | $12,673 | $1,264 |
| 1-to-10
Year Laddered Fund |
10-to-20
Year Laddered Fund | |
| Class C Service Fees | $4,224 | $422 |
| 1-to-10
Year Laddered Fund |
10-to-20
Year Laddered Fund | |
| Class A | $25,000 | $ — |
| Class C | $ 500 | $ — |
| 1-to-10
Year Laddered Fund |
10-to-20
Year Laddered Fund | |
| Purchases | $25,693,729 | $ 4,733,717 |
| Sales | $38,455,015 | $12,095,002 |
| 1-to-10 Year Laddered Fund | ||||||
| Six
Months Ended July 31, 2022 (Unaudited) |
Year
Ended January 31, 2022 | |||||
| Shares | Amount | Shares | Amount | |||
| Class A | ||||||
| Sales | 28,560 | $ 296,362 | 556,525 | $ 6,050,061 | ||
| Issued to shareholders electing to receive payments of distributions in Fund shares | 6,896 | 70,776 | 15,497 | 167,915 | ||
| Redemptions | (388,836) | (3,963,645) | (1,294,640) | (14,026,180) | ||
| Net decrease | (353,380) | $ (3,596,507) | (722,618) | $ (7,808,204) | ||
| Class C | ||||||
| Sales | 24,597 | $ 249,617 | 33,698 | $ 366,553 | ||
| Issued to shareholders electing to receive payments of distributions in Fund shares | 600 | 6,158 | 1,221 | 13,244 | ||
| Redemptions | (39,167) | (398,920) | (61,857) | (672,446) | ||
| Net decrease | (13,970) | $ (143,145) | (26,938) | $ (292,649) | ||
| Class I | ||||||
| Sales | 2,501,238 | $ 25,706,655 | 3,090,695 | $ 33,631,922 | ||
| Issued to shareholders electing to receive payments of distributions in Fund shares | 48,017 | 493,372 | 87,577 | 949,843 | ||
| Redemptions | (2,654,977) | (27,104,041) | (2,122,112) | (23,039,153) | ||
| Net increase (decrease) | (105,722) | $ (904,014) | 1,056,160 | $ 11,542,612 | ||
| 10-to-20 Year Laddered Fund | ||||||
| Six
Months Ended July 31, 2022 (Unaudited) |
Year
Ended January 31, 2022 | |||||
| Shares | Amount | Shares | Amount | |||
| Class A | ||||||
| Sales | 27,998 | $ 294,604 | 182,612 | $ 2,139,678 | ||
| Issued to shareholders electing to receive payments of distributions in Fund shares | 3,574 | 37,455 | 13,227 | 153,766 | ||
| Redemptions | (182,497) | (1,939,535) | (154,396) | (1,794,498) | ||
| Net increase (decrease) | (150,925) | $(1,607,476) | 41,443 | $ 498,946 | ||
| Class C | ||||||
| Sales | — | $ — | 15,466 | $ 182,531 | ||
| Issued to shareholders electing to receive payments of distributions in Fund shares | 200 | 2,105 | 1,038 | 12,069 | ||
| Redemptions | (21,434) | (221,476) | (18,628) | (216,405) | ||
| Net decrease | (21,234) | $ (219,371) | (2,124) | $ (21,805) | ||
| Class I | ||||||
| Sales | 96,606 | $ 1,029,488 | 712,417 | $ 8,326,515 | ||
| Issued to shareholders electing to receive payments of distributions in Fund shares | 12,055 | 126,418 | 35,986 | 418,129 | ||
| Redemptions | (567,381) | (5,866,758) | (943,932) | (10,985,720) | ||
| Net decrease | (458,720) | $(4,710,852) | (195,529) | $ (2,241,076) | ||
| 1-to-10 Year Laddered Fund | ||||||||
| Name | Value,
beginning of period |
Purchases | Sales
proceeds |
Net
realized gain (loss) |
Change
in unrealized appreciation (depreciation) |
Value,
end of period |
Dividend
income |
Units/Shares,
end of period |
| Short-Term Investments | ||||||||
| Cash Reserves Fund | $9,633,863 | $15,094,195 | $(24,727,602) | $ (457) | $ 1 | $ — | $ 1,729 | — |
| Liquidity Fund | — | 41,186,229 | (32,113,505) | — | — | 9,072,724 | 19,834 | 9,072,724 |
| Total | $(457) | $ 1 | $9,072,724 | $21,563 | ||||
| 10-to-20 Year Laddered Fund | ||||||||
| Name | Value,
beginning of period |
Purchases | Sales
proceeds |
Net
realized gain (loss) |
Change
in unrealized appreciation (depreciation) |
Value,
end of period |
Dividend
income |
Units/Shares,
end of period |
| Short-Term Investments | ||||||||
| Cash Reserves Fund | $1,399,552 | $3,905,604 | $(5,305,386) | $ 230 | $ — | $ — | $ 154 | — |
| Liquidity Fund | — | 9,891,942 | (8,878,341) | — | — | 1,013,601 | 3,574 | 1,013,601 |
| Total | $ 230 | $ — | $1,013,601 | $3,728 | ||||
| • | Level 1 – quoted prices in active markets for identical investments |
| • | Level 2 – other significant observable inputs (including quoted prices for similar investments, interest rates, prepayment speeds, credit risk, etc.) |
| • | Level 3 – significant unobservable inputs (including a fund's own assumptions in determining the fair value of investments) |
| 1-to-10 Year Laddered Fund | ||||
| Asset Description | Level 1 | Level 2 | Level 3 | Total |
| Tax-Exempt Municipal Obligations | $ — | $ 75,266,688 | $ — | $ 75,266,688 |
| Short-Term Investments | 9,072,724 | — | — | 9,072,724 |
| Total Investments | $9,072,724 | $75,266,688 | $ — | $84,339,412 |
| 10-to-20 Year Laddered Fund | ||||
| Asset Description | Level 1 | Level 2 | Level 3 | Total |
| Tax-Exempt Municipal Obligations | $ — | $ 10,200,337 | $ — | $ 10,200,337 |
| Short-Term Investments | 1,013,601 | — | — | 1,013,601 |
| Total Investments | $1,013,601 | $10,200,337 | $ — | $11,213,938 |
| Officers | |
| Eric
A. Stein President |
Jill R.
Damon Secretary |
| Deidre
E. Walsh Vice President and Chief Legal Officer |
Richard F.
Froio Chief Compliance Officer |
| James
F. Kirchner Treasurer |
|
| Trustees |
| * | Interested Trustee |
| ** | Mr. Bowser and Ms. Wiser began serving as Trustees effective April 4, 2022. |
| Privacy Notice | April 2021 |
| FACTS | WHAT
DOES EATON VANCE DO WITH YOUR PERSONAL INFORMATION? |
| Why? | Financial companies choose how they share your personal information. Federal law gives consumers the right to limit some but not all sharing. Federal law also requires us to tell you how we collect, share, and protect your personal information. Please read this notice carefully to understand what we do. |
| What? | The
types of personal information we collect and share depend on the product or service you have with us. This information can include:■ Social Security number and income ■ investment experience and risk tolerance ■ checking account number and wire transfer instructions |
| How? | All financial companies need to share customers’ personal information to run their everyday business. In the section below, we list the reasons financial companies can share their customers’ personal information; the reasons Eaton Vance chooses to share; and whether you can limit this sharing. |
| Reasons
we can share your personal information |
Does
Eaton Vance share? |
Can
you limit this sharing? |
| For our everyday business purposes — such as to process your transactions, maintain your account(s), respond to court orders and legal investigations, or report to credit bureaus | Yes | No |
| For our marketing purposes — to offer our products and services to you | Yes | No |
| For joint marketing with other financial companies | No | We don’t share |
| For our investment management affiliates’ everyday business purposes — information about your transactions, experiences, and creditworthiness | Yes | Yes |
| For our affiliates’ everyday business purposes — information about your transactions and experiences | Yes | No |
| For our affiliates’ everyday business purposes — information about your creditworthiness | No | We don’t share |
| For our investment management affiliates to market to you | Yes | Yes |
| For our affiliates to market to you | No | We don’t share |
| For nonaffiliates to market to you | No | We don’t share |
| To
limit our sharing |
Call toll-free 1-800-262-1122 or email: EVPrivacy@eatonvance.comPlease note:If you are a new customer, we can begin sharing your information 30 days from the date we sent this notice. When you are no longer our customer, we continue to share your information as described in this notice. However, you can contact us at any time to limit our sharing. |
| Questions? | Call toll-free 1-800-262-1122 or email: EVPrivacy@eatonvance.com |
| Privacy Notice — continued | April 2021 |
| Who we are | |
| Who is providing this notice? | Eaton Vance Management, Eaton Vance Distributors, Inc., Eaton Vance Trust Company, Eaton Vance Management (International) Limited, Eaton Vance Advisers International Ltd., Eaton Vance Global Advisors Limited, Eaton Vance Management’s Real Estate Investment Group, Boston Management and Research, Calvert Research and Management, Eaton Vance and Calvert Fund Families and our investment advisory affiliates (“Eaton Vance”) (see Investment Management Affiliates definition below) |
| What we do | |
| How
does Eaton Vance protect my personal information? |
To protect your personal information from unauthorized access and use, we use security measures that comply with federal law. These measures include computer safeguards and secured files and buildings. We have policies governing the proper handling of customer information by personnel and requiring third parties that provide support to adhere to appropriate security standards with respect to such information. |
| How
does Eaton Vance collect my personal information? |
We
collect your personal information, for example, when you■ open an account or make deposits or withdrawals from your account ■ buy securities from us or make a wire transfer ■ give us your contact informationWe also collect your personal information from others, such as credit bureaus, affiliates, or other companies. |
| Why can’t I limit all sharing? | Federal
law gives you the right to limit only■ sharing for affiliates’ everyday business purposes — information about your creditworthiness ■ affiliates from using your information to market to you ■ sharing for nonaffiliates to market to youState laws and individual companies may give you additional rights to limit sharing. See below for more on your rights under state law. |
| Definitions | |
| Investment
Management Affiliates |
Eaton Vance Investment Management Affiliates include registered investment advisers, registered broker- dealers, and registered and unregistered funds. Investment Management Affiliates does not include entities associated with Morgan Stanley Wealth Management, such as Morgan Stanley Smith Barney LLC and Morgan Stanley & Co. |
| Affiliates | Companies related by common ownership or control. They can be financial and nonfinancial companies.■ Our affiliates include companies with a Morgan Stanley name and financial companies such as Morgan Stanley Smith Barney LLC and Morgan Stanley & Co. |
| Nonaffiliates | Companies not related by common ownership or control. They can be financial and nonfinancial companies.■ Eaton Vance does not share with nonaffiliates so they can market to you. |
| Joint marketing | A formal agreement between nonaffiliated financial companies that together market financial products or services to you.■ Eaton Vance doesn’t jointly market. |
| Other important information | |
| Vermont: Except as permitted by law, we will not share personal information we collect about Vermont residents with Nonaffiliates unless you provide us with your written consent to share such information.California: Except as permitted by law, we will not share personal information we collect about California residents with Nonaffiliates and we will limit sharing such personal information with our Affiliates to comply with California privacy laws that apply to us. | |
Item 2. Code of Ethics
Not required in this filing.
Item 3. Audit Committee Financial Expert
Not required in this filing.
Item 4. Principal Accountant Fees and Services
Not required in this filing.
Item 5. Audit Committee of Listed Registrants
Not applicable.
Item 6. Schedule of Investments
Please see schedule of investments contained in the Report to Stockholders included under Item 1 of this Form N-CSR.
Item 7. Disclosure of Proxy Voting Policies and Procedures for Closed-End Management Investment Companies
Not applicable.
Item 8. Portfolio Managers of Closed-End Management Investment Companies
Not applicable.
Item 9. Purchases of Equity Securities by Closed-End Management Investment Company and Affiliated Purchasers
Not applicable.
Item 10. Submission of Matters to a Vote of Security Holders
No material changes.
Item 11. Controls and Procedures
(a) It is the conclusion of the registrant’s principal executive officer and principal financial officer that the effectiveness of the registrant’s current disclosure controls and procedures (such disclosure controls and procedures having been evaluated within 90 days of the date of this filing) provide reasonable assurance that the information required to be disclosed by the registrant has been recorded, processed, summarized and reported within the time period specified in the Commission’s rules and forms and that the information required to be disclosed by the registrant has been accumulated and communicated to the registrant’s principal executive officer and principal financial officer in order to allow timely decisions regarding required disclosure.
(b) There have been no changes in the registrant’s internal controls over financial reporting during the period covered by this report that has materially affected, or is reasonably likely to materially affect, the registrant’s internal control over financial reporting.
Item 12. Disclosure of Securities Lending Activities for Closed-End Management Investment Companies
Not applicable.
Item 13. Exhibits
| (a)(1) |
Registrant’s Code of Ethics – Not applicable (please see Item 2). | |
| (a)(2)(i) |
Treasurer’s Section 302 certification. | |
| (a)(2)(ii) |
President’s Section 302 certification. | |
| (b) |
Combined Section 906 certification. | |
Signatures
Pursuant to the requirements of the Securities Exchange Act of 1934 and the Investment Company Act of 1940, the registrant has duly caused this report to be signed on its behalf by the undersigned, thereunto duly authorized.
| Eaton Vance Municipals Trust II | ||
| By: | /s/ Eric A. Stein | |
| Eric A. Stein | ||
| President | ||
Date: September 16, 2022
Pursuant to the requirements of the Securities Exchange Act of 1934 and the Investment Company Act of 1940, this report has been signed below by the following persons on behalf of the registrant and in the capacities and on the dates indicated.
| By: | /s/ James F. Kirchner | |
| James F. Kirchner | ||
| Treasurer |
Date: September 16, 2022
| By: | /s/ Eric A. Stein | |
| Eric A. Stein | ||
| President |
Date: September 16, 2022