|
For additional information: |
For Immediate Release
Southwest Bancorp, Inc. Reports Results for First Quarter 2016
and Announces Quarterly Dividend
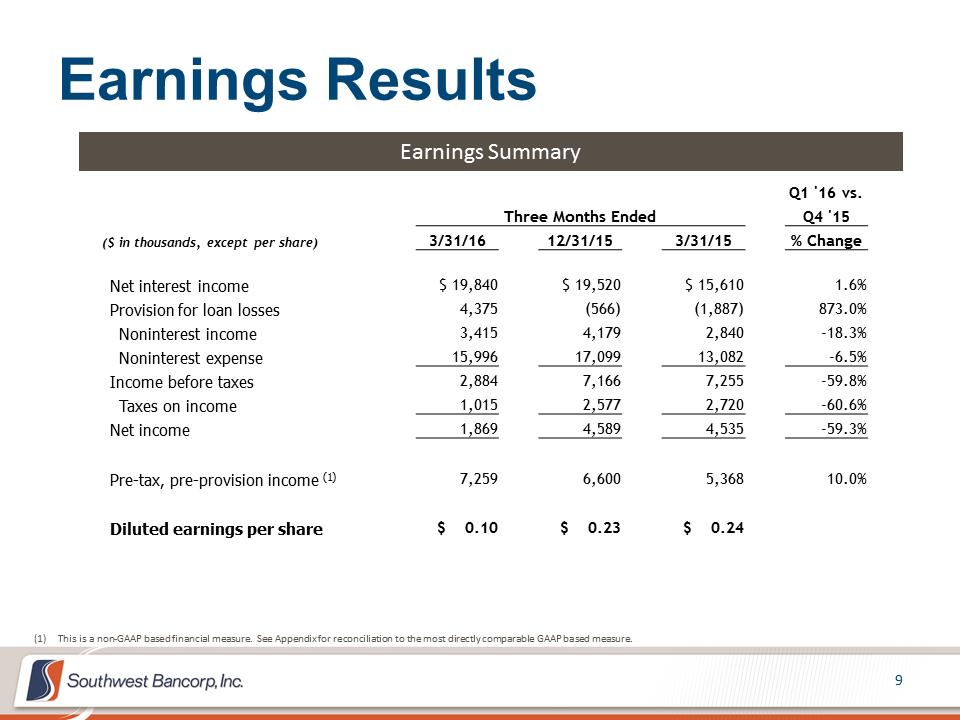
April 20, 2016, Stillwater, Oklahoma . . . . Southwest Bancorp, Inc. (NASDAQ Global Select Market - OKSB), (“Southwest”), today reported net income for the first quarter of 2016 of $1.9 million, or $0.10 per diluted share, compared to $4.5 million, or $0.24 per diluted share, for the first quarter of 2015. The decrease in first quarter net income was due to a $4.4 million loan loss provision primarily driven by the impact of low energy prices combined with deterioration in a few general business credits.
Southwest announced that its board of directors has approved a quarterly cash dividend of $0.08 per share payable May 13, 2016 to shareholders of record as of April 29, 2016.
Mark Funke, President and CEO, stated, “We continued to have strong loan production during the first quarter, but the net growth was reduced by expected payoffs on real estate loans. As energy prices remain low, we identified certain energy related exposure along with deterioration in a few general business credits that caused us to increase our loan loss reserve. Here are several highlights to take from this quarter.
|
· |
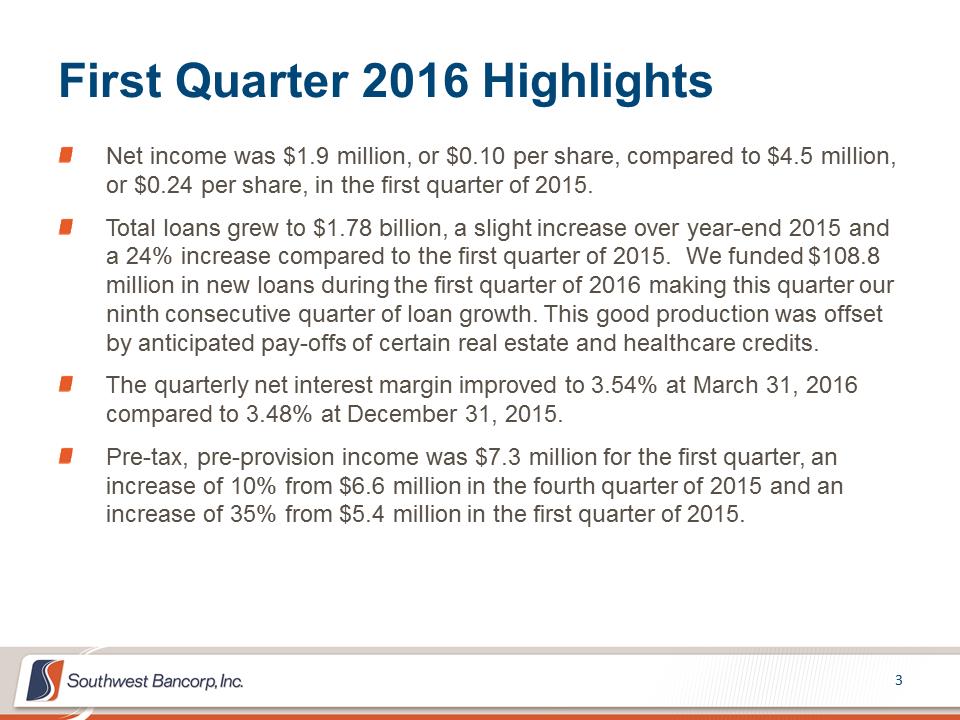
Total loans grew to $1.78 billion, a slight increase over year-end 2015 and a 24% increase compared to the first quarter of 2015. We funded $108.8 million in new loans during the first quarter of 2016 making this quarter our ninth consecutive quarter of loan growth. |
|
· |
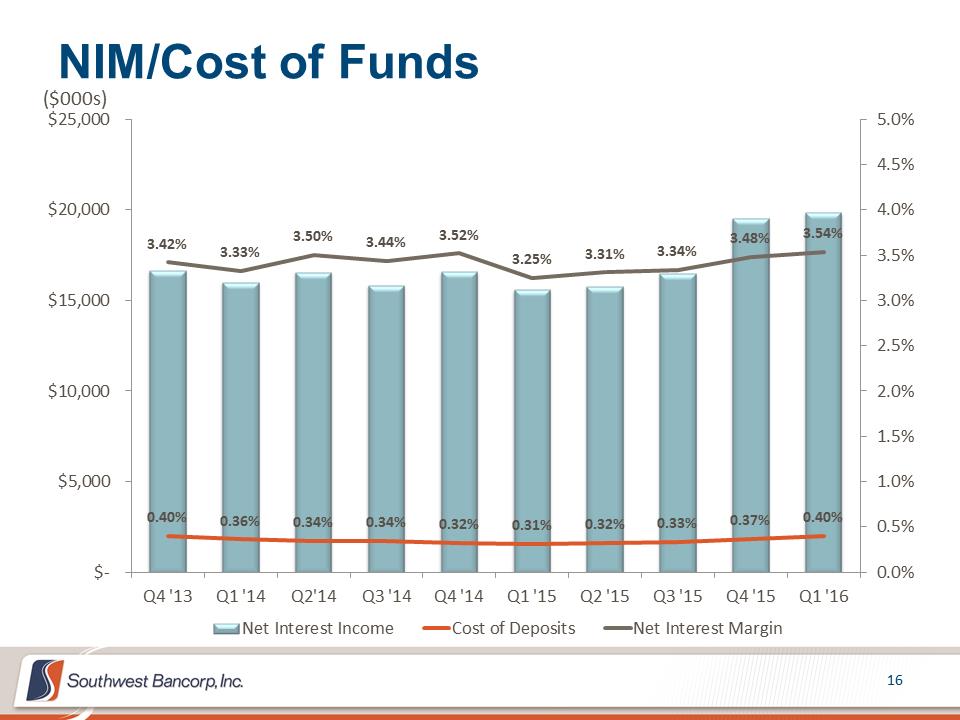
The quarterly net interest margin improved to 3.54% at March 31, 2016 compared to 3.48% at December 31, 2015. |
|
· |
Pre-tax, pre-provision income was $7.3 million for the first quarter, an increase of 10% from $6.6 million in the fourth quarter of 2015 and an increase of 35% from $5.4 million in the first quarter of 2015. |
|
· |
On February 23, 2016 our board of directors authorized a third consecutive share repurchase program of up to another 5.0%, or approximately 967,000 shares, which became effective during the first quarter upon the completion of the repurchase of all of the shares under the prior program. During the first quarter of 2016, Southwest purchased 803,546 shares for a total of $12.7 million, and since August 2014, Southwest has repurchased 1,925,104 shares for a total of $31.4 million. |
“Although the quarter was less than we expected, we will continue to focus our company on producing consistent, conservative, and sustainable earnings through the expansion of our revenue base while prudently managing risk and expenses.”
Financial Overview
Condition: As of March 31, 2016, total assets were $2.4 billion, an increase of $3.8 million, when compared to December 31, 2015. As of March 31, 2016, total loans were $1.8 billion, an increase of $2.5 million from the prior quarter end. As of March 31, 2016, investment securities were $423.0 million, an increase of $10.9 million from the
prior quarter end. Cash and cash equivalents at March 31, 2016 were $67.4 million, down $10.8 million from December 31, 2015.
At March 31, 2016, the allowance for loan losses was $27.2 million, an increase of $1.1 million when compared to December 31, 2015 and a decrease of $0.1 million when compared to March 31, 2015. The allowance for loan losses to portfolio loans was 1.53% as of March 31, 2016, up from 1.47% as of December 31, 2015, and down from 1.91% as of March 31, 2015. The allowance for loan losses to nonperforming loans was 122.012% as of March 31, 2016, compared to 128.23% as of December 31, 2015 and 297.78% as of March 31, 2015. The total allowance for loan losses combined with the purchase discount on acquired loans represents 1.96% of gross loans as of March 31, 2016, compared to 1.94% as of December 31, 2015.
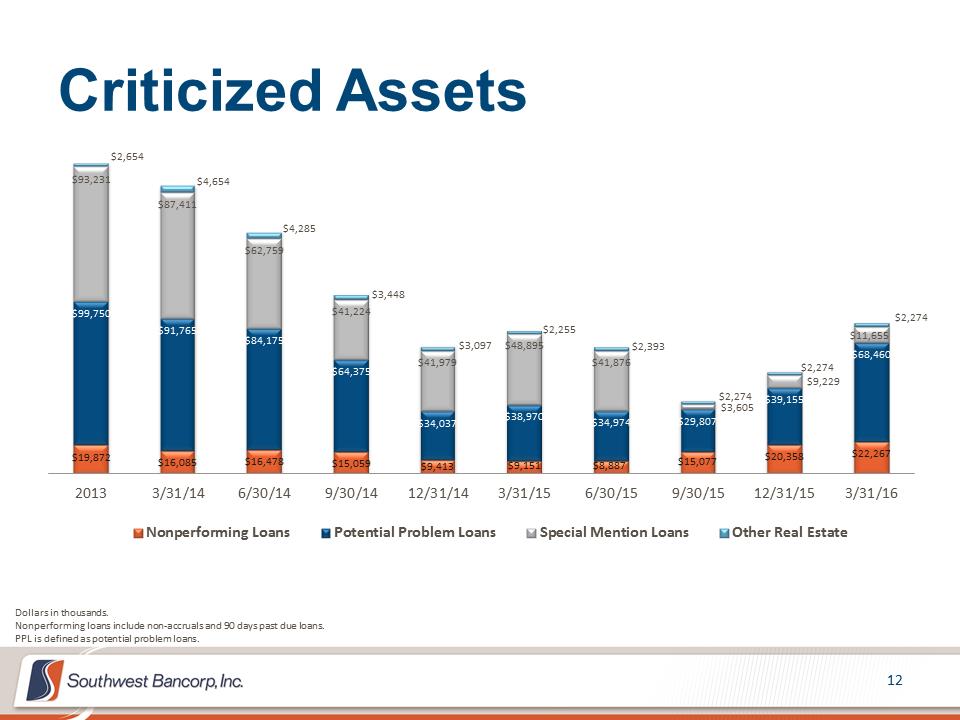
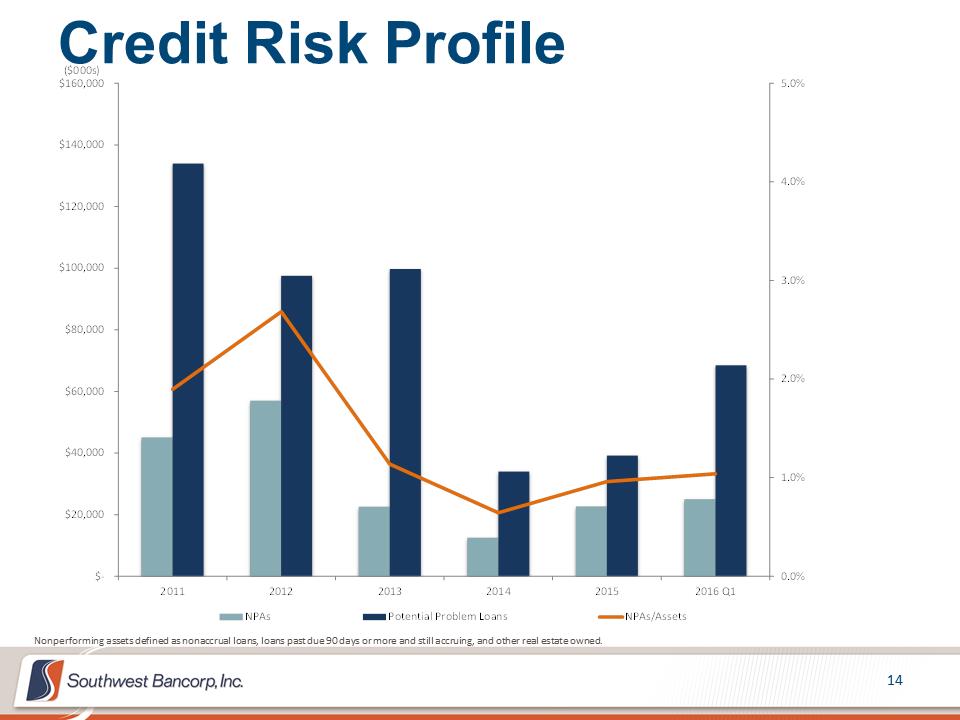
Nonperforming loans were $22.3 million at March 31, 2016, an increase of $2.0 million from December 31, 2015, and an increase of $13.1 million from March 31, 2015. Other real estate at March 31, 2016 was $2.3 million, which is flat from December 31, 2015, and March 31, 2015. Nonperforming assets were $24.5 million, or 1.38% of portfolio loans and other real estate, as of March 31, 2016, compared to $22.6 million, or 1.28% of portfolio loans and other real estate, as of December 31, 2015, and $11.4 million, or 0.80% of portfolio loans and other real estate, as of March 31, 2015.
As of March 31, 2016, total deposits were $1.9 billion, an increase of $11.1 million, when compared to December 31, 2015. Total core funding, which includes all non-brokered deposits and sweep repurchase agreements, comprised 87% and 88% of total funding as of March 31, 2016 and December 31, 2015, respectively. Wholesale funding, including Federal Home Loan Bank borrowings, federal funds purchased, and brokered deposits, accounted for 13% and 12% of total funding at March 31, 2016 and December 31, 2015, respectively. See Table 6 for details on core funding and non-brokered deposits, which are non-GAAP financial measures.
The capital ratios of Southwest and Bank SNB as of March 31, 2016 exceeded the criteria for regulatory classification as “well-capitalized”. Southwest’s total regulatory capital was $343.3 million, for a total risk-based capital ratio of 15.39%, Common Equity Tier 1 capital was $270.6 million, for a Common Equity Tier 1 ratio of 12.13%, and Tier 1 capital was $315.3 million, for a Tier 1 risk-based capital ratio of 14.14%. Bank SNB had total regulatory capital of $321.4 million, for a total risk-based capital ratio of 14.46% and Common Equity Tier 1 and Tier 1 capital of $293.5 million, for a Common Equity Tier 1 and Tier 1 ratio of 13.21%. Designation as a well-capitalized institution under regulations does not constitute a recommendation or endorsement by bank regulators.
First Quarter Results:
Summary: For the first quarter of 2016, net income was $1.9 million, compared to $4.6 million for the fourth quarter of 2015 and $4.5 million for the first quarter of 2015. Pre-tax, pre-provision income for the first quarter of 2016 was $7.3 million, compared to $6.6 million for the fourth quarter of 2015 and $5.4 million for the first quarter of 2015.
The $2.7 million decrease in net income compared to the fourth quarter of 2015 was primarily due to a $4.4 million provision for loan losses versus a negative provision for loan losses of $0.6 million in the prior quarter. The decrease in net income also includes a $0.8 million decrease in noninterest income, offset in part by a $0.3 million increase in net interest income, a $1.1 million decrease in noninterest expense, and a $1.6 million decrease in income taxes.
The $2.7 million decrease in our net income compared to the first quarter of 2015 was again primarily due to a $4.4 million provision for loan losses versus a negative provision of loan losses of $1.9 million in first quarter 2015. The decrease in net income also includes a $2.9 million increase in noninterest expense, offset in part by a $4.2 million increase in net interest income, a $0.6 million increase in noninterest income, and a $1.7 million decrease in income taxes. The increase in noninterest expense, net interest income, and noninterest income are due in part to the First Commercial Bancshares, Inc. acquisition that occurred in the fourth quarter of 2015.
Net Interest Income: Net interest income totaled $19.8 million for the first quarter of 2016, compared to $19.5 million for the fourth quarter of 2015 and $15.6 million for the first quarter of 2015. Net interest margin was 3.54% for the first quarter of 2016, compared to 3.48% for the fourth quarter of 2015 and 3.25% for the first quarter of 2015. Included in interest income for both the first quarter of 2016 and the fourth quarter of 2015 was $0.3 million of accelerated discount accretion, respectively. The net effect of these adjustments on the net interest margin was a
5 basis point increase, respectively for each quarter. Loans (including loans held for sale) for the first quarter of 2016 increased $2.5 million when compared to December 31, 2015, and $343.6 million when compared to March 31, 2015. Loans acquired in the fourth quarter of 2015 were $202.4 million.
Provision (Credit) for Loan Losses and Net Charge-offs: The provision for loan losses is the amount that is required to maintain the allowance for loan losses at an appropriate level based upon the inherent risks in the loan portfolio after the effects of net charge-offs or net recoveries for the period. The provision for loan losses was a provision of $4.4 million for the first quarter of 2016, compared to a negative provision of $0.6 million for the fourth quarter of 2015, and a negative provision of $1.9 million for the first quarter of 2015. The first quarter 2016 provision was driven primarily by the impact of low energy prices combined with deterioration in a few general business credits. During the first quarter of 2016, net charge-offs totaled $3.3 million, or 0.75% (annualized) of average portfolio loans, compared to net recoveries of $0.1 million, or (0.02%) (annualized) of average portfolio loans for the fourth quarter of 2015 and net recoveries of $0.7 million, or (0.20%) (annualized) of average portfolio loans for the first quarter of 2015.
Noninterest Income: Noninterest income totaled $3.4 million for the first quarter of 2016, compared to $4.2 million for the fourth quarter of 2015 and $2.8 million for the first quarter of 2015.
The $0.8 million decrease from the fourth quarter of 2015 is the result of a $0.1 million decrease in service charges and fees, a $0.2 million decrease in the gain on sales of mortgage loans, which is due to a valuation adjustment on mortgage servicing rights, and a $0.5 million decrease in other noninterest income, primarily due to customer risk management interest rate swap income, offset in part by a $0.1 million gain recognized on the sale of investment securities during the quarter.
The $0.6 million increase from the first quarter of 2015 is primarily the result of a $0.1 million increase in service charges and fees, a $0.1 million increase in the gain on sales of mortgage loans, a $0.1 million increase in gain on sale of investment securities, and a $0.3 million increase in other noninterest income, primarily income on bank owned life insurance.
Noninterest Expense: Noninterest expense totaled $16.0 million for the first quarter of 2016, compared to $17.1 million for the fourth quarter of 2015 and $13.1 million for the first quarter of 2015.
The $1.1 million decrease in noninterest expense from the fourth quarter of 2015 was primarily due to a $0.9 million decrease in personnel expense and a $0.4 million decrease in data processing, offset in part by a $0.1 million increase in occupancy and a $0.1 million increase in general and administrative expense, which includes a $0.4 million increase in the provision for unfunded loan commitments offset by $0.1 million decrease in legal fees, 0.1 million decrease in marketing expense, and a $0.1 million decrease in professional fees.
The $2.9 million increase in noninterest expense from the first quarter of 2015 consisted of a $1.4 million increase in personnel expense, a $0.4 million increase in occupancy, a $0.1 million increase in FDIC and other insurance, and a $1.0 million increase in general and administrative expense, which includes a $0.4 million increase in the provision for unfunded loan commitments, a $0.2 million increase in business development expenses, a $0.1 million increase in intangible amortization expense.
Income Tax: Income tax expense totaled $1.0 million for the first quarter of 2016, compared to $2.6 million for the fourth quarter of 2015 and $2.7 million for the first quarter of 2015. The income tax expense fluctuates in relation to pre-tax income levels. The first quarter of 2016 effective tax rate was 35.19%, compared to 35.96% for the fourth quarter of 2015 and 37.50% for the first quarter of 2015. The decline in the effective tax rate includes the impact of an increase in tax exempt income, as a percentage of pre-tax income.
Conference Call
Southwest will host a conference call to review these results on Wednesday, April 20, 2016 at 11:00 a.m. Eastern Time (10:00 a.m. Central Time). Investors, news media, and others may pre-register for the call using the following link to receive a special dial-in number and PIN: http://dpregister.com/10083475. Telephone participants who are unable to pre-register may access the call by telephone at 866-218-2402 (toll-free) or 412-902-4190 (international). Participants are encouraged to dial into the call approximately 10 minutes prior to the start time. The call and corresponding presentation slides will be webcast live on Southwest’s website at www.oksb.com or http://services.choruscall.com/links/oksb160420. An audio replay will be available one hour after the call at 877-
344-7529 (toll-free) or 412-317-0088 (international), conference number 10083475. Telephone replay access will be available until 9:00 a.m. Eastern Time on May 20, 2016.
Southwest Bancorp and Subsidiaries
Southwest is the holding company for Bank SNB, an Oklahoma state banking corporation (“Bank SNB”). Bank SNB offers commercial and consumer lending, deposit and investment services, specialized cash management, and other financial services from offices in Oklahoma, Texas, Kansas, and Colorado. Bank SNB was chartered in 1894 and Southwest was organized in 1981 as the holding company. At March 31, 2016, Southwest had total assets of approximately $2.4 billion, deposits of $1.9 billion, and shareholders’ equity of $285.7 million.
Southwest’s area of expertise focuses on the special financial needs of healthcare and health professionals, businesses and their managers and owners, commercial lending, energy banking, and commercial real estate borrowers. The strategic focus on healthcare lending was established in 1974. Southwest and its banking subsidiary provide credit and other remittance services, such as deposits, cash management, and document imaging for physicians and other healthcare practitioners to start or develop their practices and finance the development and purchase of medical offices, clinics, surgical care centers, hospitals, and similar facilities. As of March 31, 2016, approximately $427.2 million, or 24%, of loans were loans to individuals and businesses in the healthcare industry. Regular market reviews are conducted of (i) current and potential healthcare lending business, and (ii) the appropriate concentrations within healthcare based upon economic and regulatory conditions.
Southwest’s common stock is traded on the NASDAQ Global Select Market under the symbol OKSB.
Caution About Forward-Looking Statements
Southwest makes forward-looking statements in this news release that are subject to risks and uncertainties. These statements are intended to be covered by the safe harbor provision for forward-looking statements contained in the Private Securities Litigation Reform Act of 1995.
These forward-looking statements include:
|
· |
Statements of Southwest's goals, intentions, and expectations; |
|
· |
Estimates of risks and of future costs and benefits; |
|
· |
Expectations regarding Southwest’s future financial performance and the financial performance of its operating segments; |
|
· |
Expectations regarding regulatory actions; |
|
· |
Expectations regarding Southwest’s ability to utilize tax loss benefits; |
|
· |
Expectations regarding Southwest’s stock repurchase program; |
|
· |
Expectations regarding dividends; |
|
· |
Expectations regarding acquisitions and divestitures; |
|
· |
Assessments of loan quality, probable loan losses, and the amount and timing of loan payoffs; |
|
· |
Estimates of the value of assets held for sale or available for sale; and |
|
· |
Statements of Southwest’s ability to achieve financial and other goals. |
These forward-looking statements are subject to significant uncertainties because they are based upon: the amount and timing of future changes in interest rates, market behavior, and other economic conditions; future laws, regulations, and accounting principles; changes in regulatory standards and examination policies, and a variety of other matters. These other matters include, among other things, the direct and indirect effects of economic conditions on interest rates, credit quality, loan demand, liquidity, and monetary and supervisory policies of banking regulators. Because of these uncertainties, the actual future results may be materially different from the results indicated by these forward-looking statements. In addition, Southwest's past growth and performance do not necessarily indicate future results. For other factors, risks, and uncertainties that could cause actual results to differ materially from estimates and projections contained in forward-looking statements, please read Southwest’s reports filed with the Securities and Exchange Commission, including its Annual Report on Form 10-K for the year ended December 31, 2015. You are urged to carefully review and consider the cautionary statements and other disclosures made in those filings, specifically those under the heading “Risk Factors”.
The cautionary statements in this release also identify important factors and possible events that involve risk and uncertainties that could cause actual results to differ materially from those contained in the forward-looking statements. These forward-looking statements speak only as of the date on which the statements were made. Southwest does not intend, and undertakes no obligation, to update or revise any forward-looking statements contained in this release, whether as a result of differences in actual results, changes in assumptions, or changes in other factors affecting such statements, except as required by law.
Southwest is required under generally accepted accounting principles to evaluate subsequent events and their impact, if any, on its financial statements as of March 31, 2016 through the date its financial statements are filed with the Securities and Exchange Commission. The March 31, 2016 financial statements included in this release will be adjusted if necessary to properly reflect the impact of subsequent events on estimates used to prepare those statements.
The Southwest Bancorp, Inc. logo is available at
http://www.globenewswire.com/newsroom/prs/?pkgid=8074
The Bank SNB logo is available at
http://www.globenewswire.com/newsroom/prs/?pkgid=23106
Financial Tables
|
Unaudited Financial Highlights |
Table 1 |
|
Unaudited Consolidated Statements of Financial Condition |
Table 2 |
|
Unaudited Consolidated Statements of Operations |
Table 3 |
|
Unaudited Average Balances, Yields, and Rates-Quarterly |
Table 4 |
|
Unaudited Quarterly Summary Loan Data |
Table 5 |
|
Unaudited Quarterly Summary Financial Data |
Table 6 |
|
Unaudited Quarterly Supplemental Analytical Data |
Table 7 |
|
SOUTHWEST BANCORP, INC. |
Table 1 |
|
|
First Quarter |
Fourth Quarter |
|||||||||||
|
QUARTERLY HIGHLIGHTS |
2016 |
2015 |
% Change |
2015 |
% Change |
||||||||
|
Operations |
|||||||||||||
|
Net interest income |
$ |
19,840 |
$ |
15,610 | 27% |
$ |
19,520 | 2% | |||||
|
Provision (credit) for loan losses |
4,375 | (1,887) | (332) | (566) | (873) | ||||||||
|
Noninterest income |
3,415 | 2,840 | 20 | 4,179 | (18) | ||||||||
|
Noninterest expense |
15,996 | 13,082 | 22 | 17,099 | (6) | ||||||||
|
Income before taxes |
2,884 | 7,255 | (60) | 7,166 | (60) | ||||||||
|
Taxes on income |
1,015 | 2,720 | (63) | 2,577 | (61) | ||||||||
|
Net income |
1,869 | 4,535 | (59) | 4,589 | (59) | ||||||||
|
Diluted earnings per share |
0.10 | 0.24 | (60) | 0.23 | (58) | ||||||||
|
Balance Sheet |
|||||||||||||
|
Total assets |
2,360,819 | 2,003,079 | 18 | 2,357,022 | 0 | ||||||||
|
Loans held for sale |
1,803 | 9,106 | (80) | 7,453 | (76) | ||||||||
|
Portfolio loans |
1,780,081 | 1,429,139 | 25 | 1,771,976 | 0 | ||||||||
|
Total deposits |
1,895,248 | 1,616,454 | 17 | 1,884,105 | 1 | ||||||||
|
Total shareholders' equity |
285,661 | 271,444 | 5 | 296,098 | (4) | ||||||||
|
Book value per common share |
14.81 | 14.26 | 4 | 14.80 | 0 | ||||||||
|
Key Ratios |
|||||||||||||
|
Net interest margin |
3.54% | 3.25% | 3.48% | ||||||||||
|
Efficiency ratio |
68.41 | 70.47 | 71.49 | ||||||||||
|
Total capital to risk-weighted assets |
15.39 | 19.36 | 16.79 | ||||||||||
|
Nonperforming loans to portfolio loans |
1.25 | 0.64 | 1.15 | ||||||||||
|
Shareholders' equity to total assets |
12.10 | 13.55 | 12.56 | ||||||||||
|
Tangible common equity to tangible assets* |
11.49 | 13.50 | 11.95 | ||||||||||
|
Return on average assets (annualized) |
0.32 | 0.92 | 0.78 | ||||||||||
|
Return on average common equity (annualized) |
2.56 | 6.78 | 6.14 | ||||||||||
|
Return on average tangible common equity (annualized)** |
2.71 | 6.81 | 6.46 | ||||||||||
Balance sheet amounts and ratios are as of period end unless otherwise noted.
* This is a Non-GAAP financial measure. Please see Table 7 for a reconciliation to the most directly comparable GAAP based measure.
** This is a Non-GAAP financial measure.
Please see accompanying tables for additional financial information.
|
|
|
|
SOUTHWEST BANCORP, INC. |
Table 2 |
|
|
March 31, |
December 31, |
March 31, |
|||||||||||||
|
|
2016 |
2015 |
2015 |
|||||||||||||
|
Assets |
||||||||||||||||
|
Cash and due from banks |
$ |
27,102 |
$ |
24,971 |
$ |
20,510 | ||||||||||
|
Interest-bearing deposits |
40,251 | 53,158 | 133,886 | |||||||||||||
|
Cash and cash equivalents |
67,353 | 78,129 | 154,396 | |||||||||||||
|
Securities held to maturity (fair values of $12,248, $12,282, and $11,921 respectively) |
11,757 | 11,797 | 11,393 | |||||||||||||
|
Securities available for sale (amortized cost of $409,093, $401,136 and $363,352, respectively) |
411,273 | 400,331 | 366,152 | |||||||||||||
|
Loans held for sale |
1,803 | 7,453 | 9,106 | |||||||||||||
|
Loans receivable |
1,780,081 | 1,771,975 | 1,429,139 | |||||||||||||
|
Less: Allowance for loan losses |
(27,168) | (26,106) | (27,250) | |||||||||||||
|
Net loans receivable |
1,752,913 | 1,745,869 | 1,401,889 | |||||||||||||
|
Accrued interest receivable |
5,838 | 5,767 | 4,974 | |||||||||||||
|
Non-hedge derivative asset |
4,307 | 1,793 | 1,273 | |||||||||||||
|
Premises and equipment, net |
23,533 | 23,819 | 18,437 | |||||||||||||
|
Other real estate |
2,274 | 2,274 | 2,255 | |||||||||||||
|
Goodwill |
13,467 | 13,467 | 1,214 | |||||||||||||
|
Other intangible assets, net |
6,145 | 6,615 | 3,866 | |||||||||||||
|
Other assets |
60,156 | 59,708 | 28,124 | |||||||||||||
|
Total assets |
$ |
2,360,819 |
$ |
2,357,022 |
$ |
2,003,079 | ||||||||||
|
|
||||||||||||||||
|
Liabilities |
||||||||||||||||
|
Deposits: |
||||||||||||||||
|
Noninterest-bearing demand |
$ |
552,499 |
$ |
596,494 |
$ |
506,952 | ||||||||||
|
Interest-bearing demand |
168,210 | 151,015 | 140,659 | |||||||||||||
|
Money market accounts |
540,323 | 534,357 | 488,569 | |||||||||||||
|
Savings accounts |
56,235 | 56,333 | 34,413 | |||||||||||||
|
Time deposits of $100,000 or more |
348,783 | 311,538 | 227,426 | |||||||||||||
|
Other time deposits |
229,198 | 234,368 | 218,435 | |||||||||||||
|
Total deposits |
1,895,248 | 1,884,105 | 1,616,454 | |||||||||||||
|
Accrued interest payable |
894 | 867 | 770 | |||||||||||||
|
Non-hedge derivative liability |
4,307 | 1,793 | 1,273 | |||||||||||||
|
Other liabilities |
10,553 | 11,684 | 8,167 | |||||||||||||
|
Other borrowings |
117,763 | 110,927 | 58,578 | |||||||||||||
|
Subordinated debentures |
46,393 | 51,548 | 46,393 | |||||||||||||
|
Total liabilities |
2,075,158 | 2,060,924 | 1,731,635 | |||||||||||||
|
|
||||||||||||||||
|
Shareholders' equity |
||||||||||||||||
|
Common stock - $1 par value; 40,000,000 shares authorized; |
||||||||||||||||
|
21,225,034, 21,138,028 and 19,900,350 shares issued, respectively |
21,225 | 21,138 | 19,900 | |||||||||||||
|
Additional paid-in capital |
122,070 | 121,966 | 101,395 | |||||||||||||
|
Retained earnings |
173,496 | 173,210 | 163,818 | |||||||||||||
|
Accumulated other comprehensive income (loss) |
546 | (1,290) | 673 | |||||||||||||
|
Treasury stock, at cost, 1,939,989, 1,131,226 and 867,310 shares, respectively |
(31,676) | (18,926) | (14,342) | |||||||||||||
|
Total shareholders' equity |
285,661 | 296,098 | 271,444 | |||||||||||||
|
Total liabilities and shareholders' equity |
$ |
2,360,819 |
$ |
2,357,022 |
$ |
2,003,079 | ||||||||||
|
SOUTHWEST BANCORP, INC. |
Table 3 |
|
|
For the three months ended |
|||||||
|
|
March 31, |
December 31, |
March 31, |
|||||
|
|
2016 |
2015 |
2015 |
|||||
|
Interest income |
||||||||
|
Loans |
$ |
20,030 |
$ |
19,725 |
$ |
15,570 | ||
|
Investment securities |
1,965 | 1,813 | 1,553 | |||||
|
Other interest-earning assets |
53 | 46 | 101 | |||||
|
Total interest income |
22,048 | 21,584 | 17,224 | |||||
|
|
||||||||
|
Interest expense |
||||||||
|
Interest-bearing deposits |
1,307 | 1,196 | 835 | |||||
|
Other borrowings |
309 | 261 | 227 | |||||
|
Subordinated debentures |
592 | 607 | 552 | |||||
|
Total interest expense |
2,208 | 2,064 | 1,614 | |||||
|
|
||||||||
|
Net interest income |
19,840 | 19,520 | 15,610 | |||||
|
|
||||||||
|
Provision (credit) for loan losses |
4,375 | (566) | (1,887) | |||||
|
|
||||||||
|
Net interest income after provision for loan losses |
15,465 | 20,086 | 17,497 | |||||
|
|
||||||||
|
Noninterest income |
||||||||
|
Service charges and fees |
2,549 | 2,676 | 2,428 | |||||
|
Gain on sales of mortgage loans |
401 | 645 | 348 | |||||
|
Gain on sale/call of investment securities, net |
126 |
- |
5 | |||||
|
Other noninterest income |
339 | 858 | 59 | |||||
|
Total noninterest income |
3,415 | 4,179 | 2,840 | |||||
|
|
||||||||
|
Noninterest expense |
||||||||
|
Salaries and employee benefits |
9,342 | 10,273 | 7,914 | |||||
|
Occupancy |
2,671 | 2,586 | 2,284 | |||||
|
Data processing |
470 | 847 | 446 | |||||
|
FDIC and other insurance |
368 | 384 | 312 | |||||
|
Other real estate, net |
13 | 8 | 21 | |||||
|
General and administrative |
3,132 | 3,001 | 2,105 | |||||
|
Total noninterest expense |
15,996 | 17,099 | 13,082 | |||||
|
Income before taxes |
2,884 | 7,166 | 7,255 | |||||
|
Taxes on income |
1,015 | 2,577 | 2,720 | |||||
|
Net income |
$ |
1,869 |
$ |
4,589 |
$ |
4,535 | ||
|
|
||||||||
|
Basic earnings per common share |
$ |
0.10 |
$ |
0.23 |
$ |
0.24 | ||
|
Diluted earnings per common share |
0.10 | 0.23 | 0.24 | |||||
|
Common dividends declared per share |
0.08 | 0.06 | 0.06 | |||||
|
SOUTHWEST BANCORP, INC. |
Table 4 |
|
|
For the three months ended |
|||||||||||||
|
|
March 31, 2016 |
December 31, 2015 |
March 31, 2015 |
|||||||||||
|
|
Average |
Average |
Average |
Average |
Average |
Average |
||||||||
|
|
Balance |
Yield/Rate |
Balance |
Yield/Rate |
Balance |
Yield/Rate |
||||||||
|
Assets |
||||||||||||||
|
Loans |
$ |
1,788,992 | 4.50% |
$ |
1,744,374 | 4.49% |
$ |
1,419,137 | 4.45% | |||||
|
Investment securities |
412,307 | 1.92 | 413,701 | 1.74 | 367,877 | 1.71 | ||||||||
|
Other interest-earning assets |
51,031 | 0.42 | 64,562 | 0.28 | 158,940 | 0.26 | ||||||||
|
Total interest-earning assets |
2,252,330 | 3.94 | 2,222,637 | 3.85 | 1,945,954 | 3.59 | ||||||||
|
Other assets |
107,874 | 101,003 | 49,460 | |||||||||||
|
Total assets |
$ |
2,360,204 |
$ |
2,323,640 |
$ |
1,995,414 | ||||||||
|
|
||||||||||||||
|
Liabilities and Shareholders' Equity |
||||||||||||||
|
Interest-bearing demand deposits |
$ |
160,638 | 0.16% |
$ |
137,154 | 0.15% |
$ |
138,895 | 0.10% | |||||
|
Money market accounts |
542,800 | 0.24 | 541,976 | 0.18 | 484,639 | 0.15 | ||||||||
|
Savings accounts |
55,834 | 0.14 | 53,603 | 0.13 | 33,350 | 0.10 | ||||||||
|
Time deposits |
564,213 | 0.65 | 548,145 | 0.63 | 434,409 | 0.57 | ||||||||
|
Total interest-bearing deposits |
1,323,485 | 0.40 | 1,280,878 | 0.37 | 1,091,293 | 0.31 | ||||||||
|
Other borrowings |
117,171 | 1.06 | 80,343 | 1.29 | 72,307 | 1.27 | ||||||||
|
Subordinated debentures |
48,546 | 4.88 | 51,044 | 4.76 | 46,393 | 4.76 | ||||||||
|
Total interest-bearing liabilities |
1,489,202 | 0.60 | 1,412,265 | 0.58 | 1,209,993 | 0.54 | ||||||||
|
|
||||||||||||||
|
Noninterest-bearing demand deposits |
563,022 | 594,537 | 503,275 | |||||||||||
|
Other liabilities |
14,769 | 20,149 | 10,918 | |||||||||||
|
Shareholders' equity |
293,211 | 296,689 | 271,228 | |||||||||||
|
Total liabilities and shareholders' equity |
$ |
2,360,204 |
$ |
2,323,640 |
$ |
1,995,414 | ||||||||
|
|
||||||||||||||
|
Net interest income and spread |
3.34% | 3.27% | 3.05% | |||||||||||
|
Net interest margin (1) |
3.54% | 3.48% | 3.25% | |||||||||||
|
Average interest-earning assets |
||||||||||||||
|
to average interest-bearing liabilities |
151.24% | 157.38% | 160.82% | |||||||||||
|
|
||||||||||||||
|
(1) Net interest margin = annualized net interest income / average interest-earning assets |
||||||||||||||
|
SOUTHWEST BANCORP, INC. |
Table 5 |
|
|
2016 |
2015 |
||||||||||||
|
|
Mar. 31 |
Dec. 31 |
Sep. 30 |
Jun. 30 |
Mar. 31 |
|||||||||
|
LOAN COMPOSITION |
||||||||||||||
|
Real estate mortgage: |
||||||||||||||
|
Commercial |
$ |
878,822 |
$ |
938,462 |
$ |
869,250 |
$ |
759,406 |
$ |
759,676 | ||||
|
One-to-four family residential |
158,078 | 161,958 | 95,906 | 85,338 | 86,343 | |||||||||
|
Real estate construction: |
||||||||||||||
|
Commercial |
156,454 | 129,070 | 126,407 | 186,140 | 192,052 | |||||||||
|
One-to-four family residential |
24,202 | 21,337 | 12,866 | 13,107 | 12,586 | |||||||||
|
Commercial |
543,822 | 507,173 | 423,480 | 384,788 | 366,282 | |||||||||
|
Installment and consumer: |
||||||||||||||
|
Other |
20,506 | 21,429 | 20,185 | 20,651 | 21,306 | |||||||||
|
Total loans, including held for sale |
1,781,884 | 1,779,429 | 1,548,094 | 1,449,430 | 1,438,245 | |||||||||
|
Less allowance for loan losses |
(27,168) | (26,106) | (26,593) | (26,219) | (27,250) | |||||||||
|
Total loans, net |
$ |
1,754,716 |
$ |
1,753,323 |
$ |
1,521,501 |
$ |
1,423,211 |
$ |
1,410,995 | ||||
|
LOANS BY SEGMENT |
||||||||||||||
|
Oklahoma banking**** |
$ |
1,060,482 |
$ |
1,048,473 |
$ |
832,282 |
$ |
810,367 |
$ |
814,949 | ||||
|
Texas banking |
560,421 | 580,476 | 563,010 | 493,047 | 478,005 | |||||||||
|
Kansas banking |
160,981 | 150,480 | 152,802 | 146,016 | 145,291 | |||||||||
|
Total loans |
$ |
1,781,884 |
$ |
1,779,429 |
$ |
1,548,094 |
$ |
1,449,430 |
$ |
1,438,245 | ||||
|
NONPERFORMING LOANS BY TYPE |
||||||||||||||
|
Construction & development |
$ |
1,444 |
$ |
1,010 |
$ |
391 |
$ |
416 |
$ |
392 | ||||
|
Commercial real estate |
3,830 | 3,992 | 1,795 | 2,141 | 2,247 | |||||||||
|
Commercial |
13,461 | 13,491 | 11,727 | 5,114 | 5,447 | |||||||||
|
One-to-four family residential |
3,448 | 1,777 | 1,016 | 1,216 | 1,065 | |||||||||
|
Consumer |
84 | 88 | 148 |
- |
- |
|||||||||
|
Total nonperforming loans |
$ |
22,267 |
$ |
20,358 |
$ |
15,077 |
$ |
8,887 |
$ |
9,151 | ||||
|
NONPERFORMING LOANS BY SEGMENT |
||||||||||||||
|
Oklahoma banking**** |
$ |
7,978 |
$ |
6,948 |
$ |
2,846 |
$ |
1,670 |
$ |
2,244 | ||||
|
Texas banking |
13,521 | 12,450 | 11,025 | 5,353 | 5,264 | |||||||||
|
Kansas banking |
768 | 960 | 1,206 | 1,864 | 1,643 | |||||||||
|
Total nonperforming loans |
$ |
22,267 |
$ |
20,358 |
$ |
15,077 |
$ |
8,887 |
$ |
9,151 | ||||
|
OTHER REAL ESTATE BY TYPE |
||||||||||||||
|
Construction & development |
$ |
2,060 |
$ |
2,060 |
$ |
2,025 |
$ |
2,035 |
$ |
2,035 | ||||
|
Commercial real estate |
214 | 214 | 249 | 358 | 220 | |||||||||
|
Total other real estate |
$ |
2,274 |
$ |
2,274 |
$ |
2,274 |
$ |
2,393 |
$ |
2,255 | ||||
|
OTHER REAL ESTATE BY SEGMENT |
||||||||||||||
|
Oklahoma banking**** |
$ |
274 |
$ |
274 |
$ |
200 |
$ |
200 |
$ |
- |
||||
|
Texas banking |
2,000 | 2,000 | 2,025 | 2,000 | 2,000 | |||||||||
|
Kansas banking |
- |
- |
49 | 193 | 255 | |||||||||
|
Total other real estate |
$ |
2,274 |
$ |
2,274 |
$ |
2,274 |
$ |
2,393 |
$ |
2,255 | ||||
|
|
||||||||||||||
|
****Due to immateriality, Colorado banking is included within Oklahoma banking. |
||||||||||||||
|
Continued |
||||||||||||||
|
SOUTHWEST BANCORP, INC. |
Table 5 |
|
|
2016 |
2015 |
||||||||||||
|
|
Mar. 31 |
Dec. 31 |
Sep. 30 |
Jun. 30 |
Mar. 31 |
|||||||||
|
POTENTIAL PROBLEM LOANS BY TYPE |
||||||||||||||
|
Construction & development |
$ |
- |
$ |
- |
$ |
- |
$ |
- |
$ |
201 | ||||
|
Commercial real estate |
36,216 | 26,981 | 22,362 | 20,375 | 24,672 | |||||||||
|
Commercial |
29,931 | 9,879 | 7,366 | 14,519 | 14,016 | |||||||||
|
One-to-four family residential |
2,275 | 2,285 | 79 | 80 | 81 | |||||||||
|
Consumer |
38 | 10 |
- |
- |
- |
|||||||||
|
Total potential problem loans |
$ |
68,460 |
$ |
39,155 |
$ |
29,807 |
$ |
34,974 |
$ |
38,970 | ||||
|
POTENTIAL PROBLEM LOANS BY SEGMENT |
||||||||||||||
|
Oklahoma banking**** |
$ |
46,102 |
$ |
32,970 |
$ |
23,597 |
$ |
23,231 |
$ |
26,713 | ||||
|
Texas banking |
18,801 | 4,165 | 4,086 | 9,180 | 9,541 | |||||||||
|
Kansas banking |
3,557 | 2,020 | 2,124 | 2,563 | 2,716 | |||||||||
|
Total potential problem loans |
$ |
68,460 |
$ |
39,155 |
$ |
29,807 |
$ |
34,974 |
$ |
38,970 | ||||
|
ALLOWANCE ACTIVITY |
||||||||||||||
|
Balance, beginning of period |
$ |
26,106 |
$ |
26,593 |
$ |
26,219 |
$ |
27,250 |
$ |
28,452 | ||||
|
Charge offs |
3,725 | 569 | 226 | 325 | 230 | |||||||||
|
Recoveries |
412 | 648 | 577 | 430 | 915 | |||||||||
|
Net charge offs (recoveries) |
3,313 | (79) | (351) | (105) | (685) | |||||||||
|
Provision (credit) for loan losses |
4,375 | (566) | 23 | (1,136) | (1,887) | |||||||||
|
Balance, end of period |
$ |
27,168 |
$ |
26,106 |
$ |
26,593 |
$ |
26,219 |
$ |
27,250 | ||||
|
NET CHARGE OFFS BY TYPE |
||||||||||||||
|
Construction & development |
$ |
- |
$ |
- |
$ |
(16) |
$ |
(15) |
$ |
5 | ||||
|
Commercial real estate |
(187) | 219 | 24 | 82 | (118) | |||||||||
|
Commercial |
3,408 | (286) | (325) | (52) | (188) | |||||||||
|
One-to-four family residential |
41 | (48) | (68) | (91) | (331) | |||||||||
|
Consumer |
51 | 36 | 34 | (29) | (53) | |||||||||
|
Total net charge offs (recoveries) by type |
$ |
3,313 |
$ |
(79) |
$ |
(351) |
$ |
(105) |
$ |
(685) | ||||
|
NET CHARGE OFFS BY SEGMENT |
||||||||||||||
|
Oklahoma banking**** |
$ |
458 |
$ |
288 |
$ |
(86) |
$ |
25 |
$ |
(309) | ||||
|
Texas banking |
952 | (415) | (103) | (72) | (114) | |||||||||
|
Kansas banking |
1,903 | 48 | (162) | (58) | (262) | |||||||||
|
Total net charge offs (recoveries) by segment |
$ |
3,313 |
$ |
(79) |
$ |
(351) |
$ |
(105) |
$ |
(685) | ||||
|
|
||||||||||||||
|
****Due to immateriality, Colorado banking is included within Oklahoma banking. |
||||||||||||||
|
SOUTHWEST BANCORP, INC. |
Table 6
|
|
|
2016 |
2015 |
||||||||||||
|
|
Mar. 31 |
Dec. 31 |
Sep. 30 |
Jun. 30 |
Mar. 31 |
|||||||||
|
PER SHARE DATA |
||||||||||||||
|
Basic earnings per common share |
$ |
0.10 |
$ |
0.23 |
$ |
0.22 |
$ |
0.22 |
$ |
0.24 | ||||
|
Diluted earnings per common share |
0.10 | 0.23 | 0.22 | 0.22 | 0.24 | |||||||||
|
Common dividends declared per share |
0.08 | 0.06 | 0.06 | 0.06 | 0.06 | |||||||||
|
Book value per common share |
14.81 | 14.80 | 14.57 | 14.38 | 14.26 | |||||||||
|
Tangible book value per share* |
13.97 | 13.98 | 14.49 | 14.29 | 14.17 | |||||||||
|
COMMON STOCK |
||||||||||||||
|
Shares issued |
21,225,034 | 21,138,028 | 19,901,336 | 19,900,855 | 19,900,350 | |||||||||
|
Less treasury shares |
1,939,989 | 1,131,226 | 868,617 | 867,310 | 867,310 | |||||||||
|
Outstanding shares |
19,285,045 | 20,006,802 | 19,032,719 | 19,033,545 | 19,033,040 | |||||||||
|
OTHER FINANCIAL DATA |
||||||||||||||
|
Investment securities |
$ |
423,030 |
$ |
412,128 |
$ |
388,543 |
$ |
373,260 |
$ |
377,545 | ||||
|
Loans held for sale |
1,803 | 7,453 | 7,024 | 6,687 | 9,106 | |||||||||
|
Portfolio loans |
1,780,081 | 1,771,975 | 1,541,070 | 1,442,743 | 1,429,139 | |||||||||
|
Total loans |
1,781,884 | 1,779,428 | 1,548,094 | 1,449,430 | 1,438,245 | |||||||||
|
Total assets |
2,360,819 | 2,357,022 | 2,059,899 | 2,031,581 | 2,003,079 | |||||||||
|
Total deposits |
1,895,248 | 1,884,105 | 1,626,250 | 1,624,446 | 1,616,454 | |||||||||
|
Other borrowings |
117,763 | 110,927 | 96,801 | 75,839 | 58,578 | |||||||||
|
Subordinated debentures |
46,393 | 51,548 | 46,393 | 46,393 | 46,393 | |||||||||
|
Total shareholders' equity |
285,661 | 296,098 | 277,344 | 273,681 | 271,444 | |||||||||
|
Mortgage servicing portfolio |
434,340 | 432,318 | 422,845 | 415,961 | 407,903 | |||||||||
|
INTANGIBLE ASSET DATA |
||||||||||||||
|
Goodwill |
$ |
13,467 |
$ |
13,467 |
$ |
1,214 |
$ |
1,214 |
$ |
1,214 | ||||
|
Core deposit intangible |
2,734 | 2,894 | 342 | 405 | 467 | |||||||||
|
Mortgage servicing rights |
3,411 | 3,721 | 3,631 | 3,518 | 3,399 | |||||||||
|
Total intangible assets |
$ |
19,612 |
$ |
20,082 |
$ |
5,187 |
$ |
5,137 |
$ |
5,080 | ||||
|
Intangible amortization expense |
$ |
341 |
$ |
330 |
$ |
243 |
$ |
243 |
$ |
168 | ||||
|
DEPOSIT COMPOSITION |
||||||||||||||
|
Non-interest bearing demand |
$ |
552,499 |
$ |
596,494 |
$ |
526,159 |
$ |
515,156 |
$ |
506,952 | ||||
|
Interest-bearing demand |
168,210 | 151,015 | 114,877 | 131,547 | 140,659 | |||||||||
|
Money market accounts |
540,323 | 534,357 | 502,028 | 496,178 | 488,569 | |||||||||
|
Savings accounts |
56,235 | 56,333 | 36,163 | 35,647 | 34,413 | |||||||||
|
Time deposits of $100,000 or more |
348,783 | 311,538 | 238,318 | 233,105 | 227,426 | |||||||||
|
Other time deposits |
229,198 | 234,368 | 208,705 | 212,813 | 218,435 | |||||||||
|
Total deposits** |
$ |
1,895,248 |
$ |
1,884,105 |
$ |
1,626,250 |
$ |
1,624,446 |
$ |
1,616,454 | ||||
|
OFFICES AND EMPLOYEES |
||||||||||||||
|
FTE Employees |
411 | 412 | 358 | 361 | 360 | |||||||||
|
Branches |
32 | 32 | 23 | 23 | 22 | |||||||||
|
Assets per employee |
$ |
5,744 |
$ |
5,721 |
$ |
5,754 |
$ |
5,628 |
$ |
5,564 | ||||
|
____________________ |
||||||||||||||
|
*This is a Non-GAAP based financial measure. |
||||||||||||||
|
**Calculation of Non-brokered Deposits and Core Funding (Non-GAAP Financial Measures) |
||||||||||||||
|
Total deposits |
$ |
1,895,248 |
$ |
1,884,105 |
$ |
1,626,250 |
$ |
1,624,446 |
$ |
1,616,454 | ||||
|
Less: |
||||||||||||||
|
Brokered time deposits |
55,901 | 39,797 | 10,086 | 7,683 | 7,694 | |||||||||
|
Other brokered deposits |
140,372 | 135,880 | 133,025 | 103,025 | 83,025 | |||||||||
|
Non-brokered deposits |
$ |
1,698,975 |
$ |
1,708,428 |
$ |
1,483,139 |
$ |
1,513,738 |
$ |
1,525,735 | ||||
|
Plus: |
||||||||||||||
|
Sweep repurchase agreements |
42,763 | 37,273 | 50,801 | 50,839 | 33,578 | |||||||||
|
Core funding |
$ |
1,741,738 |
$ |
1,745,701 |
$ |
1,533,940 |
$ |
1,564,577 |
$ |
1,559,313 | ||||
|
|
||||||||||||||
|
Balance sheet amounts are as of period end unless otherwise noted. |
||||||||||||||
|
SOUTHWEST BANCORP, INC. |
Table 7
|
|
|
2016 |
2015 |
||||||||||||
|
|
Mar. 31 |
Dec. 31 |
Sep. 30 |
Jun. 30 |
Mar. 31 |
|||||||||
|
PERFORMANCE RATIOS |
||||||||||||||
|
Return on average assets (annualized) |
0.32% | 0.78% | 0.81% | 0.85% | 0.92% | |||||||||
|
Return on average common equity (annualized) |
2.56 | 6.14 | 5.94 | 6.11 | 6.78 | |||||||||
|
Return on average tangible common equity |
||||||||||||||
|
(annualized)* |
2.71 | 6.46 | 5.97 | 6.14 | 6.82 | |||||||||
|
Net interest margin (annualized) |
3.54 | 3.48 | 3.34 | 3.31 | 3.25 | |||||||||
|
Total dividends declared to net income |
84.66 | 26.22 | 27.53 | 27.45 | 25.19 | |||||||||
|
Effective tax rate |
35.19 | 35.96 | 35.84 | 34.51 | 37.49 | |||||||||
|
Efficiency ratio |
68.41 | 71.49 | 68.25 | 72.43 | 70.47 | |||||||||
|
NONPERFORMING ASSETS |
||||||||||||||
|
Nonaccrual loans |
$ |
22,161 |
$ |
19,858 |
$ |
15,076 |
$ |
8,887 |
$ |
9,151 | ||||
|
90 days past due and accruing |
106 | 500 | 1 |
- |
- |
|||||||||
|
Total nonperforming loans |
22,267 | 20,358 | 15,077 | 8,887 | 9,151 | |||||||||
|
Other real estate |
2,274 | 2,274 | 2,274 | 2,393 | 2,255 | |||||||||
|
Total nonperforming assets |
$ |
24,541 |
$ |
22,632 |
$ |
17,351 |
$ |
11,280 |
$ |
11,406 | ||||
|
Potential problem loans |
$ |
68,460 |
$ |
39,155 |
$ |
29,807 |
$ |
34,974 |
$ |
38,970 | ||||
|
ASSET QUALITY RATIOS |
||||||||||||||
|
Nonperforming assets to portfolio loans and |
||||||||||||||
|
other real estate |
1.38% | 1.28% | 1.12% | 0.78% | 0.80% | |||||||||
|
Nonperforming loans to portfolio loans |
1.25 | 1.15 | 0.98 | 0.62 | 0.64 | |||||||||
|
Allowance for loan losses to portfolio loans |
1.53 | 1.47 | 1.73 | 1.82 | 1.91 | |||||||||
|
Allowance for loan losses to |
||||||||||||||
|
nonperforming loans |
122.01 | 128.23 | 176.38 | 295.03 | 297.78 | |||||||||
|
Net loan charge-offs to average portfolio |
||||||||||||||
|
loans (annualized) |
0.75 | (0.02) | (0.09) | (0.03) | (0.20) | |||||||||
|
CAPITAL RATIOS |
||||||||||||||
|
Average total shareholders' equity to |
||||||||||||||
|
average assets |
12.42% | 12.77% | 13.59% | 13.87% | 13.59% | |||||||||
|
Leverage ratio |
13.45 | 14.41 | 15.84 | 16.12 | 15.75 | |||||||||
|
Common equity tier 1 capital |
12.13 | 13.21 | 14.57 | 15.30 | 15.51 | |||||||||
|
Tier 1 capital to risk-weighted assets |
14.14 | 15.53 | 16.95 | 17.84 | 18.10 | |||||||||
|
Total capital to risk-weighted assets |
15.39 | 16.79 | 18.21 | 19.09 | 19.36 | |||||||||
|
Tangible common equity to tangible assets*** |
11.49 | 11.95 | 13.40 | 13.40 | 13.48 | |||||||||
|
REGULATORY CAPITAL DATA |
||||||||||||||
|
Common equity tier 1 capital |
$ |
270,564 |
$ |
282,737 |
$ |
275,350 |
$ |
272,048 |
$ |
269,007 | ||||
|
Tier I capital |
315,326 | 332,468 | 320,350 | 317,048 | 314,007 | |||||||||
|
Total capital |
343,287 | 359,300 | 344,095 | 339,412 | 335,734 | |||||||||
|
Total risk adjusted assets |
2,230,326 | 2,140,344 | 1,889,892 | 1,777,618 | 1,734,401 | |||||||||
|
Average total assets |
2,344,259 | 2,307,421 | 2,022,972 | 1,966,577 | 1,993,446 | |||||||||
|
____________________ |
||||||||||||||
|
*This is a Non-GAAP based financial measure. |
||||||||||||||
|
***Calculation of Tangible Common Equity to Tangible Assets (Non-GAAP Financial Measure) |
||||||||||||||
|
Total shareholders' equity |
$ |
285,661 |
$ |
296,098 |
$ |
277,344 |
$ |
273,681 |
$ |
271,444 | ||||
|
Less goodwill and core deposit intangible |
16,201 | 16,361 | 1,556 | 1,619 | 1,681 | |||||||||
|
Tangible common equity |
$ |
269,460 |
$ |
279,737 |
$ |
275,788 |
$ |
272,062 |
$ |
269,763 | ||||
|
Total assets |
$ |
2,360,819 |
$ |
2,357,022 |
$ |
2,059,899 |
$ |
2,031,581 |
$ |
2,003,079 | ||||
|
Less goodwill and core deposit intangible |
16,201 | 16,361 | 1,556 | 1,619 | 1,681 | |||||||||
|
Tangible assets |
$ |
2,344,618 |
$ |
2,340,661 |
$ |
2,058,343 |
$ |
2,029,962 |
$ |
2,001,398 | ||||
|
Total shareholders' equity to total assets |
12.10% | 12.56% | 13.46% | 13.47% | 13.55% | |||||||||
|
Tangible common equity to tangible assets |
11.49% | 11.95% | 13.40% | 13.40% | 13.48% | |||||||||
|
|
||||||||||||||
|
Balance sheet amounts and ratios are as of period end unless otherwise noted. |
||||||||||||||

 2016 First Quarter Earnings Presentation April 20, 2016 NASDAQ: OKSB
 Forward Looking Statements We make forward-looking statements in this presentation that are subject to risks and uncertainties. We intend these statements to be covered by the safe harbor provision for forward-looking statements contained in the Private Securities Litigation Reform Act of 1995. These forward-looking statements include: •Statements of Southwest's goals, intentions, and expectations; •Estimates of risks and of future costs and benefits; •Expectations regarding our future financial performance and the financial performance of our operating segments; •Expectations regarding regulatory actions; •Expectations regarding our ability to utilize tax loss benefits; •Expectations regarding our stock repurchase program; •Expectations regarding dividends; •Expectations regarding acquisitions and divestitures; •Assessments of loan quality, probable loan losses, and the amount and timing of loan payoffs; •Estimates of the value of assets held for sale or available for sale; and •Statements of our ability to achieve financial and other goals. These forward-looking statements are subject to significant uncertainties because they are based upon: the amount and timing of future changes in interest rates, market behavior, and other economic conditions; future laws, regulations, and accounting principles; changes in regulatory standards and examination policies, and a variety of other matters. These other matters include, among other things, the direct and indirect effects of economic conditions on interest rates, credit quality, loan demand, liquidity, and monetary and supervisory policies of banking regulators. Because of these uncertainties, the actual future results may be materially different from the results indicated by these forward-looking statements. In addition, Southwest's past growth and performance do not necessarily indicate our future results. For other factors, risks, and uncertainties that could cause actual results to differ materially from estimates and projections contained in forward-looking statements, please read the “Risk Factors” contained in Southwest’s reports to the Securities and Exchange Commission. We do not intend, or undertake no obligation, to update or revise any forward-looking statements contained in this presentation, whether as a result of differences in actual results, changes in assumptions, or changes in other factors affecting said statements, except as required by law.
 First Quarter 2016 Highlights Net income was $1.9 million, or $0.10 per share, compared to $4.5 million, or $0.24 per share, in the first quarter of 2015. Total loans grew to $1.78 billion, a slight increase over year-end 2015 and a 24% increase compared to the first quarter of 2015. We funded $108.8 million in new loans during the first quarter of 2016 making this quarter our ninth consecutive quarter of loan growth. This good production was offset by anticipated pay-offs of certain real estate and healthcare credits. The quarterly net interest margin improved to 3.54% at March 31, 2016 compared to 3.48% at December 31, 2015. Pre-tax, pre-provision income was $7.3 million for the first quarter, an increase of 10% from $6.6 million in the fourth quarter of 2015 and an increase of 35% from $5.4 million in the first quarter of 2015.
 First Quarter 2016 Highlights-cont. Our fourth quarter 2015 acquisition of FCB has been fully integrated, and projected expense savings have been mostly realized. Colorado team making positive inroads in that market. Our Board approved a cash dividend of $0.08 per share payable on May 13, 2016 to shareholders of record on April 29, 2016. On February 23, 2016, our Board of Directors authorized a third consecutive share repurchase program of up to another 5.0%, or approximately 967,000 shares, which became effective during the first quarter of 2016 upon the completion of the repurchase of all of the shares under the prior program. Our capital ratios all remain strong and well above the criteria for regulatory classification as “well-capitalized”.
 Credit Quality Highlights First Quarter 2016 Potential problem loans increased by $29.3 million to $68.4 million, or 3.8% of total portfolio loans. This increase was driven by both the energy sector slowdown and general business credits not impacted by energy. We experienced a modest increase in nonperforming numbers of $1.9 million, which was limited by a resolution and settlement structure in a long standing problem credit. We reached a resolution on the AZ hospital loans and other real estate creating an opportunity for potential full repayment of the remaining $8.2 million in book balance plus a significant potential recovery. A provision for loan losses in the amount of $4.4 million was made, increasing our reserve position to 1.53% of portfolio loans. We incurred net charge-offs of $3.3 million centered in three loans.
 Energy Highlights First Quarter 2016 Total direct energy exposure at 3/31/16 included $92.6 million in commitments and $57.0 million in funded debt, down from $96.8 million and $63.4 million at 12/31/15, respectively. Energy exposure represents 3.2% of our total funded credit portfolio. 80% oil and 20% gas. The portfolio is advanced 56% to reserve-based credits and 44% to services. Including the specific allocation, the ALLL for energy credits is 6.2%. Only ten reserve-based borrowers with commitments in excess of $1.0 million. One reserve-based credit of $5.4 million, included in criticized, is nonperforming with a $2.8 million allocated reserve. No participations purchased in our reserve-based portfolio.
 Energy Highlights (continued) The services portfolio has $25 million funded with six credits having commitments in excess of $1 million. 78.6% of funded service portfolio is comprised of three credits, all of which are participations purchased from larger banks. SNC exam results received after quarter end downgraded one service-based credit to criticized but not to a PPL status. Including the SNC downgrade, we have eight credits totaling $22.0 million, or 38.7% of the energy portfolio, that are criticized. Portfolio has been stressed at various levels including $30 oil and $1.80 gas flat as worst case. Would reflect potential need of an additional approximately $4 to $5 million in reserves over time. Approved no new energy credits in the first quarter.
 Financial Highlights 2013 FY 2014 FY 2015 FY 2015 FQ1 2015 FQ2 2015 FQ3 2015 FQ4 2016 FQ1 ($ in thousands except per share data) 12/31/13 12/31/14 12/31/15 3/31/15 6/30/15 9/30/15 12/31/15 3/31/16 Balance Sheet Total Assets 1,981,423 1,942,034 2,357,022 2,003,079 2,031,581 2,059,899 2,357,022 2,360,819 Total Gross Loans 1,270,903 1,399,991 1,779,429 1,438,245 1,449,430 1,548,094 1,779,429 1,781,884 Total Deposits 1,584,086 1,533,999 1,884,105 1,616,454 1,624,446 1,626,250 1,884,105 1,895,248 Total Equity 259,187 270,786 296,098 271,444 273,681 277,344 296,098 285,661 Profitability (%) Net Income ($000) 17,435 21,030 17,407 4,535 4,161 4,122 4,589 1,869 ROAA 0.86 1.09 0.84 0.92 0.85 0.81 0.78 0.32 ROAE 6.90 7.82 6.23 6.78 6.11 5.94 6.14 2.56 Net Interest Margin 3.19 3.45 3.35 3.25 3.31 3.34 3.48 3.54 Efficiency Ratio 73.30 72.02 70.67 70.47 72.43 68.25 71.49 68.41 Balance Sheet Ratios / Capital (%) Loans/ Deposits 80.23 91.26 94.44 88.98 89.23 95.19 94.44 94.02 Tangible Common Equity/ Tang Assets(1)(3) 12.94 13.89 11.95 13.48 13.40 13.40 11.95 11.49 Common Equity Tier 1 Capital Ratio NA NA 13.21 15.51 15.30 14.57 13.21 12.13 Tier 1 Risk Based Capital Ratio 20.28 19.70 15.53 18.10 17.84 16.95 15.53 14.14 Total Risk Based Capital Ratio 21.59 20.96 16.79 19.36 19.09 18.21 16.79 15.39 Tier 1 Leverage Ratio 14.86 16.45 14.41 15.75 16.12 15.84 14.41 13.45 Asset Quality (%)(2) NPLs/ Portfolio Loans 1.57 0.67 1.15 0.64 0.62 0.98 1.15 1.25 NCOs/ Avg Portfolio Loans 0.22 0.12 (0.08) (0.20) (0.03) (0.09) (0.02) 0.75 Reserves/Portfolio Loans 2.89 2.03 1.47 1.91 1.82 1.73 1.47 1.53 Reserves/ NPLs 184.50 302.26 128.23 297.78 295.03 176.38 128.23 122.01 Per Share Data Tangible Book Value Per Share(1)(3) 12.97 14.02 13.98 14.17 14.29 14.49 13.98 13.97 Earnings Per Share 0.89 1.07 0.90 0.24 0.22 0.22 0.23 0.10 (1) Intangible assets defined as goodwill for purposes of these calculations. (2)NPLs defined as Non-Accrual loans + Loans 90+ Days Past Due, NPAs defined as NPLs + OREO. (3)This is a non-GAAP based financial measure. See Appendix for reconciliation to the most directly comparable GAAP based measure.
 Earnings Results Earnings Summary Q1 '16 vs. Three Months Ended Q4 '15 ($ in thousands, except per share) 3/31/16 12/31/15 3/31/15 % Change Net interest income $ 19,840 $ 19,520 $ 15,610 1.6% Provision for loan losses 4,375 (566) (1,887) 873.0% Noninterest income 3,415 4,179 2,840 -18.3% Noninterest expense 15,996 17,099 13,082 -6.5% Income before taxes 2,884 7,166 7,255 -59.8% Taxes on income 1,015 2,577 2,720 -60.6% Net income 1,869 4,589 4,535 -59.3% Pre-tax, pre-provision income (1) 7,259 6,600 5,368 10.0% Diluted earnings per share $ 0.10 $ 0.23 $ 0.24 (1)This is a non-GAAP based financial measure. See Appendix for reconciliation to the most directly comparable GAAP based measure.
 Loan Portfolio Owner Occupied CRE $306.3 17% Non-Owner Occupied CRE $572.5 32% Residential Real Estate $182.3 10% Consumer $20.5 1% Construction & Development $156.5 9% Commercial & Industrial $543.8 31% Dollars in millions unless otherwise noted. Loans by Type Loans by Segment Owner Occupied CRE $242.9 17% Non-Owner Occupied CRE $516.8 36% Residential Real Estate $98.9 7% Consumer $21.3 2% Construction & Development $192.1 13% Commercial & Industrial $366.3 25% 3/31/2016 $1.78 billion 3/31/2015 $1.44 billion Kansas $161.0 9% Oklahoma $1,012.4 57% Colorado $48.1 3% Texas $560.4 31% Kansas $145.3 10% Oklahoma $814.9 57% Texas $478.0 33%
 Nonperforming Loans Owner Occupied CRE $0.9 4% Non-Owner Occupied CRE $3.0 13% Residential Real Estate $3.4 16% Consumer $0.1 0% Construction & Development $1.4 7% Commercial & Industrial $1.6 7% Energy Commercial & Industrial $5.4 24% Healthcare Commercial & Industrial $6.5 29% Dollars in millions unless otherwise noted. Nonperforming loans include non-accruals and 90 days past due loans. By Type By Geographic Location Owner Occupied CRE $1.4 15% Non-Owner Occupied CRE $0.8 9% Residential Real Estate $1.1 12% Construction & Development $0.4 4% Commercial & Industrial $0.3 3% Healthcare Commercial & Industrial $5.2 57% 3/31/2016 $22.3 million 3/31/2015 $9.2 million Kansas $0.5 2% Oklahoma $5.6 25% Arizona $6.1 28% Texas $7.4 33% Other $2.7 12% Kansas $1.6 18% Oklahoma $2.2 25% Arizona $4.9 53% Texas $0.4 4%
 Criticized Assets $19,872 $16,085 $16,478 $15,059 $9,413 $9,151 $8,887 $15,077 $20,358 $22,267 $99,750 $91,765 $84,175 $64,375 $34,037 $38,970 $34,974 $29,807 $39,155 $68,460 $93,231 $87,411 $62,759 $41,224 $41,979 $48,895 $41,876 $3,605 $9,229 $11,655 $2,654 $4,654 $4,285 $3,448 $3,097 $2,255 $2,393 $2,274 $2,274 $2,274 20133/31/146/30/149/30/1412/31/143/31/156/30/159/30/1512/31/153/31/16Nonperforming LoansPotential Problem LoansSpecial Mention LoansOther Real EstateDollars in thousands. Nonperforming loans include non-accruals and 90 days past due loans. PPL is defined as potential problem loans.
 Loan Loss Reserve to NPL+PPL 30.65% 32.38% 32.87% 38.92% 65.48% 56.63% 59.78% 59.25% 43.90% 29.94% 20133/31/146/30/149/30/1412/31/143/31/156/30/159/30/1512/31/153/31/16Nonperforming loans include non-accruals and 90 days past due loans. PPL is defined as potential problem loans.
 Credit Risk Profile Nonperforming assets defined as nonaccrual loans, loans past due 90 days or more and still accruing, and other real estate owned. 0.0%1.0%2.0%3.0%4.0%5.0% $- $20,000 $40,000 $60,000 $80,000 $100,000 $120,000 $140,000 $160,000201120122013201420152016 Q1($000s)NPAsPotential Problem LoansNPAs/Assets
 Strong Core Deposit Franchise $1.9 billion Total Deposits (3/31/16) Deposits by Type Cost of Deposits 0.40% 0.36% 0.34% 0.34% 0.32% 0.31% 0.32% 0.33% 0.37% 0.40% 12/31/133/31/146/30/149/30/1412/31/143/31/156/30/159/30/1512/31/153/31/16Non-interest Bearing Demand$552 29%Interest Bearing Demand$168 9%Money market Accounts$540 29%Savings Accounts$56 3%Time Deposits $100,000 or More$349 18%Other Time Deposits$229 12%Dollars in millions.
 NIM/Cost of Funds 0.40% 0.36% 0.34% 0.34% 0.32% 0.31% 0.32% 0.33% 0.37% 0.40% 3.42% 3.33% 3.50% 3.44% 3.52% 3.25% 3.31% 3.34% 3.48% 3.54% 0.0%0.5%1.0%1.5%2.0%2.5%3.0%3.5%4.0%4.5%5.0% $- $5,000 $10,000 $15,000 $20,000 $25,000Q4 '13Q1 '14Q2'14Q3 '14Q4 '14Q1 '15Q2 '15Q3 '15Q4 '15Q1 '16($000s) Net Interest IncomeCost of DepositsNet Interest Margin
 Noninterest Income $3,068 $3,025 $8,246 $3,084 $4,576 $2,840 $3,409 $4,029 $4,179 $3,415 12/31/133/31/146/30/149/30/1412/31/143/31/156/30/159/30/1512/31/153/31/16Service Charges and FeesGain on Sales of LoansGain on Investment SecuritiesOtherDollars in thousands.
 Noninterest Expense $15,065 $14,107 $15,332 $13,358 $14,115 $13,082 $13,982 $14,077 $17,099 $15,996 12/31/133/3/146/30/149/30/1412/31/143/31/156/30/159/30/1512/31/153/31/16Salaries and Employee BenefitsOccupancyGeneral and AdministrativeOtherDollars in thousands.
 Strong Capital Position 21.6%21.6%21.0%19.4%19.1%18.2%16.8%15.4%0.0%5.0%10.0%15.0%20.0%25.0%12/31/1212/31/1312/31/143/31/156/30/159/30/1512/31/153/31/1620.3%20.3%19.7%18.1%17.8%17.0%15.5%14.1%0.0%5.0%10.0%15.0%20.0%25.0%12/31/1212/31/1312/31/143/31/156/30/159/30/1512/31/153/31/1615.2%17.2%16.9%15.5%15.3%14.6%13.2%12.1%0.0%5.0%10.0%15.0%20.0%25.0%12/31/1212/31/1312/31/143/31/156/30/159/30/1512/31/153/31/1615.0%14.9%16.5%15.8%16.1%15.8%14.4%13.5%0.0%5.0%10.0%15.0%20.0%25.0%12/31/1212/31/1312/31/143/31/156/30/159/30/1512/31/153/31/16Tier 1 Leverage Ratio Common Equity Tier 1 Note: 3/31/15 calculated consistent with Basel III; previous figures consistent with General Risk-based Rules. Tier 1 Risk-based Capital Ratio Total Risk-Based Capital Ratio 6.5% Well Capitalized 8.0% Well Capitalized 10.0% Well Capitalized 5.0% Well Capitalized
 2016 Priorities Maintain strong credit quality along with conservative balance sheet and risk management. Continue appropriate growth in the commercial banking sector. Grow deposit base commensurate with loan growth. Focus on fee based income growth in mortgage, consumer and treasury. Assess, manage and add talent where available and appropriate throughout the organization. Drive growth in the healthcare banking segment. Deploy capital in a manner that grows the organization and enhances shareholder value. Manage expenses to drive operating efficiency improvements. Ensure that the repurchase and dividend programs are providing the best shareholder returns.
 ADDITIONAL FINANCIAL INFORMATION
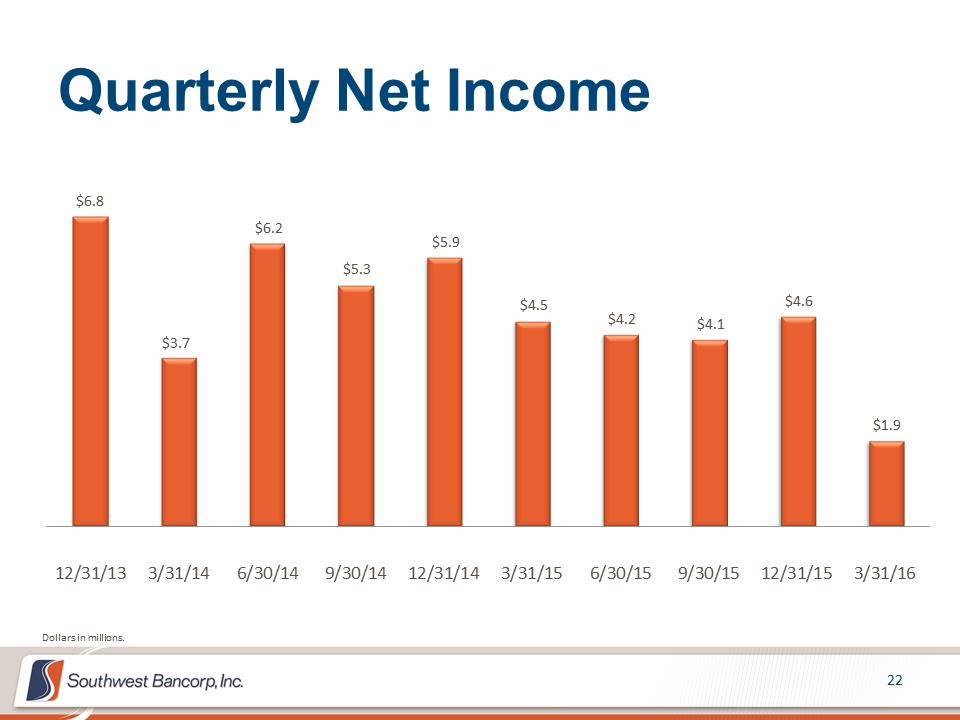 Quarterly Net Income $6.8 $3.7 $6.2 $5.3 $5.9 $4.5 $4.2 $4.1 $4.6 $1.9 12/31/133/31/146/30/149/30/1412/31/143/31/156/30/159/30/1512/31/153/31/16Dollars in millions.
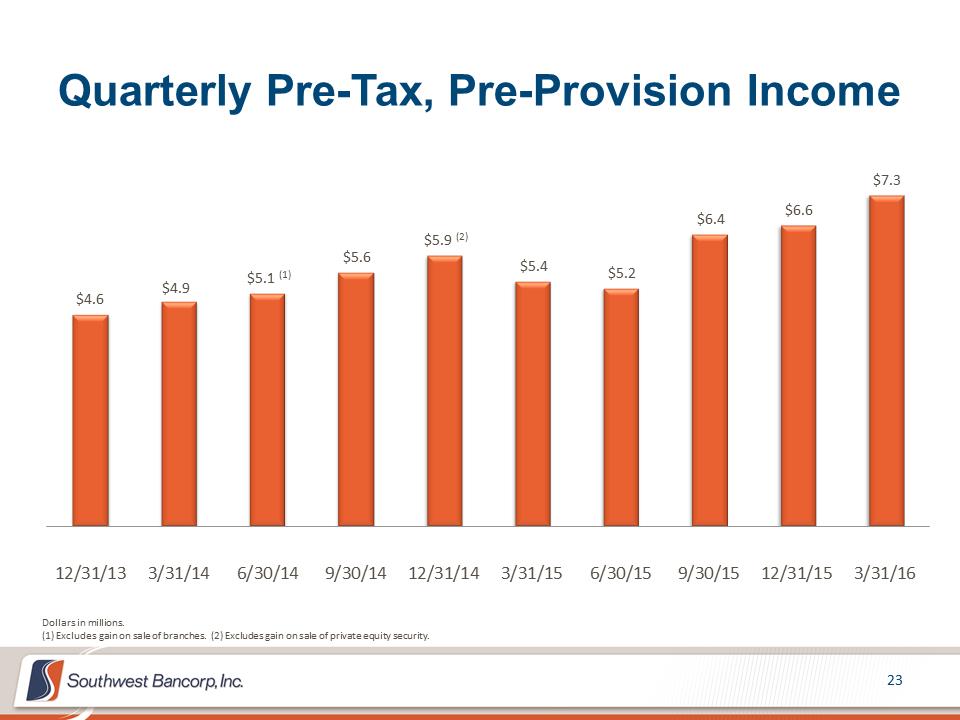 Quarterly Pre-Tax, Pre-Provision Income $4.6 $4.9 $5.1 (1) $5.6 $5.9 (2) $5.4 $5.2 $6.4 $6.6 $7.3 12/31/133/31/146/30/149/30/1412/31/143/31/156/30/159/30/1512/31/153/31/16Dollars in millions. Excludes gain on sale of branches. (2) Excludes gain on sale of private equity security.
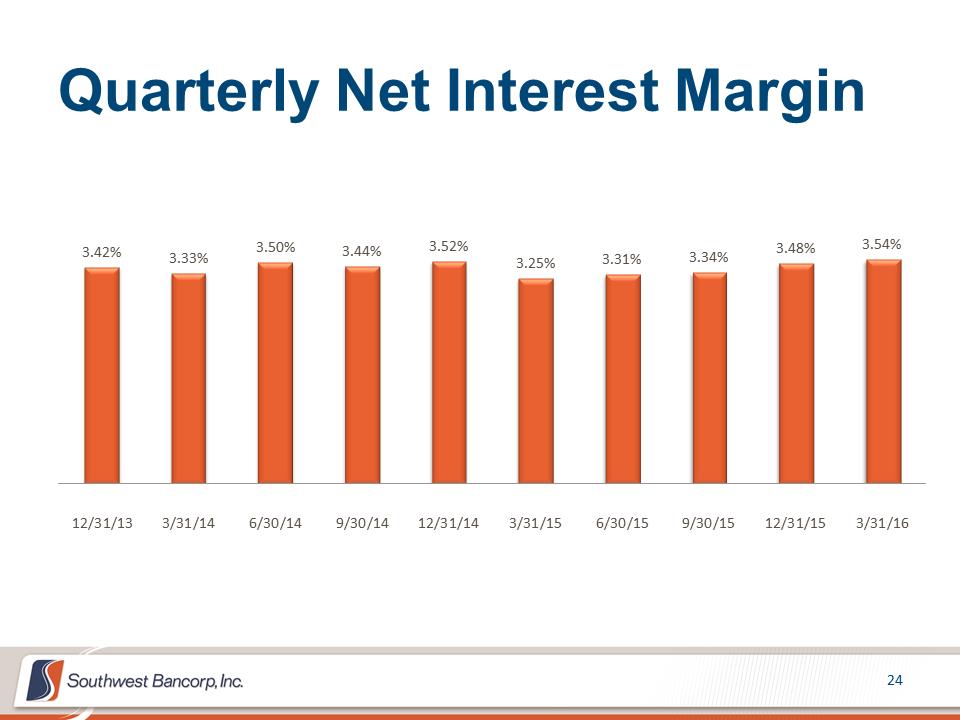 Quarterly Net Interest Margin 3.42% 3.33% 3.50% 3.44% 3.52% 3.25% 3.31% 3.34% 3.48% 3.54% 12/31/133/31/146/30/149/30/1412/31/143/31/156/30/159/30/1512/31/153/31/16
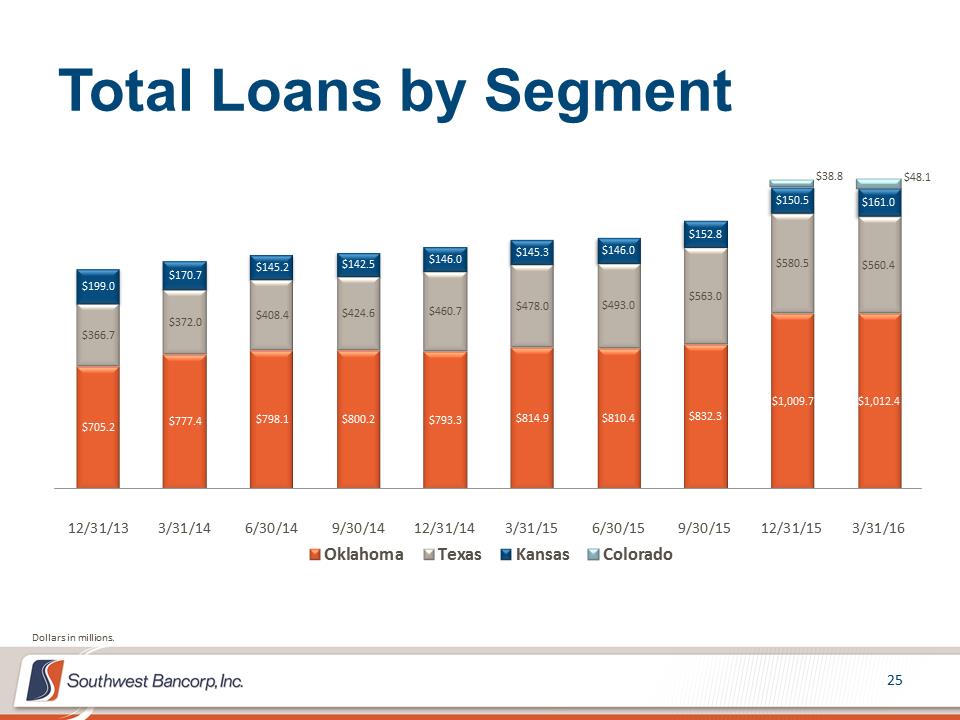 Total Loans by Segment $705.2 $777.4 $798.1 $800.2 $793.3 $814.9 $810.4 $832.3 $1,009.7 $1,012.4 $366.7 $372.0 $408.4 $424.6 $460.7 $478.0 $493.0 $563.0 $580.5 $560.4 $199.0 $170.7 $145.2 $142.5 $146.0 $145.3 $146.0 $152.8 $150.5 $161.0 $38.8 $48.1 12/31/133/31/146/30/149/30/1412/31/143/31/156/30/159/30/1512/31/153/31/16OklahomaTexasKansasColoradoDollars in millions.
 Potential Problem Loans by Segment $29.0 $29.2 $23.9 $23.9 $25.0 $26.7 $23.2 $23.6 $30.2 $43.4 $65.1 $58.4 $57.0 $38.6 $6.3 $9.5 $9.2 $4.1 $4.2 $18.8 $5.7 $4.2 $3.2 $1.9 $2.8 $2.7 $2.6 $2.1 $2.0 $3.6 $2.8 $2.7 12/31/133/31/146/30/149/30/1412/31/143/3/156/30/159/30/1512/31/153/31/16OklahomaTexasKansasColoradoDollars in millions.
 Provision for Loan Loss $(6.50) $(0.99) $(0.36) $(2.90) $(2.39) $(1.89) $(1.14) $0.02 $(0.57) $4.38 12/31/133/31/146/30/149/30/1412/31/143/31/156/30/159/30/1512/31/153/31/16Dollars in millions.
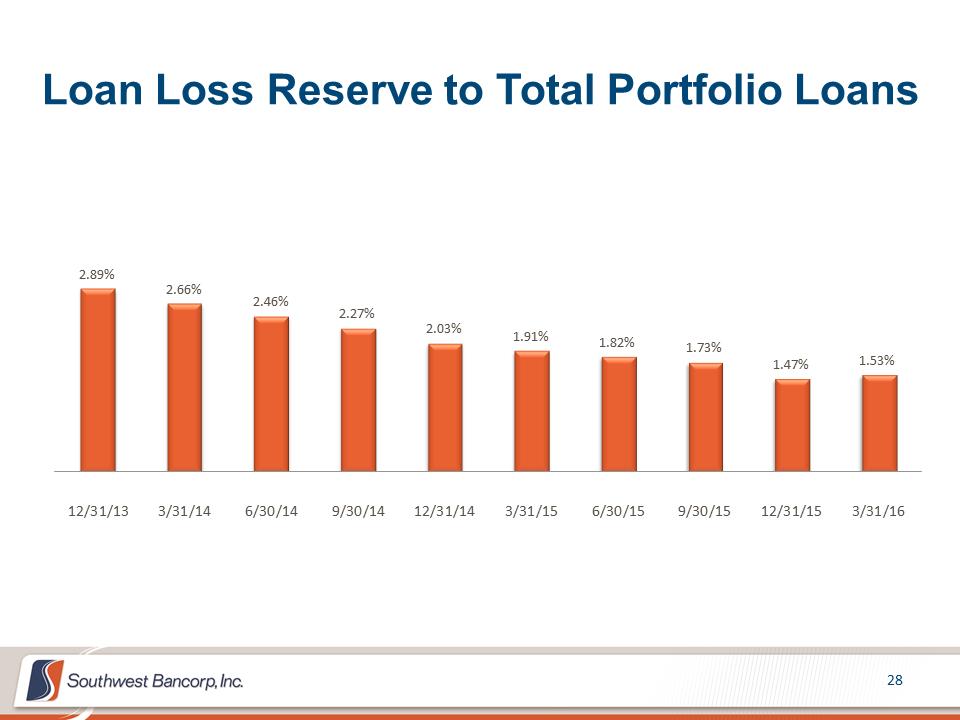 Loan Loss Reserve to Total Portfolio Loans 2.89% 2.66% 2.46% 2.27% 2.03% 1.91% 1.82% 1.73% 1.47% 1.53% 12/31/133/31/146/30/149/30/1412/31/143/31/156/30/159/30/1512/31/153/31/16
 Loan Loss Reserve to Nonperforming Loans 184.50% 217.13% 200.77% 205.29% 302.26% 297.78% 295.03% 176.38% 128.23% 122.01% 12/31/133/31/146/30/149/30/1412/31/143/31/156/30/159/30/1512/31/153/31/16
 APPENDIX
 The subsequent tables present non-GAAP reconciliations of the following calculations: –Tangible Common Equity (TCE) to Tangible Assets (TA) ratio –Tangible Book Value per Share –Pre-tax, Pre-provision Income
 TCA to TA and Tangible Book Value Per Share Dollars in thousands, except per share amounts. 12/31/201312/31/201412/31/201512/31/20143/31/20156/30/20159/30/201512/31/20153/31/2016Total Equity$259,187 $270,786 $296,098 $270,786 $271,444 $273,681 $277,344 $296,098 $285,661 Less Goodwill & Core Deposits3,2721,74416,3611,7441,6811,6191,55616,36116,201TCE$255,915 $269,042 $279,737 $269,042 $269,763 $272,062 $275,788 $279,737 $269,460 Total Assets$1,981,423 $1,942,034 $2,357,022 $1,942,034 $2,003,079 $2,031,581 $2,059,899 $2,357,022 $2,360,819 Less Goodwill & Core Deposits3,2721,74416,3611,7441,6811,6191,55616,36116,201TA$1,978,151 $1,940,290 $2,340,661 $1,940,290 $2,001,398 $2,029,962 $2,058,343 $2,340,661 $2,344,618 Common Equity to Assets13.08%13.94%12.56%13.94%13.55%13.47%13.46%12.56%12.10%TCE to TA12.94%13.87%11.95%13.87%13.48%13.40%13.40%11.95%11.49%Shares outstanding19,732,92619,193,05920,006,80219,193,05919,033,04019,033,54519,032,71920,006,80219,285,045Book Value per Common Share$13.13 $14.11 $14.80 $14.11 $14.26 $14.38 $14.57 $14.80 $14.81 Tangible BV per Share$12.97 $14.02 $13.98 $14.02 $14.17 $14.29 $14.49 $13.98 $13.97 12/31/20133/31/20146/30/20149/30/201412/31/20143/31/20156/30/20159/30/201512/31/20153/31/2016Net Income6,832$ 3,691$ 6,152$ 5,288$ 5,899$ 4,535$ 4,161$ 4,122$ 4,589$ 1,869$ Taxes on Income4,310 2,214 3,691 3,172 3,540 2,720 2,193 2,303 2,577 1,015 Provision(6,502) (986) (355) (2,897) (2,386) (1,887) (1,136) 23 (566) 4,375 Pre-tax, Pre-provision Income4,640$ 4,919$ 9,488$ 5,563$ 7,053$ 5,368$ 5,218$ 6,448$ 6,600$ 7,259$ Gain on sale of bank branches4,378$ Gain on sale of private equity security1,120$ Adjusted Pre-tax, Pre-provision Income5,110$ 5,933$ Pre-tax, Pre-provision Income