Exhibit 99.D
Description of
The Republic of Argentina
June 19, 2017
D-1
TABLE OF CONTENTS
| PAGE | ||||
| Recent Developments |
D-3 | |||
| Defined Terms and Certain Conventions |
D-9 | |||
| Presentation of Statistical and Other Information |
D-14 | |||
| Forward-Looking Statements |
D-17 | |||
| Data Dissemination |
D-18 | |||
| Summary |
D-19 | |||
| The Republic of Argentina |
D-20 | |||
| The Argentine Economy |
D-28 | |||
| Gross Domestic Product and Structure of the Economy |
D-43 | |||
| Balance of Payments |
D-68 | |||
| Monetary System |
D-90 | |||
| Public Sector Finances |
D-114 | |||
| Public Sector Debt |
D-146 | |||
D-2
The information contained in this section supplements the information about the Republic corresponding to the headings below that are contained in this Annual Report. This information is not necessarily indicative of the Argentine economy or fiscal results for the full year or any other period. You should read the following discussion of recent developments together with the more detailed information appearing elsewhere in this Annual Report.
THE ARGENTINE ECONOMY
Macri Administration: 2015-Present
Since December 2016, the Macri administration has continued to introduce significant economic and policy reforms intended to further its overall economic program, including:
| • | Infrastructure. On January 10, 2017, a multi-sector agreement among the province of Neuquén, several oil companies and labor unions, setting forth productivity incentives in the collective employment agreements intended to facilitate the development of the Vaca Muerta oil fields. |
| • | Housing loans to middle-income sectors. On March 23, 2017, the Ministry of Finances announced the implementation of a program aimed at increasing home equity loans to middle-income sectors by state-owned banks (Banco de la Nación Argentina, Banco Provincia de Buenos Aires and Banco de la Ciudad de Buenos Aires). Financing will be made available for home equity loans having maturities of up to 30 years with interest rates equal to Unidades de Valor Adquisitivo (UVAs). |
| • | Entrepreneurship Law. In April 2017, to improve productivity, Congress enacted the Ley de Emprendedores (Entrepreneurship Law), easing the procedures for the establishment of corporations, granting financial benefits to stakeholders, and providing for 0% interest loans to these corporations to enhance productive activities. |
| • | Exports. On May 10, 2017, Ministry of Agriculture announced the resumption of citrus exports to Brazil, which had been suspended since 2009. |
| • | Program for Labor Integration in Business (PIL). On May 3, 2017, the government announced the availability of financial incentives for companies that employed registered unemployed labor force to cover a portion of the employee’s salary as a means of reducing unemployment. |
| • | Financial policy. Since April 2016, Argentina has continued settling claims with holders of Untendered Debt consistent with the terms of its February 2016 Settlement Proposal. As of March 31, 2017, the outstanding principal amount of Untendered Debt that was not subject to a settlement agreement totaled approximately U.S.$1.43 billion, of which the outstanding principal amount of foreign law governed Untendered Debt that was not subject to a settlement agreement and was not time-barred (in the Republic’s understanding) totaled approximately U.S.$803 million. In May 2017, the Republic reached a settlement agreements with holders of an additional U.S.$92 million in principal amount of foreign law governed Untendered Debt. |
GROSS DOMESTIC PRODUCT AND STRUCTURE OF THE ECONOMY
Poverty
In March 2017, the INDEC resumed the publication of its semiannual series on poverty and extreme poverty rates. In the second half of 2016, 21.5% of Argentina’s households and 30.3% of the population stood below the poverty line, while 4.5% of the households and 6.1% of the population stood below the extreme poverty line.
D-3
According to the INDEC, in April 2017, the essential food basket for households was Ps.5,918.8, which increased the essential goods and services basket to Ps.14,501.1.
The unemployment rate in the first quarter of 2017 stood at 9.2%, which represents a 1.6% increase from the last quarter of 2016, according to the INDEC. However, the activity rate (which is the percentage of employed individuals plus unemployed individuals over total population) was 45.5%, 0.2% higher than the last quarter of 2016. The unemployment rate in the Greater Buenos Aires metropolitan region was 10.9%, the highest unemployment rate in the country.
BALANCE OF PAYMENTS
In the four-month period ended April 30, 2017, the Republic’s trade balance registered a U.S.$1.2 billion deficit.
During this period, exports totaled U.S.$17.5 billion, an increase of 1.8% compared to the same period in 2016. The increase was driven by a 5.9% increase in export prices, and offset by a 3.9% decrease in volume. Exports of fuel and energy grew by 17.1%, of manufactured goods of industrial origin by 7.1%, and of manufactured goods of agricultural origin by 1.5%, while exports of primary product decreased by 5.2%, in each case compared to the same period in 2016.
In the four-month period ended April 30, 2017, imports totaled U.S.$18.7 billion, a 9.1% increase from U.S.$17.2 billion during the same period in 2016. The increase was primarily driven by an increase in imports of passenger motor vehicles, capital goods, consumer goods, fuels and lubricants, and intermediate goods, which grew by 40.2%, 17.2%, 16.7%, 15.2%, and 1.4%, respectively. The increase in imports was partially offset by a 5.0% decline in imports of parts and accessories for capital goods.
International Reserves
As of June 12, 2017, the gross international reserve assets of the Central Bank totaled U.S.$44.8 billion, compared to U.S.$38.8 billion as of December 31, 2016.
MONETARY SYSTEM
Monetary Policy
Inflation
On January 11, February 9, March 9, April 11, May 10 and June 8, 2017, the INDEC published inflation rates (CPI) of 1.3%, 2.5%, 2.4%, 2.6% and 1.3% for January, February, March, April and May 2017, respectively.
On May 18, 2017, the INDEC announced that starting July 11, 2017 it will publish a national CPI (“National CPI”) which will provide regional and national CPI data. The first National CPI publication will present information for the period of January–June of 2017.
The National CPI will be based on a survey conducted by INDEC and several provincial statistical offices. The survey will be conducted in 39 urban areas encompassing each of the Republic’s jurisdictions. Results will not be reported by province, but on a national level and for six statistical regions: the Greater Buenos Aires, Metropolitan area (which is the CPI that resumed publication in June 2016), the Cuyo region, the Northeast region, the Northwest region, the Central (Pampeana) Region and the Southern (Patagonia) region.
The National CPI will follow current international standards and classify individual consumption by purpose, disaggregating information based on 12 factors, instead of the nine factors currently used in the preparation of CPI.
The adoption of the National CPI brings Argentina’s statistical practice into line with the OECD guidelines as well as the methodology followed by with the statistical divisions of international organizations including the United Nations, World Bank, International Monetary Fund, Economic Commission for Latin America and the Caribbean, and the Inter-American Development Bank.
D-4
PUBLIC SECTOR FINANCES
National Public Accounts
Four-months ended April 30, 2017
The preliminary fiscal primary results of the government for the four months ended April 30, 2017 resulted in a primary deficit of Ps. 60.0 billion.
While revenues for the period increased at a rate of 40% (year on year), primary expenses increased at a rate of 36% (year on year), of which capital expenditures increased at a rate of 45% (year on year) and social security outlays increased at a rate of 40% (year on year), and the remaining primary expenditures increased at a rate of 28% (year on year).
PUBLIC SECTOR DEBT
Foreign Currency-Denominated Debt in 2017
Between January 1 and June 14, 2017, the Republic issued foreign currency-denominated debt in an aggregate principal amount of U.S.$10.6 billion, consisting of U.S. Dollar-denominated global bonds for an aggregate principal amount of U.S.$7.0 billion, BONARs of several series for an aggregate principal amount of U.S.$3.6 billion and a CHF 400 million bond.
Foreign Currency-Denominated Debt Service
Projected Performing Foreign Currency-Denominated Public Debt Service by Instrument for Primary Issues between January 1 and June 14, 2017 (1) (in millions of U.S. dollars)
| 2017 | 2018 | 2019 | 2020 | |||||||||||||||||||||||||||||
| Capital | Interest | Capital | Interest | Capital | Interest | Capital | Interest | |||||||||||||||||||||||||
| U.S. $5.625% Bonds due 2022 |
— | U.S.$ | 91.4 | — | U.S.$ | 182.8 | — | U.S.$ | 182.8 | — | U.S.$ | 182.8 | ||||||||||||||||||||
| U.S. $6.875% Bonds due 2027 |
— | 128.9 | — | 257.8 | — | 257.8 | — | 257.8 | ||||||||||||||||||||||||
| BONAR 20 |
— | 7.3 | — | 7.3 | — | 7.3 | 91.7 | 7.3 | ||||||||||||||||||||||||
| BONAR 25 |
— | 44.2 | — | 88.3 | 88.3 | — | 88.3 | |||||||||||||||||||||||||
| BONAR 37 |
— | 77.0 | — | 154.1 | — | 154.1 | — | 154.1 | ||||||||||||||||||||||||
| 2021 | 2022 | 2023 | 2024 | |||||||||||||||||||||||||||||
| Capital | Interest | Capital | Interest | Capital | Interest | Capital | Interest | |||||||||||||||||||||||||
| U.S. $5.625% Bonds due 2022 |
— | U.S.$ | 182.8 | U.S.$ | 3,250.00 | U.S.$ | 91.4 | — | — | — | — | |||||||||||||||||||||
| U.S. $6.875% Bonds due 2027 |
— | 257.8 | — | 257.8 | — | 257.8 | — | 257.8 | ||||||||||||||||||||||||
| BONAR 20 |
— | — | — | — | — | — | — | — | ||||||||||||||||||||||||
| BONAR 25 |
— | 88.3 | — | 88.3 | 506.8 | 88.3 | 506.8 | 59.2 | ||||||||||||||||||||||||
| BONAR 37 |
— | 154.1 | — | 154.1 | — | 154.1 | — | 154.1 | ||||||||||||||||||||||||
| (1) | Preliminary figures. |
Source: INDEC and Ministry of the Treasury.
Projected Performing Foreign Currency-Denominated Public Debt Service by Instrument for Primary Issues between January 1 and June 14, 2017(1) (in millions of CHF)
| 2017 | 2018 | 2019 | 2020 | |||||||||||||||||||||||||||||
| Capital | Interest | Capital | Interest | Capital | Interest | Capital | Interest | |||||||||||||||||||||||||
| CHF 3.375% Bonds due 2020 |
— | 6.8 | — | 13.5 | — | 13.5 | 400.0 | 13.5 | ||||||||||||||||||||||||
| (1) | Preliminary figures. |
| Source: | INDEC and Ministry of the Treasury. |
U.S. Dollar-Denominated Treasury Bills Program
As of June 14, 2017, U.S.$14.9 billion aggregate principal amount of LETES were outstanding, of which U.S.$11.1 billion were held by the private sector.
D-5
Local Currency-Denominated Debt in 2017
Between January 1 and June 14, 2017, the Republic issued local currency-denominated bonds for an aggregate principal amount of Ps.145.2 billion, of which Ps.11.7 billion corresponded to the BONCER 2021, Ps.79.9 billion corresponded to the floating rate Treasury Bonds due 2019, Ps.12.4 billion corresponded to the fixed rate Treasury Bonds due 2021, Ps.4.5 billion corresponded to the fixed rate Treasury Bonds due 2023, Ps.6.6 billion corresponded to the fixed rate Treasury Bonds due 2026 and Ps.30 billion corresponded to the floating rate BONAR due 2022. Additionally, the Republic issued two Bonds to ANSES in an aggregate principal amount of Ps.33.8 billion.
Legal Proceedings
Individual litigation in the United States
As of the date of this Annual Report, 101 actions involving bonds with a nominal amount of approximately U.S.$599 million were pending in the District Court. Judgments for a total value of approximately U.S.$707 million have been entered in actions involving bonds with a nominal amount of approximately U.S.$377 million.
On February 29, 2016 and March 3, 2016, certain plaintiffs filed suit against the Republic in the District Court based on their purported ownership of bonds with a nominal amount of U.S.$2.2 million governed by New York law, and with a nominal amount of approximately €6.0 million governed by Italian law, German law, and English law. The Republic moved to dismiss the claims that were based on Italian law and German law on the grounds of lack of jurisdictional and/or insufficient service of process. The District Court granted the Republic’s motion to dismiss on August 2, 2016. On September 22, 2016 the District Court denied plaintiffs’ request to reconsider the portion of its opinion dismissing the German law claims. On May 16, 2017 plaintiffs moved for partial summary judgment on a portion of their claims that had become payable within six years prior to filing suit. As of the date of this report, the Republic’s response to the motion is pending.
On March 31, 2017, judgment creditors served discovery requests on the Republic, seeking discovery into assets of the Republic. On May 1, 2017, the Republic objected to the discovery requests.
On September 29, 2016, a creditor filed suit against the Republic in the District Court based on its purported ownership of bonds with a nominal amount of approximately U.S.$5.3 million governed by New York law and bonds with a nominal amount of €1.0 million governed German law. The Republic moved to dismiss the complaint on April 4, 2017, and briefing was completed on May 18, 2017. The court’s ruling is pending.
Class Action litigation in the United States
As of the date of this report, of the 15 actions filed against the Republic on behalf of a class of holders of defaulted bonds in the New York District Court, class certification had been granted in 13 of these 15 actions.
On May 27, 2016, the District Court preliminarily approved the settlement agreements reached by the Republic and representatives of nine of these classes. The settlement agreement provided for the payment to class members of an amount equal to 150% of their unpaid principal. See “Public Sector Debt—Legal Proceedings—The Settlement.” After holding fairness hearings, the District Court entered an order approving the settlements. The District Court has since entered a final judgment for the Brecher class for a nominal amount of up to €1.9 million. The Republic expects that, if the District Court also enters judgments in the eight Seijas class actions, the nominal amount to be settled in these nine class actions will total approximately U.S.$17.5 million.
The Settlement
As of the date of this Annual Report, agreements in principle have been executed with holders of approximately 85% of the nominal amount under Untendered Debt outstanding as of December 31, 2015 (including in the calculation claims that the Republic considers time-barred and for which no agreements have been entered into).
Creditors who settled their claims have agreed, upon payment, to dismiss with prejudice all litigation against the Republic, including all enforcement proceedings. As of the date of this Annual Report, payments to settling creditors had resulted in the dismissal of claims in the United States for an aggregate nominal amount of approximately U.S.$ 3.1 billion, plus interest, and the satisfaction of judgments in the amount of approximately U.S.$4.8 billion. In addition, the Republic is currently reviewing executed settlement agreements for the purpose of reconciling those agreements to claims in the District Court, for the purpose of dismissing any and all actions and or judgments where the asserted claims have been settled.
On May 30, 2017, the Republic entered into an agreement in principle with creditors of the Republic holding bonds with a nominal amount of approximately U.S.$92 million, with judgments totaling approximately U.S.$216.7 million.
D-6
Litigation in Germany
As of the date of this report, final judgments have been entered for a total amount of approximately € 159.8 million in principal plus interest and costs in suits brought against the Republic in Germany relating to defaulted bonds, while claims seeking approximately € 371.7 million in principal on defaulted debt, plus interest, have been filed in Germany, although no final judgment has yet been rendered.
Litigation in Argentina
Recognition and enforcement of foreign judgments in Argentina. In Argentina, plaintiffs in four actions have sought recognition of U.S. judgments totaling approximately U.S.$24 million. In three of these cases the proceedings reached the Supreme Court, which confirmed the respective Court of Appeals decisions dismissing the claims for recognition of the foreign judgment. As of the date of this Annual Report, the fourth case is pending before the lower court. In all cases in which Argentine courts dismissed a claim for recognition and enforcement of the U.S. judgments, the courts held, as the Republic had argued, that although the Republic’s issuance of the bonds in which plaintiff had an interest constituted a commercial activity, the Republic’s declaration of a default as a consequence of an economic and social emergency constituted an exercise of its sovereign powers and should have been given deference by the foreign court. The Republic has entered into settlement agreements on the terms of its February 2016 proposal with all plaintiffs that sought recognition of U.S. judgments in Argentina.
D-7
Other Non-Creditor Litigation in the U.S.
On April 8, 2015, Petersen Energía Inversora, S.A.U. and Petersen Energía, S.A.U. (the “Petersen Entities”) filed a claim against the Republic in relation to the 2012 expropriation of YPF in the District Court.
The Petersen Entities seek compensatory damages (in an amount to be determined) arising out of an alleged breach of the bylaws of YPF by the Republic that allegedly occurred when it expropriated 51% of Class D shares of YPF. In September 2015, the Republic moved to dismiss the complaint, asserting, among other things, that the District Court lacks jurisdiction under the FSIA. On September 9, 2016, the District Court granted in part and denied in part the Republic’s motion to dismiss plaintiffs’ complaint. The Second Circuit Court of Appeals heard arguments on June 15, 2017. A decision is pending as of the date of this Annual Report.
D-8
DEFINED TERMS AND CERTAIN CONVENTIONS
Certain Defined Terms
All references in this Annual Report to “Argentina” or the “Republic” are to the Republic of Argentina, and to the “Government” are to the non-financial sector of the federal government of Argentina, excluding the Central Bank, Banco de la Nación Argentina and Banco de Inversión y Comercio Exterior (Foreign Investment and Trade Bank, or “BICE”).
The terms set forth below have the following meanings for purposes of this Annual Report:
| • | April 2016 Transaction, refers to the April 22, 2016, U.S.$16.5 billion issuance of new debt securities in the international capital markets by the Republic, of which U.S.$9.3 billion were applied to satisfy settlement payments in connection with agreements with holders of Untendered Debt. |
| • | BADLAR rate is an average rate published by the Central Bank based on a survey of financial institutions in Argentina regarding the nominal annual interest rate in peso-denominated time deposits of more than Ps.1.0 million from 30 to 35 days. |
| • | Defaulted debt or debt in default as of any given date refers to all of Argentina’s public indebtedness on which Argentina is not paying principal or interest as of such date, plus any past due principal and interest payments calculated at contractual rates. |
| • | Gross domestic product, or GDP, means the total value of final products and services produced in Argentina during the relevant period. |
| • | Non-performing debt refers to public indebtedness of Argentina that was formally subject to the moratorium declared by the Government in December 2001, other than “Untendered Debt.” Argentina’s non-performing debt encompasses all the public debt in which Argentina is in default as of any given date (other than Untendered Debt), including past due principal and interest payments calculated at contractual rates. Non-performing debt also includes the following: |
| (i) | certain debt obligations on which the Government has continued to make payments on a case-by-case basis (such as in cases of extreme necessity (e.g., for senior citizens 75 years of age or older) or when the provision of essential services is threatened), despite being formally subject to the suspension of debt payments; and |
| (ii) | certain obligations that resulted from the advance payment of tax obligations by certain companies. These advance tax payments gave rise to claims against the Government for the amount of the payment. The Government considers these claims additional public indebtedness of Argentina and they are treated as such in the Government’s accounts. These claims, however, are discharged when the tax obligation that gave rise to the advanced payment actually becomes payable, at which time the tax obligation is cancelled. Accordingly, although formally subject to the suspension of payments, the Government’s obligations in respect of these claims are not in default. |
| • | Settlement Proposal refers to the proposal, published by the Republic on February 5, 2016 in the Ministry of the Treasury and Public Finances’ website, to settle all claims on Untendered Debt not otherwise time-barred, including bonds in litigation in the United States, subject to two conditions: first, obtaining approval by the Argentine Congress, and second, lifting the pari passu injunctions. The Settlement Proposal contemplated two frameworks for settlement. The “pari passu option,” which was extended as an option to plaintiffs holding pari passu injunctions granted by courts of the United States, provided for payment equal to the full amount of money judgment or an accrued claim value less a specified discount. The “standard option,” which remains open to holders of Untendered Debt, whether or not they had pari passu injunctions, provides for payment equal to 100% of the outstanding principal amount of the relevant debt securities plus up to 50% of that original principal as interest. Any eligible holder of Untendered Debt may agree to the terms of the standard option, in accordance with the procedures set forth and published by the Ministry of the Treasury and, in accordance with such terms, becomes party to a binding agreement in principle with the Republic once the amounts to be paid are reconciled and the agreement is countersigned by the Republic. The Settlement Proposal is not available for claims on principal or interest that are time-barred. |
D-9
| • | Untendered Debt means, with respect to data included herein through 2016, defaulted debt in respect of securities that were eligible for, but not tendered in, the 2005 Debt Exchange and the 2010 Debt Exchange. References to Untendered Debt in this Annual Report do not constitute, and shall not be read or construed to constitute a waiver of any defenses available to the Republic with respect to the enforcement of any claim thereunder. See “Preservation of Defenses.” The Republic is not paying time-barred claims on principal or interest, and the Settlement Proposal is not available for claims on principal or interest that are time-barred. Any amounts of Untendered Debt set forth in this Annual Report have been defined in this Annual Report to include unpaid principal plus accrued and unpaid interest at contractual rates through December 31, 2016, including penalty or default interest. In settling outstanding disputes with holdout creditors pursuant to the Settlement Proposal, the Republic took into consideration interest accrued after the originally scheduled maturity of each defaulted series of securities (other than time-barred interest), as well as default interest. For information regarding the Republic’s Settlement Proposal to settle claims on the Untendered Debt, see “Public Sector Debt—Legal Proceedings.” |
| • | 2005 Debt Exchange refers to the restructuring and exchange of public debt that had been in default since the end of 2001 undertaken by the Government between January and May of 2005. |
| • | 2010 Debt Exchange refers to the restructuring and exchange of public debt that had been in default since the end of 2001 undertaken by the Government between April and December 2010. |
For purposes of this Annual Report, the following terms, which refer to various public debt instruments, have the meanings set forth below:
| • | BAADE. “Argentine Saving Bond for Economic Development” and the “Saving Promissory Note for Economic Development” are both to be issued by the Ministry of the Treasury and to be denominated in U.S. dollars, maturing in 2016 and accruing interest at a 4% rate. Funds obtained from the issuance of these bonds will be used to finance public investment projects in strategic sectors like infrastructure and hydrocarbons. |
| • | Bocones. Bonds that the Government began issuing in 1991 to restructure its obligations to pensioners and suppliers and to settle reparations of members of family of victims of the military dictatorship. |
| • | Bogar. Bonds issued by the Provincial Development Fund to restructure debt obligations of the provinces. These bonds are guaranteed by the Government and secured by a pledge of certain provincial tax revenues. |
| • | Bogar 2018. Bogar with maturity date in 2018. |
| • | Bogar 2020. Bogar with maturity date in 2020. |
| • | Bonacs. Bonds that the Government began issuing in 2015 for general purposes of the Government, with a floating interest rate (LEBACs and others) and maturity in 2016. |
| • | Bonads. Dollar denominated bonds payable in pesos (dollar linked) that the Government began issuing in 2014 for general purposes of the Government. |
| • | Bonares. Bonds that the Government began issuing in 2006 for general purposes of the Government and in exchange for CER-index linked bonds. |
| • | Global Bond. For purposes of this section under the caption “Certain Defined Terms,” Government bonds issued in the international capital markets under the Government’s shelf registration statements filed with the SEC. |
D-10
| • | LEBACs. Short-term notes issued by the Central Bank. They are denominated principally in pesos. |
| • | National Guaranteed Loans. Tax-secured loans that the Government exchanged for previously outstanding Government bonds as part of a voluntary debt offers that took place in 2001. Holders of National Guaranteed Loans retained the right to recover their original bonds upon default. |
| • | NOBACs. Medium-term notes issued by the Central Bank denominated only in pesos. |
| • | Promissory Notes Pesos 2019. Promissory notes issued in pesos at an annual floating interest rate equal to the BADLAR rate plus 250 basis points with an amount equal to the BADLAR rate to be capitalized during the first two years and paying 250 basis points interest rate during such period, and paying the full floating interest rate thereafter, maturing in 2019. |
| • | 2017 Globals. U.S. dollar-denominated Global Bonds due 2017 issued in the international capital markets pursuant to the 2010 Debt Exchange. |
| • | 2035 GDP-Linked Securities. Long-term Government Treasury securities denominated in U.S. dollars, euros, Japanese yen and pesos issued in the international capital markets pursuant to the 2005 Debt Exchange and expiring no later than December 2035. |
| • | 2035 GDP-Linked Securities (2010). Long-term Government Treasury securities denominated in U.S. dollars, euros, Japanese yen and pesos issued in the international capital markets pursuant to the 2010 Debt Exchange and expiring no later than December 2035. |
| • | 2038 Par Bonds. Long-term Government Treasury bonds denominated in U.S. dollars, euros, Japanese yen and pesos issued in the international capital markets pursuant to the 2005 Debt Exchange. |
| • | 2038 Par Bonds (2010). Long-term Government Treasury bonds denominated in U.S. dollars, euros, Japanese yen and pesos issued in the international capital markets pursuant to the 2010 Debt Exchange. |
| • | 2045 Quasi-Par Bonds. Long-term Government Treasury bonds denominated in pesos issued in the international capital markets pursuant to the 2005 Debt Exchange. |
Preservation of Defenses
Nothing in this Annual Report, or in any communication from the Republic, constitutes an acknowledgment or admission of the existence of any claim or any liability of the Republic to pay that claim or an acknowledgment that any ability to bring proceedings in any jurisdiction in respect of such claim or any limitation period relating thereto has been revived or reinstated, or an express or implied promise to pay any such claim (or part thereof). Whether or not a claim exists, the Republic may in its sole discretion and only if written notice to that effect is received from a duly authorized officer of the Republic, attribute a value to such claim for purposes of the Republic’s Settlement Proposal or for any other purpose. All defenses available to the Republic relating to any applicable statute of limitations or otherwise are expressly preserved for all purposes. This Annual Report may not be relied upon as evidence of the Republic’s agreement that a claim exists, or of the Republic’s willingness, ability or obligation to pay any claim. Any attribution of any value to any claim for purposes of the Republic’s Settlement Proposal or for any other purpose will not be considered an acknowledgment of the existence or validity of that claim and any consideration given by or on behalf of the Republic to the proponent of that claim will be consideration only for the agreement by the proponent of that claim to cease all actions or proceedings in respect of that claim and to irrevocably assign and transfer to the Republic all rights, if any, with respect to such claim and to undertake to complete any and all formalities or requirements necessary to ensure that if such claim existed neither the proponent nor any successor or assignee of the proponent (other than the Republic) is able to evidence or allege such claim to remain in existence or to be a liability of the Republic.
D-11
Exchange Rates and Exchange Controls
The Republic publishes most of its economic indicators and other statistics in pesos. Beginning in February 2002, the peso was allowed to float against other currencies. After several years of fluctuations in the nominal exchange rate, the peso lost approximately 14% of its value against the U.S. dollar in 2012. Despite increased Central Bank intervention and measures to limit Argentine residents’ access to foreign currency, the peso devalued by 32.6% and 31.3% against the U.S. dollar in 2013 and 2014, respectively. In December 2015, the Macri administration eliminated a significant portion of the foreign exchange restrictions and the Central Bank returned to a free-float policy with interventions designed to enhance the operation of the foreign exchange market. Immediately after a significant portion of the foreign exchange controls were lifted on December 16, 2015, the peso devalued by approximately 40%, as the peso-U.S. dollar exchange rate reached Ps.13.76 to U.S.$1.00 on December 17, 2015. The peso has since floated freely with limited intervention by the Central Bank, and the nominal exchange rate experienced moderate variations. On December 31, 2016, the exchange rate was Ps.15.85 to U.S.$1.00.
Exchange Rates
The following table sets forth the annual high, low, average and period-end “reference” exchange rates for the periods indicated, expressed in pesos per U.S. dollar and not adjusted for inflation. There can be no assurance that the peso will not depreciate or appreciate in the future. The Federal Reserve Bank of New York does not report a noon buying rate for pesos.
| Exchange rates(1) | ||||||||||||||||
| High | Low | Average(2) | Period end | |||||||||||||
| Year ended December 31, |
||||||||||||||||
| 2011 |
4.304 | 3.972 | 4.130 | 4.303 | ||||||||||||
| 2012 |
4.917 | 4.305 | 4.552 | 4.917 | ||||||||||||
| 2013 |
6.518 | 4.923 | 5.479 | 6.518 | ||||||||||||
| 2014 |
8.556 | 6.543 | 8.119 | 8.552 | ||||||||||||
| 2015 |
13.763 | 8.554 | 9.269 | 13.005 | ||||||||||||
| 2016 |
16.039 | 13.069 | 14.779 | 15.850 | ||||||||||||
| January 2017 |
16.053 | 15.808 | 15.907 | 15.912 | ||||||||||||
| February 2017 |
15.835 | 15.368 | 15.598 | 15.455 | ||||||||||||
| March 2017 |
15.669 | 15.382 | 15.524 | 15.382 | ||||||||||||
| April 2017 |
15.453 | 15.174 | 15.360 | 15.427 | ||||||||||||
| May 2017 |
16.142 | 15.269 | 15.698 | 16.142 | ||||||||||||
| June 2017(3) |
16.058 | 15.900 | 15.994 | 15.932 | ||||||||||||
| (1) | Central Bank reference exchange rates (Communication A 3500 of Central Bank). |
| (2) | Average of daily closing quotes. |
| (3) | Through June 12, 2017. |
| Source: | Central Bank. |
Currency conversions, including conversions of pesos into U.S. dollars, are included for the convenience of the reader only and should not be construed as a representation that the amounts in question have been, could have been or could be converted into any particular denomination, at any particular rate or at all.
As of June 12, 2017, the peso-dollar reference exchange rate was Ps.15.932 to U.S.$1.00.
Exchange Controls
In response to the deterioration of the Argentine economy and financial system in 2001, the inability of the Republic to service its public external indebtedness and the decreased level of deposits in the financial system, the Government issued Decree No. 1,570/2001 on December 3, 2001, which established certain monetary and currency exchange control measures, including restrictions on the free disposition of funds deposited in banks and restrictions on the transfer of funds abroad, subject to certain exceptions.
In addition to the above measures, on February 8, 2002, the Government and the Central Bank made certain transfers of funds abroad to service principal and/or interest payments on foreign indebtedness subject to prior authorization. From 2011 until the Macri administration took office in December 2015, the Government increased controls on the sale of foreign currency and the acquisition of foreign assets by local residents, limiting the possibility of transferring funds abroad. In 2012, the Government adopted an import procedure under which any import of products required the pre-approval of local authorities in the form of a Declaración Jurada Anticipada de Importación (Advance Sworn Import Declaration, or “DJAI”). The DJAI was a precondition for the importer to gain access to the foreign exchange market to pay for imported products, which was, in effect, a material barrier to the import of goods into Argentina, as any alternative method of payment significantly increased the costs of such transactions.
D-12
Together with the regulations established in 2012 that subjected certain foreign exchange transactions to prior approval by the Argentine tax authorities or the Central Bank, the measures taken by the Fernández de Kirchner administration significantly curtailed access to the Mercado Único y Libre de Cambio (the “MULC”). In response, an unofficial U.S. dollar trading market developed in which the peso-U.S. dollar exchange rate differed substantially from the official peso-U.S. dollar exchange rate.
Current Regulations
As of December 2016, in line with the economic reforms implemented by the Macri administration, the Ministry of Finances and the Central Bank issued regulations that eliminated most substantially all of the foreign exchange restrictions imposed since 2011. Following an initial set of measures adopted in December 2015 with the aim of increasing capital inflows, the Government and the Central Bank introduced additional measures to eliminate a significant portion of the restrictions affecting the trade balance. In this regard, on August 8, 2016 the Central Bank introduced further material changes to the foreign exchange regime and established, as of August 9, 2016, a new foreign exchange regime by means of Communication “A” 6037 (as amended) that significantly eases access to the MULC. On December 30, 2016, the Central Bank further eased foreign exchange controls by eliminating the mandatory repatriation of proceeds from export services. On January 4, 2017, the Ministry of the Treasury eliminated the mandatory minimum stay period applicable to (i) the inflow of funds to the local foreign exchange market arising from certain foreign indebtedness and (ii) any entry of funds to the foreign exchange market by non-residents.
D-13
PRESENTATION OF STATISTICAL AND OTHER INFORMATION
All annual information presented in this Annual Report is based upon January 1 to December 31 periods, unless otherwise indicated. Totals in some tables in this Annual Report may differ from the sum of the individual items in those tables due to rounding.
Unless otherwise stated, prices and figures are stated in current values of the currency presented, and references in this Annual Report to “pesos” and “Ps.” are to Argentine pesos, references to “U.S. dollars” and “U.S.$” are to the currency of the United States of America, references to “euros,” “€” and “EUR” are to the currency of the European Union, references to “CHF” are to Swiss francs and references to “Japanese yen” or “JPY” are to Japanese yens.
Information in this Annual Report that is identified as being derived from a publication of the Republic or one of its respective agencies or instrumentalities is included as public official statements made on the authority of the Republic. Certain statistical information included in this Annual Report is preliminary and is subject to change, completion or amendment.
INDEC
Statistical information reported in this Annual Report has been derived from official publications of, and information supplied by, a number of agencies, including the INDEC and the Dirección General de Estadística y Censos de la Ciudad de Buenos Aires (General Directorate of Statistics and Census of the City of Buenos Aires).
During the Fernández de Kirchner administration, the INDEC—the only institution in Argentina with the statutory authority to produce official nationwide statistics—underwent institutional and methodological reforms that gave rise to controversy regarding the reliability of the information that it produced, including CPI, GDP, unemployment and poverty data. Reports published by the International Monetary Fund (“IMF”) have stated that their staff uses alternative measures of inflation for macroeconomic surveillance, including data produced by private sources, which have shown inflation rates considerably higher than those published by the INDEC between 2007 and 2015. The IMF also censured Argentina for failing to make sufficient progress, as required under the Articles of Agreement of the IMF, in adopting remedial measures to address the quality of official data, including CPI and GDP data. In February 2014, the INDEC released a new inflation index, known as the Indice de Precios al Consumidor Nacional Urbano (National Urban Consumer Price Index, or “CPI Nu”), which was intended to measure prices on goods across the country and replaced the previous index that only measured inflation in the City of Buenos Aires and its surrounding areas. Although this new methodology was expected to bring inflation statistics closer to those estimated by private sources, differences between official inflation data and private estimates remained.
On January 8, 2016, based on its determination that the INDEC had failed to produce reliable statistical information, particularly with respect to CPI, GDP and foreign trade data, as well as poverty and unemployment rates, President Macri declared a state of administrative emergency for the national statistical system and the INDEC until December 31, 2016. The INDEC suspended publication of certain statistical data pending reorganization of its technical and administrative structure to recover its ability to produce reliable statistical information. The INDEC published official CPI figures published by the City of Buenos Aires and the Province of San Luis for reference for the first four months of 2016. In June 2016, the INDEC began publishing an official inflation rate using its new methodology for calculating the CPI.
On June 29, 2016, the INDEC published (the “INDEC Report”) a revised calculation of the 2004 gross domestic product (“GDP”), which forms the basis of Argentina’s real GDP calculation for every year thereafter. Among other adjustments, in calculating GDP for 2004 the INDEC made changes to the composition of GDP that resulted in a downward adjustment of approximately 10% for that year. In calculating real GDP for subsequent years based on the revised 2004 GDP, the INDEC used deflators that are consistent with its revised methodology to calculate inflation. By understating inflation in the past, the INDEC had overstated growth in real terms. For more information, see “—Certain Methodologies.”
On November 9, 2016, the IMF Executive Board lifted its censure on the Republic, noting that the Republic has resumed the publication of data in a manner consistent with its obligations under the Articles of Agreement of the IMF.
D-14
As of the date of this Annual Report, the INDEC has published the INDEC Report (which includes GDP data), the CPI for May, June, July, August, September, October, November and December 2016, and January, February, March, April and May 2017 and certain revised foreign trade and balance of payment statistics for the years 2010 through 2015 since the state of administrative emergency was declared on January 8, 2016, which are included in this Annual Report.
The INDEC is currently implementing a number of measures to produce reliable statistical information that include, among others, investments in basic statistical collection procedures, the expansion of social statistics and the strengthening of economic development statistics. In this context, the INDEC is planning a series of initiatives that are expected to improve the reliability of basic statistics, including conducting a national household expenditure survey for the period 2017-2018, extending the basket of goods and prices covered to include locations across Argentina (previously limited to the greater Buenos Aires area) for purposes of calculating CPI, a mining census in 2017, an economic activity census and an agricultural census in 2018, in all cases to be carried out prior to next national census scheduled for 2020.
In relation to the revision and production of historical statistical information, in particular related to poverty, the INDEC, in its September 2016 Incidence Report on Poverty and Indigence, states that it continues to have reservations with respect to statistical series between January 2007 and December 2015, except for any information that has been restated in the relevant 2016 reports.
The INDEC’s reservations result from the inability to obtain adequate historical data that would allow for the completion of series left incomplete prior to the declaration of statistical emergency. Accordingly, reports on poverty and indigence levels for the missing periods and dates cannot be reconstructed primarily to the lack of reliable data for the relevant periods and as of the relevant dates. In furtherance of the authority delegated to the INDEC by Decrees No. 181/15 and 55/16, the INDEC has commissioned studies to determine the adequacy of the process for obtaining data, the process for the analysis of such data, the elaboration of indicators and its publication procedures.
National Public Accounts
Historically, transfers from the Central Bank and the Fondo de Garantía de Sustentabilidad (the “FGS”) to the Government were recorded as current fiscal revenue under “other non-tax revenue.” Starting in 2016 (and on a pro forma basis for 2015), the Government now classifies income generated by the Central Bank and the FGS as financial revenue that does not form part of the calculation of the primary fiscal balance. See “Public Sector Finances—Introduction.”
Certain Methodologies
CER and CVS. Certain data included in this Annual Report has been adjusted for inflation based on the Coeficiente de Estabilización de Referencia (Stabilization Coefficient, or “CER”), or the Coeficiente de Variación Salarial (“CVS”). CERs are units of account whose value in pesos is indexed to consumer price inflation. Following the declaration of a state of administrative emergency for the national statistical system and the INDEC in January 2016, the INDEC suspended its publication of the CPI index that had been used to determine the value of CERs in pesos since February 2014. Accordingly, between January 12 and June 2, 2016, the Government issued a series of resolutions designating either the CPI calculated by the government of the City of Buenos Aires or the CPI calculated by the Province of San Luis as the index to be used by the Central Bank to calculate the CER. On June 15, July 13, August 12 and September 13, October 13, November 10, December 15, 2016, January 11, February 9, March 9, April 11, May 10 and June 8, 2017, the INDEC published the inflation rates for May, June, July, August, September, October, November and December 2016, and January, February, March, April and May 2017, respectively, using its new methodology for calculating the CPI. On June 16, 2016, the Government announced that beginning on June 26, 2016 it would resume using the INDEC CPI to calculate the CER. The nominal amount of a CER-based financial instrument is converted to a CER-adjusted amount and interest on the financial instrument is calculated on the CER-adjusted balance. CVSs are units of account whose value in pesos is determined based on changes in an index of public and private sector wages. The nominal amount of a CVS-based financial instrument is converted to a CVS-adjusted amount and interest on the financial instrument is calculated on the CVS-adjusted balance. Adjustments and payments on the Republic’s debt indexed to the CER and CVS are not subject to restatement or revision.
Exports. Exports are calculated based upon (i) for purposes of foreign trade, statistics reported to Argentine customs upon departure of goods from Argentina on a FOB basis and (ii) for purposes of the balance of payments accounts, statistics collected on a FOB basis.
Imports. Imports are calculated based upon (i) for purposes of foreign trade, statistics reported to Argentine customs upon entry of goods into Argentina on a cost, insurance and freight included basis (“CIF basis”) and (ii) for purposes of the balance of payments accounts, statistics collected on a free on board (“FOB basis”) at a given departure location.
D-15
Inflation. The rate of inflation or inflation rate provides an aggregate measure of the rate of change in the prices of goods and services in the economy. The inflation rate is generally measured by the rate of change in the CPI between two periods unless otherwise specified. The annual percentage rate of change in the CPI as of a particular date is calculated by comparing the index as of that date against the index as of the date twelve months prior. The CPI in Argentina is calculated by the INDEC. However, as a result of widespread concerns regarding the credibility of the INDEC’s calculations that resulted in the declaration of a state of administrative emergency in January 2016, alternative measures of CPI inflation are presented in this Annual Report for certain periods using the CPI calculated by the government of the City of Buenos Aires (the “City of Buenos Aires CPI”) and by the government of the Province of San Luis (the “Province of San Luis CPI”) for certain periods. The CPI for May, June, July, August, September, October, November and December 2016, and January, February, March, April and May 2017 were published by the INDEC on June 15, July 13, August 12, September, October 13, November 10, December 15, 2016, January 11, February 9, March 9, April 11, May 10 and June 8, 2017, respectively, based on the INDEC’s new methodology for calculating the CPI. The City of Buenos Aires CPI and Province of San Luis CPI are based on a weighted basket of consumer goods and services that reflects the pattern of consumption of households that reside in the City of Buenos Aires and the Province of San Luis, respectively. All references in this Annual Report to “CPI” are to the “INDEC CPI,” the “City of Buenos Aires CPI” or “the Province of San Luis CPI,” as indicated herein. References to “constant 2004 prices” in this Annual Report relate to data that was revised by the INDEC and included in the INDEC Report.
Underemployment rate. Underemployment rate represents the percentage of Argentina’s labor force that has worked fewer than 35 hours during the week preceding the date of measurement and seeks to work more.
Unemployment rate. Unemployment rate represents the percentage of Argentina’s labor force that has not worked a minimum of one hour with remuneration or 15 hours without remuneration during the week preceding the date of measurement. The “labor force” refers to the sum of the population in major urban centers across Argentina that has worked a minimum of one hour with remuneration or 15 hours without remuneration during the week preceding the date of measurement plus the population that is unemployed but actively seeking employment.
D-16
This Annual Report contains forward-looking statements. Forward-looking statements are statements that are not historical facts, including statements about the Republic’s beliefs and expectations. These statements are based on the Republic’s current plans, estimates and projections. Therefore, undue reliance should not be placed on such statements. Forward-looking statements speak only as of the date they are made. The Republic undertakes no obligation to update any of them in light of new information or future events.
Forward-looking statements involve inherent risks and uncertainties. A number of important factors could cause actual results to differ materially from those contained in any forward-looking statement. The information contained in this Annual Report identifies important factors that could cause such differences. Such factors include, but are not limited to:
| • | adverse domestic factors, such as: |
| • | increases in inflation; |
| • | increases in domestic interest rates; and |
| • | exchange rate volatility, any of which could lead to lower economic growth or a decrease in Argentina’s international reserves; |
| • | adverse external factors, such as: |
| • | declines in foreign investment, which could deprive the Argentine economy of capital needed for economic growth; |
| • | changes in international prices (including commodity prices) and high international interest rates, either of which could increase Argentina’s current account deficit and budgetary expenditures; and |
| • | recession or low economic growth in Argentina’s trading partners, which could decrease exports from Argentina and the country’s international competitiveness, induce a contraction of the Argentine economy and, indirectly, reduce tax revenues and other public sector revenues and adversely affect the country’s fiscal accounts; |
| • | other adverse factors, such as: |
| • | climatic events; and |
| • | international or domestic hostilities and political uncertainty, including the effects of the mid-term legislative elections to be held in October 2017; |
| • | adverse outcomes in ongoing litigation and arbitration proceedings in several jurisdictions that may lead to new judgments and awards against Argentina. |
D-17
Argentina subscribes to the Special Data Dissemination Standard (“SDDS”) of the IMF, which is designed to improve the timeliness and quality of information of subscribing member countries. The SDDS requires subscribing member countries to provide schedules indicating, in advance, the date on which data will be released (the so-called “Advance Release Calendar”). For Argentina, precise dates or “no-later-than-dates” for the release of data under the SDDS are disseminated in advance through the Advance Release Calendar, which is published on the Internet under the International Monetary Fund’s Dissemination Standards Bulletin Board. Summary methodologies of all metadata to enhance transparency of statistical compilation are also provided on the Internet under the International Monetary Fund’s Dissemination Standards Bulletin Board. The Internet website is located at http://dsbb.imf.org. The Republic, the Government nor any agents acting on behalf of the Republic or the Government in connection with this Annual Report accepts any responsibility for information included on that website, and its contents are not intended to be incorporated by reference into this Annual Report.
D-18
Selected Economic Information
(in billions of pesos unless otherwise indicated)
| For the year ended and as of December 31, | ||||||||||||||||||||
| 2012 | 2013 | 2014 | 2015 | 2016 | ||||||||||||||||
| THE ECONOMY: |
||||||||||||||||||||
| Real GDP (in billions of 2004 pesos) |
Ps. | 703.5 | Ps. | 720.4 | Ps. | 702.3 | Ps. | 720.9 | Ps. | 704.3 | ||||||||||
| Rate of change from prior year |
(1.0 | )% | 2.4 | % | (2.5 | )% | 2.6 | % | (2.3 | )% | ||||||||||
| Nominal GDP |
2,637.9 | 3,348.3 | 4,579.1 | 5,854.0 | 8,056.0 | |||||||||||||||
| Nominal GDP per capita (in thousands of U.S. dollars) |
U.S.$ | 13.9 | U.S.$ | 14.5 | U.S.$ | 13.2 | U.S.$ | 14.6 | U.S.$ | 12.5 | ||||||||||
| Inflation (as measured by INDEC CPI) |
10.8 | % | 10.9 | % | 23.9 | % | n.a. | n.a. | ||||||||||||
| Inflation (as measured by the City of Buenos Aires CPI) |
n.a. | 26.6 | % | 38.0 | % | 26.9 | % | 41.0 | % | |||||||||||
| Inflation (as measured by the Province of San Luis CPI) |
23.0 | % | 31.9 | % | 39.0 | % | 31.6 | % | 31.4 | % | ||||||||||
| Unemployment rate |
6.9 | % | 6.4 | % | 6.9 | % | 5.9 | %(1) | 7.6 | % | ||||||||||
| Population(1) |
40.1 | 40.1 | 40.1 | 40.1 | 40.1 | |||||||||||||||
| BALANCE OF PAYMENTS (in billions of U.S. dollars): |
||||||||||||||||||||
| Current account |
U.S.$ | (1.4 | ) | U.S.$ | (12.1 | ) | U.S.$ | (8.0 | ) | U.S.$ | (16.8 | ) | U.S.$ | (15.0 | ) | |||||
| Of which: |
||||||||||||||||||||
| Imports of goods |
65.0 | 71.3 | 62.4 | 57.2 | 53.2 | |||||||||||||||
| Exports of goods |
80.0 | 76.0 | 68.4 | 56.8 | 57.7 | |||||||||||||||
| Capital and financial account |
(1.3 | ) | 3.5 | 9.5 | 13.2 | 29.1 | ||||||||||||||
| Errors and omissions |
(0.5 | ) | (3.2 | ) | (0.2 | ) | (1.3 | ) | (0.4 | ) | ||||||||||
| Change in gross international reserves deposited in the Central Bank |
(3.3 | ) | (11.8 | ) | 1.2 | (4.9 | ) | 13.7 | ||||||||||||
| Gross international reserves deposited in the Central Bank |
43.3 | 30.6 | 31.4 | 25.6 | 38.8 | |||||||||||||||
| PUBLIC FINANCE: |
||||||||||||||||||||
| Revenues |
Ps. | 543.8 | Ps. | 707.9 | Ps. | 997.2 | Ps. | 1,298.6 | Ps. | 1,748.9 | ||||||||||
| As a % of GDP |
20.6 | % | 21.1 | % | 21.8 | % | 22.2 | % | 21.7 | % | ||||||||||
| Expenditures |
548.2 | 730.4 | 1,035.8 | 1,403.4 | 1,928.8 | |||||||||||||||
| As a % of GDP |
20.8 | % | 21.8 | % | 22.6 | % | 24.0 | % | 23.9 | % | ||||||||||
| Primary fiscal balance |
(4.4 | ) | (22.5 | ) | (38.6 | ) | (104.8 | ) | (179.9 | ) | ||||||||||
| As a % of GDP |
(0.2 | )% | (0.7 | )% | (0.8 | )% | (1.8 | )% | (2.2 | )% | ||||||||||
| Overall fiscal balance |
(55.6 | ) | (64.5 | ) | (109.7 | ) | (225.6 | ) | (365.2 | ) | ||||||||||
| As a % of GDP |
(2.1 | )% | (1.9 | )% | (2.4 | )% | (3.9 | )% | (4.5 | )% | ||||||||||
| PUBLIC DEBT (including arrears) (in billions of U.S. dollars): |
||||||||||||||||||||
| Peso-denominated debt |
U.S.$ | 81.2 | U.S.$ | 77.3 | U.S.$ | 78.0 | U.S.$ | 73.9 | U.S.$ | 87.2 | ||||||||||
| Foreign-currency denominated debt |
135.7 | 146.2 | 161.3 | 166.8 | 188.3 | |||||||||||||||
| Total gross public debt |
U.S.$ | 216.9 | U.S.$ | 223.4 | U.S.$ | 239.3 | U.S.$ | 240.7 | U.S.$ | 275.4 | ||||||||||
|
|
|
|
|
|
|
|
|
|
|
|||||||||||
| Total gross debt (including arrears and Untendered Debt) as a % of GDP |
40.4 | % | 43.5 | % | 44.7 | % | 53.5 | % | 54.2 | % | ||||||||||
| Total gross debt (including arrears and Untendered Debt) as a % of Government revenues |
196.2 | % | 205.8 | % | 205.2 | % | 241.0 | % | 249.6 | % | ||||||||||
| (1) | In millions. Based on the census conducted in 2010. As of 2016, the INDEC estimates a total population of 43.6 million. |
| n.a. | = not available. |
Source: INDEC and Ministry of the Treasury.
D-19
Map of Argentina
Territory and Population
The Republic of Argentina consists of 23 provinces and the City of Buenos Aires. Located in the southeastern region of South America, Argentina is the second largest country in Latin America and the eighth globally in terms of territory, covering approximately 3.8 million square kilometers (1.5 million square miles), including territorial claims in the Antarctic region (covering approximately 970,000 square kilometers) and to certain south Atlantic islands (covering approximately 5,000 square kilometers), excluding the recently recognized extension by Argentina’s sovereign rights in the South Atlantic Ocean. See “—Foreign Affairs and International Organizations—Sovereign Territorial Disputes.”
The most densely inhabited areas and the main agricultural regions of the country are located on the wide temperate belt that stretches across central Argentina. The country’s population as of 2010, the year of the most recent census, was an estimated 40.1 million. As of 2016, the INDEC estimates a total population of 43.6 million. As of 2010, approximately 91.0% of the population of Argentina lived in urban areas and approximately 46.2% of the population (18.5 million people) lived in the City of Buenos Aires and the heavily populated urban area surrounding the City of Buenos Aires, known as the Greater Buenos Aires Area. During the period from 2001 to 2014, Argentina’s population grew at an estimated average annual rate of 1.1%, and as of 2010, approximately 98.1% of the population over the age of 10 and older was literate. The table below sets forth comparative gross national income (“GNI”) figures and selected other comparative statistics using 2014 data (the most recent year for which such comparative information is available).
Population
| Argentina | Brazil | Chile | Colombia | Mexico | Peru | United States |
||||||||||||||||||||||
| Per capita GNI(1) |
U.S.$ | 13,480 | U.S.$ | 11,530 | U.S.$ | 14,910 | U.S.$ | 7,970 | U.S.$ | 9,870 | U.S.$ | 6,360 | U.S.$ | 55,200 | ||||||||||||||
| Life expectancy (in years)(2) |
76 | 74 | 81 | 74 | 77 | 74 | 79 | |||||||||||||||||||||
| Infant mortality (% of live births)(2) |
1.2 | % | 1.4 | % | 0.7 | % | 1.5 | % | 1.3 | % | 1.4 | % | 0.6 | % | ||||||||||||||
| Adult literacy rate (% of population age 15 or older)(3) |
98 | % | 91 | % | 97 | % | 94 | % | 94 | % | 94 | % | n.a. | |||||||||||||||
| (1) | Calculated using the World Bank Atlas method. |
| (2) | Data as of 2013 |
| (3) | Data as of 2013, except for Peru (2012) and Chile and Colombia (2011). |
| n.a. | = not available. |
Source: 2014 World Bank World Development Indicators, unless otherwise specified.
Government
The Argentine Constitution, first adopted in 1853, provides for a tripartite system of government divided into an executive branch headed by the President, a legislative branch consisting of a bicameral Congress, and a judicial branch headed by the Supreme Court of Justice. The Constitution was last amended in 1994. Each province and the City of Buenos Aires has its own constitution and the people of each province elect a governor and legislators who are independent from the Government. The Government may directly intervene in the administration of the provincial governments in certain emergency situations, including, among others, to secure the republican form of government and in the case of foreign invasions.
Executive Branch
The president and vice president are directly elected for a four-year term, may serve for a maximum of two consecutive terms and may be re-elected after one term out of office. The president oversees the administration of the country and has the power to veto laws in whole or in part. Congress may override a presidential veto by a
D-20
two-thirds majority vote in each chamber. The Jefatura de Gabinete de Ministros (Office of the Chief of the Cabinet of Ministers) is responsible for the administration of the country and prepares the Government’s annual budget, which is subject to congressional approval. The president chooses the chief of the Cabinet of Ministers, who may be removed by the vote of an absolute majority of both houses of Congress. All references in this Annual Report to the “Executive Power” are to the executive branch as described herein.
Congress
Congress is composed of the Senate and the Chamber of Deputies.
The Senate. There are a total of 72 senate seats, with three for each province and three for the City of Buenos Aires. Of the three senators from each district, two represent the party receiving the most votes in that district, and the third represents the party receiving the second-most votes. Senators are elected by popular vote to serve for six-year terms. Elections are held for one-third of the senate seats every two years. The last Senate elections were held in October 2015.
The Chamber of Deputies. The Chamber of Deputies consists of 257 seats, which are allocated in proportion to each district’s population. Deputies are elected by popular vote to serve four-year terms. Elections for half of the seats are held every two years. The last elections for seats in the Chamber of Deputies were held in October 2015.
Judicial System
The judicial system is composed of federal and provincial trial courts, courts of appeal and the Supreme Court of Justice (“Supreme Court”) which has up to five justices.
The Consejo de la Magistratura (Judicial Council) consists of an independent panel of lawyers, representatives of the judiciary, legislators, a representative of the executive branch and an academic. This body oversees the administration of the judicial branch, the initiation of impeachment proceedings against judges other than Supreme Court justices and the selection of judges. The Jurado de Enjuiciamiento (Jury of Prosecution) decides proceedings initiated by the Judicial Council to remove judges.
The president appoints all Supreme Court justices subject to Senate approval. All federal court judges are also appointed by the president subject to Senate approval, but they must be selected from a list of individuals submitted by the Judicial Council. Supreme Court justices and all federal court judges are subject to a mandatory retirement age of 75. All judicial appointments must be approved by two-thirds of the Senate. Pursuant to a presidential decree, candidates’ identities and certain additional information are published, and the executive branch provides for a period of public comment on each nomination before it is submitted to the Senate.
Following the retirement of two justices, the Supreme Court had three sitting justices as of December 2015. President Macri nominated Mr. Horacio Daniel Rosatti and Mr. Carlos Fernando Rosenkrantz to the Supreme Court. Both nominees were confirmed by the Senate in June 2016. The Supreme Court has five confirmed sitting justices.
Recent Political History
Argentina has been under uninterrupted civilian rule since 1983, when the last military government came to an end due to poor economic management and the loss of a brief war with the United Kingdom over the Islas Malvinas. In 1983, Raúl Alfonsín was elected president. In 1989, Raúl Alfonsín was succeeded as president by Carlos Menem, who was re-elected in 1995 to a four-year term following the 1994 constitutional amendments that reduced the presidential term to four years from six.
D-21
After a decade of relative stability, Argentina faced an unprecedented social, economic and political crisis beginning in 2001 and 2002. See “The Argentine Economy—Economic History and Background.” During this crisis, Argentina’s economy contracted significantly and poverty and unemployment reached record levels. The administration of President Fernando de la Rúa, who took office in October 1999, was unable to restore economic growth and during the second half of 2001, the deepening economic recession fueled rising social unrest.
Ongoing widespread riots and protests forced President de la Rúa and his entire cabinet to resign on December 19 and 20, 2001. Between December 2001 and January 2002, Congress appointed three successive presidents pursuant to the Constitution, including Eduardo Duhalde, who called for elections to be held on April 27, 2003, prior to the scheduled expiration of his term. Néstor Kirchner, former governor of the province of Santa Cruz, was elected and sworn in as president on May 25, 2003. President Kirchner’s term expired on December 10, 2007. His term in office was marked by economic growth, a reduction of poverty and unemployment rates and large-scale debt renegotiations with a majority of the holders of defaulted Argentine bonds.
On October 28, 2007, Cristina E. Fernández de Kirchner, from the Frente para la Victoria (Front for Victory) party and President Kirchner’s wife, was elected president. On October 23, 2011, President Fernández de Kirchner was re-elected for a second four-year term, which ended on December 10, 2015.
On November 22, 2015, Mauricio Macri, the candidate from the Cambiemos alliance, was elected president with 51.3% of the votes, after the first presidential run-off election in Argentine history. In addition, congressional elections were held in October 2015 for one-third of the members of the Senate and half of the members of the Chamber of Deputies, whose terms expired in December 2015. As of the date of this Annual Report, the Cambiemos alliance has the largest bloc in the Chamber of Deputies, while the Front for Victory party retains a majority of the Senate (taking into account alliances among parties). The next congressional elections are scheduled for October 2017.
Political Parties
The following are Argentina’s principal national political parties:
Cambiemos, founded in 2015, is a coalition of several parties, including primarily:
| • | Unión Propuesta Republicana (Republican Proposal Union, or “Unión PRO”); |
| • | Unión Cívica Radical (Radical Civic Union, or “UCR”); and |
| • | Coalición Cívica (Civic Coalition, or “ARI”). |
Partido Justicialista (PJ), or Peronist Party, evolved from former President Juan D. Perón’s efforts in the 1940s, and includes the following factions:
| • | Front for Victory; and |
| • | Frente Peronista (Peronist Front). |
Frente Renovador (Renewal Front, or “FR”), founded in 2013 as a split-off from the PJ. In connection with the 2015 presidential elections, the FR and the former governor of the Province of Córdoba, Juan Manuel de la Sota, formed the Unidos por una Nueva Alternativa (“UNA”) coalition.
In addition, certain provincial political parties have important representation in Congress, including locally-based parties from Santiago del Estero, Neuquén, San Luis and Catamarca.
D-22
The following table shows the party composition of the Chamber of Deputies and Senate following the elections in the years specified.
| Chamber of Deputies(1) | Senate(2) | |||||||||||||||||||||||
| 2011 | 2013(6) | 2015 | 2011 | 2013(6) | 2015 | |||||||||||||||||||
| Party: |
||||||||||||||||||||||||
| Partido Justicialista |
137 | 127 | 98 | 32 | 38 | 40 | ||||||||||||||||||
| Front for Victory(3) |
116 | 117 | 81 | 32 | 31 | 40 | ||||||||||||||||||
| Peronist Front/ Federal PJ(4) |
21 | 10 | 17 | — | 7 | — | ||||||||||||||||||
| Radical Civic Union |
40 | 41 | (6) | 41 | 14 | 13 | 8 | |||||||||||||||||
| Unión PRO |
11 | 18 | 41 | 3 | 6 | |||||||||||||||||||
| UNA |
28 | |||||||||||||||||||||||
| ARI/Civic Coalition |
6 | 3 | (7) | 5 | 1 | 1 | (7) | |||||||||||||||||
| Frente Renovador |
16 | — | — | — | ||||||||||||||||||||
| FAP(5) |
22 | 15 | — | 4 | 5 | |||||||||||||||||||
| Others(7) |
41 | 37 | 44 | 21 | 12 | (7) | 18 | |||||||||||||||||
|
|
|
|
|
|
|
|
|
|
|
|
|
|||||||||||||
| Total |
257 | 257 | 257 | 72 | 72 | 72 | ||||||||||||||||||
|
|
|
|
|
|
|
|
|
|
|
|
|
|||||||||||||
| (1) | Composition of the Chamber of Deputies as of December 10 of each year specified, when the deputies elected during such year took office. |
| (2) | Composition of the Senate as of December 31 of each year specified. |
| (3) | The members of this faction are included in the Partido Justicialista total. In addition to elected deputies and senators, the figures for Front for Victory include deputies and senators from other factions of the Peronist Party who became members of the Front for Victory while in office. |
| (4) | These members of this faction are included in the Partido Justicialista total. Frente Peronista / PJ Federal is the “dissident” Peronist Party, which is the wing of the PJ that is not politically aligned with the Front for Victory and was founded in 2005. Its principal members include Eduardo Duhalde, Felipe Solá and Alberto Rodriguez Saá. |
| (5) | FAP is a center-left coalition composed of various parties, founded in 2011. In the October 2015 elections, the parties Generación para el Encuentro Nacional (“GEN”), Libres del Sur (Free Movement from the South) and Poder para el Espacio Social (Power for the Social Space) formed an electoral alliance “SURGEN”. |
| (6) | In the October 2015 elections, the ARI/Civic Coalition, the Radical Civic Union and Unión Propuesta Republicana (“PRO”) formed an electoral alliance “Cambiemos”. |
| (7) | Includes other registered parties, primarily represented by one legislator each, and certain local political parties of the provinces. |
Source: Senate and Chamber of Deputies of Argentina.
In accordance with the political reform bill passed by Congress on December 2, 2009, elections in Argentina are subject to the following regulations:
| • | Private contributions for electoral campaigns must be from physical persons, not companies. In addition, the Government distributes 50% of state funds for media advertisements equally among all candidate lists, and the remaining 50% is distributed according to the percentage obtained by each political party in the previous election. |
| • | Primary elections to elect presidential and congressional candidates must be open, mandatory and simultaneous. All citizens are allowed to vote in the primary of their choosing, regardless of party affiliation. |
| • | In order to compete in national elections, candidates must obtain at least 1.5% of the vote in the presidential primary contest (including coalitions) and have the support of a certain number of affiliates as specified in the bill. |
Foreign Affairs and International Organizations
Argentina maintains diplomatic relations with a variety of countries and is a member of several international organizations. Argentina is a charter member of the United Nations, a founding member of the Organization of American States (“OAS”), and a member of the following international organizations, among others:
| • | the International Monetary Fund; |
| • | the World Bank Group; |
D-23
| • | the International Finance Corporation; |
| • | the IADB; |
| • | the Corporación Andina de Fomento (the Andean Promotion Corporation, or “CAF”); |
| • | the Fondo Financiero para el Desarrollo de la Cuenca del Plata (Financial Fund for the Development of the River Plate Basin, or “FONPLATA”); |
| • | the Central American Bank for Economic Integration (“CABEI”); |
| • | the International Fund for Agricultural Development (“IFDA”); |
| • | the World Trade Organization (“WTO”); |
| • | the International Labor Organization; |
| • | the Financial Action Task Force and the Financial Action Task Force on Money Laundering in South America (“GAFISUD”); |
| • | the International Association of Insurance Supervisors; |
| • | the International Organization of Securities Commissions; |
| • | the World Customs Organization; and |
| • | the Asociación Latinoamericana de Integración (Latin American Integration Association, or “ALADI”). |
G-20
Argentina has been a member of the G-20, an informal forum that promotes discussion between developed and emerging-market countries on key issues related to the global economy, since it was established in 1999. The country members designated the G-20 to be the premier forum for their international economic cooperation. In 2018, Argentina will chair the G20.
Bilateral Investment Treaties (“BITs”)
Argentina has entered into 55 bilateral investment treaties with various countries out of which 52 are still in force. For the past 15 years, arbitration proceedings have been brought against Argentina before the International Centre for Settlement of Investment Disputes (“ICSID”), in accordance with UNCITRAL rules, under several BITs primarily as a result of measure adopted in response to the economic and political crisis of 2001. As of the date of this Annual Report, most of these cases have already concluded or have been settled.
The Financial Stability Board
The Financial Stability Board (“FSB”) is an international body that monitors and makes recommendations about the global financial system. The FSB seeks to strengthen financial systems and increase the stability of international financial markets; it does so by coordinating with its members’ national financial authorities and international standard-setting bodies as they work toward developing strong regulatory, supervisory and other financial sector policies to promote international financial stability. The FSB aims to foster a level playing field by encouraging consistent implementation of these policies across sectors and jurisdictions.
Argentina has been a member of the FSB since 2009, with participation of the Central Bank. In 2015, following a review of the FSB’s structure of representation, Argentina gained a second seat in the Plenary.
D-24
G-24
Argentina has been a member of the Group of Twenty-Four since the Intergovernmental Group of Twenty-Four on International Monetary Affairs and Development (G-24) was established in 1971. The purpose of the group is to coordinate the position of developing countries on monetary and development issues, particularly issues on the agendas of the IMF Committee and the Development Committee, and to ensure increased representation and participation of developing countries in negotiations on international monetary system reform.
MERCOSUR
Argentina is a founding member of the Southern Common Market (“MERCOSUR”), established in March 1991 with Brazil, Paraguay and Uruguay as full members or the “Member States.” In July 2012, the founding members (other than Paraguay) admitted the Republic of Venezuela as a full member of MERCOSUR, and in December 2013, Paraguay acknowledged Venezuela’s status as a full member. On December 2, 2016, Venezuela’s status as a full member was temporarily suspended by the other Member States, after it was considered to have failed to implement MERCOSUR regulations in the established four-year period, in accordance with the undertakings assumed in 2012 in connection with its admission to MERCOSUR. In July 2015, Bolivia signed a protocol to become a full member of MERCOSUR, which remains subject to ratification by the congresses of Brazil, Paraguay and Bolivia. Upon approval, Bolivia will have a four-year period to gradually adopt MERCOSUR’s regulations.
Chile, Colombia, Ecuador, Peru, Guyana and Suriname are “Associate States” of MERCOSUR, having signed Free Trade Agreements (“FTAs”) with the trade bloc. Approximately 80% of the regional trade in free from tariffs.
Under the Mercosur Treaty, the founding members of MERCOSUR pledged:
| (1) | to create a free trade area in goods, services and factors of production by eliminating or significantly reducing, in some cases over a period of years, import duties, tariffs and other barriers to trade among members; |
| (2) | to establish common external tariffs for trade with non-members, and |
| (3) | to adopt a common trade policy towards third countries and blocs. |
With the aim of transforming the region into a customs union, in December 1994, the founding members of MERCOSUR agreed to implement a common external tariff. The common external tariff regime took effect on January 1, 2001, however, each member was allowed to exclude certain items from the regime. The full implementation of the customs union has been deferred until 2024, as the exceptions period has been extended to allow Argentina and Brazil to maintain their list of exceptions until December 31, 2021, Uruguay until December 31, 2022, and Paraguay until December 31, 2023.
MERCOSUR members have not yet fully harmonized non-tariff barriers and tariffs exceptions as well as national trade regimes in order to advance in a policy of no border controls.
MERCOSUR has created regional bodies and institutions that aim to further develop the integration process between its members, encompassing several areas such as, energy, transport, communications, education, health, justice, science and technology. MERCOSUR residents also benefit from special residency and work permit regimes within the territory of members of the bloc.
Since its establishment, MERCOSUR has entered into agreements with third parties to facilitate trade, including agreements: (i) establishing a free trade zone with Bolivia in 2006 and Chile in 2014; (ii) establishing a gradual free trade zone for certain goods between 2005 and 2020 with Colombia, Ecuador and Venezuela (which was agreed to prior to Venezuela’s membership); (iii) establishing a gradual free trade zone with Peru for certain goods between 2006 and 2021; (iv) eliminating tariffs beginning in 2008 and reducing tariffs beginning in 2009 with respect to certain goods traded with Cuba and India, respectively; and (v) eliminating tariffs for certain goods traded with Israel between 2009 and 2029. In accordance with MERCOSUR regulations, each of these agreements was negotiated by the Member States as a trade bloc.
D-25
MERCOSUR has also entered into agreements with third parties outside the Americas, including:
| • | Preferential trade agreements with the Southern African Customs Union (SACU) in 2008 and with India in 2009; |
| • | Free trade agreements with Israel, Egypt and Palestine; |
| • | Economic and Commercial dialogues with Japan, Australia, New Zealand, ASEAN and the Euro-Asian Economic Union; and |
| • | Framework Agreements with a view to initiating trade negotiations with Morocco, Lebanon and Tunisia. |
As of the date of this Annual Report, MERCOSUR has launched trade negotiations with the European Free Trade Agreement (EFTA) and is waiting for the negotiating mandates from Canada and South Korea.
Finally, MERCOSUR and the European Union have re-launched negotiations for the development of free trade in a bi-regional association agreement.
UNASUR
Unión de Naciones Suramericanas (Union of South American Nations, or “UNASUR”), is a South American organization, formed by 12 South American countries to foster integration and unity among the countries and their people, with the aim of eliminating socioeconomic inequality by prioritizing political dialogue (including the “democracy clause” which suspends the membership of any country in which a sovereign government is removed through undemocratic means) social policies, education, energy, infrastructure, finance and the environment. Within UNASUR, the Counsel of Economy and Finance is responsible for analyzing economic topics of regional interest such as international reserves, financial safety nets, trade and economic development. UNASUR’s members are Argentina, Bolivia, Brazil, Chile, Colombia, Ecuador, Guyana, Paraguay, Peru, Suriname, Uruguay and Venezuela.
The Malvinas Sovereignty Dispute
Argentina reaffirms its legitimate sovereignty rights over the Malvinas, South Georgias and South Sandwich Islands and the surrounding maritime areas, which are an integral part of its national territory. Due to the fact that these territories are illegally occupied by the United Kingdom, they are subject to a sovereignty dispute, recognized by ten United Nations General Assembly (the “General Assembly”) resolutions, more than 30 resolutions of the Special Committee on Decolonization and numerous pronouncement of the OAS and other international organizations and regional and bi-regional forums. In particular, the General Assembly has recognized the existence of a sovereignty dispute between Argentina and the United Kingdom and has requested both governments to resume negotiations in order to find a peaceful solution as soon as possible.
Many regional and international organizations have reiterated the importance of Argentina and the United Kingdom complying with the provisions of Resolution 31/49 of the General Assembly, which calls upon both parties to refrain from adopting decisions that entail the introduction of unilateral modifications to the situation while the dispute resolution process recommended by the General Assembly is ongoing.
Despite the repeated calls for negotiations made by the international community, the United Kingdom not only refuses to negotiate, but also continues to take unilateral actions over the disputed areas, including the exploration for and exploitation of renewable and non-renewable natural resources.
D-26
Continental Shelf
On March 11, 2016, the United Nations Commission on the Limits of the Continental Shelf (the “CLCS”) unanimously approved a recommendation that expanded Argentina’s maritime territory in the South Atlantic Ocean (the “CLCS Recommendation”). The surface area within the designated limits covers approximately 0.7 million square miles.
Under the 1982 United Nations Convention on the Law of the Sea, CLCS recommendations to coastal states on matters related to the establishment of the outer limits of their continental shelf are not binding, but the limits of the continental shelf established by a coastal state based on such recommendations are final and binding.
The CLCS Recommendation has not been contested by any other country or territory. Argentina’s submission to the CLCS regarding the outer limit of its continental shelf comprised the continental, insular and Antarctic territory. The CLCS, however, postponed the analysis of any areas that are the subject of controversy with the United Kingdom as well as any portion of Argentina’s continental shelf that overlaps with territories that fall within the scope of the Antarctic Treaty dated December 1, 1959 (as amended), to which Argentina is a party. Consequently, the recommendation does not cover such areas.
The CLCS Recommendation and Argentina’s affirmation of rights over the extended continental shelf are expected to have a beneficial economic impact insofar as, according to Article 77 of the United Nations Convention on the Law of the Sea, the coastal state has sovereign rights over the continental shelf with respect to exploration and exploitation of natural resources.
D-27
Economic History and Background
Background
In the late 1800s and early 1900s, Argentina enjoyed a period of great prosperity, with per capita GDP rising to the level of many Western European countries. During this period of growth, Argentina’s economy relied heavily on sustained international demand for its agricultural commodity exports.
The onset of the Great Depression and World War II, however, brought dramatic changes in the Argentine economy as a decline in world trade deprived the country of its main source of revenue. The Government responded to these developments with a major shift in economic policy, adopting a model of state-led capitalism and import-substitution. Accordingly, state intervention in the economy became pronounced.
Beginning in the 1940s, the Government nationalized many basic industries and services and raised import barriers in a bid to make Argentina self-sufficient in industry and agriculture and to shelter its economy from foreign competition. Government involvement in sectors ranging from oil and electricity to telecommunications and financial services became significant.
Although in the 1950s a new era of worldwide prosperity began, the Government’s role in the economy remained significant and Argentina experienced relatively low growth in comparison with other developing countries.
Although manufacturing had become the largest component of the economy by the mid-1970s, the country’s exports continued to be dominated by agricultural products. During this period, the Argentine economy continued to grow at substandard levels.
In 1976, the Government began to shift away from the import-substitution model, lowering import barriers and liberalizing restrictions on foreign borrowings. The adoption of a crawling-peg exchange rate regime by the Central Bank induced appreciation of the peso and incurrence of external indebtedness by the public and private sectors between 1977 and 1981. Despite this shift in policy, from 1981 through 1990, economic growth was undermined by:
| • | political instability; |
| • | large subsidies of state-owned enterprises; |
| • | high inflation; |
| • | periodic devaluations of the currency; |
| • | an inefficient tax collection system; and |
| • | inefficient production. |
From 1981 through 1990, the average annual real GDP contraction was 0.7%. The Government financed its fiscal deficits during this period primarily through Central Bank credit and loans from foreign bilateral and multilateral creditors. The increase in Central Bank credit to the Government resulted in unchecked increases in the money supply that led to high levels of inflation. From 1981 through 1990, average annual inflation was 876.0%. Additionally, in 1982 the Government defaulted on its external debt.
During the 1980s, the Government adopted several economic plans in an effort to stabilize the economy. While these plans achieved some initial success, they ultimately failed and the continued high levels of state intervention in the economy inhibited its competitiveness. These factors, combined with high levels of inflation, frequent changes in Government policy and financial market instability, prevented the Argentine economy from achieving real growth.
D-28
Liberalization of the Economy. In mid-1989, the Menem administration inherited an economy suffering from hyperinflation and in deep recession. Relations with external creditors were strained, commercial bank debts had been subjected to two restructurings and were again accumulating past-due interest, IMF and World Bank programs had lapsed and payments to the World Bank and the IADB were frequently late. The immediate objectives of the Menem administration were to stabilize prices and improve relations with external creditors.
Following several unsuccessful efforts to stabilize the economy and end hyperinflation, the Menem administration adopted an economic program that sought to liberalize the economy and impose monetary discipline. The new economic program, which came to be known as the Convertibility Regime, was centered on the Convertibility Law of 1991 and related measures. Its principal features were the following:
| • | a fixed exchange rate regime that pegged the peso to the U.S. dollar and tied the monetary base to international reserves, limiting the Central Bank’s monetary policy tools; |
| • | privatization, deregulation and trade liberalization programs; and |
| • | the improvement of relations with external creditors (including by refinancing a substantial portion of the Government’s debt through the Brady restructuring in 1992). |
The Convertibility Regime and the Government’s free-market initiatives temporarily achieved price stability, increased the efficiency and productivity of the Argentine economy and attracted significant foreign investment. Real GDP grew 9.1% in 1991 and 7.9% in 1992. From 1993 through 1998, real GDP grew at an average annual rate of 4.8%, despite a 2.8% contraction in 1995 largely attributable to the capital flight triggered by the Mexican financial crisis of 1994.
The Convertibility Regime, however, had significant shortcomings, including the following:
| • | Inflexible monetary policy. By stripping the Central Bank of its monetary discretion, the Convertibility Regime limited the use of monetary policy to stimulate the economy in response to downturns in economic activity. |
| • | Dependence on foreign capital. Any sharp reduction of foreign capital inflows, often triggered by factors beyond the Government’s control, threatened untimely contractions of the money supply. Argentina’s dependence on foreign capital was heightened by the opening of the Argentine economy to foreign trade, which resulted in significant trade deficits, and by the Government’s recurring fiscal deficits, which were heavily financed with foreign capital. |
| • | Vulnerability to external shocks. The dependence on foreign capital, coupled with the lifting of state controls on capital flows, made the Argentine economy vulnerable to external shocks. |
| • | Over-reliance on certain economic sectors. As a result of the real appreciation of the peso and the peso’s peg to the U.S. dollar, economic growth during this period was driven by the services sector, and in particular the financial and public services sectors, with production-based manufacturing and industrial sectors lagging behind. In addition, any contribution from the agricultural sector from increased volume of production was offset by declining international commodity prices. |
| • | Rising unemployment. Despite economic growth, the relative slow growth in labor intensive sectors such as construction and manufacturing increased unemployment levels. |
The shortcomings of the Convertibility Regime became evident during the economic downturn triggered by the Mexican financial crisis of 1994. The collapse of Mexico’s crawling-peg exchange rate undermined investors’ confidence in emerging markets and raised doubts about the sustainability of the Convertibility Regime. This loss of confidence triggered a sharp reduction in net capital inflows, which turned into net capital outflows in 1995, causing a liquidity crisis in the Argentine banking system. As a result, Argentina experienced its first economic contraction since the Convertibility Regime had been implemented.
D-29
Following the Mexican crisis, Argentina’s economy resumed the levels of growth it had recorded in the first half of the 1990s. From 1996 through 1998, GDP increased at an annual average rate of 5.8%. However, the Government relied heavily on borrowings, first from external sources and ultimately from the local banking system and the newly-organized private pension funds, to finance the deficit. Beginning in the last quarter of 1997, external factors, including regional financial crises in Asia and Russia, rising U.S. interest rates and falling commodity prices, caused the capital flows to turn negative, economic activity to decline sharply, ultimately precipitating the economic crisis of 2001.
The Crisis and Beginning of Recovery: 2001 and 2002
During the last six months of 2001, the growing perception that a devaluation of the peso was imminent triggered a massive run on bank deposits and a significant acceleration of capital flight from the Argentine economy. Total deposits in the Argentine banking system fell by 20.3% in the last six months of 2001 and the Central Bank’s international reserves fell by 42.1% in the same period.
In a last bid to safeguard the Convertibility Regime and avert the collapse of the banking sector, in December 2001, the Government imposed strict per-person, per-month limits on bank withdrawals (known as the corralito), effectively limiting the ability of depositors to withdraw approximately U.S.$60 billion in peso and dollar demand deposits from the financial system. It also imposed strict foreign exchange restrictions in Argentina. Shortly thereafter, the Government announced that it would defer interest and principal payments on a substantial portion of the Government’s debt.
Massive social unrest led to the early resignation of President de la Rúa’s administration and triggered a political crisis that culminated with the election of Mr. Eduardo Duhalde as president in January 2002. Congress passed the Public Emergency and Reform Law of 2002 (the “Public Emergency Law”) which formally terminated the parity between the peso and the U.S. dollar and brought the Convertibility Regime to an end. Through the enactment of the Public Emergency Law and a series of decrees, the Duhalde administration took the following measures:
| • | ratified the suspension of payments of Argentina’s sovereign debt except for debt with multilateral credit agencies; |
| • | eliminated the dual exchange rate system adopted immediately following the end of the Convertibility Regime and replaced it with a single exchange rate that allowed the value of the peso to float against other currencies, resulting in a 240.1% increase in the U.S. dollar-peso exchange rate in 2002; |
| • | ordered the “asymmetric” conversion into pesos (known as “pesification”) of certain U.S. dollar-denominated assets and liabilities at the following exchange rates: Ps.1.00 per U.S.$1.00 for private sector debt (individual and corporate U.S. dollar-denominated debt) with financial institutions and other creditors, Ps.1.40 per U.S.$1.00 for all U.S. dollar-denominated public sector debt instruments in the portfolios of national and provincial financial institutions’ portfolios and Ps.1.40 per U.S.$1.00 for all U.S. dollar-denominated bank deposits; |
| • | amended the charter of the Central Bank to allow it to print currency, make certain short-term advances to the Government and act as a lender of last resort to financial institutions experiencing liquidity difficulties; and |
| • | imposed further restrictions on bank withdrawals (known as the corralón) until December 2002, which effectively froze all term deposits and subjected them to mandatory restructuring. |
Additionally, further restrictions on foreign exchange transactions were introduced in 2002, including:
| • | limits on the amount of U.S. dollars that could be held per month in bank accounts; |
D-30
| • | limits on transfers of foreign currency outside of Argentina; and |
| • | restrictions on foreign trade transactions. |
The economic crisis peaked during the first six months of 2002. During this period, economic activity collapsed with the largest contraction in the level of economic activity in Argentine history, fiscal revenues fell, inflation rose significantly and the financial system’s liquidity crisis worsened. In addition to the controls over the foreign exchange market, the Government imposed mandatory repatriation of export proceeds. Strict foreign exchange controls, together with a significant surplus in the country’s trade balance, ensured a supply of foreign currency to the market and resulted in the appreciation of the peso in the second half of the year.
By the middle of 2002, the policy of combining the sale of international reserves with the tightening of controls over the foreign exchange market and capital movements succeeded in stabilizing the peso. As the domestic currency stabilized, inflationary pressures declined. This, combined with the expansion of the monetary base, permitted a gradual stabilization of interest rates, which had sharply increased following the end of the Convertibility Regime.
During the last six months of 2002, real GDP contraction had slowed to 6.7%, as compared to the last six months of 2001, and Argentina recorded a U.S.$5.0 billion surplus in its current account. As of December 31, 2002:
| • | the peso had appreciated to Ps.3.36 per dollar, compared to a low of Ps.3.87 on June 26, 2002; |
| • | inflation, as measured by INDEC CPI, was 8.0% for the six month period ended December 31, 2002, compared to 30.5% for the six-month period ended June 30, 2002. In 2002, inflation, as measured by INDEC CPI was 40.9% and as measured by the wholesale price index (“WPI”) was 118.0%, which, although significant, was relatively low in comparison to the more than 240.1% depreciation of the peso against the U.S. dollar during that year; and |
| • | the Central Bank’s international reserves had increased to U.S.$10.5 billion, from U.S.$9.6 billion on June 30, 2002. |
Despite the improvement in economic conditions during the last six months of 2002, overall GDP declined 10.9% for the year compared to 2001.
To prevent the continued appreciation of the peso, the Central Bank eased certain of the foreign exchange restrictions imposed between November 2002 and January 2003. The improved economic conditions, in particular the reduction in capital flight from the Argentine economy, also allowed the Government to begin lifting restrictions on bank withdrawals in November 2002.
By the end of 2002, the economy seemed to have bottomed out from the crisis and the recession that began in 1998. However, the recovery was set against extremely depressed levels of economic activity, similar to those of the early 1990s. In addition, the recovery was the result of a set of economic policies aimed mainly at managing the crisis, but failed to include structural reforms needed to generate sustainable long-term economic growth.
The Kirchner Administration: 2003-2007
Néstor Kirchner became president of Argentina on May 25, 2003. The economic recovery that began in the last six months of 2002 continued during 2003, with GDP growing by 8.8% in 2003. This improvement was primarily a result of a growth in demand for Argentine exports, increased domestic production spurred by improved consumer and investor confidence and the substitution of imported products with domestic products. During the first year of the Kirchner administration, quasi-currencies (treasury bonds issued by the Argentine provinces during the economic crisis) were withdrawn from circulation and restrictions on bank deposits were lifted. In the same year, renewed confidence in the financial system was evidenced by a 24.0% increase in nominal terms in total bank deposits.
D-31
The Argentine economy continued to grow in 2004, 2005, 2006 and 2007 at rates of 9.0% (representing the rate of change from 2003 to 2004, calculated using data published by the INDEC prior to June 29, 2016), 8.9%, 8.1% and 9.0%, respectively. During this period, the international reserves of the Central Bank increased to Ps.145.5 billion as of December 31, 2007, compared to Ps.41.4 billion as of December 31, 2003. The Kirchner administration’s fiscal and trade policies aimed to generate a fiscal surplus as well as a trade surplus. In each of 2004, 2005 and 2006, Argentina recorded a trade surplus while the Government generated fiscal surpluses primarily through increased tax collections contributed by exports. Inflationary pressures increased in 2007 and through mid-2008 as a result of growing demand and continued supply constraints.
Fernández de Kirchner’s Administration: 2008-2015
Cristina E. Fernández de Kirchner, the wife of former President Néstor Kirchner, became president of Argentina on December 10, 2007, and was reelected in 2011, extending her term in office until December 2015.
The strong economic rebound that took place in Argentina between 2003 and 2007 began to fade during the first half of 2008. President Fernández de Kirchner sought a one-year extension of the Public Emergency Law in December 2007, which empowered the administration to govern a broad range of issues without congressional approval. The Fernández de Kirchner administration continued, and over time expanded, the interventionist economic policies of the prior administration, including expansionary fiscal and monetary policies aimed at maintaining economic growth rates, as well as price controls, tariff limits, subsidies and export taxes.
In March 2008, a series of hikes in export taxes on agricultural products sparked a five-month conflict with farmers. By the third quarter of 2008, the Argentine economy began to experience a downturn that was aggravated by the escalation of the global financial crisis. In November 2008, Congress approved a law nationalizing the private pension system in Argentina, under which the assets held by private pension funds, including significant equity interests in a wide range of listed companies, were transferred to a separate fund as part of a new public system administered by the ANSES. Argentina experienced episodes of bank deposit withdrawals and capital outflows in 2008. The Central Bank raised interest rates to limit capital outflows from Argentina just as the economic downturn set in, which, in turn, exacerbated the downturn in the economy.
By mid-2009, public finances had rapidly deteriorated, with public expenditures growing at double the pace of revenue during the first half of the year as the Government attempted to limit the effects of the recession. Private estimates of economic activity showed contractions between 2.5% and 6.0% during the first six months of 2009. The Fernández de Kirchner administration lost control of both houses of Congress in the midterm legislative elections held in June 2009.
Although economic activity began to recover during the fourth quarter of 2009 due, in large part, to growth in industrial activity, public finances continued to weaken. Extraordinary revenue, including social security contributions and public transfers from government agencies such as the Central Bank and ANSES, played a key role in supporting the 19% rise in total public sector revenue in 2009. During 2009, however, social tension continued to increase. In response to opposition and left-wing union demands, the Government announced the extension of two anti-poverty programs—a family allowance for formal sector workers earning less than a monthly threshold and income support for informal sector workers and the unemployed.
In late 2009, the Government issued a Decreto de Necesidad y Urgencia (emergency decree) making foreign reserves held by the Central Bank available for external debt payments. Resistance from the Central Bank’s president, Mr. Martín Redrado, to transfer Central Bank reserves for this use led to a standoff between the administration and the Central Bank, which ultimately resulted in Mr. Redrado’s resignation in January 2010 and renewed concerns over governability, political stability and debt sustainability.
Inflationary pressures rose rapidly in early 2010 as the Central Bank initiated its practice of providing financing to the Government to cover a portion of the fiscal deficit. The INDEC reported that 12-month inflation had reached 9.1% in February 2010, while private surveys estimated that inflation had reached between 20 to 25% during the same period. At the same time, the economy began to show signs of recovery, as industrial output increased. The Argentine economy grew by 10.1% in 2010, reaching the highest level of growth since 2005. This growth was primarily driven by high commodity prices, a rapid rise in wages, the appreciation of the peso and higher levels of inflation, which spurred growth in construction and investments in durable equipment. Growth in
D-32
private consumption was, to a significant extent, attributable to continued increases in Government subsidies and transfers during the year (including through the administration’s anti-poverty programs). In contrast, the current account deteriorated during 2010, with the current-account surplus falling from U.S.$8.2 billion in 2009 to a deficit of U.S.$1.5 billion in 2010, as the trade surplus, a key source of foreign currency, narrowed by more than 20% in 2010.
In June 2010, the Government conducted the 2010 Debt Exchange to restructure Untendered Debt, with an acceptance rate of 81%. Although approximately 92% of Argentina’s defaulted debt was restructured through its 2005 and 2010 Debt Exchanges, an aggregate principal amount of approximately U.S.$6.1 billion of Untendered Debt remained outstanding following these debt restructuring initiatives and litigation with the holdout creditors continued.
The Central Bank continued its expansionary monetary policy in 2011, particularly through its purchases of foreign currency and lending to the Treasury. The Central Bank additionally continued its sterilization efforts to support the peso through the issuance of Central Bank notes (LEBACs and NOBACs).
Shortly after her reelection in October 2011, the Fernández de Kirchner administration introduced a series of capital and foreign-exchange controls intended to increase foreign currency supply and reduce foreign currency demand. During the 12-month period ending in December 2011, capital outflows were estimated to have reached U.S.$25 billion, or nearly half of the Central Bank’s foreign reserves. As a result, demand for U.S. dollars increased, leading to an increase in the gap between the official and unofficial exchange rates.
Argentina also began to experience energy shortages in 2011, following years of very limited investment in the energy sector, as well as the electricity and natural gas tariff-freeze maintained since 2002 as part of the Government’s emergency measures. Between 2008 and 2011, subsidies to the energy and transport sectors had increased by 156% as the energy foreign trade deficit grew. The public sector recorded a deficit of Ps.30.7 billion in 2011 compared to a public-sector surplus of Ps.3.1 billion in 2010.
With the support of Congress, which came under the control of President Fernández de Kirchner’s party with the October 2011 general election, the Government continued its interventionist policies in 2012. In the wake of narrowing fiscal and external surpluses and slowing economic activity, in April 2012, the Government announced an amendment to the Central Bank’s charter, which increased its discretion in policymaking and provided it with additional tools to intervene in the financial system, including in pursuit of its new aim of promoting economic growth with social equity. In May 2012, Congress approved the administration’s bill to nationalize 51% of the shares of the country’s largest oil company, YPF S.A. (“YPF”) which was majority-owned by Spain’s Repsol S.A. (“Repsol”).
In mid-2012, new restrictions on the purchase of foreign currency were introduced. The Government’s attempts to shore up foreign reserves were primarily driven by its dual goals of accumulating U.S. dollars to service its external debt obligations and maintaining a buffer to avoid a currency run in the event of a deterioration of global market conditions or sharp slowdown of domestic economic activity.
There was a marked deceleration of economic activity in 2012, as real GDP contracted by 1.0%, compared to an expansion of 6.0% in 2011. The year was also marked by rising social unrest, with major antigovernment protests held across the country and the first 24-hour general strike since 2003, reflecting growing dissatisfaction with the sharp economic slowdown, persistent high inflation and increasingly restrictive foreign-exchange controls.
During 2012, the primary balance fell sharply to a deficit of Ps.4.4 billion—the first deficit since 1996—from a surplus of Ps.4.9 billion in 2011, as expansionary fiscal policies that relied in part on Central Bank financing failed to prevent an economic slowdown and a decrease in tax revenue growth. The overall fiscal deficit represented an estimated 2.1% of GDP in 2012.
Facing continued social unrest, in June 2013, the Fernández de Kirchner administration announced an increase in social transfers through two programs providing child allowances to households based on certain income thresholds. In an ongoing attempt to stem inflation, in June 2013, the Government announced price freezes that covered approximately 500 products (including food, beverages, cleaning products and toiletries) for an initial three-month period, which was subsequently extended through a series of price freezes into 2014. The economy experienced moderate growth in 2013, as real GDP grew 2.4% compared to the previous year. Nevertheless, the poverty rate is estimated to have increased above 20% during the same period.
D-33
In January 2014, the Central Bank allowed the peso to depreciate by a nominal 7% in one day—the largest correction to occur in a single day since the 2001-2002 crisis—as international reserves fell below U.S.$30 billion. Shortly thereafter, the Government announced an easing of certain foreign-exchange controls. In an effort to tame inflation, the Government also launched the Precios Cuidados program in January 2014, which established price controls on a broad range of basic household and other products.
In February 2014, the Government and Repsol reached an agreement on the terms of the compensation payable to Repsol for the expropriation of the YPF shares. Such compensation totaled U.S.$5.8 billion payable by delivery of Argentine sovereign bonds with various maturities. The agreement, which was ratified by Law No. 26,932, settled the claim filed by Repsol with the ICSID.
In May 2014, the Government reached a settlement agreement with the members of the Paris Club, a group of sovereign creditors, in connection with outstanding debt owed to Paris Club members on which the Government had defaulted during the 2001-2002 economic crisis. In accordance with the terms of the agreement, the total outstanding debt will be canceled over a five-year period. See “Public Sector Debt—Debt Record—Paris Club.”
By mid-2014, INDEC data revealed that the Argentine economy was in recession. This data was based on the new methodology established by the INDEC in February 2014 in response to the IMF’s censure of Argentina in 2013 for failing to provide accurate statistics in accordance with the IMF’s articles of agreement. Although this new methodology brought the INDEC’s statistics closer to those estimated by private sources, differences between official data and private estimates remained.
In June 2014, the Government was constrained by an order of the District Court ruling that it make ratable payments to holdout creditors whenever it repays holders of its bonds issued pursuant to the 2005 and 2010 Debt Exchanges (the “2005 and 2010 Exchange Bonds”). The Government refused to comply with the District Court’s order and was prevented, by operation of the court’s injunction, from making payments to holders of certain of its restructured bonds issued under New York law. This event prevented Argentina from regaining access to the international capital markets, thereby increasing the risk of a balance-of-payment crisis.
In August 2014, a 24-hour general strike, triggered by increasing unemployment and a fall in real wages, halted public transport and key services. A trend in declining industrial output that began in the third quarter of 2013 continued through 2014, as the country’s manufacturing, mining and utilities sectors faced an erosion of consumer and business confidence, continued high inflation and waning demand from Argentina’s biggest export market, Brazil. By October 2014, the gap between the official and unofficial foreign currency exchange rates widened to 80%. In 2014, the fiscal deficit continued to grow, as total expenditure growth outpaced revenue growth, primarily as a result of an increase in the Government’s social benefit and pension payments.
Between mid-2014 and March 2015, the premium for U.S. dollars offered in the unofficial market narrowed from approximately 80% to 55%. This premium reduction reflected the temporary boost provided by a U.S.$10.3 billion three-year currency-swap agreement between the Central Bank and the People’s Bank of China, as well as the Central Bank’s issuance of U.S. dollar-denominated local bonds. However, the Government failed to address underlying fiscal and external imbalances. During 2014, the overall fiscal deficit rose to Ps.109.7 billion, representing a 70% increase compared to 2013. In total, primary spending rose by 41.8%, with transfers to the private sector, particularly in the form of energy subsidies and social aid, driving this expansion. Real GDP contracted by 2.5% in 2014.
With global capital markets closed to Argentina since the 2001 sovereign default, a trade surplus fueled by high international commodity prices remained the main source of foreign currency reserves for the Central Bank for over a decade. However, exports were undermined in 2014 by continuing external competitiveness problems, falling commodity prices and an economic slowdown in Brazil, Argentina’s primary market for manufactured exports. In total, export earnings fell by 10% in 2014. Although imports also fell substantially, the trade surplus narrowed to U.S.$6.0 billion. Inflows of foreign currency during 2014, including through currency swap agreements entered into by the Central Bank with the People’s Bank of China, increased international reserves, leading to the first annual increase in the balance of payments since 2010.
D-34
In 2015, the Government continued to spend heavily, prioritizing fiscal expansion ahead of the general election in October. The continued growth in Government spending contributed to a modest recovery of the Argentine economy beginning in the first quarter of 2015. Despite a deceleration of inflation, monetary expansion accelerated in the first half of 2015. During 2015, the monetary supply rose by 30.2%, compared to a 20.5% increase in 2014. The difference between 2014 and 2015 reflected a change in the Central Bank’s sterilization policy: in 2014, the Central Bank sterilized Ps.94.6 billion and raised interest rates on Central Bank notes (LEBACs), whereas sterilization fell significantly to Ps.8.7 billion during 2015 as a decrease in the LEBAC rate reduced investments by the financial system in Central Bank notes. In a move to boost consumption, in July 2015, the minimum wage was increased by 31.4%—the first major increase since September 2014.
By mid-2015, China had become an important trading partner (as Argentina’s second-largest export destination after Brazil) and source of foreign exchange, particularly in light of the Government’s inability to access the international capital markets. As a result, the depreciation of the renminbi led the Government to tighten foreign-exchange controls in August 2015, with a view to protecting its international reserves and avoiding a currency crisis. In an effort to avoid a peso devaluation before leaving office in December 2015, the Fernández de Kirchner administration further tightened foreign exchange controls and raised interest rates in November 2015.
Principal Government Policies and their Impact on Argentina’s Economy (2011-2015)
The Fernández de Kirchner administration failed to change policies that were introduced as temporary, emergency measures in response to the 2001-2002 economic crisis (including foreign exchange controls, export taxes and the freeze on electricity and natural gas tariffs). Increasing intervention by the Government in the economy through price controls and measures designed to discourage substitute imports, as well as exports of certain products, and an increased tax burden on productive activities had the effect of reversing the upward trend in the competitiveness of Argentina’s commodities exports and total manufacturing activities. At the same time, the expropriation of domestic corporations, strict capital controls and the related appreciation of the peso in real terms discouraged investment. The administration’s systematic use of expansionary monetary and fiscal policies throughout the business cycle promoted chronic high inflation. Domestic savings and the development of local capital markets were undermined by the imposition of negative real interest rates. The macroeconomic imbalances that resulted from inconsistent macroeconomic policies and the unresolved litigation with holders of Untendered Debt limited the Republic’s access to international capital markets, resulting in the Government’s growing dependence on Central Bank peso financing and the use of Central Bank foreign currency reserves to service public debt. President Fernández de Kirchner’s policies increasingly eroded businesses’ confidence in the Argentine economy, which resulted in a lack of investment, capital outflows and a significant decline in the Central Bank’s international reserves.
The principal government policies of the Fernández de Kirchner administration and their primary effects were as follows:
| 1. | Expansionary monetary policy and foreign exchange controls. An expansionary monetary policy and pervasive foreign exchange controls, coupled with an unwillingness to allow the peso to float freely, resulted in a real appreciation of the peso and a loss of competitiveness of Argentine production. The expansionary monetary policy fueled inflation (which grew from 9.5% in 2011 to 24.0% in 2014, as measured by the INDEC CPI, or from 23.3% in 2011 to 39.0% in 2014, as measured by the Province of San Luis CPI). |
| 2. | Increased regulation to confront inflationary pressures. In response to accelerating inflation, the Fernández de Kirchner administration resorted to measures aimed at controlling supply, rather than reining in demand. These measures included discretionary subsidies, export restrictions and price controls. These measures created additional distortions in relative prices and deterred long-term investment in key sectors of the Argentine economy, including the energy sector. |
| 3. | Discouraged investments. The real appreciation of the peso and foreign exchange controls adversely affected investment generally. In the energy sector, the lack of investment was exacerbated by the Government’s unwillingness to correct utility tariffs that had remained frozen for the Greater Buenos Aires Area (approximately 15 million inhabitants) since the 2001-2002 economic crisis. Argentina—once a net exporter of energy—became a net importer in 2011 with total energy imports of |
D-35
| U.S.$6.5 billion in 2014 and U.S.$4.6 billion in 2015. The Government’s reluctance to adjust tariffs and its decision to subsidize energy consumption resulted in direct and indirect transfers to the energy sector, increasing from Ps.50.3 billion in 2011 to Ps.161.2 billion in 2015. |
| 4. | Expanding public expenditures. Expanding expenditures by the public sector resulting from a policy of heavily subsidizing energy and transport, the increase in employment through the creation of public sector employment, a broadening of pension benefits and a significant expansion of social welfare benefits eroded the fiscal surplus created between 2003 and 2009, and resulted in rising primary fiscal deficits beginning in 2012 (0.2% of GDP), which, by December 2015, grew to 1.8% of GDP for 2015. |
| 5. | Dependence on Central Bank financing. The Fernández de Kirchner administration relied on the Central Bank to finance a growing portion of the Government’s deficit (from a surplus of Ps.4.9 billion in 2011 to a deficit of Ps.104.8 billion in 2015). Advances to the Government further increased inflationary pressures, while the recurrent use of the Central Bank’s U.S. dollar-denominated reserves to make payment on the Government’s foreign debt caused international reserves to decline substantially. As of December 31, 2015, the Central Bank´s international reserves stood at U.S.$25.6 billion, compared to U.S.$46.4 billion as of December 31, 2011. |
Macri Administration: 2015-Present
Presidential and congressional elections in Argentina took place on October 25, 2015, and a runoff election between the two leading presidential candidates was held on November 22, 2015, resulting in Mr. Mauricio Macri (from the Cambiemos coalition) being elected President of Argentina. The Macri administration assumed office on December 10, 2015.
Since assuming office, the Macri administration has announced and executed several significant economic and policy reforms, including:
| • | Foreign exchange reforms. The Macri administration eliminated substantially all of the foreign exchange restrictions, including certain currency controls, that were imposed by the Fernández de Kirchner administration. These reforms provided greater flexibility and easier access to the foreign exchange market (MULC). See “Exchange Rates and Exchange Controls—Exchange Controls” for a description of the principal measures adopted as of the date of this Annual Report. |
| • | INDEC reforms. On January 8, 2016, based on its determination that the INDEC had failed to produce reliable statistical information, particularly with respect to CPI, GDP, poverty and foreign trade data, the Macri administration declared a state of administrative emergency for the national statistical system and the INDEC until December 31, 2016. As of the date of this Annual Report, the INDEC has published certain revised data, including foreign trade and balance of payment statistics, as well as the CPI for May, June, July, August, September, October, November and December 2016, and January, February, March, April and May 2017. On June 29, 2016, the INDEC published the INDEC Report including revised GDP data for the years 2004 through 2015. On September 22, 2016, the INDEC resumed publication of its essential goods and services basket assessment. On November 9, 2016, the IMF Executive Board lifted its censure on the Republic, noting that the Republic had resumed the publication of data in a manner consistent with its obligations under the Articles of Agreement of the IMF. For more information, see “Presentation of Statistical and Other Information—Certain Methodologies.” |
| • | Access to Public Information Act. On September 14, 2016, Congress passed Law No. 27,275, which granted any Argentine citizen the right to access certain information of, among others, the Government, the attorney general’s office, the Judiciary Council, Congress, the Central Bank, entities owned by the Argentine state, institutions or funds administered by the Government and business organizations or trusts that have received public funds. |
D-36
| • | Financial policy. Soon after taking office, the Macri administration sought to settle the outstanding claims with the holders of Untendered Debt, and the Minister of the Treasury designed a debt restructuring and cancellation program with the aim of reducing the amount of outstanding Untendered Debt. In February 2016, the Republic entered into agreements in principle to settle outstanding claims with certain holders of Untendered Debt and put forward a proposal to other holders of Untendered Debt, including those with pending claims in U.S. courts, subject to two conditions: obtaining approval by the Argentine Congress and lifting the pari passu injunctions. On March 2, 2016, the District Court agreed to vacate the pari passu injunctions, subject to two conditions: first, the repealing of all legislative obstacles to settlement with holders of Untendered Debt, and second, full payment to holders of pari passu injunctions with whom the Government had entered into agreements in principle on or before February 29, 2016, in accordance with the specific terms of such agreements. On April 13, 2016, the District Court’s order was affirmed by the Second Circuit Court of Appeals. On March 31, 2016, the Argentine Congress repealed the legislative obstacles to the settlement and approved the Settlement Proposal. Argentina closed the April 2016 Transaction on April 22, 2016 and applied U.S.$9.3 billion of the net proceeds to satisfy settlement payments on agreements of holders of approximately U.S.$4.2 billion principal amount of Untendered Debt. Upon confirmation that the conditions set forth in its March 2, 2016 order had been satisfied, the District Court ordered the vacatur of all pari passu injunctions. |
Since April 2016, Argentina has continued settling claims with holders of Untendered Debt consistent with the terms of its February 2016 Settlement Proposal. As of March 31, 2017, the outstanding principal amount of Untendered Debt that was not subject to a settlement agreement totaled approximately U.S.$1.43 billion, of which the outstanding principal amount of foreign law governed Untendered Debt that was not subject to a settlement agreement and was not time-barred (in the Republic’s understanding) totaled approximately U.S.$803 million. In May 2017, the Republic reached a settlement agreements with holders of an additional U.S.$92 million in principal amount of foreign law governed Untendered Debt.
On December 22, 2016, in a case involving certain creditors that had not responded to the February 2016 Settlement Proposal and alleged a continued violation of the pari passu clause, the District Court found that no continued pari passu violation existed although the plaintiffs’ bonds remained unpaid while Argentina was paying its consenting creditors as well as the newly issued bonds. In its ruling, the District Court also found that under New York law claims relating to Untendered Debt governed by New York law become time-barred after six years.
| • | Foreign Currency-Denominated Bonds. Since the April 2016 Transaction, Argentina has issued foreign currency-denominated bonds in aggregate amounts of U.S.$9.75 billion, €2.5 billion, and CHF 400 million under foreign law and reopened securities issued under local law for a total of U.S.$2 billion. In April 2017, Argentina issued U.S.$1.8 billion in bonds under local law. In addition, Argentina accessed the domestic US-dollar market by issuing Treasury bonds (LETES), of which U.S.$14.9 billion were outstanding as of June 14, 2017. |
| • | Foreign trade reforms. The Kirchner and Fernández de Kirchner administrations imposed export duties and other restrictions on several sectors, particularly the agricultural sector. The Macri administration eliminated export duties on wheat, corn, beef, mining, oil and regional products, and reduced the duty on soybean exports by 5%, from 35% to 30%. A 5% export duty on most industrial exports was also eliminated. On February 17, 2017, the Macri administration eliminated import duties, effective as of April 1, 2017, on computers, computer parts and ancillary products (such as printers and digitizers). With respect to payments for imports of goods and services to be performed abroad, the Macri administration eliminated the restrictions on access to the MULC. In addition, importers were offered short-term debt securities issued by the Republic to be used to repay outstanding commercial debt for the import of goods. |
| • | Fiscal policy. The Macri administration took steps to anchor the fiscal accounts, to reduce the primary fiscal deficit, and pursued a primary fiscal deficit target of 4.8% of GDP in 2016 through the elimination of subsidies, the reorganization of certain expenditures and the generation of increased revenue through the Tax Amnesty. The Macri administration’s ultimate aim is to achieve a balanced primary budget by 2019. The 2017 budget projects a fiscal deficit representing 4.2% of GDP in 2017. |
D-37
| • | Correction of monetary imbalances. The Macri administration announced the adoption of an inflation targeting regime in parallel with the floating exchange rate regime and set inflation targets for the next four years, including a band of 12-17% for 2017. The Central Bank has increased sterilization efforts to reduce excess monetary imbalances and raised peso interest rates to offset inflationary pressure. Inflation from December 2015 to December 2016, as measured by City of Buenos Aires, stood at 41.0%. Inflation from May to December 2016, as measured by INDEC, stood at 16.9%. In January 2017, the Central Bank began using the 7-day repo reference rate as the anchor of its inflation targeting regime. Short term notes issued by the Central Bank (LEBACs) would be used to manage liquidity. |
| • | National electricity state of emergency and reforms. Following years of very limited investment in the energy sector, as well as the continued freeze on electricity and natural gas tariffs since the 2001-2002 economic crisis, Argentina began to experience energy shortages in 2011. In response to the growing energy crisis, the Macri administration declared a state of emergency with respect to the national electricity system, which will remain in effect until December 31, 2017. The state of emergency allows the Government to take actions designed to ensure the supply of electricity to the country, such as instructing the Ministry of Energy and Mining to design and implement, with the cooperation of all federal public entities, a coordinated program to guarantee the quality and security of the electricity system. In addition, through Resolution No. 6/2016 of the Ministry of Energy and Mining and Resolution No. 1/2016 of the Ente Nacional Regulador de la Electricidad (National Electricity Regulatory Agency, or “ENRE”), the Macri administration announced the elimination of a portion of energy subsidies currently in effect and a substantial increase in electricity rates. As a result, average electricity prices have already increased and could increase further. By correcting tariffs, modifying the regulatory framework and reducing the Government’s role as an active market participant, the Macri administration sought to correct distortions in the energy sector and stimulate investment. However, as described below, certain of the Government’s initiatives were challenged in the Argentine courts and resulted in judicial injunctions or rulings limiting the Government’s initiatives. |
During 2016, lower court injunctions suspended in certain provinces and cities end-user electricity tariff increases implemented as of February 1, 2016, and instructed the Ministry of Energy and Mining and the ENRE to conduct a non-binding public hearing prior to sanctioning any such increases. On October 28, 2016, a non-binding public hearing was conducted by the Ministry of Energy and Mining and ENRE to present tariff proposals submitted by distribution companies covering the greater Buenos Aires area (approximately 15 million inhabitants) for the 2017-2021 period in the framework of the Integral Tariff Review (as defined below). On December 14, 2016, eight non-binding public hearings (in Buenos Aires, Mendoza, Neuquén, Mar del Plata, Formosa, Santiago del Estero and Puerto Madryn) were conducted by the Ministry of Energy and Mining and ENRE to present tariff proposals for electricity transmission at the national and regional level and the seasonal reference prices of capacity and energy in the wholesale electricity market, as well as a proposal to reduce subsidies for the 2017-2021 period. The determination of the final tariffs and reference prices effective from February 1, 2017 was implemented through Resolution No. 20/2017 of the Secretary of Energy and Resolution No. 64/2017 of the ENRE. During 2017, lower court injunctions suspended end-user electricity tariff increases, implemented as of February 1, 2017, in the provinces of Buenos Aires and Chaco.
| • | Tariff increases. With the aim of encouraging companies to invest and improve the services they offer and enabling the Government to assist those in need, the Macri administration has begun updating the tariffs for electricity, transportation, gas and water services (the “Integral Tariff Review”). Each of the announced tariff increases contemplates a tarifa social (social tariff), which is designed to provide support to vulnerable groups, including beneficiaries of social programs, retirees and pensioners that receive up to two minimum pensions, workers that receive up to two minimum salaries, individuals with disabilities, individuals registered in the Monotributo Social program, domestic workers and individuals receiving unemployment insurance. Subsequent modifications to these announced tariff increases were made, including a 20% discount on the regular distribution price for 400 designated energy-intensive companies that purchase electricity directly from distributors. |
D-38
On August 18, 2016, the Supreme Court of Argentina in “Centro de Estudios para la Promoción de la Igualdad y la Solidaridad v/ Ministry of Energy and Mining,” affirmed lower court injunctions suspending end-user natural gas tariff increases sanctioned as of April 1, 2016, and instructed the Ministry of Energy and Mining and ENARGAS to conduct a non-binding public hearing prior to sanctioning any such increases. On September 16, 2016, a non-binding public hearing was conducted by the Ministry of Energy and Mining and ENARGAS to submit (i) transitional tariffs for transportation and distribution of natural gas at the national level in the framework of the Integral Tariff Review for the period 2017-2021, (ii) a new set of gas prices at the Point of Entry to the Transportation System (PIST) and (iii) a proposal to reduce subsidies for the period 2016-2022. Between October 2 and 7, 2016, public hearings were also conducted at the national level with regard to tariff proposals for gas transportation and distribution throughout the country for the period 2017-2021 in the framework of the Integral Tariff Review.
On October 6, 2016, after conducting non-binding public hearings, the Ministry of Energy and Mining and ENARGAS published a new end-user gas tariff scheme. The scheme establishes a two tariff schedule for private residences, establishing lower tariffs for units that decreased consumption compared to the same period in the previous year by at least 15%.
On October 11, 2016, the Ministry of Energy and Mining (a) expanded the amount of eligible beneficiaries of social tariffs to include retirees and pensioners that receive pensions equal to up to two minimum salaries, certain war veterans and medically dependent customers, and (b) decreed that institutions that perform activities of public interest would be entitled to residential rates.
During 2016, the year-on-year increase in the price of energy in the wholesale electricity market for end-users, which excludes transportation and distribution costs and accounts for approximately 45% of the tariff to end-users in the City of Buenos Aires, totaled 233% (from Ps.96/MWh to Ps.320/MWh on average), while the increase in the price of natural gas for end-users was 68% (from Ps.37/MMBtu to Ps.62/MMBtu on average). The determination of the new PIST gas prices and final tariffs for gas transportation and distribution throughout the country effective as from April 1, 2017, was implemented through Resolution No. 74-E/2017 of the Secretary of Energy and several other resolutions of the ENARGAS.
During 2017, the increase in the price of energy in the wholesale electricity market for end-users, which excludes transportation and distribution costs and accounts for approximately 45% of the tariff to end-users in the City of Buenos Aires, totaled 100% (from Ps.320/MWh to Ps.640/MWh on average), while the increase in the price of natural gas for end-users was 20% (from Ps.62/MMBtu to Ps.75/MMBtu on average).
| • | Retiree Programs. On June 29, 2016, Congress passed a bill approving the Historical Reparations Program for Retirees and Pensioners, which took effect upon its publication in the official gazette. The main aspects of this program, which is designed to conform government social security policies to Supreme Court rulings, include (i) payments to more than two million retirees and the retroactive compensation of more than 300,000 retirees and (ii) the creation of a pensión universal (universal pension) for the elderly, which guarantees an income for all individuals over 65 years of age who are otherwise ineligible for retirement. The Historical Reparations Program for Retirees and Pensioners will give retroactive compensation to retirees in an aggregate amount of more than Ps.47.0 billion and involve expenses of up to Ps.75.0 billion to cover all potential beneficiaries. The bill provides that assets held by the FGS, including equity interests, may be sold to finance this program. |
| • | Tax Amnesty Law. In July 2016, the Régimen de Sinceramiento Fiscal (the “Tax Amnesty Law”) was introduced to promote the voluntary declaration of assets by Argentine residents. The law allowed Argentine tax residents holding undeclared funds or assets located in Argentina or abroad |
D-39
| to (i) declare such property until March 31, 2017 without facing prosecution for tax evasion or being required to pay outstanding tax liabilities on the assets, provided they can provide evidence that the assets were held by certain specified cut-off dates, and (ii) keep the declared property outside Argentina and not repatriate such property to Argentina. |
On April 4, 2017 the Ministry of the Treasury and the AFIP announced that, through March 31, 2017, which was the deadline under the Tax Amnesty Law, U.S.$116.8 billion in cash holdings, real estate and securities had been declared.
| • | Social Measures. On April 16, 2016, President Macri announced a series of measures intended to alleviate the impact of adverse conditions of certain social sectors, including: |
| • | the eligibility of over half a million children of self-employed individuals to receive the same allowances as those provided to employed workers. In addition, temporary workers will receive allowances throughout the year, including for the months they are not employed; |
| • | the harmonization of Asignación Universal por Hijo (Universal Child Allowance) with local programs to permit eligibility for more than one program; |
| • | a bill, which was approved by Congress on June 8, 2016, to refund up to Ps.300 per month in VAT paid on the purchase of certain staples (such as food, clothing and cleaning supplies) by retirees that receive minimum pensions and individuals receiving the Universal Child or pregnancy allowance; this limit will be adjusted based on the variation of the prices; |
| • | a one-time allowance of Ps.500 for retirees receiving minimum pensions and individuals receiving the Universal Child Allowance; and |
| • | a 20% increase in amounts paid under the Plan Argentina Trabaja program (Argentine Jobs Program) and Ellas Hacen (Women Make) program and an increase in the limit on annual income, from Ps.48,000 to Ps.72,000, for those eligible for the Monotributo Social program. |
In addition, on December 14, 2016, Congress approved Law No. 27,345, which among other measures, declared a social emergency until December 31, 2019.
| • | Precios Cuidados and Precios Claros. The Government also announced modifications to the Precios Cuidados program, which was originally launched in January 2014 to establish price controls on a broad range of basic household and other products. The new program ran from September 6, 2016 to January 6, 2017, and was further extended until December 31, 2017, and includes fresh products such as fruits, vegetables and certain meats. The Precios Claros program was implemented to allow consumers to compare prices between hundreds of supermarket products. For more information, see “—Poverty and Income Distribution.” |
D-40
| • | Public Bid Process for New Renewable Energy Generation Units. On March 22, 2016, the Secretariat of Energy called for bids to install 1,000 MW of new renewable energy units (the “RenovAR Program”). This bid process is governed by Law No. 27,191 and Decree No. 531/16, which encouraged the increase of energy generation from renewable sources by providing, among other things, significant tax benefits. On September 5, 2016, bids for a total of 6,366 MW were presented under the first round of this renewable energy bidding process. Bids submitted under this first round included 49 distinct wind energy projects totaling 3,468 MW and 58 distinct solar energy projects totaling 2,834 MW. Bids were also submitted for 11 biomass-biogas projects totaling 53 MW and 5 small hydroelectric projects totaling 11 MW. On October 7, 2016, the winning bids for the first round of the RenovAR Program to incorporate 1,109 MW of electricity generated from renewable sources were announced. Twelve wind energy projects were awarded for 708 MW, four solar energy projects for 400 MW and one biomass-biogas project for 1 MW. |
On October 31, 2016, the Ministry of Energy and Mining, by means of Resolution 252/2016, launched round 1.5 of the RenovAR Program as a continuation of round 1. This follow-up round allowed participants to resubmit their bids with a new price. The Ministry of Energy and Mining indicated that it would award new projects if, among other conditions, the price was below the U.S.$59.39 MWh threshold for wind projects (the weighted average price of projects awarded in round 1). On November 25, 2016, the Ministry finalized the auction process for the installation of new renewable energy units and, under Resolution 281/2016, granted awards in the amount of 1,281.5 MW, with an average price of U.S.$53.98 per MWh, including wind energy projects and 20 solar energy projects.
| • | Strengthening of Regional Economies. On October 3, 2016, the Government announced a plan to strengthen regional economies. The plan is expected to include increased reimbursements for exports of regional products, policies to improve disease control operations performed by the Servicio Nacional de Sanidad y Calidad Agroalimentaria (SENASA) and the creation of a new fund to provide credit for agroindustrial investment. |
| • | Aviation Sector Development. On September 21, 2016, the Government announced its “Plan Integral” (Comprehensive Plan) construction program, which is intended to boost the development of the civil aviation sector and includes investments of more than Ps.22.0 billion over the 2017-2020 period. |
| • | Border Pass. On October 28, 2016, President Macri announced the commencement of the preselection period for tenders for the construction of the Paso Agua Negra (Agua Negra Pass) tunnel, which will link the province of San Juan with the Coquimbo port in Chile to improve cargo transportation across Argentina and Chile. The construction cost is estimated at U.S.$1.5 billion. |
| • | Promotion of productive activity. In October 2016, through the issuance of regulations supplementing the Ley Pyme (SME Act), the following tax benefits for SMEs were introduced: |
| • | the notional minimum income tax for SMEs was eliminated; |
| • | SMEs can deduct taxes paid on financial transactions from income tax payments; |
| • | SMEs may defer monthly VAT payments for 90 days; |
| • | SMEs may deduct 10% of their investments from their income tax payments; and |
| • | SMEs will receive VAT returns from investments, in the form of a tax credit bond, to be used for tax paying purposes. |
D-41
In December 2016, the European Investment Bank approved a €60 million line of credit to finance micro and small and medium-sized enterprises, prioritizing productive investments, the use of renewable energies and the development of foreign trade.
| • | Private-Public Partnerships Law. On November 16, 2016, Congress approved the Private-Public Partnerships’ Law, which provides for a special regime for infrastructure projects by private investors in partnership with the public sector. Pursuant to this law, the Government and private investors may enter into different types of arrangements depending on the needs of the project, such as agreements, trusts or the creation of sociedades anónimas (corporations). On February 27, 2017, the Government issued Decree No. 118/2017, which regulates the Private-Public Partnerships’ Law. |
| • | Amendment to the Capital Markets Law. In November 2016, the Government submitted a bill to Congress with comprehensive amendments to the current Capital Markets Law No. 26,831, and other related laws. Furthermore, the bill provides for the amendment of certain tax provisions and regulations relating to derivatives, as well as for the promotion of a financial inclusion program. The main proposed amendments, which are generally intended to increase flexibility and legal certainty while mitigating systemic risk and avoiding conflict of interests, include: |
| • | Amendments affecting the power and function of the Comisión Nacional de Valores (the “CNV”), including the CNV’s power to appoint observers with veto powers and to remove a company’s board of directors without the prior intervention of a competent court; |
| • | the reestablishment of the jurisdiction of the commercial courts (as opposed to courts with jurisdiction over administrative matters) to hear appeals relating to resolutions and fines imposed by the CNV; |
| • | a modification of the criteria to determine, among other things, the price and launch of mandatory tender offers triggered by a change in control; and |
| • | amendments relating to the sanctions and other powers of the CNV and other amendments relating to the regulation of certain financial products and activities. |
As of the date of this Annual Report, the bill has not been passed by Congress.
| • | Climate change. The National Cabinet on Climate Change was created, which will establish policies and seek to generate public awareness. |
| • | Increase in Minimum Income. In December 2016, Congress approved an increase in the minimum income threshold (on a net basis) by approximately 23%, from Ps.25,000 to Ps.30,670 for married workers with two children and from Ps.18,880 to Ps.23,185 for single workers. The minimum income threshold will be subject to automatic adjustment going forward, by reference to increases in the average wages paid to public sector employees. Congress also passed modifications to the income tax brackets to take into account the impact of inflation in recent years. |
The fiscal, monetary and currency adjustments undertaken by the Macri administration may subdue growth in the short term, but seek to guide the economy toward a sustained path for growth in the medium-term. Immediately after the foreign exchange controls were lifted on December 16, 2015, the dismantling of the multiple exchange regime resulted in the official peso exchange rate (available only for certain types of transactions) adjusting in value by 40.1%, as the peso-U.S. dollar exchange rate reached Ps.13.76 to U.S.$1.00 on December 17, 2015. The Central Bank has since allowed the peso to float with limited intervention intended to ensure the orderly operation of the foreign exchange market. As of December 31, 2016, the exchange rate stood at Ps.15.85 per U.S.$1.00.
D-42
GROSS DOMESTIC PRODUCT AND STRUCTURE OF THE ECONOMY
GDP is a measure of the total value of final products and services produced in a country. Nominal GDP measures the total value of final production in current prices. Real GDP measures the total value of final production in constant prices of a particular year, thus allowing historical GDP comparisons that exclude the effects of inflation. Argentina’s real GDP figures are measured in pesos and are based on constant 2004 prices, as revised in the INDEC Report. Among other adjustments, in calculating GDP for 2004 the INDEC made changes to the composition of GDP that resulted in a downward adjustment of approximately 12% for that year. In calculating real GDP for subsequent years based on the revised 2004 GDP, the INDEC used deflators that are consistent with its revised methodology to calculate inflation. By understating inflation in the past, the INDEC had overstated growth in real terms.
The information set forth below in this section has been derived from statistics included in the INDEC Report.
The following table sets forth the evolution of GDP and per capita GDP for the periods specified, at current prices.
Evolution of GDP and Per Capita GDP
(at current prices)
| 2012 | 2013 | 2014 | 2015 | 2016 | ||||||||||||||||
| GDP (in millions of pesos)(1) |
Ps. | 2,637,914 | Ps. | 3,348,308 | Ps. | 4,579,086 | Ps. | 5,854,014 | Ps. | 8,055,988 | ||||||||||
| GDP (in millions of U.S. dollars)(1) |
U.S.$ | 579,573 | U.S.$ | 611,129 | U.S.$ | 564,009 | U.S.$ | 631,574 | U.S.$ | 545,081 | ||||||||||
| Per capita GDP(1) |
U.S.$ | 13,888 | U.S.$ | 14,481 | U.S.$ | 13,218 | U.S.$ | 14,643 | U.S.$ | 12,505 | ||||||||||
| Peso / U.S. dollar exchange rate(2) |
4.55 | 5.48 | 8.12 | 9.27 | 14.78 | |||||||||||||||
| (1) | GDP figures in this table are expressed in nominal terms. |
| (2) | Average nominal exchange rate for the period specified. |
Source: INDEC and Ministry of the Treasury.
The following tables set forth information on Argentina’s real GDP, by expenditure, for the periods specified, at constant 2004 prices.
Composition of Real GDP by Expenditure
(in millions of pesos, at constant 2004 prices)
| 2012 | 2013 | 2014 | 2015 | 2016 | ||||||||||||||||
| Consumption: |
||||||||||||||||||||
| Public sector consumption |
Ps. | 83,473 | Ps. | 87,916 | Ps. | 90,505 | Ps. | 96,649 | Ps. | 96,930 | ||||||||||
| Private consumption |
507,217 | 525,675 | 502,764 | 520,536 | 513,349 | |||||||||||||||
|
|
|
|
|
|
|
|
|
|
|
|||||||||||
| Total consumption |
590,690 | 613,591 | 593,270 | 617,185 | 610,279 | |||||||||||||||
| Gross investment |
142,718 | 146,057 | 136,190 | 141,421 | 133,616 | |||||||||||||||
| Exports of goods and services |
154,900 | 149,447 | 139,017 | 138,241 | 143,321 | |||||||||||||||
| Imports of goods and services |
183,074 | 190,183 | 168,350 | 177,962 | 187,557 | |||||||||||||||
|
|
|
|
|
|
|
|
|
|
|
|||||||||||
| Net exports/(imports) |
(28,174 | ) | (40,735 | ) | (29,333 | ) | (39,720 | ) | (44,236 | ) | ||||||||||
| Inventory provision |
(1,748 | ) | 1,495 | 2,179 | 2,012 | 4,671 | ||||||||||||||
| Statistical discrepancy |
— | — | — | — | — | |||||||||||||||
|
|
|
|
|
|
|
|
|
|
|
|||||||||||
| Real GDP |
Ps. | 703,486 | Ps. | 720,407 | Ps. | 702,306 | Ps. | 720,898 | Ps. | 704,330 | ||||||||||
|
|
|
|
|
|
|
|
|
|
|
|||||||||||
D-43
Composition of Real GDP by Expenditure
(as % of total real GDP, at constant 2004 prices)
| 2012 | 2013 | 2014 | 2015 | 2016 | ||||||||||||||||
| Consumption: |
||||||||||||||||||||
| Public sector consumption |
11.9 | % | 12.2 | % | 12.9 | % | 13.4 | % | 13.8 | % | ||||||||||
| Private consumption |
72.1 | 73.0 | 71.6 | 72.2 | 72.9 | |||||||||||||||
|
|
|
|
|
|
|
|
|
|
|
|||||||||||
| Total consumption |
84.0 | 85.2 | 84.5 | 85.6 | 86.6 | |||||||||||||||
| Gross investment |
20.3 | 20.3 | 19.4 | 19.6 | 19.0 | |||||||||||||||
| Exports of goods and services |
22.0 | 20.7 | 19.8 | 19.2 | 20.3 | |||||||||||||||
| Imports of goods and services |
26.0 | 26.4 | 24.0 | 24.7 | 26.6 | |||||||||||||||
|
|
|
|
|
|
|
|
|
|
|
|||||||||||
| Net exports/(imports) |
(4.0 | ) | (5.7 | ) | (4.2 | ) | (5.5 | ) | (6.3 | ) | ||||||||||
| Inventory provision |
(0.2 | ) | 0.2 | 0.3 | 0.3 | 0.7 | ||||||||||||||
| Statistical discrepancy |
— | — | — | — | — | |||||||||||||||
|
|
|
|
|
|
|
|
|
|
|
|||||||||||
| Real GDP |
100.0 | % | 100.0 | % | 100.0 | 100.0 | % | 100.0 | % | |||||||||||
|
|
|
|
|
|
|
|
|
|
|
|||||||||||
Source: INDEC and Ministry of the Treasury.
Evolution of Real GDP by Expenditure
(% change from previous year, at constant 2004 prices)
| 2012 | 2013 | 2014 | 2015 | 2016 | ||||||||||||||||
| Consumption: |
||||||||||||||||||||
| Public sector consumption |
3.0 | % | 5.3 | % | 2.9 | % | 6.8 | % | 0.3 | % | ||||||||||
| Private consumption |
1.1 | 3.6 | (4.4 | ) | 3.5 | (1.4 | ) | |||||||||||||
|
|
|
|
|
|
|
|
|
|
|
|||||||||||
| Total consumption |
1.4 | % | 3.9 | % | (3.3 | )% | 4.0 | % | (1.1 | )% | ||||||||||
| Gross investment |
(7.1 | ) | 2.3 | (6.8 | ) | 3.8 | (5.5 | ) | ||||||||||||
| Exports of goods and services |
(4.1 | ) | (3.5 | ) | (7.0 | ) | (0.6 | ) | 3.7 | |||||||||||
| Imports of goods and services |
(4.7 | ) | 3.9 | (11.5 | ) | 5.7 | 5.4 | |||||||||||||
|
|
|
|
|
|
|
|
|
|
|
|||||||||||
| Net exports/(imports) |
8.0 | % | (44.6 | )% | 28.0 | % | (35.4 | )% | (11.4 | )% | ||||||||||
| Inventory provision |
(134.0 | ) | 185.5 | % | 45.7 | % | (7.7 | ) | 132.1 | |||||||||||
| Statistical discrepancy |
— | — | — | — | — | |||||||||||||||
|
|
|
|
|
|
|
|
|
|
|
|||||||||||
| Real GDP |
(1.0 | )% | 2.4 | % | (2.5 | )% | 2.6 | % | (2.3 | )% | ||||||||||
|
|
|
|
|
|
|
|
|
|
|
|||||||||||
The following tables set forth information on Argentina’s gross investment, by expenditure, for the periods indicated, at constant 2004 prices.
Composition of Gross Investment
(in millions of pesos, at constant 2004 prices)
| 2012 | 2013 | 2014 | 2015 | 2016 | ||||||||||||||||
| Natural Resources and others(1) |
Ps. 495 | Ps. 528 | Ps. 529 | Ps. 537 | Ps. 531 | |||||||||||||||
| Durable equipment for production |
||||||||||||||||||||
| Machinery and equipment: |
||||||||||||||||||||
| National |
22,710 | 23,926 | 21,605 | 23,287 | 22,955 | |||||||||||||||
| Imported |
36,440 | 35,173 | 33,804 | 35,785 | 35,468 | |||||||||||||||
|
|
|
|
|
|
|
|
|
|
|
|||||||||||
| Total |
59,151 | 59,099 | 55,408 | 59,072 | 58,423 | |||||||||||||||
| Transport products |
||||||||||||||||||||
| National |
12,540 | 13,521 | 10,273 | 10,703 | 10,541 | |||||||||||||||
| Imported |
5,603 | 7,479 | 6,160 | 5,816 | 7,680 | |||||||||||||||
| Total |
18,143 | 21,000 | 16,433 | 16,519 | 18,222 | |||||||||||||||
| Total durable equipment for production |
77,294 | 80,099 | 71,841 | 75,591 | 76,644 | |||||||||||||||
| Construction(2) |
64,929 | 65,429 | 63,819 | 65,293 | 7,807 | |||||||||||||||
|
|
|
|
|
|
|
|
|
|
|
|||||||||||
| Total gross investment |
Ps. 142,718 | Ps. 146,057 | Ps. 136,190 | Ps. 141,421 | Ps. 133,616 | |||||||||||||||
|
|
|
|
|
|
|
|
|
|
|
|||||||||||
| (1) | Includes research and development and cultivated biological resources. |
| (2) | Includes mining exploration. |
Source: INDEC and Ministry of the Treasury.
D-44
Composition of Gross Investment
(as % of total Gross Investment, at constant 2004 prices)
| 2012 | 2013 | 2014 | 2015 | 2016 | ||||||||||||||||
| Natural Resources and others(1) |
0.3 | % | 0.4 | % | 0.4 | % | 0.4 | % | 0.4 | % | ||||||||||
| Durable equipment for production |
||||||||||||||||||||
| Machinery and equipment: |
||||||||||||||||||||
| National |
15.9 | 16.4 | 15.9 | 16.5 | 17.2 | |||||||||||||||
| Imported |
25.5 | 24.1 | 24.8 | 25.3 | 26.5 | |||||||||||||||
|
|
|
|
|
|
|
|
|
|
|
|||||||||||
| Total |
41.4 | % | 40.5 | % | 40.7 | % | 41.8 | % | 43.7 | % | ||||||||||
| Transport products |
||||||||||||||||||||
| National |
8.8 | 9.3 | 7.5 | 7.6 | 7.9 | |||||||||||||||
| Imported |
3.9 | 5.1 | 4.5 | 4.1 | 5.7 | |||||||||||||||
|
|
|
|
|
|
|
|
|
|
|
|||||||||||
| Total |
12.7 | % | 14.4 | % | 12.1 | % | 11.7 | % | 13.6 | % | ||||||||||
| Total durable equipment for production |
54.2 | 54.8 | 52.8 | 53.5 | 57.4 | |||||||||||||||
| Construction(2) |
45.5 | 44.8 | 46.9 | 46.2 | 5.8 | |||||||||||||||
|
|
|
|
|
|
|
|
|
|
|
|||||||||||
| Total gross investment |
100.0 | % | 100.0 | % | 100.0 | % | 100.0 | % | 100.0 | % | ||||||||||
|
|
|
|
|
|
|
|
|
|
|
|||||||||||
| (1) | Includes research and development and cultivated biological resources. |
| (2) | Includes mining exploration. |
Source: INDEC and Ministry of the Treasury
Evolution of Gross Investment
(% change from previous year, at constant 2004 prices)
| 2012 | 2013 | 2014 | 2015 | 2016 | ||||||||||||||||
| Natural Resources and others(1) |
1.6 | % | 6.7 | % | 0.2 | % | 1.5 | % | (1.2 | )% | ||||||||||
| Durable equipment for production |
||||||||||||||||||||
| Machinery and equipment: |
||||||||||||||||||||
| National |
(6.2 | ) | 5.4 | (9.7 | ) | 7.8 | (1.4 | ) | ||||||||||||
| Imported |
(13.0 | ) | (3.5 | ) | (3.9 | ) | 5.9 | (0.9 | ) | |||||||||||
|
|
|
|
|
|
|
|
|
|
|
|||||||||||
| Total |
(10.5 | )% | (0.1 | )% | (6.2 | )% | 6.6 | % | (1.1 | )% | ||||||||||
| Transport products |
||||||||||||||||||||
| National |
2.5 | 7.8 | (24.0 | ) | 4.2 | (1.5 | ) | |||||||||||||
| Imported |
(27.5 | ) | 33.5 | (17.6 | ) | (5.6 | ) | 32.0 | ||||||||||||
|
|
|
|
|
|
|
|
|
|
|
|||||||||||
| Total |
(9.1 | )% | 15.7 | % | (21.7 | )% | 0.5 | % | 10.3 | % | ||||||||||
| Total durable equipment for production |
(10.2 | ) | 3.6 | (10.3 | ) | 5.2 | 1.4 | |||||||||||||
| Construction(2) |
(3.1 | ) | 0.8 | (2.5 | ) | 2.3 | (88.0 | ) | ||||||||||||
|
|
|
|
|
|
|
|
|
|
|
|||||||||||
| Total gross investment |
(7.1 | )% | 2.3 | % | (6.8 | )% | 3.8 | % | (5.5 | )% | ||||||||||
|
|
|
|
|
|
|
|
|
|
|
|||||||||||
| (1) | Includes research and development and cultivated biological resources. |
| (2) | Includes mining exploration. |
Source: INDEC and Ministry of the Treasury.
D-45
Overview of GDP
In 2012, Argentina’s real GDP contracted 1.0%. This economic slowdown was attributed to local and external factors, primarily the deceleration of growth in developing economies, including Argentina’s principal trading partners, and an extended drought affecting agricultural production. Real GDP contraction in 2012 was primarily attributable to a 7.1% decline in gross investment resulting from a 10.2% decrease in investments in durable equipment for production and a 3.1% decrease in construction investments. However, this decline was partially offset by an 8.0% increase in net exports.
Following GDP contraction in 2012, Argentina’s real GDP growth recovered in 2013 at a rate of 2.4%. Domestic demand in 2013 helped to offset weak demand from the rest of the world. Real GDP growth in 2013 was primarily driven by a 3.9% increase in total consumption, resulting from a 5.3% increase in public sector consumption and a 3.6% increase in private sector consumption, as well as a 2.3% increase in gross investment due to a 3.6% increase in investments in durable equipment of production and a 0.8% increase in construction investments.
In 2014, Argentina’s real GDP decreased by 2.5%, reflecting the impact of the deceleration of growth in developing economies on Argentina’s exports, growing uncertainty in the financial sector and fluctuations in foreign exchange rates. The contraction of economic activity in 2014 primarily resulted from a 6.8% decrease in gross investment, a 7.0% decrease in exports and a 3.3% decrease in total consumption.
Following GDP contraction in 2014, Argentina’s real GDP increased by 2.6% in 2015, reflecting a recovery in consumption, due to an improvement in the labor market and investment. Real GDP growth in 2015 was primarily driven by a 3.8% increase in gross investment, resulting from a 5.2% increase in total durable equipment of production and a 2.3% increase in construction, as well as a 4.0% increase in total consumption due to a 6.8% increase in public sector consumption and a 3.5% increase in private sector consumption.
In 2016, Argentina’s real GDP decreased by 2.3%, primarily as a result of a 5.5% decrease in gross investment, as well as 1.1% decrease in total consumption and a 5.4% increase in imports, which resulted in an increase of 11.4% of the negative balance in net exports.
Principal Sectors of the Economy
The following tables set forth the composition of Argentina’s real GDP by economic sector for the periods specified.
Real GDP by Sector
(in millions of pesos, at constant 2004 prices)
| 2012 | 2013 | 2014 | 2015 | 2016 | ||||||||||||||||
| Primary production: |
||||||||||||||||||||
| Agriculture, livestock, fisheries and forestry |
Ps. 44,606 | Ps. 49,726 | Ps. 51,269 | Ps. 55,177 | Ps. 52,252 | |||||||||||||||
| Mining and extractives (including petroleum and gas) |
23,350 | 22,405 | 22,755 | 23,403 | 22,168 | |||||||||||||||
|
|
|
|
|
|
|
|
|
|
|
|||||||||||
| Total primary production |
67,957 | 72,131 | 74,024 | 78,580 | 74,419 | |||||||||||||||
| Secondary production: |
||||||||||||||||||||
| Manufacturing |
128,986 | 130,926 | 124,309 | 125,253 | 118,121 | |||||||||||||||
| Construction |
22,369 | 22,346 | 21,895 | 22,547 | 20,005 | |||||||||||||||
| Electricity, gas and water |
11,662 | 11,718 | 11,949 | 12,362 | 12,534 | |||||||||||||||
|
|
|
|
|
|
|
|
|
|
|
|||||||||||
| Total secondary production |
163,018 | 164,990 | 158,152 | 160,161 | 150,660 | |||||||||||||||
| Services: |
||||||||||||||||||||
| Transportation, storage and communications |
52,515 | 53,754 | 54,168 | 55,581 | 57,357 | |||||||||||||||
| Trade, hotels and restaurants |
106,916 | 109,311 | 102,447 | 105,370 | 103,106 | |||||||||||||||
| Financial, real estate, business and rental services |
97,645 | 98,924 | 97,803 | 99,726 | 98,202 | |||||||||||||||
| Public administration, education, health, social and personal services |
92,882 | 94,638 | 96,264 | 99,100 | 100,534 | |||||||||||||||
| Domestic services(1) |
4,154 | 4,247 | 4,259 | 4,285 | 4,264 | |||||||||||||||
|
|
|
|
|
|
|
|
|
|
|
|||||||||||
| Total services |
354,112 | 360,875 | 354,941 | 364,062 | 363,463 | |||||||||||||||
| Plus import duties less adjustment for banking service(2) |
118,400 | 122,412 | 115,189 | 118,095 | 115,787 | |||||||||||||||
|
|
|
|
|
|
|
|
|
|
|
|||||||||||
| Total real GDP |
Ps. 703,486 | Ps. 720,407 | Ps. 702,306 | Ps. 720,898 | Ps. 704,330 | |||||||||||||||
|
|
|
|
|
|
|
|
|
|
|
|||||||||||
D-46
| (1) | Includes services completed by domestic workers including caretakers, domestic servants and private chauffeurs. |
| (2) | The production figures in this table do not include duties assessed on imports used in production, which must be taken into account for purposes of determining real GDP. Import duties for purposes of determining real GDP are recorded under this line item. |
Source: INDEC and Ministry of the Treasury
Real GDP by Sector
(as a % of real GDP, at constant 2004 prices)
| 2012 | 2013 | 2014 | 2015 | 2016 | ||||||||||||||||
| Primary production: |
||||||||||||||||||||
| Agriculture, livestock, fisheries and forestry |
6.3 | % | 6.9 | % | 7.3 | % | 7.7 | % | 7.4 | % | ||||||||||
| Mining and extractives (including petroleum and gas) |
3.2 | 3.1 | 3.2 | 3.2 | 3.1 | |||||||||||||||
|
|
|
|
|
|
|
|
|
|
|
|||||||||||
| Total primary production |
9.7 | % | 10.0 | % | 10.5 | % | 10.9 | % | 10.6 | % | ||||||||||
| Secondary production: |
||||||||||||||||||||
| Manufacturing |
18.3 | 18.2 | 17.7 | 17.4 | 16.8 | |||||||||||||||
| Construction |
3.2 | 3.1 | 3.1 | 3.1 | 2.8 | |||||||||||||||
| Electricity, gas and water |
1.7 | 1.6 | 1.7 | 1.7 | 1.8 | |||||||||||||||
|
|
|
|
|
|
|
|
|
|
|
|||||||||||
| Total secondary production |
23.2 | % | 22.9 | % | 22.5 | % | 22.2 | % | 21.4 | % | ||||||||||
| Services: |
||||||||||||||||||||
| Transportation, storage and communication |
7.5 | 7.5 | 7.7 | 7.7 | 8.1 | |||||||||||||||
| Trade, hotels and restaurants |
15.2 | 15.2 | 14.6 | 14.6 | 14.6 | |||||||||||||||
| Financial, real estate, business and rental services |
13.9 | 13.7 | 13.9 | 13.8 | 13.9 | |||||||||||||||
| Public administration, education, health, social and personal services |
13.2 | 13.1 | 13.7 | 13.7 | 14.3 | |||||||||||||||
| Domestic services(1) |
0.6 | 0.6 | 0.6 | 0.6 | 0.6 | |||||||||||||||
|
|
|
|
|
|
|
|
|
|
|
|||||||||||
| Total services |
50.3 | % | 50.1 | % | 50.5 | % | 50.5 | % | 51.6 | % | ||||||||||
| Plus import duties less adjustment for banking service(2) |
16.8 | 17.0 | 16.4 | 16.4 | 16.4 | |||||||||||||||
|
|
|
|
|
|
|
|
|
|
|
|||||||||||
| Total real GDP |
100.0 | % | 100.0 | % | 100.0 | % | 100.0 | % | 100.0 | % | ||||||||||
|
|
|
|
|
|
|
|
|
|
|
|||||||||||
| (1) | Includes services completed by domestic workers including caretakers, domestic servants and private chauffeurs. |
| (2) | The production figures in this table do not include duties assessed on imports used in production, which must be taken into account for purposes of determining real GDP. Import duties for purposes of determining real GDP are recorded under this line item. |
Source: INDEC and Ministry of the Treasury
In 2012, real GDP decreased by 1.0%. This contraction in economic activity was primarily due to the primary production sector, which decreased by 9.2% and accounted for 9.7% of real GDP for 2012, and the secondary production sector, which decreased by 2.3%, primarily as a result of a 2.9% decrease in manufacturing. As compared to 2011, the services sector increased by 0.7%, primarily driven by a 4.5% increase in domestic services.
In 2013, real GDP increased by 2.4%. Growth was primarily driven by the services sector, which increased by 1.9% and accounted for 50.1% of real GDP for 2013. Within the services sector, financial services experienced the highest growth. As compared to 2012, the primary production sector increased by 6.1%, primarily as a result of an increase in agriculture, livestock, fisheries and forestry, while the secondary production sector increased by 1.2%, primarily as a result of a 1.5% increase in manufacturing.
In 2014, real GDP decreased by 2.5%. This decline in real GDP was primarily driven by the services sector, which decreased by 1.6% and accounted for 50.5% of real GDP for 2014. Within the services sector, public administration services experienced the highest growth. As compared to 2013, the secondary production sector decreased by 4.1%, primarily as a result of a 5.1% decrease in manufacturing, while the primary production sector increased by 2.6%, primarily as a result of 3.1% growth in agriculture, livestock, fisheries and forestry.
D-47
In 2015, real GDP increased by 2.6%. Growth was primarily driven by the services sector, which increased by 2.6% and accounted for 50.5% of real GDP for 2015. Within the services sector, public administration experienced the highest rate of growth. As compared to 2014, the primary production sector increased by 6.2% and the secondary production sector increased by 1.3%.
In 2016, real GDP decreased by 2.3%. This decline was due to the contraction in the secondary production sector, primary production sector and the services sector. As compared to 2015, the secondary production sector decreased by 5.9%, the primary production sector decreased by 5.3% and the services sector decreased by 0.2%, with the transportation, storage and communication sector as well as the public administration, education, health, social and personal services, showing positive growth and partially mitigating the contraction of the economy.
The following table sets forth Argentina’s real GDP growth by sector for the periods specified.
Real GDP Growth by Sector
(% change from previous year, at constant 2004 prices)
| 2012 | 2013 | 2014 | 2015 | 2016 | ||||||||||||||||
| Primary production: |
||||||||||||||||||||
| Agriculture, livestock, fisheries and forestry |
(12.9 | )% | 11.5 | % | 3.1 | % | 7.6 | % | (5.3 | )% | ||||||||||
| Mining and extractives (including petroleum and gas) |
(1.2 | ) | (4.0 | ) | 1.6 | 2.8 | (5.3 | ) | ||||||||||||
|
|
|
|
|
|
|
|
|
|
|
|||||||||||
| Total primary production |
(9.2 | ) | 6.1 | 2.6 | 6.2 | (5.3 | ) | |||||||||||||
| Secondary production: |
||||||||||||||||||||
| Manufacturing |
(2.9 | ) | 1.5 | (5.1 | ) | 0.8 | (5.7 | ) | ||||||||||||
| Construction |
(2.4 | ) | (0.1 | ) | (2.0 | ) | 3.0 | (11.3 | ) | |||||||||||
| Electricity, gas and water |
4.7 | 0.5 | 2.0 | 3.5 | 1.4 | % | ||||||||||||||
|
|
|
|
|
|
|
|
|
|
|
|||||||||||
| Total secondary production |
(2.3 | ) | 1.2 | (4.1 | ) | 1.3 | (5.9 | ) | ||||||||||||
| Services: |
||||||||||||||||||||
| Transportation, storage and communication |
0.6 | 2.4 | 0.8 | 2.6 | 3.2 | % | ||||||||||||||
| Trade, hotels and restaurants |
(2.4 | ) | 2.2 | (6.3 | ) | 2.9 | (2.1 | ) | ||||||||||||
| Financial, real estate, business and rental services |
1.5 | 1.3 | (1.1 | ) | 2.0 | (1.5 | ) | |||||||||||||
| Public administration, education, health, social and personal services |
3.4 | 1.9 | 1.7 | 2.9 | 1.4 | % | ||||||||||||||
| Domestic services(1) |
4.5 | 2.2 | 0.3 | 0.6 | (0.5 | ) | ||||||||||||||
|
|
|
|
|
|
|
|
|
|
|
|||||||||||
| Total services |
0.7 | 1.9 | (1.6 | ) | 2.6 | (0.2 | )% | |||||||||||||
| Plus import duties less adjustment for banking service(2) |
1.0 | 3.4 | (5.9 | ) | 2.5 | (2.0 | ) | |||||||||||||
|
|
|
|
|
|
|
|
|
|
|
|||||||||||
| Total real GDP |
(1.0 | )% | 2.4 | % | (2.5 | )% | 2.6 | % | (2.3 | )% | ||||||||||
|
|
|
|
|
|
|
|
|
|
|
|||||||||||
| (1) | Includes services completed by domestic workers including caretakers, domestic servants and private chauffeurs. |
| (2) | The production figures in this table do not include duties assessed on imports used in production, which must be taken into account for purposes of determining real GDP. Import duties for purposes of determining real GDP are recorded under this line item. |
Source: INDEC and Ministry of the Treasury.
Primary Production
In 2016, the total primary sector production decreased by 5.3% compared to 2015. The fishing sector decreased by 0.1%, from U.S.$2.2 billion in 2015 to U.S.$2.2 billion in 2016. The decline in primary sector production during 2016 was mainly driven by a 5.3% decrease in agriculture, livestock and game.
D-48
The following tables set forth Argentina’s primary production and growth for the periods specified.
Primary Production
(in millions of pesos, at constant 2004 prices)
| 2012 | 2013 | 2014 | 2015 | 2016 | ||||||||||||||||
| Agriculture, livestock and game |
Ps. 41,439 | Ps. 46,058 | Ps. 47,565 | Ps. 51,429 | Ps. 48,514 | |||||||||||||||
| Fishing |
1,756 | 2,157 | 2,184 | 2,239 | 2,236 | |||||||||||||||
| Forestry, logging and related services |
1,412 | 1,511 | 1,520 | 1,509 | 1,501 | |||||||||||||||
| Mining and extractives (including petroleum and gas) |
23,350 | 22,405 | 22,755 | 23,403 | 22,168 | |||||||||||||||
|
|
|
|
|
|
|
|
|
|
|
|||||||||||
| Total sector production |
Ps. 67,957 | Ps. 72,131 | Ps. 74,024 | Ps. 78,580 | Ps. 74,419 | |||||||||||||||
Source: INDEC and Ministry of the Treasury
Primary Production
(% change from previous year, at constant 2004 prices)
| 2012 | 2013 | 2014 | 2015 | 2016 | ||||||||||||||||
| Agriculture, livestock and game |
(13.9 | )% | 11.1 | % | 3.3 | % | 8.1 | % | (5.7 | )% | ||||||||||
| Fishing |
0.6 | 22.9 | 1.2 | 2.5 | (0.1 | ) | ||||||||||||||
| Forestry, logging and related services |
7.1 | 7.0 | 0.6 | (0.7 | ) | (0.5 | ) | |||||||||||||
| Mining and extractives (including petroleum and gas) |
(1.2 | ) | (4.0 | ) | 1.6 | 2.8 | (5.3 | ) | ||||||||||||
|
|
|
|
|
|
|
|
|
|
|
|||||||||||
| Total sector production |
(9.2 | )% | 6.1 | % | 2.6 | % | 6.2 | % | (5.3 | )% | ||||||||||
Source: INDEC and Ministry of the Treasury
Agriculture, Livestock, Fisheries and Forestry
Argentina relies exclusively on its domestic supply for virtually all agricultural and livestock products, and is a major exporter of primary products, including cereals, grains, meat and fish. Crop production consists primarily of soy, corn and wheat. During the 2015 to 2016 season, soy, corn, and wheat production represented 47.0%, 31.8% and 9.0% of total agricultural production, respectively. During 2016, Argentina’s agriculture, livestock, fisheries and forestry sector accounted for 7.4% of real GDP.
As of the date of this Annual Report, the INDEC has not yet released revised segment-by-segment production and growth data for Argentina’s agriculture, livestock and hunting or forestry sectors for the years 2011-2016.
Mining and Extractives (Including Petroleum and Gas Production)
The mining and extractives sector consists primarily of precious and semi-precious metals, coal, petroleum and gas exploration and production. Historically, mining activity in Argentina has represented a small part of the economy, accounting for 3.1% of real GDP in 2016.
Argentina is the second largest producer of natural gas and the fourth largest producer of crude oil in Latin America, based on 2015 production, according to the 2016 edition of the BP Statistical Review of World Energy, published in June 2015. Since its expropriation of 51% of the shares of YPF, the Government has controlled YPF, which, as of December 31, 2016, held interests in 110 oil and gas fields in Argentina. YPF, in association with private partners, is also engaged in projects relating to the exploration and development of unconventional resources, including shale oil and gas, primarily in the Vaca Muerta formation located in the provinces of Neuquén and Río Negro. See “Role of the State in the Economy—Oil and Gas Industry,” “The Argentine Economy—Fernández de Kirchner’s Administration: 2008 2015,” “—Principal Government Policies and their Impact on Argentina’s Economy (2011-2015)” and “Macri Administration: 2015-Present.”
D-49
Argentina’s oil and gas industry and the energy sector became the target of intense regulation during the Kirchner and Fernández de Kirchner administrations, including price controls, export restrictions and other measures that maintained local prices below international price levels. Those same policies, when international oil prices dropped, resulted in subsidies being paid to oil producers to support domestic prices. These measures are in the process of being dismantled by the Macri administration.
Secondary Production
Manufacturing
Argentina’s manufacturing sector primarily consists of the production of food and beverages, chemical products and substances, common metals, rubber and plastic products, motor vehicles, trailers and semi-trailers and apparel. The 2001-2002 economic crisis that severely affected Argentina—with GDP contracting 10.9% in 2002—had a significant adverse effect on this sector. The adoption of import-substitution policies commencing in 2002 contributed to the growth of this sector by 4.8% on average each year. Between 2003 and 2008, growth was also fueled by growth of manufactured products, which became competitive due to the effects of the devaluation of the peso and investments aimed at stimulating production. The manufacturing of industrial products, such as chemical products, planes and ships, and agricultural products, such as crops and livestock, also contributed to exports during this period. In 2016, the manufacturing sector accounted for 16.8 % of real GDP.
During 2012, the manufacturing sector contracted by 2.9% compared to 2011. This decrease was primarily driven by:
| • | a 9.9% decrease in machinery and equipment, accounting for 23.1% of the total contraction in the manufacturing sector in 2012; |
| • | an 8.2% decrease in the production of motor vehicles, trailers, and semi-trailers, accounting for 15.6% of the total contraction in the manufacturing sector in 2012; and |
| • | a 5.7% decrease in common metals, accounting for 14.9% of the total contraction in the manufacturing sector in 2012. |
This decrease was partially offset by a 4.4% increase in the chemical product and substance sector and a 20.3% increase in entertainment and communication equipment.
In 2013, the manufacturing sector grew by 1.5% compared to 2012. This increase was primarily driven by:
| • | a 5.2% increase in chemical products and substances, accounting for 45.7% of the total expansion in the manufacturing sector in 2013; |
| • | an 8.4% increase in the production of motor vehicles, trailers, and semi-trailers, accounting for 29.5% of the total expansion in the manufacturing sector in 2013; and |
| • | an 8.0% increase in non-metallic minerals, accounting for 22.2% of the total expansion in the manufacturing sector in 2013. |
This increase was partially offset by a 5.0% decrease in the metal products sector.
During 2014, the manufacturing sector contracted by 5.1% compared to 2013. This decrease was primarily driven by:
| • | a 20.6% decrease in the production of motor vehicles, trailers, and semi-trailers, accounting for 22.9% of the total contraction in the manufacturing sector in 2014; |
| • | a 12.3% decrease in the production of machinery and equipment, accounting for 15.3% of the total expansion in the manufacturing sector in 2014; and |
D-50
| • | a 13.6% decrease in metal products, accounting for 11.9% of the total expansion in the manufacturing sector in 2014. |
During 2015, the manufacturing sector increased by 0.8% compared to 2014. This increase was primarily driven by:
| • | a 3.5% increase in food and beverages; |
| • | a 7.1% increase in rubber and plastic products; and |
| • | a 7.8% increase in furniture. |
This increase was partially offset by an 8.4% decrease in common metals production and an 11.8% decrease in motor vehicles, trailers, and semi-trailers.
During 2016, the manufacturing sector contracted by 5.7% compared to 2015. This decrease was primarily driven by:
| • | a 10.6% decrease in common metals; |
| • | a 4.8% decrease in chemical products and substances; |
| • | a 2.5% decrease in food and beverages; and |
| • | an 11.8% decrease in wearing apparel. |
All manufacturing sectors experienced a decrease in their production.
Construction
There is a strong correlation between the evolution of real GDP and the construction sector, which primarily consists of residential projects. The construction sector accounted for 2.8% of real GDP in 2016.
In 2012, the level of activity in the construction sector decreased by 2.4% compared to 2011, primarily due to a deceleration of overall economic activity. During 2012, the construction sector accounted for 3.2% of real GDP. Investment in construction in the hydrocarbons sector decreased in 2012, while construction activity in all other public and private sectors increased.
In 2013, the level of activity in the construction sector decreased by 0.1% compared to 2012. In 2013, the construction sector accounted for 3.1% of real GDP.
In 2014, the level of activity in the construction sector decreased by 2.0% compared to 2013, primarily due to unemployment in both the private and public sectors. In 2014, the construction sector accounted for 3.1% of real GDP.
In 2015, the level of activity in the construction sector increased by 3.0% compared to 2014, primarily due to an increase in private sector projects, which was partially offset by a decrease in public sector projects and construction activity in the hydrocarbons sector.
In 2016, the level of activity in the construction sector decreased by 11.3% compared to 2015.
Electricity, Gas and Water
Electricity in Argentina is primarily produced from combined cycle (which uses both gas and steam turbines to produce electricity) and hydroelectric sources, with supplemental generation from gas, coal and nuclear plants. The electricity, gas and water sector represents a small fraction of the Argentine economy, accounting for 1.8% of real GDP in 2016.
D-51
Although electricity production in Argentina experienced positive growth between 2012 and 2015, the rates of growth decelerated during this period. Electricity production increased by 3.8%, 3.2%, 1.1%, and 4.3% in 2012, 2013, 2014, and 2015 respectively, in each case as compared to the previous year. During this period, Argentina relied in part on fuel imports to meet excess consumption needs. The following table sets forth information on Argentina’s electricity sector for the periods specified.
Principal Economic Indicators of the Electricity Sector
(in GW/hr, unless otherwise specified)
| 2012 | 2013 | 2014 | 2015 | 2016 | ||||||||||||||||
| Production of electricity sector |
||||||||||||||||||||
| Combined cycle |
51,838 | 51,661 | 51,032 | 52,576 | n.a. | |||||||||||||||
| Hydroelectric |
36,626 | 40,330 | 40,663 | 41,464 | n.a. | |||||||||||||||
| Other(1) |
37,340 | 37,829 | 39,510 | 42,830 | n.a. | |||||||||||||||
|
|
|
|
|
|
|
|
|
|
|
|||||||||||
| Imports(2) |
423 | 342 | 1,390 | 1,655 | n.a. | |||||||||||||||
|
|
|
|
|
|
|
|
|
|
|
|||||||||||
| Total generation |
125,804 | 129,820 | 131,205 | 136,870 | n.a. | |||||||||||||||
|
|
|
|
|
|
|
|
|
|
|
|||||||||||
| Consumption by economic sector |
||||||||||||||||||||
| Industrial |
36,611 | 38,141 | 38,025 | 41,025 | n.a. | |||||||||||||||
| Residential |
36,464 | 38,821 | 40,387 | 42,079 | n.a. | |||||||||||||||
| Commercial |
18,777 | 18,854 | 19,494 | 21,565 | n.a. | |||||||||||||||
| Others |
10,705 | 9,749 | 9,936 | 10,501 | n.a. | |||||||||||||||
|
|
|
|
|
|
|
|
|
|
|
|||||||||||
| Government |
3,420 | 3,844 | 4,004 | 4,164 | n.a. | |||||||||||||||
|
|
|
|
|
|
|
|
|
|
|
|||||||||||
| Total consumption |
105,978 | 109,409 | 111,845 | 119,334 | n.a. | |||||||||||||||
|
|
|
|
|
|
|
|
|
|
|
|||||||||||
| (1) | Includes diesel, wind, nuclear, gas, steam and solar energy. |
| (2) | Imports, primarily from Uruguay, to meet domestic demand in excess of domestic production. |
| n.a. | = not available. |
Source: INDEC and Ministry of the Treasury.
In December 2015, President Macri declared a state of emergency with respect to the national electrical system that is expected to remain in effect until December 31, 2017. The state of emergency has and will allow the Government to take actions designed to guarantee the supply of electricity to the country such as instructing the Ministry of Energy and Mining to design and implement, with the cooperation of all federal public entities, a coordinated program to guarantee the quality and security of the electricity system. In addition, the Macri administration announced the elimination of some energy subsidies currently in effect and a substantial increase in electricity rates. For more information, see “—Economic History and Background—Macri Administration: 2015-Present” and “—Role of the State in the Economy—Oil and Gas Industry.”
The following table sets forth the imports and exports of fuel and energy for the periods specified.
Exports and Imports of Fuel and Energy
| 2012 | 2013 | 2014 | 2015 | 2016 | ||||||||||||||||
| Total FOB exports (in millions of U.S. dollars) |
U.S.$ | 79,982 | U.S.$ | 75,963 | U.S.$ | 68,407 | U.S.$ | 56,788 | U.S.$ | 57,733 | ||||||||||
| Fuel and energy (in millions of U.S. dollars) |
6,978 | 5,562 | 4,950 | 2,252 | 1,996 | |||||||||||||||
| As a % of total FOB exports |
8.7 | % | 7.3 | % | 7.2 | % | 4.0 | % | 3.5 | % | ||||||||||
| Change from previous year |
(3.6 | )% | (5.0 | )% | (9.9 | )% | (17.0 | )% | 1.7 | % | ||||||||||
|
|
|
|
|
|
|
|
|
|
|
|||||||||||
| Total CIF imports (in millions of U.S. dollars) |
U.S.$ | 67,974 | U.S.$ | 74,442 | U.S.$ | 65,230 | U.S.$ | 59,757 | U.S.$ | 55,610 | ||||||||||
| Fuel and energy (in millions of U.S. dollars) |
9,128 | 12,464 | 11,455 | 6,842 | 4,739 | |||||||||||||||
| As a % of total CIF imports |
13.4 | % | 16.7 | % | 17.6 | % | 11.4 | % | 8.5 | % | ||||||||||
| Change from previous year |
(8.1 | )% | 9.5 | % | (12.4 | )% | (8.4 | )% | (6.9 | )% | ||||||||||
|
|
|
|
|
|
|
|
|
|
|
|||||||||||
| Net (imports) exports of fuel and energy (in millions of U.S. dollars) |
U.S.$ | (2,150 | ) | U.S.$ | (6,902 | ) | U.S.$ | (6,505 | ) | U.S.$ | (4,590 | ) | U.S.$ | (2,743 | ) | |||||
|
|
|
|
|
|
|
|
|
|
|
|||||||||||
Source: INDEC and Ministry of the Treasury.
D-52
Evolution of Exports and Imports of Fuel and Energy
(% change in volume from previous year)
| 2012 | 2013 | 2014 | 2015 | 2016 | ||||||||||||||||
| Change in volume of exports |
(5.9 | )% | (3.7 | )% | (7.9 | )% | (1.5 | )% | 6.6 | % | ||||||||||
| Change in volume of imports |
(6.3 | )% | 3.7 | % | (12.5 | )% | 3.8 | % | 3.8 | % | ||||||||||
Source: INDEC and Ministry of the Treasury.
Services
The services sector represents the largest portion of the Argentine economy, accounting for 50.3% of real GDP in 2012, 50.1% in 2013, 50.5% in 2014, 50.5% in 2015, and 51.6% in 2016.
The following tables set forth the composition and growth of the services sector for the periods specified.
Composition of Services Sector
(in millions of pesos, at constant 2004 prices)
| 2012 | 2013 | 2014 | 2015 | 2016 | ||||||||||||||||
| Wholesale and retail trade and repairs |
95,946 | 98,339 | 91,605 | 94,337 | 91,871 | |||||||||||||||
| Transportation, storage and communication services |
52,515 | 53,754 | 54,168 | 55,581 | 57,357 | |||||||||||||||
| Real estate, business and rental services |
70,809 | 71,328 | 70,964 | 72,546 | 72,058 | |||||||||||||||
| Education, social and health services |
44,663 | 45,905 | 46,957 | 48,383 | 49,496 | |||||||||||||||
| Financial services |
26,836 | 27,596 | 26,839 | 27,181 | 26,144 | |||||||||||||||
| Other community, social and personal services |
18,874 | 18,611 | 18,253 | 18,597 | 18,300 | |||||||||||||||
| Public administration |
29,346 | 30,121 | 31,055 | 32,120 | 32,738 | |||||||||||||||
| Hotels and restaurants |
10,970 | 10,972 | 10,842 | 11,033 | 11,235 | |||||||||||||||
|
|
|
|
|
|
|
|
|
|
|
|||||||||||
| Domestic Services(1) |
4,154 | 4,247 | 4,259 | 4,285 | 4,264 | |||||||||||||||
|
|
|
|
|
|
|
|
|
|
|
|||||||||||
| Total |
354,112 | 360,875 | 354,941 | 364,062 | 363,463 | |||||||||||||||
|
|
|
|
|
|
|
|
|
|
|
|||||||||||
| (1) | Includes services completed by domestics workers including caretakers, domestic servants and private chauffeurs. |
Source: INDEC and Ministry of the Treasury.
Growth of Services Sector
(% change from prior year, at constant 2004 prices)
| 2012 | 2013 | 2014 | 2015 | 2016 | ||||||||||||||||
| Wholesale and retail trade and repairs |
(2.8 | )% | 2.5 | % | (6.8 | )% | 3.0 | % | (2.6 | )% | ||||||||||
| Transportation, storage and communication services |
0.6 | % | 2.4 | % | 0.8 | % | 2.6 | % | 3.2 | |||||||||||
| Real estate, business and rental services |
(0.6 | )% | 0.7 | % | (0.5 | )% | 2.2 | % | (0.7 | ) | ||||||||||
| Education, social and health services |
4.3 | % | 2.8 | % | 2.3 | % | 3.0 | % | 2.3 | |||||||||||
| Financial services |
7.3 | % | 2.8 | % | (2.7 | )% | 1.3 | % | (3.8 | ) | ||||||||||
| Other community, social and personal services |
1.8 | % | (1.4 | )% | (1.9 | )% | 1.9 | % | (1.6 | ) | ||||||||||
| Public administration |
3.0 | % | 2.6 | % | 3.1 | % | 3.4 | % | 1.9 | |||||||||||
| Hotels and restaurants |
1.4 | % | 0.0 | % | (1.2 | )% | 1.8 | % | 1.8 | |||||||||||
| Domestic services(1) |
4.5 | % | 2.2 | % | 0.3 | % | 0.6 | % | (0.5 | ) | ||||||||||
|
|
|
|
|
|
|
|
|
|
|
|||||||||||
| Total |
0.7 | % | 1.9 | % | (1.6 | )% | 2.6 | % | (0.2 | )% | ||||||||||
|
|
|
|
|
|
|
|
|
|
|
|||||||||||
| (1) Includes services completed by domestics workers including caretakers, domestic servants and private chauffeurs. Source: INDEC and Ministry of the Treasury. |
D-53
Between 2012 and 2016, the services sector grew by 2.6%, with contractions in 2014 (1.6%) and 2016 (0.2%). This increase was primarily driven by growth in transportation, storage, and communication services which increased by 9.2%, education and social and health services, which increased by 10.8%, and public administration, which increased by 11.6% during this period.
During 2012, the services sector grew at a decelerated rate of 0.7%, primarily due to a decline in wholesale and retail trade and repairs. In 2012, the services sector was the only sector that contributed positively to GDP growth, increasing as a percent of GDP from 49.5% in 2011 to 50.3% in 2012.
In 2013, the services sector grew by 1.9%. This increase resulted from growth in each sub-sector other than community, social and personal services and hotels and restaurants, with particular growth in education and social and health services, public administration and wholesale and retail trade and repairs.
In 2014, the services sector decreased by 1.6% compared to 2013. This decrease was primarily driven by the contraction of wholesale and retail trade and repairs.
In 2015, the services sector grew by 2.6% compared to 2014. This growth was primarily driven by the increase in wholesale and retail trade and repairs and real estate, business and rental services.
In 2016, the services sector contracted by 0.2% compared to 2015. This decrease was primarily driven by a 2.6% decrease in wholesale and retail trade and repairs services, as well as a 3.8% decrease in financial services. This decrease was offset by a 3.2% increase in transportation, storage and communication services and a 2.3% increase in education, social and health services. In 2016, the services sector accounted for 51.6% of real GDP.
Telecommunications
The telecommunications sector has grown in terms of the total number of lines each year since 2001. Much of this growth has resulted from a substantial increase in the use of mobile communications, which have become increasingly common in Argentina as more affordable cellular phone plans have become available and consumers’ purchasing power has improved.
D-54
In October 2009, the Argentine Congress passed the Audiovisual Communication Services Law No. 26.522 (the “LSCA”) to replace the general legal framework under which the audiovisual media industry had operated in Argentina for approximately three decades. This law, which imposed restrictions on the ownership of licenses, was challenged by private companies operating in the audiovisual media industry on several grounds, including its encroachment on constitutional rights. On October 29, 2013, the Supreme Court of Argentina upheld the constitutionality of the LSCA.
On December 16, 2014, Congress passed Law No. 27,078 (the “Digital Argentina Act”), which partially repealed the existing National Telecommunications Law No. 19,798 and conditioned the effectiveness of Decree No. 764/00 (which had deregulated the telecommunications market) on certain new regulations. The most significant change to the former National Telecommunications system was the creation of a new public service referred to as “Public and Strategic Infrastructure Use and Access Service for and among Providers.” By characterizing this activity as a public service, providers (including audiovisual communication service providers) could be required to grant other “Information and Communication Technologies” (or “TIC,” the term used to refer to telecommunication services under the Digital Argentina Act) service providers access to network elements, related resources or services for such other TIC service providers to render their own services. Networks and infrastructure owners could be required to grant network access to competitors that had not made investments in their own infrastructure.
Until December 2015, the Argentine media industry was governed by the LSCA and the Digital Argentina Act, and subject to the oversight of two different enforcement agencies: (a) in the case of the audiovisual media industry, by the LSCA and its federal enforcement authority (the “AFSCA”), and (b) in the case of the telecommunications industry, by the Digital Argentina Act and its federal enforcement authority (the “AFTIC”).
On December 29, 2015, the Macri administration issued Decree No. 267/2015 (the “New Media Decree”) pursuant to which it intends, among other measures, to gradually converge the audiovisual media and telecommunications industries under the same regulatory framework. Among other things, the New Media Decree (i) creates a new National Communications Agency (“Enacom”), a self-governing decentralized entity under the Ministry of Communications, which replaces AFSCA and AFTIC as the authorities empowered to enforce the LSCA and the Digital Argentina Act; (ii) repeals and amends several provisions of the LSCA, including mandatory divestment requirements; and (iii) eliminates the restriction on providers offering open broadcasting television services and subscription television services in the same area.
Employment and Labor
Unemployment and Underemployment
The INDEC prepares a series of indices used to measure the social, demographic and economic characteristics of the Argentine population based on data generally collected in the Permanent Household Survey (Encuesta Permanente de Hogares, or “EPH”). Please see “Presentation of Statistical and Other Information—Certain Methodologies” for important information regarding the reliability of INDEC data.
The following table sets forth employment figures for the periods indicated.
Employment and Unemployment Rates(1)
| Fourth quarter of | Third quarter of(*) | Fourth quarter of | ||||||||||||||
| 2013 | 2014 | 2015 | 2016 | |||||||||||||
| Greater Buenos Aires Area: |
||||||||||||||||
| Labor force rate(2) |
47.3 | % | 46.5 | % | 46.1 | % | 47.0 | % | ||||||||
| Employment rate(3) |
44.3 | 43.2 | 43.4 | 43.0 | ||||||||||||
| Unemployment rate(4) |
6.5 | 7.2 | 6.0 | 8.5 | ||||||||||||
| Underemployment rate(5) |
8.1 | 10.0 | 9.7 | 11.7 | ||||||||||||
| Major interior cities:(1) |
||||||||||||||||
| Labor force rate(2) |
43.8 | 43.9 | 43.4 | 43.4 | ||||||||||||
D-55
| Fourth quarter of | Third quarter of(*) | Fourth quarter of | ||||||||||||||
| 2013 | 2014 | 2015 | 2016 | |||||||||||||
| Employment rate(3) |
41.1 | 41.0 | 40.9 | 40.7 | ||||||||||||
| Unemployment rate(4) |
6.3 | 6.6 | 5.7 | 6.4 | ||||||||||||
| Underemployment rate(5) |
7.4 | 8.0 | 7.5 | 8.5 | ||||||||||||
| Total urban: |
||||||||||||||||
| Labor force rate(2) |
45.6 | 45.2 | 44.8 | 45.3 | ||||||||||||
| Employment rate(3) |
42.7 | 42.1 | 42.2 | 41.9 | ||||||||||||
| Unemployment rate(4) |
6.4 | 6.9 | 5.9 | 7.6 | ||||||||||||
| Underemployment rate(5) |
7.8 | % | 9.1 | % | 8.6 | % | 10.3 | % | ||||||||
| (1) | Figures are based on 28 major cities. The current methodology to measure EPH is applied to every major city except Rawson - Trelew, San Nicolás -Villa Constitución and Viedma - Carmen de Patagones, which are still being measured using the old methodology given the resource constraints of cities located in the interior of the country. |
| (2) | The labor force consists of the sum of the population that has worked a minimum of (i) one hour with remuneration, or (ii) 15 hours without remuneration during the week preceding the date of measurement plus the population that is unemployed but actively seeking employment. |
| (3) | To be considered employed, a person above the minimum age requirement must have worked at least one hour with remuneration or 15 hours without remuneration during the preceding week. |
| (4) | Unemployed population as a percentage of the labor force. The unemployed population does not include the underemployed population. |
| (5) | Underemployed population as a percentage of the labor force. Workers are considered underemployed if they work fewer than 35 hours per week and wish to work more. |
| (*) | Data for the fourth quarter of 2015 is not available. |
Source: INDEC and Ministry of the Treasury.
In January 2002, the Government implemented the Plan Jefes y Jefas de Hogar (Heads of Households Program). Under the Heads of Households Program, unemployed heads of households with one or more children under the age of 18 or with disabled dependents of any age receive Ps.150 per month (an amount that has periodically been adjusted for inflation) in exchange for at least four hours of either community service or participation in other public works projects. Persons receiving benefits under the Heads of Households program are considered employed in the Government’s employment statistics, including in the tables presented in this section “Employment and Labor.” During the height of the economic crisis in the first three months of 2002, there were approximately 1.4 million beneficiaries in this program. As unemployment decreased and new programs were created to address other employment related matters such as adequate job training, the number of beneficiaries declined.
The Informal Economy
Argentina has an informal economy composed primarily of employees not registered with Argentina’s social security system but working in legitimate businesses and, to a lesser degree, in unregistered businesses. Because of its nature, the informal economy is difficult to track through statistical information or other reliable data.
A second and more modest segment of Argentina’s informal sector consists of economic activities that take place outside the formal economy or deviate from official norms for economic transactions. These include small businesses, usually those owned by individuals and families, which produce and exchange legal goods and services but may not have the appropriate business permits, report their tax liability, comply with labor regulations or have legal guarantees in place for suppliers and end users. As of the fourth quarter of 2016, the INDEC estimates that the informal economy decreased to 33.6% of the total labor force compared to 34.6% as of the fourth quarter of 2012.
D-56
The following table provides the estimated percentage of workers in Argentina’s formal and informal economies for the periods specified.
Formal and Informal Economies(1)
(as a percentage of total)
| 2012 | 2013 | 2014 | Third quarter of 2015(*) |
Fourth quarter of 2016 |
||||||||||||||||
| Formal |
65.4 | % | 66.5 | % | 65.7 | % | 66.9 | % | 66.4 | % | ||||||||||
| Informal |
34.6 | 33.5 | 34.3 | 33.1 | 33.6 | |||||||||||||||
|
|
|
|
|
|
|
|
|
|
|
|||||||||||
| Total |
100.0 | % | 100.0 | % | 100.0 | % | 100.0 | % | 100 | % | ||||||||||
|
|
|
|
|
|
|
|
|
|
|
|||||||||||
| (1) | Figures presented here do not include participants in the Heads of Households Program and individuals under the age of 18. |
Source: INDEC and Ministry of the Treasury.
| (*) | Data for the fourth quarter of 2015 is not available. |
The following table sets forth employment figures by sector for the periods specified.
Employment
(% by sector) (1)
| As of June 30, | ||||||||||||||||
| 2012 | 2013 | 2014 | 2015(2) | |||||||||||||
| Primary production: |
||||||||||||||||
| Agriculture, livestock, fisheries and forestry |
4.6 | % | 4.5 | % | 4.6 | % | 4.6 | % | ||||||||
| Mining and extractives (including petroleum and gas) |
0.7 | 0.7 | 0.7 | 0.8 | ||||||||||||
|
|
|
|
|
|
|
|
|
|||||||||
| Total primary production |
5.3 | 5.3 | 5.3 | 5.3 | ||||||||||||
| Secondary production: |
||||||||||||||||
| Manufacturing |
15.6 | 15.5 | 15.6 | 14.9 | ||||||||||||
| Construction |
5.4 | 5.2 | 5.4 | 5.3 | ||||||||||||
| Electricity, gas and water |
0.8 | 0.8 | 0.8 | 0.8 | ||||||||||||
|
|
|
|
|
|
|
|
|
|||||||||
| Total secondary production |
21.7 | 21.5 | 21.7 | 21.0 | ||||||||||||
| Services: |
||||||||||||||||
| Transportation, storage and communication |
6.7 | 6.7 | 6.7 | 6.6 | ||||||||||||
| Trade, hotels and restaurants |
18.2 | 18.1 | 18.2 | 17.9 | ||||||||||||
| Financial, real estate, business and rental services |
13.4 | 13.3 | 13.4 | 13.2 | ||||||||||||
| Public administration, education, health, social and personal services |
34.5 | 35.0 | 34.5 | 35.9 | ||||||||||||
|
|
|
|
|
|
|
|
|
|||||||||
| Total services |
72.9 | 73.1 | 72.9 | 73.6 | ||||||||||||
| Other |
— | 0.1 | 0.1 | — | ||||||||||||
|
|
|
|
|
|
|
|
|
|||||||||
| Total |
100.0 | % | 100.0 | % | 100.0 | % | 100.0 | % | ||||||||
|
|
|
|
|
|
|
|
|
|||||||||
| (1) | Annual average for each year indicated. |
| (2) | Last available information is as of the second quarter of 2015. |
Source: INDEC and Ministry of the Treasury.
D-57
Labor Regulation
During the 1990s, the Government implemented several labor reform packages designed to increase the flexibility of Argentina’s labor market and the collective bargaining process. The Government sought to remove regulations that inhibited employers’ ability to adjust their workforce to account for prevailing economic conditions, including through the removal of regulations requiring long-term employment contracts and severance payments. However, in response to the global financial crisis that began in 2008, the Government enacted a series of policies designed to protect employment in certain sectors deemed to be vital to the Argentine economy. In doing so, the Government took steps to reverse many of the reforms enacted in the 1990s.
Labor unions in Argentina continue to exercise significant influence in the collective bargaining process. Both local and federal unions have staged various strikes in recent years to protest for salary increases. Strikes and demonstrations tend to have brief but significant impacts on transportation, and succeed in bringing production in various sectors of the economy to a temporary halt, in most cases for periods of only a few days. In the past, several of these strikes were accompanied by violent demonstrations.
Wages and Labor Productivity
The Ministry of Employment and Social Security, through the Wage Council, sets a single minimum wage annually for all sectors of the economy, based on macroeconomic indicators such as GDP growth and inflation. The minimum monthly wage for public and private employees was increased by 19.3% in 2012, 25.2% in 2013, 27.4% in 2014 and 31.4% in 2015, and 32.8% in 2016 in each case as compared to the previous year. In January 2014, the minimum wage was raised to Ps.3,600, and increased again in September 2014 to Ps.4,400. In 2015, the minimum wage further increased to Ps.5,588. In January 2016, the Ministry of Employment and Social Security, through the Wage Council, increased the minimum monthly wage to Ps.6,060. In May 2016, the minimum monthly wage was further increased to Ps.8,060, representing an increase of 33%, which became fully effective in January 2017. This increase in wages was implemented in three phases: 12.3% in June 2016 (to Ps.6,810), 12.4% in September 2016 (to Ps.7,560) and 8.3% in January 2017 (to Ps.8,060). In addition, unemployment insurance was increased by 750%, with the minimum amount set as Ps.1,875 and the maximum amount as Ps.3,000 for the first three months, which gradually decreases to Ps.1,200 after one year.
D-58
The following table provides the average monthly minimum nominal wage of Argentine employees, including estimates for those employed in the informal economy, for the years specified.
Average Monthly Minimum Nominal Wage
(in current pesos)
| As of December 31, |
Average Monthly Minimum Wage |
Average Cost of Basic Basket (1) |
Average Monthly Minimum Wage (as a % of Average Cost of Basic Basket) |
|||||||||
| 2012 |
2,423 | 1,521 | 159.3 | |||||||||
| 2013 |
3,035 | 1,692 | 179.4 | |||||||||
| 2014 |
3,867 | n.a. | (2) | n.a. | (2) | |||||||
| 2015 |
5,079 | n.a. | (2) | n.a. | (2) | |||||||
| 2016 |
6,748 | n.a. | (2) | n.a. | (2) | |||||||
| (1) | Average cost of a basket of essential goods and services for a “reference” family used to measure the poverty line. A “reference” family is considered a family of four: two adults, one male, age 35, and one female, age 31, and two children, ages 5 and 8. |
| (2) | The INDEC discontinued the publication of this information in 2014. |
| n.a. | = not available. |
Source: Ministry of Employment and Social Security and Ministry of the Treasury.
D-59
The following table provides the percentage change in the nominal wage of Argentine employees for the years specified.
Nominal Wage
| (% change from prior year) | ||||||||||||||||
| Private Sector | Public Sector |
Total | ||||||||||||||
| Formal | Informal | |||||||||||||||
| December 2012 |
24.8 | 33.5 | 17.8 | 24.5 | ||||||||||||
| December 2013 |
25.2 | 27.7 | 26.2 | 25.9 | ||||||||||||
| December 2014 |
31.5 | 40.0 | 33.9 | 33.7 | ||||||||||||
| December 2015 |
30.1 | n.a. | 33.6 | n.a. | ||||||||||||
| December 2016 |
32.9 | % | n.a. | 32.6 | % | n.a. | ||||||||||
| (1) | Data for the first ten months of 2015 as compared to the same period in 2014. |
Source: Ministry of the Treasury, based on information provided by the INDEC.
Poverty and Income Distribution
In the second half of 2012, 5.4% of the population (as compared to 6.5% in the same period of 2011) and 4.0% of households (as compared to 4.8% in the same period of 2011) in 31 urban centers (including Buenos Aires) lived below the poverty line. In the second half of 2002, during the crisis, 57.5% of the population lived below the poverty line, meaning a 52.1 percentage points reduction in the previous decade. The INDEC discontinued the publication of poverty data for the years 2013, 2014 and 2015.
On September 22, 2016, the INDEC resumed publication of its essential goods and services basket assessment for the Greater Buenos Aires area. On February 21, 2017, this assessment indicated that a standard family required Ps.13,324 to gain access to the essential goods and services basket in January 2017, compared to Ps.11,320 in April 2016.
According to indicators published by the INDEC on September 28, 2016, in the second quarter of 2016, 32.2% of the population and 23.1% of households lived below the poverty and extreme poverty lines, respectively.
In the second half of 2016, 21.5% of Argentina’s households and 30.3% of the population stood below the poverty line, while 4.5% of the households and 6.1% of the population stood below the extreme poverty line.
Until 2001, assessments of national poverty levels were based primarily on figures for the Greater Buenos Aires Area. Between 2001 and 2012, the Government collected poverty statistics for urban centers in addition to the Greater Buenos Aires Area. Additionally, the Government changed the frequency of calculating national poverty levels from a semi-annual spot analysis conducted in May and October to a constant analysis, with results published on a quarterly basis through 2012. During this period, the Encuesta Permanente de Hogares (Permanent Household Survey) collected data on a continual basis. The survey used four observation points, resulting in the gathering of quarterly data, with a view to providing information relating to the workforce in each relevant area. Until it discontinued publication of poverty data, the Government also provided quarterly information relating to poverty. Poverty data is not available for the years 2013, 2014 and 2015.
Poverty estimates depend on the relevant methodologies used to calculate poverty levels. There are a number of differences between the methods used by Argentina through 2012 and the methods used by other countries, including other MERCOSUR members. In particular, poverty estimates depend, in part, on inflation estimates. Because estimates regarding inflation in Argentina have differed in material ways, poverty estimates may also differ significantly. The Government relied on the INDEC’s data relating to poverty, which has differed materially from poverty data published by other sources. See “Monetary System—Inflation” for important information regarding the reliability of this data.
The measurement of poverty is based on a basket of goods and services (consisting primarily of food, clothing, transportation, health care, housing and education), which is considered the minimum necessary to sustain an individual. “Essential goods and services” in the basket that the Government has subsidized include natural gas, electricity, bus transportation and suburban and urban mass transportation, rail transportation, subway
D-60
transportation, fuel and education. The method in use by Argentina in 2011 and 2012 for measuring poverty was adopted early in the 1990s. The prices of the basket were initially valued in 1985 and the monetary value of the items were updated on a monthly basis by applying the changes in consumer prices for the Greater Buenos Aires Area. This measurement only accounted for the metropolitan area of Buenos Aires until 2001, when a change in methodology expanded it to the rest of the country.
The following table sets forth the poverty levels in Argentina:
Poverty(1)
(% of population)
| Second half of |
Households | Population | ||||||
| 2011 |
4.8 | % | 6.5 | % | ||||
| 2012 |
4.0 | 5.4 | ||||||
| 2013 |
n.a. | n.a. | ||||||
| 2014 |
n.a. | n.a. | ||||||
| 2015 |
n.a. | n.a. | ||||||
| 2016 |
21.5 | 30.3 | ||||||
| (1) | The poverty line is based on the estimated cost of a basket of essential goods and services during a given period, which varies depending on the characteristics of each individual and each household. For instance, men between the ages of 30 and 59 who earned less than Ps.454.49 per month during December 2011 lived below the poverty line. For households, a family of four (two adults, one male age 35 and one female age 31, and two children ages 5 and 8) that earned in total less than Ps.1,328.5 per month during December 2011 lived below the poverty line. |
n.a. = not available.
Source: INDEC and Ministry of the Treasury.
From 2012 to 2016, the top 10% of the population in Argentina, in terms of annual income, contributed 2.4% more to the total national income and the top 20% contributed 2.2% more. During the same period, the bottom 40% of the population decreased its contribution to the total national income by 0.7%. In the fourth quarter of 2016, the top 10% of the population in Argentina accounted for 30.3% of total national income and the top 20% of the population accounted for 46.7% of total national income. The table below sets forth figures on the distribution of income as of the dates specified.
Evolution of Income Distribution
(% of total national income)
| Fourth quarter of | Second quarter of |
|||||||||||||||||||||||
| Income group |
2011 | 2012 | 2013 | 2014 | 2015 | 2016 | ||||||||||||||||||
| Lowest 40% |
14.4 | % | 15.4 | % | 15.6 | % | 15.1 | % | 15.7 | % | 14.7 | % | ||||||||||||
| Next 20% |
15.5 | 16.3 | 16.1 | 15.8 | 16.2 | 15.1 | ||||||||||||||||||
| Next 20% |
23.0 | 23.8 | 23.6 | 23.4 | 23.7 | 22.5 | ||||||||||||||||||
| Highest 20% |
47.1 | 44.5 | 44.6 | 45.6 | 44.4 | 47.9 | ||||||||||||||||||
| Highest 10% |
30.2 | % | 27.9 | % | 28.1 | % | 29.1 | % | 28.2 | % | 31.3 | % | ||||||||||||
Source: INDEC and Ministry of the Treasury.
The Government has taken measures to address growing poverty and unemployment in Argentina, although the impact of these measures on poverty has not yet been accurately measured given the lack of official data over the past years. The measures adopted between 2012 and 2016 include the following:
| • | Several increases in social security payments to workers under the Heads of Household Program. Between 2012 to 2016, the Government increased social security payments by 151.0%. In May 2014, the Government expanded the number of workers eligible to receive these payments by raising the applicable salary limit; |
| • | Extension of the Programa de Empleo Comunitario (Community Employment Program), created in 2003, through which under qualified workers who are 16 years old or older are entitled to receive a monthly payment in exchange for assisting in a project run by one of the participating organizations. Beneficiaries of this program are not entitled to receive monetary assistance through any other governmental program; |
D-61
| • | Public sector job training for Heads of Households Program beneficiaries and Community Employment Program workers; |
| • | Periodic increases in the minimum monthly payment for beneficiaries of the public pension system; |
| • | Periodic increases in the minimum monthly wage for public and private employees; |
| • | A 30.2% annual increase in the salaries of public employees each year between 2012 and 2016; |
| • | Implementation of the Herramientas por trabajo (Tools for Work) program that provides unemployed Heads of Households Program beneficiaries with funds to purchase tools and materials and with technical assistance to develop their projects; |
| • | Certain beneficiaries of the Heads of Household Program determined to be in situations “of high vulnerability,” were transitioned to the Familias por la Inclusión Social (Families for Social Inclusion) program, which provides a variable monthly payment to beneficiaries of the Heads of Households Program who are living in poverty and have three or more children under the age of 19. Educational support and workshops that promote family and community development, as well as professional and educational assistance, also form part of the program. Beneficiaries who are actively searching for a formal job also receive employment and training insurance; |
| • | Increase in the budget allocated for the Argentine Jobs Program, which, among other things, promotes the development of sustainable production activities, funds jobs through cooperatives and provides funding for social investment programs; |
| • | Asignación Por Embarazo (Pregnancy Allowance), through which ANSES provides a monthly payment of Ps.966 to pregnant women (as of December 2016) who meet certain requirements, including being unemployed (with an unemployed spouse), working in the informal economy (earning less than the minimum wage) or benefiting from the Argentine Jobs Program. A higher monthly payment is provided for disabled children; |
| • | Monotributo Social through which self-employed individuals are able to access health insurance benefits and the pension system, among other public benefits; |
| • | Jóvenes con más y mejor trabajo (Youth With More and Betters Jobs Program), through which unemployed individuals between the ages of 18 and 24 who have not completed primary or secondary school receive public assistance to allow them to complete their education, receive training, obtain practical experience in work environments, and/or receive a job placement; |
| • | Seguro de capacitación y empleo (Training and Employment Insurance), through which unemployed individuals who are 18 years old or older are entitled to receive a monthly payment, subject to their completion of primary and secondary school, and complete job training activities; |
| • | Expansion of the Programa Construir Empleo (Building Jobs Program) through which individuals 18 years or older who are unable to find employment receive public assistance and are placed in infrastructure jobs to develop or improve their construction skills; |
D-62
| • | Programa Intercosecha (Between Harvest Program), originally the Prórroga del Plan Interzafra program established in 2004, which provides assistance to permanent and temporary workers in the agricultural and agro-industrial sectors during periods between harvest seasons through job placements and the promotion of improved working conditions. Beneficiaries of this plan are not entitled to receive assistance through any other governmental program; |
| • | Programa de Respaldo a Estudiantes de Argentina, PROGRESAR (Supporting Argentine Students Program), which provides monthly payments to students between the ages of 18 and 24 who are either unemployed, work in the informal segment of the economy or whose salary falls below the minimum wage and whose family members face the same conditions; |
| • | Increase in the benefits provided to workers employed by businesses participating in the Programa de recuperación productiva (Productive Recovery Program), which was created in 2002 with the objective of supporting the wages of workers employed by struggling businesses. As of December 31, 2015, the number of workers receiving benefits through this program had risen to 76,529; and |
| • | The Programa de Crédito Argentino para la Vivienda Única Familiar (Credit Program for Family Living), “PRO.CRE.AR. BICENTENARIO” was implemented, through which 400,000 credit lines were expected to be opened between 2012 and 2016. The objective of the program is to provide for the living costs of Argentine residents based on their different socioeconomic conditions and family situations. |
Role of the State in the Economy
State-Owned Entities
The Government carries out certain functions and commercial activities through state-owned and state-controlled enterprises, including the following:
| • | Aerolíneas Argentinas S.A. (“Aerolíneas Argentinas”), the country’s largest airline and its affiliate Austral Líneas Aéreas Cielos del Sur S.A. (“Austral”); |
| • | Banco de la Nación Argentina, the national bank of Argentina; |
| • | Banco de Inversión y Comercio Exterior S.A. (“BICE”); |
| • | Agua y Saneamientos Argentinos S.A. (“AYSA”), which provides essential services of potable water and sanitation; |
| • | Correo Oficial de la República Argentina (“Correo Argentino”), the national postal service; |
| • | Energía Argentina S.A. (“ENARSA”), a state-owned energy company; |
| • | Operadora Ferroviaria S.E., the national railway company; and |
| • | YPF, a state-controlled energy company. |
State Involvement in the Economy
Following the crisis of 2001 to 2002, the Government reversed a number of measures implemented during the 1990s to deregulate the economy and reduce government intervention. Through November 2015, the Government re-introduced several state controls, most notably the following:
D-63
| • | the absorption and replacement of the former private pension system for a public “pay as you go” pension system, as well as the transfer of all resources previously administered by the private pension funds, including significant equity interests in a wide range of listed companies, to the FGS to be administered by the ANSES; |
| • | direct involvement in the oil and gas industry through the creation of ENARSA, the enactment of the Hydrocarbons Law (defined below) and the expropriation of 51% of the shares of YPF; |
| • | increased regulation of utility companies, including a continued Government-imposed freeze on utility rates; |
| • | the revocation of concessions for certain public services (including several railway lines and water services); |
| • | restrictions on capital transfers and other monetary transactions (see “Monetary System—Regulation of the Financial Sector”); |
| • | continued price controls on transportation and agricultural and energy products (see “The Argentine Economy—Primary Production”); |
| • | export tariffs on agricultural products (see “Balance of Payments—Trade Regulation”); |
| • | subsidies to the energy and transportation sectors (see “Public Sector Finances—National Public Accounts”); and |
| • | export regulations (see “Balance of Payments—Trade Regulation”). |
Expropriation Measures
During the Fernández de Kirchner administration, the government adopted a series of expropriation and nationalization measures. In December 2008, Congress approved a law declaring that the shares of Aerolíneas Argentinas, Austral and their subsidiaries, Optar S.A., Jet Paq S.A. and Aerohandling S.A. were “of public interest” and therefore subject to expropriation in accordance with the Argentine Expropriation Law. Under the valuation guidelines established in the Argentine Expropriation Law, the Tribunal de Tasaciones de la Nación (National Valuation Tribunal), estimated that these entities had an aggregate negative value approximately ranging between U.S.$602.0 million and U.S.$872.0 million. For a discussion of related arbitration proceedings, see “Public Sector Debt—Legal Proceedings—ICSID Arbitration.”
Oil and Gas Industry
In response to declining output in the oil and gas sector between 2002 and 2006, the Government adopted measures intended to allow producers to increase internal supply and meet export commitments. These measures included tax incentives, access to areas for further hydrocarbon exploration and extraction and improved distribution and transport systems. The Government additionally imposed price controls on hydrocarbon products such as gas and oil, while subsidizing the oil and gas sector in order to compensate producers for their losses stemming from the price controls and ensure adequate supply in the Argentine domestic market. Transfers to the energy sector totaled, Ps.62.3 billion in 2012, Ps.95.4 billion in 2013, Ps.213.7 billion in 2014, Ps.161.2 billion in 2015, and Ps.235.5 billion in 2016. The following table shows the proved reserves of petroleum and natural gas in Argentina as of the dates specified.
Proved Reserves
| 2012 | 2013 | 2014 | 2015 | 2016 | ||||||||||||||||
| Crude oil1) |
374,289 | 370,374 | 380,028 | 380,730 | n.a. | |||||||||||||||
| Natural gas(2) |
315,508 | 328,260 | 332,164 | 350,483 | n.a. | |||||||||||||||
| (1) | In thousands of cubic meters. |
| (2) | In billions of cubic meters. |
n.a. = not available.
Source: Ministry of Planning, Secretary of Energy.
D-64
In 2011 and 2012, the Government took a series of measures to increase state regulation and involvement in the oil and gas industry. These measures include steps to expropriate a controlling stake of YPF, the country’s largest oil and gas company.
In April 2012, the Government intervened in YPF, the country’s largest oil and gas company, which was controlled by the Spanish group Repsol, and sent a bill to Congress to expropriate 51% of the shares of YPF. These actions were taken to address a marked decrease in oil and gas reserves resulting from low levels of past investment, which affected the Argentine oil and gas industry and caused an increase in oil and gas imports.
In April 2012, the Government decreed the removal of directors and senior officers of YPF, which was controlled by the Spanish group Repsol, and submitted a bill Congress to expropriate shares held by Repsol representing 51% of the shares of YPF. Congress approved the bill in May 2012 through the passage of Law No. 26,741 (the “Hydrocarbons Law”), which declared the production, industrialization, transportation and marketing of hydrocarbons to be activities of public interest and fundamental policies of Argentina, and empowered the Government to adopt any measures necessary to achieve self-sufficiency in hydrocarbon supply. As provided in the Hydrocarbons law, 51% of the expropriated shares are held by the Government and the remaining 49% have been split among the oil producing provinces of Argentina. The Hydrocarbons Law additionally provided for the expropriation of 51% of the shares of the gas distribution company, YPF GAS S.A. In February 2014, the Government and Repsol reached an agreement on the terms of the compensation payable to Repsol for the expropriation of the YPF shares. Such compensation totaled U.S.$5.8 billion payable by delivery of Argentine sovereign bonds with various maturities. The agreement, which was ratified by Law No. 26,932, settled the claim filed by Repsol with the ICSID.
In August 2013, YPF and Chevron agreed to jointly exploit the unconventional hydrocarbons located in approximately 100 oil wells in the province of Neuquén. Additionally, YPF and the province of Neuquén agreed to extend YPF’s concession in the province for 35 years.
In July 2012, pursuant to the Hydrocarbons Law, the Government created a planning and coordination commission for the sector (the “Hydrocarbons Commission”). The Hydrocarbons Commission had the power to publish reference prices for crude oil and natural gas, monitor prices charged by private oil and gas companies and supervise investment in the oil sector. In December 2015, the Macri administration issued Decree No. 272/2015 dissolving the Hydrocarbons Commission, transferring its functions and authority to the Ministry of Energy and Mining. According to Decree No. 272/2015, all decisions adopted in the past by the Hydrocarbons Commission remain valid until reversed or modified by the Ministry of Energy and Mining. The Ministry is carrying out a full review of the former Hydrocarbon Commission’s rules regarding registration and disclosure requirements applicable to companies operating in the oil and gas sector.
Concessions
During the 1990s, state-owned entities were partially privatized through Government concessions. The sectors of the economy in which the largest number of concessions were granted included communications, highway and road construction, transportation, and oil and gas exploration and production.
After the devaluation of the peso, in February 2002, the Duhalde administration instructed the Ministry of the Economy to renegotiate public services concession contracts through the authority of a newly formed commission for the renegotiation of contracts for public works and services (the “Concession Commission”). The Concession Commission was authorized to renegotiate concession contracts and establish new tariff structures for the public services involved, the improvement of those services and the increase in their security and profits. During the first phase of the renegotiations, out of the 61 total public service concession entities, 58 were required to present reports to the Concession Commission to allow it to evaluate the status of each concession. The three remaining public service concessions, Correo Argentino, Thales Spectrum (the company that administered Argentina’s airwaves) and Transportes Metropolitanos General San Martín S.A. (the company that operated the San Martín, Roca and Belgrano railways), were revoked. Since the formation of the Concession Commission, the Government has revoked four additional concessions.
D-65
During the period between the formation of the Concession Commission and December 10, 2015, few renegotiations of concession contracts were successfully completed and implemented, and tariff structures for public services remained generally unmodified other than certain adjustments to reflect increases in labor and operational costs. Although some agreements providing for tariff increases were reached in connection with electricity concessions and most gas distribution concessions, the implementation of such increases were deferred. To offset a portion of the losses incurred by concession companies due to the lack of tariff revenues, the Fernández de Kirchner administration transferred cash subsidies to these companies to cover operating expenses and assumed the debt of electricity companies relating to unpaid energy purchases.
Several arbitration proceedings relating to public utilities and other previously privatized public services have been brought before the ICSID by foreign entities that invested in Argentine utilities during the privatizations of the 1990s. For additional discussion of ICSID arbitration proceedings, see “Public Sector Debt—Legal Proceedings—ICSID Arbitration.”
Private-Public Partnerships
Since 2005, the private-public partnership (“PPP”) system established by Decree No. 967/2005 has provided for the formation of special purpose entities by private investors and the Government in connection with certain infrastructure projects. Under this system, the Government may make an “equity contribution” in the form of the right to utilize a public asset (e.g., a public road or public service). However, as of the date of this Annual Report, no such entities have been formed under the PPP system.
On November 16, 2016, Congress enacted Law No. 27,328 which established a new PPP system. On February 20, 2017, the Macri administration issued Decree No. 118/2017, which regulated the new PPP system, repealed the previous PPP system established by Decree No. 967/2005 and declared all PPP projects of “national interest.”
In addition, the new private initiative regime established by Decree No. 118/2017 allows private investors, public entities, provinces, municipalities and the City of Buenos Aires to request Government approval for infrastructure projects. If approved, the initiator is granted a preferential right in the public bidding process launched in connection with such project. The new PPP system also fosters the direct or indirect involvement of SMEs, national corporations and national workforce, and will require that a minimum of 33% of all goods and services involved in the projects to be of national origin.
Environment
Beginning in 2002, Argentina has initiated various measures to regulate, monitor and improve environmental standards. The majority of these measures require industrial companies to meet more stringent safety standards. In addition, as a member of the Kyoto Protocol, Argentina has implemented various regulations aimed at curbing greenhouse gas emissions.
In 2002, the Ley General de Medioambiente (General Environment Law) was enacted, ratifying the formation of the Consejo Federal de Medioambiente (Federal Environmental Council), whose objective is to create a comprehensive environmental policy, coordinate regional and national programs and strategies for environmental management, formulate polices for the sustainable use of environmental resources, promote economic development and growth planning, supervise and conduct environmental impact studies, establish environmental standards, carry out comparative studies and manage the international financing of environmental projects.
In March 2016, the Government signed an agreement with the World Bank to finance the Cuenca Matanza – Riachuelo Sustainable Development Program for a total cost of approximately U.S.$1 billion.
Measures enacted to strengthen monitoring and enforcement to ensure compliance with environmental standards include the following:
D-66
| • | Law No. 26,011, which was enacted in 2007, approved the Stockholm Agreement relating to persistent organic contaminants; |
| • | the Proyecto de Desarrollo Sustentable de la Cuenca Matanza - Riachuelo (Cuenca Matanza – Riachuelo Sustainable Development Program) earmarks a portion of its funds for use in purchasing computing equipment to strengthen the Autoridad de Cuenca Matanza Riachuelo (Cuenca Matanza Riachuelo Authority) under the supervision of the Secretaría de Ambiente y Desarrollo Sustentable de la Jefatura de Gabinete de Ministros (Department for Environmental and Sustainable Development of the Cabinet of Ministers); |
| • | Proyecto Nacional para la Gestión Integral de los Residuos Sólidos Urbanos (National Project for the Management of Urban Solid Waste) is the first national project aimed at implementing solutions to waste problems through sustainable measures. The project provides technical and financial assistance for the development of infrastructure and related systems as an incentive for provinces and municipalities to develop their own plans and comprehensive management systems; |
| • | Unidad de Medio Ambiente (Environmental Unit) supports sustainable industrial development in Argentina by promoting environmental factors as a means of improving efficiency and competitiveness; and |
| • | El Fondo integral para el Desarrollo Regional (FONDER) finances the development of productive activities and services focused on the needs of micro-, small- and medium-sized enterprises (“MSMEs”) and sectors with the aim of promoting job creation, increasing exports and developing local markets. |
D-67
Balance of Payments
Overview
The balance of payments accounts are used to record the value of the transactions carried out between a country’s residents and the rest of the world. Balance of payments accounts consist of two accounts: the current account, a broad measure of the country’s international trade, financial services and current transfers, and the capital and financial account, which measures the country’s level of international borrowing, lending and investment. The Republic’s balance of payments registered a deficit in each of the years 2012, 2013, and 2015 and registered a surplus in each of 2014 and 2016.
In 2016, the Republic’s balance of payments registered a U.S.$13.7 billion surplus. This surplus was primarily due to:
| • | a U.S$15.0 billion deficit in the current account, which represented a U.S.$1.8 billion deficit decrease from the U.S.$16.8 billion deficit recorded in 2015; |
| • | a U.S.$29.1 billion surplus in the capital and financial account, which represented a U.S.$15.9 billion surplus increase from the U.S.$13.2 billion surplus recorded in 2015; and |
| • | a U.S$382 million deficit in errors and omissions, representing a U.S.$948 million decrease from the U.S.$1.3 billion deficit recorded in 2015. |
In 2016, the deficit in the current account was mainly the result of a change in the non-financial services account, which increased from a deficit of U.S.$3.9 billion in 2015 to a deficit of U.S.$7.0 billion in 2016. This increase was offset by an increase in the surplus in the trade balance account, as a result of decreased imports. The change in the trade balance resulted from a 1.7% increase in exports and a 6.9% decrease in imports. The deficit of the financial services account increased by U.S.$429 million as compared to 2015, mainly due to a 26.8% increase in interest payments.
The capital and financial account registered a deficit in 2012 followed by surpluses in each of the years between 2013 and 2016. The 2016 surplus was primarily due to:
| • | a U.S.$31.2 billion increase in inflows to the non-financial public sector, which increased from U.S.$2.9 billion deficit in 2015 to U.S.$28.3 billion surplus in 2016; |
This increase was partially offset by a U.S.$8.2 billion decrease in the net inflows to the Central Bank, a U.S.$5.0 billion decrease in the net inflows of other financial entities and a US$2.3 billion decrease in the net inflows of the non-financial private sector, which decreased from a U.S.$7.0 billion surplus in 2015 to a U.S.$4.7 billion surplus in 2016.
D-68
The following table sets forth information on the Republic’s balance of payments for the periods specified.
Balance of Payments
(in millions of U.S. dollars)
| 2012(1) | 2013(1) | 2014(1) | 2015(1) | 2016(1) | ||||||||||||||||
| Current Account: |
||||||||||||||||||||
| Exports of goods(2) |
U.S.$ | 79,982 | U.S.$ | 75,963 | U.S.$ | 68,407 | U.S.$ | 56,788 | U.S.$ | 57,733 | ||||||||||
| Imports of goods(3) |
65,043 | 71,293 | 62,429 | 57,176 | 53,243 | |||||||||||||||
| Trade balance |
14,940 | 4,670 | 5,978 | (388 | ) | 4,490 | ||||||||||||||
| Non-financial services, net(4) |
(2,985 | ) | (3,708 | ) | (3,063 | ) | (3,925 | ) | (7,010 | ) | ||||||||||
| Financial services: |
||||||||||||||||||||
| Interest, net |
(3,597 | ) | (3,628 | ) | (3,855 | ) | (4,473 | ) | (5,673 | ) | ||||||||||
| Dividends, net |
(9,193 | ) | (8,578 | ) | (6,887 | ) | (7,646 | ) | (6,865 | ) | ||||||||||
| Other income (expense) |
(64 | ) | (73 | ) | (46 | ) | (2 | ) | (13 | ) | ||||||||||
| Total financial services, net |
(12,854 | ) | (12,279 | ) | (10,788 | ) | (12,122 | ) | (12,551 | ) | ||||||||||
| Current transfers, net |
(541 | ) | (826 | ) | (158 | ) | (372 | ) | 46 | |||||||||||
| Total current account |
(1,440 | ) | (12,143 | ) | (8,031 | ) | (16,806 | ) | (15,024 | ) | ||||||||||
| Capital and Financial Account: |
||||||||||||||||||||
| Financial account: |
||||||||||||||||||||
| Central Bank(5) |
(2,000 | ) | (2,000 | ) | 3,200 | 7,580 | (607 | ) | ||||||||||||
| Other financial entities(6) |
352 | 845 | 642 | 1,445 | (3,546 | ) | ||||||||||||||
| Non-financial public sector(7) |
(3,015 | ) | 843 | 5,510 | (2,855 | ) | 28,320 | |||||||||||||
| Non-financial private sector(8) |
3,266 | 3,771 | 59 | 6,981 | 4,727 | |||||||||||||||
| Total financial account |
(1,397 | ) | 3,460 | 9,411 | 13,152 | 28,894 | ||||||||||||||
| Capital account(9) |
48 | 33 | 59 | 51 | 237 | |||||||||||||||
| Capital and financial account |
(1,349 | ) | 3,493 | 9,470 | 13,203 | 29,131 | ||||||||||||||
| Errors and omissions |
(516 | ) | (3,174 | ) | (244 | ) | (1,330 | ) | (382 | ) | ||||||||||
| Balance of payments |
U.S.$ | (3,305 | ) | U.S.$ | (11,824 | ) | U.S.$ | 1,195 | U.S.$ | (4,933 | ) | U.S.$ | 13,725 | |||||||
| Change in Gross international reserves deposited in the Central Bank(10) |
U.S.$ | (3,305 | ) | U.S.$ | (11,824 | ) | U.S.$ | 1,195 | U.S.$ | (4,933 | ) | U.S.$ | 13,725 | |||||||
| (1) | Includes results of the 2005 and 2010 Debt Exchanges. |
| (2) | Exports are calculated on an FOB basis. |
| (3) | Imports are calculated on an FOB basis. |
| (4) | Includes import and export freight and insurance fees paid to non-residents. |
| (5) | Includes transactions between the Central Bank and foreign entities. |
| (6) | Includes operations of financial entities (other than the Central Bank) with respect to foreign creditors. |
| (7) | Includes operations of the national government, provincial governments, municipal governments and decentralized governmental organizations with respect to foreign entities, including principal and interest arrears, in the form of bonds, loans from international organizations, operations with the Paris Club and privatizations of state-owned entities. |
| (8) | Includes operations of the private sector with foreign parties and accrued payment obligations to foreign residents. |
| (9) | Includes certain non-recurring capital transfers (such as debt forgiveness or capital brought into Argentina by immigrants) and the transfer of certain non-financial assets or intangible assets (such as intellectual property). |
| (10) | Does not include the value of bonds issued by the Government and held as reserves by the Central Bank. |
Current Account
The Republic’s current account consists of the merchandise trade balance, net non-financial services, net financial services and net current transfers. The current account registered deficits for each year between 2012 and 2016 period.
D-69
The most important drivers of the current account between 2012 and 2016 were:
| • | increases in commodity prices in 2012, followed by a decline in 2013-2015. In 2013 and 2014, the lower trade surplus resulted from a decline in external sales that exceeded the decrease in imports. In 2015, the trade deficit was mostly due to the evolution of prices, and to a lesser extent, to the deterioration of export volumes and the increase in the quantity of imports. In 2016, the price of raw materials decreased although the decline in the value of exports from 2015 was more than offset by an increase in volume. In 2016, the decrease in imports was driven both by a decrease in import prices as well as by a decrease in imported volumes; |
| • | capital outflows due to interest and dividend payments; and |
| • | outflows due to increasing demand for non-financial services, mainly related to freight and passenger transportation, tourism and royalties. |
In 2012, the current account registered a deficit due to a deficit in total financial and non-financial services that was partially offset by a trade balance surplus. Imports decreased at a higher rate than exports, resulting in a higher trade balance as compared to 2011.
In 2013, the current account registered a U.S.$12.1 billion deficit, mainly as a result of a decrease in the trade surplus and an increase in the deficit of the non-financial services account, which was partially offset by a decrease in the deficit of the financial services account as compared to 2012. Imports increased by 9.6%, while exports decreased by 5.0%, resulting in a lower trade balance as compared to 2012.
In 2014, the current account registered a U.S.$8.0 billion deficit, as compared to the U.S.$12.1 billion deficit registered in 2013. This decrease in the deficit was mainly the result of a decrease in the deficit of the financial services account, an increase in trade balance and a reduction in the deficit of the non-financial services account.
In 2015, the current account registered a U.S.$16.0 billion deficit, as compared to the U.S.$8.0 billion deficit registered in 2014. The increase in the deficit was mainly the result of a decrease in the trade surplus, an increase in the deficit of the non-financial services account and an increase in the deficit of the financial services account as compared to 2014. Imports decreased by 8.4%, while exports decreased by 17.0%, resulting in a negative trade balance as compared to 2014.
In 2016, the current account registered a U.S.$15.0 billion deficit, as compared to the U.S.$16.8 billion deficit registered in 2015. The decrease in the deficit was mainly the result of a trade surplus compared to a deficit in 2015. Imports decreased by 6.9%, while exports increased by 1.7%, resulting in a positive trade balance as compared to 2015. This improvement was partially offset by an increase in the deficit of the non-financial services account as compared to 2015.
Exports
In 2012, exports totaled U.S.$80.0 billion, representing a 3.6% decrease as compared to 2011, primarily due to a 5.9% decrease in export volumes, which was partially offset by a 2.4% increase in prices.
In 2012:
| • | exports of primary products decreased by 4.0%. This decrease resulted from a reduction in both prices and volumes. Prices fell by 2.6% while volumes exported decreased by 1.4%; |
| • | exports of manufactured goods of agricultural origin decreased by 3.2%. This decrease resulted from a reduction in volumes, which was partially offset by an increase in prices. Prices increased by 7.1% while volumes exported decreased by 9.6%; |
| • | exports of manufactured goods of industrial origin decreased by 5.6%. This decrease resulted from a 7.1% reduction in volumes exported, which was partially offset by a 1.7% increase in prices; and |
D-70
| • | exports of fuel and energy increased by 4.4%. This growth resulted from a 8.9% increase in volumes exported, which was partially offset by a 4.1% decrease in prices. |
In 2013, exports totaled U.S.$76.0 billion, representing a 5.0% decrease as compared to 2012, primarily due to a 3.7% decrease in export volumes and a 1.4% decrease in prices.
In 2013:
| • | exports of primary products decreased by 6.7%. This decrease resulted from a 8.6% reduction in volumes exported, which was partially offset by a 2.1% increase in prices; |
| • | exports of manufactured goods of agricultural origin increased by 0.8%. This increase resulted from a 1.3% rise in prices and a 0.5% decrease in volumes; |
| • | exports of manufactured goods of industrial origin decreased by 5.7%. This reduction resulted from a 0.6% decrease in volumes exported and a 5.2% decrease in prices; and |
| • | exports of fuel and energy decreased by 20.3%. This reduction resulted from a 21.4% decrease in volumes and a 1.4% increase in prices. |
In 2014, exports totaled U.S.$68.4 billion, representing a 9.9% decrease as compared to 2013, primarily due to a 7.9% reduction in export volumes and a 2.4% decrease in prices.
In 2014:
| • | exports of primary products decreased by 19.9%. This decrease resulted from a reduction in both prices and volumes. Prices fell by 11.7% and volumes exported decreased by 9.3%; |
| • | exports of manufactured goods of agricultural origin decreased by 2.2%. This decrease resulted from a reduction in both volumes and prices. Volumes exported decreased by 1.5% and prices fell by 0.8%; |
| • | exports of manufactured goods of industrial origin decreased by 11.1%. This decrease resulted from a 12.4% reduction in volumes exported, which was partially offset by a 1.5% increase in prices; and |
| • | exports of fuel and energy decreased by 11.7%. This decrease resulted from a reduction in both prices and volumes. Prices fell by 5.7% and volumes exported decreased by 6.4%. |
In 2015, Argentine exports totaled U.S.$56.8 billion, representing a 17.0% decrease as compared to 2014, primarily due to a 1.5% reduction in export volumes and a 15.6% decrease in prices.
In 2015:
| • | exports of primary products decreased by 6.7%. This decrease resulted from an 18.6% fall in prices and a 14.7% increase in volumes exported; |
| • | exports of manufactured goods of agricultural origin decreased by 11.8%. This decrease resulted primarily from a 20.0% fall in prices, which was partially offset by an increase in volumes exported; |
| • | exports of manufactured goods of industrial origin decreased by 21.2%. This decrease resulted from a 2.5% fall in prices and a 19.2% reduction in volumes exported; and |
| • | exports of fuel and energy decreased by 54.2%. This decrease resulted from a 45.5% fall in prices and a 15.7% reduction in volumes exported. |
In 2016, Argentine exports totaled U.S.$57.7 billion, representing a 1.7% increase as compared to 2015, primarily due to a 6.6% increase in export volumes and a 4.6% decrease in prices.
D-71
In 2016:
| • | exports of primary products increased by 17.9%. This increase resulted from a 22.9% increase in volume, which was partially offset by a 4.1% decrease in prices |
| • | exports of manufactured goods of agricultural origin increased slightly by 0.2%. This increase resulted primarily from a 4.3% increase in volumes exported, which was offset by a 4.0% decrease in prices; |
| • | exports of manufactured goods of industrial origin decreased by 6.6%. This decrease resulted from a 4.1% fall in prices and a 2.6% reduction in volumes exported; and |
| • | exports of fuel and energy decreased by 11.3%. This decrease resulted from a 12.3% fall in prices, which was partially offset by a 1.2% increase in volumes exported. |
Argentina’s main exports in recent years have been commodities such as soy and cereals, as well as processed agricultural products and industrial goods. In 2016, 67.6% of all exports were agricultural (either primary or processed).
The following tables set forth information on Argentina’s major export products for the periods specified.
Exports by Groups of Products(1)
(in millions of U.S. dollars)
| 2012 | 2013 | 2014 | 2015 | 2016 | ||||||||||||||||
| Primary products: |
||||||||||||||||||||
| Cereal |
U.S.$ | 9,530 | U.S.$ | 8,312 | U.S.$ | 5,237 | U.S.$ | 4,842 | U.S.$ | 6,990 | ||||||||||
| Seeds and oilseeds |
3,796 | 4,616 | 4,211 | 4,746 | 3,840 | |||||||||||||||
| Copper |
2,098 | 1,360 | 1.250 | 711 | 935 | |||||||||||||||
| Fruits |
1,024 | 1,071 | 966 | 776 | 874 | |||||||||||||||
| Fish and raw seafood |
990 | 1,182 | 1,256 | 1,180 | 1,422 | |||||||||||||||
| Vegetables |
699 | 451 | 507 | 461 | 723 | |||||||||||||||
| Tobacco |
370 | 325 | 265 | 195 | 372 | |||||||||||||||
| Honey |
215 | 213 | 204 | 164 | 169 | |||||||||||||||
| Others |
318 | 234 | 317 | 216 | 287 | |||||||||||||||
| Total |
19,040 | 17,764 | 14.214 | 13,291 | 15,612 | |||||||||||||||
| Manufactured goods of agricultural origin: |
||||||||||||||||||||
| Residues(2) |
10,971 | 12,028 | 12,845 | 10,650 | 10,803 | |||||||||||||||
| Oils and fats |
5,929 | 5,182 | 4,316 | 4,703 | 4.969 | |||||||||||||||
| Meat |
1,942 | 2,008 | 1,935 | 1,444 | 1,538 | |||||||||||||||
| Vegetable Products |
1,370 | 1,287 | 1,021 | 1,113 | 1,158 | |||||||||||||||
| Dairy food |
1,296 | 1,450 | 1,309 | 866 | 634 | |||||||||||||||
| Grain mill products |
1,185 | 904 | 1,026 | 870 | 751 | |||||||||||||||
| Drinks, alcoholic beverages and vinegar |
1,033 | 987 | 939 | 929 | 927 | |||||||||||||||
| Hides and skins |
880 | 958 | 1,044 | 861 | 750 | |||||||||||||||
| Others |
2,177 | 2,198 | 1,985 | 1,855 | 1,812 | |||||||||||||||
| Total |
26,784 | 27,002 | 26,420 | 23,291 | 23,342 | |||||||||||||||
| Manufactured goods of industrial origin: |
||||||||||||||||||||
| Transport equipment |
9,569 | 10,098 | 8,345 | 5,992 | 5,029 | |||||||||||||||
| Chemicals |
5,644 | 4,909 | 4,982 | 4,153 | 4,478 | |||||||||||||||
| Basic metals |
2,840 | 2,542 | 2,263 | 1,344 | 1,253 | |||||||||||||||
| Stones and precious metals |
2,567 | 2,054 | 2,068 | 2,514 | 2,256 | |||||||||||||||
| Machines and equipment |
2,371 | 2,277 | 1,882 | 1,375 | 1,231 | |||||||||||||||
| Plastics |
1,390 | 1,287 | 1,293 | 950 | 978 | |||||||||||||||
| Maritime, fluvial and air transport vehicles |
650 | 576 | 313 | 290 | 341 | |||||||||||||||
| Paper, cardboard, and printed publications |
524 | 486 | 449 | 387 | 334 | |||||||||||||||
| Rubber and its manufactures |
393 | 373 | 339 | 228 | 252 | |||||||||||||||
D-72
| 2012 | 2013 | 2014 | 2015 | 2016 | ||||||||||||||||
| Others |
1,233 | 1,034 | 889 | 721 | 610 | |||||||||||||||
| Total |
27,181 | 25,635 | 22,823 | 17,955 | 16,760 | |||||||||||||||
| Fuel and energy: |
||||||||||||||||||||
| Fuel |
6,841 | 5,562 | 4,950 | 2,251 | 1,936 | |||||||||||||||
| Energy |
137 | — | — | 1 | 3 | |||||||||||||||
| Total |
6,978 | 5,562 | 4,950 | 2,252 | 1,938 | |||||||||||||||
| Total exports |
U.S.$ | 79,982 | U.S.$ | 75,963 | U.S.$ | 68,407 | U.S.$ | 56,788 | U.S.$ | 57,665 | ||||||||||
| (1) | Measured on an FOB basis. |
| (2) | Residues refer to the byproducts left over from the processing of agricultural goods that can be resold for other purposes. |
Source: INDEC and Ministry of the Treasury.
Exports by Groups of Products(1)
(as % of total exports)
| 2012 | 2013 | 2014 | 2015 | 2016 | ||||||||||||||||
| Primary products: |
||||||||||||||||||||
| Cereal |
11.9 | % | 10.9 | % | 7.7 | % | 8.5 | % | 12.1 | % | ||||||||||
| Seeds and oilseeds |
4.7 | 6.1 | 6.2 | 8.4 | 6.7 | |||||||||||||||
| Copper |
2.6 | 1.8 | 1.8 | 1.3 | 1.6 | |||||||||||||||
| Fruits |
1.3 | 1.4 | 1.4 | 1.4 | 1.5 | |||||||||||||||
| Fish and raw seafood |
1.2 | 1.6 | 1.8 | 2.1 | 2.5 | |||||||||||||||
| Vegetables |
0.9 | 0.6 | 0.7 | 0.8 | 1.3 | |||||||||||||||
| Tobacco |
0.5 | 0.4 | 0.4 | 0.3 | 0.6 | |||||||||||||||
| Honey |
0.3 | 0.3 | 0.3 | 0.3 | 0.3 | |||||||||||||||
| Others |
0.4 | 0.3 | 0.5 | 0.4 | 0.5 | |||||||||||||||
| Total |
23.8 | % | 23.4 | % | 20.8 | % | 23.4 | % | 27.1 | % | ||||||||||
| Manufactured goods of agricultural origin: |
||||||||||||||||||||
| Residues(2) |
13.7 | % | 15.8 | % | 18.8 | % | 18.8 | % | 18.7 | % | ||||||||||
| Oils and fats |
7.4 | 6.8 | 6.3 | 8.3 | 8.6 | |||||||||||||||
| Meat |
2.4 | 2.6 | 2.8 | 2.5 | 2.7 | |||||||||||||||
| Vegetable Products |
1.7 | 1.7 | 1.5 | 2.0 | 2.0 | |||||||||||||||
| Dairy food |
1.6 | 1.9 | 1.9 | 1.5 | 1.1 | |||||||||||||||
| Grain mill products |
1.5 | 1.2 | 1.5 | 1.5 | 1.3 | |||||||||||||||
| Drinks, alcoholic beverages and vinegar |
1.3 | 1.3 | 1.4 | 1.6 | 1.6 | |||||||||||||||
| Hides and skins |
1.1 | 1.3 | 1.5 | 1.5 | 1.3 | |||||||||||||||
| Others |
2.7 | 2.9 | 2.9 | 3.3 | 3.1 | |||||||||||||||
| Total |
33.5 | % | 35.5 | % | 38.6 | % | 41.0 | % | 40.5 | % | ||||||||||
| Manufactured goods of industrial origin: |
||||||||||||||||||||
| Transport equipment |
12.0 | % | 13.3 | % | 12.2 | % | 10.6 | % | 8.7 | % | ||||||||||
| Chemicals |
7.1 | 6.5 | 7.3 | 7.3 | 7.8 | |||||||||||||||
| Basic metals |
3.6 | 3.3 | 3.3 | 2.4 | 2.2 | |||||||||||||||
| Stones and precious metals |
3.2 | 2.7 | 3.0 | 4.4 | 3.9 | |||||||||||||||
| Machines and equipment |
3.0 | 3.0 | 2.8 | 2.4 | 2.1 | |||||||||||||||
| Plastics |
1.7 | 1.7 | 1.9 | 1.7 | 1.7 | |||||||||||||||
| Maritime, fluvial and air transport vehicles |
0.8 | 0.8 | 0.5 | 0.5 | 0.6 | |||||||||||||||
| Paper, cardboard, and printed publications |
0.7 | 0.6 | 0.7 | 0.7 | 0.6 | |||||||||||||||
| Rubber and its manufactures |
0.5 | 0.5 | 0.5 | 0.4 | 0.4 | |||||||||||||||
| Others |
1.5 | 1.4 | 1.3 | 1.3 | 1.1 | |||||||||||||||
| Total |
34.0 | % | 33.7 | % | 33.4 | % | 31.6 | % | 29.1 | % | ||||||||||
| Fuel and energy: |
||||||||||||||||||||
| Fuel |
8.6 | % | 7.3 | % | 7.2 | % | 4.0 | % | 3.4 | % | ||||||||||
| Energy |
0.2 | — | — | — | — | |||||||||||||||
| Total |
8.7 | 7.3 | 7.2 | 4.0 | 3.4 | |||||||||||||||
| Total Exports |
100.0 | % | 100.0 | % | 100.0 | % | 100.0 | % | 100.0 | % | ||||||||||
| (1) | Measured on an FOB basis. |
| (2) | Residues refer to the byproducts left over from the processing of agricultural goods that can be resold for other purposes. |
Source: INDEC and Ministry of the Treasury.
D-73
Imports
In 2012, imports of goods decreased by 8.1% to U.S.$68.0 billion from U.S.$74.0 billion in 2011. 46.5% of total imports were intermediate and capital goods. Imports of fuel and energy decreased by 6.8% and imports of motor vehicles for passengers decreased by 4.2%, both types of imports together representing approximately 18.4% of total imports.
In 2013, imports of goods increased by 9.5% to U.S.$74.4 billion from U.S.$68.0 billion in 2012. Intermediate and capital goods represented 42.0% of total imports. Imports of fuel and energy increased by 36.5% and imports of motor vehicles for passengers increased by 31.8%.
In 2014, imports of goods decreased by 12.4% to U.S.$65.2 billion from U.S.$74.4 billion in 2013. Intermediate and capital goods represented 46.5% of total imports. Imports of motor vehicles for passengers decreased by 49.5%, imports of spare parts and accessories for capital goods decreased by 18.2% and imports of consumption goods decreased by 11.6%.
In 2015, imports of goods decreased by 8.4% to U.S.$59.8 billion from U.S.$65.2 billion in 2014. Intermediate and capital goods represented 49.9% of total imports. Imports of fuel and energy decreased by 40.3% and imports of motor vehicles for passengers decreased by 6.2%, while imports of spare parts and accessories for capital goods decreased by 3.0% and imports of consumption goods increased by 3.0%, in each case in terms of their U.S. dollar value.
In 2016, imports of goods decreased by 7.0% to U.S.$55.6 billion from U.S.$59.8 billion in 2015. Intermediate and capital goods represented 27.8% of total imports. Imports of fuel and energy decreased by 30.7% and imports of motor vehicles for passengers increased by 33.5%, while imports of spare parts and accessories for capital goods decreased by 10.8% and imports of consumption goods increased by 9.1%, in each case in terms of their U.S. dollar value.
The following tables set forth information on Argentina’s major import products for the periods specified.
Imports by Groups of Products(1)
(in millions of U.S. dollars)
| 2012 | 2013 | 2014 | 2015 | 2016 | ||||||||||||||||
| Machines, instruments and electric materials |
U.S.$ | 17,533 | U.S.$ | 18,808 | U.S.$ | 16,795 | U.S.$ | 16,928 | U.S.$ | 15,412 | ||||||||||
| Transport equipment |
13,140 | 15,040 | 10,395 | 9,647 | 11,414 | |||||||||||||||
| Industrial products |
10,057 | 10,108 | 9,802 | 9,439 | 8,485 | |||||||||||||||
| Mineral products |
9,609 | 13,056 | 12,099 | 7,334 | 5,029 | |||||||||||||||
| Plastic, rubber and manufactures |
4,118 | 4,207 | 3,742 | 3,642 | 3,186 | |||||||||||||||
| Common metals and manufactures |
3,918 | 3,643 | 3,432 | 3,524 | 2,622 | |||||||||||||||
| Optical instruments, medical-surgical precision equipment, watches and music equipment |
1,708 | 1,762 | 1,699 | 1,892 | 1,683 | |||||||||||||||
| Textiles and manufactures |
1,588 | 1,524 | 1,385 | 1,425 | 1,464 | |||||||||||||||
| Wood pulp, paper and paperboard |
1,263 | 1,218 | 1,111 | 1,212 | 1,047 | |||||||||||||||
| Commodities and other products |
1,043 | 1,042 | 905 | 910 | 1,031 | |||||||||||||||
| Feeding products, beverages and tobacco |
998 | 944 | 897 | 873 | 922 | |||||||||||||||
| Products of vegetable origin |
598 | 623 | 618 | 643 | 977 | |||||||||||||||
D-74
| 2012 | 2013 | 2014 | 2015 | 2016 | ||||||||||||||||
| Stone manufactures, plaster and cement, asbestos, mica, ceramic and glass |
536 | 568 | 543 | 603 | 580 | |||||||||||||||
| Footwear, umbrellas, artificial flowers and others |
463 | 488 | 417 | 474 | 612 | |||||||||||||||
| Live animals and products of animal origin |
235 | 198 | 173 | 167 | 243 | |||||||||||||||
| Other products |
1,166 | 1,213 | 1,214 | 1,073 | 903 | |||||||||||||||
| Total imports |
U.S.$ | 67,974 | U.S.$ | 74,442 | U.S.$ | 65,229 | U.S.$ | 59,787 | U.S.$ | 55,610 | ||||||||||
| (1) | Measured on a CIF basis. Figures presented in this table differ from those presented in the tables titled “Balance of Payments” because the latter were calculated on a FOB basis. |
Source: INDEC and Ministry of the Treasury.
Imports by Groups of Products(1)
(as % of total imports)
| 2012 | 2013 | 2014 | 2015 | 2016 | ||||||||||||||||
| Machines, instruments and electric materials |
25.8 | % | 25.3 | % | 25.7 | % | 28.3 | % | 27.7 | % | ||||||||||
| Transport equipment |
19.3 | 20.2 | 15.9 | 16.1 | 20.5 | |||||||||||||||
| Industrial products |
14.8 | 13.6 | 15.0 | 15.8 | 15.3 | |||||||||||||||
| Mineral products |
14.1 | 17.5 | 18.5 | 12.3 | 9.0 | |||||||||||||||
| Plastic, rubber and manufactures |
6.1 | 5.7 | 5.7 | 6.1 | 5.7 | |||||||||||||||
| Common metals and manufactures |
5.8 | 4.9 | 5.3 | 5.9 | 4.7 | |||||||||||||||
| Optical instruments, medical-surgical precision equipment, watches and music equipment |
2.5 | 2.4 | 2.6 | 3.2 | 3.0 | |||||||||||||||
| Textiles and manufactures |
2.3 | 2.0 | 2.1 | 2.4 | 2.6 | |||||||||||||||
| Wood pulp, paper and paperboard |
1.9 | 1.6 | 1.7 | 2.0 | 1.9 | |||||||||||||||
| Commodities and other products |
1.5 | 1.4 | 1.4 | 1.5 | 1.9 | |||||||||||||||
| Feeding products, beverages and tobacco |
1.5 | 1.3 | 1.4 | 1.5 | 1.7 | |||||||||||||||
| Products of vegetable origin |
0.9 | 0.8 | 0.9 | 1.1 | 1.8 | |||||||||||||||
| Stone manufactures, plaster, cement, asbestos, mica, ceramic and glass |
0.8 | 0.8 | 0.8 | 1.0 | 1.0 | |||||||||||||||
| Footwear, umbrellas, artificial flowers and others |
0.7 | 0.7 | 0.6 | 0.8 | 1.1 | |||||||||||||||
| Live animals and products of animal origin |
0.3 | 0.3 | 0.3 | 0.3 | 0.4 | |||||||||||||||
| Other products |
1.7 | 1.6 | 1.9 | 1.8 | 1.6 | |||||||||||||||
| Total imports |
100.0 | % | 100.0 | % | 100.0 | % | 100.0 | % | 100.0 | % | ||||||||||
| (1) | Measured on a CIF basis. Figures presented in this table differ from those presented in the tables titled “Balance of Payments” because they were calculated on a FOB basis. |
Source: INDEC and Ministry of the Treasury.
Trade Regulation
Until the beginning of the 1990s, Argentina had a relatively closed economy modeled around import substitution policies with significant trade barriers. Although certain reforms were pursued from the 1960s through the 1980s to liberalize trade, it was only during the Menem administration in the 1990s that the Government implemented significant trade liberalization measures.
Trade policies remained relatively stable during the 1990s, marked by few export tariffs and low import tariffs in certain sectors of the economy. Following the collapse of the Convertibility Regime in 2002, the Government introduced trade measures intended to increase Government revenues, stem the outflow of foreign currencies, manage the pricing of basic goods and protect the stability and growth of local industries.
D-75
The Ministry of Agriculture, Livestock and Fisheries regulates production and sale of agricultural products, while the Unidad de Coordinación y Evaluación de Subsidios al Consumo Interno (Unit of Coordination and Evaluation of Subsidies to Internal Consumption), formed in 2011, manages subsidies and support to the agricultural sector.
In 2012, a complaint was submitted to the dispute settlement body of the WTO challenging Argentina’s use of non-trade barriers and certain practices of the Government with respect to imports. The dispute related to two primary measures: (i) the requirement for importers to file a non-automatic import license in the form of a DJAI and (ii) the imposition of trade-related requirements mandating foreign companies to limit their imports, offset their imports with equivalent exports and increase the local content of products made within Argentina as a condition to import into Argentina or to obtain certain benefits. The WTO dispute settlement body found that such practices violated international trade rules. Argentina was given until December 31, 2015, to comply with the WTO’s ruling. On January 14, 2016, Argentina notified the dispute settlement body of the WTO that it had repealed the disputed measures and, on January 18, 2016, the European Union and Argentina informed the dispute settlement body that an understanding had been reached.
Geographic Distribution of Trade
Argentina’s primary trading partner is Brazil. Argentina also conducts a substantial amount of trade with China, the United States and other countries in Latin America and Europe.
The following tables provide information on the geographic distribution of Argentine exports for the periods specified.
Geographic Distribution of Exports(1)
(in millions of U.S. dollars)
| 2012 | 2013 | 2014 | 2015 | 2016 | ||||||||||||||||
| Brazil |
U.S.$ | 16,457 | U.S.$ | 15,949 | U.S.$ | 13,883 | U.S.$ | 10,100 | U.S.$ | 9,029 | ||||||||||
| China |
5,379 | 5,837 | 4,792 | 5,388 | 4,661 | |||||||||||||||
| United States |
4,023 | 4,182 | 4,082 | 3,433 | 4,483 | |||||||||||||||
| Chile |
5,055 | 3,825 | 2,794 | 2,404 | 2,298 | |||||||||||||||
| Venezuela |
2,220 | 2,157 | 1,987 | 1,370 | 707 | |||||||||||||||
| Spain |
2,515 | 1,669 | 1,694 | 1,362 | 379 | |||||||||||||||
| Germany |
1,970 | 1,637 | 1,536 | 1,340 | 697 | |||||||||||||||
| Uruguay |
1,954 | 1,845 | 1,650 | 1,331 | 1,153 | |||||||||||||||
| Canada |
2,213 | 1,703 | 1,655 | 1,295 | 1,148 | |||||||||||||||
| Netherlands |
2,204 | 1,913 | 1,574 | 1,213 | 1,002 | |||||||||||||||
| Peru |
1,925 | 1,421 | 1,114 | 721 | 820 | |||||||||||||||
| Rest of ALADI(2) |
5,861 | 5,361 | 4,548 | 3,475 | 3,483 | |||||||||||||||
| Rest of EU |
4,856 | 4,619 | 4,894 | 4,323 | 6,461 | |||||||||||||||
| Rest of Asia(3) |
12,160 | 13,112 | 12,213 | 10,769 | 12,628 | |||||||||||||||
| Rest of world(4) |
9,093 | 8,617 | 8,120 | 7,328 | 8,110 | |||||||||||||||
| Indeterminate destination(5) |
2,097 | 2,116 | 1,871 | 936 | 674 | |||||||||||||||
| Total(6) |
U.S.$ | 79,982 | U.S.$ | 75,963 | U.S.$ | 68,407 | U.S.$ | 56,788 | U.S.$ | 57,733 | ||||||||||
| Memorandum items: |
||||||||||||||||||||
| MERCOSUR(7) |
U.S.$ | 21,999 | U.S.$ | 21,250 | U.S.$ | 18,735 | U.S.$ | 13,856 | U.S.$ | 11,869 | ||||||||||
| ALADI |
U.S.$ | 33,472 | U.S.$ | 30,558 | U.S.$ | 25,976 | U.S.$ | 19,401 | U.S.$ | 17,490 | ||||||||||
| (1) | Measured on an FOB basis. |
| (2) | As of December 31, 2016, ALADI comprises the following countries: Argentina, Bolivia, Brazil, Chile, Colombia, Cuba, Ecuador, Mexico, Paraguay, Peru, Panama, Uruguay and Venezuela. |
| (3) | Figure includes all Asian countries except for China. |
| (4) | Includes all other countries for which exports are not significant enough for a separate line item. |
| (5) | Includes exports for which the destination could not be identified. |
D-76
| (6) | Figures in this table are updated less frequently than those presented in the “Balance of Payments” table and thus total exports in this table may differ from those in the “Balance of Payments” table. |
| (7) | As of December 31, 2016, MERCOSUR includes the following countries as full members: Argentina, Brazil, Paraguay and Uruguay. For more information on MERCOSUR members see “The Republic of Argentina—Foreign Affairs and International Organizations—MERCOSUR.” |
Source: INDEC and Ministry of the Treasury.
Geographic Distribution of Exports(1)
(as % of total exports)
| 2012 | 2013 | 2014 | 2015 | 2016 | ||||||||||||||||
| Brazil |
20.6 | % | 21.0 | % | 20.3 | % | 17.8 | % | 15.6 | % | ||||||||||
| China |
6.7 | 7.7 | 7.0 | 9.5 | 8.1 | |||||||||||||||
| United States |
5.0 | 5.5 | 6.0 | 6.0 | 7.8 | |||||||||||||||
| Chile |
6.3 | 5.0 | 4.1 | 4.2 | 4.0 | |||||||||||||||
| Venezuela |
2.8 | 2.8 | 2.9 | 2.4 | 1.2 | |||||||||||||||
| Spain |
3.1 | 2.2 | 2.5 | 2.4 | 0.7 | |||||||||||||||
| Germany |
2.5 | 2.2 | 2.2 | 2.4 | 1.2 | |||||||||||||||
| Uruguay |
2.4 | 2.4 | 2.4 | 2.3 | 2.0 | |||||||||||||||
| Canada . |
2.8 | 2.2 | 2.4 | 2.3 | 2.0 | |||||||||||||||
| Netherlands |
2.8 | 2.5 | 2.3 | 2.1 | 1.7 | |||||||||||||||
| Peru |
2.4 | 1.9 | 1.6 | 1.3 | 1.4 | |||||||||||||||
| Rest of ALADI(2) |
7.3 | 7.1 | 6.6 | 6.1 | 6.0 | |||||||||||||||
| Rest of EU |
6.1 | 6.1 | 7.2 | 7.6 | 11.2 | |||||||||||||||
| Rest of Asia(3) |
15.2 | 17.3 | 17.9 | 19.0 | 21.9 | |||||||||||||||
| Rest of world(4) |
11.4 | 11.3 | 11.9 | 12.9 | 14.0 | |||||||||||||||
| Indeterminate destination(5) |
2.6 | 2.8 | 2.7 | 1.6 | 1.2 | |||||||||||||||
| Total(6) |
100.0 | % | 100.0 | % | 100.0 | % | 100.0 | % | 100.0 | % | ||||||||||
| Memorandum items: |
||||||||||||||||||||
| MERCOSUR(7) |
27.5 | % | 28.0 | % | 27.4 | % | 24.4 | % | 20.6 | % | ||||||||||
| ALADI |
41.8 | % | 40.2 | % | 38.0 | % | 34.2 | % | 30.3 | % | ||||||||||
| (1) | Measured on an FOB basis. |
| (2) | As of December 31, 2016, ALADI includes the following countries: Argentina, Bolivia, Brazil, Chile, Colombia, Cuba, Ecuador, Mexico, Paraguay, Panama, Peru, Uruguay and Venezuela. |
| (3) | Figure includes all Asian countries except for China. |
| (4) | Includes all other countries for which exports are not significant enough for a separate line item. |
| (5) | Includes exports for which the destination could not be identified. |
| (6) | Figures in this table are updated less frequently than those presented in the “Balance of Payments” table and thus total exports in this table may differ from those in the “Balance of Payments” table. |
| (7) | As of December 31, 2016, MERCOSUR includes the following countries as full members: Argentina, Brazil, Paraguay and Uruguay. For more information on MERCOSUR members see “The Republic of Argentina—Foreign Affairs and International Organizations—MERCOSUR.” |
Source: INDEC and Ministry of the Treasury.
The following tables provide information on the geographic distribution of Argentina’s imports for the periods specified.
Geographic Distribution of Imports(1)
(in millions of U.S. dollars)
| 2012 | 2013 | 2014 | 2015 | 2016 | ||||||||||||||||
| Brazil |
U.S.$ | 17,805 | U.S.$ | 19,321 | U.S.$ | 14,293 | U.S.$ | 13,100 | U.S. $ | 13,674 | ||||||||||
| China |
9,932 | 11,341 | 10,743 | 11,776 | 10,483 | |||||||||||||||
| United States |
8,476 | 8,069 | 8,834 | 7,700 | 6,985 | |||||||||||||||
| Germany |
3,698 | 3,892 | 3,507 | 3,130 | 471 | |||||||||||||||
| Mexico |
889 | 970 | 908 | 820 | 1,785 | |||||||||||||||
D-77
| 2012 | 2013 | 2014 | 2015 | 2016 | ||||||||||||||||
| France |
1,591 | 1,740 | 1,416 | 1,450 | 921 | |||||||||||||||
| Italy |
1,453 | 1,666 | 1,629 | 1,370 | 1,447 | |||||||||||||||
| Japan |
1,498 | 1,521 | 1,374 | 1,223 | 953 | |||||||||||||||
| Spain |
1,317 | 1,371 | 1,073 | 957 | 312 | |||||||||||||||
| Chile |
1,006 | 970 | 819 | 717 | 689 | |||||||||||||||
| Netherlands |
1,130 | 1,075 | 780 | 452 | 1,436 | |||||||||||||||
| Rest of ALADI(2) |
4,444 | 6,021 | 5,073 | 4,004 | 2,600 | |||||||||||||||
| Rest of EU |
4,226 | 4,476 | 3,855 | 3,909 | 6,145 | |||||||||||||||
| Rest of Asia(3) |
5,164 | 6,198 | 5,198 | 4,923 | 5,194 | |||||||||||||||
| Rest of world(4) |
4,670 | 5,160 | 5,022 | 3,700 | 2,103 | |||||||||||||||
| Indeterminate origin(5) |
675 | 651 | 706 | 526 | 412 | |||||||||||||||
| Total |
U.S.$ | 67,974 | U.S.$ | 74,442 | U.S.$ | 65,230 | U.S.$ | 59,757 | U.S.$ | 55,610 | ||||||||||
| Memorandum items: |
||||||||||||||||||||
| MERCOSUR(6) |
U.S.$ | 18,827 | U.S.$ | 20,449 | U.S.$ | 15,272 | U.S.$ | 13,968 | U.S.$ | 14,948 | ||||||||||
| ALADI |
U.S.$ | 24,144 | U.S.$ | 27,282 | U.S.$ | 21,093 | U.S.$ | 18,641 | U.S.$ | 18,748 | ||||||||||
| (1) | Measured on a CIF basis. |
| (2) | As of December 31, 2016, ALADI includes the following countries: Argentina, Bolivia, Brazil, Chile, Colombia, Cuba, Ecuador, Mexico, Paraguay, Panama, Peru, Uruguay and Venezuela. |
| (3) | Figure includes all Asian countries except for China and Japan. |
| (4) | Includes all other countries for which imports are not significant enough for a separate line item. |
| (5) | Includes imports for which the origin could not be identified. |
| (6) | As of December 31, 2016, MERCOSUR includes the following countries as full members: Argentina, Brazil, Paraguay and Uruguay. For more information on MERCOSUR members see “The Republic of Argentina—Foreign Affairs and International Organizations—MERCOSUR.” |
Source: INDEC and Ministry of the Treasury.
Geographic Distribution of Imports(1)
(as % of total imports)
| 2012 | 2013 | 2014 | 2015 | 2016 | ||||||||||||||||
| Brazil |
26.2 | % | 26.0 | % | 21.9 | % | 21.9 | % | 24.6 | % | ||||||||||
| China |
14.6 | 15.2 | 16.5 | 19.7 | 18.9 | |||||||||||||||
| United States |
12.5 | 10.8 | 13.5 | 12.9 | 12.6 | |||||||||||||||
| Germany |
5.4 | 5.2 | 5.4 | 5.2 | 0.8 | |||||||||||||||
| Mexico |
1.3 | 1.3 | 1.4 | 1.4 | 3.2 | |||||||||||||||
| France |
2.3 | 2.3 | 2.2 | 2.4 | 1.7 | |||||||||||||||
| Italy |
2.1 | 2.2 | 2.5 | 2.3 | 2.6 | |||||||||||||||
| Japan |
2.2 | 2.0 | 2.1 | 2.0 | 1.7 | |||||||||||||||
| Spain |
1.9 | 1.8 | 1.6 | 1.6 | 0.6 | |||||||||||||||
| Chile |
1.5 | 1.3 | 1.3 | 1.2 | 1.2 | |||||||||||||||
| Netherlands |
1.7 | 1.4 | 1.2 | 0.8 | 2.6 | |||||||||||||||
| Rest of ALADI(2) |
6.5 | 8.1 | 7.8 | 6.7 | 4.7 | |||||||||||||||
| Rest of EU |
6.2 | 6.0 | 5.9 | 6.5 | 11.1 | |||||||||||||||
| Rest of Asia(3) |
7.6 | 8.3 | 8.0 | 8.2 | 9.3 | |||||||||||||||
| Rest of world(4) |
6.9 | 6.9 | 7.7 | 6.2 | 3.8 | |||||||||||||||
| Indeterminate origin(5) |
1.0 | 0.9 | 1.1 | 0.9 | 0.7 | |||||||||||||||
| Total |
100.0 | % | 100.0 | % | 100.0 | % | 100.0 | % | 100.0 | % | ||||||||||
| Memorandum items: |
||||||||||||||||||||
| MERCOSUR(6) |
27.7 | % | 27.5 | % | 23.4 | % | 23.4 | % | 26.9 | % | ||||||||||
| ALADI |
35.5 | % | 36.6 | % | 32.3 | % | 31.2 | % | 33.7 | % | ||||||||||
D-78
| (1) | Measured on a CIF basis. |
| (2) | As of December 31, 2016, ALADI comprises the following countries: Argentina, Bolivia, Brazil, Chile, Colombia, Cuba, Ecuador, Mexico, Paraguay, Panama, Peru, Uruguay and Venezuela. |
| (3) | Figure includes all Asian countries except for China and Japan. |
| (4) | Includes all other countries for which imports are not significant enough for a separate line item. |
| (5) | Includes imports for which the origin could not be identified. |
| (6) | As of December 31, 2016, MERCOSUR includes the following countries as full members: Argentina, Brazil, Paraguay and Uruguay. |
Source: INDEC and Ministry of the Treasury.
Trade with MERCOSUR Countries
Common market framework. In addition to Argentina, the MERCOSUR “Member States” include Brazil, Paraguay, Uruguay and, since 2012, Venezuela. In December 2012, Bolivia began the process of accession as a Member State, having previously been an Associate State. MERCOSUR’s objective is to gradually integrate the economies of its member countries through the elimination of trade barriers, the harmonization of macroeconomic policies and the establishment of a common external tariff and a common external trade policy. See “The Republic of Argentina—Foreign Affairs and International Organizations—MERCOSUR.”
Trade within MERCOSUR. Trade among MERCOSUR Member States increased significantly in the 10 years leading up to 2010, but has decreased ever since. During 2014, intra-regional commerce represented 13.1% of all MERCOSUR commerce, the lowest level since 2006. This decline has occurred in the context of deteriorating external and internal economic conditions. This negative performance has been a widespread phenomenon affecting all Member States.
Argentina’s trade with MERCOSUR reached U.S.$26.8 billion in 2016, representing 23.7% of Argentina’s total trade. Argentine exports to the other MERCOSUR Member States amounted to more than U.S.$11.9 billion, equivalent to 20.6% of Argentina’s total global exports, while imports from MERCOSUR amounted to U.S.$14.9 billion, equivalent to 26.9% of Argentina’s total imports. Argentina registered a U.S.$3.1 million trade deficit with MERCOSUR in 2016, as compared to a deficit of U.S.$112 million deficit in 2015, primarily due to a U.S.$1.6 billion increased in the trade deficit with Brazil and a U.S.$1.6 billion increase in the trade deficit with Venezuela.
Brazil
Brazil is Argentina’s primary export market and source of imports. Manufactured goods of industrial origin account for approximately 80% of commerce between the countries. In 2016, the main imports from Brazil included intermediate goods, which totaled U.S.$3.9 billion, and motor vehicles which totaled U.S.$3.4 billion. The main exports to Brazil in 2016 were manufactured goods of industrial origin, which totaled U.S.$5.7 billion, followed by primary products, which totaled U.S.$1.8 billion. In 2016, Argentina’s trade deficit with Brazil was U.S.$4.6 billion, as compared to a deficit of U.S.$3.0 million in 2015, primarily as a result of a 4.4% increase in total imports from Brazil, which was further accentuated by a 10.6% decrease in total exports to Brazil. The deterioration of the trade deficit is attributable in part to the slowdown affecting Brazil’s economy.
The decrease in exports as compared to 2015 was mainly the result of the decreases in the following products:
| • | manufactured goods of industrial origin, which decreased by 20.8% to U.S.$5.7 billion; and |
| • | fuel and energy, which decreased by 21.8% to U.S.$218 million. |
The increase in imports in 2016 as compared to 2015 was primarily due to a 41.3% increase in imports of capital goods and a 29.0% increase in imports of motor vehicles.
China
China has become one of Argentina’s main trade partners. The main imports from China include chemical products, machinery and electronic devices, motorcycles and engines with small cylinder volumes, and toys. The main exports to China include agricultural commodities, such as wheat, soy and corn.
D-79
In 2016, the main imports from China included capital goods, which totaled U.S.$3.1 billion, and spare parts and accessories, which totaled U.S.$2.8 billion. The main exports to China in 2016 were primary products, which totaled U.S.$3.2 billion, followed by manufactured products of agricultural origin, which totaled U.S.$0.9 billion. In 2016, Argentina’s trade deficit with China was U.S.$5.8 billion, as compared to U.S.$6.4 billion in 2015, primarily as a result of a 13.5% decrease in total exports, which was partially offset by a 11.0% decrease in total imports to China.
The decrease in imports as compared to 2015 was mainly the result of the increases in the following products:
| • | spare parts and accessories, which decreased by 21.1% to U.S.$2.8 billion; and |
| • | capital goods, which decreased by 11.9% to U.S.$3.1 billion. |
The decrease in exports in 2016 as compared to 2015 was primarily due to a 16.6% decrease in exports of primary products, and a 22.1% decrease in manufactured products of industrial origin exports.
United States
Historically, the United States has been one of Argentina’s most important trade partners. Manufactured goods constitute a significant share of Argentine exports to the United States, while capital and intermediate goods constitute a significant share of Argentina’s imports from the United States.
In 2016, the main imports from the United States included intermediate goods, which totaled U.S.$2.1 billion, and capital goods (such as machines, instruments and electric materials), which totaled U.S.$1.8 billion. The main exports to the United States for the same period were manufactured products of industrial origin, which totaled U.S.$2.8 billion, followed by manufactured products of agricultural origin, which totaled U.S.$0.9 million. In 2016, Argentina’s trade deficit with the United States was U.S.$2.5 billion, as compared to a deficit of U.S.$4.3 billion in 2015, mainly due to a 30.6% increase in total exports to the United States, which was partially offset by a 9.3% decrease in total imports from the United States.
The decrease in imports as compared to 2015 was mainly the result of decreases in the following products:
| • | intermediate goods, which decreased by 21.8% to U.S.$2.1 billion; and |
| • | energy and fuel, which decreased by 10.4% to U.S.$1.2 billion. |
The increase in exports in 2016 as compared to 2015 was primarily due to a 84.2% increase in exports of manufactured products of industrial origin, and a 2.3% increase in primary products exports. This increase was partially offset by a 13.5% decrease in exports of manufactured goods of agricultural origin and a 22.0% decrease in exports of energy and fuel.
In March 2012, the United States suspended Argentina from the U.S. Generalized System of Preferences, or “GSP,” under which certain Argentine exports enjoyed preferential tariffs, due to Argentina’s failure to comply with ICSID awards related to U.S. companies. For a discussion on payment by Argentina of ICSID awards see “Public Sector Debt—Legal Proceedings—Litigation in Argentina.”
Non-Financial Services Trade
The non-financial services trade balance reflects the amount of services (other than financial services, encompassing payments of interest, dividends and other income) that Argentine residents purchase outside Argentina, relative to the amount of non-financial services that foreigners purchase in Argentina. For instance, a deficit in non-financial service trade indicates that the value of non-financial services purchased by Argentine residents outside Argentina exceeds the value of non-financial services purchased in Argentina by foreigners. Argentina’s non-financial services account reflects in part Argentina’s overall level of trade in goods since it includes the freight and insurance services associated with these transactions.
The main components of Argentina’s non-financial services trade deficit were:
D-80
| • | transportation, with a deficit that increased to U.S.$2.4 billion in 2016, as compared to a deficit of U.S.$2.0 billion in 2015; |
| • | royalties, with a deficit that increased to U.S.$2.0 billion in 2016, as compared to a deficit of U.S.$1.7 billion in 2015; and |
| • | tourism, with a deficit that increased to U.S.$3.6 billion in 2016, from U.S.$1.5 billion in 2015. |
These changes in deficit were partially offset by professional, technical and business services, which registered a surplus of U.S.$1.3 billion in 2016 as compared to a surplus of U.S.$1.6 billion in 2015.
In 2012, the deficit in non-financial services trade increased U.S.$0.8 billion to U.S.$3.0 billion, as a result of a higher rate of increase in imports of non-financial services, which exceeded the increase in exports. Specifically, the increase in non-financial services trade deficit was due to:
| • | an increase in the deficit of the tourism account of U.S.$0.8 billion to U.S.$1.0 billion in 2012, as compared to a U.S.$188 million deficit registered in 2011; and |
| • | a 10.6% deficit increase in royalties. |
These effects were partially offset by an 8.5% surplus increase in professional, technical and business services.
In 2013, the deficit in non-financial services trade increased U.S.$0.7 billion to U.S.$3.7 billion, as a result of the higher rate of increase in imports of non-financial services, which exceeded the increase in exports. Specifically, the increase in non-financial services trade deficit was due to:
| • | a 14.4% surplus decrease in professional, technical and business services; |
| • | a 22.7% increase in the deficit of the tourism account of U.S.$230.0 million to U.S.$1.3 billion in 2013, as compared to a U.S.$1.0 billion deficit registered in 2012; and |
| • | a 7.9% deficit increase in transport account of U.S.$190.0 million to U.S.$2.6 billion in 2013. |
In 2014, the deficit in non-financial services trade decreased U.S.$0.6 billion to U.S.$3.1 billion, as a result of higher rate of increase in exports of non-financial services, which exceeded the increase in imports. Specifically, the decrease in non-financial services trade deficit was due to:
| • | a 34.7% deficit decrease in transport, particularly passenger transport; and |
| • | a 41.6% deficit decrease in tourism account of U.S.$518 million to U.S.$0.7 billion in 2014. |
These deficit decreases were partially offset by a 24.2% decrease in the surplus of professional, technical and business services to U.S.$1.5 billion.
In 2015, the deficit in non-financial services trade increased U.S.$0.9 billion to U.S.$4.0 billion, as a result of an increase in imports of non-financial services that exceeded the increase in exports. Specifically, the increase in the non-financial services trade deficit was due to:
| • | a U.S.$0.8 billion increase in the deficit of the tourism account to U.S.$1.5 billion in 2015, as compared to a U.S.$0.7 billion deficit registered in 2014; and |
| • | a 15.4% deficit increase in transport account of U.S.$262 million to U.S.$2.0 billion in 2015. |
These deficit decreases were partially offset by a 3.6% decrease in the deficit in royalties to U.S.$1.7 billion.
D-81
In 2016, the deficit in non-financial services trade increased from U.S.$3.9 billion to U.S.$7.0 billion, as a result of an increase in imports of non-financial services that was exacerbated by a decrease in exports. Specifically, the increase in the non-financial services trade deficit was due to:
| • | a U.S.$2.1 billion increase in the deficit of the tourism account to U.S.$3.6 billion in 2016, as compared to a U.S.$1.5 billion deficit registered in 2015; and |
| • | a 23.6% deficit increase of U.S.$460 million in the transportation account to U.S.$2.4 billion in 2016. |
The table below sets forth the net results of Argentina’s non-financial services trade for the periods specified.
Non-Financial Services
(in millions of U.S. dollars, at current prices)
| 2012 | 2013 | 2014 | 2015 | 2016 | ||||||||||||||||
| Transportation: |
||||||||||||||||||||
| Freight |
U.S.$ | (1,684 | ) | U.S.$ | (1,884 | ) | U.S.$ | (1,636 | ) | U.S.$ | (1,520 | ) | U.S.$ | (1,492 | ) | |||||
| Passenger |
(1,699 | ) | (1,884 | ) | (1,254 | ) | (1,755 | ) | (2,205 | ) | ||||||||||
| Other |
977 | 1,172 | 1,195 | 1,318 | 1,280 | |||||||||||||||
| Total |
(2,406 | ) | (2,596 | ) | (1,696 | ) | (1,957 | ) | (2,417 | ) | ||||||||||
| Tourism |
(1,015 | ) | (1,245 | ) | (727 | ) | (1,520 | ) | (3,598 | ) | ||||||||||
| Royalties |
(1,971 | ) | (1,981 | ) | (1,804 | ) | (1,738 | ) | (1,950 | ) | ||||||||||
| Professional, technical, business services |
2,342 | 2,005 | 1,520 | 1,647 | 1,335 | |||||||||||||||
| Others(1) |
65 | 108 | (357 | ) | (356 | ) | (381 | ) | ||||||||||||
| Total non-financial services |
U.S.$ | (2,985 | ) | U.S.$ | (3,708 | ) | U.S.$ | (3,063 | ) | U.S.$ | (3,925 | ) | U.S.$ | (7,010) | ||||||
| (1) | Includes communication, construction, insurance, financial, information, entertainment and recreational services, as well as certain Government services. |
Source: INDEC and Ministry of the Treasury.
Tourism
In 2012, the tourism sector registered a U.S.$1.0 billion deficit, primarily due to a 8.7% decrease in inflows related to non-residents traveling to Argentina and a 6.5% increase in outflows related to residents traveling abroad.
In 2013, the tourism sector registered a U.S.$1.3 billion deficit, primarily due to an 11.7% decrease in inflows related to non-residents traveling to Argentina, which was partially offset by a 5.7% decrease in outflows related to residents traveling abroad.
In 2014, the tourism sector deficit decreased by 41.3% from U.S.$1.3 billion in 2013 to U.S.$0.7 billion in 2014. This deficit decrease was primarily due to a 7.2% increase in inflows related to non-residents traveling to Argentina and a 3.7% decrease in outflows related to residents traveling abroad.
In 2015, the tourism sector registered a U.S.$1.5 billion deficit in 2015, primarily due to a 10.4% increase in outflows related to residents traveling abroad Argentina and a 5.1% decrease in inflows related to non-residents traveling to Argentina.
In 2016, the tourism sector registered a U.S.$3.6 billion deficit.
D-82
The following table sets forth tourism information for the dates specified.
Tourism Statistics
| 2012 | 2013 | 2014 | 2015 | |||||||||||||
| Foreign non-resident arrivals (in thousands) |
14,747 | 13,700 | 15,276 | 14,234 | ||||||||||||
| Average length of stay (number of nights) |
11.76 | 11.34 | 10.98 | 11.30 | ||||||||||||
| Income from tourism (in millions of U.S.$) |
4,890 | 4,324 | 4,635 | 4,400 | ||||||||||||
| Expenses from tourism (in millions of U.S.$) |
5,905 | 5,569 | 5,362 | 5,920 | ||||||||||||
| Balance (in millions of U.S.$) |
(1,015 | ) | (1,245 | ) | (727 | ) | (1,520 | ) | ||||||||
Source: INDEC and Ministry of the Treasury.
Financial Services Trade
The financial services trade balance reflects the net amount of dividends, interest and other financial income flowing into and out of Argentina. For example, a deficit in net dividend payments indicates that Argentine companies pay more in dividends to foreign shareholders than what foreign companies pay in dividends to Argentine shareholders.
In 2012, the financial services deficit decreased by 7.4% to U.S.$12.9 billion, primarily due to a 14.4% decrease in net dividend outflows (particularly dividends to the non-financial private sector resulting from foreign direct investment), as compared to 2011. Additionally, net interest payments increased 16.4% as compared to 2011, mainly due to an increase in interest outflows from the non-financial public sector.
In 2013, the financial services deficit decreased by 4.5% to U.S.$12.3 billion, primarily due to a 6.7% decrease in net dividend outflows (particularly dividends resulting from foreign direct investment), as compared to 2012.
In 2014, the financial services deficit decreased by 12.1% to U.S.$10.8 billion, primarily due to a 19.7% decrease in net dividend outflows, partially offset by a 6.3% increase in net interest outflows, as compared to 2013. The decrease in net dividend was mainly due to lower payments to non-residents resulting from foreign direct investment, as compared to 2013. The increase in net interest was primarily due to higher interest payments made by the non-financial public sector to non-residents.
In 2015, the financial services deficit increased by 12.4% to U.S.$12.1 billion, primarily due to an 11.0% increase in net dividend outflows and a 16.0% increase in net interest outflows. The increase in net dividend outflows was due to higher payments to non-residents resulting from foreign direct investment, as compared to 2014. The increase in net interest outflows was due to higher interest payments made from the non-financial public sector and the financial sector to non-residents.
In 2016, the financial services deficit increased by 3.5% to U.S.$12.6 billion, primarily due to an 26.8% increase in net interest outflows which was partially offset by a 10.2% decrease in net dividend outflows. The decrease in net dividend outflows was due to lower payments to non-residents resulting from foreign direct investment, as compared to 2015. The increase in net interest outflows was due to higher interest payments made from the non-financial public sector and the financial sector to non-residents.
Capital and Financial Account
Argentina’s capital and financial account measures the country’s level of international borrowing, lending and investment.
D-83
2012
In 2012, the capital and financial account registered a deficit of U.S.$1.3 billion as compared to a surplus of U.S.$2.0 billion in 2011.
Central Bank. Capital flows to the Central Bank decreased from a surplus of U.S.$5.0 billion in 2011 to a deficit of U.S.$2.0 billion in 2012. This capital outflow was mainly the result of a cancellation of loans granted by multilateral credit organizations.
Non-financial private sector. Capital flows increased from a deficit of U.S.$6.8 billion in 2011 to a surplus of U.S.$3.3 billion in 2012. This net increase in capital inflows was mainly due to a U.S.$8.8 billion decrease in investments in external assets by residents from a U.S.$19.7 billion deficit recorded in 2011 to a U.S.$10.9 billion deficit recorded in 2012.
Non-financial public sector. Capital flows decreased from a deficit of U.S.$2.1 billion in 2011 to a deficit of U.S.$3.0 billion in 2012. This increase in capital outflows was mainly attributable to a U.S.$689 million increase in payments made to non-residents under GDP-linked securities in December 2012, as compared to December 2011, a U.S.$589 million reduction in net disbursements by multilateral credit organizations, and a U.S.$631 million reduction in net disbursements related to debt issued by the provinces, which was partially offset by the U.S.$759 million decrease in amortization payments by the Government, in each case as compared to 2011.
Other financial entities. Capital flows decreased to a surplus of U.S.$352 million in 2012, from a surplus of U.S.$1.9 billion in 2011. This decrease was mainly due to a U.S.$1.2 billion decrease in net inflows from deposits and credits by non-residents (from an inflow of U.S.$742 million to an outflow of U.S.$455 million).
2013
In 2013, the capital and financial account registered a surplus of U.S.$3.5 billion as compared to a deficit of U.S.$1.3 billion in 2012.
Central Bank. Capital flows to the Central Bank remained stable in 2013 as compared to 2012, registering a deficit of U.S.$2.0 billion. This capital outflow was mainly the result of a cancellation of loans granted by multilateral credit organizations.
Non-financial private sector. Capital inflows increased from a surplus of U.S.$3.3 billion in 2012 to a surplus of U.S.$3.8 billion in 2013.
Non-financial public sector. Capital flows increased from a deficit of U.S.$3.0 billion in 2012 to a surplus of U.S.$843 million in 2013. The net increase in capital inflows primarily resulted from the fact that no payments became due under the terms of the GDP-linked Securities in 2013.
Other financial entities. Capital flows increased to a surplus of U.S.$845 million in 2013 from a surplus of U.S.$352 million in 2012. This increase in capital inflows was mainly due to a U.S.$488 million increase in loans from abroad.
2014
In 2014, the capital and financial account registered a surplus of U.S.$9.5 billion as compared to a surplus of U.S.$3.5 billion in 2013.
Central Bank. Capital flows to the Central Bank increased from a deficit of U.S.$2.0 billion in 2013 to a surplus of U.S.$3.2 billion in 2014. This capital inflow was mainly the result of the currency swap with the People’s Bank of China and other international disbursements.
Non-financial private sector. Capital flows decreased from a surplus of U.S.$3.8 billion in 2013 to a surplus of U.S.$59 million in 2014. This decrease in capital inflows was mainly due to a U.S.$7.0 billion decrease in investments in local assets by foreign investors, including the expropriation of 51% of the shares of YPF, from a U.S.$9.5 billion surplus recorded in 2013 to a U.S.$2.5 billion surplus recorded in 2014. This decrease was partially offset by a U.S.$2.2 billion decrease in investments in external assets by residents, from a U.S.$5.3 billion deficit recorded in 2013 to a U.S.$3.1 billion deficit recorded in 2014.
D-84
Non-financial public sector. Capital inflows increased from a surplus of U.S.$843 million in 2013 to a surplus of U.S.$5.5 billion in 2014, mainly due to the recording of the bonds issued to Repsol as compensation for the expropriation of 51% of the shares of YPF.
The expropriation of 51% of the shares of YPF and the corresponding compensation paid to Repsol had a neutral net effect on the overall balance of payments in 2014.
Other financial entities. Capital flows decreased to a surplus of U.S.$642 million in 2014 from a surplus of U.S.$845 million in 2013. This decrease in capital inflows was mainly due to a U.S.$256 million decrease in foreign investment in 2014, reaching U.S.$678 million, as compared to U.S.$934 million in 2013.
2015
In 2015, the capital and financial account registered a surplus of U.S.$13.2 billion as compared to a surplus of U.S.$9.5 billion in 2014.
Central Bank. Capital flows to the Central Bank increased from a surplus of U.S.$3.2 billion to a surplus of U.S.$7.6 billion. This capital inflow was mainly the result of the currency swap with the People’s Bank of China and other international disbursements.
Non-financial private sector. Capital flows increased from a surplus of U.S.$59 million in 2014 to a surplus of U.S.$7.0 billion in 2015. The net increase in capital inflows was mainly due to a U.S.$12.5 billion increase in investments in local assets by foreign investors, from a U.S.$2.5 billion surplus recorded in 2014 to a U.S.$15.0 billion surplus recorded in 2015. This increase was partially offset by a U.S.$6.4 billion increase in investments in external assets by residents, from a U.S.$3.1 billion deficit recorded in 2014 to a U.S.$9.4 billion deficit recorded in 2015.
Non-financial public sector. Capital flows decreased from a surplus of U.S.$5.5 billion in 2014 to a deficit of U.S.$2.9 billion in 2015. The decrease in net capital inflows reflected a U.S.$3.4 billion increase in amortization payments and the absence of inflows from issuances in 2015, as compared to the U.S.$5.0 billion inflow registered in 2014.
Other financial entities. Capital inflows increased to a surplus of U.S.$1.4 billion in 2015 from a surplus of U.S.$642 million in 2014. This increase in capital inflows was mainly due to a U.S.$820 million increase in foreign investment in 2015, reaching U.S.$1.3 billion, as compared to U.S.$678 million in 2014.
2016
In 2016, the capital and financial account registered a surplus of U.S.$29.1 billion as compared to a surplus of U.S.$13.2 billion in 2015.
Central Bank. Capital flows to the Central Bank generated a surplus of U.S.$7.6 billion in 2015 and a deficit of U.S.$607 million in 2016. This capital outflow in 2016 was mainly the result of payments to international organizations and other central banks.
Non-financial private sector. Capital flows decreased from a surplus of U.S.$7.0 billion in 2015 to a surplus of U.S.$4.7 billion in 2016. The net decrease in capital inflows was mainly due to a U.S.$10.2 billion decrease in investments in local assets by foreign investors, from a U.S.$15.0 billion surplus recorded in 2015 to a U.S.$4.7 billion surplus recorded in 2016. This decrease was partially offset by a U.S.$8.0 billion decrease in investments in external assets by residents, from a U.S.$9.4 billion deficit recorded in 2015 to a U.S.$1.4 billion deficit recorded in 2016.
D-85
Non-financial public sector. Capital flows increased from a deficit of U.S.$2.9 billion in 2015 to a surplus of U.S.$28.3 billion in 2016. The increase in net capital inflows reflected a U.S.$31.0 billion increase in net proceeds from international debt capital markets transactions, as compared to no inflow registered in 2015.
Other financial entities. Capital inflows recorded a deficit of U.S.$3.5 billion in 2016 compared to a surplus of U.S.$1.4 billion in 2015. This decrease in capital inflows was mainly due to a U.S.$1.9 billion deficit increase in cash and deposits in 2016, reaching U.S.$2.5 billion deficit, as compared to U.S.$605 million deficit in 2015.
Foreign Investment Regulation
With the aim of increasing capital inflows, the Government and the Central Bank have introduced a set of measures to eliminate substantially all of the restrictions affecting the balance of payments. For more information, see “Exchange Rates and Exchange Controls—Exchange Controls.” For further explanation of restrictions on capital transfers, see “Monetary System—Foreign Exchange and International Reserves.”
Evolution of Portfolio and Foreign Direct Investment
The following table sets forth information on portfolio investment, foreign direct investment and other investment in the Argentine economy.
Flows of Portfolio, Foreign Direct and Other Investment
(in millions of U.S. dollars)
| 2012 | 2013 | 2014 | 2015 | 2016 | ||||||||||||||||
| Direct investment: |
||||||||||||||||||||
| In Argentina by non-Argentine residents(1) |
U.S.$ | 15,324 | U.S.$ | 9,822 | U.S.$ | 5,065 | U.S.$ | 11,759 | U.S.$ | 5,745 | ||||||||||
| Outside Argentina by Argentine residents(2) |
(1,055 | ) | (890 | ) | (1,921 | ) | (875 | ) | (887 | ) | ||||||||||
| Direct investment, net |
14,269 | 8,932 | 3,145 | 10,884 | 4,858 | |||||||||||||||
| Portfolio investment: |
||||||||||||||||||||
| In Argentina by non-Argentine residents(1) |
(1,167 | ) | (339 | ) | 6.241 | (296 | ) | 44,585 | ||||||||||||
| Outside Argentina by Argentine residents (2) |
(15 | ) | (19 | ) | (10 | ) | (8 | ) | (17 | ) | ||||||||||
| Derivative financial instruments |
(2,908 | ) | 32 | 168 | 25 | (222 | ) | |||||||||||||
| Portfolio investment, net |
(4.202 | ) | (326 | ) | 6,400 | (279 | ) | 44,347 | ||||||||||||
| Other investment:(3) |
||||||||||||||||||||
| In Argentina by non-Argentine residents(1) |
(611 | ) | 105 | 2,358 | 11,886 | (16,604 | ) | |||||||||||||
| Outside Argentina by Argentine residents (2) |
(9,972 | ) | (4,370 | ) | (1,640 | ) | (9,339 | ) | (3,707 | ) | ||||||||||
| Other investment, net |
U.S.$ | (10,583 | ) | U.S.$ | (4,265 | ) | U.S.$ | 718 | U.S.$ | 2,547 | U.S.$ | (20,311) | ||||||||
| (1) | Reflects the variation in the value of net local assets owned by non-Argentine residents. If during any period, non-Argentine residents purchased more local assets than they sold, the amount for that period would be positive. |
| (2) | Reflects the variation in the value of the net external assets owned by Argentine residents. If during any period, Argentine residents purchased more external assets than they sold, the amount for that period would be negative. |
| (3) | Includes assets (loans, commercial loans and others) and liabilities (trade credit, loans, arrears and others). |
Source: INDEC and Ministry of the Treasury.
D-86
Foreign Direct Investment
Foreign direct investment in Argentina increased significantly following the implementation of the Convertibility Regime and the elimination of barriers to foreign investment. A significant portion of the capital inflows in the early to mid-1990s resulted from the privatization of state-owned entities that attracted private foreign capital. Net foreign direct investment in Argentina peaked in 1999 with the completion of the privatization of YPF, a process that started in 1992. In the following years, the Government reversed course and expropriated certain private companies, including 51% of the shares of YPF in 2012. As a result, capital inflows from foreign direct investment declined significantly.
In 2012, net foreign direct investment increased by 52.6% to U.S.$14.3 billion, as compared to U.S.$9.4 billion in 2011. This increase was mainly driven by a U.S.$4.5 billion increase in investments made in Argentina by non-residents, primarily related to the investment of profits by the non-financial private sector, and a U.S.$433 million decrease in investments made abroad by Argentine residents, which resulted from a U.S.$528 million decrease in investments made abroad by the local non-financial private sector. This decrease was partially offset by a U.S.$95 million increase in investments made abroad by the local financial private sector.
In 2013, net foreign direct investment decreased by 37.4% to U.S.$8.9 billion, as compared to U.S.$14.3 billion in 2012. This decrease was mainly driven by a U.S.$5.5 billion decrease in investments made in Argentina by non-residents, partially offset by a U.S.$165 million decrease in investments made abroad by Argentine residents.
In 2014, net foreign direct investment decreased by 64.8% to U.S.$3.1 billion, as compared to U.S.$8.9 billion in 2013. This decrease was mainly driven by a U.S.$4.8 billion decrease in investments made in Argentina by non-residents, and a U.S.$1.0 billion increase in investments made abroad by Argentine residents.
In 2015, net foreign direct investment increased by U.S.$7.7 billion to U.S.$10.9 billion, as compared to U.S.$3.1 billion in 2014. This increase was mainly driven by a U.S.$6.7 billion increase in investments made in Argentina by non-residents and a U.S.$1.0 billion decrease in investments made abroad by Argentine residents.
In 2016, net foreign direct investment decreased by U.S.$6.0 billion to U.S.$4.9 billion, as compared to U.S.$10.9 billion in 2015. This decrease was mainly driven by a U.S.$6.0 billion decrease in investments made in Argentina by non-residents, attributable to the elimination of foreign exchange restrictions that had curtailed remittances to foreign shareholders, which had been retained in Argentina in prior years.
Portfolio Investment
Portfolio investments, consisting of the purchase of stocks, bonds or other securities, tend to be highly liquid and short-term, making them particularly responsive to fluctuations in the market.
In 2012, the deficit in net portfolio investment increased to a U.S.$4.2 billion as compared to a U.S.$3.9 billion deficit registered in 2011. This deficit increase was mainly due to a U.S.$552 million increase in outflows related to transactions with derivative financial instruments, resulting in a U.S.$2.9 billion deficit as compared to a U.S.$2.4 billion deficit in 2011. This deficit was partially offset by a U.S.$410 million decrease in the deficit in net sales of assets made within Argentina to foreign investors, which decreased from a deficit of U.S.$1.6 billion in 2011 to a deficit of U.S.$1.2 billion in 2012.
The balance in net portfolio investment increased to a U.S.$326 million deficit in 2013 from a U.S.$4.2 billion deficit in 2012. Net inflows related to transactions with derivative financial instruments increased by U.S.$2.9 billion in 2013, resulting in a U.S.$32 million surplus as compared to a U.S.$2.9 billion deficit in 2012. Net sales of assets made within Argentina to foreign investors increased from a deficit of U.S.$1.2 billion in 2012 to a deficit of U.S.$339 million in 2013.
In 2014, the surplus in net portfolio investment increased from a U.S.$326 million deficit in 2013 to a U.S.$6.4 billion surplus in 2014. Net sales of assets made within Argentina to foreign investors increased from a deficit of U.S.$339 million in 2013 to a surplus of U.S.$6.2 billion in 2014. Net inflows related to transactions with derivative financial instruments increased by U.S.$136 million in 2014, resulting in a U.S.$168 million surplus as compared to a U.S.$32 million surplus in 2013.
D-87
In 2015, the surplus in net portfolio investment decreased from a U.S.$6.4 billion in 2014 to U.S.$279 million in 2015. This decrease mainly resulted from a decrease in net sales of assets made within Argentina to foreign investors, which decreased from a surplus of U.S.$6.2 billion in 2014 to a deficit of U.S.$296 million in 2015.
Inflows related to transactions with derivative financial instruments decreased by U.S.$143 million in 2015, resulting in a U.S.$25 million surplus as compared to a U.S.$168 million surplus in 2014.
In 2016, the surplus in net portfolio investment increased from a deficit of U.S.$279 million in 2015 to a surplus of U.S.$44.3 billion in 2016. This increase mainly resulted from net sales of financial assets by Argentine issuers (including the Government) to foreign investors, which increased from a deficit of U.S.$296 million in 2015 to a surplus of U.S.$44.6 billion in 2016.
Inflows related to transactions with derivative financial instruments decrease by U.S.$247 million in 2016, resulting in a U.S.$222 million deficit as compared to a U.S.$25 million surplus in 2015.
Other Investment
Other investment includes data on other assets and liabilities of the non-financial public sector, the non-financial private sector, the financial sector and the Central Bank:
| • | assets of the non-financial public sector include loans from bi-national bodies and contributions to international organizations; |
| • | assets of the financial sector include foreign currency holdings and deposits in foreign banks; |
| • | assets of the private sector include foreign assets of Argentine companies who are involved in exports as well as assets related to direct trade financing including, among others, foreign assets; |
| • | financial sector liabilities include deposits by non-residents in the domestic financial system, credit facilities opened by residents abroad and financial assistance by international organizations to resident entities; |
| • | Central Bank liabilities include transactions between the Central Bank and international organizations (such as the IMF) and the purchase of Central Bank securities by non-residents; |
| • | Non-financial private sector liabilities include loans from private sources such as loans from international organizations, banks, suppliers, and official agencies; and |
| • | Non-financial public sector liabilities include loans to the public sector granted by international organizations, banks, official agencies and other governments. |
In 2012, the other investment deficit increased by 42.2% to U.S.$10.6 billion. During this period, investments made abroad by Argentine residents decreased by 46.4% to U.S.$10.0 billion from U.S.$18.6 billion in 2011. This decrease was mainly caused by an U.S.$8.3 billion reduction in the acquisition of other foreign assets by the local non-financial private sector. In the same period, investments by non-residents in Argentina decreased resulting in an outflow of U.S.$611million from an inflow of U.S.$12.4 billion registered in 2011, primarily as a result of a decrease in net loans to the Central Bank, reaching a U.S.$2.0 billion deficit as compared to a U.S.$5.0 billion surplus in 2011.
In 2013, the other investment deficit decreased by 59.7% to U.S.$4.3 billion. During this period, investments made abroad by Argentine residents decreased by 56.2% to U.S.$4.4 billion from U.S.$10.0 billion in 2012 and investments by non-residents in Argentina decreased, resulting in an inflow of U.S.$105 million from an outflow of U.S.$611 million in 2012.
D-88
In 2014, the other investment increased from a deficit of U.S.$4.3 billion to a surplus of U.S.$718 million. During this period, investments made abroad by Argentine residents increased by 62.5% to U.S.$1.6 billion deficit from U.S.$4.4 billion deficit in 2013, while investments by non-residents in Argentina increased resulting in an inflow of U.S.$2.4 billion from an intflow of U.S.$105 million in 2013.
In 2015, other investments increased by U.S.$1.8billion, resulting in a surplus of U.S.$2.5 billion. During this period, investments made abroad by Argentine residents increased by U.S.$7.7 billion to U.S.$9.3 billion from U.S.$1.6 billion in 2014, while investments by non-residents in Argentina resulted in an inflow of U.S.$11.9 billion compared to U.S.$2.4 billion in 2014.
In 2016, other investments decreased by U.S.$22.9 billion, resulting in a deficit of U.S.$20.3 billion. During this period, investments made abroad by Argentine residents decreased by U.S.$5.6 billion to U.S.$3.7 billion from U.S.$9.3 billion in 2015, while investments by non-residents in Argentina resulted in an outflow of U.S.$16.6 billion compared to a U.S.$11.9 billion inflow in 2015.
International Reserves
As of December 31, 2016, the gross international reserve assets of the Central Bank totaled U.S.$38.8 billion, compared to U.S.$25.6 billion as of December 31, 2015. For more information regarding the change in gross international reserves deposited at the Central Bank see “Monetary System—Foreign Exchange and International Reserves.”
D-89
The Central Bank
Founded in 1935, the Central Bank is the principal monetary and financial authority in Argentina. The Central Bank operates pursuant to its charter and the Ley de Entidades Financieras (Financial Institutions Law).
The Central Bank is governed by a ten-member board of directors, which is headed by the president of the Central Bank. The president of the Central Bank and the members of the board of directors are appointed by the president and confirmed by the Senate. They serve for fixed terms of six years, may be reappointed and may be removed by the president only for cause. Under the terms of its charter, the Central Bank must operate independently from the Government.
On December 11, 2015, newly elected President Macri issued Decree 36/2015 appointing Mr. Federico Adolfo Sturzenegger as president of the Central Bank. Mr. Sturzenegger assumed the presidency of the Central Bank on the date of his appointment, however, as of the date of this Annual Report, the Senate has not yet confirmed his appointment. On December 11, 2015, five new members of the board of directors were also appointed by President Macri and remain subject to Senate confirmation.
Under the Central Bank’s charter, as most recently amended in 2012, the Central Bank, among other things:
| • | must promote monetary and financial stability, employment and economic growth with social equity; |
| • | is empowered to regulate interest rates and regulate and guide lending activities; |
| • | may grant exceptional advances to the Government in an amount up to the equivalent of 10% of the revenues collected by the Government in the preceding 12-month period; |
| • | must hold and manage the international reserves, including gold and foreign currency; |
| • | must implement the exchange rate policy in accordance with applicable legislation; and |
| • | must act as financial agent of the Government and contribute to the proper functioning of capital markets, regulate any activity connected with the financial system and foreign exchange transactions and protect the rights of consumers of financial services. |
Monetary Policy
Background
From 1991 through 2001, Argentina’s monetary policy was governed by the Convertibility Law of 1991, which pegged the peso to the U.S. dollar at a one-to-one exchange rate and required the Central Bank to maintain international monetary reserves at least equal to the monetary base (consisting of domestic currency in circulation and financial institutions’ peso-denominated deposits with the Central Bank). During the Convertibility Regime, the peso appreciated in real terms and the Central Bank did not have the necessary tools to react to the external shocks that affected the Argentine economy, such as the Mexico Crisis in 1995 and the Asian Crisis in 1997. In addition, commencing in 1995 the Argentine Government increased its reliance on the international capital markets to finance its operations, creating additional demand for foreign exchange reserves at the pegged rate. By December 2001, continued capital flight from the Argentine economy had made the Convertibility Regime unsustainable. On January 6, 2002, Congress enacted the Public Emergency Law, effectively bringing an end to the Convertibility Regime by eliminating the requirement that the Central Bank’s gross international reserves be at all times equal to at least 100% of the monetary base. The Public Emergency Law abolished the peg between the peso and the U.S. dollar and granted the executive branch the power to regulate the foreign exchange market and to establish exchange rates.
D-90
In 2002, Mr. Alfonso Prat-Gay was appointed president of the Central Bank. During his tenure (which ended in 2004), the Central Bank implemented a series of measures designed to restore monetary stability and bolster the international reserves of the Central Bank. These measures included the elimination of the quasi-currencies issued by several provinces during the 2001-2002 crisis, the recapitalization of several financial institutions that were affected by the decree mandating asymmetric pesification of their balance sheets in 2002, the adoption of inflation targets intended to limit the impact of an acceleration of economic growth, an increase in the Central Bank’s international reserves, the expansion of the financial system’s lending activities and the encouragement of capital market transactions as a source of financing economic growth.
During the last quarter of 2004, the Central Bank began accumulating international monetary reserves and implemented various measures to manage the increasing monetary base.
During the second half of 2007, in response to tightening credit markets, the Central Bank intervened in the foreign exchange market to manage increasing volatility in the exchange rate, provided liquidity to local banks and expanded the monetary base.
Starting in the second half of 2008, in response to the global financial crisis, the Central Bank intervened to avoid a significant depreciation of the peso and to provide additional liquidity to the market. The Central Bank’s actions included, among other measures, managing the yields on repo loans, auctioning put options on LEBACs and NOBACs and reducing the minimum reserve requirements in foreign currency for financial institutions. These measures allowed banks to keep their liquidity ratios within appropriate levels and sought to stimulate lending by banks.
In late 2009, the Government issued a Decreto de Necesidad y Urgencia (emergency decree) making foreign reserves held by the Central Bank available for external debt payments. Resistance from the Central Bank’s president, Mr. Martín Redrado, who succeeded Mr. Prat-Gay in 2004, to transfer Central Bank reserves for this use led to a standoff between the administration and the Central Bank, which ultimately resulted in Mr. Redrado’s resignation in January 2010 and renewed concerns over governability, political stability and debt sustainability. Ms. Mercedes Marcó del Pont was appointed president of the Central Bank and her tenure, which ended with her resignation on November 18, 2013, was marked by monetary policies designed to accommodate the fiscal needs of the Government, as well as the decision to promote economic growth by expanding domestic demand at the expense of monetary stability.
On February 18, 2010, President Fernández de Kirchner created the Council for the Coordination of Monetary, Financial and Exchange Rate Policies (the “Council”). The Council was chaired by the Minister of Economy and Public Finances and included two additional members of the Ministry of the Treasury (the Secretary of Economic Policy and the Secretary of Finance), as well as three members of the Central Bank (the president, the vice-president and one additional member of the board of the Central Bank).
Following the amendment of the Central Bank’s charter in 2012, the Central Bank adopted various monetary policy initiatives and provided continued financing to the Government. As pressure on the peso began to develop, the Central Bank effectively implemented a multiple exchange rate regime that was favorable to exports, discouraged imports but favored overseas tourism by Argentine residents, contributing to the continued erosion of the Central Bank’s international monetary reserves.
Following Ms. Marcó del Pont’s resignation on November 18, 2013, President Fernández de Kirchner appointed Mr. Juan Carlos Fábrega as president of the Central Bank. During Mr. Fábrega’s administration, which ended on October 10, 2014, attempts were made to restore monetary stability that were short-lived. Foreign exchange policy, however, remained within the purview of the Ministry of Finances, giving rise to inconsistent monetary and foreign exchange policies.
On February 2, 2014, President Fernández de Kirchner appointed the then acting chairman of the CNV, Mr. Alejandro Vanoli, as president of the Central Bank. During 2014 and 2015, the Central Bank continued to finance the Government’s fiscal deficit. The Central Bank reinforced limitations on access to foreign exchange, which resulted in the continued depletion of international monetary reserves, which decreased from U.S.$31.4 billion as of December 31, 2014, to U.S.$25.6 billion as of December 31, 2015. In November 2015, the Central Bank sold 180-day future dollar contracts at rates that were inconsistent with international market rates to allay increasing fears of a significant depreciation of the peso.
D-91
As of December 2015, the Central Bank adopted, among others, the following series of measures intended to correct distortions that resulted from policies implemented under the Fernandez de Kirchner administration:
| • | Foreign exchange market: The peso was allowed to float, dismantling the unofficial multiple exchange rate regime, foreign exchange transfers for current transactions were again permitted. A program to bring current payments due an account of imports was approved, and the Central Bank swapped a renminbi position into U.S dollars to further bolster its international monetary reserves. |
| • | Inflation: The Central Bank announced its decision to implement a long-term monetary policy based on inflation targeting, and to rely on short-term interest notes as its primary monetary policy tool. |
| • | International Reserves: A swap of non-transferable notes of the Government into marketable securities allowed the Central Bank to strengthen its balance sheet and improve its reserves position. |
For 2016, the Central Bank adopted, among others, the following measures:
| • | it eliminated caps on lending and deposit interest rates; |
| • | it introduced a new financial instrument intended to safeguard savings and long-term loans from the effects of inflation. In April 2016, the Central Bank by means of Communication “A” 5945 (as amended and restated by Communication “A” 6069) introduced the first instrument, known as Unidades de Valor Adquisitivo (UVAs), with an initial value based on the average construction cost of a square meter in the cities of Buenos Aires, Córdoba, Rosario, Salta and the coastal region (Santa Fe de la Vera Cruz to Paraná) as of March 31, 2016. The value of UVAs is adjusted on a daily basis, based on the CER. In September 2016, the Government by means of Law No. 27,271, introduced the second instrument, known as Unidades de Vivienda (UVIs) with an initial value based on the average construction cost of a square meter in Argentina. The value of UVIs is adjusted on a monthly basis, based on the “Índice de la Construcción para el Gran Buenos Aires” published by the INDEC; |
| • | it implemented measures aimed at directing idle funds towards productive activities; |
| • | it promoted competition in the financial intermediation industry by allowing employees to open payment of wages accounts without involving the employer in the process; |
| • | it relaxed requirements for opening new bank branches, allowing financial entities to expand into regions that have had less access to financial services. Authorized the creation of mobile branches and automatic terminals; |
| • | it implemented regulations and oversight activities in line with international standards, achieving the highest standards under the Basel regulations III (Regulatory Consistency Assessment Programme – RCAP). The Central Bank also adjusted certain capital requirements to the Basel standards; and |
| • | it provided for the creation of free savings accounts, debit cards, transfers in ATMs or via home-banking, aimed at easing access to financial services. |
D-92
The Central Bank’s Policy Objectives for 2017
The Central Bank maintains the following policy objectives for 2017.
| • | Recover monetary stability: the Central Bank will focus its policy on restoring monetary stability and gradually reducing inflation rates to levels consistent with those of other emerging markets that manage monetary policy, with inflation targets. The inflation targeting structure is based on: (i) the reduction of advances to the Government, (ii) a floating exchange rate, (iii) communication of economic indicators to the public, and (iv) using short-term interest rates as its principal monetary policy tool. The nominal anchor of the Central Bank’s monetary policy will be the monetary rate, and its policies will be based on predetermined inflation targets. The Central Bank has set inflation targets for the next four years, including a band of 12-17% for 2017 and a 5% target by end of 2019. To regulate market liquidity, the Central Bank will conduct periodic auctions of Central Bank peso-denominated notes. The peso has been allowed to float and the Central Bank will intervene to preserve the orderly operation of the foreign exchange market. |
| • | Ensure the stability and promote the growth of the financial system: the Central Bank intends to continue promoting the growth of the financial system and enhancing savings in pesos by fostering the subscription of peso-denominated instruments. These measures aim to strengthen the credit system, which in turn, is expected to benefit productive activities and improve rates and access to housing loans for the general population. |
| • | Increase access to banking and financial intermediation services: the Central Bank expects to continue promoting measures designed to reduce the use of cash to settle transactions and increase electronic means of payment. |
Monetary Policy
As of the date of this Annual Report, the Central Bank’s monetary policy is based on the following guidelines:
| • | use short-term interest rates as its principal tool to implement monetary policy, which will be based on the spread between the bid and ask rate of the 7-day repurchase agreements (pases) reference rate. The Central Bank will determine the rate on a weekly basis. Once the interest rate is set, monetary aggregates are expected to adjust according to liquidity needs; |
| • | all changes in liquidity amounts that are not accompanied by a change in liquidity demand will be absorbed by the Central Bank, relying on the following instruments: |
| • | repurchase agreements (pases); |
| • | purchases and sales of securities; and |
| • | Central Bank bills and Central Bank notes auctions; and |
| • | with respect to the foreign exchange and international reserves policy, maintaining a managed floating exchange rate regime to limit exchange rate volatility and thereby limit the impact of any internal or external shocks to the Argentine economy. |
D-93
The following table sets forth information on the Central Bank’s balance sheet as of the dates specified.
Central Bank Balance Sheet
(in millions of pesos, unless otherwise specified)
| As of December 31, | ||||||||||||||||||||
| 2012 | 2013 | 2014 | 2015 | 2016 | ||||||||||||||||
| Assets |
||||||||||||||||||||
| International reserves: |
||||||||||||||||||||
| Gold |
Ps. | 16,357 | Ps. | 15,575 | Ps. | 20,138 | Ps. | 27,401 | Ps. | 33,313 | ||||||||||
| Foreign currency |
8,396 | 14,473 | 84,015 | 144,744 | 368,453 | |||||||||||||||
| Placements of foreign currency |
187,906 | 168,967 | 164,106 | 159,791 | 207,294 | |||||||||||||||
| Other(1) |
212 | 439 | 339 | 518 | 5,479 | |||||||||||||||
|
|
|
|
|
|
|
|
|
|
|
|||||||||||
| Total international reserves(2) |
212,871 | 199,454 | 268,597 | 332,453 | 614,538 | |||||||||||||||
| Public bonds(3) |
190,647 | 301,778 | 481,558 | 867,621 | 1,098,212 | |||||||||||||||
| Credits to: |
||||||||||||||||||||
| Government (temporary advances) |
127,730 | 182,600 | 251,450 | 331,850 | 382,230 | |||||||||||||||
| Financial system |
3,712 | 4,664 | 4,596 | 2,998 | 1,439 | |||||||||||||||
| International organizations(4) |
10,857 | 15,743 | 30,137 | 46,971 | 65,469 | |||||||||||||||
| Other assets(5) |
24,749 | 18,653 | 74,626 | 225,963 | 276,400 | |||||||||||||||
|
|
|
|
|
|
|
|
|
|
|
|||||||||||
| Total assets |
570,566 | 722,891 | 1,110,963 | 1,807,856 | 2,438,342 | |||||||||||||||
|
|
|
|
|
|
|
|
|
|
|
|||||||||||
| Liabilities |
||||||||||||||||||||
| Monetary Base: |
||||||||||||||||||||
| Currency in circulation(6) |
237,010 | 289,208 | 358,752 | 478,777 | 594,616 | |||||||||||||||
| Current accounts in pesos(7) |
70,342 | 87,988 | 103,812 | 145,113 | 227,049 | |||||||||||||||
|
|
|
|
|
|
|
|
|
|
|
|||||||||||
| Total monetary base |
307,352 | 377,197 | 462,564 | 623,890 | 821,664 | |||||||||||||||
| Deposits: |
||||||||||||||||||||
| Government deposits |
6,683 | 12,166 | 35,316 | 5,078 | 18,726 | |||||||||||||||
| Other deposits |
41,746 | 69,592 | 75,229 | 171,937 | 246,759 | |||||||||||||||
|
|
|
|
|
|
|
|
|
|
|
|||||||||||
| Total deposits |
48,429 | 81,758 | 110,545 | 177,016 | 265,485 | |||||||||||||||
| Obligation to international organizations |
3,443 | 4,599 | 5,839 | 8,223 | 9,887 | |||||||||||||||
| Central Bank notes: |
||||||||||||||||||||
| Notes issued in foreign currency |
— | — | 5,680 | 31,273 | — | |||||||||||||||
| Notes issued in pesos |
99,855 | 110,547 | 276,456 | 385,619 | 698,425 | |||||||||||||||
|
|
|
|
|
|
|
|
|
|
|
|||||||||||
| Total Central Bank notes(8) |
99,855 | 110,547 | 282,135 | 416,892 | 698,425 | |||||||||||||||
| Other liabilities |
50,167 | 41,524 | 141,564 | 404,491 | 508,259 | |||||||||||||||
|
|
|
|
|
|
|
|
|
|
|
|||||||||||
| Total liabilities |
509,246 | 615,624 | 1,002,648 | 1,630,510 | 2,303,720 | |||||||||||||||
|
|
|
|
|
|
|
|
|
|
|
|||||||||||
| Net assets |
Ps. | 61,320 | Ps. | 107,268 | Ps. | 108,315 | Ps. | 177,346 | Ps. | 134,623 | ||||||||||
|
|
|
|
|
|
|
|
|
|
|
|||||||||||
| Memorandum items: |
||||||||||||||||||||
| International reserves (in millions of U.S. dollars) |
U.S.$ | 43,290 | U.S.$ | 30,600 | U.S.$ | 31,408 | U.S.$ | 25,563 | U.S.$ | 38,772 | ||||||||||
| International reserves of the central bank (in months of total imports) |
6.2 | 4.1 | 4.8 | 4.1 | 6.4 | |||||||||||||||
| Exchange rate Ps./U.S.$(9) |
4.92 | 6.52 | 8.55 | 13.01 | 15.85 | |||||||||||||||
| (1) | Includes net results of transactions under a Reciprocal Credit Agreement with ALADI. |
| (2) | Includes short-term foreign-currency denominated bonds and foreign currency-denominated deposits. |
| (3) | Includes a 1990 consolidated Treasury note, IMF obligations and others. |
| (4) | Includes transfers to international organizations from Government accounts and transfers to the Government from the IMF. |
| (5) | Includes transition accounts and others. |
| (6) | Includes cash in vaults at banks and does not include quasi-currencies. |
| (7) | Includes bank reserves in pesos at Central Bank. |
| (8) | Includes LEBACs and NOBACs. |
| (9) | Exchange rate used by the Central Bank to publish its balance sheet. |
| Source: | Central Bank |
D-94
Liquidity Aggregates
The monetary base consists of domestic currency in circulation (including cash held in vaults by banks) and peso-denominated deposits of financial entities with the Central Bank. Additionally, the Central Bank employs the following bi-monetary aggregates to measure the level of liquidity in the economy and control inflation:
| • | M1 measures domestic currency in circulation plus peso-denominated demand deposits and foreign currency-denominated demand deposits; |
| • | M2 measures M1 plus peso-denominated savings deposits and foreign currency-denominated savings deposits; and |
| • | M3 measures M2 plus all other peso-denominated deposits and foreign currency-denominated deposits. |
The following tables set forth information on Argentina’s liquidity aggregates as of the dates specified:
Liquidity Aggregates
(in millions of pesos)
| As of December 31, | ||||||||||||||||||||
| 2012 | 2013 | 2014 | 2015 | 2016 | ||||||||||||||||
| Currency in circulation(1) |
Ps. | 237,010 | Ps. | 289,208 | Ps. | 358,752 | Ps. | 478,777 | Ps. | 594,616 | ||||||||||
| M1 |
397,842 | 496,728 | 640,870 | 804,666 | 1,033,908 | |||||||||||||||
| M2 |
530,022 | 662,411 | 859,921 | 1,133,787 | 1,662,509 | |||||||||||||||
| M3 |
796,440 | 999,888 | 1,283,153 | 1,761,355 | 2,422,522 | |||||||||||||||
| Monetary base |
307,352 | 377,197 | 462,564 | 623,890 | 821,664 | |||||||||||||||
| (1) | Does not include cash in vaults at banks or quasi-currencies. |
Source: Central Bank
Liquidity Aggregates
(% change from previous period)
| As of December 31, | ||||||||||||||||||||
| 2012 | 2013 | 2014 | 2015 | 2016 | ||||||||||||||||
| Currency in circulation(1) |
37.0 | % | 22.0 | % | 24.0 | % | 33.5 | % | 24.2 | % | ||||||||||
| M1 |
37.8 | % | 24.9 | % | 29.0 | % | 25.6 | % | 28.5 | % | ||||||||||
| M2 |
35.1 | % | 25.0 | % | 29.8 | % | 31.8 | % | 46.6 | % | ||||||||||
| M3 |
31.6 | % | 25.5 | % | 28.3 | % | 37.3 | % | 37.5 | % | ||||||||||
| Monetary base |
37.9 | % | 22.7 | % | 22.6 | % | 34.9 | % | 31.7 | % | ||||||||||
| (1) | Does not include cash in vaults at banks or quasi-currencies |
Source: Central Bank.
The growth of the monetary base between 2012 and 2015 was driven primarily by the Central Bank’s continued financing of the Government, which over time dwarfed the contractive effect of the Central Bank’s practice of purchasing of foreign exchange sustained through 2007. In 2016, the variation in the monetary base was mainly a result of purchases of foreign currency.
Foreign Exchange and International Reserves
As of December 31, 2012, the Central Bank’s international reserves stood at U.S.$43.3 billion, 6.7% lower than the previous year, of which U.S.$38.2 billion were foreign currency deposits, U.S.$1.7 were foreign currency and U.S.$3.3 billion were gold.
D-95
As of December 31, 2013, the Central Bank’s international reserves totaled U.S.$30.6 billion, 29.3% lower than the previous year, of which U.S.$25.9 billion were foreign currency deposits, U.S.$2.4 billion were foreign currency and U.S.$2.2 billion were gold.
As of December 31, 2014, the Central Bank’s international reserves totaled U.S.$31.4 billion, 2.6% higher than the previous year, of which U.S.$19.2 billion were foreign currency deposits, U.S.$9.82 billion were foreign currency and U.S.$2.4 billion were gold.
As of December 31, 2015, the Central Bank’s international reserves totaled U.S.$25.6 billion, 18.6% lower than the previous year, of which U.S.$12.3 billion were foreign currency deposits, U.S.$11.1 billion were foreign currency and U.S.$2.1 billion were gold.
As of December 31, 2016, the Central Bank’s international reserves totaled U.S.$38.8 billion, 51.7% higher than the previous year, of which U.S.$13.1 billion were foreign currency deposits, U.S.$23.2 billion were foreign currency and U.S.$2.1 billion were gold.
From 2011 to 2015, the Central Bank made loans to the Government for payments to private debt holders through the Fondo de Desendeudamiento Argentino (Repayment Fund, which was established in 2010, and to make payments to multilateral agencies. In exchange, the Central Bank received 10-year U.S. dollar-denominated non-transferable Treasury notes. In December 2015, a portion of the non-transferable Treasury notes were exchanged for marketable securities of the Republic (Bonar 22, Bonar 25 and Bonar 27). For a description of the loans to the Government see “Public Sector Debt—Overview.”
The following table sets forth the peso’s exchange rate against the U.S. dollar for the periods indicated.
Nominal Exchange Rate (1)
(pesos per U.S. dollar)
| Average | At end of period | |||||||
| 2012 |
4.55 | 4.92 | ||||||
| 2013 |
5.48 | 6.52 | ||||||
| 2014 |
8.12 | 8.55 | ||||||
| 2015 |
9.27 | 13.01 | ||||||
| 2016 |
14.78 | 15.85 | ||||||
| (1) | The exchange rate used is the “reference exchange rate.” |
Source: Central Bank.
The average nominal exchange rate was Ps.4.55 per U.S.$1.00 dollar in 2012. In 2013, the average nominal exchange rate reached Ps.5.48 per U.S.$1.00, while in 2014 the average nominal exchange rate increased to Ps.8.12 per U.S.$1.00. As of December 31, 2014, the exchange rate increased to Ps.8.55 per U.S.$1.00, from Ps.6.52 as of December 31, 2013. As of December 31, 2015, the exchange rate stood at Ps.13.01 per U.S.$1.00, compared to Ps.8.55 as of December 31, 2014. As of December 31, 2016, the exchange rate stood at Ps.15.85 per U.S.$1.00, compared to Ps.13.01 as of December 31, 2015.
Since the Macri administration took office in December 2015, the Central Bank has allowed the peso to freely float against other currencies with Central Bank intervention limited to measures designed to ensure the orderly operation of the foreign exchange market. While the Central Bank retains the ability to intervene in the foreign exchange market in response to external shocks, it has announced the adoption of an inflation targeting regime and its intention to relinquish the use of foreign exchange rates as a tool to combat inflation.
Restrictions and Other Regulations on Foreign Exchange Transactions
In December 2015 and August 2016, certain restrictions on foreign exchange transactions and capital outflows were lifted. For a description of the principal measures adopted as of the date of this Annual Report, see “Exchange Rates and Exchange Controls—Exchange Controls.”
D-96
Voluntary deposits of foreign currency holdings
In May 2013, with the aim of channeling undeclared foreign currency savings into infrastructure development, the energy sector and the real estate sector, the Argentine Congress authorized the Ministry of the Treasury and Public Finances and the Central Bank to issue a series of financial instruments that are subscribed with foreign currency held both in Argentina and abroad.
The Bono Argentino de Ahorro para el Desarrollo Económico (Argentine Savings Bond for Economic Development or “BAADE”) and the Savings Promissory Note for Economic Development are U.S. dollar-denominated promissory notes issued by the Ministry of the Treasury. The proceeds from the issuance of these notes were to be directed to finance public investment projects in strategic sectors, such as infrastructure and the hydrocarbons sector. Both instruments mature in 2016 and accrue an annual interest rate of 4% payable bi-annually.
The Certificados de Depósito de Inversión (Certificates of Deposit for Investment or “CEDIN”), are convertible, tax-free savings certificates issued by Central Bank in exchange for undeclared U.S. dollar savings. CEDINs may be redeemed for U.S. dollars at a financial institution, subject to verification that the CEDINs have been used in a permitted real estate or property transaction such as the purchase of land, new housing construction or real estate improvements.
These initiatives have not been extended since December 2015.
In July 2016, the Tax Amnesty Law was introduced to promote the voluntary declaration of assets by Argentine residents. On April 4, 2017, the Ministry of the Treasury and the AFIP announced that, through March 31, 2017, which was the deadline under the Tax Amnesty Law, U.S.$116.8 billion in cash holdings, real estate and securities had been declared. See “Public Sector Finances—Tax Regime—Tax Amnesty Law.”
Inflation
National Statistical System’s State of Emergency
On January 8, 2016, based on its determination that the INDEC had failed to produce reliable statistical information, particularly with respect to CPI, GDP, foreign trade data, poverty and unemployment rates; President Macri declared a state of administrative emergency for the national statistical system and the INDEC until December 31, 2016. The INDEC suspended publication of certain statistical data pending reorganization of its technical and administrative structure to recover its ability to produce sufficient and reliable statistical information. During the first six months of this reorganization period, the INDEC published official CPI figures published by the City of Buenos Aires and the Province of San Luis for reference. Certain foreign trade and balance of payments statistics for the years 2011 through 2015 were released by the INDEC after the state of administrative emergency was declared on January 8, 2016, and are included herein. On June 29, 2016, the INDEC published the INDEC Report including revised GDP data for the years 2004 through 2015. The revised GDP information for the years 2011 through 2015 is included in this Annual Report. For more information, see “Presentation of Statistical and Other Information—Certain Methodologies.”
Prices are affected by numerous factors, including levels of supply and demand, rates of economic growth, monetary policy and commodity prices. From 2011 to 2015, Argentina experienced increases in inflation as measured by CPI and WPI that reflected the continued growth in the levels of private consumption and economic activity (including exports and public and private investment), which applied upward pressure on the demand for goods and services.
During 2012, the INDEC CPI increased by 10.8% and the WPI increased by 13.1%. The increase in the INDEC CPI during 2012 was mainly due to increases in the prices of certain services and goods, principally leisure (14.1%), transport and communication (13.5%), healthcare (13.3%) and home equipment and maintenance (11.9%). The increase in the WPI was mainly driven by a 13.4% increase in the prices of domestic products and a 9.7% increase in the price of imported products.
D-97
During 2013, the INDEC CPI increased by 10.9% and the WPI increased by 14.8%. The increase in the INDEC CPI during 2013 was mainly due to increases in the price of education (16.6%), leisure (15.6%), healthcare (14.7%) and home equipment and maintenance (14.4%). The increase in the WPI was mainly driven by a 19.5% increase in the prices of imported products and a 14.5% increase in the prices of domestic products, mainly primary products.
In February 2014, the INDEC released a new inflation index relying on a different methodology (the CPI Nu) intended to measure prices of goods on a country-wide basis.
The annual change in CPI during 2014 cannot be estimated due to the implementation of the new INDEC methodology. However, since December 2013, the Secretary of Economic Policy published monthly CPI figures (using the new methodology). Using this information, the annual change in INDEC CPI as of December 2014 was 24%, mainly due to increases in healthcare (29%), transport and communication (28%) and leisure, home equipment and maintenance (27%). The 28.3% increase in the WPI during 2014 was driven by an increase in the prices of domestic products and a 27.7% increase in the prices of imported products.
The INDEC has not published complete CPI or WPI information for 2015. During 2015, the City of Buenos Aires CPI was 26.9% and the Province of San Luis CPI was 31.6%.
During 2016, the City of Buenos Aires CPI was 41.0% and the Province of San Luis CPI was 31.4%. Inflation (CPI) from May to December 2016, as measured by INDEC, stood at 16.9%. See “Presentation of Statistical and Other Information—INDEC.”
The following table sets forth inflation rates as measured by INDEC and WPI for the periods specified.
Inflation(1)
Evolution of the annual rate of change in the INDEC CPI and WPI
(% change from previous year)
| Consumer Price Index |
Wholesale Price Index |
|||||||
| 2011 |
9.5 | % | 12.7 | % | ||||
| 2012 |
10.8 | % | 13.1 | % | ||||
| 2013 |
10.9 | % | 14.8 | % | ||||
| (1) | Annual figures reflect accumulated annual inflation. |
Source: INDEC and Ministry of the Treasury.
Inflation(1)
Evolution of the annual rate of change in the City of Buenos Aires CPI
(% change from previous year)
| Consumer Price Index | ||||
| 2011 |
n.a. | |||
| 2012 |
n.a. | |||
| 2013 |
26.6 | |||
| 2014 |
38.0 | |||
| 2015 |
26.9 | |||
| 2016 |
41.0 | % | ||
| (1) | Annual figures reflect accumulated annual inflation. |
n.a. = not available.
Source: INDEC and Ministry of the Treasury.
D-98
Inflation(1)
Evolution of the annual rate of change in the San Luis CPI
(% change from previous year)
| Consumer Price Index | ||||
| 2011 |
23.3 | % | ||
| 2012 |
23.0 | |||
| 2013 |
31.9 | |||
| 2014 |
39.0 | |||
| 2015 |
31.6 | |||
| 2016 |
31.4 | % | ||
| (1) | Annual figures reflect accumulated annual inflation. |
Source: INDEC and Ministry of the Treasury.
Inflation(1)
Evolution of the annual rate of change in the INDEC CPINu and WPI
(% change from previous period, unless otherwise specified)
| Consumer Price Index | Wholesale Price Index | |||||||
| 2014 |
24.0 | % | 28.3 | % | ||||
| January |
3.7 | 5.0 | ||||||
| February |
3.4 | 5.1 | ||||||
| March |
2.6 | 2.4 | ||||||
| April |
1.8 | 1.7 | ||||||
| May |
1.4 | 3.6 | ||||||
| June |
1.3 | 1.5 | ||||||
| July |
1.4 | 1.3 | ||||||
| August |
1.3 | 1.6 | ||||||
| September |
1.4 | 3.3 | ||||||
| October |
1.2 | 1.2 | ||||||
| November |
1.1 | 0.9 | ||||||
| December |
1.0 | 1.0 | ||||||
| 2015 |
n.a. | n.a. | ||||||
| January |
1.1 | 0.2 | ||||||
| February |
0.9 | 0.2 | ||||||
| March |
1.3 | 1.0 | ||||||
| April |
1.1 | 1.7 | ||||||
| May |
1.0 | 1.5 | ||||||
| June |
1.0 | 1.3 | ||||||
| July |
1.3 | 1.4 | ||||||
| August |
1.2 | 2.9 | ||||||
| September |
1.2 | 1.4 | ||||||
| October |
1.1 | 0.9 | ||||||
| November(1) |
n.a. | n.a. | ||||||
| December(1) |
n.a. | n.a. | ||||||
| 2016 |
n.a. | 34.5 | ||||||
| January |
n.a. | 9.0 | ||||||
| February |
n.a. | 5.0 | ||||||
| March |
n.a. | 2.4 | ||||||
| April |
n.a. | 1.5 | ||||||
| May |
n.a. | n.a. | ||||||
| June |
n.a. | n.a. | ||||||
| July |
n.a. | n.a. | ||||||
| August |
n.a. | n.a. | ||||||
| September |
n.a. | n.a. | ||||||
| October |
n.a. | n.a. | ||||||
| November |
n.a. | n.a. | ||||||
| December |
n.a. | n.a. | ||||||
| (1) | Annual figures reflect accumulated annual inflation. Monthly figures reflect inflation for that month, as compared to the prior month. |
n.a. = not available.
Source: INDEC and Ministry of the Treasury.
D-99
Inflation(1)
Evolution of the annual rate of change in the INDEC CPI and WPI
(% change from previous period, unless otherwise specified)
| New Consumer Price Index | Wholesale Price Index | |||||||
| 2016 |
||||||||
| May |
4.2 | % | 3.6 | % | ||||
| June |
3.1 | % | 2.9 | % | ||||
| July |
2.0 | % | 2.7 | % | ||||
| August |
0.2 | % | 0.4 | % | ||||
| September |
1.1 | % | 0.4 | % | ||||
| October |
2.4 | % | 0.6 | % | ||||
| November |
1.6 | % | 1.1 | % | ||||
| December |
1.2 | % | 0.8 | % | ||||
| (1) | Annual figures reflect accumulated annual inflation. Monthly figures reflect inflation for that month, as compared to the prior month. |
Source: INDEC and Ministry of the Treasury.
The Central Bank and the Government introduced two new financial instruments intended to safeguard savings and long-term loans from the effects of inflation. In April 2016, the Central Bank by means of Communication “A” 5945 (as amended and restated by Communication “A” 6069) introduced the first instrument, known as Unidades de Valor Adquisitivo (UVAs), with an initial value based on the average construction cost of a square meter in the cities of Buenos Aires, Córdoba, Rosario, Salta and the coastal region (Santa Fe de la Vera Cruz to Paraná) as of March 31, 2016. The value of UVAs is adjusted on a daily basis, based on the CER. In September 2016, the Government by means of Law No. 27,271, introduced the second instrument, known as Unidades de Vivienda (UVIs) with an initial value based on the average construction cost of a square meter in Argentina. The value of UVIs is adjusted on a monthly basis, based on the “Índice de la Construcción para el Gran Buenos Aires” published by the INDEC.
Regulation of the Financial Sector
The Central Bank regulates the financial sector. The Central Bank has the authority to set minimum capital, liquidity and solvency requirements, approve bank mergers, approve certain capital increases and transfers of stock, grant and revoke banking licenses and authorize the establishment of branches of foreign financial institutions in Argentina. The Central Bank also regularly monitors the activities and operations of financial institutions, requiring them to submit periodic financial reports, and is authorized to adopt regulations in accordance with the Financial Institutions Law.
The Central Bank regulates the financial sector primarily through the Superintendence of Financial Institutions, which is responsible for enforcing Argentina’s banking laws, establishing accounting and financial reporting requirements for the banking sector, monitoring and regulating the lending practices of financial institutions and establishing rules for participation of financial institutions in the foreign exchange market and the issuance of bonds and other securities.
In 2011, the Central Bank published a roadmap for the implementation of Basel III. Since then, the Central Bank has taken steps to adopt these regulations with the aim of identify risks relating to liquidity shortages in systemically important domestic financial institutions, and to begin implementing the comprehensive set of reform measures under Basel III. Having implemented the majority of its short-term commitments under Basel III, the next step in the Central Bank’s plan is to conform certain regulations applicable to the financial sector to Basel III standards and introduce certain complementary measures, including tools to monitor the liquidity of the banking sector. During the first half of 2016, the Basel Committee on Capital Adequacy of the Bank of International Settlement will carry out a periodic review of Argentina’s adoption of international standards relating to the regulation of capital and bank liquidity. The primary purpose of this review is to ensure consistent application of these standards among all Basel Committee members.
D-100
Composition of the Financial Sector
As of December 31, 2016, there were 78 financial institutions operating in Argentina as compared to 81 in 2012. The following table sets forth the number of financial institutions operating in Argentina as of the dates specified.
Number of Financial Institutions in Operation in the Financial System, by Type
| As of December 31, | ||||||||||||||||||||
| 2012 | 2013 | 2014 | 2015 | 2016 | ||||||||||||||||
| State-owned banks(1) |
12 | 12 | 12 | 13 | 13 | |||||||||||||||
| Private banks |
53 | 54 | 53 | 49 | 50 | |||||||||||||||
| Financial entities other than banks |
16 | 15 | 15 | 15 | 14 | |||||||||||||||
| Credit Institutions (Cajas de Crédito) |
— | 1 | 1 | 1 | 1 | |||||||||||||||
|
|
|
|
|
|
|
|
|
|
|
|||||||||||
| Total |
81 | 82 | 81 | 78 | 78 | |||||||||||||||
|
|
|
|
|
|
|
|
|
|
|
|||||||||||
| (1) | Includes national, provincial and municipal banks. |
Source: Central Bank.
Number of Financial Institutions in Operation in the Financial System, Domestic and Foreign
| As of December 31, | ||||||||||||||||||||
| 2012 | 2013 | 2014 | 2015 | 2016 | ||||||||||||||||
| National institutions(1) |
52 | 53 | 52 | 52 | 52 | |||||||||||||||
| Foreign-owned institutions(2) |
29 | 29 | 29 | 26 | 26 | |||||||||||||||
|
|
|
|
|
|
|
|
|
|
|
|||||||||||
| Total |
81 | 82 | 81 | 78 | 78 | |||||||||||||||
|
|
|
|
|
|
|
|
|
|
|
|||||||||||
| (1) | Includes state-owned banks, private banks and other financial institutions (such as credit unions). |
| (2) | Includes private foreign banks and other foreign financial entities other than banks. |
Source: Central Bank.
Assets and Liabilities of the Financial System
Net assets of the financial system have continued to grow in nominal terms since 2011. The quality of these bank assets, as well as bank profitability, has also improved since 2011. Deposits have increased, with 2015 year-end total deposits having increased 193% as compared to 2011 year-end total deposits.
In 2010, the Central Bank created the Programa de Financiamiento Productivo del Bicentenario (Bicentenary Productive Financing Program or “BPFP”) to stimulate the industrial sector. Through the BPFP, the Central Bank provides long-term secured funding to financial institutions, which, in turn, reduces borrowing costs for companies. Under the BPFP, each financial entity pays a 9% nominal annual rate on funds borrowed, while the total financial cost for the ultimate borrower is set at a 9.9% nominal annual rate. As of December 31, 2015, the BPFP remained in place. The BPFP finances programs designed to increase productivity, competitiveness and employment, encourage import substitution and promote domestic company exports. As of December 31, 2014, a total of Ps.8.2 billion of borrowings have been approved under this program, of which approximately Ps.6.6 billion had been disbursed as of December 31, 2015. BPFP financing has primarily been utilized by the manufacturing sector, followed by the services and primary sectors. The Central Bank did not publish information related to the BPFP in 2016.
During 2012, the Central Bank created the Credit Line for Productive Investments program to increase local production and encourage investments. The regulation governing this program (Communication A 5319 issued by the Central Bank) requires any “major” financial institution accounting for 1% or more of total banking deposits operating as a financial agent of the Republic, a province, the City of Buenos Aires and/or other municipalities to lend at least 5% of its private-sector deposits to companies operating in the domestic productive sector. Loans must carry a term of a least 36 months and a maximum rate of 15.01%, and at least half of these loans must be granted to MSMEs. The initial program has been extended and remains available.
D-101
As of December 31, 2015, each financial institution subject to Communication A 5802 (issued by the Central Bank in connection with the Credit Line for Productive Investments program) was required to lend, in the form of peso-denominated loans, at least 7.5% of its private-sector deposits as of May 2015. Effective 2016, the Central Bank approved the increase of the lending base to 15.5% of the participating banks’ private sector deposits as of December 2016.
Within the framework of its amended charter, the Central Bank implemented a third initiative to increase lending to the productive sector, and to MSMEs in particular, through a reduction of peso reserve requirements based on the share of a bank’s lending to MSMEs relative to its total lending to the private sector.
The following tables set forth the assets and liabilities of the Argentine financial system as of the dates specified.
Total Assets and Liabilities of the Financial System by Type of Institution
(in millions of pesos)
| As of December 31, | ||||||||||||||||||||
| 2012 | 2013 | 2014 | 2015 | 2016 | ||||||||||||||||
| State-owned banks:(1) |
||||||||||||||||||||
| Assets |
Ps. | 340,791 | Ps. | 430,439 | Ps. | 592,575 | Ps. | 752,960 | Ps. | 1,154,748 | ||||||||||
| Liabilities |
309,517 | 387,754 | 531,406 | 667,561 | 1,040,432 | |||||||||||||||
|
|
|
|
|
|
|
|
|
|
|
|||||||||||
| Net |
31,274 | 42,685 | 61,168 | 85,399 | 114,316 | |||||||||||||||
| Private banks: |
||||||||||||||||||||
| Assets |
432,994 | 553,831 | 728,045 | 1,071,357 | 1,450,303 | |||||||||||||||
| Liabilities |
376,774 | 478,792 | 625,877 | 935,641 | 1,274,597 | |||||||||||||||
|
|
|
|
|
|
|
|
|
|
|
|||||||||||
| Net |
56,220 | 75,039 | 102,168 | 135,716 | 175,706 | |||||||||||||||
| Financial entities other than banks: |
||||||||||||||||||||
| Assets |
16,241 | 20,506 | 19,929 | 22,998 | 40,621 | |||||||||||||||
| Liabilities |
12,915 | 16,541 | 15,052 | 17,250 | 33,436 | |||||||||||||||
|
|
|
|
|
|
|
|
|
|
|
|||||||||||
| Net |
3,326 | 3,965 | 4,877 | 5,748 | 7,185 | |||||||||||||||
| Total assets and liabilities: |
||||||||||||||||||||
| Assets |
790,026 | 1,004,775 | 1,340,548 | 1,847,314 | 2,645,672 | |||||||||||||||
| Liabilities |
699,205 | 883,086 | 1,172,335 | 1,620,451 | 2,348,465 | |||||||||||||||
|
|
|
|
|
|
|
|
|
|
|
|||||||||||
| Total net |
Ps. | 90,820 | Ps. | 121,689 | Ps. | 168,213 | Ps. | 226,863 | Ps. | 297,207 | ||||||||||
|
|
|
|
|
|
|
|
|
|
|
|||||||||||
| (1) | Includes national, provincial and municipal banks. |
Source: Central Bank.
Total Assets and Liabilities in the Financial System by Type of Institution
(% change from the previous period)
| As of December 31, | ||||||||||||||||||||
| 2012 | 2013 | 2014 | 2015 | 2016 | ||||||||||||||||
| State-owned banks:(1) |
||||||||||||||||||||
| Assets |
35.3 | % | 26.3 | % | 37.7 | % | 27.1 | % | 53.4 | % | ||||||||||
| Liabilities |
36.0 | 25.3 | 37.0 | 25.6 | 55.9 | |||||||||||||||
|
|
|
|
|
|
|
|
|
|
|
|||||||||||
| Net |
28.5 | 36.5 | 43.3 | 39.6 | 33.9 | |||||||||||||||
| Private banks: |
||||||||||||||||||||
| Assets |
18.9 | 27.9 | 31.5 | 47.2 | 35.4 | |||||||||||||||
| Liabilities |
17.3 | 27.1 | 30.7 | 49.5 | 36.2 | |||||||||||||||
|
|
|
|
|
|
|
|
|
|
|
|||||||||||
| Net |
30.7 | 33.5 | 36.2 | 32.8 | 29.5 | |||||||||||||||
| Financial entities other than banks: |
||||||||||||||||||||
| Assets |
31.4 | 26.3 | % | (2.8 | )% | 15.4 | 76.6 | |||||||||||||
| Liabilities |
34.8 | 28.1 | % | (9.0 | )% | 14.6 | 93.8 | |||||||||||||
|
|
|
|
|
|
|
|
|
|
|
|||||||||||
| Net |
19.6 | 19.2 | % | 23.0 | % | 17.9 | 25.0 | |||||||||||||
| Total assets and liabilities: |
||||||||||||||||||||
| Assets |
25.7 | 27.2 | 33.4 | 37.8 | 43.2 | |||||||||||||||
| Liabilities |
25.2 | 26.3 | 32.8 | 38.2 | 44.9 | |||||||||||||||
|
|
|
|
|
|
|
|
|
|
|
|||||||||||
| Total net |
29.5 | % | 34.0 | % | 38.2 | % | 34.9 | % | 31.0 | % | ||||||||||
|
|
|
|
|
|
|
|
|
|
|
|||||||||||
| (1) | Includes national, provincial and municipal banks. |
Source: Central Bank.
D-102
Assets
From 2012 to 2016, total assets of the financial system increased in nominal terms by 25.7% to Ps.790.0 billion in 2012, 27.2% to Ps.1,004.8 billion in 2013, 33.4% to Ps.1,340.5 billion in 2014, 37.8% to Ps.1,847.3 billion in 2015 and 43.2% to Ps.2,645.7 billion in 2016.
Loan Portfolio and Risk Profile
The following tables set forth loan data by type of institution in the financial sector as of the dates specified.
Outstanding Loans by Type of Financial Institution
(in millions of pesos)
| As of December 31, | ||||||||||||||||||||
| 2012 | 2013 | 2014 | 2015 | 2016 | ||||||||||||||||
| State-owned banks(1) |
Ps. | 160,306 | Ps. | 205,780 | Ps. | 241,043 | Ps. | 320,582 | Ps. | 359,248 | ||||||||||
| Private banks |
250,515 | 326,707 | 392,023 | 546,389 | 160,041 | |||||||||||||||
| Financial entities other than banks |
13,508 | 17,736 | 16,140 | 19,074 | 617,665 | |||||||||||||||
|
|
|
|
|
|
|
|
|
|
|
|||||||||||
| Total |
Ps. | 424,329 | Ps. | 550,223 | Ps. | 649,206 | Ps. | 886,046 | Ps. | 1,136,954 | ||||||||||
|
|
|
|
|
|
|
|
|
|
|
|||||||||||
| (1) | Includes national, provincial and municipal banks. |
Source: Central Bank.
Outstanding Loans by Type of Financial Institution
(as a % of total)
| As of December 31, | ||||||||||||||||||||
| 2012 | 2013 | 2014 | 2015 | 2016 | ||||||||||||||||
| State-owned banks(1) |
37.8 | % | 37.4 | % | 37.1 | % | 36.2 | % | 31.6 | % | ||||||||||
| Private banks |
59.0 | 59.4 | 60.4 | 61.7 | 14.1 | % | ||||||||||||||
| Financial entities other than banks |
3.2 | 3.2 | 2.5 | 2.2 | 54.3 | % | ||||||||||||||
|
|
|
|
|
|
|
|
|
|
|
|||||||||||
| Total |
100.0 | % | 100.0 | % | 100.0 | % | 100.0 | % | 100.0 | % | ||||||||||
|
|
|
|
|
|
|
|
|
|
|
|||||||||||
| (1) | Includes national, provincial and municipal banks. |
Source: Central Bank.
Allocation of Outstanding Loans by Sector
(in millions of pesos)
| As of December 31, | ||||||||||||||||||||
| 2012 | 2013 | 2014 | 2015 | 2016 | ||||||||||||||||
| Non-financial public sector |
Ps. | 39,951 | Ps. | 48,438 | Ps. | 51,470 | Ps. | 75,254 | Ps. | 52,825 | ||||||||||
| Financial sector (public and private) |
10,299 | 13,049 | 10,729 | 13,199 | 26,426 | |||||||||||||||
| Non-financial private sector |
383,674 | 501,853 | 604,062 | 819,174 | 1,085,655 | |||||||||||||||
| Provisions for doubtful accounts |
(9,596 | ) | (13,117 | ) | (17,054 | ) | (21,581 | ) | (27,953 | ) | ||||||||||
|
|
|
|
|
|
|
|
|
|
|
|||||||||||
| Total |
Ps. | 424,329 | Ps. | 550,223 | Ps. | 649,206 | Ps. | 886,046 | Ps. | 1,136,954 | ||||||||||
|
|
|
|
|
|
|
|
|
|
|
|||||||||||
Source: Central Bank.
D-103
Allocation of Outstanding Loans by Sector
(% change from the previous period)
| As of December 31, | ||||||||||||||||||||
| 2012 | 2013 | 2014 | 2015 | 2016 | ||||||||||||||||
| Non-financial public sector |
27.4 | % | 21.2 | % | 6.3 | % | 46.2 | % | (29.8 | )% | ||||||||||
| Financial sector (public and private) |
11.2 | 26.7 | (17.8 | ) | 23.0 | 100.2 | ||||||||||||||
| Non-financial private sector |
31.5 | 30.8 | 20.4 | 35.6 | 32.5 | |||||||||||||||
| Provisions for doubtful accounts |
33.8 | 36.7 | 30.0 | 26.5 | 29.5 | |||||||||||||||
|
|
|
|
|
|
|
|
|
|
|
|||||||||||
| Total |
30.5 | % | 29.7 | % | 18.0 | % | 36.5 | % | 28.3 | % | ||||||||||
|
|
|
|
|
|
|
|
|
|
|
|||||||||||
Source: Central Bank.
During 2012, peso-denominated loans to the private and public sectors increased by 39.2%, from Ps.268.6 billion in 2011 to Ps.373.9 billion in 2012 and U.S. dollar-denominated loans to the private and public sectors decreased by 42.2%, from U.S.$9.6 billion in 2011 to U.S.$5.5 billion in 2012.
During 2013, peso-denominated loans to the private and public sectors increased by 33.2% to Ps.498.2 billion, and U.S. dollar-denominated loans to the private and public sectors decreased by 33.4% to U.S.$3.7 billion, as compared to 2012. Peso-denominated personal loans also increased by 31.2% during this period due to an expansion in all categories as compared to 2012.
During 2014, peso-denominated loans to the private and public sectors increased 18.6% as compared to 2013. U.S. dollar-denominated loans to the private and public sector decreased 9.8%, from U.S.$3.7 billion in 2013 to U.S.$3.3 billion in 2014 and peso-denominated loans to the private sector increased 20.3%, from Ps.457.0 billion in 2013 to Ps.549.6 billion in 2014.
During 2015, peso-denominated loans to the private and public sectors increased by 38.4% as compared to 2014. U.S. dollar-denominated loans to the private and public sector decreased by 11.9%, from U.S.$3.3 billion in 2014 to U.S.$2.9 billion in 2015 and peso-denominated loans to the private sector increased by 37.4%, from Ps.549.8 billion in 2014 to Ps.755.4 billion in 2015.
During 2016, peso-denominated loans to the private and public sectors increased by 14.0% as compared to 2015. U.S. dollar-denominated loans to the private and public sector increased by 214.5%, from U.S.$2.9 billion in 2015 to U.S.$9.2 billion in 2016 and peso-denominated loans to the private sector increased by 17.4%, from Ps.755.4 billion in 2015 to Ps.886.6 billion in 2016.
Risk classification remained stable from 2012 through 2016, with practically no loans being classified as irrecoverable throughout the period.
D-104
The following table sets forth information regarding loans of the financial system by risk category and type of institution.
Risk Classification of Aggregate Assets of the Financial System
by Type of Institution
(as a % of total loans, as of December 31, 2016)
| Public Banks(7) |
Private Banks |
Financial Companies |
Credit Unions |
Financial System |
||||||||||||||||
| Risk category: |
||||||||||||||||||||
| Current(1) |
97.34 | % | 97.63 | % | 93.13 | % | 85.30 | % | 97.40 | % | ||||||||||
| Potentially problematic: |
||||||||||||||||||||
| Under observation and inadequate payment(2) |
0.88 | 0.90 | 2.96 | 4.88 | 0.96 | |||||||||||||||
| Under negotiation or restructuring(3) |
0.57 | 0.59 | 1.46 | 3.71 | 0.61 | |||||||||||||||
| Problematic(4) |
0.70 | 0.65 | 1.97 | 4.21 | 0.71 | |||||||||||||||
| Insolvent(5) |
0.51 | 0.22 | 0.47 | 1.88 | 0.33 | |||||||||||||||
| Irrecoverable(6) |
0.00 | 0.00 | 0.01 | 0.02 | 0.00 | |||||||||||||||
|
|
|
|
|
|
|
|
|
|
|
|||||||||||
| Total |
100 | % | 100 | % | 100 | % | 100 | % | 100 | % | ||||||||||
|
|
|
|
|
|
|
|
|
|
|
|||||||||||
| (1) | Loans where financial condition of debtor demonstrates its ability to meet financial obligations. The Superintendent of Financial Institutions requires loan-loss reserves of 1% for current loans (secured and unsecured). |
| (2) | Loans where financial condition of debtor demonstrates its ability to currently meet financial obligations, although external circumstances exist which, if not corrected, could compromise the debtor’s ability to fulfill its obligations in the future. The Superintendent of Financial Institutions requires loan-loss reserves of 3% (with guarantees) and 5% (without guarantees) for these loans. |
| (3) | Loans to debtors that have entered into restructuring negotiations within 60 days of declaring their inability to meet certain financial obligations. The Superintendent of Financial Institutions requires loan-loss reserves of 12% (with guarantees) and 25% (without guarantees) for these loans. |
| (4) | Loans where inability of debtor to meet its financial obligations would result in significant financial losses to the lender. The Superintendent of Financial Institutions requires loan-loss reserves of 25% (with guarantees) and 50% (without guarantees) for these loans. |
| (5) | Loans where there is a high probability that debtor would become insolvent upon meeting its financial obligations. The Superintendent of Financial Institutions requires loan-loss reserves of 50% (with guarantees) and 100% (without guarantees) for these loans. |
| (6) | Loans where financial condition of debtor demonstrates low probability that payments in default may be recovered. The Superintendent of Financial Institutions requires loan-loss reserves of 100% (with guarantees) and 100% (without guarantees) for these loans. |
| (7) | Includes national, provincial and municipal banks. |
Source: Central Bank.
Liabilities
From 2012 to 2016, total liabilities of the financial system increased by 25.2% to Ps.699.2 billion in 2012, 26.3% to Ps.883.1 billion in 2013, 32.8% to Ps.1,172.3 billion in 2014, 38.2% to Ps.1,620.5 billion in 2015 and 44.9% to Ps.2,348.5 billion in 2016.
Deposits
During 2012, total deposits in Argentina’s banking system increased by 28.8% to Ps.595.8 billion as of December 31, 2012. Non-financial public sector deposits increased by 25.2% as of December 31, 2012. Deposits by the non-financial private sector increased by 30.4%, due to 33.5% increase in demand deposits, a 20.7% increase in deposits in savings accounts and a 35.3% increase in term deposits as of December 31, 2012.
Broken down by currency and sector, deposits were as follows as of December 31, 2012:
| • | total peso-denominated deposits increased by 37.1% to Ps.525.0 billion compared to the same date in 2011; |
| • | peso-denominated deposits by the non-financial public sector increased by 26.3% to Ps.152.5 billion compared to the same date in 2011; |
| • | peso-denominated deposits by the non-financial private sector increased by 42.1% to Ps.372.5 billion compared to the same date in 2011; and |
D-105
| • | total dollar-denominated deposits decreased by 28.6% to U.S.$9.4 billion as compared to the same date in 2011. |
During 2013, total deposits in Argentina’s banking system increased by 26.3% to Ps.752.4 billion as of December 31, 2013. Non-financial public sector deposits increased by 23.6% as of December 31, 2013. Deposits by the non-financial private sector increased by 27.4%, due to a 21.4% increase in demand deposits, a 27.0% increase in deposits in savings accounts and a 31.1% increase in term deposits as of December 31, 2013.
Broken down by currency and sector, deposits were as follows as of December 31, 2013:
| • | total peso-denominated deposits increased by 27.2% to Ps.667.7 billion compared to the same date in 2012; |
| • | peso-denominated deposits by the non-financial public sector increased by 20.1% to Ps.183.2 billion compared to the same date in 2012; |
| • | peso-denominated deposits by the non-financial private sector increased by 30.1% to Ps.484.5 billion compared to the same date in 2012; and |
| • | total dollar-denominated deposits decreased by 12.0% to U.S.$8.3 billion compared to the same date in 2012. |
During 2014, total deposits in Argentina’s banking system increased by 30.2% to Ps.979.4 billion as of December 31, 2014. Non-financial public sector deposits increased by 26.5% as of December 31, 2014. Deposits by the non-financial private sector increased by 31.5%, due to a 32.7% increase in demand deposits, a 36.2% increase in deposits in savings accounts and a 27.7% increase in term deposits as of December 31, 2014.
Broken down by currency, deposits were as follows as of December 31, 2014:
| • | total peso-denominated deposits increased by 25.8% to Ps.840.1 billion compared to the same date in 2013; |
| • | peso-denominated deposits by the non-financial public sector increased by 17.6% to Ps.215.4 billion compared to the same date in 2013; |
| • | peso-denominated deposits by the non-financial private sector increased by 28.9% to Ps.624.7 billion compared to the same date in 2013; and |
| • | total dollar-denominated deposits increased by 6.4% to U.S.$8.8 billion, compared to the same date in 2013. |
During 2015, total deposits in Argentina’s banking system increased by 38.4% to Ps.1,355.4 billion as of December 31, 2015. Non-financial public sector deposits increased by 13.3% as of December 31, 2015. Deposits by the non-financial private sector increased by 47.4%, due to a 24.9% increase in demand deposits, a 48.5% increase in deposits in savings accounts and a 60.6% increase in term deposits as of December 31, 2015.
Broken down by currency, deposits were as follows as of December 31, 2015:
| • | total peso-denominated deposits increased by 37.1% to Ps.1,151.7 billion compared to the same date in 2014; |
| • | peso-denominated deposits by the non-financial public sector increased by 22.6% to Ps.264.1 billion compared to the same date in 2014; |
| • | peso-denominated deposits by the non-financial private sector increased by 42.1% to Ps.887.6 billion compared to the same date in 2014; and |
D-106
| • | total dollar-denominated deposits increased by 20.4% to U.S.$10.6 billion, compared to the same date in 2014. |
During 2016, total deposits in Argentina’s banking system increased by 45.3% to Ps.1,969.0 billion as of December 31, 2016. Non-financial public sector deposits increased by 51.8% as of December 31, 2016. Deposits by the non-financial private sector increased 43.2%, due to a 38.3% increase in demand deposits, a 64.9% increase in deposits in savings accounts and a 14.5% increase in term deposits as of December 31, 2016.
Broken down by currency, deposits were as follows as of December 31, 2016:
| • | total peso-denominated deposits increased by 21.3% to Ps.1,397.5 billion compared to the same date in 2015; |
| • | peso-denominated deposits by the non-financial public increased by 15.3% to Ps.304.4 billion compared to the same date in 2015; |
| • | peso-denominated deposits by the non-financial private sector increased by 23.1% to Ps.1,093 billion compared to the same date in 2015; and |
| • | total dollar-denominated deposits increased by 131.3% to U.S.$24.5 billion, compared to the same date in 2015. |
The following tables set forth information on total deposits in the financial sector as of the dates specified.
Deposits by Type of Financial Institution
(in millions of pesos)
| As of December 31, | ||||||||||||||||||||
| 2012 | 2013 | 2014 | 2015 | 2016 | ||||||||||||||||
| State-owned banks(1) |
Ps. | 275,832 | Ps. | 349,722 | Ps. | 466,142 | Ps. | 607,504 | Ps. | 919,438 | ||||||||||
| Private banks |
317,443 | 400,108 | 509,774 | 744,606 | 1,044,548 | |||||||||||||||
| Financial entities other than banks |
2,489 | 2,592 | 3,471 | 3,242 | 5,042 | |||||||||||||||
|
|
|
|
|
|
|
|
|
|
|
|||||||||||
| Total |
Ps. | 595,764 | Ps. | 752,422 | Ps. | 979,387 | Ps. | 1,355,353 | Ps. | 1,969,029 | ||||||||||
|
|
|
|
|
|
|
|
|
|
|
|||||||||||
| (1) | Includes national, provincial and municipal banks. |
Source: Central Bank.
Deposits by Type of Financial Institution
(as a % of total)
| As of December 31, | ||||||||||||||||||||
| 2012 | 2013 | 2014 | 2015 | 2016 | ||||||||||||||||
| State-owned banks(1) |
46.3 | % | 46.5 | % | 47.6 | % | 44.8 | % | 46.7 | % | ||||||||||
| Private banks |
53.3 | 53.2 | 52.1 | 54.9 | 53.0 | |||||||||||||||
| Financial entities other than banks |
0.4 | 0.3 | 0.4 | 0.2 | 0.3 | |||||||||||||||
|
|
|
|
|
|
|
|
|
|
|
|||||||||||
| Total |
100.0 | % | 100.0 | % | 100.0 | % | 100.0 | % | 100.0 | % | ||||||||||
|
|
|
|
|
|
|
|
|
|
|
|||||||||||
| (1) | Includes national, provincial and municipal banks. |
Source: Central Bank.
D-107
Deposits by Sector and by Type of Deposit
(in millions of pesos)
| As of December 31, | ||||||||||||||||||||
| 2012 | 2013 | 2014 | 2015 | 2016 | ||||||||||||||||
| Non-financial public sector |
Ps. | 164,437 | Ps. | 203,214 | Ps. | 256,996 | Ps. | 291,104 | Ps. | 441,890 | ||||||||||
| Financial sector (public and private) |
973 | 1,123 | 1,747 | 1,659 | 5,451 | |||||||||||||||
| Non-financial private sector |
430,354 | 548,086 | 720,645 | 1,062,590 | 1,521,687 | |||||||||||||||
| Demand deposits |
109,770 | 133,246 | 176,858 | 220,829 | 305,445 | |||||||||||||||
| Savings accounts |
117,353 | 148,992 | 202,931 | 301,304 | 496,770 | |||||||||||||||
| Term deposits |
189,821 | 248,789 | 317,742 | 510,385 | 584,603 | |||||||||||||||
| Others |
13,411 | 17,058 | 23,113 | 30,072 | 134,869 | |||||||||||||||
|
|
|
|
|
|
|
|
|
|
|
|||||||||||
| Total deposits |
Ps. | 595,764 | Ps. | 752,422 | Ps. | 979,388 | Ps. | 1,355,353 | Ps. | 1,969,029 | ||||||||||
|
|
|
|
|
|
|
|
|
|
|
|||||||||||
Source: Central Bank.
Deposits by Sector and by Type of Deposit
(% change from the previous period)
| As of December 31, | ||||||||||||||||||||
| 2012 | 2013 | 2014 | 2015 | 2016 | ||||||||||||||||
| Non-financial public sector |
25.2 | % | 23.6 | % | 26.5 | % | 13.3 | % | 51.8 | % | ||||||||||
| Financial sector (public and private) |
(10.6 | ) | 15.4 | 55.6 | (5.1 | ) | 228.7 | |||||||||||||
| Non-financial private sector |
30.4 | 27.4 | 31.5 | 47.4 | 43.2 | |||||||||||||||
| Demand deposits |
33.5 | 21.4 | 32.7 | 24.9 | 38.3 | |||||||||||||||
| Savings accounts |
20.7 | 27.0 | 36.2 | 48.5 | 64.9 | |||||||||||||||
| Term deposits |
35.3 | 31.1 | 27.7 | 60.6 | 14.5 | |||||||||||||||
| Others |
28.7 | 27.2 | 35.5 | 30.1 | 348.5 | |||||||||||||||
|
|
|
|
|
|
|
|
|
|
|
|||||||||||
| Total deposits |
28.8 | % | 26.3 | % | 30.2 | % | 38.4 | % | 45.3 | % | ||||||||||
|
|
|
|
|
|
|
|
|
|
|
|||||||||||
Source: Central Bank.
Interest Rates
Interest Rates on Bank Loans
As of December 31, 2016, the annual average interbank rate on peso-denominated loans was 29.1% (as compared to 21.9% as of December 31, 2015). The overdraft current account rate increased from 24.9% as of December 31, 2015 to 25.1% as of December 31, 2016. The annual average dollar-denominated interbank rate decreased from 3.1% as of December 31, 2015 to 0.4% as of December 31, 2016.
As of December 31, 2016, nominal annual interest rates on peso-denominated personal loans increased to 39.12% from 39% as of December 31, 2015 and the average interest rates on peso-denominated mortgage loans decreased from 22.86% as of December 31, 2015 to 19.7% as of December 31, 2016.
D-108
The following table sets forth information regarding average interest rates on bank loans for the periods specified.
Interest Rates on Bank Loans
(nominal annual interest rate)
| 2012 | 2013 | 2014 | 2015 | 2016 | ||||||||||||||||
| Domestic currency: |
||||||||||||||||||||
| Interbank(1) |
10.0 | % | 13.2 | % | 17.9 | % | 21.9 | % | 29.1 | % | ||||||||||
| Overdraft Current Account(2) |
14.1 | 17.2 | 23.9 | 24.9 | 25.1 | |||||||||||||||
| Foreign currency: |
||||||||||||||||||||
| Interbank(1) |
2.5 | % | 2.3 | % | 1.0 | % | 3.1 | % | 0.4 | % | ||||||||||
| (1) | Average interbank rate. |
| (2) | Average interest rate on current account peso-denominated overdrafts. |
Source: Central Bank.
Interest Rates on Deposits
The average nominal annual interest rate on peso-denominated term deposits increased from 10.8% in 2011 to 12.1% in 2012. The average nominal annual interest rate on U.S. dollar-denominated term deposits increased from 0.37% in 2011 to 0.60% in 2012. The peso BADLAR rate for private banks decreased from 18.8% in December 2011 to 15.4% in December 2012. The average nominal annual interest rate on peso-denominated term deposits increased from 12.1% in 2012 to 14.8% in 2013. The average nominal annual interest rate on U.S. dollar-denominated term deposits increased from 0.60% in 2012 to 0.61% in 2013. The peso BADLAR rate for private banks increased from 15.4% in December 2012 to 20.2% in December 2013.
The average nominal annual interest rate on peso-denominated term deposits increased from 14.8% in 2013 to 20.8% in 2014. The average nominal annual interest rate on U.S. dollar-denominated term deposits increased from 0.61% in 2013 to 1.05% in 2014. The peso BADLAR rate for private banks decreased from 20.2% in December 2013 to 20.0% in December 2014.
The average nominal annual interest rate on peso-denominated term deposits increased from 20.8% in 2014 to 21.7% in 2015. The average nominal annual interest rate on U.S. dollar-denominated term deposits increased from 1.05% in 2014 to 1.8% in 2015. The peso BADLAR rate for private banks increased from 20.0% in December 2014 to 27.5% in December 2015.
The average nominal annual interest rate on peso-denominated term deposits increased from 21.7% in 2015 to 24.4% in 2016. The average nominal annual interest rate on U.S. dollar-denominated term deposits decreased from 1.8% in 2015 to 0.9% in 2016. The peso BADLAR rate for private banks decreased from 27.5% in December 2015 to 20.0% in December 2016.
D-109
The following table sets forth information regarding average interest rates on bank deposits for the periods specified.
Interest Rates on Deposits and LEBACs
(nominal annual interest rate)
| 2012 | 2013 | 2014 | 2015 | 2016 | ||||||||||||||||
| Domestic currency: |
||||||||||||||||||||
| Savings deposits |
0.3 | % | 0.2 | % | 0.2 | % | 0.2 | % | 0.2 | % | ||||||||||
| Term deposits(1) |
12.1 | 14.8 | 20.8 | 21.7 | 24.4 | |||||||||||||||
| Average deposit rate(2) |
8.2 | 10.2 | 14.3 | 14.6 | 16.2 | |||||||||||||||
| LEBAC(3) |
13.8 | 15.7 | 27.7 | 28.8 | 30.0 | |||||||||||||||
| Foreign currency: |
||||||||||||||||||||
| Savings deposits |
0.06 | 0.06 | 0.04 | — | — | |||||||||||||||
| Term deposits(1) |
0.60 | 0.61 | 1.05 | 1.8 | 0.9 | |||||||||||||||
| Average deposit rate(2) |
0.4 | 0.4 | 0.7 | 1.1 | 0.4 | |||||||||||||||
| LEBAC(3) |
n.a. | n.a. | 2.8 | % | 3.4 | % | 1.4 | % | ||||||||||||
| (1) | Weighted average interest rate on all term deposits. |
| (2) | Weighted average interest rate on term deposits plus savings deposits. |
| (3) | Weighted average annual rate for all term LEBAC. |
n.a. = not available.
Source: Central Bank.
Securities Markets
In the Argentine securities market, Government bonds dominate trading activities, followed by trading of corporate equity securities and corporate bonds. Trading of other instruments such as futures and options represents only a small portion of market activity, although futures trading has increased somewhat since mid-2002 due to the development of the futures trading market.
Regulation of the Securities Markets
The Argentine securities markets are regulated by the CNV and the stock markets. The CNV supervises all agents that carry out transactions in Argentina’s public securities markets, including brokers, public companies, mutual funds and clearinghouses, and has the authority to regulate and control the public offering of all securities, other than the primary issue of Government securities. The primary markets are the MERVAL and MAE.
On December 29, 2016, the CNV authorized Bolsas y Mercados Argentinos (“ByMA”) as a market for the listing of securities through a public offering approval. The ByMA began its activities on May 23, 2017 and, subsequently, all listing of notes on the MERVAL were automatically transferred to ByMA.
In the first half of the 1990s, changes to the legal framework provided for the issuance and trading of new financial products in the Argentine capital markets, including commercial paper, new types of corporate bonds, as well as futures and options. This period was characterized by relatively low levels of regulation of the Argentine securities market and limited enforcement In November 2013, Congress approved the Capital Markets Law No. 26, 831, which empowered the CNV to strengthen disclosure and regulatory standards for the Argentine securities market. The new standards were introduced through changes to the CNV’s rules implemented under Resolution 622/2013.
As of December 31, 2012, the market capitalization of Argentina’s securities markets for equities was U.S.$470.6 billion, a 25.7% increase compared to the market capitalization of Argentina’s securities markets for equities as of December 31, 2011, mainly as a result of the increase in equity prices in the international financial markets.
As of December 31, 2013, the market capitalization of Argentina’s securities markets for equities was U.S.$514.9 billion, a 9% increase compared to the market capitalization of Argentina’s securities markets for equities as of December 31, 2012, mainly as a result of an increase in the total amount of public bonds traded.
D-110
As of December 31, 2014, the market capitalization of Argentina’s securities markets for equities was U.S.$455.2 billion, a 12% decrease compared to the market capitalization of Argentina’s securities markets for equities as of December 31, 2013, mainly as a result of changes in the exchange rate.
As of December 31, 2015, the market capitalization of Argentina’s securities markets for equities was U.S.$355.2 billion, a 22% decrease compared to the market capitalization of Argentina’s securities markets for equities as of December 31, 2014, mainly as a result of changes in the exchange rate.
As of December 31, 2016, the market capitalization of Argentina’s securities markets for equities was U.S.$284.7 billion, a 20% decrease compared to the market capitalization of Argentina’s securities markets for equities as of December 31, 2015, mainly as a result of changes in the exchange rate.
Mutual Funds and the FGS
From 2005 to 2008, individuals, pension funds and mutual funds constituted the largest groups of investors in Argentina’s capital markets.
On November 20, 2008, Congress approved Law No. 26,425, which took effect on December 9, 2008 and nationalized the private pension system. Under this law, the former private pension system was absorbed and replaced by the Sistema Solidario de Reparto (Argentine Integrated Pension System), structured as a “pay as you go” system. As a result, all of the resources administered by the private pension funds, including significant equity interests in a wide range of listed companies, were transferred to a separate fund, the FGS, to be administered by the ANSES. The assets held in the FGS may only be used to make advances to the Government to cover unexpected budget deficits that prevent the Government (through ANSES) from honoring its obligation to make social security and pension payments through the Argentine Integrated Pension System. The Fund holds a wide range of financial assets, including without limitation public sector securities, shares of corporations, fixed and floating rate instruments, bonds, mutual funds, securities representing debt issued under trusts and mortgage bonds. As of December 2015, the Fund was valued at Ps.664.0 billion. Securities and obligaciones negociables (bonds) continued to be the FGS’s most important investments, representing 64.6% of the total value of the Fund. These investments increased by 34.6% with respect to November 2014, being the highest segment of investment to increase on a year-to-year basis.
Total Assets of the FGS
| 2012 | 2013 | 2014 | 2015 | 2016 | ||||||||||||||||
| Assets (in millions of pesos) |
Ps. | 244.8 | Ps. | 329.5 | Ps. | 472.2 | Ps. | 664.0 | Ps. | 875.4 | ||||||||||
| Percentage increase from previous year |
22.7 | % | 34.6 | % | 43.3 | % | 40.6 | % | 31.8 | % | ||||||||||
Source: FGS.
During 2012, total investments in production and infrastructure increased by 14.7% compared to 2011, to Ps.31.9 billion. Total investment in the production sector was mainly allocated to energy infrastructure and public works projects. In 2013, FGS investments in projects for economic development increased by 40.0% compared to the previous year, to Ps.44.7 billion. In 2014, FGS investments in corporate and sovereign bonds increased by 47.8% compared to the previous year, to Ps.318.7 billion. As of December 31, 2015, FGS investments amounted to Ps.664.0 billion, a 40.6% increase compared to December 31, 2014. As of December 31, 2016, FGS investments amounted to Ps.875.4 billion, a 31.8% increase compared to December 31, 2015.
FGS Special Lending and Other Programs
In April 2010, the FGS established the Programa Conectar Igualdad (Connecting Equality Program). The program aims to improve the public education system and reduce the educational, social and technological gap. Through the program, 3,500,000 netbooks were distributed to secondary school students and teachers, as well as to special education and teacher training centers, between 2010 and 2013. The objective of the Connecting Equality Program is to achieve full literacy in information and communications technologies, thereby providing access to technological and information resources regardless of social, economic or geographical (rural and urban) conditions.
D-111
During 2012, the FGS established the Programa de Crédito Argentino para la Vivienda Única Familiar (“Procrear” or Bicentenary Argentine Credit Program for Permanent Family Homes). The program was designed to permit homeowner credit lines for up to 400,000 houses over the course of four years. The program seeks to meet the housing needs of citizens country-wide, taking into account diverse socioeconomic conditions and family situations. In addition, this program aims to promote economic activity in the construction sector, thereby fostering increased production, employment and consumption in the overall economy. In connection with Procrear, the FGS established two additional credit line programs: one for the purchase of land for the purpose of home construction and another for the purchase of newly constructed homes or apartments. As of October 31, 2015, credit lines for a total of Ps.31.6 billion had been granted under Procrear and related programs.
During 2014, the FGS established the Programa de Respaldo a Estudiantes de Argentina (Argentine Student Support Program). The main goal of this program is to improve the conditions of at-risk families through improved access to education. The program aims to support youth between the ages of 18 and 24, with the main objectives of assuring their completion of secondary or higher education and offering training or internships at various workplaces.
On June 29, 2016, Congress passed a bill approving the Historical Reparations Program for Retirees and Pensioners, which took effect upon its publication in the official gazette. The main aspects of this program, which is designed to conform government social security policies to Supreme Court rulings, include (i) payments to more than two million retirees and the retroactive compensation of more than 300,000 retirees and (ii) the creation of a pensión universal (universal pension) for the elderly, which guarantees an income for all individuals over 65 years of age who are otherwise ineligible for retirement. The Historical Reparations Program for Retirees and Pensioners will give retroactive compensation to retirees in an aggregate amount of more than Ps.47.0 billion and involve expenses of up to Ps.75.0 billion to cover all potential beneficiaries. The bill provides that assets held by the FGS, including equity interests, may be sold to finance this program.
Government Bonds
In terms of trading volume, the Argentine bond market is dominated by Government securities. In 2012, Government bond trading volumes increased to U.S.$36.5 billion. As of December 31, 2013, the total traded amount of public bonds increased to U.S.$49.1 billion. In 2014, the total traded amount increased to U.S.$58.0 billion. In 2015, the total traded amount decreased to U.S.$56.4 billion. In 2016, the total traded amount increased to U.S.$70.4 billion.
For a description of the types of domestic bonds issued by the Government see “Public Sector Debt.”
Corporate Bonds
Corporate bonds can be issued in registered form and may be denominated in local or foreign currency. Interest rates on corporate bonds may be fixed or floating and can vary substantially with market conditions and the creditworthiness of the issuer.
Equities
The Argentine equities market is regulated by the CNV. Authorized markets, following CNV standards set the rules that companies must follow in order to list their equity securities on those markets.
In 2012, equity trading volume decreased by 33.9% to U.S.$2.1 billion as of December 31, 2012. In 2012 and 2013, the number of listed companies remained stable at 97 listed companies, one less compared to 2011. In 2014, equity total trading volume increased by 41.8% from U.S.$3.4 billion as of December 31, 2013 to U.S.$4.8 billion as of December 31, 2014. In 2015, equity total trading volume increased by 4.3% from U.S.$4.8 billion as of December 31, 2014 to U.S.$5.0 billion as of December 31, 2015. In 2016, equity total trading volume decreased by 9.7% to U.S.$4.5 billion as of December 31, 2016.
The following table sets forth certain data regarding the market capitalization and average daily trading volume on the Buenos Aires Stock Exchange as of the dates specified.
D-112
Market Capitalization and Traded Amount
on the Buenos Aires Stock Exchange
(in millions of U.S. dollars, unless otherwise specified)
| As of December 31, | ||||||||||||||||||||
| 2012 | 2013 | 2014 | 2015 | 2016 | ||||||||||||||||
| Market capitalization (in billions of U.S. Dollars) |
U.S.$ | 470.6 | U.S.$ | 514.9 | U.S.$ | 455.2 | U.S.$ | 355.2 | U.S.$ | 284.7 | ||||||||||
| Average daily traded amount |
221.0 | 285.2 | 301.9 | 334.3 | 367.2 | |||||||||||||||
| Shares |
8.7 | 14.0 | 18.8 | 20.6 | 18.3 | |||||||||||||||
| Corporate bonds |
3.6 | 9.3 | 11.5 | 7.8 | 8.9 | |||||||||||||||
| Public bonds |
151.4 | 203.6 | 228.8 | 233.1 | 286.2 | |||||||||||||||
| Others(1) |
57.4 | 58.4 | 42.8 | 72.9 | 53.8 | |||||||||||||||
| Total traded amount(2) |
53,246.6 | 68,713.7 | 76,533.6 | 80,887.3 | 90,328.6 | |||||||||||||||
| Shares |
2,091.2 | 3,365.0 | 4,772.6 | 4,976.6 | 4,495.4 | |||||||||||||||
| Corporate bonds |
863.9 | 2,233.9 | 2,915.7 | 1,871.5 | 2,179.7 | |||||||||||||||
| Public bonds |
36,475.5 | 49,062.2 | 58,013.4 | 56,403.5 | 70,416.9 | |||||||||||||||
| Others(1) |
U.S.$ | 13,816.0 | U.S.$ | 14,052.7 | U.S.$ | 10,831.9 | U.S.$ | 17,635.7 | U.S.$ | 13,236.6 | ||||||||||
| (1) | Includes mutual funds, index futures, options and others. |
| (2) | Total traded amounts for each year. |
Source: Buenos Aires Stock Exchange.
D-113
Introduction
Argentina’s public sector comprises national, provincial and municipal entities. These entities are divided into the non-financial public sector and the financial public sector. The non-financial public sector consists of national, provincial and municipal administrations, state-owned enterprises, certain public agencies and special-purpose fiduciary funds. The National Administration, in turn, is composed of the Central Administration, decentralized agencies and social security institutions (including former provincial pension funds). The financial public sector consists of the Central Bank, the Banco de la Nación Argentina, the BICE and ten other public financial entities (including provincial and municipal banks).
The chart below sets forth the organizational structure of Argentina’s public sector, excluding the non-financial municipal sector.
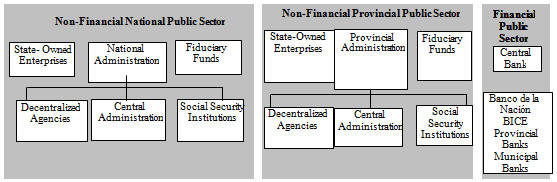
The Central Administration comprises the executive, legislative and judicial branches of the Government, including the public ministries. National decentralized agencies include governmental institutions, such as the AFIP with a budget, revenues and expenditures separate from the Central Administration. The national social security institutions consist of the ANSES, which is a self-governing entity, the Armed Forces Pension Fund and the Federal Police Pension Fund. As of the date of this Annual Report, ten provinces and the City of Buenos Aires have transferred their social security obligations to ANSES. See “—Social Security.” These former provincial obligations are currently managed by ANSES.
The national public accounts reflect the consolidated results of the non-financial national public sector. Transfers from the Central Bank and the FGS to the Government, however, were included in the Government’s current fiscal revenues through December 31, 2015. Starting in 2016 (and on a pro forma basis for 2015) the Macri administration has decided to present transfers to the Government from the Central Bank and the FGS separately below the primary fiscal balance. The Government will also present, as a separate line item under the heading of primary expenditures, the aggregate amount of obligations with suppliers that were not timely honored and deferred to a subsequent fiscal year.
Argentina’s provincial and local authorities are independent from the Government and maintain separate fiscal accounts. Accordingly, the fiscal results of the provinces and local governments are not reflected in the national public accounts. The Central Administration, however, is legally required to transfer a portion of its revenues to the provinces and from time to time has also provided other forms of financial assistance to the provinces. See “Public Sector Finances—Fiscal Relations with the Provinces.”
Except as otherwise specified in the discussion below, the national public accounts are presented using a cash-basis method, which computes revenues and expenditures in the period in which cash flows take place, regardless of the period in which they were accrued. In the discussion of the National Public Accounts below and throughout this Annual Report, the non-financial national public sector is referred to as the “Government.” Additionally, we refer to the fiscal balance of the non-financial national public sector as the “primary fiscal balance.” This primary fiscal balance does not reflect the issuance of Bocones, a debt instrument issued by the Government to discharge a portion of its payment obligations (e.g., with suppliers) or interest payments. The overall balance of the non-financial national public sector includes interest payments unless otherwise specified.
D-114
On November 20, 2008, Congress approved Law No. 26,425, which took effect on December 9, 2008 and nationalized the private pension system. Under this law, the former private pension system was absorbed and replaced by the Argentine Integrated Pension System, structured as a “pay as you go” system. As a result, all of the resources administered by the private pension funds, including significant equity interests in a wide range of listed companies, were transferred to a separate fund, the FGS, to be administered by the ANSES. The assets held in the FGS may only be used to make advances to the Government to cover unexpected budget deficits that prevent the Government (through ANSES) from honoring its obligation to make social security and pension payments through the Argentine Integrated Pension System. As of December 2016, the Fund was valued at Ps.875.4 billion.
Decree N. 2,103/08 requires that the proceeds of the FGS shall be invested in the acquisition of financial assets that include, among other instruments, public bonds or local securities of recognized solvency. The Administración Nacional de la Seguridad Social (The Argentine National Social Security Administration or “ANSES”) prioritizes investments that, besides of producing profitability, promote national infrastructure and that in turn stimulate the Argentine economy and generate formal employment.
The FGS has decision making bodies and control bodies. The first is composed by the Executive Director of ANSES, who manages the FGS with the assistance of the Executive Committee (composed of the Secretary of Finance, Treasury and Economic Policy of the Ministry of Economy and Public Finance). In addition, the Deputy Director of Operations of the FGS is the Executive Secretary of the Executive Committee and also its Operating Manager. Decisions are taken by simple majority and the Executive Director of ANSES has the veto rights. Control bodies are comprised of the Council of the FGS (which includes representatives of workers, retirees, businessmen, legislators, the cabinet of ministers and of the ANSES), the Bicameral Commission for Control of Funds, the Audit of the FGS, the General Audit Office of the Nation, the General Audit of the Nation and the Office of the Ombudsman of the Nation.
National Public Accounts
From 2012 to 2016, the Government recorded deficits in both the primary fiscal balance and the overall balance, which primarily resulted from an increase in Government expenditures aimed at stimulating private consumption, including through the funding of social programs and increases in social security benefits. Expenditures grew during this period, as the Government significantly increased social security payments, public benefits and transfers to the provinces.
In 2012, the primary fiscal balance recorded a deficit of 0.2% of nominal GDP and the overall balance of the non-financial public sector recorded a deficit of 2.1% of nominal GDP. In 2013, the primary fiscal balance recorded a deficit of 0.7% of nominal GDP and the overall balance of the non-financial public sector recorded a deficit of 1.9% of GDP. In 2014, the primary balance recorded a deficit of 0.8% of nominal GDP and the overall balance of the non-financial public sector recorded a deficit of 2.4% of nominal GDP. In 2015, the primary balance recorded a deficit of 1.8% of nominal GDP and the overall balance of the non-financial public sector recorded a deficit of 3.9% of nominal GDP. In 2016, the primary balance recorded a deficit of 2.2% of nominal GDP and the overall balance of the non-financial public sector recorded a deficit of 4.5% of nominal GDP.
D-115
Evolution of Fiscal Results: 2012 to 2016
National Public Accounts
(in millions of pesos)
| 2012 | 2013 | 2014 | 2015 | 2016 | 2016 New methodology(1) |
|||||||||||||||||||
| Fiscal revenue |
||||||||||||||||||||||||
| Current revenue: |
||||||||||||||||||||||||
| National Administration taxes(2) |
Ps. | 329,553 | Ps. | 404,461 | Ps. | 563,416 | Ps. | 708,801 | Ps. | 976,663 | Ps. | 976,663 | ||||||||||||
| Social security tax(2) |
174,388 | 229,890 | 300,889 | 419,419 | 558,087 | 558,087 | ||||||||||||||||||
| Net operating result from state-owned enterprises |
(6,583 | ) | (10,025 | ) | (26,012 | ) | (24,627 | ) | (44,011 | ) | (44,011 | ) | ||||||||||||
| Other non-tax revenue(3) |
46,249 | 83,504 | 158,489 | 194,516 | 257,726 | 94,116 | ||||||||||||||||||
| Capital revenue(4) |
211 | 59 | 426 | 457 | 443 | 443 | ||||||||||||||||||
|
|
|
|
|
|
|
|
|
|
|
|
|
|||||||||||||
| Total fiscal revenues(5) |
Ps. | 543,818 | Ps. | 707,889 | Ps. | 997,208 | Ps. | 1,298,566 | Ps. | 1,748,908 | Ps. | 1,629,309 | ||||||||||||
|
|
|
|
|
|
|
|
|
|
|
|
|
|||||||||||||
| Primary expenditures(6) |
||||||||||||||||||||||||
| Current expenditures: |
||||||||||||||||||||||||
| National Administration wages |
79,133 | 101,643 | 143,182 | 199,066 | 266,831 | 266,831 | ||||||||||||||||||
| Goods and services |
25,051 | 35,760 | 51,289 | 69,469 | 79,327 | 79,327 | ||||||||||||||||||
| Social security(7) |
204,617 | 272,066 | 363,385 | 535,697 | 734,717 | 734,717 | ||||||||||||||||||
| Transfers to provinces |
12,344 | 14,605 | 18,333 | 27,614 | 73,589 | 73,589 | ||||||||||||||||||
| Other transfers(8) |
143,637 | 183,748 | 284,304 | 374,174 | 573,125 | 573,125 | ||||||||||||||||||
| Other expenditures |
21,627 | 31,799 | 44,008 | 36,456 | 19,188 | 63,089 | ||||||||||||||||||
| Capital expenditures |
61,784 | 90,747 | 131,268 | 160,887 | 182,045 | 182,045 | ||||||||||||||||||
|
|
|
|
|
|
|
|
|
|
|
|
|
|||||||||||||
| Total primary expenditures |
548,193 | 730,368 | 1,035,769 | 1,403,363 | 1,928,823 | 1,972,724 | ||||||||||||||||||
|
|
|
|
|
|
|
|
|
|
|
|
|
|||||||||||||
| Primary fiscal balance |
Ps. | (4,375 | ) | Ps. | (22,479 | ) | Ps. | (38,562 | ) | Ps. | (104,797 | ) | Ps. | (179,915 | ) | Ps. | (343,415 | ) | ||||||
|
|
|
|
|
|
|
|
|
|
|
|
|
|||||||||||||
| Interest payments(9) |
(51,190 | ) | (41,998 | ) | (71,158 | ) | (120,840 | ) | (185,253 | ) | (131,260 | ) | ||||||||||||
| Privatization proceeds |
1 | — | — | — | — | — | ||||||||||||||||||
|
|
|
|
|
|
|
|
|
|
|
|
|
|||||||||||||
| Overall balance of non-financial public sector |
Ps. | (55,563 | ) | Ps. | (64,477 | ) | Ps. | (109,720 | ) | Ps. | (225,637 | ) | Ps. | (365,169 | ) | Ps. | (474,675 | ) | ||||||
|
|
|
|
|
|
|
|
|
|
|
|
|
|||||||||||||
| (1) | Calculated based on the new methodology and not comparable with previous years. “Other non-tax revenues” excludes transfers from the Central Bank and the FGS and “Interest Payments” excludes intra-public sector interest payments. |
| (2) | Figures presented in this table differ from those presented in the tables titled “Composition of Tax Revenues” because they exclude revenues (and transfers) co-participated with the provinces and because they are published after the figures in the “Composition of Tax Revenues” table and thus reflect updated information. |
| (3) | Includes sale of goods and services of the public administration, operational revenues, transfers from the Central Bank and the FGS, current transfers and other transfers. |
| (4) | Excludes revenues from privatization. |
| (5) | Includes pension contributions mandated by the Argentine Integrated Pension System. |
| (6) | The Government discharges certain of its payment obligations (e.g., with suppliers) by issuing bonds known as Bocones. Bocones constitute bonds to be paid in the future rather than cash payments, and were not recorded as primary expenditures in the periods presented in this table or reflected as part of the overall balance of the non-financial public sector. See the table below titled “National Public Accounts (New Presentation)” for a description of the treatment of Bocones under the new presentation. The amount of such Bocones issued in 2012, 2013, 2014, 2015 and 2016 was Ps.1.1 billion, Ps.1.6 billion, Ps.1.3 billion, Ps.1.6 billion and Ps.0.59 billion, respectively. For a description of these securities, see “Public Sector Debt—Debt Management Following the 2001 Debt Crisis.” |
| (7) | Amounts presented under “Social security” in this table are calculated on a cash basis and therefore differ from those presented in the table entitled “Composition of National Public Expenditures,” which are calculated using the accrual method of accounting and correspond to the National Administration. |
| (8) | Includes transfers to the private sector (including subsidies), to the public sector (e.g., transfers to universities), to the Heads of Households Program and to state-owned companies. |
| (9) | Includes interest payments on bonds issued pursuant to the 2005 Debt Exchange and the 2010 Debt Exchange. |
Source: Ministry of the Treasury.
D-116
National Public Accounts
(as a percentage of GDP)
| 2012(8) | 2013(8) | 2014(8) | 2015(8) | 2016(8) | 2016 New Methodology(9) |
|||||||||||||||||||
| Fiscal revenue |
||||||||||||||||||||||||
| Current revenue: |
||||||||||||||||||||||||
| National Administration taxes(1) |
12.5 | % | 12.1 | % | 12.3 | % | 12.1 | % | 12.1 | % | 12.1 | % | ||||||||||||
| Social security tax(1) |
6.6 | 6.9 | 6.6 | 7.2 | 6.9 | 6.9 | ||||||||||||||||||
| Net operating result from state-owned enterprises |
(0.2 | ) | (0.3 | ) | (0.6 | ) | (0.4 | ) | (0.5 | ) | (0.5 | ) | ||||||||||||
| Other non-tax revenue (2) |
1.8 | 2.5 | 3.5 | 3.3 | 3.2 | 1.2 | ||||||||||||||||||
| Capital revenue(3) |
— | — | — | — | — | — | ||||||||||||||||||
| Total fiscal revenues(4) |
20.6 | 21.1 | 21.8 | 22.2 | 21.7 | 20.2 | ||||||||||||||||||
| Primary expenditures(5) |
||||||||||||||||||||||||
| Current expenditures: |
||||||||||||||||||||||||
| National Administration wages |
3.0 | 3.0 | 3.1 | 3.4 | 3.3 | 3.3 | ||||||||||||||||||
| Goods and services |
0.9 | 1.1 | 1.1 | 1.2 | 1.0 | 1.0 | ||||||||||||||||||
| Social security(6) |
7.8 | 8.1 | 7.9 | 9.2 | 9.1 | 9.1 | ||||||||||||||||||
| Transfers to provinces |
0.5 | 0.4 | 0.4 | 0.5 | 0.9 | 0.9 | ||||||||||||||||||
| Other transfers(7) |
5.4 | 5.5 | 6.2 | 6.4 | 7.1 | 7.1 | ||||||||||||||||||
| Other expenditures |
0.8 | 0.9 | 1.0 | 0.6 | 0.2 | 0.8 | ||||||||||||||||||
| Capital expenditures |
2.3 | 2.7 | 2.9 | 2.7 | 2.3 | 2.3 | ||||||||||||||||||
|
|
|
|
|
|
|
|
|
|
|
|
|
|||||||||||||
| Total primary expenditures |
20.8 | 21.8 | 22.6 | 24.0 | 23.9 | 24.5 | ||||||||||||||||||
|
|
|
|
|
|
|
|
|
|
|
|
|
|||||||||||||
| Primary fiscal balance |
(0.2 | ) | (0.7 | ) | (0.8 | ) | (1.8 | ) | (2.2 | ) | (4.3 | ) | ||||||||||||
|
|
|
|
|
|
|
|
|
|
|
|
|
|||||||||||||
| Interest payments(8) |
(1.9 | ) | (1.3 | ) | (1.6 | ) | (2.1 | ) | (2.3 | ) | (1.6 | ) | ||||||||||||
| Privatization proceeds |
— | — | — | — | — | — | ||||||||||||||||||
|
|
|
|
|
|
|
|
|
|
|
|
|
|||||||||||||
| Overall balance of non-financial public sector |
(2.1 | )% | (1.9 | )% | (2.4 | )% | (3.9 | )% | (4.5 | )% | (5.9 | )% | ||||||||||||
|
|
|
|
|
|
|
|
|
|
|
|
|
|||||||||||||
| (1) | Figures presented in this table differ from those presented in the tables titled “Composition of Tax Revenues” because they exclude revenues (and transfers) co-participated with the provinces and because they are published after the figures in the “Composition of Tax Revenues” table and thus reflect updated information. |
| (2) | Includes sale of goods and services of the public administration, operational revenues, transfers from the Central Bank and the FGS, current transfers and other transfers. |
| (3) | Excludes revenues from privatization. |
| (4) | Includes pension contributions mandated by the Argentine Integrated Pension System. |
| (5) | The Government discharges certain of its payment obligations (e.g., with suppliers) by issuing bonds known as Bocones. Bocones constitute bonds to be paid in the future rather than cash payments, and were not recorded as primary expenditures in the periods presented in this table or reflected as part of the overall balance of the non-financial public sector. See the table below titled “National Public Accounts (New Presentation)” for a description of the treatment of Bocones under the new presentation. The amount of such Bocones issued in 2012, 2013, 2014, 2015 and 2016 was Ps.1.1 billion, Ps.1.6 billion, Ps.1.3 billion, Ps.1.6 billion and Ps.0.59 billion, respectively. For a description of these securities, see “Public Sector Debt—Debt Management Following the 2001 Debt Crisis.” |
| (6) | Amounts presented under “Social security” in this table are calculated on a cash basis and therefore differ from those presented in the table entitled “Composition of National Public Expenditures,” which are calculated using the accrual method of accounting and correspond to the National Administration. |
| (7) | Includes transfers to the private sector (including subsidies), to the public sector (e.g., transfers to universities), to the Heads of Households Program and to state-owned companies. |
| (8) | Includes interest payments on bonds issued pursuant to the 2005 Debt Exchange and the 2010 Debt Exchange. |
| (9) | Calculated based on the new methodology and not comparable with the previous years. “Other non-tax revenues” excludes transfers from the Central Bank and the FGS and “Interest Payments” excludes intra-public sector interest payments. |
Source: Ministry of the Treasury.
D-117
In March 2016, the Macri administration adopted a new methodology intended to increase transparency in the reporting of fiscal results. The main modifications introduced in the new presentation of fiscal results consist of excluding transfers from the Central Bank and FGS to the Government from total current fiscal revenues and excluding interest payments on public debt made by the Government from total current fiscal expenditures.
The following table sets forth the national public accounts for 2014 and 2015, on a pro forma basis, based on the new presentation that has been adopted by the Macri administration. In addition, for the year 2015 it includes an estimate of the increase in the amount of deferred current obligations. Since the expenditures of the non-financial public sector are recorded at the time of payment in accordance with the cash method of accounting, expenditures relating to the consumption of goods and services incurred in a given period are recorded in a subsequent period if payment is deferred as a result of the Government’s discretionary power to do so. Recording the non-financial public sector’s accrued expenditures is a way to monitor the discrepancy between expenditures associated with actual consumption during a period which will be actually paid for during subsequent periods.
National Public Accounts (New Presentation)
(in millions of pesos, except percentages)
| Pro forma 2014 | Pro forma 2015 | % Change | ||||||||||
| Fiscal revenue |
||||||||||||
| Total current fiscal revenues |
Ps. | 906,260 | Ps. | 1,192,870 | 31.6 | % | ||||||
| Primary expenditures |
||||||||||||
| Total current primary expenditures |
(1,061,780 | ) | (1,427,990 | ) | 34.5 | % | ||||||
| Deferred current obligations(1) |
(12,890 | ) | (56,540 | ) | 338.6 | % | ||||||
| Primary fiscal balance |
(168,410 | ) | (291,660 | ) | 73.2 | % | ||||||
| Transfers on capital(2) |
45,800 | 9,480 | (79.3 | )% | ||||||||
| Overall balance of non-financial public sector |
Ps. | (122,610 | ) | Ps. | (282,180 | ) | 130.1 | % | ||||
| (1) | Includes the aggregate amount of the Government’s obligations with suppliers that were not timely honored and deferred to a subsequent fiscal year. These payment obligations previously were not recorded as primary expenditures. |
| (2) | Includes transfers from the Central Bank and FGS to the Government and interest payments on public debt made by the Government. |
Source: Ministry of the Treasury.
Amounts in the discussion of fiscal results below are those presented in the immediately preceding tables, with the exception of revenues from social security taxes, value-added taxes (“VAT”), income taxes, taxes on goods and services and taxes on fuel, each of which refers to data presented in the table titled “Composition of Tax Revenues” presented in “—Tax Regime,” which include revenues (and transfers) “co-participated” with the provinces (see “Public Sector Finances—Fiscal Relations with the Provinces”) and pension contributions mandated by the Argentine Integrated Pension System.
On January 2017, the Ministry of the Treasury published a new financial report aimed at increasing transparency of public sector accounts and granting citizens further access to information regarding the use and allocation of the Republic’s expenditures. The new financial report excludes property income and payments made within the public sector.
The new methodology has not been used to revise the years prior to its implementation and as a result the analysis below employs the previously accepted methodology for 2012, 2013, 2014 and 2015, which includes property income and payments made within the public sector, and the new methodology for 2016 (except that for the purpose of easing comparability, 2016 information has also been presented on a pro forma basis in accordance with the previously accepted methodology).
Fiscal Result of 2012 Compared to Fiscal Result of 2011
Primary fiscal balance. The primary fiscal balance in 2012 recorded a deficit of Ps.4.4 billion in 2012, compared to a surplus of Ps.4.9 billion in 2011. While total revenues increased by 25.9% in 2012, primary expenditures increased to a greater extent, by 28.3%. Total revenues and primary expenditures increased in excess of the amount initially budgeted for 2012.
Fiscal revenues. In 2012, fiscal revenues increased by 25.9% to Ps.543.8 billion from Ps.432.0 billion in 2011. This increase was mainly driven by social security taxes, VAT, income tax, taxes on foreign trade and other non-tax revenues, which accounted for approximately 89.4% of the total increase. The increase in fiscal revenues includes:
D-118
| • | an increase in revenues from social security contributions, which accounted for approximately 36.4% of the total increase; |
| • | an increase in revenues from VAT, which accounted for approximately 20.6% of the total increase; |
| • | an increase in revenues from income tax, which accounted for approximately 14.7% of the total increase; |
| • | an increase in revenues from taxes on foreign trade, which accounted for approximately 9.5% of the total change increase, mainly due to increases in foreign trade activity, agricultural commodity prices, nominal peso-U.S. dollar exchange rate depreciation and an increase in the variable tax rate applicable to biodiesel exports; and |
| • | an increase in other non-tax revenues, which accounted for approximately 8.2% of the total increase, primarily driven by an increase in profits generated by the Argentine Integrated Pension System, which was partially offset by an 11.5% decrease in the transfer of profits from the Central Bank. |
Primary expenditures. In 2012, primary expenditures (excluding interest payments) of the national public sector increased by 28.3% from Ps.427.1 billion in 2011 to Ps.548.2 billion in 2012. This increase was mainly due to the following factors:
| • | social security outlays, which accounted for approximately 47.5% of the overall increase, increased by 39.1%, from Ps.147.1 billion in 2011 to Ps.204.6 billion in 2012, mainly as a result of an increase in the number of retirees and successive increases in pension income. During 2012, minimum pension income increased by an average of 31.1%; |
| • | other transfers (including external sector transfers, private sector subsidies and transfers to autonomous public entities such as universities), which accounted for approximately 17.9% of the overall increase, increased by 17.8%, from Ps.122.0 billion in 2011 to Ps.143.6 billion in 2012. This increase was mainly due to the increase in subsidies to the transport and electricity sectors. The increase in other transfers was also driven by the increase in outlays to universities and social security payments, particularly through the Universal Child Allowance and Universal Pregnancy Allowance programs; |
| • | National Administration wages, which accounted for approximately 14.8% of the total increase, increased by 29.3% from Ps.61.2 billion in 2011 to Ps.79.1 billion in 2012, primarily as a result of the periodic adjustment to the salaries of public employees during 2012, which increased by an average of 25.8% in the aggregate, and a 2.8% increase in the number of national public sector employees from 368,996 as of December 31, 2011 to 379,388 as of December 31, 2012; and |
| • | capital expenditures, which accounted for approximately 6.8% of the overall increase, increased by 15.5% from Ps.53.5 billion in 2011 to Ps.61.8 billion in 2012. This increase was primarily due to an increase in direct Government investment, principally for the purchase of computers to distribute to public school students through the Connecting Equality program, the construction and maintenance of roads and capital transfers to provinces and private companies, primarily for infrastructure projects. |
Overall fiscal balance. Due to a higher increase in primary expenditures than revenues, as well as higher interest payments during 2012, the overall fiscal deficit increased from Ps.30.7 billion in 2011 to Ps.55.6 billion in 2012. For a discussion of interest payments in 2012, see “Public Sector Debt—Foreign Currency Denominated Debt—Foreign Currency Denominated Debt Services” and “Public Sector Debt—Peso-Denominated Debt—Peso-Denominated Debt Service.”
D-119
Fiscal Result of 2013 Compared to Fiscal Results of 2012
Primary fiscal balance. The primary deficit increased from Ps.4.4 billion in 2012 to Ps.22.5 billion in 2013. While total revenues increased by 30.2% in 2013, primary expenditures increased by 33.2%. Total revenues and primary expenditures increased in excess of the amount initially budgeted for 2013.
Fiscal revenues. In 2013, fiscal revenues increased by 30.2% to Ps.707.9 from Ps.543.8 billion in 2012. This increase was mainly driven by social security taxes, VAT, income tax, taxes on foreign trade and other non-tax revenues, which accounted for approximately 91.4% of the total increase. The increase in fiscal revenues includes:
| • | an increase in revenues from social security contributions, which accounted for approximately 33.8% of the total increase; |
| • | an increase in other non-tax revenues, which accounted for approximately 22.7% of the total increase, primarily driven by increase in profits generated by the Argentine Integrated Pension System and a 316.7% increase in the transfer of profits from the Central Bank; |
| • | an increase in revenues from VAT, which accounted for approximately 18.7% of the total increase; |
| • | an increase in revenues from income tax, which accounted for approximately 14.8% of the total increase; and |
| • | an increase in revenues from taxes on foreign trade, which accounted for approximately 1.5% of the total increase. |
Primary expenditures. In 2013, primary expenditures (excluding interest payments) of the national public sector increased by 33.2% from Ps.548.2 billion in 2012 to Ps.730.4 billion in 2013. This increase was mainly due to the following factors:
| • | social security outlays, which accounted for approximately 37.0% of the overall increase, increased by 33.0%, from Ps.204.6 billion in 2012 to Ps.272.1 billion in 2013, mainly as a result of successive increases in pension income. In 2013, minimum pension income increased by an average of 31.8%; |
| • | other transfers (including external sector transfers, private sector subsidies and transfers to autonomous public entities such as universities), which accounted for approximately 22.0% of the overall increase, increased by 27.9%, from Ps.143.6 billion in 2012 to Ps.183.7 billion in 2013. This increase was mainly due to the raise in subsidies to the electricity and energy sectors. The increase in other transfers was also driven by the increase in outlays to universities and social security payments, particularly through the Universal Child Allowance and Universal Pregnancy Allowance programs; |
| • | capital expenditures, which accounted for approximately 15.9% of the overall increase, increased by 46.9% from Ps.61.8 billion in 2012 to Ps.90.7 billion in 2013. This increase was primarily due to an increase in transfers to provinces for infrastructure projects through the Fondo Federal Solidario (Joint Federal Fund) (see “Public Sector Finances—Fiscal Relations with the Provinces—Revenue Transfers”) and direct Government investment, principally for housing projects under the Plan Más Cerca, Más Municipio, Mejor País, Más Patria program and financial assistance to railway service companies for the improvement and renewal of railway infrastructure; and |
| • | National Administration wages, which accounted for approximately 12.4% of the total increase, increased by 28.4% from Ps.79.1 billion in 2012 to Ps.101.6 billion in 2013, primarily as a result of two successive increases in the salaries of public employees during 2013, which increased by an average of 23.5%, and a 4.4% increase in the number of national public sector employees from 379,338 as of December 30, 2012 to 396,138 as of December 30, 2013. |
D-120
Overall fiscal balance. Due to a higher increase in primary expenditures than revenues during 2013, the overall fiscal deficit increased from Ps.55.6 billion in 2012 to Ps.64.5 billion in 2013. For a discussion of interest payments in 2013, see “Public Sector Debt—Foreign Currency Denominated Debt—Foreign Currency Denominated Debt Services” and “Public Sector Debt—Peso-Denominated Debt—Peso-Denominated Debt Service.”
Fiscal Result of 2014 Compared to Fiscal Results of 2013
Primary fiscal balance. The primary deficit increased from Ps.22.5 billion in 2013 to Ps.38.6 billion in 2014. Total revenues and primary expenditures increased in excess of the amount initially budgeted for 2014. While total revenues increased by 40.9% in 2014, primary expenditures increased by 41.8%, resulting in a larger primary deficit.
Fiscal revenues. In 2014, fiscal revenues increased by 40.9% to Ps.997.2 billion from Ps.707.9 billion in 2013. This increase was mainly driven by social security taxes, VAT, income tax, taxes on foreign trade and other non-tax revenue, which accounted for approximately 93.5% of the total increase. The increase in fiscal revenues includes:
| • | an increase in revenues from social security contributions, which accounted for approximately 24.6% of the total increase; |
| • | an increase in other non-tax revenues, which accounted for approximately 26.0% of the total increase, primarily driven by an increase in the transfer of profits from the Central Bank from Ps.32.2 billion in 2013 to Ps.78.4 billion in 2014, and an increase in profits generated by the Argentine Integrated Pension System; |
| • | an increase in revenues from income tax, which accounted for approximately 15.6% of the total increase; |
| • | an increase in revenues from VAT, which accounted for approximately 15.3% of the total increase; and |
| • | an increase in revenues from taxes on foreign trade, which accounted for approximately 11.9% of the total change increase, mainly due to nominal peso-U.S. dollar exchange rate depreciation, which was partially offset by a decrease in taxes biodiesel exports, as a result of the impact of decreased oil and fuel commodity prices on the variable tax rate. |
Primary expenditures. In 2014, primary expenditures (excluding interest payments) of the national public sector increased by 41.8% from Ps.730.4 billion in 2013 to Ps.1,035.8 billion in 2014. This increase was mainly due to the following factors:
| • | other transfers (including external sector transfers, private sector subsidies and transfers to autonomous public entities such as universities), which accounted for approximately 32.9% of the overall increase, increased by 54.7%, from Ps.183.7 billion in 2013 to Ps.284.3 billion in 2014. This increase was mainly due to the increase in subsidies to the electricity sector. The increase in other transfers was also driven by the increase in outlays to social security payments, particularly through the Universal Child Allowance and Universal Pregnancy Allowance; |
| • | social security outlays, which accounted for approximately 29.9% of the overall increase, increased by 33.6%, from Ps.272.1 billion in 2013 to Ps.363.4 billion in 2014, mainly as a result of an increase in the number of retirees and successive increases in pension income. During 2014, pensions increased by an average of 30.5%, including as a result of the Government’s extension of the social security system in September 2014 to cover individuals who had reached, or were within two years of reaching, the eligible age to collect such benefits but have not contributed to the system for the required number of years. This extension applied to the self-employed and those subject to the monotributo (self-employment tax) system; |
D-121
| • | National Administration wages, which accounted for approximately 13.6% of the total increase, increased by 40.9% from Ps.101.6 billion in 2013 to Ps.143.2 billion in 2014, primarily as a result of the periodic adjustment to the salaries of public employees during 2014, which increased by an average of 35.8% in the aggregate, and a 3.8% increase in the number of national public sector employees from 396,138 as of December 31, 2013 to 411,045 as of December 31, 2014; and |
| • | capital expenditures, which accounted for approximately 13.3% of the overall increase, increased by 44.7% from Ps.90.7 billion in 2013 to Ps.131.3 billion in 2014. This increase was primarily due to an increase in direct Government investment and transfers to the provinces and the City of Buenos Aires, principally for the construction and maintenance of roads, as well the purchase of equipment for investments in railway and other infrastructure projects and, to a lesser extent, the Programa de Estímulo a la Inyección Excedente de Gas Natural (Natural Gas Stimulus Plan), investments in electricity generation projects, the development of housing infrastructure through the Techo Digno program, mortgage lending through the PRO.CRE.AR Bicentenario program and the development of economic and social infrastructure in the provinces and municipalities through the Joint Federal Fund (see “Public Sector Finances—Fiscal Relations with the Provinces—Revenue Transfers”). |
Fiscal Result of 2015 Compared to Fiscal Results of 2014
Primary fiscal balance. The primary deficit increased from Ps.38.6 billion in 2014 to Ps.104.8 billion in 2015. Total revenues and primary expenditures increased in excess of the amount initially budgeted for 2015. While total revenues increased by 30.2% in 2015, primary expenditures increased by 35.5%, resulting in a larger primary deficit.
Fiscal revenues. In 2015, fiscal revenues increased by 30.2% to Ps.1,299 billion from Ps.997.2 billion in 2014. This increase was mainly driven by social security taxes, VAT, income tax, taxes on fuel, financial transactions and other non-tax revenue, which accounted for approximately 96.8% of the total increase. The increase in fiscal revenues includes:
| • | an increase in revenues from social security contributions, which accounted for approximately 37.7% of the total increase; |
| • | an increase in other non-tax revenues, which accounted for approximately 11.4% of the total increase, primarily driven by an increase in profits generated by the Argentine Integrated Pension System and managed by the FGS; |
| • | an increase in revenues from income tax, which accounted for approximately 19.7% of the total increase; |
| • | an increase in revenues from VAT, which accounted for approximately 19.3% of the total increase; and an increase in revenues from taxes on foreign trade, mainly due to an increase in imports tax contribution, which was partially offset by a decrease in export tax revenues. |
Primary expenditures. In 2015, primary expenditures (excluding interest payments) of the national public sector increased by 35.5% from Ps.1,035.8 billion in 2014 to Ps.1,403 billion in 2015. This increase was mainly due to the following factors:
| • | other transfers (including external sector transfers, private sector subsidies and transfers to autonomous public entities such as universities), which accounted for approximately 24.4% of the overall increase, increased by 31.6%, from Ps.284.3 billion in 2014 to Ps.374.2 billion in 2015. This increase was mainly due to the increase in subsidies to the electricity sector. The increase in other transfers was also driven by the increase in outlays to social security payments, particularly through the Universal Child Allowance and Universal Pregnancy Allowance; |
D-122
| • | social security outlays, which accounted for approximately 46.9% of the overall increase, increased by 47.4%, from Ps.363.4 billion in 2014 to Ps.535.7 billion in 2015, mainly as a result of an increase in the number of retirees and successive increases in pension income. During 2015, pensions increased by an average of 33.0%; |
| • | National Administration wages, which accounted for approximately 15.2% of the total increase, increased by 39.0% from Ps.143.2 billion in 2014 to Ps.199.1 billion in 2015; and |
| • | capital expenditures, which accounted for approximately 8.1% of the overall increase, increased by 22.6% from Ps.131.3 billion in 2014 to Ps.160.9 billion in 2015. This increase was primarily due to capital expenditures in energy, transport and housing infrastructure. |
Fiscal Result of 2016 Compared to Fiscal Results of 2015
In March 2016, the Macri administration adopted a new methodology in the reporting of fiscal results. As a result, fiscal results for 2016 are not directly comparable to fiscal results for 2015, which were calculated using the prior methodology. The fiscal results for 2016 below have been calculated on a pro forma basis to be comparable to the data prepared based on the previously accepted methodology.
Primary fiscal balance. The primary deficit recorded for 2016 was Ps.180.0 billion, compared to a deficit of Ps.104.8 billion for 2015. Total primary revenues increased by 34.7% in 2016, and primary expenditures (excluding interest payments) increased by 37.4%.
Fiscal revenues. In 2016, fiscal revenues increased by 34.7% to Ps.1,748.9 billion from Ps.1,298.6 billion in 2015. This increase was mainly driven by an increase in revenues generated by other taxes, including fines related with the Tax Amnesty Law, social security taxes, VAT, tax on financial transactions, import taxes and income tax.
Primary expenditures. In 2016, primary expenditures (excluding interest payments) of the national public sector increased by 37.4% from Ps.1,403.4 billion in 2015 to Ps.1,928.8 billion in 2016. This increase was mainly due to the following factors:
| • | social security outlays, which accounted for approximately 37.9% of the overall increase in expenditure, increased by 37.2%, from Ps.535.7 billion in 2015 to Ps.734.7 billion in 2016, mainly as a result of an increase in the number of retirees and successive increases in pension payments; |
| • | other transfers (including external sector transfers, private sector subsidies and transfers to autonomous public entities such as universities), which accounted for approximately 37.9% of the overall increase, increased by 53.2%, from Ps.374.2 billion in 2015 to Ps.573.1 billion in 2016. This increase was mainly due to the increase in subsidies to the electricity sector. The increase in other transfers was also driven by the increase in outlays to social security payments, particularly through the Universal Child Allowance and Universal Pregnancy Allowances, and transfers to local transportation providers and the “Acciones de Sustentabilidad de Suministro de Energía Eléctica” Program. Since March 2016, family allowances to self-employed and temporary workers have been extended. This measure is available to 514,000 children and their families. |
| • | national administration wages, which accounted for approximately 12.9% of the total increase, increased by 34.0% from Ps.199.1 billion in 2015 to Ps.266.8 billion in 2016. Capital expenditures, increased from Ps.160.9 billion in 2015 to Ps.182.0 billion in 2016. |
| • | transfers to the Government from the Central Bank and FGS increased by 36.6% in 2016, while interest payments increased by 53.3% in the same period. |
D-123
Overall fiscal balance. The overall fiscal balance recorded a deficit of Ps.365.2 billion in 2016, compared to a deficit of Ps.225.6 billion in 2015.
Tax Regime
In Argentina, the legal authority to impose taxes is shared by Congress, the provincial legislatures and, within certain limits, the municipalities.
Federal taxes must be authorized by an act of Congress, although the executive branch is empowered to issue regulations and decrees necessary to implement congressional legislation. Argentina does not have a federal revenue code; instead, separate laws, which are amended frequently, govern different categories of taxes. The Ministry of the Treasury is responsible for the collection of federal fiscal revenues. The Ministry of the Treasury carries out this task mainly through the AFIP.
Figures presented in this section differ from those presented in “—National Public Accounts” section because they include revenues (and transfers) “co-participated” (see “Public Sector Finances—Fiscal Relations with the Provinces”) with the provinces.
Composition of Tax Revenues
The Government levies the following taxes:
| • | VAT on goods and services; |
| • | income taxes; |
| • | social security taxes; |
| • | taxes on foreign trade; |
| • | taxes on capital; |
| • | taxes on fuel; and |
| • | other taxes on goods and services (such as consumption taxes and tax on financial transactions). |
Traditionally, the Government derived most of its revenue from VAT, social security contributions and income taxes. See “—Tax Regime—Composition of Tax Revenues.”
Tax revenues for the year ended December 31, 2016 totaled Ps.2,112.4 billion, an increase of 34.8 % as compared to 2015. The increase was primarily the result of:
| • | revenues from fines related to the Tax Amnesty Law; |
| • | an increase in nominal wages of the public and private sectors; |
| • | an increase in prices of products and services; and |
| • | continued improvements in tax collection mechanisms. |
During 2016:
| • | income tax revenues increased by 13.6%, primarily due to larger income tax advance payments made by companies in 2016 that was partially offset by a decrease in revenues from individuals. The decline in payments primarily resulted from the elimination of income tax withholdings on foreign purchases and an increase in the tax bracket base for individuals. Additional factors that contributed to the decline in income tax revenues from individuals were an increase in income tax deductions for individuals, an increase in tax deductions based on contributions to the social security system, and the elimination of income tax on the annual complementary salary paid at the of 2015 for certain tax brackets. |
D-124
| • | duties on foreign trade increased 15.1 % as compared to 2015. Export taxes revenues decreased by 5.8% as a result of the elimination or reduction of export tax rates while import tax collection increased by 58.7% result of an increase in nominal exchange rate; |
| • | social security taxes increased by 33.7%, mainly driven by increased taxable wages as compared to 2015, and changes in legislation, including the increase of the maximum taxable base for the calculation of contributions; |
| • | VAT revenues increased by 34.7% as a result of a 49.8% increase in the national tax bureau VAT and a 28.4% increase in customs VAT, in each case as compared to 2015, primarily as a result of an increase in nominal consumption, which was partially offset by increased returns and exchanges to grain exporters and producers; |
| • | revenues from taxes on financial transactions increased by 35.1% in 2016 as a result of an increase in banking transactions; and |
| • | revenues related to the Tax Amnesty Law resulted in a Ps.110.7 billion increase in tax revenues in December 2016. |
The following tables set forth the composition of the Government’s tax revenues for the periods specified.
Composition of Tax Revenues
(in millions of pesos)
| 2012 | 2013 | 2014 | 2015(3) | 2016(3) | ||||||||||||||||
| VAT |
Ps.190,496 | Ps.249,006 | Ps.331,203 | Ps.433,076 | Ps.583,217 | |||||||||||||||
| Tax on Financial Transaction |
44,652 | 57,249 | 77,651 | 98,736 | 133,721 | |||||||||||||||
| Social security taxes(1) |
179,777 | 236,072 | 307,656 | 415,410 | 555,320 | |||||||||||||||
| Taxes on income |
140,108 | 185,688 | 269,809 | 384,536 | 436,927 | |||||||||||||||
| Corporate income tax |
81,938 | 99,346 | 132,178 | 185,725 | 235,866 | |||||||||||||||
| Personal income tax |
54,494 | 79,803 | 125,503 | 188,218 | 174,248 | |||||||||||||||
| Others |
3,676 | 6,539 | 12,128 | 10,593 | 26,814 | |||||||||||||||
| Import and export taxes |
78,677 | 79,940 | 115,283 | 113,053 | 130,080 | |||||||||||||||
| Taxes on capital |
7,409 | 10,471 | 14,575 | 18,538 | 19,976 | |||||||||||||||
| Taxes on fuel |
25,785 | 31,010 | 44,490 | 56,478 | 75,664 | |||||||||||||||
| Other taxes on goods and services |
17,242 | 21,347 | 29,020 | 40,291 | 59,908 | |||||||||||||||
| Others |
4,759 | 3,110 | 5,599 | 6,931 | 117,594 | |||||||||||||||
|
|
|
|
|
|
|
|
|
|
|
|||||||||||
| Tax regularization |
934 | (1,313 | ) | 1,340 | 1,306 | 110,721 | ||||||||||||||
| Others |
3,825 | 4,423 | 4,260 | 5,624 | 6,873 | |||||||||||||||
| Gross tax revenues(2) |
688,905 | 873,893 | 1,195,287 | 1,567,050 | 2,112,408 | |||||||||||||||
| Tax refunds |
(1,987 | ) | (5,394 | ) | (11,215 | ) | (8,831 | ) | (14,983 | ) | ||||||||||
|
|
|
|
|
|
|
|
|
|
|
|||||||||||
| Net tax revenues |
Ps.686,918 | Ps.868,499 | Ps.1,184,072 | Ps.1,558,219 | Ps.2,097,425 | |||||||||||||||
|
|
|
|
|
|
|
|
|
|
|
|||||||||||
| (1) | Revenues for 2012, 2013, 2014, 2015 and 2016 include pension contributions resulting from the Argentine Integrated Pension System. |
| (2) | Gross tax revenues include certain tax revenues that are collected and later refunded, such as VAT and income tax, which are refundable in certain circumstances. Such refunds are deducted from gross tax revenues to calculate net tax revenues. |
| (3) | Preliminary data. |
| Source: | Ministry of the Treasury. |
D-125
Composition of Tax Revenues
(as a percentage of total Government fiscal revenues)
| 2012 | 2013 | 2014 | 2015(3) | 2016(3) | ||||||||||||||||
| VAT |
27.7 | % | 28.7 | % | 28.0 | % | 27.8 | % | 27.8 | % | ||||||||||
| Tax on Financial Transaction |
6.5 | % | 6.6 | % | 6.6 | % | 6.3 | % | 6.4 | % | ||||||||||
| Social security taxes(1) |
26.2 | % | 27.2 | % | 26.0 | % | 26.7 | % | 26.5 | % | ||||||||||
| Taxes on income |
20.4 | % | 21.4 | % | 22.8 | % | 24.7 | % | 20.8 | % | ||||||||||
| Corporate income tax |
11.9 | % | 11.4 | % | 11.2 | % | 11.9 | % | 11.2 | % | ||||||||||
| Personal income tax |
7.9 | % | 9.2 | % | 10.6 | % | 12.1 | % | 8.3 | % | ||||||||||
| Others |
0.5 | % | 0.8 | % | 1.0 | % | 0.7 | % | 1.3 | % | ||||||||||
| Import and export taxes |
11.5 | % | 9.2 | % | 9.7 | % | 7.3 | % | 6.2 | % | ||||||||||
| Taxes on capital |
1.1 | % | 1.2 | % | 1.2 | % | 1.2 | % | 1.0 | % | ||||||||||
| Taxes on fuel |
3.8 | % | 3.6 | % | 3.8 | % | 3.6 | % | 3.6 | % | ||||||||||
| Other taxes on goods and services(2) |
2.5 | % | 2.5 | % | 2.5 | % | 2.6 | % | 2.9 | % | ||||||||||
| Others |
0.7 | % | 0.4 | % | 0.5 | % | 0.4 | % | 5.6 | % | ||||||||||
|
|
|
|
|
|
|
|
|
|
|
|||||||||||
| Tax regularization |
0.1 | % | (0.2 | )% | 0.1 | % | 0.1 | % | 5.3 | % | ||||||||||
| Others |
0.6 | % | 0.5 | % | 0.4 | % | 0.4 | % | 0.3 | % | ||||||||||
| Gross tax revenues (2) |
100.3 | % | 100.6 | % | 100.9 | % | 100.6 | % | 100.7 | % | ||||||||||
| Tax refunds |
(0.3 | ) | (0.6 | ) | (0.9 | ) | (0.6 | ) | (0.7 | )% | ||||||||||
|
|
|
|
|
|
|
|
|
|
|
|||||||||||
| Net tax revenues |
100.0 | % | 100.0 | % | 100.0 | % | 100.0 | % | 100.0 | % | ||||||||||
|
|
|
|
|
|
|
|
|
|
|
|||||||||||
| (1) | Revenues for 2012, 2013, 2014, 2015 and 2016 include pension contributions resulting from the Argentine Integrated Pension System. |
| (2) | Gross tax revenues include certain tax revenues that are collected and later refunded, such as VAT and income tax, which are refundable in certain circumstances. Such refunds are deducted from gross tax revenues to calculate net tax revenues. |
| (3) | Preliminary Data. |
| Source: | Ministry of the Treasury. |
The information below is a brief description of the principal taxes levied by the Government, except for social security taxes. For a description of social security taxes see “Social Security.”
Value Added Tax
VAT is levied on sales of goods and services within Argentina, and the rendering of services abroad when the effective use of those services takes place in Argentina and the provider of the service is registered as a VAT taxable person. VAT is also applied on imports.
As of the date of this Annual Report, the general VAT rate is 21.0%. An increased rate of 27.0% applies to the provision of gas, electricity, water, sewage and telecommunications services for non-residential purposes. A reduced rate of 10.5% applies in certain cases, including housing projects, the sale of livestock and other agricultural products, the sale of capital goods and certain financial revenues and expenses.
VAT revenues increased by 34.7% in 2016 as compared to 2015, primarily as a result of an increase in nominal consumption, which was partially offset by increased returns and exchanges to grain exporters and producers.
The Government also levies certain taxes on the consumption of certain goods and services. The following table sets forth a sample of the tax rates applicable to certain products.
D-126
Composition of Taxes on Goods and Services
| Product |
Rate (%) | |||
| Goods |
||||
| Tobacco products |
20–75 | |||
| Alcoholic beverages |
8–20 | |||
| Non-alcoholic beverages (including extracts, concentrates and mineral water) |
4–8 | |||
| Luxury items |
20 | |||
| Recreational sporting equipment (including private planes and yachts) |
10 | |||
| Electronic products |
17 | |||
| Cars, engines and motorcycles |
10–20 | |||
| Services |
||||
| Insurances |
0.1–23 | |||
| Satellite and Cell phones (mobile phones) |
4 | |||
| Source: | Ministry of the Treasury. |
Since 2010, the Government has collected a tax on mobile phones. The tax is equal to 1% of customers’ payments (abonos) to cell phone companies (net of VAT). The proceeds of this tax are allocated to the promotion of Olympic sports through the Ente Nacional de Alto Rendimiento Deportivo, or Enard (National Board of High Performance Sports).
Taxes on Income
Argentine legal residents and corporations domiciled in Argentina are subject to income tax on their worldwide income. Nonresidents are subject to tax only on income from Argentine sources.
The income of national, provincial or local authorities, as well as non-profit organizations (including cooperatives, religious institutions and foundations), is exempt from income tax. The Government also exempts or creates special incentives (in the form of tax breaks) for projects carried out in certain locations, such as Tierra del Fuego, and for certain economic activities, such as public transportation and garbage collection.
There are three categories of taxes on income in Argentina:
| • | Impuesto a las ganancias (income tax). For Argentine resident individuals, the rate of this tax varies according to income level, ranging from 9% to 35%. A 15% tax rate applies to net income derived from trade of securities. In case the trade is conducted through certain markets, an exemption may apply for Argentine resident individuals. For all business entities, the rate is 35% applicable on worldwide net income. For non-resident individuals and entities the rate is 35%, however, it is generally applied on a presumed income portion contained in payments to non-residents (which usually causes the effective tax rate to be lower). |
| • | Gravamen de emergencia sobre premios de determinados juegos de sorteos y concursos deportivos (emergency tax on lotteries and gaming proceeds). The rate of this tax is 31% and it is levied on 90% of the net amount of gains from lotteries and games. |
| • | Impuesto a la ganancia mínima presunta (notional minimum income tax). Subject to certain exceptions, such as stock and other equity interests in entities subject to income tax, a 1% tax is levied on the value of certain assets held by businesses and individuals at the end of each fiscal year to the extent their aggregate value exceeds a minimum threshold. Amounts paid on account of income tax are deductible from this tax to avoid double taxation. The minimum income tax rate supplements the income tax rate. The fiscal obligation in each year is set at the higher of both taxes. However, if the minimum income tax exceeds income tax, the excess can be credited against future income tax payment obligations for up to ten years. This tax has been abrogated for tax periods initiated after January 1, 2019. |
Income tax accounted on average for 22% of total tax revenues from 2012 through 2016. In 2016, income tax accounted for 20.8% of total tax revenues.
D-127
In 2016, Congress abrogated the application of the 10% income tax withholding on dividends paid by Argentine companies.
On March 22, 2016, the AFIP increased the amount of gross income (from Ps.96,000 to Ps.200,000) above which employees must submit an affidavit of personal assets, and increased the amount of gross income (from Ps.144,000 to Ps.300,000) above which employees must submit an affidavit of personal assets and income tax reports.
Congress also passed modifications to the income tax brackets to take into account the impact of inflation in recent years.
Taxes on Foreign Trade
Taxes on foreign trade consist of export and import taxes. Import taxes are levied on goods and services imported into Argentina for consumption. They are assessed either ad valorem (i.e., on the actual value of the good or service) or per unit (expressed as a fixed amount per unit), or a combination of both. Rates for import taxes range from 0% to 35%. Imports of capital goods that are not produced in Argentina are taxed at a 2% rate, while those produced in Argentina are subject to, in general, a 14% rate. Certain products, such as textiles, footwear and toys are taxed at a special rate. Export taxes were introduced in 2002. Export taxes became an important source of revenue for the Government beginning in 2003, primarily as a result of the high international prices for commodities and the devaluation of the peso, which during the initial years increased the competitiveness and value of Argentina’s U.S. dollar exports in pesos. Domestic inflation and the real appreciation of the peso eroded the competitiveness of Argentine exports.
Set forth below are certain export tax rates that were in effect as of December 10 and as of December 31, 2015, after President Macri issued a decree significantly reducing export taxes.
Exports of crude oil and fuels:
| • | if the international price per barrel of crude oil and fuel is less than U.S.$71.00, the applicable export tax is 1%; and |
| • | if international price per barrel of crude oil and fuel is higher than U.S.$71.00, the export tax is calculated according to the following formula: |
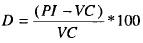
where D is export tax, PI is international price and VC is “price cut” (maximum net amount after taxes that an exporter can be paid; as of December 31, 2015, the Government set the “price cut” at U.S.$70.00 per barrel);
| • | 5% on exports of raw wool and sheared wool; |
| • | 5% on exports of metal waste; |
| • | 5%-10% on exports of hides and skins; |
| • | 5%-10% on exports of natural cork; |
| • | 5%-10% on exports of mineral products; |
| • | 20% on exports of paper and cardboard for recycling; |
D-128
| • | 27% on exports of soy oils and other products derived from soy; |
| • | 30% on exports of oilseeds from soy; |
| • | 100% on exports of natural gas; |
| • | Biofuel. The export tax is calculated according to the following formula: |
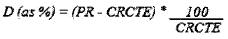
where
D is export tax, PR is reference price and CRCTE is equal to the sum of total costs and the return on total capital used.
In 2012, export taxes on agricultural products represented 37.5% of total export taxes, export taxes on fuel products represented 25.4% of total export taxes, and export taxes on food and beverages represented 25.0% of total export taxes. The share of total export taxes stemming from fuel products increased in 2012 primarily as a result of an increase in crude oil exports. In addition, in August 2012, the Government replaced the fixed tax rate applicable to biodiesel exports with a variable rate determined by a governmental agency primarily on the basis of international prices and production costs.
In 2013, export taxes on agricultural products represented 36.3% of total export taxes, export taxes on food and beverages represented 35.2% of total export taxes and export taxes on fuel products represented 14.0% of total export taxes.
In 2014, export taxes on food and beverages represented 39.3% of total export taxes, export taxes on agricultural products represented 36.2% of total export taxes and export taxes on fuel products represented 10.7% of total export taxes.
In 2015, export taxes on food and beverages represented 39.3% of total export taxes, export taxes on agricultural products represented 36.2% of total export taxes and export taxes on fuel products represented 10.7% of total export taxes.
In the first half of 2016, export taxes on food and beverages represented 51.9% of total export taxes, export taxes on agricultural products represented 45.4% of total export taxes and export taxes on fuel products represented 1.7% of total export taxes.
Import and export tax revenues increased by 15.1%, from Ps.113.1 billion in 2015 to Ps.130.1 billion in 2016. Export taxes decreased by 5.8% in 2016 as compared to 2015 due to the elimination or reduction of export taxes. Import taxes increased by 58.7% due to an increase in the nominal exchange rate.
Taxes on Capital
Taxes on capital include taxes on the value of personal assets owned by individuals, taxes on the net worth of credit unions and a tax on the sales of real estate
Taxes on Financial transactions
The tax on financial transactions was introduced in 2001 and has become an important source of revenue for the Government. The tax is levied on the full amount of most financial transactions, with certain limited exemptions. The standard tax rate is 0.6% for credits and debits from checking accounts and 1.2% for transfers of funds and other cash transfers. The tax on financial transactions was originally scheduled to expire in December 2002, but Congress extended the expiration date on several consecutive occasions. As a result, the tax on credits and debits from checking accounts will remain in force until December 31, 2017.
D-129
Taxes on Fuels
The Government levies taxes on the sale of various fuels, including liquid fuels, such as gasoline and diesel, and compressed natural gas. Through 2015, the tax on the sale of liquid fuels was generally levied on importers, refineries and distributors and ranged from 17.1% to 63% of the net sales price depending on the type of fuel.
Tax Enforcement
Argentina historically had a low rate of tax collection. The Government has taken steps to improve its level of tax collection since 2003, when the Plan Antievasión (Anti-evasion Program) was approved by Congress. Recent initiatives introduced by the Government to improve tax collection include the following:
Tax Cooperation Agreements
Argentina and Uruguay have entered into a cooperation agreement to facilitate the sharing of tax information. Under this agreement, the tax authorities of both countries are able to share certain tax information to detect tax evasion.
Argentina has signed cooperation agreements with numerous countries to promote international cooperation in tax matters through the exchange of information and increase the transparency of cross-border commercial transactions. These agreements provide for the sharing of tax information in documentary form and, in certain circumstances, allow representatives of a country’s competent authority to conduct interviews and examine records in the territory of a counterparty. In other cases, these agreements provide for mutual assistance in customs procedures.
Argentina is also a party to the Convention on Mutual Administrative Assistance in Tax Matters and to the Multilateral Competent Authority Agreement promoted by the Organization for Economic Co-operation and Development (OECD).
On October 11 2016, Argentina and Chile’s double taxation treaty entered into force, after Argentina notified Chile that its internal requirements had been satisfied.
On November 16, 2016, Argentina and Switzerland signed a declaration agreeing to the automatic exchange of tax-related information and a memorandum of understanding regarding the existing double taxation treaty between both countries in relation to certain taxes, such as income taxes and wealth taxes, which includes mechanisms to avoid abuses of the system through tax evasion.
In December 2016, Argentina and the United States signed a tax information agreement that seeks to combat tax evasion and promote transparency.
On March 17, 2017, Argentina and Brazil signed an agreement related to the automatic exchange of tax-related information. The aim is to allow each state to identify tax payers’ properties and holdings in the other state.
Tax Regularization Program
In May 2013, with the aim of directing undeclared foreign currency savings of Argentine residents for use in the development of infrastructure projects, as well as in the energy and real estate sectors, Congress passed a law authorizing the issuance of certain securities to be subscribed with undeclared foreign currency. This initiative has not been renewed since December 2015. For more information see “Monetary System—Foreign Exchange and International Reserves—Voluntary Declaration of Foreign Currency.”
Tax Amnesty Law
The legislative debate on the Tax Amnesty Law related mainly to the expected impact of the proposed law on the repatriation of capital held abroad by Argentine residents, its effectiveness to reduce money laundering, undeclared consumption, hidden liabilities and the possibility to enhance the development of the capital markets sector and foster investment in Argentina.
D-130
In July 2016, a voluntary and extraordinary tax disclosure and regularization regime for the holding of foreign and local currency and assets located in Argentina and abroad was enacted by the Federal Congress (Law 27,260). Tax disclosure as well as regularization of tax obligations could be conducted until March 31, 2017, while the disclosure of cash had to be made before October 31, 2016. A special tax was applicable on the value of the undeclared cash and assets, unless adherent taxpayers subscribed certain investment securities. Among other aspects, the regime also provides benefits for compliant taxpayers, certain changes in the personal assets tax, the abrogation of the 10% income tax withholding on dividends distributed by Argentine companies and the abrogation of the notional minimum income tax commencing on January 1, 2019. To date, 20 out of 23 Argentine provinces have adhered to the referred regime. Corrientes, Chubut and Formosa, are the only Provinces that have not adhered to the Tax Amnesty Law.
In August 2016, the Government announced the issuance of two new bonds, BONAR 0% 2019 and BONAR 1% 2023 for up to U.S.$8.0 billion, which could be subscribed by taxpayers participating in the Tax Amnesty Law.
On April 4, 2017, the Ministry of the Treasury and the AFIP announced that, through March 31, 2017, the deadline under the Tax Amnesty Law U.S.$116.8 billion in cash holdings, real estate and securities had been declared.
Composition of Public Expenditures
Public sector expenditures include general administrative expenses, debt service payments, investments in public infrastructure and services, expenditures related to defense and security, administrative expenses of the judiciary and social program expenditures.
The following table sets forth the National Administration’s public expenditures for the periods specified, calculated using an accrual method, which computes revenues and expenditures in the periods in which they are accrued, regardless of the period in which payments take place. This method differs from the cash-basis used to calculate national public accounts. See “—Introduction.”
Composition of National Public Expenditures(1)
(as a percentage of GDP)
| 2012 | 2013 | 2014 | 2015 | 2016 | ||||||||||||||||
| General administration |
0.9 | % | 1.0 | % | 1.0 | % | 1.3 | % | 2.0 | % | ||||||||||
| Defense and security |
1.2 | 1.2 | 1.3 | 1.7 | 2.3 | |||||||||||||||
| Justice |
0.3 | 0.4 | 0.4 | 0.5 | 0.7 | |||||||||||||||
| Social programs |
12.5 | 13.4 | 13.4 | 18.8 | 26.1 | |||||||||||||||
| Social security(2) |
9.0 | 9.4 | 9.3 | 13.4 | 19.3 | |||||||||||||||
| Culture, education, science and technology |
1.8 | 1.9 | 1.9 | 2.6 | 3.4 | |||||||||||||||
| Health |
0.7 | 0.9 | 0.9 | 1.2 | 1.6 | |||||||||||||||
| Housing |
0.5 | 0.8 | 0.9 | 1.0 | 1.0 | |||||||||||||||
| Social welfare |
0.4 | 0.4 | 0.4 | 0.5 | 0.7 | |||||||||||||||
| Labor |
0.1 | 0.1 | 0.1 | 0.1 | 0.2 | |||||||||||||||
| Public expenditures on economic infrastructure and services |
4.5 | 5.1 | 6.8 | 6.5 | 8.5 | |||||||||||||||
| Public debt service(3) |
1.8 | 1.3 | 1.9 | 2.4 | 6.7 | |||||||||||||||
|
|
|
|
|
|
|
|
|
|
|
|||||||||||
| Total |
21.3 | % | 22.4 | % | 24.8 | % | 24.5 | % | 26.3 | % | ||||||||||
|
|
|
|
|
|
|
|
|
|
|
|||||||||||
| (1) | The budget figures contained in this table do not include amounts budgeted for entities that form part of Argentina’s national non-financial public sector but are not part of the National Administration. Figures also do not include interest accrued on Untendered Debt, a portion of which was paid with a portion of the net proceeds of the debt securities issued by the Government on April 22, 2016. Untendered Debt has been defined to include only unpaid principal plus accrued and unpaid interest at contractual rates through its originally scheduled maturity. Such amounts do not include penalty or default interest. The Republic is not paying time-barred claims on principal or interest, and the Settlement Proposal is not available for claims on principal or interest that are time-barred. In settling outstanding disputes with holdout creditors pursuant to the Settlement Proposal, the Republic took into consideration interest accrued after the originally scheduled maturity of each defaulted series of securities (other than time-barred interest), as well as default interest. For information regarding the Republic’s Settlement Proposal to settle claims on the Untendered Debt, see “Public Sector Debt—Legal Proceedings.” |
D-131
| (2) | Figures presented under “Social security” in this table differ from those presented in the table “National Public Accounts” because they were calculated using different methodologies. |
| (3) | Based on performing debt. |
| Source: | Ministry of the Treasury. |
Composition of National Public Expenditures(1)
(as a percentage of total Government expenditures)
| 2012 | 2013 | 2014 | 2015 | 2016 | ||||||||||||||||
| General administration |
4.3 | % | 4.4 | % | 3.9 | % | 4.2 | % | 4.3 | % | ||||||||||
| Defense and security |
5.4 | 5.5 | 5.4 | 5.5 | 5.0 | |||||||||||||||
| Justice |
1.6 | 1.6 | 1.4 | 1.6 | 1.5 | |||||||||||||||
| Social programs |
58.8 | 59.8 | 54.1 | 60.2 | 56.4 | |||||||||||||||
| Social security(2) |
42.1 | 41.9 | 37.5 | 42.7 | 41.7 | |||||||||||||||
| Culture, education, science and technology |
8.5 | 8.5 | 7.7 | 8.4 | 7.4 | |||||||||||||||
| Health |
3.5 | 3.8 | 3.5 | 3.9 | 3.5 | |||||||||||||||
| Housing |
2.3 | 3.5 | 3.4 | 3.2 | 2.1 | |||||||||||||||
| Social welfare |
1.9 | 1.7 | 1.7 | 1.5 | 1.4 | |||||||||||||||
| Labor |
0.6 | 0.5 | 0.4 | 0.4 | 0.3 | |||||||||||||||
| Public expenditures on economic infrastructure and services |
21.4 | 22.7 | 27.5 | 20.8 | 18.3 | |||||||||||||||
| Public debt service(3) |
8.5 | 6.0 | 7.7 | 7.7 | 14.5 | |||||||||||||||
|
|
|
|
|
|
|
|
|
|
|
|||||||||||
| Total |
100.0 | % | 100.0 | % | 100.0 | % | 100.0 | % | 100.0 | % | ||||||||||
|
|
|
|
|
|
|
|
|
|
|
|||||||||||
| (1) | The budget figures contained in this table do not include amounts budgeted for entities that form part of Argentina’s national non-financial public sector, but are not part of the National Administration. Figures also do not include interest accrued on Untendered Debt, a portion of which was paid with a portion of the net proceeds of the debt securities issued by the Government on April 22, 2016. Untendered Debt has been defined to include only unpaid principal plus accrued and unpaid interest at contractual rates through its originally scheduled maturity. Such amounts do not include penalty or default interest. The Republic is not paying time-barred claims on principal or interest, and the Settlement Proposal is not available for claims on principal or interest that are time-barred. In settling outstanding disputes with holdout creditors pursuant to the Settlement Proposal, the Republic took into consideration interest accrued after the originally scheduled maturity of each defaulted series of securities (other than time-barred interest), as well as default interest. For information regarding the Republic’s Settlement Proposal to settle claims on the Untendered Debt, see “Public Sector Debt—Legal Proceedings.” |
| (2) | Figures presented under “Social security” in this table differ from those presented in the table titled “National Public Accounts” because they were calculated using different methodologies. |
| (3) | Based on performing debt. |
| Source: | Ministry of the Treasury. |
Expenditures for social programs, investments in public infrastructure and services and public debt service represented the largest portion of Government’s expenditures, accounting on average for 88.9% of total Government expenditures from 2012 through 2016.
Expenditures on Social Programs
The Government devotes a substantial portion of its revenues to social programs. From 2012 to 2016, social programs expenditures accounted on average for 57.9% of annual Government expenditures, of which social security payments alone accounted on average for 41.2 %. These social programs include the social security system, cultural goods and services, education, science and technology programs, the health-care system, low-income housing programs, social welfare programs and labor subsidies. In addition, under current law, 6% of the Government’s annual budget must be allocated to education, science and technology. See “The Argentine Economy—Poverty and Income Distribution.”
Public Infrastructure and Services
The main projects in public infrastructure include the following:
| • | construction of railroads and roads; |
| • | construction and improvements to power lines to transport electricity; |
| • | extension of gas transportation systems for thermoelectric plants; and |
D-132
| • | construction of water pipelines and drainage. |
For more information see “—Infrastructure Development.”
On December 21, 2016, the Supreme Court of Argentina suspended the construction at the “Presidente Néstor Kirchner” and “Governor Jorge Cepernic” dams in the province of Santa Cruz. The Supreme Court found that the legally mandated environmental impact assessment and public hearing regarding the projects had not been conducted and conditioned the continuation of the works to the completion of those procedures.
Public Debt Service
The Government has only recorded interest paid on performing debt. The data discussed below does not include interest accrued on Untendered Debt, a portion of which was paid with a portion of the net proceeds of the debt securities issued by the Government in the April 2016 Transaction. Untendered Debt has been defined to include only unpaid principal plus accrued and unpaid interest at contractual rates through its originally scheduled maturity. Such amounts do not include penalty or default interest. The Republic is not paying time-barred claims on principal or interest, and the Settlement Proposal is not available for claims on principal or interest that are time-barred. In settling outstanding disputes with holdout creditors, the Government took into consideration interest accrued after the originally scheduled maturity of each defaulted series of securities (other than time-barred interest), as well as default interest. For information regarding the Government’s Settlement Proposal to settle claims on the Untendered Debt, see “Public Sector Debt—Legal Proceedings.” Interest paid on the new debt securities going forward will be reflected under Public Debt Service. In 2012, interest payments as a percentage of total expenditures decreased to 8.5%, but increased by 15.8% in nominal terms, mainly due to higher interest payments on Bonares and payments on GDP-Linked Securities, commercial bank debt and Treasury notes. In 2013, interest payments as a percentage of total expenditures decreased to 6.0%, and also decreased by 6.7% in nominal terms, primarily due to the fact that no payments under the GDP-Linked Securities were due. In 2014, interest payments as a percentage of total expenditures increased to 7.7%, and increased by 94.2% in nominal terms, mainly due to higher interest payments for Bonares, Discounts and interest payments on debt owed to multilateral agencies. In 2015, interest payments as a percentage of total expenditures remained stable at 7.7%, and increased by 26.0% in nominal terms, mainly due to payments on Bonares, Discounts and Treasury notes. In 2016, interest payments as a percentage of total expenditures increased to 14.5%, and increased by 180% in nominal terms, mainly due to interest payments on Bonares, Discounts and Treasury notes See “Public Sector Debt—Foreign Currency—Denominated Debt—Foreign Currency—Denominated Debt Service.”
Defense and Security
From 2012 to 2015, government expenditures in defense and security remained relatively stable, representing 5.4% of total expenditures in 2012, 5.5% of total expenditures in 2013, 5.4% of total expenditures in 2014 and 5.5% of total expenditures in 2015. In 2016, government expenditures in defense and security decreased to 5.0% of total expenditures.
General Administration Expenses
In 2012, general administration expenses as a percentage of total government expenditures decreased from 5.0% in 2011 to 4.4% in 2012, but increased by 6.1% in nominal terms as compared to 2011. This decrease was mainly driven by a slower growth of general administration expenses in 2012 as compared to other government expenditures.
In 2013, general administration expenses as a percentage of total government expenditures remained 4.4%, but increased by 38.7% in nominal terms as compared to 2012.
In 2014, general administration expenses as a percentage of total government expenditures decreased from 4.3% in 2013 to 3.9% in 2014, but increased by 33.0% in nominal terms as compared to 2013. This decrease was mainly driven by a slower pace of growth of general administration expenses in 2014 as compared to other government expenditures.
In 2015, general administration expenses as a percentage of total government expenditures increased from 3.9% in 2014 to 4.2%, and increased by 36.4% in nominal terms as compared to 2014.
D-133
In 2016, general administration expenses as a percentage of total government expenditures increased from 4.2% in 2015 to 4.3% in 2016, and increased by 50.5% in nominal terms as compared to 2015.
Infrastructure Development
The following table sets forth the composition of the governments expenditure in infrastructure development for the years indicated.
Composition of Public Expenditures
(as a percentage of total expenditures)
| 2012 | 2013 | 2014 | 2015 | 2016 | ||||||||||||||||
| Public expenditures on economic infrastructure |
21.4 | % | 22.7 | % | 27.5 | % | 20.8 | % | 18.3 | % | ||||||||||
| Energy, fuels and mining |
11.1 | 12.7 | 18.8 | 12.2 | 11.1 | |||||||||||||||
| Communications |
0.9 | 1.1 | 0.8 | 0.8 | 0.4 | |||||||||||||||
| Transport |
7.8 | 7.4 | 6.6 | 6.2 | 5.5 | |||||||||||||||
| Ecology and environment |
0.3 | 0.3 | 0.3 | 0.2 | 0.2 | |||||||||||||||
| Agriculture |
0.6 | 0.6 | 0.5 | 0.5 | 0.4 | |||||||||||||||
| Industry |
0.3 | 0.3 | 0.3 | 0.4 | 0.5 | |||||||||||||||
| Trade, tourism and other services |
0.3 | 0.3 | 0.2 | 0.3 | 0.1 | |||||||||||||||
| Insurance and finances |
0.1 | % | — | — | — | — | ||||||||||||||
| Source: | Ministry of the Treasury. |
Composition of Public Expenditures
(as a percentage of GDP)
| 2012 | 2013 | 2014 | 2015 | 2016 | ||||||||||||||||
| Public expenditures on economic infrastructure |
4.5 | % | 5.1 | % | 6.8 | % | 6.5 | % | 8.5 | % | ||||||||||
| Energy, fuels and mining |
2.4 | 2.6 | 4.7 | 3.8 | 5.1 | |||||||||||||||
| Communications |
0.2 | 0.2 | 0.2 | 0.3 | 0.2 | |||||||||||||||
| Transport |
1.7 | 1.6 | 1.6 | 1.9 | 2.5 | |||||||||||||||
| Ecology and environment |
0.1 | — | 0.1 | 0.1 | 0.1 | |||||||||||||||
| Agriculture |
0.1 | 0.1 | 0.1 | 0.2 | 0.2 | |||||||||||||||
| Industry |
0.1 | 0.1 | 0.1 | 0.1 | 0.2 | |||||||||||||||
| Trade. tourism and other services |
0.1 | 0.1 | — | 0.1 | 0.1 | |||||||||||||||
| Insurance and finances |
— | — | — | — | — | |||||||||||||||
| Source: | INDEC and Ministry of the Treasury. |
The Budget
The Chief of the Cabinet of Ministers is responsible for preparing the National Administration’s budget, which must project the National Administration’s fiscal results for the next three years. Although the budget is tri-annual, Congress only approves the budget for the following year. Once a budget is approved, the Government can supply the allocated amounts to the various agencies and to the provinces and the City of Buenos Aires on a quarterly basis. The Auditoría General de la Nación (National General Audit Agency) is responsible for supervising budgetary compliance by the National Administration and its agencies. The Public Sector Financial Administration Law prohibits the Government from borrowing to cover operating expenses.
D-134
The 2017 Budget
The 2017 budget was approved on December 21, 2016.
The table below presents a comparison of the 2017 budget against the 2016 results.
| Budget Comparison (in millions of pesos) |
||||||||||||||||
| Actual 2016 | Budget 2017 | Difference | ||||||||||||||
| Ps. | % | |||||||||||||||
| Current Revenues |
1,792,476.6 | 2,068,482.8 | 276,006.2 | 15.4 | % | |||||||||||
| Tax Revenues |
976,663.0 | 1,104,127.5 | 127,464.5 | 13.1 | % | |||||||||||
| Social Security Contributions |
558,087.3 | 698,814.3 | 140,727.0 | 25.2 | % | |||||||||||
| Non-Tax Revenues |
41,279.8 | 50,176.9 | 8,897.1 | 21.6 | % | |||||||||||
| Sales of Goods and Services of the Public Administration |
5,568.8 | 11,100.8 | 5,532.0 | 99.3 | % | |||||||||||
| Property Taxes |
191,170.5 | 201,501.1 | 10,330.6 | 5.4 | % | |||||||||||
| Current Transfers |
9,046.1 | 1,443.3 | (7,602.8 | ) | (84.0 | )% | ||||||||||
| Other Revenues |
10,661.1 | 1,318.9 | (9,342.2 | ) | (87.6 | )% | ||||||||||
| Operating Surplus of Public Entities |
— | — | — | — | ||||||||||||
|
|
|
|
|
|
|
|
|
|||||||||
| Current Expenditures |
1,976,042.5 | 2,314,013.5 | 337,971.0 | 17.1 | % | |||||||||||
| Consumption Expenditures |
346,170.9 | 426,913.7 | 80,742.8 | 23.3 | % | |||||||||||
| Personnel |
266,831.3 | 319,341.3 | 52,510.0 | 19.7 | % | |||||||||||
| Goods and services |
98,405.0 | 107,572.4 | 9,167.4 | 9.3 | % | |||||||||||
| Property Taxes |
185,363.8 | 255,945.8 | 70,582.0 | 38.1 | % | |||||||||||
| Social Security Expenditures |
734,716.8 | 963,181.1 | 228,464.3 | 31.1 | % | |||||||||||
| Direct Taxes |
n.a. | 3,542.2 | n.a. | n.a. | ||||||||||||
| Other Losses |
n.a. | 3,574.8 | n.a. | n.a. | ||||||||||||
| Current Transfers |
646,714.6 | 632,568.7 | (14,145.9 | ) | (2.2 | )% | ||||||||||
| Operating Deficit of Public Entities |
44,011.0 | 28,287.2 | (15,723.8 | ) | (35.7 | )% | ||||||||||
|
|
|
|
|
|
|
|
|
|||||||||
| Primary Result |
(183,565.9 | ) | (245,530.7 | ) | (61,964.8 | ) | 33.8 | % | ||||||||
| Capital Revenues |
442.5 | 388.04 | (54.5 | ) | (12.3 | )% | ||||||||||
| Capital Expenditures |
182,045.2 | 236,917.8 | 54,872.6 | 30.1 | % | |||||||||||
| Real Direct Investment |
78,713.7 | 108,460.9 | 29,747.2 | 37.8 | % | |||||||||||
| Capital Transfers |
84,197.7 | 112,692.3 | 28,494.6 | 33.8 | % | |||||||||||
| Financial Investment |
19,133.8 | 15,764.6 | (3,369.2 | ) | (17.6 | )% | ||||||||||
| Total Revenues |
1,792,919.1 | 2,068,871.2 | 275,952.1 | 15.4 | % | |||||||||||
| Total Expenditures |
2,158,087.7 | 2,550,931.3 | 392,843.6 | 18.2 | % | |||||||||||
| Total Primary Expenditures |
1,972,834.3 | 2,295,001.0 | 322,166.7 | 16.3 | % | |||||||||||
| Primary Result |
(179,915.2 | ) | (226,129.8 | ) | (46,214.6 | ) | 25.7 | % | ||||||||
| Primary Result without Central Bank and FGS Gains (losses) |
(343,525.5 | ) | (405,033.2 | ) | (61,507.7 | ) | 17.9 | |||||||||
| Financial Result |
(365,168.6 | ) | (482,060.1 | ) | (116,891.5 | ) | 32.0 | % | ||||||||
|
|
|
|
|
|
|
|
|
|||||||||
n.a. = not available.
The 2017 budget projects a fiscal deficit representing 4.2% of GDP in 2017. This projected fiscal deficit represents an increase from the previously projected 3.3% of GDP, primarily as a result of two factors: the August 2016 decision of the Supreme Court of Argentina (which held that gas tariffs that had been announced for residential users must retroactively return to the levels in effect before tariff increases were implemented) and the Ley de Reparación Histórica a los Jubilados (the Historical Reparations Law for Retirees and Pensioners), which will increase pension expenditures. The budget does not include any estimate of revenues arising from the Tax Amnesty Law. The proceeds of financings in the international capital markets contemplated by the Republic, have been and are expected to be applied to cover the Republic’s financing needs in 2017. For more information, see “—Macri Administration: 2015-Present—Tariff Increases” and “—Retiree Programs.”
D-135
One of the cornerstones of the 2017 budget is the expansion of social programs designed to meet the needs of the most vulnerable groups, including the following:
| • | Childhood Programs. The 2017 budget allocates funds for (i) the Plan Nacional de Primera Infancia (National Plan for Early Childhood), (ii) the construction of 3,000 preschools to advance compulsory schooling for children aged three and older, and (iii) the expansion of the Child Allowance Program to reach 4.1 million beneficiaries, including 514,000 children of monotributistas (self-employed workers), and 200,000 children of temporary workers. |
| • | Healthcare and Retiree Programs. The 2017 budget provides for the Cobertura Universal de Salud (Universal Health Insurance Coverage Plan) for 15 million residents who lack health insurance coverage and the Historical Reparation Plan for Retirees and Pensioners, which is expected to reach 2.4 million retirees. |
| • | National Housing Plan. With the aim of addressing the housing needs of low and middle-income families, the 2017 budget also provides for the implementation of the Plan Nacional de Vivienda (National Housing Plan), which includes the construction of 120,000 homes and granting 175,000 subsidized housing loans over a three-year period. |
Overall, social security expenditures are expected to grow by 35% in 2017.
The 2017 budget further provides for an increase in the minimum monthly wage to Ps.8,060 in January 2017. This increase in wages was implemented in three phases: 12.3% in June 2016 (to Ps.6,810), 12.4% in September 2016 (to Ps.7,560) and 8.3% in January 2017 (to Ps.8,060).
Infrastructure. The 2017 budget additionally allocates funds for investments in infrastructure projects, including:
| • | Plan Belgrano, which involves a Ps.95 billion investment to promote infrastructure development in the northern provinces of Argentina; |
| • | rebuilding the national transportation system to increase the competitiveness of regional economies, including through a U.S.$2.0 billion investment for the construction of 2,800 kilometers of highways over a four-year period; and |
| • | the ongoing Plan Nacional de Agua 2016-2019 (National Water Plan 2016-2019), which is expected to generate 500,000 jobs. |
Fiscal Relations with the Provinces
Each of Argentina’s 23 provinces and the City of Buenos Aires is a separate legal and fiscal entity, independent from one another and the Government. Argentina’s federal system allocates significant responsibility for public services and other public expenditures to the provinces, but relies primarily on a centralized system of tax collection. The provinces rely on revenue transfers from the Government, primarily through the co-participation regime. See “—Revenue Transfers.” Under the co-participation revenue-sharing system, the provinces delegate to the Government their constitutional authority to collect certain taxes, and the Government, in turn, agrees to transfer a portion of the revenues generated from such taxes to the provinces.
From 2011 to 2014, the aggregate annual expenditures of the provinces (including the City of Buenos Aires) averaged 14.4% of nominal GDP, while the provinces (including the City of Buenos Aires), on average, collected annual revenues of approximately 14.0% of nominal GDP (including co-participation amounts). Several provinces declared during the last quarter of 2009 that they were facing substantial fiscal deficits in 2009 and experiencing cash constraints. The growth rate of provincial expenditures exceeded the growth rate of tax revenues. As a result, in May 2010, the Government established a debt restructuring program for the debt owed by the Argentine provinces to the Government, including Bogars. Under this program, the Government would make contributions (aportes del tesoro nacional) to the provinces to be applied to cancel a portion of the debt owed to the Government. The balance of the outstanding debt would be repaid over the following 20 years, in pesos, at an
D-136
annual interest rate of 6% and secured with co participation revenues. The first interest and principal payments were scheduled for January 2012. As of December 2011, 17 provinces had participated in the debt refinancing program representing approximately Ps.58.4 billion of debt owed by the provinces to the Government.
The following table sets forth a summary of the changes in the aggregate fiscal results at the provincial level for the years specified.
Summary of Revenues and Expenditures of the Provinces and the City of Buenos Aires
(in millions of pesos)(1)
| As of December 31, | As of September 30, | |||||||||||||||||||||||
| 2012 | 2013 | 2014 | 2015 | 2015 | 2016 | |||||||||||||||||||
| Revenues |
||||||||||||||||||||||||
| Current revenues: |
||||||||||||||||||||||||
| Administration taxes: |
||||||||||||||||||||||||
| Provincial taxes |
Ps. 121,213 | Ps. 175,468 | Ps. 241,076 | Ps. 314,666 | Ps.229,906.7 | Ps.310,029.5 | ||||||||||||||||||
| National taxes: |
||||||||||||||||||||||||
| Co-participation |
135,050 | 175,827 | 240,385 | 329,946 | 236,498.1 | 334,905.1 | ||||||||||||||||||
| Other national taxes |
35,185 | 45,794 | 63,566 | 85,463 | 63,333.4 | 73,646.7 | ||||||||||||||||||
|
|
|
|
|
|
|
|
|
|
|
|
|
|||||||||||||
| Total national taxes |
170,235 | 221,620 | 303,951 | 415,408 | 299,831.6 | 408,551.9 | ||||||||||||||||||
|
|
|
|
|
|
|
|
|
|
|
|
|
|||||||||||||
| Total administration taxes |
291,448 | 397,089 | 545,027 | 730,074 | 529,738.3 | 718,581.4 | ||||||||||||||||||
| Other non-tax revenue |
21,768 | 27,283 | 39,878 | 45,432 | 32,714.4 | 43,493.4 | ||||||||||||||||||
| Sale of goods and services of the public administration |
2,512 | 2,816 | 4,102 | 4,991 | 3,548.9 | 5,133.6 | ||||||||||||||||||
| Property taxes |
1,054 | 1,873 | 3,225 | 4,153 | 2,721.5 | 6,972.0 | ||||||||||||||||||
| Current transfers |
20,546 | 21,983 | 37,251 | 48,897 | 35,307.0 | 44,620.3 | ||||||||||||||||||
|
|
|
|
|
|
|
|
|
|
|
|
|
|||||||||||||
| Total current revenues |
337,327 | 451,043 | 629,483 | 833,547 | 604,030.2 | 818,800.8 | ||||||||||||||||||
| Capital revenue |
20,936 | 29,456 | 41,981 | 53,308 | 42,028.7 | 43,954.7 | ||||||||||||||||||
|
|
|
|
|
|
|
|
|
|
|
|
|
|||||||||||||
| Total revenues |
Ps. | 337,327 | Ps. | 451,043 | Ps. | 629,482 | Ps. | 883,547 | Ps. | 646,058.8 | Ps. | 862,755.5 | ||||||||||||
|
|
|
|
|
|
|
|
|
|
|
|
|
|||||||||||||
| Expenditures |
||||||||||||||||||||||||
| Current expenditures: |
||||||||||||||||||||||||
| Consumption expenditures: |
||||||||||||||||||||||||
| Provincial administration wages |
198,435 | 255,621 | 351,760 | 500,574 | 352,783.1 | 482,921.5 | ||||||||||||||||||
| Consumer goods |
9,242 | 12,043 | 16,733 | 23,369 | 15,549.9 | 19,393.0 | ||||||||||||||||||
| Services |
25,654 | 32,958 | 44,945 | 66,636 | 45,385.0 | 54,543.3 | ||||||||||||||||||
|
|
|
|
|
|
|
|
|
|
|
|
|
|||||||||||||
| Total consumption expenditures |
233,331 | 300,622 | 413,438 | 590,579 | 413,718.0 | 556,857.8 | ||||||||||||||||||
| Interest payments |
5,684 | 7,464 | 11,590 | 15,853 | 9,066.1 | 17,850.4 | ||||||||||||||||||
| Current transfers |
87,536 | 115,478 | 158,025 | 211,961 | 148,914.2 | 202,219.7 | ||||||||||||||||||
|
|
|
|
|
|
|
|
|
|
|
|
|
|||||||||||||
| Total current expenditures |
326,552 | 423,564 | 583,054 | 818,393 | 571,698.3 | 776,927.9 | ||||||||||||||||||
| Capital expenditures |
||||||||||||||||||||||||
| Direct investment |
34,606 | 50,211 | 67,342 | 93,338 | 67,900.8 | 66,599.4 | ||||||||||||||||||
| Capital transfers |
7,881 | 11,220 | 18,754 | 22,292 | 14,680.1 | 19,753.9 | ||||||||||||||||||
| Financial investment |
3,487 | 5,303 | 6,154 | 9,100 | 5,594.5 | 8,797.2 | ||||||||||||||||||
|
|
|
|
|
|
|
|
|
|
|
|
|
|||||||||||||
| Total capital expenditures |
45,974 | 66,734 | 92,251 | 124,729 | 88,175.4 | 95,150.4 | ||||||||||||||||||
|
|
|
|
|
|
|
|
|
|
|
|
|
|||||||||||||
| Total expenditures |
372,525 | 490,299 | 675,305 | 943,122 | 659,873.7 | 872,078.4 | ||||||||||||||||||
|
|
|
|
|
|
|
|
|
|
|
|
|
|||||||||||||
|
|
|
|
|
|
|
|
|
|
|
|
|
|||||||||||||
| Fiscal balance |
Ps, | (14,263) | Ps. | (9,799) | Ps. | (3,841) | Ps. | (56,267) | Ps.(13,814.9) | Ps. | (9,322.8) | |||||||||||||
|
|
|
|
|
|
|
|
|
|
|
|
|
|||||||||||||
| (1) | Figures calculated using the accrual method. |
| Source: | Ministry of the Treasury. |
D-137
The following table sets forth a summary of the aggregate fiscal results at the provincial level for the years specified, in percentage terms.
Summary of Revenues and Expenditures of the Provinces and the City of Buenos Aires
(% change from the previous year)(1)
| As of December 31, | As of September 30, |
|||||||||||||||||||
| 2012 | 2013 | 2014 | 2015 | 2016(2) | ||||||||||||||||
| Revenues |
||||||||||||||||||||
| Current revenues: |
||||||||||||||||||||
| Administration taxes: |
||||||||||||||||||||
| Provincial taxes |
30.5 | % | 44.8 | % | 37.4 | % | 30.5 | % | 34.9 | % | ||||||||||
| National taxes: |
||||||||||||||||||||
| Co-participation |
26.9 | 30.2 | 36.7 | 37.3 | 41.6 | |||||||||||||||
| Other national taxes |
26.9 | 30.2 | 38.8 | 34.4 | 16.3 | |||||||||||||||
| Total national taxes |
26.9 | 30.2 | 37.1 | 36.7 | 36.3 | |||||||||||||||
|
|
|
|
|
|
|
|
|
|
|
|||||||||||
| Total administration taxes |
28.4 | 36.2 | 37.3 | 34.0 | 35.6 | |||||||||||||||
|
|
|
|
|
|
|
|
|
|
|
|||||||||||
| Other non-tax revenue |
28.0 | 25.3 | 46.2 | 13.9 | 32.9 | |||||||||||||||
| Sale of goods and services of the public administration |
23.3 | 12.1 | 45.7 | 21.7 | 44.7 | |||||||||||||||
| Property taxes |
32.3 | 77.7 | 72.2 | 28.8 | 156.2 | |||||||||||||||
| Current transfers |
(7.0 | ) | 7.0 | 69.4 | 31.3 | 26.4 | ||||||||||||||
|
|
|
|
|
|
|
|
|
|
|
|||||||||||
| Total current revenues |
25.4 | 33.7 | 39.6 | 32.4 | 35.6 | |||||||||||||||
| Capital revenue |
8.1 | 40.7 | 42.5 | 27.0 | 4.6 | |||||||||||||||
|
|
|
|
|
|
|
|
|
|
|
|||||||||||
| Total revenues |
25.4 | % | 33.7 | % | 39.6 | % | 32.4 | % | 33.5 | |||||||||||
|
|
|
|
|
|
|
|
|
|
|
|||||||||||
| Expenditures |
||||||||||||||||||||
| Current expenditures: |
||||||||||||||||||||
| Consumption expenditures: |
||||||||||||||||||||
| Provincial administration wages |
29.5 | 28.8 | 37.6 | 42.3 | 36.9 | |||||||||||||||
| Consumer goods |
18.1 | 30.3 | 38.9 | 39.7 | 24.7 | |||||||||||||||
| Services |
19.4 | 28.5 | 36.4 | 48.3 | 20.2 | |||||||||||||||
|
|
|
|
|
|
|
|
|
|
|
|||||||||||
| Total consumption expenditures |
27.8 | 28.8 | 37.5 | 42.8 | 34.6 | |||||||||||||||
| Interest payments(3) |
40.4 | 31.3 | 55.3 | 36.8 | 96.9 | |||||||||||||||
| Current transfers |
21.2 | 31.9 | 36.8 | 34.1 | 35.8 | |||||||||||||||
|
|
|
|
|
|
|
|
|
|
|
|||||||||||
| Total current expenditures |
26.2 | 29.7 | 37.7 | 40.4 | 35.9 | |||||||||||||||
| Capital expenditures |
||||||||||||||||||||
| Direct investment |
(1.4 | ) | 45.1 | 34.1 | 38.6 | (1.9 | ) | |||||||||||||
| Capital transfers |
(10.3 | ) | 42.4 | 67.1 | 18.9 | 34.6 | ||||||||||||||
| Financial investment |
5.1 | 52.1 | 16.1 | 47.9 | 57.2 | |||||||||||||||
|
|
|
|
|
|
|
|
|
|
|
|||||||||||
| Total capital expenditures |
(2.6 | ) | 45.2 | 38,2 | 35.2 | 7.9 | ||||||||||||||
|
|
|
|
|
|
|
|
|
|
|
|||||||||||
| Total expenditures |
21.7 | 31.6 | 37.7 | 39.7 | 32.2 | |||||||||||||||
|
|
|
|
|
|
|
|
|
|
|
|||||||||||
| Fiscal balance |
(19.5 | )% | (31.3 | )% | (60.8 | )% | 1,364.9 | % | (32.5 | )% | ||||||||||
|
|
|
|
|
|
|
|
|
|
|
|||||||||||
| (1) | Figures calculated using the accrual method. |
| (2) | Compared to the same period in 2015. |
| Source: | Ministry of the Treasury. |
D-138
Summary of Revenues and Expenditures of the Provinces and the City of Buenos Aires
(as percentage of GDP)(1)
| As of December 31, | As of September 30, |
|||||||||||||||||||||||
| 2012 | 2013 | 2014 | 2015 | 2015 | 2016 | |||||||||||||||||||
| Revenues |
||||||||||||||||||||||||
| Current revenues: |
||||||||||||||||||||||||
| Administration taxes: |
||||||||||||||||||||||||
| Provincial taxes |
4.6 | % | 5.2 | % | 5.3 | % | 5.4 | % | 4.1 | % | 4.0 | % | ||||||||||||
| National taxes: |
||||||||||||||||||||||||
| Co-participation |
5.1 | 5.3 | 5.2 | 5.6 | 4.2 | 4.3 | ||||||||||||||||||
| Other national taxes |
1.3 | 1.4 | 1.4 | 1.5 | 1.1 | 0.9 | ||||||||||||||||||
|
|
|
|
|
|
|
|
|
|
|
|
|
|||||||||||||
| Total national taxes |
6.5 | 6.6 | 6.6 | 7.1 | 5.3 | 5.2 | ||||||||||||||||||
|
|
|
|
|
|
|
|
|
|
|
|
|
|||||||||||||
| Total administration taxes |
11.0 | 11.9 | 11.9 | 12.5 | 9.4 | 9.2 | ||||||||||||||||||
| Other non-tax revenue |
0.8 | 0.8 | 0.9 | 0.8 | 0.6 | 0.6 | ||||||||||||||||||
| Sale of goods and services of the public administration |
0.1 | 0.1 | 0.1 | 0.1 | 0.1 | 0.1 | ||||||||||||||||||
| Property taxes |
— | 0.1 | 0.1 | — | — | 0.1 | ||||||||||||||||||
| Current transfers |
0.8 | 0.7 | 0.8 | 0.8 | 0.6 | 0.6 | ||||||||||||||||||
|
|
|
|
|
|
|
|
|
|
|
|
|
|||||||||||||
| Total current revenues |
12.8 | 13.5 | 13.7 | 14.2 | 10.7 | 10.5 | ||||||||||||||||||
| Capital revenue |
0.8 | 0.9 | 0.9 | 0.9 | 0.7 | 0.6 | ||||||||||||||||||
|
|
|
|
|
|
|
|
|
|
|
|
|
|||||||||||||
| Total revenues |
13.6 | 14.4 | 14.7 | 15.1 | 11.4 | 11.1 | ||||||||||||||||||
|
|
|
|
|
|
|
|
|
|
|
|
|
|||||||||||||
| Expenditures |
||||||||||||||||||||||||
| Current expenditures: |
||||||||||||||||||||||||
| Consumption expenditures: |
||||||||||||||||||||||||
| Provincial administration wages |
7.5 | 7.6 | 7.7 | 8.6 | 6.2 | 6.2 | ||||||||||||||||||
| Consumer goods |
0.4 | 0.4 | 0.4 | 0.4 | 0.3 | 0.2 | ||||||||||||||||||
| Services |
1.0 | 1.0 | 1.0 | 1.1 | 0.8 | 0.7 | ||||||||||||||||||
|
|
|
|
|
|
|
|
|
|
|
|
|
|||||||||||||
| Total consumption expenditures |
8.8 | 9.0 | 9.0 | 10.1 | 7.3 | 7.1 | ||||||||||||||||||
| Interest payments |
0.2 | 0.2 | 0.3 | 0.3 | 0.2 | 0.2 | ||||||||||||||||||
| Current transfers |
3.3 | 3.4 | 3.5 | 3.6 | 2.6 | 2.6 | ||||||||||||||||||
|
|
|
|
|
|
|
|
|
|
|
|
|
|||||||||||||
| Total current expenditures |
12.4 | 12.7 | 12.7 | 14.0 | 10.1 | 10.0 | ||||||||||||||||||
| Capital expenditures |
||||||||||||||||||||||||
| Direct investment |
1.3 | 1.5 | 1.5 | 1.6 | 1.2 | 0.9 | ||||||||||||||||||
| Capital transfers |
0.3 | 0.3 | 0.4 | 0.4 | 0.3 | 0.3 | ||||||||||||||||||
| Financial investment |
0.1 | 0.2 | 0.1 | 0.2 | 0.1 | 0.1 | ||||||||||||||||||
|
|
|
|
|
|
|
|
|
|
|
|
|
|||||||||||||
| Total capital expenditures |
1.7 | 2.0 | 2.0 | 2.1 | 1.6 | 1.2 | ||||||||||||||||||
|
|
|
|
|
|
|
|
|
|
|
|
|
|||||||||||||
| Total expenditures |
14.1 | 14.6 | 14.7 | 16.1 | 11.7 | 11.2 | ||||||||||||||||||
|
|
|
|
|
|
|
|
|
|
|
|
|
|||||||||||||
| Fiscal balance |
(0.5 | )% | (0.3 | )% | (0.1 | )% | (1.6 | )% | (0.2 | ) | (0.1 | ) | ||||||||||||
|
|
|
|
|
|
|
|
|
|
|
|
|
|||||||||||||
| (1) | Figures calculated using the accrual method. |
| Source: | INDEC and Ministry of the Treasury. |
Revenue Transfers
The Co-Participation Law of 1988, as amended in 2002 (the “1988 Co-Participation Law”) governs the current co-participation regime. Originally intended as a temporary measure, the 1988 Co-Participation Law has been automatically renewed every year since it was due to expire at the end of 1989. Although the 1994 amendments to the Constitution called for the adoption of a new co-participation law by 1996, none has been adopted. Since the mid-1980s, the executive branches of the Government and the provinces and the City of Buenos Aires have maintained consensual agreements concerning revenue transfers, which Congress has routinely ratified. The Comisión Federal de Impuestos (Federal Tax Commission), a federal agency created pursuant to the 1988 Co-Participation Law, monitors compliance with the co-participation regime.
D-139
Since 2002, under the 1988 Co-Participation Law, unless otherwise specified, the Government has been required to transfer certain tax revenues to a co-participation fund and allocate such revenues as follows:
| • | 54.7% to the provinces; |
| • | 42.3% to the Government; |
| • | 2.0% to be divided among certain provinces to compensate them for losses suffered as a result of fiscal imbalances caused by prior co-participation arrangements; and |
| • | 1.0% to the Aportes del Tesoro Nacional fund (the “ATN Fund”) created in 1998 to correct provincial fiscal imbalances or grant emergency aid to the provinces by making transfers from the Government to an affected province. |
Until recently, 15% of total tax revenues subject to the co-participation regime were withheld by the Government to fund the social security system.
A 1992 agreement among the Government, the provinces and the City of Buenos Aires that permitted this 15% deduction was extended and later codified in 2006 under Article 76 of Law No. 26,078, Presupuesto de Gastos y Recursos de la Administración Nacional para el Ejercicio 2006 (the “2006 National Budget Law”). In November 2015, the Supreme Court of Argentina declared Article 76 unconstitutional as applied to the provinces of Córdoba, San Luis and Santa Fe, and ordered the Government to return the funds that had been withheld from these provinces since 2006, plus accrued interest. Later that month, President Fernández de Kirchner issued an emergency decree expanding the Supreme Court’s ruling to funds that were withheld from all provinces and the City of Buenos Aires under Article 76. This decree was repealed shortly after President Macri took office.
In addition to the co-participation regime, several other revenue-distribution arrangements exist between the Government and the provinces. These special distribution arrangements include the following:
| • | Income tax. Income tax revenues are allocated as follows: |
| • | 20% to the national social security system; |
| • | the lesser of 10% and Ps.650 million to the Province of Buenos Aires (any revenues exceeding Ps.650 million up to the 10% limit are distributed among the remaining provinces); |
| • | 4% to the provinces (other than the Province of Buenos Aires); |
| • | 2% to the ATN Fund; and |
| • | 64% to be distributed as provided in the 1988 Co-Participation Law, as amended in 2002. |
| • | VAT. VAT revenues are allocated as follows: 11% to the national social security system and the remaining 89% as provided in the 1988 Co-Participation Law. |
| • | Taxes on personal goods. Revenues from taxes on personal goods are allocated as follows: 6.27% to the provinces and the City of Buenos Aires and 93.73% as provided in the 1988 Co-Participation Law. |
| • | Taxes on fuels. Revenue from most taxes on fuels are allocated to the national social security system, except for revenues from taxes on naphtha and natural gas, which are divided among the national social security system, the Government, the provinces and the Fondo Nacional de la Vivienda (National Housing Fund). |
D-140
| • | Tax on financial transactions. Revenues from taxes on financial transactions are allocated as follows: 70% to the Government; and 30% as provided in the 1988 Co-Participation Law. |
| • | Monotributo (self-employment tax). Revenue from the self-employment tax is divided into a tax component and a social security component. The tax component is allocated as follows: 70% to the national social security system and 30% as provided in the 1988 Co-Participation Law. The social security component is entirely allocated to the national social security system. |
| • | Fondo Federal Solidario (Joint Federal Fund). In March 2009, the Government created the Joint Federal Fund for infrastructure expenditures in the provinces and municipalities, which is financed by 30% of the tax revenues from soy exports. These funds are distributed among the provinces according to the 1988 Co-Participation Law. |
Agreement for a New Federalism
In February 2016, the Macri administration issued an emergency decree creating the Programa Acuerdo para el Nuevo Federalismo (“Agreement for a New Federalism”) and forming a designated council with the objective of reaching an agreement among the Government and provinces, other than Córdoba, San Luis and Santa Fe, for the gradual repayment of funds withheld under Article 76 of the 2006 National Budget Law. In May 2016, each province (other than Córdoba, San Luis and Santa Fe) and the City of Buenos Aires agreed to be bound by the terms of the Agreement for a New Federalism, through which they will gradually recover their share of the 15% withheld by the Government, subject to certain conditions. A special financing facility through ANSES will provide the equivalent of 6% of such 15% owed to those provinces and the City of Buenos Aires during 2016, and 3% each year during a 5 year period thereafter. The Government reached separate agreements with Córdoba, San Luis and Santa Fe, reflecting the restitution in favor of those provinces ordered by the Supreme Court.
On October 25, 2016, the Minister of the Treasury and Public Finance along with the provincial ministers of finance announced the inclusion of certain amendments to the Fiscal Responsibility Law (Ley de Responsabilidad Fiscal) in the 2017 Budgeting. The amendments aim to reduce the overall public sector deficit by 10% in 2017, enhance transparency in provincial public accounts and restrain public spending by capping public spending increases in 2017 at the growth rate of nominal GDP.
The Consejo Federal de Responsabilidad Fiscal (Federal Council of Fiscal Responsibility) agreed a joint work schedule to create a comprehensive and definitive reform to be implemented in 2018.
On October 26, 2016, agreements were signed to normalize the financial relationship between the Province of Córdoba, ANSES and the Government. Pursuant to these agreements, the Government acknowledges the debt of financial assistance owed to the provincial pension fund of the Province of Córdoba in line with the parameters established in the Ley de la Reparación Histórica (Law of Historical Reparation). Additionally, the Government committed to assist the provincial pension fund during 2016 with Ps.3.4 billion. Part of the Government’s debt held by the Province of Córdoba was set-off against claims of the Government against the Province of Córdoba. The remainder, which amounts to Ps.2.0 billion, will be paid by ANSES, of which Ps.1.5 billion will be transferred immediately to the province and the remaining Ps.500 million will be transferred once the province’s social security system is conformed to the national social security system.
Other Arrangements with the Provinces
Since the late 1990s, the Government entered into different arrangements with the provinces to regularize their fiscal situation. Under these arrangements, the government provides financial assistance to the provinces in various forms and subject to various conditions. Some of these programs are highlighted below.
Bogars. Between 2002 and 2004, the Government restructured the debts of a number of provinces through a new bond, known as Bogar, which replaced the outstanding debt of provinces participating in this restructuring. These bonds (subject to indexation via CER) were issued by the Provincial Development Fund in an aggregate principal amount of Ps.21.7 billion, and their payment is secured through a Government guarantee. The Government’s guarantee is, in turn, secured through a pledge of the province’s share of revenues from the tax on financial transactions and co-participation taxes. In practice, the Government deducted payments due by the
D-141
Provinces under the Bogar from transfers of co-participation taxes to the provinces. As of December 31, 2012, Ps.35.6 billion, or 94.6%, of Bogar were refinanced under the program established in 2010 to refinance the debt owed by the Provinces to the Government. The increase in the amount outstanding since the first refinancing, in December, 2012, was due to the CER indexation adjustments. See “Public Sector Finances—Fiscal Relations with the Provinces.”
Fiscal Responsibility Law. The Fiscal Responsibility Law was enacted in 2004 and is only binding on those provinces and the City of Buenos Aires, that approved it. To date, 21 of the 23 provinces have approved the Fiscal Responsibility Law. In 2009, the City of Buenos Aires voluntarily abandoned the Fiscal Responsibility Law. This law implements important reforms to the fiscal framework for Argentina’s national, provincial and municipal public sectors. Some of its key features include the following:
| • | the Government and the provinces must prepare annual fiscal programs for each upcoming year setting forth certain fiscal policies, targets and projections, and regularly publish their fiscal results on their respective websites; |
| • | the growth rate of the primary expenditures of the national and provincial governments may not exceed the projected nominal GDP growth rate; |
| • | the Government and the provinces must maintain balanced budgets; |
| • | the Government and the provinces must create special anti-cyclical funds to reduce volatility in the fiscal cycle; |
| • | the provinces may not incur debt service obligations in excess of 15% of provincial current revenues net of co-participation transfers to the municipal governments (other than in connection with expenditures for the promotion of economic activity, employment and social assistance). Any province in breach of this limit would be precluded, with certain exceptions, from incurring additional debt; |
| • | the Government must commit to reduce its outstanding debt as a percentage of nominal GDP following its debt restructuring; |
| • | the provinces must seek approval from the Government’s Ministry of the Treasury to incur debt or issue guarantees; and |
| • | the Ministry of the Treasury must base its approval of provincial debt issues or guarantees on the parameters set forth in the law. |
The Fiscal Responsibility Law, however, does not implement any amendments to the revenue-sharing regime between the Government and the provinces (including the City of Buenos Aires).
Since 2009, Congress has approved amendments to the Fiscal Responsibility Law to grant flexibility to the fiscal regulation. This increased flexibility refers both to public expenditure growth and to the level of financial results. In addition, the provinces may incur debt service obligations in excess of 15% of current provincial revenues net of co-participation transfers to the municipal governments during the relevant year. In light of the effects of the global financial crisis on provincial finances and the pressure on provincial governments to maintain provincial public spending at budgeted levels, these amendments seek to aid provincial governments in addressing their fiscal deficits.
Social Security
Nationalization of the Pension Funds System
On November 20, 2008, Congress approved Law No. 26,425, which took effect on December 9, 2008 and nationalized the private pension system. Under this law, the former private pension system was absorbed and replaced by the Argentine Integrated Pension System, structured as a “pay as you go” system. As a result, all of the
D-142
resources administered by the private pension funds, including significant equity interests in a wide range of listed companies, were transferred to a separate fund, the FGS, to be administered by the ANSES. The assets held in the FGS may only be used to make advances to the Government to cover unexpected budget deficits that prevent the Government (through ANSES) from honoring its obligation to make social security and pension payments through the Argentine Integrated Pension System. See “Public Sector Finances—Introduction.”
Social Security Framework
ANSES is a self-governing entity with its own legal status, distinct from that of the National Government, and enjoys financial and economic autonomy.
Three separate institutions manage Argentina’s national public pension system:
| • | ANSES, which oversees the pension funds of the general public; |
| • | the Instituto de Ayuda Financiera para Pago de Retiros y Pensiones Militares (Armed Forces Pension Fund), which manages a special pension fund for the armed forces; and |
| • | the Caja de Retiros, Jubilaciones y Pensiones de la Policía Federal (Federal Police Pension Fund), which manages a special pension fund for federal law enforcement personnel. |
A significant portion of ANSES’s investments portfolio includes government issued debt.
Between 1994 and 1996, the Government assumed responsibility for operating the provincial pension systems of 10 provinces and the City of Buenos Aires. The Government merged these provincial pension funds into ANSES.
The current public social security system provides the following main benefits for retirees and for eligible individuals:
| • | Prestación básica universal (Basic pension). ANSES provides a basic pension to all individuals who have paid social security contributions for a majority of their working lives and have reached retirement age, regardless of the amount of the contributions made. The amount of this benefit is fixed by law and bears no relation to the amount of the contributions. |
| • | Prestación compensatoria (Compensatory pension). ANSES also provides a compensatory pension to recipients of the basic pension in proportion to any social security contributions made by or on behalf of such recipient prior to July 1994. The amount of this supplemental pension is determined based on an individual’s social security contributions and the length of time during which contributions were made. |
| • | Prestación adicional por permanencia (Additional pension). Recipients of the basic pension and compensatory pension also receive an additional pension. The amount of this benefit is equivalent to 1.5% of the average yearly salary during the ten years before retirement, multiplied by each service year for which an individual made social security contributions. |
| • | Retiro por invalidez (Disability retirement). Allowance granted to disabled individuals under the age of 65. |
| • | Jubilación por edad avanzada (Pension for the elderly). Allowance granted to individuals over the age of 70 who do not qualify for a basic retirement pension. |
| • | Pensión por fallecimiento (Death pension). Allowance granted to certain dependents of a deceased retiree, if at the time of the retiree’s death, such dependents were unable to work due to a disability. |
D-143
| • | Universal Child Allowance: ANSES provides a monthly pension of Ps.837 per child under the age of 18 and Ps.2,730 per disabled child (with no age limit) of workers in the informal sector of the economy, employees with income below the minimum monthly wage and the unemployed. |
| • | Asignación Universal por Embarazo (Universal Pregnancy Allowance). ANSES provides a monthly allowance to pregnant women, who have no medical insurance, from the twelfth week of pregnancy. |
In September 2014, the Government extended the social security system to cover individuals who had reached, or were within two years of reaching, the eligible age to collect such benefits but have not contributed to the system for the required number of years. This extension contributed to the 30.5% average increase in pensions during 2014. See “The Argentine Economy—Economic History and Background—Macri Administration: 2015 Present.”
Argentina’s social security system also includes the following two unemployment programs:
| • | unemployment insurance that provides one-time or monthly benefits to terminated employees and their dependents who meet certain requirements; and |
| • | the Heads of Households program, sponsored by the World Bank, under which unemployed heads of households receive benefit payments in exchange for community service. Heads of Households program beneficiaries may opt for a new plan called Más y Mejor Empleo (More and Better Jobs), as well as the Seguro de Capacitación y Empleo (Training and Employment Insurance) and the Programa Familias por la Inclusión Social (Families for Social Inclusion Program). |
Currently, the national social security system is funded primarily through the following taxes:
| • | payroll taxes based on employee wages (usually 11% for employees and between 17% and 21% for employers, depending on the employer’s line of business); |
| • | mandatory employee contributions to the Instituto Nacional de Servicios Sociales para Jubilados y Pensionados (National Institute of Pensioner and Retiree Social Services) (equal to 3% of the employee’s wages); |
| • | the employee health system tax based on employee wages (3% for employees and 6% for employers); and |
| • | the monotributo (self-employment tax) system applicable to self-employed individuals (under which amounts are determined on an individual basis according to assumed income ranges for various lines of work). |
Other fiscal revenues currently allocated to cover costs of the social security system include the following:
| • | Ps.120 million from income tax revenues plus an additional 20% of income tax revenues in excess of Ps.580 million; |
| • | 11% of VAT revenues; |
D-144
| • | 100% of revenues from taxes on diesel fuel, kerosene and compressed natural gas, and 21% of revenues from taxes on naphtha and natural gas; |
| • | 70% of revenues from the monotributo (self-employment tax); and |
| • | 30% of gross revenues from privatizations. |
Until recently, 15% of total tax revenues subject to the co-participation regime were also withheld by the Government to fund the social security system. See “Public Sector Finances—Fiscal Relations with the Provinces—Revenue Transfers.”
Evolution of Social Security Revenues and Expenditures
From 2012 to 2016, the social security system increased its surplus from Ps.20 billion to a surplus of Ps.21.3 billion. This increase was primarily due to a net increase in social security revenues. During this period, social security expenditures increased by 255%, primarily due to an increase in the number of beneficiaries and the automatic increase in benefit amounts provided under the Ley de Movilidad Previsional (Social Security Mobility Law).
Social security revenues. In 2012, social security revenues increased 31.0% as compared to 2011 from Ps.137.2 billion in 2011 to Ps.179.8 billion, primarily as a result of an increase in nominal wages and the number of registered workers. In 2013, social security revenues increased 31.3% as compared to 2012 from Ps.179.8 billion in 2012 to Ps.236.1 billion, primarily as a result of an increase in nominal wages and the number of registered workers. In 2014, social security revenues increased 30.3% as compared to 2013 from Ps.236.1 billion in 2013 to Ps.307.7 billion. In 2015, social security revenues increased 35.0% as compared to 2014 from Ps.307.7 billion to Ps.415.4 billion. In 2016, social security revenues increased 33.7% as compared to 2015 from Ps.415.4 billion to Ps.555.3 billion, mainly driven by an increased taxable wages as compared to 2015, and changes in legislation, including the increase of the maximum taxable base for the calculation of contributions.
Social security expenditures. Law No. 26,417 was enacted in October 2008 to address the mobility of public social security regimes. This law guarantees a minimum pension, which is adjusted semi-annually by reference to changes in both the wage index published by INDEC and tax revenues. In 2012, social security expenditures increased 35.1% to Ps.236.5 billion primarily as a result of increases in pension payments to retirees. In 2013, social security expenditures increased 33.1% to Ps.314.8 billion primarily as a result of increases in pension payments to retirees. In 2014, social security expenditures increased 35.1% to Ps.425.3 billion primarily as a result of increases in pension payments to retirees. In 2015, social security expenditures increased 43.8% to Ps.611.5 billion primarily as a result of increases in pension payments to retirees. In 2016, social security expenditures increased 44.5% to Ps.883.6 billion primarily as a result of increases in pension payments to retirees.
D-145
Overview
Unless otherwise specified, all amounts of the Republic’s outstanding securities included in this section “Public Debt” were calculated as of December 31, 2016.
The Republic’s total gross public debt consists of foreign currency-denominated and peso-denominated debt owed directly by the Government and indirect debt consisting of Government guarantees of obligations of other national public institutions, the provinces (including the City of Buenos Aires) and private sector entities. It does not include direct debt of the provinces or other entities that is not guaranteed by the Government. Except where indicated, foreign currency-denominated debt and peso-denominated debt is comprised of performing and non-performing debt (including Untendered Debt). Untendered Debt has been defined to include unpaid principal plus accrued and unpaid interest at contractual rates through December 31, 2016 plus compensatory or default interest. In settling outstanding disputes with holdout creditors pursuant to the Settlement Proposal, the Republic took into consideration interest accrued after the originally scheduled maturity of each defaulted series of securities (other than time-barred interest), as well as default interest. The Republic is not paying time-barred claims on principal or interest, and the Settlement Proposal is not available for claims on principal or interest that are time-barred. For information regarding the Republic’s Settlement Proposal to settle claims on the Untendered Debt, see “—Legal Proceedings.”
As of December 31, 2016, nominal claims on account of Untendered Debt (including however claims that the Republic considers time-barred), as registered in the public accounts of the Ministry of the Treasury, totaled approximately U.S.$8.5 billion. Of such U.S.$8.5 billion, U.S.$4.0 billion were claims that had been settled but remained subject to implementation.
The Republic’s total gross public debt, including Untendered Debt, for the years 2012 through 2016, was:
| • | U.S.$216 billion, as of December 31, 2012; |
| • | U.S.$223.4 billion, as of December 31, 2013; |
| • | U.S.$239.3 billion, as of December 31, 2014; |
| • | U.S.$240.7 billion, as of December 31, 2015; and |
| • | U.S.$275.4 billion, as of December 31, 2016. |
A significant portion of the Untendered Debt was subject to legal proceedings in courts of various international jurisdictions and monetary judgments against the Republic were entered in many proceedings. These monetary judgments include penalty interest and interest on interest depending on the applicable legislation of each jurisdiction. A significant portion of the Untendered Debt was settled following the Republic’s Settlement Proposal.
As of December 31, 2016, the Republic’s total gross public debt was U.S.$275.4 billion. Peso-denominated debt totaled Ps.1,381.5 billion (U.S.$87.2 billion), representing 31.6% of the Republic’s total gross public debt, of which 7.1% corresponded to CER-index linked debt. Foreign currency-denominated debt totaled U.S.$188.3 billion, representing 68.4% of the Republic’s total gross public debt.
As of December 31, 2016, total gross public debt (including non-performing debt and Untendered Debt) by type of creditor was as follows:
| • | 50.8% of total gross public debt, or U.S.$139.9 billion, primarily consisted of Public Debt held by National Public Sector Agencies. |
| • | 39.0% of total gross public debt, or U.S.$107.5 billion, was Public Debt held by private sector creditors. |
| • | 10.2% of total gross public debt, or U.S.$28.1 billion, primarily consisted of Public Debt held by other creditors. |
D-146
As of December 31, 2016, total gross public debt (excluding non-performing debt and Untendered Debt) by type of instrument was as follows: 67.1%, or U.S.$184.7 billion, in bonds; 17.4%, or U.S.$47.8 billion temporary advances from the Central Bank and Treasury notes; 10.2%, or U.S.$28.1 billion, in loans from multilateral and bilateral lenders; 1.6% or U.S.$4.4 billion, in loans from commercial banks and suppliers; and 0.7%, or U.S.$1.8 billion, in National Guaranteed Loans (after the exchanges of National Guaranteed Loans that occurred prior to October 2009. See “—Debt Management Following the 2001 Debt Crisis—Other Restructurings and Liability Management Transactions”).
As of December 31, 2016, non-performing debt (excluding Untendered Debt) totaled U.S.$103.4 million, or 0.04% of total gross public debt, of which U.S.$60.5 million represented non-performing debt not yet due and U.S.$42.9 million corresponded to non-performing debt subject to restructuring or in arrears.
Between 2011 and 2015, the Government borrowed against freely available international reserves from the Central Bank to fund the repayment of public debt. Through a 2010 emergency decree, the Argentine Debt Repayment Fund) was established to fund the repayment of debt held by private creditors. Additionally, the Central Bank advanced funds to service debt with international financial institutions and bilateral official sector creditors. For each amount borrowed, the Central Bank receives a non-transferrable 10-year Treasury note. See “Monetary System—Foreign Exchange and International Reserves.”
The following table shows the amounts borrowed from the Central Bank specifically to fund the repayment of public debt for the periods indicated.
| Government Borrowing from the Central Bank(1) (in billions of U.S. dollars) |
||||||||||||||||||||
| 2012 | 2013 | 2014 | 2015 | 2016 | ||||||||||||||||
| Payments to Official Sector |
U.S.$ | 2.1 | U.S.$ | 2.3 | U.S.$ | 3.0 | — | — | ||||||||||||
| Debt Repayment Fund |
5.7 | 7.1 | 7.9 | 10.6 | — | |||||||||||||||
|
|
|
|
|
|
|
|
|
|
|
|||||||||||
| Total |
U.S.$ | 7.8 | U.S.$ | 9.4 | U.S.$ | 10.9 | U.S.$ | 10.6 | — | |||||||||||
|
|
|
|
|
|
|
|
|
|
|
|||||||||||
| (1) | Temporary advances in local currency by the Central Bank to the Government are not included. |
| Source: | Ministry of the Treasury. |
Debt Record
Introduction
From time to time, the Republic carries out debt restructuring transactions in accordance with Section 65 of Law No. 24,156 and other applicable legislation. During the past 23 years, the Republic has entered into three restructurings of external and domestic debt in default: the Brady Plan, the 2005 Debt Exchange and the 2010 Debt Exchange. In 2001, in an effort to avoid a default, the Republic conducted a major voluntary exchange, referred to as the “Mega Canje,” of existing Government bonds for new bonds with longer maturities. However, the debt exchange provided only temporary relief and failed to contain the surge in the Government’s borrowing costs. In 2014, the Republic reached a settlement agreement with the members of the Paris Club, a group of official sector creditors, in connection with outstanding debt owed to Paris Club members on which the Republic had defaulted during the 2001-2002 economic crisis. See “—Debt Record—Paris Club.”
The Brady Plan. In April 1992, the Republic announced a refinancing agreement under the Brady Plan relating to medium- and long-term debt owed to commercial banks. The Brady Plan:
| • | applied to an estimated U.S.$28.5 billion in debt, including an estimated U.S.$9.3 billion in interest arrears. This amount represented over 96% of the commercial bank debt then outstanding; and |
| • | effected a reduction of approximately U.S.$3 billion in the nominal amount of the Republic’s foreign debt. |
For further discussion of the Brady Plan, see “—Prior Debt Restructurings—The Brady Plan.”
D-147
2001 Debt Crisis, 2005 Debt Exchange and 2010 Debt Exchange
On December 24, 2001, the Government (under the temporary administration of President Rodríguez Saá) declared a moratorium on a substantial portion of the Republic’s public debt. President Duhalde, his successor, endorsed the moratorium when he took office several days later. The Public Emergency Law, enacted on January 6, 2002 (which has been extended until December 31, 2019), authorized the Government to take the measures necessary to create conditions for an economic recovery and to restructure the Republic’s public debt.
On February 6, 2002, the Government issued Decree No. 256, which officially suspended payments on the Republic’s public debt and authorized the Ministry of the Treasury to undertake a restructuring of these obligations. Subsequently, the Government issued Resolution No. 73 (April 2002), Resolution No. 350 (September 2002), Resolution No. 449 (October 2002) and Resolution No. 158 (March 2003), pursuant to which it refined the scope of the suspension of debt payments. As a result of these measures, the Government continued to meet its debt obligations to the following creditors:
| • | multilateral official lenders; |
| • | creditors that agreed to the pesification of their National Guaranteed Loans; |
| • | holders of new bonds (such as Boden) issued after the Government announced the suspension of debt payments; and |
| • | certain other categories of public debt. |
2005 Debt Exchange. In 2005, the Government offered to restructure public external and domestic debt affected by the 2001 moratorium pursuant to an exchange offer. The 2005 Debt Exchange:
| • | pertained to approximately U.S.$81.8 billion of defaulted debt (including the nominal value of the eligible securities and accrued past-due interest accumulated as of December 31, 2001); |
| • | did not recognize accrued past due interest accumulated from December 31, 2001 to December 31, 2003, which would have increased the amount of this portion of debt to at least U.S.$102.6 billion; and |
| • | resulted in the tendering of securities with an aggregate value of approximately U.S.$62.3 billion, representing 76.2% of the aggregate value of eligible securities. |
For further discussion of the 2005 Debt Exchange, see “—Debt Management Following the 2001 Debt Crisis—2005 Debt Exchange.”
2010 Debt Exchange. On April 30, 2010, the Republic extended a debt restructuring invitation (the “April Invitation”) to the holders of 149 different series of securities on which it had defaulted in 2001 to exchange such debt for 2033 Discount Bonds (2010), 2038 Par Bonds (2010), 2017 Globals, 2035 GDP-Linked Securities (2010) and, in certain cases, a cash payment. In December 2010, the Republic reopened the April Invitation in the domestic market (the “December Invitation”), and the December Invitation closed on December 31, 2010. In accordance with a contractual commitment contained in the securities issued in the 2005 Debt Exchange, which granted holders of such securities the right to participate in any offer by the Republic to repurchase, exchange or amend any of the Untendered Debt, the securities issued in the 2005 Debt Exchange were eligible to participate in the 2010 Debt Exchange. The aggregate eligible amount of securities in default tendered in the 2010 Debt Exchange, including the April Invitation, the December Invitation, and the offer conducted by the Republic in Japan concurrently with the April Invitation, totaled approximately U.S.$12.4 billion, representing approximately 66.2% of the aggregate eligible amount of eligible securities. As a result of the 2005 and 2010 Debt Exchanges, the Republic restructured approximately 92% of the defaulted debt eligible for the 2005 and 2010 Debt Exchanges.
For further discussion of the 2010 Debt Exchange, see “—Debt Management Following the 2001 Debt Crisis—2010 Debt Exchange.”
D-148
Prior Debt Restructurings
Paris Club. The Republic restructured debt due to members of the Paris Club, a group of sovereign creditors, through five separate agreements in 1985, 1987, 1989, 1991 and 1992. During the debt crisis that began in 2001, the Republic defaulted on its outstanding debt owed to Paris Club members. As of April 30, 2014, the total outstanding debt owed to members of the Paris Club amounted to U.S.$9,690 million, which consisted of U.S.$4,955 million in principal, U.S.$1,102 million in interest and U.S.$3,633 million in penalty interest. On May 29, 2014, the Republic reached a settlement agreement with the Paris Club to cancel the total outstanding debt in five years. Under the terms of the settlement agreement, the Republic made an initial principal payment of U.S.$650 million in July 2014 and an additional principal payment of U.S.$500 million in May 2015, in each case together with accrued and unpaid interest. The outstanding balance accrues interest at a rate of 3.00% per annum.
For further discussion of debt owed to Paris Club lenders, see “—Debt Owed to Financial Institutions—Bilateral Debt and Private Creditors’ Debt.”
Commercial Banks. In 1985 and 1987, the Republic negotiated the restructuring of U.S.$34.7 billion in debt owed to international commercial bank creditors. In addition to the banks extending new loans in the aggregate amount of approximately U.S.$3.0 billion, two bond issuances formed part of this restructuring: “new money bonds” and “alternative participation instruments,” or “APIs.” Interest payments to bank creditors were suspended in April 1988 and resumed on a partial basis until the refinancing of medium- and long-term commercial bank debt under the Brady Plan (as described below).
The Brady Plan. In April 1992, the Republic announced a refinancing agreement under the Brady Plan relating to medium- and long-term debt owed to commercial banks. The Brady Plan applied to an estimated U.S.$28.5 billion in debt, including an estimated U.S.$9.3 billion in interest arrears, representing over 96.0% of the commercial bank debt then outstanding. The Brady Plan effected a reduction of approximately U.S.$3 billion in the nominal amount of the Republic’s foreign debt.
Over 96.0% of the commercial bank debt was refinanced pursuant to the Brady Plan. The Brady Plan provided for the issuance of par bonds, discount bonds and floating rate bonds, or “FRBs,” and a cash payout of U.S.$700 million in exchange for previously outstanding commercial bank debt of U.S.$28.5 billion, which included U.S.$9.3 billion of interest in arrears.
The Republic serviced the Brady Bonds until its default in 2001. Approximately 95.7% of the then outstanding U.S. dollar-denominated Brady Bonds and 81.3% of the then-outstanding euro-denominated Brady Bonds were exchanged in the 2005 Debt Exchange.
As of December 31, 2016:
| • | U.S.$558.0 million (including interest accrued at contractual rates but excluding penalty interest) of par Brady Bonds that had not been tendered in the 2005 and 2010 Debt Exchanges remained outstanding and consisted of: (i) U.S.$223.2 million of past due principal amounts and principal that had not become due and (ii) U.S.$334.8 million of past due interest amounts; |
| • | U.S.$139.1 million (including interest accrued at contractual rates but excluding penalty interest) of discount Brady Bonds that had not been tendered in the 2005 and 2010 Debt Exchanges remained outstanding and consisted of: (i) U.S.$69.5 million of past due principal amounts and principal that had not become due and (ii) U.S.$69.6 million of past due interest amounts; and |
| • | U.S.$49.7 million (including interest accrued at contractual rates but excluding penalty interest) of FRBs that had not been tendered in the 2005 and 2010 Debt Exchanges remained outstanding and consisted of: (i) U.S.$36.5 million of past due principal amounts and principal that had not become due and (ii) U.S.$13.2 million of past due interest amounts. |
D-149
Principal payments and a portion of interest payments on the par and discount Brady Bonds are secured by collateral. For a description of these security arrangements, see “—Debt Management Following the 2001 Debt Crisis—Secured or Guaranteed Debt.”
Debt Management Following the 2001 Debt Crisis
2005 Debt Exchange
On January 14, 2005, the Republic invited holders of 152 different series of securities on which it had defaulted in 2001 to exchange their defaulted debt for 2038 Par Bonds, 2045 Quasi-Par Bonds, 2033 Discount Bonds and 2035 GDP-Linked Securities. The aggregate eligible amount of securities that were eligible to participate in the exchange (including principal of the eligible securities plus accrued but unpaid interest accumulated through December 2001) was approximately U.S.$81.8 billion. The aggregate eligible amount of securities tendered in the 2005 Debt Exchange was (in each case together with past due interest) approximately U.S.$62.3 billion, representing 76.2% of the aggregate eligible amount of eligible securities.
Depending on the security tendered and the time of tender, holders of eligible securities who participated in the 2005 Debt Exchange were entitled to receive, in exchange for their securities, different combinations of the following:
| • | the 2038 Par Bonds due December 31, 2038; |
| • | the 2033 Discount Bonds due December 31, 2033; |
| • | the 2045 Quasi-Par Bonds due December 31, 2045; and |
| • | the 2035 GDP-Linked Securities with a notional amount of GDP-linked securities expiring no later than December 15, 2035. |
Until December 31, 2014, participants in the 2005 Debt Exchange had the right to participate in any future offer by the Republic to repurchase, exchange or amend any of the Untendered Debt.
Mandatory repurchase clauses require the Republic to allocate defined amounts to the repurchase of bonds issued in the 2005 Debt Exchange and certain other indebtedness. In addition, the Republic is required to repurchase bonds issued in the 2005 Debt Exchange if the Republic’s GDP exceeds a pre-established threshold.
The terms of the securities issued in the 2005 Debt Exchange were as follows.
The 2038 Par Bonds:
| • | were issued in an aggregate principal amount of U.S.$15.0 billion; |
| • | mature in 2038; and |
| • | bear interest at fixed rates rising from 1.33% to 5.25% (for 2038 Par Bonds denominated in U.S. dollars), from 1.20% to 4.74% (for 2038 Par Bonds denominated in euros), from 0.24% to 0.94% (for 2038 Par Bonds denominated in Japanese yen), and from 0.63% to 2.48% (for 2038 Par Bonds denominated in pesos). |
The 2033 Discount Bonds:
| • | were issued in an aggregate principal amount of U.S.$11.9 billion; |
| • | mature in 2033; and |
D-150
| • | bear interest at a fixed rate of 8.28% (for 2033 Discount Bonds denominated in U.S. dollars), 7.82% (for 2033 Discount Bonds denominated in euros), 4.33% (for 2033 Discount Bonds denominated in Japanese yen), and 5.83% (for 2033 Discount Bonds denominated in pesos). |
The 2045 Quasi-Par Bonds:
| • | were issued in an aggregate principal amount of Ps.24.3 billion (approximately U.S.$8.3 billion); |
| • | mature in 2045; and |
| • | bear interest at a fixed rate of 3.31%. |
The 2035 GDP-Linked Securities:
| • | were issued in a notional amount of approximately U.S.$62.3 billion; |
| • | were issued originally as a single unit with the underlying 2038 Par Bonds, 2033 Discount Bonds and 2045 Quasi-Par Bonds; |
| • | expire no later than December 15, 2035; and |
| • | provide for payments in respect of any given reference year only if a number of conditions are met relating to the performance of the Republic’s GDP in such year; the total amount to be paid during the life of the 2035 GDP-Linked Securities, per unit of 2035 GDP-Linked Security, cannot exceed 0.48 minus payments made under 2035 GDP-Linked Securities issued in the 2005 Debt Exchange through 2010, measured per unit of currency. |
The outstanding principal amount of all 2038 Par Bonds, 2033 Discount Bonds and 2045 Quasi-Par Bonds denominated in pesos is adjusted for inflation based on the CER, a unit of account whose value in pesos is indexed to consumer price inflation in Argentina, as measured by changes in the CPI. See “Presentation of Statistical and Other Information—Certain Methodologies.”
Brady bondholders tendered Brady Bonds for an aggregate principal amount of approximately U.S.$2.8 billion and €235 million and received their present value in cash from the redemption of the Brady Bonds’ principal collateral.
2010 Debt Exchange
On April 30, 2010, the Republic launched the April Invitation, an invitation to holders of the securities issued in the 2005 Debt Exchange and of 149 different series of securities on which it had defaulted in 2001 to exchange such debt for the new securities described below and, in certain cases, a cash payment.
Holders of eligible securities who participated in either the April Invitation or in the offer conducted by the Republic in Japan concurrently with the April Invitation were entitled to receive, in exchange for their securities, different combinations of the following:
| • | the 2033 Discount Bonds (2010) due December 2033 and denominated in U.S. dollars, euros, Japanese yen and pesos; |
| • | the 2038 Par Bonds (2010) due December 2038 and denominated in U.S. dollars, euros, Japanese yen and pesos; |
| • | the 2017 Globals due 2017 and denominated in U.S. dollars; and |
D-151
| • | the 2035 GDP-Linked Securities (2010) expiring no later than December 2035 and denominated in U.S. dollars, euros, Japanese yen and pesos. |
In December 2010, the Republic launched the December Invitation as a reopening of the April Invitation in the domestic market. The December Invitation closed on December 31, 2010.
Holders of eligible securities who participated in the December Invitation were entitled to receive, in exchange for their securities, different combinations of the following:
| • | 2033 Discount Bonds (2010) denominated in U.S. dollars and pesos; |
| • | 2017 Globals; and |
| • | 2035 GDP-Linked Securities (2010) denominated in U.S. dollars and pesos. |
The terms of the securities issued in the 2010 Debt Exchange were as follows:
The 2038 Par Bonds (2010):
| • | were issued in an aggregate principal amount of approximately U.S.$2.0 billion; |
| • | mature in 2038; and |
| • | bear interest at fixed rates rising from 2.50% to 5.25% (for 2038 Par Bonds (2010) denominated in U.S. dollars), from 2.26% to 4.74% (for 2038 Par Bonds (2010) denominated in euros), from 0.45% to 0.94% (for 2038 Par Bonds (2010) denominated in Japanese yen) and from 1.18% to 2.48% (for 2038 Par Bonds (2010) denominated in pesos). |
The 2033 Discount Bonds (2010):
| • | were issued in an aggregate principal amount of approximately U.S.$3.4 billion; |
| • | mature in 2033; and |
| • | bear interest at a fixed rate of 8.28% (for 2033 Discount Bonds (2010) denominated in U.S. dollars), 7.82% (for 2033 Discount Bonds (2010) denominated in euros), 4.33% (for 2033 Discount Bonds (2010) denominated in Japanese yen) and 5.83% (for 2033 Discount Bonds (2010) denominated in pesos). |
The 2017 Globals:
| • | were issued in an aggregate principal amount of approximately U.S.$950 million; |
| • | mature in 2017; and |
| • | bear interest at a fixed rate of 8.75%. |
The 2035 GDP-Linked Securities (2010):
| • | were issued in a notional amount of approximately U.S.$12.2 billion; |
| • | expire no later than December 15, 2035; and |
| • | provide for payments in respect of any given reference year only if a number of conditions relating to the performance of the Republic’s GDP in such year are met; the total amount to be paid during the life of the 2035 GDP-Linked Securities (2010), per unit of 2035 GDP-Linked Security (2010), cannot exceed 0.48 minus payments made under 2035 GDP-Linked Securities issued in the 2005 Debt Exchange through 2010, measured per unit of currency. |
D-152
The aggregate eligible amount of securities in default tendered in the 2010 Debt Exchange, totaled approximately U.S.$12.4 billion, representing approximately 66.2% of the aggregate eligible amount of eligible securities.
Brady Bond Invitation
During December 2010, the Republic announced an invitation to the holders of the Brady Bonds, or the “Brady Invitation,” to tender their Brady Bonds in exchange for a combination of 2033 Discount Bonds (2010), 2017 Globals, 2035 GDP-linked Securities (2010) and cash payment. The Brady Invitation was, however, subject to the requirement that the Court of Appeals affirm the lower court’s ruling allowing the release, liquidation and transfer to the tendering holders of the proceeds of the collateral securing the tendered Brady Bonds. On July 20, 2011, the Court of Appeals reversed the lower court. As a result, on August 5, 2011, the Republic cancelled the Brady Invitation without accepting any tenders. All tenders under the Brady Invitation were automatically deemed rejected.
The Pari Passu Litigation
Following the Republic’s default on its debt at the end of 2001, certain of its creditors filed numerous lawsuits against the Republic in several jurisdictions, including the United States. For additional information regarding litigation in the United States, including the pari passu litigation and the Republic’s Settlement Proposal to settle claims on the Untendered Debt, see “Public Sector Debt—Legal Proceedings.”
Indirect Debt
The Government guarantees—in part or in full—principal and interest payments on certain debt obligations of the provinces and other national and private entities. A portion of these Government guarantees is secured by assets or tax receivables of the Government.
As of December 31, 2016, the Government guaranteed third-party obligations for an aggregate amount of U.S.$2.9 billion (including past due principal and interest) as compared to U.S.$2.5 billion as of December 31, 2015, consisting of the following obligations:
| • | U.S.$1.5 billion in provincial debt (including the City of Buenos Aires), all of which was secured by assets of the issuer; |
| • | U.S.$1.4 billion in debt owed by public sector entities other than the Government (such as Banco de la Nación Argentina); and |
| • | U.S.$12.6 million in debt of private sector entities; none of these debts were secured by assets of the Republic. |
On May 10, 2010, the Government created a federal program for the refinancing of provincial debt. See “Public Sector Finances—Fiscal Relations with the Provinces.”
Secured or Guaranteed Debt
Certain of the Government’s debt obligations are secured by pledges of specific assets, including tax receivables and other forms of collateral. A description of these security arrangements follows:
National Guaranteed Loans. These peso-denominated loans are secured by a pledge of the Government’s share of the revenue derived from the tax on financial transactions and co-participation taxes (i.e., taxes the Government is required to share with the provinces under the 1988 Co-Participation Law). As of December 31, 2016, the outstanding principal amount of National Guaranteed Loans was approximately U.S.$1.8 billion. See “—Debt Management Following the 2001 Debt Crisis—Other Restructurings and Liability Management Transactions.”
D-153
Brady Bonds. The full principal amount of par and discount Brady Bonds is secured, in the case of U.S. dollar-denominated bonds, by zero-coupon U.S. Treasury notes and, in the case of euro-denominated bonds (which were originally denominated in deutsche marks), by zero-coupon bonds issued by Kreditanstaltfür Wiederaufbau (Germany’s development bank). The collateral securing these bonds cannot be drawn upon until the maturity date of these bonds in 2023. As of December 31, 2016, the value of the collateral was U.S.$206.3 million. A portion of the interest payable on Brady Bonds was also collateralized.
Spanish Bonds. In 1993, as part of the Brady restructuring, the Government issued unsecured bonds maturing in 2008 (instead of 30-year Brady Bonds) to Spanish banks. These bonds are guaranteed by the Spanish government, which performed under its guarantee following the Government’s suspension of debt payments in 2001. In 2014, the Government settled on all amounts owed to the Spanish government for a total payment of U.S.$93.7 million. As December 31, 2016, the amounts outstanding under these loans totaled U.S.$67.1 million.
Evolution of Public Debt
From 2012 through 2016, the Republic’s total gross public debt (including Untendered Debt) increased by 27.0% from U.S.$216.9 billion as of December 31, 2012 to U.S.$275.4 billion as of December 31, 2016, mainly as a result of higher issuances than amortization payments, inflation adjustments and compounding interest. These factors were partially offset by the nominal depreciation of the euro, which reduced euro-denominated debt when expressed in U.S. dollars, and the nominal depreciation of the peso, which reduced peso-denominated debt when expressed in U.S. dollars.
As of December 31, 2016, foreign currency-denominated debt represented 68.4% of total gross public debt compared to 69.3% of total gross public debt as of December 31, 2015. The increase in foreign currency-denominated debt as of December 31, 2016 as compared to December 31, 2015 was mainly due to the issuance of Birad for U.S.$.19.3 billion, Birae for €2.5 billion and treasury notes for U.S.$ 7.8 billion.
From 2012 to 2015, the Republic had limited access to international capital markets and as a result, most of the new debt incurred in this period represented domestic debt issued in pesos and U.S. dollars. Moreover, during this period, a substantial portion of the domestic debt issued by the Government was acquired by the public sector. As of December 31, 2016, 50.8% of the Republic’s total public debt was held by public sector. In addition, 28.9% of the Republic’s total foreign currency-denominated debt was held by public sector as of December 31, 2016.
The following table sets forth information on the Republic’s total gross public debt as of the dates indicated.
Total Gross Public Debt(1)
(in millions of U.S. dollars)
| 2012 | 2013 | 2014 | 2015 | 2016 | ||||||||||||||||
| Peso-denominated Debt:(2) |
||||||||||||||||||||
| Performing |
U.S.$ | 80,960 | U.S.$ | 77,152 | U.S.$ | 77,876 | U.S.$ | 73,819 | U.S.$ | 87,068 | ||||||||||
| Non-performing debt not yet due(3) |
92 | — | — | — | — | |||||||||||||||
| Non-performing principal arrears |
6 | 5 | 4 | 3 | 3 | |||||||||||||||
| Non-performing interest arrears |
— | — | — | — | — | |||||||||||||||
|
|
|
|
|
|
|
|
|
|
|
|||||||||||
| Untendered Debt(5) |
148 | 112 | 107 | 81 | 90 | |||||||||||||||
| Total peso-denominated debt |
81,207 | 77,269 | 77,987 | 73,903 | 87,161 | |||||||||||||||
| As a % of total gross public debt |
37.4 | % | 34.6 | % | 32.6 | % | 30.7 | % | 31.6 | % | ||||||||||
| Foreign currency-denominated debt:(4) | ||||||||||||||||||||
| Performing |
110,071 | 119,330 | 143,763 | 148,780 | 179,806 | |||||||||||||||
| Non-performing debt not yet due (3) |
232 | 213 | 60 | 60 | 60 | |||||||||||||||
| Non-performing principal arrears |
5,065 | 4,901 | 36 | 33 | 32 | |||||||||||||||
| Non-performing interest arrears |
1,037 | 1,030 | 9 | 8 | 8 | |||||||||||||||
|
|
|
|
|
|
|
|
|
|
|
|||||||||||
| Non-performing compensatory interest |
3,268 | 3,504 | — | — | — | |||||||||||||||
| Untendered Debt(5) |
16,040 | 17,193 | 17,472 | 17,881 | 8,378 | |||||||||||||||
| Total foreign currency-denominated debt |
135,713 | 146,170 | 161,339 | 166,762 | 188,285 | |||||||||||||||
D-154
| 2012 | 2013 | 2014 | 2015 | 2016 | ||||||||||||||||
| As a % of total gross public debt |
62.6 | % | 65.4 | % | 67.4 | % | 69.3 | % | 68.4 | % | ||||||||||
|
|
|
|
|
|
|
|
|
|
|
|||||||||||
| Total gross public debt (including arrears) (6)(7) |
216,920 | 223,439 | 239,326 | 240,665 | 275,446 | |||||||||||||||
|
|
|
|
|
|
|
|
|
|
|
|||||||||||
| Collateral and other credits |
(9,372 | ) | (7,136 | ) | (1,734 | ) | (1,891 | ) | (1,818 | ) | ||||||||||
|
|
|
|
|
|
|
|
|
|
|
|||||||||||
|
|
|
|
|
|
|
|
|
|
|
|||||||||||
| Total public debt less collateral and other credits |
207,548 | 216,303 | 237,592 | 238,774 | 273,628 | |||||||||||||||
|
|
|
|
|
|
|
|
|
|
|
|||||||||||
| Memorandum items: |
||||||||||||||||||||
|
|
|
|
|
|
|
|
|
|
|
|||||||||||
| Total gross public debt (including arrears) as a % of GDP(8) |
40.4 | % | 43.5 | % | 44.7 | % | 53.5 | % | 54.2 | % | ||||||||||
|
|
|
|
|
|
|
|
|
|
|
|||||||||||
| Total gross public debt (including arrears) as a % of annual Government revenues |
196.2 | % | 205.8 | % | 205.2 | % | 241.0 | % | 249.6 | % | ||||||||||
|
|
|
|
|
|
|
|
|
|
|
|||||||||||
| Exchange rate(9) |
4.92 | 6.52 | 8.55 | 13.01 | 15.85 | |||||||||||||||
| CER(9) |
3.18 | 3.52 | 4.38 | 5.04 | 6.84 | |||||||||||||||
| (1) | Total debt was calculated using the exchange rate at the end of each period. |
| (2) | Includes public debt denominated in local currency (public bonds, National Guaranteed Loans, Bogars (except for 2014, 2015 and 2016), temporary advances from the Central Bank, Treasury notes, commercial-bank debt, promissory notes and others). Includes debt instruments initially issued in U.S. dollars but converted into pesos. For a list of these instruments, see “—Debt Management Following the 2001 Debt Crisis.” Beginning in 2014, Bogars are not included in the total gross public debt. |
| (3) | For a definition of non-performing debt, see “Certain Defined Terms and Conventions—Certain Defined Terms.” |
| (4) | Includes public debt denominated in foreign currencies (multilateral and bilateral debt, public bonds, commercial-bank debt and others). |
| (5) | Includes claims on principal and/or interest that the Republic considers time-barred. For information regarding the Republic’s Settlement Proposal to settle claims on the Untendered Debt, see “—Legal Proceedings.” |
| (6) | Includes Untendered Debt. |
| (7) | Includes collateral and other credits representing an obligation from the main obligor to reimburse the Republic for amounts paid. |
| (8) | GDP figures are expressed in nominal terms. |
| (9) | Exchange rate and CER used to calculate public debt totals for end of each period. |
| Source: | INDEC and Ministry of the Treasury. |
In 2012, the Republic’s total gross public debt increased 10.0% to U.S.$216.9 billion (40.4% of nominal GDP). The increase in total gross public debt was primarily a result of:
| • | the issuance of U.S.$36.8 billion in peso-denominated debt; |
| • | the issuance of U.S.$16.2 billion in foreign currency-denominated debt; and |
| • | compounding of U.S.$1.1 billion in interest. |
These factors were partially offset by principal payments that totaled U.S.$28.4 billion, exchange rate fluctuations that reduced debt by U.S.$5.3 billion and CER linked debt adjustments of U.S.$1.2 billion.
In 2013, the Republic’s total gross public debt increased by 3.0% to U.S.$223.4 billion (43.5% of nominal GDP). The increase in total gross public debt was primarily a result of:
| • | the issuance of U.S.$41.6 billion in peso-denominated debt; |
| • | the issuance of U.S.$15.4 billion in foreign currency-denominated debt; and |
| • | compounding of U.S.$1.1 billion in interest. |
These factors were partially offset by principal payments that totaled U.S.$33.8 billion, exchange rate fluctuations that reduced debt by U.S.$13.3 billion and CER linked debt adjustments of U.S.$5.7 billion.
In 2014, the Republic’s total gross public debt increased by 7.1% to U.S.$239.3 billion (44.7% of nominal GDP). The increase in total gross public debt was primarily a result of:
D-155
| • | the issuance of U.S.$57.0 billion in peso-denominated debt; |
| • | the issuance of U.S.$36.9 billion in foreign currency-denominated debt; and |
| • | compounding of U.S.$0.03 billion in interest. |
These factors were partially offset by principal payments that totaled U.S.$52.8 billion, exchange rate fluctuations that reduced debt by U.S.$15.3 billion, inflation adjustments of U.S.$1.2 billion and a methodological adjustment that excluded obligations due between 2018 and 2020 under Bogar by a total of U.S.$5.6 billion.
In 2015, the Republic’s total gross public debt increased by 0.6% to U.S.$240.7 billion (53.5% of nominal GDP). The increase in total gross public debt was primarily a result of:
| • | the issuance of U.S.$61.8 billion in peso-denominated debt; and |
| • | the issuance of U.S.$33.8 billion in foreign currency-denominated debt. |
These factors were partially offset by principal payments that totaled U.S.$62.6 billion, exchange rate fluctuations that reduced debt by U.S.$26.9 billion and CER linked debt adjustments of U.S.$5.1 billion.
In 2016, the Republic’s total gross public debt increased 14.5% to U.S.$275.4 billion (54.2% of nominal GDP). The increase in total gross public debt was primarily a result of:
| • | the issuance of U.S.$52.5 billion in peso-denominated debt; |
| • | the issuance of U.S.$44.8 billion in foreign currency-denominated debt; and |
| • | CER linked debt adjustments of U.S.$1.9 billion. |
These factors were partially offset by principal payments that totaled U.S.$44.5 billion, exchange rate fluctuations that reduced debt by U.S.$10.4 billion.
The following table sets forth information on intra-public sector issuances between January 1, 2012 and December 31, 2016, which provided new financing to the Treasury.
D-156
Intra-Public Sector Issuances (1)
(in millions of U.S. dollars)
| For the year ended December 31, | ||||||||||||||||||||
| 2012 | 2013 | 2014 | 2015 | 2016 | ||||||||||||||||
| Temporary advances(2) |
U.S.$ | 27,150 | U.S.$ | 24,567 | U.S.$ | 28,068 | U.S.$ | 32,181 | U.S.$ | 21,233 | ||||||||||
| Peso-denominated debt |
27,150 | 24,567 | 28,068 | 32,181 | 21,233 | |||||||||||||||
| Foreign currency-denominated debt |
— | — | — | — | — | |||||||||||||||
| Nontransferable notes Central Bank |
7,758 | 9,425 | 10,940 | 10,640 | 376 | |||||||||||||||
| Peso-denominated debt |
— | — | — | — | — | |||||||||||||||
| Foreign currency-denominated debt (3) |
7,758 | 9,425 | 10,940 | 10,640 | 376 | |||||||||||||||
| Treasury notes |
3,262 | 1,143 | 5,293 | 6,437 | 23,652 | |||||||||||||||
| Peso-denominated debt(4) |
2,680 | 548 | 4,672 | 5,796 | 10,879 | |||||||||||||||
| Foreign currency-denominated debt (5) |
582 | 595 | 621 | 641 | 12,773 | |||||||||||||||
| Loans from BNA |
3,695 | 3,668 | 2,307 | 3,506 | — | |||||||||||||||
| Peso-denominated debt(6) |
3,695 | 3,668 | 2,307 | 3,506 | — | |||||||||||||||
| Foreign currency-denominated debt |
— | — | — | — | — | |||||||||||||||
| Bonars |
1,259 | 7,411 | 3,437 | 2,527 | 945 | |||||||||||||||
| Peso-denominated debt(7) |
— | 7,411 | 2,537 | 1,070 | 945 | |||||||||||||||
| Foreign currency-denominated debt(8) |
1,259 | — | 900 | 1,456 | — | |||||||||||||||
| Bonads |
— | — | 347 | 2,157 | — | |||||||||||||||
| Peso-denominated debt(9) |
— | — | 347 | 2,157 | — | |||||||||||||||
| Foreign currency-denominated debt |
— | — | — | — | — | |||||||||||||||
| Promissory notes |
152 | — | — | 1,140 | — | |||||||||||||||
| Peso-denominated debt(10) |
152 | — | — | 1,140 | — | |||||||||||||||
| Foreign currency-denominated debt |
— | — | — | — | — | |||||||||||||||
| Bonacs |
— | — | — | 457 | — | |||||||||||||||
| Peso-denominated debt(11) |
— | — | — | 457 | — | |||||||||||||||
| Foreign currency-denominated debt |
— | — | — | — | — | |||||||||||||||
| Boncer |
— | — | — | — | 643 | |||||||||||||||
| Peso-denominated debt |
— | — | — | — | 643 | |||||||||||||||
| Foreign currency-denominated debt (12) |
— | — | — | — | — | |||||||||||||||
|
|
|
|
|
|
|
|
|
|
|
|||||||||||
| Total Argentine securities issued |
U.S.$ | 43,276 | U.S.$ | 46,213 | U.S.$ | 50,391 | U.S.$ | 59,045 | U.S.$ | 46,849 | ||||||||||
|
|
|
|
|
|
|
|
|
|
|
|||||||||||
| (1) | The figures in the table show the amount in U.S. dollars of financings entered into with Argentine public agencies, which provided new financing to the Treasury in each of the periods indicated in the table. The total amount for each period set forth in the table does not purport to show the outstanding amount with respect to such financings as of any specified date, but rather purports to show the total amount in U.S. dollars of such financings between January 1 and December 31 for each of the years in the period 2012 to 2016. |
| (2) | Financing from the Central Bank.. |
| (3) | Includes nontransferable notes issued to the Central Bank. The applicable rate of these notes is the lesser of LIBOR minus 1% and the yield of international reserves and maturity dates between January 3, 2016 and April 29, 2026. |
| (4) | Treasury notes with a maturity dates between February 14, 2012 and October 31, 2018. |
| (5) | Treasury notes with a maturity dates between February 6, 2012 and July3, 2017. |
| (6) | These loans bear interest at an annual floating rate equal to BADLAR plus 100 basis points. Principal will amortize in 24 consecutive monthly installments starting on the fifth business day of January 2011, 2012, 2013, 2014and 2015, or the fifth business day of the month following 6 months of disbursement to be met, and thereafter on the fifth business day of each month. |
| (7) | Bonars with an interest rate ranging from BADLAR plus 325 basis points to BADLAR plus 200 basis points and maturity dates between March 18, 2016, and December, 23, 2020. |
| (8) | Bonars with a fixed interest rates ranging from 7% to 9% and maturity dates between April 17, 2017 and May 7, 2024. |
| (9) | Bonads with a fixed interest rate ranging from 0.75% to 2.50% and maturity dates February 22, 2017 and June 4, 2018. |
| (10) | Promissory notes with a maturity date on February 28, 2016 and March 8, 2016 |
| (11) | Bonacs with a floating interest rate (LEBACs and others) and maturity dates March 31, 2016 and September 30, 2016. |
| (12) | Boncer with an interest rate ranging from 2.25% to 2.50% and maturity dates April 28, 2020 and July 22, 2021. |
| Source: | Ministry of the Treasury. |
D-157
Debt by Interest Rate
The following tables set forth information on the Republic’s total gross public debt by type of interest rates.
Total Gross Public Debt by Type of Interest Rate(1)
(in millions of U.S. dollars)
| As of December 31, | ||||||||||||||||||||
| 2012 | 2013 | 2014 | 2015 | 2016 | ||||||||||||||||
| Fixed rate(2) |
124,696 | 117,307 | 116,627 | 127,611 | 154,438 | |||||||||||||||
| Variable rate |
65,134 | 76,032 | 89,627 | 85,427 | 85,659 | |||||||||||||||
| BADLAR. |
18,514 | 18,478 | 21,378 | 18,574 | 15,078 | |||||||||||||||
| LIBOR |
8,070 | 9,226 | 9,668 | 9,910 | 11,641 | |||||||||||||||
| LIBOR minus 1%(3) |
33,482 | 42,907 | 53,847 | 48,388 | 48,687 | |||||||||||||||
| IADB |
295 | 398 | 556 | 299 | 387 | |||||||||||||||
| Term deposit interest rate(4) |
— | — | — | — | — | |||||||||||||||
| Others(5) |
4,772 | 5,023 | 4,178 | 8,256 | 9,866 | |||||||||||||||
| Zero rate(6) |
27,091 | 30,100 | 33,072 | 27,626 | 35,349 | |||||||||||||||
|
|
|
|
|
|
|
|
|
|
|
|||||||||||
| Total gross public debt |
216,920 | 223,439 | 239,326 | 240,665 | 275,446 | |||||||||||||||
|
|
|
|
|
|
|
|
|
|
|
|||||||||||
| (1) | Includes past due principal and interest. |
| (2) | Includes bonds, the principal amount of which is adjusted for inflation in the Republic as measured by CER. The amount of such CER-linked debt (including past due principal and interest payments) was U.S.$19.6 billion as of December 31, 2016. |
| (3) | Nontransferable notes issued to the Central Bank (Central Bank 2016, 2020, 2021, 2022, 2023, 2024, 2025 and 2026), which were issued as compensation for the cancellation of debt with the IMF, private debt holders, multilateral agencies and bilateral lenders. The applicable rate of these notes is the minimum of LIBOR minus 1% and the yield of international reserves. |
| (4) | Daily average for peso and dollar term deposits as reported by the Central Bank. |
| (5) | Includes savings accounts interest rate and others. |
| (6) | Includes temporary advances from the Central Bank and promissory notes. As of December 31, 2016, the aggregate amount outstanding under temporary advances from the Central Bank was U.S.$24.1 billion. As of December 31, 2015, the aggregate amount outstanding under temporary advances from the Central Bank was U.S.$25.5 billion. As of December 31, 2014, the amount of temporary advances from the Central Bank was U.S.$29.4 billion. As of December 31, 2013, the amount of temporary advances from the Central Bank was U.S.$28.0 billion and the amount of promissory notes in foreign currency was U.S.$130 million. As of December 31, 2012, the amount of temporary advances from the Central Bank was U.S.$26.0 billion and the amount of promissory notes in foreign currency was U.S.$130 million. |
| Source: | Ministry of the Treasury. |
D-158
Total Gross Public Debt by Type of Interest Rate(1)
(as a percentage of total gross public debt)
| As of December 31, | ||||||||||||||||||||
| 2012 | 2013 | 2014 | 2015 | 2016 | ||||||||||||||||
| Fixed rate(2) |
57.5 | % | 52.5 | % | 48.7 | % | 53.0 | % | 56.1 | % | ||||||||||
| Variable rate |
30.0 | % | 34.0 | % | 37.4 | % | 35.5 | % | 31.1 | % | ||||||||||
| BADLAR |
8.5 | % | 8.3 | % | 8.9 | % | 7.7 | % | 5.5 | % | ||||||||||
| LIBOR |
3.7 | % | 4.1 | % | 4.0 | % | 4.1 | % | 4.2 | % | ||||||||||
| LIBOR minus 1%(3) |
15.4 | % | 19.2 | % | 22.5 | % | 20.1 | % | 17.7 | % | ||||||||||
| IADB |
0.1 | % | 0.2 | % | 0.2 | % | 0.1 | % | 0.1 | % | ||||||||||
| Term deposit interest rate(4) |
— | — | — | — | — | |||||||||||||||
| Others(5) |
2.2 | % | 2.2 | % | 1.7 | % | 3.4 | % | 3.6 | % | ||||||||||
| Zero rate(6) |
12.5 | % | 13.5 | % | 13.8 | % | 11.5 | % | 12.8 | % | ||||||||||
|
|
|
|
|
|
|
|
|
|
|
|||||||||||
| Total gross public debt |
100.0 | % | 100.0 | % | 100.0 | % | 100.0 | % | 100.0 | % | ||||||||||
|
|
|
|
|
|
|
|
|
|
|
|||||||||||
| (1) | Includes past due principal and interest. |
| (2) | Includes bonds, the principal amount of which is adjusted for inflation in the Republic as measured by CER. The amount of such CER-linked debt (including past due principal and interest payments) was U.S.$19.6 billion as of December 31, 2016. |
| (3) | Nontransferable notes issued to the Central Bank (Central Bank 2016, 2020, 2021, 2022, 2023, 2024, 2025 and 2026), which were issued as compensation for the cancellation of debt with the IMF, private debt holders, multilateral agencies and bilateral lenders. The applicable rate of these notes is the minimum of LIBOR minus 1% and the yield of international reserves. |
| (4) | Daily average for peso and dollar term deposits as reported by the Central Bank. |
| (5) | Includes savings accounts interest rate and others. |
| (6) | Includes temporary advances from the Central Bank and promissory notes. As of December 31, 2016, the amount of temporary advances from the Central Bank was U.S.$24.1 billion. As of December 31, 2015, the amount of temporary advances from the Central Bank was U.S.$25.5 billion. As of December 31, 2014, the amount of temporary advances from the Central Bank was U.S.$29.4 billion. As of December 31, 2013, the amount of temporary advances from the Central Bank was U.S.$28.0 billion and the amount of promissory notes in foreign currency was U.S.$130 million. As of December 31, 2012, the amount of temporary advances from the Central Bank was U.S.$26.0 billion and the amount of promissory notes in foreign currency was U.S.$130 million. |
Source: INDEC and Ministry of the Treasury.
As of December 31, 2016, the composition of the public debt (excluding Untendered Debt) by interest rate included:
| • | fixed rate peso-denominated debt, such as 2045 Quasi-Par Bonds, 2033 Discount Bonds, Bonte 2026, Bonte 2021, National Guaranteed Loans, Bonte 2018, Treasury notes, Bonad 2017, 2038 Par Bonds, Bonad 2018, Bocones and others; |
| • | fixed rate foreign currency-denominated debt, such as 2038 Par Bonds, 2033 Discount Bonds, Bonar X, Birad 2026, Birad 2021, Birad 2019, Birad 2046, Bonar XVIII, Bonar XIX, Bonar XXIV, Bonar XX, Bonar XXII, Bonar XXV, Bonar XXVII, bilateral debt, multilateral debt and Treasury notes; |
| • | zero rate peso-denominated debt, such as temporary advances from the Central Bank, Treasury notes and Promissory Notes; |
| • | zero rate foreign currency-denominated debt, such as promissory notes, Treasury notes and multilateral debt; |
| • | floating rate peso-denominated debt, such as Treasury notes, Bonar Pesos 2017, Bonar Pesos 2018, Bonar Pesos 2019, Bonar Pesos 2020, Promissory Notes Pesos 2019, Bonac 2017, Bocones, loans from Banco de la Nación Argentina, and all debt issued at BADLAR, savings, LEBACs or term deposit interest rates; and |
| • | floating rate foreign currency-denominated debt, such as LIBOR rate instruments including loans from multilateral organizations and bilateral debt, nontransferable issued to the Central Bank (Central Bank 2021, 2022, 2023, 2024 and 2025, in compensation for advances applied to cancel the debt with private creditors, multilateral organizations and bilateral lenders), and nontransferable issued to the Central Bank for an increase in the Republic of Argentina’s quota in the IMF, a portion of the bilateral debt and IADB rate loans. |
D-159
Maturity Profile
For purposes of its debt maturity profile, the Republic divides its debt into three categories: short-term debt, medium- and long-term debt, arrears and Untendered Debt. Principal and interest arrears, having already matured, are not included in the amount of short-term or medium- and long-term debt but are included in the total amount of debt outstanding. Compensatory and default interest and Untendered Debt are also included in the total amount of debt.
D-160
The following tables set forth the Republic’s total public debt by term as of the dates indicated.
Total Gross Public Debt by Term
(in millions of U.S. dollars)
| As of December 31, | ||||||||||||||||||||
| 2012 | 2013 | 2014 | 2015 | 2016 | ||||||||||||||||
|
Short-term(1) |
U.S.$ | 31,272 | U.S.$ | 31,737 | U.S.$ | 38,135 | U.S.$ | 34,058 | U.S.$ | 48,850 | ||||||||||
| Medium-term and long-term(2) |
160,083 | 164,957 | 183,564 | 188,602 | 218,085 | |||||||||||||||
| Arrears: |
||||||||||||||||||||
| Principal |
5,071 | 4,906 | 40 | 36 | 35 | |||||||||||||||
| Interest |
1,038 | 1,030 | 9 | 8 | 8 | |||||||||||||||
|
|
|
|
|
|
|
|
|
|
|
|||||||||||
| Compensatory Interest(3) |
3,268 | 3,504 | — | — | — | |||||||||||||||
|
|
|
|
|
|
|
|
|
|
|
|||||||||||
| Total arrears |
9,377 | 9,440 | 49 | 44 | 43 | |||||||||||||||
|
|
|
|
|
|
|
|
|
|
|
|||||||||||
| Untendered Debt(4) |
16,188 | 17,305 | 17,578 | 17,962 | 8,468 | |||||||||||||||
|
|
|
|
|
|
|
|
|
|
|
|||||||||||
| Total gross public debt(5) |
216,920 | 223,439 | 239,326 | 240,665 | 275,446 | |||||||||||||||
|
|
|
|
|
|
|
|
|
|
|
|||||||||||
| (1) | Debt with original maturity of one year or less. |
| (2) | Debt with original maturity of more than one year. |
| (3) | Compensatory interest is estimated by reference to contractual rates. |
| (4) | Includes claims on principal and/or interest that the Republic considers time-barred. |
| (5) | Amounts include Untendered Debt. For information regarding the Republic’s Settlement Proposal to settle claims on the Untendered Debt, see “—Legal Proceedings.” |
Source: Ministry of the Treasury.
Total Gross Public Debt by Term
(as a percentage of total gross public debt)
| As of December 31, | ||||||||||||||||||||
| 2012 | 2013 | 2014 | 2015 | 2016 | ||||||||||||||||
|
Short-term(1) |
14.4 | % | 14.2 | % | 15.9 | % | 14.2 | % | 17.7 | % | ||||||||||
| Medium-term and long-term(2) |
73.8 | 73.8 | 76.7 | 78.4 | 79.2 | |||||||||||||||
| Arrears: |
— | — | — | — | — | |||||||||||||||
| Principal |
2.3 | 2.2 | — | — | — | |||||||||||||||
| Interest |
0.5 | 0.5 | — | — | — | |||||||||||||||
|
|
|
|
|
|
|
|
|
|
|
|||||||||||
| Compensatory Interest(3) |
1.5 | 1.6 | — | — | — | |||||||||||||||
|
|
|
|
|
|
|
|
|
|
|
|||||||||||
| Total arrears |
4.3 | 4.2 | — | — | — | |||||||||||||||
|
|
|
|
|
|
|
|
|
|
|
|||||||||||
| Untendered Debt(4) |
7.5 | 7.7 | 7.3 | 7.5 | 3.1 | |||||||||||||||
|
|
|
|
|
|
|
|
|
|
|
|||||||||||
| Total gross public debt(5) |
100.0 | % | 100.0 | % | 100.0 | % | 100.0 | % | 100.0 | % | ||||||||||
|
|
|
|
|
|
|
|
|
|
|
|||||||||||
| (1) | Debt with original maturity of one year or less. |
| (2) | Debt with original maturity of more than one year. |
| (3) | Compensatory interest is estimated by reference to contractual rates. |
| (4) | Includes claims on principal and/or interest that the Republic considers time-barred. |
| (5) | Amounts include Untendered Debt. For information regarding the Republic’s Settlement Proposal to settle claims on the Untendered Debt, see “—Legal Proceedings.” |
Source: Ministry of the Treasury.
The Republic’s short-term debt increased to 17.7% of total gross public debt as of December 31, 2016 from 14.4% as of December 31, 2012, primarily due to the increase in treasury notes by U.S.$.18.5 billion to U.S.$.23.7 billion.
In 2016, the Republic’s short-term debt increased by 43.4% to U.S.$48.9 billion from U.S.$34.1 billion in 2015. This increase was primarily due to an increase in Treasury notes issued to public sector entities and private sector, from U.S.$7.7 billion in 2015 to U.S.$23.7 billion in 2016.
The Republic’s medium- and long-term debt increased in relative terms at 79.2% of total gross public debt (excluding non-performing and Untendered Debt) as of December 31, 2016 compared to 73.8% of total gross public debt as of December 31, 2012, and increased in absolute terms by U.S.$58 billion to U.S.$218.1 billion as of December 31, 2016 from U.S.$160.1 billion as of December 31, 2012, primarily due to:
D-161
| • | higher issuances than amortization payments; |
| • | debt issuances in connection with the 2010 Debt Exchange; |
| • | inflation adjustments; and |
| • | compounding interest. |
These factors were partially offset by the nominal depreciation of the euro, which reduced euro-denominated debt when expressed in U.S. dollars, the nominal depreciation of the peso, which reduced peso-denominated debt when expressed in U.S. dollars.
Distribution of Total Gross Public Debt by Type of Creditor
The following tables set forth information relating to the Republic’s performing and non-performing public debt (including Untendered Debt) by creditor.
Total Gross Performing and Non-Performing Public Debt by Creditor
(in millions of U.S. dollars)
| As of December 31, | ||||||||||||||||||||
| 2012 | 2013 | 2014 | 2015 | 2016 | ||||||||||||||||
| Performing debt |
||||||||||||||||||||
| Medium-term and long-term debt: |
||||||||||||||||||||
| Official debt: |
||||||||||||||||||||
| Multilateral debt: |
||||||||||||||||||||
| Inter-American Development Bank |
U.S.$ | 10,766 | U.S.$ | 10,994 | U.S.$ | 11,341 | U.S.$ | 11,207 | U.S.$ | 11,422 | ||||||||||
| World Bank |
5,626 | 6,122 | 6,007 | 5,852 | 6,048 | |||||||||||||||
| Corporación Andina de Fomento |
1,851 | 2,191 | 2,419 | 2,590 | 2,641 | |||||||||||||||
| FONPLATA |
63 | 53 | 53 | 82 | 81 | |||||||||||||||
| European Investment Bank |
14 | 9 | 5 | — | — | |||||||||||||||
| International Fund for the Development of Agriculture |
15 | 25 | 32 | 38 | 39 | |||||||||||||||
| Total multilateral debt |
18,335 | 19,394 | 19,857 | 19,768 | 20,230 | |||||||||||||||
| Paris Club |
8,124 | 7,272 | 5,859 | |||||||||||||||||
| Bilateral debt |
677 | 615 | 1,059 | 1,994 | 1,993 | |||||||||||||||
| Total bilateral debt |
677 | 615 | 9,183 | 9,266 | 7,852 | |||||||||||||||
|
|
|
|
|
|
|
|
|
|
|
|||||||||||
| Total official debt |
19,011 | 20,009 | 29,040 | 29,034 | 28,083 | |||||||||||||||
| Suppliers |
1,811 | 1,565 | 1,262 | 1,045 | 1,518 | |||||||||||||||
| Commercial banks |
7,213 | 6,005 | 4,282 | 3,923 | 1,879 | |||||||||||||||
| Bonds: |
||||||||||||||||||||
| Peso-denominated bonds |
33,398 | 32,618 | 34,332 | 34,512 | 43,798 | |||||||||||||||
| Foreign currency-denominated bonds |
86,915 | 95,942 | 111,711 | 117,952 | 140,902 | |||||||||||||||
| Total bonds |
120,313 | 128,559 | 146,043 | 152,463 | 184,700 | |||||||||||||||
|
|
|
|
|
|
|
|
|
|
|
|||||||||||
| National Guaranteed Loans |
3,753 | 3,035 | 2,877 | 2,076 | 1,845 | |||||||||||||||
| Bogars |
7,657 | 5,571 | — | — | — | |||||||||||||||
| Total medium-term and long-term debt |
159,759 | 164,744 | 183,504 | 188,541 | 218,025 | |||||||||||||||
|
|
|
|
|
|
|
|
|
|
|
|||||||||||
| Short-term debt: |
||||||||||||||||||||
| Treasury notes |
5,244 | 3,679 | 8,732 | 7,687 | 23,700 | |||||||||||||||
| Temporary advances from the Central Bank |
25,972 | 28,002 | 29,402 | 25,517 | 24,115 | |||||||||||||||
| Promissory notes |
56 | 56 | — | 854 | 1,305 | |||||||||||||||
| Total short-term debt |
31,272 | 31,737 | 38,135 | 34,058 | 48,850 | |||||||||||||||
|
|
|
|
|
|
|
|
|
|
|
|||||||||||
| Total performing debt |
191,031 | 196,481 | 221,639 | 222,599 | 266,875 | |||||||||||||||
|
|
|
|
|
|
|
|
|
|
|
|||||||||||
| Non-performing debt(1) |
||||||||||||||||||||
| Non-performing debt not yet due: |
||||||||||||||||||||
| Medium-term and long-term debt: |
||||||||||||||||||||
| Bilateral debt(2) |
172 | 152 | — | — | — | |||||||||||||||
| Suppliers |
92 | — | — | — | — | |||||||||||||||
| Commercial banks |
60 | 60 | 60 | 60 | 60 | |||||||||||||||
| Total non-performing debt not yet due |
324 | 213 | 60 | 60 | 60 | |||||||||||||||
|
|
|
|
|
|
|
|
|
|
|
|||||||||||
| Non-performing principal and interest arrears: |
||||||||||||||||||||
| Paris Club |
3,113 | 3,074 | — | — | — | |||||||||||||||
| Other bilateral debt |
2,266 | 2,182 | — | — | — | |||||||||||||||
| Commercial banks |
648 | 667 | 38 | 34 | 32 | |||||||||||||||
D-162
| As of December 31, | ||||||||||||||||||||
| 2012 | 2013 | 2014 | 2015 | 2016 | ||||||||||||||||
| Suppliers |
82 | 13 | 11 | 10 | 11 | |||||||||||||||
| Compensatory interest |
3,268 | 3,504 | — | — | — | |||||||||||||||
|
|
|
|
|
|
|
|
|
|
|
|||||||||||
| Total non-performing principal and interest arrears |
9,377 | 9,440 | 49 | 44 | 43 | |||||||||||||||
|
|
|
|
|
|
|
|
|
|
|
|||||||||||
| Total non-performing debt |
9,701 | 9,653 | 109 | 104 | 103 | |||||||||||||||
| Untendered Debt(3) |
16,188 | 17,305 | 17,578 | 17,962 | 8,468 | |||||||||||||||
|
|
|
|
|
|
|
|
|
|
|
|||||||||||
| Total gross public debt including arrears(4) |
216,920 | 223,439 | 239,326 | 240,665 | 275,446 | |||||||||||||||
|
|
|
|
|
|
|
|
|
|
|
|||||||||||
| (1) | For a definition of non-performing debt, see “Certain Defined Terms and Conventions—Certain Defined Terms.” |
| (2) | Bilateral debt is debt with sovereign governments. |
| (3) | Includes claims on principal and/or interest that the Republic considers time-barred. |
| (4) | Figures include Untendered Debt. For information regarding the Republic’s Settlement Proposal to settle claims on the Untendered Debt, see “—Legal Proceedings.” |
Source: Ministry of the Treasury.
Total Gross Performing and Non-Performing Public Debt by Creditor
(as a % of total gross public debt)
| As of December 31, | ||||||||||||||||||||
| 2012 | 2013 | 2014 | 2015 | 2016 | ||||||||||||||||
| Performing debt |
||||||||||||||||||||
| Medium-term and long-term debt: |
||||||||||||||||||||
| Official debt: |
||||||||||||||||||||
| Multilateral debt: |
||||||||||||||||||||
| Inter-American Development Bank |
5.0 | % | 4.9 | % | 4.7 | % | 4.7 | % | 4.1 | % | ||||||||||
| World Bank |
2.6 | % | 2.7 | % | 2.5 | % | 2.4 | % | 2.2 | % | ||||||||||
| Corporación Andina de Fomento |
0.9 | % | 1.0 | % | 1.0 | % | 1.1 | % | 1.0 | % | ||||||||||
| FONPLATA |
— | — | — | — | — | |||||||||||||||
| European Investment Bank |
— | — | — | — | — | |||||||||||||||
| International Fund for the Development of Agriculture |
— | — | — | — | — | |||||||||||||||
| Total multilateral debt |
8.5 | % | 8.7 | % | 8.3 | % | 8.2 | % | 7.3 | % | ||||||||||
| Paris Club |
— | — | 3.4 | % | 3.0 | % | 2.1 | % | ||||||||||||
| Bilateral debt |
0.3 | % | 0.3 | % | 0.4 | % | 0.8 | % | 0.7 | % | ||||||||||
|
|
|
|
|
|
|
|
|
|
|
|||||||||||
| Total bilateral debt |
0.3 | % | 0.3 | % | 3.8 | % | 3.9 | % | 2.9 | % | ||||||||||
|
|
|
|
|
|
|
|
|
|
|
|||||||||||
| Total official debt |
8.8 | % | 9.0 | % | 12.1 | % | 12.1 | % | 10.2 | % | ||||||||||
| Suppliers |
0.8 | % | 0.7 | % | 0.5 | % | 0.4 | % | 0.6 | % | ||||||||||
| Commercial banks |
3.3 | % | 2.7 | % | 1.8 | % | 1.6 | % | 0.7 | % | ||||||||||
| Bonds: |
||||||||||||||||||||
| Peso-denominated bonds |
15.4 | % | 14.6 | % | 14.3 | % | 14.3 | % | 15.9 | % | ||||||||||
| Foreign currency-denominated bonds |
40.1 | % | 42.9 | % | 46.7 | % | 49.0 | % | 51.2 | % | ||||||||||
|
|
|
|
|
|
|
|
|
|
|
|||||||||||
| Total bonds |
55.5 | % | 57.5 | % | 61.0 | % | 63.4 | % | 67.1 | % | ||||||||||
| National Guaranteed Loans |
1.7 | % | 1.4 | % | 1.2 | % | 0.9 | % | 0.7 | % | ||||||||||
| Bogars |
3.5 | % | 2.5 | % | — | — | — | |||||||||||||
|
|
|
|
|
|
|
|
|
|
|
|||||||||||
| Total medium-term and long-term debt |
73.6 | % | 73.7 | % | 76.7 | % | 78.3 | % | 79.2 | % | ||||||||||
| Short-term debt: |
||||||||||||||||||||
| Treasury notes |
2.4 | % | 1.6 | % | 3.6 | % | 3.2 | % | 8.6 | % | ||||||||||
| Temporary advances from the Central Bank |
12.0 | % | 12.5 | % | 12.3 | % | 10.6 | % | 8.8 | % | ||||||||||
| Promissory notes |
— | — | — | 0.4 | % | 0.4 | % | |||||||||||||
|
|
|
|
|
|
|
|
|
|
|
|||||||||||
| Total short term debt |
14.4 | % | 14.2 | % | 15.9 | % | 14.2 | % | 17.7 | % | ||||||||||
|
|
|
|
|
|
|
|
|
|
|
|||||||||||
| Total performing gross public debt |
88.1 | % | 87.9 | % | 92.6 | % | 92.5 | % | 96.9 | % | ||||||||||
| Non-performing debt (1) |
||||||||||||||||||||
| Non-performing debt not yet due: |
||||||||||||||||||||
| Medium-term and long-term debt: |
||||||||||||||||||||
| Bilateral debt (2) |
0.1 | % | 0.1 | % | — | — | — | |||||||||||||
| Suppliers |
— | — | — | — | — | |||||||||||||||
| Commercial banks |
— | — | — | — | — | |||||||||||||||
| Total non-performing debt not yet due |
0.1 | % | 0.1 | % | — | — | — | |||||||||||||
|
|
|
|
|
|
|
|
|
|
|
|||||||||||
| Non-performing principal and interest arrears: |
||||||||||||||||||||
| Paris Club |
1.4 | % | 1.4 | % | — | — | — | |||||||||||||
| Other bilateral debt |
1.0 | % | 1.0 | % | — | — | — | |||||||||||||
| Commercial banks |
0.3 | % | 0.3 | % | — | — | — | |||||||||||||
| Suppliers |
— | — | — | — | — | |||||||||||||||
| Compensatory interest |
1.5 | % | 1.6 | % | — | — | — | |||||||||||||
|
|
|
|
|
|
|
|
|
|
|
|||||||||||
| Total non-performing principal and interest arrears |
4 | % | 4 | % | 0 | % | 0 | % | 0 | % | ||||||||||
|
|
|
|
|
|
|
|
|
|
|
|||||||||||
| Total non-performing debt |
4.5 | % | 4.3 | % | 0.05 | % | 0.04 | % | 0.04 | % | ||||||||||
|
|
|
|
|
|
|
|
|
|
|
|||||||||||
| Untendered Debt (3) |
7.5 | % | 7.7 | % | 7.3 | % | 7.5 | % | 3.1 | % | ||||||||||
|
|
|
|
|
|
|
|
|
|
|
|||||||||||
| Total gross public debt (4) |
100.0 | % | 100.0 | % | 100.0 | % | 100.0 | % | 100.0 | % | ||||||||||
|
|
|
|
|
|
|
|
|
|
|
|||||||||||
D-163
| (1) | For a definition of non-performing debt, see “Certain Defined Terms and Conventions—Certain Defined Terms.” |
| (2) | Bilateral debt is debt with sovereign governments. |
| (3) | Includes claims on principal and/or interest that the Republic considers time-barred. |
| (4) | Includes Untendered Debt. For information regarding the Republic’s Settlement Proposal to settle claims on the Untendered Debt, see “—Legal Proceedings.” |
Source: Ministry of the Treasury.
Performing Debt
Medium-term and long-term debt decreased to 81.7% of total performing debt as of December 31, 2016, from 83.6% as of December 31, 2012, but increased in absolute terms by U.S.$58.3 billion to U.S.$218.0 billion as of December 31, 2016 from U.S.$159.8 billion as of December 31, 2012, as a result of higher issuances than amortization payments, issuances of new bonds, the Paris Club settlement agreement and inflation adjustments. These factors were partially offset by the nominal depreciation of the euro, which reduced euro-denominated debt when expressed in U.S. dollars, the nominal depreciation of the peso, which reduced peso-denominated debt when expressed in U.S. dollars and liability management transactions during 2009.
Multilateral debt decreased to 7.6% of total performing debt as of December 31, 2016, from 9.6% as of December 31, 2012, but increased in absolute terms by U.S.$1.9 billion to U.S.$20.2 billion as of December 31, 2016 from U.S.$18.3 billion as of December 31, 2012, primarily as a result of higher disbursements than amortization payments.
Bilateral debt increased to 2.9% of total performing debt as of December 31, 2016, from 0.4% as of December 31, 2012, and increased in absolute terms by U.S.$7.2 billion to U.S.$7.9 billion as of December 31, 2016 from U.S.$0.7 billion as of December 31, 2012, primarily as a result of higher disbursements than amortization payments.
Bond debt increased to 69.2% of total performing debt as of December 31, 2016, from 63.0% as of December 31, 2012, and increased in absolute terms by U.S.$64.4 billion to U.S.$184.7 billion as of December 31, 2016 from U.S.$120.3 billion as of December 31, 2012. This increase was primarily a result of:
| • | higher issuances than amortization payments; |
| • | inflation adjustments; and |
| • | compounding interest. |
This increase was partially offset by exchange rate fluctuations (the nominal depreciation of the euro, which reduced euro-denominated debt when expressed in U.S. dollars and the nominal depreciation of the peso, which reduced peso-denominated debt when expressed in U.S. dollars).
Short-term debt increased to 18.3% of total performing debt as of December 31, 2016, from 16.4% as of December 31, 2012, primarily as a result of increases in the amount of Treasury notes and Promissory notes. This increase was partially offset by a decrease in temporary advances from the Central Bank.
National Guaranteed Loans debt decreased to 0.7% of total performing debt as of December 31, 2016, from 2.0% as of December 31, 2012, primarily as a result of amortization payments and liability management transactions.
Non-Performing Debt (excluding Untendered Debt)
As of December 31, 2016, commercial banks debt represented 89.8% of total non-performing debt (excluding Untendered Debt), and suppliers debt represented 10.2% of non-performing debt.
Changes in Total Gross Performing Public Debt by Creditor in 2016
In 2016, bond debt, treasury notes, multilateral debt, suppliers debt and promissory notes debt increased as a percentage of the Republic’s total gross public debt as compared to 2015.
D-164
The Republic’s bond debt increased to 67.1% of the Republic’s total gross public debt from 63.4% in 2015, and increased in absolute terms by U.S.$32.2 billion to U.S.$184.7 billion from U.S.$152.5 billion in 2015. This increase resulted primarily from:
| • | the issuance of Birads, Biraes, Bonar 2020, Bonar 2018, Bonacs, Boncer 2021, Bontes, Boncer 2020 and Letes; |
| • | an increase in debt amounts due to CER adjustments; and |
| • | compounding of interest. |
These effects were partially offset by amortization payments, depreciation of the peso, which reduced peso-denominated debt when expressed in U.S. dollars, and depreciation of the euro, which reduced euro denominated debt when expressed in U.S. dollars.
In 2016, the Republic’s treasury notes debt increased by 5.4 percentage points in relative terms as a percentage of the Republic’s total gross public debt from 3.2% in 2015 to 8.6% in 2016, and increased by U.S.$16.0 billion in absolute terms to U.S.$23.7 billion in 2016 from U.S.$7.7 billion in 2015.
In 2016, the Republic’s multilateral debt decreased by 0.9% in relative terms as a percentage of the Republic’s total gross public debt from 8.2% in 2015 to 7.3% in 2016, but increased by U.S.$0.5 billion in absolute terms to U.S.$20.2 billion in 2016 from U.S.$19.8 billion in 2015.
The Republic’s suppliers debt increased in relative terms to 0.6% of the Republic’s total gross public debt in 2016 from 0.4% in 2015, and increased in absolute terms by U.S.$0.5 billion to U.S.$1.5 billion in 2016 from U.S.$1.0 billion in 2015.
The Republic’s promissory notes debt remained stable in relative terms to 0.4% of the Republic’s total gross public debt in 2016 from 0.4% in 2015, and increased in absolute terms by U.S.$0.2 billion to U.S.$1.0 billion in 2016 from U.S.$0.9 billion in 2015.
The debt increase in the above-mentioned categories was partially offset by decreases in the following categories:
| • | The Republic’s temporary advances debt decreased to 9.0% in relative terms as a percentage of the Republic’s total gross performing public debt from 11.5% in 2015, and decreased by U.S.$1.4 billion in absolute terms to U.S.$24.1 billion in 2016 from U.S.$25.5 billion in 2015. |
| • | The Republic’s National Guaranteed Loans decreased as a percentage of the Republic’s total gross performing public debt. National Guaranteed Loans decreased in relative terms to 0.7% of total gross public debt from 0.9% in 2015 and decreased by U.S.$0.2 billion in absolute terms to U.S.$1.8 billion in 2016 as compared to U.S.$2.1 billion in 2015. The decline in value can be attributed to higher payments in amortizations. The currency exchange rate’s depreciation reduced the value of guaranteed loans in dollars. The effect was partially counterbalanced by an increase in debt amounts due to CER adjustments. |
| • | The Republic’s commercial bank debt decreased in relative terms to 0.7% of the Republic’s total gross performing public debt, and decreased by U.S.$2.0 billion in absolute terms. . |
| • | The Republic’s bilateral debt decreased in relative terms to 2.9% of the Republic’s total gross performing public debt from 4.2% in 2015 and decreased in absolute terms by U.S.$1.4 billion. |
Foreign Currency-Denominated Debt
The following tables set forth information regarding the Republic’s total foreign currency-denominated debt, including past due principal and interest and compensatory and default interest, as of the dates indicated. .
D-165
Foreign Currency-Denominated Public Debt by Instrument(1)
(in millions of U.S. dollars)
| As of December 31, | ||||||||||||||||||||
| 2012 | 2013 | 2014 | 2015 | 2016 | ||||||||||||||||
| Performing debt |
U.S.$ | 110,071 | U.S.$ | 119,330 | U.S.$ | 143,763 | U.S.$ | 148,780 | U.S.$ | 179,806 | ||||||||||
| Non-transferable notes to the Central Bank 2016, 2020, 2021, 2022, 2023, 2024 and 2025 |
33,482 | 42,907 | 53,847 | 48,388 | 48,687 | |||||||||||||||
| Bonar |
12,733 | 11,176 | 16,526 | 35,418 | 36,890 | |||||||||||||||
| Multilateral debt |
18,335 | 19,394 | 19,857 | 19,768 | 20,230 | |||||||||||||||
| Birad |
19,250 | |||||||||||||||||||
| 2033 Discount Bonds |
13,253 | 13,739 | 14,970 | 14,585 | 14,483 | |||||||||||||||
| 2038 Par Bonds |
13,409 | 13,645 | 12,790 | 12,167 | 11,975 | |||||||||||||||
| Treasury notes |
2,215 | 1,695 | 1,687 | 699 | 9,545 | |||||||||||||||
| Bilateral debt |
677 | 615 | 9,183 | 9,266 | 7,852 | |||||||||||||||
| 2033 Discount Bonds (2010) |
4,916 | 5,175 | 4,733 | 4,404 | 4,316 | |||||||||||||||
| Birae |
2,632 | |||||||||||||||||||
| 2038 Par Bonds (2010) |
2,076 | 2,154 | 1,915 | 1,737 | 1,690 | |||||||||||||||
| 2017 Globals |
966 | 966 | 966 | 966 | 966 | |||||||||||||||
| Promissory notes |
130 | 130 | 385 | 249 | 123 | |||||||||||||||
| Commercial banks |
62 | 62 | 62 | 50 | 37 | |||||||||||||||
| Bocones |
3 | 3 | 3 | 3 | 3 | |||||||||||||||
| Baade |
— | 220 | 249 | 272 | — | |||||||||||||||
| Boden |
6,063 | 5,945 | 5,700 | — | — | |||||||||||||||
| Other |
1,750 | 1,504 | 889 | 808 | 1,128 | |||||||||||||||
| Non-performing debt |
9,602 | 9,648 | 105 | 101 | 100 | |||||||||||||||
| Non-performing debt not yet due |
232 | 213 | 60 | 60 | 60 | |||||||||||||||
| Non-performing debt arrears |
6,102 | 5,931 | 44 | 41 | 40 | |||||||||||||||
|
|
|
|
|
|
|
|
|
|
|
|||||||||||
| Compensatory Interest |
3,268 | 3,504 | — | — | — | |||||||||||||||
|
|
|
|
|
|
|
|
|
|
|
|||||||||||
| Untendered debt(2) |
16,040 | 17,193 | 17,472 | 17,881 | 8,378 | |||||||||||||||
|
|
|
|
|
|
|
|
|
|
|
|||||||||||
| Total foreign currency-denominated debt |
135,713 | 146,170 | 161,339 | 166,762 | 188,285 | |||||||||||||||
|
|
|
|
|
|
|
|
|
|
|
|||||||||||
| (1) | Includes performing and non-performing debt (including Untendered Debt). For information regarding the Republic’s Settlement Proposal to settle claims on the Untendered Debt, see “Public Sector Debt—Legal Proceedings.” |
| (2) | Includes claims on principal and/or interest that the Republic considers time-barred. |
Source: Ministry of the Treasury.
Gross Foreign Currency-Denominated Public Debt(1)
(in millions of U.S. dollars)
| As of December 31, | ||||||||||||||||||||
| 2012 | 2013 | 2014 | 2015 | 2016 | ||||||||||||||||
| Foreign currency-denominated debt(2) |
135,713 | 146,170 | 161,339 | 166,762 | 188,285 | |||||||||||||||
| As a % of GDP |
23.4 | % | 23.9 | % | 28.6 | % | 26.4 | % | 34.5 | % | ||||||||||
| As a % of Government revenues |
113.6 | % | 113.1 | % | 131.4 | % | 119.0 | % | 159.1 | % | ||||||||||
| As a % of exports |
142.6 | % | 161.2 | % | 196.1 | % | 235.4 | % | 267.0 | % | ||||||||||
| As a % of international reserves |
313.5 | % | 477.7 | % | 513.1 | % | 652.4 | % | 485.6 | % | ||||||||||
| As a % of total gross public debt |
62.6 | % | 65.4 | % | 67.4 | % | 69.3 | % | 68.4 | % | ||||||||||
| (1) | Includes performing and non-performing (including Untendered Debt) |
| (2) | Includes Untendered Debt. For information regarding the Republic’s Settlement Proposal to settle all claims on the Untendered Debt, see “—Legal Proceedings.” |
Source: INDEC and Ministry of the Treasury.
Foreign Currency-Denominated Debt in 2016
In 2016, the Republic’s foreign currency-denominated debt, increased by 12.9% to U.S.$188.3 billion as compared to December 31, 2015, primarily as a result of the issuance of Birad and Birae and BONAR 18, 23 and 19. New debt issuances was partially offset by principal amortizations (BONAR 2016, short term notes, multilateral debt and Paris Club). In addition, the nominal depreciation of the Euro against the U.S. dollar reduced Euro-denominated debt when expressed in U.S. dollars.
D-166
The following table sets forth information regarding the Republic’s total foreign currency-denominated debt by type of currency as of the dates indicated.
Gross Foreign Currency-Denominated Public Debt, by Currency(1)
(in millions of U.S. dollars)
| As of December 31, | ||||||||||||||||||||
| 2012 | 2013 | 2014 | 2015 | 2016 | ||||||||||||||||
| U.S. dollars |
106,590 | 115,842 | 134,782 | 142,841 | 163,422 | |||||||||||||||
| Euro |
25,559 | 27,181 | 23,909 | 21,422 | 22,752 | |||||||||||||||
| Japanese yen |
2,894 | 2,443 | 2,043 | 1,937 | 1,651 | |||||||||||||||
| Other(2) |
671 | 704 | 606 | 561 | 459 | |||||||||||||||
|
|
|
|
|
|
|
|
|
|
|
|||||||||||
| Foreign currency-denominated debt |
135,713 | 146,170 | 161,339 | 166,762 | 188,285 | |||||||||||||||
|
|
|
|
|
|
|
|
|
|
|
|||||||||||
| (1) | Includes Untendered Debt. For information regarding the Republic’s Settlement Proposal to settle claims on the Untendered Debt, see “—Legal Proceedings.” |
| (2) | Figures include Danish crown, Swedish crown, Canadian dollar, Australian dollar and Kuwaiti dinar. |
Source: Ministry of the Treasury.
As of December 31, 2016, the Republic’s total gross foreign currency public debt was denominated as follows:
| • | 86.8% in U.S. dollars; |
| • | 12.1% in euro; |
| • | 0.9% in Japanese yen; and |
| • | 0.2% in other foreign currencies. |
Performing Foreign Currency-Denominated Debt Service
In 2012, the Republic’s interest expense on its foreign currency-denominated debt was U.S.$6.6 billion (1.1% of nominal GDP for 2012). In 2013, the Republic’s interest expense on its foreign currency-denominated debt was U.S.$3.3 billion (0.5% of nominal GDP for 2013). In 2014, the Republic’s interest expense on its foreign currency-denominated debt was U.S.$3.5 billion (0.6% of nominal GDP for 2014). In 2015, the Republic’s interest expense on its foreign currency-denominated debt was U.S.$5.8 billion (0.9% of nominal GDP for 2015). In 2016, the Republic’s interest expense on its foreign currency denominated debt was U.S.$6.6 billion (1.2% of nominal GDP for 2016).
Interest expense on performing foreign currency-denominated debt decreased by U.S.$53 million to U.S.$6.6 billion in 2016 from U.S.$6.6 billion in 2012.
Interest expense on performing foreign currency-denominated debt increased in 2016 by U.S.$807 million, from U.S.$5.8 billion in 2015 to U.S.$6.6 billion. This increase resulted primarily as a result of higher payments in conection with new issues during 2016 (BIRAD and BONAR 22, 25 and 27).
The following table sets forth information regarding the Republic’s projected debt service obligations on its performing foreign currency-denominated debt for the periods indicated, as of December 31, 2016.
Projected Performing Foreign Currency-Denominated Public Debt Service by Creditor(1)(2)
(in millions of U.S. dollars)
| 2017 | 2018 | 2019 | 2020 | |||||||||||||||||||||||||||||
| Capital | Interest | Capital | Interest | Capital | Interest | Capital | Interest | |||||||||||||||||||||||||
| Multilateral debt: |
||||||||||||||||||||||||||||||||
| Inter-American Development Bank |
U.S.$ | 884 | U.S.$ | 404 | U.S.$ | 850 | U.S.$ | 370 | U.S.$ | 839 | U.S.$ | 337 | U.S.$ | 810 | U.S.$ | 304 | ||||||||||||||||
| World Bank |
626 | 134 | 670 | 119 | 480 | 104 | 415 | 95 | ||||||||||||||||||||||||
D-167
| Corporación Andina de Fomento |
299 | 80 | 310 | 72 | 328 | 62 | 333 | 52 | ||||||||||||||||||||||||
| FONPLATA |
10 | 3 | 12 | 3 | 12 | 2 | 5 | 2 | ||||||||||||||||||||||||
| European Investment Bank |
— | — | — | — | — | — | — | — | ||||||||||||||||||||||||
| International Fund for Agricultural Development |
5 | — | 5 | — | 5 | — | 5 | — | ||||||||||||||||||||||||
| Total multilateral debt |
1,825 | 622 | 1,847 | 564 | 1,665 | 504 | 1,568 | 453 | ||||||||||||||||||||||||
| Bilateral debt |
89 | 88 | 85 | 85 | 138 | 80 | 173 | 74 | ||||||||||||||||||||||||
| Paris Club |
1,899 | 255 | 1,899 | 201 | 2,060 | 168 | — | — | ||||||||||||||||||||||||
| Total Bilateral debt |
1,988 | 343 | 1,985 | 285 | 2,198 | 247 | 173 | 74 | ||||||||||||||||||||||||
| Total official debt |
3,813 | 965 | 3,831 | 849 | 3,863 | 752 | 1,741 | 527 | ||||||||||||||||||||||||
| Suppliers |
150 | 71 | 164 | 60 | 179 | 49 | 197 | 36 | ||||||||||||||||||||||||
| Commercial banks |
12 | — | 12 | — | 12 | — | — | — | ||||||||||||||||||||||||
| Bonds: |
||||||||||||||||||||||||||||||||
| Bonds |
7,918 | 6,068 | 3,374 | 5,869 | 5,913 | 5,420 | 4,089 | 5,221 | ||||||||||||||||||||||||
| Treasury notes |
9,545 | 30 | — | — | — | — | — | — | ||||||||||||||||||||||||
| Promissory notes |
39 | 0 | 36 | 0 | 30 | 0 | 17 | — | ||||||||||||||||||||||||
| Total bonds |
17,502 | 6,098 | 3,411 | 5,869 | 5,943 | 5,420 | 4,105 | 5,221 | ||||||||||||||||||||||||
|
|
|
|
|
|
|
|
|
|
|
|
|
|
|
|
|
|||||||||||||||||
| Total performing foreign currency-denominated debt service |
21,477 | 7,135 | 7,418 | 6,779 | 9,997 | 6,221 | 6,044 | 5,784 | ||||||||||||||||||||||||
|
|
|
|
|
|
|
|
|
|
|
|
|
|
|
|
|
| 2021 | 2022 | 2023 | 2024 | |||||||||||||||||||||||||||||
| Capital | Interest | Capital | Interest | Capital | Interest | Capital | Interest | |||||||||||||||||||||||||
| Multilateral debt: |
||||||||||||||||||||||||||||||||
| Inter-American Development Bank |
U.S.$ | 773 | U.S.$ | 272 | U.S.$ | 694 | U.S.$ | 245 | U.S.$ | 674 | U.S.$ | 220 | U.S.$ | 653 | U.S.$ | 197 | ||||||||||||||||
| World Bank |
355 | 86 | 239 | 80 | 194 | 75 | 195 | 70 | ||||||||||||||||||||||||
| Corporación Andina de Fomento |
303 | 44 | 276 | 35 | 203 | 28 | 195 | 21 | ||||||||||||||||||||||||
| FONPLATA |
5 | 2 | 5 | 1 | 5 | 1 | 5 | 1 | ||||||||||||||||||||||||
| European Investment Bank |
— | — | — | — | — | — | — | — | ||||||||||||||||||||||||
| International Fund for Agricultural Development |
5 | — | 5 | — | 4 | — | 3 | 0 | ||||||||||||||||||||||||
| Total multilateral debt |
1,441 | 404 | 1,219 | 361 | 1,080 | 324 | 1,050 | 289 | ||||||||||||||||||||||||
| Bilateral debt |
192 | 65 | 169 | 57 | 159 | 50 | 158 | 42 | ||||||||||||||||||||||||
| Paris Club |
— | — | — | — | — | — | — | — | ||||||||||||||||||||||||
| Total Bilateral debt |
192 | 65 | 169 | 57 | 159 | 50 | 158 | 42 | ||||||||||||||||||||||||
| Total official debt |
1,633 | 470 | 1,388 | 418 | 1,239 | 373 | 1,209 | 331 | ||||||||||||||||||||||||
| Suppliers |
217 | 23 | 175 | 9 | 32 | 2 | 1 | — | ||||||||||||||||||||||||
| Commercial banks |
— | — | — | — | — | — | — | — | ||||||||||||||||||||||||
| Bonds: |
||||||||||||||||||||||||||||||||
| Bonds |
15,366 | 4,721 | 14,812 | 4,442 | 11,327 | 3,921 | 14,063 | 3,746 | ||||||||||||||||||||||||
| Treasury notes |
— | — | — | — | — | — | — | — | ||||||||||||||||||||||||
| Promissory notes |
1 | — | — | — | — | — | — | — | ||||||||||||||||||||||||
| Total bonds |
15,367 | 4,721 | 14,812 | 4,442 | 11,327 | 3,921 | 14,063 | 3,746 | ||||||||||||||||||||||||
|
|
|
|
|
|
|
|
|
|
|
|
|
|
|
|
|
|||||||||||||||||
| Total performing foreign currency-denominated debt service |
17,218 | 5,214 | 16,375 | 4,869 | 12,597 | 4,296 | 15,273 | 4,077 | ||||||||||||||||||||||||
|
|
|
|
|
|
|
|
|
|
|
|
|
|
|
|
|
|||||||||||||||||
| (1) | Calculated based on total debt, exchange and interest rates as of December 31, 2016. |
| (2) | Includes payments made by the Government to comply with judgments obtained by private parties through acciones de amparo. See “—Legal Proceedings—Litigation in Argentina.” |
Source: INDEC and Ministry of the Treasury.
D-168
Peso-Denominated Debt
The following table sets forth information regarding the Republic’s total peso-denominated debt as of the dates indicated.
Peso-Denominated Debt by Instrument(1)
(in millions of U.S. dollars)
| As of December 31, | ||||||||||||||||||||
| 2012 | 2013 | 2014 | 2015 | 2016 | ||||||||||||||||
| Performing |
U.S.$ | 80,960 | U.S.$ | 77,152 | U.S.$ | 77,876 | U.S.$ | 73,819 | U.S.$ | 87,068 | ||||||||||
| Temporary advances from the Central Bank |
25,972 | 28,002 | 29,402 | 25,517 | 24,115 | |||||||||||||||
| Treasury notes |
3,029 | 1,984 | 7,045 | 6,988 | 14,156 | |||||||||||||||
| Bonte |
10,511 | |||||||||||||||||||
| 2033 Discount Bonds |
5,809 | 4,928 | 4,672 | 3,535 | 9,636 | |||||||||||||||
| Bonar |
9,774 | 12,447 | 13,512 | 10,178 | 9,510 | |||||||||||||||
| Bonad |
— | — | 2,000 | 6,526 | 5,526 | |||||||||||||||
| 2045 Quasi-Par Bonds |
13,997 | 12,058 | 11,432 | 8,649 | 3,938 | |||||||||||||||
| Boncer |
2,271 | |||||||||||||||||||
| National Guaranteed Loans |
3,753 | 3,035 | 2,877 | 2,076 | 1,845 | |||||||||||||||
| Promissory notes |
2,184 | 1,364 | 1,098 | 1,603 | 1,809 | |||||||||||||||
| Commercial banks |
4,965 | 4,579 | 3,121 | 3,124 | 1,068 | |||||||||||||||
| 2038 Par Bonds |
1,271 | 1,059 | 1,004 | 760 | 846 | |||||||||||||||
| Bocones |
1,946 | 1,671 | 1,461 | 880 | 789 | |||||||||||||||
| Bonac |
— | — | — | 3,845 | 668 | |||||||||||||||
| 2033 Discount Bonds (2010) |
70 | 59 | 56 | 42 | 47 | |||||||||||||||
| 2038 Par Bonds (2010) |
5 | 4 | 4 | 3 | 3 | |||||||||||||||
| Bogar |
7,657 | 5,571 | — | — | — | |||||||||||||||
| Boden |
198 | 81 | — | — | — | |||||||||||||||
| Other |
329 | 309 | 191 | 94 | 330 | |||||||||||||||
| Non-performing debt |
247 | 117 | 111 | 84 | 93 | |||||||||||||||
| Non-performing debt not yet due |
92 | — | — | — | — | |||||||||||||||
| Non-performing debt arrears |
6 | 5 | 4 | 3 | 3 | |||||||||||||||
|
|
|
|
|
|
|
|
|
|
|
|||||||||||
| Untendered debt(2) |
148 | 112 | 107 | 81 | 90 | |||||||||||||||
|
|
|
|
|
|
|
|
|
|
|
|||||||||||
| Total peso-denominated debt |
81,207 | 77,269 | 77,987 | 73,903 | 87,161 | |||||||||||||||
|
|
|
|
|
|
|
|
|
|
|
|||||||||||
| (1) | Includes performing and non-performing (including Untendered Debt). For information regarding the Republic’s Settlement Proposal to settle claims on the Untendered Debt, see “—Legal Proceedings.” |
| (2) | Includes claims on principal and/or interest that the Republic considers time-barred. |
Source: Ministry of the Treasury.
Total peso-denominated debt, increased 7.3% to Ps.1,381.5 billion (U.S.$87.2 billion, or 31.6% of gross public total debt) as of December 31, 2016 from Ps.399.4 billion (U.S.$81.2 billion, or 37.4% of gross public total debt) as of December 31, 2012, primarily as a result of:
| • | the issuance of peso-denominated debt in the domestic market; |
| • | the increase in treasury notes; |
| • | adjustments to inflation since a portion of the peso-denominated debt is subject to adjustment for inflation based on CER; and |
| • | compounding interest. |
Performing Peso-Denominated Debt Service
In 2012, interest on the Republic’s peso-denominated debt increased by 42.6% from Ps.14.9 billion in 2011 to Ps.21.2 billion (U.S.$4.7 billion, or 41.5% of total interest). This increase was primarily due to higher interest payments on Bonares (Ps.2.4 billion in 2012), payments made under GDP-Linked Securities (Ps.1.0 billion in 2012) and higher interest payments on debt with loans from BNA (Ps.735 million in 2012), Treasury notes (Ps.615 million in 2012), Bocones (Ps.91 million in 2012) and National Guaranteed Loans (Ps.78 million in 2012). This increase was partially offset by reductions in interest payments on Bogars (Ps.11 million in 2012).
D-169
In 2013, interest on the Republic’s peso-denominated debt increased by 11.6% from Ps.21.2 billion in 2012 to Ps.23.7 billion (U.S.$4.3 billion, or 56.5% of total interest). This increase was primarily due to higher interest payments on Bonares (Ps.3.5 billion in 2013), loans from BNA (Ps.1.1 billion in 2013), Treasury Notes (Ps.1.0 billion in 2013), Bocones (Ps.79 million in 2013) and National Guaranteed Loans (Ps.65 million in 2013). This increase was partially offset mainly by reductions in interest payments one 2005 and 2010 Exchange Bonds (Ps.3.8 billion in 2013), Bodenes (Ps.23 million in 2013), Bogars (Ps.16 million in 2013) and other peso-denominated debt (Ps.1.8 billion in 2013).
In 2014, interest on the Republic’s peso-denominated debt increased by 78.8% from Ps.23.7 billion in 2013 to Ps.42.4 billion (U.S.$5.2 billion, or 59.6% of total interest). This increase was primarily due to higher interest payments on Bonares (Ps.12.0 billion in 2014), 2005 and 2010 Exchange Bonds (Ps.2.5 billion in 2014), loans from BNA (Ps.2.3 billion in 2014), Bocones (Ps.618 million in 2014), Treasury notes (Ps.519 million in 2014) and National Guaranteed Loans (Ps.155 million in 2014). This increase was partially offset by reductions in interest payments on Bogars (Ps.750 million in 2014) and Bodenes (Ps.9 million in 2014).
In 2015, interest on the Republic’s peso-denominated debt increased by 57.6% from Ps.42.4 billion in 2014 to Ps.66.8 billion (U.S.$7.2 billion, or 55.3% of total interest). This increase was primarily due to higher interest payments on Treasury notes (Ps.7.7 billion in 2015), Bonac (Ps.7.4 billion in 2015), 2005 and 2010 Exchange Bonds (Ps.5.9 billion in 2015), Bonar (Ps.3.3 billion in 2015), Bonad (Ps.337 million in 2015), Bocones (Ps.322 million in 2015) and National Guaranteed Loans (Ps.270 million in 2015). This increase was partially offset by reductions in interest payments on other peso denominated debt (Ps.445 million in 2015), loans from BNA (Ps.376 million in 2015) and Bodenes (Ps.9 million in 2015).
In 2016, interest on the Republic’s peso denominated debt increased by 30.5% from Ps.66.8 billion in 2015 to Ps.87.2 billion (U.S.$5.9 billion, or 72.2% of total interest). This increase was primarily due to higher payments on Bonar and Bonac. This increase was partially offset by lower payments on debt restructuring bonds related with CER.
D-170
The following table sets forth information regarding the Republic’s projected debt service on its performing peso-denominated public debt for the periods indicated.
Projected Performing Peso-Denominated Public Debt Service by Creditor(1)(2)
(in millions of U.S. dollars)
| 2017 | 2018 | 2019 | 2020 | |||||||||||||||||||||||||||||
| Capital | Interest | Capital | Interest | Capital | Interest | Capital | Interest | |||||||||||||||||||||||||
| Bonds |
U.S.$ | 6,465 | U.S.$ | 4,686 | U.S.$ | 6,183 | U.S.$ | 4,031 | U.S.$ | 2,541 | U.S.$ | 2,954 | U.S.$ | 4,678 | U.S.$ | 2,558 | ||||||||||||||||
| National guaranteed loans |
745 | 71 | 197 | 50 | 19 | 45 | 23 | 44 | ||||||||||||||||||||||||
| Commercial banks |
1,025 | 204 | 35 | 85 | 344 | 27 | 4 | 8 | ||||||||||||||||||||||||
| Suppliers |
1,313 | — | — | — | — | — | — | — | ||||||||||||||||||||||||
| Temporary Advances from the Central Bank |
21,787 | — | 2,328 | — | — | — | — | — | ||||||||||||||||||||||||
| Treasury notes |
13,311 | 2,118 | 845 | 87 | — | — | — | — | ||||||||||||||||||||||||
|
|
|
|
|
|
|
|
|
|
|
|
|
|
|
|
|
|||||||||||||||||
| Promissory notes |
— | — | — | — | — | — | — | — | ||||||||||||||||||||||||
|
|
|
|
|
|
|
|
|
|
|
|
|
|
|
|
|
|||||||||||||||||
| Total performing peso-denominated debt service |
44,646 | 7,079 | 9,588 | 4,253 | 2,903 | 3,026 | 4,705 | 2,611 | ||||||||||||||||||||||||
|
|
|
|
|
|
|
|
|
|
|
|
|
|
|
|
|
|||||||||||||||||
| 2021 | 2022 | 2023 | 2024 | |||||||||||||||||||||||||||||
| Capital | Interest | Capital | Interest | Capital | Interest | Capital | Interest | |||||||||||||||||||||||||
| Bonds |
U.S.$ | 4,336 | U.S.$ | 1,953 | U.S.$ | 166 | U.S.$ | 1,336 | U.S.$ | 1,506 | U.S.$ | 1,322 | U.S.$ | 419 | U.S.$ | 1,085 | ||||||||||||||||
| National guaranteed loans |
— | 44 | — | 44 | — | 44 | — | 44 | ||||||||||||||||||||||||
| Commercial banks |
— | 8 | — | 8 | — | 8 | 8 | |||||||||||||||||||||||||
| Suppliers |
— | — | — | — | — | — | — | — | ||||||||||||||||||||||||
| Temporary Advances from the Central Bank |
— | — | — | — | — | — | — | — | ||||||||||||||||||||||||
| Treasury notes |
— | — | — | — | — | — | — | — | ||||||||||||||||||||||||
|
|
|
|||||||||||||||||||||||||||||||
| Promissory notes |
— | — | — | — | — | — | — | — | ||||||||||||||||||||||||
|
|
|
|
|
|
|
|
|
|
|
|
|
|
|
|
|
|||||||||||||||||
| Total performing peso-denominated debt service |
4,336 | 2,005 | 166 | 1,388 | 1,506 | 1,373 | 419 | 1,136 | ||||||||||||||||||||||||
|
|
|
|
|
|
|
|
|
|
|
|
|
|
|
|
|
|||||||||||||||||
| (1) | Calculated based on the stock of debt, exchange rate and interest rates as of December 31, 2016. |
| (2) | Includes payments made by the Government to comply with judgments obtained by private parties through acciones de amparo. See “—Legal Proceedings—Litigation in the Republic. |
Source: Ministry of the Treasury.
Debt Owed to Financial Institutions
Historically, the IMF, the IADB and the World Bank have provided the Republic with financial support subject to the Government’s compliance with stabilization and reform policies. The financial support of the World Bank and the IADB include sector-specific and structural loans intended to finance social programs, public works and structural projects at the national and provincial levels. From 2012 to 2016, outstanding amounts owed by the Government to multilateral creditors increased by U.S.$1.9 billion (or 10.3%) to U.S.$20.2 billion, mainly as a because disbursements increased to U.S.$11.5 billion while amortizations increased to U.S.$9.1 billion.
| • | During 2012, the Government made principal payments to multilateral lenders of U.S.$1.7 billion, compared to disbursements by multilateral lenders to the Government of U.S.$2.1 billion. |
| • | During 2013, the Government made principal payments to multilateral lenders of U.S.$1.7 billion, compared to disbursements by multilateral lenders to the Government of U.S.$2.8 billion. |
D-171
| • | During 2014, the Government made principal payments to multilateral lenders of U.S.$1.8 billion, compared to disbursements by multilateral lenders to the Government of U.S.$2.3 billion. |
| • | During 2015, the Government made principal payments to multilateral lenders of U.S.$2.0 billion, compared to disbursements by multilateral lenders to the Government of U.S.$1.9 billion. |
| • | During 2016, the Government made principal payments to multilateral lenders of U.S.$1.9 billion, compared to disbursements by multilateral lenders to the Government of U.S.$2.4 billion. |
From 2012 to 2016, the total amount of interest payments to multilateral lenders (including the IADB, the World Bank and other institutions) was U.S.$2.8 billion. The Government also guarantees multilateral debt owed by the provinces. These obligations totaled U.S.$880 million as of December 31, 2016.
D-172
The following table sets forth the disbursements from, and payments to, multilateral lenders as of the dates indicated.
Disbursements/Payments - Multilateral Lenders
(in millions of U.S. dollars)
| As of December 31, | ||||||||||||||||||||
| 2012 | 2013 | 2014 | 2015 | 2016 | ||||||||||||||||
| World Bank: |
||||||||||||||||||||
| Disbursements |
U.S.$ | 753 | U.S.$ | 1,155 | U.S.$ | 571 | U.S.$ | 642 | U.S.$ | 936 | ||||||||||
| Principal payments |
(685 | ) | (665 | ) | (670 | ) | (790 | ) | (740 | ) | ||||||||||
| Disbursements, net of principal payments |
69 | 490 | (99 | ) | (148 | ) | 197 | |||||||||||||
| Interest payments |
(131 | ) | (139 | ) | (129 | ) | (138 | ) | (119 | ) | ||||||||||
| Payment of commissions |
(1 | ) | — | — | (1 | ) | (3 | ) | ||||||||||||
|
|
|
|
|
|
|
|
|
|
|
|||||||||||
| Net (outflows) inflows |
(64 | ) | 350 | (227 | ) | (287 | ) | 75 | ||||||||||||
| Inter-American Development Bank: |
||||||||||||||||||||
| Disbursements |
1,017 | 1,121 | 1,277 | 770 | 1,210 | |||||||||||||||
| Principal payments |
(908 | ) | (901 | ) | (936 | ) | (990 | ) | (869 | ) | ||||||||||
| Disbursements, net of principal payments |
108 | 220 | 340 | (220 | ) | 341 | ||||||||||||||
| Interest payments |
(310 | ) | (366 | ) | (366 | ) | (420 | ) | (429 | ) | ||||||||||
| Payments of commissions |
(7 | ) | (9 | ) | (10 | ) | (9 | ) | (18 | ) | ||||||||||
|
|
|
|
|
|
|
|
|
|
|
|||||||||||
| Net (outflows) inflows |
(209 | ) | (155 | ) | (35 | ) | (649 | ) | (106 | ) | ||||||||||
| FAD:(1) |
||||||||||||||||||||
| Disbursements |
14 | 18 | 14 | 14 | 8 | |||||||||||||||
| Principal payments |
(9 | ) | (5 | ) | (4 | ) | (4 | ) | (5 | ) | ||||||||||
| Disbursements, net of principal payments |
5 | 12 | 9 | 10 | 3 | |||||||||||||||
| Interest payments |
— | — | — | — | — | |||||||||||||||
| Payments of commissions |
— | — | — | — | — | |||||||||||||||
|
|
|
|
|
|
|
|
|
|
|
|||||||||||
| Net (outflows) inflows |
5 | 12 | 9 | 10 | 2 | |||||||||||||||
|
|
|
|
|
|
|
|
|
|
|
|||||||||||
| FONPLATA:(2) |
||||||||||||||||||||
| Disbursements |
1 | — | 11 | 41 | 11 | |||||||||||||||
| Principal payments |
(15 | ) | (11 | ) | (11 | ) | (16 | ) | (11 | ) | ||||||||||
| Disbursements, net of principal |
(14 | ) | (11 | ) | — | 24 | — | |||||||||||||
| Interest payments |
(3 | ) | (2 | ) | (2 | ) | (2 | ) | (2 | ) | ||||||||||
| Payments of commissions |
— | — | — | (1 | ) | (3 | ) | |||||||||||||
|
|
|
|
|
|
|
|
|
|
|
|||||||||||
| Net (outflows) inflows |
(17 | ) | (13 | ) | (2 | ) | 21 | (5 | ) | |||||||||||
|
|
|
|
|
|
|
|
|
|
|
|||||||||||
| Corporación Andina de Fomento: |
||||||||||||||||||||
| Disbursements |
348 | 477 | 408 | 420 | 283 | |||||||||||||||
| Principal payments |
(122 | ) | (136 | ) | (180 | ) | (217 | ) | (232 | ) | ||||||||||
| Disbursements, net of principal |
226 | 340 | 228 | 202 | 51 | |||||||||||||||
| Interest payments |
(43 | ) | (47 | ) | (50 | ) | (61 | ) | (68 | ) | ||||||||||
| Payments of commissions |
(2 | ) | (3 | ) | (4 | ) | (5 | ) | (4 | ) | ||||||||||
|
|
|
|
|
|
|
|
|
|
|
|||||||||||
| Net (outflows) inflows |
180 | 290 | 173 | 136 | (22 | ) | ||||||||||||||
|
|
|
|
|
|
|
|
|
|
|
|||||||||||
| The European Investment Bank |
||||||||||||||||||||
| Disbursements |
— | — | — | — | — | |||||||||||||||
| Principal payments |
(4 | ) | (4 | ) | (5 | ) | (5 | ) | — | |||||||||||
| Disbursements, net of principal |
(4 | ) | (4 | ) | (5 | ) | (5 | ) | — | |||||||||||
| Interest payments |
(1 | ) | (1 | ) | (1 | ) | (1 | ) | — | |||||||||||
| Payments of commissions |
— | — | — | — | — | |||||||||||||||
|
|
|
|
|
|
|
|
|
|
|
|||||||||||
| Net (outflows) inflows |
(5 | ) | (5 | ) | (5 | ) | (5 | ) | — | |||||||||||
|
|
|
|
|
|
|
|
|
|
|
|||||||||||
| Total disbursements |
2,132 | 2,770 | 2,280 | 1,886 | 2,448 | |||||||||||||||
| Total principal payments |
(1,742 | ) | (1,723 | ) | (1,805 | ) | (2,022 | ) | (1,857 | ) | ||||||||||
| Disbursements, net of principal |
390 | 1,048 | 475 | (136 | ) | 591 | ||||||||||||||
| Total interest payments |
(489 | ) | (555 | ) | (548 | ) | (622 | ) | (619 | ) | ||||||||||
| Total commissions |
(11 | ) | (13 | ) | (15 | ) | (15 | ) | (28 | ) | ||||||||||
|
|
|
|
|
|
|
|
|
|
|
|||||||||||
| Total net (outflows) inflows |
U.S.$ | (110 | ) | U.S.$ | 479 | U.S.$ | (88 | ) | U.S.$ | (774 | ) | U.S.$ | (56 | ) | ||||||
|
|
|
|
|
|
|
|
|
|
|
|||||||||||
D-173
| (1) | International Fund for Agricultural Development. |
| (2) | Financial Fund for the development of the Plata Valley. |
Source: Ministry of the Treasury.
International Monetary Fund
The IMF organized two separate financial aid packages for the Republic during the years leading up to the collapse of the Convertibility Regime—one in December 2000, and the other in August 2001. As part of these packages, the IMF increased the amount available to the Republic under its credit facilities and secured for the Republic other sources of funding (including loan commitments from the World Bank, the IADB and the Spanish government).
Between 2001 and 2005, the Republic reduced its outstanding IMF debt from U.S.$14.0 billion as of December 31, 2001, to U.S.$9.5 billion as of December 31, 2005. In August 2004, the IMF suspended disbursements under the 2003 Stand-By Arrangement after the Government indefinitely postponed the scheduled review of its performance under the arrangement.
On January 3, 2006, the Government repaid all of its outstanding debt owed to the IMF in a single payment of U.S.$9.5 billion. The payment to the IMF represented 7.4% of the total Argentine public debt and saved U.S.$568 million in interest. The Government borrowed funds from the Central Bank to make the payment, which resulted in a 33.3% reduction of the Central Bank’s reserves from U.S.$28.1 billion to U.S.$18.6 billion. The Government issued a 10-year U.S. dollar-denominated non-transferable Treasury note to repay the Central Bank for this financing. Given that the IMF liability was exchanged for Central Bank liability of the same value, the IMF repayment did not affect the Government’s total debt.
On November 9, 2016, the IMF concluded the Article IV Consultation with Argentina. Under Article IV of the IMF’s Articles of Agreement, the IMF holds bilateral discussions with members, usually every year. IMF staff visits the country, collects economic and financial information, and discusses the country’s economic developments and policies with officials. The IMF staff then prepares a report, which forms the basis for discussion by the Executive Board. The most recent Article IV Consultation with Argentina had taken place in July 2006. The report is publicly available on the IMF’s website at http://www.imf.org/external/pubs/cat/longres.aspx?sk=44386. The contents of this website are not intended to be incorporated by reference into this Annual Report.
World Bank
Between 2012 and 2016, the World Bank disbursed approximately U.S.$4.1 billion in loans to the Government partly for activities designed to foster economic recovery, both at the national and provincial levels, including for infrastructure and education projects, as well as for various social development programs such as health and the environment. As of December 31, 2016, the aggregate outstanding principal amount of World Bank loans to the Republic was U.S.$197 billion, while approximately U.S.$2.4 billion of committed loans from the World Bank remained undisbursed.
Between 2012 and 2016, the Republic made principal payments in an aggregate amount of U.S.$3.5 billion under World Bank loans, and a total of U.S.$655 million on account of interest.
IADB
Between 2012 and 2016, the IADB disbursed approximately U.S.$5.4 billion in loans to the Republic, partly for activities designed to foster economic growth and partly for various social development programs such as health, infrastructure and education. As of December 31, 2016, the aggregate outstanding principal amount of IADB loans to the Republic was U.S.$341 million, while approximately U.S.$2.8 billion of IADB committed loans remained undisbursed.
Between 2012 and 2016, the Republic made principal payments in an aggregate amount of U.S.$4.6 billion under IADB loans and U.S.$1.9 billion on account of interest.
D-174
FONPLATA and CAF
Between 2012 and 2016, the Fondo Financiero para el Desarrollo de la Cuenca del Plata (Financial Fund for the Development of the Plata Valley or “FONPLATA”) disbursed an aggregate amount of U.S.$63.7 million to the Republic for economic development and social programs. During this period, the Republic made principal payments to FONPLATA in an aggregate amount of U.S.$63.6 million, and the aggregate principal amount outstanding under loans made by FONPLATA was U.S.$0.08 million as of December 31, 2016, while U.S.$98.5 million in approved loans from FONPLATA remained undisbursed, including a U.S.$16.5 million loan to the Republic to improve the province of Buenos Aires’s ports approved in 2008.
Between 2012 and 2016, CAF disbursed approximately U.S.$1.9 billion to the Republic mostly in loans for infrastructure programs. During this period, the Republic made principal payments to CAF in an aggregate amount of U.S.$887.2 million, of which U.S.$232 million were paid in 2016. The aggregate principal amount outstanding under loans made by CAF was U.S.$51 million as of December 31, 2016, while U.S.$1.7 billion in approved loans from CAF remain undisbursed.
Bilateral Debt and Private Creditors’ Debt
Bilateral debt is composed of debt that is referred to as Paris Club debt and other bilateral debt. Paris Club debt includes all debt with country members of the Paris Club that has been restructured in negotiation rounds with members of the Paris Club. See “—Debt Record—Paris Club.” Other bilateral debt includes all other debt with sovereign governments. Substantially all of the Republic’s bilateral debt relates to debt owed to country members of the Paris Club and is treated under the Paris Club framework.
Private creditors’ debt is composed of debt with suppliers and debt with commercial banks. A portion of private creditors’ debt is guaranteed by export credit insurance granted by foreign government agencies and is treated under the Paris Club framework. On May 28, 2014, the Republic reached an agreement with the members of the Paris Club for the cancellation of the debt owed by the Republic, amounting to U.S.$9,690 million (U.S.$4,955 million in principal U.S.$1,102 million in interest and U.S.$3,633 million in penalty interest).
Legal Proceedings
Litigation in the United States
Following the Republic’s default on its debt at the end of 2001, certain of its creditors filed numerous lawsuits against the Republic in several jurisdictions, including the United States. Plaintiffs in these actions generally have asserted that the Republic failed to make timely payments of interest and/or principal on their bonds, and have sought judgments for the nominal value of and accrued interest on those bonds.
As discussed in greater detail under “—The Settlement,” to date, the Republic has reached agreements with most of its creditors, and stipulations of dismissal and orders of satisfaction of judgment have been filed and approved by the courts in numerous actions. The Republic continues to seek to resolve its outstanding litigation, and has reached agreements in principle with many additional creditors.
Individual litigation in the United States
As of December 31, 2016, 126 actions involving bonds with a nominal value of approximately U.S.$684 million were pending in the District Court. Judgments for a total value of approximately U.S.$840 million had been entered in actions involving bonds with a nominal value of approximately U.S.$456 million.
Class litigation in the United States
As of the date of this Annual Report, of the 15 actions filed against the Republic on behalf of a class of holders of defaulted bonds in New York, class certification had been granted in 13 of these 15 actions.
D-175
On May 27, 2016, the District Court preliminarily approved the settlement agreements reached by the Republic and representatives of nine of these classes. The settlement agreement provided for the payment to class members of an amount equal to 150% of their unpaid principal. See “—The Settlement.” On November 10, 2016, the District Court held a fairness hearing on whether to give final approval to the settlement. The Court set a deadline of November 15, 2016 for the submission of all claims and supporting documentation for inclusion in the settlements. The Republic expects that, if approved by the District Court, the nominal value amount to be settled in these nine class actions will total approximately U.S.$17.5 million.
Pari passu litigation
In February 2012, plaintiffs in 13 actions in New York, involving claims for bonds issued under the 1994 Fiscal Agency Agreement (the “1994 FAA Bonds”) for a nominal value of U.S.$428 million, plus interest, obtained an order of the District Court enjoining the Republic from making scheduled interest payments on the 2005 and 2010 Exchange Bonds unless the Republic paid the plaintiffs in full. The order was stayed pending appeals and became effective on June 18, 2014, after the U.S. Supreme Court denied the Republic’s petition for a writ of certiorari of the Court of Appeal’s order affirming the pari passu injunctions.
On October 30, 2015, the District Court issued new pari passu injunctions (“me too” injunctions), substantially similar to the ones already in effect, in 49 additional proceedings, involving claims for a nominal value over U.S.$2.1 billion under the 1994 FAA Bonds, plus billions more in pre- and post-judgment interest. Numerous additional motions seeking to extend the reach of the pari passu injunctions were filed and were pending in January 2016, when the Republic approached holders of Untendered Debt to settle outstanding disputes. As part of the Settlement, the pari passu injunctions were lifted. See “—The Settlement.”
On August 10, 2016, the District Court denied plaintiffs’ 2015 motions for pari passu relief in two separate actions without prejudice, indicating that such requests were moot given the changed circumstances that rendered the pari passu injunctions no longer necessary.
On December 22, 2016, in a case involving certain creditors that had not responded to the February 2016 settlement proposal and alleged a continued violation of the pari passu clause, the District Court found that no continued pari passu violation existed although the plaintiffs’ bonds remained unpaid while Argentina was paying its consenting creditors as well as the newly issued bonds.
The Settlement
As of the date of this Annual Report, agreements in principle have been executed with holders of approximately 85% of the nominal amount of Untendered Debt outstanding as of December 31, 2015 (including in the calculation claims that the Republic considers time-barred and for which no agreements have been entered into). On February 5, 2016, the Republic published on the Ministry of Finances’ website the Settlement Proposal to settle all claims on Untendered Debt not otherwise time-barred, including bonds in litigation in the United States, subject to two conditions: first, obtaining approval by the Argentine Congress, and second, lifting the pari passu injunctions. The Settlement Proposal contemplated two frameworks for settlement. The “pari passu option,” which was extended as an option to plaintiffs holding pari passu injunctions, provided for payment equal to the full amount of money judgment or an accrued claim value less a specified discount. The “standard option,” which remains open to holders of Untendered Debt, whether or not they had pari passu injunctions, provides for payment equal to 100% of the principal amount of the relevant debt securities plus up to 50% of that original principal as interest. Any eligible holder of Untendered Debt may agree to the terms of the standard option, in accordance with the procedures set forth and published by the Ministry of the Treasury and, in accordance with such terms, becomes party to a binding agreement in principle with the Republic once the agreement is countersigned by the Republic. The Settlement Proposal is not available for claims on principal or interest that are time-barred.
On February 19, 2016, the District Court entered an indicative ruling in the “me too” actions providing that if the Court of Appeals were to remand those cases (which were then on appeal), the District Court would grant the Republic’s motion to vacate the “me too” injunctions. Following remand by the Court of Appeals, the District Court, on March 2, 2016, issued an order indicating it would vacate all pari passu injunctions, including the “me too” injunctions, subject to two conditions: first, the repeal of all legislative obstacles to settlement with holders of Untendered Debt, and second, full payment to holders of pari passu injunctions with whom the Republic had entered into an agreement in principle on or before February 29, 2016, in accordance with the specific terms of such agreements. On April 13, 2016, the District Court’s order was affirmed by the Second Circuit Court of Appeals.
D-176
On March 31, 2016, the Argentine Congress passed the Debt Authorization Law, thereby repealing the legislative obstacles to the settlement and approving the Settlement Proposal. On April 22, 2016, Argentina issued U.S.$16.5 billion of new debt securities in the international capital markets, and applied U.S.$9.3 billion of the net proceeds to satisfy settlement payments on agreements with holders of approximately U.S.$4.2 billion principal amount of Untendered Debt. Upon confirmation that the conditions set forth in its March 2, 2016 order had been satisfied, the District Court, on April 22, 2016, ordered the vacatur of all pari passu injunctions.
On May 5, 2016, interest payments on 2005 and 2010 Exchange Bonds payable to the trustee were transferred by the trustee to holders of such bonds.
On July 20, 2016, the Republic announced and published settlement procedures for holders of eligible German law-governed bonds. Per the instructions released by the Ministry of Finances, the procedures contemplate two different settlement avenues: “Fast Track Settlement” and “Individual Settlement.”
Creditors who settled their claims have agreed, upon payment, to dismiss with prejudice all litigation against the Republic, including all enforcement proceedings. As of December 31, 2016, payments to settling creditors had resulted in the dismissal of claims in the United States for an aggregate nominal value of approximately U.S.$3.1 billion, plus interest, and the satisfaction of judgments in the amount of approximately U.S.$4.8 billion. In addition, the Republic is currently reviewing executed settlement agreements for the purpose of reconciling those agreements to claims in the District Court, for the purpose of dismissing any and all actions and or judgments where the asserted claims have been settled.
Certain Italian bondholders represented by Task Force Argentina, TFA, that were claimants in an arbitration against the Republic before the ICSID concerning Republic-issued bonds filed three suits in the District Court for an unspecified amount concerning the same securities. These three suits had been stayed pending the outcome of the arbitration, and on January 31, 2016, the Republic entered into an agreement in principle with TFA to settle the arbitration and related litigation claims of these Italian bondholders, which was superseded by a settlement agreement entered into on April 21, 2016. The three suits were dismissed with prejudice in accordance with the terms of a consent award dated December 29, 2016. For a discussion of the arbitration, see “—ICSID Arbitration.”
One pending class action, where no agreement in principle has been reached, sought to enjoin the Republic from communicating and settling with holders of the bond series at issue. On April 21, 2016 the District Court denied that plaintiff’s motion. Plaintiff appealed and on December 22, 2016 the Court of Appeals dismissed the appeal.
On July 20, 2016, the Republic published settlement procedures for holders of eligible German law governed bonds implementing the Settlement Proposal for those bonds. As of the date of this Annual Report, the Republic has received tenders by holders of bonds for a nominal amount of EUR194 million.
Post-settlement litigation in the United States
On February 29, 2016 and March 3, 2016, certain plaintiffs filed suit against the Republic in the District Court based on their purported ownership of bonds with a nominal value of U.S.$2.2 million governed by New York law, and with a nominal value of €6.0 million governed by Italian law, German law, and English law. The Republic moved to dismiss the claims that were based on Italian law and German law on the grounds of lack of jurisdictional and/or insufficient service of process. The District Court granted the Republic’s motion to dismiss on August 2, 2016. On September 22, 2016 the District Court denied plaintiffs’ request to reconsider the portion of its opinion dismissing the German law claims.
On March 25, 2016, a group of creditors filed suit against the Republic in the District Court, seeking a
D-177
declaration that the settlement-related documents sent to the Republic—which the Republic had not countersigned—were binding settlement agreements. The District Court granted the Republic’s motion to dismiss plaintiffs’ complaint on April 12, 2016, concluding that in the absence of a countersignature by the Republic, no binding contracts with the plaintiffs had been formed. Plaintiffs appealed this dismissal and the appeal remains pending as of the date of this Annual Report.
On June 1, 2016, a creditor filed suit against the Republic in the District Court based on its purported ownership of an unidentified amount of Argentine bonds governed by New York, German, English, and Italian law. The Republic and plaintiff requested that the Republic’s response to plaintiff’s complaint be due 60 days after plaintiff has filed proof that it served the Republic via the Hague Service Convention. The District Court granted that request on July 28, 2016. As of the date of this Annual Report, plaintiff has not filed such proof of service.
On June 22, 2016, plaintiffs in three actions who purported to hold bonds with a nominal value of U.S.$20.9 million amended their complaints against the Republic, seeking damages for breach of contract, injunctive relief and specific performance based on the Republic’s alleged breach of the pari passu clause, and damages based on the Republic’s alleged breach of the pari passu clause. On July 20, 2016, the Republic moved to dismiss plaintiffs’ claims alleging breach of the pari passu clause as well as plaintiffs’ money damages claims to the extent plaintiffs sought to recover principal and/or interest that had come due more than six years prior to the filing of the complaint. On December 22, 2016, the District Court granted the partial motion to dismiss, finding that no continued pari passu violation existed although the plaintiffs’ bonds remained unpaid while Argentina was paying its consenting creditors as well as the newly issued bonds. In its ruling, the District Court also found that under the applicable New York statute of limitations, claims relating to Untendered Debt become time-barred after six years.
On September 29, 2016, a creditor filed suit against the Republic in the District Court based on its purported ownership of bonds with a nominal value of approximately U.S.$5.3 million governed by New York law and bonds with a nominal value of €1.0 million governed German law. The Republic’s response to the complaint is pending.
In November 2016, a creditor filed two suits against the Republic in the District Court based on its ownership of bonds with a nominal value of approximately U.S.$62.1 million, €3.0 million, and CHF 2.0 million governed by New York law, German law, and Swiss law. Plaintiff includes claims for breach of pari passu provision substantially similar to the claim later dismissed by the District Court on December 22, 2016 in a similar case (see above). The Republic’s response to the complaints is pending.
Beginning in November 2016, creditors of the Republic holding bonds with a nominal value of approximately U.S.$92 million, with judgments totaling approximately U.S.$216.7 million served discovery requests on the Republic and subpoenas on multiple third parties, including certain financial institutions. The discovery requests and subpoenas demanded the production of documents and information relating to the assets of the Republic and of entities allegedly related to the Republic. The Republic has objected to the discovery demands served on it.
Efforts to attach or execute Argentine property in U.S. Litigation
In the United States, creditors’ execution remedies against a foreign state are limited by the United States Foreign Sovereign Immunities Act of 1976 (the “FSIA”) to assets of such foreign state that are used for a commercial activity in the United States. The FSIA also provides special protection from attachment and execution to reserves of foreign central banks and military and diplomatic property. While most attempts to execute property of the Republic or of alleged alter egos of the Republic have been rejected by the courts in most cases, in a few instances plaintiffs seeking payment under the Republic’s Untendered Debt had succeeded in attaching and restraining assets of the Republic.
On May 26, 2016, the District Court denied a motion brought by judgment creditors in two actions seeking to attach and execute the proceeds from the bond issuance that accompanied the settlement that are not being used to pay settlements, which the plaintiffs alleged to be property of the Republic. On October 17, 2016, the Court of Appeals affirmed the District Court’s ruling, denying the creditor’s attempt to execute against the proceeds.
D-178
Proceedings for foreign recognition of U.S. judgments
Certain plaintiffs have sought, and in some instances obtained, recognition of their U.S. judgments in foreign courts, including in the United Kingdom, Luxembourg, France, Belgium, Switzerland, Ghana and Argentina. These plaintiffs have settled their claims against the Republic, and the proceedings in these jurisdictions are in the process of being dismissed.
Litigation in Germany
As of December 31, 2016, final judgments have been entered for a total amount of approximately €159.6 million in principal plus interest and costs in suits brought against the Republic in Germany relating to defaulted bonds, while claims seeking approximately €0.6 million in principal on defaulted debt, plus interest, have been filed in Germany although, no final judgment has yet been rendered.
Several bondholders commenced proceedings in Germany seeking to obtain pari passu relief similar to the relief granted by New York Courts. German courts at both the trial and appellate level have declined to grant such relief, although such decisions are subject to further appeals.
Plaintiffs who try to execute on their judgments may not attach assets used for diplomatic or consular purposes, such as bank accounts of the Republic’s embassy and consulates. To the Republic’s knowledge, plaintiffs in Germany have succeeded in attaching monies of the Republic held with paying agents (for the payment of interest on other Government debt). Some creditors have also attached the Republic’s claims against other plaintiffs (i.e., those who withdrew their claims against the Republic or lost their actions in whole or in part), who are liable for the Republic’s costs (statutory attorneys’ fees and, if applicable, court fees) under Germany’s “losing party pays” system, to the extent the amount of such claims had not been set off by those plaintiffs.
Certain plaintiffs have sought recognition of their German judgments in foreign courts, including the United States and Luxemburg.
Litigation in Japan
On February 10, 2010, the Republic was served with a complaint filed by the commissioned companies for bondholders in Japan, claiming approximately JPY11 billion in nominal value, plus interest, in connection with four series of defaulted bonds issued by the Republic under Japanese law. Plaintiffs withdrew most of their claim as a result of their participation in the 2010 Debt Exchange. In January 2013 a Tokyo court dismissed the complaint, finding that the commissioned companies for bondholders lacked standing to bring the complaint. In January 2014, the High Court affirmed the District Court’s ruling and the plaintiffs then appealed to the Supreme Court. On June 2, 2016, the Supreme Court reversed the High Court and remanded the case to the Tokyo District Court for further proceedings. On June 8, 2016 the Republic paid a settlement agreement covering three series of defaulted bonds issued by the Republic under Japanese law for a nominal value of JPY933,000. As of the date of this Annual Report, the outstanding nominal value of bonds in litigation amounted to JPY1.87 billion.
Litigation in France
Following the agreement reached by the Republic with plaintiffs holding U.S. judgments, all related enforcement proceedings in France have been dismissed.
Litigation in Luxemburg
Beginning in January 2009, plaintiffs holding German judgments totaling approximately EUR 73 million obtained court orders in Luxembourg to attach assets of the Republic held by local banks. No assets of the Republic were attached as a result of these court orders. As of the date of this Annual Report, no further court proceedings were pending before the local courts.
D-179
Litigation in Spain
On April 10, 2014, a plaintiff who obtained a judgment in Germany initiated proceedings before a court in Madrid in order to attach the Republic’s assets located in Spain. On May 14, 2015, the court permitted that plaintiff to execute its German judgment on the Republic’s property in Spain. In December 2015, the court denied the Republic’s request to vacate that order and the Republic appealed the ruling. On September 28, 2016 the Court of Appeals granted the Republic’s appeal and vacated the lower court’s execution order. Plaintiff appealed this decision and the appeal of that ruling remains pending as of the date of this Annual Report.
Litigation in Argentina
Since the 2001 economic crisis, the Republic has been sued in Argentina on claims relating to steps it took during the crisis, seeking, among other things, payment on defaulted bonds. These lawsuits generally have been unsuccessful. The Supreme Court of Argentina has issued several decisions in which it consistently upheld the constitutionality of the emergency measures adopted as a result of the 2001 economic crisis, including the deferral of payment on bonds. Most of these local lawsuits have been dismissed.
Recognition and enforcement of foreign judgments in Argentina. Argentine law permits the enforcement in Argentina of a final judgment issued by a competent foreign court, provided that the defendant’s right to an adequate defense is guaranteed, the judgment or award does not contravene principles of Argentine public order, and the judgment or award is not incompatible with another judgment previously or simultaneously issued by an Argentine court. Foreign creditors have generally not brought suits or sought to enforce their foreign judgments or awards in Argentina.
In Argentina, plaintiffs in four actions have sought recognition of U.S. judgments totaling approximately U.S.$24 million. In three of these cases the proceedings reached the Supreme Court, which confirmed the respective Court of Appeals decisions dismissing the claims for recognition of the foreign judgment. As of the date of this Annual Report, the fourth case is pending before the lower court. In all cases in which Argentine courts dismissed a claim for recognition and enforcement of the U.S. judgments, the courts held, as the Republic had argued, that although the Republic’s issuance of the bonds in which plaintiff had an interest constituted a commercial activity, the Republic’s declaration of a default as a consequence of an economic and social emergency constituted an exercise of its sovereign powers and should have been given deference by the foreign court. Since the Republic published the Settlement proposal in February 2016, it has entered into settlement agreements with the all plaintiffs who have sought recognition of U.S. judgments in Argentina.
Enforcement of arbitration awards in Argentina. In order for a creditor to collect on an award against the Republic in Argentina, the creditor must first notify the competent authorities and request payment with funds from the current fiscal year’s budget. If there are no such funds available, the creditor may request that the payment of the award be included in the budget for the following fiscal year. In order for the award to be included in the budget for the following fiscal year, which the Executive Power must present to Congress before September 15 of the previous year, the creditor must notify the competent authorities before July 31 of the previous year. If the creditor complies with these requirements but the Republic does not include the award in the following fiscal year’s budget or fails to make payment during the following fiscal year, then the creditor is entitled to attempt to execute upon assets of the Republic in order to satisfy the award.
In addition, there are cases regarding bonds which are subject to Argentine law.
ICSID Arbitration
Argentina has been a party to arbitration proceedings under the 1965 Convention on the Settlement of Investment Disputes between States and Nationals of Other States (“ICSID Convention”), including as a result of measures implemented in 2001 and 2002 to address Argentina’s economic crisis.
As of the date of this Annual Report, there are six final awards issued by ICSID tribunals against Argentina for an aggregate total of U.S.$850.1 million, and Argentina is seeking the annulment of two additional awards for an aggregate total of U.S.$421.9 million. Additionally, a claimant in one of these cases is seeking the annulment of one award for an aggregate total of U.S.$13.4 million. There are five ongoing cases against Argentina before ICSID with claims totaling U.S.$1.6 billion, and in one of these cases (with aggregate claims totaling U.S.$1.6 billion) the ICSID tribunal has already ruled that it has jurisdiction. There are five additional cases with claims totaling
D-180
U.S.$997.0 million in which the parties agreed to suspend the proceedings pending settlement discussions. A successful completion of these negotiations could lead additional ICSID claimants to withdraw their claims, although the Republic can offer no assurance to this effect.
On October 8, 2013, the Republic settled with four ICSID claimants and paid with bonds an aggregate amount of U.S.$406 million. On May 13, 2016, the Republic settled one additional case and paid with bonds an aggregate amount of U.S.$51.97 million. See “—Other Arbitration.”
On June 28, 2016, the Republic and TFA commenced the closing of a settlement agreement to settle the claims of the Italian bondholders, which was finalized on July 14, 2016. Payments to settling holders were made on July 14, 2016. The case was dismissed with prejudice in accordance with the terms of a consent award dated December 29, 2016. See “—The Settlement” above.
Other Arbitration
Claimants have also filed claims before arbitral tribunals under the rules of the United Nations Commission on International Trade Law (“UNCITRAL”) and under the rules of the International Chamber of Commerce (“ICC”).
As of the date of this Annual Report there was one final outstanding UNCITRAL award against Argentina for a total of U.S.$7.39 million and Argentina is seeking the annulment of two additional awards for an aggregate amount of U.S.$21.05 million. As of such date, there were three ongoing cases against Argentina before UNCITRAL and ICC tribunals with claims totaling U.S.$625.43 million, including one case with a U.S.$508.70 million claim in which the tribunal had already ruled that it has jurisdiction. There was one additional case with a claim of U.S.$168.69 million in which the parties agreed to suspend the proceedings pending settlement discussions.
In October 2013 and May 2016, Argentina settled two final awards issued by an UNCITRAL tribunal that awarded a claim against Argentina for U.S.$104.00 million and U.S.$189.46 million, respectively.
Other Non Creditor Litigation in the U.S.
On April 8, 2015, Petersen Energía Inversora, S.A.U. and Petersen Energía, S.A.U. (the “Petersen Entities”) filed a claim against the Republic in relation to the 2012 expropriation of YPF in the District Court.
The Petersen Entities seek compensatory damages (in an amount to be determined) arising out of an alleged breach of the bylaws of YPF by the Republic that allegedly occurred when it expropriated 51% of Class D shares of YPF. In September 2015, the Republic moved to dismiss the complaint, asserting, among other things, that the District Court lacks jurisdiction under the FSIA. On September 9, 2016, the District Court granted in part and denied in part the Republic’s motion to dismiss plaintiffs’ complaint. The Second Circuit Court of Appeals heard arguments on June 15, 2017. A decision is pending as of the date of this Annual Report.
On November 3, 2016, Eton Park Capital Management, L.P., Eton Park Master Fund, Ltd. and Eton Park fund, L.P. filed a complaint against the Republic seeking compensatory damages (in an amount to be determined) arising out of an alleged breach of the bylaws of YPF by the Republic resulting from the expropriation of 51% of Class D shares of YPF. The Republic has not been formally notified and has the right to request the dismissal of the complaint.
D-181