|
|
Smithfield Foods It’s to Focus Return Time on Shareholder April 2013 |
|
|
Additional Information Continental Grain Company (“Continental Grain” or “CGC”) intends to make a filing with the Securities and Exchange Commission of a definitive proxy statement and an accompanying proxy card to be used to solicit proxies in connection with the Stockholders any adjournments or special meeting that 2013 Annual Meeting of (including postponements thereof or any may be called in lieu thereof) (the “2013 Annual Meeting”) of Smithfield Foods, Inc. (“SFD” or the “Company”). Information relating to the participants in such proxy solicitation can be found in the Schedule 13D, and amendments thereto, filed by Continental Grain with the Securities and Exchange Commission. Stockholders are advised to read the definitive proxy statement and other documents related to the solicitation of stockholders of the Company for use at the 2013 Annual Meeting h th b il bl b th ill t i i t t i f ti i l di dditi l i f ti l ti t th when they become available because they will contain important information, including additional information relating to the participants in such proxy solicitation. When completed and available, Continental Grain’s definitive proxy statement and a form of proxy will be mailed to stockholders of the Company. These materials and other materials filed by Continental Grain in connection with the solicitation of proxies will be available at no charge at the Securities and Exchange Commission’s website at www.sec.gov. Cautionary Statement Regarding Forward-Looking Statements The information herein contains “forward-looking statements.” Specific forward-looking statements can be identified by the fact that they do not relate strictly to historical or current facts and include, without limitation, words such as “may,” “will,” “ t ”“b li ”“ ti i t ”“ l ”“ ti t ”“ j t ”“t t ”“f t ”“ k ”“ ld” th ti f “expects,” “believes,” “anticipates,” “plans,” “estimates,” “projects,” “targets,” “forecasts,” “seeks,” “could” or the negative of such terms or other variations on such terms or comparable terminology. Similarly, statements that describe our objectives, plans or goals are forward-looking. Our forward-looking statements are based on our current intent, belief, expectations, estimates and projections regarding the Company and projections regarding the industry in which it operates. These statements are not guarantees of future performance and involve risks, uncertainties, assumptions and other factors that are difficult to di t d th t ld t l lt t diff t i ll A di l h ld t l f dl ki predict and that could cause actual results to differ materially. Accordingly, you should not rely upon forward-looking statements as a prediction of actual results and actual results may vary materially from what is expressed in or indicated by the forward-looking statements. 2 |
|
|
Executive Summary Smithfield Foods has valuable assets. This potential will not be realized without an overhaul in strategic direction, significant operational improvements and balance sheet maximization • As a long term investor and currently the Company’s 2nd largest shareholder (~6.2% stake(1) vs. combined Management and Board’s ~2%), Continental Grain Company is compelled to respond to the recent SFD Investor Presentation, which was disappointing and failed to address the issues raised in our recent memo to the Board • The Smithfield April 2013 investor presentation presents a distorted picture of the Company Dismisses value that can be unlocked through structuring and managing the business in a more efficient manner • outright the • Seeks to justify a “business as usual approach” despite destroying shareholder value since Larry Pope and the current management team took over in Sept. 2006 (SFD stock price return of -15% underperformed S&P500 and peers(2) by 34% and 106% underperformance, respectively) • Demonstrates an unwillingness to address the issues that hamper SFD’s valuation and total shareholder returns, which are in the lowest quartile vs. peers since Sept. 2006 (. vs. Peer(2) median and top peer of 127% and 171%, respectively) • Drawing from our long history in agribusiness, Continental Grain Company has developed an action plan designed to create substantial value • Consider splitting the Company into three independent companies by divesting underperforming / highly volatile Hog assets Production and select European segment • Reinvest proceeds in additional share repurchases • Institute an annual dividend with a payout ratio in line with peers • Restructure to achieve profitability levels in line with peers • corporate governance directors and managers with relevant experience and tying management 3 Improve by adding new compensation to shareholder returns We believe our plan, if executed appropriately, will achieve a stock price for SFD of $40 per share in 3 years (1) Includes affiliates. (2) Peers includes Hillshire, Hormel, Seaboard and Tyson. Hillshire stock price adjusted for spin-off prior to 5/28/12. |
|
|
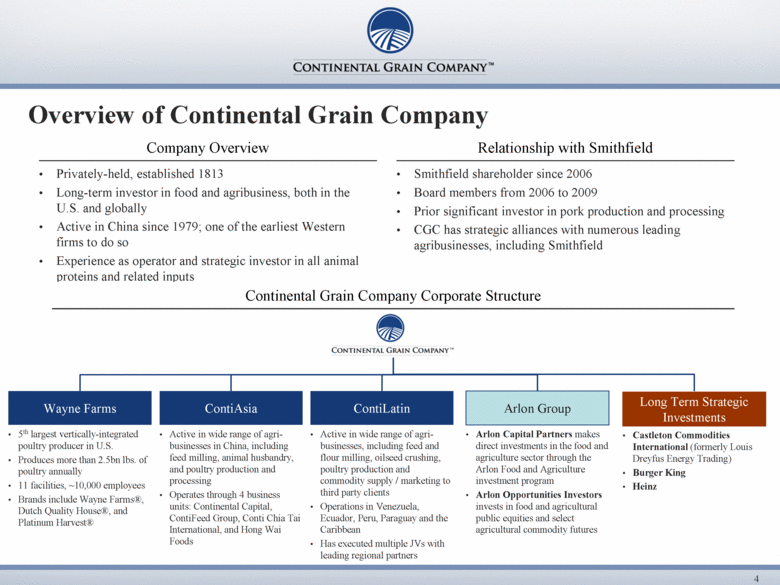
Privately-held, established 1813 Long-term investor in food and agribusiness, both in the U.S. and globally Active in China since 1979; one of the earliest Western firms to do so Experience as operator and strategic investor in all animal proteins and related inputs Smithfield shareholder since 2006 Board members from 2006 to 2009 Prior significant investor in pork production and processing CGC has strategic alliances with numerous leading agribusinesses, including Smithfield Company Overview Relationship with Smithfield 5th largest vertically-integrated poultry producer in U.S. Produces more than 2.5bn lbs. of poultry annually 11 facilities, ~10,000 employees Brands include Wayne Farms®, Dutch Quality House®, and Platinum Harvest® Active in wide range of agri-businesses in China, including feed milling, animal husbandry, and poultry production and processing Operates through 4 business units: Continental Capital, ContiFeed Group, Conti Chia Tai International, and Hong Wai Foods Active in wide range of agri-businesses, including feed and flour milling, oilseed crushing, poultry production and commodity supply / marketing to third party clients Operations in Venezuela, Ecuador, Peru, Paraguay and the Caribbean Has executed multiple JVs with leading regional partners Arlon Capital Partners makes direct investments in the food and agriculture sector through the Arlon Food and Agriculture investment program Arlon Opportunities Investors invests in food and agricultural public equities and select agricultural commodity futures Overview of Continental Grain Company 4 Wayne Farms ContiAsia ContiLatin Arlon Group Continental Grain Company Corporate Structure Castleton Commodities International (formerly Louis Dreyfus Energy Trading) Burger King Heinz Long Term Strategic Investments |
|
|
The Problem with Smithfield e ob e w t S t e d |
|
|
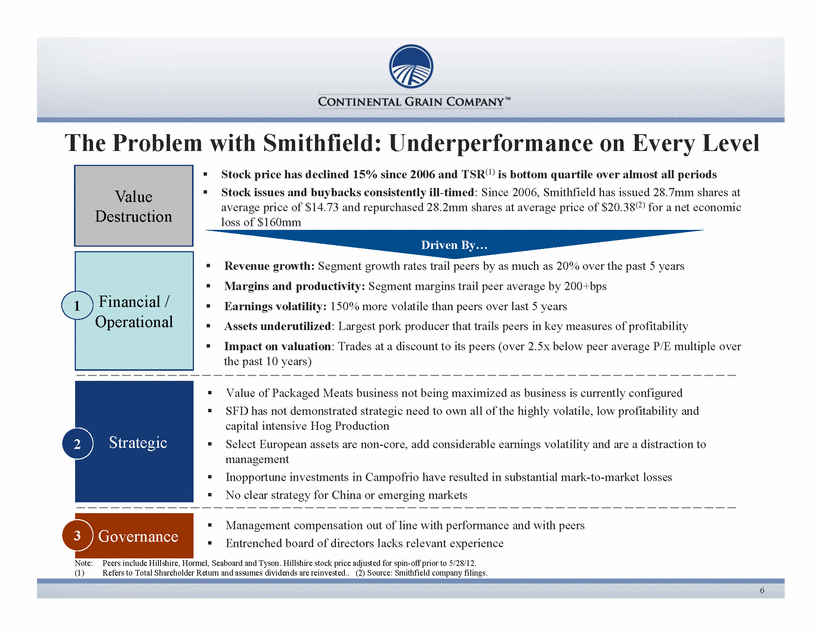
The Problem with Smithfield: Underperformance on Every Level Stock price has declined 15% since 2006 and TSR(1) is bottom quartile over almost all periods Stock issues and buybacks consistently ill-timed: Since 2006, Smithfield has issued 28.7mm shares at Value Revenue growth: Segment growth rates trail peers by as much as 20% over the past 5 years y y , average price of $14.73 and repurchased 28.2mm shares at average price of $20.38(2) for a net economic loss of $160mm Destruction Driven By Margins and productivity: Segment margins trail peer average by 200+bps Earnings volatility: 150% more volatile than peers over last 5 years Assets underutilized: Largest pork producer that trails peers in key measures of profitability Impact on valuation: Trades at a discount to its peers (over 2.5x below peer average P/E multiple over h 10 ) Financial / Operational 1 S i Value of Packaged Meats business not being maximized as business is currently configured SFD has not demonstrated strategic need to own all of the highly volatile, low profitability and capital intensive Hog Production the past years) Strategic Select European assets are non-core, add considerable earnings volatility and are a distraction to management Inopportune investments in Campofrio have resulted in substantial mark-to-market losses No clear strategy for China or emerging markets 2 6 Governance Management compensation out of line with performance and with peers Entrenched board of directors lacks relevant experience 3 Note: Peers include Hillshire, Hormel, Seaboard and Tyson. Hillshire stock price adjusted for spin-off prior to 5/28/12. (1) Refers to Total Shareholder Return and assumes dividends are reinvested (2) Source: Smithfield company filings. |
|
|
1 Value has Been Destroyed on Current Management’s Watch 150% 100% +125% Larry Pope appointed CEO on Sep 1, 2006 +91% 0% 50% +64% +19% (50%) (15%) Point at which SFD chose to i A il (100%) Aug-06 Jun-07 Apr-08 Feb-09 Dec-09 Oct-10 Aug-11 Jun-12 Apr-13 Smithfield Tyson Hormel S&P500 Peer Average measure returns in April 2013 Investor Presentation (1) 7 Smithfield is one of the only major protein producers to have destroyed value over given timeframe Source: FactSet as of 4/19/13. (1) Peer average includes Hormel, Hillshire, Seaboard and Tyson. Hillshire stock price adjusted for spin-off prior to 5/28/12. |
|
|
1 LTM SFD Trails Peers in Total Return Regardless of Timeframe Under Current Management Team(1) 24% 38% 47% 112% 156% (15%) Peer Median Peer Median Top Peer Top Peer Last 5 Years Last 10 Years 1261% 86% 130% 44% 482% (11%) Peer M di Peer M di Top Peer Top Peer Source: FactSet as of 4/19/13. Note: Dollars in millions. Represents TSR as of 4/19/13. TSR assumes dividends reinvested. Peers include Hillshire, Hormel, Seaboard and Tyson. Kraft excluded for comparability. Hillshire stock price adjusted for spin-off prior to 5/28/12. (1) Since 8/31/06. Median Median 8 |
|
|
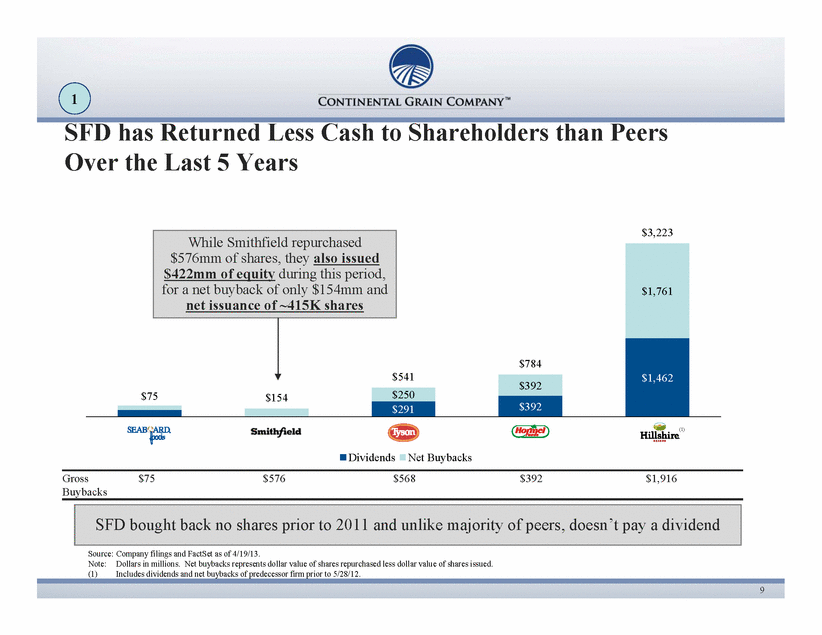
1 SFD has Returned Less Cash to Shareholders than Peers Over the Last 5 Years $3,223 While Smithfield repurchased $576mm of shares, they also issued $422mm $1,761 of equity during this period, for a net buyback of only $154mm and net issuance of ~415K shares $291 $392 $1,462 $75 $250 $392 $154 $541 $784 Seaboard Smithfield Tyson Hormel Hillshire (1) Dividends Net Buybacks Gross $75 $576 $568 $392 $1,916 Buybacks 9 Source: Company filings and FactSet as of 4/19/13. Note: Dollars in millions. Net buybacks represents dollar value of shares repurchased less dollar value of shares issued. (1) Includes dividends and net buybacks of predecessor firm prior to 5/28/12. SFD bought back no shares prior to 2011 and unlike majority of peers, doesn’t pay a dividend |
|
|
1 Smithfield Equity Issuances and Buybacks have been Untimely Since 2006, Smithfield has issued 28.7mm shares at average price of $14.73 and repurchased 28.2mm shares at average price of $20.38(1) $35 $40 SFD sold a $122mm equity stake to COFCO at $17.45/share in July 2008, and then repurchased the entire $25 $30 stake in November 2012 for $21.12 / share $25.44 $15 $20 Shares repurchased since June of 2011 have been significantly above issuance prices $400mm of $5 $10 $300mm equity offering at $13.85 /share in September 2009 convertible senior notes sold in July 2008 10 $0 Aug-06 Jun-07 Apr-08 Feb-09 Dec-09 Oct-10 Aug-11 Jun-12 Apr-13 Source: FactSet as of 4/19/13. Note: Dollars in millions. (1) Source: Smithfield company filings. |
|
|
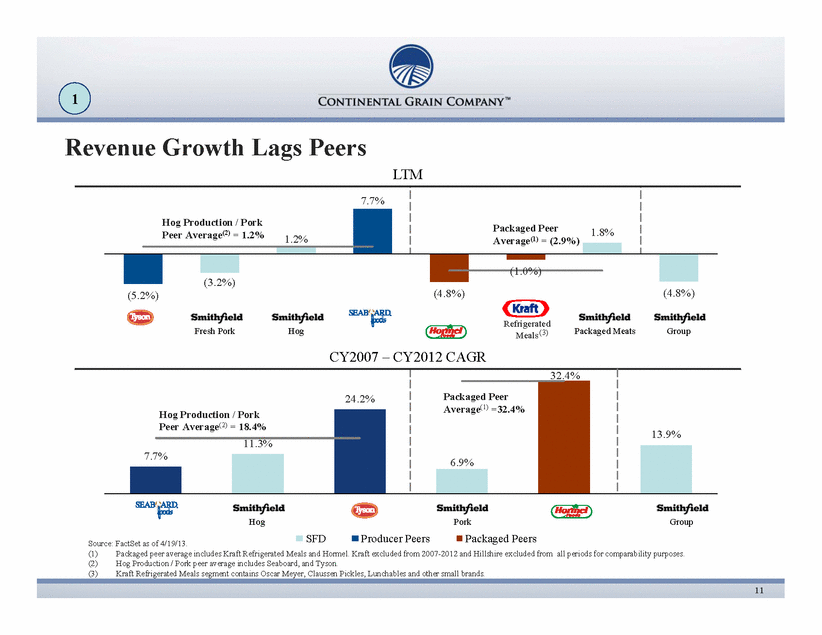
1 Revenue Growth Lags Peers LTM 1.2% 7.7% (1.0%) 1.8% Packaged Peer Average(1) = (2.9%) Hog Production / Pork Peer Average(2) = 1.2% (5.2%) (3.2%) (4.8%) (4.8%) Group Fresh Pork Hog Packaged Meats CY2007 CAGR Refrigerated Meals(3) 24.2% 32.4% 13.9% Hog Production / Pork Peer Average(2) = 18.4% – CY2012 Packaged Peer Average(1) =32.4% 7.7% 11.3% 6.9% 11 Source: FactSet as of 4/19/13. (1) Packaged peer average includes Kraft Refrigerated Meals and Hormel. Kraft excluded from 2007-2012 and Hillshire excluded from all periods for comparability purposes. (2) Hog Production / Pork peer average includes Seaboard, and Tyson. (3) Kraft Refrigerated Meals segment contains Oscar Meyer, Claussen Pickles, Lunchables and other small brands. Group Hog Pork SFD Producer Peers Packaged Peers |
|
|
1 Operational Underperformance $548 2012A Revenue / Employee $285 $295 $423 $432 Peer Average(1) = $424 S Source: Company filings. Note: Dollars in thousands. (1) Peer average excludes Smithfield. Smithfield trails peers on the key operational metric of Revenue Employee 12 |
|
|
1 Restructuring: Treading Water • Smithfield has spent over $200mm in restructuring costs since FY2009 yet operating margins remain below segment peer averages in Hog Production, Packaged and Pork segments LTM Operating Margin 8.4% 7.6% 8.9% 9.2% 11.5% / Pork Peer Average(2) = Packaged Peer Average(1) = 9.9% 3.0% 3.8% Hog Production 5.0% (1.1%) Hog Production Fresh Pork Packaged Meats Refrigerated Meals (3) 13 Source: FactSet as of 4/19/13. Note: Dollars in thousands. (1) Packaged peer average includes Hillshire, Hormel and Kraft. (2) Hog Production / Pork peer average includes Seaboard and Tyson. (3) Kraft Refrigerated Meals segment contains Oscar Meyer, Claussen Pickles, Lunchables and other small brands. |
|
|
1 Earnings Volatility vs. Peers • SFD’s earnings volatility has increased over time, despite management’s stated efforts to manage risk through hedging and has been consistently higher than that of its key peers Select Protein Company EPS Volatility 1.39 1.86 0.71 0.85 1.00 1.14 0.44 0.40 0.34 Last Years Last Years St Dev 14 15 St. Dev. 10 Last 5 Years St. Dev. Hormel Tyson Smithfield Source: Capital IQ as of 4/19/13. |
|
|
1 Smithfield is not Maximizing its Impressive Portfolio of Assets Mentioned Mention Stock price has increased 90% since September 2009 More than 2x size of next competitor Share price has declined 15% since current management took over vs. 90% increase for peers(1) SFD Investor Presentation But Forgot to Bigger than next 3 largest competitors combined U.S. margin Bottom-quartile shareholder returns over all periods Segment growth rates and margins trail peers in every leader by wide Significantly larger than Tyson, JBS and Hormel # 1 Supplier export respect Earnings volatility 150% greater than peer average Trails peer average Supp e to e po t #1 position in several European countries revenue per employee by ~30% 15 Smithfield's market leading position is not translating into higher profitability (1) Peers includes Hillshire, Hormel, Seaboard and Tyson. Hillshire stock price adjusted for spin-off prior to 5/28/12. |
|
|
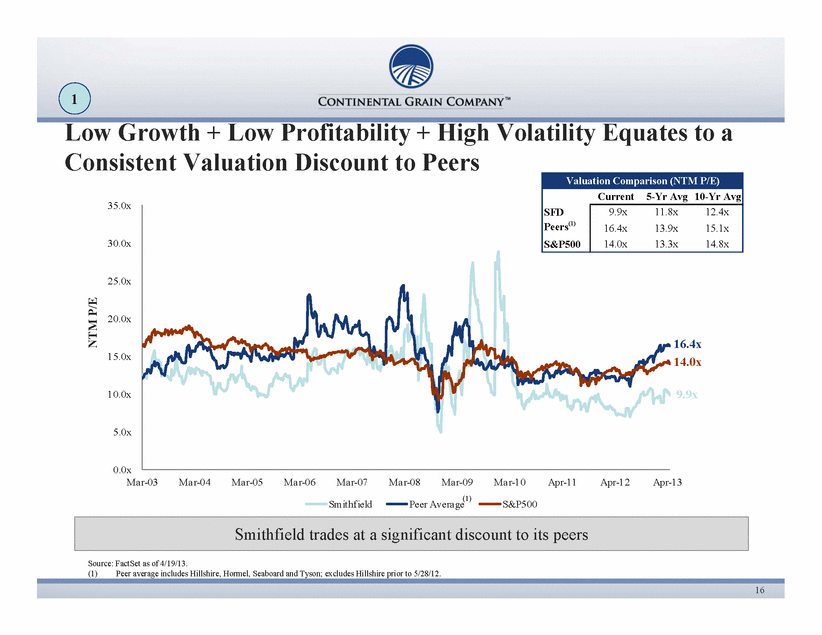
1 Low Growth + Low Profitability + High Volatility Equates to a Consistent Valuation Discount to Peers Valuation Comparison (NTM P/E) Current 5-Yr Avg 10-Yr Avg 30.0x 35.0x SFD 9.9x 11.8x 12.4x Peers(1) 16.4x 13.9x 15.1x S&P500 14.0x 13.3x 14.8x 15 0x 20.0x 25.0x 16.4x NTM P/E 5.0x 10.0x 15.0x 14.0x 9.9x 0.0x M ar-03 Mar-04 Mar-05 Mar-06 Mar-07 Mar-08 Mar-09 Mar-10 Apr-11 Apr-12 Apr-13 Smithfield Peer Average S&P500 (1) 16 Smithfield trades at a significant discount to its peers Source: FactSet as of 4/19/13. (1) Peer average includes Hillshire, Hormel, Seaboard and Tyson; excludes Hillshire prior to 5/28/12. |
|
|
2 Strategic Considerations Regarding Hog Production & International Divisions • Source verification and quality control are critical, but why does Smithfield feel that they need to own all of this business? Hog Production profitability has been steadily decreasing Hog Production is a highly volatile business Management has described the business as a drag on profitability and not its focus Hog g gp y No other major public pork processor or packaged meats company owns significant hog production assets • Peers do not have issues with either pork quality or quantity • Smithfield already slaughters nearly twice as many hogs as it produces, requiring Production y g y y g p , q g purchases from the outside • We recognize that the International business has been profitable as of late, but is this business, as currently configured, best positioned to create value for SFD shareholders? Disparate concentrated in Eastern Europe but also including assets in assortment of assets the U.K. and Mexico Limited overlap and no obvious synergies with U.S. pork businesses Sub-scale and low productivity to earnings given both impact International 17 Highly volatile the business mix and the FX Campofrio has consistently destroyed shareholder value over the past 5 years Current Intl. strategy significantly undervalues China, the world’s largest pork market |
|
|
2 Hog Production Profitability has been Steadily Decreasing • SFD states that average hog production industry returns are $6.88/head since 1975 • Average industry profitability has been negative in the last five years and only marginally profitable over last 20 years Hog Production Industry, Average P&L per Head $6.88 $2.19 $1.94 $3.97 $4.00 $8.00 ($5.66) ($8.00) ($4.00) $0.00 L L L L L Last 37 Years Last 20 Years Last 15 Years Last 10 Years Last 5 Years 18 Source: Estimated returns farrow to finish hog production in Iowa; Iowa State University (per Smithfield April 2013 Investor Presentation). Note: Calendarized to Smithfield fiscal year end. |
|
|
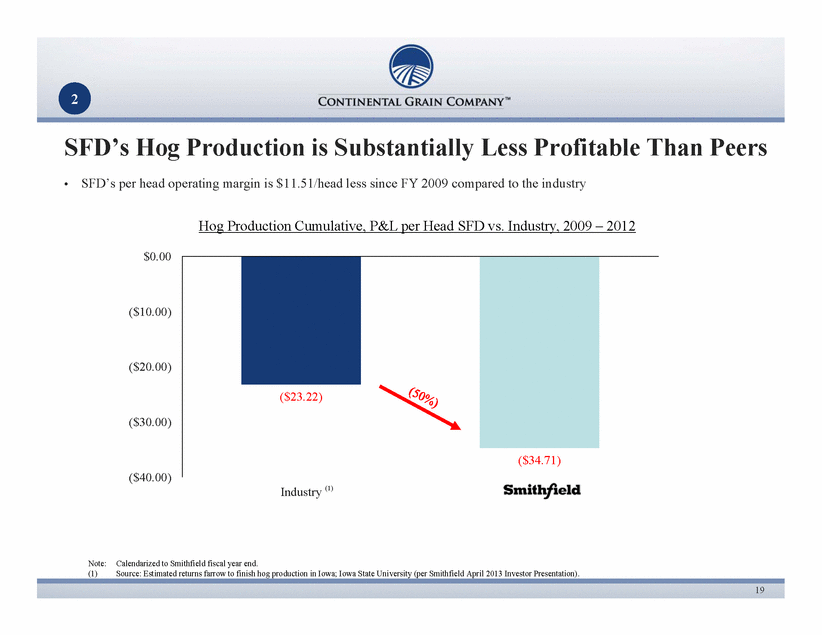
2 SFD’s Hog Production is Substantially Less Profitable Than Peers • SFD’s per head operating margin is $11.51/head less since FY 2009 compared to the industry $0.00 Hog Production Cumulative, P&L per Head SFD vs. Industry, 2009 – 2012 ($10.00) ($23.22) ($30.00) ($20.00) ($34.71) ($40.00) Industry SFD (1) 19 Note: Calendarized to Smithfield fiscal year end. (1) Source: Estimated returns farrow to finish hog production in Iowa; Iowa State University (per Smithfield April 2013 Investor Presentation). |
|
|
2 Hog Production Increases Volatility • Smithfield operating profit volatility since 2004 was 142% • Excluding Hog Production, Smithfield operating profit volatility would have been 97% • Excluding both Hog Production and International, Smithfield operating profit volatility since 2004 would have been 85% Operating Margin Hog Production Pork International Average = 3.0% Average = 4.5% Average = 3.7% Volatility = 91.9% Volatility = 38.4% Volatility = 180.4% Impacted by FX 8.7% 22.8% 18.3% 11.8% 8.3% 5.4% 3.7% 2.2% 2.0% 5.0% 4.7% 3.8% 5.8% 7.3% 5.6% 1.7% 1.1% 3.9% 6.3% 0.4% 10.0% 8.6% 2.9% (4.1%) (20.2%) (24.4%) (1.4%) 20 Source: Company filings. Data represents fiscal year ending April 30. Note: Excludes intercompany sales and unallocated corporate expense. '04 '05 '06 '07 '08 '09 '10 '11 '12 '04 '05 '06 '07 '08 '09 '10 '11 '12 '04 '05 '06 '07 '08 '09 '10 '11 '12 |
|
|
2 Hog Production – In Management’s Own Words “ What we're doing is taking out volatility. We are not trying to maximize the profitability of the hog farm It seems hard to have that discussion But we're not We're trying to measured more farm. discussion. we re not. We re have a and predictable hog production segment because we're trying to use the hog production to be part and advance the meat business. Our business is the meat business, not the live production business. So we're using live production to feed that and what we're trying to do is take the volatility, yes.” - Larry Pope, Q2 FY 2013 Earnings Call Management has stated that Hog Production is a major drag on “ I think while as we have said again and again and again we believe that side of the business is going to be more volatile. Given the impact of the ethanol policy of this country on corn pricing that that's going to be much more volatile than it has in the past and that's one of the reasons we have cut back our exposure to the live production side of the business, because we don't think it's going to be as as it was in the past and volatility surrounding j g profitability and not the Company’s focus profitable we think there is going to be a lot more that.” - Larry Pope, Q1 FY 2011 Earnings Call “ The big issue is that I think that the losses in Hog Production are coming to an end, and coming to an end pretty quickly right now. And so that has been a severe drain on this P&L and has dragged the stock down and I understand that. People don't know when this is going to turn around.” - Larry Pope, Q1 FY 2011 Earnings Call “ F d i I' ll b i i i b h b i W ' hi 21 From my standpoint, I've actually never been more optimistic about the business. We've got one thing that‘s impacting this business. That's live hog production.” - Larry Pope, Q1 FY 2010 Earnings Call |
|
|
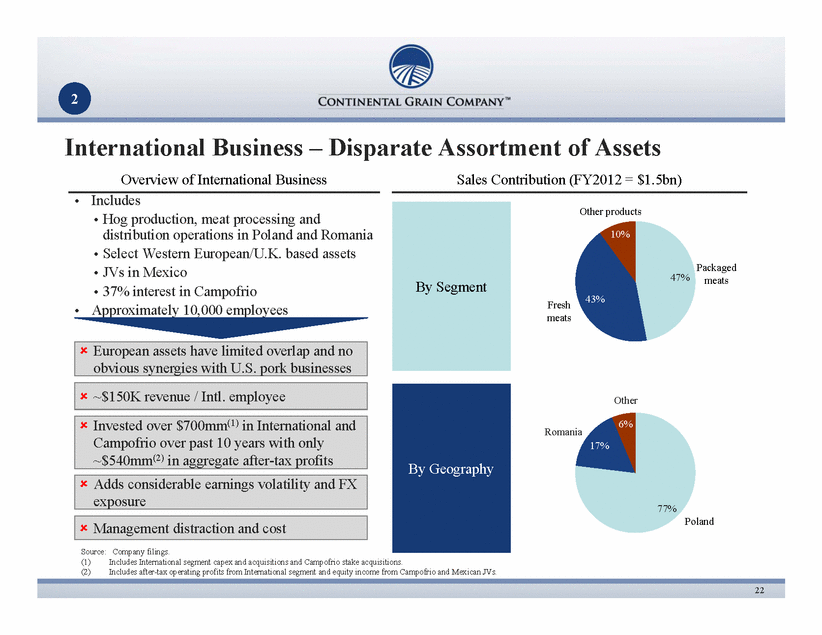
2 Sales Contribution (FY2012 = $1.5bn) International Business – Disparate Assortment of Assets I l d Overview of International Business 47% 10% • Includes • Hog production, meat processing and distribution operations in Poland and Romania • Select Western European/U.K. based assets • JVs in Mexico Packaged t Other products 43% • 37% interest in Campofrio • Approximately 10,000 employees meats Fresh meats By Segment European assets have limited overlap and no 6% Other Romania p p obvious synergies with U.S. pork businesses ~$150K revenue / Intl. employee Invested over $700mm(1) in International and f i i h l 77% 17% l d By Geography Adds considerable earnings volatility and FX exposure Campofrio over past 10 years with only ~$540mm(2) in aggregate after-tax profits 22 Source: Company filings. (1) Includes International segment capex and acquisitions and Campofrio stake acquisitions. (2) Includes after-tax operating profits from International segment and equity income from Campofrio and Mexican JVs. Poland Management distraction and cost |
|
|
2 International Business – Smithfield’s Stake in Campofrio € 14.00 Aug 2004: SFD increases 22% CFG stock down 34% since Smithfield employee (1) € 12.00 SFD Campofrio Investment Position 37.8 stake in CFG to Robert A. Sharpe II appointed CEO(€ 8.00 € 10.00 Total Cost € 321.4 Average Cost / Share € 8.50 Current Market Price € 4.87 Mark-to-market loss (€ 137.3) Jan increases € 6.00 Feb 2004: SFD Purchases 15% stake in CFG 2006: SFD stake in CFG to 23% Jun 2008: SFD receives CFG shares € 4.87 O kt k t b i S ithfi ld’ l it i t t i € 4.00 2004 2005 2006 2007 2008 2009 2010 2011 2012 2013 in merger of Groupe Smithfield with CFG; stake increased to 37% 23 On a mark-to-market basis, Smithfield’s loss on its investment in Campofrio is ~€137mm Source: FactSet as of 4/19/13. (1) As of 12/31/08. |
|
|
2 China – In Need of a More Thoughtful Strategy • Current China strategy consists of exporting low value products (offal) and relying on sporadic & volatile carcass exports to China • We believe this significantly undervalues the world’s largest pork market • COFCO (former 5% shareholder) provided an opportunity to work with a leading Chinese agriculture operator • Smithfield chose to not pursue a true collaborative and working relationship with COFCO, resulting in COFCO’s resigning its board seat and ultimately selling its stock back to SFD • Smithfield needs to formulate a leverages the Company’s strength and and articulate China strategy that Company s seeks to enhance its position in the world’s largest pork market • Potential strategic initiatives include: • Sell U.S. pork in the form of carcasses and higher value parts • Market Smithfield brands to Chinese consumers, as Hormel has done very successfully , y y • Hormel branded products are found in almost all major Chinese supermarkets and sell at twice the value of local brands • Selective investments in China’s pork industry with best-in-class local partners World Pork Production(1) h World Pork Consumption(1) h 49% 22% 10% 3% 15% China EU Other U.S. Brazil 50% 21% 8% 3% 19% China Other U.S. Russia 24 Current strategy undervalues importance of Chinese Market EU Source: U.S. Census Bureau, Statistical Abstract of the United States: 2012. Data represents 2010 figures. |
|
|
3 Highest Management Compensation Among Peers Despite bottom of industry performance, SFD has the highest management compensation amongst peers $46.8 $25.2 $24.5 Last Fiscal Year $141.6 $100.4 $82.3 Last 5 Years Aggregate Source: Company filings. Note: Dollars in millions. 25 |
|
|
3 Management Compensation – A Disconnect with Shareholder Returns Since Larry Pope took over as CEO in September 2006, he has been paid a total of $58.7mm and senior management has been compensated a total of $172mm $154 $166 $160 $180 $ of Value Created per $ of CEO Salary Earned(1) • On a per year basis for Larry Pope, this is $9.8mm, or 37% higher than the average annual compensation of the CEOs of SFD’s three main competitors during their tenures $133 $100 $120 $140 • At the same time, each of these other companies’ CEOs has created significant shareholder value since they became CEO, as evidenced by the adjoining graph While their compensation plan so $40 $60 $80 SFD has altered that it is better tied to shareholder return, we believe it does not go far enough in aligning interests between management and shareholders $4 $0 $20 SFD (Larry Pope, 8/3/06) HRL (Jeffrey Ettinger 06) TSN (Donniue Smith 11/19/09) HSH (Sean Connolly 7/1/12) 26 Ettinger, 1/1/Smith, Connolly, Source: Company filings. (1) Defined as increase in market cap plus cumulative dividends under CEO tenure. |
|
|
3 Entrenched and Deficient Board of Directors No directors have any experience within a major branded consumer or packaged foods company No directors, other than former CEO Joe Luter and current CEO Larry Pope, have experience as a public company CEO Name Age Potential Concerns Joseph Luter III (Chairman) 74 Has been Chairman for 38 years Son is part of executive management team No directors have significant experience in corporate strategy or restructuring p g Melvin Wright (Director Emeritus) 83 No agribusiness experience; all financial services Carol Crawford (Director) 69 No agribusiness experience; largely academic and public service Qualification for compensation committee questionable Previously served as a Smithfield director from 1991-1998 Wendell Murphy (Director) 73 Has extensive business relationships with the Company; Not independent John Schwieters (Director) 72 No agribusiness experience; long time audit committee chairman Trible (Director) 65 Christopher Newport University has received over $10 million dollars from Smithfield and related i i I d d i bl Paul entities; Independence questionable Dr. Frank Royal (Director) 72 No agribusiness experience; is a medical doctor Qualification for compensation committee questionable David Nelson (Director) 53 No operating experience; career has been spent as sell-side agribusiness analyst Rabobank major lender to SFD; Independence questionable Source: Company reports and websites. j ; p q Margaret Lewis (Director) 58 No agribusiness experience; all healthcare Dr. Richard Crowder (Director) 72 27 |
|
|
The Case For the Continental Grain V l C ti Pl Value Creation Plan |
|
|
The Continental Grain Value Creation Plan Split three distinct companies Generate proceeds in excess of Activity Expected Impact Financial into – Divest 51% of Hog Production and select European assets – Continue to own Campofrio stake and Mexican assets I tit t l di id d 1 $1billion to reinvest in additional share repurchases Dividend payout ratio in line with peers implies $75mm or $0.50 per Operational Institute annual dividend Restructure to achieve peer average profitability levels Create optionality for packaged meats business as a standalone 2 p p p share Improve margins and EBITDA by up to ~150 bps or ~ $100 million Achieve valuation multiple in line p enterprise or as a sale to a larger competitor Immediately add 3 board members whose background and experience properly reflects S ithfi ld’ t b i th ft ti t t th / b d h p with premium packaged foods peers Governance Smithfield’s current business; thereafter continue to strengthen renew board each year Improve management depth in several business units Further align management compensation with shareholder return Strengthen/renew Board and management of Campofrio in order to drive turnaround 3 29 We believe our plan, if executed appropriately, will achieve a stock price for SFD of $40 per share in 3 years(1) Source: Continental Grain Company estimates. (1) See slide 33. |
|
|
1 Hog Production Divestiture Considerations Plan and Rationale Illustrative Valuation of Hog Production • For sake of conservatism, valuing off 20 Year Historical average, vs. 37- f Last 20 Year Avg. P&L Avg. P&L per Hog $2.19 • SFD sells majority stake (51%) in order to de-consolidate from financials • Allows SFD shareholders to share Business’s year average of $6.88 highlighted by SFD in April 2013 Investor Presentation Annual Hogs Sold (mm) 15.8 FY'12 D&A 72 Illustrative ~$100 in the improvement and creates optionality for full sale • Universe of potential partners would include large hog producers who have EBITDA Illustrative Multiple 4.0x $400 5.0x $500 g gp production expertise and/or Asian based investors with an interest in a guaranteed pork supply • Ensure supply post transaction via i f l Gross Proceeds to SFD: $200 - $250 mm Based on historical industry margins and Smithfield’s historical production, Wall Street analysts value Hog Production value at 4.0x – 5.0x(1) execution of a supply agreement 30 y g p we believe Hog Production could be worth between $400 and $500 million, and generate immediate proceeds of +$200 million to Smithfield assuming 51% sale Source: Bank of America, Credit Suisse, and JPMorgan research. |
|
|
1 International Segment Divestiture Considerations Smithfield European Assets (Poland, Romania, U.K.) International Peer Multiples (EV / LTM EBITDA) • Romania/Poland assets contribute 94% of segment revenue; estimated ~$150mm in EBITDA • Based on International segment LTM EBITDA of ~$160 million 6.0x Bell AG • Given obvious linkages between Mexican JVs and core business, it would be retained 5.9x Campofrio Plan for Campofrio A i i l d hi db d ih 5.4x HKScan Oyj • Appoint executive leadership and board with relevant European CPG experience • Board membership is a distraction to Smithfield executives; should resign in favor of handpicked representatives with experience Wall Street analysts value International Segment at 4.5x – 7.0x(1) turnaround • Smithfield to work with Oaktree (24% owner) to restructure Campofrio and position for a potential sale to a European strategic bidder 31 We believe the European assets could be worth up to $1 billion and divesting would remove a distraction and allow Smithfield to reinvest the proceeds in its core business Source: FactSet as of 4/19/2013. Per Bank of America, Credit Suisse, and JPMorgan research. |
|
|
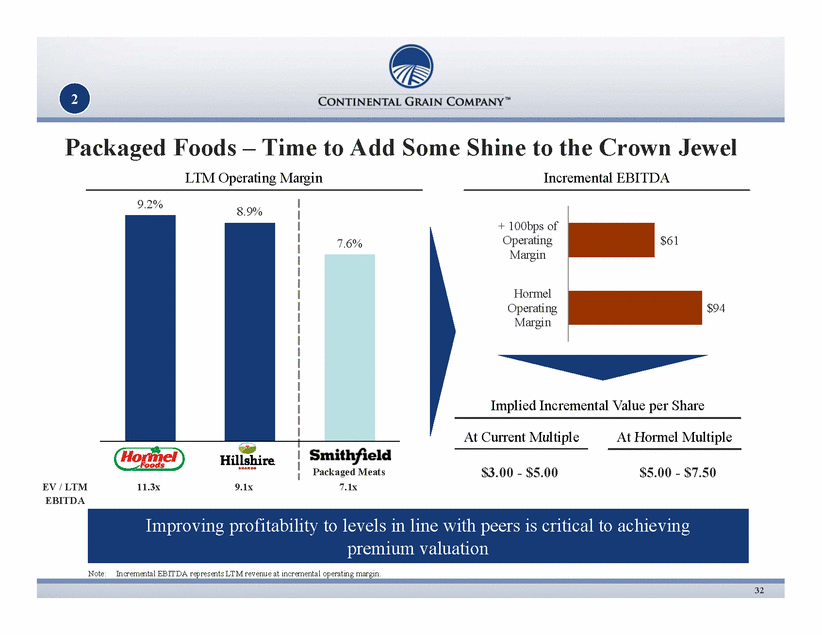
2 Packaged Foods – Time to Add Some Shine to the Crown Jewel LTM Operating Margin Incremental EBITDA 9.2% 8.9% 7.6% $61 + 100bps of Operating Margin $94 Hormel Operating Margin At Current Multiple At Hormel Implied Incremental Value per Share Hormel Hillshire Smithfield Packaged Meats Packaged Meats EV / LTM EBITDA 11.3x 9.1x 7.1x Multiple $3.00 - $5.00 $5.00 - $7.50 32 Note: Incremental EBITDA represents LTM revenue at incremental operating margin. Improving profitability to levels in line with peers is critical to achieving premium valuation |
|
|
Putting it All TogetherCreating a “Must Own” Stock $55.00 Change of control transaction at a 30% $25.44 $1.50 $6.00 $3.50 $5.50 $42.00 premium Implies ~65% appreciation to current share price Current Price Sell 51% of Hog Production Divest European Assets Restructuring Multiple Expansion Illustrative Share Price Hog Production is contributed to a JV Standalone packaged meats business is restructured to bring margins inline with top peers 1 2 3 Select international assets are divested and proceeds are used to repurchase shares ~11x EV / LTM EBITDA multiple 4 and de-consolidated; proceeds are used to repurchase shares p g business is restructured to bring margins inline with top peers and proceeds are used to repurchase shares p (in line with Hormel) following restructuring as SFD achieves peer level of efficiency and accompanying valuation l i 33 We believe successful execution of the Continental Grain Value Creation Plan will expand the Company’s valuation multiple and lead to significant gains for all Smithfield stakeholders valuation |


