UNITED STATES
SECURITIES AND EXCHANGE COMMISSION
Washington, D.C. 20549
Form 6-K
REPORT OF FOREIGN PRIVATE ISSUER
PURSUANT TO RULE 13a-16 OR 15d-16 UNDER
THE SECURITIES EXCHANGE ACT OF 1934
For the month of October 2019
Commission File Number: 001-36898
COLLIERS INTERNATIONAL GROUP INC.
(Translation of registrant's name into English)
1140 Bay Street, Suite 4000
Toronto, Ontario, Canada
M5S 2B4
(Address of principal executive office)
Indicate by check mark whether the registrant files or will file annual reports under cover of Form 20-F or Form 40-F.
Form 20-F [ ] Form 40-F [ X ]
Indicate by check mark if the registrant is submitting the Form 6-K in paper as permitted by Regulation S-T Rule 101(b)(1): [ ]
Indicate by check mark if the registrant is submitting the Form 6-K in paper as permitted by Regulation S-T Rule 101(b)(7): [ ]
Indicate by check mark whether by furnishing the information contained in this Form, the Registrant is also thereby furnishing the information to the Commission pursuant to Rule 12g3-2(b) under the Securities Exchange Act of 1934:
Yes [ ] No [X]
If “Yes” is marked, indicate the file number assigned to the Registrant in connection with Rule 12g3-2(b): N/A
SIGNATURE
Pursuant to the requirements of the Securities Exchange Act of 1934, the registrant has duly caused this report to be signed on its behalf by the undersigned, thereunto duly authorized.
COLLIERS INTERNATIONAL GROUP INC. | ||
Date: October 29, 2019 | /s/ John B. Friedrichsen | |
Name: John B. Friedrichsen | ||
Title: Chief Financial Officer | ||
EXHIBIT INDEX
EXHIBIT 99.1
Colliers International Reports Third Quarter Results
Solid operating results with higher margins
Operating highlights:
Three months ended | Nine months ended | ||||||||||
September 30 | September 30 | ||||||||||
(in millions of US$, except EPS) | 2019 | 2018 | 2019 | 2018 | |||||||
Revenues | $ | 736.9 | $ | 715.7 | $ | 2,117.5 | $ | 1,935.5 | |||
Adjusted EBITDA (note 1) | 84.3 | 72.7 | 215.2 | 178.2 | |||||||
Adjusted EPS (note 2) | 1.04 | 0.92 | 2.65 | 2.32 | |||||||
GAAP operating earnings | 48.2 | 42.0 | 118.8 | 103.3 | |||||||
GAAP EPS | 0.74 | 0.41 | 1.37 | 1.13 |
TORONTO, Oct. 29, 2019 (GLOBE NEWSWIRE) -- Colliers International Group Inc. (NASDAQ: CIGI) (TSX: CIGI) today reported operating and financial results for its third quarter ended September 30, 2019. All amounts are in US dollars.
Revenues for the third quarter were $736.9 million, a 3% increase (5% in local currency) relative to the same quarter in the prior year, adjusted EBITDA (note 1) was $84.3 million, up 16% (18% in local currency) and adjusted EPS (note 2) was $1.04, a 13% increase versus the prior year quarter. Third quarter adjusted EPS would have been approximately $0.03 higher excluding foreign exchange impacts. GAAP operating earnings were $48.2 million, relative to $42.0 million in the prior year period. GAAP diluted net earnings per common share was $0.74 in the quarter, up 80% versus $0.41 per share for the same quarter a year ago with the increase impacted by a reduction in non-controlling interest redemption increment stemming from translation of Euro-denominated non-controlling interests. Third quarter GAAP EPS would have been approximately $0.03 higher excluding changes in foreign exchange rates.
For the nine months ended September 30, 2019, revenues were $2.1 billion, a 9% increase (12% in local currency) relative to the comparable prior year period, adjusted EBITDA was $215.2 million, up 21% (23% in local currency) and adjusted EPS was $2.65, a 14% increase versus the prior year period. Year-to-date adjusted EPS would have been approximately $0.08 higher excluding foreign exchange impacts. GAAP operating earnings were $118.8 million, relative to $103.3 million in the prior year period. GAAP diluted net earnings per common share for the nine month period was $1.37, compared to $1.13 per share in the prior year period. Year-to-date GAAP EPS would have been approximately $0.08 higher excluding changes in foreign exchange rates.
“Colliers delivered solid operating results with higher margins for the third quarter. Year-to-date internal revenue growth was 4%, in line with our full-year expectations. Given our performance over the first nine months and our current outlook, we expect to finish the year strongly,” said Jay S. Hennick, Chairman and CEO of Colliers International. “Earlier this month, we completed the strategic acquisition of Synergy Property Development Services, the leader in project management services in India. Synergy will merge with our existing operations in India under the Colliers International brand and will take its place as one of the top players in one of the world’s fastest growing economies. So far this year we have completed four acquisitions which, together with internal growth, puts us on-track to meet or exceed our five year target to double our size by the end of 2020,” he concluded.
About Colliers International Group Inc.
Colliers International (NASDAQ, TSX: CIGI) is a leading global real estate services and investment management company. With operations in 68 countries, our 14,000 enterprising people work collaboratively to provide expert advice and services to maximize the value of property for real estate occupiers, owners and investors. For more than 20 years, our experienced leadership team, owning approximately 40% of our equity, have delivered industry-leading investment returns for shareholders. In 2018, corporate revenues were $2.8 billion ($3.3 billion including affiliates), with more than $26 billion of assets under management.
Learn more about how we accelerate success at corporate.colliers.com, Twitter @Colliers or LinkedIn.
Consolidated Revenues by Line of Service
Three months ended | Nine months ended | |||||||||||||||
(in thousands of US$) | September 30 | Growth | Growth | September 30 | Growth | Growth | ||||||||||
(LC = local currency) | 2019 | 2018 | in US$ % | in LC % | 2019 | 2018 | in US$ % | in LC % | ||||||||
Outsourcing & Advisory | $ | 277,741 | $ | 258,673 | 7% | 10% | $ | 817,763 | $ | 755,882 | 8% | 12% | ||||
Lease Brokerage | 218,754 | 229,294 | -5% | -3% | 653,912 | 618,692 | 6% | 8% | ||||||||
Sales Brokerage | 200,515 | 195,925 | 2% | 4% | 515,983 | 523,872 | -2% | 1% | ||||||||
Investment Management | 39,873 | 31,829 | 25% | 26% | 129,865 | 37,098 | NM | NM | ||||||||
Total revenues | $ | 736,883 | $ | 715,721 | 3% | 5% | $ | 2,117,523 | $ | 1,935,544 | 9% | 12% | ||||
Consolidated revenues for the third quarter grew 5% on a local currency basis, with significant contributions from Outsourcing & Advisory and Investment Management. Consolidated internal revenue growth in local currencies was 2% (note 3), led by Outsourcing & Advisory as well as Investment Management, offset by modest declines in Lease Brokerage against a strong prior year quarter.
For the nine months ended September 30, 2019, consolidated revenues grew 12% on a local currency basis, with significant contributions from Investment Management and Outsourcing & Advisory. Year-to-date consolidated internal revenue growth in local currencies was 4%, led by Outsourcing & Advisory and Lease Brokerage.
Segmented Third Quarter Results
The Americas region’s revenues totalled $424.3 million for the third quarter compared to $404.6 million in the prior year quarter, up 5% (5% in local currency). Local currency revenue growth was 5% all from acquisitions, with 8% internal growth in Outsourcing & Advisory offset by a decline in Lease Brokerage. In the comparative prior year quarter, internal revenue growth was a very strong 9% balanced among service lines. Adjusted EBITDA was $38.8 million, versus $33.3 million in the prior year quarter, with margins higher due to service mix and lower discretionary expenses. GAAP operating earnings were $26.5 million, versus $24.4 million in the prior year period.
EMEA region revenues totalled $138.8 million for the third quarter, down 5% (-1% in local currency) compared to $146.3 million in the prior year quarter, comprised of a local currency internal decline of 3% offset by 2% growth from acquisitions. Internal revenues were impacted by a decline in Lease Brokerage for the quarter mostly due to timing, with a significant number of transactions expected to be recorded in the fourth quarter. Adjusted EBITDA was $12.6 million, versus $17.3 million in the prior year quarter, with the decline attributable to lower revenues and service mix. GAAP operating earnings were $5.1 million, versus $9.4 million in the prior year quarter.
Asia Pacific region revenues totalled $133.5 million for the third quarter compared to $132.5 million in the prior year quarter, up 1% (5% in local currency). Local currency internal revenue growth was 4%, led by Outsourcing & Advisory, with 1% growth from acquisitions. Adjusted EBITDA was $18.6 million, relative to $17.8 million in the prior year quarter. GAAP operating earnings were $17.2 million, versus $16.2 million in the prior year quarter.
Investment Management revenues for the third quarter were $39.9 million compared to $31.8 million in the prior year quarter, up 25%. Local currency revenue growth of 26% was all internally generated and reflected incremental management fees from new capital commitments completed year to date. Pass-through revenue from historical carried interest represented $0.5 million for the third quarter versus $2.1 million in the prior year quarter. Adjusted EBITDA was $15.9 million relative to $9.6 million in the prior year quarter. Operating earnings, which are impacted by acquisition-related intangible asset amortization, were $9.3 million in the quarter, versus $2.4 million in the prior year quarter. Assets under management stood at $30.6 billion as of September 30, 2019, up 18% from $25.9 billion in the third quarter of 2018.
Unallocated global corporate costs as reported in adjusted EBITDA were $1.7 million in the third quarter, relative to $5.3 million in the prior year period. The corporate GAAP operating loss for the third quarter was $10.0 million, relative to $10.4 million in the prior period.
Conference Call
Colliers will be holding a conference call on Tuesday, October 29, 2019 at 11:00 a.m. Eastern Time to discuss the quarter’s results. The call, as well as a supplemental slide presentation, will be simultaneously web cast and can be accessed live or after the call at corporate.colliers.com in the Events section.
Adoption of New Lease Accounting Standard
On January 1, 2019, the Company adopted FASB Accounting Standard Codification Topic 842, Leases (“ASC 842”). ASC 842 requires the recognition of operating lease right-of-use assets and lease liabilities for virtually all premise and equipment leases on the consolidated balance sheet, with no impact on earnings. The Company adopted ASC 842 effective January 1, 2019 without adjusting comparative periods and recorded a $261.3 million right-of-use asset and corresponding $294.6 million lease liability as of September 30, 2019.
Forward-looking Statements
This press release includes or may include forward-looking statements. Forward-looking statements include the Company’s financial performance outlook and statements regarding goals, beliefs, strategies, objectives, plans or current expectations. These statements involve known and unknown risks, uncertainties and other factors which may cause the actual results to be materially different from any future results, performance or achievements contemplated in the forward-looking statements. Such factors include: economic conditions, especially as they relate to commercial and consumer credit conditions and business spending; commercial real estate property values, vacancy rates and general conditions of financial liquidity for real estate transactions; the effects of changes in foreign exchange rates in relation to the US dollar on Canadian dollar, Euro, Australian dollar and UK pound sterling denominated revenues and expenses; competition in markets served by the Company; labor shortages or increases in commission, wage and benefit costs; disruptions or security failures in information technology systems; and political conditions or events, including elections, referenda, changes to international trade and immigration policies, and any outbreak or escalation of terrorism or hostilities.
Additional factors and explanatory information are identified in the Company’s Annual Information Form for the year ended December 31, 2018 under the heading “Risk Factors” (which factors are adopted herein and a copy of which can be obtained at www.sedar.com) and other periodic filings with Canadian and US securities regulators. Forward looking statements contained in this press release are made as of the date hereof and are subject to change. All forward-looking statements in this press release are qualified by these cautionary statements. Except as required by applicable law, Colliers undertakes no obligation to publicly update or revise any forward-looking statement, whether as a result of new information, future events or otherwise.
Summary financial information is provided in this press release. This press release should be read in conjunction with the Company's quarterly financial statements and MD&A to be made available on SEDAR at www.sedar.com.
Notes
1. Reconciliation of net earnings to adjusted EBITDA:
Adjusted EBITDA is defined as net earnings, adjusted to exclude: (i) income tax; (ii) other expense (income); (iii) interest expense; (iv) depreciation and amortization; (v) acquisition-related items; (vi) restructuring costs and (vii) stock-based compensation expense. We use adjusted EBITDA to evaluate our own operating performance and our ability to service debt, as well as an integral part of our planning and reporting systems. Additionally, we use this measure in conjunction with discounted cash flow models to determine the Company’s overall enterprise valuation and to evaluate acquisition targets. We present adjusted EBITDA as a supplemental measure because we believe such measure is useful to investors as a reasonable indicator of operating performance because of the low capital intensity of the Company’s service operations. We believe this measure is a financial metric used by many investors to compare companies, especially in the services industry. This measure is not a recognized measure of financial performance under GAAP in the United States, and should not be considered as a substitute for operating earnings, net earnings or cash flow from operating activities, as determined in accordance with GAAP. Our method of calculating adjusted EBITDA may differ from other issuers and accordingly, this measure may not be comparable to measures used by other issuers. A reconciliation of net earnings to adjusted EBITDA appears below.
Three months ended | Nine months ended | |||||||||||||||
(in thousands of US$) | September 30 | September 30 | ||||||||||||||
2019 | 2018 | 2019 | 2018 | |||||||||||||
Net earnings | $ | 28,673 | $ | 25,384 | $ | 69,711 | $ | 62,727 | ||||||||
Income tax | 12,868 | 10,257 | 27,270 | 27,832 | ||||||||||||
Other income, net | (663 | ) | (581 | ) | (985 | ) | (1,041 | ) | ||||||||
Interest expense, net | 7,298 | 6,896 | 22,775 | 13,753 | ||||||||||||
Operating earnings | 48,176 | 41,956 | 118,771 | 103,271 | ||||||||||||
Depreciation and amortization | 22,835 | 23,161 | 69,281 | 55,303 | ||||||||||||
Acquisition-related items | 8,867 | 6,271 | 18,765 | 14,265 | ||||||||||||
Restructuring costs | 2,826 | - | 3,141 | 416 | ||||||||||||
Stock-based compensation expense | 1,558 | 1,277 | 5,199 | 4,978 | ||||||||||||
Adjusted EBITDA | $ | 84,262 | $ | 72,665 | $ | 215,157 | $ | 178,233 | ||||||||
2. Reconciliation of net earnings and diluted net earnings per common share to adjusted net earnings and adjusted earnings per share:
Adjusted earnings per share is defined as diluted net earnings per common share, adjusted for the effect, after income tax, of: (i) the non-controlling interest redemption increment; (ii) amortization expense related to intangible assets recognized in connection with acquisitions; (iii) acquisition-related items; (iv) restructuring costs and (v) stock-based compensation expense. We believe this measure is useful to investors because it provides a supplemental way to understand the underlying operating performance of the Company and enhances the comparability of operating results from period to period. Adjusted earnings per share is not a recognized measure of financial performance under GAAP, and should not be considered as a substitute for diluted net earnings per share, as determined in accordance with GAAP. Our method of calculating this non-GAAP measure may differ from other issuers and, accordingly, this measure may not be comparable to measures used by other issuers. A reconciliation of net earnings to adjusted net earnings and of diluted net earnings per share to adjusted earnings per share appears below.
Three months ended | Nine months ended | |||||||||||||||
(in thousands of US$) | September 30 | September 30 | ||||||||||||||
2019 | 2018 | 2019 | 2018 | |||||||||||||
Net earnings | $ | 28,673 | $ | 25,384 | $ | 69,711 | $ | 62,727 | ||||||||
Non-controlling interest share of earnings | (6,069 | ) | (4,073 | ) | (13,900 | ) | (8,290 | ) | ||||||||
Amortization of intangible assets | 14,878 | 15,255 | 44,835 | 32,624 | ||||||||||||
Acquisition-related items | 8,867 | 6,271 | 18,765 | 14,265 | ||||||||||||
Restructuring costs | 2,826 | - | 3,141 | 416 | ||||||||||||
Stock-based compensation expense | 1,558 | 1,277 | 5,199 | 4,978 | ||||||||||||
Income tax on adjustments | (6,524 | ) | (5,440 | ) | (14,740 | ) | (10,413 | ) | ||||||||
Non-controlling interest on adjustments | (2,507 | ) | (1,929 | ) | (7,099 | ) | (3,979 | ) | ||||||||
Adjusted net earnings | $ | 41,702 | $ | 36,745 | $ | 105,912 | $ | 92,328 | ||||||||
Three months ended | Nine months ended | |||||||||||||||
(in US$) | September 30 | September 30 | ||||||||||||||
2019 | 2018 | 2019 | 2018 | |||||||||||||
Diluted net earnings per common share | $ | 0.74 | $ | 0.41 | $ | 1.37 | $ | 1.13 | ||||||||
Non-controlling interest redemption increment | (0.18 | ) | 0.13 | 0.02 | 0.24 | |||||||||||
Amortization of intangible assets, net of tax | 0.23 | 0.23 | 0.69 | 0.52 | ||||||||||||
Acquisition-related items | 0.16 | 0.12 | 0.38 | 0.30 | ||||||||||||
Restructuring costs, net of tax | 0.05 | - | 0.06 | 0.01 | ||||||||||||
Stock-based compensation expense, net of tax | 0.04 | 0.03 | 0.13 | 0.12 | ||||||||||||
Adjusted earnings per share | $ | 1.04 | $ | 0.92 | $ | 2.65 | $ | 2.32 | ||||||||
3. Local currency revenue growth rate and internal revenue growth
Percentage revenue variances presented on a local currency basis are calculated by translating the current period results of our non-US dollar denominated operations to US dollars using the foreign currency exchange rates from the periods against which the current period results are being compared. Percentage revenue variances presented on an internal growth basis are calculated assuming no impact from acquired entities in the current and prior periods. Revenue from acquired entities, including any foreign exchange impacts, are treated as acquisition growth until the respective anniversaries of the acquisitions. We believe that these revenue growth rate methodologies provide a framework for assessing the Company’s performance and operations excluding the effects of foreign currency exchange rate fluctuations and acquisitions. Since these revenue growth rate measures are not calculated under GAAP, they may not be comparable to similar measures used by other issuers.
4. Assets under management
We use the term assets under management (“AUM”) as a measure of the scale of our Investment Management operations. AUM is defined as the gross market value of operating assets and the projected gross cost of development properties of the funds, partnerships and accounts to which we provide management and advisory services, including capital that such funds, partnerships and accounts have the right to call from investors pursuant to capital commitments. Our definition of AUM may differ from those used by other issuers and as such may not be directly comparable to similar measures used by other issuers.
COLLIERS INTERNATIONAL GROUP INC. | |||||||||||||||||
Condensed Consolidated Statements of Earnings | |||||||||||||||||
(in thousands of US dollars, except per share amounts) | |||||||||||||||||
Three months | Nine months | ||||||||||||||||
ended September 30 | ended September 30 | ||||||||||||||||
(unaudited) | 2019 | 2018 | 2019 | 2018 | |||||||||||||
Revenues | $ | 736,883 | $ | 715,721 | $ | 2,117,523 | $ | 1,935,544 | |||||||||
Cost of revenues | 477,365 | 472,079 | 1,382,933 | 1,265,104 | |||||||||||||
Selling, general and administrative expenses | 179,640 | 172,254 | 527,773 | 497,601 | |||||||||||||
Depreciation | 7,957 | 7,906 | 24,446 | 22,679 | |||||||||||||
Amortization of intangible assets | 14,878 | 15,255 | 44,835 | 32,624 | |||||||||||||
Acquisition-related items (1) | 8,867 | 6,271 | 18,765 | 14,265 | |||||||||||||
Operating earnings | 48,176 | 41,956 | 118,771 | 103,271 | |||||||||||||
Interest expense, net | 7,298 | 6,896 | 22,775 | 13,753 | |||||||||||||
Other income | (663 | ) | (581 | ) | (985 | ) | (1,041 | ) | |||||||||
Earnings before income tax | 41,541 | 35,641 | 96,981 | 90,559 | |||||||||||||
Income tax expense | 12,868 | 10,257 | 27,270 | 27,832 | |||||||||||||
Net earnings | 28,673 | 25,384 | 69,711 | 62,727 | |||||||||||||
Non-controlling interest share of earnings | 6,069 | 4,073 | 13,900 | 8,290 | |||||||||||||
Non-controlling interest redemption increment | (7,043 | ) | 5,125 | 919 | 9,439 | ||||||||||||
Net earnings attributable to Company | $ | 29,647 | $ | 16,186 | $ | 54,892 | $ | 44,998 | |||||||||
Net earnings per common share | |||||||||||||||||
Basic | $ | 0.75 | $ | 0.41 | $ | 1.39 | $ | 1.15 | |||||||||
Diluted | $ | 0.74 | $ | 0.41 | $ | 1.37 | $ | 1.13 | |||||||||
Adjusted earnings per share (2) | $ | 1.04 | $ | 0.92 | $ | 2.65 | $ | 2.32 | |||||||||
Weighted average common shares (thousands) | |||||||||||||||||
Basic | 39,608 | 39,198 | 39,481 | 39,139 | |||||||||||||
Diluted | 40,029 | 39,934 | 39,938 | 39,821 | |||||||||||||
Notes to Condensed Consolidated Statements of Earnings
(1) Acquisition-related items include transaction costs, contingent acquisition consideration fair value adjustments, and contingent acquisition consideration-related compensation expense.
(2) See definition and reconciliation above.
Condensed Consolidated Balance Sheets | |||||||||
(in thousands of US dollars) | |||||||||
(unaudited) | September 30, 2019 | December 31, 2018 | September 30, 2018 | ||||||
Assets | |||||||||
Cash and cash equivalents | $ | 101,676 | $ | 127,032 | $ | 114,737 | |||
Accounts receivable and contract assets | 352,574 | 554,700 | 495,255 | ||||||
Prepaids and other assets | 150,309 | 78,581 | 80,710 | ||||||
Current assets | 604,559 | 760,313 | 690,702 | ||||||
Other non-current assets | 81,267 | 83,765 | 86,616 | ||||||
Fixed assets | 101,392 | 93,483 | 89,234 | ||||||
Operating lease right-of-use assets | 261,277 | - | - | ||||||
Deferred income tax | 40,084 | 34,195 | 38,631 | ||||||
Goodwill and intangible assets | 1,351,336 | 1,385,824 | 1,398,056 | ||||||
Total assets | $ | 2,439,915 | $ | 2,357,580 | $ | 2,303,239 | |||
Liabilities and shareholders' equity | |||||||||
Accounts payable and accrued liabilities | $ | 578,591 | $ | 720,938 | $ | 584,331 | |||
Other current liabilities | 61,542 | 75,929 | 66,597 | ||||||
Long-term debt - current | 6,507 | 1,834 | 2,415 | ||||||
Operating lease liabilities - current | 69,551 | - | - | ||||||
Current liabilities | 716,191 | 798,701 | 653,343 | ||||||
Long-term debt - non-current | 604,361 | 670,289 | 818,113 | ||||||
Operating lease liabilities - non-current | 225,060 | - | - | ||||||
Other liabilities | 92,743 | 125,706 | 125,211 | ||||||
Deferred income tax | 21,118 | 27,550 | 28,042 | ||||||
Redeemable non-controlling interests | 323,362 | 343,361 | 334,910 | ||||||
Shareholders' equity | 457,080 | 391,973 | 343,620 | ||||||
Total liabilities and equity | $ | 2,439,915 | $ | 2,357,580 | $ | 2,303,239 | |||
Supplemental balance sheet information | |||||||||
Total debt | $ | 610,868 | $ | 672,123 | $ | 820,528 | |||
Total debt, net of cash | 509,192 | 545,091 | 705,791 | ||||||
Net debt / pro forma adjusted EBITDA ratio | 1.5 | 1.6 | 2.2 | ||||||
Consolidated Statements of Cash Flows | ||||||||||||||||
(in thousands of US dollars) | ||||||||||||||||
Three months ended | Nine months ended | |||||||||||||||
September 30 | September 30 | |||||||||||||||
(unaudited) | 2019 | 2018 | 2019 | 2018 | ||||||||||||
Cash provided by (used in) | ||||||||||||||||
Operating activities | ||||||||||||||||
Net earnings | $ | 28,673 | $ | 25,384 | $ | 69,711 | $ | 62,727 | ||||||||
Items not affecting cash: | ||||||||||||||||
Depreciation and amortization | 22,835 | 23,161 | 69,281 | 55,303 | ||||||||||||
Deferred income tax | (2,941 | ) | 1,406 | (9,985 | ) | 2,805 | ||||||||||
Other | 15,935 | 10,563 | 46,577 | 27,106 | ||||||||||||
64,502 | 60,514 | 175,584 | 147,941 | |||||||||||||
Net change from assets/liabilities | ||||||||||||||||
Accounts receivable and contract assets | (7,851 | ) | (31,538 | ) | 14,217 | 16,793 | ||||||||||
Prepaids and other assets | (6,407 | ) | (2,100 | ) | (16,782 | ) | (7,401 | ) | ||||||||
Payables and accruals | 36,654 | 74,210 | (167,097 | ) | (83,674 | ) | ||||||||||
Other | 1,716 | (1,380 | ) | 5,280 | (923 | ) | ||||||||||
Contingent acquisition consideration paid | (499 | ) | (1,509 | ) | (5,712 | ) | (4,365 | ) | ||||||||
Sale proceeds from AR facility, net of repurchases | (1,730 | ) | - | 117,695 | - | |||||||||||
Net cash provided by operating activities | 86,385 | 98,197 | 123,185 | 68,371 | ||||||||||||
Investing activities | ||||||||||||||||
Acquisition of businesses, net of cash acquired | - | (476,108 | ) | (23,677 | ) | (574,688 | ) | |||||||||
Disposition of business, net of cash disposed | - | 17,287 | - | 17,287 | ||||||||||||
Purchases of fixed assets | (7,245 | ) | (7,571 | ) | (31,309 | ) | (21,561 | ) | ||||||||
Cash collections on AR facility deferred purchase price | 7,827 | - | 15,164 | - | ||||||||||||
Other investing activities | (4,311 | ) | (3,913 | ) | (19,913 | ) | (21,873 | ) | ||||||||
Net cash used in investing activities | (3,729 | ) | (470,305 | ) | (59,735 | ) | (600,835 | ) | ||||||||
Financing activities | ||||||||||||||||
Increase in long-term debt, net | (70,124 | ) | 401,907 | (48,700 | ) | 574,268 | ||||||||||
Purchases of non-controlling interests, net | (4,063 | ) | - | (10,828 | ) | (73 | ) | |||||||||
Dividends paid to common shareholders | (1,979 | ) | (1,959 | ) | (3,940 | ) | (3,906 | ) | ||||||||
Distributions paid to non-controlling interests | (8,294 | ) | (3,544 | ) | (27,851 | ) | (16,147 | ) | ||||||||
Other financing activities | 4,376 | (8,805 | ) | 6,775 | (11,494 | ) | ||||||||||
Net cash provided by (used in) financing activities | (80,084 | ) | 387,599 | (84,544 | ) | 542,648 | ||||||||||
Effect of exchange rate changes on cash | (2,988 | ) | (5,000 | ) | (4,262 | ) | (3,970 | ) | ||||||||
Increase (decrease) in cash and cash equivalents | (416 | ) | 10,491 | (25,356 | ) | 6,214 | ||||||||||
Cash and cash equivalents, beginning of period | 102,092 | 104,246 | 127,032 | 108,523 | ||||||||||||
Cash and cash equivalents, end of period | $ | 101,676 | $ | 114,737 | $ | 101,676 | $ | 114,737 | ||||||||
Segmented Results | |||||||||||||||||||
(in thousands of US dollars) | |||||||||||||||||||
Asia | Investment | ||||||||||||||||||
(unaudited) | Americas | EMEA | Pacific | Management | Corporate | Consolidated | |||||||||||||
Three months ended September 30 | |||||||||||||||||||
2019 | |||||||||||||||||||
Revenues | $ | 424,258 | $ | 138,819 | $ | 133,512 | $ | 39,873 | $ | 421 | $ | 736,883 | |||||||
Adjusted EBITDA | 38,790 | 12,645 | 18,606 | 15,918 | (1,696 | ) | 84,262 | ||||||||||||
Operating earnings | 26,490 | 5,132 | 17,241 | 9,295 | (9,982 | ) | 48,176 | ||||||||||||
2018 | |||||||||||||||||||
Revenues | $ | 404,607 | $ | 146,339 | $ | 132,518 | $ | 31,829 | $ | 428 | $ | 715,721 | |||||||
Adjusted EBITDA | 33,279 | 17,325 | 17,805 | 9,580 | (5,324 | ) | 72,665 | ||||||||||||
Operating earnings | 24,396 | 9,364 | 16,201 | 2,422 | (10,427 | ) | 41,956 | ||||||||||||
Asia | Investment | ||||||||||||||||||
Americas | EMEA | Pacific | Management | Corporate | Consolidated | ||||||||||||||
Nine months ended September 30 | |||||||||||||||||||
2019 | |||||||||||||||||||
Revenues | $ | 1,204,472 | $ | 410,877 | $ | 370,926 | $ | 129,865 | $ | 1,383 | $ | 2,117,523 | |||||||
Adjusted EBITDA | 101,177 | 29,180 | 43,714 | 45,398 | (4,312 | ) | 215,157 | ||||||||||||
Operating earnings | 68,278 | 5,828 | 38,996 | 25,181 | (19,512 | ) | 118,771 | ||||||||||||
2018 | |||||||||||||||||||
Revenues | $ | 1,121,716 | $ | 406,352 | $ | 369,149 | $ | 37,098 | $ | 1,229 | $ | 1,935,544 | |||||||
Adjusted EBITDA | 95,911 | 39,533 | 44,388 | 8,399 | (9,998 | ) | 178,233 | ||||||||||||
Operating earnings | 71,203 | 14,945 | 39,046 | 1,220 | (23,143 | ) | 103,271 | ||||||||||||
COMPANY CONTACTS:
Jay S. Hennick
Chairman & CEO
John B. Friedrichsen
CFO
(416) 960-9500
Exhibit 99.2
Colliers International Group Inc. Third Quarter 2019 Financial Results October 29, 2019
Forward - Looking Statements This presentation includes or may include forward - looking statements. Forward - looking statements include the Company’s financial performance outlook and statements regarding goals, beliefs, strategies, objectives, plans or current expectations. These sta tem ents involve known and unknown risks, uncertainties and other factors which may cause the actual results to be materially different from a ny future results, performance or achievements contemplated in the forward - looking statements. Such factors include: economic conditions, especiall y as they relate to commercial and consumer credit conditions and business spending; commercial real estate property values, vacancy ra tes and general conditions of financial liquidity for real estate transactions; the effects of changes in foreign exchange rates in r ela tion to the US dollar on Canadian dollar, Australian dollar, UK pound sterling and Euro denominated revenues and expenses; competition in markets s erv ed by the Company; labor shortages or increases in commission, wage and benefit costs; disruptions or security failures in information tec hnology systems; and political conditions or events, including elections, referenda, changes to international trade and immigration p oli cies and any outbreak or escalation of terrorism or hostilities. Additional factors and explanatory information are identified in the Company’s Annual Information Form for the year ended Dec emb er 31, 2018 under the heading “Risk Factors” (which factors are adopted herein and a copy of which can be obtained at www.sedar.com) an d other periodic filings with Canadian and US securities regulators. Forward looking statements contained in this presentation are ma de as of the date hereof and are subject to change. All forward - looking statements in this press release are qualified by these cautionary stateme nts. Except as required by applicable law, Colliers undertakes no obligation to publicly update or revise any forward - looking statement, whethe r as a result of new information, future events or otherwise. Non - GAAP measures This presentation makes reference to the non - GAAP measures Adjusted EBITDA and Adjusted EPS. Please refer to Appendix for reconciliations to GAAP measures. 2
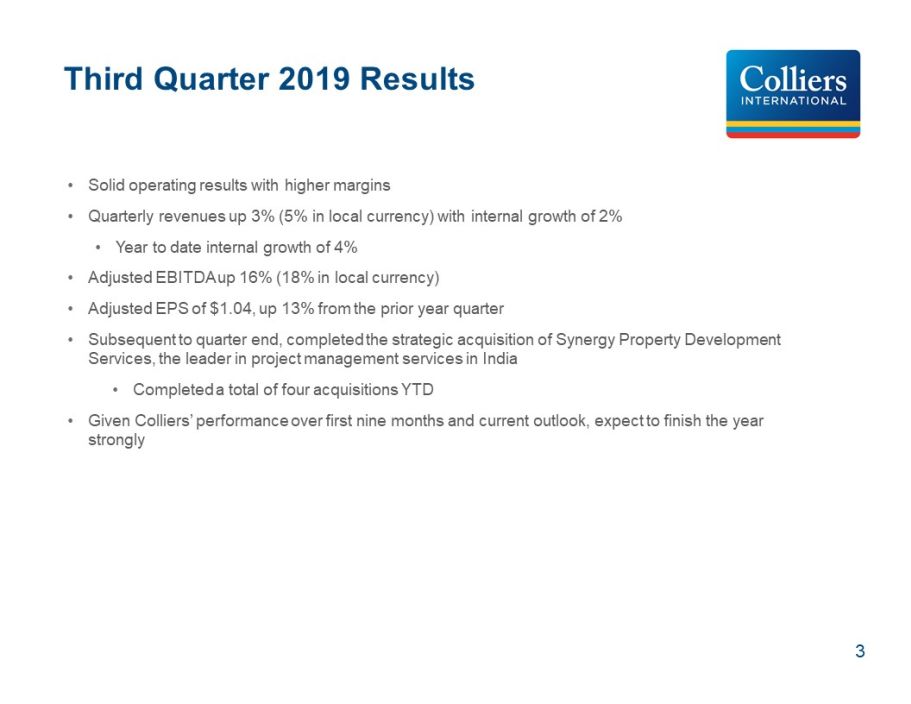
3 Third Quarter 2019 Results • Solid operating results with higher margins • Quarterly revenues up 3% (5% in local currency) with internal growth of 2% • Year to date internal growth of 4% • Adjusted EBITDA up 16% (18% in local currency) • Adjusted EPS of $1.04, up 13% from the prior year quarter • Subsequent to quarter end, completed the strategic acquisition of Synergy Property Development Services, the leader in project management services in India • Completed a total of four acquisitions YTD • Given performance over first nine months and current outlook, expect to finish the year strongly
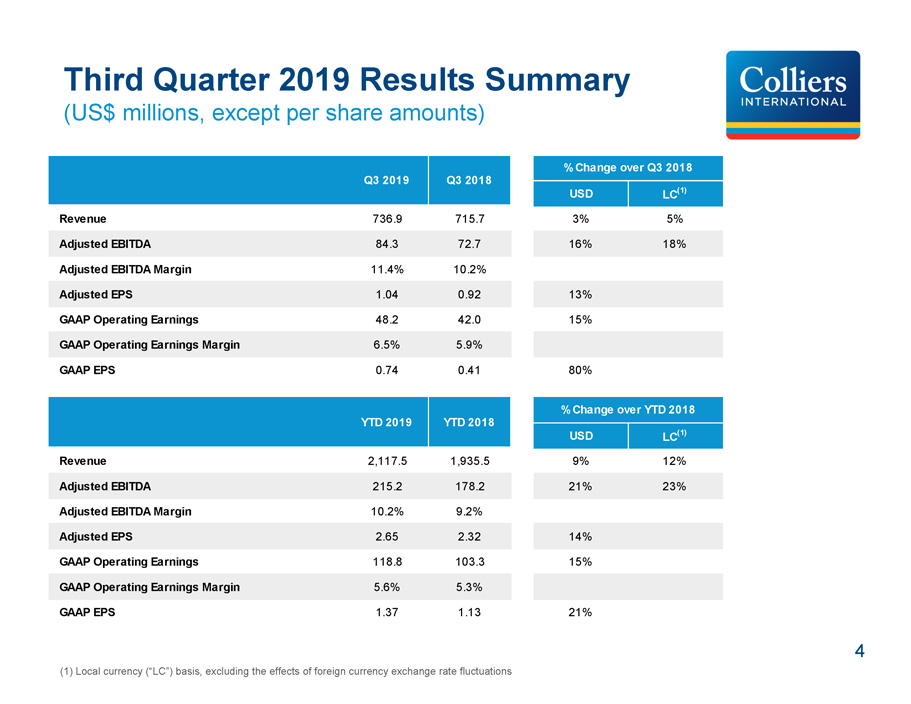
4 Third Quarter 2019 Results Summary (US$ millions, except per share amounts) (1) Local currency (“LC”) basis, excluding the effects of foreign currency exchange rate fluctuations USD LC (1) Revenue 736.9 715.7 3% 5% Adjusted EBITDA 84.3 72.7 16% 18% Adjusted EBITDA Margin 11.4% 10.2% Adjusted EPS 1.04 0.92 13% GAAP Operating Earnings 48.2 42.0 15% GAAP Operating Earnings Margin 6.5% 5.9% GAAP EPS 0.74 0.41 80% USD LC (1) Revenue 2,117.5 1,935.5 9% 12% Adjusted EBITDA 215.2 178.2 21% 23% Adjusted EBITDA Margin 10.2% 9.2% Adjusted EPS 2.65 2.32 14% GAAP Operating Earnings 118.8 103.3 15% GAAP Operating Earnings Margin 5.6% 5.3% GAAP EPS 1.37 1.13 21% Q3 2019 Q3 2018 % Change over Q3 2018 YTD 2019 YTD 2018 % Change over YTD 2018
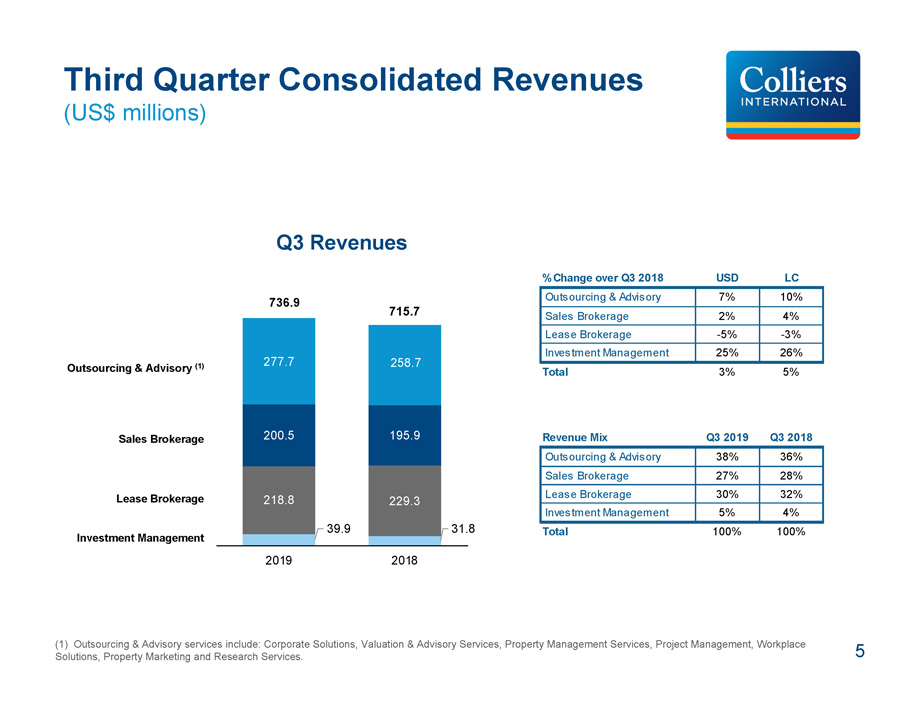
5 Third Quarter Consolidated Revenues (US$ millions) (1) Outsourcing & Advisory services include: Corporate Solutions, Valuation & Advisory Services, Property Management Service s, Project Management, Workplace Solutions, Property Marketing and Research Services. Q3 Revenues Outsourcing & Advisory (1) Sales Brokerage Lease Brokerage Investment Management 39.9 31.8 218.8 229.3 200.5 195.9 277.7 258.7 736.9 715.7 2019 2018 % Change over Q3 2018 USD LC Outsourcing & Advisory 7% 10% Sales Brokerage 2% 4% Lease Brokerage -5% -3% Investment Management 25% 26% Total 3% 5% Revenue Mix Q3 2019 Q3 2018 Outsourcing & Advisory 38% 36% Sales Brokerage 27% 28% Lease Brokerage 30% 32% Investment Management 5% 4% Total 100% 100%
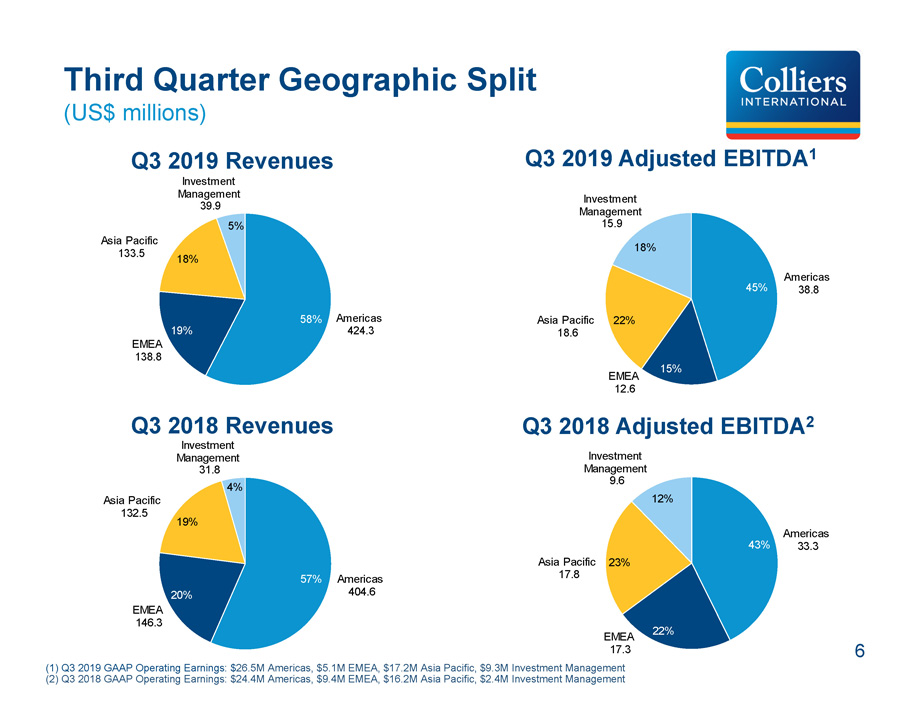
6 (1) Q3 2019 GAAP Operating Earnings: $ 26.5M Americas, $5.1M EMEA, $17.2M Asia Pacific, $9.3M Investment Management (2) Q3 2018 GAAP Operating Earnings: $24.4M Americas, $9.4M EMEA, $16.2M Asia Pacific, $2.4M Investment Management Q3 2019 Revenues Q3 2019 Adjusted EBITDA 1 Third Quarter Geographic Split (US$ millions) Q3 2018 Revenues Q3 2018 Adjusted EBITDA 2 58% 19% 18% 5% Americas 424.3 EMEA 138.8 Asia Pacific 133.5 Investment Management 39.9 43% 22% 12% 23% Americas 33.3 EMEA 17.3 Asia Pacific 17.8 Investment Management 9.6 57% 20% 19% 4% Americas 404.6 EMEA 146.3 Asia Pacific 132.5 Investment Management 31.8 45% 15% 22% 18% Americas 38.8 EMEA 12.6 Asia Pacific 18.6 Investment Management 15.9
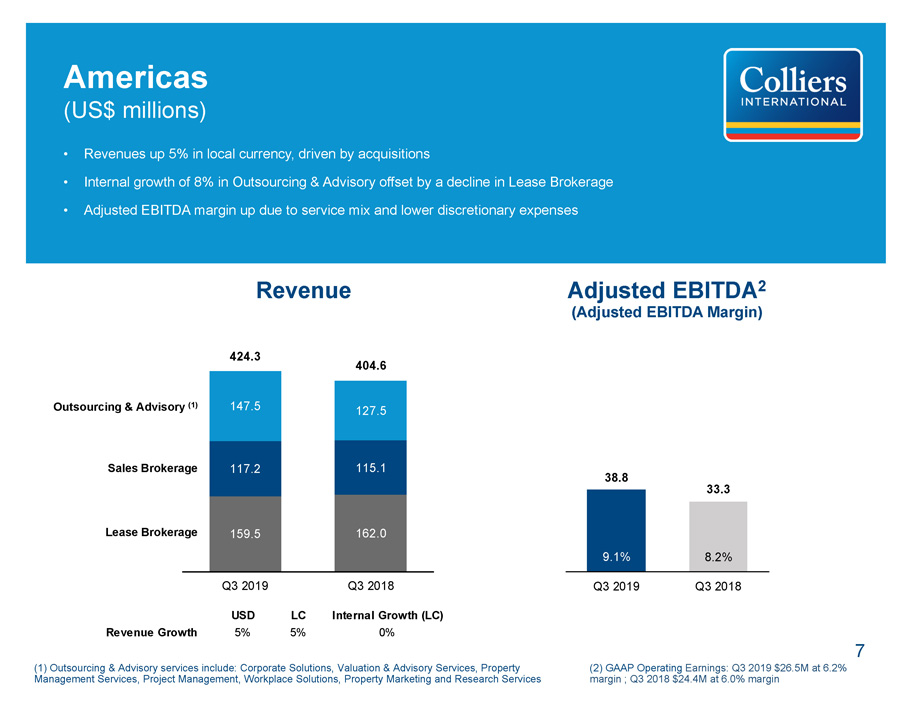
7 (1) Outsourcing & Advisory services include: Corporate Solutions, Valuation & Advisory Services, Property Management Services, Project Management, Workplace Solutions, Property Marketing and Research Services Americas (US$ millions) • Revenues up 5% in local currency, driven by acquisitions • Internal growth of 8% in Outsourcing & Advisory offset by a decline in Lease Brokerage • Adjusted EBITDA margin up due to service mix and lower discretionary expenses Outsourcing & Advisory (1) Sales Brokerage Lease Brokerage (2) GAAP Operating Earnings: Q3 2019 $26.5M at 6.2% margin ; Q3 2018 $24.4M at 6.0% margin Revenue Adjusted EBITDA 2 (Adjusted EBITDA Margin) 159.5 162.0 117.2 115.1 147.5 127.5 424.3 404.6 Q3 2019 Q3 2018 38.8 33.3 9.1% 8.2% Q3 2019 Q3 2018 USD LC Internal Growth (LC) Revenue Growth 5% 5% 0%
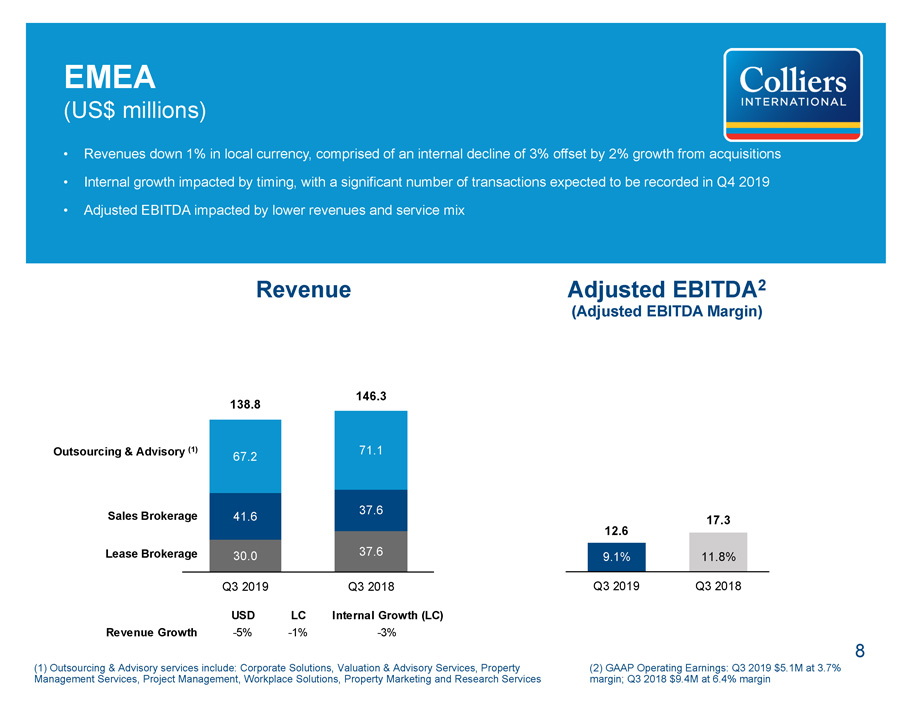
8 (1) Outsourcing & Advisory services include: Corporate Solutions, Valuation & Advisory Services, Property Management Services, Project Management, Workplace Solutions, Property Marketing and Research Services Revenue EMEA (US$ millions) Adjusted EBITDA 2 (Adjusted EBITDA Margin) • Revenues down 1% in local currency, comprised of an internal decline of 3% offset by 2% growth from acquisitions • Internal growth impacted by timing, with a significant number of transactions expected to be recorded in Q4 2019 • Adjusted EBITDA impacted by lower revenues and service mix (2) GAAP Operating Earnings: Q3 2019 $5.1M at 3.7% margin; Q3 2018 $9.4M at 6.4% margin Outsourcing & Advisory (1) Sales Brokerage Lease Brokerage 30.0 37.6 41.6 37.6 67.2 71.1 138.8 146.3 Q3 2019 Q3 2018 12.6 17.3 9.1% 11.8% Q3 2019 Q3 2018 USD LC Internal Growth (LC) Revenue Growth -5% -1% -3%
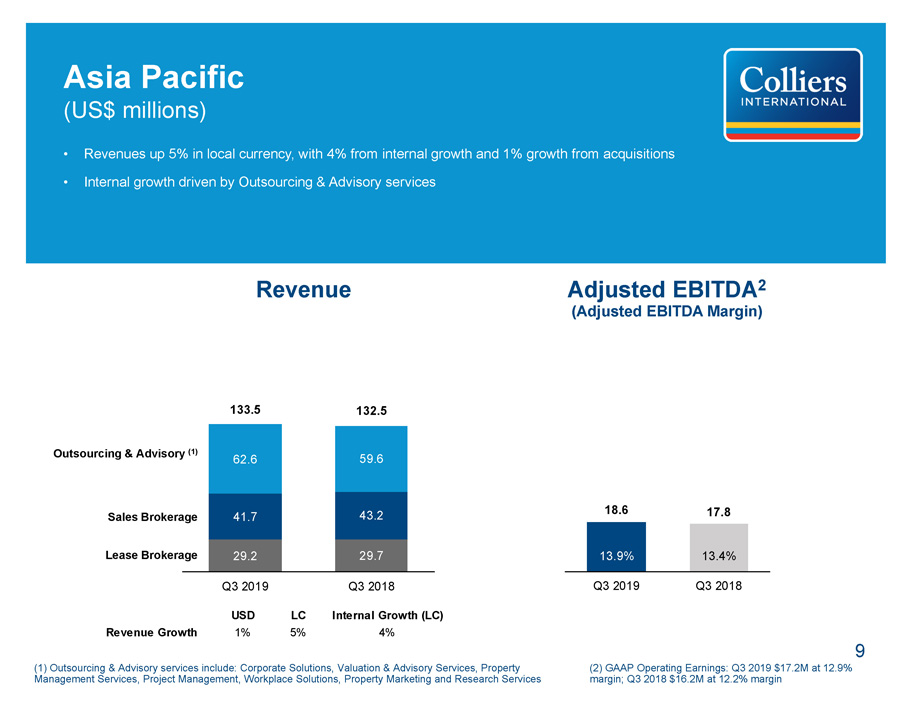
9 (1) Outsourcing & Advisory services include: Corporate Solutions, Valuation & Advisory Services, Property Management Services, Project Management, Workplace Solutions, Property Marketing and Research Services Asia Pacific (US$ millions) • Revenues up 5% in local currency, with 4% from internal growth and 1% growth from acquisitions • Internal growth driven by Outsourcing & Advisory services (2) GAAP Operating Earnings: Q3 2019 $17.2M at 12.9% margin; Q3 2018 $16.2M at 12.2% margin Revenue Adjusted EBITDA 2 (Adjusted EBITDA Margin) Outsourcing & Advisory (1) Sales Brokerage Lease Brokerage 29.2 29.7 41.7 43.2 62.6 59.6 133.5 132.5 Q3 2019 Q3 2018 18.6 17.8 13.9% 13.4% Q3 2019 Q3 2018 USD LC Internal Growth (LC) Revenue Growth 1% 5% 4%
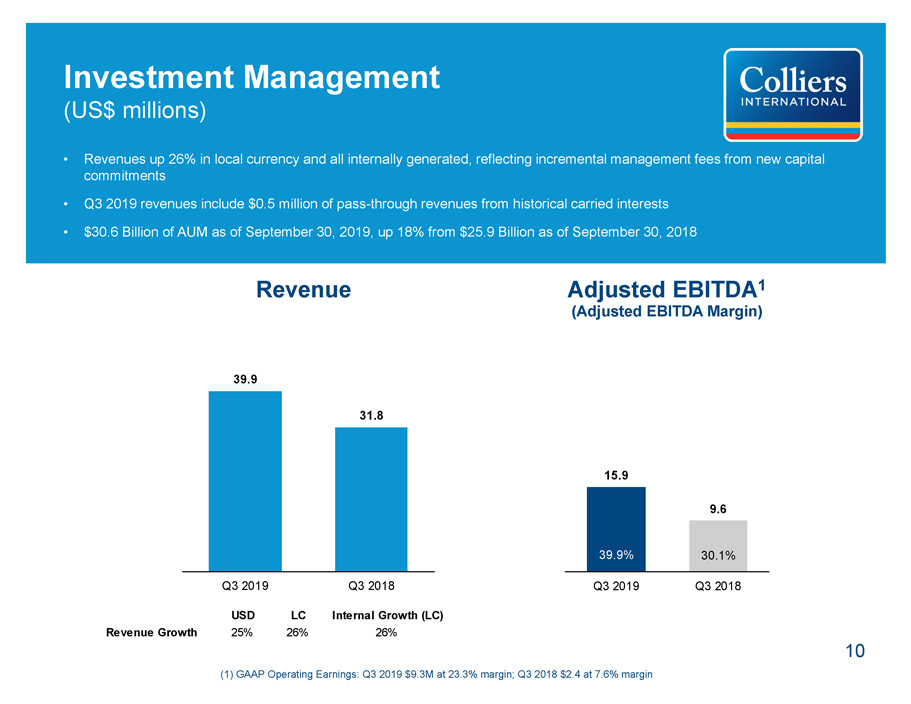
10 Investment Management (US$ millions) • Revenues up 26% in local currency and all internally generated, reflecting incremental management fees from new capital commitments • Q3 2019 revenues include $0.5 million of pass - through revenues from historical carried interests • $30.6 Billion of AUM as of September 30, 2019, up 18% from $25.9 Billion as of September 30, 2018 (1) GAAP Operating Earnings: Q3 2019 $9.3M at 23.3% margin; Q3 2018 $2.4 at 7.6% margin Revenue Adjusted EBITDA 1 (Adjusted EBITDA Margin) USD LC Internal Growth (LC) Revenue Growth 25% 26% 26% 39.9 31.8 Q3 2019 Q3 2018 15.9 9.6 39.9% 30.1% Q3 2019 Q3 2018
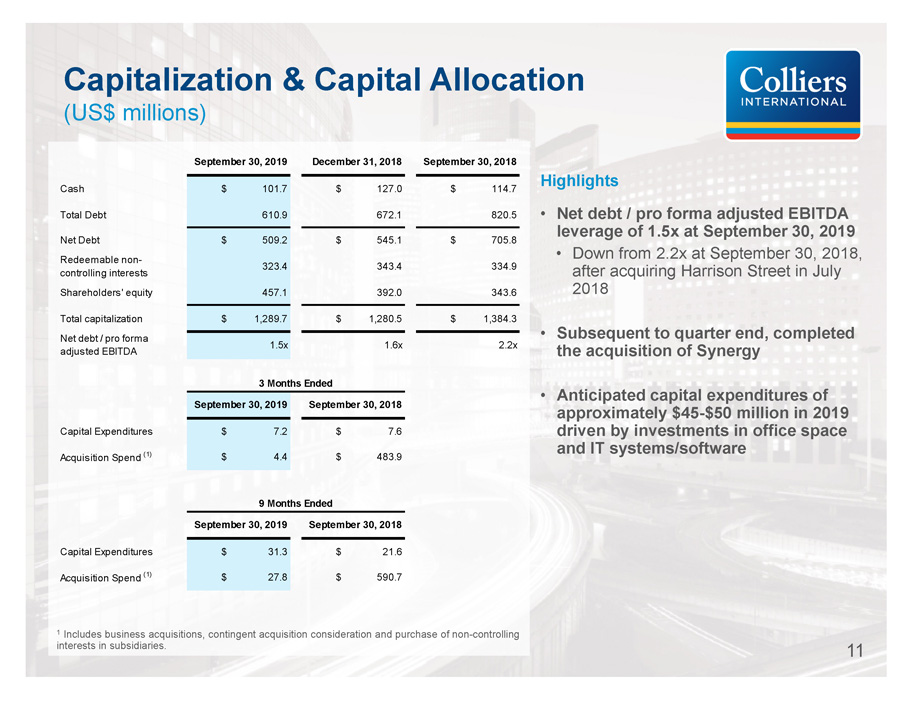
11 1 Includes business acquisitions, contingent acquisition consideration and purchase of non - controlling interests in subsidiaries. Capitalization & Capital Allocation (US$ millions) Highlights • Net debt / pro forma adjusted EBITDA leverage of 1.5x at September 30, 2019 • Down from 2.2x at September 30, 2018, after acquiring Harrison Street in July 2018 • Subsequent to quarter end, completed the acquisition of Synergy • Anticipated capital expenditures of approximately $45 - $50 million in 2019 driven by investments in office space and IT systems/software Cash $ 101.7 $ 127.0 $ 114.7 Total Debt 610.9 672.1 820.5 Net Debt $ 509.2 $ 545.1 $ 705.8 Redeemable non- controlling interests 323.4 343.4 334.9 Shareholders' equity 457.1 392.0 343.6 Total capitalization $ 1,289.7 $ 1,280.5 $ 1,384.3 Net debt / pro forma adjusted EBITDA 1.5x 1.6x 2.2x Capital Expenditures $ 7.2 $ 7.6 Acquisition Spend (1) $ 4.4 $ 483.9 Capital Expenditures $ 31.3 $ 21.6 Acquisition Spend (1) $ 27.8 $ 590.7 9 Months Ended September 30, 2019 September 30, 2018 September 30, 2019 December 31, 2018 September 30, 2018 3 Months Ended September 30, 2019 September 30, 2018
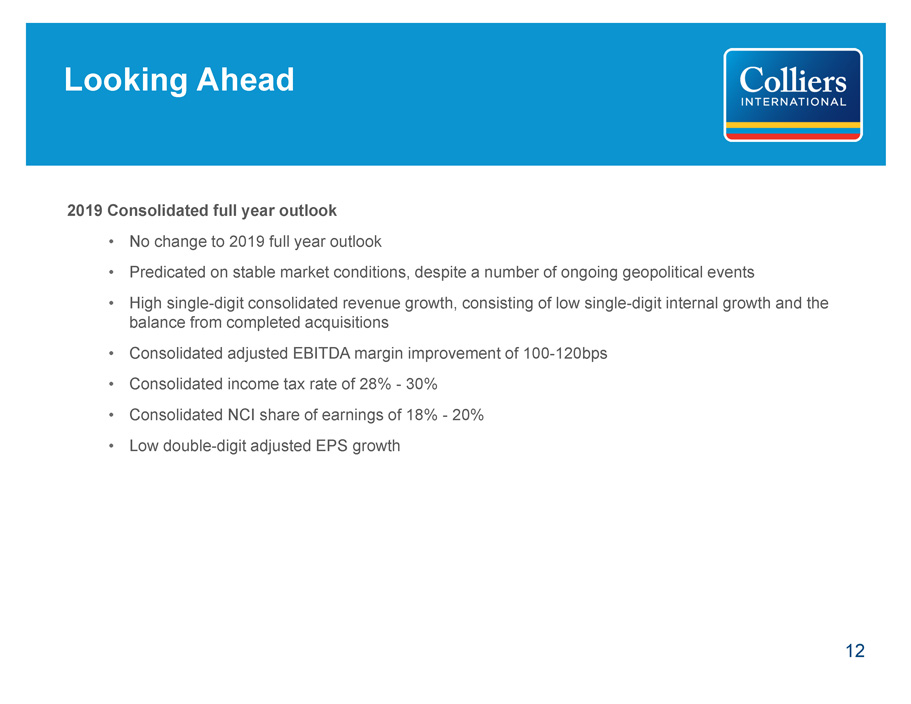
12 Looking Ahead 2019 Consolidated full year outlook • No change to 2019 full year outlook • Predicated on stable market conditions, despite a number of ongoing geopolitical events • High single - digit consolidated revenue growth, consisting of low single - digit internal growth and the balance from completed acquisitions • Consolidated adjusted EBITDA margin improvement of 100 - 120bps • Consolidated income tax rate of 28% - 30% • Consolidated NCI share of earnings of 18% - 20% • Low double - digit adjusted EPS growth
Appendix Reconciliation of non - GAAP measures
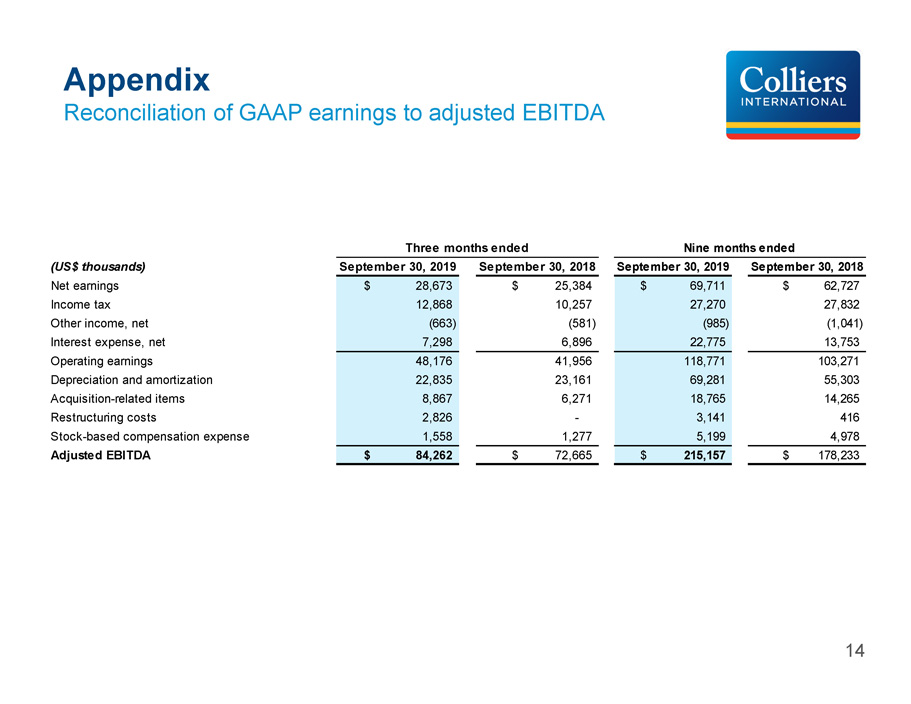
14 Appendix Reconciliation of GAAP earnings to adjusted EBITDA (US$ thousands) Net earnings $ 28,673 $ 25,384 Income tax 12,868 10,257 Other income, net (663) (581) Interest expense, net 7,298 6,896 Operating earnings 48,176 41,956 Depreciation and amortization 22,835 23,161 Acquisition-related items 8,867 6,271 Restructuring costs 2,826 - Stock-based compensation expense 1,558 1,277 Adjusted EBITDA $ 84,262 $ 72,665 Three months ended September 30, 2019 September 30, 2018 $ 69,711 $ 62,727 27,270 27,832 (985) (1,041) 22,775 13,753 118,771 103,271 69,281 55,303 18,765 14,265 3,141 416 5,199 4,978 $ 215,157 $ 178,233 Nine months ended September 30, 2019 September 30, 2018
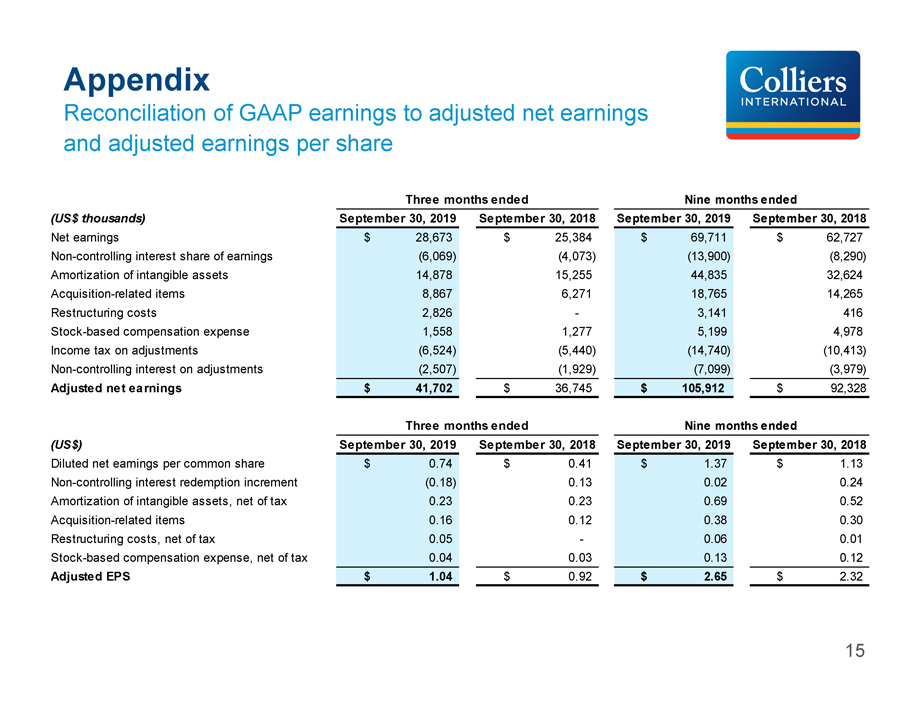
15 Appendix Reconciliation of GAAP earnings to adjusted net earnings and adjusted earnings per share (US$ thousands) Net earnings $ 28,673 $ 25,384 Non-controlling interest share of earnings (6,069) (4,073) Amortization of intangible assets 14,878 15,255 Acquisition-related items 8,867 6,271 Restructuring costs 2,826 - Stock-based compensation expense 1,558 1,277 Income tax on adjustments (6,524) (5,440) Non-controlling interest on adjustments (2,507) (1,929) Adjusted net earnings $ 41,702 $ 36,745 (US$) Diluted net earnings per common share $ 0.74 $ 0.41 Non-controlling interest redemption increment (0.18) 0.13 Amortization of intangible assets, net of tax 0.23 0.23 Acquisition-related items 0.16 0.12 Restructuring costs, net of tax 0.05 - Stock-based compensation expense, net of tax 0.04 0.03 Adjusted EPS $ 1.04 $ 0.92 Three months ended September 30, 2019 September 30, 2018 Three months ended September 30, 2019 September 30, 2018 $ 69,711 $ 62,727 (13,900) (8,290) 44,835 32,624 18,765 14,265 3,141 416 5,199 4,978 (14,740) (10,413) (7,099) (3,979) $ 105,912 $ 92,328 $ 1.37 $ 1.13 0.02 0.24 0.69 0.52 0.38 0.30 0.06 0.01 0.13 0.12 $ 2.65 $ 2.32 Nine months ended September 30, 2019 September 30, 2018 Nine months ended September 30, 2019 September 30, 2018