EXHIBIT 1
FIRSTSERVICE CORPORATION
ANNUAL INFORMATION FORM
For the year ended December 31, 2013
February 24, 2014
TABLE OF CONTENTS
|
Forward-looking statements
|
3
|
|
Corporate structure
|
4
|
|
General development of the business
|
4
|
|
Business description
|
5
|
|
Business strategy
|
10
|
|
Seasonality
|
11
|
|
Trademarks
|
11
|
|
Employees
|
12
|
|
Non-controlling interests
|
12
|
|
Dividends and dividend policy
|
12
|
|
Capital structure
|
13
|
|
Market for securities
|
14
|
|
Transfer agents and registrars
|
15
|
|
Directors and officers
|
15
|
|
Legal proceedings and regulatory actions
|
16
|
|
Properties
|
16
|
|
Reconciliation of non-GAAP financial measures
|
17
|
|
Risk factors
|
18
|
|
Interest of management and others in material transactions
|
22
|
|
Material contracts
|
22
|
|
Cease trade orders, bankruptcies, penalties or sanctions
|
22
|
|
Conflicts of interest
|
23
|
|
Experts
|
24
|
|
Audit Committee
|
24
|
|
Additional information
|
26
|
|
Exhibit "A" – Audit Committee Mandate
|
Forward-looking statements
This Annual Information Form contains "forward looking statements" which reflect the current expectations, estimates, forecasts and projections of management regarding our future growth, results of operations, performance and business prospects and opportunities. Wherever possible, words such as "may," "would," "could," "will," "anticipate," "believe," "plan," "expect," "intend," "estimate," "aim," "endeavour" and similar expressions have been used to identify these forward-looking statements. These statements reflect management's current beliefs with respect to future events and are based on information currently available to management. Forward-looking statements involve significant known and unknown risks, uncertainties and assumptions. Many factors could cause our actual results, performance or achievements to be materially different from any future results, performance or achievements that may be expressed or implied by such forward-looking statements, including, without limitation, those listed in the "Risk Factors" section of this Annual Information Form. Should one or more of these risks or uncertainties materialize, or should assumptions underlying the forward-looking statements prove incorrect, actual results, performance or achievements could vary materially from those expressed or implied by the forward-looking statements contained in this Annual Information Form. These factors should be considered carefully and prospective investors should not place undue reliance on the forward-looking statements. Although the forward-looking statements contained in this Annual Information Form are based upon what management currently believes to be reasonable assumptions, we cannot assure prospective investors that actual results, performance or achievements will be consistent with these forward-looking statements. These forward-looking statements are made as of the date of this Annual Information Form and we do not intend, and do not assume any obligation, to update or revise these forward-looking statements.
-3-
FIRSTSERVICE CORPORATION
ANNUAL INFORMATION FORM
February 24, 2014
All amounts referred to in this Annual Information Form ("AIF") are in United States dollars unless otherwise indicated. All financial and statistical data in this AIF is presented as at December 31, 2013 unless otherwise indicated.
Corporate structure
FirstService Corporation ("we," "us," "our," the "Company" or "FirstService") was formed under the Business Corporations Act (Ontario) by Certificate of Incorporation dated February 25, 1988. The Company amalgamated with Coloma Resources Limited pursuant to a Certificate of Amalgamation dated July 31, 1988, and the amalgamated corporation continued under the name "FirstService Corporation".
By Certificate of Amendment dated April 2, 1990, the Company: (i) consolidated each of its Class A Subordinate Voting Shares on a 30 to 1 basis and changed the designation of that class of shares to "Subordinate Voting Shares", each such share carrying one vote; and (ii) consolidated each of its Class B shares on a 30 to 1 basis and changed the designation of that class of shares to "Multiple Voting Shares", each such share carrying 20 votes.
By Certificate of Amendment dated June 27, 2007, the first series of Preference Shares of the Company were created and designated as 7% cumulative preference shares, series 1 (the "Preferred Shares"), with each Preferred Share having a stated value of US$25.00 and carrying a fixed cumulative annual dividend of US$1.75 payable quarterly. All outstanding Preferred Shares were eliminated on May 3, 2013 by way of a partial redemption for cash of $39.2 million immediately followed by a mandatory conversion of all then remaining Preferred Shares into Subordinate Voting Shares, which resulted in the issuance of 2.89 million new Subordinate Voting Shares.
Our Subordinate Voting Shares are publicly traded on both the Toronto Stock Exchange ("TSX") (symbol: FSV) and The NASDAQ Global Select Market ("NASDAQ") (symbol: FSRV). Our head and registered office is located at 1140 Bay Street, Suite 4000, Toronto, Ontario, M5S 2B4.
Our fiscal year-end is December 31. On May 14, 2008, our Board of Directors approved a change in year-end to December 31, effective December 31, 2008. Our previous fiscal year-end was March 31.
The following chart sets out the significant subsidiaries of the Company as of December 31, 2013. The voting securities of such subsidiaries not controlled by us are those owned by operating management of each respective subsidiary.
|
Name of subsidiary
|
Percentage of voting
securities owned by
FirstService
|
Jurisdiction of
incorporation or
formation
|
|
American Pool Enterprises, Inc.
|
96.4%
|
Delaware
|
|
Colliers Macaulay Nicolls Inc.
|
86.9%
|
Ontario
|
|
FirstService Commercial Real Estate Services Inc.
|
88.7%
|
Ontario
|
|
FirstService International Holdings s.a.r.l.
|
100.0%
|
Luxembourg
|
|
FirstService RE Holdings (USA), Inc.
|
99.0%
|
Delaware
|
|
FirstService Residential, Inc.
|
97.6%
|
Delaware
|
|
FirstService Residential Florida, Inc.
|
97.6%
|
Florida
|
|
FirstService Residential Management Canada Inc.
|
100.0%
|
Ontario
|
|
FirstService (USA), Inc.
|
100.0%
|
Delaware
|
|
FS Brands, Inc.
|
95.7%
|
Delaware
|
General development of the business
Our origins date back to 1972 when Jay S. Hennick, the Founder and CEO of the Company, started a Toronto commercial swimming pool and recreational facility management business, which became the foundation of FirstService. In 1993, we completed our initial public offering on the TSX, raising C$20 million. In 1995, our shares were listed on NASDAQ. In 1997, a second stock offering was completed in Canada and the United States raising US$20 million. In December 2004, a stock dividend was declared effectively achieving a 2-for-1 stock split for all outstanding Subordinate Voting Shares and Multiple Voting Shares (together, the "Common Shares").
-4-
From 1994 to present, we completed numerous acquisitions and selected divestitures, developing, growing and focusing on the real estate services provided by us today.
In 1996, we obtained a revolving credit facility from a syndicate of banks, which has been amended and restated at various times to the present, most recently on March 1, 2012 when the facility was increased to $350 million for a five year term. In October 2003, we completed a private placement of $50 million of 6.40% Senior Notes due September 30, 2015, of which $25 million remained outstanding as of December 31, 2013. In April 2005, we completed a private placement of $100 million of 5.44% Senior Notes due April 1, 2015, of which $40 million remained outstanding as of December 31, 2013. In January 2013, we completed a private placement of $150 million of 3.84% Senior Notes due 2025 with a group of U.S. institutional investors, all of which remained outstanding as of December 31, 2013. The proceeds from the issuance of the 3.84% Senior Notes were used to repay borrowings under our revolving credit facility.
In 2004, we established a new commercial real estate services division under the "Colliers International" brand with the acquisition of Colliers Macaulay Nicolls Inc. ("CMN"). CMN's real estate services offerings included brokerage (sale and leasing), property management, valuation and advisory services.
In 2006, we disposed of Resolve Corporation, our Business Services division, through an initial public offering of income trust units in Canada. In 2008, we disposed of our Integrated Security Services division, which included Intercon Security in Canada and SST in the United States, for gross cash proceeds of approximately $187.5 million. These disposals marked a significant milestone in the execution of our strategy of focusing on real estate services for future growth.
In November 2009, we completed a public offering in Canada of $77 million principal amount of 6.5% Convertible Unsecured Subordinated Debentures (the "Convertible Debentures"). The Convertible Debentures were convertible into Subordinated Voting Shares at the option of the holder at any time prior to the earlier of December 31, 2014 or the date specified by us for redemption, at a conversion price of $28.00 per Subordinate Voting Share, subject to adjustment in certain events. In September 2013, we completed the early redemption of our Convertible Debentures in accordance with the redemption rights attached to the Convertible Debentures. Leading up to the redemption, we received conversion requests from substantially all holders of the Convertible Debentures, which resulted in the issuance of 2.74 million new Subordinate Voting Shares.
In September 2013, we completed the sale of Field Asset Services, LLC, a property preservation and distressed asset management services provider within our Property Services segment, for gross cash proceeds of $55 million.
Business description
FirstService is a global leader in the rapidly growing real estate services sector. As one of the largest property managers in the world, FirstService manages more than 2.5 billion square feet of residential and commercial properties through its industry-leading service platforms in Commercial Real Estate Services, delivered through Colliers International, one of the top global players in commercial real estate services; Residential Real Estate Services, delivered through FirstService Residential, the largest provider of residential property management services in North America, and Property Services, delivered through FirstService Brands, a leading provider of essential property services through franchise systems and company-owned operations.
-5-
Each service line provides near-essential services, generates a significant percentage of recurring revenues, has substantial operating cash flow, generates superior returns on invested capital and can be leveraged through margin enhancement, cross-selling or consolidation.
Our business is conducted through three operating segments as shown below:
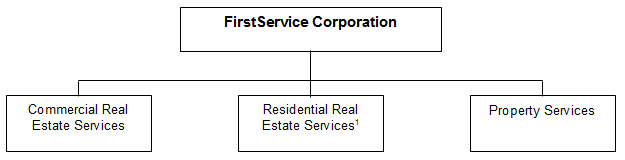
|
Revenues
by operating segment
|
Year ended December 31
|
|||||||||||||||
|
(in thousands of US$)
|
2013
|
2012
|
2011
|
2010
|
||||||||||||
|
Commercial Real Estate Services
|
$ | 1,318,779 | $ | 1,170,427 | $ | 994,579 | $ | 861,917 | ||||||||
|
Residential Real Estate Services1
|
884,334 | 814,617 | 736,029 | 643,050 | ||||||||||||
|
Property Services
|
140,317 | 125,204 | 121,172 | 112,153 | ||||||||||||
| Corporate | 204 | 218 | 188 | 180 | ||||||||||||
|
Total
|
$ | 2,343,634 | $ | 2,110,466 | $ | 1,851,968 | $ | 1,617,300 | ||||||||
|
Adjusted EBITDA2
by operating segment
|
Year ended December 31
|
|||||||||||||||
|
(in thousands of US$)
|
2013
|
2012
|
2011
|
2010
|
||||||||||||
|
Commercial Real Estate Services
|
$ | 116,003 | $ | 78,949 | $ | 51,900 | $ | 39,485 | ||||||||
|
Residential Real Estate Services1
|
57,878 | 60,818 | 57,819 | 56,565 | ||||||||||||
|
Property Services
|
28,878 | 24,113 | 19,960 | 16,403 | ||||||||||||
| Corporate | (17,298 | ) | (11,617 | ) | (14,362 | ) | (19,511 | ) | ||||||||
|
Total
|
$ | 185,461 | $ | 152,263 | $ | 115,317 | $ | 92,942 | ||||||||
Commercial Real Estate Services
FirstService, operating under the Colliers International brand name, is one of the world's largest commercial real estate services providers offering a full range of commercial real estate services in the United States, Canada, Australia, the United Kingdom, Germany and several other countries in Asia, Europe and Latin America. In 2013, operations in the Americas generated 56% of total revenues for this segment, while the Asia-Pacific region generated 27% and Europe generated 17%. We provide services to owners, investors and tenants, including brokerage (sale, leasing, and mortgage), property management and maintenance, valuation, project management and corporate advisory services.
Commercial real estate brokers match buyers and sellers of real estate (investors, developers or owners-users) as well as owners and tenants of space for lease in return for a commission generally based on the value of the transaction. Our brokerage activities focus primarily on office, industrial, retail and multi-unit residential properties. Brokerage activities represent approximately 63% of segment revenues and provide opportunities for cross selling other real estate services. In 2013, through a network of approximately 2,900 brokers in 211 offices in 35 countries, we executed transactions across a diverse client base, including corporations, financial institutions, governments and individuals. Typically, brokers earn a direct commission on individual transactions, which provides variability in the cost structure.
___________________________
|
1
|
Previously referred to as "Residential Property Management".
|
|
2
|
Adjusted EBITDA is a financial measure that is not calculated in accordance with GAAP. For a reconciliation of this and other non-GAAP financial measures, see "Reconciliation of non-GAAP financial measures" in this AIF.
|
-6-
Commercial property management focuses on the same client segments as brokerage; however, fees are typically multi-year fixed fee contracts that are largely recurring in nature.
Our international corporate advisory group partners with large corporations in managing their overall real estate portfolio and transactions. Professional staff combines proprietary technology with high level strategic planning, portfolio management, lease administration and facilities and project management. Fees in corporate advisory are derived from a combination of fixed fee services and transaction-based brokerage fees.
Commercial real estate brokerage is cyclical and seasonal in nature, affected by external factors, including interest rates, access to financing, investor and consumer confidence and other macroeconomic factors and political risk in any specific region. Our revenues in this segment are weighted more heavily to the latter half of the calendar year, with approximately 60% of transactions occurring in fiscal quarters ending in September and December.
We are the largest member and controlling shareholder of Colliers International Property Consultants ("CIPC"), the owner of the global "Colliers International" commercial real estate services brand and trademarks. Each member of CIPC is entitled to use the "Colliers International" brand and trademarks exclusively within a designated country (or region in the case of the United States). Colliers International is recognized (in The Lipsey Company's 2013 Top 25 Commercial Real Estate Brands Survey for service firms) as the number 2 most recognized commercial real estate services brand worldwide with 485 offices in 63 countries. Colliers International is a global brand name supported by local market intelligence to serve the international community of investors, owners and users of real estate. In addition to the Colliers International brand, we also own and operate the MHPM Project Leaders and PKF Hotel and Hospitality Consulting USA commercial real estate brands.
Commercial real estate firms can be segmented into two tiers: (i) large global full-service firms with international service capabilities; and (ii) regional and niche firms with strengths in their respective local markets. Recent industry trends have seen an increase in outsourcing by multi-national clients with global needs creating an opportunity for full-service global players like Colliers International, and by extension, FirstService. There has also been a recent trend amongst larger firms to further improve their market position through consolidation. However, the commercial real estate competitive landscape market remains highly fragmented.
Our growth strategy in this segment is to expand the suite of complementary service offerings and the geographical markets where services are offered. This will continue to be achieved both organically and through selective acquisitions. We also plan to enhance our brand and service delivery through increased recruiting of real estate professionals, broker training and continued development of proprietary market tools and research resources.
Residential Real Estate Services
We are a manager of private residential communities in North America. Private residential communities include condominiums, cooperatives, homeowner associations, master-planned communities and a variety of other residential developments governed by common interest or multi-unit residential community associations (collectively referred to as "community associations"). Residents of community associations appoint or elect volunteer homeowner board members to oversee the operations of the community associations. The board may choose to hire a professional property manager like FirstService. In total, we manage over 1.5 million residential units in more than 6,500 community associations in 21 American states and 3 Canadian provinces.
We operate under the brand name FirstService Residential. In June 2013, we re-branded and replaced 18 legacy regional brands with one brand to create a unified North American market presence to allow a simplified and consistent sales strategy, as well as to streamline certain operations. Approximately 92% of revenues are generated from U.S. operations, and 8% from Canadian operations.
-7-
In the Residential Real Estate Services industry, there are two types of professional property management companies: (i) traditional property managers; and (ii) full-service property managers. Traditional property managers primarily handle administrative property management functions on behalf of their community association clients, such as advising homeowner boards on matters relating to the operation of their communities, collecting monthly maintenance fees, sourcing and paying suppliers, preparing financial statements and contracting out support services. Full-service property managers provide the same services as traditional property managers but also provide a variety of other services under one comprehensive contract.
We are a full-service property manager and in many markets provide a full range of ancillary services, including facility maintenance, janitorial, front-desk, swimming pool management, heating and air conditioning, energy advisory, commercial association management, concierge services, resale processing, sales, leasing, landscaping and pest control. In most markets we provide financial services (cash management and other transaction-related services, collections, specialized property insurance brokerage and energy retrofit financing) utilizing the scale of our operations to economically benefit clients. Ancillary services are provided under the following brands: American Pool Enterprises, Planned Companies, Service America, FirstService Financial, MarWest Commercial, Abigail Michaels, FS Energy, and Superior Pool.
Residential property management and recurring ancillary services are generally provided under contract, with a fixed monthly fee. Contracts range in duration from 1 to 3 years, but are generally cancellable by either party with 30 to 90 days’ notice.
The aggregate budget of all the community associations in the United States is estimated by the Community Associations Institute (“CAI”) (a national U.S. organization dedicated to fostering community associations) to be approximately US$51 billion. The aggregate budget of the community associations managed by FirstService is estimated at approximately US$6 billion. Currently, we estimate that we access in the range of 12-15% of the aggregate budget of our communities through the various services that we offer. Our strategy is to continue to add communities under management while striving to earn a greater percentage of the aggregate budget by introducing additional value-added services and products, thereby offering clients a single point of accountability and leveraging our scale and purchasing power to the benefit of the community associations we serve.
Based on 2012 U.S. industry data compiled by the CAI in 2013, we estimate that: (i) approximately 63.4 million Americans, representing 25.9 million households, live in condominiums, cooperatives, planned communities and other residential developments governed by common interest or multiple unit residential community associations; this represents 24% of U.S. homes (ii) more than 50% of new homes currently being built in and around major metropolitan areas in the United States are within these categories; and (iii) there are approximately 323,600 community associations in the United States. The market is currently growing at a rate of approximately 2% per year as a result of the 4,000 to 8,000 new community associations formed each year. Similar growth rates are expected in Canada.
Typically, owners of private residential units are required to pay monthly or quarterly fees to cover the expenses of managing the community association's business activities and maintaining the common areas of the property. Historically, decision making for communities was delegated to volunteer boards of directors elected by the owners. Increasingly, these volunteer boards have outsourced the responsibility to manage the day-to-day operation and maintenance of community property to professional property management companies. The CAI estimates that 30-40% of community associations are self-managed by homeowner boards. There is a growing trend from self-management to professional management, which is believed to increase the effective growth rate for professional property management companies.
The residential property management industry is extremely fragmented and dominated by numerous local and regional management companies of which there are estimated to be 8,000 across North America. Only a small number of such companies, however, have the expertise and capital to provide both traditional property management services as well as the other support services provided by full-service property managers. We estimate our market share at 5% (based on the number of units we manage in the U.S. relative to the CAI’s data for the number of households governed by community associations in the U.S.). We currently operate in major markets that constitute over 70% of the total North American market. We enjoy a competitive advantage because of our size and geographic footprint, depth of management and financial resources, and operating expertise.
-8-
Our business in this segment is subject to regulation by the U.S. states and Canadian provinces in which we operate. In many regions, laws require that property managers must be licensed, which involves certain examinations and continuing education. In addition, our residential real estate sales and leasing operations are subject to regulation as a real estate brokerage by the various states and provinces in which we operate.
Property Services
In our Property Services division, we provide a variety of residential and commercial services in North America through franchise networks and company-owned locations. The principal brands in this division include Paul Davis Restoration, CertaPro Painters, California Closets, College Pro Painters, Pillar to Post Home Inspectors, and Floorcoverings International.
Franchise brands
We own and operate six franchise networks as follows:
|
(i)
|
Paul Davis Restoration is a Jacksonville, Florida based franchisor of residential and commercial restoration services serving the insurance industry in the United States through 315 franchises. Paul Davis provides full service water, fire and mold cleanup and restoration services for property damaged by natural or man-made disasters. Royalties are earned from franchisees based on a percentage of franchisee gross revenues.
|
|
(ii)
|
CertaPro Painters is a residential and commercial painting franchise system with 351 franchises operating in major markets across the United States and Canada as well as master franchises in other countries around the world. CertaPro Painters focuses on high-end residential and commercial painting and decorating work and other programs for property managers who have portfolios of condominium and commercial properties. Royalties are earned based on a percentage of franchisee gross revenues or a fixed monthly fee, plus administrative fees for various ancillary services.
|
|
(iii)
|
California Closets is a provider of installed closet and home storage solutions. Headquartered in San Francisco, California Closets has 86 franchises in the United States and Canada as well as master franchises in other countries around the world. There are currently 100 branded California Closets retail showrooms in operation in North America which are used by franchisees to demonstrate and sell the product. Royalties are earned based on a percentage of franchisee gross revenues.
|
|
(iv)
|
College Pro Painters is a seasonal exterior residential painting and window cleaning franchise system operating in most U.S. states and across Canada with 639 franchises. It recruits students and trains them to operate the business, including price estimating, marketing, operating procedures, hiring, customer service and safety. Royalties are earned based on a percentage of franchisee gross revenues. College Pro Painters’ operations are seasonal with revenue and earnings generated in the June and September quarters followed by losses in the December and March quarters.
|
|
(v)
|
Pillar to Post Home Inspectors is one of North America's largest home inspection service providers. Services are provided through a network of 367 franchises. Royalties are earned on a percentage of franchisee gross revenues.
|
-9-
|
(vi)
|
Floorcoverings International is a residential and commercial floor coverings design and installation franchise system operating in North America with 88 franchises. Royalties are earned based on a percentage of franchisee gross revenues.
|
The aggregate system-wide revenues of our 1,846 franchisees were $1.1 billion for 2013. Franchise agreements are for terms of five or ten years, with the exception of College Pro Painters where the agreements are for a term of one year. Royalties are reported and paid to us monthly in arrears. All franchise agreements contain renewal provisions that can be invoked by FirstService at little or no cost.
The franchised services industry is highly fragmented, consisting principally of a large number of smaller, single-service or single-concept companies. Due to the large size of the overall market for these services, dominant market share is not considered necessary for becoming a major player in the industry. However, because of the low barriers to entry in this segment, we believe that brand name recognition among consumers is a critical factor in achieving long-term success in the businesses we operate.
Franchise businesses are subject to U.S. Federal Trade Commission regulations and state and provincial laws that regulate the offering and sale of franchises. Presently, the Company is authorized to sell franchises in 40 states, in all Canadian provinces and in several other countries around the world. In all jurisdictions, we endeavor to have our franchises meet or exceed regulatory standards.
Company-owned operations
We own and operate nine California Closets retail operations located in major population centers in the United States and Canada. These operations were acquired from franchisees with the goal of accelerating revenue growth, in part through investment in branded retail showrooms.
Business strategy
We operate in the real estate services sector. Our objective is to increase the revenues, profitability and market position of each operating unit and subsequently acquired business, while maintaining the highest level of service to our customers.
Over the course of time, and as we have grown, our management style and way of doing business has been refined and enhanced into an approach we call "The FirstService Way". Built on seven strategic pillars, it has guided our growth and attracted strong management teams with visions for the future success of their businesses. The seven principles of our business strategy are defined below:
|
1.
|
Partnership philosophy. We believe equity ownership by our management teams is essential. Our partners enjoy autonomy over front-line operating decisions, while equity ownership allows direct participation in the financial outcomes of their decisions. With significant equity interests in the businesses they operate, management's interests are aligned with our shareholders in building long-term value. These interests are in the form of a non-transferable direct minority equity ownership position, stock options or in equity-like notional value appreciation plans. In almost all cases, we have the right to purchase ("call") the minority interest at a formula price based on a multiple of trailing adjusted EBITDA. Minority shareholders have the right to require us to purchase their shares at the same price, generally in tranches over a two or three year period.
|
|
2.
|
Focus on internal growth. We have a keen focus on operational excellence. We set high internal growth targets and leverage our scale, competitive advantages, and sales channels by enhancing and broadening our service offerings. These differentiate us from competitors and support strong internal growth. Our performance-based compensation plan is structured to reward internal growth.
|
|
3.
|
Performance-based compensation. Successful management teams are well compensated for driving growth. Aligning our key operating managers with our shareholders through generous performance-based compensation programs ensures that they have the incentive needed to continue growing the business. In general, senior managers receive bonuses that are based on a percentage of the amount by which their results exceed prior year adjusted EBITDA on a "same-store" basis. Lower level managers' incentives are also aligned with business unit adjusted EBITDA targets, but may include other measures deemed important for growing their business. We believe these programs are effective incentives to operating management to deliver internal growth and consistent, high-quality service in a cost-effective manner.
|
-10-
|
4.
|
Acquisition strategy. Our disciplined approach to acquisitions ensures we invest in high-potential, well-managed businesses, at a fair price. New acquisitions are selected to augment our internal growth strategies and also to support the growth of the Company as a whole. The acquisition strategy entails the systematic acquisition of established, well managed, and profitable real estate service companies operating in fragmented industries that: (i) enhance the market position of an existing service line, provide an entry into a new geographic region/market, or introduce a new service line; and (ii) provide a return on invested capital that exceeds our weighted average cost of capital. Each acquisition must meet strict criteria that include the following:
|
|
·
|
Strong, experienced management teams in place that are interested in growing their businesses and in being rewarded through performance-based compensation;
|
|
·
|
History of consistent profitability, supported by significant contractual revenues;
|
|
·
|
Non-capital intensive operations with a variable cost structure;
|
|
·
|
Leading positions in the markets served; and
|
|
·
|
One or more senior managers who wish to retain a meaningful minority interest in the acquired company in order to participate directly in its future growth and development as part of FirstService.
|
|
5.
|
People development process. Retaining and promoting key operating managers is one of our most important practices. Each year, the key people within our businesses are evaluated in a consistent manner; strength, weaknesses and internal career opportunities are discussed, as are opportunities for advancement with other FirstService business units.
|
|
6.
|
Management and review process. We have a rigorous process of oversight and operational review to maximize cash flows, increase margins, manage operational risk and monitor performance indicators. Sharing of best practices is proactively incorporated into our management and review process to ensure that each business benefits from the experience of others.
|
|
7.
|
Strategic planning process. We utilize a consistent strategic planning process to determine the major issues facing our operating units. Short-term and long-term goals are reviewed and agreed upon, barriers are discussed and solutions are developed. Progress in achieving goals is monitored to ensure that we successfully execute our strategy and adapt to changes in our markets.
|
Seasonality
Certain segments of the Company's operations are subject to seasonal variations. This seasonality results in variations in quarterly revenues and operating margins. In particular, the Commercial Real Estate Services operation generates peak revenues and earnings in the month of December followed by a low in January and February as a result of the timing of closings on commercial real estate brokerage transactions. Revenues and earnings during the balance of the year are relatively even. These brokerage operations comprised approximately 35% of 2013 consolidated revenues. Variations can also be caused by acquisitions or dispositions, which alter the consolidated service mix.
Trademarks
Our trademarks are important for the advertising and brand awareness of all of our businesses and franchises. We take precautions to defend the value of our trademarks by maintaining legal registrations and by litigating against alleged infringements, if necessary.
In our Commercial Real Estate Services division, the Colliers International trademark is recorded as an acquired intangible asset in our consolidated financial statements. The Colliers International trademark is highly recognized in the commercial real estate industry.
-11-
Our Residential Real Estate Services operations adopted the FirstService Residential trademark in June 2013, replacing 18 legacy regional brands. The adoption of common branding was designed to create a unified North American market presence signifying our market leadership, to showcase our commitment to service excellence and to leverage our strengths to the benefit of current and future clients. No value has been ascribed to the FirstService Residential trademark in our consolidated financial statements. The legacy regional brands were subject to accelerated amortization totaling $11.2 million in 2013, resulting in a carrying value of nil as of December 31, 2013.
In our Property Services unit, three franchise systems – California Closets, Paul Davis Restoration, and Pillar to Post Home Inspectors – have trademarks to which value has been ascribed in our consolidated financial statements. The value of these trademarks is derived from the recognition they enjoy among the target audiences for the respective property services. These trademarks have been in existence for many years, and their prominence among consumers has grown over time through the addition of franchisees and the ongoing marketing programs conducted by both franchisees and the Company.
Employees
We have approximately 24,000 employees.
Non-controlling interests
We own a majority interest in substantially all of our operations, while operating management of each subsidiary owns the remaining shares. This structure was designed to maintain control at FirstService while providing significant risks and rewards of equity ownership to management at the operating businesses. In almost all cases, we have the right to "call" management's shares, usually payable at our option with any combination of Subordinate Voting Shares or cash. We may also be obligated to acquire certain of these non-controlling interests in the event of death, disability or cessation of employment or if the shares are "put" by the holder, subject to annual limitations on these puts imposed by the relevant shareholder agreements. These arrangements provide significant flexibility to us in connection with management succession planning and shareholder liquidity matters.
Dividends and dividend policy
Dividend policy
Our Board of Directors adopted a new dividend policy, effective on May 3, 2013, pursuant to which we make quarterly cash dividends to holders of Common Shares of record at the close of business on the last business day of each calendar quarter. The quarterly dividend was initially set at US$0.10 per Common Share (a rate of US$0.40 per annum). Each quarterly dividend is paid within 30 days after the record date.
We commenced paying the quarterly Common Share dividend under the new dividend policy effective for the quarter ended June 30, 2013. For the purposes of the Income Tax Act (Canada) and any similar provincial legislation, all dividends on the Common Shares will be eligible dividends unless indicated otherwise.
Our outstanding Preferred Shares were eliminated effective May 3, 2013. The final quarterly Preferred Share dividend of US$0.4375 was paid on March 31, 2013.
The terms of the Common Share dividend policy remain, among other things, at the discretion of our Board of Directors. Future dividends on the Common Shares, if any, will depend on the results of FirstService's operations, cash requirements, financial condition, contractual restrictions, business opportunities, provisions of applicable law and other relevant factors. Under the terms of the Company's amended and restated credit facility, the Company is not permitted to pay dividends, whether in cash or in specie, in the circumstances of an event of default thereunder occurring and continuing or an event of default occurring as a consequence thereof. See "Material contracts" below.
-12-
Dividend history
The aggregate cash dividends declared per Common Share in respect of the years ended December 31, 2013, December 31, 2012 and December 31, 2011 were US$0.30, nil and nil, respectively.
The aggregate of the cash dividends declared per Preferred Share in respect of the years ended December 31, 2013, December 31, 2012 and December 31, 2011 were US$0.4375, US$1.75 and US$1.75, respectively.
Capital structure
Share capital
The authorized capital of the Company consists of an unlimited number of preference shares, issuable in series, at the discretion of the Board of Directors of the Company, of which are authorized an unlimited number of Preferred Shares, an unlimited number of Subordinate Voting Shares and an unlimited number of convertible Multiple Voting Shares. As of February 24, 2014, there were 34,571,488 Subordinate Voting Shares and 1,325,694 Multiple Voting Shares issued and outstanding.
The holders of Subordinate Voting Shares are entitled to one (1) vote in respect of each Subordinate Voting Share held at all meetings of the shareholders of the Company. The holders of Multiple Voting Shares are entitled to twenty (20) votes in respect of each Multiple Voting Share held at all meetings of the shareholders of the Company. Each Multiple Voting Share is convertible into one Subordinate Voting Share at the option of the holder. Effective December 15, 2004, a stock dividend was declared, effectively achieving a 2-for-1 stock split for all outstanding Subordinate and Multiple Voting Shares.
On August 1, 2007 a stock dividend occurred in the amount of one Preferred Share for every five Common Shares. The Preferred Shares have a stated value of US$25.00, carry a fixed cumulative annual dividend of US$1.75 payable quarterly and are redeemable, in whole or in part, for cash or Subordinate Voting Shares at the option of the Company. The holders of the Preferred Shares are not entitled, except as otherwise provided by law or in the conditions attaching to the preference shares as a class, to receive notice of, attend or vote at any meeting of the shareholders of the Company. All outstanding Preferred Shares were eliminated on May 3, 2013 by way of a partial redemption for cash immediately followed by a mandatory conversion of all then remaining Preferred Shares into Subordinate Voting Shares.
A summary of certain rights attaching to the Subordinate Voting Shares is set out in the section entitled "Certain Rights of Holders of Subordinate Voting Shares" contained in the Company's Management Information Circular (the "Circular") to be filed in connection with the Company's annual meeting of shareholders to be held on April 8, 2014, which section is incorporated herein by reference.
Convertible Debentures
The Convertible Debentures were issued pursuant to a trust indenture between FirstService and TMX Equity Transfer Services (formerly known as Equity Financial Trust Company; formerly known as Equity Transfer & Trust Company), as trustee, dated November 10, 2009. In September 2013, we completed the early redemption of the Convertible Debentures in accordance with the redemption rights attached to the Convertible Debentures. Leading up to the redemption, we received conversion requests from substantially all holders of Convertible Debentures, which resulted in the issuance of 2.74 million new Subordinate Voting Shares.
-13-
Market for securities
The Company's Subordinate Voting Shares are listed for trading on the TSX and NASDAQ. The Company's Multiple Voting Shares are not listed and do not trade on any public market or quotation system.
The Company's Preferred Shares and Convertible Debentures were each listed for trading on the TSX, and traded in US$. The Preferred Shares and Convertible Debentures were delisted from trading on the TSX prior to the commencement of trading on May 3, 2013 and September 23, 2013, respectively.
The tables below detail the price ranges and volumes traded of Subordinate Voting Shares on NASDAQ in U.S. dollars, and the TSX in Canadian dollars and of Preferred Shares and Convertible Debentures on the TSX in US dollars, in each case, on a monthly basis, during the year ended December 31, 2013 (in the case of the Preferred Shares and Convertible Debentures, until they were delisted on the dates set out above):
|
Subordinate Voting Shares
|
||||||
|
NASDAQ
|
TSX
|
|||||
|
Month
|
High Price
(US$)
|
Low Price
(US$)
|
Volume
Traded
|
High Price
(C$)
|
Low Price
(C$)
|
Volume
Traded
|
|
January 2013
|
29.71
|
26.88
|
649,618
|
29.73
|
26.54
|
757,076
|
|
February 2013
|
32.29
|
29.35
|
509,713
|
32.94
|
29.37
|
831,783
|
|
March 2013
|
33.35
|
31.41
|
526,150
|
34.25
|
32.40
|
950,667
|
|
April 2013
|
34.77
|
32.12
|
1,476,474
|
35.34
|
32.65
|
1,873,550
|
|
May 2013
|
34.11
|
31.49
|
995,690
|
34.29
|
32.54
|
1,011,782
|
|
June 2013
|
32.19
|
29.00
|
493,612
|
33.30
|
30.51
|
1,734,723
|
|
July 2013
|
37.49
|
30.21
|
610,968
|
38.74
|
32.02
|
1,240,816
|
|
August 2013
|
37.27
|
34.39
|
525,638
|
38.60
|
36.22
|
988,825
|
|
September 2013
|
40.64
|
35.02
|
474,233
|
40.58
|
36.86
|
1,289,660
|
|
October 2013
|
42.55
|
38.65
|
307,046
|
44.50
|
39.90
|
1,453,898
|
|
November 2013
|
42.49
|
40.65
|
337,368
|
44.88
|
42.51
|
862,179
|
|
December 2013
|
43.34
|
39.84
|
304,481
|
46.00
|
42.55
|
827,454
|
|
Preferred Shares
|
Convertible Debentures
|
|||||
|
TSX
|
TSX
|
|||||
|
Month
|
High Price
(US$)
|
Low Price
(US$)
|
Volume
Traded
|
High Price
(US$)
|
Low Price
(US$)
|
Volume
Traded
|
|
January 2013
|
26.00
|
25.30
|
29,083
|
113.00
|
112.25
|
112,193
|
|
February 2013
|
25.99
|
25.31
|
144,516
|
121.00
|
113.50
|
62,621
|
|
March 2013
|
25.55
|
25.11
|
135,986
|
122.00
|
119.00
|
83,782
|
|
April 2013
|
27.50
|
25.00
|
637,506
|
125.00
|
119.50
|
26,640
|
|
May 2013
|
26.10
|
25.67
|
75,610
|
122.00
|
117.00
|
1,860
|
|
June 2013
|
–
|
–
|
–
|
118.00
|
112.00
|
43,170
|
|
July 2013
|
–
|
–
|
–
|
122.02
|
114.75
|
65,670
|
|
August 2013
|
–
|
–
|
–
|
130.00
|
123.64
|
2,870
|
|
September 2013
|
–
|
–
|
–
|
134.92
|
124.00
|
29,420
|
|
October 2013
|
–
|
–
|
–
|
–
|
–
|
–
|
|
November 2013
|
–
|
–
|
–
|
–
|
–
|
–
|
|
December 2013
|
–
|
–
|
–
|
–
|
–
|
–
|
Transfer agents and registrars
The transfer agent and registrar for the Subordinate Voting Shares, as well as the previously outstanding Preferred Shares and Convertible Debentures, is TMX Equity Transfer Services, 200 University Ave., Suite 300, Toronto, Ontario, M5H 4H1. The transfer agent and registrar for the Multiple Voting Shares is the Company at 1140 Bay Street, Suite 4000, Toronto, Ontario, M5S 2B4.
-14-
Directors and officers
Directors – The following are the directors of the Company as at February 24, 2014:
|
Name and
province/country of
residence
|
Age
|
Present position and tenure
|
Principal occupation during
last five years
|
|
David R. Beatty 2,3
Ontario, Canada
|
72
|
Director since May 15, 2001
|
Corporate Director; Chair and CEO, Beatinvest Limited (an investment company); formerly the Managing Director of the Canadian Coalition for Good Governance; Director of the Institute of Corporate Directors; Director of the Clarkson Centre for Business Ethics and Board Effectiveness and Professor of Strategic Management at The Rotman School of Management, University of Toronto
|
|
Brendan Calder 2,3
Ontario, Canada
|
67
|
Director since June 14, 1996
|
Corporate Director;
Effective Executive in Residence & Adjunct Professor of Strategic Management at the Rotman School of Management, University of Toronto; Chair of Rotman's Desautels Centre for Integrative Thinking; formerly the founding Chair of the Rotman International Centre for Pension Management
|
|
Peter F. Cohen1,3
Ontario, Canada
|
61
|
Director since March 30, 1990; Chair of the Board since May 2005
|
President, Dawsco Group
(an Ontario-based real estate and investment company)
|
|
Bernard I. Ghert1
Ontario, Canada
|
74
|
Director since June 23, 2004
|
Corporate Director;
Chairman of the Independent Review Committee of the Middlefield Group of Funds; President of the B.I. Ghert Family Foundation
|
|
Jay S. Hennick
Ontario, Canada
|
57
|
Chief Executive Officer and Director since May 30, 1988
|
Founder and Chief Executive Officer of the Company
|
|
Steven S. Rogers
Ontario, Canada
|
57
|
Director since August 30, 1989
|
President, Four Box Holdings Inc. (an investment holding company). Prior to July 2012 - President and Chief Executive Officer, Property Services division of the Company
|
|
Michael D. Harris 2
Ontario, Canada
|
69
|
Director since June 26, 2006
|
Senior Business Advisor, Fasken Martineau DuMoulin LLP; Former Senior Business Advisor, Cassels Brock & Blackwell LP; Former Senior Business Advisor, Goodmans LLP; President of own consulting firm, Steane Consulting Ltd.; Corporate Director; Senior Fellow, The Fraser Institute;
Former Premier of the Province of Ontario
|
|
Michael Stein1
Ontario, Canada
|
63
|
Director since December 12, 2013
|
Chairman and Chief Executive Officer of MPI Group Inc.; Chairman and Founder of Canadian Apartment Properties Real Estate Investment Trust (CAPREIT)
|
|
1.
|
Member of Audit Committee
|
|
2.
|
Member of Executive Compensation Committee
|
|
3.
|
Member of Nominating and Corporate Governance Committee
|
Each director remains in office until the following annual shareholders' meeting of the Company or until the election or appointment of his successor, unless he resigns, his office becomes vacant or he becomes disqualified to act as a director. All directors stand for election or re-election annually.
Further background information regarding the directors of the Company is set out in the sections entitled "Business of the Meeting – Election of Directors" and "Statement of Corporate Governance Practices" contained in the Circular, which sections are incorporated herein by reference.
-15-
Officers – The following are the executive officers of the Company as at February 24, 2014:
|
Name and
province/country of
residence
|
Age
|
Present position with the Company
|
First became
an officer
|
|
Jay S. Hennick
Ontario, Canada
|
57
|
Founder and Chief Executive Officer
|
1988
|
|
D. Scott Patterson
Ontario, Canada
|
53
|
President and Chief Operating Officer
|
1995
|
|
John B. Friedrichsen Ontario, Canada
|
52
|
Senior Vice President and Chief Financial Officer
|
1998
|
|
Elias Mulamoottil
Ontario, Canada
|
44
|
Senior Vice President, Strategy and Corporate Development
|
2007
|
|
Douglas G. Cooke Ontario, Canada
|
54
|
Vice President, Corporate Controller and Corporate Secretary
|
1995
|
|
Christian Mayer
Ontario, Canada
|
41
|
Vice President, Finance
|
2010
|
|
Neil Chander
Ontario, Canada
|
41
|
Vice President, Tax
|
2010
|
|
Jeremy Rakusin
Ontario, Canada
|
45
|
Vice President, Strategy and Corporate Development
|
2012
|
As of February 24, 2014, the directors and executive officers of the Company, as a group, owned or controlled 4,644,588 Subordinate Voting Shares, which represents 13.4% of the total Subordinate Voting Shares outstanding on such date. The directors and officers, as a group, controlled 51.0% of the total voting rights as of such date when all Multiple Voting Shares and Subordinate Voting Shares are considered. Mr. Hennick controls all of the Company's Multiple Voting Shares.
Legal proceedings and regulatory actions
In the normal course of operations, the Company is subject to routine claims and litigation incidental to its business. Litigation currently pending or threatened against the Company includes disputes with former employees and commercial liability claims related to services provided by the Company. The Company believes resolution of such proceedings, combined with amounts set aside, will not have a material impact on the Company's financial condition or the results of operations.
Properties
The following chart provides a summary of the properties occupied by the Company and its subsidiaries as at December 31, 2013:
|
(square feet)
|
United
States
(leased)
|
United
States
(owned)
|
Canada
(leased)
|
Canada
(owned)
|
International
(leased)
|
International
(owned)
|
|
Commercial Real Estate Services
|
598,000
|
-
|
285,000
|
-
|
620,000
|
-
|
|
Residential Real Estate Services
|
1,020,000
|
114,000
|
70,000
|
-
|
-
|
-
|
|
Property Services
|
260,000
|
-
|
39,000
|
-
|
-
|
-
|
|
Corporate
|
-
|
-
|
-
|
20,000
|
-
|
-
|
-16-
Reconciliation of non-GAAP financial measures
In this AIF, we make reference to "adjusted EBITDA" and "adjusted EPS," which are financial measures that are not calculated in accordance with GAAP.
Adjusted EBITDA is defined as net earnings from continuing operations, adjusted to exclude: (i) income tax; (ii) other expense (income); (iii) interest expense; (iv) depreciation and amortization; (v) acquisition-related items; and (vi) stock-based compensation expense. The Company uses adjusted EBITDA to evaluate its own operating performance and its ability to service debt, as well as an integral part of its planning and reporting systems. Additionally, this measure is used in conjunction with discounted cash flow models to determine the Company’s overall enterprise valuation and to evaluate acquisition targets. Adjusted EBITDA is presented as a supplemental measure because the Company believes such measure is useful to investors as a reasonable indicator of operating performance because of the low capital intensity of its service operations. The Company believes this measure is a financial metric used by many investors to compare companies, especially in the services industry. This measure is not a recognized measure of financial performance under GAAP in the United States, and should not be considered as a substitute for operating earnings, net earnings from continuing operations or cash flow from operating activities, as determined in accordance with GAAP. The Company’s method of calculating adjusted EBITDA may differ from other issuers and accordingly, this measure may not be comparable to measures used by other issuers. A reconciliation of net earnings from continuing operations to adjusted EBITDA appears below.
|
|
Year ended
|
|||||||||||
|
(in thousands of US$)
|
December 31
|
|||||||||||
|
|
2013
|
2012
|
2011
|
|||||||||
|
|
|
|
|
|||||||||
|
Net earnings from continuing operations
|
$ | 47,640 | $ | 42,217 | $ | 76,925 | ||||||
|
Income tax
|
22,624 | 21,007 | (43,823 | ) | ||||||||
|
Other expense (income)
|
(1,531 | ) | (2,441 | ) | 6,317 | |||||||
|
Interest expense, net
|
21,501 | 19,565 | 16,798 | |||||||||
|
Operating earnings
|
90,234 | 80,348 | 56,217 | |||||||||
|
Depreciation and amortization
|
71,995 | 48,155 | 46,526 | |||||||||
|
Acquisition-related items
|
10,498 | 16,326 | 4,649 | |||||||||
|
Stock-based compensation expense
|
12,734 | 7,434 | 2,335 | |||||||||
|
Reorganization charge
|
- | - | 5,590 | |||||||||
|
Adjusted EBITDA
|
$ | 185,461 | $ | 152,263 | $ | 115,317 | ||||||
Adjusted EPS is defined as diluted net earnings (loss) per common share from continuing operations, adjusted for the effect, after income tax, of: (i) the non-controlling interest redemption increment; (ii) acquisition-related items; (iii) amortization of intangible assets recognized in connection with acquisitions; and (iv) stock-based compensation expense. The Company believes this measure is useful to investors because it provides a supplemental way to understand the underlying operating performance of the Company and enhances the comparability of operating results from period to period. Adjusted EPS is not a recognized measure of financial performance under GAAP, and should not be considered as a substitute for diluted net earnings per common share from continuing operations, as determined in accordance with GAAP. The Company’s method of calculating this non-GAAP measure may differ from other issuers and, accordingly, this measure may not be comparable to measures used by other issuers. A reconciliation of diluted net earnings (loss) per common share from continuing operations to adjusted EPS appears below.
-17-
|
|
Year ended
|
|||||||||||
|
(in US$)
|
December 31
|
|||||||||||
|
|
2013
|
2012
|
2011
|
|||||||||
|
|
|
|
|
|||||||||
|
Diluted net (loss) earnings per common share
|
|
|
|
|||||||||
|
from continuing operations
|
$ | (0.46 | ) | $ | (0.08 | ) | $ | 1.35 | ||||
|
Non-controlling interest redemption increment
|
1.25 | 0.69 | 0.42 | |||||||||
|
Acquisition-related items
|
0.30 | 0.51 | 0.14 | |||||||||
|
Amortization of intangible assets, net of tax
|
0.73 | 0.36 | 0.38 | |||||||||
|
Stock-based compensation expense, net of tax
|
0.33 | 0.16 | 0.05 | |||||||||
|
Impairment loss on equity investment
|
- | - | 0.10 | |||||||||
|
Reorganization charge
|
- | - | 0.12 | |||||||||
|
Deferred income tax asset valuation allowance
|
- | - | (1.52 | ) | ||||||||
|
Adjusted EPS
|
$ | 2.15 | $ | 1.64 | $ | 1.04 | ||||||
We believe that the presentation of adjusted EBITDA and adjusted EPS, which are non-GAAP financial measures, provides important supplemental information to management and investors regarding financial and business trends relating to the Company’s financial condition and results of operations. We use these non-GAAP financial measures when evaluating operating performance because we believe that the inclusion or exclusion of the items described above, for which the amounts are non-cash or non-recurring in nature, provides a supplemental measure of our operating results that facilitates comparability of our operating performance from period to period, against our business model objectives, and against other companies in our industry. We have chosen to provide this information to investors so they can analyze our operating results in the same way that management does and use this information in their assessment of our core business and the valuation of the Company. Adjusted EBITDA and adjusted EPS are not calculated in accordance with GAAP, and should be considered supplemental to, and not as a substitute for, or superior to, financial measures calculated in accordance with GAAP. Non-GAAP financial measures have limitations in that they do not reflect all of the costs or benefits associated with the operations of our business as determined in accordance with GAAP. As a result, investors should not consider these measures in isolation or as a substitute for analysis of our results as reported under GAAP.
Risk factors
Investors in the Company's securities should carefully consider the following risks, as well as the other information contained in this AIF and Management's discussion and analysis of results of operations and financial condition for the year ended December 31, 2013. If any of the following risks actually occurs, our business could be materially harmed. The risks and uncertainties described below are not the only ones we face. Additional risks and uncertainties, including those of which we are currently unaware or we currently deem immaterial, may also adversely affect our business.
Economic conditions, especially as they relate to credit conditions and consumer spending
During periods of economic slowdown or contraction, our business is impacted directly. Credit conditions affect commercial real estate transactions, which reduces the demand for our services. Consumer spending directly impacts our Property Services operations businesses because as consumers spend less on property services, our revenues decline. These factors could also negatively impact the timing or the ultimate collection of accounts receivable, which would negatively impact our operating revenues, profitability and cash flow.
Commercial real estate property values, vacancy rates and general conditions of financial liquidity for real estate transactions
Since our Commercial Real Estate Services segment accounted for 56% of our revenues in 2013, factors affecting the commercial real estate industry have a direct impact on our operations. Property values have a direct impact on the commissions earned on sales transactions. Vacancy rates affect market lease rates and the duration of lease commitments, which are the basis of leasing commissions earned. Both property values and vacancy rates can influence the number of sales transactions that occur.
-18-
Residential real estate property values, resale rates and general conditions of financial liquidity for real estate transactions
We provide various services at residential properties in our Property Services and Residential Real Estate Services operations. Property values and consumer confidence are strongly correlated with demand for our services, including painting, closet installation, general maintenance, collections and resale processing.
Extreme weather conditions impact demand for our services or our ability to perform those services
Natural disasters, such as hurricanes, can have a direct impact in our Property Services and Residential Real Estate Services operations. These events damage property, which require various services that our companies offer such as restoration and large-scale landscaping. They may also harm our employees, facilities and franchisees, resulting in an inability to serve clients and generate revenues.
Economic deterioration impacts our ability to recover goodwill and other intangible assets
Expectations of future earnings drive the recoverability of goodwill and other intangible assets, which are tested, at least, on an annual basis. During the year ended December 31, 2009, we recorded a $29.6 million impairment charge to our Commercial Real Estate Services segment's goodwill. A future deterioration of operating performance may necessitate additional non-cash impairment charges.
Ability to generate cash from our businesses to fund future acquisitions and meet our debt obligations
We rely on our businesses to generate the necessary cash to service our financial obligations. As at December 31, 2013, we have $372.8 million of debt outstanding ($230.1 million net of cash) that will be required to be refinanced or repaid over the next eleven years. We also have $166.3 million of available un-drawn credit at December 31, 2013. To date, we have been able to meet all of our debt obligations, however with a decline in performance in some of our businesses, surplus cash may not be available to be remitted which may result in the inability to meet a debt repayment.
An important component of our growth strategy is strategic and selective acquisitions, which we tend to complete with cash. Although we have a revolving credit facility available to us as noted above, we also rely on surplus cash on hand to fund acquisitions. If cash on hand is not available and the credit facility is fully utilized, then future acquisitions may not be possible.
The effects of changes in foreign exchange rates in relation to the U.S. dollar on our Canadian dollar, Australian dollar, UK pound sterling and Euro denominated revenues and expenses
We generate approximately 40% of our revenues outside the United States. Consequently, our consolidated results are impacted directly by fluctuations in the relative strength of the U.S. dollar versus the Canadian dollar, Australian dollar, UK pound sterling and Euro currencies.
In the future, we expect to acquire additional international operations. As a consequence, the impact of foreign currency exchange rate fluctuations may increase.
Competition in the markets served by the Company
We operate in highly competitive markets. Changes in the source and intensity of competition in the markets served by us impact the demand for our services and may result in additional pricing pressures. The relatively low capital cost of entry to certain of our businesses has led to strong competitive markets, including regional and local owner-operated companies. Regional and local competitors operating in a limited geographic area may have lower labour, benefits and overhead costs. The principal methods of competition in our businesses include name recognition, quality and speed of service, pricing, customer satisfaction and reputation. No assurance can be given that we will be able to compete successfully against current or future competitors and that the competitive pressures that we face will not result in reduced market share or negatively impact our financial performance.
Labour shortages or increases in wage and benefit costs
As a services company, our primary asset is the human capital that comprises our workforce. In particular, we rely on property managers, real estate brokers, franchisees and other skilled staff to generate revenues. A shortage, or increase in wage and benefit costs, of this human capital could reduce our revenues and profitability.
-19-
The effects of changes in interest rates on our cost of borrowing
As at December 31, 2013, we had $322.6 million of debt at variable interest rates. As a result, changes in base rates such as LIBOR affect our interest expense as these base rates fluctuate. On our fixed rate debt, we have from time-to-time entered into fixed-for-floating interest rate swaps, where advantageous, to convert the fixed interest payments to floating. These swaps are intended to manage interest rate sensitivity and reduce overall interest costs.
Continued compliance with the financial covenants under our debt agreements, or our ability to negotiate a waiver of certain covenants with our lenders
Although we have always been in compliance with our financial covenants, a prolonged decline in our earnings performance could result in a non-compliance with one or more financial covenants. If the Company fails to meet its payment or other obligations under its amended and restated credit facility, the lenders will be entitled to demand immediate repayment of all amounts owing and thereafter, if unpaid, exercise their secured creditor rights.
Unexpected increases in operating costs, such as insurance, workers' compensation, health care and fuel prices
As a services company, the costs of providing services to our customers can fluctuate. Certain operating costs, such as fuel prices, are based on market rates which we cannot control and, absent an offsetting price increase in our services, have a direct impact on our operating margins.
Changes in the frequency or severity of insurance incidents relative to our historical experience
Adverse changes in claims experience could increase our insurance costs and/or increase the risk of being unable to renew insurance coverage at our operations. In each of our operating segments, we effectively self-insure certain risks, with a layer of third-party insurance for catastrophic claims. An increase in the frequency or severity of claims in these areas could materially affect our financial position and results of operations. There can be no assurance that we will be able to obtain insurance coverage on favourable economic terms in the future.
Our ability to make acquisitions at reasonable prices and successfully integrate acquired operations
As an acquisitive organization, we actively pursue acquisitions to expand our global footprint and services offerings as well as supplement existing businesses. Not only does our acquisition strategy depend on the continued availability of suitable targets, it also depends on the ability to negotiate favorable terms and conditions. Another risk with acquisitions is the ability to integrate the acquired business into an existing service line.
Declaration of dividends on Common Shares
Future dividends on the Common Shares will depend on the Company's results of operations, financial condition, capital requirements, general business conditions and other factors that the Company's Board of Directors may deem relevant. Additionally, under the Company's amended and restated credit facility, the Company is not permitted to pay dividends, whether in cash or in specie, in the circumstances of an event of default thereunder occurring and continuing or an event of default occurring as a consequence thereof.
Risks arising from any regulatory review and litigation
While management is not currently aware of any formal regulatory reviews or investigations, the commencement of any such reviews or investigations may result in the diversion of significant management attention and resources and, if the securities regulators determine that a violation of securities or other laws may have occurred, or has occurred, the Company or its officers and directors may receive notices regarding potential enforcement action or prosecution and could be subject to civil or criminal penalties or other remedies. For example, the Company or its officers could be required to pay substantial damages, fines or other penalties, the regulators could seek an injunction against the Company or seek to ban an officer or director of the Company from acting as such, any of which actions would have a material adverse effect on the Company.
-20-
Intellectual property and other proprietary rights that are material to our business
Our ability to compete effectively depends in part on our rights to service marks, trademarks, trade names and other intellectual property rights we own or license (including "Colliers International"). We have not sought to register every one of our marks in every country in which they are used. Furthermore, because of the differences in foreign trademark, patent and other intellectual property or proprietary rights laws, we may not receive the same protection in other countries as we would in Canada or the United States. If we are unable to protect our proprietary information and brand names, we could suffer a material adverse effect on our business, financial condition or results of operations. Litigation may be necessary to enforce our intellectual property rights and protect our proprietary information, or to defend against claims by third parties that our products or services infringe their intellectual property rights. Any litigation or claims brought by or against us could result in substantial costs and diversion of our resources. A successful claim of trademark, patent or other intellectual property infringement against us, or any other successful challenge to the use of our intellectual property, could subject us to damages or prevent us from providing certain services under our recognized brand names, which could have a material adverse effect on our business, financial condition or results of operations.
Disruptions or security failures in our information technology systems
Our information technology systems facilitate our ability to monitor, operate and control our operations. While we have disaster recovery plans in place, any disruption in these plans or the failure of our information technology systems to operate as expected could, depending on the magnitude of the problem, adversely affect our operating results by limiting, among other things, our capacity to monitor, operate and control our operations effectively. In addition, because our systems contain information about individuals and businesses, our failure to maintain the security of the data we hold, whether the result of our own error or the malfeasance or errors of others, could harm our reputation or give rise to legal liabilities relating to violations of privacy laws or otherwise, which may lead to lower revenues, increased costs and other material adverse effects on our results of operations.
Multiple Voting Shares and a change of control
The existence of the Multiple Voting Shares results in various impediments on the ability or desire of a third party to acquire control of the Company. This may discourage, delay or prevent a change of control of the Company or an acquisition of the Company at a price that shareholders may find attractive. The existence of the Multiple Voting Shares also may discourage proxy contests and make it difficult or impossible for the Company's holders of Subordinate Voting Shares to elect directors and take other corporate actions.
Blank cheque preference shares
The Company has the right to issue so-called "blank cheque" preference shares which may affect the voting and liquidation rights of holders of Common Shares. The Company's Board of Directors is authorized, without any further shareholder approval, to issue one or more additional series of preference shares in an unlimited number and to set the rights, privileges, restrictions and conditions attached thereto.
Political conditions, including any outbreak or escalation of terrorism or hostilities and the impact thereof on our business
Political events and situations can have an effect on our Company because of our global operations. Events could occur that may hamper our ability to manage operations, extract cash and implement FirstService policies in certain regions, particularly in developing countries that have had a recent history of political and economic instability.
Changes in government policies at the federal, state/provincial or local level that may adversely impact our businesses
As a multinational company, changes in laws and regulation at the different jurisdictional levels can have direct effect on our operations. It is difficult to predict the future impact of the legislative and regulatory requirements affecting our businesses. The laws and regulations applicable to our businesses will likely change in the future and affect our operations and financial performance. In addition, if we were to fail to comply with any applicable law or regulation, we could be subject to substantial fines or damages, be involved in litigation, suffer losses to our reputation and suffer the loss of licenses or penalties that may affect how our business is operated, which, in turn, would have a material adverse effect on our business, financial condition and results of operations.
-21-
Interest of management and others in material transactions
There are no material interests, direct or indirect, of directors or executive officers of the Company, any shareholder who beneficially owns, directly or indirectly, or exercises control or direction over more than 10% of the outstanding shares of the Company, or any known associate or affiliate of such persons in any transactions within the three most recently completed financial years of the Company or during the current financial year which has materially affected, or is reasonably expected to materially affect, the Company.
Material contracts
On February 1, 2004, the Company, upon the review, report and recommendation of the Executive Compensation Committee of the Board of Directors of the Company, entered into a management services agreement (the "Management Services Agreement") with Jayset Capital Corp. ("Jayset") and Jay S. Hennick. Mr. Hennick is the sole officer, director and shareholder of Jayset. The particulars of the Management Services Agreement are set out in the section entitled "Executive Compensation – Management Contract" contained in the Circular, which section is incorporated herein by reference.
The Company entered into a: (i) Note and Guarantee Agreement dated as of January 16, 2013 among the Company, FirstService Delaware LP and others in respect of the Company's 3.84% Guaranteed Senior Secured Notes due 2025; (ii) Amended and Restated Note and Guarantee Agreement dated as of January 16, 2013 (amending and restating the original agreement dated as of April 1, 2005) among the Company, FirstService Delaware, LP and others in respect of the Company's 5.44% Guaranteed Senior Secured Notes due 2015; and (iii) Amended and Restated Note and Guarantee Agreement dated as of January 16, 2013 (amending and restating the original agreement dated as of September 29, 2003) among the Company, FirstService Delaware, LP and others in respect of the Company's 6.40% Guaranteed Secured Notes due 2015. The foregoing Note and Guarantee Agreements were entered into in connection with the Company's issuance of guaranteed senior secured notes on the dates indicated. The Note and Guarantee Agreements, and subsequent amendments, are available on SEDAR.
On March 1, 2012, the Company entered into a sixth amended and restated credit agreement (the "Amended and Restated Credit Agreement") with a syndicate of lenders. The Amended and Restated Credit Agreement increased the committed senior revolving credit facility to $350 million from $275 million and includes an uncommitted accordion provision allowing for an additional $100 million of borrowing capacity under certain circumstances. Pursuant to the Amended and Restated Credit Agreement, the senior revolving credit facility has a five year term ending March 1, 2017 and bears interest at 1.25% to 3.00% over floating reference rates, depending on certain leverage ratios. The remaining terms were substantially unchanged from the prior credit agreement. The Amended and Restated Credit Agreement is available on SEDAR.
Cease trade orders, bankruptcies, penalties or sanctions
To the best of the knowledge of the Company:
|
(A)
|
none of the directors or executive officers of the Company is, as at the date of this AIF, or has been, within 10 years before the date of this AIF, a director, chief executive officer or chief financial officer of any company (including the Company) that: (i) was subject to an order that was issued while the director or executive officer was acting in the capacity as director, chief executive officer or chief financial officer; or (ii) was subject to an order that was issued after the director or executive officer ceased to be a director, chief executive officer or chief financial officer and which resulted from an event that occurred while that person was acting in the capacity as director, chief executive officer or chief financial officer;
|
-22-
|
(B)
|
none of the directors or executive officers of the Company, or a shareholder holding a sufficient number of securities of the Company to affect materially the control the Company: (a) is, as at the date of this AIF, or has been, within 10 years before the date of this AIF, a director or executive officer of any company (including the Company) that, while that person was acting in that capacity, or within a year of that person ceasing to act in that capacity, became bankrupt, made a proposal under any legislation relating to bankruptcy or insolvency or was subject to or instituted any proceedings, arrangement or compromise with creditors or had a receiver, receiver manager or trustee appointed to hold its assets; or (b) has, within the 10 years before the date of this AIF, become bankrupt, made a proposal under any legislation relating to bankruptcy or insolvency, or become subject to or instituted any proceedings, arrangement or compromise with creditors, or had a receiver, receiver manager or trustee appointed to hold the assets of the director, executive officer or shareholder;
|
except for: (i) David R. Beatty who was a director of Thistle Mining Inc. ("Thistle") when Thistle announced on December 21, 2004 that it intended to undertake a restructuring under the Companies' Creditors Arrangement Act. While Thistle completed the restructuring on June 30, 2005, its common shares were suspended from trading on the Alternative Investment Market from June 30, 2005 to July 13, 2005 and its common shares were suspended from trading on the TSX on December 31, 2004 due to the restructuring until Thistle delisted in February 2006. Mr. Beatty is no longer a director of Thistle; (ii) Michael D. Harris who (A) is a director of Grant Forest Products Inc., an Ontario corporation, which, among others, filed for and obtained protection under the Companies' Creditors Arrangement Act on June 25, 2009 and (B) was a director of Naturade, Inc., a company publicly traded in the United States, from December 2005 until August 2006, which company, within a year after Mr. Harris' resignation as a director, filed for reorganization under Chapter 11 of the U.S. Bankruptcy Code; and (iii) Brendan Calder, who is a director of Coventree Inc. ("Coventree"). In 2009, staff of the Ontario Securities Commission ("OSC") commenced proceedings against Coventree with respect to alleged breaches of Ontario securities laws relating to Coventree's continuous disclosure obligations. In September 2011, the OSC released its decision and concluded that Coventree breached sections 75(1) and 75(2) of the Securities Act (Ontario) by (a) failing to file a news release and material change report in respect of the decision of Dominion Bond Rating Service in January of 2007 to change its credit rating methodology; and (b) failing to file a news release and a material change report with respect to liquidity and liquidity-related events and the risk of a market disruption in the days leading up to the ABCP market disruption that occurred on August 13, 2007. In a decision released on November 9, 2011, the OSC ordered Coventree to pay an administrative penalty of $1 million and to pay $250,000 of the costs incurred by OSC staff in connection with the hearing. The OSC also ordered that trading in any securities by Coventree cease and that any Ontario securities law exemptions not apply to Coventree until its winding up is completed, provided that these orders will not prevent the winding up of Coventree or trades in securities reasonably related to that winding up. Mr. Calder was a director of Coventree in 2007 during the period of time to which the OSC proceedings relate, however no proceedings were brought against Mr. Calder in his individual capacity with respect to these matters.
Conflicts of interest
Certain directors and officers of the Company are engaged in and will continue to engage in activities outside the Company, and as a result, certain directors and officers of the Company may become subject to conflicts of interest. The Business Corporations Act (Ontario) provides that in the event that a director has an interest in a contract or proposed contract or agreement, the director shall disclose his interest in such contract or agreement and shall refrain from voting on any matter in respect of such contract or agreement unless otherwise provided under the Business Corporations Act (Ontario). To the extent that conflicts of interest arise, such conflicts will be resolved in accordance with the provisions of the Business Corporations Act (Ontario).
As at the date hereof, the Company is not aware of any existing or potential material conflicts of interest between the Company and a director or officer of the Company.
-23-
Experts
The Company's independent registered public accounting firm is PricewaterhouseCoopers LLP, who has issued an independent auditors' report dated February 24, 2014 in respect of the Company's consolidated financial statements as of December 31, 2013 and 2012 and for each of the years in the three year period ended December 31, 2013 and on the effectiveness of the Company's internal control over financial reporting as at December 31, 2013. PricewaterhouseCoopers LLP has advised that they are independent with respect to the Company within the meaning of the Rules of Professional Conduct of the Institute of Chartered Accountants of Ontario and the rules of the U.S. Securities and Exchange Commission.
Audit Committee
The Audit Committee is comprised of three members who are each "independent" and "financially literate" as required by Multilateral Instrument 52-110 Audit Committees (the "Audit Committee Rule"). The members of the Audit Committee during the year ended December 31, 2013 were Messrs. Ghert, Beatty and Cohen. On February 11, 2014, Mr. Stein was appointed to the Audit Committee and Mr. Beatty stepped down. Mr. Ghert was appointed Chair of the Audit Committee in May 2005. The Audit Committee has the authority to conduct any investigation appropriate to fulfilling its responsibilities, and it has direct access to the external auditors as well as to anyone in the Company. The Audit Committee has the ability to retain, at the Company's expense, special legal, accounting, or other consultants or experts it deems necessary in the performance of its duties. The Audit Committee meets at least four times annually, or more frequently as circumstances dictate.
The Audit Committee reviews the annual and interim financial statements intended for circulation among shareholders and reports upon these to the Board of Directors of the Company (the "Board") prior to their approval by the full Board. The Audit Committee is also responsible for the oversight of the integrity of the Company's internal accounting and control systems. The Audit Committee communicates directly with the Company's external auditors in order to discuss audit and related matters whenever appropriate. In addition, the Board may defer to the Audit Committee on other matters and questions relating to the financial position of the Company and its affiliates. All reports made to the Company's ethics hotline are reviewed by the Audit Committee at its next meeting. The Board has adopted an Audit Committee mandate, a copy of which is annexed as Exhibit "A" to this AIF. The Audit Committee mandate is also published on the Company's website (www.firstservice.com)
The education and related experience of each of the members of the Audit Committee that is relevant to the performance by such members of their responsibilities on such committee is described below.
Bernard I. Ghert (Chair) – Mr. Ghert holds a Master of Business Administration degree. Mr. Ghert was previously President and Chief Executive Officer of the Cadillac Fairview Corporation Limited from 1981 to 1987 and President of Stelworth Investments Inc. from 1987 to 1992. Mr. Ghert has been a director of many organizations in the private and public sectors, including Cadillac Fairview, Stelworth, CT Financial and Canada Trust, Wellington Insurance and the Canada Deposit Insurance Corporation. Mr. Ghert has served as Director of the Managers of several Middlefield Funds, President of the Canadian Institute of Public Real Estate Companies and was a former member of the Advisory Board of the Office of the Superintendent of Financial Institutions. Mr. Ghert currently is Chairman of the Independent Review Committee of the Middlefield Group of Funds and President of the B.I. Ghert Family Foundation. Mr. Ghert is a past Chair of the Mount Sinai Hospital Board of Directors.
Peter F. Cohen – Mr. Cohen is a Chartered Professional Accountant and a former partner in an audit practice of a public accounting firm. Mr. Cohen is currently the Chair of the Board of the Company and President and Chief Executive Officer of the Dawsco Group, a private real estate and investment company owned by Mr. Cohen and his family. Mr. Cohen was a co-founder and Chair and Chief Executive Officer of Centrefund Realty Corporation, a publicly traded shopping center investment company until August 2000 when control of the company was sold. Mr. Cohen is a member of the boards of a number of private companies and charities.
-24-
David R. Beatty – Mr. Beatty is currently the Chairman and Chief Executive Officer of Beatinvest Limited (an investment company), Director of the Institute of Corporate Directors, Director of the Clarkson Centre for Business Ethics and Board Effectiveness and Professor of Strategic Management at The Rotman School of Management, University of Toronto. Mr. Beatty was previously the founding Managing Director of the Canadian Coalition for Good Governance, founding Chairman of Orogen Minerals Limited, Chairman and Chief Executive Officer of Old Canada Investment Corporation Limited and President of Weston Foods. Mr. Beatty is Honorary Consul to Canada for the Government of Papua New Guinea and in 1993 was awarded the O.B.E. A graduate in economics from the University of Toronto (Trinity College), he was a Nuffield Scholar at the University of Cambridge (Queens' College) where he obtained a Master of Arts degree in Economics.
Michael Stein – Mr. Stein is the Chairman and Founder of Canadian Apartment Properties Real Estate Investment Trust (CAPREIT), a publicly traded residential landlord, has served as a Director on its Board of Trustees of since 1997. He has been Chairman and Chief Executive Officer of MPI Group Inc., a company engaged in real estate investment and development, since 1994. Between 2000 and 2006, Mr. Stein served on the Board of Directors of Goldcorp Inc., a public natural resource company. Mr. Stein is a graduate engineer and holds a Master of Business Administration degree from Columbia University in New York.
The Audit Committee Rule requires the Company to disclose whether its Audit Committee has adopted specific policies and procedures for the engagement of non-audit services and to prepare a summary of these policies and procedures. The mandate of the Audit Committee provides that it is such committee's responsibility to: (a) approve the appointment and, when circumstances warrant, discharge of the external auditor and monitor its qualifications, performance and independence; (b) approve and oversee the disclosure of all audit services provided by the external auditor to the Company or any of its subsidiaries, determining which non-audit services the external auditor are prohibited from providing and, exceptionally, pre-approve and oversee the disclosure of permitted non-audit services to be performed by the external auditor, in accordance with applicable laws and regulations; and (c) approve the basis and amount of the external auditor's fees and other significant compensation. The Audit Committee has adopted a pre-approval policy pursuant to which the Company may not engage the Company's external auditor to carry out certain non-audit services that are deemed inconsistent with the independence of auditors under U.S. and Canadian applicable laws. The Audit Committee must pre-approve all audit services as well as permitted non-audit services. The Audit Committee has delegated to the Chair of the Audit Committee, who is independent, the authority to act on behalf of the Audit Committee with respect to the pre-approval of all audit and permitted non-audit services provided by its external auditors from time to time. Any approvals by the Chair are reported to the full Audit Committee at its next meeting.
In addition to performing the audit of the Company's annual consolidated financial statements, PricewaterhouseCoopers LLP provided other services to the Company and they billed the Company the following fees for each of the Company's two most recently completed fiscal periods:
|
(in thousands of C$)
|
Year ended December 31, 2013
|
Year ended December 31, 2012
|
||||||
|
Audit fees (note 1)
|
$ | 2,254 | $ | 1,934 | ||||
|
Audit-related fees (note 2)
|
55 | 33 | ||||||
|
Tax fees (note 3)
|
371 | 476 | ||||||
|
All other fees (note 4)
|
4 | 10 | ||||||
| $ | 2,684 | $ | 2,453 | |||||
Notes:
|
1.
|
Refers to the aggregate fees billed by the Company's external auditor for audit services relating to the audit of FirstService Corporation and statutory audits required by subsidiaries.
|
|
2.
|
Refers to the aggregate fees billed for assurance and related services by the Company's external auditor that are reasonably related to the performance of the audit or review of the Company's financial statements and are not reported under (1) above, including professional services rendered by the Company's external auditor for accounting consultations on proposed transactions and consultations related to accounting and reporting standards. Such fees included amounts incurred in respect of: due diligence and other work related to the disposition and acquisition of businesses, such work being unrelated to the audit of the Company's financial statements; accounting consultations with respect to proposed transactions, as well as other audit-related services.
|
|
3.
|
Refers to the aggregate fees billed for professional services rendered by the Company's external auditor for tax compliance, tax advice and tax planning.
|
|
4.
|
Refers to fees for licensing and subscriptions to accounting and tax research tools.
|
-25-
Additional information
Additional information, including the directors' and officers' remuneration and indebtedness, principal holders of the Company's securities and options to purchase securities, where applicable, is contained in the Circular.
Copies of publicly filed documents of the Company, including those incorporated herein by reference, can be found through the SEDAR web site at www.sedar.com. Additional financial information is provided in the Company's consolidated financial statements and Management's discussion and analysis of results of operations and financial condition for the year ended December 31, 2013.
Upon request, the Corporate Secretary of the Company will provide to any person or company:
|
(a)
|
when the securities of the Company are in the course of a distribution pursuant to a short form prospectus or a preliminary short form prospectus has been filed in respect of a distribution of its securities:
|
|
|
(i)
|
one copy of the current AIF of the Company, together with one copy of any document, or the pertinent pages of any document, incorporated by reference in the AIF;
|
|
|
(ii)
|
one copy of the comparative consolidated financial statements of the Company for its most recently completed financial year for which financial statements have been filed together with the accompanying reports of the auditors and one copy of the most recent interim consolidated financial statements of the Company that have been filed, if any, for any period after the end of its most recently completed financial year;
|
|
|
(iii)
|
one copy of the information circular of the Company in respect of its most recent annual meeting of shareholders that involved the election of directors or one copy of any annual filing prepared instead of that information circular, as appropriate; and
|
|
|
(iv)
|
one copy of any other documents that are incorporated by reference into the preliminary short form prospectus or the short form prospectus and are not required to be provided under (i) to (iii) above.
|
|
(b)
|
at any other time, one copy of any document referred to in (a)(i), (ii) and (iii) above, provided that the Company may require the payment of a reasonable charge if the request is made by a person or company who is not a shareholder of the Company.
|
-26-
EXHIBIT "A"
AUDIT COMMITTEE MANDATE
Purpose
The Audit Committee (the "Committee") is appointed by and shall assist the Board of Directors (the "Board") of FirstService Corporation (the "Company") in fulfilling its oversight responsibilities in the following principal areas: (i) accounting policies and practices, (ii) the financial reporting process, (iii) financial statements provided by the Company to the public, (iv) risk management including systems of accounting and financial controls, (v) appointing, overseeing and evaluating the work and independence of the external auditors, and (vi) compliance with applicable legal and regulatory requirements. In addition to the responsibilities specifically enumerated in this Mandate, the Board may refer to the Committee such matters and questions relating to the financial position and operations of the Company and its subsidiaries as the Board may from time to time see fit.
Membership
The Committee shall consist of at least three directors appointed annually by the Board and selected based upon the following, in accordance with applicable laws, rules and regulations:
Independence. Each member shall be independent in accordance with applicable legal and regulatory requirements and in such regard shall have no direct or indirect material relationship with the Company which could, in the view of the Board, reasonably interfere with the exercise of a member's independent judgment.
Financially Literate. Each member shall be financially literate or must become financially literate within a reasonable period of time after his or her appointment to the Committee. For these purposes, an individual is financially literate if he or she has the ability to read and understand a set of financial statements that present a breadth and level of complexity of accounting issues that are generally comparable to the breadth and complexity of the issues that can reasonably be expected to be raised by the Company's financial statements.
Commitment. In addition to being a member of the Committee, if a member is also on the audit committee or board of directors of other public companies or organizations, the Board shall determine that such simultaneous service does not impair the ability of such member to serve effectively on the Committee.
Chair and Secretary
The Chair of the Committee shall be selected by the Board. If the Chair is not present, the members of the Committee may designate a Chair for the meeting by majority vote of the members present. The Secretary of the Company shall be the Secretary of the Committee, provided that if the Secretary is not present, the Chair of the meeting may appoint a secretary for the meeting with the consent of the other Committee members who are present.
Meetings
The times and locations of meetings of the Committee and the calling of and procedures at such meetings, shall be determined from time to time by the Chair of the Committee, in consultation with management when necessary, provided that there shall be a minimum of four meetings per year. The Committee shall have sufficient notice in order to prepare for each meeting. Notice of each meeting shall also be given to the external auditors of the Company, and meetings shall be convened whenever requested by the external auditors or any member of the Committee in accordance with applicable law.
Meeting Agendas
Agendas for meetings of the Committee shall be developed by the Chair of the Committee in consultation with management and the corporate secretary, and shall be circulated to the Committee members prior to any meetings.
Resources and Authority
The Committee shall have the resources and the authority to discharge its responsibilities, including the authority to engage, at the expense of the Company, outside consultants, independent legal counsel and other advisors as it determines necessary to carry out its duties, without seeking approval of the Board or management.
The Committee shall have the authority to conduct any investigation necessary and appropriate to fulfilling its responsibilities, and has direct access and authority to communicate directly with the external auditors, legal counsel and officers and employees of the Company.
The members of the Committee have the right, for the purpose of performing their duties, to inspect the books and records of the Company and to discuss such accounts and records and any matters relating to the financial position, risk management and internal controls of the Company with the officers and external auditors of the Company.
Responsibilities
The Company's management is responsible for preparing the Company's financial statements while the external auditors are responsible for auditing those financial statements. The Committee is responsible for overseeing the conduct of those activities by the Company's management and external auditors, and overseeing the activities of any internal audit initiatives. The Company's external auditors are accountable to the Committee as representatives of the Company's shareholders.
It is recognized that members of the Committee are not full-time employees of the Company and do not represent themselves to be accountants or auditors by profession or experts in the fields of accounting or auditing or the preparation of financial statements. It is not the duty or responsibility of the Committee or its members to conduct "field work" or other types of auditing or accounting reviews or procedures. Each member of the Committee shall be entitled to rely on (i) the integrity of those persons and organizations within and outside the Company from whom it receives information, and (ii) the accuracy of the financial and other information provided to the Committee by such persons or organizations absent actual knowledge to the contrary.
The specific responsibilities of the Committee are as follows:
Financial Reporting Process and Financial Statements
In consultation with the external auditors and management, review the integrity of the Company's financial reporting process, both internal and external, and any major issues as to the adequacy of the internal controls and any special audit procedures adopted in light of any material control deficiencies; Review all material transactions and contracts entered into by the Company with any insider or related party of the Company, other than director, officer or employee compensation which is approved by the Compensation Committee; Review with management and the external auditors the Company's annual audited consolidated financial statements and discuss with the external auditors all matters required to be discussed by generally accepted auditing standards (GAAS) in Canada and the Public Company Accounting Oversight Board (United States). This would include reviewing the annual audit committee report prepared by the external auditors describing: (i) all critical accounting policies used by the Company, (ii) any material alternative accounting treatments within generally accepted accounting principles (GAAP) that have been discussed with management of the Company, including the ramifications of the use of such alternative treatments and disclosures, and (iii) any other material written communications between the external auditors and management; Following completion of the annual audit, review with management and the external auditors any significant issues, concerns or difficulties encountered and resolve any disagreements between management and the external auditors; Review the interim quarterly and annual financial statements and annual and interim press releases prior to the release of earnings information, including earnings guidance provided to analysts; Review and be satisfied that adequate procedures are in place for the review of the public disclosure of financial information by the Company extracted or derived from the Company's financial statements, other than as referred to in (f), and periodically assess the adequacy of those procedures; and Meet separately with management and with the external auditors, including at the time of the annual audit plan review with management and the external auditors.
External Auditors
The Committee shall require the external auditor to report directly to it and is responsible for the selection, nomination, compensation, retention, termination and oversight of the work of the external auditors engaged for the purpose of issuing an auditor's report or performing other audit, review or attest services for the Company, and in such regard recommend to the Board the external auditors to be nominated for approval by the shareholders; Pre-approve all audit engagements and the provision by the external auditors of all non-audit services, including fees and terms for all audit and non-audit engagements, and in such regard the Committee may establish the types of non-audit services the external auditors shall be prohibited from providing and shall establish the types of audit, audit related and non-audit services for which the Committee will retain the external auditors. The Committee may delegate the responsibility to pre-approve non-audit services to one of its members and any such delegated pre-approvals shall be presented to the Committee at its next scheduled meeting ; Review and approve the Company's policies for the hiring of partners and employees and former partners and employees of the external auditing firm; Consider, assess and report to the Board with regard to the independence and performance of the external auditors; and Request and review annually a report by the external auditors regarding the auditing firm's internal quality-control procedures, any material issues raised by the most recent internal quality-control review of the auditing firm, or by any inquiry or investigation by governmental or professional authorities, within the past five years.
-A2-
Internal Controls and Risk Management
Oversee management's design, implementation and evaluation of the Company's internal controls over financial reporting, including compliance with the requirements of the Sarbanes-Oxley Act. Receive and review reports from management and the external auditors with regard to the reliability and effective operation of the Company's accounting systems and internal controls; Discuss with management the Company's approach to risk assessment and management, controls over fraud and assessment of the need for internal auditing; Establish policies and procedures for the confidential, anonymous submission by employees of the Company of any concerns regarding questionable accounting or other acts and for the receipt, retention and treatment of complaints received regarding accounting, internal accounting controls or auditing matters.
Legal and Regulatory Requirements
Receive and review timely analysis by management of significant issues relating to public disclosure and reporting, including, prior to finalization, the Management's Discussion and Analysis and Annual Information Form; Prepare the report of the Committee required to be included with the Company's periodic filings; and Assist the Board in the oversight of compliance with legal and regulatory matters.
Additional Responsibilities
Report regularly to the Board, including on matters such as the quality and integrity of the Company's financial statements, compliance with legal and regulatory requirements, the results of any internal audit initiatives, including evaluation of internal controls over financial reporting for purposes of compliance with Sarbanes-Oxley, and the performance and independence of the external auditors; and Reassess annually the adequacy of the Committee's Mandate and prepare and review with the Board an annual performance evaluation of the Committee.
-A3-