May 7, 2021
PRESS RELEASE
Century Casinos, Inc. Announces First Quarter 2021 Results
Colorado Springs, Colorado – May 7, 2021 – Century Casinos, Inc. (Nasdaq Capital Market®: CNTY) today announced its financial results for the three months ended March 31, 2021.
First Quarter 2021 Highlights*
|
· |
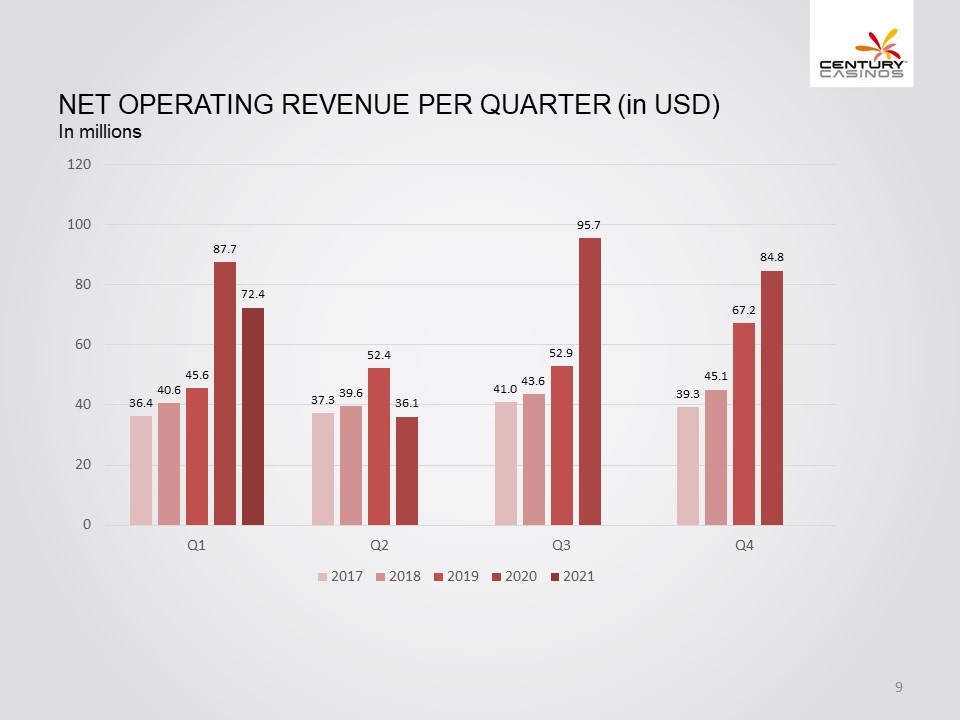
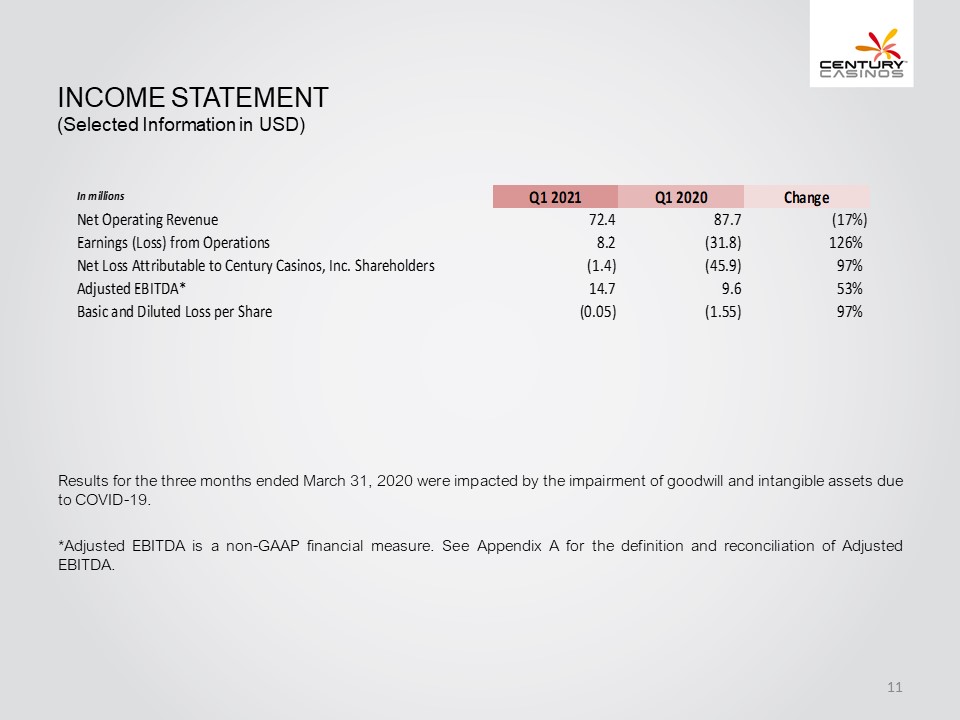
Net operating revenue was $72.4 million, a decrease of 17% from the three months ended March 31, 2020. |
|
· |
Earnings from operations was $8.2 million, an increase of 126% from the three months ended March 31, 2020. |
|
· |
Net loss attributable to Century Casinos, Inc. shareholders was ($1.4) million, a change of 97% from the three months ended March 31, 2020. |
|
· |
Adjusted EBITDA** was $14.7 million, an increase of 53% from the three months ended March 31, 2020. |
|
· |
Loss per share was ($0.05). |
|
· |
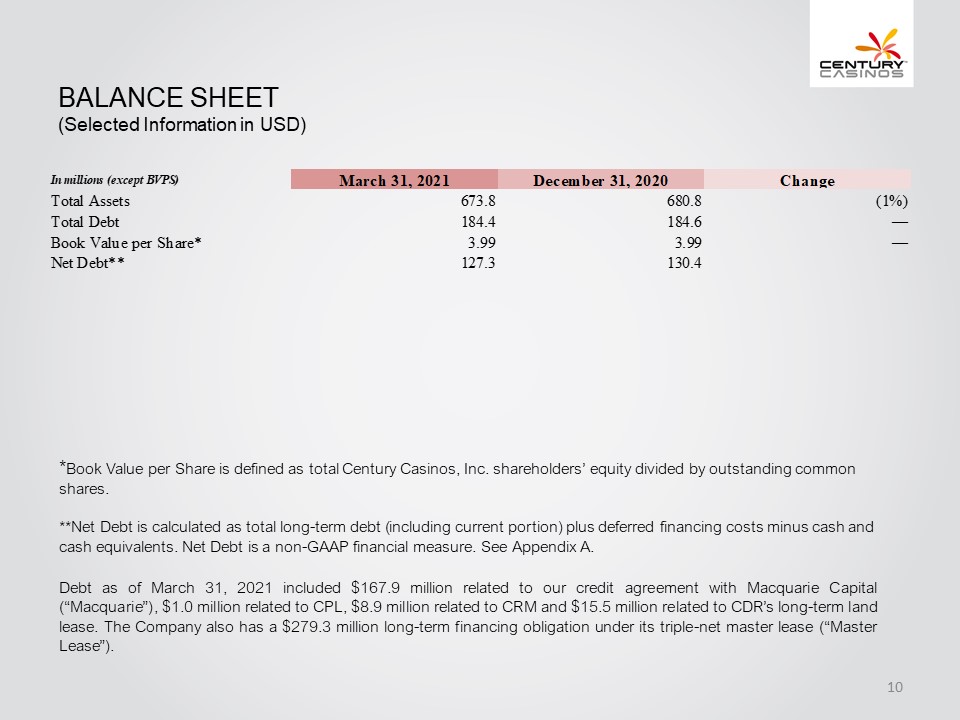
Book value per share*** at March 31, 2021 was $3.99. |
COVID-19 Update
In late 2019, an outbreak of COVID-19 was identified in China and has since spread throughout much of the world. The COVID-19 pandemic has had an adverse effect on the Company’s 2020 and first quarter 2021 results of operations and financial condition and the Company expects this situation will continue to have an adverse impact on its results in 2021. The duration and ultimate impact of the COVID-19 pandemic otherwise remains uncertain.
The Company’s Canada properties are currently closed. Its Poland casinos closed most recently on March 20, 2021 and are expected to reopen on May 8, 2021. The Company’s casinos in the United States have been open since June 2020 but have been required to vary their operations based on the governmental health and safety requirements in the jurisdictions in which they are located.
* Amounts presented are rounded. As such, rounding differences could occur in period over period changes and percentages reported.
** Adjusted EBITDA and Adjusted EBITDA margin are Non-US GAAP financial measures. See discussion and reconciliation of Non-US GAAP financial measures in Supplemental Information below.
*** The Company defines book value per share as total Century Casinos, Inc. shareholders’ equity divided by outstanding common shares.
The consolidated results for the three months ended March 31, 2021 and 2020 are as follows:
|
|
|
|
|
|
|
|
|
|
|
|
For the three months |
|
|
|||||
|
Amounts in thousands, except per share data |
ended March 31, |
|
|
|||||
|
Consolidated Results: |
|
|
2021 |
|
|
2020 |
|
% Change |
|
Net Operating Revenue |
|
$ |
72,415 |
|
$ |
87,656 |
|
(17%) |
|
Earnings (Loss) from Operations |
|
|
8,248 |
|
|
(31,772) |
|
126% |
|
Net Loss Attributable to Century Casinos, Inc. Shareholders |
|
$ |
(1,419) |
|
$ |
(45,856) |
|
97% |
|
|
|
|
|
|
|
|
|
|
|
Adjusted EBITDA** |
|
$ |
14,744 |
|
$ |
9,644 |
|
53% |
|
|
|
|
|
|
|
|
|
|
|
Loss Per Share Attributable to Century Casinos, Inc. Shareholders: |
|
|
|
|
|
|
|
|
|
Basic and Diluted |
|
$ |
(0.05) |
|
$ |
(1.55) |
|
97% |
|
|
|
|
|
|
|
|
|
|
“We are pleased with the strong Adjusted EBITDA for the first quarter, driven almost exclusively by our properties in the US because our properties in Canada were closed for the entire quarter and our casinos in Poland were closed for most of the quarter. We estimate the negative impact of these closures to Adjusted EBITDA was at least $6.7 million,” Erwin Haitzmann and Peter Hoetzinger, Co-Chief Executive Officers of Century Casinos remarked. “For the third quarter in a row, we have been able to achieve high operating margins and we believe that will continue to be attainable. We look forward to the reopening of our casinos in Poland on May 8, our casinos and racetracks reopening in Canada and to a busy summer season in North America as the pandemic subsides,” Messrs. Haitzmann and Hoetzinger concluded.
Reportable Segment Results*
The table below shows the Company’s reporting units and operating segments that are included in each of the Company’s reportable segments as of March 31, 2021:
|
|
|
|
|
Reportable Segment |
Operating Segment |
Reporting Unit |
|
United States |
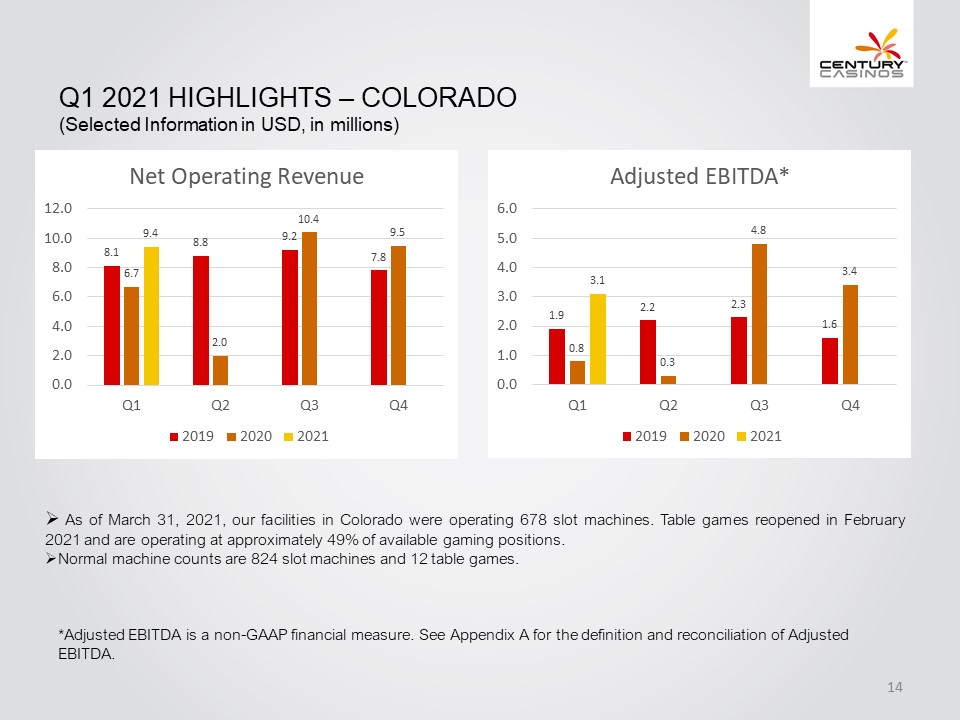
Colorado |
Century Casino & Hotel - Central City |
|
|
|
Century Casino & Hotel - Cripple Creek |
|
|
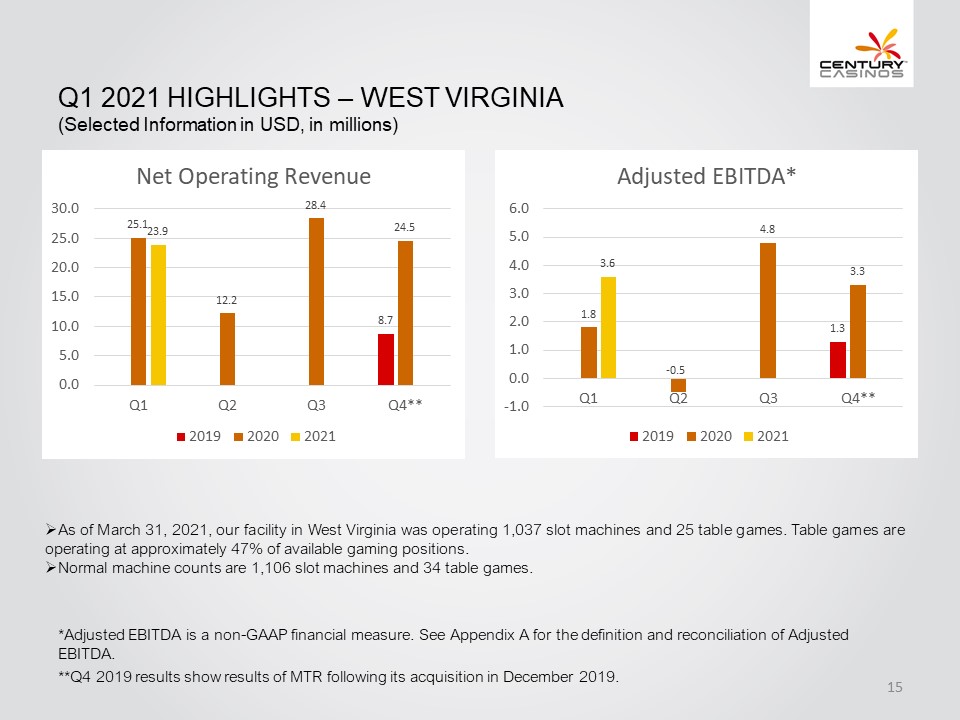
West Virginia |
Mountaineer Casino, Racetrack & Resort |
|
|
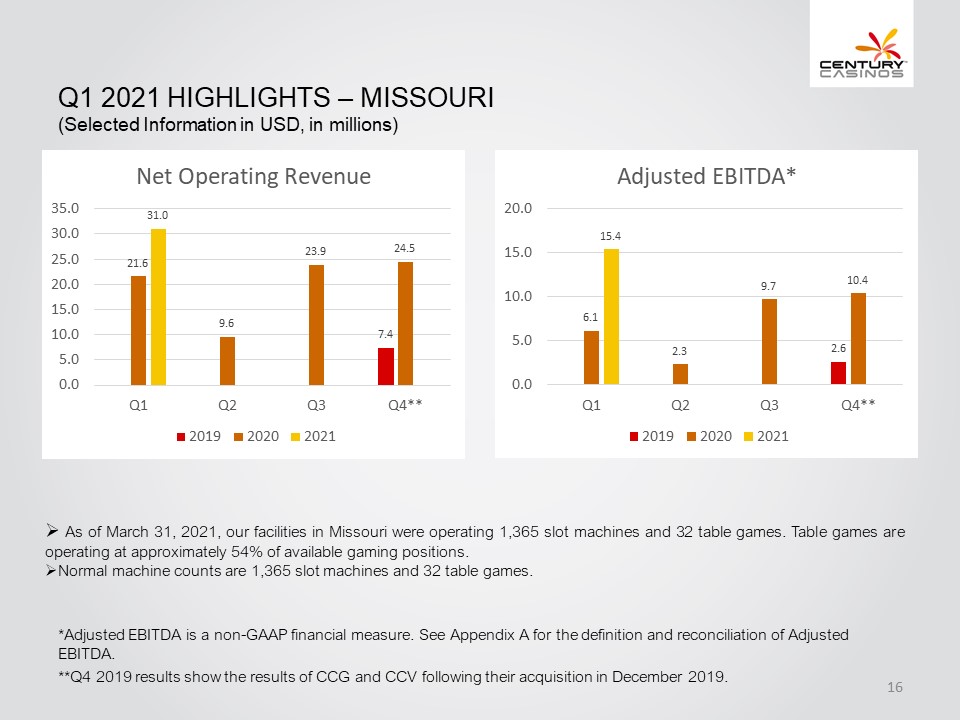
Missouri |
Century Casino Cape Girardeau |
|
|
|
Century Casino Caruthersville |
|
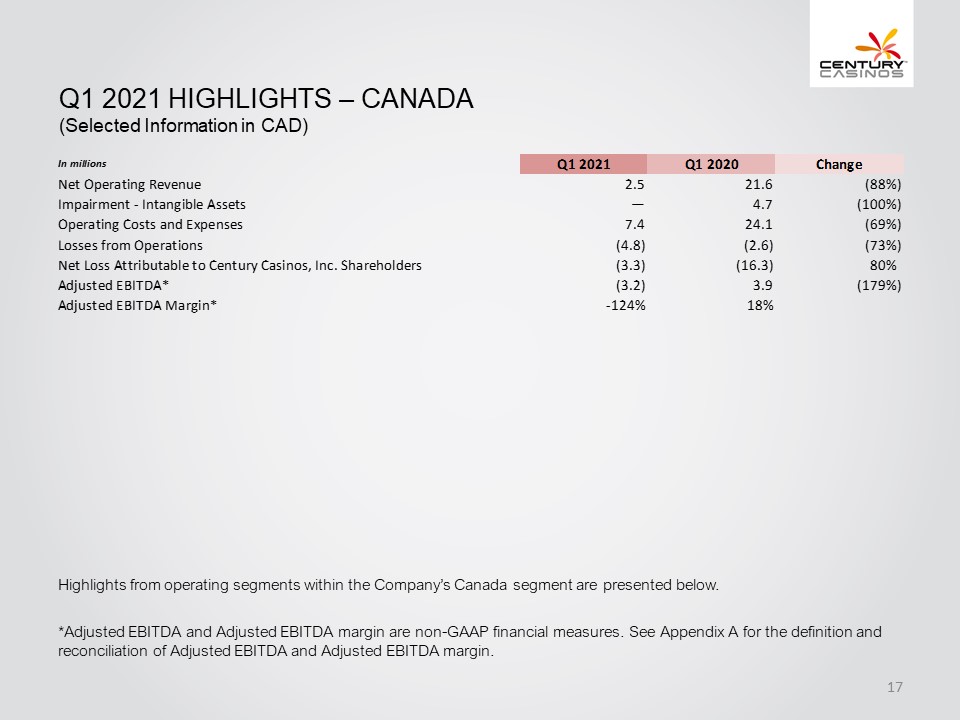
Canada |
Edmonton |
Century Casino & Hotel - Edmonton |
|
|
|
Century Casino St. Albert |
|
|
|
Century Mile Racetrack and Casino |
|
|
Calgary |
Century Downs Racetrack and Casino |
|
|
|
Century Sports |
|
|
|
Century Bets! Inc. |
|
Poland |
Poland |
Casinos Poland |
|
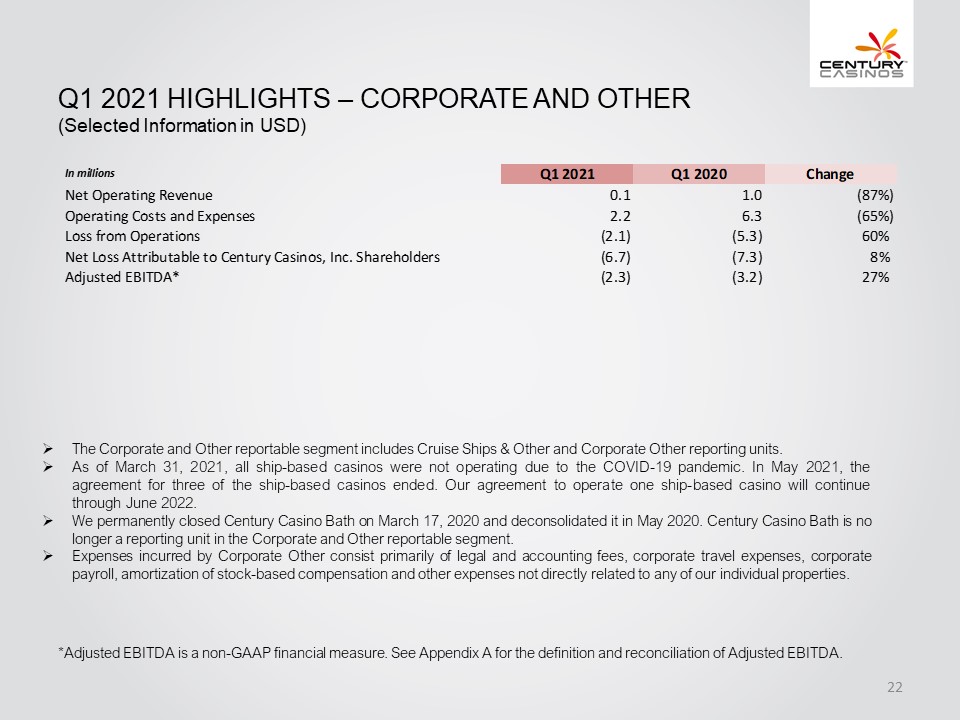
Corporate and Other |
Corporate and Other |
Cruise Ships & Other |
|
|
|
Corporate Other |
* Amounts presented are rounded. As such, rounding differences could occur in period over period changes and percentages reported.
** Adjusted EBITDA and Adjusted EBITDA margin are Non-US GAAP financial measures. See discussion and reconciliation of Non-US GAAP financial measures in Supplemental Information below.
2/9
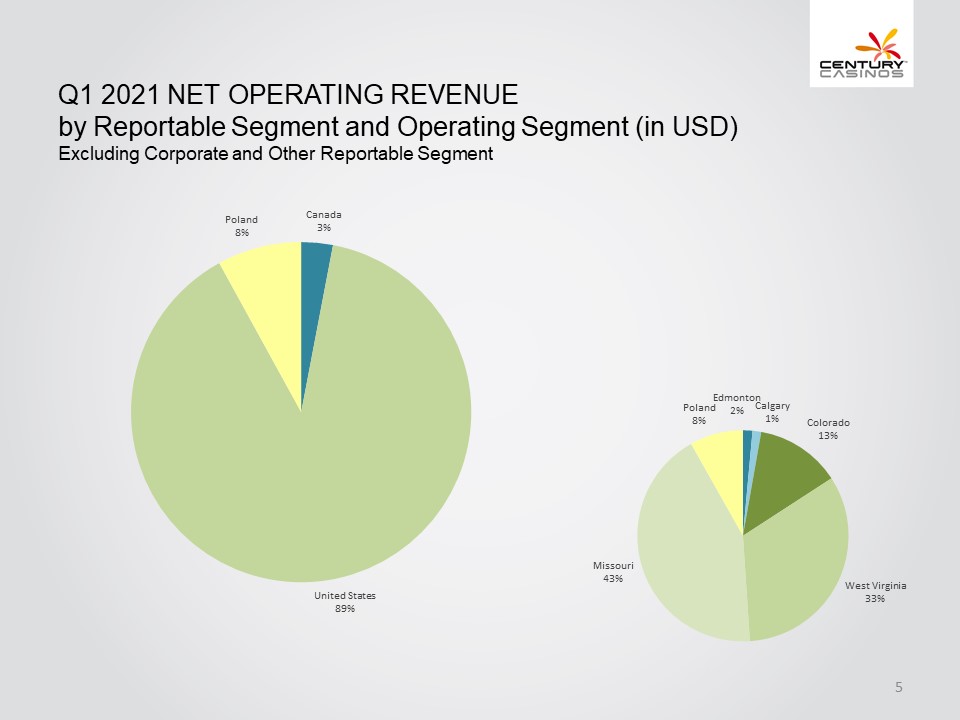
The Company’s net operating revenue decreased by ($15.2) million, or (17%), for the three months ended March 31, 2021, compared to the three months ended March 31, 2020. Following is a summary of the changes in net operating revenue by reportable segment for the three months ended March 31, 2021, compared to the three months ended March 31, 2020:
|
|
|
|
|
|
|
|
|
|
|
|
|
|
|
|
Net Operating Revenue |
|||||||||
|
|
|
For the three months |
|
|
|
|
|
||||
|
|
|
ended March 31, |
|
|
|
|
|
||||
|
Amounts in thousands |
|
2021 |
|
2020 |
|
$ Change |
|
% Change |
|||
|
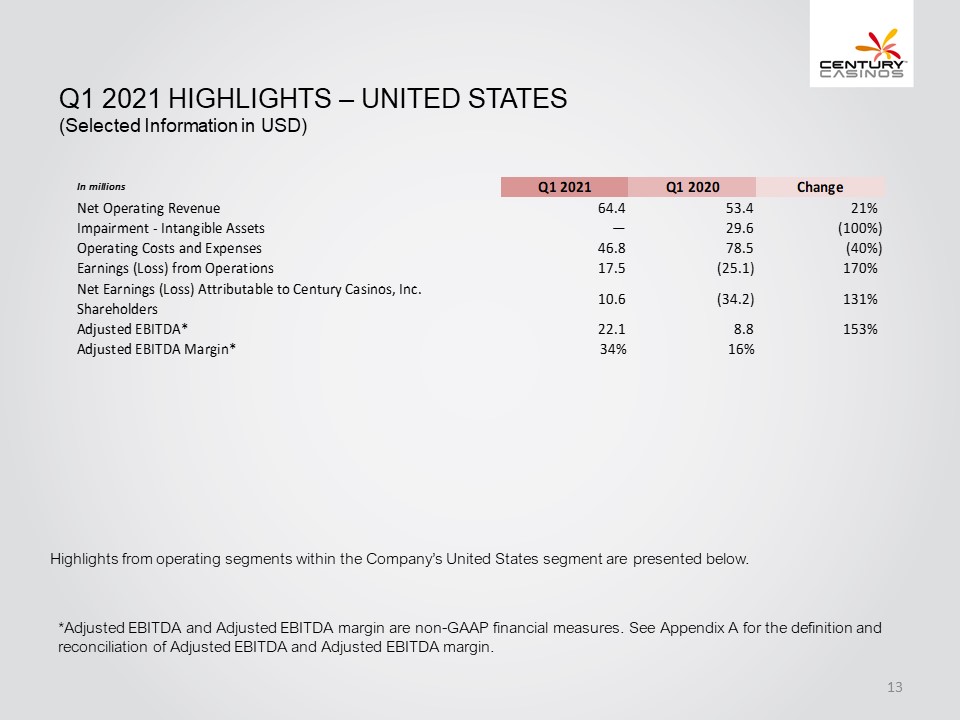
United States |
|
$ |
64,371 |
|
$ |
53,427 |
|
$ |
10,944 |
|
20% |
|
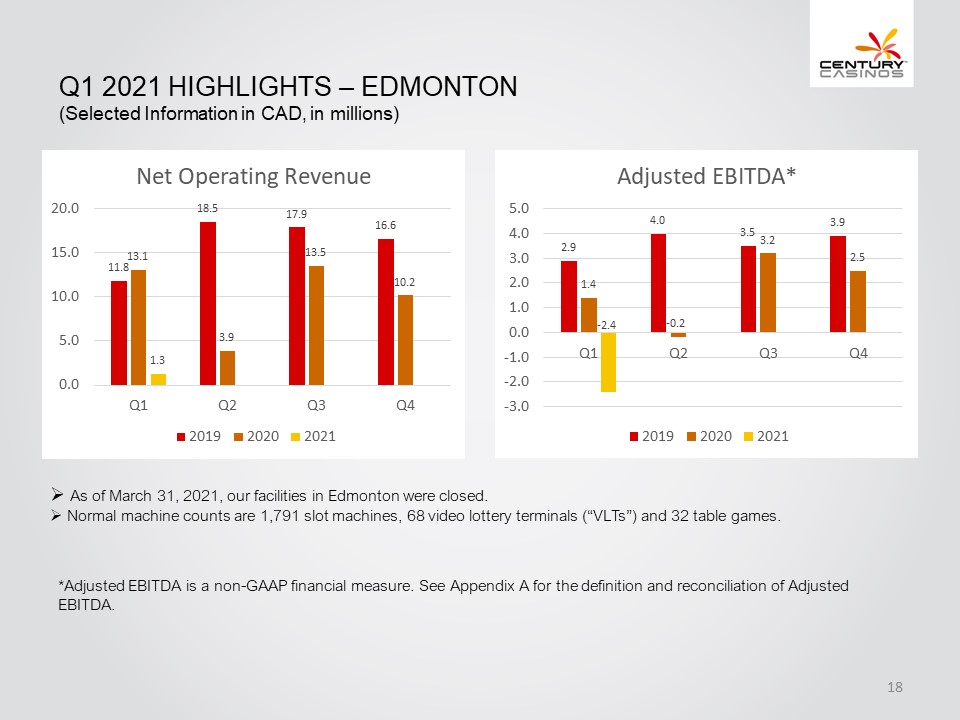
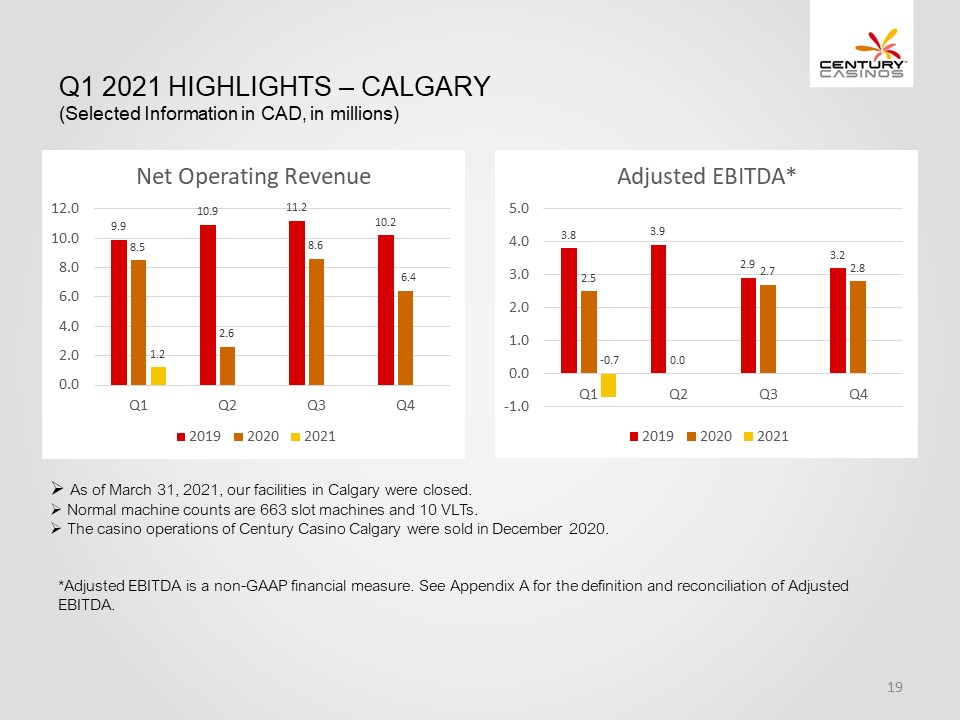
Canada |
|
|
2,011 |
|
|
16,187 |
|
|
(14,176) |
|
(88%) |
|
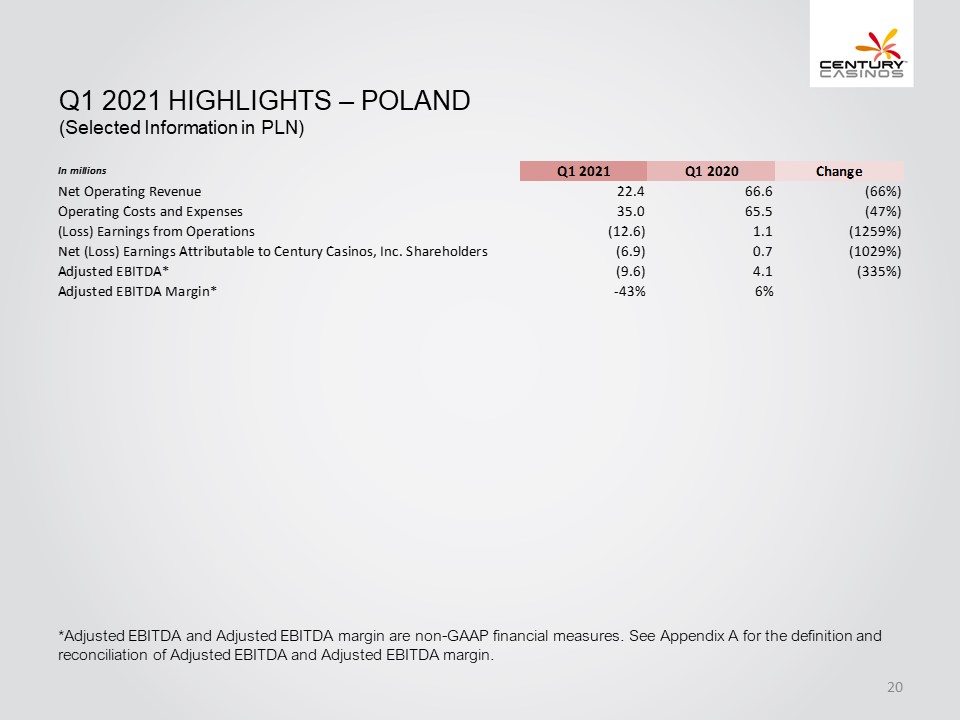
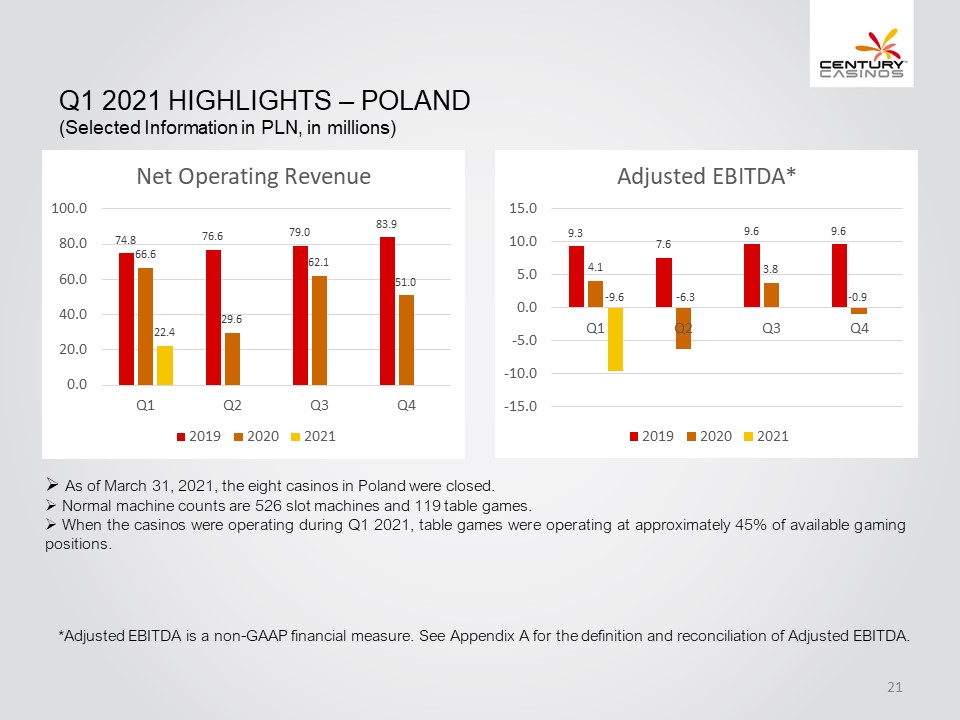
Poland |
|
|
5,910 |
|
|
17,062 |
|
|
(11,152) |
|
(65%) |
|
Corporate and Other |
|
|
123 |
|
|
980 |
|
|
(857) |
|
(87%) |
|
Consolidated |
|
$ |
72,415 |
|
$ |
87,656 |
|
$ |
(15,241) |
|
(17%) |
|
|
|
|
|
|
|
|
|
|
|
|
|
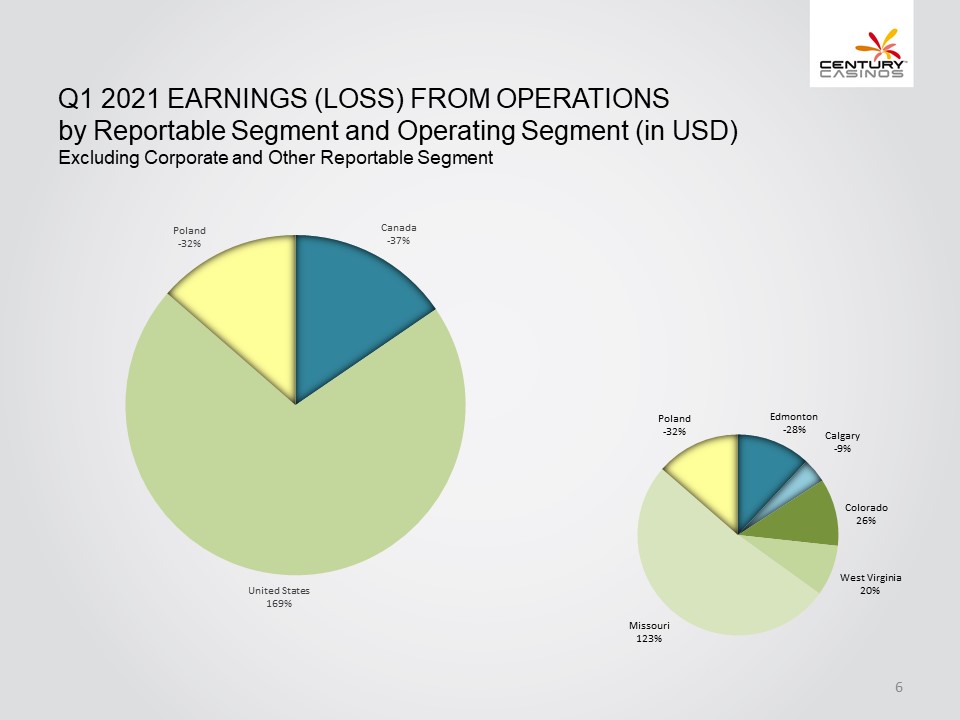
The Company’s earnings from operations increased by $40.0 million, or 126%, for the three months ended March 31, 2021, compared to the three months ended March 31, 2020. Following is a summary of the changes in earnings (loss) from operations by reportable segment for the three months ended March 31, 2021, compared to the three months ended March 31, 2020:
|
|
|
|
|
|
|
|
|
|
|
|
|
|
|
|
Earnings (Loss) from Operations |
|||||||||
|
|
|
For the three months |
|
|
|
|
|
||||
|
|
|
ended March 31, |
|
|
|
|
|
||||
|
Amounts in thousands |
|
2021 |
|
2020 |
|
$ Change |
|
% Change |
|||
|
United States |
|
$ |
17,529 |
|
$ |
(25,091) |
|
$ |
42,620 |
|
170% |
|
Canada |
|
|
(3,820) |
|
|
(1,678) |
|
|
(2,142) |
|
(128%) |
|
Poland |
|
|
(3,360) |
|
|
294 |
|
|
(3,654) |
|
(1243%) |
|
Corporate and Other |
|
|
(2,101) |
|
|
(5,297) |
|
|
3,196 |
|
60% |
|
Consolidated |
|
$ |
8,248 |
|
$ |
(31,772) |
|
$ |
40,020 |
|
126% |
|
|
|
|
|
|
|
|
|
|
|
|
|
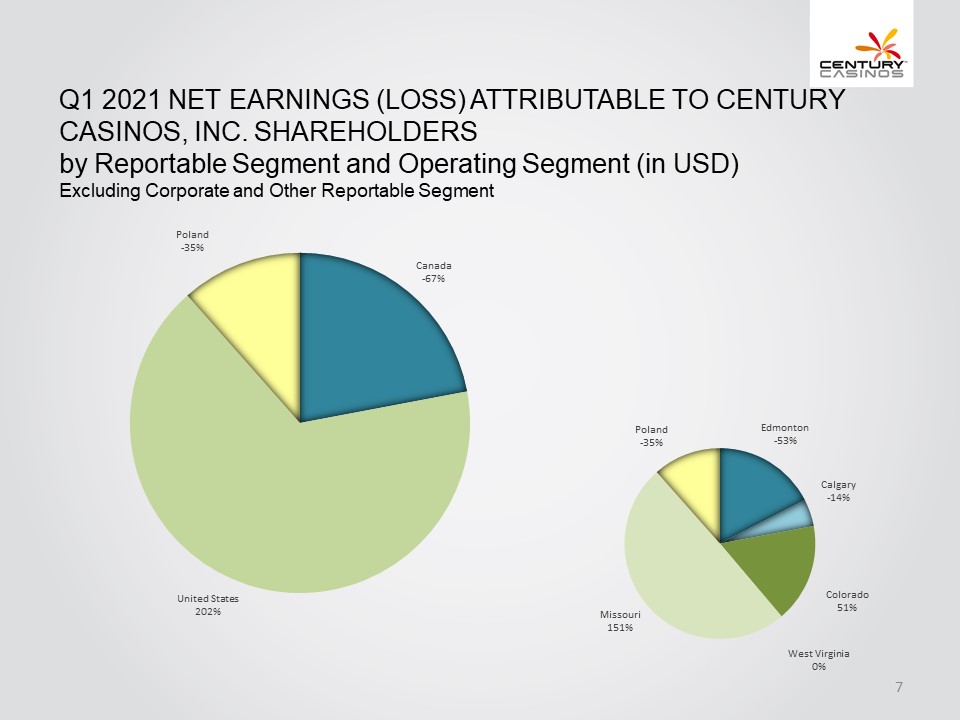
Net loss attributable to Century Casinos, Inc. shareholders decreased by $44.4 million, or 97%, for the three months ended March 31, 2021, compared to the three months ended March 31, 2020. Following is a summary of the changes in net earnings (loss) attributable to Century Casinos, Inc. shareholders by reportable segment for the three months ended March 31, 2021, compared to the three months ended March 31, 2020:
|
|
Net Earnings (Loss) Attributable to Century Casinos, Inc. Shareholders |
||||||||||
|
|
For the three months |
||||||||||
|
|
ended March 31, |
||||||||||
|
Amounts in thousands |
2021 |
2020 |
$ Change |
% Change |
|||||||
|
United States |
$ |
10,594 |
$ |
(34,219) |
$ |
44,813 | 131% | ||||
|
Canada |
(3,512) | (4,408) | 896 | 20% | |||||||
|
Poland |
(1,835) | 31 | (1,866) | (6019%) | |||||||
|
Corporate and Other |
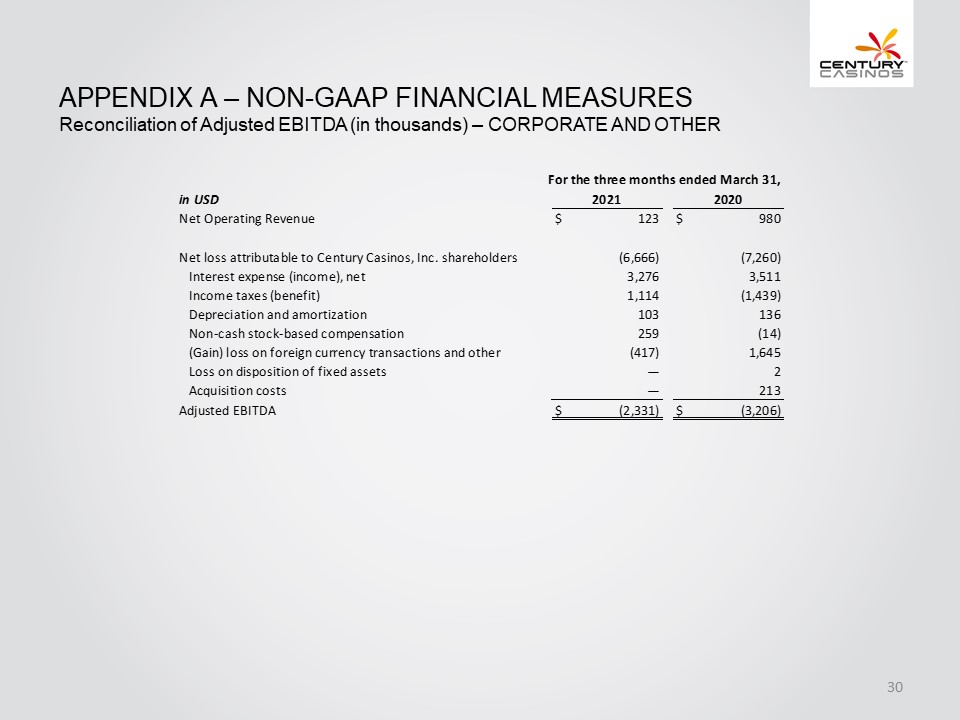
(6,666) | (7,260) | 594 | 8% | |||||||
|
Consolidated |
$ |
(1,419) |
$ |
(45,856) |
$ |
44,437 | 97% | ||||
|
|
|||||||||||
* Amounts presented are rounded. As such, rounding differences could occur in period over period changes and percentages reported.
** Adjusted EBITDA and Adjusted EBITDA margin are Non-US GAAP financial measures. See discussion and reconciliation of Non-US GAAP financial measures in Supplemental Information below.
3/9
Items deducted from or added to earnings from operations to arrive at net earnings (loss) attributable to Century Casinos, Inc. shareholders include interest income, interest expense, gains (losses) on foreign currency transactions and other, income tax expense and non-controlling interests.
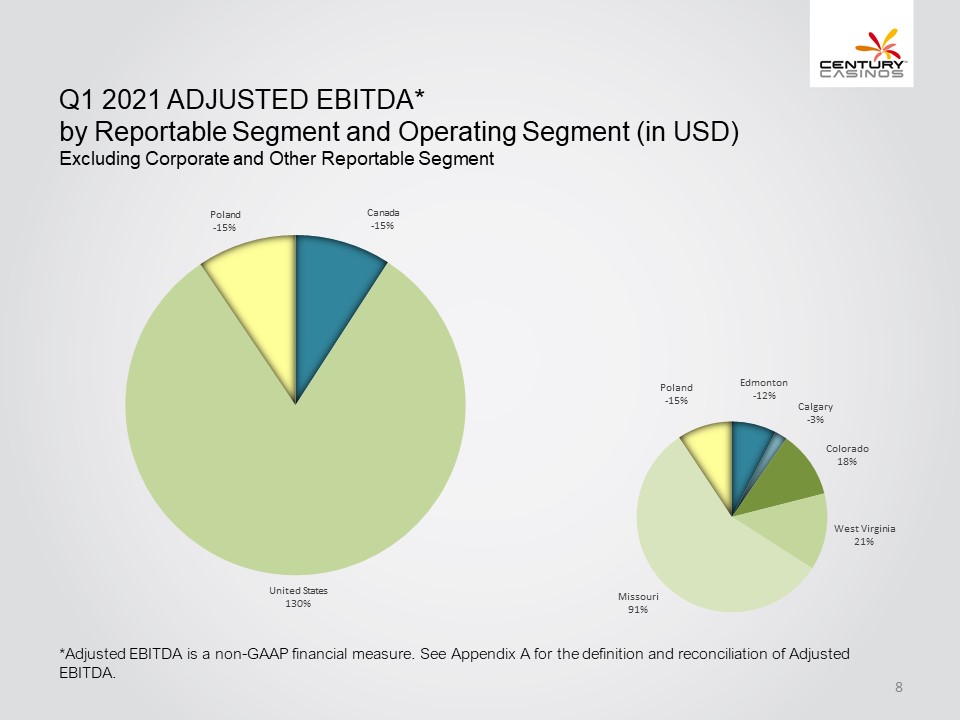
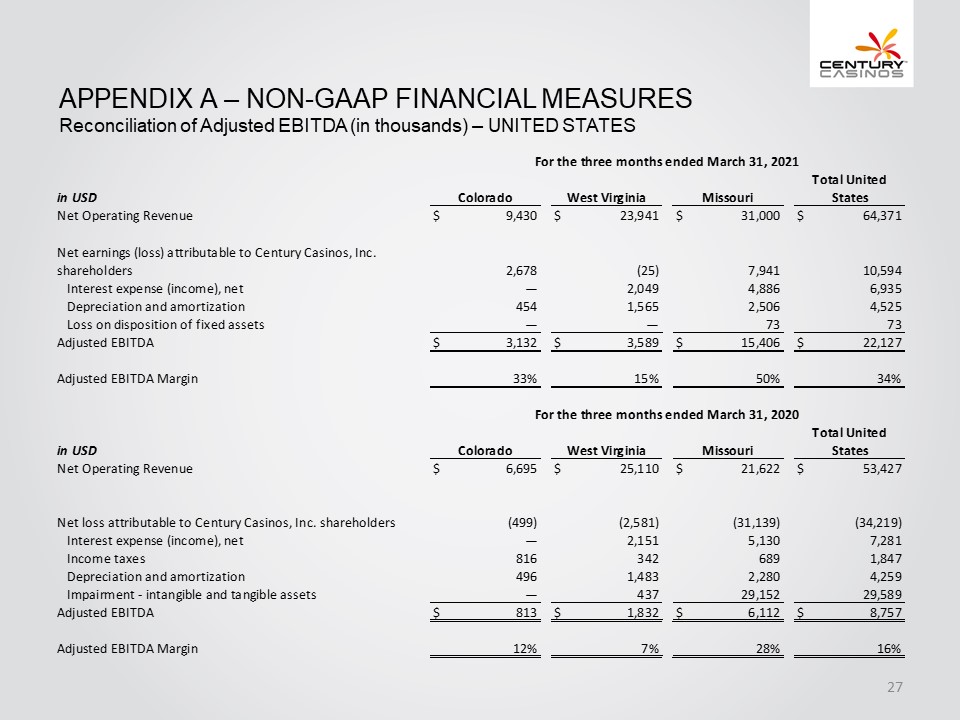
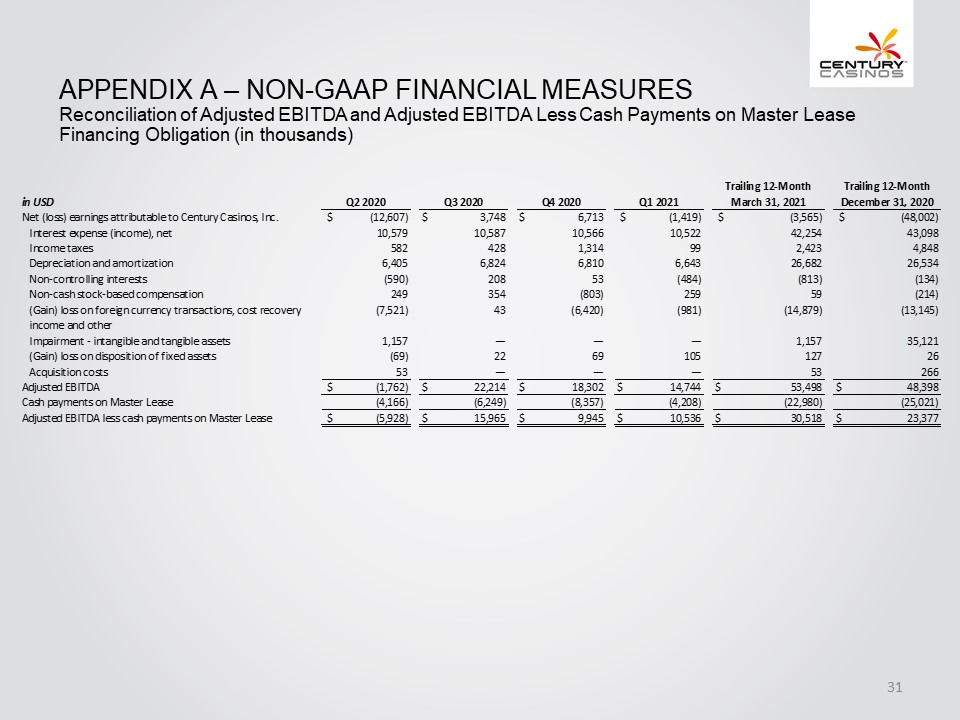
Adjusted EBITDA** increased by $5.1 million, or 53%, for the three months ended March 31, 2021 compared to the three months ended March 31, 2020. Following is a summary of the changes in Adjusted EBITDA** by reportable segment for the three months ended March 31, 2021 compared to the three months ended March 31, 2020:
|
|
|
|
|
|
|
|
|
|
|
|
|
|
|
|
Adjusted EBITDA** |
|||||||||
|
|
|
For the three months |
|
|
|
|
|
||||
|
|
|
ended March 31, |
|
|
|
|
|
||||
|
Amounts in thousands |
|
2021 |
|
2020 |
|
$ Change |
|
% Change |
|||
|
United States |
|
$ |
22,127 |
|
$ |
8,757 |
|
$ |
13,370 |
|
153% |
|
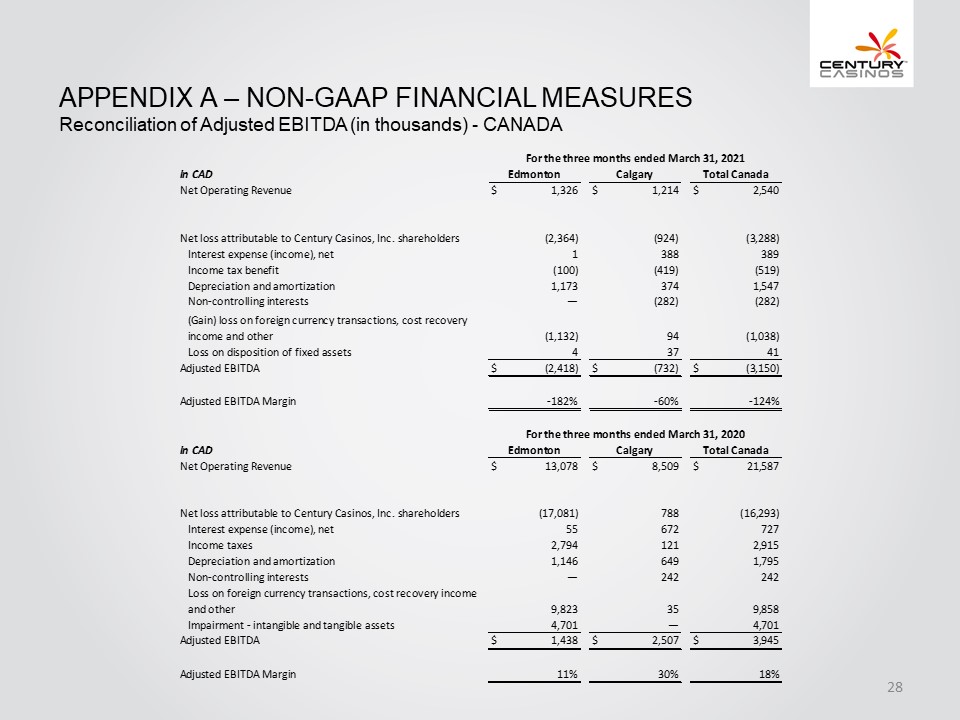
Canada |
|
|
(2,485) |
|
|
3,034 |
|
|
(5,519) |
|
(182%) |
|
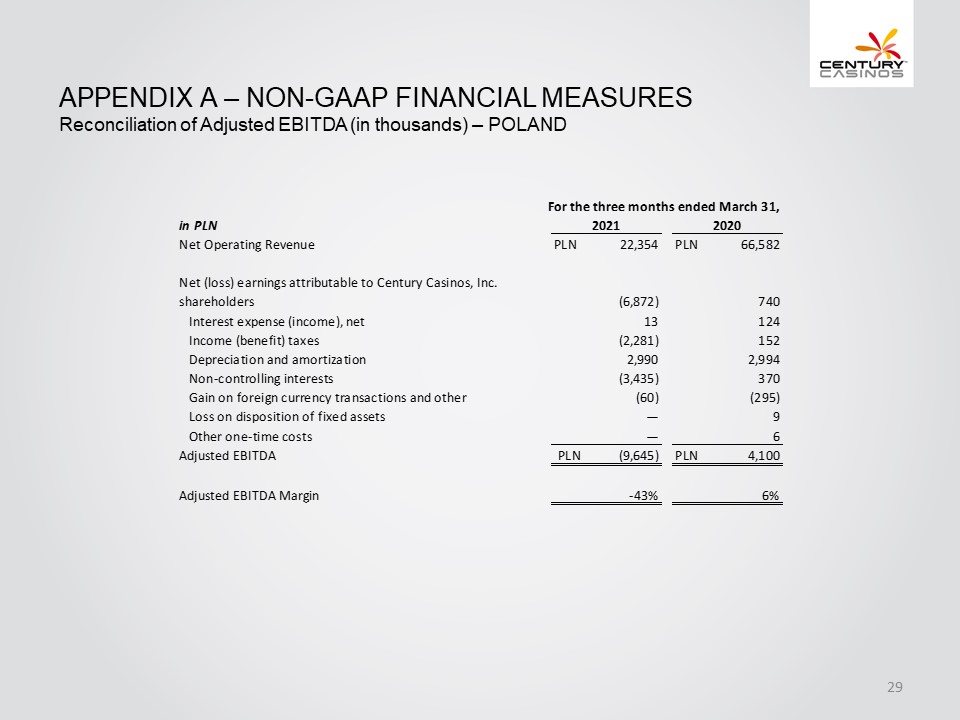
Poland |
|
|
(2,567) |
|
|
1,059 |
|
|
(3,626) |
|
(342%) |
|
Corporate and Other |
|
|
(2,331) |
|
|
(3,206) |
|
|
875 |
|
27% |
|
Consolidated |
|
$ |
14,744 |
|
$ |
9,644 |
|
$ |
5,100 |
|
53% |
|
|
|
|
|
|
|
|
|
|
|
|
|
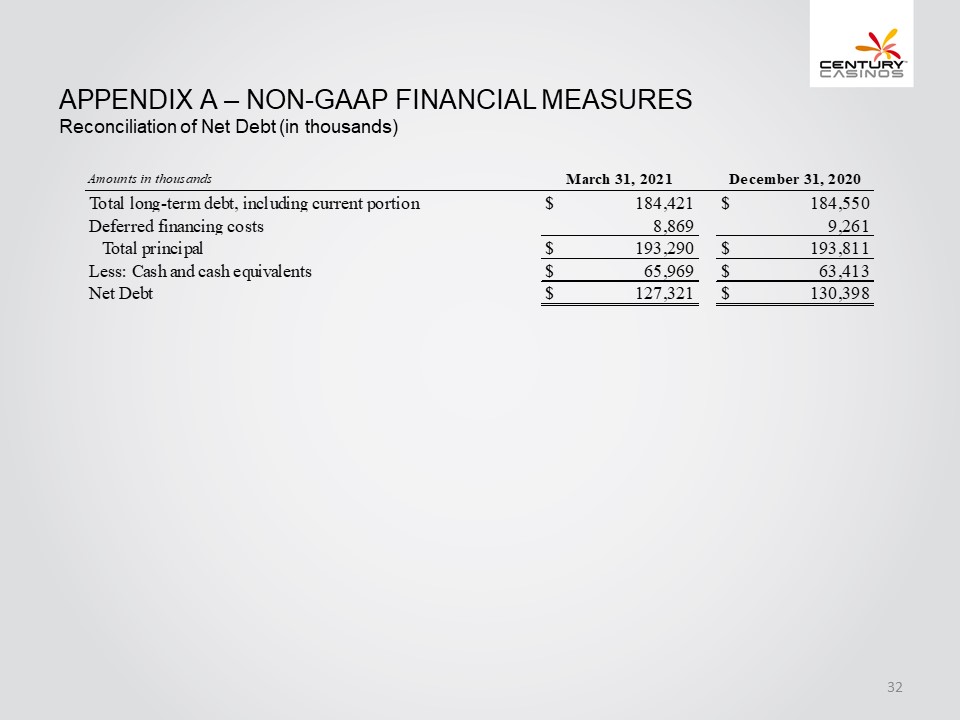
Balance Sheet and Liquidity
As of March 31, 2021, the Company had $66.0 million in cash and cash equivalents and $184.4 million in outstanding debt on its balance sheet compared to $63.4 million in cash and cash equivalents and $184.6 million in outstanding debt at December 31, 2020. The outstanding debt as of March 31, 2021 included $167.9 million related to the Company’s credit agreement with Macquarie Capital (“Macquarie”), $1.0 million of bank debt related to Casinos Poland, $8.9 million of bank debt related to Century Resorts Management GmbH (“CRM”), and $15.5 million related to a long-term land lease for Century Downs Racetrack and Casino (“CDR”), net of $8.9 million in deferred financing costs. The Company also has a $279.3 million long-term financing obligation under its triple net master lease (“Master Lease”).
Conference Call Information
Today the Company will post a copy of its quarterly report on Form 10-Q filed with the SEC for the quarter ended March 31, 2021 on its website at www.cnty.com/investor/financials/sec-filings/. The Company will also post a presentation of the first quarter results on its website at www.cnty.com/investor/presentations/.
The Company will host its first quarter 2021 earnings conference call today, Friday, May 7, at 8:00 am MDT. U.S. domestic participants should dial 1-844-244-9160. For all international participants, please use 330-931-4670 to dial-in. Participants may listen to the call live at centurycasinos.adobeconnect.com/earningsrelease or obtain a recording of the call on the Company’s website until May 31, 2021 at www.cnty.com/investor/financials/sec-filings/.
* Amounts presented are rounded. As such, rounding differences could occur in period over period changes and percentages reported.
** Adjusted EBITDA and Adjusted EBITDA margin are Non-US GAAP financial measures. See discussion and reconciliation of Non-US GAAP financial measures in Supplemental Information below.
4/9
CENTURY CASINOS, INC. AND SUBSIDIARIES
UNAUDITED FINANCIAL INFORMATION – US GAAP BASIS
|
|
|
Condensed Consolidated Statements of Loss |
|
|
|
|
|
|
|
|
|
|
For the three months |
|||||
|
|
ended March 31, |
|||||
|
Amounts in thousands, except for per share information |
|
2021 |
|
2020 |
||
|
Operating revenue: |
|
|
|
|
|
|
|
Net operating revenue |
|
$ |
72,415 |
|
$ |
87,656 |
|
Operating costs and expenses: |
|
|
|
|
|
|
|
Total operating costs and expenses |
|
|
64,167 |
|
|
119,428 |
|
Earnings (loss) from operations |
|
|
8,248 |
|
|
(31,772) |
|
Non-operating (expense) income, net |
|
|
(10,052) |
|
|
(11,365) |
|
Loss before income taxes |
|
|
(1,804) |
|
|
(43,137) |
|
Income tax provision |
|
|
(99) |
|
|
(2,524) |
|
Net loss |
|
|
(1,903) |
|
|
(45,661) |
|
Net loss (earnings) attributable to non-controlling interests |
|
|
484 |
|
|
(195) |
|
Net loss attributable to Century Casinos, Inc. shareholders |
|
$ |
(1,419) |
|
$ |
(45,856) |
|
|
|
|
|
|
|
|
|
Loss per share attributable to Century Casinos, Inc. shareholders: |
||||||
|
Basic |
|
$ |
(0.05) |
|
$ |
(1.55) |
|
Diluted |
|
$ |
(0.05) |
|
$ |
(1.55) |
|
|
|
|
|
|
|
|
|
Weighted average common shares |
|
|
|
|
|
|
|
Basic |
|
|
29,576 |
|
|
29,507 |
|
Diluted |
|
|
29,576 |
|
|
29,507 |
|
|
|
|
|
|
|
|
|
|
|
|
|
|
|
|
|
Condensed Consolidated Balance Sheets |
|
|
|
|
|
|
|
|
|
March 31, |
|
December 31, |
||
|
Amounts in thousands |
|
2021 |
|
2020 |
||
|
Assets |
|
|
|
|
|
|
|
Current assets |
|
$ |
93,166 |
|
$ |
94,622 |
|
Property and equipment, net |
|
|
482,495 |
|
|
485,248 |
|
Other assets |
|
|
98,144 |
|
|
100,890 |
|
Total assets |
|
$ |
673,805 |
|
$ |
680,760 |
|
|
|
|
|
|
|
|
|
Liabilities and Equity |
|
|
|
|
|
|
|
Current liabilities |
|
$ |
55,827 |
|
$ |
60,163 |
|
Non-current liabilities |
|
|
492,547 |
|
|
493,614 |
|
Century Casinos, Inc. shareholders' equity |
|
|
118,010 |
|
|
118,154 |
|
Non-controlling interests |
|
|
7,421 |
|
|
8,829 |
|
Total liabilities and equity |
|
$ |
673,805 |
|
$ |
680,760 |
5/9
CENTURY CASINOS, INC. AND SUBSIDIARIES
UNAUDITED SUPPLEMENTAL INFORMATION
Adjusted EBITDA Margins **
|
|
For the three months |
|
|
|
ended March 31, |
|
|
|
2021 |
2020 |
|
United States |
34% | 16% |
|
Canada |
(124%) | 19% |
|
Poland |
(43%) | 6% |
|
Corporate and Other |
(1895%) | (327%) |
|
Consolidated Adjusted EBITDA Margin |
20% | 11% |
|
|
||
Reconciliation of Adjusted EBITDA* to Net Earnings (Loss) Attributable to Century Casinos, Inc. Shareholders by Reportable Segment.
|
|
|
|
|
|
|
|
|
|
|
|
|
|
|
|
|
|
|
For the three months ended March 31, 2021 |
||||||||||||||
|
Amounts in thousands |
|
|
United States |
|
|
Canada |
|
|
Poland |
|
|
Corporate and Other |
|
|
Total |
|
Net earnings (loss) attributable to Century Casinos, Inc. shareholders |
|
$ |
10,594 |
|
$ |
(3,512) |
|
$ |
(1,835) |
|
$ |
(6,666) |
|
$ |
(1,419) |
|
Interest expense (income), net (1) |
|
|
6,935 |
|
|
307 |
|
|
4 |
|
|
3,276 |
|
|
10,522 |
|
Income taxes (benefit) |
|
|
— |
|
|
(409) |
|
|
(606) |
|
|
1,114 |
|
|
99 |
|
Depreciation and amortization |
|
|
4,525 |
|
|
1,222 |
|
|
793 |
|
|
103 |
|
|
6,643 |
|
Net earnings (loss) attributable to non-controlling interests |
|
|
— |
|
|
432 |
|
|
(916) |
|
|
— |
|
|
(484) |
|
Non-cash stock-based compensation |
|
|
— |
|
|
— |
|
|
— |
|
|
259 |
|
|
259 |
|
Gain on foreign currency transactions, cost recovery income and other |
|
|
— |
|
|
(557) |
|
|
(7) |
|
|
(417) |
|
|
(981) |
|
Loss on disposition of fixed assets |
|
|
73 |
|
|
32 |
|
|
— |
|
|
— |
|
|
105 |
|
Adjusted EBITDA |
|
$ |
22,127 |
|
$ |
(2,485) |
|
$ |
(2,567) |
|
$ |
(2,331) |
|
$ |
14,744 |
|
|
|
|
|
|
|
|
|
|
|
|
|
|
|
|
|
|
(1) |
Expense of $6.9 million related to the Master Lease is included in interest expense (income), net in the United States segment. Expense of $0.4 million related to the CDR land lease is included in interest expense (income), net in the Canada segment. Cash payments related to the Master Lease and CDR land lease were $4.2 million and $0.3 million, respectively, for the period presented. |
6/9
CENTURY CASINOS, INC. AND SUBSIDIARIES
UNAUDITED SUPPLEMENTAL INFORMATION
Reconciliation of Adjusted EBITDA* to Net (Loss) Earnings Attributable to Century Casinos, Inc. Shareholders by Reportable Segment.
|
|
|
|
|
|
|
|
|
|
|
|
|
|
|
|
|
|
|
For the three months ended March 31, 2020 |
||||||||||||||
|
Amounts in thousands |
|
|
United States |
|
|
Canada |
|
|
Poland |
|
|
Corporate and Other |
|
|
Total |
|
Net (loss) earnings attributable to Century Casinos, Inc. shareholders |
|
$ |
(34,219) |
|
$ |
(4,408) |
|
$ |
31 |
|
$ |
(7,260) |
|
$ |
(45,856) |
|
Interest expense (income), net (1) |
|
|
7,281 |
|
|
543 |
|
|
31 |
|
|
3,511 |
|
|
11,366 |
|
Income taxes (benefit) |
|
|
1,847 |
|
|
2,071 |
|
|
45 |
|
|
(1,439) |
|
|
2,524 |
|
Depreciation and amortization |
|
|
4,259 |
|
|
1,337 |
|
|
763 |
|
|
136 |
|
|
6,495 |
|
Net earnings attributable to non-controlling interests |
|
|
— |
|
|
180 |
|
|
15 |
|
|
— |
|
|
195 |
|
Non-cash stock-based compensation |
|
|
— |
|
|
— |
|
|
— |
|
|
(14) |
|
|
(14) |
|
(Gain) loss on foreign currency transactions and cost recovery income |
|
|
— |
|
|
(64) |
|
|
172 |
|
|
645 |
|
|
753 |
|
Impairment - intangible and tangible assets (2) |
|
|
29,589 |
|
|
3,375 |
|
|
— |
|
|
1,000 |
|
|
33,964 |
|
Loss on disposition of fixed assets |
|
|
— |
|
|
— |
|
|
2 |
|
|
2 |
|
|
4 |
|
Acquisition costs |
|
|
— |
|
|
— |
|
|
— |
|
|
213 |
|
|
213 |
|
Adjusted EBITDA |
|
$ |
8,757 |
|
$ |
3,034 |
|
$ |
1,059 |
|
$ |
(3,206) |
|
$ |
9,644 |
|
|
|
|
|
|
|
|
|
|
|
|
|
|
|
|
|
|
(1) |
Expense of $7.3 million related to the Master Lease is included in interest expense (income), net in the United States segment. Expense of $0.5 million related to the CDR land lease is included in interest expense (income), net in the Canada segment. Cash payments related to the Master Lease and CDR land lease were $6.2 million and $0.5 million, respectively, for the period presented. |
|
(2) |
Expense of $29.6 million and $3.4 million is included in the United States and Canada segments, respectively, related to the impairment of goodwill and intangible assets. Expense of $1.0 million is included in the Corporate and Other segment related to the impairment of the Mendoza Central Entretenimientos S.A. investment. |
7/9
CENTURY CASINOS, INC. AND SUBSIDIARIES
UNAUDITED SUPPLEMENTAL INFORMATION
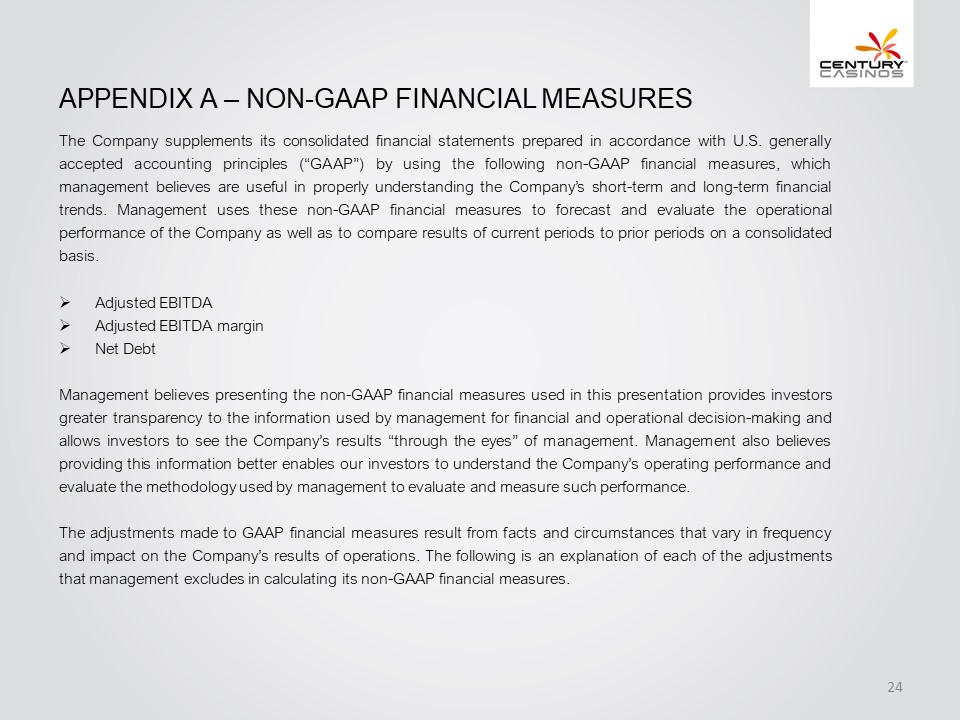
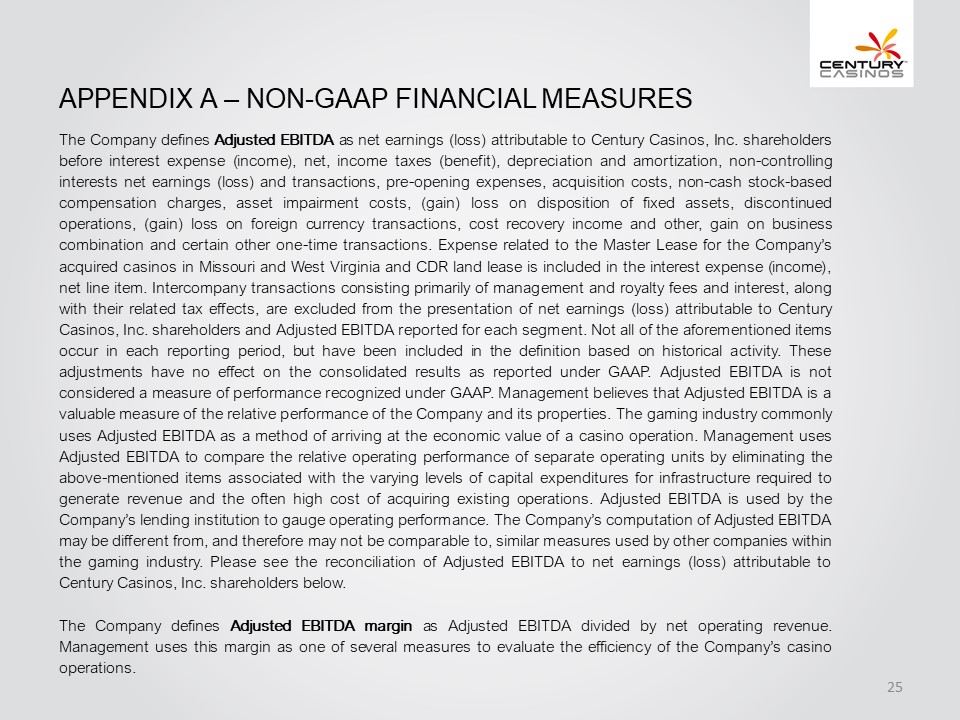
* The Company defines Adjusted EBITDA as net earnings (loss) attributable to Century Casinos, Inc. shareholders before interest expense (income), net, income taxes (benefit), depreciation and amortization, non-controlling interests net earnings (loss) and transactions, pre-opening expenses, acquisition costs, non-cash stock-based compensation charges, asset impairment costs, (gain) loss on disposition of fixed assets, discontinued operations, (gain) loss on foreign currency transactions, cost recovery income and other, gain on business combination and certain other one-time transactions. Expense related to the Master Lease and CDR land lease is included in the interest expense (income), net line item. Intercompany transactions consisting primarily of management and royalty fees and interest, along with their related tax effects, are excluded from the presentation of net earnings (loss) attributable to Century Casinos, Inc. shareholders and Adjusted EBITDA reported for each segment. Not all of the aforementioned items occur in each reporting period, but have been included in the definition based on historical activity. These adjustments have no effect on the consolidated results as reported under US GAAP. Adjusted EBITDA is not considered a measure of performance recognized under US GAAP. Management believes that Adjusted EBITDA is a valuable measure of the relative performance of the Company and its properties. The gaming industry commonly uses Adjusted EBITDA as a method of arriving at the economic value of a casino operation. Management uses Adjusted EBITDA to compare the relative operating performance of separate operating units by eliminating the above-mentioned items associated with the varying levels of capital expenditures for infrastructure required to generate revenue and the often high cost of acquiring existing operations. Adjusted EBITDA is used by the Company’s lending institution to gauge operating performance. The Company’s computation of Adjusted EBITDA may be different from, and therefore may not be comparable to, similar measures used by other companies within the gaming industry. Please see the reconciliation of Adjusted EBITDA to net earnings (loss) attributable to Century Casinos, Inc. shareholders above.
** The Company defines Adjusted EBITDA margin as Adjusted EBITDA divided by net operating revenue. Adjusted EBITDA margin is a non-US GAAP measure. Management uses this margin as one of several measures to evaluate the efficiency of the Company’s casino operations.
About Century Casinos, Inc.:
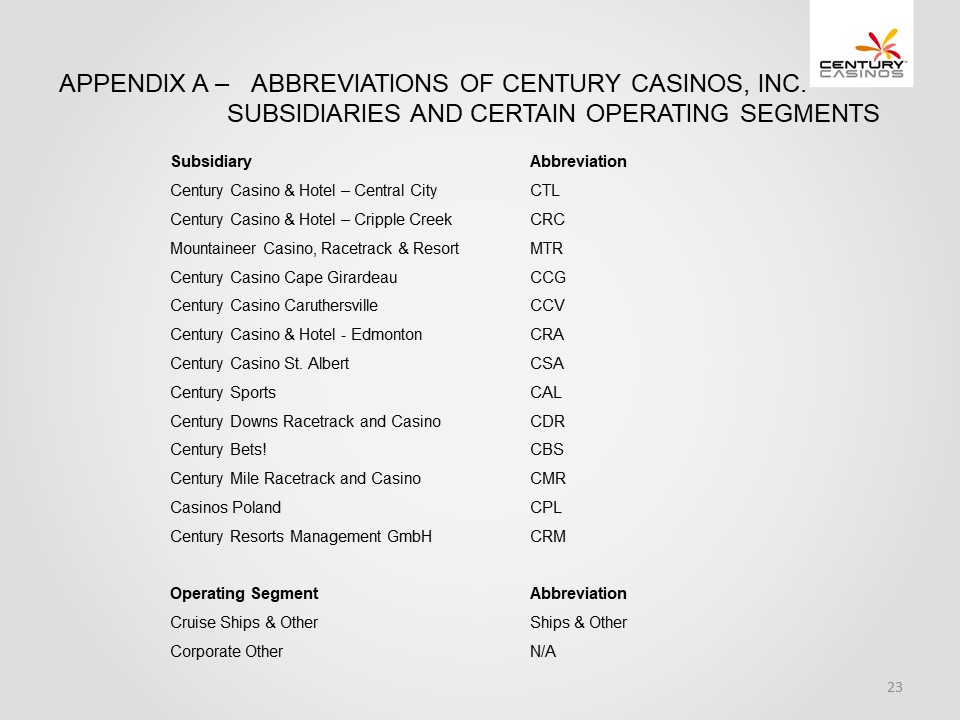
Century Casinos, Inc. is a casino entertainment company. The Company owns and operates Century Casino & Hotels in Cripple Creek and Central City, Colorado, and in Edmonton, Alberta, Canada; the Century Casino in Cape Girardeau and Caruthersville, Missouri, and in St. Albert, Alberta, Canada; Mountaineer Casino, Racetrack & Resort in New Cumberland, West Virginia; the Century Mile Racetrack and Casino (“CMR”) in Edmonton, Alberta, Canada; and Century Bets! Inc. (“CBS”). CBS and CMR operate the pari-mutuel off-track horse betting networks in southern and northern Alberta, respectively. Through its Austrian subsidiary, CRM, the Company holds a 66.6% ownership interest in Casinos Poland Ltd., the owner and operator of eight casinos throughout Poland; and a 75% ownership interest in Century Downs Racetrack and Casino in Calgary, Alberta, Canada. The Company operates one ship-based casino. The Company, through CRM, also owns a 7.5% interest in, and provides consulting services to, Mendoza Central Entretenimientos S.A., a company that provides gaming-related services to Casino de Mendoza in Mendoza, Argentina. The Company continues to pursue other projects in various stages of development.
Century Casinos’ common stock trades on The Nasdaq Capital Market® under the symbol CNTY.
For more information about Century Casinos, visit our website at www.cnty.com.
8/9
CENTURY CASINOS, INC. AND SUBSIDIARIES
UNAUDITED SUPPLEMENTAL INFORMATION
This release may contain “forward-looking statements” within the meaning of Section 27A of the Securities Act of 1933, as amended, Section 21E of the Securities Exchange Act of 1934, as amended, and the Private Securities Litigation Reform Act of 1995. These statements are based on the beliefs and assumptions of the management of Century Casinos based on information currently available to management. Such forward-looking statements include, but are not limited to, statements regarding future results of operations, including statements about operating margins, the impact of the current coronavirus (COVID-19) pandemic, estimates of the financial impact of COVID-19 and timing for reopening of our properties and a reduction in the impact of COVID-19, the adequacy of cash flows from operations and available cash to meet our future liquidity needs, particularly if we cannot operate our casinos due to COVID-19 or their operations are restricted, operating efficiencies, synergies and operational performance, the prospects for and timing and costs of new projects, projects in development and other opportunities, our credit agreement with Macquarie and obligations under our Master Lease and our ability to repay our debt and other obligations, investments in joint ventures, outcomes of legal proceedings, changes in our tax provisions or exposure to additional income tax liabilities, and plans for our casinos and our Company. Such forward-looking statements are subject to risks, uncertainties and other factors that could cause actual results to differ materially from future results expressed or implied by such forward-looking statements. Important factors that could cause actual results to differ materially from the forward-looking statements include, among others, the risks described in the section entitled “Risk Factors” under Item 1A in our Annual Report on Form 10-K for the year ended December 31, 2020, and in subsequent periodic and current SEC filings we may make. Century Casinos disclaims any obligation to revise or update any forward-looking statement that may be made from time to time by it or on its behalf.
9/9