Exhibit 99.1
LEXINGTON REALTY TRUST
QUARTERLY SUPPLEMENTAL INFORMATION
December 31, 2016
Table of Contents
| Section | Page | |
| Fourth Quarter 2016 Earnings Press Release | 3 | |
| Portfolio Data | ||
| Investment / Capital Recycling Summary | 15 | |
| Build-To-Suit Projects / Forward Purchase Commitments | 16 | |
| Financing Summary | 17 | |
| Leasing Summary | 18 | |
| Other Revenue Data | 20 | |
| Portfolio Detail by Asset Class | 22 | |
| Portfolio Composition | 23 | |
| Components of Net Asset Value | 24 | |
| Top Markets | 25 | |
| Single-Tenant Office Markets | 26 | |
| Tenant Industry Diversification | 27 | |
| Top 10 Tenants or Guarantors | 28 | |
| Lease Rollover Schedules – GAAP Basis | 29 | |
| Property Leases and Vacancies – Consolidated Portfolio | 31 | |
| Property Leases and Vacancies – Non-consolidated Portfolio | 38 | |
| Select Credit Metrics Summary | 39 | |
| Financial Covenants | 40 | |
| Mortgages and Notes Payable | 41 | |
| Debt Maturity Schedule | 44 | |
| Mortgage Loans Receivable | 45 | |
| Selected Balance Sheet and Income Statement Account Data | 46 | |
| Non-GAAP Measures – Definitions | 47 | |
| Reconciliation of Non-GAAP Measures | 49 | |
| Investor Information | 53 |
This Quarterly Earnings Press Release and Quarterly Supplemental Information contains certain forward-looking statements which involve known and unknown risks, uncertainties or other factors not under the control of Lexington Realty Trust “Lexington”, which may cause actual results, performance or achievements of Lexington and its subsidiaries to be materially different from the results, performance, or other expectations implied by these forward-looking statements. Factors that could cause or contribute to such differences include, but are not limited to, those discussed under the headings “Management’s Discussion and Analysis of Financial Condition and Results of Operations” and “Risk Factors” in Lexington’s periodic reports filed with the Securities and Exchange Commission, including, but not limited to, risks related to: (1) the authorization of Lexington’s Board of Trustees of future dividend declarations, (2) Lexington’s ability to achieve its estimates of net income attributable to common shareholders and Adjusted Company FFO available to all equityholders and unitholders – diluted for the year ending December 31, 2017, (3) the successful consummation of any lease, acquisition, build-to-suit, disposition, financing or other transaction on the terms described herein or at all, (4) the failure to continue to qualify as a real estate investment trust, (5) changes in general business and economic conditions, including the impact of any new legislation, (6) competition, (7) increases in real estate construction costs, (8) changes in interest rates, (9) changes in accessibility of debt and equity capital markets, and (10) future impairment charges. Copies of the periodic reports Lexington files with the Securities and Exchange Commission are available on Lexington’s web site at www.lxp.com. Forward-looking statements, which are based on certain assumptions and describe Lexington’s future plans, strategies and expectations, are generally identifiable by use of the words “believes,” “expects,” “intends,” “anticipates,” “estimates,” “projects,” may,” “plans,” “predicts,” “will,” “will likely result,” “is optimistic,” “goal,” “objective” or similar expressions. Except as required by law, Lexington undertakes no obligation to revise those forward-looking statements to reflect events or circumstances after the occurrence of unanticipated events. Accordingly, there is no assurance that Lexington’s expectations will be realized.
| LEXINGTON REALTY TRUST | |
| TRADED: NYSE: LXP | |
| One Penn Plaza, Suite 4015 | |
| New York, NY 10119-4015 |
FOR IMMEDIATE RELEASE
LEXINGTON REALTY TRUST REPORTS FOURTH QUARTER 2016 RESULTS
New York, NY - Wednesday, March 1, 2017 - Lexington Realty Trust (“Lexington”) (NYSE:LXP), a real estate investment trust focused on single-tenant real estate investments, today announced results for the fourth quarter and year ended December 31, 2016.
Fourth Quarter 2016 Highlights
| • | Generated Net Income attributable to common shareholders of $14.4 million, or $0.06 per diluted common share. |
| • | Generated Adjusted Company Funds From Operations available to all equityholders and unitholders - diluted (“Adjusted Company FFO”) of $59.7 million, or $0.24 per diluted common share. |
| • | Acquired two industrial properties for an aggregate cost of $97.5 million and completed three of the four buildings of the Lake Jackson, TX build-to-suit project at an estimated cost of $78.5 million. |
| • | Disposed of nine office properties for $87.1 million. |
| • | Invested $25.4 million in on-going build-to-suit projects. |
| • | Committed to acquire two industrial properties in 2017 for an aggregate cost of $71.7 million. |
| • | Completed 658,000 square feet of new leases and lease extensions with overall portfolio 96.0% leased at quarter end. |
Full Year 2016 Highlights
| • | Generated Net Income attributable to common shareholders of $89.1 million, or $0.37 per diluted common share. |
| • | Generated Adjusted Company FFO of $277.7 million, or $1.14 per diluted common share, inclusive of $0.03 per diluted common share related to the Westlake, Texas termination payment received and fully included as income in the second quarter of 2016. |
| • | Acquired/completed six consolidated properties and one nonconsolidated property for an aggregate initial basis of $390.1 million. |
| • | Disposed of 28 consolidated properties for gross proceeds of $663.0 million. |
| • | Completed 4.7 million square feet of new leases and lease extensions. |
| • | Retired $374.1 million of secured debt, which had a weighted-average fixed interest rate of 5.0% and a weighted-average term to maturity of 6.6 years and obtained $254.7 million of secured debt with a weighted-average fixed interest rate of 4.3% and a weighted-average term to maturity of 19.1 years. |
| • | Repaid all $177.0 million of borrowings outstanding under its $400.0 million unsecured revolving credit facility. |
| • | Repurchased 1.2 million common shares at an average price of $7.56 per share and issued 1.0 million common shares at an average price of $10.75 per share under its At-The-Market (“ATM”) offering program. |
| 3 |
Subsequent Events
| • | Disposed of six properties for aggregate gross proceeds of $88.9 million. |
| • | Acquired two industrial properties for an aggregate purchase price of $50.6 million. |
| • | Issued 1.6 million common shares at an average gross price of $10.89 per share under its ATM offering program. |
| • | Completed the last building at the Lake Jackson, Texas build-to-suit project. |
| • | Sold the tenant-in-common interest in the Oklahoma City, Oklahoma property for $6.3 million and collected $8.5 million in full satisfaction of the loan receivable owed from the other tenant-in-common. |
| • | Sold the Kennewick, Washington loan receivable for $80.4 million. |
Adjusted Company FFO is a non-GAAP financial measure. It and certain other non-GAAP financial measures are defined and reconciled later in this press release.
T. Wilson Eglin, Chief Executive Officer and President of Lexington Realty Trust, commented “Positive fourth quarter activity rounded out a highly successful year for Lexington. Sales during the quarter brought total 2016 consolidated disposition volume to $663 million at GAAP and cash cap rates of 10.2% and 5.1%, respectively. We used the proceeds to complete $390 million of new investment activity at favorable spreads and to improve our balance sheet, which brought our leverage to 5.2x net debt to Adjusted EBITDA, its lowest level in recent years. Our investments were more focused in the industrial area during the quarter, and this represents a trend that is expected to continue in 2017.”
FINANCIAL RESULTS
Revenues
For the quarter ended December 31, 2016, total gross revenues were $95.3 million, compared with total gross revenues of $106.6 million for the quarter ended December 31, 2015. The decrease was primarily attributable to 2016 property sales, particularly the sale of the New York City land investments, and lease expirations, partially offset by revenue generated from property acquisitions and new leases.
Net Income Attributable to Common Shareholders
For the quarter ended December 31, 2016, net income attributable to common shareholders was $14.4 million, or $0.06 per diluted share, compared with net income attributable to common shareholders for the quarter ended December 31, 2015 of $33.2 million, or $0.14 per diluted share.
Adjusted Company FFO
For the quarter ended December 31, 2016, Lexington generated Adjusted Company FFO of $59.7 million, or $0.24 per diluted share, compared to Adjusted Company FFO for the quarter ended December 31, 2015 of $69.6 million, or $0.29 per diluted share.
Dividends/Distributions
As previously announced, during the fourth quarter of 2016, Lexington declared a regular quarterly common share dividend/distribution for the quarter ended December 31, 2016 of $0.175 per common share/unit, which was paid on January 17, 2017 to common shareholders/unitholders of record as of December 30, 2016. Lexington previously announced and declared a dividend of $0.8125 per share on its Series C Cumulative Convertible Preferred Stock (“Series C Preferred Shares”), which was paid on February 15, 2017 to Series C Preferred Shareholders of record as of January 31, 2017.
| 4 |
Transaction Activity
ACQUISITIONS AND COMPLETED BUILD-TO-SUIT TRANSACTIONS
| Primary Tenant (Guarantor) | Location | Sq. Ft. | Property Type | Initial Basis ($000) | Estimated Annual GAAP Rent ($000) | Initial Annualized Cash Rent ($000) | Estimated GAAP Yield | Initial Cash Yield | Approximate Term (Yrs) | |||||||||||||||||||||
| Aryzta, LLC (Aryzta AG) | Romeoville, IL | 188,000 | Industrial | $ | 52,700 | $ | 3,544 | $ | 3,301 | 6.7 | % | 6.3 | % | 15 | ||||||||||||||||
| Amazon.com.dedc, LLC (Amazon.com Inc.) | Edwardsville, IL | 770,000 | Industrial | 44,800 | 2,682 | 2,501 | 6.0 | % | 5.6 | % | 10 | |||||||||||||||||||
| The Dow Chemical Company(1) | Lake Jackson, TX | 389,000 | Office | 78,484 | 8,673 | 7,108 | 9.5 | % | 7.7 | % | 20 | |||||||||||||||||||
| 1,347,000 | $ | 175,984 | $ | 14,899 | $ | 12,910 | 7.8 | % | 6.7 | % | ||||||||||||||||||||
| 1. | Three of four buildings completed in Q4 2016. Estimated GAAP and cash yields reflect estimated costs of completion of final building and developer partner payout of all four buildings, as set forth in the table immediately below. |
ON-GOING BUILD-TO-SUIT PROJECTS
| Location | Sq. Ft. | Property Type | Maximum Commitment/ Estimated Completion Cost ($000) | GAAP Investment Balance as of 12/31/2016 ($000)(1) | Estimated Completion Date | Approximate Lease Term (Yrs) | ||||||||||||
| Lake Jackson, TX(2) | 275,000 | Office | $ | 78,447 | $ | 55,960 | 1Q 17 | 20 | ||||||||||
| Charlotte, NC | 201,000 | Office | 62,445 | 40,443 | 2Q 17 | 15 | ||||||||||||
| Opelika, AL | 165,000 | Industrial | 37,000 | 10,249 | 2Q 17 | 25 | ||||||||||||
| 641,000 | $ | 177,892 | $ | 106,652 | ||||||||||||||
| 1. | During the quarter, Lexington funded $25.4 million of the projected costs of the above projects, including the completed Lake Jackson buildings. |
| 2. | Total project is 664,000 square feet. 389,000 square feet completed in Q4 2016 as set forth in the table above. |
FORWARD PURCHASE COMMITMENTS
| Location | Sq. Ft. | Property Type | Maximum Acquisition Cost ($000) | Estimated Acquisition Date | Estimated GAAP Yield | Estimated Initial Cash Yield | Approximate Lease Term (Yrs) | |||||||||||||||
| Grand Prairie, TX | 215,000 | Industrial | $ | 24,725 | 2Q 17 | 7.6 | % | 6.2 | % | 20 | ||||||||||||
| Warren, MI(1) | 260,000 | Industrial | 47,000 | 3Q 17 | 8.3 | % | 7.3 | % | 15 | |||||||||||||
| 475,000 | $ | 71,725 | 8.0 | % | 6.9 | % | ||||||||||||||||
| 1. | Lexington provided a $4.6 million letter of credit to secure its obligation to purchase this property. |
PROPERTY DISPOSITIONS
| Primary Tenant | Location | Property Type | Gross Disposition Price ($000) | Annualized Net Income(1)(2) ($000) | Annualized NOI(1) ($000) | Month of Disposition | ||||||||||||
| Vacant | Canonsburg, PA | Office | $ | 8,250 | $ | (330 | ) | $ | (330 | ) | October | |||||||
| Avnet, Inc. | Phoenix, AZ | Office | 32,000 | 1,276 | 1,949 | October | ||||||||||||
| Bank of America, National Association | Los Angeles, CA | Office | 19,200 | 1,014 | 1,107 | November | ||||||||||||
| BluePearl Holdings, LLC(3) | Tampa, FL/Houston TX | Office | 15,177 | 566 | 946 | November | ||||||||||||
| Nextel of Texas, Inc.(4) | Temple, TX | Office | 7,463 | (366 | ) | 800 | December | |||||||||||
| Vacant | Westmont, IL | Office | 5,000 | (682 | ) | (635 | ) | December | ||||||||||
| $ | 87,090 | $ | 1,478 | $ | 3,837 | |||||||||||||
| 1. | Quarterly period prior to sale annualized. |
| 2. | Excludes impairment charges recognized. |
| 3. | Includes four properties. |
| 4. | Conveyed to lender in a foreclosure sale. |
| 5 |
LOAN INVESTMENTS
Lexington collected an aggregate $1.6 million in full satisfaction of three loan investments secured by portfolios of single-tenant retail properties.
Leasing Activity
During the fourth quarter of 2016, Lexington executed the following new and extended leases:
| LEASE EXTENSIONS | ||||||||||||||
| Location | Primary Tenant(1) | Prior Term | Lease Expiration Date | Sq. Ft. | ||||||||||
| Office/Multi-Tenant | ||||||||||||||
| 1 | San Antonio | TX | United Healthcare Services, Inc. | 11/2017 | 11/2024 | 142,500 | ||||||||
| 2-3 | Various | HI/PA | N/A | 2016-2017 | 2019-2020 | 1,521 | ||||||||
| 3 | Total office lease extensions | 144,021 | ||||||||||||
| Industrial/Multi-Tenant | ||||||||||||||
| 1 | Plymouth | IN | Bay Valley Foods, LLC | 12/2016 | 12/2018 | 300,500 | ||||||||
| 2 | Antioch | TN | Wirtgen America, Inc. | 12/2016 | 12/2019 | 73,500 | ||||||||
| 2 | Total industrial/multi-tenant lease extensions | 374,000 | ||||||||||||
| Other | ||||||||||||||
| 1 | Chattanooga | TN | BI-LO LLC/K-VA-T Food Stores, Inc. | 06/2017 | 06/2019 | 42,130 | ||||||||
| 1 | Total other lease extensions | 42,130 | ||||||||||||
| 6 | Total lease extensions | 560,151 | ||||||||||||
| NEW LEASES | ||||||||||||
| Location | Lease Expiration Date | Sq. Ft. | ||||||||||
| Office/Multi-Tenant | ||||||||||||
| 1 | Farmers Branch | TX | Brain Synergy Institute, LLC d/b/a Cerebrum Health Centers | 09/2024 | 12,707 | |||||||
| 2 | Richmond | VA | N/A | 02/2027 | 8,503 | |||||||
| 3 | Hampton | VA | Wisconsin Physicians Service Insurance Corporation(2) | 08/2023 | 71,073 | |||||||
| 4-9 | Honolulu/Farmers Branch | HI/TX | N/A | 2017-2022 | 5,436 | |||||||
| 9 | Total new office leases | 97,719 | ||||||||||
| 9 | Total new leases | 97,719 | ||||||||||
| 15 | TOTAL NEW AND EXTENDED LEASES | 657,870 | ||||||||||
| 1. | Leases greater than 10,000 square feet. |
| 2. | Lease commences January 1, 2020 following expiration of existing tenant's lease. |
As of December 31, 2016, Lexington's portfolio was 96.0% leased, excluding any property subject to a mortgage in default.
| 6 |
BALANCE SHEET/CAPITAL MARKETS
In the fourth quarter of 2016, Lexington issued 976,109 common shares at an average price of $10.75 per share under its ATM offering program.
During the fourth quarter of 2016, Lexington satisfied $14.0 million of secured debt with a weighted-average interest rate of 5.2%.
2017 EARNINGS GUIDANCE
Lexington estimates that its net income attributable to common shareholders per diluted common share for the year ended December 31, 2017 will be within an expected range of $0.64 to $0.67. Lexington estimates that its Adjusted Company FFO for the year ended December 31, 2017 will be within an expected range of $0.94 to $0.98 per diluted common share. This guidance is forward looking, excludes the impact of certain items and is based on current expectations.
FOURTH QUARTER 2016 CONFERENCE CALL
Lexington will host a conference call today, Wednesday, March 1, 2017, at 8:30 a.m. Eastern Time, to discuss its results for the quarter ended December 31, 2016. Interested parties may participate in this conference call by dialing 1-844-825-9783 (U.S.), 1-412-317-5163 (International) or 1-855-669-9657 (Canada). A replay of the call will be available through June 1, 2017, at 1-877-344-7529 (U.S.), 1-412-317-0088 (International) or 1-855-669-9658 (Canada); pin code for all replay numbers is 10100256. A live webcast of the conference call will be available at www.lxp.com within the Investors section.
| 7 |
ABOUT LEXINGTON REALTY TRUST
Lexington Realty Trust (NYSE: LXP) is a publicly traded real estate investment trust (REIT) that owns a diversified portfolio of real estate assets consisting primarily of equity and debt investments in single-tenant net-leased commercial properties across the United States. Lexington seeks to expand its portfolio through build-to-suit transactions, sale-leaseback transactions and other transactions, including acquisitions. For more information, including Lexington's Quarterly Supplemental Information package, or to follow Lexington on social media, visit www.lxp.com.
Contact:
Investor or Media Inquiries for Lexington Realty Trust:
Heather Gentry, Senior Vice President of Investor Relations
Lexington Realty Trust
Phone: (212) 692-7200 E-mail: hgentry@lxp.com
This release contains certain forward-looking statements which involve known and unknown risks, uncertainties or other factors not under Lexington's control which may cause actual results, performance or achievements of Lexington and its subsidiaries to be materially different from the results, performance, or other expectations implied by these forward-looking statements. Factors that could cause or contribute to such differences include, but are not limited to, those discussed under the headings “Management's Discussion and Analysis of Financial Condition and Results of Operations” and “Risk Factors” in Lexington's periodic reports filed with the Securities and Exchange Commission, including, but not limited to, risks related to: (1) the authorization by Lexington's Board of Trustees of future dividend declarations, (2) Lexington's ability to achieve its estimates of net income attributable to common shareholders and Adjusted Company FFO for the year ending December 31, 2017, (3) the successful consummation of any lease, acquisition, build-to-suit, disposition, financing or other transaction on the terms described herein or at all, (4) the failure to continue to qualify as a REIT, (5) changes in general business and economic conditions, including the impact of any legislation, (6) competition, (7) increases in real estate construction costs, (8) changes in interest rates, (9) changes in accessibility of debt and equity capital markets, and (10) future impairment charges. Copies of the periodic reports Lexington has filed with the Securities and Exchange Commission are available on Lexington's web site at www.lxp.com. Forward-looking statements, which are based on certain assumptions and describe Lexington's future plans, strategies and expectations, are generally identifiable by use of the words “believes,” “expects,” “intends,” “anticipates,” “estimates,” “projects”, “may,” “plans,” “predicts,” “will,” “will likely result,” “is optimistic,” “goal,” “objective” or similar expressions. Except as required by law, Lexington undertakes no obligation to revise those forward-looking statements to reflect events or circumstances after the occurrence of unanticipated events. Accordingly, there is no assurance that Lexington's expectations will be realized.
References to Lexington refer to Lexington Realty Trust and its consolidated subsidiaries. All interests in properties and loans are held through special purpose entities, which are separate and distinct legal entities, some of which are consolidated for financial statement purposes and/or disregarded for income tax purposes. The assets and credit of each special purpose entity with a property subject to a mortgage loan (a “property owner subsidiary”) are not available to creditors to satisfy the debt or other obligations of any other person, including any other special purpose entity or affiliate. Consolidated entities that are not property owner subsidiaries do not directly own any of the assets of a property owner subsidiary (or the general partner, member of managing member of such property owner subsidiary, but merely hold partnership, membership or beneficial interests therein, which interests are subordinate to the claims of the property owner subsidiary's general partner's, member's or managing member's creditors).
| 8 |
Non-GAAP Financial Measures - Definitions
Lexington has used non-GAAP financial measures as defined by the Securities and Exchange Commission Regulation G in this Quarterly Earnings Press Release and in other public disclosures.
Lexington believes that the measures defined below are helpful to investors in measuring our performance or that of an individual investment. Since these measures exclude certain items which are included in their respective most comparable measures under generally accepted accounting principles (“GAAP”), reliance on the measures has limitations; management compensates for these limitations by using the measures simply as supplemental measures that are weighed in balance with other GAAP measures. These measures are not necessarily indications of our cash flow available to fund cash needs. Additionally, they should not be used as an alternative to the respective most comparable GAAP measures when evaluating Lexington's financial performance or cash flow from operating, investing or financing activities or liquidity.
Cash Rent: Cash Rent is calculated by making adjustments to GAAP rent to remove the impact of GAAP required adjustments to rental income such as adjustments for straight-line rents relating to free rent periods and contractual rent increases. Cash Rent excludes lease termination income. Lexington believes Cash Rent provides a meaningful indication of an investment's ability to fund cash needs.
Company Funds Available for Distribution (“FAD”): FAD is calculated by making adjustments to Adjusted Company FFO (see below) for (1) straight-line rent adjustments, (2) lease incentive amortization, (3) amortization of above/below market leases, (4) lease termination payments, net, (5) non-cash interest, net, (6) non-cash charges, net, (7) cash paid for tenant improvements, and (8) cash paid for lease costs. Although FAD may not be comparable to that of other real estate investment trusts (“REITs”), Lexington believes it provides a meaningful indication of its ability to fund cash needs. FAD is a non-GAAP financial measure and should not be viewed as an alternative measurement of operating performance to net income, as an alternative to net cash flows from operating activities or as a measure of liquidity.
Funds from Operations (“FFO”) and Adjusted Company FFO: Lexington believes that Funds from Operations, or FFO, which is a non-GAAP measure, is a widely recognized and appropriate measure of the performance of an equity REIT. Lexington believes FFO is frequently used by securities analysts, investors and other interested parties in the evaluation of REITs, many of which present FFO when reporting their results. FFO is intended to exclude GAAP historical cost depreciation and amortization of real estate and related assets, which assumes that the value of real estate diminishes ratably over time. Historically, however, real estate values have risen or fallen with market conditions. As a result, FFO provides a performance measure that, when compared year over year, reflects the impact to operations from trends in occupancy rates, rental rates, operating costs, development activities, interest costs and other matters without the inclusion of depreciation and amortization, providing perspective that may not necessarily be apparent from net income.
The National Association of Real Estate Investment Trusts, or NAREIT, defines FFO as “net income (or loss) computed in accordance with GAAP, excluding gains (or losses) from sales of property, plus real estate depreciation and amortization and after adjustments for non-consolidated partnerships and joint ventures.” NAREIT clarified its computation of FFO to exclude impairment charges on depreciable real estate owned directly or indirectly. FFO does not represent cash generated from operating activities in accordance with GAAP and is not indicative of cash available to fund cash needs.
Lexington presents FFO available to common shareholders and unitholders - basic and also presents FFO available to all equityholders and unitholders - diluted on a company-wide basis as if all securities that are convertible, at the holder's option, into Lexington’s common shares, are converted at the beginning of the period. Lexington also presents Adjusted Company FFO available to all equityholders and unitholders - diluted which adjusts FFO available to all equityholders and unitholders - diluted for certain items which we believe are not indicative of the operating results of Lexington's real estate portfolio. Lexington believes this is an appropriate presentation as it is frequently requested by security analysts, investors and other interested parties. Since others do not calculate these measures in a similar fashion, these measures may not be comparable to similarly titled measures as reported by others. These measures should not be considered as an alternative to net income as an indicator of Lexington’s operating performance or as an alternative to cash flow as a measure of liquidity.
GAAP and Cash Yield or Capitalization Rate: GAAP and cash yields or capitalization rates are measures of operating performance used to evaluate the individual performance of an investment. These measures are not presented or intended to be viewed as a liquidity or performance measure that present a numerical measure of Lexington's historical or future financial performance, financial position or cash flows. The yield or capitalization rate is calculated by dividing the annualized NOI (as defined below, except GAAP rent adjustments are added back to rental income to calculate GAAP yield or capitalization rate) the investment is expected to generate (or has generated) by the acquisition/completion cost (or sale) price.
Net Operating Income (“NOI”): NOI is a measure of operating performance used to evaluate the individual performance of an investment. This measure is not presented or intended to be viewed as a liquidity or performance measure that presents a numerical measure of Lexington's historical or future financial performance, financial position or cash flows. Lexington defines NOI as operating revenues (rental income (less GAAP rent adjustments and lease termination income), tenant reimbursements and other property income) less property operating expenses. Other REITs may use different methodologies for calculating NOI, and accordingly, Lexington's NOI may not be comparable to that of other companies. Because NOI excludes general and administrative expenses, interest expense, depreciation and amortization, acquisition-related expenses, other nonproperty income and losses, and gains and losses from property dispositions, it provides a performance measure that, when compared year over year, reflects the revenues and expenses directly associated with owning and operating commercial real estate and the impact to operations from trends in occupancy rates, rental rates, and operating costs, providing a perspective on operations not immediately apparent from net income. Lexington believes that net income is the most directly comparable GAAP measure to NOI.
# # #
| 9 |
LEXINGTON REALTY TRUST AND CONSOLIDATED SUBSIDIARIES
CONDENSED CONSOLIDATED STATEMENTS OF OPERATIONS
(Unaudited and in thousands, except share and per share data)
| Three months ended December 31, | Twelve months ended December 31, | |||||||||||||||
| 2016 | 2015 | 2016 | 2015 | |||||||||||||
| Gross revenues: | ||||||||||||||||
| Rental | $ | 87,261 | $ | 98,934 | $ | 398,065 | $ | 399,485 | ||||||||
| Tenant reimbursements | 8,065 | 7,692 | 31,431 | 31,354 | ||||||||||||
| Total gross revenues | 95,326 | 106,626 | 429,496 | 430,839 | ||||||||||||
| Expense applicable to revenues: | ||||||||||||||||
| Depreciation and amortization | (41,361 | ) | (41,403 | ) | (166,048 | ) | (163,198 | ) | ||||||||
| Property operating | (12,512 | ) | (14,055 | ) | (47,355 | ) | (59,655 | ) | ||||||||
| General and administrative | (8,072 | ) | (6,750 | ) | (31,104 | ) | (29,276 | ) | ||||||||
| Non-operating income | 3,543 | 3,216 | 13,043 | 11,429 | ||||||||||||
| Interest and amortization expense | (19,459 | ) | (21,466 | ) | (88,032 | ) | (89,739 | ) | ||||||||
| Debt satisfaction gains (charges), net | (157 | ) | 11,397 | (975 | ) | 25,150 | ||||||||||
| Impairment charges | (24,332 | ) | (2,762 | ) | (100,236 | ) | (36,832 | ) | ||||||||
| Gains on sales of properties | 23,097 | — | 81,510 | 23,307 | ||||||||||||
| Income before provision for income taxes, equity in earnings of non-consolidated entities and discontinued operations | 16,073 | 34,803 | 90,299 | 112,025 | ||||||||||||
| Provision for income taxes | (340 | ) | (104 | ) | (1,439 | ) | (568 | ) | ||||||||
| Equity in earnings of non-consolidated entities | 1,196 | 814 | 7,590 | 1,752 | ||||||||||||
| Income from continuing operations | 16,929 | 35,513 | 96,450 | 113,209 | ||||||||||||
| Discontinued operations: | ||||||||||||||||
| Income from discontinued operations | — | — | — | 109 | ||||||||||||
| Provision for income taxes | — | — | — | (4 | ) | |||||||||||
| Gains on sales of properties | — | — | — | 1,577 | ||||||||||||
| Total discontinued operations | — | — | — | 1,682 | ||||||||||||
| Net income | 16,929 | 35,513 | 96,450 | 114,891 | ||||||||||||
| Less net income attributable to noncontrolling interests | (928 | ) | (663 | ) | (826 | ) | (3,188 | ) | ||||||||
| Net income attributable to Lexington Realty Trust shareholders | 16,001 | 34,850 | 95,624 | 111,703 | ||||||||||||
| Dividends attributable to preferred shares – Series C | (1,572 | ) | (1,572 | ) | (6,290 | ) | (6,290 | ) | ||||||||
| Allocation to participating securities | (38 | ) | (49 | ) | (225 | ) | (313 | ) | ||||||||
| Net income attributable to common shareholders | $ | 14,391 | $ | 33,229 | $ | 89,109 | $ | 105,100 | ||||||||
| Income per common share – basic: | ||||||||||||||||
| Income from continuing operations | $ | 0.06 | $ | 0.14 | $ | 0.38 | $ | 0.44 | ||||||||
| Income from discontinued operations | — | — | — | 0.01 | ||||||||||||
| Net income attributable to common shareholders | $ | 0.06 | $ | 0.14 | $ | 0.38 | $ | 0.45 | ||||||||
| Weighted-average common shares outstanding – basic | 235,066,967 | 233,448,100 | 233,633,058 | 233,455,056 | ||||||||||||
| Income per common share – diluted: | ||||||||||||||||
| Income from continuing operations | $ | 0.06 | $ | 0.14 | $ | 0.37 | $ | 0.44 | ||||||||
| Income from discontinued operations | — | — | — | 0.01 | ||||||||||||
| Net income attributable to common shareholders | $ | 0.06 | $ | 0.14 | $ | 0.37 | $ | 0.45 | ||||||||
| Weighted-average common shares outstanding – diluted | 235,204,568 | 239,411,055 | 237,679,031 | 233,751,775 | ||||||||||||
| Amounts attributable to common shareholders: | ||||||||||||||||
| Income from continuing operations | $ | 14,391 | $ | 33,229 | $ | 89,109 | $ | 103,418 | ||||||||
| Income from discontinued operations | — | — | — | 1,682 | ||||||||||||
| Net income attributable to common shareholders | $ | 14,391 | $ | 33,229 | $ | 89,109 | $ | 105,100 | ||||||||
| 10 |
LEXINGTON REALTY TRUST AND CONSOLIDATED SUBSIDIARIES
CONDENSED CONSOLIDATED BALANCE SHEETS
As of December 31,
(Unaudited and in thousands, except share and per share data)
| 2016 | 2015 | |||||||
| Assets: | ||||||||
| Real estate, at cost | $ | 3,533,172 | $ | 3,789,711 | ||||
| Real estate - intangible assets | 597,294 | 692,778 | ||||||
| Investments in real estate under construction | 106,652 | 95,402 | ||||||
| 4,237,118 | 4,577,891 | |||||||
| Less: accumulated depreciation and amortization | 1,208,792 | 1,179,969 | ||||||
| Real estate, net | 3,028,326 | 3,397,922 | ||||||
| Assets held for sale | 23,808 | 24,425 | ||||||
| Cash and cash equivalents | 86,637 | 93,249 | ||||||
| Restricted cash | 31,142 | 10,637 | ||||||
| Investment in and advances to non-consolidated entities | 67,125 | 31,054 | ||||||
| Deferred expenses, net | 33,360 | 42,000 | ||||||
| Loans receivable, net | 94,210 | 95,871 | ||||||
| Rent receivable – current | 7,516 | 7,193 | ||||||
| Rent receivable – deferred | 31,455 | 87,547 | ||||||
| Other assets | 37,888 | 18,505 | ||||||
| Total assets | $ | 3,441,467 | $ | 3,808,403 | ||||
| Liabilities and Equity: | ||||||||
| Liabilities: | ||||||||
| Mortgages and notes payable, net | $ | 738,047 | $ | 872,643 | ||||
| Revolving credit facility borrowings | — | 177,000 | ||||||
| Term loans payable, net | 501,093 | 500,076 | ||||||
| Senior notes payable, net | 494,362 | 493,526 | ||||||
| Convertible notes payable, net | — | 12,126 | ||||||
| Trust preferred securities, net | 127,096 | 126,996 | ||||||
| Dividends payable | 47,264 | 45,440 | ||||||
| Liabilities held for sale | 191 | 8,405 | ||||||
| Accounts payable and other liabilities | 59,601 | 41,479 | ||||||
| Accrued interest payable | 6,704 | 8,851 | ||||||
| Deferred revenue - including below market leases, net | 39,895 | 42,524 | ||||||
| Prepaid rent | 14,723 | 16,806 | ||||||
| Total liabilities | 2,028,976 | 2,345,872 | ||||||
| Commitments and contingencies | ||||||||
| Equity: | ||||||||
| Preferred shares, par value $0.0001 per share; authorized 100,000,000 shares: | ||||||||
| Series C Cumulative Convertible Preferred, liquidation preference $96,770; 1,935,400 shares issued and outstanding | 94,016 | 94,016 | ||||||
| Common shares, par value $0.0001 per share; authorized 400,000,000 shares, 238,037,177 and 234,575,225 shares issued and outstanding in 2016 and 2015, respectively | 24 | 23 | ||||||
| Additional paid-in-capital | 2,800,736 | 2,776,837 | ||||||
| Accumulated distributions in excess of net income | (1,500,966 | ) | (1,428,908 | ) | ||||
| Accumulated other comprehensive loss | (1,033 | ) | (1,939 | ) | ||||
| Total shareholders’ equity | 1,392,777 | 1,440,029 | ||||||
| Noncontrolling interests | 19,714 | 22,502 | ||||||
| Total equity | 1,412,491 | 1,462,531 | ||||||
| Total liabilities and equity | $ | 3,441,467 | $ | 3,808,403 | ||||
| 11 |
LEXINGTON REALTY TRUST AND CONSOLIDATED SUBSIDIARIES
EARNINGS PER SHARE
(Unaudited and in thousands, except share and per share data)
| Three Months Ended December 31, | Twelve Months Ended December 31, | |||||||||||||||
| 2016 | 2015 | 2016 | 2015 | |||||||||||||
| EARNINGS PER SHARE: | ||||||||||||||||
| Basic: | ||||||||||||||||
| Income from continuing operations attributable to common shareholders | $ | 14,391 | $ | 33,229 | $ | 89,109 | $ | 103,418 | ||||||||
| Income from discontinued operations attributable to common shareholders | — | — | — | 1,682 | ||||||||||||
| Net income attributable to common shareholders | $ | 14,391 | $ | 33,229 | $ | 89,109 | $ | 105,100 | ||||||||
| Weighted-average number of common shares outstanding | 235,066,967 | 233,448,100 | 233,633,058 | 233,455,056 | ||||||||||||
| Income per common share: | ||||||||||||||||
| Income from continuing operations | $ | 0.06 | $ | 0.14 | $ | 0.38 | $ | 0.44 | ||||||||
| Income from discontinued operations | — | — | — | 0.01 | ||||||||||||
| Net income attributable to common shareholders | $ | 0.06 | $ | 0.14 | $ | 0.38 | $ | 0.45 | ||||||||
| Diluted: | ||||||||||||||||
| Income from continuing operations attributable to common shareholders - basic | $ | 14,391 | $ | 33,229 | $ | 89,109 | $ | 103,418 | ||||||||
| Impact of assumed conversions | — | 711 | (159 | ) | — | |||||||||||
| Income from continuing operations attributable to common shareholders | 14,391 | 33,940 | 88,950 | 103,418 | ||||||||||||
| Income from discontinued operations attributable to common shareholders - basic | — | — | — | 1,682 | ||||||||||||
| Impact of assumed conversions | — | — | — | — | ||||||||||||
| Income from discontinued operations attributable to common shareholders | — | — | — | 1,682 | ||||||||||||
| Net income attributable to common shareholders | $ | 14,391 | $ | 33,940 | $ | 88,950 | $ | 105,100 | ||||||||
| Weighted-average common shares outstanding - basic | 235,066,967 | 233,448,100 | 233,633,058 | 233,455,056 | ||||||||||||
| Effect of dilutive securities: | ||||||||||||||||
| Share options | 137,601 | 220,125 | 230,352 | 296,719 | ||||||||||||
| Operating Partnership Units | — | 3,834,962 | 3,815,621 | — | ||||||||||||
| 6.00% Convertible Guaranteed Notes | — | 1,907,868 | — | — | ||||||||||||
| Weighted-average common shares outstanding - diluted | 235,204,568 | 239,411,055 | 237,679,031 | 233,751,775 | ||||||||||||
| Income per common share: | ||||||||||||||||
| Income from continuing operations | $ | 0.06 | $ | 0.14 | $ | 0.37 | $ | 0.44 | ||||||||
| Income from discontinued operations | — | — | — | 0.01 | ||||||||||||
| Net income attributable to common shareholders | $ | 0.06 | $ | 0.14 | $ | 0.37 | $ | 0.45 | ||||||||
| 12 |
LEXINGTON REALTY TRUST AND CONSOLIDATED SUBSIDIARIES
ADJUSTED COMPANY FUNDS FROM OPERATIONS & FUNDS AVAILABLE FOR DISTRIBUTION
(Unaudited and in thousands, except share and per share data)
| Three Months Ended December 31, | Twelve Months Ended December 31, | |||||||||||||||
| 2016 | 2015 | 2016 | 2015 | |||||||||||||
| FUNDS FROM OPERATIONS: | ||||||||||||||||
| Basic and Diluted: | ||||||||||||||||
| Net income attributable to common shareholders | $ | 14,391 | $ | 33,229 | $ | 89,109 | $ | 105,100 | ||||||||
| Adjustments: | ||||||||||||||||
| Depreciation and amortization | 39,840 | 39,708 | 159,363 | 157,644 | ||||||||||||
| Impairment charges - real estate | 24,332 | 2,762 | 100,236 | 36,832 | ||||||||||||
| Noncontrolling interests - OP units | 686 | 457 | (159 | ) | 1,999 | |||||||||||
| Amortization of leasing commissions | 1,520 | 1,695 | 6,684 | 5,554 | ||||||||||||
| Joint venture and noncontrolling interest adjustment | 369 | 453 | 1,111 | 1,788 | ||||||||||||
| Gains on sales of properties, including non-consolidated entities | (23,729 | ) | (487 | ) | (87,520 | ) | (25,371 | ) | ||||||||
| Tax on sales of properties | 2 | — | 52 | — | ||||||||||||
| FFO available to common shareholders and unitholders - basic | 57,411 | 77,817 | 268,876 | 283,546 | ||||||||||||
| Preferred dividends | 1,572 | 1,572 | 6,290 | 6,290 | ||||||||||||
| Interest and amortization on 6.00% Convertible Notes | — | 253 | 532 | 1,048 | ||||||||||||
| Amount allocated to participating securities | 38 | 49 | 225 | 313 | ||||||||||||
| FFO available to all equityholders and unitholders - diluted | 59,021 | 79,691 | 275,923 | 291,197 | ||||||||||||
| Debt satisfaction (gains) charges, net, including non-consolidated entities | 157 | (11,397 | ) | 975 | (25,086 | ) | ||||||||||
| Transaction costs/Other | 508 | 1,285 | 837 | 1,864 | ||||||||||||
| Adjusted Company FFO available to all equityholders and unitholders - diluted | 59,686 | 69,579 | 277,735 | 267,975 | ||||||||||||
| FUNDS AVAILABLE FOR DISTRIBUTION: | ||||||||||||||||
| Adjustments: | ||||||||||||||||
| Straight-line rents | (2,051 | ) | (12,460 | ) | (37,748 | ) | (47,702 | ) | ||||||||
| Lease incentives | 417 | 387 | 1,673 | 1,544 | ||||||||||||
| Amortization of above/below market leases | 530 | 418 | 2,057 | 261 | ||||||||||||
| Lease termination payments, net | (1,814 | ) | 2,420 | (8,216 | ) | 3,086 | ||||||||||
| Non-cash interest, net | (387 | ) | (638 | ) | (1,913 | ) | (118 | ) | ||||||||
| Non-cash charges, net | 2,092 | 2,213 | 8,998 | 8,821 | ||||||||||||
| Tenant improvements | (665 | ) | (7,242 | ) | (1,957 | ) | (20,426 | ) | ||||||||
| Lease costs | (393 | ) | (2,439 | ) | (6,558 | ) | (6,681 | ) | ||||||||
| Company Funds Available for Distribution | $ | 57,415 | $ | 52,238 | $ | 234,071 | $ | 206,760 | ||||||||
| Per Common Share and Unit Amounts | ||||||||||||||||
| Basic: | ||||||||||||||||
| FFO | $ | 0.24 | $ | 0.33 | $ | 1.13 | $ | 1.19 | ||||||||
| Diluted: | ||||||||||||||||
| FFO | $ | 0.24 | $ | 0.33 | $ | 1.13 | $ | 1.19 | ||||||||
| Adjusted Company FFO | $ | 0.24 | $ | 0.29 | $ | 1.14 | $ | 1.10 | ||||||||
| Weighted-Average Common Shares | ||||||||||||||||
| Basic: | ||||||||||||||||
| Weighted-average common shares outstanding - basic EPS | 235,066,967 | 233,448,100 | 233,633,058 | 233,455,056 | ||||||||||||
| Operating partnership units(1) | 3,808,185 | 3,834,962 | 3,815,621 | 3,848,434 | ||||||||||||
| Weighted-average common shares outstanding - basic FFO | 238,875,152 | 237,283,062 | 237,448,679 | 237,303,490 | ||||||||||||
| Diluted: | ||||||||||||||||
| Weighted-average common shares outstanding - diluted EPS | 235,204,568 | 239,411,055 | 237,679,031 | 233,751,775 | ||||||||||||
| Unvested share-based payment awards | 674,053 | — | 549,049 | 3,326 | ||||||||||||
| 6.00% Convertible Guaranteed Notes | — | — | 1,077,626 | 2,041,629 | ||||||||||||
| Operating partnership units(1) | 3,808,185 | — | — | 3,848,434 | ||||||||||||
| Preferred shares - Series C | 4,710,570 | 4,710,570 | 4,710,570 | 4,710,570 | ||||||||||||
| Weighted-average common shares outstanding - diluted FFO | 244,397,376 | 244,121,625 | 244,016,276 | 244,355,734 | ||||||||||||
| (1) | Includes OP units other than OP units held by Lexington. |
| 13 |
RECONCILIATION OF NON-GAAP MEASURES
2017 EARNINGS GUIDANCE
| Twelve Months Ended December 31, 2017 | ||||||||
| Range | ||||||||
| Estimated: | ||||||||
| Net income attributable to common shareholders per diluted common share(1) | $ | 0.64 | $ | 0.67 | ||||
| Depreciation and amortization | 0.67 | 0.68 | ||||||
| Impact of capital transactions | (0.37 | ) | (0.37 | ) | ||||
| Estimated Adjusted Company FFO per diluted common share | $ | 0.94 | $ | 0.98 | ||||
| (1) | Assumes all convertible securities are dilutive. |
| 14 |
LEXINGTON REALTY TRUST
2016 Fourth Quarter Investment / Capital Recycling Summary
PROPERTY INVESTMENTS
| Primary Tenant (Guarantor) | Location | Property Type | Initial Basis ($000) | Initial Estimated Annualized GAAP Rent ($000) | Initial Estimated Annualized Cash Rent ($000) (1) | Initial Estimated GAAP Yield (1) | Initial Estimated Cash Yield (1) | Month Closed | Primary Lease Expiration | |||||||||||||||||||||||
| 1 | The Dow Chemical Company(2) | Lake Jackson | TX | Office | $ | 78,484 | $ | 8,673 | $ | 7,108 | 9.5 | % | 7.7 | % | Nov | 10/2036 | ||||||||||||||||
| 2 | Aryzta LLC (Aryzta AG) | Romeoville | IL | Industrial | 52,700 | 3,544 | 3,301 | 6.7 | % | 6.3 | % | Dec | 10/2031 | |||||||||||||||||||
| 3 | Amazon.com.dedc, LLC (Amazon.com, Inc.) | Edwardsville | IL | Industrial | 44,800 | 2,682 | 2,501 | 6.0 | % | 5.6 | % | Dec | 09/2026 | |||||||||||||||||||
| 3 | TOTAL PROPERTY INVESTMENTS | $ | 175,984 | $ | 14,899 | $ | 12,910 | 7.8 | % | 6.7 | % | |||||||||||||||||||||
CAPITAL RECYCLING
| PROPERTY DISPOSITIONS | ||||||||||||||||||||||||||||||
| Primary Tenant | Location | Property
Type | Gross
Sale Price ($000) | Annualized
Net Income ($000) (3)(5) | Annualized
NOI ($000)(1)(3) | Month
of Disposition | % Leased | Gross Sale Price PSF | ||||||||||||||||||||||
| 1 | Vacant | Canonsburg | PA | Office | $ | 8,250 | $ | (330 | ) | $ | (330 | ) | October | 0 | % | $ | 76.48 | |||||||||||||
| 2 | Avnet, Inc. | Phoenix | AZ | Office | 32,000 | 1,276 | 1,949 | October | 100 | % | 181.40 | |||||||||||||||||||
| 3 | Bank of America, National Association | Los Angeles | CA | Office | 19,200 | 1,014 | 1,107 | November | 100 | % | 232.65 | |||||||||||||||||||
| 4-7 | BluePearl Holdings, LLC | Tampa / Houston | FL / TX | Office | 15,177 | 566 | 946 | November | 100 | % | 378.26 | |||||||||||||||||||
| 8 | Nextel of Texas, Inc. (4) | Temple | TX | Office | 7,463 | (366 | ) | 800 | December | 50 | % | 68.60 | ||||||||||||||||||
| 9 | Vacant | Westmont | IL | Office | 5,000 | (682 | ) | (635 | ) | December | 0 | % | 18.54 | |||||||||||||||||
| 9 | TOTAL PROPERTY DISPOSITIONS | $ | 87,090 | $ | 1,478 | $ | 3,837 | |||||||||||||||||||||||
Footnotes
| (1) | See definitions of non-GAAP measures and reconciliations to applicable GAAP measures in this document. |
| (2) | Three of four buildings completed in Q4 2016. Estimated GAAP and cash yields reflect estimated costs of completion of final building and developer partner payout of all four buildings. |
| (3) | 3Q 2016 annualized. |
| (4) | Conveyed to lender in a foreclosure sale. |
| (5) | Excludes impairment charges recognized. |
| 15 |
LEXINGTON REALTY TRUST
2016 Fourth Quarter Build-to-Suit Projects / Forward Purchase Commitments
BUILD-TO-SUIT PROJECTED CONSTRUCTION FUNDING SCHEDULE (1)
| Location | Sq. Ft | Property Type | Approximate Lease Term (Years) | Maximum Commitment/ Estimated Completion Cost ($000) | Investment
balance as of 12/31/16 ($000) | Estimated
Cash Investment Next 12 Months ($000) | Estimated
Completion/ Acquisition Date | Estimated
Initial GAAP Yield (4) | Estimated
Initial Cash Yield (4) | |||||||||||||||||||||||||||||||||||||
| Q1 2017 | Q2 2017 | Q3 2017 | Q4 2017 | |||||||||||||||||||||||||||||||||||||||||||
| 1 | Lake Jackson (2) | TX | 275,000 | Office | 20 | $ | 78,447 | $ | 55,960 | $ | - | $ | - | $ | - | $ | - | 1Q 17 | 9.5 | % | 7.7 | % | ||||||||||||||||||||||||
| 2 | Charlotte | NC | 201,000 | Office | 15 | 62,445 | 40,443 | 11,980 | 9,080 | - | - | 2Q 17 | 9.5 | % | 8.3 | % | ||||||||||||||||||||||||||||||
| 3 | Opelika | AL | 165,000 | Industrial | 25 | 37,000 | 10,249 | 14,620 | 11,670 | - | - | 2Q 17 | 9.0 | % | 7.1 | % | ||||||||||||||||||||||||||||||
| 3 | TOTAL BUILD-TO-SUIT PROJECTS (3) | $ | 177,892 | $ | 106,652 | $ | 26,600 | $ | 20,750 | $ | - | $ | - | |||||||||||||||||||||||||||||||||
FORWARD PURCHASE COMMITMENTS (1)
| Location | Sq. Ft. | Property
Type | Approximate
Lease Term (Years) | Maximum
Acquisition Cost ($000) | Estimated
Completion Date | Estimated
GAAP Yield (4) | Estimated
Initial Cash Yield (4) | |||||||||||||||||
| 1 | Grand Prairie, TX | 215,000 | Industrial | 20 | $ | 24,725 | 2Q 17 | 7.6 | % | 6.2 | % | |||||||||||||
| 2 | Warren, MI (5) | 260,000 | Industrial | 15 | 47,000 | 3Q 17 | 8.3 | % | 7.3 | % | ||||||||||||||
| $ | 71,725 | |||||||||||||||||||||||
| 2 | TOTAL FORWARD PURCHASE COMMITMENTS | |||||||||||||||||||||||
Footnotes
| (1) | Lexington can give no assurance that any of the build-to-suit projects or other potential investments that are under commitment or contract or in process will be completed or, if completed, will perform to Lexington's expectations. |
| (2) | Three of four buildings completed in Q4 2016. Estimated completion cost and investment balance at 12/31/2016 reflect the fourth building. Estimated GAAP and cash yields reflect completion costs of all buildings and developer partner payout of all four buildings. In July 2016, Lexington obtained $197.2 million of non-recourse financing. The loan bears interest at a fixed rate of 4.04%. The estimated remaining costs to fund the entire project of $71.6 million were escrowed at closing, approximately $27.9 million of which has been used through Q4 2016 to fund project costs. |
| (3) | Investment balance in accordance with GAAP included in investment in real estate under construction. Aggregate equity invested is $109.1 million. |
| (4) | See definitions of non-GAAP measures and reconciliations to applicable GAAP measures in this document. |
| (5) | Lexington provided a $4.6 million letter of credit to secure its obligation to purchase this property. |
| 16 |
LEXINGTON REALTY TRUST
2016 Fourth Quarter Financing Summary
DEBT RETIRED
| Location | Primary Tenant (Guarantor) | Property Type | Face
/ Satisfaction ($000) | Fixed Rate | Maturity
Date | |||||||||
| Consolidated Mortgage Debt: | ||||||||||||||
| Huntington, WV | AMZN WVCS LLC (Amazon.com, Inc.) | Office | $ | 6,500 | 4.15 | % | 02/2017 | |||||||
| Temple, TX(1) | Nextel of Texas, Inc. (Nextel Finance Company) | Office | 7,463 | 6.09 | % | N/A | ||||||||
| $ | 13,963 | |||||||||||||
Footnotes:
| (1) | Conveyed to lender in a foreclosure sale. |
| 17 |
LEXINGTON REALTY TRUST
2016 Fourth Quarter Leasing Summary
LEASE EXTENSIONS
| Tenant | Location | Prior
Term | Lease
Expiration Date | Sq. Ft. | New
GAAP Rent Per Annum ($000)(1) | Prior
GAAP Rent Per Annum ($000) | New
Cash Rent Per Annum ($000)(1)(3) | Prior
Cash Rent Per Annum ($000)(3) | ||||||||||||||||||||||
| Office / Multi-Tenant Office | ||||||||||||||||||||||||||||||
| 1 | United HealthCare Services, Inc. | San Antonio | TX | 11/2017 | 11/2024 | 142,500 | $ | 1,957 | $ | 1,866 | $ | 2,159 | $ | 2,048 | ||||||||||||||||
| 2-3 | Various | Various | HI/PA | 2016-2017 | 2019-2020 | 1,521 | 63 | 57 | 63 | 57 | ||||||||||||||||||||
| 3 | Total office lease extensions | 144,021 | $ | 2,020 | $ | 1,923 | $ | 2,222 | $ | 2,105 | ||||||||||||||||||||
| Industrial / Multi-Tenant Industrial | ||||||||||||||||||||||||||||||
| 1 | Bay Valley Foods, LLC | Plymouth | IN | 12/2016 | 12/2018 | 300,500 | $ | 841 | $ | 785 | $ | 841 | $ | 826 | ||||||||||||||||
| 2 | Wirtgen America, Inc. | Antioch | TN | 12/2016 | 12/2019 | 73,500 | 210 | 210 | 210 | 210 | ||||||||||||||||||||
| 2 | Total industrial lease extensions | 374,000 | $ | 1,051 | $ | 995 | $ | 1,051 | $ | 1,036 | ||||||||||||||||||||
| ` | ||||||||||||||||||||||||||||||
| Other | ||||||||||||||||||||||||||||||
| 1 | BI-LO, LLC / K-VA-T Food Stores, Inc. | Chattanooga | TN | 06/2017 | 06/2019 | 42,130 | $ | 131 | $ | 127 | $ | 131 | $ | 128 | ||||||||||||||||
| 1 | Total other lease extension | 42,130 | $ | 131 | $ | 127 | $ | 131 | $ | 128 | ||||||||||||||||||||
| 6 | TOTAL EXTENDED LEASES | 560,151 | $ | 3,202 | $ | 3,045 | $ | 3,404 | $ | 3,269 | ||||||||||||||||||||
NEW LEASES
| Tenant | Location | Lease
Expiration Date | Sq. Ft. | New
GAAP Rent Per Annum ($000)(1) | New
Cash Rent Per Annum ($000)(1)(3) | |||||||||||||||
| Office/Multi-Tenant Office | ||||||||||||||||||||
| 1 | Brain Synergy Institute, LLC d/b/a Cerebrum Health Centers | Farmers Branch | TX | 09/2024 | 12,707 | $ | 191 | $ | 191 | |||||||||||
| 2 | Pacific Summit Energy LLC | Richmond | VA | 02/2027 | 8,503 | 133 | 133 | |||||||||||||
| 3 | Wisconsin Physicians Service Insurance Corporation (4) | Hampton | VA | 08/2023 | 71,073 | 1,062 | 1,203 | |||||||||||||
| 4-9 | Various | Honolulu/ Farmers Branch | HI/TX | 2017-2022 | 5,436 | 38 | 38 | |||||||||||||
| 9 | Total office new leases | 97,719 | $ | 1,424 | $ | 1,565 | ||||||||||||||
| 9 | TOTAL NEW LEASES | 97,719 | $ | 1,424 | $ | 1,565 | ||||||||||||||
| 15 | TOTAL NEW AND EXTENDED LEASES | 657,870 | $ | 4,626 | $ | 4,969 | ||||||||||||||
| 18 |
LEXINGTON REALTY TRUST
2016 Fourth Quarter Leasing Summary (Continued)
LEASE NON-RENEWALS / LEASE REJECTIONS (2)
| Tenant | Location | Lease Expiration Date | Sq. Ft. | YTD 9/30/2016 GAAP Rent ($000) | YTD 9/30/2016 Cash Rent ($000)(3) | |||||||||||||||
| Office | ||||||||||||||||||||
| 1 | Hnedak Bobo Group, Inc. | Memphis | TN | 10/2016 | 37,229 | $ | 376 | $ | 389 | |||||||||||
| 2 | Physicians Choice Laboratory Services, LLC (5) | Rock Hill | SC | 03/2039 | 104,497 | 1,429 | 1,456 | |||||||||||||
| 2 | TOTAL LEASE NON-RENEWALS / LEASE REJECTIONS | 141,726 | $ | 1,805 | $ | 1,845 | ||||||||||||||
Footnotes
| (1) | Assumes twelve months rent from the later of 1/1/17 or lease commencement/extension, excluding free rent periods as applicable. |
| (2) | Excludes multi-tenant properties. |
| (3) | See definitions of non-GAAP measures and reconciliations to applicable GAAP measures in this document. |
| (4) | Lease commences 1/1/20 following expiration of existing tenant's lease. |
| (5) | On 10/26/2016, the tenant filed as assignment for the benefit of creditors under Florida law and rejected the lease. |
| 19 |
LEXINGTON REALTY TRUST
Other Revenue Data
12/31/2016
($000)
Other Revenue Data
| GAAP Rent | ||||||||||||
| Asset Class | Twelve months ended | |||||||||||
| 12/31/16(1) | 12/31/16 Percentage | 12/31/15 Percentage (5) | ||||||||||
| Office | $ | 176,860 | 52.9 | % | 49.6 | % | ||||||
| Industrial | 132,605 | 39.7 | % | 30.5 | % | |||||||
| Multi-tenant | 12,604 | 3.8 | % | 3.0 | % | |||||||
| Other | 12,099 | 3.6 | % | 16.9 | % | |||||||
| $ | 334,168 | 100.0 | % | 100.0 | % | |||||||
| GAAP Rent | ||||||||||||
| Credit Ratings (2) | Twelve months ended | |||||||||||
| 12/31/16(1) | 12/31/16 Percentage | 12/31/15 Percentage | ||||||||||
| Investment Grade | $ | 123,769 | 37.0 | % | 34.0 | % | ||||||
| Non-Investment Grade | 56,836 | 17.0 | % | 15.1 | % | |||||||
| Unrated | 153,563 | 46.0 | % | 50.9 | % | |||||||
| $ | 334,168 | 100.0 | % | 100.0 | % | |||||||
| Weighted-Average Lease Term - Cash Basis | As of 12/31/16 | As of 12/31/15 | ||
| 8.6 years | 9.1 years | (3) |
Rent Estimates for Current Assets
| Year | GAAP (4) | Cash (4) | Projected Straight-line / GAAP Rent Adjustments | |||||||||
| 2017 | $ | 341,673 | $ | 328,054 | $ | (13,619 | ) | |||||
| 2018 | 325,077 | 314,764 | (10,313 | ) | ||||||||
Footnotes
| (1) | Twelve months ended 12/31/2016 GAAP rent, excluding termination income, recognized for consolidated properties owned as of 12/31/2016. |
| (2) | Credit ratings are based upon either tenant, guarantor or parent. Generally, multi-tenant assets are included in unrated. |
| (3) | Adjusted to reflect NY land leases to first purchase option date. |
| (4) | Amounts assume (1) lease terms for non-cancellable periods only, (2) no new or renegotiated leases are entered into after 12/31/2016, and (3) no properties are sold or acquired after 12/31/2016. |
| (5) | Houston, TX (Industrial Terminals Management L.L.C.) and Missouri City, TX (Vulcan Construction Materials, LP) reclassed to industrial from "other". |
| 20 |
LEXINGTON REALTY TRUST
Other Revenue Data (Continued)
12/31/2016
($000)
Same-Store NOI (1)
| Twelve months ended December 31, | ||||||||||||
| 2016 | 2015 | 2014 | ||||||||||
| Total Cash Rent | $ | 261,721 | $ | 266,309 | $ | 265,814 | ||||||
| Tenant Reimbursements | 24,623 | 25,077 | 25,306 | |||||||||
| Property Operating Expenses | (38,232 | ) | (41,782 | ) | (42,707 | ) | ||||||
| Same-Store NOI | $ | 248,112 | $ | 249,604 | $ | 248,413 | ||||||
| Change in Same-Store NOI | (0.6 | %) | 0.5 | % | ||||||||
| Same-Store Percent Leased (2) | As of 12/31/16 | As of 12/31/15 | As of 12/31/14 | |||||||||
| 95.8 | % | 98.1 | % | 98.2 | % | |||||||
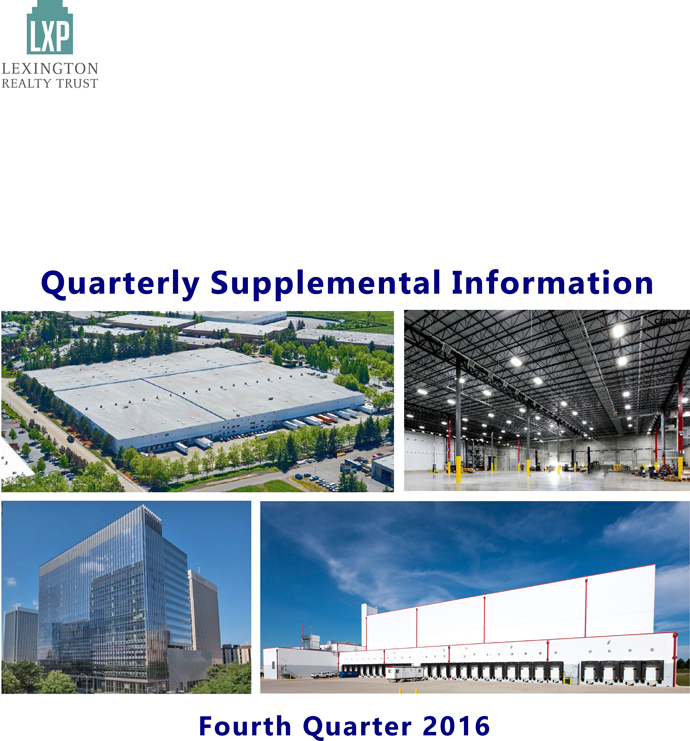
Lease Escalation Data (3)
Footnotes
| (1) | NOI is on a consolidated cash basis for all consolidated properties except properties acquired/expanded and sold in 2016, 2015 and 2014 and properties subject to secured mortgage loans in default at December 31, 2016. See definitions of non-GAAP measures and reconciliations to applicable GAAP measures in this document. |
| (2) | Excludes properties acquired or sold in 2016, 2015 and 2014 and properties subject to secured mortgage loans in default as of 12/31/2016. |
| (3) | Based on twelve months consolidated cash rents for single-tenant leases (properties greater than 70% leased) owned as of December 31, 2016. Excludes parking operations and rents from prior tenants. |
| 21 |
LEXINGTON REALTY TRUST
Portfolio Detail By Asset Class
12/31/2016
($000, except square footage)
| Asset Class | YE 2014 | YE 2015 | YE 2016 | |||||||||
| Office | ||||||||||||
| % of ABR (1) | 51.2 | % | 49.6 | % | 52.9 | % | ||||||
| LTL (5) | 31.4 | % | 23.2 | % | 26.9 | % | ||||||
| STL (6) | 68.6 | % | 76.8 | % | 73.1 | % | ||||||
| Leased | 98.6 | % | 99.6 | % | 99.6 | % | ||||||
| Wtd. Avg. Lease Term (2) | 7.4 | 7.2 | 7.2 | |||||||||
| Mortgage Debt | $ | 426,635 | $ | 329,696 | $ | 490,948 | ||||||
| % Investment Grade (1) | 53.3 | % | 48.0 | % | 48.1 | % | ||||||
| Square Feet | 13,264,134 | 12,847,877 | 11,569,940 | |||||||||
| Industrial (7) | ||||||||||||
| % of ABR (1) | 25.4 | % | 30.5 | % | 39.7 | % | ||||||
| LTL (5) | 47.9 | % | 47.4 | % | 50.8 | % | ||||||
| STL (6) | 52.1 | % | 52.6 | % | 49.2 | % | ||||||
| Leased | 99.7 | % | 99.6 | % | 99.9 | % | ||||||
| Wtd. Avg. Lease Term (2) | 8.8 | 10.1 | 10.4 | |||||||||
| Mortgage Debt | $ | 177,951 | $ | 292,293 | $ | 240,790 | ||||||
| % Investment Grade (1) | 26.6 | % | 27.9 | % | 26.2 | % | ||||||
| Square Feet | 22,745,140 | 25,693,585 | 27,476,653 | |||||||||
| Multi-Tenant | ||||||||||||
| % of ABR (1) | 8.6 | % | 3.0 | % | 3.8 | % | ||||||
| Leased | 53.9 | % | 44.1 | % | 43.2 | % | ||||||
| Wtd. Avg. Lease Term (2) | 6.9 | 3.4 | 3.0 | |||||||||
| Mortgage Debt | $ | 116,763 | $ | 14,118 | $ | 10,586 | ||||||
| % Investment Grade (1) | 19.3 | % | 36.9 | % | 14.2 | % | ||||||
| Square Feet | 2,414,889 | 2,301,864 | 2,971,126 | |||||||||
| Other | ||||||||||||
| % of ABR (1) | 14.8 | % | 16.9 | % | 3.6 | % | ||||||
| LTL (5) | 86.8 | % | 88.0 | % | 42.7 | % | ||||||
| STL (6) | 13.2 | % | 12.0 | % | 57.3 | % | ||||||
| Leased | 94.3 | % | 98.0 | % | 100.0 | % | ||||||
| Wtd. Avg. Lease Term (2)(3) | 18.2 | 18.5 | 14.6 | |||||||||
| Mortgage Debt | $ | 226,645 | $ | 255,218 | $ | 2,849 | ||||||
| % Investment Grade (1) | 4.5 | % | 3.3 | % | 17.8 | % | ||||||
| Square Feet | 1,447,724 | 1,426,697 | 1,306,578 | |||||||||
| Loans Receivable | $ | 105,635 | $ | 95,871 | $ | 94,210 | ||||||
| Construction in progress (4) | $ | 121,184 | $ | 103,954 | $ | 111,771 | ||||||
Footnotes
| (1) | Percentage of GAAP rent, excluding termination income, for consolidated properties owned as of each respective year end. |
| (2) | Cash basis. |
| (3) | Cash basis adjusted to reflect NY land leases to the first purchase option date. |
| (4) | Includes development classified as real estate under construction on a consolidated basis. |
| (5) | Long-term leases ("LTL") are defined as leases having a remaining term of ten years or longer. |
| (6) | Short-term leases ("STL") are defined as leases having a remaining term of less than ten years. |
| (7) | Houston, TX (Industrial Terminals Management, L.L.C.) and Missouri City, TX (Vulcan Construction Materials, LP) reclassed to industrial from "other". |
| 22 |
LEXINGTON REALTY TRUST
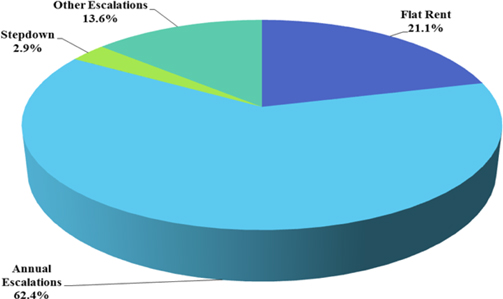
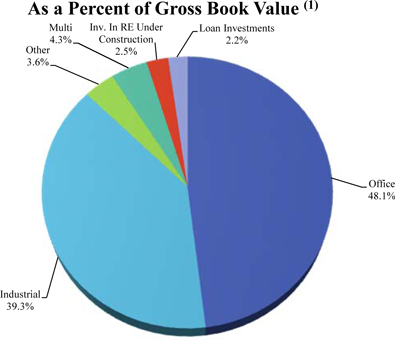
Portfolio Composition
12/31/2016
Footnotes
| (1) | Based on gross book value of real estate assets, real estate under construction, and loans receivable as of 12/31/2016. |
| (2) | Based on respective calendar year end twelve months GAAP rent, excluding termination income. |
| 23 |
LEXINGTON REALTY TRUST
Components of Net Asset Value
12/31/2016
($000)
The purpose of providing the following information is to enable readers to derive their own estimates of net asset value. This information is not intended to be an asset-by-asset or enterprise valuation.
| Consolidated properties twelve month net operating income (NOI) (1) | ||||
| Office | $ | 163,727 | ||
| Industrial | 119,015 | |||
| Multi-Tenant | 3,383 | |||
| Other | 9,283 | |||
| Total Net Operating Income | $ | 295,408 | ||
| Lexington's share of non-consolidated twelve month NOI (1) | ||||
| Office | $ | 1,067 | ||
| Other | 1,048 | |||
| $ | 2,115 | |||
| Other income | ||||
| Advisory fees | $ | 1,038 | ||
| In service assets not fairly valued by capitalized NOI method (1) | ||||
| Wholly-owned assets less than 70% leased | $ | 88,339 | ||
| Wholly-owned assets acquired in 2016 | $ | 306,393 | ||
| Non-consolidated asset completed in 2016 | $ | 54,061 | ||
| Add other assets: | ||||
| Assets held for sale | $ | 23,808 | ||
| Loans receivable | 94,210 | |||
| Development investment at cost incurred | 114,192 | |||
| Cash and cash equivalents | 86,637 | |||
| Restricted cash | 31,142 | |||
| Accounts receivable, net | 7,516 | |||
| Other assets | 37,888 | |||
| Total other assets | $ | 395,393 | ||
| Liabilities: | ||||
| Corporate level debt (face amount) | $ | 1,134,120 | ||
| Mortgages and notes payable (face amount) | 745,173 | |||
| Liabilities held for sale | 191 | |||
| Dividends payable | 47,264 | |||
| Accounts payable, accrued expenses and other liabilities | 81,028 | |||
| Preferred stock, at liquidation value | 96,770 | |||
| Lexington's share of non-consolidated mortgages | 8,472 | |||
| Total deductions | $ | 2,113,018 | ||
| Common shares & OP units at 12/31/2016 | 241,808,819 |
Footnotes
| (1) | NOI for the existing property portfolio at December 31, 2016, excludes NOI related to assets undervalued by a capitalized NOI method and assets held for sale. Assets undervalued by a capitalized NOI method are identified generally by occupancies under 70% and assets acquired in 2016. For assets in this category an NOI capitalization approach is not appropriate, and accordingly, Lexington's net book value has been used. See definitions of non-GAAP measures and reconciliations to applicable GAAP measures in this document. |
| 24 |
LEXINGTON REALTY TRUST
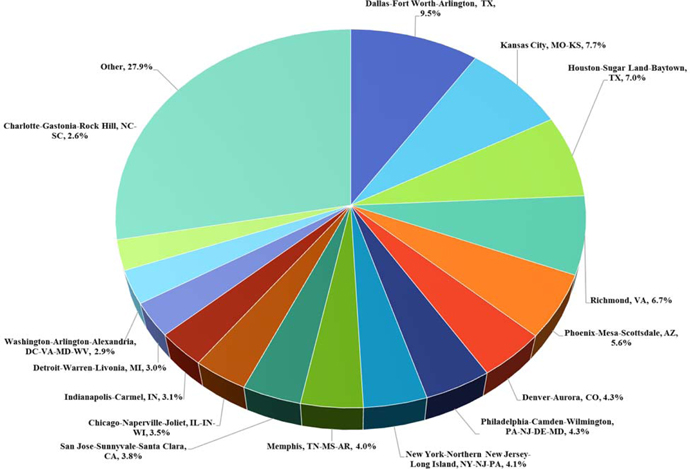
Top Markets
12/31/2016
| Core Based Statistical Area (2) | Percent of GAAP Rent as of 12/31/16 (1) | |||||
| 1 | Houston-Sugar Land-Baytown, TX | 7.6 | % | |||
| 2 | Dallas-Fort Worth-Arlington, TX | 6.8 | % | |||
| 3 | Memphis, TN-MS-AR | 5.0 | % | |||
| 4 | Kansas City, MO-KS | 4.1 | % | |||
| 5 | New York-Northern New Jersey-Long Island, NY-NJ-PA | 4.0 | % | |||
| 6 | Kennewick-Pasco-Richland, WA | 3.9 | % | |||
| 7 | Phoenix-Mesa-Scottsdale, AZ | 3.6 | % | |||
| 8 | Richmond, VA | 3.6 | % | |||
| 9 | Detroit-Warren-Livonia, MI | 3.1 | % | |||
| 10 | Philadelphia-Camden-Wilmington, PA-NJ-DE-MD | 2.6 | % | |||
| 11 | Denver-Aurora, CO | 2.3 | % | |||
| 12 | Columbus, OH | 2.2 | % | |||
| 13 | Las Vegas-Paradise, NV | 2.0 | % | |||
| 14 | San Jose-Sunnyvale-Santa Clara, CA | 2.0 | % | |||
| 15 | Chicago-Naperville-Joliet, IL-IN-WI | 1.9 | % | |||
| 16 | Jackson, MS | 1.9 | % | |||
| 17 | Charlotte-Gastonia-Rock Hill, NC-SC | 1.8 | % | |||
| 18 | Indianapolis-Carmel, IN | 1.7 | % | |||
| 19 | Orlando-Kissimmee, FL | 1.6 | % | |||
| 20 | Atlanta-Sandy Springs-Marietta, GA | 1.6 | % | |||
| Total Top Markets (3) | 63.4 | % | ||||
Footnotes
| (1) | Twelve months ended 12/31/2016 GAAP rent, excluding termination income, recognized for consolidated properties owned as of 12/31/2016. |
| (2) | A Core Based Statistical Area is the official term for a functional region based around an urban center of at least 10,000 people, based on standards published by the Office of Management and Budget (OMB) in 2000. These standards are used to replace the definitions of metropolitan areas that were defined in 1990. |
| (3) | Total shown may differ from detailed amounts due to rounding. |
| 25 |
LEXINGTON REALTY TRUST
Single-Tenant Office Markets (1)(2)
12/31/2016
Footnotes
| (1) | Twelve months ended 12/31/2016 GAAP rent, excluding termination income, recognized for consolidated single-tenant office properties owned as of 12/31/2016. |
| (2) | A Core Based Statistical Area is the official term for a functional region based around an urban center of at least 10,000 people, based on standards published by the Office of Management and Budget (OMB) in 2000. These standards are used to replace the definitions of metropolitan areas that were defined in 1990. |
| 26 |
LEXINGTON REALTY TRUST
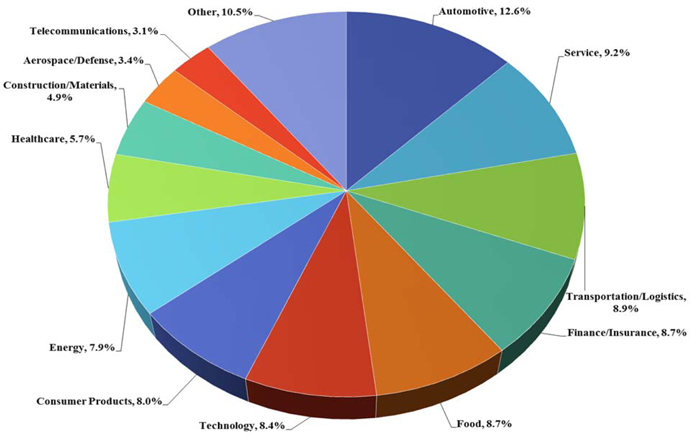
Tenant Industry Diversification (1)
12/31/2016
Footnotes
| (1) | Twelve months ended 12/31/2016 GAAP rent, excluding termination income, recognized for consolidated properties owned as of 12/31/2016. |
| 27 |
LEXINGTON REALTY TRUST
Top 10 Tenants or Guarantors
12/31/2016
Top 10 Tenants or Guarantors - GAAP Basis
| Tenants or Guarantors | Number of Leases | Sq. Ft. Leased | Sq. Ft. Leased as a Percent of Consolidated Portfolio (2) | GAAP Rent as of 12/31/2016 ($000) (1) | Percent of GAAP Rent as of 12/31/2016 ($000) (1) (2) | |||||||||||||||
| Preferred Freezer Services of Richland, LLC / Preferred Freezer Services, LLC & Preferred Freezer Services Operating, LLC | 1 | 456,412 | 1.1 | % | $ | 13,133 | 3.9 | % | ||||||||||||
| FedEx Corporation / Federal Express Corporation | 2 | 661,616 | 1.5 | % | 12,148 | 3.6 | % | |||||||||||||
| Metalsa Structural Products, Inc. / Dana Structural Products, LLC / Dana Holding Corporation and Dana Limited | 7 | 2,053,359 | 4.7 | % | 9,941 | 3.0 | % | |||||||||||||
| United States of America | 3 | 398,214 | 0.9 | % | 9,728 | 2.9 | % | |||||||||||||
| Nissan North America, Inc. | 2 | 1,691,049 | 3.9 | % | 9,625 | 2.9 | % | |||||||||||||
| Swiss Re America Holding Corporation / Westport Insurance Corporation / Swiss Re Management (US) Corporation | 2 | 476,123 | 1.1 | % | 7,667 | 2.3 | % | |||||||||||||
| McGuireWoods LLP | 1 | 224,537 | 0.5 | % | 7,183 | 2.1 | % | |||||||||||||
| Morgan, Lewis & Bockius LLP | 1 | 289,432 | 0.7 | % | 7,015 | 2.1 | % | |||||||||||||
| Industrial Terminals Management, L.L.C. /Maritime Holdings (Delaware) LLC | 1 | 132,449 | 0.3 | % | 6,773 | 2.0 | % | |||||||||||||
| Xerox Corporation | 1 | 202,000 | 0.5 | % | 6,642 | 2.0 | % | |||||||||||||
| 21 | 6,585,191 | 15.2 | % | $ | 89,855 | 26.9 | % | |||||||||||||
Footnotes
| (1) | Twelve months ended 12/31/2016 GAAP rent, excluding termination income, recognized for consolidated properties owned as of 12/31/2016. |
| (2) | Total shown may differ from detailed amounts due to rounding. |
| 28 |
LEXINGTON REALTY TRUST
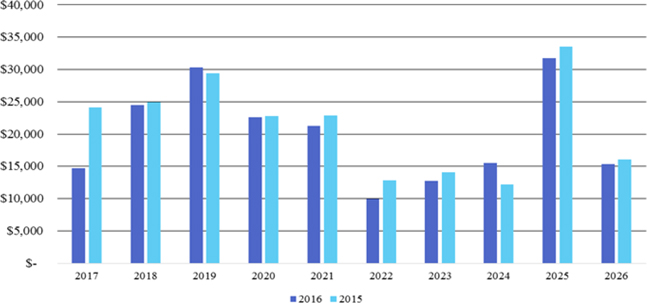
Lease Rollover Schedule - Consolidated Single-Tenant Properties GAAP Basis
12/31/2016
($000)
| Year | Number of Leases Expiring | GAAP Rent as of 12/31/2016 | Percent of GAAP Rent as of 12/31/2016 | Percent of GAAP Rent as of 12/31/2015 | ||||||||||||
| 2017 | 9 | $ | 14,692 | 4.6 | % | 6.6 | % | |||||||||
| 2018 | 31 | 24,455 | 7.7 | % | 6.8 | % | ||||||||||
| 2019 | 23 | 30,349 | 9.5 | % | 8.0 | % | ||||||||||
| 2020 | 16 | 22,639 | 7.1 | % | 6.2 | % | ||||||||||
| 2021 | 11 | 21,256 | 6.7 | % | 6.2 | % | ||||||||||
| 2022 | 5 | 9,983 | 3.1 | % | 3.5 | % | ||||||||||
| 2023 | 7 | 12,734 | 4.0 | % | 3.9 | % | ||||||||||
| 2024 | 10 | 15,555 | 4.9 | % | 3.3 | % | ||||||||||
| 2025 | 18 | 31,732 | 10.0 | % | 9.2 | % | ||||||||||
| 2026 | 14 | 15,391 | 4.8 | % | 4.4 | % | ||||||||||
| Thereafter | 51 | 120,062 | 37.7 | % | 38.2 | % | ||||||||||
| Total (1) | 195 | $ | 318,848 | 100.0 | % | |||||||||||
Footnotes
| (1) | Total shown may differ from detailed amounts due to rounding and does not include multi-tenant properties, parking operations and lease termination income. |
| 29 |
LEXINGTON REALTY TRUST
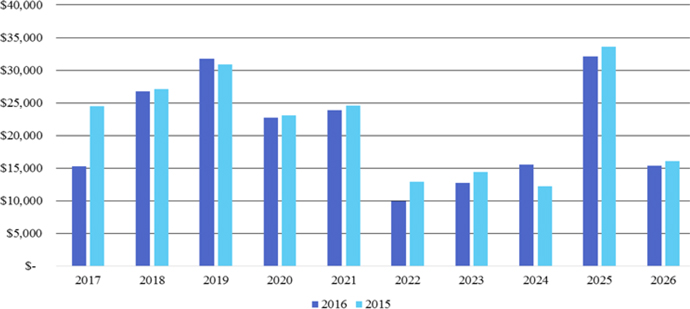
Lease Rollover Schedule - Consolidated Properties GAAP Basis
12/31/2016
($000)
| Year | Number of Leases Expiring | GAAP Rent as of 12/31/2016 | Percent of GAAP Rent as of 12/31/2016 | |||||||||
| 2017 | 38 | $ | 15,266 | 4.7 | % | |||||||
| 2018 | 45 | 26,751 | 8.2 | % | ||||||||
| 2019 | 30 | 31,791 | 9.7 | % | ||||||||
| 2020 | 17 | 22,743 | 7.0 | % | ||||||||
| 2021 | 17 | 23,902 | 7.3 | % | ||||||||
| 2022 | 6 | 9,983 | 3.1 | % | ||||||||
| 2023 | 7 | 12,734 | 3.9 | % | ||||||||
| 2024 | 11 | 15,555 | 4.8 | % | ||||||||
| 2025 | 19 | 32,142 | 9.8 | % | ||||||||
| 2026 | 14 | 15,391 | 4.7 | % | ||||||||
| Thereafter | 51 | 120,062 | 36.8 | % | ||||||||
| Total (1) | 255 | $ | 326,320 | 100.0 | % | |||||||
Footnotes
| (1) | Total shown may differ from detailed amounts due to rounding and does not include parking operations and lease termination income. |
| 30 |
LEXINGTON REALTY TRUST
Property Leases and Vacancies - Consolidated Portfolio - 12/31/2016
| Year of Lease Expiration | Date of Lease Expiration | Property Location | City | State | Note | Primary Tenant (Guarantor) | Sq.Ft. Leased or Available (1) | GAAP Rent as of 12/31/2016 ($000) (3) | Cash Rent as of 12/31/2016 ($000) (2) | 12/31/2016 Debt Balance ($000) | Debt Maturity | |||||||||||||||||||
| OFFICE PROPERTIES | ||||||||||||||||||||||||||||||
| 2017 | 1/31/2017 | 10300 Kincaid Dr. | Fishers | IN | 16 | Roche Diagnostics Operations, Inc. | 193,000 | 2,935 | 3,579 | - | - | |||||||||||||||||||
| 1311 Broadfield Blvd. | Houston | TX | 5, 25 | Transocean Offshore Deepwater Drilling, Inc. (Transocean Sedco Forex, Inc.) | 155,040 | 2,576 | 2,636 | - | - | |||||||||||||||||||||
| 9/30/2017 | 9201 East Dry Creek Rd. | Centennial | CO | — | Arrow Electronics, Inc. | 128,500 | 2,256 | 2,801 | - | - | ||||||||||||||||||||
| 10/31/2017 | 4455 American Way | Baton Rouge | LA | — | New Cingular Wireless PCS, LLC | 70,100 | 1,058 | 1,082 | - | - | ||||||||||||||||||||
| 5201 West Barraque St. | Pine Bluff | AR | — | Entergy Services, Inc. | 27,189 | 320 | 387 | - | - | |||||||||||||||||||||
| 12/1/2017 | 800 East Canal St. | Richmond | VA | 24 | CRG-Richmond Tenant, LLC | 42,947 | 492 | 492 | - | - | ||||||||||||||||||||
| 2018 | 1/31/2018 | 820 Gears Rd. | Houston | TX | 23 | Ricoh, USA, Inc. | 78,895 | 1,154 | 1,101 | - | - | |||||||||||||||||||
| 2/28/2018 | 10475 Crosspoint Blvd. | Indianapolis | IN | — | DMC Insurance Inc. | 3,764 | 26 | 26 | - | - | ||||||||||||||||||||
| 850-950 Warrenville Rd. | Lisle | IL | — | Flexible Steel Lacing Company, d/b/a Flexco, Inc. | 7,535 | 143 | 143 | - | - | |||||||||||||||||||||
| 5/30/2018 | 13651 McLearen Rd. | Herndon | VA | — | United States of America | 159,644 | 3,402 | 3,696 | - | - | ||||||||||||||||||||
| 5/31/2018 | 8900 Freeport Pkwy. | Irving | TX | — | Pacific Union Financial, LLC. | 43,396 | 784 | 900 | - | - | ||||||||||||||||||||
| 6/30/2018 | 100 Barnes Rd. | Wallingford | CT | — | 3M Company | 44,400 | 507 | 515 | - | - | ||||||||||||||||||||
| 420 Riverport Rd. | Kingsport | TN | — | Kingsport Power Company | 42,770 | 128 | 310 | - | - | |||||||||||||||||||||
| 8/31/2018 | 3500 North Loop Rd. | McDonough | GA | — | Litton Loan Servicing LP | 62,218 | 961 | 1,341 | - | - | ||||||||||||||||||||
| 9/30/2018 | 1701 Market St. | Philadelphia | PA | — | CBC Restaurant Corp. | 8,070 | 211 | 224 | - | - | ||||||||||||||||||||
| 10/31/2018 | 3943 Denny Ave. | Pascagoula | MS | — | Huntington Ingalls Incorporated | 94,841 | 593 | 593 | - | - | ||||||||||||||||||||
| 12/22/2018 | 5200 Metcalf Ave. | Overland Park | KS | — | Swiss Re America Holding Corporation / Westport Insurance Corporation / Swiss Re Management (US) Corporation | 320,198 | 5,248 | 5,216 | 33,503 | 05/2019 | ||||||||||||||||||||
| 2019 | 1/31/2019 | 2999 Southwest 6th St. | Redmond | OR | — | VoiceStream PCS I, LLC / T-Mobile West Corporation (T-Mobile USA, Inc.) | 77,484 | 1,469 | 1,773 | - | - | |||||||||||||||||||
| 4/1/2019 | 9201 Stateline Rd. | Kansas City | MO | — | Swiss Re America Holding Corporation / Westport Insurance Corporation / Swiss Re Management (US) Corporation | 155,925 | 2,419 | 2,419 | 15,968 | 05/2019 | ||||||||||||||||||||
| 6/19/2019 | 3965 Airways Blvd. | Memphis | TN | — | Federal Express Corporation | 521,286 | 7,013 | 7,016 | - | - | ||||||||||||||||||||
| 6/30/2019 | 3265 East Goldstone Dr. | Meridian | ID | — | VoiceStream PCS Holding, LLC / T-Mobile PCS Holdings, LLC (T-Mobile USA, Inc.) | 77,484 | 1,105 | 1,437 | 8,883 | 08/2019 | ||||||||||||||||||||
| 7/15/2019 | 19019 North 59th Ave. | Glendale | AZ | — | Honeywell International Inc. | 252,300 | 1,902 | 1,915 | - | - | ||||||||||||||||||||
| 7/31/2019 | 500 Jackson St. | Columbus | IN | — | Cummins Inc. | 390,100 | 4,540 | 4,762 | 16,649 | 07/2019 | ||||||||||||||||||||
| 10/31/2019 | 10475 Crosspoint Blvd. | Indianapolis | IN | — | John Wiley & Sons, Inc. | 123,416 | 2,268 | 2,288 | - | - | ||||||||||||||||||||
| 9601 Renner Blvd. | Lenexa | KS | — | VoiceStream PCS II Corporation (T-Mobile USA, Inc.) | 77,484 | 1,142 | 1,463 | 9,056 | 12/2019 | |||||||||||||||||||||
| 12/31/2019 | 850-950 Warrenville Rd. | Lisle | IL | 4 | National-Louis University | 91,879 | 1,548 | 1,592 | 9,275 | N/A | ||||||||||||||||||||
| 2020 | 2/14/2020 | 5600 Broken Sound Blvd. | Boca Raton | FL | — | Canon Solutions America, Inc. (Oce - USA Holding, Inc.) | 143,290 | 2,244 | 2,470 | 19,365 | 02/2020 | |||||||||||||||||||
| 3/31/2020 | 1701 Market St. | Philadelphia | PA | — | Car-Tel Communications, Inc. | 1,220 | 56 | 56 | - | - | ||||||||||||||||||||
| 5/31/2020 | 2401 Cherahala Blvd. | Knoxville | TN | — | AdvancePCS, Inc. / CaremarkPCS, L.L.C. | 59,748 | 773 | 756 | - | - | ||||||||||||||||||||
| 6/30/2020 | 3711 San Gabriel | Mission | TX | — | VoiceStream PCS II Corporation / T-Mobile West Corporation | 75,016 | 989 | 949 | - | - | ||||||||||||||||||||
| 7/31/2020 | 13775 McLearen Rd. | Herndon | VA | 12 | Orange Business Services U.S., Inc. (Equant N.V.) | 132,617 | 1,663 | 1,776 | - | - | ||||||||||||||||||||
| 8/31/2020 | 133 First Park Dr. | Oakland | ME | — | Omnipoint Holdings, Inc. (T-Mobile USA, Inc.) | 78,610 | 1,147 | 1,453 | 8,627 | 10/2020 | ||||||||||||||||||||
| 9/30/2020 | 600 Business Center Dr. | Lake Mary | FL | 7 | JPMorgan Chase Bank, National Association | 125,155 | 1,757 | 1,679 | - | - | ||||||||||||||||||||
| 9200 South Park Center Loop | Orlando | FL | — | Zenith Education Group, Inc. (ECMC Group, Inc.) | 59,927 | 1,136 | 1,150 | 9,309 | 02/2017 | |||||||||||||||||||||
| 550 International Parkway | Lake Mary | FL | 7 | JPMorgan Chase Bank, National Association | 125,920 | 1,762 | 1,689 | - | - | |||||||||||||||||||||
| 10/31/2020 | 12209 West Markham St. | Little Rock | AR | — | Entergy Arkansas, Inc. | 36,311 | 237 | 237 | - | - | ||||||||||||||||||||
| 2021 | 1/31/2021 | 1701 Market St. | Philadelphia | PA | — | Morgan, Lewis & Bockius LLP | 289,432 | 4,299 | 4,360 | - | - | |||||||||||||||||||
| 6/30/2021 | 1415 Wyckoff Rd. | Wall | NJ | — | New Jersey Natural Gas Company | 157,511 | 3,774 | 3,774 | 14,816 | 01/2021 | ||||||||||||||||||||
| 2050 Roanoke Rd. | Westlake | TX | 11, 18 | Charles Schwab & Co, Inc. | 130,199 | 871 | 707 | - | - | |||||||||||||||||||||
| 8/31/2021 | 333 Three D Systems Cir. | Rock Hill | SC | — | 3D Systems Corporation | 80,028 | 688 | 683 | - | - | ||||||||||||||||||||
| 11/30/2021 | 29 South Jefferson Rd. | Whippany | NJ | — | CAE SimuFlite, Inc. (CAE INC.) | 123,734 | 2,327 | 2,534 | 13,219 | 11/2021 | ||||||||||||||||||||
| 12/31/2021 | 2800 Waterford Lake Dr. | Midlothian | VA | — | Alstom Power, Inc. | 99,057 | 2,184 | 2,256 | - | - | ||||||||||||||||||||
| 31 |
LEXINGTON REALTY TRUST
Property Leases and Vacancies - Consolidated Portfolio - 12/31/2016
| Year of Lease Expiration | Date of Lease Expiration | Property Location | City | State | Note | Primary Tenant (Guarantor) | Sq.Ft. Leased or Available (1) | GAAP Rent as of 12/31/2016 ($000) (3) | Cash Rent as of 12/31/2016 ($000) (2) | 12/31/2016 Debt Balance ($000) | Debt Maturity | |||||||||||||||||||
| OFFICE PROPERTIES | ||||||||||||||||||||||||||||||
| 2022 | 6/30/2022 | 8555 South River Pkwy. | Tempe | AZ | — | Versum Materials US, LLC | 95,133 | 1,740 | 1,640 | - | - | |||||||||||||||||||
| 7/31/2022 | 1440 E 15th Street | Tucson | AZ | — | CoxCom, LLC | 28,591 | 560 | 560 | - | - | ||||||||||||||||||||
| 11/30/2022 | 4201 Marsh Ln. | Carrollton | TX | 7 | Carlson Restaurants Inc. (Carlson, Inc.) | 130,000 | 1,866 | 2,161 | - | - | ||||||||||||||||||||
| 12/31/2022 | 231 N. Martingale Rd. | Schaumburg | IL | — | CEC Educational Services, LLC (Career Education Corporation) | 317,198 | 4,478 | 4,398 | - | - | ||||||||||||||||||||
| 2023 | 2/28/2023 | 1315 West Century Dr. | Louisville | CO | — | Rogue Wave Software, Inc. | 20,000 | 291 | 238 | - | - | |||||||||||||||||||
| 3/31/2023 | 8900 Freeport Pkwy. | Irving | TX | — | Nissan Motor Acceptance Corporation (Nissan North America, Inc.) | 225,049 | 3,425 | 3,658 | - | - | ||||||||||||||||||||
| 8/31/2023 | 400 Butler Farm Rd. | Hampton | VA | 22 | Nextel Communications of the Mid-Atlantic, Inc. (Nextel Finance Company) / Wisconsin Physicians Service Insurance Corp. | 100,632 | 1,006 | 1,011 | - | - | ||||||||||||||||||||
| 12/14/2023 | 3333 Coyote Hill Rd. | Palo Alto | CA | — | Xerox Corporation | 202,000 | 6,642 | 7,070 | 43,285 | 12/2023 | ||||||||||||||||||||
| 2024 | 2/14/2024 | 1362 Celebration Blvd. | Florence | SC | — | MED3000, Inc. | 32,000 | 573 | 554 | - | - | |||||||||||||||||||
| 5/31/2024 | 3476 Stateview Blvd. | Fort Mill | SC | — | Wells Fargo Bank, N.A. | 169,083 | 1,951 | 1,840 | - | - | ||||||||||||||||||||
| 3480 Stateview Blvd. | Fort Mill | SC | — | Wells Fargo Bank, N.A. | 169,218 | 2,026 | 1,842 | - | - | |||||||||||||||||||||
| 8/31/2024 | 10475 Crosspoint Blvd. | Indianapolis | IN | — | RGN-Indianapolis I, LLC | 14,236 | 295 | 295 | - | - | ||||||||||||||||||||
| 10/31/2024 | 1409 Centerpoint Blvd. | Knoxville | TN | — | Alstom Power, Inc. | 84,404 | 1,255 | 1,152 | - | - | ||||||||||||||||||||
| 11/30/2024 | 6200 Northwest Pkwy. | San Antonio | TX | — | United HealthCare Services, Inc. | 142,500 | 1,869 | 2,011 | - | - | ||||||||||||||||||||
| 12/31/2024 | 12000 & 12025 Tech Center Dr. | Livonia | MI | — | Kelsey-Hayes Company (TRW Automotive Inc.) | 180,230 | 1,691 | 1,605 | - | - | ||||||||||||||||||||
| 2025 | 1/31/2025 | 1401 Nolan Ryan Expy. | Arlington | TX | — | Triumph Aerostructures, LLC (Triumph Group, Inc.) | 111,409 | 1,633 | 1,686 | - | - | |||||||||||||||||||
| 2/28/2025 | 6555 Sierra Dr. | Irving | TX | — | TXU Energy Retail Company, LLC (Texas Competitive Electric Holding Company, LLC) | 247,254 | 2,804 | 3,016 | - | - | ||||||||||||||||||||
| 1401 Nolan Ryan Expy. | Arlington | TX | — | Cyient, Inc. (Infotech Enterprise Limited) | 13,590 | 197 | 204 | - | - | |||||||||||||||||||||
| 3/14/2025 | 601 & 701 Experian Pkwy. | Allen | TX | — | Experian Information Solutions, Inc. / TRW, Inc.(Experian Holdings, Inc.) | 292,700 | 2,966 | 3,073 | - | - | ||||||||||||||||||||
| 5/31/2025 | 1701 Market St. | Philadelphia | PA | — | TruMark Financial Credit Union | 2,641 | 241 | 241 | - | - | ||||||||||||||||||||
| 6/30/2025 | 2500 Patrick Henry Pkwy. | McDonough | GA | — | Georgia Power Company | 111,911 | 1,422 | 1,332 | - | - | ||||||||||||||||||||
| 9/30/2025 | 10001 Richmond Ave. | Houston | TX | — | Schlumberger Holdings Corp. | 554,385 | 6,038 | 5,306 | - | - | ||||||||||||||||||||
| 11/30/2025 | 11707 Miracle Hills Dr. | Omaha | NE | — | Wipro Data Center and Cloud Services, Inc. (Infocrossing, Inc.) | 85,200 | 1,167 | 1,167 | - | - | ||||||||||||||||||||
| 12/31/2025 | 2005 East Technology Cir. | Tempe | AZ | — | Wipro Data Center and Cloud Services, Inc. (Infocrossing, Inc.) | 60,000 | 1,128 | 1,128 | - | - | ||||||||||||||||||||
| 4001 International Pkwy. | Carrollton | TX | — | Motel 6 Operating, LP | 138,443 | 2,226 | 2,130 | - | - | |||||||||||||||||||||
| 2026 | 3/31/2026 | 500 Olde Worthington Rd. | Westerville | OH | — | InVentiv Communications, Inc. | 97,000 | 1,107 | 846 | - | - | |||||||||||||||||||
| 4/30/2026 | 800 East Canal St. | Richmond | VA | — | Richmond Belly Ventures, LLC (David Duke, Lauren Duke, Terrence Kee, Cara Kee and John Bokel) | 2,568 | 51 | 51 | - | - | ||||||||||||||||||||
| 6/30/2026 | 10419 North 30th St. | Tampa | FL | — | Time Customer Service, Inc. / Time Incorporated | 132,981 | 805 | 1,238 | - | - | ||||||||||||||||||||
| 11/30/2026 | 500 Kinetic Dr. | Huntington | WV | — | AMZN WVCS LLC (Amazon.com, Inc.) | 68,693 | 1,268 | 1,092 | - | - | ||||||||||||||||||||
| 12/29/2026 | 5500 New Albany Rd. | Columbus | OH | — | Evans, Mechwart, Hambleton & Tilton, Inc. | 104,807 | 1,737 | 1,645 | - | - | ||||||||||||||||||||
| 2027 | 1/31/2027 | 1701 Market St. | Philadelphia | PA | — | Drybar Holdings LLC | 1,975 | 34 | 26 | - | - | |||||||||||||||||||
| 2/28/2027 | 800 East Canal St. | Richmond | VA | — | Pacific Summit Energy LLC (Sumitomo Corporation of Americas) | 8,503 | - | - | - | - | ||||||||||||||||||||
| 4/30/2027 | 1315 West Century Dr. | Louisville | CO | — | Global Healthcare Exchange, Inc. (Global Healthcare Exchange, LLC) | 86,877 | 1,289 | 1,186 | - | - | ||||||||||||||||||||
| 6/30/2027 | 3902 Gene Field Rd. | St. Joseph | MO | — | Boehringer Ingelheim Vetmedica, Inc. (Boehringer Ingelheim USA Corporation) | 98,849 | 1,993 | 1,841 | - | - | ||||||||||||||||||||
| 7/6/2027 | 2221 Schrock Rd. | Columbus | OH | — | MS Consultants, Inc. | 42,290 | 633 | 597 | - | - | ||||||||||||||||||||
| 8/7/2027 | 25 Lakeview Dr. | Jessup | PA | — | TMG Health, Inc. | 150,000 | 2,501 | 2,044 | - | - | ||||||||||||||||||||
| 10/31/2027 | 11201 Renner Blvd. | Lenexa | KS | — | United States of America | 169,585 | 4,867 | 4,352 | 34,981 | 11/2027 | ||||||||||||||||||||
| 11/30/2027 | 1700 Millrace Dr. | Eugene | OR | 10 | Oregon Research Institute / Educational Policy Improvement Center | 80,011 | 2,086 | 1,731 | - | - | ||||||||||||||||||||
| 12/31/2027 | 333 Mt. Hope Ave. | Rockaway | NJ | — | Atlantic Health System, Inc. | 92,326 | 1,194 | 1,316 | - | - | ||||||||||||||||||||
| 2028 | 4/30/2028 | 9655 Maroon Cir. | Englewood | CO | — | TriZetto Corporation | 166,912 | 3,844 | 3,574 | - | - | |||||||||||||||||||
| 2029 | 1/31/2029 | 6226 West Sahara Ave. | Las Vegas | NV | — | Nevada Power Company | 282,000 | 4,253 | 3,089 | - | - | |||||||||||||||||||
| 3/31/2029 | 2800 High Meadow Cir. | Auburn Hills | MI | — | Faurecia USA Holdings, Inc. | 278,000 | 3,547 | 3,157 | - | - | ||||||||||||||||||||
| 2030 | 8/31/2030 | 800 East Canal St. | Richmond | VA | — | McGuireWoods LLP | 224,537 | 7,183 | 6,546 | 57,500 | 02/2031 | |||||||||||||||||||
| 9/30/2030 | 800 East Canal St. | Richmond | VA | — | CCA Industries, Inc. (The Riverstone Group, LLC), | 25,707 | 693 | 657 | - | - | ||||||||||||||||||||
| 32 |
LEXINGTON REALTY TRUST
Property Leases and Vacancies - Consolidated Portfolio - 12/31/2016
| Year of Lease Expiration | Date of Lease Expiration | Property Location | City | State | Note | Primary Tenant (Guarantor) | Sq.Ft. Leased or Available (1) | GAAP Rent as of 12/31/2016 ($000) (3) | Cash Rent as of 12/31/2016 ($000) (2) | 12/31/2016 Debt Balance ($000) | Debt Maturity | |||||||||||||||||||
| OFFICE PROPERTIES | ||||||||||||||||||||||||||||||
| 2031 | 1/10/2031 | 810 Gears Rd. | Houston | TX | — | United States of America | 68,985 | 1,459 | 924 | - | - | |||||||||||||||||||
| 3/1/2031 | 800 East Canal St. | Richmond | VA | — | Towne Bank | 26,047 | 857 | 575 | - | - | ||||||||||||||||||||
| 2032 | 10/31/2032 | 143 Diamond Ave. | Parachute | CO | — | Encana Oil and Gas (USA) Inc. (Alenco Inc.) | 49,024 | 1,284 | 1,094 | - | - | |||||||||||||||||||
| 12/31/2032 | 3030 North 3rd St. | Phoenix | AZ | — | CopperPoint Mutual Insurance Company | 252,400 | 5,056 | 4,137 | - | - | ||||||||||||||||||||
| 2033 | 11/30/2033 | 1331 Capitol Ave. | Omaha | NE | — | The Gavilon Group, LLC | 127,810 | 3,311 | 2,887 | - | - | |||||||||||||||||||
| 2036 | 10/31/2036 | 270 Abner Jackson Pkwy. | Lake Jackson | TX | — | The Dow Chemical Company | 389,188 | 1,084 | 2,674 | 196,512 | 10/2036 | |||||||||||||||||||
| 2088 | 8/8/2088 | 800 East Canal St. | Richmond | VA | — | The City of Richmond, Virginia | - | 411 | 411 | - | - | |||||||||||||||||||
| N/A | N/A | 1701 Market St. | Philadelphia | PA | — | Parking Operations | - | 2,716 | 2,716 | - | - | |||||||||||||||||||
| Vacancy | 1701 Market St. | Philadelphia | PA | — | (Available for Lease) | 699 | - | - | - | - | ||||||||||||||||||||
| 810 Gears Rd. | Houston | TX | — | (Available for Lease) | 9,910 | - | - | - | - | |||||||||||||||||||||
| 1401 Nolan Ryan Expy. | Arlington | TX | — | (Available for Lease) | 36,809 | - | - | - | - | |||||||||||||||||||||
| OFFICE TOTAL/WEIGHTED AVERAGE | 99.6% Leased | 11,569,940 | $ | 176,860 | $ | 175,960 | $ | 490,948 | ||||||||||||||||||||||
| 33 |
LEXINGTON REALTY TRUST
Property Leases and Vacancies - Consolidated Portfolio - 12/31/2016
| Year of Lease Expiration | Date of Lease Expiration | Property Location | City | State | Note | Primary Tenant (Guarantor) | Sq. Ft. Leased or Available (1) | GAAP Rent as of 12/31/2016 ($000) (3) | Cash Rent as of 12/31/2016 ($000) (2) | 12/31/2016 Debt Balance ($000) | Debt Maturity | |||||||||||||||||||
| INDUSTRIAL PROPERTIES | ||||||||||||||||||||||||||||||
| 2017 | 4/30/2017 | 3600 Army Post Rd. | Des Moines | IA | — | HP Enterprise Services, LLC | 405,000 | 2,052 | 2,668 | - | - | |||||||||||||||||||
| 9/30/2017 | 250 Swathmore Ave. | High Point | NC | — | Steelcase Inc. | 244,851 | 1,087 | 1,145 | - | - | ||||||||||||||||||||
| 12/31/2017 | 2203 Sherrill Dr. | Statesville | NC | — | Ozburn-Hessey Logistics, LLC (OHH Acquisition Corporation) | 639,800 | 1,916 | 2,080 | - | - | ||||||||||||||||||||
| 2018 | 6/30/2018 | 1133 Poplar Creek Rd. | Henderson | NC | — | Staples, Inc. | 196,946 | 860 | 862 | - | - | |||||||||||||||||||
| 1650-1654 Williams Rd. | Columbus | OH | — | ODW Logistics, Inc. | 772,450 | 1,342 | 1,347 | - | - | |||||||||||||||||||||
| 9/30/2018 | 50 Tyger River Dr. | Duncan | SC | — | Plastic Omnium Auto Exteriors, LLC | 221,833 | 1,025 | 1,025 | - | - | ||||||||||||||||||||
| 904 Industrial Rd. | Marshall | MI | — | Tenneco Automotive Operating Company, Inc. (Tenneco, Inc.) | 246,508 | 698 | 841 | - | - | |||||||||||||||||||||
| 12/31/2018 | 120 Southeast Pkwy. Dr. | Franklin | TN | — | Essex Group, Inc. (United Technologies Corporation) | 289,330 | 735 | 735 | - | - | ||||||||||||||||||||
| 2935 Van Vactor Dr. | Plymouth | IN | — | Bay Valley Foods, LLC | 300,500 | 785 | 826 | - | - | |||||||||||||||||||||
| 749 Southrock Dr. | Rockford | IL | — | Jacobson Warehouse Company, Inc. (Jacobson Distribution Company and Jacobson Transportation Company, Inc.) | 150,000 | 471 | 525 | - | - | |||||||||||||||||||||
| 2019 | 10/17/2019 | 10345 Philipp Pkwy. | Streetsboro | OH | — | L'Oreal USA S/D, Inc. (L’Oreal USA, Inc.) | 649,250 | 2,611 | 2,817 | 17,304 | 09/2019 | |||||||||||||||||||
| 12/31/2019 | 191 Arrowhead Dr. | Hebron | OH | — | Owens Corning Insulating Systems, LLC | 250,410 | 559 | 559 | - | - | ||||||||||||||||||||
| 200 Arrowhead Dr. | Hebron | OH | — | Owens Corning Insulating Systems, LLC | 400,522 | 894 | 894 | - | - | |||||||||||||||||||||
| 2415 US Hwy. 78 East | Moody | AL | — | Michelin North America, Inc. | 595,346 | 1,408 | 1,394 | - | - | |||||||||||||||||||||
| 3686 South Central Ave. | Rockford | IL | — | Pierce Packaging Co. | 93,000 | 307 | 307 | - | - | |||||||||||||||||||||
| 2020 | 1/31/2020 | 101 Michelin Dr. | Laurens | SC | — | Michelin North America, Inc. | 1,164,000 | 3,387 | 3,387 | - | - | |||||||||||||||||||
| 3/31/2020 | 2425 Hwy. 77 North | Waxahachie | TX | 7 | James Hardie Building Products, Inc. (James Hardie NV & James Hardie Industries NV) | 335,610 | 3,400 | 3,400 | - | - | ||||||||||||||||||||
| 5/31/2020 | 359 Gateway Dr. | Lavonia | GA | — | TI Group Automotive Systems, LLC (TI Automotive Ltd.) | 133,221 | 952 | 1,200 | 7,326 | 12/2020 | ||||||||||||||||||||
| 6/30/2020 | 3102 Queen Palm Dr. | Tampa | FL | — | Time Customer Service, Inc. (Time Incorporated) | 229,605 | 1,234 | 1,299 | - | - | ||||||||||||||||||||
| 9/30/2020 | 3350 Miac Cove Rd. | Memphis | TN | — | Mimeo.com, Inc. | 107,400 | 409 | 439 | - | - | ||||||||||||||||||||
| 12/19/2020 | 1901 Ragu Dr. | Owensboro | KY | 6 | Unilever Supply Chain, Inc. (Unilever United States, Inc.) | 443,380 | 1,493 | 1,199 | - | - | ||||||||||||||||||||
| 2021 | 3/31/2021 | 2455 Premier Row | Orlando | FL | — | Walgreen Co. / Walgreen Eastern Co. | 205,016 | 786 | 508 | - | - | |||||||||||||||||||
| 5/31/2021 | 291 Park Center Dr. | Winchester | VA | — | Kraft Heinz Foods Company | 344,700 | 1,412 | 1,338 | - | - | ||||||||||||||||||||
| 9/30/2021 | 3820 Micro Dr. | Millington | TN | — | Ingram Micro L.P. (Ingram Micro Inc.) | 701,819 | 1,812 | 1,737 | - | - | ||||||||||||||||||||
| 10/25/2021 | 6938 Elm Valley Dr. | Kalamazoo | MI | — | Dana Commercial Vehicle Products, LLC (Dana Holding Corporation and Dana Limited) | 150,945 | 1,747 | 2,027 | - | - | ||||||||||||||||||||
| 11/30/2021 | 2880 Kenny Biggs Rd. | Lumberton | NC | — | Quickie Manufacturing Corporation | 423,280 | 1,356 | 1,395 | - | - | ||||||||||||||||||||
| 2022 | 3/31/2022 | 5417 Campus Dr. | Shreveport | LA | — | The Tire Rack, Inc. | 257,849 | 1,339 | 1,276 | - | - | |||||||||||||||||||
| 2023 | 2/28/2023 | 7670 Hacks Cross Rd. | Olive Branch | MS | — | MAHLE Aftermarket Inc. (MAHLE Industries, Incorporated) | 268,104 | 906 | 885 | - | - | |||||||||||||||||||
| 12/31/2023 | 1601 Pratt Ave. | Marshall | MI | — | Autocam Corporation | 58,707 | 308 | 308 | - | - | ||||||||||||||||||||
| 2024 | 4/30/2024 | 113 Wells St. | North Berwick | ME | — | United Technologies Corporation | 993,685 | 1,801 | 1,965 | 3,426 | 04/2019 | |||||||||||||||||||
| 5/31/2024 | 901 East Bingen Point Way | Bingen | WA | — | The Boeing Company | 124,539 | 2,636 | 2,546 | - | - | ||||||||||||||||||||
| 10/31/2024 | 43955 Plymouth Oaks Blvd. | Plymouth | MI | — | Tower Automotive Operations USA I, LLC / Tower Automotive Products Inc. (Tower Automotive, Inc.) | 290,133 | 1,458 | 1,378 | - | - | ||||||||||||||||||||
| 2025 | 6/30/2025 | 10000 Business Blvd. | Dry Ridge | KY | — | Dana Light Axle Products, LLC (Dana Holding Corporation and Dana Limited) | 336,350 | 1,346 | 1,346 | - | - | |||||||||||||||||||
| 301 Bill Bryan Rd. | Hopkinsville | KY | — | Metalsa Structural Products, Inc. / Dana Structural Products, LLC (Dana Holding Corporation and Dana Limited) | 424,904 | 1,687 | 1,687 | - | - | |||||||||||||||||||||
| 4010 Airpark Dr. | Owensboro | KY | — | Metalsa Structural Products, Inc. / Dana Structural Products, LLC (Dana Holding Corporation and Dana Limited) | 211,598 | 1,208 | 1,208 | - | - | |||||||||||||||||||||
| 730 North Black Branch Rd. | Elizabethtown | KY | — | Metalsa Structural Products, Inc. / Dana Structural Products, LLC (Dana Holding Corporation and Dana Limited) | 167,770 | 537 | 537 | - | - | |||||||||||||||||||||
| 750 North Black Branch Rd. | Elizabethtown | KY | — | Metalsa Structural Products, Inc. / Dana Structural Products, LLC (Dana Holding Corporation and Dana Limited) | 539,592 | 2,838 | 2,838 | - | - | |||||||||||||||||||||
| 7/14/2025 | 590 Ecology Ln. | Chester | SC | — | Boral Stone Products LLC (Boral Limited) | 420,597 | 1,683 | 2,277 | 8,055 | 08/2025 | ||||||||||||||||||||
| 7/31/2025 | 7005 Cochran Rd. | Glenwillow | OH | — | Royal Appliance Mfg. Co. | 458,000 | 2,061 | 2,101 | - | - | ||||||||||||||||||||
| 12/31/2025 | 1700 47th Ave North | Minneapolis | MN | — | Owens Corning Roofing and Asphalt, LLC | 18,620 | 550 | 550 | - | - | ||||||||||||||||||||
| 2026 | 3/30/2026 | 121 Technology Dr. | Durham | NH | 15 | Heidelberg Americas, Inc. (Heidelberger Druckmaschinen AG) / Goss International Americas, Inc. (Goss International Corporation) | 500,500 | 2,537 | 2,479 | - | - | |||||||||||||||||||
| 3/31/2026 | 633 Garrett Pkwy. | Lewisburg | TN | — | Calsonic Kansei North America, Inc. | 310,000 | 1,287 | 1,195 | - | - | ||||||||||||||||||||
| 6/30/2026 | 351 Chamber Dr. | Chillicothe | OH | — | The Kitchen Collection, Inc. | 475,218 | 1,159 | 1,096 | - | - | ||||||||||||||||||||
| 9/30/2026 | 900 Industrial Blvd. | Crossville | TN | — | Dana Commercial Vehicle Products, LLC | 222,200 | 578 | 578 | - | - | ||||||||||||||||||||
| 3931 Lakeview Corporate Dr. | Edwardsville | IL | — | AMAZON.COM.DEDC, LLC (Amazon.com, Inc.) | 769,500 | 74 | 74 | - | - | |||||||||||||||||||||
| 10/31/2026 | 5001 Greenwood Rd. | Shreveport | LA | — | Libbey Glass Inc. (Libbey Inc.) | 646,000 | 2,165 | 2,141 | 19,000 | 07/2017 | ||||||||||||||||||||
| 11/30/2026 | 250 Rittenhouse Cir. | Bristol | PA | — | Northtec LLC (The Estée Lauder Companies Inc.) | 241,977 | 1,146 | 1,114 | - | - | ||||||||||||||||||||
| 34 |
LEXINGTON REALTY TRUST
Property Leases and Vacancies - Consolidated Portfolio - 12/31/2016
| Year of Lease Expiration | Date of Lease Expiration | Property Location | City | State | Note | Primary Tenant (Guarantor) | Sq. Ft. Leased or Available (1) | GAAP Rent as of 12/31/2016 ($000) (3) | Cash Rent as of 12/31/2016 ($000) (2) | 12/31/2016 Debt Balance ($000) | Debt Maturity | |||||||||||||||||||
| INDUSTRIAL PROPERTIES | ||||||||||||||||||||||||||||||
| 736 Addison Rd. | Erwin | NY | — | Corning Property Management Corporation | 408,000 | 1,241 | 1,335 | 7,448 | 10/2018 | |||||||||||||||||||||
| 2027 | 2/28/2027 | 3456 Meyers Ave. | Memphis | TN | — | Sears, Roebuck and Co. / Sears Logistics Services | 780,000 | 1,694 | 1,592 | - | - | |||||||||||||||||||
| 554 Nissan Pkwy. | Canton | MS | — | Nissan North America, Inc. | 1,466,000 | 6,200 | 5,773 | - | - | |||||||||||||||||||||
| 4/30/2027 | 2424 Alpine Rd. | Eau Claire | WI | 20 | Silver Spring Foods, Inc. (Huntsinger Farms, Inc.) | 159,000 | 1,002 | 1,070 | - | - | ||||||||||||||||||||
| 6/30/2027 | 1501 Nolan Ryan Expy. | Arlington | TX | — | Arrow Electronics, Inc. | 74,739 | 53 | - | - | - | ||||||||||||||||||||
| 12/31/2027 | 10590 Hamilton Ave. | Cincinnati | OH | — | The Hillman Group, Inc. | 264,598 | 813 | 781 | - | - | ||||||||||||||||||||
| 2028 | 3/31/2028 | 29-01-Borden Ave./29-10 Hunters Point Ave. | Long Island City | NY | — | FedEx Ground Package System, Inc. (FedEx Corporation) | 140,330 | 5,135 | 4,770 | 46,309 | 03/2028 | |||||||||||||||||||
| 8/31/2028 | 1420 Greenwood Rd. | McDonough | GA | 11, 19 | United States Cold Storage, Inc | 296,972 | 2,155 | 1,587 | 21,922 | 11/2017 | ||||||||||||||||||||
| 2029 | 11/24/2029 | 318 Pappy Dunn Blvd. | Anniston | AL | — | International Automotive Components Group North America, Inc. | 276,782 | 1,740 | 1,598 | - | - | |||||||||||||||||||
| 2030 | 3/31/2030 | 549 Wingo Rd. | Byhalia | MS | — | Asics America Corporation (Asics Corporation) | 855,878 | 4,368 | 3,916 | - | - | |||||||||||||||||||
| 5/31/2030 | 3301 Stagecoach Rd. NE | Thomson | GA | — | Hollander Sleep Products, LLC (Hollander Home Fashions Holdings) | 208,000 | 929 | 843 | - | - | ||||||||||||||||||||
| 2031 | 5/31/2031 | 671 Washburn Switch Rd. | Shelby | NC | — | Clearwater Paper Corporation | 673,518 | 2,601 | 2,343 | - | - | |||||||||||||||||||
| 10/31/2031 | 1020 W. Airport Road | Romeoville | IL | — | ARYZTA LLC (ARYZTA AG) | 188,166 | 210 | 202 | - | - | ||||||||||||||||||||
| 2032 | 4/30/2032 | 13930 Pike Rd. | Missouri City | TX | — | Vulcan Construction Materials, LP (Vulcan Materials Company) | - | 2,123 | 1,880 | - | - | |||||||||||||||||||
| 10/31/2032 | 27255 SW 95th Ave | Wilsonville | OR | — | Pacific Foods of Oregon Inc. d/b/a Pacific Natural Foods | 508,277 | 788 | 640 | - | - | ||||||||||||||||||||
| 2034 | 9/30/2034 | 5625 North Sloan Ln. | North Las Vegas | NV | — | Nicholas and Co., Inc. | 180,235 | 2,556 | 2,194 | - | - | |||||||||||||||||||
| 10/31/2034 | 1001 Innovation Rd. | Rantoul | IL | — | Bell Sports, Inc. (Vista Outdoor Inc.) | 813,126 | 4,183 | 3,556 | - | - | ||||||||||||||||||||
| 2035 | 3/31/2035 | 13863 Industrial Rd. | Houston | TX | — | Curtis Kelly, Inc. (Spitzer Industries, Inc.) | 187,800 | 2,435 | 2,034 | - | - | |||||||||||||||||||
| 7007 F.M. 362 Rd. | Brookshire | TX | — | Orizon Industries, Inc. (Spitzer Industries, Inc.) | 262,095 | 1,911 | 1,596 | - | - | |||||||||||||||||||||
| 6/30/2035 | 111 West Oakview Pkwy. | Oak Creek | WI | — | Stella & Chewy's LLC | 164,007 | 2,098 | 1,865 | - | - | ||||||||||||||||||||
| 8/31/2035 | 2800 Polar Way | Richland | WA | 21 | Preferred Freezer Services of Richland, LLC (Preferred Freezer Services, LLC & Preferred Freezer Services Operating, LLC) | 456,412 | 13,133 | 10,864 | 110,000 | 01/2026 | ||||||||||||||||||||
| 10/22/2035 | 2860 Clark St. | Detroit | MI | — | FCA US LLC (f/k/a Chrysler Group LLC) | 190,003 | 2,174 | 2,174 | - | - | ||||||||||||||||||||
| 2036 | 6/30/2036 | 100 Ryobi Drive | Anderson | SC | — | One World Technologies, Inc. (Techtronic Industries Co. Ltd.) | 1,327,022 | 2,248 | 1,850 | - | - | |||||||||||||||||||
| 2038 | 3/31/2038 | 13901/14035 Industrial Rd. | Houston | TX | — | Industrial Terminals Management, L.L.C. (Maritime Holdings (Delaware) LLC) | 132,449 | 6,773 | 5,583 | - | - | |||||||||||||||||||
| N/A | Vacancy | 3350 Miac Cove Rd. | Memphis | TN | — | (Available for Lease) | 32,679 | - | - | - | - | |||||||||||||||||||
| INDUSTRIAL TOTAL/WEIGHTED AVERAGE | 99.9% Leased | 27,476,653 | $ | 132,605 | $ | 125,579 | $ | 240,790 | ||||||||||||||||||||||
| 35 |
LEXINGTON REALTY TRUST
Property Leases and Vacancies - Consolidated Portfolio - 12/31/2016
| Year of Lease Expiration | Date of Lease Expiration | Property Location | City | State | Note | Primary Tenant (Guarantor) | Sq.Ft. | Percentage Leased | GAAP Rent as of 12/31/2016 ($000) (3) | Cash Rent as of 12/31/2016 ($000) (2) | 12/31/2016 Debt Balance ($000) | Debt Maturity | ||||||||||||||||||||||
| MULTI-TENANT PROPERTIES (8,14) | ||||||||||||||||||||||||||||||||||
| 104 & 110 Front St. | Memphis | TN | 4, 11 | Available for lease | 37,229 | 0 | % | 418 | 432 | 3,496 | 01/2017 | |||||||||||||||||||||||
| 11511 Luna Rd. | Farmers Branch | TX | 11 | International Business Machines Corporation | 181,072 | 45 | % | 1,767 | 1,486 | - | - | |||||||||||||||||||||||
| 1200 Jupiter Rd. | Garland | TX | 7, 11 | Available for lease | 278,759 | 0 | % | 677 | 628 | - | - | |||||||||||||||||||||||
| 13430 North Black Canyon Fwy. | Phoenix | AZ | — | Multi-Tenant | 138,940 | 92 | % | 2,317 | 2,356 | - | - | |||||||||||||||||||||||
| 1460 Tobias Gadson Blvd. | Charleston | SC | 11 | Vallen Distribution, Inc. | 50,076 | 41'% | 421 | 635 | 7,090 | 02/2021 | ||||||||||||||||||||||||
| 2210 Enterprise Dr. | Florence | SC | 11 | Caliber Funding, LLC | 176,557 | 21 | % | 701 | 756 | - | - | |||||||||||||||||||||||
| 26555 Northwestern Pkwy. | Southfield | MI | — | Available for lease | 359,645 | 0 | % | - | - | - | - | |||||||||||||||||||||||
| 33 Commercial St. A | Foxborough | MA | — | Available for lease | 84,441 | 0 | % | - | - | - | - | |||||||||||||||||||||||
| 3165 McKelvey Rd. | Bridgeton | MO | — | BJC Health System | 51,067 | 50 | % | 403 | 434 | - | - | |||||||||||||||||||||||
| 6050 Dana Way | Antioch | TN | — | Multi-Tenant | 674,528 | 98 | % | 2,299 | 2,251 | - | - | |||||||||||||||||||||||
| 7111 Crabb Rd. | Temperance | MI | 11 | Hollingsworth Logistics Group LLC | 756,856 | 38 | % | 1,434 | 1,428 | - | - | |||||||||||||||||||||||
| 854 Paragon Way | Rock Hill | SC | 11, 13 | Available for lease | 104,497 | 0 | % | 1,429 | 1,456 | - | - | |||||||||||||||||||||||
| King St./1042 Fort St. Mall | Honolulu | HI | — | Multi-Tenant | 77,459 | 50 | % | 738 | 739 | - | - | |||||||||||||||||||||||
| MULTI-TENANT TOTAL/WEIGHTED AVERAGE | 43.2% Leased | 2,971,126 | $ | 12,604 | $ | 12,601 | $ | 10,586 | ||||||||||||||||||||||||||
| 36 |
LEXINGTON REALTY TRUST
Property Leases and Vacancies - Consolidated Portfolio - 12/31/2016
| Year of Lease Expiration | Date of Lease Expiration | Property Location | City | State | Note | Primary Tenant (Guarantor) | Sq.Ft. Leased or Available (1) | GAAP Rent as of 12/31/2016 ($000) (3) | Cash Rent as of 12/31/2016 ($000) (2) | 12/31/2016 Debt Balance ($000) | Debt Maturity | |||||||||||||||||||
| OTHER PROPERTIES | ||||||||||||||||||||||||||||||
| 2018 | 2/26/2018 | 4831 Whipple Ave., NW | Canton | OH | — | Best Buy Co., Inc. | 46,350 | 465 | 465 | - | - | |||||||||||||||||||
| 2/28/2018 | 291 Talbert Blvd. | Lexington | NC | 9 | Food Lion, LLC / Delhaize America, Inc. | 23,000 | 138 | 138 | - | - | ||||||||||||||||||||
| 2411 West Beverly St. | Staunton | VA | 9 | Food Lion, LLC / Delhaize America, Inc. | 23,000 | 166 | 166 | - | - | |||||||||||||||||||||
| 7/1/2018 | 1053 Mineral Springs Rd. | Paris | TN | — | The Kroger Co. | 31,170 | 169 | 159 | - | - | ||||||||||||||||||||
| 9/30/2018 | 835 Julian Ave. | Thomasville | NC | — | Mighty Dollar, LLC | 23,767 | 81 | 81 | - | - | ||||||||||||||||||||
| 10/31/2018 | 130 Midland Ave. | Port Chester | NY | — | St Anthony Supermarket Corp. (Anthony Pena, Marina Pena, Anthony Corona and Robert Corona) | 59,613 | 975 | 458 | - | - | ||||||||||||||||||||
| 5104 North Franklin Rd. | Lawrence | IN | — | Marsh Supermarkets, Inc. / Marsh Supermarkets, LLC | 28,721 | 193 | 193 | - | - | |||||||||||||||||||||
| 12/31/2018 | 1150 West Carl Sandburg Dr. | Galesburg | IL | — | Kmart Stores of Illinois LLC / Kmart Corporation | 94,970 | 329 | 223 | 307 | 07/2018 | ||||||||||||||||||||
| 12080 Carmel Mountain Rd. | San Diego | CA | — | Sears, Roebuck and Co / Kmart Corporation | 107,210 | 751 | 254 | 348 | 07/2018 | |||||||||||||||||||||
| 21082 Pioneer Plaza Dr. | Watertown | NY | — | Kmart Corporation | 120,727 | 482 | 374 | 514 | 07/2018 | |||||||||||||||||||||
| 255 Northgate Dr. | Manteca | CA | — | Kmart Corporation | 107,489 | 555 | 398 | 546 | 07/2018 | |||||||||||||||||||||
| 5350 Leavitt Rd. | Lorain | OH | — | Kmart Corporation | 193,193 | 731 | 564 | 773 | 07/2018 | |||||||||||||||||||||
| 97 Seneca Trail | Fairlea | WV | — | Kmart Corporation | 90,933 | 347 | 263 | 361 | 07/2018 | |||||||||||||||||||||
| 2019 | 3/31/2019 | B.E.C. 45th St./Lee Blvd. | Lawton | OK | — | Associated Wholesale Grocers, Inc. / Safeway, Inc. | 30,757 | 189 | 185 | - | - | |||||||||||||||||||
| 6/30/2019 | 1600 East 23rd St. | Chattanooga | TN | — | BI-LO, LLC / K-VA-T Food Stores, Inc. | 42,130 | 128 | 128 | - | - | ||||||||||||||||||||
| 12/31/2019 | 1066 Main St. | Forest Park | GA | — | Bank of America, N.A. (Bank of America Corporation) | 14,859 | 199 | 199 | - | - | ||||||||||||||||||||
| 1698 Mountain Industrial Blvd. | Stone Mountain | GA | — | Bank of America, N.A. (Bank of America Corporation) | 5,704 | 95 | 95 | - | - | |||||||||||||||||||||
| 201 West Main St. | Cumming | GA | — | Bank of America, N.A. (Bank of America Corporation) | 14,208 | 198 | 198 | - | - | |||||||||||||||||||||
| 2223 North Druid Hills Rd. | Atlanta | GA | — | Bank of America, N.A. (Bank of America Corporation) | 6,260 | 112 | 112 | - | - | |||||||||||||||||||||
| 4545 Chamblee – Dunwoody Rd. | Dunwoody | GA | — | Bank of America, N.A. (Bank of America Corporation) | 4,565 | 88 | 88 | - | - | |||||||||||||||||||||
| 825 Southway Dr. | Jonesboro | GA | — | Bank of America, N.A. (Bank of America Corporation) | 4,894 | 77 | 77 | - | - | |||||||||||||||||||||
| 956 Ponce de Leon Ave. | Atlanta | GA | — | Bank of America, N.A. (Bank of America Corporation) | 3,900 | 78 | 78 | - | - | |||||||||||||||||||||
| 2023 | 2/28/2023 | 733 East Main St. | Jefferson | NC | — | Food Lion, LLC / Delhaize America, Inc. | 34,555 | 156 | 160 | - | - | |||||||||||||||||||
| 2026 | 5/31/2026 | 6910 South Memorial Hwy. | Tulsa | OK | — | Toys “R” Us, Inc. / Toys "R" Us-Delaware, Inc. | 43,123 | 236 | 236 | - | - | |||||||||||||||||||
| 2028 | 8/31/2028 | 9803 Edmonds Way | Edmonds | WA | 7 | Puget Consumers Co-op d/b/a PCC Natural Markets | 35,459 | 646 | 646 | - | - | |||||||||||||||||||
| 11/30/2028 | 832 N. Westover Blvd . | Albany | GA | — | Gander Mountain Company | 45,554 | 693 | 628 | - | - | ||||||||||||||||||||
| 2029 | 1/31/2029 | 175 Holt Garrison Pkwy. | Danville | VA | — | Home Depot USA, Inc. | - | 216 | 260 | - | - | |||||||||||||||||||
| 2043 | 2/28/2043 | 1237 W. Sherman Ave. | Vineland | NJ | — | HealthSouth Rehabilitation Hospital of South Jersey, LLC (HealthSouth Corporation) | 39,287 | 1,129 | 1,129 | - | - | |||||||||||||||||||
| 2048 | 12/31/2048 | 30 Light St | Baltimore | MD | — | 30 Charm City, LLC | - | 299 | 299 | - | - | |||||||||||||||||||
| 2055 | 1/31/2055 | 499 Derbyshire Dr. | Venice | FL | — | Littlestone Brotherhood LLC | 31,180 | 1,908 | 1,287 | - | - | |||||||||||||||||||
| 2112 | 8/31/2112 | 201-215 N. Charles St. | Baltimore | MD | — | 201 NC Leasehold LLC | - | 270 | 270 | - | - | |||||||||||||||||||
| OTHER TOTAL/WEIGHTED AVERAGE | 100% Leased | 1,306,578 | $ | 12,099 | $ | 9,811 | $ | 2,849 | ||||||||||||||||||||||
| TOTAL CONSOLIDATED PORTFOLIO/WEIGHTED AVERAGE | 95.9% Leased (17) | 43,324,297 | $ | 334,168 | $ | 323,951 | $ | 745,173 | ||||||||||||||||||||||
Footnotes
| 1 | Square footage leased or available. |
| 2 | Twelve months ended 12/31/2016 cash rent. See definitions of non-GAAP measures and reconciliations to applicable GAAP measures in this document. |
| 3 | Twelve months ended 12/31/2016 GAAP rent, excluding termination income. |
| 4 | Mortgage encumbering the property is in default as of 12/31/2016. |
| 5 | Tenant terminated its lease effective 1/31/2017 for a cash payment of $3.5 million received in 2015. |
| 6 | Lexington has a 71.1% interest in this property. |
| 7 | Property sold subsequent to 12/31/2016. |
| 8 | Multi-tenant properties are properties less than 50% leased to a single tenant. |
| 9 | Subsequent to 12/31/2016, lease extended to 2/28/2023. |
| 10 | Educational Policy Improvement Center lease for 10,791 square feet expires 11/2019; however, space is then leased to Oregon Research Institute through 11/2027. |
| 11 | Cash and GAAP rent amounts represent/include prior tenant. |
| 12 | 21,365 square feet is leased to 7/31/2025. |
| 13 | On 10/26/2016, the tenant filed an assignment for the benefit of creditors under Florida law, and the tenant rejected the lease. |
| 14 | The multi-tenanted properties incurred approximately $5.2 million in operating expenses, net for the twelve months ended 12/31/2016. |
| 15 | Heidelberg Americas, Inc. lease expires 3/30/2021; however, new tenant (Goss International Americas, Inc.) lease expires 3/30/2026. |
| 16 | Tenant terminated its lease effective 1/31/2017 for a cash payment of $2.0 million received in July 2015 and an additional $2.0 million received in January 2017. |
| 17 | Consolidated portfolio is 96.0% leased, excluding properties owned subject to mortgages in default. |
| 18 | TD Auto Finance LLC lease terminated effective 2/29/2016 for a payment of $7.7 million, which was paid in April 2016. New lease with Charles Schwab & Co. Inc. commenced 3/1/2016. |
| 19 | Americold Logistics, LLC lease terminated effective 4/15/2016 for $1.0 million to be paid over an 18-month period. New lease with United States Cold Storage, Inc. commenced 4/16/2016. |
| 20 | Tenant exercised purchase option for $13.6 million. Property classified as held for sale. |
| 21 | ConAgra Foods, Inc. provides credit support. |
| 22 | Nextel Communications of the Mid-Atlantic, Inc. (Nextel Finance Company) lease for 100,632 square feet expires 12/31/2019; however, 71,073 square feet is then leased to Wisconsin Physicians Service Insurance Corp. through 8/31/2023. |
| 23 | Subsequent to 12/31/2016, lease extended to 1/31/2019. |
| 24 | Part of Richmond, Virginia property, which is primarily leased to McGuireWoods LLP. |
| 25 | Subsequent to 12/31/2016, 54,426 square feet leased to 3/31/2028. |
| 37 |
LEXINGTON REALTY TRUST
Property Leases and Vacancies - Non-consolidated Portfolio - 12/31/2016
| Year of Lease Expiration | Date of Lease Expiration | Property Location | City | State | Note | Primary Tenant (Guarantor) | Sq.Ft. | LXP % Ownership | GAAP Rent as of 12/31/2016 ($000) (3) | Cash Rent as of 12/31/2016 ($000) (2) | 12/31/2016 Debt Balance ($000) | Debt Maturity | ||||||||||||||||||||||
| NON-CONSOLIDATED PROPERTIES | ||||||||||||||||||||||||||||||||||
| 2019 | 8/31/2019 | 3201 Quail Springs Pkwy. | Oklahoma City | OK | 2 | DCP Midstream, LLC | 25,000 | 40 | % | 325 | 325 | - | - | |||||||||||||||||||||
| 2020 | 11/30/2020 | 3201 Quail Springs Pkwy. | Oklahoma City | OK | 2 | AT&T Corp. / AT&T Services, Inc. / New Cingular Wireless Services, Inc. | 103,500 | 40 | % | 1,538 | 1,374 | - | - | |||||||||||||||||||||
| 2028 | 3/31/2028 | 100 Gander Way | Palm Beach Gardens | FL | — | Gander Mountain Company | 120,000 | 25 | % | 3,054 | 2,916 | 14,168 | 03/2018 | |||||||||||||||||||||
| 2029 | 1/31/2029 | 18839 McKay Blvd. | Humble | TX | — | Triumph Rehabilitation Hospital of Northeast Houston, LLC (RehabCare Group, Inc.) | 55,646 | 15 | % | 2,733 | 2,446 | 14,078 | 05/2017 | |||||||||||||||||||||
| 2033 | 10/31/2033 | 607 & 611 Lumsden Professional Ct. | Brandon | FL | 1 | BluePearl Holdings, LLC | 8,500 | 15 | % | 195 | 195 | - | - | |||||||||||||||||||||
| 4525 Ulmerton Rd. | Clearwater | FL | 1 | BluePearl Holdings, LLC | 3,000 | 15 | % | 116 | 116 | - | - | |||||||||||||||||||||||
| 455 Abernathy Rd. | Atlanta | GA | 1 | BluePearl Holdings, LLC | 32,000 | 15 | % | 1,209 | 960 | - | - | |||||||||||||||||||||||
| 820 Frontage Rd. | Northfield | IL | 1 | BluePearl Holdings, LLC | 14,000 | 15 | % | 453 | 453 | - | - | |||||||||||||||||||||||
| 4126 Packard Rd. | Ann Arbor | MI | 1 | BluePearl Holdings, LLC | 3,500 | 15 | % | 53 | 53 | - | - | |||||||||||||||||||||||
| 29080 Inkster Rd. | Southfield | MI | 1 | BluePearl Holdings, LLC | 38,000 | 15 | % | 1,274 | 1,095 | 18,791 | 11/2018 | |||||||||||||||||||||||
| 2036 | 8/31/2036 | 2203 North Westgreen Boulevard | Katy | TX | — | British Schools of America, LLC | 274,000 | 25 | % | 2,162 | 2,162 | - | - | |||||||||||||||||||||
| NON-CONSOLIDATED TOTAL/WEIGHTED AVERAGE | 100.0% Leased | 677,146 | $ | 13,112 | $ | 12,095 | $ | 47,037 | ||||||||||||||||||||||||||
Footnotes
| 1 | All mortgage notes are cross-collateralized and cross-defaulted. |
| 2 | Subsequent to 12/31/2016, Lexington sold its interest in the property. |
| 38 |
LEXINGTON REALTY TRUST
Select Credit Metrics Summary (1)
| 12/31/2016 | ||||
| Adjusted Company FFO Payout Ratio | 60.5 | % | ||
| Unencumbered Assets (2) | $3.31 billion | |||
| Unencumbered NOI | 73.5 | % | ||
| (Debt + Preferred) / Gross Assets | 41.9 | % | ||
| Debt/Gross Assets | 39.8 | % | ||
| Secured Debt / Gross Assets | 15.8 | % | ||
| Net Debt / Adjusted EBITDA | 5.2 | x | ||
| (Net Debt + Preferred) / Adjusted EBITDA | 5.5 | x | ||
| Credit Facilities Availability (3) | $395.4 million | |||
| Development / Gross Assets | 2.4 | % | ||
Footnotes
| (1) | See reconciliations of non-GAAP measures in this document. Lexington believes these credit metrics provide investors with additional information to evaluate its liquidity and performance. |
| (2) | Includes loans receivable. |
| (3) | Subject to covenant compliance. |
| 39 |
LEXINGTON REALTY TRUST
FINANCIAL COVENANTS (1)
Corporate Level Debt
| Bank Loans: | Must be: | 12/31/2016 | ||
| Maximum Leverage | < 60% | 42.3% | ||
| Fixed Charge Coverage | > 1.5x | 2.6x | ||
| Recourse Secured Indebtedness Ratio | < 10% cap value | 0.0% | ||
| Secured Indebtedness Ratio | < 45% | 17.3% | ||
| Unsecured Debt Service Coverage | > 2.0x | 5.1x | ||
| Unencumbered Leverage | < 60% | 34.0% | ||
| Bonds: | ||||
| Debt to Total Assets | < 60% | 40.4% | ||
| Secured Debt to Total Assets | < 40% | 16.0% | ||
| Debt Service Coverage | > 1.5x | 4.1x | ||
| Unencumbered Assets to Unsecured Debt | > 150% | 310.4% |
Footnotes
| (1) | The following is a summary of the key financial covenants for Lexington's credit facility and term loans and senior notes, as defined and calculated per the terms of the credit facility and term loans and senior notes, as applicable. These calculations are presented to show Lexington's compliance with such covenants only and are not measures of Lexington's liquidity or performance. |
| 40 |
LEXINGTON REALTY TRUST
Consolidated Properties: Mortgages and Notes Payable
12/31/2016
| Property | Footnotes | Debt Balance ($000) | Interest Rate (%) | Maturity (a) | Current Estimated Annual Debt Service ($000) (c) | Balloon Payment ($000) | ||||||||||||||
| Mortgages with Balloons | ||||||||||||||||||||
| Lisle, IL | (b) | $ | 9,275 | 6.500 | % | N/A | $ | - | $ | 9,275 | ||||||||||
| Memphis, TN | (b) | 3,496 | 5.710 | % | 01/2017 | - | 3,496 | |||||||||||||
| Orlando, FL | 9,309 | 5.722 | % | 02/2017 | 46 | 9,309 | ||||||||||||||
| Shreveport, LA | 19,000 | 5.690 | % | 07/2017 | 637 | 19,000 | ||||||||||||||
| McDonough, GA | 21,922 | 6.110 | % | 11/2017 | 1,509 | 21,651 | ||||||||||||||
| Erwin, NY | 7,448 | 5.910 | % | 10/2018 | 728 | 6,637 | ||||||||||||||
| Overland Park, KS | 33,503 | 5.891 | % | 05/2019 | 2,657 | 31,812 | ||||||||||||||
| Kansas City, MO | 15,968 | 5.883 | % | 05/2019 | 1,268 | 15,179 | ||||||||||||||
| Columbus, IN | 16,649 | 2.210 | % | 07/2019 | 4,757 | 4,993 | ||||||||||||||
| Meridian, ID | 8,883 | 6.010 | % | 08/2019 | 753 | 7,675 | ||||||||||||||
| Streetsboro, OH | 17,304 | 5.749 | % | 09/2019 | 1,344 | 16,338 | ||||||||||||||
| Lenexa, KS | 9,056 | 6.270 | % | 12/2019 | 774 | 7,770 | ||||||||||||||
| Boca Raton, FL | 19,365 | 6.470 | % | 02/2020 | 1,542 | 18,414 | ||||||||||||||
| Oakland, ME | 8,627 | 5.930 | % | 10/2020 | 750 | 7,660 | ||||||||||||||
| Lavonia, GA | 7,326 | 5.460 | % | 12/2020 | 741 | 5,895 | ||||||||||||||
| Charleston, SC | 7,090 | 5.850 | % | 02/2021 | 520 | 6,632 | ||||||||||||||
| Whippany, NJ | 13,219 | 6.298 | % | 11/2021 | 1,344 | 10,400 | ||||||||||||||
| Chester, SC | 8,055 | 5.380 | % | 08/2025 | 1,144 | 362 | ||||||||||||||
| Richland, WA | 110,000 | 4.000 | % | 01/2026 | 4,400 | 99,492 | ||||||||||||||
| Lenexa, KS | 34,981 | 3.700 | % | 11/2027 | 3,052 | 10,000 | ||||||||||||||
| Richmond, VA | 57,500 | 5.191 | % | 02/2031 | 3,026 | 53,176 | ||||||||||||||
| Lake Jackson, TX | 196,512 | 4.040 | % | 10/2036 | 11,926 | 11,305 | ||||||||||||||
| Subtotal/Wtg. Avg./Years Remaining (i) | $ | 634,488 | 4.734 | % | 10.5 | $ | 42,918 | $ | 376,471 | |||||||||||
| Full Amortizing Mortgages | ||||||||||||||||||||
| Lorain, OH | 773 | 7.750 | % | 07/2018 | 569 | - | ||||||||||||||
| Manteca, CA | 546 | 7.750 | % | 07/2018 | 402 | - | ||||||||||||||
| Watertown, NY | 514 | 7.750 | % | 07/2018 | 378 | - | ||||||||||||||
| Fairlea, WV | 361 | 7.750 | % | 07/2018 | 265 | - | ||||||||||||||
| San Diego, CA | 348 | 7.750 | % | 07/2018 | 256 | - | ||||||||||||||
| Galesburg, IL | 307 | 7.750 | % | 07/2018 | 225 | - | ||||||||||||||
| North Berwick, ME | 3,426 | 3.560 | % | 04/2019 | 1,532 | - | ||||||||||||||
| Wall, NJ | 14,816 | 6.250 | % | 01/2021 | 3,774 | - | ||||||||||||||
| Palo Alto, CA | 43,285 | 3.970 | % | 12/2023 | 7,059 | - | ||||||||||||||
| Long Island City, NY | 46,309 | 3.500 | % | 03/2028 | 4,538 | - | ||||||||||||||
| Subtotal/Wtg. Avg./Years Remaining (i) | $ | 110,685 | 4.163 | % | 8.0 | $ | 18,998 | $ | - | |||||||||||
| Subtotal/Wtg. Avg./Years Remaining (i) | $ | 745,173 | 4.649 | % | 10.1 | $ | 61,916 | $ | 376,471 | |||||||||||
| 41 |
LEXINGTON REALTY TRUST
Consolidated Properties: Mortgages and Notes Payable
12/31/2016
| Property | Footnotes | Debt Balance ($000) | Interest Rate (%) | Maturity (a) | Current Estimated Annual Debt Service ($000) (c) | Balloon Payment ($000) | ||||||||||||||
| Corporate (f) | ||||||||||||||||||||
| Term Loan | (g) | $ | 250,000 | 2.192 | % | 08/2020 | $ | 5,556 | $ | 250,000 | ||||||||||
| Term Loan | (h) | 255,000 | 2.523 | % | 01/2021 | 6,523 | 255,000 | |||||||||||||
| Senior Notes | 250,000 | 4.250 | % | 06/2023 | 10,625 | 250,000 | ||||||||||||||
| Senior Notes | 250,000 | 4.400 | % | 06/2024 | 11,000 | 250,000 | ||||||||||||||
| Trust Preferred Notes | (d) | 129,120 | 6.804 | % | 04/2037 | 8,785 | 129,120 | |||||||||||||
| Subtotal/Wtg. Avg./Years Remaining (i) | $ | 1,134,120 | 3.732 | % | 7.0 | $ | 42,489 | $ | 1,134,120 | |||||||||||
| Total/Wtg. Avg./Years Remaining (i) | (e) | $ | 1,879,293 | 4.096 | % | 8.3 | $ | 104,405 | $ | 1,510,591 | ||||||||||
Footnotes
| (a) | Subtotal and total based on weighted-average term to maturity shown in years based on debt balance. |
| (b) | Loan is in default as of December 31, 2016. |
| (c) | Remaining payments for debt with less than 12 months to maturity, all others are debt service for next 12 months. |
| (d) | Rate fixed through 04/2017; thereafter, three month LIBOR plus 170 bps. |
| (e) | See reconciliations of non-GAAP measures in this document. |
| (f) | Unsecured. |
| (g) | Rate ranges from LIBOR plus 0.90% to 1.75%. LIBOR rate fixed at 1.09% through February 2018 via interest rate swap agreements. |
| (h) | Rate ranges from LIBOR plus 0.90% to 1.75%. LIBOR rate fixed at 1.42% through January 2019 via interest rate swap agreements. |
| (i) | Total shown may differ from detailed amounts due to rounding. |
| 42 |
LEXINGTON REALTY TRUST
Non- Consolidated Investments: Mortgages & Notes Payable
12/31/2016
| Joint Venture | Debt Balance ($000) | Interest Rate (%) | Maturity | Current Estimated Annual Debt Service ($000) (3) | Balloon Payment ($000) | |||||||||||||
| Rehab Humble Lessee (1) | $ | 14,078 | 4.700 | % | 05/2017 | $ | 371 | $ | 13,982 | |||||||||
| Gan Palm Beach Lessee (2) | 14,168 | 3.700 | % | 03/2018 | 842 | 13,768 | ||||||||||||
| BP Lessee (1) | 18,791 | 4.010 | % | 11/2018 | 764 | 18,791 | ||||||||||||
| Total/Wtg. Avg. (1)/Years Remaining (2) | $ | 47,037 | 4.123 | % | 1.2 | $ | 1,977 | $ | 46,541 | |||||||||
Footnotes
| (1) | Lexington has a 15% equity interest in the joint venture. |
| (2) | Lexington has a 25% equity interest in the joint venture. |
| (3) | Remaining payments for debt with less than 12 months to maturity, all others are debt service for next 12 months. |
| 43 |
LEXINGTON REALTY TRUST
Debt Maturity Schedule
12/31/2016
($000)
| Consolidated Properties | ||||||||||||
| Year | Mortgage Scheduled Amortization | Mortgage Balloon Payments | Corporate Debt | |||||||||
| 2017 | $ | 30,000 | $ | 62,731 | $ | - | ||||||
| 2018 | 30,076 | 6,637 | - | |||||||||
| 2019 | 26,681 | 83,767 | - | |||||||||
| 2020 | 23,178 | 31,969 | 250,000 | |||||||||
| 2021 | 23,433 | 17,032 | 255,000 | |||||||||
| $ | 133,368 | $ | 202,136 | $ | 505,000 | |||||||
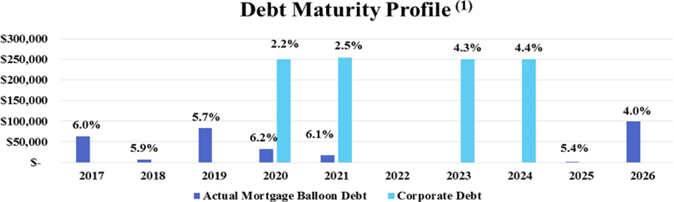
Footnotes
| (1) | Percentage denotes weighted-average interest rate. |
| 44 |
LEXINGTON REALTY TRUST
Mortgage Loans Receivable
12/31/2016
| Collateral | Current | |||||||||||||||||||||
| City | State | Loan Balance ($000)(1) | Interest Rate | Maturity Date | Estimated Annual Debt Service ($000)(2) | Balloon Payment ($000) | ||||||||||||||||
| Office | Oklahoma City (3) | OK | $ | 8,501 | 11.50 | % | N/A | $ | - | $ | 8,420 | |||||||||||
| Hospital | Kennewick (4) | WA | 85,709 | 9.00 | % | 05/2022 | 7,438 | 87,245 | ||||||||||||||
| Total Mortgage Loans Receivable | $ | 94,210 | $ | 7,438 | $ | 95,665 | ||||||||||||||||
Footnotes
| (1) | Includes accrued interest receivable, loan losses, and net origination fees. |
| (2) | Remaining collections for debt less than 12 months to maturity, all others are debt service for next 12 months. |
| (3) | Short-term loan to tenant-in-common, which was in default at 12/31/2016. Amount collected in full in February 2017. |
| (4) | Subsequent to 12/31/2016, loan sold for a gross sale price of $80.4 million. |
| 45 |
LEXINGTON REALTY TRUST
Selected Balance Sheet and Income Statement Account Data
12/31/2016
($000)
| Balance Sheet | ||||
| Other assets | $ | 37,888 | ||
| The components of other assets are: | ||||
| Deposits | $ | 917 | ||
| Equipment | 621 | |||
| Prepaids | 1,604 | |||
| Other receivables | 1,265 | |||
| Deferred lease incentives | 13,128 | |||
| Lake Jackson developer escrows | 20,183 | |||
| Interest rate swap derivative asset | 44 | |||
| Other | 126 | |||
| Accounts payable and other liabilities | ||||
| The components of accounts payable and other liabilities are: | $ | 59,601 | ||
| Accounts payable and accrued expenses | $ | 16,569 | ||
| CIP accruals and other | 6,300 | |||
| Taxes | 682 | |||
| Deferred lease and loan costs | 7,636 | |||
| Deposits | 1,148 | |||
| Escrows | 1,072 | |||
| Transaction / build-to-suit costs | 25,117 | |||
| Interest rate swap derivative liability | 1,077 | |||
| Income Statement - Twelve months ended December 31, 2016 | ||||
| Non-cash interest expense, net | $ | (469 | ) | |
| 46 |
LEXINGTON REALTY TRUST
NON-GAAP MEASURES
DEFINITIONS
Lexington has used non-GAAP financial measures as defined by the Securities and Exchange Commission Regulation G in the Quarterly Earnings Press Release, in this Quarterly Supplemental Information and in other public disclosures.
Lexington believes that the measures defined below are helpful to investors in measuring our performance or that of an individual investment. Since these measures exclude certain items which are included in their respective most comparable Generally Accepted Accounting Principles (“GAAP”) measures, reliance on the measures has limitations; management compensates for these limitations by using the measures simply as supplemental measures that are weighed in balance with other GAAP measures. These measures are not necessarily indications of our cash flow available to fund cash needs. Additionally, they should not be used as an alternative to the respective most comparable GAAP measures when evaluating Lexington's financial performance or cash flow from operating, investing, or financing activities or liquidity.
Definitions:
Adjusted EBITDA: Adjusted EBITDA represents EBITDA (earnings before interest, taxes, depreciation and amortization) modified to include other adjustments to GAAP net income for gains on sales of properties, impairment charges, debt satisfaction gains (charges), net, non-cash charges, net, straight-line adjustments and adjustments for pro-rata share of non-wholly owned entities. Lexington’s calculation of Adjusted EBITDA may not be comparable to similarly titled measures used by other companies. Lexington believes that net income is the most directly comparable GAAP measure to Adjusted EBITDA.
Cash Rent: Cash Rent is calculated by making adjustments to GAAP rent to remove the impact of GAAP required adjustments to rental income such as adjustments for straight-line rents related to free rent periods and contractual rent increases. Cash Rent excludes lease termination income. Lexington believes Cash Rent provides a meaningful indication of an investments ability to fund cash needs.
Funds from Operations (“FFO”) and Adjusted Company FFO: Lexington believes that Funds from Operations, or FFO, which is a non-GAAP measure, is a widely recognized and appropriate measure of the performance of an equity real estate investment trust (“REIT”). Lexington believes FFO is frequently used by securities analysts, investors and other interested parties in the evaluation of REITs, many of which present FFO when reporting their results. FFO is intended to exclude GAAP historical cost depreciation and amortization of real estate and related assets, which assumes that the value of real estate diminishes ratably over time. Historically, however, real estate values have risen or fallen with market conditions. As a result, FFO provides a performance measure that, when compared year over year, reflects the impact to operations from trends in occupancy rates, rental rates, operating costs, development activities, interest costs and other matters without the inclusion of depreciation and amortization, providing perspective that may not necessarily be apparent from net income.
The National Association of Real Estate Investment Trusts, or NAREIT, defines FFO as “net income (or loss) computed in accordance with GAAP, excluding gains (or losses) from sales of property, plus real estate depreciation and amortization and after adjustments for non-consolidated partnerships and joint ventures.” NAREIT clarified its computation of FFO to exclude impairment charges on depreciable real estate owned directly or indirectly. FFO does not represent cash generated from operating activities in accordance with GAAP and is not indicative of cash available to fund cash needs.
Lexington presents FFO available to common shareholders and unitholders - basic and also presents FFO available to all equityholders and unitholders - diluted on a company-wide basis as if all securities that are convertible, at the holder's option, into Lexington’s common shares, are converted at the beginning of the period. Lexington also presents Adjusted Company FFO available to all equityholders and unitholders - diluted which adjusts FFO available to all equityholders and unitholders - diluted for certain items which we believe are not indicative of the operating results of Lexington's real estate portfolio. Lexington believes this is an appropriate presentation as it is frequently requested by security analysts, investors and other interested parties. Since others do not calculate these measures in a similar fashion, these measures may not be comparable to similarly titled measures as reported by others. These measures should not be considered as an alternative to net income as an indicator of Lexington’s operating performance or as an alternative to cash flow as a measure of liquidity.
GAAP and Cash Yield or Capitalization Rate: GAAP and cash yields or capitalization rates are measures of operating performance used to evaluate the individual performance of an investment. These measures are not presented or intended to be viewed as a liquidity or performance measure that present a numerical measure of Lexington's historical or future financial performance, financial position or cash flows. The yield or capitalization rate is calculated by dividing the annualized NOI (as defined below, except GAAP rent adjustments are added back to rental income to calculate GAAP yield or capitalization rate) the investment is expected to generate (or has generated) by the acquisition/completion cost (or sale) price.
| 47 |
LEXINGTON REALTY TRUST
NON-GAAP MEASURES
DEFINITIONS (CONTINUED)
Net Operating Income (NOI): NOI is a measure of operating performance used to evaluate the individual performance of an investment. This measure is not presented or intended to be viewed as a liquidity or performance measure that presents a numerical measure of Lexington's historical or future financial performance, financial position or cash flows. Lexington defines NOI as operating revenues (rental income (less GAAP rent adjustments and lease termination income), tenant reimbursements and other property income) less property operating expenses. Other REITs may use different methodologies for calculating NOI, and accordingly, Lexington's NOI may not be comparable to that of other companies. Because NOI excludes general and administrative expenses, interest expense, depreciation and amortization, acquisition-related expenses, other nonproperty income and losses, and gains and losses from property dispositions, it provides a performance measure that, when compared year over year, reflects the revenues and expenses directly associated with owning and operating commercial real estate and the impact to operations from trends in occupancy rates, rental rates, and operating costs, providing a perspective on operations not immediately apparent from net income. Lexington believes that net income is the most directly comparable GAAP measure to NOI.
Same-Store NOI: Same-Store NOI represents the NOI for consolidated properties that were owned and included in our portfolio for two comparable reporting periods excluding properties encumbered by mortgage loans in default and the revenue associated with the expansion of properties, as applicable. As Same-Store NOI excludes the change in NOI from acquired and disposed of properties and certain other properties, it highlights operating trends such as occupancy levels, rental rates and operating costs on properties. Other REITs may use different methodologies for calculating Same-Store NOI, and accordingly, Lexington's Same-Store NOI may not be comparable to other REITs. Management believes that Same-Store NOI is a useful supplemental measure of Lexington's operating performance. However, Same-Store NOI should not be viewed as an alternative measure of Lexington 's financial performance since it does not reflect the operations of Lexington's entire portfolio, nor does it reflect the impact of general and administrative expenses, acquisition-related expenses, interest expense, depreciation and amortization costs, other nonproperty income and losses, the level of capital expenditures and leasing costs necessary to maintain the operating performance of Lexington's properties, or trends in development and construction activities which are significant economic costs and activities that could materially impact Lexington's results from operations. Lexington believes that net income is the most directly comparable GAAP measure to Same-Store NOI.
| 48 |
LEXINGTON REALTY TRUST
RECONCILIATION OF NON-GAAP MEASURES
($000)
| Twelve months ended December 31, 2016 | ||||
| Cash Rent Reconciliation: | ||||
| Rental revenue as reported | $ | 398,065 | ||
| Rental revenue from sold properties | (47,550 | ) | ||
| Lease termination income | (16,347 | ) | ||
| GAAP rent per supplement | 334,168 | |||
| GAAP rent adjustments: (1) | ||||
| Straight-line adjustments | (13,724 | ) | ||
| Lease incentives | 1,610 | |||
| Amortization of above/below market leases | 1,897 | |||
| Cash rent per supplement | $ | 323,951 | ||
Consolidated debt reconciliation December 31, 2016:
| GAAP Balance | Deferred Loan Costs, net | Discounts | Gross Balance | |||||||||||||
| Mortgages and notes payable (2) | $ | 738,047 | $ | 7,126 | $ | - | $ | 745,173 | ||||||||
| Term loans payable (3) | 501,093 | 3,907 | - | 505,000 | ||||||||||||
| Senior notes payable(3) | 494,362 | 3,858 | 1,780 | 500,000 | ||||||||||||
| Trust preferred securities (3) | 127,096 | 2,024 | - | 129,120 | ||||||||||||
| Consolidated debt | $ | 1,860,598 | $ | 16,915 | $ | 1,780 | $ | 1,879,293 | ||||||||
Footnotes
| (1) | Individual items are adjusted for sold properties, which were previously reflected in the reconciliation. |
| (2) | Secured. |
| (3) | Unsecured. |
| 49 |
LEXINGTON REALTY TRUST
RECONCILIATION OF NON-GAAP MEASURES (CONTINUED)
($000)
Same-Store NOI Reconciliation:
| Twelve months ended December 31, | ||||||||||||
| 2016 | 2015 | 2014 | ||||||||||
| Net Income | $ | 96,450 | $ | 114,891 | $ | 97,463 | ||||||
| Interest and amortization expense | 88,032 | 89,792 | 100,400 | |||||||||
| Provision for income taxes | 1,439 | 572 | 1,168 | |||||||||
| Depreciation and amortization | 166,048 | 163,198 | 163,469 | |||||||||
| General and administrative | 31,104 | 29,277 | 28,285 | |||||||||
| Transaction costs | 836 | 2,404 | 1,901 | |||||||||
| Non-operating income | (13,043 | ) | (11,429 | ) | (16,839 | ) | ||||||
| Gains on sales of properties | (81,510 | ) | (24,884 | ) | (57,507 | ) | ||||||
| Gains on sales of financial assets | - | - | (855 | ) | ||||||||
| Impairment charges and loan losses | 100,236 | 36,832 | 51,100 | |||||||||
| Debt satisfaction (gains) charges, net | 975 | (25,150 | ) | 9,764 | ||||||||
| Equity in earnings of non-consolidated entities | (7,590 | ) | (1,752 | ) | (626 | ) | ||||||
| Lease termination income | (17,363 | ) | (4,241 | ) | (2,072 | ) | ||||||
| Straight-line adjustments | (37,748 | ) | (47,702 | ) | (47,227 | ) | ||||||
| Lease incentives | 1,673 | 1,544 | 1,490 | |||||||||
| Amortization of above/below market leases | 2,057 | 261 | 1,136 | |||||||||
| Net Operating Income - ("NOI") | 331,596 | 323,613 | 331,050 | |||||||||
| Less NOI: | ||||||||||||
| Disposed of properties | (21,793 | ) | (42,208 | ) | (71,755 | ) | ||||||
| Acquired properties | (57,970 | ) | (28,326 | ) | (8,856 | ) | ||||||
| Expansion revenue | (1,530 | ) | (1,317 | ) | - | |||||||
| Properties in default | (2,191 | ) | (2,158 | ) | (2,026 | ) | ||||||
| Same-Store NOI | $ | 248,112 | $ | 249,604 | $ | 248,413 | ||||||
NOI for NAV:
| Twelve months | ||||
| December 31, 2016 | ||||
| NOI per above | $ | 331,596 | ||
| Less NOI: | ||||
| Disposed of properties | (21,793 | ) | ||
| Assets held for sale | (3,229 | ) | ||
| Assets acquired in 2016 | (7,762 | ) | ||
| Assets less than 70% leased / Other | (3,404 | ) | ||
| NOI for NAV | $ | 295,408 | ||
| 50 |
LEXINGTON REALTY TRUST
RECONCILIATION OF NON-GAAP MEASURES (CONTINUED)
($000)
Reconciliation to Adjusted EBITDA:
| Year end December 31, 2016 | ||||
| Net income attributable to Lexington Realty Trust shareholders | $ | 95,624 | ||
| Interest and amortization expense | 88,032 | |||
| Provision for income taxes | 1,439 | |||
| Depreciation and amortization | 166,048 | |||
| Straight-line adjustments | (37,748 | ) | ||
| Lease incentives | 1,673 | |||
| Amortization of above/below market leases | 2,057 | |||
| Gains on sales of properties | (81,510 | ) | ||
| Impairment charges | 100,236 | |||
| Debt satisfaction charges, net | 975 | |||
| Non-cash charges, net | 8,998 | |||
| Pro-rata share adjustments: | ||||
| Non-consolidated entities adjustment | (4,810 | ) | ||
| Noncontrolling interests adjustment | (108 | ) | ||
| Adjusted EBITDA | $ | 340,906 | ||
| 51 |
LEXINGTON REALTY TRUST
RECONCILIATION OF NON-GAAP MEASURES (CONTINUED)
($000)
Reconciliation of Select Credit Metrics:
| Adjusted Company FFO Payout: | Twelve months ended December 31, 2016 | (Debt + Preferred) / Gross Assets: | Twelve months ended December 31, 2016 | |||||||
| Common share dividends per share | $ | 0.69 | Consolidated debt | $ | 1,860,598 | |||||
| Adjusted Company FFO per diluted share | 1.14 | Preferred shares liquidation preference | 96,770 | |||||||
| Adjusted Company FFO payout ratio | 60.5 | % | Debt and preferred | $ | 1,957,368 | |||||
| Unencumbered Assets: | Total assets | $ | 3,441,467 | |||||||
| Real estate, at cost | $ | 4,237,118 | Plus depreciation and amortization: | |||||||
| held for sale real estate, at cost | 33,746 | Real estate | 1,208,792 | |||||||
| less encumbered real estate, at cost | (1,055,768 | ) | Deferred lease costs | 24,482 | ||||||
| Loans receivable, net | 94,210 | |||||||||
| Unencumbered assets | $ | 3,309,306 | Gross assets | $ | 4,674,741 | |||||
| Unencumbered NOI: | (Debt + Preferred) / Gross Assets | 41.9 | % | |||||||
| NOI | $ | 331,596 | ||||||||
| Disposed of properties NOI | (21,793 | ) | Debt / Gross Assets: | |||||||
| Adjusted NOI | 309,803 | Consolidated debt | $ | 1,860,598 | ||||||
| less encumbered adjusted NOI | (81,980 | ) | ||||||||
| Unencumbered adjusted NOI | $ | 227,823 | Gross assets | $ | 4,674,741 | |||||
| Unencumbered NOI % | 73.5 | % | ||||||||
| Debt / Gross assets | 39.8 | % | ||||||||
| Net Debt / Adjusted EBITDA: | ||||||||||
| Adjusted EBITDA | $ | 340,906 | Secured Debt / Gross Assets: | |||||||
| Mortgages and notes payable | $ | 738,047 | ||||||||
| Consolidated debt | $ | 1,860,598 | ||||||||
| less cash and cash equivalents | (86,637 | ) | Gross assets | $ | 4,674,741 | |||||
| Net debt | $ | 1,773,961 | ||||||||
| Secured Debt / Gross Assets | 15.8 | % | ||||||||
| Net debt / Adjusted EBITDA | 5.2 | x | ||||||||
| (Net Debt + Preferred) / Adjusted EBITDA: | Development / Gross Assets: | |||||||||
| Adjusted EBITDA | $ | 340,906 | Investment in real estate under construction | $ | 106,652 | |||||
| Construction in progress | 5,119 | |||||||||
| Net debt | $ | 1,773,961 | Development | $ | 111,771 | |||||
| Preferred shares liquidation preference | 96,770 | |||||||||
| Net debt + preferred | $ | 1,870,731 | Gross assets | $ | 4,674,741 | |||||
| (Net Debt + Preferred) / Adjusted EBITDA | 5.5 | x | Development / Gross Assets | 2.4 | % | |||||
| 52 |
Investor Information
| Transfer Agent |
| Computershare | Overnight Correspondence: |
| PO Box 30170 | 211 Quality Circle, Suite 210 |
| College Station, TX 77842-3170 | College Station, TX, 77845 |
| (800) 850-3948 | |
| www-us.computershare.com/investor |
| Investor Relations |
Heather Gentry
Senior Vice President, Investor Relations
| Telephone (direct) | (212) 692-7219 |
| Facsimile (main) | (212) 594-6600 |
| hgentry@lxp.com |
| Research Coverage |
| Bank of America/Merrill Lynch | KeyBanc Capital Markets Inc. | |||
| James Feldman | (646) 855-5808 | Craig Mailman | (917) 368-2316 | |
| Barclays Capital | Ladenburg Thalmann & Co., Inc. | |||
| Ross L. Smotrich | (212) 526-2306 | Daniel P. Donlan | (212) 409-2056 | |
| Evercore Partners | Stifel Nicolaus | |||
| Sheila K. McGrath | (212) 497-0882 | John W. Guinee | (443) 224-1307 | |
| J.P. Morgan Chase | Wells Fargo Securities, LLC | |||
| Anthony Paolone | (212) 622-6682 | Todd J. Stender | (562) 637-1371 | |
| Jeffries & Company, Inc. | ||||
| Jon Peterson | (212) 284-1705 |
| 53 |